UNITED STATES
SECURITIES AND EXCHANGE COMMISSION
Washington, D.C. 20549
FORM N-CSR
CERTIFIED SHAREHOLDER REPORT OF REGISTERED MANAGEMENT INVESTMENT COMPANIES
Investment Company Act file number 811-04367
Columbia Funds Series Trust I
(Exact name of registrant as specified in charter)
290 Congress Street
Boston, MA 02210
(Address of principal executive offices) (Zip code)
Daniel J. Beckman
c/o Columbia Management Investment Advisers, LLC
290 Congress Street
Boston, MA 02210
Ryan C. Larrenaga, Esq.
c/o Columbia Management Investment Advisers, LLC
290 Congress Street
Boston, MA 02210
(Name and address of agent for service)
Registrant's telephone number, including area code: (800) 345-6611
Date of fiscal year end: April 30
Date of reporting period: April 30, 2024
Form N-CSR is to be used by management investment companies to file reports with the Commission not later than 10 days after the transmission to stockholders of any report that is required to be transmitted to stockholders under Rule 30e-1 under the Investment Company Act of 1940 (17 CFR 270.30e-1). The Commission may use the information provided on Form N-CSR in its regulatory, disclosure review, inspection, and policymaking roles.
A registrant is required to disclose the information specified by Form N-CSR, and the Commission will make this information public. A registrant is not required to respond to the collection of information contained in Form N-CSR unless the Form displays a currently valid Office of Management and Budget ("OMB") control number. Please direct comments concerning the accuracy of the information collection burden estimate and any suggestions for reducing the burden to Secretary, Securities and Exchange Commission, 100 F Street, NE, Washington, DC 20549. The OMB has reviewed this collection of information under the clearance requirements of 44 U.S.C. § 3507.
Item 1. Reports to Stockholders.
Columbia Bond Fund
Annual Report
April 30, 2024
In October 2022, the Securities and Exchange Commission (SEC) adopted a final rule, "Tailored Shareholder Reports for Mutual Funds and Exchange-Traded Funds; Fee Information in Investment Company Advertisements." The rule and form amendments will, among other things, require the Fund to transmit concise and visually engaging shareholder reports that highlight key information. The amendments will require that funds tag information in a structured data format and that certain more in-depth information be made available online and available for delivery free of charge to investors on request. The amendments became effective January 24, 2023. There is an 18-month transition period after the effective date of the amendments.
Each Tailored Shareholder Report will be share-class specific and will highlight key fund information the SEC believes is most relevant to investors in assessing their investment in the Fund. Much of the information, including a Fund’s financial statements, that is currently disclosed in a Fund’s shareholder reports will instead be made available on the Fund’s website and filed on Form N-CSR on an annual and semiannual basis. This information will be delivered to investors free of charge upon request. Columbia Fund reports will follow the Tailored Shareholder Report approach beginning with reports covering the period ending May 31, 2024.
The new rule also requires the Fund to mail a printed version of the Tailored Shareholder Report to all shareholders who have not elected to receive shareholder reports electronically. Rather than receiving a postcard notifying investors that the shareholder report for Funds in which they invest is available online, investors will begin receiving the Tailored Shareholder Report in the mail unless they have elected to receive their Fund documents electronically.
| No Financial Institution Guarantee | |
If you elect to receive the shareholder report for Columbia Bond Fund (the Fund) in paper, mailed to you, the Fund mails one shareholder report to each shareholder address, unless such shareholder elects to receive shareholder reports from the Fund electronically via e-mail or by having a paper notice mailed to you (Postcard Notice) that your Fund’s shareholder report is available at the Columbia funds’ website (columbiathreadneedleus.com/investor/). If you would like more than one report in paper to be mailed to you, or would like to elect to receive reports via e-mail or access them through Postcard Notice, please call shareholder services at 800.345.6611 and additional reports will be sent to you.
Proxy voting policies and procedures
The policy of the Board of Trustees is to vote the proxies of the companies in which the Fund holds investments consistent with the procedures as stated in the Statement of Additional Information (SAI). You may obtain a copy of the SAI without charge by calling 800.345.6611; contacting your financial intermediary; visiting columbiathreadneedleus.com/investor/; or searching the website of the Securities and Exchange Commission (SEC) at sec.gov. Information regarding how the Fund voted proxies relating to portfolio securities is filed with the SEC by August 31st for the most recent 12-month period ending June 30th of that year, and is available without charge by visiting columbiathreadneedleus.com/investor/, or searching the website of the SEC at sec.gov.
Quarterly schedule of investments
The Fund files a complete schedule of portfolio holdings with the SEC for the first and third quarters of each fiscal year on Form N-PORT. The Fund’s Form N-PORT filings are available on the SEC’s website at sec.gov. The Fund’s complete schedule of portfolio holdings, as filed on Form N-PORT, is available on columbiathreadneedleus.com/investor/ or can also be obtained without charge, upon request, by calling 800.345.6611.
Additional Fund information
For more information about the Fund, please visit columbiathreadneedleus.com/investor/ or call 800.345.6611. Customer Service Representatives are available to answer your questions Monday through Friday from 8 a.m. to 7 p.m. Eastern time.
Fund investment manager
Columbia Management Investment Advisers, LLC (the Investment Manager)
290 Congress Street
Boston, MA 02210
Fund distributor
Columbia Management Investment Distributors, Inc.
290 Congress Street
Boston, MA 02210
Fund transfer agent
Columbia Management Investment Services Corp.
P.O. Box 219104
Kansas City, MO 64121-9104
Columbia Bond Fund | Annual Report 2024
Fund at a Glance(Unaudited) Investment objective
The Fund seeks current income, consistent with minimal fluctuation of principal.
Portfolio management
Jason Callan
Lead Portfolio Manager
Managed Fund since 2016
Gene Tannuzzo, CFA
Portfolio Manager
Managed Fund since 2017
Alex Christensen, CFA
Portfolio Manager
Managed Fund since 2021
Average annual total returns (%) (for the period ended April 30, 2024) |
| | | | | |
| | | | | |
| | | | | |
| | | | |
| | | | |
| | | | |
| | | | |
Bloomberg U.S. Aggregate Bond Index | | | | |
Returns for Class A shares are shown with and without the maximum initial sales charge of 4.75%. The Fund’s other share classes are not subject to sales charges and have limited eligibility. Please see the Fund’s prospectus for details. Performance for different share classes will vary based on differences in sales charges and fees associated with each share class. All results shown assume reinvestment of distributions during the period. Returns do not reflect the deduction of taxes that a shareholder may pay on Fund distributions or on the redemption of Fund shares. Performance results reflect the effect of any fee waivers or reimbursements of Fund expenses by Columbia Management Investment Advisers, LLC and/or any of its affiliates. Absent these fee waivers or expense reimbursement arrangements, performance results would have been lower.
The performance information shown represents past performance and is not a guarantee of future results. The investment return and principal value of your investment will fluctuate so that your shares, when redeemed, may be worth more or less than their original cost. Current performance may be lower or higher than the performance information shown. You may obtain performance information current to the most recent month-end by contacting your financial intermediary, visiting columbiathreadneedleus.com/investor/ or calling 800.345.6611.
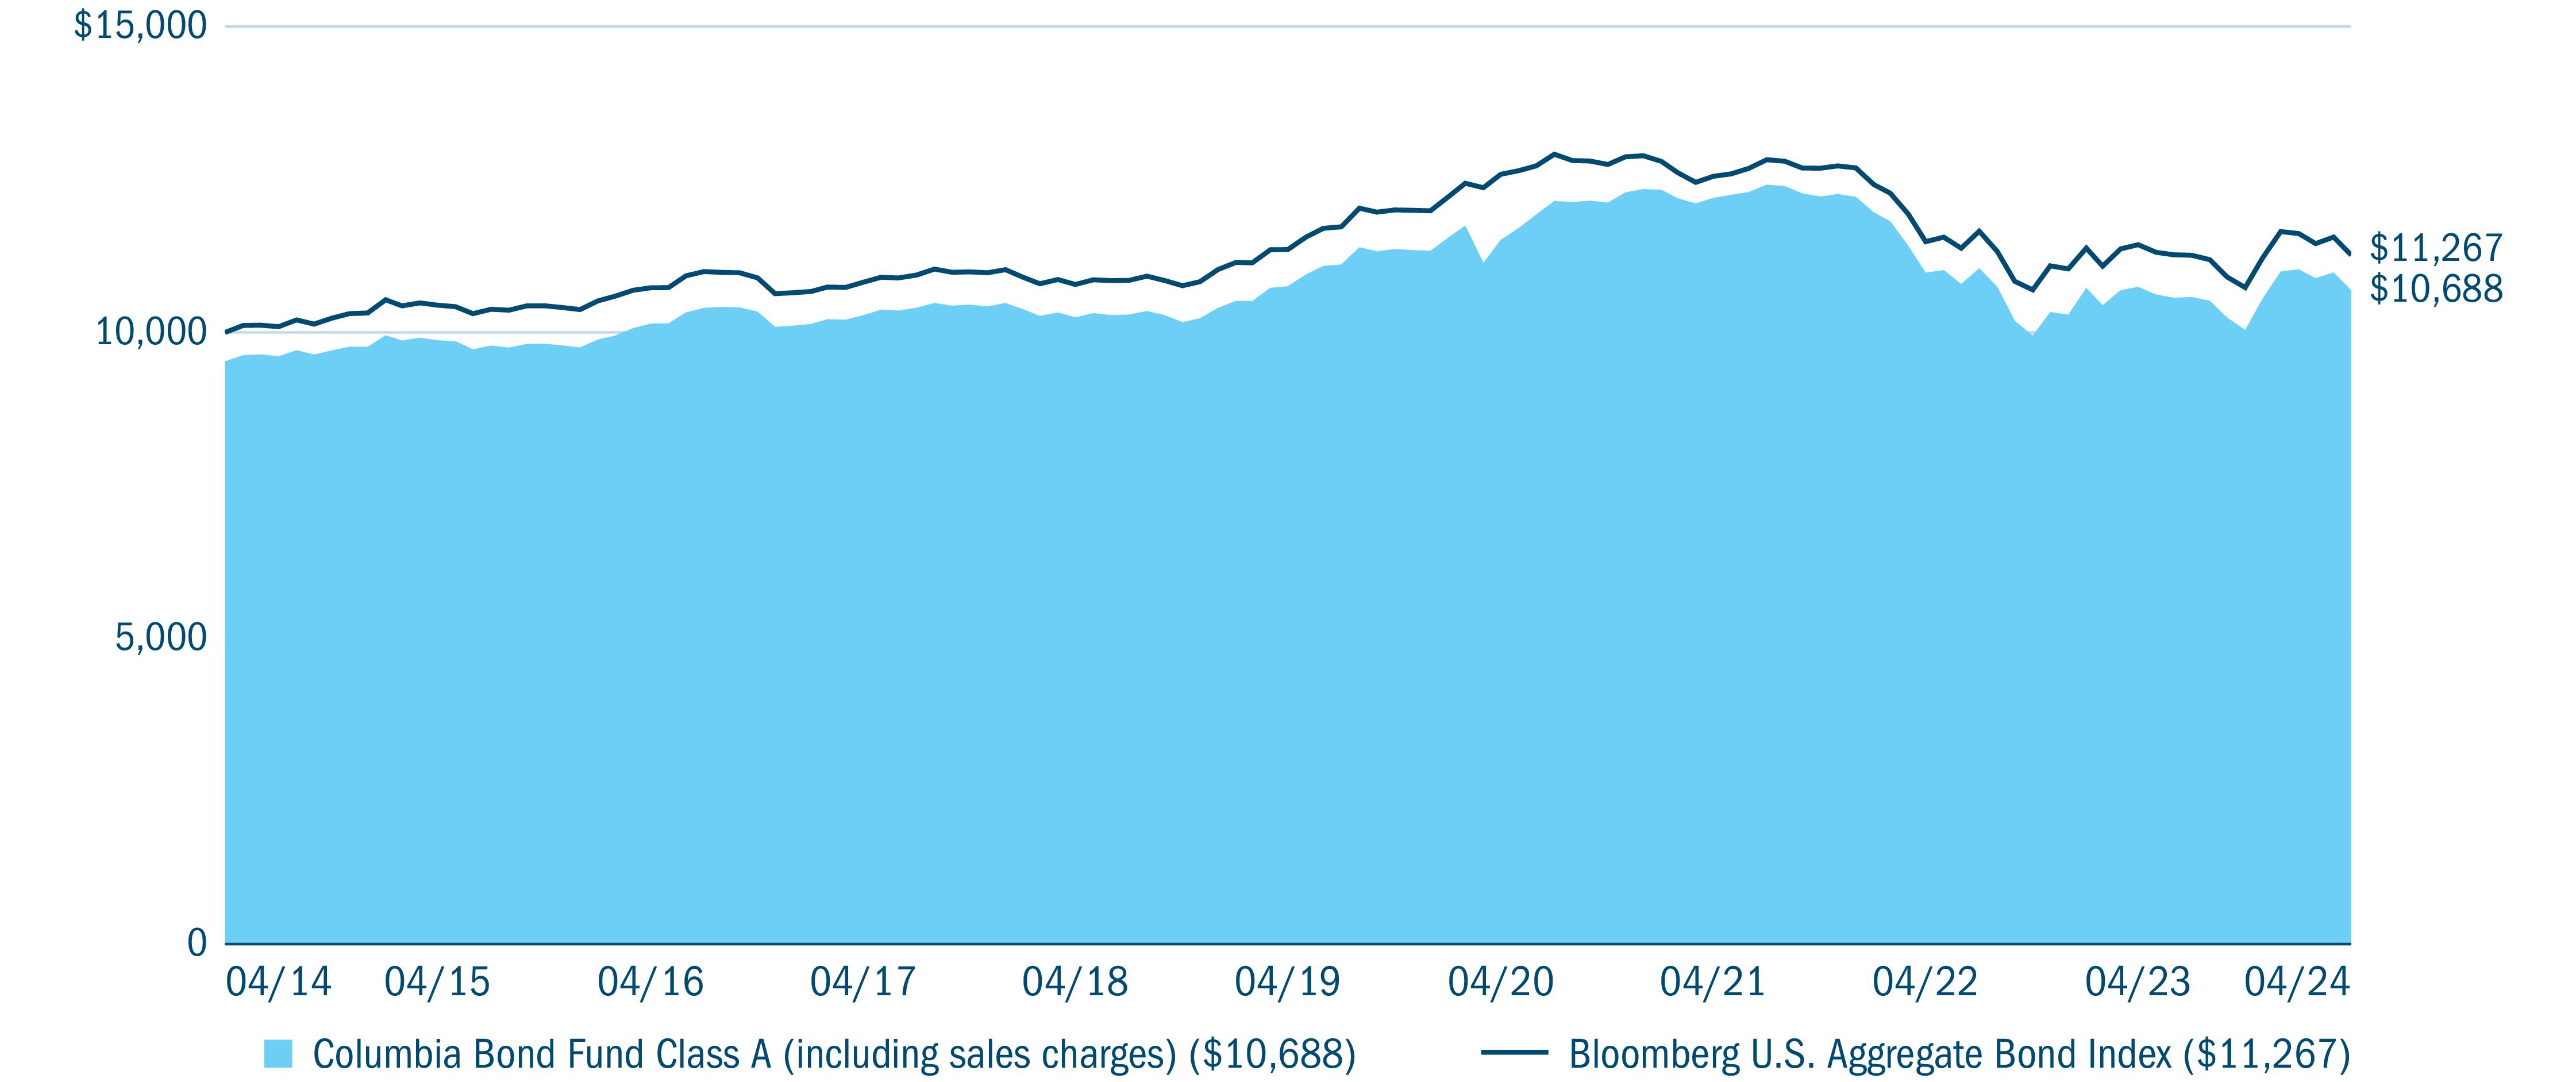
The Bloomberg U.S. Aggregate Bond Index is a broad-based benchmark that measures the investment-grade, U.S. dollar-denominated, fixed-rate taxable bond market, including Treasuries, government-related and corporate securities, mortgage-backed securities (agency fixed-rate and hybrid adjustable-rate mortgage passthroughs), asset-backed securities, and commercial mortgage-backed securities.
Indices are not available for investment, are not professionally managed and do not reflect sales charges, fees, brokerage commissions, taxes or other expenses of investing. Securities in the Fund may not match those in an index.
Columbia Bond Fund | Annual Report 2024
3
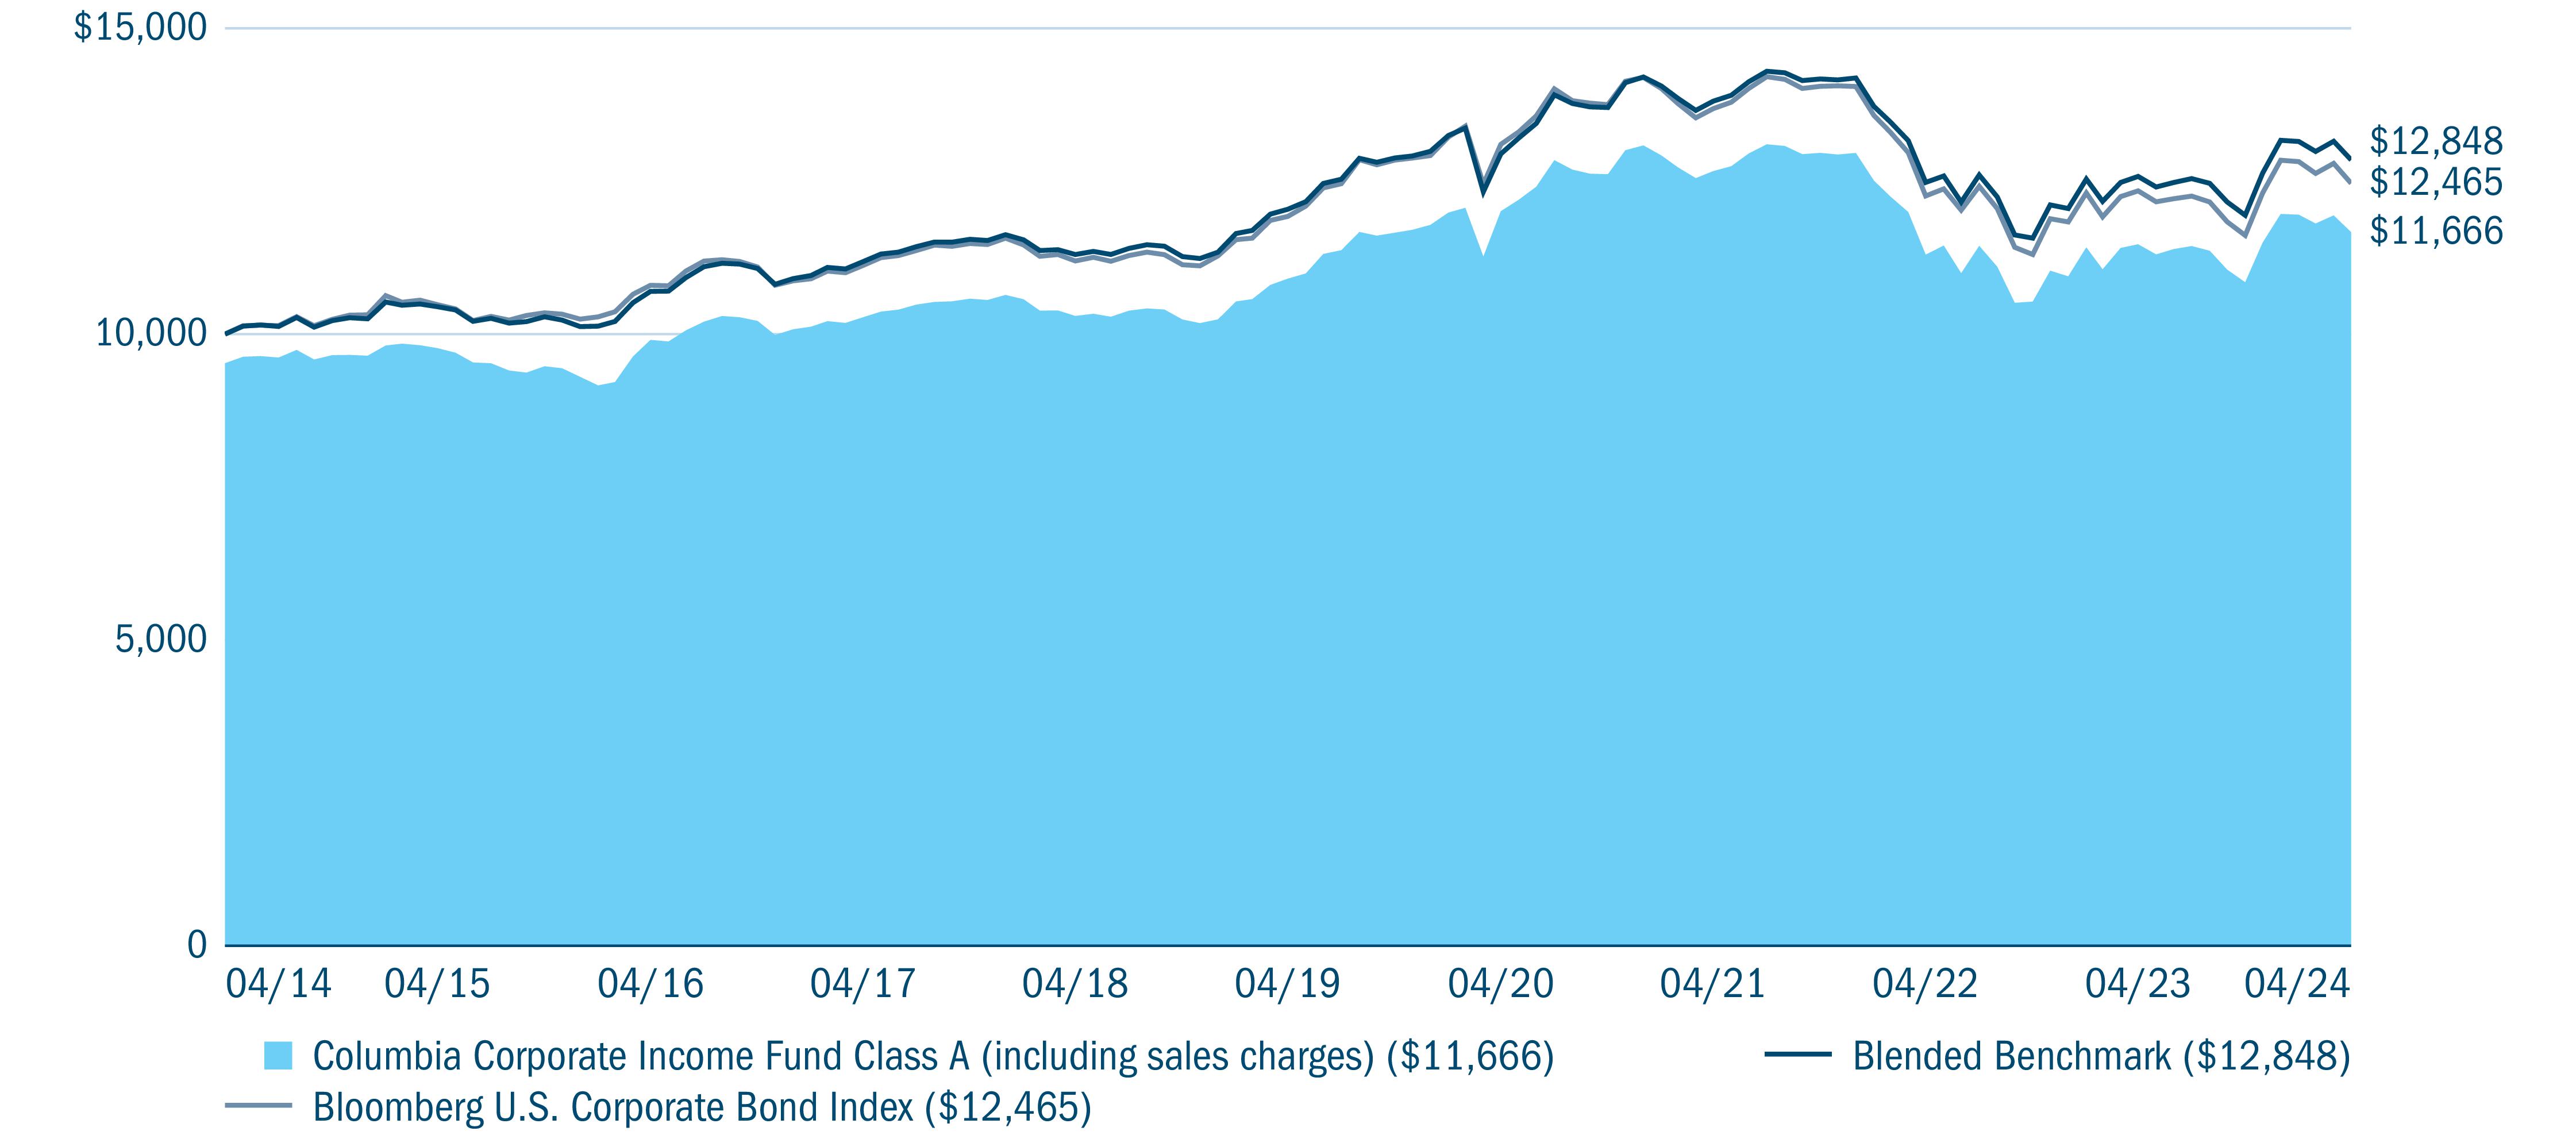
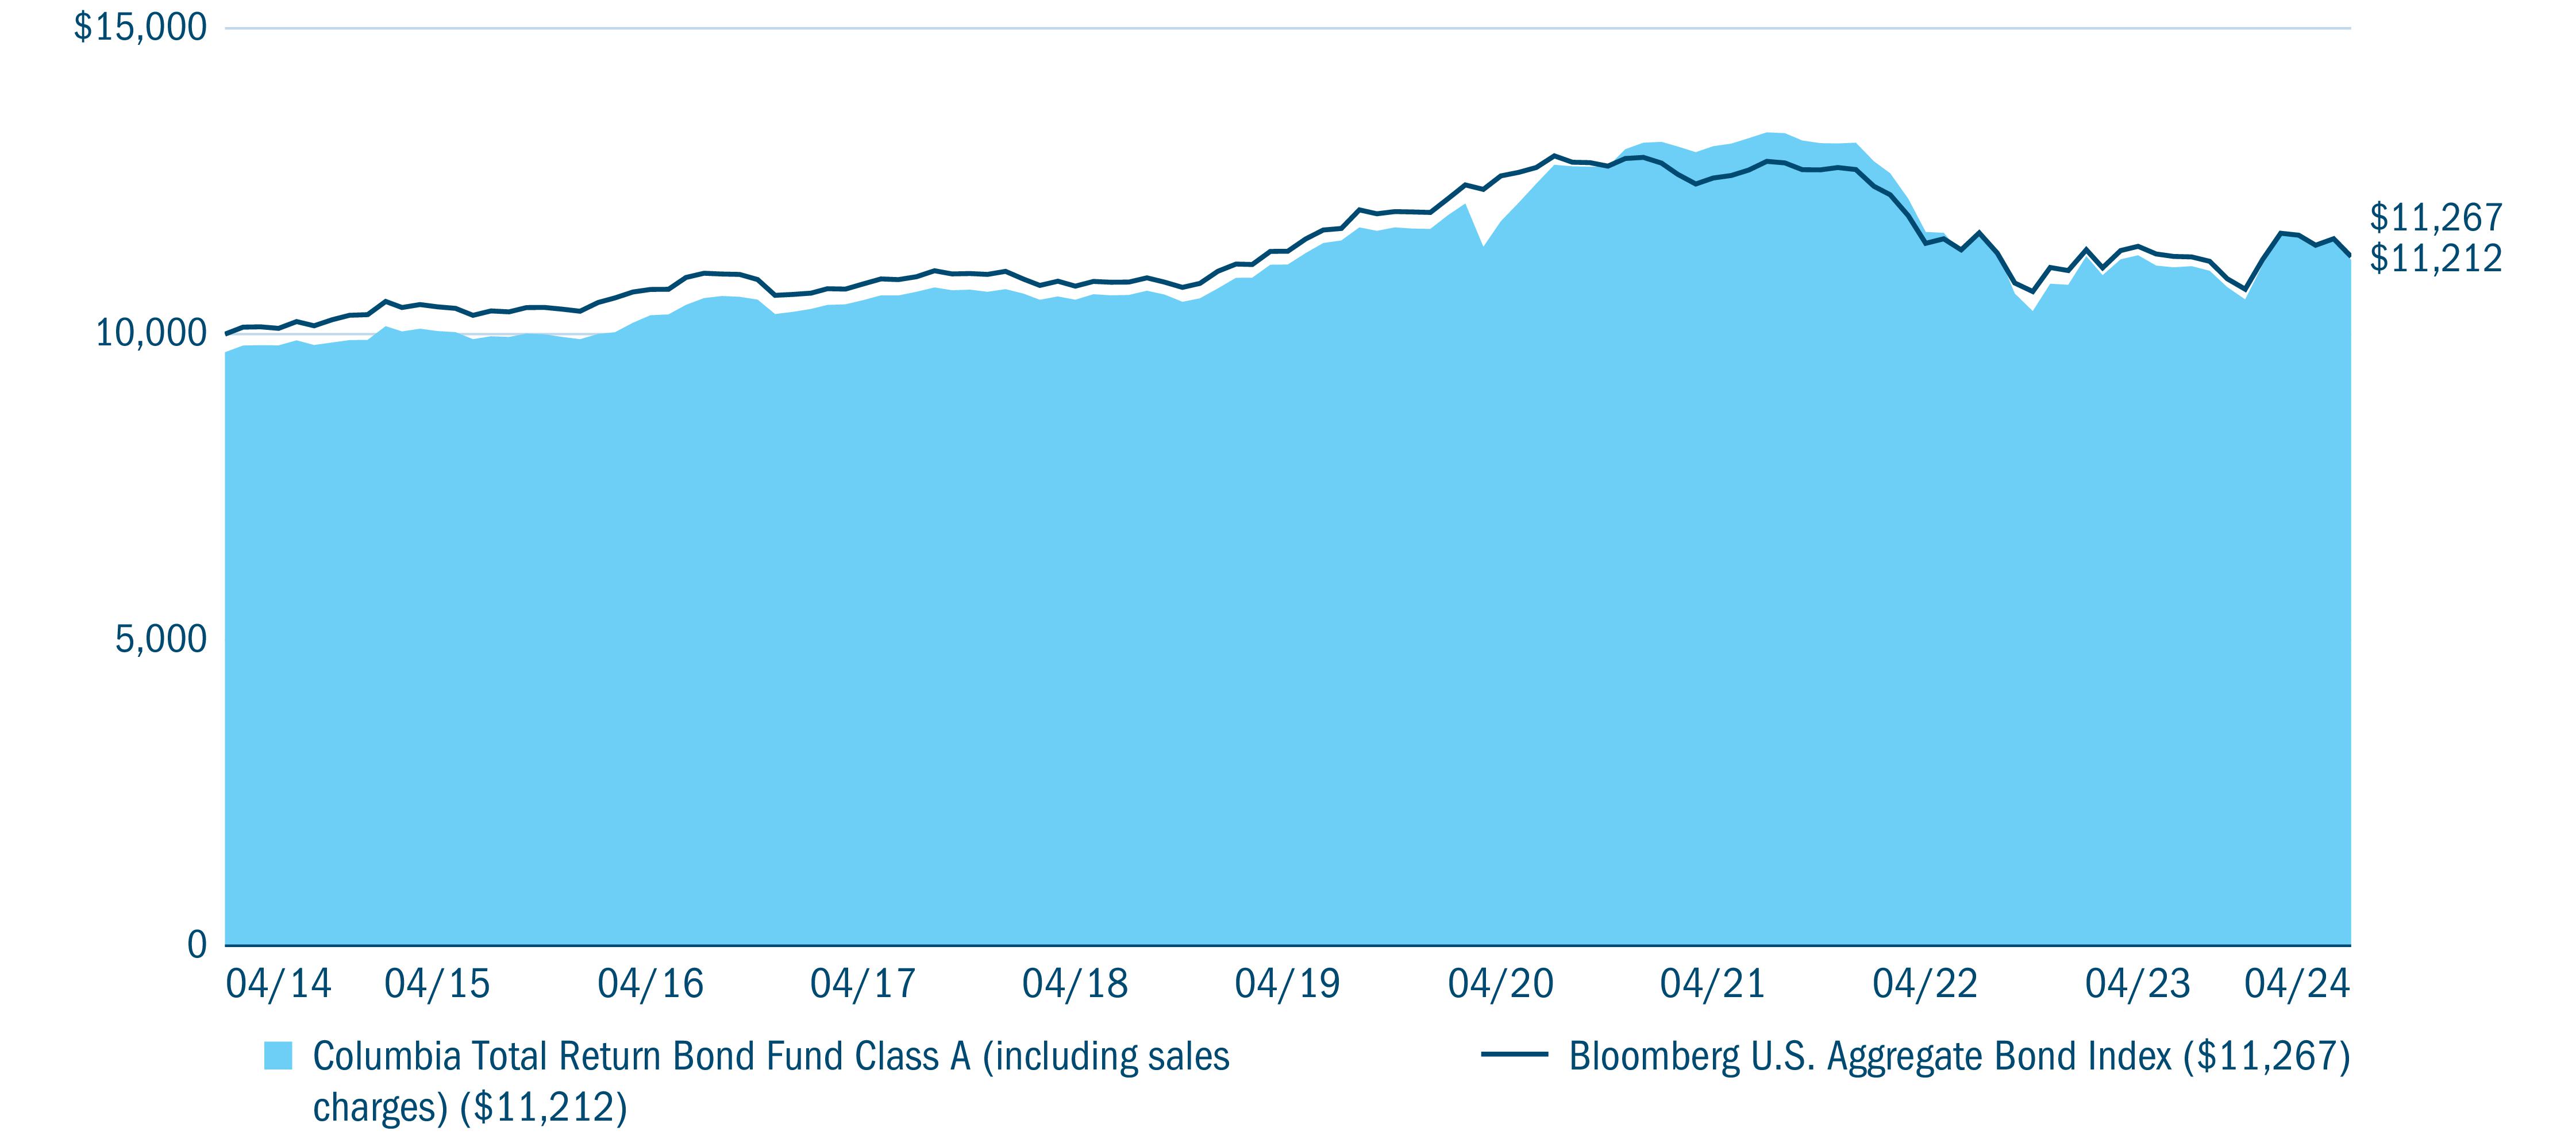
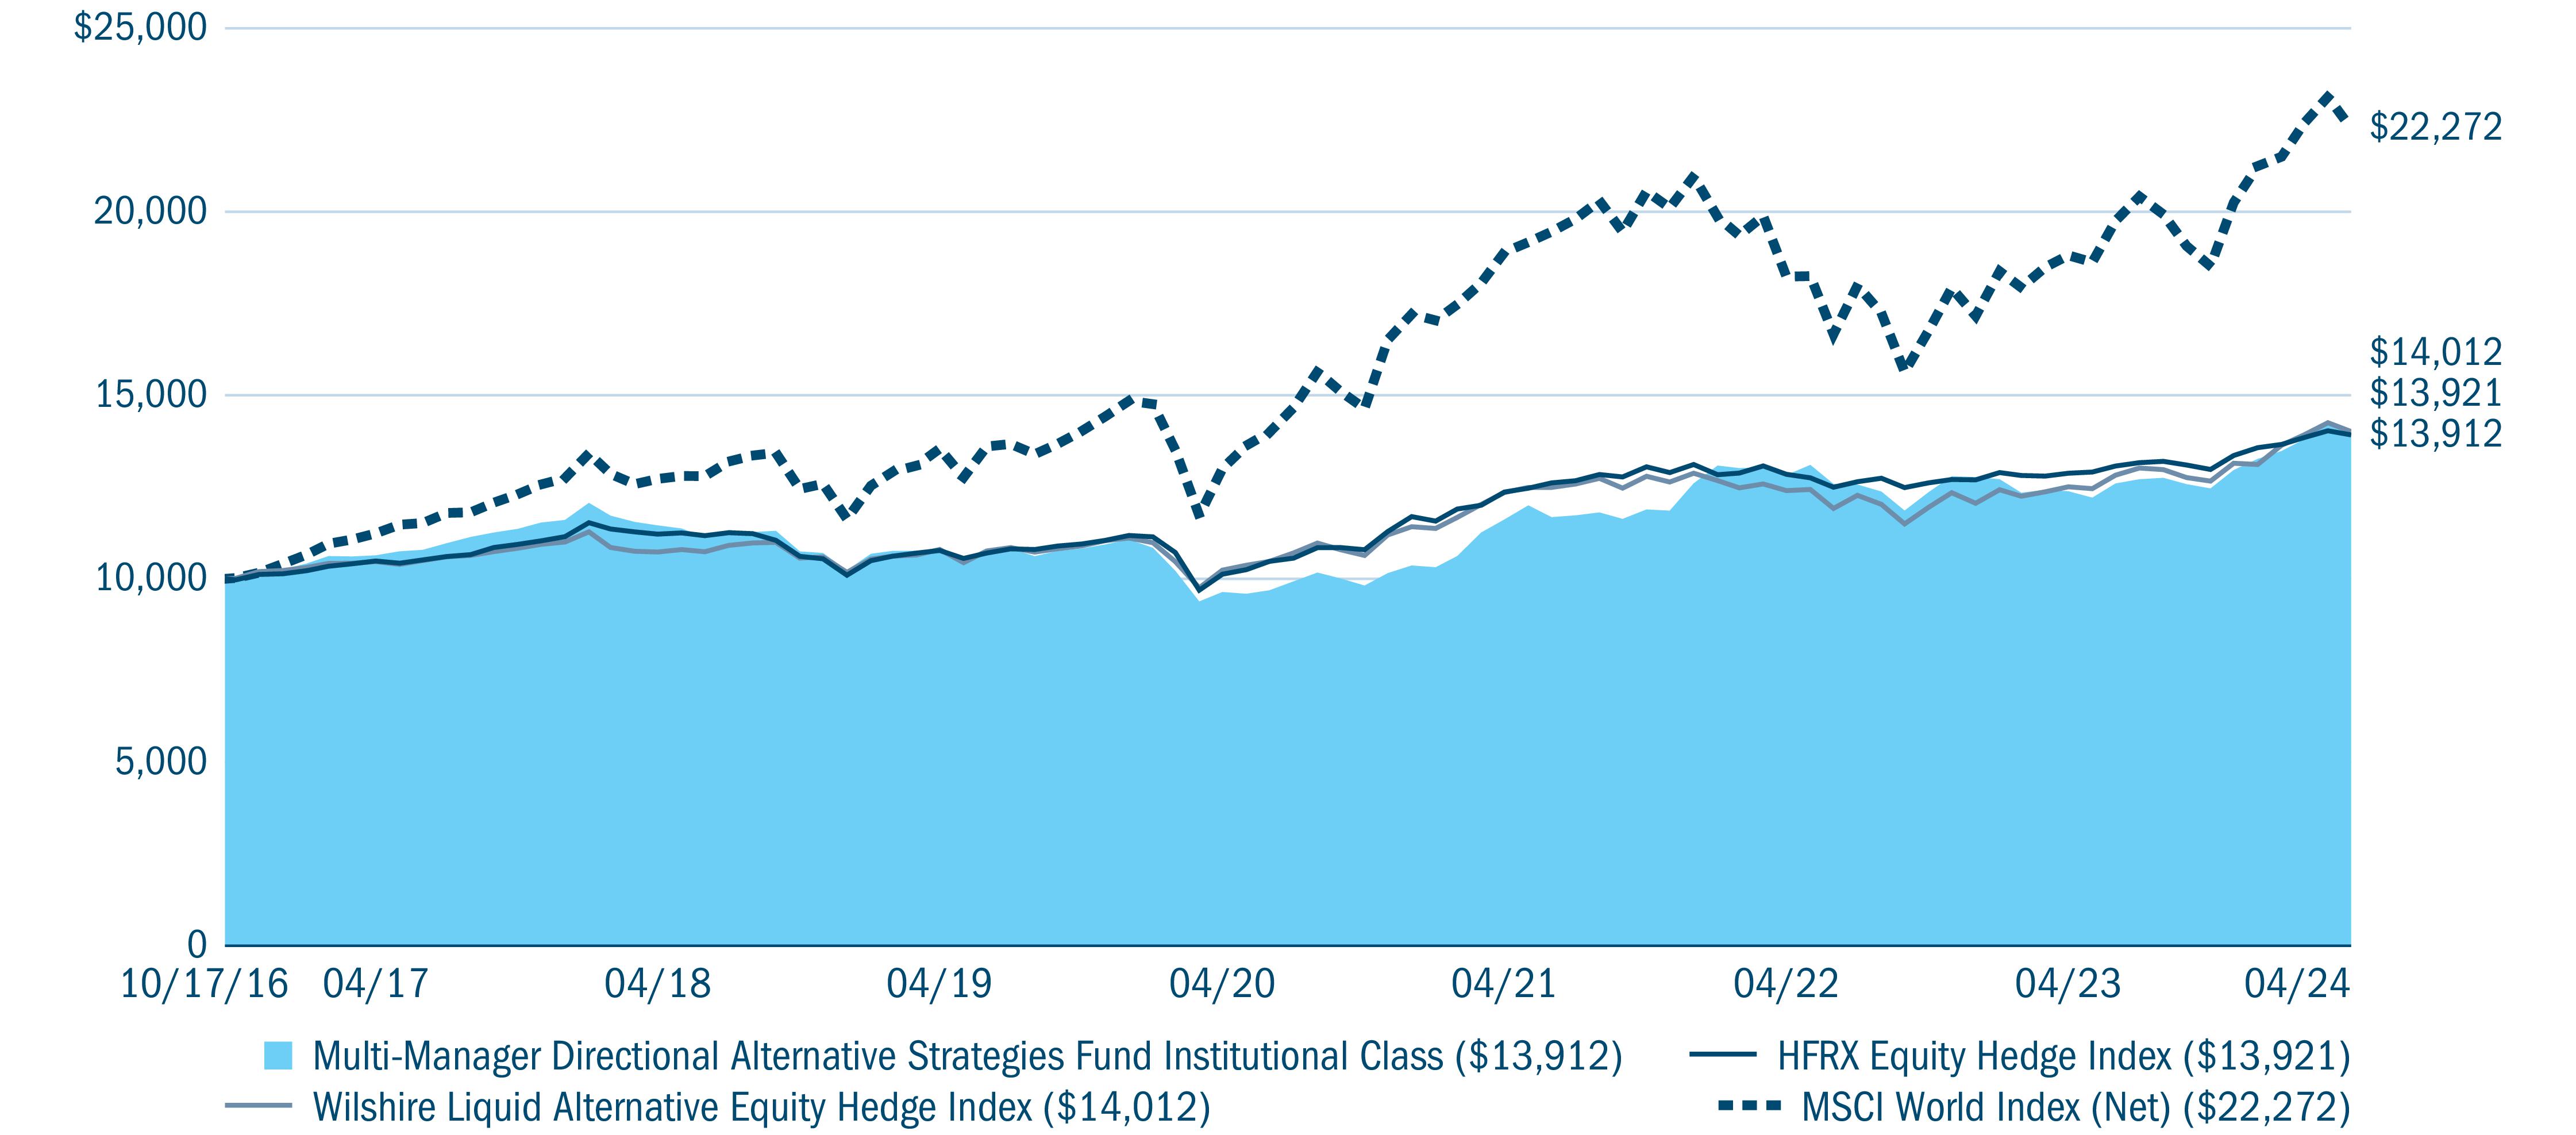
Fund at a Glance (continued)(Unaudited) Performance of a hypothetical $10,000 investment (April 30, 2014 — April 30, 2024)
The chart above shows the change in value of a hypothetical $10,000 investment in Class A shares of Columbia Bond Fund during the stated time period, and does not reflect the deduction of taxes that a shareholder may pay on Fund distributions or on the redemption of Fund shares.
Portfolio breakdown (%) (at April 30, 2024) |
Asset-Backed Securities - Non-Agency | |
Call Option Contracts Purchased | |
Commercial Mortgage-Backed Securities - Agency | |
Commercial Mortgage-Backed Securities - Non-Agency | |
| |
| |
| |
| |
Put Option Contracts Purchased | |
Residential Mortgage-Backed Securities - Agency | |
Residential Mortgage-Backed Securities - Non-Agency | |
| |
Percentages indicated are based upon total investments including option contracts purchased and excluding all other investments in derivatives, if any. The Fund’s portfolio composition is subject to change.
Quality breakdown (%) (at April 30, 2024) |
| |
| |
| |
| |
| |
| |
Percentages indicated are based upon total fixed income investments.
Bond ratings apply to the underlying holdings of the Fund and not the Fund itself and are divided into categories ranging from highest to lowest credit quality, determined by using the middle rating of Moody’s, S&P and Fitch, after dropping the highest and lowest available ratings. When ratings are available from only two rating agencies, the lower rating is used. When a rating is available from only one rating agency, that rating is used. If a security is not rated but has a rating by Kroll and/or DBRS, the same methodology is applied to those bonds that would otherwise be not rated. When a bond is not rated by any rating agency, it is designated as “Not rated.” Credit quality ratings assigned by a rating agency are subjective opinions, not statements of fact, and are subject to change, including daily. The ratings assigned by credit rating agencies are but one of the considerations that the Investment Manager and/or Fund’s subadviser incorporates into its credit analysis process, along with such other issuer-specific factors as cash flows, capital structure and leverage ratios, ability to de-leverage (repay) through free cash flow, quality of management, market positioning and access to capital, as well as such security-specific factors as the terms of the security (e.g., interest rate and time to maturity) and the amount and type of any collateral.
4
Columbia Bond Fund | Annual Report 2024
Manager Discussion of Fund Performance(Unaudited) At April 30, 2024, approximately 40.22% of the Fund’s shares were owned in the aggregate by affiliated funds-of-funds managed by Columbia Management Investment Advisers, LLC (the Investment Manager). As a result of asset allocation decisions by the Investment Manager, it is possible that the Fund may experience relatively large purchases or redemptions from affiliated funds-of-funds. The Investment Manager seeks to minimize the impact of these transactions by structuring them over a reasonable period of time. The Fund may experience increased expenses as it buys and sells securities as a result of purchases or redemptions by affiliated funds-of-funds.
For the 12-month period that ended April 30, 2024, Class A shares of Columbia Bond Fund returned -0.53% excluding sales charges. The Fund’s benchmark, the Bloomberg U.S. Aggregate Bond Index, returned -1.47% for the same period.
Market overview
For the 12 months that ended April 30, 2024, returns for the broader bond market were constrained as U.S. Treasury yields finished the period notably higher. At the same time, performance for credit-sensitive sectors of the market was supported by a resilient economic backdrop.
Inflation continued to ease as 2023 progressed, with June U.S. consumer price inflation coming in at 3.0%. With the economic and employment backdrop remaining strong despite the past policy tightening of the U.S. Federal Reserve (Fed), the central bank would implement additional 25 basis point increases at its May and July meetings, leaving the target range for the federal funds rate at 5.25% to 5.50%. (A basis point is 1/100 of a percent.) The Fed held rates steady at its last three meetings of 2023, citing the improving inflation outlook.
Entering 2024, with inflation seemingly headed towards the Fed’s 2% target, investors were anticipating as many as six or seven rate cuts in 2024, beginning as soon as March 2024. However, these hopes were dampened as U.S. economic and employment data remained robust, largely dispelling any lingering recession concerns. In addition, the pace of progress in taming inflation remained highly incremental. Against this backdrop, the consensus outlook shifted by the end of the first quarter of 2024 to encompass three Fed rate cuts before year end, with the first occurring in June. Inflation data for March reported in April actually reflected an uptick, leading investors to further push back expectations for the first rate cut to the fall. As of April 30, 2024, the yield on the 10-year U.S. Treasury note closed at 4.69% versus 3.44% 12 months earlier.
The Fund’s notable contributors during the period
•
In broad terms, positive contributions to the Fund’s performance relative to the benchmark were driven by overweight exposure to credit-based sectors, along with an underweight to U.S. Treasuries as the yield curve moved higher over the period.
•
Most notably, exposure to consumer-based credit proved beneficial, led by holdings of non-agency mortgage-backed securities as housing fundamentals remained strong and borrower delinquencies remained low.
•
Positioning in asset-backed securities was also additive, highlighted by holdings of unsecured consumer loans and collateralized loan obligations with floating interest rates.
•
Within corporate bonds, the Fund took advantage of shifting expectations around growth and inflation to add value by tactically increasing or decreasing its overall credit risk exposure.
•
In addition, a focus on the financials sector at the expense of industrials contributed positively. Within financials, the Fund favored the largest, global systemically important banks subject to the most rigorous capital requirements while avoiding the regional and second-tier banks viewed as most vulnerable to any downturn in conditions.
The Fund’s notable detractors during the period
•
The Fund’s positioning with respect to interest rates weighed most heavily on relative performance. Specifically, the Fund had an above-benchmark stance with respect to duration and corresponding interest rate sensitivity as U.S. Treasury yields moved higher over the period.
•
In addition, performance for the Fund’s agency mortgage-backed security holdings suffered against a backdrop of elevated interest rate volatility which at various junctures raised concerns around either a pick-up in prepayments or duration extension.
Columbia Bond Fund | Annual Report 2024
5
Manager Discussion of Fund Performance (continued)(Unaudited) Derivative usage
We invested in highly-liquid, widely traded Treasury futures and interest rate swaption contracts to help manage portfolio duration. These enabled us to efficiently implement our yield curve opinions and offset unintended yield curve impacts from other investments in the portfolio. We also used indexed exposure to credit default swaps to manage the Fund’s overall level of credit risk. On a standalone basis, the Fund’s use of derivatives had a negative impact on performance.
Market risk may affect a single issuer, sector of the economy, industry or the market as a whole. Mortgage- and asset-backed securities are affected by interest rates, financial health of issuers/originators, creditworthiness of entities providing credit enhancements and the value of underlying assets. Fixed-income securities present issuer default risk. A rise in interest rates may result in a price decline of fixed-income instruments held by the Fund, negatively impacting its performance and NAV. Falling rates may result in the Fund investing in lower yielding debt instruments, lowering the Fund’s income and yield. These risks may be heightened for longer maturity and duration securities. Non-investment-grade (high-yield or junk) securities present greater price volatility and more risk to principal and income than higher rated securities. Prepayment and extension risk exists because the timing of payments on a loan, bond or other investment may accelerate when interest rates fall or decelerate when interest rates rise which may reduce investment opportunities and potential returns. Investing in derivatives is a specialized activity that involves special risks that subject the Fund to significant loss potential, including when used as leverage, and may result in greater fluctuation in Fund value. See the Fund’s prospectus for more information on these and other risks.
The views expressed in this report reflect the current views of the respective parties who have contributed to this report. These views are not guarantees of future performance and involve certain risks, uncertainties and assumptions that are difficult to predict, so actual outcomes and results may differ significantly from the views expressed. These views are subject to change at any time based upon economic, market or other conditions and the respective parties disclaim any responsibility to update such views. These views may not be relied on as investment advice and, because investment decisions for a Columbia fund are based on numerous factors, may not be relied on as an indication of trading intent on behalf of any particular Columbia fund. References to specific securities should not be construed as a recommendation or investment advice.
6
Columbia Bond Fund | Annual Report 2024
Understanding Your Fund’s Expenses(Unaudited) As an investor, you incur two types of costs. There are shareholder transaction costs, which generally include sales charges on purchases and may include redemption fees. There are also ongoing fund costs, which generally include management fees, distribution and/or service fees, and other fund expenses. The following information is intended to help you understand your ongoing costs (in dollars) of investing in the Fund and to help you compare these costs with the ongoing costs of investing in other mutual funds.
Analyzing your Fund’s expenses
To illustrate these ongoing costs, we have provided examples and calculated the expenses paid by investors in each share class of the Fund during the period. The actual and hypothetical information in the table is based on an initial investment of $1,000 at the beginning of the period indicated and held for the entire period. Expense information is calculated two ways and each method provides you with different information. The amount listed in the “Actual” column is calculated using the Fund’s actual operating expenses and total return for the period. You may use the Actual information, together with the amount invested, to estimate the expenses that you paid over the period. Simply divide your account value by $1,000 (for example, an $8,600 account value divided by $1,000 = 8.6), then multiply the results by the expenses paid during the period under the “Actual” column. The amount listed in the “Hypothetical” column assumes a 5% annual rate of return before expenses (which is not the Fund’s actual return) and then applies the Fund’s actual expense ratio for the period to the hypothetical return. You should not use the hypothetical account values and expenses to estimate either your actual account balance at the end of the period or the expenses you paid during the period. See “Compare with other funds” below for details on how to use the hypothetical data.
Compare with other funds
Since all mutual funds are required to include the same hypothetical calculations about expenses in shareholder reports, you can use this information to compare the ongoing cost of investing in the Fund with other funds. To do so, compare the hypothetical example with the 5% hypothetical examples that appear in the shareholder reports of other funds. As you compare hypothetical examples of other funds, it is important to note that hypothetical examples are meant to highlight the ongoing costs of investing in a fund only and do not reflect any transaction costs, such as sales charges, or redemption or exchange fees. Therefore, the hypothetical calculations are useful in comparing ongoing costs only, and will not help you determine the relative total costs of owning different funds. If transaction costs were included in these calculations, your costs would be higher.
November 1, 2023 — April 30, 2024 |
| Account value at the
beginning of the
period ($) | Account value at the
end of the
period ($) | Expenses paid during
the period ($) | Fund’s annualized
expense ratio (%) |
| | | | | | | |
| | | | | | | |
| | | | | | | |
| | | | | | | |
| | | | | | | |
| | | | | | | |
Expenses paid during the period are equal to the annualized expense ratio for each class as indicated above, multiplied by the average account value over the period and then multiplied by the number of days in the Fund’s most recent fiscal half year and divided by 366.
Expenses do not include fees and expenses incurred indirectly by the Fund from its investment in underlying funds, including affiliated and non-affiliated pooled investment vehicles, such as mutual funds and exchange-traded funds.
Had Columbia Management Investment Advisers, LLC and/or certain of its affiliates not waived/reimbursed certain fees and expenses, account value at the end of the period would have been reduced.
Columbia Bond Fund | Annual Report 2024
7
Portfolio of InvestmentsApril 30, 2024(Percentages represent value of investments compared to net assets)
Investments in securities
Asset-Backed Securities - Non-Agency 21.0% |
| | | | |
|
|
| | | | |
Subordinated Series 2023-1PL Class B |
| | | | |
Subordinated Series 2023-3PL Class C |
| | | | |
|
|
| | | | |
Affirm Asset Securitization Trust(a) |
|
| | | | |
|
| | | | |
|
| | | | |
American Credit Acceptance Receivables Trust(a) |
Subordinated Series 2022-2 Class C |
| | | | |
Avant Loans Funding Trust(a) |
Subordinated Series 2021-REV1 Class B |
| | | | |
Bain Capital Credit CLO Ltd.(a),(b) |
|
3-month Term SOFR + 1.662%
04/23/2031 | | | | |
Carlyle Global Market Strategies CLO Ltd.(a),(b) |
Series 2016-1A Class A1R2 |
3-month Term SOFR + 1.402%
Floor 1.140%
04/20/2034 | | | | |
|
|
3-month Term SOFR + 1.662%
01/20/2030 | | | | |
Carvana Auto Receivables Trust(a) |
|
| | | | |
|
Series 2018-C17A Class A2R |
3-month Term SOFR + 1.862%
Floor 1.600%
04/30/2031 | | | | |
Dell Equipment Finance Trust(a) |
|
| | | | |
Asset-Backed Securities - Non-Agency (continued) |
| | | | |
Dryden 83 CLO Ltd.(a),(b) |
|
3-month Term SOFR + 2.412%
Floor 2.150%
01/18/2032 | | | | |
|
|
3-month Term SOFR + 1.612%
Floor 1.350%
05/15/2031 | | | | |
|
|
| | | | |
Subordinated Series 2021-3A Class C |
| | | | |
Subordinated Series 2022-1A Class C |
| | | | |
Subordinated Series 2023-3A Class B |
| | | | |
Exeter Automobile Receivables Trust |
|
| | | | |
Subordinated Series 2023-3A Class B |
| | | | |
GLS Auto Receivables Issuer Trust(a) |
Subordinated Series 2022-1A-B Class B |
| | | | |
GLS Auto Select Receivables Trust(a) |
|
| | | | |
LendingPoint Asset Securitization Trust(a) |
Subordinated Series 2022-A Class C |
| | | | |
|
|
| | | | |
Madison Park Funding XXIV Ltd.(a),(b) |
|
3-month Term SOFR + 2.012%
10/20/2029 | | | | |
Madison Park Funding XXVII Ltd.(a),(b) |
|
3-month Term SOFR + 1.612%
04/20/2030 | | | | |
Marlette Funding Trust(a) |
|
| | | | |
The accompanying Notes to Financial Statements are an integral part of this statement.
8
Columbia Bond Fund | Annual Report 2024
Portfolio of Investments (continued)April 30, 2024 Asset-Backed Securities - Non-Agency (continued) |
| | | | |
|
| | | | |
Octagon Investment Partners 35 Ltd.(a),(b) |
|
3-month Term SOFR + 1.662%
Floor 1.400%
01/20/2031 | | | | |
Octagon Investment Partners XXII Ltd.(a),(b) |
|
3-month Term SOFR + 1.712%
Floor 1.450%
01/22/2030 | | | | |
Oportun Issuance Trust(a) |
|
| | | | |
|
| | | | |
|
|
| | | | |
|
| | | | |
|
| | | | |
|
| | | | |
|
| | | | |
Subordinated Series 2022-1 Class B |
| | | | |
Subordinated Series 2022-2 Class B |
| | | | |
Subordinated Series 2023-7 Class B |
| | | | |
Subordinated Series 2024-3 Class B |
| | | | |
Pagaya AI Debt Trust(a),(c) |
Subordinated Series 2023-7 Class AB |
| | | | |
Palmer Square Loan Funding Ltd.(a),(b) |
Series 2022-3A Class A1BR |
3-month Term SOFR + 1.400%
Floor 1.400%
04/15/2031 | | | | |
Prosper Marketplace Issuance Trust(a) |
Subordinated Series 2023-1A Class B |
| | | | |
Asset-Backed Securities - Non-Agency (continued) |
| | | | |
|
Subordinated Series 2023-1A Class B |
| | | | |
Research-Driven Pagaya Motor Asset Trust(a) |
|
| | | | |
Research-Driven Pagaya Motor Asset Trust IV(a) |
|
| | | | |
Research-Driven Pagaya Motor Trust(a) |
|
| | | | |
|
|
3-month Term SOFR + 1.862%
Floor 1.600%
07/15/2035 | | | | |
|
Series 2014-14A Class A1R2 |
3-month Term SOFR + 1.352%
Floor 1.090%
01/15/2030 | | | | |
Santander Drive Auto Receivables Trust |
|
| | | | |
Santander Revolving Auto Loan Trust(a) |
|
| | | | |
|
|
| | | | |
|
| | | | |
|
| | | | |
Upstart Pass-Through Trust(a) |
|
| | | | |
|
| | | | |
|
| | | | |
|
| | | | |
Upstart Securitization Trust(a) |
|
| | | | |
|
| | | | |
The accompanying Notes to Financial Statements are an integral part of this statement.
Columbia Bond Fund | Annual Report 2024
9
Portfolio of Investments (continued)April 30, 2024 Asset-Backed Securities - Non-Agency (continued) |
| | | | |
Subordinated Series 2021-5 Class B |
| | | | |
Upstart Structured Pass-Through Trust(a) |
|
| | | | |
Westlake Automobile Receivables Trust(a) |
|
| | | | |
Total Asset-Backed Securities — Non-Agency
(Cost $177,815,819) | |
|
Commercial Mortgage-Backed Securities - Agency 0.1% |
| | | | |
Federal Home Loan Mortgage Corp. Multifamily Structured Pass-Through Certificates(c) |
Series 2017-K070 Class A2 |
| | | | |
Total Commercial Mortgage-Backed Securities - Agency
(Cost $1,011,771) | |
|
Commercial Mortgage-Backed Securities - Non-Agency 8.0% |
| | | | |
BAMLL Commercial Mortgage Securities Trust(a),(c) |
|
| | | | |
Braemar Hotels & Resorts Trust(a),(b) |
|
1-month Term SOFR + 0.867%
Floor 0.820%
06/15/2035 | | | | |
COMM Mortgage Trust(a),(c) |
Subordinated Series 2020-CBM Class D |
| | | | |
Corevest American Finance Trust(a) |
|
| | | | |
Credit Suisse Mortgage Capital Certificates OA LLC(a) |
|
| | | | |
|
Subordinated Series 2016-SFP Class D |
| | | | |
Invitation Homes Trust(a),(b) |
Subordinated Series 2018-SFR4 Class C |
1-month Term SOFR + 1.514%
Floor 1.400%
01/17/2038 | | | | |
JPMorgan Chase Commercial Mortgage Securities Trust(a),(c) |
Subordinated Series 2021-2NU Class C |
| | | | |
Morgan Stanley Capital I Trust(a),(c) |
|
| | | | |
Commercial Mortgage-Backed Securities - Non-Agency (continued) |
| | | | |
New Residential Mortgage Loan Trust(a) |
|
| | | | |
One New York Plaza Trust(a),(b) |
Subordinated Series 2020-1NYP Class B |
1-month Term SOFR + 1.614%
Floor 1.500%
01/15/2036 | | | | |
Subordinated Series 2020-1NYP Class C |
1-month Term SOFR + 2.314%
Floor 2.200%
01/15/2036 | | | | |
Progress Residential Trust(a) |
|
| | | | |
|
| | | | |
|
| | | | |
|
| | | | |
Subordinated Series 2022-SFR4 Class B |
| | | | |
SFO Commercial Mortgage Trust(a),(b) |
|
1-month Term SOFR + 1.264%
Floor 1.150%
05/15/2038 | | | | |
|
|
| | | | |
UBS Commercial Mortgage Trust(a),(b) |
|
1-month Term SOFR + 1.297%
Floor 1.250%
02/15/2032 | | | | |
Wells Fargo Commercial Mortgage Trust(a),(b) |
Subordinated Series 2017-SMP Class C |
1-month Term SOFR + 1.372%
Floor 1.200%
12/15/2034 | | | | |
Total Commercial Mortgage-Backed Securities - Non-Agency
(Cost $73,899,907) | |
The accompanying Notes to Financial Statements are an integral part of this statement.
10
Columbia Bond Fund | Annual Report 2024
Portfolio of Investments (continued)April 30, 2024
|
| | |
|
|
Crimson Wine Group Ltd.(d) | | |
| |
|
Oil, Gas & Consumable Fuels 0.0% |
| | |
| |
|
|
Jefferies Financial Group, Inc. | | |
| |
Total Common Stocks
(Cost $—) | |
Corporate Bonds & Notes 18.6% |
| | | | |
|
|
| | | | |
|
| | | | |
|
| | | | |
L3Harris Technologies, Inc. |
| | | | |
| | | | |
|
| | | | |
|
| | | | |
Raytheon Technologies Corp. |
| | | | |
| |
|
|
| | | | |
| | | | |
| | | | |
|
| | | | |
|
| | | | |
Corporate Bonds & Notes (continued) |
| | | | |
Goldman Sachs Group, Inc. (The)(f) |
| | | | |
| | | | |
|
| | | | |
|
| | | | |
| | | | |
| | | | |
|
| | | | |
| | | | |
| | | | |
|
| | | | |
PNC Financial Services Group, Inc. (The)(f) |
| | | | |
|
| | | | |
|
| | | | |
| | | | |
| |
|
Charter Communications Operating LLC/Capital |
| | | | |
| | | | |
| | | | |
| |
Construction Machinery 0.2% |
|
| | | | |
|
|
| | | | |
|
| | | | |
| | | | |
|
| | | | |
|
| | | | |
|
| | | | |
The accompanying Notes to Financial Statements are an integral part of this statement.
Columbia Bond Fund | Annual Report 2024
11
Portfolio of Investments (continued)April 30, 2024 Corporate Bonds & Notes (continued) |
| | | | |
Pacific Gas and Electric Co. |
| | | | |
| |
|
|
| | | | |
Bacardi Ltd./Bacardi-Martini BV(a) |
| | | | |
Constellation Brands, Inc. |
| | | | |
|
| | | | |
Pepsico Singapore Financing I Pte Ltd. |
| | | | |
| |
|
|
| | | | |
| | | | |
GE HealthCare Technologies, Inc. |
| | | | |
|
| | | | |
| |
Healthcare Insurance 1.8% |
|
| | | | |
| | | | |
|
| | | | |
| | | | |
|
| | | | |
| | | | |
| |
|
Peachtree Corners Funding Trust(a) |
| | | | |
Media and Entertainment 0.6% |
Warnermedia Holdings, Inc. |
| | | | |
|
|
| | | | |
Corporate Bonds & Notes (continued) |
| | | | |
Kinder Morgan Energy Partners LP |
| | | | |
|
| | | | |
Plains All American Pipeline LP/Finance Corp. |
| | | | |
Western Midstream Operating LP |
| | | | |
| |
|
|
| | | | |
|
|
| | | | |
|
| | | | |
|
| | | | |
Pfizer Investment Enterprises Pte., Ltd. |
| | | | |
| |
|
|
| | | | |
| | | | |
| |
|
|
| | | | |
NXP BV/Funding LLC/USA, Inc. |
| | | | |
| | | | |
| |
Transportation Services 0.4% |
|
| | | | |
|
|
| | | | |
Total Corporate Bonds & Notes
(Cost $167,721,212) | |
|
The accompanying Notes to Financial Statements are an integral part of this statement.
12
Columbia Bond Fund | Annual Report 2024
Portfolio of Investments (continued)April 30, 2024 Inflation-Indexed Bonds 1.5% |
| | | | |
|
U.S. Treasury Inflation-Indexed Bond |
| | | | |
| | | | |
| | | | |
| |
Total Inflation-Indexed Bonds
(Cost $13,340,809) | |
|
Residential Mortgage-Backed Securities - Agency 40.6% |
| | | | |
|
CMO Series 2023-46 Class SC |
30-day Average SOFR + 5.886%
Cap 6.000%
06/25/2050 | | | | |
Federal Home Loan Mortgage Corp.(h) |
| | | | |
| | | | |
Federal Home Loan Mortgage Corp. |
| | | | |
| | | | |
| | | | |
| | | | |
| | | | |
Federal Home Loan Mortgage Corp.(b),(g) |
|
-1.0 x 30-day Average SOFR + 5.936%
Cap 6.050%
08/25/2049 | | | | |
Federal Home Loan Mortgage Corp.(g) |
|
| | | | |
Federal Home Loan Mortgage Corp. REMICS(b),(g) |
|
-1.0 x 30-day Average SOFR + 5.886%
Cap 6.000%
01/15/2048 | | | | |
Federal National Mortgage Association |
| | | | |
| | | | |
| | | | |
| | | | |
| | | | |
Residential Mortgage-Backed Securities - Agency (continued) |
| | | | |
Federal National Mortgage Association(h) |
| | | | |
| | | | |
| | | | |
| | | | |
| | | | |
| | | | |
Federal National Mortgage Association(b),(g) |
CMO Series 2016-53 Class KS |
-1.0 x 30-day Average SOFR + 5.886%
Cap 6.000%
08/25/2046 | | | | |
CMO Series 2016-57 Class SA |
-1.0 x 30-day Average SOFR + 5.886%
Cap 6.000%
08/25/2046 | | | | |
CMO Series 2016-93 Class SL |
-1.0 x 30-day Average SOFR + 6.536%
Cap 6.650%
12/25/2046 | | | | |
CMO Series 2017-109 Class SA |
-1.0 x 30-day Average SOFR + 6.036%
Cap 6.150%
01/25/2048 | | | | |
CMO Series 2017-20 Class SA |
-1.0 x 30-day Average SOFR + 5.986%
Cap 6.100%
04/25/2047 | | | | |
CMO Series 2017-54 Class SN |
-1.0 x 30-day Average SOFR + 6.036%
Cap 6.150%
07/25/2047 | | | | |
CMO Series 2018-66 Class SM |
-1.0 x 30-day Average SOFR + 6.086%
Cap 6.200%
09/25/2048 | | | | |
CMO Series 2018-74 Class SA |
-1.0 x 30-day Average SOFR + 6.036%
Cap 6.150%
10/25/2048 | | | | |
The accompanying Notes to Financial Statements are an integral part of this statement.
Columbia Bond Fund | Annual Report 2024
13
Portfolio of Investments (continued)April 30, 2024 Residential Mortgage-Backed Securities - Agency (continued) |
| | | | |
CMO Series 2019-33 Class SB |
-1.0 x 30-day Average SOFR + 5.936%
Cap 6.050%
07/25/2049 | | | | |
CMO Series 2019-60 Class SH |
-1.0 x 30-day Average SOFR + 5.936%
Cap 6.050%
10/25/2049 | | | | |
CMO Series 2019-67 Class SE |
-1.0 x 30-day Average SOFR + 5.936%
Cap 6.050%
11/25/2049 | | | | |
Federal National Mortgage Association(g) |
CMO Series 2021-3 Class TI |
| | | | |
Federal National Mortgage Association REMICS(b),(g) |
CMO Series 2017-108 Class SA |
-1.0 x 30-day Average SOFR + 6.036%
Cap 6.150%
01/25/2048 | | | | |
CMO Series 2019-73 Class SC |
-1.0 x 30-day Average SOFR + 5.936%
Cap 6.050%
12/25/2049 | | | | |
CMO Series 2020-39 Class MS |
-1.0 x 30-day Average SOFR + 5.966%
Cap 6.080%
06/25/2050 | | | | |
|
|
| | | | |
|
| | | | |
Government National Mortgage Association(b) |
1-year CMT + 1.500%
Cap 10.000%
04/20/2028 | | | | |
Government National Mortgage Association(h) |
| | | | |
Government National Mortgage Association(b),(g) |
CMO Series 2017-112 Class SJ |
-1.0 x 1-month Term SOFR + 5.546%
Cap 5.660%
07/20/2047 | | | | |
Residential Mortgage-Backed Securities - Agency (continued) |
| | | | |
CMO Series 2017-130 Class HS |
-1.0 x 1-month Term SOFR + 6.086%
Cap 6.200%
08/20/2047 | | | | |
CMO Series 2017-149 Class BS |
-1.0 x 1-month Term SOFR + 6.086%
Cap 6.200%
10/20/2047 | | | | |
CMO Series 2017-163 Class SA |
-1.0 x 1-month Term SOFR + 6.086%
Cap 6.200%
11/20/2047 | | | | |
CMO Series 2017-37 Class SB |
-1.0 x 1-month Term SOFR + 6.036%
Cap 6.150%
03/20/2047 | | | | |
CMO Series 2018-103 Class SA |
-1.0 x 1-month Term SOFR + 6.086%
Cap 6.200%
08/20/2048 | | | | |
CMO Series 2018-112 Class LS |
-1.0 x 1-month Term SOFR + 6.086%
Cap 6.200%
08/20/2048 | | | | |
CMO Series 2018-125 Class SK |
-1.0 x 1-month Term SOFR + 6.136%
Cap 6.250%
09/20/2048 | | | | |
CMO Series 2018-134 Class KS |
-1.0 x 1-month Term SOFR + 6.086%
Cap 6.200%
10/20/2048 | | | | |
CMO Series 2018-148 Class SB |
-1.0 x 1-month Term SOFR + 6.086%
Cap 6.200%
01/20/2048 | | | | |
CMO Series 2018-151 Class SA |
-1.0 x 1-month Term SOFR + 6.036%
Cap 6.150%
11/20/2048 | | | | |
The accompanying Notes to Financial Statements are an integral part of this statement.
14
Columbia Bond Fund | Annual Report 2024
Portfolio of Investments (continued)April 30, 2024 Residential Mortgage-Backed Securities - Agency (continued) |
| | | | |
CMO Series 2018-89 Class MS |
-1.0 x 1-month Term SOFR + 6.086%
Cap 6.200%
06/20/2048 | | | | |
CMO Series 2018-91 Class DS |
-1.0 x 1-month Term SOFR + 6.086%
Cap 6.200%
07/20/2048 | | | | |
CMO Series 2019-20 Class JS |
-1.0 x 1-month Term SOFR + 5.886%
Cap 6.000%
02/20/2049 | | | | |
CMO Series 2019-5 Class SH |
-1.0 x 1-month Term SOFR + 6.036%
Cap 6.150%
01/20/2049 | | | | |
CMO Series 2019-56 Class SG |
-1.0 x 1-month Term SOFR + 6.036%
Cap 6.150%
05/20/2049 | | | | |
CMO Series 2019-59 Class KS |
-1.0 x 1-month Term SOFR + 5.936%
Cap 6.050%
05/20/2049 | | | | |
CMO Series 2019-74 Class PS |
-1.0 x 1-month Term SOFR + 5.936%
Cap 6.050%
06/20/2049 | | | | |
CMO Series 2019-85 Class SC |
-1.0 x 1-month Term SOFR + 6.036%
Cap 6.150%
07/20/2049 | | | | |
CMO Series 2019-90 Class SD |
-1.0 x 1-month Term SOFR + 6.036%
Cap 6.150%
07/20/2049 | | | | |
CMO Series 2019-92 Class SD |
-1.0 x 1-month Term SOFR + 5.986%
Cap 6.100%
07/20/2049 | | | | |
Residential Mortgage-Backed Securities - Agency (continued) |
| | | | |
CMO Series 2020-11 Class LS |
-1.0 x 1-month Term SOFR + 6.164%
Cap 6.050%
01/20/2050 | | | | |
CMO Series 2020-188 Class SA |
-1.0 x 1-month Term SOFR + 6.186%
Cap 6.300%
12/20/2050 | | | | |
CMO Series 2020-21 Class VS |
-1.0 x 1-month Term SOFR + 6.164%
Cap 6.050%
02/20/2050 | | | | |
CMO Series 2020-61 Class SW |
-1.0 x 1-month Term SOFR + 5.936%
Cap 6.050%
08/20/2049 | | | | |
CMO Series 2020-62 Class SG |
-1.0 x 1-month Term SOFR + 6.036%
Cap 6.150%
05/20/2050 | | | | |
CMO Series 2022-207 Class SA |
-1.0 x 1-month Term SOFR + 5.886%
Cap 6.000%
09/20/2049 | | | | |
CMO Series 2022-207 Class SC |
-1.0 x 1-month Term SOFR + 5.986%
Cap 6.100%
01/20/2050 | | | | |
CMO Series 2023-141 Class SN |
-1.0 x 1-month Term SOFR + 5.936%
Cap 6.050%
04/20/2049 | | | | |
CMO Series 2023-17 Class SY |
-1.0 x 1-month Term SOFR + 5.936%
Cap 6.050%
05/20/2050 | | | | |
CMO Series 2023-47 Class DS |
-1.0 x 1-month Term SOFR + 5.936%
Cap 6.050%
09/20/2049 | | | | |
The accompanying Notes to Financial Statements are an integral part of this statement.
Columbia Bond Fund | Annual Report 2024
15
Portfolio of Investments (continued)April 30, 2024 Residential Mortgage-Backed Securities - Agency (continued) |
| | | | |
CMO Series 2024-30 Class XH |
-1.0 x 30-day Average SOFR + 5.850%
Cap 5.850%
02/20/2054 | | | | |
Government National Mortgage Association(g) |
CMO Series 2020-164 Class CI |
| | | | |
CMO Series 2020-175 Class KI |
| | | | |
CMO Series 2020-191 Class UG |
| | | | |
CMO Series 2021-119 Class QI |
| | | | |
CMO Series 2021-139 Class IC |
| | | | |
CMO Series 2021-16 Class KI |
| | | | |
Government National Mortgage Association TBA(e) |
| | | | |
| | | | |
Uniform Mortgage-Backed Security TBA(e) |
| | | | |
| | | | |
| | | | |
| | | | |
| | | | |
| | | | |
Total Residential Mortgage-Backed Securities - Agency
(Cost $366,266,435) | |
|
Residential Mortgage-Backed Securities - Non-Agency 24.1% |
| | | | |
510 Asset Backed Trust(a),(c) |
CMO Series 2021-NPL2 Class A1 |
| | | | |
Angel Oak Mortgage Trust(a),(c) |
CMO Series 2020-1 Class M1 |
| | | | |
CMO Series 2020-3 Class A1 |
| | | | |
CMO Series 2021-5 Class A2 |
| | | | |
Angel Oak Mortgage Trust I LLC(a),(c) |
CMO Series 2018-3 Class M1 |
| | | | |
Residential Mortgage-Backed Securities - Non-Agency (continued) |
| | | | |
Arroyo Mortgage Trust(a),(c) |
CMO Series 2019-2 Class A3 |
| | | | |
|
CMO Series 2020-1 Class M1 |
| | | | |
Bellemeade Re Ltd.(a),(b) |
CMO Series 2019-3A Class M1C |
1-month Term SOFR + 2.064%
Floor 1.950%
07/25/2029 | | | | |
CMO Series 2022-1 Class M1A |
30-day Average SOFR + 1.750%
Floor 1.750%
01/26/2032 | | | | |
BRAVO Residential Funding Trust(a),(c) |
CMO Series 2020-NQM1 Class M1 |
| | | | |
CMO Series 2020-RPL2 Class A1 |
| | | | |
CMO Series 2021-A Class A1 |
| | | | |
Bunker Hill Loan Depositary Trust(a),(c) |
CMO Series 2019-3 Class A2 |
| | | | |
CMO Series 2019-3 Class A3 |
| | | | |
CMO Series 2020-1 Class A1 |
| | | | |
BVRT Financing Trust(a),(b),(i) |
CMO Series 2021-3F Class M2 |
30-day Average SOFR + 2.900%
Floor 2.900%
07/12/2033 | | | | |
CHNGE Mortgage Trust(a),(c) |
CMO Series 2022-1 Class A1 |
| | | | |
CMO Series 2022-2 Class A1 |
| | | | |
CMO Series 2022-3 Class A1 |
| | | | |
CMO Series 2023-3 Class A1 |
| | | | |
COLT Mortgage Loan Trust(a),(c) |
CMO Series 2020-2 Class A2 |
| | | | |
CMO Series 2021-3 Class A1 |
| | | | |
The accompanying Notes to Financial Statements are an integral part of this statement.
16
Columbia Bond Fund | Annual Report 2024
Portfolio of Investments (continued)April 30, 2024 Residential Mortgage-Backed Securities - Non-Agency (continued) |
| | | | |
CMO Series 2021-5 Class A2 |
| | | | |
Connecticut Avenue Securities Trust(a),(b) |
CMO Series 2022-R01 Class 1M2 |
30-day Average SOFR + 1.900%
12/25/2041 | | | | |
CMO Series 2022-R04 Class 1M2 |
30-day Average SOFR + 3.100%
03/25/2042 | | | | |
Credit Suisse Mortgage Trust(a),(c) |
CMO Series 2021-NQM2 Class A2 |
| | | | |
CMO Series 2021-RPL2 Class A1A |
| | | | |
|
CMO Series 2020-RPL2 Class A12 |
| | | | |
CMO Series 2020-RPL6 Class A1 |
| | | | |
CMO Series 2021-NQM8 Class A1 |
| | | | |
CMO Series 2022-NQM1 Class A3 |
| | | | |
CMO Series 2022-RPL3 Class A1 |
| | | | |
Subordinated CMO Series 2020-RPL3 Class A1 |
| | | | |
Deephaven Residential Mortgage Trust(a),(c) |
CMO Series 2021-1 Class A2 |
| | | | |
Ellington Financial Mortgage Trust(a),(c) |
CMO Series 2020-1 Class A3 |
| | | | |
Freddie Mac STACR REMIC Trust(a),(b) |
CMO Series 2021-DNA3 Class M1 |
30-day Average SOFR + 0.750%
10/25/2033 | | | | |
CMO Series 2022-DNA1 Class M1B |
30-day Average SOFR + 1.850%
01/25/2042 | | | | |
Subordinated CMO Series 2022-DNA6 Class M1A |
30-day Average SOFR + 2.150%
09/25/2042 | | | | |
Freddie Mac Structured Agency Credit Risk Debt Notes(a),(b) |
CMO Series 2022-DNA2 Class M1B |
30-day Average SOFR + 2.400%
02/25/2042 | | | | |
Residential Mortgage-Backed Securities - Non-Agency (continued) |
| | | | |
FWD Securitization Trust(a),(c) |
CMO Series 2020-INV1 Class M1 |
| | | | |
|
CMO Series 2021-CM1 Class A1 |
| | | | |
|
CMO Series 2021-CM2 Class A1 |
| | | | |
CMO Series 2022-NQM2 Class A3 |
| | | | |
GS Mortgage-Backed Securities Corp. Trust(a),(c) |
CMO Series 2021-NQM1 Class A1 |
| | | | |
|
Subordinated CMO Series 2022-1 Class M1A |
30-day Average SOFR + 2.850%
10/25/2034 | | | | |
Imperial Fund Mortgage Trust(a),(c) |
CMO Series 2021-NQM4 Class A2 |
| | | | |
Legacy Mortgage Asset Trust(a),(c) |
CMO Series 2021-GS2 Class A1 |
| | | | |
CMO Series 2021-SL2 Class A |
| | | | |
Mello Mortgage Capital Acceptance(a),(c) |
CMO Series 2024-SD1 Class A3 |
| | | | |
|
CMO Series 2020-NQM2 Class M1 |
| | | | |
CMO Series 2020-NQM3 Class A1 |
| | | | |
CMO Series 2020-NQM3 Class A2 |
| | | | |
CMO Series 2020-NQM3 Class A3 |
| | | | |
CMO Series 2021-INV2 Class A3 |
| | | | |
|
CMO Series 2021-INV1 Class A2 |
| | | | |
CMO Series 2021-INV1 Class A3 |
| | | | |
New Residential Mortgage Loan Trust(a),(c) |
CMO Series 2018-1A Class A1A |
| | | | |
The accompanying Notes to Financial Statements are an integral part of this statement.
Columbia Bond Fund | Annual Report 2024
17
Portfolio of Investments (continued)April 30, 2024 Residential Mortgage-Backed Securities - Non-Agency (continued) |
| | | | |
NRZ Excess Spread-Collateralized Notes(a) |
|
| | | | |
Oaktown Re III Ltd.(a),(b) |
CMO Series 2019-1A Class M1B |
30-day Average SOFR + 2.064%
Floor 1.950%
07/25/2029 | | | | |
PMT Credit Risk Transfer Trust(a),(b) |
|
1-month Term SOFR + 3.864%
Floor 3.750%
05/30/2025 | | | | |
Preston Ridge Partners Mortgage Trust(a),(c) |
CMO Series 2020-6 Class A1 |
| | | | |
CMO Series 2021-2 Class A1 |
| | | | |
CMO Series 2021-3 Class A1 |
| | | | |
CMO Series 2021-8 Class A1 |
| | | | |
Pretium Mortgage Credit Partners(a),(c) |
CMO Series 2022-NPL1 Class A1 |
| | | | |
|
CMO Series 2021-AFC1 Class A3 |
| | | | |
CMO Series 2021-AFC1 Class M1 |
| | | | |
|
CMO Series 2021-RPL1 Class A1 |
| | | | |
CMO Series 2023-RCF2 Class A2 |
| | | | |
Residential Mortgage Loan Trust(a),(c) |
CMO Series 2019-3 Class A3 |
| | | | |
Stanwich Mortgage Loan Co. LLC(a),(c) |
CMO Series 2021-NPB1 Class A1 |
| | | | |
Starwood Mortgage Residential Trust(a),(c) |
CMO Series 2019-INV1 Class A3 |
| | | | |
CMO Series 2020-2 Class A3 |
| | | | |
CMO Series 2020-3 Class A3 |
| | | | |
Residential Mortgage-Backed Securities - Non-Agency (continued) |
| | | | |
CMO Series 2020-3 Class M1 |
| | | | |
CMO Series 2020-INV1 Class A2 |
| | | | |
CMO Series 2020-INV1 Class A3 |
| | | | |
CMO Series 2021-3 Class A1 |
| | | | |
Towd Point Mortgage Trust(a),(c) |
CMO Series 2019-4 Class M1B |
| | | | |
|
CMO Series 2021-INV2 Class A1 |
| | | | |
Vendee Mortgage Trust(c),(g) |
CMO Series 1998-1 Class 2IO |
| | | | |
CMO Series 1998-3 Class IO |
| | | | |
Verus Securitization Trust(a),(c) |
CMO Series 2019-INV3 Class A3 |
| | | | |
CMO Series 2020-1 Class A3 |
| | | | |
CMO Series 2020-4 Class A3 |
| | | | |
CMO Series 2021-4 Class A2 |
| | | | |
Verus Securitization Trust(a) |
CMO Series 2020-INV1 Class A2 |
| | | | |
CMO Series 2020-INV1 Class A3 |
| | | | |
|
CMO Series 2020-1R Class A3 |
| | | | |
CMO Series 2021-1R Class A1 |
| | | | |
Total Residential Mortgage-Backed Securities - Non-Agency
(Cost $221,983,783) | |
Call Option Contracts Purchased 0.1% |
| | | | |
| |
|
Put Option Contracts Purchased 0.1% |
| | | | |
| |
The accompanying Notes to Financial Statements are an integral part of this statement.
18
Columbia Bond Fund | Annual Report 2024
Portfolio of Investments (continued)April 30, 2024
|
| | |
Columbia Short-Term Cash Fund, 5.485%(j),(k) | | |
Total Money Market Funds
(Cost $40,617,125) | |
Total Investments in Securities
(Cost: $1,064,138,261) | |
Other Assets & Liabilities, Net | | |
| |
At April 30, 2024, securities and/or cash totaling $10,355,482 were pledged as collateral.
Investments in derivatives
|
| | | | | Value/Unrealized
appreciation ($) | Value/Unrealized
depreciation ($) |
U.S. Treasury 2-Year Note | | | | | | |
U.S. Treasury 5-Year Note | | | | | | |
| | | | | | |
| | | | | | |
|
| | | | | Value/Unrealized
appreciation ($) | Value/Unrealized
depreciation ($) |
| | | | | | |
U.S. Treasury 10-Year Note | | | | | | |
| | | | | | |
Call option contracts purchased |
| | | | | | | | |
10-Year OTC interest rate swap with Citi to receive exercise rate and pay SOFR | | | | | | | | |
10-Year OTC interest rate swap with Morgan Stanley to receive exercise rate and pay SOFR | | | | | | | | |
| | | | | | | | |
Put option contracts purchased |
| | | | | | | | |
10-Year OTC interest rate swap with Citi to receive SOFR and pay exercise rate | | | | | | | | |
5-Year OTC interest rate swap with Citi to receive SOFR and pay exercise rate | | | | | | | | |
| | | | | | | | |
The accompanying Notes to Financial Statements are an integral part of this statement.
Columbia Bond Fund | Annual Report 2024
19
Portfolio of Investments (continued)April 30, 2024 Notes to Portfolio of Investments
| Represents privately placed and other securities and instruments exempt from Securities and Exchange Commission registration (collectively, private placements), such as Section 4(a)(2) and Rule 144A eligible securities, which are often sold only to qualified institutional buyers. At April 30, 2024, the total value of these securities amounted to $454,763,902, which represents 53.76% of total net assets. |
| Variable rate security. The interest rate shown was the current rate as of April 30, 2024. |
| Variable or floating rate security, the interest rate of which adjusts periodically based on changes in current interest rates and prepayments on the underlying pool of assets. The interest rate shown was the current rate as of April 30, 2024. |
| Non-income producing investment. |
| Represents a security purchased on a when-issued basis. |
| Represents a variable rate security with a step coupon where the rate adjusts according to a schedule for a series of periods, typically lower for an initial period and then increasing to a higher coupon rate thereafter. The interest rate shown was the current rate as of April 30, 2024. |
| Represents interest only securities which have the right to receive the monthly interest payments on an underlying pool of mortgage loans. |
| This security or a portion of this security has been pledged as collateral in connection with derivative contracts. |
| Valuation based on significant unobservable inputs. |
| The rate shown is the seven-day current annualized yield at April 30, 2024. |
| As defined in the Investment Company Act of 1940, as amended, an affiliated company is one in which the Fund owns 5% or more of the company’s outstanding voting securities, or a company which is under common ownership or control with the Fund. The value of the holdings and transactions in these affiliated companies during the year ended April 30, 2024 are as follows: |
| | | | Net change in
unrealized
appreciation
(depreciation)($) | | | | |
Columbia Short-Term Cash Fund, 5.485% |
| | | | | | | | |
Abbreviation Legend
| Collateralized Mortgage Obligation |
| Constant Maturity Treasury |
| Secured Overnight Financing Rate |
| |
Currency Legend
Fair value measurements
The Fund categorizes its fair value measurements according to a three-level hierarchy that maximizes the use of observable inputs and minimizes the use of unobservable inputs by prioritizing that the most observable input be used when available. Observable inputs are those that market participants would use in pricing an investment based on market data obtained from sources independent of the reporting entity. Unobservable inputs are those that reflect the Fund’s assumptions about the information market participants would use in pricing an investment. An investment’s level within the fair value hierarchy is based on the lowest level of any input that is deemed significant to the asset’s or liability’s fair value measurement. The input levels are not necessarily an indication of the risk or liquidity associated with investments at that level. For example, certain U.S. government securities are generally high quality and liquid, however, they are reflected as Level 2 because the inputs used to determine fair value may not always be quoted prices in an active market.
Fair value inputs are summarized in the three broad levels listed below:
■
Level 1 — Valuations based on quoted prices for investments in active markets that the Fund has the ability to access at the measurement date. Valuation adjustments are not applied to Level 1 investments.
■
Level 2 — Valuations based on other significant observable inputs (including quoted prices for similar securities, interest rates, prepayment speeds, credit risks, etc.).
■
Level 3 — Valuations based on significant unobservable inputs (including the Fund’s own assumptions and judgment in determining the fair value of investments).
Inputs that are used in determining fair value of an investment may include price information, credit data, volatility statistics, and other factors. These inputs can be either observable or unobservable. The availability of observable inputs can vary between investments, and is affected by various factors such as the type of investment, and the volume and level of activity for that investment or similar investments in the marketplace. The inputs will be considered by the Investment Manager, along with any other relevant factors in the calculation of an investment’s fair value. The Fund uses prices and inputs that are current as of the measurement date, which may include periods of market dislocations. During these periods, the availability of prices and inputs may be reduced for many investments. This condition could cause an investment to be reclassified between the various levels within the hierarchy.
The accompanying Notes to Financial Statements are an integral part of this statement.
20
Columbia Bond Fund | Annual Report 2024
Portfolio of Investments (continued)April 30, 2024 Fair value measurements (continued)
Investments falling into the Level 3 category are primarily supported by quoted prices from brokers and dealers participating in the market for those investments. However, these may be classified as Level 3 investments due to lack of market transparency and corroboration to support these quoted prices. Additionally, valuation models may be used as the pricing source for any remaining investments classified as Level 3. These models may rely on one or more significant unobservable inputs and/or significant assumptions by the Investment Manager. Inputs used in valuations may include, but are not limited to, financial statement analysis, capital account balances, discount rates and estimated cash flows, and comparable company data.
The Fund’s Board of Trustees (the Board) has designated the Investment Manager, through its Valuation Committee (the Committee), as valuation designee, responsible for determining the fair value of the assets of the Fund for which market quotations are not readily available using valuation procedures approved by the Board. The Committee consists of voting and non-voting members from various groups within the Investment Manager’s organization, including operations and accounting, trading and investments, compliance, risk management and legal.
The Committee meets at least monthly to review and approve valuation matters, which may include a description of specific valuation determinations, data regarding pricing information received from approved pricing vendors and brokers and the results of Board-approved valuation policies and procedures (the Policies). The Policies address, among other things, instances when market quotations are or are not readily available, including recommendations of third party pricing vendors and a determination of appropriate pricing methodologies; events that require specific valuation determinations and assessment of fair value techniques; securities with a potential for stale pricing, including those that are illiquid, restricted, or in default; and the effectiveness of third party pricing vendors, including periodic reviews of vendors. The Committee meets more frequently, as needed, to discuss additional valuation matters, which may include the need to review back-testing results, review time-sensitive information or approve related valuation actions. Representatives of Columbia Management Investment Advisers, LLC report to the Board at each of its regularly scheduled meetings to discuss valuation matters and actions during the period, similar to those described earlier.
The following table is a summary of the inputs used to value the Fund’s investments at April 30, 2024:
| | | | |
Investments in Securities | | | | |
Asset-Backed Securities - Non-Agency | | | | |
Commercial Mortgage-Backed Securities - Agency | | | | |
Commercial Mortgage-Backed Securities - Non-Agency | | | | |
| | | | |
| | | | |
| | | | |
| | | | |
| | | | |
| | | | |
| | | | |
Residential Mortgage-Backed Securities - Agency | | | | |
Residential Mortgage-Backed Securities - Non-Agency | | | | |
Call Option Contracts Purchased | | | | |
Put Option Contracts Purchased | | | | |
| | | | |
Total Investments in Securities | | | | |
Investments in Derivatives | | | | |
| | | | |
| | | | |
| | | | |
| | | | |
| | | | |
See the Portfolio of Investments for all investment classifications not indicated in the table.
The Fund’s assets assigned to the Level 2 input category are generally valued using the market approach, in which a security’s value is determined through reference to prices and information from market transactions for similar or identical assets.
Futures contracts are valued at unrealized appreciation (depreciation).
The accompanying Notes to Financial Statements are an integral part of this statement.
Columbia Bond Fund | Annual Report 2024
21
Portfolio of Investments (continued)April 30, 2024 Fair value measurements (continued)
The following table is a reconciliation of Level 3 assets for which significant observable and unobservable inputs were used to determine fair value:
| Balance
as of
04/30/2023
($) | Increase
(decrease)
in accrued
discounts/
premiums
($) | | Change
in unrealized
appreciation
(depreciation)
($) | | | | Transfers
out of
Level 3
($) | Balance
as of
04/30/2024
($) |
Asset-Backed Securities — Non-Agency | | | | | | | | | |
Residential Mortgage-Backed Securities — Non-Agency | | | | | | | | | |
| | | | | | | | | |
Financial assets were transferred from Level 3 to Level 2 as observable market inputs were utilized and management determined that there was sufficient, reliable and observable market data to value these assets as of period end.
The Fund’s assets assigned to the Level 3 category are valued utilizing the valuation technique deemed the most appropriate in the circumstances. The following table is a summary of valuation technique(s) used to value the Fund’s investments at April 30, 2024:
| | |
Residential Mortgage-Backed Securities - Non-Agency | Single Market Quotes from Broker | |
The appropriateness of fair values for these securities is monitored on an ongoing basis which may include results of back testing, manual price reviews and other control procedures. Significant increases (decreases) to any of these inputs would have resulted in a significantly higher (lower) fair value measurement.
The accompanying Notes to Financial Statements are an integral part of this statement.
22
Columbia Bond Fund | Annual Report 2024
Statement of Assets and LiabilitiesApril 30, 2024
| |
Investments in securities, at value | |
Unaffiliated issuers (cost $1,022,039,736) | |
Affiliated issuers (cost $40,617,125) | |
Option contracts purchased (cost $1,481,400) | |
| |
Cash collateral held at broker for: | |
| |
| |
| |
| |
| |
Variation margin for futures contracts | |
Expense reimbursement due from Investment Manager | |
| |
Deferred compensation of board members | |
| |
| |
| |
| |
Investments purchased on a delayed delivery basis | |
| |
Distributions to shareholders | |
Variation margin for futures contracts | |
| |
Distribution and/or service fees | |
| |
Compensation of board members | |
| |
Deferred compensation of board members | |
| |
Net assets applicable to outstanding capital stock | |
| |
| |
Total distributable earnings (loss) | |
Total - representing net assets applicable to outstanding capital stock | |
The accompanying Notes to Financial Statements are an integral part of this statement.
Columbia Bond Fund | Annual Report 2024
23
Statement of Assets and Liabilities (continued)April 30, 2024 | |
| |
| |
Net asset value per share | |
| |
Maximum offering price per share (calculated by dividing the net asset value per share by 1.0 minus the maximum sales charge for Class A shares) | |
| |
| |
| |
Net asset value per share | |
| |
| |
| |
Net asset value per share | |
| |
| |
| |
Net asset value per share | |
| |
| |
| |
Net asset value per share | |
The accompanying Notes to Financial Statements are an integral part of this statement.
24
Columbia Bond Fund | Annual Report 2024
Statement of OperationsYear Ended April 30, 2024
| |
| |
Dividends — unaffiliated issuers | |
Dividends — affiliated issuers | |
| |
| |
| |
| |
| |
| |
Distribution and/or service fees | |
| |
| |
| |
| |
| |
| |
| |
| |
| |
| |
| |
| |
| |
| |
Printing and postage fees | |
| |
| |
| |
| |
Compensation of chief compliance officer | |
Compensation of board members | |
Deferred compensation of board members | |
| |
| |
Fees waived or expenses reimbursed by Investment Manager and its affiliates | |
Fees waived by transfer agent | |
| |
| |
| |
| |
| |
Realized and unrealized gain (loss) — net | |
Net realized gain (loss) on: | |
Investments — unaffiliated issuers | |
Investments — affiliated issuers | |
| |
Option contracts purchased | |
| |
| |
Net change in unrealized appreciation (depreciation) on: | |
Investments — unaffiliated issuers | |
Investments — affiliated issuers | |
| |
Option contracts purchased | |
Net change in unrealized appreciation (depreciation) | |
Net realized and unrealized loss | |
Net decrease in net assets resulting from operations | |
The accompanying Notes to Financial Statements are an integral part of this statement.
Columbia Bond Fund | Annual Report 2024
25
Statement of Changes in Net Assets
| | |
| | |
| | |
| | |
Net change in unrealized appreciation (depreciation) | | |
Net decrease in net assets resulting from operations | | |
Distributions to shareholders | | |
Net investment income and net realized gains | | |
| | |
| | |
| | |
| | |
| | |
| | |
| | |
| | |
Total distributions to shareholders | | |
Decrease in net assets from capital stock activity | | |
Total decrease in net assets | | |
Net assets at beginning of year | | |
Net assets at end of year | | |
The accompanying Notes to Financial Statements are an integral part of this statement.
26
Columbia Bond Fund | Annual Report 2024
Statement of Changes in Net Assets (continued)
The accompanying Notes to Financial Statements are an integral part of this statement.
Columbia Bond Fund | Annual Report 2024
27
The following table is intended to help you understand the Fund’s financial performance. Certain information reflects financial results for a single share of a class held for the periods shown. Per share net investment income (loss) amounts are calculated based on average shares outstanding during the period. Total return assumes reinvestment of all dividends and distributions, if any. Total return does not reflect payment of sales charges, if any. Total return and portfolio turnover are not annualized for periods of less than one year. The ratios of expenses and net investment income are annualized for periods of less than one year. The portfolio turnover rate is calculated without regard to purchase and sales transactions of short-term instruments and certain derivatives, if any. If such transactions were included, the Fund’s portfolio turnover rate may be higher.
| Net asset value,
beginning of
period | | Net
realized
and
unrealized
gain (loss) | Total from
investment
operations | Distributions
from net
investment
income | Distributions
from net
realized
gains | Total
distributions to
shareholders |
|
| | | | | | | |
| | | | | | | |
| | | | | | | |
| | | | | | | |
| | | | | | | |
|
| | | | | | | |
| | | | | | | |
| | | | | | | |
| | | | | | | |
| | | | | | | |
|
| | | | | | | |
| | | | | | | |
| | | | | | | |
| | | | | | | |
| | | | | | | |
|
| | | | | | | |
| | | | | | | |
| | | | | | | |
| | | | | | | |
| | | | | | | |
|
| | | | | | | |
| | | | | | | |
| | | | | | | |
| | | | | | | |
| | | | | | | |
Notes to Financial Highlights |
| In addition to the fees and expenses that the Fund bears directly, the Fund indirectly bears a pro rata share of the fees and expenses of any other funds in which it invests. Such indirect expenses are not included in the Fund’s reported expense ratios. |
| Total net expenses include the impact of certain fee waivers/expense reimbursements made by the Investment Manager and certain of its affiliates, if applicable. |
| Ratios include interest on collateral expense which is less than 0.01%. |
| The benefits derived from expense reductions had an impact of less than 0.01%. |
| Per share amounts have been adjusted on a retroactive basis to reflect a 4 to 1 reverse stock split completed after the close of business on September 11, 2020. |
The accompanying Notes to Financial Statements are an integral part of this statement.
28
Columbia Bond Fund | Annual Report 2024
Financial Highlights (continued)
| Net
asset
value,
end of
period | | Total gross
expense
ratio to
average
| Total net
expense
ratio to
average
| Net investment
income
ratio to
average
net assets | | Net
assets,
end of
period
(000’s) |
|
| | | | | | | |
| | | | | | | |
| | | | | | | |
| | | | | | | |
| | | | | | | |
|
| | | | | | | |
| | | | | | | |
| | | | | | | |
| | | | | | | |
| | | | | | | |
|
| | | | | | | |
| | | | | | | |
| | | | | | | |
| | | | | | | |
| | | | | | | |
|
| | | | | | | |
| | | | | | | |
| | | | | | | |
| | | | | | | |
| | | | | | | |
|
| | | | | | | |
| | | | | | | |
| | | | | | | |
| | | | | | | |
| | | | | | | |
The accompanying Notes to Financial Statements are an integral part of this statement.
Columbia Bond Fund | Annual Report 2024
29
Notes to Financial StatementsApril 30, 2024 Note 1. Organization
Columbia Bond Fund (the Fund), a series of Columbia Funds Series Trust I (the Trust), is a diversified fund. The Trust is registered under the Investment Company Act of 1940, as amended (the 1940 Act), as an open-end management investment company organized as a Massachusetts business trust.
Fund shares
The Trust may issue an unlimited number of shares (without par value). The Fund offers each of the share classes listed in the Statement of Assets and Liabilities. Although all share classes generally have identical voting, dividend and liquidation rights, each share class votes separately when required by the Trust’s organizational documents or by law. Each share class has its own expense and sales charge structure. Different share classes may have different minimum initial investment amounts and pay different net investment income distribution amounts to the extent the expenses of distributing such share classes vary. Distributions to shareholders in a liquidation will be proportional to the net asset value of each share class.
As described in the Fund’s prospectus, Class A shares are offered to the general public for investment. Advisor Class, Institutional Class, Institutional 2 Class and Institutional 3 Class shares are available for purchase through authorized investment professionals to omnibus retirement plans or to institutional investors and to certain other investors as also described in the Fund’s prospectus.
In September 2023, the Fund’s Board of Trustees approved the liquidation of Class V shares of the Fund on December 8, 2023. Effective at the open of business on October 25, 2023, any applicable contingent deferred sales charges were waived on redemptions and exchanges out of Class V shares, and effective at the open of business on November 27, 2023, Class V shares of the Fund were closed to all investors. For federal tax purposes, this liquidation was treated as a redemption of fund shares.
The Fund’s Board of Trustees also approved a proposal to accelerate the conversion of Class C shares into Class A shares of the Fund and a proposal to liquidate Class R shares of the Fund. Effective on February 12, 2024, Class C shares of the Fund were closed to new and existing investors and effective on April 15, 2024, shares held by Class C shareholders were converted into Class A shares in a tax-free transaction. Effective on March 11, 2024, Class R shares of the Fund were closed to new and existing investors and effective on April 19, 2024, Class R shares of the Fund were liquidated. For federal tax purposes, this liquidation was treated as a redemption of fund shares.
Note 2. Summary of significant accounting policies
Basis of preparation
The Fund is an investment company that applies the accounting and reporting guidance in the Financial Accounting Standards Board (FASB) Accounting Standards Codification Topic 946, Financial Services - Investment Companies (ASC 946). The financial statements are prepared in accordance with U.S. generally accepted accounting principles (GAAP), which requires management to make certain estimates and assumptions that affect the reported amounts of assets and liabilities, the disclosure of contingent assets and liabilities at the date of the financial statements and the reported amounts of income and expenses during the reporting period. Actual results could differ from those estimates.
The following is a summary of significant accounting policies followed by the Fund in the preparation of its financial statements.
Security valuation
Equity securities listed on an exchange are valued at the closing price or last trade price on their primary exchange at the close of business of the New York Stock Exchange. Securities with a closing price not readily available or not listed on any exchange are valued at the mean between the closing bid and ask prices. Listed preferred stocks convertible into common stocks are valued using an evaluated price from a pricing service.
30
Columbia Bond Fund | Annual Report 2024
Notes to Financial Statements (continued)April 30, 2024 Debt securities generally are valued based on prices obtained from pricing services, which are intended to reflect market transactions for normal, institutional-size trading units of similar securities. The services may use various pricing techniques that take into account, as applicable, factors such as yield, quality, coupon rate, maturity, type of issue, trading characteristics and other data, as well as approved independent broker-dealer quotes. Debt securities for which quotations are not readily available or not believed to be reflective of market value may also be valued based upon a bid quote from an approved independent broker-dealer. Debt securities maturing in 60 days or less are valued primarily at amortized market value, unless this method results in a valuation that management believes does not approximate fair value.
Asset- and mortgage-backed securities are generally valued by pricing services, which utilize pricing models that incorporate the securities’ cash flow and loan performance data. These models also take into account available market data, including trades, market quotations, and benchmark yield curves for identical or similar securities. Factors used to identify similar securities may include, but are not limited to, issuer, collateral type, vintage, prepayment speeds, collateral performance, credit ratings, credit enhancement and expected life. Asset-backed securities for which quotations are readily available may also be valued based upon an over-the-counter or exchange bid quote from an approved independent broker-dealer. Debt securities maturing in 60 days or less are valued primarily at amortized market value, unless this method results in a valuation that management believes does not approximate fair value.
Investments in open-end investment companies (other than exchange-traded funds (ETFs)), are valued at the latest net asset value reported by those companies as of the valuation time.
Futures and options on futures contracts are valued based upon the settlement price at the close of regular trading on their principal exchanges or, in the absence of a settlement price, at the mean of the latest quoted bid and ask prices.
Option contracts are valued at the mean of the latest quoted bid and ask prices on their primary exchanges. Option contracts, including over-the-counter option contracts, with no readily available market quotations are valued using mid-market evaluations from independent third-party vendors.
Investments for which market quotations are not readily available, or that have quotations which management believes are not reflective of market value or reliable, are valued at fair value as determined in good faith under procedures approved by the Board of Trustees. If a security or class of securities (such as foreign securities) is valued at fair value, such value is likely to be different from the quoted or published price for the security, if available.
The determination of fair value often requires significant judgment. To determine fair value, management may use assumptions including but not limited to future cash flows and estimated risk premiums. Multiple inputs from various sources may be used to determine fair value.
GAAP requires disclosure regarding the inputs and valuation techniques used to measure fair value and any changes in valuation inputs or techniques. In addition, investments shall be disclosed by major category. This information is disclosed following the Fund’s Portfolio of Investments.
Derivative instruments
The Fund invests in certain derivative instruments, as detailed below, in seeking to meet its investment objectives. Derivatives are instruments whose values depend on, or are derived from, in whole or in part, the value of one or more securities, currencies, commodities, indices, or other assets or instruments. Derivatives may be used to increase investment flexibility (including to maintain cash reserves while maintaining desired exposure to certain assets), for risk management (hedging) purposes, to facilitate trading, to reduce transaction costs and to pursue higher investment returns. The Fund may also use derivative instruments to mitigate certain investment risks, such as foreign currency exchange rate risk, interest rate risk and credit risk. Derivatives may involve various risks, including the potential inability of the counterparty to fulfill its obligations under the terms of the contract, the potential for an illiquid secondary market (making it difficult for the Fund to sell or terminate, including at favorable prices) and the potential for market movements which may expose the Fund to gains or losses in excess of the amount shown in the Statement of Assets and Liabilities. The notional amounts of derivative instruments, if applicable, are not recorded in the financial statements.
Columbia Bond Fund | Annual Report 2024
31
Notes to Financial Statements (continued)April 30, 2024 A derivative instrument may suffer a marked-to-market loss if the value of the contract decreases due to an unfavorable change in the market rates or values of the underlying instrument. Losses can also occur if the counterparty does not perform its obligations under the contract. The Fund’s risk of loss from counterparty credit risk on over-the-counter derivatives is generally limited to the aggregate unrealized gain netted against any collateral held by the Fund and the amount of any variation margin held by the counterparty, plus any replacement costs or related amounts. With exchange-traded or centrally cleared derivatives, there is reduced counterparty credit risk to the Fund since the clearinghouse or central counterparty provides some protection in the case of clearing member default. The clearinghouse or central counterparty stands between the buyer and the seller of the contract; therefore, failure of the clearinghouse or central counterparty may pose additional counterparty credit risk. However, credit risk still exists in exchange-traded or centrally cleared derivatives with respect to initial and variation margin that is held in a broker’s customer account. While clearing brokers are required to segregate customer margin from their own assets, in the event that a clearing broker becomes insolvent or goes into bankruptcy and at that time there is a shortfall in the aggregate amount of margin held by the clearing broker for all its clients and such shortfall is remedied by the central counterparty or otherwise, U.S. bankruptcy laws will typically allocate that shortfall on a pro-rata basis across all the clearing broker’s customers (including the Fund), potentially resulting in losses to the Fund.
In order to better define its contractual rights and to secure rights that will help the Fund mitigate its counterparty risk, the Fund may enter into an International Swaps and Derivatives Association, Inc. Master Agreement (ISDA Master Agreement) or similar agreement with its derivatives counterparties. An ISDA Master Agreement is an agreement between the Fund and a counterparty that governs over-the-counter derivatives and foreign exchange forward contracts and contains, among other things, collateral posting terms and netting provisions in the event of a default and/or termination event. Under an ISDA Master Agreement, the Fund may, under certain circumstances, offset with the counterparty certain derivative instruments’ payables and/or receivables with collateral held and/or posted and create one single net payment. The provisions of the ISDA Master Agreement typically permit a single net payment in the event of default (close-out netting), including the bankruptcy or insolvency of the counterparty. Note, however, that bankruptcy or insolvency laws of a particular jurisdiction may impose restrictions on or prohibitions against the right of offset or netting in bankruptcy, insolvency or other events.
Collateral (margin) requirements differ by type of derivative. Margin requirements are established by the clearinghouse or central counterparty for exchange-traded and centrally cleared derivatives. Brokers can ask for margin in excess of the minimum in certain circumstances. Collateral terms for most over-the-counter derivatives are subject to regulatory requirements to exchange variation margin with trading counterparties and may have contract specific margin terms as well. For over-the-counter derivatives traded under an ISDA Master Agreement, the collateral requirements are typically calculated by netting the marked-to-market amount for each transaction under such agreement and comparing that amount to the value of any variation margin currently pledged by the Fund and/or the counterparty. Generally, the amount of collateral due from or to a party has to exceed a minimum transfer amount threshold (e.g., $250,000) before a transfer has to be made. To the extent amounts due to the Fund from its counterparties are not fully collateralized, contractually or otherwise, the Fund bears the risk of loss from counterparty nonperformance. The Fund may also pay interest expense on cash collateral received from the broker or receive interest income on cash collateral pledged to the broker. The Fund attempts to mitigate counterparty risk by only entering into agreements with counterparties that it believes have the financial resources to honor their obligations and by monitoring the financial stability of those counterparties.
Certain ISDA Master Agreements allow counterparties of over-the-counter derivatives transactions to terminate derivatives contracts prior to maturity in the event the Fund’s net asset value declines by a stated percentage over a specified time period or if the Fund fails to meet certain terms of the ISDA Master Agreement, which would cause the Fund to accelerate payment of any net liability owed to the counterparty. The Fund also has termination rights if the counterparty fails to meet certain terms of the ISDA Master Agreement. In determining whether to exercise such termination rights, the Fund would consider, in addition to counterparty credit risk, whether termination would result in a net liability owed from the counterparty.
For financial reporting purposes, the Fund does not offset derivative assets and derivative liabilities that are subject to netting arrangements in the Statement of Assets and Liabilities.
Futures contracts
Futures contracts are exchange-traded and represent commitments for the future purchase or sale of an asset at a specified price on a specified date. The Fund bought and sold futures contracts to manage the duration and yield curve exposure of the Fund versus the benchmark and to manage exposure to movements in interest rates. These instruments may be used for
32
Columbia Bond Fund | Annual Report 2024
Notes to Financial Statements (continued)April 30, 2024 other purposes in future periods. Upon entering into futures contracts, the Fund bears risks that it may not achieve the anticipated benefits of the futures contracts and may realize a loss. Additional risks include counterparty credit risk, the possibility of an illiquid market, and that a change in the value of the contract or option may not correlate with changes in the value of the underlying asset.
Upon entering into a futures contract, the Fund deposits cash or securities with the broker, known as a futures commission merchant (FCM), in an amount sufficient to meet the initial margin requirement. The initial margin deposit must be maintained at an established level over the life of the contract. Cash deposited as initial margin is recorded in the Statement of Assets and Liabilities as margin deposits. Securities deposited as initial margin are designated in the Portfolio of Investments. Subsequent payments (variation margin) are made or received by the Fund each day. The variation margin payments are equal to the daily change in the contract value and are recorded as variation margin receivable or payable and are offset in unrealized gains or losses. The Fund generally expects to earn interest income on its margin deposits. The Fund recognizes a realized gain or loss when the contract is closed or expires. Futures contracts involve, to varying degrees, risk of loss in excess of the variation margin disclosed in the Statement of Assets and Liabilities.
Options contracts
Options are contracts which entitle the holder to purchase or sell securities or other identified assets at a specified price, or in the case of index option contracts, to receive or pay the difference between the index value and the strike price of the index option contract. Option contracts can be either exchange-traded or over-the-counter. The Fund purchased and has written option contracts to manage exposure to fluctuations in interest rates. These instruments may be used for other purposes in future periods. Completion of transactions for option contracts traded in the over-the-counter market depends upon the performance of the other party. Collateral may be collected or posted by the Fund to secure over-the-counter option contract trades. Collateral held or posted by the Fund for such option contract trades must be returned to the broker or the Fund upon closure, exercise or expiration of the contract.
Options contracts purchased are recorded as investments. When the Fund writes an options contract, the premium received is recorded as an asset and an amount equivalent to the premium is recorded as a liability in the Statement of Assets and Liabilities and is subsequently adjusted to reflect the current fair value of the option written. Changes in the fair value of the written option are recorded as unrealized appreciation or depreciation until the contract is exercised or has expired. The Fund realizes a gain or loss when the option contract is closed or expires. When option contracts are exercised, the proceeds on sales for a written call or purchased put option contract, or the purchase cost for a written put or purchased call option contract, is adjusted by the amount of premium received or paid.
For over-the-counter options purchased, the Fund bears the risk of loss of the amount of the premiums paid plus the positive change in market values net of any collateral held by the Fund should the counterparty fail to perform under the contracts. Option contracts written by the Fund do not typically give rise to significant counterparty credit risk, as options written generally obligate the Fund and not the counterparty to perform. The risk in writing a call option contract is that the Fund gives up the opportunity for profit if the market price of the security increases above the strike price and the option contract is exercised. The risk in writing a put option contract is that the Fund may incur a loss if the market price of the security decreases below the strike price and the option contract is exercised. Exercise of a written option could result in the Fund purchasing or selling a security or foreign currency when it otherwise would not, or at a price different from the current market value. In purchasing and writing options, the Fund bears the risk of an unfavorable change in the value of the underlying instrument or the risk that the Fund may not be able to enter into a closing transaction due to an illiquid market.
Interest rate swaption contracts
Interest rate swaption contracts entered into by the Fund typically represent an option that gives the purchaser the right, but not the obligation, to enter into an interest rate swap contract on a future date. Each interest rate swaption contract will specify if the buyer is entitled to receive the fixed or floating rate if the interest rate is exercised. Changes in the value of a purchased interest rate swaption contracts are reported as unrealized appreciation or depreciation on options in the Statement of Assets and Liabilities. Gain or loss is recognized in the Statement of Operations when the interest rate swaption contract is closed or expires.
Columbia Bond Fund | Annual Report 2024
33
Notes to Financial Statements (continued)April 30, 2024 When the Fund writes an interest rate swaption contract, the premium received is recorded as an asset and an amount equivalent to the premium is recorded as a liability in the Statement of Assets and Liabilities and is subsequently adjusted to reflect the current fair value of the interest rate swaption contract written. Premiums received from writing interest rate swaption contracts that expire unexercised are recorded by the Fund on the expiration date as realized gains from options written in the Statement of Operations. The difference between the premium and the amount paid on effecting a closing purchase transaction, including brokerage commissions, is also recorded as realized gain, or if the premium is less than the amount paid for the closing purchase, as realized loss. These amounts are reflected as net realized gain (loss) on options written in the Statement of Operations.
Effects of derivative transactions in the financial statements
The following tables are intended to provide additional information about the effect of derivatives on the financial statements of the Fund, including: the fair value of derivatives by risk category and the location of those fair values in the Statement of Assets and Liabilities; and the impact of derivative transactions over the period in the Statement of Operations, including realized and unrealized gains (losses). The derivative instrument schedules following the Portfolio of Investments present additional information regarding derivative instruments outstanding at the end of the period, if any.
The following table is a summary of the fair value of derivative instruments (not considered to be hedging instruments for accounting disclosure purposes) at April 30, 2024:
| | |
| Statement
of assets and liabilities
location | |
| Component of total distributable earnings (loss) — unrealized appreciation on futures contracts | |
| Investments, at value — Option contracts purchased | |
| | |
| | |
| Statement
of assets and liabilities
location | |
| Component of total distributable earnings (loss) — unrealized depreciation on futures contracts | |
| Includes cumulative appreciation (depreciation) as reported in the tables following the Portfolio of Investments. Only the current day’s variation margin for futures and centrally cleared swaps, if any, is reported in receivables or payables in the Statement of Assets and Liabilities. |
The following table indicates the effect of derivative instruments (not considered to be hedging instruments for accounting disclosure purposes) in the Statement of Operations for the year ended April 30, 2024:
Amount of realized gain (loss) on derivatives recognized in income |
| | Option
contracts
purchased
($) | Option
contracts
written
($) | |
| | | | |
Change in unrealized appreciation (depreciation) on derivatives recognized in income |
| | Option
contracts
purchased
($) | |
| | | |
34
Columbia Bond Fund | Annual Report 2024
Notes to Financial Statements (continued)April 30, 2024 The following table is a summary of the average daily outstanding volume by derivative instrument for the year ended April 30, 2024:
| Average notional
amounts ($) |
| |
Futures contracts — short | |
| |
Option contracts purchased | |
| |
Asset- and mortgage-backed securities
The Fund may invest in asset-backed and mortgage-backed securities. The maturity dates shown represent the original maturity of the underlying obligation. Actual maturity may vary based upon prepayment activity on these obligations. All, or a portion, of the obligation may be prepaid at any time because the underlying asset may be prepaid. As a result, decreasing market interest rates could result in an increased level of prepayment. An increased prepayment rate will have the effect of shortening the maturity of the security. Unless otherwise noted, the coupon rates presented are fixed rates.
Delayed delivery securities
The Fund may trade securities on other than normal settlement terms, including securities purchased or sold on a “when-issued” or "forward commitment" basis. This may increase risk to the Fund since the other party to the transaction may fail to deliver, which could cause the Fund to subsequently invest at less advantageous prices. The Fund designates cash or liquid securities in an amount equal to the delayed delivery commitment.
To be announced securities
The Fund may trade securities on a To Be Announced (TBA) basis. As with other delayed-delivery transactions, a seller agrees to issue a TBA security at a future date. However, the seller does not specify the particular securities to be delivered. Instead, the Fund agrees to accept any security that meets specified terms.
In some cases, Master Securities Forward Transaction Agreements (MSFTAs) may be used to govern transactions of certain forward-settling agency mortgage-backed securities, such as delayed-delivery and TBAs, between the Fund and counterparty. The MSFTA maintains provisions for, among other things, initiation and confirmation, payment and transfer, events of default, termination, and maintenance of collateral relating to such transactions.
Mortgage dollar roll transactions
The Fund may enter into mortgage “dollar rolls” in which the Fund sells securities for delivery in the current month and simultaneously contracts with the same counterparty to repurchase similar but not identical securities (same type, coupon and maturity) on a specified future date. These transactions may increase the Fund’s portfolio turnover rate. During the roll period, the Fund loses the right to receive principal and interest paid on the securities sold. However, the Fund may benefit because it receives negotiated amounts in the form of reductions of the purchase price for the future purchase plus the interest earned on the cash proceeds of the securities sold until the settlement date of the forward purchase. The Fund records the incremental difference between the forward purchase and sale of each forward roll as a realized gain or loss. Unless any realized gains exceed the income, capital appreciation, and gain or loss due to mortgage prepayments that would have been realized on the securities sold as part of the mortgage dollar roll, the use of this technique may diminish the investment performance of the Fund compared to what the performance would have been without the use of mortgage dollar rolls. Mortgage dollar rolls involve the risk that the market value of the securities the Fund is obligated to repurchase may decline below the repurchase price, or that the counterparty may default on its obligations. All cash proceeds will be invested in instruments that are permissible investments for the Fund. The Fund identifies cash or liquid securities in an amount equal to the forward purchase price. The Fund does not currently enter into mortgage dollar rolls that are accounted for as financing transactions.
Columbia Bond Fund | Annual Report 2024
35
Notes to Financial Statements (continued)April 30, 2024 Treasury inflation protected securities
The Fund may invest in treasury inflation protected securities (TIPS). The principal amount of TIPS is adjusted periodically and is increased for inflation or decreased for deflation based on a monthly published index. These adjustments are recorded as interest income in the Statement of Operations. Coupon payments are based on the adjusted principal at the time the interest is paid.
Interest only and principal only securities
The Fund may invest in Interest Only (IO) or Principal Only (PO) securities. IOs are stripped securities entitled to receive all of the security’s interest, but none of its principal. IOs are particularly sensitive to changes in interest rates and therefore subject to greater fluctuations in price than typical interest bearing debt securities. IOs are also subject to credit risk because the Fund may not receive all or part of the interest payments if the issuer, obligor, guarantor or counterparty defaults on its obligation. Payments received for IOs are included in interest income in the Statement of Operations. Because no principal will be received at the maturity of an IO, adjustments are made to the cost of the security on a monthly basis until maturity. These adjustments are included in interest income in the Statement of Operations. POs are stripped securities entitled to receive the principal from the underlying obligation, but not the interest. POs are particularly sensitive to changes in interest rates and therefore are subject to fluctuations in price. POs are also subject to credit risk because the Fund may not receive all or part of its principal if the issuer, obligor, guarantor or counterparty defaults on its obligation. The Fund may also invest in IO or PO stripped mortgage-backed securities. Payments received for POs are treated as reductions to the cost and par value of the securities.
Offsetting of assets and liabilities
The following table presents the Fund’s gross and net amount of assets and liabilities available for offset under netting arrangements as well as any related collateral received or pledged by the Fund as of April 30, 2024:
| | | |
| | | |
Call option contracts purchased | | | |
Put option contracts purchased | | | |
| | | |
Total financial and derivative net assets | | | |
Total collateral received (pledged) (a) | | | |
| | | |
| In some instances, the actual collateral received and/or pledged may be more than the amount shown due to overcollateralization. |
| Represents the net amount due from/(to) counterparties in the event of default. |
Security transactions
Security transactions are accounted for on the trade date. Cost is determined and gains (losses) are based upon the specific identification method for both financial statement and federal income tax purposes.
Income recognition
Interest income is recorded on an accrual basis. Market premiums and discounts, including original issue discounts, are amortized and accreted, respectively, over the expected life of the security on all debt securities, unless otherwise noted. The Fund classifies gains and losses realized on prepayments received on mortgage-backed securities as adjustments to interest income.
The Fund may place a debt security on non-accrual status and reduce related interest income when it becomes probable that the interest will not be collected and the amount of uncollectible interest can be reasonably estimated. The Fund may also adjust accrual rates when it becomes probable the full interest will not be collected and a partial payment will be received. A defaulted debt security is removed from non-accrual status when the issuer resumes interest payments or when collectability of interest is reasonably assured.
36
Columbia Bond Fund | Annual Report 2024
Notes to Financial Statements (continued)April 30, 2024 Corporate actions and dividend income are recorded on the ex-dividend date.
The Fund may receive distributions from holdings in equity securities, business development companies (BDCs), exchange-traded funds (ETFs), limited partnerships (LPs), other regulated investment companies (RICs), and real estate investment trusts (REITs), which report information as to the tax character of their distributions annually. These distributions are allocated to dividend income, capital gain and return of capital based on actual information reported. Return of capital is recorded as a reduction of the cost basis of securities held. If the Fund no longer owns the applicable securities, return of capital is recorded as a realized gain. With respect to REITs, to the extent actual information has not yet been reported, estimates for return of capital are made by Columbia Management Investment Advisers, LLC (the Investment Manager), a wholly-owned subsidiary of Ameriprise Financial, Inc. (Ameriprise Financial). The Investment Manager’s estimates are subsequently adjusted when the actual character of the distributions is disclosed by the REITs, which could result in a proportionate change in return of capital to shareholders.
Awards from class action litigation are recorded as a reduction of cost basis if the Fund still owns the applicable securities on the payment date. If the Fund no longer owns the applicable securities on the payment date, the proceeds are recorded as realized gains.
Expenses
General expenses of the Trust are allocated to the Fund and other funds of the Trust based upon relative net assets or other expense allocation methodologies determined by the nature of the expense. Expenses directly attributable to the Fund are charged to the Fund. Expenses directly attributable to a specific class of shares are charged to that share class.
Determination of class net asset value
All income, expenses (other than class-specific expenses, which are charged to that share class, as shown in the Statement of Operations) and realized and unrealized gains (losses) are allocated to each class of the Fund on a daily basis, based on the relative net assets of each class, for purposes of determining the net asset value of each class.
Federal income tax status
The Fund intends to qualify each year as a regulated investment company under Subchapter M of the Internal Revenue Code, as amended, and will distribute substantially all of its investment company taxable income and net capital gain, if any, for its tax year, and as such will not be subject to federal income taxes. In addition, the Fund intends to distribute in each calendar year substantially all of its ordinary income, capital gain net income and certain other amounts, if any, such that the Fund should not be subject to federal excise tax. Therefore, no federal income or excise tax provision is recorded.
Distributions to shareholders
Distributions from net investment income, if any, are declared daily and paid monthly. Net realized capital gains, if any, are distributed at least annually. Income distributions and capital gain distributions are determined in accordance with federal income tax regulations, which may differ from GAAP.
Guarantees and indemnifications
Under the Trust’s organizational documents and, in some cases, by contract, its officers and trustees are indemnified against certain liabilities arising out of the performance of their duties to the Trust or its funds. In addition, certain of the Fund’s contracts with its service providers contain general indemnification clauses. The Fund’s maximum exposure under these arrangements is unknown since the amount of any future claims that may be made against the Fund cannot be determined, and the Fund has no historical basis for predicting the likelihood of any such claims.
Recent accounting pronouncements and regulatory updates
Tailored Shareholder Reports
In October 2022, the Securities and Exchange Commission adopted a final rule, "Tailored Shareholder Reports for Mutual Funds and Exchange-Traded Funds; Fee Information in Investment Company Advertisements." The rule and form amendments will, among other things, require the Fund to transmit concise and visually engaging shareholder reports that
Columbia Bond Fund | Annual Report 2024
37
Notes to Financial Statements (continued)April 30, 2024 highlight key information. The amendments will require that funds tag information in a structured data format and that certain more in-depth information be made available online and available for delivery free of charge to investors on request. The amendments became effective January 24, 2023. There is an 18-month transition period after the effective date of the amendments.
Note 3. Fees and other transactions with affiliates
Management services fees
The Fund has entered into a Management Agreement with Columbia Management Investment Advisers, LLC (the Investment Manager), a wholly-owned subsidiary of Ameriprise Financial, Inc. (Ameriprise Financial). Under the Management Agreement, the Investment Manager provides the Fund with investment research and advice, as well as administrative and accounting services. The management services fee is an annual fee that is equal to a percentage of the Fund’s daily net assets that declines from 0.50% to 0.34% as the Fund’s net assets increase. The effective management services fee rate for the year ended April 30, 2024 was 0.50% of the Fund’s average daily net assets.
Compensation of Board members
Members of the Board of Trustees who are not officers or employees of the Investment Manager or Ameriprise Financial are compensated for their services to the Fund as disclosed in the Statement of Operations. Under a Deferred Compensation Plan (the Deferred Plan), these members of the Board of Trustees may elect to defer payment of up to 100% of their compensation. Deferred amounts are treated as though equivalent dollar amounts had been invested in shares of certain funds managed by the Investment Manager. The Fund’s liability for these amounts is adjusted for market value changes and remains in the Fund until distributed in accordance with the Deferred Plan. All amounts payable under the Deferred Plan constitute a general unsecured obligation of the Fund. The expense for the Deferred Plan, which includes Trustees’ fees deferred during the current period as well as any gains or losses on the Trustees’ deferred compensation balances as a result of market fluctuations, is included in "Deferred compensation of board members" in the Statement of Operations.
Compensation of Chief Compliance Officer
The Board of Trustees has appointed a Chief Compliance Officer for the Fund in accordance with federal securities regulations. As disclosed in the Statement of Operations, a portion of the Chief Compliance Officer’s total compensation is allocated to the Fund, along with other allocations to affiliated registered investment companies managed by the Investment Manager and its affiliates, based on relative net assets.
Transfer agency fees
Under a Transfer and Dividend Disbursing Agent Agreement, Columbia Management Investment Services Corp. (the Transfer Agent), an affiliate of the Investment Manager and a wholly-owned subsidiary of Ameriprise Financial, is responsible for providing transfer agency services to the Fund. The Transfer Agent has contracted with SS&C GIDS, Inc. (SS&C GIDS) to serve as sub-transfer agent. The Transfer Agent pays the fees of SS&C GIDS for services as sub-transfer agent and SS&C GIDS is not entitled to reimbursement for such fees from the Fund (with the exception of out-of-pocket fees).
The Fund pays the Transfer Agent a monthly transfer agency fee based on the number or the average value of accounts, depending on the type of account. In addition, the Fund pays the Transfer Agent a fee for shareholder services based on the number of accounts or on a percentage of the average aggregate value of the Fund’s shares maintained in omnibus accounts up to the lesser of the amount charged by the financial intermediary or a cap established by the Board of Trustees from time to time.
The Transfer Agent also receives compensation from the Fund for various shareholder services and reimbursements for certain out-of-pocket fees. Total transfer agency fees for Institutional 2 Class and Institutional 3 Class shares are subject to an annual limitation of not more than 0.07% and 0.02%, respectively, of the average daily net assets attributable to each share class. In addition, prior to September 1, 2023, Institutional 2 Class shares were subject to a contractual transfer agency fee annual limitation of not more than 0.05% and Institutional 3 Class shares were subject to a contractual transfer agency fee annual limitation of not more than 0.00% of the average daily net assets attributable to each share class.
38
Columbia Bond Fund | Annual Report 2024
Notes to Financial Statements (continued)April 30, 2024 For the year ended April 30, 2024, the Fund’s effective transfer agency fee rates as a percentage of average daily net assets of each class were as follows:
An annual minimum account balance fee of $20 may apply to certain accounts with a value below the applicable share class’s initial minimum investment requirements to reduce the impact of small accounts on transfer agency fees. These minimum account balance fees are remitted to the Fund and recorded as part of expense reductions in the Statement of Operations. For the year ended April 30, 2024, these minimum account balance fees reduced total expenses of the Fund by $731.
Distribution and service fees
The Fund has entered into an agreement with Columbia Management Investment Distributors, Inc. (the Distributor), an affiliate of the Investment Manager and a wholly-owned subsidiary of Ameriprise Financial, for distribution and shareholder services. The Board of Trustees has approved, and the Fund has adopted, distribution and shareholder service plans (the Plans) applicable to certain share classes, which set the distribution and service fees for the Fund. These fees are calculated daily and are intended to compensate the Distributor and/or eligible selling and/or servicing agents for selling shares of the Fund and providing services to investors.
Under the Plans, the Fund pays a monthly service fee to the Distributor at the maximum annual rate of 0.25% of the average daily net assets attributable to Class A and Class C shares of the Fund. Also under the Plans, the Fund pays a monthly distribution fee to the Distributor at the maximum annual rates of 0.75% and 0.50% of the average daily net assets attributable to Class C and Class R shares of the Fund, respectively. As a result of Class C shares of the Fund being converted into Class A shares, April 15, 2024 was the last day the Fund paid a distribution and service fee for Class C shares. As a result of Class R shares of the Fund being liquidated, April 19, 2024 was the last day the Fund paid a distribution and service fee for Class R shares.
Shareholder services fees
The Fund had adopted a shareholder services plan that permitted it to pay for certain services provided to Class V shareholders by their selling and/or servicing agents. The Fund may have paid shareholder servicing fees up to an aggregate annual rate of 0.40% of the Fund’s average daily net assets attributable to Class V shares (comprised of up to 0.20% for shareholder services and up to 0.20% for administrative support services). These fees were limited to an aggregate annual rate of not more than 0.15% of the Fund’s average daily net assets attributable to Class V shares. As a result of Class V shares of the Fund being liquidated, December 8, 2023 was the last day the Fund paid a shareholder services fee for Class V shares.
Sales charges (unaudited)
Sales charges, including front-end charges and contingent deferred sales charges (CDSCs), received by the Distributor for distributing Fund shares for the year ended April 30, 2024, if any, are listed below:
Columbia Bond Fund | Annual Report 2024
39
Notes to Financial Statements (continued)April 30, 2024 | This charge is imposed on certain investments of between $1 million and $50 million redeemed within 18 months after purchase, as follows: 1.00% if redeemed within 12 months after purchase, and 0.50% if redeemed more than 12, but less than 18, months after purchase, with certain limited exceptions. |
| This charge applies to redemptions within 12 months after purchase, with certain limited exceptions. |
The Fund’s other share classes are not subject to sales charges.
Expenses waived/reimbursed by the Investment Manager and its affiliates
The Investment Manager and certain of its affiliates have contractually agreed to waive fees and/or reimburse expenses (excluding certain fees and expenses described below) for the period(s) disclosed below, unless sooner terminated at the sole discretion of the Board of Trustees, so that the Fund’s net operating expenses, after giving effect to fees waived/expenses reimbursed and any balance credits and/or overdraft charges from the Fund’s custodian, do not exceed the following annual rate(s) as a percentage of the classes’ average daily net assets:
| September 1, 2023
through
August 31, 2024 | Prior to
September 1, 2023 |
| | |
| | |
| | |
| | |
| | |
Under the agreement governing these fee waivers and/or expense reimbursement arrangements, the following fees and expenses are excluded from the waiver/reimbursement commitment, and therefore will be paid by the Fund, if applicable: taxes (including foreign transaction taxes), expenses associated with investments in affiliated and non-affiliated pooled investment vehicles (including mutual funds and exchange-traded funds), transaction costs and brokerage commissions, costs related to any securities lending program, dividend expenses associated with securities sold short, inverse floater program fees and expenses, transaction charges and interest on borrowed money, interest, costs associated with shareholder meetings, infrequent and/or unusual expenses and any other expenses the exclusion of which is specifically approved by the Board of Trustees. This agreement may be modified or amended only with approval from the Investment Manager, certain of its affiliates and the Fund. Reflected in the contractual cap commitment, prior to September 1, 2023, is the Transfer Agent’s contractual agreement to limit total transfer agency fees to an annual rate of not more than 0.05% for Institutional 2 Class and 0.00% for Institutional 3 Class of the average daily net assets attributable to each share class. Any fees waived and/or expenses reimbursed under the expense reimbursement arrangements described above are not recoverable by the Investment Manager or its affiliates in future periods.
Note 4. Federal tax information
The timing and character of income and capital gain distributions are determined in accordance with income tax regulations, which may differ from GAAP because of temporary or permanent book to tax differences.
At April 30, 2024, these differences were primarily due to differing treatment for deferral/reversal of wash sale losses, derivative investments, tax straddles, principal and/or interest from fixed income securities, capital loss carryforwards, trustees’ deferred compensation and distributions. To the extent these differences were permanent, reclassifications were made among the components of the Fund’s net assets. Temporary differences do not require reclassifications.
The following reclassifications were made:
Excess of distributions
over net investment
income ($) | Accumulated
net realized
(loss) ($) | |
| | |
Net investment income (loss) and net realized gains (losses), as disclosed in the Statement of Operations, and net assets were not affected by this reclassification.
40
Columbia Bond Fund | Annual Report 2024
Notes to Financial Statements (continued)April 30, 2024 The tax character of distributions paid during the years indicated was as follows:
Year Ended April 30, 2024 | Year Ended April 30, 2023 |
| Long-term
capital gains ($) | | | Long-term
capital gains ($) | |
| | | | | |
Short-term capital gain distributions, if any, are considered ordinary income distributions for tax purposes.
At April 30, 2024, the components of distributable earnings on a tax basis were as follows:
Undistributed
ordinary income ($) | Undistributed
long-term
capital gains ($) | Capital loss
carryforwards ($) | Net unrealized
(depreciation) ($) |
| | | |
At April 30, 2024, the cost of all investments for federal income tax purposes along with the aggregate gross unrealized appreciation and depreciation based on that cost was:
| Gross unrealized
appreciation ($) | Gross unrealized
(depreciation) ($) | Net unrealized
(depreciation) ($) |
| | | |
Tax cost of investments and unrealized appreciation/(depreciation) may also include timing differences that do not constitute adjustments to tax basis.
The following capital loss carryforwards, determined at April 30, 2024, may be available to reduce future net realized gains on investments, if any, to the extent permitted by the Internal Revenue Code. In addition, for the year ended April 30, 2024, capital loss carryforwards utilized, if any, were as follows:
No expiration
short-term ($) | No expiration
long-term ($) | | |
| | | |
Management of the Fund has concluded that there are no significant uncertain tax positions in the Fund that would require recognition in the financial statements. However, management’s conclusion may be subject to review and adjustment at a later date based on factors including, but not limited to, new tax laws, regulations, and administrative interpretations (including relevant court decisions). Generally, the Fund’s federal tax returns for the prior three fiscal years remain subject to examination by the Internal Revenue Service.
Note 5. Portfolio information
The cost of purchases and proceeds from sales of securities, excluding short-term investments and derivatives, if any, aggregated to $2,712,209,671 and $2,813,247,920, respectively, for the year ended April 30, 2024, of which $2,369,485,801 and $2,365,741,065, respectively, were U.S. government securities. The amount of purchase and sale activity impacts the portfolio turnover rate reported in the Financial Highlights.
Note 6. Affiliated money market fund
The Fund invests in Columbia Short-Term Cash Fund, an affiliated money market fund established for the exclusive use by the Fund and other affiliated funds (the Affiliated MMF). The income earned by the Fund from such investments is included as Dividends - affiliated issuers in the Statement of Operations. As an investing fund, the Fund indirectly bears its proportionate share of the expenses of the Affiliated MMF. The Affiliated MMF prices its shares with a floating net asset value. The Securities and Exchange Commission has adopted amendments to money market fund rules requiring institutional prime money market funds like the Affiliated MMF to be subject to a discretionary liquidity fee of up to 2% if the imposition of such a fee is determined to be in the best interest of the Affiliated MMF and, by October 2, 2024, to a mandatory liquidity fee if daily net redemptions exceed 5% of net assets.
Columbia Bond Fund | Annual Report 2024
41
Notes to Financial Statements (continued)April 30, 2024 Note 7. Interfund lending
Pursuant to an exemptive order granted by the Securities and Exchange Commission, the Fund participates in a program (the Interfund Program) allowing each participating Columbia Fund (each, a Participating Fund) to lend money directly to and, except for closed-end funds and money market funds, borrow money directly from other Participating Funds for temporary purposes. The amounts eligible for borrowing and lending under the Interfund Program are subject to certain restrictions.
Interfund loans are subject to the risk that the borrowing fund could be unable to repay the loan when due, and a delay in repayment to the lending fund could result in lost opportunities and/or additional lending costs. The exemptive order is subject to conditions intended to mitigate conflicts of interest arising from the Investment Manager’s relationship with each Participating Fund.
The Fund’s activity in the Interfund Program during the year ended April 30, 2024 was as follows:
| | Weighted average
interest rate (%) | Number of days
with outstanding loans |
| | | |
Interest income earned by the Fund is recorded as Interfund lending in the Statement of Operations. The Fund had no outstanding interfund loans at April 30, 2024.
Note 8. Line of credit
The Fund has access to a revolving credit facility with a syndicate of banks led by JPMorgan Chase Bank, N.A., Citibank, N.A. and Wells Fargo Bank, N.A. whereby the Fund may borrow for the temporary funding of shareholder redemptions or for other temporary or emergency purposes. Pursuant to an October 26, 2023 amendment and restatement, the credit facility, which is an agreement between the Fund and certain other funds managed by the Investment Manager or an affiliated investment manager, severally and not jointly, permits aggregate borrowings up to $900 million. Interest is currently charged to each participating fund based on its borrowings at a rate equal to the higher of (i) the federal funds effective rate, (ii) the secured overnight financing rate plus 0.10% and (iii) the overnight bank funding rate plus, in each case, 1.00%. Each borrowing under the credit facility matures no later than 60 days after the date of borrowing. The Fund also pays a commitment fee equal to its pro rata share of the unused amount of the credit facility at a rate of 0.15% per annum. The commitment fee is included in other expenses in the Statement of Operations. This agreement expires annually in October unless extended or renewed. Prior to the October 26, 2023 amendment and restatement, the Fund had access to a revolving credit facility with a syndicate of banks led by JPMorgan Chase Bank, N.A., Citibank, N.A. and Wells Fargo Bank, N.A. which permitted collective borrowings up to $950 million. Interest was charged to each participating fund based on its borrowings at a rate equal to the higher of (i) the federal funds effective rate, (ii) the secured overnight financing rate plus 0.10% and (iii) the overnight bank funding rate plus, in each case, 1.00%.
The Fund had no borrowings during the year ended April 30, 2024.
Note 9. Significant risks
Credit risk
Credit risk is the risk that the value of debt instruments in the Fund’s portfolio may decline because the issuer defaults or otherwise becomes unable or unwilling, or is perceived to be unable or unwilling, to honor its financial obligations, such as making payments to the Fund when due. Credit rating agencies assign credit ratings to certain debt instruments to indicate their credit risk. Lower-rated or unrated debt instruments held by the Fund may present increased credit risk as compared to higher-rated debt instruments.
Derivatives risk
Losses involving derivative instruments may be substantial, because a relatively small movement in the underlying reference (which is generally the price, rate or other economic indicator associated with a security(ies), commodity, currency, index or other instrument or asset) may result in a substantial loss for the Fund. In addition to the potential for increased losses, the
42
Columbia Bond Fund | Annual Report 2024
Notes to Financial Statements (continued)April 30, 2024 use of derivative instruments may lead to increased volatility within the Fund. Derivatives will typically increase the Fund’s exposure to principal risks to which it is otherwise exposed, and may expose the Fund to additional risks, including correlation risk, counterparty risk, hedging risk, leverage risk, liquidity risk and pricing risk.
Interest rate risk
Interest rate risk is the risk of losses attributable to changes in interest rates. In general, if interest rates rise, the values of debt instruments tend to fall, and if interest rates fall, the values of debt instruments tend to rise. Actions by governments and central banking authorities can result in increases or decreases in interest rates. Higher periods of inflation could lead such authorities to raise interest rates. Increasing interest rates may negatively affect the value of debt securities held by the Fund, resulting in a negative impact on the Fund’s performance and net asset value per share. In general, the longer the maturity or duration of a debt security, the greater its sensitivity to changes in interest rates. The Fund is subject to the risk that the income generated by its investments may not keep pace with inflation.
Liquidity risk
Liquidity risk is the risk associated with a lack of marketability of investments which may make it difficult to sell the investment at a desirable time or price. Changing regulatory, market or other conditions or environments (for example, the interest rate or credit environments) may adversely affect the liquidity of the Fund’s investments. The Fund may have to accept a lower selling price for the holding, sell other investments, or forego another, more appealing investment opportunity. Generally, the less liquid the market at the time the Fund sells a portfolio investment, the greater the risk of loss or decline of value to the Fund. A less liquid market can lead to an increase in Fund redemptions, which may negatively impact Fund performance and net asset value per share, including, for example, if the Fund is forced to sell securities in a down market.
Market risk
The Fund may incur losses due to declines in the value of one or more securities in which it invests. These declines may be due to factors affecting a particular issuer, or the result of, among other things, political, regulatory, market, economic or social developments affecting the relevant market(s) more generally. In addition, turbulence in financial markets and reduced liquidity in equity, credit and/or fixed income markets may negatively affect many issuers, which could adversely affect the Fund’s ability to price or value hard-to-value assets in thinly traded and closed markets and could cause significant redemptions and operational challenges. Global economies and financial markets are increasingly interconnected, and conditions and events in one country, region or financial market may adversely impact issuers in a different country, region or financial market. These risks may be magnified if certain events or developments adversely interrupt the global supply chain; in these and other circumstances, such risks might affect companies worldwide. As a result, local, regional or global events such as terrorism, war, other conflicts, natural disasters, disease/virus outbreaks and epidemics or other public health issues, recessions, depressions or other events – or the potential for such events – could have a significant negative impact on global economic and market conditions.
The large-scale invasion of Ukraine by Russia in February 2022 has resulted in sanctions and market disruptions, including declines in regional and global stock markets, unusual volatility in global commodity markets and significant devaluations of Russian currency. The extent and duration of the military action are impossible to predict but could continue to be significant. Market disruption caused by the Russian military action, and any countermeasures or responses thereto (including international sanctions, a downgrade in a country’s credit rating, purchasing and financing restrictions, boycotts, tariffs, changes in consumer or purchaser preferences, cyberattacks and espionage) could continue to have severe adverse impacts on regional and/or global securities and commodities markets, including markets for oil and natural gas. These impacts may include reduced market liquidity, distress in credit markets, further disruption of global supply chains, increased risk of inflation, restricted cross-border payments and limited access to investments and/or assets in certain international markets and/or issuers. These developments and other related events could negatively impact Fund performance.
Mortgage- and other asset-backed securities risk
The value of any mortgage-backed and other asset-backed securities including collateralized debt obligations, if any, held by the Fund may be affected by, among other things, changes or perceived changes in: interest rates; factors concerning the interests in and structure of the issuer or the originator of the mortgages or other assets; the creditworthiness of the entities that provide any supporting letters of credit, surety bonds or other credit enhancements; or the market’s assessment of the
Columbia Bond Fund | Annual Report 2024
43
Notes to Financial Statements (continued)April 30, 2024 quality of underlying assets. Payment of principal and interest on some mortgage-backed securities (but not the market value of the securities themselves) may be guaranteed by the full faith and credit of a particular U.S. Government agency, authority, enterprise or instrumentality, and some, but not all, are also insured or guaranteed by the U.S. Government. Mortgage-backed securities issued by non-governmental issuers (such as commercial banks, savings and loan institutions, private mortgage insurance companies, mortgage bankers and other secondary market issuers) may entail greater risk than obligations guaranteed by the U.S. Government. Mortgage- and other asset-backed securities are subject to liquidity risk and prepayment risk. A decline or flattening of housing values may cause delinquencies in mortgages (especially sub-prime or non-prime mortgages) underlying mortgage-backed securities and thereby adversely affect the ability of the mortgage-backed securities issuer to make principal and/or interest payments to mortgage-backed securities holders, including the Fund. Rising or high interest rates tend to extend the duration of mortgage- and other asset-backed securities, making their prices more volatile and more sensitive to changes in interest rates.
Shareholder concentration risk
At April 30, 2024, one unaffiliated shareholder of record owned 36.5% of the outstanding shares of the Fund in one or more accounts. The Fund has no knowledge about whether any portion of those shares was owned beneficially. Affiliated shareholders of record owned 47.8% of the outstanding shares of the Fund in one or more accounts. Fund shares sold to or redeemed by concentrated accounts may have a significant effect on the operations of the Fund. In the case of a large redemption, the Fund may be forced to sell investments at inopportune times, including its liquid positions, which may result in Fund losses and the Fund holding a higher percentage of less liquid positions. Large redemptions could result in decreased economies of scale and increased operating expenses for non-redeeming Fund shareholders.
Note 10. Subsequent events
Management has evaluated the events and transactions that have occurred through the date the financial statements were issued and noted no items requiring adjustment of the financial statements or additional disclosure.
Note 11. Information regarding pending and settled legal proceedings
Ameriprise Financial and certain of its affiliates are involved in the normal course of business in legal proceedings which include regulatory inquiries, arbitration and litigation, including class actions concerning matters arising in connection with the conduct of their activities as part of a diversified financial services firm. Ameriprise Financial believes that the Fund is not currently the subject of, and that neither Ameriprise Financial nor any of its affiliates are the subject of, any pending legal, arbitration or regulatory proceedings that are likely to have a material adverse effect on the Fund or the ability of Ameriprise Financial or its affiliates to perform under their contracts with the Fund. Ameriprise Financial is required to make quarterly (10-Q), annual (10-K) and, as necessary, 8-K filings with the Securities and Exchange Commission (SEC) on legal and regulatory matters that relate to Ameriprise Financial and its affiliates. Copies of these filings may be obtained by accessing the SEC website at www.sec.gov.
There can be no assurance that these matters, or the adverse publicity associated with them, will not result in increased Fund redemptions, reduced sale of Fund shares or other adverse consequences to the Fund. Further, although we believe proceedings are not likely to have a material adverse effect on the Fund or the ability of Ameriprise Financial or its affiliates to perform under their contracts with the Fund, these proceedings are subject to uncertainties and, as such, we are unable to estimate the possible loss or range of loss that may result. An adverse outcome in one or more of these proceedings could result in adverse judgments, settlements, fines, penalties or other relief that could have a material adverse effect on the consolidated financial condition or results of operations of Ameriprise Financial or one or more of its affiliates that provide services to the Fund.
44
Columbia Bond Fund | Annual Report 2024
Report of Independent Registered Public Accounting Firm
To the Board of Trustees of Columbia Funds Series Trust I and Shareholders of Columbia Bond Fund
Opinion on the Financial Statements
We have audited the accompanying statement of assets and liabilities, including the portfolio of investments, of Columbia Bond Fund (one of the funds constituting Columbia Funds Series Trust I, referred to hereafter as the "Fund") as of April 30, 2024, the related statement of operations for the year ended April 30, 2024, the statement of changes in net assets for each of the two years in the period ended April 30, 2024, including the related notes, and the financial highlights for each of the five years in the period ended April 30, 2024 (collectively referred to as the "financial statements"). In our opinion, the financial statements present fairly, in all material respects, the financial position of the Fund as of April 30, 2024, the results of its operations for the year then ended, the changes in its net assets for each of the two years in the period ended April 30, 2024 and the financial highlights for each of the five years in the period ended April 30, 2024 in conformity with accounting principles generally accepted in the United States of America.
Basis for Opinion
These financial statements are the responsibility of the Fund’s management. Our responsibility is to express an opinion on the Fund’s financial statements based on our audits. We are a public accounting firm registered with the Public Company Accounting Oversight Board (United States) (PCAOB) and are required to be independent with respect to the Fund in accordance with the U.S. federal securities laws and the applicable rules and regulations of the Securities and Exchange Commission and the PCAOB.
We conducted our audits of these financial statements in accordance with the standards of the PCAOB. Those standards require that we plan and perform the audit to obtain reasonable assurance about whether the financial statements are free of material misstatement, whether due to error or fraud.
Our audits included performing procedures to assess the risks of material misstatement of the financial statements, whether due to error or fraud, and performing procedures that respond to those risks. Such procedures included examining, on a test basis, evidence regarding the amounts and disclosures in the financial statements. Our audits also included evaluating the accounting principles used and significant estimates made by management, as well as evaluating the overall presentation of the financial statements. Our procedures included confirmation of securities owned as of April 30, 2024 by correspondence with the custodian, transfer agent and brokers; when replies were not received from brokers, we performed other auditing procedures. We believe that our audits provide a reasonable basis for our opinion.
/s/PricewaterhouseCoopers LLP
Minneapolis, Minnesota
June 20, 2024
We have served as the auditor of one or more investment companies within the Columbia Funds Complex since 1977.
Columbia Bond Fund | Annual Report 2024
45
Federal Income Tax Information
(Unaudited)
The Fund hereby designates the following tax attributes for the fiscal year ended April 30, 2024. Shareholders will be notified in early 2025 of the amounts for use in preparing 2024 income tax returns.
Section
163(j)
Interest
Dividends | |
| |
Section 163(j) Interest Dividends. The percentage of ordinary income distributed during the fiscal year that shareholders may treat as interest income for purposes of IRC Section 163(j), subject to holding period requirements and other limitations.
TRUSTEES AND OFFICERS
(Unaudited)
The Board oversees the Fund’s operations and appoints officers who are responsible for day-to-day business decisions based on policies set by the Board. The following table provides basic biographical information about the Fund’s Trustees as of the printing of this report, including their principal occupations during the past five years, although specific titles for individuals may have varied over the period. The year set forth beneath Length of Service in the table below is the year in which the Trustee was first appointed or elected as Trustee to any Fund currently in the Columbia Funds Complex or a predecessor thereof. Under current Board policy, each Trustee generally serves until December 31 of the year such Trustee turns seventy-five (75).
Independent trustees
Name,
address,
year of birth | Position held
with the Columbia Funds and
length of service | Principal occupation(s)
during past five years
and other relevant
professional experience | Number of
Funds in the
Columbia Funds
Complex*
overseen | Other directorships
held by Trustee
during the past five years
and other relevant Board experience |
George S. Batejan
c/o Columbia Management
Investment Advisers, LLC
290 Congress Street
Boston, MA 02210
1954 | | Executive Vice President, Global Head of Technology and Operations, Janus Capital Group, Inc., 2010-2016 | | Former Chairman of the Board, NICSA (National Investment Company Services Association) (Executive Committee, Nominating Committee and Governance Committee), 2014-2016; former Director, Intech Investment Management, 2011-2016; former Board Member, Metro Denver Chamber of Commerce, 2015-2016; former Advisory Board Member, University of Colorado Business School, 2015-2018; former Board Member, Chase Bank International, 1993-1994 |
46
Columbia Bond Fund | Annual Report 2024
TRUSTEES AND OFFICERS (continued)(Unaudited)Independent trustees (continued) Name, address, year of birth | Position held with the Columbia Funds and length of service | Principal occupation(s) during past five years and other relevant professional experience | Number of Funds in the Columbia Funds Complex* overseen | Other directorships held by Trustee during the past five years and other relevant Board experience |
Kathleen Blatz
c/o Columbia Management
Investment Advisers, LLC
290 Congress Street
Boston, MA 02210
1954 | | Attorney, specializing in arbitration and mediation; Trustee of Gerald Rauenhorst 1982 Trusts, since 2020; Chief Justice, Minnesota Supreme Court, 1998-2006; Associate Justice, Minnesota Supreme Court, 1996-1998; Fourth Judicial District Court Judge, Hennepin County, 1994-1996; Attorney in private practice and public service, 1984-1993; State Representative, Minnesota House of Representatives, 1979-1993, which included service on the Tax and Financial Institutions and Insurance Committees; Member and Interim Chair, Minnesota Sports Facilities Authority, January-July 2017; Interim President and Chief Executive Officer, Blue Cross and Blue Shield of Minnesota (health care insurance), February-July 2018, April-October 2021 | | Former Trustee, Blue Cross and Blue Shield of Minnesota, 2009-2021 (Chair of the Business Development Committee, 2014-2017; Chair of the Governance Committee, 2017-2019); former Member and Chair of the Board, Minnesota Sports Facilities Authority, January 2017-July 2017; former Director, Robina Foundation, 2009-2020 (Chair, 2014-2020); Director, Richard M. Schulze Family Foundation, since 2021 |
Pamela G. Carlton
c/o Columbia Management
Investment Advisers, LLC
290 Congress Street
Boston, MA 02210
1954 | Chair since 2023; Trustee since 2007 | President, Springboard – Partners in Cross Cultural Leadership (consulting company), since 2003; Managing Director of US Equity Research, JP Morgan Chase, 1999-2003; Director of US Equity Research, Chase Asset Management, 1996-1999; Co-Director Latin America Research, 1993-1996, COO Global Research, 1992-1996, Co-Director of US Research, 1991-1992, Investment Banker, 1982-1991, Morgan Stanley; Attorney, Cleary Gottlieb Steen & Hamilton LLP, 1980-1982 | | Trustee, New York Presbyterian Hospital Board, since 1996; Director, DR Bank (Audit Committee, since 2017 and Audit Committee Chair, since November 2023); Director, Evercore Inc. (Audit Committee, Nominating and Governance Committee) (financial services company), since 2019; Director, Apollo Commercial Real Estate Finance, Inc. (Chair, Nominating and Governance Committee), since 2021; the Governing Council of the Independent Directors Council (IDC), since 2021 |
Janet Langford Carrig
c/o Columbia Management
Investment Advisers, LLC
290 Congress Street
Boston, MA 02210
1957 | | Senior Vice President, General Counsel and Corporate Secretary, ConocoPhillips (independent energy company), September 2007-October 2018 | | Director, EQT Corporation (natural gas producer), since 2019; former Director, Whiting Petroleum Corporation (independent oil and gas company), 2020-2022 |
J. Kevin Connaughton
c/o Columbia Management
Investment Advisers, LLC
290 Congress Street
Boston, MA 02210
1964 | | CEO and President, RhodeWay Financial (non-profit financial planning firm), since December 2022; Member, FINRA National Adjudicatory Council, January 2020-December 2023; Adjunct Professor of Finance, Bentley University January 2018-April 2023; Consultant to Independent Trustees of CFVIT and CFST I from March 2016 to June 2020 with respect to CFVIT and to December 2020 with respect to CFST I; Managing Director and General Manager of Mutual Fund Products, Columbia Management Investment Advisers, LLC, May 2010-February 2015; President, Columbia Funds, 2008-2015; and senior officer of Columbia Funds and affiliated funds, 2003-2015 | | Former Director, The Autism Project, March 2015-December 2021; former Member of the Investment Committee, St. Michael’s College, November 2015-February 2020; former Trustee, St. Michael’s College, June 2017-September 2019; former Trustee, New Century Portfolios (former mutual fund complex), January 2015-December 2017 |
Columbia Bond Fund | Annual Report 2024
47
TRUSTEES AND OFFICERS (continued)(Unaudited)Independent trustees (continued) Name, address, year of birth | Position held with the Columbia Funds and length of service | Principal occupation(s) during past five years and other relevant professional experience | Number of Funds in the Columbia Funds Complex* overseen | Other directorships held by Trustee during the past five years and other relevant Board experience |
Olive M. Darragh
c/o Columbia Management
Investment Advisers, LLC
290 Congress Street
Boston, MA 02210
1962 | | Managing Director of Darragh Inc. (strategy and talent management consulting firm), since 2010; Founder and CEO, Zolio, Inc. (investment management talent identification platform), since 2004; Consultant to Independent Trustees of CFVIT and CFST I from June 2019 to June 2020 with respect to CFVIT and to December 2020 with respect to CFST I; Partner, Tudor Investments, 2004-2010; Senior Partner, McKinsey & Company (consulting), 1990-2004; Touche Ross CPA, 1985-1988 | | Treasurer, Edinburgh University US Trust Board, since January 2023; Member, HBS Community Action Partners Board, since September 2022; former Director, University of Edinburgh Business School (Member of US Board), 2004-2019; former Director, Boston Public Library Foundation, 2008-2017 |
Patricia M. Flynn
c/o Columbia Management
Investment Advisers, LLC
290 Congress Street
Boston, MA 02210
1950 | | Professor Emeritus of Economics and Management, Bentley University, since 2023; Professor of Economics and Management, Bentley University, 1976-2023; Dean, McCallum Graduate School of Business, Bentley University, 1992-2002 | | Former Trustee, MA Taxpayers Foundation, 1997-2022; former Director, The MA Business Roundtable, 2003-2019; former Chairperson, Innovation Index Advisory Committee, MA Technology Collaborative, 1997-2020 |
Brian J. Gallagher
c/o Columbia Management
Investment Advisers, LLC
290 Congress Street
Boston, MA 02210
1954 | | Retired; Partner with Deloitte & Touche LLP and its predecessors, 1977-2016 | | Trustee, Catholic Schools Foundation, since 2004 |
Douglas A. Hacker
c/o Columbia Management
Investment Advisers, LLC
290 Congress Street
Boston, MA 02210
1955 | | Independent business executive, since May 2006; Executive Vice President – Strategy of United Airlines, December 2002 - May 2006; President of UAL Loyalty Services (airline marketing company), September 2001-December 2002; Executive Vice President and Chief Financial Officer of United Airlines, July 1999-September 2001 | | Director, SpartanNash Company (food distributor), since November 2013 (Chair of the Board, since May 2021); Director, Aircastle Limited (aircraft leasing), since August 2006 (Chair of Audit Committee); former Director, Nash Finch Company (food distributor), 2005-2013; former Director, SeaCube Container Leasing Ltd. (container leasing), 2010-2013; and former Director, Travelport Worldwide Limited (travel information technology), 2014-2019 |
Nancy T. Lukitsh
c/o Columbia Management
Investment Advisers, LLC
290 Congress Street
Boston, MA 02210
1956 | | Senior Vice President, Partner and Director of Marketing, Wellington Management Company, LLP (investment adviser), 1997-2010; Chair, Wellington Management Portfolios (commingled non-U.S. investment pools), 2007-2010; Director, Wellington Trust Company, NA and other Wellington affiliates, 1997-2010 | | |
48
Columbia Bond Fund | Annual Report 2024
TRUSTEES AND OFFICERS (continued)(Unaudited)Independent trustees (continued) Name, address, year of birth | Position held with the Columbia Funds and length of service | Principal occupation(s) during past five years and other relevant professional experience | Number of Funds in the Columbia Funds Complex* overseen | Other directorships held by Trustee during the past five years and other relevant Board experience |
David M. Moffett
c/o Columbia Management
Investment Advisers, LLC
290 Congress Street
Boston, MA 02210
1952 | | Retired; former Chief Executive Officer of Freddie Mac and Chief Financial Officer of U.S. Bank | | Director, CSX Corporation (transportation suppliers); Director, PayPal Holdings Inc. (payment and data processing services); former Director, eBay Inc. (online trading community), 2007-2015; and former Director, CIT Bank, CIT Group Inc. (commercial and consumer finance), 2010-2016; former Senior Adviser to The Carlyle Group (financial services), March 2008-September 2008; former Governance Consultant to Bridgewater Associates, January 2013-December 2015 |
Catherine James Paglia
c/o Columbia Management
Investment Advisers, LLC
290 Congress Street
Boston, MA 02210
1952 | | Director, Enterprise Asset Management, Inc. (private real estate and asset management company), since September 1998; Managing Director and Partner, Interlaken Capital, Inc., 1989-1997; Vice President, 1982-1985, Principal, 1985-1987, Managing Director, 1987-1989, Morgan Stanley; Vice President, Investment Banking, 1980-1982, Associate, Investment Banking, 1976-1980, Dean Witter Reynolds, Inc. | | Director, Valmont Industries, Inc. (irrigation systems manufacturer), since 2012; Trustee, Carleton College (on the Investment Committee), since 1987; Trustee, Carnegie Endowment for International Peace (on the Investment Committee), since 2009 |
Natalie A. Trunow
c/o Columbia Management
Investment Advisers, LLC
290 Congress Street
Boston, MA 02210
1967 | | Chief Executive Officer, Millennial Portfolio Solutions LLC (asset management and consulting services), January 2016-January 2021; Non-executive Member of the Investment Committee and Valuation Committee, Sarona Asset Management Inc. (private equity firm) since September 2019; Advisor, Horizon Investments (asset management and consulting services), August 2018-January 2022; Advisor, Paradigm Asset Management, November 2016-January 2022; Consultant to Independent Trustees of CFVIT and CFST I from September 2016 to June 2020 with respect to CFVIT and to December 2020 with respect to CFST I; Director of Investments/Consultant, Casey Family Programs, April 2016-November 2016; Senior Vice President and Chief Investment Officer, Calvert Investments, August 2008-January 2016; Section Head and Portfolio Manager, General Motors Asset Management, June 1997-August 2008 | | Independent Director, Investment Committee, Health Services for Children with Special Needs, Inc., 2010-2021; Independent Director, (Executive Committee and Chair, Audit Committee), Consumer Credit Counseling Services (formerly Guidewell Financial Solutions), since 2016; Independent Director, (Investment Committee), Sarona Asset Management, since 2019 |
Sandra L. Yeager
c/o Columbia Management
Investment Advisers, LLC
290 Congress Street
Boston, MA 02210
1964 | | Retired; President and founder, Hanoverian Capital, LLC (SEC registered investment advisor firm), 2008-2016; Managing Director, DuPont Capital, 2006-2008; Managing Director, Morgan Stanley Investment Management, 2004-2006; Senior Vice President, Alliance Bernstein, 1990-2004 | | Former Director, NAPE (National Alliance for Partnerships in Equity) Education Foundation, October 2016-October 2020; Advisory Board, Jennersville YMCA, June 2022-June 2023 |
Columbia Bond Fund | Annual Report 2024
49
TRUSTEES AND OFFICERS (continued)(Unaudited)Independent trustees (continued) Interested trustee affiliated with Investment Manager**
Name,
address,
year of birth | Position held with the Columbia Funds and length of service | Principal occupation(s) during the
past five years and other relevant
professional experience | Number of
Funds in the
Columbia Funds
Complex* overseen | Other directorships
held by Trustee
during the past
five years and
other relevant Board experience |
Daniel J. Beckman
c/o Columbia Management
Investment Advisers, LLC
290 Congress Street
Boston, MA 02210
1962 | Trustee since November 2021 and President since June 2021 | President and Principal Executive Officer of the Columbia Funds, since June 2021; Vice President, Columbia Management Investment Advisers, LLC, since April 2015; formerly, Vice President – Head of North America Product, Columbia Management Investment Advisers, LLC, April 2015 – December 2023; President and Principal Executive Officer, Columbia Acorn/Wanger Funds, since July 2021 | | Director, Ameriprise Trust Company, since October 2016; Director, Columbia Management Investment Distributors, Inc., since November 2018; Board of Governors, Columbia Wanger Asset Management, LLC, since January 2022 |
| The term “Columbia Funds Complex” as used herein includes Columbia Seligman Premium Technology Growth Fund, Tri-Continental Corporation and each series of Columbia Funds Series Trust (CFST), Columbia Funds Series Trust I (CFST I), Columbia Funds Series Trust II (CFST II), Columbia ETF Trust I (CET I), Columbia ETF Trust II (CET II), Columbia Funds Variable Insurance Trust (CFVIT) and Columbia Funds Variable Series Trust II (CFVST II). Messrs. Batejan, Beckman, Gallagher, Hacker and Moffett and Mses. Blatz, Carlton, Carrig, Flynn, Paglia, and Yeager serve as directors of Columbia Seligman Premium Technology Growth Fund and Tri-Continental Corporation. |
| Interested person (as defined under the 1940 Act) by reason of being an officer, director, security holder and/or employee of the Investment Manager or Ameriprise Financial. |
The Statement of Additional Information has additional information about the Fund’s Board members and is available, without charge, upon request by calling 800.345.6611, visiting columbiathreadneedleus.com/investor/ or contacting your financial intermediary.
The Board has appointed officers who are responsible for day-to-day business decisions based on policies it has established. The officers serve at the pleasure of the Board. The following table provides basic information about the Officers of the Fund as of the printing of this report, including principal occupations during the past five years, although their specific titles may have varied over the period. In addition to Mr. Beckman, who is President and Principal Executive Officer, the Fund’s other officers are:
Fund officers
Name,
address and
year of birth | Position and year
first appointed to
position for any Fund
in the Columbia
Funds Complex or a
predecessor thereof | Principal occupation(s) during past five years |
Michael G. Clarke
290 Congress Street
Boston, MA 02210
1969 | Chief Financial Officer and Principal Financial Officer (2009); Senior Vice President (2019); Treasurer and Chief Accounting Officer (Principal Accounting Officer) (2024) for CFST, CFST I, CFST II, CFVIT and CFVST II | Senior Vice President and North America Head of Operations & Investor Services, Columbia Management Investment Advisers, LLC, since June 2023 (previously Senior Vice President and Head of Global Operations, March 2022 – June 2023, Vice President, Head of North America Operations, and Co-Head of Global Operations, June 2019 - February 2022 and Vice President – Accounting and Tax, May 2010 - May 2019); senior officer of Columbia Funds and affiliated funds, since 2002. Director, Ameriprise Trust Company, since June 2023. |
50
Columbia Bond Fund | Annual Report 2024
TRUSTEES AND OFFICERS (continued)(Unaudited)Fund officers (continued) Name, address and year of birth | Position and year first appointed to position for any Fund in the Columbia Funds Complex or a predecessor thereof | Principal occupation(s) during past five years |
Marybeth Pilat
290 Congress Street
Boston, MA 02210
1968 | Treasurer and Chief Accounting Officer (Principal Accounting Officer) and Principal Financial Officer (2020) for CET I and CET II; Assistant Treasurer, CFST, CFST I, CFST II, CFVIT and CFVST II | Vice President – Product Pricing and Administration, Columbia Management Investment Advisers, LLC, since May 2017. |
William F. Truscott
290 Congress Street
Boston, MA 02210
1960 | Senior Vice President (2001) | Formerly, Trustee/Director of Columbia Funds Complex or legacy funds, November 2001 - January 1, 2021; Chief Executive Officer, Global Asset Management, Ameriprise Financial, Inc., since September 2012; Chairman of the Board and President, Columbia Management Investment Advisers, LLC, since July 2004 and February 2012, respectively; Chairman of the Board and Chief Executive Officer, Columbia Management Investment Distributors, Inc., since November 2008 and February 2012, respectively; Chairman of the Board and Director, TAM UK International Holdings Limited, since July 2021; formerly Chairman of the Board and Director, Threadneedle Asset Management Holdings, Sàrl, March 2013 – December 2022 and December 2008 – December 2022, respectively; senior executive of various entities affiliated with Columbia Threadneedle Investments. |
Christopher O. Petersen
5228 Ameriprise Financial Center
Minneapolis, MN 55474
1970 | Senior Vice President and Assistant Secretary (2021) | Formerly, Trustee/Director of funds within the Columbia Funds Complex, July 1, 2020 - November 22, 2021; Senior Vice President and Assistant General Counsel, Ameriprise Financial, Inc., since September 2021 (previously Vice President and Lead Chief Counsel, January 2015 - September 2021); formerly, President and Principal Executive Officer of the Columbia Funds, 2015 - 2021; officer of Columbia Funds and affiliated funds, since 2007. |
Thomas P. McGuire
290 Congress Street
Boston, MA 02210
1972 | Senior Vice President and Chief Compliance Officer (2012) | Vice President – Asset Management Compliance, Ameriprise Financial, Inc., since May 2010; Chief Compliance Officer, Columbia Acorn/Wanger Funds, since December 2015; formerly, Chief Compliance Officer, Ameriprise Certificate Company, September 2010 – September 2020. |
Ryan C. Larrenaga
290 Congress Street
Boston, MA 02210
1970 | Senior Vice President (2017), Chief Legal Officer (2017), and Secretary (2015) | Vice President and Chief Counsel, Ameriprise Financial, Inc., since August 2018 (previously Vice President and Group Counsel, August 2011 - August 2018); Chief Legal Officer, Columbia Acorn/Wanger Funds, since September 2020; officer of Columbia Funds and affiliated funds, since 2005. |
Michael E. DeFao
290 Congress Street
Boston, MA 02210
1968 | Vice President (2011) and Assistant Secretary (2010) | Vice President and Chief Counsel, Ameriprise Financial, Inc., since May 2010; Vice President, Chief Legal Officer and Assistant Secretary, Columbia Management Investment Advisers, LLC, since October 2021 (previously Vice President and Assistant Secretary, May 2010 – September 2021). |
Lyn Kephart-Strong
5903 Ameriprise Financial Center
Minneapolis, MN 55474
1960 | | Vice President, Global Investment Operations Services, Columbia Management Investment Advisers, LLC, since 2010; President, Columbia Management Investment Services Corp., since October 2014; President, Ameriprise Trust Company, since January 2017. |
Columbia Bond Fund | Annual Report 2024
51
Liquidity Risk Management Program
(Unaudited)
Pursuant to Rule 22e-4 under the 1940 Act, the Fund has adopted a liquidity risk management program (Program). The Program’s principal objectives include assessing, managing and periodically reviewing the Fund’s liquidity risk. Liquidity risk is defined as the risk that the Fund could not meet redemption requests without significant dilution of remaining investors’ interests in the Fund.
The Board has appointed the Investment Manager as the program administrator for the Fund’s Program. The Investment Manager has delegated oversight of the Program to its Liquidity Risk Management Committee (the Committee). At a board meeting during the fiscal period, the Committee provided the Board with a report addressing the operations of the program and assessing its adequacy and effectiveness of implementation for the period January 1, 2023, through December 31, 2023, including:
•
the Fund had sufficient liquidity to both meet redemptions and operate effectively on behalf of shareholders;
•
there were no material changes to the Program during the period;
•
the implementation of the Program was effective to manage the Fund’s liquidity risk; and
•
the Program operated adequately during the period.
There can be no assurance that the Program will achieve its objectives in the future. Please refer to the Fund’s prospectus for more information regarding the Fund’s exposure to liquidity risk and other principal risks to which an investment in the Fund may be subject.
52
Columbia Bond Fund | Annual Report 2024
[THIS PAGE INTENTIONALLY LEFT BLANK]
[THIS PAGE INTENTIONALLY LEFT BLANK]
[THIS PAGE INTENTIONALLY LEFT BLANK]
Columbia Bond Fund
P.O. Box 219104
Kansas City, MO 64121-9104
Please read and consider the investment objectives, risks, charges and expenses for any fund carefully before investing. For a prospectus and summary prospectus, which contains this and other important information about the Fund, go to
columbiathreadneedleus.com/investor/. The Fund is distributed by Columbia Management Investment Distributors, Inc., member FINRA, and managed by Columbia Management Investment Advisers, LLC.
Columbia Threadneedle Investments (Columbia Threadneedle) is the global brand name of the Columbia and Threadneedle group of companies. All rights reserved.
© 2024 Columbia Management Investment Advisers, LLC.
columbiathreadneedleus.com/investor/
Columbia Small Cap Value Fund I
Annual Report
April 30, 2024
In October 2022, the Securities and Exchange Commission (SEC) adopted a final rule, "Tailored Shareholder Reports for Mutual Funds and Exchange-Traded Funds; Fee Information in Investment Company Advertisements." The rule and form amendments will, among other things, require the Fund to transmit concise and visually engaging shareholder reports that highlight key information. The amendments will require that funds tag information in a structured data format and that certain more in-depth information be made available online and available for delivery free of charge to investors on request. The amendments became effective January 24, 2023. There is an 18-month transition period after the effective date of the amendments.
Each Tailored Shareholder Report will be share-class specific and will highlight key fund information the SEC believes is most relevant to investors in assessing their investment in the Fund. Much of the information, including a Fund’s financial statements, that is currently disclosed in a Fund’s shareholder reports will instead be made available on the Fund’s website and filed on Form N-CSR on an annual and semiannual basis. This information will be delivered to investors free of charge upon request. Columbia Fund reports will follow the Tailored Shareholder Report approach beginning with reports covering the period ending May 31, 2024.
The new rule also requires the Fund to mail a printed version of the Tailored Shareholder Report to all shareholders who have not elected to receive shareholder reports electronically. Rather than receiving a postcard notifying investors that the shareholder report for Funds in which they invest is available online, investors will begin receiving the Tailored Shareholder Report in the mail unless they have elected to receive their Fund documents electronically.
| No Financial Institution Guarantee | |
If you elect to receive the shareholder report for Columbia Small Cap Value Fund I (the Fund) in paper, mailed to you, the Fund mails one shareholder report to each shareholder address, unless such shareholder elects to receive shareholder reports from the Fund electronically via e-mail or by having a paper notice mailed to you (Postcard Notice) that your Fund’s shareholder report is available at the Columbia funds’ website (columbiathreadneedleus.com/investor/). If you would like more than one report in paper to be mailed to you, or would like to elect to receive reports via e-mail or access them through Postcard Notice, please call shareholder services at 800.345.6611 and additional reports will be sent to you.
Proxy voting policies and procedures
The policy of the Board of Trustees is to vote the proxies of the companies in which the Fund holds investments consistent with the procedures as stated in the Statement of Additional Information (SAI). You may obtain a copy of the SAI without charge by calling 800.345.6611; contacting your financial intermediary; visiting columbiathreadneedleus.com/investor/; or searching the website of the Securities and Exchange Commission (SEC) at sec.gov. Information regarding how the Fund voted proxies relating to portfolio securities is filed with the SEC by August 31st for the most recent 12-month period ending June 30th of that year, and is available without charge by visiting columbiathreadneedleus.com/investor/, or searching the website of the SEC at sec.gov.
Quarterly schedule of investments
The Fund files a complete schedule of portfolio holdings with the SEC for the first and third quarters of each fiscal year on Form N-PORT. The Fund’s Form N-PORT filings are available on the SEC’s website at sec.gov. The Fund’s complete schedule of portfolio holdings, as filed on Form N-PORT, is available on columbiathreadneedleus.com/investor/ or can also be obtained without charge, upon request, by calling 800.345.6611.
Additional Fund information
For more information about the Fund, please visit columbiathreadneedleus.com/investor/ or call 800.345.6611. Customer Service Representatives are available to answer your questions Monday through Friday from 8 a.m. to 7 p.m. Eastern time.
Fund investment manager
Columbia Management Investment Advisers, LLC (the Investment Manager)
290 Congress Street
Boston, MA 02210
Fund distributor
Columbia Management Investment Distributors, Inc.
290 Congress Street
Boston, MA 02210
Fund transfer agent
Columbia Management Investment Services Corp.
P.O. Box 219104
Kansas City, MO 64121-9104
Columbia Small Cap Value Fund I | Annual Report 2024
Fund at a Glance(Unaudited) Investment objective
The Fund seeks long-term capital appreciation.
Portfolio management
Jeremy Javidi, CFA
Lead Portfolio Manager
Managed Fund since 2005
C. Bryan Lassiter, CFA
Portfolio Manager
Managed Fund since November 2023
Morningstar style boxTM
The Morningstar Style Box is based on a fund’s portfolio holdings. For equity funds, the vertical axis shows the market capitalization of the stocks owned, and the horizontal axis shows investment style (value, blend, or growth). Information shown is based on the most recent data provided by Morningstar.
© 2024 Morningstar, Inc. All rights reserved. The Morningstar information contained herein: (1) is proprietary to Morningstar and/or its content providers; (2) may not be copied or distributed; and (3) is not warranted to be accurate, complete or timely. Neither Morningstar nor its content providers are responsible for any damages or losses arising from any use of this information.
Average annual total returns (%) (for the period ended April 30, 2024) |
| | | | | |
| | | | | |
| | | | | |
| | | | |
| | | | | |
| | | | | |
| | | | |
| | | | |
| | | | |
| | | | |
| | | | |
Returns for Class A shares are shown with and without the maximum initial sales charge of 5.75%. Returns for Class C shares are shown with and without the 1.00% contingent deferred sales charges for the first year only. The Fund’s other share classes are not subject to sales charges and have limited eligibility. Please see the Fund’s prospectus for details. Performance for different share classes will vary based on differences in sales charges and fees associated with each share class. All results shown assume reinvestment of distributions during the period. Returns do not reflect the deduction of taxes that a shareholder may pay on Fund distributions or on the redemption of Fund shares. Performance results reflect the effect of any fee waivers or reimbursements of Fund expenses by Columbia Management Investment Advisers, LLC and/or any of its affiliates. Absent these fee waivers or expense reimbursement arrangements, performance results would have been lower.
The performance information shown represents past performance and is not a guarantee of future results. The investment return and principal value of your investment will fluctuate so that your shares, when redeemed, may be worth more or less than their original cost. Current performance may be lower or higher than the performance information shown. You may obtain performance information current to the most recent month-end by contacting your financial intermediary, visiting columbiathreadneedleus.com/investor/ or calling 800.345.6611.
The Russell 2000 Value Index, an unmanaged index, tracks the performance of those Russell 2000 Index companies with lower price-to-book ratios and lower forecasted growth values.
Indices are not available for investment, are not professionally managed and do not reflect sales charges, fees, brokerage commissions, taxes or other expenses of investing. Securities in the Fund may not match those in an index.
Columbia Small Cap Value Fund I | Annual Report 2024
3
Fund at a Glance (continued)(Unaudited) Performance of a hypothetical $10,000 investment (April 30, 2014 — April 30, 2024)
The chart above shows the change in value of a hypothetical $10,000 investment in Class A shares of Columbia Small Cap Value Fund I during the stated time period, and does not reflect the deduction of taxes that a shareholder may pay on Fund distributions or on the redemption of Fund shares.
Portfolio breakdown (%) (at April 30, 2024) |
| |
| |
| |
Percentages indicated are based upon total investments excluding investments in derivatives, if any. The Fund’s portfolio composition is subject to change.
Equity sector breakdown (%) (at April 30, 2024) |
| |
| |
| |
| |
| |
| |
| |
| |
| |
| |
| |
| |
Percentages indicated are based upon total equity investments. The Fund’s portfolio composition is subject to change.
4
Columbia Small Cap Value Fund I | Annual Report 2024
Manager Discussion of Fund Performance(Unaudited) For the 12-month period that ended April 30, 2024, Class A shares of Columbia Small Cap Value Fund I returned 18.34% excluding sales charges. The Fund’s benchmark, the Russell 2000 Value Index, returned 14.03% for the same period.
Market overview
U.S. equities posted broad-based gains for the 12 months ending April 30, 2024, but trajectory throughout the period was neither smooth nor steady. After a strong start, markets slid sharply but reversed about halfway through the period and accelerated until losing momentum over the final month. Several themes dominated the back-and-forth sentiment, especially the direction of interest rates and expectations for investment opportunities related to artificial intelligence (AI).
In addition to burgeoning AI enthusiasm, upbeat sentiment during the first few months of the period was driven by hopes that the Fed’s string of interest rate hikes was coming to an end. Even though a 25 basis-point hike in early May brought the target federal funds rate upper bound to 5.25%, a level not seen since mid-2006, investor appetite remained hearty for high-growth companies with future earnings made currently more attractive by lower interest rates. Perhaps most significant, especially for more-optimistic investors, was an expectation that the May hike and comments from Fed Chair Jerome Powell signaled the so-called “peak Fed,” or at least a pause in further hikes. Worries that a strong economy with unemployment at a 70-year low would keep inflation high and trigger another increase at the Fed’s June meeting did little to dent investor enthusiasm, and neither did projections for more rate increases that accompanied a hoped-for pause that did come at the Fed’s June 2023 meeting. Likewise, hawkish comments from Powell strengthening the case for additional increases did little to dissuade bullish expectations that rate cuts, and not just a pause, were finally coming into view.
Less-optimistic investors focused on the possibility that a vibrant and still-growing economy would keep inflation high enough to delay potential rate cuts and maybe even drive further increases. A severely inverted yield curve – long believed to be a sure sign of coming recession – added to pessimism, as did geopolitical tensions and lingering concerns about the health of banks and commercial real estate. Surging U.S. Treasury yields added to investor anxiety when the yield on the 10-year Treasury note closed above levels last seen in 2008.
Sentiment began to improve when the Fed held rates steady at its November and December 2023 meetings, triggering expectations that inflation may have cooled enough to forestall more rate hikes and perhaps even spur cutting in early 2024. Even though Fed officials cautioned that inflation remained too high and further tightening may be needed, stocks rose sharply, with the Dow Jones Industrial Average reaching a record high and the S&P 500 Index coming close to its all-time best as well. Hopes for rate cuts starting in March 2024 evaporated when the Fed made no commitment at its January 2024 meeting and left the benchmark overnight borrowing rate in the historically elevated range of 5.25% – 5.50%. Despite the anticipated kickoff for cuts shifting to June 2024, any disappointments with the delay were offset by comfort found in consistent projections for a total of three cuts during the remainder of 2024. Hotter-than-expected inflation reports for January and February 2024 did little to dissuade investors from bidding equities higher, and neither did commentary from a couple of officials that questioned the Fed’s generally dovish stance. (Dovish tends to suggest lower interest rates; opposite of hawkish.)
Equities closed the period by snapping a five-month up streak as hints of cracks in AI enthusiasm compounded disappointment over mounting rate-cut delays. A few tech and communications services stocks, notably Alphabet, continued to benefit from AI exposure, but sentiment was not entirely positive. Meta Platforms, for example, worried investors by announcing a ramp-up in AI spending, while chipmakers dropped sharply mid-month when Super Micro Computer failed to pre-announce results and sparked a broad selloff as investors began to question whether the group might be overpriced.
Concurrent worries included armed conflict between Israel and Iran as well as domestic economic data that reduced the probabilities of rate cuts in 2024, particularly reports that pointed to stubborn inflation and sub-par growth. As investors considered these data against a backdrop of generally hawkish comments ahead of the Fed’s May 1, 2024 meeting, hopes evaporated for an announcement of three rate cuts starting in June due to a bigger-than-expected jump in labor costs and a weak report on the economic health of manufacturing in the Chicago region. Questions about the timing and number of rate cuts shifted from when to if.
Columbia Small Cap Value Fund I | Annual Report 2024
5
Manager Discussion of Fund Performance (continued)(Unaudited) Despite the downbeat end to the period, major market benchmarks ended with solid double-digit returns. The S&P 500 Index was up more than 22%, while small-cap stocks, as represented by the Russell 2000 Index, finished up more than 13%. As measured by subsets of the S&P 500, communication services and information technology stocks were top performers, while consumer staples and utilities stocks lagged with smaller positive results.
The Fund’s notable contributors during the period
•
The Fund’s outperformance of its benchmark was driven primarily by strong, broad-based stock selection, particularly within the financials and communication services sectors.
•
Sector allocation meaningfully helped relative results as well, particularly underweights to the utilities and real estate sectors and overweights to the industrials and information technology sectors.
•
Top individual contributors during the period included:
○
Thermal management solutions provider Modine Manufacturing Co. and fiber-optic networking products Applied Optoelectronics, Inc., which each pleased investors with expectations for accelerated growth driven by AI data centers.
○
Apparel retailer Gap, Inc., which rose on evidence of recovery across its brand lineup. The position was eliminated.
○
Aerospace systems maker Moog, Inc., which delivered above-consensus results and an improving outlook.
○
Wire and cable manufacturer Encore Wire Corp., which rose steadily through the period as investors appreciated its strong balance sheet, cash distributions and long-term growth potential.
The Fund’s notable detractors during the period
•
Security selection within the industrials and information technology sector more than offset beneficial security selection and detracted from relative results, as did an underweight to the energy sector.
•
Notable individual detractors included:
○
Auto-rental provider Hertz Global Holdings, Inc., which worried investors with higher costs and potential liquidity concerns.
○
Tea, snacks and personal products maker Hain Celestial Group, Inc., which disappointed investors with its complexity and presumed lack of a cohesive growth strategy. The position was eliminated.
○
Biopharmaceutical Sage Therapeutics, Inc., which fell sharply after the U.S. Food and Drug Administration provided only partial approval for the company’s depression treatment. The position was eliminated.
○
Paper maker Glatfelter Corp., which posted weak sales.
○
Hair-care products provider Olaplex Holdings, Inc., which fell on frustrations over heavier-than-expected costs and competitive pressures. The position was eliminated.
Market risk may affect a single issuer, sector of the economy, industry or the market as a whole. Foreign investments subject the Fund to risks, including political, economic, market, social and others within a particular country, as well as to currency instabilities and less stringent financial and accounting standards generally applicable to U.S. issuers. Investments in small-cap companies may be subject to greater volatility and price fluctuations because they may be thinly traded and less liquid. Value securities may be unprofitable if the market fails to recognize their intrinsic worth or the portfolio manager misgauged that worth. The Fund may invest significantly in issuers within a particular sector, which may be negatively affected by market, economic or other conditions, making the Fund more vulnerable to unfavorable developments in the sector. See the Fund’s prospectus for more information on these and other risks.
The views expressed in this report reflect the current views of the respective parties who have contributed to this report. These views are not guarantees of future performance and involve certain risks, uncertainties and assumptions that are difficult to predict, so actual outcomes and results may differ significantly from the views expressed. These views are subject to change at any time based upon economic, market or other conditions and the respective
6
Columbia Small Cap Value Fund I | Annual Report 2024
Manager Discussion of Fund Performance (continued)(Unaudited) parties disclaim any responsibility to update such views. These views may not be relied on as investment advice and, because investment decisions for a Columbia fund are based on numerous factors, may not be relied on as an indication of trading intent on behalf of any particular Columbia fund. References to specific securities should not be construed as a recommendation or investment advice.
Columbia Small Cap Value Fund I | Annual Report 2024
7
Understanding Your Fund’s Expenses(Unaudited) As an investor, you incur two types of costs. There are shareholder transaction costs, which generally include sales charges on purchases and may include redemption fees. There are also ongoing fund costs, which generally include management fees, distribution and/or service fees, and other fund expenses. The following information is intended to help you understand your ongoing costs (in dollars) of investing in the Fund and to help you compare these costs with the ongoing costs of investing in other mutual funds.
Analyzing your Fund’s expenses
To illustrate these ongoing costs, we have provided examples and calculated the expenses paid by investors in each share class of the Fund during the period. The actual and hypothetical information in the table is based on an initial investment of $1,000 at the beginning of the period indicated and held for the entire period. Expense information is calculated two ways and each method provides you with different information. The amount listed in the “Actual” column is calculated using the Fund’s actual operating expenses and total return for the period. You may use the Actual information, together with the amount invested, to estimate the expenses that you paid over the period. Simply divide your account value by $1,000 (for example, an $8,600 account value divided by $1,000 = 8.6), then multiply the results by the expenses paid during the period under the “Actual” column. The amount listed in the “Hypothetical” column assumes a 5% annual rate of return before expenses (which is not the Fund’s actual return) and then applies the Fund’s actual expense ratio for the period to the hypothetical return. You should not use the hypothetical account values and expenses to estimate either your actual account balance at the end of the period or the expenses you paid during the period. See “Compare with other funds” below for details on how to use the hypothetical data.
Compare with other funds
Since all mutual funds are required to include the same hypothetical calculations about expenses in shareholder reports, you can use this information to compare the ongoing cost of investing in the Fund with other funds. To do so, compare the hypothetical example with the 5% hypothetical examples that appear in the shareholder reports of other funds. As you compare hypothetical examples of other funds, it is important to note that hypothetical examples are meant to highlight the ongoing costs of investing in a fund only and do not reflect any transaction costs, such as sales charges, or redemption or exchange fees. Therefore, the hypothetical calculations are useful in comparing ongoing costs only, and will not help you determine the relative total costs of owning different funds. If transaction costs were included in these calculations, your costs would be higher.
November 1, 2023 — April 30, 2024 |
| Account value at the
beginning of the
period ($) | Account value at the
end of the
period ($) | Expenses paid during
the period ($) | Fund’s annualized
expense ratio (%) |
| | | | | | | |
| | | | | | | |
| | | | | | | |
| | | | | | | |
| | | | | | | |
| | | | | | | |
| | | | | | | |
| | | | | | | |
Expenses paid during the period are equal to the annualized expense ratio for each class as indicated above, multiplied by the average account value over the period and then multiplied by the number of days in the Fund’s most recent fiscal half year and divided by 366.
Expenses do not include fees and expenses incurred indirectly by the Fund from its investment in underlying funds, including affiliated and non-affiliated pooled investment vehicles, such as mutual funds and exchange-traded funds.
8
Columbia Small Cap Value Fund I | Annual Report 2024
Portfolio of InvestmentsApril 30, 2024(Percentages represent value of investments compared to net assets)
Investments in securities
|
| | |
Communication Services 3.0% |
Diversified Telecommunication Services 0.3% |
Bandwidth, Inc., Class A(a) | | |
|
| | |
| | |
| | |
| | |
Interactive Media & Services 0.7% |
| | |
| | |
| | |
|
| | |
Wireless Telecommunication Services 0.9% |
Telephone and Data Systems, Inc. | | |
United States Cellular Corp.(a) | | |
| | |
Total Communication Services | |
Consumer Discretionary 14.6% |
Automobile Components 1.6% |
| | |
Modine Manufacturing Co.(a) | | |
| | |
| | |
|
| | |
| | |
Savers Value Village, Inc.(a) | | |
| | |
|
Educational Development Corp.(a) | | |
Diversified Consumer Services 1.1% |
American Public Education, Inc.(a) | | |
| | |
| | |
Common Stocks (continued) |
| | |
Hotels, Restaurants & Leisure 1.0% |
| | |
| | |
| | |
|
Cavco Industries, Inc.(a) | | |
Century Communities, Inc. | | |
Hamilton Beach Brands Holding Co. | | |
| | |
| | |
| | |
| | |
| | |
Universal Electronics, Inc.(a) | | |
| | |
|
| | |
Malibu Boats, Inc., Class A(a) | | |
Topgolf Callaway Brands Corp.(a) | | |
| | |
|
1-800-Flowers.com, Inc., Class A(a) | | |
| | |
| | |
Brilliant Earth Group, Inc., Class A(a) | | |
| | |
| | |
Lulu’s Fashion Lounge Holdings, Inc.(a) | | |
National Vision Holdings, Inc.(a) | | |
ThredUp, Inc., Class A(a) | | |
| | |
| | |
The accompanying Notes to Financial Statements are an integral part of this statement.
Columbia Small Cap Value Fund I | Annual Report 2024
9
Portfolio of Investments (continued)April 30, 2024 Common Stocks (continued) |
| | |
Textiles, Apparel & Luxury Goods 1.6% |
Canada Goose Holdings, Inc.(a) | | |
| | |
| | |
| | |
| | |
| | |
Total Consumer Discretionary | |
|
|
Duckhorn Portfolio, Inc. (The)(a) | | |
| | |
| | |
Consumer Staples Distribution & Retail 0.6% |
| | |
| | |
| | |
|
Fresh Del Monte Produce, Inc. | | |
| | |
| | |
Personal Care Products 0.3% |
Honest Co., Inc. (The)(a) | | |
| |
|
Energy Equipment & Services 2.8% |
Natural Gas Services Group, Inc.(a) | | |
Newpark Resources, Inc.(a) | | |
| | |
Patterson-UTI Energy, Inc. | | |
| | |
| | |
Oil, Gas & Consumable Fuels 4.6% |
| | |
Delek U.S. Holdings, Inc. | | |
| | |
Magnolia Oil & Gas Corp., Class A | | |
| | |
Common Stocks (continued) |
| | |
| | |
| | |
| | |
| |
|
|
| | |
| | |
| | |
| | |
Central Pacific Financial Corp. | | |
| | |
Columbia Banking System, Inc. | | |
Community Trust Bancorp, Inc. | | |
Community West Bancshares | | |
| | |
| | |
| | |
| | |
HomeTrust Bancshares, Inc. | | |
| | |
| | |
Provident Financial Holdings, Inc. | | |
| | |
| | |
Southern First Bancshares, Inc.(a) | | |
| | |
| | |
| | |
Western New England Bancorp, Inc. | | |
| | |
| | |
|
| | |
|
| | |
The accompanying Notes to Financial Statements are an integral part of this statement.
10
Columbia Small Cap Value Fund I | Annual Report 2024
Portfolio of Investments (continued)April 30, 2024 Common Stocks (continued) |
| | |
|
| | |
Cass Information Systems, Inc. | | |
| | |
| | |
International Money Express, Inc.(a) | | |
NMI Holdings, Inc., Class A(a) | | |
| | |
| | |
|
Global Indemnity Group LLC | | |
Greenlight Capital Re Ltd., Class A(a) | | |
Horace Mann Educators Corp. | | |
| | |
| | |
| | |
| |
|
|
Apellis Pharmaceuticals, Inc.(a) | | |
Arrowhead Pharmaceuticals, Inc.(a) | | |
BioCryst Pharmaceuticals, Inc.(a) | | |
| | |
| | |
Lexicon Pharmaceuticals, Inc.(a) | | |
Olema Pharmaceuticals, Inc.(a) | | |
SpringWorks Therapeutics, Inc.(a) | | |
Travere Therapeutics, Inc.(a) | | |
| | |
| | |
Health Care Equipment & Supplies 1.2% |
| | |
| | |
| | |
| | |
Common Stocks (continued) |
| | |
Health Care Providers & Services 0.7% |
Castle Biosciences, Inc.(a) | | |
| | |
Fulgent Genetics, Inc.(a) | | |
| | |
Health Care Technology 1.1% |
GoodRx Holdings, Inc., Class A(a) | | |
| | |
| | |
| | |
Life Sciences Tools & Services 0.2% |
| | |
|
ANI Pharmaceuticals, Inc.(a) | | |
| | |
Supernus Pharmaceuticals, Inc.(a) | | |
Taro Pharmaceutical Industries Ltd.(a) | | |
| | |
| |
|
|
| | |
Air Freight & Logistics 0.2% |
Radiant Logistics, Inc.(a) | | |
|
| | |
| | |
| | |
Commercial Services & Supplies 1.0% |
| | |
Healthcare Services Group, Inc.(a) | | |
| | |
| | |
Electrical Equipment 0.8% |
GrafTech International Ltd. | | |
| | |
| | |
The accompanying Notes to Financial Statements are an integral part of this statement.
Columbia Small Cap Value Fund I | Annual Report 2024
11
Portfolio of Investments (continued)April 30, 2024 Common Stocks (continued) |
| | |
Ground Transportation 1.6% |
Hertz Global Holdings, Inc.(a) | | |
| | |
Schneider National, Inc., Class B | | |
| | |
| | |
|
| | |
| | |
Greenbrier Companies, Inc. (The) | | |
| | |
John Bean Technologies Corp. | | |
Manitex International, Inc.(a) | | |
Markforged Holding Corp.(a) | | |
| | |
| | |
| | |
Marine Transportation 2.0% |
| | |
| | |
| | |
|
Sun Country Airlines Holdings, Inc.(a) | | |
Professional Services 3.0% |
| | |
| | |
| | |
| | |
| | |
| | |
Trading Companies & Distributors 1.1% |
BlueLinx Holdings, Inc.(a) | | |
H&E Equipment Services, Inc. | | |
| | |
| | |
| |
Common Stocks (continued) |
| | |
Information Technology 9.7% |
Communications Equipment 1.5% |
Applied Optoelectronics, Inc.(a) | | |
| | |
Lumentum Holdings, Inc.(a) | | |
Netscout Systems, Inc.(a) | | |
| | |
Electronic Equipment, Instruments & Components 3.9% |
| | |
FARO Technologies, Inc.(a) | | |
| | |
Luna Innovations, Inc.(a) | | |
Methode Electronics, Inc. | | |
| | |
| | |
| | |
TTM Technologies, Inc.(a) | | |
Vishay Precision Group, Inc.(a) | | |
| | |
| | |
|
Kyndryl Holdings, Inc.(a) | | |
Semiconductors & Semiconductor Equipment 2.0% |
| | |
| | |
MagnaChip Semiconductor Corp.(a) | | |
Navitas Semiconductor Corp.(a) | | |
| | |
Valens Semiconductor Ltd.(a) | | |
| | |
|
| | |
Clear Secure, Inc., Class A | | |
| | |
| | |
| | |
| | |
| | |
The accompanying Notes to Financial Statements are an integral part of this statement.
12
Columbia Small Cap Value Fund I | Annual Report 2024
Portfolio of Investments (continued)April 30, 2024 Common Stocks (continued) |
| | |
Technology Hardware, Storage & Peripherals 0.2% |
Nano Dimension Ltd., ADR(a) | | |
Total Information Technology | |
|
|
| | |
| | |
| | |
Tronox Holdings PLC, Class A | | |
| | |
Construction Materials 1.2% |
Summit Materials, Inc., Class A(a) | | |
Containers & Packaging 0.5% |
| | |
|
Ampco-Pittsburgh Corp.(a) | | |
| | |
| | |
| | |
| | |
| | |
| | |
| | |
Pan American Silver Corp. | | |
Radius Recycling, Inc., Class A | | |
Torex Gold Resources, Inc.(a) | | |
Universal Stainless & Alloy Products, Inc.(a) | | |
| | |
Paper & Forest Products 0.5% |
Clearwater Paper Corp.(a) | | |
| | |
| | |
| |
|
|
American Assets Trust, Inc. | | |
Common Stocks (continued) |
| | |
|
Universal Health Realty Income Trust | | |
Hotel & Resort REITs 1.4% |
Park Hotels & Resorts, Inc. | | |
| | |
| | |
|
| | |
Highwoods Properties, Inc. | | |
| | |
|
| | |
|
| | |
| | |
| | |
| |
|
|
Northwestern Energy Group, Inc. | | |
| | |
| | |
|
| | |
| | |
| | |
| | |
|
| | |
| |
Total Common Stocks
(Cost $1,112,401,090) | |
|
The accompanying Notes to Financial Statements are an integral part of this statement.
Columbia Small Cap Value Fund I | Annual Report 2024
13
Portfolio of Investments (continued)April 30, 2024 |
| | |
Columbia Short-Term Cash Fund, 5.485%(b),(c) | | |
Total Money Market Funds
(Cost $2,317,272) | |
Total Investments in Securities
(Cost: $1,114,718,362) | |
Other Assets & Liabilities, Net | | |
| |
Notes to Portfolio of Investments
| Non-income producing investment. |
| As defined in the Investment Company Act of 1940, as amended, an affiliated company is one in which the Fund owns 5% or more of the company’s outstanding voting securities, or a company which is under common ownership or control with the Fund. The value of the holdings and transactions in these affiliated companies during the year ended April 30, 2024 are as follows: |
| | | | Net change in
unrealized
appreciation
(depreciation)($) | | | | |
Columbia Short-Term Cash Fund, 5.485% |
| | | | | | | | |
|
| | | | | | | | |
| | | | | | | | |
| Issuer was not an affiliate at the end of period. |
| The rate shown is the seven-day current annualized yield at April 30, 2024. |
Abbreviation Legend
| American Depositary Receipt |
Fair value measurements
The Fund categorizes its fair value measurements according to a three-level hierarchy that maximizes the use of observable inputs and minimizes the use of unobservable inputs by prioritizing that the most observable input be used when available. Observable inputs are those that market participants would use in pricing an investment based on market data obtained from sources independent of the reporting entity. Unobservable inputs are those that reflect the Fund’s assumptions about the information market participants would use in pricing an investment. An investment’s level within the fair value hierarchy is based on the lowest level of any input that is deemed significant to the asset’s or liability’s fair value measurement. The input levels are not necessarily an indication of the risk or liquidity associated with investments at that level. For example, certain U.S. government securities are generally high quality and liquid, however, they are reflected as Level 2 because the inputs used to determine fair value may not always be quoted prices in an active market.
Fair value inputs are summarized in the three broad levels listed below:
■
Level 1 — Valuations based on quoted prices for investments in active markets that the Fund has the ability to access at the measurement date. Valuation adjustments are not applied to Level 1 investments.
■
Level 2 — Valuations based on other significant observable inputs (including quoted prices for similar securities, interest rates, prepayment speeds, credit risks, etc.).
■
Level 3 — Valuations based on significant unobservable inputs (including the Fund’s own assumptions and judgment in determining the fair value of investments).
Inputs that are used in determining fair value of an investment may include price information, credit data, volatility statistics, and other factors. These inputs can be either observable or unobservable. The availability of observable inputs can vary between investments, and is affected by various factors such as the type of investment, and the volume and level of activity for that investment or similar investments in the marketplace. The inputs will be considered by the Investment Manager, along with any other relevant factors in the calculation of an investment’s fair value. The Fund uses prices and inputs that are current as of the measurement date, which may include periods of market dislocations. During these periods, the availability of prices and inputs may be reduced for many investments. This condition could cause an investment to be reclassified between the various levels within the hierarchy.
Foreign equity securities actively traded in markets where there is a significant delay in the local close relative to the New York Stock Exchange are classified as Level 2. The values of these securities may include an adjustment to reflect the impact of market movements following the close of local trading, as described in Note 2 to the financial statements – Security valuation.
The accompanying Notes to Financial Statements are an integral part of this statement.
14
Columbia Small Cap Value Fund I | Annual Report 2024
Portfolio of Investments (continued)April 30, 2024 Fair value measurements (continued)
Investments falling into the Level 3 category are primarily supported by quoted prices from brokers and dealers participating in the market for those investments. However, these may be classified as Level 3 investments due to lack of market transparency and corroboration to support these quoted prices. Additionally, valuation models may be used as the pricing source for any remaining investments classified as Level 3. These models may rely on one or more significant unobservable inputs and/or significant assumptions by the Investment Manager. Inputs used in valuations may include, but are not limited to, financial statement analysis, capital account balances, discount rates and estimated cash flows, and comparable company data.
The Fund’s Board of Trustees (the Board) has designated the Investment Manager, through its Valuation Committee (the Committee), as valuation designee, responsible for determining the fair value of the assets of the Fund for which market quotations are not readily available using valuation procedures approved by the Board. The Committee consists of voting and non-voting members from various groups within the Investment Manager’s organization, including operations and accounting, trading and investments, compliance, risk management and legal.
The Committee meets at least monthly to review and approve valuation matters, which may include a description of specific valuation determinations, data regarding pricing information received from approved pricing vendors and brokers and the results of Board-approved valuation policies and procedures (the Policies). The Policies address, among other things, instances when market quotations are or are not readily available, including recommendations of third party pricing vendors and a determination of appropriate pricing methodologies; events that require specific valuation determinations and assessment of fair value techniques; securities with a potential for stale pricing, including those that are illiquid, restricted, or in default; and the effectiveness of third party pricing vendors, including periodic reviews of vendors. The Committee meets more frequently, as needed, to discuss additional valuation matters, which may include the need to review back-testing results, review time-sensitive information or approve related valuation actions. Representatives of Columbia Management Investment Advisers, LLC report to the Board at each of its regularly scheduled meetings to discuss valuation matters and actions during the period, similar to those described earlier.
The following table is a summary of the inputs used to value the Fund’s investments at April 30, 2024:
| | | | |
Investments in Securities | | | | |
| | | | |
| | | | |
| | | | |
| | | | |
| | | | |
| | | | |
| | | | |
| | | | |
| | | | |
| | | | |
| | | | |
| | | | |
| | | | |
| | | | |
Total Investments in Securities | | | | |
See the Portfolio of Investments for all investment classifications not indicated in the table.
The Fund’s assets assigned to the Level 2 input category are generally valued using the market approach, in which a security’s value is determined through reference to prices and information from market transactions for similar or identical assets. These assets include certain foreign securities for which a third party statistical pricing service may be employed for purposes of fair market valuation. The model utilized by such third party statistical pricing service takes into account a security’s correlation to available market data including, but not limited to, intraday index, ADR, and exchange-traded fund movements.
The accompanying Notes to Financial Statements are an integral part of this statement.
Columbia Small Cap Value Fund I | Annual Report 2024
15
Statement of Assets and LiabilitiesApril 30, 2024
| |
Investments in securities, at value | |
Unaffiliated issuers (cost $1,112,401,090) | |
Affiliated issuers (cost $2,317,272) | |
| |
| |
| |
| |
| |
Deferred compensation of board members | |
| |
| |
| |
| |
| |
| |
| |
Distribution and/or service fees | |
| |
Compensation of board members | |
| |
Deferred compensation of board members | |
| |
Net assets applicable to outstanding capital stock | |
| |
| |
Total distributable earnings (loss) | |
Total - representing net assets applicable to outstanding capital stock | |
The accompanying Notes to Financial Statements are an integral part of this statement.
16
Columbia Small Cap Value Fund I | Annual Report 2024
Statement of Assets and Liabilities (continued)April 30, 2024 | |
| |
| |
Net asset value per share | |
| |
Maximum offering price per share (calculated by dividing the net asset value per share by 1.0 minus the maximum sales charge for Class A shares) | |
| |
| |
| |
Net asset value per share | |
| |
| |
| |
Net asset value per share | |
| |
| |
| |
Net asset value per share | |
| |
| |
| |
Net asset value per share | |
| |
| |
| |
Net asset value per share | |
| |
| |
| |
Net asset value per share | |
The accompanying Notes to Financial Statements are an integral part of this statement.
Columbia Small Cap Value Fund I | Annual Report 2024
17
Statement of OperationsYear Ended April 30, 2024
| |
| |
Dividends — unaffiliated issuers | |
Dividends — affiliated issuers | |
| |
| |
| |
| |
Distribution and/or service fees | |
| |
| |
| |
| |
| |
| |
| |
| |
| |
| |
| |
| |
Printing and postage fees | |
| |
| |
| |
Interest on interfund lending | |
Compensation of chief compliance officer | |
Compensation of board members | |
Deferred compensation of board members | |
| |
| |
| |
| |
| |
Realized and unrealized gain (loss) — net | |
Net realized gain (loss) on: | |
Investments — unaffiliated issuers | |
Investments — affiliated issuers | |
Foreign currency translations | |
| |
Net change in unrealized appreciation (depreciation) on: | |
Investments — unaffiliated issuers | |
Investments — affiliated issuers | |
Foreign currency translations | |
Net change in unrealized appreciation (depreciation) | |
Net realized and unrealized gain | |
Net increase in net assets resulting from operations | |
The accompanying Notes to Financial Statements are an integral part of this statement.
18
Columbia Small Cap Value Fund I | Annual Report 2024
Statement of Changes in Net Assets
| | |
| | |
| | |
| | |
Net change in unrealized appreciation (depreciation) | | |
Net increase in net assets resulting from operations | | |
Distributions to shareholders | | |
Net investment income and net realized gains | | |
| | |
| | |
| | |
| | |
| | |
| | |
| | |
Total distributions to shareholders | | |
Increase in net assets from capital stock activity | | |
Total increase in net assets | | |
Net assets at beginning of year | | |
Net assets at end of year | | |
The accompanying Notes to Financial Statements are an integral part of this statement.
Columbia Small Cap Value Fund I | Annual Report 2024
19
Statement of Changes in Net Assets (continued)
The accompanying Notes to Financial Statements are an integral part of this statement.
20
Columbia Small Cap Value Fund I | Annual Report 2024
[THIS PAGE INTENTIONALLY LEFT BLANK]
Columbia Small Cap Value Fund I | Annual Report 2024
21
The following table is intended to help you understand the Fund’s financial performance. Certain information reflects financial results for a single share of a class held for the periods shown. Per share net investment income (loss) amounts are calculated based on average shares outstanding during the period. Total return assumes reinvestment of all dividends and distributions, if any. Total return does not reflect payment of sales charges, if any. Total return and portfolio turnover are not annualized for periods of less than one year. The ratios of expenses and net investment income are annualized for periods of less than one year. The portfolio turnover rate is calculated without regard to purchase and sales transactions of short-term instruments and certain derivatives, if any. If such transactions were included, the Fund’s portfolio turnover rate may be higher.
| Net asset value,
beginning of
period | Net
investment
income
(loss) | Net
realized
and
unrealized
gain (loss) | Total from
investment
operations | Distributions
from net
investment
income | Distributions
from net
realized
gains | Total
distributions to
shareholders |
|
| | | | | | | |
| | | | | | | |
| | | | | | | |
| | | | | | | |
| | | | | | | |
|
| | | | | | | |
| | | | | | | |
| | | | | | | |
| | | | | | | |
| | | | | | | |
|
| | | | | | | |
| | | | | | | |
| | | | | | | |
| | | | | | | |
| | | | | | | |
|
| | | | | | | |
| | | | | | | |
| | | | | | | |
| | | | | | | |
| | | | | | | |
|
| | | | | | | |
| | | | | | | |
| | | | | | | |
| | | | | | | |
| | | | | | | |
The accompanying Notes to Financial Statements are an integral part of this statement.
22
Columbia Small Cap Value Fund I | Annual Report 2024
Financial Highlights (continued)
| Net
asset
value,
end of
period | | Total gross
expense
ratio to
average
| Total net
expense
ratio to
average
| Net investment
income (loss)
ratio to
average
net assets | | Net
assets,
end of
period
(000’s) |
|
| | | | | | | |
| | | | | | | |
| | | | | | | |
| | | | | | | |
| | | | | | | |
|
| | | | | | | |
| | | | | | | |
| | | | | | | |
| | | | | | | |
| | | | | | | |
|
| | | | | | | |
| | | | | | | |
| | | | | | | |
| | | | | | | |
| | | | | | | |
|
| | | | | | | |
| | | | | | | |
| | | | | | | |
| | | | | | | |
| | | | | | | |
|
| | | | | | | |
| | | | | | | |
| | | | | | | |
| | | | | | | |
| | | | | | | |
The accompanying Notes to Financial Statements are an integral part of this statement.
Columbia Small Cap Value Fund I | Annual Report 2024
23
Financial Highlights (continued)
| Net asset value,
beginning of
period | Net
investment
income
(loss) | Net
realized
and
unrealized
gain (loss) | Total from
investment
operations | Distributions
from net
investment
income | Distributions
from net
realized
gains | Total
distributions to
shareholders |
|
| | | | | | | |
| | | | | | | |
| | | | | | | |
| | | | | | | |
| | | | | | | |
|
| | | | | | | |
| | | | | | | |
| | | | | | | |
| | | | | | | |
| | | | | | | |
Notes to Financial Highlights |
| In addition to the fees and expenses that the Fund bears directly, the Fund indirectly bears a pro rata share of the fees and expenses of any other funds in which it invests. Such indirect expenses are not included in the Fund’s reported expense ratios. |
| Total net expenses include the impact of certain fee waivers/expense reimbursements made by the Investment Manager and certain of its affiliates, if applicable. |
| Ratios include interfund lending expense which is less than 0.01%. |
| The benefits derived from expense reductions had an impact of less than 0.01%. |
| Ratios include line of credit interest expense which is less than 0.01%. |
The accompanying Notes to Financial Statements are an integral part of this statement.
24
Columbia Small Cap Value Fund I | Annual Report 2024
Financial Highlights (continued)
| Net
asset
value,
end of
period | | Total gross
expense
ratio to
average
| Total net
expense
ratio to
average
| Net investment
income (loss)
ratio to
average
net assets | | Net
assets,
end of
period
(000’s) |
|
| | | | | | | |
| | | | | | | |
| | | | | | | |
| | | | | | | |
| | | | | | | |
|
| | | | | | | |
| | | | | | | |
| | | | | | | |
| | | | | | | |
| | | | | | | |
The accompanying Notes to Financial Statements are an integral part of this statement.
Columbia Small Cap Value Fund I | Annual Report 2024
25
Notes to Financial StatementsApril 30, 2024 Note 1. Organization
Columbia Small Cap Value Fund I (the Fund), a series of Columbia Funds Series Trust I (the Trust), is a diversified fund. The Trust is registered under the Investment Company Act of 1940, as amended (the 1940 Act), as an open-end management investment company organized as a Massachusetts business trust.
Fund shares
The Trust may issue an unlimited number of shares (without par value). The Fund offers each of the share classes listed in the Statement of Assets and Liabilities. Although all share classes generally have identical voting, dividend and liquidation rights, each share class votes separately when required by the Trust’s organizational documents or by law. Each share class has its own expense and sales charge structure. Different share classes may have different minimum initial investment amounts and pay different net investment income distribution amounts to the extent the expenses of distributing such share classes vary. Distributions to shareholders in a liquidation will be proportional to the net asset value of each share class.
As described in the Fund’s prospectus, Class A and Class C shares are offered to the general public for investment. Class C shares automatically convert to Class A shares after 8 years. Advisor Class, Institutional Class, Institutional 2 Class, Institutional 3 Class and Class R shares are available for purchase through authorized investment professionals to omnibus retirement plans or to institutional investors and to certain other investors as also described in the Fund’s prospectus.
Note 2. Summary of significant accounting policies
Basis of preparation
The Fund is an investment company that applies the accounting and reporting guidance in the Financial Accounting Standards Board (FASB) Accounting Standards Codification Topic 946, Financial Services - Investment Companies (ASC 946). The financial statements are prepared in accordance with U.S. generally accepted accounting principles (GAAP), which requires management to make certain estimates and assumptions that affect the reported amounts of assets and liabilities, the disclosure of contingent assets and liabilities at the date of the financial statements and the reported amounts of income and expenses during the reporting period. Actual results could differ from those estimates.
The following is a summary of significant accounting policies followed by the Fund in the preparation of its financial statements.
Security valuation
Equity securities listed on an exchange are valued at the closing price or last trade price on their primary exchange at the close of business of the New York Stock Exchange. Securities with a closing price not readily available or not listed on any exchange are valued at the mean between the closing bid and ask prices. Listed preferred stocks convertible into common stocks are valued using an evaluated price from a pricing service.
Foreign equity securities are valued based on the closing price or last trade price on their primary exchange at the close of business of the New York Stock Exchange. If any foreign equity security closing prices are not readily available, the securities are valued at the mean of the latest quoted bid and ask prices on such exchanges or markets. Foreign currency exchange rates are determined at the scheduled closing time of the New York Stock Exchange. Many securities markets and exchanges outside the U.S. close prior to the close of the New York Stock Exchange; therefore, the closing prices for securities in such markets or on such exchanges may not fully reflect events that occur after such close but before the close of the New York Stock Exchange. In those situations, foreign securities will be fair valued pursuant to a policy approved by the Board of Trustees. Under the policy, the Fund may utilize a third-party pricing service to determine these fair values. The third-party pricing service takes into account multiple factors, including, but not limited to, movements in the U.S. securities markets, certain depositary receipts, futures contracts and foreign exchange rates that have occurred subsequent to the close of the foreign exchange or market, to determine a good faith estimate that reasonably reflects the current market conditions as of the close of the New York Stock Exchange. The fair value of a security is likely to be different from the quoted or published price, if available.
Investments in open-end investment companies (other than exchange-traded funds (ETFs)), are valued at the latest net asset value reported by those companies as of the valuation time.
26
Columbia Small Cap Value Fund I | Annual Report 2024
Notes to Financial Statements (continued)April 30, 2024 Investments for which market quotations are not readily available, or that have quotations which management believes are not reflective of market value or reliable, are valued at fair value as determined in good faith under procedures approved by the Board of Trustees. If a security or class of securities (such as foreign securities) is valued at fair value, such value is likely to be different from the quoted or published price for the security, if available.
The determination of fair value often requires significant judgment. To determine fair value, management may use assumptions including but not limited to future cash flows and estimated risk premiums. Multiple inputs from various sources may be used to determine fair value.
GAAP requires disclosure regarding the inputs and valuation techniques used to measure fair value and any changes in valuation inputs or techniques. In addition, investments shall be disclosed by major category. This information is disclosed following the Fund’s Portfolio of Investments.
Foreign currency transactions and translations
The values of all assets and liabilities denominated in foreign currencies are generally translated into U.S. dollars at exchange rates determined at the close of regular trading on the New York Stock Exchange. Net realized and unrealized gains (losses) on foreign currency transactions and translations include gains (losses) arising from the fluctuation in exchange rates between trade and settlement dates on securities transactions, gains (losses) arising from the disposition of foreign currency and currency gains (losses) between the accrual and payment dates on dividends, interest income and foreign withholding taxes.
For financial statement purposes, the Fund does not distinguish that portion of gains (losses) on investments which is due to changes in foreign exchange rates from that which is due to changes in market prices of the investments. Such fluctuations are included with the net realized and unrealized gains (losses) on investments in the Statement of Operations.
Security transactions
Security transactions are accounted for on the trade date. Cost is determined and gains (losses) are based upon the specific identification method for both financial statement and federal income tax purposes.
Income recognition
Corporate actions and dividend income are generally recorded net of any non-reclaimable tax withholdings, on the ex-dividend date or upon receipt of an ex-dividend notification in the case of certain foreign securities.
The Fund may receive distributions from holdings in equity securities, business development companies (BDCs), exchange-traded funds (ETFs), limited partnerships (LPs), other regulated investment companies (RICs), and real estate investment trusts (REITs), which report information as to the tax character of their distributions annually. These distributions are allocated to dividend income, capital gain and return of capital based on actual information reported. Return of capital is recorded as a reduction of the cost basis of securities held. If the Fund no longer owns the applicable securities, return of capital is recorded as a realized gain. With respect to REITs, to the extent actual information has not yet been reported, estimates for return of capital are made by Columbia Management Investment Advisers, LLC (the Investment Manager), a wholly-owned subsidiary of Ameriprise Financial, Inc. (Ameriprise Financial). The Investment Manager’s estimates are subsequently adjusted when the actual character of the distributions is disclosed by the REITs, which could result in a proportionate change in return of capital to shareholders.
Awards from class action litigation are recorded as a reduction of cost basis if the Fund still owns the applicable securities on the payment date. If the Fund no longer owns the applicable securities on the payment date, the proceeds are recorded as realized gains.
Expenses
General expenses of the Trust are allocated to the Fund and other funds of the Trust based upon relative net assets or other expense allocation methodologies determined by the nature of the expense. Expenses directly attributable to the Fund are charged to the Fund. Expenses directly attributable to a specific class of shares are charged to that share class.
Columbia Small Cap Value Fund I | Annual Report 2024
27
Notes to Financial Statements (continued)April 30, 2024 Determination of class net asset value
All income, expenses (other than class-specific expenses, which are charged to that share class, as shown in the Statement of Operations) and realized and unrealized gains (losses) are allocated to each class of the Fund on a daily basis, based on the relative net assets of each class, for purposes of determining the net asset value of each class.
Federal income tax status
The Fund intends to qualify each year as a regulated investment company under Subchapter M of the Internal Revenue Code, as amended, and will distribute substantially all of its investment company taxable income and net capital gain, if any, for its tax year, and as such will not be subject to federal income taxes. In addition, the Fund intends to distribute in each calendar year substantially all of its ordinary income, capital gain net income and certain other amounts, if any, such that the Fund should not be subject to federal excise tax. Therefore, no federal income or excise tax provision is recorded.
Foreign taxes
The Fund may be subject to foreign taxes on income, gains on investments or currency repatriation, a portion of which may be recoverable. The Fund will accrue such taxes and recoveries, as applicable, based upon its current interpretation of tax rules and regulations that exist in the markets in which it invests.
Realized gains in certain countries may be subject to foreign taxes at the Fund level, based on statutory rates. The Fund accrues for such foreign taxes on realized and unrealized gains at the appropriate rate for each jurisdiction, as applicable. The amount, if any, is disclosed as a liability in the Statement of Assets and Liabilities.
Distributions to shareholders
Distributions from net investment income, if any, are declared and paid semi-annually. Net realized capital gains, if any, are distributed at least annually. Income distributions and capital gain distributions are determined in accordance with federal income tax regulations, which may differ from GAAP.
Guarantees and indemnifications
Under the Trust’s organizational documents and, in some cases, by contract, its officers and trustees are indemnified against certain liabilities arising out of the performance of their duties to the Trust or its funds. In addition, certain of the Fund’s contracts with its service providers contain general indemnification clauses. The Fund’s maximum exposure under these arrangements is unknown since the amount of any future claims that may be made against the Fund cannot be determined, and the Fund has no historical basis for predicting the likelihood of any such claims.
Recent accounting pronouncements and regulatory updates
Tailored Shareholder Reports
In October 2022, the Securities and Exchange Commission adopted a final rule, "Tailored Shareholder Reports for Mutual Funds and Exchange-Traded Funds; Fee Information in Investment Company Advertisements." The rule and form amendments will, among other things, require the Fund to transmit concise and visually engaging shareholder reports that highlight key information. The amendments will require that funds tag information in a structured data format and that certain more in-depth information be made available online and available for delivery free of charge to investors on request. The amendments became effective January 24, 2023. There is an 18-month transition period after the effective date of the amendments.
Note 3. Fees and other transactions with affiliates
Management services fees
The Fund has entered into a Management Agreement with Columbia Management Investment Advisers, LLC (the Investment Manager), a wholly-owned subsidiary of Ameriprise Financial, Inc. (Ameriprise Financial). Under the Management Agreement, the Investment Manager provides the Fund with investment research and advice, as well as administrative and accounting
28
Columbia Small Cap Value Fund I | Annual Report 2024
Notes to Financial Statements (continued)April 30, 2024 services. The management services fee is an annual fee that is equal to a percentage of the Fund’s daily net assets that declines from 0.85% to 0.73% as the Fund’s net assets increase. The effective management services fee rate for the year ended April 30, 2024 was 0.81% of the Fund’s average daily net assets.
Compensation of Board members
Members of the Board of Trustees who are not officers or employees of the Investment Manager or Ameriprise Financial are compensated for their services to the Fund as disclosed in the Statement of Operations. Under a Deferred Compensation Plan (the Deferred Plan), these members of the Board of Trustees may elect to defer payment of up to 100% of their compensation. Deferred amounts are treated as though equivalent dollar amounts had been invested in shares of certain funds managed by the Investment Manager. The Fund’s liability for these amounts is adjusted for market value changes and remains in the Fund until distributed in accordance with the Deferred Plan. All amounts payable under the Deferred Plan constitute a general unsecured obligation of the Fund. The expense for the Deferred Plan, which includes Trustees’ fees deferred during the current period as well as any gains or losses on the Trustees’ deferred compensation balances as a result of market fluctuations, is included in "Deferred compensation of board members" in the Statement of Operations.
Compensation of Chief Compliance Officer
The Board of Trustees has appointed a Chief Compliance Officer for the Fund in accordance with federal securities regulations. As disclosed in the Statement of Operations, a portion of the Chief Compliance Officer’s total compensation is allocated to the Fund, along with other allocations to affiliated registered investment companies managed by the Investment Manager and its affiliates, based on relative net assets.
Transactions with affiliates
The Fund is permitted to engage in purchase and/or sale transactions with affiliates and/or accounts that have a common investment manager (or affiliated investment managers), common directors/trustees, and/or common officers under specified conditions outlined in a policy adopted by the Board, pursuant to Rule 17a-7 under the 1940 Act (cross-trades). The Board relies on quarterly written representation from the Fund’s Chief Compliance Officer that cross-trades complied with approved policy.
For the year ended April 30, 2024, the Fund engaged in cross-trades as follows:
| | Net realized gain (loss) ($) |
| | |
Transfer agency fees
Under a Transfer and Dividend Disbursing Agent Agreement, Columbia Management Investment Services Corp. (the Transfer Agent), an affiliate of the Investment Manager and a wholly-owned subsidiary of Ameriprise Financial, is responsible for providing transfer agency services to the Fund. The Transfer Agent has contracted with SS&C GIDS, Inc. (SS&C GIDS) to serve as sub-transfer agent. The Transfer Agent pays the fees of SS&C GIDS for services as sub-transfer agent and SS&C GIDS is not entitled to reimbursement for such fees from the Fund (with the exception of out-of-pocket fees).
The Fund pays the Transfer Agent a monthly transfer agency fee based on the number or the average value of accounts, depending on the type of account. In addition, the Fund pays the Transfer Agent a fee for shareholder services based on the number of accounts or on a percentage of the average aggregate value of the Fund’s shares maintained in omnibus accounts up to the lesser of the amount charged by the financial intermediary or a cap established by the Board of Trustees from time to time.
The Transfer Agent also receives compensation from the Fund for various shareholder services and reimbursements for certain out-of-pocket fees. Total transfer agency fees for Institutional 2 Class and Institutional 3 Class shares are subject to an annual limitation of not more than 0.07% and 0.02%, respectively, of the average daily net assets attributable to each share class.
Columbia Small Cap Value Fund I | Annual Report 2024
29
Notes to Financial Statements (continued)April 30, 2024 For the year ended April 30, 2024, the Fund’s effective transfer agency fee rates as a percentage of average daily net assets of each class were as follows:
An annual minimum account balance fee of $20 may apply to certain accounts with a value below the applicable share class’s initial minimum investment requirements to reduce the impact of small accounts on transfer agency fees. These minimum account balance fees are remitted to the Fund and recorded as part of expense reductions in the Statement of Operations. For the year ended April 30, 2024, these minimum account balance fees reduced total expenses of the Fund by $2,363.
Distribution and service fees
The Fund has entered into an agreement with Columbia Management Investment Distributors, Inc. (the Distributor), an affiliate of the Investment Manager and a wholly-owned subsidiary of Ameriprise Financial, for distribution and shareholder services. The Board of Trustees has approved, and the Fund has adopted, distribution and shareholder service plans (the Plans) applicable to certain share classes, which set the distribution and service fees for the Fund. These fees are calculated daily and are intended to compensate the Distributor and/or eligible selling and/or servicing agents for selling shares of the Fund and providing services to investors.
Under the Plans, the Fund pays a monthly service fee to the Distributor at the maximum annual rate of 0.25% of the average daily net assets attributable to Class A and Class C shares of the Fund. Also under the Plans, the Fund pays a monthly distribution fee to the Distributor at the maximum annual rates of 0.75% and 0.50% of the average daily net assets attributable to Class C and Class R shares of the Fund, respectively.
Sales charges (unaudited)
Sales charges, including front-end charges and contingent deferred sales charges (CDSCs), received by the Distributor for distributing Fund shares for the year ended April 30, 2024, if any, are listed below:
| This charge is imposed on certain investments of between $1 million and $50 million redeemed within 18 months after purchase, as follows: 1.00% if redeemed within 12 months after purchase, and 0.50% if redeemed more than 12, but less than 18, months after purchase, with certain limited exceptions. |
| This charge applies to redemptions within 12 months after purchase, with certain limited exceptions. |
The Fund’s other share classes are not subject to sales charges.
30
Columbia Small Cap Value Fund I | Annual Report 2024
Notes to Financial Statements (continued)April 30, 2024 Expenses waived/reimbursed by the Investment Manager and its affiliates
The Investment Manager and certain of its affiliates have contractually agreed to waive fees and/or reimburse expenses (excluding certain fees and expenses described below) for the period(s) disclosed below, unless sooner terminated at the sole discretion of the Board of Trustees, so that the Fund’s net operating expenses, after giving effect to fees waived/expenses reimbursed and any balance credits and/or overdraft charges from the Fund’s custodian, do not exceed the following annual rate(s) as a percentage of the classes’ average daily net assets:
| Fee rate(s) contractual
through
August 31, 2024 |
| |
| |
| |
| |
| |
| |
| |
Under the agreement governing these fee waivers and/or expense reimbursement arrangements, the following fees and expenses are excluded from the waiver/reimbursement commitment, and therefore will be paid by the Fund, if applicable: taxes (including foreign transaction taxes), expenses associated with investments in affiliated and non-affiliated pooled investment vehicles (including mutual funds and exchange-traded funds), transaction costs and brokerage commissions, costs related to any securities lending program, dividend expenses associated with securities sold short, inverse floater program fees and expenses, transaction charges and interest on borrowed money, interest, costs associated with shareholder meetings, infrequent and/or unusual expenses and any other expenses the exclusion of which is specifically approved by the Board of Trustees. This agreement may be modified or amended only with approval from the Investment Manager, certain of its affiliates and the Fund. Any fees waived and/or expenses reimbursed under the expense reimbursement arrangements described above are not recoverable by the Investment Manager or its affiliates in future periods.
Note 4. Federal tax information
The timing and character of income and capital gain distributions are determined in accordance with income tax regulations, which may differ from GAAP because of temporary or permanent book to tax differences.
At April 30, 2024, these differences were primarily due to differing treatment for deferral/reversal of wash sale losses, investments in partnerships and/or grantor trusts, capital loss carryforwards, trustees’ deferred compensation, foreign currency transactions, passive foreign investment company (pfic) holdings, earnings and profits distributed to shareholders on the redemption of shares and miscellaneous adjustments. To the extent these differences were permanent, reclassifications were made among the components of the Fund’s net assets. Temporary differences do not require reclassifications.
The following reclassifications were made:
Excess of distributions
over net investment
income ($) | Accumulated
net realized
gain ($) | |
| | |
Net investment income (loss) and net realized gains (losses), as disclosed in the Statement of Operations, and net assets were not affected by this reclassification.
Columbia Small Cap Value Fund I | Annual Report 2024
31
Notes to Financial Statements (continued)April 30, 2024 The tax character of distributions paid during the years indicated was as follows:
Year Ended April 30, 2024 | Year Ended April 30, 2023 |
| Long-term
capital gains ($) | | | Long-term
capital gains ($) | |
| | | | | |
Short-term capital gain distributions, if any, are considered ordinary income distributions for tax purposes.
At April 30, 2024, the components of distributable earnings on a tax basis were as follows:
Undistributed
ordinary income ($) | Undistributed
long-term
capital gains ($) | Capital loss
carryforwards ($) | Net unrealized
appreciation ($) |
| | | |
At April 30, 2024, the cost of all investments for federal income tax purposes along with the aggregate gross unrealized appreciation and depreciation based on that cost was:
| Gross unrealized
appreciation ($) | Gross unrealized
(depreciation) ($) | Net unrealized
appreciation ($) |
| | | |
Tax cost of investments and unrealized appreciation/(depreciation) may also include timing differences that do not constitute adjustments to tax basis.
The following capital loss carryforwards, determined at April 30, 2024, may be available to reduce future net realized gains on investments, if any, to the extent permitted by the Internal Revenue Code. In addition, for the year ended April 30, 2024, capital loss carryforwards utilized, if any, were as follows:
No expiration
short-term ($) | No expiration
long-term ($) | | |
| | | |
Management of the Fund has concluded that there are no significant uncertain tax positions in the Fund that would require recognition in the financial statements. However, management’s conclusion may be subject to review and adjustment at a later date based on factors including, but not limited to, new tax laws, regulations, and administrative interpretations (including relevant court decisions). Generally, the Fund’s federal tax returns for the prior three fiscal years remain subject to examination by the Internal Revenue Service.
Note 5. Portfolio information
The cost of purchases and proceeds from sales of securities, excluding short-term investments and derivatives, if any, aggregated to $987,970,605 and $1,036,928,245, respectively, for the year ended April 30, 2024. The amount of purchase and sale activity impacts the portfolio turnover rate reported in the Financial Highlights.
Note 6. Affiliated money market fund
The Fund invests in Columbia Short-Term Cash Fund, an affiliated money market fund established for the exclusive use by the Fund and other affiliated funds (the Affiliated MMF). The income earned by the Fund from such investments is included as Dividends - affiliated issuers in the Statement of Operations. As an investing fund, the Fund indirectly bears its proportionate share of the expenses of the Affiliated MMF. The Affiliated MMF prices its shares with a floating net asset value. The Securities and Exchange Commission has adopted amendments to money market fund rules requiring institutional prime money market funds like the Affiliated MMF to be subject to a discretionary liquidity fee of up to 2% if the imposition of such a fee is determined to be in the best interest of the Affiliated MMF and, by October 2, 2024, to a mandatory liquidity fee if daily net redemptions exceed 5% of net assets.
32
Columbia Small Cap Value Fund I | Annual Report 2024
Notes to Financial Statements (continued)April 30, 2024 Note 7. Interfund lending
Pursuant to an exemptive order granted by the Securities and Exchange Commission, the Fund participates in a program (the Interfund Program) allowing each participating Columbia Fund (each, a Participating Fund) to lend money directly to and, except for closed-end funds and money market funds, borrow money directly from other Participating Funds for temporary purposes. The amounts eligible for borrowing and lending under the Interfund Program are subject to certain restrictions.
Interfund loans are subject to the risk that the borrowing fund could be unable to repay the loan when due, and a delay in repayment to the lending fund could result in lost opportunities and/or additional lending costs. The exemptive order is subject to conditions intended to mitigate conflicts of interest arising from the Investment Manager’s relationship with each Participating Fund.
The Fund’s activity in the Interfund Program during the year ended April 30, 2024 was as follows:
| | Weighted average
interest rate (%) | Number of days
with outstanding loans |
| | | |
Interest expense incurred by the Fund is recorded as Interest on interfund lending in the Statement of Operations. The Fund had no outstanding interfund loans at April 30, 2024.
Note 8. Line of credit
The Fund has access to a revolving credit facility with a syndicate of banks led by JPMorgan Chase Bank, N.A., Citibank, N.A. and Wells Fargo Bank, N.A. whereby the Fund may borrow for the temporary funding of shareholder redemptions or for other temporary or emergency purposes. Pursuant to an October 26, 2023 amendment and restatement, the credit facility, which is an agreement between the Fund and certain other funds managed by the Investment Manager or an affiliated investment manager, severally and not jointly, permits aggregate borrowings up to $900 million. Interest is currently charged to each participating fund based on its borrowings at a rate equal to the higher of (i) the federal funds effective rate, (ii) the secured overnight financing rate plus 0.10% and (iii) the overnight bank funding rate plus, in each case, 1.00%. Each borrowing under the credit facility matures no later than 60 days after the date of borrowing. The Fund also pays a commitment fee equal to its pro rata share of the unused amount of the credit facility at a rate of 0.15% per annum. The commitment fee is included in other expenses in the Statement of Operations. This agreement expires annually in October unless extended or renewed. Prior to the October 26, 2023 amendment and restatement, the Fund had access to a revolving credit facility with a syndicate of banks led by JPMorgan Chase Bank, N.A., Citibank, N.A. and Wells Fargo Bank, N.A. which permitted collective borrowings up to $950 million. Interest was charged to each participating fund based on its borrowings at a rate equal to the higher of (i) the federal funds effective rate, (ii) the secured overnight financing rate plus 0.10% and (iii) the overnight bank funding rate plus, in each case, 1.00%.
The Fund had no borrowings during the year ended April 30, 2024.
Note 9. Significant risks
Market risk
The Fund may incur losses due to declines in the value of one or more securities in which it invests. These declines may be due to factors affecting a particular issuer, or the result of, among other things, political, regulatory, market, economic or social developments affecting the relevant market(s) more generally. In addition, turbulence in financial markets and reduced liquidity in equity, credit and/or fixed income markets may negatively affect many issuers, which could adversely affect the Fund’s ability to price or value hard-to-value assets in thinly traded and closed markets and could cause significant redemptions and operational challenges. Global economies and financial markets are increasingly interconnected, and conditions and events in one country, region or financial market may adversely impact issuers in a different country, region or financial market. These risks may be magnified if certain events or developments adversely interrupt the global supply chain; in these and other circumstances, such risks might affect companies worldwide. As a result, local, regional or global events
Columbia Small Cap Value Fund I | Annual Report 2024
33
Notes to Financial Statements (continued)April 30, 2024 such as terrorism, war, other conflicts, natural disasters, disease/virus outbreaks and epidemics or other public health issues, recessions, depressions or other events – or the potential for such events – could have a significant negative impact on global economic and market conditions.
The large-scale invasion of Ukraine by Russia in February 2022 has resulted in sanctions and market disruptions, including declines in regional and global stock markets, unusual volatility in global commodity markets and significant devaluations of Russian currency. The extent and duration of the military action are impossible to predict but could continue to be significant. Market disruption caused by the Russian military action, and any countermeasures or responses thereto (including international sanctions, a downgrade in a country’s credit rating, purchasing and financing restrictions, boycotts, tariffs, changes in consumer or purchaser preferences, cyberattacks and espionage) could continue to have severe adverse impacts on regional and/or global securities and commodities markets, including markets for oil and natural gas. These impacts may include reduced market liquidity, distress in credit markets, further disruption of global supply chains, increased risk of inflation, restricted cross-border payments and limited access to investments and/or assets in certain international markets and/or issuers. These developments and other related events could negatively impact Fund performance.
Shareholder concentration risk
At April 30, 2024, one unaffiliated shareholders of record owned 28.2% of the outstanding shares of the Fund in one or more accounts. The Fund has no knowledge about whether any portion of those shares was owned beneficially. Fund shares sold to or redeemed by concentrated accounts may have a significant effect on the operations of the Fund. In the case of a large redemption, the Fund may be forced to sell investments at inopportune times, including its liquid positions, which may result in Fund losses and the Fund holding a higher percentage of less liquid positions. Large redemptions could result in decreased economies of scale and increased operating expenses for non-redeeming Fund shareholders.
Small- and mid-cap company risk
Investments in small- and mid-capitalization companies (small- and mid-cap companies) often involve greater risks than investments in larger, more established companies (larger companies) because small- and mid-cap companies tend to have less predictable earnings and may lack the management experience, financial resources, product diversification and competitive strengths of larger companies. Securities of small- and mid-cap companies may be less liquid and more volatile than the securities of larger companies.
Note 10. Subsequent events
Management has evaluated the events and transactions that have occurred through the date the financial statements were issued and noted no items requiring adjustment of the financial statements or additional disclosure.
Note 11. Information regarding pending and settled legal proceedings
Ameriprise Financial and certain of its affiliates are involved in the normal course of business in legal proceedings which include regulatory inquiries, arbitration and litigation, including class actions concerning matters arising in connection with the conduct of their activities as part of a diversified financial services firm. Ameriprise Financial believes that the Fund is not currently the subject of, and that neither Ameriprise Financial nor any of its affiliates are the subject of, any pending legal, arbitration or regulatory proceedings that are likely to have a material adverse effect on the Fund or the ability of Ameriprise Financial or its affiliates to perform under their contracts with the Fund. Ameriprise Financial is required to make quarterly (10-Q), annual (10-K) and, as necessary, 8-K filings with the Securities and Exchange Commission (SEC) on legal and regulatory matters that relate to Ameriprise Financial and its affiliates. Copies of these filings may be obtained by accessing the SEC website at www.sec.gov.
There can be no assurance that these matters, or the adverse publicity associated with them, will not result in increased Fund redemptions, reduced sale of Fund shares or other adverse consequences to the Fund. Further, although we believe proceedings are not likely to have a material adverse effect on the Fund or the ability of Ameriprise Financial or its affiliates to perform under their contracts with the Fund, these proceedings are subject to uncertainties and, as such, we are unable to estimate the possible loss or range of loss that may result. An adverse outcome in one or more of these proceedings could
34
Columbia Small Cap Value Fund I | Annual Report 2024
Notes to Financial Statements (continued)April 30, 2024 result in adverse judgments, settlements, fines, penalties or other relief that could have a material adverse effect on the consolidated financial condition or results of operations of Ameriprise Financial or one or more of its affiliates that provide services to the Fund.
Columbia Small Cap Value Fund I | Annual Report 2024
35
Report of Independent Registered Public Accounting Firm
To the Board of Trustees of Columbia Funds Series Trust I and Shareholders of Columbia Small Cap Value Fund I
Opinion on the Financial Statements
We have audited the accompanying statement of assets and liabilities, including the portfolio of investments, of Columbia Small Cap Value Fund I (one of the funds constituting Columbia Funds Series Trust I, referred to hereafter as the "Fund") as of April 30, 2024, the related statement of operations for the year ended April 30, 2024, the statement of changes in net assets for each of the two years in the period ended April 30, 2024, including the related notes, and the financial highlights for each of the five years in the period ended April 30, 2024 (collectively referred to as the "financial statements"). In our opinion, the financial statements present fairly, in all material respects, the financial position of the Fund as of April 30, 2024, the results of its operations for the year then ended, the changes in its net assets for each of the two years in the period ended April 30, 2024 and the financial highlights for each of the five years in the period ended April 30, 2024 in conformity with accounting principles generally accepted in the United States of America.
Basis for Opinion
These financial statements are the responsibility of the Fund’s management. Our responsibility is to express an opinion on the Fund’s financial statements based on our audits. We are a public accounting firm registered with the Public Company Accounting Oversight Board (United States) (PCAOB) and are required to be independent with respect to the Fund in accordance with the U.S. federal securities laws and the applicable rules and regulations of the Securities and Exchange Commission and the PCAOB.
We conducted our audits of these financial statements in accordance with the standards of the PCAOB. Those standards require that we plan and perform the audit to obtain reasonable assurance about whether the financial statements are free of material misstatement, whether due to error or fraud.
Our audits included performing procedures to assess the risks of material misstatement of the financial statements, whether due to error or fraud, and performing procedures that respond to those risks. Such procedures included examining, on a test basis, evidence regarding the amounts and disclosures in the financial statements. Our audits also included evaluating the accounting principles used and significant estimates made by management, as well as evaluating the overall presentation of the financial statements. Our procedures included confirmation of securities owned as of April 30, 2024 by correspondence with the custodian, transfer agent and brokers; when replies were not received from brokers, we performed other auditing procedures. We believe that our audits provide a reasonable basis for our opinion.
/s/PricewaterhouseCoopers LLP
Minneapolis, Minnesota
June 20, 2024
We have served as the auditor of one or more investment companies within the Columbia Funds Complex since 1977.
36
Columbia Small Cap Value Fund I | Annual Report 2024
Federal Income Tax Information
(Unaudited)
The Fund hereby designates the following tax attributes for the fiscal year ended April 30, 2024. Shareholders will be notified in early 2025 of the amounts for use in preparing 2024 income tax returns.
| Dividends
received
deduction | |
| | |
Qualified dividend income. For taxable, non-corporate shareholders, the percentage of ordinary income distributed during the fiscal year that represents qualified dividend income subject to reduced tax rates.
Dividends received deduction. The percentage of ordinary income distributed during the fiscal year that qualifies for the corporate dividends received deduction.
Capital gain dividend. The Fund designates as a capital gain dividend the amount reflected above, or if subsequently determined to be different, the net capital gain of such fiscal period.
TRUSTEES AND OFFICERS
(Unaudited)
The Board oversees the Fund’s operations and appoints officers who are responsible for day-to-day business decisions based on policies set by the Board. The following table provides basic biographical information about the Fund’s Trustees as of the printing of this report, including their principal occupations during the past five years, although specific titles for individuals may have varied over the period. The year set forth beneath Length of Service in the table below is the year in which the Trustee was first appointed or elected as Trustee to any Fund currently in the Columbia Funds Complex or a predecessor thereof. Under current Board policy, each Trustee generally serves until December 31 of the year such Trustee turns seventy-five (75).
Independent trustees
Name,
address,
year of birth | Position held
with the Columbia Funds and
length of service | Principal occupation(s)
during past five years
and other relevant
professional experience | Number of
Funds in the
Columbia Funds
Complex*
overseen | Other directorships
held by Trustee
during the past five years
and other relevant Board experience |
George S. Batejan
c/o Columbia Management
Investment Advisers, LLC
290 Congress Street
Boston, MA 02210
1954 | | Executive Vice President, Global Head of Technology and Operations, Janus Capital Group, Inc., 2010-2016 | | Former Chairman of the Board, NICSA (National Investment Company Services Association) (Executive Committee, Nominating Committee and Governance Committee), 2014-2016; former Director, Intech Investment Management, 2011-2016; former Board Member, Metro Denver Chamber of Commerce, 2015-2016; former Advisory Board Member, University of Colorado Business School, 2015-2018; former Board Member, Chase Bank International, 1993-1994 |
Columbia Small Cap Value Fund I | Annual Report 2024
37
TRUSTEES AND OFFICERS (continued)(Unaudited)Independent trustees (continued) Name, address, year of birth | Position held with the Columbia Funds and length of service | Principal occupation(s) during past five years and other relevant professional experience | Number of Funds in the Columbia Funds Complex* overseen | Other directorships held by Trustee during the past five years and other relevant Board experience |
Kathleen Blatz
c/o Columbia Management
Investment Advisers, LLC
290 Congress Street
Boston, MA 02210
1954 | | Attorney, specializing in arbitration and mediation; Trustee of Gerald Rauenhorst 1982 Trusts, since 2020; Chief Justice, Minnesota Supreme Court, 1998-2006; Associate Justice, Minnesota Supreme Court, 1996-1998; Fourth Judicial District Court Judge, Hennepin County, 1994-1996; Attorney in private practice and public service, 1984-1993; State Representative, Minnesota House of Representatives, 1979-1993, which included service on the Tax and Financial Institutions and Insurance Committees; Member and Interim Chair, Minnesota Sports Facilities Authority, January-July 2017; Interim President and Chief Executive Officer, Blue Cross and Blue Shield of Minnesota (health care insurance), February-July 2018, April-October 2021 | | Former Trustee, Blue Cross and Blue Shield of Minnesota, 2009-2021 (Chair of the Business Development Committee, 2014-2017; Chair of the Governance Committee, 2017-2019); former Member and Chair of the Board, Minnesota Sports Facilities Authority, January 2017-July 2017; former Director, Robina Foundation, 2009-2020 (Chair, 2014-2020); Director, Richard M. Schulze Family Foundation, since 2021 |
Pamela G. Carlton
c/o Columbia Management
Investment Advisers, LLC
290 Congress Street
Boston, MA 02210
1954 | Chair since 2023; Trustee since 2007 | President, Springboard – Partners in Cross Cultural Leadership (consulting company), since 2003; Managing Director of US Equity Research, JP Morgan Chase, 1999-2003; Director of US Equity Research, Chase Asset Management, 1996-1999; Co-Director Latin America Research, 1993-1996, COO Global Research, 1992-1996, Co-Director of US Research, 1991-1992, Investment Banker, 1982-1991, Morgan Stanley; Attorney, Cleary Gottlieb Steen & Hamilton LLP, 1980-1982 | | Trustee, New York Presbyterian Hospital Board, since 1996; Director, DR Bank (Audit Committee, since 2017 and Audit Committee Chair, since November 2023); Director, Evercore Inc. (Audit Committee, Nominating and Governance Committee) (financial services company), since 2019; Director, Apollo Commercial Real Estate Finance, Inc. (Chair, Nominating and Governance Committee), since 2021; the Governing Council of the Independent Directors Council (IDC), since 2021 |
Janet Langford Carrig
c/o Columbia Management
Investment Advisers, LLC
290 Congress Street
Boston, MA 02210
1957 | | Senior Vice President, General Counsel and Corporate Secretary, ConocoPhillips (independent energy company), September 2007-October 2018 | | Director, EQT Corporation (natural gas producer), since 2019; former Director, Whiting Petroleum Corporation (independent oil and gas company), 2020-2022 |
J. Kevin Connaughton
c/o Columbia Management
Investment Advisers, LLC
290 Congress Street
Boston, MA 02210
1964 | | CEO and President, RhodeWay Financial (non-profit financial planning firm), since December 2022; Member, FINRA National Adjudicatory Council, January 2020-December 2023; Adjunct Professor of Finance, Bentley University January 2018-April 2023; Consultant to Independent Trustees of CFVIT and CFST I from March 2016 to June 2020 with respect to CFVIT and to December 2020 with respect to CFST I; Managing Director and General Manager of Mutual Fund Products, Columbia Management Investment Advisers, LLC, May 2010-February 2015; President, Columbia Funds, 2008-2015; and senior officer of Columbia Funds and affiliated funds, 2003-2015 | | Former Director, The Autism Project, March 2015-December 2021; former Member of the Investment Committee, St. Michael’s College, November 2015-February 2020; former Trustee, St. Michael’s College, June 2017-September 2019; former Trustee, New Century Portfolios (former mutual fund complex), January 2015-December 2017 |
38
Columbia Small Cap Value Fund I | Annual Report 2024
TRUSTEES AND OFFICERS (continued)(Unaudited)Independent trustees (continued) Name, address, year of birth | Position held with the Columbia Funds and length of service | Principal occupation(s) during past five years and other relevant professional experience | Number of Funds in the Columbia Funds Complex* overseen | Other directorships held by Trustee during the past five years and other relevant Board experience |
Olive M. Darragh
c/o Columbia Management
Investment Advisers, LLC
290 Congress Street
Boston, MA 02210
1962 | | Managing Director of Darragh Inc. (strategy and talent management consulting firm), since 2010; Founder and CEO, Zolio, Inc. (investment management talent identification platform), since 2004; Consultant to Independent Trustees of CFVIT and CFST I from June 2019 to June 2020 with respect to CFVIT and to December 2020 with respect to CFST I; Partner, Tudor Investments, 2004-2010; Senior Partner, McKinsey & Company (consulting), 1990-2004; Touche Ross CPA, 1985-1988 | | Treasurer, Edinburgh University US Trust Board, since January 2023; Member, HBS Community Action Partners Board, since September 2022; former Director, University of Edinburgh Business School (Member of US Board), 2004-2019; former Director, Boston Public Library Foundation, 2008-2017 |
Patricia M. Flynn
c/o Columbia Management
Investment Advisers, LLC
290 Congress Street
Boston, MA 02210
1950 | | Professor Emeritus of Economics and Management, Bentley University, since 2023; Professor of Economics and Management, Bentley University, 1976-2023; Dean, McCallum Graduate School of Business, Bentley University, 1992-2002 | | Former Trustee, MA Taxpayers Foundation, 1997-2022; former Director, The MA Business Roundtable, 2003-2019; former Chairperson, Innovation Index Advisory Committee, MA Technology Collaborative, 1997-2020 |
Brian J. Gallagher
c/o Columbia Management
Investment Advisers, LLC
290 Congress Street
Boston, MA 02210
1954 | | Retired; Partner with Deloitte & Touche LLP and its predecessors, 1977-2016 | | Trustee, Catholic Schools Foundation, since 2004 |
Douglas A. Hacker
c/o Columbia Management
Investment Advisers, LLC
290 Congress Street
Boston, MA 02210
1955 | | Independent business executive, since May 2006; Executive Vice President – Strategy of United Airlines, December 2002 - May 2006; President of UAL Loyalty Services (airline marketing company), September 2001-December 2002; Executive Vice President and Chief Financial Officer of United Airlines, July 1999-September 2001 | | Director, SpartanNash Company (food distributor), since November 2013 (Chair of the Board, since May 2021); Director, Aircastle Limited (aircraft leasing), since August 2006 (Chair of Audit Committee); former Director, Nash Finch Company (food distributor), 2005-2013; former Director, SeaCube Container Leasing Ltd. (container leasing), 2010-2013; and former Director, Travelport Worldwide Limited (travel information technology), 2014-2019 |
Nancy T. Lukitsh
c/o Columbia Management
Investment Advisers, LLC
290 Congress Street
Boston, MA 02210
1956 | | Senior Vice President, Partner and Director of Marketing, Wellington Management Company, LLP (investment adviser), 1997-2010; Chair, Wellington Management Portfolios (commingled non-U.S. investment pools), 2007-2010; Director, Wellington Trust Company, NA and other Wellington affiliates, 1997-2010 | | |
Columbia Small Cap Value Fund I | Annual Report 2024
39
TRUSTEES AND OFFICERS (continued)(Unaudited)Independent trustees (continued) Name, address, year of birth | Position held with the Columbia Funds and length of service | Principal occupation(s) during past five years and other relevant professional experience | Number of Funds in the Columbia Funds Complex* overseen | Other directorships held by Trustee during the past five years and other relevant Board experience |
David M. Moffett
c/o Columbia Management
Investment Advisers, LLC
290 Congress Street
Boston, MA 02210
1952 | | Retired; former Chief Executive Officer of Freddie Mac and Chief Financial Officer of U.S. Bank | | Director, CSX Corporation (transportation suppliers); Director, PayPal Holdings Inc. (payment and data processing services); former Director, eBay Inc. (online trading community), 2007-2015; and former Director, CIT Bank, CIT Group Inc. (commercial and consumer finance), 2010-2016; former Senior Adviser to The Carlyle Group (financial services), March 2008-September 2008; former Governance Consultant to Bridgewater Associates, January 2013-December 2015 |
Catherine James Paglia
c/o Columbia Management
Investment Advisers, LLC
290 Congress Street
Boston, MA 02210
1952 | | Director, Enterprise Asset Management, Inc. (private real estate and asset management company), since September 1998; Managing Director and Partner, Interlaken Capital, Inc., 1989-1997; Vice President, 1982-1985, Principal, 1985-1987, Managing Director, 1987-1989, Morgan Stanley; Vice President, Investment Banking, 1980-1982, Associate, Investment Banking, 1976-1980, Dean Witter Reynolds, Inc. | | Director, Valmont Industries, Inc. (irrigation systems manufacturer), since 2012; Trustee, Carleton College (on the Investment Committee), since 1987; Trustee, Carnegie Endowment for International Peace (on the Investment Committee), since 2009 |
Natalie A. Trunow
c/o Columbia Management
Investment Advisers, LLC
290 Congress Street
Boston, MA 02210
1967 | | Chief Executive Officer, Millennial Portfolio Solutions LLC (asset management and consulting services), January 2016-January 2021; Non-executive Member of the Investment Committee and Valuation Committee, Sarona Asset Management Inc. (private equity firm) since September 2019; Advisor, Horizon Investments (asset management and consulting services), August 2018-January 2022; Advisor, Paradigm Asset Management, November 2016-January 2022; Consultant to Independent Trustees of CFVIT and CFST I from September 2016 to June 2020 with respect to CFVIT and to December 2020 with respect to CFST I; Director of Investments/Consultant, Casey Family Programs, April 2016-November 2016; Senior Vice President and Chief Investment Officer, Calvert Investments, August 2008-January 2016; Section Head and Portfolio Manager, General Motors Asset Management, June 1997-August 2008 | | Independent Director, Investment Committee, Health Services for Children with Special Needs, Inc., 2010-2021; Independent Director, (Executive Committee and Chair, Audit Committee), Consumer Credit Counseling Services (formerly Guidewell Financial Solutions), since 2016; Independent Director, (Investment Committee), Sarona Asset Management, since 2019 |
Sandra L. Yeager
c/o Columbia Management
Investment Advisers, LLC
290 Congress Street
Boston, MA 02210
1964 | | Retired; President and founder, Hanoverian Capital, LLC (SEC registered investment advisor firm), 2008-2016; Managing Director, DuPont Capital, 2006-2008; Managing Director, Morgan Stanley Investment Management, 2004-2006; Senior Vice President, Alliance Bernstein, 1990-2004 | | Former Director, NAPE (National Alliance for Partnerships in Equity) Education Foundation, October 2016-October 2020; Advisory Board, Jennersville YMCA, June 2022-June 2023 |
40
Columbia Small Cap Value Fund I | Annual Report 2024
TRUSTEES AND OFFICERS (continued)(Unaudited)Independent trustees (continued) Interested trustee affiliated with Investment Manager**
Name,
address,
year of birth | Position held with the Columbia Funds and length of service | Principal occupation(s) during the
past five years and other relevant
professional experience | Number of
Funds in the
Columbia Funds
Complex* overseen | Other directorships
held by Trustee
during the past
five years and
other relevant Board experience |
Daniel J. Beckman
c/o Columbia Management
Investment Advisers, LLC
290 Congress Street
Boston, MA 02210
1962 | Trustee since November 2021 and President since June 2021 | President and Principal Executive Officer of the Columbia Funds, since June 2021; Vice President, Columbia Management Investment Advisers, LLC, since April 2015; formerly, Vice President – Head of North America Product, Columbia Management Investment Advisers, LLC, April 2015 – December 2023; President and Principal Executive Officer, Columbia Acorn/Wanger Funds, since July 2021 | | Director, Ameriprise Trust Company, since October 2016; Director, Columbia Management Investment Distributors, Inc., since November 2018; Board of Governors, Columbia Wanger Asset Management, LLC, since January 2022 |
| The term “Columbia Funds Complex” as used herein includes Columbia Seligman Premium Technology Growth Fund, Tri-Continental Corporation and each series of Columbia Funds Series Trust (CFST), Columbia Funds Series Trust I (CFST I), Columbia Funds Series Trust II (CFST II), Columbia ETF Trust I (CET I), Columbia ETF Trust II (CET II), Columbia Funds Variable Insurance Trust (CFVIT) and Columbia Funds Variable Series Trust II (CFVST II). Messrs. Batejan, Beckman, Gallagher, Hacker and Moffett and Mses. Blatz, Carlton, Carrig, Flynn, Paglia, and Yeager serve as directors of Columbia Seligman Premium Technology Growth Fund and Tri-Continental Corporation. |
| Interested person (as defined under the 1940 Act) by reason of being an officer, director, security holder and/or employee of the Investment Manager or Ameriprise Financial. |
The Statement of Additional Information has additional information about the Fund’s Board members and is available, without charge, upon request by calling 800.345.6611, visiting columbiathreadneedleus.com/investor/ or contacting your financial intermediary.
The Board has appointed officers who are responsible for day-to-day business decisions based on policies it has established. The officers serve at the pleasure of the Board. The following table provides basic information about the Officers of the Fund as of the printing of this report, including principal occupations during the past five years, although their specific titles may have varied over the period. In addition to Mr. Beckman, who is President and Principal Executive Officer, the Fund’s other officers are:
Fund officers
Name,
address and
year of birth | Position and year
first appointed to
position for any Fund
in the Columbia
Funds Complex or a
predecessor thereof | Principal occupation(s) during past five years |
Michael G. Clarke
290 Congress Street
Boston, MA 02210
1969 | Chief Financial Officer and Principal Financial Officer (2009); Senior Vice President (2019); Treasurer and Chief Accounting Officer (Principal Accounting Officer) (2024) for CFST, CFST I, CFST II, CFVIT and CFVST II | Senior Vice President and North America Head of Operations & Investor Services, Columbia Management Investment Advisers, LLC, since June 2023 (previously Senior Vice President and Head of Global Operations, March 2022 – June 2023, Vice President, Head of North America Operations, and Co-Head of Global Operations, June 2019 - February 2022 and Vice President – Accounting and Tax, May 2010 - May 2019); senior officer of Columbia Funds and affiliated funds, since 2002. Director, Ameriprise Trust Company, since June 2023. |
Columbia Small Cap Value Fund I | Annual Report 2024
41
TRUSTEES AND OFFICERS (continued)(Unaudited)Fund officers (continued) Name, address and year of birth | Position and year first appointed to position for any Fund in the Columbia Funds Complex or a predecessor thereof | Principal occupation(s) during past five years |
Marybeth Pilat
290 Congress Street
Boston, MA 02210
1968 | Treasurer and Chief Accounting Officer (Principal Accounting Officer) and Principal Financial Officer (2020) for CET I and CET II; Assistant Treasurer, CFST, CFST I, CFST II, CFVIT and CFVST II | Vice President – Product Pricing and Administration, Columbia Management Investment Advisers, LLC, since May 2017. |
William F. Truscott
290 Congress Street
Boston, MA 02210
1960 | Senior Vice President (2001) | Formerly, Trustee/Director of Columbia Funds Complex or legacy funds, November 2001 - January 1, 2021; Chief Executive Officer, Global Asset Management, Ameriprise Financial, Inc., since September 2012; Chairman of the Board and President, Columbia Management Investment Advisers, LLC, since July 2004 and February 2012, respectively; Chairman of the Board and Chief Executive Officer, Columbia Management Investment Distributors, Inc., since November 2008 and February 2012, respectively; Chairman of the Board and Director, TAM UK International Holdings Limited, since July 2021; formerly Chairman of the Board and Director, Threadneedle Asset Management Holdings, Sàrl, March 2013 – December 2022 and December 2008 – December 2022, respectively; senior executive of various entities affiliated with Columbia Threadneedle Investments. |
Christopher O. Petersen
5228 Ameriprise Financial Center
Minneapolis, MN 55474
1970 | Senior Vice President and Assistant Secretary (2021) | Formerly, Trustee/Director of funds within the Columbia Funds Complex, July 1, 2020 - November 22, 2021; Senior Vice President and Assistant General Counsel, Ameriprise Financial, Inc., since September 2021 (previously Vice President and Lead Chief Counsel, January 2015 - September 2021); formerly, President and Principal Executive Officer of the Columbia Funds, 2015 - 2021; officer of Columbia Funds and affiliated funds, since 2007. |
Thomas P. McGuire
290 Congress Street
Boston, MA 02210
1972 | Senior Vice President and Chief Compliance Officer (2012) | Vice President – Asset Management Compliance, Ameriprise Financial, Inc., since May 2010; Chief Compliance Officer, Columbia Acorn/Wanger Funds, since December 2015; formerly, Chief Compliance Officer, Ameriprise Certificate Company, September 2010 – September 2020. |
Ryan C. Larrenaga
290 Congress Street
Boston, MA 02210
1970 | Senior Vice President (2017), Chief Legal Officer (2017), and Secretary (2015) | Vice President and Chief Counsel, Ameriprise Financial, Inc., since August 2018 (previously Vice President and Group Counsel, August 2011 - August 2018); Chief Legal Officer, Columbia Acorn/Wanger Funds, since September 2020; officer of Columbia Funds and affiliated funds, since 2005. |
Michael E. DeFao
290 Congress Street
Boston, MA 02210
1968 | Vice President (2011) and Assistant Secretary (2010) | Vice President and Chief Counsel, Ameriprise Financial, Inc., since May 2010; Vice President, Chief Legal Officer and Assistant Secretary, Columbia Management Investment Advisers, LLC, since October 2021 (previously Vice President and Assistant Secretary, May 2010 – September 2021). |
Lyn Kephart-Strong
5903 Ameriprise Financial Center
Minneapolis, MN 55474
1960 | | Vice President, Global Investment Operations Services, Columbia Management Investment Advisers, LLC, since 2010; President, Columbia Management Investment Services Corp., since October 2014; President, Ameriprise Trust Company, since January 2017. |
42
Columbia Small Cap Value Fund I | Annual Report 2024
Liquidity Risk Management Program
(Unaudited)
Pursuant to Rule 22e-4 under the 1940 Act, the Fund has adopted a liquidity risk management program (Program). The Program’s principal objectives include assessing, managing and periodically reviewing the Fund’s liquidity risk. Liquidity risk is defined as the risk that the Fund could not meet redemption requests without significant dilution of remaining investors’ interests in the Fund.
The Board has appointed the Investment Manager as the program administrator for the Fund’s Program. The Investment Manager has delegated oversight of the Program to its Liquidity Risk Management Committee (the Committee). At a board meeting during the fiscal period, the Committee provided the Board with a report addressing the operations of the program and assessing its adequacy and effectiveness of implementation for the period January 1, 2023, through December 31, 2023, including:
•
the Fund had sufficient liquidity to both meet redemptions and operate effectively on behalf of shareholders;
•
there were no material changes to the Program during the period;
•
the implementation of the Program was effective to manage the Fund’s liquidity risk; and
•
the Program operated adequately during the period.
There can be no assurance that the Program will achieve its objectives in the future. Please refer to the Fund’s prospectus for more information regarding the Fund’s exposure to liquidity risk and other principal risks to which an investment in the Fund may be subject.
Columbia Small Cap Value Fund I | Annual Report 2024
43
Columbia Small Cap Value Fund I
P.O. Box 219104
Kansas City, MO 64121-9104
Please read and consider the investment objectives, risks, charges and expenses for any fund carefully before investing. For a prospectus and summary prospectus, which contains this and other important information about the Fund, go to
columbiathreadneedleus.com/investor/. The Fund is distributed by Columbia Management Investment Distributors, Inc., member FINRA, and managed by Columbia Management Investment Advisers, LLC.
Columbia Threadneedle Investments (Columbia Threadneedle) is the global brand name of the Columbia and Threadneedle group of companies. All rights reserved.
© 2024 Columbia Management Investment Advisers, LLC.
columbiathreadneedleus.com/investor/
Columbia U.S. Treasury Index Fund
Annual Report
April 30, 2024
In October 2022, the Securities and Exchange Commission (SEC) adopted a final rule, "Tailored Shareholder Reports for Mutual Funds and Exchange-Traded Funds; Fee Information in Investment Company Advertisements." The rule and form amendments will, among other things, require the Fund to transmit concise and visually engaging shareholder reports that highlight key information. The amendments will require that funds tag information in a structured data format and that certain more in-depth information be made available online and available for delivery free of charge to investors on request. The amendments became effective January 24, 2023. There is an 18-month transition period after the effective date of the amendments.
Each Tailored Shareholder Report will be share-class specific and will highlight key fund information the SEC believes is most relevant to investors in assessing their investment in the Fund. Much of the information, including a Fund’s financial statements, that is currently disclosed in a Fund’s shareholder reports will instead be made available on the Fund’s website and filed on Form N-CSR on an annual and semiannual basis. This information will be delivered to investors free of charge upon request. Columbia Fund reports will follow the Tailored Shareholder Report approach beginning with reports covering the period ending May 31, 2024.
The new rule also requires the Fund to mail a printed version of the Tailored Shareholder Report to all shareholders who have not elected to receive shareholder reports electronically. Rather than receiving a postcard notifying investors that the shareholder report for Funds in which they invest is available online, investors will begin receiving the Tailored Shareholder Report in the mail unless they have elected to receive their Fund documents electronically.
| No Financial Institution Guarantee | |
If you elect to receive the shareholder report for Columbia U.S. Treasury Index Fund (the Fund) in paper, mailed to you, the Fund mails one shareholder report to each shareholder address, unless such shareholder elects to receive shareholder reports from the Fund electronically via e-mail or by having a paper notice mailed to you (Postcard Notice) that your Fund’s shareholder report is available at the Columbia funds’ website (columbiathreadneedleus.com/investor/). If you would like more than one report in paper to be mailed to you, or would like to elect to receive reports via e-mail or access them through Postcard Notice, please call shareholder services at 800.345.6611 and additional reports will be sent to you.
Proxy voting policies and procedures
The policy of the Board of Trustees is to vote the proxies of the companies in which the Fund holds investments consistent with the procedures as stated in the Statement of Additional Information (SAI). You may obtain a copy of the SAI without charge by calling 800.345.6611; contacting your financial intermediary; visiting columbiathreadneedleus.com/investor/; or searching the website of the Securities and Exchange Commission (SEC) at sec.gov. Information regarding how the Fund voted proxies relating to portfolio securities is filed with the SEC by August 31st for the most recent 12-month period ending June 30th of that year, and is available without charge by visiting columbiathreadneedleus.com/investor/, or searching the website of the SEC at sec.gov.
Quarterly schedule of investments
The Fund files a complete schedule of portfolio holdings with the SEC for the first and third quarters of each fiscal year on Form N-PORT. The Fund’s Form N-PORT filings are available on the SEC’s website at sec.gov. The Fund’s complete schedule of portfolio holdings, as filed on Form N-PORT, is available on columbiathreadneedleus.com/investor/ or can also be obtained without charge, upon request, by calling 800.345.6611.
Additional Fund information
For more information about the Fund, please visit columbiathreadneedleus.com/investor/ or call 800.345.6611. Customer Service Representatives are available to answer your questions Monday through Friday from 8 a.m. to 7 p.m. Eastern time.
Fund investment manager
Columbia Management Investment Advisers, LLC (the Investment Manager)
290 Congress Street
Boston, MA 02210
Fund distributor
Columbia Management Investment Distributors, Inc.
290 Congress Street
Boston, MA 02210
Fund transfer agent
Columbia Management Investment Services Corp.
P.O. Box 219104
Kansas City, MO 64121-9104
Columbia U.S. Treasury Index Fund | Annual Report 2024
Fund at a Glance(Unaudited) Investment objective
The Fund seeks total return that corresponds to the total return of the FTSE USBIG Treasury Index, before fees and expenses.
Portfolio management
Alan Erickson, CFA
Portfolio Manager
Managed Fund since 2017
Average annual total returns (%) (for the period ended April 30, 2024) |
| | | | | |
| | | | |
| | | | |
| | | | |
| | | | |
FTSE USBIG Treasury Index | | | | |
The Fund’s other share classes are not subject to sales charges and have limited eligibility. Please see the Fund’s prospectus for details. Performance for different share classes will vary based on differences in sales charges and fees associated with each share class. All results shown assume reinvestment of distributions during the period. Returns do not reflect the deduction of taxes that a shareholder may pay on Fund distributions or on the redemption of Fund shares. Performance results reflect the effect of any fee waivers or reimbursements of Fund expenses by Columbia Management Investment Advisers, LLC and/or any of its affiliates. Absent these fee waivers or expense reimbursement arrangements, performance results would have been lower.
The performance information shown represents past performance and is not a guarantee of future results. The investment return and principal value of your investment will fluctuate so that your shares, when redeemed, may be worth more or less than their original cost. Current performance may be lower or higher than the performance information shown. You may obtain performance information current to the most recent month-end by contacting your financial intermediary, visiting columbiathreadneedleus.com/investor/ or calling 800.345.6611.
*
The returns shown for periods prior to the share class inception date (including returns for the Life of the Fund, if shown, which are since Fund inception) include the returns of the Fund’s oldest share class. These returns are adjusted to reflect any higher class-related operating expenses of the newer share classes, as applicable. Please visit columbiathreadneedleus.com/investor/investment-products/mutual-funds/appended-performance for more information.
The FTSE USBIG Treasury Index tracks the performance of US Dollar-denominated bonds issued in the US investment-grade bond market. The index includes fixed-rate U.S. Treasury bonds with USD 5 billion public amount outstanding and greater than one year to maturity. The index excludes U.S. Federal Reserve purchases, inflation-indexed securities and STRIPS.
Indices are not available for investment, are not professionally managed and do not reflect sales charges, fees, brokerage commissions, taxes or other expenses of investing. Securities in the Fund may not match those in an index.
Columbia U.S. Treasury Index Fund | Annual Report 2024
3
Fund at a Glance (continued)(Unaudited) Performance of a hypothetical $10,000 investment (April 30, 2014 — April 30, 2024)
The chart above shows the change in value of a hypothetical $10,000 investment in Class A shares of Columbia U.S. Treasury Index Fund during the stated time period, and does not reflect the deduction of taxes that a shareholder may pay on Fund distributions or on the redemption of Fund shares.
Portfolio breakdown (%) (at April 30, 2024) |
| |
U.S. Treasury Obligations | |
| |
Percentages indicated are based upon total investments excluding investments in derivatives, if any. The Fund’s portfolio composition is subject to change.
Quality breakdown (%) (at April 30, 2024) |
| |
| |
Percentages indicated are based upon total fixed income investments.
Bond ratings apply to the underlying holdings of the Fund and not the Fund itself and are divided into categories ranging from highest to lowest credit quality, determined by using the middle rating of Moody’s, S&P and Fitch, after dropping the highest and lowest available ratings. When ratings are available from only two rating agencies, the lower rating is used. When a rating is available from only one rating agency, that rating is used. If a security is not rated but has a rating by Kroll and/or DBRS, the same methodology is applied to those bonds that would otherwise be not rated. When a bond is not rated by any rating agency, it is designated as “Not rated.” Credit quality ratings assigned by a rating agency are subjective opinions, not statements of fact, and are subject to change, including daily. The ratings assigned by credit rating agencies are but one of the considerations that the Investment Manager and/or Fund’s subadviser incorporates into its credit analysis process, along with such other issuer-specific factors as cash flows, capital structure and leverage ratios, ability to de-leverage (repay) through free cash flow, quality of management, market positioning and access to capital, as well as such security-specific factors as the terms of the security (e.g., interest rate and time to maturity) and the amount and type of any collateral.
4
Columbia U.S. Treasury Index Fund | Annual Report 2024
Manager Discussion of Fund Performance(Unaudited) At April 30, 2024, approximately 83.66% of the Fund’s shares were owned in the aggregate by affiliated funds-of-funds managed by Columbia Management Investment Advisers, LLC (the Investment Manager). As a result of asset allocation decisions by the Investment Manager, it is possible that the Fund may experience relatively large purchases or redemptions from affiliated funds-of-funds. The Investment Manager seeks to minimize the impact of these transactions by structuring them over a reasonable period of time. The Fund may experience increased expenses as it buys and sells securities as a result of purchases or redemptions by affiliated funds-of-funds.
For the 12-month period that ended April 30, 2024, Class A shares of Columbia U.S. Treasury Index Fund returned -3.01%. The Fund’s benchmark, the FTSE USBIG Treasury Index, returned -2.75% for the same time period. Mutual funds, unlike unmanaged indices, incur operating expenses.
Market overview
During the annual period, the U.S. Treasury market was driven by expectations around U.S. Federal Reserve (Fed) monetary policy and by a U.S. economy that proved resilient against the highest overnight federal funds target rate in 17 years. (The overnight rate is the interest rate at which a bank lends or borrows funds from another bank in the overnight market. It is the interest rate the Fed sets to target monetary policy.) As inflation moved lower in 2023 from elevated levels in 2022, the U.S. Treasury market began to anticipate a lower overnight rate in early 2024. Confirmation of this view came from numerous Fed policymakers, with their statements driving a significant U.S. Treasury yield rally at the end of 2023. The 10-year U.S. Treasury yield ended 2023 at 3.88% after hitting 5% in late October.
In the first four months of 2024, however, inflation rose again, albeit modestly, and overall economic growth remained stronger than consensus expected. In turn, at the end of the annual period, the U.S. Treasury market was pricing for an initial Fed interest rate cut likely pushed out to the fourth quarter of 2024. The 10-year U.S. Treasury yield ended April 2024 at 4.68%, the highest seen since the third quarter of 2023. For the annual period overall, the U.S. Treasury yield curve (as measured by the difference between the two-year yield and the 10-year yield) remained inverted but fluctuated widely, with a differential of approximately 100 basis points in mid-2023 and ending the annual period with a differential of 35 basis points. (An inverted yield curve is one wherein the yields on shorter-term maturities are higher than the yields on longer-term maturities. A basis point is 1/100th of a percentage point.)
The Fund’s notable detractors during the period
•
The Fund attempts to match the return of its benchmark, the unmanaged FTSE USBIG Treasury Index. The negative return for the benchmark was driven by longer maturity U.S. Treasuries, which underperformed shorter maturity U.S. Treasuries during the annual period.
•
Securities with maturities of longer than five years posted a total return of -7.70% during the annual period.
The Fund’s notable contributors during the period
•
The front end, or shorter-term maturities, of the U.S. Treasury yield curve posted positive returns during the annual period, as the shorter duration, or interest rate sensitivity, of these issues mitigated the negative price pressure and the benchmark was able to capture the higher yields as the market priced higher.
•
U.S. Treasury securities with maturities of less than five years posted a positive return of 1.10% for the annual period overall.
Market risk may affect a single issuer, sector of the economy, industry or the market as a whole. The U.S. government may be unable or unwilling to honor its financial obligations. Securities issued or guaranteed by federal agencies and U.S. government-sponsored instrumentalities may or may not be backed by the full faith and credit of the U.S. government. A rise in interest rates may result in a price decline of fixed-income instruments held by the Fund, negatively impacting its performance and NAV. Falling rates may result in the Fund investing in lower yielding debt instruments, lowering the Fund’s income and yield. These risks may be heightened for longer maturity and duration securities. The Fund’s net value will generally decline when the performance of its targeted index declines. See the Fund’s prospectus for more information on these and other risks.
The views expressed in this report reflect the current views of the respective parties who have contributed to this report. These views are not guarantees of future performance and involve certain risks, uncertainties and assumptions that are difficult to predict, so actual outcomes and results may differ significantly from the views expressed. These views are subject to change at any time based upon economic, market or other conditions and the respective
Columbia U.S. Treasury Index Fund | Annual Report 2024
5
Manager Discussion of Fund Performance (continued)(Unaudited) parties disclaim any responsibility to update such views. These views may not be relied on as investment advice and, because investment decisions for a Columbia fund are based on numerous factors, may not be relied on as an indication of trading intent on behalf of any particular Columbia fund. References to specific securities should not be construed as a recommendation or investment advice.
6
Columbia U.S. Treasury Index Fund | Annual Report 2024
Understanding Your Fund’s Expenses(Unaudited) As an investor, you incur two types of costs. There are shareholder transaction costs, which generally include sales charges on purchases and may include redemption fees. There are also ongoing fund costs, which generally include management fees, distribution and/or service fees, and other fund expenses. The following information is intended to help you understand your ongoing costs (in dollars) of investing in the Fund and to help you compare these costs with the ongoing costs of investing in other mutual funds.
Analyzing your Fund’s expenses
To illustrate these ongoing costs, we have provided examples and calculated the expenses paid by investors in each share class of the Fund during the period. The actual and hypothetical information in the table is based on an initial investment of $1,000 at the beginning of the period indicated and held for the entire period. Expense information is calculated two ways and each method provides you with different information. The amount listed in the “Actual” column is calculated using the Fund’s actual operating expenses and total return for the period. You may use the Actual information, together with the amount invested, to estimate the expenses that you paid over the period. Simply divide your account value by $1,000 (for example, an $8,600 account value divided by $1,000 = 8.6), then multiply the results by the expenses paid during the period under the “Actual” column. The amount listed in the “Hypothetical” column assumes a 5% annual rate of return before expenses (which is not the Fund’s actual return) and then applies the Fund’s actual expense ratio for the period to the hypothetical return. You should not use the hypothetical account values and expenses to estimate either your actual account balance at the end of the period or the expenses you paid during the period. See “Compare with other funds” below for details on how to use the hypothetical data.
Compare with other funds
Since all mutual funds are required to include the same hypothetical calculations about expenses in shareholder reports, you can use this information to compare the ongoing cost of investing in the Fund with other funds. To do so, compare the hypothetical example with the 5% hypothetical examples that appear in the shareholder reports of other funds. As you compare hypothetical examples of other funds, it is important to note that hypothetical examples are meant to highlight the ongoing costs of investing in a fund only and do not reflect any transaction costs, such as sales charges, or redemption or exchange fees. Therefore, the hypothetical calculations are useful in comparing ongoing costs only, and will not help you determine the relative total costs of owning different funds. If transaction costs were included in these calculations, your costs would be higher.
November 1, 2023 — April 30, 2024 |
| Account value at the
beginning of the
period ($) | Account value at the
end of the
period ($) | Expenses paid during
the period ($) | Fund’s annualized
expense ratio (%) |
| | | | | | | |
| | | | | | | |
| | | | | | | |
| | | | | | | |
| | | | | | | |
Expenses paid during the period are equal to the annualized expense ratio for each class as indicated above, multiplied by the average account value over the period and then multiplied by the number of days in the Fund’s most recent fiscal half year and divided by 366.
Expenses do not include fees and expenses incurred indirectly by the Fund from its investment in underlying funds, including affiliated and non-affiliated pooled investment vehicles, such as mutual funds and exchange-traded funds.
Had Columbia Management Investment Advisers, LLC and/or certain of its affiliates not waived/reimbursed certain fees and expenses, account value at the end of the period would have been reduced.
Columbia U.S. Treasury Index Fund | Annual Report 2024
7
Portfolio of InvestmentsApril 30, 2024(Percentages represent value of investments compared to net assets)
Investments in securities
U.S. Treasury Obligations 98.8% |
| | | | |
|
| | | | |
| | | | |
| | | | |
| | | | |
| | | | |
| | | | |
| | | | |
| | | | |
| | | | |
| | | | |
| | | | |
| | | | |
| | | | |
| | | | |
| | | | |
| | | | |
| | | | |
| | | | |
| | | | |
| | | | |
| | | | |
| | | | |
| | | | |
| | | | |
| | | | |
| | | | |
| | | | |
| | | | |
| | | | |
| | | | |
| | | | |
| | | | |
| | | | |
| | | | |
| | | | |
| | | | |
| | | | |
| | | | |
| | | | |
| | | | |
| | | | |
| | | | |
| | | | |
| | | | |
| | | | |
| | | | |
| | | | |
| | | | |
| | | | |
| | | | |
| | | | |
| | | | |
| | | | |
| | | | |
U.S. Treasury Obligations (continued) |
| | | | |
| | | | |
| | | | |
| | | | |
| | | | |
| | | | |
| | | | |
| | | | |
| | | | |
| | | | |
| | | | |
| | | | |
| | | | |
| | | | |
| | | | |
| | | | |
| | | | |
| | | | |
| | | | |
| | | | |
| | | | |
| | | | |
| | | | |
| | | | |
| | | | |
| | | | |
| | | | |
| | | | |
| | | | |
| | | | |
| | | | |
| | | | |
| | | | |
| | | | |
| | | | |
| | | | |
| | | | |
| | | | |
| | | | |
| | | | |
| | | | |
| | | | |
| | | | |
| | | | |
| | | | |
| | | | |
| | | | |
| | | | |
| | | | |
| | | | |
| | | | |
| | | | |
| | | | |
| | | | |
| | | | |
| | | | |
The accompanying Notes to Financial Statements are an integral part of this statement.
8
Columbia U.S. Treasury Index Fund | Annual Report 2024
Portfolio of Investments (continued)April 30, 2024 U.S. Treasury Obligations (continued) |
| | | | |
| | | | |
| | | | |
| | | | |
| | | | |
| | | | |
| | | | |
| | | | |
| | | | |
| | | | |
| | | | |
| | | | |
| | | | |
| | | | |
| | | | |
| | | | |
| | | | |
| | | | |
| | | | |
| | | | |
| | | | |
| | | | |
| | | | |
| | | | |
| | | | |
| | | | |
| | | | |
| | | | |
| | | | |
| | | | |
| | | | |
| | | | |
| | | | |
| | | | |
| | | | |
| | | | |
| | | | |
| | | | |
| | | | |
| | | | |
| | | | |
| | | | |
| | | | |
| | | | |
| | | | |
| | | | |
| | | | |
| | | | |
| | | | |
| | | | |
| | | | |
| | | | |
| | | | |
| | | | |
| | | | |
| | | | |
| | | | |
| | | | |
U.S. Treasury Obligations (continued) |
| | | | |
| | | | |
| | | | |
| | | | |
| | | | |
| | | | |
| | | | |
| | | | |
| | | | |
| | | | |
| | | | |
| | | | |
| | | | |
| | | | |
| | | | |
| | | | |
| | | | |
| | | | |
| | | | |
| | | | |
| | | | |
| | | | |
| | | | |
| | | | |
| | | | |
| | | | |
| | | | |
| | | | |
| | | | |
| | | | |
| | | | |
| | | | |
| | | | |
| | | | |
| | | | |
| | | | |
| | | | |
| | | | |
| | | | |
| | | | |
| | | | |
| | | | |
| | | | |
| | | | |
| | | | |
| | | | |
| | | | |
| | | | |
| | | | |
| | | | |
| | | | |
| | | | |
| | | | |
| | | | |
| | | | |
| | | | |
| | | | |
| | | | |
The accompanying Notes to Financial Statements are an integral part of this statement.
Columbia U.S. Treasury Index Fund | Annual Report 2024
9
Portfolio of Investments (continued)April 30, 2024 U.S. Treasury Obligations (continued) |
| | | | |
| | | | |
| | | | |
| | | | |
| | | | |
| | | | |
| | | | |
| | | | |
| | | | |
| | | | |
| | | | |
| | | | |
| | | | |
| | | | |
| | | | |
| | | | |
| | | | |
| | | | |
| | | | |
| | | | |
| | | | |
| | | | |
| | | | |
| | | | |
| | | | |
| | | | |
| | | | |
| | | | |
| | | | |
| | | | |
| | | | |
| | | | |
| | | | |
U.S. Treasury Obligations (continued) |
| | | | |
| | | | |
| | | | |
| | | | |
| | | | |
| | | | |
| | | | |
| | | | |
| | | | |
| | | | |
| | | | |
| | | | |
| | | | |
| | | | |
| | | | |
| | | | |
Total U.S. Treasury Obligations
(Cost $1,187,774,944) | |
|
| | |
Columbia Short-Term Cash Fund, 5.485%(a),(b) | | |
Total Money Market Funds
(Cost $5,676,666) | |
Total Investments in Securities
(Cost: $1,193,451,610) | |
Other Assets & Liabilities, Net | | |
| |
Notes to Portfolio of Investments
| The rate shown is the seven-day current annualized yield at April 30, 2024. |
| As defined in the Investment Company Act of 1940, as amended, an affiliated company is one in which the Fund owns 5% or more of the company’s outstanding voting securities, or a company which is under common ownership or control with the Fund. The value of the holdings and transactions in these affiliated companies during the year ended April 30, 2024 are as follows: |
| | | | Net change in
unrealized
appreciation
(depreciation)($) | | | | |
Columbia Short-Term Cash Fund, 5.485% |
| | | | | | | | |
Fair value measurements
The Fund categorizes its fair value measurements according to a three-level hierarchy that maximizes the use of observable inputs and minimizes the use of unobservable inputs by prioritizing that the most observable input be used when available. Observable inputs are those that market participants would use in pricing an investment based on market data obtained from sources independent of the reporting entity. Unobservable inputs are those that reflect the Fund’s assumptions about the information market participants would use in pricing an investment. An investment’s level within the fair value hierarchy is based on the lowest level of any input that is deemed significant to the asset’s or liability’s fair value measurement. The input levels are not necessarily an indication of the risk or liquidity associated with investments at that level. For example, certain U.S. government securities are generally high quality and liquid, however, they are reflected as Level 2 because the inputs used to determine fair value may not always be quoted prices in an active market.
Fair value inputs are summarized in the three broad levels listed below:
The accompanying Notes to Financial Statements are an integral part of this statement.
10
Columbia U.S. Treasury Index Fund | Annual Report 2024
Portfolio of Investments (continued)April 30, 2024 Fair value measurements (continued)
■
Level 1 — Valuations based on quoted prices for investments in active markets that the Fund has the ability to access at the measurement date. Valuation adjustments are not applied to Level 1 investments.
■
Level 2 — Valuations based on other significant observable inputs (including quoted prices for similar securities, interest rates, prepayment speeds, credit risks, etc.).
■
Level 3 — Valuations based on significant unobservable inputs (including the Fund’s own assumptions and judgment in determining the fair value of investments).
Inputs that are used in determining fair value of an investment may include price information, credit data, volatility statistics, and other factors. These inputs can be either observable or unobservable. The availability of observable inputs can vary between investments, and is affected by various factors such as the type of investment, and the volume and level of activity for that investment or similar investments in the marketplace. The inputs will be considered by the Investment Manager, along with any other relevant factors in the calculation of an investment’s fair value. The Fund uses prices and inputs that are current as of the measurement date, which may include periods of market dislocations. During these periods, the availability of prices and inputs may be reduced for many investments. This condition could cause an investment to be reclassified between the various levels within the hierarchy.
Investments falling into the Level 3 category are primarily supported by quoted prices from brokers and dealers participating in the market for those investments. However, these may be classified as Level 3 investments due to lack of market transparency and corroboration to support these quoted prices. Additionally, valuation models may be used as the pricing source for any remaining investments classified as Level 3. These models may rely on one or more significant unobservable inputs and/or significant assumptions by the Investment Manager. Inputs used in valuations may include, but are not limited to, financial statement analysis, capital account balances, discount rates and estimated cash flows, and comparable company data.
The Fund’s Board of Trustees (the Board) has designated the Investment Manager, through its Valuation Committee (the Committee), as valuation designee, responsible for determining the fair value of the assets of the Fund for which market quotations are not readily available using valuation procedures approved by the Board. The Committee consists of voting and non-voting members from various groups within the Investment Manager’s organization, including operations and accounting, trading and investments, compliance, risk management and legal.
The Committee meets at least monthly to review and approve valuation matters, which may include a description of specific valuation determinations, data regarding pricing information received from approved pricing vendors and brokers and the results of Board-approved valuation policies and procedures (the Policies). The Policies address, among other things, instances when market quotations are or are not readily available, including recommendations of third party pricing vendors and a determination of appropriate pricing methodologies; events that require specific valuation determinations and assessment of fair value techniques; securities with a potential for stale pricing, including those that are illiquid, restricted, or in default; and the effectiveness of third party pricing vendors, including periodic reviews of vendors. The Committee meets more frequently, as needed, to discuss additional valuation matters, which may include the need to review back-testing results, review time-sensitive information or approve related valuation actions. Representatives of Columbia Management Investment Advisers, LLC report to the Board at each of its regularly scheduled meetings to discuss valuation matters and actions during the period, similar to those described earlier.
The following table is a summary of the inputs used to value the Fund’s investments at April 30, 2024:
| | | | |
Investments in Securities | | | | |
U.S. Treasury Obligations | | | | |
| | | | |
Total Investments in Securities | | | | |
See the Portfolio of Investments for all investment classifications not indicated in the table.
The Fund’s assets assigned to the Level 2 input category are generally valued using the market approach, in which a security’s value is determined through reference to prices and information from market transactions for similar or identical assets.
The accompanying Notes to Financial Statements are an integral part of this statement.
Columbia U.S. Treasury Index Fund | Annual Report 2024
11
Statement of Assets and LiabilitiesApril 30, 2024
| |
Investments in securities, at value | |
Unaffiliated issuers (cost $1,187,774,944) | |
Affiliated issuers (cost $5,676,666) | |
| |
| |
| |
| |
| |
Expense reimbursement due from Investment Manager | |
Deferred compensation of board members | |
| |
| |
| |
| |
| |
Distributions to shareholders | |
| |
Distribution and/or service fees | |
Compensation of board members | |
Deferred compensation of board members | |
| |
Net assets applicable to outstanding capital stock | |
| |
| |
Total distributable earnings (loss) | |
Total - representing net assets applicable to outstanding capital stock | |
| |
| |
| |
Net asset value per share | |
| |
| |
| |
Net asset value per share | |
| |
| |
| |
Net asset value per share | |
| |
| |
| |
Net asset value per share | |
The accompanying Notes to Financial Statements are an integral part of this statement.
12
Columbia U.S. Treasury Index Fund | Annual Report 2024
Statement of OperationsYear Ended April 30, 2024
| |
| |
Dividends — affiliated issuers | |
| |
| |
| |
| |
Distribution and/or service fees | |
| |
| |
Compensation of board members | |
Deferred compensation of board members | |
| |
Fees waived or expenses reimbursed by Investment Manager and its affiliates | |
| |
| |
| |
Realized and unrealized gain (loss) — net | |
Net realized gain (loss) on: | |
Investments — unaffiliated issuers | |
Investments — affiliated issuers | |
| |
Net change in unrealized appreciation (depreciation) on: | |
Investments — unaffiliated issuers | |
Investments — affiliated issuers | |
Net change in unrealized appreciation (depreciation) | |
Net realized and unrealized loss | |
Net decrease in net assets resulting from operations | |
The accompanying Notes to Financial Statements are an integral part of this statement.
Columbia U.S. Treasury Index Fund | Annual Report 2024
13
Statement of Changes in Net Assets
| | |
| | |
| | |
| | |
Net change in unrealized appreciation (depreciation) | | |
Net decrease in net assets resulting from operations | | |
Distributions to shareholders | | |
Net investment income and net realized gains | | |
| | |
| | |
| | |
| | |
| | |
Total distributions to shareholders | | |
Decrease in net assets from capital stock activity | | |
Total decrease in net assets | | |
Net assets at beginning of year | | |
Net assets at end of year | | |
The accompanying Notes to Financial Statements are an integral part of this statement.
14
Columbia U.S. Treasury Index Fund | Annual Report 2024
Statement of Changes in Net Assets (continued)
The accompanying Notes to Financial Statements are an integral part of this statement.
Columbia U.S. Treasury Index Fund | Annual Report 2024
15
The following table is intended to help you understand the Fund’s financial performance. Certain information reflects financial results for a single share of a class held for the periods shown. Per share net investment income (loss) amounts are calculated based on average shares outstanding during the period. Total return assumes reinvestment of all dividends and distributions, if any. Total return does not reflect payment of sales charges, if any. Total return and portfolio turnover are not annualized for periods of less than one year. The ratios of expenses and net investment income are annualized for periods of less than one year. The portfolio turnover rate is calculated without regard to purchase and sales transactions of short-term instruments and certain derivatives, if any. If such transactions were included, the Fund’s portfolio turnover rate may be higher.
| Net asset value,
beginning of
period | | Net
realized
and
unrealized
gain (loss) | Total from
investment
operations | Distributions
from net
investment
income | Distributions
from net
realized
gains | Total
distributions to
shareholders |
|
| | | | | | | |
| | | | | | | |
| | | | | | | |
| | | | | | | |
| | | | | | | |
|
| | | | | | | |
| | | | | | | |
| | | | | | | |
| | | | | | | |
| | | | | | | |
|
| | | | | | | |
| | | | | | | |
| | | | | | | |
| | | | | | | |
| | | | | | | |
|
| | | | | | | |
| | | | | | | |
| | | | | | | |
| | | | | | | |
| | | | | | | |
Notes to Financial Highlights |
| In addition to the fees and expenses that the Fund bears directly, the Fund indirectly bears a pro rata share of the fees and expenses of any other funds in which it invests. Such indirect expenses are not included in the Fund’s reported expense ratios. |
| Total net expenses include the impact of certain fee waivers/expense reimbursements made by the Investment Manager and certain of its affiliates, if applicable. |
| The benefits derived from expense reductions had an impact of less than 0.01%. |
| Ratios include the impact of voluntary waivers paid by the Investment Manager. For the periods indicated below, if the Investment Manager had not paid these voluntary waivers, the Fund’s net expense ratio would increase by: |
The accompanying Notes to Financial Statements are an integral part of this statement.
16
Columbia U.S. Treasury Index Fund | Annual Report 2024
Financial Highlights (continued)
| Net
asset
value,
end of
period | | Total gross
expense
ratio to
average
| Total net
expense
ratio to
average
| Net investment
income
ratio to
average
net assets | | Net
assets,
end of
period
(000’s) |
|
| | | | | | | |
| | | | | | | |
| | | | | | | |
| | | | | | | |
| | | | | | | |
|
| | | | | | | |
| | | | | | | |
| | | | | | | |
| | | | | | | |
| | | | | | | |
|
| | | | | | | |
| | | | | | | |
| | | | | | | |
| | | | | | | |
| | | | | | | |
|
| | | | | | | |
| | | | | | | |
| | | | | | | |
| | | | | | | |
| | | | | | | |
The accompanying Notes to Financial Statements are an integral part of this statement.
Columbia U.S. Treasury Index Fund | Annual Report 2024
17
Notes to Financial StatementsApril 30, 2024 Note 1. Organization
Columbia U.S. Treasury Index Fund (the Fund), a series of Columbia Funds Series Trust I (the Trust), is a diversified fund. The Trust is registered under the Investment Company Act of 1940, as amended (the 1940 Act), as an open-end management investment company organized as a Massachusetts business trust.
Fund shares
The Trust may issue an unlimited number of shares (without par value). The Fund offers each of the share classes listed in the Statement of Assets and Liabilities. Although all share classes generally have identical voting, dividend and liquidation rights, each share class votes separately when required by the Trust’s organizational documents or by law. Each share class has its own expense and sales charge structure. Different share classes may have different minimum initial investment amounts and pay different net investment income distribution amounts to the extent the expenses of distributing such share classes vary. Distributions to shareholders in a liquidation will be proportional to the net asset value of each share class.
As described in the Fund’s prospectus, Class A shares are offered to the general public for investment. Institutional Class, Institutional 2 Class and Institutional 3 Class shares are available for purchase through authorized investment professionals to omnibus retirement plans or to institutional investors and to certain other investors as also described in the Fund’s prospectus.
The Fund’s Board of Trustees approved a proposal to accelerate the conversion of Class C shares into Class A shares of the Fund. Effective on February 12, 2024, Class C shares of the Fund were closed to new and existing investors and effective on April 15, 2024, shares held by Class C shareholders were converted into Class A shares in a tax-free transaction.
Note 2. Summary of significant accounting policies
Basis of preparation
The Fund is an investment company that applies the accounting and reporting guidance in the Financial Accounting Standards Board (FASB) Accounting Standards Codification Topic 946, Financial Services - Investment Companies (ASC 946). The financial statements are prepared in accordance with U.S. generally accepted accounting principles (GAAP), which requires management to make certain estimates and assumptions that affect the reported amounts of assets and liabilities, the disclosure of contingent assets and liabilities at the date of the financial statements and the reported amounts of income and expenses during the reporting period. Actual results could differ from those estimates.
The following is a summary of significant accounting policies followed by the Fund in the preparation of its financial statements.
Security valuation
Debt securities generally are valued based on prices obtained from pricing services, which are intended to reflect market transactions for normal, institutional-size trading units of similar securities. The services may use various pricing techniques that take into account, as applicable, factors such as yield, quality, coupon rate, maturity, type of issue, trading characteristics and other data, as well as approved independent broker-dealer quotes. Debt securities for which quotations are not readily available or not believed to be reflective of market value may also be valued based upon a bid quote from an approved independent broker-dealer. Debt securities maturing in 60 days or less are valued primarily at amortized market value, unless this method results in a valuation that management believes does not approximate fair value.
Investments in open-end investment companies (other than exchange-traded funds (ETFs)), are valued at the latest net asset value reported by those companies as of the valuation time.
Investments for which market quotations are not readily available, or that have quotations which management believes are not reflective of market value or reliable, are valued at fair value as determined in good faith under procedures approved by the Board of Trustees. If a security or class of securities (such as foreign securities) is valued at fair value, such value is likely to be different from the quoted or published price for the security, if available.
18
Columbia U.S. Treasury Index Fund | Annual Report 2024
Notes to Financial Statements (continued)April 30, 2024 The determination of fair value often requires significant judgment. To determine fair value, management may use assumptions including but not limited to future cash flows and estimated risk premiums. Multiple inputs from various sources may be used to determine fair value.
GAAP requires disclosure regarding the inputs and valuation techniques used to measure fair value and any changes in valuation inputs or techniques. In addition, investments shall be disclosed by major category. This information is disclosed following the Fund’s Portfolio of Investments.
Security transactions
Security transactions are accounted for on the trade date. Cost is determined and gains (losses) are based upon the specific identification method for both financial statement and federal income tax purposes.
Income recognition
Interest income is recorded on an accrual basis. Market premiums and discounts, including original issue discounts, are amortized and accreted, respectively, over the expected life of the security on all debt securities, unless otherwise noted.
The Fund may place a debt security on non-accrual status and reduce related interest income when it becomes probable that the interest will not be collected and the amount of uncollectible interest can be reasonably estimated. The Fund may also adjust accrual rates when it becomes probable the full interest will not be collected and a partial payment will be received. A defaulted debt security is removed from non-accrual status when the issuer resumes interest payments or when collectability of interest is reasonably assured.
Dividend income is recorded on the ex-dividend date.
Expenses
General expenses of the Trust are allocated to the Fund and other funds of the Trust based upon relative net assets or other expense allocation methodologies determined by the nature of the expense. Expenses directly attributable to the Fund are charged to the Fund. Expenses directly attributable to a specific class of shares are charged to that share class.
Determination of class net asset value
All income, expenses (other than class-specific expenses, which are charged to that share class, as shown in the Statement of Operations) and realized and unrealized gains (losses) are allocated to each class of the Fund on a daily basis, based on the relative net assets of each class, for purposes of determining the net asset value of each class.
Federal income tax status
The Fund intends to qualify each year as a regulated investment company under Subchapter M of the Internal Revenue Code, as amended, and will distribute substantially all of its investment company taxable income and net capital gain, if any, for its tax year, and as such will not be subject to federal income taxes. In addition, the Fund intends to distribute in each calendar year substantially all of its ordinary income, capital gain net income and certain other amounts, if any, such that the Fund should not be subject to federal excise tax. Therefore, no federal income or excise tax provision is recorded.
Distributions to shareholders
Distributions from net investment income, if any, are declared daily and paid monthly. Net realized capital gains, if any, are distributed at least annually. Income distributions and capital gain distributions are determined in accordance with federal income tax regulations, which may differ from GAAP.
Guarantees and indemnifications
Under the Trust’s organizational documents and, in some cases, by contract, its officers and trustees are indemnified against certain liabilities arising out of the performance of their duties to the Trust or its funds. In addition, certain of the Fund’s contracts with its service providers contain general indemnification clauses. The Fund’s maximum exposure under these arrangements is unknown since the amount of any future claims that may be made against the Fund cannot be determined, and the Fund has no historical basis for predicting the likelihood of any such claims.
Columbia U.S. Treasury Index Fund | Annual Report 2024
19
Notes to Financial Statements (continued)April 30, 2024 Recent accounting pronouncements and regulatory updates
Tailored Shareholder Reports
In October 2022, the Securities and Exchange Commission adopted a final rule, "Tailored Shareholder Reports for Mutual Funds and Exchange-Traded Funds; Fee Information in Investment Company Advertisements." The rule and form amendments will, among other things, require the Fund to transmit concise and visually engaging shareholder reports that highlight key information. The amendments will require that funds tag information in a structured data format and that certain more in-depth information be made available online and available for delivery free of charge to investors on request. The amendments became effective January 24, 2023. There is an 18-month transition period after the effective date of the amendments.
Note 3. Fees and other transactions with affiliates
Management services fees
The Fund has entered into a Management Agreement with Columbia Management Investment Advisers, LLC (the Investment Manager), a wholly-owned subsidiary of Ameriprise Financial, Inc. (Ameriprise Financial). Under the Management Agreement, the Investment Manager provides the Fund with investment research and advice, as well as administrative and accounting services. The management services fee is an annual fee that is equal to 0.40% of the Fund’s daily net assets.
The Investment Manager, from the management services fee it receives from the Fund, pays all operating expenses of the Fund, with the exception of brokerage fees and commissions, taxes, interest, fees and expenses of Board of Trustees who are not officers, directors or employees of the Investment Manager or its affiliates, distribution and/or shareholder servicing and any extraordinary non-recurring expenses that may arise, including litigation fees.
Compensation of Board members
Members of the Board of Trustees who are not officers or employees of the Investment Manager or Ameriprise Financial are compensated for their services to the Fund as disclosed in the Statement of Operations. Under a Deferred Compensation Plan (the Deferred Plan), these members of the Board of Trustees may elect to defer payment of up to 100% of their compensation. Deferred amounts are treated as though equivalent dollar amounts had been invested in shares of certain funds managed by the Investment Manager. The Fund’s liability for these amounts is adjusted for market value changes and remains in the Fund until distributed in accordance with the Deferred Plan. All amounts payable under the Deferred Plan constitute a general unsecured obligation of the Fund. The expense for the Deferred Plan, which includes Trustees’ fees deferred during the current period as well as any gains or losses on the Trustees’ deferred compensation balances as a result of market fluctuations, is included in "Deferred compensation of board members" in the Statement of Operations.
Compensation of Chief Compliance Officer
The Board of Trustees has appointed a Chief Compliance Officer for the Fund in accordance with federal securities regulations. A portion of the Chief Compliance Officer’s total compensation is allocated to the Fund, along with other allocations to affiliated registered investment companies managed by the Investment Manager and its affiliates, based on relative net assets. The expenses of the Chief Compliance Officer allocated to the Fund are payable by the Investment Manager.
Transfer agency fees
Under a Transfer and Dividend Disbursing Agent Agreement, Columbia Management Investment Services Corp. (the Transfer Agent), an affiliate of the Investment Manager and a wholly-owned subsidiary of Ameriprise Financial, is responsible for providing transfer agency services to the Fund. The Transfer Agent has contracted with SS&C GIDS, Inc. (SS&C GIDS) to serve as sub-transfer agent.
The transfer agency fees are payable by the Investment Manager. The Transfer Agent pays the fees of SS&C GIDS for services as sub-transfer agent and SS&C GIDS is not entitled to reimbursement for such fees from the Fund. The Transfer Agent also receives compensation from the Investment Manager for various shareholder services and reimbursements for certain out-of-pocket expenses.
20
Columbia U.S. Treasury Index Fund | Annual Report 2024
Notes to Financial Statements (continued)April 30, 2024 An annual minimum account balance fee of $20 may apply to certain accounts with a value below the applicable share class’s initial minimum investment requirements to reduce the impact of small accounts on transfer agency fees. These minimum account balance fees are remitted to the Fund and recorded as part of expense reductions in the Statement of Operations. For the year ended April 30, 2024, these minimum account balance fees reduced total expenses of the Fund by $600.
Distribution and service fees
The Fund has entered into an agreement with Columbia Management Investment Distributors, Inc. (the Distributor), an affiliate of the Investment Manager and a wholly-owned subsidiary of Ameriprise Financial, for distribution and shareholder services. The Board of Trustees has approved, and the Fund has adopted, distribution and shareholder service plans (the Plans) applicable to certain share classes, which set the distribution and service fees for the Fund. These fees are calculated daily and are intended to compensate the Distributor and/or eligible selling and/or servicing agents for selling shares of the Fund and providing services to investors.
Under the Plans, the Fund pays a monthly service fee to the Distributor at the maximum annual rate of 0.15% of the average daily net assets attributable to Class A and Class C shares of the Fund. Also under the Plans, the Fund pays a monthly distribution fee to the Distributor at the maximum annual rate of 0.65% of the average daily net assets attributable to Class C shares of the Fund. As a result of Class C shares of the Fund being converted into Class A shares, April 15, 2024 was the last day the Fund paid a distribution and service fee for Class C shares.
Sales charges (unaudited)
Sales charges, including front-end charges and CDSCs, received by the Distributor for distributing Fund shares for the year ended April 30, 2024, if any, are listed below:
| This charge applies to redemptions within 12 months after purchase, with certain limited exceptions. |
The Fund’s other share classes are not subject to sales charges.
Expenses waived/reimbursed by the Investment Manager and its affiliates
The Investment Manager and certain of its affiliates have contractually agreed to waive fees and/or reimburse expenses (excluding certain fees and expenses described below) for the period(s) disclosed below, unless sooner terminated at the sole discretion of the Board of Trustees, so that the Fund’s net operating expenses, after giving effect to fees waived/expenses reimbursed and any balance credits and/or overdraft charges from the Fund’s custodian, do not exceed the following annual rate(s) as a percentage of the classes’ average daily net assets:
| Fee rate(s) contractual
through
August 31, 2024 |
| |
| |
| |
| |
Under the agreement governing these fee waivers and/or expense reimbursement arrangements, the following fees and expenses are excluded from the waiver/reimbursement commitment, and therefore will be paid by the Fund, if applicable: taxes (including foreign transaction taxes), expenses associated with investments in affiliated and non-affiliated pooled investment vehicles (including mutual funds and exchange-traded funds), transaction costs and brokerage commissions, costs related to any securities lending program, dividend expenses associated with securities sold short, inverse floater program fees and expenses, transaction charges and interest on borrowed money, interest, costs associated with shareholder meetings, infrequent and/or unusual expenses and any other expenses the exclusion of which is
Columbia U.S. Treasury Index Fund | Annual Report 2024
21
Notes to Financial Statements (continued)April 30, 2024 specifically approved by the Board of Trustees. This agreement may be modified or amended only with approval from the Investment Manager, certain of its affiliates and the Fund. Any fees waived and/or expenses reimbursed under the expense reimbursement arrangements described above are not recoverable by the Investment Manager or its affiliates in future periods.
Note 4. Federal tax information
The timing and character of income and capital gain distributions are determined in accordance with income tax regulations, which may differ from GAAP because of temporary or permanent book to tax differences.
At April 30, 2024, these differences were primarily due to differing treatment for deferral/reversal of wash sale losses, capital loss carryforwards, trustees’ deferred compensation and distributions. To the extent these differences were permanent, reclassifications were made among the components of the Fund’s net assets. Temporary differences do not require reclassifications.
The Fund did not have any permanent differences; therefore, no reclassifications were made.
The tax character of distributions paid during the years indicated was as follows:
Year Ended April 30, 2024 | Year Ended April 30, 2023 |
| Long-term
capital gains ($) | | | Long-term
capital gains ($) | |
| | | | | |
Short-term capital gain distributions, if any, are considered ordinary income distributions for tax purposes.
At April 30, 2024, the components of distributable earnings on a tax basis were as follows:
Undistributed
ordinary income ($) | Undistributed
long-term
capital gains ($) | Capital loss
carryforwards ($) | Net unrealized
(depreciation) ($) |
| | | |
At April 30, 2024, the cost of all investments for federal income tax purposes along with the aggregate gross unrealized appreciation and depreciation based on that cost was:
| Gross unrealized
appreciation ($) | Gross unrealized
(depreciation) ($) | Net unrealized
(depreciation) ($) |
| | | |
Tax cost of investments and unrealized appreciation/(depreciation) may also include timing differences that do not constitute adjustments to tax basis.
The following capital loss carryforwards, determined at April 30, 2024, may be available to reduce future net realized gains on investments, if any, to the extent permitted by the Internal Revenue Code. In addition, for the year ended April 30, 2024, capital loss carryforwards utilized, if any, were as follows:
No expiration
short-term ($) | No expiration
long-term ($) | | |
| | | |
Management of the Fund has concluded that there are no significant uncertain tax positions in the Fund that would require recognition in the financial statements. However, management’s conclusion may be subject to review and adjustment at a later date based on factors including, but not limited to, new tax laws, regulations, and administrative interpretations (including relevant court decisions). Generally, the Fund’s federal tax returns for the prior three fiscal years remain subject to examination by the Internal Revenue Service.
22
Columbia U.S. Treasury Index Fund | Annual Report 2024
Notes to Financial Statements (continued)April 30, 2024 Note 5. Portfolio information
The cost of purchases and proceeds from sales of securities, excluding short-term investments and derivatives, if any, aggregated to $583,346,341 and $617,050,498, respectively, for the year ended April 30, 2024, of which $583,346,341 and $617,050,498, respectively, were U.S. government securities. The amount of purchase and sale activity impacts the portfolio turnover rate reported in the Financial Highlights.
Note 6. Affiliated money market fund
The Fund invests in Columbia Short-Term Cash Fund, an affiliated money market fund established for the exclusive use by the Fund and other affiliated funds (the Affiliated MMF). The income earned by the Fund from such investments is included as Dividends - affiliated issuers in the Statement of Operations. As an investing fund, the Fund indirectly bears its proportionate share of the expenses of the Affiliated MMF. The Affiliated MMF prices its shares with a floating net asset value. The Securities and Exchange Commission has adopted amendments to money market fund rules requiring institutional prime money market funds like the Affiliated MMF to be subject to a discretionary liquidity fee of up to 2% if the imposition of such a fee is determined to be in the best interest of the Affiliated MMF and, by October 2, 2024, to a mandatory liquidity fee if daily net redemptions exceed 5% of net assets.
Note 7. Interfund lending
Pursuant to an exemptive order granted by the Securities and Exchange Commission, the Fund participates in a program (the Interfund Program) allowing each participating Columbia Fund (each, a Participating Fund) to lend money directly to and, except for closed-end funds and money market funds, borrow money directly from other Participating Funds for temporary purposes. The amounts eligible for borrowing and lending under the Interfund Program are subject to certain restrictions.
Interfund loans are subject to the risk that the borrowing fund could be unable to repay the loan when due, and a delay in repayment to the lending fund could result in lost opportunities and/or additional lending costs. The exemptive order is subject to conditions intended to mitigate conflicts of interest arising from the Investment Manager’s relationship with each Participating Fund.
The Fund did not borrow or lend money under the Interfund Program during the year ended April 30, 2024.
Note 8. Line of credit
The Fund has access to a revolving credit facility with a syndicate of banks led by JPMorgan Chase Bank, N.A., Citibank, N.A. and Wells Fargo Bank, N.A. whereby the Fund may borrow for the temporary funding of shareholder redemptions or for other temporary or emergency purposes. Pursuant to an October 26, 2023 amendment and restatement, the credit facility, which is an agreement between the Fund and certain other funds managed by the Investment Manager or an affiliated investment manager, severally and not jointly, permits aggregate borrowings up to $900 million. Interest is currently charged to each participating fund based on its borrowings at a rate equal to the higher of (i) the federal funds effective rate, (ii) the secured overnight financing rate plus 0.10% and (iii) the overnight bank funding rate plus, in each case, 1.00%. Each borrowing under the credit facility matures no later than 60 days after the date of borrowing. The Fund also pays a commitment fee equal to its pro rata share of the unused amount of the credit facility at a rate of 0.15% per annum. The commitment fee is included in other expenses in the Statement of Operations. This agreement expires annually in October unless extended or renewed. Prior to the October 26, 2023 amendment and restatement, the Fund had access to a revolving credit facility with a syndicate of banks led by JPMorgan Chase Bank, N.A., Citibank, N.A. and Wells Fargo Bank, N.A. which permitted collective borrowings up to $950 million. Interest was charged to each participating fund based on its borrowings at a rate equal to the higher of (i) the federal funds effective rate, (ii) the secured overnight financing rate plus 0.10% and (iii) the overnight bank funding rate plus, in each case, 1.00%.
The Fund had no borrowings during the year ended April 30, 2024.
Columbia U.S. Treasury Index Fund | Annual Report 2024
23
Notes to Financial Statements (continued)April 30, 2024 Note 9. Significant risks
Credit risk
Credit risk is the risk that the value of debt instruments in the Fund’s portfolio may decline because the issuer defaults or otherwise becomes unable or unwilling, or is perceived to be unable or unwilling, to honor its financial obligations, such as making payments to the Fund when due. Credit rating agencies assign credit ratings to certain debt instruments to indicate their credit risk. Lower-rated or unrated debt instruments held by the Fund may present increased credit risk as compared to higher-rated debt instruments.
Interest rate risk
Interest rate risk is the risk of losses attributable to changes in interest rates. In general, if interest rates rise, the values of debt instruments tend to fall, and if interest rates fall, the values of debt instruments tend to rise. Actions by governments and central banking authorities can result in increases or decreases in interest rates. Higher periods of inflation could lead such authorities to raise interest rates. Increasing interest rates may negatively affect the value of debt securities held by the Fund, resulting in a negative impact on the Fund’s performance and net asset value per share. In general, the longer the maturity or duration of a debt security, the greater its sensitivity to changes in interest rates. The Fund is subject to the risk that the income generated by its investments may not keep pace with inflation.
Market risk
The Fund may incur losses due to declines in the value of one or more securities in which it invests. These declines may be due to factors affecting a particular issuer, or the result of, among other things, political, regulatory, market, economic or social developments affecting the relevant market(s) more generally. In addition, turbulence in financial markets and reduced liquidity in equity, credit and/or fixed income markets may negatively affect many issuers, which could adversely affect the Fund’s ability to price or value hard-to-value assets in thinly traded and closed markets and could cause significant redemptions and operational challenges. Global economies and financial markets are increasingly interconnected, and conditions and events in one country, region or financial market may adversely impact issuers in a different country, region or financial market. These risks may be magnified if certain events or developments adversely interrupt the global supply chain; in these and other circumstances, such risks might affect companies worldwide. As a result, local, regional or global events such as terrorism, war, other conflicts, natural disasters, disease/virus outbreaks and epidemics or other public health issues, recessions, depressions or other events – or the potential for such events – could have a significant negative impact on global economic and market conditions.
The large-scale invasion of Ukraine by Russia in February 2022 has resulted in sanctions and market disruptions, including declines in regional and global stock markets, unusual volatility in global commodity markets and significant devaluations of Russian currency. The extent and duration of the military action are impossible to predict but could continue to be significant. Market disruption caused by the Russian military action, and any countermeasures or responses thereto (including international sanctions, a downgrade in a country’s credit rating, purchasing and financing restrictions, boycotts, tariffs, changes in consumer or purchaser preferences, cyberattacks and espionage) could continue to have severe adverse impacts on regional and/or global securities and commodities markets, including markets for oil and natural gas. These impacts may include reduced market liquidity, distress in credit markets, further disruption of global supply chains, increased risk of inflation, restricted cross-border payments and limited access to investments and/or assets in certain international markets and/or issuers. These developments and other related events could negatively impact Fund performance.
Passive investment risk
The Fund is not “actively” managed and may be affected by a general decline in market segments related to its Index’s investment exposures. The Fund invests in securities or instruments included in, or believed by the Investment Manager to be representative of the Index regardless of their investment merits. The Fund does not seek temporary defensive positions when markets decline or appear overvalued. The decision of whether to remove a security from the tracking index is made by an independent index provider who is not affiliated with the Fund or the Investment Manager.
24
Columbia U.S. Treasury Index Fund | Annual Report 2024
Notes to Financial Statements (continued)April 30, 2024 Shareholder concentration risk
At April 30, 2024, affiliated shareholders of record owned 87.1% of the outstanding shares of the Fund in one or more accounts. Fund shares sold to or redeemed by concentrated accounts may have a significant effect on the operations of the Fund. In the case of a large redemption, the Fund may be forced to sell investments at inopportune times, including its liquid positions, which may result in Fund losses and the Fund holding a higher percentage of less liquid positions. Large redemptions could result in decreased economies of scale and increased operating expenses for non-redeeming Fund shareholders.
Note 10. Subsequent events
Management has evaluated the events and transactions that have occurred through the date the financial statements were issued. Other than as noted below, there were no items requiring adjustment of the financial statements or additional disclosure.
Following the period end, shareholders of the Fund redeemed $282,652,964, which represented approximately 25.7% of the Fund’s net assets as of April 30, 2024.
Note 11. Information regarding pending and settled legal proceedings
Ameriprise Financial and certain of its affiliates are involved in the normal course of business in legal proceedings which include regulatory inquiries, arbitration and litigation, including class actions concerning matters arising in connection with the conduct of their activities as part of a diversified financial services firm. Ameriprise Financial believes that the Fund is not currently the subject of, and that neither Ameriprise Financial nor any of its affiliates are the subject of, any pending legal, arbitration or regulatory proceedings that are likely to have a material adverse effect on the Fund or the ability of Ameriprise Financial or its affiliates to perform under their contracts with the Fund. Ameriprise Financial is required to make quarterly (10-Q), annual (10-K) and, as necessary, 8-K filings with the Securities and Exchange Commission (SEC) on legal and regulatory matters that relate to Ameriprise Financial and its affiliates. Copies of these filings may be obtained by accessing the SEC website at www.sec.gov.
There can be no assurance that these matters, or the adverse publicity associated with them, will not result in increased Fund redemptions, reduced sale of Fund shares or other adverse consequences to the Fund. Further, although we believe proceedings are not likely to have a material adverse effect on the Fund or the ability of Ameriprise Financial or its affiliates to perform under their contracts with the Fund, these proceedings are subject to uncertainties and, as such, we are unable to estimate the possible loss or range of loss that may result. An adverse outcome in one or more of these proceedings could result in adverse judgments, settlements, fines, penalties or other relief that could have a material adverse effect on the consolidated financial condition or results of operations of Ameriprise Financial or one or more of its affiliates that provide services to the Fund.
Columbia U.S. Treasury Index Fund | Annual Report 2024
25
Report of Independent Registered Public Accounting Firm
To the Board of Trustees of Columbia Funds Series Trust I and Shareholders of Columbia U.S. Treasury Index Fund
Opinion on the Financial Statements
We have audited the accompanying statement of assets and liabilities, including the portfolio of investments, of Columbia U.S. Treasury Index Fund (one of the funds constituting Columbia Funds Series Trust I, referred to hereafter as the "Fund") as of April 30, 2024, the related statement of operations for the year ended April 30, 2024, the statement of changes in net assets for each of the two years in the period ended April 30, 2024, including the related notes, and the financial highlights for each of the five years in the period ended April 30, 2024 (collectively referred to as the "financial statements"). In our opinion, the financial statements present fairly, in all material respects, the financial position of the Fund as of April 30, 2024, the results of its operations for the year then ended, the changes in its net assets for each of the two years in the period ended April 30, 2024 and the financial highlights for each of the five years in the period ended April 30, 2024 in conformity with accounting principles generally accepted in the United States of America.
Basis for Opinion
These financial statements are the responsibility of the Fund’s management. Our responsibility is to express an opinion on the Fund’s financial statements based on our audits. We are a public accounting firm registered with the Public Company Accounting Oversight Board (United States) (PCAOB) and are required to be independent with respect to the Fund in accordance with the U.S. federal securities laws and the applicable rules and regulations of the Securities and Exchange Commission and the PCAOB.
We conducted our audits of these financial statements in accordance with the standards of the PCAOB. Those standards require that we plan and perform the audit to obtain reasonable assurance about whether the financial statements are free of material misstatement, whether due to error or fraud.
Our audits included performing procedures to assess the risks of material misstatement of the financial statements, whether due to error or fraud, and performing procedures that respond to those risks. Such procedures included examining, on a test basis, evidence regarding the amounts and disclosures in the financial statements. Our audits also included evaluating the accounting principles used and significant estimates made by management, as well as evaluating the overall presentation of the financial statements. Our procedures included confirmation of securities owned as of April 30, 2024 by correspondence with the custodian, transfer agent and brokers; when replies were not received from brokers, we performed other auditing procedures. We believe that our audits provide a reasonable basis for our opinion.
/s/PricewaterhouseCoopers LLP
Minneapolis, Minnesota
June 20, 2024
We have served as the auditor of one or more investment companies within the Columbia Funds Complex since 1977.
26
Columbia U.S. Treasury Index Fund | Annual Report 2024
Federal Income Tax Information
(Unaudited)
The Fund hereby designates the following tax attributes for the fiscal year ended April 30, 2024. Shareholders will be notified in early 2025 of the amounts for use in preparing 2024 income tax returns.
Section
163(j)
Interest
Dividends | |
| |
Section 163(j) Interest Dividends. The percentage of ordinary income distributed during the fiscal year that shareholders may treat as interest income for purposes of IRC Section 163(j), subject to holding period requirements and other limitations.
TRUSTEES AND OFFICERS
(Unaudited)
The Board oversees the Fund’s operations and appoints officers who are responsible for day-to-day business decisions based on policies set by the Board. The following table provides basic biographical information about the Fund’s Trustees as of the printing of this report, including their principal occupations during the past five years, although specific titles for individuals may have varied over the period. The year set forth beneath Length of Service in the table below is the year in which the Trustee was first appointed or elected as Trustee to any Fund currently in the Columbia Funds Complex or a predecessor thereof. Under current Board policy, each Trustee generally serves until December 31 of the year such Trustee turns seventy-five (75).
Independent trustees
Name,
address,
year of birth | Position held
with the Columbia Funds and
length of service | Principal occupation(s)
during past five years
and other relevant
professional experience | Number of
Funds in the
Columbia Funds
Complex*
overseen | Other directorships
held by Trustee
during the past five years
and other relevant Board experience |
George S. Batejan
c/o Columbia Management
Investment Advisers, LLC
290 Congress Street
Boston, MA 02210
1954 | | Executive Vice President, Global Head of Technology and Operations, Janus Capital Group, Inc., 2010-2016 | | Former Chairman of the Board, NICSA (National Investment Company Services Association) (Executive Committee, Nominating Committee and Governance Committee), 2014-2016; former Director, Intech Investment Management, 2011-2016; former Board Member, Metro Denver Chamber of Commerce, 2015-2016; former Advisory Board Member, University of Colorado Business School, 2015-2018; former Board Member, Chase Bank International, 1993-1994 |
Columbia U.S. Treasury Index Fund | Annual Report 2024
27
TRUSTEES AND OFFICERS (continued)(Unaudited)Independent trustees (continued) Name, address, year of birth | Position held with the Columbia Funds and length of service | Principal occupation(s) during past five years and other relevant professional experience | Number of Funds in the Columbia Funds Complex* overseen | Other directorships held by Trustee during the past five years and other relevant Board experience |
Kathleen Blatz
c/o Columbia Management
Investment Advisers, LLC
290 Congress Street
Boston, MA 02210
1954 | | Attorney, specializing in arbitration and mediation; Trustee of Gerald Rauenhorst 1982 Trusts, since 2020; Chief Justice, Minnesota Supreme Court, 1998-2006; Associate Justice, Minnesota Supreme Court, 1996-1998; Fourth Judicial District Court Judge, Hennepin County, 1994-1996; Attorney in private practice and public service, 1984-1993; State Representative, Minnesota House of Representatives, 1979-1993, which included service on the Tax and Financial Institutions and Insurance Committees; Member and Interim Chair, Minnesota Sports Facilities Authority, January-July 2017; Interim President and Chief Executive Officer, Blue Cross and Blue Shield of Minnesota (health care insurance), February-July 2018, April-October 2021 | | Former Trustee, Blue Cross and Blue Shield of Minnesota, 2009-2021 (Chair of the Business Development Committee, 2014-2017; Chair of the Governance Committee, 2017-2019); former Member and Chair of the Board, Minnesota Sports Facilities Authority, January 2017-July 2017; former Director, Robina Foundation, 2009-2020 (Chair, 2014-2020); Director, Richard M. Schulze Family Foundation, since 2021 |
Pamela G. Carlton
c/o Columbia Management
Investment Advisers, LLC
290 Congress Street
Boston, MA 02210
1954 | Chair since 2023; Trustee since 2007 | President, Springboard – Partners in Cross Cultural Leadership (consulting company), since 2003; Managing Director of US Equity Research, JP Morgan Chase, 1999-2003; Director of US Equity Research, Chase Asset Management, 1996-1999; Co-Director Latin America Research, 1993-1996, COO Global Research, 1992-1996, Co-Director of US Research, 1991-1992, Investment Banker, 1982-1991, Morgan Stanley; Attorney, Cleary Gottlieb Steen & Hamilton LLP, 1980-1982 | | Trustee, New York Presbyterian Hospital Board, since 1996; Director, DR Bank (Audit Committee, since 2017 and Audit Committee Chair, since November 2023); Director, Evercore Inc. (Audit Committee, Nominating and Governance Committee) (financial services company), since 2019; Director, Apollo Commercial Real Estate Finance, Inc. (Chair, Nominating and Governance Committee), since 2021; the Governing Council of the Independent Directors Council (IDC), since 2021 |
Janet Langford Carrig
c/o Columbia Management
Investment Advisers, LLC
290 Congress Street
Boston, MA 02210
1957 | | Senior Vice President, General Counsel and Corporate Secretary, ConocoPhillips (independent energy company), September 2007-October 2018 | | Director, EQT Corporation (natural gas producer), since 2019; former Director, Whiting Petroleum Corporation (independent oil and gas company), 2020-2022 |
J. Kevin Connaughton
c/o Columbia Management
Investment Advisers, LLC
290 Congress Street
Boston, MA 02210
1964 | | CEO and President, RhodeWay Financial (non-profit financial planning firm), since December 2022; Member, FINRA National Adjudicatory Council, January 2020-December 2023; Adjunct Professor of Finance, Bentley University January 2018-April 2023; Consultant to Independent Trustees of CFVIT and CFST I from March 2016 to June 2020 with respect to CFVIT and to December 2020 with respect to CFST I; Managing Director and General Manager of Mutual Fund Products, Columbia Management Investment Advisers, LLC, May 2010-February 2015; President, Columbia Funds, 2008-2015; and senior officer of Columbia Funds and affiliated funds, 2003-2015 | | Former Director, The Autism Project, March 2015-December 2021; former Member of the Investment Committee, St. Michael’s College, November 2015-February 2020; former Trustee, St. Michael’s College, June 2017-September 2019; former Trustee, New Century Portfolios (former mutual fund complex), January 2015-December 2017 |
28
Columbia U.S. Treasury Index Fund | Annual Report 2024
TRUSTEES AND OFFICERS (continued)(Unaudited)Independent trustees (continued) Name, address, year of birth | Position held with the Columbia Funds and length of service | Principal occupation(s) during past five years and other relevant professional experience | Number of Funds in the Columbia Funds Complex* overseen | Other directorships held by Trustee during the past five years and other relevant Board experience |
Olive M. Darragh
c/o Columbia Management
Investment Advisers, LLC
290 Congress Street
Boston, MA 02210
1962 | | Managing Director of Darragh Inc. (strategy and talent management consulting firm), since 2010; Founder and CEO, Zolio, Inc. (investment management talent identification platform), since 2004; Consultant to Independent Trustees of CFVIT and CFST I from June 2019 to June 2020 with respect to CFVIT and to December 2020 with respect to CFST I; Partner, Tudor Investments, 2004-2010; Senior Partner, McKinsey & Company (consulting), 1990-2004; Touche Ross CPA, 1985-1988 | | Treasurer, Edinburgh University US Trust Board, since January 2023; Member, HBS Community Action Partners Board, since September 2022; former Director, University of Edinburgh Business School (Member of US Board), 2004-2019; former Director, Boston Public Library Foundation, 2008-2017 |
Patricia M. Flynn
c/o Columbia Management
Investment Advisers, LLC
290 Congress Street
Boston, MA 02210
1950 | | Professor Emeritus of Economics and Management, Bentley University, since 2023; Professor of Economics and Management, Bentley University, 1976-2023; Dean, McCallum Graduate School of Business, Bentley University, 1992-2002 | | Former Trustee, MA Taxpayers Foundation, 1997-2022; former Director, The MA Business Roundtable, 2003-2019; former Chairperson, Innovation Index Advisory Committee, MA Technology Collaborative, 1997-2020 |
Brian J. Gallagher
c/o Columbia Management
Investment Advisers, LLC
290 Congress Street
Boston, MA 02210
1954 | | Retired; Partner with Deloitte & Touche LLP and its predecessors, 1977-2016 | | Trustee, Catholic Schools Foundation, since 2004 |
Douglas A. Hacker
c/o Columbia Management
Investment Advisers, LLC
290 Congress Street
Boston, MA 02210
1955 | | Independent business executive, since May 2006; Executive Vice President – Strategy of United Airlines, December 2002 - May 2006; President of UAL Loyalty Services (airline marketing company), September 2001-December 2002; Executive Vice President and Chief Financial Officer of United Airlines, July 1999-September 2001 | | Director, SpartanNash Company (food distributor), since November 2013 (Chair of the Board, since May 2021); Director, Aircastle Limited (aircraft leasing), since August 2006 (Chair of Audit Committee); former Director, Nash Finch Company (food distributor), 2005-2013; former Director, SeaCube Container Leasing Ltd. (container leasing), 2010-2013; and former Director, Travelport Worldwide Limited (travel information technology), 2014-2019 |
Nancy T. Lukitsh
c/o Columbia Management
Investment Advisers, LLC
290 Congress Street
Boston, MA 02210
1956 | | Senior Vice President, Partner and Director of Marketing, Wellington Management Company, LLP (investment adviser), 1997-2010; Chair, Wellington Management Portfolios (commingled non-U.S. investment pools), 2007-2010; Director, Wellington Trust Company, NA and other Wellington affiliates, 1997-2010 | | |
Columbia U.S. Treasury Index Fund | Annual Report 2024
29
TRUSTEES AND OFFICERS (continued)(Unaudited)Independent trustees (continued) Name, address, year of birth | Position held with the Columbia Funds and length of service | Principal occupation(s) during past five years and other relevant professional experience | Number of Funds in the Columbia Funds Complex* overseen | Other directorships held by Trustee during the past five years and other relevant Board experience |
David M. Moffett
c/o Columbia Management
Investment Advisers, LLC
290 Congress Street
Boston, MA 02210
1952 | | Retired; former Chief Executive Officer of Freddie Mac and Chief Financial Officer of U.S. Bank | | Director, CSX Corporation (transportation suppliers); Director, PayPal Holdings Inc. (payment and data processing services); former Director, eBay Inc. (online trading community), 2007-2015; and former Director, CIT Bank, CIT Group Inc. (commercial and consumer finance), 2010-2016; former Senior Adviser to The Carlyle Group (financial services), March 2008-September 2008; former Governance Consultant to Bridgewater Associates, January 2013-December 2015 |
Catherine James Paglia
c/o Columbia Management
Investment Advisers, LLC
290 Congress Street
Boston, MA 02210
1952 | | Director, Enterprise Asset Management, Inc. (private real estate and asset management company), since September 1998; Managing Director and Partner, Interlaken Capital, Inc., 1989-1997; Vice President, 1982-1985, Principal, 1985-1987, Managing Director, 1987-1989, Morgan Stanley; Vice President, Investment Banking, 1980-1982, Associate, Investment Banking, 1976-1980, Dean Witter Reynolds, Inc. | | Director, Valmont Industries, Inc. (irrigation systems manufacturer), since 2012; Trustee, Carleton College (on the Investment Committee), since 1987; Trustee, Carnegie Endowment for International Peace (on the Investment Committee), since 2009 |
Natalie A. Trunow
c/o Columbia Management
Investment Advisers, LLC
290 Congress Street
Boston, MA 02210
1967 | | Chief Executive Officer, Millennial Portfolio Solutions LLC (asset management and consulting services), January 2016-January 2021; Non-executive Member of the Investment Committee and Valuation Committee, Sarona Asset Management Inc. (private equity firm) since September 2019; Advisor, Horizon Investments (asset management and consulting services), August 2018-January 2022; Advisor, Paradigm Asset Management, November 2016-January 2022; Consultant to Independent Trustees of CFVIT and CFST I from September 2016 to June 2020 with respect to CFVIT and to December 2020 with respect to CFST I; Director of Investments/Consultant, Casey Family Programs, April 2016-November 2016; Senior Vice President and Chief Investment Officer, Calvert Investments, August 2008-January 2016; Section Head and Portfolio Manager, General Motors Asset Management, June 1997-August 2008 | | Independent Director, Investment Committee, Health Services for Children with Special Needs, Inc., 2010-2021; Independent Director, (Executive Committee and Chair, Audit Committee), Consumer Credit Counseling Services (formerly Guidewell Financial Solutions), since 2016; Independent Director, (Investment Committee), Sarona Asset Management, since 2019 |
Sandra L. Yeager
c/o Columbia Management
Investment Advisers, LLC
290 Congress Street
Boston, MA 02210
1964 | | Retired; President and founder, Hanoverian Capital, LLC (SEC registered investment advisor firm), 2008-2016; Managing Director, DuPont Capital, 2006-2008; Managing Director, Morgan Stanley Investment Management, 2004-2006; Senior Vice President, Alliance Bernstein, 1990-2004 | | Former Director, NAPE (National Alliance for Partnerships in Equity) Education Foundation, October 2016-October 2020; Advisory Board, Jennersville YMCA, June 2022-June 2023 |
30
Columbia U.S. Treasury Index Fund | Annual Report 2024
TRUSTEES AND OFFICERS (continued)(Unaudited)Independent trustees (continued) Interested trustee affiliated with Investment Manager**
Name,
address,
year of birth | Position held with the Columbia Funds and length of service | Principal occupation(s) during the
past five years and other relevant
professional experience | Number of
Funds in the
Columbia Funds
Complex* overseen | Other directorships
held by Trustee
during the past
five years and
other relevant Board experience |
Daniel J. Beckman
c/o Columbia Management
Investment Advisers, LLC
290 Congress Street
Boston, MA 02210
1962 | Trustee since November 2021 and President since June 2021 | President and Principal Executive Officer of the Columbia Funds, since June 2021; Vice President, Columbia Management Investment Advisers, LLC, since April 2015; formerly, Vice President – Head of North America Product, Columbia Management Investment Advisers, LLC, April 2015 – December 2023; President and Principal Executive Officer, Columbia Acorn/Wanger Funds, since July 2021 | | Director, Ameriprise Trust Company, since October 2016; Director, Columbia Management Investment Distributors, Inc., since November 2018; Board of Governors, Columbia Wanger Asset Management, LLC, since January 2022 |
| The term “Columbia Funds Complex” as used herein includes Columbia Seligman Premium Technology Growth Fund, Tri-Continental Corporation and each series of Columbia Funds Series Trust (CFST), Columbia Funds Series Trust I (CFST I), Columbia Funds Series Trust II (CFST II), Columbia ETF Trust I (CET I), Columbia ETF Trust II (CET II), Columbia Funds Variable Insurance Trust (CFVIT) and Columbia Funds Variable Series Trust II (CFVST II). Messrs. Batejan, Beckman, Gallagher, Hacker and Moffett and Mses. Blatz, Carlton, Carrig, Flynn, Paglia, and Yeager serve as directors of Columbia Seligman Premium Technology Growth Fund and Tri-Continental Corporation. |
| Interested person (as defined under the 1940 Act) by reason of being an officer, director, security holder and/or employee of the Investment Manager or Ameriprise Financial. |
The Statement of Additional Information has additional information about the Fund’s Board members and is available, without charge, upon request by calling 800.345.6611, visiting columbiathreadneedleus.com/investor/ or contacting your financial intermediary.
The Board has appointed officers who are responsible for day-to-day business decisions based on policies it has established. The officers serve at the pleasure of the Board. The following table provides basic information about the Officers of the Fund as of the printing of this report, including principal occupations during the past five years, although their specific titles may have varied over the period. In addition to Mr. Beckman, who is President and Principal Executive Officer, the Fund’s other officers are:
Fund officers
Name,
address and
year of birth | Position and year
first appointed to
position for any Fund
in the Columbia
Funds Complex or a
predecessor thereof | Principal occupation(s) during past five years |
Michael G. Clarke
290 Congress Street
Boston, MA 02210
1969 | Chief Financial Officer and Principal Financial Officer (2009); Senior Vice President (2019); Treasurer and Chief Accounting Officer (Principal Accounting Officer) (2024) for CFST, CFST I, CFST II, CFVIT and CFVST II | Senior Vice President and North America Head of Operations & Investor Services, Columbia Management Investment Advisers, LLC, since June 2023 (previously Senior Vice President and Head of Global Operations, March 2022 – June 2023, Vice President, Head of North America Operations, and Co-Head of Global Operations, June 2019 - February 2022 and Vice President – Accounting and Tax, May 2010 - May 2019); senior officer of Columbia Funds and affiliated funds, since 2002. Director, Ameriprise Trust Company, since June 2023. |
Columbia U.S. Treasury Index Fund | Annual Report 2024
31
TRUSTEES AND OFFICERS (continued)(Unaudited)Fund officers (continued) Name, address and year of birth | Position and year first appointed to position for any Fund in the Columbia Funds Complex or a predecessor thereof | Principal occupation(s) during past five years |
Marybeth Pilat
290 Congress Street
Boston, MA 02210
1968 | Treasurer and Chief Accounting Officer (Principal Accounting Officer) and Principal Financial Officer (2020) for CET I and CET II; Assistant Treasurer, CFST, CFST I, CFST II, CFVIT and CFVST II | Vice President – Product Pricing and Administration, Columbia Management Investment Advisers, LLC, since May 2017. |
William F. Truscott
290 Congress Street
Boston, MA 02210
1960 | Senior Vice President (2001) | Formerly, Trustee/Director of Columbia Funds Complex or legacy funds, November 2001 - January 1, 2021; Chief Executive Officer, Global Asset Management, Ameriprise Financial, Inc., since September 2012; Chairman of the Board and President, Columbia Management Investment Advisers, LLC, since July 2004 and February 2012, respectively; Chairman of the Board and Chief Executive Officer, Columbia Management Investment Distributors, Inc., since November 2008 and February 2012, respectively; Chairman of the Board and Director, TAM UK International Holdings Limited, since July 2021; formerly Chairman of the Board and Director, Threadneedle Asset Management Holdings, Sàrl, March 2013 – December 2022 and December 2008 – December 2022, respectively; senior executive of various entities affiliated with Columbia Threadneedle Investments. |
Christopher O. Petersen
5228 Ameriprise Financial Center
Minneapolis, MN 55474
1970 | Senior Vice President and Assistant Secretary (2021) | Formerly, Trustee/Director of funds within the Columbia Funds Complex, July 1, 2020 - November 22, 2021; Senior Vice President and Assistant General Counsel, Ameriprise Financial, Inc., since September 2021 (previously Vice President and Lead Chief Counsel, January 2015 - September 2021); formerly, President and Principal Executive Officer of the Columbia Funds, 2015 - 2021; officer of Columbia Funds and affiliated funds, since 2007. |
Thomas P. McGuire
290 Congress Street
Boston, MA 02210
1972 | Senior Vice President and Chief Compliance Officer (2012) | Vice President – Asset Management Compliance, Ameriprise Financial, Inc., since May 2010; Chief Compliance Officer, Columbia Acorn/Wanger Funds, since December 2015; formerly, Chief Compliance Officer, Ameriprise Certificate Company, September 2010 – September 2020. |
Ryan C. Larrenaga
290 Congress Street
Boston, MA 02210
1970 | Senior Vice President (2017), Chief Legal Officer (2017), and Secretary (2015) | Vice President and Chief Counsel, Ameriprise Financial, Inc., since August 2018 (previously Vice President and Group Counsel, August 2011 - August 2018); Chief Legal Officer, Columbia Acorn/Wanger Funds, since September 2020; officer of Columbia Funds and affiliated funds, since 2005. |
Michael E. DeFao
290 Congress Street
Boston, MA 02210
1968 | Vice President (2011) and Assistant Secretary (2010) | Vice President and Chief Counsel, Ameriprise Financial, Inc., since May 2010; Vice President, Chief Legal Officer and Assistant Secretary, Columbia Management Investment Advisers, LLC, since October 2021 (previously Vice President and Assistant Secretary, May 2010 – September 2021). |
Lyn Kephart-Strong
5903 Ameriprise Financial Center
Minneapolis, MN 55474
1960 | | Vice President, Global Investment Operations Services, Columbia Management Investment Advisers, LLC, since 2010; President, Columbia Management Investment Services Corp., since October 2014; President, Ameriprise Trust Company, since January 2017. |
32
Columbia U.S. Treasury Index Fund | Annual Report 2024
Liquidity Risk Management Program
(Unaudited)
Pursuant to Rule 22e-4 under the 1940 Act, the Fund has adopted a liquidity risk management program (Program). The Program’s principal objectives include assessing, managing and periodically reviewing the Fund’s liquidity risk. Liquidity risk is defined as the risk that the Fund could not meet redemption requests without significant dilution of remaining investors’ interests in the Fund.
The Board has appointed the Investment Manager as the program administrator for the Fund’s Program. The Investment Manager has delegated oversight of the Program to its Liquidity Risk Management Committee (the Committee). At a board meeting during the fiscal period, the Committee provided the Board with a report addressing the operations of the program and assessing its adequacy and effectiveness of implementation for the period January 1, 2023, through December 31, 2023, including:
•
the Fund had sufficient liquidity to both meet redemptions and operate effectively on behalf of shareholders;
•
there were no material changes to the Program during the period;
•
the implementation of the Program was effective to manage the Fund’s liquidity risk; and
•
the Program operated adequately during the period.
There can be no assurance that the Program will achieve its objectives in the future. Please refer to the Fund’s prospectus for more information regarding the Fund’s exposure to liquidity risk and other principal risks to which an investment in the Fund may be subject.
Columbia U.S. Treasury Index Fund | Annual Report 2024
33
[THIS PAGE INTENTIONALLY LEFT BLANK]
[THIS PAGE INTENTIONALLY LEFT BLANK]
Columbia U.S. Treasury Index Fund
P.O. Box 219104
Kansas City, MO 64121-9104
Please read and consider the investment objectives, risks, charges and expenses for any fund carefully before investing. For a prospectus and summary prospectus, which contains this and other important information about the Fund, go to
columbiathreadneedleus.com/investor/. The Fund is distributed by Columbia Management Investment Distributors, Inc., member FINRA, and managed by Columbia Management Investment Advisers, LLC.
Columbia Threadneedle Investments (Columbia Threadneedle) is the global brand name of the Columbia and Threadneedle group of companies. All rights reserved.
© 2024 Columbia Management Investment Advisers, LLC.
columbiathreadneedleus.com/investor/
Columbia Corporate Income Fund
Annual Report
April 30, 2024
In October 2022, the Securities and Exchange Commission (SEC) adopted a final rule, "Tailored Shareholder Reports for Mutual Funds and Exchange-Traded Funds; Fee Information in Investment Company Advertisements." The rule and form amendments will, among other things, require the Fund to transmit concise and visually engaging shareholder reports that highlight key information. The amendments will require that funds tag information in a structured data format and that certain more in-depth information be made available online and available for delivery free of charge to investors on request. The amendments became effective January 24, 2023. There is an 18-month transition period after the effective date of the amendments.
Each Tailored Shareholder Report will be share-class specific and will highlight key fund information the SEC believes is most relevant to investors in assessing their investment in the Fund. Much of the information, including a Fund’s financial statements, that is currently disclosed in a Fund’s shareholder reports will instead be made available on the Fund’s website and filed on Form N-CSR on an annual and semiannual basis. This information will be delivered to investors free of charge upon request. Columbia Fund reports will follow the Tailored Shareholder Report approach beginning with reports covering the period ending May 31, 2024.
The new rule also requires the Fund to mail a printed version of the Tailored Shareholder Report to all shareholders who have not elected to receive shareholder reports electronically. Rather than receiving a postcard notifying investors that the shareholder report for Funds in which they invest is available online, investors will begin receiving the Tailored Shareholder Report in the mail unless they have elected to receive their Fund documents electronically.
| No Financial Institution Guarantee | |
If you elect to receive the shareholder report for Columbia Corporate Income Fund (the Fund) in paper, mailed to you, the Fund mails one shareholder report to each shareholder address, unless such shareholder elects to receive shareholder reports from the Fund electronically via e-mail or by having a paper notice mailed to you (Postcard Notice) that your Fund’s shareholder report is available at the Columbia funds’ website (columbiathreadneedleus.com/investor/). If you would like more than one report in paper to be mailed to you, or would like to elect to receive reports via e-mail or access them through Postcard Notice, please call shareholder services at 800.345.6611 and additional reports will be sent to you.
Proxy voting policies and procedures
The policy of the Board of Trustees is to vote the proxies of the companies in which the Fund holds investments consistent with the procedures as stated in the Statement of Additional Information (SAI). You may obtain a copy of the SAI without charge by calling 800.345.6611; contacting your financial intermediary; visiting columbiathreadneedleus.com/investor/; or searching the website of the Securities and Exchange Commission (SEC) at sec.gov. Information regarding how the Fund voted proxies relating to portfolio securities is filed with the SEC by August 31st for the most recent 12-month period ending June 30th of that year, and is available without charge by visiting columbiathreadneedleus.com/investor/, or searching the website of the SEC at sec.gov.
Quarterly schedule of investments
The Fund files a complete schedule of portfolio holdings with the SEC for the first and third quarters of each fiscal year on Form N-PORT. The Fund’s Form N-PORT filings are available on the SEC’s website at sec.gov. The Fund’s complete schedule of portfolio holdings, as filed on Form N-PORT, is available on columbiathreadneedleus.com/investor/ or can also be obtained without charge, upon request, by calling 800.345.6611.
Additional Fund information
For more information about the Fund, please visit columbiathreadneedleus.com/investor/ or call 800.345.6611. Customer Service Representatives are available to answer your questions Monday through Friday from 8 a.m. to 7 p.m. Eastern time.
Fund investment manager
Columbia Management Investment Advisers, LLC (the Investment Manager)
290 Congress Street
Boston, MA 02210
Fund distributor
Columbia Management Investment Distributors, Inc.
290 Congress Street
Boston, MA 02210
Fund transfer agent
Columbia Management Investment Services Corp.
P.O. Box 219104
Kansas City, MO 64121-9104
Columbia Corporate Income Fund | Annual Report 2024
Fund at a Glance(Unaudited) Investment objective
The Fund seeks total return, consisting primarily of current income and secondarily of capital appreciation.
Portfolio management
Tom Murphy, CFA
Lead Portfolio Manager
Managed Fund since 2011
Royce Wilson, CFA
Portfolio Manager
Managed Fund since 2020
John Dawson, CFA
Portfolio Manager
Managed Fund since 2020
Shannon Rinehart, CFA
Portfolio Manager
Managed Fund since February 2022
Average annual total returns (%) (for the period ended April 30, 2024) |
| | | | | |
| | | | | |
| | | | | |
| | | | |
| | | | |
| | | | |
| | | | |
| | | | |
Bloomberg U.S. Corporate Bond Index | | | | |
Returns for Class A shares are shown with and without the maximum initial sales charge of 4.75%. The Fund’s other share classes are not subject to sales charges and have limited eligibility. Please see the Fund’s prospectus for details. Performance for different share classes will vary based on differences in sales charges and fees associated with each share class. All results shown assume reinvestment of distributions during the period. Returns do not reflect the deduction of taxes that a shareholder may pay on Fund distributions or on the redemption of Fund shares. Performance results reflect the effect of any fee waivers or reimbursements of Fund expenses by Columbia Management Investment Advisers, LLC and/or any of its affiliates. Absent these fee waivers or expense reimbursement arrangements, performance results would have been lower.
The performance information shown represents past performance and is not a guarantee of future results. The investment return and principal value of your investment will fluctuate so that your shares, when redeemed, may be worth more or less than their original cost. Current performance may be lower or higher than the performance information shown. You may obtain performance information current to the most recent month-end by contacting your financial intermediary, visiting columbiathreadneedleus.com/investor/ or calling 800.345.6611.
The Blended Benchmark is a weighted custom benchmark, established by the Investment Manager, consisting of an 85% weighting in the Bloomberg U.S. Corporate Bond Index and a 15% weighting in the ICE Bank of America (ICE BofA) U.S. Cash Pay High Yield Constrained Index, which tracks the performance of U.S. dollar-denominated below investment grade corporate debt, currently in a coupon paying period that is publicly issued in the U.S. domestic market. Effective July 1, 2022, the ICE BofA U.S. Cash Pay High Yield Constrained Index now includes transaction costs.
The Bloomberg U.S. Corporate Bond Index measures the investment-grade, fixed-rate, taxable, corporate bond market.
Indices are not available for investment, are not professionally managed and do not reflect sales charges, fees, brokerage commissions, taxes, other expenses of investing or, for ICE BofA U.S. Cash Pay High Yield Constrained Index for periods prior to July 2022, transaction costs. Securities in the Fund may not match those in an index.
Columbia Corporate Income Fund | Annual Report 2024
3
Fund at a Glance (continued)(Unaudited) Performance of a hypothetical $10,000 investment (April 30, 2014 — April 30, 2024)
The chart above shows the change in value of a hypothetical $10,000 investment in Class A shares of Columbia Corporate Income Fund during the stated time period, and does not reflect the deduction of taxes that a shareholder may pay on Fund distributions or on the redemption of Fund shares.
Portfolio breakdown (%) (at April 30, 2024) |
| |
| |
| |
Foreign Government Obligations | |
| |
| |
U.S. Treasury Obligations | |
| |
Percentages indicated are based upon total investments excluding investments in derivatives, if any. The Fund’s portfolio composition is subject to change.
Quality breakdown (%) (at April 30, 2024) |
| |
| |
| |
| |
| |
| |
| |
| |
| |
Percentages indicated are based upon total fixed income investments.
Bond ratings apply to the underlying holdings of the Fund and not the Fund itself and are divided into categories ranging from highest to lowest credit quality, determined by using the middle rating of Moody’s, S&P and Fitch, after dropping the highest and lowest available ratings. When ratings are available from only two rating agencies, the lower rating is used. When a rating is available from only one rating agency, that rating is used. If a security is not rated but has a rating by Kroll and/or DBRS, the same methodology is applied to those bonds that would otherwise be not rated. When a bond is not rated by any rating agency, it is designated as “Not rated.” Credit quality ratings assigned by a rating agency are subjective opinions, not statements of fact, and are subject to change, including daily. The ratings assigned by credit rating agencies are but one of the considerations that the Investment Manager and/or Fund’s subadviser incorporates into its credit analysis process, along with such other issuer-specific factors as cash flows, capital structure and leverage ratios, ability to de-leverage (repay) through free cash flow, quality of management, market positioning and access to capital, as well as such security-specific factors as the terms of the security (e.g., interest rate and time to maturity) and the amount and type of any collateral.
4
Columbia Corporate Income Fund | Annual Report 2024
Manager Discussion of Fund Performance(Unaudited) At April 30, 2024, approximately 38.06% of the Fund’s shares were owned in the aggregate by affiliated funds-of-funds managed by Columbia Management Investment Advisers, LLC (the Investment Manager). As a result of asset allocation decisions by the Investment Manager, it is possible that the Fund may experience relatively large purchases or redemptions from affiliated funds-of-funds. The Investment Manager seeks to minimize the impact of these transactions by structuring them over a reasonable period of time. The Fund may experience increased expenses as it buys and sells securities as a result of purchases or redemptions by affiliated funds-of-funds.
For the 12-month period that ended April 30, 2024, Class A shares of Columbia Corporate Income Fund returned 1.72% excluding sales charges. During the same time period, the Fund’s Blended Benchmark returned 2.14% and the Bloomberg U.S. Corporate Bond Index returned 1.00%.
Market Overview
For the 12 months ended April 30, 2024, returns for the broader bond market were constrained as U.S. Treasury yields finished the period notably higher. However, returns for corporate bonds, especially below-investment-grade high-yield issues, were supported by firm credit sentiment given a resilient economic backdrop.
Inflation continued to ease as 2023 progressed, with June U.S. consumer price inflation coming in at 3.0%. With the economic and employment backdrop remaining strong despite the past policy tightening by the U.S. Federal Reserve (Fed), the central bank implemented additional 25 basis point increases at its May and July 2023 meetings, leaving the target range for Fed funds at 5.25% to 5.50%. (A basis point is 1/100 of a percent.) The Fed held rates steady at its last three meetings of 2023, citing the improving inflation outlook.
Entering 2024, with inflation seemingly headed towards the Fed’s 2% target, investors were anticipating as many as six or seven rate cuts in 2024, beginning as soon as March 2024. However, these hopes were dampened as U.S. economic and employment data remained robust, largely dispelling any lingering recession concerns. In addition, the pace of progress in taming inflation remained highly incremental. Against this backdrop, the consensus outlook shifted by the end of the first quarter to encompass three Fed rate cuts before year end, with the first expected to occur in June 2024. Inflation data for March 2024 reported in April actually reflected an uptick, leading investors to further push back expectations for the first rate cut to the fall. As of April 30, 2024, the yield on the 10-year U.S. Treasury note closed at 4.69% versus 3.44% 12 months earlier.
The Fund’s notable detractors during the period
•
The Fund’s more conservative positioning with respect to overall credit risk weighed on performance relative to the Blended Benchmark. Most notably, the Fund was underweight the below-investment-grade high-yield issues that led performance by a wide margin for the period.
•
The Fund’s overall industry allocation detracted, principally due to overweights to both aerospace & defense and electric utilities.
The Fund’s notable contributors during the period
•
Positive contributions to the Fund’s performance relative to the Blended Benchmark over the 12-month period were highlighted by security selection. Individual bond positions that proved most beneficial included overweights to a healthcare company, a home improvement retailer and a food & beverage company.
•
While the Fund’s overall industry allocation detracted, overweight exposure to life insurance companies and banks aided relative return.
•
The Fund’s stance with respect to duration (and corresponding interest rate sensitivity) and positioning along the yield curve added slightly to performance. Duration and yield curve positioning are generally not a meaningful source of relative performance for the Fund as the management team seeks to maintain portfolio duration within a fairly narrow band around that of the benchmark.
Columbia Corporate Income Fund | Annual Report 2024
5
Manager Discussion of Fund Performance (continued)(Unaudited) Derivative usage
The Fund employed derivatives during the past 12 months in order to maintain portfolio duration in keeping with the benchmark. On a stand-alone basis, the use of these derivatives had a positive impact on Fund performance.
Market risk may affect a single issuer, sector of the economy, industry or the market as a whole. Fixed-income securities present issuer default risk. A rise in interest rates may result in a price decline of fixed-income instruments held by the Fund, negatively impacting its performance and NAV. Falling rates may result in the Fund investing in lower yielding debt instruments, lowering the Fund’s income and yield. These risks may be heightened for longer maturity and duration securities. Non-investment-grade (high-yield or junk) securities present greater price volatility and more risk to principal and income than higher rated securities. Prepayment and extension risk exists because the timing of payments on a loan, bond or other investment may accelerate when interest rates fall or decelerate when interest rates rise which may reduce investment opportunities and potential returns. Investing in derivatives is a specialized activity that involves special risks that subject the Fund to significant loss potential, including when used as leverage, and may result in greater fluctuation in fund value. Liquidity risk is associated with the difficulty of selling underlying investments at a desirable time or price.See the Fund’s prospectus for more information on these and other risks.
The views expressed in this report reflect the current views of the respective parties who have contributed to this report. These views are not guarantees of future performance and involve certain risks, uncertainties and assumptions that are difficult to predict, so actual outcomes and results may differ significantly from the views expressed. These views are subject to change at any time based upon economic, market or other conditions and the respective parties disclaim any responsibility to update such views. These views may not be relied on as investment advice and, because investment decisions for a Columbia fund are based on numerous factors, may not be relied on as an indication of trading intent on behalf of any particular Columbia fund. References to specific securities should not be construed as a recommendation or investment advice.
6
Columbia Corporate Income Fund | Annual Report 2024
Understanding Your Fund’s Expenses(Unaudited) As an investor, you incur two types of costs. There are shareholder transaction costs, which generally include sales charges on purchases and may include redemption fees. There are also ongoing fund costs, which generally include management fees, distribution and/or service fees, and other fund expenses. The following information is intended to help you understand your ongoing costs (in dollars) of investing in the Fund and to help you compare these costs with the ongoing costs of investing in other mutual funds.
Analyzing your Fund’s expenses
To illustrate these ongoing costs, we have provided examples and calculated the expenses paid by investors in each share class of the Fund during the period. The actual and hypothetical information in the table is based on an initial investment of $1,000 at the beginning of the period indicated and held for the entire period. Expense information is calculated two ways and each method provides you with different information. The amount listed in the “Actual” column is calculated using the Fund’s actual operating expenses and total return for the period. You may use the Actual information, together with the amount invested, to estimate the expenses that you paid over the period. Simply divide your account value by $1,000 (for example, an $8,600 account value divided by $1,000 = 8.6), then multiply the results by the expenses paid during the period under the “Actual” column. The amount listed in the “Hypothetical” column assumes a 5% annual rate of return before expenses (which is not the Fund’s actual return) and then applies the Fund’s actual expense ratio for the period to the hypothetical return. You should not use the hypothetical account values and expenses to estimate either your actual account balance at the end of the period or the expenses you paid during the period. See “Compare with other funds” below for details on how to use the hypothetical data.
Compare with other funds
Since all mutual funds are required to include the same hypothetical calculations about expenses in shareholder reports, you can use this information to compare the ongoing cost of investing in the Fund with other funds. To do so, compare the hypothetical example with the 5% hypothetical examples that appear in the shareholder reports of other funds. As you compare hypothetical examples of other funds, it is important to note that hypothetical examples are meant to highlight the ongoing costs of investing in a fund only and do not reflect any transaction costs, such as sales charges, or redemption or exchange fees. Therefore, the hypothetical calculations are useful in comparing ongoing costs only, and will not help you determine the relative total costs of owning different funds. If transaction costs were included in these calculations, your costs would be higher.
November 1, 2023 — April 30, 2024 |
| Account value at the
beginning of the
period ($) | Account value at the
end of the
period ($) | Expenses paid during
the period ($) | Fund’s annualized
expense ratio (%) |
| | | | | | | |
| | | | | | | |
| | | | | | | |
| | | | | | | |
| | | | | | | |
| | | | | | | |
Expenses paid during the period are equal to the annualized expense ratio for each class as indicated above, multiplied by the average account value over the period and then multiplied by the number of days in the Fund’s most recent fiscal half year and divided by 366.
Expenses do not include fees and expenses incurred indirectly by the Fund from its investment in underlying funds, including affiliated and non-affiliated pooled investment vehicles, such as mutual funds and exchange-traded funds.
Had Columbia Management Investment Advisers, LLC and/or certain of its affiliates not waived/reimbursed certain fees and expenses, account value at the end of the period would have been reduced.
Columbia Corporate Income Fund | Annual Report 2024
7
Portfolio of InvestmentsApril 30, 2024(Percentages represent value of investments compared to net assets)
Investments in securities
|
| | |
|
|
Mr. Cooper Group, Inc.(a) | | |
| |
Total Common Stocks
(Cost $1,077,470) | |
|
| | | | |
|
|
|
| | | | |
Total Convertible Bonds
(Cost $456,948) | |
|
Corporate Bonds & Notes 94.3% |
| | | | |
|
BAE Systems Holdings, Inc.(b) |
| | | | |
|
| | | | |
| | | | |
|
| | | | |
| | | | |
|
| | | | |
|
| | | | |
| | | | |
L3Harris Technologies, Inc. |
| | | | |
| | | | |
|
| | | | |
|
| | | | |
|
| | | | |
Raytheon Technologies Corp. |
| | | | |
Corporate Bonds & Notes (continued) |
| | | | |
Spirit AeroSystems, Inc.(b) |
| | | | |
| | | | |
|
| | | | |
| | | | |
| | | | |
| |
|
|
| | | | |
American Airlines, Inc.(b) |
| | | | |
American Airlines, Inc./AAdvantage Loyalty IP Ltd.(b) |
| | | | |
| | | | |
Hawaiian Brand Intellectual Property Ltd./Miles Loyalty Ltd.(b) |
| | | | |
|
| | | | |
| | | | |
United Airlines, Inc. Pass-Through Trust |
| | | | |
| |
|
American Axle & Manufacturing, Inc. |
| | | | |
|
| | | | |
Ford Motor Credit Co. LLC |
| | | | |
| | | | |
| | | | |
| | | | |
|
| | | | |
KAR Auction Services, Inc.(b) |
| | | | |
Panther BF Aggregator 2 LP/Finance Co., Inc.(b) |
| | | | |
| | | | |
ZF North America Capital, Inc.(b) |
| | | | |
| | | | |
| |
The accompanying Notes to Financial Statements are an integral part of this statement.
8
Columbia Corporate Income Fund | Annual Report 2024
Portfolio of Investments (continued)April 30, 2024 Corporate Bonds & Notes (continued) |
| | | | |
|
|
| | | | |
|
| | | | |
| | | | |
| | | | |
|
| | | | |
|
| | | | |
| | | | |
Goldman Sachs Group, Inc. (The)(d) |
| | | | |
| | | | |
|
| | | | |
| | | | |
|
| | | | |
| | | | |
| | | | |
|
| | | | |
| | | | |
| | | | |
|
| | | | |
PNC Financial Services Group, Inc. (The)(d) |
| | | | |
|
| | | | |
| | | | |
Washington Mutual Bank(e),(f),(g) |
|
| | | | |
|
| | | | |
| | | | |
| |
Brokerage/Asset Managers/Exchanges 0.1% |
|
| | | | |
AG TTMT Escrow Issuer LLC(b) |
| | | | |
Aretec Escrow Issuer 2, Inc.(b) |
| | | | |
Corporate Bonds & Notes (continued) |
| | | | |
Aretec Escrow Issuer, Inc.(b) |
| | | | |
|
| | | | |
| |
|
American Builders & Contractors Supply Co., Inc.(b) |
| | | | |
Beacon Roofing Supply, Inc.(b) |
| | | | |
| | | | |
|
| | | | |
James Hardie International Finance DAC(b) |
| | | | |
SRS Distribution, Inc.(b) |
| | | | |
| | | | |
| | | | |
Summit Materials LLC /Finance Corp.(b) |
| | | | |
Summit Materials LLC/Finance Corp.(b) |
| | | | |
|
| | | | |
| |
|
CCO Holdings LLC/Capital Corp.(b) |
| | | | |
| | | | |
| | | | |
| | | | |
CCO Holdings LLC/Capital Corp. |
| | | | |
CCO Holdings LLC/Holdings Capital Corp.(b) |
| | | | |
Charter Communications Operating LLC/Capital |
| | | | |
| | | | |
| | | | |
|
| | | | |
|
| | | | |
| | | | |
| | | | |
| | | | |
The accompanying Notes to Financial Statements are an integral part of this statement.
Columbia Corporate Income Fund | Annual Report 2024
9
Portfolio of Investments (continued)April 30, 2024 Corporate Bonds & Notes (continued) |
| | | | |
| | | | |
|
| | | | |
|
| | | | |
|
| | | | |
| | | | |
| | | | |
|
| | | | |
Virgin Media Finance PLC(b) |
| | | | |
Virgin Media Secured Finance PLC(b) |
| | | | |
VZ Secured Financing BV(b) |
| | | | |
|
| | | | |
|
| | | | |
|
| | | | |
| |
|
|
| | | | |
Axalta Coating Systems LLC(b) |
| | | | |
Axalta Coating Systems LLC/Dutch Holding B BV(b) |
| | | | |
Cheever Escrow Issuer LLC(b) |
| | | | |
Element Solutions, Inc.(b) |
| | | | |
|
| | | | |
|
| | | | |
Illuminate Buyer LLC/Holdings IV, Inc.(b) |
| | | | |
|
| | | | |
INEOS Quattro Finance 2 PLC(b) |
| | | | |
Corporate Bonds & Notes (continued) |
| | | | |
|
| | | | |
Innophos Holdings, Inc.(b) |
| | | | |
Iris Holdings, Inc.(b),(h) |
| | | | |
Olympus Water US Holding Corp.(b) |
| | | | |
| | | | |
| | | | |
|
| | | | |
|
| | | | |
| | | | |
| | | | |
| |
Construction Machinery 0.1% |
H&E Equipment Services, Inc.(b) |
| | | | |
Ritchie Bros Holdings, Inc.(b) |
| | | | |
| | | | |
United Rentals North America, Inc. |
| | | | |
| | | | |
| | | | |
| |
Consumer Cyclical Services 0.2% |
|
| | | | |
|
| | | | |
| | | | |
Match Group Holdings II LLC(b) |
| | | | |
|
| | | | |
Uber Technologies, Inc.(b) |
| | | | |
| | | | |
| |
|
|
| | | | |
The accompanying Notes to Financial Statements are an integral part of this statement.
10
Columbia Corporate Income Fund | Annual Report 2024
Portfolio of Investments (continued)April 30, 2024 Corporate Bonds & Notes (continued) |
| | | | |
CD&R Smokey Buyer, Inc.(b) |
| | | | |
|
| | | | |
| | | | |
|
| | | | |
| | | | |
Scotts Miracle-Gro Co. (The) |
| | | | |
| | | | |
|
| | | | |
| | | | |
| |
Diversified Manufacturing 1.9% |
|
| | | | |
Chart Industries, Inc.(b) |
| | | | |
Emerald Debt Merger Sub LLC(b) |
| | | | |
|
| | | | |
|
| | | | |
|
| | | | |
| | | | |
|
| | | | |
Vertical US Newco, Inc.(b) |
| | | | |
WESCO Distribution, Inc.(b) |
| | | | |
| | | | |
| | | | |
| | | | |
| |
|
|
| | | | |
| | | | |
| | | | |
|
| | | | |
Corporate Bonds & Notes (continued) |
| | | | |
American Transmission Systems, Inc.(b) |
| | | | |
|
| | | | |
| | | | |
Clearway Energy Operating LLC(b) |
| | | | |
| | | | |
| | | | |
|
| | | | |
|
| | | | |
|
| | | | |
| | | | |
Duke Energy Carolinas LLC |
| | | | |
|
| | | | |
|
| | | | |
|
| | | | |
| | | | |
|
| | | | |
|
| | | | |
|
| | | | |
| | | | |
|
| | | | |
| | | | |
|
| | | | |
|
| | | | |
Jersey Central Power & Light Co.(b) |
| | | | |
Leeward Renewable Energy Operations LLC(b) |
| | | | |
NextEra Energy Capital Holdings, Inc. |
| | | | |
The accompanying Notes to Financial Statements are an integral part of this statement.
Columbia Corporate Income Fund | Annual Report 2024
11
Portfolio of Investments (continued)April 30, 2024 Corporate Bonds & Notes (continued) |
| | | | |
NextEra Energy Operating Partners LP(b) |
| | | | |
| | | | |
| | | | |
|
| | | | |
|
| | | | |
Pacific Gas and Electric Co. |
| | | | |
|
| | | | |
San Diego Gas & Electric Co. |
| | | | |
Southern California Edison Co. |
| | | | |
TerraForm Power Operating LLC(b) |
| | | | |
Virginia Electric and Power Co. |
| | | | |
Vistra Operations Co. LLC(b) |
| | | | |
| | | | |
| | | | |
| | | | |
| | | | |
| | | | |
|
| | | | |
| | | | |
|
| | | | |
| |
|
|
| | | | |
GFL Environmental, Inc.(b) |
| | | | |
| | | | |
| | | | |
| | | | |
| | | | |
| | | | |
|
| | | | |
| |
Corporate Bonds & Notes (continued) |
| | | | |
|
|
| | | | |
| | | | |
|
| | | | |
| | | | |
| | | | |
|
| | | | |
| | | | |
| | | | |
Provident Funding Associates LP/Finance Corp.(b) |
| | | | |
Quicken Loans LLC/Co-Issuer, Inc.(b) |
| | | | |
Rocket Mortgage LLC/Co-Issuer, Inc.(b) |
| | | | |
|
| | | | |
United Wholesale Mortgage LLC(b) |
| | | | |
| | | | |
| |
|
Bacardi Ltd./Bacardi-Martini BV(b) |
| | | | |
|
| | | | |
Chobani LLC/Finance Corp., Inc.(b) |
| | | | |
Constellation Brands, Inc. |
| | | | |
Darling Ingredients, Inc.(b) |
| | | | |
|
| | | | |
FAGE International SA/USA Dairy Industry, Inc.(b) |
| | | | |
|
| | | | |
|
| | | | |
Mondelez International, Inc. |
| | | | |
The accompanying Notes to Financial Statements are an integral part of this statement.
12
Columbia Corporate Income Fund | Annual Report 2024
Portfolio of Investments (continued)April 30, 2024 Corporate Bonds & Notes (continued) |
| | | | |
Pepsico Singapore Financing I Pte Ltd. |
| | | | |
|
| | | | |
| | | | |
| | | | |
Primo Water Holdings, Inc.(b) |
| | | | |
Simmons Foods, Inc./Prepared Foods, Inc./Pet Food, Inc./Feed(b) |
| | | | |
Triton Water Holdings, Inc.(b) |
| | | | |
|
| | | | |
| | | | |
| | | | |
| | | | |
| |
|
|
| | | | |
|
| | | | |
Caesars Entertainment, Inc.(b) |
| | | | |
| | | | |
| | | | |
CDI Escrow Issuer, Inc.(b) |
| | | | |
|
| | | | |
|
| | | | |
International Game Technology PLC(b) |
| | | | |
Light & Wonder International, Inc.(b) |
| | | | |
MGM Resorts International |
| | | | |
Midwest Gaming Borrower LLC(b) |
| | | | |
Penn National Gaming, Inc.(b) |
| | | | |
Scientific Games Holdings LP/US FinCo, Inc.(b) |
| | | | |
Scientific Games International, Inc.(b) |
| | | | |
Corporate Bonds & Notes (continued) |
| | | | |
Wynn Resorts Finance LLC/Capital Corp.(b) |
| | | | |
| |
|
Acadia Healthcare Co., Inc.(b) |
| | | | |
|
| | | | |
| | | | |
Bausch & Lomb Escrow Corp.(b) |
| | | | |
|
| | | | |
Catalent Pharma Solutions, Inc.(b) |
| | | | |
Charles River Laboratories International, Inc.(b) |
| | | | |
| | | | |
CHS/Community Health Systems, Inc.(b) |
| | | | |
| | | | |
| | | | |
| | | | |
| | | | |
|
| | | | |
|
| | | | |
|
| | | | |
|
| | | | |
|
| | | | |
| | | | |
Indigo Merger Sub, Inc.(b) |
| | | | |
|
| | | | |
Medline Borrower LP/Co-Issuer, Inc.(b) |
| | | | |
Mozart Debt Merger Sub, Inc.(b) |
| | | | |
| | | | |
|
| | | | |
The accompanying Notes to Financial Statements are an integral part of this statement.
Columbia Corporate Income Fund | Annual Report 2024
13
Portfolio of Investments (continued)April 30, 2024 Corporate Bonds & Notes (continued) |
| | | | |
|
| | | | |
Surgery Center Holdings, Inc.(b) |
| | | | |
|
| | | | |
| | | | |
| | | | |
Tenet Healthcare Corp.(b) |
| | | | |
| |
Healthcare Insurance 4.4% |
|
| | | | |
| | | | |
|
| | | | |
| | | | |
| | | | |
|
| | | | |
| | | | |
| | | | |
| |
|
Shea Homes LP/Funding Corp. |
| | | | |
| | | | |
Taylor Morrison Communities, Inc.(b) |
| | | | |
| | | | |
| |
|
|
| | | | |
| | | | |
Canadian Natural Resources Ltd. |
| | | | |
Civitas Resources, Inc.(b) |
| | | | |
| | | | |
| | | | |
|
| | | | |
| | | | |
Colgate Energy Partners III LLC(b) |
| | | | |
Corporate Bonds & Notes (continued) |
| | | | |
Comstock Resources, Inc.(b) |
| | | | |
| | | | |
| | | | |
CrownRock LP/Finance, Inc.(b) |
| | | | |
| | | | |
|
| | | | |
Endeavor Energy Resources LP/Finance, Inc.(b) |
| | | | |
Hilcorp Energy I LP/Finance Co.(b) |
| | | | |
| | | | |
| | | | |
| | | | |
| | | | |
|
| | | | |
| | | | |
Permian Resources Operating LLC(b) |
| | | | |
|
| | | | |
| | | | |
| |
|
BP Capital Markets America, Inc. |
| | | | |
|
| | | | |
| |
|
|
| | | | |
|
| | | | |
| | | | |
| | | | |
Carnival Holdings Bermuda Ltd.(b) |
| | | | |
Cedar Fair LP/Canada’s Wonderland Co./Magnum Management Corp./Millennium |
| | | | |
Cedar Fair LP/Canada’s Wonderland Co./Magnum Management Corp./Millennium Op |
| | | | |
The accompanying Notes to Financial Statements are an integral part of this statement.
14
Columbia Corporate Income Fund | Annual Report 2024
Portfolio of Investments (continued)April 30, 2024 Corporate Bonds & Notes (continued) |
| | | | |
|
| | | | |
| | | | |
| | | | |
Live Nation Entertainment, Inc.(b) |
| | | | |
| | | | |
|
| | | | |
| | | | |
Royal Caribbean Cruises Ltd.(b) |
| | | | |
| | | | |
| | | | |
| | | | |
| | | | |
Six Flags Entertainment Corp.(b) |
| | | | |
Six Flags Entertainment Corp./Theme Parks, Inc.(b),(c) |
| | | | |
Vail Resorts, Inc.(b),(c) |
| | | | |
|
| | | | |
| | | | |
| |
|
Guardian Life Global Funding(b) |
| | | | |
Met Tower Global Funding(b) |
| | | | |
Metropolitan Life Global Funding I(b) |
| | | | |
| | | | |
| | | | |
New York Life Global Funding(b) |
| | | | |
New York Life Insurance Co.(b) |
|
| | | | |
Northwestern Mutual Global Funding(b) |
| | | | |
Northwestern Mutual Life Insurance Co. (The)(b) |
|
| | | | |
Pacific Life Global Funding II(b) |
| | | | |
Corporate Bonds & Notes (continued) |
| | | | |
Peachtree Corners Funding Trust(b) |
| | | | |
Principal Life Global Funding II(b) |
| | | | |
| | | | |
Teachers Insurance & Annuity Association of America(b) |
|
| | | | |
| | | | |
|
| | | | |
| |
|
Hilton Domestic Operating Co., Inc.(b) |
| | | | |
| | | | |
Hilton Grand Vacations Borrower Escrow LLC(b) |
| | | | |
Marriott Ownership Resorts, Inc.(b) |
| | | | |
| |
Media and Entertainment 1.5% |
Clear Channel Outdoor Holdings, Inc.(b) |
| | | | |
| | | | |
| | | | |
| | | | |
iHeartCommunications, Inc. |
| | | | |
| | | | |
|
| | | | |
Outfront Media Capital LLC/Corp.(b) |
| | | | |
| | | | |
| | | | |
Playtika Holding Corp.(b) |
| | | | |
|
| | | | |
Univision Communications, Inc.(b) |
| | | | |
| | | | |
| | | | |
|
| | | | |
The accompanying Notes to Financial Statements are an integral part of this statement.
Columbia Corporate Income Fund | Annual Report 2024
15
Portfolio of Investments (continued)April 30, 2024 Corporate Bonds & Notes (continued) |
| | | | |
Warnermedia Holdings, Inc. |
| | | | |
| |
|
Alcoa Nederland Holding BV(b) |
| | | | |
Allegheny Technologies, Inc. |
| | | | |
| | | | |
|
| | | | |
|
| | | | |
| | | | |
|
| | | | |
| | | | |
|
| | | | |
| | | | |
|
| | | | |
| | | | |
| | | | |
| |
|
Antero Midstream Partners LP/Finance Corp.(b) |
| | | | |
CNX Midstream Partners LP(b) |
| | | | |
Delek Logistics Partners LP/Finance Corp.(b) |
| | | | |
|
| | | | |
| | | | |
|
| | | | |
|
| | | | |
EQM Midstream Partners LP |
| | | | |
| | | | |
EQM Midstream Partners LP(b) |
| | | | |
| | | | |
| | | | |
| | | | |
Corporate Bonds & Notes (continued) |
| | | | |
| | | | |
Hess Midstream Operations LP(b) |
| | | | |
|
| | | | |
Kinder Morgan Energy Partners LP |
| | | | |
| | | | |
|
| | | | |
|
| | | | |
| | | | |
|
| | | | |
| | | | |
| | | | |
Plains All American Pipeline LP/Finance Corp. |
| | | | |
|
| | | | |
| | | | |
|
| | | | |
TransMontaigne Partners LP/TLP Finance Corp. |
| | | | |
Venture Global Calcasieu Pass LLC(b) |
| | | | |
| | | | |
| | | | |
Venture Global LNG, Inc.(b) |
| | | | |
| | | | |
| | | | |
| | | | |
Western Midstream Operating LP |
| | | | |
| |
|
|
| | | | |
| | | | |
| |
|
Kodiak Gas Services LLC(b) |
| | | | |
The accompanying Notes to Financial Statements are an integral part of this statement.
16
Columbia Corporate Income Fund | Annual Report 2024
Portfolio of Investments (continued)April 30, 2024 Corporate Bonds & Notes (continued) |
| | | | |
Nabors Industries Ltd.(b) |
| | | | |
| | | | |
Nabors Industries, Inc.(b) |
| | | | |
| | | | |
Transocean Aquila Ltd.(b) |
| | | | |
Transocean Titan Financing Ltd.(b) |
| | | | |
|
| | | | |
| | | | |
USA Compression Partners LP/Finance Corp.(b) |
| | | | |
| |
|
|
| | | | |
Williams Scotsman International, Inc.(b) |
| | | | |
| |
|
Ladder Capital Finance Holdings LLLP/Corp.(b) |
| | | | |
| | | | |
Park Intermediate Holdings LLC/Domestic Property/Finance Co-Issuer(b) |
| | | | |
Park Intermediate Holdings LLC/PK Domestic Property LLC/Finance Co-Issuer(b) |
| | | | |
RHP Hotel Properties LP/Finance Corp.(b) |
| | | | |
| | | | |
| | | | |
|
| | | | |
| | | | |
Service Properties Trust(b) |
| | | | |
| |
|
Ardagh Metal Packaging Finance USA LLC/PLC(b) |
| | | | |
| | | | |
|
| | | | |
Corporate Bonds & Notes (continued) |
| | | | |
Clydesdale Acquisition Holdings, Inc.(b) |
| | | | |
Trivium Packaging Finance BV(b) |
| | | | |
| | | | |
| |
|
|
| | | | |
|
| | | | |
|
| | | | |
Bausch Health Companies, Inc.(b) |
| | | | |
| | | | |
| | | | |
|
| | | | |
Grifols Escrow Issuer SA(b) |
| | | | |
|
| | | | |
| | | | |
Pfizer Investment Enterprises Pte., Ltd. |
| | | | |
|
| | | | |
| | | | |
| |
|
Alliant Holdings Intermediate LLC/Co-Issuer(b) |
| | | | |
| | | | |
| | | | |
| | | | |
| | | | |
|
| | | | |
|
| | | | |
| | | | |
BroadStreet Partners, Inc.(b) |
| | | | |
|
| | | | |
The accompanying Notes to Financial Statements are an integral part of this statement.
Columbia Corporate Income Fund | Annual Report 2024
17
Portfolio of Investments (continued)April 30, 2024 Corporate Bonds & Notes (continued) |
| | | | |
HUB International Ltd.(b) |
| | | | |
| | | | |
HUB International, Ltd.(b) |
| | | | |
Panther Escrow Issuer LLC(b) |
| | | | |
|
| | | | |
| |
|
Genesee & Wyoming, Inc.(b) |
| | | | |
|
| | | | |
| |
|
|
| | | | |
|
Fertitta Entertainment LLC/Finance Co., Inc.(b) |
| | | | |
|
| | | | |
|
| | | | |
| |
|
Asbury Automotive Group, Inc.(b) |
| | | | |
Group 1 Automotive, Inc.(b) |
| | | | |
|
| | | | |
| | | | |
|
| | | | |
| | | | |
|
| | | | |
| | | | |
LCM Investments Holdings II LLC(b) |
| | | | |
| | | | |
Corporate Bonds & Notes (continued) |
| | | | |
|
| | | | |
|
| | | | |
| | | | |
PetSmart, Inc./Finance Corp.(b) |
| | | | |
| | | | |
Wolverine World Wide, Inc.(b) |
| | | | |
| |
|
Albertsons Companies LLC/Safeway, Inc./New Albertsons LP/Albertsons LLC(b) |
| | | | |
Albertsons Companies, Inc./Safeway, Inc./New Albertsons LP/Albertsons LLC(b) |
| | | | |
| | | | |
| | | | |
| |
|
|
| | | | |
|
| | | | |
| | | | |
Boxer Parent Co., Inc.(b) |
| | | | |
|
| | | | |
Central Parent LLC/CDK Global II LLC/Financing, Co., Inc.(b) |
| | | | |
Central Parent, Inc./CDK Global, Inc.(b) |
| | | | |
Clarivate Science Holdings Corp.(b) |
| | | | |
| | | | |
Cloud Software Group, Inc.(b) |
| | | | |
Condor Merger Sub, Inc.(b) |
| | | | |
Dun & Bradstreet Corp. (The)(b) |
| | | | |
|
| | | | |
| | | | |
The accompanying Notes to Financial Statements are an integral part of this statement.
18
Columbia Corporate Income Fund | Annual Report 2024
Portfolio of Investments (continued)April 30, 2024 Corporate Bonds & Notes (continued) |
| | | | |
|
| | | | |
| | | | |
GTCR W-2 Merger Sub LLC(b) |
| | | | |
|
| | | | |
Helios Software Holdings, Inc.(b) |
| | | | |
Helios Software Holdings, Inc./ION Corporate Solutions Finance Sarl(b),(c) |
| | | | |
|
| | | | |
International Business Machines Corp. |
| | | | |
ION Trading Technologies Sarl(b) |
| | | | |
|
| | | | |
Minerva Merger Sub, Inc.(b) |
| | | | |
NCR Atleos Escrow Corp.(b) |
| | | | |
|
| | | | |
| | | | |
| | | | |
Neptune Bidco US, Inc.(b) |
| | | | |
NXP BV/Funding LLC/USA, Inc. |
| | | | |
|
| | | | |
|
| | | | |
| | | | |
Shift4 Payments LLC/Finance Sub, Inc.(b) |
| | | | |
Tempo Acquisition LLC/Finance Corp.(b) |
| | | | |
|
| | | | |
|
| | | | |
ZoomInfo Technologies LLC/Finance Corp.(b) |
| | | | |
| |
Corporate Bonds & Notes (continued) |
| | | | |
|
|
| | | | |
Transportation Services 1.3% |
Avis Budget Car Rental LLC/Finance, Inc.(b) |
| | | | |
|
| | | | |
| |
|
Altice France Holding SA(b) |
| | | | |
|
| | | | |
| | | | |
| | | | |
|
| | | | |
| | | | |
|
| | | | |
| | | | |
Vmed O2 UK Financing I PLC(b) |
| | | | |
| | | | |
| | | | |
| |
|
|
| | | | |
| | | | |
Frontier Communications Holdings LLC(b) |
| | | | |
| | | | |
|
| | | | |
| | | | |
Iliad Holding SASU(b),(c) |
| | | | |
Verizon Communications, Inc. |
| | | | |
| |
Total Corporate Bonds & Notes
(Cost $1,646,514,252) | |
|
The accompanying Notes to Financial Statements are an integral part of this statement.
Columbia Corporate Income Fund | Annual Report 2024
19
Portfolio of Investments (continued)April 30, 2024 Foreign Government Obligations(i) 0.1% |
| | | | |
|
|
| | | | |
| | | | |
| | | | |
| | | | |
| | | | |
| |
Total Foreign Government Obligations
(Cost $1,961,187) | |
|
|
| | | | |
|
WR Grace Holdings LLC(j),(k) |
|
3-month Term SOFR + 3.750%
Floor 0.500%
09/22/2028 | | | | |
Consumer Cyclical Services 0.1% |
8th Avenue Food & Provisions, Inc.(j),(k) |
|
1-month Term SOFR + 3.750%
10/01/2025 | | | | |
Arches Buyer, Inc.(j),(k) |
|
1-month Term SOFR + 3.250%
Floor 0.500%
12/06/2027 | | | | |
| |
|
Truist Insurance Holdings LLC(j),(k),(l) |
|
3-month Term SOFR + 4.750%
03/08/2032 | | | | |
|
|
|
1-month Term SOFR + 3.750%
Floor 0.750%
02/11/2028 | | | | |
|
| | | | |
|
Ascend Learning LLC(j),(k) |
|
1-month Term SOFR + 3.500%
Floor 0.500%
12/11/2028 | | | | |
|
1-month Term SOFR + 5.750%
Floor 0.500%
12/10/2029 | | | | |
|
|
1-month Term SOFR + 7.000%
02/19/2029 | | | | |
|
|
3-month Term SOFR + 3.500%
02/10/2031 | | | | |
| |
Total Senior Loans
(Cost $2,933,367) | |
|
U.S. Treasury Obligations 2.7% |
| | | | |
|
| | | | |
| | | | |
| | | | |
Total U.S. Treasury Obligations
(Cost $45,554,808) | |
|
| | |
Columbia Short-Term Cash Fund, 5.485%(m),(n) | | |
Total Money Market Funds
(Cost $26,998,815) | |
Total Investments in Securities
(Cost: $1,725,496,847) | |
Other Assets & Liabilities, Net | | |
| |
At April 30, 2024, securities and/or cash totaling $5,867,924 were pledged as collateral.
The accompanying Notes to Financial Statements are an integral part of this statement.
20
Columbia Corporate Income Fund | Annual Report 2024
Portfolio of Investments (continued)April 30, 2024 Investments in derivatives
|
| | | | | Value/Unrealized
appreciation ($) | Value/Unrealized
depreciation ($) |
| | | | | | |
U.S. Treasury 2-Year Note | | | | | | |
U.S. Treasury 5-Year Note | | | | | | |
| | | | | | |
|
| | | | | Value/Unrealized
appreciation ($) | Value/Unrealized
depreciation ($) |
U.S. Treasury 10-Year Note | | | | | | |
U.S. Treasury Ultra 10-Year Note | | | | | | |
| | | | | | |
| | | | | | |
Notes to Portfolio of Investments
| Non-income producing investment. |
| Represents privately placed and other securities and instruments exempt from Securities and Exchange Commission registration (collectively, private placements), such as Section 4(a)(2) and Rule 144A eligible securities, which are often sold only to qualified institutional buyers. At April 30, 2024, the total value of these securities amounted to $441,624,113, which represents 27.08% of total net assets. |
| Represents a security purchased on a when-issued basis. |
| Represents a variable rate security with a step coupon where the rate adjusts according to a schedule for a series of periods, typically lower for an initial period and then increasing to a higher coupon rate thereafter. The interest rate shown was the current rate as of April 30, 2024. |
| Represents fair value as determined in good faith under procedures approved by the Board of Trustees. At April 30, 2024, the total value of these securities amounted to $9,525, which represents less than 0.01% of total net assets. |
| Represents a security in default. |
| Valuation based on significant unobservable inputs. |
| Payment-in-kind security. Interest can be paid by issuing additional par of the security or in cash. |
| Principal and interest may not be guaranteed by a governmental entity. |
| The stated interest rate represents the weighted average interest rate at April 30, 2024 of contracts within the senior loan facility. Interest rates on contracts are primarily determined either weekly, monthly or quarterly by reference to the indicated base lending rate and spread and the reset period. Base lending rates may be subject to a floor or minimum rate. The interest rate for senior loans purchased on a when-issued or delayed delivery basis will be determined upon settlement, therefore no interest rate is disclosed. Senior loans often require prepayments from excess cash flows or permit the borrowers to repay at their election. The degree to which borrowers repay cannot be predicted with accuracy. As a result, remaining maturities of senior loans may be less than the stated maturities. Generally, the Fund is contractually obligated to receive approval from the agent bank and/or borrower prior to the disposition of a senior loan. |
| Variable rate security. The interest rate shown was the current rate as of April 30, 2024. |
| Represents a security purchased on a forward commitment basis. |
| The rate shown is the seven-day current annualized yield at April 30, 2024. |
| As defined in the Investment Company Act of 1940, as amended, an affiliated company is one in which the Fund owns 5% or more of the company’s outstanding voting securities, or a company which is under common ownership or control with the Fund. The value of the holdings and transactions in these affiliated companies during the year ended April 30, 2024 are as follows: |
| | | | Net change in
unrealized
appreciation
(depreciation)($) | | | | |
Columbia Short-Term Cash Fund, 5.485% |
| | | | | | | | |
Abbreviation Legend
| Secured Overnight Financing Rate |
The accompanying Notes to Financial Statements are an integral part of this statement.
Columbia Corporate Income Fund | Annual Report 2024
21
Portfolio of Investments (continued)April 30, 2024 Currency Legend
Fair value measurements
The Fund categorizes its fair value measurements according to a three-level hierarchy that maximizes the use of observable inputs and minimizes the use of unobservable inputs by prioritizing that the most observable input be used when available. Observable inputs are those that market participants would use in pricing an investment based on market data obtained from sources independent of the reporting entity. Unobservable inputs are those that reflect the Fund’s assumptions about the information market participants would use in pricing an investment. An investment’s level within the fair value hierarchy is based on the lowest level of any input that is deemed significant to the asset’s or liability’s fair value measurement. The input levels are not necessarily an indication of the risk or liquidity associated with investments at that level. For example, certain U.S. government securities are generally high quality and liquid, however, they are reflected as Level 2 because the inputs used to determine fair value may not always be quoted prices in an active market.
Fair value inputs are summarized in the three broad levels listed below:
■
Level 1 — Valuations based on quoted prices for investments in active markets that the Fund has the ability to access at the measurement date. Valuation adjustments are not applied to Level 1 investments.
■
Level 2 — Valuations based on other significant observable inputs (including quoted prices for similar securities, interest rates, prepayment speeds, credit risks, etc.).
■
Level 3 — Valuations based on significant unobservable inputs (including the Fund’s own assumptions and judgment in determining the fair value of investments).
Inputs that are used in determining fair value of an investment may include price information, credit data, volatility statistics, and other factors. These inputs can be either observable or unobservable. The availability of observable inputs can vary between investments, and is affected by various factors such as the type of investment, and the volume and level of activity for that investment or similar investments in the marketplace. The inputs will be considered by the Investment Manager, along with any other relevant factors in the calculation of an investment’s fair value. The Fund uses prices and inputs that are current as of the measurement date, which may include periods of market dislocations. During these periods, the availability of prices and inputs may be reduced for many investments. This condition could cause an investment to be reclassified between the various levels within the hierarchy.
Investments falling into the Level 3 category are primarily supported by quoted prices from brokers and dealers participating in the market for those investments. However, these may be classified as Level 3 investments due to lack of market transparency and corroboration to support these quoted prices. Additionally, valuation models may be used as the pricing source for any remaining investments classified as Level 3. These models may rely on one or more significant unobservable inputs and/or significant assumptions by the Investment Manager. Inputs used in valuations may include, but are not limited to, financial statement analysis, capital account balances, discount rates and estimated cash flows, and comparable company data.
The Fund’s Board of Trustees (the Board) has designated the Investment Manager, through its Valuation Committee (the Committee), as valuation designee, responsible for determining the fair value of the assets of the Fund for which market quotations are not readily available using valuation procedures approved by the Board. The Committee consists of voting and non-voting members from various groups within the Investment Manager’s organization, including operations and accounting, trading and investments, compliance, risk management and legal.
The Committee meets at least monthly to review and approve valuation matters, which may include a description of specific valuation determinations, data regarding pricing information received from approved pricing vendors and brokers and the results of Board-approved valuation policies and procedures (the Policies). The Policies address, among other things, instances when market quotations are or are not readily available, including recommendations of third party pricing vendors and a determination of appropriate pricing methodologies; events that require specific valuation determinations and assessment of fair value techniques; securities with a potential for stale pricing, including those that are illiquid, restricted, or in default; and the effectiveness of third party pricing vendors, including periodic reviews of vendors. The Committee meets more frequently, as needed, to discuss additional valuation matters, which may include the need to review back-testing results, review time-sensitive information or approve related valuation actions. Representatives of Columbia Management Investment Advisers, LLC report to the Board at each of its regularly scheduled meetings to discuss valuation matters and actions during the period, similar to those described earlier.
The following table is a summary of the inputs used to value the Fund’s investments at April 30, 2024:
| | | | |
Investments in Securities | | | | |
| | | | |
| | | | |
| | | | |
| | | | |
| | | | |
Foreign Government Obligations | | | | |
| | | | |
U.S. Treasury Obligations | | | | |
| | | | |
Total Investments in Securities | | | | |
Investments in Derivatives | | | | |
| | | | |
| | | | |
| | | | |
| | | | |
| | | | |
See the Portfolio of Investments for all investment classifications not indicated in the table.
The accompanying Notes to Financial Statements are an integral part of this statement.
22
Columbia Corporate Income Fund | Annual Report 2024
Portfolio of Investments (continued)April 30, 2024 Fair value measurements (continued)
The Fund’s assets assigned to the Level 2 input category are generally valued using the market approach, in which a security’s value is determined through reference to prices and information from market transactions for similar or identical assets.
Derivative instruments are valued at unrealized appreciation (depreciation).
The Fund does not hold any significant investments (greater than one percent of net assets) categorized as Level 3.
The accompanying Notes to Financial Statements are an integral part of this statement.
Columbia Corporate Income Fund | Annual Report 2024
23
Statement of Assets and LiabilitiesApril 30, 2024
| |
Investments in securities, at value | |
Unaffiliated issuers (cost $1,698,498,032) | |
Affiliated issuers (cost $26,998,815) | |
| |
| |
| |
| |
| |
Investments sold on a delayed delivery basis | |
| |
| |
| |
| |
Variation margin for futures contracts | |
Expense reimbursement due from Investment Manager | |
| |
Deferred compensation of board members | |
| |
| |
| |
| |
Investments purchased on a delayed delivery basis | |
| |
Distributions to shareholders | |
Variation margin for futures contracts | |
| |
Distribution and/or service fees | |
| |
Compensation of board members | |
| |
Deferred compensation of board members | |
| |
Net assets applicable to outstanding capital stock | |
| |
| |
Total distributable earnings (loss) | |
Total - representing net assets applicable to outstanding capital stock | |
The accompanying Notes to Financial Statements are an integral part of this statement.
24
Columbia Corporate Income Fund | Annual Report 2024
Statement of Assets and Liabilities (continued)April 30, 2024 | |
| |
| |
Net asset value per share | |
| |
Maximum offering price per share (calculated by dividing the net asset value per share by 1.0 minus the maximum sales charge for Class A shares) | |
| |
| |
| |
Net asset value per share | |
| |
| |
| |
Net asset value per share | |
| |
| |
| |
Net asset value per share | |
| |
| |
| |
Net asset value per share | |
The accompanying Notes to Financial Statements are an integral part of this statement.
Columbia Corporate Income Fund | Annual Report 2024
25
Statement of OperationsYear Ended April 30, 2024
| |
| |
Dividends — affiliated issuers | |
| |
| |
| |
| |
| |
| |
Distribution and/or service fees | |
| |
| |
| |
| |
| |
| |
| |
| |
| |
| |
Printing and postage fees | |
| |
| |
| |
Compensation of chief compliance officer | |
Compensation of board members | |
Deferred compensation of board members | |
| |
| |
Fees waived or expenses reimbursed by Investment Manager and its affiliates | |
Fees waived by transfer agent | |
| |
| |
| |
| |
| |
Realized and unrealized gain (loss) — net | |
Net realized gain (loss) on: | |
Investments — unaffiliated issuers | |
Investments — affiliated issuers | |
Foreign currency translations | |
| |
| |
Net change in unrealized appreciation (depreciation) on: | |
Investments — unaffiliated issuers | |
Investments — affiliated issuers | |
| |
Net change in unrealized appreciation (depreciation) | |
Net realized and unrealized loss | |
Net increase in net assets resulting from operations | |
The accompanying Notes to Financial Statements are an integral part of this statement.
26
Columbia Corporate Income Fund | Annual Report 2024
Statement of Changes in Net Assets
| | |
| | |
| | |
| | |
Net change in unrealized appreciation (depreciation) | | |
Net increase in net assets resulting from operations | | |
Distributions to shareholders | | |
Net investment income and net realized gains | | |
| | |
| | |
| | |
| | |
| | |
| | |
Total distributions to shareholders | | |
Increase in net assets from capital stock activity | | |
Total increase in net assets | | |
Net assets at beginning of year | | |
Net assets at end of year | | |
The accompanying Notes to Financial Statements are an integral part of this statement.
Columbia Corporate Income Fund | Annual Report 2024
27
Statement of Changes in Net Assets (continued)
The accompanying Notes to Financial Statements are an integral part of this statement.
28
Columbia Corporate Income Fund | Annual Report 2024
[THIS PAGE INTENTIONALLY LEFT BLANK]
Columbia Corporate Income Fund | Annual Report 2024
29
The following table is intended to help you understand the Fund’s financial performance. Certain information reflects financial results for a single share of a class held for the periods shown. Per share net investment income (loss) amounts are calculated based on average shares outstanding during the period. Total return assumes reinvestment of all dividends and distributions, if any. Total return does not reflect payment of sales charges, if any. Total return and portfolio turnover are not annualized for periods of less than one year. The ratios of expenses and net investment income are annualized for periods of less than one year. The portfolio turnover rate is calculated without regard to purchase and sales transactions of short-term instruments and certain derivatives, if any. If such transactions were included, the Fund’s portfolio turnover rate may be higher.
| Net asset value,
beginning of
period | | Net
realized
and
unrealized
gain (loss) | Total from
investment
operations | Distributions
from net
investment
income | Distributions
from net
realized
gains | Total
distributions to
shareholders |
|
| | | | | | | |
| | | | | | | |
| | | | | | | |
| | | | | | | |
| | | | | | | |
|
| | | | | | | |
| | | | | | | |
| | | | | | | |
| | | | | | | |
| | | | | | | |
|
| | | | | | | |
| | | | | | | |
| | | | | | | |
| | | | | | | |
| | | | | | | |
|
| | | | | | | |
| | | | | | | |
| | | | | | | |
| | | | | | | |
| | | | | | | |
The accompanying Notes to Financial Statements are an integral part of this statement.
30
Columbia Corporate Income Fund | Annual Report 2024
Financial Highlights (continued)
| Net
asset
value,
end of
period | | Total gross
expense
ratio to
average
| Total net
expense
ratio to
average
| Net investment
income
ratio to
average
net assets | | Net
assets,
end of
period
(000’s) |
|
| | | | | | | |
| | | | | | | |
| | | | | | | |
| | | | | | | |
| | | | | | | |
|
| | | | | | | |
| | | | | | | |
| | | | | | | |
| | | | | | | |
| | | | | | | |
|
| | | | | | | |
| | | | | | | |
| | | | | | | |
| | | | | | | |
| | | | | | | |
|
| | | | | | | |
| | | | | | | |
| | | | | | | |
| | | | | | | |
| | | | | | | |
The accompanying Notes to Financial Statements are an integral part of this statement.
Columbia Corporate Income Fund | Annual Report 2024
31
Financial Highlights (continued)
| Net asset value,
beginning of
period | | Net
realized
and
unrealized
gain (loss) | Total from
investment
operations | Distributions
from net
investment
income | Distributions
from net
realized
gains | Total
distributions to
shareholders |
|
| | | | | | | |
| | | | | | | |
| | | | | | | |
| | | | | | | |
| | | | | | | |
Notes to Financial Highlights |
| In addition to the fees and expenses that the Fund bears directly, the Fund indirectly bears a pro rata share of the fees and expenses of any other funds in which it invests. Such indirect expenses are not included in the Fund’s reported expense ratios. |
| Total net expenses include the impact of certain fee waivers/expense reimbursements made by the Investment Manager and certain of its affiliates, if applicable. |
| The benefits derived from expense reductions had an impact of less than 0.01%. |
The accompanying Notes to Financial Statements are an integral part of this statement.
32
Columbia Corporate Income Fund | Annual Report 2024
Financial Highlights (continued)
| Net
asset
value,
end of
period | | Total gross
expense
ratio to
average
| Total net
expense
ratio to
average
| Net investment
income
ratio to
average
net assets | | Net
assets,
end of
period
(000’s) |
|
| | | | | | | |
| | | | | | | |
| | | | | | | |
| | | | | | | |
| | | | | | | |
The accompanying Notes to Financial Statements are an integral part of this statement.
Columbia Corporate Income Fund | Annual Report 2024
33
Notes to Financial StatementsApril 30, 2024 Note 1. Organization
Columbia Corporate Income Fund (the Fund), a series of Columbia Funds Series Trust I (the Trust), is a diversified fund. The Trust is registered under the Investment Company Act of 1940, as amended (the 1940 Act), as an open-end management investment company organized as a Massachusetts business trust.
Fund shares
The Trust may issue an unlimited number of shares (without par value). The Fund offers each of the share classes listed in the Statement of Assets and Liabilities. Although all share classes generally have identical voting, dividend and liquidation rights, each share class votes separately when required by the Trust’s organizational documents or by law. Each share class has its own expense and sales charge structure. Different share classes may have different minimum initial investment amounts and pay different net investment income distribution amounts to the extent the expenses of distributing such share classes vary. Distributions to shareholders in a liquidation will be proportional to the net asset value of each share class.
As described in the Fund’s prospectus, Class A shares are offered to the general public for investment. Advisor Class, Institutional Class, Institutional 2 Class and Institutional 3 Class shares are available for purchase through authorized investment professionals to omnibus retirement plans or to institutional investors and to certain other investors as also described in the Fund’s prospectus.
The Fund’s Board of Trustees approved a proposal to accelerate the conversion of Class C shares into Class A shares of the Fund. Effective on February 12, 2024, Class C shares of the Fund were closed to new and existing investors and effective on April 15, 2024, shares held by Class C shareholders were converted into Class A shares in a tax-free transaction.
Note 2. Summary of significant accounting policies
Basis of preparation
The Fund is an investment company that applies the accounting and reporting guidance in the Financial Accounting Standards Board (FASB) Accounting Standards Codification Topic 946, Financial Services - Investment Companies (ASC 946). The financial statements are prepared in accordance with U.S. generally accepted accounting principles (GAAP), which requires management to make certain estimates and assumptions that affect the reported amounts of assets and liabilities, the disclosure of contingent assets and liabilities at the date of the financial statements and the reported amounts of income and expenses during the reporting period. Actual results could differ from those estimates. The Fund received a reimbursement for expenses overbilled by a third party. Such reimbursement is included as an offset to other expenses on the Statement of Operations. All fee waivers and expense reimbursements by Columbia Management Investment Advisers, LLC and its affiliates were applied before giving effect to the third party reimbursement.
The following is a summary of significant accounting policies followed by the Fund in the preparation of its financial statements.
Security valuation
Equity securities listed on an exchange are valued at the closing price or last trade price on their primary exchange at the close of business of the New York Stock Exchange. Securities with a closing price not readily available or not listed on any exchange are valued at the mean between the closing bid and ask prices. Listed preferred stocks convertible into common stocks are valued using an evaluated price from a pricing service.
Debt securities generally are valued based on prices obtained from pricing services, which are intended to reflect market transactions for normal, institutional-size trading units of similar securities. The services may use various pricing techniques that take into account, as applicable, factors such as yield, quality, coupon rate, maturity, type of issue, trading characteristics and other data, as well as approved independent broker-dealer quotes. Debt securities for which quotations are not readily available or not believed to be reflective of market value may also be valued based upon a bid quote from an approved independent broker-dealer. Debt securities maturing in 60 days or less are valued primarily at amortized market value, unless this method results in a valuation that management believes does not approximate fair value.
34
Columbia Corporate Income Fund | Annual Report 2024
Notes to Financial Statements (continued)April 30, 2024 Senior loan securities for which reliable market quotations are readily available are generally valued by pricing services at the average of the bids received.
Investments in open-end investment companies (other than exchange-traded funds (ETFs)), are valued at the latest net asset value reported by those companies as of the valuation time.
Futures and options on futures contracts are valued based upon the settlement price at the close of regular trading on their principal exchanges or, in the absence of a settlement price, at the mean of the latest quoted bid and ask prices.
Investments for which market quotations are not readily available, or that have quotations which management believes are not reflective of market value or reliable, are valued at fair value as determined in good faith under procedures approved by the Board of Trustees. If a security or class of securities (such as foreign securities) is valued at fair value, such value is likely to be different from the quoted or published price for the security, if available.
The determination of fair value often requires significant judgment. To determine fair value, management may use assumptions including but not limited to future cash flows and estimated risk premiums. Multiple inputs from various sources may be used to determine fair value.
GAAP requires disclosure regarding the inputs and valuation techniques used to measure fair value and any changes in valuation inputs or techniques. In addition, investments shall be disclosed by major category. This information is disclosed following the Fund’s Portfolio of Investments.
Foreign currency transactions and translations
The values of all assets and liabilities denominated in foreign currencies are generally translated into U.S. dollars at exchange rates determined at the close of regular trading on the New York Stock Exchange. Net realized and unrealized gains (losses) on foreign currency transactions and translations include gains (losses) arising from the fluctuation in exchange rates between trade and settlement dates on securities transactions, gains (losses) arising from the disposition of foreign currency and currency gains (losses) between the accrual and payment dates on dividends, interest income and foreign withholding taxes.
For financial statement purposes, the Fund does not distinguish that portion of gains (losses) on investments which is due to changes in foreign exchange rates from that which is due to changes in market prices of the investments. Such fluctuations are included with the net realized and unrealized gains (losses) on investments in the Statement of Operations.
Derivative instruments
The Fund invests in certain derivative instruments, as detailed below, in seeking to meet its investment objectives. Derivatives are instruments whose values depend on, or are derived from, in whole or in part, the value of one or more securities, currencies, commodities, indices, or other assets or instruments. Derivatives may be used to increase investment flexibility (including to maintain cash reserves while maintaining desired exposure to certain assets), for risk management (hedging) purposes, to facilitate trading, to reduce transaction costs and to pursue higher investment returns. The Fund may also use derivative instruments to mitigate certain investment risks, such as foreign currency exchange rate risk, interest rate risk and credit risk. Derivatives may involve various risks, including the potential inability of the counterparty to fulfill its obligations under the terms of the contract, the potential for an illiquid secondary market (making it difficult for the Fund to sell or terminate, including at favorable prices) and the potential for market movements which may expose the Fund to gains or losses in excess of the amount shown in the Statement of Assets and Liabilities. The notional amounts of derivative instruments, if applicable, are not recorded in the financial statements.
A derivative instrument may suffer a marked-to-market loss if the value of the contract decreases due to an unfavorable change in the market rates or values of the underlying instrument. Losses can also occur if the counterparty does not perform its obligations under the contract. The Fund’s risk of loss from counterparty credit risk on over-the-counter derivatives is generally limited to the aggregate unrealized gain netted against any collateral held by the Fund and the amount of any variation margin held by the counterparty, plus any replacement costs or related amounts. With exchange-traded or centrally cleared derivatives, there is reduced counterparty credit risk to the Fund since the clearinghouse or central counterparty provides some protection in the case of clearing member default. The clearinghouse or central counterparty stands between
Columbia Corporate Income Fund | Annual Report 2024
35
Notes to Financial Statements (continued)April 30, 2024 the buyer and the seller of the contract; therefore, failure of the clearinghouse or central counterparty may pose additional counterparty credit risk. However, credit risk still exists in exchange-traded or centrally cleared derivatives with respect to initial and variation margin that is held in a broker’s customer account. While clearing brokers are required to segregate customer margin from their own assets, in the event that a clearing broker becomes insolvent or goes into bankruptcy and at that time there is a shortfall in the aggregate amount of margin held by the clearing broker for all its clients and such shortfall is remedied by the central counterparty or otherwise, U.S. bankruptcy laws will typically allocate that shortfall on a pro-rata basis across all the clearing broker’s customers (including the Fund), potentially resulting in losses to the Fund.
In order to better define its contractual rights and to secure rights that will help the Fund mitigate its counterparty risk, the Fund may enter into an International Swaps and Derivatives Association, Inc. Master Agreement (ISDA Master Agreement) or similar agreement with its derivatives counterparties. An ISDA Master Agreement is an agreement between the Fund and a counterparty that governs over-the-counter derivatives and foreign exchange forward contracts and contains, among other things, collateral posting terms and netting provisions in the event of a default and/or termination event. Under an ISDA Master Agreement, the Fund may, under certain circumstances, offset with the counterparty certain derivative instruments’ payables and/or receivables with collateral held and/or posted and create one single net payment. The provisions of the ISDA Master Agreement typically permit a single net payment in the event of default (close-out netting), including the bankruptcy or insolvency of the counterparty. Note, however, that bankruptcy or insolvency laws of a particular jurisdiction may impose restrictions on or prohibitions against the right of offset or netting in bankruptcy, insolvency or other events.
Collateral (margin) requirements differ by type of derivative. Margin requirements are established by the clearinghouse or central counterparty for exchange-traded and centrally cleared derivatives. Brokers can ask for margin in excess of the minimum in certain circumstances. Collateral terms for most over-the-counter derivatives are subject to regulatory requirements to exchange variation margin with trading counterparties and may have contract specific margin terms as well. For over-the-counter derivatives traded under an ISDA Master Agreement, the collateral requirements are typically calculated by netting the marked-to-market amount for each transaction under such agreement and comparing that amount to the value of any variation margin currently pledged by the Fund and/or the counterparty. Generally, the amount of collateral due from or to a party has to exceed a minimum transfer amount threshold (e.g., $250,000) before a transfer has to be made. To the extent amounts due to the Fund from its counterparties are not fully collateralized, contractually or otherwise, the Fund bears the risk of loss from counterparty nonperformance. The Fund may also pay interest expense on cash collateral received from the broker or receive interest income on cash collateral pledged to the broker. The Fund attempts to mitigate counterparty risk by only entering into agreements with counterparties that it believes have the financial resources to honor their obligations and by monitoring the financial stability of those counterparties.
Certain ISDA Master Agreements allow counterparties of over-the-counter derivatives transactions to terminate derivatives contracts prior to maturity in the event the Fund’s net asset value declines by a stated percentage over a specified time period or if the Fund fails to meet certain terms of the ISDA Master Agreement, which would cause the Fund to accelerate payment of any net liability owed to the counterparty. The Fund also has termination rights if the counterparty fails to meet certain terms of the ISDA Master Agreement. In determining whether to exercise such termination rights, the Fund would consider, in addition to counterparty credit risk, whether termination would result in a net liability owed from the counterparty.
For financial reporting purposes, the Fund does not offset derivative assets and derivative liabilities that are subject to netting arrangements in the Statement of Assets and Liabilities.
Futures contracts
Futures contracts are exchange-traded and represent commitments for the future purchase or sale of an asset at a specified price on a specified date. The Fund bought and sold futures contracts to manage the duration and yield curve exposure of the Fund versus the benchmark and to manage exposure to movements in interest rates. These instruments may be used for other purposes in future periods. Upon entering into futures contracts, the Fund bears risks that it may not achieve the anticipated benefits of the futures contracts and may realize a loss. Additional risks include counterparty credit risk, the possibility of an illiquid market, and that a change in the value of the contract or option may not correlate with changes in the value of the underlying asset.
36
Columbia Corporate Income Fund | Annual Report 2024
Notes to Financial Statements (continued)April 30, 2024 Upon entering into a futures contract, the Fund deposits cash or securities with the broker, known as a futures commission merchant (FCM), in an amount sufficient to meet the initial margin requirement. The initial margin deposit must be maintained at an established level over the life of the contract. Cash deposited as initial margin is recorded in the Statement of Assets and Liabilities as margin deposits. Securities deposited as initial margin are designated in the Portfolio of Investments. Subsequent payments (variation margin) are made or received by the Fund each day. The variation margin payments are equal to the daily change in the contract value and are recorded as variation margin receivable or payable and are offset in unrealized gains or losses. The Fund generally expects to earn interest income on its margin deposits. The Fund recognizes a realized gain or loss when the contract is closed or expires. Futures contracts involve, to varying degrees, risk of loss in excess of the variation margin disclosed in the Statement of Assets and Liabilities.
Effects of derivative transactions in the financial statements
The following tables are intended to provide additional information about the effect of derivatives on the financial statements of the Fund, including: the fair value of derivatives by risk category and the location of those fair values in the Statement of Assets and Liabilities; and the impact of derivative transactions over the period in the Statement of Operations, including realized and unrealized gains (losses). The derivative instrument schedules following the Portfolio of Investments present additional information regarding derivative instruments outstanding at the end of the period, if any.
The following table is a summary of the fair value of derivative instruments (not considered to be hedging instruments for accounting disclosure purposes) at April 30, 2024:
| | |
| Statement
of assets and liabilities
location | |
| Component of total distributable earnings (loss) — unrealized appreciation on futures contracts | |
| | |
| Statement
of assets and liabilities
location | |
| Component of total distributable earnings (loss) — unrealized depreciation on futures contracts | |
| Includes cumulative appreciation (depreciation) as reported in the tables following the Portfolio of Investments. Only the current day’s variation margin for futures and centrally cleared swaps, if any, is reported in receivables or payables in the Statement of Assets and Liabilities. |
The following table indicates the effect of derivative instruments (not considered to be hedging instruments for accounting disclosure purposes) in the Statement of Operations for the year ended April 30, 2024:
Amount of realized gain (loss) on derivatives recognized in income |
| |
| |
|
Change in unrealized appreciation (depreciation) on derivatives recognized in income |
| |
| |
The following table is a summary of the average daily outstanding volume by derivative instrument for the year ended April 30, 2024:
| Average notional
amounts ($) |
| |
Futures contracts — short | |
Columbia Corporate Income Fund | Annual Report 2024
37
Notes to Financial Statements (continued)April 30, 2024 Investments in senior loans
The Fund may invest in senior loan assignments. When the Fund purchases an assignment of a senior loan, the Fund typically has direct rights against the borrower; provided, however, that the Fund’s rights may be more limited than the lender from which it acquired the assignment and the Fund may be able to enforce its rights only through an administrative agent. Although certain senior loan assignments are secured by collateral, the Fund could experience delays or limitations in realizing such collateral or have its interest subordinated to other indebtedness of the obligor. In the event that the administrator or collateral agent of a loan becomes insolvent or enters into receivership or bankruptcy, the Fund may incur costs and delays in realizing payment or may suffer a loss of principal and/or interest. The risk of loss is greater for unsecured or subordinated loans. In addition, senior loan assignments are vulnerable to market, economic or other conditions or events that may reduce the demand for senior loan assignments and certain senior loan assignments which were liquid when purchased, may become illiquid.
The Fund may enter into senior loan assignments where all or a portion of the loan may be unfunded. The Fund is obligated to fund these commitments at the borrower’s discretion. These commitments, if any, are generally traded and priced in the same manner as other senior loan securities and are disclosed as unfunded senior loan commitments in the Fund’s Portfolio of Investments with a corresponding payable for investments purchased. The Fund designates cash or liquid securities to cover these commitments.
Delayed delivery securities
The Fund may trade securities on other than normal settlement terms, including securities purchased or sold on a “when-issued” or "forward commitment" basis. This may increase risk to the Fund since the other party to the transaction may fail to deliver, which could cause the Fund to subsequently invest at less advantageous prices. The Fund designates cash or liquid securities in an amount equal to the delayed delivery commitment.
Security transactions
Security transactions are accounted for on the trade date. Cost is determined and gains (losses) are based upon the specific identification method for both financial statement and federal income tax purposes.
The trade date for senior loans purchased in the primary market is the date on which the loan is allocated. The trade date for senior loans purchased in the secondary market is the date on which the transaction is entered into.
Income recognition
Interest income is recorded on an accrual basis. Market premiums and discounts, including original issue discounts, are amortized and accreted, respectively, over the expected life of the security on all debt securities, unless otherwise noted. For convertible securities, premiums attributable to the conversion feature are not amortized.
The Fund may place a debt security on non-accrual status and reduce related interest income when it becomes probable that the interest will not be collected and the amount of uncollectible interest can be reasonably estimated. The Fund may also adjust accrual rates when it becomes probable the full interest will not be collected and a partial payment will be received. A defaulted debt security is removed from non-accrual status when the issuer resumes interest payments or when collectability of interest is reasonably assured.
Corporate actions and dividend income are recorded on the ex-dividend date.
The Fund may receive distributions from holdings in equity securities, business development companies (BDCs), exchange-traded funds (ETFs), limited partnerships (LPs), other regulated investment companies (RICs), and real estate investment trusts (REITs), which report information as to the tax character of their distributions annually. These distributions are allocated to dividend income, capital gain and return of capital based on actual information reported. Return of capital is recorded as a reduction of the cost basis of securities held. If the Fund no longer owns the applicable securities, return of capital is recorded as a realized gain. With respect to REITs, to the extent actual information has not yet been reported, estimates for return of capital are made by Columbia Management Investment Advisers, LLC (the Investment Manager), a
38
Columbia Corporate Income Fund | Annual Report 2024
Notes to Financial Statements (continued)April 30, 2024 wholly-owned subsidiary of Ameriprise Financial, Inc. (Ameriprise Financial). The Investment Manager’s estimates are subsequently adjusted when the actual character of the distributions is disclosed by the REITs, which could result in a proportionate change in return of capital to shareholders.
Awards from class action litigation are recorded as a reduction of cost basis if the Fund still owns the applicable securities on the payment date. If the Fund no longer owns the applicable securities on the payment date, the proceeds are recorded as realized gains.
The value of additional securities received as an income payment through a payment-in-kind, if any, is recorded as interest income and increases the cost basis of such securities.
The Fund may receive other income from senior loans, including amendment fees, consent fees and commitment fees. These fees are recorded as income when received by the Fund. These amounts are included in Interest Income in the Statement of Operations.
Expenses
General expenses of the Trust are allocated to the Fund and other funds of the Trust based upon relative net assets or other expense allocation methodologies determined by the nature of the expense. Expenses directly attributable to the Fund are charged to the Fund. Expenses directly attributable to a specific class of shares are charged to that share class.
Determination of class net asset value
All income, expenses (other than class-specific expenses, which are charged to that share class, as shown in the Statement of Operations) and realized and unrealized gains (losses) are allocated to each class of the Fund on a daily basis, based on the relative net assets of each class, for purposes of determining the net asset value of each class.
Federal income tax status
The Fund intends to qualify each year as a regulated investment company under Subchapter M of the Internal Revenue Code, as amended, and will distribute substantially all of its investment company taxable income and net capital gain, if any, for its tax year, and as such will not be subject to federal income taxes. In addition, the Fund intends to distribute in each calendar year substantially all of its ordinary income, capital gain net income and certain other amounts, if any, such that the Fund should not be subject to federal excise tax. Therefore, no federal income or excise tax provision is recorded.
Foreign taxes
The Fund may be subject to foreign taxes on income, gains on investments or currency repatriation, a portion of which may be recoverable. The Fund will accrue such taxes and recoveries, as applicable, based upon its current interpretation of tax rules and regulations that exist in the markets in which it invests.
Realized gains in certain countries may be subject to foreign taxes at the Fund level, based on statutory rates. The Fund accrues for such foreign taxes on realized and unrealized gains at the appropriate rate for each jurisdiction, as applicable. The amount, if any, is disclosed as a liability in the Statement of Assets and Liabilities.
Distributions to shareholders
Distributions from net investment income, if any, are declared daily and paid monthly. Net realized capital gains, if any, are distributed at least annually. Income distributions and capital gain distributions are determined in accordance with federal income tax regulations, which may differ from GAAP.
Guarantees and indemnifications
Under the Trust’s organizational documents and, in some cases, by contract, its officers and trustees are indemnified against certain liabilities arising out of the performance of their duties to the Trust or its funds. In addition, certain of the Fund’s contracts with its service providers contain general indemnification clauses. The Fund’s maximum exposure under these arrangements is unknown since the amount of any future claims that may be made against the Fund cannot be determined, and the Fund has no historical basis for predicting the likelihood of any such claims.
Columbia Corporate Income Fund | Annual Report 2024
39
Notes to Financial Statements (continued)April 30, 2024 Recent accounting pronouncements and regulatory updates
Tailored Shareholder Reports
In October 2022, the Securities and Exchange Commission adopted a final rule, "Tailored Shareholder Reports for Mutual Funds and Exchange-Traded Funds; Fee Information in Investment Company Advertisements." The rule and form amendments will, among other things, require the Fund to transmit concise and visually engaging shareholder reports that highlight key information. The amendments will require that funds tag information in a structured data format and that certain more in-depth information be made available online and available for delivery free of charge to investors on request. The amendments became effective January 24, 2023. There is an 18-month transition period after the effective date of the amendments.
Note 3. Fees and other transactions with affiliates
Management services fees
The Fund has entered into a Management Agreement with Columbia Management Investment Advisers, LLC (the Investment Manager), a wholly-owned subsidiary of Ameriprise Financial, Inc. (Ameriprise Financial). Under the Management Agreement, the Investment Manager provides the Fund with investment research and advice, as well as administrative and accounting services. The management services fee is an annual fee that is equal to a percentage of the Fund’s daily net assets that declines from 0.50% to 0.34% as the Fund’s net assets increase. The effective management services fee rate for the year ended April 30, 2024 was 0.49% of the Fund’s average daily net assets.
Compensation of Board members
Members of the Board of Trustees who are not officers or employees of the Investment Manager or Ameriprise Financial are compensated for their services to the Fund as disclosed in the Statement of Operations. Under a Deferred Compensation Plan (the Deferred Plan), these members of the Board of Trustees may elect to defer payment of up to 100% of their compensation. Deferred amounts are treated as though equivalent dollar amounts had been invested in shares of certain funds managed by the Investment Manager. The Fund’s liability for these amounts is adjusted for market value changes and remains in the Fund until distributed in accordance with the Deferred Plan. All amounts payable under the Deferred Plan constitute a general unsecured obligation of the Fund. The expense for the Deferred Plan, which includes Trustees’ fees deferred during the current period as well as any gains or losses on the Trustees’ deferred compensation balances as a result of market fluctuations, is included in "Deferred compensation of board members" in the Statement of Operations.
Compensation of Chief Compliance Officer
The Board of Trustees has appointed a Chief Compliance Officer for the Fund in accordance with federal securities regulations. As disclosed in the Statement of Operations, a portion of the Chief Compliance Officer’s total compensation is allocated to the Fund, along with other allocations to affiliated registered investment companies managed by the Investment Manager and its affiliates, based on relative net assets.
Transfer agency fees
Under a Transfer and Dividend Disbursing Agent Agreement, Columbia Management Investment Services Corp. (the Transfer Agent), an affiliate of the Investment Manager and a wholly-owned subsidiary of Ameriprise Financial, is responsible for providing transfer agency services to the Fund. The Transfer Agent has contracted with SS&C GIDS, Inc. (SS&C GIDS) to serve as sub-transfer agent. The Transfer Agent pays the fees of SS&C GIDS for services as sub-transfer agent and SS&C GIDS is not entitled to reimbursement for such fees from the Fund (with the exception of out-of-pocket fees).
The Fund pays the Transfer Agent a monthly transfer agency fee based on the number or the average value of accounts, depending on the type of account. In addition, the Fund pays the Transfer Agent a fee for shareholder services based on the number of accounts or on a percentage of the average aggregate value of the Fund’s shares maintained in omnibus accounts up to the lesser of the amount charged by the financial intermediary or a cap established by the Board of Trustees from time to time.
40
Columbia Corporate Income Fund | Annual Report 2024
Notes to Financial Statements (continued)April 30, 2024 The Transfer Agent also receives compensation from the Fund for various shareholder services and reimbursements for certain out-of-pocket fees. Total transfer agency fees for Institutional 2 Class and Institutional 3 Class shares are subject to an annual limitation of not more than 0.07% and 0.02%, respectively, of the average daily net assets attributable to each share class. In addition, effective through August 31, 2024, Institutional 2 Class shares are subject to a contractual transfer agency fee annual limitation of not more than 0.05% and Institutional 3 Class shares are subject to a contractual transfer agency fee annual limitation of not more than 0.00% of the average daily net assets attributable to each share class.
For the year ended April 30, 2024, the Fund’s effective transfer agency fee rates as a percentage of average daily net assets of each class were as follows:
An annual minimum account balance fee of $20 may apply to certain accounts with a value below the applicable share class’s initial minimum investment requirements to reduce the impact of small accounts on transfer agency fees. These minimum account balance fees are remitted to the Fund and recorded as part of expense reductions in the Statement of Operations. For the year ended April 30, 2024, these minimum account balance fees reduced total expenses of the Fund by $765.
Distribution and service fees
The Fund has entered into an agreement with Columbia Management Investment Distributors, Inc. (the Distributor), an affiliate of the Investment Manager and a wholly-owned subsidiary of Ameriprise Financial, for distribution and shareholder services. The Board of Trustees has approved, and the Fund has adopted, distribution and shareholder service plans (the Plans) applicable to certain share classes, which set the distribution and service fees for the Fund. These fees are calculated daily and are intended to compensate the Distributor and/or eligible selling and/or servicing agents for selling shares of the Fund and providing services to investors.
Under the Plans, the Fund pays a monthly service fee to the Distributor at the maximum annual rate of 0.25% of the average daily net assets attributable to Class A and Class C shares of the Fund. Also under the Plans, the Fund pays a monthly distribution fee to the Distributor at the maximum annual rate of 0.55% of the average daily net assets attributable to Class C shares of the Fund. As a result of Class C shares of the Fund being converted into Class A shares, April 15, 2024 was the last day the Fund paid a distribution and service fee for Class C shares.
Sales charges (unaudited)
Sales charges, including front-end charges and contingent deferred sales charges (CDSCs), received by the Distributor for distributing Fund shares for the year ended April 30, 2024, if any, are listed below:
| This charge is imposed on certain investments of between $1 million and $50 million redeemed within 18 months after purchase, as follows: 1.00% if redeemed within 12 months after purchase, and 0.50% if redeemed more than 12, but less than 18, months after purchase, with certain limited exceptions. |
| This charge applies to redemptions within 12 months after purchase, with certain limited exceptions. |
The Fund’s other share classes are not subject to sales charges.
Columbia Corporate Income Fund | Annual Report 2024
41
Notes to Financial Statements (continued)April 30, 2024 Expenses waived/reimbursed by the Investment Manager and its affiliates
The Investment Manager and certain of its affiliates have contractually agreed to waive fees and/or reimburse expenses (excluding certain fees and expenses described below) for the period(s) disclosed below, unless sooner terminated at the sole discretion of the Board of Trustees, so that the Fund’s net operating expenses, after giving effect to fees waived/expenses reimbursed and any balance credits and/or overdraft charges from the Fund’s custodian, do not exceed the following annual rate(s) as a percentage of the classes’ average daily net assets:
| September 1, 2023
through
August 31, 2024 | Prior to
September 1, 2023 |
| | |
| | |
| | |
| | |
| | |
Under the agreement governing these fee waivers and/or expense reimbursement arrangements, the following fees and expenses are excluded from the waiver/reimbursement commitment, and therefore will be paid by the Fund, if applicable: taxes (including foreign transaction taxes), expenses associated with investments in affiliated and non-affiliated pooled investment vehicles (including mutual funds and exchange-traded funds), transaction costs and brokerage commissions, costs related to any securities lending program, dividend expenses associated with securities sold short, inverse floater program fees and expenses, transaction charges and interest on borrowed money, interest, costs associated with shareholder meetings, infrequent and/or unusual expenses and any other expenses the exclusion of which is specifically approved by the Board of Trustees. This agreement may be modified or amended only with approval from the Investment Manager, certain of its affiliates and the Fund. In addition to the contractual agreement, the Investment Manager and certain of its affiliates have voluntarily agreed to waive fees and/or reimburse Fund expenses (excluding certain fees and expenses described above) so that Fund level expenses (expenses directly attributable to the Fund and not to a specific share class) are waived proportionately across all share classes. This arrangement may be revised or discontinued at any time. Reflected in the contractual cap commitment, effective through August 31, 2024, is the Transfer Agent’s contractual agreement to limit total transfer agency fees to an annual rate of not more than 0.05% for Institutional 2 Class and 0.00% for Institutional 3 Class of the average daily net assets attributable to each share class, unless sooner terminated at the sole discretion of the Board of Trustees. Any fees waived and/or expenses reimbursed under the expense reimbursement arrangements described above are not recoverable by the Investment Manager or its affiliates in future periods.
Note 4. Federal tax information
The timing and character of income and capital gain distributions are determined in accordance with income tax regulations, which may differ from GAAP because of temporary or permanent book to tax differences.
At April 30, 2024, these differences were primarily due to differing treatment for deferral/reversal of wash sale losses, derivative investments, tax straddles, principal and/or interest from fixed income securities, defaulted securities/troubled debt, capital loss carryforwards, trustees’ deferred compensation, distributions and foreign currency transactions. To the extent these differences were permanent, reclassifications were made among the components of the Fund’s net assets. Temporary differences do not require reclassifications.
The following reclassifications were made:
Excess of distributions
over net investment
income ($) | Accumulated
net realized
(loss) ($) | |
| | |
Net investment income (loss) and net realized gains (losses), as disclosed in the Statement of Operations, and net assets were not affected by this reclassification.
42
Columbia Corporate Income Fund | Annual Report 2024
Notes to Financial Statements (continued)April 30, 2024 The tax character of distributions paid during the years indicated was as follows:
Year Ended April 30, 2024 | Year Ended April 30, 2023 |
| Long-term
capital gains ($) | | | Long-term
capital gains ($) | |
| | | | | |
Short-term capital gain distributions, if any, are considered ordinary income distributions for tax purposes.
At April 30, 2024, the components of distributable earnings on a tax basis were as follows:
Undistributed
ordinary income ($) | Undistributed
long-term
capital gains ($) | Capital loss
carryforwards ($) | Net unrealized
(depreciation) ($) |
| | | |
At April 30, 2024, the cost of all investments for federal income tax purposes along with the aggregate gross unrealized appreciation and depreciation based on that cost was:
| Gross unrealized
appreciation ($) | Gross unrealized
(depreciation) ($) | Net unrealized
(depreciation) ($) |
| | | |
Tax cost of investments and unrealized appreciation/(depreciation) may also include timing differences that do not constitute adjustments to tax basis.
The following capital loss carryforwards, determined at April 30, 2024, may be available to reduce future net realized gains on investments, if any, to the extent permitted by the Internal Revenue Code. In addition, for the year ended April 30, 2024, capital loss carryforwards utilized, if any, were as follows:
No expiration
short-term ($) | No expiration
long-term ($) | | |
| | | |
Management of the Fund has concluded that there are no significant uncertain tax positions in the Fund that would require recognition in the financial statements. However, management’s conclusion may be subject to review and adjustment at a later date based on factors including, but not limited to, new tax laws, regulations, and administrative interpretations (including relevant court decisions). Generally, the Fund’s federal tax returns for the prior three fiscal years remain subject to examination by the Internal Revenue Service.
Note 5. Portfolio information
The cost of purchases and proceeds from sales of securities, excluding short-term investments and derivatives, if any, aggregated to $1,913,806,195 and $1,853,570,921, respectively, for the year ended April 30, 2024, of which $115,694,326 and $127,278,398, respectively, were U.S. government securities. The amount of purchase and sale activity impacts the portfolio turnover rate reported in the Financial Highlights.
Note 6. Affiliated money market fund
The Fund invests in Columbia Short-Term Cash Fund, an affiliated money market fund established for the exclusive use by the Fund and other affiliated funds (the Affiliated MMF). The income earned by the Fund from such investments is included as Dividends - affiliated issuers in the Statement of Operations. As an investing fund, the Fund indirectly bears its proportionate share of the expenses of the Affiliated MMF. The Affiliated MMF prices its shares with a floating net asset value. The Securities and Exchange Commission has adopted amendments to money market fund rules requiring institutional prime money market funds like the Affiliated MMF to be subject to a discretionary liquidity fee of up to 2% if the imposition of such a fee is determined to be in the best interest of the Affiliated MMF and, by October 2, 2024, to a mandatory liquidity fee if daily net redemptions exceed 5% of net assets.
Columbia Corporate Income Fund | Annual Report 2024
43
Notes to Financial Statements (continued)April 30, 2024 Note 7. Interfund lending
Pursuant to an exemptive order granted by the Securities and Exchange Commission, the Fund participates in a program (the Interfund Program) allowing each participating Columbia Fund (each, a Participating Fund) to lend money directly to and, except for closed-end funds and money market funds, borrow money directly from other Participating Funds for temporary purposes. The amounts eligible for borrowing and lending under the Interfund Program are subject to certain restrictions.
Interfund loans are subject to the risk that the borrowing fund could be unable to repay the loan when due, and a delay in repayment to the lending fund could result in lost opportunities and/or additional lending costs. The exemptive order is subject to conditions intended to mitigate conflicts of interest arising from the Investment Manager’s relationship with each Participating Fund.
The Fund’s activity in the Interfund Program during the year ended April 30, 2024 was as follows:
| | Weighted average
interest rate (%) | Number of days
with outstanding loans |
| | | |
Interest income earned by the Fund is recorded as Interfund lending in the Statement of Operations. The Fund had no outstanding interfund loans at April 30, 2024.
Note 8. Line of credit
The Fund has access to a revolving credit facility with a syndicate of banks led by JPMorgan Chase Bank, N.A., Citibank, N.A. and Wells Fargo Bank, N.A. whereby the Fund may borrow for the temporary funding of shareholder redemptions or for other temporary or emergency purposes. Pursuant to an October 26, 2023 amendment and restatement, the credit facility, which is an agreement between the Fund and certain other funds managed by the Investment Manager or an affiliated investment manager, severally and not jointly, permits aggregate borrowings up to $900 million. Interest is currently charged to each participating fund based on its borrowings at a rate equal to the higher of (i) the federal funds effective rate, (ii) the secured overnight financing rate plus 0.10% and (iii) the overnight bank funding rate plus, in each case, 1.00%. Each borrowing under the credit facility matures no later than 60 days after the date of borrowing. The Fund also pays a commitment fee equal to its pro rata share of the unused amount of the credit facility at a rate of 0.15% per annum. The commitment fee is included in other expenses in the Statement of Operations. This agreement expires annually in October unless extended or renewed. Prior to the October 26, 2023 amendment and restatement, the Fund had access to a revolving credit facility with a syndicate of banks led by JPMorgan Chase Bank, N.A., Citibank, N.A. and Wells Fargo Bank, N.A. which permitted collective borrowings up to $950 million. Interest was charged to each participating fund based on its borrowings at a rate equal to the higher of (i) the federal funds effective rate, (ii) the secured overnight financing rate plus 0.10% and (iii) the overnight bank funding rate plus, in each case, 1.00%.
The Fund had no borrowings during the year ended April 30, 2024.
Note 9. Significant risks
Credit risk
Credit risk is the risk that the value of debt instruments in the Fund’s portfolio may decline because the issuer defaults or otherwise becomes unable or unwilling, or is perceived to be unable or unwilling, to honor its financial obligations, such as making payments to the Fund when due. Credit rating agencies assign credit ratings to certain debt instruments to indicate their credit risk. Lower-rated or unrated debt instruments held by the Fund may present increased credit risk as compared to higher-rated debt instruments.
Derivatives risk
Losses involving derivative instruments may be substantial, because a relatively small movement in the underlying reference (which is generally the price, rate or other economic indicator associated with a security(ies), commodity, currency, index or other instrument or asset) may result in a substantial loss for the Fund. In addition to the potential for increased losses, the
44
Columbia Corporate Income Fund | Annual Report 2024
Notes to Financial Statements (continued)April 30, 2024 use of derivative instruments may lead to increased volatility within the Fund. Derivatives will typically increase the Fund’s exposure to principal risks to which it is otherwise exposed, and may expose the Fund to additional risks, including correlation risk, counterparty risk, hedging risk, leverage risk, liquidity risk and pricing risk.
Interest rate risk
Interest rate risk is the risk of losses attributable to changes in interest rates. In general, if interest rates rise, the values of debt instruments tend to fall, and if interest rates fall, the values of debt instruments tend to rise. Actions by governments and central banking authorities can result in increases or decreases in interest rates. Higher periods of inflation could lead such authorities to raise interest rates. Increasing interest rates may negatively affect the value of debt securities held by the Fund, resulting in a negative impact on the Fund’s performance and net asset value per share. In general, the longer the maturity or duration of a debt security, the greater its sensitivity to changes in interest rates. The Fund is subject to the risk that the income generated by its investments may not keep pace with inflation.
Liquidity risk
Liquidity risk is the risk associated with a lack of marketability of investments which may make it difficult to sell the investment at a desirable time or price. Changing regulatory, market or other conditions or environments (for example, the interest rate or credit environments) may adversely affect the liquidity of the Fund’s investments. The Fund may have to accept a lower selling price for the holding, sell other investments, or forego another, more appealing investment opportunity. Generally, the less liquid the market at the time the Fund sells a portfolio investment, the greater the risk of loss or decline of value to the Fund. A less liquid market can lead to an increase in Fund redemptions, which may negatively impact Fund performance and net asset value per share, including, for example, if the Fund is forced to sell securities in a down market.
Market risk
The Fund may incur losses due to declines in the value of one or more securities in which it invests. These declines may be due to factors affecting a particular issuer, or the result of, among other things, political, regulatory, market, economic or social developments affecting the relevant market(s) more generally. In addition, turbulence in financial markets and reduced liquidity in equity, credit and/or fixed income markets may negatively affect many issuers, which could adversely affect the Fund’s ability to price or value hard-to-value assets in thinly traded and closed markets and could cause significant redemptions and operational challenges. Global economies and financial markets are increasingly interconnected, and conditions and events in one country, region or financial market may adversely impact issuers in a different country, region or financial market. These risks may be magnified if certain events or developments adversely interrupt the global supply chain; in these and other circumstances, such risks might affect companies worldwide. As a result, local, regional or global events such as terrorism, war, other conflicts, natural disasters, disease/virus outbreaks and epidemics or other public health issues, recessions, depressions or other events – or the potential for such events – could have a significant negative impact on global economic and market conditions.
The large-scale invasion of Ukraine by Russia in February 2022 has resulted in sanctions and market disruptions, including declines in regional and global stock markets, unusual volatility in global commodity markets and significant devaluations of Russian currency. The extent and duration of the military action are impossible to predict but could continue to be significant. Market disruption caused by the Russian military action, and any countermeasures or responses thereto (including international sanctions, a downgrade in a country’s credit rating, purchasing and financing restrictions, boycotts, tariffs, changes in consumer or purchaser preferences, cyberattacks and espionage) could continue to have severe adverse impacts on regional and/or global securities and commodities markets, including markets for oil and natural gas. These impacts may include reduced market liquidity, distress in credit markets, further disruption of global supply chains, increased risk of inflation, restricted cross-border payments and limited access to investments and/or assets in certain international markets and/or issuers. These developments and other related events could negatively impact Fund performance.
Shareholder concentration risk
At April 30, 2024, affiliated shareholders of record owned 60.4% of the outstanding shares of the Fund in one or more accounts. Fund shares sold to or redeemed by concentrated accounts may have a significant effect on the operations of the Fund. In the case of a large redemption, the Fund may be forced to sell investments at inopportune times, including its liquid
Columbia Corporate Income Fund | Annual Report 2024
45
Notes to Financial Statements (continued)April 30, 2024 positions, which may result in Fund losses and the Fund holding a higher percentage of less liquid positions. Large redemptions could result in decreased economies of scale and increased operating expenses for non-redeeming Fund shareholders.
Note 10. Subsequent events
Management has evaluated the events and transactions that have occurred through the date the financial statements were issued and noted no items requiring adjustment of the financial statements or additional disclosure.
Note 11. Information regarding pending and settled legal proceedings
Ameriprise Financial and certain of its affiliates are involved in the normal course of business in legal proceedings which include regulatory inquiries, arbitration and litigation, including class actions concerning matters arising in connection with the conduct of their activities as part of a diversified financial services firm. Ameriprise Financial believes that the Fund is not currently the subject of, and that neither Ameriprise Financial nor any of its affiliates are the subject of, any pending legal, arbitration or regulatory proceedings that are likely to have a material adverse effect on the Fund or the ability of Ameriprise Financial or its affiliates to perform under their contracts with the Fund. Ameriprise Financial is required to make quarterly (10-Q), annual (10-K) and, as necessary, 8-K filings with the Securities and Exchange Commission (SEC) on legal and regulatory matters that relate to Ameriprise Financial and its affiliates. Copies of these filings may be obtained by accessing the SEC website at www.sec.gov.
There can be no assurance that these matters, or the adverse publicity associated with them, will not result in increased Fund redemptions, reduced sale of Fund shares or other adverse consequences to the Fund. Further, although we believe proceedings are not likely to have a material adverse effect on the Fund or the ability of Ameriprise Financial or its affiliates to perform under their contracts with the Fund, these proceedings are subject to uncertainties and, as such, we are unable to estimate the possible loss or range of loss that may result. An adverse outcome in one or more of these proceedings could result in adverse judgments, settlements, fines, penalties or other relief that could have a material adverse effect on the consolidated financial condition or results of operations of Ameriprise Financial or one or more of its affiliates that provide services to the Fund.
46
Columbia Corporate Income Fund | Annual Report 2024
Report of Independent Registered Public Accounting Firm
To the Board of Trustees of Columbia Funds Series Trust I and Shareholders of Columbia Corporate Income Fund
Opinion on the Financial Statements
We have audited the accompanying statement of assets and liabilities, including the portfolio of investments, of Columbia Corporate Income Fund (one of the funds constituting Columbia Funds Series Trust I, referred to hereafter as the "Fund") as of April 30, 2024, the related statement of operations for the year ended April 30, 2024, the statement of changes in net assets for each of the two years in the period ended April 30, 2024, including the related notes, and the financial highlights for each of the five years in the period ended April 30, 2024 (collectively referred to as the "financial statements"). In our opinion, the financial statements present fairly, in all material respects, the financial position of the Fund as of April 30, 2024, the results of its operations for the year then ended, the changes in its net assets for each of the two years in the period ended April 30, 2024 and the financial highlights for each of the five years in the period ended April 30, 2024 in conformity with accounting principles generally accepted in the United States of America.
Basis for Opinion
These financial statements are the responsibility of the Fund’s management. Our responsibility is to express an opinion on the Fund’s financial statements based on our audits. We are a public accounting firm registered with the Public Company Accounting Oversight Board (United States) (PCAOB) and are required to be independent with respect to the Fund in accordance with the U.S. federal securities laws and the applicable rules and regulations of the Securities and Exchange Commission and the PCAOB.
We conducted our audits of these financial statements in accordance with the standards of the PCAOB. Those standards require that we plan and perform the audit to obtain reasonable assurance about whether the financial statements are free of material misstatement, whether due to error or fraud.
Our audits included performing procedures to assess the risks of material misstatement of the financial statements, whether due to error or fraud, and performing procedures that respond to those risks. Such procedures included examining, on a test basis, evidence regarding the amounts and disclosures in the financial statements. Our audits also included evaluating the accounting principles used and significant estimates made by management, as well as evaluating the overall presentation of the financial statements. Our procedures included confirmation of securities owned as of April 30, 2024 by correspondence with the custodian, transfer agent, brokers and agent banks; when replies were not received from brokers, we performed other auditing procedures. We believe that our audits provide a reasonable basis for our opinion.
/s/PricewaterhouseCoopers LLP
Minneapolis, Minnesota
June 20, 2024
We have served as the auditor of one or more investment companies within the Columbia Funds Complex since 1977.
Columbia Corporate Income Fund | Annual Report 2024
47
Federal Income Tax Information
(Unaudited)
The Fund hereby designates the following tax attributes for the fiscal year ended April 30, 2024. Shareholders will be notified in early 2025 of the amounts for use in preparing 2024 income tax returns.
Section
163(j)
Interest
Dividends | |
| |
Section 163(j) Interest Dividends. The percentage of ordinary income distributed during the fiscal year that shareholders may treat as interest income for purposes of IRC Section 163(j), subject to holding period requirements and other limitations.
TRUSTEES AND OFFICERS
(Unaudited)
The Board oversees the Fund’s operations and appoints officers who are responsible for day-to-day business decisions based on policies set by the Board. The following table provides basic biographical information about the Fund’s Trustees as of the printing of this report, including their principal occupations during the past five years, although specific titles for individuals may have varied over the period. The year set forth beneath Length of Service in the table below is the year in which the Trustee was first appointed or elected as Trustee to any Fund currently in the Columbia Funds Complex or a predecessor thereof. Under current Board policy, each Trustee generally serves until December 31 of the year such Trustee turns seventy-five (75).
Independent trustees
Name,
address,
year of birth | Position held
with the Columbia Funds and
length of service | Principal occupation(s)
during past five years
and other relevant
professional experience | Number of
Funds in the
Columbia Funds
Complex*
overseen | Other directorships
held by Trustee
during the past five years
and other relevant Board experience |
George S. Batejan
c/o Columbia Management
Investment Advisers, LLC
290 Congress Street
Boston, MA 02210
1954 | | Executive Vice President, Global Head of Technology and Operations, Janus Capital Group, Inc., 2010-2016 | | Former Chairman of the Board, NICSA (National Investment Company Services Association) (Executive Committee, Nominating Committee and Governance Committee), 2014-2016; former Director, Intech Investment Management, 2011-2016; former Board Member, Metro Denver Chamber of Commerce, 2015-2016; former Advisory Board Member, University of Colorado Business School, 2015-2018; former Board Member, Chase Bank International, 1993-1994 |
48
Columbia Corporate Income Fund | Annual Report 2024
TRUSTEES AND OFFICERS (continued)(Unaudited)Independent trustees (continued) Name, address, year of birth | Position held with the Columbia Funds and length of service | Principal occupation(s) during past five years and other relevant professional experience | Number of Funds in the Columbia Funds Complex* overseen | Other directorships held by Trustee during the past five years and other relevant Board experience |
Kathleen Blatz
c/o Columbia Management
Investment Advisers, LLC
290 Congress Street
Boston, MA 02210
1954 | | Attorney, specializing in arbitration and mediation; Trustee of Gerald Rauenhorst 1982 Trusts, since 2020; Chief Justice, Minnesota Supreme Court, 1998-2006; Associate Justice, Minnesota Supreme Court, 1996-1998; Fourth Judicial District Court Judge, Hennepin County, 1994-1996; Attorney in private practice and public service, 1984-1993; State Representative, Minnesota House of Representatives, 1979-1993, which included service on the Tax and Financial Institutions and Insurance Committees; Member and Interim Chair, Minnesota Sports Facilities Authority, January-July 2017; Interim President and Chief Executive Officer, Blue Cross and Blue Shield of Minnesota (health care insurance), February-July 2018, April-October 2021 | | Former Trustee, Blue Cross and Blue Shield of Minnesota, 2009-2021 (Chair of the Business Development Committee, 2014-2017; Chair of the Governance Committee, 2017-2019); former Member and Chair of the Board, Minnesota Sports Facilities Authority, January 2017-July 2017; former Director, Robina Foundation, 2009-2020 (Chair, 2014-2020); Director, Richard M. Schulze Family Foundation, since 2021 |
Pamela G. Carlton
c/o Columbia Management
Investment Advisers, LLC
290 Congress Street
Boston, MA 02210
1954 | Chair since 2023; Trustee since 2007 | President, Springboard – Partners in Cross Cultural Leadership (consulting company), since 2003; Managing Director of US Equity Research, JP Morgan Chase, 1999-2003; Director of US Equity Research, Chase Asset Management, 1996-1999; Co-Director Latin America Research, 1993-1996, COO Global Research, 1992-1996, Co-Director of US Research, 1991-1992, Investment Banker, 1982-1991, Morgan Stanley; Attorney, Cleary Gottlieb Steen & Hamilton LLP, 1980-1982 | | Trustee, New York Presbyterian Hospital Board, since 1996; Director, DR Bank (Audit Committee, since 2017 and Audit Committee Chair, since November 2023); Director, Evercore Inc. (Audit Committee, Nominating and Governance Committee) (financial services company), since 2019; Director, Apollo Commercial Real Estate Finance, Inc. (Chair, Nominating and Governance Committee), since 2021; the Governing Council of the Independent Directors Council (IDC), since 2021 |
Janet Langford Carrig
c/o Columbia Management
Investment Advisers, LLC
290 Congress Street
Boston, MA 02210
1957 | | Senior Vice President, General Counsel and Corporate Secretary, ConocoPhillips (independent energy company), September 2007-October 2018 | | Director, EQT Corporation (natural gas producer), since 2019; former Director, Whiting Petroleum Corporation (independent oil and gas company), 2020-2022 |
J. Kevin Connaughton
c/o Columbia Management
Investment Advisers, LLC
290 Congress Street
Boston, MA 02210
1964 | | CEO and President, RhodeWay Financial (non-profit financial planning firm), since December 2022; Member, FINRA National Adjudicatory Council, January 2020-December 2023; Adjunct Professor of Finance, Bentley University January 2018-April 2023; Consultant to Independent Trustees of CFVIT and CFST I from March 2016 to June 2020 with respect to CFVIT and to December 2020 with respect to CFST I; Managing Director and General Manager of Mutual Fund Products, Columbia Management Investment Advisers, LLC, May 2010-February 2015; President, Columbia Funds, 2008-2015; and senior officer of Columbia Funds and affiliated funds, 2003-2015 | | Former Director, The Autism Project, March 2015-December 2021; former Member of the Investment Committee, St. Michael’s College, November 2015-February 2020; former Trustee, St. Michael’s College, June 2017-September 2019; former Trustee, New Century Portfolios (former mutual fund complex), January 2015-December 2017 |
Columbia Corporate Income Fund | Annual Report 2024
49
TRUSTEES AND OFFICERS (continued)(Unaudited)Independent trustees (continued) Name, address, year of birth | Position held with the Columbia Funds and length of service | Principal occupation(s) during past five years and other relevant professional experience | Number of Funds in the Columbia Funds Complex* overseen | Other directorships held by Trustee during the past five years and other relevant Board experience |
Olive M. Darragh
c/o Columbia Management
Investment Advisers, LLC
290 Congress Street
Boston, MA 02210
1962 | | Managing Director of Darragh Inc. (strategy and talent management consulting firm), since 2010; Founder and CEO, Zolio, Inc. (investment management talent identification platform), since 2004; Consultant to Independent Trustees of CFVIT and CFST I from June 2019 to June 2020 with respect to CFVIT and to December 2020 with respect to CFST I; Partner, Tudor Investments, 2004-2010; Senior Partner, McKinsey & Company (consulting), 1990-2004; Touche Ross CPA, 1985-1988 | | Treasurer, Edinburgh University US Trust Board, since January 2023; Member, HBS Community Action Partners Board, since September 2022; former Director, University of Edinburgh Business School (Member of US Board), 2004-2019; former Director, Boston Public Library Foundation, 2008-2017 |
Patricia M. Flynn
c/o Columbia Management
Investment Advisers, LLC
290 Congress Street
Boston, MA 02210
1950 | | Professor Emeritus of Economics and Management, Bentley University, since 2023; Professor of Economics and Management, Bentley University, 1976-2023; Dean, McCallum Graduate School of Business, Bentley University, 1992-2002 | | Former Trustee, MA Taxpayers Foundation, 1997-2022; former Director, The MA Business Roundtable, 2003-2019; former Chairperson, Innovation Index Advisory Committee, MA Technology Collaborative, 1997-2020 |
Brian J. Gallagher
c/o Columbia Management
Investment Advisers, LLC
290 Congress Street
Boston, MA 02210
1954 | | Retired; Partner with Deloitte & Touche LLP and its predecessors, 1977-2016 | | Trustee, Catholic Schools Foundation, since 2004 |
Douglas A. Hacker
c/o Columbia Management
Investment Advisers, LLC
290 Congress Street
Boston, MA 02210
1955 | | Independent business executive, since May 2006; Executive Vice President – Strategy of United Airlines, December 2002 - May 2006; President of UAL Loyalty Services (airline marketing company), September 2001-December 2002; Executive Vice President and Chief Financial Officer of United Airlines, July 1999-September 2001 | | Director, SpartanNash Company (food distributor), since November 2013 (Chair of the Board, since May 2021); Director, Aircastle Limited (aircraft leasing), since August 2006 (Chair of Audit Committee); former Director, Nash Finch Company (food distributor), 2005-2013; former Director, SeaCube Container Leasing Ltd. (container leasing), 2010-2013; and former Director, Travelport Worldwide Limited (travel information technology), 2014-2019 |
Nancy T. Lukitsh
c/o Columbia Management
Investment Advisers, LLC
290 Congress Street
Boston, MA 02210
1956 | | Senior Vice President, Partner and Director of Marketing, Wellington Management Company, LLP (investment adviser), 1997-2010; Chair, Wellington Management Portfolios (commingled non-U.S. investment pools), 2007-2010; Director, Wellington Trust Company, NA and other Wellington affiliates, 1997-2010 | | |
50
Columbia Corporate Income Fund | Annual Report 2024
TRUSTEES AND OFFICERS (continued)(Unaudited)Independent trustees (continued) Name, address, year of birth | Position held with the Columbia Funds and length of service | Principal occupation(s) during past five years and other relevant professional experience | Number of Funds in the Columbia Funds Complex* overseen | Other directorships held by Trustee during the past five years and other relevant Board experience |
David M. Moffett
c/o Columbia Management
Investment Advisers, LLC
290 Congress Street
Boston, MA 02210
1952 | | Retired; former Chief Executive Officer of Freddie Mac and Chief Financial Officer of U.S. Bank | | Director, CSX Corporation (transportation suppliers); Director, PayPal Holdings Inc. (payment and data processing services); former Director, eBay Inc. (online trading community), 2007-2015; and former Director, CIT Bank, CIT Group Inc. (commercial and consumer finance), 2010-2016; former Senior Adviser to The Carlyle Group (financial services), March 2008-September 2008; former Governance Consultant to Bridgewater Associates, January 2013-December 2015 |
Catherine James Paglia
c/o Columbia Management
Investment Advisers, LLC
290 Congress Street
Boston, MA 02210
1952 | | Director, Enterprise Asset Management, Inc. (private real estate and asset management company), since September 1998; Managing Director and Partner, Interlaken Capital, Inc., 1989-1997; Vice President, 1982-1985, Principal, 1985-1987, Managing Director, 1987-1989, Morgan Stanley; Vice President, Investment Banking, 1980-1982, Associate, Investment Banking, 1976-1980, Dean Witter Reynolds, Inc. | | Director, Valmont Industries, Inc. (irrigation systems manufacturer), since 2012; Trustee, Carleton College (on the Investment Committee), since 1987; Trustee, Carnegie Endowment for International Peace (on the Investment Committee), since 2009 |
Natalie A. Trunow
c/o Columbia Management
Investment Advisers, LLC
290 Congress Street
Boston, MA 02210
1967 | | Chief Executive Officer, Millennial Portfolio Solutions LLC (asset management and consulting services), January 2016-January 2021; Non-executive Member of the Investment Committee and Valuation Committee, Sarona Asset Management Inc. (private equity firm) since September 2019; Advisor, Horizon Investments (asset management and consulting services), August 2018-January 2022; Advisor, Paradigm Asset Management, November 2016-January 2022; Consultant to Independent Trustees of CFVIT and CFST I from September 2016 to June 2020 with respect to CFVIT and to December 2020 with respect to CFST I; Director of Investments/Consultant, Casey Family Programs, April 2016-November 2016; Senior Vice President and Chief Investment Officer, Calvert Investments, August 2008-January 2016; Section Head and Portfolio Manager, General Motors Asset Management, June 1997-August 2008 | | Independent Director, Investment Committee, Health Services for Children with Special Needs, Inc., 2010-2021; Independent Director, (Executive Committee and Chair, Audit Committee), Consumer Credit Counseling Services (formerly Guidewell Financial Solutions), since 2016; Independent Director, (Investment Committee), Sarona Asset Management, since 2019 |
Sandra L. Yeager
c/o Columbia Management
Investment Advisers, LLC
290 Congress Street
Boston, MA 02210
1964 | | Retired; President and founder, Hanoverian Capital, LLC (SEC registered investment advisor firm), 2008-2016; Managing Director, DuPont Capital, 2006-2008; Managing Director, Morgan Stanley Investment Management, 2004-2006; Senior Vice President, Alliance Bernstein, 1990-2004 | | Former Director, NAPE (National Alliance for Partnerships in Equity) Education Foundation, October 2016-October 2020; Advisory Board, Jennersville YMCA, June 2022-June 2023 |
Columbia Corporate Income Fund | Annual Report 2024
51
TRUSTEES AND OFFICERS (continued)(Unaudited)Independent trustees (continued) Interested trustee affiliated with Investment Manager**
Name,
address,
year of birth | Position held with the Columbia Funds and length of service | Principal occupation(s) during the
past five years and other relevant
professional experience | Number of
Funds in the
Columbia Funds
Complex* overseen | Other directorships
held by Trustee
during the past
five years and
other relevant Board experience |
Daniel J. Beckman
c/o Columbia Management
Investment Advisers, LLC
290 Congress Street
Boston, MA 02210
1962 | Trustee since November 2021 and President since June 2021 | President and Principal Executive Officer of the Columbia Funds, since June 2021; Vice President, Columbia Management Investment Advisers, LLC, since April 2015; formerly, Vice President – Head of North America Product, Columbia Management Investment Advisers, LLC, April 2015 – December 2023; President and Principal Executive Officer, Columbia Acorn/Wanger Funds, since July 2021 | | Director, Ameriprise Trust Company, since October 2016; Director, Columbia Management Investment Distributors, Inc., since November 2018; Board of Governors, Columbia Wanger Asset Management, LLC, since January 2022 |
| The term “Columbia Funds Complex” as used herein includes Columbia Seligman Premium Technology Growth Fund, Tri-Continental Corporation and each series of Columbia Funds Series Trust (CFST), Columbia Funds Series Trust I (CFST I), Columbia Funds Series Trust II (CFST II), Columbia ETF Trust I (CET I), Columbia ETF Trust II (CET II), Columbia Funds Variable Insurance Trust (CFVIT) and Columbia Funds Variable Series Trust II (CFVST II). Messrs. Batejan, Beckman, Gallagher, Hacker and Moffett and Mses. Blatz, Carlton, Carrig, Flynn, Paglia, and Yeager serve as directors of Columbia Seligman Premium Technology Growth Fund and Tri-Continental Corporation. |
| Interested person (as defined under the 1940 Act) by reason of being an officer, director, security holder and/or employee of the Investment Manager or Ameriprise Financial. |
The Statement of Additional Information has additional information about the Fund’s Board members and is available, without charge, upon request by calling 800.345.6611, visiting columbiathreadneedleus.com/investor/ or contacting your financial intermediary.
The Board has appointed officers who are responsible for day-to-day business decisions based on policies it has established. The officers serve at the pleasure of the Board. The following table provides basic information about the Officers of the Fund as of the printing of this report, including principal occupations during the past five years, although their specific titles may have varied over the period. In addition to Mr. Beckman, who is President and Principal Executive Officer, the Fund’s other officers are:
Fund officers
Name,
address and
year of birth | Position and year
first appointed to
position for any Fund
in the Columbia
Funds Complex or a
predecessor thereof | Principal occupation(s) during past five years |
Michael G. Clarke
290 Congress Street
Boston, MA 02210
1969 | Chief Financial Officer and Principal Financial Officer (2009); Senior Vice President (2019); Treasurer and Chief Accounting Officer (Principal Accounting Officer) (2024) for CFST, CFST I, CFST II, CFVIT and CFVST II | Senior Vice President and North America Head of Operations & Investor Services, Columbia Management Investment Advisers, LLC, since June 2023 (previously Senior Vice President and Head of Global Operations, March 2022 – June 2023, Vice President, Head of North America Operations, and Co-Head of Global Operations, June 2019 - February 2022 and Vice President – Accounting and Tax, May 2010 - May 2019); senior officer of Columbia Funds and affiliated funds, since 2002. Director, Ameriprise Trust Company, since June 2023. |
52
Columbia Corporate Income Fund | Annual Report 2024
TRUSTEES AND OFFICERS (continued)(Unaudited)Fund officers (continued) Name, address and year of birth | Position and year first appointed to position for any Fund in the Columbia Funds Complex or a predecessor thereof | Principal occupation(s) during past five years |
Marybeth Pilat
290 Congress Street
Boston, MA 02210
1968 | Treasurer and Chief Accounting Officer (Principal Accounting Officer) and Principal Financial Officer (2020) for CET I and CET II; Assistant Treasurer, CFST, CFST I, CFST II, CFVIT and CFVST II | Vice President – Product Pricing and Administration, Columbia Management Investment Advisers, LLC, since May 2017. |
William F. Truscott
290 Congress Street
Boston, MA 02210
1960 | Senior Vice President (2001) | Formerly, Trustee/Director of Columbia Funds Complex or legacy funds, November 2001 - January 1, 2021; Chief Executive Officer, Global Asset Management, Ameriprise Financial, Inc., since September 2012; Chairman of the Board and President, Columbia Management Investment Advisers, LLC, since July 2004 and February 2012, respectively; Chairman of the Board and Chief Executive Officer, Columbia Management Investment Distributors, Inc., since November 2008 and February 2012, respectively; Chairman of the Board and Director, TAM UK International Holdings Limited, since July 2021; formerly Chairman of the Board and Director, Threadneedle Asset Management Holdings, Sàrl, March 2013 – December 2022 and December 2008 – December 2022, respectively; senior executive of various entities affiliated with Columbia Threadneedle Investments. |
Christopher O. Petersen
5228 Ameriprise Financial Center
Minneapolis, MN 55474
1970 | Senior Vice President and Assistant Secretary (2021) | Formerly, Trustee/Director of funds within the Columbia Funds Complex, July 1, 2020 - November 22, 2021; Senior Vice President and Assistant General Counsel, Ameriprise Financial, Inc., since September 2021 (previously Vice President and Lead Chief Counsel, January 2015 - September 2021); formerly, President and Principal Executive Officer of the Columbia Funds, 2015 - 2021; officer of Columbia Funds and affiliated funds, since 2007. |
Thomas P. McGuire
290 Congress Street
Boston, MA 02210
1972 | Senior Vice President and Chief Compliance Officer (2012) | Vice President – Asset Management Compliance, Ameriprise Financial, Inc., since May 2010; Chief Compliance Officer, Columbia Acorn/Wanger Funds, since December 2015; formerly, Chief Compliance Officer, Ameriprise Certificate Company, September 2010 – September 2020. |
Ryan C. Larrenaga
290 Congress Street
Boston, MA 02210
1970 | Senior Vice President (2017), Chief Legal Officer (2017), and Secretary (2015) | Vice President and Chief Counsel, Ameriprise Financial, Inc., since August 2018 (previously Vice President and Group Counsel, August 2011 - August 2018); Chief Legal Officer, Columbia Acorn/Wanger Funds, since September 2020; officer of Columbia Funds and affiliated funds, since 2005. |
Michael E. DeFao
290 Congress Street
Boston, MA 02210
1968 | Vice President (2011) and Assistant Secretary (2010) | Vice President and Chief Counsel, Ameriprise Financial, Inc., since May 2010; Vice President, Chief Legal Officer and Assistant Secretary, Columbia Management Investment Advisers, LLC, since October 2021 (previously Vice President and Assistant Secretary, May 2010 – September 2021). |
Lyn Kephart-Strong
5903 Ameriprise Financial Center
Minneapolis, MN 55474
1960 | | Vice President, Global Investment Operations Services, Columbia Management Investment Advisers, LLC, since 2010; President, Columbia Management Investment Services Corp., since October 2014; President, Ameriprise Trust Company, since January 2017. |
Columbia Corporate Income Fund | Annual Report 2024
53
Liquidity Risk Management Program
(Unaudited)
Pursuant to Rule 22e-4 under the 1940 Act, the Fund has adopted a liquidity risk management program (Program). The Program’s principal objectives include assessing, managing and periodically reviewing the Fund’s liquidity risk. Liquidity risk is defined as the risk that the Fund could not meet redemption requests without significant dilution of remaining investors’ interests in the Fund.
The Board has appointed the Investment Manager as the program administrator for the Fund’s Program. The Investment Manager has delegated oversight of the Program to its Liquidity Risk Management Committee (the Committee). At a board meeting during the fiscal period, the Committee provided the Board with a report addressing the operations of the program and assessing its adequacy and effectiveness of implementation for the period January 1, 2023, through December 31, 2023, including:
•
the Fund had sufficient liquidity to both meet redemptions and operate effectively on behalf of shareholders;
•
there were no material changes to the Program during the period;
•
the implementation of the Program was effective to manage the Fund’s liquidity risk; and
•
the Program operated adequately during the period.
There can be no assurance that the Program will achieve its objectives in the future. Please refer to the Fund’s prospectus for more information regarding the Fund’s exposure to liquidity risk and other principal risks to which an investment in the Fund may be subject.
54
Columbia Corporate Income Fund | Annual Report 2024
[THIS PAGE INTENTIONALLY LEFT BLANK]
Columbia Corporate Income Fund
P.O. Box 219104
Kansas City, MO 64121-9104
Please read and consider the investment objectives, risks, charges and expenses for any fund carefully before investing. For a prospectus and summary prospectus, which contains this and other important information about the Fund, go to
columbiathreadneedleus.com/investor/. The Fund is distributed by Columbia Management Investment Distributors, Inc., member FINRA, and managed by Columbia Management Investment Advisers, LLC.
Columbia Threadneedle Investments (Columbia Threadneedle) is the global brand name of the Columbia and Threadneedle group of companies. All rights reserved.
© 2024 Columbia Management Investment Advisers, LLC.
columbiathreadneedleus.com/investor/
Columbia Total Return Bond Fund
Annual Report
April 30, 2024
In October 2022, the Securities and Exchange Commission (SEC) adopted a final rule, "Tailored Shareholder Reports for Mutual Funds and Exchange-Traded Funds; Fee Information in Investment Company Advertisements." The rule and form amendments will, among other things, require the Fund to transmit concise and visually engaging shareholder reports that highlight key information. The amendments will require that funds tag information in a structured data format and that certain more in-depth information be made available online and available for delivery free of charge to investors on request. The amendments became effective January 24, 2023. There is an 18-month transition period after the effective date of the amendments.
Each Tailored Shareholder Report will be share-class specific and will highlight key fund information the SEC believes is most relevant to investors in assessing their investment in the Fund. Much of the information, including a Fund’s financial statements, that is currently disclosed in a Fund’s shareholder reports will instead be made available on the Fund’s website and filed on Form N-CSR on an annual and semiannual basis. This information will be delivered to investors free of charge upon request. Columbia Fund reports will follow the Tailored Shareholder Report approach beginning with reports covering the period ending May 31, 2024.
The new rule also requires the Fund to mail a printed version of the Tailored Shareholder Report to all shareholders who have not elected to receive shareholder reports electronically. Rather than receiving a postcard notifying investors that the shareholder report for Funds in which they invest is available online, investors will begin receiving the Tailored Shareholder Report in the mail unless they have elected to receive their Fund documents electronically.
| No Financial Institution Guarantee | |
If you elect to receive the shareholder report for Columbia Total Return Bond Fund (the Fund) in paper, mailed to you, the Fund mails one shareholder report to each shareholder address, unless such shareholder elects to receive shareholder reports from the Fund electronically via e-mail or by having a paper notice mailed to you (Postcard Notice) that your Fund’s shareholder report is available at the Columbia funds’ website (columbiathreadneedleus.com/investor/). If you would like more than one report in paper to be mailed to you, or would like to elect to receive reports via e-mail or access them through Postcard Notice, please call shareholder services at 800.345.6611 and additional reports will be sent to you.
Proxy voting policies and procedures
The policy of the Board of Trustees is to vote the proxies of the companies in which the Fund holds investments consistent with the procedures as stated in the Statement of Additional Information (SAI). You may obtain a copy of the SAI without charge by calling 800.345.6611; contacting your financial intermediary; visiting columbiathreadneedleus.com/investor/; or searching the website of the Securities and Exchange Commission (SEC) at sec.gov. Information regarding how the Fund voted proxies relating to portfolio securities is filed with the SEC by August 31st for the most recent 12-month period ending June 30th of that year, and is available without charge by visiting columbiathreadneedleus.com/investor/, or searching the website of the SEC at sec.gov.
Quarterly schedule of investments
The Fund files a complete schedule of portfolio holdings with the SEC for the first and third quarters of each fiscal year on Form N-PORT. The Fund’s Form N-PORT filings are available on the SEC’s website at sec.gov. The Fund’s complete schedule of portfolio holdings, as filed on Form N-PORT, is available on columbiathreadneedleus.com/investor/ or can also be obtained without charge, upon request, by calling 800.345.6611.
Additional Fund information
For more information about the Fund, please visit columbiathreadneedleus.com/investor/ or call 800.345.6611. Customer Service Representatives are available to answer your questions Monday through Friday from 8 a.m. to 7 p.m. Eastern time.
Fund investment manager
Columbia Management Investment Advisers, LLC (the Investment Manager)
290 Congress Street
Boston, MA 02210
Fund distributor
Columbia Management Investment Distributors, Inc.
290 Congress Street
Boston, MA 02210
Fund transfer agent
Columbia Management Investment Services Corp.
P.O. Box 219104
Kansas City, MO 64121-9104
Columbia Total Return Bond Fund | Annual Report 2024
Fund at a Glance(Unaudited) Investment objective
The Fund seeks total return, consisting of current income and capital appreciation.
Portfolio management
Jason Callan
Lead Portfolio Manager
Managed Fund since 2016
Gene Tannuzzo, CFA
Portfolio Manager
Managed Fund since 2017
Alex Christensen, CFA
Portfolio Manager
Managed Fund since 2021
Average annual total returns (%) (for the period ended April 30, 2024) |
| | | | | |
| | | | | |
| | | | | |
| | | | |
| | | | | |
| | | | | |
| | | | |
| | | | |
| | | | |
| | | | |
Bloomberg U.S. Aggregate Bond Index | | | | |
Returns for Class A shares are shown with and without the maximum initial sales charge of 3.00%. Returns for Class C shares are shown with and without the 1.00% contingent deferred sales charge for the first year only. The Fund’s other share classes are not subject to sales charges and have limited eligibility. Please see the Fund’s prospectus for details. Performance for different share classes will vary based on differences in sales charges and fees associated with each share class. All results shown assume reinvestment of distributions during the period. Returns do not reflect the deduction of taxes that a shareholder may pay on Fund distributions or on the redemption of Fund shares. Performance results reflect the effect of any fee waivers or reimbursements of Fund expenses by Columbia Management Investment Advisers, LLC and/or any of its affiliates. Absent these fee waivers or expense reimbursement arrangements, performance results would have been lower.
The performance information shown represents past performance and is not a guarantee of future results. The investment return and principal value of your investment will fluctuate so that your shares, when redeemed, may be worth more or less than their original cost. Current performance may be lower or higher than the performance information shown. You may obtain performance information current to the most recent month-end by contacting your financial intermediary, visiting columbiathreadneedleus.com/investor/ or calling 800.345.6611.
The Bloomberg U.S. Aggregate Bond Index is a broad-based benchmark that measures the investment-grade, U.S. dollar-denominated, fixed-rate taxable bond market, including Treasuries, government-related and corporate securities, mortgage-backed securities (agency fixed-rate and hybrid adjustable-rate mortgage passthroughs), asset-backed securities, and commercial mortgage-backed securities.
Indices are not available for investment, are not professionally managed and do not reflect sales charges, fees, brokerage commissions, taxes or other expenses of investing. Securities in the Fund may not match those in an index.
Columbia Total Return Bond Fund | Annual Report 2024
3
Fund at a Glance (continued)(Unaudited) Performance of a hypothetical $10,000 investment (April 30, 2014 — April 30, 2024)
The chart above shows the change in value of a hypothetical $10,000 investment in Class A shares of Columbia Total Return Bond Fund during the stated time period, and does not reflect the deduction of taxes that a shareholder may pay on Fund distributions or on the redemption of Fund shares.
Portfolio breakdown (%) (at April 30, 2024) |
Asset-Backed Securities - Non-Agency | |
Call Option Contracts Purchased | |
Commercial Mortgage-Backed Securities - Non-Agency | |
| |
| |
| |
Foreign Government Obligations | |
| |
| |
Put Option Contracts Purchased | |
Residential Mortgage-Backed Securities - Agency | |
Residential Mortgage-Backed Securities - Non-Agency | |
| |
U.S. Treasury Obligations | |
| |
Percentages indicated are based upon total investments including option contracts purchased and excluding all other investments in derivatives, if any. The Fund’s portfolio composition is subject to change.
Quality breakdown (%) (at April 30, 2024) |
| |
| |
| |
| |
| |
| |
| |
| |
| |
Percentages indicated are based upon total fixed income investments.
Bond ratings apply to the underlying holdings of the Fund and not the Fund itself and are divided into categories ranging from highest to lowest credit quality, determined by using the middle rating of Moody’s, S&P and Fitch, after dropping the highest and lowest available ratings. When ratings are available from only two rating agencies, the lower rating is used. When a rating is available from only one rating agency, that rating is used. If a security is not rated but has a rating by Kroll and/or DBRS, the same methodology is applied to those bonds that would otherwise be not rated. When a bond is not rated by any rating agency, it is designated as “Not rated.” Credit quality ratings assigned by a rating agency are subjective opinions, not statements of fact, and are subject to change, including daily. The ratings assigned by credit rating agencies are but one of the considerations that the Investment Manager and/or Fund’s subadviser incorporates into
4
Columbia Total Return Bond Fund | Annual Report 2024
Fund at a Glance (continued)(Unaudited) its credit analysis process, along with such other issuer-specific factors as cash flows, capital structure and leverage ratios, ability to de-leverage (repay) through free cash flow, quality of management, market positioning and access to capital, as well as such security-specific factors as the terms of the security (e.g., interest rate and time to maturity) and the amount and type of any collateral.
Derivative breakdown (%) (at April 30, 2024)(a) |
| | | |
Forward foreign currency exchange contracts | | | |
| | | |
| | | |
| | | |
(a) Forward foreign currency exchange contracts, futures contracts and swap contracts are based upon unrealized appreciation (depreciation) as a percentage of net assets. For a description of the Fund’s investments in derivatives, see Investments in derivatives following the Portfolio of Investments, and Note 2 of the Notes to Financial Statements.
(b) Rounds to zero.
Columbia Total Return Bond Fund | Annual Report 2024
5
Manager Discussion of Fund Performance(Unaudited) For the 12-month period that ended April 30, 2024, Class A shares of Columbia Total Return Bond Fund returned -0.67% excluding sales charges. The Fund’s benchmark, the Bloomberg U.S. Aggregate Bond Index, returned -1.47% for the same period.
Market Overview
For the 12 months that ended April 30, 2024, returns for the broader bond market were constrained as U.S. Treasury yields finished the period notably higher. At the same time, performance for credit-sensitive sectors of the market was supported by a resilient economic backdrop.
Inflation continued to ease as 2023 progressed, with June U.S. consumer price inflation coming in at 3.0%. With the economic and employment backdrop remaining strong despite the past policy tightening of the U.S. Federal Reserve (Fed), the central bank would implement additional 25 basis point increases at its May and July meetings, leaving the target range for Fed funds at 5.25% to 5.50%. (A basis point is 1/100 of a percent.) The Fed held rates steady at its last three meetings of 2023, citing the improving inflation outlook.
Entering 2024, with inflation seemingly headed towards the Fed’s 2% target, investors were anticipating as many as six or seven rate cuts in 2024, beginning as soon as March 2024. However, these hopes were dampened as U.S. economic and employment data remained robust, largely dispelling any lingering recession concerns. In addition, the pace of progress in taming inflation remained highly incremental. Against this backdrop, the consensus outlook shifted by the end of the first quarter of 2024 to encompass three Fed rate cuts before year end, with the first occurring in June. Inflation data for March reported in April actually reflected an uptick, leading investors to further push back expectations for the first rate cut to the fall. As of April 30, 2024, the yield on the 10-year U.S. Treasury note closed at 4.69% versus 3.44% 12 months earlier.
The Fund’s notable contributors during the period
•
In broad terms, positive contributions to the Fund’s performance relative to the benchmark were driven by overweight exposure to credit-based sectors, along with an underweight to U.S. Treasuries as the yield curve moved higher over the period.
•
Most notably, exposure to consumer-based credit proved beneficial, led by holdings of non-agency mortgage-backed securities as housing fundamentals remained strong and borrower delinquencies remained low.
•
Positioning in asset-backed securities was also additive, highlighted by holdings of unsecured consumer loans and collateralized loan obligations with floating interest rates.
•
Within corporate bonds, the Fund took advantage of shifting expectations around growth and inflation to add value by tactically increasing or decreasing its overall credit risk exposure.
•
In addition, a focus on the financials sector at the expense of industrials contributed positively. Within financials, the Fund favored the largest, global systemically important banks subject to the most rigorous capital requirements while avoiding the regional and second-tier banks viewed as most vulnerable to any downturn in conditions.
•
Finally, off-benchmark exposure to below-investment grade, high yield corporate bonds added modestly to relative performance.
The Fund’s notable detractors during the period
•
The Fund’s positioning with respect to interest rates weighed most heavily on relative performance. Specifically, the Fund had an above-benchmark stance with respect to duration and corresponding interest rate sensitivity as U.S. Treasury yields moved higher over the period.
•
In addition, performance for the Fund’s agency mortgage-backed security holdings suffered against a backdrop of elevated interest rate volatility which at various junctures raised concerns around either a pick-up in prepayments or duration extension.
6
Columbia Total Return Bond Fund | Annual Report 2024
Manager Discussion of Fund Performance (continued)(Unaudited) Derivative usage
We invested in highly-liquid, widely traded Treasury futures and interest rate swaption contracts to help manage portfolio duration. These enable us to efficiently implement our yield curve opinions and offset unintended yield curve impacts from other investments in the portfolio. We also used indexed exposure to credit default swaps to manage the Fund’s overall level of credit risk. On a standalone basis, the Fund’s use of derivatives had a negative impact on performance.
Market risk may affect a single issuer, sector of the economy, industry or the market as a whole. Fixed-income securities present issuer default risk. A rise in interest rates may result in a price decline of fixed-income instruments held by the Fund, negatively impacting its performance and NAV. Falling rates may result in the Fund investing in lower yielding debt instruments, lowering the Fund’s income and yield. These risks may be heightened for longer maturity and duration securities. Prepayment and extension risk exists because the timing of payments on a loan, bond or other investment may accelerate when interest rates fall or decelerate when interest rates rise which may reduce investment opportunities and potential returns. Non-investment-grade (high-yield or junk) securities present greater price volatility and more risk to principal and income than higher rated securities. Investing in derivatives is a specialized activity that involves special risks that subject the Fund to significant loss potential, including when used as leverage, and may result in greater fluctuation in fund value. Market or other (e.g., interest rate) environments may adversely affect the liquidity of fund investments, negatively impacting their price. Generally, the less liquid the market at the time the Fund sells a holding, the greater the risk of loss or decline of value to the Fund. See the Fund’s prospectus for more information on these and other risks.
The views expressed in this report reflect the current views of the respective parties who have contributed to this report. These views are not guarantees of future performance and involve certain risks, uncertainties and assumptions that are difficult to predict, so actual outcomes and results may differ significantly from the views expressed. These views are subject to change at any time based upon economic, market or other conditions and the respective parties disclaim any responsibility to update such views. These views may not be relied on as investment advice and, because investment decisions for a Columbia fund are based on numerous factors, may not be relied on as an indication of trading intent on behalf of any particular Columbia fund. References to specific securities should not be construed as a recommendation or investment advice.
Columbia Total Return Bond Fund | Annual Report 2024
7
Understanding Your Fund’s Expenses(Unaudited) As an investor, you incur two types of costs. There are shareholder transaction costs, which generally include sales charges on purchases and may include redemption fees. There are also ongoing fund costs, which generally include management fees, distribution and/or service fees, and other fund expenses. The following information is intended to help you understand your ongoing costs (in dollars) of investing in the Fund and to help you compare these costs with the ongoing costs of investing in other mutual funds.
Analyzing your Fund’s expenses
To illustrate these ongoing costs, we have provided examples and calculated the expenses paid by investors in each share class of the Fund during the period. The actual and hypothetical information in the table is based on an initial investment of $1,000 at the beginning of the period indicated and held for the entire period. Expense information is calculated two ways and each method provides you with different information. The amount listed in the “Actual” column is calculated using the Fund’s actual operating expenses and total return for the period. You may use the Actual information, together with the amount invested, to estimate the expenses that you paid over the period. Simply divide your account value by $1,000 (for example, an $8,600 account value divided by $1,000 = 8.6), then multiply the results by the expenses paid during the period under the “Actual” column. The amount listed in the “Hypothetical” column assumes a 5% annual rate of return before expenses (which is not the Fund’s actual return) and then applies the Fund’s actual expense ratio for the period to the hypothetical return. You should not use the hypothetical account values and expenses to estimate either your actual account balance at the end of the period or the expenses you paid during the period. See “Compare with other funds” below for details on how to use the hypothetical data.
Compare with other funds
Since all mutual funds are required to include the same hypothetical calculations about expenses in shareholder reports, you can use this information to compare the ongoing cost of investing in the Fund with other funds. To do so, compare the hypothetical example with the 5% hypothetical examples that appear in the shareholder reports of other funds. As you compare hypothetical examples of other funds, it is important to note that hypothetical examples are meant to highlight the ongoing costs of investing in a fund only and do not reflect any transaction costs, such as sales charges, or redemption or exchange fees. Therefore, the hypothetical calculations are useful in comparing ongoing costs only, and will not help you determine the relative total costs of owning different funds. If transaction costs were included in these calculations, your costs would be higher.
November 1, 2023 — April 30, 2024 |
| Account value at the
beginning of the
period ($) | Account value at the
end of the
period ($) | Expenses paid during
the period ($) | Fund’s annualized
expense ratio (%) |
| | | | | | | |
| | | | | | | |
| | | | | | | |
| | | | | | | |
| | | | | | | |
| | | | | | | |
| | | | | | | |
| | | | | | | |
Expenses paid during the period are equal to the annualized expense ratio for each class as indicated above, multiplied by the average account value over the period and then multiplied by the number of days in the Fund’s most recent fiscal half year and divided by 366.
Expenses do not include fees and expenses incurred indirectly by the Fund from its investment in underlying funds, including affiliated and non-affiliated pooled investment vehicles, such as mutual funds and exchange-traded funds.
Had Columbia Management Investment Advisers, LLC and/or certain of its affiliates not waived/reimbursed certain fees and expenses, account value at the end of the period would have been reduced.
8
Columbia Total Return Bond Fund | Annual Report 2024
Portfolio of InvestmentsApril 30, 2024(Percentages represent value of investments compared to net assets)
Investments in securities
Asset-Backed Securities - Non-Agency 17.1% |
| | | | |
|
Subordinated Series 2024-1PL Class B |
| | | | |
|
|
| | | | |
Affirm Asset Securitization Trust(a) |
|
| | | | |
|
| | | | |
|
| | | | |
|
| | | | |
Ares LVIII CLO Ltd.(a),(b) |
|
3-month Term SOFR + 3.200%
Floor 3.200%
01/15/2035 | | | | |
Ares XLVI CLO Ltd.(a),(b) |
|
3-month Term SOFR + 1.612%
Floor 1.350%
01/15/2030 | | | | |
|
|
3-month Term SOFR + 1.762%
Floor 1.500%
11/21/2030 | | | | |
Bain Capital Credit CLO Ltd.(a),(b) |
|
3-month Term SOFR + 3.512%
Floor 3.250%
10/23/2034 | | | | |
Carlyle Global Market Strategies CLO Ltd.(a),(b) |
Series 2016-1A Class A1R2 |
3-month Term SOFR + 1.402%
Floor 1.140%
04/20/2034 | | | | |
|
|
3-month Term SOFR + 1.662%
01/20/2030 | | | | |
Carvana Auto Receivables Trust(a) |
|
| | | | |
Asset-Backed Securities - Non-Agency (continued) |
| | | | |
|
Series 2018-C17A Class A2R |
3-month Term SOFR + 1.862%
Floor 1.600%
04/30/2031 | | | | |
Citizens Auto Receivables Trust(a) |
|
| | | | |
Conn’s Receivables Funding LLC(a) |
|
| | | | |
|
|
3-month Term SOFR + 1.612%
Floor 1.350%
05/15/2031 | | | | |
|
|
| | | | |
Subordinated Series 2022-1A Class C |
| | | | |
Subordinated Series 2023-3A Class B |
| | | | |
Exeter Automobile Receivables Trust |
|
| | | | |
Subordinated Series 2023-3A Class B |
| | | | |
Exeter Automobile Receivables Trust(a) |
Subordinated Series 2021-2A Class E |
| | | | |
GLS Auto Receivables Issuer Trust(a) |
Subordinated Series 2022-1A-B Class B |
| | | | |
GLS Auto Select Receivables Trust(a) |
|
| | | | |
Goldentree Loan Opportunities XI Ltd.(a),(b) |
Series 2015-11A Class BR2 |
3-month Term SOFR + 1.612%
01/18/2031 | | | | |
LendingPoint Asset Securitization Trust(a) |
Subordinated Series 2022-A Class C |
| | | | |
Madison Park Funding XXVII Ltd.(a),(b) |
|
3-month Term SOFR + 1.612%
04/20/2030 | | | | |
The accompanying Notes to Financial Statements are an integral part of this statement.
Columbia Total Return Bond Fund | Annual Report 2024
9
Portfolio of Investments (continued)April 30, 2024 Asset-Backed Securities - Non-Agency (continued) |
| | | | |
Marlette Funding Trust(a) |
|
| | | | |
|
| | | | |
|
| | | | |
Subordinated Series 2022-2A Class C |
| | | | |
Netcredit Combined Receivables LLC(a),(c),(d) |
|
| | | | |
Octagon Investment Partners 35 Ltd.(a),(b) |
|
3-month Term SOFR + 1.662%
Floor 1.400%
01/20/2031 | | | | |
OHA Credit Partners XVI(a),(b) |
|
3-month Term SOFR + 1.412%
Floor 1.150%
10/18/2034 | | | | |
Oportun Issuance Trust(a) |
|
| | | | |
Subordinated Series 2021-B Class B |
| | | | |
Pagaya AI Debt Selection Trust(a) |
|
| | | | |
|
| | | | |
Subordinated Series 2021-3 Class B |
| | | | |
Subordinated Series 2021-5 Class B |
| | | | |
Subordinated Series 2021-HG1 Class B |
| | | | |
|
|
| | | | |
|
| | | | |
|
| | | | |
|
| | | | |
Asset-Backed Securities - Non-Agency (continued) |
| | | | |
|
| | | | |
|
| | | | |
Subordinated Series 2022-1 Class B |
| | | | |
Subordinated Series 2022-3 Class B |
| | | | |
Subordinated Series 2023-1 Class B |
| | | | |
Subordinated Series 2023-6 Class B |
| | | | |
Subordinated Series 2024-3 Class B |
| | | | |
Subordinated Series 2024-3 Class C |
| | | | |
Pagaya AI Debt Trust(a),(e) |
Subordinated Series 2023-5 Class AB |
| | | | |
PAGAYA AI Debt Trust(a),(e) |
Subordinated Series 2022-3 Class AB |
| | | | |
Palmer Square Loan Funding Ltd.(a),(b) |
|
3-month Term SOFR + 2.012%
Floor 1.750%
10/15/2029 | | | | |
Series 2022-3A Class A1BR |
3-month Term SOFR + 1.400%
Floor 1.400%
04/15/2031 | | | | |
|
|
| | | | |
Research-Driven Pagaya Motor Asset Trust(a) |
|
| | | | |
Research-Driven Pagaya Motor Asset Trust IV(a) |
|
| | | | |
Research-Driven Pagaya Motor Trust(a) |
|
| | | | |
SAFCO Auto Receivables Trust(a) |
|
| | | | |
Santander Drive Auto Receivables Trust |
|
| | | | |
The accompanying Notes to Financial Statements are an integral part of this statement.
10
Columbia Total Return Bond Fund | Annual Report 2024
Portfolio of Investments (continued)April 30, 2024 Asset-Backed Securities - Non-Agency (continued) |
| | | | |
Santander Revolving Auto Loan Trust(a) |
|
| | | | |
Stewart Park CLO Ltd.(a),(b) |
|
3-month Term SOFR + 1.632%
Floor 1.370%
01/15/2030 | | | | |
|
|
| | | | |
|
| | | | |
Upstart Pass-Through Trust(a) |
|
| | | | |
|
| | | | |
|
| | | | |
|
| | | | |
Upstart Securitization Trust(a) |
|
| | | | |
|
| | | | |
Subordinated Series 2021-4 Class B |
| | | | |
|
|
3-month Term SOFR + 3.412%
Floor 3.150%
07/15/2034 | | | | |
Westlake Automobile Receivables Trust(a) |
|
| | | | |
Total Asset-Backed Securities — Non-Agency
(Cost $489,878,027) | |
|
Commercial Mortgage-Backed Securities - Non-Agency 2.1% |
| | | | |
BAMLL Commercial Mortgage Securities Trust(a),(e) |
|
| | | | |
|
Subordinated Series 2018-BXH Class E |
1-month Term SOFR + 2.364%
Floor 2.250%
10/15/2037 | | | | |
Commercial Mortgage-Backed Securities - Non-Agency (continued) |
| | | | |
|
|
1-month Term SOFR + 2.654%
Floor 2.540%
10/15/2034 | | | | |
Braemar Hotels & Resorts Trust(a),(b) |
Subordinated Series 2018-PRME Class D |
1-month Term SOFR + 1.847%
Floor 1.925%
06/15/2035 | | | | |
|
Subordinated Series 2019-IKPR Class D |
1-month Term SOFR + 2.025%
Floor 2.140%
11/15/2038 | | | | |
Subordinated Series 2019-IKPR Class E |
1-month Term SOFR + 2.835%
Floor 2.721%
11/15/2038 | | | | |
COMM Mortgage Trust(a),(e) |
Subordinated Series 2020-CBM Class E |
| | | | |
Credit Suisse Mortgage Capital Certificates OA LLC(a) |
Subordinated Series 2014-USA Class E |
| | | | |
Subordinated Series 2014-USA Class F |
| | | | |
|
Subordinated Series 2016-SFP Class E |
| | | | |
Morgan Stanley Capital I Trust(a),(e) |
|
| | | | |
Progress Residential Trust(a) |
|
| | | | |
Subordinated Series 2020-SFR2 Class E |
| | | | |
SFO Commercial Mortgage Trust(a),(b) |
|
1-month Term SOFR + 1.264%
Floor 1.150%
05/15/2038 | | | | |
UBS Commercial Mortgage Trust(a),(b) |
|
1-month Term SOFR + 1.297%
Floor 1.250%
02/15/2032 | | | | |
The accompanying Notes to Financial Statements are an integral part of this statement.
Columbia Total Return Bond Fund | Annual Report 2024
11
Portfolio of Investments (continued)April 30, 2024 Commercial Mortgage-Backed Securities - Non-Agency (continued) |
| | | | |
Wells Fargo Commercial Mortgage Trust(a),(b) |
|
1-month Term SOFR + 1.047%
Floor 0.875%
12/15/2034 | | | | |
Total Commercial Mortgage-Backed Securities - Non-Agency
(Cost $74,928,545) | |
|
| | |
|
|
Mr. Cooper Group, Inc.(f) | | |
| |
|
|
United Airlines Holdings, Inc.(f) | | |
| |
Total Common Stocks
(Cost $1,511,077) | |
|
| | | | |
|
|
|
| | | | |
Total Convertible Bonds
(Cost $554,460) | |
|
Corporate Bonds & Notes(g) 22.2% |
| | | | |
|
|
| | | | |
|
| | | | |
|
| | | | |
|
| | | | |
L3Harris Technologies, Inc. |
| | | | |
|
| | | | |
Corporate Bonds & Notes(g) (continued) |
| | | | |
Raytheon Technologies Corp. |
| | | | |
Spirit AeroSystems, Inc.(a) |
| | | | |
| | | | |
|
| | | | |
| | | | |
| | | | |
| |
|
|
| | | | |
American Airlines, Inc.(a) |
| | | | |
American Airlines, Inc./AAdvantage Loyalty IP Ltd.(a) |
| | | | |
| | | | |
Hawaiian Brand Intellectual Property Ltd./Miles Loyalty Ltd.(a) |
| | | | |
|
| | | | |
| | | | |
| |
|
American Axle & Manufacturing, Inc. |
| | | | |
Panther BF Aggregator 2 LP/Finance Co., Inc.(a) |
| | | | |
| | | | |
ZF North America Capital, Inc.(a) |
| | | | |
| | | | |
| |
|
|
| | | | |
|
| | | | |
|
| | | | |
| | | | |
|
| | | | |
|
| | | | |
The accompanying Notes to Financial Statements are an integral part of this statement.
12
Columbia Total Return Bond Fund | Annual Report 2024
Portfolio of Investments (continued)April 30, 2024 Corporate Bonds & Notes(g) (continued) |
| | | | |
Goldman Sachs Group, Inc. (The)(i) |
| | | | |
| | | | |
|
| | | | |
|
| | | | |
| | | | |
| | | | |
|
| | | | |
| | | | |
| | | | |
|
| | | | |
PNC Financial Services Group, Inc. (The)(i) |
| | | | |
|
| | | | |
Washington Mutual Bank(c),(d),(j) |
|
| | | | |
|
| | | | |
| | | | |
| |
Brokerage/Asset Managers/Exchanges 0.1% |
|
| | | | |
AG TTMT Escrow Issuer LLC(a) |
| | | | |
Aretec Escrow Issuer 2, Inc.(a) |
| | | | |
Aretec Escrow Issuer, Inc.(a) |
| | | | |
|
| | | | |
| |
|
American Builders & Contractors Supply Co., Inc.(a) |
| | | | |
Beacon Roofing Supply, Inc.(a) |
| | | | |
| | | | |
James Hardie International Finance DAC(a) |
| | | | |
Corporate Bonds & Notes(g) (continued) |
| | | | |
SRS Distribution, Inc.(a) |
| | | | |
| | | | |
Standard Industries, Inc.(a) |
| | | | |
Summit Materials LLC /Finance Corp.(a) |
| | | | |
Summit Materials LLC/Finance Corp.(a) |
| | | | |
|
| | | | |
| |
|
CCO Holdings LLC/Capital Corp.(a) |
| | | | |
| | | | |
| | | | |
| | | | |
| | | | |
| | | | |
CCO Holdings LLC/Capital Corp. |
| | | | |
CCO Holdings LLC/Holdings Capital Corp.(a) |
| | | | |
Charter Communications Operating LLC/Capital |
| | | | |
| | | | |
| | | | |
|
| | | | |
| | | | |
| | | | |
| | | | |
| | | | |
|
| | | | |
|
| | | | |
| | | | |
| | | | |
| | | | |
|
| | | | |
Virgin Media Finance PLC(a) |
| | | | |
Virgin Media Secured Finance PLC(a) |
| | | | |
VZ Secured Financing BV(a) |
| | | | |
The accompanying Notes to Financial Statements are an integral part of this statement.
Columbia Total Return Bond Fund | Annual Report 2024
13
Portfolio of Investments (continued)April 30, 2024 Corporate Bonds & Notes(g) (continued) |
| | | | |
|
| | | | |
|
| | | | |
| |
|
|
| | | | |
Axalta Coating Systems LLC(a) |
| | | | |
Axalta Coating Systems LLC/Dutch Holding B BV(a) |
| | | | |
Braskem Netherlands Finance BV(a) |
| | | | |
Cheever Escrow Issuer LLC(a) |
| | | | |
Element Solutions, Inc.(a) |
| | | | |
|
| | | | |
|
| | | | |
Illuminate Buyer LLC/Holdings IV, Inc.(a) |
| | | | |
|
| | | | |
INEOS Quattro Finance 2 PLC(a) |
| | | | |
|
| | | | |
Innophos Holdings, Inc.(a) |
| | | | |
Iris Holdings, Inc.(a),(k) |
| | | | |
Olympus Water US Holding Corp.(a) |
| | | | |
| | | | |
| | | | |
|
| | | | |
|
| | | | |
| | | | |
| | | | |
| |
Corporate Bonds & Notes(g) (continued) |
| | | | |
Construction Machinery 0.1% |
H&E Equipment Services, Inc.(a) |
| | | | |
|
| | | | |
Ritchie Bros Holdings, Inc.(a) |
| | | | |
| | | | |
United Rentals North America, Inc. |
| | | | |
| | | | |
| | | | |
| |
Consumer Cyclical Services 0.1% |
|
| | | | |
|
| | | | |
| | | | |
|
| | | | |
Uber Technologies, Inc.(a) |
| | | | |
| |
|
|
| | | | |
CD&R Smokey Buyer, Inc.(a) |
| | | | |
|
| | | | |
| | | | |
Scotts Miracle-Gro Co. (The) |
| | | | |
|
| | | | |
| | | | |
| | | | |
| |
Diversified Manufacturing 0.5% |
|
| | | | |
Chart Industries, Inc.(a) |
| | | | |
The accompanying Notes to Financial Statements are an integral part of this statement.
14
Columbia Total Return Bond Fund | Annual Report 2024
Portfolio of Investments (continued)April 30, 2024 Corporate Bonds & Notes(g) (continued) |
| | | | |
Emerald Debt Merger Sub LLC(a) |
| | | | |
|
| | | | |
|
| | | | |
|
| | | | |
| | | | |
|
| | | | |
Vertical US Newco, Inc.(a) |
| | | | |
WESCO Distribution, Inc.(a) |
| | | | |
| | | | |
| | | | |
| | | | |
| |
|
|
| | | | |
Clearway Energy Operating LLC(a) |
| | | | |
| | | | |
| | | | |
|
| | | | |
|
| | | | |
|
| | | | |
|
| | | | |
Leeward Renewable Energy Operations LLC(a) |
| | | | |
NextEra Energy Operating Partners LP(a) |
| | | | |
| | | | |
| | | | |
| | | | |
|
| | | | |
|
| | | | |
| | | | |
| | | | |
Corporate Bonds & Notes(g) (continued) |
| | | | |
Pacific Gas and Electric Co. |
| | | | |
Pattern Energy Operations LP/Inc.(a) |
| | | | |
|
| | | | |
TerraForm Power Operating LLC(a) |
| | | | |
| | | | |
Vistra Operations Co. LLC(a) |
| | | | |
| | | | |
| | | | |
| | | | |
| | | | |
| |
|
GFL Environmental, Inc.(a) |
| | | | |
| | | | |
| | | | |
| | | | |
|
| | | | |
| |
|
|
| | | | |
| | | | |
|
| | | | |
| | | | |
| | | | |
|
| | | | |
| | | | |
| | | | |
| | | | |
Provident Funding Associates LP/Finance Corp.(a) |
| | | | |
Quicken Loans LLC/Co-Issuer, Inc.(a) |
| | | | |
Rocket Mortgage LLC/Co-Issuer, Inc.(a) |
| | | | |
|
| | | | |
| | | | |
The accompanying Notes to Financial Statements are an integral part of this statement.
Columbia Total Return Bond Fund | Annual Report 2024
15
Portfolio of Investments (continued)April 30, 2024 Corporate Bonds & Notes(g) (continued) |
| | | | |
United Wholesale Mortgage LLC(a) |
| | | | |
| | | | |
| |
|
|
| | | | |
|
| | | | |
Chobani LLC/Finance Corp., Inc.(a) |
| | | | |
Constellation Brands, Inc. |
| | | | |
FAGE International SA/USA Dairy Industry, Inc.(a) |
| | | | |
Pepsico Singapore Financing I Pte Ltd. |
| | | | |
|
| | | | |
| | | | |
| | | | |
| | | | |
Primo Water Holdings, Inc.(a) |
| | | | |
Simmons Foods, Inc./Prepared Foods, Inc./Pet Food, Inc./Feed(a) |
| | | | |
Triton Water Holdings, Inc.(a) |
| | | | |
|
| | | | |
| | | | |
| | | | |
| | | | |
| |
|
|
| | | | |
|
| | | | |
Caesars Entertainment, Inc.(a) |
| | | | |
| | | | |
| | | | |
|
| | | | |
|
| | | | |
Corporate Bonds & Notes(g) (continued) |
| | | | |
MGM Resorts International |
| | | | |
Midwest Gaming Borrower LLC(a) |
| | | | |
Penn National Gaming, Inc.(a) |
| | | | |
Scientific Games Holdings LP/US FinCo, Inc.(a) |
| | | | |
Scientific Games International, Inc.(a) |
| | | | |
| |
|
Acadia Healthcare Co., Inc.(a) |
| | | | |
|
| | | | |
| | | | |
Bausch & Lomb Escrow Corp.(a) |
| | | | |
Becton Dickinson Euro Finance SARL |
| | | | |
Catalent Pharma Solutions, Inc.(a) |
| | | | |
| | | | |
Charles River Laboratories International, Inc.(a) |
| | | | |
| | | | |
| | | | |
CHS/Community Health Systems, Inc.(a) |
| | | | |
| | | | |
| | | | |
| | | | |
| | | | |
|
| | | | |
|
| | | | |
|
| | | | |
|
| | | | |
| | | | |
|
| | | | |
| | | | |
Medline Borrower LP/Co-Issuer, Inc.(a) |
| | | | |
The accompanying Notes to Financial Statements are an integral part of this statement.
16
Columbia Total Return Bond Fund | Annual Report 2024
Portfolio of Investments (continued)April 30, 2024 Corporate Bonds & Notes(g) (continued) |
| | | | |
Mozart Debt Merger Sub, Inc.(a) |
| | | | |
| | | | |
|
| | | | |
|
| | | | |
Surgery Center Holdings, Inc.(a) |
| | | | |
|
| | | | |
| | | | |
| | | | |
| | | | |
| | | | |
| | | | |
Tenet Healthcare Corp.(a) |
| | | | |
| |
Healthcare Insurance 1.7% |
|
| | | | |
| | | | |
|
| | | | |
| | | | |
| | | | |
| | | | |
|
| | | | |
| | | | |
| |
|
Shea Homes LP/Funding Corp. |
| | | | |
Taylor Morrison Communities, Inc.(a) |
| | | | |
| |
|
|
| | | | |
| | | | |
Civitas Resources, Inc.(a) |
| | | | |
| | | | |
| | | | |
Corporate Bonds & Notes(g) (continued) |
| | | | |
|
| | | | |
Colgate Energy Partners III LLC(a) |
| | | | |
Comstock Resources, Inc.(a) |
| | | | |
| | | | |
| | | | |
CrownRock LP/Finance, Inc.(a) |
| | | | |
| | | | |
Endeavor Energy Resources LP/Finance, Inc.(a) |
| | | | |
Hilcorp Energy I LP/Finance Co.(a) |
| | | | |
| | | | |
| | | | |
| | | | |
| | | | |
| | | | |
|
| | | | |
| | | | |
Permian Resources Operating LLC(a) |
| | | | |
|
| | | | |
| |
|
|
| | | | |
|
| | | | |
| | | | |
| | | | |
Carnival Holdings Bermuda Ltd.(a) |
| | | | |
Cedar Fair LP/Canada’s Wonderland Co./Magnum Management Corp./Millennium |
| | | | |
Cedar Fair LP/Canada’s Wonderland Co./Magnum Management Corp./Millennium Op |
| | | | |
| | | | |
|
| | | | |
| | | | |
| | | | |
Live Nation Entertainment, Inc.(a) |
| | | | |
The accompanying Notes to Financial Statements are an integral part of this statement.
Columbia Total Return Bond Fund | Annual Report 2024
17
Portfolio of Investments (continued)April 30, 2024 Corporate Bonds & Notes(g) (continued) |
| | | | |
|
| | | | |
| | | | |
|
| | | | |
Royal Caribbean Cruises Ltd.(a) |
| | | | |
| | | | |
| | | | |
| | | | |
Six Flags Entertainment Corp.(a) |
| | | | |
Six Flags Entertainment Corp./Theme Parks, Inc.(a),(h) |
| | | | |
Six Flags Theme Parks, Inc.(a) |
| | | | |
Vail Resorts, Inc.(a),(h) |
| | | | |
|
| | | | |
| | | | |
| |
|
Peachtree Corners Funding Trust(a) |
| | | | |
|
Hilton Domestic Operating Co., Inc.(a) |
| | | | |
| | | | |
| | | | |
| | | | |
Hilton Grand Vacations Borrower Escrow LLC(a) |
| | | | |
Marriott Ownership Resorts, Inc.(a) |
| | | | |
Wyndham Hotels & Resorts, Inc.(a) |
| | | | |
| |
Media and Entertainment 0.6% |
Clear Channel Outdoor Holdings, Inc.(a) |
| | | | |
| | | | |
| | | | |
| | | | |
Clear Channel Worldwide Holdings, Inc.(a) |
| | | | |
Corporate Bonds & Notes(g) (continued) |
| | | | |
iHeartCommunications, Inc. |
| | | | |
| | | | |
|
| | | | |
Outfront Media Capital LLC/Corp.(a) |
| | | | |
| | | | |
| | | | |
| | | | |
Playtika Holding Corp.(a) |
| | | | |
|
| | | | |
Univision Communications, Inc.(a) |
| | | | |
| | | | |
| | | | |
Warnermedia Holdings, Inc. |
| | | | |
| |
|
Alcoa Nederland Holding BV(a) |
| | | | |
Allegheny Technologies, Inc. |
| | | | |
| | | | |
|
| | | | |
|
| | | | |
| | | | |
|
| | | | |
| | | | |
|
| | | | |
| | | | |
|
| | | | |
| | | | |
| | | | |
| |
|
Antero Midstream Partners LP/Finance Corp.(a) |
| | | | |
The accompanying Notes to Financial Statements are an integral part of this statement.
18
Columbia Total Return Bond Fund | Annual Report 2024
Portfolio of Investments (continued)April 30, 2024 Corporate Bonds & Notes(g) (continued) |
| | | | |
CNX Midstream Partners LP(a) |
| | | | |
Delek Logistics Partners LP/Finance Corp.(a) |
| | | | |
|
| | | | |
| | | | |
|
| | | | |
EQM Midstream Partners LP(a) |
| | | | |
| | | | |
| | | | |
EQM Midstream Partners LP |
| | | | |
Galaxy Pipeline Assets Bidco Ltd.(a) |
| | | | |
Hess Midstream Operations LP(a) |
| | | | |
|
| | | | |
Kinder Morgan Energy Partners LP |
| | | | |
|
| | | | |
| | | | |
Plains All American Pipeline LP/Finance Corp. |
| | | | |
|
| | | | |
| | | | |
TransMontaigne Partners LP/TLP Finance Corp. |
| | | | |
Venture Global Calcasieu Pass LLC(a) |
| | | | |
| | | | |
| | | | |
Venture Global LNG, Inc.(a) |
| | | | |
| | | | |
| | | | |
| |
|
|
| | | | |
| | | | |
| |
Corporate Bonds & Notes(g) (continued) |
| | | | |
|
Kodiak Gas Services LLC(a) |
| | | | |
Nabors Industries Ltd.(a) |
| | | | |
Nabors Industries, Inc.(a) |
| | | | |
| | | | |
Transocean Aquila Ltd.(a) |
| | | | |
Transocean Titan Financing Ltd.(a) |
| | | | |
|
| | | | |
| | | | |
USA Compression Partners LP/Finance Corp.(a) |
| | | | |
| |
|
Williams Scotsman International, Inc.(a) |
| | | | |
|
Digital Dutch Finco BV(a) |
| | | | |
Ladder Capital Finance Holdings LLLP/Corp.(a) |
| | | | |
| | | | |
Park Intermediate Holdings LLC/Domestic Property/Finance Co-Issuer(a) |
| | | | |
Park Intermediate Holdings LLC/PK Domestic Property LLC/Finance Co-Issuer(a) |
| | | | |
RHP Hotel Properties LP/Finance Corp.(a) |
| | | | |
| | | | |
| | | | |
|
| | | | |
| | | | |
Service Properties Trust(a) |
| | | | |
| |
|
Ardagh Metal Packaging Finance USA LLC/PLC(a) |
| | | | |
| | | | |
The accompanying Notes to Financial Statements are an integral part of this statement.
Columbia Total Return Bond Fund | Annual Report 2024
19
Portfolio of Investments (continued)April 30, 2024 Corporate Bonds & Notes(g) (continued) |
| | | | |
|
| | | | |
Clydesdale Acquisition Holdings, Inc.(a) |
| | | | |
Trivium Packaging Finance BV(a) |
| | | | |
| | | | |
| |
|
|
| | | | |
|
| | | | |
Bausch Health Companies, Inc.(a) |
| | | | |
Grifols Escrow Issuer SA(a) |
| | | | |
|
| | | | |
| | | | |
Pfizer Investment Enterprises Pte., Ltd. |
| | | | |
| |
|
Alliant Holdings Intermediate LLC/Co-Issuer(a) |
| | | | |
| | | | |
| | | | |
| | | | |
| | | | |
|
| | | | |
|
| | | | |
| | | | |
BroadStreet Partners, Inc.(a) |
| | | | |
|
| | | | |
HUB International Ltd.(a) |
| | | | |
| | | | |
HUB International, Ltd.(a) |
| | | | |
Panther Escrow Issuer LLC(a) |
| | | | |
Corporate Bonds & Notes(g) (continued) |
| | | | |
|
| | | | |
| |
|
Genesee & Wyoming, Inc.(a) |
| | | | |
|
|
| | | | |
|
1011778 BC ULC/New Red Finance, Inc.(a) |
| | | | |
Fertitta Entertainment LLC/Finance Co., Inc.(a) |
| | | | |
|
| | | | |
|
| | | | |
| | | | |
| |
|
Asbury Automotive Group, Inc.(a) |
| | | | |
| | | | |
Group 1 Automotive, Inc.(a) |
| | | | |
|
| | | | |
| | | | |
|
| | | | |
| | | | |
|
| | | | |
LCM Investments Holdings II LLC(a) |
| | | | |
| | | | |
|
| | | | |
|
| | | | |
| | | | |
PetSmart, Inc./Finance Corp.(a) |
| | | | |
| | | | |
The accompanying Notes to Financial Statements are an integral part of this statement.
20
Columbia Total Return Bond Fund | Annual Report 2024
Portfolio of Investments (continued)April 30, 2024 Corporate Bonds & Notes(g) (continued) |
| | | | |
Wolverine World Wide, Inc.(a) |
| | | | |
| |
|
Albertsons Companies LLC/Safeway, Inc./New Albertsons LP/Albertsons LLC(a) |
| | | | |
Albertsons Companies, Inc./Safeway, Inc./New Albertsons LP/Albertsons LLC(a) |
| | | | |
| | | | |
| |
|
|
| | | | |
| | | | |
Boxer Parent Co., Inc.(a) |
| | | | |
|
| | | | |
|
| | | | |
Central Parent LLC/CDK Global II LLC/Financing, Co., Inc.(a) |
| | | | |
Central Parent, Inc./CDK Global, Inc.(a) |
| | | | |
Clarivate Science Holdings Corp.(a) |
| | | | |
| | | | |
Cloud Software Group, Inc.(a) |
| | | | |
Condor Merger Sub, Inc.(a) |
| | | | |
Dun & Bradstreet Corp. (The)(a) |
| | | | |
|
| | | | |
|
| | | | |
| | | | |
GTCR W-2 Merger Sub LLC(a) |
| | | | |
|
| | | | |
Helios Software Holdings, Inc.(a) |
| | | | |
Helios Software Holdings, Inc./ION Corporate Solutions Finance Sarl(a),(h) |
| | | | |
Corporate Bonds & Notes(g) (continued) |
| | | | |
ION Trading Technologies Sarl(a) |
| | | | |
|
| | | | |
| | | | |
| | | | |
| | | | |
Minerva Merger Sub, Inc.(a) |
| | | | |
NCR Atleos Escrow Corp.(a) |
| | | | |
|
| | | | |
| | | | |
| | | | |
Neptune Bidco US, Inc.(a) |
| | | | |
NXP BV/Funding LLC/USA, Inc. |
| | | | |
| | | | |
|
| | | | |
|
| | | | |
|
| | | | |
|
| | | | |
Shift4 Payments LLC/Finance Sub, Inc.(a) |
| | | | |
|
| | | | |
|
| | | | |
ZoomInfo Technologies LLC/Finance Corp.(a) |
| | | | |
| |
Transportation Services 0.3% |
Avis Budget Car Rental LLC/Finance, Inc.(a) |
| | | | |
|
| | | | |
| |
|
Altice France Holding SA(a) |
| | | | |
The accompanying Notes to Financial Statements are an integral part of this statement.
Columbia Total Return Bond Fund | Annual Report 2024
21
Portfolio of Investments (continued)April 30, 2024 Corporate Bonds & Notes(g) (continued) |
| | | | |
|
| | | | |
| | | | |
| | | | |
|
| | | | |
|
| | | | |
| | | | |
|
| | | | |
Vmed O2 UK Financing I PLC(a) |
| | | | |
| | | | |
| | | | |
| |
|
Frontier Communications Holdings LLC(a) |
| | | | |
| | | | |
|
| | | | |
| | | | |
Iliad Holding SASU(a),(h) |
| | | | |
Verizon Communications, Inc. |
| | | | |
| |
Total Corporate Bonds & Notes
(Cost $704,406,802) | |
|
Foreign Government Obligations(l) 1.8% |
| | | | |
|
|
| | | | |
| | | | |
| | | | |
| | | | |
| | | | |
| |
|
Colombia Government International Bond |
| | | | |
| | | | |
| | | | |
| |
Foreign Government Obligations(l) (continued) |
| | | | |
|
Dominican Republic International Bond(a) |
| | | | |
|
Egypt Government International Bond(a) |
| | | | |
|
Export-Import Bank of India(a) |
| | | | |
|
Indonesia Asahan Aluminium PT/Mineral Industri Persero(a) |
| | | | |
|
Ivory Coast Government International Bond(a) |
| | | | |
|
|
| | | | |
| | | | |
| | | | |
| | | | |
| |
|
Paraguay Government International Bond(a) |
| | | | |
|
Qatar Government International Bond(a) |
| | | | |
|
| | | | |
| |
|
Gazprom OAO Via Gaz Capital SA(a) |
| | | | |
|
Saudi Government International Bond(a) |
| | | | |
|
Republic of South Africa Government International Bond |
| | | | |
The accompanying Notes to Financial Statements are an integral part of this statement.
22
Columbia Total Return Bond Fund | Annual Report 2024
Portfolio of Investments (continued)April 30, 2024 Foreign Government Obligations(l) (continued) |
| | | | |
United Arab Emirates 0.2% |
|
| | | | |
|
| | | | |
| |
Total Foreign Government Obligations
(Cost $65,406,647) | |
|
Inflation-Indexed Bonds 0.3% |
| | | | |
|
U.S. Treasury Inflation-Indexed Bond |
| | | | |
Total Inflation-Indexed Bonds
(Cost $7,675,245) | |
|
Residential Mortgage-Backed Securities - Agency 38.8% |
| | | | |
|
CMO Series 2023-46 Class SC |
30-day Average SOFR + 5.886%
Cap 6.000%
06/25/2050 | | | | |
CMO Series 2023-57 Class SA |
-1.0 x 30-day Average SOFR + 5.886%
Cap 6.000%
02/25/2050 | | | | |
CMO Series 2023-65 Class S |
-1.0 x 30-day Average SOFR + 5.886%
Cap 6.000%
03/25/2050 | | | | |
Federal Home Loan Mortgage Corp. |
| | | | |
| | | | |
| | | | |
| | | | |
| | | | |
| | | | |
| | | | |
| | | | |
| | | | |
Federal Home Loan Mortgage Corp.(n) |
| | | | |
Residential Mortgage-Backed Securities - Agency (continued) |
| | | | |
Federal Home Loan Mortgage Corp.(b),(m) |
|
-1.0 x 30-day Average SOFR + 5.786%
Cap 5.900%
09/15/2041 | | | | |
|
-1.0 x 30-day Average SOFR + 5.936%
Cap 6.050%
08/15/2042 | | | | |
|
-1.0 x 30-day Average SOFR + 0.554%
11/15/2042 | | | | |
|
-1.0 x 30-day Average SOFR + 5.936%
Cap 6.050%
08/25/2049 | | | | |
|
-1.0 x 30-day Average SOFR + 5.936%
Cap 6.050%
06/25/2048 | | | | |
CMO STRIPS Series 2012-278 Class S1 |
-1.0 x 30-day Average SOFR + 5.936%
Cap 6.050%
09/15/2042 | | | | |
CMO STRIPS Series 309 Class S4 |
-1.0 x 30-day Average SOFR + 5.856%
Cap 5.970%
08/15/2043 | | | | |
Federal Home Loan Mortgage Corp.(m) |
|
| | | | |
Federal Home Loan Mortgage Corp. REMICS(b),(m) |
|
-1.0 x 30-day Average SOFR + 6.036%
Cap 6.150%
07/15/2047 | | | | |
|
-1.0 x 30-day Average SOFR + 6.164%
Cap 6.050%
10/15/2049 | | | | |
The accompanying Notes to Financial Statements are an integral part of this statement.
Columbia Total Return Bond Fund | Annual Report 2024
23
Portfolio of Investments (continued)April 30, 2024 Residential Mortgage-Backed Securities - Agency (continued) |
| | | | |
|
-1.0 x 30-day Average SOFR + 5.886%
Cap 6.000%
01/15/2048 | | | | |
Federal Home Loan Mortgage Corp. REMICS(m) |
|
| | | | |
|
| | | | |
|
| | | | |
Federal National Mortgage Association(b) |
6-month Term SOFR + 1.415%
Floor 1.415%, Cap 11.040%
06/01/2032 | | | | |
1-year CMT + 2.305%
Floor 2.305%, Cap 10.430%
07/01/2037 | | | | |
Federal National Mortgage Association(n) |
| | | | |
| | | | |
Federal National Mortgage Association |
| | | | |
| | | | |
| | | | |
| | | | |
| | | | |
| | | | |
CMO Series 2017-72 Class B |
| | | | |
Federal National Mortgage Association(b),(m) |
CMO Series 2013-101 Class CS |
-1.0 x 30-day Average SOFR + 5.786%
Cap 5.900%
10/25/2043 | | | | |
CMO Series 2014-93 Class ES |
-1.0 x 30-day Average SOFR + 6.036%
Cap 6.150%
01/25/2045 | | | | |
Residential Mortgage-Backed Securities - Agency (continued) |
| | | | |
CMO Series 2016-31 Class VS |
-1.0 x 30-day Average SOFR + 5.886%
Cap 6.000%
06/25/2046 | | | | |
CMO Series 2016-53 Class KS |
-1.0 x 30-day Average SOFR + 5.886%
Cap 6.000%
08/25/2046 | | | | |
CMO Series 2016-57 Class SA |
-1.0 x 30-day Average SOFR + 5.886%
Cap 6.000%
08/25/2046 | | | | |
CMO Series 2017-109 Class SA |
-1.0 x 30-day Average SOFR + 6.036%
Cap 6.150%
01/25/2048 | | | | |
CMO Series 2017-20 Class SA |
-1.0 x 30-day Average SOFR + 5.986%
Cap 6.100%
04/25/2047 | | | | |
CMO Series 2017-54 Class NS |
-1.0 x 30-day Average SOFR + 6.036%
Cap 6.150%
07/25/2047 | | | | |
CMO Series 2017-54 Class SN |
-1.0 x 30-day Average SOFR + 6.036%
Cap 6.150%
07/25/2047 | | | | |
CMO Series 2018-66 Class SM |
-1.0 x 30-day Average SOFR + 6.086%
Cap 6.200%
09/25/2048 | | | | |
CMO Series 2018-67 MS Class MS |
-1.0 x 30-day Average SOFR + 6.086%
Cap 6.200%
09/25/2048 | | | | |
CMO Series 2018-74 Class SA |
-1.0 x 30-day Average SOFR + 6.036%
Cap 6.150%
10/25/2048 | | | | |
The accompanying Notes to Financial Statements are an integral part of this statement.
24
Columbia Total Return Bond Fund | Annual Report 2024
Portfolio of Investments (continued)April 30, 2024 Residential Mortgage-Backed Securities - Agency (continued) |
| | | | |
CMO Series 2019-33 Class SB |
-1.0 x 30-day Average SOFR + 5.936%
Cap 6.050%
07/25/2049 | | | | |
CMO Series 2019-42 Class SA |
-1.0 x 30-day Average SOFR + 5.936%
Cap 6.050%
08/25/2049 | | | | |
CMO Series 2019-60 Class SH |
-1.0 x 30-day Average SOFR + 5.936%
Cap 6.050%
10/25/2049 | | | | |
CMO Series 2019-67 Class SE |
-1.0 x 30-day Average SOFR + 5.936%
Cap 6.050%
11/25/2049 | | | | |
Federal National Mortgage Association REMICS(b),(m) |
CMO Series 2013-26 Class SE |
-1.0 x 30-day Average SOFR + 6.036%
Cap 6.150%
04/25/2043 | | | | |
|
|
| | | | |
|
| | | | |
Freddie Mac REMICS(b),(m) |
|
-1.0 x 30-day Average SOFR + 5.950%
Cap 5.950%
08/25/2053 | | | | |
|
-1.0 x 30-day Average SOFR + 5.936%
Cap 6.050%
05/15/2049 | | | | |
Government National Mortgage Association(b) |
1-year CMT + 1.500%
Floor 1.500%, Cap 11.500%
07/20/2025 | | | | |
Government National Mortgage Association(n) |
| | | | |
Government National Mortgage Association(m) |
CMO Series 2014-184 Class CI |
| | | | |
Residential Mortgage-Backed Securities - Agency (continued) |
| | | | |
CMO Series 2020-175 Class KI |
| | | | |
CMO Series 2020-189 Class HI |
| | | | |
CMO Series 2020-191 Class UG |
| | | | |
CMO Series 2021-119 Class QI |
| | | | |
CMO Series 2021-140 Class IJ |
| | | | |
CMO Series 2021-16 Class KI |
| | | | |
CMO Series 2021-89 Class IO |
| | | | |
CMO Series 2021-97 Class IQ |
| | | | |
Government National Mortgage Association(b),(m) |
CMO Series 2016-120 Class NS |
-1.0 x 1-month Term SOFR + 5.986%
Cap 6.100%
09/20/2046 | | | | |
CMO Series 2017-130 Class GS |
-1.0 x 1-month Term SOFR + 6.086%
Cap 6.200%
08/20/2047 | | | | |
CMO Series 2017-130 Class HS |
-1.0 x 1-month Term SOFR + 6.086%
Cap 6.200%
08/20/2047 | | | | |
CMO Series 2017-134 Class SD |
-1.0 x 1-month Term SOFR + 6.086%
Cap 6.200%
09/20/2047 | | | | |
CMO Series 2017-149 Class BS |
-1.0 x 1-month Term SOFR + 6.086%
Cap 6.200%
10/20/2047 | | | | |
CMO Series 2017-153 Class SE |
-1.0 x 1-month Term SOFR + 6.086%
Cap 6.200%
10/20/2047 | | | | |
The accompanying Notes to Financial Statements are an integral part of this statement.
Columbia Total Return Bond Fund | Annual Report 2024
25
Portfolio of Investments (continued)April 30, 2024 Residential Mortgage-Backed Securities - Agency (continued) |
| | | | |
CMO Series 2017-163 Class SA |
-1.0 x 1-month Term SOFR + 6.086%
Cap 6.200%
11/20/2047 | | | | |
CMO Series 2017-37 Class SB |
-1.0 x 1-month Term SOFR + 6.036%
Cap 6.150%
03/20/2047 | | | | |
CMO Series 2018-103 Class SA |
-1.0 x 1-month Term SOFR + 6.086%
Cap 6.200%
08/20/2048 | | | | |
CMO Series 2018-112 Class LS |
-1.0 x 1-month Term SOFR + 6.086%
Cap 6.200%
08/20/2048 | | | | |
CMO Series 2018-125 Class SK |
-1.0 x 1-month Term SOFR + 6.136%
Cap 6.250%
09/20/2048 | | | | |
CMO Series 2018-134 Class KS |
-1.0 x 1-month Term SOFR + 6.086%
Cap 6.200%
10/20/2048 | | | | |
CMO Series 2018-139 Class SC |
-1.0 x 1-month Term SOFR + 6.036%
Cap 6.150%
10/20/2048 | | | | |
CMO Series 2018-148 Class HS |
-1.0 x 1-month Term SOFR + 6.086%
Cap 6.200%
11/20/2045 | | | | |
CMO Series 2018-148 Class SB |
-1.0 x 1-month Term SOFR + 6.086%
Cap 6.200%
01/20/2048 | | | | |
CMO Series 2018-151 Class SA |
-1.0 x 1-month Term SOFR + 6.036%
Cap 6.150%
11/20/2048 | | | | |
Residential Mortgage-Backed Securities - Agency (continued) |
| | | | |
CMO Series 2018-89 Class MS |
-1.0 x 1-month Term SOFR + 6.086%
Cap 6.200%
06/20/2048 | | | | |
CMO Series 2018-89 Class SM |
-1.0 x 1-month Term SOFR + 6.086%
Cap 6.200%
06/20/2048 | | | | |
CMO Series 2018-91 Class DS |
-1.0 x 1-month Term SOFR + 6.086%
Cap 6.200%
07/20/2048 | | | | |
CMO Series 2019-20 Class JS |
-1.0 x 1-month Term SOFR + 5.886%
Cap 6.000%
02/20/2049 | | | | |
CMO Series 2019-5 Class SH |
-1.0 x 1-month Term SOFR + 6.036%
Cap 6.150%
01/20/2049 | | | | |
CMO Series 2019-56 Class SG |
-1.0 x 1-month Term SOFR + 6.036%
Cap 6.150%
05/20/2049 | | | | |
CMO Series 2019-59 Class KS |
-1.0 x 1-month Term SOFR + 5.936%
Cap 6.050%
05/20/2049 | | | | |
CMO Series 2019-6 Class SD |
-1.0 x 1-month Term SOFR + 5.986%
Cap 6.100%
01/20/2049 | | | | |
CMO Series 2019-85 Class SC |
-1.0 x 1-month Term SOFR + 6.036%
Cap 6.150%
07/20/2049 | | | | |
CMO Series 2019-90 Class SD |
-1.0 x 1-month Term SOFR + 6.036%
Cap 6.150%
07/20/2049 | | | | |
The accompanying Notes to Financial Statements are an integral part of this statement.
26
Columbia Total Return Bond Fund | Annual Report 2024
Portfolio of Investments (continued)April 30, 2024 Residential Mortgage-Backed Securities - Agency (continued) |
| | | | |
CMO Series 2020-21 Class VS |
-1.0 x 1-month Term SOFR + 6.164%
Cap 6.050%
02/20/2050 | | | | |
CMO Series 2020-61 Class SW |
-1.0 x 1-month Term SOFR + 5.936%
Cap 6.050%
08/20/2049 | | | | |
CMO Series 2020-62 Class SG |
-1.0 x 1-month Term SOFR + 6.036%
Cap 6.150%
05/20/2050 | | | | |
CMO Series 2021-116 Class YS |
-1.0 x 1-month Term SOFR + 6.086%
Cap 6.200%
09/20/2050 | | | | |
CMO Series 2022-18 Class SL |
-1.0 x 30-day Average SOFR + 6.300%
Cap 6.300%
01/20/2052 | | | | |
CMO Series 2022-207 Class SC |
-1.0 x 1-month Term SOFR + 5.986%
Cap 6.100%
01/20/2050 | | | | |
CMO Series 2022-63 Class GS |
-1.0 x 30-day Average SOFR + 5.500%
Cap 5.500%
04/20/2052 | | | | |
CMO Series 2022-81 Class SK |
-1.0 x 1-month Term SOFR + 6.086%
Cap 6.200%
08/20/2047 | | | | |
CMO Series 2023-101 Class SE |
-1.0 x 30-day Average SOFR + 6.000%
Cap 6.000%
07/20/2053 | | | | |
CMO Series 2023-132 Class SB |
-1.0 x 30-day Average SOFR + 6.500%
Cap 6.500%
09/20/2053 | | | | |
Residential Mortgage-Backed Securities - Agency (continued) |
| | | | |
CMO Series 2023-141 Class SN |
-1.0 x 1-month Term SOFR + 5.936%
Cap 6.050%
04/20/2049 | | | | |
CMO Series 2023-17 Class SY |
-1.0 x 1-month Term SOFR + 5.936%
Cap 6.050%
05/20/2050 | | | | |
CMO Series 2023-66 Class AS |
-1.0 x 1-month Term SOFR + 5.986%
Cap 6.100%
09/20/2049 | | | | |
CMO Series 2024-30 Class XH |
-1.0 x 30-day Average SOFR + 5.850%
Cap 5.850%
02/20/2054 | | | | |
Government National Mortgage Association TBA(h) |
| | | | |
| | | | |
| | | | |
Uniform Mortgage-Backed Security TBA(h) |
| | | | |
| | | | |
| | | | |
| | | | |
| | | | |
Total Residential Mortgage-Backed Securities - Agency
(Cost $1,200,646,309) | |
|
Residential Mortgage-Backed Securities - Non-Agency 18.8% |
| | | | |
510 Asset Backed Trust(a),(e) |
CMO Series 2021-NPL2 Class A1 |
| | | | |
Angel Oak Mortgage Trust I LLC(a),(e) |
CMO Series 2018-3 Class M1 |
| | | | |
BRAVO Residential Funding Trust(a),(e) |
CMO Series 2021-A Class A1 |
| | | | |
BVRT Financing Trust(a),(b),(d) |
CMO Series 2021-3F Class M2 |
30-day Average SOFR + 2.900%
Floor 2.900%
07/12/2033 | | | | |
|
CMO Series 2021-RTL1 Class A1 |
| | | | |
The accompanying Notes to Financial Statements are an integral part of this statement.
Columbia Total Return Bond Fund | Annual Report 2024
27
Portfolio of Investments (continued)April 30, 2024 Residential Mortgage-Backed Securities - Non-Agency (continued) |
| | | | |
CHNGE Mortgage Trust(a),(e) |
CMO Series 2022-1 Class M1 |
| | | | |
CMO Series 2022-3 Class A1 |
| | | | |
CMO Series 2022-5 Class A1 |
| | | | |
CMO Series 2023-3 Class A1 |
| | | | |
Citigroup Mortgage Loan Trust, Inc.(a) |
Subordinated CMO Series 2014-C Class B1 |
| | | | |
COLT Mortgage Loan Trust(a),(e) |
CMO Series 2021-3 Class A1 |
| | | | |
CMO Series 2021-5 Class A3 |
| | | | |
CMO Series 2021-6 Class A3 |
| | | | |
Connecticut Avenue Securities Trust(a),(b) |
CMO Series 2019-HRP1 Class M2 |
30-day Average SOFR + 2.264%
11/25/2039 | | | | |
CMO Series 2022-R01 Class 1M2 |
30-day Average SOFR + 1.900%
12/25/2041 | | | | |
Credit Suisse Mortgage Trust(a),(e) |
CMO Series 2021-NQM1 Class A3 |
| | | | |
|
CMO Series 2020-RPL2 Class A12 |
| | | | |
CMO Series 2022-RPL3 Class A1 |
| | | | |
Deephaven Residential Mortgage Trust(a),(e) |
CMO Series 2020-2 Class M1 |
| | | | |
CMO Series 2021-4 Class A1 |
| | | | |
CMO Series 2021-4 Class A3 |
| | | | |
Ellington Financial Mortgage Trust(a),(e) |
CMO Series 2019-2 Class M1 |
| | | | |
|
CMO Series 2023-HE3 Class B |
| | | | |
Residential Mortgage-Backed Securities - Non-Agency (continued) |
| | | | |
FMC GMSR Issuer Trust(a),(e) |
CMO Series 2020-GT1 Class A |
| | | | |
|
CMO Series 2020-CS02 Class M4 |
30-day Average SOFR + 0.000%
06/25/2033 | | | | |
Freddie Mac STACR REMIC Trust(a),(b) |
CMO Series 2021-DNA5 Class M2 |
30-day Average SOFR + 1.650%
01/25/2034 | | | | |
CMO Series 2021-HQA1 Class M2 |
30-day Average SOFR + 2.250%
08/25/2033 | | | | |
CMO Series 2022-DNA1 Class M1B |
30-day Average SOFR + 1.850%
01/25/2042 | | | | |
CMO Series 2022-HQA1 Class M2 |
30-day Average SOFR + 5.250%
03/25/2042 | | | | |
CMO Series 2023-HQA1 Class M1B |
30-day Average SOFR + 3.500%
05/25/2043 | | | | |
Subordinated CMO Series 2021-HQA1 Class B2 |
30-day Average SOFR + 5.000%
08/25/2033 | | | | |
Freddie Mac Structured Agency Credit Risk Debt Notes(a),(b) |
CMO Series 2019-CS03 Class M2 |
30-day Average SOFR + 0.114%
10/25/2032 | | | | |
|
CMO Series 2021-CM1 Class A1 |
| | | | |
|
CMO Series 2021-NQM6 Class A2 |
| | | | |
CMO Series 2021-NQM6 Class A3 |
| | | | |
CMO Series 2021-NQM7 Class A3 |
| | | | |
Genworth Mortgage Insurance Corp.(a),(b) |
CMO Series 2021-3 Class M1B |
30-day Average SOFR + 2.900%
Floor 2.900%
02/25/2034 | | | | |
Imperial Fund Mortgage Trust(a),(e) |
CMO Series 2021-NQM4 Class A2 |
| | | | |
The accompanying Notes to Financial Statements are an integral part of this statement.
28
Columbia Total Return Bond Fund | Annual Report 2024
Portfolio of Investments (continued)April 30, 2024 Residential Mortgage-Backed Securities - Non-Agency (continued) |
| | | | |
Legacy Mortgage Asset Trust(a),(e) |
CMO Series 2021-GS1 Class A1 |
| | | | |
CMO Series 2021-GS2 Class A1 |
| | | | |
CMO Series 2021-SL2 Class A |
| | | | |
|
CMO Series 2020-NQM1 Class M1 |
| | | | |
CMO Series 2020-NQM2 Class M1 |
| | | | |
Mill City Mortgage Loan Trust(a),(e) |
CMO Series 2023-NQM1 Class A1 |
| | | | |
New Residential Mortgage Loan Trust(a),(e) |
Subordinated CMO Series 2020-RPL1 Class B4 |
| | | | |
NRZ Excess Spread-Collateralized Notes(a) |
|
| | | | |
Oaktown Re VI Ltd.(a),(b) |
CMO Series 2021-1A Class M1B |
30-day Average SOFR + 2.050%
Floor 2.050%
10/25/2033 | | | | |
PMT Credit Risk Transfer Trust(a),(b) |
|
1-month Term SOFR + 3.864%
Floor 3.750%
05/30/2025 | | | | |
Point Securitization Trust(a),(e) |
CMO Series 2021-1 Class A1 |
| | | | |
Preston Ridge Partners Mortgage Trust(a),(e) |
CMO Series 2021-2 Class A1 |
| | | | |
CMO Series 2021-3 Class A1 |
| | | | |
CMO Series 2021-7 Class A1 |
| | | | |
CMO Series 2021-8 Class A1 |
| | | | |
|
CMO Series 2024-NPL1 Class A1 |
| | | | |
CMO Series 2024-RN1 Class A1 |
| | | | |
Residential Mortgage-Backed Securities - Non-Agency (continued) |
| | | | |
Pretium Mortgage Credit Partners(a),(e) |
CMO Series 2022-NPL1 Class A1 |
| | | | |
Pretium Mortgage Credit Partners I LLC(a),(e) |
CMO Series 2021-NPL2 Class A1 |
| | | | |
Pretium Mortgage Credit Partners LLC(a),(e) |
CMO Series 2021-RN2 Class A1 |
| | | | |
|
CMO Series 2021-RPL1 Class A1 |
| | | | |
|
CMO Series 2024-1 Class A1 |
| | | | |
Residential Mortgage Loan Trust(a),(e) |
CMO Series 2019-3 Class A3 |
| | | | |
Saluda Grade Alternative Mortgage Trust(a) |
CMO Series 2020-FIG1 Class A1 |
| | | | |
Saluda Grade Alternative Mortgage Trust(a),(c),(d),(e) |
Subordinated CMO Series 2023-FIG4 Class CE |
| | | | |
SG Residential Mortgage Trust(a),(e) |
CMO Series 2019-3 Class M1 |
| | | | |
Stanwich Mortgage Loan Co. LLC(a),(e) |
CMO Series 2021-NPB1 Class A1 |
| | | | |
Starwood Mortgage Residential Trust(a),(e) |
CMO Series 2020-3 Class M1 |
| | | | |
CMO Series 2021-3 Class A1 |
| | | | |
CMO Series 2021-6 Class A3 |
| | | | |
CMO Series 2022-2 Class A1 |
| | | | |
Toorak Mortgage Corp., Ltd.(a),(e) |
CMO Series 2021-1 Class A1 |
| | | | |
|
CMO Series 2021-2 Class M1B |
1-month Term SOFR + 2.714%
Floor 2.600%
10/25/2033 | | | | |
The accompanying Notes to Financial Statements are an integral part of this statement.
Columbia Total Return Bond Fund | Annual Report 2024
29
Portfolio of Investments (continued)April 30, 2024 Residential Mortgage-Backed Securities - Non-Agency (continued) |
| | | | |
|
CMO Series 2023-1 Class A |
| | | | |
VCAT Asset Securitization LLC(a),(e) |
CMO Series 2021-NPL3 Class A2 |
| | | | |
CMO Series 2021-NPL6 Class A1 |
| | | | |
|
CMO Series 2021-NPL4 Class A2 |
| | | | |
CMO Series 2021-NPL5 Class A1 |
| | | | |
CMO Series 2021-NPL5 Class A2 |
| | | | |
Vericrest Opportunity Loan Transferee CVI LLC(a),(e) |
CMO Series 2021-NP12 Class A1 |
| | | | |
Vericrest Opportunity Loan Transferee XCIX LLC(a),(e) |
CMO Series 2021-NPL8 Class A1 |
| | | | |
Vericrest Opportunity Loan Transferee XCVI LLC(a),(e) |
CMO Series 2021-NPL5 Class A1 |
| | | | |
Verus Securitization Trust(a),(e) |
CMO Series 2020-1 Class M1 |
| | | | |
CMO Series 2020-4 Class M1 |
| | | | |
CMO Series 2021-5 Class A2 |
| | | | |
CMO Series 2021-5 Class A3 |
| | | | |
CMO Series 2021-5 Class M1 |
| | | | |
CMO Series 2021-7 Class A3 |
| | | | |
CMO Series 2021-R1 Class A1 |
| | | | |
Subordinated CMO Series 2021-8 Class B1 |
| | | | |
|
CMO Series 2019-2 Class A3 |
| | | | |
|
CMO Series 2021-1R Class A1 |
| | | | |
Residential Mortgage-Backed Securities - Non-Agency (continued) |
| | | | |
CMO Series 2021-1R Class A2 |
| | | | |
Total Residential Mortgage-Backed Securities - Non-Agency
(Cost $574,154,254) | |
|
|
| | | | |
|
|
|
3-month Term SOFR + 2.750%
08/24/2028 | | | | |
|
AAdvantage Loyalty IP Ltd./American Airlines, Inc.(b),(o) |
|
6-month Term SOFR + 3.500%
06/04/2029 | | | | |
|
|
3-month Term SOFR + 2.500%
03/21/2031 | | | | |
United Airlines, Inc.(b),(o) |
|
3-month Term SOFR + 2.750%
02/22/2031 | | | | |
| |
|
American Axle & Manufacturing, Inc.(b),(o) |
|
1-month Term SOFR + 3.500%
Floor 0.500%
12/13/2029 | | | | |
First Brands Group LLC(b),(o) |
|
3-month Term SOFR + 5.000%
Floor 1.000%
03/30/2027 | | | | |
| |
Brokerage/Asset Managers/Exchanges 0.1% |
|
|
1-month Term SOFR + 2.500%
Floor 0.500%
02/04/2028 | | | | |
The accompanying Notes to Financial Statements are an integral part of this statement.
30
Columbia Total Return Bond Fund | Annual Report 2024
Portfolio of Investments (continued)April 30, 2024 |
| | | | |
Aretec Group, Inc.(b),(o) |
|
1-month Term SOFR + 4.500%
08/09/2030 | | | | |
Citadel Securities LP(b),(o) |
|
1-month Term SOFR + 2.250%
07/29/2030 | | | | |
Hightower Holding LLC (b),(o) |
|
3-month Term SOFR + 4.000%
Floor 0.750%
04/21/2028 | | | | |
Russell Investments US Institutional Holdco, Inc.(b),(o) |
|
1-month Term SOFR + 5.000%
Floor 1.000%
05/30/2027 | | | | |
|
|
1-month Term SOFR + 3.000%
01/13/2029 | | | | |
| |
|
Foundation Building Materials, Inc.(b),(o),(p) |
|
1-month Term SOFR + 3.250%
Floor 0.500%
01/31/2028 | | | | |
Hunter Douglas Holding BV(b),(o) |
|
3-month Term SOFR + 3.500%
Floor 0.500%
02/26/2029 | | | | |
LBM Acquisition LLC(b),(o) |
|
1-month Term SOFR + 3.750%
Floor 0.750%
12/17/2027 | | | | |
Quikrete Holdings, Inc.(b),(o) |
Tranche B1 1st Lien Term Loan |
1-month Term SOFR + 2.500%
04/14/2031 | | | | |
SRS Distribution, Inc.(b),(o) |
|
1-month Term SOFR + 3.250%
Floor 0.500%
06/02/2028 | | | | |
|
| | | | |
Standard Building Solutions, Inc.(b),(o) |
|
1-month Term SOFR + 2.250%
Floor 0.500%
09/22/2028 | | | | |
White Cap Supply Holdings LLC(b),(o) |
|
1-month Term SOFR + 3.750%
Floor 0.500%
10/19/2027 | | | | |
| |
|
UPC Financing Partnership(b),(o) |
|
1-month Term SOFR + 3.000%
01/31/2029 | | | | |
Virgin Media Bristol LLC(b),(o) |
|
1-month Term SOFR + 2.500%
01/31/2028 | | | | |
| |
|
Axalta Coating Systems Dutch Holding B BV/Axalta Coating Systems US Holdings, |
|
1-month Term SOFR + 2.000%
Floor 0.500%
12/20/2029 | | | | |
Ineos Quattro Holdings UK Ltd.(b),(o) |
|
1-month Term SOFR + 4.250%
04/02/2029 | | | | |
Ineos US Finance LLC(b),(o) |
|
1-month Term SOFR + 3.750%
02/07/2031 | | | | |
Olympus Water US Holding Corp.(b),(o) |
|
3-month Term SOFR + 3.750%
11/09/2028 | | | | |
Windsor Holdings III LLC(b),(o) |
|
1-month Term SOFR + 4.000%
08/01/2030 | | | | |
WR Grace Holdings LLC(b),(o) |
|
3-month Term SOFR + 3.750%
Floor 0.500%
09/22/2028 | | | | |
| |
The accompanying Notes to Financial Statements are an integral part of this statement.
Columbia Total Return Bond Fund | Annual Report 2024
31
Portfolio of Investments (continued)April 30, 2024 |
| | | | |
Consumer Cyclical Services 0.1% |
8th Avenue Food & Provisions, Inc.(b),(o) |
|
1-month Term SOFR + 3.750%
10/01/2025 | | | | |
|
|
3-month Term SOFR + 2.750%
Floor 0.500%
07/10/2028 | | | | |
Arches Buyer, Inc.(b),(o) |
|
1-month Term SOFR + 3.250%
Floor 0.500%
12/06/2027 | | | | |
Cast & Crew LLC(b),(o),(p) |
|
1-month Term SOFR + 3.750%
Floor 0.500%
12/29/2028 | | | | |
Conservice Midco LLC(b),(o) |
|
1-month Term SOFR + 4.000%
05/13/2027 | | | | |
Corporation Service Co.(b),(o) |
|
1-month Term SOFR + 2.750%
Floor 0.500%
11/02/2029 | | | | |
Cushman & Wakefield US Borrower LLC(b),(o) |
|
1-month Term SOFR + 3.250%
Floor 0.500%
01/31/2030 | | | | |
Fleet Midco I Ltd.(b),(o) |
|
1-month Term SOFR + 3.250%
02/21/2031 | | | | |
PG Polaris Bidco SARL(b),(o) |
|
3-month Term SOFR + 3.500%
03/26/2031 | | | | |
Prime Security Services Borrower LLC(b),(o),(p) |
Tranche B1 1st Lien Term Loan |
3-month Term SOFR + 2.250%
10/13/2030 | | | | |
|
|
3-month Term SOFR + 4.500%
Floor 0.500%
01/15/2027 | | | | |
|
| | | | |
Uber Technologies, Inc.(b),(o) |
|
3-month Term SOFR + 2.750%
03/03/2030 | | | | |
| |
|
|
|
3-month Term SOFR + 3.250%
02/17/2031 | | | | |
Bombardier Recreational Products, Inc.(b),(o) |
|
1-month Term SOFR + 2.750%
01/22/2031 | | | | |
Recess Holdings, Inc.(b),(o) |
|
3-month Term SOFR + 4.500%
Floor 1.000%
02/20/2030 | | | | |
| |
Diversified Manufacturing 0.1% |
Barnes Group, Inc.(b),(o) |
|
1-month Term SOFR + 2.500%
09/03/2030 | | | | |
CD&R Hydra Buyer, Inc.(b),(o) |
|
3-month Term SOFR + 4.000%
03/25/2031 | | | | |
|
|
1-month Term SOFR + 2.500%
05/31/2030 | | | | |
Husky Injection Molding Systems Ltd./Yukon Acquisition, Inc.(b),(o),(p) |
|
3-month Term SOFR + 5.000%
02/01/2029 | | | | |
|
|
1-month Term SOFR + 3.250%
06/21/2028 | | | | |
TK Elevator Midco GmbH(b),(o) |
|
6-month Term SOFR + 3.500%
Floor 0.500%
04/30/2030 | | | | |
The accompanying Notes to Financial Statements are an integral part of this statement.
32
Columbia Total Return Bond Fund | Annual Report 2024
Portfolio of Investments (continued)April 30, 2024 |
| | | | |
WEC US Holdings Ltd.(b),(o),(p) |
|
1-month Term SOFR + 2.750%
01/27/2031 | | | | |
| |
|
|
|
1-month Term SOFR + 2.000%
01/13/2031 | | | | |
EFS Cogen Holdings I LLC(b),(o) |
|
3-month Term SOFR + 3.500%
Floor 1.000%
10/01/2027 | | | | |
Vistra Zero Operating Company LLC(b),(o),(p) |
|
1-month Term SOFR + 2.750%
04/30/2031 | | | | |
| |
|
Covanta Holdings Corp. (b),(o) |
|
1-month Term SOFR + 2.500%
Floor 0.500%
11/30/2028 | | | | |
|
1-month Term SOFR + 2.500%
Floor 0.500%
11/30/2028 | | | | |
| |
|
Aramark Intermediate HoldCo Corp.(b),(o) |
|
1-month Term SOFR + 2.000%
04/06/2028 | | | | |
Primary Products Finance LLC(b),(o) |
|
3-month Term SOFR + 3.500%
Floor 0.500%
04/01/2029 | | | | |
Triton Water Holdings, Inc.(b),(o) |
|
3-month Term SOFR + 3.250%
Floor 0.500%
03/31/2028 | | | | |
| |
|
| | | | |
|
Caesars Entertainment, Inc.(b),(o) |
|
1-month Term SOFR + 2.750%
Floor 0.500%
02/06/2031 | | | | |
ECL Entertainment LLC(b),(o),(p) |
|
3-month Term SOFR + 4.000%
08/31/2030 | | | | |
|
|
3-month Term SOFR + 3.500%
Floor 0.500%
10/31/2029 | | | | |
Fertitta Entertainment LLC(b),(o) |
|
1-month Term SOFR + 3.750%
Floor 0.500%
01/27/2029 | | | | |
Flutter Entertainment PLC(b),(o) |
|
3-month Term SOFR + 2.250%
Floor 0.500%
11/25/2030 | | | | |
|
|
3-month Term SOFR + 4.250%
Floor 0.750%
12/11/2028 | | | | |
Ontario Gaming GTA LP(b),(o),(p) |
Tranche B 1st Lien Term Loan |
3-month Term SOFR + 4.250%
Floor 0.500%
08/01/2030 | | | | |
Penn Entertainment, Inc.(b),(o) |
|
1-month Term SOFR + 2.750%
Floor 0.500%
05/03/2029 | | | | |
Scientific Games Holdings LP(b),(o),(p) |
|
3-month Term SOFR + 3.250%
Floor 0.500%
04/04/2029 | | | | |
| |
|
Agiliti Health, Inc.(b),(o),(p) |
|
3-month Term SOFR + 3.000%
05/01/2030 | | | | |
The accompanying Notes to Financial Statements are an integral part of this statement.
Columbia Total Return Bond Fund | Annual Report 2024
33
Portfolio of Investments (continued)April 30, 2024 |
| | | | |
Medline Borrower LP(b),(o) |
|
1-month Term SOFR + 2.750%
Floor 0.500%
10/23/2028 | | | | |
Parexel International, Inc.(b),(o) |
|
1-month Term SOFR + 3.250%
Floor 0.500%
11/15/2028 | | | | |
Select Medical Corp.(b),(o) |
|
1-month Term SOFR + 3.000%
03/06/2027 | | | | |
|
|
3-month Term SOFR + 4.000%
09/27/2030 | | | | |
Surgery Center Holdings, Inc.(b),(o) |
|
1-month Term SOFR + 3.500%
12/19/2030 | | | | |
Upstream Newco, Inc.(b),(o) |
|
3-month Term SOFR + 4.250%
11/20/2026 | | | | |
| |
|
Hamilton Projects Acquiror LLC(b),(o) |
|
1-month Term SOFR + 4.500%
Floor 1.000%
06/17/2027 | | | | |
|
Alterra Mountain Co.(b),(o) |
|
1-month Term SOFR + 3.250%
08/17/2028 | | | | |
|
|
1-month Term SOFR + 3.000%
Floor 0.750%
08/09/2027 | | | | |
Cinemark USA, Inc.(b),(o) |
|
3-month Term SOFR + 3.750%
Floor 0.500%
05/24/2030 | | | | |
|
| | | | |
Formula One Management Ltd.(b),(o) |
Tranche B 1st Lien Term Loan |
3-month Term SOFR + 2.250%
Floor 0.500%
01/15/2030 | | | | |
Motion Acquisition Ltd.(b),(o),(p) |
|
3-month Term SOFR + 3.500%
11/12/2029 | | | | |
|
Tranche B3 1st Lien Term Loan |
3-month Term SOFR + 2.750%
Floor 0.750%
04/29/2026 | | | | |
| |
|
Hilton Grand Vacations Borrower LLC(b),(o),(p) |
|
1-month Term SOFR + 2.500%
Floor 0.500%
08/02/2028 | | | | |
Playa Resorts Holding BV(b),(o) |
|
1-month Term SOFR + 3.250%
01/05/2029 | | | | |
| |
Media and Entertainment 0.1% |
|
|
1-month Term SOFR + 2.500%
Floor 0.500%
10/25/2028 | | | | |
Cengage Learning, Inc.(b),(o) |
Tranche B 1st Lien Term Loan |
1-month Term SOFR + 4.250%
Floor 1.000%
03/24/2031 | | | | |
Creative Artists Agency LLC(b),(o) |
|
1-month Term SOFR + 3.250%
11/27/2028 | | | | |
Dotdash Meredith, Inc.(b),(o) |
|
1-month Term SOFR + 4.000%
Floor 0.500%
12/01/2028 | | | | |
The accompanying Notes to Financial Statements are an integral part of this statement.
34
Columbia Total Return Bond Fund | Annual Report 2024
Portfolio of Investments (continued)April 30, 2024 |
| | | | |
E.W. Scripps Co. (The)(b),(o) |
|
1-month Term SOFR + 3.000%
Floor 0.750%
01/07/2028 | | | | |
Playtika Holding Corp.(b),(o) |
|
1-month Term SOFR + 2.750%
03/13/2028 | | | | |
StubHub Holdco Sub LLC(b),(o) |
|
1-month Term SOFR + 4.750%
03/15/2030 | | | | |
Univision Communications, Inc.(b),(o) |
|
1-month Term SOFR + 3.250%
Floor 0.750%
01/31/2029 | | | | |
| |
|
|
|
3-month Term SOFR + 3.000%
Floor 0.500%
12/31/2030 | | | | |
Oryx Midstream Services Permian Basin LLC(b),(o) |
|
1-month Term SOFR + 3.000%
Floor 0.500%
10/05/2028 | | | | |
Whitewater DBR Holdco LLC(b),(o) |
|
3-month Term SOFR + 2.750%
03/03/2031 | | | | |
| |
Other Financial Institutions 0.1% |
19th Holdings Golf LLC(b),(o) |
|
1-month Term SOFR + 3.250%
Floor 0.500%
02/07/2029 | | | | |
Freeport LNG Investments LLLP(b),(o) |
|
3-month Term SOFR + 3.500%
Floor 0.500%
12/21/2028 | | | | |
GIP Pilot Acquisition Partners LP(b),(o) |
|
3-month Term SOFR + 3.000%
10/04/2030 | | | | |
|
| | | | |
IGT Holding IV AB/IFS(b),(o) |
|
3-month Term SOFR + 3.400%
Floor 0.500%
03/31/2028 | | | | |
| |
|
Artera Services LLC(b),(o) |
Tranche C 1st Lien Term Loan |
3-month Term SOFR + 4.500%
02/15/2031 | | | | |
Brand Industrial Services, Inc.(b),(o) |
|
3-month Term SOFR + 4.500%
Floor 0.500%
08/01/2030 | | | | |
|
|
1-month Term SOFR + 2.250%
01/17/2031 | | | | |
| |
|
Charter Next Generation, Inc.(b),(o) |
|
1-month Term SOFR + 3.500%
12/01/2027 | | | | |
Clydesdale Acquisition Holdings, Inc.(b),(o) |
Tranche B 1st Lien Term Loan |
1-month Term SOFR + 3.675%
Floor 0.500%
04/13/2029 | | | | |
Pactiv Evergreen, Inc.(b),(o) |
|
1-month Term SOFR + 3.250%
Floor 0.500%
09/24/2028 | | | | |
| |
|
Jazz Pharmaceuticals PLC(b),(o) |
|
1-month Term SOFR + 3.000%
Floor 0.500%
05/05/2028 | | | | |
|
AssuredPartners, Inc.(b),(o),(p) |
|
1-month Term SOFR + 3.500%
Floor 0.500%
02/14/2031 | | | | |
The accompanying Notes to Financial Statements are an integral part of this statement.
Columbia Total Return Bond Fund | Annual Report 2024
35
Portfolio of Investments (continued)April 30, 2024 |
| | | | |
|
|
1-month Term SOFR + 3.250%
07/31/2027 | | | | |
Broadstreet Partners, Inc.(b),(o) |
|
1-month Term SOFR + 3.750%
01/27/2029 | | | | |
Hub International Ltd.(b),(o) |
|
1-month Term SOFR + 3.250%
Floor 0.750%
06/20/2030 | | | | |
Sedgwick Claims Management Services, Inc./Lightning Cayman Merger Sub Ltd.(b),(o) |
|
1-month Term SOFR + 3.750%
02/24/2028 | | | | |
Truist Insurance Holdings LLC(b),(o),(p) |
|
3-month Term SOFR + 3.250%
03/24/2031 | | | | |
| |
|
|
|
1-month Term SOFR + 2.250%
09/20/2030 | | | | |
|
|
1-month Term SOFR + 2.750%
Floor 0.750%
12/15/2027 | | | | |
|
|
1-month Term SOFR + 3.250%
Floor 0.500%
08/03/2028 | | | | |
| |
|
Great Outdoors Group LLC(b),(o) |
|
1-month Term SOFR + 3.750%
Floor 0.750%
03/06/2028 | | | | |
Harbor Freight Tools USA, Inc.(b),(o) |
|
1-month Term SOFR + 2.750%
Floor 0.500%
10/19/2027 | | | | |
|
| | | | |
|
|
1-month Term SOFR + 3.750%
Floor 0.750%
02/11/2028 | | | | |
| |
|
|
|
1-month Term SOFR + 3.500%
06/08/2028 | | | | |
Ascend Learning LLC(b),(o) |
|
1-month Term SOFR + 3.500%
Floor 0.500%
12/11/2028 | | | | |
|
1-month Term SOFR + 5.750%
Floor 0.500%
12/10/2029 | | | | |
athenahealth Group, Inc.(b),(o) |
|
1-month Term SOFR + 3.250%
Floor 0.500%
02/15/2029 | | | | |
Barracuda Parent LLC(b),(o) |
|
6-month Term SOFR + 4.500%
Floor 0.500%
08/15/2029 | | | | |
Boost Newco Borrower LLC(b),(o) |
|
3-month Term SOFR + 3.000%
Floor 0.500%
01/31/2031 | | | | |
Camelot US Acquisition LLC(b),(o) |
|
1-month Term SOFR + 2.750%
01/31/2031 | | | | |
Central Parent LLC(b),(o) |
|
3-month Term SOFR + 4.000%
07/06/2029 | | | | |
Cloud Software Group, Inc.(b),(o) |
Tranche A 1st Lien Term Loan |
3-month Term SOFR + 4.500%
09/29/2028 | | | | |
The accompanying Notes to Financial Statements are an integral part of this statement.
36
Columbia Total Return Bond Fund | Annual Report 2024
Portfolio of Investments (continued)April 30, 2024 |
| | | | |
|
|
1-month Term SOFR + 3.750%
Floor 0.500%
10/08/2028 | | | | |
Cotiviti Holdings, Inc.(b),(o),(p) |
|
3-month Term SOFR + 3.250%
05/01/2031 | | | | |
|
|
1-month Term SOFR + 7.000%
02/19/2029 | | | | |
Dun & Bradstreet Corp. (The)(b),(o) |
|
1-month Term SOFR + 2.750%
01/18/2029 | | | | |
Ellucian Holdings, Inc.(b),(o) |
Tranche B1 1st Lien Term Loan |
1-month Term SOFR + 3.500%
Floor 0.500%
10/09/2029 | | | | |
Genesys Cloud Services Holdings I LLC(b),(o) |
|
1-month Term SOFR + 3.750%
Floor 0.750%
12/01/2027 | | | | |
Greeneden US Holdings I LLC(b),(o) |
|
1-month Term SOFR + 3.500%
Floor 0.750%
12/01/2027 | | | | |
Helios Software Holdings, Inc./ION Corporate Solutions Finance SARL(b),(o) |
|
3-month Term SOFR + 3.750%
07/18/2030 | | | | |
|
|
3-month Term SOFR + 4.250%
Floor 0.750%
09/30/2028 | | | | |
|
Tranche B1 1st Lien Term Loan |
3-month Term SOFR + 3.750%
Floor 0.750%
03/02/2028 | | | | |
Ingram Micro, Inc.(b),(o) |
|
3-month Term SOFR + 3.000%
Floor 0.500%
06/30/2028 | | | | |
|
| | | | |
Lummus Technology Holdings V LLC(b),(o) |
|
1-month Term SOFR + 3.500%
12/31/2029 | | | | |
|
|
1-month Term SOFR + 3.750%
Floor 0.500%
03/01/2029 | | | | |
Mitchell International, Inc.(b),(o) |
|
1-month Term SOFR + 3.750%
Floor 0.500%
10/15/2028 | | | | |
Nielsen Consumer, Inc.(b),(o) |
|
1-month Term SOFR + 6.250%
Floor 0.500%
03/06/2028 | | | | |
|
|
1-month Term SOFR + 2.750%
01/31/2030 | | | | |
|
Tranche B 1st Lien Term Loan |
1-month Term SOFR + 3.750%
Floor 0.750%
02/01/2028 | | | | |
|
|
1-month Term SOFR + 3.250%
Floor 0.500%
08/31/2028 | | | | |
Sovos Compliance LLC(b),(o) |
|
1-month Term SOFR + 4.500%
Floor 0.500%
08/11/2028 | | | | |
|
|
3-month Term SOFR + 3.500%
02/10/2031 | | | | |
Ultra Clean Holdings, Inc.(b),(o) |
|
1-month Term SOFR + 3.500%
02/25/2028 | | | | |
| |
The accompanying Notes to Financial Statements are an integral part of this statement.
Columbia Total Return Bond Fund | Annual Report 2024
37
Portfolio of Investments (continued)April 30, 2024 |
| | | | |
Transportation Services 0.0% |
Brown Group Holding LLC(b),(o) |
|
3-month Term SOFR + 3.000%
Floor 0.500%
07/02/2029 | | | | |
|
Crown Subsea Communications Holdings, Inc.(b),(o) |
|
3-month Term SOFR + 4.750%
Floor 0.750%
01/30/2031 | | | | |
Total Senior Loans
(Cost $41,196,480) | |
|
U.S. Treasury Obligations 1.8% |
| | | | |
|
| | | | |
| | | | |
| | | | |
| | | | |
Total U.S. Treasury Obligations
(Cost $54,556,026) | |
Call Option Contracts Purchased 0.1% |
| | | | |
| |
|
Put Option Contracts Purchased 0.2% |
| | | | |
| |
|
| | |
Columbia Short-Term Cash Fund, 5.485%(q),(r) | | |
Total Money Market Funds
(Cost $193,660,990) | |
Total Investments in Securities
(Cost: $3,420,614,546) | |
Other Assets & Liabilities, Net | | |
| |
At April 30, 2024, securities and/or cash totaling $41,217,164 were pledged as collateral.
Investments in derivatives
Forward foreign currency exchange contracts |
| | | | Unrealized
appreciation ($) | Unrealized
depreciation ($) |
| | | | | |
|
| | | | | Value/Unrealized
appreciation ($) | Value/Unrealized
depreciation ($) |
U.S. Treasury 10-Year Note | | | | | | |
U.S. Treasury 2-Year Note | | | | | | |
U.S. Treasury 5-Year Note | | | | | | |
| | | | | | |
| | | | | | |
The accompanying Notes to Financial Statements are an integral part of this statement.
38
Columbia Total Return Bond Fund | Annual Report 2024
Portfolio of Investments (continued)April 30, 2024 |
| | | | | Value/Unrealized
appreciation ($) | Value/Unrealized
depreciation ($) |
| | | | | | |
| | | | | | |
| | | | | | |
Call option contracts purchased |
| | | | | | | | |
10-Year OTC interest rate swap with Citi to receive exercise rate and pay SOFR | | | | | | | | |
10-Year OTC interest rate swap with Morgan Stanley to receive exercise rate and pay SOFR | | | | | | | | |
10-Year OTC interest rate swap with Morgan Stanley to receive exercise rate and pay SOFR | | | | | | | | |
5-Year OTC interest rate swap with Citi to receive exercise rate and pay SOFR | | | | | | | | |
| | | | | | | | |
Put option contracts purchased |
| | | | | | | | |
10-Year OTC interest rate swap with Citi to receive SOFR and pay exercise rate | | | | | | | | |
10-Year OTC interest rate swap with Goldman Sachs International to receive SOFR and pay exercise rate | Goldman Sachs International | | | | | | | |
5-Year OTC interest rate swap with Citi to receive SOFR and pay exercise rate | | | | | | | | |
5-Year OTC interest rate swap with Morgan Stanley to receive SOFR and pay exercise rate | | | | | | | | |
5-Year OTC interest rate swap with Morgan Stanley to receive SOFR and pay exercise rate | | | | | | | | |
| | | | | | | | |
Credit default swap contracts - buy protection |
| | | | | | | | Periodic
payments
receivable
(payable)
($) | | | Unrealized
appreciation
($) | Unrealized
depreciation
($) |
Markit CMBX North America Index, Series 11 BBB- | | | | | | | | | | | | |
Markit CMBX North America Index, Series 12 BBB- | | | | | | | | | | | | |
Markit CMBX North America Index, Series 11 BBB- | Goldman Sachs International | | | | | | | | | | | |
Markit CMBX North America Index, Series 10 BBB- | | | | | | | | | | | | |
Markit CMBX North America Index, Series 11 BBB- | | | | | | | | | | | | |
The accompanying Notes to Financial Statements are an integral part of this statement.
Columbia Total Return Bond Fund | Annual Report 2024
39
Portfolio of Investments (continued)April 30, 2024 Credit default swap contracts - buy protection (continued) |
| | | | | | | | Periodic payments receivable (payable) ($) | | | Unrealized appreciation ($) | Unrealized depreciation ($) |
Markit CMBX North America Index, Series 10 BBB- | | | | | | | | | | | | |
Markit CMBX North America Index, Series 16 BBB- | | | | | | | | | | | | |
| | | | | | | | | | | | |
Cleared credit default swap contracts - buy protection |
| | | | | | | | | | Unrealized
appreciation
($) | Unrealized
depreciation
($) |
Markit CDX North America High Yield Index, Series 42 | | | | | | | | | | | |
Credit default swap contracts - sell protection |
| | | | | | | | | Periodic
payments
receivable
(payable)
($) | | | Unrealized
appreciation
($) | Unrealized
depreciation
($) |
Markit CMBX North America Index, Series 10 BBB- | | | | | | | | | | | | | |
Markit CMBX North America Index, Series 10 BBB- | | | | | | | | | | | | | |
Markit CMBX North America Index, Series 10 BBB- | | | | | | | | | | | | | |
Markit CMBX North America Index, Series 8 BBB- | | | | | | | | | | | | | |
| | | | | | | | | | | | | |
* Implied credit spreads, represented in absolute terms, utilized in determining the market value of credit default swap agreements on corporate or sovereign issues as of period end serve as an indicator of the current status of the payment/performance risk and represent the likelihood or risk of default for the credit derivative. The implied credit spread of a particular referenced entity reflects the cost of buying/selling protection and may include upfront payments required to be made to enter into the agreement. Wider credit spreads represent a deterioration of the referenced entity’s credit soundness and a greater likelihood or risk of default or other credit event occurring as defined under the terms of the agreement.
Notes to Portfolio of Investments
| Represents privately placed and other securities and instruments exempt from Securities and Exchange Commission registration (collectively, private placements), such as Section 4(a)(2) and Rule 144A eligible securities, which are often sold only to qualified institutional buyers. At April 30, 2024, the total value of these securities amounted to $1,325,075,197, which represents 46.12% of total net assets. |
| Variable rate security. The interest rate shown was the current rate as of April 30, 2024. |
| Represents fair value as determined in good faith under procedures approved by the Board of Trustees. At April 30, 2024, the total value of these securities amounted to $13,803,980, which represents 0.48% of total net assets. |
| Valuation based on significant unobservable inputs. |
| Variable or floating rate security, the interest rate of which adjusts periodically based on changes in current interest rates and prepayments on the underlying pool of assets. The interest rate shown was the current rate as of April 30, 2024. |
| Non-income producing investment. |
The accompanying Notes to Financial Statements are an integral part of this statement.
40
Columbia Total Return Bond Fund | Annual Report 2024
Portfolio of Investments (continued)April 30, 2024 Notes to Portfolio of Investments (continued)
| Principal amounts are denominated in United States Dollars unless otherwise noted. |
| Represents a security purchased on a when-issued basis. |
| Represents a variable rate security with a step coupon where the rate adjusts according to a schedule for a series of periods, typically lower for an initial period and then increasing to a higher coupon rate thereafter. The interest rate shown was the current rate as of April 30, 2024. |
| Represents a security in default. |
| Payment-in-kind security. Interest can be paid by issuing additional par of the security or in cash. |
| Principal and interest may not be guaranteed by a governmental entity. |
| Represents interest only securities which have the right to receive the monthly interest payments on an underlying pool of mortgage loans. |
| This security or a portion of this security has been pledged as collateral in connection with derivative contracts. |
| The stated interest rate represents the weighted average interest rate at April 30, 2024 of contracts within the senior loan facility. Interest rates on contracts are primarily determined either weekly, monthly or quarterly by reference to the indicated base lending rate and spread and the reset period. Base lending rates may be subject to a floor or minimum rate. The interest rate for senior loans purchased on a when-issued or delayed delivery basis will be determined upon settlement, therefore no interest rate is disclosed. Senior loans often require prepayments from excess cash flows or permit the borrowers to repay at their election. The degree to which borrowers repay cannot be predicted with accuracy. As a result, remaining maturities of senior loans may be less than the stated maturities. Generally, the Fund is contractually obligated to receive approval from the agent bank and/or borrower prior to the disposition of a senior loan. |
| Represents a security purchased on a forward commitment basis. |
| The rate shown is the seven-day current annualized yield at April 30, 2024. |
| As defined in the Investment Company Act of 1940, as amended, an affiliated company is one in which the Fund owns 5% or more of the company’s outstanding voting securities, or a company which is under common ownership or control with the Fund. The value of the holdings and transactions in these affiliated companies during the year ended April 30, 2024 are as follows: |
| | | | Net change in
unrealized
appreciation
(depreciation)($) | | | | |
Columbia Short-Term Cash Fund, 5.485% |
| | | | | | | | |
Abbreviation Legend
| Collateralized Mortgage Obligation |
| Constant Maturity Treasury |
| Secured Overnight Financing Rate |
| Separate Trading of Registered Interest and Principal Securities |
| |
Currency Legend
Fair value measurements
The Fund categorizes its fair value measurements according to a three-level hierarchy that maximizes the use of observable inputs and minimizes the use of unobservable inputs by prioritizing that the most observable input be used when available. Observable inputs are those that market participants would use in pricing an investment based on market data obtained from sources independent of the reporting entity. Unobservable inputs are those that reflect the Fund’s assumptions about the information market participants would use in pricing an investment. An investment’s level within the fair value hierarchy is based on the lowest level of any input that is deemed significant to the asset’s or liability’s fair value measurement. The input levels are not necessarily an indication of the risk or liquidity associated with investments at that level. For example, certain U.S. government securities are generally high quality and liquid, however, they are reflected as Level 2 because the inputs used to determine fair value may not always be quoted prices in an active market.
Fair value inputs are summarized in the three broad levels listed below:
■
Level 1 — Valuations based on quoted prices for investments in active markets that the Fund has the ability to access at the measurement date. Valuation adjustments are not applied to Level 1 investments.
■
Level 2 — Valuations based on other significant observable inputs (including quoted prices for similar securities, interest rates, prepayment speeds, credit risks, etc.).
■
Level 3 — Valuations based on significant unobservable inputs (including the Fund’s own assumptions and judgment in determining the fair value of investments).
The accompanying Notes to Financial Statements are an integral part of this statement.
Columbia Total Return Bond Fund | Annual Report 2024
41
Portfolio of Investments (continued)April 30, 2024 Fair value measurements (continued)
Inputs that are used in determining fair value of an investment may include price information, credit data, volatility statistics, and other factors. These inputs can be either observable or unobservable. The availability of observable inputs can vary between investments, and is affected by various factors such as the type of investment, and the volume and level of activity for that investment or similar investments in the marketplace. The inputs will be considered by the Investment Manager, along with any other relevant factors in the calculation of an investment’s fair value. The Fund uses prices and inputs that are current as of the measurement date, which may include periods of market dislocations. During these periods, the availability of prices and inputs may be reduced for many investments. This condition could cause an investment to be reclassified between the various levels within the hierarchy.
Investments falling into the Level 3 category are primarily supported by quoted prices from brokers and dealers participating in the market for those investments. However, these may be classified as Level 3 investments due to lack of market transparency and corroboration to support these quoted prices. Additionally, valuation models may be used as the pricing source for any remaining investments classified as Level 3. These models may rely on one or more significant unobservable inputs and/or significant assumptions by the Investment Manager. Inputs used in valuations may include, but are not limited to, financial statement analysis, capital account balances, discount rates and estimated cash flows, and comparable company data.
The Fund’s Board of Trustees (the Board) has designated the Investment Manager, through its Valuation Committee (the Committee), as valuation designee, responsible for determining the fair value of the assets of the Fund for which market quotations are not readily available using valuation procedures approved by the Board. The Committee consists of voting and non-voting members from various groups within the Investment Manager’s organization, including operations and accounting, trading and investments, compliance, risk management and legal.
The Committee meets at least monthly to review and approve valuation matters, which may include a description of specific valuation determinations, data regarding pricing information received from approved pricing vendors and brokers and the results of Board-approved valuation policies and procedures (the Policies). The Policies address, among other things, instances when market quotations are or are not readily available, including recommendations of third party pricing vendors and a determination of appropriate pricing methodologies; events that require specific valuation determinations and assessment of fair value techniques; securities with a potential for stale pricing, including those that are illiquid, restricted, or in default; and the effectiveness of third party pricing vendors, including periodic reviews of vendors. The Committee meets more frequently, as needed, to discuss additional valuation matters, which may include the need to review back-testing results, review time-sensitive information or approve related valuation actions. Representatives of Columbia Management Investment Advisers, LLC report to the Board at each of its regularly scheduled meetings to discuss valuation matters and actions during the period, similar to those described earlier.
The following table is a summary of the inputs used to value the Fund’s investments at April 30, 2024:
| | | | |
Investments in Securities | | | | |
Asset-Backed Securities - Non-Agency | | | | |
Commercial Mortgage-Backed Securities - Non-Agency | | | | |
| | | | |
| | | | |
| | | | |
| | | | |
| | | | |
| | | | |
Foreign Government Obligations | | | | |
| | | | |
Residential Mortgage-Backed Securities - Agency | | | | |
Residential Mortgage-Backed Securities - Non-Agency | | | | |
| | | | |
U.S. Treasury Obligations | | | | |
Call Option Contracts Purchased | | | | |
Put Option Contracts Purchased | | | | |
| | | | |
Total Investments in Securities | | | | |
Investments in Derivatives | | | | |
| | | | |
| | | | |
| | | | |
| | | | |
Forward Foreign Currency Exchange Contracts | | | | |
| | | | |
| | | | |
| | | | |
See the Portfolio of Investments for all investment classifications not indicated in the table.
The Fund’s assets assigned to the Level 2 input category are generally valued using the market approach, in which a security’s value is determined through reference to prices and information from market transactions for similar or identical assets.
Forward foreign currency exchange contracts, futures contracts and swap contracts are valued at unrealized appreciation (depreciation).
The accompanying Notes to Financial Statements are an integral part of this statement.
42
Columbia Total Return Bond Fund | Annual Report 2024
Portfolio of Investments (continued)April 30, 2024 Fair value measurements (continued)
The following table is a reconciliation of Level 3 assets for which significant observable and unobservable inputs were used to determine fair value:
| Balance
as of
04/30/2023
($) | Increase
(decrease)
in accrued
discounts/
premiums
($) | | Change
in unrealized
appreciation
($) | | | | Transfers
out of
Level 3
($) | Balance
as of
04/30/2024
($) |
Asset-Backed Securities — Non-Agency | | | | | | | | | |
| | | | | | | | | |
Residential Mortgage-Backed Securities — Non-Agency | | | | | | | | | |
| | | | | | | | | |
(a) Change in unrealized appreciation (depreciation) relating to securities held at April 30, 2024 was $67,467, which is comprised of Asset-Backed Securities — Non-Agency of $43,525 and Residential Mortgage-Backed Securities — Non-Agency of $23,942.
Financial assets were transferred from Level 3 to Level 2 as observable market inputs were utilized and management determined that there was sufficient, reliable and observable market data to value these assets as of period end.
The Fund’s assets assigned to the Level 3 category are valued utilizing the valuation technique deemed the most appropriate in the circumstances. The following table is a summary of valuation technique(s) used to value the Fund’s investments at April 30, 2024:
| | |
Asset-Backed Securities - Non-Agency | Single Market Quotes from Broker | |
| | |
Residential Mortgage-Backed Securities - Non-Agency | Single Market Quotes from Broker | |
| | |
The appropriateness of fair values for these securities is monitored on an ongoing basis which may include results of back testing, manual price reviews and other control procedures. Significant increases (decreases) to any of these inputs would have resulted in a significantly higher (lower) fair value measurement.
The accompanying Notes to Financial Statements are an integral part of this statement.
Columbia Total Return Bond Fund | Annual Report 2024
43
Statement of Assets and LiabilitiesApril 30, 2024
| |
Investments in securities, at value | |
Unaffiliated issuers (cost $3,214,913,872) | |
Affiliated issuers (cost $193,660,990) | |
Option contracts purchased (cost $12,039,684) | |
| |
Foreign currency (cost $69,013) | |
Cash collateral held at broker for: | |
| |
| |
| |
| |
Unrealized appreciation on swap contracts | |
Upfront payments on swap contracts | |
| |
| |
Investments sold on a delayed delivery basis | |
| |
| |
| |
| |
Variation margin for futures contracts | |
Variation margin for swap contracts | |
Expense reimbursement due from Investment Manager | |
| |
Deferred compensation of board members | |
| |
| |
Unrealized depreciation on forward foreign currency exchange contracts | |
Unrealized depreciation on swap contracts | |
Upfront receipts on swap contracts | |
| |
| |
Investments purchased on a delayed delivery basis | |
| |
Distributions to shareholders | |
Variation margin for futures contracts | |
| |
Distribution and/or service fees | |
| |
Compensation of board members | |
| |
Deferred compensation of board members | |
| |
Net assets applicable to outstanding capital stock | |
| |
| |
Total distributable earnings (loss) | |
Total - representing net assets applicable to outstanding capital stock | |
The accompanying Notes to Financial Statements are an integral part of this statement.
44
Columbia Total Return Bond Fund | Annual Report 2024
Statement of Assets and Liabilities (continued)April 30, 2024 | |
| |
| |
Net asset value per share | |
| |
Maximum offering price per share (calculated by dividing the net asset value per share by 1.0 minus the maximum sales charge for Class A shares) | |
| |
| |
| |
Net asset value per share | |
| |
| |
| |
Net asset value per share | |
| |
| |
| |
Net asset value per share | |
| |
| |
| |
Net asset value per share | |
| |
| |
| |
Net asset value per share | |
| |
| |
| |
Net asset value per share | |
The accompanying Notes to Financial Statements are an integral part of this statement.
Columbia Total Return Bond Fund | Annual Report 2024
45
Statement of OperationsYear Ended April 30, 2024
| |
| |
Dividends — affiliated issuers | |
| |
| |
| |
| |
| |
| |
Distribution and/or service fees | |
| |
| |
| |
| |
| |
| |
| |
| |
| |
| |
| |
| |
Printing and postage fees | |
| |
| |
| |
| |
Compensation of chief compliance officer | |
Compensation of board members | |
Deferred compensation of board members | |
| |
| |
Fees waived or expenses reimbursed by Investment Manager and its affiliates | |
Fees waived by transfer agent | |
| |
| |
| |
| |
| |
The accompanying Notes to Financial Statements are an integral part of this statement.
46
Columbia Total Return Bond Fund | Annual Report 2024
Statement of Operations (continued)Year Ended April 30, 2024 Realized and unrealized gain (loss) — net | |
Net realized gain (loss) on: | |
Investments — unaffiliated issuers | |
Investments — affiliated issuers | |
Foreign currency translations | |
Forward foreign currency exchange contracts | |
| |
Option contracts purchased | |
| |
| |
| |
Net change in unrealized appreciation (depreciation) on: | |
Investments — unaffiliated issuers | |
Investments — affiliated issuers | |
Foreign currency translations | |
Forward foreign currency exchange contracts | |
| |
Option contracts purchased | |
| |
| |
Net change in unrealized appreciation (depreciation) | |
Net realized and unrealized loss | |
Net decrease in net assets resulting from operations | |
The accompanying Notes to Financial Statements are an integral part of this statement.
Columbia Total Return Bond Fund | Annual Report 2024
47
Statement of Changes in Net Assets
| | |
| | |
| | |
| | |
Net change in unrealized appreciation (depreciation) | | |
Net decrease in net assets resulting from operations | | |
Distributions to shareholders | | |
Net investment income and net realized gains | | |
| | |
| | |
| | |
| | |
| | |
| | |
| | |
Total distributions to shareholders | | |
Increase (decrease) in net assets from capital stock activity | | |
Total increase (decrease) in net assets | | |
Net assets at beginning of year | | |
Net assets at end of year | | |
The accompanying Notes to Financial Statements are an integral part of this statement.
48
Columbia Total Return Bond Fund | Annual Report 2024
Statement of Changes in Net Assets (continued)
| | |
| | |
| | | | |
|
| | | | |
| | | | |
| | | | |
| | | | |
| | | | |
| | | | |
| | | | |
| | | | |
| | | | |
| | | | |
| | | | |
| | | | |
| | | | |
| | | | |
| | | | |
| | | | |
| | | | |
| | | | |
| | | | |
| | | | |
| | | | |
| | | | |
| | | | |
| | | | |
| | | | |
| | | | |
| | | | |
| | | | |
| | | | |
| | | | |
| | | | |
| | | | |
| | | | |
| | | | |
| | | | |
Total net increase (decrease) | | | | |
The accompanying Notes to Financial Statements are an integral part of this statement.
Columbia Total Return Bond Fund | Annual Report 2024
49
The following table is intended to help you understand the Fund’s financial performance. Certain information reflects financial results for a single share of a class held for the periods shown. Per share net investment income (loss) amounts are calculated based on average shares outstanding during the period. Total return assumes reinvestment of all dividends and distributions, if any. Total return does not reflect payment of sales charges, if any. Total return and portfolio turnover are not annualized for periods of less than one year. The ratios of expenses and net investment income are annualized for periods of less than one year. The portfolio turnover rate is calculated without regard to purchase and sales transactions of short-term instruments and certain derivatives, if any. If such transactions were included, the Fund’s portfolio turnover rate may be higher.
| Net asset value,
beginning of
period | | Net
realized
and
unrealized
gain (loss) | Total from
investment
operations | Distributions
from net
investment
income | Distributions
from net
realized
gains | Total
distributions to
shareholders |
|
| | | | | | | |
| | | | | | | |
| | | | | | | |
| | | | | | | |
| | | | | | | |
|
| | | | | | | |
| | | | | | | |
| | | | | | | |
| | | | | | | |
| | | | | | | |
|
| | | | | | | |
| | | | | | | |
| | | | | | | |
| | | | | | | |
| | | | | | | |
|
| | | | | | | |
| | | | | | | |
| | | | | | | |
| | | | | | | |
| | | | | | | |
|
| | | | | | | |
| | | | | | | |
| | | | | | | |
| | | | | | | |
| | | | | | | |
The accompanying Notes to Financial Statements are an integral part of this statement.
50
Columbia Total Return Bond Fund | Annual Report 2024
Financial Highlights (continued)
| Net
asset
value,
end of
period | | Total gross
expense
ratio to
average
| Total net
expense
ratio to
average
| Net investment
income
ratio to
average
net assets | | Net
assets,
end of
period
(000’s) |
|
| | | | | | | |
| | | | | | | |
| | | | | | | |
| | | | | | | |
| | | | | | | |
|
| | | | | | | |
| | | | | | | |
| | | | | | | |
| | | | | | | |
| | | | | | | |
|
| | | | | | | |
| | | | | | | |
| | | | | | | |
| | | | | | | |
| | | | | | | |
|
| | | | | | | |
| | | | | | | |
| | | | | | | |
| | | | | | | |
| | | | | | | |
|
| | | | | | | |
| | | | | | | |
| | | | | | | |
| | | | | | | |
| | | | | | | |
The accompanying Notes to Financial Statements are an integral part of this statement.
Columbia Total Return Bond Fund | Annual Report 2024
51
Financial Highlights (continued)
| Net asset value,
beginning of
period | | Net
realized
and
unrealized
gain (loss) | Total from
investment
operations | Distributions
from net
investment
income | Distributions
from net
realized
gains | Total
distributions to
shareholders |
|
| | | | | | | |
| | | | | | | |
| | | | | | | |
| | | | | | | |
| | | | | | | |
|
| | | | | | | |
| | | | | | | |
| | | | | | | |
| | | | | | | |
| | | | | | | |
Notes to Financial Highlights |
| In addition to the fees and expenses that the Fund bears directly, the Fund indirectly bears a pro rata share of the fees and expenses of any other funds in which it invests. Such indirect expenses are not included in the Fund’s reported expense ratios. |
| Total net expenses include the impact of certain fee waivers/expense reimbursements made by the Investment Manager and certain of its affiliates, if applicable. |
| Ratios include interest on collateral expense. For the periods indicated below, if interest on collateral expense had been excluded, expenses would have been lower by: |
| The benefits derived from expense reductions had an impact of less than 0.01%. |
| Per share amounts have been adjusted on a retroactive basis to reflect a 4 to 1 reverse stock split completed after the close of business on September 11, 2020. |
The accompanying Notes to Financial Statements are an integral part of this statement.
52
Columbia Total Return Bond Fund | Annual Report 2024
Financial Highlights (continued)
| Net
asset
value,
end of
period | | Total gross
expense
ratio to
average
| Total net
expense
ratio to
average
| Net investment
income
ratio to
average
net assets | | Net
assets,
end of
period
(000’s) |
|
| | | | | | | |
| | | | | | | |
| | | | | | | |
| | | | | | | |
| | | | | | | |
|
| | | | | | | |
| | | | | | | |
| | | | | | | |
| | | | | | | |
| | | | | | | |
The accompanying Notes to Financial Statements are an integral part of this statement.
Columbia Total Return Bond Fund | Annual Report 2024
53
Notes to Financial StatementsApril 30, 2024 Note 1. Organization
Columbia Total Return Bond Fund (the Fund), a series of Columbia Funds Series Trust I (the Trust), is a diversified fund. The Trust is registered under the Investment Company Act of 1940, as amended (the 1940 Act), as an open-end management investment company organized as a Massachusetts business trust.
Fund shares
The Trust may issue an unlimited number of shares (without par value). The Fund offers each of the share classes listed in the Statement of Assets and Liabilities. Although all share classes generally have identical voting, dividend and liquidation rights, each share class votes separately when required by the Trust’s organizational documents or by law. Each share class has its own expense and sales charge structure. Different share classes may have different minimum initial investment amounts and pay different net investment income distribution amounts to the extent the expenses of distributing such share classes vary. Distributions to shareholders in a liquidation will be proportional to the net asset value of each share class.
As described in the Fund’s prospectus, Class A and Class C shares are offered to the general public for investment. Class C shares automatically convert to Class A shares after 8 years. Advisor Class, Institutional Class, Institutional 2 Class, Institutional 3 Class and Class R shares are available for purchase through authorized investment professionals to omnibus retirement plans or to institutional investors and to certain other investors as also described in the Fund’s prospectus.
Note 2. Summary of significant accounting policies
Basis of preparation
The Fund is an investment company that applies the accounting and reporting guidance in the Financial Accounting Standards Board (FASB) Accounting Standards Codification Topic 946, Financial Services - Investment Companies (ASC 946). The financial statements are prepared in accordance with U.S. generally accepted accounting principles (GAAP), which requires management to make certain estimates and assumptions that affect the reported amounts of assets and liabilities, the disclosure of contingent assets and liabilities at the date of the financial statements and the reported amounts of income and expenses during the reporting period. Actual results could differ from those estimates.
The following is a summary of significant accounting policies followed by the Fund in the preparation of its financial statements.
Security valuation
Equity securities listed on an exchange are valued at the closing price or last trade price on their primary exchange at the close of business of the New York Stock Exchange. Securities with a closing price not readily available or not listed on any exchange are valued at the mean between the closing bid and ask prices. Listed preferred stocks convertible into common stocks are valued using an evaluated price from a pricing service.
Debt securities generally are valued based on prices obtained from pricing services, which are intended to reflect market transactions for normal, institutional-size trading units of similar securities. The services may use various pricing techniques that take into account, as applicable, factors such as yield, quality, coupon rate, maturity, type of issue, trading characteristics and other data, as well as approved independent broker-dealer quotes. Debt securities for which quotations are not readily available or not believed to be reflective of market value may also be valued based upon a bid quote from an approved independent broker-dealer. Debt securities maturing in 60 days or less are valued primarily at amortized market value, unless this method results in a valuation that management believes does not approximate fair value.
Asset- and mortgage-backed securities are generally valued by pricing services, which utilize pricing models that incorporate the securities’ cash flow and loan performance data. These models also take into account available market data, including trades, market quotations, and benchmark yield curves for identical or similar securities. Factors used to identify similar securities may include, but are not limited to, issuer, collateral type, vintage, prepayment speeds, collateral performance, credit ratings, credit enhancement and expected life. Asset-backed securities for which quotations are readily available may also be valued based upon an over-the-counter or exchange bid quote from an approved independent broker-dealer. Debt securities maturing in 60 days or less are valued primarily at amortized market value, unless this method results in a valuation that management believes does not approximate fair value.
54
Columbia Total Return Bond Fund | Annual Report 2024
Notes to Financial Statements (continued)April 30, 2024 Senior loan securities for which reliable market quotations are readily available are generally valued by pricing services at the average of the bids received.
Investments in open-end investment companies (other than exchange-traded funds (ETFs)), are valued at the latest net asset value reported by those companies as of the valuation time.
Forward foreign currency exchange contracts are marked-to-market based upon foreign currency exchange rates provided by a pricing service.
Futures and options on futures contracts are valued based upon the settlement price at the close of regular trading on their principal exchanges or, in the absence of a settlement price, at the mean of the latest quoted bid and ask prices.
Option contracts are valued at the mean of the latest quoted bid and ask prices on their primary exchanges. Option contracts, including over-the-counter option contracts, with no readily available market quotations are valued using mid-market evaluations from independent third-party vendors.
Swap transactions are valued through an independent pricing service or broker, or if neither is available, through an internal model based upon observable inputs.
Investments for which market quotations are not readily available, or that have quotations which management believes are not reflective of market value or reliable, are valued at fair value as determined in good faith under procedures approved by the Board of Trustees. If a security or class of securities (such as foreign securities) is valued at fair value, such value is likely to be different from the quoted or published price for the security, if available.
The determination of fair value often requires significant judgment. To determine fair value, management may use assumptions including but not limited to future cash flows and estimated risk premiums. Multiple inputs from various sources may be used to determine fair value.
GAAP requires disclosure regarding the inputs and valuation techniques used to measure fair value and any changes in valuation inputs or techniques. In addition, investments shall be disclosed by major category. This information is disclosed following the Fund’s Portfolio of Investments.
Foreign currency transactions and translations
The values of all assets and liabilities denominated in foreign currencies are generally translated into U.S. dollars at exchange rates determined at the close of regular trading on the New York Stock Exchange. Net realized and unrealized gains (losses) on foreign currency transactions and translations include gains (losses) arising from the fluctuation in exchange rates between trade and settlement dates on securities transactions, gains (losses) arising from the disposition of foreign currency and currency gains (losses) between the accrual and payment dates on dividends, interest income and foreign withholding taxes.
For financial statement purposes, the Fund does not distinguish that portion of gains (losses) on investments which is due to changes in foreign exchange rates from that which is due to changes in market prices of the investments. Such fluctuations are included with the net realized and unrealized gains (losses) on investments in the Statement of Operations.
Derivative instruments
The Fund invests in certain derivative instruments, as detailed below, in seeking to meet its investment objectives. Derivatives are instruments whose values depend on, or are derived from, in whole or in part, the value of one or more securities, currencies, commodities, indices, or other assets or instruments. Derivatives may be used to increase investment flexibility (including to maintain cash reserves while maintaining desired exposure to certain assets), for risk management (hedging) purposes, to facilitate trading, to reduce transaction costs and to pursue higher investment returns. The Fund may also use derivative instruments to mitigate certain investment risks, such as foreign currency exchange rate risk, interest rate risk and credit risk. Derivatives may involve various risks, including the potential inability of the counterparty to fulfill its obligations under the terms of the contract, the potential for an illiquid secondary market (making it difficult for the Fund to
Columbia Total Return Bond Fund | Annual Report 2024
55
Notes to Financial Statements (continued)April 30, 2024 sell or terminate, including at favorable prices) and the potential for market movements which may expose the Fund to gains or losses in excess of the amount shown in the Statement of Assets and Liabilities. The notional amounts of derivative instruments, if applicable, are not recorded in the financial statements.
A derivative instrument may suffer a marked-to-market loss if the value of the contract decreases due to an unfavorable change in the market rates or values of the underlying instrument. Losses can also occur if the counterparty does not perform its obligations under the contract. The Fund’s risk of loss from counterparty credit risk on over-the-counter derivatives is generally limited to the aggregate unrealized gain netted against any collateral held by the Fund and the amount of any variation margin held by the counterparty, plus any replacement costs or related amounts. With exchange-traded or centrally cleared derivatives, there is reduced counterparty credit risk to the Fund since the clearinghouse or central counterparty provides some protection in the case of clearing member default. The clearinghouse or central counterparty stands between the buyer and the seller of the contract; therefore, failure of the clearinghouse or central counterparty may pose additional counterparty credit risk. However, credit risk still exists in exchange-traded or centrally cleared derivatives with respect to initial and variation margin that is held in a broker’s customer account. While clearing brokers are required to segregate customer margin from their own assets, in the event that a clearing broker becomes insolvent or goes into bankruptcy and at that time there is a shortfall in the aggregate amount of margin held by the clearing broker for all its clients and such shortfall is remedied by the central counterparty or otherwise, U.S. bankruptcy laws will typically allocate that shortfall on a pro-rata basis across all the clearing broker’s customers (including the Fund), potentially resulting in losses to the Fund.
In order to better define its contractual rights and to secure rights that will help the Fund mitigate its counterparty risk, the Fund may enter into an International Swaps and Derivatives Association, Inc. Master Agreement (ISDA Master Agreement) or similar agreement with its derivatives counterparties. An ISDA Master Agreement is an agreement between the Fund and a counterparty that governs over-the-counter derivatives and foreign exchange forward contracts and contains, among other things, collateral posting terms and netting provisions in the event of a default and/or termination event. Under an ISDA Master Agreement, the Fund may, under certain circumstances, offset with the counterparty certain derivative instruments’ payables and/or receivables with collateral held and/or posted and create one single net payment. The provisions of the ISDA Master Agreement typically permit a single net payment in the event of default (close-out netting), including the bankruptcy or insolvency of the counterparty. Note, however, that bankruptcy or insolvency laws of a particular jurisdiction may impose restrictions on or prohibitions against the right of offset or netting in bankruptcy, insolvency or other events.
Collateral (margin) requirements differ by type of derivative. Margin requirements are established by the clearinghouse or central counterparty for exchange-traded and centrally cleared derivatives. Brokers can ask for margin in excess of the minimum in certain circumstances. Collateral terms for most over-the-counter derivatives are subject to regulatory requirements to exchange variation margin with trading counterparties and may have contract specific margin terms as well. For over-the-counter derivatives traded under an ISDA Master Agreement, the collateral requirements are typically calculated by netting the marked-to-market amount for each transaction under such agreement and comparing that amount to the value of any variation margin currently pledged by the Fund and/or the counterparty. Generally, the amount of collateral due from or to a party has to exceed a minimum transfer amount threshold (e.g., $250,000) before a transfer has to be made. To the extent amounts due to the Fund from its counterparties are not fully collateralized, contractually or otherwise, the Fund bears the risk of loss from counterparty nonperformance. The Fund may also pay interest expense on cash collateral received from the broker or receive interest income on cash collateral pledged to the broker. The Fund attempts to mitigate counterparty risk by only entering into agreements with counterparties that it believes have the financial resources to honor their obligations and by monitoring the financial stability of those counterparties.
Certain ISDA Master Agreements allow counterparties of over-the-counter derivatives transactions to terminate derivatives contracts prior to maturity in the event the Fund’s net asset value declines by a stated percentage over a specified time period or if the Fund fails to meet certain terms of the ISDA Master Agreement, which would cause the Fund to accelerate payment of any net liability owed to the counterparty. The Fund also has termination rights if the counterparty fails to meet certain terms of the ISDA Master Agreement. In determining whether to exercise such termination rights, the Fund would consider, in addition to counterparty credit risk, whether termination would result in a net liability owed from the counterparty.
For financial reporting purposes, the Fund does not offset derivative assets and derivative liabilities that are subject to netting arrangements in the Statement of Assets and Liabilities.
56
Columbia Total Return Bond Fund | Annual Report 2024
Notes to Financial Statements (continued)April 30, 2024 Forward foreign currency exchange contracts
Forward foreign currency exchange contracts are over-the-counter agreements between two parties to buy and sell a currency at a set price on a future date. The Fund utilized forward foreign currency exchange contracts to hedge the currency exposure associated with some or all of the Fund’s securities and to shift foreign currency exposure back to U.S. dollars. These instruments may be used for other purposes in future periods.
The values of forward foreign currency exchange contracts fluctuate daily with changes in foreign currency exchange rates. Changes in the value of these contracts are recorded as unrealized appreciation or depreciation until the contract is exercised or has expired. The Fund will realize a gain or loss when the forward foreign currency exchange contract is closed or expires. Non-deliverable forward foreign currency exchange contracts are settled with the counterparty in U.S. dollars without delivery of foreign currency.
The use of forward foreign currency exchange contracts does not eliminate fluctuations in the prices of the Fund’s portfolio securities. The risks of forward foreign currency exchange contracts include movement in the values of the foreign currencies relative to the U.S. dollar (or other foreign currencies) and the possibility that counterparties will not complete their contractual obligations, which may be in excess of the amount reflected, if any, in the Statement of Assets and Liabilities.
Futures contracts
Futures contracts are exchange-traded and represent commitments for the future purchase or sale of an asset at a specified price on a specified date. The Fund bought and sold futures contracts to manage the duration and yield curve exposure of the Fund versus the benchmark and to manage exposure to movements in interest rates. These instruments may be used for other purposes in future periods. Upon entering into futures contracts, the Fund bears risks that it may not achieve the anticipated benefits of the futures contracts and may realize a loss. Additional risks include counterparty credit risk, the possibility of an illiquid market, and that a change in the value of the contract or option may not correlate with changes in the value of the underlying asset.
Upon entering into a futures contract, the Fund deposits cash or securities with the broker, known as a futures commission merchant (FCM), in an amount sufficient to meet the initial margin requirement. The initial margin deposit must be maintained at an established level over the life of the contract. Cash deposited as initial margin is recorded in the Statement of Assets and Liabilities as margin deposits. Securities deposited as initial margin are designated in the Portfolio of Investments. Subsequent payments (variation margin) are made or received by the Fund each day. The variation margin payments are equal to the daily change in the contract value and are recorded as variation margin receivable or payable and are offset in unrealized gains or losses. The Fund generally expects to earn interest income on its margin deposits. The Fund recognizes a realized gain or loss when the contract is closed or expires. Futures contracts involve, to varying degrees, risk of loss in excess of the variation margin disclosed in the Statement of Assets and Liabilities.
Options contracts
Options are contracts which entitle the holder to purchase or sell securities or other identified assets at a specified price, or in the case of index option contracts, to receive or pay the difference between the index value and the strike price of the index option contract. Option contracts can be either exchange-traded or over-the-counter. The Fund purchased and has written option contracts to manage exposure to fluctuations in interest rates. These instruments may be used for other purposes in future periods. Completion of transactions for option contracts traded in the over-the-counter market depends upon the performance of the other party. Collateral may be collected or posted by the Fund to secure over-the-counter option contract trades. Collateral held or posted by the Fund for such option contract trades must be returned to the broker or the Fund upon closure, exercise or expiration of the contract.
Options contracts purchased are recorded as investments. When the Fund writes an options contract, the premium received is recorded as an asset and an amount equivalent to the premium is recorded as a liability in the Statement of Assets and Liabilities and is subsequently adjusted to reflect the current fair value of the option written. Changes in the fair value of the written option are recorded as unrealized appreciation or depreciation until the contract is exercised or has expired. The Fund realizes a gain or loss when the option contract is closed or expires. When option contracts are exercised, the proceeds on sales for a written call or purchased put option contract, or the purchase cost for a written put or purchased call option contract, is adjusted by the amount of premium received or paid.
Columbia Total Return Bond Fund | Annual Report 2024
57
Notes to Financial Statements (continued)April 30, 2024 For over-the-counter options purchased, the Fund bears the risk of loss of the amount of the premiums paid plus the positive change in market values net of any collateral held by the Fund should the counterparty fail to perform under the contracts. Option contracts written by the Fund do not typically give rise to significant counterparty credit risk, as options written generally obligate the Fund and not the counterparty to perform. The risk in writing a call option contract is that the Fund gives up the opportunity for profit if the market price of the security increases above the strike price and the option contract is exercised. The risk in writing a put option contract is that the Fund may incur a loss if the market price of the security decreases below the strike price and the option contract is exercised. Exercise of a written option could result in the Fund purchasing or selling a security or foreign currency when it otherwise would not, or at a price different from the current market value. In purchasing and writing options, the Fund bears the risk of an unfavorable change in the value of the underlying instrument or the risk that the Fund may not be able to enter into a closing transaction due to an illiquid market.
Interest rate swaption contracts
Interest rate swaption contracts entered into by the Fund typically represent an option that gives the purchaser the right, but not the obligation, to enter into an interest rate swap contract on a future date. Each interest rate swaption contract will specify if the buyer is entitled to receive the fixed or floating rate if the interest rate is exercised. Changes in the value of a purchased interest rate swaption contracts are reported as unrealized appreciation or depreciation on options in the Statement of Assets and Liabilities. Gain or loss is recognized in the Statement of Operations when the interest rate swaption contract is closed or expires.
When the Fund writes an interest rate swaption contract, the premium received is recorded as an asset and an amount equivalent to the premium is recorded as a liability in the Statement of Assets and Liabilities and is subsequently adjusted to reflect the current fair value of the interest rate swaption contract written. Premiums received from writing interest rate swaption contracts that expire unexercised are recorded by the Fund on the expiration date as realized gains from options written in the Statement of Operations. The difference between the premium and the amount paid on effecting a closing purchase transaction, including brokerage commissions, is also recorded as realized gain, or if the premium is less than the amount paid for the closing purchase, as realized loss. These amounts are reflected as net realized gain (loss) on options written in the Statement of Operations.
Swap contracts
Swap contracts are negotiated in the over-the-counter market and are entered into bilaterally or centrally cleared (centrally cleared swap contract). In a centrally cleared swap contract, immediately following execution of the swap contract with a broker, the swap contract is novated to a central counterparty and the central counterparty becomes the Fund’s counterparty to the centrally cleared swap contract. The Fund is required to deposit initial margin with the futures commission merchant (FCM), which pledges it through to the central counterparty in the form of cash or securities in an amount that varies depending on the size and risk profile of the particular swap contract. Securities deposited as initial margin are designated in the Portfolio of Investments and cash deposited is recorded in the Statement of Assets and Liabilities as margin deposits. For a bilateral swap contract, the Fund has credit exposure to the broker, but exchanges daily variation margin with the broker based on the mark-to-market value of the swap contract to minimize that exposure. For centrally cleared swap contracts, the Fund has minimal credit exposure to the FCM because the central counterparty stands between the Fund and the relevant buyer/seller on the other side of the contract. Swap contracts are marked-to-market daily and changes in value are recorded as unrealized appreciation (depreciation). The daily change in valuation of centrally cleared swap contracts, if any, is recorded as a receivable or payable for variation margin in the Statement of Assets and Liabilities.
Entering into these contracts involves, to varying degrees, elements of interest, liquidity and counterparty credit risk in excess of the amounts recognized in the Statement of Assets and Liabilities. Such risks involve the possibility that there may be unfavorable changes in interest rates, market conditions or other conditions, that it may be difficult to initiate a swap transaction or liquidate a position at an advantageous time or price which may result in significant losses, and that the bilateral counterparty, FCM or central counterparty, as applicable, may not fulfill its obligation under the contract.
Credit default swap contracts
The Fund entered into credit default swap contracts to increase or decrease its credit exposure to an index and to manage credit risk exposure. These instruments may be used for other purposes in future periods. Credit default swap contracts are transactions in which one party pays fixed periodic payments to a counterparty in consideration for an agreement from the
58
Columbia Total Return Bond Fund | Annual Report 2024
Notes to Financial Statements (continued)April 30, 2024 counterparty to make a specific payment should a specified credit event(s) take place. Although specified credit events are contract specific, credit events are typically bankruptcy, failure to pay, restructuring, obligation acceleration, obligation default, or repudiation/moratorium.
As the purchaser of a credit default swap contract, the Fund purchases protection by paying a periodic interest rate on the notional amount to the counterparty. The interest amount is accrued daily as a component of unrealized appreciation (depreciation) and is recorded as a realized loss upon payment. If a credit event as specified in the contract occurs, the Fund may have the option either to deliver the reference obligation to the seller in exchange for a cash payment of its par amount, or to receive a net cash settlement equal to the par amount less an agreed-upon value of the reference obligation as of the date of the credit event. The difference between the value of the obligation or cash delivered and the notional amount received will be recorded as a realized gain (loss).
As the seller of a credit default swap contract, the Fund sells protection to a buyer and will generally receive a periodic interest rate on a notional amount. The interest amount is accrued daily as a component of unrealized appreciation (depreciation) and is recorded as a realized gain upon receipt of the payment. If a credit event as specified in the contract with the counterparty occurs, the Fund may either be required to accept the reference obligation from the buyer in exchange for a cash payment of its notional amount, or to pay the buyer a net cash settlement equal to the notional amount less an agreed-upon value of the reference obligation (recovery value) as of the date of the credit event. The difference between the value of the obligation or cash received and the notional amount paid will be recorded as a realized gain (loss). The maximum potential amount of undiscounted future payments the Fund could be required to make as the seller of protection under a credit default swap contract is equal to the notional amount of the reference obligation. These potential amounts may be partially offset by any recovery values of the respective reference obligations or upfront receipts upon entering into the agreement. The notional amounts and market values of all credit default swap contracts in which the Fund is the seller of protection, if any, are disclosed in the Credit Default Swap Contracts Outstanding schedule following the Portfolio of Investments.
As a protection seller, the Fund bears the risk of loss from the credit events specified in the contract with the counterparty. For credit default swap contracts on credit indices, quoted market prices and resulting market values serve as an indicator of the current status of the payment/performance risk. Increasing market values, in absolute terms when compared to the notional amount of the swap, represent a deterioration of the reference entity’s credit soundness and a greater likelihood or risk of default or other credit event occurring as defined under the terms of the contract.
Any upfront payment or receipt by the Fund upon entering into a credit default swap contract is recorded as an asset or liability, respectively, and amortized daily as a component of realized gain (loss) in the Statement of Operations. Credit default swap contracts are valued daily, and the change in value is recorded as unrealized appreciation (depreciation) until the termination of the swap, at which time a realized gain (loss) is recorded.
Credit default swap contracts can involve greater risks than if a fund had invested in the reference obligation directly since, in addition to general market risks, credit default swaps are subject to counterparty credit risk, leverage risk, hedging risk, correlation risk and liquidity risk.
Effects of derivative transactions in the financial statements
The following tables are intended to provide additional information about the effect of derivatives on the financial statements of the Fund, including: the fair value of derivatives by risk category and the location of those fair values in the Statement of Assets and Liabilities; and the impact of derivative transactions over the period in the Statement of Operations, including realized and unrealized gains (losses). The derivative instrument schedules following the Portfolio of Investments present additional information regarding derivative instruments outstanding at the end of the period, if any.
Columbia Total Return Bond Fund | Annual Report 2024
59
Notes to Financial Statements (continued)April 30, 2024 The following table is a summary of the fair value of derivative instruments (not considered to be hedging instruments for accounting disclosure purposes) at April 30, 2024:
| | |
| Statement
of assets and liabilities
location | |
| Component of total distributable earnings (loss) — unrealized appreciation on swap contracts | |
| Upfront payments on swap contracts | |
| Component of total distributable earnings (loss) — unrealized appreciation on futures contracts | |
| Investments, at value — Option contracts purchased | |
| | |
| | |
| Statement
of assets and liabilities
location | |
| Component of total distributable earnings (loss) — unrealized depreciation on swap contracts | |
| Upfront receipts on swap contracts | |
| Unrealized depreciation on forward foreign currency exchange contracts | |
| Component of total distributable earnings (loss) — unrealized depreciation on futures contracts | |
| | |
| Includes cumulative appreciation (depreciation) as reported in the tables following the Portfolio of Investments. Only the current day’s variation margin for futures and centrally cleared swaps, if any, is reported in receivables or payables in the Statement of Assets and Liabilities. |
The following table indicates the effect of derivative instruments (not considered to be hedging instruments for accounting disclosure purposes) in the Statement of Operations for the year ended April 30, 2024:
Amount of realized gain (loss) on derivatives recognized in income |
| Forward
foreign
currency
exchange
contracts
($) | | Option
contracts
purchased
($) | Option
contracts
written
($) | | |
| | | | | | |
| | | | | | |
| | | | | | |
| | | | | | |
|
Change in unrealized appreciation (depreciation) on derivatives recognized in income |
| Forward
foreign
currency
exchange
contracts
($) | | Option
contracts
purchased
($) | Option
contracts
written
($) | | |
| | | | | | |
| | | | | | |
| | | | | | |
| | | | | | |
60
Columbia Total Return Bond Fund | Annual Report 2024
Notes to Financial Statements (continued)April 30, 2024 The following table is a summary of the average daily outstanding volume by derivative instrument for the year ended April 30, 2024:
| Average notional
amounts ($) |
| |
Futures contracts — short | |
Credit default swap contracts — buy protection | |
Credit default swap contracts — sell protection | |
| |
Option contracts purchased | |
| |
| Average unrealized
appreciation ($) | Average unrealized
depreciation ($) |
Forward foreign currency exchange contracts | | |
Investments in senior loans
The Fund may invest in senior loan assignments. When the Fund purchases an assignment of a senior loan, the Fund typically has direct rights against the borrower; provided, however, that the Fund’s rights may be more limited than the lender from which it acquired the assignment and the Fund may be able to enforce its rights only through an administrative agent. Although certain senior loan assignments are secured by collateral, the Fund could experience delays or limitations in realizing such collateral or have its interest subordinated to other indebtedness of the obligor. In the event that the administrator or collateral agent of a loan becomes insolvent or enters into receivership or bankruptcy, the Fund may incur costs and delays in realizing payment or may suffer a loss of principal and/or interest. The risk of loss is greater for unsecured or subordinated loans. In addition, senior loan assignments are vulnerable to market, economic or other conditions or events that may reduce the demand for senior loan assignments and certain senior loan assignments which were liquid when purchased, may become illiquid.
The Fund may enter into senior loan assignments where all or a portion of the loan may be unfunded. The Fund is obligated to fund these commitments at the borrower’s discretion. These commitments, if any, are generally traded and priced in the same manner as other senior loan securities and are disclosed as unfunded senior loan commitments in the Fund’s Portfolio of Investments with a corresponding payable for investments purchased. The Fund designates cash or liquid securities to cover these commitments.
Asset- and mortgage-backed securities
The Fund may invest in asset-backed and mortgage-backed securities. The maturity dates shown represent the original maturity of the underlying obligation. Actual maturity may vary based upon prepayment activity on these obligations. All, or a portion, of the obligation may be prepaid at any time because the underlying asset may be prepaid. As a result, decreasing market interest rates could result in an increased level of prepayment. An increased prepayment rate will have the effect of shortening the maturity of the security. Unless otherwise noted, the coupon rates presented are fixed rates.
Delayed delivery securities
The Fund may trade securities on other than normal settlement terms, including securities purchased or sold on a “when-issued” or "forward commitment" basis. This may increase risk to the Fund since the other party to the transaction may fail to deliver, which could cause the Fund to subsequently invest at less advantageous prices. The Fund designates cash or liquid securities in an amount equal to the delayed delivery commitment.
Columbia Total Return Bond Fund | Annual Report 2024
61
Notes to Financial Statements (continued)April 30, 2024 To be announced securities
The Fund may trade securities on a To Be Announced (TBA) basis. As with other delayed-delivery transactions, a seller agrees to issue a TBA security at a future date. However, the seller does not specify the particular securities to be delivered. Instead, the Fund agrees to accept any security that meets specified terms.
In some cases, Master Securities Forward Transaction Agreements (MSFTAs) may be used to govern transactions of certain forward-settling agency mortgage-backed securities, such as delayed-delivery and TBAs, between the Fund and counterparty. The MSFTA maintains provisions for, among other things, initiation and confirmation, payment and transfer, events of default, termination, and maintenance of collateral relating to such transactions.
Mortgage dollar roll transactions
The Fund may enter into mortgage “dollar rolls” in which the Fund sells securities for delivery in the current month and simultaneously contracts with the same counterparty to repurchase similar but not identical securities (same type, coupon and maturity) on a specified future date. These transactions may increase the Fund’s portfolio turnover rate. During the roll period, the Fund loses the right to receive principal and interest paid on the securities sold. However, the Fund may benefit because it receives negotiated amounts in the form of reductions of the purchase price for the future purchase plus the interest earned on the cash proceeds of the securities sold until the settlement date of the forward purchase. The Fund records the incremental difference between the forward purchase and sale of each forward roll as a realized gain or loss. Unless any realized gains exceed the income, capital appreciation, and gain or loss due to mortgage prepayments that would have been realized on the securities sold as part of the mortgage dollar roll, the use of this technique may diminish the investment performance of the Fund compared to what the performance would have been without the use of mortgage dollar rolls. Mortgage dollar rolls involve the risk that the market value of the securities the Fund is obligated to repurchase may decline below the repurchase price, or that the counterparty may default on its obligations. All cash proceeds will be invested in instruments that are permissible investments for the Fund. The Fund identifies cash or liquid securities in an amount equal to the forward purchase price. The Fund does not currently enter into mortgage dollar rolls that are accounted for as financing transactions.
Treasury inflation protected securities
The Fund may invest in treasury inflation protected securities (TIPS). The principal amount of TIPS is adjusted periodically and is increased for inflation or decreased for deflation based on a monthly published index. These adjustments are recorded as interest income in the Statement of Operations. Coupon payments are based on the adjusted principal at the time the interest is paid.
Interest only and principal only securities
The Fund may invest in Interest Only (IO) or Principal Only (PO) securities. IOs are stripped securities entitled to receive all of the security’s interest, but none of its principal. IOs are particularly sensitive to changes in interest rates and therefore subject to greater fluctuations in price than typical interest bearing debt securities. IOs are also subject to credit risk because the Fund may not receive all or part of the interest payments if the issuer, obligor, guarantor or counterparty defaults on its obligation. Payments received for IOs are included in interest income in the Statement of Operations. Because no principal will be received at the maturity of an IO, adjustments are made to the cost of the security on a monthly basis until maturity. These adjustments are included in interest income in the Statement of Operations. POs are stripped securities entitled to receive the principal from the underlying obligation, but not the interest. POs are particularly sensitive to changes in interest rates and therefore are subject to fluctuations in price. POs are also subject to credit risk because the Fund may not receive all or part of its principal if the issuer, obligor, guarantor or counterparty defaults on its obligation. The Fund may also invest in IO or PO stripped mortgage-backed securities. Payments received for POs are treated as reductions to the cost and par value of the securities.
62
Columbia Total Return Bond Fund | Annual Report 2024
Notes to Financial Statements (continued)April 30, 2024 Offsetting of assets and liabilities
The following table presents the Fund’s gross and net amount of assets and liabilities available for offset under netting arrangements as well as any related collateral received or pledged by the Fund as of April 30, 2024:
| | | Goldman
Sachs
International
($) | | | | |
| | | | | | | |
Centrally cleared credit default swap contracts (b) | | | | | | | |
Call option contracts purchased | | | | | | | |
Put option contracts purchased | | | | | | | |
OTC credit default swap contracts (c) | | | | | | | |
| | | | | | | |
| | | | | | | |
Forward foreign currency exchange contracts | | | | | | | |
OTC credit default swap contracts (c) | | | | | | | |
| | | | | | | |
Total financial and derivative net assets | | | | | | | |
Total collateral received (pledged) (d) | | | | | | | |
| | | | | | | |
| Exposure can only be netted across transactions governed under the same master agreement with the same legal entity. |
| Centrally cleared swaps are included within payable/receivable for variation margin in the Statement of Assets and Liabilities. |
| Over-the-Counter (OTC) swap contracts are presented at market value plus periodic payments receivable (payable), which is comprised of unrealized appreciation, unrealized depreciation, upfront payments and upfront receipts. |
| In some instances, the actual collateral received and/or pledged may be more than the amount shown due to overcollateralization. |
| Represents the net amount due from/(to) counterparties in the event of default. |
Security transactions
Security transactions are accounted for on the trade date. Cost is determined and gains (losses) are based upon the specific identification method for both financial statement and federal income tax purposes.
The trade date for senior loans purchased in the primary market is the date on which the loan is allocated. The trade date for senior loans purchased in the secondary market is the date on which the transaction is entered into.
Income recognition
Interest income is recorded on an accrual basis. Market premiums and discounts, including original issue discounts, are amortized and accreted, respectively, over the expected life of the security on all debt securities, unless otherwise noted. The Fund classifies gains and losses realized on prepayments received on mortgage-backed securities as adjustments to interest income. For convertible securities, premiums attributable to the conversion feature are not amortized.
The Fund may place a debt security on non-accrual status and reduce related interest income when it becomes probable that the interest will not be collected and the amount of uncollectible interest can be reasonably estimated. The Fund may also adjust accrual rates when it becomes probable the full interest will not be collected and a partial payment will be received. A defaulted debt security is removed from non-accrual status when the issuer resumes interest payments or when collectability of interest is reasonably assured.
Corporate actions and dividend income are recorded on the ex-dividend date.
The Fund may receive distributions from holdings in equity securities, business development companies (BDCs), exchange-traded funds (ETFs), limited partnerships (LPs), other regulated investment companies (RICs), and real estate investment trusts (REITs), which report information as to the tax character of their distributions annually. These distributions are allocated to dividend income, capital gain and return of capital based on actual information reported. Return of capital is recorded as a reduction of the cost basis of securities held. If the Fund no longer owns the applicable securities, return of
Columbia Total Return Bond Fund | Annual Report 2024
63
Notes to Financial Statements (continued)April 30, 2024 capital is recorded as a realized gain. With respect to REITs, to the extent actual information has not yet been reported, estimates for return of capital are made by Columbia Management Investment Advisers, LLC (the Investment Manager), a wholly-owned subsidiary of Ameriprise Financial, Inc. (Ameriprise Financial). The Investment Manager’s estimates are subsequently adjusted when the actual character of the distributions is disclosed by the REITs, which could result in a proportionate change in return of capital to shareholders.
Awards from class action litigation are recorded as a reduction of cost basis if the Fund still owns the applicable securities on the payment date. If the Fund no longer owns the applicable securities on the payment date, the proceeds are recorded as realized gains.
The value of additional securities received as an income payment through a payment-in-kind, if any, is recorded as interest income and increases the cost basis of such securities.
The Fund may receive other income from senior loans, including amendment fees, consent fees and commitment fees. These fees are recorded as income when received by the Fund. These amounts are included in Interest Income in the Statement of Operations.
Expenses
General expenses of the Trust are allocated to the Fund and other funds of the Trust based upon relative net assets or other expense allocation methodologies determined by the nature of the expense. Expenses directly attributable to the Fund are charged to the Fund. Expenses directly attributable to a specific class of shares are charged to that share class.
Determination of class net asset value
All income, expenses (other than class-specific expenses, which are charged to that share class, as shown in the Statement of Operations) and realized and unrealized gains (losses) are allocated to each class of the Fund on a daily basis, based on the relative net assets of each class, for purposes of determining the net asset value of each class.
Federal income tax status
The Fund intends to qualify each year as a regulated investment company under Subchapter M of the Internal Revenue Code, as amended, and will distribute substantially all of its investment company taxable income and net capital gain, if any, for its tax year, and as such will not be subject to federal income taxes. In addition, the Fund intends to distribute in each calendar year substantially all of its ordinary income, capital gain net income and certain other amounts, if any, such that the Fund should not be subject to federal excise tax. Therefore, no federal income or excise tax provision is recorded.
Foreign taxes
The Fund may be subject to foreign taxes on income, gains on investments or currency repatriation, a portion of which may be recoverable. The Fund will accrue such taxes and recoveries, as applicable, based upon its current interpretation of tax rules and regulations that exist in the markets in which it invests.
Realized gains in certain countries may be subject to foreign taxes at the Fund level, based on statutory rates. The Fund accrues for such foreign taxes on realized and unrealized gains at the appropriate rate for each jurisdiction, as applicable. The amount, if any, is disclosed as a liability in the Statement of Assets and Liabilities.
Distributions to shareholders
Distributions from net investment income, if any, are declared daily and paid monthly. Net realized capital gains, if any, are distributed at least annually. Income distributions and capital gain distributions are determined in accordance with federal income tax regulations, which may differ from GAAP.
64
Columbia Total Return Bond Fund | Annual Report 2024
Notes to Financial Statements (continued)April 30, 2024 Guarantees and indemnifications
Under the Trust’s organizational documents and, in some cases, by contract, its officers and trustees are indemnified against certain liabilities arising out of the performance of their duties to the Trust or its funds. In addition, certain of the Fund’s contracts with its service providers contain general indemnification clauses. The Fund’s maximum exposure under these arrangements is unknown since the amount of any future claims that may be made against the Fund cannot be determined, and the Fund has no historical basis for predicting the likelihood of any such claims.
Recent accounting pronouncements and regulatory updates
Tailored Shareholder Reports
In October 2022, the Securities and Exchange Commission adopted a final rule, "Tailored Shareholder Reports for Mutual Funds and Exchange-Traded Funds; Fee Information in Investment Company Advertisements." The rule and form amendments will, among other things, require the Fund to transmit concise and visually engaging shareholder reports that highlight key information. The amendments will require that funds tag information in a structured data format and that certain more in-depth information be made available online and available for delivery free of charge to investors on request. The amendments became effective January 24, 2023. There is an 18-month transition period after the effective date of the amendments.
Note 3. Fees and other transactions with affiliates
Management services fees
The Fund has entered into a Management Agreement with Columbia Management Investment Advisers, LLC (the Investment Manager), a wholly-owned subsidiary of Ameriprise Financial, Inc. (Ameriprise Financial). Under the Management Agreement, the Investment Manager provides the Fund with investment research and advice, as well as administrative and accounting services. The management services fee is an annual fee that is equal to a percentage of the Fund’s daily net assets that declines from 0.50% to 0.34% as the Fund’s net assets increase. The effective management services fee rate for the year ended April 30, 2024 was 0.48% of the Fund’s average daily net assets.
Compensation of Board members
Members of the Board of Trustees who are not officers or employees of the Investment Manager or Ameriprise Financial are compensated for their services to the Fund as disclosed in the Statement of Operations. Under a Deferred Compensation Plan (the Deferred Plan), these members of the Board of Trustees may elect to defer payment of up to 100% of their compensation. Deferred amounts are treated as though equivalent dollar amounts had been invested in shares of certain funds managed by the Investment Manager. The Fund’s liability for these amounts is adjusted for market value changes and remains in the Fund until distributed in accordance with the Deferred Plan. All amounts payable under the Deferred Plan constitute a general unsecured obligation of the Fund. The expense for the Deferred Plan, which includes Trustees’ fees deferred during the current period as well as any gains or losses on the Trustees’ deferred compensation balances as a result of market fluctuations, is included in "Deferred compensation of board members" in the Statement of Operations.
Compensation of Chief Compliance Officer
The Board of Trustees has appointed a Chief Compliance Officer for the Fund in accordance with federal securities regulations. As disclosed in the Statement of Operations, a portion of the Chief Compliance Officer’s total compensation is allocated to the Fund, along with other allocations to affiliated registered investment companies managed by the Investment Manager and its affiliates, based on relative net assets.
Transfer agency fees
Under a Transfer and Dividend Disbursing Agent Agreement, Columbia Management Investment Services Corp. (the Transfer Agent), an affiliate of the Investment Manager and a wholly-owned subsidiary of Ameriprise Financial, is responsible for providing transfer agency services to the Fund. The Transfer Agent has contracted with SS&C GIDS, Inc. (SS&C GIDS) to serve as sub-transfer agent. The Transfer Agent pays the fees of SS&C GIDS for services as sub-transfer agent and SS&C GIDS is not entitled to reimbursement for such fees from the Fund (with the exception of out-of-pocket fees).
Columbia Total Return Bond Fund | Annual Report 2024
65
Notes to Financial Statements (continued)April 30, 2024 The Fund pays the Transfer Agent a monthly transfer agency fee based on the number or the average value of accounts, depending on the type of account. In addition, the Fund pays the Transfer Agent a fee for shareholder services based on the number of accounts or on a percentage of the average aggregate value of the Fund’s shares maintained in omnibus accounts up to the lesser of the amount charged by the financial intermediary or a cap established by the Board of Trustees from time to time.
The Transfer Agent also receives compensation from the Fund for various shareholder services and reimbursements for certain out-of-pocket fees. Total transfer agency fees for Institutional 2 Class and Institutional 3 Class shares are subject to an annual limitation of not more than 0.07% and 0.02%, respectively, of the average daily net assets attributable to each share class. In addition, prior to September 1, 2023, Institutional 2 Class shares were subject to a contractual transfer agency fee annual limitation of not more than 0.05% and Institutional 3 Class shares were subject to a contractual transfer agency fee annual limitation of not more than 0.00% of the average daily net assets attributable to each share class.
For the year ended April 30, 2024, the Fund’s effective transfer agency fee rates as a percentage of average daily net assets of each class were as follows:
An annual minimum account balance fee of $20 may apply to certain accounts with a value below the applicable share class’s initial minimum investment requirements to reduce the impact of small accounts on transfer agency fees. These minimum account balance fees are remitted to the Fund and recorded as part of expense reductions in the Statement of Operations. For the year ended April 30, 2024, these minimum account balance fees reduced total expenses of the Fund by $1,477.
Distribution and service fees
The Fund has entered into an agreement with Columbia Management Investment Distributors, Inc. (the Distributor), an affiliate of the Investment Manager and a wholly-owned subsidiary of Ameriprise Financial, for distribution and shareholder services. The Board of Trustees has approved, and the Fund has adopted, distribution and shareholder service plans (the Plans) applicable to certain share classes, which set the distribution and service fees for the Fund. These fees are calculated daily and are intended to compensate the Distributor and/or eligible selling and/or servicing agents for selling shares of the Fund and providing services to investors.
Under the Plans, the Fund pays a monthly service fee to the Distributor at the maximum annual rate of 0.25% of the average daily net assets attributable to Class A and Class C shares of the Fund. Also under the Plans, the Fund pays a monthly distribution fee to the Distributor at the maximum annual rates of 0.10%, 0.75% and 0.50% of the average daily net assets attributable to Class A, Class C and Class R shares of the Fund, respectively.
Although the Fund may pay distribution and service fees up to a maximum annual rate of 0.35% of the Fund’s average daily net assets attributable to Class A shares (comprised of up to 0.10% for distribution services and up to 0.25% for shareholder services), the Fund currently limits such fees to an aggregate fee of not more than 0.25% of the Fund’s average daily net assets attributable to Class A shares.
66
Columbia Total Return Bond Fund | Annual Report 2024
Notes to Financial Statements (continued)April 30, 2024 Sales charges (unaudited)
Sales charges, including front-end charges and contingent deferred sales charges (CDSCs), received by the Distributor for distributing Fund shares for the year ended April 30, 2024, if any, are listed below:
| This charge is imposed on certain investments of between $1 million and $50 million redeemed within 18 months after purchase, as follows: 1.00% if redeemed within 12 months after purchase, and 0.50% if redeemed more than 12, but less than 18, months after purchase, with certain limited exceptions. |
| This charge applies to redemptions within 12 months after purchase, with certain limited exceptions. |
The Fund’s other share classes are not subject to sales charges.
Expenses waived/reimbursed by the Investment Manager and its affiliates
The Investment Manager and certain of its affiliates have contractually agreed to waive fees and/or reimburse expenses (excluding certain fees and expenses described below) for the period(s) disclosed below, unless sooner terminated at the sole discretion of the Board of Trustees, so that the Fund’s net operating expenses, after giving effect to fees waived/expenses reimbursed and any balance credits and/or overdraft charges from the Fund’s custodian, do not exceed the following annual rate(s) as a percentage of the classes’ average daily net assets:
| September 1, 2023
through
August 31, 2024 | Prior to
September 1, 2023 |
| | |
| | |
| | |
| | |
| | |
| | |
| | |
Under the agreement governing these fee waivers and/or expense reimbursement arrangements, the following fees and expenses are excluded from the waiver/reimbursement commitment, and therefore will be paid by the Fund, if applicable: taxes (including foreign transaction taxes), expenses associated with investments in affiliated and non-affiliated pooled investment vehicles (including mutual funds and exchange-traded funds), transaction costs and brokerage commissions, costs related to any securities lending program, dividend expenses associated with securities sold short, inverse floater program fees and expenses, transaction charges and interest on borrowed money, costs associated with shareholder meetings, infrequent and/or unusual expenses and any other expenses the exclusion of which is specifically approved by the Board of Trustees. This agreement may be modified or amended only with approval from the Investment Manager, certain of its affiliates and the Fund. In addition to the contractual agreement, the Investment Manager and certain of its affiliates have voluntarily agreed to waive fees and/or reimburse Fund expenses (excluding certain fees and expenses described above) so that Fund level expenses (expenses directly attributable to the Fund and not to a specific share class) are waived proportionately across all share classes. This arrangement may be revised or discontinued at any time. Reflected in the contractual cap commitment, prior to September 1, 2023, is the Transfer Agent’s contractual agreement to limit total transfer agency fees to an annual rate of not more than 0.05% for Institutional 2 Class and 0.00% for Institutional 3 Class of the average daily net assets attributable to each share class. Any fees waived and/or expenses reimbursed under the expense reimbursement arrangements described above are not recoverable by the Investment Manager or its affiliates in future periods.
Note 4. Federal tax information
The timing and character of income and capital gain distributions are determined in accordance with income tax regulations, which may differ from GAAP because of temporary or permanent book to tax differences.
Columbia Total Return Bond Fund | Annual Report 2024
67
Notes to Financial Statements (continued)April 30, 2024 At April 30, 2024, these differences were primarily due to differing treatment for deferral/reversal of wash sale losses, foreign currency transactions, derivative investments, swap investments, tax straddles, principal and/or interest from fixed income securities, defaulted securities/troubled debt, capital loss carryforwards, trustees’ deferred compensation and distributions. To the extent these differences were permanent, reclassifications were made among the components of the Fund’s net assets. Temporary differences do not require reclassifications.
The following reclassifications were made:
Undistributed net
investment
income ($) | Accumulated
net realized
(loss) ($) | |
| | |
Net investment income (loss) and net realized gains (losses), as disclosed in the Statement of Operations, and net assets were not affected by this reclassification.
The tax character of distributions paid during the years indicated was as follows:
Year Ended April 30, 2024 | Year Ended April 30, 2023 |
| Long-term
capital gains ($) | | | Long-term
capital gains ($) | |
| | | | | |
Short-term capital gain distributions, if any, are considered ordinary income distributions for tax purposes.
At April 30, 2024, the components of distributable earnings on a tax basis were as follows:
Undistributed
ordinary income ($) | Undistributed
long-term
capital gains ($) | Capital loss
carryforwards ($) | Net unrealized
(depreciation) ($) |
| | | |
At April 30, 2024, the cost of all investments for federal income tax purposes along with the aggregate gross unrealized appreciation and depreciation based on that cost was:
| Gross unrealized
appreciation ($) | Gross unrealized
(depreciation) ($) | Net unrealized
(depreciation) ($) |
| | | |
Tax cost of investments and unrealized appreciation/(depreciation) may also include timing differences that do not constitute adjustments to tax basis.
The following capital loss carryforwards, determined at April 30, 2024, may be available to reduce future net realized gains on investments, if any, to the extent permitted by the Internal Revenue Code. In addition, for the year ended April 30, 2024, capital loss carryforwards utilized, if any, were as follows:
No expiration
short-term ($) | No expiration
long-term ($) | | |
| | | |
Management of the Fund has concluded that there are no significant uncertain tax positions in the Fund that would require recognition in the financial statements. However, management’s conclusion may be subject to review and adjustment at a later date based on factors including, but not limited to, new tax laws, regulations, and administrative interpretations (including relevant court decisions). Generally, the Fund’s federal tax returns for the prior three fiscal years remain subject to examination by the Internal Revenue Service.
68
Columbia Total Return Bond Fund | Annual Report 2024
Notes to Financial Statements (continued)April 30, 2024 Note 5. Portfolio information
The cost of purchases and proceeds from sales of securities, excluding short-term investments and derivatives, if any, aggregated to $8,463,125,244 and $8,594,771,817, respectively, for the year ended April 30, 2024, of which $7,139,943,824 and $7,025,781,063, respectively, were U.S. government securities. The amount of purchase and sale activity impacts the portfolio turnover rate reported in the Financial Highlights.
Note 6. Affiliated money market fund
The Fund invests in Columbia Short-Term Cash Fund, an affiliated money market fund established for the exclusive use by the Fund and other affiliated funds (the Affiliated MMF). The income earned by the Fund from such investments is included as Dividends - affiliated issuers in the Statement of Operations. As an investing fund, the Fund indirectly bears its proportionate share of the expenses of the Affiliated MMF. The Affiliated MMF prices its shares with a floating net asset value. The Securities and Exchange Commission has adopted amendments to money market fund rules requiring institutional prime money market funds like the Affiliated MMF to be subject to a discretionary liquidity fee of up to 2% if the imposition of such a fee is determined to be in the best interest of the Affiliated MMF and, by October 2, 2024, to a mandatory liquidity fee if daily net redemptions exceed 5% of net assets.
Note 7. Interfund lending
Pursuant to an exemptive order granted by the Securities and Exchange Commission, the Fund participates in a program (the Interfund Program) allowing each participating Columbia Fund (each, a Participating Fund) to lend money directly to and, except for closed-end funds and money market funds, borrow money directly from other Participating Funds for temporary purposes. The amounts eligible for borrowing and lending under the Interfund Program are subject to certain restrictions.
Interfund loans are subject to the risk that the borrowing fund could be unable to repay the loan when due, and a delay in repayment to the lending fund could result in lost opportunities and/or additional lending costs. The exemptive order is subject to conditions intended to mitigate conflicts of interest arising from the Investment Manager’s relationship with each Participating Fund.
The Fund’s activity in the Interfund Program during the year ended April 30, 2024 was as follows:
| | Weighted average
interest rate (%) | Number of days
with outstanding loans |
| | | |
Interest income earned by the Fund is recorded as Interfund lending in the Statement of Operations. The Fund had no outstanding interfund loans at April 30, 2024.
Note 8. Line of credit
The Fund has access to a revolving credit facility with a syndicate of banks led by JPMorgan Chase Bank, N.A., Citibank, N.A. and Wells Fargo Bank, N.A. whereby the Fund may borrow for the temporary funding of shareholder redemptions or for other temporary or emergency purposes. Pursuant to an October 26, 2023 amendment and restatement, the credit facility, which is an agreement between the Fund and certain other funds managed by the Investment Manager or an affiliated investment manager, severally and not jointly, permits aggregate borrowings up to $900 million. Interest is currently charged to each participating fund based on its borrowings at a rate equal to the higher of (i) the federal funds effective rate, (ii) the secured overnight financing rate plus 0.10% and (iii) the overnight bank funding rate plus, in each case, 1.00%. Each borrowing under the credit facility matures no later than 60 days after the date of borrowing. The Fund also pays a commitment fee equal to its pro rata share of the unused amount of the credit facility at a rate of 0.15% per annum. The commitment fee is included in other expenses in the Statement of Operations. This agreement expires annually in October unless extended or renewed. Prior to the October 26, 2023 amendment and restatement, the Fund had access to a revolving credit facility with a syndicate of banks led by JPMorgan Chase Bank, N.A., Citibank, N.A. and Wells Fargo Bank, N.A. which permitted collective borrowings up to $950 million. Interest was charged to each participating fund based on its borrowings at a rate equal to the higher of (i) the federal funds effective rate, (ii) the secured overnight financing rate plus 0.10% and (iii) the overnight bank funding rate plus, in each case, 1.00%.
Columbia Total Return Bond Fund | Annual Report 2024
69
Notes to Financial Statements (continued)April 30, 2024 The Fund had no borrowings during the year ended April 30, 2024.
Note 9. Significant risks
Credit risk
Credit risk is the risk that the value of debt instruments in the Fund’s portfolio may decline because the issuer defaults or otherwise becomes unable or unwilling, or is perceived to be unable or unwilling, to honor its financial obligations, such as making payments to the Fund when due. Credit rating agencies assign credit ratings to certain debt instruments to indicate their credit risk. Lower-rated or unrated debt instruments held by the Fund may present increased credit risk as compared to higher-rated debt instruments.
Derivatives risk
Losses involving derivative instruments may be substantial, because a relatively small movement in the underlying reference (which is generally the price, rate or other economic indicator associated with a security(ies), commodity, currency, index or other instrument or asset) may result in a substantial loss for the Fund. In addition to the potential for increased losses, the use of derivative instruments may lead to increased volatility within the Fund. Derivatives will typically increase the Fund’s exposure to principal risks to which it is otherwise exposed, and may expose the Fund to additional risks, including correlation risk, counterparty risk, hedging risk, leverage risk, liquidity risk and pricing risk.
High-yield investments risk
Securities and other debt instruments held by the Fund that are rated below investment grade (commonly called "high-yield" or "junk" bonds) and unrated debt instruments of comparable quality expose the Fund to a greater risk of loss of principal and income than a fund that invests solely or primarily in investment grade debt instruments. In addition, these investments have greater price fluctuations, are less liquid and are more likely to experience a default than higher-rated debt instruments. High-yield debt instruments are considered to be predominantly speculative with respect to the issuer’s capacity to pay interest and repay principal.
Interest rate risk
Interest rate risk is the risk of losses attributable to changes in interest rates. In general, if interest rates rise, the values of debt instruments tend to fall, and if interest rates fall, the values of debt instruments tend to rise. Actions by governments and central banking authorities can result in increases or decreases in interest rates. Higher periods of inflation could lead such authorities to raise interest rates. Increasing interest rates may negatively affect the value of debt securities held by the Fund, resulting in a negative impact on the Fund’s performance and net asset value per share. In general, the longer the maturity or duration of a debt security, the greater its sensitivity to changes in interest rates. The Fund is subject to the risk that the income generated by its investments may not keep pace with inflation.
Liquidity risk
Liquidity risk is the risk associated with a lack of marketability of investments which may make it difficult to sell the investment at a desirable time or price. Changing regulatory, market or other conditions or environments (for example, the interest rate or credit environments) may adversely affect the liquidity of the Fund’s investments. The Fund may have to accept a lower selling price for the holding, sell other investments, or forego another, more appealing investment opportunity. Generally, the less liquid the market at the time the Fund sells a portfolio investment, the greater the risk of loss or decline of value to the Fund. A less liquid market can lead to an increase in Fund redemptions, which may negatively impact Fund performance and net asset value per share, including, for example, if the Fund is forced to sell securities in a down market.
Market risk
The Fund may incur losses due to declines in the value of one or more securities in which it invests. These declines may be due to factors affecting a particular issuer, or the result of, among other things, political, regulatory, market, economic or social developments affecting the relevant market(s) more generally. In addition, turbulence in financial markets and reduced liquidity in equity, credit and/or fixed income markets may negatively affect many issuers, which could adversely affect the Fund’s ability to price or value hard-to-value assets in thinly traded and closed markets and could cause significant
70
Columbia Total Return Bond Fund | Annual Report 2024
Notes to Financial Statements (continued)April 30, 2024 redemptions and operational challenges. Global economies and financial markets are increasingly interconnected, and conditions and events in one country, region or financial market may adversely impact issuers in a different country, region or financial market. These risks may be magnified if certain events or developments adversely interrupt the global supply chain; in these and other circumstances, such risks might affect companies worldwide. As a result, local, regional or global events such as terrorism, war, other conflicts, natural disasters, disease/virus outbreaks and epidemics or other public health issues, recessions, depressions or other events – or the potential for such events – could have a significant negative impact on global economic and market conditions.
The large-scale invasion of Ukraine by Russia in February 2022 has resulted in sanctions and market disruptions, including declines in regional and global stock markets, unusual volatility in global commodity markets and significant devaluations of Russian currency. The extent and duration of the military action are impossible to predict but could continue to be significant. Market disruption caused by the Russian military action, and any countermeasures or responses thereto (including international sanctions, a downgrade in a country’s credit rating, purchasing and financing restrictions, boycotts, tariffs, changes in consumer or purchaser preferences, cyberattacks and espionage) could continue to have severe adverse impacts on regional and/or global securities and commodities markets, including markets for oil and natural gas. These impacts may include reduced market liquidity, distress in credit markets, further disruption of global supply chains, increased risk of inflation, restricted cross-border payments and limited access to investments and/or assets in certain international markets and/or issuers. These developments and other related events could negatively impact Fund performance.
Mortgage- and other asset-backed securities risk
The value of any mortgage-backed and other asset-backed securities including collateralized debt obligations, if any, held by the Fund may be affected by, among other things, changes or perceived changes in: interest rates; factors concerning the interests in and structure of the issuer or the originator of the mortgages or other assets; the creditworthiness of the entities that provide any supporting letters of credit, surety bonds or other credit enhancements; or the market’s assessment of the quality of underlying assets. Payment of principal and interest on some mortgage-backed securities (but not the market value of the securities themselves) may be guaranteed by the full faith and credit of a particular U.S. Government agency, authority, enterprise or instrumentality, and some, but not all, are also insured or guaranteed by the U.S. Government. Mortgage-backed securities issued by non-governmental issuers (such as commercial banks, savings and loan institutions, private mortgage insurance companies, mortgage bankers and other secondary market issuers) may entail greater risk than obligations guaranteed by the U.S. Government. Mortgage- and other asset-backed securities are subject to liquidity risk and prepayment risk. A decline or flattening of housing values may cause delinquencies in mortgages (especially sub-prime or non-prime mortgages) underlying mortgage-backed securities and thereby adversely affect the ability of the mortgage-backed securities issuer to make principal and/or interest payments to mortgage-backed securities holders, including the Fund. Rising or high interest rates tend to extend the duration of mortgage- and other asset-backed securities, making their prices more volatile and more sensitive to changes in interest rates.
Shareholder concentration risk
At April 30, 2024, affiliated shareholders of record owned 46.4% of the outstanding shares of the Fund in one or more accounts. Fund shares sold to or redeemed by concentrated accounts may have a significant effect on the operations of the Fund. In the case of a large redemption, the Fund may be forced to sell investments at inopportune times, including its liquid positions, which may result in Fund losses and the Fund holding a higher percentage of less liquid positions. Large redemptions could result in decreased economies of scale and increased operating expenses for non-redeeming Fund shareholders.
Note 10. Subsequent events
Management has evaluated the events and transactions that have occurred through the date the financial statements were issued and noted no items requiring adjustment of the financial statements or additional disclosure.
Note 11. Information regarding pending and settled legal proceedings
Ameriprise Financial and certain of its affiliates are involved in the normal course of business in legal proceedings which include regulatory inquiries, arbitration and litigation, including class actions concerning matters arising in connection with the conduct of their activities as part of a diversified financial services firm. Ameriprise Financial believes that the Fund is not
Columbia Total Return Bond Fund | Annual Report 2024
71
Notes to Financial Statements (continued)April 30, 2024 currently the subject of, and that neither Ameriprise Financial nor any of its affiliates are the subject of, any pending legal, arbitration or regulatory proceedings that are likely to have a material adverse effect on the Fund or the ability of Ameriprise Financial or its affiliates to perform under their contracts with the Fund. Ameriprise Financial is required to make quarterly (10-Q), annual (10-K) and, as necessary, 8-K filings with the Securities and Exchange Commission (SEC) on legal and regulatory matters that relate to Ameriprise Financial and its affiliates. Copies of these filings may be obtained by accessing the SEC website at www.sec.gov.
There can be no assurance that these matters, or the adverse publicity associated with them, will not result in increased Fund redemptions, reduced sale of Fund shares or other adverse consequences to the Fund. Further, although we believe proceedings are not likely to have a material adverse effect on the Fund or the ability of Ameriprise Financial or its affiliates to perform under their contracts with the Fund, these proceedings are subject to uncertainties and, as such, we are unable to estimate the possible loss or range of loss that may result. An adverse outcome in one or more of these proceedings could result in adverse judgments, settlements, fines, penalties or other relief that could have a material adverse effect on the consolidated financial condition or results of operations of Ameriprise Financial or one or more of its affiliates that provide services to the Fund.
72
Columbia Total Return Bond Fund | Annual Report 2024
Report of Independent Registered Public Accounting Firm
To the Board of Trustees of Columbia Funds Series Trust I and Shareholders of Columbia Total Return Bond Fund
Opinion on the Financial Statements
We have audited the accompanying statement of assets and liabilities, including the portfolio of investments, of Columbia Total Return Bond Fund (one of the funds constituting Columbia Funds Series Trust I, referred to hereafter as the "Fund") as of April 30, 2024, the related statement of operations for the year ended April 30, 2024, the statement of changes in net assets for each of the two years in the period ended April 30, 2024, including the related notes, and the financial highlights for each of the five years in the period ended April 30, 2024 (collectively referred to as the "financial statements"). In our opinion, the financial statements present fairly, in all material respects, the financial position of the Fund as of April 30, 2024, the results of its operations for the year then ended, the changes in its net assets for each of the two years in the period ended April 30, 2024 and the financial highlights for each of the five years in the period ended April 30, 2024 in conformity with accounting principles generally accepted in the United States of America.
Basis for Opinion
These financial statements are the responsibility of the Fund’s management. Our responsibility is to express an opinion on the Fund’s financial statements based on our audits. We are a public accounting firm registered with the Public Company Accounting Oversight Board (United States) (PCAOB) and are required to be independent with respect to the Fund in accordance with the U.S. federal securities laws and the applicable rules and regulations of the Securities and Exchange Commission and the PCAOB.
We conducted our audits of these financial statements in accordance with the standards of the PCAOB. Those standards require that we plan and perform the audit to obtain reasonable assurance about whether the financial statements are free of material misstatement, whether due to error or fraud.
Our audits included performing procedures to assess the risks of material misstatement of the financial statements, whether due to error or fraud, and performing procedures that respond to those risks. Such procedures included examining, on a test basis, evidence regarding the amounts and disclosures in the financial statements. Our audits also included evaluating the accounting principles used and significant estimates made by management, as well as evaluating the overall presentation of the financial statements. Our procedures included confirmation of securities owned as of April 30, 2024 by correspondence with the custodian, transfer agent, brokers and agent banks; when replies were not received from brokers, we performed other auditing procedures. We believe that our audits provide a reasonable basis for our opinion.
/s/PricewaterhouseCoopers LLP
Minneapolis, Minnesota
June 20, 2024
We have served as the auditor of one or more investment companies within the Columbia Funds Complex since 1977.
Columbia Total Return Bond Fund | Annual Report 2024
73
Federal Income Tax Information
(Unaudited)
The Fund hereby designates the following tax attributes for the fiscal year ended April 30, 2024. Shareholders will be notified in early 2025 of the amounts for use in preparing 2024 income tax returns.
Section
163(j)
Interest
Dividends | |
| |
Section 163(j) Interest Dividends. The percentage of ordinary income distributed during the fiscal year that shareholders may treat as interest income for purposes of IRC Section 163(j), subject to holding period requirements and other limitations.
TRUSTEES AND OFFICERS
(Unaudited)
The Board oversees the Fund’s operations and appoints officers who are responsible for day-to-day business decisions based on policies set by the Board. The following table provides basic biographical information about the Fund’s Trustees as of the printing of this report, including their principal occupations during the past five years, although specific titles for individuals may have varied over the period. The year set forth beneath Length of Service in the table below is the year in which the Trustee was first appointed or elected as Trustee to any Fund currently in the Columbia Funds Complex or a predecessor thereof. Under current Board policy, each Trustee generally serves until December 31 of the year such Trustee turns seventy-five (75).
Independent trustees
Name,
address,
year of birth | Position held
with the Columbia Funds and
length of service | Principal occupation(s)
during past five years
and other relevant
professional experience | Number of
Funds in the
Columbia Funds
Complex*
overseen | Other directorships
held by Trustee
during the past five years
and other relevant Board experience |
George S. Batejan
c/o Columbia Management
Investment Advisers, LLC
290 Congress Street
Boston, MA 02210
1954 | | Executive Vice President, Global Head of Technology and Operations, Janus Capital Group, Inc., 2010-2016 | | Former Chairman of the Board, NICSA (National Investment Company Services Association) (Executive Committee, Nominating Committee and Governance Committee), 2014-2016; former Director, Intech Investment Management, 2011-2016; former Board Member, Metro Denver Chamber of Commerce, 2015-2016; former Advisory Board Member, University of Colorado Business School, 2015-2018; former Board Member, Chase Bank International, 1993-1994 |
74
Columbia Total Return Bond Fund | Annual Report 2024
TRUSTEES AND OFFICERS (continued)(Unaudited)Independent trustees (continued) Name, address, year of birth | Position held with the Columbia Funds and length of service | Principal occupation(s) during past five years and other relevant professional experience | Number of Funds in the Columbia Funds Complex* overseen | Other directorships held by Trustee during the past five years and other relevant Board experience |
Kathleen Blatz
c/o Columbia Management
Investment Advisers, LLC
290 Congress Street
Boston, MA 02210
1954 | | Attorney, specializing in arbitration and mediation; Trustee of Gerald Rauenhorst 1982 Trusts, since 2020; Chief Justice, Minnesota Supreme Court, 1998-2006; Associate Justice, Minnesota Supreme Court, 1996-1998; Fourth Judicial District Court Judge, Hennepin County, 1994-1996; Attorney in private practice and public service, 1984-1993; State Representative, Minnesota House of Representatives, 1979-1993, which included service on the Tax and Financial Institutions and Insurance Committees; Member and Interim Chair, Minnesota Sports Facilities Authority, January-July 2017; Interim President and Chief Executive Officer, Blue Cross and Blue Shield of Minnesota (health care insurance), February-July 2018, April-October 2021 | | Former Trustee, Blue Cross and Blue Shield of Minnesota, 2009-2021 (Chair of the Business Development Committee, 2014-2017; Chair of the Governance Committee, 2017-2019); former Member and Chair of the Board, Minnesota Sports Facilities Authority, January 2017-July 2017; former Director, Robina Foundation, 2009-2020 (Chair, 2014-2020); Director, Richard M. Schulze Family Foundation, since 2021 |
Pamela G. Carlton
c/o Columbia Management
Investment Advisers, LLC
290 Congress Street
Boston, MA 02210
1954 | Chair since 2023; Trustee since 2007 | President, Springboard – Partners in Cross Cultural Leadership (consulting company), since 2003; Managing Director of US Equity Research, JP Morgan Chase, 1999-2003; Director of US Equity Research, Chase Asset Management, 1996-1999; Co-Director Latin America Research, 1993-1996, COO Global Research, 1992-1996, Co-Director of US Research, 1991-1992, Investment Banker, 1982-1991, Morgan Stanley; Attorney, Cleary Gottlieb Steen & Hamilton LLP, 1980-1982 | | Trustee, New York Presbyterian Hospital Board, since 1996; Director, DR Bank (Audit Committee, since 2017 and Audit Committee Chair, since November 2023); Director, Evercore Inc. (Audit Committee, Nominating and Governance Committee) (financial services company), since 2019; Director, Apollo Commercial Real Estate Finance, Inc. (Chair, Nominating and Governance Committee), since 2021; the Governing Council of the Independent Directors Council (IDC), since 2021 |
Janet Langford Carrig
c/o Columbia Management
Investment Advisers, LLC
290 Congress Street
Boston, MA 02210
1957 | | Senior Vice President, General Counsel and Corporate Secretary, ConocoPhillips (independent energy company), September 2007-October 2018 | | Director, EQT Corporation (natural gas producer), since 2019; former Director, Whiting Petroleum Corporation (independent oil and gas company), 2020-2022 |
J. Kevin Connaughton
c/o Columbia Management
Investment Advisers, LLC
290 Congress Street
Boston, MA 02210
1964 | | CEO and President, RhodeWay Financial (non-profit financial planning firm), since December 2022; Member, FINRA National Adjudicatory Council, January 2020-December 2023; Adjunct Professor of Finance, Bentley University January 2018-April 2023; Consultant to Independent Trustees of CFVIT and CFST I from March 2016 to June 2020 with respect to CFVIT and to December 2020 with respect to CFST I; Managing Director and General Manager of Mutual Fund Products, Columbia Management Investment Advisers, LLC, May 2010-February 2015; President, Columbia Funds, 2008-2015; and senior officer of Columbia Funds and affiliated funds, 2003-2015 | | Former Director, The Autism Project, March 2015-December 2021; former Member of the Investment Committee, St. Michael’s College, November 2015-February 2020; former Trustee, St. Michael’s College, June 2017-September 2019; former Trustee, New Century Portfolios (former mutual fund complex), January 2015-December 2017 |
Columbia Total Return Bond Fund | Annual Report 2024
75
TRUSTEES AND OFFICERS (continued)(Unaudited)Independent trustees (continued) Name, address, year of birth | Position held with the Columbia Funds and length of service | Principal occupation(s) during past five years and other relevant professional experience | Number of Funds in the Columbia Funds Complex* overseen | Other directorships held by Trustee during the past five years and other relevant Board experience |
Olive M. Darragh
c/o Columbia Management
Investment Advisers, LLC
290 Congress Street
Boston, MA 02210
1962 | | Managing Director of Darragh Inc. (strategy and talent management consulting firm), since 2010; Founder and CEO, Zolio, Inc. (investment management talent identification platform), since 2004; Consultant to Independent Trustees of CFVIT and CFST I from June 2019 to June 2020 with respect to CFVIT and to December 2020 with respect to CFST I; Partner, Tudor Investments, 2004-2010; Senior Partner, McKinsey & Company (consulting), 1990-2004; Touche Ross CPA, 1985-1988 | | Treasurer, Edinburgh University US Trust Board, since January 2023; Member, HBS Community Action Partners Board, since September 2022; former Director, University of Edinburgh Business School (Member of US Board), 2004-2019; former Director, Boston Public Library Foundation, 2008-2017 |
Patricia M. Flynn
c/o Columbia Management
Investment Advisers, LLC
290 Congress Street
Boston, MA 02210
1950 | | Professor Emeritus of Economics and Management, Bentley University, since 2023; Professor of Economics and Management, Bentley University, 1976-2023; Dean, McCallum Graduate School of Business, Bentley University, 1992-2002 | | Former Trustee, MA Taxpayers Foundation, 1997-2022; former Director, The MA Business Roundtable, 2003-2019; former Chairperson, Innovation Index Advisory Committee, MA Technology Collaborative, 1997-2020 |
Brian J. Gallagher
c/o Columbia Management
Investment Advisers, LLC
290 Congress Street
Boston, MA 02210
1954 | | Retired; Partner with Deloitte & Touche LLP and its predecessors, 1977-2016 | | Trustee, Catholic Schools Foundation, since 2004 |
Douglas A. Hacker
c/o Columbia Management
Investment Advisers, LLC
290 Congress Street
Boston, MA 02210
1955 | | Independent business executive, since May 2006; Executive Vice President – Strategy of United Airlines, December 2002 - May 2006; President of UAL Loyalty Services (airline marketing company), September 2001-December 2002; Executive Vice President and Chief Financial Officer of United Airlines, July 1999-September 2001 | | Director, SpartanNash Company (food distributor), since November 2013 (Chair of the Board, since May 2021); Director, Aircastle Limited (aircraft leasing), since August 2006 (Chair of Audit Committee); former Director, Nash Finch Company (food distributor), 2005-2013; former Director, SeaCube Container Leasing Ltd. (container leasing), 2010-2013; and former Director, Travelport Worldwide Limited (travel information technology), 2014-2019 |
Nancy T. Lukitsh
c/o Columbia Management
Investment Advisers, LLC
290 Congress Street
Boston, MA 02210
1956 | | Senior Vice President, Partner and Director of Marketing, Wellington Management Company, LLP (investment adviser), 1997-2010; Chair, Wellington Management Portfolios (commingled non-U.S. investment pools), 2007-2010; Director, Wellington Trust Company, NA and other Wellington affiliates, 1997-2010 | | |
76
Columbia Total Return Bond Fund | Annual Report 2024
TRUSTEES AND OFFICERS (continued)(Unaudited)Independent trustees (continued) Name, address, year of birth | Position held with the Columbia Funds and length of service | Principal occupation(s) during past five years and other relevant professional experience | Number of Funds in the Columbia Funds Complex* overseen | Other directorships held by Trustee during the past five years and other relevant Board experience |
David M. Moffett
c/o Columbia Management
Investment Advisers, LLC
290 Congress Street
Boston, MA 02210
1952 | | Retired; former Chief Executive Officer of Freddie Mac and Chief Financial Officer of U.S. Bank | | Director, CSX Corporation (transportation suppliers); Director, PayPal Holdings Inc. (payment and data processing services); former Director, eBay Inc. (online trading community), 2007-2015; and former Director, CIT Bank, CIT Group Inc. (commercial and consumer finance), 2010-2016; former Senior Adviser to The Carlyle Group (financial services), March 2008-September 2008; former Governance Consultant to Bridgewater Associates, January 2013-December 2015 |
Catherine James Paglia
c/o Columbia Management
Investment Advisers, LLC
290 Congress Street
Boston, MA 02210
1952 | | Director, Enterprise Asset Management, Inc. (private real estate and asset management company), since September 1998; Managing Director and Partner, Interlaken Capital, Inc., 1989-1997; Vice President, 1982-1985, Principal, 1985-1987, Managing Director, 1987-1989, Morgan Stanley; Vice President, Investment Banking, 1980-1982, Associate, Investment Banking, 1976-1980, Dean Witter Reynolds, Inc. | | Director, Valmont Industries, Inc. (irrigation systems manufacturer), since 2012; Trustee, Carleton College (on the Investment Committee), since 1987; Trustee, Carnegie Endowment for International Peace (on the Investment Committee), since 2009 |
Natalie A. Trunow
c/o Columbia Management
Investment Advisers, LLC
290 Congress Street
Boston, MA 02210
1967 | | Chief Executive Officer, Millennial Portfolio Solutions LLC (asset management and consulting services), January 2016-January 2021; Non-executive Member of the Investment Committee and Valuation Committee, Sarona Asset Management Inc. (private equity firm) since September 2019; Advisor, Horizon Investments (asset management and consulting services), August 2018-January 2022; Advisor, Paradigm Asset Management, November 2016-January 2022; Consultant to Independent Trustees of CFVIT and CFST I from September 2016 to June 2020 with respect to CFVIT and to December 2020 with respect to CFST I; Director of Investments/Consultant, Casey Family Programs, April 2016-November 2016; Senior Vice President and Chief Investment Officer, Calvert Investments, August 2008-January 2016; Section Head and Portfolio Manager, General Motors Asset Management, June 1997-August 2008 | | Independent Director, Investment Committee, Health Services for Children with Special Needs, Inc., 2010-2021; Independent Director, (Executive Committee and Chair, Audit Committee), Consumer Credit Counseling Services (formerly Guidewell Financial Solutions), since 2016; Independent Director, (Investment Committee), Sarona Asset Management, since 2019 |
Sandra L. Yeager
c/o Columbia Management
Investment Advisers, LLC
290 Congress Street
Boston, MA 02210
1964 | | Retired; President and founder, Hanoverian Capital, LLC (SEC registered investment advisor firm), 2008-2016; Managing Director, DuPont Capital, 2006-2008; Managing Director, Morgan Stanley Investment Management, 2004-2006; Senior Vice President, Alliance Bernstein, 1990-2004 | | Former Director, NAPE (National Alliance for Partnerships in Equity) Education Foundation, October 2016-October 2020; Advisory Board, Jennersville YMCA, June 2022-June 2023 |
Columbia Total Return Bond Fund | Annual Report 2024
77
TRUSTEES AND OFFICERS (continued)(Unaudited)Independent trustees (continued) Interested trustee affiliated with Investment Manager**
Name,
address,
year of birth | Position held with the Columbia Funds and length of service | Principal occupation(s) during the
past five years and other relevant
professional experience | Number of
Funds in the
Columbia Funds
Complex* overseen | Other directorships
held by Trustee
during the past
five years and
other relevant Board experience |
Daniel J. Beckman
c/o Columbia Management
Investment Advisers, LLC
290 Congress Street
Boston, MA 02210
1962 | Trustee since November 2021 and President since June 2021 | President and Principal Executive Officer of the Columbia Funds, since June 2021; Vice President, Columbia Management Investment Advisers, LLC, since April 2015; formerly, Vice President – Head of North America Product, Columbia Management Investment Advisers, LLC, April 2015 – December 2023; President and Principal Executive Officer, Columbia Acorn/Wanger Funds, since July 2021 | | Director, Ameriprise Trust Company, since October 2016; Director, Columbia Management Investment Distributors, Inc., since November 2018; Board of Governors, Columbia Wanger Asset Management, LLC, since January 2022 |
| The term “Columbia Funds Complex” as used herein includes Columbia Seligman Premium Technology Growth Fund, Tri-Continental Corporation and each series of Columbia Funds Series Trust (CFST), Columbia Funds Series Trust I (CFST I), Columbia Funds Series Trust II (CFST II), Columbia ETF Trust I (CET I), Columbia ETF Trust II (CET II), Columbia Funds Variable Insurance Trust (CFVIT) and Columbia Funds Variable Series Trust II (CFVST II). Messrs. Batejan, Beckman, Gallagher, Hacker and Moffett and Mses. Blatz, Carlton, Carrig, Flynn, Paglia, and Yeager serve as directors of Columbia Seligman Premium Technology Growth Fund and Tri-Continental Corporation. |
| Interested person (as defined under the 1940 Act) by reason of being an officer, director, security holder and/or employee of the Investment Manager or Ameriprise Financial. |
The Statement of Additional Information has additional information about the Fund’s Board members and is available, without charge, upon request by calling 800.345.6611, visiting columbiathreadneedleus.com/investor/ or contacting your financial intermediary.
The Board has appointed officers who are responsible for day-to-day business decisions based on policies it has established. The officers serve at the pleasure of the Board. The following table provides basic information about the Officers of the Fund as of the printing of this report, including principal occupations during the past five years, although their specific titles may have varied over the period. In addition to Mr. Beckman, who is President and Principal Executive Officer, the Fund’s other officers are:
Fund officers
Name,
address and
year of birth | Position and year
first appointed to
position for any Fund
in the Columbia
Funds Complex or a
predecessor thereof | Principal occupation(s) during past five years |
Michael G. Clarke
290 Congress Street
Boston, MA 02210
1969 | Chief Financial Officer and Principal Financial Officer (2009); Senior Vice President (2019); Treasurer and Chief Accounting Officer (Principal Accounting Officer) (2024) for CFST, CFST I, CFST II, CFVIT and CFVST II | Senior Vice President and North America Head of Operations & Investor Services, Columbia Management Investment Advisers, LLC, since June 2023 (previously Senior Vice President and Head of Global Operations, March 2022 – June 2023, Vice President, Head of North America Operations, and Co-Head of Global Operations, June 2019 - February 2022 and Vice President – Accounting and Tax, May 2010 - May 2019); senior officer of Columbia Funds and affiliated funds, since 2002. Director, Ameriprise Trust Company, since June 2023. |
78
Columbia Total Return Bond Fund | Annual Report 2024
TRUSTEES AND OFFICERS (continued)(Unaudited)Fund officers (continued) Name, address and year of birth | Position and year first appointed to position for any Fund in the Columbia Funds Complex or a predecessor thereof | Principal occupation(s) during past five years |
Marybeth Pilat
290 Congress Street
Boston, MA 02210
1968 | Treasurer and Chief Accounting Officer (Principal Accounting Officer) and Principal Financial Officer (2020) for CET I and CET II; Assistant Treasurer, CFST, CFST I, CFST II, CFVIT and CFVST II | Vice President – Product Pricing and Administration, Columbia Management Investment Advisers, LLC, since May 2017. |
William F. Truscott
290 Congress Street
Boston, MA 02210
1960 | Senior Vice President (2001) | Formerly, Trustee/Director of Columbia Funds Complex or legacy funds, November 2001 - January 1, 2021; Chief Executive Officer, Global Asset Management, Ameriprise Financial, Inc., since September 2012; Chairman of the Board and President, Columbia Management Investment Advisers, LLC, since July 2004 and February 2012, respectively; Chairman of the Board and Chief Executive Officer, Columbia Management Investment Distributors, Inc., since November 2008 and February 2012, respectively; Chairman of the Board and Director, TAM UK International Holdings Limited, since July 2021; formerly Chairman of the Board and Director, Threadneedle Asset Management Holdings, Sàrl, March 2013 – December 2022 and December 2008 – December 2022, respectively; senior executive of various entities affiliated with Columbia Threadneedle Investments. |
Christopher O. Petersen
5228 Ameriprise Financial Center
Minneapolis, MN 55474
1970 | Senior Vice President and Assistant Secretary (2021) | Formerly, Trustee/Director of funds within the Columbia Funds Complex, July 1, 2020 - November 22, 2021; Senior Vice President and Assistant General Counsel, Ameriprise Financial, Inc., since September 2021 (previously Vice President and Lead Chief Counsel, January 2015 - September 2021); formerly, President and Principal Executive Officer of the Columbia Funds, 2015 - 2021; officer of Columbia Funds and affiliated funds, since 2007. |
Thomas P. McGuire
290 Congress Street
Boston, MA 02210
1972 | Senior Vice President and Chief Compliance Officer (2012) | Vice President – Asset Management Compliance, Ameriprise Financial, Inc., since May 2010; Chief Compliance Officer, Columbia Acorn/Wanger Funds, since December 2015; formerly, Chief Compliance Officer, Ameriprise Certificate Company, September 2010 – September 2020. |
Ryan C. Larrenaga
290 Congress Street
Boston, MA 02210
1970 | Senior Vice President (2017), Chief Legal Officer (2017), and Secretary (2015) | Vice President and Chief Counsel, Ameriprise Financial, Inc., since August 2018 (previously Vice President and Group Counsel, August 2011 - August 2018); Chief Legal Officer, Columbia Acorn/Wanger Funds, since September 2020; officer of Columbia Funds and affiliated funds, since 2005. |
Michael E. DeFao
290 Congress Street
Boston, MA 02210
1968 | Vice President (2011) and Assistant Secretary (2010) | Vice President and Chief Counsel, Ameriprise Financial, Inc., since May 2010; Vice President, Chief Legal Officer and Assistant Secretary, Columbia Management Investment Advisers, LLC, since October 2021 (previously Vice President and Assistant Secretary, May 2010 – September 2021). |
Lyn Kephart-Strong
5903 Ameriprise Financial Center
Minneapolis, MN 55474
1960 | | Vice President, Global Investment Operations Services, Columbia Management Investment Advisers, LLC, since 2010; President, Columbia Management Investment Services Corp., since October 2014; President, Ameriprise Trust Company, since January 2017. |
Columbia Total Return Bond Fund | Annual Report 2024
79
Liquidity Risk Management Program
(Unaudited)
Pursuant to Rule 22e-4 under the 1940 Act, the Fund has adopted a liquidity risk management program (Program). The Program’s principal objectives include assessing, managing and periodically reviewing the Fund’s liquidity risk. Liquidity risk is defined as the risk that the Fund could not meet redemption requests without significant dilution of remaining investors’ interests in the Fund.
The Board has appointed the Investment Manager as the program administrator for the Fund’s Program. The Investment Manager has delegated oversight of the Program to its Liquidity Risk Management Committee (the Committee). At a board meeting during the fiscal period, the Committee provided the Board with a report addressing the operations of the program and assessing its adequacy and effectiveness of implementation for the period January 1, 2023, through December 31, 2023, including:
•
the Fund had sufficient liquidity to both meet redemptions and operate effectively on behalf of shareholders;
•
there were no material changes to the Program during the period;
•
the implementation of the Program was effective to manage the Fund’s liquidity risk; and
•
the Program operated adequately during the period.
There can be no assurance that the Program will achieve its objectives in the future. Please refer to the Fund’s prospectus for more information regarding the Fund’s exposure to liquidity risk and other principal risks to which an investment in the Fund may be subject.
80
Columbia Total Return Bond Fund | Annual Report 2024
[THIS PAGE INTENTIONALLY LEFT BLANK]
[THIS PAGE INTENTIONALLY LEFT BLANK]
[THIS PAGE INTENTIONALLY LEFT BLANK]
Columbia Total Return Bond Fund
P.O. Box 219104
Kansas City, MO 64121-9104
Please read and consider the investment objectives, risks, charges and expenses for any fund carefully before investing. For a prospectus and summary prospectus, which contains this and other important information about the Fund, go to
columbiathreadneedleus.com/investor/. The Fund is distributed by Columbia Management Investment Distributors, Inc., member FINRA, and managed by Columbia Management Investment Advisers, LLC.
Columbia Threadneedle Investments (Columbia Threadneedle) is the global brand name of the Columbia and Threadneedle group of companies. All rights reserved.
© 2024 Columbia Management Investment Advisers, LLC.
columbiathreadneedleus.com/investor/
Multi-Manager Directional Alternative Strategies Fund
Annual Report
April 30, 2024
In October 2022, the Securities and Exchange Commission (SEC) adopted a final rule, "Tailored Shareholder Reports for Mutual Funds and Exchange-Traded Funds; Fee Information in Investment Company Advertisements." The rule and form amendments will, among other things, require the Fund to transmit concise and visually engaging shareholder reports that highlight key information. The amendments will require that funds tag information in a structured data format and that certain more in-depth information be made available online and available for delivery free of charge to investors on request. The amendments became effective January 24, 2023. There is an 18-month transition period after the effective date of the amendments.
Each Tailored Shareholder Report will be share-class specific and will highlight key fund information the SEC believes is most relevant to investors in assessing their investment in the Fund. Much of the information, including a Fund’s financial statements, that is currently disclosed in a Fund’s shareholder reports will instead be made available on the Fund’s website and filed on Form N-CSR on an annual and semiannual basis. This information will be delivered to investors free of charge upon request. Columbia Fund reports will follow the Tailored Shareholder Report approach beginning with reports covering the period ending May 31, 2024.
The new rule also requires the Fund to mail a printed version of the Tailored Shareholder Report to all shareholders who have not elected to receive shareholder reports electronically. Rather than receiving a postcard notifying investors that the shareholder report for Funds in which they invest is available online, investors will begin receiving the Tailored Shareholder Report in the mail unless they have elected to receive their Fund documents electronically.
| No Financial Institution Guarantee | |
If you elect to receive the shareholder report for Multi-Manager Directional Alternative Strategies Fund (the Fund) in paper, mailed to you, the Fund mails one shareholder report to each shareholder address, unless such shareholder elects to receive shareholder reports from the Fund electronically via e-mail or by having a paper notice mailed to you (Postcard Notice) that your Fund’s shareholder report is available at the Columbia funds’ website (columbiathreadneedleus.com/investor/). If you would like more than one report in paper to be mailed to you, or would like to elect to receive reports via e-mail or access them through Postcard Notice, please call shareholder services at 800.345.6611 and additional reports will be sent to you.
Proxy voting policies and procedures
The policy of the Board of Trustees is to vote the proxies of the companies in which the Fund holds investments consistent with the procedures as stated in the Statement of Additional Information (SAI). You may obtain a copy of the SAI without charge by calling 800.345.6611; contacting your financial intermediary; visiting columbiathreadneedleus.com/investor/; or searching the website of the Securities and Exchange Commission (SEC) at sec.gov. Information regarding how the Fund voted proxies relating to portfolio securities is filed with the SEC by August 31st for the most recent 12-month period ending June 30th of that year, and is available without charge by visiting columbiathreadneedleus.com/investor/, or searching the website of the SEC at sec.gov.
Quarterly schedule of investments
The Fund files a complete schedule of portfolio holdings with the SEC for the first and third quarters of each fiscal year on Form N-PORT. The Fund’s Form N-PORT filings are available on the SEC’s website at sec.gov. The Fund’s complete schedule of portfolio holdings, as filed on Form N-PORT, is available on columbiathreadneedleus.com/investor/or can also be obtained without charge, upon request, by calling 800.345.6611.
Additional Fund information
For more information about the Fund, please visit columbiathreadneedleus.com/investor/ or call 800.345.6611. Customer Service Representatives are available to answer your questions Monday through Friday from 8 a.m. to 7 p.m. Eastern time.
You may obtain the current net asset value (NAV) of Fund shares at no cost by calling 800.345.6611 or by sending an e-mail to serviceinquiries@columbiathreadneedle.com.
Fund investment manager
Columbia Management Investment Advisers, LLC (the Investment Manager)
290 Congress Street
Boston, MA 02210
Fund distributor
Columbia Management Investment Distributors, Inc.
290 Congress Street
Boston, MA 02210
Fund transfer agent
Columbia Management Investment Services Corp.
P.O. Box 219104
Kansas City, MO 64121-9104
Multi-Manager Directional Alternative Strategies Fund | Annual Report 2024
Fund at a Glance(Unaudited) Investment objective
The Fund seeks capital appreciation.
Portfolio management
Allspring Global Investments, LLC
Harindra de Silva, CFA
David Krider, CFA
Kevin Cole, CFA
Boston Partners Global Investors, Inc.
Joseph Feeney, Jr., CFA
Scott Burgess, CFA
Average annual total returns (%) (for the period ended April 30, 2024) |
| | | | | |
| | | | |
| | | | |
Wilshire Liquid Alternative Equity Hedge Index | | | | |
| | | | |
All results shown assume reinvestment of distributions during the period. Returns do not reflect the deduction of taxes that a shareholder may pay on Fund distributions or on the redemption of Fund shares. Performance results reflect the effect of any fee waivers or reimbursements of Fund expenses by Columbia Management Investment Advisers, LLC and/or any of its affiliates. Absent these fee waivers or expense reimbursement arrangements, performance results would have been lower.
The performance information shown represents past performance and is not a guarantee of future results. The investment return and principal value of your investment will fluctuate so that your shares, when redeemed, may be worth more or less than their original cost. Current performance may be lower or higher than the performance information shown. You may obtain performance information current to the most recent month-end by contacting your financial intermediary, visiting columbiathreadneedleus.com/investor/ or calling 800.345.6611.
*
The returns shown for periods prior to the share class inception date (including returns for the Life of the Fund, if shown, which are since Fund inception) include the returns of the Fund’s oldest share class. Returns shown for periods prior to the inception date of the Fund’s Institutional Class shares include the returns of the Fund’s Class A shares for the period from October 17, 2016 (the inception date of the Fund) through January 2, 2017. Class A shares were offered prior to the Fund’s Institutional Class shares but have since been merged into the Fund’s Institutional Class shares. These returns are adjusted to reflect any higher class-related operating expenses of the newer share classes, as applicable. Please visit columbiathreadneedleus.com/investor/investment-products/mutual-funds/appended-performance for more information. The Fund’s performance prior to February 17, 2022, reflects returns achieved by one or more different subadviser(s) that managed the Fund according to different principal investment strategies. If the Fund’s current subadvisers and strategies had been in place for the prior periods, results shown may have been different.
The HFRX Equity Hedge Index strategies maintain positions both long and short in primarily equity and equity derivative securities. Equity Hedge managers would typically maintain at least 50%, and may in some cases be substantially entirely invested in equities, both long and short. Hedge Fund Research, Inc. (HFR) utilizes a UCITSIII compliant methodology to construct the HFRX Hedge Fund Indices. The methodology is based on defined and predetermined rules and objective criteria to select and rebalance components to maximize representation of the Hedge Fund Universe. HFRX Indices utilize state-of-the-art quantitative techniques and analysis; multi-level screening, cluster analysis, Monte-Carlo simulations and optimization techniques ensure that each Index is a pure representation of its corresponding investment focus.
The Wilshire Liquid Alternative Equity Hedge Index measures the performance of the equity hedge strategy component of the Wilshire Liquid Alternative Index℠. Equity hedge investment strategies predominantly invest in long and short equities. The Wilshire Liquid Alternative Equity Hedge Index (WLIQAEH) is designed to provide a broad measure of the liquid alternative equity hedge market.
The MSCI World Index (Net) is a free float-adjusted market capitalization weighted index that is designed to measure the equity market performance of developed markets.
Indices are not available for investment, are not professionally managed and do not reflect sales charges, fees, brokerage commissions, taxes (except the MSCI World Index (Net), which reflect reinvested dividends net of withholding taxes) or other expenses of investing. Securities in the Fund may not match those in an index.
Multi-Manager Directional Alternative Strategies Fund | Annual Report 2024
3
Fund at a Glance (continued)(Unaudited) Performance of a hypothetical $10,000 investment (October 17, 2016 — April 30, 2024)
The chart above shows the change in value of a hypothetical $10,000 investment in Institutional Class shares of Multi-Manager Directional Alternative Strategies Fund during the stated time period, and does not reflect the deduction of taxes that a shareholder may pay on Fund distributions or on the redemption of Fund shares.
Portfolio breakdown — long positions (%) (at April 30, 2024) |
| |
Exchange-Traded Equity Funds | |
| |
| |
| |
| |
| Includes investments in Money Market Funds, including investing for the purpose of covering obligations relating to the Fund’s investment in derivatives. For a description of the Fund’s investments in derivatives, see Investments in derivatives following the Portfolio of Investments and the derivative instruments discussion in Note 2 to the Notes to Financial Statements. |
Percentages indicated are based upon total investments net of investments sold short and excluding investments in derivatives, if any. The Fund’s portfolio composition is subject to change.
Portfolio breakdown — short positions (%) (at April 30, 2024) |
| |
| |
| |
| |
Percentages indicated are based upon total investments net of investments sold short and excluding investments in derivatives, if any. The Fund’s portfolio composition is subject to change.
Equity sector breakdown — long positions (%) (at April 30, 2024) |
| |
| |
| |
| |
| |
| |
| |
| |
| |
| |
| |
| |
Percentages indicated are based upon total long equity investments. The Fund’s portfolio composition is subject to change.
4
Multi-Manager Directional Alternative Strategies Fund | Annual Report 2024
Fund at a Glance (continued)(Unaudited)
Equity sector breakdown — short positions (%) (at April 30, 2024) |
| |
| |
| |
| |
| |
| |
| |
| |
| |
| |
| |
| |
Percentages indicated are based upon total short equity investments. The Fund’s portfolio composition is subject to change.
Multi-Manager Directional Alternative Strategies Fund | Annual Report 2024
5
Manager Discussion of Fund Performance(Unaudited) Columbia Management Investment Advisers, LLC (CMIA) serves as the investment manager for the Fund and attempts to achieve the Fund’s objective by selecting one or more subadvisers to manage sleeves of the Fund independently of each other. During the 12-month period ended April 30, 2024, the Fund was managed by three independent money management firms, and each invested a portion of the portfolio’s assets. Effective September 5, 2023, J.P. Morgan Investment Management Inc. (JPMorgan) no longer served as a subadviser to the Fund. CMIA is responsible for managing cash flows into and out of the Fund resulting from the purchase and redemption of Fund shares. As of April 30, 2024, CMIA, Allspring Global Investments, LLC (Allspring) and Boston Partners Global Investors, Inc. doing business as Boston Partners (Boston Partners) managed approximately 32.5%, 28.5% and 39.0% of the Fund’s assets, respectively.
For the 12-month period that ended April 30, 2024, Institutional Class shares of Multi-Manager Directional Alternative Strategies Fund returned 12.34%. During the same time period, the HFRX Equity Hedge Index returned 8.12%, the Wilshire Liquid Alternative Equity Hedge Index returned 12.04% and the MSCI World Index (Net), returned 18.39%.
The Fund’s subadvisers employ a variety of alternative investment strategies, involving strategies, techniques and practices designed to seek capital appreciation through participation in the broad equity and other markets, while hedging overall market exposure relative to traditional long-only equity strategies. Generally, the Fund seeks to provide higher risk-adjusted returns with lower volatility compared to equity markets.
Market overview
U.S. equities, as measured by the S&P 500 Index, advanced during the annual period, generating a robust double-digit return, as higher growth stocks within the communication services, financials, information technology and industrials sectors generally led the market. The real estate, energy, health care and consumer staples sectors were the laggards. Repercussions of the regional banking crisis and the debt ceiling impasse in Congress were in focus early in the annual period. On the positive side, after nearly two years of high inflation hitting consumer wallets and contributing to a swift rise in interest rates, a mostly sustained inflation downtrend appeared to be underway, albeit with levels still stickier than initially thought back in early 2023. A pivot by the U.S. Federal Reserve (Fed) on its intentions for the future path of interest rates also served as a tailwind for U.S. equity market gains during the annual period, even as consensus expectations for the timing and extent of 2024 interest rate cuts got pushed out to later in the calendar year. Also of note was a broadening of market strength as the annual period progressed beyond the so-called Magnificent Seven, i.e., the group of high performing and influential companies that drove U.S. equity performance for much of 2023.
Global equities, as measured by the MSCI World Index (Net), similarly posted strong double-digit gains for the annual period, though short-term volatility was heightened. Global equities moved sharply higher early in the annual period, pulled back briefly in the second half of 2023, and then moved significantly higher again in early 2024. This predominately bullish market witnessed only minor pullbacks, mainly driven by shifting market consensus toward the U.S. Fed’s timing and degree of interest rate cuts, ultimately determining the Fed would likely be slower to cut interest rates than had been expected by market participants early in the annual period.
Allspring
Our portion of the Fund underperformed its custom benchmark, comprised 50% of the MSCI World Index (Net) and 50% of the FTSE Three-Month U.S. Treasury Bill Index, during the annual period due primarily to effective stock selection.
Our portion of the Fund utilizes short positions to pursue downside protection, risk hedging and enhanced stock selection. Our Global Long/Short strategy attempts to achieve a consistent 100% Long/30% Short structure at all times.
Notable detractors in our portion of the Fund during the period
•
In terms of risk profile, our portion of the Fund maintained a short position to high beta securities, which hurt, as high beta securities outperformed the market during the annual period.
•
Positions in diversified mining company Ivanhoe Mines Ltd. and beverage and brewing company Molson Coors Beverage Co. were the largest negative contributors to performance. These holdings exhibited factor exposures that were penalized by the market environment.
6
Multi-Manager Directional Alternative Strategies Fund | Annual Report 2024
Manager Discussion of Fund Performance (continued)(Unaudited) •
Having an underweighted exposure to the information technology sector was the greatest negative contributor from a relative sector weighting perspective.
•
An overweighted allocation to Hong Kong, which underperformed our custom benchmark, and underweighted allocations to the U.S. and the Netherlands, which outperformed our custom benchmark, negatively contributed to relative results.
Notable contributors to our portion of the Fund during the period
•
Our stock selection model performed well during the annual period.
•
The portfolio maintained an overweight exposure to higher alpha securities and a short exposure to lower alpha securities, which proved beneficial as low alpha securities substantially underperformed the market and high alpha securities substantially outperformed the market during the annual period.
•
Our stock selection model dynamically favored certain valuation and quality characteristics that outperformed during the annual period. Specifically, an emphasis on companies with strong capital efficiency and forward valuations relative to their price positively affected results, as these characteristics were rewarded by investors.
•
Long positions in Google parent company Alphabet, Inc. and metals and mining company Rio Tinto Ltd. were the largest positive contributors to performance. These holdings exhibited factor exposures that were rewarded by the market environment.
•
From a relative sector weighting perspective, having an underweighted exposure to the health care sector contributed most positively.
•
From a country perspective, underweighted positions in the U.K., France and Switzerland made the most positive contributions within our portion of the Fund, as each underperformed our custom benchmark during the annual period.
Boston Partners
Our portion of the Fund underperformed its benchmark, the S&P 500 Index, for the 12 months ended April 30, 2024, primarily a result of less net equity exposure compared to the 100% net long S&P 500 Index. Our portion of the Fund averaged 59% net long exposure during the annual period. Additionally, the long portfolio within our portion of the Fund trailed the S&P 500 Index during the annual period. Our portion of the Fund is populated with long positions in statistically inexpensive companies and short positions in expensive companies, which overall was a headwind to performance. Value stocks, as measured by the Russell 3000 Value Index, rose 13.45% for the annual period, while growth stocks, as measured by the Russell 3000 Growth Index, gained 30.75%. In turn, the long portfolio in our portion of the Fund underperformed the S&P 500 Index, while the short portfolio performed well on a relative basis, rising in price significantly less than the S&P 500 Index, as persistently high interest rates weighed on many lower quality, less profitable companies.
Our portion of the Fund utilized several total return swaps during the annual period to get short exposure when 1) exchanges forbid cash short sales; 2) taxes or other market features make cash long purchases or sales expensive; and 3) to provide additional return when implied volatilities are sufficiently high and stocks held long are near target price. That said, during the annual period, these total return swaps represented only a small portion of the portfolio and had minimal impact on performance.
Notable detractors in our portion of the Fund during the period
•
On a relative basis, long positions in the communication services, consumer discretionary and materials sectors detracted from performance during the annual period.
○
Within the communication services sector, not owning a position in social media platform operator Meta Platforms, Inc. hurt relative performance. Holding long positions in television broadcasting and digital media company Nexstar Media Group, Inc. and media company TEGNA Inc., which each underperformed the S&P 500 Index during the annual period, also detracted.
○
In the consumer discretionary sector, long positions in sports betting and gambling company Entain PLC and casino entertainment company Boyd Gaming Corp. dampened relative performance.
Multi-Manager Directional Alternative Strategies Fund | Annual Report 2024
7
Manager Discussion of Fund Performance (continued)(Unaudited) ○
In the materials sector, long positions in agricultural sciences company FMC Corp. and crop protection company Corteva Inc. detracted from relative results.
•
Short positions in the information technology and energy sectors were the top detractors from relative performance in our portion of the Fund during the annual period.
○
In the information technology sector, short positions in software developer Palantir Technologies Inc. and microelectronics producer Entegris, Inc. detracted, as these companies saw accelerating revenue growth due to market sentiment around artificial intelligence.
○
Within the energy sector, short positions in Antero Resources Corp. and Permian Resources Corp. detracted, as several of the more capital-intensive exploration and production companies benefited from rising oil prices during the annual period.
Notable contributors to our portion of the Fund during the period
•
Long positions in the financials, industrials and energy sectors were the top positive contributors to relative performance during the annual period.
○
Within the financials sector, long positions in diversified financial services company Wells Fargo & Co. and bank holding company East West Bancorp, Inc. benefited from higher interest rates.
○
In the industrials sector, long positions in defense-related companies, including Howmet Aerospace Inc. and BWX Technologies, Inc., outperformed the S&P 500 Index, as the Ukrainian conflict drove increased defense spending in the U.S. and Europe.
○
In the energy sector, long positions in refiner Marathon Petroleum Corp. and oilfield services company Weatherford International PLC performed especially well.
•
Short positions in the consumer discretionary, financials and communication services sectors were significant positive contributors to our portion of the Fund’s relative results.
○
In the consumer discretionary sector, short positions in QuantumScape Corp., an energy storage company, and LGI Homes, Inc., which engages in the design, construction and marketing of new homes, proved beneficial, as each saw their share price fall significantly during the annual period.
○
In the financials sector, short positions in Aozora Bank, Ltd. and Community Bank System, Inc. added value, as select regional banks faced renewed balance sheet scrutiny in the wake of New York Community Bancorp, Inc. announcing a massive loan loss provision, thus pressuring their shares.
○
Within the communication services sector, short positions in mass media and entertainment conglomerate Paramount Global and advertising services provider Dentsu, Inc. contributed positively, as each experienced a significant share price decline during the annual period.
JPMorgan
We managed our portion of the Fund during the annual period from May 1, 2023 through September 4, 2023. During that time, our portion of the Fund outperformed its custom benchmark, comprised 50% of the S&P 500 Index and 50% of the FTSE Three-Month U.S. Treasury Bill Index.
Within our portion of the Fund, the long portfolio remained conservatively postured with notable positions in macro-agnostic companies, such as managed care, utilities and defensive consumer companies. Short positions were largest in select consumer and financials companies.
Notable contributors to our portion of the Fund during the period
•
The long portfolio was the largest positive contributor to relative results during the period we managed a portion of the Fund.
8
Multi-Manager Directional Alternative Strategies Fund | Annual Report 2024
Manager Discussion of Fund Performance (continued)(Unaudited) •
Long positions within the information technology sector, such as semiconductor companies NVIDIA Corp. and NXP Semiconductors NV, were among the top positive contributors.
•
Long positions within the consumer discretionary sector, such as cruise company Royal Caribbean Group, also added relative value.
Notable detractors in our portion of the Fund during the period
•
The short portfolio was the largest detractor from relative results during the period we managed a portion of the Fund.
•
Short positions in electric vehicle maker Rivian Automotive, Inc. within the consumer discretionary sector and office real estate investment trust SL Green Realty Corp. within the real estate sector, each of which rallied during the period, were among the top individual detractors.
•
Long positions within the health care sector, such as health insurance company Humana, Inc., also dampened relative results.
Market risk may affect a single issuer, sector of the economy, industry or the market as a whole. The Fund is managed by multiple advisers independently of one another, which may result in contradicting trades (i.e., with no net benefit to the Fund), while increasing transaction costs. As a non-diversified fund, fewer investments could have a greater effect on performance. Alternative investments cover a broad range of strategies and structures designed to be low or non-correlated to traditional equity and fixed-income markets with along-term expectation of illiquidity. Alternative investments involve substantial risks and are more volatile than traditional investments, making them more suitable for investors with an above-average tolerance for risk. Investing in derivatives is a specialized activity that involves special risks that subject the Fund to significant loss potential, including when used as leverage, and may result in greater fluctuation in fund value. Short positions (where the underlying asset is not owned) can create unlimited risk. The Fund’s use of leverage allows for investment exposure in excess of net assets, thereby magnifying volatility of returns and risk of loss. Foreign investments subject the Fund to risks, including political, economic, market, social and others within a particular country, as well as to currency instabilities and less stringent financial and accounting standards generally applicable to U.S. issuers. Risks are enhanced for emerging market issuers. A rise in interest rates may result in a price decline of fixed-income instruments held by the Fund, negatively impacting its performance and NAV. Falling rates may result in the Fund investing in lower yielding debt instruments, lowering the Fund’s income and yield. These risks may be heightened for longer maturity and duration securities. Fixed-income securities present issuer default risk. Non-investment-grade (high-yield or junk) securities present greater price volatility and more risk to principal and income than higher rated securities.See the Fund’s prospectus for more information on these and other risks.
The views expressed in this report reflect the current views of the respective parties. These views are not guarantees of future performance and involve certain risks, uncertainties and assumptions that are difficult to predict, so actual outcomes and results may differ significantly from the views expressed. These views are subject to change at any time based upon economic, market or other conditions and the respective parties disclaim any responsibility to update such views. These views may not be relied on as investment advice and, because investment decisions for a Columbia fund are based on numerous factors, may not be relied on as an indication of trading intent on behalf of any particular Columbia fund. References to specific securities should not be construed as a recommendation or investment advice.
Multi-Manager Directional Alternative Strategies Fund | Annual Report 2024
9
Understanding Your Fund’s Expenses(Unaudited) As an investor, you incur two types of costs. There are shareholder transaction costs, which may include redemption fees. There are also ongoing fund costs, which generally include management fees, distribution and/or service fees, and other fund expenses. The following information is intended to help you understand your ongoing costs (in dollars) of investing in the Fund and to help you compare these costs with the ongoing costs of investing in other mutual funds.
Analyzing your Fund’s expenses
To illustrate these ongoing costs, we have provided examples and calculated the expenses paid by investors in each share class of the Fund during the period. The actual and hypothetical information in the table is based on an initial investment of $1,000 at the beginning of the period indicated and held for the entire period. Expense information is calculated two ways and each method provides you with different information. The amount listed in the “Actual” column is calculated using the Fund’s actual operating expenses and total return for the period. You may use the Actual information, together with the amount invested, to estimate the expenses that you paid over the period. Simply divide your account value by $1,000 (for example, an $8,600 account value divided by $1,000 = 8.6), then multiply the results by the expenses paid during the period under the “Actual” column. The amount listed in the “Hypothetical” column assumes a 5% annual rate of return before expenses (which is not the Fund’s actual return) and then applies the Fund’s actual expense ratio for the period to the hypothetical return. You should not use the hypothetical account values and expenses to estimate either your actual account balance at the end of the period or the expenses you paid during the period. See “Compare with other funds” below for details on how to use the hypothetical data.
Compare with other funds
Since all mutual funds are required to include the same hypothetical calculations about expenses in shareholder reports, you can use this information to compare the ongoing cost of investing in the Fund with other funds. To do so, compare the hypothetical example with the 5% hypothetical examples that appear in the shareholder reports of other funds. As you compare hypothetical examples of other funds, it is important to note that hypothetical examples are meant to highlight the ongoing costs of investing in a fund only and do not reflect any transaction costs, such as redemption or exchange fees. Therefore, the hypothetical calculations are useful in comparing ongoing costs only, and will not help you determine the relative total costs of owning different funds. If transaction costs were included in these calculations, your costs would be higher.
November 1, 2023 — April 30, 2024 |
| Account value at the
beginning of the
period ($) | Account value at the
end of the
period ($) | Expenses paid during
the period ($) | Fund’s annualized
expense ratio (%) |
| | | | | | | |
| | | | | | | |
Expenses paid during the period are equal to the annualized expense ratio for each class as indicated above, multiplied by the average account value over the period and then multiplied by the number of days in the Fund’s most recent fiscal half year and divided by 366.
Expenses do not include fees and expenses incurred indirectly by the Fund from its investment in underlying funds, including affiliated and non-affiliated pooled investment vehicles, such as mutual funds and exchange-traded funds.
Had Columbia Management Investment Advisers, LLC and/or certain of its affiliates not waived/reimbursed certain fees and expenses, account value at the end of the period would have been reduced.
The Fund is offered only through certain wrap fee programs sponsored and/or managed by Ameriprise Financial, Inc. or its affiliates. Participants in wrap fee programs pay other fees that are not included in the above table. Please refer to the wrap program documents for information about the fees charged.
10
Multi-Manager Directional Alternative Strategies Fund | Annual Report 2024
Portfolio of InvestmentsApril 30, 2024(Percentages represent value of investments compared to net assets)
Investments in securities
|
| | |
Communication Services 4.6% |
Diversified Telecommunication Services 0.3% |
| | |
| | |
Cogeco Communications, Inc. | | |
Deutsche Telekom AG, Registered Shares | | |
| | |
|
| | |
Live Nation Entertainment, Inc.(a),(b) | | |
Take-Two Interactive Software, Inc.(b) | | |
Vivid Seats, Inc., Class A(b) | | |
| | |
Interactive Media & Services 2.3% |
Alphabet, Inc., Class A(a),(b) | | |
Alphabet, Inc., Class C(a),(b) | | |
| | |
| | |
Meta Platforms, Inc., Class A(a) | | |
| | |
|
AMC Networks, Inc., Class A(a),(b) | | |
Charter Communications, Inc., Class A(a),(b) | | |
Comcast Corp., Class A(a) | | |
| | |
| | |
| | |
Wireless Telecommunication Services 0.6% |
| | |
| | |
| | |
Total Communication Services | |
Common Stocks (continued) |
| | |
Consumer Discretionary 5.6% |
|
| | |
| | |
| | |
|
| | |
| | |
| | |
|
| | |
| | |
| | |
Diversified Consumer Services 0.3% |
| | |
Hotels, Restaurants & Leisure 2.0% |
Booking Holdings, Inc.(a) | | |
| | |
| | |
Flutter Entertainment PLC(b) | | |
| | |
MGM Resorts International(b) | | |
Restaurant Brands International, Inc. | | |
Wyndham Hotels & Resorts, Inc. | | |
| | |
| | |
|
Beazer Homes USA, Inc.(a),(b) | | |
| | |
Dream Finders Homes, Inc., Class A(a),(b) | | |
| | |
| | |
| | |
| | |
Tempur Sealy International, Inc.(a) | | |
| | |
The accompanying Notes to Financial Statements are an integral part of this statement.
Multi-Manager Directional Alternative Strategies Fund | Annual Report 2024
11
Portfolio of Investments (continued)April 30, 2024 Common Stocks (continued) |
| | |
|
| | |
| | |
| | |
| | |
TJX Companies, Inc. (The) | | |
| | |
| | |
Textiles, Apparel & Luxury Goods 0.2% |
| | |
Deckers Outdoor Corp.(a),(b) | | |
Swatch Group AG (The), Registered Shares | | |
| | |
Total Consumer Discretionary | |
|
|
Coca-Cola Bottling Co. Consolidated(a) | | |
Coca-Cola Europacific Partners PLC(a) | | |
Constellation Brands, Inc., Class A | | |
Molson Coors Beverage Co., Class B(a) | | |
| | |
Consumer Staples Distribution & Retail 1.5% |
Albertsons Companies, Inc., Class A | | |
Costco Wholesale Corp.(a) | | |
Empire Co., Ltd., Class A | | |
| | |
| | |
| | |
U.S. Foods Holding Corp.(a),(b) | | |
Walgreens Boots Alliance, Inc.(a) | | |
| | |
| | |
|
Archer-Daniels-Midland Co.(a) | | |
| | |
| | |
| | |
| | |
Common Stocks (continued) |
| | |
| | |
Simply Good Foods Co. (The)(b) | | |
| | |
|
Central Garden & Pet Co.(a),(b) | | |
| | |
| | |
| | |
| | |
Personal Care Products 0.3% |
BellRing Brands, Inc.(a),(b) | | |
| | |
| | |
| | |
|
| | |
Philip Morris International, Inc.(a) | | |
| | |
| |
|
Energy Equipment & Services 1.3% |
| | |
| | |
| | |
| | |
| | |
| | |
| | |
Weatherford International PLC(a),(b) | | |
| | |
Oil, Gas & Consumable Fuels 2.3% |
| | |
| | |
Canadian Natural Resources Ltd. | | |
| | |
| | |
| | |
| | |
The accompanying Notes to Financial Statements are an integral part of this statement.
12
Multi-Manager Directional Alternative Strategies Fund | Annual Report 2024
Portfolio of Investments (continued)April 30, 2024 Common Stocks (continued) |
| | |
Kosmos Energy Ltd.(a),(b) | | |
Marathon Petroleum Corp.(a) | | |
| | |
| | |
| | |
| | |
| | |
| |
|
|
| | |
Banca Monte dei Paschi di Siena SpA(b) | | |
| | |
Bank of Georgia Group PLC | | |
| | |
| | |
| | |
Customers Bancorp, Inc.(a),(b) | | |
| | |
East West Bancorp, Inc.(a) | | |
| | |
First Citizens BancShares Inc., Class A(a) | | |
Hana Financial Group, Inc. | | |
| | |
Huntington Bancshares, Inc.(a) | | |
| | |
| | |
Metropolitan Bank Holding Corp.(a),(b) | | |
Mizuho Financial Group, Inc. | | |
| | |
| | |
| | |
| | |
Sumitomo Mitsui Financial Group, Inc. | | |
Tokyo Kiraboshi Financial Group, Inc. | | |
United Overseas Bank Ltd. | | |
| | |
| | |
Common Stocks (continued) |
| | |
|
Bank of New York Mellon Corp. (The)(a) | | |
Charles Schwab Corp. (The) | | |
Deutsche Bank AG, Registered Shares | | |
Evercore, Inc., Class A(a) | | |
Franklin Resources, Inc.(a) | | |
Goldman Sachs Group, Inc. (The) | | |
LPL Financial Holdings, Inc. | | |
| | |
| | |
|
| | |
Discover Financial Services | | |
| | |
| | |
| | |
|
A-Mark Precious Metals, Inc.(a) | | |
Berkshire Hathaway, Inc., Class B(a),(b) | | |
Corebridge Financial, Inc.(a) | | |
| | |
| | |
Fidelity National Information Services, Inc. | | |
| | |
| | |
| | |
| | |
| | |
|
| | |
| | |
| | |
BRP Group, Inc., Class A(b) | | |
| | |
| | |
Fairfax Financial Holdings Ltd. | | |
First American Financial Corp. | | |
| | |
The accompanying Notes to Financial Statements are an integral part of this statement.
Multi-Manager Directional Alternative Strategies Fund | Annual Report 2024
13
Portfolio of Investments (continued)April 30, 2024 Common Stocks (continued) |
| | |
James River Group Holdings Ltd.(a) | | |
| | |
| | |
| | |
RenaissanceRe Holdings Ltd. | | |
Travelers Companies, Inc. (The) | | |
White Mountains Insurance Group Ltd. | | |
| | |
| | |
| |
|
|
| | |
| | |
| | |
| | |
| | |
Roivant Sciences Ltd.(a),(b) | | |
United Therapeutics Corp.(a),(b) | | |
| | |
Health Care Equipment & Supplies 0.7% |
| | |
Becton Dickinson & Co.(a) | | |
Boston Scientific Corp.(b) | | |
GE HealthCare Technologies, Inc.(a) | | |
| | |
OraSure Technologies, Inc.(a),(b) | | |
| | |
| | |
Zimmer Biomet Holdings, Inc. | | |
| | |
Health Care Providers & Services 4.1% |
AMN Healthcare Services, Inc.(b) | | |
| | |
| | |
| | |
| | |
| | |
Common Stocks (continued) |
| | |
| | |
| | |
| | |
| | |
| | |
Molina Healthcare, Inc.(a),(b) | | |
| | |
| | |
| | |
Life Sciences Tools & Services 0.5% |
| | |
Fortrea Holdings, Inc.(b) | | |
| | |
| | |
Thermo Fisher Scientific, Inc. | | |
| | |
|
Amphastar Pharmaceuticals, Inc.(a),(b) | | |
| | |
Bristol-Myers Squibb Co.(a) | | |
| | |
| | |
| | |
| | |
| | |
| | |
| | |
| |
|
|
| | |
| | |
| | |
| | |
| | |
| | |
Howmet Aerospace, Inc.(a) | | |
Huntington Ingalls Industries, Inc.(a) | | |
The accompanying Notes to Financial Statements are an integral part of this statement.
14
Multi-Manager Directional Alternative Strategies Fund | Annual Report 2024
Portfolio of Investments (continued)April 30, 2024 Common Stocks (continued) |
| | |
| | |
| | |
| | |
Air Freight & Logistics 0.1% |
| | |
|
Advanced Drainage Systems, Inc. | | |
| | |
Builders FirstSource, Inc.(a),(b) | | |
| | |
| | |
| | |
| | |
Commercial Services & Supplies 0.4% |
| | |
| | |
| | |
| | |
Construction & Engineering 0.3% |
| | |
| | |
WillScot Mobile Mini Holdings Corp.(b) | | |
| | |
Electrical Equipment 1.1% |
| | |
| | |
| | |
| | |
NEXTracker, Inc., Class A(b) | | |
| | |
Powell Industries, Inc.(a) | | |
Sensata Technologies Holding | | |
| | |
Ground Transportation 0.1% |
| | |
Common Stocks (continued) |
| | |
Industrial Conglomerates 1.1% |
CK Hutchison Holdings Ltd. | | |
Honeywell International, Inc. | | |
Jardine Cycle & Carriage Ltd. | | |
Jardine Matheson Holdings Ltd. | | |
Siemens AG, Registered Shares | | |
| | |
|
Allison Transmission Holdings, Inc. | | |
| | |
Atmus Filtration Technologies, Inc.(b) | | |
| | |
| | |
| | |
| | |
Hitachi Construction Machine Co., Ltd. | | |
Hyster-Yale Materials Handling, Inc.(a) | | |
| | |
| | |
| | |
| | |
| | |
| | |
Westinghouse Air Brake Technologies Corp.(a) | | |
| | |
Marine Transportation 0.5% |
| | |
| | |
| | |
|
Ryanair Holdings PLC, ADR | | |
Professional Services 1.7% |
Adecco Group AG, Registered Shares | | |
| | |
Huron Consulting Group, Inc.(b) | | |
| | |
| | |
Science Applications International Corp. | | |
The accompanying Notes to Financial Statements are an integral part of this statement.
Multi-Manager Directional Alternative Strategies Fund | Annual Report 2024
15
Portfolio of Investments (continued)April 30, 2024 Common Stocks (continued) |
| | |
SS&C Technologies Holdings, Inc. | | |
| | |
| | |
| | |
Trading Companies & Distributors 0.8% |
Beacon Roofing Supply, Inc.(b) | | |
| | |
| | |
WESCO International, Inc.(a) | | |
| | |
| |
Information Technology 8.9% |
Communications Equipment 0.4% |
Arista Networks, Inc.(a),(b) | | |
| | |
| | |
| | |
Electronic Equipment, Instruments & Components 1.5% |
Arrow Electronics, Inc.(a),(b) | | |
| | |
| | |
| | |
| | |
Keysight Technologies, Inc.(b) | | |
Zebra Technologies Corp., Class A(b) | | |
| | |
|
| | |
Cognizant Technology Solutions Corp., Class A | | |
International Business Machines Corp.(a) | | |
| | |
Semiconductors & Semiconductor Equipment 3.1% |
Advanced Micro Devices, Inc.(b) | | |
| | |
| | |
| | |
| | |
Microchip Technology, Inc. | | |
Common Stocks (continued) |
| | |
| | |
| | |
| | |
| | |
| | |
SCREEN Holdings Co., Ltd. | | |
| | |
| | |
|
| | |
| | |
Check Point Software Technologies Ltd.(b) | | |
Consensus Cloud Solutions, Inc.(a),(b) | | |
Dropbox, Inc., Class A(a),(b) | | |
| | |
| | |
| | |
| | |
Palo Alto Networks, Inc.(a),(b) | | |
| | |
| | |
Technology Hardware, Storage & Peripherals 1.2% |
| | |
| | |
| | |
Samsung Electronics Co., Ltd. | | |
| | |
| | |
Total Information Technology | |
|
|
DuPont de Nemours, Inc.(a) | | |
| | |
| | |
| | |
| | |
The accompanying Notes to Financial Statements are an integral part of this statement.
16
Multi-Manager Directional Alternative Strategies Fund | Annual Report 2024
Portfolio of Investments (continued)April 30, 2024 Common Stocks (continued) |
| | |
Construction Materials 0.7% |
| | |
| | |
| | |
|
Dundee Precious Metals, Inc. | | |
| | |
| | |
| | |
| | |
| | |
Teck Resources Ltd., Class B | | |
| | |
| |
|
|
Americold Realty Trust, Inc.(a) | | |
Real Estate Management & Development 0.3% |
Swire Pacific Ltd., Class A | | |
|
Equity LifeStyle Properties, Inc.(a) | | |
Essex Property Trust, Inc. | | |
| | |
|
| | |
| | |
| | |
|
| | |
| | |
Extra Space Storage, Inc. | | |
Lamar Advertising Co., Class A(a) | | |
| | |
| | |
| |
Common Stocks (continued) |
| | |
|
|
American Electric Power Co., Inc.(a) | | |
| | |
Chubu Electric Power Co., Inc. | | |
| | |
Kansai Electric Power Co., Inc. (The) | | |
| | |
| | |
| | |
Scottish & Southern Energy PLC | | |
| | |
Tokyo Electric Power Co. Holdings, Inc.(b) | | |
| | |
|
New Jersey Resources Corp. | | |
| | |
| | |
|
| | |
| | |
Consolidated Edison, Inc.(a) | | |
| | |
| | |
| | |
| |
Total Common Stocks
(Cost $149,693,241) | |
|
Exchange-Traded Equity Funds 16.6% |
| | |
|
| | |
Total Exchange-Traded Equity Funds
(Cost $40,818,887) | |
The accompanying Notes to Financial Statements are an integral part of this statement.
Multi-Manager Directional Alternative Strategies Fund | Annual Report 2024
17
Portfolio of Investments (continued)April 30, 2024
|
| | | |
Consumer Discretionary 0.3% |
|
| | | |
| | | |
| | | |
Total Consumer Discretionary | |
Total Preferred Stocks
(Cost $814,329) | |
|
| | |
Information Technology —% |
|
Constellation Software, Inc.(b),(c),(d) | | |
Total Information Technology | |
| |
|
|
| | |
Columbia Short-Term Cash Fund, 5.485%(e),(f) | | |
Total Money Market Funds
(Cost $49,543,744) | |
Total Investments
(Cost $240,870,201) | |
|
Investments in Securities Sold Short |
|
|
| | |
Communication Services (1.8)% |
Diversified Telecommunication Services (0.1)% |
| | |
Liberty Global Ltd., Class C(b) | | |
| | |
|
AMC Entertainment Holdings, Inc., Class A(b) | | |
Lions Gate Entertainment Corp.(b) | | |
| | |
| | |
|
Common Stocks (continued) |
| | |
Interactive Media & Services (0.1)% |
| | |
| | |
| | |
|
| | |
Clear Channel Outdoor Holdings, Inc.(b) | | |
| | |
| | |
Trade Desk, Inc. (The)(b) | | |
| | |
| | |
| | |
Total Communication Services | |
Consumer Discretionary (3.3)% |
Automobile Components (0.7)% |
Luminar Technologies, Inc.(b) | | |
Mobileye Global, Inc., Class A(b) | | |
| | |
| | |
| | |
| | |
|
Rivian Automotive, Inc.(b) | | |
| | |
| | |
|
B&M European Value Retail SA | | |
Hotels, Restaurants & Leisure (0.8)% |
| | |
Cheesecake Factory, Inc. (The) | | |
Choice Hotels International, Inc. | | |
| | |
| | |
Kura Sushi USA, Inc., Class A(b) | | |
Life Time Group Holdings, Inc.(b) | | |
Marriott Vacations Worldwide Corp. | | |
Playa Hotels & Resorts NV(b) | | |
The accompanying Notes to Financial Statements are an integral part of this statement.
18
Multi-Manager Directional Alternative Strategies Fund | Annual Report 2024
Portfolio of Investments (continued)April 30, 2024 |
Common Stocks (continued) |
| | |
Portillo’s, Inc., Class A(b) | | |
| | |
| | |
Soho House & Co., Inc., Class A(b) | | |
| | |
| | |
Household Durables (0.2)% |
| | |
| | |
| | |
|
| | |
|
Dick’s Sporting Goods, Inc. | | |
Dufry AG, Registered Shares(b) | | |
Floor & Decor Holdings, Inc., Class A(b) | | |
| | |
| | |
| | |
Textiles, Apparel & Luxury Goods (0.1)% |
| | |
| | |
| | |
| | |
Total Consumer Discretionary | |
|
|
| | |
Duckhorn Portfolio, Inc. (The)(b) | | |
National Beverage Corp.(b) | | |
Treasury Wine Estates Ltd. | | |
| | |
Consumer Staples Distribution & Retail (0.1)% |
| | |
|
Common Stocks (continued) |
| | |
|
Barry Callebaut AG, Registered Shares | | |
| | |
| | |
| | |
| | |
Household Products (0.2)% |
| | |
| |
|
Oil, Gas & Consumable Fuels (1.2)% |
Antero Resources Corp.(b) | | |
| | |
| | |
| | |
Occidental Petroleum Corp. | | |
| | |
| | |
| | |
| | |
| |
|
|
| | |
| | |
Commerce Bancshares, Inc. | | |
Commonwealth Bank of Australia | | |
Community Bank System, Inc. | | |
Cullen/Frost Bankers, Inc. | | |
| | |
First Financial Bankshares, Inc. | | |
| | |
| | |
Texas Capital Bancshares, Inc.(b) | | |
| | |
| | |
The accompanying Notes to Financial Statements are an integral part of this statement.
Multi-Manager Directional Alternative Strategies Fund | Annual Report 2024
19
Portfolio of Investments (continued)April 30, 2024 |
Common Stocks (continued) |
| | |
|
| | |
| | |
| | |
| | |
| | |
| | |
| | |
| | |
|
Credit Acceptance Corp.(b) | | |
Upstart Holdings, Inc.(b) | | |
| | |
Financial Services (0.3)% |
| | |
|
Cincinnati Financial Corp. | | |
Erie Indemnity Co., Class A | | |
Kinsale Capital Group, Inc. | | |
Legal & General Group PLC | | |
| | |
| | |
| | |
| | |
| |
|
|
| | |
| | |
Ascendis Pharma A/S ADR(b) | | |
| | |
Legend Biotech Corp., ADR(b) | | |
Madrigal Pharmaceuticals, Inc.(b) | | |
| | |
MoonLake Immunotherapeutics(b) | | |
| | |
Recursion Pharmaceuticals, Inc., Class A(b) | | |
Rhythm Pharmaceuticals, Inc.(b) | | |
|
Common Stocks (continued) |
| | |
| | |
Twist Bioscience Corp.(b) | | |
| | |
Health Care Equipment & Supplies (0.2)% |
| | |
| | |
Tandem Diabetes Care, Inc.(b) | | |
| | |
Health Care Providers & Services (0.4)% |
23andMe Holding Co., Class A(b) | | |
| | |
| | |
Community Health Systems, Inc.(b) | | |
| | |
Privia Health Group, Inc.(b) | | |
| | |
Health Care Technology (0.3)% |
| | |
Definitive Healthcare Corp.(b) | | |
Doximity, Inc., Class A(b) | | |
GoodRx Holdings, Inc., Class A(b) | | |
| | |
Life Sciences Tools & Services (0.3)% |
10X Genomics, Inc., Class A(b) | | |
| | |
Oxford Nanopore Technologies PLC(b) | | |
| | |
| | |
|
Cassava Sciences, Inc.(b) | | |
Corcept Therapeutics, Inc.(b) | | |
| | |
| | |
Nippon Shinyaku Co., Ltd. | | |
Pliant Therapeutics, Inc.(b) | | |
The accompanying Notes to Financial Statements are an integral part of this statement.
20
Multi-Manager Directional Alternative Strategies Fund | Annual Report 2024
Portfolio of Investments (continued)April 30, 2024 |
Common Stocks (continued) |
| | |
Revance Therapeutics, Inc.(b) | | |
Sumitomo Pharma Co., Ltd.(b) | | |
| | |
| |
|
Aerospace & Defense (0.5)% |
| | |
| | |
| | |
| | |
| | |
| | |
Virgin Galactic Holdings, Inc.(b) | | |
| | |
Commercial Services & Supplies (0.2)% |
Montrose Environmental Group, Inc.(b) | | |
Electrical Equipment (0.7)% |
Ballard Power Systems, Inc.(b) | | |
ChargePoint Holdings, Inc.(b) | | |
| | |
| | |
| | |
Furukawa Electric Co., Ltd. | | |
| | |
| | |
| | |
| | |
| | |
|
| | |
| | |
| | |
| | |
| | |
| | |
Passenger Airlines (0.1)% |
| | |
|
Common Stocks (continued) |
| | |
Professional Services (0.4)% |
| | |
| | |
| | |
| | |
| | |
Trading Companies & Distributors (0.4)% |
| | |
SiteOne Landscape Supply, Inc.(b) | | |
| | |
Transportation Infrastructure (0.2)% |
| | |
| |
Information Technology (1.6)% |
Electronic Equipment, Instruments & Components (0.4)% |
| | |
| | |
| | |
| | |
|
| | |
| | |
| | |
| | |
Semiconductors & Semiconductor Equipment (0.4)% |
| | |
Lattice Semiconductor Corp.(b) | | |
| | |
| | |
|
| | |
| | |
Palantir Technologies, Inc., Class A(b) | | |
| | |
| | |
Total Information Technology | |
The accompanying Notes to Financial Statements are an integral part of this statement.
Multi-Manager Directional Alternative Strategies Fund | Annual Report 2024
21
Portfolio of Investments (continued)April 30, 2024 |
Common Stocks (continued) |
| | |
|
|
Axalta Coating Systems Ltd.(b) | | |
| | |
Ganfeng Lithium Group Co., Ltd., Class H | | |
| | |
| | |
PureCycle Technologies, Inc.(b) | | |
Sumitomo Chemical Co., Ltd. | | |
| | |
Containers & Packaging (0.0)% |
| | |
|
Compass Minerals International, Inc. | | |
| | |
| | |
First Quantum Minerals Ltd. | | |
Freeport-McMoRan Copper & Gold, Inc. | | |
Ivanhoe Mines Ltd., Class A(b) | | |
Lynas Rare Earths Ltd.(b) | | |
| | |
| | |
| | |
| |
|
|
Nomura Real Estate Master Fund, Inc. | | |
|
| | |
|
| | |
Real Estate Management & Development (0.5)% |
| | |
| | |
| | |
| | |
| | |
|
Common Stocks (continued) |
| | |
|
| | |
Mid-America Apartment Communities, Inc. | | |
| | |
|
Unibail-Rodamco-Westfield(b) | | |
|
Digital Realty Trust, Inc. | | |
| |
|
|
| | |
Independent Power and Renewable Electricity Producers (0.0)% |
| | |
| |
Total Common Stocks
(Proceeds $65,582,078) | |
|
| | | |
Consumer Discretionary (0.0)% |
|
Dr. Ing. h.c. F. Porsche AG | | | |
Total Consumer Discretionary | |
Total Preferred Stocks
(Proceeds $82,788) | |
|
| | |
|
|
Cassava Sciences, Inc.(b) | | |
| |
Total Warrants
(Proceeds $15,432) | |
Total Investments in Securities Sold Short
(Proceeds $65,680,298) | |
Total Investments in Securities, Net of Securities Sold Short | |
Other Assets & Liabilities, Net | | |
| |
The accompanying Notes to Financial Statements are an integral part of this statement.
22
Multi-Manager Directional Alternative Strategies Fund | Annual Report 2024
Portfolio of Investments (continued)April 30, 2024 At April 30, 2024, securities and/or cash totaling $125,110,238 were pledged as collateral.
Investments in derivatives
Call option contracts written |
| | | | | | | | |
| | | | | | | | |
Notes to Portfolio of Investments
| This security or a portion of this security has been pledged as collateral in connection with investments sold short and/or derivative contracts. |
| Non-income producing investment. |
| Represents fair value as determined in good faith under procedures approved by the Board of Trustees. At April 30, 2024, the total value of these securities amounted to $0, which represents less than 0.01% of total net assets. |
| Valuation based on significant unobservable inputs. |
| The rate shown is the seven-day current annualized yield at April 30, 2024. |
| As defined in the Investment Company Act of 1940, as amended, an affiliated company is one in which the Fund owns 5% or more of the company’s outstanding voting securities, or a company which is under common ownership or control with the Fund. The value of the holdings and transactions in these affiliated companies during the year ended April 30, 2024 are as follows: |
| | | | Net change in
unrealized
appreciation
(depreciation)($) | | | | |
Columbia Short-Term Cash Fund, 5.485% |
| | | | | | | | |
Abbreviation Legend
| American Depositary Receipt |
Currency Legend
Fair value measurements
The Fund categorizes its fair value measurements according to a three-level hierarchy that maximizes the use of observable inputs and minimizes the use of unobservable inputs by prioritizing that the most observable input be used when available. Observable inputs are those that market participants would use in pricing an investment based on market data obtained from sources independent of the reporting entity. Unobservable inputs are those that reflect the Fund’s assumptions about the information market participants would use in pricing an investment. An investment’s level within the fair value hierarchy is based on the lowest level of any input that is deemed significant to the asset’s or liability’s fair value measurement. The input levels are not necessarily an indication of the risk or liquidity associated with investments at that level. For example, certain U.S. government securities are generally high quality and liquid, however, they are reflected as Level 2 because the inputs used to determine fair value may not always be quoted prices in an active market.
Fair value inputs are summarized in the three broad levels listed below:
■
Level 1 — Valuations based on quoted prices for investments in active markets that the Fund has the ability to access at the measurement date. Valuation adjustments are not applied to Level 1 investments.
■
Level 2 — Valuations based on other significant observable inputs (including quoted prices for similar securities, interest rates, prepayment speeds, credit risks, etc.).
■
Level 3 — Valuations based on significant unobservable inputs (including the Fund’s own assumptions and judgment in determining the fair value of investments).
Inputs that are used in determining fair value of an investment may include price information, credit data, volatility statistics, and other factors. These inputs can be either observable or unobservable. The availability of observable inputs can vary between investments, and is affected by various factors such as the type of investment, and the volume and level of activity for that investment or similar investments in the marketplace. The inputs will be considered by the Investment Manager, along with any other relevant factors in the calculation of an investment’s fair value. The Fund uses prices and inputs that are current as of the measurement date, which may include periods of market dislocations. During these periods, the availability of prices and inputs may be reduced for many investments. This condition could cause an investment to be reclassified between the various levels within the hierarchy.
Foreign equity securities actively traded in markets where there is a significant delay in the local close relative to the New York Stock Exchange are classified as Level 2. The values of these securities may include an adjustment to reflect the impact of market movements following the close of local trading, as described in Note 2 to the financial statements – Security valuation.
The accompanying Notes to Financial Statements are an integral part of this statement.
Multi-Manager Directional Alternative Strategies Fund | Annual Report 2024
23
Portfolio of Investments (continued)April 30, 2024 Fair value measurements (continued)
Investments falling into the Level 3 category are primarily supported by quoted prices from brokers and dealers participating in the market for those investments. However, these may be classified as Level 3 investments due to lack of market transparency and corroboration to support these quoted prices. Additionally, valuation models may be used as the pricing source for any remaining investments classified as Level 3. These models may rely on one or more significant unobservable inputs and/or significant assumptions by the Investment Manager. Inputs used in valuations may include, but are not limited to, financial statement analysis, capital account balances, discount rates and estimated cash flows, and comparable company data.
The Fund’s Board of Trustees (the Board) has designated the Investment Manager, through its Valuation Committee (the Committee), as valuation designee, responsible for determining the fair value of the assets of the Fund for which market quotations are not readily available using valuation procedures approved by the Board. The Committee consists of voting and non-voting members from various groups within the Investment Manager’s organization, including operations and accounting, trading and investments, compliance, risk management and legal.
The Committee meets at least monthly to review and approve valuation matters, which may include a description of specific valuation determinations, data regarding pricing information received from approved pricing vendors and brokers and the results of Board-approved valuation policies and procedures (the Policies). The Policies address, among other things, instances when market quotations are or are not readily available, including recommendations of third party pricing vendors and a determination of appropriate pricing methodologies; events that require specific valuation determinations and assessment of fair value techniques; securities with a potential for stale pricing, including those that are illiquid, restricted, or in default; and the effectiveness of third party pricing vendors, including periodic reviews of vendors. The Committee meets more frequently, as needed, to discuss additional valuation matters, which may include the need to review back-testing results, review time-sensitive information or approve related valuation actions. Representatives of Columbia Management Investment Advisers, LLC report to the Board at each of its regularly scheduled meetings to discuss valuation matters and actions during the period, similar to those described earlier.
The following table is a summary of the inputs used to value the Fund’s investments at April 30, 2024:
| | | | |
Investments in Securities | | | | |
| | | | |
| | | | |
| | | | |
| | | | |
| | | | |
| | | | |
| | | | |
| | | | |
| | | | |
| | | | |
| | | | |
| | | | |
| | | | |
Exchange-Traded Equity Funds | | | | |
| | | | |
| | | | |
| | | | |
| | | | |
| | | | |
| | | | |
| | | | |
Total Investments in Securities | | | | |
Investments in Securities Sold Short | | | | |
| | | | |
| | | | |
| | | | |
| | | | |
| | | | |
| | | | |
| | | | |
| | | | |
| | | | |
| | | | |
| | | | |
| | | | |
| | | | |
The accompanying Notes to Financial Statements are an integral part of this statement.
24
Multi-Manager Directional Alternative Strategies Fund | Annual Report 2024
Portfolio of Investments (continued)April 30, 2024 Fair value measurements (continued)
| | | | |
| | | | |
| | | | |
| | | | |
| | | | |
| | | | |
| | | | |
Total Investments in Securities Sold Short | | | | |
Total Investments in Securities, Net of Securities Sold Short | | | | |
Investments in Derivatives | | | | |
| | | | |
Call Option Contracts Written | | | | |
| | | | |
See the Portfolio of Investments for all investment classifications not indicated in the table.
The Fund’s assets assigned to the Level 2 input category are generally valued using the market approach, in which a security’s value is determined through reference to prices and information from market transactions for similar or identical assets. These assets include certain foreign securities for which a third party statistical pricing service may be employed for purposes of fair market valuation. The model utilized by such third party statistical pricing service takes into account a security’s correlation to available market data including, but not limited to, intraday index, ADR, and exchange-traded fund movements.
The Fund does not hold any significant investments (greater than one percent of net assets) categorized as Level 3.
The accompanying Notes to Financial Statements are an integral part of this statement.
Multi-Manager Directional Alternative Strategies Fund | Annual Report 2024
25
Statement of Assets and LiabilitiesApril 30, 2024
| |
Investments in securities, at value | |
Unaffiliated issuers (cost $191,326,457) | |
Affiliated issuers (cost $49,543,744) | |
Cash collateral held at broker for: | |
| |
| |
| |
| |
| |
| |
| |
Expense reimbursement due from Investment Manager | |
| |
Deferred compensation of board members | |
| |
| |
Securities sold short, at value (proceeds $65,680,298) | |
Option contracts written, at value (premiums received $3,432) | |
| |
Foreign currency (cost $22,298) | |
| |
| |
| |
Dividends and interest on securities sold short | |
| |
| |
Compensation of board members | |
| |
Deferred compensation of board members | |
| |
Net assets applicable to outstanding capital stock | |
| |
| |
Total distributable earnings (loss) | |
Total - representing net assets applicable to outstanding capital stock | |
| |
| |
| |
Net asset value per share | |
The accompanying Notes to Financial Statements are an integral part of this statement.
26
Multi-Manager Directional Alternative Strategies Fund | Annual Report 2024
Statement of OperationsYear Ended April 30, 2024
| |
| |
Dividends — unaffiliated issuers | |
Dividends — affiliated issuers | |
| |
| |
| |
| |
| |
| |
| |
| |
| |
Printing and postage fees | |
| |
| |
| |
Dividends and interest on securities sold short | |
Interest on interfund lending | |
Compensation of chief compliance officer | |
Compensation of board members | |
Deferred compensation of board members | |
| |
| |
Fees waived or expenses reimbursed by Investment Manager and its affiliates | |
| |
| |
Realized and unrealized gain (loss) — net | |
Net realized gain (loss) on: | |
Investments — unaffiliated issuers | |
Investments — affiliated issuers | |
Foreign currency translations | |
Option contracts purchased | |
| |
| |
| |
| |
Net change in unrealized appreciation (depreciation) on: | |
Investments — unaffiliated issuers | |
Investments — affiliated issuers | |
Foreign currency translations | |
Option contracts purchased | |
| |
| |
| |
Net change in unrealized appreciation (depreciation) | |
Net realized and unrealized gain | |
Net increase in net assets resulting from operations | |
The accompanying Notes to Financial Statements are an integral part of this statement.
Multi-Manager Directional Alternative Strategies Fund | Annual Report 2024
27
Statement of Changes in Net Assets
| | |
| | |
| | |
| | |
Net change in unrealized appreciation (depreciation) | | |
Net increase (decrease) in net assets resulting from operations | | |
Distributions to shareholders | | |
Net investment income and net realized gains | | |
| | |
Total distributions to shareholders | | |
Increase (decrease) in net assets from capital stock activity | | |
Total increase (decrease) in net assets | | |
Net assets at beginning of year | | |
Net assets at end of year | | |
| | |
| | |
| | | | |
|
| | | | |
| | | | |
| | | | |
| | | | |
| | | | |
Total net increase (decrease) | | | | |
The accompanying Notes to Financial Statements are an integral part of this statement.
28
Multi-Manager Directional Alternative Strategies Fund | Annual Report 2024
The following table is intended to help you understand the Fund’s financial performance. Certain information reflects financial results for a single share of a class held for the periods shown. Per share net investment income (loss) amounts are calculated based on average shares outstanding during the period. Total return assumes reinvestment of all dividends and distributions, if any. Total return does not reflect payment of sales charges, if any. Total return and portfolio turnover are not annualized for periods of less than one year. The ratios of expenses and net investment income are annualized for periods of less than one year. The portfolio turnover rate is calculated without regard to purchase and sales transactions of short-term instruments and certain derivatives, if any. If such transactions were included, the Fund’s portfolio turnover rate may be higher.
| |
| | | | |
| | | | | |
Net asset value, beginning of period | | | | | |
Income (loss) from investment operations: | | | | | |
Net investment income (loss) | | | | | |
Net realized and unrealized gain (loss) | | | | | |
Total from investment operations | | | | | |
Distributions to shareholders | | | | | |
Distributions from net investment income | | | | | |
Distributions from net realized gains | | | | | |
Total distributions to shareholders | | | | | |
Net asset value, end of period | | | | | |
| | | | | |
Ratios to average net assets | | | | | |
| | | | | |
Total net expenses(a),(e) | | | | | |
Net investment income (loss) | | | | | |
| | | | | |
Net assets, end of period (in thousands) | | | | | |
| | | | | |
Notes to Financial Highlights |
| In addition to the fees and expenses that the Fund bears directly, the Fund indirectly bears a pro rata share of the fees and expenses of any other funds in which it invests. Such indirect expenses are not included in the Fund’s reported expense ratios. |
| Ratios include dividends and interest on securities sold short. If dividends and interest on securities sold short had been excluded, expenses would have been lower by: |
| Ratios include interfund lending expense which is less than 0.01%. |
| Ratios include interest on collateral expense which is less than 0.01%. |
| Total net expenses include the impact of certain fee waivers/expense reimbursements made by the Investment Manager and certain of its affiliates, if applicable. |
The accompanying Notes to Financial Statements are an integral part of this statement.
Multi-Manager Directional Alternative Strategies Fund | Annual Report 2024
29
Notes to Financial StatementsApril 30, 2024 Note 1. Organization
Multi-Manager Directional Alternative Strategies Fund (the Fund), a series of Columbia Funds Series Trust I (the Trust), is a diversified fund. The Trust is registered under the Investment Company Act of 1940, as amended (the 1940 Act), as an open-end management investment company organized as a Massachusetts business trust.
Fund shares
The Trust may issue an unlimited number of shares (without par value). The Fund is offered only through certain wrap fee programs sponsored and/or managed by Ameriprise Financial, Inc. (Ameriprise Financial) or its affiliates. The Fund offers the share class listed in the Statement of Assets and Liabilities which is not subject to any front-end sales charge or contingent deferred sales charge.
Note 2. Summary of significant accounting policies
Basis of preparation
The Fund is an investment company that applies the accounting and reporting guidance in the Financial Accounting Standards Board (FASB) Accounting Standards Codification Topic 946, Financial Services - Investment Companies (ASC 946). The financial statements are prepared in accordance with U.S. generally accepted accounting principles (GAAP), which requires management to make certain estimates and assumptions that affect the reported amounts of assets and liabilities, the disclosure of contingent assets and liabilities at the date of the financial statements and the reported amounts of income and expenses during the reporting period. Actual results could differ from those estimates.
The following is a summary of significant accounting policies followed by the Fund in the preparation of its financial statements.
Security valuation
Equity securities listed on an exchange are valued at the closing price or last trade price on their primary exchange at the close of business of the New York Stock Exchange. Securities with a closing price not readily available or not listed on any exchange are valued at the mean between the closing bid and ask prices. Listed preferred stocks convertible into common stocks are valued using an evaluated price from a pricing service.
Foreign equity securities are valued based on the closing price or last trade price on their primary exchange at the close of business of the New York Stock Exchange. If any foreign equity security closing prices are not readily available, the securities are valued at the mean of the latest quoted bid and ask prices on such exchanges or markets. Foreign currency exchange rates are determined at the scheduled closing time of the New York Stock Exchange. Many securities markets and exchanges outside the U.S. close prior to the close of the New York Stock Exchange; therefore, the closing prices for securities in such markets or on such exchanges may not fully reflect events that occur after such close but before the close of the New York Stock Exchange. In those situations, foreign securities will be fair valued pursuant to a policy approved by the Board of Trustees. Under the policy, the Fund may utilize a third-party pricing service to determine these fair values. The third-party pricing service takes into account multiple factors, including, but not limited to, movements in the U.S. securities markets, certain depositary receipts, futures contracts and foreign exchange rates that have occurred subsequent to the close of the foreign exchange or market, to determine a good faith estimate that reasonably reflects the current market conditions as of the close of the New York Stock Exchange. The fair value of a security is likely to be different from the quoted or published price, if available.
Investments in open-end investment companies (other than exchange-traded funds (ETFs)), are valued at the latest net asset value reported by those companies as of the valuation time.
Option contracts are valued at the mean of the latest quoted bid and ask prices on their primary exchanges. Option contracts, including over-the-counter option contracts, with no readily available market quotations are valued using mid-market evaluations from independent third-party vendors.
30
Multi-Manager Directional Alternative Strategies Fund | Annual Report 2024
Notes to Financial Statements (continued)April 30, 2024 Investments for which market quotations are not readily available, or that have quotations which management believes are not reflective of market value or reliable, are valued at fair value as determined in good faith under procedures approved by the Board of Trustees. If a security or class of securities (such as foreign securities) is valued at fair value, such value is likely to be different from the quoted or published price for the security, if available.
The determination of fair value often requires significant judgment. To determine fair value, management may use assumptions including but not limited to future cash flows and estimated risk premiums. Multiple inputs from various sources may be used to determine fair value.
GAAP requires disclosure regarding the inputs and valuation techniques used to measure fair value and any changes in valuation inputs or techniques. In addition, investments shall be disclosed by major category. This information is disclosed following the Fund’s Portfolio of Investments.
Foreign currency transactions and translations
The values of all assets and liabilities denominated in foreign currencies are generally translated into U.S. dollars at exchange rates determined at the close of regular trading on the New York Stock Exchange. Net realized and unrealized gains (losses) on foreign currency transactions and translations include gains (losses) arising from the fluctuation in exchange rates between trade and settlement dates on securities transactions, gains (losses) arising from the disposition of foreign currency and currency gains (losses) between the accrual and payment dates on dividends, interest income and foreign withholding taxes.
For financial statement purposes, the Fund does not distinguish that portion of gains (losses) on investments which is due to changes in foreign exchange rates from that which is due to changes in market prices of the investments. Such fluctuations are included with the net realized and unrealized gains (losses) on investments in the Statement of Operations.
Derivative instruments
The Fund invests in certain derivative instruments, as detailed below, in seeking to meet its investment objectives. Derivatives are instruments whose values depend on, or are derived from, in whole or in part, the value of one or more securities, currencies, commodities, indices, or other assets or instruments. Derivatives may be used to increase investment flexibility (including to maintain cash reserves while maintaining desired exposure to certain assets), for risk management (hedging) purposes, to facilitate trading, to reduce transaction costs and to pursue higher investment returns. The Fund may also use derivative instruments to mitigate certain investment risks, such as foreign currency exchange rate risk, interest rate risk and credit risk. Derivatives may involve various risks, including the potential inability of the counterparty to fulfill its obligations under the terms of the contract, the potential for an illiquid secondary market (making it difficult for the Fund to sell or terminate, including at favorable prices) and the potential for market movements which may expose the Fund to gains or losses in excess of the amount shown in the Statement of Assets and Liabilities. The notional amounts of derivative instruments, if applicable, are not recorded in the financial statements.
A derivative instrument may suffer a marked-to-market loss if the value of the contract decreases due to an unfavorable change in the market rates or values of the underlying instrument. Losses can also occur if the counterparty does not perform its obligations under the contract. The Fund’s risk of loss from counterparty credit risk on over-the-counter derivatives is generally limited to the aggregate unrealized gain netted against any collateral held by the Fund and the amount of any variation margin held by the counterparty, plus any replacement costs or related amounts. With exchange-traded or centrally cleared derivatives, there is reduced counterparty credit risk to the Fund since the clearinghouse or central counterparty provides some protection in the case of clearing member default. The clearinghouse or central counterparty stands between the buyer and the seller of the contract; therefore, failure of the clearinghouse or central counterparty may pose additional counterparty credit risk. However, credit risk still exists in exchange-traded or centrally cleared derivatives with respect to initial and variation margin that is held in a broker’s customer account. While clearing brokers are required to segregate customer margin from their own assets, in the event that a clearing broker becomes insolvent or goes into bankruptcy and at that time there is a shortfall in the aggregate amount of margin held by the clearing broker for all its clients and such shortfall is remedied by the central counterparty or otherwise, U.S. bankruptcy laws will typically allocate that shortfall on a pro-rata basis across all the clearing broker’s customers (including the Fund), potentially resulting in losses to the Fund.
Multi-Manager Directional Alternative Strategies Fund | Annual Report 2024
31
Notes to Financial Statements (continued)April 30, 2024 In order to better define its contractual rights and to secure rights that will help the Fund mitigate its counterparty risk, the Fund may enter into an International Swaps and Derivatives Association, Inc. Master Agreement (ISDA Master Agreement) or similar agreement with its derivatives counterparties. An ISDA Master Agreement is an agreement between the Fund and a counterparty that governs over-the-counter derivatives and foreign exchange forward contracts and contains, among other things, collateral posting terms and netting provisions in the event of a default and/or termination event. Under an ISDA Master Agreement, the Fund may, under certain circumstances, offset with the counterparty certain derivative instruments’ payables and/or receivables with collateral held and/or posted and create one single net payment. The provisions of the ISDA Master Agreement typically permit a single net payment in the event of default (close-out netting), including the bankruptcy or insolvency of the counterparty. Note, however, that bankruptcy or insolvency laws of a particular jurisdiction may impose restrictions on or prohibitions against the right of offset or netting in bankruptcy, insolvency or other events.
Collateral (margin) requirements differ by type of derivative. Margin requirements are established by the clearinghouse or central counterparty for exchange-traded and centrally cleared derivatives. Brokers can ask for margin in excess of the minimum in certain circumstances. Collateral terms for most over-the-counter derivatives are subject to regulatory requirements to exchange variation margin with trading counterparties and may have contract specific margin terms as well. For over-the-counter derivatives traded under an ISDA Master Agreement, the collateral requirements are typically calculated by netting the marked-to-market amount for each transaction under such agreement and comparing that amount to the value of any variation margin currently pledged by the Fund and/or the counterparty. Generally, the amount of collateral due from or to a party has to exceed a minimum transfer amount threshold (e.g., $250,000) before a transfer has to be made. To the extent amounts due to the Fund from its counterparties are not fully collateralized, contractually or otherwise, the Fund bears the risk of loss from counterparty nonperformance. The Fund may also pay interest expense on cash collateral received from the broker or receive interest income on cash collateral pledged to the broker. The Fund attempts to mitigate counterparty risk by only entering into agreements with counterparties that it believes have the financial resources to honor their obligations and by monitoring the financial stability of those counterparties.
Certain ISDA Master Agreements allow counterparties of over-the-counter derivatives transactions to terminate derivatives contracts prior to maturity in the event the Fund’s net asset value declines by a stated percentage over a specified time period or if the Fund fails to meet certain terms of the ISDA Master Agreement, which would cause the Fund to accelerate payment of any net liability owed to the counterparty. The Fund also has termination rights if the counterparty fails to meet certain terms of the ISDA Master Agreement. In determining whether to exercise such termination rights, the Fund would consider, in addition to counterparty credit risk, whether termination would result in a net liability owed from the counterparty.
For financial reporting purposes, the Fund does not offset derivative assets and derivative liabilities that are subject to netting arrangements in the Statement of Assets and Liabilities.
Options contracts
Options are contracts which entitle the holder to purchase or sell securities or other identified assets at a specified price, or in the case of index option contracts, to receive or pay the difference between the index value and the strike price of the index option contract. Option contracts can be either exchange-traded or over-the-counter. The Fund purchased and has written option contracts to decrease the Fund’s exposure to equity risk, to increase return on investments and to protect gains. These instruments may be used for other purposes in future periods. Completion of transactions for option contracts traded in the over-the-counter market depends upon the performance of the other party. Collateral may be collected or posted by the Fund to secure over-the-counter option contract trades. Collateral held or posted by the Fund for such option contract trades must be returned to the broker or the Fund upon closure, exercise or expiration of the contract.
Options contracts purchased are recorded as investments. When the Fund writes an options contract, the premium received is recorded as an asset and an amount equivalent to the premium is recorded as a liability in the Statement of Assets and Liabilities and is subsequently adjusted to reflect the current fair value of the option written. Changes in the fair value of the written option are recorded as unrealized appreciation or depreciation until the contract is exercised or has expired. The Fund realizes a gain or loss when the option contract is closed or expires. When option contracts are exercised, the proceeds on sales for a written call or purchased put option contract, or the purchase cost for a written put or purchased call option contract, is adjusted by the amount of premium received or paid.
32
Multi-Manager Directional Alternative Strategies Fund | Annual Report 2024
Notes to Financial Statements (continued)April 30, 2024 For over-the-counter options purchased, the Fund bears the risk of loss of the amount of the premiums paid plus the positive change in market values net of any collateral held by the Fund should the counterparty fail to perform under the contracts. Option contracts written by the Fund do not typically give rise to significant counterparty credit risk, as options written generally obligate the Fund and not the counterparty to perform. The risk in writing a call option contract is that the Fund gives up the opportunity for profit if the market price of the security increases above the strike price and the option contract is exercised. The risk in writing a put option contract is that the Fund may incur a loss if the market price of the security decreases below the strike price and the option contract is exercised. Exercise of a written option could result in the Fund purchasing or selling a security or foreign currency when it otherwise would not, or at a price different from the current market value. In purchasing and writing options, the Fund bears the risk of an unfavorable change in the value of the underlying instrument or the risk that the Fund may not be able to enter into a closing transaction due to an illiquid market.
Swap contracts
Swap contracts are negotiated in the over-the-counter market and are entered into bilaterally or centrally cleared (centrally cleared swap contract). In a centrally cleared swap contract, immediately following execution of the swap contract with a broker, the swap contract is novated to a central counterparty and the central counterparty becomes the Fund’s counterparty to the centrally cleared swap contract. The Fund is required to deposit initial margin with the futures commission merchant (FCM), which pledges it through to the central counterparty in the form of cash or securities in an amount that varies depending on the size and risk profile of the particular swap contract. Securities deposited as initial margin are designated in the Portfolio of Investments and cash deposited is recorded in the Statement of Assets and Liabilities as margin deposits. For a bilateral swap contract, the Fund has credit exposure to the broker, but exchanges daily variation margin with the broker based on the mark-to-market value of the swap contract to minimize that exposure. For centrally cleared swap contracts, the Fund has minimal credit exposure to the FCM because the central counterparty stands between the Fund and the relevant buyer/seller on the other side of the contract. Swap contracts are marked-to-market daily and changes in value are recorded as unrealized appreciation (depreciation). The daily change in valuation of centrally cleared swap contracts, if any, is recorded as a receivable or payable for variation margin in the Statement of Assets and Liabilities.
Entering into these contracts involves, to varying degrees, elements of interest, liquidity and counterparty credit risk in excess of the amounts recognized in the Statement of Assets and Liabilities. Such risks involve the possibility that there may be unfavorable changes in interest rates, market conditions or other conditions, that it may be difficult to initiate a swap transaction or liquidate a position at an advantageous time or price which may result in significant losses, and that the bilateral counterparty, FCM or central counterparty, as applicable, may not fulfill its obligation under the contract.
Total return swap contracts
The Fund entered into total return swap contracts to manage long or short exposure to the total return on a specified reference security in return for periodic payments based on a fixed or variable interest rate. These instruments may be used for other purposes in future periods. Total return swap contracts may be used to obtain exposure to an underlying reference security, instrument, or other asset or index or market without owning, taking physical custody of, or short selling any such security, instrument or asset in a market.
Total return swap contracts are valued daily, and the change in value is recorded as unrealized appreciation (depreciation) until the termination of the swap, at which time the Fund will realize a gain (loss). Periodic payments received (or made) by the Fund over the term of the contract are recorded as realized gains (losses). Total return swap contracts are subject to the risk associated with the investment in the underlying reference security, instrument or asset. This risk may be offset if the Fund holds any of the underlying reference security, instrument or asset. Total return swap contracts are subject to the risk that the counterparty may not fulfill its obligations under the contract. This risk is offset by the daily exchange of variation margin with the swap counterparty.
Effects of derivative transactions in the financial statements
The following tables are intended to provide additional information about the effect of derivatives on the financial statements of the Fund, including: the fair value of derivatives by risk category and the location of those fair values in the Statement of Assets and Liabilities; and the impact of derivative transactions over the period in the Statement of Operations, including realized and unrealized gains (losses). The derivative instrument schedules following the Portfolio of Investments present additional information regarding derivative instruments outstanding at the end of the period, if any.
Multi-Manager Directional Alternative Strategies Fund | Annual Report 2024
33
Notes to Financial Statements (continued)April 30, 2024 The following table is a summary of the fair value of derivative instruments (not considered to be hedging instruments for accounting disclosure purposes) at April 30, 2024:
| | |
| Statement
of assets and liabilities
location | |
| Option contracts written, at value | |
The following table indicates the effect of derivative instruments (not considered to be hedging instruments for accounting disclosure purposes) in the Statement of Operations for the year ended April 30, 2024:
Amount of realized gain (loss) on derivatives recognized in income |
| Option
contracts
purchased
($) | Option
contracts
written
($) | | |
| | | | |
|
Change in unrealized appreciation (depreciation) on derivatives recognized in income |
| Option
contracts
purchased
($) | Option
contracts
written
($) | | |
| | | | |
The following table is a summary of the average daily outstanding volume by derivative instrument for the year ended April 30, 2024:
| |
Option contracts purchased | |
| |
| Average unrealized
appreciation ($) | Average unrealized
depreciation ($) |
Total return swap contracts | | |
Short sales
The Fund may sell a security it does not own in anticipation of a decline in the fair value of the security. When the Fund sells a security short, it must borrow the security sold short and deliver it to the broker-dealer through which it made the short sale. The Fund is required to maintain a margin account with the broker and to pledge assets to the broker as collateral for the borrowed security. Securities pledged as collateral are designated in the Portfolio of Investments. In addition, the collateral is recorded as cash collateral held at broker in the Statement of Assets and Liabilities. The Fund can purchase the same security at the current market price and deliver it to the broker to close out the short sale. The Fund is obligated to pay the broker a fee for borrowing the security and may receive rebate income from the investment of collateral. The net amount of income or fees is included in "Interest income" (for net income received) or “Dividends and interest on securities sold short” (for net expense) in the Statement of Operations. A short position is reported as a liability at fair value in the Statement of Assets and Liabilities. The Fund must also pay the broker for any dividends accrued (recognized on ex-date) on the borrowed security. This amount is recorded as an expense in the Statement of Operations. The Fund will record a gain if the security declines in value, and will realize a loss if the security appreciates. Such gain, limited to the price at which the Fund sold the security short, or such loss, potentially unlimited in size because the short position loses value as the market price of the security sold short increases, will be recognized upon the termination of a short sale.
34
Multi-Manager Directional Alternative Strategies Fund | Annual Report 2024
Notes to Financial Statements (continued)April 30, 2024 Offsetting of assets and liabilities
The following table presents the Fund’s gross and net amount of assets and liabilities available for offset under netting arrangements as well as any related collateral received or pledged by the Fund as of April 30, 2024:
| | | |
| | | |
Call option contracts written | | | |
| | | |
| | | |
Total financial and derivative net assets | | | |
Total collateral received (pledged) (a) | | | |
| | | |
| In some instances, the actual collateral received and/or pledged may be more than the amount shown due to overcollateralization. |
| Represents the net amount due from/(to) counterparties in the event of default. |
Security transactions
Security transactions are accounted for on the trade date. Cost is determined and gains (losses) are based upon the specific identification method for both financial statement and federal income tax purposes.
Income recognition
Interest income is recorded on an accrual basis.
Corporate actions and dividend income are generally recorded net of any non-reclaimable tax withholdings, on the ex-dividend date or upon receipt of an ex-dividend notification in the case of certain foreign securities.
The Fund may receive distributions from holdings in equity securities, business development companies (BDCs), exchange-traded funds (ETFs), limited partnerships (LPs), other regulated investment companies (RICs), and real estate investment trusts (REITs), which report information as to the tax character of their distributions annually. These distributions are allocated to dividend income, capital gain and return of capital based on actual information reported. Return of capital is recorded as a reduction of the cost basis of securities held. If the Fund no longer owns the applicable securities, return of capital is recorded as a realized gain. With respect to REITs, to the extent actual information has not yet been reported, estimates for return of capital are made by Columbia Management Investment Advisers, LLC (the Investment Manager), a wholly-owned subsidiary of Ameriprise Financial, Inc. (Ameriprise Financial). The Investment Manager’s estimates are subsequently adjusted when the actual character of the distributions is disclosed by the REITs, which could result in a proportionate change in return of capital to shareholders.
Awards from class action litigation are recorded as a reduction of cost basis if the Fund still owns the applicable securities on the payment date. If the Fund no longer owns the applicable securities on the payment date, the proceeds are recorded as realized gains.
Expenses
General expenses of the Trust are allocated to the Fund and other funds of the Trust based upon relative net assets or other expense allocation methodologies determined by the nature of the expense. Expenses directly attributable to the Fund are charged to the Fund. Expenses directly attributable to a specific class of shares are charged to that share class.
Determination of class net asset value
All income, expenses (other than class-specific expenses, which are charged to that share class, as shown in the Statement of Operations) and realized and unrealized gains (losses) are allocated to each class of the Fund on a daily basis, based on the relative net assets of each class, for purposes of determining the net asset value of each class.
Multi-Manager Directional Alternative Strategies Fund | Annual Report 2024
35
Notes to Financial Statements (continued)April 30, 2024 Federal income tax status
The Fund intends to qualify each year as a regulated investment company under Subchapter M of the Internal Revenue Code, as amended, and will distribute substantially all of its investment company taxable income and net capital gain, if any, for its tax year, and as such will not be subject to federal income taxes. In addition, the Fund intends to distribute in each calendar year substantially all of its ordinary income, capital gain net income and certain other amounts, if any, such that the Fund should not be subject to federal excise tax. Therefore, no federal income or excise tax provision is recorded.
Foreign taxes
The Fund may be subject to foreign taxes on income, gains on investments or currency repatriation, a portion of which may be recoverable. The Fund will accrue such taxes and recoveries, as applicable, based upon its current interpretation of tax rules and regulations that exist in the markets in which it invests.
Realized gains in certain countries may be subject to foreign taxes at the Fund level, based on statutory rates. The Fund accrues for such foreign taxes on realized and unrealized gains at the appropriate rate for each jurisdiction, as applicable. The amount, if any, is disclosed as a liability in the Statement of Assets and Liabilities.
Distributions to shareholders
Distributions from net investment income, if any, are declared and paid annually. Net realized capital gains, if any, are distributed at least annually. Income distributions and capital gain distributions are determined in accordance with federal income tax regulations, which may differ from GAAP.
Guarantees and indemnifications
Under the Trust’s organizational documents and, in some cases, by contract, its officers and trustees are indemnified against certain liabilities arising out of the performance of their duties to the Trust or its funds. In addition, certain of the Fund’s contracts with its service providers contain general indemnification clauses. The Fund’s maximum exposure under these arrangements is unknown since the amount of any future claims that may be made against the Fund cannot be determined, and the Fund has no historical basis for predicting the likelihood of any such claims.
Recent accounting pronouncements and regulatory updates
Tailored Shareholder Reports
In October 2022, the Securities and Exchange Commission adopted a final rule, "Tailored Shareholder Reports for Mutual Funds and Exchange-Traded Funds; Fee Information in Investment Company Advertisements." The rule and form amendments will, among other things, require the Fund to transmit concise and visually engaging shareholder reports that highlight key information. The amendments will require that funds tag information in a structured data format and that certain more in-depth information be made available online and available for delivery free of charge to investors on request. The amendments became effective January 24, 2023. There is an 18-month transition period after the effective date of the amendments.
Note 3. Fees and other transactions with affiliates
Management services fees
The Fund has entered into a Management Agreement with Columbia Management Investment Advisers, LLC (the Investment Manager), a wholly-owned subsidiary of Ameriprise Financial, Inc. (Ameriprise Financial). Under the Management Agreement, the Investment Manager provides the Fund with investment research and advice, as well as administrative and accounting services. The Investment Manager is responsible for the ultimate oversight of investments made by the Fund. The Fund’s subadvisers (see Subadvisory agreements below) have the primary responsibility for the day-to-day portfolio management of the Fund. The management services fee is equal to 1.60% of the Fund’s daily net assets.
Effective September 5, 2023 (Waiver Effective Date), the Investment Manager is voluntarily waiving a portion of its management fee effective on Fund assets formerly managed by a Fund subadviser that was terminated on the Waiver Effective Date (the Former Subadviser’s Sleeve), which assets have been managed directly by the Investment Manager since
36
Multi-Manager Directional Alternative Strategies Fund | Annual Report 2024
Notes to Financial Statements (continued)April 30, 2024 that date. The Investment Manager will waive its management fees in an amount equal to the subadvisory fees that would have been paid by the Investment Manager to the former subadviser with respect to the Former Subadviser’s Sleeve (based on the fee schedule in the terminated subadvisory agreement between the Investment Manager and the former subadviser and the daily value of such assets). This voluntary management fee waiver is not taken into account as an offset to the Fund’s operating expenses when calculating an existing contractual fee waiver/reimbursement arrangement between the Fund and the Investment Manager. This arrangement may be revised or discontinued at any time.
Subadvisory agreements
The Investment Manager has entered into Subadvisory Agreements with Allspring Global Investments, LLC and Boston Partners Global Investors, Inc., each of which subadvises a portion of the assets of the Fund. Prior to September 5, 2023, J.P. Morgan Investment Management Inc. served as a subadviser to the Fund. On March 14, 2024, the Board of Trustees approved a Subadvisory Agreement with Summit Partners Public Asset Management, LLC (Summit Partners) to serve as a subadviser to a portion of the assets of the Fund. Summit Partners is expected to start managing a portion of the Fund’s assets in the third quarter of 2024. New investments in the Fund, net of any redemptions, are allocated in accordance with the Investment Manager’s determination. Each subadviser’s proportionate share of investments in the Fund will vary due to market fluctuations. The Investment Manager compensates each subadviser to manage the investment of the Fund’s assets.
Compensation of Board members
Members of the Board of Trustees who are not officers or employees of the Investment Manager or Ameriprise Financial are compensated for their services to the Fund as disclosed in the Statement of Operations. Under a Deferred Compensation Plan (the Deferred Plan), these members of the Board of Trustees may elect to defer payment of up to 100% of their compensation. Deferred amounts are treated as though equivalent dollar amounts had been invested in shares of certain funds managed by the Investment Manager. The Fund’s liability for these amounts is adjusted for market value changes and remains in the Fund until distributed in accordance with the Deferred Plan. All amounts payable under the Deferred Plan constitute a general unsecured obligation of the Fund. The expense for the Deferred Plan, which includes Trustees’ fees deferred during the current period as well as any gains or losses on the Trustees’ deferred compensation balances as a result of market fluctuations, is included in "Deferred compensation of board members" in the Statement of Operations.
Compensation of Chief Compliance Officer
The Board of Trustees has appointed a Chief Compliance Officer for the Fund in accordance with federal securities regulations. As disclosed in the Statement of Operations, a portion of the Chief Compliance Officer’s total compensation is allocated to the Fund, along with other allocations to affiliated registered investment companies managed by the Investment Manager and its affiliates, based on relative net assets.
Transfer agency fees
Under a Transfer and Dividend Disbursing Agent Agreement, Columbia Management Investment Services Corp. (the Transfer Agent), an affiliate of the Investment Manager and a wholly-owned subsidiary of Ameriprise Financial, is responsible for providing transfer agency services to the Fund. The Transfer Agent has contracted with SS&C GIDS, Inc. (SS&C GIDS) to serve as sub-transfer agent. The Transfer Agent pays the fees of SS&C GIDS for services as sub-transfer agent and SS&C GIDS is not entitled to reimbursement for such fees from the Fund (with the exception of out-of-pocket fees).
The Fund pays the Transfer Agent a monthly transfer agency fee based on the number or the average value of accounts, depending on the type of account. In addition, the Fund pays the Transfer Agent a fee for shareholder services based on the number of accounts or on a percentage of the average aggregate value of the Fund’s shares maintained in omnibus accounts up to the lesser of the amount charged by the financial intermediary or a cap established by the Board of Trustees from time to time.
The Transfer Agent also receives compensation from the Fund for various shareholder services and reimbursements for certain out-of-pocket fees.
Multi-Manager Directional Alternative Strategies Fund | Annual Report 2024
37
Notes to Financial Statements (continued)April 30, 2024 For the year ended April 30, 2024, the Fund’s effective transfer agency fee rate as a percentage of average daily net assets was as follows:
Distribution and service fees
The Fund has an agreement with Columbia Management Investment Distributors, Inc. (the Distributor), an affiliate of the Investment Manager and a wholly-owned subsidiary of Ameriprise Financial, for distribution and shareholder services. The Fund does not pay the Distributor a fee for the distribution services it provides to the Fund.
Expenses waived/reimbursed by the Investment Manager and its affiliates
The Investment Manager and certain of its affiliates have contractually agreed to waive fees and/or reimburse expenses (excluding certain fees and expenses described below) for the period(s) disclosed below, unless sooner terminated at the sole discretion of the Board of Trustees, so that the Fund’s net operating expenses, after giving effect to fees waived/expenses reimbursed and any balance credits and/or overdraft charges from the Fund’s custodian, do not exceed the following annual rate(s) as a percentage of the classes’ average daily net assets:
| Fee rate(s) contractual
through
August 31, 2024 |
| |
Under the agreement governing these fee waivers and/or expense reimbursement arrangements, the following fees and expenses are excluded from the waiver/reimbursement commitment, and therefore will be paid by the Fund, if applicable: taxes (including foreign transaction taxes), expenses associated with investments in affiliated and non-affiliated pooled investment vehicles (including mutual funds and exchange-traded funds), transaction costs and brokerage commissions, costs related to any securities lending program, dividend expenses associated with securities sold short, inverse floater program fees and expenses, transaction charges and interest on borrowed money, interest, costs associated with shareholder meetings, infrequent and/or unusual expenses and any other expenses the exclusion of which is specifically approved by the Board of Trustees. This agreement may be modified or amended only with the approval from the Investment Manager, certain of its affiliates and the Fund. The Fund’s management services fee voluntary waiver, which took effect on September 5, 2023, is also excluded from the waiver/reimbursement commitment and, therefore, provides an additional benefit to the Fund’s shareholders. This arrangement may be revised or discontinued at any time. Any fees waived and/or expenses reimbursed under the expense reimbursement arrangements described above are not recoverable by the Investment Manager or its affiliates in future periods.
Note 4. Federal tax information
The timing and character of income and capital gain distributions are determined in accordance with income tax regulations, which may differ from GAAP because of temporary or permanent book to tax differences.
At April 30, 2024, these differences were primarily due to differing treatment for deferral/reversal of wash sale losses, foreign currency transactions, passive foreign investment company (pfic) holdings, tax straddles, constructive sales of appreciated financial positions, derivative investments, trustees’ deferred compensation, non-deductible expenses, swap investments and miscellaneous adjustments. To the extent these differences were permanent, reclassifications were made among the components of the Fund’s net assets. Temporary differences do not require reclassifications.
The following reclassifications were made:
Undistributed net
investment
income ($) | Accumulated
net realized
(loss) ($) | |
| | |
38
Multi-Manager Directional Alternative Strategies Fund | Annual Report 2024
Notes to Financial Statements (continued)April 30, 2024 Net investment income (loss) and net realized gains (losses), as disclosed in the Statement of Operations, and net assets were not affected by this reclassification.
The tax character of distributions paid during the years indicated was as follows:
Year Ended April 30, 2024 | Year Ended April 30, 2023 |
| Long-term
capital gains ($) | | | Long-term
capital gains ($) | |
| | | | | |
Short-term capital gain distributions, if any, are considered ordinary income distributions for tax purposes.
At April 30, 2024, the components of distributable earnings on a tax basis were as follows:
Undistributed
ordinary income ($) | Undistributed
long-term
capital gains ($) | Capital loss
carryforwards ($) | Net unrealized
appreciation ($) |
| | | |
At April 30, 2024, the cost of all investments for federal income tax purposes along with the aggregate gross unrealized appreciation and depreciation based on that cost was:
| Gross unrealized
appreciation ($) | Gross unrealized
(depreciation) ($) | Net unrealized
appreciation ($) |
| | | |
Tax cost of investments and unrealized appreciation/(depreciation) may also include timing differences that do not constitute adjustments to tax basis.
The following capital loss carryforwards, determined at April 30, 2024, may be available to reduce future net realized gains on investments, if any, to the extent permitted by the Internal Revenue Code. In addition, for the year ended April 30, 2024, capital loss carryforwards utilized, if any, were as follows:
No expiration
short-term ($) | No expiration
long-term ($) | | |
| | | |
Management of the Fund has concluded that there are no significant uncertain tax positions in the Fund that would require recognition in the financial statements. However, management’s conclusion may be subject to review and adjustment at a later date based on factors including, but not limited to, new tax laws, regulations, and administrative interpretations (including relevant court decisions). Generally, the Fund’s federal tax returns for the prior three fiscal years remain subject to examination by the Internal Revenue Service.
Note 5. Portfolio information
The cost of purchases and proceeds from sales of securities, excluding short-term investments and derivatives, if any, aggregated to $566,729,571 and $579,265,530, respectively, for the year ended April 30, 2024. The amount of purchase and sale activity impacts the portfolio turnover rate reported in the Financial Highlights.
Brokerage commissions paid to brokers affiliated with the Investment Manager of the Fund were $2,283 for the year ended April 30, 2024.
Note 6. Affiliated money market fund
The Fund invests in Columbia Short-Term Cash Fund, an affiliated money market fund established for the exclusive use by the Fund and other affiliated funds (the Affiliated MMF). The income earned by the Fund from such investments is included as Dividends - affiliated issuers in the Statement of Operations. As an investing fund, the Fund indirectly bears its proportionate share of the expenses of the Affiliated MMF. The Affiliated MMF prices its shares with a floating net asset value. The
Multi-Manager Directional Alternative Strategies Fund | Annual Report 2024
39
Notes to Financial Statements (continued)April 30, 2024 Securities and Exchange Commission has adopted amendments to money market fund rules requiring institutional prime money market funds like the Affiliated MMF to be subject to a discretionary liquidity fee of up to 2% if the imposition of such a fee is determined to be in the best interest of the Affiliated MMF and, by October 2, 2024, to a mandatory liquidity fee if daily net redemptions exceed 5% of net assets.
Note 7. Interfund lending
Pursuant to an exemptive order granted by the Securities and Exchange Commission, the Fund participates in a program (the Interfund Program) allowing each participating Columbia Fund (each, a Participating Fund) to lend money directly to and, except for closed-end funds and money market funds, borrow money directly from other Participating Funds for temporary purposes. The amounts eligible for borrowing and lending under the Interfund Program are subject to certain restrictions.
Interfund loans are subject to the risk that the borrowing fund could be unable to repay the loan when due, and a delay in repayment to the lending fund could result in lost opportunities and/or additional lending costs. The exemptive order is subject to conditions intended to mitigate conflicts of interest arising from the Investment Manager’s relationship with each Participating Fund.
The Fund’s activity in the Interfund Program during the year ended April 30, 2024 was as follows:
| | Weighted average
interest rate (%) | Number of days
with outstanding loans |
| | | |
| | | |
Interest income earned and interest expense incurred by the Fund are recorded as Interfund lending and Interest on interfund lending, respectively, in the Statement of Operations. The Fund had no outstanding interfund loans at April 30, 2024.
Note 8. Line of credit
The Fund has access to a revolving credit facility with a syndicate of banks led by JPMorgan Chase Bank, N.A., Citibank, N.A. and Wells Fargo Bank, N.A. whereby the Fund may borrow for the temporary funding of shareholder redemptions or for other temporary or emergency purposes. Pursuant to an October 26, 2023 amendment and restatement, the credit facility, which is an agreement between the Fund and certain other funds managed by the Investment Manager or an affiliated investment manager, severally and not jointly, permits aggregate borrowings up to $900 million. Interest is currently charged to each participating fund based on its borrowings at a rate equal to the higher of (i) the federal funds effective rate, (ii) the secured overnight financing rate plus 0.10% and (iii) the overnight bank funding rate plus, in each case, 1.00%. Each borrowing under the credit facility matures no later than 60 days after the date of borrowing. The Fund also pays a commitment fee equal to its pro rata share of the unused amount of the credit facility at a rate of 0.15% per annum. The commitment fee is included in other expenses in the Statement of Operations. This agreement expires annually in October unless extended or renewed. Prior to the October 26, 2023 amendment and restatement, the Fund had access to a revolving credit facility with a syndicate of banks led by JPMorgan Chase Bank, N.A., Citibank, N.A. and Wells Fargo Bank, N.A. which permitted collective borrowings up to $950 million. Interest was charged to each participating fund based on its borrowings at a rate equal to the higher of (i) the federal funds effective rate, (ii) the secured overnight financing rate plus 0.10% and (iii) the overnight bank funding rate plus, in each case, 1.00%.
The Fund had no borrowings during the year ended April 30, 2024.
Note 9. Significant risks
Alternative strategies investment risk
An investment in alternative investment strategies (Alternative Strategies) involves risks, which may be significant. Alternative Strategies may include strategies, instruments or other assets, such as derivatives, that seek investment returns uncorrelated with the broad equity and fixed income/debt markets, as well as those providing exposure to other markets
40
Multi-Manager Directional Alternative Strategies Fund | Annual Report 2024
Notes to Financial Statements (continued)April 30, 2024 (such as commodity markets), including but not limited to absolute (positive) return strategies. Alternative Strategies may fail to achieve their desired performance, market or other exposure, or their returns (or lack thereof) may be more correlated with the broad equity and/or fixed income/debt markets than was anticipated, and the Fund may lose money.
Market risk
The Fund may incur losses due to declines in the value of one or more securities in which it invests. These declines may be due to factors affecting a particular issuer, or the result of, among other things, political, regulatory, market, economic or social developments affecting the relevant market(s) more generally. In addition, turbulence in financial markets and reduced liquidity in equity, credit and/or fixed income markets may negatively affect many issuers, which could adversely affect the Fund’s ability to price or value hard-to-value assets in thinly traded and closed markets and could cause significant redemptions and operational challenges. Global economies and financial markets are increasingly interconnected, and conditions and events in one country, region or financial market may adversely impact issuers in a different country, region or financial market. These risks may be magnified if certain events or developments adversely interrupt the global supply chain; in these and other circumstances, such risks might affect companies worldwide. As a result, local, regional or global events such as terrorism, war, other conflicts, natural disasters, disease/virus outbreaks and epidemics or other public health issues, recessions, depressions or other events – or the potential for such events – could have a significant negative impact on global economic and market conditions.
The large-scale invasion of Ukraine by Russia in February 2022 has resulted in sanctions and market disruptions, including declines in regional and global stock markets, unusual volatility in global commodity markets and significant devaluations of Russian currency. The extent and duration of the military action are impossible to predict but could continue to be significant. Market disruption caused by the Russian military action, and any countermeasures or responses thereto (including international sanctions, a downgrade in a country’s credit rating, purchasing and financing restrictions, boycotts, tariffs, changes in consumer or purchaser preferences, cyberattacks and espionage) could continue to have severe adverse impacts on regional and/or global securities and commodities markets, including markets for oil and natural gas. These impacts may include reduced market liquidity, distress in credit markets, further disruption of global supply chains, increased risk of inflation, restricted cross-border payments and limited access to investments and/or assets in certain international markets and/or issuers. These developments and other related events could negatively impact Fund performance.
Shareholder concentration risk
At April 30, 2024, affiliated shareholders of record owned 100.0% of the outstanding shares of the Fund in one or more accounts. Fund shares sold to or redeemed by concentrated accounts may have a significant effect on the operations of the Fund. In the case of a large redemption, the Fund may be forced to sell investments at inopportune times, including its liquid positions, which may result in Fund losses and the Fund holding a higher percentage of less liquid positions. Large redemptions could result in decreased economies of scale and increased operating expenses for non-redeeming Fund shareholders.
Short positions risk
The Fund may establish short positions which introduce more risk to the Fund than long positions (where the Fund owns the instrument or other asset) because the maximum sustainable loss on an instrument or other asset purchased (held long) is limited to the amount paid for the instrument or other asset plus the transaction costs, whereas there is no maximum price of the shorted instrument or other asset when purchased in the open market. Therefore, in theory, short positions have unlimited risk. The Fund’s use of short positions in effect “leverages” the Fund. Leverage potentially exposes the Fund to greater risks of loss due to unanticipated market movements, which may magnify losses and increase the volatility of returns. To the extent the Fund takes a short position in a derivative instrument or other asset, this involves the risk of a potentially unlimited increase in the value of the underlying instrument or other asset.
Note 10. Subsequent events
Management has evaluated the events and transactions that have occurred through the date the financial statements were issued and noted no items requiring adjustment of the financial statements or additional disclosure.
Multi-Manager Directional Alternative Strategies Fund | Annual Report 2024
41
Notes to Financial Statements (continued)April 30, 2024 Note 11. Information regarding pending and settled legal proceedings
Ameriprise Financial and certain of its affiliates are involved in the normal course of business in legal proceedings which include regulatory inquiries, arbitration and litigation, including class actions concerning matters arising in connection with the conduct of their activities as part of a diversified financial services firm. Ameriprise Financial believes that the Fund is not currently the subject of, and that neither Ameriprise Financial nor any of its affiliates are the subject of, any pending legal, arbitration or regulatory proceedings that are likely to have a material adverse effect on the Fund or the ability of Ameriprise Financial or its affiliates to perform under their contracts with the Fund. Ameriprise Financial is required to make quarterly (10-Q), annual (10-K) and, as necessary, 8-K filings with the Securities and Exchange Commission (SEC) on legal and regulatory matters that relate to Ameriprise Financial and its affiliates. Copies of these filings may be obtained by accessing the SEC website at www.sec.gov.
There can be no assurance that these matters, or the adverse publicity associated with them, will not result in increased Fund redemptions, reduced sale of Fund shares or other adverse consequences to the Fund. Further, although we believe proceedings are not likely to have a material adverse effect on the Fund or the ability of Ameriprise Financial or its affiliates to perform under their contracts with the Fund, these proceedings are subject to uncertainties and, as such, we are unable to estimate the possible loss or range of loss that may result. An adverse outcome in one or more of these proceedings could result in adverse judgments, settlements, fines, penalties or other relief that could have a material adverse effect on the consolidated financial condition or results of operations of Ameriprise Financial or one or more of its affiliates that provide services to the Fund.
42
Multi-Manager Directional Alternative Strategies Fund | Annual Report 2024
Report of Independent Registered Public Accounting Firm
To the Board of Trustees of Columbia Funds Series Trust I and Shareholders of Multi-Manager Directional Alternative Strategies Fund
Opinion on the Financial Statements
We have audited the accompanying statement of assets and liabilities, including the portfolio of investments, of Multi-Manager Directional Alternative Strategies Fund (one of the funds constituting Columbia Funds Series Trust I, referred to hereafter as the "Fund") as of April 30, 2024, the related statement of operations for the year ended April 30, 2024, the statement of changes in net assets for each of the two years in the period ended April 30, 2024, including the related notes, and the financial highlights for each of the five years in the period ended April 30, 2024 (collectively referred to as the "financial statements"). In our opinion, the financial statements present fairly, in all material respects, the financial position of the Fund as of April 30, 2024, the results of its operations for the year then ended, the changes in its net assets for each of the two years in the period ended April 30, 2024 and the financial highlights for each of the five years in the period ended April 30, 2024 in conformity with accounting principles generally accepted in the United States of America.
Basis for Opinion
These financial statements are the responsibility of the Fund’s management. Our responsibility is to express an opinion on the Fund’s financial statements based on our audits. We are a public accounting firm registered with the Public Company Accounting Oversight Board (United States) (PCAOB) and are required to be independent with respect to the Fund in accordance with the U.S. federal securities laws and the applicable rules and regulations of the Securities and Exchange Commission and the PCAOB.
We conducted our audits of these financial statements in accordance with the standards of the PCAOB. Those standards require that we plan and perform the audit to obtain reasonable assurance about whether the financial statements are free of material misstatement, whether due to error or fraud.
Our audits included performing procedures to assess the risks of material misstatement of the financial statements, whether due to error or fraud, and performing procedures that respond to those risks. Such procedures included examining, on a test basis, evidence regarding the amounts and disclosures in the financial statements. Our audits also included evaluating the accounting principles used and significant estimates made by management, as well as evaluating the overall presentation of the financial statements. Our procedures included confirmation of securities owned as of April 30, 2024 by correspondence with the custodian, transfer agent and brokers; when replies were not received from brokers, we performed other auditing procedures. We believe that our audits provide a reasonable basis for our opinion.
/s/PricewaterhouseCoopers LLP
Minneapolis, Minnesota
June 20, 2024
We have served as the auditor of one or more investment companies within the Columbia Funds Complex since 1977.
Multi-Manager Directional Alternative Strategies Fund | Annual Report 2024
43
Federal Income Tax Information
(Unaudited)
The Fund hereby designates the following tax attributes for the fiscal year ended April 30, 2024. Shareholders will be notified in early 2025 of the amounts for use in preparing 2024 income tax returns.
| Dividends
received
deduction | | |
| | | |
Qualified dividend income. For taxable, non-corporate shareholders, the percentage of ordinary income distributed during the fiscal year that represents qualified dividend income subject to reduced tax rates.
Dividends received deduction. The percentage of ordinary income distributed during the fiscal year that qualifies for the corporate dividends received deduction.
Section 199A dividends. For taxable, non-corporate shareholders, the percentage of ordinary income distributed during the fiscal year that represents Section 199A dividends potentially eligible for a 20% deduction.
Capital gain dividend. The Fund designates as a capital gain dividend the amount reflected above, or if subsequently determined to be different, the net capital gain of such fiscal period.
TRUSTEES AND OFFICERS
(Unaudited)
The Board oversees the Fund’s operations and appoints officers who are responsible for day-to-day business decisions based on policies set by the Board. The following table provides basic biographical information about the Fund’s Trustees as of the printing of this report, including their principal occupations during the past five years, although specific titles for individuals may have varied over the period. The year set forth beneath Length of Service in the table below is the year in which the Trustee was first appointed or elected as Trustee to any Fund currently in the Columbia Funds Complex or a predecessor thereof. Under current Board policy, each Trustee generally serves until December 31 of the year such Trustee turns seventy-five (75).
44
Multi-Manager Directional Alternative Strategies Fund | Annual Report 2024
TRUSTEES AND OFFICERS (continued)(Unaudited) Independent trustees
Name,
address,
year of birth | Position held
with the Columbia Funds and
length of service | Principal occupation(s)
during past five years
and other relevant
professional experience | Number of
Funds in the
Columbia Funds
Complex*
overseen | Other directorships
held by Trustee
during the past five years
and other relevant Board experience |
George S. Batejan
c/o Columbia Management
Investment Advisers, LLC
290 Congress Street
Boston, MA 02210
1954 | | Executive Vice President, Global Head of Technology and Operations, Janus Capital Group, Inc., 2010-2016 | | Former Chairman of the Board, NICSA (National Investment Company Services Association) (Executive Committee, Nominating Committee and Governance Committee), 2014-2016; former Director, Intech Investment Management, 2011-2016; former Board Member, Metro Denver Chamber of Commerce, 2015-2016; former Advisory Board Member, University of Colorado Business School, 2015-2018; former Board Member, Chase Bank International, 1993-1994 |
Kathleen Blatz
c/o Columbia Management
Investment Advisers, LLC
290 Congress Street
Boston, MA 02210
1954 | | Attorney, specializing in arbitration and mediation; Trustee of Gerald Rauenhorst 1982 Trusts, since 2020; Chief Justice, Minnesota Supreme Court, 1998-2006; Associate Justice, Minnesota Supreme Court, 1996-1998; Fourth Judicial District Court Judge, Hennepin County, 1994-1996; Attorney in private practice and public service, 1984-1993; State Representative, Minnesota House of Representatives, 1979-1993, which included service on the Tax and Financial Institutions and Insurance Committees; Member and Interim Chair, Minnesota Sports Facilities Authority, January-July 2017; Interim President and Chief Executive Officer, Blue Cross and Blue Shield of Minnesota (health care insurance), February-July 2018, April-October 2021 | | Former Trustee, Blue Cross and Blue Shield of Minnesota, 2009-2021 (Chair of the Business Development Committee, 2014-2017; Chair of the Governance Committee, 2017-2019); former Member and Chair of the Board, Minnesota Sports Facilities Authority, January 2017-July 2017; former Director, Robina Foundation, 2009-2020 (Chair, 2014-2020); Director, Richard M. Schulze Family Foundation, since 2021 |
Pamela G. Carlton
c/o Columbia Management
Investment Advisers, LLC
290 Congress Street
Boston, MA 02210
1954 | Chair since 2023; Trustee since 2007 | President, Springboard – Partners in Cross Cultural Leadership (consulting company), since 2003; Managing Director of US Equity Research, JP Morgan Chase, 1999-2003; Director of US Equity Research, Chase Asset Management, 1996-1999; Co-Director Latin America Research, 1993-1996, COO Global Research, 1992-1996, Co-Director of US Research, 1991-1992, Investment Banker, 1982-1991, Morgan Stanley; Attorney, Cleary Gottlieb Steen & Hamilton LLP, 1980-1982 | | Trustee, New York Presbyterian Hospital Board, since 1996; Director, DR Bank (Audit Committee, since 2017 and Audit Committee Chair, since November 2023); Director, Evercore Inc. (Audit Committee, Nominating and Governance Committee) (financial services company), since 2019; Director, Apollo Commercial Real Estate Finance, Inc. (Chair, Nominating and Governance Committee), since 2021; the Governing Council of the Independent Directors Council (IDC), since 2021 |
Multi-Manager Directional Alternative Strategies Fund | Annual Report 2024
45
TRUSTEES AND OFFICERS (continued)(Unaudited)Independent trustees (continued) Name, address, year of birth | Position held with the Columbia Funds and length of service | Principal occupation(s) during past five years and other relevant professional experience | Number of Funds in the Columbia Funds Complex* overseen | Other directorships held by Trustee during the past five years and other relevant Board experience |
Janet Langford Carrig
c/o Columbia Management
Investment Advisers, LLC
290 Congress Street
Boston, MA 02210
1957 | | Senior Vice President, General Counsel and Corporate Secretary, ConocoPhillips (independent energy company), September 2007-October 2018 | | Director, EQT Corporation (natural gas producer), since 2019; former Director, Whiting Petroleum Corporation (independent oil and gas company), 2020-2022 |
J. Kevin Connaughton
c/o Columbia Management
Investment Advisers, LLC
290 Congress Street
Boston, MA 02210
1964 | | CEO and President, RhodeWay Financial (non-profit financial planning firm), since December 2022; Member, FINRA National Adjudicatory Council, January 2020-December 2023; Adjunct Professor of Finance, Bentley University January 2018-April 2023; Consultant to Independent Trustees of CFVIT and CFST I from March 2016 to June 2020 with respect to CFVIT and to December 2020 with respect to CFST I; Managing Director and General Manager of Mutual Fund Products, Columbia Management Investment Advisers, LLC, May 2010-February 2015; President, Columbia Funds, 2008-2015; and senior officer of Columbia Funds and affiliated funds, 2003-2015 | | Former Director, The Autism Project, March 2015-December 2021; former Member of the Investment Committee, St. Michael’s College, November 2015-February 2020; former Trustee, St. Michael’s College, June 2017-September 2019; former Trustee, New Century Portfolios (former mutual fund complex), January 2015-December 2017 |
Olive M. Darragh
c/o Columbia Management
Investment Advisers, LLC
290 Congress Street
Boston, MA 02210
1962 | | Managing Director of Darragh Inc. (strategy and talent management consulting firm), since 2010; Founder and CEO, Zolio, Inc. (investment management talent identification platform), since 2004; Consultant to Independent Trustees of CFVIT and CFST I from June 2019 to June 2020 with respect to CFVIT and to December 2020 with respect to CFST I; Partner, Tudor Investments, 2004-2010; Senior Partner, McKinsey & Company (consulting), 1990-2004; Touche Ross CPA, 1985-1988 | | Treasurer, Edinburgh University US Trust Board, since January 2023; Member, HBS Community Action Partners Board, since September 2022; former Director, University of Edinburgh Business School (Member of US Board), 2004-2019; former Director, Boston Public Library Foundation, 2008-2017 |
Patricia M. Flynn
c/o Columbia Management
Investment Advisers, LLC
290 Congress Street
Boston, MA 02210
1950 | | Professor Emeritus of Economics and Management, Bentley University, since 2023; Professor of Economics and Management, Bentley University, 1976-2023; Dean, McCallum Graduate School of Business, Bentley University, 1992-2002 | | Former Trustee, MA Taxpayers Foundation, 1997-2022; former Director, The MA Business Roundtable, 2003-2019; former Chairperson, Innovation Index Advisory Committee, MA Technology Collaborative, 1997-2020 |
Brian J. Gallagher
c/o Columbia Management
Investment Advisers, LLC
290 Congress Street
Boston, MA 02210
1954 | | Retired; Partner with Deloitte & Touche LLP and its predecessors, 1977-2016 | | Trustee, Catholic Schools Foundation, since 2004 |
46
Multi-Manager Directional Alternative Strategies Fund | Annual Report 2024
TRUSTEES AND OFFICERS (continued)(Unaudited)Independent trustees (continued) Name, address, year of birth | Position held with the Columbia Funds and length of service | Principal occupation(s) during past five years and other relevant professional experience | Number of Funds in the Columbia Funds Complex* overseen | Other directorships held by Trustee during the past five years and other relevant Board experience |
Douglas A. Hacker
c/o Columbia Management
Investment Advisers, LLC
290 Congress Street
Boston, MA 02210
1955 | | Independent business executive, since May 2006; Executive Vice President – Strategy of United Airlines, December 2002 - May 2006; President of UAL Loyalty Services (airline marketing company), September 2001-December 2002; Executive Vice President and Chief Financial Officer of United Airlines, July 1999-September 2001 | | Director, SpartanNash Company (food distributor), since November 2013 (Chair of the Board, since May 2021); Director, Aircastle Limited (aircraft leasing), since August 2006 (Chair of Audit Committee); former Director, Nash Finch Company (food distributor), 2005-2013; former Director, SeaCube Container Leasing Ltd. (container leasing), 2010-2013; and former Director, Travelport Worldwide Limited (travel information technology), 2014-2019 |
Nancy T. Lukitsh
c/o Columbia Management
Investment Advisers, LLC
290 Congress Street
Boston, MA 02210
1956 | | Senior Vice President, Partner and Director of Marketing, Wellington Management Company, LLP (investment adviser), 1997-2010; Chair, Wellington Management Portfolios (commingled non-U.S. investment pools), 2007-2010; Director, Wellington Trust Company, NA and other Wellington affiliates, 1997-2010 | | |
David M. Moffett
c/o Columbia Management
Investment Advisers, LLC
290 Congress Street
Boston, MA 02210
1952 | | Retired; former Chief Executive Officer of Freddie Mac and Chief Financial Officer of U.S. Bank | | Director, CSX Corporation (transportation suppliers); Director, PayPal Holdings Inc. (payment and data processing services); former Director, eBay Inc. (online trading community), 2007-2015; and former Director, CIT Bank, CIT Group Inc. (commercial and consumer finance), 2010-2016; former Senior Adviser to The Carlyle Group (financial services), March 2008-September 2008; former Governance Consultant to Bridgewater Associates, January 2013-December 2015 |
Catherine James Paglia
c/o Columbia Management
Investment Advisers, LLC
290 Congress Street
Boston, MA 02210
1952 | | Director, Enterprise Asset Management, Inc. (private real estate and asset management company), since September 1998; Managing Director and Partner, Interlaken Capital, Inc., 1989-1997; Vice President, 1982-1985, Principal, 1985-1987, Managing Director, 1987-1989, Morgan Stanley; Vice President, Investment Banking, 1980-1982, Associate, Investment Banking, 1976-1980, Dean Witter Reynolds, Inc. | | Director, Valmont Industries, Inc. (irrigation systems manufacturer), since 2012; Trustee, Carleton College (on the Investment Committee), since 1987; Trustee, Carnegie Endowment for International Peace (on the Investment Committee), since 2009 |
Multi-Manager Directional Alternative Strategies Fund | Annual Report 2024
47
TRUSTEES AND OFFICERS (continued)(Unaudited)Independent trustees (continued) Name, address, year of birth | Position held with the Columbia Funds and length of service | Principal occupation(s) during past five years and other relevant professional experience | Number of Funds in the Columbia Funds Complex* overseen | Other directorships held by Trustee during the past five years and other relevant Board experience |
Natalie A. Trunow
c/o Columbia Management
Investment Advisers, LLC
290 Congress Street
Boston, MA 02210
1967 | | Chief Executive Officer, Millennial Portfolio Solutions LLC (asset management and consulting services), January 2016-January 2021; Non-executive Member of the Investment Committee and Valuation Committee, Sarona Asset Management Inc. (private equity firm) since September 2019; Advisor, Horizon Investments (asset management and consulting services), August 2018-January 2022; Advisor, Paradigm Asset Management, November 2016-January 2022; Consultant to Independent Trustees of CFVIT and CFST I from September 2016 to June 2020 with respect to CFVIT and to December 2020 with respect to CFST I; Director of Investments/Consultant, Casey Family Programs, April 2016-November 2016; Senior Vice President and Chief Investment Officer, Calvert Investments, August 2008-January 2016; Section Head and Portfolio Manager, General Motors Asset Management, June 1997-August 2008 | | Independent Director, Investment Committee, Health Services for Children with Special Needs, Inc., 2010-2021; Independent Director, (Executive Committee and Chair, Audit Committee), Consumer Credit Counseling Services (formerly Guidewell Financial Solutions), since 2016; Independent Director, (Investment Committee), Sarona Asset Management, since 2019 |
Sandra L. Yeager
c/o Columbia Management
Investment Advisers, LLC
290 Congress Street
Boston, MA 02210
1964 | | Retired; President and founder, Hanoverian Capital, LLC (SEC registered investment advisor firm), 2008-2016; Managing Director, DuPont Capital, 2006-2008; Managing Director, Morgan Stanley Investment Management, 2004-2006; Senior Vice President, Alliance Bernstein, 1990-2004 | | Former Director, NAPE (National Alliance for Partnerships in Equity) Education Foundation, October 2016-October 2020; Advisory Board, Jennersville YMCA, June 2022-June 2023 |
Interested trustee affiliated with Investment Manager**
Name,
address,
year of birth | Position held with the Columbia Funds and length of service | Principal occupation(s) during the
past five years and other relevant
professional experience | Number of
Funds in the
Columbia Funds
Complex* overseen | Other directorships
held by Trustee
during the past
five years and
other relevant Board experience |
Daniel J. Beckman
c/o Columbia Management
Investment Advisers, LLC
290 Congress Street
Boston, MA 02210
1962 | Trustee since November 2021 and President since June 2021 | President and Principal Executive Officer of the Columbia Funds, since June 2021; Vice President, Columbia Management Investment Advisers, LLC, since April 2015; formerly, Vice President – Head of North America Product, Columbia Management Investment Advisers, LLC, April 2015 – December 2023; President and Principal Executive Officer, Columbia Acorn/Wanger Funds, since July 2021 | | Director, Ameriprise Trust Company, since October 2016; Director, Columbia Management Investment Distributors, Inc., since November 2018; Board of Governors, Columbia Wanger Asset Management, LLC, since January 2022 |
| The term “Columbia Funds Complex” as used herein includes Columbia Seligman Premium Technology Growth Fund, Tri-Continental Corporation and each series of Columbia Funds Series Trust (CFST), Columbia Funds Series Trust I (CFST I), Columbia Funds Series Trust II (CFST II), Columbia ETF Trust I (CET I), Columbia ETF Trust II (CET II), Columbia Funds Variable Insurance Trust (CFVIT) and Columbia Funds Variable Series Trust II (CFVST II). Messrs. Batejan, Beckman, Gallagher, Hacker and Moffett and Mses. Blatz, Carlton, Carrig, Flynn, Paglia, and Yeager serve as directors of Columbia Seligman Premium Technology Growth Fund and Tri-Continental Corporation. |
| Interested person (as defined under the 1940 Act) by reason of being an officer, director, security holder and/or employee of the Investment Manager or Ameriprise Financial. |
48
Multi-Manager Directional Alternative Strategies Fund | Annual Report 2024
TRUSTEES AND OFFICERS (continued)(Unaudited) The Statement of Additional Information has additional information about the Fund’s Board members and is available, without charge, upon request by calling 800.345.6611, visiting columbiathreadneedleus.com/investor/ or contacting your financial intermediary.
The Board has appointed officers who are responsible for day-to-day business decisions based on policies it has established. The officers serve at the pleasure of the Board. The following table provides basic information about the Officers of the Fund as of the printing of this report, including principal occupations during the past five years, although their specific titles may have varied over the period. In addition to Mr. Beckman, who is President and Principal Executive Officer, the Fund’s other officers are:
Fund officers
Name,
address and
year of birth | Position and year
first appointed to
position for any Fund
in the Columbia
Funds Complex or a
predecessor thereof | Principal occupation(s) during past five years |
Michael G. Clarke
290 Congress Street
Boston, MA 02210
1969 | Chief Financial Officer and Principal Financial Officer (2009); Senior Vice President (2019); Treasurer and Chief Accounting Officer (Principal Accounting Officer) (2024) for CFST, CFST I, CFST II, CFVIT and CFVST II | Senior Vice President and North America Head of Operations & Investor Services, Columbia Management Investment Advisers, LLC, since June 2023 (previously Senior Vice President and Head of Global Operations, March 2022 – June 2023, Vice President, Head of North America Operations, and Co-Head of Global Operations, June 2019 - February 2022 and Vice President – Accounting and Tax, May 2010 - May 2019); senior officer of Columbia Funds and affiliated funds, since 2002. Director, Ameriprise Trust Company, since June 2023. |
Marybeth Pilat
290 Congress Street
Boston, MA 02210
1968 | Treasurer and Chief Accounting Officer (Principal Accounting Officer) and Principal Financial Officer (2020) for CET I and CET II; Assistant Treasurer, CFST, CFST I, CFST II, CFVIT and CFVST II | Vice President – Product Pricing and Administration, Columbia Management Investment Advisers, LLC, since May 2017. |
William F. Truscott
290 Congress Street
Boston, MA 02210
1960 | Senior Vice President (2001) | Formerly, Trustee/Director of Columbia Funds Complex or legacy funds, November 2001 - January 1, 2021; Chief Executive Officer, Global Asset Management, Ameriprise Financial, Inc., since September 2012; Chairman of the Board and President, Columbia Management Investment Advisers, LLC, since July 2004 and February 2012, respectively; Chairman of the Board and Chief Executive Officer, Columbia Management Investment Distributors, Inc., since November 2008 and February 2012, respectively; Chairman of the Board and Director, TAM UK International Holdings Limited, since July 2021; formerly Chairman of the Board and Director, Threadneedle Asset Management Holdings, Sàrl, March 2013 – December 2022 and December 2008 – December 2022, respectively; senior executive of various entities affiliated with Columbia Threadneedle Investments. |
Christopher O. Petersen
5228 Ameriprise Financial Center
Minneapolis, MN 55474
1970 | Senior Vice President and Assistant Secretary (2021) | Formerly, Trustee/Director of funds within the Columbia Funds Complex, July 1, 2020 - November 22, 2021; Senior Vice President and Assistant General Counsel, Ameriprise Financial, Inc., since September 2021 (previously Vice President and Lead Chief Counsel, January 2015 - September 2021); formerly, President and Principal Executive Officer of the Columbia Funds, 2015 - 2021; officer of Columbia Funds and affiliated funds, since 2007. |
Thomas P. McGuire
290 Congress Street
Boston, MA 02210
1972 | Senior Vice President and Chief Compliance Officer (2012) | Vice President – Asset Management Compliance, Ameriprise Financial, Inc., since May 2010; Chief Compliance Officer, Columbia Acorn/Wanger Funds, since December 2015; formerly, Chief Compliance Officer, Ameriprise Certificate Company, September 2010 – September 2020. |
Ryan C. Larrenaga
290 Congress Street
Boston, MA 02210
1970 | Senior Vice President (2017), Chief Legal Officer (2017), and Secretary (2015) | Vice President and Chief Counsel, Ameriprise Financial, Inc., since August 2018 (previously Vice President and Group Counsel, August 2011 - August 2018); Chief Legal Officer, Columbia Acorn/Wanger Funds, since September 2020; officer of Columbia Funds and affiliated funds, since 2005. |
Multi-Manager Directional Alternative Strategies Fund | Annual Report 2024
49
TRUSTEES AND OFFICERS (continued)(Unaudited)Fund officers (continued) Name, address and year of birth | Position and year first appointed to position for any Fund in the Columbia Funds Complex or a predecessor thereof | Principal occupation(s) during past five years |
Michael E. DeFao
290 Congress Street
Boston, MA 02210
1968 | Vice President (2011) and Assistant Secretary (2010) | Vice President and Chief Counsel, Ameriprise Financial, Inc., since May 2010; Vice President, Chief Legal Officer and Assistant Secretary, Columbia Management Investment Advisers, LLC, since October 2021 (previously Vice President and Assistant Secretary, May 2010 – September 2021). |
Lyn Kephart-Strong
5903 Ameriprise Financial Center
Minneapolis, MN 55474
1960 | | Vice President, Global Investment Operations Services, Columbia Management Investment Advisers, LLC, since 2010; President, Columbia Management Investment Services Corp., since October 2014; President, Ameriprise Trust Company, since January 2017. |
Liquidity Risk Management Program
(Unaudited)
Pursuant to Rule 22e-4 under the 1940 Act, the Fund has adopted a liquidity risk management program (Program). The Program’s principal objectives include assessing, managing and periodically reviewing the Fund’s liquidity risk. Liquidity risk is defined as the risk that the Fund could not meet redemption requests without significant dilution of remaining investors’ interests in the Fund.
The Board has appointed the Investment Manager as the program administrator for the Fund’s Program. The Investment Manager has delegated oversight of the Program to its Liquidity Risk Management Committee (the Committee). At a board meeting during the fiscal period, the Committee provided the Board with a report addressing the operations of the program and assessing its adequacy and effectiveness of implementation for the period January 1, 2023, through December 31, 2023, including:
•
the Fund had sufficient liquidity to both meet redemptions and operate effectively on behalf of shareholders;
•
there were no material changes to the Program during the period;
•
the implementation of the Program was effective to manage the Fund’s liquidity risk; and
•
the Program operated adequately during the period.
There can be no assurance that the Program will achieve its objectives in the future. Please refer to the Fund’s prospectus for more information regarding the Fund’s exposure to liquidity risk and other principal risks to which an investment in the Fund may be subject.
50
Multi-Manager Directional Alternative Strategies Fund | Annual Report 2024
Approval of Subadvisory Agreement
(Unaudited)
Columbia Management Investment Advisers, LLC (the Investment Manager, and together with its domestic and global affiliates, Columbia Threadneedle Investments), a wholly-owned subsidiary of Ameriprise Financial, Inc. (Ameriprise Financial), serves as the investment manager to Multi-Manager Directional Alternative Strategies Fund (the Fund). Under a management agreement (the Management Agreement), the Investment Manager provides investment advice and other services to the Fund and other funds distributed by Columbia Management Investment Distributors, Inc. (collectively, the Funds). In addition, under the subadvisory agreements between the Investment Manager and each of Allspring Global Investments, LLC (Allspring) and Boston Partners Global Investors, Inc. (Boston Partners), the subadvisers provide portfolio management and related services for the Fund. At their meeting on March 14, 2024, the Fund’s Board of Trustees (the Board), including the independent Board members (the Independent Trustees), approved an additional subadvisory agreement for the Fund, between the Investment Manager and Summit Partners (the Subadvisory Agreement), including the fees thereof.
The Independent Trustees noted the discussion relating to the renewal and approval of the advisory and subadvisory agreements for the Fund at the Contracts Committee and full Board meetings in June 2023 (the June Meeting) and, in that connection, the discussion by independent legal counsel to the Independent Trustees (Independent Legal Counsel) of the Board’s responsibilities pursuant to Sections 15(c) and 36(b) of the 1940 Act and the factors that should be considered in determining whether to approve or renew an investment management agreement. The Independent Trustees considered that they should apply these factors in considering the Subadvisory Agreement.
The Independent Trustees also considered that they should take into account the variety of written materials and oral presentations they received regarding the proposed Subadvisory Agreement at their Investment Review Committee meeting on March 13, 2024 (the IRC Meeting), as well as all of the information previously considered at the June Meeting regarding the proposed 15(c) renewal of the existing advisory and subadvisory agreements.
Following an analysis and discussion of the foregoing, and the factors identified below, the Board, including all of the Independent Trustees, approved the Subadvisory Agreement.
Nature, Extent and Quality of Services Proposed to be Provided by Summit Partners
The Independent Trustees considered their analysis of various reports and presentations they received at the IRC Meeting detailing the services to be performed by Summit Partners, as subadviser for the Fund, as well as the firm’s history, reputation, expertise, resources and relative capabilities, and the qualifications of its personnel. The Board considered the diligence and selection process undertaken by the Investment Manager to select Summit Partners, including the Investment Manager’s rationale for recommending Summit Partners, and the process for monitoring the Summit Partners’ ongoing performance of services for the Fund.
The Board observed that Summit Partners’ compliance program had been reviewed by the Fund’s Chief Compliance Officer and was determined by him to be reasonably designed to prevent violation of the federal securities laws by the Fund. The Board also observed that information had been presented regarding Summit Partners’ ability to carry out its responsibilities under the proposed Subadvisory Agreement. The Board also considered the information provided by management regarding the personnel, risk controls, philosophy, and investment processes of Summit Partners. The Board also noted the presentation by Summit Partners to the Board’s Investment Review Committee.
The Board also discussed the acceptability of the terms of the proposed Subadvisory Agreement. The Board considered that the proposed Subadvisory Agreement was generally similar in scope and form to subadvisory agreements applicable to other subadvised Funds, including those already in effect for the Fund.
Based on these and related factors (including investment performance as discussed below), the Board concluded, within the context of their overall conclusions, that the nature, extent and quality of the services to be provided to the Fund under the Subadvisory Agreement supported the approval of the Subadvisory Agreement.
Investment Performance
The Board observed Summit Partners’ relevant performance results versus industry benchmarks, versus the other subadvisers of the Fund and versus peers over various periods, noting competitive results versus peers and industry benchmarks over certain of the 1-, 3- and 5-year periods ended December 31, 2023.
Multi-Manager Directional Alternative Strategies Fund | Annual Report 2024
51
Approval of Subadvisory Agreement (continued)(Unaudited) Based on these and related factors, the Board concluded, within the context of their overall conclusions, that the performance of Summit Partners, in light of other considerations, supported the approval of the Subadvisory Agreement.
Comparative Fees, Costs of Services Provided and Profits Realized by Columbia Threadneedle and Its Affiliates from Their Relationships with the Fund and Summit Partners
The Board reviewed the proposed level of subadvisory fees under the proposed Subadvisory Agreement, noting that the proposed subadvisory fees payable to Summit Partners would be paid by the Investment Manager and would not impact the fees paid by the Fund. The Board observed that the proposed subadvisory fees for Summit Partners were within a reasonable range of subadvisory fees paid by the Investment Manager to the subadvisers of other Funds with similar strategies. The Trustees observed that management fees, which were not proposed to change, remained within the range of other peers and that the Fund’s expense ratio also remained within the range of other peers. Additionally, the Board considered the expected minor increase in total profitability of the Investment Manager and its affiliates in connection with the hiring of Summit Partners. Because the Subadvisory Agreement was negotiated at arms length by the Investment Manager, which is responsible for payments to Summit Partners thereunder, the Board did not consider the profitability to Summit Partners from its relationship with the Fund.
Based on these and related factors, the Board concluded, within the context of their overall conclusions, that the proposed levels of subadvisory fees, anticipated costs of services provided and the expected profitability to the Investment Manager and its affiliates from their relationships with the Fund also supported the approval of the Subadvisory Agreement.
Economies of Scale to be Realized
The Board also considered the economies of scale that may be realized by the Investment Manager and its affiliates as the Fund grows and took note of the extent to which shareholders might also benefit from such growth. The Board considered, in this regard, the expected increase in profitability to the Investment Manager as a result of the proposed engagement of Summit Partners. The Board took into account, in this regard, the significant oversight services provided by the Investment Manager to the Fund. The Board also observed that fees to be paid under the Subadvisory Agreement would not impact fees paid by the Fund (as subadvisory fees are paid by the Investment Manager and not the Fund). The Board observed that the Fund’s management agreement with the Investment Manager continues to provide for sharing of economies of scale as management fees decline as assets increase at pre-established breakpoints. The Independent Trustees also noted, for the Subadvisory Agreement, there were no breakpoints proposed for Summit Partners’ fees.
Conclusion
The Independent Trustees considered all information that they, their legal counsel or the Investment Manager believed reasonably necessary to evaluate and to approve the Subadvisory Agreement. In reaching its decision to approve the Subadvisory Agreement, no single factor was determinative. On March 14, 2024, the Board, including all of the Independent Trustees, determined that fees payable under the Subadvisory Agreement were fair and reasonable in light of the extent and quality of services provided and approved the Subadvisory Agreement.
52
Multi-Manager Directional Alternative Strategies Fund | Annual Report 2024
[THIS PAGE INTENTIONALLY LEFT BLANK]
[THIS PAGE INTENTIONALLY LEFT BLANK]
[THIS PAGE INTENTIONALLY LEFT BLANK]
Multi-Manager Directional Alternative Strategies Fund
P.O. Box 219104
Kansas City, MO 64121-9104
Please read and consider the investment objectives, risks, charges and expenses for any fund carefully before investing. For a prospectus and summary prospectus, which contains this and other important information about the Fund, go to
columbiathreadneedleus.com/investor/. The Fund is distributed by Columbia Management Investment Distributors, Inc., member FINRA, and managed by Columbia Management Investment Advisers, LLC.
Columbia Threadneedle Investments (Columbia Threadneedle) is the global brand name of the Columbia and Threadneedle group of companies. All rights reserved.
© 2024 Columbia Management Investment Advisers, LLC.
columbiathreadneedleus.com/investor/
Item 2. Code of Ethics.
The registrant has adopted a code of ethics (the “Code”) that applies to the registrant’s principal executive officer, principal financial officer, principal accounting officer or controller, or persons performing similar functions, regardless of whether these individuals are employed by the registrant or a third party. During the period covered by this report, there were not any amendments to a provision of the Code that relates to any element of the code of ethics definition enumerated in paragraph (b) of Item 2 of Form N-CSR. During the period covered by this report, there were no waivers, including any implicit waivers, from a provision of the Code that relates to one or more of the items set forth in paragraph (b) of Item 2 of Form N-CSR. A copy of the Code is attached hereto.
Item 3. Audit Committee Financial Expert.
The registrant’s Board of Trustees has determined that David M. Moffett, Brian J. Gallagher, J. Kevin Connaughton, Sandra L. Yeager, and Douglas A. Hacker, each of whom are members of the registrant’s Board of Trustees and Audit Committee, each qualify as an audit committee financial expert. Mr. Moffett, Mr. Gallagher, Mr. Connaughton, Ms. Yeager, and Mr. Hacker are each independent trustees, as defined in paragraph (a)(2) of this item’s instructions.
Item 4. Principal Accountant Fees and Services.
Fee information below is disclosed for the series of the relevant registrant whose reports to shareholders are included in this annual filing.
(a) Audit Fees. Aggregate Audit Fees billed by the principal accountant for professional services rendered during the fiscal years ended April 30, 2024 and April 30, 2023 are approximately as follows:
| |
2024 | 2023 |
$238,488 | $231,540 |
Audit Fees include amounts related to the audit of the registrant’s annual financial statements or services that are normally provided by the accountant in connection with statutory and regulatory filings or engagements for those fiscal years.
(b) Audit-Related Fees. Aggregate Audit-Related Fees billed to the registrant by the principal accountant for professional services rendered during the fiscal years ended April 30, 2024 and April 30, 2023 are approximately as follows:
Audit-Related Fees, if any, include amounts for assurance and related services by the principal accountant that are reasonably related to the performance of the audit of the registrant’s financial statements and are not reported in Audit Fees above.
During the fiscal years ended April 30, 2024 and April 30, 2023, there were no Audit-Related Fees billed by the registrant’s principal accountant to the registrant’s investment adviser (not including any sub-adviser whose role is primarily portfolio management and is subcontracted with or overseen by another investment adviser) and any entity controlling, controlled by, or under common control with the adviser that provides ongoing services to the registrant for an engagement that related directly to the operations and financial reporting of the registrant.
(c) Tax Fees. Aggregate Tax Fees billed by the principal accountant to the registrant for professional services rendered during the fiscal years ended April 30, 2024 and April 30, 2023 are approximately as follows:
| |
2024 | 2023 |
$77,100 | $78,100 |
Tax Fees include amounts for the review of annual tax returns, the review of required shareholder distribution calculations and typically include amounts for professional services by the principal accountant for tax compliance, tax advice and tax planning.
During the fiscal years ended April 30, 2024 and April 30, 2023, there were no Tax Fees billed by the registrant’s principal accountant to the registrant’s investment adviser (not including any sub-adviser whose role is primarily portfolio management and is subcontracted with or overseen by another investment adviser) and any entity controlling, controlled by, or under common control with the adviser that provides ongoing services to the registrant for an engagement that related directly to the operations and financial reporting of the registrant.
(d) All Other Fees. Aggregate All Other Fees billed by the principal accountant to the registrant for professional services rendered during the fiscal years ended April 30, 2024 and April 30, 2023 are approximately as follows:
All Other Fees, if any, include amounts for products and services provided by the principal accountant, other than the services reported in paragraphs (a) through (c) above.
Aggregate All Other Fees billed by the registrant’s principal accountant to the registrant’s investment adviser (not including any sub-adviser whose role is primarily portfolio management and is subcontracted with or overseen by another investment adviser) and any entity controlling, controlled by, or under common control with the adviser that provides ongoing services to the registrant for an engagement that related directly to the operations and financial reporting of the registrant during the fiscal years ended April 30, 2024 and April 30, 2023 are approximately as follows:
| |
2024 | 2023 |
$581,000 | $577,000 |
In fiscal years 2024 and 2023, All Other Fees primarily consists of fees billed for internal control examinations of the registrant’s transfer agent and investment adviser.
(e)(1) Audit Committee Pre-Approval Policies and Procedures
The registrant’s Audit Committee is required to pre-approve the engagement of the registrant’s independent auditors to provide audit and non-audit services to the registrant and non-audit services to its investment adviser (excluding any sub-adviser whose role is primarily portfolio management and is sub-contracted or overseen by another investment adviser (the “Adviser”) or any entity controlling, controlled by or under common control with the Adviser that provides ongoing services to the Fund (a “Control Affiliate”) if the engagement relates directly to the operations and financial reporting of the registrant.
The Audit Committee has adopted a Policy for Engagement of Independent Auditors for Audit and Non-Audit Services (the “Policy”). The Policy sets forth the understanding of the Audit Committee regarding the engagement of the registrant’s independent accountants to provide (i) audit and permissible audit-related, tax and other services to the registrant (“Fund Services”); (ii) non-audit services to the registrant’s Adviser and any Control Affiliates, that relates directly to the operations and financial reporting of a Fund (“Fund-related Adviser Services”); and (iii) certain other audit and non-audit services to the registrant’s Adviser and its Control Affiliates. A service will require specific pre-approval by the Audit Committee if it is to be provided by the Fund’s independent auditor; provided, however, that pre-approval of non-audit services to the Fund, the Adviser or Control Affiliates may be waived if certain de minimis requirements set forth in the SEC’s rules are met.
Under the Policy, the Audit Committee may delegate pre-approval authority to any pre-designated member or members who are independent board members. The member(s) to whom such authority is delegated must report, for informational purposes only, any pre-approval decisions to the Audit Committee at its next regular meeting. The Audit Committee's responsibilities with respect to the pre-approval of services performed by the independent auditor may not be delegated to management.
On an annual basis, at a regularly scheduled Audit Committee meeting, the Fund’s Treasurer or other Fund officer shall submit to the Audit Committee a schedule of the types of Fund Services and Fund-related Adviser Services that are subject to specific pre-approval. This schedule will provide a description of each type of service that is subject to specific pre-approval, along with total projected fees for each service. The pre-approval will generally cover a one-year period. The Audit Committee will review and approve the types of services and the projected fees for the next one-year period and may add to, or subtract from, the list of pre-approved services from time to time, based on subsequent determinations. This specific approval acknowledges that the Audit Committee is in agreement with the specific types of services that the independent auditor will be permitted to perform and the projected fees for each service.
The Fund’s Treasurer or other Fund officer shall report to the Audit Committee at each of its regular meetings regarding all Fund Services or Fund-related Adviser Services provided since the last such report was rendered, including a description of the services, by category, with forecasted fees for the annual reporting period, proposed changes requiring specific pre-approval and a description of services provided by the independent auditor, by category, with actual fees during the current reporting period.
*****
(e)(2) None, or 0%, of the Audit-Related Fees, Tax Fees and All Other Fees paid by the Fund or affiliated entities relating directly to the operations and financial reporting of the Registrant disclosed above were approved by the audit committee pursuant to paragraphs (c)(7)(i)(C) of Rule 2-01 of Regulation S-X (which permits audit committee approval after the start of the engagement with respect to services other than audit, review or attest services, if certain conditions are satisfied).
(f) Not applicable.
(g) The aggregate non-audit fees billed by the registrant’s accountant for services rendered to the registrant, and rendered to the registrant’s investment adviser (not including any sub-adviser whose role is primarily portfolio management and is subcontracted with or overseen by another investment adviser), and any entity controlling, controlled by, or under common control with the adviser that provides ongoing services to the registrant for the fiscal years ended April 30, 2024 and April 30, 2023 are approximately as follows:
| |
2024 | 2023 |
$658,100 | $680,100 |
(h) The registrant’s Audit Committee of the Board of Directors has considered whether the provision of non-audit services that were rendered to the registrant’s adviser (not including any sub-adviser whose role is primarily portfolio management and is subcontracted with or overseen by another investment adviser), and any entity controlling, controlled by, or under common control with the investment adviser that provides ongoing services to the registrant that were not pre-approved pursuant to paragraph (c)(7)(ii) of Rule 2-01 of Regulation S-X, is compatible with maintaining the principal accountant’s independence.
(i) Not applicable.
(j) Not applicable.
Item 5. Audit Committee of Listed Registrants.
Not applicable.
Item 6. Investments
(a) | The registrant’s “Schedule I – Investments in securities of unaffiliated issuers” (as set forth in 17 CFR 210.12-12) is included in Item 1 of this Form N-CSR. |
Item 7. Disclosure of Proxy Voting Policies and Procedures for Closed-End Management Investment Companies.
Not applicable.
Item 8. Portfolio Managers of Closed-End Management Investment Companies.
Not applicable.
Item 9. Purchases of Equity Securities by Closed-End Management Investment Company and Affiliated Purchasers.
Not applicable.
Item 10. Submission of Matters to a Vote of Security Holders.
There were no material changes to the procedures by which shareholders may recommend nominees to the registrant's board of directors.
Item 11. Controls and Procedures.
(a) | The registrant’s principal executive officer and principal financial officer, based on their evaluation of the registrant’s disclosure controls and procedures as of a date within 90 days of the filing of this report, have concluded that such controls and procedures are adequately designed to ensure that information required to be disclosed by the registrant in Form N-CSR is accumulated and communicated to the registrant’s management, including the principal executive officer and principal financial officer, or persons performing similar functions, as appropriate to allow timely decisions regarding required disclosure. |
(b) | There was no change in the registrant's internal control over financial reporting that occurred during the period covered by this report that has materially affected, or is reasonably likely to materially affect, the registrant's internal control over financial reporting. |
Item 12. Disclosure of Securities Lending Activities for Closed-End Management Investment Companies
Not applicable.
Item 13. Exhibits.
(a)(1) Code of ethics required to be disclosed under Item 2 of Form N-CSR attached hereto as Exhibit 99.CODE ETH.
(a)(2) Certifications pursuant to Rule 30a-2(a) under the Investment Company Act of 1940 (17 CFR 270.30a-2(a)) attached hereto as Exhibit 99.CERT.
(b) Certification pursuant to Rule 30a-2(b) under the Investment Company Act of 1940 (17 CFR 270.30a-2(b)) attached hereto as Exhibit 99.906CERT.
SIGNATURES
Pursuant to the requirements of the Securities Exchange Act of 1934 and the Investment Company Act of 1940, the registrant has duly caused this report to be signed on its behalf by the undersigned, thereunto duly authorized.
(registrant) | Columbia Funds Series Trust I |
| |
By (Signature and Title) | /s/ Daniel J. Beckman |
| Daniel J. Beckman, President and Principal Executive Officer |
| |
Date | June 20, 2024 |
| |
| |
Pursuant to the requirements of the Securities Exchange Act of 1934 and the Investment Company Act of 1940, this report has been signed below by the following persons on behalf of the registrant and in the capacities and on the dates indicated.
By (Signature and Title) | /s/ Daniel J. Beckman |
| Daniel J. Beckman, President and Principal Executive Officer |
| |
Date | June 20, 2024 |
By (Signature and Title) | /s/ Michael G. Clarke |
| Michael G. Clarke, Chief Financial Officer, Treasurer, |
| Chief Accounting Officer, Principal Financial Officer and Senior Vice President |
| |
Date | June 20, 2024 |