UNITED STATES
SECURITIES AND EXCHANGE COMMISSION
Washington, D.C. 20549
FORM N-CSR
CERTIFIED SHAREHOLDER REPORT OF REGISTERED MANAGEMENT INVESTMENT COMPANIES
Investment Company Act file number 811-04367
Columbia Funds Series Trust I
(Exact name of registrant as specified in charter)
290 Congress Street
Boston, MA 02210
(Address of principal executive offices) (Zip code)
Daniel J. Beckman
c/o Columbia Management Investment Advisers, LLC
290 Congress Street
Boston, MA 02210
Ryan C. Larrenaga, Esq.
c/o Columbia Management Investment Advisers, LLC
290 Congress Street
Boston, MA 02210
(Name and address of agent for service)
Registrant's telephone number, including area code: (800) 345-6611
Date of fiscal year end: October 31
Date of reporting period: October 31, 2023
Form N-CSR is to be used by management investment companies to file reports with the Commission not later than 10 days after the transmission to stockholders of any report that is required to be transmitted to stockholders under Rule 30e-1 under the Investment Company Act of 1940 (17 CFR 270.30e-1). The Commission may use the information provided on Form N-CSR in its regulatory, disclosure review, inspection, and policymaking roles.
A registrant is required to disclose the information specified by Form N-CSR, and the Commission will make this information public. A registrant is not required to respond to the collection of information contained in Form N-CSR unless the Form displays a currently valid Office of Management and Budget ("OMB") control number. Please direct comments concerning the accuracy of the information collection burden estimate and any suggestions for reducing the burden to Secretary, Securities and Exchange Commission, 100 F Street, NE, Washington, DC 20549. The OMB has reviewed this collection of information under the clearance requirements of 44 U.S.C. § 3507.
Item 1. Reports to Stockholders.

Annual Report
October 31, 2023
Columbia Strategic California Municipal Income Fund
Not FDIC or NCUA Insured • No Financial Institution Guarantee • May Lose Value
If you elect to receive the shareholder report for Columbia Strategic California Municipal Income Fund (the Fund) in paper, mailed to you, the Fund mails one shareholder report to each shareholder address, unless such shareholder elects to receive shareholder reports from the Fund electronically via e-mail or by having a paper notice mailed to you (Postcard Notice) that your Fund’s shareholder report is available at the Columbia funds’ website (columbiathreadneedleus.com/investor/). If you would like more than one report in paper to be mailed to you, or would like to elect to receive reports via e-mail or access them through Postcard Notice, please call shareholder services at 800.345.6611 and additional reports will be sent to you.
Proxy voting policies and procedures
The policy of the Board of Trustees is to vote the proxies of the companies in which the Fund holds investments consistent with the procedures as stated in the Statement of Additional Information (SAI). You may obtain a copy of the SAI without charge by calling 800.345.6611; contacting your financial intermediary; visiting columbiathreadneedleus.com/investor/; or searching the website of the Securities and Exchange Commission (SEC) at sec.gov. Information regarding how the Fund voted proxies relating to portfolio securities is filed with the SEC by August 31st for the most recent 12-month period ending June 30th of that year, and is available without charge by visiting columbiathreadneedleus.com/investor/, or searching the website of the SEC at sec.gov.
Quarterly schedule of investments
The Fund files a complete schedule of portfolio holdings with the SEC for the first and third quarters of each fiscal year on Form N-PORT. The Fund’s Form N-PORT filings are available on the SEC’s website at sec.gov. The Fund’s complete schedule of portfolio holdings, as filed on Form N-PORT, is available on columbiathreadneedleus.com/investor/ or can also be obtained without charge, upon request, by calling 800.345.6611.
Additional Fund information
For more information about the Fund, please visit columbiathreadneedleus.com/investor/ or call 800.345.6611. Customer Service Representatives are available to answer your questions Monday through Friday from 8 a.m. to 7 p.m. Eastern time.
Fund investment manager
Columbia Management Investment Advisers, LLC (the Investment Manager)
290 Congress Street
Boston, MA 02210
Fund distributor
Columbia Management Investment Distributors, Inc.
290 Congress Street
Boston, MA 02210
Fund transfer agent
Columbia Management Investment Services Corp.
P.O. Box 219104
Kansas City, MO 64121-9104
Columbia Strategic California Municipal Income Fund | Annual Report 2023
Fund at a Glance
(Unaudited)
Investment objective
The Fund seeks total return, with a focus on income exempt from federal income tax and California individual income tax and capital appreciation.
Portfolio management
Douglas White, CFA
Lead Portfolio Manager
Managed Fund since 2018
Catherine Stienstra
Portfolio Manager
Managed Fund since 2010
| Average annual total returns (%) (for the period ended October 31, 2023) |
| | | Inception | 1 Year | 5 Years | 10 Years |
| Class A | Excluding sales charges | 06/16/86 | 0.89 | -0.79 | 1.54 |
| | Including sales charges | | -2.13 | -1.39 | 1.24 |
| Advisor Class | 03/19/13 | 1.09 | -0.55 | 1.78 |
| Class C | Excluding sales charges | 08/01/97 | 0.38 | -1.26 | 1.07 |
| | Including sales charges | | -0.59 | -1.26 | 1.07 |
| Institutional Class | 09/19/05 | 1.09 | -0.56 | 1.77 |
| Institutional 2 Class* | 03/01/16 | 1.09 | -0.57 | 1.73 |
| Institutional 3 Class* | 03/01/17 | 1.16 | -0.50 | 1.74 |
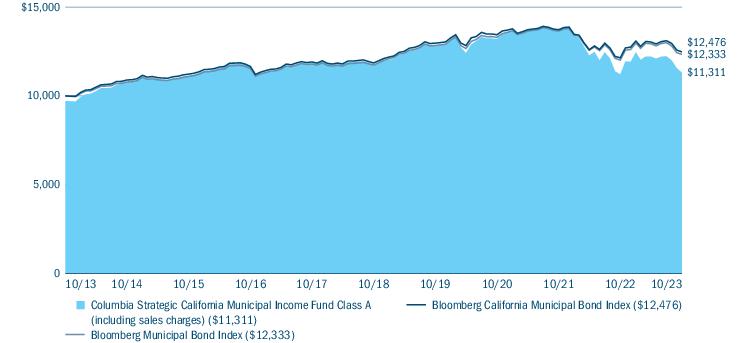
| Bloomberg California Municipal Bond Index | | 2.72 | 1.03 | 2.24 |
| Bloomberg Municipal Bond Index | | 2.64 | 1.00 | 2.12 |
Returns for Class A shares are shown with and without the maximum initial sales charge of 3.00%. Returns for Class C shares are shown with and without the 1.00% contingent deferred sales charge for the first year only. The Fund’s other share classes are not subject to sales charges and have limited eligibility. Please see the Fund’s prospectus for details. Performance for different share classes will vary based on differences in sales charges and fees associated with each share class. All results shown assume reinvestment of distributions during the period. Returns do not reflect the deduction of taxes that a shareholder may pay on Fund distributions or on the redemption of Fund shares. Performance results reflect the effect of any fee waivers or reimbursements of Fund expenses by Columbia Management Investment Advisers, LLC and/or any of its affiliates. Absent these fee waivers or expense reimbursement arrangements, performance results would have been lower.
The performance information shown represents past performance and is not a guarantee of future results. The investment return and principal value of your investment will fluctuate so that your shares, when redeemed, may be worth more or less than their original cost. Current performance may be lower or higher than the performance information shown. You may obtain performance information current to the most recent month-end by contacting your financial intermediary, visiting columbiathreadneedleus.com/investor/ or calling 800.345.6611.
| * | The returns shown for periods prior to the share class inception date (including returns for the Life of the Fund, if shown, which are since Fund inception) include the returns of the Fund’s oldest share class. These returns are adjusted to reflect any higher class-related operating expenses of the newer share classes, as applicable. Please visit columbiathreadneedleus.com/investor/investment-products/mutual-funds/appended-performance for more information. |
The Bloomberg California Municipal Bond Index is a subset of the Bloomberg Municipal Bond Index consisting solely of bonds issued by obligors located in the state of California.
The Bloomberg Municipal Bond Index is an unmanaged index considered representative of the broad market for investment-grade, tax-exempt bonds with a maturity of at least one year.
Indices are not available for investment, are not professionally managed and do not reflect sales charges, fees brokerage commissions, taxes or other expenses of investing. Securities in the Fund may not match those in an index.
Columbia Strategic California Municipal Income Fund | Annual Report 2023
| 3 |
Fund at a Glance (continued)
(Unaudited)
Performance of a hypothetical $10,000 investment (October 31, 2013 — October 31, 2023)
The chart above shows the change in value of a hypothetical $10,000 investment in Class A shares of Columbia Strategic California Municipal Income Fund during the stated time period, and does not reflect the deduction of taxes that a shareholder may pay on Fund distributions or on the redemption of Fund shares.
| Quality breakdown (%) (at October 31, 2023) |
| AAA rating | 0.5 |
| AA rating | 27.7 |
| A rating | 24.5 |
| BBB rating | 18.4 |
| BB rating | 2.5 |
| Not rated | 26.4 |
| Total | 100.0 |
Percentages indicated are based upon total fixed income investments.
Bond ratings apply to the underlying holdings of the Fund and not the Fund itself and are divided into categories ranging from highest to lowest credit quality, determined by using the middle rating of Moody’s, S&P and Fitch, after dropping the highest and lowest available ratings. When ratings are available from only two rating agencies, the lower rating is used. When a rating is available from only one rating agency, that rating is used. If a security is not rated but has a rating by Kroll and/or DBRS, the same methodology is applied to those bonds that would otherwise be not rated. When a bond is not rated by any rating agency, it is designated as “Not rated.” Credit quality ratings assigned by a rating agency are subjective opinions, not statements of fact, and are subject to change, including daily. The ratings assigned by credit rating agencies are but one of the considerations that the Investment Manager and/or Fund’s subadviser incorporates into its credit analysis process, along with such other issuer-specific factors as cash flows, capital structure and leverage ratios, ability to de-leverage (repay) through free cash flow, quality of management, market positioning and access to capital, as well as such security-specific factors as the terms of the security (e.g., interest rate and time to maturity) and the amount and type of any collateral.
| 4 | Columbia Strategic California Municipal Income Fund | Annual Report 2023 |
Manager Discussion of Fund Performance
(Unaudited)
For the 12-month period that ended October 31, 2023, Class A shares of Columbia Strategic California Municipal Income Fund returned 0.89% excluding sales charges. Institutional Class shares of the Fund returned 1.09%. The Fund’s benchmark, the Bloomberg California Municipal Bond Index, returned 2.72%. The Bloomberg Municipal Bond Index, which is national in scope, returned 2.64%.
Market overview
Municipal bonds delivered positive performance in the early part of the 12-month period, closing out a tumultuous 2022 and starting 2023 with a strong rally that was driven by high hopes for an end to the aggressive interest-rate hiking campaign by the U.S. Federal Reserve (Fed). Unfortunately, sentiment quickly unwound in February, as the market reconsidered the persistence of inflation and a consistently strong labor market. A more hawkish Fed led to a sell-off in rates, sending the 10-Year Treasury yield nearly 15 basis points (bps) higher from where it started in 2023. (A basis point is 1/100 of one percent.) In March, an unforeseen banking crisis unfolded, partially driven by higher interest rates. The weakness in the banking sector indicated the potential for additional downside risk to economic growth. In its late-March 2023 meeting, the Fed pushed through another 25 bps hike, but moderated its stance, signaling that we were closer to a pause, despite the data.
Treasury and municipal interest rates rose during the second quarter of 2023, as the regional banking crisis settled down, and the focus on the Fed’s tightening policy reignited. For the first time since it started hiking in March 2022, the Fed did not raise rates at its June meeting. Fed Chairman Powell took a hawkish stance and communicated the need to continue tightening and the possibility of rates remaining higher for longer. The Treasury and municipal markets experienced significant sell-offs in the third quarter of 2023, with the 10-year Treasury yield rising and municipal yields following a similar but more pronounced path. Treasury and municipal yields reached multi-year highs. Inflation remained stubbornly elevated, despite the Fed’s aggressive rate-hiking cycle. The Fed hiked rates 25 bps in July 2023 and indicated there may be one additional hike by year end. Municipal market yields increased in the final month of the period, the fourth consecutive month of rising rates. Nearly every segment of the market — credit quality, maturity, sector and state — delivered negative performance.
Investor aversion to interest-rate sensitive fixed income saw outflows from most fixed-income segments in favor of attractive rates on cash and cash-like instruments. Flows into money market funds and CDs, and out of most actively managed fixed-income mutual funds, particularly those on the long end of the curve, were a sustained theme over the 12-month period. That said, the much higher yields municipal bonds offer now versus one year ago, or even just a few months ago, make municipals a much more attractive investment option, particularly as we believe we are at or near the end of the Fed’s interest rate hiking cycle. Fundamentals across most sectors remained healthy, and defaults were low by historical standards. A small number of sectors, such as hospitals and continuing care retirement communities saw some weakening in their fundamentals. In addition, while U.S. states are sensitive to a possible economic slowdown or a capital market sell-off, many appeared relatively well positioned due to ongoing strengths in the economy and labor market along with high cash cushions, budget reserves, support from federal aid and relatively strong tax collections. Also, many states have managed recent budget surpluses conservatively in anticipation of a potential economic slowdown. However, a number of states, such as California and New York, have forecasted budget deficits in the coming years, and the municipal market may face additional pressures if the economy slows, and unemployment rises.
California’s economy performed relatively well, despite headwinds from inflation and rising rates. State GDP is expected to grow at a comparable level to the national average and, despite the unemployment rate of 4.8% trending above the 3.9% national rate, the state’s employment has surpassed pre-pandemic levels. The strong employment levels have been driven by the technology and health care industries. However, California is facing growing economic headwinds with a persistently high cost of housing and registering the first year of population decline, albeit very modestly, following decades of population growth. Fiscally, California remained in an overall sound position, but headwinds are increasing. The state’s highly progressive income tax structure resulted in record level tax collections through 2022. However, as equity and fixed-income market valuations have deteriorated, the state’s tax revenue performance has also deteriorated. Positively, California has learned from its experience during the 2008-09 Great Recession and has created budget guardrails to improve state budget stability through the full economic cycle. Some notable attributes that differentiate California’s fiscal outlook today from a decade ago include prudent setting aside of record level tax revenue collections towards budget and supplemental pension
Columbia Strategic California Municipal Income Fund | Annual Report 2023
| 5 |
Manager Discussion of Fund Performance (continued)
(Unaudited)
contributions that have the effect of increasing the rate of amortization of unfunded pension liabilities. Voters have also enacted various new budget laws that limit the amount of tax revenue outperformance the state is able to spend, in addition to creating budget laws that automatically funnel outperformance of capital gains taxes into multiple different budget reserves.
The Fund’s notable detractors during the period
| • | The primary detractor from the Fund’s performance during the period was a position in the bonds of the Puerto Rico Electric Power Authority. The utility company entered bankruptcy in July 2017 with just over $8 billion in outstanding debt. In late June 2023, the bankruptcy court issued a surprise ruling that bondholders can claim just a percentage of the outstanding debt’s value that was much lower than expected. Bondholders have begun to work on an appeal. |
| • | Security selection in tobacco bonds, and bonds rated A and BBB also detracted from the Fund’s results. |
| • | Overweighted allocations relative to the benchmark in municipal bonds with maturities of 30 years and longer and in airport bonds further weighed on the Fund’s relative performance. |
The Fund’s notable contributors during the period
| • | The Fund’s overweighted positions in lower quality bonds, specifically in non-rated and BBB rated municipal bonds, were key contributors to Fund performance versus its benchmark. |
| • | Security selection in the special tax, charter school and hospital sectors, along with selections in municipal bonds with maturities of 22-25 years and in AAA rated bonds also benefited Fund performance during the period. |
Derivatives usage
The Fund employed U.S. Treasury futures at various times during the period to manage duration. The impact on results was modestly negative.
Fixed-income securities present issuer default risk. The Fund invests substantially in municipal securities and will be affected by tax, legislative, regulatory, demographic or political changes, as well as changes impacting a state’s financial, economic or other conditions. A relatively small number of tax-exempt issuers may necessitate the Fund investing more heavily in a single issuer and, therefore, be more exposed to the risk of loss than a fund that invests more broadly. The value of the Fund’s portfolio may be more volatile than a more geographically diversified fund. Prepayment and extension risk exists because the timing of payments on a loan, bond or other investment may accelerate when interest rates fall or decelerate when interest rates rise which may reduce investment opportunities and potential returns. A rise in interest rates may result in a price decline of fixed-income instruments held by the Fund, negatively impacting its performance and NAV. Falling rates may result in the Fund investing in lower yielding debt instruments, lowering the Fund’s income and yield. These risks may be heightened for longer maturity and duration securities. Non-investment-grade (high-yield or junk) securities present greater price volatility and more risk to principal and income than higher rated securities. Market risk may affect a single issuer, sector of the economy, industry or the market as a whole. Federal and state tax rules apply to capital gain distributions and any gains or losses on sales. Income may be subject to state or local taxes. Liquidity risk is associated with the difficulty of selling underlying investments at a desirable time or price. Investing in derivatives is a specialized activity that involves special risks, which may result in significant losses. See the Fund’s prospectus for more information on these and other risks.
The views expressed in this report reflect the current views of the respective parties who have contributed to this report. These views are not guarantees of future performance and involve certain risks, uncertainties and assumptions that are difficult to predict, so actual outcomes and results may differ significantly from the views expressed. These views are subject to change at any time based upon economic, market or other conditions and the respective parties disclaim any responsibility to update such views. These views may not be relied on as investment advice and, because investment decisions for a Columbia fund are based on numerous factors, may not be relied on as an indication of trading intent on behalf of any particular Columbia fund. References to specific securities should not be construed as a recommendation or investment advice.
| 6 | Columbia Strategic California Municipal Income Fund | Annual Report 2023 |
Understanding Your Fund’s Expenses
(Unaudited)
As an investor, you incur two types of costs. There are shareholder transaction costs, which generally include sales charges on purchases and may include redemption fees. There are also ongoing fund costs, which generally include management fees, distribution and/or service fees, and other fund expenses. The following information is intended to help you understand your ongoing costs (in dollars) of investing in the Fund and to help you compare these costs with the ongoing costs of investing in other mutual funds.
Analyzing your Fund’s expenses
To illustrate these ongoing costs, we have provided examples and calculated the expenses paid by investors in each share class of the Fund during the period. The actual and hypothetical information in the table is based on an initial investment of $1,000 at the beginning of the period indicated and held for the entire period. Expense information is calculated two ways and each method provides you with different information. The amount listed in the “Actual” column is calculated using the Fund’s actual operating expenses and total return for the period. You may use the Actual information, together with the amount invested, to estimate the expenses that you paid over the period. Simply divide your account value by $1,000 (for example, an $8,600 account value divided by $1,000 = 8.6), then multiply the results by the expenses paid during the period under the “Actual” column. The amount listed in the “Hypothetical” column assumes a 5% annual rate of return before expenses (which is not the Fund’s actual return) and then applies the Fund’s actual expense ratio for the period to the hypothetical return. You should not use the hypothetical account values and expenses to estimate either your actual account balance at the end of the period or the expenses you paid during the period. See “Compare with other funds” below for details on how to use the hypothetical data.
Compare with other funds
Since all mutual funds are required to include the same hypothetical calculations about expenses in shareholder reports, you can use this information to compare the ongoing cost of investing in the Fund with other funds. To do so, compare the hypothetical example with the 5% hypothetical examples that appear in the shareholder reports of other funds. As you compare hypothetical examples of other funds, it is important to note that hypothetical examples are meant to highlight the ongoing costs of investing in a fund only and do not reflect any transaction costs, such as sales charges, or redemption or exchange fees. Therefore, the hypothetical calculations are useful in comparing ongoing costs only, and will not help you determine the relative total costs of owning different funds. If transaction costs were included in these calculations, your costs would be higher.
| May 1, 2023 — October 31, 2023 |
| | Account value at the
beginning of the
period ($) | Account value at the
end of the
period ($) | Expenses paid during
the period ($) | Fund’s annualized
expense ratio (%) |
| | Actual | Hypothetical | Actual | Hypothetical | Actual | Hypothetical | Actual |
| Class A | 1,000.00 | 1,000.00 | 926.10 | 1,021.76 | 3.58 | 3.76 | 0.73 |
| Advisor Class | 1,000.00 | 1,000.00 | 927.10 | 1,022.78 | 2.60 | 2.73 | 0.53 |
| Class C | 1,000.00 | 1,000.00 | 923.80 | 1,019.21 | 6.03 | 6.33 | 1.23 |
| Institutional Class | 1,000.00 | 1,000.00 | 927.10 | 1,022.78 | 2.60 | 2.73 | 0.53 |
| Institutional 2 Class | 1,000.00 | 1,000.00 | 927.20 | 1,022.78 | 2.60 | 2.73 | 0.53 |
| Institutional 3 Class | 1,000.00 | 1,000.00 | 927.40 | 1,023.03 | 2.36 | 2.47 | 0.48 |
Expenses paid during the period are equal to the annualized expense ratio for each class as indicated above, multiplied by the average account value over the period and then multiplied by the number of days in the Fund’s most recent fiscal half year and divided by 365.
Expenses do not include fees and expenses incurred indirectly by the Fund from its investment in underlying funds, including affiliated and non-affiliated pooled investment vehicles, such as mutual funds and exchange-traded funds.
Had Columbia Management Investment Advisers, LLC and/or certain of its affiliates not waived/reimbursed certain fees and expenses, account value at the end of the period would have been reduced.
Columbia Strategic California Municipal Income Fund | Annual Report 2023
| 7 |
Portfolio of Investments
October 31, 2023
(Percentages represent value of investments compared to net assets)
Investments in securities
| Floating Rate Notes 0.5% |
| Issue Description | Yield | | Principal
Amount ($) | Value ($) |
| Variable Rate Demand Notes 0.5% |
| City of Murray(a),(b) |
| Revenue Bonds |
| IHC Health Services, Inc. |
| Series 2005A (JPMorgan Chase Bank) |
| 05/15/2037 | 3.870% | | 600,000 | 600,000 |
| New York City Water & Sewer System(a),(b) |
| Revenue Bonds |
| 2nd General Resolution |
| Series 2013 (JPMorgan Chase Bank) |
| 06/15/2050 | 3.950% | | 1,100,000 | 1,100,000 |
| Total | 1,700,000 |
Total Floating Rate Notes
(Cost $1,700,000) | 1,700,000 |
|
| Municipal Bonds 98.2% |
| Issue Description | Coupon
Rate | | Principal
Amount ($) | Value ($) |
| Airport 4.2% |
| City of Los Angeles Department of Airports(c) |
| Refunding Revenue Bonds |
| Green Bonds |
| Subordinated Series 2023 |
| 05/15/2037 | 5.000% | | 1,630,000 | 1,631,637 |
| Revenue Bonds |
| Los Angeles International Airport |
| Subordinated Series 2017 |
| 05/15/2041 | 5.000% | | 1,500,000 | 1,456,145 |
| San Diego County Regional Airport Authority(c) |
| Revenue Bonds |
| Private Activity |
| Series 2023 |
| 07/01/2048 | 5.000% | | 2,500,000 | 2,397,264 |
| San Francisco City & County Airport Commission - San Francisco International Airport(c) |
| Refunding Revenue Bonds |
| SFO Fuel Co., LLC |
| Series 2019 |
| 01/01/2047 | 5.000% | | 1,000,000 | 959,364 |
| Revenue Bonds |
| San Francisco International Airport |
| Series 2016 |
| 05/01/2041 | 5.000% | | 1,305,000 | 1,265,472 |
| Unrefunded Revenue Bonds |
| Series 2014A |
| 05/01/2044 | 5.000% | | 3,000,000 | 2,870,236 |
| Municipal Bonds (continued) |
| Issue Description | Coupon
Rate | | Principal
Amount ($) | Value ($) |
| San Francisco City & County Airport Commission-San Francisco International Airport(c),(d) |
| Refunding Revenue Bonds |
| Second Series 2023C |
| 05/01/2048 | 5.750% | | 3,000,000 | 3,117,458 |
| Total | 13,697,576 |
| Charter Schools 8.9% |
| California Infrastructure & Economic Development Bank |
| Revenue Bonds |
| Equitable School Revolving Fund |
| Series 2022 |
| 11/01/2057 | 5.000% | | 3,000,000 | 2,727,130 |
| California Infrastructure & Economic Development Bank(e) |
| Revenue Bonds |
| WFCS Portfolio Project |
| Series 2021 |
| 01/01/2056 | 5.000% | | 1,300,000 | 916,585 |
| Wonderful Foundations Charter School Portfolio Projects |
| Series 2020 |
| 01/01/2055 | 5.000% | | 2,200,000 | 1,558,367 |
| California Infrastructure & Economic Development Bank(e),(f) |
| Revenue Bonds |
| WFCS Portfolio Project |
| Subordinated Series 2021 |
| 01/01/2061 | 0.000% | | 19,500,000 | 832,094 |
| California Public Finance Authority |
| Revenue Bonds |
| Laverne Elementary Prep Academy Project |
| Series 2019 |
| 06/15/2039 | 5.000% | | 870,000 | 758,548 |
| 06/15/2049 | 5.000% | | 1,400,000 | 1,135,109 |
| California School Finance Authority(e) |
| Refunding Revenue Bonds |
| Classical Academies Oceanside Project |
| Series 2022 |
| 10/01/2061 | 5.000% | | 3,500,000 | 2,950,629 |
| Ivy Academia Project |
| Series 2021A |
| 06/01/2061 | 4.000% | | 1,000,000 | 597,612 |
| Revenue Bonds |
| Alliance College-Ready Public Schools |
| Series 2015 |
| 07/01/2035 | 5.000% | | 3,010,000 | 2,977,297 |
| 07/01/2045 | 5.000% | | 1,705,000 | 1,525,151 |
| Aspire Public Schools |
| Series 2022 |
| 08/01/2061 | 5.000% | | 4,000,000 | 3,456,665 |
The accompanying Notes to Financial Statements are an integral part of this statement.
| 8 | Columbia Strategic California Municipal Income Fund | Annual Report 2023 |
Portfolio of Investments (continued)
October 31, 2023
| Municipal Bonds (continued) |
| Issue Description | Coupon
Rate | | Principal
Amount ($) | Value ($) |
| Girls Athletic Leadership School |
| Series 2021 |
| 06/01/2051 | 4.000% | | 1,000,000 | 645,262 |
| 06/01/2061 | 4.000% | | 2,890,000 | 1,749,670 |
| Green Dot Public School Project |
| Series 2015A |
| 08/01/2035 | 5.000% | | 1,510,000 | 1,508,372 |
| Series 2018 |
| 08/01/2048 | 5.000% | | 1,750,000 | 1,535,909 |
| Hawking Steam Charter School Project |
| Series 2022 |
| 07/01/2062 | 5.500% | | 1,775,000 | 1,579,218 |
| KIPP Los Angeles Projects |
| Series 2014A |
| 07/01/2044 | 5.125% | | 1,000,000 | 950,410 |
| Series 2015A |
| 07/01/2045 | 5.000% | | 1,000,000 | 929,231 |
| Santa Clarita Valley International School Project |
| Series 2021 |
| 06/01/2061 | 4.000% | | 1,175,000 | 761,549 |
| Total | 29,094,808 |
| Disposal 0.2% |
| California Municipal Finance Authority(c) |
| Revenue Bonds |
| Republic Services, Inc. Project |
| Series 2023 (Mandatory Put 09/01/33) |
| 08/31/2053 | 4.375% | | 750,000 | 710,546 |
| Higher Education 4.7% |
| California Educational Facilities Authority |
| Refunding Revenue Bonds |
| Loma Linda University |
| Series 2017A |
| 04/01/2047 | 5.000% | | 4,250,000 | 4,109,630 |
| University of the Pacific |
| Series 2015 |
| 11/01/2036 | 5.000% | | 2,000,000 | 2,008,638 |
| California Public Finance Authority(e) |
| Revenue Bonds |
| California University of Science and Medicine |
| Series 2019 |
| 07/01/2054 | 6.250% | | 3,000,000 | 3,059,734 |
| California Statewide Communities Development Authority(e) |
| Revenue Bonds |
| California Baptist University |
| Series 2014A |
| 11/01/2043 | 6.375% | | 3,000,000 | 3,001,010 |
| Municipal Bonds (continued) |
| Issue Description | Coupon
Rate | | Principal
Amount ($) | Value ($) |
| Lancer Plaza Project |
| Series 2013 |
| 11/01/2033 | 5.625% | | 1,400,000 | 1,386,830 |
| 11/01/2043 | 5.875% | | 1,875,000 | 1,766,838 |
| Total | 15,332,680 |
| Hospital 14.6% |
| California Health Facilities Financing Authority |
| Refunding Revenue Bonds |
| El Camino Hospital |
| Series 2015A |
| 02/01/2040 | 5.000% | | 2,000,000 | 1,988,514 |
| PIH Health |
| Series 2020A |
| 06/01/2050 | 4.000% | | 4,500,000 | 3,535,687 |
| Revenue Bonds |
| City of Hope Obligated Group |
| Series 2019 |
| 11/15/2045 | 4.000% | | 8,000,000 | 6,533,566 |
| El Camino Hospital |
| Series 2017 |
| 02/01/2047 | 5.000% | | 4,000,000 | 3,930,781 |
| Kaiser Permanente |
| Subordinated Series 2017A-2 |
| 11/01/2044 | 4.000% | | 7,000,000 | 6,272,745 |
| Subordinated Series 2020A-2 |
| 11/01/2051 | 4.000% | | 1,000,000 | 851,781 |
| California Municipal Finance Authority |
| Refunding Revenue Bonds |
| Community Medical Centers |
| Series 2017A |
| 02/01/2047 | 5.000% | | 2,000,000 | 1,885,102 |
| Revenue Bonds |
| Clincas Del Camino Real, Inc. |
| Series 2020 |
| 03/01/2050 | 4.000% | | 5,000,000 | 3,248,466 |
| California Public Finance Authority |
| Refunding Revenue Bonds |
| Henry Mayo Newhall Memorial Hospital |
| Series 2017 |
| 10/15/2047 | 5.000% | | 4,000,000 | 3,638,281 |
| California Statewide Communities Development Authority |
| Refunding Revenue Bonds |
| Adventist Health System |
| Series 2018 |
| 03/01/2042 | 4.000% | | 5,000,000 | 4,178,323 |
| Adventist Health System West |
| Series 2015 |
| 03/01/2035 | 5.000% | | 1,850,000 | 1,859,362 |
The accompanying Notes to Financial Statements are an integral part of this statement.
Columbia Strategic California Municipal Income Fund | Annual Report 2023
| 9 |
Portfolio of Investments (continued)
October 31, 2023
| Municipal Bonds (continued) |
| Issue Description | Coupon
Rate | | Principal
Amount ($) | Value ($) |
| Revenue Bonds |
| Loma Linda University Medical Center |
| Series 2014 |
| 12/01/2054 | 5.500% | | 2,660,000 | 2,530,356 |
| California Statewide Communities Development Authority(e) |
| Revenue Bonds |
| Loma Linda University Medical Center |
| Series 2018 |
| 12/01/2058 | 5.500% | | 3,000,000 | 2,740,030 |
| City of Upland |
| Refunding Certificate of Participation |
| San Antonio Regional Hospital |
| Series 2017 |
| 01/01/2042 | 4.000% | | 3,000,000 | 2,366,905 |
| Regents of the University of California Medical Center |
| Revenue Bonds |
| Series 2022P |
| 05/15/2053 | 4.000% | | 2,500,000 | 2,121,039 |
| Washington Township Health Care District |
| Refunding Revenue Bonds |
| Series 2019A |
| 07/01/2048 | 4.000% | | 500,000 | 371,046 |
| Total | 48,051,984 |
| Human Service Provider 1.7% |
| California Municipal Finance Authority |
| Refunding Revenue Bonds |
| Harbor Regional Center Project |
| Series 2015 |
| 11/01/2039 | 5.000% | | 2,000,000 | 2,020,888 |
| Inland Regional Center Project |
| Series 2015 |
| 06/15/2045 | 5.000% | | 3,500,000 | 3,518,044 |
| Total | 5,538,932 |
| Local Appropriation 0.7% |
| City of Modesto |
| Certificate of Participation |
| Community Center Refinancing Project |
| Series 1993A (AMBAC) |
| 11/01/2023 | 5.000% | | 295,000 | 295,001 |
| Sacramento City Schools Joint Powers Financing Authority |
| Refunding Revenue Bonds |
| Series 2006A (BAM) |
| 03/01/2040 | 5.000% | | 2,000,000 | 2,003,327 |
| Total | 2,298,328 |
| Municipal Bonds (continued) |
| Issue Description | Coupon
Rate | | Principal
Amount ($) | Value ($) |
| Local General Obligation 13.4% |
| Alameda Unified School District-Alameda County |
| Unlimited General Obligation Bonds |
| Election of 2014 |
| Series 2019C |
| 08/01/2042 | 3.000% | | 1,000,000 | 722,568 |
| Carlsbad Unified School District |
| Unlimited General Obligation Bonds |
| Election of 2018 |
| Series 2019A |
| 08/01/2048 | 3.125% | | 2,750,000 | 1,953,457 |
| Series 2021B |
| 08/01/2046 | 3.000% | | 3,175,000 | 2,184,513 |
| 08/01/2050 | 2.375% | | 3,000,000 | 1,639,730 |
| Cerritos Community College District |
| Unlimited General Obligation Bonds |
| Series 2019C |
| 08/01/2044 | 3.000% | | 5,000,000 | 3,609,783 |
| Chaffey Joint Union High School District(f) |
| Unlimited General Obligation Bonds |
| Series 2019D |
| 08/01/2034 | 0.000% | | 500,000 | 310,186 |
| 08/01/2035 | 0.000% | | 660,000 | 388,082 |
| 08/01/2036 | 0.000% | | 1,000,000 | 553,013 |
| Coast Community College District(f) |
| Unlimited General Obligation Bonds |
| Election of 2012 |
| Series 2019F |
| 08/01/2041 | 0.000% | | 2,125,000 | 830,626 |
| 08/01/2043 | 0.000% | | 7,250,000 | 2,513,594 |
| Compton Unified School District(f) |
| Unlimited General Obligation Bonds |
| Compton Unified School District |
| Series 2019B (BAM) |
| 06/01/2036 | 0.000% | | 2,750,000 | 1,465,200 |
| Conejo Valley Unified School District(f) |
| Unlimited General Obligation Bonds |
| Series 2015A (AGM) |
| 08/01/2029 | 0.000% | | 1,650,000 | 1,278,005 |
| 08/01/2030 | 0.000% | | 1,000,000 | 733,345 |
| East Side Union High School District |
| Unlimited General Obligation Refunding Bonds |
| Series 2003B (NPFGC) |
| 08/01/2026 | 5.250% | | 360,000 | 374,021 |
| El Monte Union High School District(f) |
| Unlimited General Obligation Bonds |
| Series 2021E |
| 06/01/2046 | 0.000% | | 2,765,000 | 797,368 |
| Fremont Union High School District |
| Unlimited General Obligation Bonds |
| Series 2021A |
| 08/01/2037 | 3.000% | | 2,045,000 | 1,651,866 |
The accompanying Notes to Financial Statements are an integral part of this statement.
| 10 | Columbia Strategic California Municipal Income Fund | Annual Report 2023 |
Portfolio of Investments (continued)
October 31, 2023
| Municipal Bonds (continued) |
| Issue Description | Coupon
Rate | | Principal
Amount ($) | Value ($) |
| Glendale Community College District(f) |
| Unlimited General Obligation Bonds |
| Series 2020B |
| 08/01/2044 | 0.000% | | 1,550,000 | 481,829 |
| 02/01/2045 | 0.000% | | 1,250,000 | 376,424 |
| Long Beach Unified School District(f) |
| Unlimited General Obligation Bonds |
| Series 2015D-1 |
| 08/01/2032 | 0.000% | | 1,500,000 | 1,004,205 |
| Manteca Unified School District(f) |
| Unlimited General Obligation Bonds |
| Capital Appreciation - Election of 2004 |
| Series 2006 (NPFGC) |
| 08/01/2032 | 0.000% | | 5,440,000 | 3,692,093 |
| Monterey Peninsula Community College District(f) |
| Unlimited General Obligation Refunding Bonds |
| Series 2016 |
| 08/01/2032 | 0.000% | | 3,500,000 | 2,381,533 |
| 08/01/2033 | 0.000% | | 2,000,000 | 1,295,648 |
| Mount San Antonio Community College District(f) |
| Unlimited General Obligation Bonds |
| Election of 2008 |
| Series 2021E |
| 08/01/2046 | 0.000% | | 8,230,000 | 2,499,245 |
| Pomona Unified School District(f) |
| Unlimited General Obligation Bonds |
| Series 2016G (AGM) |
| 08/01/2033 | 0.000% | | 1,000,000 | 642,904 |
| 08/01/2034 | 0.000% | | 1,610,000 | 992,520 |
| Poway Unified School District(f) |
| Unlimited General Obligation Bonds |
| Improvement District No. 2007-1-A |
| Series 2009 |
| 08/01/2030 | 0.000% | | 2,295,000 | 1,730,431 |
| San Diego Unified School District(f) |
| Unlimited General Obligation Bonds |
| Capital Appreciation Bonds |
| Series 2016I |
| 07/01/2034 | 0.000% | | 5,000,000 | 3,009,330 |
| San Diego Unified School District |
| Unlimited General Obligation Bonds |
| Series 2019B |
| 07/01/2048 | 3.250% | | 5,000,000 | 3,600,385 |
| Sierra Kings Health Care District |
| Unlimited General Obligation Refunding Bonds |
| Series 2015 |
| 08/01/2037 | 5.000% | | 1,500,000 | 1,448,421 |
| Total | 44,160,325 |
| Municipal Bonds (continued) |
| Issue Description | Coupon
Rate | | Principal
Amount ($) | Value ($) |
| Multi-Family 14.1% |
| California Community Housing Agency(e) |
| Revenue Bonds |
| Junior Bonds |
| Series 2021A-2 |
| 02/01/2043 | 4.000% | | 3,000,000 | 2,303,185 |
| The Arbors |
| Series 2020A |
| 08/01/2050 | 5.000% | | 3,500,000 | 2,915,280 |
| California Housing Finance Agency |
| Revenue Bonds |
| Series 2021-1A |
| 11/20/2035 | 3.500% | | 4,379,684 | 3,790,370 |
| California Municipal Finance Authority |
| Refunding Revenue Bonds |
| Caritas Projects |
| Series 2017A |
| 08/15/2042 | 4.000% | | 1,000,000 | 844,087 |
| Revenue Bonds |
| Bowles Hall Foundation |
| Series 2015A |
| 06/01/2050 | 5.000% | | 1,250,000 | 1,154,912 |
| Caritas Affordable Housing |
| Series 2014 |
| 08/15/2049 | 5.250% | | 3,500,000 | 3,441,710 |
| Subordinated Series 2014 |
| 08/15/2049 | 5.875% | | 1,000,000 | 946,056 |
| CMFA Special Finance Agency(e) |
| Revenue Bonds |
| Junior Bonds - Latitude33 |
| Series 2021A |
| 12/01/2045 | 4.000% | | 3,000,000 | 2,146,420 |
| Junior Bonds - Solana at Grand |
| Series 2021A-2 |
| 08/01/2045 | 4.000% | | 3,000,000 | 2,200,155 |
| CMFA Special Finance Agency VIII(e) |
| Revenue Bonds |
| Elan Huntington Beach |
| Series 2021 |
| 08/01/2047 | 4.000% | | 1,900,000 | 1,410,458 |
| CSCDA Community Improvement Authority(e) |
| Revenue Bonds |
| Jefferson-Anaheim Social Bonds |
| Series 2021 |
| 08/01/2056 | 3.125% | | 2,500,000 | 1,526,671 |
| Parallel-Anaheim Social Bonds |
| Series 2021 |
| 08/01/2056 | 4.000% | | 1,760,000 | 1,198,340 |
The accompanying Notes to Financial Statements are an integral part of this statement.
Columbia Strategic California Municipal Income Fund | Annual Report 2023
| 11 |
Portfolio of Investments (continued)
October 31, 2023
| Municipal Bonds (continued) |
| Issue Description | Coupon
Rate | | Principal
Amount ($) | Value ($) |
| Pasadena Portfolio Social Bonds |
| Series 2021 |
| 12/01/2056 | 3.000% | | 2,000,000 | 1,186,058 |
| 12/01/2056 | 4.000% | | 1,000,000 | 638,793 |
| Social Bonds |
| Series 2021A-2 |
| 10/01/2056 | 4.000% | | 3,000,000 | 1,946,030 |
| Social Bonds - Mezzanine Lien - 777 Place-Pomona |
| Series 2021 |
| 05/01/2057 | 4.000% | | 2,000,000 | 1,258,673 |
| Social Bonds - Mezzanine Lien - Park Crossing Apartments |
| Series 2021 |
| 12/01/2048 | 4.000% | | 2,000,000 | 1,305,722 |
| Social Bonds - Mezzanine Lien - Westgate Phase 1-Pasadena |
| Series 2021 |
| 06/01/2057 | 4.000% | | 2,000,000 | 1,177,183 |
| Social Bonds - Millennium South Bay-Hawthorne |
| Series 2021 |
| 07/01/2058 | 4.000% | | 2,000,000 | 1,221,641 |
| Social Bonds - Monterey Station-Pomona |
| Series 2021 |
| 07/01/2058 | 4.000% | | 2,000,000 | 1,214,686 |
| Social Bonds - Senior Lien - Park Crossing Apartments |
| Series 2021 |
| 12/01/2058 | 3.250% | | 1,500,000 | 872,863 |
| The Link - Glendale Social Bonds |
| Subordinated Series 2021 |
| 07/01/2056 | 4.000% | | 3,500,000 | 2,227,206 |
| Union South Bay Social Bonds |
| Series 2021 |
| 07/01/2056 | 4.000% | | 2,000,000 | 1,308,370 |
| Federal Home Loan Mortgage Corp. Multifamily ML Certificates |
| Revenue Bonds |
| Series 2019-ML05 |
| 11/25/2033 | 3.350% | | 3,752,757 | 3,196,099 |
| Freddie Mac Multifamily Certificates |
| Revenue Bonds |
| Series 2021-ML10 Class A (FHLMC) |
| 06/25/2038 | 2.046% | | 2,431,646 | 1,692,447 |
| Hastings Campus Housing Finance Authority |
| Revenue Bonds |
| Green Bonds |
| Series 2020A |
| 07/01/2061 | 5.000% | | 4,000,000 | 3,060,759 |
| Total | 46,184,174 |
| Municipal Power 1.3% |
| Guam Power Authority(g) |
| Refunding Revenue Bonds |
| Series 2022A |
| 10/01/2043 | 5.000% | | 3,000,000 | 2,801,785 |
| Municipal Bonds (continued) |
| Issue Description | Coupon
Rate | | Principal
Amount ($) | Value ($) |
| Puerto Rico Electric Power Authority(g),(h) |
| Revenue Bonds |
| Series 2010XX |
| 07/01/2040 | 0.000% | | 1,965,000 | 491,250 |
| Series 2012A |
| 07/01/2042 | 0.000% | | 4,250,000 | 1,062,500 |
| Total | 4,355,535 |
| Other Bond Issue 0.6% |
| City of Long Beach Marina System |
| Revenue Bonds |
| Series 2015 |
| 05/15/2040 | 5.000% | | 2,000,000 | 1,891,626 |
| Prepaid Gas 3.7% |
| California Community Choice Financing Authority |
| Revenue Bonds |
| Green Bonds - Clean Energy Project |
| Series 2023 (Mandatory Put 03/01/31) |
| 01/31/2054 | 5.000% | | 7,000,000 | 6,973,452 |
| Series 2023 (Mandatory Put 08/01/29) |
| 12/01/2053 | 5.000% | | 1,000,000 | 993,451 |
| California Community Choice Financing Authority(i) |
| Revenue Bonds |
| Green Bonds - Clean Energy Project |
| Series 2023 (Mandatory Put 11/01/30) |
| 09/30/2054 | 5.500% | | 3,000,000 | 3,090,045 |
| M-S-R Energy Authority |
| Revenue Bonds |
| Series 2009B |
| 11/01/2034 | 7.000% | | 1,000,000 | 1,162,473 |
| Total | 12,219,421 |
| Refunded / Escrowed 1.4% |
| California School Finance Authority(e) |
| Prerefunded 07/01/25 Revenue Bonds |
| River Springs Charter School Project |
| Series 2015 |
| 07/01/2046 | 6.375% | | 1,000,000 | 1,041,049 |
| 07/01/2046 | 6.375% | | 155,000 | 160,326 |
| Prerefunded 08/01/25 Revenue Bonds |
| Aspire Public Schools |
| Series 2016 |
| 08/01/2041 | 5.000% | | 150,000 | 153,083 |
| Glendale Unified School District(f) |
| Prerefunded 09/01/25 Unlimited General Obligation Bonds |
| Series 2015B |
| 09/01/2031 | 0.000% | | 1,900,000 | 1,356,761 |
| Prerefunded 09/01/25 Unlimited General Obligation Refunding Bonds |
| Series 2015B |
| 09/01/2032 | 0.000% | | 1,000,000 | 679,804 |
The accompanying Notes to Financial Statements are an integral part of this statement.
| 12 | Columbia Strategic California Municipal Income Fund | Annual Report 2023 |
Portfolio of Investments (continued)
October 31, 2023
| Municipal Bonds (continued) |
| Issue Description | Coupon
Rate | | Principal
Amount ($) | Value ($) |
| Riverside Community College District(f) |
| Prerefunded 02/01/25 Unlimited General Obligation Bonds |
| Election of 2004 |
| Series 2015E |
| 08/01/2030 | 0.000% | | 600,000 | 446,346 |
| 08/01/2031 | 0.000% | | 1,000,000 | 706,092 |
| Total | 4,543,461 |
| Resource Recovery 0.0% |
| California Municipal Finance Authority(c),(e),(h) |
| Revenue Bonds |
| UTS Renewable Energy-Waste Water Facilities |
| Series 2011 |
| 12/01/2032 | 0.000% | | 2,745,000 | 54,900 |
| Retirement Communities 3.9% |
| California Municipal Finance Authority |
| Refunding Revenue Bonds |
| HumanGood Obligation Group |
| Series 2019A |
| 10/01/2044 | 4.000% | | 2,500,000 | 2,021,244 |
| Revenue Bonds |
| HumanGood California Obligated Group |
| Series 2021 |
| 10/01/2046 | 4.000% | | 2,000,000 | 1,580,655 |
| 10/01/2049 | 4.000% | | 2,500,000 | 1,931,026 |
| California Public Finance Authority(e) |
| Revenue Bonds |
| Enso Village Project - Green Bonds |
| Series 2021 |
| 11/15/2046 | 5.000% | | 1,000,000 | 823,108 |
| 11/15/2056 | 5.000% | | 1,000,000 | 782,622 |
| California Statewide Communities Development Authority |
| Refunding Revenue Bonds |
| American Baptist Homes West |
| Series 2015 |
| 10/01/2045 | 5.000% | | 3,155,000 | 2,860,068 |
| Front Porch Communities & Services |
| Series 2017 |
| 04/01/2047 | 4.000% | | 1,750,000 | 1,376,315 |
| Series 2021 |
| 04/01/2046 | 3.000% | | 1,000,000 | 656,752 |
| 04/01/2051 | 3.000% | | 1,250,000 | 767,778 |
| Total | 12,799,568 |
| Sales Tax 3.9% |
| Commonwealth of Puerto Rico(f),(g) |
| Revenue Notes |
| Series 2022 |
| 11/01/2051 | 0.000% | | 1,945,522 | 984,921 |
| Subordinated Series 2022 |
| 11/01/2043 | 0.000% | | 876,694 | 436,155 |
| Municipal Bonds (continued) |
| Issue Description | Coupon
Rate | | Principal
Amount ($) | Value ($) |
| Puerto Rico Sales Tax Financing Corp.(f),(g) |
| Revenue Bonds |
| Series 2018A-1 |
| 07/01/2046 | 0.000% | | 27,900,000 | 6,915,749 |
| Puerto Rico Sales Tax Financing Corp.(g) |
| Revenue Bonds |
| Series 2019A1 |
| 07/01/2058 | 5.000% | | 5,000,000 | 4,365,039 |
| Total | 12,701,864 |
| Special Non Property Tax 0.1% |
| Puerto Rico Highway & Transportation Authority(f),(g) |
| Revenue Bonds |
| Series 2022B |
| 07/01/2032 | 0.000% | | 198,983 | 126,852 |
| Series 2022C |
| 07/01/2053 | 0.000% | | 340,377 | 217,842 |
| Total | 344,694 |
| Special Property Tax 8.4% |
| Bakersfield Redevelopment Agency |
| Tax Allocation Bonds |
| Old Town Kern Pioneer |
| Series 2009A |
| 08/01/2029 | 7.500% | | 915,000 | 916,880 |
| Southeast Bakersfield |
| Series 2009B |
| 08/01/2029 | 7.250% | | 430,000 | 430,860 |
| Chula Vista Municipal Financing Authority |
| Refunding Special Tax Bonds |
| Series 2015A |
| 09/01/2035 | 5.000% | | 2,460,000 | 2,500,322 |
| 09/01/2036 | 5.000% | | 2,435,000 | 2,468,577 |
| City & County of San Francisco Infrastructure & Revitalization Financing District No. 1(e) |
| Tax Allocation Bonds |
| Facilities Increment - Treasure Island |
| Series 2022 |
| 09/01/2052 | 5.000% | | 1,000,000 | 833,907 |
| City of Dublin |
| Special Tax Bonds |
| Improvement Area No. 3 |
| Series 2021 |
| 09/01/2045 | 4.000% | | 850,000 | 663,134 |
| 09/01/2051 | 4.000% | | 865,000 | 639,907 |
| City of Irvine |
| Special Tax Bonds |
| Community Facilities District 2013-3 |
| Series 2014 |
| 09/01/2039 | 5.000% | | 750,000 | 745,290 |
| 09/01/2044 | 5.000% | | 2,525,000 | 2,426,882 |
The accompanying Notes to Financial Statements are an integral part of this statement.
Columbia Strategic California Municipal Income Fund | Annual Report 2023
| 13 |
Portfolio of Investments (continued)
October 31, 2023
| Municipal Bonds (continued) |
| Issue Description | Coupon
Rate | | Principal
Amount ($) | Value ($) |
| City of Yucaipa |
| Refunding Special Tax Bonds |
| Community Facilities District No. 98-1 |
| Series 2011 |
| 09/01/2030 | 5.375% | | 1,500,000 | 1,500,911 |
| Elk Grove Unified School District |
| Refunding Special Tax Bonds |
| Community Facilities District No. 1 |
| Series 1995 (AMBAC) |
| 12/01/2024 | 6.500% | | 905,000 | 916,872 |
| Inland Valley Development Agency |
| Refunding Tax Allocation Bonds |
| Series 2014A |
| 09/01/2044 | 5.000% | | 5,000,000 | 4,787,485 |
| Irvine Facilities Financing Authority |
| Special Tax Bonds |
| Irvine Great Park Infrastructure Project |
| Series 2023 (BAM) |
| 09/01/2058 | 4.000% | | 1,000,000 | 840,157 |
| Irvine Unified School District |
| Special Tax Bonds |
| Community Facilities District Number 09-1 |
| Series 2019A |
| 09/01/2040 | 4.000% | | 685,000 | 574,227 |
| Jurupa Public Financing Authority |
| Refunding Special Tax Bonds |
| Series 2014A |
| 09/01/2042 | 5.000% | | 1,000,000 | 1,002,797 |
| Pittsburg Successor Agency Redevelopment Agency(f) |
| Tax Allocation Bonds |
| Los Medanos Community Development Project |
| Series 1999 (AMBAC) |
| 08/01/2024 | 0.000% | | 2,100,000 | 2,033,227 |
| River Islands Public Financing Authority |
| Special Tax Refunding Bonds |
| Improvement Area No. 1 |
| Series 2022A-1 (AGM) |
| 09/01/2052 | 5.250% | | 1,000,000 | 1,024,955 |
| San Francisco City & County Redevelopment Agency |
| Tax Allocation Bonds |
| Mission Bay South Redevelopment Project |
| Series 2014A |
| 08/01/2043 | 5.000% | | 1,000,000 | 1,002,727 |
| Santa Monica Redevelopment Agency |
| Tax Allocation Bonds |
| Earthquake Recovery Redevelopment |
| Series 2011 |
| 07/01/2036 | 5.875% | | 1,250,000 | 1,251,967 |
| Municipal Bonds (continued) |
| Issue Description | Coupon
Rate | | Principal
Amount ($) | Value ($) |
| Tracy Community Facilities District(d) |
| Special Tax Bonds |
| Series 2023 |
| 09/01/2053 | 5.875% | | 1,000,000 | 981,087 |
| Total | 27,542,171 |
| State Appropriated 1.5% |
| California State Public Works Board |
| Revenue Bonds |
| Series 2014B |
| 10/01/2039 | 5.000% | | 1,000,000 | 1,004,301 |
| Various Correctional Facilities |
| Series 2014A |
| 09/01/2039 | 5.000% | | 3,895,000 | 3,910,335 |
| Total | 4,914,636 |
| State General Obligation 1.9% |
| State of California |
| Unlimited General Obligation Bonds |
| Series 2019 |
| 04/01/2045 | 3.250% | | 3,650,000 | 2,851,485 |
| Unlimited General Obligation Refunding Bonds |
| Series 2023 |
| 10/01/2050 | 4.000% | | 4,000,000 | 3,471,069 |
| Unrefunded Unlimited General Obligation Bonds |
| Series 2004 |
| 04/01/2029 | 5.300% | | 2,000 | 2,002 |
| Total | 6,324,556 |
| Tobacco 2.8% |
| California County Tobacco Securitization Agency(f) |
| Refunding Revenue Bonds |
| Capital Allocation |
| Subordinated Series 2020B-2 |
| 06/01/2055 | 0.000% | | 17,780,000 | 2,454,111 |
| Sonoma County Securitization Corp. |
| Series 2020 |
| 06/01/2055 | 0.000% | | 10,000,000 | 1,550,666 |
| Golden State Tobacco Securitization Corp.(f) |
| Refunding Revenue Bonds |
| Subordinated Series 2021B-2 |
| 06/01/2066 | 0.000% | | 40,000,000 | 3,267,356 |
| Tobacco Securitization Authority of Northern California(f) |
| Refunding Revenue Bonds |
| Sacramento County Tobacco Securitization Corp. Senior Bonds |
| Series 2021 |
| 06/01/2060 | 0.000% | | 5,000,000 | 591,733 |
The accompanying Notes to Financial Statements are an integral part of this statement.
| 14 | Columbia Strategic California Municipal Income Fund | Annual Report 2023 |
Portfolio of Investments (continued)
October 31, 2023
| Municipal Bonds (continued) |
| Issue Description | Coupon
Rate | | Principal
Amount ($) | Value ($) |
| Tobacco Securitization Authority of Southern California(f) |
| Refunding Revenue Bonds |
| San Diego County Tobacco Asset Securitization Corp. |
| Series 2019 |
| 06/01/2054 | 0.000% | | 7,000,000 | 1,200,349 |
| Total | 9,064,215 |
| Turnpike / Bridge / Toll Road 3.3% |
| Foothill-Eastern Transportation Corridor Agency(f) |
| Refunding Revenue Bonds |
| Series 2015 |
| 01/15/2033 | 0.000% | | 5,000,000 | 3,210,559 |
| Foothill-Eastern Transportation Corridor Agency |
| Refunding Revenue Bonds |
| Subordinated Series 2019B-2 |
| 01/15/2053 | 3.500% | | 5,000,000 | 3,570,592 |
| Riverside County Transportation Commission(f) |
| Revenue Bonds |
| Capital Appreciation - Senior Lien |
| Series 2013B |
| 06/01/2032 | 0.000% | | 2,055,000 | 1,350,931 |
| 06/01/2033 | 0.000% | | 2,940,000 | 1,839,278 |
| Unrefunded Revenue Bonds |
| Senior Lien |
| Series 2013 |
| 06/01/2029 | 0.000% | | 1,265,000 | 965,303 |
| Total | 10,936,663 |
| Water & Sewer 2.9% |
| City of Riverside Sewer |
| Refunding Revenue Bonds |
| Series 2015A |
| 08/01/2040 | 5.000% | | 3,185,000 | 3,211,821 |
| Metropolitan Water District of Southern California |
| Revenue Bonds |
| Series 2023A |
| 04/01/2053 | 5.000% | | 5,000,000 | 5,173,863 |
| Puerto Rico Commonwealth Aqueduct & Sewer Authority(e),(g) |
| Refunding Revenue Bonds |
| Senior Lien |
| Series 2020A |
| 07/01/2047 | 5.000% | | 1,425,000 | 1,262,436 |
| Total | 9,648,120 |
Total Municipal Bonds
(Cost $400,171,893) | 322,410,783 |
|
| Municipal Short Term 1.2% |
| Issue Description | Yield | | Principal
Amount ($) | Value ($) |
| Disposal 0.6% |
| California Municipal Finance Authority(c) |
| Refunding Revenue Bonds |
| Republic Services, Inc. Project |
| Series 2021 (Mandatory Put 04/01/24) |
| 06/30/2041 | 4.700% | | 2,000,000 | 2,000,184 |
| Other Bond Issue 0.6% |
| California Infrastructure & Economic Development Bank(c),(e) |
| Revenue Bonds |
| Series 2023 (Mandatory Put 08/15/24) |
| 01/01/2050 | 7.970% | | 2,000,000 | 2,006,167 |
Total Municipal Short Term
(Cost $4,000,000) | 4,006,351 |
| Money Market Funds 0.7% |
| | Shares | Value ($) |
| BlackRock Liquidity Funds MuniCash, Institutional Shares, 3.823%(j) | 2,242,260 | 2,242,260 |
Total Money Market Funds
(Cost $2,242,260) | 2,242,260 |
Total Investments in Securities
(Cost: $408,114,153) | 330,359,394 |
| Other Assets & Liabilities, Net | | (1,851,961) |
| Net Assets | 328,507,433 |
The accompanying Notes to Financial Statements are an integral part of this statement.
Columbia Strategic California Municipal Income Fund | Annual Report 2023
| 15 |
Portfolio of Investments (continued)
October 31, 2023
Notes to Portfolio of Investments
| (a) | The Fund is entitled to receive principal and interest from the guarantor after a day or a week’s notice or upon maturity. The maturity date disclosed represents the final maturity. |
| (b) | Represents a variable rate security where the coupon rate adjusts on specified dates (generally daily or weekly) using the prevailing money market rate. The interest rate shown was the current rate as of October 31, 2023. |
| (c) | Income from this security may be subject to alternative minimum tax. |
| (d) | Represents a security purchased on a when-issued basis. |
| (e) | Represents privately placed and other securities and instruments exempt from Securities and Exchange Commission registration (collectively, private placements), such as Section 4(a)(2) and Rule 144A eligible securities, which are often sold only to qualified institutional buyers. At October 31, 2023, the total value of these securities amounted to $71,603,795, which represents 21.80% of total net assets. |
| (f) | Zero coupon bond. |
| (g) | Municipal obligations include debt obligations issued by or on behalf of territories, possessions, or sovereign nations within the territorial boundaries of the United States. At October 31, 2023, the total value of these securities amounted to $18,664,529, which represents 5.68% of total net assets. |
| (h) | Represents a security in default. |
| (i) | Represents a variable rate security with a step coupon where the rate adjusts according to a schedule for a series of periods, typically lower for an initial period and then increasing to a higher coupon rate thereafter. The interest rate shown was the current rate as of October 31, 2023. |
| (j) | The rate shown is the seven-day current annualized yield at October 31, 2023. |
Abbreviation Legend
| AGM | Assured Guaranty Municipal Corporation |
| AMBAC | Ambac Assurance Corporation |
| BAM | Build America Mutual Assurance Co. |
| FHLMC | Federal Home Loan Mortgage Corporation |
| NPFGC | National Public Finance Guarantee Corporation |
Fair value measurements
The Fund categorizes its fair value measurements according to a three-level hierarchy that maximizes the use of observable inputs and minimizes the use of unobservable inputs by prioritizing that the most observable input be used when available. Observable inputs are those that market participants would use in pricing an investment based on market data obtained from sources independent of the reporting entity. Unobservable inputs are those that reflect the Fund’s assumptions about the information market participants would use in pricing an investment. An investment’s level within the fair value hierarchy is based on the lowest level of any input that is deemed significant to the asset’s or liability’s fair value measurement. The input levels are not necessarily an indication of the risk or liquidity associated with investments at that level. For example, certain U.S. government securities are generally high quality and liquid, however, they are reflected as Level 2 because the inputs used to determine fair value may not always be quoted prices in an active market.
Fair value inputs are summarized in the three broad levels listed below:
| ■ | Level 1 — Valuations based on quoted prices for investments in active markets that the Fund has the ability to access at the measurement date. Valuation adjustments are not applied to Level 1 investments. |
| ■ | Level 2 — Valuations based on other significant observable inputs (including quoted prices for similar securities, interest rates, prepayment speeds, credit risks, etc.). |
| ■ | Level 3 — Valuations based on significant unobservable inputs (including the Fund’s own assumptions and judgment in determining the fair value of investments). |
Inputs that are used in determining fair value of an investment may include price information, credit data, volatility statistics, and other factors. These inputs can be either observable or unobservable. The availability of observable inputs can vary between investments, and is affected by various factors such as the type of investment, and the volume and level of activity for that investment or similar investments in the marketplace. The inputs will be considered by the Investment Manager, along with any other relevant factors in the calculation of an investment’s fair value. The Fund uses prices and inputs that are current as of the measurement date, which may include periods of market dislocations. During these periods, the availability of prices and inputs may be reduced for many investments. This condition could cause an investment to be reclassified between the various levels within the hierarchy.
Investments falling into the Level 3 category are primarily supported by quoted prices from brokers and dealers participating in the market for those investments. However, these may be classified as Level 3 investments due to lack of market transparency and corroboration to support these quoted prices. Additionally, valuation models may be used as the pricing source for any remaining investments classified as Level 3. These models may rely on one or more significant unobservable inputs and/or significant assumptions by the Investment Manager. Inputs used in valuations may include, but are not limited to, financial statement analysis, capital account balances, discount rates and estimated cash flows, and comparable company data.
The Fund’s Board of Trustees (the Board) has designated the Investment Manager, through its Valuation Committee (the Committee), as valuation designee, responsible for determining the fair value of the assets of the Fund for which market quotations are not readily available using valuation procedures approved by the Board. The Committee consists of voting and non-voting members from various groups within the Investment Manager’s organization, including operations and accounting, trading and investments, compliance, risk management and legal.
The Committee meets at least monthly to review and approve valuation matters, which may include a description of specific valuation determinations, data regarding pricing information received from approved pricing vendors and brokers and the results of Board-approved valuation policies and procedures (the Policies). The Policies address, among other things, instances when market quotations are or are not readily available, including recommendations of third party pricing vendors and a determination of appropriate pricing methodologies; events that require specific valuation determinations and assessment of fair value techniques; securities with a potential for stale pricing, including those that are illiquid, restricted, or in default; and the effectiveness of third party pricing vendors, including periodic reviews of vendors. The Committee meets more frequently, as needed, to discuss additional valuation matters, which may include the need to review back-testing results, review time-sensitive information or approve related valuation actions. Representatives of Columbia Management Investment Advisers, LLC report to the Board at each of its regularly scheduled meetings to discuss valuation matters and actions during the period, similar to those described earlier.
The accompanying Notes to Financial Statements are an integral part of this statement.
| 16 | Columbia Strategic California Municipal Income Fund | Annual Report 2023 |
Portfolio of Investments (continued)
October 31, 2023
Fair value measurements (continued)
The following table is a summary of the inputs used to value the Fund’s investments at October 31, 2023:
| | Level 1 ($) | Level 2 ($) | Level 3 ($) | Total ($) |
| Investments in Securities | | | | |
| Floating Rate Notes | — | 1,700,000 | — | 1,700,000 |
| Municipal Bonds | — | 322,410,783 | — | 322,410,783 |
| Municipal Short Term | — | 4,006,351 | — | 4,006,351 |
| Money Market Funds | 2,242,260 | — | — | 2,242,260 |
| Total Investments in Securities | 2,242,260 | 328,117,134 | — | 330,359,394 |
See the Portfolio of Investments for all investment classifications not indicated in the table.
The Fund’s assets assigned to the Level 2 input category are generally valued using the market approach, in which a security’s value is determined through reference to prices and information from market transactions for similar or identical assets.
The accompanying Notes to Financial Statements are an integral part of this statement.
Columbia Strategic California Municipal Income Fund | Annual Report 2023
| 17 |
Statement of Assets and Liabilities
October 31, 2023
| Assets | |
| Investments in securities, at value | |
| Unaffiliated issuers (cost $408,114,153) | $330,359,394 |
| Cash | 28,585 |
| Receivable for: | |
| Capital shares sold | 1,307,005 |
| Dividends | 4,420 |
| Interest | 3,761,199 |
| Trustees’ fees | 119,404 |
| Expense reimbursement due from Investment Manager | 344 |
| Prepaid expenses | 6,429 |
| Total assets | 335,586,780 |
| Liabilities | |
| Payable for: | |
| Investments purchased on a delayed delivery basis | 4,091,000 |
| Capital shares redeemed | 1,664,635 |
| Distributions to shareholders | 1,115,826 |
| Management services fees | 4,215 |
| Distribution and/or service fees | 1,367 |
| Transfer agent fees | 16,695 |
| Trustees’ fees | 158,692 |
| Other expenses | 26,917 |
| Total liabilities | 7,079,347 |
| Net assets applicable to outstanding capital stock | $328,507,433 |
| Represented by | |
| Paid in capital | 428,613,175 |
| Total distributable earnings (loss) | (100,105,742) |
| Total - representing net assets applicable to outstanding capital stock | $328,507,433 |
| Class A | |
| Net assets | $209,810,665 |
| Shares outstanding | 8,733,589 |
| Net asset value per share | $24.02 |
| Maximum sales charge | 3.00% |
| Maximum offering price per share (calculated by dividing the net asset value per share by 1.0 minus the maximum sales charge for Class A shares) | $24.76 |
| Advisor Class | |
| Net assets | $3,044,110 |
| Shares outstanding | 126,612 |
| Net asset value per share | $24.04 |
| Class C | |
| Net assets | $11,261,271 |
| Shares outstanding | 468,764 |
| Net asset value per share | $24.02 |
| Institutional Class | |
| Net assets | $88,154,033 |
| Shares outstanding | 3,667,968 |
| Net asset value per share | $24.03 |
| Institutional 2 Class | |
| Net assets | $1,607,499 |
| Shares outstanding | 66,787 |
| Net asset value per share | $24.07 |
| Institutional 3 Class | |
| Net assets | $14,629,855 |
| Shares outstanding | 605,499 |
| Net asset value per share | $24.16 |
The accompanying Notes to Financial Statements are an integral part of this statement.
| 18 | Columbia Strategic California Municipal Income Fund | Annual Report 2023 |
Statement of Operations
Year Ended October 31, 2023
| Net investment income | |
| Income: | |
| Dividends — unaffiliated issuers | $53,459 |
| Interest | 16,412,405 |
| Total income | 16,465,864 |
| Expenses: | |
| Management services fees | 1,822,917 |
| Distribution and/or service fees | |
| Class A | 492,244 |
| Class C | 90,370 |
| Transfer agent fees | |
| Class A | 157,185 |
| Advisor Class | 2,809 |
| Class C | 8,249 |
| Institutional Class | 67,955 |
| Institutional 2 Class | 1,044 |
| Institutional 3 Class | 1,171 |
| Trustees’ fees | 25,898 |
| Custodian fees | 10,768 |
| Printing and postage fees | 18,019 |
| Registration fees | 16,846 |
| Accounting services fees | 30,090 |
| Legal fees | 18,608 |
| Interest on interfund lending | 6,987 |
| Compensation of chief compliance officer | 80 |
| Other | 17,096 |
| Total expenses | 2,788,336 |
| Fees waived or expenses reimbursed by Investment Manager and its affiliates | (144,008) |
| Expense reduction | (180) |
| Total net expenses | 2,644,148 |
| Net investment income | 13,821,716 |
| Realized and unrealized gain (loss) — net | |
| Net realized gain (loss) on: | |
| Investments — unaffiliated issuers | (12,331,721) |
| Futures contracts | (988,353) |
| Net realized loss | (13,320,074) |
| Net change in unrealized appreciation (depreciation) on: | |
| Investments — unaffiliated issuers | 9,230,231 |
| Net change in unrealized appreciation (depreciation) | 9,230,231 |
| Net realized and unrealized loss | (4,089,843) |
| Net increase in net assets resulting from operations | $9,731,873 |
The accompanying Notes to Financial Statements are an integral part of this statement.
Columbia Strategic California Municipal Income Fund | Annual Report 2023
| 19 |
Statement of Changes in Net Assets
| | Year Ended
October 31, 2023 | Year Ended
October 31, 2022 |
| Operations | | |
| Net investment income | $13,821,716 | $17,527,268 |
| Net realized loss | (13,320,074) | (5,894,945) |
| Net change in unrealized appreciation (depreciation) | 9,230,231 | (123,902,832) |
| Net increase (decrease) in net assets resulting from operations | 9,731,873 | (112,270,509) |
| Distributions to shareholders | | |
| Net investment income and net realized gains | | |
| Class A | (8,607,160) | (9,691,959) |
| Advisor Class | (162,141) | (180,482) |
| Class C | (387,072) | (451,207) |
| Institutional Class | (3,921,274) | (8,598,967) |
| Institutional 2 Class | (64,814) | (79,201) |
| Institutional 3 Class | (674,836) | (361,157) |
| Total distributions to shareholders | (13,817,297) | (19,362,973) |
| Decrease in net assets from capital stock activity | (93,022,368) | (192,601,017) |
| Total decrease in net assets | (97,107,792) | (324,234,499) |
| Net assets at beginning of year | 425,615,225 | 749,849,724 |
| Net assets at end of year | $328,507,433 | $425,615,225 |
The accompanying Notes to Financial Statements are an integral part of this statement.
| 20 | Columbia Strategic California Municipal Income Fund | Annual Report 2023 |
Statement of Changes in Net Assets (continued)
| | Year Ended | Year Ended |
| | October 31, 2023 | October 31, 2022 |
| | Shares | Dollars ($) | Shares | Dollars ($) |
| Capital stock activity |
| Class A | | | | |
| Shares sold | 1,045,784 | 27,271,614 | 1,239,979 | 34,868,694 |
| Distributions reinvested | 283,957 | 7,366,590 | 293,274 | 8,252,780 |
| Shares redeemed | (2,646,032) | (68,834,069) | (2,624,523) | (73,106,204) |
| Net decrease | (1,316,291) | (34,195,865) | (1,091,270) | (29,984,730) |
| Advisor Class | | | | |
| Shares sold | 45,528 | 1,173,934 | 109,216 | 3,021,317 |
| Distributions reinvested | 6,230 | 161,819 | 6,389 | 180,165 |
| Shares redeemed | (106,480) | (2,728,797) | (140,609) | (3,921,442) |
| Net decrease | (54,722) | (1,393,044) | (25,004) | (719,960) |
| Class C | | | | |
| Shares sold | 132,047 | 3,459,018 | 136,655 | 3,824,037 |
| Distributions reinvested | 13,385 | 346,961 | 14,146 | 398,874 |
| Shares redeemed | (191,661) | (4,979,029) | (273,732) | (7,587,303) |
| Net decrease | (46,229) | (1,173,050) | (122,931) | (3,364,392) |
| Institutional Class | | | | |
| Shares sold | 2,067,971 | 54,112,792 | 2,798,983 | 79,536,336 |
| Distributions reinvested | 119,493 | 3,103,979 | 182,653 | 5,179,555 |
| Shares redeemed | (4,168,062) | (108,802,621) | (9,037,144) | (254,322,821) |
| Net decrease | (1,980,598) | (51,585,850) | (6,055,508) | (169,606,930) |
| Institutional 2 Class | | | | |
| Shares sold | 150,703 | 4,011,067 | 1,779 | 53,945 |
| Distributions reinvested | 2,484 | 64,511 | 2,796 | 78,899 |
| Shares redeemed | (164,029) | (4,282,190) | (15,749) | (454,784) |
| Net decrease | (10,842) | (206,612) | (11,174) | (321,940) |
| Institutional 3 Class | | | | |
| Shares sold | 217,645 | 5,724,487 | 784,968 | 20,951,222 |
| Distributions reinvested | 7,702 | 200,993 | 10,105 | 289,120 |
| Shares redeemed | (398,191) | (10,393,427) | (357,169) | (9,843,407) |
| Net increase (decrease) | (172,844) | (4,467,947) | 437,904 | 11,396,935 |
| Total net decrease | (3,581,526) | (93,022,368) | (6,867,983) | (192,601,017) |
The accompanying Notes to Financial Statements are an integral part of this statement.
Columbia Strategic California Municipal Income Fund | Annual Report 2023
| 21 |
The following table is intended to help you understand the Fund’s financial performance. Certain information reflects financial results for a single share of a class held for the periods shown. Per share net investment income (loss) amounts are calculated based on average shares outstanding during the period. Total return assumes reinvestment of all dividends and distributions, if any. Total return does not reflect payment of sales charges, if any. Total return and portfolio turnover are not annualized for periods of less than one year. The ratios of expenses and net investment income are annualized for periods of less than one year. The portfolio turnover rate is calculated without regard to purchase and sales transactions of short-term instruments and certain derivatives, if any. If such transactions were included, the Fund’s portfolio turnover rate may be higher.
| | Net asset value,
beginning of
period | Net
investment
income | Net
realized
and
unrealized
gain (loss) | Total from
investment
operations | Distributions
from net
investment
income | Distributions
from net
realized
gains | Total
distributions to
shareholders |
| Class A |
| Year Ended 10/31/2023 | $24.66 | 0.91 | (0.64) | 0.27 | (0.91) | — | (0.91) |
| Year Ended 10/31/2022 | $31.08 | 0.82 | (6.34) | (5.52) | (0.82) | (0.08) | (0.90) |
| Year Ended 10/31/2021 | $30.83 | 0.74 | 0.37 | 1.11 | (0.74) | (0.12) | (0.86) |
| Year Ended 10/31/2020(e) | $31.12 | 0.81 | 0.01(f) | 0.82 | (0.81) | (0.30) | (1.11) |
| Year Ended 10/31/2019(e) | $29.49 | 1.00 | 1.71 | 2.71 | (1.00) | (0.08) | (1.08) |
| Advisor Class |
| Year Ended 10/31/2023 | $24.68 | 0.96 | (0.64) | 0.32 | (0.96) | — | (0.96) |
| Year Ended 10/31/2022 | $31.11 | 0.88 | (6.35) | (5.47) | (0.88) | (0.08) | (0.96) |
| Year Ended 10/31/2021 | $30.86 | 0.80 | 0.37 | 1.17 | (0.80) | (0.12) | (0.92) |
| Year Ended 10/31/2020(e) | $31.14 | 0.89 | 0.01(f) | 0.90 | (0.88) | (0.30) | (1.18) |
| Year Ended 10/31/2019(e) | $29.50 | 1.04 | 1.72 | 2.76 | (1.04) | (0.08) | (1.12) |
| Class C |
| Year Ended 10/31/2023 | $24.66 | 0.78 | (0.64) | 0.14 | (0.78) | — | (0.78) |
| Year Ended 10/31/2022 | $31.08 | 0.68 | (6.34) | (5.66) | (0.68) | (0.08) | (0.76) |
| Year Ended 10/31/2021 | $30.83 | 0.58 | 0.37 | 0.95 | (0.58) | (0.12) | (0.70) |
| Year Ended 10/31/2020(e) | $31.12 | 0.67 | 0.01(f) | 0.68 | (0.67) | (0.30) | (0.97) |
| Year Ended 10/31/2019(e) | $29.49 | 0.84 | 1.71 | 2.55 | (0.84) | (0.08) | (0.92) |
| Institutional Class |
| Year Ended 10/31/2023 | $24.67 | 0.96 | (0.64) | 0.32 | (0.96) | — | (0.96) |
| Year Ended 10/31/2022 | $31.09 | 0.87 | (6.33) | (5.46) | (0.88) | (0.08) | (0.96) |
| Year Ended 10/31/2021 | $30.85 | 0.80 | 0.36 | 1.16 | (0.80) | (0.12) | (0.92) |
| Year Ended 10/31/2020(e) | $31.13 | 0.88 | 0.02(f) | 0.90 | (0.88) | (0.30) | (1.18) |
| Year Ended 10/31/2019(e) | $29.50 | 1.08 | 1.67 | 2.75 | (1.04) | (0.08) | (1.12) |
| Institutional 2 Class |
| Year Ended 10/31/2023 | $24.71 | 0.97 | (0.64) | 0.33 | (0.97) | — | (0.97) |
| Year Ended 10/31/2022 | $31.14 | 0.89 | (6.36) | (5.47) | (0.88) | (0.08) | (0.96) |
| Year Ended 10/31/2021 | $30.89 | 0.81 | 0.37 | 1.18 | (0.81) | (0.12) | (0.93) |
| Year Ended 10/31/2020(e) | $31.18 | 0.90 | 0.00(f),(h) | 0.90 | (0.89) | (0.30) | (1.19) |
| Year Ended 10/31/2019(e) | $29.54 | 1.00 | 1.80 | 2.80 | (1.08) | (0.08) | (1.16) |
The accompanying Notes to Financial Statements are an integral part of this statement.
| 22 | Columbia Strategic California Municipal Income Fund | Annual Report 2023 |
Financial Highlights (continued)
| | Net
asset
value,
end of
period | Total
return | Total gross
expense
ratio to
average
net assets(a) | Total net
expense
ratio to
average
net assets(a),(b) | Net investment
income
ratio to
average
net assets | Portfolio
turnover | Net
assets,
end of
period
(000’s) |
| Class A |
| Year Ended 10/31/2023 | $24.02 | 0.89% | 0.77%(c) | 0.73%(c),(d) | 3.50% | 24% | $209,811 |
| Year Ended 10/31/2022 | $24.66 | (18.07%) | 0.77%(c) | 0.73%(c),(d) | 2.88% | 18% | $247,853 |
| Year Ended 10/31/2021 | $31.08 | 3.61% | 0.80% | 0.74%(d) | 2.35% | 14% | $346,280 |
| Year Ended 10/31/2020(e) | $30.83 | 2.69% | 0.81% | 0.78%(d) | 2.64% | 30% | $329,728 |
| Year Ended 10/31/2019(e) | $31.12 | 9.31% | 0.82%(c) | 0.80%(c),(d) | 3.26% | 37% | $347,854 |
| Advisor Class |
| Year Ended 10/31/2023 | $24.04 | 1.09% | 0.57%(c) | 0.53%(c),(d) | 3.69% | 24% | $3,044 |
| Year Ended 10/31/2022 | $24.68 | (17.92%) | 0.55%(c) | 0.53%(c),(d) | 3.07% | 18% | $4,476 |
| Year Ended 10/31/2021 | $31.11 | 3.82% | 0.55% | 0.54%(d) | 2.55% | 14% | $6,418 |
| Year Ended 10/31/2020(e) | $30.86 | 3.03% | 0.56% | 0.54%(d) | 2.88% | 30% | $4,506 |
| Year Ended 10/31/2019(e) | $31.14 | 9.59% | 0.57%(c) | 0.54%(c),(d) | 3.37% | 37% | $6,206 |
| Class C |
| Year Ended 10/31/2023 | $24.02 | 0.38% | 1.27%(c) | 1.23%(c),(d) | 3.00% | 24% | $11,261 |
| Year Ended 10/31/2022 | $24.66 | (18.48%) | 1.37%(c) | 1.23%(c),(d) | 2.37% | 18% | $12,701 |
| Year Ended 10/31/2021 | $31.08 | 3.09% | 1.55% | 1.24%(d) | 1.86% | 14% | $19,828 |
| Year Ended 10/31/2020(e) | $30.83 | 2.22% | 1.56% | 1.24%(d),(g) | 2.19% | 30% | $23,783 |
| Year Ended 10/31/2019(e) | $31.12 | 8.82% | 1.57%(c) | 1.25%(c),(d),(g) | 2.82% | 37% | $31,410 |
| Institutional Class |
| Year Ended 10/31/2023 | $24.03 | 1.09% | 0.57%(c) | 0.53%(c),(d) | 3.69% | 24% | $88,154 |
| Year Ended 10/31/2022 | $24.67 | (17.90%) | 0.55%(c) | 0.53%(c),(d) | 3.00% | 18% | $139,361 |
| Year Ended 10/31/2021 | $31.09 | 3.78% | 0.55% | 0.54%(d) | 2.54% | 14% | $363,917 |
| Year Ended 10/31/2020(e) | $30.85 | 3.00% | 0.56% | 0.54%(d) | 2.87% | 30% | $260,443 |
| Year Ended 10/31/2019(e) | $31.13 | 9.58% | 0.57%(c) | 0.55%(c),(d) | 3.49% | 37% | $192,055 |
| Institutional 2 Class |
| Year Ended 10/31/2023 | $24.07 | 1.09% | 0.56%(c) | 0.53%(c) | 3.66% | 24% | $1,607 |
| Year Ended 10/31/2022 | $24.71 | (17.89%) | 0.54%(c) | 0.52%(c) | 3.09% | 18% | $1,918 |
| Year Ended 10/31/2021 | $31.14 | 3.83% | 0.54% | 0.52% | 2.57% | 14% | $2,765 |
| Year Ended 10/31/2020(e) | $30.89 | 2.89% | 0.54% | 0.52% | 2.92% | 30% | $2,283 |
| Year Ended 10/31/2019(e) | $31.18 | 9.59% | 0.56%(c) | 0.53%(c) | 3.29% | 37% | $3,302 |
The accompanying Notes to Financial Statements are an integral part of this statement.
Columbia Strategic California Municipal Income Fund | Annual Report 2023
| 23 |
Financial Highlights (continued)
| | Net asset value,
beginning of
period | Net
investment
income | Net
realized
and
unrealized
gain (loss) | Total from
investment
operations | Distributions
from net
investment
income | Distributions
from net
realized
gains | Total
distributions to
shareholders |
| Institutional 3 Class |
| Year Ended 10/31/2023 | $24.80 | 0.98 | (0.64) | 0.34 | (0.98) | — | (0.98) |
| Year Ended 10/31/2022 | $31.26 | 0.91 | (6.39) | (5.48) | (0.90) | (0.08) | (0.98) |
| Year Ended 10/31/2021 | $31.01 | 0.82 | 0.38 | 1.20 | (0.83) | (0.12) | (0.95) |
| Year Ended 10/31/2020(e) | $31.29 | 0.91 | 0.02(f) | 0.93 | (0.91) | (0.30) | (1.21) |
| Year Ended 10/31/2019(e) | $29.65 | 1.08 | 1.72 | 2.80 | (1.08) | (0.08) | (1.16) |
| Notes to Financial Highlights |
| (a) | In addition to the fees and expenses that the Fund bears directly, the Fund indirectly bears a pro rata share of the fees and expenses of any other funds in which it invests. Such indirect expenses are not included in the Fund’s reported expense ratios. |
| (b) | Total net expenses include the impact of certain fee waivers/expense reimbursements made by the Investment Manager and certain of its affiliates, if applicable. |
| (c) | Ratios include interfund lending expense which is less than 0.01%. |
| (d) | The benefits derived from expense reductions had an impact of less than 0.01%. |
| (e) | Per share amounts have been adjusted on a retroactive basis to reflect a 4 to 1 reverse stock split completed after the close of business on September 11, 2020. |
| (f) | Calculation of the net gain (loss) per share (both realized and unrealized) does not correlate to the aggregate realized and unrealized gain (loss) presented in the Statement of Operations due to timing of Fund shares sold and redeemed in relation to fluctuations in the market value of the portfolio. |
| (g) | Ratios include the impact of voluntary waivers paid by the Investment Manager. For the periods indicated below, if the Investment Manager had not paid these voluntary waivers, the Fund’s net expense ratio would increase by: |
| | 10/31/2020 | 10/31/2019 |
| Class C | 0.25% | 0.30% |
The accompanying Notes to Financial Statements are an integral part of this statement.
| 24 | Columbia Strategic California Municipal Income Fund | Annual Report 2023 |
Financial Highlights (continued)
| | Net
asset
value,
end of
period | Total
return | Total gross
expense
ratio to
average
net assets(a) | Total net
expense
ratio to
average
net assets(a),(b) | Net investment
income
ratio to
average
net assets | Portfolio
turnover | Net
assets,
end of
period
(000’s) |
| Institutional 3 Class |
| Year Ended 10/31/2023 | $24.16 | 1.16% | 0.51%(c) | 0.47%(c) | 3.75% | 24% | $14,630 |
| Year Ended 10/31/2022 | $24.80 | (17.86%) | 0.49%(c) | 0.47%(c) | 3.23% | 18% | $19,306 |
| Year Ended 10/31/2021 | $31.26 | 3.88% | 0.48% | 0.47% | 2.62% | 14% | $10,641 |
| Year Ended 10/31/2020(e) | $31.01 | 3.07% | 0.49% | 0.47% | 2.94% | 30% | $8,284 |
| Year Ended 10/31/2019(e) | $31.29 | 9.63% | 0.50%(c) | 0.48%(c) | 3.55% | 37% | $6,648 |
The accompanying Notes to Financial Statements are an integral part of this statement.
Columbia Strategic California Municipal Income Fund | Annual Report 2023
| 25 |
Notes to Financial Statements
October 31, 2023
Note 1. Organization
Columbia Strategic California Municipal Income Fund (the Fund), a series of Columbia Funds Series Trust I (the Trust), is a diversified fund. The Trust is registered under the Investment Company Act of 1940, as amended (the 1940 Act), as an open-end management investment company organized as a Massachusetts business trust.
Fund shares
The Trust may issue an unlimited number of shares (without par value). The Fund offers each of the share classes listed in the Statement of Assets and Liabilities. Although all share classes generally have identical voting, dividend and liquidation rights, each share class votes separately when required by the Trust’s organizational documents or by law. Each share class has its own expense and sales charge structure. Different share classes may have different minimum initial investment amounts and pay different net investment income distribution amounts to the extent the expenses of distributing such share classes vary. Distributions to shareholders in a liquidation will be proportional to the net asset value of each share class.
As described in the Fund’s prospectus, Class A and Class C shares are offered to the general public for investment. Class C shares automatically convert to Class A shares after 8 years. Advisor Class, Institutional Class, Institutional 2 Class and Institutional 3 Class shares are available for purchase through authorized investment professionals to omnibus retirement plans or to institutional investors and to certain other investors as also described in the Fund’s prospectus.
Note 2. Summary of significant accounting policies
Basis of preparation
The Fund is an investment company that applies the accounting and reporting guidance in the Financial Accounting Standards Board (FASB) Accounting Standards Codification Topic 946, Financial Services - Investment Companies (ASC 946). The financial statements are prepared in accordance with U.S. generally accepted accounting principles (GAAP), which requires management to make certain estimates and assumptions that affect the reported amounts of assets and liabilities, the disclosure of contingent assets and liabilities at the date of the financial statements and the reported amounts of income and expenses during the reporting period. Actual results could differ from those estimates.
The following is a summary of significant accounting policies followed by the Fund in the preparation of its financial statements.
Security valuation
Debt securities generally are valued based on prices obtained from pricing services, which are intended to reflect market transactions for normal, institutional-size trading units of similar securities. The services may use various pricing techniques that take into account, as applicable, factors such as yield, quality, coupon rate, maturity, type of issue, trading characteristics and other data, as well as approved independent broker-dealer quotes. Debt securities for which quotations are not readily available or not believed to be reflective of market value may also be valued based upon a bid quote from an approved independent broker-dealer. Debt securities maturing in 60 days or less are valued primarily at amortized market value, unless this method results in a valuation that management believes does not approximate fair value.
Investments in open-end investment companies (other than exchange-traded funds (ETFs)), are valued at the latest net asset value reported by those companies as of the valuation time.
Investments for which market quotations are not readily available, or that have quotations which management believes are not reflective of market value or reliable, are valued at fair value as determined in good faith under procedures approved by the Board of Trustees. If a security or class of securities (such as foreign securities) is valued at fair value, such value is likely to be different from the quoted or published price for the security, if available.
The determination of fair value often requires significant judgment. To determine fair value, management may use assumptions including but not limited to future cash flows and estimated risk premiums. Multiple inputs from various sources may be used to determine fair value.
| 26 | Columbia Strategic California Municipal Income Fund | Annual Report 2023 |
Notes to Financial Statements (continued)
October 31, 2023
GAAP requires disclosure regarding the inputs and valuation techniques used to measure fair value and any changes in valuation inputs or techniques. In addition, investments shall be disclosed by major category. This information is disclosed following the Fund’s Portfolio of Investments.
Derivative instruments
The Fund invests in certain derivative instruments, as detailed below, in seeking to meet its investment objectives. Derivatives are instruments whose values depend on, or are derived from, in whole or in part, the value of one or more securities, currencies, commodities, indices, or other assets or instruments. Derivatives may be used to increase investment flexibility (including to maintain cash reserves while maintaining desired exposure to certain assets), for risk management (hedging) purposes, to facilitate trading, to reduce transaction costs and to pursue higher investment returns. The Fund may also use derivative instruments to mitigate certain investment risks, such as foreign currency exchange rate risk, interest rate risk and credit risk. Derivatives may involve various risks, including the potential inability of the counterparty to fulfill its obligations under the terms of the contract, the potential for an illiquid secondary market (making it difficult for the Fund to sell or terminate, including at favorable prices) and the potential for market movements which may expose the Fund to gains or losses in excess of the amount shown in the Statement of Assets and Liabilities. The notional amounts of derivative instruments, if applicable, are not recorded in the financial statements.
A derivative instrument may suffer a marked-to-market loss if the value of the contract decreases due to an unfavorable change in the market rates or values of the underlying instrument. Losses can also occur if the counterparty does not perform its obligations under the contract. The Fund’s risk of loss from counterparty credit risk on over-the-counter derivatives is generally limited to the aggregate unrealized gain netted against any collateral held by the Fund and the amount of any variation margin held by the counterparty, plus any replacement costs or related amounts. With exchange-traded or centrally cleared derivatives, there is reduced counterparty credit risk to the Fund since the clearinghouse or central counterparty provides some protection in the case of clearing member default. The clearinghouse or central counterparty stands between the buyer and the seller of the contract; therefore, failure of the clearinghouse or central counterparty may pose additional counterparty credit risk. However, credit risk still exists in exchange-traded or centrally cleared derivatives with respect to initial and variation margin that is held in a broker’s customer account. While clearing brokers are required to segregate customer margin from their own assets, in the event that a clearing broker becomes insolvent or goes into bankruptcy and at that time there is a shortfall in the aggregate amount of margin held by the clearing broker for all its clients and such shortfall is remedied by the central counterparty or otherwise, U.S. bankruptcy laws will typically allocate that shortfall on a pro-rata basis across all the clearing broker’s customers (including the Fund), potentially resulting in losses to the Fund.
In order to better define its contractual rights and to secure rights that will help the Fund mitigate its counterparty risk, the Fund may enter into an International Swaps and Derivatives Association, Inc. Master Agreement (ISDA Master Agreement) or similar agreement with its derivatives counterparties. An ISDA Master Agreement is an agreement between the Fund and a counterparty that governs over-the-counter derivatives and foreign exchange forward contracts and contains, among other things, collateral posting terms and netting provisions in the event of a default and/or termination event. Under an ISDA Master Agreement, the Fund may, under certain circumstances, offset with the counterparty certain derivative instruments’ payables and/or receivables with collateral held and/or posted and create one single net payment. The provisions of the ISDA Master Agreement typically permit a single net payment in the event of default (close-out netting), including the bankruptcy or insolvency of the counterparty. Note, however, that bankruptcy or insolvency laws of a particular jurisdiction may impose restrictions on or prohibitions against the right of offset or netting in bankruptcy, insolvency or other events.
Collateral (margin) requirements differ by type of derivative. Margin requirements are established by the clearinghouse or central counterparty for exchange-traded and centrally cleared derivatives. Brokers can ask for margin in excess of the minimum in certain circumstances. Collateral terms for most over-the-counter derivatives are subject to regulatory requirements to exchange variation margin with trading counterparties and may have contract specific margin terms as well. For over-the-counter derivatives traded under an ISDA Master Agreement, the collateral requirements are typically calculated by netting the marked-to-market amount for each transaction under such agreement and comparing that amount to the value of any variation margin currently pledged by the Fund and/or the counterparty. Generally, the amount of collateral due from or to a party has to exceed a minimum transfer amount threshold (e.g., $250,000) before a transfer has to be made. To the extent amounts due to the Fund from its counterparties are not fully collateralized, contractually or otherwise, the Fund bears the risk of loss from counterparty nonperformance. The Fund may also pay interest expense on cash collateral received from
Columbia Strategic California Municipal Income Fund | Annual Report 2023
| 27 |
Notes to Financial Statements (continued)
October 31, 2023
the broker or receive interest income on cash collateral pledged to the broker. The Fund attempts to mitigate counterparty risk by only entering into agreements with counterparties that it believes have the financial resources to honor their obligations and by monitoring the financial stability of those counterparties.
Certain ISDA Master Agreements allow counterparties of over-the-counter derivatives transactions to terminate derivatives contracts prior to maturity in the event the Fund’s net asset value declines by a stated percentage over a specified time period or if the Fund fails to meet certain terms of the ISDA Master Agreement, which would cause the Fund to accelerate payment of any net liability owed to the counterparty. The Fund also has termination rights if the counterparty fails to meet certain terms of the ISDA Master Agreement. In determining whether to exercise such termination rights, the Fund would consider, in addition to counterparty credit risk, whether termination would result in a net liability owed from the counterparty.
For financial reporting purposes, the Fund does not offset derivative assets and derivative liabilities that are subject to netting arrangements in the Statement of Assets and Liabilities.
Futures contracts
Futures contracts are exchange-traded and represent commitments for the future purchase or sale of an asset at a specified price on a specified date. The Fund bought and sold futures contracts to manage exposure to movements in interest rates. These instruments may be used for other purposes in future periods. Upon entering into futures contracts, the Fund bears risks that it may not achieve the anticipated benefits of the futures contracts and may realize a loss. Additional risks include counterparty credit risk, the possibility of an illiquid market, and that a change in the value of the contract or option may not correlate with changes in the value of the underlying asset.
Upon entering into a futures contract, the Fund deposits cash or securities with the broker, known as a futures commission merchant (FCM), in an amount sufficient to meet the initial margin requirement. The initial margin deposit must be maintained at an established level over the life of the contract. Cash deposited as initial margin is recorded in the Statement of Assets and Liabilities as margin deposits. Securities deposited as initial margin are designated in the Portfolio of Investments. Subsequent payments (variation margin) are made or received by the Fund each day. The variation margin payments are equal to the daily change in the contract value and are recorded as variation margin receivable or payable and are offset in unrealized gains or losses. The Fund generally expects to earn interest income on its margin deposits. The Fund recognizes a realized gain or loss when the contract is closed or expires. Futures contracts involve, to varying degrees, risk of loss in excess of the variation margin disclosed in the Statement of Assets and Liabilities.
Effects of derivative transactions in the financial statements
The following tables are intended to provide additional information about the effect of derivatives on the financial statements of the Fund, including: the fair value of derivatives by risk category and the location of those fair values in the Statement of Assets and Liabilities; and the impact of derivative transactions over the period in the Statement of Operations, including realized and unrealized gains (losses). The derivative instrument schedules following the Portfolio of Investments present additional information regarding derivative instruments outstanding at the end of the period, if any.
The following table indicates the effect of derivative instruments (not considered to be hedging instruments for accounting disclosure purposes) in the Statement of Operations for the year ended October 31, 2023:
| Amount of realized gain (loss) on derivatives recognized in income |
| Risk exposure category | Futures
contracts
($) |
| Interest rate risk | (988,353) |
The following table is a summary of the average daily outstanding volume by derivative instrument for the year ended October 31, 2023:
| Derivative instrument | Average notional
amounts ($) |
| Futures contracts — short | 8,145,677 |
| 28 | Columbia Strategic California Municipal Income Fund | Annual Report 2023 |
Notes to Financial Statements (continued)
October 31, 2023
Delayed delivery securities
The Fund may trade securities on other than normal settlement terms, including securities purchased or sold on a “when-issued” or "forward commitment" basis. This may increase risk to the Fund since the other party to the transaction may fail to deliver, which could cause the Fund to subsequently invest at less advantageous prices. The Fund designates cash or liquid securities in an amount equal to the delayed delivery commitment.
Security transactions
Security transactions are accounted for on the trade date. Cost is determined and gains (losses) are based upon the specific identification method for both financial statement and federal income tax purposes.
Income recognition
Interest income is recorded on an accrual basis. Market premiums and discounts, including original issue discounts, are amortized and accreted, respectively, over the expected life of the security on all debt securities, unless otherwise noted.
The Fund may place a debt security on non-accrual status and reduce related interest income when it becomes probable that the interest will not be collected and the amount of uncollectible interest can be reasonably estimated. The Fund may also adjust accrual rates when it becomes probable the full interest will not be collected and a partial payment will be received. A defaulted debt security is removed from non-accrual status when the issuer resumes interest payments or when collectability of interest is reasonably assured.
Dividend income is recorded on the ex-dividend date.
Expenses
General expenses of the Trust are allocated to the Fund and other funds of the Trust based upon relative net assets or other expense allocation methodologies determined by the nature of the expense. Expenses directly attributable to the Fund are charged to the Fund. Expenses directly attributable to a specific class of shares are charged to that share class.
Determination of class net asset value
All income, expenses (other than class-specific expenses, which are charged to that share class, as shown in the Statement of Operations) and realized and unrealized gains (losses) are allocated to each class of the Fund on a daily basis, based on the relative net assets of each class, for purposes of determining the net asset value of each class.
Federal income tax status
The Fund intends to qualify each year as a regulated investment company under Subchapter M of the Internal Revenue Code, as amended, and will distribute substantially all of its net tax-exempt and investment company taxable income and net capital gain, if any, for its tax year, and as such will not be subject to federal income taxes. In addition, the Fund intends to distribute in each calendar year substantially all of its ordinary income, capital gain net income and certain other amounts, if any, such that the Fund should not be subject to federal excise tax. Therefore, no federal income or excise tax provision is recorded.
Distributions to shareholders
Distributions from net investment income, if any, are declared daily and paid monthly. Net realized capital gains, if any, are distributed at least annually. Income distributions and capital gain distributions are determined in accordance with federal income tax regulations, which may differ from GAAP.
Guarantees and indemnifications
Under the Trust’s organizational documents and, in some cases, by contract, its officers and trustees are indemnified against certain liabilities arising out of the performance of their duties to the Trust or its funds. In addition, certain of the Fund’s contracts with its service providers contain general indemnification clauses. The Fund’s maximum exposure under these arrangements is unknown since the amount of any future claims that may be made against the Fund cannot be determined, and the Fund has no historical basis for predicting the likelihood of any such claims.
Columbia Strategic California Municipal Income Fund | Annual Report 2023
| 29 |
Notes to Financial Statements (continued)
October 31, 2023
Recent accounting pronouncements and regulatory updates
Tailored Shareholder Reports
In October 2022, the Securities and Exchange Commission adopted a final rule relating to Tailored Shareholder Reports for Mutual Funds and Exchange-Traded Funds; Fee Information in Investment Company Advertisements. The rule and form amendments will, among other things, require the Fund to transmit concise and visually engaging shareholder reports that highlight key information. The amendments will require that funds tag information in a structured data format and that certain more in-depth information be made available online and available for delivery free of charge to investors on request. The amendments became effective January 24, 2023. There is an 18-month transition period after the effective date of the amendments.
Note 3. Fees and other transactions with affiliates
Management services fees
The Fund has entered into a Management Agreement with Columbia Management Investment Advisers, LLC (the Investment Manager), a wholly-owned subsidiary of Ameriprise Financial, Inc. (Ameriprise Financial). Under the Management Agreement, the Investment Manager provides the Fund with investment research and advice, as well as administrative and accounting services. The management services fee is an annual fee that is equal to a percentage of the Fund’s daily net assets that declines from 0.47% to 0.31% as the Fund’s net assets increase. The effective management services fee rate for the year ended October 31, 2023 was 0.47% of the Fund’s average daily net assets.
Compensation of Board members
Members of the Board of Trustees who are not officers or employees of the Investment Manager or Ameriprise Financial are compensated for their services to the Fund as disclosed in the Statement of Operations. Under a Deferred Compensation Plan (the Deferred Plan), these members of the Board of Trustees may elect to defer payment of up to 100% of their compensation. Deferred amounts are treated as though equivalent dollar amounts had been invested in shares of certain funds managed by the Investment Manager. The Fund’s liability for these amounts is adjusted for market value changes and remains in the Fund until distributed in accordance with the Deferred Plan. All amounts payable under the Deferred Plan constitute a general unsecured obligation of the Fund. The expense for the Deferred Plan, which includes Trustees’ fees deferred during the current period as well as any gains or losses on the Trustees’ deferred compensation balances as a result of market fluctuations, is included in "Trustees’ fees" in the Statement of Operations.
Compensation of Chief Compliance Officer
The Board of Trustees has appointed a Chief Compliance Officer for the Fund in accordance with federal securities regulations. As disclosed in the Statement of Operations, a portion of the Chief Compliance Officer’s total compensation is allocated to the Fund, along with other allocations to affiliated registered investment companies managed by the Investment Manager and its affiliates, based on relative net assets.
Transfer agency fees
Under a Transfer and Dividend Disbursing Agent Agreement, Columbia Management Investment Services Corp. (the Transfer Agent), an affiliate of the Investment Manager and a wholly-owned subsidiary of Ameriprise Financial, is responsible for providing transfer agency services to the Fund. The Transfer Agent has contracted with SS&C GIDS, Inc. (SS&C GIDS) to serve as sub-transfer agent. Prior to January 1, 2023, SS&C GIDS was known as DST Asset Manager Solutions, Inc. The Transfer Agent pays the fees of SS&C GIDS for services as sub-transfer agent and SS&C GIDS is not entitled to reimbursement for such fees from the Fund (with the exception of out-of-pocket fees).
The Fund pays the Transfer Agent a monthly transfer agency fee based on the number or the average value of accounts, depending on the type of account. In addition, the Fund pays the Transfer Agent a fee for shareholder services based on the number of accounts or on a percentage of the average aggregate value of the Fund’s shares maintained in omnibus accounts up to the lesser of the amount charged by the financial intermediary or a cap established by the Board of Trustees from time to time.
| 30 | Columbia Strategic California Municipal Income Fund | Annual Report 2023 |
Notes to Financial Statements (continued)
October 31, 2023
The Transfer Agent also receives compensation from the Fund for various shareholder services and reimbursements for certain out-of-pocket fees. Total transfer agency fees for Institutional 2 Class and Institutional 3 Class shares are subject to an annual limitation of not more than 0.07% and 0.02%, respectively, of the average daily net assets attributable to each share class.
For the year ended October 31, 2023, the Fund’s effective transfer agency fee rates as a percentage of average daily net assets of each class were as follows:
| | Effective rate (%) |
| Class A | 0.06 |
| Advisor Class | 0.06 |
| Class C | 0.06 |
| Institutional Class | 0.06 |
| Institutional 2 Class | 0.06 |
| Institutional 3 Class | 0.01 |
An annual minimum account balance fee of $20 may apply to certain accounts with a value below the applicable share class’s initial minimum investment requirements to reduce the impact of small accounts on transfer agency fees. These minimum account balance fees are remitted to the Fund and recorded as part of expense reductions in the Statement of Operations. For the year ended October 31, 2023, these minimum account balance fees reduced total expenses of the Fund by $180.
Distribution and service fees
The Fund has entered into an agreement with Columbia Management Investment Distributors, Inc. (the Distributor), an affiliate of the Investment Manager and a wholly-owned subsidiary of Ameriprise Financial, for distribution and shareholder services. The Board of Trustees has approved, and the Fund has adopted, distribution and shareholder service plans (the Plans) applicable to certain share classes, which set the distribution and service fees for the Fund. These fees are calculated daily and are intended to compensate the Distributor and/or eligible selling and/or servicing agents for selling shares of the Fund and providing services to investors.
Under the Plans, the Fund pays a monthly service fee to the Distributor at the maximum annual rate of 0.20% and 0.25% of the average daily net assets attributable to Class A and Class C shares of the Fund, respectively. Also under the Plans, the Fund pays a monthly distribution fee to the Distributor at the maximum annual rate of 0.45% of the average daily net assets attributable to Class C shares of the Fund.
Sales charges (unaudited)
Sales charges, including front-end charges and contingent deferred sales charges (CDSCs), received by the Distributor for distributing Fund shares for the year ended October 31, 2023, if any, are listed below:
| | Front End (%) | CDSC (%) | Amount ($) |
| Class A | 3.00 | 0.75(a) | 19,893 |
| Class C | — | 1.00(b) | 219 |
| (a) | This charge is imposed on certain investments of $500,000 or more if redeemed within 12 months after purchase. |
| (b) | This charge applies to redemptions within 12 months after purchase, with certain limited exceptions. |
The Fund’s other share classes are not subject to sales charges.
Columbia Strategic California Municipal Income Fund | Annual Report 2023
| 31 |
Notes to Financial Statements (continued)
October 31, 2023
Expenses waived/reimbursed by the Investment Manager and its affiliates
The Investment Manager and certain of its affiliates have contractually agreed to waive fees and/or reimburse expenses (excluding certain fees and expenses described below) for the period(s) disclosed below, unless sooner terminated at the sole discretion of the Board of Trustees, so that the Fund’s net operating expenses, after giving effect to fees waived/expenses reimbursed and any balance credits and/or overdraft charges from the Fund’s custodian, do not exceed the following annual rate(s) as a percentage of the classes’ average daily net assets:
| | March 1, 2023
through
February 29, 2024 | Prior to
March 1, 2023 |
| Class A | 0.74% | 0.74% |
| Advisor Class | 0.54 | 0.54 |
| Class C | 1.24 | 1.24 |
| Institutional Class | 0.54 | 0.54 |
| Institutional 2 Class | 0.53 | 0.52 |
| Institutional 3 Class | 0.48 | 0.47 |
Under the agreement governing these fee waivers and/or expense reimbursement arrangements, the following fees and expenses are excluded from the waiver/reimbursement commitment, and therefore will be paid by the Fund, if applicable: taxes (including foreign transaction taxes), expenses associated with investments in affiliated and non-affiliated pooled investment vehicles (including mutual funds and exchange-traded funds), transaction costs and brokerage commissions, costs related to any securities lending program, dividend expenses associated with securities sold short, inverse floater program fees and expenses, transaction charges and interest on borrowed money, interest, costs associated with shareholder meetings, infrequent and/or unusual expenses and any other expenses the exclusion of which is specifically approved by the Board of Trustees. This agreement may be modified or amended only with approval from the Investment Manager, certain of its affiliates and the Fund. In addition to the contractual agreement, the Investment Manager and certain of its affiliates have voluntarily agreed to waive fees and/or reimburse Fund expenses (excluding certain fees and expenses described above) so that Fund level expenses (expenses directly attributable to the Fund and not to a specific share class) are waived proportionately across all share classes. This arrangement may be revised or discontinued at any time. Any fees waived and/or expenses reimbursed under the expense reimbursement arrangements described above are not recoverable by the Investment Manager or its affiliates in future periods.
Note 4. Federal tax information
The timing and character of income and capital gain distributions are determined in accordance with income tax regulations, which may differ from GAAP because of temporary or permanent book to tax differences.
At October 31, 2023, these differences were primarily due to differing treatment for deferral/reversal of wash sale losses, tax straddles, defaulted securities/troubled debt, capital loss carryforwards, trustees’ deferred compensation, distributions, re-characterization of distributions for investments and investments in partnerships and/or grantor trusts. To the extent these differences were permanent, reclassifications were made among the components of the Fund’s net assets. Temporary differences do not require reclassifications.
The following reclassifications were made:
Undistributed net
investment
income ($) | Accumulated
net realized
(loss) ($) | Paid in
capital ($) |
| 112,728 | (112,731) | 3 |
Net investment income (loss) and net realized gains (losses), as disclosed in the Statement of Operations, and net assets were not affected by this reclassification.
| 32 | Columbia Strategic California Municipal Income Fund | Annual Report 2023 |
Notes to Financial Statements (continued)
October 31, 2023
The tax character of distributions paid during the years indicated was as follows:
| Year Ended October 31, 2023 | Year Ended October 31, 2022 |
Ordinary
income ($) | Tax-exempt
income ($) | Long-term
capital gains ($) | Total ($) | Ordinary
income ($) | Tax-exempt
income ($) | Long-term
capital gains ($) | Total ($) |
| 43,700 | 13,773,597 | — | 13,817,297 | 1,346,728 | 17,499,893 | 516,353 | 19,362,974 |
Short-term capital gain distributions, if any, are considered ordinary income distributions for tax purposes.
At October 31, 2023, the components of distributable earnings on a tax basis were as follows:
Undistributed
ordinary income ($) | Undistributed tax-
exempt income ($) | Undistributed
long-term
capital gains ($) | Capital loss
carryforwards ($) | Net unrealized
(depreciation) ($) |
| — | 3,842,309 | — | (22,438,002) | (80,236,230) |
At October 31, 2023, the cost of all investments for federal income tax purposes along with the aggregate gross unrealized appreciation and depreciation based on that cost was:
Federal
tax cost ($) | Gross unrealized
appreciation ($) | Gross unrealized
(depreciation) ($) | Net unrealized
(depreciation) ($) |
| 410,595,624 | 683,020 | (80,919,250) | (80,236,230) |
Tax cost of investments and unrealized appreciation/(depreciation) may also include timing differences that do not constitute adjustments to tax basis.
The following capital loss carryforwards, determined at October 31, 2023, may be available to reduce future net realized gains on investments, if any, to the extent permitted by the Internal Revenue Code. In addition, for the year ended October 31, 2023, capital loss carryforwards utilized, if any, were as follows:
No expiration
short-term ($) | No expiration
long-term ($) | Total ($) | Utilized ($) |
| (17,207,182) | (5,230,820) | (22,438,002) | — |
Management of the Fund has concluded that there are no significant uncertain tax positions in the Fund that would require recognition in the financial statements. However, management’s conclusion may be subject to review and adjustment at a later date based on factors including, but not limited to, new tax laws, regulations, and administrative interpretations (including relevant court decisions). Generally, the Fund’s federal tax returns for the prior three fiscal years remain subject to examination by the Internal Revenue Service.
Note 5. Portfolio information
The cost of purchases and proceeds from sales of securities, excluding short-term investments and derivatives, if any, aggregated to $91,069,311 and $185,767,580, respectively, for the year ended October 31, 2023, of which $0 and $34,117, respectively, were U.S. government securities. The amount of purchase and sale activity impacts the portfolio turnover rate reported in the Financial Highlights.
Note 6. Interfund lending
Pursuant to an exemptive order granted by the Securities and Exchange Commission, the Fund participates in a program (the Interfund Program) allowing each participating Columbia Fund (each, a Participating Fund) to lend money directly to and, except for closed-end funds and money market funds, borrow money directly from other Participating Funds for temporary purposes. The amounts eligible for borrowing and lending under the Interfund Program are subject to certain restrictions.
Columbia Strategic California Municipal Income Fund | Annual Report 2023
| 33 |
Notes to Financial Statements (continued)
October 31, 2023
Interfund loans are subject to the risk that the borrowing fund could be unable to repay the loan when due, and a delay in repayment to the lending fund could result in lost opportunities and/or additional lending costs. The exemptive order is subject to conditions intended to mitigate conflicts of interest arising from the Investment Manager’s relationship with each Participating Fund.
The Fund’s activity in the Interfund Program during the year ended October 31, 2023 was as follows:
| Borrower or lender | Average loan
balance ($) | Weighted average
interest rate (%) | Number of days
with outstanding loans |
| Borrower | 2,500,000 | 4.87 | 22 |
Interest expense incurred by the Fund is recorded as interfund lending in the Statement of Operations. The Fund had no outstanding interfund loans at October 31, 2023.
Note 7. Line of credit
The Fund has access to a revolving credit facility with a syndicate of banks led by JPMorgan Chase Bank, N.A., Citibank, N.A. and Wells Fargo Bank, N.A. whereby the Fund may borrow for the temporary funding of shareholder redemptions or for other temporary or emergency purposes. Pursuant to an October 26, 2023 amendment and restatement, the credit facility, which is an agreement between the Fund and certain other funds managed by the Investment Manager or an affiliated investment manager, severally and not jointly, permits aggregate borrowings up to $900 million. Interest is currently charged to each participating fund based on its borrowings at a rate equal to the higher of (i) the federal funds effective rate, (ii) the secured overnight financing rate plus 0.10% and (iii) the overnight bank funding rate plus, in each case, 1.00%. Each borrowing under the credit facility matures no later than 60 days after the date of borrowing. The Fund also pays a commitment fee equal to its pro rata share of the unused amount of the credit facility at a rate of 0.15% per annum. The commitment fee is included in other expenses in the Statement of Operations. This agreement expires annually in October unless extended or renewed. Prior to the October 26, 2023 amendment and restatement, the Fund had access to a revolving credit facility with a syndicate of banks led by JPMorgan Chase Bank, N.A., Citibank, N.A. and Wells Fargo Bank, N.A. which permitted collective borrowings up to $950 million. Interest was charged to each participating fund based on its borrowings at a rate equal to the higher of (i) the federal funds effective rate, (ii) the secured overnight financing rate plus 0.10% and (iii) the overnight bank funding rate plus, in each case, 1.00%.
The Fund had no borrowings during the year ended October 31, 2023.
Note 8. Significant risks
Credit risk
Credit risk is the risk that the value of debt instruments in the Fund’s portfolio may decline because the issuer defaults or otherwise becomes unable or unwilling, or is perceived to be unable or unwilling, to honor its financial obligations, such as making payments to the Fund when due. Credit rating agencies assign credit ratings to certain debt instruments to indicate their credit risk. Lower-rated or unrated debt instruments held by the Fund may present increased credit risk as compared to higher-rated debt instruments.
Derivatives risk
Losses involving derivative instruments may be substantial, because a relatively small movement in the underlying reference (which is generally the price, rate or other economic indicator associated with a security(ies), commodity, currency, index or other instrument or asset) may result in a substantial loss for the Fund. In addition to the potential for increased losses, the use of derivative instruments may lead to increased volatility within the Fund. Derivatives will typically increase the Fund’s exposure to principal risks to which it is otherwise exposed, and may expose the Fund to additional risks, including correlation risk, counterparty risk, hedging risk, leverage risk, liquidity risk and pricing risk.
| 34 | Columbia Strategic California Municipal Income Fund | Annual Report 2023 |
Notes to Financial Statements (continued)
October 31, 2023
High-yield investments risk
Securities and other debt instruments held by the Fund that are rated below investment grade (commonly called "high-yield" or "junk" bonds) and unrated debt instruments of comparable quality expose the Fund to a greater risk of loss of principal and income than a fund that invests solely or primarily in investment grade debt instruments. In addition, these investments have greater price fluctuations, are less liquid and are more likely to experience a default than higher-rated debt instruments. High-yield debt instruments are considered to be predominantly speculative with respect to the issuer’s capacity to pay interest and repay principal.
Interest rate risk
Interest rate risk is the risk of losses attributable to changes in interest rates. In general, if interest rates rise, the values of debt instruments tend to fall, and if interest rates fall, the values of debt instruments tend to rise. Actions by governments and central banking authorities can result in increases or decreases in interest rates. Higher periods of inflation could lead such authorities to raise interest rates. Increasing interest rates may negatively affect the value of debt securities held by the Fund, resulting in a negative impact on the Fund’s performance and net asset value per share. In general, the longer the maturity or duration of a debt security, the greater its sensitivity to changes in interest rates. The Fund is subject to the risk that the income generated by its investments may not keep pace with inflation.
Liquidity risk
Liquidity risk is the risk associated with a lack of marketability of investments which may make it difficult to sell the investment at a desirable time or price. Changing regulatory, market or other conditions or environments (for example, the interest rate or credit environments) may adversely affect the liquidity of the Fund’s investments. The Fund may have to accept a lower selling price for the holding, sell other investments, or forego another, more appealing investment opportunity. Generally, the less liquid the market at the time the Fund sells a portfolio investment, the greater the risk of loss or decline of value to the Fund. A less liquid market can lead to an increase in Fund redemptions, which may negatively impact Fund performance and net asset value per share, including, for example, if the Fund is forced to sell securities in a down market.
Market risk
The Fund may incur losses due to declines in the value of one or more securities in which it invests. These declines may be due to factors affecting a particular issuer, or the result of, among other things, political, regulatory, market, economic or social developments affecting the relevant market(s) more generally. In addition, turbulence in financial markets and reduced liquidity in equity, credit and/or fixed income markets may negatively affect many issuers, which could adversely affect the Fund’s ability to price or value hard-to-value assets in thinly traded and closed markets and could cause significant redemptions and operational challenges. Global economies and financial markets are increasingly interconnected, and conditions and events in one country, region or financial market may adversely impact issuers in a different country, region or financial market. These risks may be magnified if certain events or developments adversely interrupt the global supply chain; in these and other circumstances, such risks might affect companies worldwide. As a result, local, regional or global events such as terrorism, war, other conflicts, natural disasters, disease/virus outbreaks and epidemics or other public health issues, recessions, depressions or other events – or the potential for such events – could have a significant negative impact on global economic and market conditions.
Municipal securities risk
Municipal securities are debt obligations generally issued to obtain funds for various public purposes, including general financing for state and local governments, or financing for a specific project or public facility, and include obligations of the governments of the U.S. territories, commonwealths and possessions such as Guam, Puerto Rico and the U.S. Virgin Islands to the extent such obligations are exempt from state and U.S. federal income taxes. The value of municipal securities can be significantly affected by actual or expected political and legislative changes at the federal or state level. Municipal securities may be fully or partially backed by the taxing authority of the local government, by the credit of a private issuer, by the current or anticipated revenues from a specific project or specific assets or by domestic or foreign entities providing credit support, such as letters of credit, guarantees or insurance, and are generally classified into general obligation bonds and special revenue obligations. Because many municipal securities are issued to finance projects in sectors such as education, health care, transportation and utilities, conditions in those sectors can affect the overall municipal market.
Columbia Strategic California Municipal Income Fund | Annual Report 2023
| 35 |
Notes to Financial Statements (continued)
October 31, 2023
Issuers in a state, territory, commonwealth or possession in which the Fund invests may experience significant financial difficulties for various reasons, including as the result of events that cannot be reasonably anticipated or controlled such as economic downturns or similar periods of economic stress, social conflict or unrest, labor disruption and natural disasters. Such financial difficulties may lead to credit rating downgrades or defaults of such issuers which in turn, could affect the market values and marketability of many or all municipal obligations of issuers in such state, territory, commonwealth or possession. The value of the Fund’s shares will be negatively impacted to the extent it invests in such securities. The Fund’s annual and semiannual reports show the Fund’s investment exposures at a point in time. The risk of investing in the Fund is directly correlated to the Fund’s investment exposures.
Because the Fund invests substantially in municipal securities issued by the state identified in the Fund’s name and political sub-divisions of that state, the Fund will be particularly affected by adverse tax, legislative, regulatory, demographic or political changes as well as changes impacting the state’s financial, economic or other condition and prospects. In addition, because of the relatively small number of issuers of tax-exempt securities in the state, the Fund may invest a higher percentage of assets in a single issuer and, therefore, be more exposed to the risk of loss than a fund that invests more broadly. The value of municipal and other securities owned by the Fund also may be adversely affected by future changes in federal or state income tax laws.
Shareholder concentration risk
At October 31, 2023, affiliated shareholders of record owned 30.0% of the outstanding shares of the Fund in one or more accounts. Fund shares sold to or redeemed by concentrated accounts may have a significant effect on the operations of the Fund. In the case of a large redemption, the Fund may be forced to sell investments at inopportune times, including its liquid positions, which may result in Fund losses and the Fund holding a higher percentage of less liquid positions. Large redemptions could result in decreased economies of scale and increased operating expenses for non-redeeming Fund shareholders.
Note 9. Subsequent events
Management has evaluated the events and transactions that have occurred through the date the financial statements were issued and noted no items requiring adjustment of the financial statements or additional disclosure.
Note 10. Information regarding pending and settled legal proceedings
Ameriprise Financial and certain of its affiliates are involved in the normal course of business in legal proceedings which include regulatory inquiries, arbitration and litigation, including class actions concerning matters arising in connection with the conduct of their activities as part of a diversified financial services firm. Ameriprise Financial believes that the Fund is not currently the subject of, and that neither Ameriprise Financial nor any of its affiliates are the subject of, any pending legal, arbitration or regulatory proceedings that are likely to have a material adverse effect on the Fund or the ability of Ameriprise Financial or its affiliates to perform under their contracts with the Fund. Ameriprise Financial is required to make quarterly (10-Q), annual (10-K) and, as necessary, 8-K filings with the Securities and Exchange Commission (SEC) on legal and regulatory matters that relate to Ameriprise Financial and its affiliates. Copies of these filings may be obtained by accessing the SEC website at www.sec.gov.
There can be no assurance that these matters, or the adverse publicity associated with them, will not result in increased Fund redemptions, reduced sale of Fund shares or other adverse consequences to the Fund. Further, although we believe proceedings are not likely to have a material adverse effect on the Fund or the ability of Ameriprise Financial or its affiliates to perform under their contracts with the Fund, these proceedings are subject to uncertainties and, as such, we are unable to estimate the possible loss or range of loss that may result. An adverse outcome in one or more of these proceedings could result in adverse judgments, settlements, fines, penalties or other relief that could have a material adverse effect on the consolidated financial condition or results of operations of Ameriprise Financial or one or more of its affiliates that provide services to the Fund.
| 36 | Columbia Strategic California Municipal Income Fund | Annual Report 2023 |
Report of Independent Registered Public Accounting Firm
To the Board of Trustees of Columbia Funds Series Trust I and Shareholders of Columbia Strategic California Municipal Income Fund
Opinion on the Financial Statements
We have audited the accompanying statement of assets and liabilities, including the portfolio of investments, of Columbia Strategic California Municipal Income Fund (one of the funds constituting Columbia Funds Series Trust I, referred to hereafter as the "Fund") as of October 31, 2023, the related statement of operations for the year ended October 31, 2023, the statement of changes in net assets for each of the two years in the period ended October 31, 2023, including the related notes, and the financial highlights for each of the five years in the period ended October 31, 2023 (collectively referred to as the "financial statements"). In our opinion, the financial statements present fairly, in all material respects, the financial position of the Fund as of October 31, 2023, the results of its operations for the year then ended, the changes in its net assets for each of the two years in the period ended October 31, 2023 and the financial highlights for each of the five years in the period ended October 31, 2023 in conformity with accounting principles generally accepted in the United States of America.
Basis for Opinion
These financial statements are the responsibility of the Fund’s management. Our responsibility is to express an opinion on the Fund’s financial statements based on our audits. We are a public accounting firm registered with the Public Company Accounting Oversight Board (United States) (PCAOB) and are required to be independent with respect to the Fund in accordance with the U.S. federal securities laws and the applicable rules and regulations of the Securities and Exchange Commission and the PCAOB.
We conducted our audits of these financial statements in accordance with the standards of the PCAOB. Those standards require that we plan and perform the audit to obtain reasonable assurance about whether the financial statements are free of material misstatement, whether due to error or fraud.
Our audits included performing procedures to assess the risks of material misstatement of the financial statements, whether due to error or fraud, and performing procedures that respond to those risks. Such procedures included examining, on a test basis, evidence regarding the amounts and disclosures in the financial statements. Our audits also included evaluating the accounting principles used and significant estimates made by management, as well as evaluating the overall presentation of the financial statements. Our procedures included confirmation of securities owned as of October 31, 2023 by correspondence with the custodian, transfer agent and brokers; when replies were not received from brokers, we performed other auditing procedures. We believe that our audits provide a reasonable basis for our opinion.
/s/PricewaterhouseCoopers LLP
Minneapolis, Minnesota
December 20, 2023
We have served as the auditor of one or more investment companies within the Columbia Funds Complex since 1977.
Columbia Strategic California Municipal Income Fund | Annual Report 2023
| 37 |
Federal Income Tax Information
(Unaudited)
The Fund hereby designates the following tax attributes for the fiscal year ended October 31, 2023. Shareholders will be notified in early 2024 of the amounts for use in preparing 2023 income tax returns.
Exempt-
interest
dividends | |
| 99.68% | |
Exempt-interest dividends. The percentage of net investment income distributed during the fiscal year that qualifies as exempt-interest dividends for federal income tax purposes. A portion of the income may be subject to federal alternative minimum tax.
TRUSTEES AND OFFICERS
(Unaudited)
The Board oversees the Fund’s operations and appoints officers who are responsible for day-to-day business decisions based on policies set by the Board. The following table provides basic biographical information about the Fund’s Trustees as of the printing of this report, including their principal occupations during the past five years, although specific titles for individuals may have varied over the period. The year set forth beneath Length of Service in the table below is the year in which the Trustee was first appointed or elected as Trustee to any Fund currently in the Columbia Funds Complex or a predecessor thereof. Under current Board policy, each Trustee generally serves until December 31 of the year such Trustee turns seventy-five (75).
Independent trustees
Name,
address,
year of birth | Position held
with the Columbia Funds and
length of service | Principal occupation(s)
during past five years
and other relevant
professional experience | Number of
Funds in the
Columbia Funds
Complex*
overseen | Other directorships
held by Trustee
during the past five years
and other relevant Board experience |
George S. Batejan
c/o Columbia Management
Investment Advisers, LLC
290 Congress Street
Boston, MA 02210
1954 | Trustee since 2017 | Executive Vice President, Global Head of Technology and Operations, Janus Capital Group, Inc., 2010-2016 | 170 | Former Chairman of the Board, NICSA (National Investment Company Services Association) (Executive Committee, Nominating Committee and Governance Committee), 2014-2016; former Director, Intech Investment Management, 2011-2016; former Board Member, Metro Denver Chamber of Commerce, 2015-2016; former Advisory Board Member, University of Colorado Business School, 2015-2018; former Board Member, Chase Bank International, 1993-1994 |
| 38 | Columbia Strategic California Municipal Income Fund | Annual Report 2023 |
TRUSTEES AND OFFICERS (continued)
(Unaudited)
Independent trustees (continued)
Name,
address,
year of birth | Position held
with the Columbia Funds and
length of service | Principal occupation(s)
during past five years
and other relevant
professional experience | Number of
Funds in the
Columbia Funds
Complex*
overseen | Other directorships
held by Trustee
during the past five years
and other relevant Board experience |
Kathleen Blatz
c/o Columbia Management
Investment Advisers, LLC
290 Congress Street
Boston, MA 02210
1954 | Trustee since 2006 | Attorney, specializing in arbitration and mediation; Chief Justice, Minnesota Supreme Court, 1998-2006; Associate Justice, Minnesota Supreme Court, 1996-1998; Fourth Judicial District Court Judge, Hennepin County, 1994-1996; Attorney in private practice and public service, 1984-1993; State Representative, Minnesota House of Representatives, 1979-1993, which included service on the Tax and Financial Institutions and Insurance Committees; Member and Interim Chair, Minnesota Sports Facilities Authority, January-July 2017; Interim President and Chief Executive Officer, Blue Cross and Blue Shield of Minnesota (health care insurance), February-July 2018, April-October 2021 | 170 | Former Trustee, Blue Cross and Blue Shield of Minnesota, 2009-2021 (Chair of the Business Development Committee, 2014-2017; Chair of the Governance Committee, 2017-2019); former Member and Chair of the Board, Minnesota Sports Facilities Authority, January 2017-July 2017; former Director, Robina Foundation, 2009-2020 (Chair, 2014-2020); Director, Richard M. Schulze Family Foundation, since 2021 |
Pamela G. Carlton
c/o Columbia Management
Investment Advisers, LLC
290 Congress Street
Boston, MA 02210
1954 | Chair since 2023; Trustee since 2007 | President, Springboard – Partners in Cross Cultural Leadership (consulting company), since 2003; Managing Director of US Equity Research, JP Morgan Chase, 1999-2003; Director of US Equity Research, Chase Asset Management, 1996-1999; Co-Director Latin America Research, 1993-1996, COO Global Research, 1992-1996, Co-Director of US Research, 1991-1992, Investment Banker, 1982-1991, Morgan Stanley; Attorney, Cleary Gottlieb Steen & Hamilton LLP, 1980-1982 | 170 | Trustee, New York Presbyterian Hospital Board, since 1996; Director, DR Bank (Audit Committee) since 2017; Director, Evercore Inc. (Audit Committee, Nominating and Governance Committee), since 2019; Director, Apollo Commercial Real Estate Finance, Inc. (Chair, Nominating and Governance Committee) (financial services), since 2021; the Governing Council of the Independent Directors Council (IDC), since 2021 |
Janet Langford Carrig
c/o Columbia Management
Investment Advisers, LLC
290 Congress Street
Boston, MA 02210
1957 | Trustee since 1996 | Senior Vice President, General Counsel and Corporate Secretary, ConocoPhillips (independent energy company), September 2007-October 2018 | 170 | Director, EQT Corporation (natural gas producer), since 2019; former Director, Whiting Petroleum Corporation (independent oil and gas company), 2020-2022 |
J. Kevin Connaughton
c/o Columbia Management
Investment Advisers, LLC
290 Congress Street
Boston, MA 02210
1964 | Trustee since 2020 | CEO and President, RhodeWay Financial (non-profit financial planning firm), since December 2022; Member, FINRA National Adjudicatory Council, since January 2020; Adjunct Professor of Finance, Bentley University since January 2018; Consultant to Independent Trustees of CFVIT and CFST I from March 2016 to June 2020 with respect to CFVIT and to December 2020 with respect to CFST I; Managing Director and General Manager of Mutual Fund Products, Columbia Management Investment Advisers, LLC, May 2010-February 2015; President, Columbia Funds, 2008-2015; and senior officer of Columbia Funds and affiliated funds, 2003-2015 | 168 | Former Director, The Autism Project, March 2015-December 2021; former Member of the Investment Committee, St. Michael’s College, November 2015-February 2020; former Trustee, St. Michael’s College, June 2017-September 2019; former Trustee, New Century Portfolios (former mutual fund complex), January 2015-December 2017 |
Columbia Strategic California Municipal Income Fund | Annual Report 2023
| 39 |
TRUSTEES AND OFFICERS (continued)
(Unaudited)
Independent trustees (continued)
Name,
address,
year of birth | Position held
with the Columbia Funds and
length of service | Principal occupation(s)
during past five years
and other relevant
professional experience | Number of
Funds in the
Columbia Funds
Complex*
overseen | Other directorships
held by Trustee
during the past five years
and other relevant Board experience |
Olive M. Darragh
c/o Columbia Management
Investment Advisers, LLC
290 Congress Street
Boston, MA 02210
1962 | Trustee since 2020 | Managing Director of Darragh Inc. (strategy and talent management consulting firm), since 2010; Founder and CEO, Zolio, Inc. (investment management talent identification platform), since 2004; Consultant to Independent Trustees of CFVIT and CFST I from June 2019 to June 2020 with respect to CFVIT and to December 2020 with respect to CFST I; Partner, Tudor Investments, 2004-2010; Senior Partner, McKinsey & Company (consulting), 1990-2004; Touche Ross CPA, 1985-1988 | 168 | Treasurer, Edinburgh University US Trust Board, since January 2023; Member, HBS Community Action Partners Board, since September 2022; former Director, University of Edinburgh Business School (Member of US Board), 2004-2019; former Director, Boston Public Library Foundation, 2008-2017 |
Patricia M. Flynn
c/o Columbia Management
Investment Advisers, LLC
290 Congress Street
Boston, MA 02210
1950 | Trustee since 2004 | Professor Emeritus of Economics and Management, Bentley University, since 2023; Professor of Economics and Management, Bentley University, 1976-2023; Dean, McCallum Graduate School of Business, Bentley University, 1992-2002 | 170 | Former Trustee, MA Taxpayers Foundation, 1997-2022; former Director, The MA Business Roundtable, 2003-2019; former Chairperson, Innovation Index Advisory Committee, MA Technology Collaborative, 1997-2020 |
Brian J. Gallagher
c/o Columbia Management
Investment Advisers, LLC
290 Congress Street
Boston, MA 02210
1954 | Trustee since 2017 | Retired; Partner with Deloitte & Touche LLP and its predecessors, 1977-2016 | 170 | Trustee, Catholic Schools Foundation, since 2004 |
Douglas A. Hacker
c/o Columbia Management
Investment Advisers, LLC
290 Congress Street
Boston, MA 02210
1955 | Trustee since 1996 | Independent business executive, since May 2006; Executive Vice President – Strategy of United Airlines, December 2002 - May 2006; President of UAL Loyalty Services (airline marketing company), September 2001-December 2002; Executive Vice President and Chief Financial Officer of United Airlines, July 1999-September 2001 | 170 | Director, SpartanNash Company since November 2013 (Chair of the Board, since May 2021) (food distributor); Director, Aircastle Limited (Chair of Audit Committee) (aircraft leasing), since August 2006; former Director, Nash Finch Company (food distributor), 2005-2013; former Director, SeaCube Container Leasing Ltd. (container leasing), 2010-2013; and former Director, Travelport Worldwide Limited (travel information technology), 2014-2019 |
Nancy T. Lukitsh
c/o Columbia Management
Investment Advisers, LLC
290 Congress Street
Boston, MA 02210
1956 | Trustee since 2011 | Senior Vice President, Partner and Director of Marketing, Wellington Management Company, LLP (investment adviser), 1997-2010; Chair, Wellington Management Portfolios (commingled non-U.S. investment pools), 2007-2010; Director, Wellington Trust Company, NA and other Wellington affiliates, 1997-2010 | 168 | None |
| 40 | Columbia Strategic California Municipal Income Fund | Annual Report 2023 |
TRUSTEES AND OFFICERS (continued)
(Unaudited)
Independent trustees (continued)
Name,
address,
year of birth | Position held
with the Columbia Funds and
length of service | Principal occupation(s)
during past five years
and other relevant
professional experience | Number of
Funds in the
Columbia Funds
Complex*
overseen | Other directorships
held by Trustee
during the past five years
and other relevant Board experience |
David M. Moffett
c/o Columbia Management
Investment Advisers, LLC
290 Congress Street
Boston, MA 02210
1952 | Trustee since 2011 | Retired; former Chief Executive Officer of Freddie Mac and Chief Financial Officer of U.S. Bank | 168 | Director, CSX Corporation (transportation suppliers); Director, PayPal Holdings Inc. (payment and data processing services); Trustee, University of Oklahoma Foundation; former Director, eBay Inc. (online trading community), 2007-2015; and former Director, CIT Bank, CIT Group Inc. (commercial and consumer finance), 2010-2016; former Senior Adviser to The Carlyle Group (financial services), March 2008-September 2008; former Governance Consultant to Bridgewater Associates, January 2013-December 2015 |
Catherine James Paglia
c/o Columbia Management
Investment Advisers, LLC
290 Congress Street
Boston, MA 02210
1952 | Trustee since 2004 | Director, Enterprise Asset Management, Inc. (private real estate and asset management company), since September 1998; Managing Director and Partner, Interlaken Capital, Inc., 1989-1997; Vice President, 1982-1985, Principal, 1985-1987, Managing Director, 1987-1989, Morgan Stanley; Vice President, Investment Banking, 1980-1982, Associate, Investment Banking, 1976-1980, Dean Witter Reynolds, Inc. | 170 | Director, Valmont Industries, Inc. (irrigation systems manufacturer), since 2012; Trustee, Carleton College (on the Investment Committee), since 1987; Trustee, Carnegie Endowment for International Peace (on the Investment Committee), since 2009 |
Natalie A. Trunow
c/o Columbia Management
Investment Advisers, LLC
290 Congress Street
Boston, MA 02210
1967 | Trustee since 2020 | Chief Executive Officer, Millennial Portfolio Solutions LLC (asset management and consulting services), January 2016-January 2021; Non-executive Member of the Investment Committee and Valuation Committee, Sarona Asset Management Inc. (private equity firm) since September 2019; Advisor, Horizon Investments (asset management and consulting services), August 2018-January 2022; Advisor, Paradigm Asset Management, November 2016-January 2022; Consultant to Independent Trustees of CFVIT and CFST I from September 2016 to June 2020 with respect to CFVIT and to December 2020 with respect to CFST I; Director of Investments/Consultant, Casey Family Programs, April 2016-November 2016; Senior Vice President and Chief Investment Officer, Calvert Investments, August 2008-January 2016; Section Head and Portfolio Manager, General Motors Asset Management, June 1997-August 2008 | 168 | Independent Director, Investment Committee, Health Services for Children with Special Needs, Inc., 2010-2021; Independent Director, (Executive Committee and Chair, Audit Committee), Consumer Credit Counseling Services (formerly Guidewell Financial Solutions), since 2016; Independent Director, (Investment Committee), Sarona Asset Management, since 2019 |
Columbia Strategic California Municipal Income Fund | Annual Report 2023
| 41 |
TRUSTEES AND OFFICERS (continued)
(Unaudited)
Independent trustees (continued)
Name,
address,
year of birth | Position held
with the Columbia Funds and
length of service | Principal occupation(s)
during past five years
and other relevant
professional experience | Number of
Funds in the
Columbia Funds
Complex*
overseen | Other directorships
held by Trustee
during the past five years
and other relevant Board experience |
Sandra L. Yeager
c/o Columbia Management
Investment Advisers, LLC
290 Congress Street
Boston, MA 02210
1964 | Trustee since 2017 | Retired; President and founder, Hanoverian Capital, LLC (SEC registered investment advisor firm), 2008-2016; Managing Director, DuPont Capital, 2006-2008; Managing Director, Morgan Stanley Investment Management, 2004-2006; Senior Vice President, Alliance Bernstein, 1990-2004 | 170 | Former Director, NAPE (National Alliance for Partnerships in Equity) Education Foundation, October 2016-October 2020; Advisory Board, Jennersville YMCA, since 2022 |
Interested trustee affiliated with Investment Manager**
Name,
address,
year of birth | Position held with the Columbia Funds and length of service | Principal occupation(s) during the
past five years and other relevant
professional experience | Number of
Funds in the
Columbia Funds
Complex* overseen | Other directorships
held by Trustee
during the past
five years and
other relevant Board experience |
Daniel J. Beckman
c/o Columbia Management
Investment Advisers, LLC
290 Congress Street
Boston, MA 02210
1962 | Trustee since November 2021 and President since June 2021 | Vice President – Head of North America Product, Columbia Management Investment Advisers, LLC, since April 2015; President and Principal Executive Officer of the Columbia Funds, since June 2021; officer of Columbia Funds and affiliated funds, 2020-2021; Co-President and Principal Executive Officer, Columbia Acorn/Wanger Funds, since July 2021 | 170 | Director, Ameriprise Trust Company, since October 2016; Director, Columbia Management Investment Distributors, Inc. since November 2018; Board of Governors, Columbia Wanger Asset Management, LLC since, January 2022; Director, Columbia Threadneedle Canada, Inc., since December 2022 |
| * | The term “Columbia Funds Complex” as used herein includes Columbia Seligman Premium Technology Growth Fund, Tri-Continental Corporation and each series of Columbia Funds Series Trust (CFST), Columbia Funds Series Trust I (CFST I), Columbia Funds Series Trust II (CFST II), Columbia ETF Trust I (CET I), Columbia ETF Trust II (CET II), Columbia Funds Variable Insurance Trust (CFVIT) and Columbia Funds Variable Series Trust II (CFVST II). Messrs. Batejan, Beckman, Gallagher and Hacker and Mses. Blatz, Carlton, Carrig, Flynn, Paglia, and Yeager serve as directors of Columbia Seligman Premium Technology Growth Fund and Tri-Continental Corporation. |
| ** | Interested person (as defined under the 1940 Act) by reason of being an officer, director, security holder and/or employee of the Investment Manager or Ameriprise Financial. |
The Statement of Additional Information has additional information about the Fund’s Board members and is available, without charge, upon request by calling 800.345.6611, visiting columbiathreadneedleus.com/investor/ or contacting your financial intermediary.
| 42 | Columbia Strategic California Municipal Income Fund | Annual Report 2023 |
TRUSTEES AND OFFICERS (continued)
(Unaudited)
The Board has appointed officers who are responsible for day-to-day business decisions based on policies it has established. The officers serve at the pleasure of the Board. The following table provides basic information about the Officers of the Fund as of the printing of this report, including principal occupations during the past five years, although their specific titles may have varied over the period. In addition to Mr. Beckman, who is President and Principal Executive Officer, the Fund’s other officers are:
Fund officers
Name,
address and
year of birth | Position and year
first appointed to
position for any Fund
in the Columbia
Funds Complex or a
predecessor thereof | Principal occupation(s) during past five years |
Michael G. Clarke
290 Congress Street
Boston, MA 02210
1969 | Chief Financial Officer and Principal Financial Officer (2009) and Senior Vice President (2019) | Senior Vice President and North America Head of Operations & Investor Services, Columbia Management Investment Advisers, LLC, since June 2023 (previously Senior Vice President and Head of Global Operations, March 2022 – June 2023, Vice President, Head of North America Operations, and Co-Head of Global Operations, June 2019 - February 2022 and Vice President – Accounting and Tax, May 2010 - May 2019); senior officer of Columbia Funds and affiliated funds, since 2002. Director, Ameriprise Trust Company, since June 2023. |
Joseph Beranek
5890 Ameriprise Financial Center
Minneapolis, MN 55474
1965 | Treasurer and Chief Accounting Officer (Principal Accounting Officer) (2019) and Principal Financial Officer (2020), CFST, CFST I, CFST II, CFVIT and CFVST II; Assistant Treasurer, CET I and CET II | Vice President – Mutual Fund Accounting and Financial Reporting, Columbia Management Investment Advisers, LLC, since December 2018 and March 2017, respectively. |
Marybeth Pilat
290 Congress Street
Boston, MA 02210
1968 | Treasurer and Chief Accounting Officer (Principal Accounting Officer) and Principal Financial Officer (2020) for CET I and CET II; Assistant Treasurer, CFST, CFST I, CFST II, CFVIT and CFVST II | Vice President – Product Pricing and Administration, Columbia Management Investment Advisers, LLC, since May 2017. |
William F. Truscott
290 Congress Street
Boston, MA 02210
1960 | Senior Vice President (2001) | Formerly, Trustee/Director of Columbia Funds Complex or legacy funds, November 2001 - January 1, 2021; Chief Executive Officer, Global Asset Management, Ameriprise Financial, Inc., since September 2012; Chairman of the Board and President, Columbia Management Investment Advisers, LLC, since July 2004 and February 2012, respectively; Chairman of the Board and Chief Executive Officer, Columbia Management Investment Distributors, Inc., since November 2008 and February 2012, respectively; Chairman of the Board and Director, Threadneedle Asset Management Holdings, Sàrl, since March 2013 and December 2008, respectively; senior executive of various entities affiliated with Columbia Threadneedle. |
Christopher O. Petersen
5228 Ameriprise Financial Center
Minneapolis, MN 55474
1970 | Senior Vice President and Assistant Secretary (2021) | Formerly, Trustee/Director of funds within the Columbia Funds Complex, July 1, 2020 - November 22, 2021; Senior Vice President and Assistant General Counsel, Ameriprise Financial, Inc., since September 2021 (previously Vice President and Lead Chief Counsel, January 2015 - September 2021); formerly, President and Principal Executive Officer of the Columbia Funds, 2015 - 2021; officer of Columbia Funds and affiliated funds, since 2007. |
Thomas P. McGuire
290 Congress Street
Boston, MA 02210
1972 | Senior Vice President and Chief Compliance Officer (2012) | Vice President – Asset Management Compliance, Ameriprise Financial, Inc., since May 2010; Chief Compliance Officer, Columbia Acorn/Wanger Funds, since December 2015; formerly, Chief Compliance Officer, Ameriprise Certificate Company, September 2010 – September 2020. |
Ryan C. Larrenaga
290 Congress Street
Boston, MA 02210
1970 | Senior Vice President (2017), Chief Legal Officer (2017), and Secretary (2015) | Vice President and Chief Counsel, Ameriprise Financial, Inc., since August 2018 (previously Vice President and Group Counsel, August 2011 - August 2018); Chief Legal Officer, Columbia Acorn/Wanger Funds, since September 2020; officer of Columbia Funds and affiliated funds, since 2005. |
Columbia Strategic California Municipal Income Fund | Annual Report 2023
| 43 |
TRUSTEES AND OFFICERS (continued)
(Unaudited)
Fund officers (continued)
Name,
address and
year of birth | Position and year
first appointed to
position for any Fund
in the Columbia
Funds Complex or a
predecessor thereof | Principal occupation(s) during past five years |
Michael E. DeFao
290 Congress Street
Boston, MA 02210
1968 | Vice President (2011) and Assistant Secretary (2010) | Vice President and Chief Counsel, Ameriprise Financial, Inc., since May 2010; Vice President, Chief Legal Officer and Assistant Secretary, Columbia Management Investment Advisers, LLC, since October 2021 (previously Vice President and Assistant Secretary, May 2010 – September 2021). |
Lyn Kephart-Strong
5903 Ameriprise Financial Center
Minneapolis, MN 55474
1960 | Vice President (2015) | Vice President, Global Investment Operations Services, Columbia Management Investment Advisers, LLC, since 2010; Director (since January 2007) and President (since October 2014), Columbia Management Investment Services Corp.; Director (since December 2017) and President (since January 2017), Ameriprise Trust Company. |
Approval of Management Agreement
(Unaudited)
Columbia Management Investment Advisers, LLC (the Investment Manager, and together with its domestic and global affiliates, Columbia Threadneedle Investments), a wholly-owned subsidiary of Ameriprise Financial, Inc. (Ameriprise Financial), serves as the investment manager to Columbia Strategic California Municipal Income Fund (the Fund). Under a management agreement (the Management Agreement), the Investment Manager provides investment advice and other services to the Fund and other funds distributed by Columbia Management Investment Distributors, Inc. (collectively, the Funds).
On an annual basis, the Fund’s Board of Trustees (the Board), including the independent Board members (the Independent Trustees), considers renewal of the Management Agreement. The Investment Manager prepared detailed reports for the Board and its Contracts Committee (including its Contracts Subcommittee) in February, March, April, May and June 2023, including reports providing the results of analyses performed by a third-party data provider, Broadridge Financial Solutions, Inc. (Broadridge), and comprehensive responses by the Investment Manager to written requests for information by independent legal counsel to the Independent Trustees (Independent Legal Counsel), to assist the Board in making this determination. In addition, throughout the year, the Board (or its committees or subcommittees) regularly meets with portfolio management teams and senior management personnel and reviews information prepared by the Investment Manager addressing the services the Investment Manager provides and Fund performance. The Board also accords appropriate weight to the work, deliberations and conclusions of the various committees (including their subcommittees), such as the Contracts Committee, the Investment Review Committee, the Audit Committee and the Compliance Committee in determining whether to continue the Management Agreement.
The Board, at its June 22, 2023 Board meeting (the June Meeting), considered the renewal of the Management Agreement for an additional one-year term. At the June Meeting, Independent Legal Counsel reviewed with the Independent Trustees various factors relevant to the Board’s consideration of advisory agreements and the Board’s legal responsibilities related to such consideration. The Independent Trustees considered all information that they, their legal counsel or the Investment Manager believed reasonably necessary to evaluate and to approve the continuation of the Management Agreement. Among other things, the information and factors considered included the following:
| • | Information on the investment performance of the Fund relative to the performance of a group of mutual funds determined to be comparable to the Fund by Broadridge, as well as performance relative to one or more benchmarks; |
| • | Information on the Fund’s management fees and total expenses, including information comparing the Fund’s expenses to those of a group of comparable mutual funds, as determined by Broadridge; |
| 44 | Columbia Strategic California Municipal Income Fund | Annual Report 2023 |
Approval of Management Agreement (continued)
(Unaudited)
| • | The Investment Manager’s agreement to contractually limit or cap total operating expenses for the Fund so that total operating expenses (excluding certain fees and expenses, such as transaction costs and certain other investment related expenses, interest, taxes, acquired fund fees and expenses and infrequent and/or unusual expenses) would not exceed a specified annual rate, as a percentage of the Fund’s net assets; |
| • | Terms of the Management Agreement; |
| • | Descriptions of other agreements and arrangements with affiliates of the Investment Manager relating to the operations of the Fund, including agreements with respect to the provision of transfer agency and shareholder services to the Fund; |
| • | Descriptions of various services performed by the Investment Manager under the Management Agreement, including portfolio management and portfolio trading practices; |
| • | Information regarding any recently negotiated management fees of similarly-managed portfolios of other institutional clients of the Investment Manager; |
| • | Information regarding the resources of the Investment Manager, including information regarding senior management, portfolio managers and other personnel; |
| • | Information regarding the capabilities of the Investment Manager with respect to compliance monitoring services; |
| • | The profitability to the Investment Manager and its affiliates from their relationships with the Fund; and |
| • | Report provided by the Board’s independent fee consultant, JDL Consultants, LLC (JDL). |
Following an analysis and discussion of the foregoing, and the factors identified below, the Board, including all of the Independent Trustees, approved the renewal of the Management Agreement.
Nature, extent and quality of services provided by the Investment Manager
The Board analyzed various reports and presentations it had received detailing the services performed by the Investment Manager, as well as its history, expertise, resources and relative capabilities, and the qualifications of its personnel.
The Board specifically considered the many developments during recent years concerning the services provided by the Investment Manager. Among other things, the Board noted the organization and depth of the equity and credit research departments. The Board further observed the enhancements to the investment risk management department’s processes, systems and oversight over the past several years. The Board also took into account the broad scope of services provided by the Investment Manager to the Fund, including, among other services, investment, risk and compliance oversight. The Board also took into account the information it received concerning the Investment Manager’s ability to attract and retain key portfolio management personnel and that it has sufficient resources to provide competitive and adequate compensation to investment personnel.
In connection with the Board’s evaluation of the overall package of services provided by the Investment Manager, the Board also considered the nature, quality and range of administrative services provided to the Fund by the Investment Manager, as well as the achievements in 2022 in the performance of administrative services, and noted the various enhancements anticipated for 2023. In evaluating the quality of services provided under the Management Agreement, the Board also took into account the organization and strength of the Fund’s and its service providers’ compliance programs. The Board also reviewed the financial condition of the Investment Manager and its affiliates and each entity’s ability to carry out its responsibilities under the Management Agreement and the Fund’s other service agreements.
In addition, the Board discussed the acceptability of the terms of the Management Agreement, noting that no changes were proposed from the form of agreement previously approved. The Board also noted the wide array of legal and compliance services provided to the Fund under the Management Agreement.
After reviewing these and related factors (including investment performance as discussed below), the Board concluded, within the context of their overall conclusions, that the nature, extent and quality of the services provided to the Fund under the Management Agreement supported the continuation of the Management Agreement.
Columbia Strategic California Municipal Income Fund | Annual Report 2023
| 45 |
Approval of Management Agreement (continued)
(Unaudited)
Investment performance
The Board carefully reviewed the investment performance of the Fund, including detailed reports providing the results of analyses performed by each of the Investment Manager, Broadridge and JDL collectively showing, for various periods (including since manager inception): (i) the performance of the Fund, (ii) the Fund’s performance relative to peers and benchmarks and (iii) the net assets of the Fund. The Board observed the Fund’s underperformance for certain periods, noting that such Fund’s performance was generally consistent with expectations in light of the interrelationship of the Fund’s specific investment strategy with prevailing market conditions.
The Board also reviewed a description of the third-party data provider’s methodology for identifying the Fund’s peer groups for purposes of performance and expense comparisons.
The Board also considered the Investment Manager’s performance and reputation generally. After reviewing these and related factors, the Board concluded, within the context of their overall conclusions, that the performance of the Fund and the Investment Manager, in light of other considerations, supported the continuation of the Management Agreement.
Comparative fees, costs of services provided and the profits realized by the Investment Manager and its affiliates from their relationships with the Fund
The Board reviewed comparative fees and the costs of services provided under the Management Agreement. The Board members considered detailed comparative information set forth in an annual report on fees and expenses, including, among other things, data (based on analyses conducted by Broadridge and JDL) showing a comparison of the Fund’s expenses with median expenses paid by funds in its comparative peer universe, as well as data showing the Fund’s contribution to the Investment Manager’s profitability.
The Board considered the reports of JDL, which assisted in the Board’s analysis of the Funds’ performance and expenses and the reasonableness of the Funds’ fee rates. The Board accorded particular weight to the notion that a primary objective of the level of fees is to achieve a rational pricing model applied consistently across the various product lines in the Fund family, while assuring that the overall fees for each Fund (with certain exceptions) are generally in line with the current “pricing philosophy” such that Fund total expense ratios, in general, approximate or are lower than the median expense ratios of funds in the same Lipper comparison universe. The Board took into account that the Fund’s total expense ratio (after considering proposed expense caps/waivers) was slightly below the peer universe’s median expense ratio shown in the reports.
After reviewing these and related factors, the Board concluded, within the context of their overall conclusions, that the levels of management fees and expenses of the Fund, in light of other considerations, supported the continuation of the Management Agreement.
The Board also considered the profitability of the Investment Manager and its affiliates in connection with the Investment Manager providing management services to the Fund. With respect to the profitability of the Investment Manager and its affiliates, the Independent Trustees referred to information discussing the profitability to the Investment Manager and Ameriprise Financial from managing, operating and distributing the Funds. The Board considered that the profitability generated by the Investment Manager in 2022 had declined from 2021 levels, due to a variety of factors, including the decreased assets under management of the Funds. It also took into account the indirect economic benefits flowing to the Investment Manager or its affiliates in connection with managing or distributing the Funds, such as the enhanced ability to offer various other financial products to Ameriprise Financial customers, soft dollar benefits and overall reputational advantages. The Board noted that the fees paid by the Fund should permit the Investment Manager to offer competitive compensation to its personnel, make necessary investments in its business and earn an appropriate profit. After reviewing these and related factors, the Board concluded, within the context of their overall conclusions, that the costs of services provided and the profitability to the Investment Manager and its affiliates from their relationships with the Fund supported the continuation of the Management Agreement.
| 46 | Columbia Strategic California Municipal Income Fund | Annual Report 2023 |
Approval of Management Agreement (continued)
(Unaudited)
Economies of scale
The Board considered the potential existence of economies of scale in the provision by the Investment Manager of services to the Fund, and whether those economies of scale were shared with the Fund through breakpoints in investment management fees or other means, such as expense limitation arrangements and additional investments by the Investment Manager in investment, trading, compliance and other resources. The Board considered the economies of scale that might be realized as the Fund’s net asset level grows and took note of the extent to which Fund shareholders might also benefit from such growth. In this regard, the Board took into account that management fees decline as Fund assets exceed various breakpoints all of which have not been surpassed. The Board observed that the Management Agreement provided for breakpoints in the management fee rate schedule that allow opportunities for shareholders to realize lower fees as Fund assets grow and that there are additional opportunities through other means for sharing economies of scale with shareholders.
Conclusion
The Board reviewed all of the above considerations in reaching its decision to approve the continuation of the Management Agreement. In reaching its conclusions, no single factor was determinative.
On June 22, 2023, the Board, including all of the Independent Trustees, determined that fees payable under the Management Agreement were fair and reasonable in light of the extent and quality of services provided and approved the renewal of the Management Agreement.
Columbia Strategic California Municipal Income Fund | Annual Report 2023
| 47 |
Columbia Strategic California Municipal Income Fund
P.O. Box 219104
Kansas City, MO 64121-9104
Please read and consider the investment objectives, risks, charges and expenses for any fund carefully before investing. For a prospectus and summary prospectus, which contains this and other important information about the Fund, go to
columbiathreadneedleus.com/investor/. The Fund is distributed by Columbia Management Investment Distributors, Inc., member FINRA, and managed by Columbia Management Investment Advisers, LLC.
Columbia Threadneedle Investments (Columbia Threadneedle) is the global brand name of the Columbia and Threadneedle group of companies. All rights reserved.
© 2023 Columbia Management Investment Advisers, LLC.
columbiathreadneedleus.com/investor/

Annual Report
October 31, 2023
Columbia Intermediate Duration Municipal Bond Fund
Not FDIC or NCUA Insured • No Financial Institution Guarantee • May Lose Value
If you elect to receive the shareholder report for Columbia Intermediate Duration Municipal Bond Fund (the Fund) in paper, mailed to you, the Fund mails one shareholder report to each shareholder address, unless such shareholder elects to receive shareholder reports from the Fund electronically via e-mail or by having a paper notice mailed to you (Postcard Notice) that your Fund’s shareholder report is available at the Columbia funds’ website (columbiathreadneedleus.com/investor/). If you would like more than one report in paper to be mailed to you, or would like to elect to receive reports via e-mail or access them through Postcard Notice, please call shareholder services at 800.345.6611 and additional reports will be sent to you.
Proxy voting policies and procedures
The policy of the Board of Trustees is to vote the proxies of the companies in which the Fund holds investments consistent with the procedures as stated in the Statement of Additional Information (SAI). You may obtain a copy of the SAI without charge by calling 800.345.6611; contacting your financial intermediary; visiting columbiathreadneedleus.com/investor/; or searching the website of the Securities and Exchange Commission (SEC) at sec.gov. Information regarding how the Fund voted proxies relating to portfolio securities is filed with the SEC by August 31st for the most recent 12-month period ending June 30th of that year, and is available without charge by visiting columbiathreadneedleus.com/investor/, or searching the website of the SEC at sec.gov.
Quarterly schedule of investments
The Fund files a complete schedule of portfolio holdings with the SEC for the first and third quarters of each fiscal year on Form N-PORT. The Fund’s Form N-PORT filings are available on the SEC’s website at sec.gov. The Fund’s complete schedule of portfolio holdings, as filed on Form N-PORT, is available on columbiathreadneedleus.com/investor/ or can also be obtained without charge, upon request, by calling 800.345.6611.
Additional Fund information
For more information about the Fund, please visit columbiathreadneedleus.com/investor/ or call 800.345.6611. Customer Service Representatives are available to answer your questions Monday through Friday from 8 a.m. to 7 p.m. Eastern time.
Fund investment manager
Columbia Management Investment Advisers, LLC (the Investment Manager)
290 Congress Street
Boston, MA 02210
Fund distributor
Columbia Management Investment Distributors, Inc.
290 Congress Street
Boston, MA 02210
Fund transfer agent
Columbia Management Investment Services Corp.
P.O. Box 219104
Kansas City, MO 64121-9104
Columbia Intermediate Duration Municipal Bond Fund | Annual Report 2023
Fund at a Glance
(Unaudited)
Investment objective
The Fund seeks current income exempt from federal income tax, consistent with preservation of principal.
Portfolio management
Paul Fuchs, CFA
Lead Portfolio Manager
Managed Fund since 2012
Douglas Rangel, CFA
Portfolio Manager
Managed Fund since June 2022
| Average annual total returns (%) (for the period ended October 31, 2023) |
| | | Inception | 1 Year | 5 Years | 10 Years |
| Class A | Excluding sales charges | 11/25/02 | 2.35 | 0.92 | 1.60 |
| | Including sales charges | | -0.69 | 0.32 | 1.29 |
| Advisor Class | 03/19/13 | 2.56 | 1.13 | 1.81 |
| Class C | Excluding sales charges | 11/25/02 | 1.74 | 0.30 | 0.98 |
| | Including sales charges | | 0.75 | 0.30 | 0.98 |
| Institutional Class | 06/14/93 | 2.56 | 1.13 | 1.81 |
| Institutional 2 Class | 11/08/12 | 2.64 | 1.20 | 1.89 |
| Institutional 3 Class* | 03/01/17 | 2.70 | 1.23 | 1.88 |
| Class V | Excluding sales charges | 06/26/00 | 2.41 | 0.98 | 1.65 |
| | Including sales charges | | -2.50 | 0.01 | 1.15 |
| Bloomberg 3-15 Year Blend Municipal Bond Index | | 2.49 | 1.27 | 1.97 |
Returns for Class A shares are shown with and without the maximum initial sales charge of 3.00%. Returns for Class C shares are shown with and without the 1.00% contingent deferred sales charge for the first year only. Returns for Class V shares are shown with and without the maximum initial sales charge of 4.75%. The Fund’s other share classes are not subject to sales charges and have limited eligibility. Please see the Fund’s prospectus for details. Performance for different share classes will vary based on differences in sales charges and fees associated with each share class. All results shown assume reinvestment of distributions during the period. Returns do not reflect the deduction of taxes that a shareholder may pay on Fund distributions or on the redemption of Fund shares. Performance results reflect the effect of any fee waivers or reimbursements of Fund expenses by Columbia Management Investment Advisers, LLC and/or any of its affiliates. Absent these fee waivers or expense reimbursement arrangements, performance results would have been lower.
The performance information shown represents past performance and is not a guarantee of future results. The investment return and principal value of your investment will fluctuate so that your shares, when redeemed, may be worth more or less than their original cost. Current performance may be lower or higher than the performance information shown. You may obtain performance information current to the most recent month-end by contacting your financial intermediary, visiting columbiathreadneedleus.com/investor/ or calling 800.345.6611.
| * | The returns shown for periods prior to the share class inception date (including returns for the Life of the Fund, if shown, which are since Fund inception) include the returns of the Fund’s oldest share class. These returns are adjusted to reflect any higher class-related operating expenses of the newer share classes, as applicable. Please visit columbiathreadneedleus.com/investor/investment-products/mutual-funds/appended-performance for more information. |
The Bloomberg 3–15 Year Blend Municipal Bond Index is an unmanaged index that tracks the performance of municipal bonds issued after December 31, 1990, with remaining maturities between 2 and 17 years and at least $7 million in principal amount outstanding.
Indices are not available for investment, are not professionally managed and do not reflect sales charges, fees, brokerage commissions, taxes or other expenses of investing. Securities in the Fund may not match those in an index.
Columbia Intermediate Duration Municipal Bond Fund | Annual Report 2023
| 3 |
Fund at a Glance (continued)
(Unaudited)
Performance of a hypothetical $10,000 investment (October 31, 2013 — October 31, 2023)
The chart above shows the change in value of a hypothetical $10,000 investment in Class A shares of Columbia Intermediate Duration Municipal Bond Fund during the stated time period, and does not reflect the deduction of taxes that a shareholder may pay on Fund distributions or on the redemption of Fund shares.
| Quality breakdown (%) (at October 31, 2023) |
| AAA rating | 3.5 |
| AA rating | 31.5 |
| A rating | 45.4 |
| BBB rating | 12.2 |
| BB rating | 4.1 |
| CCC rating | 0.5 |
| Not rated | 2.8 |
| Total | 100.0 |
Percentages indicated are based upon total fixed income investments.
Bond ratings apply to the underlying holdings of the Fund and not the Fund itself and are divided into categories ranging from highest to lowest credit quality, determined by using the middle rating of Moody’s, S&P and Fitch, after dropping the highest and lowest available ratings. When ratings are available from only two rating agencies, the lower rating is used. When a rating is available from only one rating agency, that rating is used. If a security is not rated but has a rating by Kroll and/or DBRS, the same methodology is applied to those bonds that would otherwise be not rated. When a bond is not rated by any rating agency, it is designated as “Not rated.” Credit quality ratings assigned by a rating agency are subjective opinions, not statements of fact, and are subject to change, including daily. The ratings assigned by credit rating agencies are but one of the considerations that the Investment Manager and/or Fund’s subadviser incorporates into its credit analysis process, along with such other issuer-specific factors as cash flows, capital structure and leverage ratios, ability to de-leverage (repay) through free cash flow, quality of management, market positioning and access to capital, as well as such security-specific factors as the terms of the security (e.g., interest rate and time to maturity) and the amount and type of any collateral.
Top Ten States/Territories (%)
(at October 31, 2023) |
| Illinois | 16.2 |
| California | 12.0 |
| Texas | 9.3 |
| New York | 6.3 |
| Florida | 5.2 |
| Massachusetts | 4.0 |
| Pennsylvania | 3.7 |
| District of Columbia | 3.5 |
| New Jersey | 3.4 |
| Michigan | 3.2 |
Percentages indicated are based upon total investments excluding Money Market Funds and investments in derivatives, if any.
For further detail about these holdings, please refer to the section entitled “Portfolio of Investments.”
Fund holdings are as of the date given, are subject to change at any time, and are not recommendations to buy or sell any security.
| 4 | Columbia Intermediate Duration Municipal Bond Fund | Annual Report 2023 |
Manager Discussion of Fund Performance
(Unaudited)
For the 12-month period that ended October 31, 2023, Class A shares of Columbia Intermediate Duration Municipal Bond Fund returned 2.35% excluding sales charges. Institutional Class shares of the Fund returned 2.56%. The Fund’s benchmark, the Bloomberg 3-15 Year Blend Municipal Bond Index, returned 2.49% for the same time period.
Market overview
Municipal bonds delivered positive performance in the early part of the 12-month period, closing out a tumultuous 2022 and starting 2023 with a strong rally that was driven by high hopes for an end to the aggressive interest-rate hiking campaign by the U.S. Federal Reserve (Fed). Unfortunately, sentiment quickly unwound in February, as the market reconsidered the persistence of inflation and a still-too-strong labor market. A more hawkish Fed led to a sell-off in rates, sending the 10-Year Treasury yield nearly 15 basis points (bps) higher from where it started 2023. (A basis point is 1/100 of one percent.) In March, an unforeseen banking crisis unfolded, partially driven by higher interest rates. The weakness in the banking sector indicated the potential for additional downside risk to economic growth. In its late-March 2023 meeting, the Fed pushed through another 25 bps hike, but moderated its stance, signaling that we were closer to a pause, despite the data.
Treasury and municipal interest rates rose during the second quarter of 2023, as the regional banking crisis settled down, and the focus on the Fed’s tightening policy reignited. For the first time since it started hiking in March 2022, the Fed did not raise rates at its June meeting. Fed Chairman Powell took a hawkish stance and communicated the need to continue tightening and the possibility of rates remaining higher for longer. The Treasury and municipal markets experienced significant sell-offs in the third quarter of 2023, with the 10-year Treasury yield rising and municipal yields following a similar but more pronounced path. Treasury and municipal yields reached multi-year highs. Inflation remained stubbornly elevated, despite the Fed’s aggressive rate-hiking cycle. The Fed hiked rates 25 bps in July 2023 and indicated there may be one additional hike by year end. Municipal market yields increased in the final month of the period, the fourth consecutive month of rising rates. Nearly every segment of the market — credit quality, maturity, sector and state — delivered negative performance.
Investor aversion to interest-rate sensitive fixed income saw outflows from most fixed-income segments in favor of attractive rates on cash and cash-like instruments. Flows into money market funds and CDs, and out of most actively managed fixed-income mutual funds, particularly those on the long end of the curve, were a sustained theme over the 12-month period. That said, in our view the much higher yields municipal bonds offer now versus one year ago, or even just a few months ago, make municipals a much more attractive investment option, particularly as we believe we are at or near the end of the Fed’s interest rate hiking cycle. Fundamentals across most sectors remained healthy, and defaults were low by historical standards. A small number of sectors, such as hospitals and continuing care retirement communities (CCRCs) saw some weakening in their fundamentals. In addition, while U.S. states are sensitive to a possible economic slowdown or a capital market sell-off, many appeared relatively well positioned due to ongoing strengths in the economy and labor market along with high cash cushions, budget reserves, support from federal aid and relatively strong tax collections. Also, many states have managed recent budget surpluses conservatively in anticipation of a potential economic slowdown. However, a number of states, such as California and New York, have forecasted budget deficits in the coming years, and the municipal market may face additional pressures if the economy slows, and unemployment rises.
The Fund experienced an increased level of portfolio turnover during the period, as compared to the previous reporting period during which portfolio activity was muted due to a challenging market environment. Portfolio turnover during the period ended October 31, 2023 was due to portfolio rebalancing and a decline in overall Fund assets.
The Fund’s notable contributors during the period
| • | The Fund maintained a below benchmark duration for the entire 12-month period. After initially declining during the first three months, interest rates rose meaningfully during the remainder of the period. The below benchmark positioning helped to limit price declines as rates increased. Having a below benchmark exposure to interest rates in the six months during the period in which returns were negative aided the Fund in outperforming in five of them. |
| • | Portfolio return was positive due to the high level of income or yield, which more than offset price declines that occurred during the period. |
Columbia Intermediate Duration Municipal Bond Fund | Annual Report 2023
| 5 |
Manager Discussion of Fund Performance (continued)
(Unaudited)
| • | The Fund maintained a barbell maturity profile, with additional exposure to bonds maturing in the 0–2 year and 17+ year range. This positioning benefited the Fund during the period as the best municipal bond returns were produced in the very shortest and longest maturities. (A barbell strategy focuses allocations on the longest and shortest ends of the maturity spectrum, giving the appearance of a barbell shape.) |
| • | An overweighted allocation to the lower investment-grade and non-investment grade quality segments contributed to Fund results as these areas outperformed higher quality segments during the period. |
| • | At the sector level, the Fund’s state general obligation municipal bond exposure performed very well as holdings in Illinois, the largest issuer exposure in the portfolio, performed well. |
| • | Hospitals, toll roads and refunded bonds, which all represent meaningful weights in the portfolio, also outperformed, contributing positively to Fund performance. |
The Fund’s notable detractors during the period
| • | The Fund’s exposure to CCRCs detracted from performance during the period. CCRCs have struggled with financial operating performance since 2022, due in large part to the increase in labor costs. We have focused on the Fund’s exposure to identify and reduce exposure to those CCRC issuers we believe will not rebound in 2024. |
| • | Other sectors that performed poorly for the Fund during the period were transportation and public power. The lackluster performance was not due to fundamental issues but rather the timing of Fund purchases during the period. We believe these purchases will perform better going forward. |
| • | The Fund’s zero-coupon bonds underperformed their benchmark counterparts during the period. Relative to the benchmark’s zero-coupon bonds, the portfolio’s holdings are of a higher quality and are roughly fifty percent shorter in terms of maturity, and duration which contributed to their relative underperformance. |
Fixed-income securities present issuer default risk. The Fund invests substantially in municipal securities and will be affected by tax, legislative, regulatory, demographic or political changes, as well as changes impacting a state’s financial, economic or other conditions. A relatively small number of tax-exempt issuers may necessitate the Fund investing more heavily in a single issuer and, therefore, be more exposed to the risk of loss than a fund that invests more broadly. Prepayment and extension risk exists because the timing of payments on a loan, bond or other investment may accelerate when interest rates fall or decelerate when interest rates rise which may reduce investment opportunities and potential returns. A rise in interest rates may result in a price decline of fixed-income instruments held by the Fund, negatively impacting its performance and NAV. Falling rates may result in the Fund investing in lower yielding debt instruments, lowering the Fund’s income and yield. These risks may be heightened for longer maturity and duration securities. Non-investment-grade (high-yield or junk) securities present greater price volatility and more risk to principal and income than higher rated securities. Market risk may affect a single issuer, sector of the economy, industry or the market as a whole. Federal and state tax rules apply to capital gain distributions and any gains or losses on sales. Income may be subject to state, local or alternative minimum taxes. See the Fund’s prospectus for more information on these and other risks.
The views expressed in this report reflect the current views of the respective parties who have contributed to this report. These views are not guarantees of future performance and involve certain risks, uncertainties and assumptions that are difficult to predict, so actual outcomes and results may differ significantly from the views expressed. These views are subject to change at any time based upon economic, market or other conditions and the respective parties disclaim any responsibility to update such views. These views may not be relied on as investment advice and, because investment decisions for a Columbia fund are based on numerous factors, may not be relied on as an indication of trading intent on behalf of any particular Columbia fund. References to specific securities should not be construed as a recommendation or investment advice.
| 6 | Columbia Intermediate Duration Municipal Bond Fund | Annual Report 2023 |
Understanding Your Fund’s Expenses
(Unaudited)
As an investor, you incur two types of costs. There are shareholder transaction costs, which generally include sales charges on purchases and may include redemption fees. There are also ongoing fund costs, which generally include management fees, distribution and/or service fees, and other fund expenses. The following information is intended to help you understand your ongoing costs (in dollars) of investing in the Fund and to help you compare these costs with the ongoing costs of investing in other mutual funds.
Analyzing your Fund’s expenses
To illustrate these ongoing costs, we have provided examples and calculated the expenses paid by investors in each share class of the Fund during the period. The actual and hypothetical information in the table is based on an initial investment of $1,000 at the beginning of the period indicated and held for the entire period. Expense information is calculated two ways and each method provides you with different information. The amount listed in the “Actual” column is calculated using the Fund’s actual operating expenses and total return for the period. You may use the Actual information, together with the amount invested, to estimate the expenses that you paid over the period. Simply divide your account value by $1,000 (for example, an $8,600 account value divided by $1,000 = 8.6), then multiply the results by the expenses paid during the period under the “Actual” column. The amount listed in the “Hypothetical” column assumes a 5% annual rate of return before expenses (which is not the Fund’s actual return) and then applies the Fund’s actual expense ratio for the period to the hypothetical return. You should not use the hypothetical account values and expenses to estimate either your actual account balance at the end of the period or the expenses you paid during the period. See “Compare with other funds” below for details on how to use the hypothetical data.
Compare with other funds
Since all mutual funds are required to include the same hypothetical calculations about expenses in shareholder reports, you can use this information to compare the ongoing cost of investing in the Fund with other funds. To do so, compare the hypothetical example with the 5% hypothetical examples that appear in the shareholder reports of other funds. As you compare hypothetical examples of other funds, it is important to note that hypothetical examples are meant to highlight the ongoing costs of investing in a fund only and do not reflect any transaction costs, such as sales charges, or redemption or exchange fees. Therefore, the hypothetical calculations are useful in comparing ongoing costs only, and will not help you determine the relative total costs of owning different funds. If transaction costs were included in these calculations, your costs would be higher.
| May 1, 2023 — October 31, 2023 |
| | Account value at the
beginning of the
period ($) | Account value at the
end of the
period ($) | Expenses paid during
the period ($) | Fund’s annualized
expense ratio (%) |
| | Actual | Hypothetical | Actual | Hypothetical | Actual | Hypothetical | Actual |
| Class A | 1,000.00 | 1,000.00 | 973.50 | 1,022.37 | 3.07 | 3.14 | 0.61 |
| Advisor Class | 1,000.00 | 1,000.00 | 975.50 | 1,023.39 | 2.06 | 2.11 | 0.41 |
| Class C | 1,000.00 | 1,000.00 | 971.60 | 1,019.31 | 6.08 | 6.23 | 1.21 |
| Institutional Class | 1,000.00 | 1,000.00 | 975.50 | 1,023.39 | 2.06 | 2.11 | 0.41 |
| Institutional 2 Class | 1,000.00 | 1,000.00 | 974.80 | 1,023.85 | 1.61 | 1.65 | 0.32 |
| Institutional 3 Class | 1,000.00 | 1,000.00 | 975.10 | 1,024.05 | 1.41 | 1.44 | 0.28 |
| Class V | 1,000.00 | 1,000.00 | 973.70 | 1,022.63 | 2.82 | 2.89 | 0.56 |
Expenses paid during the period are equal to the annualized expense ratio for each class as indicated above, multiplied by the average account value over the period and then multiplied by the number of days in the Fund’s most recent fiscal half year and divided by 365.
Expenses do not include fees and expenses incurred indirectly by the Fund from its investment in underlying funds, including affiliated and non-affiliated pooled investment vehicles, such as mutual funds and exchange-traded funds.
Had Columbia Management Investment Advisers, LLC and/or certain of its affiliates not waived/reimbursed certain fees and expenses, account value at the end of the period would have been reduced.
Columbia Intermediate Duration Municipal Bond Fund | Annual Report 2023
| 7 |
Portfolio of Investments
October 31, 2023
(Percentages represent value of investments compared to net assets)
Investments in securities
| Floating Rate Notes 0.6% |
| Issue Description | Yield | | Principal
Amount ($) | Value ($) |
| Massachusetts 0.3% |
| JPMorgan Chase Putters/Drivers Trust(a),(b),(c),(d) |
| Tax-Exempt Preferred |
| Series 2020-5033 (JPMorgan Chase Bank) |
| 11/16/2024 | 4.550% | | 5,000,000 | 5,000,000 |
| Minnesota 0.0% |
| City of Minneapolis(c),(d) |
| Revenue Bonds |
| Fairview Health Services |
| Series 2018 (Wells Fargo Bank NA) |
| 11/15/2048 | 3.950% | | 500,000 | 500,000 |
| New York 0.3% |
| New York City Transitional Finance Authority(c),(d) |
| Revenue Bonds |
| Future Tax Secured |
| Subordinated Series 2012C (JPMorgan Chase Bank) |
| 11/01/2036 | 3.950% | | 2,000,000 | 2,000,000 |
| New York City Water & Sewer System(c),(d) |
| Revenue Bonds |
| 2nd General Resolution |
| Series 2013 (JPMorgan Chase Bank) |
| 06/15/2050 | 3.950% | | 2,500,000 | 2,500,000 |
| Total | 4,500,000 |
| Utah 0.0% |
| City of Murray(c),(d) |
| Revenue Bonds |
| IHC Health Services, Inc. |
| Series 2005A (JPMorgan Chase Bank) |
| 05/15/2037 | 3.870% | | 500,000 | 500,000 |
Total Floating Rate Notes
(Cost $10,500,000) | 10,500,000 |
|
| Municipal Bonds 98.4% |
| Issue Description | Coupon
Rate | | Principal
Amount ($) | Value ($) |
| Alabama 2.0% |
| Black Belt Energy Gas District(e) |
| Prerefunded 11/30/23 Revenue Bonds |
| Series 2018B-1 |
0.7 x 1-month Term SOFR + 0.900%
11/30/2048 | 4.585% | | 4,000,000 | 3,999,934 |
| Municipal Bonds (continued) |
| Issue Description | Coupon
Rate | | Principal
Amount ($) | Value ($) |
| Black Belt Energy Gas District |
| Revenue Bonds |
| Project No. 5 |
| Series 2020A-1 (Mandatory Put 10/01/26) |
| 10/01/2049 | 4.000% | | 11,500,000 | 11,143,101 |
| Series 2023A (Mandatory Put 10/01/30) |
| 01/01/2054 | 5.250% | | 9,000,000 | 9,009,166 |
| UAB Medicine Finance Authority |
| Refunding Revenue Bonds |
| University of Alabama - Medicine |
| Series 2017B2 |
| 09/01/2036 | 5.000% | | 2,340,000 | 2,358,186 |
| 09/01/2037 | 5.000% | | 2,030,000 | 2,035,674 |
| 09/01/2041 | 5.000% | | 1,020,000 | 994,296 |
| Revenue Bonds |
| University of Alabama - Medicine |
| Series 2019 |
| 09/01/2044 | 4.000% | | 2,470,000 | 2,108,018 |
| Total | 31,648,375 |
| Alaska 0.2% |
| Alaska Housing Finance Corp. |
| Prerefunded 12/01/24 Revenue Bonds |
| State Capital Project Bonds II |
| Series 2014 |
| 12/01/2028 | 5.000% | | 2,500,000 | 2,530,512 |
| 06/01/2029 | 5.000% | | 1,000,000 | 1,012,204 |
| Total | 3,542,716 |
| Arizona 2.2% |
| Arizona Industrial Development Authority(a) |
| Refunding Revenue Bonds |
| Arizona Agribusiness & Equine Center, Inc. Project |
| Series 2017B |
| 03/01/2037 | 5.000% | | 1,250,000 | 1,118,300 |
| 03/01/2042 | 5.000% | | 1,000,000 | 846,273 |
| Revenue Bonds |
| Cadence Campus Project |
| Series 2020A |
| 07/15/2030 | 4.000% | | 535,000 | 496,156 |
| 07/15/2040 | 4.000% | | 925,000 | 728,150 |
| 07/15/2050 | 4.000% | | 1,600,000 | 1,117,364 |
| Doral Academy Nevada - Fire Mesa |
| Series 2019A |
| 07/15/2029 | 3.550% | | 995,000 | 900,716 |
| 07/15/2049 | 5.000% | | 3,350,000 | 2,762,216 |
The accompanying Notes to Financial Statements are an integral part of this statement.
| 8 | Columbia Intermediate Duration Municipal Bond Fund | Annual Report 2023 |
Portfolio of Investments (continued)
October 31, 2023
| Municipal Bonds (continued) |
| Issue Description | Coupon
Rate | | Principal
Amount ($) | Value ($) |
| Lone Mountain Campus Projects |
| Series 2019 |
| 12/15/2029 | 3.750% | | 485,000 | 437,390 |
| 12/15/2039 | 5.000% | | 400,000 | 352,975 |
| 12/15/2049 | 5.000% | | 700,000 | 567,301 |
| Pinecrest Academy - Horizon |
| Series 2018 |
| 07/15/2038 | 5.750% | | 1,750,000 | 1,736,128 |
| Arizona State University |
| Revenue Bonds |
| Green Bonds |
| Series 2019A |
| 07/01/2037 | 5.000% | | 7,800,000 | 8,067,177 |
| Industrial Development Authority of the City of Phoenix (The)(a) |
| Revenue Bonds |
| FAC-Legacy Traditional Schools Project |
| Series 2016 |
| 07/01/2031 | 5.000% | | 3,000,000 | 2,947,399 |
| La Paz County Industrial Development Authority |
| Revenue Bonds |
| Charter School Solutions - Harmony Public Schools Project |
| Series 2016 |
| 02/15/2036 | 5.000% | | 2,800,000 | 2,664,084 |
| 02/15/2046 | 5.000% | | 1,000,000 | 850,927 |
| Series 2018 |
| 02/15/2048 | 5.000% | | 1,185,000 | 995,142 |
| Maricopa County Industrial Development Authority |
| Refunding Revenue Bonds |
| Horizon Community Learning Center |
| Series 2016 |
| 07/01/2035 | 5.000% | | 2,325,000 | 2,115,702 |
| Revenue Bonds |
| Reid Traditional Schools Project |
| Series 2016 |
| 07/01/2036 | 5.000% | | 750,000 | 723,911 |
| Maricopa County Industrial Development Authority(a) |
| Refunding Revenue Bonds |
| Legacy Traditional Schools Project |
| Series 2019 |
| 07/01/2039 | 5.000% | | 1,000,000 | 900,213 |
| Paradise Schools Project |
| Series 2016 |
| 07/01/2047 | 5.000% | | 1,225,000 | 1,043,701 |
| Salt River Project Agricultural Improvement & Power District |
| Revenue Bonds |
| Series 2023A |
| 01/01/2043 | 5.000% | | 3,000,000 | 3,087,030 |
| Total | 34,458,255 |
| Municipal Bonds (continued) |
| Issue Description | Coupon
Rate | | Principal
Amount ($) | Value ($) |
| Arkansas 0.1% |
| University of Arkansas |
| Prerefunded 11/01/24 Revenue Bonds |
| Various Facilities - Fayetteville Campus |
| Series 2015 |
| 11/01/2030 | 5.000% | | 1,000,000 | 1,011,294 |
| California 11.9% |
| Alvord Unified School District(f) |
| Unlimited General Obligation Bonds |
| 2007 Election |
| Series 2011B (AGM) |
| 08/01/2046 | 0.000% | | 1,150,000 | 1,163,213 |
| Bay Area Toll Authority(e) |
| Revenue Bonds |
| San Francisco Bay Area Toll Bridge |
| Series 2013 (Mandatory Put 04/01/27) |
Muni Swap Index Yield + 1.250%
04/01/2036 | 5.340% | | 5,000,000 | 4,995,497 |
| Burbank Unified School District(f) |
| Prerefunded 02/01/25 Unlimited General Obligation Bonds |
| Convertible |
| Series 2015A |
| 08/01/2031 | 0.000% | | 1,325,000 | 1,346,059 |
| California Educational Facilities Authority |
| Revenue Bonds |
| Chapman University |
| Series 2015 |
| 04/01/2028 | 5.000% | | 1,000,000 | 1,017,598 |
| 04/01/2029 | 5.000% | | 1,650,000 | 1,672,409 |
| 04/01/2030 | 5.000% | | 1,700,000 | 1,720,345 |
| California Health Facilities Financing Authority |
| Prerefunded 11/15/25 Revenue Bonds |
| Sutter Health Obligation Group |
| Series 2016A |
| 11/15/2033 | 5.000% | | 5,000,000 | 5,114,964 |
| Refunding Revenue Bonds |
| Children’s Hospital |
| Series 2017A |
| 08/15/2042 | 5.000% | | 1,000,000 | 940,849 |
| El Camino Hospital |
| Series 2015A |
| 02/01/2029 | 5.000% | | 1,485,000 | 1,503,289 |
| Revenue Bonds |
| El Camino Hospital |
| Series 2017 |
| 02/01/2034 | 5.000% | | 1,750,000 | 1,782,155 |
| California Municipal Finance Authority |
| Refunding Revenue Bonds |
| Community Medical Centers |
| Series 2017A |
| 02/01/2042 | 5.000% | | 1,500,000 | 1,452,160 |
The accompanying Notes to Financial Statements are an integral part of this statement.
Columbia Intermediate Duration Municipal Bond Fund | Annual Report 2023
| 9 |
Portfolio of Investments (continued)
October 31, 2023
| Municipal Bonds (continued) |
| Issue Description | Coupon
Rate | | Principal
Amount ($) | Value ($) |
| Revenue Bonds |
| National University |
| Series 2019A |
| 04/01/2037 | 5.000% | | 1,470,000 | 1,474,841 |
| California School Finance Authority(a) |
| Refunding Revenue Bonds |
| Aspire Public Schools |
| Series 2016 |
| 08/01/2036 | 5.000% | | 1,910,000 | 1,884,393 |
| Revenue Bonds |
| Aspire Public Schools Obligation Group |
| Series 2021 |
| 08/01/2041 | 4.000% | | 500,000 | 410,368 |
| California State Public Works Board |
| Refunding Revenue Bonds |
| Various Capital Projects |
| Series 2023 |
| 09/01/2037 | 5.000% | | 4,800,000 | 5,127,371 |
| 09/01/2038 | 5.000% | | 1,000,000 | 1,059,866 |
| Revenue Bonds |
| Various Capital Projects |
| Series 2013I |
| 11/01/2029 | 5.000% | | 2,500,000 | 2,505,222 |
| 11/01/2031 | 5.500% | | 2,930,000 | 2,938,517 |
| Various Correctional Facilities |
| Series 2014A |
| 09/01/2031 | 5.000% | | 15,350,000 | 15,454,068 |
| California Statewide Communities Development Authority |
| Prerefunded 10/01/24 Revenue Bonds |
| Henry Mayo Newhall Memorial Hospital |
| Series 2014A (AGM) |
| 10/01/2034 | 5.000% | | 5,000,000 | 5,064,929 |
| Revenue Bonds |
| Methodist Hospital of Southern California |
| Series 2018 |
| 01/01/2038 | 5.000% | | 3,000,000 | 2,863,450 |
| Series 2017 |
| 05/15/2033 | 5.000% | | 1,350,000 | 1,354,742 |
| 05/15/2034 | 5.000% | | 1,000,000 | 1,001,904 |
| 05/15/2035 | 5.000% | | 2,200,000 | 2,198,044 |
| City of Los Angeles Department of Airports(b) |
| Refunding Revenue Bonds |
| Green Bonds |
| Subordinated Series 2023 |
| 05/15/2039 | 5.250% | | 2,000,000 | 2,037,899 |
| 05/15/2040 | 5.250% | | 1,320,000 | 1,341,448 |
| Los Angeles International Airport |
| Subordinated Series 2022 |
| 05/15/2029 | 5.000% | | 2,060,000 | 2,109,623 |
| Revenue Bonds |
| Series 2020C |
| 05/15/2030 | 5.000% | | 5,000,000 | 5,163,577 |
| Municipal Bonds (continued) |
| Issue Description | Coupon
Rate | | Principal
Amount ($) | Value ($) |
| City of Tulare Sewer |
| Refunding Revenue Bonds |
| Series 2015 (AGM) |
| 11/15/2030 | 5.000% | | 1,910,000 | 1,946,536 |
| 11/15/2031 | 5.000% | | 1,000,000 | 1,019,180 |
| 11/15/2032 | 5.000% | | 1,610,000 | 1,640,803 |
| City of Upland |
| Refunding Certificate of Participation |
| San Antonio Regional Hospital |
| Series 2017 |
| 01/01/2035 | 4.000% | | 1,000,000 | 874,668 |
| Del Mar Race Track Authority |
| Refunding Revenue Bonds |
| Series 2015 |
| 10/01/2035 | 5.000% | | 2,665,000 | 2,419,169 |
| Escondido Union High School District(f) |
| Unlimited General Obligation Bonds |
| Capital Appreciation - Election of 2008 |
| Series 2009A (AGM) |
| 08/01/2031 | 0.000% | | 480,000 | 344,298 |
| Escondido Union High School District(g) |
| Unlimited General Obligation Bonds |
| Convertible |
| Series 2011 |
| 08/01/2032 | 5.450% | | 1,250,000 | 1,286,726 |
| Fresno Unified School District |
| Unlimited General Obligation Refunding Bonds |
| Series 2002A (MBIA) |
| 08/01/2026 | 6.000% | | 1,650,000 | 1,685,152 |
| Golden State Tobacco Securitization Corp. |
| Prerefunded 06/01/25 Asset-Backed Revenue Bonds |
| Series 2015A |
| 06/01/2033 | 5.000% | | 5,250,000 | 5,355,856 |
| Prerefunded 06/01/27 Revenue Bonds |
| Series 2017A-1 |
| 06/01/2028 | 5.000% | | 1,000,000 | 1,046,557 |
| 06/01/2029 | 5.000% | | 1,000,000 | 1,046,557 |
| Hartnell Community College District(f) |
| Unlimited General Obligation Refunding Bonds |
| Capital Appreciation Serial Bonds |
| Series 2015A |
| 08/01/2035 | 0.000% | | 2,650,000 | 1,524,589 |
| Lakeside Union School District/Kern County(f) |
| Unlimited General Obligation Bonds |
| Capital Appreciation - Election |
| Series 2009 Escrowed to Maturity (AGM) |
| 09/01/2027 | 0.000% | | 5,000 | 4,336 |
| Los Angeles County Sanitation Districts Financing Authority |
| Refunding Revenue Bonds |
| Capital Projects - District #14 |
| Subordinated Series 2015 |
| 10/01/2033 | 5.000% | | 4,000,000 | 4,075,216 |
The accompanying Notes to Financial Statements are an integral part of this statement.
| 10 | Columbia Intermediate Duration Municipal Bond Fund | Annual Report 2023 |
Portfolio of Investments (continued)
October 31, 2023
| Municipal Bonds (continued) |
| Issue Description | Coupon
Rate | | Principal
Amount ($) | Value ($) |
| Manteca Unified School District(f) |
| Unlimited General Obligation Bonds |
| Capital Appreciation - Election of 2004 |
| Series 2006 (NPFGC) |
| 08/01/2024 | 0.000% | | 5,000,000 | 4,847,750 |
| Mount Diablo Unified School District(g) |
| Unlimited General Obligation Bonds |
| Capital Appreciation - Election of 2010 |
| Series 2010A (AGM) |
| 08/01/2035 | 5.750% | | 2,125,000 | 2,177,292 |
| M-S-R Energy Authority |
| Revenue Bonds |
| Series 2009A |
| 11/01/2039 | 6.500% | | 4,940,000 | 5,558,372 |
| Norman Y Mineta San Jose International Airport SJC |
| Refunding Revenue Bonds |
| Series 2017B |
| 03/01/2042 | 5.000% | | 1,665,000 | 1,678,979 |
| Norman Y. Mineta San Jose International Airport(b) |
| Refunding Revenue Bonds |
| Series 2017A |
| 03/01/2041 | 5.000% | | 1,000,000 | 969,817 |
| Pasadena Public Financing Authority(f) |
| Revenue Bonds |
| Capital Appreciation - Rose Bowl |
| Series 2010A |
| 03/01/2029 | 0.000% | | 2,000,000 | 1,575,744 |
| Pico Rivera Water Authority |
| Revenue Bonds |
| Water System Project |
| Series 1999A (NPFGC) |
| 05/01/2029 | 5.500% | | 1,980,000 | 2,036,175 |
| Rancho Santiago Community College District(f) |
| Unlimited General Obligation Bonds |
| Capital Appreciation - Election of 2002 |
| Series 2006C (AGM) |
| 09/01/2031 | 0.000% | | 28,000,000 | 19,928,700 |
| Sacramento Redevelopment Agency Successor Agency |
| Refunding Tax Allocation Bonds |
| Subordinated Series 2015A (BAM) |
| 12/01/2027 | 5.000% | | 235,000 | 240,095 |
| 12/01/2028 | 5.000% | | 425,000 | 433,870 |
| 12/01/2030 | 5.000% | | 1,000,000 | 1,018,489 |
| 12/01/2031 | 5.000% | | 2,000,000 | 2,033,097 |
| San Francisco City & County Airport Commission - San Francisco International Airport(b) |
| Revenue Bonds |
| Series 2019E |
| 05/01/2045 | 5.000% | | 13,500,000 | 12,974,531 |
| Municipal Bonds (continued) |
| Issue Description | Coupon
Rate | | Principal
Amount ($) | Value ($) |
| San Joaquin Hills Transportation Corridor Agency(f) |
| Revenue Bonds |
| Senior Lien |
| Series 1993 Escrowed to Maturity |
| 01/01/2025 | 0.000% | | 22,405,000 | 21,424,627 |
| San Jose Unified School District(f) |
| Unlimited General Obligation Bonds |
| Capital Appreciation - Election of 2002 |
| Series 2006C (NPFGC) |
| 08/01/2027 | 0.000% | | 1,495,000 | 1,280,318 |
| State of California |
| Unlimited General Obligation Bonds |
| Series 2015 |
| 03/01/2033 | 5.000% | | 2,500,000 | 2,524,718 |
| Tustin Community Facilities District |
| Refunding Special Tax Bonds |
| Legacy Villages of Columbus #06-1 |
| Series 2015 |
| 09/01/2031 | 5.000% | | 1,000,000 | 1,012,902 |
| 09/01/2033 | 5.000% | | 1,250,000 | 1,264,759 |
| Vallejo City Unified School District |
| Unlimited General Obligation Refunding Bonds |
| Series 2002A (MBIA) |
| 08/01/2025 | 5.900% | | 690,000 | 695,309 |
| WateReuse Finance Authority |
| Refunding Revenue Bonds |
| Vallejo Sanitation and Flood |
| Series 2014 (BAM) |
| 05/01/2036 | 5.500% | | 2,635,000 | 2,651,870 |
| Total | 187,295,857 |
| Colorado 3.0% |
| Arkansas River Power Authority |
| Refunding Revenue Bonds |
| Series 2018A |
| 10/01/2038 | 5.000% | | 2,250,000 | 2,145,671 |
| City & County of Denver |
| Revenue Bonds |
| Series 2018A-1 |
| 08/01/2041 | 5.000% | | 8,000,000 | 8,062,086 |
| City & County of Denver Airport System(b) |
| Refunding Revenue Bonds |
| Series 2017A |
| 11/15/2030 | 5.000% | | 5,010,000 | 5,079,186 |
| Series 2022D |
| 11/15/2039 | 5.750% | | 2,250,000 | 2,380,243 |
| System |
| Subordinated Series 2018A |
| 12/01/2048 | 5.000% | | 3,000,000 | 2,808,693 |
The accompanying Notes to Financial Statements are an integral part of this statement.
Columbia Intermediate Duration Municipal Bond Fund | Annual Report 2023
| 11 |
Portfolio of Investments (continued)
October 31, 2023
| Municipal Bonds (continued) |
| Issue Description | Coupon
Rate | | Principal
Amount ($) | Value ($) |
| Colorado Health Facilities Authority |
| Prerefunded 06/01/27 Revenue Bonds |
| Evangelical Lutheran Good Samaritan Society |
| Series 2017 |
| 06/01/2030 | 5.000% | | 2,000,000 | 2,073,368 |
| 06/01/2047 | 5.000% | | 1,000,000 | 1,036,684 |
| Refunding Revenue Bonds |
| CommonSpirit Health |
| Series 2019A |
| 08/01/2044 | 4.000% | | 2,000,000 | 1,609,984 |
| 08/01/2049 | 4.000% | | 2,265,000 | 1,749,601 |
| Covenant Retirement Communities |
| Series 2015 |
| 12/01/2023 | 5.000% | | 215,000 | 214,923 |
| 12/01/2026 | 5.000% | | 1,860,000 | 1,838,738 |
| 12/01/2028 | 5.000% | | 1,000,000 | 979,739 |
| 12/01/2030 | 5.000% | | 1,400,000 | 1,359,272 |
| Revenue Bonds |
| Parkview Medical Center, Inc. Project |
| Series 2020 |
| 09/01/2045 | 4.000% | | 1,000,000 | 786,429 |
| 09/01/2050 | 4.000% | | 1,500,000 | 1,129,098 |
| Denver City & County School District No. 1 |
| Unlimited General Obligation Bonds |
| Series 2021 |
| 12/01/2039 | 5.000% | | 5,000,000 | 5,198,181 |
| E-470 Public Highway Authority(e) |
| Refunding Revenue Bonds |
| Series 2021B (Mandatory Put 09/01/24) |
0.7 x SOFR + 0.350%
09/01/2039 | 3.908% | | 2,000,000 | 1,990,861 |
| Park Creek Metropolitan District |
| Refunding Revenue Bonds |
| Senior Limited Property Tax |
| Series 2015 |
| 12/01/2030 | 5.000% | | 1,895,000 | 1,917,219 |
| Refunding Tax Allocation Bonds |
| Limited Property Tax |
| Series 2015 |
| 12/01/2032 | 5.000% | | 1,500,000 | 1,514,320 |
| Regional Transportation District |
| Certificate of Participation |
| Series 2015 |
| 06/01/2027 | 5.000% | | 2,925,000 | 2,971,931 |
| Total | 46,846,227 |
| Connecticut 1.3% |
| Connecticut State Health & Educational Facilities Authority |
| Refunding Revenue Bonds |
| Fairfield University |
| Series 2018S |
| 07/01/2029 | 5.000% | | 1,000,000 | 1,033,796 |
| Municipal Bonds (continued) |
| Issue Description | Coupon
Rate | | Principal
Amount ($) | Value ($) |
| State of Connecticut |
| Revenue Bonds |
| Special Tax Obligation |
| Series 2020 |
| 05/01/2040 | 5.000% | | 2,130,000 | 2,189,050 |
| Unlimited General Obligation Bonds |
| Series 2016A |
| 03/15/2027 | 5.000% | | 2,155,000 | 2,213,167 |
| Series 2017A |
| 04/15/2034 | 5.000% | | 3,000,000 | 3,089,809 |
| Series 2019A |
| 04/15/2036 | 5.000% | | 2,200,000 | 2,297,915 |
| Social Bonds |
| Series 2022F |
| 11/15/2038 | 5.000% | | 2,000,000 | 2,096,556 |
| University of Connecticut |
| Revenue Bonds |
| Series 2016A |
| 03/15/2032 | 5.000% | | 2,000,000 | 2,042,018 |
| Series 2017A |
| 01/15/2033 | 5.000% | | 4,000,000 | 4,090,348 |
| Series 2019A |
| 11/01/2036 | 5.000% | | 1,485,000 | 1,526,547 |
| Total | 20,579,206 |
| Delaware 0.2% |
| City of Wilmington |
| Unlimited General Obligation Bonds |
| Series 2013A |
| 10/01/2025 | 5.000% | | 3,715,000 | 3,716,628 |
| District of Columbia 3.5% |
| District of Columbia |
| Refunding Revenue Bonds |
| Children’s Hospital |
| Series 2015 |
| 07/15/2030 | 5.000% | | 3,000,000 | 3,025,466 |
| Friendship Public Charter School |
| Series 2016 |
| 06/01/2036 | 5.000% | | 4,815,000 | 4,645,123 |
| 06/01/2046 | 5.000% | | 1,385,000 | 1,211,540 |
| Revenue Bonds |
| KIPP DC Project |
| Series 2019 |
| 07/01/2044 | 4.000% | | 3,480,000 | 2,832,572 |
| Unlimited General Obligation Bonds |
| Series 2023A |
| 01/01/2039 | 5.000% | | 1,000,000 | 1,047,247 |
The accompanying Notes to Financial Statements are an integral part of this statement.
| 12 | Columbia Intermediate Duration Municipal Bond Fund | Annual Report 2023 |
Portfolio of Investments (continued)
October 31, 2023
| Municipal Bonds (continued) |
| Issue Description | Coupon
Rate | | Principal
Amount ($) | Value ($) |
| Metropolitan Washington Airports Authority(b) |
| Refunding Revenue Bonds |
| Airport System |
| Series 2019A |
| 10/01/2037 | 5.000% | | 5,000,000 | 4,926,362 |
| Series 2023A |
| 10/01/2039 | 5.250% | | 1,400,000 | 1,425,117 |
| Metropolitan Washington Airports Authority Dulles Toll Road |
| Refunding Revenue Bonds |
| Dulles Metrorail |
| Subordinated Series 2019 |
| 10/01/2049 | 4.000% | | 3,000,000 | 2,344,380 |
| Metropolitan Washington Airports Authority Dulles Toll Road(f) |
| Revenue Bonds |
| Capital Appreciation - 2nd Senior Lien |
| Series 2009B (AGM) |
| 10/01/2024 | 0.000% | | 20,980,000 | 20,207,065 |
| 10/01/2025 | 0.000% | | 7,500,000 | 6,923,029 |
| 10/01/2026 | 0.000% | | 5,000,000 | 4,423,486 |
| Washington Convention & Sports Authority |
| Refunding Revenue Bonds |
| Series 2018A |
| 10/01/2030 | 5.000% | | 1,500,000 | 1,553,346 |
| Total | 54,564,733 |
| Florida 5.1% |
| Central Florida Expressway Authority |
| Refunding Revenue Bonds |
| Senior Lien |
| Series 2017 (BAM) |
| 07/01/2041 | 4.000% | | 4,000,000 | 3,427,911 |
| City of Atlantic Beach |
| Revenue Bonds |
| Fleet Landing Project |
| Series 2018 |
| 11/15/2048 | 5.000% | | 1,750,000 | 1,425,674 |
| Series 2018A |
| 11/15/2043 | 5.000% | | 1,085,000 | 919,136 |
| City of Lakeland Department of Electric Utilities |
| Refunding Revenue Bonds |
| Series 2010 (AGM) |
| 10/01/2028 | 5.250% | | 1,250,000 | 1,331,573 |
| City of Orlando Tourist Development Tax |
| Refunding Revenue Bonds |
| Senior Lien - Tourist Development |
| Series 2017 (AGM) |
| 11/01/2035 | 5.000% | | 2,270,000 | 2,275,417 |
| City of Tampa(f) |
| Revenue Bonds |
| Capital Appreciation |
| Series 2020A |
| 09/01/2034 | 0.000% | | 650,000 | 361,233 |
| Municipal Bonds (continued) |
| Issue Description | Coupon
Rate | | Principal
Amount ($) | Value ($) |
| County of Broward Airport System(b) |
| Revenue Bonds |
| Series 2015A |
| 10/01/2026 | 5.000% | | 750,000 | 749,789 |
| 10/01/2031 | 5.000% | | 1,000,000 | 990,486 |
| County of Miami-Dade Aviation |
| Refunding Revenue Bonds |
| Series 2014B |
| 10/01/2025 | 5.000% | | 800,000 | 806,533 |
| 10/01/2032 | 5.000% | | 6,620,000 | 6,572,913 |
| County of Miami-Dade Aviation(b) |
| Revenue Bonds |
| Series 2019A |
| 10/01/2044 | 4.000% | | 1,000,000 | 820,320 |
| County of Miami-Dade Rickenbacker Causeway |
| Revenue Bonds |
| Series 2014 |
| 10/01/2033 | 5.000% | | 1,215,000 | 1,216,777 |
| County of Miami-Dade Seaport Department(b) |
| Refunding Revenue Bonds |
| Series 2023A |
| 10/01/2039 | 5.000% | | 3,000,000 | 2,954,246 |
| County of Miami-Dade Water & Sewer System |
| Revenue Bonds |
| Series 2017A |
| 10/01/2033 | 5.000% | | 2,000,000 | 2,023,031 |
| County of Osceola Transportation(f) |
| Refunding Revenue Bonds |
| Series 2020A-2 |
| 10/01/2034 | 0.000% | | 1,850,000 | 1,040,691 |
| Series 2020A-2 (AGM) |
| 10/01/2030 | 0.000% | | 1,200,000 | 841,267 |
| Emerald Coast Utilities Authority |
| Refunding Revenue Bonds |
| Utility System |
| Series 2015 (BAM) |
| 01/01/2032 | 5.000% | | 1,445,000 | 1,457,808 |
| Halifax Hospital Medical Center |
| Refunding Revenue Bonds |
| Series 2016 |
| 06/01/2026 | 5.000% | | 1,525,000 | 1,548,655 |
| 06/01/2027 | 5.000% | | 1,295,000 | 1,307,654 |
| Hillsborough County Aviation Authority |
| Prerefunded 10/01/24 Revenue Bonds |
| Tampa International Airport |
| Subordinated Series 2015B |
| 10/01/2031 | 5.000% | | 1,600,000 | 1,615,742 |
| 10/01/2032 | 5.000% | | 2,300,000 | 2,322,629 |
The accompanying Notes to Financial Statements are an integral part of this statement.
Columbia Intermediate Duration Municipal Bond Fund | Annual Report 2023
| 13 |
Portfolio of Investments (continued)
October 31, 2023
| Municipal Bonds (continued) |
| Issue Description | Coupon
Rate | | Principal
Amount ($) | Value ($) |
| Miami-Dade County Educational Facilities Authority |
| Refunding Revenue Bonds |
| University of Miami |
| Series 2015A |
| 04/01/2031 | 5.000% | | 2,000,000 | 2,006,130 |
| Mid-Bay Bridge Authority |
| Refunding Revenue Bonds |
| Series 2015A |
| 10/01/2030 | 5.000% | | 2,150,000 | 2,153,021 |
| Monroe County School District |
| Refunding Certificate of Participation |
| Series 2018A |
| 06/01/2034 | 5.000% | | 1,000,000 | 1,045,828 |
| Orange County School Board |
| Refunding Certificate of Participation |
| Series 2016C |
| 08/01/2033 | 5.000% | | 5,000,000 | 5,109,903 |
| Palm Beach County Health Facilities Authority |
| Revenue Bonds |
| Lifespace Communities, Inc. |
| Series 2018 |
| 05/15/2036 | 5.000% | | 2,550,000 | 2,149,650 |
| 05/15/2037 | 5.000% | | 2,500,000 | 2,061,362 |
| Pasco County School Board |
| Refunding Certificate of Participation |
| Series 2015A |
| 08/01/2026 | 5.000% | | 4,620,000 | 4,697,321 |
| 08/01/2027 | 5.000% | | 2,500,000 | 2,540,995 |
| Polk County Industrial Development Authority |
| Refunding Revenue Bonds |
| Carpenter’s Home Estates |
| Series 2019 |
| 01/01/2029 | 5.000% | | 590,000 | 571,702 |
| 01/01/2039 | 5.000% | | 300,000 | 262,237 |
| 01/01/2049 | 5.000% | | 1,000,000 | 791,452 |
| Sarasota County Health Facilities Authority |
| Refunding Revenue Bonds |
| Village of Isle Project |
| Series 2016 |
| 01/01/2030 | 5.000% | | 750,000 | 718,466 |
| 01/01/2031 | 5.000% | | 935,000 | 887,905 |
| 01/01/2032 | 5.000% | | 1,100,000 | 1,035,138 |
| Sarasota County Public Hospital District |
| Revenue Bonds |
| Memorial Hospital District |
| Series 2018 |
| 07/01/2041 | 5.000% | | 5,000,000 | 4,870,395 |
| School Board of Miami-Dade County (The) |
| Refunding Certificate of Participation |
| Series 2015A |
| 05/01/2030 | 5.000% | | 2,500,000 | 2,525,653 |
| Municipal Bonds (continued) |
| Issue Description | Coupon
Rate | | Principal
Amount ($) | Value ($) |
| Southeast Overtown Park West Community Redevelopment Agency(a) |
| Tax Allocation Bonds |
| Series 2014A-1 |
| 03/01/2030 | 5.000% | | 2,925,000 | 2,925,394 |
| St. Johns County Industrial Development Authority |
| Refunding Revenue Bonds |
| Vicar’s Landing Project |
| Series 2021 |
| 12/15/2041 | 4.000% | | 500,000 | 363,309 |
| 12/15/2046 | 4.000% | | 500,000 | 338,840 |
| 12/15/2050 | 4.000% | | 500,000 | 325,425 |
| Sterling Hill Community Development District(h) |
| Special Assessment Bonds |
| Series 2003B |
| 11/01/2010 | 0.000% | | 137,787 | 70,271 |
| Volusia County Educational Facility Authority |
| Refunding Revenue Bonds |
| Embry Riddle Aeronautical University |
| Series 2020 |
| 10/15/2044 | 5.000% | | 5,850,000 | 5,754,004 |
| Revenue Bonds |
| Series 2015B |
| 10/15/2030 | 5.000% | | 1,510,000 | 1,518,393 |
| Total | 80,732,279 |
| Georgia 2.8% |
| City of Atlanta Department of Aviation |
| Refunding Revenue Bonds |
| General |
| Subordinated Series 2014 |
| 01/01/2033 | 5.000% | | 1,000,000 | 1,001,556 |
| City of Atlanta Water & Wastewater |
| Revenue Bonds |
| Series 2018B |
| 11/01/2043 | 5.000% | | 3,000,000 | 2,999,115 |
| Fulton County Development Authority |
| Refunding Revenue Bonds |
| Spelman College |
| Series 2015 |
| 06/01/2032 | 5.000% | | 3,630,000 | 3,660,655 |
| Gainesville & Hall County Development Authority |
| Refunding Revenue Bonds |
| Riverside Military Academy |
| Series 2017 |
| 03/01/2027 | 5.000% | | 410,000 | 378,990 |
| 03/01/2037 | 5.000% | | 2,500,000 | 1,903,591 |
| 03/01/2052 | 5.125% | | 2,925,000 | 1,926,583 |
| Gainesville & Hall County Hospital Authority |
| Refunding Revenue Bonds |
| Northeast Georgia Health System, Inc. Project |
| Series 2017 |
| 02/15/2037 | 5.000% | | 2,000,000 | 2,015,818 |
The accompanying Notes to Financial Statements are an integral part of this statement.
| 14 | Columbia Intermediate Duration Municipal Bond Fund | Annual Report 2023 |
Portfolio of Investments (continued)
October 31, 2023
| Municipal Bonds (continued) |
| Issue Description | Coupon
Rate | | Principal
Amount ($) | Value ($) |
| Northeast Georgia Health Systems, Inc. |
| Series 2017 |
| 02/15/2036 | 5.000% | | 1,500,000 | 1,518,802 |
| 02/15/2042 | 5.000% | | 3,000,000 | 2,913,481 |
| Series 2020 |
| 02/15/2040 | 4.000% | | 7,000,000 | 6,090,619 |
| Georgia State Road & Tollway Authority(a),(f) |
| Prerefunded 06/01/24 Revenue Bonds |
| I-75 S Express Lanes Project |
| Series 2014 |
| 06/01/2034 | 0.000% | | 3,750,000 | 1,981,082 |
| Revenue Bonds |
| I-75 S Express Lanes Project |
| Series 2014 Escrowed to Maturity |
| 06/01/2024 | 0.000% | | 210,000 | 205,193 |
| Main Street Natural Gas, Inc.(e) |
| Prerefunded 12/01/23 Revenue Bonds |
| Series 2018D |
0.7 x 1-month Term SOFR + 0.830%
07/31/2048 | 4.515% | | 500,000 | 499,747 |
| Series 2018E |
Muni Swap Index Yield + 0.570%
07/31/2048 | 4.660% | | 10,000,000 | 9,994,470 |
| Main Street Natural Gas, Inc. |
| Revenue Bonds |
| Series 2019A |
| 05/15/2030 | 5.000% | | 2,750,000 | 2,730,611 |
| 05/15/2031 | 5.000% | | 4,000,000 | 3,966,690 |
| Total | 43,787,003 |
| Guam 0.1% |
| Territory of Guam(i) |
| Refunding Revenue Bonds |
| Section 30 |
| Series 2016A |
| 12/01/2032 | 5.000% | | 1,310,000 | 1,308,927 |
| 12/01/2033 | 5.000% | | 1,000,000 | 996,479 |
| Total | 2,305,406 |
| Idaho 0.1% |
| Idaho Health Facilities Authority |
| Revenue Bonds |
| Terraces of Boise Project |
| Series 2021 |
| 10/01/2031 | 3.800% | | 2,100,000 | 1,703,641 |
| Illinois 16.0% |
| Chicago Board of Education |
| Revenue Bonds |
| Series 2017 |
| 04/01/2046 | 6.000% | | 1,500,000 | 1,508,105 |
| Municipal Bonds (continued) |
| Issue Description | Coupon
Rate | | Principal
Amount ($) | Value ($) |
| Series 2018 |
| 04/01/2042 | 5.000% | | 1,500,000 | 1,373,367 |
| 04/01/2046 | 5.000% | | 1,250,000 | 1,113,174 |
| Chicago Housing Authority |
| Revenue Bonds |
| Series 2018A (HUD) |
| 01/01/2037 | 5.000% | | 2,500,000 | 2,517,972 |
| Chicago Midway International Airport |
| Refunding Revenue Bonds |
| 2nd Lien |
| Series 2014B |
| 01/01/2029 | 5.000% | | 3,000,000 | 3,007,976 |
| Chicago O’Hare International Airport |
| General Obligation Refunding Bonds |
| Senior Lien |
| Series 2016B |
| 01/01/2033 | 5.000% | | 2,000,000 | 2,016,927 |
| Refunding Revenue Bonds |
| General Senior Lien |
| Series 2017B |
| 01/01/2038 | 5.000% | | 2,290,000 | 2,265,133 |
| Chicago O’Hare International Airport(b) |
| Refunding Revenue Bonds |
| Senior Lien |
| Series 2018 |
| 01/01/2037 | 5.000% | | 1,200,000 | 1,175,676 |
| Series 2018A |
| 01/01/2038 | 5.000% | | 4,250,000 | 4,153,602 |
| 01/01/2039 | 5.000% | | 1,250,000 | 1,216,562 |
| Series 2022 |
| 01/01/2038 | 5.000% | | 1,000,000 | 978,297 |
| 01/01/2039 | 5.000% | | 1,215,000 | 1,183,737 |
| 01/01/2040 | 5.000% | | 1,770,000 | 1,713,990 |
| Series 2015A |
| 01/01/2026 | 5.000% | | 1,500,000 | 1,499,260 |
| 01/01/2031 | 5.000% | | 1,000,000 | 990,952 |
| Chicago Park District |
| Limited General Obligation Bonds |
| Series 2016A |
| 01/01/2040 | 5.000% | | 1,000,000 | 969,412 |
| Limited General Obligation Refunding Bonds |
| Series 2016B |
| 01/01/2031 | 5.000% | | 1,790,000 | 1,800,028 |
| Chicago Transit Authority |
| Revenue Bonds |
| Second Lien |
| Series 2017 |
| 12/01/2046 | 5.000% | | 3,000,000 | 2,883,327 |
The accompanying Notes to Financial Statements are an integral part of this statement.
Columbia Intermediate Duration Municipal Bond Fund | Annual Report 2023
| 15 |
Portfolio of Investments (continued)
October 31, 2023
| Municipal Bonds (continued) |
| Issue Description | Coupon
Rate | | Principal
Amount ($) | Value ($) |
| Chicago Transit Authority Sales Tax Receipts Fund |
| Refunding Revenue Bonds |
| Second Lien |
| Junior Subordinated Series 2020A |
| 12/01/2050 | 4.000% | | 3,000,000 | 2,313,002 |
| City of Chicago |
| Unlimited General Obligation Bonds |
| Series 2017A |
| 01/01/2038 | 6.000% | | 10,000,000 | 10,239,389 |
| Series 2019A |
| 01/01/2040 | 5.000% | | 6,500,000 | 6,285,745 |
| 01/01/2044 | 5.000% | | 11,750,000 | 11,067,001 |
| Unlimited General Obligation Refunding Bonds |
| Series 2020A |
| 01/01/2028 | 5.000% | | 6,000,000 | 6,107,834 |
| City of Chicago Wastewater Transmission |
| Refunding Revenue Bonds |
| 2nd Lien |
| Junior Subordinated Series 2017B |
| 01/01/2032 | 5.000% | | 2,000,000 | 2,007,318 |
| 01/01/2035 | 5.000% | | 3,310,000 | 3,325,107 |
| Series 2015C |
| 01/01/2031 | 5.000% | | 3,715,000 | 3,719,395 |
| 01/01/2039 | 5.000% | | 500,000 | 467,648 |
| Series 2017B |
| 01/01/2033 | 5.000% | | 2,500,000 | 2,517,632 |
| City of Chicago Waterworks |
| Refunding Revenue Bonds |
| 2nd Lien |
| Series 2016 |
| 11/01/2025 | 5.000% | | 2,000,000 | 2,033,228 |
| 11/01/2027 | 5.000% | | 3,750,000 | 3,808,020 |
| Revenue Bonds |
| 2nd Lien |
| Junior Subordinated Series 2016A-1 |
| 11/01/2027 | 5.000% | | 1,000,000 | 1,015,472 |
| 11/01/2029 | 5.000% | | 1,000,000 | 1,012,603 |
| Series 2016A-1 |
| 11/01/2028 | 5.000% | | 1,000,000 | 1,015,022 |
| City of Springfield Electric |
| Refunding Revenue Bonds |
| Senior Lien |
| Series 2015 |
| 03/01/2028 | 5.000% | | 1,000,000 | 1,006,090 |
| 03/01/2029 | 5.000% | | 1,000,000 | 1,005,449 |
| Municipal Bonds (continued) |
| Issue Description | Coupon
Rate | | Principal
Amount ($) | Value ($) |
| Cook County Community Consolidated School District No. 65 Evanston(f) |
| Unlimited General Obligation Bonds |
| Limited Tax |
| Series 2014 |
| 12/01/2027 | 0.000% | | 300,000 | 245,736 |
| 12/01/2029 | 0.000% | | 400,000 | 295,440 |
| 12/01/2030 | 0.000% | | 1,130,000 | 791,030 |
| 12/01/2031 | 0.000% | | 1,500,000 | 993,975 |
| Cook County School District No. 144 Prairie Hills(f) |
| Unlimited General Obligation Bonds |
| Capital Appreciation |
| Series 2011C (AGM) |
| 12/01/2028 | 0.000% | | 2,830,000 | 2,224,953 |
| 12/01/2029 | 0.000% | | 2,580,000 | 1,926,047 |
| Cook County School District No. 83 Mannheim |
| Unlimited General Obligation Bonds |
| School |
| Series 2013 |
| 06/01/2033 | 5.625% | | 2,980,000 | 3,276,629 |
| County of Cook |
| Unlimited General Obligation Refunding Bonds |
| Series 2016A |
| 11/15/2028 | 5.000% | | 3,150,000 | 3,229,910 |
| 11/15/2031 | 5.000% | | 2,750,000 | 2,773,641 |
| County of Cook Sales Tax |
| Refunding Revenue Bonds |
| Series 2018 |
| 11/15/2035 | 5.250% | | 1,520,000 | 1,566,119 |
| 11/15/2036 | 5.250% | | 3,000,000 | 3,071,370 |
| Illinois Finance Authority |
| Improvement Refunding Bonds |
| Chicago International |
| Series 2017 |
| 12/01/2037 | 5.000% | | 1,000,000 | 931,240 |
| 12/01/2047 | 5.000% | | 1,000,000 | 851,298 |
| Prerefunded 01/01/27 Revenue Bonds |
| Edward-Elmhurst Healthcare |
| Series 2017 |
| 01/01/2036 | 5.000% | | 2,000,000 | 2,066,564 |
| Prerefunded 01/01/28 Revenue Bonds |
| Edward-Elmhurst Healthcare |
| Series 2018 |
| 01/01/2044 | 5.000% | | 5,000,000 | 5,217,636 |
| Prerefunded 05/15/25 Revenue Bonds |
| Plymouth Place |
| Series 2015 |
| 05/15/2030 | 5.000% | | 1,000,000 | 1,016,607 |
| Refunding Revenue Bonds |
| OSF Healthcare System |
| Series 2015A |
| 11/15/2026 | 5.000% | | 1,000,000 | 1,008,983 |
| 11/15/2027 | 5.000% | | 500,000 | 504,281 |
The accompanying Notes to Financial Statements are an integral part of this statement.
| 16 | Columbia Intermediate Duration Municipal Bond Fund | Annual Report 2023 |
Portfolio of Investments (continued)
October 31, 2023
| Municipal Bonds (continued) |
| Issue Description | Coupon
Rate | | Principal
Amount ($) | Value ($) |
| Plymouth Place |
| Series 2015 Escrowed to Maturity |
| 05/15/2025 | 5.000% | | 430,000 | 434,166 |
| Rush University Medical Center |
| Series 2015A |
| 11/15/2032 | 5.000% | | 10,000,000 | 10,004,003 |
| Series 2018A |
| 05/15/2043 | 5.000% | | 5,000,000 | 4,787,073 |
| Revenue Bonds |
| University of Illinois at Urbana-Champaign Project |
| Series 2019 |
| 10/01/2049 | 5.000% | | 1,250,000 | 1,145,173 |
| Illinois Municipal Electric Agency |
| Refunding Revenue Bonds |
| Series 2015A |
| 02/01/2030 | 5.000% | | 12,060,000 | 12,184,643 |
| Illinois State Toll Highway Authority |
| Refunding Revenue Bonds |
| Series 2016A |
| 12/01/2032 | 5.000% | | 7,790,000 | 7,894,247 |
| Series 2019A |
| 01/01/2031 | 5.000% | | 500,000 | 523,731 |
| Revenue Bonds |
| Series 2014C |
| 01/01/2032 | 5.000% | | 9,600,000 | 9,653,087 |
| Unrefunded Revenue Bonds |
| Series 2016A |
| 12/01/2031 | 4.000% | | 5,000,000 | 4,975,779 |
| Kane McHenry Cook & De Kalb Counties Unit School District No. 300 |
| Unlimited General Obligation Refunding Bonds |
| Series 2015 |
| 01/01/2024 | 5.000% | | 1,000,000 | 1,001,257 |
| 01/01/2026 | 5.000% | | 4,000,000 | 4,025,955 |
| Metropolitan Pier & Exposition Authority(f) |
| Refunding Revenue Bonds |
| Capital Appreciation - McCormick Place Expansion Project |
| Series 1996A (NPFGC) |
| 06/15/2024 | 0.000% | | 1,000,000 | 972,065 |
| Revenue Bonds |
| McCormick Place Expansion Project |
| Series 2002 Escrowed to Maturity (NPFGC) |
| 12/14/2023 | 0.000% | | 775,000 | 771,350 |
| Unrefunded Revenue Bonds |
| McCormick Place Expansion Project |
| Series 2002 (NPFGC) |
| 12/15/2023 | 0.000% | | 60,000 | 59,685 |
| Railsplitter Tobacco Settlement Authority |
| Prerefunded 06/01/26 Revenue Bonds |
| Series 2017 |
| 05/31/2027 | 5.000% | | 4,185,000 | 4,284,809 |
| Municipal Bonds (continued) |
| Issue Description | Coupon
Rate | | Principal
Amount ($) | Value ($) |
| Sales Tax Securitization Corp. |
| Refunding Revenue Bonds |
| Sales Tax Securitization |
| Series 2017 |
| 01/01/2029 | 5.000% | | 1,000,000 | 1,029,319 |
| 01/01/2030 | 5.000% | | 1,450,000 | 1,486,785 |
| Senior Lien |
| Series 2020A |
| 01/01/2030 | 5.000% | | 2,000,000 | 2,094,160 |
| Series 2018A |
| 01/01/2031 | 5.000% | | 2,000,000 | 2,043,447 |
| Series 2018C |
| 01/01/2043 | 5.250% | | 5,000,000 | 5,021,586 |
| South Suburban College Community School District No. 510(f) |
| Limited General Obligation Bonds |
| Capital Appreciation - Limited Tax |
| Series 2009 (AGM) |
| 12/01/2025 | 0.000% | | 1,000,000 | 905,145 |
| Southwestern Illinois Development Authority |
| Revenue Bonds |
| Local Government - Southwestern Illinois Flood Prevention District Council Project |
| Subordinated Series 2016 |
| 10/15/2029 | 5.000% | | 1,780,000 | 1,810,292 |
| 10/15/2032 | 5.000% | | 1,335,000 | 1,356,966 |
| State of Illinois |
| Revenue Bonds |
| Junior Obligations |
| Series 2018B |
| 06/15/2034 | 5.000% | | 5,000,000 | 5,038,818 |
| Unlimited General Obligation Bonds |
| Series 2014 |
| 02/01/2031 | 5.250% | | 5,000,000 | 4,971,201 |
| Series 2016 |
| 06/01/2026 | 5.000% | | 5,000,000 | 5,079,958 |
| 11/01/2030 | 5.000% | | 1,000,000 | 1,013,073 |
| Series 2019B |
| 11/01/2034 | 4.000% | | 5,000,000 | 4,625,882 |
| Series 2020 |
| 05/01/2039 | 5.500% | | 4,000,000 | 4,092,146 |
| 05/01/2045 | 5.750% | | 2,000,000 | 2,039,850 |
| Series 2020C |
| 05/01/2030 | 5.500% | | 1,500,000 | 1,569,933 |
| Series 2021A |
| 03/01/2038 | 4.000% | | 3,000,000 | 2,636,241 |
| Series 2023B |
| 05/01/2040 | 5.250% | | 1,690,000 | 1,690,303 |
| Unlimited General Obligation Refunding Bonds |
| Series 2016 |
| 02/01/2026 | 5.000% | | 7,000,000 | 7,097,002 |
The accompanying Notes to Financial Statements are an integral part of this statement.
Columbia Intermediate Duration Municipal Bond Fund | Annual Report 2023
| 17 |
Portfolio of Investments (continued)
October 31, 2023
| Municipal Bonds (continued) |
| Issue Description | Coupon
Rate | | Principal
Amount ($) | Value ($) |
| Series 2018A |
| 10/01/2029 | 5.000% | | 2,400,000 | 2,463,084 |
| Series 2018B |
| 10/01/2027 | 5.000% | | 2,300,000 | 2,355,264 |
| 10/01/2029 | 5.000% | | 5,000,000 | 5,131,425 |
| Will County School District No. 114 Manhattan(f) |
| Unlimited General Obligation Bonds |
| Capital Appreciation |
| Series 2005 (NPFGC) |
| 12/01/2023 | 0.000% | | 1,285,000 | 1,279,907 |
| Total | 252,853,721 |
| Indiana 0.6% |
| City of Indianapolis Thermal Energy System |
| Refunding Revenue Bonds |
| 1st Lien |
| Series 2014A |
| 10/01/2032 | 5.000% | | 1,400,000 | 1,413,210 |
| City of Rockport |
| Refunding Revenue Bonds |
| Power Company Project |
| Series 2018A |
| 06/01/2025 | 3.050% | | 2,100,000 | 2,048,591 |
| Indiana Finance Authority |
| Revenue Bonds |
| BHI Senior Living |
| Series 2016A |
| 11/15/2046 | 5.250% | | 2,500,000 | 2,213,504 |
| Series 2018 |
| 11/15/2038 | 5.000% | | 2,000,000 | 1,833,340 |
| Ohio Valley Electric Corp. Project |
| Series 2020 |
| 11/01/2030 | 3.000% | | 2,000,000 | 1,769,504 |
| 11/01/2030 | 3.000% | | 1,000,000 | 884,752 |
| Total | 10,162,901 |
| Iowa 0.5% |
| Iowa Finance Authority |
| Revenue Bonds |
| Lifespace Communities, Inc. |
| Series 2016 |
| 05/15/2036 | 5.000% | | 4,065,000 | 3,426,795 |
| Series 2018A |
| 05/15/2043 | 5.000% | | 1,000,000 | 760,836 |
| Northcrest, Inc. Project |
| Series 2018A |
| 03/01/2048 | 5.000% | | 1,250,000 | 966,903 |
| Municipal Bonds (continued) |
| Issue Description | Coupon
Rate | | Principal
Amount ($) | Value ($) |
| PEFA, Inc. |
| Revenue Bonds |
| Series 2019 (Mandatory Put 09/01/26) |
| 09/01/2049 | 5.000% | | 3,000,000 | 2,979,559 |
| Total | 8,134,093 |
| Kentucky 1.5% |
| Kentucky Economic Development Finance Authority |
| Revenue Bonds |
| Baptist Healthcare Systems |
| Series 2017B |
| 08/15/2041 | 5.000% | | 3,500,000 | 3,405,741 |
| Kentucky Municipal Power Agency |
| Refunding Revenue Bonds |
| Series 2015A |
| 09/01/2029 | 5.000% | | 4,000,000 | 4,029,495 |
| Kentucky Public Energy Authority(e) |
| Revenue Bonds |
| Series 2019A-2 (Mandatory Put 06/01/25) |
0.7 x 1-month Term SOFR + 1.120%
12/01/2049 | 4.805% | | 7,000,000 | 6,980,997 |
| Louisville/Jefferson County Metropolitan Government |
| Refunding Revenue Bonds |
| Norton Healthcare, Inc. |
| Series 2016 |
| 10/01/2030 | 5.000% | | 1,300,000 | 1,308,112 |
| 10/01/2031 | 5.000% | | 3,500,000 | 3,518,304 |
| Paducah Electric Plant Board |
| Refunding Revenue Bonds |
| Series 2016A (AGM) |
| 10/01/2027 | 5.000% | | 2,000,000 | 2,048,032 |
| 10/01/2028 | 5.000% | | 1,850,000 | 1,893,919 |
| Total | 23,184,600 |
| Louisiana 0.4% |
| City of Bossier City Utilities |
| Prerefunded 10/01/24 Revenue Bonds |
| Series 2014 |
| 10/01/2031 | 5.000% | | 1,160,000 | 1,171,933 |
| City of Shreveport Water & Sewer |
| Refunding Revenue Bonds |
| Series 2014A (BAM) |
| 12/01/2025 | 4.000% | | 2,210,000 | 2,213,016 |
| Louisiana Public Facilities Authority |
| Refunding Revenue Bonds |
| Ochsner Clinic Foundation Project |
| Series 2017 |
| 05/15/2042 | 5.000% | | 2,500,000 | 2,399,965 |
| Total | 5,784,914 |
The accompanying Notes to Financial Statements are an integral part of this statement.
| 18 | Columbia Intermediate Duration Municipal Bond Fund | Annual Report 2023 |
Portfolio of Investments (continued)
October 31, 2023
| Municipal Bonds (continued) |
| Issue Description | Coupon
Rate | | Principal
Amount ($) | Value ($) |
| Maine 0.2% |
| Maine Health & Higher Educational Facilities Authority |
| Revenue Bonds |
| Main Health Services |
| Series 2018A |
| 07/01/2043 | 5.000% | | 3,500,000 | 3,406,218 |
| Maryland 1.0% |
| County of Anne Arundel |
| Limited General Obligation Bonds |
| Consolidated General Improvements |
| Series 2019 |
| 10/01/2031 | 5.000% | | 3,500,000 | 3,743,964 |
| Maryland Economic Development Corp. |
| Tax Allocation Bonds |
| Port Covington Project |
| Series 2020 |
| 09/01/2030 | 3.250% | | 500,000 | 447,990 |
| Maryland Health & Higher Educational Facilities Authority |
| Refunding Revenue Bonds |
| Meritus Medical Center Issue |
| Series 2015 |
| 07/01/2028 | 5.000% | | 1,300,000 | 1,306,089 |
| State of Maryland |
| Unlimited General Obligation Refunding Bonds |
| Series 2017B |
| 08/01/2026 | 5.000% | | 10,000,000 | 10,351,241 |
| Total | 15,849,284 |
| Massachusetts 3.7% |
| Commonwealth of Massachusetts |
| Limited General Obligation Bonds |
| Consolidated Loan of 2023 |
| Series 2023 |
| 05/01/2040 | 5.000% | | 870,000 | 912,709 |
| Series 2018A |
| 01/01/2035 | 5.000% | | 10,000,000 | 10,418,327 |
| Series 2019A |
| 01/01/2037 | 5.000% | | 850,000 | 881,466 |
| 01/01/2039 | 5.000% | | 3,960,000 | 4,050,555 |
| Limited General Obligation Refunding Bonds |
| Series 2023C |
| 08/01/2040 | 5.000% | | 5,000,000 | 5,250,324 |
| Massachusetts Bay Transportation Authority(f) |
| Refunding Revenue Bonds |
| Series 2016A |
| 07/01/2029 | 0.000% | | 3,500,000 | 2,665,601 |
| Municipal Bonds (continued) |
| Issue Description | Coupon
Rate | | Principal
Amount ($) | Value ($) |
| Massachusetts Bay Transportation Authority Sales Tax |
| Revenue Bonds |
| Sustainability Bonds |
| Subordinated Series 2017 |
| 07/01/2046 | 5.000% | | 4,465,000 | 4,463,864 |
| Massachusetts Development Finance Agency |
| Refunding Revenue Bonds |
| Emerson College |
| Series 2017A |
| 01/01/2034 | 5.000% | | 1,000,000 | 1,003,726 |
| Foxborough Regional Charter |
| Series 2017 |
| 07/01/2037 | 5.000% | | 1,400,000 | 1,287,247 |
| Lahey Clinic Obligation |
| Series 2015F |
| 08/15/2031 | 5.000% | | 2,490,000 | 2,518,732 |
| 08/15/2032 | 5.000% | | 4,120,000 | 4,167,729 |
| 08/15/2033 | 5.000% | | 3,000,000 | 3,033,780 |
| Simmons University |
| Series 2018L |
| 10/01/2034 | 5.000% | | 2,390,000 | 2,371,659 |
| 10/01/2035 | 5.000% | | 2,000,000 | 1,967,165 |
| Revenue Bonds |
| UMass Boston Student Housing Project |
| Series 2016 |
| 10/01/2032 | 5.000% | | 1,300,000 | 1,290,723 |
| 10/01/2036 | 5.000% | | 4,600,000 | 4,380,947 |
| Massachusetts Development Finance Agency(a) |
| Refunding Revenue Bonds |
| Newbridge Charles, Inc. |
| Series 2017 |
| 10/01/2032 | 4.000% | | 2,000,000 | 1,723,096 |
| 10/01/2037 | 5.000% | | 500,000 | 445,866 |
| 10/01/2047 | 5.000% | | 500,000 | 408,539 |
| Revenue Bonds |
| Linden Ponds, Inc. Facility |
| Series 2018 |
| 11/15/2033 | 5.000% | | 975,000 | 974,022 |
| Massachusetts Port Authority(b) |
| Refunding Revenue Bonds |
| Series 2019A |
| 07/01/2040 | 5.000% | | 4,000,000 | 3,944,989 |
| Total | 58,161,066 |
| Michigan 3.2% |
| Fraser Public School District |
| Unlimited General Obligation Refunding Bonds |
| Series 2015 |
| 05/01/2025 | 5.000% | | 1,700,000 | 1,729,049 |
The accompanying Notes to Financial Statements are an integral part of this statement.
Columbia Intermediate Duration Municipal Bond Fund | Annual Report 2023
| 19 |
Portfolio of Investments (continued)
October 31, 2023
| Municipal Bonds (continued) |
| Issue Description | Coupon
Rate | | Principal
Amount ($) | Value ($) |
| Great Lakes Water Authority Sewage Disposal System |
| Refunding Revenue Bonds |
| Senior Lien |
| Series 2018B |
| 07/01/2029 | 5.000% | | 3,600,000 | 3,807,477 |
| Marshall Public Schools |
| Unlimited General Obligation Refunding Bonds |
| Marshall Public School District |
| Series 2015 |
| 11/01/2028 | 4.000% | | 1,380,000 | 1,381,610 |
| 11/01/2029 | 4.000% | | 940,000 | 940,196 |
| Michigan Finance Authority |
| Refunding Revenue Bonds |
| Henry Ford Health System |
| Series 2016 |
| 11/15/2041 | 5.000% | | 1,000,000 | 963,164 |
| Local Government Loan Program - Great Lakes Water Authority |
| Series 2015 |
| 07/01/2029 | 5.000% | | 950,000 | 960,945 |
| 07/01/2032 | 5.000% | | 1,500,000 | 1,517,282 |
| 07/01/2034 | 5.000% | | 500,000 | 503,602 |
| Senior Lien - Great Lakes Water Authority |
| Series 2014C-6 |
| 07/01/2033 | 5.000% | | 800,000 | 803,661 |
| Series 2014H-1 |
| 10/01/2026 | 5.000% | | 3,300,000 | 3,323,755 |
| Revenue Bonds |
| Local Government Loan Program - Great Lakes Water Authority |
| Series 2015 |
| 07/01/2026 | 5.000% | | 175,000 | 177,213 |
| 07/01/2027 | 5.000% | | 600,000 | 607,778 |
| 07/01/2033 | 5.000% | | 5,000,000 | 5,041,600 |
| Multimodal-McLaren Health Care |
| Series 2019 |
| 02/15/2044 | 4.000% | | 4,000,000 | 3,374,322 |
| Senior Lien - Great Lakes Water Authority |
| Series 2014 (AGM) |
| 07/01/2029 | 5.000% | | 1,500,000 | 1,507,745 |
| 07/01/2030 | 5.000% | | 1,500,000 | 1,508,039 |
| Series 2014C-3 (AGM) |
| 07/01/2032 | 5.000% | | 1,000,000 | 1,005,294 |
| Michigan State University |
| Refunding Revenue Bonds |
| Series 2023A |
| 08/15/2040 | 5.000% | | 5,550,000 | 5,797,153 |
| Michigan Strategic Fund(b) |
| Revenue Bonds |
| I-75 Improvement Project |
| Series 2018 |
| 12/31/2043 | 5.000% | | 3,400,000 | 3,146,529 |
| Municipal Bonds (continued) |
| Issue Description | Coupon
Rate | | Principal
Amount ($) | Value ($) |
| Royal Oak Hospital Finance Authority |
| Prerefunded 03/01/24 Revenue Bonds |
| William Beaumont Hospital |
| Series 2014D |
| 09/01/2032 | 5.000% | | 4,075,000 | 4,085,535 |
| Wayne County Airport Authority(b) |
| Refunding Revenue Bonds |
| Series 2015F |
| 12/01/2026 | 5.000% | | 3,000,000 | 2,999,349 |
| Wayne County Airport Authority |
| Revenue Bonds |
| Detroit Metro |
| Series 2018 |
| 12/01/2036 | 5.000% | | 3,205,000 | 3,240,332 |
| Series 2015D |
| 12/01/2030 | 5.000% | | 1,250,000 | 1,249,150 |
| Total | 49,670,780 |
| Minnesota 1.0% |
| City of Maple Grove |
| Refunding Revenue Bonds |
| Maple Grove Hospital Corp. |
| Series 2017 |
| 05/01/2029 | 5.000% | | 2,720,000 | 2,740,619 |
| Duluth Economic Development Authority |
| Refunding Revenue Bonds |
| Essentia Health Obligation Group |
| Series 2018 |
| 02/15/2043 | 5.000% | | 1,000,000 | 942,533 |
| Revenue Bonds |
| Benedictine Health System |
| Series 2021 |
| 07/01/2036 | 4.000% | | 3,000,000 | 2,339,453 |
| Housing & Redevelopment Authority of The City of St. Paul |
| Refunding Revenue Bonds |
| Fairview Health Services |
| Series 2017 |
| 11/15/2029 | 5.000% | | 1,050,000 | 1,064,693 |
| HealthPartners Obligation Group |
| Series 2015 |
| 07/01/2028 | 5.000% | | 6,400,000 | 6,433,012 |
| Watertown-Mayer Independent School District No. 111(f) |
| Unlimited General Obligation Bonds |
| Series 2020A |
| 02/01/2030 | 0.000% | | 2,475,000 | 1,840,668 |
| Woodbury Housing & Redevelopment Authority |
| Revenue Bonds |
| St. Therese of Woodbury |
| Series 2014 |
| 12/01/2034 | 5.000% | | 1,000,000 | 912,284 |
| Total | 16,273,262 |
The accompanying Notes to Financial Statements are an integral part of this statement.
| 20 | Columbia Intermediate Duration Municipal Bond Fund | Annual Report 2023 |
Portfolio of Investments (continued)
October 31, 2023
| Municipal Bonds (continued) |
| Issue Description | Coupon
Rate | | Principal
Amount ($) | Value ($) |
| Mississippi 0.8% |
| Mississippi Business Finance Corp. |
| Refunding Revenue Bonds |
| Pollution Control Project |
| Series 2019 |
| 09/01/2028 | 3.200% | | 4,000,000 | 3,792,274 |
| Mississippi Hospital Equipment & Facilities Authority |
| Refunding Revenue Bonds |
| Forrest County General Hospital Project |
| Series 2019 |
| 01/01/2039 | 4.000% | | 1,500,000 | 1,281,855 |
| 01/01/2040 | 4.000% | | 1,100,000 | 925,244 |
| State of Mississippi |
| Revenue Bonds |
| Series 2015E |
| 10/15/2029 | 5.000% | | 3,500,000 | 3,528,108 |
| State of Mississippi Gaming Tax |
| Revenue Bonds |
| Series 2019A |
| 10/15/2036 | 5.000% | | 3,395,000 | 3,414,972 |
| Total | 12,942,453 |
| Missouri 1.3% |
| Health & Educational Facilities Authority |
| Refunding Revenue Bonds |
| Mosaic Health System |
| Series 2019 |
| 02/15/2044 | 4.000% | | 2,000,000 | 1,608,215 |
| 02/15/2049 | 4.000% | | 2,500,000 | 1,983,497 |
| Health & Educational Facilities Authority of the State of Missouri |
| Refunding Revenue Bonds |
| CoxHealth |
| Series 2015A |
| 11/15/2028 | 5.000% | | 6,210,000 | 6,195,631 |
| St. Luke’s Health Systems, Inc. |
| Series 2016 |
| 11/15/2034 | 5.000% | | 3,000,000 | 3,029,112 |
| Kansas City Industrial Development Authority(b) |
| Revenue Bonds |
| Kansas City International Airport |
| Series 2019 |
| 03/01/2046 | 5.000% | | 2,000,000 | 1,881,616 |
| Lee’s Summit Industrial Development Authority |
| Revenue Bonds |
| John Knox Village Project |
| Series 2016A |
| 08/15/2036 | 5.000% | | 1,100,000 | 949,474 |
| 08/15/2051 | 5.000% | | 2,405,000 | 1,788,840 |
| Municipal Bonds (continued) |
| Issue Description | Coupon
Rate | | Principal
Amount ($) | Value ($) |
| Missouri Joint Municipal Electric Utility Commission |
| Refunding Revenue Bonds |
| Prairie State Project |
| Series 2015A |
| 12/01/2029 | 5.000% | | 2,000,000 | 2,022,675 |
| St. Louis County Industrial Development Authority |
| Refunding Revenue Bonds |
| Friendship Village St. Louis |
| Series 2017 |
| 09/01/2048 | 5.000% | | 1,000,000 | 788,510 |
| St. Andrew’s Resources for Seniors Obligated Group |
| Series 2015 |
| 12/01/2025 | 5.000% | | 625,000 | 616,020 |
| Total | 20,863,590 |
| Nebraska 1.3% |
| Nebraska Public Power District |
| General Refunding Revenue Bonds |
| Series 2016B |
| 01/01/2037 | 5.000% | | 7,435,000 | 7,486,077 |
| Omaha Public Power District(j) |
| Revenue Bonds |
| Series 2023A |
| 02/01/2038 | 5.000% | | 1,200,000 | 1,265,016 |
| Public Power Generation Agency |
| Refunding Revenue Bonds |
| Whelan Energy Center Unit |
| Series 2015 |
| 01/01/2027 | 5.000% | | 11,865,000 | 11,966,799 |
| Total | 20,717,892 |
| Nevada 0.9% |
| City of Carson City |
| Refunding Revenue Bonds |
| Carson Tahoe Regional Medical Center |
| Series 2017 |
| 09/01/2031 | 5.000% | | 1,000,000 | 992,268 |
| 09/01/2033 | 5.000% | | 1,000,000 | 986,288 |
| County of Clark |
| Revenue Bonds |
| Series 2023 |
| 07/01/2039 | 5.000% | | 5,000,000 | 5,175,048 |
| County of Clark Department of Aviation |
| Refunding Revenue Bonds |
| Subordinated Series 2017A-2 |
| 07/01/2040 | 5.000% | | 4,000,000 | 3,953,817 |
| System - Lien |
| Subordinated Series 2014 (AGM) |
| 07/01/2029 | 5.000% | | 1,200,000 | 1,199,537 |
| 07/01/2030 | 5.000% | | 1,000,000 | 999,453 |
The accompanying Notes to Financial Statements are an integral part of this statement.
Columbia Intermediate Duration Municipal Bond Fund | Annual Report 2023
| 21 |
Portfolio of Investments (continued)
October 31, 2023
| Municipal Bonds (continued) |
| Issue Description | Coupon
Rate | | Principal
Amount ($) | Value ($) |
| State of Nevada Department of Business & Industry(a) |
| Revenue Bonds |
| Somerset Academy |
| Series 2018A |
| 12/15/2029 | 4.500% | | 465,000 | 437,171 |
| Total | 13,743,582 |
| New Jersey 3.3% |
| New Jersey Economic Development Authority |
| Prerefunded 12/15/26 Revenue Bonds |
| Series 2016BBB |
| 06/15/2030 | 5.500% | | 2,500,000 | 2,625,585 |
| Revenue Bonds |
| Transportation Project |
| Series 2020 |
| 11/01/2036 | 5.000% | | 5,000,000 | 5,105,203 |
| New Jersey Transportation Trust Fund Authority(f) |
| Capital Appreciation Revenue Bonds |
| Transportation System |
| Series 2006C (AGM) |
| 12/15/2029 | 0.000% | | 3,060,000 | 2,345,091 |
| Revenue Bonds |
| Capital Appreciation - Transportation System |
| Series 2006C |
| 12/15/2024 | 0.000% | | 440,000 | 420,354 |
| New Jersey Transportation Trust Fund Authority |
| Refunding Revenue Bonds |
| Federal Highway Reimbursement |
| Series 2018 |
| 06/15/2030 | 5.000% | | 1,000,000 | 1,016,198 |
| 06/15/2031 | 5.000% | | 1,000,000 | 1,014,965 |
| Transportation System |
| Series 2018A |
| 12/15/2034 | 5.000% | | 1,500,000 | 1,537,662 |
| Series 2019 |
| 12/15/2033 | 5.000% | | 3,000,000 | 3,111,307 |
| Revenue Bonds |
| Series 2019BB |
| 06/15/2036 | 4.000% | | 1,000,000 | 933,670 |
| 06/15/2044 | 4.000% | | 2,500,000 | 2,138,336 |
| 06/15/2050 | 4.000% | | 3,500,000 | 2,905,531 |
| Series 2020AA |
| 06/15/2038 | 4.000% | | 1,000,000 | 912,054 |
| Transportation Program |
| Series 2019 |
| 06/15/2037 | 5.000% | | 4,465,000 | 4,518,916 |
| Transportation System |
| Series 2014D |
| 06/15/2032 | 5.000% | | 5,000,000 | 5,015,899 |
| Municipal Bonds (continued) |
| Issue Description | Coupon
Rate | | Principal
Amount ($) | Value ($) |
| New Jersey Turnpike Authority |
| Refunding Revenue Bonds |
| Series 2017E |
| 01/01/2029 | 5.000% | | 1,500,000 | 1,571,297 |
| Series 2017G |
| 01/01/2035 | 5.000% | | 6,000,000 | 6,215,581 |
| Revenue Bonds |
| Series 2015E |
| 01/01/2031 | 5.000% | | 500,000 | 503,367 |
| Tobacco Settlement Financing Corp. |
| Refunding Revenue Bonds |
| Series 2018A |
| 06/01/2031 | 5.000% | | 2,750,000 | 2,832,626 |
| 06/01/2032 | 5.000% | | 2,000,000 | 2,058,204 |
| 06/01/2033 | 5.000% | | 1,500,000 | 1,541,927 |
| 06/01/2034 | 5.000% | | 2,000,000 | 2,054,086 |
| 06/01/2046 | 5.250% | | 2,440,000 | 2,395,578 |
| Total | 52,773,437 |
| New Mexico 0.2% |
| City of Santa Fe |
| Revenue Bonds |
| El Castillo Retirement Project |
| Series 2019 |
| 05/15/2044 | 5.000% | | 1,350,000 | 1,058,140 |
| County of Bernalillo |
| Refunding Revenue Bonds |
| Series 1998 |
| 04/01/2027 | 5.250% | | 2,205,000 | 2,264,065 |
| Total | 3,322,205 |
| New York 5.9% |
| Buffalo & Erie County Industrial Land Development Corp. |
| Refunding Revenue Bonds |
| Charter School For Applied Technologies Project |
| Series 2017 |
| 06/01/2035 | 5.000% | | 1,000,000 | 993,294 |
| Revenue Bonds |
| Tapestry-Charter School Project |
| Series 2017 |
| 08/01/2037 | 5.000% | | 1,300,000 | 1,172,566 |
| 08/01/2047 | 5.000% | | 1,000,000 | 836,553 |
| City of New York |
| Unlimited General Obligation Bonds |
| Series 2018E-1 |
| 03/01/2034 | 5.250% | | 3,000,000 | 3,138,390 |
| 03/01/2035 | 5.250% | | 2,500,000 | 2,605,319 |
| 03/01/2037 | 5.000% | | 1,120,000 | 1,140,978 |
| Subordinated Series 2023E-1 |
| 04/01/2043 | 5.250% | | 6,000,000 | 6,219,772 |
The accompanying Notes to Financial Statements are an integral part of this statement.
| 22 | Columbia Intermediate Duration Municipal Bond Fund | Annual Report 2023 |
Portfolio of Investments (continued)
October 31, 2023
| Municipal Bonds (continued) |
| Issue Description | Coupon
Rate | | Principal
Amount ($) | Value ($) |
| Hudson Yards Infrastructure Corp. |
| Refunding Revenue Bonds |
| Series 2017A |
| 02/15/2034 | 5.000% | | 5,000,000 | 5,117,576 |
| Long Island Power Authority |
| Revenue Bonds |
| Green Bonds |
| Series 2023E |
| 09/01/2037 | 5.000% | | 900,000 | 943,828 |
| 09/01/2038 | 5.000% | | 1,500,000 | 1,555,103 |
| Metropolitan Transportation Authority |
| Refunding Revenue Bonds |
| Green Bonds |
| Series 2017C-1 |
| 11/15/2034 | 5.000% | | 1,815,000 | 1,836,995 |
| Revenue Bonds |
| Series 2016C-1 |
| 11/15/2036 | 5.000% | | 2,325,000 | 2,308,189 |
| Metropolitan Transportation Authority(e) |
| Refunding Revenue Bonds |
| Transportation |
| Subordinated Series 2021 (AGM) (Mandatory Put 04/01/24) |
0.7 x SOFR + 0.550%
11/01/2032 | 4.108% | | 2,250,000 | 2,249,387 |
| New York City Transitional Finance Authority |
| Refunding Revenue Bonds |
| Future Tax Secured |
| Subordinated Series 2015C |
| 11/01/2026 | 5.000% | | 1,000,000 | 1,013,377 |
| Revenue Bonds |
| Future Tax Secured |
| Subordinated Series 2016B-1 |
| 08/01/2034 | 5.000% | | 4,000,000 | 4,078,816 |
| Subordinated Series 2017F-1 |
| 05/01/2038 | 5.000% | | 4,000,000 | 4,038,543 |
| Subordinated Series 2018 |
| 08/01/2036 | 5.000% | | 5,555,000 | 5,692,711 |
| New York Power Authority(j) |
| Revenue Bonds |
| Green Transmission Project |
| Series 2023A (AGM) |
| 11/15/2039 | 5.250% | | 400,000 | 427,249 |
| New York State Dormitory Authority(a) |
| Refunding Revenue Bonds |
| Garnet Health Medical Center |
| Series 2017 |
| 12/01/2035 | 5.000% | | 500,000 | 448,867 |
| Orange Regional Medical Center |
| Series 2017 |
| 12/01/2037 | 5.000% | | 500,000 | 440,429 |
| Municipal Bonds (continued) |
| Issue Description | Coupon
Rate | | Principal
Amount ($) | Value ($) |
| New York State Dormitory Authority |
| Refunding Revenue Bonds |
| Memorial Sloan-Kettering Cancer Center |
| Series 2017 |
| 07/01/2035 | 4.000% | | 1,500,000 | 1,422,309 |
| North Shore - Long Island Jewish Obligation Group |
| Series 2015A |
| 05/01/2031 | 5.000% | | 9,830,000 | 9,860,298 |
| Series 2018A |
| 03/15/2037 | 5.250% | | 1,695,000 | 1,766,264 |
| New York State Urban Development Corp. |
| Revenue Bonds |
| Series 2023A |
| 03/15/2035 | 5.000% | | 5,000,000 | 5,417,556 |
| New York Transportation Development Corp.(b) |
| Revenue Bonds |
| Delta Air Lines, Inc. LaGuardia |
| Series 2020 |
| 10/01/2035 | 5.000% | | 6,000,000 | 5,690,518 |
| 10/01/2045 | 4.375% | | 1,500,000 | 1,235,061 |
| LaGuardia Airport Terminal B |
| Series 2016 (AGM) |
| 07/01/2032 | 4.000% | | 2,500,000 | 2,362,999 |
| New York Transportation Development Corp.(b),(j) |
| Revenue Bonds |
| LaGuardia Airport Terminal C&D |
| Series 2023 |
| 04/01/2035 | 6.000% | | 2,500,000 | 2,585,837 |
| Port Authority of New York & New Jersey(b) |
| Refunding Revenue Bonds |
| Consolidated Bonds |
| Series 2022 |
| 08/01/2039 | 5.000% | | 2,000,000 | 1,989,613 |
| Series 2023-238 |
| 07/15/2038 | 5.000% | | 4,300,000 | 4,296,150 |
| Series 2023-242 |
| 12/01/2038 | 5.000% | | 1,400,000 | 1,398,772 |
| State of New York |
| Unlimited General Obligation Bonds |
| Series 2023B |
| 03/15/2039 | 5.000% | | 2,155,000 | 2,262,166 |
| Triborough Bridge & Tunnel Authority |
| Refunding Revenue Bonds |
| Green Bonds |
| Series 2023C |
| 11/15/2040 | 5.250% | | 1,000,000 | 1,049,869 |
| MTA Bridges and Tunnels |
| Series 2023 |
| 11/15/2038 | 5.000% | | 1,000,000 | 1,035,427 |
The accompanying Notes to Financial Statements are an integral part of this statement.
Columbia Intermediate Duration Municipal Bond Fund | Annual Report 2023
| 23 |
Portfolio of Investments (continued)
October 31, 2023
| Municipal Bonds (continued) |
| Issue Description | Coupon
Rate | | Principal
Amount ($) | Value ($) |
| Revenue Bonds |
| TBTA Capital Lockbox - City Sales Tax |
| Series 2023A |
| 05/15/2040 | 5.000% | | 875,000 | 904,963 |
| Triborough Bridge & Tunnel Authority(e) |
| Refunding Revenue Bonds |
| MTA Bridges and Tunnels |
| Series 2021 (Mandatory Put 02/01/24) |
0.7 x SOFR + 0.380%
01/01/2032 | 3.938% | | 1,960,000 | 1,954,185 |
| TSASC, Inc. |
| Refunding Revenue Bonds |
| Series 2017A |
| 06/01/2036 | 5.000% | | 1,000,000 | 1,008,783 |
| 06/01/2041 | 5.000% | | 1,000,000 | 978,220 |
| Total | 93,476,932 |
| North Carolina 1.2% |
| North Carolina Capital Facilities Finance Agency |
| Refunding Revenue Bonds |
| The Arc of North Carolina |
| Series 2017 |
| 10/01/2034 | 5.000% | | 2,325,000 | 2,163,555 |
| North Carolina Medical Care Commission |
| Refunding Revenue Bonds |
| Presbyterian Homes |
| Series 2016C |
| 10/01/2031 | 4.000% | | 1,000,000 | 944,651 |
| Sharon Towers |
| Series 2019A |
| 07/01/2029 | 4.000% | | 1,970,000 | 1,784,785 |
| Revenue Bonds |
| Presbyterian Homes |
| Series 2020 |
| 10/01/2045 | 4.000% | | 660,000 | 517,100 |
| 10/01/2045 | 5.000% | | 1,500,000 | 1,396,066 |
| North Carolina Municipal Power Agency No. 1 |
| Refunding Revenue Bonds |
| Series 2015A |
| 01/01/2031 | 5.000% | | 2,000,000 | 2,023,509 |
| North Carolina Turnpike Authority |
| Revenue Bonds |
| Senior Lien - Triangle Expressway |
| Series 2019 |
| 01/01/2049 | 5.000% | | 1,500,000 | 1,431,853 |
| State of North Carolina |
| Refunding Revenue Bonds |
| Series 2014B |
| 06/01/2025 | 5.000% | | 5,000,000 | 5,096,189 |
| Municipal Bonds (continued) |
| Issue Description | Coupon
Rate | | Principal
Amount ($) | Value ($) |
| University of North Carolina at Greensboro |
| Refunding Revenue Bonds |
| General |
| Series 2017 |
| 04/01/2035 | 4.000% | | 1,200,000 | 1,125,168 |
| 04/01/2036 | 4.000% | | 1,000,000 | 926,253 |
| University of North Carolina at Wilmington |
| Refunding Revenue Bonds |
| Student Housing Projects |
| Series 2016 |
| 06/01/2031 | 4.000% | | 2,040,000 | 1,981,868 |
| Total | 19,390,997 |
| Ohio 0.7% |
| Cleveland Department of Public Utilities Division of Water |
| Prerefunded 01/01/24 Revenue Bonds |
| Series 2015Y |
| 01/01/2029 | 4.000% | | 1,000,000 | 1,000,032 |
| 01/01/2030 | 4.000% | | 1,000,000 | 1,000,032 |
| County of Franklin |
| Revenue Bonds |
| OPRS Communities |
| Series 2016C |
| 07/01/2029 | 5.000% | | 2,000,000 | 1,931,007 |
| County of Miami |
| Improvement Refunding Bonds |
| Kettering Health Network |
| Series 2019 |
| 08/01/2045 | 5.000% | | 2,220,000 | 2,138,776 |
| State of Ohio |
| Unlimited General Obligation Bonds |
| Series 2022A |
| 03/01/2037 | 5.000% | | 1,000,000 | 1,063,767 |
| 03/01/2038 | 5.000% | | 1,500,000 | 1,576,404 |
| 03/01/2039 | 5.000% | | 2,000,000 | 2,090,696 |
| Total | 10,800,714 |
| Oklahoma 0.3% |
| Norman Regional Hospital Authority |
| Refunding Revenue Bonds |
| Series 2016 |
| 09/01/2027 | 5.000% | | 2,000,000 | 1,994,065 |
| Tulsa County Industrial Authority |
| Refunding Revenue Bonds |
| Montereau, Inc. Project |
| Series 2017 |
| 11/15/2037 | 5.250% | | 2,750,000 | 2,585,913 |
| 11/15/2045 | 5.250% | | 250,000 | 222,211 |
| Total | 4,802,189 |
The accompanying Notes to Financial Statements are an integral part of this statement.
| 24 | Columbia Intermediate Duration Municipal Bond Fund | Annual Report 2023 |
Portfolio of Investments (continued)
October 31, 2023
| Municipal Bonds (continued) |
| Issue Description | Coupon
Rate | | Principal
Amount ($) | Value ($) |
| Oregon 0.6% |
| Hospital Facilities Authority of Multnomah County |
| Prerefunded 10/01/24 Revenue Bonds |
| Mirabella at South Waterfront |
| Series 2014A |
| 10/01/2034 | 5.125% | | 1,000,000 | 1,008,262 |
| Multnomah & Clackamas Counties School District No. 10JT Gresham-Barlow(f) |
| Unlimited General Obligation Bonds |
| Series 2017A |
| 06/15/2033 | 0.000% | | 7,160,000 | 4,525,527 |
| State of Oregon Department of Transportation |
| Revenue Bonds |
| Series 2022A |
| 11/15/2038 | 5.000% | | 2,000,000 | 2,105,317 |
| 11/15/2039 | 5.000% | | 2,145,000 | 2,246,598 |
| Total | 9,885,704 |
| Pennsylvania 3.7% |
| Berks County Industrial Development Authority |
| Prerefunded 05/15/25 Revenue Bonds |
| Highlands at Wyomissing |
| Series 2018 |
| 05/15/2043 | 5.000% | | 350,000 | 361,879 |
| Prerefunded 05/15/25 Revenue Bonds |
| Highlands at Wyomissing |
| Series 2018 |
| 05/14/2038 | 5.000% | | 255,000 | 263,655 |
| Refunding Revenue Bonds |
| Highlands at Wyomissing |
| Series 2017 |
| 05/15/2032 | 5.000% | | 1,050,000 | 1,015,979 |
| 05/15/2047 | 5.000% | | 1,630,000 | 1,340,661 |
| Revenue Bonds |
| Highlands at Wyomissing |
| Series 2017 |
| 05/15/2042 | 5.000% | | 1,655,000 | 1,418,376 |
| Bucks County Industrial Development Authority |
| Refunding Revenue Bonds |
| Pennswood Village Project |
| Series 2018 |
| 10/01/2037 | 5.000% | | 1,250,000 | 1,174,652 |
| Commonwealth Financing Authority |
| Revenue Bonds |
| Tobacco Master Settlement Payment |
| Series 2018 |
| 06/01/2029 | 5.000% | | 1,500,000 | 1,542,285 |
| 06/01/2032 | 5.000% | | 1,000,000 | 1,023,403 |
| 06/01/2033 | 5.000% | | 1,250,000 | 1,278,362 |
| 06/01/2034 | 5.000% | | 1,000,000 | 1,021,408 |
| 06/01/2035 | 5.000% | | 1,000,000 | 1,018,512 |
| Municipal Bonds (continued) |
| Issue Description | Coupon
Rate | | Principal
Amount ($) | Value ($) |
| Cumberland County Municipal Authority |
| Prerefunded 01/01/25 Revenue Bonds |
| Diakon Lutheran Social Ministries |
| Series 2015 |
| 01/01/2027 | 5.000% | | 750,000 | 758,138 |
| 01/01/2028 | 5.000% | | 1,175,000 | 1,187,749 |
| Refunding Revenue Bonds |
| Diakon Lutheran |
| Series 2015 |
| 01/01/2027 | 5.000% | | 1,440,000 | 1,434,081 |
| 01/01/2028 | 5.000% | | 2,170,000 | 2,154,584 |
| Delaware River Joint Toll Bridge Commission |
| Revenue Bonds |
| Series 2017 |
| 07/01/2033 | 5.000% | | 2,250,000 | 2,305,770 |
| Delaware River Port Authority |
| Revenue Bonds |
| Series 2018A |
| 01/01/2036 | 5.000% | | 2,000,000 | 2,080,723 |
| Geisinger Authority |
| Refunding Revenue Bonds |
| Geisinger Health System |
| Series 2017 |
| 02/15/2039 | 5.000% | | 2,500,000 | 2,463,415 |
| Lancaster County Hospital Authority |
| Revenue Bonds |
| Moravian Manors, Inc. Project |
| Series 2019A |
| 06/15/2044 | 5.000% | | 1,000,000 | 798,136 |
| Lancaster County Solid Waste Management Authority |
| Prerefunded 12/15/23 Revenue Bonds |
| Series 2013A |
| 12/15/2029 | 5.250% | | 3,100,000 | 3,104,797 |
| Montgomery County Higher Education and Health Authority |
| Refunding Revenue Bonds |
| Thomas Jefferson University Project |
| Series 2019 |
| 09/01/2044 | 4.000% | | 1,000,000 | 837,848 |
| Montgomery County Industrial Development Authority |
| Refunding Revenue Bonds |
| Acts Retirement - Life Communities |
| Series 2016 |
| 11/15/2036 | 5.000% | | 4,315,000 | 4,147,048 |
| Meadowood Senior Living Project |
| Series 2018 |
| 12/01/2038 | 5.000% | | 1,000,000 | 909,947 |
| Northampton County General Purpose Authority |
| Refunding Revenue Bonds |
| St. Luke’s University Health Network |
| Series 2016 |
| 08/15/2026 | 5.000% | | 3,770,000 | 3,817,672 |
The accompanying Notes to Financial Statements are an integral part of this statement.
Columbia Intermediate Duration Municipal Bond Fund | Annual Report 2023
| 25 |
Portfolio of Investments (continued)
October 31, 2023
| Municipal Bonds (continued) |
| Issue Description | Coupon
Rate | | Principal
Amount ($) | Value ($) |
| Pennsylvania Economic Development Financing Authority(b) |
| Revenue Bonds |
| The PennDOT Major Bridges Package One Project |
| Series 2022 |
| 06/30/2039 | 5.500% | | 5,690,000 | 5,792,989 |
| Pennsylvania Turnpike Commission |
| Refunding Revenue Bonds |
| Subordinated Series 2017-3 |
| 12/01/2037 | 4.000% | | 2,975,000 | 2,665,124 |
| Revenue Bonds |
| Series 2017A-1 |
| 12/01/2037 | 5.000% | | 1,250,000 | 1,276,851 |
| Series 2018A-2 |
| 12/01/2036 | 5.000% | | 2,500,000 | 2,579,805 |
| Subordinated Series 2017A |
| 12/01/2042 | 5.500% | | 3,000,000 | 3,037,505 |
| Subordinated Series 2017B-1 |
| 06/01/2042 | 5.000% | | 5,450,000 | 5,420,163 |
| Total | 58,231,517 |
| Rhode Island 0.1% |
| Rhode Island Turnpike & Bridge Authority |
| Refunding Revenue Bonds |
| Series 2016A |
| 10/01/2033 | 5.000% | | 1,300,000 | 1,317,889 |
| South Carolina 3.0% |
| County of Florence |
| Refunding Revenue Bonds |
| McLeod Regional Medical Center Project |
| Series 2014 |
| 11/01/2031 | 5.000% | | 3,610,000 | 3,622,941 |
| 11/01/2032 | 5.000% | | 5,000,000 | 5,014,927 |
| Patriots Energy Group Financing Agency |
| Revenue Bonds |
| Series 2018A (Mandatory Put 02/01/24) |
| 10/01/2048 | 4.000% | | 2,500,000 | 2,491,435 |
| Patriots Energy Group Financing Agency(e) |
| Revenue Bonds |
| Series 2018B (Mandatory Put 02/01/24) |
0.7 x 1-month Term SOFR + 0.860%
10/01/2048 | 4.545% | | 8,000,000 | 7,999,919 |
| South Carolina Jobs-Economic Development Authority |
| Prerefunded 11/01/24 Revenue Bonds |
| York Preparatory Academy Project |
| Series 2014A |
| 11/01/2033 | 7.000% | | 590,000 | 605,476 |
| Refunding Revenue Bonds |
| Episcopal Home Still Hopes |
| Series 2018 |
| 04/01/2038 | 5.000% | | 2,000,000 | 1,706,861 |
| Municipal Bonds (continued) |
| Issue Description | Coupon
Rate | | Principal
Amount ($) | Value ($) |
| Prisma Health Obligated Group |
| Series 2018 |
| 05/01/2036 | 5.000% | | 7,000,000 | 6,972,906 |
| Revenue Bonds |
| Lutheran Homes of South Carolina Obligation Group |
| Series 2013 |
| 05/01/2028 | 5.000% | | 3,500,000 | 3,270,924 |
| Wofford College Project |
| Series 2019 |
| 04/01/2038 | 5.000% | | 930,000 | 931,212 |
| South Carolina Jobs-Economic Development Authority(a) |
| Revenue Bonds |
| Series 2015A |
| 08/15/2025 | 4.500% | | 260,000 | 250,833 |
| South Carolina Public Service Authority |
| Refunding Revenue Bonds |
| Series 2015A |
| 12/01/2026 | 5.000% | | 7,000,000 | 7,033,876 |
| Series 2016A |
| 12/01/2030 | 5.000% | | 4,000,000 | 4,036,346 |
| Series 2016B |
| 12/01/2032 | 5.000% | | 3,265,000 | 3,290,728 |
| Total | 47,228,384 |
| South Dakota 0.3% |
| South Dakota Health & Educational Facilities Authority |
| Revenue Bonds |
| Regional Health |
| Series 2017 |
| 09/01/2029 | 5.000% | | 1,700,000 | 1,726,248 |
| 09/01/2030 | 5.000% | | 2,250,000 | 2,282,365 |
| Total | 4,008,613 |
| Tennessee 0.5% |
| Chattanooga Health Educational & Housing Facility Board |
| Refunding Revenue Bonds |
| Student Housing - CDFI Phase I |
| Series 2015 |
| 10/01/2029 | 5.000% | | 1,000,000 | 1,006,116 |
| Knox County Health Educational & Housing Facility Board |
| Refunding Revenue Bonds |
| Covenant Health Services |
| Series 2016A |
| 01/01/2042 | 5.000% | | 5,815,000 | 5,414,023 |
| Metropolitan Government Nashville & Davidson County Health & Educational Facilities Board |
| Revenue Bonds |
| Vanderbilt University Medical Center |
| Series 2016 |
| 07/01/2031 | 5.000% | | 1,000,000 | 1,011,057 |
| Total | 7,431,196 |
The accompanying Notes to Financial Statements are an integral part of this statement.
| 26 | Columbia Intermediate Duration Municipal Bond Fund | Annual Report 2023 |
Portfolio of Investments (continued)
October 31, 2023
| Municipal Bonds (continued) |
| Issue Description | Coupon
Rate | | Principal
Amount ($) | Value ($) |
| Texas 9.2% |
| Austin Independent School District |
| Unlimited General Obligation Bonds |
| Series 2023 |
| 08/01/2039 | 5.000% | | 2,000,000 | 2,074,405 |
| 08/01/2040 | 5.000% | | 3,000,000 | 3,091,781 |
| Bexar County Health Facilities Development Corp. |
| Refunding Revenue Bonds |
| Army Retirement Residence Foundation |
| Series 2018 |
| 07/15/2033 | 5.000% | | 1,000,000 | 903,222 |
| Bexar County Hospital District |
| Limited General Obligation Refunding Bonds |
| Series 2019 |
| 02/15/2034 | 5.000% | | 1,000,000 | 1,038,694 |
| 02/15/2038 | 5.000% | | 1,250,000 | 1,274,207 |
| Central Texas Regional Mobility Authority |
| Prerefunded 07/01/25 Revenue Bonds |
| Senior Lien |
| Series 2015A |
| 01/01/2030 | 5.000% | | 1,550,000 | 1,576,590 |
| Central Texas Regional Mobility Authority(f) |
| Revenue Bonds |
| Capital Appreciation |
| Series 2010 |
| 01/01/2025 | 0.000% | | 1,000,000 | 943,912 |
| Central Texas Turnpike System |
| Refunding Revenue Bonds |
| Subordinated Series 2015C |
| 08/15/2031 | 5.000% | | 7,500,000 | 7,406,155 |
| 08/15/2032 | 5.000% | | 6,000,000 | 5,903,549 |
| 08/15/2034 | 5.000% | | 10,240,000 | 9,992,292 |
| City of Austin Airport System |
| Revenue Bonds |
| Series 2017A |
| 11/15/2035 | 5.000% | | 1,000,000 | 1,004,741 |
| City of Austin Electric Utility |
| Refunding Revenue Bonds |
| Series 2023 |
| 11/15/2040 | 5.000% | | 5,000,000 | 5,178,327 |
| City of Beaumont Waterworks & Sewer System |
| Prerefunded 09/01/25 Revenue Bonds |
| Subordinated Series 2015A (BAM) |
| 09/01/2030 | 5.000% | | 1,000,000 | 1,010,479 |
| Refunding Revenue Bonds |
| Subordinated Series 2015A (BAM) |
| 09/01/2026 | 5.000% | | 1,000,000 | 1,012,855 |
| 09/01/2027 | 5.000% | | 600,000 | 607,852 |
| City of Garland Electric Utility System |
| Refunding Revenue Bonds |
| Series 2019 |
| 03/01/2037 | 5.000% | | 1,700,000 | 1,738,645 |
| Municipal Bonds (continued) |
| Issue Description | Coupon
Rate | | Principal
Amount ($) | Value ($) |
| City of Houston |
| Refunding Revenue Bonds |
| Convention & Entertainment Facilities |
| Series 2014 |
| 09/01/2030 | 5.000% | | 1,000,000 | 1,005,553 |
| Series 2015 |
| 09/01/2027 | 5.000% | | 1,215,000 | 1,222,636 |
| 09/01/2029 | 5.000% | | 1,500,000 | 1,508,939 |
| City of Houston Airport System |
| Refunding Revenue Bonds |
| Subordinated Series 2018B |
| 07/01/2030 | 5.000% | | 1,375,000 | 1,425,877 |
| Subordinated Series 2018D |
| 07/01/2035 | 5.000% | | 2,500,000 | 2,579,060 |
| City of Houston Airport System(b) |
| Refunding Revenue Bonds |
| Subordinated Series 2023A (AGM) |
| 07/01/2040 | 5.250% | | 3,780,000 | 3,824,557 |
| City of Houston Combined Utility System |
| Refunding Revenue Bonds |
| 1st Lien |
| Series 2016B |
| 11/15/2034 | 5.000% | | 10,000,000 | 10,177,160 |
| City of Houston Hotel Occupancy Tax |
| Refunding Revenue Bonds |
| Convention & Entertainment Facilities Department |
| Series 2015 |
| 09/01/2026 | 5.000% | | 250,000 | 251,632 |
| Clifton Higher Education Finance Corp. |
| Revenue Bonds |
| International Leadership |
| Series 2015 |
| 08/15/2035 | 5.500% | | 11,500,000 | 11,093,198 |
| County of Bexar |
| Prerefunded 08/15/24 Revenue Bonds |
| Venue Project |
| Series 2015 (AGM) |
| 08/15/2031 | 5.000% | | 1,280,000 | 1,290,239 |
| Crane County Water District |
| Prerefunded 02/15/25 Unlimited General Obligation Bonds |
| Series 2015 |
| 02/15/2030 | 5.000% | | 1,000,000 | 1,010,729 |
| Grand Parkway Transportation Corp.(g) |
| Revenue Bonds |
| Convertible |
| Subordinated Series 2013 |
| 10/01/2030 | 5.050% | | 1,000,000 | 1,051,482 |
| Lancaster Independent School District |
| Unlimited General Obligation Refunding Bonds |
| Series 2015 (BAM) |
| 02/15/2029 | 4.000% | | 3,000,000 | 2,981,287 |
The accompanying Notes to Financial Statements are an integral part of this statement.
Columbia Intermediate Duration Municipal Bond Fund | Annual Report 2023
| 27 |
Portfolio of Investments (continued)
October 31, 2023
| Municipal Bonds (continued) |
| Issue Description | Coupon
Rate | | Principal
Amount ($) | Value ($) |
| Lower Colorado River Authority |
| Refunding Revenue Bonds |
| Series 2015D |
| 05/15/2026 | 5.000% | | 695,000 | 700,124 |
| 05/15/2027 | 5.000% | | 1,355,000 | 1,365,390 |
| New Hope Cultural Education Facilities Finance Corp.(h) |
| Revenue Bonds |
| Cardinal Bay, Inc. - Village on the Park |
| Series 2016 |
| 07/01/2036 | 0.000% | | 2,250,000 | 1,541,250 |
| New Hope Cultural Education Facilities Finance Corp. |
| Revenue Bonds |
| NCCD-College Station Properties LLC |
| Series 2015A |
| 07/01/2030 | 5.000% | | 7,800,000 | 7,078,500 |
| North Texas Tollway Authority |
| Refunding Revenue Bonds |
| 1st Tier |
| Series 2017A |
| 01/01/2034 | 5.000% | | 1,000,000 | 1,018,964 |
| 01/01/2048 | 5.000% | | 5,000,000 | 4,951,000 |
| 2nd Tier |
| Series 2015A |
| 01/01/2032 | 5.000% | | 16,800,000 | 16,851,302 |
| Series 2015B |
| 01/01/2027 | 5.000% | | 2,090,000 | 2,108,470 |
| North Texas Tollway Authority(f) |
| Refunding Revenue Bonds |
| Series 2008D (AGM) |
| 01/01/2029 | 0.000% | | 7,770,000 | 6,223,864 |
| Plano Independent School District |
| Unlimited General Obligation Bonds |
| Series 2023 |
| 02/15/2038 | 5.000% | | 1,400,000 | 1,464,370 |
| Port Beaumont Navigation District(a),(b) |
| Refunding Revenue Bonds |
| Jefferson Gulf Coast Energy LLC |
| Series 2020 |
| 01/01/2035 | 3.625% | | 1,500,000 | 1,132,492 |
| Revenue Bonds |
| Jefferson Gulf Coast Energy Project |
| Series 2021 |
| 01/01/2036 | 2.750% | | 1,275,000 | 849,779 |
| Tarrant County Cultural Education Facilities Finance Corp. |
| Refunding Revenue Bonds |
| Air Force Villages Project |
| Series 2016 |
| 05/15/2045 | 5.000% | | 5,145,000 | 3,909,898 |
| Buckner Retirement Services |
| Series 2017 |
| 11/15/2037 | 5.000% | | 2,175,000 | 1,989,113 |
| 11/15/2046 | 5.000% | | 1,250,000 | 1,071,206 |
| Municipal Bonds (continued) |
| Issue Description | Coupon
Rate | | Principal
Amount ($) | Value ($) |
| Revenue Bonds |
| Buckner Retirement Services |
| Series 2016B |
| 11/15/2046 | 5.000% | | 2,000,000 | 1,716,120 |
| Texas Transportation Commission(f) |
| Revenue Bonds |
| First Tier Toll |
| Series 2019 |
| 08/01/2038 | 0.000% | | 550,000 | 237,098 |
| Texas Water Development Board |
| Revenue Bonds |
| State Water Implementation Fund |
| Series 2018 |
| 10/15/2038 | 5.000% | | 3,000,000 | 3,057,223 |
| Waco Independent School District |
| Prerefunded 08/15/24 Unlimited General Obligation Bonds |
| Series 2015 |
| 08/15/2028 | 4.000% | | 1,000,000 | 999,577 |
| 08/15/2029 | 4.000% | | 2,380,000 | 2,378,994 |
| Total | 144,824,789 |
| Utah 0.3% |
| City of Salt Lake City Airport(b) |
| Revenue Bonds |
| Series 2023A |
| 07/01/2038 | 5.250% | | 1,450,000 | 1,468,762 |
| Intermountain Power Agency |
| Revenue Bonds |
| Series 2023A |
| 07/01/2037 | 5.000% | | 1,000,000 | 1,056,497 |
| Salt Lake City Corp. Airport |
| Revenue Bonds |
| Series 2017B |
| 07/01/2032 | 5.000% | | 1,000,000 | 1,015,671 |
| 07/01/2033 | 5.000% | | 1,000,000 | 1,013,721 |
| Total | 4,554,651 |
| Vermont 0.6% |
| Vermont Educational & Health Buildings Financing Agency |
| Refunding Revenue Bonds |
| University of Vermont Medical Center |
| Series 2016A |
| 12/01/2033 | 5.000% | | 10,000,000 | 10,070,436 |
| Virgin Islands, U.S. 0.2% |
| Virgin Islands Public Finance Authority(a),(i) |
| Revenue Bonds |
| Grant Anticipation |
| Series 2015 |
| 09/01/2030 | 5.000% | | 2,320,000 | 2,288,288 |
The accompanying Notes to Financial Statements are an integral part of this statement.
| 28 | Columbia Intermediate Duration Municipal Bond Fund | Annual Report 2023 |
Portfolio of Investments (continued)
October 31, 2023
| Municipal Bonds (continued) |
| Issue Description | Coupon
Rate | | Principal
Amount ($) | Value ($) |
| Series 2015 |
| 09/01/2033 | 5.000% | | 1,000,000 | 991,602 |
| Total | 3,279,890 |
| Virginia 0.2% |
| Henrico County Economic Development Authority |
| Refunding Revenue Bonds |
| Westminster Canterbury Project |
| Series 2018 |
| 10/01/2037 | 5.000% | | 1,000,000 | 983,324 |
| Henrico County Economic Development Authority(k) |
| Revenue Bonds |
| Registered Savrs |
| Series 1992 Escrowed to Maturity (AGM) |
| 08/23/2027 | 7.459% | | 50,000 | 50,000 |
| Virginia Gateway Community Development Authority |
| Refunding Special Assessment Bonds |
| Series 2012 |
| 03/01/2030 | 5.000% | | 1,500,000 | 1,419,561 |
| Total | 2,452,885 |
| Washington 1.5% |
| Energy Northwest |
| Refunding Revenue Bonds |
| Columbia Generating Station |
| Series 2023 |
| 07/01/2039 | 5.000% | | 4,000,000 | 4,171,840 |
| FYI Properties |
| Refunding Revenue Bonds |
| Green Bonds - State of Washington DIS Project |
| Series 2019 |
| 06/01/2031 | 5.000% | | 5,000,000 | 5,190,151 |
| King County Public Hospital District No. 1 |
| Limited General Obligation Refunding Bonds |
| Valley Medical Center |
| Series 2017 |
| 12/01/2031 | 5.000% | | 4,000,000 | 4,037,058 |
| King County Public Hospital District No. 4 |
| Revenue Bonds |
| Series 2015A |
| 12/01/2025 | 5.000% | | 2,080,000 | 2,028,897 |
| 12/01/2030 | 5.750% | | 2,820,000 | 2,808,387 |
| Port of Seattle(b) |
| Revenue Bonds |
| Intermediate Lien |
| Subordinated Series 2019 |
| 04/01/2044 | 4.000% | | 1,000,000 | 822,700 |
| Municipal Bonds (continued) |
| Issue Description | Coupon
Rate | | Principal
Amount ($) | Value ($) |
| Washington State Housing Finance Commission |
| Prerefunded 07/01/25 Revenue Bonds |
| Heron’s Key |
| Series 2015A |
| 07/01/2030 | 6.500% | | 570,000 | 588,021 |
| 07/01/2035 | 6.750% | | 1,090,000 | 1,128,779 |
| Washington State Housing Finance Commission(a) |
| Refunding Revenue Bonds |
| Horizon House Project |
| Series 2017 |
| 01/01/2029 | 5.000% | | 840,000 | 786,446 |
| 01/01/2038 | 5.000% | | 2,000,000 | 1,620,751 |
| Total | 23,183,030 |
| West Virginia 0.5% |
| West Virginia Hospital Finance Authority |
| Refunding Revenue Bonds |
| Cabell Huntington Hospital Obligation |
| Series 2018 |
| 01/01/2043 | 5.000% | | 1,750,000 | 1,590,670 |
| Revenue Bonds |
| University Healthcare System |
| Series 2017 |
| 06/01/2042 | 5.000% | | 3,665,000 | 3,542,012 |
| West Virginia University(f) |
| Revenue Bonds |
| University System Project |
| Series 2019A (AMBAC) |
| 04/01/2030 | 0.000% | | 3,460,000 | 2,602,930 |
| Total | 7,735,612 |
| Wisconsin 1.2% |
| Public Finance Authority |
| Refunding Revenue Bonds |
| Fellowship Senior Living Project |
| Series 2019A |
| 01/01/2046 | 4.000% | | 2,000,000 | 1,400,602 |
| Mountain Island Charter Schools |
| Series 2017 |
| 07/01/2037 | 5.000% | | 820,000 | 766,395 |
| 07/01/2047 | 5.000% | | 1,000,000 | 851,310 |
| Retirement Housing Foundation |
| Series 2017 Escrowed to Maturity |
| 11/15/2029 | 5.000% | | 2,500,000 | 2,652,769 |
| 11/15/2030 | 5.000% | | 1,620,000 | 1,731,773 |
| Revenue Bonds |
| ACTS Retirement - Life Communities |
| Series 2020 |
| 11/15/2041 | 5.000% | | 250,000 | 229,112 |
The accompanying Notes to Financial Statements are an integral part of this statement.
Columbia Intermediate Duration Municipal Bond Fund | Annual Report 2023
| 29 |
Portfolio of Investments (continued)
October 31, 2023
| Municipal Bonds (continued) |
| Issue Description | Coupon
Rate | | Principal
Amount ($) | Value ($) |
| Public Finance Authority(a) |
| Refunding Revenue Bonds |
| Mary’s Woods at Marylhurst |
| Series 2017 |
| 05/15/2037 | 5.250% | | 1,000,000 | 898,549 |
| Wisconsin Center District |
| Refunding Revenue Bonds |
| Junior Dedicated |
| Series 1999 (AGM) |
| 12/15/2027 | 5.250% | | 1,510,000 | 1,564,298 |
| Wisconsin Center District(f) |
| Revenue Bonds |
| Senior Dedicated - Milwaukee Arena Project |
| Series 2016 |
| 12/15/2033 | 0.000% | | 2,200,000 | 1,329,930 |
| 12/15/2034 | 0.000% | | 6,665,000 | 3,800,308 |
| Wisconsin Health & Educational Facilities Authority |
| Refunding Revenue Bonds |
| ProHealth Care, Inc. Obligated Group |
| Series 2015 |
| 08/15/2031 | 5.000% | | 1,000,000 | 992,427 |
| Municipal Bonds (continued) |
| Issue Description | Coupon
Rate | | Principal
Amount ($) | Value ($) |
| Rogers Memorial Hospital, Inc. |
| Series 2014A |
| 07/01/2034 | 5.000% | | 2,500,000 | 2,449,133 |
| Total | 18,666,606 |
Total Municipal Bonds
(Cost $1,628,673,231) | 1,551,377,652 |
| Money Market Funds 0.0% |
| | Shares | Value ($) |
| BlackRock Liquidity Funds MuniCash, Institutional Shares, 3.823%(l) | 158,068 | 158,068 |
Total Money Market Funds
(Cost $158,068) | 158,068 |
Total Investments in Securities
(Cost $1,639,331,299) | 1,562,035,720 |
| Other Assets & Liabilities, Net | | 15,000,691 |
| Net Assets | $1,577,036,411 |
Notes to Portfolio of Investments
| (a) | Represents privately placed and other securities and instruments exempt from Securities and Exchange Commission registration (collectively, private placements), such as Section 4(a)(2) and Rule 144A eligible securities, which are often sold only to qualified institutional buyers. At October 31, 2023, the total value of these securities amounted to $42,057,442, which represents 2.67% of total net assets. |
| (b) | Income from this security may be subject to alternative minimum tax. |
| (c) | The Fund is entitled to receive principal and interest from the guarantor after a day or a week’s notice or upon maturity. The maturity date disclosed represents the final maturity. |
| (d) | Represents a variable rate security where the coupon rate adjusts on specified dates (generally daily or weekly) using the prevailing money market rate. The interest rate shown was the current rate as of October 31, 2023. |
| (e) | Variable rate security. The interest rate shown was the current rate as of October 31, 2023. |
| (f) | Zero coupon bond. |
| (g) | Represents a variable rate security with a step coupon where the rate adjusts according to a schedule for a series of periods, typically lower for an initial period and then increasing to a higher coupon rate thereafter. The interest rate shown was the current rate as of October 31, 2023. |
| (h) | Represents a security in default. |
| (i) | Municipal obligations include debt obligations issued by or on behalf of territories, possessions, or sovereign nations within the territorial boundaries of the United States. At October 31, 2023, the total value of these securities amounted to $5,585,296, which represents 0.35% of total net assets. |
| (j) | Represents a security purchased on a when-issued basis. |
| (k) | Represents a variable rate security where the coupon adjusts periodically through an auction process. |
| (l) | The rate shown is the seven-day current annualized yield at October 31, 2023. |
Abbreviation Legend
| AGM | Assured Guaranty Municipal Corporation |
| AMBAC | Ambac Assurance Corporation |
| BAM | Build America Mutual Assurance Co. |
| HUD | U.S. Department of Housing and Urban Development |
| NPFGC | National Public Finance Guarantee Corporation |
| SOFR | Secured Overnight Financing Rate |
The accompanying Notes to Financial Statements are an integral part of this statement.
| 30 | Columbia Intermediate Duration Municipal Bond Fund | Annual Report 2023 |
Portfolio of Investments (continued)
October 31, 2023
Fair value measurements
The Fund categorizes its fair value measurements according to a three-level hierarchy that maximizes the use of observable inputs and minimizes the use of unobservable inputs by prioritizing that the most observable input be used when available. Observable inputs are those that market participants would use in pricing an investment based on market data obtained from sources independent of the reporting entity. Unobservable inputs are those that reflect the Fund’s assumptions about the information market participants would use in pricing an investment. An investment’s level within the fair value hierarchy is based on the lowest level of any input that is deemed significant to the asset’s or liability’s fair value measurement. The input levels are not necessarily an indication of the risk or liquidity associated with investments at that level. For example, certain U.S. government securities are generally high quality and liquid, however, they are reflected as Level 2 because the inputs used to determine fair value may not always be quoted prices in an active market.
Fair value inputs are summarized in the three broad levels listed below:
| ■ | Level 1 — Valuations based on quoted prices for investments in active markets that the Fund has the ability to access at the measurement date. Valuation adjustments are not applied to Level 1 investments. |
| ■ | Level 2 — Valuations based on other significant observable inputs (including quoted prices for similar securities, interest rates, prepayment speeds, credit risks, etc.). |
| ■ | Level 3 — Valuations based on significant unobservable inputs (including the Fund’s own assumptions and judgment in determining the fair value of investments). |
Inputs that are used in determining fair value of an investment may include price information, credit data, volatility statistics, and other factors. These inputs can be either observable or unobservable. The availability of observable inputs can vary between investments, and is affected by various factors such as the type of investment, and the volume and level of activity for that investment or similar investments in the marketplace. The inputs will be considered by the Investment Manager, along with any other relevant factors in the calculation of an investment’s fair value. The Fund uses prices and inputs that are current as of the measurement date, which may include periods of market dislocations. During these periods, the availability of prices and inputs may be reduced for many investments. This condition could cause an investment to be reclassified between the various levels within the hierarchy.
Investments falling into the Level 3 category are primarily supported by quoted prices from brokers and dealers participating in the market for those investments. However, these may be classified as Level 3 investments due to lack of market transparency and corroboration to support these quoted prices. Additionally, valuation models may be used as the pricing source for any remaining investments classified as Level 3. These models may rely on one or more significant unobservable inputs and/or significant assumptions by the Investment Manager. Inputs used in valuations may include, but are not limited to, financial statement analysis, capital account balances, discount rates and estimated cash flows, and comparable company data.
The Fund’s Board of Trustees (the Board) has designated the Investment Manager, through its Valuation Committee (the Committee), as valuation designee, responsible for determining the fair value of the assets of the Fund for which market quotations are not readily available using valuation procedures approved by the Board. The Committee consists of voting and non-voting members from various groups within the Investment Manager’s organization, including operations and accounting, trading and investments, compliance, risk management and legal.
The Committee meets at least monthly to review and approve valuation matters, which may include a description of specific valuation determinations, data regarding pricing information received from approved pricing vendors and brokers and the results of Board-approved valuation policies and procedures (the Policies). The Policies address, among other things, instances when market quotations are or are not readily available, including recommendations of third party pricing vendors and a determination of appropriate pricing methodologies; events that require specific valuation determinations and assessment of fair value techniques; securities with a potential for stale pricing, including those that are illiquid, restricted, or in default; and the effectiveness of third party pricing vendors, including periodic reviews of vendors. The Committee meets more frequently, as needed, to discuss additional valuation matters, which may include the need to review back-testing results, review time-sensitive information or approve related valuation actions. Representatives of Columbia Management Investment Advisers, LLC report to the Board at each of its regularly scheduled meetings to discuss valuation matters and actions during the period, similar to those described earlier.
The following table is a summary of the inputs used to value the Fund’s investments at October 31, 2023:
| | Level 1 ($) | Level 2 ($) | Level 3 ($) | Total ($) |
| Investments in Securities | | | | |
| Floating Rate Notes | — | 10,500,000 | — | 10,500,000 |
| Municipal Bonds | — | 1,551,377,652 | — | 1,551,377,652 |
| Money Market Funds | 158,068 | — | — | 158,068 |
| Total Investments in Securities | 158,068 | 1,561,877,652 | — | 1,562,035,720 |
See the Portfolio of Investments for all investment classifications not indicated in the table.
The Fund’s assets assigned to the Level 2 input category are generally valued using the market approach, in which a security’s value is determined through reference to prices and information from market transactions for similar or identical assets.
The accompanying Notes to Financial Statements are an integral part of this statement.
Columbia Intermediate Duration Municipal Bond Fund | Annual Report 2023
| 31 |
Statement of Assets and Liabilities
October 31, 2023
| Assets | |
| Investments in securities, at value | |
| Unaffiliated issuers (cost $1,639,331,299) | $1,562,035,720 |
| Receivable for: | |
| Capital shares sold | 8,594,034 |
| Dividends | 15,157 |
| Interest | 21,753,729 |
| Trustees’ fees | 320,829 |
| Expense reimbursement due from Investment Manager | 8,648 |
| Prepaid expenses | 12,005 |
| Total assets | 1,592,740,122 |
| Liabilities | |
| Due to custodian | 27,862 |
| Payable for: | |
| Investments purchased on a delayed delivery basis | 4,255,110 |
| Capital shares redeemed | 5,534,678 |
| Distributions to shareholders | 4,691,351 |
| Management services fees | 20,104 |
| Distribution and/or service fees | 2,268 |
| Transfer agent fees | 117,706 |
| Trustees’ fees | 565,458 |
| Other expenses | 40,083 |
| Other liabilities | 449,091 |
| Total liabilities | 15,703,711 |
| Net assets applicable to outstanding capital stock | $1,577,036,411 |
| Represented by | |
| Paid in capital | 1,689,748,645 |
| Total distributable earnings (loss) | (112,712,234) |
| Total - representing net assets applicable to outstanding capital stock | $1,577,036,411 |
The accompanying Notes to Financial Statements are an integral part of this statement.
| 32 | Columbia Intermediate Duration Municipal Bond Fund | Annual Report 2023 |
Statement of Assets and Liabilities (continued)
October 31, 2023
| Class A | |
| Net assets | $360,251,616 |
| Shares outstanding | 39,710,143 |
| Net asset value per share | $9.07 |
| Maximum sales charge | 3.00% |
| Maximum offering price per share (calculated by dividing the net asset value per share by 1.0 minus the maximum sales charge for Class A shares) | $9.35 |
| Advisor Class | |
| Net assets | $233,683,711 |
| Shares outstanding | 25,777,935 |
| Net asset value per share | $9.07 |
| Class C | |
| Net assets | $11,407,605 |
| Shares outstanding | 1,257,024 |
| Net asset value per share | $9.08 |
| Institutional Class | |
| Net assets | $300,057,516 |
| Shares outstanding | 33,058,851 |
| Net asset value per share | $9.08 |
| Institutional 2 Class | |
| Net assets | $217,919,742 |
| Shares outstanding | 24,048,514 |
| Net asset value per share | $9.06 |
| Institutional 3 Class | |
| Net assets | $445,200,293 |
| Shares outstanding | 49,013,222 |
| Net asset value per share | $9.08 |
| Class V | |
| Net assets | $8,515,928 |
| Shares outstanding | 938,550 |
| Net asset value per share | $9.07 |
| Maximum sales charge | 4.75% |
| Maximum offering price per share (calculated by dividing the net asset value per share by 1.0 minus the maximum sales charge for Class V shares) | $9.52 |
The accompanying Notes to Financial Statements are an integral part of this statement.
Columbia Intermediate Duration Municipal Bond Fund | Annual Report 2023
| 33 |
Statement of Operations
Year Ended October 31, 2023
| Net investment income | |
| Income: | |
| Dividends — unaffiliated issuers | $132,970 |
| Interest | 63,485,081 |
| Total income | 63,618,051 |
| Expenses: | |
| Management services fees | 7,750,197 |
| Distribution and/or service fees | |
| Class A | 814,154 |
| Class C | 104,801 |
| Class V | 13,324 |
| Transfer agent fees | |
| Class A | 563,077 |
| Advisor Class | 377,032 |
| Class C | 18,113 |
| Institutional Class | 417,542 |
| Institutional 2 Class | 118,335 |
| Institutional 3 Class | 26,069 |
| Class V | 12,286 |
| Trustees’ fees | 79,886 |
| Custodian fees | 22,891 |
| Printing and postage fees | 39,675 |
| Registration fees | 189,514 |
| Accounting services fees | 30,090 |
| Legal fees | 36,595 |
| Compensation of chief compliance officer | 323 |
| Other | 25,275 |
| Total expenses | 10,639,179 |
| Fees waived or expenses reimbursed by Investment Manager and its affiliates | (3,669,271) |
| Expense reduction | (291) |
| Total net expenses | 6,969,617 |
| Net investment income | 56,648,434 |
| Realized and unrealized gain (loss) — net | |
| Net realized gain (loss) on: | |
| Investments — unaffiliated issuers | (3,208,971) |
| Net realized loss | (3,208,971) |
| Net change in unrealized appreciation (depreciation) on: | |
| Investments — unaffiliated issuers | (11,333,847) |
| Net change in unrealized appreciation (depreciation) | (11,333,847) |
| Net realized and unrealized loss | (14,542,818) |
| Net increase in net assets resulting from operations | $42,105,616 |
The accompanying Notes to Financial Statements are an integral part of this statement.
| 34 | Columbia Intermediate Duration Municipal Bond Fund | Annual Report 2023 |
Statement of Changes in Net Assets
| | Year Ended
October 31, 2023 | Year Ended
October 31, 2022 |
| Operations | | |
| Net investment income | $56,648,434 | $56,978,498 |
| Net realized loss | (3,208,971) | (10,662,978) |
| Net change in unrealized appreciation (depreciation) | (11,333,847) | (257,962,078) |
| Net increase (decrease) in net assets resulting from operations | 42,105,616 | (211,646,558) |
| Distributions to shareholders | | |
| Net investment income and net realized gains | | |
| Class A | (13,034,361) | (13,827,063) |
| Advisor Class | (9,269,003) | (13,149,808) |
| Class C | (340,774) | (369,158) |
| Institutional Class | (10,287,650) | (22,171,179) |
| Institutional 2 Class | (7,585,620) | (6,630,337) |
| Institutional 3 Class | (15,826,767) | (2,882,381) |
| Class V | (289,040) | (304,977) |
| Total distributions to shareholders | (56,633,215) | (59,334,903) |
| Increase (decrease) in net assets from capital stock activity | (29,384,170) | 814,535,517 |
| Total increase (decrease) in net assets | (43,911,769) | 543,554,056 |
| Net assets at beginning of year | 1,620,948,180 | 1,077,394,124 |
| Net assets at end of year | $1,577,036,411 | $1,620,948,180 |
The accompanying Notes to Financial Statements are an integral part of this statement.
Columbia Intermediate Duration Municipal Bond Fund | Annual Report 2023
| 35 |
Statement of Changes in Net Assets (continued)
| | Year Ended | Year Ended |
| | October 31, 2023 | October 31, 2022 |
| | Shares | Dollars ($) | Shares | Dollars ($) |
| Capital stock activity |
| Class A | | | | |
| Shares sold | 6,927,554 | 65,158,756 | 11,137,745 | 108,033,610 |
| Fund reorganization | — | — | 40,018,544 | 418,942,544 |
| Distributions reinvested | 1,313,308 | 12,331,042 | 1,339,824 | 13,060,573 |
| Shares redeemed | (14,844,091) | (139,614,071) | (22,571,331) | (219,568,903) |
| Net increase (decrease) | (6,603,229) | (62,124,273) | 29,924,782 | 320,467,824 |
| Advisor Class | | | | |
| Shares sold | 11,144,033 | 104,807,349 | 11,953,049 | 115,430,719 |
| Fund reorganization | — | — | 104,285,243 | 1,091,126,562 |
| Distributions reinvested | 385,557 | 3,620,405 | 741,482 | 7,334,116 |
| Shares redeemed | (19,406,797) | (181,885,045) | (83,957,434) | (846,171,485) |
| Net increase (decrease) | (7,877,207) | (73,457,291) | 33,022,340 | 367,719,912 |
| Class C | | | | |
| Shares sold | 331,356 | 3,108,246 | 323,953 | 3,143,313 |
| Distributions reinvested | 35,874 | 336,958 | 36,996 | 364,294 |
| Shares redeemed | (511,742) | (4,799,215) | (561,033) | (5,477,035) |
| Net decrease | (144,512) | (1,354,011) | (200,084) | (1,969,428) |
| Institutional Class | | | | |
| Shares sold | 19,160,561 | 179,111,178 | 26,207,959 | 256,850,438 |
| Distributions reinvested | 880,284 | 8,264,854 | 639,833 | 6,267,849 |
| Shares redeemed | (14,149,351) | (132,321,730) | (80,313,608) | (777,426,642) |
| Net increase (decrease) | 5,891,494 | 55,054,302 | (53,465,816) | (514,308,355) |
| Institutional 2 Class | | | | |
| Shares sold | 15,704,212 | 148,259,107 | 37,283,407 | 379,870,809 |
| Distributions reinvested | 809,801 | 7,583,291 | 685,489 | 6,625,571 |
| Shares redeemed | (15,095,097) | (141,345,105) | (17,780,268) | (171,551,925) |
| Net increase | 1,418,916 | 14,497,293 | 20,188,628 | 214,944,455 |
| Institutional 3 Class | | | | |
| Shares sold | 23,684,749 | 222,521,796 | 49,716,333 | 475,725,762 |
| Distributions reinvested | 77,460 | 727,101 | 17,642 | 169,983 |
| Shares redeemed | (19,704,517) | (185,138,002) | (5,055,019) | (47,743,112) |
| Net increase | 4,057,692 | 38,110,895 | 44,678,956 | 428,152,633 |
| Class V | | | | |
| Shares sold | 4,394 | 41,113 | 3,511 | 34,693 |
| Distributions reinvested | 22,917 | 215,076 | 23,104 | 227,198 |
| Shares redeemed | (38,996) | (367,274) | (76,062) | (733,415) |
| Net decrease | (11,685) | (111,085) | (49,447) | (471,524) |
| Total net increase (decrease) | (3,268,531) | (29,384,170) | 74,099,359 | 814,535,517 |
The accompanying Notes to Financial Statements are an integral part of this statement.
| 36 | Columbia Intermediate Duration Municipal Bond Fund | Annual Report 2023 |
[THIS PAGE INTENTIONALLY LEFT BLANK]
Columbia Intermediate Duration Municipal Bond Fund | Annual Report 2023
| 37 |
The following table is intended to help you understand the Fund’s financial performance. Certain information reflects financial results for a single share of a class held for the periods shown. Per share net investment income (loss) amounts are calculated based on average shares outstanding during the period. Total return assumes reinvestment of all dividends and distributions, if any. Total return does not reflect payment of sales charges, if any. Total return and portfolio turnover are not annualized for periods of less than one year. The ratios of expenses and net investment income are annualized for periods of less than one year. The portfolio turnover rate is calculated without regard to purchase and sales transactions of short-term instruments and certain derivatives, if any. If such transactions were included, the Fund’s portfolio turnover rate may be higher.
| | Net asset value,
beginning of
period | Net
investment
income | Net
realized
and
unrealized
gain (loss) | Total from
investment
operations | Distributions
from net
investment
income | Distributions
from net
realized
gains | Total
distributions to
shareholders |
| Class A |
| Year Ended 10/31/2023 | $9.15 | 0.30 | (0.08) | 0.22 | (0.30) | — | (0.30) |
| Year Ended 10/31/2022 | $10.46 | 0.28 | (1.28) | (1.00) | (0.29) | (0.02) | (0.31) |
| Year Ended 10/31/2021 | $10.51 | 0.27 | 0.00(e) | 0.27 | (0.27) | (0.05) | (0.32) |
| Year Ended 10/31/2020 | $10.59 | 0.28 | (0.03) | 0.25 | (0.29) | (0.04) | (0.33) |
| Year Ended 10/31/2019 | $10.11 | 0.31 | 0.48 | 0.79 | (0.31) | (0.00)(e) | (0.31) |
| Advisor Class |
| Year Ended 10/31/2023 | $9.15 | 0.32 | (0.08) | 0.24 | (0.32) | — | (0.32) |
| Year Ended 10/31/2022 | $10.45 | 0.30 | (1.28) | (0.98) | (0.30) | (0.02) | (0.32) |
| Year Ended 10/31/2021 | $10.50 | 0.29 | 0.00(e) | 0.29 | (0.29) | (0.05) | (0.34) |
| Year Ended 10/31/2020 | $10.59 | 0.30 | (0.04) | 0.26 | (0.31) | (0.04) | (0.35) |
| Year Ended 10/31/2019 | $10.11 | 0.33 | 0.48 | 0.81 | (0.33) | (0.00)(e) | (0.33) |
| Class C |
| Year Ended 10/31/2023 | $9.16 | 0.24 | (0.08) | 0.16 | (0.24) | — | (0.24) |
| Year Ended 10/31/2022 | $10.46 | 0.22 | (1.27) | (1.05) | (0.23) | (0.02) | (0.25) |
| Year Ended 10/31/2021 | $10.51 | 0.21 | 0.00(e) | 0.21 | (0.21) | (0.05) | (0.26) |
| Year Ended 10/31/2020 | $10.59 | 0.21 | (0.03) | 0.18 | (0.22) | (0.04) | (0.26) |
| Year Ended 10/31/2019 | $10.12 | 0.24 | 0.48 | 0.72 | (0.25) | (0.00)(e) | (0.25) |
| Institutional Class |
| Year Ended 10/31/2023 | $9.16 | 0.32 | (0.08) | 0.24 | (0.32) | — | (0.32) |
| Year Ended 10/31/2022 | $10.46 | 0.30 | (1.28) | (0.98) | (0.30) | (0.02) | (0.32) |
| Year Ended 10/31/2021 | $10.51 | 0.29 | 0.00(e) | 0.29 | (0.29) | (0.05) | (0.34) |
| Year Ended 10/31/2020 | $10.60 | 0.30 | (0.04) | 0.26 | (0.31) | (0.04) | (0.35) |
| Year Ended 10/31/2019 | $10.12 | 0.33 | 0.48 | 0.81 | (0.33) | (0.00)(e) | (0.33) |
| Institutional 2 Class |
| Year Ended 10/31/2023 | $9.14 | 0.33 | (0.08) | 0.25 | (0.33) | — | (0.33) |
| Year Ended 10/31/2022 | $10.45 | 0.31 | (1.29) | (0.98) | (0.31) | (0.02) | (0.33) |
| Year Ended 10/31/2021 | $10.49 | 0.30 | 0.01 | 0.31 | (0.30) | (0.05) | (0.35) |
| Year Ended 10/31/2020 | $10.58 | 0.31 | (0.05) | 0.26 | (0.31) | (0.04) | (0.35) |
| Year Ended 10/31/2019 | $10.10 | 0.34 | 0.48 | 0.82 | (0.34) | (0.00)(e) | (0.34) |
The accompanying Notes to Financial Statements are an integral part of this statement.
| 38 | Columbia Intermediate Duration Municipal Bond Fund | Annual Report 2023 |
Financial Highlights (continued)
| | Net
asset
value,
end of
period | Total
return | Total gross
expense
ratio to
average
net assets(a) | Total net
expense
ratio to
average
net assets(a),(b) | Net investment
income
ratio to
average
net assets | Portfolio
turnover | Net
assets,
end of
period
(000’s) |
| Class A |
| Year Ended 10/31/2023 | $9.07 | 2.35% | 0.83% | 0.61%(c) | 3.20% | 16% | $360,252 |
| Year Ended 10/31/2022 | $9.15 | (9.76%) | 0.81%(d) | 0.60%(c),(d) | 2.86% | 3% | $423,921 |
| Year Ended 10/31/2021 | $10.46 | 2.61% | 0.83% | 0.70%(c) | 2.55% | 5% | $171,415 |
| Year Ended 10/31/2020 | $10.51 | 2.36% | 0.82% | 0.73%(c) | 2.70% | 9% | $156,865 |
| Year Ended 10/31/2019 | $10.59 | 7.94% | 0.82%(f) | 0.76%(c),(f) | 2.97% | 14% | $152,575 |
| Advisor Class |
| Year Ended 10/31/2023 | $9.07 | 2.56% | 0.63% | 0.41%(c) | 3.40% | 16% | $233,684 |
| Year Ended 10/31/2022 | $9.15 | (9.50%) | 0.61%(d) | 0.40%(c),(d) | 3.01% | 3% | $307,823 |
| Year Ended 10/31/2021 | $10.45 | 2.81% | 0.63% | 0.50%(c) | 2.75% | 5% | $6,615 |
| Year Ended 10/31/2020 | $10.50 | 2.47% | 0.62% | 0.53%(c) | 2.90% | 9% | $6,249 |
| Year Ended 10/31/2019 | $10.59 | 8.15% | 0.62%(f) | 0.56%(c),(f) | 3.22% | 14% | $5,927 |
| Class C |
| Year Ended 10/31/2023 | $9.08 | 1.74% | 1.43% | 1.21%(c) | 2.60% | 16% | $11,408 |
| Year Ended 10/31/2022 | $9.16 | (10.21%) | 1.42%(d) | 1.20%(c),(d) | 2.24% | 3% | $12,833 |
| Year Ended 10/31/2021 | $10.46 | 1.99% | 1.47% | 1.30%(c) | 1.94% | 5% | $16,754 |
| Year Ended 10/31/2020 | $10.51 | 1.71% | 1.47% | 1.38%(c) | 2.06% | 9% | $21,469 |
| Year Ended 10/31/2019 | $10.59 | 7.14% | 1.47%(f) | 1.41%(c),(f) | 2.33% | 14% | $23,522 |
| Institutional Class |
| Year Ended 10/31/2023 | $9.08 | 2.56% | 0.63% | 0.41%(c) | 3.41% | 16% | $300,058 |
| Year Ended 10/31/2022 | $9.16 | (9.49%) | 0.62%(d) | 0.40%(c),(d) | 2.99% | 3% | $248,789 |
| Year Ended 10/31/2021 | $10.46 | 2.81% | 0.63% | 0.50%(c) | 2.75% | 5% | $843,761 |
| Year Ended 10/31/2020 | $10.51 | 2.47% | 0.62% | 0.53%(c) | 2.90% | 9% | $900,641 |
| Year Ended 10/31/2019 | $10.60 | 8.15% | 0.62%(f) | 0.56%(c),(f) | 3.17% | 14% | $1,012,229 |
| Institutional 2 Class |
| Year Ended 10/31/2023 | $9.06 | 2.64% | 0.54% | 0.32% | 3.49% | 16% | $217,920 |
| Year Ended 10/31/2022 | $9.14 | (9.53%) | 0.55%(d) | 0.33%(d) | 3.16% | 3% | $206,896 |
| Year Ended 10/31/2021 | $10.45 | 2.98% | 0.56% | 0.44% | 2.81% | 5% | $25,496 |
| Year Ended 10/31/2020 | $10.49 | 2.54% | 0.55% | 0.47% | 2.98% | 9% | $30,056 |
| Year Ended 10/31/2019 | $10.58 | 8.24% | 0.55%(f) | 0.49%(f) | 3.21% | 14% | $35,836 |
The accompanying Notes to Financial Statements are an integral part of this statement.
Columbia Intermediate Duration Municipal Bond Fund | Annual Report 2023
| 39 |
Financial Highlights (continued)
| | Net asset value,
beginning of
period | Net
investment
income | Net
realized
and
unrealized
gain (loss) | Total from
investment
operations | Distributions
from net
investment
income | Distributions
from net
realized
gains | Total
distributions to
shareholders |
| Institutional 3 Class |
| Year Ended 10/31/2023 | $9.16 | 0.33 | (0.08) | 0.25 | (0.33) | — | (0.33) |
| Year Ended 10/31/2022 | $10.47 | 0.33 | (1.30) | (0.97) | (0.32) | (0.02) | (0.34) |
| Year Ended 10/31/2021 | $10.52 | 0.30 | 0.01 | 0.31 | (0.31) | (0.05) | (0.36) |
| Year Ended 10/31/2020 | $10.61 | 0.32 | (0.05) | 0.27 | (0.32) | (0.04) | (0.36) |
| Year Ended 10/31/2019 | $10.13 | 0.34 | 0.49 | 0.83 | (0.35) | (0.00)(e) | (0.35) |
| Class V |
| Year Ended 10/31/2023 | $9.15 | 0.31 | (0.08) | 0.23 | (0.31) | — | (0.31) |
| Year Ended 10/31/2022 | $10.46 | 0.29 | (1.29) | (1.00) | (0.29) | (0.02) | (0.31) |
| Year Ended 10/31/2021 | $10.50 | 0.27 | 0.02 | 0.29 | (0.28) | (0.05) | (0.33) |
| Year Ended 10/31/2020 | $10.59 | 0.29 | (0.05) | 0.24 | (0.29) | (0.04) | (0.33) |
| Year Ended 10/31/2019 | $10.11 | 0.32 | 0.48 | 0.80 | (0.32) | (0.00)(e) | (0.32) |
| Notes to Financial Highlights |
| (a) | In addition to the fees and expenses that the Fund bears directly, the Fund indirectly bears a pro rata share of the fees and expenses of any other funds in which it invests. Such indirect expenses are not included in the Fund’s reported expense ratios. |
| (b) | Total net expenses include the impact of certain fee waivers/expense reimbursements made by the Investment Manager and certain of its affiliates, if applicable. |
| (c) | The benefits derived from expense reductions had an impact of less than 0.01%. |
| (d) | Ratios include interfund lending expense which is less than 0.01%. |
| (e) | Rounds to zero. |
| (f) | Ratios include line of credit interest expense which is less than 0.01%. |
The accompanying Notes to Financial Statements are an integral part of this statement.
| 40 | Columbia Intermediate Duration Municipal Bond Fund | Annual Report 2023 |
Financial Highlights (continued)
| | Net
asset
value,
end of
period | Total
return | Total gross
expense
ratio to
average
net assets(a) | Total net
expense
ratio to
average
net assets(a),(b) | Net investment
income
ratio to
average
net assets | Portfolio
turnover | Net
assets,
end of
period
(000’s) |
| Institutional 3 Class |
| Year Ended 10/31/2023 | $9.08 | 2.70% | 0.50% | 0.28% | 3.54% | 16% | $445,200 |
| Year Ended 10/31/2022 | $9.16 | (9.46%) | 0.52%(d) | 0.28%(d) | 3.50% | 3% | $411,988 |
| Year Ended 10/31/2021 | $10.47 | 2.93% | 0.52% | 0.39% | 2.86% | 5% | $2,897 |
| Year Ended 10/31/2020 | $10.52 | 2.59% | 0.51% | 0.42% | 3.01% | 9% | $2,495 |
| Year Ended 10/31/2019 | $10.61 | 8.27% | 0.51%(f) | 0.44%(f) | 3.28% | 14% | $2,542 |
| Class V |
| Year Ended 10/31/2023 | $9.07 | 2.41% | 0.78% | 0.56%(c) | 3.25% | 16% | $8,516 |
| Year Ended 10/31/2022 | $9.15 | (9.72%) | 0.77%(d) | 0.55%(c),(d) | 2.90% | 3% | $8,699 |
| Year Ended 10/31/2021 | $10.46 | 2.76% | 0.78% | 0.65%(c) | 2.60% | 5% | $10,456 |
| Year Ended 10/31/2020 | $10.50 | 2.31% | 0.77% | 0.68%(c) | 2.75% | 9% | $10,887 |
| Year Ended 10/31/2019 | $10.59 | 7.99% | 0.77%(f) | 0.71%(c),(f) | 3.02% | 14% | $11,562 |
The accompanying Notes to Financial Statements are an integral part of this statement.
Columbia Intermediate Duration Municipal Bond Fund | Annual Report 2023
| 41 |
Notes to Financial Statements
October 31, 2023
Note 1. Organization
Columbia Intermediate Duration Municipal Bond Fund (the Fund), a series of Columbia Funds Series Trust I (the Trust), is a diversified fund. The Trust is registered under the Investment Company Act of 1940, as amended (the 1940 Act), as an open-end management investment company organized as a Massachusetts business trust.
Fund shares
The Trust may issue an unlimited number of shares (without par value). The Fund offers each of the share classes listed in the Statement of Assets and Liabilities. Although all share classes generally have identical voting, dividend and liquidation rights, each share class votes separately when required by the Trust’s organizational documents or by law. Each share class has its own expense and sales charge structure. Different share classes may have different minimum initial investment amounts and pay different net investment income distribution amounts to the extent the expenses of distributing such share classes vary. Distributions to shareholders in a liquidation will be proportional to the net asset value of each share class.
As described in the Fund’s prospectus, Class A and Class C shares are offered to the general public for investment. Class C shares automatically convert to Class A shares after 8 years. Advisor Class, Institutional Class, Institutional 2 Class and Institutional 3 Class are available through authorized investment professionals to omnibus retirement plans or to institutional investors and to certain other investors as also described in the Fund’s prospectus. Class V shares are available only to investors who received (and who continuously held) Class V shares in connection with previous fund reorganizations.
In September 2023, the Fund’s Board of Trustees approved the liquidation of Class V shares of the Fund on December 8, 2023. Effective at the open of business on October 25, 2023, any applicable contingent deferred sales charges were waived on redemptions and exchanges out of Class V shares, and effective at the open of business on November 27, 2023, Class V shares of the Fund were closed to all investors. For federal tax purposes, this liquidation was treated as a redemption of fund shares.
Note 2. Summary of significant accounting policies
Basis of preparation
The Fund is an investment company that applies the accounting and reporting guidance in the Financial Accounting Standards Board (FASB) Accounting Standards Codification Topic 946, Financial Services - Investment Companies (ASC 946). The financial statements are prepared in accordance with U.S. generally accepted accounting principles (GAAP), which requires management to make certain estimates and assumptions that affect the reported amounts of assets and liabilities, the disclosure of contingent assets and liabilities at the date of the financial statements and the reported amounts of income and expenses during the reporting period. Actual results could differ from those estimates.
The following is a summary of significant accounting policies followed by the Fund in the preparation of its financial statements.
Security valuation
Debt securities generally are valued based on prices obtained from pricing services, which are intended to reflect market transactions for normal, institutional-size trading units of similar securities. The services may use various pricing techniques that take into account, as applicable, factors such as yield, quality, coupon rate, maturity, type of issue, trading characteristics and other data, as well as approved independent broker-dealer quotes. Debt securities for which quotations are not readily available or not believed to be reflective of market value may also be valued based upon a bid quote from an approved independent broker-dealer. Debt securities maturing in 60 days or less are valued primarily at amortized market value, unless this method results in a valuation that management believes does not approximate fair value.
Investments in open-end investment companies (other than exchange-traded funds (ETFs)), are valued at the latest net asset value reported by those companies as of the valuation time.
| 42 | Columbia Intermediate Duration Municipal Bond Fund | Annual Report 2023 |
Notes to Financial Statements (continued)
October 31, 2023
Investments for which market quotations are not readily available, or that have quotations which management believes are not reflective of market value or reliable, are valued at fair value as determined in good faith under procedures approved by the Board of Trustees. If a security or class of securities (such as foreign securities) is valued at fair value, such value is likely to be different from the quoted or published price for the security, if available.
The determination of fair value often requires significant judgment. To determine fair value, management may use assumptions including but not limited to future cash flows and estimated risk premiums. Multiple inputs from various sources may be used to determine fair value.
GAAP requires disclosure regarding the inputs and valuation techniques used to measure fair value and any changes in valuation inputs or techniques. In addition, investments shall be disclosed by major category. This information is disclosed following the Fund’s Portfolio of Investments.
Delayed delivery securities
The Fund may trade securities on other than normal settlement terms, including securities purchased or sold on a “when-issued” or "forward commitment" basis. This may increase risk to the Fund since the other party to the transaction may fail to deliver, which could cause the Fund to subsequently invest at less advantageous prices. The Fund designates cash or liquid securities in an amount equal to the delayed delivery commitment.
Security transactions
Security transactions are accounted for on the trade date. Cost is determined and gains (losses) are based upon the specific identification method for both financial statement and federal income tax purposes.
Income recognition
Interest income is recorded on an accrual basis. Market premiums and discounts, including original issue discounts, are amortized and accreted, respectively, over the expected life of the security on all debt securities, unless otherwise noted.
The Fund may place a debt security on non-accrual status and reduce related interest income when it becomes probable that the interest will not be collected and the amount of uncollectible interest can be reasonably estimated. The Fund may also adjust accrual rates when it becomes probable the full interest will not be collected and a partial payment will be received. A defaulted debt security is removed from non-accrual status when the issuer resumes interest payments or when collectability of interest is reasonably assured.
Dividend income is recorded on the ex-dividend date.
Expenses
General expenses of the Trust are allocated to the Fund and other funds of the Trust based upon relative net assets or other expense allocation methodologies determined by the nature of the expense. Expenses directly attributable to the Fund are charged to the Fund. Expenses directly attributable to a specific class of shares are charged to that share class.
Determination of class net asset value
All income, expenses (other than class-specific expenses, which are charged to that share class, as shown in the Statement of Operations) and realized and unrealized gains (losses) are allocated to each class of the Fund on a daily basis, based on the relative net assets of each class, for purposes of determining the net asset value of each class.
Federal income tax status
The Fund intends to qualify each year as a regulated investment company under Subchapter M of the Internal Revenue Code, as amended, and will distribute substantially all of its net tax-exempt and investment company taxable income and net capital gain, if any, for its tax year, and as such will not be subject to federal income taxes. In addition, the Fund intends to distribute in each calendar year substantially all of its ordinary income, capital gain net income and certain other amounts, if any, such that the Fund should not be subject to federal excise tax. Therefore, no federal income or excise tax provision is recorded.
Columbia Intermediate Duration Municipal Bond Fund | Annual Report 2023
| 43 |
Notes to Financial Statements (continued)
October 31, 2023
Distributions to shareholders
Distributions from net investment income, if any, are declared daily and paid monthly. Net realized capital gains, if any, are distributed at least annually. Income distributions and capital gain distributions are determined in accordance with federal income tax regulations, which may differ from GAAP.
Guarantees and indemnifications
Under the Trust’s organizational documents and, in some cases, by contract, its officers and trustees are indemnified against certain liabilities arising out of the performance of their duties to the Trust or its funds. In addition, certain of the Fund’s contracts with its service providers contain general indemnification clauses. The Fund’s maximum exposure under these arrangements is unknown since the amount of any future claims that may be made against the Fund cannot be determined, and the Fund has no historical basis for predicting the likelihood of any such claims.
Recent accounting pronouncements and regulatory updates
Tailored Shareholder Reports
In October 2022, the Securities and Exchange Commission adopted a final rule relating to Tailored Shareholder Reports for Mutual Funds and Exchange-Traded Funds; Fee Information in Investment Company Advertisements. The rule and form amendments will, among other things, require the Fund to transmit concise and visually engaging shareholder reports that highlight key information. The amendments will require that funds tag information in a structured data format and that certain more in-depth information be made available online and available for delivery free of charge to investors on request. The amendments became effective January 24, 2023. There is an 18-month transition period after the effective date of the amendments.
Note 3. Fees and other transactions with affiliates
Management services fees
The Fund has entered into a Management Agreement with Columbia Management Investment Advisers, LLC (the Investment Manager), a wholly-owned subsidiary of Ameriprise Financial, Inc. (Ameriprise Financial). Under the Management Agreement, the Investment Manager provides the Fund with investment research and advice, as well as administrative and accounting services. The management services fee is an annual fee that is equal to a percentage of the Fund’s daily net assets that declines from 0.48% to 0.29% as the Fund’s net assets increase. The effective management services fee rate for the year ended October 31, 2023 was 0.46% of the Fund’s average daily net assets.
Compensation of Board members
Members of the Board of Trustees who are not officers or employees of the Investment Manager or Ameriprise Financial are compensated for their services to the Fund as disclosed in the Statement of Operations. Under a Deferred Compensation Plan (the Deferred Plan), these members of the Board of Trustees may elect to defer payment of up to 100% of their compensation. Deferred amounts are treated as though equivalent dollar amounts had been invested in shares of certain funds managed by the Investment Manager. The Fund’s liability for these amounts is adjusted for market value changes and remains in the Fund until distributed in accordance with the Deferred Plan. All amounts payable under the Deferred Plan constitute a general unsecured obligation of the Fund. The expense for the Deferred Plan, which includes Trustees’ fees deferred during the current period as well as any gains or losses on the Trustees’ deferred compensation balances as a result of market fluctuations, is included in "Trustees’ fees" in the Statement of Operations.
Compensation of Chief Compliance Officer
The Board of Trustees has appointed a Chief Compliance Officer for the Fund in accordance with federal securities regulations. As disclosed in the Statement of Operations, a portion of the Chief Compliance Officer’s total compensation is allocated to the Fund, along with other allocations to affiliated registered investment companies managed by the Investment Manager and its affiliates, based on relative net assets.
| 44 | Columbia Intermediate Duration Municipal Bond Fund | Annual Report 2023 |
Notes to Financial Statements (continued)
October 31, 2023
Transfer agency fees
Under a Transfer and Dividend Disbursing Agent Agreement, Columbia Management Investment Services Corp. (the Transfer Agent), an affiliate of the Investment Manager and a wholly-owned subsidiary of Ameriprise Financial, is responsible for providing transfer agency services to the Fund. The Transfer Agent has contracted with SS&C GIDS, Inc. (SS&C GIDS) to serve as sub-transfer agent. Prior to January 1, 2023, SS&C GIDS was known as DST Asset Manager Solutions, Inc. The Transfer Agent pays the fees of SS&C GIDS for services as sub-transfer agent and SS&C GIDS is not entitled to reimbursement for such fees from the Fund (with the exception of out-of-pocket fees).
The Fund pays the Transfer Agent a monthly transfer agency fee based on the number or the average value of accounts, depending on the type of account. In addition, the Fund pays the Transfer Agent a fee for shareholder services based on the number of accounts or on a percentage of the average aggregate value of the Fund’s shares maintained in omnibus accounts up to the lesser of the amount charged by the financial intermediary or a cap established by the Board of Trustees from time to time.
The Transfer Agent also receives compensation from the Fund for various shareholder services and reimbursements for certain out-of-pocket fees. Total transfer agency fees for Institutional 2 Class and Institutional 3 Class shares are subject to an annual limitation of not more than 0.07% and 0.02%, respectively, of the average daily net assets attributable to each share class.
For the year ended October 31, 2023, the Fund’s effective transfer agency fee rates as a percentage of average daily net assets of each class were as follows:
| | Effective rate (%) |
| Class A | 0.14 |
| Advisor Class | 0.14 |
| Class C | 0.14 |
| Institutional Class | 0.14 |
| Institutional 2 Class | 0.05 |
| Institutional 3 Class | 0.01 |
| Class V | 0.14 |
An annual minimum account balance fee of $20 may apply to certain accounts with a value below the applicable share class’s initial minimum investment requirements to reduce the impact of small accounts on transfer agency fees. These minimum account balance fees are remitted to the Fund and recorded as part of expense reductions in the Statement of Operations. For the year ended October 31, 2023, these minimum account balance fees reduced total expenses of the Fund by $291.
Distribution and service fees
The Fund has entered into an agreement with Columbia Management Investment Distributors, Inc. (the Distributor), an affiliate of the Investment Manager and a wholly-owned subsidiary of Ameriprise Financial, for distribution and shareholder services. The Board of Trustees has approved, and the Fund has adopted, distribution and shareholder service plans (the Plans) applicable to certain share classes, which set the distribution and service fees for the Fund. These fees are calculated daily and are intended to compensate the Distributor and/or eligible selling and/or servicing agents for selling shares of the Fund and providing services to investors.
Under the Plans, the Fund pays a monthly service fee to the Distributor at the maximum annual rate of 0.20% of the average daily net assets attributable to Class A and Class C shares of the Fund. Also under the Plans, the Fund pays a monthly distribution fee to the Distributor at the maximum annual rate of 0.60% of the average daily net assets attributable to Class C shares of the Fund.
Columbia Intermediate Duration Municipal Bond Fund | Annual Report 2023
| 45 |
Notes to Financial Statements (continued)
October 31, 2023
Shareholder services fees
The Fund has adopted a shareholder services plan that permits it to pay for certain services provided to Class V shareholders by their selling and/or servicing agents. The Fund may pay shareholder servicing fees up to an aggregate annual rate of 0.40% of the Fund’s average daily net assets attributable to Class V shares (comprised of up to 0.20% for shareholder services and up to 0.20% for administrative support services). These fees are currently limited to an aggregate annual rate of not more than 0.15% of the Fund’s average daily net assets attributable to Class V shares.
Sales charges (unaudited)
Sales charges, including front-end charges and contingent deferred sales charges (CDSCs), received by the Distributor for distributing Fund shares for the year ended October 31, 2023, if any, are listed below:
| | Front End (%) | CDSC (%) | Amount ($) |
| Class A | 3.00 | 0.75(a) | 47,306 |
| Class C | — | 1.00(b) | 623 |
| Class V | 4.75 | 0.50 - 1.00(c) | — |
| (a) | This charge is imposed on certain investments of $500,000 or more if redeemed within 12 months after purchase. |
| (b) | This charge applies to redemptions within 12 months after purchase, with certain limited exceptions. |
| (c) | This charge is imposed on certain investments of between $1 million and $50 million redeemed within 18 months after purchase, as follows: 1.00% if redeemed within 12 months after purchase, and 0.50% if redeemed more than 12, but less than 18, months after purchase, with certain limited exceptions. |
The Fund’s other share classes are not subject to sales charges.
Expenses waived/reimbursed by the Investment Manager and its affiliates
The Investment Manager and certain of its affiliates have contractually agreed to waive fees and/or reimburse expenses (excluding certain fees and expenses described below) for the period(s) disclosed below, unless sooner terminated at the sole discretion of the Board of Trustees, so that the Fund’s net operating expenses, after giving effect to fees waived/expenses reimbursed and any balance credits and/or overdraft charges from the Fund’s custodian, do not exceed the following annual rate(s) as a percentage of the classes’ average daily net assets:
| | Fee rate(s) contractual through February 29, 2024 |
| Class A | 0.61% |
| Advisor Class | 0.41 |
| Class C | 1.21 |
| Institutional Class | 0.41 |
| Institutional 2 Class | 0.33 |
| Institutional 3 Class | 0.28 |
| Class V | 0.56 |
Under the agreement governing these fee waivers and/or expense reimbursement arrangements, the following fees and expenses are excluded from the waiver/reimbursement commitment, and therefore will be paid by the Fund, if applicable: taxes (including foreign transaction taxes), expenses associated with investments in affiliated and non-affiliated pooled investment vehicles (including mutual funds and exchange-traded funds), transaction costs and brokerage commissions, costs related to any securities lending program, dividend expenses associated with securities sold short, inverse floater program fees and expenses, transaction charges and interest on borrowed money, interest, costs associated with shareholder meetings, infrequent and/or unusual expenses and any other expenses the exclusion of which is specifically approved by the Board of Trustees. This agreement may be modified or amended only with approval from the Investment Manager, certain of its affiliates and the Fund. In addition to the contractual agreement, the Investment Manager and certain of its affiliates have voluntarily agreed to waive fees and/or reimburse Fund expenses (excluding certain fees and expenses described above) so that Fund level expenses (expenses directly attributable to the Fund and not to a specific share class) are waived proportionately across all share classes. This arrangement may be revised or discontinued at any time. Any fees waived and/or expenses reimbursed under the expense reimbursement arrangements described above are not recoverable by the Investment Manager or its affiliates in future periods.
| 46 | Columbia Intermediate Duration Municipal Bond Fund | Annual Report 2023 |
Notes to Financial Statements (continued)
October 31, 2023
Note 4. Federal tax information
The timing and character of income and capital gain distributions are determined in accordance with income tax regulations, which may differ from GAAP because of temporary or permanent book to tax differences.
At October 31, 2023, these differences were primarily due to differing treatment for principal and/or interest from fixed income securities, capital loss carryforwards, trustees’ deferred compensation, distributions and re-characterization of distributions for investments. To the extent these differences were permanent, reclassifications were made among the components of the Fund’s net assets. Temporary differences do not require reclassifications.
The following reclassifications were made:
Undistributed net
investment
income ($) | Accumulated
net realized
(loss) ($) | Paid in
capital ($) |
| (11) | 11 | — |
Net investment income (loss) and net realized gains (losses), as disclosed in the Statement of Operations, and net assets were not affected by this reclassification.
The tax character of distributions paid during the years indicated was as follows:
| Year Ended October 31, 2023 | Year Ended October 31, 2022 |
Ordinary
income ($) | Tax-exempt
income ($) | Long-term
capital gains ($) | Total ($) | Ordinary
income ($) | Tax-exempt
income ($) | Long-term
capital gains ($) | Total ($) |
| 404,160 | 56,229,055 | — | 56,633,215 | 331,306 | 56,634,590 | 2,369,007 | 59,334,903 |
Short-term capital gain distributions, if any, are considered ordinary income distributions for tax purposes.
At October 31, 2023, the components of distributable earnings on a tax basis were as follows:
Undistributed
ordinary income ($) | Undistributed tax-
exempt income ($) | Undistributed
long-term
capital gains ($) | Capital loss
carryforwards ($) | Net unrealized
(depreciation) ($) |
| — | 6,283,681 | — | (38,080,763) | (75,659,732) |
At October 31, 2023, the cost of all investments for federal income tax purposes along with the aggregate gross unrealized appreciation and depreciation based on that cost was:
Federal
tax cost ($) | Gross unrealized
appreciation ($) | Gross unrealized
(depreciation) ($) | Net unrealized
(depreciation) ($) |
| 1,637,695,452 | 6,968,723 | (82,628,455) | (75,659,732) |
Tax cost of investments and unrealized appreciation/(depreciation) may also include timing differences that do not constitute adjustments to tax basis.
The following capital loss carryforwards, determined at October 31, 2023, may be available to reduce future net realized gains on investments, if any, to the extent permitted by the Internal Revenue Code. In addition, for the year ended October 31, 2023, capital loss carryforwards utilized, if any, were as follows:
No expiration
short-term ($) | No expiration
long-term ($) | Total ($) | Utilized ($) |
| (28,068,754) | (10,012,009) | (38,080,763) | — |
Columbia Intermediate Duration Municipal Bond Fund | Annual Report 2023
| 47 |
Notes to Financial Statements (continued)
October 31, 2023
Management of the Fund has concluded that there are no significant uncertain tax positions in the Fund that would require recognition in the financial statements. However, management’s conclusion may be subject to review and adjustment at a later date based on factors including, but not limited to, new tax laws, regulations, and administrative interpretations (including relevant court decisions). Generally, the Fund’s federal tax returns for the prior three fiscal years remain subject to examination by the Internal Revenue Service.
Note 5. Portfolio information
The cost of purchases and proceeds from sales of securities, excluding short-term investments and derivatives, if any, aggregated to $264,904,845 and $275,824,417, respectively, for the year ended October 31, 2023. The amount of purchase and sale activity impacts the portfolio turnover rate reported in the Financial Highlights.
Note 6. Interfund lending
Pursuant to an exemptive order granted by the Securities and Exchange Commission, the Fund participates in a program (the Interfund Program) allowing each participating Columbia Fund (each, a Participating Fund) to lend money directly to and, except for closed-end funds and money market funds, borrow money directly from other Participating Funds for temporary purposes. The amounts eligible for borrowing and lending under the Interfund Program are subject to certain restrictions.
Interfund loans are subject to the risk that the borrowing fund could be unable to repay the loan when due, and a delay in repayment to the lending fund could result in lost opportunities and/or additional lending costs. The exemptive order is subject to conditions intended to mitigate conflicts of interest arising from the Investment Manager’s relationship with each Participating Fund.
The Fund did not borrow or lend money under the Interfund Program during the year ended October 31, 2023.
Note 7. Line of credit
The Fund has access to a revolving credit facility with a syndicate of banks led by JPMorgan Chase Bank, N.A., Citibank, N.A. and Wells Fargo Bank, N.A. whereby the Fund may borrow for the temporary funding of shareholder redemptions or for other temporary or emergency purposes. Pursuant to an October 26, 2023 amendment and restatement, the credit facility, which is an agreement between the Fund and certain other funds managed by the Investment Manager or an affiliated investment manager, severally and not jointly, permits aggregate borrowings up to $900 million. Interest is currently charged to each participating fund based on its borrowings at a rate equal to the higher of (i) the federal funds effective rate, (ii) the secured overnight financing rate plus 0.10% and (iii) the overnight bank funding rate plus, in each case, 1.00%. Each borrowing under the credit facility matures no later than 60 days after the date of borrowing. The Fund also pays a commitment fee equal to its pro rata share of the unused amount of the credit facility at a rate of 0.15% per annum. The commitment fee is included in other expenses in the Statement of Operations. This agreement expires annually in October unless extended or renewed. Prior to the October 26, 2023 amendment and restatement, the Fund had access to a revolving credit facility with a syndicate of banks led by JPMorgan Chase Bank, N.A., Citibank, N.A. and Wells Fargo Bank, N.A. which permitted collective borrowings up to $950 million. Interest was charged to each participating fund based on its borrowings at a rate equal to the higher of (i) the federal funds effective rate, (ii) the secured overnight financing rate plus 0.10% and (iii) the overnight bank funding rate plus, in each case, 1.00%.
The Fund had no borrowings during the year ended October 31, 2023.
Note 8. Fund reorganization
At the close of business on December 10, 2021, the Fund acquired the assets and assumed the identified liabilities of BMO Intermediate Tax-Free Fund (the Acquired Fund), a series of BMO Funds, Inc. The reorganization was completed after shareholders of the Acquired Fund approved a plan of reorganization at a shareholder meeting held on November 23, 2021. The purpose of the reorganization was to combine two funds with comparable investment objectives and strategies.
The aggregate net assets of the Fund immediately before the reorganization were $1,074,755,495 and the combined net assets immediately after the reorganization were $2,584,824,601.
| 48 | Columbia Intermediate Duration Municipal Bond Fund | Annual Report 2023 |
Notes to Financial Statements (continued)
October 31, 2023
The reorganization was accomplished by a tax-free exchange of 130,446,790 shares of the Acquired Fund valued at $1,510,069,106 (including $116,128,348 of unrealized appreciation/(depreciation)).
In exchange for the Acquired Fund’s shares, the Fund issued the following number of shares:
| | Shares |
| Class A | 40,018,544 |
| Advisor Class | 104,285,243 |
For financial reporting purposes, net assets received and shares issued by the Fund were recorded at fair value; however, the Acquired Fund’s cost of investments was carried forward.
The Fund’s financial statements reflect both the operations of the Fund for the period prior to the reorganization and the combined Fund for the period subsequent to the reorganization. Because the combined investment portfolios have been managed as a single integrated portfolio since the reorganization was completed, it is not practicable to separate the amounts of revenue and earnings of the Acquired Fund that have been included in the combined Fund’s Statement of Operations since the reorganization was completed.
Assuming the reorganization had been completed on November 1, 2021, the Fund’s pro-forma results of operations for the year ended October 31, 2022 would have been approximately:
| | ($) |
| Net investment income | 61,608,000 |
| Net realized loss | (8,790,000) |
| Net change in unrealized appreciation/(depreciation) | (254,774,000) |
| Net decrease in net assets from operations | (201,956,000) |
Note 9. Significant risks
Credit risk
Credit risk is the risk that the value of debt instruments in the Fund’s portfolio may decline because the issuer defaults or otherwise becomes unable or unwilling, or is perceived to be unable or unwilling, to honor its financial obligations, such as making payments to the Fund when due. Credit rating agencies assign credit ratings to certain debt instruments to indicate their credit risk. Lower-rated or unrated debt instruments held by the Fund may present increased credit risk as compared to higher-rated debt instruments.
Interest rate risk
Interest rate risk is the risk of losses attributable to changes in interest rates. In general, if interest rates rise, the values of debt instruments tend to fall, and if interest rates fall, the values of debt instruments tend to rise. Actions by governments and central banking authorities can result in increases or decreases in interest rates. Higher periods of inflation could lead such authorities to raise interest rates. Increasing interest rates may negatively affect the value of debt securities held by the Fund, resulting in a negative impact on the Fund’s performance and net asset value per share. In general, the longer the maturity or duration of a debt security, the greater its sensitivity to changes in interest rates. The Fund is subject to the risk that the income generated by its investments may not keep pace with inflation.
Liquidity risk
Liquidity risk is the risk associated with a lack of marketability of investments which may make it difficult to sell the investment at a desirable time or price. Changing regulatory, market or other conditions or environments (for example, the interest rate or credit environments) may adversely affect the liquidity of the Fund’s investments. The Fund may have to accept a lower selling price for the holding, sell other investments, or forego another, more appealing investment opportunity. Generally, the less liquid the market at the time the Fund sells a portfolio investment, the greater the risk of loss or decline of value to the Fund. A less liquid market can lead to an increase in Fund redemptions, which may negatively impact Fund performance and net asset value per share, including, for example, if the Fund is forced to sell securities in a down market.
Columbia Intermediate Duration Municipal Bond Fund | Annual Report 2023
| 49 |
Notes to Financial Statements (continued)
October 31, 2023
Market risk
The Fund may incur losses due to declines in the value of one or more securities in which it invests. These declines may be due to factors affecting a particular issuer, or the result of, among other things, political, regulatory, market, economic or social developments affecting the relevant market(s) more generally. In addition, turbulence in financial markets and reduced liquidity in equity, credit and/or fixed income markets may negatively affect many issuers, which could adversely affect the Fund’s ability to price or value hard-to-value assets in thinly traded and closed markets and could cause significant redemptions and operational challenges. Global economies and financial markets are increasingly interconnected, and conditions and events in one country, region or financial market may adversely impact issuers in a different country, region or financial market. These risks may be magnified if certain events or developments adversely interrupt the global supply chain; in these and other circumstances, such risks might affect companies worldwide. As a result, local, regional or global events such as terrorism, war, other conflicts, natural disasters, disease/virus outbreaks and epidemics or other public health issues, recessions, depressions or other events – or the potential for such events – could have a significant negative impact on global economic and market conditions.
Municipal securities risk
Municipal securities are debt obligations generally issued to obtain funds for various public purposes, including general financing for state and local governments, or financing for a specific project or public facility, and include obligations of the governments of the U.S. territories, commonwealths and possessions such as Guam, Puerto Rico and the U.S. Virgin Islands to the extent such obligations are exempt from state and U.S. federal income taxes. The value of municipal securities can be significantly affected by actual or expected political and legislative changes at the federal or state level. Municipal securities may be fully or partially backed by the taxing authority of the local government, by the credit of a private issuer, by the current or anticipated revenues from a specific project or specific assets or by domestic or foreign entities providing credit support, such as letters of credit, guarantees or insurance, and are generally classified into general obligation bonds and special revenue obligations. Because many municipal securities are issued to finance projects in sectors such as education, health care, transportation and utilities, conditions in those sectors can affect the overall municipal market.
Issuers in a state, territory, commonwealth or possession in which the Fund invests may experience significant financial difficulties for various reasons, including as the result of events that cannot be reasonably anticipated or controlled such as economic downturns or similar periods of economic stress, social conflict or unrest, labor disruption and natural disasters. Such financial difficulties may lead to credit rating downgrades or defaults of such issuers which in turn, could affect the market values and marketability of many or all municipal obligations of issuers in such state, territory, commonwealth or possession. The value of the Fund’s shares will be negatively impacted to the extent it invests in such securities. The Fund’s annual and semiannual reports show the Fund’s investment exposures at a point in time. The risk of investing in the Fund is directly correlated to the Fund’s investment exposures.
Securities issued by a particular state and its instrumentalities are subject to the risk of unfavorable developments in such state. A municipal security can be significantly affected by adverse tax, legislative, regulatory, demographic or political changes as well as changes in a particular state’s (state and its instrumentalities’) financial, economic or other condition and prospects.
Shareholder concentration risk
At October 31, 2023, one unaffiliated shareholder of record owned 29.9% of the outstanding shares of the Fund in one or more accounts. The Fund has no knowledge about whether any portion of those shares was owned beneficially. Fund shares sold to or redeemed by concentrated accounts may have a significant effect on the operations of the Fund. In the case of a large redemption, the Fund may be forced to sell investments at inopportune times, including its liquid positions, which may result in Fund losses and the Fund holding a higher percentage of less liquid positions. Large redemptions could result in decreased economies of scale and increased operating expenses for non-redeeming Fund shareholders.
Note 10. Subsequent events
Management has evaluated the events and transactions that have occurred through the date the financial statements were issued. Other than as noted in Note 1 above, there were no items requiring adjustment of the financial statements or additional disclosure.
| 50 | Columbia Intermediate Duration Municipal Bond Fund | Annual Report 2023 |
Notes to Financial Statements (continued)
October 31, 2023
Note 11. Information regarding pending and settled legal proceedings
Ameriprise Financial and certain of its affiliates are involved in the normal course of business in legal proceedings which include regulatory inquiries, arbitration and litigation, including class actions concerning matters arising in connection with the conduct of their activities as part of a diversified financial services firm. Ameriprise Financial believes that the Fund is not currently the subject of, and that neither Ameriprise Financial nor any of its affiliates are the subject of, any pending legal, arbitration or regulatory proceedings that are likely to have a material adverse effect on the Fund or the ability of Ameriprise Financial or its affiliates to perform under their contracts with the Fund. Ameriprise Financial is required to make quarterly (10-Q), annual (10-K) and, as necessary, 8-K filings with the Securities and Exchange Commission (SEC) on legal and regulatory matters that relate to Ameriprise Financial and its affiliates. Copies of these filings may be obtained by accessing the SEC website at www.sec.gov.
There can be no assurance that these matters, or the adverse publicity associated with them, will not result in increased Fund redemptions, reduced sale of Fund shares or other adverse consequences to the Fund. Further, although we believe proceedings are not likely to have a material adverse effect on the Fund or the ability of Ameriprise Financial or its affiliates to perform under their contracts with the Fund, these proceedings are subject to uncertainties and, as such, we are unable to estimate the possible loss or range of loss that may result. An adverse outcome in one or more of these proceedings could result in adverse judgments, settlements, fines, penalties or other relief that could have a material adverse effect on the consolidated financial condition or results of operations of Ameriprise Financial or one or more of its affiliates that provide services to the Fund.
Columbia Intermediate Duration Municipal Bond Fund | Annual Report 2023
| 51 |
Report of Independent Registered Public Accounting Firm
To the Board of Trustees of Columbia Funds Series Trust I and Shareholders of Columbia Intermediate Duration Municipal Bond Fund
Opinion on the Financial Statements
We have audited the accompanying statement of assets and liabilities, including the portfolio of investments, of Columbia Intermediate Duration Municipal Bond Fund (one of the funds constituting Columbia Funds Series Trust I, referred to hereafter as the "Fund") as of October 31, 2023, the related statement of operations for the year ended October 31, 2023, the statement of changes in net assets for each of the two years in the period ended October 31, 2023, including the related notes, and the financial highlights for each of the five years in the period ended October 31, 2023 (collectively referred to as the "financial statements"). In our opinion, the financial statements present fairly, in all material respects, the financial position of the Fund as of October 31, 2023, the results of its operations for the year then ended, the changes in its net assets for each of the two years in the period ended October 31, 2023 and the financial highlights for each of the five years in the period ended October 31, 2023 in conformity with accounting principles generally accepted in the United States of America.
Basis for Opinion
These financial statements are the responsibility of the Fund’s management. Our responsibility is to express an opinion on the Fund’s financial statements based on our audits. We are a public accounting firm registered with the Public Company Accounting Oversight Board (United States) (PCAOB) and are required to be independent with respect to the Fund in accordance with the U.S. federal securities laws and the applicable rules and regulations of the Securities and Exchange Commission and the PCAOB.
We conducted our audits of these financial statements in accordance with the standards of the PCAOB. Those standards require that we plan and perform the audit to obtain reasonable assurance about whether the financial statements are free of material misstatement, whether due to error or fraud.
Our audits included performing procedures to assess the risks of material misstatement of the financial statements, whether due to error or fraud, and performing procedures that respond to those risks. Such procedures included examining, on a test basis, evidence regarding the amounts and disclosures in the financial statements. Our audits also included evaluating the accounting principles used and significant estimates made by management, as well as evaluating the overall presentation of the financial statements. Our procedures included confirmation of securities owned as of October 31, 2023 by correspondence with the custodian, transfer agent and brokers; when replies were not received from brokers, we performed other auditing procedures. We believe that our audits provide a reasonable basis for our opinion.
/s/PricewaterhouseCoopers LLP
Minneapolis, Minnesota
December 20, 2023
We have served as the auditor of one or more investment companies within the Columbia Funds Complex since 1977.
| 52 | Columbia Intermediate Duration Municipal Bond Fund | Annual Report 2023 |
Federal Income Tax Information
(Unaudited)
The Fund hereby designates the following tax attributes for the fiscal year ended October 31, 2023. Shareholders will be notified in early 2024 of the amounts for use in preparing 2023 income tax returns.
Exempt-
interest
dividends | |
| 99.29% | |
Exempt-interest dividends. The percentage of net investment income distributed during the fiscal year that qualifies as exempt-interest dividends for federal income tax purposes. A portion of the income may be subject to federal alternative minimum tax.
TRUSTEES AND OFFICERS
(Unaudited)
The Board oversees the Fund’s operations and appoints officers who are responsible for day-to-day business decisions based on policies set by the Board. The following table provides basic biographical information about the Fund’s Trustees as of the printing of this report, including their principal occupations during the past five years, although specific titles for individuals may have varied over the period. The year set forth beneath Length of Service in the table below is the year in which the Trustee was first appointed or elected as Trustee to any Fund currently in the Columbia Funds Complex or a predecessor thereof. Under current Board policy, each Trustee generally serves until December 31 of the year such Trustee turns seventy-five (75).
Independent trustees
Name,
address,
year of birth | Position held
with the Columbia Funds and
length of service | Principal occupation(s)
during past five years
and other relevant
professional experience | Number of
Funds in the
Columbia Funds
Complex*
overseen | Other directorships
held by Trustee
during the past five years
and other relevant Board experience |
George S. Batejan
c/o Columbia Management
Investment Advisers, LLC
290 Congress Street
Boston, MA 02210
1954 | Trustee since 2017 | Executive Vice President, Global Head of Technology and Operations, Janus Capital Group, Inc., 2010-2016 | 170 | Former Chairman of the Board, NICSA (National Investment Company Services Association) (Executive Committee, Nominating Committee and Governance Committee), 2014-2016; former Director, Intech Investment Management, 2011-2016; former Board Member, Metro Denver Chamber of Commerce, 2015-2016; former Advisory Board Member, University of Colorado Business School, 2015-2018; former Board Member, Chase Bank International, 1993-1994 |
Columbia Intermediate Duration Municipal Bond Fund | Annual Report 2023
| 53 |
TRUSTEES AND OFFICERS (continued)
(Unaudited)
Independent trustees (continued)
Name,
address,
year of birth | Position held
with the Columbia Funds and
length of service | Principal occupation(s)
during past five years
and other relevant
professional experience | Number of
Funds in the
Columbia Funds
Complex*
overseen | Other directorships
held by Trustee
during the past five years
and other relevant Board experience |
Kathleen Blatz
c/o Columbia Management
Investment Advisers, LLC
290 Congress Street
Boston, MA 02210
1954 | Trustee since 2006 | Attorney, specializing in arbitration and mediation; Chief Justice, Minnesota Supreme Court, 1998-2006; Associate Justice, Minnesota Supreme Court, 1996-1998; Fourth Judicial District Court Judge, Hennepin County, 1994-1996; Attorney in private practice and public service, 1984-1993; State Representative, Minnesota House of Representatives, 1979-1993, which included service on the Tax and Financial Institutions and Insurance Committees; Member and Interim Chair, Minnesota Sports Facilities Authority, January-July 2017; Interim President and Chief Executive Officer, Blue Cross and Blue Shield of Minnesota (health care insurance), February-July 2018, April-October 2021 | 170 | Former Trustee, Blue Cross and Blue Shield of Minnesota, 2009-2021 (Chair of the Business Development Committee, 2014-2017; Chair of the Governance Committee, 2017-2019); former Member and Chair of the Board, Minnesota Sports Facilities Authority, January 2017-July 2017; former Director, Robina Foundation, 2009-2020 (Chair, 2014-2020); Director, Richard M. Schulze Family Foundation, since 2021 |
Pamela G. Carlton
c/o Columbia Management
Investment Advisers, LLC
290 Congress Street
Boston, MA 02210
1954 | Chair since 2023; Trustee since 2007 | President, Springboard – Partners in Cross Cultural Leadership (consulting company), since 2003; Managing Director of US Equity Research, JP Morgan Chase, 1999-2003; Director of US Equity Research, Chase Asset Management, 1996-1999; Co-Director Latin America Research, 1993-1996, COO Global Research, 1992-1996, Co-Director of US Research, 1991-1992, Investment Banker, 1982-1991, Morgan Stanley; Attorney, Cleary Gottlieb Steen & Hamilton LLP, 1980-1982 | 170 | Trustee, New York Presbyterian Hospital Board, since 1996; Director, DR Bank (Audit Committee) since 2017; Director, Evercore Inc. (Audit Committee, Nominating and Governance Committee), since 2019; Director, Apollo Commercial Real Estate Finance, Inc. (Chair, Nominating and Governance Committee) (financial services), since 2021; the Governing Council of the Independent Directors Council (IDC), since 2021 |
Janet Langford Carrig
c/o Columbia Management
Investment Advisers, LLC
290 Congress Street
Boston, MA 02210
1957 | Trustee since 1996 | Senior Vice President, General Counsel and Corporate Secretary, ConocoPhillips (independent energy company), September 2007-October 2018 | 170 | Director, EQT Corporation (natural gas producer), since 2019; former Director, Whiting Petroleum Corporation (independent oil and gas company), 2020-2022 |
J. Kevin Connaughton
c/o Columbia Management
Investment Advisers, LLC
290 Congress Street
Boston, MA 02210
1964 | Trustee since 2020 | CEO and President, RhodeWay Financial (non-profit financial planning firm), since December 2022; Member, FINRA National Adjudicatory Council, since January 2020; Adjunct Professor of Finance, Bentley University since January 2018; Consultant to Independent Trustees of CFVIT and CFST I from March 2016 to June 2020 with respect to CFVIT and to December 2020 with respect to CFST I; Managing Director and General Manager of Mutual Fund Products, Columbia Management Investment Advisers, LLC, May 2010-February 2015; President, Columbia Funds, 2008-2015; and senior officer of Columbia Funds and affiliated funds, 2003-2015 | 168 | Former Director, The Autism Project, March 2015-December 2021; former Member of the Investment Committee, St. Michael’s College, November 2015-February 2020; former Trustee, St. Michael’s College, June 2017-September 2019; former Trustee, New Century Portfolios (former mutual fund complex), January 2015-December 2017 |
| 54 | Columbia Intermediate Duration Municipal Bond Fund | Annual Report 2023 |
TRUSTEES AND OFFICERS (continued)
(Unaudited)
Independent trustees (continued)
Name,
address,
year of birth | Position held
with the Columbia Funds and
length of service | Principal occupation(s)
during past five years
and other relevant
professional experience | Number of
Funds in the
Columbia Funds
Complex*
overseen | Other directorships
held by Trustee
during the past five years
and other relevant Board experience |
Olive M. Darragh
c/o Columbia Management
Investment Advisers, LLC
290 Congress Street
Boston, MA 02210
1962 | Trustee since 2020 | Managing Director of Darragh Inc. (strategy and talent management consulting firm), since 2010; Founder and CEO, Zolio, Inc. (investment management talent identification platform), since 2004; Consultant to Independent Trustees of CFVIT and CFST I from June 2019 to June 2020 with respect to CFVIT and to December 2020 with respect to CFST I; Partner, Tudor Investments, 2004-2010; Senior Partner, McKinsey & Company (consulting), 1990-2004; Touche Ross CPA, 1985-1988 | 168 | Treasurer, Edinburgh University US Trust Board, since January 2023; Member, HBS Community Action Partners Board, since September 2022; former Director, University of Edinburgh Business School (Member of US Board), 2004-2019; former Director, Boston Public Library Foundation, 2008-2017 |
Patricia M. Flynn
c/o Columbia Management
Investment Advisers, LLC
290 Congress Street
Boston, MA 02210
1950 | Trustee since 2004 | Professor Emeritus of Economics and Management, Bentley University, since 2023; Professor of Economics and Management, Bentley University, 1976-2023; Dean, McCallum Graduate School of Business, Bentley University, 1992-2002 | 170 | Former Trustee, MA Taxpayers Foundation, 1997-2022; former Director, The MA Business Roundtable, 2003-2019; former Chairperson, Innovation Index Advisory Committee, MA Technology Collaborative, 1997-2020 |
Brian J. Gallagher
c/o Columbia Management
Investment Advisers, LLC
290 Congress Street
Boston, MA 02210
1954 | Trustee since 2017 | Retired; Partner with Deloitte & Touche LLP and its predecessors, 1977-2016 | 170 | Trustee, Catholic Schools Foundation, since 2004 |
Douglas A. Hacker
c/o Columbia Management
Investment Advisers, LLC
290 Congress Street
Boston, MA 02210
1955 | Trustee since 1996 | Independent business executive, since May 2006; Executive Vice President – Strategy of United Airlines, December 2002 - May 2006; President of UAL Loyalty Services (airline marketing company), September 2001-December 2002; Executive Vice President and Chief Financial Officer of United Airlines, July 1999-September 2001 | 170 | Director, SpartanNash Company since November 2013 (Chair of the Board, since May 2021) (food distributor); Director, Aircastle Limited (Chair of Audit Committee) (aircraft leasing), since August 2006; former Director, Nash Finch Company (food distributor), 2005-2013; former Director, SeaCube Container Leasing Ltd. (container leasing), 2010-2013; and former Director, Travelport Worldwide Limited (travel information technology), 2014-2019 |
Nancy T. Lukitsh
c/o Columbia Management
Investment Advisers, LLC
290 Congress Street
Boston, MA 02210
1956 | Trustee since 2011 | Senior Vice President, Partner and Director of Marketing, Wellington Management Company, LLP (investment adviser), 1997-2010; Chair, Wellington Management Portfolios (commingled non-U.S. investment pools), 2007-2010; Director, Wellington Trust Company, NA and other Wellington affiliates, 1997-2010 | 168 | None |
Columbia Intermediate Duration Municipal Bond Fund | Annual Report 2023
| 55 |
TRUSTEES AND OFFICERS (continued)
(Unaudited)
Independent trustees (continued)
Name,
address,
year of birth | Position held
with the Columbia Funds and
length of service | Principal occupation(s)
during past five years
and other relevant
professional experience | Number of
Funds in the
Columbia Funds
Complex*
overseen | Other directorships
held by Trustee
during the past five years
and other relevant Board experience |
David M. Moffett
c/o Columbia Management
Investment Advisers, LLC
290 Congress Street
Boston, MA 02210
1952 | Trustee since 2011 | Retired; former Chief Executive Officer of Freddie Mac and Chief Financial Officer of U.S. Bank | 168 | Director, CSX Corporation (transportation suppliers); Director, PayPal Holdings Inc. (payment and data processing services); Trustee, University of Oklahoma Foundation; former Director, eBay Inc. (online trading community), 2007-2015; and former Director, CIT Bank, CIT Group Inc. (commercial and consumer finance), 2010-2016; former Senior Adviser to The Carlyle Group (financial services), March 2008-September 2008; former Governance Consultant to Bridgewater Associates, January 2013-December 2015 |
Catherine James Paglia
c/o Columbia Management
Investment Advisers, LLC
290 Congress Street
Boston, MA 02210
1952 | Trustee since 2004 | Director, Enterprise Asset Management, Inc. (private real estate and asset management company), since September 1998; Managing Director and Partner, Interlaken Capital, Inc., 1989-1997; Vice President, 1982-1985, Principal, 1985-1987, Managing Director, 1987-1989, Morgan Stanley; Vice President, Investment Banking, 1980-1982, Associate, Investment Banking, 1976-1980, Dean Witter Reynolds, Inc. | 170 | Director, Valmont Industries, Inc. (irrigation systems manufacturer), since 2012; Trustee, Carleton College (on the Investment Committee), since 1987; Trustee, Carnegie Endowment for International Peace (on the Investment Committee), since 2009 |
Natalie A. Trunow
c/o Columbia Management
Investment Advisers, LLC
290 Congress Street
Boston, MA 02210
1967 | Trustee since 2020 | Chief Executive Officer, Millennial Portfolio Solutions LLC (asset management and consulting services), January 2016-January 2021; Non-executive Member of the Investment Committee and Valuation Committee, Sarona Asset Management Inc. (private equity firm) since September 2019; Advisor, Horizon Investments (asset management and consulting services), August 2018-January 2022; Advisor, Paradigm Asset Management, November 2016-January 2022; Consultant to Independent Trustees of CFVIT and CFST I from September 2016 to June 2020 with respect to CFVIT and to December 2020 with respect to CFST I; Director of Investments/Consultant, Casey Family Programs, April 2016-November 2016; Senior Vice President and Chief Investment Officer, Calvert Investments, August 2008-January 2016; Section Head and Portfolio Manager, General Motors Asset Management, June 1997-August 2008 | 168 | Independent Director, Investment Committee, Health Services for Children with Special Needs, Inc., 2010-2021; Independent Director, (Executive Committee and Chair, Audit Committee), Consumer Credit Counseling Services (formerly Guidewell Financial Solutions), since 2016; Independent Director, (Investment Committee), Sarona Asset Management, since 2019 |
| 56 | Columbia Intermediate Duration Municipal Bond Fund | Annual Report 2023 |
TRUSTEES AND OFFICERS (continued)
(Unaudited)
Independent trustees (continued)
Name,
address,
year of birth | Position held
with the Columbia Funds and
length of service | Principal occupation(s)
during past five years
and other relevant
professional experience | Number of
Funds in the
Columbia Funds
Complex*
overseen | Other directorships
held by Trustee
during the past five years
and other relevant Board experience |
Sandra L. Yeager
c/o Columbia Management
Investment Advisers, LLC
290 Congress Street
Boston, MA 02210
1964 | Trustee since 2017 | Retired; President and founder, Hanoverian Capital, LLC (SEC registered investment advisor firm), 2008-2016; Managing Director, DuPont Capital, 2006-2008; Managing Director, Morgan Stanley Investment Management, 2004-2006; Senior Vice President, Alliance Bernstein, 1990-2004 | 170 | Former Director, NAPE (National Alliance for Partnerships in Equity) Education Foundation, October 2016-October 2020; Advisory Board, Jennersville YMCA, since 2022 |
Interested trustee affiliated with Investment Manager**
Name,
address,
year of birth | Position held with the Columbia Funds and length of service | Principal occupation(s) during the
past five years and other relevant
professional experience | Number of
Funds in the
Columbia Funds
Complex* overseen | Other directorships
held by Trustee
during the past
five years and
other relevant Board experience |
Daniel J. Beckman
c/o Columbia Management
Investment Advisers, LLC
290 Congress Street
Boston, MA 02210
1962 | Trustee since November 2021 and President since June 2021 | Vice President – Head of North America Product, Columbia Management Investment Advisers, LLC, since April 2015; President and Principal Executive Officer of the Columbia Funds, since June 2021; officer of Columbia Funds and affiliated funds, 2020-2021; Co-President and Principal Executive Officer, Columbia Acorn/Wanger Funds, since July 2021 | 170 | Director, Ameriprise Trust Company, since October 2016; Director, Columbia Management Investment Distributors, Inc. since November 2018; Board of Governors, Columbia Wanger Asset Management, LLC since, January 2022; Director, Columbia Threadneedle Canada, Inc., since December 2022 |
| * | The term “Columbia Funds Complex” as used herein includes Columbia Seligman Premium Technology Growth Fund, Tri-Continental Corporation and each series of Columbia Funds Series Trust (CFST), Columbia Funds Series Trust I (CFST I), Columbia Funds Series Trust II (CFST II), Columbia ETF Trust I (CET I), Columbia ETF Trust II (CET II), Columbia Funds Variable Insurance Trust (CFVIT) and Columbia Funds Variable Series Trust II (CFVST II). Messrs. Batejan, Beckman, Gallagher and Hacker and Mses. Blatz, Carlton, Carrig, Flynn, Paglia, and Yeager serve as directors of Columbia Seligman Premium Technology Growth Fund and Tri-Continental Corporation. |
| ** | Interested person (as defined under the 1940 Act) by reason of being an officer, director, security holder and/or employee of the Investment Manager or Ameriprise Financial. |
The Statement of Additional Information has additional information about the Fund’s Board members and is available, without charge, upon request by calling 800.345.6611, visiting columbiathreadneedleus.com/investor/ or contacting your financial intermediary.
Columbia Intermediate Duration Municipal Bond Fund | Annual Report 2023
| 57 |
TRUSTEES AND OFFICERS (continued)
(Unaudited)
The Board has appointed officers who are responsible for day-to-day business decisions based on policies it has established. The officers serve at the pleasure of the Board. The following table provides basic information about the Officers of the Fund as of the printing of this report, including principal occupations during the past five years, although their specific titles may have varied over the period. In addition to Mr. Beckman, who is President and Principal Executive Officer, the Fund’s other officers are:
Fund officers
Name,
address and
year of birth | Position and year
first appointed to
position for any Fund
in the Columbia
Funds Complex or a
predecessor thereof | Principal occupation(s) during past five years |
Michael G. Clarke
290 Congress Street
Boston, MA 02210
1969 | Chief Financial Officer and Principal Financial Officer (2009) and Senior Vice President (2019) | Senior Vice President and North America Head of Operations & Investor Services, Columbia Management Investment Advisers, LLC, since June 2023 (previously Senior Vice President and Head of Global Operations, March 2022 – June 2023, Vice President, Head of North America Operations, and Co-Head of Global Operations, June 2019 - February 2022 and Vice President – Accounting and Tax, May 2010 - May 2019); senior officer of Columbia Funds and affiliated funds, since 2002. Director, Ameriprise Trust Company, since June 2023. |
Joseph Beranek
5890 Ameriprise Financial Center
Minneapolis, MN 55474
1965 | Treasurer and Chief Accounting Officer (Principal Accounting Officer) (2019) and Principal Financial Officer (2020), CFST, CFST I, CFST II, CFVIT and CFVST II; Assistant Treasurer, CET I and CET II | Vice President – Mutual Fund Accounting and Financial Reporting, Columbia Management Investment Advisers, LLC, since December 2018 and March 2017, respectively. |
Marybeth Pilat
290 Congress Street
Boston, MA 02210
1968 | Treasurer and Chief Accounting Officer (Principal Accounting Officer) and Principal Financial Officer (2020) for CET I and CET II; Assistant Treasurer, CFST, CFST I, CFST II, CFVIT and CFVST II | Vice President – Product Pricing and Administration, Columbia Management Investment Advisers, LLC, since May 2017. |
William F. Truscott
290 Congress Street
Boston, MA 02210
1960 | Senior Vice President (2001) | Formerly, Trustee/Director of Columbia Funds Complex or legacy funds, November 2001 - January 1, 2021; Chief Executive Officer, Global Asset Management, Ameriprise Financial, Inc., since September 2012; Chairman of the Board and President, Columbia Management Investment Advisers, LLC, since July 2004 and February 2012, respectively; Chairman of the Board and Chief Executive Officer, Columbia Management Investment Distributors, Inc., since November 2008 and February 2012, respectively; Chairman of the Board and Director, Threadneedle Asset Management Holdings, Sàrl, since March 2013 and December 2008, respectively; senior executive of various entities affiliated with Columbia Threadneedle. |
Christopher O. Petersen
5228 Ameriprise Financial Center
Minneapolis, MN 55474
1970 | Senior Vice President and Assistant Secretary (2021) | Formerly, Trustee/Director of funds within the Columbia Funds Complex, July 1, 2020 - November 22, 2021; Senior Vice President and Assistant General Counsel, Ameriprise Financial, Inc., since September 2021 (previously Vice President and Lead Chief Counsel, January 2015 - September 2021); formerly, President and Principal Executive Officer of the Columbia Funds, 2015 - 2021; officer of Columbia Funds and affiliated funds, since 2007. |
Thomas P. McGuire
290 Congress Street
Boston, MA 02210
1972 | Senior Vice President and Chief Compliance Officer (2012) | Vice President – Asset Management Compliance, Ameriprise Financial, Inc., since May 2010; Chief Compliance Officer, Columbia Acorn/Wanger Funds, since December 2015; formerly, Chief Compliance Officer, Ameriprise Certificate Company, September 2010 – September 2020. |
Ryan C. Larrenaga
290 Congress Street
Boston, MA 02210
1970 | Senior Vice President (2017), Chief Legal Officer (2017), and Secretary (2015) | Vice President and Chief Counsel, Ameriprise Financial, Inc., since August 2018 (previously Vice President and Group Counsel, August 2011 - August 2018); Chief Legal Officer, Columbia Acorn/Wanger Funds, since September 2020; officer of Columbia Funds and affiliated funds, since 2005. |
| 58 | Columbia Intermediate Duration Municipal Bond Fund | Annual Report 2023 |
TRUSTEES AND OFFICERS (continued)
(Unaudited)
Fund officers (continued)
Name,
address and
year of birth | Position and year
first appointed to
position for any Fund
in the Columbia
Funds Complex or a
predecessor thereof | Principal occupation(s) during past five years |
Michael E. DeFao
290 Congress Street
Boston, MA 02210
1968 | Vice President (2011) and Assistant Secretary (2010) | Vice President and Chief Counsel, Ameriprise Financial, Inc., since May 2010; Vice President, Chief Legal Officer and Assistant Secretary, Columbia Management Investment Advisers, LLC, since October 2021 (previously Vice President and Assistant Secretary, May 2010 – September 2021). |
Lyn Kephart-Strong
5903 Ameriprise Financial Center
Minneapolis, MN 55474
1960 | Vice President (2015) | Vice President, Global Investment Operations Services, Columbia Management Investment Advisers, LLC, since 2010; Director (since January 2007) and President (since October 2014), Columbia Management Investment Services Corp.; Director (since December 2017) and President (since January 2017), Ameriprise Trust Company. |
Approval of Management Agreement
(Unaudited)
Columbia Management Investment Advisers, LLC (the Investment Manager, and together with its domestic and global affiliates, Columbia Threadneedle Investments), a wholly-owned subsidiary of Ameriprise Financial, Inc. (Ameriprise Financial), serves as the investment manager to Columbia Intermediate Duration Municipal Bond Fund (the Fund). Under a management agreement (the Management Agreement), the Investment Manager provides investment advice and other services to the Fund and other funds distributed by Columbia Management Investment Distributors, Inc. (collectively, the Funds).
On an annual basis, the Fund’s Board of Trustees (the Board), including the independent Board members (the Independent Trustees), considers renewal of the Management Agreement. The Investment Manager prepared detailed reports for the Board and its Contracts Committee (including its Contracts Subcommittee) in February, March, April, May and June 2023, including reports providing the results of analyses performed by a third-party data provider, Broadridge Financial Solutions, Inc. (Broadridge), and comprehensive responses by the Investment Manager to written requests for information by independent legal counsel to the Independent Trustees (Independent Legal Counsel), to assist the Board in making this determination. In addition, throughout the year, the Board (or its committees or subcommittees) regularly meets with portfolio management teams and senior management personnel and reviews information prepared by the Investment Manager addressing the services the Investment Manager provides and Fund performance. The Board also accords appropriate weight to the work, deliberations and conclusions of the various committees (including their subcommittees), such as the Contracts Committee, the Investment Review Committee, the Audit Committee and the Compliance Committee in determining whether to continue the Management Agreement.
The Board, at its June 22, 2023 Board meeting (the June Meeting), considered the renewal of the Management Agreement for an additional one-year term. At the June Meeting, Independent Legal Counsel reviewed with the Independent Trustees various factors relevant to the Board’s consideration of advisory agreements and the Board’s legal responsibilities related to such consideration. The Independent Trustees considered all information that they, their legal counsel or the Investment Manager believed reasonably necessary to evaluate and to approve the continuation of the Management Agreement. Among other things, the information and factors considered included the following:
| • | Information on the investment performance of the Fund relative to the performance of a group of mutual funds determined to be comparable to the Fund by Broadridge, as well as performance relative to one or more benchmarks; |
| • | Information on the Fund’s management fees and total expenses, including information comparing the Fund’s expenses to those of a group of comparable mutual funds, as determined by Broadridge; |
Columbia Intermediate Duration Municipal Bond Fund | Annual Report 2023
| 59 |
Approval of Management Agreement (continued)
(Unaudited)
| • | The Investment Manager’s agreement to contractually limit or cap total operating expenses for the Fund so that total operating expenses (excluding certain fees and expenses, such as transaction costs and certain other investment related expenses, interest, taxes, acquired fund fees and expenses and infrequent and/or unusual expenses) would not exceed a specified annual rate, as a percentage of the Fund’s net assets; |
| • | Terms of the Management Agreement; |
| • | Descriptions of other agreements and arrangements with affiliates of the Investment Manager relating to the operations of the Fund, including agreements with respect to the provision of transfer agency and shareholder services to the Fund; |
| • | Descriptions of various services performed by the Investment Manager under the Management Agreement, including portfolio management and portfolio trading practices; |
| • | Information regarding any recently negotiated management fees of similarly-managed portfolios of other institutional clients of the Investment Manager; |
| • | Information regarding the resources of the Investment Manager, including information regarding senior management, portfolio managers and other personnel; |
| • | Information regarding the capabilities of the Investment Manager with respect to compliance monitoring services; |
| • | The profitability to the Investment Manager and its affiliates from their relationships with the Fund; and |
| • | Report provided by the Board’s independent fee consultant, JDL Consultants, LLC (JDL). |
Following an analysis and discussion of the foregoing, and the factors identified below, the Board, including all of the Independent Trustees, approved the renewal of the Management Agreement.
Nature, extent and quality of services provided by the Investment Manager
The Board analyzed various reports and presentations it had received detailing the services performed by the Investment Manager, as well as its history, expertise, resources and relative capabilities, and the qualifications of its personnel.
The Board specifically considered the many developments during recent years concerning the services provided by the Investment Manager. Among other things, the Board noted the organization and depth of the equity and credit research departments. The Board further observed the enhancements to the investment risk management department’s processes, systems and oversight over the past several years. The Board also took into account the broad scope of services provided by the Investment Manager to the Fund, including, among other services, investment, risk and compliance oversight. The Board also took into account the information it received concerning the Investment Manager’s ability to attract and retain key portfolio management personnel and that it has sufficient resources to provide competitive and adequate compensation to investment personnel.
In connection with the Board’s evaluation of the overall package of services provided by the Investment Manager, the Board also considered the nature, quality and range of administrative services provided to the Fund by the Investment Manager, as well as the achievements in 2022 in the performance of administrative services, and noted the various enhancements anticipated for 2023. In evaluating the quality of services provided under the Management Agreement, the Board also took into account the organization and strength of the Fund’s and its service providers’ compliance programs. The Board also reviewed the financial condition of the Investment Manager and its affiliates and each entity’s ability to carry out its responsibilities under the Management Agreement and the Fund’s other service agreements.
In addition, the Board discussed the acceptability of the terms of the Management Agreement, noting that no changes were proposed from the form of agreement previously approved. The Board also noted the wide array of legal and compliance services provided to the Fund under the Management Agreement.
After reviewing these and related factors (including investment performance as discussed below), the Board concluded, within the context of their overall conclusions, that the nature, extent and quality of the services provided to the Fund under the Management Agreement supported the continuation of the Management Agreement.
| 60 | Columbia Intermediate Duration Municipal Bond Fund | Annual Report 2023 |
Approval of Management Agreement (continued)
(Unaudited)
Investment performance
The Board carefully reviewed the investment performance of the Fund, including detailed reports providing the results of analyses performed by each of the Investment Manager, Broadridge and JDL collectively showing, for various periods (including since manager inception): (i) the performance of the Fund, (ii) the Fund’s performance relative to peers and benchmarks and (iii) the net assets of the Fund. The Board observed that the Fund’s performance for certain periods ranked above median based on information provided by Broadridge.
The Board also reviewed a description of the third-party data provider’s methodology for identifying the Fund’s peer groups for purposes of performance and expense comparisons.
The Board also considered the Investment Manager’s performance and reputation generally. After reviewing these and related factors, the Board concluded, within the context of their overall conclusions, that the performance of the Fund and the Investment Manager, in light of other considerations, supported the continuation of the Management Agreement.
Comparative fees, costs of services provided and the profits realized by the Investment Manager and its affiliates from their relationships with the Fund
The Board reviewed comparative fees and the costs of services provided under the Management Agreement. The Board members considered detailed comparative information set forth in an annual report on fees and expenses, including, among other things, data (based on analyses conducted by Broadridge and JDL) showing a comparison of the Fund’s expenses with median expenses paid by funds in its comparative peer universe, as well as data showing the Fund’s contribution to the Investment Manager’s profitability.
The Board considered the reports of JDL, which assisted in the Board’s analysis of the Funds’ performance and expenses and the reasonableness of the Funds’ fee rates. The Board accorded particular weight to the notion that a primary objective of the level of fees is to achieve a rational pricing model applied consistently across the various product lines in the Fund family, while assuring that the overall fees for each Fund (with certain exceptions) are generally in line with the current “pricing philosophy” such that Fund total expense ratios, in general, approximate or are lower than the median expense ratios of funds in the same Lipper comparison universe. The Board took into account that the Fund’s total expense ratio (after considering proposed expense caps/waivers) was below the peer universe’s median expense ratio shown in the reports.
After reviewing these and related factors, the Board concluded, within the context of their overall conclusions, that the levels of management fees and expenses of the Fund, in light of other considerations, supported the continuation of the Management Agreement.
The Board also considered the profitability of the Investment Manager and its affiliates in connection with the Investment Manager providing management services to the Fund. With respect to the profitability of the Investment Manager and its affiliates, the Independent Trustees referred to information discussing the profitability to the Investment Manager and Ameriprise Financial from managing, operating and distributing the Funds. The Board considered that the profitability generated by the Investment Manager in 2022 had declined from 2021 levels, due to a variety of factors, including the decreased assets under management of the Funds. It also took into account the indirect economic benefits flowing to the Investment Manager or its affiliates in connection with managing or distributing the Funds, such as the enhanced ability to offer various other financial products to Ameriprise Financial customers, soft dollar benefits and overall reputational advantages. The Board noted that the fees paid by the Fund should permit the Investment Manager to offer competitive compensation to its personnel, make necessary investments in its business and earn an appropriate profit. After reviewing these and related factors, the Board concluded, within the context of their overall conclusions, that the costs of services provided and the profitability to the Investment Manager and its affiliates from their relationships with the Fund supported the continuation of the Management Agreement.
Columbia Intermediate Duration Municipal Bond Fund | Annual Report 2023
| 61 |
Approval of Management Agreement (continued)
(Unaudited)
Economies of scale
The Board considered the potential existence of economies of scale in the provision by the Investment Manager of services to the Fund, and whether those economies of scale were shared with the Fund through breakpoints in investment management fees or other means, such as expense limitation arrangements and additional investments by the Investment Manager in investment, trading, compliance and other resources. The Board considered the economies of scale that might be realized as the Fund’s net asset level grows and took note of the extent to which Fund shareholders might also benefit from such growth. In this regard, the Board took into account that management fees decline as Fund assets exceed various breakpoints, all of which have not been surpassed. The Board observed that the Management Agreement provided for breakpoints in the management fee rate schedule that allow opportunities for shareholders to realize lower fees as Fund assets grow and that there are additional opportunities through other means for sharing economies of scale with shareholders.
Conclusion
The Board reviewed all of the above considerations in reaching its decision to approve the continuation of the Management Agreement. In reaching its conclusions, no single factor was determinative.
On June 22, 2023, the Board, including all of the Independent Trustees, determined that fees payable under the Management Agreement were fair and reasonable in light of the extent and quality of services provided and approved the renewal of the Management Agreement.
| 62 | Columbia Intermediate Duration Municipal Bond Fund | Annual Report 2023 |
[THIS PAGE INTENTIONALLY LEFT BLANK]
Columbia Intermediate Duration Municipal Bond Fund
P.O. Box 219104
Kansas City, MO 64121-9104
Please read and consider the investment objectives, risks, charges and expenses for any fund carefully before investing. For a prospectus and summary prospectus, which contains this and other important information about the Fund, go to
columbiathreadneedleus.com/investor/. The Fund is distributed by Columbia Management Investment Distributors, Inc., member FINRA, and managed by Columbia Management Investment Advisers, LLC.
Columbia Threadneedle Investments (Columbia Threadneedle) is the global brand name of the Columbia and Threadneedle group of companies. All rights reserved.
© 2023 Columbia Management Investment Advisers, LLC.
columbiathreadneedleus.com/investor/

Annual Report
October 31, 2023
Columbia Massachusetts Intermediate Municipal Bond Fund
Not FDIC or NCUA Insured • No Financial Institution Guarantee • May Lose Value
If you elect to receive the shareholder report for Columbia Massachusetts Intermediate Municipal Bond Fund (the Fund) in paper, mailed to you, the Fund mails one shareholder report to each shareholder address, unless such shareholder elects to receive shareholder reports from the Fund electronically via e-mail or by having a paper notice mailed to you (Postcard Notice) that your Fund’s shareholder report is available at the Columbia funds’ website (columbiathreadneedleus.com/investor/). If you would like more than one report in paper to be mailed to you, or would like to elect to receive reports via e-mail or access them through Postcard Notice, please call shareholder services at 800.345.6611 and additional reports will be sent to you.
Proxy voting policies and procedures
The policy of the Board of Trustees is to vote the proxies of the companies in which the Fund holds investments consistent with the procedures as stated in the Statement of Additional Information (SAI). You may obtain a copy of the SAI without charge by calling 800.345.6611; contacting your financial intermediary; visiting columbiathreadneedleus.com/investor/; or searching the website of the Securities and Exchange Commission (SEC) at sec.gov. Information regarding how the Fund voted proxies relating to portfolio securities is filed with the SEC by August 31st for the most recent 12-month period ending June 30th of that year, and is available without charge by visiting columbiathreadneedleus.com/investor/, or searching the website of the SEC at sec.gov.
Quarterly schedule of investments
The Fund files a complete schedule of portfolio holdings with the SEC for the first and third quarters of each fiscal year on Form N-PORT. The Fund’s Form N-PORT filings are available on the SEC’s website at sec.gov. The Fund’s complete schedule of portfolio holdings, as filed on Form N-PORT, is available on columbiathreadneedleus.com/investor/ or can also be obtained without charge, upon request, by calling 800.345.6611.
Additional Fund information
For more information about the Fund, please visit columbiathreadneedleus.com/investor/ or call 800.345.6611. Customer Service Representatives are available to answer your questions Monday through Friday from 8 a.m. to 7 p.m. Eastern time.
Fund investment manager
Columbia Management Investment Advisers, LLC (the Investment Manager)
290 Congress Street
Boston, MA 02210
Fund distributor
Columbia Management Investment Distributors, Inc.
290 Congress Street
Boston, MA 02210
Fund transfer agent
Columbia Management Investment Services Corp.
P.O. Box 219104
Kansas City, MO 64121-9104
Columbia Massachusetts Intermediate Municipal Bond Fund | Annual Report 2023
Fund at a Glance
(Unaudited)
Investment objective
The Fund seeks as high a level of current interest income exempt from federal income tax and, to the extent possible, from Massachusetts individual income tax, as is consistent with relative stability of principal.
Portfolio management
Paul Fuchs, CFA
Lead Portfolio Manager
Managed Fund since 2012
Douglas Rangel, CFA
Portfolio Manager
Managed the Fund since 2022
| Average annual total returns (%) (for the period ended October 31, 2023) |
| | | Inception | 1 Year | 5 Years | 10 Years |
| Class A | Excluding sales charges | 12/09/02 | 2.06 | 0.45 | 1.09 |
| | Including sales charges | | -1.04 | -0.15 | 0.78 |
| Advisor Class | 03/19/13 | 2.21 | 0.70 | 1.34 |
| Class C | Excluding sales charges | 12/09/02 | 1.60 | 0.02 | 0.64 |
| | Including sales charges | | 0.61 | 0.02 | 0.64 |
| Institutional Class | 06/14/93 | 2.32 | 0.72 | 1.36 |
| Institutional 2 Class* | 03/01/16 | 2.35 | 0.77 | 1.39 |
| Institutional 3 Class* | 03/01/17 | 2.43 | 0.81 | 1.42 |
| Class V | Excluding sales charges | 06/26/00 | 2.17 | 0.55 | 1.19 |
| | Including sales charges | | -2.67 | -0.43 | 0.70 |
| Bloomberg 3-15 Year Blend Municipal Bond Index | | 2.49 | 1.27 | 1.97 |
Returns for Class A shares are shown with and without the maximum initial sales charge of 3.00%. Returns for Class C shares are shown with and without the 1.00% contingent deferred sales charge for the first year only. Returns for Class V shares are shown with and without the maximum initial sales charge of 4.75%. The Fund’s other share classes are not subject to sales charges and have limited eligibility. Please see the Fund’s prospectus for details. Performance for different share classes will vary based on differences in sales charges and fees associated with each share class. All results shown assume reinvestment of distributions during the period. Returns do not reflect the deduction of taxes that a shareholder may pay on Fund distributions or on the redemption of Fund shares. Performance results reflect the effect of any fee waivers or reimbursements of Fund expenses by Columbia Management Investment Advisers, LLC and/or any of its affiliates. Absent these fee waivers or expense reimbursement arrangements, performance results would have been lower.
The performance information shown represents past performance and is not a guarantee of future results. The investment return and principal value of your investment will fluctuate so that your shares, when redeemed, may be worth more or less than their original cost. Current performance may be lower or higher than the performance information shown. You may obtain performance information current to the most recent month-end by contacting your financial intermediary, visiting columbiathreadneedleus.com/investor/ or calling 800.345.6611.
| * | The returns shown for periods prior to the share class inception date (including returns for the Life of the Fund, if shown, which are since Fund inception) include the returns of the Fund’s oldest share class. These returns are adjusted to reflect any higher class-related operating expenses of the newer share classes, as applicable. Please visit columbiathreadneedleus.com/investor/investment-products/mutual-funds/appended-performance for more information. |
The Bloomberg 3–15 Year Blend Municipal Bond Index is an unmanaged index that tracks the performance of municipal bonds issued after December 31, 1990, with remaining maturities between 2 and 17 years and at least $7 million in principal amount outstanding.
Indices are not available for investment, are not professionally managed and do not reflect sales charges, fees, brokerage commissions, taxes or other expenses of investing. Securities in the Fund may not match those in an index.
Columbia Massachusetts Intermediate Municipal Bond Fund | Annual Report 2023
| 3 |
Fund at a Glance (continued)
(Unaudited)
Performance of a hypothetical $10,000 investment (October 31, 2013 — October 31, 2023)
The chart above shows the change in value of a hypothetical $10,000 investment in Class A shares of Columbia Massachusetts Intermediate Municipal Bond Fund during the stated time period, and does not reflect the deduction of taxes that a shareholder may pay on Fund distributions or on the redemption of Fund shares.
| Quality breakdown (%) (at October 31, 2023) |
| AAA rating | 6.7 |
| AA rating | 38.5 |
| A rating | 27.5 |
| BBB rating | 22.2 |
| BB rating | 4.3 |
| Not rated | 0.8 |
| Total | 100.0 |
Percentages indicated are based upon total fixed income investments.
Bond ratings apply to the underlying holdings of the Fund and not the Fund itself and are divided into categories ranging from highest to lowest credit quality, determined by using the middle rating of Moody’s, S&P and Fitch, after dropping the highest and lowest available ratings. When ratings are available from only two rating agencies, the lower rating is used. When a rating is available from only one rating agency, that rating is used. If a security is not rated but has a rating by Kroll and/or DBRS, the same methodology is applied to those bonds that would otherwise be not rated. When a bond is not rated by any rating agency, it is designated as “Not rated.” Credit quality ratings assigned by a rating agency are subjective opinions, not statements of fact, and are subject to change, including daily. The ratings assigned by credit rating agencies are but one of the considerations that the Investment Manager and/or Fund’s subadviser incorporates into its credit analysis process, along with such other issuer-specific factors as cash flows, capital structure and leverage ratios, ability to de-leverage (repay) through free cash flow, quality of management, market positioning and access to capital, as well as such security-specific factors as the terms of the security (e.g., interest rate and time to maturity) and the amount and type of any collateral.
| 4 | Columbia Massachusetts Intermediate Municipal Bond Fund | Annual Report 2023 |
Manager Discussion of Fund Performance
(Unaudited)
For the 12-month period that ended October 31, 2023, Class A shares of Columbia Massachusetts Intermediate Municipal Bond Fund returned 2.06% excluding sales charges. Institutional Class shares of the Fund returned 2.32%. The Fund’s benchmark, the Bloomberg 3-15 Year Blend Municipal Bond Index, returned 2.49% for the same time period.
Market overview
Municipal bonds delivered positive performance in the early part of the 12-month period, closing out a tumultuous 2022 and starting 2023 with a strong rally that was driven by high hopes for an end to the aggressive interest-rate hiking campaign by the U.S. Federal Reserve (Fed). Unfortunately, sentiment quickly unwound in February, as the market reconsidered the persistence of inflation and a still-too-strong labor market. A more hawkish Fed led to a sell-off in rates, sending the 10-Year Treasury yield nearly 15 basis points (bps) higher from where it started 2023. (A basis point is 1/100 of one percent.) In March, an unforeseen banking crisis unfolded, partially driven by higher interest rates. The weakness in the banking sector indicated the potential for additional downside risk to economic growth. In its late-March 2023 meeting, the Fed pushed through another 25 bps hike, but moderated its stance, signaling that we were closer to a pause, despite the data.
Treasury and municipal interest rates rose during the second quarter of 2023, as the regional banking crisis settled down, and the focus on the Fed’s tightening policy reignited. For the first time since it started hiking in March 2022, the Fed did not raise rates at its June meeting. Fed Chairman Powell took a hawkish stance and communicated the need to continue tightening and the possibility of rates remaining higher for longer. The Treasury and municipal markets experienced significant sell-offs in the third quarter of 2023, with the 10-year Treasury yield rising and municipal yields following a similar but more pronounced path. Treasury and municipal yields reached multi-year highs. Inflation remained stubbornly elevated, despite the Fed’s aggressive rate-hiking cycle. The Fed hiked rates 25 bps in July 2023 and indicated there may be one additional hike by year end. Municipal market yields increased in the final month of the period, the fourth consecutive month of rising rates. Nearly every segment of the market — credit quality, maturity, sector and state — delivered negative performance.
Investor aversion to interest-rate sensitive fixed income saw outflows from most fixed-income segments in favor of attractive rates on cash and cash-like instruments. Flows into money market funds and CDs, and out of most actively managed fixed-income mutual funds, particularly those on the long end of the curve, were a sustained theme over the 12-month period. That said, in our view the much higher yields municipal bonds offer now versus one year ago, or even just a few months ago, make municipals a much more attractive investment option, particularly as we believe we are at or near the end of the Fed’s interest rate hiking cycle. Fundamentals across most sectors remained healthy, and defaults were low by historical standards. A small number of sectors, such as hospitals and continuing care retirement communities (CCRCs) saw some weakening in their fundamentals. In addition, while U.S. states are sensitive to a possible economic slowdown or a capital market sell-off, many appeared relatively well positioned due to ongoing strengths in the economy and labor market along with high cash cushions, budget reserves, support from federal aid and relatively strong tax collections. Also, many states have managed recent budget surpluses conservatively in anticipation of a potential economic slowdown. However, a number of states, such as California and New York, have forecasted budget deficits in the coming years, and the municipal market may face additional pressures if the economy slows, and unemployment rises.
The economy of the Commonwealth of Massachusetts remained strong throughout the 12-month period and its unemployment rate was at a record low 2.6% at the end of September 2023. Massachusetts maintained a strong and established presence in many high-paying industries and continued to have the second highest per capita income in the nation. The strong economy correlated with good financial performance for Massachusetts. Fiscal 2023 state tax collections were slightly below the strong fiscal 2022 levels, due primarily to a decline in capital gains collections, but were sufficient to produce a surplus above expenditures and an increase in the Commonwealth’s financial reserves to record high levels.
The Fund’s notable contributors during the period
| • | The Fund maintained a below benchmark duration for the entire 12-month period. After initially declining during the first three months, interest rates rose meaningfully during the remainder of the period. The below benchmark positioning helped to limit price declines as rates increased. Having a below benchmark exposure to interest rates in the six months during the period in which returns were negative aided the Fund in outperforming in five of them. |
| • | Portfolio return was positive due to the high level of income or yield, which more than offset price declines that occurred during the period. |
Columbia Massachusetts Intermediate Municipal Bond Fund | Annual Report 2023
| 5 |
Manager Discussion of Fund Performance (continued)
(Unaudited)
| • | The Fund had additional exposure to municipal bonds maturing in the 0–2 year and 8-17 year range. This positioning benefited the Fund during the period as higher returns were produced in the very shortest and longer maturities. |
| • | An overweighted allocation to the lower investment-grade and non-investment grade quality segments contributed to Fund results as these areas outperformed higher quality segments during the period. |
| • | At the sector level, the Fund’s exposure to the hospital and education sectors performed well. These two sectors, which are synonymous with the Commonwealth of Massachusetts, represent the Fund’s largest sector exposures. |
The Fund’s notable detractors during the period
| • | The Fund’s exposure to CCRCs detracted from performance. CCRCs have struggled with financial operating performance since 2022 due in large part to the increase in labor costs. We have focused research on this sector and expect a continued rebound in 2024. |
| • | Other sectors that performed poorly were charter schools and special tax. The lackluster performance of special tax issues related to the Mass Bay Transportation Authority was not due to fundamental issues but rather the timing of Fund sales during the period, their maturity and zero-coupon structure. |
| • | The Fund’s underweighting to the broader transportation sector versus its national benchmark detracted from performance. At the national level, returns were strong across airport, toll roads and transportation systems. A big driver of the national transportation sector was the Metropolitan Transportation Authority in New York City which was upgraded recently due to continued improvement in operations. |
Fixed-income securities present issuer default risk. The Fund invests substantially in municipal securities and will be affected by tax, legislative, regulatory, demographic or political changes, as well as changes impacting a state’s financial, economic or other conditions. A relatively small number of tax-exempt issuers may necessitate the Fund investing more heavily in a single issuer and, therefore, be more exposed to the risk of loss than a fund that invests more broadly. The value of the Fund’s portfolio may be more volatile than a more geographically diversified fund. Prepayment and extension risk exists because the timing of payments on a loan, bond or other investment may accelerate when interest rates fall or decelerate when interest rates rise which may reduce investment opportunities and potential returns. A rise in interest rates may result in a price decline of fixed-income instruments held by the Fund, negatively impacting its performance and NAV. Falling rates may result in the Fund investing in lower yielding debt instruments, lowering the Fund’s income and yield. These risks may be heightened for longer maturity and duration securities. Non-investment-grade (high-yield or junk) securities present greater price volatility and more risk to principal and income than higher rated securities. Market risk may affect a single issuer, sector of the economy, industry or the market as a whole. Federal and state tax rules apply to capital gain distributions and any gains or losses on sales. Income may be subject to state or local taxes. Liquidity risk is associated with the difficulty of selling underlying investments at a desirable time or price. See the Fund’s prospectus for more information on these and other risks.
The views expressed in this report reflect the current views of the respective parties who have contributed to this report. These views are not guarantees of future performance and involve certain risks, uncertainties and assumptions that are difficult to predict, so actual outcomes and results may differ significantly from the views expressed. These views are subject to change at any time based upon economic, market or other conditions and the respective parties disclaim any responsibility to update such views. These views may not be relied on as investment advice and, because investment decisions for a Columbia fund are based on numerous factors, may not be relied on as an indication of trading intent on behalf of any particular Columbia fund. References to specific securities should not be construed as a recommendation or investment advice.
| 6 | Columbia Massachusetts Intermediate Municipal Bond Fund | Annual Report 2023 |
Understanding Your Fund’s Expenses
(Unaudited)
As an investor, you incur two types of costs. There are shareholder transaction costs, which generally include sales charges on purchases and may include redemption fees. There are also ongoing fund costs, which generally include management fees, distribution and/or service fees, and other fund expenses. The following information is intended to help you understand your ongoing costs (in dollars) of investing in the Fund and to help you compare these costs with the ongoing costs of investing in other mutual funds.
Analyzing your Fund’s expenses
To illustrate these ongoing costs, we have provided examples and calculated the expenses paid by investors in each share class of the Fund during the period. The actual and hypothetical information in the table is based on an initial investment of $1,000 at the beginning of the period indicated and held for the entire period. Expense information is calculated two ways and each method provides you with different information. The amount listed in the “Actual” column is calculated using the Fund’s actual operating expenses and total return for the period. You may use the Actual information, together with the amount invested, to estimate the expenses that you paid over the period. Simply divide your account value by $1,000 (for example, an $8,600 account value divided by $1,000 = 8.6), then multiply the results by the expenses paid during the period under the “Actual” column. The amount listed in the “Hypothetical” column assumes a 5% annual rate of return before expenses (which is not the Fund’s actual return) and then applies the Fund’s actual expense ratio for the period to the hypothetical return. You should not use the hypothetical account values and expenses to estimate either your actual account balance at the end of the period or the expenses you paid during the period. See “Compare with other funds” below for details on how to use the hypothetical data.
Compare with other funds
Since all mutual funds are required to include the same hypothetical calculations about expenses in shareholder reports, you can use this information to compare the ongoing cost of investing in the Fund with other funds. To do so, compare the hypothetical example with the 5% hypothetical examples that appear in the shareholder reports of other funds. As you compare hypothetical examples of other funds, it is important to note that hypothetical examples are meant to highlight the ongoing costs of investing in a fund only and do not reflect any transaction costs, such as sales charges, or redemption or exchange fees. Therefore, the hypothetical calculations are useful in comparing ongoing costs only, and will not help you determine the relative total costs of owning different funds. If transaction costs were included in these calculations, your costs would be higher.
| May 1, 2023 — October 31, 2023 |
| | Account value at the
beginning of the
period ($) | Account value at the
end of the
period ($) | Expenses paid during
the period ($) | Fund’s annualized
expense ratio (%) |
| | Actual | Hypothetical | Actual | Hypothetical | Actual | Hypothetical | Actual |
| Class A | 1,000.00 | 1,000.00 | 968.50 | 1,021.40 | 4.01 | 4.12 | 0.80 |
| Advisor Class | 1,000.00 | 1,000.00 | 968.70 | 1,022.68 | 2.76 | 2.83 | 0.55 |
| Class C | 1,000.00 | 1,000.00 | 966.30 | 1,019.11 | 6.26 | 6.43 | 1.25 |
| Institutional Class | 1,000.00 | 1,000.00 | 969.80 | 1,022.68 | 2.76 | 2.83 | 0.55 |
| Institutional 2 Class | 1,000.00 | 1,000.00 | 970.00 | 1,022.88 | 2.56 | 2.63 | 0.51 |
| Institutional 3 Class | 1,000.00 | 1,000.00 | 970.50 | 1,023.19 | 2.26 | 2.32 | 0.45 |
| Class V | 1,000.00 | 1,000.00 | 969.00 | 1,021.91 | 3.51 | 3.61 | 0.70 |
Expenses paid during the period are equal to the annualized expense ratio for each class as indicated above, multiplied by the average account value over the period and then multiplied by the number of days in the Fund’s most recent fiscal half year and divided by 365.
Expenses do not include fees and expenses incurred indirectly by the Fund from its investment in underlying funds, including affiliated and non-affiliated pooled investment vehicles, such as mutual funds and exchange-traded funds.
Had Columbia Management Investment Advisers, LLC and/or certain of its affiliates not waived/reimbursed certain fees and expenses, account value at the end of the period would have been reduced.
Columbia Massachusetts Intermediate Municipal Bond Fund | Annual Report 2023
| 7 |
Portfolio of Investments
October 31, 2023
(Percentages represent value of investments compared to net assets)
Investments in securities
| Floating Rate Notes 0.6% |
| Issue Description | Yield | | Principal
Amount ($) | Value ($) |
| Variable Rate Demand Notes 0.6% |
| New York City Transitional Finance Authority(a),(b) |
| Revenue Bonds |
| Future Tax Secured |
| Subordinated Series 2015 (JPMorgan Chase Bank) |
| 02/01/2045 | 3.950% | | 600,000 | 600,000 |
Total Floating Rate Notes
(Cost $600,000) | 600,000 |
|
| Municipal Bonds 96.8% |
| Issue Description | Coupon
Rate | | Principal
Amount ($) | Value ($) |
| Airport 4.3% |
| Massachusetts Port Authority(c) |
| Refunding Revenue Bonds |
| BosFuel Project |
| Series 2019A |
| 07/01/2038 | 5.000% | | 1,000,000 | 977,784 |
| Revenue Bonds |
| Series 2019C |
| 07/01/2035 | 5.000% | | 2,000,000 | 2,029,000 |
| Series 2021E |
| 07/01/2038 | 5.000% | | 1,000,000 | 996,030 |
| Massachusetts Port Authority |
| Revenue Bonds |
| Series 2015A |
| 07/01/2026 | 5.000% | | 600,000 | 609,344 |
| Total | 4,612,158 |
| Charter Schools 2.9% |
| Massachusetts Development Finance Agency |
| Refunding Revenue Bonds |
| Foxborough Regional Charter |
| Series 2017 |
| 07/01/2037 | 5.000% | | 1,800,000 | 1,655,033 |
| International Charter School |
| Series 2015 |
| 04/15/2025 | 5.000% | | 215,000 | 213,171 |
| 04/15/2033 | 5.000% | | 1,335,000 | 1,303,084 |
| Total | 3,171,288 |
| Higher Education 26.9% |
| Massachusetts Development Finance Agency |
| Refunding Revenue Bonds |
| Babson College |
| Series 2015A |
| 10/01/2025 | 5.000% | | 600,000 | 610,302 |
| Municipal Bonds (continued) |
| Issue Description | Coupon
Rate | | Principal
Amount ($) | Value ($) |
| Boston University |
| Series 2006BB2 |
| 10/01/2037 | 4.000% | | 2,120,000 | 1,989,190 |
| Brandeis University |
| Series 2018R |
| 10/01/2035 | 5.000% | | 1,005,000 | 1,043,748 |
| 10/01/2036 | 5.000% | | 1,140,000 | 1,175,682 |
| Series 2019 |
| 10/01/2036 | 5.000% | | 1,535,000 | 1,587,401 |
| Emerson College |
| Series 2017A |
| 01/01/2033 | 5.000% | | 1,500,000 | 1,508,200 |
| 01/01/2034 | 5.000% | | 1,000,000 | 1,003,726 |
| Simmons College |
| Series 2015K-1 |
| 10/01/2026 | 5.000% | | 3,005,000 | 3,015,802 |
| 10/01/2028 | 5.000% | | 1,100,000 | 1,106,698 |
| Simmons University |
| Series 2018L |
| 10/01/2034 | 5.000% | | 500,000 | 496,163 |
| 10/01/2035 | 5.000% | | 455,000 | 447,530 |
| Suffolk University |
| Series 2019 |
| 07/01/2035 | 5.000% | | 870,000 | 868,218 |
| Tufts University |
| Series 2015Q |
| 08/15/2030 | 5.000% | | 1,000,000 | 1,017,827 |
| Western New England University |
| Series 2015 |
| 09/01/2032 | 5.000% | | 500,000 | 488,822 |
| 09/01/2033 | 5.000% | | 1,225,000 | 1,190,746 |
| 09/01/2034 | 5.000% | | 1,285,000 | 1,239,266 |
| Woods Hole Oceanographic Institution |
| Series 2018 |
| 06/01/2036 | 5.000% | | 650,000 | 666,511 |
| Worcester Polytechnic Institute |
| Series 2016 |
| 09/01/2034 | 5.000% | | 500,000 | 507,652 |
| Series 2017 |
| 09/01/2037 | 5.000% | | 290,000 | 296,013 |
| Revenue Bonds |
| Babson College |
| Series 2017 |
| 10/01/2032 | 5.000% | | 885,000 | 905,847 |
| 10/01/2033 | 5.000% | | 900,000 | 920,223 |
The accompanying Notes to Financial Statements are an integral part of this statement.
| 8 | Columbia Massachusetts Intermediate Municipal Bond Fund | Annual Report 2023 |
Portfolio of Investments (continued)
October 31, 2023
| Municipal Bonds (continued) |
| Issue Description | Coupon
Rate | | Principal
Amount ($) | Value ($) |
| Bentley University |
| Series 2016 |
| 07/01/2035 | 4.000% | | 1,000,000 | 927,817 |
| 07/01/2036 | 4.000% | | 1,000,000 | 919,965 |
| Brandeis University |
| Series 2019S-2 |
| 10/01/2033 | 5.000% | | 1,150,000 | 1,203,842 |
| Simmons College |
| Series 2006H |
| 10/01/2033 | 5.250% | | 1,000,000 | 1,016,160 |
| Worcester Polytechnic Institute |
| Series 2019 |
| 09/01/2038 | 5.000% | | 865,000 | 888,163 |
| Massachusetts Health & Educational Facilities Authority |
| Revenue Bonds |
| Boston College |
| Series 2008M-1 |
| 06/01/2024 | 5.500% | | 2,000,000 | 2,019,630 |
| Total | 29,061,144 |
| Hospital 16.8% |
| Massachusetts Development Finance Agency |
| Refunding Revenue Bonds |
| CareGroup |
| Series 2015H-1 |
| 07/01/2030 | 5.000% | | 1,170,000 | 1,183,223 |
| Series 2016I |
| 07/01/2033 | 5.000% | | 2,000,000 | 2,013,716 |
| Lahey Clinic Obligation |
| Series 2015F |
| 08/15/2031 | 5.000% | | 3,000,000 | 3,034,617 |
| 08/15/2034 | 5.000% | | 2,250,000 | 2,274,177 |
| Partners HealthCare System |
| Series 2016 |
| 07/01/2031 | 5.000% | | 3,000,000 | 3,061,341 |
| Series 2020 |
| 07/01/2037 | 5.000% | | 1,000,000 | 1,026,553 |
| Series 2021G |
| 07/01/2038 | 5.000% | | 225,000 | 221,132 |
| UMass Memorial Healthcare |
| Series 2016I |
| 07/01/2030 | 5.000% | | 2,295,000 | 2,316,564 |
| Series 2017 |
| 07/01/2031 | 5.000% | | 1,000,000 | 1,008,410 |
| Revenue Bonds |
| CareGroup |
| Series 2018J1 |
| 07/01/2036 | 5.000% | | 985,000 | 999,588 |
| 07/01/2037 | 5.000% | | 1,035,000 | 1,042,741 |
| Total | 18,182,062 |
| Municipal Bonds (continued) |
| Issue Description | Coupon
Rate | | Principal
Amount ($) | Value ($) |
| Human Service Provider 0.8% |
| Massachusetts Development Finance Agency |
| Refunding Revenue Bonds |
| Seven Hills Foundation |
| Series 2021 |
| 09/01/2039 | 4.000% | | 1,000,000 | 823,288 |
| Joint Power Authority 1.5% |
| Berkshire Wind Power Cooperative Corp. |
| Refunding Revenue Bonds |
| Berkshire Wind Project |
| Series 2017 |
| 07/01/2029 | 5.000% | | 1,000,000 | 1,038,672 |
| Massachusetts Municipal Wholesale Electric Co. |
| Revenue Bonds |
| Project 2015A |
| Series 2021A |
| 07/01/2039 | 4.000% | | 620,000 | 562,834 |
| Total | 1,601,506 |
| Multi-Family 3.0% |
| Massachusetts Development Finance Agency |
| Revenue Bonds |
| UMass Boston Student Housing Project |
| Series 2016 |
| 10/01/2033 | 5.000% | | 1,235,000 | 1,220,701 |
| 10/01/2034 | 5.000% | | 2,000,000 | 1,962,021 |
| Total | 3,182,722 |
| Other Bond Issue 6.5% |
| Martha’s Vineyard Land Bank |
| Refunding Revenue Bonds |
| Green Bonds |
| Series 2014 |
| 05/01/2029 | 5.000% | | 1,000,000 | 1,005,770 |
| Series 2017 (BAM) |
| 05/01/2034 | 5.000% | | 500,000 | 516,444 |
| 05/01/2035 | 5.000% | | 500,000 | 516,340 |
| Massachusetts Development Finance Agency |
| Refunding Revenue Bonds |
| Broad Institute |
| Series 2017 |
| 04/01/2034 | 5.000% | | 2,500,000 | 2,571,978 |
| 04/01/2035 | 5.000% | | 2,350,000 | 2,410,596 |
| Total | 7,021,128 |
| Pool / Bond Bank 1.9% |
| Massachusetts Clean Water Trust (The) |
| Revenue Bonds |
| Green Bonds |
| Series 2019 |
| 08/01/2038 | 5.000% | | 2,000,000 | 2,087,260 |
The accompanying Notes to Financial Statements are an integral part of this statement.
Columbia Massachusetts Intermediate Municipal Bond Fund | Annual Report 2023
| 9 |
Portfolio of Investments (continued)
October 31, 2023
| Municipal Bonds (continued) |
| Issue Description | Coupon
Rate | | Principal
Amount ($) | Value ($) |
| Prep School 1.9% |
| Massachusetts Development Finance Agency |
| Refunding Revenue Bonds |
| Dexter Southfield |
| Series 2015 |
| 05/01/2030 | 5.000% | | 1,035,000 | 1,048,127 |
| Revenue Bonds |
| Trustees of Deerfield Academy |
| Series 2023 |
| 10/01/2032 | 5.000% | | 925,000 | 1,023,738 |
| Total | 2,071,865 |
| Refunded / Escrowed 6.8% |
| Massachusetts Development Finance Agency |
| Prerefunded 07/01/25 Revenue Bonds |
| Partners HealthCare System |
| Series 2015 |
| 07/01/2032 | 5.000% | | 2,795,000 | 2,849,730 |
| Prerefunded 10/01/24 Revenue Bonds |
| Children’s Hospital |
| Series 2014P |
| 10/01/2031 | 5.000% | | 1,200,000 | 1,210,731 |
| Massachusetts State College Building Authority(d) |
| Revenue Bonds |
| Capital Appreciation |
| Series 1999A Escrowed to Maturity (NPFGC) |
| 05/01/2028 | 0.000% | | 4,000,000 | 3,337,710 |
| Total | 7,398,171 |
| Retirement Communities 6.8% |
| Massachusetts Development Finance Agency |
| Refunding Revenue Bonds |
| 1st Mortgage-Berkshire Retirement Community |
| Series 2015 |
| 07/01/2031 | 5.000% | | 1,250,000 | 1,235,418 |
| Orchard Cove, Inc. |
| Series 2019 |
| 10/01/2039 | 4.000% | | 985,000 | 792,618 |
| 10/01/2039 | 5.000% | | 250,000 | 227,932 |
| Salem Community Corp. |
| Series 2022 |
| 01/01/2040 | 5.125% | | 1,000,000 | 847,602 |
| Massachusetts Development Finance Agency(e) |
| Refunding Revenue Bonds |
| Loomis Obligated Group |
| Series 2022 |
| 01/01/2031 | 4.000% | | 1,500,000 | 1,406,220 |
| Newbridge Charles, Inc. |
| Series 2017 |
| 10/01/2032 | 4.000% | | 1,500,000 | 1,292,322 |
| Municipal Bonds (continued) |
| Issue Description | Coupon
Rate | | Principal
Amount ($) | Value ($) |
| Revenue Bonds |
| Linden Ponds, Inc. Facility |
| Series 2018 |
| 11/15/2033 | 5.000% | | 1,500,000 | 1,498,495 |
| Total | 7,300,607 |
| Sales Tax 5.2% |
| Massachusetts Bay Transportation Authority(d) |
| Refunding Revenue Bonds |
| Series 2016A |
| 07/01/2029 | 0.000% | | 3,000,000 | 2,284,801 |
| 07/01/2032 | 0.000% | | 5,105,000 | 3,316,941 |
| Total | 5,601,742 |
| State General Obligation 9.4% |
| Commonwealth of Massachusetts |
| Limited General Obligation Bonds |
| Consolidated Loan of 2023 |
| Series 2023 |
| 05/01/2040 | 5.000% | | 1,000,000 | 1,049,091 |
| Series 2016I |
| 12/01/2030 | 5.000% | | 3,000,000 | 3,097,390 |
| Series 2019G |
| 09/01/2036 | 4.000% | | 2,000,000 | 1,941,955 |
| Limited General Obligation Refunding Bonds |
| Series 2023C |
| 08/01/2040 | 5.000% | | 1,000,000 | 1,050,065 |
| Unlimited General Obligation Refunding Bonds |
| Series 2004C (AMBAC) |
| 12/01/2024 | 5.500% | | 3,000,000 | 3,056,804 |
| Total | 10,195,305 |
| Student Loan 0.2% |
| Massachusetts Educational Financing Authority(c) |
| Revenue Bonds |
| Series 2020B |
| 07/01/2028 | 5.000% | | 250,000 | 252,155 |
| Turnpike / Bridge / Toll Road 1.9% |
| Massachusetts Transportation Trust Fund Metropolitan Highway System |
| Refunding Revenue Bonds |
| Series 2019A |
| 01/01/2035 | 5.000% | | 2,000,000 | 2,085,694 |
Total Municipal Bonds
(Cost $111,418,263) | 104,648,095 |
The accompanying Notes to Financial Statements are an integral part of this statement.
| 10 | Columbia Massachusetts Intermediate Municipal Bond Fund | Annual Report 2023 |
Portfolio of Investments (continued)
October 31, 2023
| Money Market Funds 1.8% |
| | Shares | Value ($) |
| BlackRock Liquidity Funds MuniCash, Institutional Shares, 3.823%(f) | 1,975,455 | 1,975,455 |
Total Money Market Funds
(Cost $1,975,455) | 1,975,455 |
Total Investments in Securities
(Cost: $113,993,718) | 107,223,550 |
| Other Assets & Liabilities, Net | | 876,665 |
| Net Assets | 108,100,215 |
Notes to Portfolio of Investments
| (a) | The Fund is entitled to receive principal and interest from the guarantor after a day or a week’s notice or upon maturity. The maturity date disclosed represents the final maturity. |
| (b) | Represents a variable rate security where the coupon rate adjusts on specified dates (generally daily or weekly) using the prevailing money market rate. The interest rate shown was the current rate as of October 31, 2023. |
| (c) | Income from this security may be subject to alternative minimum tax. |
| (d) | Zero coupon bond. |
| (e) | Represents privately placed and other securities and instruments exempt from Securities and Exchange Commission registration (collectively, private placements), such as Section 4(a)(2) and Rule 144A eligible securities, which are often sold only to qualified institutional buyers. At October 31, 2023, the total value of these securities amounted to $4,197,037, which represents 3.88% of total net assets. |
| (f) | The rate shown is the seven-day current annualized yield at October 31, 2023. |
Abbreviation Legend
| AMBAC | Ambac Assurance Corporation |
| BAM | Build America Mutual Assurance Co. |
| NPFGC | National Public Finance Guarantee Corporation |
Fair value measurements
The Fund categorizes its fair value measurements according to a three-level hierarchy that maximizes the use of observable inputs and minimizes the use of unobservable inputs by prioritizing that the most observable input be used when available. Observable inputs are those that market participants would use in pricing an investment based on market data obtained from sources independent of the reporting entity. Unobservable inputs are those that reflect the Fund’s assumptions about the information market participants would use in pricing an investment. An investment’s level within the fair value hierarchy is based on the lowest level of any input that is deemed significant to the asset’s or liability’s fair value measurement. The input levels are not necessarily an indication of the risk or liquidity associated with investments at that level. For example, certain U.S. government securities are generally high quality and liquid, however, they are reflected as Level 2 because the inputs used to determine fair value may not always be quoted prices in an active market.
Fair value inputs are summarized in the three broad levels listed below:
| ■ | Level 1 — Valuations based on quoted prices for investments in active markets that the Fund has the ability to access at the measurement date. Valuation adjustments are not applied to Level 1 investments. |
| ■ | Level 2 — Valuations based on other significant observable inputs (including quoted prices for similar securities, interest rates, prepayment speeds, credit risks, etc.). |
| ■ | Level 3 — Valuations based on significant unobservable inputs (including the Fund’s own assumptions and judgment in determining the fair value of investments). |
Inputs that are used in determining fair value of an investment may include price information, credit data, volatility statistics, and other factors. These inputs can be either observable or unobservable. The availability of observable inputs can vary between investments, and is affected by various factors such as the type of investment, and the volume and level of activity for that investment or similar investments in the marketplace. The inputs will be considered by the Investment Manager, along with any other relevant factors in the calculation of an investment’s fair value. The Fund uses prices and inputs that are current as of the measurement date, which may include periods of market dislocations. During these periods, the availability of prices and inputs may be reduced for many investments. This condition could cause an investment to be reclassified between the various levels within the hierarchy.
Investments falling into the Level 3 category are primarily supported by quoted prices from brokers and dealers participating in the market for those investments. However, these may be classified as Level 3 investments due to lack of market transparency and corroboration to support these quoted prices. Additionally, valuation models may be used as the pricing source for any remaining investments classified as Level 3. These models may rely on one or more significant unobservable inputs and/or significant assumptions by the Investment Manager. Inputs used in valuations may include, but are not limited to, financial statement analysis, capital account balances, discount rates and estimated cash flows, and comparable company data.
The Fund’s Board of Trustees (the Board) has designated the Investment Manager, through its Valuation Committee (the Committee), as valuation designee, responsible for determining the fair value of the assets of the Fund for which market quotations are not readily available using valuation procedures approved by the Board. The Committee consists of voting and non-voting members from various groups within the Investment Manager’s organization, including operations and accounting, trading and investments, compliance, risk management and legal.
The accompanying Notes to Financial Statements are an integral part of this statement.
Columbia Massachusetts Intermediate Municipal Bond Fund | Annual Report 2023
| 11 |
Portfolio of Investments (continued)
October 31, 2023
Fair value measurements (continued)
The Committee meets at least monthly to review and approve valuation matters, which may include a description of specific valuation determinations, data regarding pricing information received from approved pricing vendors and brokers and the results of Board-approved valuation policies and procedures (the Policies). The Policies address, among other things, instances when market quotations are or are not readily available, including recommendations of third party pricing vendors and a determination of appropriate pricing methodologies; events that require specific valuation determinations and assessment of fair value techniques; securities with a potential for stale pricing, including those that are illiquid, restricted, or in default; and the effectiveness of third party pricing vendors, including periodic reviews of vendors. The Committee meets more frequently, as needed, to discuss additional valuation matters, which may include the need to review back-testing results, review time-sensitive information or approve related valuation actions. Representatives of Columbia Management Investment Advisers, LLC report to the Board at each of its regularly scheduled meetings to discuss valuation matters and actions during the period, similar to those described earlier.
The following table is a summary of the inputs used to value the Fund’s investments at October 31, 2023:
| | Level 1 ($) | Level 2 ($) | Level 3 ($) | Total ($) |
| Investments in Securities | | | | |
| Floating Rate Notes | — | 600,000 | — | 600,000 |
| Municipal Bonds | — | 104,648,095 | — | 104,648,095 |
| Money Market Funds | 1,975,455 | — | — | 1,975,455 |
| Total Investments in Securities | 1,975,455 | 105,248,095 | — | 107,223,550 |
See the Portfolio of Investments for all investment classifications not indicated in the table.
The Fund’s assets assigned to the Level 2 input category are generally valued using the market approach, in which a security’s value is determined through reference to prices and information from market transactions for similar or identical assets.
The accompanying Notes to Financial Statements are an integral part of this statement.
| 12 | Columbia Massachusetts Intermediate Municipal Bond Fund | Annual Report 2023 |
Statement of Assets and Liabilities
October 31, 2023
| Assets | |
| Investments in securities, at value | |
| Unaffiliated issuers (cost $113,993,718) | $107,223,550 |
| Receivable for: | |
| Capital shares sold | 137,533 |
| Dividends | 2,164 |
| Interest | 1,162,766 |
| Trustees’ fees | 95,251 |
| Expense reimbursement due from Investment Manager | 415 |
| Prepaid expenses | 3,745 |
| Total assets | 108,625,424 |
| Liabilities | |
| Due to custodian | 14,701 |
| Payable for: | |
| Capital shares redeemed | 117,504 |
| Distributions to shareholders | 256,938 |
| Management services fees | 1,392 |
| Distribution and/or service fees | 177 |
| Transfer agent fees | 4,407 |
| Trustees’ fees | 110,620 |
| Other expenses | 19,470 |
| Total liabilities | 525,209 |
| Net assets applicable to outstanding capital stock | $108,100,215 |
| Represented by | |
| Paid in capital | 119,042,369 |
| Total distributable earnings (loss) | (10,942,154) |
| Total - representing net assets applicable to outstanding capital stock | $108,100,215 |
The accompanying Notes to Financial Statements are an integral part of this statement.
Columbia Massachusetts Intermediate Municipal Bond Fund | Annual Report 2023
| 13 |
Statement of Assets and Liabilities (continued)
October 31, 2023
| Class A | |
| Net assets | $19,508,247 |
| Shares outstanding | 2,115,251 |
| Net asset value per share | $9.22 |
| Maximum sales charge | 3.00% |
| Maximum offering price per share (calculated by dividing the net asset value per share by 1.0 minus the maximum sales charge for Class A shares) | $9.51 |
| Advisor Class | |
| Net assets | $4,955,523 |
| Shares outstanding | 537,782 |
| Net asset value per share | $9.21 |
| Class C | |
| Net assets | $635,990 |
| Shares outstanding | 68,980 |
| Net asset value per share | $9.22 |
| Institutional Class | |
| Net assets | $16,457,597 |
| Shares outstanding | 1,783,530 |
| Net asset value per share | $9.23 |
| Institutional 2 Class | |
| Net assets | $8,377 |
| Shares outstanding | 907 |
| Net asset value per share | $9.24 |
| Institutional 3 Class | |
| Net assets | $59,040,563 |
| Shares outstanding | 6,369,332 |
| Net asset value per share | $9.27 |
| Class V | |
| Net assets | $7,493,918 |
| Shares outstanding | 812,535 |
| Net asset value per share | $9.22 |
| Maximum sales charge | 4.75% |
| Maximum offering price per share (calculated by dividing the net asset value per share by 1.0 minus the maximum sales charge for Class V shares) | $9.68 |
The accompanying Notes to Financial Statements are an integral part of this statement.
| 14 | Columbia Massachusetts Intermediate Municipal Bond Fund | Annual Report 2023 |
Statement of Operations
Year Ended October 31, 2023
| Net investment income | |
| Income: | |
| Dividends — unaffiliated issuers | $39,383 |
| Interest | 4,058,059 |
| Total income | 4,097,442 |
| Expenses: | |
| Management services fees | 581,589 |
| Distribution and/or service fees | |
| Class A | 50,130 |
| Class C | 6,277 |
| Class V | 12,542 |
| Transfer agent fees | |
| Class A | 23,058 |
| Advisor Class | 6,731 |
| Class C | 1,035 |
| Institutional Class | 19,101 |
| Institutional 2 Class | 6 |
| Institutional 3 Class | 4,279 |
| Class V | 9,626 |
| Trustees’ fees | 17,593 |
| Custodian fees | 1,457 |
| Printing and postage fees | 10,396 |
| Registration fees | 31,058 |
| Accounting services fees | 30,090 |
| Legal fees | 14,831 |
| Interest on interfund lending | 148 |
| Compensation of chief compliance officer | 27 |
| Other | 13,054 |
| Total expenses | 833,028 |
| Fees waived or expenses reimbursed by Investment Manager and its affiliates | (160,053) |
| Expense reduction | (140) |
| Total net expenses | 672,835 |
| Net investment income | 3,424,607 |
| Realized and unrealized gain (loss) — net | |
| Net realized gain (loss) on: | |
| Investments — unaffiliated issuers | (1,918,695) |
| Net realized loss | (1,918,695) |
| Net change in unrealized appreciation (depreciation) on: | |
| Investments — unaffiliated issuers | 2,424,666 |
| Net change in unrealized appreciation (depreciation) | 2,424,666 |
| Net realized and unrealized gain | 505,971 |
| Net increase in net assets resulting from operations | $3,930,578 |
The accompanying Notes to Financial Statements are an integral part of this statement.
Columbia Massachusetts Intermediate Municipal Bond Fund | Annual Report 2023
| 15 |
Statement of Changes in Net Assets
| | Year Ended
October 31, 2023 | Year Ended
October 31, 2022 |
| Operations | | |
| Net investment income | $3,424,607 | $4,182,054 |
| Net realized loss | (1,918,695) | (2,450,425) |
| Net change in unrealized appreciation (depreciation) | 2,424,666 | (21,030,470) |
| Net increase (decrease) in net assets resulting from operations | 3,930,578 | (19,298,841) |
| Distributions to shareholders | | |
| Net investment income and net realized gains | | |
| Class A | (495,982) | (578,309) |
| Advisor Class | (159,007) | (91,828) |
| Class C | (18,120) | (26,811) |
| Institutional Class | (452,300) | (3,198,139) |
| Institutional 2 Class | (239) | (1,799) |
| Institutional 3 Class | (2,036,158) | (503,745) |
| Class V | (215,193) | (255,178) |
| Total distributions to shareholders | (3,376,999) | (4,655,809) |
| Decrease in net assets from capital stock activity | (35,208,984) | (44,981,884) |
| Total decrease in net assets | (34,655,405) | (68,936,534) |
| Net assets at beginning of year | 142,755,620 | 211,692,154 |
| Net assets at end of year | $108,100,215 | $142,755,620 |
The accompanying Notes to Financial Statements are an integral part of this statement.
| 16 | Columbia Massachusetts Intermediate Municipal Bond Fund | Annual Report 2023 |
Statement of Changes in Net Assets (continued)
| | Year Ended | Year Ended |
| | October 31, 2023 | October 31, 2022 |
| | Shares | Dollars ($) | Shares | Dollars ($) |
| Capital stock activity |
| Class A | | | | |
| Shares sold | 246,062 | 2,352,755 | 275,160 | 2,716,151 |
| Distributions reinvested | 48,086 | 458,540 | 53,178 | 529,379 |
| Shares redeemed | (486,771) | (4,667,772) | (583,361) | (5,751,051) |
| Net decrease | (192,623) | (1,856,477) | (255,023) | (2,505,521) |
| Advisor Class | | | | |
| Shares sold | 274,401 | 2,629,088 | 419,273 | 3,984,516 |
| Distributions reinvested | 16,629 | 158,566 | 9,233 | 91,575 |
| Shares redeemed | (359,009) | (3,415,123) | (188,835) | (1,879,882) |
| Net increase (decrease) | (67,979) | (627,469) | 239,671 | 2,196,209 |
| Class C | | | | |
| Shares sold | 12,632 | 120,796 | 13,110 | 128,449 |
| Distributions reinvested | 1,898 | 18,120 | 2,680 | 26,807 |
| Shares redeemed | (69,536) | (663,799) | (53,435) | (530,773) |
| Net decrease | (55,006) | (524,883) | (37,645) | (375,517) |
| Institutional Class | | | | |
| Shares sold | 527,786 | 5,028,014 | 770,487 | 7,953,399 |
| Distributions reinvested | 37,060 | 353,662 | 35,509 | 354,796 |
| Shares redeemed | (600,089) | (5,737,635) | (14,766,132) | (144,215,542) |
| Net decrease | (35,243) | (355,959) | (13,960,136) | (135,907,347) |
| Institutional 2 Class | | | | |
| Distributions reinvested | — | — | 148 | 1,510 |
| Shares redeemed | — | — | (8,840) | (86,265) |
| Net decrease | — | — | (8,692) | (84,755) |
| Institutional 3 Class | | | | |
| Shares sold | 512,614 | 4,944,923 | 11,182,415 | 109,017,750 |
| Distributions reinvested | 645 | 6,167 | 400 | 3,986 |
| Shares redeemed | (3,736,257) | (35,835,442) | (1,605,428) | (15,462,865) |
| Net increase (decrease) | (3,222,998) | (30,884,352) | 9,577,387 | 93,558,871 |
| Class V | | | | |
| Shares sold | 6,294 | 59,947 | 5,557 | 55,770 |
| Distributions reinvested | 13,306 | 126,927 | 15,256 | 152,162 |
| Shares redeemed | (120,424) | (1,146,718) | (212,805) | (2,071,756) |
| Net decrease | (100,824) | (959,844) | (191,992) | (1,863,824) |
| Total net decrease | (3,674,673) | (35,208,984) | (4,636,430) | (44,981,884) |
The accompanying Notes to Financial Statements are an integral part of this statement.
Columbia Massachusetts Intermediate Municipal Bond Fund | Annual Report 2023
| 17 |
The following table is intended to help you understand the Fund’s financial performance. Certain information reflects financial results for a single share of a class held for the periods shown. Per share net investment income (loss) amounts are calculated based on average shares outstanding during the period. Total return assumes reinvestment of all dividends and distributions, if any. Total return does not reflect payment of sales charges, if any. Total return and portfolio turnover are not annualized for periods of less than one year. The ratios of expenses and net investment income are annualized for periods of less than one year. The portfolio turnover rate is calculated without regard to purchase and sales transactions of short-term instruments and certain derivatives, if any. If such transactions were included, the Fund’s portfolio turnover rate may be higher.
| | Net asset value,
beginning of
period | Net
investment
income | Net
realized
and
unrealized
gain (loss) | Total from
investment
operations | Distributions
from net
investment
income | Distributions
from net
realized
gains | Total
distributions to
shareholders |
| Class A |
| Year Ended 10/31/2023 | $9.26 | 0.24 | (0.04)(c) | 0.20 | (0.24) | — | (0.24) |
| Year Ended 10/31/2022 | $10.59 | 0.21 | (1.30) | (1.09) | (0.21) | (0.03) | (0.24) |
| Year Ended 10/31/2021 | $10.62 | 0.21 | (0.03) | 0.18 | (0.21) | (0.00)(f) | (0.21) |
| Year Ended 10/31/2020 | $10.65 | 0.24 | (0.03) | 0.21 | (0.23) | (0.01) | (0.24) |
| Year Ended 10/31/2019 | $10.17 | 0.29 | 0.51 | 0.80 | (0.29) | (0.03) | (0.32) |
| Advisor Class |
| Year Ended 10/31/2023 | $9.26 | 0.26 | (0.05)(c) | 0.21 | (0.26) | — | (0.26) |
| Year Ended 10/31/2022 | $10.58 | 0.24 | (1.30) | (1.06) | (0.23) | (0.03) | (0.26) |
| Year Ended 10/31/2021 | $10.61 | 0.23 | (0.03) | 0.20 | (0.23) | (0.00)(f) | (0.23) |
| Year Ended 10/31/2020 | $10.64 | 0.26 | (0.02) | 0.24 | (0.26) | (0.01) | (0.27) |
| Year Ended 10/31/2019 | $10.16 | 0.31 | 0.51 | 0.82 | (0.31) | (0.03) | (0.34) |
| Class C |
| Year Ended 10/31/2023 | $9.26 | 0.20 | (0.05)(c) | 0.15 | (0.19) | — | (0.19) |
| Year Ended 10/31/2022 | $10.58 | 0.16 | (1.29) | (1.13) | (0.16) | (0.03) | (0.19) |
| Year Ended 10/31/2021 | $10.62 | 0.16 | (0.04) | 0.12 | (0.16) | (0.00)(f) | (0.16) |
| Year Ended 10/31/2020 | $10.64 | 0.19 | (0.02) | 0.17 | (0.18) | (0.01) | (0.19) |
| Year Ended 10/31/2019 | $10.16 | 0.24 | 0.51 | 0.75 | (0.24) | (0.03) | (0.27) |
| Institutional Class |
| Year Ended 10/31/2023 | $9.27 | 0.26 | (0.04)(c) | 0.22 | (0.26) | — | (0.26) |
| Year Ended 10/31/2022 | $10.58 | 0.23 | (1.28) | (1.05) | (0.23) | (0.03) | (0.26) |
| Year Ended 10/31/2021 | $10.62 | 0.23 | (0.04) | 0.19 | (0.23) | (0.00)(f) | (0.23) |
| Year Ended 10/31/2020 | $10.65 | 0.26 | (0.02) | 0.24 | (0.26) | (0.01) | (0.27) |
| Year Ended 10/31/2019 | $10.17 | 0.31 | 0.51 | 0.82 | (0.31) | (0.03) | (0.34) |
| Institutional 2 Class |
| Year Ended 10/31/2023 | $9.28 | 0.27 | (0.05)(c) | 0.22 | (0.26) | — | (0.26) |
| Year Ended 10/31/2022 | $10.61 | 0.24 | (1.31) | (1.07) | (0.23) | (0.03) | (0.26) |
| Year Ended 10/31/2021 | $10.64 | 0.24 | (0.03) | 0.21 | (0.24) | (0.00)(f) | (0.24) |
| Year Ended 10/31/2020 | $10.66 | 0.28 | (0.02) | 0.26 | (0.27) | (0.01) | (0.28) |
| Year Ended 10/31/2019 | $10.18 | 0.32 | 0.51 | 0.83 | (0.32) | (0.03) | (0.35) |
The accompanying Notes to Financial Statements are an integral part of this statement.
| 18 | Columbia Massachusetts Intermediate Municipal Bond Fund | Annual Report 2023 |
Financial Highlights (continued)
| | Net
asset
value,
end of
period | Total
return | Total gross
expense
ratio to
average
net assets(a) | Total net
expense
ratio to
average
net assets(a),(b) | Net investment
income
ratio to
average
net assets | Portfolio
turnover | Net
assets,
end of
period
(000’s) |
| Class A |
| Year Ended 10/31/2023 | $9.22 | 2.06% | 0.93%(d) | 0.80%(d),(e) | 2.51% | 8% | $19,508 |
| Year Ended 10/31/2022 | $9.26 | (10.47%) | 0.89%(d) | 0.78%(d),(e) | 2.10% | 3% | $21,377 |
| Year Ended 10/31/2021 | $10.59 | 1.65% | 0.90% | 0.81%(e) | 1.92% | 8% | $27,129 |
| Year Ended 10/31/2020 | $10.62 | 2.02% | 0.90% | 0.81%(e) | 2.23% | 13% | $28,012 |
| Year Ended 10/31/2019 | $10.65 | 7.92% | 0.90% | 0.80%(e) | 2.75% | 15% | $23,968 |
| Advisor Class |
| Year Ended 10/31/2023 | $9.21 | 2.21% | 0.68%(d) | 0.55%(d),(e) | 2.76% | 8% | $4,956 |
| Year Ended 10/31/2022 | $9.26 | (10.16%) | 0.63%(d) | 0.53%(d),(e) | 2.37% | 3% | $5,606 |
| Year Ended 10/31/2021 | $10.58 | 1.91% | 0.65% | 0.56%(e) | 2.17% | 8% | $3,872 |
| Year Ended 10/31/2020 | $10.61 | 2.27% | 0.65% | 0.56%(e) | 2.48% | 13% | $3,834 |
| Year Ended 10/31/2019 | $10.64 | 8.19% | 0.65% | 0.55%(e) | 3.00% | 15% | $3,188 |
| Class C |
| Year Ended 10/31/2023 | $9.22 | 1.60% | 1.38%(d) | 1.25%(d),(e) | 2.06% | 8% | $636 |
| Year Ended 10/31/2022 | $9.26 | (10.79%) | 1.45%(d) | 1.23%(d),(e) | 1.63% | 3% | $1,148 |
| Year Ended 10/31/2021 | $10.58 | 1.10% | 1.65% | 1.26%(e) | 1.47% | 8% | $1,710 |
| Year Ended 10/31/2020 | $10.62 | 1.65% | 1.65% | 1.26%(e),(g) | 1.80% | 13% | $2,617 |
| Year Ended 10/31/2019 | $10.64 | 7.44% | 1.65% | 1.25%(e),(g) | 2.32% | 15% | $3,472 |
| Institutional Class |
| Year Ended 10/31/2023 | $9.23 | 2.32% | 0.68%(d) | 0.55%(d),(e) | 2.77% | 8% | $16,458 |
| Year Ended 10/31/2022 | $9.27 | (10.06%) | 0.64%(d) | 0.54%(d),(e) | 2.28% | 3% | $16,856 |
| Year Ended 10/31/2021 | $10.58 | 1.81% | 0.65% | 0.56%(e) | 2.17% | 8% | $167,020 |
| Year Ended 10/31/2020 | $10.62 | 2.27% | 0.65% | 0.56%(e) | 2.49% | 13% | $182,343 |
| Year Ended 10/31/2019 | $10.65 | 8.19% | 0.65% | 0.55%(e) | 3.01% | 15% | $177,665 |
| Institutional 2 Class |
| Year Ended 10/31/2023 | $9.24 | 2.35% | 0.63%(d) | 0.51%(d) | 2.81% | 8% | $8 |
| Year Ended 10/31/2022 | $9.28 | (10.20%) | 0.60%(d) | 0.50%(d) | 2.30% | 3% | $8 |
| Year Ended 10/31/2021 | $10.61 | 1.96% | 0.59% | 0.50% | 2.23% | 8% | $102 |
| Year Ended 10/31/2020 | $10.64 | 2.43% | 0.59% | 0.49% | 2.61% | 13% | $226 |
| Year Ended 10/31/2019 | $10.66 | 8.25% | 0.59% | 0.49% | 3.03% | 15% | $408 |
The accompanying Notes to Financial Statements are an integral part of this statement.
Columbia Massachusetts Intermediate Municipal Bond Fund | Annual Report 2023
| 19 |
Financial Highlights (continued)
| | Net asset value,
beginning of
period | Net
investment
income | Net
realized
and
unrealized
gain (loss) | Total from
investment
operations | Distributions
from net
investment
income | Distributions
from net
realized
gains | Total
distributions to
shareholders |
| Institutional 3 Class |
| Year Ended 10/31/2023 | $9.31 | 0.28 | (0.05)(c) | 0.23 | (0.27) | — | (0.27) |
| Year Ended 10/31/2022 | $10.64 | 0.26 | (1.32) | (1.06) | (0.24) | (0.03) | (0.27) |
| Year Ended 10/31/2021 | $10.67 | 0.24 | (0.02) | 0.22 | (0.25) | (0.00)(f) | (0.25) |
| Year Ended 10/31/2020 | $10.70 | 0.27 | (0.02) | 0.25 | (0.27) | (0.01) | (0.28) |
| Year Ended 10/31/2019 | $10.22 | 0.33 | 0.50 | 0.83 | (0.32) | (0.03) | (0.35) |
| Class V |
| Year Ended 10/31/2023 | $9.26 | 0.25 | (0.04)(c) | 0.21 | (0.25) | — | (0.25) |
| Year Ended 10/31/2022 | $10.59 | 0.22 | (1.31) | (1.09) | (0.21) | (0.03) | (0.24) |
| Year Ended 10/31/2021 | $10.62 | 0.22 | (0.03) | 0.19 | (0.22) | (0.00)(f) | (0.22) |
| Year Ended 10/31/2020 | $10.65 | 0.25 | (0.03) | 0.22 | (0.24) | (0.01) | (0.25) |
| Year Ended 10/31/2019 | $10.17 | 0.30 | 0.51 | 0.81 | (0.30) | (0.03) | (0.33) |
| Notes to Financial Highlights |
| (a) | In addition to the fees and expenses that the Fund bears directly, the Fund indirectly bears a pro rata share of the fees and expenses of any other funds in which it invests. Such indirect expenses are not included in the Fund’s reported expense ratios. |
| (b) | Total net expenses include the impact of certain fee waivers/expense reimbursements made by the Investment Manager and certain of its affiliates, if applicable. |
| (c) | Calculation of the net gain (loss) per share (both realized and unrealized) does not correlate to the aggregate realized and unrealized gain (loss) presented in the Statement of Operations due to timing of Fund shares sold and redeemed in relation to fluctuations in the market value of the portfolio. |
| (d) | Ratios include interfund lending expense which is less than 0.01%. |
| (e) | The benefits derived from expense reductions had an impact of less than 0.01%. |
| (f) | Rounds to zero. |
| (g) | Ratios include the impact of voluntary waivers paid by the Investment Manager. For the periods indicated below, if the Investment Manager had not paid these voluntary waivers, the Fund’s net expense ratio would increase by: |
| | 10/31/2020 | 10/31/2019 |
| Class C | 0.25% | 0.30% |
The accompanying Notes to Financial Statements are an integral part of this statement.
| 20 | Columbia Massachusetts Intermediate Municipal Bond Fund | Annual Report 2023 |
Financial Highlights (continued)
| | Net
asset
value,
end of
period | Total
return | Total gross
expense
ratio to
average
net assets(a) | Total net
expense
ratio to
average
net assets(a),(b) | Net investment
income
ratio to
average
net assets | Portfolio
turnover | Net
assets,
end of
period
(000’s) |
| Institutional 3 Class |
| Year Ended 10/31/2023 | $9.27 | 2.43% | 0.57%(d) | 0.44%(d) | 2.87% | 8% | $59,041 |
| Year Ended 10/31/2022 | $9.31 | (10.11%) | 0.56%(d) | 0.44%(d) | 2.77% | 3% | $89,300 |
| Year Ended 10/31/2021 | $10.64 | 2.02% | 0.55% | 0.45% | 2.28% | 8% | $159 |
| Year Ended 10/31/2020 | $10.67 | 2.38% | 0.54% | 0.45% | 2.58% | 13% | $173 |
| Year Ended 10/31/2019 | $10.70 | 8.28% | 0.54% | 0.44% | 3.12% | 15% | $128 |
| Class V |
| Year Ended 10/31/2023 | $9.22 | 2.17% | 0.83%(d) | 0.70%(d),(e) | 2.61% | 8% | $7,494 |
| Year Ended 10/31/2022 | $9.26 | (10.38%) | 0.79%(d) | 0.68%(d),(e) | 2.19% | 3% | $8,460 |
| Year Ended 10/31/2021 | $10.59 | 1.76% | 0.80% | 0.71%(e) | 2.02% | 8% | $11,700 |
| Year Ended 10/31/2020 | $10.62 | 2.12% | 0.80% | 0.71%(e) | 2.34% | 13% | $12,363 |
| Year Ended 10/31/2019 | $10.65 | 8.03% | 0.80% | 0.70%(e) | 2.86% | 15% | $12,839 |
The accompanying Notes to Financial Statements are an integral part of this statement.
Columbia Massachusetts Intermediate Municipal Bond Fund | Annual Report 2023
| 21 |
Notes to Financial Statements
October 31, 2023
Note 1. Organization
Columbia Massachusetts Intermediate Municipal Bond Fund (the Fund), a series of Columbia Funds Series Trust I (the Trust), is a non-diversified fund. The Trust is registered under the Investment Company Act of 1940, as amended (the 1940 Act), as an open-end management investment company organized as a Massachusetts business trust.
Fund shares
The Trust may issue an unlimited number of shares (without par value). The Fund offers each of the share classes listed in the Statement of Assets and Liabilities. Although all share classes generally have identical voting, dividend and liquidation rights, each share class votes separately when required by the Trust’s organizational documents or by law. Each share class has its own expense and sales charge structure. Different share classes may have different minimum initial investment amounts and pay different net investment income distribution amounts to the extent the expenses of distributing such share classes vary. Distributions to shareholders in a liquidation will be proportional to the net asset value of each share class.
As described in the Fund’s prospectus, Class A and Class C shares are offered to the general public for investment. Class C shares automatically convert to Class A shares after 8 years. Advisor Class, Institutional Class, Institutional 2 Class and Institutional 3 Class are available through authorized investment professionals to omnibus retirement plans or to institutional investors and to certain other investors as also described in the Fund’s prospectus. Class V shares are available only to investors who received (and who continuously held) Class V shares in connection with previous fund reorganizations.
In September 2023, the Fund’s Board of Trustees approved the liquidation of Class V shares of the Fund on December 8, 2023. Effective at the open of business on October 25, 2023, any applicable contingent deferred sales charges were waived on redemptions and exchanges out of Class V shares, and effective at the open of business on November 27, 2023, Class V shares of the Fund were closed to all investors. For federal tax purposes, this liquidation was treated as a redemption of fund shares.
Note 2. Summary of significant accounting policies
Basis of preparation
The Fund is an investment company that applies the accounting and reporting guidance in the Financial Accounting Standards Board (FASB) Accounting Standards Codification Topic 946, Financial Services - Investment Companies (ASC 946). The financial statements are prepared in accordance with U.S. generally accepted accounting principles (GAAP), which requires management to make certain estimates and assumptions that affect the reported amounts of assets and liabilities, the disclosure of contingent assets and liabilities at the date of the financial statements and the reported amounts of income and expenses during the reporting period. Actual results could differ from those estimates.
The following is a summary of significant accounting policies followed by the Fund in the preparation of its financial statements.
Security valuation
Debt securities generally are valued based on prices obtained from pricing services, which are intended to reflect market transactions for normal, institutional-size trading units of similar securities. The services may use various pricing techniques that take into account, as applicable, factors such as yield, quality, coupon rate, maturity, type of issue, trading characteristics and other data, as well as approved independent broker-dealer quotes. Debt securities for which quotations are not readily available or not believed to be reflective of market value may also be valued based upon a bid quote from an approved independent broker-dealer. Debt securities maturing in 60 days or less are valued primarily at amortized market value, unless this method results in a valuation that management believes does not approximate fair value.
Investments in open-end investment companies (other than exchange-traded funds (ETFs)), are valued at the latest net asset value reported by those companies as of the valuation time.
| 22 | Columbia Massachusetts Intermediate Municipal Bond Fund | Annual Report 2023 |
Notes to Financial Statements (continued)
October 31, 2023
Investments for which market quotations are not readily available, or that have quotations which management believes are not reflective of market value or reliable, are valued at fair value as determined in good faith under procedures approved by the Board of Trustees. If a security or class of securities (such as foreign securities) is valued at fair value, such value is likely to be different from the quoted or published price for the security, if available.
The determination of fair value often requires significant judgment. To determine fair value, management may use assumptions including but not limited to future cash flows and estimated risk premiums. Multiple inputs from various sources may be used to determine fair value.
GAAP requires disclosure regarding the inputs and valuation techniques used to measure fair value and any changes in valuation inputs or techniques. In addition, investments shall be disclosed by major category. This information is disclosed following the Fund’s Portfolio of Investments.
Security transactions
Security transactions are accounted for on the trade date. Cost is determined and gains (losses) are based upon the specific identification method for both financial statement and federal income tax purposes.
Income recognition
Interest income is recorded on an accrual basis. Market premiums and discounts, including original issue discounts, are amortized and accreted, respectively, over the expected life of the security on all debt securities, unless otherwise noted.
The Fund may place a debt security on non-accrual status and reduce related interest income when it becomes probable that the interest will not be collected and the amount of uncollectible interest can be reasonably estimated. The Fund may also adjust accrual rates when it becomes probable the full interest will not be collected and a partial payment will be received. A defaulted debt security is removed from non-accrual status when the issuer resumes interest payments or when collectability of interest is reasonably assured.
Dividend income is recorded on the ex-dividend date.
Expenses
General expenses of the Trust are allocated to the Fund and other funds of the Trust based upon relative net assets or other expense allocation methodologies determined by the nature of the expense. Expenses directly attributable to the Fund are charged to the Fund. Expenses directly attributable to a specific class of shares are charged to that share class.
Determination of class net asset value
All income, expenses (other than class-specific expenses, which are charged to that share class, as shown in the Statement of Operations) and realized and unrealized gains (losses) are allocated to each class of the Fund on a daily basis, based on the relative net assets of each class, for purposes of determining the net asset value of each class.
Federal income tax status
The Fund intends to qualify each year as a regulated investment company under Subchapter M of the Internal Revenue Code, as amended, and will distribute substantially all of its net tax-exempt and investment company taxable income and net capital gain, if any, for its tax year, and as such will not be subject to federal income taxes. In addition, the Fund intends to distribute in each calendar year substantially all of its ordinary income, capital gain net income and certain other amounts, if any, such that the Fund should not be subject to federal excise tax. Therefore, no federal income or excise tax provision is recorded.
Distributions to shareholders
Distributions from net investment income, if any, are declared daily and paid monthly. Net realized capital gains, if any, are distributed at least annually. Income distributions and capital gain distributions are determined in accordance with federal income tax regulations, which may differ from GAAP.
Columbia Massachusetts Intermediate Municipal Bond Fund | Annual Report 2023
| 23 |
Notes to Financial Statements (continued)
October 31, 2023
Guarantees and indemnifications
Under the Trust’s organizational documents and, in some cases, by contract, its officers and trustees are indemnified against certain liabilities arising out of the performance of their duties to the Trust or its funds. In addition, certain of the Fund’s contracts with its service providers contain general indemnification clauses. The Fund’s maximum exposure under these arrangements is unknown since the amount of any future claims that may be made against the Fund cannot be determined, and the Fund has no historical basis for predicting the likelihood of any such claims.
Recent accounting pronouncements and regulatory updates
Tailored Shareholder Reports
In October 2022, the Securities and Exchange Commission adopted a final rule relating to Tailored Shareholder Reports for Mutual Funds and Exchange-Traded Funds; Fee Information in Investment Company Advertisements. The rule and form amendments will, among other things, require the Fund to transmit concise and visually engaging shareholder reports that highlight key information. The amendments will require that funds tag information in a structured data format and that certain more in-depth information be made available online and available for delivery free of charge to investors on request. The amendments became effective January 24, 2023. There is an 18-month transition period after the effective date of the amendments.
Note 3. Fees and other transactions with affiliates
Management services fees
The Fund has entered into a Management Agreement with Columbia Management Investment Advisers, LLC (the Investment Manager), a wholly-owned subsidiary of Ameriprise Financial, Inc. (Ameriprise Financial). Under the Management Agreement, the Investment Manager provides the Fund with investment research and advice, as well as administrative and accounting services. The management services fee is an annual fee that is equal to a percentage of the Fund’s daily net assets that declines from 0.47% to 0.31% as the Fund’s net assets increase. The effective management services fee rate for the year ended October 31, 2023 was 0.47% of the Fund’s average daily net assets.
Compensation of Board members
Members of the Board of Trustees who are not officers or employees of the Investment Manager or Ameriprise Financial are compensated for their services to the Fund as disclosed in the Statement of Operations. Under a Deferred Compensation Plan (the Deferred Plan), these members of the Board of Trustees may elect to defer payment of up to 100% of their compensation. Deferred amounts are treated as though equivalent dollar amounts had been invested in shares of certain funds managed by the Investment Manager. The Fund’s liability for these amounts is adjusted for market value changes and remains in the Fund until distributed in accordance with the Deferred Plan. All amounts payable under the Deferred Plan constitute a general unsecured obligation of the Fund. The expense for the Deferred Plan, which includes Trustees’ fees deferred during the current period as well as any gains or losses on the Trustees’ deferred compensation balances as a result of market fluctuations, is included in "Trustees’ fees" in the Statement of Operations.
Compensation of Chief Compliance Officer
The Board of Trustees has appointed a Chief Compliance Officer for the Fund in accordance with federal securities regulations. As disclosed in the Statement of Operations, a portion of the Chief Compliance Officer’s total compensation is allocated to the Fund, along with other allocations to affiliated registered investment companies managed by the Investment Manager and its affiliates, based on relative net assets.
Transfer agency fees
Under a Transfer and Dividend Disbursing Agent Agreement, Columbia Management Investment Services Corp. (the Transfer Agent), an affiliate of the Investment Manager and a wholly-owned subsidiary of Ameriprise Financial, is responsible for providing transfer agency services to the Fund. The Transfer Agent has contracted with SS&C GIDS, Inc. (SS&C GIDS) to
| 24 | Columbia Massachusetts Intermediate Municipal Bond Fund | Annual Report 2023 |
Notes to Financial Statements (continued)
October 31, 2023
serve as sub-transfer agent. Prior to January 1, 2023, SS&C GIDS was known as DST Asset Manager Solutions, Inc. The Transfer Agent pays the fees of SS&C GIDS for services as sub-transfer agent and SS&C GIDS is not entitled to reimbursement for such fees from the Fund (with the exception of out-of-pocket fees).
The Fund pays the Transfer Agent a monthly transfer agency fee based on the number or the average value of accounts, depending on the type of account. In addition, the Fund pays the Transfer Agent a fee for shareholder services based on the number of accounts or on a percentage of the average aggregate value of the Fund’s shares maintained in omnibus accounts up to the lesser of the amount charged by the financial intermediary or a cap established by the Board of Trustees from time to time.
The Transfer Agent also receives compensation from the Fund for various shareholder services and reimbursements for certain out-of-pocket fees. Total transfer agency fees for Institutional 2 Class and Institutional 3 Class shares are subject to an annual limitation of not more than 0.07% and 0.02%, respectively, of the average daily net assets attributable to each share class.
For the year ended October 31, 2023, the Fund’s effective transfer agency fee rates as a percentage of average daily net assets of each class were as follows:
| | Effective rate (%) |
| Class A | 0.11 |
| Advisor Class | 0.12 |
| Class C | 0.12 |
| Institutional Class | 0.12 |
| Institutional 2 Class | 0.07 |
| Institutional 3 Class | 0.01 |
| Class V | 0.12 |
An annual minimum account balance fee of $20 may apply to certain accounts with a value below the applicable share class’s initial minimum investment requirements to reduce the impact of small accounts on transfer agency fees. These minimum account balance fees are remitted to the Fund and recorded as part of expense reductions in the Statement of Operations. For the year ended October 31, 2023, these minimum account balance fees reduced total expenses of the Fund by $140.
Distribution and service fees
The Fund has entered into an agreement with Columbia Management Investment Distributors, Inc. (the Distributor), an affiliate of the Investment Manager and a wholly-owned subsidiary of Ameriprise Financial, for distribution and shareholder services. The Board of Trustees has approved, and the Fund has adopted, distribution and shareholder service plans (the Plans) applicable to certain share classes, which set the distribution and service fees for the Fund. These fees are calculated daily and are intended to compensate the Distributor and/or eligible selling and/or servicing agents for selling shares of the Fund and providing services to investors.
Under the Plans, the Fund pays a monthly service fee to the Distributor at the maximum annual rate of 0.25% of the average daily net assets attributable to Class A and Class C shares of the Fund. Also under the Plans, the Fund pays a monthly distribution fee to the Distributor at the maximum annual rate of 0.45% of the average daily net assets attributable to Class C shares of the Fund.
Shareholder services fees
The Fund has adopted a shareholder services plan that permits it to pay for certain services provided to Class V shareholders by their selling and/or servicing agents. The Fund may pay shareholder servicing fees up to an aggregate annual rate of 0.40% of the Fund’s average daily net assets attributable to Class V shares (comprised of up to 0.20% for shareholder services and up to 0.20% for administrative support services). These fees are currently limited to an aggregate annual rate of not more than 0.15% of the Fund’s average daily net assets attributable to Class V shares.
Columbia Massachusetts Intermediate Municipal Bond Fund | Annual Report 2023
| 25 |
Notes to Financial Statements (continued)
October 31, 2023
Sales charges (unaudited)
Sales charges, including front-end charges and contingent deferred sales charges (CDSCs), received by the Distributor for distributing Fund shares for the year ended October 31, 2023, if any, are listed below:
| | Front End (%) | CDSC (%) | Amount ($) |
| Class A | 3.00 | 0.75(a) | 283 |
| Class C | — | 1.00(b) | 73 |
| Class V | 4.75 | 0.50 - 1.00(c) | — |
| (a) | This charge is imposed on certain investments of $500,000 or more if redeemed within 12 months after purchase. |
| (b) | This charge applies to redemptions within 12 months after purchase, with certain limited exceptions. |
| (c) | This charge is imposed on certain investments of between $1 million and $50 million redeemed within 18 months after purchase, as follows: 1.00% if redeemed within 12 months after purchase, and 0.50% if redeemed more than 12, but less than 18, months after purchase, with certain limited exceptions. |
The Fund’s other share classes are not subject to sales charges.
Expenses waived/reimbursed by the Investment Manager and its affiliates
The Investment Manager and certain of its affiliates have contractually agreed to waive fees and/or reimburse expenses (excluding certain fees and expenses described below) for the period(s) disclosed below, unless sooner terminated at the sole discretion of the Board of Trustees, so that the Fund’s net operating expenses, after giving effect to fees waived/expenses reimbursed and any balance credits and/or overdraft charges from the Fund’s custodian, do not exceed the following annual rate(s) as a percentage of the classes’ average daily net assets:
| | March 1, 2023
through
February 29, 2024 | Prior to
March 1, 2023 |
| Class A | 0.81% | 0.81% |
| Advisor Class | 0.56 | 0.56 |
| Class C | 1.26 | 1.26 |
| Institutional Class | 0.56 | 0.56 |
| Institutional 2 Class | 0.51 | 0.50 |
| Institutional 3 Class | 0.45 | 0.45 |
| Class V | 0.71 | 0.71 |
Under the agreement governing these fee waivers and/or expense reimbursement arrangements, the following fees and expenses are excluded from the waiver/reimbursement commitment, and therefore will be paid by the Fund, if applicable: taxes (including foreign transaction taxes), expenses associated with investments in affiliated and non-affiliated pooled investment vehicles (including mutual funds and exchange-traded funds), transaction costs and brokerage commissions, costs related to any securities lending program, dividend expenses associated with securities sold short, inverse floater program fees and expenses, transaction charges and interest on borrowed money, interest, costs associated with shareholder meetings, infrequent and/or unusual expenses and any other expenses the exclusion of which is specifically approved by the Board of Trustees. This agreement may be modified or amended only with approval from the Investment Manager, certain of its affiliates and the Fund. In addition to the contractual agreement, the Investment Manager and certain of its affiliates have voluntarily agreed to waive fees and/or reimburse Fund expenses (excluding certain fees and expenses described above) so that Fund level expenses (expenses directly attributable to the Fund and not to a specific share class) are waived proportionately across all share classes. This arrangement may be revised or discontinued at any time. Any fees waived and/or expenses reimbursed under the expense reimbursement arrangements described above are not recoverable by the Investment Manager or its affiliates in future periods.
Note 4. Federal tax information
The timing and character of income and capital gain distributions are determined in accordance with income tax regulations, which may differ from GAAP because of temporary or permanent book to tax differences.
| 26 | Columbia Massachusetts Intermediate Municipal Bond Fund | Annual Report 2023 |
Notes to Financial Statements (continued)
October 31, 2023
At October 31, 2023, these differences were primarily due to differing treatment for principal and/or interest from fixed income securities, capital loss carryforwards, trustees’ deferred compensation, distributions and re-characterization of distributions for investments. To the extent these differences were permanent, reclassifications were made among the components of the Fund’s net assets. Temporary differences do not require reclassifications.
The following reclassifications were made:
Undistributed net
investment
income ($) | Accumulated
net realized
(loss) ($) | Paid in
capital ($) |
| (4) | 4 | — |
Net investment income (loss) and net realized gains (losses), as disclosed in the Statement of Operations, and net assets were not affected by this reclassification.
The tax character of distributions paid during the years indicated was as follows:
| Year Ended October 31, 2023 | Year Ended October 31, 2022 |
Ordinary
income ($) | Tax-exempt
income ($) | Long-term
capital gains ($) | Total ($) | Ordinary
income ($) | Tax-exempt
income ($) | Long-term
capital gains ($) | Total ($) |
| 14,107 | 3,362,892 | — | 3,376,999 | 1,487 | 4,112,010 | 542,312 | 4,655,809 |
Short-term capital gain distributions, if any, are considered ordinary income distributions for tax purposes.
At October 31, 2023, the components of distributable earnings on a tax basis were as follows:
Undistributed
ordinary income ($) | Undistributed tax-
exempt income ($) | Undistributed
long-term
capital gains ($) | Capital loss
carryforwards ($) | Net unrealized
(depreciation) ($) |
| — | 304,948 | — | (4,368,667) | (6,511,437) |
At October 31, 2023, the cost of all investments for federal income tax purposes along with the aggregate gross unrealized appreciation and depreciation based on that cost was:
Federal
tax cost ($) | Gross unrealized
appreciation ($) | Gross unrealized
(depreciation) ($) | Net unrealized
(depreciation) ($) |
| 113,734,989 | 206,553 | (6,717,990) | (6,511,437) |
Tax cost of investments and unrealized appreciation/(depreciation) may also include timing differences that do not constitute adjustments to tax basis.
The following capital loss carryforwards, determined at October 31, 2023, may be available to reduce future net realized gains on investments, if any, to the extent permitted by the Internal Revenue Code. In addition, for the year ended October 31, 2023, capital loss carryforwards utilized, if any, were as follows:
No expiration
short-term ($) | No expiration
long-term ($) | Total ($) | Utilized ($) |
| — | (4,368,667) | (4,368,667) | — |
Management of the Fund has concluded that there are no significant uncertain tax positions in the Fund that would require recognition in the financial statements. However, management’s conclusion may be subject to review and adjustment at a later date based on factors including, but not limited to, new tax laws, regulations, and administrative interpretations (including relevant court decisions). Generally, the Fund’s federal tax returns for the prior three fiscal years remain subject to examination by the Internal Revenue Service.
Columbia Massachusetts Intermediate Municipal Bond Fund | Annual Report 2023
| 27 |
Notes to Financial Statements (continued)
October 31, 2023
Note 5. Portfolio information
The cost of purchases and proceeds from sales of securities, excluding short-term investments and derivatives, if any, aggregated to $9,509,990 and $44,710,510, respectively, for the year ended October 31, 2023. The amount of purchase and sale activity impacts the portfolio turnover rate reported in the Financial Highlights.
Note 6. Interfund lending
Pursuant to an exemptive order granted by the Securities and Exchange Commission, the Fund participates in a program (the Interfund Program) allowing each participating Columbia Fund (each, a Participating Fund) to lend money directly to and, except for closed-end funds and money market funds, borrow money directly from other Participating Funds for temporary purposes. The amounts eligible for borrowing and lending under the Interfund Program are subject to certain restrictions.
Interfund loans are subject to the risk that the borrowing fund could be unable to repay the loan when due, and a delay in repayment to the lending fund could result in lost opportunities and/or additional lending costs. The exemptive order is subject to conditions intended to mitigate conflicts of interest arising from the Investment Manager’s relationship with each Participating Fund.
The Fund’s activity in the Interfund Program during the year ended October 31, 2023 was as follows:
| Borrower or lender | Average loan
balance ($) | Weighted average
interest rate (%) | Number of days
with outstanding loans |
| Borrower | 366,667 | 4.85 | 3 |
Interest expense incurred by the Fund is recorded as interfund lending in the Statement of Operations. The Fund had no outstanding interfund loans at October 31, 2023.
Note 7. Line of credit
The Fund has access to a revolving credit facility with a syndicate of banks led by JPMorgan Chase Bank, N.A., Citibank, N.A. and Wells Fargo Bank, N.A. whereby the Fund may borrow for the temporary funding of shareholder redemptions or for other temporary or emergency purposes. Pursuant to an October 26, 2023 amendment and restatement, the credit facility, which is an agreement between the Fund and certain other funds managed by the Investment Manager or an affiliated investment manager, severally and not jointly, permits aggregate borrowings up to $900 million. Interest is currently charged to each participating fund based on its borrowings at a rate equal to the higher of (i) the federal funds effective rate, (ii) the secured overnight financing rate plus 0.10% and (iii) the overnight bank funding rate plus, in each case, 1.00%. Each borrowing under the credit facility matures no later than 60 days after the date of borrowing. The Fund also pays a commitment fee equal to its pro rata share of the unused amount of the credit facility at a rate of 0.15% per annum. The commitment fee is included in other expenses in the Statement of Operations. This agreement expires annually in October unless extended or renewed. Prior to the October 26, 2023 amendment and restatement, the Fund had access to a revolving credit facility with a syndicate of banks led by JPMorgan Chase Bank, N.A., Citibank, N.A. and Wells Fargo Bank, N.A. which permitted collective borrowings up to $950 million. Interest was charged to each participating fund based on its borrowings at a rate equal to the higher of (i) the federal funds effective rate, (ii) the secured overnight financing rate plus 0.10% and (iii) the overnight bank funding rate plus, in each case, 1.00%.
The Fund had no borrowings during the year ended October 31, 2023.
Note 8. Significant risks
Credit risk
Credit risk is the risk that the value of debt instruments in the Fund’s portfolio may decline because the issuer defaults or otherwise becomes unable or unwilling, or is perceived to be unable or unwilling, to honor its financial obligations, such as making payments to the Fund when due. Credit rating agencies assign credit ratings to certain debt instruments to indicate their credit risk. Lower-rated or unrated debt instruments held by the Fund may present increased credit risk as compared to higher-rated debt instruments.
| 28 | Columbia Massachusetts Intermediate Municipal Bond Fund | Annual Report 2023 |
Notes to Financial Statements (continued)
October 31, 2023
Interest rate risk
Interest rate risk is the risk of losses attributable to changes in interest rates. In general, if interest rates rise, the values of debt instruments tend to fall, and if interest rates fall, the values of debt instruments tend to rise. Actions by governments and central banking authorities can result in increases or decreases in interest rates. Higher periods of inflation could lead such authorities to raise interest rates. Increasing interest rates may negatively affect the value of debt securities held by the Fund, resulting in a negative impact on the Fund’s performance and net asset value per share. In general, the longer the maturity or duration of a debt security, the greater its sensitivity to changes in interest rates. The Fund is subject to the risk that the income generated by its investments may not keep pace with inflation.
Liquidity risk
Liquidity risk is the risk associated with a lack of marketability of investments which may make it difficult to sell the investment at a desirable time or price. Changing regulatory, market or other conditions or environments (for example, the interest rate or credit environments) may adversely affect the liquidity of the Fund’s investments. The Fund may have to accept a lower selling price for the holding, sell other investments, or forego another, more appealing investment opportunity. Generally, the less liquid the market at the time the Fund sells a portfolio investment, the greater the risk of loss or decline of value to the Fund. A less liquid market can lead to an increase in Fund redemptions, which may negatively impact Fund performance and net asset value per share, including, for example, if the Fund is forced to sell securities in a down market.
Market risk
The Fund may incur losses due to declines in the value of one or more securities in which it invests. These declines may be due to factors affecting a particular issuer, or the result of, among other things, political, regulatory, market, economic or social developments affecting the relevant market(s) more generally. In addition, turbulence in financial markets and reduced liquidity in equity, credit and/or fixed income markets may negatively affect many issuers, which could adversely affect the Fund’s ability to price or value hard-to-value assets in thinly traded and closed markets and could cause significant redemptions and operational challenges. Global economies and financial markets are increasingly interconnected, and conditions and events in one country, region or financial market may adversely impact issuers in a different country, region or financial market. These risks may be magnified if certain events or developments adversely interrupt the global supply chain; in these and other circumstances, such risks might affect companies worldwide. As a result, local, regional or global events such as terrorism, war, other conflicts, natural disasters, disease/virus outbreaks and epidemics or other public health issues, recessions, depressions or other events – or the potential for such events – could have a significant negative impact on global economic and market conditions.
Municipal securities risk
Municipal securities are debt obligations generally issued to obtain funds for various public purposes, including general financing for state and local governments, or financing for a specific project or public facility, and include obligations of the governments of the U.S. territories, commonwealths and possessions such as Guam, Puerto Rico and the U.S. Virgin Islands to the extent such obligations are exempt from state and U.S. federal income taxes. The value of municipal securities can be significantly affected by actual or expected political and legislative changes at the federal or state level. Municipal securities may be fully or partially backed by the taxing authority of the local government, by the credit of a private issuer, by the current or anticipated revenues from a specific project or specific assets or by domestic or foreign entities providing credit support, such as letters of credit, guarantees or insurance, and are generally classified into general obligation bonds and special revenue obligations. Because many municipal securities are issued to finance projects in sectors such as education, health care, transportation and utilities, conditions in those sectors can affect the overall municipal market.
Issuers in a state, territory, commonwealth or possession in which the Fund invests may experience significant financial difficulties for various reasons, including as the result of events that cannot be reasonably anticipated or controlled such as economic downturns or similar periods of economic stress, social conflict or unrest, labor disruption and natural disasters. Such financial difficulties may lead to credit rating downgrades or defaults of such issuers which in turn, could affect the market values and marketability of many or all municipal obligations of issuers in such state, territory, commonwealth or possession. The value of the Fund’s shares will be negatively impacted to the extent it invests in such securities. The Fund’s annual and semiannual reports show the Fund’s investment exposures at a point in time. The risk of investing in the Fund is directly correlated to the Fund’s investment exposures.
Columbia Massachusetts Intermediate Municipal Bond Fund | Annual Report 2023
| 29 |
Notes to Financial Statements (continued)
October 31, 2023
Because the Fund invests substantially in municipal securities issued by the state identified in the Fund’s name and political sub-divisions of that state, the Fund will be particularly affected by adverse tax, legislative, regulatory, demographic or political changes as well as changes impacting the state’s financial, economic or other condition and prospects. In addition, because of the relatively small number of issuers of tax-exempt securities in the state, the Fund may invest a higher percentage of assets in a single issuer and, therefore, be more exposed to the risk of loss than a fund that invests more broadly. The value of municipal and other securities owned by the Fund also may be adversely affected by future changes in federal or state income tax laws.
Non-diversification risk
A non-diversified fund is permitted to invest a greater percentage of its total assets in fewer issuers than a diversified fund. This increases the risk that a change in the value of any one investment held by the Fund could affect the overall value of the Fund more than it would affect that of a diversified fund holding a greater number of investments. Accordingly, the Fund’s value will likely be more volatile than the value of a more diversified fund.
Shareholder concentration risk
At October 31, 2023, one unaffiliated shareholder of record owned 60.1% of the outstanding shares of the Fund in one or more accounts. The Fund has no knowledge about whether any portion of those shares was owned beneficially. Fund shares sold to or redeemed by concentrated accounts may have a significant effect on the operations of the Fund. In the case of a large redemption, the Fund may be forced to sell investments at inopportune times, including its liquid positions, which may result in Fund losses and the Fund holding a higher percentage of less liquid positions. Large redemptions could result in decreased economies of scale and increased operating expenses for non-redeeming Fund shareholders.
Note 9. Subsequent events
Management has evaluated the events and transactions that have occurred through the date the financial statements were issued. Other than as noted in Note 1 above, there were no items requiring adjustment of the financial statements or additional disclosure.
Note 10. Information regarding pending and settled legal proceedings
Ameriprise Financial and certain of its affiliates are involved in the normal course of business in legal proceedings which include regulatory inquiries, arbitration and litigation, including class actions concerning matters arising in connection with the conduct of their activities as part of a diversified financial services firm. Ameriprise Financial believes that the Fund is not currently the subject of, and that neither Ameriprise Financial nor any of its affiliates are the subject of, any pending legal, arbitration or regulatory proceedings that are likely to have a material adverse effect on the Fund or the ability of Ameriprise Financial or its affiliates to perform under their contracts with the Fund. Ameriprise Financial is required to make quarterly (10-Q), annual (10-K) and, as necessary, 8-K filings with the Securities and Exchange Commission (SEC) on legal and regulatory matters that relate to Ameriprise Financial and its affiliates. Copies of these filings may be obtained by accessing the SEC website at www.sec.gov.
There can be no assurance that these matters, or the adverse publicity associated with them, will not result in increased Fund redemptions, reduced sale of Fund shares or other adverse consequences to the Fund. Further, although we believe proceedings are not likely to have a material adverse effect on the Fund or the ability of Ameriprise Financial or its affiliates to perform under their contracts with the Fund, these proceedings are subject to uncertainties and, as such, we are unable to estimate the possible loss or range of loss that may result. An adverse outcome in one or more of these proceedings could result in adverse judgments, settlements, fines, penalties or other relief that could have a material adverse effect on the consolidated financial condition or results of operations of Ameriprise Financial or one or more of its affiliates that provide services to the Fund.
| 30 | Columbia Massachusetts Intermediate Municipal Bond Fund | Annual Report 2023 |
Report of Independent Registered Public Accounting Firm
To the Board of Trustees of Columbia Funds Series Trust I and Shareholders of Columbia Massachusetts Intermediate Municipal Bond Fund
Opinion on the Financial Statements
We have audited the accompanying statement of assets and liabilities, including the portfolio of investments, of Columbia Massachusetts Intermediate Municipal Bond Fund (one of the funds constituting Columbia Funds Series Trust I, referred to hereafter as the "Fund") as of October 31, 2023, the related statement of operations for the year ended October 31, 2023, the statement of changes in net assets for each of the two years in the period ended October 31, 2023, including the related notes, and the financial highlights for each of the five years in the period ended October 31, 2023 (collectively referred to as the "financial statements"). In our opinion, the financial statements present fairly, in all material respects, the financial position of the Fund as of October 31, 2023, the results of its operations for the year then ended, the changes in its net assets for each of the two years in the period ended October 31, 2023 and the financial highlights for each of the five years in the period ended October 31, 2023 in conformity with accounting principles generally accepted in the United States of America.
Basis for Opinion
These financial statements are the responsibility of the Fund’s management. Our responsibility is to express an opinion on the Fund’s financial statements based on our audits. We are a public accounting firm registered with the Public Company Accounting Oversight Board (United States) (PCAOB) and are required to be independent with respect to the Fund in accordance with the U.S. federal securities laws and the applicable rules and regulations of the Securities and Exchange Commission and the PCAOB.
We conducted our audits of these financial statements in accordance with the standards of the PCAOB. Those standards require that we plan and perform the audit to obtain reasonable assurance about whether the financial statements are free of material misstatement, whether due to error or fraud.
Our audits included performing procedures to assess the risks of material misstatement of the financial statements, whether due to error or fraud, and performing procedures that respond to those risks. Such procedures included examining, on a test basis, evidence regarding the amounts and disclosures in the financial statements. Our audits also included evaluating the accounting principles used and significant estimates made by management, as well as evaluating the overall presentation of the financial statements. Our procedures included confirmation of securities owned as of October 31, 2023 by correspondence with the custodian and transfer agent. We believe that our audits provide a reasonable basis for our opinion.
/s/PricewaterhouseCoopers LLP
Minneapolis, Minnesota
December 20, 2023
We have served as the auditor of one or more investment companies within the Columbia Funds Complex since 1977.
Columbia Massachusetts Intermediate Municipal Bond Fund | Annual Report 2023
| 31 |
Federal Income Tax Information
(Unaudited)
The Fund hereby designates the following tax attributes for the fiscal year ended October 31, 2023. Shareholders will be notified in early 2024 of the amounts for use in preparing 2023 income tax returns.
Exempt-
interest
dividends | |
| 99.58% | |
Exempt-interest dividends. The percentage of net investment income distributed during the fiscal year that qualifies as exempt-interest dividends for federal income tax purposes. A portion of the income may be subject to federal alternative minimum tax.
TRUSTEES AND OFFICERS
(Unaudited)
The Board oversees the Fund’s operations and appoints officers who are responsible for day-to-day business decisions based on policies set by the Board. The following table provides basic biographical information about the Fund’s Trustees as of the printing of this report, including their principal occupations during the past five years, although specific titles for individuals may have varied over the period. The year set forth beneath Length of Service in the table below is the year in which the Trustee was first appointed or elected as Trustee to any Fund currently in the Columbia Funds Complex or a predecessor thereof. Under current Board policy, each Trustee generally serves until December 31 of the year such Trustee turns seventy-five (75).
Independent trustees
Name,
address,
year of birth | Position held
with the Columbia Funds and
length of service | Principal occupation(s)
during past five years
and other relevant
professional experience | Number of
Funds in the
Columbia Funds
Complex*
overseen | Other directorships
held by Trustee
during the past five years
and other relevant Board experience |
George S. Batejan
c/o Columbia Management
Investment Advisers, LLC
290 Congress Street
Boston, MA 02210
1954 | Trustee since 2017 | Executive Vice President, Global Head of Technology and Operations, Janus Capital Group, Inc., 2010-2016 | 170 | Former Chairman of the Board, NICSA (National Investment Company Services Association) (Executive Committee, Nominating Committee and Governance Committee), 2014-2016; former Director, Intech Investment Management, 2011-2016; former Board Member, Metro Denver Chamber of Commerce, 2015-2016; former Advisory Board Member, University of Colorado Business School, 2015-2018; former Board Member, Chase Bank International, 1993-1994 |
| 32 | Columbia Massachusetts Intermediate Municipal Bond Fund | Annual Report 2023 |
TRUSTEES AND OFFICERS (continued)
(Unaudited)
Independent trustees (continued)
Name,
address,
year of birth | Position held
with the Columbia Funds and
length of service | Principal occupation(s)
during past five years
and other relevant
professional experience | Number of
Funds in the
Columbia Funds
Complex*
overseen | Other directorships
held by Trustee
during the past five years
and other relevant Board experience |
Kathleen Blatz
c/o Columbia Management
Investment Advisers, LLC
290 Congress Street
Boston, MA 02210
1954 | Trustee since 2006 | Attorney, specializing in arbitration and mediation; Chief Justice, Minnesota Supreme Court, 1998-2006; Associate Justice, Minnesota Supreme Court, 1996-1998; Fourth Judicial District Court Judge, Hennepin County, 1994-1996; Attorney in private practice and public service, 1984-1993; State Representative, Minnesota House of Representatives, 1979-1993, which included service on the Tax and Financial Institutions and Insurance Committees; Member and Interim Chair, Minnesota Sports Facilities Authority, January-July 2017; Interim President and Chief Executive Officer, Blue Cross and Blue Shield of Minnesota (health care insurance), February-July 2018, April-October 2021 | 170 | Former Trustee, Blue Cross and Blue Shield of Minnesota, 2009-2021 (Chair of the Business Development Committee, 2014-2017; Chair of the Governance Committee, 2017-2019); former Member and Chair of the Board, Minnesota Sports Facilities Authority, January 2017-July 2017; former Director, Robina Foundation, 2009-2020 (Chair, 2014-2020); Director, Richard M. Schulze Family Foundation, since 2021 |
Pamela G. Carlton
c/o Columbia Management
Investment Advisers, LLC
290 Congress Street
Boston, MA 02210
1954 | Chair since 2023; Trustee since 2007 | President, Springboard – Partners in Cross Cultural Leadership (consulting company), since 2003; Managing Director of US Equity Research, JP Morgan Chase, 1999-2003; Director of US Equity Research, Chase Asset Management, 1996-1999; Co-Director Latin America Research, 1993-1996, COO Global Research, 1992-1996, Co-Director of US Research, 1991-1992, Investment Banker, 1982-1991, Morgan Stanley; Attorney, Cleary Gottlieb Steen & Hamilton LLP, 1980-1982 | 170 | Trustee, New York Presbyterian Hospital Board, since 1996; Director, DR Bank (Audit Committee) since 2017; Director, Evercore Inc. (Audit Committee, Nominating and Governance Committee), since 2019; Director, Apollo Commercial Real Estate Finance, Inc. (Chair, Nominating and Governance Committee) (financial services), since 2021; the Governing Council of the Independent Directors Council (IDC), since 2021 |
Janet Langford Carrig
c/o Columbia Management
Investment Advisers, LLC
290 Congress Street
Boston, MA 02210
1957 | Trustee since 1996 | Senior Vice President, General Counsel and Corporate Secretary, ConocoPhillips (independent energy company), September 2007-October 2018 | 170 | Director, EQT Corporation (natural gas producer), since 2019; former Director, Whiting Petroleum Corporation (independent oil and gas company), 2020-2022 |
J. Kevin Connaughton
c/o Columbia Management
Investment Advisers, LLC
290 Congress Street
Boston, MA 02210
1964 | Trustee since 2020 | CEO and President, RhodeWay Financial (non-profit financial planning firm), since December 2022; Member, FINRA National Adjudicatory Council, since January 2020; Adjunct Professor of Finance, Bentley University since January 2018; Consultant to Independent Trustees of CFVIT and CFST I from March 2016 to June 2020 with respect to CFVIT and to December 2020 with respect to CFST I; Managing Director and General Manager of Mutual Fund Products, Columbia Management Investment Advisers, LLC, May 2010-February 2015; President, Columbia Funds, 2008-2015; and senior officer of Columbia Funds and affiliated funds, 2003-2015 | 168 | Former Director, The Autism Project, March 2015-December 2021; former Member of the Investment Committee, St. Michael’s College, November 2015-February 2020; former Trustee, St. Michael’s College, June 2017-September 2019; former Trustee, New Century Portfolios (former mutual fund complex), January 2015-December 2017 |
Columbia Massachusetts Intermediate Municipal Bond Fund | Annual Report 2023
| 33 |
TRUSTEES AND OFFICERS (continued)
(Unaudited)
Independent trustees (continued)
Name,
address,
year of birth | Position held
with the Columbia Funds and
length of service | Principal occupation(s)
during past five years
and other relevant
professional experience | Number of
Funds in the
Columbia Funds
Complex*
overseen | Other directorships
held by Trustee
during the past five years
and other relevant Board experience |
Olive M. Darragh
c/o Columbia Management
Investment Advisers, LLC
290 Congress Street
Boston, MA 02210
1962 | Trustee since 2020 | Managing Director of Darragh Inc. (strategy and talent management consulting firm), since 2010; Founder and CEO, Zolio, Inc. (investment management talent identification platform), since 2004; Consultant to Independent Trustees of CFVIT and CFST I from June 2019 to June 2020 with respect to CFVIT and to December 2020 with respect to CFST I; Partner, Tudor Investments, 2004-2010; Senior Partner, McKinsey & Company (consulting), 1990-2004; Touche Ross CPA, 1985-1988 | 168 | Treasurer, Edinburgh University US Trust Board, since January 2023; Member, HBS Community Action Partners Board, since September 2022; former Director, University of Edinburgh Business School (Member of US Board), 2004-2019; former Director, Boston Public Library Foundation, 2008-2017 |
Patricia M. Flynn
c/o Columbia Management
Investment Advisers, LLC
290 Congress Street
Boston, MA 02210
1950 | Trustee since 2004 | Professor Emeritus of Economics and Management, Bentley University, since 2023; Professor of Economics and Management, Bentley University, 1976-2023; Dean, McCallum Graduate School of Business, Bentley University, 1992-2002 | 170 | Former Trustee, MA Taxpayers Foundation, 1997-2022; former Director, The MA Business Roundtable, 2003-2019; former Chairperson, Innovation Index Advisory Committee, MA Technology Collaborative, 1997-2020 |
Brian J. Gallagher
c/o Columbia Management
Investment Advisers, LLC
290 Congress Street
Boston, MA 02210
1954 | Trustee since 2017 | Retired; Partner with Deloitte & Touche LLP and its predecessors, 1977-2016 | 170 | Trustee, Catholic Schools Foundation, since 2004 |
Douglas A. Hacker
c/o Columbia Management
Investment Advisers, LLC
290 Congress Street
Boston, MA 02210
1955 | Trustee since 1996 | Independent business executive, since May 2006; Executive Vice President – Strategy of United Airlines, December 2002 - May 2006; President of UAL Loyalty Services (airline marketing company), September 2001-December 2002; Executive Vice President and Chief Financial Officer of United Airlines, July 1999-September 2001 | 170 | Director, SpartanNash Company since November 2013 (Chair of the Board, since May 2021) (food distributor); Director, Aircastle Limited (Chair of Audit Committee) (aircraft leasing), since August 2006; former Director, Nash Finch Company (food distributor), 2005-2013; former Director, SeaCube Container Leasing Ltd. (container leasing), 2010-2013; and former Director, Travelport Worldwide Limited (travel information technology), 2014-2019 |
Nancy T. Lukitsh
c/o Columbia Management
Investment Advisers, LLC
290 Congress Street
Boston, MA 02210
1956 | Trustee since 2011 | Senior Vice President, Partner and Director of Marketing, Wellington Management Company, LLP (investment adviser), 1997-2010; Chair, Wellington Management Portfolios (commingled non-U.S. investment pools), 2007-2010; Director, Wellington Trust Company, NA and other Wellington affiliates, 1997-2010 | 168 | None |
| 34 | Columbia Massachusetts Intermediate Municipal Bond Fund | Annual Report 2023 |
TRUSTEES AND OFFICERS (continued)
(Unaudited)
Independent trustees (continued)
Name,
address,
year of birth | Position held
with the Columbia Funds and
length of service | Principal occupation(s)
during past five years
and other relevant
professional experience | Number of
Funds in the
Columbia Funds
Complex*
overseen | Other directorships
held by Trustee
during the past five years
and other relevant Board experience |
David M. Moffett
c/o Columbia Management
Investment Advisers, LLC
290 Congress Street
Boston, MA 02210
1952 | Trustee since 2011 | Retired; former Chief Executive Officer of Freddie Mac and Chief Financial Officer of U.S. Bank | 168 | Director, CSX Corporation (transportation suppliers); Director, PayPal Holdings Inc. (payment and data processing services); Trustee, University of Oklahoma Foundation; former Director, eBay Inc. (online trading community), 2007-2015; and former Director, CIT Bank, CIT Group Inc. (commercial and consumer finance), 2010-2016; former Senior Adviser to The Carlyle Group (financial services), March 2008-September 2008; former Governance Consultant to Bridgewater Associates, January 2013-December 2015 |
Catherine James Paglia
c/o Columbia Management
Investment Advisers, LLC
290 Congress Street
Boston, MA 02210
1952 | Trustee since 2004 | Director, Enterprise Asset Management, Inc. (private real estate and asset management company), since September 1998; Managing Director and Partner, Interlaken Capital, Inc., 1989-1997; Vice President, 1982-1985, Principal, 1985-1987, Managing Director, 1987-1989, Morgan Stanley; Vice President, Investment Banking, 1980-1982, Associate, Investment Banking, 1976-1980, Dean Witter Reynolds, Inc. | 170 | Director, Valmont Industries, Inc. (irrigation systems manufacturer), since 2012; Trustee, Carleton College (on the Investment Committee), since 1987; Trustee, Carnegie Endowment for International Peace (on the Investment Committee), since 2009 |
Natalie A. Trunow
c/o Columbia Management
Investment Advisers, LLC
290 Congress Street
Boston, MA 02210
1967 | Trustee since 2020 | Chief Executive Officer, Millennial Portfolio Solutions LLC (asset management and consulting services), January 2016-January 2021; Non-executive Member of the Investment Committee and Valuation Committee, Sarona Asset Management Inc. (private equity firm) since September 2019; Advisor, Horizon Investments (asset management and consulting services), August 2018-January 2022; Advisor, Paradigm Asset Management, November 2016-January 2022; Consultant to Independent Trustees of CFVIT and CFST I from September 2016 to June 2020 with respect to CFVIT and to December 2020 with respect to CFST I; Director of Investments/Consultant, Casey Family Programs, April 2016-November 2016; Senior Vice President and Chief Investment Officer, Calvert Investments, August 2008-January 2016; Section Head and Portfolio Manager, General Motors Asset Management, June 1997-August 2008 | 168 | Independent Director, Investment Committee, Health Services for Children with Special Needs, Inc., 2010-2021; Independent Director, (Executive Committee and Chair, Audit Committee), Consumer Credit Counseling Services (formerly Guidewell Financial Solutions), since 2016; Independent Director, (Investment Committee), Sarona Asset Management, since 2019 |
Columbia Massachusetts Intermediate Municipal Bond Fund | Annual Report 2023
| 35 |
TRUSTEES AND OFFICERS (continued)
(Unaudited)
Independent trustees (continued)
Name,
address,
year of birth | Position held
with the Columbia Funds and
length of service | Principal occupation(s)
during past five years
and other relevant
professional experience | Number of
Funds in the
Columbia Funds
Complex*
overseen | Other directorships
held by Trustee
during the past five years
and other relevant Board experience |
Sandra L. Yeager
c/o Columbia Management
Investment Advisers, LLC
290 Congress Street
Boston, MA 02210
1964 | Trustee since 2017 | Retired; President and founder, Hanoverian Capital, LLC (SEC registered investment advisor firm), 2008-2016; Managing Director, DuPont Capital, 2006-2008; Managing Director, Morgan Stanley Investment Management, 2004-2006; Senior Vice President, Alliance Bernstein, 1990-2004 | 170 | Former Director, NAPE (National Alliance for Partnerships in Equity) Education Foundation, October 2016-October 2020; Advisory Board, Jennersville YMCA, since 2022 |
Interested trustee affiliated with Investment Manager**
Name,
address,
year of birth | Position held with the Columbia Funds and length of service | Principal occupation(s) during the
past five years and other relevant
professional experience | Number of
Funds in the
Columbia Funds
Complex* overseen | Other directorships
held by Trustee
during the past
five years and
other relevant Board experience |
Daniel J. Beckman
c/o Columbia Management
Investment Advisers, LLC
290 Congress Street
Boston, MA 02210
1962 | Trustee since November 2021 and President since June 2021 | Vice President – Head of North America Product, Columbia Management Investment Advisers, LLC, since April 2015; President and Principal Executive Officer of the Columbia Funds, since June 2021; officer of Columbia Funds and affiliated funds, 2020-2021; Co-President and Principal Executive Officer, Columbia Acorn/Wanger Funds, since July 2021 | 170 | Director, Ameriprise Trust Company, since October 2016; Director, Columbia Management Investment Distributors, Inc. since November 2018; Board of Governors, Columbia Wanger Asset Management, LLC since, January 2022; Director, Columbia Threadneedle Canada, Inc., since December 2022 |
| * | The term “Columbia Funds Complex” as used herein includes Columbia Seligman Premium Technology Growth Fund, Tri-Continental Corporation and each series of Columbia Funds Series Trust (CFST), Columbia Funds Series Trust I (CFST I), Columbia Funds Series Trust II (CFST II), Columbia ETF Trust I (CET I), Columbia ETF Trust II (CET II), Columbia Funds Variable Insurance Trust (CFVIT) and Columbia Funds Variable Series Trust II (CFVST II). Messrs. Batejan, Beckman, Gallagher and Hacker and Mses. Blatz, Carlton, Carrig, Flynn, Paglia, and Yeager serve as directors of Columbia Seligman Premium Technology Growth Fund and Tri-Continental Corporation. |
| ** | Interested person (as defined under the 1940 Act) by reason of being an officer, director, security holder and/or employee of the Investment Manager or Ameriprise Financial. |
The Statement of Additional Information has additional information about the Fund’s Board members and is available, without charge, upon request by calling 800.345.6611, visiting columbiathreadneedleus.com/investor/ or contacting your financial intermediary.
| 36 | Columbia Massachusetts Intermediate Municipal Bond Fund | Annual Report 2023 |
TRUSTEES AND OFFICERS (continued)
(Unaudited)
The Board has appointed officers who are responsible for day-to-day business decisions based on policies it has established. The officers serve at the pleasure of the Board. The following table provides basic information about the Officers of the Fund as of the printing of this report, including principal occupations during the past five years, although their specific titles may have varied over the period. In addition to Mr. Beckman, who is President and Principal Executive Officer, the Fund’s other officers are:
Fund officers
Name,
address and
year of birth | Position and year
first appointed to
position for any Fund
in the Columbia
Funds Complex or a
predecessor thereof | Principal occupation(s) during past five years |
Michael G. Clarke
290 Congress Street
Boston, MA 02210
1969 | Chief Financial Officer and Principal Financial Officer (2009) and Senior Vice President (2019) | Senior Vice President and North America Head of Operations & Investor Services, Columbia Management Investment Advisers, LLC, since June 2023 (previously Senior Vice President and Head of Global Operations, March 2022 – June 2023, Vice President, Head of North America Operations, and Co-Head of Global Operations, June 2019 - February 2022 and Vice President – Accounting and Tax, May 2010 - May 2019); senior officer of Columbia Funds and affiliated funds, since 2002. Director, Ameriprise Trust Company, since June 2023. |
Joseph Beranek
5890 Ameriprise Financial Center
Minneapolis, MN 55474
1965 | Treasurer and Chief Accounting Officer (Principal Accounting Officer) (2019) and Principal Financial Officer (2020), CFST, CFST I, CFST II, CFVIT and CFVST II; Assistant Treasurer, CET I and CET II | Vice President – Mutual Fund Accounting and Financial Reporting, Columbia Management Investment Advisers, LLC, since December 2018 and March 2017, respectively. |
Marybeth Pilat
290 Congress Street
Boston, MA 02210
1968 | Treasurer and Chief Accounting Officer (Principal Accounting Officer) and Principal Financial Officer (2020) for CET I and CET II; Assistant Treasurer, CFST, CFST I, CFST II, CFVIT and CFVST II | Vice President – Product Pricing and Administration, Columbia Management Investment Advisers, LLC, since May 2017. |
William F. Truscott
290 Congress Street
Boston, MA 02210
1960 | Senior Vice President (2001) | Formerly, Trustee/Director of Columbia Funds Complex or legacy funds, November 2001 - January 1, 2021; Chief Executive Officer, Global Asset Management, Ameriprise Financial, Inc., since September 2012; Chairman of the Board and President, Columbia Management Investment Advisers, LLC, since July 2004 and February 2012, respectively; Chairman of the Board and Chief Executive Officer, Columbia Management Investment Distributors, Inc., since November 2008 and February 2012, respectively; Chairman of the Board and Director, Threadneedle Asset Management Holdings, Sàrl, since March 2013 and December 2008, respectively; senior executive of various entities affiliated with Columbia Threadneedle. |
Christopher O. Petersen
5228 Ameriprise Financial Center
Minneapolis, MN 55474
1970 | Senior Vice President and Assistant Secretary (2021) | Formerly, Trustee/Director of funds within the Columbia Funds Complex, July 1, 2020 - November 22, 2021; Senior Vice President and Assistant General Counsel, Ameriprise Financial, Inc., since September 2021 (previously Vice President and Lead Chief Counsel, January 2015 - September 2021); formerly, President and Principal Executive Officer of the Columbia Funds, 2015 - 2021; officer of Columbia Funds and affiliated funds, since 2007. |
Thomas P. McGuire
290 Congress Street
Boston, MA 02210
1972 | Senior Vice President and Chief Compliance Officer (2012) | Vice President – Asset Management Compliance, Ameriprise Financial, Inc., since May 2010; Chief Compliance Officer, Columbia Acorn/Wanger Funds, since December 2015; formerly, Chief Compliance Officer, Ameriprise Certificate Company, September 2010 – September 2020. |
Ryan C. Larrenaga
290 Congress Street
Boston, MA 02210
1970 | Senior Vice President (2017), Chief Legal Officer (2017), and Secretary (2015) | Vice President and Chief Counsel, Ameriprise Financial, Inc., since August 2018 (previously Vice President and Group Counsel, August 2011 - August 2018); Chief Legal Officer, Columbia Acorn/Wanger Funds, since September 2020; officer of Columbia Funds and affiliated funds, since 2005. |
Columbia Massachusetts Intermediate Municipal Bond Fund | Annual Report 2023
| 37 |
TRUSTEES AND OFFICERS (continued)
(Unaudited)
Fund officers (continued)
Name,
address and
year of birth | Position and year
first appointed to
position for any Fund
in the Columbia
Funds Complex or a
predecessor thereof | Principal occupation(s) during past five years |
Michael E. DeFao
290 Congress Street
Boston, MA 02210
1968 | Vice President (2011) and Assistant Secretary (2010) | Vice President and Chief Counsel, Ameriprise Financial, Inc., since May 2010; Vice President, Chief Legal Officer and Assistant Secretary, Columbia Management Investment Advisers, LLC, since October 2021 (previously Vice President and Assistant Secretary, May 2010 – September 2021). |
Lyn Kephart-Strong
5903 Ameriprise Financial Center
Minneapolis, MN 55474
1960 | Vice President (2015) | Vice President, Global Investment Operations Services, Columbia Management Investment Advisers, LLC, since 2010; Director (since January 2007) and President (since October 2014), Columbia Management Investment Services Corp.; Director (since December 2017) and President (since January 2017), Ameriprise Trust Company. |
Approval of Management Agreement
(Unaudited)
Columbia Management Investment Advisers, LLC (the Investment Manager, and together with its domestic and global affiliates, Columbia Threadneedle Investments), a wholly-owned subsidiary of Ameriprise Financial, Inc. (Ameriprise Financial), serves as the investment manager to Columbia Massachusetts Intermediate Municipal Bond Fund (the Fund). Under a management agreement (the Management Agreement), the Investment Manager provides investment advice and other services to the Fund and other funds distributed by Columbia Management Investment Distributors, Inc. (collectively, the Funds).
On an annual basis, the Fund’s Board of Trustees (the Board), including the independent Board members (the Independent Trustees), considers renewal of the Management Agreement. The Investment Manager prepared detailed reports for the Board and its Contracts Committee (including its Contracts Subcommittee) in February, March, April, May and June 2023, including reports providing the results of analyses performed by a third-party data provider, Broadridge Financial Solutions, Inc. (Broadridge), and comprehensive responses by the Investment Manager to written requests for information by independent legal counsel to the Independent Trustees (Independent Legal Counsel), to assist the Board in making this determination. In addition, throughout the year, the Board (or its committees or subcommittees) regularly meets with portfolio management teams and senior management personnel and reviews information prepared by the Investment Manager addressing the services the Investment Manager provides and Fund performance. The Board also accords appropriate weight to the work, deliberations and conclusions of the various committees (including their subcommittees), such as the Contracts Committee, the Investment Review Committee, the Audit Committee and the Compliance Committee in determining whether to continue the Management Agreement.
The Board, at its June 22, 2023 Board meeting (the June Meeting), considered the renewal of the Management Agreement for an additional one-year term. At the June Meeting, Independent Legal Counsel reviewed with the Independent Trustees various factors relevant to the Board’s consideration of advisory agreements and the Board’s legal responsibilities related to such consideration. The Independent Trustees considered all information that they, their legal counsel or the Investment Manager believed reasonably necessary to evaluate and to approve the continuation of the Management Agreement. Among other things, the information and factors considered included the following:
| • | Information on the investment performance of the Fund relative to the performance of a group of mutual funds determined to be comparable to the Fund by Broadridge, as well as performance relative to one or more benchmarks; |
| 38 | Columbia Massachusetts Intermediate Municipal Bond Fund | Annual Report 2023 |
Approval of Management Agreement (continued)
(Unaudited)
| • | Information on the Fund’s management fees and total expenses, including information comparing the Fund’s expenses to those of a group of comparable mutual funds, as determined by Broadridge; |
| • | The Investment Manager’s agreement to contractually limit or cap total operating expenses for the Fund so that total operating expenses (excluding certain fees and expenses, such as transaction costs and certain other investment related expenses, interest, taxes, acquired fund fees and expenses and infrequent and/or unusual expenses) would not exceed a specified annual rate, as a percentage of the Fund’s net assets; |
| • | Terms of the Management Agreement; |
| • | Descriptions of other agreements and arrangements with affiliates of the Investment Manager relating to the operations of the Fund, including agreements with respect to the provision of transfer agency and shareholder services to the Fund; |
| • | Descriptions of various services performed by the Investment Manager under the Management Agreement, including portfolio management and portfolio trading practices; |
| • | Information regarding any recently negotiated management fees of similarly-managed portfolios of other institutional clients of the Investment Manager; |
| • | Information regarding the resources of the Investment Manager, including information regarding senior management, portfolio managers and other personnel; |
| • | Information regarding the capabilities of the Investment Manager with respect to compliance monitoring services; |
| • | The profitability to the Investment Manager and its affiliates from their relationships with the Fund; and |
| • | Report provided by the Board’s independent fee consultant, JDL Consultants, LLC (JDL). |
Following an analysis and discussion of the foregoing, and the factors identified below, the Board, including all of the Independent Trustees, approved the renewal of the Management Agreement.
Nature, extent and quality of services provided by the Investment Manager
The Board analyzed various reports and presentations it had received detailing the services performed by the Investment Manager, as well as its history, expertise, resources and relative capabilities, and the qualifications of its personnel.
The Board specifically considered the many developments during recent years concerning the services provided by the Investment Manager. Among other things, the Board noted the organization and depth of the equity and credit research departments. The Board further observed the enhancements to the investment risk management department’s processes, systems and oversight over the past several years. The Board also took into account the broad scope of services provided by the Investment Manager to the Fund, including, among other services, investment, risk and compliance oversight. The Board also took into account the information it received concerning the Investment Manager’s ability to attract and retain key portfolio management personnel and that it has sufficient resources to provide competitive and adequate compensation to investment personnel.
In connection with the Board’s evaluation of the overall package of services provided by the Investment Manager, the Board also considered the nature, quality and range of administrative services provided to the Fund by the Investment Manager, as well as the achievements in 2022 in the performance of administrative services, and noted the various enhancements anticipated for 2023. In evaluating the quality of services provided under the Management Agreement, the Board also took into account the organization and strength of the Fund’s and its service providers’ compliance programs. The Board also reviewed the financial condition of the Investment Manager and its affiliates and each entity’s ability to carry out its responsibilities under the Management Agreement and the Fund’s other service agreements.
In addition, the Board discussed the acceptability of the terms of the Management Agreement, noting that no changes were proposed from the form of agreement previously approved. The Board also noted the wide array of legal and compliance services provided to the Fund under the Management Agreement.
Columbia Massachusetts Intermediate Municipal Bond Fund | Annual Report 2023
| 39 |
Approval of Management Agreement (continued)
(Unaudited)
After reviewing these and related factors (including investment performance as discussed below), the Board concluded, within the context of their overall conclusions, that the nature, extent and quality of the services provided to the Fund under the Management Agreement supported the continuation of the Management Agreement.
Investment performance
The Board carefully reviewed the investment performance of the Fund, including detailed reports providing the results of analyses performed by each of the Investment Manager, Broadridge and JDL collectively showing, for various periods (including since manager inception): (i) the performance of the Fund, (ii) the Fund’s performance relative to peers and benchmarks and (iii) the net assets of the Fund. The Board observed the Fund’s underperformance for certain periods, noting that such Fund’s performance was generally consistent with expectations in light of the interrelationship of the Fund’s specific investment strategy with prevailing market conditions.
The Board also reviewed a description of the third-party data provider’s methodology for identifying the Fund’s peer groups for purposes of performance and expense comparisons.
The Board also considered the Investment Manager’s performance and reputation generally. After reviewing these and related factors, the Board concluded, within the context of their overall conclusions, that the performance of the Fund and the Investment Manager, in light of other considerations, supported the continuation of the Management Agreement.
Comparative fees, costs of services provided and the profits realized by the Investment Manager and its affiliates from their relationships with the Fund
The Board reviewed comparative fees and the costs of services provided under the Management Agreement. The Board members considered detailed comparative information set forth in an annual report on fees and expenses, including, among other things, data (based on analyses conducted by Broadridge and JDL) showing a comparison of the Fund’s expenses with median expenses paid by funds in its comparative peer universe, as well as data showing the Fund’s contribution to the Investment Manager’s profitability.
The Board considered the reports of JDL, which assisted in the Board’s analysis of the Funds’ performance and expenses and the reasonableness of the Funds’ fee rates. The Board accorded particular weight to the notion that a primary objective of the level of fees is to achieve a rational pricing model applied consistently across the various product lines in the Fund family, while assuring that the overall fees for each Fund (with certain exceptions) are generally in line with the current “pricing philosophy” such that Fund total expense ratios, in general, approximate or are lower than the median expense ratios of funds in the same Lipper comparison universe. The Board took into account that the Fund’s total expense ratio (after considering proposed expense caps/waivers) approximated the peer universe’s median expense ratio.
After reviewing these and related factors, the Board concluded, within the context of their overall conclusions, that the levels of management fees and expenses of the Fund, in light of other considerations, supported the continuation of the Management Agreement.
The Board also considered the profitability of the Investment Manager and its affiliates in connection with the Investment Manager providing management services to the Fund. With respect to the profitability of the Investment Manager and its affiliates, the Independent Trustees referred to information discussing the profitability to the Investment Manager and Ameriprise Financial from managing, operating and distributing the Funds. The Board considered that the profitability generated by the Investment Manager in 2022 had declined from 2021 levels, due to a variety of factors, including the decreased assets under management of the Funds. It also took into account the indirect economic benefits flowing to the Investment Manager or its affiliates in connection with managing or distributing the Funds, such as the enhanced ability to offer various other financial products to Ameriprise Financial customers, soft dollar benefits and overall reputational advantages. The Board noted that the fees paid by the Fund should permit the Investment Manager to offer competitive compensation to its personnel, make necessary investments in its business and earn an appropriate profit. After reviewing these and related factors, the Board concluded, within the context of their overall conclusions, that the costs of services provided and the profitability to the Investment Manager and its affiliates from their relationships with the Fund supported the continuation of the Management Agreement.
| 40 | Columbia Massachusetts Intermediate Municipal Bond Fund | Annual Report 2023 |
Approval of Management Agreement (continued)
(Unaudited)
Economies of scale
The Board considered the potential existence of economies of scale in the provision by the Investment Manager of services to the Fund, and whether those economies of scale were shared with the Fund through breakpoints in investment management fees or other means, such as expense limitation arrangements and additional investments by the Investment Manager in investment, trading, compliance and other resources. The Board considered the economies of scale that might be realized as the Fund’s net asset level grows and took note of the extent to which Fund shareholders might also benefit from such growth. In this regard, the Board took into account that management fees decline as Fund assets exceed various breakpoints, all of which have not been surpassed. The Board observed that the Management Agreement provided for breakpoints in the management fee rate schedule that allow opportunities for shareholders to realize lower fees as Fund assets grow and that there are additional opportunities through other means for sharing economies of scale with shareholders.
Conclusion
The Board reviewed all of the above considerations in reaching its decision to approve the continuation of the Management Agreement. In reaching its conclusions, no single factor was determinative.
On June 22, 2023, the Board, including all of the Independent Trustees, determined that fees payable under the Management Agreement were fair and reasonable in light of the extent and quality of services provided and approved the renewal of the Management Agreement.
Columbia Massachusetts Intermediate Municipal Bond Fund | Annual Report 2023
| 41 |
[THIS PAGE INTENTIONALLY LEFT BLANK]
[THIS PAGE INTENTIONALLY LEFT BLANK]
Columbia Massachusetts Intermediate Municipal Bond Fund
P.O. Box 219104
Kansas City, MO 64121-9104
Please read and consider the investment objectives, risks, charges and expenses for any fund carefully before investing. For a prospectus and summary prospectus, which contains this and other important information about the Fund, go to
columbiathreadneedleus.com/investor/. The Fund is distributed by Columbia Management Investment Distributors, Inc., member FINRA, and managed by Columbia Management Investment Advisers, LLC.
Columbia Threadneedle Investments (Columbia Threadneedle) is the global brand name of the Columbia and Threadneedle group of companies. All rights reserved.
© 2023 Columbia Management Investment Advisers, LLC.
columbiathreadneedleus.com/investor/

Annual Report
October 31, 2023
Columbia Strategic New York Municipal Income Fund
Not FDIC or NCUA Insured • No Financial Institution Guarantee • May Lose Value
If you elect to receive the shareholder report for Columbia Strategic New York Municipal Income Fund (the Fund) in paper, mailed to you, the Fund mails one shareholder report to each shareholder address, unless such shareholder elects to receive shareholder reports from the Fund electronically via e-mail or by having a paper notice mailed to you (Postcard Notice) that your Fund’s shareholder report is available at the Columbia funds’ website (columbiathreadneedleus.com/investor/). If you would like more than one report in paper to be mailed to you, or would like to elect to receive reports via e-mail or access them through Postcard Notice, please call shareholder services at 800.345.6611 and additional reports will be sent to you.
Proxy voting policies and procedures
The policy of the Board of Trustees is to vote the proxies of the companies in which the Fund holds investments consistent with the procedures as stated in the Statement of Additional Information (SAI). You may obtain a copy of the SAI without charge by calling 800.345.6611; contacting your financial intermediary; visiting columbiathreadneedleus.com/investor/; or searching the website of the Securities and Exchange Commission (SEC) at sec.gov. Information regarding how the Fund voted proxies relating to portfolio securities is filed with the SEC by August 31st for the most recent 12-month period ending June 30th of that year, and is available without charge by visiting columbiathreadneedleus.com/investor/, or searching the website of the SEC at sec.gov.
Quarterly schedule of investments
The Fund files a complete schedule of portfolio holdings with the SEC for the first and third quarters of each fiscal year on Form N-PORT. The Fund’s Form N-PORT filings are available on the SEC’s website at sec.gov. The Fund’s complete schedule of portfolio holdings, as filed on Form N-PORT, is available on columbiathreadneedleus.com/investor/ or can also be obtained without charge, upon request, by calling 800.345.6611.
Additional Fund information
For more information about the Fund, please visit columbiathreadneedleus.com/investor/ or call 800.345.6611. Customer Service Representatives are available to answer your questions Monday through Friday from 8 a.m. to 7 p.m. Eastern time.
Fund investment manager
Columbia Management Investment Advisers, LLC (the Investment Manager)
290 Congress Street
Boston, MA 02210
Fund distributor
Columbia Management Investment Distributors, Inc.
290 Congress Street
Boston, MA 02210
Fund transfer agent
Columbia Management Investment Services Corp.
P.O. Box 219104
Kansas City, MO 64121-9104
Columbia Strategic New York Municipal Income Fund | Annual Report 2023
Fund at a Glance
(Unaudited)
Investment objective
The Fund seeks total return, with a focus on income exempt from federal income tax and New York individual income tax and capital appreciation.
Portfolio management
Douglas White, CFA
Lead Portfolio Manager
Managed Fund since 2018
Catherine Stienstra
Portfolio Manager
Managed Fund since 2010
| Average annual total returns (%) (for the period ended October 31, 2023) |
| | | Inception | 1 Year | 5 Years | 10 Years |
| Class A | Excluding sales charges | 09/26/86 | 2.20 | -0.37 | 1.51 |
| | Including sales charges | | -0.85 | -0.97 | 1.20 |
| Advisor Class | 03/19/13 | 2.46 | -0.12 | 1.76 |
| Class C | Excluding sales charges | 08/01/97 | 1.74 | -0.80 | 1.04 |
| | Including sales charges | | 0.76 | -0.80 | 1.04 |
| Institutional Class | 09/01/11 | 2.42 | -0.12 | 1.75 |
| Institutional 2 Class | 11/08/12 | 2.47 | -0.08 | 1.77 |
| Institutional 3 Class* | 03/01/17 | 2.53 | -0.06 | 1.71 |
| Bloomberg New York Municipal Bond Index | | 3.21 | 0.82 | 1.95 |
| Bloomberg Municipal Bond Index | | 2.64 | 1.00 | 2.12 |
Returns for Class A shares are shown with and without the maximum initial sales charge of 3.00%. Returns for Class C shares are shown with and without the 1.00% contingent deferred sales charge for the first year only. The Fund’s other share classes are not subject to sales charges and have limited eligibility. Please see the Fund’s prospectus for details. Performance for different share classes will vary based on differences in sales charges and fees associated with each share class. All results shown assume reinvestment of distributions during the period. Returns do not reflect the deduction of taxes that a shareholder may pay on Fund distributions or on the redemption of Fund shares. Performance results reflect the effect of any fee waivers or reimbursements of Fund expenses by Columbia Management Investment Advisers, LLC and/or any of its affiliates. Absent these fee waivers or expense reimbursement arrangements, performance results would have been lower.
The performance information shown represents past performance and is not a guarantee of future results. The investment return and principal value of your investment will fluctuate so that your shares, when redeemed, may be worth more or less than their original cost. Current performance may be lower or higher than the performance information shown. You may obtain performance information current to the most recent month-end by contacting your financial intermediary, visiting columbiathreadneedleus.com/investor/ or calling 800.345.6611.
| * | The returns shown for periods prior to the share class inception date (including returns for the Life of the Fund, if shown, which are since Fund inception) include the returns of the Fund’s oldest share class. These returns are adjusted to reflect any higher class-related operating expenses of the newer share classes, as applicable. Please visit columbiathreadneedleus.com/investor/investment-products/mutual-funds/appended-performance for more information. |
The Bloomberg New York Municipal Bond Index is a subset of the Bloomberg Municipal Bond Index consisting solely of bonds issued by obligors located in the state of New York.
The Bloomberg Municipal Bond Index is an unmanaged index considered representative of the broad market for investment-grade, tax-exempt bonds with a maturity of at least one year.
Indices are not available for investment, are not professionally managed and do not reflect sales charges, fees, brokerage commissions, taxes or other expenses of investing. Securities in the Fund may not match those in an index.
Columbia Strategic New York Municipal Income Fund | Annual Report 2023
| 3 |
Fund at a Glance (continued)
(Unaudited)
Performance of a hypothetical $10,000 investment (October 31, 2013 — October 31, 2023)
The chart above shows the change in value of a hypothetical $10,000 investment in Class A shares of Columbia Strategic New York Municipal Income Fund during the stated time period, and does not reflect the deduction of taxes that a shareholder may pay on Fund distributions or on the redemption of Fund shares.
| Quality breakdown (%) (at October 31, 2023) |
| AAA rating | 4.1 |
| AA rating | 40.7 |
| A rating | 13.4 |
| BBB rating | 17.5 |
| BB rating | 6.9 |
| B rating | 1.5 |
| Not rated | 15.9 |
| Total | 100.0 |
Percentages indicated are based upon total fixed income investments.
Bond ratings apply to the underlying holdings of the Fund and not the Fund itself and are divided into categories ranging from highest to lowest credit quality, determined by using the middle rating of Moody’s, S&P and Fitch, after dropping the highest and lowest available ratings. When ratings are available from only two rating agencies, the lower rating is used. When a rating is available from only one rating agency, that rating is used. If a security is not rated but has a rating by Kroll and/or DBRS, the same methodology is applied to those bonds that would otherwise be not rated. When a bond is not rated by any rating agency, it is designated as “Not rated.” Credit quality ratings assigned by a rating agency are subjective opinions, not statements of fact, and are subject to change, including daily. The ratings assigned by credit rating agencies are but one of the considerations that the Investment Manager and/or Fund’s subadviser incorporates into its credit analysis process, along with such other issuer-specific factors as cash flows, capital structure and leverage ratios, ability to de-leverage (repay) through free cash flow, quality of management, market positioning and access to capital, as well as such security-specific factors as the terms of the security (e.g., interest rate and time to maturity) and the amount and type of any collateral.
| 4 | Columbia Strategic New York Municipal Income Fund | Annual Report 2023 |
Manager Discussion of Fund Performance
(Unaudited)
For the 12-month period that ended October 31, 2023, Class A shares of Columbia Strategic New York Municipal Income Fund returned 2.20% excluding sales charges. Institutional Class shares of the Fund returned 2.42%. The Fund’s benchmark, the Bloomberg New York Municipal Bond Index, returned 3.21%. The Bloomberg Municipal Bond Index, which is national in scope, returned 2.64%.
Market overview
Municipal bonds delivered positive performance in the early part of the 12-month period, closing out a tumultuous 2022 and starting 2023 with a strong rally that was driven by high hopes for an end to the aggressive interest-rate hiking campaign by the U.S. Federal Reserve (Fed). Unfortunately, sentiment quickly unwound in February, as the market reconsidered the persistence of inflation and a consistently strong labor market. A more hawkish Fed led to a sell-off in rates, sending the 10-Year Treasury yield nearly 15 basis points (bps) higher from where it started in 2023. (A basis point is 1/100 of one percent.) In March, an unforeseen banking crisis unfolded, partially driven by higher interest rates. The weakness in the banking sector indicated the potential for additional downside risk to economic growth. In its late-March 2023 meeting, the Fed pushed through another 25 bps hike, but moderated its stance, signaling that we were closer to a pause, despite the data.
Treasury and municipal interest rates rose during the second quarter of 2023, as the regional banking crisis settled down, and the focus on the Fed’s tightening policy reignited. For the first time since it started hiking in March 2022, the Fed did not raise rates at its June meeting. Fed Chairman Powell took a hawkish stance and communicated the need to continue tightening and the possibility of rates remaining higher for longer. The Treasury and municipal markets experienced significant sell-offs in the third quarter of 2023, with the 10-year Treasury yield rising and municipal yields following a similar but more pronounced path. Treasury and municipal yields reached multi-year highs. Inflation remained stubbornly elevated, despite the Fed’s aggressive rate-hiking cycle. The Fed hiked rates 25 bps in July 2023 and indicated there may be one additional hike by year end. Municipal market yields increased in the final month of the period, the fourth consecutive month of rising rates. Nearly every segment of the market — credit quality, maturity, sector and state — delivered negative performance.
Investor aversion to interest-rate sensitive fixed income saw outflows from most fixed-income segments in favor of attractive rates on cash and cash-like instruments. Flows into money market funds and CDs, and out of most actively managed fixed-income mutual funds, particularly those on the long end of the curve, were a sustained theme over the 12-month period. That said, in our view, the much higher yields municipal bonds offer now versus one year ago, or even just a few months ago, make municipals a much more attractive investment option, particularly as we believe we are at or near the end of the Fed’s interest rate hiking cycle. Fundamentals across most sectors remained healthy, and defaults were low by historical standards. A small number of sectors, such as hospitals and continuing care retirement communities (CCRCs) saw some weakening in their fundamentals. In addition, while U.S. states are sensitive to a possible economic slowdown or a capital market sell-off, many appeared relatively well positioned due to ongoing strengths in the economy and labor market along with high cash cushions, budget reserves, support from federal aid and relatively strong tax collections. Also, many states have managed recent budget surpluses conservatively in anticipation of a potential economic slowdown. However, a number of states, such as California and New York, have forecasted budget deficits in the coming years, and the municipal market may face additional pressures if the economy slows, and unemployment rises.
The New York state economy has shown signs of resilience through 2023, with an ongoing gradual recovery following the pandemic. Steady employment growth in 2023 has enabled New York to finally surpass pre-pandemic employment levels with growth being driven by health care, professional and business services, and leisure and hospitality. The finance industry continued to underperform through 2023 with several firms having announced layoffs and expectations for another lean year for bonuses which will translate into likely softness in the state’s personal income tax revenue performance. Despite the below median pace of economic rebound for the state of New York, the absolute levels of improvement have been ample enough to markedly improve the overall fiscal health of the state’s credit profile through significant tax revenue outperformance. Like many other U.S. States, New York has been prudent with the unexpected tax revenue windfall through building up budget reserves to record levels. These have put the state in a healthy position to absorb a slowing economy and lower capital market valuations which will impact the state through lower capital gains taxes from high earners and Wall Street. New York state has a sound fiscal track record of prudent budget management, which is demonstrated by their high credit ratings and below median pension burden from well-funded pension plans. With expectations of a slowing economic outlook, the
Columbia Strategic New York Municipal Income Fund | Annual Report 2023
| 5 |
Manager Discussion of Fund Performance (continued)
(Unaudited)
municipal market will be looking for the state of New York to remain committed to fiscal prudence. One notable headwind facing New York in the coming years will be assisting the NY MTA with its fiscal challenges without material negative impact to the state’s credit profile, as the billions in Federal COVID Aid provided to the MTA wind down in coming years.
The Fund’s notable detractors during the period
| • | The primary detractor from the Fund’s performance during the period was a position in the bonds of the Puerto Rico Electric Power Authority (PREPA). The utility company entered bankruptcy in July 2017 with just over $8 billion in outstanding debt. In late June 2023, the bankruptcy court issued a surprise ruling that bondholders can claim just a percentage of the outstanding debt’s value that was much lower than expected. Bondholders have begun to work on an appeal. |
| • | Overweighted allocations relative to the benchmark in charter schools, continuing care retirement communities (CCRCs) and municipal bonds with maturities of 30 years and longer weighed on the Fund’s relative performance. |
| • | Security selection in municipal bonds rated BBB and AAA and in CCRCs also detracted from the Fund’s results. |
The Fund’s notable contributors during the period
| • | The Fund’s overweighted allocations to medium and lower quality bonds, specifically in non-rated and BBB rated municipal bonds, were key contributors to Fund performance versus its benchmark. |
| • | Overweights in the airline, tobacco and resource recovery sectors also contributed to Fund performance during the period. |
| • | Security selection in municipal bonds with maturities of 22-30 years, selections in the transportation, charter schools and hospital sectors, and selections in A and AA rated bonds also benefited Fund performance during the period. |
Derivatives usage
The Fund employed U.S. Treasury futures at various times during the period to manage duration. The impact on results was modestly negative.
Fixed-income securities present issuer default risk. The Fund invests substantially in municipal securities and will be affected by tax, legislative, regulatory, demographic or political changes, as well as changes impacting a state’s financial, economic or other conditions. A relatively small number of tax-exempt issuers may necessitate the Fund investing more heavily in a single issuer and, therefore, be more exposed to the risk of loss than a Fund that invests more broadly. The value of the Fund’s portfolio may be more volatile than a more geographically diversified fund. Prepayment and extension risk exists because the timing of payments on a loan, bond or other investment may accelerate when interest rates fall or decelerate when interest rates rise which may reduce investment opportunities and potential returns. A rise in interest rates may result in a price decline of fixed-income instruments held by the Fund, negatively impacting its performance and NAV. Falling rates may result in the Fund investing in lower yielding debt instruments, lowering the Fund’s income and yield. These risks may be heightened for longer maturity and duration securities. Non-investment-grade (high-yield or junk) securities present greater price volatility and more risk to principal and income than higher rated securities. Market risk may affect a single issuer, sector of the economy, industry or the market as a whole. Federal and state tax rules apply to capital gain distributions and any gains or losses on sales. Income may be subject to state or local taxes. Liquidity risk is associated with the difficulty of selling underlying investments at a desirable time or price. Investing in derivatives is a specialized activity that involves special risks, which may result in significant losses. See the Fund’s prospectus for more information on these and other risks.
The views expressed in this report reflect the current views of the respective parties who have contributed to this report. These views are not guarantees of future performance and involve certain risks, uncertainties and assumptions that are difficult to predict, so actual outcomes and results may differ significantly from the views expressed. These views are subject to change at any time based upon economic, market or other conditions and the respective parties disclaim any responsibility to update such views. These views may not be relied on as investment advice and, because investment decisions for a Columbia fund are based on numerous factors, may not be relied on as an indication of trading intent on behalf of any particular Columbia fund. References to specific securities should not be construed as a recommendation or investment advice.
| 6 | Columbia Strategic New York Municipal Income Fund | Annual Report 2023 |
Understanding Your Fund’s Expenses
(Unaudited)
As an investor, you incur two types of costs. There are shareholder transaction costs, which generally include sales charges on purchases and may include redemption fees. There are also ongoing fund costs, which generally include management fees, distribution and/or service fees, and other fund expenses. The following information is intended to help you understand your ongoing costs (in dollars) of investing in the Fund and to help you compare these costs with the ongoing costs of investing in other mutual funds.
Analyzing your Fund’s expenses
To illustrate these ongoing costs, we have provided examples and calculated the expenses paid by investors in each share class of the Fund during the period. The actual and hypothetical information in the table is based on an initial investment of $1,000 at the beginning of the period indicated and held for the entire period. Expense information is calculated two ways and each method provides you with different information. The amount listed in the “Actual” column is calculated using the Fund’s actual operating expenses and total return for the period. You may use the Actual information, together with the amount invested, to estimate the expenses that you paid over the period. Simply divide your account value by $1,000 (for example, an $8,600 account value divided by $1,000 = 8.6), then multiply the results by the expenses paid during the period under the “Actual” column. The amount listed in the “Hypothetical” column assumes a 5% annual rate of return before expenses (which is not the Fund’s actual return) and then applies the Fund’s actual expense ratio for the period to the hypothetical return. You should not use the hypothetical account values and expenses to estimate either your actual account balance at the end of the period or the expenses you paid during the period. See “Compare with other funds” below for details on how to use the hypothetical data.
Compare with other funds
Since all mutual funds are required to include the same hypothetical calculations about expenses in shareholder reports, you can use this information to compare the ongoing cost of investing in the Fund with other funds. To do so, compare the hypothetical example with the 5% hypothetical examples that appear in the shareholder reports of other funds. As you compare hypothetical examples of other funds, it is important to note that hypothetical examples are meant to highlight the ongoing costs of investing in a fund only and do not reflect any transaction costs, such as sales charges, or redemption or exchange fees. Therefore, the hypothetical calculations are useful in comparing ongoing costs only, and will not help you determine the relative total costs of owning different funds. If transaction costs were included in these calculations, your costs would be higher.
| May 1, 2023 — October 31, 2023 |
| | Account value at the
beginning of the
period ($) | Account value at the
end of the
period ($) | Expenses paid during
the period ($) | Fund’s annualized
expense ratio (%) |
| | Actual | Hypothetical | Actual | Hypothetical | Actual | Hypothetical | Actual |
| Class A | 1,000.00 | 1,000.00 | 935.50 | 1,021.56 | 3.80 | 3.97 | 0.77 |
| Advisor Class | 1,000.00 | 1,000.00 | 936.60 | 1,022.83 | 2.57 | 2.68 | 0.52 |
| Class C | 1,000.00 | 1,000.00 | 932.90 | 1,019.26 | 6.01 | 6.28 | 1.22 |
| Institutional Class | 1,000.00 | 1,000.00 | 936.60 | 1,022.83 | 2.57 | 2.68 | 0.52 |
| Institutional 2 Class | 1,000.00 | 1,000.00 | 936.90 | 1,022.88 | 2.52 | 2.63 | 0.51 |
| Institutional 3 Class | 1,000.00 | 1,000.00 | 937.00 | 1,023.14 | 2.27 | 2.37 | 0.46 |
Expenses paid during the period are equal to the annualized expense ratio for each class as indicated above, multiplied by the average account value over the period and then multiplied by the number of days in the Fund’s most recent fiscal half year and divided by 365.
Expenses do not include fees and expenses incurred indirectly by the Fund from its investment in underlying funds, including affiliated and non-affiliated pooled investment vehicles, such as mutual funds and exchange-traded funds.
Had Columbia Management Investment Advisers, LLC and/or certain of its affiliates not waived/reimbursed certain fees and expenses, account value at the end of the period would have been reduced.
Columbia Strategic New York Municipal Income Fund | Annual Report 2023
| 7 |
Portfolio of Investments
October 31, 2023
(Percentages represent value of investments compared to net assets)
Investments in securities
| Floating Rate Notes 0.3% |
| Issue Description | Yield | | Principal
Amount ($) | Value ($) |
| Variable Rate Demand Notes 0.3% |
| New York City Water & Sewer System(a),(b) |
| Revenue Bonds |
| 2nd General Resolution |
| Series 2013 (JPMorgan Chase Bank) |
| 06/15/2050 | 3.950% | | 400,000 | 400,000 |
Total Floating Rate Notes
(Cost $400,000) | 400,000 |
|
| Municipal Bonds 99.2% |
| Issue Description | Coupon
Rate | | Principal
Amount ($) | Value ($) |
| Air Transportation 6.3% |
| New York City Industrial Development Agency(c) |
| Refunding Revenue Bonds |
| Trips Obligated Group |
| Series 2012A |
| 07/01/2028 | 5.000% | | 1,725,000 | 1,691,891 |
| New York Transportation Development Corp.(c) |
| Refunding Revenue Bonds |
| American Airlines, Inc. Project |
| Series 2021 |
| 08/01/2031 | 3.000% | | 1,300,000 | 1,089,626 |
| Terminal 4 John F. Kennedy International Airport Project |
| Series 2020 |
| 12/01/2040 | 4.000% | | 600,000 | 496,849 |
| 12/01/2041 | 4.000% | | 600,000 | 491,878 |
| Revenue Bonds |
| Terminal 4 John F. Kennedy International Airport Project |
| Series 2022 |
| 12/01/2041 | 5.000% | | 1,000,000 | 952,255 |
| 12/01/2042 | 4.000% | | 1,000,000 | 807,536 |
| New York Transportation Development Corp.(c),(d) |
| Revenue Bonds |
| LaGuardia Airport Terminal C&D |
| Series 2023 |
| 04/01/2040 | 5.625% | | 1,500,000 | 1,489,603 |
| Total | 7,019,638 |
| Airport 0.5% |
| Niagara Frontier Transportation Authority(c) |
| Refunding Revenue Bonds |
| Buffalo Niagara International Airport |
| Series 2019 |
| 04/01/2039 | 5.000% | | 525,000 | 508,663 |
| Municipal Bonds (continued) |
| Issue Description | Coupon
Rate | | Principal
Amount ($) | Value ($) |
| Charter Schools 6.8% |
| Albany Capital Resource Corp. |
| Refunding Revenue Bonds |
| Brighter Choice Elementary |
| Series 2021 |
| 04/01/2037 | 4.000% | | 1,000,000 | 799,200 |
| Build NYC Resource Corp. |
| Revenue Bonds |
| Academic Leadership Charter School Project |
| Series 2021 |
| 06/15/2036 | 4.000% | | 200,000 | 170,895 |
| International Leadership Charter School |
| Series 2013 |
| 07/01/2033 | 5.750% | | 1,500,000 | 1,424,170 |
| Social Bonds - KIPP NYC Public School Facilities Canal West Project |
| Series 2023 |
| 07/01/2062 | 5.250% | | 1,000,000 | 908,188 |
| Build NYC Resource Corp.(e) |
| Revenue Bonds |
| International Leadership Charter School |
| Series 2016 |
| 07/01/2046 | 6.250% | | 265,000 | 246,802 |
| New World Preparatory Charter School Project |
| Series 2021 |
| 06/15/2051 | 4.000% | | 690,000 | 458,218 |
| Secton Education Partners-Brilla Project |
| Series 2021 |
| 11/01/2051 | 4.000% | | 1,000,000 | 672,862 |
| Social Bonds - East Harlem Scholars Academy Charter School Project |
| Series 2022 |
| 06/01/2062 | 5.750% | | 1,000,000 | 917,927 |
| Unity Preparatory Charter School of Brooklyn Project |
| Series 2023 |
| 06/15/2063 | 5.500% | | 1,000,000 | 869,611 |
| Hempstead Town Local Development Corp. |
| Revenue Bonds |
| Evergreen Charter School Project |
| Series 2022A |
| 06/15/2057 | 5.500% | | 500,000 | 441,840 |
| Monroe County Industrial Development Corp.(e) |
| Revenue Bonds |
| Social Bonds - Academy of Health Sciences Charter School Project |
| Series 2022 |
| 07/01/2057 | 6.000% | | 750,000 | 670,694 |
| Total | 7,580,407 |
The accompanying Notes to Financial Statements are an integral part of this statement.
| 8 | Columbia Strategic New York Municipal Income Fund | Annual Report 2023 |
Portfolio of Investments (continued)
October 31, 2023
| Municipal Bonds (continued) |
| Issue Description | Coupon
Rate | | Principal
Amount ($) | Value ($) |
| Disposal 1.5% |
| New York State Environmental Facilities Corp.(c),(e) |
| Revenue Bonds |
| Casella Waste Systems, Inc. |
| Series 2019 (Mandatory Put 12/03/29) |
| 12/01/2044 | 2.875% | | 2,000,000 | 1,708,151 |
| Health Services 1.3% |
| New York State Dormitory Authority |
| Refunding Revenue Bonds |
| Icahn School of Medicine at Mount Sinai |
| Series 2015 |
| 07/01/2040 | 5.000% | | 1,500,000 | 1,419,214 |
| Higher Education 1.7% |
| Build NYC Resource Corp. |
| Refunding Revenue Bonds |
| Manhattan College Project |
| Series 2017 |
| 08/01/2042 | 4.000% | | 750,000 | 615,358 |
| New York State Dormitory Authority |
| Revenue Bonds |
| St. John’s University |
| Series 2007C (NPFGC) |
| 07/01/2026 | 5.250% | | 1,205,000 | 1,237,434 |
| Total | 1,852,792 |
| Hospital 3.9% |
| Genesee County Funding Corp. (The) |
| Refunding Revenue Bonds |
| Rochester Regional Health Project |
| Series 2022 |
| 12/01/2052 | 5.250% | | 500,000 | 472,986 |
| New York State Dormitory Authority |
| Refunding Revenue Bonds |
| Montefiore Obligated Group |
| Series 2020A |
| 09/01/2050 | 4.000% | | 1,000,000 | 745,094 |
| North Shore - Long Island Jewish Obligation Group |
| Series 2015A |
| 05/01/2037 | 5.000% | | 2,000,000 | 1,979,551 |
| New York State Dormitory Authority(e) |
| Refunding Revenue Bonds |
| Orange Regional Medical Center |
| Series 2017 |
| 12/01/2037 | 5.000% | | 400,000 | 352,343 |
| Westchester County Local Development Corp. |
| Refunding Revenue Bonds |
| Westchester Medical Center |
| Series 2016 |
| 11/01/2037 | 3.750% | | 1,000,000 | 741,394 |
| Total | 4,291,368 |
| Municipal Bonds (continued) |
| Issue Description | Coupon
Rate | | Principal
Amount ($) | Value ($) |
| Joint Power Authority 1.8% |
| New York Power Authority |
| Refunding Revenue Bonds |
| Series 2020A |
| 11/15/2055 | 4.000% | | 500,000 | 404,270 |
| Revenue Bonds |
| Green Transmission Project |
| Series 2022 (AGM) |
| 11/15/2061 | 4.000% | | 2,000,000 | 1,588,649 |
| Total | 1,992,919 |
| Local Appropriation 0.9% |
| Suffolk County Judicial Facilities Agency |
| Revenue Bonds |
| H. Lee Dennison Building |
| Series 2013 |
| 11/01/2025 | 5.000% | | 1,000,000 | 1,000,379 |
| Local General Obligation 6.6% |
| City of New York |
| Unlimited General Obligation Bonds |
| Series 2022A-1 |
| 09/01/2046 | 4.000% | | 3,000,000 | 2,569,625 |
| Series 2022D-1 |
| 05/01/2042 | 5.250% | | 1,250,000 | 1,294,830 |
| 05/01/2043 | 5.250% | | 1,000,000 | 1,033,770 |
| Subordinated Series 2023E-1 |
| 04/01/2047 | 5.250% | | 750,000 | 769,216 |
| 04/01/2050 | 4.000% | | 1,000,000 | 840,738 |
| Unlimited General Obligation Refunding Bonds |
| Subordinated Series 2023F-1 |
| 08/01/2037 | 5.000% | | 250,000 | 262,868 |
| City of Poughkeepsie |
| Limited General Obligation Refunding Bonds |
| Series 2019 |
| 06/01/2031 | 5.000% | | 600,000 | 592,733 |
| Total | 7,363,780 |
| Multi-Family 9.3% |
| Housing Development Corp. |
| Revenue Bonds |
| Sustainable Neighborhood |
| Series 2017G |
| 11/01/2047 | 3.700% | | 2,000,000 | 1,537,545 |
| New York City Housing Development Corp. |
| Refunding Revenue Bonds |
| Sustainable Neighborhood |
| Series 2019 |
| 11/01/2039 | 3.800% | | 1,410,000 | 1,207,337 |
| 11/01/2049 | 3.650% | | 875,000 | 646,707 |
The accompanying Notes to Financial Statements are an integral part of this statement.
Columbia Strategic New York Municipal Income Fund | Annual Report 2023
| 9 |
Portfolio of Investments (continued)
October 31, 2023
| Municipal Bonds (continued) |
| Issue Description | Coupon
Rate | | Principal
Amount ($) | Value ($) |
| Revenue Bonds |
| Series 2018K |
| 11/01/2048 | 4.000% | | 735,000 | 586,071 |
| Sustainable Development Bonds |
| Series 2021 |
| 05/01/2051 | 2.750% | | 1,000,000 | 588,691 |
| Sustainable Neighborhood |
| Series 2019 |
| 11/01/2049 | 3.250% | | 1,710,000 | 1,174,006 |
| New York State Housing Finance Agency |
| Revenue Bonds |
| Affordable Housing |
| Series 2017M |
| 11/01/2042 | 3.650% | | 750,000 | 592,048 |
| Series 2019D |
| 11/01/2044 | 3.700% | | 1,000,000 | 775,812 |
| Climate Bond Certified/Sustainability Bonds |
| Series 2019 |
| 11/01/2044 | 3.150% | | 840,000 | 586,922 |
| Green Bonds |
| Series 2017H |
| 11/01/2047 | 3.650% | | 1,360,000 | 1,018,638 |
| Series 2017L (GNMA) |
| 11/01/2037 | 3.300% | | 540,000 | 452,699 |
| Sustainability Bonds |
| Series 2019I |
| 11/01/2039 | 3.000% | | 800,000 | 596,927 |
| Series 2021J-1 (FHA) |
| 11/01/2056 | 2.875% | | 1,000,000 | 586,993 |
| Total | 10,350,396 |
| Municipal Power 3.1% |
| Guam Power Authority(f) |
| Refunding Revenue Bonds |
| Series 2022A |
| 10/01/2043 | 5.000% | | 500,000 | 466,964 |
| 10/01/2044 | 5.000% | | 500,000 | 461,544 |
| Long Island Power Authority |
| Refunding Revenue Bonds |
| Series 2014A |
| 09/01/2044 | 5.000% | | 1,000,000 | 987,975 |
| Revenue Bonds |
| Green Bonds |
| Series 2023E |
| 09/01/2048 | 5.000% | | 1,000,000 | 987,866 |
| Puerto Rico Electric Power Authority(f),(g) |
| Revenue Bonds |
| Series 2010XX |
| 07/01/2040 | 0.000% | | 1,000,000 | 250,000 |
| Municipal Bonds (continued) |
| Issue Description | Coupon
Rate | | Principal
Amount ($) | Value ($) |
| Series 2012A |
| 07/01/2042 | 0.000% | | 1,250,000 | 312,500 |
| Total | 3,466,849 |
| Nursing Home 0.7% |
| Monroe County Industrial Development Corp. |
| Refunding Revenue Bonds |
| St. Ann’s Community Project |
| Series 2019 |
| 01/01/2050 | 5.000% | | 1,000,000 | 742,359 |
| Other Bond Issue 2.7% |
| New York Liberty Development Corp. |
| Refunding Revenue Bonds |
| Green Bonds - 4 World Trade Center Project |
| Series 2021 |
| 11/15/2051 | 3.000% | | 500,000 | 321,869 |
| New York Transportation Development Corp.(c) |
| Revenue Bonds |
| New York State Thruway Service Areas Project |
| Series 2021 |
| 10/31/2046 | 4.000% | | 1,500,000 | 1,186,618 |
| 04/30/2053 | 4.000% | | 2,000,000 | 1,500,754 |
| Total | 3,009,241 |
| Other Industrial Development Bond 0.3% |
| New York Liberty Development Corp. |
| Revenue Bonds |
| Goldman Sachs Headquarters |
| Series 2007 |
| 10/01/2037 | 5.500% | | 260,000 | 270,021 |
| Pool / Bond Bank 0.0% |
| New York State Dormitory Authority |
| Unrefunded Revenue Bonds |
| School Districts Bond Financing Program |
| Series 2009 (AGM) |
| 10/01/2036 | 5.125% | | 15,000 | 15,017 |
| Ports 9.3% |
| New York Liberty Development Corp. |
| Refunding Revenue Bonds |
| Series 2021-1WTC |
| 02/15/2042 | 3.000% | | 2,000,000 | 1,418,042 |
| Port Authority of New York & New Jersey(c) |
| Refunding Revenue Bonds |
| 193rd Series 2015 |
| 10/15/2035 | 5.000% | | 2,635,000 | 2,652,719 |
| Consolidated 186th |
| Series 2014 |
| 10/15/2044 | 5.000% | | 1,000,000 | 958,709 |
The accompanying Notes to Financial Statements are an integral part of this statement.
| 10 | Columbia Strategic New York Municipal Income Fund | Annual Report 2023 |
Portfolio of Investments (continued)
October 31, 2023
| Municipal Bonds (continued) |
| Issue Description | Coupon
Rate | | Principal
Amount ($) | Value ($) |
| Port Authority of New York & New Jersey |
| Refunding Revenue Bonds |
| Consolidated 211th |
| Series 2018 |
| 09/01/2043 | 4.000% | | 2,000,000 | 1,738,314 |
| Revenue Bonds |
| Consolidated 85th |
| Series 1993 |
| 03/01/2028 | 5.375% | | 1,240,000 | 1,281,011 |
| Consolidated 93rd |
| Series 1994 |
| 06/01/2094 | 6.125% | | 2,250,000 | 2,264,592 |
| Total | 10,313,387 |
| Prep School 1.5% |
| Build NYC Resource Corp. |
| Refunding Revenue Bonds |
| Series 2015 |
| 06/01/2033 | 5.000% | | 500,000 | 504,379 |
| 06/01/2035 | 5.000% | | 700,000 | 704,865 |
| Rensselaer County Industrial Development Agency |
| Refunding Revenue Bonds |
| Emma Willard School Project |
| Series 2015A |
| 01/01/2036 | 5.000% | | 500,000 | 504,800 |
| Total | 1,714,044 |
| Recreation 0.6% |
| Western Regional Off-Track Betting Corp.(e) |
| Refunding Revenue Bonds |
| Series 2021 |
| 12/01/2041 | 4.125% | | 1,000,000 | 692,523 |
| Refunded / Escrowed 0.8% |
| Build NYC Resource Corp. |
| Prerefunded 08/01/25 Revenue Bonds |
| YMCA of Greater New York Project |
| Series 2015 |
| 08/01/2040 | 5.000% | | 900,000 | 918,499 |
| Resource Recovery 1.0% |
| Build NYC Resource Corp.(c),(e) |
| Refunding Revenue Bonds |
| Pratt Paper, Inc. Project |
| Series 2014 |
| 01/01/2035 | 5.000% | | 750,000 | 729,937 |
| Jefferson County Industrial Development Agency(c),(e),(g) |
| Revenue Bonds |
| ReEnergy Black River LLC P |
| Series 2019 |
| 01/01/2024 | 0.000% | | 955,273 | 382,109 |
| Total | 1,112,046 |
| Municipal Bonds (continued) |
| Issue Description | Coupon
Rate | | Principal
Amount ($) | Value ($) |
| Retirement Communities 6.6% |
| Brookhaven Local Development Corp. |
| Refunding Revenue Bonds |
| Jefferson’s Ferry Project |
| Series 2016 |
| 11/01/2036 | 5.250% | | 750,000 | 727,335 |
| Revenue Bonds |
| Jefferson’s Ferry Project |
| Series 2020 |
| 11/01/2055 | 4.000% | | 1,000,000 | 696,508 |
| Huntington Local Development Corp. |
| Revenue Bonds |
| Fountaingate Garden Project |
| Series 2021A |
| 07/01/2056 | 5.250% | | 2,000,000 | 1,426,358 |
| Suffolk County Economic Development Corp. |
| Refunding Revenue Bonds |
| Peconic Landing at Southhold, Inc. |
| Series 2020 |
| 12/01/2040 | 5.000% | | 1,540,000 | 1,366,211 |
| Tompkins County Development Corp. |
| Refunding Revenue Bonds |
| Kendal at Ithaca, Inc. Project |
| Series 2014 |
| 07/01/2044 | 5.000% | | 1,655,000 | 1,435,648 |
| Ulster County Capital Resource Corp.(e) |
| Refunding Revenue Bonds |
| Woodland Pond at New Paltz |
| Series 2017 |
| 09/15/2047 | 5.250% | | 500,000 | 341,814 |
| 09/15/2053 | 5.250% | | 1,000,000 | 654,695 |
| Westchester County Local Development Corp.(e) |
| Revenue Bonds |
| Purchase Senior Learning Community |
| Series 2021 |
| 07/01/2056 | 5.000% | | 1,000,000 | 708,567 |
| Total | 7,357,136 |
| Sales Tax 8.0% |
| Commonwealth of Puerto Rico(f),(h) |
| Revenue Notes |
| Series 2022 |
| 11/01/2051 | 0.000% | | 520,296 | 263,400 |
| Subordinated Series 2022 |
| 11/01/2043 | 0.000% | | 350,677 | 174,462 |
| Puerto Rico Sales Tax Financing Corp.(f),(h) |
| Revenue Bonds |
| Series 2018A-1 |
| 07/01/2046 | 0.000% | | 12,100,000 | 2,999,303 |
The accompanying Notes to Financial Statements are an integral part of this statement.
Columbia Strategic New York Municipal Income Fund | Annual Report 2023
| 11 |
Portfolio of Investments (continued)
October 31, 2023
| Municipal Bonds (continued) |
| Issue Description | Coupon
Rate | | Principal
Amount ($) | Value ($) |
| Puerto Rico Sales Tax Financing Corp.(f) |
| Revenue Bonds |
| Series 2019A1 |
| 07/01/2058 | 5.000% | | 1,000,000 | 873,008 |
| Triborough Bridge & Tunnel Authority |
| Revenue Bonds |
| Sales Tax - MTA Bridges & Tunnels |
| Series 2022 |
| 05/15/2062 | 5.250% | | 2,500,000 | 2,539,234 |
| TBTA Capital Lockbox - City Sales Tax |
| Series 2023A |
| 05/15/2063 | 5.500% | | 2,000,000 | 2,077,929 |
| Total | 8,927,336 |
| Single Family 1.9% |
| State of New York Mortgage Agency |
| Refunding Revenue Bonds |
| Series 2019-217 |
| 04/01/2039 | 3.625% | | 135,000 | 112,375 |
| Revenue Bonds |
| Social Bonds |
| Series 2023-250 (HUD) |
| 10/01/2053 | 4.900% | | 1,000,000 | 945,930 |
| State of New York Mortgage Agency(c) |
| Refunding Revenue Bonds |
| Series 2019-218 |
| 04/01/2033 | 3.600% | | 950,000 | 853,477 |
| 04/01/2038 | 3.850% | | 170,000 | 166,196 |
| Total | 2,077,978 |
| Special Non Property Tax 9.1% |
| Metropolitan Transportation Authority(h) |
| Refunding Revenue Bonds |
| Series 2012A |
| 11/15/2032 | 0.000% | | 2,500,000 | 1,653,114 |
| New York City Transitional Finance Authority |
| Revenue Bonds |
| Future Tax Secured |
| Subordinated Series 2022A-1 |
| 08/01/2048 | 4.000% | | 3,000,000 | 2,533,558 |
| Subordinated Series 2023A |
| 05/01/2047 | 5.000% | | 1,000,000 | 1,002,526 |
| Subordinated Series 2023F-1 |
| 02/01/2047 | 5.250% | | 1,000,000 | 1,026,620 |
| New York State Thruway Authority |
| Refunding Revenue Bonds |
| Personal Income Tax - Bidding Group |
| Series 2022A |
| 03/15/2050 | 4.000% | | 2,000,000 | 1,703,198 |
| Municipal Bonds (continued) |
| Issue Description | Coupon
Rate | | Principal
Amount ($) | Value ($) |
| Puerto Rico Highway & Transportation Authority(f),(h) |
| Revenue Bonds |
| Series 2022B |
| 07/01/2032 | 0.000% | | 53,221 | 33,928 |
| Series 2022C |
| 07/01/2053 | 0.000% | | 91,041 | 58,267 |
| Triborough Bridge & Tunnel Authority |
| Refunding Revenue Bonds |
| Green Bonds |
| Series 2023C |
| 11/15/2043 | 5.000% | | 1,000,000 | 1,015,596 |
| Revenue Bonds |
| Senior Lien Green Bonds |
| Series 2022D-2 |
| 05/15/2052 | 5.500% | | 1,000,000 | 1,044,152 |
| Total | 10,070,959 |
| Special Property Tax 0.7% |
| Glen Cove Local Economic Assistance Corp. |
| Refunding Revenue Bonds |
| Garview Point Public Improvement Project |
| Series 2016 |
| 01/01/2056 | 5.000% | | 1,000,000 | 794,155 |
| Tobacco 5.2% |
| Chautauqua Tobacco Asset Securitization Corp. |
| Refunding Revenue Bonds |
| Series 2014 |
| 06/01/2034 | 5.000% | | 1,000,000 | 935,092 |
| New York Counties Tobacco Trust VI |
| Refunding Revenue Bonds |
| Tobacco Settlement Pass-Through |
| Series 2016 |
| 06/01/2051 | 5.000% | | 2,000,000 | 1,698,607 |
| Suffolk Tobacco Asset Securitization Corp.(h) |
| Refunding Revenue Bonds |
| Subordinated Series 2021B-2 |
| 06/01/2066 | 0.000% | | 3,000,000 | 253,305 |
| TSASC, Inc. |
| Refunding Revenue Bonds |
| Series 2017A |
| 06/01/2041 | 5.000% | | 3,000,000 | 2,934,660 |
| Total | 5,821,664 |
| Transportation 4.0% |
| Metropolitan Transportation Authority |
| Refunding Revenue Bonds |
| Series 2017D |
| 11/15/2042 | 4.000% | | 1,000,000 | 843,978 |
The accompanying Notes to Financial Statements are an integral part of this statement.
| 12 | Columbia Strategic New York Municipal Income Fund | Annual Report 2023 |
Portfolio of Investments (continued)
October 31, 2023
| Municipal Bonds (continued) |
| Issue Description | Coupon
Rate | | Principal
Amount ($) | Value ($) |
| Revenue Bonds |
| Green Bonds |
| Series 2020C-1 |
| 11/15/2050 | 5.000% | | 2,000,000 | 1,899,412 |
| Transportation |
| Series 2015B |
| 11/15/2040 | 5.000% | | 1,675,000 | 1,646,614 |
| Total | 4,390,004 |
| Water & Sewer 3.1% |
| New York City Municipal Water Finance Authority |
| Refunding Revenue Bonds |
| Series 2023DD |
| 06/15/2047 | 5.000% | | 1,000,000 | 1,007,062 |
| Revenue Bonds |
| Subordinated Series 2023AA-1 |
| 06/15/2053 | 5.250% | | 2,000,000 | 2,056,593 |
| Puerto Rico Commonwealth Aqueduct & Sewer Authority(e),(f) |
| Refunding Revenue Bonds |
| Senior Lien |
| Series 2020A |
| 07/01/2047 | 5.000% | | 425,000 | 376,516 |
| Total | 3,440,171 |
Total Municipal Bonds
(Cost $130,324,927) | 110,221,096 |
| Money Market Funds 0.6% |
| | Shares | Value ($) |
| BlackRock Liquidity Funds MuniCash, Institutional Shares, 3.823%(i) | 653,680 | 653,680 |
Total Money Market Funds
(Cost $653,680) | 653,680 |
Total Investments in Securities
(Cost: $131,378,607) | 111,274,776 |
| Other Assets & Liabilities, Net | | (128,936) |
| Net Assets | 111,145,840 |
Notes to Portfolio of Investments
| (a) | The Fund is entitled to receive principal and interest from the guarantor after a day or a week’s notice or upon maturity. The maturity date disclosed represents the final maturity. |
| (b) | Represents a variable rate security where the coupon rate adjusts on specified dates (generally daily or weekly) using the prevailing money market rate. The interest rate shown was the current rate as of October 31, 2023. |
| (c) | Income from this security may be subject to alternative minimum tax. |
| (d) | Represents a security purchased on a when-issued basis. |
| (e) | Represents privately placed and other securities and instruments exempt from Securities and Exchange Commission registration (collectively, private placements), such as Section 4(a)(2) and Rule 144A eligible securities, which are often sold only to qualified institutional buyers. At October 31, 2023, the total value of these securities amounted to $9,782,769, which represents 8.80% of total net assets. |
| (f) | Municipal obligations include debt obligations issued by or on behalf of territories, possessions, or sovereign nations within the territorial boundaries of the United States. At October 31, 2023, the total value of these securities amounted to $6,269,892, which represents 5.64% of total net assets. |
| (g) | Represents a security in default. |
| (h) | Zero coupon bond. |
| (i) | The rate shown is the seven-day current annualized yield at October 31, 2023. |
Abbreviation Legend
| AGM | Assured Guaranty Municipal Corporation |
| FHA | Federal Housing Authority |
| GNMA | Government National Mortgage Association |
| HUD | U.S. Department of Housing and Urban Development |
| NPFGC | National Public Finance Guarantee Corporation |
The accompanying Notes to Financial Statements are an integral part of this statement.
Columbia Strategic New York Municipal Income Fund | Annual Report 2023
| 13 |
Portfolio of Investments (continued)
October 31, 2023
Fair value measurements
The Fund categorizes its fair value measurements according to a three-level hierarchy that maximizes the use of observable inputs and minimizes the use of unobservable inputs by prioritizing that the most observable input be used when available. Observable inputs are those that market participants would use in pricing an investment based on market data obtained from sources independent of the reporting entity. Unobservable inputs are those that reflect the Fund’s assumptions about the information market participants would use in pricing an investment. An investment’s level within the fair value hierarchy is based on the lowest level of any input that is deemed significant to the asset’s or liability’s fair value measurement. The input levels are not necessarily an indication of the risk or liquidity associated with investments at that level. For example, certain U.S. government securities are generally high quality and liquid, however, they are reflected as Level 2 because the inputs used to determine fair value may not always be quoted prices in an active market.
Fair value inputs are summarized in the three broad levels listed below:
| ■ | Level 1 — Valuations based on quoted prices for investments in active markets that the Fund has the ability to access at the measurement date. Valuation adjustments are not applied to Level 1 investments. |
| ■ | Level 2 — Valuations based on other significant observable inputs (including quoted prices for similar securities, interest rates, prepayment speeds, credit risks, etc.). |
| ■ | Level 3 — Valuations based on significant unobservable inputs (including the Fund’s own assumptions and judgment in determining the fair value of investments). |
Inputs that are used in determining fair value of an investment may include price information, credit data, volatility statistics, and other factors. These inputs can be either observable or unobservable. The availability of observable inputs can vary between investments, and is affected by various factors such as the type of investment, and the volume and level of activity for that investment or similar investments in the marketplace. The inputs will be considered by the Investment Manager, along with any other relevant factors in the calculation of an investment’s fair value. The Fund uses prices and inputs that are current as of the measurement date, which may include periods of market dislocations. During these periods, the availability of prices and inputs may be reduced for many investments. This condition could cause an investment to be reclassified between the various levels within the hierarchy.
Investments falling into the Level 3 category are primarily supported by quoted prices from brokers and dealers participating in the market for those investments. However, these may be classified as Level 3 investments due to lack of market transparency and corroboration to support these quoted prices. Additionally, valuation models may be used as the pricing source for any remaining investments classified as Level 3. These models may rely on one or more significant unobservable inputs and/or significant assumptions by the Investment Manager. Inputs used in valuations may include, but are not limited to, financial statement analysis, capital account balances, discount rates and estimated cash flows, and comparable company data.
The Fund’s Board of Trustees (the Board) has designated the Investment Manager, through its Valuation Committee (the Committee), as valuation designee, responsible for determining the fair value of the assets of the Fund for which market quotations are not readily available using valuation procedures approved by the Board. The Committee consists of voting and non-voting members from various groups within the Investment Manager’s organization, including operations and accounting, trading and investments, compliance, risk management and legal.
The Committee meets at least monthly to review and approve valuation matters, which may include a description of specific valuation determinations, data regarding pricing information received from approved pricing vendors and brokers and the results of Board-approved valuation policies and procedures (the Policies). The Policies address, among other things, instances when market quotations are or are not readily available, including recommendations of third party pricing vendors and a determination of appropriate pricing methodologies; events that require specific valuation determinations and assessment of fair value techniques; securities with a potential for stale pricing, including those that are illiquid, restricted, or in default; and the effectiveness of third party pricing vendors, including periodic reviews of vendors. The Committee meets more frequently, as needed, to discuss additional valuation matters, which may include the need to review back-testing results, review time-sensitive information or approve related valuation actions. Representatives of Columbia Management Investment Advisers, LLC report to the Board at each of its regularly scheduled meetings to discuss valuation matters and actions during the period, similar to those described earlier.
The following table is a summary of the inputs used to value the Fund’s investments at October 31, 2023:
| | Level 1 ($) | Level 2 ($) | Level 3 ($) | Total ($) |
| Investments in Securities | | | | |
| Floating Rate Notes | — | 400,000 | — | 400,000 |
| Municipal Bonds | — | 110,221,096 | — | 110,221,096 |
| Money Market Funds | 653,680 | — | — | 653,680 |
| Total Investments in Securities | 653,680 | 110,621,096 | — | 111,274,776 |
See the Portfolio of Investments for all investment classifications not indicated in the table.
The Fund’s assets assigned to the Level 2 input category are generally valued using the market approach, in which a security’s value is determined through reference to prices and information from market transactions for similar or identical assets.
The accompanying Notes to Financial Statements are an integral part of this statement.
| 14 | Columbia Strategic New York Municipal Income Fund | Annual Report 2023 |
Statement of Assets and Liabilities
October 31, 2023
| Assets | |
| Investments in securities, at value | |
| Unaffiliated issuers (cost $131,378,607) | $111,274,776 |
| Cash | 3,770 |
| Receivable for: | |
| Capital shares sold | 430,537 |
| Dividends | 1,083 |
| Interest | 1,751,802 |
| Trustees’ fees | 81,098 |
| Expense reimbursement due from Investment Manager | 323 |
| Prepaid expenses | 3,591 |
| Total assets | 113,546,980 |
| Liabilities | |
| Payable for: | |
| Investments purchased on a delayed delivery basis | 1,464,600 |
| Capital shares redeemed | 428,189 |
| Distributions to shareholders | 379,664 |
| Management services fees | 1,429 |
| Distribution and/or service fees | 616 |
| Transfer agent fees | 6,584 |
| Trustees’ fees | 96,329 |
| Other expenses | 23,729 |
| Total liabilities | 2,401,140 |
| Net assets applicable to outstanding capital stock | $111,145,840 |
| Represented by | |
| Paid in capital | 136,987,930 |
| Total distributable earnings (loss) | (25,842,090) |
| Total - representing net assets applicable to outstanding capital stock | $111,145,840 |
| Class A | |
| Net assets | $74,887,376 |
| Shares outstanding | 3,156,406 |
| Net asset value per share | $23.73 |
| Maximum sales charge | 3.00% |
| Maximum offering price per share (calculated by dividing the net asset value per share by 1.0 minus the maximum sales charge for Class A shares) | $24.46 |
| Advisor Class | |
| Net assets | $4,763,431 |
| Shares outstanding | 201,082 |
| Net asset value per share | $23.69 |
| Class C | |
| Net assets | $5,454,950 |
| Shares outstanding | 230,027 |
| Net asset value per share | $23.71 |
| Institutional Class | |
| Net assets | $19,576,126 |
| Shares outstanding | 825,825 |
| Net asset value per share | $23.70 |
| Institutional 2 Class | |
| Net assets | $1,023,624 |
| Shares outstanding | 43,286 |
| Net asset value per share | $23.65 |
| Institutional 3 Class | |
| Net assets | $5,440,333 |
| Shares outstanding | 229,363 |
| Net asset value per share | $23.72 |
The accompanying Notes to Financial Statements are an integral part of this statement.
Columbia Strategic New York Municipal Income Fund | Annual Report 2023
| 15 |
Statement of Operations
Year Ended October 31, 2023
| Net investment income | |
| Income: | |
| Dividends — unaffiliated issuers | $23,869 |
| Interest | 5,255,645 |
| Total income | 5,279,514 |
| Expenses: | |
| Management services fees | 582,758 |
| Distribution and/or service fees | |
| Class A | 208,365 |
| Class C | 48,493 |
| Transfer agent fees | |
| Class A | 62,437 |
| Advisor Class | 3,960 |
| Class C | 5,203 |
| Institutional Class | 16,876 |
| Institutional 2 Class | 709 |
| Institutional 3 Class | 349 |
| Trustees’ fees | 17,539 |
| Custodian fees | 9,475 |
| Printing and postage fees | 13,412 |
| Registration fees | 14,000 |
| Accounting services fees | 30,090 |
| Legal fees | 14,828 |
| Interest on interfund lending | 1,005 |
| Compensation of chief compliance officer | 25 |
| Other | 12,253 |
| Total expenses | 1,041,777 |
| Fees waived or expenses reimbursed by Investment Manager and its affiliates | (136,446) |
| Expense reduction | (100) |
| Total net expenses | 905,231 |
| Net investment income | 4,374,283 |
| Realized and unrealized gain (loss) — net | |
| Net realized gain (loss) on: | |
| Investments — unaffiliated issuers | (3,404,569) |
| Futures contracts | (281,144) |
| Net realized loss | (3,685,713) |
| Net change in unrealized appreciation (depreciation) on: | |
| Investments — unaffiliated issuers | 3,565,327 |
| Net change in unrealized appreciation (depreciation) | 3,565,327 |
| Net realized and unrealized loss | (120,386) |
| Net increase in net assets resulting from operations | $4,253,897 |
The accompanying Notes to Financial Statements are an integral part of this statement.
| 16 | Columbia Strategic New York Municipal Income Fund | Annual Report 2023 |
Statement of Changes in Net Assets
| | Year Ended
October 31, 2023 | Year Ended
October 31, 2022 |
| Operations | | |
| Net investment income | $4,374,283 | $4,867,220 |
| Net realized loss | (3,685,713) | (1,925,091) |
| Net change in unrealized appreciation (depreciation) | 3,565,327 | (35,541,351) |
| Net increase (decrease) in net assets resulting from operations | 4,253,897 | (32,599,222) |
| Distributions to shareholders | | |
| Net investment income and net realized gains | | |
| Class A | (2,888,558) | (3,629,505) |
| Advisor Class | (193,810) | (444,337) |
| Class C | (208,070) | (328,432) |
| Institutional Class | (834,514) | (1,816,669) |
| Institutional 2 Class | (42,437) | (83,975) |
| Institutional 3 Class | (182,734) | (59,663) |
| Total distributions to shareholders | (4,350,123) | (6,362,581) |
| Decrease in net assets from capital stock activity | (22,751,495) | (28,180,403) |
| Total decrease in net assets | (22,847,721) | (67,142,206) |
| Net assets at beginning of year | 133,993,561 | 201,135,767 |
| Net assets at end of year | $111,145,840 | $133,993,561 |
The accompanying Notes to Financial Statements are an integral part of this statement.
Columbia Strategic New York Municipal Income Fund | Annual Report 2023
| 17 |
Statement of Changes in Net Assets (continued)
| | Year Ended | Year Ended |
| | October 31, 2023 | October 31, 2022 |
| | Shares | Dollars ($) | Shares | Dollars ($) |
| Capital stock activity |
| Class A | | | | |
| Shares sold | 296,213 | 7,567,021 | 216,711 | 5,862,614 |
| Distributions reinvested | 89,545 | 2,268,519 | 106,218 | 2,976,310 |
| Shares redeemed | (628,800) | (15,979,060) | (811,582) | (22,448,591) |
| Net decrease | (243,042) | (6,143,520) | (488,653) | (13,609,667) |
| Advisor Class | | | | |
| Shares sold | 99,844 | 2,489,578 | 150,959 | 4,107,086 |
| Distributions reinvested | 7,649 | 193,400 | 15,991 | 443,968 |
| Shares redeemed | (341,233) | (8,755,337) | (140,897) | (3,815,274) |
| Net increase (decrease) | (233,740) | (6,072,359) | 26,053 | 735,780 |
| Class C | | | | |
| Shares sold | 19,233 | 491,234 | 36,038 | 992,089 |
| Distributions reinvested | 7,581 | 192,200 | 10,227 | 286,714 |
| Shares redeemed | (124,864) | (3,180,530) | (120,876) | (3,269,679) |
| Net decrease | (98,050) | (2,497,096) | (74,611) | (1,990,876) |
| Institutional Class | | | | |
| Shares sold | 430,247 | 10,924,894 | 747,219 | 20,982,927 |
| Distributions reinvested | 28,270 | 716,353 | 43,837 | 1,224,278 |
| Shares redeemed | (735,574) | (18,642,055) | (1,535,616) | (41,284,391) |
| Net decrease | (277,057) | (7,000,808) | (744,560) | (19,077,186) |
| Institutional 2 Class | | | | |
| Shares sold | 1,056 | 26,975 | 45,686 | 1,356,649 |
| Distributions reinvested | 1,667 | 42,110 | 2,964 | 83,608 |
| Shares redeemed | (10,564) | (270,395) | (59,067) | (1,616,812) |
| Net decrease | (7,841) | (201,310) | (10,417) | (176,555) |
| Institutional 3 Class | | | | |
| Shares sold | 128,673 | 3,250,327 | 271,895 | 6,978,728 |
| Distributions reinvested | 1,790 | 45,301 | 1,103 | 30,662 |
| Shares redeemed | (161,479) | (4,132,030) | (41,224) | (1,071,289) |
| Net increase (decrease) | (31,016) | (836,402) | 231,774 | 5,938,101 |
| Total net decrease | (890,746) | (22,751,495) | (1,060,414) | (28,180,403) |
The accompanying Notes to Financial Statements are an integral part of this statement.
| 18 | Columbia Strategic New York Municipal Income Fund | Annual Report 2023 |
[THIS PAGE INTENTIONALLY LEFT BLANK]
Columbia Strategic New York Municipal Income Fund | Annual Report 2023
| 19 |
The following table is intended to help you understand the Fund’s financial performance. Certain information reflects financial results for a single share of a class held for the periods shown. Per share net investment income (loss) amounts are calculated based on average shares outstanding during the period. Total return assumes reinvestment of all dividends and distributions, if any. Total return does not reflect payment of sales charges, if any. Total return and portfolio turnover are not annualized for periods of less than one year. The ratios of expenses and net investment income are annualized for periods of less than one year. The portfolio turnover rate is calculated without regard to purchase and sales transactions of short-term instruments and certain derivatives, if any. If such transactions were included, the Fund’s portfolio turnover rate may be higher.
| | Net asset value,
beginning of
period | Net
investment
income | Net
realized
and
unrealized
gain (loss) | Total from
investment
operations | Distributions
from net
investment
income | Distributions
from net
realized
gains | Total
distributions to
shareholders |
| Class A |
| Year Ended 10/31/2023 | $24.04 | 0.89 | (0.32) | 0.57 | (0.88) | — | (0.88) |
| Year Ended 10/31/2022 | $30.32 | 0.76 | (6.05) | (5.29) | (0.76) | (0.23) | (0.99) |
| Year Ended 10/31/2021 | $29.68 | 0.73 | 0.81 | 1.54 | (0.72) | (0.18) | (0.90) |
| Year Ended 10/31/2020(e) | $30.29 | 0.78 | (0.32) | 0.46 | (0.78) | (0.29) | (1.07) |
| Year Ended 10/31/2019(e) | $28.51 | 0.88 | 1.78 | 2.66 | (0.88) | — | (0.88) |
| Advisor Class |
| Year Ended 10/31/2023 | $24.00 | 0.94 | (0.31) | 0.63 | (0.94) | — | (0.94) |
| Year Ended 10/31/2022 | $30.27 | 0.84 | (6.05) | (5.21) | (0.83) | (0.23) | (1.06) |
| Year Ended 10/31/2021 | $29.64 | 0.80 | 0.81 | 1.61 | (0.80) | (0.18) | (0.98) |
| Year Ended 10/31/2020(e) | $30.25 | 0.85 | (0.32) | 0.53 | (0.85) | (0.29) | (1.14) |
| Year Ended 10/31/2019(e) | $28.47 | 0.96 | 1.78 | 2.74 | (0.96) | — | (0.96) |
| Class C |
| Year Ended 10/31/2023 | $24.02 | 0.77 | (0.31) | 0.46 | (0.77) | — | (0.77) |
| Year Ended 10/31/2022 | $30.30 | 0.64 | (6.05) | (5.41) | (0.64) | (0.23) | (0.87) |
| Year Ended 10/31/2021 | $29.67 | 0.59 | 0.81 | 1.40 | (0.59) | (0.18) | (0.77) |
| Year Ended 10/31/2020(e) | $30.28 | 0.65 | (0.33) | 0.32 | (0.64) | (0.29) | (0.93) |
| Year Ended 10/31/2019(e) | $28.50 | 0.76 | 1.78 | 2.54 | (0.76) | — | (0.76) |
| Institutional Class |
| Year Ended 10/31/2023 | $24.02 | 0.95 | (0.33) | 0.62 | (0.94) | — | (0.94) |
| Year Ended 10/31/2022 | $30.29 | 0.83 | (6.04) | (5.21) | (0.83) | (0.23) | (1.06) |
| Year Ended 10/31/2021 | $29.66 | 0.80 | 0.81 | 1.61 | (0.80) | (0.18) | (0.98) |
| Year Ended 10/31/2020(e) | $30.26 | 0.85 | (0.31) | 0.54 | (0.85) | (0.29) | (1.14) |
| Year Ended 10/31/2019(e) | $28.49 | 0.96 | 1.77 | 2.73 | (0.96) | — | (0.96) |
| Institutional 2 Class |
| Year Ended 10/31/2023 | $23.96 | 0.95 | (0.31) | 0.64 | (0.95) | — | (0.95) |
| Year Ended 10/31/2022 | $30.22 | 0.83 | (6.03) | (5.20) | (0.83) | (0.23) | (1.06) |
| Year Ended 10/31/2021 | $29.58 | 0.81 | 0.81 | 1.62 | (0.80) | (0.18) | (0.98) |
| Year Ended 10/31/2020(e) | $30.19 | 0.86 | (0.32) | 0.54 | (0.86) | (0.29) | (1.15) |
| Year Ended 10/31/2019(e) | $28.42 | 0.96 | 1.77 | 2.73 | (0.96) | — | (0.96) |
The accompanying Notes to Financial Statements are an integral part of this statement.
| 20 | Columbia Strategic New York Municipal Income Fund | Annual Report 2023 |
Financial Highlights (continued)
| | Net
asset
value,
end of
period | Total
return | Total gross
expense
ratio to
average
net assets(a) | Total net
expense
ratio to
average
net assets(a),(b) | Net investment
income
ratio to
average
net assets | Portfolio
turnover | Net
assets,
end of
period
(000’s) |
| Class A |
| Year Ended 10/31/2023 | $23.73 | 2.20% | 0.89%(c) | 0.78%(c),(d) | 3.49% | 23% | $74,887 |
| Year Ended 10/31/2022 | $24.04 | (17.84%) | 0.86%(c) | 0.78%(c),(d) | 2.74% | 22% | $81,708 |
| Year Ended 10/31/2021 | $30.32 | 5.23% | 0.85% | 0.78%(d) | 2.39% | 18% | $117,874 |
| Year Ended 10/31/2020(e) | $29.68 | 1.59% | 0.85%(c) | 0.80%(c),(d) | 2.63% | 26% | $114,883 |
| Year Ended 10/31/2019(e) | $30.29 | 9.37% | 0.85% | 0.80%(d) | 3.00% | 46% | $117,062 |
| Advisor Class |
| Year Ended 10/31/2023 | $23.69 | 2.46% | 0.63%(c) | 0.53%(c),(d) | 3.71% | 23% | $4,763 |
| Year Ended 10/31/2022 | $24.00 | (17.64%) | 0.61%(c) | 0.53%(c),(d) | 3.00% | 22% | $10,435 |
| Year Ended 10/31/2021 | $30.27 | 5.46% | 0.61% | 0.53%(d) | 2.63% | 18% | $12,373 |
| Year Ended 10/31/2020(e) | $29.64 | 1.84% | 0.60%(c) | 0.55%(c),(d) | 2.88% | 26% | $9,151 |
| Year Ended 10/31/2019(e) | $30.25 | 9.66% | 0.60% | 0.55%(d) | 3.23% | 46% | $6,470 |
| Class C |
| Year Ended 10/31/2023 | $23.71 | 1.74% | 1.34%(c) | 1.23%(c),(d) | 3.02% | 23% | $5,455 |
| Year Ended 10/31/2022 | $24.02 | (18.23%) | 1.43%(c) | 1.23%(c),(d) | 2.28% | 22% | $7,882 |
| Year Ended 10/31/2021 | $30.30 | 4.72% | 1.60% | 1.23%(d) | 1.94% | 18% | $12,203 |
| Year Ended 10/31/2020(e) | $29.67 | 1.10% | 1.60%(c) | 1.25%(c),(d),(f) | 2.18% | 26% | $15,103 |
| Year Ended 10/31/2019(e) | $30.28 | 9.04% | 1.60% | 1.25%(d),(f) | 2.56% | 46% | $19,693 |
| Institutional Class |
| Year Ended 10/31/2023 | $23.70 | 2.42% | 0.64%(c) | 0.53%(c),(d) | 3.73% | 23% | $19,576 |
| Year Ended 10/31/2022 | $24.02 | (17.62%) | 0.61%(c) | 0.53%(c),(d) | 2.94% | 22% | $26,486 |
| Year Ended 10/31/2021 | $30.29 | 5.46% | 0.60% | 0.53%(d) | 2.63% | 18% | $55,959 |
| Year Ended 10/31/2020(e) | $29.66 | 1.77% | 0.60%(c) | 0.55%(c),(d) | 2.88% | 26% | $51,296 |
| Year Ended 10/31/2019(e) | $30.26 | 9.80% | 0.60% | 0.55%(d) | 3.24% | 46% | $52,745 |
| Institutional 2 Class |
| Year Ended 10/31/2023 | $23.65 | 2.47% | 0.62%(c) | 0.51%(c) | 3.75% | 23% | $1,024 |
| Year Ended 10/31/2022 | $23.96 | (17.62%) | 0.59%(c) | 0.51%(c) | 2.94% | 22% | $1,225 |
| Year Ended 10/31/2021 | $30.22 | 5.52% | 0.59% | 0.52% | 2.65% | 18% | $1,860 |
| Year Ended 10/31/2020(e) | $29.58 | 1.78% | 0.58%(c) | 0.53%(c) | 2.89% | 26% | $1,977 |
| Year Ended 10/31/2019(e) | $30.19 | 9.84% | 0.58% | 0.53% | 3.28% | 46% | $4,207 |
The accompanying Notes to Financial Statements are an integral part of this statement.
Columbia Strategic New York Municipal Income Fund | Annual Report 2023
| 21 |
Financial Highlights (continued)
| | Net asset value,
beginning of
period | Net
investment
income | Net
realized
and
unrealized
gain (loss) | Total from
investment
operations | Distributions
from net
investment
income | Distributions
from net
realized
gains | Total
distributions to
shareholders |
| Institutional 3 Class |
| Year Ended 10/31/2023 | $24.03 | 0.97 | (0.32) | 0.65 | (0.96) | — | (0.96) |
| Year Ended 10/31/2022 | $30.31 | 0.89 | (6.09) | (5.20) | (0.85) | (0.23) | (1.08) |
| Year Ended 10/31/2021 | $29.67 | 0.82 | 0.82 | 1.64 | (0.82) | (0.18) | (1.00) |
| Year Ended 10/31/2020(e) | $30.28 | 0.87 | (0.32) | 0.55 | (0.87) | (0.29) | (1.16) |
| Year Ended 10/31/2019(e) | $28.50 | 0.96 | 1.78 | 2.74 | (0.96) | — | (0.96) |
| Notes to Financial Highlights |
| (a) | In addition to the fees and expenses that the Fund bears directly, the Fund indirectly bears a pro rata share of the fees and expenses of any other funds in which it invests. Such indirect expenses are not included in the Fund’s reported expense ratios. |
| (b) | Total net expenses include the impact of certain fee waivers/expense reimbursements made by the Investment Manager and certain of its affiliates, if applicable. |
| (c) | Ratios include interfund lending expense which is less than 0.01%. |
| (d) | The benefits derived from expense reductions had an impact of less than 0.01%. |
| (e) | Per share amounts have been adjusted on a retroactive basis to reflect a 4 to 1 reverse stock split completed after the close of business on September 11, 2020. |
| (f) | Ratios include the impact of voluntary waivers paid by the Investment Manager. For the periods indicated below, if the Investment Manager had not paid these voluntary waivers, the Fund’s net expense ratio would increase by: |
| | 10/31/2020 | 10/31/2019 |
| Class C | 0.25% | 0.30% |
The accompanying Notes to Financial Statements are an integral part of this statement.
| 22 | Columbia Strategic New York Municipal Income Fund | Annual Report 2023 |
Financial Highlights (continued)
| | Net
asset
value,
end of
period | Total
return | Total gross
expense
ratio to
average
net assets(a) | Total net
expense
ratio to
average
net assets(a),(b) | Net investment
income
ratio to
average
net assets | Portfolio
turnover | Net
assets,
end of
period
(000’s) |
| Institutional 3 Class |
| Year Ended 10/31/2023 | $23.72 | 2.53% | 0.57%(c) | 0.46%(c) | 3.81% | 23% | $5,440 |
| Year Ended 10/31/2022 | $24.03 | (17.59%) | 0.55%(c) | 0.46%(c) | 3.42% | 22% | $6,257 |
| Year Ended 10/31/2021 | $30.31 | 5.56% | 0.54% | 0.47% | 2.70% | 18% | $867 |
| Year Ended 10/31/2020(e) | $29.67 | 1.87% | 0.54%(c) | 0.49%(c) | 2.95% | 26% | $780 |
| Year Ended 10/31/2019(e) | $30.28 | 9.71% | 0.54% | 0.49% | 3.17% | 46% | $741 |
The accompanying Notes to Financial Statements are an integral part of this statement.
Columbia Strategic New York Municipal Income Fund | Annual Report 2023
| 23 |
Notes to Financial Statements
October 31, 2023
Note 1. Organization
Columbia Strategic New York Municipal Income Fund (the Fund), a series of Columbia Funds Series Trust I (the Trust), is a non-diversified fund. The Trust is registered under the Investment Company Act of 1940, as amended (the 1940 Act), as an open-end management investment company organized as a Massachusetts business trust.
Fund shares
The Trust may issue an unlimited number of shares (without par value). The Fund offers each of the share classes listed in the Statement of Assets and Liabilities. Although all share classes generally have identical voting, dividend and liquidation rights, each share class votes separately when required by the Trust’s organizational documents or by law. Each share class has its own expense and sales charge structure. Different share classes may have different minimum initial investment amounts and pay different net investment income distribution amounts to the extent the expenses of distributing such share classes vary. Distributions to shareholders in a liquidation will be proportional to the net asset value of each share class.
As described in the Fund’s prospectus, Class A and Class C shares are offered to the general public for investment. Class C shares automatically convert to Class A shares after 8 years. Advisor Class, Institutional Class, Institutional 2 Class and Institutional 3 Class shares are available for purchase through authorized investment professionals to omnibus retirement plans or to institutional investors and to certain other investors as also described in the Fund’s prospectus.
Note 2. Summary of significant accounting policies
Basis of preparation
The Fund is an investment company that applies the accounting and reporting guidance in the Financial Accounting Standards Board (FASB) Accounting Standards Codification Topic 946, Financial Services - Investment Companies (ASC 946). The financial statements are prepared in accordance with U.S. generally accepted accounting principles (GAAP), which requires management to make certain estimates and assumptions that affect the reported amounts of assets and liabilities, the disclosure of contingent assets and liabilities at the date of the financial statements and the reported amounts of income and expenses during the reporting period. Actual results could differ from those estimates.
The following is a summary of significant accounting policies followed by the Fund in the preparation of its financial statements.
Security valuation
Debt securities generally are valued based on prices obtained from pricing services, which are intended to reflect market transactions for normal, institutional-size trading units of similar securities. The services may use various pricing techniques that take into account, as applicable, factors such as yield, quality, coupon rate, maturity, type of issue, trading characteristics and other data, as well as approved independent broker-dealer quotes. Debt securities for which quotations are not readily available or not believed to be reflective of market value may also be valued based upon a bid quote from an approved independent broker-dealer. Debt securities maturing in 60 days or less are valued primarily at amortized market value, unless this method results in a valuation that management believes does not approximate fair value.
Investments in open-end investment companies (other than exchange-traded funds (ETFs)), are valued at the latest net asset value reported by those companies as of the valuation time.
Investments for which market quotations are not readily available, or that have quotations which management believes are not reflective of market value or reliable, are valued at fair value as determined in good faith under procedures approved by the Board of Trustees. If a security or class of securities (such as foreign securities) is valued at fair value, such value is likely to be different from the quoted or published price for the security, if available.
The determination of fair value often requires significant judgment. To determine fair value, management may use assumptions including but not limited to future cash flows and estimated risk premiums. Multiple inputs from various sources may be used to determine fair value.
| 24 | Columbia Strategic New York Municipal Income Fund | Annual Report 2023 |
Notes to Financial Statements (continued)
October 31, 2023
GAAP requires disclosure regarding the inputs and valuation techniques used to measure fair value and any changes in valuation inputs or techniques. In addition, investments shall be disclosed by major category. This information is disclosed following the Fund’s Portfolio of Investments.
Derivative instruments
The Fund invests in certain derivative instruments, as detailed below, in seeking to meet its investment objectives. Derivatives are instruments whose values depend on, or are derived from, in whole or in part, the value of one or more securities, currencies, commodities, indices, or other assets or instruments. Derivatives may be used to increase investment flexibility (including to maintain cash reserves while maintaining desired exposure to certain assets), for risk management (hedging) purposes, to facilitate trading, to reduce transaction costs and to pursue higher investment returns. The Fund may also use derivative instruments to mitigate certain investment risks, such as foreign currency exchange rate risk, interest rate risk and credit risk. Derivatives may involve various risks, including the potential inability of the counterparty to fulfill its obligations under the terms of the contract, the potential for an illiquid secondary market (making it difficult for the Fund to sell or terminate, including at favorable prices) and the potential for market movements which may expose the Fund to gains or losses in excess of the amount shown in the Statement of Assets and Liabilities. The notional amounts of derivative instruments, if applicable, are not recorded in the financial statements.
A derivative instrument may suffer a marked-to-market loss if the value of the contract decreases due to an unfavorable change in the market rates or values of the underlying instrument. Losses can also occur if the counterparty does not perform its obligations under the contract. The Fund’s risk of loss from counterparty credit risk on over-the-counter derivatives is generally limited to the aggregate unrealized gain netted against any collateral held by the Fund and the amount of any variation margin held by the counterparty, plus any replacement costs or related amounts. With exchange-traded or centrally cleared derivatives, there is reduced counterparty credit risk to the Fund since the clearinghouse or central counterparty provides some protection in the case of clearing member default. The clearinghouse or central counterparty stands between the buyer and the seller of the contract; therefore, failure of the clearinghouse or central counterparty may pose additional counterparty credit risk. However, credit risk still exists in exchange-traded or centrally cleared derivatives with respect to initial and variation margin that is held in a broker’s customer account. While clearing brokers are required to segregate customer margin from their own assets, in the event that a clearing broker becomes insolvent or goes into bankruptcy and at that time there is a shortfall in the aggregate amount of margin held by the clearing broker for all its clients and such shortfall is remedied by the central counterparty or otherwise, U.S. bankruptcy laws will typically allocate that shortfall on a pro-rata basis across all the clearing broker’s customers (including the Fund), potentially resulting in losses to the Fund.
In order to better define its contractual rights and to secure rights that will help the Fund mitigate its counterparty risk, the Fund may enter into an International Swaps and Derivatives Association, Inc. Master Agreement (ISDA Master Agreement) or similar agreement with its derivatives counterparties. An ISDA Master Agreement is an agreement between the Fund and a counterparty that governs over-the-counter derivatives and foreign exchange forward contracts and contains, among other things, collateral posting terms and netting provisions in the event of a default and/or termination event. Under an ISDA Master Agreement, the Fund may, under certain circumstances, offset with the counterparty certain derivative instruments’ payables and/or receivables with collateral held and/or posted and create one single net payment. The provisions of the ISDA Master Agreement typically permit a single net payment in the event of default (close-out netting), including the bankruptcy or insolvency of the counterparty. Note, however, that bankruptcy or insolvency laws of a particular jurisdiction may impose restrictions on or prohibitions against the right of offset or netting in bankruptcy, insolvency or other events.
Collateral (margin) requirements differ by type of derivative. Margin requirements are established by the clearinghouse or central counterparty for exchange-traded and centrally cleared derivatives. Brokers can ask for margin in excess of the minimum in certain circumstances. Collateral terms for most over-the-counter derivatives are subject to regulatory requirements to exchange variation margin with trading counterparties and may have contract specific margin terms as well. For over-the-counter derivatives traded under an ISDA Master Agreement, the collateral requirements are typically calculated by netting the marked-to-market amount for each transaction under such agreement and comparing that amount to the value of any variation margin currently pledged by the Fund and/or the counterparty. Generally, the amount of collateral due from or to a party has to exceed a minimum transfer amount threshold (e.g., $250,000) before a transfer has to be made. To the extent amounts due to the Fund from its counterparties are not fully collateralized, contractually or otherwise, the Fund bears the risk of loss from counterparty nonperformance. The Fund may also pay interest expense on cash collateral received from
Columbia Strategic New York Municipal Income Fund | Annual Report 2023
| 25 |
Notes to Financial Statements (continued)
October 31, 2023
the broker or receive interest income on cash collateral pledged to the broker. The Fund attempts to mitigate counterparty risk by only entering into agreements with counterparties that it believes have the financial resources to honor their obligations and by monitoring the financial stability of those counterparties.
Certain ISDA Master Agreements allow counterparties of over-the-counter derivatives transactions to terminate derivatives contracts prior to maturity in the event the Fund’s net asset value declines by a stated percentage over a specified time period or if the Fund fails to meet certain terms of the ISDA Master Agreement, which would cause the Fund to accelerate payment of any net liability owed to the counterparty. The Fund also has termination rights if the counterparty fails to meet certain terms of the ISDA Master Agreement. In determining whether to exercise such termination rights, the Fund would consider, in addition to counterparty credit risk, whether termination would result in a net liability owed from the counterparty.
For financial reporting purposes, the Fund does not offset derivative assets and derivative liabilities that are subject to netting arrangements in the Statement of Assets and Liabilities.
Futures contracts
Futures contracts are exchange-traded and represent commitments for the future purchase or sale of an asset at a specified price on a specified date. The Fund bought and sold futures contracts to manage exposure to movements in interest rates. These instruments may be used for other purposes in future periods. Upon entering into futures contracts, the Fund bears risks that it may not achieve the anticipated benefits of the futures contracts and may realize a loss. Additional risks include counterparty credit risk, the possibility of an illiquid market, and that a change in the value of the contract or option may not correlate with changes in the value of the underlying asset.
Upon entering into a futures contract, the Fund deposits cash or securities with the broker, known as a futures commission merchant (FCM), in an amount sufficient to meet the initial margin requirement. The initial margin deposit must be maintained at an established level over the life of the contract. Cash deposited as initial margin is recorded in the Statement of Assets and Liabilities as margin deposits. Securities deposited as initial margin are designated in the Portfolio of Investments. Subsequent payments (variation margin) are made or received by the Fund each day. The variation margin payments are equal to the daily change in the contract value and are recorded as variation margin receivable or payable and are offset in unrealized gains or losses. The Fund generally expects to earn interest income on its margin deposits. The Fund recognizes a realized gain or loss when the contract is closed or expires. Futures contracts involve, to varying degrees, risk of loss in excess of the variation margin disclosed in the Statement of Assets and Liabilities.
Effects of derivative transactions in the financial statements
The following tables are intended to provide additional information about the effect of derivatives on the financial statements of the Fund, including: the fair value of derivatives by risk category and the location of those fair values in the Statement of Assets and Liabilities; and the impact of derivative transactions over the period in the Statement of Operations, including realized and unrealized gains (losses). The derivative instrument schedules following the Portfolio of Investments present additional information regarding derivative instruments outstanding at the end of the period, if any.
At October 31, 2023, the Fund had no outstanding derivatives.
The following table indicates the effect of derivative instruments (not considered to be hedging instruments for accounting disclosure purposes) in the Statement of Operations for the year ended October 31, 2023:
| Amount of realized gain (loss) on derivatives recognized in income |
| Risk exposure category | Futures
contracts
($) |
| Interest rate risk | (281,144) |
| 26 | Columbia Strategic New York Municipal Income Fund | Annual Report 2023 |
Notes to Financial Statements (continued)
October 31, 2023
The following table is a summary of the average daily outstanding volume by derivative instrument for the year ended October 31, 2023:
| Derivative instrument | Average notional
amounts ($) |
| Futures contracts — short | 2,544,927 |
Delayed delivery securities
The Fund may trade securities on other than normal settlement terms, including securities purchased or sold on a “when-issued” or "forward commitment" basis. This may increase risk to the Fund since the other party to the transaction may fail to deliver, which could cause the Fund to subsequently invest at less advantageous prices. The Fund designates cash or liquid securities in an amount equal to the delayed delivery commitment.
Security transactions
Security transactions are accounted for on the trade date. Cost is determined and gains (losses) are based upon the specific identification method for both financial statement and federal income tax purposes.
Income recognition
Interest income is recorded on an accrual basis. Market premiums and discounts, including original issue discounts, are amortized and accreted, respectively, over the expected life of the security on all debt securities, unless otherwise noted.
The Fund may place a debt security on non-accrual status and reduce related interest income when it becomes probable that the interest will not be collected and the amount of uncollectible interest can be reasonably estimated. The Fund may also adjust accrual rates when it becomes probable the full interest will not be collected and a partial payment will be received. A defaulted debt security is removed from non-accrual status when the issuer resumes interest payments or when collectability of interest is reasonably assured.
Dividend income is recorded on the ex-dividend date.
Expenses
General expenses of the Trust are allocated to the Fund and other funds of the Trust based upon relative net assets or other expense allocation methodologies determined by the nature of the expense. Expenses directly attributable to the Fund are charged to the Fund. Expenses directly attributable to a specific class of shares are charged to that share class.
Determination of class net asset value
All income, expenses (other than class-specific expenses, which are charged to that share class, as shown in the Statement of Operations) and realized and unrealized gains (losses) are allocated to each class of the Fund on a daily basis, based on the relative net assets of each class, for purposes of determining the net asset value of each class.
Federal income tax status
The Fund intends to qualify each year as a regulated investment company under Subchapter M of the Internal Revenue Code, as amended, and will distribute substantially all of its net tax-exempt and investment company taxable income and net capital gain, if any, for its tax year, and as such will not be subject to federal income taxes. In addition, the Fund intends to distribute in each calendar year substantially all of its ordinary income, capital gain net income and certain other amounts, if any, such that the Fund should not be subject to federal excise tax. Therefore, no federal income or excise tax provision is recorded.
Distributions to shareholders
Distributions from net investment income, if any, are declared daily and paid monthly. Net realized capital gains, if any, are distributed at least annually. Income distributions and capital gain distributions are determined in accordance with federal income tax regulations, which may differ from GAAP.
Columbia Strategic New York Municipal Income Fund | Annual Report 2023
| 27 |
Notes to Financial Statements (continued)
October 31, 2023
Guarantees and indemnifications
Under the Trust’s organizational documents and, in some cases, by contract, its officers and trustees are indemnified against certain liabilities arising out of the performance of their duties to the Trust or its funds. In addition, certain of the Fund’s contracts with its service providers contain general indemnification clauses. The Fund’s maximum exposure under these arrangements is unknown since the amount of any future claims that may be made against the Fund cannot be determined, and the Fund has no historical basis for predicting the likelihood of any such claims.
Recent accounting pronouncements and regulatory updates
Tailored Shareholder Reports
In October 2022, the Securities and Exchange Commission adopted a final rule relating to Tailored Shareholder Reports for Mutual Funds and Exchange-Traded Funds; Fee Information in Investment Company Advertisements. The rule and form amendments will, among other things, require the Fund to transmit concise and visually engaging shareholder reports that highlight key information. The amendments will require that funds tag information in a structured data format and that certain more in-depth information be made available online and available for delivery free of charge to investors on request. The amendments became effective January 24, 2023. There is an 18-month transition period after the effective date of the amendments.
Note 3. Fees and other transactions with affiliates
Management services fees
The Fund has entered into a Management Agreement with Columbia Management Investment Advisers, LLC (the Investment Manager), a wholly-owned subsidiary of Ameriprise Financial, Inc. (Ameriprise Financial). Under the Management Agreement, the Investment Manager provides the Fund with investment research and advice, as well as administrative and accounting services. The management services fee is an annual fee that is equal to a percentage of the Fund’s daily net assets that declines from 0.47% to 0.31% as the Fund’s net assets increase. The effective management services fee rate for the year ended October 31, 2023 was 0.47% of the Fund’s average daily net assets.
Compensation of Board members
Members of the Board of Trustees who are not officers or employees of the Investment Manager or Ameriprise Financial are compensated for their services to the Fund as disclosed in the Statement of Operations. Under a Deferred Compensation Plan (the Deferred Plan), these members of the Board of Trustees may elect to defer payment of up to 100% of their compensation. Deferred amounts are treated as though equivalent dollar amounts had been invested in shares of certain funds managed by the Investment Manager. The Fund’s liability for these amounts is adjusted for market value changes and remains in the Fund until distributed in accordance with the Deferred Plan. All amounts payable under the Deferred Plan constitute a general unsecured obligation of the Fund. The expense for the Deferred Plan, which includes Trustees’ fees deferred during the current period as well as any gains or losses on the Trustees’ deferred compensation balances as a result of market fluctuations, is included in "Trustees’ fees" in the Statement of Operations.
Compensation of Chief Compliance Officer
The Board of Trustees has appointed a Chief Compliance Officer for the Fund in accordance with federal securities regulations. As disclosed in the Statement of Operations, a portion of the Chief Compliance Officer’s total compensation is allocated to the Fund, along with other allocations to affiliated registered investment companies managed by the Investment Manager and its affiliates, based on relative net assets.
Transfer agency fees
Under a Transfer and Dividend Disbursing Agent Agreement, Columbia Management Investment Services Corp. (the Transfer Agent), an affiliate of the Investment Manager and a wholly-owned subsidiary of Ameriprise Financial, is responsible for providing transfer agency services to the Fund. The Transfer Agent has contracted with SS&C GIDS, Inc. (SS&C GIDS) to
| 28 | Columbia Strategic New York Municipal Income Fund | Annual Report 2023 |
Notes to Financial Statements (continued)
October 31, 2023
serve as sub-transfer agent. Prior to January 1, 2023, SS&C GIDS was known as DST Asset Manager Solutions, Inc. The Transfer Agent pays the fees of SS&C GIDS for services as sub-transfer agent and SS&C GIDS is not entitled to reimbursement for such fees from the Fund (with the exception of out-of-pocket fees).
The Fund pays the Transfer Agent a monthly transfer agency fee based on the number or the average value of accounts, depending on the type of account. In addition, the Fund pays the Transfer Agent a fee for shareholder services based on the number of accounts or on a percentage of the average aggregate value of the Fund’s shares maintained in omnibus accounts up to the lesser of the amount charged by the financial intermediary or a cap established by the Board of Trustees from time to time.
The Transfer Agent also receives compensation from the Fund for various shareholder services and reimbursements for certain out-of-pocket fees. Total transfer agency fees for Institutional 2 Class and Institutional 3 Class shares are subject to an annual limitation of not more than 0.07% and 0.02%, respectively, of the average daily net assets attributable to each share class.
For the year ended October 31, 2023, the Fund’s effective transfer agency fee rates as a percentage of average daily net assets of each class were as follows:
| | Effective rate (%) |
| Class A | 0.07 |
| Advisor Class | 0.08 |
| Class C | 0.08 |
| Institutional Class | 0.07 |
| Institutional 2 Class | 0.06 |
| Institutional 3 Class | 0.01 |
An annual minimum account balance fee of $20 may apply to certain accounts with a value below the applicable share class’s initial minimum investment requirements to reduce the impact of small accounts on transfer agency fees. These minimum account balance fees are remitted to the Fund and recorded as part of expense reductions in the Statement of Operations. For the year ended October 31, 2023, these minimum account balance fees reduced total expenses of the Fund by $100.
Distribution and service fees
The Fund has entered into an agreement with Columbia Management Investment Distributors, Inc. (the Distributor), an affiliate of the Investment Manager and a wholly-owned subsidiary of Ameriprise Financial, for distribution and shareholder services. The Board of Trustees has approved, and the Fund has adopted, distribution and shareholder service plans (the Plans) applicable to certain share classes, which set the distribution and service fees for the Fund. These fees are calculated daily and are intended to compensate the Distributor and/or eligible selling and/or servicing agents for selling shares of the Fund and providing services to investors.
Under the Plans, the Fund pays a monthly service fee to the Distributor at the maximum annual rate of 0.25% of the average daily net assets attributable to Class A and Class C shares of the Fund. Also under the Plans, the Fund pays a monthly distribution fee to the Distributor at the maximum annual rate of 0.45% of the average daily net assets attributable to Class C shares of the Fund.
Sales charges (unaudited)
Sales charges, including front-end charges and contingent deferred sales charges (CDSCs), received by the Distributor for distributing Fund shares for the year ended October 31, 2023, if any, are listed below:
| | Front End (%) | CDSC (%) | Amount ($) |
| Class A | 3.00 | 0.75(a) | 10,684 |
| Class C | — | 1.00(b) | 454 |
| (a) | This charge is imposed on certain investments of $500,000 or more if redeemed within 12 months after purchase. |
| (b) | This charge applies to redemptions within 12 months after purchase, with certain limited exceptions. |
Columbia Strategic New York Municipal Income Fund | Annual Report 2023
| 29 |
Notes to Financial Statements (continued)
October 31, 2023
The Fund’s other share classes are not subject to sales charges.
Expenses waived/reimbursed by the Investment Manager and its affiliates
The Investment Manager and certain of its affiliates have contractually agreed to waive fees and/or reimburse expenses (excluding certain fees and expenses described below) for the period(s) disclosed below, unless sooner terminated at the sole discretion of the Board of Trustees, so that the Fund’s net operating expenses, after giving effect to fees waived/expenses reimbursed and any balance credits and/or overdraft charges from the Fund’s custodian, do not exceed the following annual rate(s) as a percentage of the classes’ average daily net assets:
| | Fee rate(s) contractual
through
February 29, 2024 |
| Class A | 0.78% |
| Advisor Class | 0.53 |
| Class C | 1.23 |
| Institutional Class | 0.53 |
| Institutional 2 Class | 0.51 |
| Institutional 3 Class | 0.46 |
Under the agreement governing these fee waivers and/or expense reimbursement arrangements, the following fees and expenses are excluded from the waiver/reimbursement commitment, and therefore will be paid by the Fund, if applicable: taxes (including foreign transaction taxes), expenses associated with investments in affiliated and non-affiliated pooled investment vehicles (including mutual funds and exchange-traded funds), transaction costs and brokerage commissions, costs related to any securities lending program, dividend expenses associated with securities sold short, inverse floater program fees and expenses, transaction charges and interest on borrowed money, interest, costs associated with shareholder meetings, infrequent and/or unusual expenses and any other expenses the exclusion of which is specifically approved by the Board of Trustees. This agreement may be modified or amended only with approval from the Investment Manager, certain of its affiliates and the Fund. Any fees waived and/or expenses reimbursed under the expense reimbursement arrangements described above are not recoverable by the Investment Manager or its affiliates in future periods.
Note 4. Federal tax information
The timing and character of income and capital gain distributions are determined in accordance with income tax regulations, which may differ from GAAP because of temporary or permanent book to tax differences.
At October 31, 2023, these differences were primarily due to differing treatment for tax straddles, principal and/or interest from fixed income securities, defaulted securities/troubled debt, capital loss carryforwards, trustees’ deferred compensation, distributions and re-characterization of distributions for investments. To the extent these differences were permanent, reclassifications were made among the components of the Fund’s net assets. Temporary differences do not require reclassifications.
The following reclassifications were made:
Undistributed net
investment
income ($) | Accumulated
net realized
(loss) ($) | Paid in
capital ($) |
| 32,084 | (32,084) | — |
Net investment income (loss) and net realized gains (losses), as disclosed in the Statement of Operations, and net assets were not affected by this reclassification.
| 30 | Columbia Strategic New York Municipal Income Fund | Annual Report 2023 |
Notes to Financial Statements (continued)
October 31, 2023
The tax character of distributions paid during the years indicated was as follows:
| Year Ended October 31, 2023 | Year Ended October 31, 2022 |
Ordinary
income ($) | Tax-exempt
income ($) | Long-term
capital gains ($) | Total ($) | Ordinary
income ($) | Tax-exempt
income ($) | Long-term
capital gains ($) | Total ($) |
| 38,792 | 4,311,331 | — | 4,350,123 | 696,681 | 4,825,855 | 840,045 | 6,362,581 |
Short-term capital gain distributions, if any, are considered ordinary income distributions for tax purposes.
At October 31, 2023, the components of distributable earnings on a tax basis were as follows:
Undistributed
ordinary income ($) | Undistributed tax-
exempt income ($) | Undistributed
long-term
capital gains ($) | Capital loss
carryforwards ($) | Net unrealized
(depreciation) ($) |
| — | 1,493,158 | — | (6,453,885) | (20,405,935) |
At October 31, 2023, the cost of all investments for federal income tax purposes along with the aggregate gross unrealized appreciation and depreciation based on that cost was:
Federal
tax cost ($) | Gross unrealized
appreciation ($) | Gross unrealized
(depreciation) ($) | Net unrealized
(depreciation) ($) |
| 131,680,711 | 239,607 | (20,645,542) | (20,405,935) |
Tax cost of investments and unrealized appreciation/(depreciation) may also include timing differences that do not constitute adjustments to tax basis.
The following capital loss carryforwards, determined at October 31, 2023, may be available to reduce future net realized gains on investments, if any, to the extent permitted by the Internal Revenue Code. In addition, for the year ended October 31, 2023, capital loss carryforwards utilized, if any, were as follows:
No expiration
short-term ($) | No expiration
long-term ($) | Total ($) | Utilized ($) |
| (4,554,856) | (1,899,029) | (6,453,885) | — |
Management of the Fund has concluded that there are no significant uncertain tax positions in the Fund that would require recognition in the financial statements. However, management’s conclusion may be subject to review and adjustment at a later date based on factors including, but not limited to, new tax laws, regulations, and administrative interpretations (including relevant court decisions). Generally, the Fund’s federal tax returns for the prior three fiscal years remain subject to examination by the Internal Revenue Service.
Note 5. Portfolio information
The cost of purchases and proceeds from sales of securities, excluding short-term investments and derivatives, if any, aggregated to $27,718,821 and $49,751,389, respectively, for the year ended October 31, 2023. The amount of purchase and sale activity impacts the portfolio turnover rate reported in the Financial Highlights.
Note 6. Interfund lending
Pursuant to an exemptive order granted by the Securities and Exchange Commission, the Fund participates in a program (the Interfund Program) allowing each participating Columbia Fund (each, a Participating Fund) to lend money directly to and, except for closed-end funds and money market funds, borrow money directly from other Participating Funds for temporary purposes. The amounts eligible for borrowing and lending under the Interfund Program are subject to certain restrictions.
Interfund loans are subject to the risk that the borrowing fund could be unable to repay the loan when due, and a delay in repayment to the lending fund could result in lost opportunities and/or additional lending costs. The exemptive order is subject to conditions intended to mitigate conflicts of interest arising from the Investment Manager’s relationship with each Participating Fund.
Columbia Strategic New York Municipal Income Fund | Annual Report 2023
| 31 |
Notes to Financial Statements (continued)
October 31, 2023
The Fund’s activity in the Interfund Program during the year ended October 31, 2023 was as follows:
| Borrower or lender | Average loan
balance ($) | Weighted average
interest rate (%) | Number of days
with outstanding loans |
| Borrower | 2,050,000 | 4.60 | 4 |
Interest expense incurred by the Fund is recorded as interfund lending in the Statement of Operations. The Fund had no outstanding interfund loans at October 31, 2023.
Note 7. Line of credit
The Fund has access to a revolving credit facility with a syndicate of banks led by JPMorgan Chase Bank, N.A., Citibank, N.A. and Wells Fargo Bank, N.A. whereby the Fund may borrow for the temporary funding of shareholder redemptions or for other temporary or emergency purposes. Pursuant to an October 26, 2023 amendment and restatement, the credit facility, which is an agreement between the Fund and certain other funds managed by the Investment Manager or an affiliated investment manager, severally and not jointly, permits aggregate borrowings up to $900 million. Interest is currently charged to each participating fund based on its borrowings at a rate equal to the higher of (i) the federal funds effective rate, (ii) the secured overnight financing rate plus 0.10% and (iii) the overnight bank funding rate plus, in each case, 1.00%. Each borrowing under the credit facility matures no later than 60 days after the date of borrowing. The Fund also pays a commitment fee equal to its pro rata share of the unused amount of the credit facility at a rate of 0.15% per annum. The commitment fee is included in other expenses in the Statement of Operations. This agreement expires annually in October unless extended or renewed. Prior to the October 26, 2023 amendment and restatement, the Fund had access to a revolving credit facility with a syndicate of banks led by JPMorgan Chase Bank, N.A., Citibank, N.A. and Wells Fargo Bank, N.A. which permitted collective borrowings up to $950 million. Interest was charged to each participating fund based on its borrowings at a rate equal to the higher of (i) the federal funds effective rate, (ii) the secured overnight financing rate plus 0.10% and (iii) the overnight bank funding rate plus, in each case, 1.00%.
The Fund had no borrowings during the year ended October 31, 2023.
Note 8. Significant risks
Credit risk
Credit risk is the risk that the value of debt instruments in the Fund’s portfolio may decline because the issuer defaults or otherwise becomes unable or unwilling, or is perceived to be unable or unwilling, to honor its financial obligations, such as making payments to the Fund when due. Credit rating agencies assign credit ratings to certain debt instruments to indicate their credit risk. Lower-rated or unrated debt instruments held by the Fund may present increased credit risk as compared to higher-rated debt instruments.
High-yield investments risk
Securities and other debt instruments held by the Fund that are rated below investment grade (commonly called "high-yield" or "junk" bonds) and unrated debt instruments of comparable quality expose the Fund to a greater risk of loss of principal and income than a fund that invests solely or primarily in investment grade debt instruments. In addition, these investments have greater price fluctuations, are less liquid and are more likely to experience a default than higher-rated debt instruments. High-yield debt instruments are considered to be predominantly speculative with respect to the issuer’s capacity to pay interest and repay principal.
Interest rate risk
Interest rate risk is the risk of losses attributable to changes in interest rates. In general, if interest rates rise, the values of debt instruments tend to fall, and if interest rates fall, the values of debt instruments tend to rise. Actions by governments and central banking authorities can result in increases or decreases in interest rates. Higher periods of inflation could lead such authorities to raise interest rates. Increasing interest rates may negatively affect the value of debt securities held by the Fund, resulting in a negative impact on the Fund’s performance and net asset value per share. In general, the longer the maturity or duration of a debt security, the greater its sensitivity to changes in interest rates. The Fund is subject to the risk that the income generated by its investments may not keep pace with inflation.
| 32 | Columbia Strategic New York Municipal Income Fund | Annual Report 2023 |
Notes to Financial Statements (continued)
October 31, 2023
Liquidity risk
Liquidity risk is the risk associated with a lack of marketability of investments which may make it difficult to sell the investment at a desirable time or price. Changing regulatory, market or other conditions or environments (for example, the interest rate or credit environments) may adversely affect the liquidity of the Fund’s investments. The Fund may have to accept a lower selling price for the holding, sell other investments, or forego another, more appealing investment opportunity. Generally, the less liquid the market at the time the Fund sells a portfolio investment, the greater the risk of loss or decline of value to the Fund. A less liquid market can lead to an increase in Fund redemptions, which may negatively impact Fund performance and net asset value per share, including, for example, if the Fund is forced to sell securities in a down market.
Market risk
The Fund may incur losses due to declines in the value of one or more securities in which it invests. These declines may be due to factors affecting a particular issuer, or the result of, among other things, political, regulatory, market, economic or social developments affecting the relevant market(s) more generally. In addition, turbulence in financial markets and reduced liquidity in equity, credit and/or fixed income markets may negatively affect many issuers, which could adversely affect the Fund’s ability to price or value hard-to-value assets in thinly traded and closed markets and could cause significant redemptions and operational challenges. Global economies and financial markets are increasingly interconnected, and conditions and events in one country, region or financial market may adversely impact issuers in a different country, region or financial market. These risks may be magnified if certain events or developments adversely interrupt the global supply chain; in these and other circumstances, such risks might affect companies worldwide. As a result, local, regional or global events such as terrorism, war, other conflicts, natural disasters, disease/virus outbreaks and epidemics or other public health issues, recessions, depressions or other events – or the potential for such events – could have a significant negative impact on global economic and market conditions.
Municipal securities risk
Municipal securities are debt obligations generally issued to obtain funds for various public purposes, including general financing for state and local governments, or financing for a specific project or public facility, and include obligations of the governments of the U.S. territories, commonwealths and possessions such as Guam, Puerto Rico and the U.S. Virgin Islands to the extent such obligations are exempt from state and U.S. federal income taxes. The value of municipal securities can be significantly affected by actual or expected political and legislative changes at the federal or state level. Municipal securities may be fully or partially backed by the taxing authority of the local government, by the credit of a private issuer, by the current or anticipated revenues from a specific project or specific assets or by domestic or foreign entities providing credit support, such as letters of credit, guarantees or insurance, and are generally classified into general obligation bonds and special revenue obligations. Because many municipal securities are issued to finance projects in sectors such as education, health care, transportation and utilities, conditions in those sectors can affect the overall municipal market.
Issuers in a state, territory, commonwealth or possession in which the Fund invests may experience significant financial difficulties for various reasons, including as the result of events that cannot be reasonably anticipated or controlled such as economic downturns or similar periods of economic stress, social conflict or unrest, labor disruption and natural disasters. Such financial difficulties may lead to credit rating downgrades or defaults of such issuers which in turn, could affect the market values and marketability of many or all municipal obligations of issuers in such state, territory, commonwealth or possession. The value of the Fund’s shares will be negatively impacted to the extent it invests in such securities. The Fund’s annual and semiannual reports show the Fund’s investment exposures at a point in time. The risk of investing in the Fund is directly correlated to the Fund’s investment exposures.
Because the Fund invests substantially in municipal securities issued by the state identified in the Fund’s name and political sub-divisions of that state, the Fund will be particularly affected by adverse tax, legislative, regulatory, demographic or political changes as well as changes impacting the state’s financial, economic or other condition and prospects. In addition, because of the relatively small number of issuers of tax-exempt securities in the state, the Fund may invest a higher percentage of assets in a single issuer and, therefore, be more exposed to the risk of loss than a fund that invests more broadly. The value of municipal and other securities owned by the Fund also may be adversely affected by future changes in federal or state income tax laws.
Columbia Strategic New York Municipal Income Fund | Annual Report 2023
| 33 |
Notes to Financial Statements (continued)
October 31, 2023
Non-diversification risk
A non-diversified fund is permitted to invest a greater percentage of its total assets in fewer issuers than a diversified fund. This increases the risk that a change in the value of any one investment held by the Fund could affect the overall value of the Fund more than it would affect that of a diversified fund holding a greater number of investments. Accordingly, the Fund’s value will likely be more volatile than the value of a more diversified fund.
Shareholder concentration risk
At October 31, 2023, affiliated shareholders of record owned 20.2% of the outstanding shares of the Fund in one or more accounts. Fund shares sold to or redeemed by concentrated accounts may have a significant effect on the operations of the Fund. In the case of a large redemption, the Fund may be forced to sell investments at inopportune times, including its liquid positions, which may result in Fund losses and the Fund holding a higher percentage of less liquid positions. Large redemptions could result in decreased economies of scale and increased operating expenses for non-redeeming Fund shareholders.
Note 9. Subsequent events
Management has evaluated the events and transactions that have occurred through the date the financial statements were issued and noted no items requiring adjustment of the financial statements or additional disclosure.
Note 10. Information regarding pending and settled legal proceedings
Ameriprise Financial and certain of its affiliates are involved in the normal course of business in legal proceedings which include regulatory inquiries, arbitration and litigation, including class actions concerning matters arising in connection with the conduct of their activities as part of a diversified financial services firm. Ameriprise Financial believes that the Fund is not currently the subject of, and that neither Ameriprise Financial nor any of its affiliates are the subject of, any pending legal, arbitration or regulatory proceedings that are likely to have a material adverse effect on the Fund or the ability of Ameriprise Financial or its affiliates to perform under their contracts with the Fund. Ameriprise Financial is required to make quarterly (10-Q), annual (10-K) and, as necessary, 8-K filings with the Securities and Exchange Commission (SEC) on legal and regulatory matters that relate to Ameriprise Financial and its affiliates. Copies of these filings may be obtained by accessing the SEC website at www.sec.gov.
There can be no assurance that these matters, or the adverse publicity associated with them, will not result in increased Fund redemptions, reduced sale of Fund shares or other adverse consequences to the Fund. Further, although we believe proceedings are not likely to have a material adverse effect on the Fund or the ability of Ameriprise Financial or its affiliates to perform under their contracts with the Fund, these proceedings are subject to uncertainties and, as such, we are unable to estimate the possible loss or range of loss that may result. An adverse outcome in one or more of these proceedings could result in adverse judgments, settlements, fines, penalties or other relief that could have a material adverse effect on the consolidated financial condition or results of operations of Ameriprise Financial or one or more of its affiliates that provide services to the Fund.
| 34 | Columbia Strategic New York Municipal Income Fund | Annual Report 2023 |
Report of Independent Registered Public Accounting Firm
To the Board of Trustees of Columbia Funds Series Trust I and Shareholders of Columbia Strategic New York Municipal Income Fund
Opinion on the Financial Statements
We have audited the accompanying statement of assets and liabilities, including the portfolio of investments, of Columbia Strategic New York Municipal Income Fund (one of the funds constituting Columbia Funds Series Trust I, referred to hereafter as the "Fund") as of October 31, 2023, the related statement of operations for the year ended October 31, 2023, the statement of changes in net assets for each of the two years in the period ended October 31, 2023, including the related notes, and the financial highlights for each of the five years in the period ended October 31, 2023 (collectively referred to as the "financial statements"). In our opinion, the financial statements present fairly, in all material respects, the financial position of the Fund as of October 31, 2023, the results of its operations for the year then ended, the changes in its net assets for each of the two years in the period ended October 31, 2023 and the financial highlights for each of the five years in the period ended October 31, 2023 in conformity with accounting principles generally accepted in the United States of America.
Basis for Opinion
These financial statements are the responsibility of the Fund’s management. Our responsibility is to express an opinion on the Fund’s financial statements based on our audits. We are a public accounting firm registered with the Public Company Accounting Oversight Board (United States) (PCAOB) and are required to be independent with respect to the Fund in accordance with the U.S. federal securities laws and the applicable rules and regulations of the Securities and Exchange Commission and the PCAOB.
We conducted our audits of these financial statements in accordance with the standards of the PCAOB. Those standards require that we plan and perform the audit to obtain reasonable assurance about whether the financial statements are free of material misstatement, whether due to error or fraud.
Our audits included performing procedures to assess the risks of material misstatement of the financial statements, whether due to error or fraud, and performing procedures that respond to those risks. Such procedures included examining, on a test basis, evidence regarding the amounts and disclosures in the financial statements. Our audits also included evaluating the accounting principles used and significant estimates made by management, as well as evaluating the overall presentation of the financial statements. Our procedures included confirmation of securities owned as of October 31, 2023 by correspondence with the custodian, transfer agent and broker; when a reply was not received from the broker, we performed other auditing procedures. We believe that our audits provide a reasonable basis for our opinion.
/s/PricewaterhouseCoopers LLP
Minneapolis, Minnesota
December 20, 2023
We have served as the auditor of one or more investment companies within the Columbia Funds Complex since 1977.
Columbia Strategic New York Municipal Income Fund | Annual Report 2023
| 35 |
Federal Income Tax Information
(Unaudited)
The Fund hereby designates the following tax attributes for the fiscal year ended October 31, 2023. Shareholders will be notified in early 2024 of the amounts for use in preparing 2023 income tax returns.
Exempt-
interest
dividends | |
| 99.11% | |
Exempt-interest dividends. The percentage of net investment income distributed during the fiscal year that qualifies as exempt-interest dividends for federal income tax purposes. A portion of the income may be subject to federal alternative minimum tax.
TRUSTEES AND OFFICERS
(Unaudited)
The Board oversees the Fund’s operations and appoints officers who are responsible for day-to-day business decisions based on policies set by the Board. The following table provides basic biographical information about the Fund’s Trustees as of the printing of this report, including their principal occupations during the past five years, although specific titles for individuals may have varied over the period. The year set forth beneath Length of Service in the table below is the year in which the Trustee was first appointed or elected as Trustee to any Fund currently in the Columbia Funds Complex or a predecessor thereof. Under current Board policy, each Trustee generally serves until December 31 of the year such Trustee turns seventy-five (75).
Independent trustees
Name,
address,
year of birth | Position held
with the Columbia Funds and
length of service | Principal occupation(s)
during past five years
and other relevant
professional experience | Number of
Funds in the
Columbia Funds
Complex*
overseen | Other directorships
held by Trustee
during the past five years
and other relevant Board experience |
George S. Batejan
c/o Columbia Management
Investment Advisers, LLC
290 Congress Street
Boston, MA 02210
1954 | Trustee since 2017 | Executive Vice President, Global Head of Technology and Operations, Janus Capital Group, Inc., 2010-2016 | 170 | Former Chairman of the Board, NICSA (National Investment Company Services Association) (Executive Committee, Nominating Committee and Governance Committee), 2014-2016; former Director, Intech Investment Management, 2011-2016; former Board Member, Metro Denver Chamber of Commerce, 2015-2016; former Advisory Board Member, University of Colorado Business School, 2015-2018; former Board Member, Chase Bank International, 1993-1994 |
| 36 | Columbia Strategic New York Municipal Income Fund | Annual Report 2023 |
TRUSTEES AND OFFICERS (continued)
(Unaudited)
Independent trustees (continued)
Name,
address,
year of birth | Position held
with the Columbia Funds and
length of service | Principal occupation(s)
during past five years
and other relevant
professional experience | Number of
Funds in the
Columbia Funds
Complex*
overseen | Other directorships
held by Trustee
during the past five years
and other relevant Board experience |
Kathleen Blatz
c/o Columbia Management
Investment Advisers, LLC
290 Congress Street
Boston, MA 02210
1954 | Trustee since 2006 | Attorney, specializing in arbitration and mediation; Chief Justice, Minnesota Supreme Court, 1998-2006; Associate Justice, Minnesota Supreme Court, 1996-1998; Fourth Judicial District Court Judge, Hennepin County, 1994-1996; Attorney in private practice and public service, 1984-1993; State Representative, Minnesota House of Representatives, 1979-1993, which included service on the Tax and Financial Institutions and Insurance Committees; Member and Interim Chair, Minnesota Sports Facilities Authority, January-July 2017; Interim President and Chief Executive Officer, Blue Cross and Blue Shield of Minnesota (health care insurance), February-July 2018, April-October 2021 | 170 | Former Trustee, Blue Cross and Blue Shield of Minnesota, 2009-2021 (Chair of the Business Development Committee, 2014-2017; Chair of the Governance Committee, 2017-2019); former Member and Chair of the Board, Minnesota Sports Facilities Authority, January 2017-July 2017; former Director, Robina Foundation, 2009-2020 (Chair, 2014-2020); Director, Richard M. Schulze Family Foundation, since 2021 |
Pamela G. Carlton
c/o Columbia Management
Investment Advisers, LLC
290 Congress Street
Boston, MA 02210
1954 | Chair since 2023; Trustee since 2007 | President, Springboard – Partners in Cross Cultural Leadership (consulting company), since 2003; Managing Director of US Equity Research, JP Morgan Chase, 1999-2003; Director of US Equity Research, Chase Asset Management, 1996-1999; Co-Director Latin America Research, 1993-1996, COO Global Research, 1992-1996, Co-Director of US Research, 1991-1992, Investment Banker, 1982-1991, Morgan Stanley; Attorney, Cleary Gottlieb Steen & Hamilton LLP, 1980-1982 | 170 | Trustee, New York Presbyterian Hospital Board, since 1996; Director, DR Bank (Audit Committee) since 2017; Director, Evercore Inc. (Audit Committee, Nominating and Governance Committee), since 2019; Director, Apollo Commercial Real Estate Finance, Inc. (Chair, Nominating and Governance Committee) (financial services), since 2021; the Governing Council of the Independent Directors Council (IDC), since 2021 |
Janet Langford Carrig
c/o Columbia Management
Investment Advisers, LLC
290 Congress Street
Boston, MA 02210
1957 | Trustee since 1996 | Senior Vice President, General Counsel and Corporate Secretary, ConocoPhillips (independent energy company), September 2007-October 2018 | 170 | Director, EQT Corporation (natural gas producer), since 2019; former Director, Whiting Petroleum Corporation (independent oil and gas company), 2020-2022 |
J. Kevin Connaughton
c/o Columbia Management
Investment Advisers, LLC
290 Congress Street
Boston, MA 02210
1964 | Trustee since 2020 | CEO and President, RhodeWay Financial (non-profit financial planning firm), since December 2022; Member, FINRA National Adjudicatory Council, since January 2020; Adjunct Professor of Finance, Bentley University since January 2018; Consultant to Independent Trustees of CFVIT and CFST I from March 2016 to June 2020 with respect to CFVIT and to December 2020 with respect to CFST I; Managing Director and General Manager of Mutual Fund Products, Columbia Management Investment Advisers, LLC, May 2010-February 2015; President, Columbia Funds, 2008-2015; and senior officer of Columbia Funds and affiliated funds, 2003-2015 | 168 | Former Director, The Autism Project, March 2015-December 2021; former Member of the Investment Committee, St. Michael’s College, November 2015-February 2020; former Trustee, St. Michael’s College, June 2017-September 2019; former Trustee, New Century Portfolios (former mutual fund complex), January 2015-December 2017 |
Columbia Strategic New York Municipal Income Fund | Annual Report 2023
| 37 |
TRUSTEES AND OFFICERS (continued)
(Unaudited)
Independent trustees (continued)
Name,
address,
year of birth | Position held
with the Columbia Funds and
length of service | Principal occupation(s)
during past five years
and other relevant
professional experience | Number of
Funds in the
Columbia Funds
Complex*
overseen | Other directorships
held by Trustee
during the past five years
and other relevant Board experience |
Olive M. Darragh
c/o Columbia Management
Investment Advisers, LLC
290 Congress Street
Boston, MA 02210
1962 | Trustee since 2020 | Managing Director of Darragh Inc. (strategy and talent management consulting firm), since 2010; Founder and CEO, Zolio, Inc. (investment management talent identification platform), since 2004; Consultant to Independent Trustees of CFVIT and CFST I from June 2019 to June 2020 with respect to CFVIT and to December 2020 with respect to CFST I; Partner, Tudor Investments, 2004-2010; Senior Partner, McKinsey & Company (consulting), 1990-2004; Touche Ross CPA, 1985-1988 | 168 | Treasurer, Edinburgh University US Trust Board, since January 2023; Member, HBS Community Action Partners Board, since September 2022; former Director, University of Edinburgh Business School (Member of US Board), 2004-2019; former Director, Boston Public Library Foundation, 2008-2017 |
Patricia M. Flynn
c/o Columbia Management
Investment Advisers, LLC
290 Congress Street
Boston, MA 02210
1950 | Trustee since 2004 | Professor Emeritus of Economics and Management, Bentley University, since 2023; Professor of Economics and Management, Bentley University, 1976-2023; Dean, McCallum Graduate School of Business, Bentley University, 1992-2002 | 170 | Former Trustee, MA Taxpayers Foundation, 1997-2022; former Director, The MA Business Roundtable, 2003-2019; former Chairperson, Innovation Index Advisory Committee, MA Technology Collaborative, 1997-2020 |
Brian J. Gallagher
c/o Columbia Management
Investment Advisers, LLC
290 Congress Street
Boston, MA 02210
1954 | Trustee since 2017 | Retired; Partner with Deloitte & Touche LLP and its predecessors, 1977-2016 | 170 | Trustee, Catholic Schools Foundation, since 2004 |
Douglas A. Hacker
c/o Columbia Management
Investment Advisers, LLC
290 Congress Street
Boston, MA 02210
1955 | Trustee since 1996 | Independent business executive, since May 2006; Executive Vice President – Strategy of United Airlines, December 2002 - May 2006; President of UAL Loyalty Services (airline marketing company), September 2001-December 2002; Executive Vice President and Chief Financial Officer of United Airlines, July 1999-September 2001 | 170 | Director, SpartanNash Company since November 2013 (Chair of the Board, since May 2021) (food distributor); Director, Aircastle Limited (Chair of Audit Committee) (aircraft leasing), since August 2006; former Director, Nash Finch Company (food distributor), 2005-2013; former Director, SeaCube Container Leasing Ltd. (container leasing), 2010-2013; and former Director, Travelport Worldwide Limited (travel information technology), 2014-2019 |
Nancy T. Lukitsh
c/o Columbia Management
Investment Advisers, LLC
290 Congress Street
Boston, MA 02210
1956 | Trustee since 2011 | Senior Vice President, Partner and Director of Marketing, Wellington Management Company, LLP (investment adviser), 1997-2010; Chair, Wellington Management Portfolios (commingled non-U.S. investment pools), 2007-2010; Director, Wellington Trust Company, NA and other Wellington affiliates, 1997-2010 | 168 | None |
| 38 | Columbia Strategic New York Municipal Income Fund | Annual Report 2023 |
TRUSTEES AND OFFICERS (continued)
(Unaudited)
Independent trustees (continued)
Name,
address,
year of birth | Position held
with the Columbia Funds and
length of service | Principal occupation(s)
during past five years
and other relevant
professional experience | Number of
Funds in the
Columbia Funds
Complex*
overseen | Other directorships
held by Trustee
during the past five years
and other relevant Board experience |
David M. Moffett
c/o Columbia Management
Investment Advisers, LLC
290 Congress Street
Boston, MA 02210
1952 | Trustee since 2011 | Retired; former Chief Executive Officer of Freddie Mac and Chief Financial Officer of U.S. Bank | 168 | Director, CSX Corporation (transportation suppliers); Director, PayPal Holdings Inc. (payment and data processing services); Trustee, University of Oklahoma Foundation; former Director, eBay Inc. (online trading community), 2007-2015; and former Director, CIT Bank, CIT Group Inc. (commercial and consumer finance), 2010-2016; former Senior Adviser to The Carlyle Group (financial services), March 2008-September 2008; former Governance Consultant to Bridgewater Associates, January 2013-December 2015 |
Catherine James Paglia
c/o Columbia Management
Investment Advisers, LLC
290 Congress Street
Boston, MA 02210
1952 | Trustee since 2004 | Director, Enterprise Asset Management, Inc. (private real estate and asset management company), since September 1998; Managing Director and Partner, Interlaken Capital, Inc., 1989-1997; Vice President, 1982-1985, Principal, 1985-1987, Managing Director, 1987-1989, Morgan Stanley; Vice President, Investment Banking, 1980-1982, Associate, Investment Banking, 1976-1980, Dean Witter Reynolds, Inc. | 170 | Director, Valmont Industries, Inc. (irrigation systems manufacturer), since 2012; Trustee, Carleton College (on the Investment Committee), since 1987; Trustee, Carnegie Endowment for International Peace (on the Investment Committee), since 2009 |
Natalie A. Trunow
c/o Columbia Management
Investment Advisers, LLC
290 Congress Street
Boston, MA 02210
1967 | Trustee since 2020 | Chief Executive Officer, Millennial Portfolio Solutions LLC (asset management and consulting services), January 2016-January 2021; Non-executive Member of the Investment Committee and Valuation Committee, Sarona Asset Management Inc. (private equity firm) since September 2019; Advisor, Horizon Investments (asset management and consulting services), August 2018-January 2022; Advisor, Paradigm Asset Management, November 2016-January 2022; Consultant to Independent Trustees of CFVIT and CFST I from September 2016 to June 2020 with respect to CFVIT and to December 2020 with respect to CFST I; Director of Investments/Consultant, Casey Family Programs, April 2016-November 2016; Senior Vice President and Chief Investment Officer, Calvert Investments, August 2008-January 2016; Section Head and Portfolio Manager, General Motors Asset Management, June 1997-August 2008 | 168 | Independent Director, Investment Committee, Health Services for Children with Special Needs, Inc., 2010-2021; Independent Director, (Executive Committee and Chair, Audit Committee), Consumer Credit Counseling Services (formerly Guidewell Financial Solutions), since 2016; Independent Director, (Investment Committee), Sarona Asset Management, since 2019 |
Columbia Strategic New York Municipal Income Fund | Annual Report 2023
| 39 |
TRUSTEES AND OFFICERS (continued)
(Unaudited)
Independent trustees (continued)
Name,
address,
year of birth | Position held
with the Columbia Funds and
length of service | Principal occupation(s)
during past five years
and other relevant
professional experience | Number of
Funds in the
Columbia Funds
Complex*
overseen | Other directorships
held by Trustee
during the past five years
and other relevant Board experience |
Sandra L. Yeager
c/o Columbia Management
Investment Advisers, LLC
290 Congress Street
Boston, MA 02210
1964 | Trustee since 2017 | Retired; President and founder, Hanoverian Capital, LLC (SEC registered investment advisor firm), 2008-2016; Managing Director, DuPont Capital, 2006-2008; Managing Director, Morgan Stanley Investment Management, 2004-2006; Senior Vice President, Alliance Bernstein, 1990-2004 | 170 | Former Director, NAPE (National Alliance for Partnerships in Equity) Education Foundation, October 2016-October 2020; Advisory Board, Jennersville YMCA, since 2022 |
Interested trustee affiliated with Investment Manager**
Name,
address,
year of birth | Position held with the Columbia Funds and length of service | Principal occupation(s) during the
past five years and other relevant
professional experience | Number of
Funds in the
Columbia Funds
Complex* overseen | Other directorships
held by Trustee
during the past
five years and
other relevant Board experience |
Daniel J. Beckman
c/o Columbia Management
Investment Advisers, LLC
290 Congress Street
Boston, MA 02210
1962 | Trustee since November 2021 and President since June 2021 | Vice President – Head of North America Product, Columbia Management Investment Advisers, LLC, since April 2015; President and Principal Executive Officer of the Columbia Funds, since June 2021; officer of Columbia Funds and affiliated funds, 2020-2021; Co-President and Principal Executive Officer, Columbia Acorn/Wanger Funds, since July 2021 | 170 | Director, Ameriprise Trust Company, since October 2016; Director, Columbia Management Investment Distributors, Inc. since November 2018; Board of Governors, Columbia Wanger Asset Management, LLC since, January 2022; Director, Columbia Threadneedle Canada, Inc., since December 2022 |
| * | The term “Columbia Funds Complex” as used herein includes Columbia Seligman Premium Technology Growth Fund, Tri-Continental Corporation and each series of Columbia Funds Series Trust (CFST), Columbia Funds Series Trust I (CFST I), Columbia Funds Series Trust II (CFST II), Columbia ETF Trust I (CET I), Columbia ETF Trust II (CET II), Columbia Funds Variable Insurance Trust (CFVIT) and Columbia Funds Variable Series Trust II (CFVST II). Messrs. Batejan, Beckman, Gallagher and Hacker and Mses. Blatz, Carlton, Carrig, Flynn, Paglia, and Yeager serve as directors of Columbia Seligman Premium Technology Growth Fund and Tri-Continental Corporation. |
| ** | Interested person (as defined under the 1940 Act) by reason of being an officer, director, security holder and/or employee of the Investment Manager or Ameriprise Financial. |
The Statement of Additional Information has additional information about the Fund’s Board members and is available, without charge, upon request by calling 800.345.6611, visiting columbiathreadneedleus.com/investor/ or contacting your financial intermediary.
| 40 | Columbia Strategic New York Municipal Income Fund | Annual Report 2023 |
TRUSTEES AND OFFICERS (continued)
(Unaudited)
The Board has appointed officers who are responsible for day-to-day business decisions based on policies it has established. The officers serve at the pleasure of the Board. The following table provides basic information about the Officers of the Fund as of the printing of this report, including principal occupations during the past five years, although their specific titles may have varied over the period. In addition to Mr. Beckman, who is President and Principal Executive Officer, the Fund’s other officers are:
Fund officers
Name,
address and
year of birth | Position and year
first appointed to
position for any Fund
in the Columbia
Funds Complex or a
predecessor thereof | Principal occupation(s) during past five years |
Michael G. Clarke
290 Congress Street
Boston, MA 02210
1969 | Chief Financial Officer and Principal Financial Officer (2009) and Senior Vice President (2019) | Senior Vice President and North America Head of Operations & Investor Services, Columbia Management Investment Advisers, LLC, since June 2023 (previously Senior Vice President and Head of Global Operations, March 2022 – June 2023, Vice President, Head of North America Operations, and Co-Head of Global Operations, June 2019 - February 2022 and Vice President – Accounting and Tax, May 2010 - May 2019); senior officer of Columbia Funds and affiliated funds, since 2002. Director, Ameriprise Trust Company, since June 2023. |
Joseph Beranek
5890 Ameriprise Financial Center
Minneapolis, MN 55474
1965 | Treasurer and Chief Accounting Officer (Principal Accounting Officer) (2019) and Principal Financial Officer (2020), CFST, CFST I, CFST II, CFVIT and CFVST II; Assistant Treasurer, CET I and CET II | Vice President – Mutual Fund Accounting and Financial Reporting, Columbia Management Investment Advisers, LLC, since December 2018 and March 2017, respectively. |
Marybeth Pilat
290 Congress Street
Boston, MA 02210
1968 | Treasurer and Chief Accounting Officer (Principal Accounting Officer) and Principal Financial Officer (2020) for CET I and CET II; Assistant Treasurer, CFST, CFST I, CFST II, CFVIT and CFVST II | Vice President – Product Pricing and Administration, Columbia Management Investment Advisers, LLC, since May 2017. |
William F. Truscott
290 Congress Street
Boston, MA 02210
1960 | Senior Vice President (2001) | Formerly, Trustee/Director of Columbia Funds Complex or legacy funds, November 2001 - January 1, 2021; Chief Executive Officer, Global Asset Management, Ameriprise Financial, Inc., since September 2012; Chairman of the Board and President, Columbia Management Investment Advisers, LLC, since July 2004 and February 2012, respectively; Chairman of the Board and Chief Executive Officer, Columbia Management Investment Distributors, Inc., since November 2008 and February 2012, respectively; Chairman of the Board and Director, Threadneedle Asset Management Holdings, Sàrl, since March 2013 and December 2008, respectively; senior executive of various entities affiliated with Columbia Threadneedle. |
Christopher O. Petersen
5228 Ameriprise Financial Center
Minneapolis, MN 55474
1970 | Senior Vice President and Assistant Secretary (2021) | Formerly, Trustee/Director of funds within the Columbia Funds Complex, July 1, 2020 - November 22, 2021; Senior Vice President and Assistant General Counsel, Ameriprise Financial, Inc., since September 2021 (previously Vice President and Lead Chief Counsel, January 2015 - September 2021); formerly, President and Principal Executive Officer of the Columbia Funds, 2015 - 2021; officer of Columbia Funds and affiliated funds, since 2007. |
Thomas P. McGuire
290 Congress Street
Boston, MA 02210
1972 | Senior Vice President and Chief Compliance Officer (2012) | Vice President – Asset Management Compliance, Ameriprise Financial, Inc., since May 2010; Chief Compliance Officer, Columbia Acorn/Wanger Funds, since December 2015; formerly, Chief Compliance Officer, Ameriprise Certificate Company, September 2010 – September 2020. |
Ryan C. Larrenaga
290 Congress Street
Boston, MA 02210
1970 | Senior Vice President (2017), Chief Legal Officer (2017), and Secretary (2015) | Vice President and Chief Counsel, Ameriprise Financial, Inc., since August 2018 (previously Vice President and Group Counsel, August 2011 - August 2018); Chief Legal Officer, Columbia Acorn/Wanger Funds, since September 2020; officer of Columbia Funds and affiliated funds, since 2005. |
Columbia Strategic New York Municipal Income Fund | Annual Report 2023
| 41 |
TRUSTEES AND OFFICERS (continued)
(Unaudited)
Fund officers (continued)
Name,
address and
year of birth | Position and year
first appointed to
position for any Fund
in the Columbia
Funds Complex or a
predecessor thereof | Principal occupation(s) during past five years |
Michael E. DeFao
290 Congress Street
Boston, MA 02210
1968 | Vice President (2011) and Assistant Secretary (2010) | Vice President and Chief Counsel, Ameriprise Financial, Inc., since May 2010; Vice President, Chief Legal Officer and Assistant Secretary, Columbia Management Investment Advisers, LLC, since October 2021 (previously Vice President and Assistant Secretary, May 2010 – September 2021). |
Lyn Kephart-Strong
5903 Ameriprise Financial Center
Minneapolis, MN 55474
1960 | Vice President (2015) | Vice President, Global Investment Operations Services, Columbia Management Investment Advisers, LLC, since 2010; Director (since January 2007) and President (since October 2014), Columbia Management Investment Services Corp.; Director (since December 2017) and President (since January 2017), Ameriprise Trust Company. |
Approval of Management Agreement
(Unaudited)
Columbia Management Investment Advisers, LLC (the Investment Manager, and together with its domestic and global affiliates, Columbia Threadneedle Investments), a wholly-owned subsidiary of Ameriprise Financial, Inc. (Ameriprise Financial), serves as the investment manager to Columbia Strategic New York Municipal Income Fund (the Fund). Under a management agreement (the Management Agreement), the Investment Manager provides investment advice and other services to the Fund and other funds distributed by Columbia Management Investment Distributors, Inc. (collectively, the Funds).
On an annual basis, the Fund’s Board of Trustees (the Board), including the independent Board members (the Independent Trustees), considers renewal of the Management Agreement. The Investment Manager prepared detailed reports for the Board and its Contracts Committee (including its Contracts Subcommittee) in February, March, April, May and June 2023, including reports providing the results of analyses performed by a third-party data provider, Broadridge Financial Solutions, Inc. (Broadridge), and comprehensive responses by the Investment Manager to written requests for information by independent legal counsel to the Independent Trustees (Independent Legal Counsel), to assist the Board in making this determination. In addition, throughout the year, the Board (or its committees or subcommittees) regularly meets with portfolio management teams and senior management personnel and reviews information prepared by the Investment Manager addressing the services the Investment Manager provides and Fund performance. The Board also accords appropriate weight to the work, deliberations and conclusions of the various committees (including their subcommittees), such as the Contracts Committee, the Investment Review Committee, the Audit Committee and the Compliance Committee in determining whether to continue the Management Agreement.
The Board, at its June 22, 2023 Board meeting (the June Meeting), considered the renewal of the Management Agreement for an additional one-year term. At the June Meeting, Independent Legal Counsel reviewed with the Independent Trustees various factors relevant to the Board’s consideration of advisory agreements and the Board’s legal responsibilities related to such consideration. The Independent Trustees considered all information that they, their legal counsel or the Investment Manager believed reasonably necessary to evaluate and to approve the continuation of the Management Agreement. Among other things, the information and factors considered included the following:
| • | Information on the investment performance of the Fund relative to the performance of a group of mutual funds determined to be comparable to the Fund by Broadridge, as well as performance relative to one or more benchmarks; |
| • | Information on the Fund’s management fees and total expenses, including information comparing the Fund’s expenses to those of a group of comparable mutual funds, as determined by Broadridge; |
| 42 | Columbia Strategic New York Municipal Income Fund | Annual Report 2023 |
Approval of Management Agreement (continued)
(Unaudited)
| • | The Investment Manager’s agreement to contractually limit or cap total operating expenses for the Fund so that total operating expenses (excluding certain fees and expenses, such as transaction costs and certain other investment related expenses, interest, taxes, acquired fund fees and expenses and infrequent and/or unusual expenses) would not exceed a specified annual rate, as a percentage of the Fund’s net assets; |
| • | Terms of the Management Agreement; |
| • | Descriptions of other agreements and arrangements with affiliates of the Investment Manager relating to the operations of the Fund, including agreements with respect to the provision of transfer agency and shareholder services to the Fund; |
| • | Descriptions of various services performed by the Investment Manager under the Management Agreement, including portfolio management and portfolio trading practices; |
| • | Information regarding any recently negotiated management fees of similarly-managed portfolios of other institutional clients of the Investment Manager; |
| • | Information regarding the resources of the Investment Manager, including information regarding senior management, portfolio managers and other personnel; |
| • | Information regarding the capabilities of the Investment Manager with respect to compliance monitoring services; |
| • | The profitability to the Investment Manager and its affiliates from their relationships with the Fund; and |
| • | Report provided by the Board’s independent fee consultant, JDL Consultants, LLC (JDL). |
Following an analysis and discussion of the foregoing, and the factors identified below, the Board, including all of the Independent Trustees, approved the renewal of the Management Agreement.
Nature, extent and quality of services provided by the Investment Manager
The Board analyzed various reports and presentations it had received detailing the services performed by the Investment Manager, as well as its history, expertise, resources and relative capabilities, and the qualifications of its personnel.
The Board specifically considered the many developments during recent years concerning the services provided by the Investment Manager. Among other things, the Board noted the organization and depth of the equity and credit research departments. The Board further observed the enhancements to the investment risk management department’s processes, systems and oversight over the past several years. The Board also took into account the broad scope of services provided by the Investment Manager to the Fund, including, among other services, investment, risk and compliance oversight. The Board also took into account the information it received concerning the Investment Manager’s ability to attract and retain key portfolio management personnel and that it has sufficient resources to provide competitive and adequate compensation to investment personnel.
In connection with the Board’s evaluation of the overall package of services provided by the Investment Manager, the Board also considered the nature, quality and range of administrative services provided to the Fund by the Investment Manager, as well as the achievements in 2022 in the performance of administrative services, and noted the various enhancements anticipated for 2023. In evaluating the quality of services provided under the Management Agreement, the Board also took into account the organization and strength of the Fund’s and its service providers’ compliance programs. The Board also reviewed the financial condition of the Investment Manager and its affiliates and each entity’s ability to carry out its responsibilities under the Management Agreement and the Fund’s other service agreements.
In addition, the Board discussed the acceptability of the terms of the Management Agreement, noting that no changes were proposed from the form of agreement previously approved. The Board also noted the wide array of legal and compliance services provided to the Fund under the Management Agreement.
After reviewing these and related factors (including investment performance as discussed below), the Board concluded, within the context of their overall conclusions, that the nature, extent and quality of the services provided to the Fund under the Management Agreement supported the continuation of the Management Agreement.
Columbia Strategic New York Municipal Income Fund | Annual Report 2023
| 43 |
Approval of Management Agreement (continued)
(Unaudited)
Investment performance
The Board carefully reviewed the investment performance of the Fund, including detailed reports providing the results of analyses performed by each of the Investment Manager, Broadridge and JDL collectively showing, for various periods (including since manager inception): (i) the performance of the Fund, (ii) the Fund’s performance relative to peers and benchmarks and (iii) the net assets of the Fund. The Board observed the Fund’s underperformance for certain periods, noting that such Fund’s performance was generally consistent with expectations in light of the interrelationship of the Fund’s specific investment strategy with prevailing market conditions.
The Board also reviewed a description of the third-party data provider’s methodology for identifying the Fund’s peer groups for purposes of performance and expense comparisons.
The Board also considered the Investment Manager’s performance and reputation generally. After reviewing these and related factors, the Board concluded, within the context of their overall conclusions, that the performance of the Fund and the Investment Manager, in light of other considerations, supported the continuation of the Management Agreement.
Comparative fees, costs of services provided and the profits realized by the Investment Manager and its affiliates from their relationships with the Fund
The Board reviewed comparative fees and the costs of services provided under the Management Agreement. The Board members considered detailed comparative information set forth in an annual report on fees and expenses, including, among other things, data (based on analyses conducted by Broadridge and JDL) showing a comparison of the Fund’s expenses with median expenses paid by funds in its comparative peer universe, as well as data showing the Fund’s contribution to the Investment Manager’s profitability.
The Board considered the reports of JDL, which assisted in the Board’s analysis of the Funds’ performance and expenses and the reasonableness of the Funds’ fee rates. The Board accorded particular weight to the notion that a primary objective of the level of fees is to achieve a rational pricing model applied consistently across the various product lines in the Fund family, while assuring that the overall fees for each Fund (with certain exceptions) are generally in line with the current “pricing philosophy” such that Fund total expense ratios, in general, approximate or are lower than the median expense ratios of funds in the same Lipper comparison universe. The Board took into account that the Fund’s total expense ratio (after considering proposed expense caps/waivers) approximated the peer universe’s median expense ratio.
After reviewing these and related factors, the Board concluded, within the context of their overall conclusions, that the levels of management fees and expenses of the Fund, in light of other considerations, supported the continuation of the Management Agreement.
The Board also considered the profitability of the Investment Manager and its affiliates in connection with the Investment Manager providing management services to the Fund. With respect to the profitability of the Investment Manager and its affiliates, the Independent Trustees referred to information discussing the profitability to the Investment Manager and Ameriprise Financial from managing, operating and distributing the Funds. The Board considered that the profitability generated by the Investment Manager in 2022 had declined from 2021 levels, due to a variety of factors, including the decreased assets under management of the Funds. It also took into account the indirect economic benefits flowing to the Investment Manager or its affiliates in connection with managing or distributing the Funds, such as the enhanced ability to offer various other financial products to Ameriprise Financial customers, soft dollar benefits and overall reputational advantages. The Board noted that the fees paid by the Fund should permit the Investment Manager to offer competitive compensation to its personnel, make necessary investments in its business and earn an appropriate profit. After reviewing these and related factors, the Board concluded, within the context of their overall conclusions, that the costs of services provided and the profitability to the Investment Manager and its affiliates from their relationships with the Fund supported the continuation of the Management Agreement.
| 44 | Columbia Strategic New York Municipal Income Fund | Annual Report 2023 |
Approval of Management Agreement (continued)
(Unaudited)
Economies of scale
The Board considered the potential existence of economies of scale in the provision by the Investment Manager of services to the Fund, and whether those economies of scale were shared with the Fund through breakpoints in investment management fees or other means, such as expense limitation arrangements and additional investments by the Investment Manager in investment, trading, compliance and other resources. The Board considered the economies of scale that might be realized as the Fund’s net asset level grows and took note of the extent to which Fund shareholders might also benefit from such growth. In this regard, the Board took into account that management fees decline as Fund assets exceed various breakpoints, all of which have not been surpassed. The Board observed that the Management Agreement provided for breakpoints in the management fee rate schedule that allow opportunities for shareholders to realize lower fees as Fund assets grow and that there are additional opportunities through other means for sharing economies of scale with shareholders.
Conclusion
The Board reviewed all of the above considerations in reaching its decision to approve the continuation of the Management Agreement. In reaching its conclusions, no single factor was determinative.
On June 22, 2023, the Board, including all of the Independent Trustees, determined that fees payable under the Management Agreement were fair and reasonable in light of the extent and quality of services provided and approved the renewal of the Management Agreement.
Columbia Strategic New York Municipal Income Fund | Annual Report 2023
| 45 |
[THIS PAGE INTENTIONALLY LEFT BLANK]
[THIS PAGE INTENTIONALLY LEFT BLANK]
Columbia Strategic New York Municipal Income Fund
P.O. Box 219104
Kansas City, MO 64121-9104
Please read and consider the investment objectives, risks, charges and expenses for any fund carefully before investing. For a prospectus and summary prospectus, which contains this and other important information about the Fund, go to
columbiathreadneedleus.com/investor/. The Fund is distributed by Columbia Management Investment Distributors, Inc., member FINRA, and managed by Columbia Management Investment Advisers, LLC.
Columbia Threadneedle Investments (Columbia Threadneedle) is the global brand name of the Columbia and Threadneedle group of companies. All rights reserved.
© 2023 Columbia Management Investment Advisers, LLC.
columbiathreadneedleus.com/investor/

Annual Report
October 31, 2023
Columbia New York Intermediate Municipal Bond Fund
Not FDIC or NCUA Insured • No Financial Institution Guarantee • May Lose Value
If you elect to receive the shareholder report for Columbia New York Intermediate Municipal Bond Fund (the Fund) in paper, mailed to you, the Fund mails one shareholder report to each shareholder address, unless such shareholder elects to receive shareholder reports from the Fund electronically via e-mail or by having a paper notice mailed to you (Postcard Notice) that your Fund’s shareholder report is available at the Columbia funds’ website (columbiathreadneedleus.com/investor/). If you would like more than one report in paper to be mailed to you, or would like to elect to receive reports via e-mail or access them through Postcard Notice, please call shareholder services at 800.345.6611 and additional reports will be sent to you.
Proxy voting policies and procedures
The policy of the Board of Trustees is to vote the proxies of the companies in which the Fund holds investments consistent with the procedures as stated in the Statement of Additional Information (SAI). You may obtain a copy of the SAI without charge by calling 800.345.6611; contacting your financial intermediary; visiting columbiathreadneedleus.com/investor/; or searching the website of the Securities and Exchange Commission (SEC) at sec.gov. Information regarding how the Fund voted proxies relating to portfolio securities is filed with the SEC by August 31st for the most recent 12-month period ending June 30th of that year, and is available without charge by visiting columbiathreadneedleus.com/investor/, or searching the website of the SEC at sec.gov.
Quarterly schedule of investments
The Fund files a complete schedule of portfolio holdings with the SEC for the first and third quarters of each fiscal year on Form N-PORT. The Fund’s Form N-PORT filings are available on the SEC’s website at sec.gov. The Fund’s complete schedule of portfolio holdings, as filed on Form N-PORT, is available on columbiathreadneedleus.com/investor/ or can also be obtained without charge, upon request, by calling 800.345.6611.
Additional Fund information
For more information about the Fund, please visit columbiathreadneedleus.com/investor/ or call 800.345.6611. Customer Service Representatives are available to answer your questions Monday through Friday from 8 a.m. to 7 p.m. Eastern time.
Fund investment manager
Columbia Management Investment Advisers, LLC (the Investment Manager)
290 Congress Street
Boston, MA 02210
Fund distributor
Columbia Management Investment Distributors, Inc.
290 Congress Street
Boston, MA 02210
Fund transfer agent
Columbia Management Investment Services Corp.
P.O. Box 219104
Kansas City, MO 64121-9104
Columbia New York Intermediate Municipal Bond Fund | Annual Report 2023
Fund at a Glance
(Unaudited)
Investment objective
The Fund seeks as high a level of current interest income exempt from federal income tax and, to the extent possible, from New York individual income tax, as is consistent with relative stability of principal.
Portfolio management
Paul Fuchs, CFA
Lead Portfolio Manager
Managed Fund since 2012
Douglas Rangel, CFA
Portfolio Manager
Managed the Fund since 2022
| Average annual total returns (%) (for the period ended October 31, 2023) |
| | | Inception | 1 Year | 5 Years | 10 Years |
| Class A | Excluding sales charges | 11/25/02 | 1.98 | 0.71 | 1.33 |
| | Including sales charges | | -1.08 | 0.10 | 1.03 |
| Advisor Class | 03/19/13 | 2.24 | 0.94 | 1.58 |
| Class C | Excluding sales charges | 11/25/02 | 1.52 | 0.25 | 0.88 |
| | Including sales charges | | 0.53 | 0.25 | 0.88 |
| Institutional Class | 12/31/91 | 2.24 | 0.96 | 1.59 |
| Institutional 2 Class* | 03/01/16 | 2.39 | 1.02 | 1.64 |
| Institutional 3 Class* | 03/01/17 | 2.44 | 1.07 | 1.66 |
| Class V | Excluding sales charges | 12/31/91 | 2.18 | 0.81 | 1.44 |
| | Including sales charges | | -2.67 | -0.17 | 0.95 |
| Bloomberg New York 3-15 Year Blend Municipal Bond Index | | 2.90 | 1.23 | 1.86 |
| Bloomberg 3-15 Year Blend Municipal Bond Index | | 2.49 | 1.27 | 1.97 |
Returns for Class A shares are shown with and without the maximum initial sales charge of 3.00%. Returns for Class C shares are shown with and without the 1.00% contingent deferred sales charge for the first year only. Returns for Class V shares are shown with and without the maximum initial sales charge of 4.75%. The Fund’s other share classes are not subject to sales charges and have limited eligibility. Please see the Fund’s prospectus for details. Performance for different share classes will vary based on differences in sales charges and fees associated with each share class. All results shown assume reinvestment of distributions during the period. Returns do not reflect the deduction of taxes that a shareholder may pay on Fund distributions or on the redemption of Fund shares. Performance results reflect the effect of any fee waivers or reimbursements of Fund expenses by Columbia Management Investment Advisers, LLC and/or any of its affiliates. Absent these fee waivers or expense reimbursement arrangements, performance results would have been lower.
The performance information shown represents past performance and is not a guarantee of future results. The investment return and principal value of your investment will fluctuate so that your shares, when redeemed, may be worth more or less than their original cost. Current performance may be lower or higher than the performance information shown. You may obtain performance information current to the most recent month-end by contacting your financial intermediary, visiting columbiathreadneedleus.com/investor/ or calling 800.345.6611.
| * | The returns shown for periods prior to the share class inception date (including returns for the Life of the Fund, if shown, which are since Fund inception) include the returns of the Fund’s oldest share class. Since the Fund launched more than one share class at its inception, Institutional Class shares were used. These returns are adjusted to reflect any higher class-related operating expenses of the newer share classes, as applicable. Please visit columbiathreadneedleus.com/investor/investment-products/mutual-funds/appended-performance for more information. |
The Bloomberg New York 3-15 Year Blend Municipal Bond Index tracks investment grade bonds from the state of New York and its municipalities.
The Bloomberg 3-15 Year Blend Municipal Bond Index is an unmanaged index that tracks the performance of municipal bonds issued after December 31, 1990, with remaining maturities between 2 and 17 years and at least $7 million in principal amount outstanding.
Indices are not available for investment, are not professionally managed and do not reflect sales charges, fees, brokerage commissions, taxes or other expenses of investing. Securities in the Fund may not match those in an index.
Columbia New York Intermediate Municipal Bond Fund | Annual Report 2023
| 3 |
Fund at a Glance (continued)
(Unaudited)
Performance of a hypothetical $10,000 investment (October 31, 2013 — October 31, 2023)
The chart above shows the change in value of a hypothetical $10,000 investment in Class A shares of Columbia New York Intermediate Municipal Bond Fund during the stated time period, and does not reflect the deduction of taxes that a shareholder may pay on Fund distributions or on the redemption of Fund shares.
| Quality breakdown (%) (at October 31, 2023) |
| AAA rating | 6.6 |
| AA rating | 34.3 |
| A rating | 42.2 |
| BBB rating | 11.3 |
| BB rating | 0.5 |
| Not rated | 5.1 |
| Total | 100.0 |
Percentages indicated are based upon total fixed income investments.
Bond ratings apply to the underlying holdings of the Fund and not the Fund itself and are divided into categories ranging from highest to lowest credit quality, determined by using the middle rating of Moody’s, S&P and Fitch, after dropping the highest and lowest available ratings. When ratings are available from only two rating agencies, the lower rating is used. When a rating is available from only one rating agency, that rating is used. If a security is not rated but has a rating by Kroll and/or DBRS, the same methodology is applied to those bonds that would otherwise be not rated. When a bond is not rated by any rating agency, it is designated as “Not rated.” Credit quality ratings assigned by a rating agency are subjective opinions, not statements of fact, and are subject to change, including daily. The ratings assigned by credit rating agencies are but one of the considerations that the Investment Manager and/or Fund’s subadviser incorporates into its credit analysis process, along with such other issuer-specific factors as cash flows, capital structure and leverage ratios, ability to de-leverage (repay) through free cash flow, quality of management, market positioning and access to capital, as well as such security-specific factors as the terms of the security (e.g., interest rate and time to maturity) and the amount and type of any collateral.
| 4 | Columbia New York Intermediate Municipal Bond Fund | Annual Report 2023 |
Manager Discussion of Fund Performance
(Unaudited)
For the 12-month period that ended October 31, 2023, Class A shares of Columbia New York Intermediate Municipal Bond Fund returned 1.98% excluding sales charges. Institutional Class shares of the Fund returned 2.24%. The Fund’s benchmark, the Bloomberg New York 3-15 Year Blend Municipal Bond Index, returned 2.90%, and the Bloomberg 3-15 Year Blend Municipal Bond Index, which is national in scope, returned 2.49% for the same time period.
Market overview
Municipal bonds delivered positive performance in the early part of the 12-month period, closing out a tumultuous 2022 and starting 2023 with a strong rally that was driven by high hopes for an end to the aggressive interest-rate hiking campaign by the U.S. Federal Reserve (Fed). Unfortunately, sentiment quickly unwound in February, as the market reconsidered the persistence of inflation and a consistently strong labor market. A more hawkish Fed led to a sell-off in rates, sending the 10-Year Treasury yield nearly 15 basis points (bps) higher from where it started in 2023. (A basis point is 1/100 of one percent.) In March, an unforeseen banking crisis unfolded, partially driven by higher interest rates. The weakness in the banking sector indicated the potential for additional downside risk to economic growth. In its late-March 2023 meeting, the Fed pushed through another 25 bps hike, but moderated its stance, signaling that we were closer to a pause, despite the data.
Treasury and municipal interest rates rose during the second quarter of 2023, as the regional banking crisis settled down, and the focus on the Fed’s tightening policy reignited. For the first time since it started hiking in March 2022, the Fed did not raise rates at its June meeting. Fed Chairman Powell took a hawkish stance and communicated the need to continue tightening and the possibility of rates remaining higher for longer. The Treasury and municipal markets experienced significant sell-offs in the third quarter of 2023, with the 10-year Treasury yield rising and municipal yields following a similar but more pronounced path. Treasury and municipal yields reached multi-year highs. Inflation remained stubbornly elevated, despite the Fed��s aggressive rate-hiking cycle. The Fed hiked rates 25 bps in July 2023 and indicated there may be one additional hike by year end. Municipal market yields increased in the final month of the period, the fourth consecutive month of rising rates. Nearly every segment of the market — credit quality, maturity, sector and state — delivered negative performance.
Investor aversion to interest-rate sensitive fixed income saw outflows from most fixed-income segments in favor of attractive rates on cash and cash-like instruments. Flows into money market funds and CDs, and out of most actively managed fixed-income mutual funds, particularly those on the long end of the curve, were a sustained theme over the 12-month period. That said, the much higher yields municipal bonds offered at the end of the period versus a year prior, or even just a few months prior to the end of the period, make municipals a much more attractive investment option, particularly as we believe we are at or near the end of the Fed’s interest rate hiking cycle. Fundamentals across most sectors remained healthy, and defaults were low by historical standards. A small number of sectors, such as hospitals and continuing care retirement communities (CCRCs), saw some weakening in their fundamentals. In addition, while U.S. states are sensitive to a possible economic slowdown or a capital market sell-off, many appeared relatively well positioned due to ongoing strengths in the economy and labor market along with high cash cushions, budget reserves, support from federal aid and relatively strong tax collections. Also, many states have managed recent budget surpluses conservatively in anticipation of a potential economic slowdown. However, a number of states, such as California and New York, have forecasted budget deficits in the coming years, and the municipal market may face additional pressures if the economy slows, and unemployment rises.
The New York State economy has shown signs of resilience through 2023, with an ongoing gradual recovery following the pandemic. Steady employment growth in 2023 has enabled New York to finally surpass pre-pandemic employment levels with growth being driven by health care, professional and business services, and leisure and hospitality. The finance industry continued to underperform through 2023 with several firms having announced layoffs and expectations for another lean year for bonuses, which we believe will likely translate into softness in the state’s personal income tax revenue performance. Despite the below median pace of economic rebound for the state of New York, the absolute levels of improvement have been ample enough to markedly improve the overall fiscal health of the state’s credit profile through significant tax revenue outperformance. Like many other U.S. States, New York has been prudent with the unexpected tax revenue windfall through building up budget reserves to record levels. We believe that these have put the state in a healthy position to absorb a slowing economy and lower capital market valuations which will impact the state through lower capital gains taxes from high earners and Wall Street. We believe New York has a sound fiscal track record of prudent budget management, which is demonstrated by their high credit ratings and below median pension burden from well-funded pension plans. With expectations of a slowing economic outlook, we believe the municipal market will be looking for the state of New York to
Columbia New York Intermediate Municipal Bond Fund | Annual Report 2023
| 5 |
Manager Discussion of Fund Performance (continued)
(Unaudited)
remain committed to fiscal prudence. In our view, one notable headwind facing New York in the coming years will be assisting the NY Metropolitan Transportation Authority (MTA) with its fiscal challenges without material negative impact to the state’s credit profile, as the billions in federal COVID aid provided to the MTA wind down in coming years.
The Fund experienced an increased level of portfolio turnover during the period, as compared to the previous reporting period during which portfolio activity was muted due to a challenging market environment. Portfolio turnover during the period ended October 31, 2023 represents a return to a level more in line with our expectations and possibly higher due to a decline in overall Fund assets.
The Fund’s notable detractors during the period
| • | The Fund’s exposure to CCRCs detracted from performance during the period. CCRCs have struggled with financial operating performance since 2022, due in large part to the increase in labor costs. We have focused research on this sector and expect a continued rebound in 2024. |
| • | Other sectors that performed poorly were local general obligations and special non-property tax. The lackluster performance was not due to fundamental issues but rather the timing of Fund purchases during the period. We believe these purchases will perform better going forward. |
| • | The Fund’s holdings in refunded bonds underperformed their benchmark counterparts during the period. The underperformance was due to the maturities of the refunded holdings in the benchmark being twice as long as those of the Fund’s holdings. As refunded bonds are of very high quality, we have no fundamental concerns with these positions. |
The Fund’s notable contributors during the period
| • | The Fund maintained a below benchmark duration for the entire 12-month period. After initially declining during the first three months, interest rates rose meaningfully during the remainder of the period. The below benchmark positioning helped to limit price declines as rates increased. Having a below benchmark exposure to interest rates in the six months during the period in which returns were negative aided the Fund in outperforming in five of them. |
| • | Portfolio return was positive due to the high level of income or yield, which more than offset price declines that occurred during the period. |
| • | Overweighted allocations to the lower investment-grade and non-investment grade quality segments contributed to Fund results as these areas outperformed higher quality segments during the period. |
| • | At the sector level, the Fund’s exposure to the hospital, transportation and education sectors performed well. Within the transportation sector, portfolio holdings in the Metropolitan Transportation Authority and the New York Port Authority produced healthy returns. These two issuers represent two of the Fund’s largest exposures and are synonymous with New York City. |
Fixed-income securities present issuer default risk. The Fund invests substantially in municipal securities and will be affected by tax, legislative, regulatory, demographic or political changes, as well as changes impacting a state’s financial, economic or other conditions. A relatively small number of tax-exempt issuers may necessitate the Fund investing more heavily in a single issuer and, therefore, be more exposed to the risk of loss than a Fund that invests more broadly. The value of the Fund’s portfolio may be more volatile than a more geographically diversified fund. Prepayment and extension risk exists because the timing of payments on a loan, bond or other investment may accelerate when interest rates fall or decelerate when interest rates rise which may reduce investment opportunities and potential returns. A rise in interest rates may result in a price decline of fixed-income instruments held by the Fund, negatively impacting its performance and NAV. Falling rates may result in the Fund investing in lower yielding debt instruments, lowering the Fund’s income and yield. These risks may be heightened for longer maturity and duration securities. Non-investment-grade (high-yield or junk) securities present greater price volatility and more risk to principal and income than higher rated securities. Market risk may affect a single issuer, sector of the economy, industry or the market as a whole. Federal and state tax rules apply to capital gain distributions and any gains or losses on sales. Income may be subject to state or local taxes. Liquidity risk is associated with the difficulty of selling underlying investments at a desirable time or price. Investing in derivatives is a specialized activity that involves special risks, which may result in significant losses. See the Fund’s prospectus for more information on these and other risks.
| 6 | Columbia New York Intermediate Municipal Bond Fund | Annual Report 2023 |
Manager Discussion of Fund Performance (continued)
(Unaudited)
The views expressed in this report reflect the current views of the respective parties who have contributed to this report. These views are not guarantees of future performance and involve certain risks, uncertainties and assumptions that are difficult to predict, so actual outcomes and results may differ significantly from the views expressed. These views are subject to change at any time based upon economic, market or other conditions and the respective parties disclaim any responsibility to update such views. These views may not be relied on as investment advice and, because investment decisions for a Columbia fund are based on numerous factors, may not be relied on as an indication of trading intent on behalf of any particular Columbia fund. References to specific securities should not be construed as a recommendation or investment advice.
Columbia New York Intermediate Municipal Bond Fund | Annual Report 2023
| 7 |
Understanding Your Fund’s Expenses
(Unaudited)
As an investor, you incur two types of costs. There are shareholder transaction costs, which generally include sales charges on purchases and may include redemption fees. There are also ongoing fund costs, which generally include management fees, distribution and/or service fees, and other fund expenses. The following information is intended to help you understand your ongoing costs (in dollars) of investing in the Fund and to help you compare these costs with the ongoing costs of investing in other mutual funds.
Analyzing your Fund’s expenses
To illustrate these ongoing costs, we have provided examples and calculated the expenses paid by investors in each share class of the Fund during the period. The actual and hypothetical information in the table is based on an initial investment of $1,000 at the beginning of the period indicated and held for the entire period. Expense information is calculated two ways and each method provides you with different information. The amount listed in the “Actual” column is calculated using the Fund’s actual operating expenses and total return for the period. You may use the Actual information, together with the amount invested, to estimate the expenses that you paid over the period. Simply divide your account value by $1,000 (for example, an $8,600 account value divided by $1,000 = 8.6), then multiply the results by the expenses paid during the period under the “Actual” column. The amount listed in the “Hypothetical” column assumes a 5% annual rate of return before expenses (which is not the Fund’s actual return) and then applies the Fund’s actual expense ratio for the period to the hypothetical return. You should not use the hypothetical account values and expenses to estimate either your actual account balance at the end of the period or the expenses you paid during the period. See “Compare with other funds” below for details on how to use the hypothetical data.
Compare with other funds
Since all mutual funds are required to include the same hypothetical calculations about expenses in shareholder reports, you can use this information to compare the ongoing cost of investing in the Fund with other funds. To do so, compare the hypothetical example with the 5% hypothetical examples that appear in the shareholder reports of other funds. As you compare hypothetical examples of other funds, it is important to note that hypothetical examples are meant to highlight the ongoing costs of investing in a fund only and do not reflect any transaction costs, such as sales charges, or redemption or exchange fees. Therefore, the hypothetical calculations are useful in comparing ongoing costs only, and will not help you determine the relative total costs of owning different funds. If transaction costs were included in these calculations, your costs would be higher.
| May 1, 2023 — October 31, 2023 |
| | Account value at the
beginning of the
period ($) | Account value at the
end of the
period ($) | Expenses paid during
the period ($) | Fund’s annualized
expense ratio (%) |
| | Actual | Hypothetical | Actual | Hypothetical | Actual | Hypothetical | Actual |
| Class A | 1,000.00 | 1,000.00 | 968.10 | 1,021.66 | 3.76 | 3.86 | 0.75 |
| Advisor Class | 1,000.00 | 1,000.00 | 969.30 | 1,022.93 | 2.51 | 2.58 | 0.50 |
| Class C | 1,000.00 | 1,000.00 | 965.90 | 1,019.36 | 6.01 | 6.17 | 1.20 |
| Institutional Class | 1,000.00 | 1,000.00 | 969.40 | 1,022.93 | 2.51 | 2.58 | 0.50 |
| Institutional 2 Class | 1,000.00 | 1,000.00 | 969.70 | 1,023.19 | 2.26 | 2.32 | 0.45 |
| Institutional 3 Class | 1,000.00 | 1,000.00 | 970.00 | 1,023.44 | 2.01 | 2.06 | 0.40 |
| Class V | 1,000.00 | 1,000.00 | 968.60 | 1,022.17 | 3.26 | 3.35 | 0.65 |
Expenses paid during the period are equal to the annualized expense ratio for each class as indicated above, multiplied by the average account value over the period and then multiplied by the number of days in the Fund’s most recent fiscal half year and divided by 365.
Expenses do not include fees and expenses incurred indirectly by the Fund from its investment in underlying funds, including affiliated and non-affiliated pooled investment vehicles, such as mutual funds and exchange-traded funds.
Had Columbia Management Investment Advisers, LLC and/or certain of its affiliates not waived/reimbursed certain fees and expenses, account value at the end of the period would have been reduced.
| 8 | Columbia New York Intermediate Municipal Bond Fund | Annual Report 2023 |
Portfolio of Investments
October 31, 2023
(Percentages represent value of investments compared to net assets)
Investments in securities
| Municipal Bonds 98.8% |
| Issue Description | Coupon
Rate | | Principal
Amount ($) | Value ($) |
| Air Transportation 2.2% |
| New York Transportation Development Corp.(a) |
| Refunding Revenue Bonds |
| American Airlines, Inc. Project |
| Series 2021 |
| 08/01/2031 | 3.000% | | 650,000 | 544,813 |
| Terminal 4 John F. Kennedy International Airport Project |
| Series 2020 |
| 12/01/2036 | 5.000% | | 800,000 | 795,995 |
| 12/01/2038 | 4.000% | | 300,000 | 253,777 |
| New York Transportation Development Corp. |
| Refunding Revenue Bonds |
| Terminal 4 John F. Kennedy International Airport Project |
| Series 2020 |
| 12/01/2038 | 5.000% | | 1,000,000 | 990,774 |
| Total | 2,585,359 |
| Charter Schools 1.2% |
| Build NYC Resource Corp. |
| Revenue Bonds |
| Academic Leadership Charter School Project |
| Series 2021 |
| 06/15/2036 | 4.000% | | 200,000 | 170,895 |
| Build NYC Resource Corp.(b) |
| Revenue Bonds |
| International Leadership Charter School |
| Series 2016 |
| 07/01/2046 | 6.250% | | 420,000 | 391,157 |
| Monroe County Industrial Development Corp.(b) |
| Revenue Bonds |
| True North Rochester Preparatory Charter School Project |
| Series 2020 |
| 06/01/2040 | 5.000% | | 900,000 | 829,956 |
| Total | 1,392,008 |
| Health Services 0.9% |
| New York State Dormitory Authority |
| Refunding Revenue Bonds |
| Icahn School of Medicine at Mount Sinai |
| Series 2015 |
| 07/01/2030 | 5.000% | | 1,000,000 | 1,002,537 |
| Higher Education 6.5% |
| Build NYC Resource Corp. |
| Refunding Revenue Bonds |
| Manhattan College Project |
| Series 2017 |
| 08/01/2033 | 5.000% | | 400,000 | 404,353 |
| Municipal Bonds (continued) |
| Issue Description | Coupon
Rate | | Principal
Amount ($) | Value ($) |
| County of Saratoga |
| Revenue Bonds |
| Skidmore College Project |
| Series 2018 |
| 07/01/2033 | 5.000% | | 165,000 | 170,667 |
| 07/01/2034 | 5.000% | | 200,000 | 206,838 |
| 07/01/2035 | 5.000% | | 200,000 | 206,125 |
| Dutchess County Local Development Corp. |
| Refunding Revenue Bonds |
| Culinary Institute of America (The) |
| Series 2018 |
| 07/01/2032 | 5.000% | | 220,000 | 220,537 |
| Vassar College Project |
| Series 2017 |
| 07/01/2034 | 5.000% | | 500,000 | 512,615 |
| Revenue Bonds |
| Marist College Project |
| Series 2015A |
| 07/01/2029 | 5.000% | | 1,000,000 | 1,011,708 |
| Series 2018 |
| 07/01/2031 | 5.000% | | 170,000 | 175,512 |
| 07/01/2032 | 5.000% | | 210,000 | 216,565 |
| 07/01/2033 | 5.000% | | 205,000 | 211,078 |
| New York State Dormitory Authority |
| Refunding Revenue Bonds |
| Rochester Institute |
| Series 2019A |
| 07/01/2036 | 5.000% | | 750,000 | 774,895 |
| Teacher’s College |
| Series 2017 |
| 07/01/2029 | 5.000% | | 175,000 | 181,182 |
| 07/01/2030 | 5.000% | | 150,000 | 155,375 |
| Revenue Bonds |
| New York University |
| Series 2019A |
| 07/01/2037 | 5.000% | | 2,000,000 | 2,057,034 |
| St. Lawrence County Industrial Development Agency |
| Refunding Revenue Bonds |
| Clarkson University Project |
| Series 2021 |
| 09/01/2038 | 5.000% | | 200,000 | 191,342 |
| 09/01/2039 | 5.000% | | 200,000 | 189,759 |
| Tompkins County Development Corp. |
| Refunding Revenue Bonds |
| Ithaca College Project |
| Series 2018 |
| 07/01/2034 | 5.000% | | 575,000 | 583,457 |
The accompanying Notes to Financial Statements are an integral part of this statement.
Columbia New York Intermediate Municipal Bond Fund | Annual Report 2023
| 9 |
Portfolio of Investments (continued)
October 31, 2023
| Municipal Bonds (continued) |
| Issue Description | Coupon
Rate | | Principal
Amount ($) | Value ($) |
| Troy Capital Resource Corp. |
| Refunding Revenue Bonds |
| Forward Delivery - Rensselaer Polytechnic Institute Project |
| Series 2020 |
| 09/01/2037 | 5.000% | | 250,000 | 250,497 |
| Total | 7,719,539 |
| Hospital 7.5% |
| Monroe County Industrial Development Corp. |
| Refunding Revenue Bonds |
| Highland Hospital Rochester Project |
| Series 2015 |
| 07/01/2025 | 5.000% | | 450,000 | 454,033 |
| 07/01/2026 | 5.000% | | 350,000 | 353,016 |
| University of Rochester Project |
| Series 2017 |
| 07/01/2035 | 4.000% | | 1,285,000 | 1,205,567 |
| Revenue Bonds |
| Rochester General Hospital (The) |
| Series 2017 |
| 12/01/2035 | 5.000% | | 1,000,000 | 1,000,363 |
| Nassau County Local Economic Assistance Corp. |
| Revenue Bonds |
| Catholic Health Services of Long Island |
| Series 2014 |
| 07/01/2033 | 5.000% | | 675,000 | 675,535 |
| New York State Dormitory Authority |
| Refunding Revenue Bonds |
| Memorial Sloan-Kettering Cancer Center |
| Series 2017 |
| 07/01/2034 | 4.000% | | 1,000,000 | 956,814 |
| Montefiore Obligated Group |
| Series 2020A |
| 09/01/2037 | 4.000% | | 300,000 | 260,823 |
| North Shore - Long Island Jewish Obligation Group |
| Series 2015A |
| 05/01/2031 | 5.000% | | 3,000,000 | 3,009,247 |
| New York State Dormitory Authority(b) |
| Refunding Revenue Bonds |
| Orange Regional Medical Center |
| Series 2017 |
| 12/01/2031 | 5.000% | | 1,000,000 | 929,504 |
| Total | 8,844,902 |
| Joint Power Authority 0.4% |
| New York Power Authority(c) |
| Revenue Bonds |
| Green Transmission Project |
| Series 2023A (AGM) |
| 11/15/2040 | 5.250% | | 500,000 | 529,267 |
| Municipal Bonds (continued) |
| Issue Description | Coupon
Rate | | Principal
Amount ($) | Value ($) |
| Local General Obligation 16.6% |
| City of New York |
| Unlimited General Obligation Bonds |
| Fiscal 2020 |
| Series 2019B-1 |
| 10/01/2038 | 5.000% | | 1,000,000 | 1,022,651 |
| Subordinated Series 2019H-A |
| 01/01/2035 | 5.000% | | 1,500,000 | 1,562,852 |
| Subordinated Series 2023E-1 |
| 04/01/2039 | 5.000% | | 1,200,000 | 1,241,164 |
| Unlimited General Obligation Refunding Bonds |
| Subordinated Series 2023F-1 |
| 08/01/2038 | 5.000% | | 250,000 | 260,401 |
| Unlimited General Obligation Refunding Notes |
| Series 2016C |
| 08/01/2032 | 5.000% | | 2,000,000 | 2,028,945 |
| City of Yonkers |
| Limited General Obligation Bonds |
| Series 2016A (AGM) |
| 11/15/2028 | 5.000% | | 1,780,000 | 1,824,179 |
| Series 2017A (BAM) |
| 09/01/2028 | 5.000% | | 2,090,000 | 2,160,857 |
| County of Monroe(a) |
| Limited General Obligation Public Improvement Bonds |
| Series 2019B (BAM) |
| 06/01/2027 | 5.000% | | 1,350,000 | 1,389,059 |
| County of Nassau |
| Limited General Obligation Bonds |
| Series 2017B |
| 04/01/2033 | 5.000% | | 2,000,000 | 2,046,851 |
| County of Rockland |
| Limited General Obligation Bonds |
| Series 2014A (AGM) |
| 03/01/2024 | 5.000% | | 1,450,000 | 1,455,376 |
| Monroe County Industrial Development Agency |
| Revenue Bonds |
| Rochester Schools Modernization Program |
| Series 2018 |
| 05/01/2034 | 5.000% | | 750,000 | 783,943 |
| New York State Dormitory Authority |
| Refunding Revenue Bonds |
| School Districts Bond Financing |
| Series 2013E (AGM) |
| 10/01/2031 | 5.000% | | 500,000 | 503,242 |
| School Districts Financing Program |
| Series 2015B (AGM) |
| 10/01/2027 | 5.000% | | 1,000,000 | 1,020,542 |
The accompanying Notes to Financial Statements are an integral part of this statement.
| 10 | Columbia New York Intermediate Municipal Bond Fund | Annual Report 2023 |
Portfolio of Investments (continued)
October 31, 2023
| Municipal Bonds (continued) |
| Issue Description | Coupon
Rate | | Principal
Amount ($) | Value ($) |
| Revenue Bonds |
| School District Building Financing Program |
| Series 2018 |
| 10/01/2032 | 5.000% | | 2,000,000 | 2,045,825 |
| School Districts Revenue Bond Financing Program |
| Series 2023 (AGM) |
| 10/01/2040 | 5.000% | | 300,000 | 305,817 |
| Total | 19,651,704 |
| Multi-Family 2.5% |
| Amherst Development Corp. |
| Refunding Revenue Bonds |
| University of Buffalo Student Housing |
| Series 2017 (AGM) |
| 10/01/2028 | 5.000% | | 730,000 | 763,138 |
| 10/01/2029 | 5.000% | | 1,290,000 | 1,347,045 |
| Onondaga County Trust for Cultural Resources |
| Refunding Revenue Bonds |
| Abby Lane Housing Corp. Project |
| Series 2017 |
| 05/01/2030 | 5.000% | | 420,000 | 424,154 |
| 05/01/2031 | 5.000% | | 400,000 | 403,315 |
| Total | 2,937,652 |
| Municipal Power 5.0% |
| Long Island Power Authority |
| Refunding Revenue Bonds |
| Series 2016B |
| 09/01/2027 | 5.000% | | 1,000,000 | 1,017,942 |
| 09/01/2030 | 5.000% | | 2,750,000 | 2,797,139 |
| Revenue Bonds |
| Electric System General Purpose |
| Series 2015B |
| 09/01/2032 | 5.000% | | 765,000 | 767,754 |
| General |
| Series 2017 |
| 09/01/2035 | 5.000% | | 1,200,000 | 1,214,142 |
| Green Bonds |
| Series 2023E |
| 09/01/2040 | 5.000% | | 160,000 | 163,704 |
| Total | 5,960,681 |
| Nursing Home 0.9% |
| Monroe County Industrial Development Corp. |
| Refunding Revenue Bonds |
| St. Ann’s Community Project |
| Series 2019 |
| 01/01/2030 | 4.000% | | 1,230,000 | 1,086,662 |
| Municipal Bonds (continued) |
| Issue Description | Coupon
Rate | | Principal
Amount ($) | Value ($) |
| Other Bond Issue 1.9% |
| Build NYC Resource Corp. |
| Revenue Bonds |
| Children’s Aid Society Project (The) |
| Series 2019 |
| 07/01/2036 | 4.000% | | 100,000 | 90,647 |
| Series 2015 |
| 07/01/2029 | 5.000% | | 545,000 | 545,652 |
| 07/01/2031 | 5.000% | | 715,000 | 713,959 |
| New York Transportation Development Corp.(a) |
| Revenue Bonds |
| New York State Thruway Service Areas Project |
| Series 2021 |
| 10/31/2034 | 4.000% | | 500,000 | 462,669 |
| 10/31/2041 | 4.000% | | 570,000 | 474,984 |
| Total | 2,287,911 |
| Pool / Bond Bank 0.4% |
| New York State Dormitory Authority |
| Refunding Revenue Bonds |
| New School |
| Series 2015 |
| 07/01/2029 | 5.000% | | 420,000 | 422,502 |
| Ports 5.3% |
| Port Authority of New York & New Jersey |
| Refunding Revenue Bonds |
| Consolidated 211th |
| Series 2018 |
| 09/01/2038 | 4.000% | | 1,400,000 | 1,268,363 |
| Series 2018-209 |
| 07/15/2034 | 5.000% | | 2,500,000 | 2,599,263 |
| Series 2018-211 |
| 09/01/2036 | 5.000% | | 1,000,000 | 1,030,793 |
| Port Authority of New York & New Jersey(a) |
| Refunding Revenue Bonds |
| Series 2023-238 |
| 07/15/2038 | 5.000% | | 500,000 | 499,552 |
| Revenue Bonds |
| Consolidated Bonds |
| Series 221 |
| 07/15/2037 | 4.000% | | 1,000,000 | 890,729 |
| Total | 6,288,700 |
| Prep School 0.9% |
| Build NYC Resource Corp. |
| Refunding Revenue Bonds |
| Series 2015 |
| 06/01/2026 | 5.000% | | 225,000 | 227,286 |
| 06/01/2028 | 5.000% | | 250,000 | 252,988 |
The accompanying Notes to Financial Statements are an integral part of this statement.
Columbia New York Intermediate Municipal Bond Fund | Annual Report 2023
| 11 |
Portfolio of Investments (continued)
October 31, 2023
| Municipal Bonds (continued) |
| Issue Description | Coupon
Rate | | Principal
Amount ($) | Value ($) |
| Rensselaer County Industrial Development Agency |
| Refunding Revenue Bonds |
| Emma Willard School Project |
| Series 2015A |
| 01/01/2035 | 5.000% | | 590,000 | 595,932 |
| Total | 1,076,206 |
| Recreation 0.2% |
| New York City Trust for Cultural Resources |
| Refunding Revenue Bonds |
| Carnegie Hall |
| Series 2019 |
| 12/01/2037 | 5.000% | | 275,000 | 285,238 |
| Refunded / Escrowed 6.5% |
| Build NYC Resource Corp. |
| Prerefunded 08/01/25 Revenue Bonds |
| YMCA of Greater New York Project |
| Series 2015 |
| 08/01/2029 | 5.000% | | 430,000 | 438,838 |
| Metropolitan Transportation Authority |
| Prerefunded 11/15/24 Revenue Bonds |
| Series 2014C |
| 11/15/2029 | 5.000% | | 3,000,000 | 3,036,656 |
| New York State Dormitory Authority |
| Prerefunded 07/01/25 Revenue Bonds |
| Barnard College |
| Series 2015A |
| 07/01/2030 | 5.000% | | 700,000 | 713,707 |
| New York State Dormitory Authority(d) |
| Revenue Bonds |
| Capital Appreciation - Memorial Sloan-Kettering Cancer Center |
| Series 2003-1 Escrowed to Maturity (NPFGC) |
| 07/01/2025 | 0.000% | | 3,750,000 | 3,512,476 |
| Total | 7,701,677 |
| Retirement Communities 3.3% |
| Brookhaven Local Development Corp. |
| Refunding Revenue Bonds |
| Jefferson’s Ferry Project |
| Series 2016 |
| 11/01/2036 | 5.250% | | 750,000 | 727,335 |
| Buffalo & Erie County Industrial Land Development Corp. |
| Refunding Revenue Bonds |
| Orchard Park |
| Series 2015 |
| 11/15/2029 | 5.000% | | 550,000 | 550,410 |
| 11/15/2030 | 5.000% | | 650,000 | 650,360 |
| Suffolk County Economic Development Corp. |
| Refunding Revenue Bonds |
| Peconic Landing at Southhold, Inc. |
| Series 2020 |
| 12/01/2034 | 5.000% | | 1,000,000 | 943,026 |
| Municipal Bonds (continued) |
| Issue Description | Coupon
Rate | | Principal
Amount ($) | Value ($) |
| Tompkins County Development Corp. |
| Refunding Revenue Bonds |
| Kendal at Ithaca, Inc. Project |
| Series 2014 |
| 07/01/2029 | 5.000% | | 1,000,000 | 984,934 |
| Total | 3,856,065 |
| Sales Tax 1.5% |
| New York State Dormitory Authority |
| Refunding Revenue Bonds |
| Series 2023A-1 |
| 03/15/2040 | 5.000% | | 1,000,000 | 1,023,066 |
| Triborough Bridge & Tunnel Authority |
| Revenue Bonds |
| TBTA Capital Lockbox - City Sales Tax |
| Series 2023A |
| 05/15/2039 | 5.000% | | 750,000 | 780,134 |
| Total | 1,803,200 |
| Single Family 0.1% |
| State of New York Mortgage Agency |
| Refunding Revenue Bonds |
| Series 2018-211 |
| 10/01/2038 | 3.625% | | 110,000 | 96,119 |
| Special Non Property Tax 14.8% |
| New York City Transitional Finance Authority |
| Refunding Revenue Bonds |
| Building Aid |
| Series 2018S-2A |
| 07/15/2036 | 5.000% | | 2,000,000 | 2,055,694 |
| Revenue Bonds |
| Building Aid |
| Series 2018S-3 |
| 07/15/2034 | 5.000% | | 1,000,000 | 1,038,404 |
| Future Tax Bonds |
| Subordinated Series 2020C |
| 05/01/2037 | 4.000% | | 500,000 | 465,274 |
| Future Tax Secured |
| Subordinated Series 2016E-1 |
| 02/01/2032 | 5.000% | | 3,000,000 | 3,055,496 |
| Subordinated Series 2019 |
| 11/01/2034 | 5.000% | | 3,500,000 | 3,654,357 |
| Multi-Modal |
| Subordinated Series 2023A |
| 05/01/2039 | 5.000% | | 500,000 | 518,464 |
| New York Convention Center Development Corp. |
| Refunding Revenue Bonds |
| Hotel Unit Fee Secured |
| Series 2015 |
| 11/15/2027 | 5.000% | | 2,000,000 | 2,003,740 |
The accompanying Notes to Financial Statements are an integral part of this statement.
| 12 | Columbia New York Intermediate Municipal Bond Fund | Annual Report 2023 |
Portfolio of Investments (continued)
October 31, 2023
| Municipal Bonds (continued) |
| Issue Description | Coupon
Rate | | Principal
Amount ($) | Value ($) |
| New York State Dormitory Authority |
| Refunding Revenue Bonds |
| Education |
| Series 2005B (AMBAC) |
| 03/15/2026 | 5.500% | | 1,000,000 | 1,037,807 |
| Series 2019A-2 |
| 03/15/2035 | 5.000% | | 2,000,000 | 2,085,036 |
| Series 2023A |
| 03/15/2039 | 5.000% | | 500,000 | 520,307 |
| Triborough Bridge & Tunnel Authority |
| Refunding Revenue Bonds |
| Green Bonds |
| Series 2023C |
| 11/15/2040 | 5.250% | | 1,000,000 | 1,049,869 |
| Total | 17,484,448 |
| Special Property Tax 0.9% |
| Hudson Yards Infrastructure Corp. |
| Refunding Revenue Bonds |
| Series 2017A |
| 02/15/2033 | 5.000% | | 1,000,000 | 1,024,778 |
| Tobacco 3.4% |
| Chautauqua Tobacco Asset Securitization Corp. |
| Refunding Revenue Bonds |
| Series 2014 |
| 06/01/2029 | 5.000% | | 1,135,000 | 1,093,749 |
| Suffolk Tobacco Asset Securitization Corp. |
| Refunding Revenue Bonds |
| Tobacco Settlement Asset-Backed Bonds |
| Series 2021 |
| 06/01/2038 | 4.000% | | 1,000,000 | 902,312 |
| TSASC, Inc. |
| Refunding Revenue Bonds |
| Series 2017A |
| 06/01/2031 | 5.000% | | 2,000,000 | 2,037,291 |
| Total | 4,033,352 |
| Transportation 6.4% |
| Metropolitan Transportation Authority |
| Refunding Revenue Bonds |
| Climate Bond Certified - Green |
| Series 2018 |
| 11/15/2026 | 5.000% | | 2,590,000 | 2,641,044 |
| Revenue Bonds |
| Series 2005B (AMBAC) |
| 11/15/2024 | 5.250% | | 750,000 | 757,375 |
| Series 2016C-1 |
| 11/15/2036 | 5.000% | | 3,000,000 | 2,978,309 |
| Municipal Bonds (continued) |
| Issue Description | Coupon
Rate | | Principal
Amount ($) | Value ($) |
| Metropolitan Transportation Authority(d) |
| Refunding Revenue Bonds |
| Green Bonds |
| Series 2017C-2 |
| 11/15/2029 | 0.000% | | 1,500,000 | 1,132,170 |
| Total | 7,508,898 |
| Turnpike / Bridge / Toll Road 8.9% |
| New York State Thruway Authority |
| Refunding Revenue Bonds |
| Series 2014K |
| 01/01/2029 | 5.000% | | 1,850,000 | 1,858,352 |
| 01/01/2032 | 5.000% | | 1,000,000 | 997,180 |
| Revenue Bonds |
| Junior Lien |
| Series 2016A |
| 01/01/2033 | 5.000% | | 1,000,000 | 1,001,568 |
| Series 2019B |
| 01/01/2036 | 5.000% | | 2,000,000 | 2,095,066 |
| Triborough Bridge & Tunnel Authority |
| Refunding Revenue Bonds |
| MTA Bridges and Tunnels |
| Series 2023 |
| 11/15/2037 | 5.000% | | 500,000 | 522,603 |
| Series 2018-B |
| 11/15/2031 | 5.000% | | 2,000,000 | 2,165,139 |
| Revenue Bonds |
| Series 2020D |
| 11/15/2037 | 4.000% | | 2,050,000 | 1,877,792 |
| Total | 10,517,700 |
| Water & Sewer 0.6% |
| Buffalo Municipal Water Finance Authority |
| Refunding Revenue Bonds |
| Series 2015A |
| 07/01/2028 | 5.000% | | 700,000 | 708,064 |
Total Municipal Bonds
(Cost $124,252,574) | 116,805,169 |
| Money Market Funds 0.7% |
| | Shares | Value ($) |
| BlackRock Liquidity Funds MuniCash, Institutional Shares, 3.823%(e) | 753,894 | 753,894 |
Total Money Market Funds
(Cost $753,894) | 753,894 |
Total Investments in Securities
(Cost: $125,006,468) | 117,559,063 |
| Other Assets & Liabilities, Net | | 627,880 |
| Net Assets | 118,186,943 |
The accompanying Notes to Financial Statements are an integral part of this statement.
Columbia New York Intermediate Municipal Bond Fund | Annual Report 2023
| 13 |
Portfolio of Investments (continued)
October 31, 2023
Notes to Portfolio of Investments
| (a) | Income from this security may be subject to alternative minimum tax. |
| (b) | Represents privately placed and other securities and instruments exempt from Securities and Exchange Commission registration (collectively, private placements), such as Section 4(a)(2) and Rule 144A eligible securities, which are often sold only to qualified institutional buyers. At October 31, 2023, the total value of these securities amounted to $2,150,617, which represents 1.82% of total net assets. |
| (c) | Represents a security purchased on a when-issued basis. |
| (d) | Zero coupon bond. |
| (e) | The rate shown is the seven-day current annualized yield at October 31, 2023. |
Abbreviation Legend
| AGM | Assured Guaranty Municipal Corporation |
| AMBAC | Ambac Assurance Corporation |
| BAM | Build America Mutual Assurance Co. |
| NPFGC | National Public Finance Guarantee Corporation |
Fair value measurements
The Fund categorizes its fair value measurements according to a three-level hierarchy that maximizes the use of observable inputs and minimizes the use of unobservable inputs by prioritizing that the most observable input be used when available. Observable inputs are those that market participants would use in pricing an investment based on market data obtained from sources independent of the reporting entity. Unobservable inputs are those that reflect the Fund’s assumptions about the information market participants would use in pricing an investment. An investment’s level within the fair value hierarchy is based on the lowest level of any input that is deemed significant to the asset’s or liability’s fair value measurement. The input levels are not necessarily an indication of the risk or liquidity associated with investments at that level. For example, certain U.S. government securities are generally high quality and liquid, however, they are reflected as Level 2 because the inputs used to determine fair value may not always be quoted prices in an active market.
Fair value inputs are summarized in the three broad levels listed below:
| ■ | Level 1 — Valuations based on quoted prices for investments in active markets that the Fund has the ability to access at the measurement date. Valuation adjustments are not applied to Level 1 investments. |
| ■ | Level 2 — Valuations based on other significant observable inputs (including quoted prices for similar securities, interest rates, prepayment speeds, credit risks, etc.). |
| ■ | Level 3 — Valuations based on significant unobservable inputs (including the Fund’s own assumptions and judgment in determining the fair value of investments). |
Inputs that are used in determining fair value of an investment may include price information, credit data, volatility statistics, and other factors. These inputs can be either observable or unobservable. The availability of observable inputs can vary between investments, and is affected by various factors such as the type of investment, and the volume and level of activity for that investment or similar investments in the marketplace. The inputs will be considered by the Investment Manager, along with any other relevant factors in the calculation of an investment’s fair value. The Fund uses prices and inputs that are current as of the measurement date, which may include periods of market dislocations. During these periods, the availability of prices and inputs may be reduced for many investments. This condition could cause an investment to be reclassified between the various levels within the hierarchy.
Investments falling into the Level 3 category are primarily supported by quoted prices from brokers and dealers participating in the market for those investments. However, these may be classified as Level 3 investments due to lack of market transparency and corroboration to support these quoted prices. Additionally, valuation models may be used as the pricing source for any remaining investments classified as Level 3. These models may rely on one or more significant unobservable inputs and/or significant assumptions by the Investment Manager. Inputs used in valuations may include, but are not limited to, financial statement analysis, capital account balances, discount rates and estimated cash flows, and comparable company data.
The Fund’s Board of Trustees (the Board) has designated the Investment Manager, through its Valuation Committee (the Committee), as valuation designee, responsible for determining the fair value of the assets of the Fund for which market quotations are not readily available using valuation procedures approved by the Board. The Committee consists of voting and non-voting members from various groups within the Investment Manager’s organization, including operations and accounting, trading and investments, compliance, risk management and legal.
The Committee meets at least monthly to review and approve valuation matters, which may include a description of specific valuation determinations, data regarding pricing information received from approved pricing vendors and brokers and the results of Board-approved valuation policies and procedures (the Policies). The Policies address, among other things, instances when market quotations are or are not readily available, including recommendations of third party pricing vendors and a determination of appropriate pricing methodologies; events that require specific valuation determinations and assessment of fair value techniques; securities with a potential for stale pricing, including those that are illiquid, restricted, or in default; and the effectiveness of third party pricing vendors, including periodic reviews of vendors. The Committee meets more frequently, as needed, to discuss additional valuation matters, which may include the need to review back-testing results, review time-sensitive information or approve related valuation actions. Representatives of Columbia Management Investment Advisers, LLC report to the Board at each of its regularly scheduled meetings to discuss valuation matters and actions during the period, similar to those described earlier.
The following table is a summary of the inputs used to value the Fund’s investments at October 31, 2023:
| | Level 1 ($) | Level 2 ($) | Level 3 ($) | Total ($) |
| Investments in Securities | | | | |
| Municipal Bonds | — | 116,805,169 | — | 116,805,169 |
| Money Market Funds | 753,894 | — | — | 753,894 |
| Total Investments in Securities | 753,894 | 116,805,169 | — | 117,559,063 |
See the Portfolio of Investments for all investment classifications not indicated in the table.
The accompanying Notes to Financial Statements are an integral part of this statement.
| 14 | Columbia New York Intermediate Municipal Bond Fund | Annual Report 2023 |
Portfolio of Investments (continued)
October 31, 2023
Fair value measurements (continued)
The Fund’s assets assigned to the Level 2 input category are generally valued using the market approach, in which a security’s value is determined through reference to prices and information from market transactions for similar or identical assets.
The accompanying Notes to Financial Statements are an integral part of this statement.
Columbia New York Intermediate Municipal Bond Fund | Annual Report 2023
| 15 |
Statement of Assets and Liabilities
October 31, 2023
| Assets | |
| Investments in securities, at value | |
| Unaffiliated issuers (cost $125,006,468) | $117,559,063 |
| Receivable for: | |
| Capital shares sold | 302,060 |
| Dividends | 2,514 |
| Interest | 1,731,023 |
| Trustees’ fees | 87,975 |
| Expense reimbursement due from Investment Manager | 522 |
| Prepaid expenses | 3,781 |
| Total assets | 119,686,938 |
| Liabilities | |
| Due to custodian | 6,728 |
| Payable for: | |
| Investments purchased on a delayed delivery basis | 527,860 |
| Capital shares redeemed | 555,090 |
| Distributions to shareholders | 278,976 |
| Management services fees | 1,528 |
| Distribution and/or service fees | 129 |
| Transfer agent fees | 6,523 |
| Trustees’ fees | 103,392 |
| Other expenses | 19,769 |
| Total liabilities | 1,499,995 |
| Net assets applicable to outstanding capital stock | $118,186,943 |
| Represented by | |
| Paid in capital | 128,280,840 |
| Total distributable earnings (loss) | (10,093,897) |
| Total - representing net assets applicable to outstanding capital stock | $118,186,943 |
The accompanying Notes to Financial Statements are an integral part of this statement.
| 16 | Columbia New York Intermediate Municipal Bond Fund | Annual Report 2023 |
Statement of Assets and Liabilities (continued)
October 31, 2023
| Class A | |
| Net assets | $10,985,276 |
| Shares outstanding | 1,035,498 |
| Net asset value per share | $10.61 |
| Maximum sales charge | 3.00% |
| Maximum offering price per share (calculated by dividing the net asset value per share by 1.0 minus the maximum sales charge for Class A shares) | $10.94 |
| Advisor Class | |
| Net assets | $5,257,628 |
| Shares outstanding | 496,297 |
| Net asset value per share | $10.59 |
| Class C | |
| Net assets | $2,045,696 |
| Shares outstanding | 192,808 |
| Net asset value per share | $10.61 |
| Institutional Class | |
| Net assets | $36,748,296 |
| Shares outstanding | 3,463,899 |
| Net asset value per share | $10.61 |
| Institutional 2 Class | |
| Net assets | $11,236,453 |
| Shares outstanding | 1,057,416 |
| Net asset value per share | $10.63 |
| Institutional 3 Class | |
| Net assets | $48,350,688 |
| Shares outstanding | 4,541,869 |
| Net asset value per share | $10.65 |
| Class V | |
| Net assets | $3,562,906 |
| Shares outstanding | 335,886 |
| Net asset value per share | $10.61 |
| Maximum sales charge | 4.75% |
| Maximum offering price per share (calculated by dividing the net asset value per share by 1.0 minus the maximum sales charge for Class V shares) | $11.14 |
The accompanying Notes to Financial Statements are an integral part of this statement.
Columbia New York Intermediate Municipal Bond Fund | Annual Report 2023
| 17 |
Statement of Operations
Year Ended October 31, 2023
| Net investment income | |
| Income: | |
| Dividends — unaffiliated issuers | $39,094 |
| Interest | 4,113,505 |
| Total income | 4,152,599 |
| Expenses: | |
| Management services fees | 633,414 |
| Distribution and/or service fees | |
| Class A | 28,885 |
| Class C | 17,805 |
| Class V | 5,800 |
| Transfer agent fees | |
| Class A | 13,027 |
| Advisor Class | 5,805 |
| Class C | 2,877 |
| Institutional Class | 43,474 |
| Institutional 2 Class | 6,155 |
| Institutional 3 Class | 3,747 |
| Class V | 4,365 |
| Trustees’ fees | 17,736 |
| Custodian fees | 1,332 |
| Printing and postage fees | 11,809 |
| Registration fees | 17,568 |
| Accounting services fees | 30,090 |
| Legal fees | 14,982 |
| Interest on interfund lending | 139 |
| Compensation of chief compliance officer | 28 |
| Other | 13,146 |
| Total expenses | 872,184 |
| Fees waived or expenses reimbursed by Investment Manager and its affiliates | (223,954) |
| Expense reduction | (100) |
| Total net expenses | 648,130 |
| Net investment income | 3,504,469 |
| Realized and unrealized gain (loss) — net | |
| Net realized gain (loss) on: | |
| Investments — unaffiliated issuers | (500,113) |
| Net realized loss | (500,113) |
| Net change in unrealized appreciation (depreciation) on: | |
| Investments — unaffiliated issuers | 770,000 |
| Net change in unrealized appreciation (depreciation) | 770,000 |
| Net realized and unrealized gain | 269,887 |
| Net increase in net assets resulting from operations | $3,774,356 |
The accompanying Notes to Financial Statements are an integral part of this statement.
| 18 | Columbia New York Intermediate Municipal Bond Fund | Annual Report 2023 |
Statement of Changes in Net Assets
| | Year Ended
October 31, 2023 | Year Ended
October 31, 2022 |
| Operations | | |
| Net investment income | $3,504,469 | $4,281,223 |
| Net realized loss | (500,113) | (2,203,889) |
| Net change in unrealized appreciation (depreciation) | 770,000 | (20,727,027) |
| Net increase (decrease) in net assets resulting from operations | 3,774,356 | (18,649,693) |
| Distributions to shareholders | | |
| Net investment income and net realized gains | | |
| Class A | (269,806) | (379,513) |
| Advisor Class | (133,323) | (132,815) |
| Class C | (47,898) | (67,324) |
| Institutional Class | (997,427) | (3,394,557) |
| Institutional 2 Class | (287,158) | (136,586) |
| Institutional 3 Class | (1,672,161) | (461,826) |
| Class V | (94,181) | (113,129) |
| Total distributions to shareholders | (3,501,954) | (4,685,750) |
| Decrease in net assets from capital stock activity | (25,622,190) | (47,586,448) |
| Total decrease in net assets | (25,349,788) | (70,921,891) |
| Net assets at beginning of year | 143,536,731 | 214,458,622 |
| Net assets at end of year | $118,186,943 | $143,536,731 |
The accompanying Notes to Financial Statements are an integral part of this statement.
Columbia New York Intermediate Municipal Bond Fund | Annual Report 2023
| 19 |
Statement of Changes in Net Assets (continued)
| | Year Ended | Year Ended |
| | October 31, 2023 | October 31, 2022 |
| | Shares | Dollars ($) | Shares | Dollars ($) |
| Capital stock activity |
| Class A | | | | |
| Shares sold | 316,307 | 3,473,599 | 192,222 | 2,170,444 |
| Distributions reinvested | 18,819 | 206,442 | 23,056 | 263,610 |
| Shares redeemed | (382,557) | (4,200,033) | (812,118) | (9,083,199) |
| Net decrease | (47,431) | (519,992) | (596,840) | (6,649,145) |
| Advisor Class | | | | |
| Shares sold | 299,651 | 3,287,520 | 107,342 | 1,209,167 |
| Distributions reinvested | 12,147 | 133,085 | 11,629 | 132,564 |
| Shares redeemed | (206,718) | (2,262,636) | (233,628) | (2,630,270) |
| Net increase (decrease) | 105,080 | 1,157,969 | (114,657) | (1,288,539) |
| Class C | | | | |
| Shares sold | 29,329 | 323,373 | 15,262 | 179,232 |
| Distributions reinvested | 3,678 | 40,389 | 4,698 | 53,654 |
| Shares redeemed | (110,912) | (1,217,434) | (85,031) | (961,273) |
| Net decrease | (77,905) | (853,672) | (65,071) | (728,387) |
| Institutional Class | | | | |
| Shares sold | 1,273,274 | 13,976,368 | 1,039,747 | 11,929,987 |
| Distributions reinvested | 67,618 | 741,789 | 64,380 | 732,539 |
| Shares redeemed | (1,154,420) | (12,657,925) | (12,161,557) | (135,878,571) |
| Net increase (decrease) | 186,472 | 2,060,232 | (11,057,430) | (123,216,045) |
| Institutional 2 Class | | | | |
| Shares sold | 598,567 | 6,533,725 | 561,231 | 6,231,796 |
| Distributions reinvested | 26,104 | 286,781 | 12,074 | 136,341 |
| Shares redeemed | (213,676) | (2,333,308) | (280,588) | (3,120,237) |
| Net increase | 410,995 | 4,487,198 | 292,717 | 3,247,900 |
| Institutional 3 Class | | | | |
| Shares sold | 93,089 | 1,029,348 | 7,999,143 | 89,197,711 |
| Distributions reinvested | 2,359 | 25,972 | 2,678 | 30,438 |
| Shares redeemed | (2,956,473) | (32,466,909) | (702,694) | (7,794,736) |
| Net increase (decrease) | (2,861,025) | (31,411,589) | 7,299,127 | 81,433,413 |
| Class V | | | | |
| Shares sold | 2,992 | 32,822 | 2,544 | 28,701 |
| Distributions reinvested | 5,846 | 64,136 | 6,584 | 74,998 |
| Shares redeemed | (58,766) | (639,294) | (43,643) | (489,344) |
| Net decrease | (49,928) | (542,336) | (34,515) | (385,645) |
| Total net decrease | (2,333,742) | (25,622,190) | (4,276,669) | (47,586,448) |
The accompanying Notes to Financial Statements are an integral part of this statement.
| 20 | Columbia New York Intermediate Municipal Bond Fund | Annual Report 2023 |
[THIS PAGE INTENTIONALLY LEFT BLANK]
Columbia New York Intermediate Municipal Bond Fund | Annual Report 2023
| 21 |
The following table is intended to help you understand the Fund’s financial performance. Certain information reflects financial results for a single share of a class held for the periods shown. Per share net investment income (loss) amounts are calculated based on average shares outstanding during the period. Total return assumes reinvestment of all dividends and distributions, if any. Total return does not reflect payment of sales charges, if any. Total return and portfolio turnover are not annualized for periods of less than one year. The ratios of expenses and net investment income are annualized for periods of less than one year. The portfolio turnover rate is calculated without regard to purchase and sales transactions of short-term instruments and certain derivatives, if any. If such transactions were included, the Fund’s portfolio turnover rate may be higher.
| | Net asset value,
beginning of
period | Net
investment
income | Net
realized
and
unrealized
gain (loss) | Total from
investment
operations | Distributions
from net
investment
income | Distributions
from net
realized
gains | Total
distributions to
shareholders |
| Class A |
| Year Ended 10/31/2023 | $10.65 | 0.26 | (0.04)(c) | 0.22 | (0.26) | — | (0.26) |
| Year Ended 10/31/2022 | $12.09 | 0.24 | (1.41) | (1.17) | (0.25) | (0.02) | (0.27) |
| Year Ended 10/31/2021 | $11.99 | 0.23 | 0.11 | 0.34 | (0.24) | (0.00)(f) | (0.24) |
| Year Ended 10/31/2020 | $12.07 | 0.25 | (0.07) | 0.18 | (0.26) | (0.00)(f) | (0.26) |
| Year Ended 10/31/2019 | $11.46 | 0.29 | 0.61 | 0.90 | (0.29) | — | (0.29) |
| Advisor Class |
| Year Ended 10/31/2023 | $10.63 | 0.28 | (0.04)(c) | 0.24 | (0.28) | — | (0.28) |
| Year Ended 10/31/2022 | $12.08 | 0.27 | (1.43) | (1.16) | (0.27) | (0.02) | (0.29) |
| Year Ended 10/31/2021 | $11.98 | 0.26 | 0.11 | 0.37 | (0.27) | (0.00)(f) | (0.27) |
| Year Ended 10/31/2020 | $12.06 | 0.28 | (0.07) | 0.21 | (0.29) | (0.00)(f) | (0.29) |
| Year Ended 10/31/2019 | $11.45 | 0.32 | 0.61 | 0.93 | (0.32) | — | (0.32) |
| Class C |
| Year Ended 10/31/2023 | $10.65 | 0.21 | (0.04)(c) | 0.17 | (0.21) | — | (0.21) |
| Year Ended 10/31/2022 | $12.10 | 0.19 | (1.43) | (1.24) | (0.19) | (0.02) | (0.21) |
| Year Ended 10/31/2021 | $12.00 | 0.18 | 0.10 | 0.28 | (0.18) | (0.00)(f) | (0.18) |
| Year Ended 10/31/2020 | $12.07 | 0.20 | (0.07) | 0.13 | (0.20) | (0.00)(f) | (0.20) |
| Year Ended 10/31/2019 | $11.46 | 0.24 | 0.61 | 0.85 | (0.24) | — | (0.24) |
| Institutional Class |
| Year Ended 10/31/2023 | $10.65 | 0.28 | (0.04)(c) | 0.24 | (0.28) | — | (0.28) |
| Year Ended 10/31/2022 | $12.09 | 0.27 | (1.42) | (1.15) | (0.27) | (0.02) | (0.29) |
| Year Ended 10/31/2021 | $11.99 | 0.26 | 0.11 | 0.37 | (0.27) | (0.00)(f) | (0.27) |
| Year Ended 10/31/2020 | $12.07 | 0.28 | (0.07) | 0.21 | (0.29) | (0.00)(f) | (0.29) |
| Year Ended 10/31/2019 | $11.46 | 0.32 | 0.61 | 0.93 | (0.32) | — | (0.32) |
| Institutional 2 Class |
| Year Ended 10/31/2023 | $10.66 | 0.29 | (0.03)(c) | 0.26 | (0.29) | — | (0.29) |
| Year Ended 10/31/2022 | $12.11 | 0.28 | (1.43) | (1.15) | (0.28) | (0.02) | (0.30) |
| Year Ended 10/31/2021 | $12.01 | 0.27 | 0.11 | 0.38 | (0.28) | (0.00)(f) | (0.28) |
| Year Ended 10/31/2020 | $12.09 | 0.29 | (0.08) | 0.21 | (0.29) | (0.00)(f) | (0.29) |
| Year Ended 10/31/2019 | $11.48 | 0.33 | 0.61 | 0.94 | (0.33) | — | (0.33) |
The accompanying Notes to Financial Statements are an integral part of this statement.
| 22 | Columbia New York Intermediate Municipal Bond Fund | Annual Report 2023 |
Financial Highlights (continued)
| | Net
asset
value,
end of
period | Total
return | Total gross
expense
ratio to
average
net assets(a) | Total net
expense
ratio to
average
net assets(a),(b) | Net investment
income
ratio to
average
net assets | Portfolio
turnover | Net
assets,
end of
period
(000’s) |
| Class A |
| Year Ended 10/31/2023 | $10.61 | 1.98% | 0.91%(d) | 0.75%(d),(e) | 2.34% | 12% | $10,985 |
| Year Ended 10/31/2022 | $10.65 | (9.83%) | 0.88%(d) | 0.73%(d),(e) | 2.08% | 1% | $11,528 |
| Year Ended 10/31/2021 | $12.09 | 2.84% | 0.90% | 0.75%(e) | 1.89% | 3% | $20,315 |
| Year Ended 10/31/2020 | $11.99 | 1.47% | 0.89% | 0.75%(e) | 2.10% | 7% | $22,051 |
| Year Ended 10/31/2019 | $12.07 | 7.96% | 0.90% | 0.75%(e) | 2.46% | 19% | $19,270 |
| Advisor Class |
| Year Ended 10/31/2023 | $10.59 | 2.24% | 0.66%(d) | 0.50%(d),(e) | 2.59% | 12% | $5,258 |
| Year Ended 10/31/2022 | $10.63 | (9.70%) | 0.63%(d) | 0.48%(d),(e) | 2.34% | 1% | $4,159 |
| Year Ended 10/31/2021 | $12.08 | 3.09% | 0.65% | 0.50%(e) | 2.14% | 3% | $6,109 |
| Year Ended 10/31/2020 | $11.98 | 1.72% | 0.65% | 0.50%(e) | 2.34% | 7% | $4,155 |
| Year Ended 10/31/2019 | $12.06 | 8.23% | 0.65% | 0.50%(e) | 2.71% | 19% | $1,234 |
| Class C |
| Year Ended 10/31/2023 | $10.61 | 1.52% | 1.36%(d) | 1.20%(d),(e) | 1.88% | 12% | $2,046 |
| Year Ended 10/31/2022 | $10.65 | (10.31%) | 1.44%(d) | 1.17%(d),(e) | 1.65% | 1% | $2,882 |
| Year Ended 10/31/2021 | $12.10 | 2.37% | 1.65% | 1.20%(e) | 1.45% | 3% | $4,062 |
| Year Ended 10/31/2020 | $12.00 | 1.09% | 1.64% | 1.20%(e),(g) | 1.66% | 7% | $6,319 |
| Year Ended 10/31/2019 | $12.07 | 7.47% | 1.65% | 1.20%(e),(g) | 2.05% | 19% | $9,996 |
| Institutional Class |
| Year Ended 10/31/2023 | $10.61 | 2.24% | 0.66%(d) | 0.50%(d),(e) | 2.59% | 12% | $36,748 |
| Year Ended 10/31/2022 | $10.65 | (9.61%) | 0.64%(d) | 0.48%(d),(e) | 2.30% | 1% | $34,890 |
| Year Ended 10/31/2021 | $12.09 | 3.09% | 0.65% | 0.50%(e) | 2.14% | 3% | $173,347 |
| Year Ended 10/31/2020 | $11.99 | 1.72% | 0.64% | 0.50%(e) | 2.36% | 7% | $188,611 |
| Year Ended 10/31/2019 | $12.07 | 8.23% | 0.65% | 0.50%(e) | 2.72% | 19% | $191,680 |
| Institutional 2 Class |
| Year Ended 10/31/2023 | $10.63 | 2.39% | 0.61%(d) | 0.44%(d) | 2.65% | 12% | $11,236 |
| Year Ended 10/31/2022 | $10.66 | (9.63%) | 0.59%(d) | 0.43%(d) | 2.46% | 1% | $6,893 |
| Year Ended 10/31/2021 | $12.11 | 3.16% | 0.58% | 0.43% | 2.21% | 3% | $4,284 |
| Year Ended 10/31/2020 | $12.01 | 1.79% | 0.57% | 0.43% | 2.43% | 7% | $3,489 |
| Year Ended 10/31/2019 | $12.09 | 8.29% | 0.58% | 0.43% | 2.77% | 19% | $3,916 |
The accompanying Notes to Financial Statements are an integral part of this statement.
Columbia New York Intermediate Municipal Bond Fund | Annual Report 2023
| 23 |
Financial Highlights (continued)
| | Net asset value,
beginning of
period | Net
investment
income | Net
realized
and
unrealized
gain (loss) | Total from
investment
operations | Distributions
from net
investment
income | Distributions
from net
realized
gains | Total
distributions to
shareholders |
| Institutional 3 Class |
| Year Ended 10/31/2023 | $10.68 | 0.30 | (0.03)(c) | 0.27 | (0.30) | — | (0.30) |
| Year Ended 10/31/2022 | $12.14 | 0.30 | (1.45) | (1.15) | (0.29) | (0.02) | (0.31) |
| Year Ended 10/31/2021 | $12.03 | 0.28 | 0.12 | 0.40 | (0.29) | (0.00)(f) | (0.29) |
| Year Ended 10/31/2020 | $12.12 | 0.29 | (0.08) | 0.21 | (0.30) | (0.00)(f) | (0.30) |
| Year Ended 10/31/2019 | $11.50 | 0.33 | 0.63 | 0.96 | (0.34) | — | (0.34) |
| Class V |
| Year Ended 10/31/2023 | $10.64 | 0.27 | (0.03)(c) | 0.24 | (0.27) | — | (0.27) |
| Year Ended 10/31/2022 | $12.09 | 0.25 | (1.42) | (1.17) | (0.26) | (0.02) | (0.28) |
| Year Ended 10/31/2021 | $11.99 | 0.24 | 0.11 | 0.35 | (0.25) | (0.00)(f) | (0.25) |
| Year Ended 10/31/2020 | $12.07 | 0.26 | (0.07) | 0.19 | (0.27) | (0.00)(f) | (0.27) |
| Year Ended 10/31/2019 | $11.46 | 0.31 | 0.61 | 0.92 | (0.31) | — | (0.31) |
| Notes to Financial Highlights |
| (a) | In addition to the fees and expenses that the Fund bears directly, the Fund indirectly bears a pro rata share of the fees and expenses of any other funds in which it invests. Such indirect expenses are not included in the Fund’s reported expense ratios. |
| (b) | Total net expenses include the impact of certain fee waivers/expense reimbursements made by the Investment Manager and certain of its affiliates, if applicable. |
| (c) | Calculation of the net gain (loss) per share (both realized and unrealized) does not correlate to the aggregate realized and unrealized gain (loss) presented in the Statement of Operations due to timing of Fund shares sold and redeemed in relation to fluctuations in the market value of the portfolio. |
| (d) | Ratios include interfund lending expense which is less than 0.01%. |
| (e) | The benefits derived from expense reductions had an impact of less than 0.01%. |
| (f) | Rounds to zero. |
| (g) | Ratios include the impact of voluntary waivers paid by the Investment Manager. For the periods indicated below, if the Investment Manager had not paid these voluntary waivers, the Fund’s net expense ratio would increase by: |
| | 10/31/2020 | 10/31/2019 |
| Class C | 0.26% | 0.30% |
The accompanying Notes to Financial Statements are an integral part of this statement.
| 24 | Columbia New York Intermediate Municipal Bond Fund | Annual Report 2023 |
Financial Highlights (continued)
| | Net
asset
value,
end of
period | Total
return | Total gross
expense
ratio to
average
net assets(a) | Total net
expense
ratio to
average
net assets(a),(b) | Net investment
income
ratio to
average
net assets | Portfolio
turnover | Net
assets,
end of
period
(000’s) |
| Institutional 3 Class |
| Year Ended 10/31/2023 | $10.65 | 2.44% | 0.55%(d) | 0.39%(d) | 2.69% | 12% | $48,351 |
| Year Ended 10/31/2022 | $10.68 | (9.64%) | 0.55%(d) | 0.38%(d) | 2.73% | 1% | $79,079 |
| Year Ended 10/31/2021 | $12.14 | 3.29% | 0.53% | 0.38% | 2.26% | 3% | $1,259 |
| Year Ended 10/31/2020 | $12.03 | 1.75% | 0.53% | 0.39% | 2.45% | 7% | $1,065 |
| Year Ended 10/31/2019 | $12.12 | 8.41% | 0.54% | 0.39% | 2.80% | 19% | $678 |
| Class V |
| Year Ended 10/31/2023 | $10.61 | 2.18% | 0.81%(d) | 0.65%(d),(e) | 2.44% | 12% | $3,563 |
| Year Ended 10/31/2022 | $10.64 | (9.82%) | 0.78%(d) | 0.62%(d),(e) | 2.21% | 1% | $4,107 |
| Year Ended 10/31/2021 | $12.09 | 2.94% | 0.80% | 0.65%(e) | 1.99% | 3% | $5,083 |
| Year Ended 10/31/2020 | $11.99 | 1.57% | 0.79% | 0.65%(e) | 2.21% | 7% | $5,454 |
| Year Ended 10/31/2019 | $12.07 | 8.07% | 0.80% | 0.65%(e) | 2.59% | 19% | $5,696 |
The accompanying Notes to Financial Statements are an integral part of this statement.
Columbia New York Intermediate Municipal Bond Fund | Annual Report 2023
| 25 |
Notes to Financial Statements
October 31, 2023
Note 1. Organization
Columbia New York Intermediate Municipal Bond Fund (the Fund), a series of Columbia Funds Series Trust I (the Trust), is a non-diversified fund. The Trust is registered under the Investment Company Act of 1940, as amended (the 1940 Act), as an open-end management investment company organized as a Massachusetts business trust.
Fund shares
The Trust may issue an unlimited number of shares (without par value). The Fund offers each of the share classes listed in the Statement of Assets and Liabilities. Although all share classes generally have identical voting, dividend and liquidation rights, each share class votes separately when required by the Trust’s organizational documents or by law. Each share class has its own expense and sales charge structure. Different share classes may have different minimum initial investment amounts and pay different net investment income distribution amounts to the extent the expenses of distributing such share classes vary. Distributions to shareholders in a liquidation will be proportional to the net asset value of each share class.
As described in the Fund’s prospectus, Class A and Class C shares are offered to the general public for investment. Class C shares automatically convert to Class A shares after 8 years. Advisor Class, Institutional Class, Institutional 2 Class and Institutional 3 Class are available through authorized investment professionals to omnibus retirement plans or to institutional investors and to certain other investors as also described in the Fund’s prospectus. Class V shares are available only to investors who received (and who continuously held) Class V shares in connection with previous fund reorganizations.
In September 2023, the Fund’s Board of Trustees approved the liquidation of Class V shares of the Fund on December 8, 2023. Effective at the open of business on October 25, 2023, any applicable contingent deferred sales charges were waived on redemptions and exchanges out of Class V shares, and effective at the open of business on November 27, 2023, Class V shares of the Fund were closed to all investors. For federal tax purposes, this liquidation was treated as a redemption of fund shares.
Note 2. Summary of significant accounting policies
Basis of preparation
The Fund is an investment company that applies the accounting and reporting guidance in the Financial Accounting Standards Board (FASB) Accounting Standards Codification Topic 946, Financial Services - Investment Companies (ASC 946). The financial statements are prepared in accordance with U.S. generally accepted accounting principles (GAAP), which requires management to make certain estimates and assumptions that affect the reported amounts of assets and liabilities, the disclosure of contingent assets and liabilities at the date of the financial statements and the reported amounts of income and expenses during the reporting period. Actual results could differ from those estimates.
The following is a summary of significant accounting policies followed by the Fund in the preparation of its financial statements.
Security valuation
Debt securities generally are valued based on prices obtained from pricing services, which are intended to reflect market transactions for normal, institutional-size trading units of similar securities. The services may use various pricing techniques that take into account, as applicable, factors such as yield, quality, coupon rate, maturity, type of issue, trading characteristics and other data, as well as approved independent broker-dealer quotes. Debt securities for which quotations are not readily available or not believed to be reflective of market value may also be valued based upon a bid quote from an approved independent broker-dealer. Debt securities maturing in 60 days or less are valued primarily at amortized market value, unless this method results in a valuation that management believes does not approximate fair value.
Investments in open-end investment companies (other than exchange-traded funds (ETFs)), are valued at the latest net asset value reported by those companies as of the valuation time.
| 26 | Columbia New York Intermediate Municipal Bond Fund | Annual Report 2023 |
Notes to Financial Statements (continued)
October 31, 2023
Investments for which market quotations are not readily available, or that have quotations which management believes are not reflective of market value or reliable, are valued at fair value as determined in good faith under procedures approved by the Board of Trustees. If a security or class of securities (such as foreign securities) is valued at fair value, such value is likely to be different from the quoted or published price for the security, if available.
The determination of fair value often requires significant judgment. To determine fair value, management may use assumptions including but not limited to future cash flows and estimated risk premiums. Multiple inputs from various sources may be used to determine fair value.
GAAP requires disclosure regarding the inputs and valuation techniques used to measure fair value and any changes in valuation inputs or techniques. In addition, investments shall be disclosed by major category. This information is disclosed following the Fund’s Portfolio of Investments.
Delayed delivery securities
The Fund may trade securities on other than normal settlement terms, including securities purchased or sold on a “when-issued” or "forward commitment" basis. This may increase risk to the Fund since the other party to the transaction may fail to deliver, which could cause the Fund to subsequently invest at less advantageous prices. The Fund designates cash or liquid securities in an amount equal to the delayed delivery commitment.
Security transactions
Security transactions are accounted for on the trade date. Cost is determined and gains (losses) are based upon the specific identification method for both financial statement and federal income tax purposes.
Income recognition
Interest income is recorded on an accrual basis. Market premiums and discounts, including original issue discounts, are amortized and accreted, respectively, over the expected life of the security on all debt securities, unless otherwise noted.
The Fund may place a debt security on non-accrual status and reduce related interest income when it becomes probable that the interest will not be collected and the amount of uncollectible interest can be reasonably estimated. The Fund may also adjust accrual rates when it becomes probable the full interest will not be collected and a partial payment will be received. A defaulted debt security is removed from non-accrual status when the issuer resumes interest payments or when collectability of interest is reasonably assured.
Dividend income is recorded on the ex-dividend date.
Expenses
General expenses of the Trust are allocated to the Fund and other funds of the Trust based upon relative net assets or other expense allocation methodologies determined by the nature of the expense. Expenses directly attributable to the Fund are charged to the Fund. Expenses directly attributable to a specific class of shares are charged to that share class.
Determination of class net asset value
All income, expenses (other than class-specific expenses, which are charged to that share class, as shown in the Statement of Operations) and realized and unrealized gains (losses) are allocated to each class of the Fund on a daily basis, based on the relative net assets of each class, for purposes of determining the net asset value of each class.
Federal income tax status
The Fund intends to qualify each year as a regulated investment company under Subchapter M of the Internal Revenue Code, as amended, and will distribute substantially all of its net tax-exempt and investment company taxable income and net capital gain, if any, for its tax year, and as such will not be subject to federal income taxes. In addition, the Fund intends to distribute in each calendar year substantially all of its ordinary income, capital gain net income and certain other amounts, if any, such that the Fund should not be subject to federal excise tax. Therefore, no federal income or excise tax provision is recorded.
Columbia New York Intermediate Municipal Bond Fund | Annual Report 2023
| 27 |
Notes to Financial Statements (continued)
October 31, 2023
Distributions to shareholders
Distributions from net investment income, if any, are declared daily and paid monthly. Net realized capital gains, if any, are distributed at least annually. Income distributions and capital gain distributions are determined in accordance with federal income tax regulations, which may differ from GAAP.
Guarantees and indemnifications
Under the Trust’s organizational documents and, in some cases, by contract, its officers and trustees are indemnified against certain liabilities arising out of the performance of their duties to the Trust or its funds. In addition, certain of the Fund’s contracts with its service providers contain general indemnification clauses. The Fund’s maximum exposure under these arrangements is unknown since the amount of any future claims that may be made against the Fund cannot be determined, and the Fund has no historical basis for predicting the likelihood of any such claims.
Recent accounting pronouncements and regulatory updates
Tailored Shareholder Reports
In October 2022, the Securities and Exchange Commission adopted a final rule relating to Tailored Shareholder Reports for Mutual Funds and Exchange-Traded Funds; Fee Information in Investment Company Advertisements. The rule and form amendments will, among other things, require the Fund to transmit concise and visually engaging shareholder reports that highlight key information. The amendments will require that funds tag information in a structured data format and that certain more in-depth information be made available online and available for delivery free of charge to investors on request. The amendments became effective January 24, 2023. There is an 18-month transition period after the effective date of the amendments.
Note 3. Fees and other transactions with affiliates
Management services fees
The Fund has entered into a Management Agreement with Columbia Management Investment Advisers, LLC (the Investment Manager), a wholly-owned subsidiary of Ameriprise Financial, Inc. (Ameriprise Financial). Under the Management Agreement, the Investment Manager provides the Fund with investment research and advice, as well as administrative and accounting services. The management services fee is an annual fee that is equal to a percentage of the Fund’s daily net assets that declines from 0.47% to 0.31% as the Fund’s net assets increase. The effective management services fee rate for the year ended October 31, 2023 was 0.47% of the Fund’s average daily net assets.
Compensation of Board members
Members of the Board of Trustees who are not officers or employees of the Investment Manager or Ameriprise Financial are compensated for their services to the Fund as disclosed in the Statement of Operations. Under a Deferred Compensation Plan (the Deferred Plan), these members of the Board of Trustees may elect to defer payment of up to 100% of their compensation. Deferred amounts are treated as though equivalent dollar amounts had been invested in shares of certain funds managed by the Investment Manager. The Fund’s liability for these amounts is adjusted for market value changes and remains in the Fund until distributed in accordance with the Deferred Plan. All amounts payable under the Deferred Plan constitute a general unsecured obligation of the Fund. The expense for the Deferred Plan, which includes Trustees’ fees deferred during the current period as well as any gains or losses on the Trustees’ deferred compensation balances as a result of market fluctuations, is included in "Trustees’ fees" in the Statement of Operations.
Compensation of Chief Compliance Officer
The Board of Trustees has appointed a Chief Compliance Officer for the Fund in accordance with federal securities regulations. As disclosed in the Statement of Operations, a portion of the Chief Compliance Officer’s total compensation is allocated to the Fund, along with other allocations to affiliated registered investment companies managed by the Investment Manager and its affiliates, based on relative net assets.
| 28 | Columbia New York Intermediate Municipal Bond Fund | Annual Report 2023 |
Notes to Financial Statements (continued)
October 31, 2023
Transfer agency fees
Under a Transfer and Dividend Disbursing Agent Agreement, Columbia Management Investment Services Corp. (the Transfer Agent), an affiliate of the Investment Manager and a wholly-owned subsidiary of Ameriprise Financial, is responsible for providing transfer agency services to the Fund. The Transfer Agent has contracted with SS&C GIDS, Inc. (SS&C GIDS) to serve as sub-transfer agent. Prior to January 1, 2023, SS&C GIDS was known as DST Asset Manager Solutions, Inc. The Transfer Agent pays the fees of SS&C GIDS for services as sub-transfer agent and SS&C GIDS is not entitled to reimbursement for such fees from the Fund (with the exception of out-of-pocket fees).
The Fund pays the Transfer Agent a monthly transfer agency fee based on the number or the average value of accounts, depending on the type of account. In addition, the Fund pays the Transfer Agent a fee for shareholder services based on the number of accounts or on a percentage of the average aggregate value of the Fund’s shares maintained in omnibus accounts up to the lesser of the amount charged by the financial intermediary or a cap established by the Board of Trustees from time to time.
The Transfer Agent also receives compensation from the Fund for various shareholder services and reimbursements for certain out-of-pocket fees. Total transfer agency fees for Institutional 2 Class and Institutional 3 Class shares are subject to an annual limitation of not more than 0.07% and 0.02%, respectively, of the average daily net assets attributable to each share class.
For the year ended October 31, 2023, the Fund’s effective transfer agency fee rates as a percentage of average daily net assets of each class were as follows:
| | Effective rate (%) |
| Class A | 0.11 |
| Advisor Class | 0.11 |
| Class C | 0.11 |
| Institutional Class | 0.11 |
| Institutional 2 Class | 0.06 |
| Institutional 3 Class | 0.01 |
| Class V | 0.11 |
An annual minimum account balance fee of $20 may apply to certain accounts with a value below the applicable share class’s initial minimum investment requirements to reduce the impact of small accounts on transfer agency fees. These minimum account balance fees are remitted to the Fund and recorded as part of expense reductions in the Statement of Operations. For the year ended October 31, 2023, these minimum account balance fees reduced total expenses of the Fund by $100.
Distribution and service fees
The Fund has entered into an agreement with Columbia Management Investment Distributors, Inc. (the Distributor), an affiliate of the Investment Manager and a wholly-owned subsidiary of Ameriprise Financial, for distribution and shareholder services. The Board of Trustees has approved, and the Fund has adopted, distribution and shareholder service plans (the Plans) applicable to certain share classes, which set the distribution and service fees for the Fund. These fees are calculated daily and are intended to compensate the Distributor and/or eligible selling and/or servicing agents for selling shares of the Fund and providing services to investors.
Under the Plans, the Fund pays a monthly service fee to the Distributor at the maximum annual rate of 0.25% of the average daily net assets attributable to Class A and Class C shares of the Fund. Also under the Plans, the Fund pays a monthly distribution fee to the Distributor at the maximum annual rate of 0.45% of the average daily net assets attributable to Class C shares of the Fund.
Columbia New York Intermediate Municipal Bond Fund | Annual Report 2023
| 29 |
Notes to Financial Statements (continued)
October 31, 2023
Shareholder services fees
The Fund has adopted a shareholder services plan that permits it to pay for certain services provided to Class V shareholders by their selling and/or servicing agents. The Fund may pay shareholder servicing fees up to an aggregate annual rate of 0.40% of the Fund’s average daily net assets attributable to Class V shares (comprised of up to 0.20% for shareholder services and up to 0.20% for administrative support services). These fees are currently limited to an aggregate annual rate of not more than 0.15% of the Fund’s average daily net assets attributable to Class V shares.
Sales charges (unaudited)
Sales charges, including front-end charges and contingent deferred sales charges (CDSCs), received by the Distributor for distributing Fund shares for the year ended October 31, 2023, if any, are listed below:
| | Front End (%) | CDSC (%) | Amount ($) |
| Class A | 3.00 | 0.75(a) | 4,574 |
| Class C | — | 1.00(b) | — |
| Class V | 4.75 | 0.50 - 1.00(c) | 412 |
| (a) | This charge is imposed on certain investments of $500,000 or more if redeemed within 12 months after purchase. |
| (b) | This charge applies to redemptions within 12 months after purchase, with certain limited exceptions. |
| (c) | This charge is imposed on certain investments of between $1 million and $50 million redeemed within 18 months after purchase, as follows: 1.00% if redeemed within 12 months after purchase, and 0.50% if redeemed more than 12, but less than 18, months after purchase, with certain limited exceptions. |
The Fund’s other share classes are not subject to sales charges.
Expenses waived/reimbursed by the Investment Manager and its affiliates
The Investment Manager and certain of its affiliates have contractually agreed to waive fees and/or reimburse expenses (excluding certain fees and expenses described below) for the period(s) disclosed below, unless sooner terminated at the sole discretion of the Board of Trustees, so that the Fund’s net operating expenses, after giving effect to fees waived/expenses reimbursed and any balance credits and/or overdraft charges from the Fund’s custodian, do not exceed the following annual rate(s) as a percentage of the classes’ average daily net assets:
| | March 1, 2023
through
February 29, 2024 | Prior to
March 1, 2023 |
| Class A | 0.75% | 0.75% |
| Advisor Class | 0.50 | 0.50 |
| Class C | 1.20 | 1.20 |
| Institutional Class | 0.50 | 0.50 |
| Institutional 2 Class | 0.45 | 0.43 |
| Institutional 3 Class | 0.40 | 0.38 |
| Class V | 0.65 | 0.65 |
Under the agreement governing these fee waivers and/or expense reimbursement arrangements, the following fees and expenses are excluded from the waiver/reimbursement commitment, and therefore will be paid by the Fund, if applicable: taxes (including foreign transaction taxes), expenses associated with investments in affiliated and non-affiliated pooled investment vehicles (including mutual funds and exchange-traded funds), transaction costs and brokerage commissions, costs related to any securities lending program, dividend expenses associated with securities sold short, inverse floater program fees and expenses, transaction charges and interest on borrowed money, interest, costs associated with shareholder meetings, infrequent and/or unusual expenses and any other expenses the exclusion of which is specifically approved by the Board of Trustees. This agreement may be modified or amended only with approval from the Investment Manager, certain of its affiliates and the Fund. In addition to the contractual agreement, the Investment Manager and certain of its affiliates have voluntarily agreed to waive fees and/or reimburse Fund expenses (excluding certain fees and expenses described above) so that Fund level expenses (expenses directly attributable to the Fund and not to a specific
| 30 | Columbia New York Intermediate Municipal Bond Fund | Annual Report 2023 |
Notes to Financial Statements (continued)
October 31, 2023
share class) are waived proportionately across all share classes. This arrangement may be revised or discontinued at any time. Any fees waived and/or expenses reimbursed under the expense reimbursement arrangements described above are not recoverable by the Investment Manager or its affiliates in future periods.
Note 4. Federal tax information
The timing and character of income and capital gain distributions are determined in accordance with income tax regulations, which may differ from GAAP because of temporary or permanent book to tax differences.
At October 31, 2023, these differences were primarily due to differing treatment for capital loss carryforwards, trustees’ deferred compensation, distributions and re-characterization of distributions for investments. To the extent these differences were permanent, reclassifications were made among the components of the Fund’s net assets. Temporary differences do not require reclassifications.
The following reclassifications were made:
Undistributed net
investment
income ($) | Accumulated
net realized
(loss) ($) | Paid in
capital ($) |
| (4) | 4 | — |
Net investment income (loss) and net realized gains (losses), as disclosed in the Statement of Operations, and net assets were not affected by this reclassification.
The tax character of distributions paid during the years indicated was as follows:
| Year Ended October 31, 2023 | Year Ended October 31, 2022 |
Ordinary
income ($) | Tax-exempt
income ($) | Long-term
capital gains ($) | Total ($) | Ordinary
income ($) | Tax-exempt
income ($) | Long-term
capital gains ($) | Total ($) |
| 1,446 | 3,500,508 | — | 3,501,954 | 1,412 | 4,275,882 | 408,456 | 4,685,750 |
Short-term capital gain distributions, if any, are considered ordinary income distributions for tax purposes.
At October 31, 2023, the components of distributable earnings on a tax basis were as follows:
Undistributed
ordinary income ($) | Undistributed tax-
exempt income ($) | Undistributed
long-term
capital gains ($) | Capital loss
carryforwards ($) | Net unrealized
(depreciation) ($) |
| — | 438,880 | — | (2,703,574) | (7,447,405) |
At October 31, 2023, the cost of all investments for federal income tax purposes along with the aggregate gross unrealized appreciation and depreciation based on that cost was:
Federal
tax cost ($) | Gross unrealized
appreciation ($) | Gross unrealized
(depreciation) ($) | Net unrealized
(depreciation) ($) |
| 125,006,468 | 64,873 | (7,512,278) | (7,447,405) |
Tax cost of investments and unrealized appreciation/(depreciation) may also include timing differences that do not constitute adjustments to tax basis.
The following capital loss carryforwards, determined at October 31, 2023, may be available to reduce future net realized gains on investments, if any, to the extent permitted by the Internal Revenue Code. In addition, for the year ended October 31, 2023, capital loss carryforwards utilized, if any, were as follows:
No expiration
short-term ($) | No expiration
long-term ($) | Total ($) | Utilized ($) |
| (178,333) | (2,525,241) | (2,703,574) | — |
Columbia New York Intermediate Municipal Bond Fund | Annual Report 2023
| 31 |
Notes to Financial Statements (continued)
October 31, 2023
Management of the Fund has concluded that there are no significant uncertain tax positions in the Fund that would require recognition in the financial statements. However, management’s conclusion may be subject to review and adjustment at a later date based on factors including, but not limited to, new tax laws, regulations, and administrative interpretations (including relevant court decisions). Generally, the Fund’s federal tax returns for the prior three fiscal years remain subject to examination by the Internal Revenue Service.
Note 5. Portfolio information
The cost of purchases and proceeds from sales of securities, excluding short-term investments and derivatives, if any, aggregated to $15,425,822 and $36,237,512, respectively, for the year ended October 31, 2023. The amount of purchase and sale activity impacts the portfolio turnover rate reported in the Financial Highlights.
Note 6. Interfund lending
Pursuant to an exemptive order granted by the Securities and Exchange Commission, the Fund participates in a program (the Interfund Program) allowing each participating Columbia Fund (each, a Participating Fund) to lend money directly to and, except for closed-end funds and money market funds, borrow money directly from other Participating Funds for temporary purposes. The amounts eligible for borrowing and lending under the Interfund Program are subject to certain restrictions.
Interfund loans are subject to the risk that the borrowing fund could be unable to repay the loan when due, and a delay in repayment to the lending fund could result in lost opportunities and/or additional lending costs. The exemptive order is subject to conditions intended to mitigate conflicts of interest arising from the Investment Manager’s relationship with each Participating Fund.
The Fund’s activity in the Interfund Program during the year ended October 31, 2023 was as follows:
| Borrower or lender | Average loan
balance ($) | Weighted average
interest rate (%) | Number of days
with outstanding loans |
| Borrower | 333,333 | 5.02 | 3 |
Interest expense incurred by the Fund is recorded as interfund lending in the Statement of Operations. The Fund had no outstanding interfund loans at October 31, 2023.
Note 7. Line of credit
The Fund has access to a revolving credit facility with a syndicate of banks led by JPMorgan Chase Bank, N.A., Citibank, N.A. and Wells Fargo Bank, N.A. whereby the Fund may borrow for the temporary funding of shareholder redemptions or for other temporary or emergency purposes. Pursuant to an October 26, 2023 amendment and restatement, the credit facility, which is an agreement between the Fund and certain other funds managed by the Investment Manager or an affiliated investment manager, severally and not jointly, permits aggregate borrowings up to $900 million. Interest is currently charged to each participating fund based on its borrowings at a rate equal to the higher of (i) the federal funds effective rate, (ii) the secured overnight financing rate plus 0.10% and (iii) the overnight bank funding rate plus, in each case, 1.00%. Each borrowing under the credit facility matures no later than 60 days after the date of borrowing. The Fund also pays a commitment fee equal to its pro rata share of the unused amount of the credit facility at a rate of 0.15% per annum. The commitment fee is included in other expenses in the Statement of Operations. This agreement expires annually in October unless extended or renewed. Prior to the October 26, 2023 amendment and restatement, the Fund had access to a revolving credit facility with a syndicate of banks led by JPMorgan Chase Bank, N.A., Citibank, N.A. and Wells Fargo Bank, N.A. which permitted collective borrowings up to $950 million. Interest was charged to each participating fund based on its borrowings at a rate equal to the higher of (i) the federal funds effective rate, (ii) the secured overnight financing rate plus 0.10% and (iii) the overnight bank funding rate plus, in each case, 1.00%.
The Fund had no borrowings during the year ended October 31, 2023.
| 32 | Columbia New York Intermediate Municipal Bond Fund | Annual Report 2023 |
Notes to Financial Statements (continued)
October 31, 2023
Note 8. Significant risks
Credit risk
Credit risk is the risk that the value of debt instruments in the Fund’s portfolio may decline because the issuer defaults or otherwise becomes unable or unwilling, or is perceived to be unable or unwilling, to honor its financial obligations, such as making payments to the Fund when due. Credit rating agencies assign credit ratings to certain debt instruments to indicate their credit risk. Lower-rated or unrated debt instruments held by the Fund may present increased credit risk as compared to higher-rated debt instruments.
Interest rate risk
Interest rate risk is the risk of losses attributable to changes in interest rates. In general, if interest rates rise, the values of debt instruments tend to fall, and if interest rates fall, the values of debt instruments tend to rise. Actions by governments and central banking authorities can result in increases or decreases in interest rates. Higher periods of inflation could lead such authorities to raise interest rates. Increasing interest rates may negatively affect the value of debt securities held by the Fund, resulting in a negative impact on the Fund’s performance and net asset value per share. In general, the longer the maturity or duration of a debt security, the greater its sensitivity to changes in interest rates. The Fund is subject to the risk that the income generated by its investments may not keep pace with inflation.
Liquidity risk
Liquidity risk is the risk associated with a lack of marketability of investments which may make it difficult to sell the investment at a desirable time or price. Changing regulatory, market or other conditions or environments (for example, the interest rate or credit environments) may adversely affect the liquidity of the Fund’s investments. The Fund may have to accept a lower selling price for the holding, sell other investments, or forego another, more appealing investment opportunity. Generally, the less liquid the market at the time the Fund sells a portfolio investment, the greater the risk of loss or decline of value to the Fund. A less liquid market can lead to an increase in Fund redemptions, which may negatively impact Fund performance and net asset value per share, including, for example, if the Fund is forced to sell securities in a down market.
Market risk
The Fund may incur losses due to declines in the value of one or more securities in which it invests. These declines may be due to factors affecting a particular issuer, or the result of, among other things, political, regulatory, market, economic or social developments affecting the relevant market(s) more generally. In addition, turbulence in financial markets and reduced liquidity in equity, credit and/or fixed income markets may negatively affect many issuers, which could adversely affect the Fund’s ability to price or value hard-to-value assets in thinly traded and closed markets and could cause significant redemptions and operational challenges. Global economies and financial markets are increasingly interconnected, and conditions and events in one country, region or financial market may adversely impact issuers in a different country, region or financial market. These risks may be magnified if certain events or developments adversely interrupt the global supply chain; in these and other circumstances, such risks might affect companies worldwide. As a result, local, regional or global events such as terrorism, war, other conflicts, natural disasters, disease/virus outbreaks and epidemics or other public health issues, recessions, depressions or other events – or the potential for such events – could have a significant negative impact on global economic and market conditions.
Municipal securities risk
Municipal securities are debt obligations generally issued to obtain funds for various public purposes, including general financing for state and local governments, or financing for a specific project or public facility, and include obligations of the governments of the U.S. territories, commonwealths and possessions such as Guam, Puerto Rico and the U.S. Virgin Islands to the extent such obligations are exempt from state and U.S. federal income taxes. The value of municipal securities can be significantly affected by actual or expected political and legislative changes at the federal or state level. Municipal securities may be fully or partially backed by the taxing authority of the local government, by the credit of a private issuer, by the current or anticipated revenues from a specific project or specific assets or by domestic or foreign entities providing credit support,
Columbia New York Intermediate Municipal Bond Fund | Annual Report 2023
| 33 |
Notes to Financial Statements (continued)
October 31, 2023
such as letters of credit, guarantees or insurance, and are generally classified into general obligation bonds and special revenue obligations. Because many municipal securities are issued to finance projects in sectors such as education, health care, transportation and utilities, conditions in those sectors can affect the overall municipal market.
Issuers in a state, territory, commonwealth or possession in which the Fund invests may experience significant financial difficulties for various reasons, including as the result of events that cannot be reasonably anticipated or controlled such as economic downturns or similar periods of economic stress, social conflict or unrest, labor disruption and natural disasters. Such financial difficulties may lead to credit rating downgrades or defaults of such issuers which in turn, could affect the market values and marketability of many or all municipal obligations of issuers in such state, territory, commonwealth or possession. The value of the Fund’s shares will be negatively impacted to the extent it invests in such securities. The Fund’s annual and semiannual reports show the Fund’s investment exposures at a point in time. The risk of investing in the Fund is directly correlated to the Fund’s investment exposures.
Because the Fund invests substantially in municipal securities issued by the state identified in the Fund’s name and political sub-divisions of that state, the Fund will be particularly affected by adverse tax, legislative, regulatory, demographic or political changes as well as changes impacting the state’s financial, economic or other condition and prospects. In addition, because of the relatively small number of issuers of tax-exempt securities in the state, the Fund may invest a higher percentage of assets in a single issuer and, therefore, be more exposed to the risk of loss than a fund that invests more broadly. The value of municipal and other securities owned by the Fund also may be adversely affected by future changes in federal or state income tax laws.
Non-diversification risk
A non-diversified fund is permitted to invest a greater percentage of its total assets in fewer issuers than a diversified fund. This increases the risk that a change in the value of any one investment held by the Fund could affect the overall value of the Fund more than it would affect that of a diversified fund holding a greater number of investments. Accordingly, the Fund’s value will likely be more volatile than the value of a more diversified fund.
Shareholder concentration risk
At October 31, 2023, one unaffiliated shareholder of record owned 47.8% of the outstanding shares of the Fund in one or more accounts. The Fund has no knowledge about whether any portion of those shares was owned beneficially. Fund shares sold to or redeemed by concentrated accounts may have a significant effect on the operations of the Fund. In the case of a large redemption, the Fund may be forced to sell investments at inopportune times, including its liquid positions, which may result in Fund losses and the Fund holding a higher percentage of less liquid positions. Large redemptions could result in decreased economies of scale and increased operating expenses for non-redeeming Fund shareholders.
Note 9. Subsequent events
Management has evaluated the events and transactions that have occurred through the date the financial statements were issued. Other than as noted in Note 1 above, there were no items requiring adjustment of the financial statements or additional disclosure.
Note 10. Information regarding pending and settled legal proceedings
Ameriprise Financial and certain of its affiliates are involved in the normal course of business in legal proceedings which include regulatory inquiries, arbitration and litigation, including class actions concerning matters arising in connection with the conduct of their activities as part of a diversified financial services firm. Ameriprise Financial believes that the Fund is not currently the subject of, and that neither Ameriprise Financial nor any of its affiliates are the subject of, any pending legal, arbitration or regulatory proceedings that are likely to have a material adverse effect on the Fund or the ability of Ameriprise Financial or its affiliates to perform under their contracts with the Fund. Ameriprise Financial is required to make quarterly (10-Q), annual (10-K) and, as necessary, 8-K filings with the Securities and Exchange Commission (SEC) on legal and regulatory matters that relate to Ameriprise Financial and its affiliates. Copies of these filings may be obtained by accessing the SEC website at www.sec.gov.
| 34 | Columbia New York Intermediate Municipal Bond Fund | Annual Report 2023 |
Notes to Financial Statements (continued)
October 31, 2023
There can be no assurance that these matters, or the adverse publicity associated with them, will not result in increased Fund redemptions, reduced sale of Fund shares or other adverse consequences to the Fund. Further, although we believe proceedings are not likely to have a material adverse effect on the Fund or the ability of Ameriprise Financial or its affiliates to perform under their contracts with the Fund, these proceedings are subject to uncertainties and, as such, we are unable to estimate the possible loss or range of loss that may result. An adverse outcome in one or more of these proceedings could result in adverse judgments, settlements, fines, penalties or other relief that could have a material adverse effect on the consolidated financial condition or results of operations of Ameriprise Financial or one or more of its affiliates that provide services to the Fund.
Columbia New York Intermediate Municipal Bond Fund | Annual Report 2023
| 35 |
Report of Independent Registered Public Accounting Firm
To the Board of Trustees of Columbia Funds Series Trust I and Shareholders of Columbia New York Intermediate Municipal Bond Fund
Opinion on the Financial Statements
We have audited the accompanying statement of assets and liabilities, including the portfolio of investments, of Columbia New York Intermediate Municipal Bond Fund (one of the funds constituting Columbia Funds Series Trust I, referred to hereafter as the "Fund") as of October 31, 2023, the related statement of operations for the year ended October 31, 2023, the statement of changes in net assets for each of the two years in the period ended October 31, 2023, including the related notes, and the financial highlights for each of the five years in the period ended October 31, 2023 (collectively referred to as the "financial statements"). In our opinion, the financial statements present fairly, in all material respects, the financial position of the Fund as of October 31, 2023, the results of its operations for the year then ended, the changes in its net assets for each of the two years in the period ended October 31, 2023 and the financial highlights for each of the five years in the period ended October 31, 2023 in conformity with accounting principles generally accepted in the United States of America.
Basis for Opinion
These financial statements are the responsibility of the Fund’s management. Our responsibility is to express an opinion on the Fund’s financial statements based on our audits. We are a public accounting firm registered with the Public Company Accounting Oversight Board (United States) (PCAOB) and are required to be independent with respect to the Fund in accordance with the U.S. federal securities laws and the applicable rules and regulations of the Securities and Exchange Commission and the PCAOB.
We conducted our audits of these financial statements in accordance with the standards of the PCAOB. Those standards require that we plan and perform the audit to obtain reasonable assurance about whether the financial statements are free of material misstatement, whether due to error or fraud.
Our audits included performing procedures to assess the risks of material misstatement of the financial statements, whether due to error or fraud, and performing procedures that respond to those risks. Such procedures included examining, on a test basis, evidence regarding the amounts and disclosures in the financial statements. Our audits also included evaluating the accounting principles used and significant estimates made by management, as well as evaluating the overall presentation of the financial statements. Our procedures included confirmation of securities owned as of October 31, 2023 by correspondence with the custodian, transfer agents and broker; when a reply was not received from the broker, we performed other auditing procedures. We believe that our audits provide a reasonable basis for our opinion.
/s/PricewaterhouseCoopers LLP
Minneapolis, Minnesota
December 20, 2023
We have served as the auditor of one or more investment companies within the Columbia Funds Complex since 1977.
| 36 | Columbia New York Intermediate Municipal Bond Fund | Annual Report 2023 |
Federal Income Tax Information
(Unaudited)
The Fund hereby designates the following tax attributes for the fiscal year ended October 31, 2023. Shareholders will be notified in early 2024 of the amounts for use in preparing 2023 income tax returns.
Exempt-
interest
dividends | |
| 99.96% | |
Exempt-interest dividends. The percentage of net investment income distributed during the fiscal year that qualifies as exempt-interest dividends for federal income tax purposes. A portion of the income may be subject to federal alternative minimum tax.
TRUSTEES AND OFFICERS
(Unaudited)
The Board oversees the Fund’s operations and appoints officers who are responsible for day-to-day business decisions based on policies set by the Board. The following table provides basic biographical information about the Fund’s Trustees as of the printing of this report, including their principal occupations during the past five years, although specific titles for individuals may have varied over the period. The year set forth beneath Length of Service in the table below is the year in which the Trustee was first appointed or elected as Trustee to any Fund currently in the Columbia Funds Complex or a predecessor thereof. Under current Board policy, each Trustee generally serves until December 31 of the year such Trustee turns seventy-five (75).
Independent trustees
Name,
address,
year of birth | Position held
with the Columbia Funds and
length of service | Principal occupation(s)
during past five years
and other relevant
professional experience | Number of
Funds in the
Columbia Funds
Complex*
overseen | Other directorships
held by Trustee
during the past five years
and other relevant Board experience |
George S. Batejan
c/o Columbia Management
Investment Advisers, LLC
290 Congress Street
Boston, MA 02210
1954 | Trustee since 2017 | Executive Vice President, Global Head of Technology and Operations, Janus Capital Group, Inc., 2010-2016 | 170 | Former Chairman of the Board, NICSA (National Investment Company Services Association) (Executive Committee, Nominating Committee and Governance Committee), 2014-2016; former Director, Intech Investment Management, 2011-2016; former Board Member, Metro Denver Chamber of Commerce, 2015-2016; former Advisory Board Member, University of Colorado Business School, 2015-2018; former Board Member, Chase Bank International, 1993-1994 |
Columbia New York Intermediate Municipal Bond Fund | Annual Report 2023
| 37 |
TRUSTEES AND OFFICERS (continued)
(Unaudited)
Independent trustees (continued)
Name,
address,
year of birth | Position held
with the Columbia Funds and
length of service | Principal occupation(s)
during past five years
and other relevant
professional experience | Number of
Funds in the
Columbia Funds
Complex*
overseen | Other directorships
held by Trustee
during the past five years
and other relevant Board experience |
Kathleen Blatz
c/o Columbia Management
Investment Advisers, LLC
290 Congress Street
Boston, MA 02210
1954 | Trustee since 2006 | Attorney, specializing in arbitration and mediation; Chief Justice, Minnesota Supreme Court, 1998-2006; Associate Justice, Minnesota Supreme Court, 1996-1998; Fourth Judicial District Court Judge, Hennepin County, 1994-1996; Attorney in private practice and public service, 1984-1993; State Representative, Minnesota House of Representatives, 1979-1993, which included service on the Tax and Financial Institutions and Insurance Committees; Member and Interim Chair, Minnesota Sports Facilities Authority, January-July 2017; Interim President and Chief Executive Officer, Blue Cross and Blue Shield of Minnesota (health care insurance), February-July 2018, April-October 2021 | 170 | Former Trustee, Blue Cross and Blue Shield of Minnesota, 2009-2021 (Chair of the Business Development Committee, 2014-2017; Chair of the Governance Committee, 2017-2019); former Member and Chair of the Board, Minnesota Sports Facilities Authority, January 2017-July 2017; former Director, Robina Foundation, 2009-2020 (Chair, 2014-2020); Director, Richard M. Schulze Family Foundation, since 2021 |
Pamela G. Carlton
c/o Columbia Management
Investment Advisers, LLC
290 Congress Street
Boston, MA 02210
1954 | Chair since 2023; Trustee since 2007 | President, Springboard – Partners in Cross Cultural Leadership (consulting company), since 2003; Managing Director of US Equity Research, JP Morgan Chase, 1999-2003; Director of US Equity Research, Chase Asset Management, 1996-1999; Co-Director Latin America Research, 1993-1996, COO Global Research, 1992-1996, Co-Director of US Research, 1991-1992, Investment Banker, 1982-1991, Morgan Stanley; Attorney, Cleary Gottlieb Steen & Hamilton LLP, 1980-1982 | 170 | Trustee, New York Presbyterian Hospital Board, since 1996; Director, DR Bank (Audit Committee) since 2017; Director, Evercore Inc. (Audit Committee, Nominating and Governance Committee), since 2019; Director, Apollo Commercial Real Estate Finance, Inc. (Chair, Nominating and Governance Committee) (financial services), since 2021; the Governing Council of the Independent Directors Council (IDC), since 2021 |
Janet Langford Carrig
c/o Columbia Management
Investment Advisers, LLC
290 Congress Street
Boston, MA 02210
1957 | Trustee since 1996 | Senior Vice President, General Counsel and Corporate Secretary, ConocoPhillips (independent energy company), September 2007-October 2018 | 170 | Director, EQT Corporation (natural gas producer), since 2019; former Director, Whiting Petroleum Corporation (independent oil and gas company), 2020-2022 |
J. Kevin Connaughton
c/o Columbia Management
Investment Advisers, LLC
290 Congress Street
Boston, MA 02210
1964 | Trustee since 2020 | CEO and President, RhodeWay Financial (non-profit financial planning firm), since December 2022; Member, FINRA National Adjudicatory Council, since January 2020; Adjunct Professor of Finance, Bentley University since January 2018; Consultant to Independent Trustees of CFVIT and CFST I from March 2016 to June 2020 with respect to CFVIT and to December 2020 with respect to CFST I; Managing Director and General Manager of Mutual Fund Products, Columbia Management Investment Advisers, LLC, May 2010-February 2015; President, Columbia Funds, 2008-2015; and senior officer of Columbia Funds and affiliated funds, 2003-2015 | 168 | Former Director, The Autism Project, March 2015-December 2021; former Member of the Investment Committee, St. Michael’s College, November 2015-February 2020; former Trustee, St. Michael’s College, June 2017-September 2019; former Trustee, New Century Portfolios (former mutual fund complex), January 2015-December 2017 |
| 38 | Columbia New York Intermediate Municipal Bond Fund | Annual Report 2023 |
TRUSTEES AND OFFICERS (continued)
(Unaudited)
Independent trustees (continued)
Name,
address,
year of birth | Position held
with the Columbia Funds and
length of service | Principal occupation(s)
during past five years
and other relevant
professional experience | Number of
Funds in the
Columbia Funds
Complex*
overseen | Other directorships
held by Trustee
during the past five years
and other relevant Board experience |
Olive M. Darragh
c/o Columbia Management
Investment Advisers, LLC
290 Congress Street
Boston, MA 02210
1962 | Trustee since 2020 | Managing Director of Darragh Inc. (strategy and talent management consulting firm), since 2010; Founder and CEO, Zolio, Inc. (investment management talent identification platform), since 2004; Consultant to Independent Trustees of CFVIT and CFST I from June 2019 to June 2020 with respect to CFVIT and to December 2020 with respect to CFST I; Partner, Tudor Investments, 2004-2010; Senior Partner, McKinsey & Company (consulting), 1990-2004; Touche Ross CPA, 1985-1988 | 168 | Treasurer, Edinburgh University US Trust Board, since January 2023; Member, HBS Community Action Partners Board, since September 2022; former Director, University of Edinburgh Business School (Member of US Board), 2004-2019; former Director, Boston Public Library Foundation, 2008-2017 |
Patricia M. Flynn
c/o Columbia Management
Investment Advisers, LLC
290 Congress Street
Boston, MA 02210
1950 | Trustee since 2004 | Professor Emeritus of Economics and Management, Bentley University, since 2023; Professor of Economics and Management, Bentley University, 1976-2023; Dean, McCallum Graduate School of Business, Bentley University, 1992-2002 | 170 | Former Trustee, MA Taxpayers Foundation, 1997-2022; former Director, The MA Business Roundtable, 2003-2019; former Chairperson, Innovation Index Advisory Committee, MA Technology Collaborative, 1997-2020 |
Brian J. Gallagher
c/o Columbia Management
Investment Advisers, LLC
290 Congress Street
Boston, MA 02210
1954 | Trustee since 2017 | Retired; Partner with Deloitte & Touche LLP and its predecessors, 1977-2016 | 170 | Trustee, Catholic Schools Foundation, since 2004 |
Douglas A. Hacker
c/o Columbia Management
Investment Advisers, LLC
290 Congress Street
Boston, MA 02210
1955 | Trustee since 1996 | Independent business executive, since May 2006; Executive Vice President – Strategy of United Airlines, December 2002 - May 2006; President of UAL Loyalty Services (airline marketing company), September 2001-December 2002; Executive Vice President and Chief Financial Officer of United Airlines, July 1999-September 2001 | 170 | Director, SpartanNash Company since November 2013 (Chair of the Board, since May 2021) (food distributor); Director, Aircastle Limited (Chair of Audit Committee) (aircraft leasing), since August 2006; former Director, Nash Finch Company (food distributor), 2005-2013; former Director, SeaCube Container Leasing Ltd. (container leasing), 2010-2013; and former Director, Travelport Worldwide Limited (travel information technology), 2014-2019 |
Nancy T. Lukitsh
c/o Columbia Management
Investment Advisers, LLC
290 Congress Street
Boston, MA 02210
1956 | Trustee since 2011 | Senior Vice President, Partner and Director of Marketing, Wellington Management Company, LLP (investment adviser), 1997-2010; Chair, Wellington Management Portfolios (commingled non-U.S. investment pools), 2007-2010; Director, Wellington Trust Company, NA and other Wellington affiliates, 1997-2010 | 168 | None |
Columbia New York Intermediate Municipal Bond Fund | Annual Report 2023
| 39 |
TRUSTEES AND OFFICERS (continued)
(Unaudited)
Independent trustees (continued)
Name,
address,
year of birth | Position held
with the Columbia Funds and
length of service | Principal occupation(s)
during past five years
and other relevant
professional experience | Number of
Funds in the
Columbia Funds
Complex*
overseen | Other directorships
held by Trustee
during the past five years
and other relevant Board experience |
David M. Moffett
c/o Columbia Management
Investment Advisers, LLC
290 Congress Street
Boston, MA 02210
1952 | Trustee since 2011 | Retired; former Chief Executive Officer of Freddie Mac and Chief Financial Officer of U.S. Bank | 168 | Director, CSX Corporation (transportation suppliers); Director, PayPal Holdings Inc. (payment and data processing services); Trustee, University of Oklahoma Foundation; former Director, eBay Inc. (online trading community), 2007-2015; and former Director, CIT Bank, CIT Group Inc. (commercial and consumer finance), 2010-2016; former Senior Adviser to The Carlyle Group (financial services), March 2008-September 2008; former Governance Consultant to Bridgewater Associates, January 2013-December 2015 |
Catherine James Paglia
c/o Columbia Management
Investment Advisers, LLC
290 Congress Street
Boston, MA 02210
1952 | Trustee since 2004 | Director, Enterprise Asset Management, Inc. (private real estate and asset management company), since September 1998; Managing Director and Partner, Interlaken Capital, Inc., 1989-1997; Vice President, 1982-1985, Principal, 1985-1987, Managing Director, 1987-1989, Morgan Stanley; Vice President, Investment Banking, 1980-1982, Associate, Investment Banking, 1976-1980, Dean Witter Reynolds, Inc. | 170 | Director, Valmont Industries, Inc. (irrigation systems manufacturer), since 2012; Trustee, Carleton College (on the Investment Committee), since 1987; Trustee, Carnegie Endowment for International Peace (on the Investment Committee), since 2009 |
Natalie A. Trunow
c/o Columbia Management
Investment Advisers, LLC
290 Congress Street
Boston, MA 02210
1967 | Trustee since 2020 | Chief Executive Officer, Millennial Portfolio Solutions LLC (asset management and consulting services), January 2016-January 2021; Non-executive Member of the Investment Committee and Valuation Committee, Sarona Asset Management Inc. (private equity firm) since September 2019; Advisor, Horizon Investments (asset management and consulting services), August 2018-January 2022; Advisor, Paradigm Asset Management, November 2016-January 2022; Consultant to Independent Trustees of CFVIT and CFST I from September 2016 to June 2020 with respect to CFVIT and to December 2020 with respect to CFST I; Director of Investments/Consultant, Casey Family Programs, April 2016-November 2016; Senior Vice President and Chief Investment Officer, Calvert Investments, August 2008-January 2016; Section Head and Portfolio Manager, General Motors Asset Management, June 1997-August 2008 | 168 | Independent Director, Investment Committee, Health Services for Children with Special Needs, Inc., 2010-2021; Independent Director, (Executive Committee and Chair, Audit Committee), Consumer Credit Counseling Services (formerly Guidewell Financial Solutions), since 2016; Independent Director, (Investment Committee), Sarona Asset Management, since 2019 |
| 40 | Columbia New York Intermediate Municipal Bond Fund | Annual Report 2023 |
TRUSTEES AND OFFICERS (continued)
(Unaudited)
Independent trustees (continued)
Name,
address,
year of birth | Position held
with the Columbia Funds and
length of service | Principal occupation(s)
during past five years
and other relevant
professional experience | Number of
Funds in the
Columbia Funds
Complex*
overseen | Other directorships
held by Trustee
during the past five years
and other relevant Board experience |
Sandra L. Yeager
c/o Columbia Management
Investment Advisers, LLC
290 Congress Street
Boston, MA 02210
1964 | Trustee since 2017 | Retired; President and founder, Hanoverian Capital, LLC (SEC registered investment advisor firm), 2008-2016; Managing Director, DuPont Capital, 2006-2008; Managing Director, Morgan Stanley Investment Management, 2004-2006; Senior Vice President, Alliance Bernstein, 1990-2004 | 170 | Former Director, NAPE (National Alliance for Partnerships in Equity) Education Foundation, October 2016-October 2020; Advisory Board, Jennersville YMCA, since 2022 |
Interested trustee affiliated with Investment Manager**
Name,
address,
year of birth | Position held with the Columbia Funds and length of service | Principal occupation(s) during the
past five years and other relevant
professional experience | Number of
Funds in the
Columbia Funds
Complex* overseen | Other directorships
held by Trustee
during the past
five years and
other relevant Board experience |
Daniel J. Beckman
c/o Columbia Management
Investment Advisers, LLC
290 Congress Street
Boston, MA 02210
1962 | Trustee since November 2021 and President since June 2021 | Vice President – Head of North America Product, Columbia Management Investment Advisers, LLC, since April 2015; President and Principal Executive Officer of the Columbia Funds, since June 2021; officer of Columbia Funds and affiliated funds, 2020-2021; Co-President and Principal Executive Officer, Columbia Acorn/Wanger Funds, since July 2021 | 170 | Director, Ameriprise Trust Company, since October 2016; Director, Columbia Management Investment Distributors, Inc. since November 2018; Board of Governors, Columbia Wanger Asset Management, LLC since, January 2022; Director, Columbia Threadneedle Canada, Inc., since December 2022 |
| * | The term “Columbia Funds Complex” as used herein includes Columbia Seligman Premium Technology Growth Fund, Tri-Continental Corporation and each series of Columbia Funds Series Trust (CFST), Columbia Funds Series Trust I (CFST I), Columbia Funds Series Trust II (CFST II), Columbia ETF Trust I (CET I), Columbia ETF Trust II (CET II), Columbia Funds Variable Insurance Trust (CFVIT) and Columbia Funds Variable Series Trust II (CFVST II). Messrs. Batejan, Beckman, Gallagher and Hacker and Mses. Blatz, Carlton, Carrig, Flynn, Paglia, and Yeager serve as directors of Columbia Seligman Premium Technology Growth Fund and Tri-Continental Corporation. |
| ** | Interested person (as defined under the 1940 Act) by reason of being an officer, director, security holder and/or employee of the Investment Manager or Ameriprise Financial. |
The Statement of Additional Information has additional information about the Fund’s Board members and is available, without charge, upon request by calling 800.345.6611, visiting columbiathreadneedleus.com/investor/ or contacting your financial intermediary.
Columbia New York Intermediate Municipal Bond Fund | Annual Report 2023
| 41 |
TRUSTEES AND OFFICERS (continued)
(Unaudited)
The Board has appointed officers who are responsible for day-to-day business decisions based on policies it has established. The officers serve at the pleasure of the Board. The following table provides basic information about the Officers of the Fund as of the printing of this report, including principal occupations during the past five years, although their specific titles may have varied over the period. In addition to Mr. Beckman, who is President and Principal Executive Officer, the Fund’s other officers are:
Fund officers
Name,
address and
year of birth | Position and year
first appointed to
position for any Fund
in the Columbia
Funds Complex or a
predecessor thereof | Principal occupation(s) during past five years |
Michael G. Clarke
290 Congress Street
Boston, MA 02210
1969 | Chief Financial Officer and Principal Financial Officer (2009) and Senior Vice President (2019) | Senior Vice President and North America Head of Operations & Investor Services, Columbia Management Investment Advisers, LLC, since June 2023 (previously Senior Vice President and Head of Global Operations, March 2022 – June 2023, Vice President, Head of North America Operations, and Co-Head of Global Operations, June 2019 - February 2022 and Vice President – Accounting and Tax, May 2010 - May 2019); senior officer of Columbia Funds and affiliated funds, since 2002. Director, Ameriprise Trust Company, since June 2023. |
Joseph Beranek
5890 Ameriprise Financial Center
Minneapolis, MN 55474
1965 | Treasurer and Chief Accounting Officer (Principal Accounting Officer) (2019) and Principal Financial Officer (2020), CFST, CFST I, CFST II, CFVIT and CFVST II; Assistant Treasurer, CET I and CET II | Vice President – Mutual Fund Accounting and Financial Reporting, Columbia Management Investment Advisers, LLC, since December 2018 and March 2017, respectively. |
Marybeth Pilat
290 Congress Street
Boston, MA 02210
1968 | Treasurer and Chief Accounting Officer (Principal Accounting Officer) and Principal Financial Officer (2020) for CET I and CET II; Assistant Treasurer, CFST, CFST I, CFST II, CFVIT and CFVST II | Vice President – Product Pricing and Administration, Columbia Management Investment Advisers, LLC, since May 2017. |
William F. Truscott
290 Congress Street
Boston, MA 02210
1960 | Senior Vice President (2001) | Formerly, Trustee/Director of Columbia Funds Complex or legacy funds, November 2001 - January 1, 2021; Chief Executive Officer, Global Asset Management, Ameriprise Financial, Inc., since September 2012; Chairman of the Board and President, Columbia Management Investment Advisers, LLC, since July 2004 and February 2012, respectively; Chairman of the Board and Chief Executive Officer, Columbia Management Investment Distributors, Inc., since November 2008 and February 2012, respectively; Chairman of the Board and Director, Threadneedle Asset Management Holdings, Sàrl, since March 2013 and December 2008, respectively; senior executive of various entities affiliated with Columbia Threadneedle. |
Christopher O. Petersen
5228 Ameriprise Financial Center
Minneapolis, MN 55474
1970 | Senior Vice President and Assistant Secretary (2021) | Formerly, Trustee/Director of funds within the Columbia Funds Complex, July 1, 2020 - November 22, 2021; Senior Vice President and Assistant General Counsel, Ameriprise Financial, Inc., since September 2021 (previously Vice President and Lead Chief Counsel, January 2015 - September 2021); formerly, President and Principal Executive Officer of the Columbia Funds, 2015 - 2021; officer of Columbia Funds and affiliated funds, since 2007. |
Thomas P. McGuire
290 Congress Street
Boston, MA 02210
1972 | Senior Vice President and Chief Compliance Officer (2012) | Vice President – Asset Management Compliance, Ameriprise Financial, Inc., since May 2010; Chief Compliance Officer, Columbia Acorn/Wanger Funds, since December 2015; formerly, Chief Compliance Officer, Ameriprise Certificate Company, September 2010 – September 2020. |
Ryan C. Larrenaga
290 Congress Street
Boston, MA 02210
1970 | Senior Vice President (2017), Chief Legal Officer (2017), and Secretary (2015) | Vice President and Chief Counsel, Ameriprise Financial, Inc., since August 2018 (previously Vice President and Group Counsel, August 2011 - August 2018); Chief Legal Officer, Columbia Acorn/Wanger Funds, since September 2020; officer of Columbia Funds and affiliated funds, since 2005. |
| 42 | Columbia New York Intermediate Municipal Bond Fund | Annual Report 2023 |
TRUSTEES AND OFFICERS (continued)
(Unaudited)
Fund officers (continued)
Name,
address and
year of birth | Position and year
first appointed to
position for any Fund
in the Columbia
Funds Complex or a
predecessor thereof | Principal occupation(s) during past five years |
Michael E. DeFao
290 Congress Street
Boston, MA 02210
1968 | Vice President (2011) and Assistant Secretary (2010) | Vice President and Chief Counsel, Ameriprise Financial, Inc., since May 2010; Vice President, Chief Legal Officer and Assistant Secretary, Columbia Management Investment Advisers, LLC, since October 2021 (previously Vice President and Assistant Secretary, May 2010 – September 2021). |
Lyn Kephart-Strong
5903 Ameriprise Financial Center
Minneapolis, MN 55474
1960 | Vice President (2015) | Vice President, Global Investment Operations Services, Columbia Management Investment Advisers, LLC, since 2010; Director (since January 2007) and President (since October 2014), Columbia Management Investment Services Corp.; Director (since December 2017) and President (since January 2017), Ameriprise Trust Company. |
Approval of Management Agreement
(Unaudited)
Columbia Management Investment Advisers, LLC (the Investment Manager, and together with its domestic and global affiliates, Columbia Threadneedle Investments), a wholly-owned subsidiary of Ameriprise Financial, Inc. (Ameriprise Financial), serves as the investment manager to Columbia New York Intermediate Municipal Bond Fund (the Fund). Under a management agreement (the Management Agreement), the Investment Manager provides investment advice and other services to the Fund and other funds distributed by Columbia Management Investment Distributors, Inc. (collectively, the Funds).
On an annual basis, the Fund’s Board of Trustees (the Board), including the independent Board members (the Independent Trustees), considers renewal of the Management Agreement. The Investment Manager prepared detailed reports for the Board and its Contracts Committee (including its Contracts Subcommittee) in February, March, April, May and June 2023, including reports providing the results of analyses performed by a third-party data provider, Broadridge Financial Solutions, Inc. (Broadridge), and comprehensive responses by the Investment Manager to written requests for information by independent legal counsel to the Independent Trustees (Independent Legal Counsel), to assist the Board in making this determination. In addition, throughout the year, the Board (or its committees or subcommittees) regularly meets with portfolio management teams and senior management personnel and reviews information prepared by the Investment Manager addressing the services the Investment Manager provides and Fund performance. The Board also accords appropriate weight to the work, deliberations and conclusions of the various committees (including their subcommittees), such as the Contracts Committee, the Investment Review Committee, the Audit Committee and the Compliance Committee in determining whether to continue the Management Agreement.
The Board, at its June 22, 2023 Board meeting (the June Meeting), considered the renewal of the Management Agreement for an additional one-year term. At the June Meeting, Independent Legal Counsel reviewed with the Independent Trustees various factors relevant to the Board’s consideration of advisory agreements and the Board’s legal responsibilities related to such consideration. The Independent Trustees considered all information that they, their legal counsel or the Investment Manager believed reasonably necessary to evaluate and to approve the continuation of the Management Agreement. Among other things, the information and factors considered included the following:
| • | Information on the investment performance of the Fund relative to the performance of a group of mutual funds determined to be comparable to the Fund by Broadridge, as well as performance relative to one or more benchmarks; |
Columbia New York Intermediate Municipal Bond Fund | Annual Report 2023
| 43 |
Approval of Management Agreement (continued)
(Unaudited)
| • | Information on the Fund’s management fees and total expenses, including information comparing the Fund’s expenses to those of a group of comparable mutual funds, as determined by Broadridge; |
| • | The Investment Manager’s agreement to contractually limit or cap total operating expenses for the Fund so that total operating expenses (excluding certain fees and expenses, such as transaction costs and certain other investment related expenses, interest, taxes, acquired fund fees and expenses and infrequent and/or unusual expenses) would not exceed a specified annual rate, as a percentage of the Fund’s net assets; |
| • | Terms of the Management Agreement; |
| • | Descriptions of other agreements and arrangements with affiliates of the Investment Manager relating to the operations of the Fund, including agreements with respect to the provision of transfer agency and shareholder services to the Fund; |
| • | Descriptions of various services performed by the Investment Manager under the Management Agreement, including portfolio management and portfolio trading practices; |
| • | Information regarding any recently negotiated management fees of similarly-managed portfolios of other institutional clients of the Investment Manager; |
| • | Information regarding the resources of the Investment Manager, including information regarding senior management, portfolio managers and other personnel; |
| • | Information regarding the capabilities of the Investment Manager with respect to compliance monitoring services; |
| • | The profitability to the Investment Manager and its affiliates from their relationships with the Fund; and |
| • | Report provided by the Board’s independent fee consultant, JDL Consultants, LLC (JDL). |
Following an analysis and discussion of the foregoing, and the factors identified below, the Board, including all of the Independent Trustees, approved the renewal of the Management Agreement.
Nature, extent and quality of services provided by the Investment Manager
The Board analyzed various reports and presentations it had received detailing the services performed by the Investment Manager, as well as its history, expertise, resources and relative capabilities, and the qualifications of its personnel.
The Board specifically considered the many developments during recent years concerning the services provided by the Investment Manager. Among other things, the Board noted the organization and depth of the equity and credit research departments. The Board further observed the enhancements to the investment risk management department’s processes, systems and oversight over the past several years. The Board also took into account the broad scope of services provided by the Investment Manager to the Fund, including, among other services, investment, risk and compliance oversight. The Board also took into account the information it received concerning the Investment Manager’s ability to attract and retain key portfolio management personnel and that it has sufficient resources to provide competitive and adequate compensation to investment personnel.
In connection with the Board’s evaluation of the overall package of services provided by the Investment Manager, the Board also considered the nature, quality and range of administrative services provided to the Fund by the Investment Manager, as well as the achievements in 2022 in the performance of administrative services, and noted the various enhancements anticipated for 2023. In evaluating the quality of services provided under the Management Agreement, the Board also took into account the organization and strength of the Fund’s and its service providers’ compliance programs. The Board also reviewed the financial condition of the Investment Manager and its affiliates and each entity’s ability to carry out its responsibilities under the Management Agreement and the Fund’s other service agreements.
In addition, the Board discussed the acceptability of the terms of the Management Agreement, noting that no changes were proposed from the form of agreement previously approved. The Board also noted the wide array of legal and compliance services provided to the Fund under the Management Agreement.
| 44 | Columbia New York Intermediate Municipal Bond Fund | Annual Report 2023 |
Approval of Management Agreement (continued)
(Unaudited)
After reviewing these and related factors (including investment performance as discussed below), the Board concluded, within the context of their overall conclusions, that the nature, extent and quality of the services provided to the Fund under the Management Agreement supported the continuation of the Management Agreement.
Investment performance
The Board carefully reviewed the investment performance of the Fund, including detailed reports providing the results of analyses performed by each of the Investment Manager, Broadridge and JDL collectively showing, for various periods (including since manager inception): (i) the performance of the Fund, (ii) the Fund’s performance relative to peers and benchmarks and (iii) the net assets of the Fund. The Board observed that Fund performance was well within the range of that of its peers.
The Board also reviewed a description of the third-party data provider’s methodology for identifying the Fund’s peer groups for purposes of performance and expense comparisons.
The Board also considered the Investment Manager’s performance and reputation generally. After reviewing these and related factors, the Board concluded, within the context of their overall conclusions, that the performance of the Fund and the Investment Manager, in light of other considerations, supported the continuation of the Management Agreement.
Comparative fees, costs of services provided and the profits realized by the Investment Manager and its affiliates from their relationships with the Fund
The Board reviewed comparative fees and the costs of services provided under the Management Agreement. The Board members considered detailed comparative information set forth in an annual report on fees and expenses, including, among other things, data (based on analyses conducted by Broadridge and JDL) showing a comparison of the Fund’s expenses with median expenses paid by funds in its comparative peer universe, as well as data showing the Fund’s contribution to the Investment Manager’s profitability.
The Board considered the reports of JDL, which assisted in the Board’s analysis of the Funds’ performance and expenses and the reasonableness of the Funds’ fee rates. The Board accorded particular weight to the notion that a primary objective of the level of fees is to achieve a rational pricing model applied consistently across the various product lines in the Fund family, while assuring that the overall fees for each Fund (with certain exceptions) are generally in line with the current “pricing philosophy” such that Fund total expense ratios, in general, approximate or are lower than the median expense ratios of funds in the same Lipper comparison universe. The Board took into account that the Fund’s total expense ratio (after considering proposed expense caps/waivers) approximated the peer universe’s median expense ratio.
After reviewing these and related factors, the Board concluded, within the context of their overall conclusions, that the levels of management fees and expenses of the Fund, in light of other considerations, supported the continuation of the Management Agreement.
The Board also considered the profitability of the Investment Manager and its affiliates in connection with the Investment Manager providing management services to the Fund. With respect to the profitability of the Investment Manager and its affiliates, the Independent Trustees referred to information discussing the profitability to the Investment Manager and Ameriprise Financial from managing, operating and distributing the Funds. The Board considered that the profitability generated by the Investment Manager in 2022 had declined from 2021 levels, due to a variety of factors, including the decreased assets under management of the Funds. It also took into account the indirect economic benefits flowing to the Investment Manager or its affiliates in connection with managing or distributing the Funds, such as the enhanced ability to offer various other financial products to Ameriprise Financial customers, soft dollar benefits and overall reputational advantages. The Board noted that the fees paid by the Fund should permit the Investment Manager to offer competitive compensation to its personnel, make necessary investments in its business and earn an appropriate profit. After reviewing these and related factors, the Board concluded, within the context of their overall conclusions, that the costs of services provided and the profitability to the Investment Manager and its affiliates from their relationships with the Fund supported the continuation of the Management Agreement.
Columbia New York Intermediate Municipal Bond Fund | Annual Report 2023
| 45 |
Approval of Management Agreement (continued)
(Unaudited)
Economies of scale
The Board considered the potential existence of economies of scale in the provision by the Investment Manager of services to the Fund, and whether those economies of scale were shared with the Fund through breakpoints in investment management fees or other means, such as expense limitation arrangements and additional investments by the Investment Manager in investment, trading, compliance and other resources. The Board considered the economies of scale that might be realized as the Fund’s net asset level grows and took note of the extent to which Fund shareholders might also benefit from such growth. In this regard, the Board took into account that management fees decline as Fund assets exceed various breakpoints, all of which have not been surpassed. The Board observed that the Management Agreement provided for breakpoints in the management fee rate schedule that allow opportunities for shareholders to realize lower fees as Fund assets grow and that there are additional opportunities through other means for sharing economies of scale with shareholders.
Conclusion
The Board reviewed all of the above considerations in reaching its decision to approve the continuation of the Management Agreement. In reaching its conclusions, no single factor was determinative.
On June 22, 2023, the Board, including all of the Independent Trustees, determined that fees payable under the Management Agreement were fair and reasonable in light of the extent and quality of services provided and approved the renewal of the Management Agreement.
| 46 | Columbia New York Intermediate Municipal Bond Fund | Annual Report 2023 |
[THIS PAGE INTENTIONALLY LEFT BLANK]
Columbia New York Intermediate Municipal Bond Fund
P.O. Box 219104
Kansas City, MO 64121-9104
Please read and consider the investment objectives, risks, charges and expenses for any fund carefully before investing. For a prospectus and summary prospectus, which contains this and other important information about the Fund, go to
columbiathreadneedleus.com/investor/. The Fund is distributed by Columbia Management Investment Distributors, Inc., member FINRA, and managed by Columbia Management Investment Advisers, LLC.
Columbia Threadneedle Investments (Columbia Threadneedle) is the global brand name of the Columbia and Threadneedle group of companies. All rights reserved.
© 2023 Columbia Management Investment Advisers, LLC.
columbiathreadneedleus.com/investor/

Annual Report
October 31, 2023
Columbia Connecticut Intermediate Municipal Bond Fund
Not FDIC or NCUA Insured • No Financial Institution Guarantee • May Lose Value
If you elect to receive the shareholder report for Columbia Connecticut Intermediate Municipal Bond Fund (the Fund) in paper, mailed to you, the Fund mails one shareholder report to each shareholder address, unless such shareholder elects to receive shareholder reports from the Fund electronically via e-mail or by having a paper notice mailed to you (Postcard Notice) that your Fund’s shareholder report is available at the Columbia funds’ website (columbiathreadneedleus.com/investor/). If you would like more than one report in paper to be mailed to you, or would like to elect to receive reports via e-mail or access them through Postcard Notice, please call shareholder services at 800.345.6611 and additional reports will be sent to you.
Proxy voting policies and procedures
The policy of the Board of Trustees is to vote the proxies of the companies in which the Fund holds investments consistent with the procedures as stated in the Statement of Additional Information (SAI). You may obtain a copy of the SAI without charge by calling 800.345.6611; contacting your financial intermediary; visiting columbiathreadneedleus.com/investor/; or searching the website of the Securities and Exchange Commission (SEC) at sec.gov. Information regarding how the Fund voted proxies relating to portfolio securities is filed with the SEC by August 31st for the most recent 12-month period ending June 30th of that year, and is available without charge by visiting columbiathreadneedleus.com/investor/, or searching the website of the SEC at sec.gov.
Quarterly schedule of investments
The Fund files a complete schedule of portfolio holdings with the SEC for the first and third quarters of each fiscal year on Form N-PORT. The Fund’s Form N-PORT filings are available on the SEC’s website at sec.gov. The Fund’s complete schedule of portfolio holdings, as filed on Form N-PORT, is available on columbiathreadneedleus.com/investor/ or can also be obtained without charge, upon request, by calling 800.345.6611.
Additional Fund information
For more information about the Fund, please visit columbiathreadneedleus.com/investor/ or call 800.345.6611. Customer Service Representatives are available to answer your questions Monday through Friday from 8 a.m. to 7 p.m. Eastern time.
Fund investment manager
Columbia Management Investment Advisers, LLC (the Investment Manager)
290 Congress Street
Boston, MA 02210
Fund distributor
Columbia Management Investment Distributors, Inc.
290 Congress Street
Boston, MA 02210
Fund transfer agent
Columbia Management Investment Services Corp.
P.O. Box 219104
Kansas City, MO 64121-9104
Columbia Connecticut Intermediate Municipal Bond Fund | Annual Report 2023
Fund at a Glance
(Unaudited)
Investment objective
The Fund seeks as high a level of current interest income exempt from federal income tax and, to the extent possible, from Connecticut individual income tax, as is consistent with relative stability of principal.
Portfolio management
Paul Fuchs, CFA
Lead Portfolio Manager
Managed Fund since 2016
Douglas Rangel, CFA
Portfolio Manager
Managed Fund since June 2022
| Average annual total returns (%) (for the period ended October 31, 2023) |
| | | Inception | 1 Year | 5 Years | 10 Years | | |
| Class A | Excluding sales charges | 11/18/02 | 1.35 | 0.62 | 1.12 | | |
| | Including sales charges | | -1.67 | 0.02 | 0.80 | | |
| Advisor Class | 03/19/13 | 1.60 | 0.87 | 1.37 | | |
| Class C | Excluding sales charges | 11/18/02 | 0.90 | 0.17 | 0.66 | | |
| | Including sales charges | | -0.09 | 0.17 | 0.66 | | |
| Institutional Class | 08/01/94 | 1.60 | 0.87 | 1.37 | | |
| Institutional 3 Class* | 03/01/17 | 1.70 | 0.97 | 1.44 | | |
| Class V | Excluding sales charges | 06/26/00 | 1.45 | 0.72 | 1.22 | | |
| | Including sales charges | | -3.36 | -0.26 | 0.73 | | |
| Bloomberg 3-15 Year Blend Municipal Bond Index | | 2.49 | 1.27 | 1.97 | | |
Returns for Class A shares are shown with and without the maximum initial sales charge of 3.00%. Returns for Class C shares are shown with and without the 1.00% contingent deferred sales charge for the first year only. Returns for Class V shares are shown with and without the maximum initial sales charge of 4.75%. The Fund’s other share classes are not subject to sales charges and have limited eligibility. Please see the Fund’s prospectus for details. Performance for different share classes will vary based on differences in sales charges and fees associated with each share class. All results shown assume reinvestment of distributions during the period. Returns do not reflect the deduction of taxes that a shareholder may pay on Fund distributions or on the redemption of Fund shares. Performance results reflect the effect of any fee waivers or reimbursements of Fund expenses by Columbia Management Investment Advisers, LLC and/or any of its affiliates. Absent these fee waivers or expense reimbursement arrangements, performance results would have been lower.
The performance information shown represents past performance and is not a guarantee of future results. The investment return and principal value of your investment will fluctuate so that your shares, when redeemed, may be worth more or less than their original cost. Current performance may be lower or higher than the performance information shown. You may obtain performance information current to the most recent month-end by contacting your financial intermediary, visiting columbiathreadneedleus.com/investor/ or calling 800.345.6611.
| * | The returns shown for periods prior to the share class inception date (including returns for the Life of the Fund, if shown, which are since Fund inception) include the returns of the Fund’s oldest share class. These returns are adjusted to reflect any higher class-related operating expenses of the newer share classes, as applicable. Please visit columbiathreadneedleus.com/investor/investment-products/mutual-funds/appended-performance for more information. |
The Bloomberg 3–15 Year Blend Municipal Bond Index is an unmanaged index that tracks the performance of municipal bonds issued after December 31, 1990, with remaining maturities between 2 and 17 years and at least $7 million in principal amount outstanding.
Indices are not available for investment, are not professionally managed and do not reflect sales charges, fees, brokerage commissions, taxes or other expenses of investing. Securities in the Fund may not match those in an index.
Columbia Connecticut Intermediate Municipal Bond Fund | Annual Report 2023
| 3 |
Fund at a Glance (continued)
(Unaudited)
Performance of a hypothetical $10,000 investment (October 31, 2013 — October 31, 2023)
The chart above shows the change in value of a hypothetical $10,000 investment in Class A shares of Columbia Connecticut Intermediate Municipal Bond Fund during the stated time period, and does not reflect the deduction of taxes that a shareholder may pay on Fund distributions or on the redemption of Fund shares.
| Portfolio breakdown (%) (at October 31, 2023) |
| Money Market Funds | 100.0 |
| Total | 100.0 |
Percentages indicated are based upon total investments excluding investments in derivatives, if any. The Fund’s portfolio composition is subject to change.
| 4 | Columbia Connecticut Intermediate Municipal Bond Fund | Annual Report 2023 |
Manager Discussion of Fund Performance
(Unaudited)
For the 12-month period that ended October 31, 2023, Class A shares of Columbia Connecticut Intermediate Municipal Bond Fund returned 1.35% excluding sales charges. Institutional Class shares of the Fund returned 1.60%. The Fund’s benchmark, the Bloomberg 3-15 Year Blend Municipal Bond Index, returned 2.49% for the same time period.
Market overview
Municipal bonds delivered positive performance in the early part of the 12-month period, closing out a tumultuous 2022 and starting 2023 with a strong rally that was driven by high hopes for an end to the aggressive interest-rate hiking campaign by the U.S. Federal Reserve (Fed). Unfortunately, sentiment quickly unwound in February, as the market reconsidered the persistence of inflation and a still-too-strong labor market. A more hawkish Fed led to a sell-off in rates, sending the 10-Year Treasury yield nearly 15 basis points (bps) higher from where it started 2023. (A basis point is 1/100 of one percent.) In March, an unforeseen banking crisis unfolded, partially driven by higher interest rates. The weakness in the banking sector indicated the potential for additional downside risk to economic growth. In its late-March 2023 meeting, the Fed pushed through another 25 bps hike, but moderated its stance, signaling that we were closer to a pause, despite the data.
Treasury and municipal interest rates rose during the second quarter of 2023, as the regional banking crisis settled down, and the focus on the Fed’s tightening policy reignited. For the first time since it started hiking in March 2022, the Fed did not raise rates at its June meeting. Fed Chairman Powell took a hawkish stance and communicated the need to continue tightening and the possibility of rates remaining higher for longer. The Treasury and municipal markets experienced significant sell-offs in the third quarter of 2023, with the 10-year Treasury yield rising and municipal yields following a similar but more pronounced path. Treasury and municipal yields reached multi-year highs. Inflation remained stubbornly elevated, despite the Fed’s aggressive rate-hiking cycle. The Fed hiked rates 25 bps in July 2023 and indicated there may be one additional hike by year end. Municipal market yields increased in the final month of the period, the fourth consecutive month of rising rates. Nearly every segment of the market — credit quality, maturity, sector and state — delivered negative performance.
Investor aversion to interest-rate sensitive fixed income saw outflows from most fixed-income segments in favor of attractive rates on cash and cash-like instruments. Flows into money market funds and CDs, and out of most actively managed fixed-income mutual funds, particularly those on the long end of the curve, were a sustained theme over the 12-month period. That said, in our view the much higher yields municipal bonds offer now versus one year ago, or even just a few months ago, make municipals a much more attractive investment option, particularly as we believe we are at or near the end of the Fed’s interest rate hiking cycle. Fundamentals across most sectors remained healthy, and defaults were low by historical standards. A small number of sectors, such as hospitals and continuing care retirement communities (CCRCs) saw some weakening in their fundamentals. In addition, while U.S. states are sensitive to a possible economic slowdown or a capital market sell-off, many appeared relatively well positioned due to ongoing strengths in the economy and labor market along with high cash cushions, budget reserves, support from federal aid and relatively strong tax collections. Also, many states have managed recent budget surpluses conservatively in anticipation of a potential economic slowdown. However, a number of states, such as California and New York, have forecasted budget deficits in the coming years, and the municipal market may face additional pressures if the economy slows, and unemployment rises.
For the State of Connecticut, fiscal year 2023 ended favorably, rounding out the year with revenues surpassing budget by 7%. While expectations into fiscal year 2024 have been more muted, we do expect ongoing fiscal/budget stability to be maintained. Surplus revenue from fiscal year 2023 was funneled directly into additional supplemental pension payments and increasing budget reserves to 18% from 15% of annual revenues. Connecticut’s general fund reserve level of 18% ranks the State among the highest for reserve levels in the nation. Extra pension contributions, which pays down the State’s unfunded liabilities, totaled over $7 billion (equal to 2.5 times extra annual contributions, or 31% of annual tax revenues for the State). Connecticut made the highest amount of supplementary pension contributions, compared to other states in the nation. While fiscal year 2024 includes a modest income tax rate reduction, the State’s budget was balanced, and with past extra pension contributions and healthy reserves, Connecticut is well positioned in the event of an economic slowdown.
The Fund experienced an increased level of portfolio turnover during the period, due primarily to activity related to the liquidation of the Fund.
Columbia Connecticut Intermediate Municipal Bond Fund | Annual Report 2023
| 5 |
Manager Discussion of Fund Performance (continued)
(Unaudited)
The Fund’s notable detractors during the period
| • | The largest detractors from the Fund’s performance relative to its benchmark during the period included older vintage, low coupon housing securities that fared poorly in the rising interest rate environment. |
| • | The Fund’s exposure to longer maturity Connecticut State general obligation bonds also hampered Fund performance relative to the benchmark. |
The Fund’s notable contributors during the period
| • | Positive contributions to Fund performance during the period were primarily derived from yield curve positioning, duration and security selection. |
| • | The portfolio held shorter than benchmark positioning with regard to yield curve and duration over the period, which was beneficial during a period of rising rates. |
| • | Issue selection within education, local general obligation (GO) bonds and CCRCs were also additive to Fund performance during the period. |
Fixed-income securities present issuer default risk. The Fund invests substantially in municipal securities and will be affected by tax, legislative, regulatory, demographic or political changes, as well as changes impacting a state’s financial, economic or other conditions. A relatively small number of tax-exempt issuers may necessitate the Fund investing more heavily in a single issuer and, therefore, be more exposed to the risk of loss than a fund that invests more broadly. The value of the Fund’s portfolio may be more volatile than a more geographically diversified fund. Prepayment and extension risk exists because the timing of payments on a loan, bond or other investment may accelerate when interest rates fall or decelerate when interest rates rise which may reduce investment opportunities and potential returns. A rise in interest rates may result in a price decline of fixed-income instruments held by the Fund, negatively impacting its performance and NAV. Falling rates may result in the Fund investing in lower yielding debt instruments, lowering the Fund’s income and yield. These risks may be heightened for longer maturity and duration securities. Non-investment-grade (high-yield or junk) securities present greater price volatility and more risk to principal and income than higher rated securities. Market risk may affect a single issuer, sector of the economy, industry or the market as a whole. Federal and state tax rules apply to capital gain distributions and any gains or losses on sales. Income may be subject to state or local taxes. Liquidity risk is associated with the difficulty of selling underlying investments at a desirable time or price. See the Fund’s prospectus for more information on these and other risks.
The views expressed in this report reflect the current views of the respective parties who have contributed to this report. These views are not guarantees of future performance and involve certain risks, uncertainties and assumptions that are difficult to predict, so actual outcomes and results may differ significantly from the views expressed. These views are subject to change at any time based upon economic, market or other conditions and the respective parties disclaim any responsibility to update such views. These views may not be relied on as investment advice and, because investment decisions for a Columbia fund are based on numerous factors, may not be relied on as an indication of trading intent on behalf of any particular Columbia fund. References to specific securities should not be construed as a recommendation or investment advice.
| 6 | Columbia Connecticut Intermediate Municipal Bond Fund | Annual Report 2023 |
Understanding Your Fund’s Expenses
(Unaudited)
As an investor, you incur two types of costs. There are shareholder transaction costs, which generally include sales charges on purchases and may include redemption fees. There are also ongoing fund costs, which generally include management fees, distribution and/or service fees, and other fund expenses. The following information is intended to help you understand your ongoing costs (in dollars) of investing in the Fund and to help you compare these costs with the ongoing costs of investing in other mutual funds.
Analyzing your Fund’s expenses
To illustrate these ongoing costs, we have provided examples and calculated the expenses paid by investors in each share class of the Fund during the period. The actual and hypothetical information in the table is based on an initial investment of $1,000 at the beginning of the period indicated and held for the entire period. Expense information is calculated two ways and each method provides you with different information. The amount listed in the “Actual” column is calculated using the Fund’s actual operating expenses and total return for the period. You may use the Actual information, together with the amount invested, to estimate the expenses that you paid over the period. Simply divide your account value by $1,000 (for example, an $8,600 account value divided by $1,000 = 8.6), then multiply the results by the expenses paid during the period under the “Actual” column. The amount listed in the “Hypothetical” column assumes a 5% annual rate of return before expenses (which is not the Fund’s actual return) and then applies the Fund’s actual expense ratio for the period to the hypothetical return. You should not use the hypothetical account values and expenses to estimate either your actual account balance at the end of the period or the expenses you paid during the period. See “Compare with other funds” below for details on how to use the hypothetical data.
Compare with other funds
Since all mutual funds are required to include the same hypothetical calculations about expenses in shareholder reports, you can use this information to compare the ongoing cost of investing in the Fund with other funds. To do so, compare the hypothetical example with the 5% hypothetical examples that appear in the shareholder reports of other funds. As you compare hypothetical examples of other funds, it is important to note that hypothetical examples are meant to highlight the ongoing costs of investing in a fund only and do not reflect any transaction costs, such as sales charges, or redemption or exchange fees. Therefore, the hypothetical calculations are useful in comparing ongoing costs only, and will not help you determine the relative total costs of owning different funds. If transaction costs were included in these calculations, your costs would be higher.
| May 1, 2023 — October 31, 2023 |
| | Account value at the
beginning of the
period ($) | Account value at the
end of the
period ($) | Expenses paid during
the period ($) | Fund’s annualized
expense ratio (%) |
| | Actual | Hypothetical | Actual | Hypothetical | Actual | Hypothetical | Actual |
| Class A | 1,000.00 | 1,000.00 | 962.80 | 1,021.35 | 4.05 | 4.17 | 0.81 |
| Advisor Class | 1,000.00 | 1,000.00 | 965.00 | 1,022.63 | 2.80 | 2.89 | 0.56 |
| Class C | 1,000.00 | 1,000.00 | 960.60 | 1,019.06 | 6.29 | 6.48 | 1.26 |
| Institutional Class | 1,000.00 | 1,000.00 | 965.00 | 1,022.63 | 2.80 | 2.89 | 0.56 |
| Institutional 3 Class | 1,000.00 | 1,000.00 | 965.60 | 1,023.08 | 2.35 | 2.42 | 0.47 |
| Class V | 1,000.00 | 1,000.00 | 964.20 | 1,021.86 | 3.55 | 3.66 | 0.71 |
Expenses paid during the period are equal to the annualized expense ratio for each class as indicated above, multiplied by the average account value over the period and then multiplied by the number of days in the Fund’s most recent fiscal half year and divided by 365.
Expenses do not include fees and expenses incurred indirectly by the Fund from its investment in underlying funds, including affiliated and non-affiliated pooled investment vehicles, such as mutual funds and exchange-traded funds.
Had Columbia Management Investment Advisers, LLC and/or certain of its affiliates not waived/reimbursed certain fees and expenses, account value at the end of the period would have been reduced.
Columbia Connecticut Intermediate Municipal Bond Fund | Annual Report 2023
| 7 |
Portfolio of Investments
October 31, 2023
(Percentages represent value of investments compared to net assets)
Investments in securities
| Money Market Funds 100.1% |
| | Shares | Value ($) |
| JPMorgan Institutional Tax Free Money Market Fund, Institutional Shares, 3.765%(a) | 34,208,592 | 34,213,195 |
Total Money Market Funds
(Cost $34,213,195) | 34,213,195 |
Total Investments in Securities
(Cost: $34,213,195) | 34,213,195 |
| Other Assets & Liabilities, Net | | (44,094) |
| Net Assets | 34,169,101 |
Notes to Portfolio of Investments
| (a) | The rate shown is the seven-day current annualized yield at October 31, 2023. |
Fair value measurements
The Fund categorizes its fair value measurements according to a three-level hierarchy that maximizes the use of observable inputs and minimizes the use of unobservable inputs by prioritizing that the most observable input be used when available. Observable inputs are those that market participants would use in pricing an investment based on market data obtained from sources independent of the reporting entity. Unobservable inputs are those that reflect the Fund’s assumptions about the information market participants would use in pricing an investment. An investment’s level within the fair value hierarchy is based on the lowest level of any input that is deemed significant to the asset’s or liability’s fair value measurement. The input levels are not necessarily an indication of the risk or liquidity associated with investments at that level. For example, certain U.S. government securities are generally high quality and liquid, however, they are reflected as Level 2 because the inputs used to determine fair value may not always be quoted prices in an active market.
Fair value inputs are summarized in the three broad levels listed below:
| ■ | Level 1 — Valuations based on quoted prices for investments in active markets that the Fund has the ability to access at the measurement date. Valuation adjustments are not applied to Level 1 investments. |
| ■ | Level 2 — Valuations based on other significant observable inputs (including quoted prices for similar securities, interest rates, prepayment speeds, credit risks, etc.). |
| ■ | Level 3 — Valuations based on significant unobservable inputs (including the Fund’s own assumptions and judgment in determining the fair value of investments). |
Inputs that are used in determining fair value of an investment may include price information, credit data, volatility statistics, and other factors. These inputs can be either observable or unobservable. The availability of observable inputs can vary between investments, and is affected by various factors such as the type of investment, and the volume and level of activity for that investment or similar investments in the marketplace. The inputs will be considered by the Investment Manager, along with any other relevant factors in the calculation of an investment’s fair value. The Fund uses prices and inputs that are current as of the measurement date, which may include periods of market dislocations. During these periods, the availability of prices and inputs may be reduced for many investments. This condition could cause an investment to be reclassified between the various levels within the hierarchy.
Investments falling into the Level 3 category are primarily supported by quoted prices from brokers and dealers participating in the market for those investments. However, these may be classified as Level 3 investments due to lack of market transparency and corroboration to support these quoted prices. Additionally, valuation models may be used as the pricing source for any remaining investments classified as Level 3. These models may rely on one or more significant unobservable inputs and/or significant assumptions by the Investment Manager. Inputs used in valuations may include, but are not limited to, financial statement analysis, capital account balances, discount rates and estimated cash flows, and comparable company data.
The Fund’s Board of Trustees (the Board) has designated the Investment Manager, through its Valuation Committee (the Committee), as valuation designee, responsible for determining the fair value of the assets of the Fund for which market quotations are not readily available using valuation procedures approved by the Board. The Committee consists of voting and non-voting members from various groups within the Investment Manager’s organization, including operations and accounting, trading and investments, compliance, risk management and legal.
The Committee meets at least monthly to review and approve valuation matters, which may include a description of specific valuation determinations, data regarding pricing information received from approved pricing vendors and brokers and the results of Board-approved valuation policies and procedures (the Policies). The Policies address, among other things, instances when market quotations are or are not readily available, including recommendations of third party pricing vendors and a determination of appropriate pricing methodologies; events that require specific valuation determinations and assessment of fair value techniques; securities with a potential for stale pricing, including those that are illiquid, restricted, or in default; and the effectiveness of third party pricing vendors, including periodic reviews of vendors. The Committee meets more frequently, as needed, to discuss additional valuation matters, which may include the need to review back-testing results, review time-sensitive information or approve related valuation actions. Representatives of Columbia Management Investment Advisers, LLC report to the Board at each of its regularly scheduled meetings to discuss valuation matters and actions during the period, similar to those described earlier.
The accompanying Notes to Financial Statements are an integral part of this statement.
| 8 | Columbia Connecticut Intermediate Municipal Bond Fund | Annual Report 2023 |
Portfolio of Investments (continued)
October 31, 2023
Fair value measurements (continued)
The following table is a summary of the inputs used to value the Fund’s investments at October 31, 2023:
| | Level 1 ($) | Level 2 ($) | Level 3 ($) | Total ($) |
| Investments in Securities | | | | |
| Money Market Funds | 34,213,195 | — | — | 34,213,195 |
| Total Investments in Securities | 34,213,195 | — | — | 34,213,195 |
See the Portfolio of Investments for all investment classifications not indicated in the table.
The accompanying Notes to Financial Statements are an integral part of this statement.
Columbia Connecticut Intermediate Municipal Bond Fund | Annual Report 2023
| 9 |
Statement of Assets and Liabilities
October 31, 2023
| Assets | |
| Investments in securities, at value | |
| Unaffiliated issuers (cost $34,213,195) | $34,213,195 |
| Receivable for: | |
| Capital shares sold | 96,649 |
| Dividends | 47,542 |
| Trustees’ fees | 80,263 |
| Expense reimbursement due from Investment Manager | 302 |
| Prepaid expenses | 258 |
| Total assets | 34,438,209 |
| Liabilities | |
| Payable for: | |
| Capital shares redeemed | 17,609 |
| Distributions to shareholders | 93,169 |
| Management services fees | 440 |
| Distribution and/or service fees | 65 |
| Transfer agent fees | 1,914 |
| Trustees’ fees | 94,339 |
| Accounting services fees | 15,045 |
| Other expenses | 3,815 |
| Deferred increase to paid-in capital | 42,712 |
| Total liabilities | 269,108 |
| Net assets applicable to outstanding capital stock | $34,169,101 |
| Represented by | |
| Paid in capital | 38,064,967 |
| Total distributable earnings (loss) | (3,895,866) |
| Total - representing net assets applicable to outstanding capital stock | $34,169,101 |
| Class A | |
| Net assets | $4,997,418 |
| Shares outstanding | 533,777 |
| Net asset value per share | $9.36 |
| Maximum sales charge | 3.00% |
| Maximum offering price per share (calculated by dividing the net asset value per share by 1.0 minus the maximum sales charge for Class A shares) | $9.65 |
| Advisor Class | |
| Net assets | $3,124,341 |
| Shares outstanding | 334,189 |
| Net asset value per share | $9.35 |
| Class C | |
| Net assets | $757,277 |
| Shares outstanding | 80,898 |
| Net asset value per share | $9.36 |
| Institutional Class | |
| Net assets | $9,399,105 |
| Shares outstanding | 1,004,440 |
| Net asset value per share | $9.36 |
| Institutional 3 Class | |
| Net assets | $12,106,684 |
| Shares outstanding | 1,291,026 |
| Net asset value per share | $9.38 |
| Class V | |
| Net assets | $3,784,276 |
| Shares outstanding | 404,786 |
| Net asset value per share | $9.35 |
| Maximum sales charge | 4.75% |
| Maximum offering price per share (calculated by dividing the net asset value per share by 1.0 minus the maximum sales charge for Class V shares) | $9.82 |
The accompanying Notes to Financial Statements are an integral part of this statement.
| 10 | Columbia Connecticut Intermediate Municipal Bond Fund | Annual Report 2023 |
Statement of Operations
Year Ended October 31, 2023
| Net investment income | |
| Income: | |
| Dividends — unaffiliated issuers | $84,257 |
| Interest | 1,673,028 |
| Total income | 1,757,285 |
| Expenses: | |
| Management services fees | 271,091 |
| Distribution and/or service fees | |
| Class A | 16,284 |
| Class C | 6,455 |
| Class V | 9,877 |
| Transfer agent fees | |
| Class A | 6,402 |
| Advisor Class | 4,153 |
| Class C | 907 |
| Institutional Class | 14,270 |
| Institutional 3 Class | 1,514 |
| Class V | 6,462 |
| Trustees’ fees | 16,316 |
| Custodian fees | 1,098 |
| Printing and postage fees | 10,326 |
| Registration fees | 12,912 |
| Accounting services fees | 30,090 |
| Legal fees | 13,902 |
| Compensation of chief compliance officer | 14 |
| Other | 13,730 |
| Total expenses | 435,803 |
| Fees waived or expenses reimbursed by Investment Manager and its affiliates | (108,663) |
| Total net expenses | 327,140 |
| Net investment income | 1,430,145 |
| Realized and unrealized gain (loss) — net | |
| Net realized gain (loss) on: | |
| Investments — unaffiliated issuers | (3,327,303) |
| Net realized loss | (3,327,303) |
| Net change in unrealized appreciation (depreciation) on: | |
| Investments — unaffiliated issuers | 3,940,736 |
| Net change in unrealized appreciation (depreciation) | 3,940,736 |
| Net realized and unrealized gain | 613,433 |
| Net increase in net assets resulting from operations | $2,043,578 |
The accompanying Notes to Financial Statements are an integral part of this statement.
Columbia Connecticut Intermediate Municipal Bond Fund | Annual Report 2023
| 11 |
Statement of Changes in Net Assets
| | Year Ended
October 31, 2023 | Year Ended
October 31, 2022 |
| Operations | | |
| Net investment income | $1,430,145 | $1,779,782 |
| Net realized loss | (3,327,303) | (504,494) |
| Net change in unrealized appreciation (depreciation) | 3,940,736 | (9,188,647) |
| Net increase (decrease) in net assets resulting from operations | 2,043,578 | (7,913,359) |
| Distributions to shareholders | | |
| Net investment income and net realized gains | | |
| Class A | (148,475) | (156,355) |
| Advisor Class | (106,376) | (65,400) |
| Class C | (16,897) | (19,579) |
| Institutional Class | (366,374) | (1,220,218) |
| Institutional 3 Class | (644,231) | (183,966) |
| Class V | (155,782) | (166,196) |
| Total distributions to shareholders | (1,438,135) | (1,811,714) |
| Decrease in net assets from capital stock activity | (36,574,276) | (14,152,013) |
| Total decrease in net assets | (35,968,833) | (23,877,086) |
| Net assets at beginning of year | 70,137,934 | 94,015,020 |
| Net assets at end of year | $34,169,101 | $70,137,934 |
The accompanying Notes to Financial Statements are an integral part of this statement.
| 12 | Columbia Connecticut Intermediate Municipal Bond Fund | Annual Report 2023 |
Statement of Changes in Net Assets (continued)
| | Year Ended | Year Ended |
| | October 31, 2023 | October 31, 2022 |
| | Shares | Dollars ($) | Shares | Dollars ($) |
| Capital stock activity |
| Class A | | | | |
| Shares sold | 96,012 | 933,728 | 260,888 | 2,611,638 |
| Distributions reinvested | 13,387 | 130,180 | 11,980 | 119,580 |
| Shares redeemed | (366,135) | (3,582,626) | (196,863) | (1,972,357) |
| Net increase (decrease) | (256,736) | (2,518,718) | 76,005 | 758,861 |
| Advisor Class | | | | |
| Shares sold | 229,742 | 2,238,892 | 422,045 | 4,124,720 |
| Distributions reinvested | 10,914 | 106,148 | 6,615 | 65,187 |
| Shares redeemed | (314,876) | (3,084,656) | (157,507) | (1,540,314) |
| Net increase (decrease) | (74,220) | (739,616) | 271,153 | 2,649,593 |
| Class C | | | | |
| Shares sold | 26,237 | 253,937 | 10,774 | 111,318 |
| Distributions reinvested | 1,736 | 16,880 | 1,818 | 18,360 |
| Shares redeemed | (28,027) | (274,297) | (88,458) | (883,185) |
| Net decrease | (54) | (3,480) | (75,866) | (753,507) |
| Institutional Class | | | | |
| Shares sold | 356,709 | 3,492,378 | 791,809 | 7,880,589 |
| Distributions reinvested | 30,785 | 299,494 | 22,122 | 221,971 |
| Shares redeemed | (892,661) | (8,624,766) | (6,298,278) | (62,566,439) |
| Net decrease | (505,167) | (4,832,894) | (5,484,347) | (54,463,879) |
| Institutional 3 Class | | | | |
| Shares sold | 88,269 | 867,367 | 4,338,195 | 42,803,945 |
| Distributions reinvested | 8 | 79 | — | — |
| Shares redeemed | (2,694,178) | (26,248,853) | (442,216) | (4,354,749) |
| Net increase (decrease) | (2,605,901) | (25,381,407) | 3,895,979 | 38,449,196 |
| Class V | | | | |
| Shares sold | 1,728 | 16,794 | 1,587 | 15,905 |
| Distributions reinvested | 8,696 | 84,527 | 9,350 | 93,779 |
| Shares redeemed | (335,249) | (3,199,482) | (89,535) | (901,961) |
| Net decrease | (324,825) | (3,098,161) | (78,598) | (792,277) |
| Total net decrease | (3,766,903) | (36,574,276) | (1,395,674) | (14,152,013) |
The accompanying Notes to Financial Statements are an integral part of this statement.
Columbia Connecticut Intermediate Municipal Bond Fund | Annual Report 2023
| 13 |
The following table is intended to help you understand the Fund’s financial performance. Certain information reflects financial results for a single share of a class held for the periods shown. Per share net investment income (loss) amounts are calculated based on average shares outstanding during the period. Total return assumes reinvestment of all dividends and distributions, if any. Total return does not reflect payment of sales charges, if any. Total return and portfolio turnover are not annualized for periods of less than one year. The ratios of expenses and net investment income are annualized for periods of less than one year. The portfolio turnover rate is calculated without regard to purchase and sales transactions of short-term instruments and certain derivatives, if any. If such transactions were included, the Fund’s portfolio turnover rate may be higher.
| | Net asset value,
beginning of
period | Net
investment
income | Net
realized
and
unrealized
gain (loss) | Total from
investment
operations | Distributions
from net
investment
income | Distributions
from net
realized
gains | Total
distributions to
shareholders |
| Class A |
| Year Ended 10/31/2023 | $9.45 | 0.22 | (0.09)(c) | 0.13 | (0.22) | — | (0.22) |
| Year Ended 10/31/2022 | $10.67 | 0.20 | (1.21) | (1.01) | (0.21) | (0.00)(d) | (0.21) |
| Year Ended 10/31/2021 | $10.74 | 0.21 | (0.06) | 0.15 | (0.21) | (0.01) | (0.22) |
| Year Ended 10/31/2020 | $10.68 | 0.24 | 0.06 | 0.30 | (0.24) | — | (0.24) |
| Year Ended 10/31/2019 | $10.16 | 0.27 | 0.53 | 0.80 | (0.28) | — | (0.28) |
| Advisor Class |
| Year Ended 10/31/2023 | $9.44 | 0.24 | (0.08)(c) | 0.16 | (0.25) | — | (0.25) |
| Year Ended 10/31/2022 | $10.66 | 0.23 | (1.22) | (0.99) | (0.23) | (0.00)(d) | (0.23) |
| Year Ended 10/31/2021 | $10.72 | 0.23 | (0.04) | 0.19 | (0.24) | (0.01) | (0.25) |
| Year Ended 10/31/2020 | $10.67 | 0.27 | 0.05 | 0.32 | (0.27) | — | (0.27) |
| Year Ended 10/31/2019 | $10.15 | 0.30 | 0.53 | 0.83 | (0.31) | — | (0.31) |
| Class C |
| Year Ended 10/31/2023 | $9.45 | 0.18 | (0.09)(c) | 0.09 | (0.18) | — | (0.18) |
| Year Ended 10/31/2022 | $10.67 | 0.15 | (1.21) | (1.06) | (0.16) | (0.00)(d) | (0.16) |
| Year Ended 10/31/2021 | $10.74 | 0.16 | (0.06) | 0.10 | (0.16) | (0.01) | (0.17) |
| Year Ended 10/31/2020 | $10.68 | 0.19 | 0.06 | 0.25 | (0.19) | — | (0.19) |
| Year Ended 10/31/2019 | $10.16 | 0.23 | 0.52 | 0.75 | (0.23) | — | (0.23) |
| Institutional Class |
| Year Ended 10/31/2023 | $9.45 | 0.24 | (0.08)(c) | 0.16 | (0.25) | — | (0.25) |
| Year Ended 10/31/2022 | $10.67 | 0.22 | (1.21) | (0.99) | (0.23) | (0.00)(d) | (0.23) |
| Year Ended 10/31/2021 | $10.73 | 0.24 | (0.05) | 0.19 | (0.24) | (0.01) | (0.25) |
| Year Ended 10/31/2020 | $10.68 | 0.27 | 0.05 | 0.32 | (0.27) | — | (0.27) |
| Year Ended 10/31/2019 | $10.16 | 0.30 | 0.53 | 0.83 | (0.31) | — | (0.31) |
| Institutional 3 Class |
| Year Ended 10/31/2023 | $9.47 | 0.25 | (0.08)(c) | 0.17 | (0.26) | — | (0.26) |
| Year Ended 10/31/2022 | $10.70 | 0.24 | (1.23) | (0.99) | (0.24) | (0.00)(d) | (0.24) |
| Year Ended 10/31/2021 | $10.76 | 0.25 | (0.05) | 0.20 | (0.25) | (0.01) | (0.26) |
| Year Ended 10/31/2020 | $10.70 | 0.28 | 0.06 | 0.34 | (0.28) | — | (0.28) |
| Year Ended 10/31/2019 | $10.18 | 0.31 | 0.53 | 0.84 | (0.32) | — | (0.32) |
The accompanying Notes to Financial Statements are an integral part of this statement.
| 14 | Columbia Connecticut Intermediate Municipal Bond Fund | Annual Report 2023 |
Financial Highlights (continued)
| | Net
asset
value,
end of
period | Total
return | Total gross
expense
ratio to
average
net assets(a) | Total net
expense
ratio to
average
net assets(a),(b) | Net investment
income
ratio to
average
net assets | Portfolio
turnover | Net
assets,
end of
period
(000’s) |
| Class A |
| Year Ended 10/31/2023 | $9.36 | 1.35% | 0.99% | 0.80% | 2.26% | 30% | $4,997 |
| Year Ended 10/31/2022 | $9.45 | (9.60%) | 0.93%(e) | 0.78%(e),(f) | 2.00% | 2% | $7,473 |
| Year Ended 10/31/2021 | $10.67 | 1.39% | 0.94% | 0.81%(f) | 1.94% | 9% | $7,627 |
| Year Ended 10/31/2020 | $10.74 | 2.87% | 0.93% | 0.80%(f) | 2.27% | 17% | $7,864 |
| Year Ended 10/31/2019 | $10.68 | 7.95% | 0.93% | 0.80%(f) | 2.59% | 12% | $7,910 |
| Advisor Class |
| Year Ended 10/31/2023 | $9.35 | 1.60% | 0.74% | 0.55% | 2.50% | 30% | $3,124 |
| Year Ended 10/31/2022 | $9.44 | (9.39%) | 0.67%(e) | 0.53%(e),(f) | 2.31% | 2% | $3,855 |
| Year Ended 10/31/2021 | $10.66 | 1.74% | 0.69% | 0.56%(f) | 2.19% | 9% | $1,463 |
| Year Ended 10/31/2020 | $10.72 | 3.03% | 0.68% | 0.55%(f) | 2.52% | 17% | $1,000 |
| Year Ended 10/31/2019 | $10.67 | 8.23% | 0.68% | 0.55%(f) | 2.84% | 12% | $801 |
| Class C |
| Year Ended 10/31/2023 | $9.36 | 0.90% | 1.44% | 1.25% | 1.82% | 30% | $757 |
| Year Ended 10/31/2022 | $9.45 | (10.01%) | 1.51%(e) | 1.24%(e),(f) | 1.50% | 2% | $765 |
| Year Ended 10/31/2021 | $10.67 | 0.94% | 1.69% | 1.26%(f) | 1.49% | 9% | $1,674 |
| Year Ended 10/31/2020 | $10.74 | 2.41% | 1.68% | 1.25%(f),(g) | 1.82% | 17% | $1,647 |
| Year Ended 10/31/2019 | $10.68 | 7.47% | 1.68% | 1.25%(f),(g) | 2.15% | 12% | $2,038 |
| Institutional Class |
| Year Ended 10/31/2023 | $9.36 | 1.60% | 0.74% | 0.55% | 2.51% | 30% | $9,399 |
| Year Ended 10/31/2022 | $9.45 | (9.38%) | 0.68%(e) | 0.54%(e),(f) | 2.18% | 2% | $14,263 |
| Year Ended 10/31/2021 | $10.67 | 1.74% | 0.69% | 0.56%(f) | 2.19% | 9% | $74,626 |
| Year Ended 10/31/2020 | $10.73 | 3.03% | 0.68% | 0.55%(f) | 2.52% | 17% | $77,664 |
| Year Ended 10/31/2019 | $10.68 | 8.22% | 0.68% | 0.55%(f) | 2.83% | 12% | $81,364 |
| Institutional 3 Class |
| Year Ended 10/31/2023 | $9.38 | 1.70% | 0.64% | 0.46% | 2.58% | 30% | $12,107 |
| Year Ended 10/31/2022 | $9.47 | (9.36%) | 0.61%(e) | 0.45%(e),(f) | 2.56% | 2% | $36,895 |
| Year Ended 10/31/2021 | $10.70 | 1.84% | 0.59% | 0.46% | 2.30% | 9% | $10 |
| Year Ended 10/31/2020 | $10.76 | 3.23% | 0.58% | 0.45% | 2.62% | 17% | $161 |
| Year Ended 10/31/2019 | $10.70 | 8.32% | 0.57% | 0.45% | 2.94% | 12% | $10 |
The accompanying Notes to Financial Statements are an integral part of this statement.
Columbia Connecticut Intermediate Municipal Bond Fund | Annual Report 2023
| 15 |
Financial Highlights (continued)
| | Net asset value,
beginning of
period | Net
investment
income | Net
realized
and
unrealized
gain (loss) | Total from
investment
operations | Distributions
from net
investment
income | Distributions
from net
realized
gains | Total
distributions to
shareholders |
| Class V |
| Year Ended 10/31/2023 | $9.44 | 0.23 | (0.09)(c) | 0.14 | (0.23) | — | (0.23) |
| Year Ended 10/31/2022 | $10.66 | 0.21 | (1.21) | (1.00) | (0.22) | (0.00)(d) | (0.22) |
| Year Ended 10/31/2021 | $10.72 | 0.22 | (0.05) | 0.17 | (0.22) | (0.01) | (0.23) |
| Year Ended 10/31/2020 | $10.67 | 0.25 | 0.05 | 0.30 | (0.25) | — | (0.25) |
| Year Ended 10/31/2019 | $10.15 | 0.28 | 0.53 | 0.81 | (0.29) | — | (0.29) |
| Notes to Financial Highlights |
| (a) | In addition to the fees and expenses that the Fund bears directly, the Fund indirectly bears a pro rata share of the fees and expenses of any other funds in which it invests. Such indirect expenses are not included in the Fund’s reported expense ratios. |
| (b) | Total net expenses include the impact of certain fee waivers/expense reimbursements made by the Investment Manager and certain of its affiliates, if applicable. |
| (c) | Calculation of the net gain (loss) per share (both realized and unrealized) does not correlate to the aggregate realized and unrealized gain (loss) presented in the Statement of Operations due to timing of Fund shares sold and redeemed in relation to fluctuations in the market value of the portfolio. |
| (d) | Rounds to zero. |
| (e) | Ratios include interfund lending expense which is less than 0.01%. |
| (f) | The benefits derived from expense reductions had an impact of less than 0.01%. |
| (g) | Ratios include the impact of voluntary waivers paid by the Investment Manager. For the periods indicated below, if the Investment Manager had not paid these voluntary waivers, the Fund’s net expense ratio would increase by: |
| | 10/31/2020 | 10/31/2019 |
| Class C | 0.25% | 0.30% |
The accompanying Notes to Financial Statements are an integral part of this statement.
| 16 | Columbia Connecticut Intermediate Municipal Bond Fund | Annual Report 2023 |
Financial Highlights (continued)
| | Net
asset
value,
end of
period | Total
return | Total gross
expense
ratio to
average
net assets(a) | Total net
expense
ratio to
average
net assets(a),(b) | Net investment
income
ratio to
average
net assets | Portfolio
turnover | Net
assets,
end of
period
(000’s) |
| Class V |
| Year Ended 10/31/2023 | $9.35 | 1.45% | 0.89% | 0.70% | 2.35% | 30% | $3,784 |
| Year Ended 10/31/2022 | $9.44 | (9.52%) | 0.83%(e) | 0.69%(e),(f) | 2.08% | 2% | $6,886 |
| Year Ended 10/31/2021 | $10.66 | 1.59% | 0.84% | 0.71%(f) | 2.04% | 9% | $8,615 |
| Year Ended 10/31/2020 | $10.72 | 2.88% | 0.83% | 0.70%(f) | 2.37% | 17% | $8,979 |
| Year Ended 10/31/2019 | $10.67 | 8.06% | 0.83% | 0.70%(f) | 2.69% | 12% | $9,167 |
The accompanying Notes to Financial Statements are an integral part of this statement.
Columbia Connecticut Intermediate Municipal Bond Fund | Annual Report 2023
| 17 |
Notes to Financial Statements
October 31, 2023
Note 1. Organization
Columbia Connecticut Intermediate Municipal Bond Fund (the Fund), a series of Columbia Funds Series Trust I (the Trust), is a non-diversified fund. The Trust is registered under the Investment Company Act of 1940, as amended (the 1940 Act), as an open-end management investment company organized as a Massachusetts business trust.
Fund shares
The Trust may issue an unlimited number of shares (without par value). The Fund offers each of the share classes listed in the Statement of Assets and Liabilities. Although all share classes generally have identical voting, dividend and liquidation rights, each share class votes separately when required by the Trust’s organizational documents or by law. Each share class has its own expense and sales charge structure. Different share classes may have different minimum initial investment amounts and pay different net investment income distribution amounts to the extent the expenses of distributing such share classes vary. Distributions to shareholders in a liquidation will be proportional to the net asset value of each share class.
As described in the Fund’s prospectus, Class A and Class C shares are offered to the general public for investment. Class C shares automatically convert to Class A shares after 8 years. Advisor Class, Institutional Class and Institutional 3 Class are available through authorized investment professionals to omnibus retirement plans or to institutional investors and to certain other investors as also described in the Fund’s prospectus. Class V shares are available only to investors who received (and who continuously held) Class V shares in connection with previous fund reorganizations.
The Board of Trustees of the Fund approved a Plan of Liquidation and Termination pursuant to which the Fund was liquidated and terminated. Effective at the open of business on April 14, 2023, the Fund was closed to new investors, and any applicable contingent deferred sales charges were waived on redemptions and exchanges out of the Fund. The Fund was liquidated on November 7, 2023, at which time the Fund’s shareholders received a liquidating distribution in an amount equal to the net asset value of their Fund shares.
Note 2. Summary of significant accounting policies
Basis of preparation
The Fund is an investment company that applies the accounting and reporting guidance in the Financial Accounting Standards Board (FASB) Accounting Standards Codification Topic 946, Financial Services - Investment Companies (ASC 946). The financial statements are prepared in accordance with U.S. generally accepted accounting principles (GAAP), which requires management to make certain estimates and assumptions that affect the reported amounts of assets and liabilities, the disclosure of contingent assets and liabilities at the date of the financial statements and the reported amounts of income and expenses during the reporting period. Actual results could differ from those estimates.
The following is a summary of significant accounting policies followed by the Fund in the preparation of its financial statements.
Security valuation
Investments in open-end investment companies (other than exchange-traded funds (ETFs)), are valued at the latest net asset value reported by those companies as of the valuation time.
Investments for which market quotations are not readily available, or that have quotations which management believes are not reflective of market value or reliable, are valued at fair value as determined in good faith under procedures approved by the Board of Trustees. If a security or class of securities (such as foreign securities) is valued at fair value, such value is likely to be different from the quoted or published price for the security, if available.
The determination of fair value often requires significant judgment. To determine fair value, management may use assumptions including but not limited to future cash flows and estimated risk premiums. Multiple inputs from various sources may be used to determine fair value.
| 18 | Columbia Connecticut Intermediate Municipal Bond Fund | Annual Report 2023 |
Notes to Financial Statements (continued)
October 31, 2023
GAAP requires disclosure regarding the inputs and valuation techniques used to measure fair value and any changes in valuation inputs or techniques. In addition, investments shall be disclosed by major category. This information is disclosed following the Fund’s Portfolio of Investments.
Security transactions
Security transactions are accounted for on the trade date. Cost is determined and gains (losses) are based upon the specific identification method for both financial statement and federal income tax purposes.
Income recognition
Interest income is recorded on an accrual basis. Market premiums and discounts, including original issue discounts, are amortized and accreted, respectively, over the expected life of the security on all debt securities, unless otherwise noted.
The Fund may place a debt security on non-accrual status and reduce related interest income when it becomes probable that the interest will not be collected and the amount of uncollectible interest can be reasonably estimated. The Fund may also adjust accrual rates when it becomes probable the full interest will not be collected and a partial payment will be received. A defaulted debt security is removed from non-accrual status when the issuer resumes interest payments or when collectability of interest is reasonably assured.
Dividend income is recorded on the ex-dividend date.
Expenses
General expenses of the Trust are allocated to the Fund and other funds of the Trust based upon relative net assets or other expense allocation methodologies determined by the nature of the expense. Expenses directly attributable to the Fund are charged to the Fund. Expenses directly attributable to a specific class of shares are charged to that share class.
Determination of class net asset value
All income, expenses (other than class-specific expenses, which are charged to that share class, as shown in the Statement of Operations) and realized and unrealized gains (losses) are allocated to each class of the Fund on a daily basis, based on the relative net assets of each class, for purposes of determining the net asset value of each class.
Federal income tax status
The Fund intends to qualify each year as a regulated investment company under Subchapter M of the Internal Revenue Code, as amended, and will distribute substantially all of its net tax-exempt and investment company taxable income and net capital gain, if any, for its tax year, and as such will not be subject to federal income taxes. In addition, the Fund intends to distribute in each calendar year substantially all of its ordinary income, capital gain net income and certain other amounts, if any, such that the Fund should not be subject to federal excise tax. Therefore, no federal income or excise tax provision is recorded.
Distributions to shareholders
Distributions from net investment income, if any, are declared daily and paid monthly. Net realized capital gains, if any, are distributed at least annually. Income distributions and capital gain distributions are determined in accordance with federal income tax regulations, which may differ from GAAP.
Guarantees and indemnifications
Under the Trust’s organizational documents and, in some cases, by contract, its officers and trustees are indemnified against certain liabilities arising out of the performance of their duties to the Trust or its funds. In addition, certain of the Fund’s contracts with its service providers contain general indemnification clauses. The Fund’s maximum exposure under these arrangements is unknown since the amount of any future claims that may be made against the Fund cannot be determined, and the Fund has no historical basis for predicting the likelihood of any such claims.
Recent accounting pronouncements and regulatory updates
Tailored Shareholder Reports
Columbia Connecticut Intermediate Municipal Bond Fund | Annual Report 2023
| 19 |
Notes to Financial Statements (continued)
October 31, 2023
In October 2022, the Securities and Exchange Commission adopted a final rule relating to Tailored Shareholder Reports for Mutual Funds and Exchange-Traded Funds; Fee Information in Investment Company Advertisements. The rule and form amendments will, among other things, require the Fund to transmit concise and visually engaging shareholder reports that highlight key information. The amendments will require that funds tag information in a structured data format and that certain more in-depth information be made available online and available for delivery free of charge to investors on request. The amendments became effective January 24, 2023. There is an 18-month transition period after the effective date of the amendments.
Note 3. Fees and other transactions with affiliates
Management services fees
The Fund has entered into a Management Agreement with Columbia Management Investment Advisers, LLC (the Investment Manager), a wholly-owned subsidiary of Ameriprise Financial, Inc. (Ameriprise Financial). Under the Management Agreement, the Investment Manager provides the Fund with investment research and advice, as well as administrative and accounting services. The management services fee is an annual fee that is equal to a percentage of the Fund’s daily net assets that declines from 0.47% to 0.31% as the Fund’s net assets increase. The effective management services fee rate for the year ended October 31, 2023 was 0.47% of the Fund’s average daily net assets.
Compensation of Board members
Members of the Board of Trustees who are not officers or employees of the Investment Manager or Ameriprise Financial are compensated for their services to the Fund as disclosed in the Statement of Operations. Under a Deferred Compensation Plan (the Deferred Plan), these members of the Board of Trustees may elect to defer payment of up to 100% of their compensation. Deferred amounts are treated as though equivalent dollar amounts had been invested in shares of certain funds managed by the Investment Manager. The Fund’s liability for these amounts is adjusted for market value changes and remains in the Fund until distributed in accordance with the Deferred Plan. All amounts payable under the Deferred Plan constitute a general unsecured obligation of the Fund. The expense for the Deferred Plan, which includes Trustees’ fees deferred during the current period as well as any gains or losses on the Trustees’ deferred compensation balances as a result of market fluctuations, is included in "Trustees’ fees" in the Statement of Operations.
Compensation of Chief Compliance Officer
The Board of Trustees has appointed a Chief Compliance Officer for the Fund in accordance with federal securities regulations. As disclosed in the Statement of Operations, a portion of the Chief Compliance Officer’s total compensation is allocated to the Fund, along with other allocations to affiliated registered investment companies managed by the Investment Manager and its affiliates, based on relative net assets.
Transfer agency fees
Under a Transfer and Dividend Disbursing Agent Agreement, Columbia Management Investment Services Corp. (the Transfer Agent), an affiliate of the Investment Manager and a wholly-owned subsidiary of Ameriprise Financial, is responsible for providing transfer agency services to the Fund. The Transfer Agent has contracted with SS&C GIDS, Inc. (SS&C GIDS) to serve as sub-transfer agent. Prior to January 1, 2023, SS&C GIDS was known as DST Asset Manager Solutions, Inc. The Transfer Agent pays the fees of SS&C GIDS for services as sub-transfer agent and SS&C GIDS is not entitled to reimbursement for such fees from the Fund (with the exception of out-of-pocket fees).
The Fund pays the Transfer Agent a monthly transfer agency fee based on the number or the average value of accounts, depending on the type of account. In addition, the Fund pays the Transfer Agent a fee for shareholder services based on the number of accounts or on a percentage of the average aggregate value of the Fund’s shares maintained in omnibus accounts up to the lesser of the amount charged by the financial intermediary or a cap established by the Board of Trustees from time to time.
The Transfer Agent also receives compensation from the Fund for various shareholder services and reimbursements for certain out-of-pocket fees. Total transfer agency fees for Institutional 3 Class shares are subject to an annual limitation of not more than 0.02% of the average daily net assets attributable to Institutional 3 Class shares.
| 20 | Columbia Connecticut Intermediate Municipal Bond Fund | Annual Report 2023 |
Notes to Financial Statements (continued)
October 31, 2023
For the year ended October 31, 2023, the Fund’s effective transfer agency fee rates as a percentage of average daily net assets of each class were as follows:
| | Effective rate (%) |
| Class A | 0.10 |
| Advisor Class | 0.10 |
| Class C | 0.10 |
| Institutional Class | 0.10 |
| Institutional 3 Class | 0.01 |
| Class V | 0.10 |
An annual minimum account balance fee of $20 may apply to certain accounts with a value below the applicable share class’s initial minimum investment requirements to reduce the impact of small accounts on transfer agency fees. These minimum account balance fees are remitted to the Fund and recorded as part of expense reductions in the Statement of Operations. For the year ended October 31, 2023, no minimum account balance fees were charged by the Fund.
Distribution and service fees
The Fund has entered into an agreement with Columbia Management Investment Distributors, Inc. (the Distributor), an affiliate of the Investment Manager and a wholly-owned subsidiary of Ameriprise Financial, for distribution and shareholder services. The Board of Trustees has approved, and the Fund has adopted, distribution and shareholder service plans (the Plans) applicable to certain share classes, which set the distribution and service fees for the Fund. These fees are calculated daily and are intended to compensate the Distributor and/or eligible selling and/or servicing agents for selling shares of the Fund and providing services to investors.
Under the Plans, the Fund pays a monthly service fee to the Distributor at the maximum annual rate of 0.25% of the average daily net assets attributable to Class A and Class C shares of the Fund. Also under the Plans, the Fund pays a monthly distribution fee to the Distributor at the maximum annual rate of 0.45% of the average daily net assets attributable to Class C shares of the Fund.
Shareholder services fees
The Fund has adopted a shareholder services plan that permits it to pay for certain services provided to Class V shareholders by their selling and/or servicing agents. The Fund may pay shareholder servicing fees up to an aggregate annual rate of 0.40% of the Fund’s average daily net assets attributable to Class V shares (comprised of up to 0.20% for shareholder services and up to 0.20% for administrative support services). These fees are currently limited to an aggregate annual rate of not more than 0.15% of the Fund’s average daily net assets attributable to Class V shares.
Sales charges (unaudited)
Sales charges, including front-end charges and contingent deferred sales charges (CDSCs), received by the Distributor for distributing Fund shares for the year ended October 31, 2023, if any, are listed below:
| | Front End (%) | CDSC (%) | Amount ($) |
| Class A | 3.00 | 0.75(a) | 5,009 |
| Class C | — | 1.00(b) | — |
| Class V | 4.75 | 0.50 - 1.00(c) | — |
| (a) | This charge is imposed on certain investments of $500,000 or more if redeemed within 12 months after purchase. |
| (b) | This charge applies to redemptions within 12 months after purchase, with certain limited exceptions. |
| (c) | This charge is imposed on certain investments of between $1 million and $50 million redeemed within 18 months after purchase, as follows: 1.00% if redeemed within 12 months after purchase, and 0.50% if redeemed more than 12, but less than 18, months after purchase, with certain limited exceptions. |
The Fund’s other share classes are not subject to sales charges.
Columbia Connecticut Intermediate Municipal Bond Fund | Annual Report 2023
| 21 |
Notes to Financial Statements (continued)
October 31, 2023
Expenses waived/reimbursed by the Investment Manager and its affiliates
The Investment Manager and certain of its affiliates have contractually agreed to waive fees and/or reimburse expenses (excluding certain fees and expenses described below) for the period(s) disclosed below, unless sooner terminated at the sole discretion of the Board of Trustees, so that the Fund’s net operating expenses, after giving effect to fees waived/expenses reimbursed and any balance credits and/or overdraft charges from the Fund’s custodian, do not exceed the following annual rate(s) as a percentage of the classes’ average daily net assets:
| | March 1, 2023
through
February 29, 2024 | Prior to
March 1, 2023 |
| Class A | 0.81% | 0.81% |
| Advisor Class | 0.56 | 0.56 |
| Class C | 1.26 | 1.26 |
| Institutional Class | 0.56 | 0.56 |
| Institutional 3 Class | 0.47 | 0.46 |
| Class V | 0.71 | 0.71 |
Under the agreement governing these fee waivers and/or expense reimbursement arrangements, the following fees and expenses are excluded from the waiver/reimbursement commitment, and therefore will be paid by the Fund, if applicable: taxes (including foreign transaction taxes), expenses associated with investments in affiliated and non-affiliated pooled investment vehicles (including mutual funds and exchange-traded funds), transaction costs and brokerage commissions, costs related to any securities lending program, dividend expenses associated with securities sold short, inverse floater program fees and expenses, transaction charges and interest on borrowed money, interest, costs associated with shareholder meetings, infrequent and/or unusual expenses and any other expenses the exclusion of which is specifically approved by the Board of Trustees. This agreement may be modified or amended only with approval from the Investment Manager, certain of its affiliates and the Fund. In addition to the contractual agreement, the Investment Manager and certain of its affiliates have voluntarily agreed to waive fees and/or reimburse Fund expenses (excluding certain fees and expenses described above) so that Fund level expenses (expenses directly attributable to the Fund and not to a specific share class) are waived proportionately across all share classes. This arrangement may be revised or discontinued at any time. Any fees waived and/or expenses reimbursed under the expense reimbursement arrangements described above are not recoverable by the Investment Manager or its affiliates in future periods.
Note 4. Federal tax information
The timing and character of income and capital gain distributions are determined in accordance with income tax regulations, which may differ from GAAP because of temporary or permanent book to tax differences.
At October 31, 2023, these differences were primarily due to differing treatment for capital loss carryforwards, trustees’ deferred compensation, distributions, re-characterization of distributions for investments and miscellaneous adjustments. To the extent these differences were permanent, reclassifications were made among the components of the Fund’s net assets. Temporary differences do not require reclassifications.
The following reclassifications were made:
Excess of distributions
over net investment
income ($) | Accumulated
net realized
(loss) ($) | Paid in
capital ($) |
| 2,115 | 2 | (2,117) |
Net investment income (loss) and net realized gains (losses), as disclosed in the Statement of Operations, and net assets were not affected by this reclassification.
| 22 | Columbia Connecticut Intermediate Municipal Bond Fund | Annual Report 2023 |
Notes to Financial Statements (continued)
October 31, 2023
The tax character of distributions paid during the years indicated was as follows:
| Year Ended October 31, 2023 | Year Ended October 31, 2022 |
Ordinary
income ($) | Tax-exempt
income ($) | Long-term
capital gains ($) | Total ($) | Ordinary
income ($) | Tax-exempt
income ($) | Long-term
capital gains ($) | Total ($) |
| 5,035 | 1,433,100 | — | 1,438,135 | — | 1,769,786 | 41,928 | 1,811,714 |
Short-term capital gain distributions, if any, are considered ordinary income distributions for tax purposes.
At October 31, 2023, the components of distributable earnings on a tax basis were as follows:
Undistributed
ordinary income ($) | Undistributed tax-
exempt income ($) | Undistributed
long-term
capital gains ($) | Capital loss
carryforwards ($) | Net unrealized
appreciation ($) |
| — | 122,244 | — | (3,831,128) | — |
At October 31, 2023, the cost of all investments for federal income tax purposes along with the aggregate gross unrealized appreciation and depreciation based on that cost was:
Federal
tax cost ($) | Gross unrealized
appreciation ($) | Gross unrealized
(depreciation) ($) | Net unrealized
appreciation ($) |
| 34,213,195 | — | — | — |
Tax cost of investments and unrealized appreciation/(depreciation) may also include timing differences that do not constitute adjustments to tax basis.
The following capital loss carryforwards, determined at October 31, 2023, may be available to reduce future net realized gains on investments, if any, to the extent permitted by the Internal Revenue Code. In addition, for the year ended October 31, 2023, capital loss carryforwards utilized, if any, were as follows:
No expiration
short-term ($) | No expiration
long-term ($) | Total ($) | Utilized ($) |
| (89,803) | (3,741,325) | (3,831,128) | — |
Management of the Fund has concluded that there are no significant uncertain tax positions in the Fund that would require recognition in the financial statements. However, management’s conclusion may be subject to review and adjustment at a later date based on factors including, but not limited to, new tax laws, regulations, and administrative interpretations (including relevant court decisions). Generally, the Fund’s federal tax returns for the prior three fiscal years remain subject to examination by the Internal Revenue Service.
Note 5. Portfolio information
The cost of purchases and proceeds from sales of securities, excluding short-term investments and derivatives, if any, aggregated to $16,000,000 and $81,884,996, respectively, for the year ended October 31, 2023. The amount of purchase and sale activity impacts the portfolio turnover rate reported in the Financial Highlights.
Note 6. Interfund lending
Pursuant to an exemptive order granted by the Securities and Exchange Commission, the Fund participates in a program (the Interfund Program) allowing each participating Columbia Fund (each, a Participating Fund) to lend money directly to and, except for closed-end funds and money market funds, borrow money directly from other Participating Funds for temporary purposes. The amounts eligible for borrowing and lending under the Interfund Program are subject to certain restrictions.
Interfund loans are subject to the risk that the borrowing fund could be unable to repay the loan when due, and a delay in repayment to the lending fund could result in lost opportunities and/or additional lending costs. The exemptive order is subject to conditions intended to mitigate conflicts of interest arising from the Investment Manager’s relationship with each Participating Fund.
Columbia Connecticut Intermediate Municipal Bond Fund | Annual Report 2023
| 23 |
Notes to Financial Statements (continued)
October 31, 2023
The Fund did not borrow or lend money under the Interfund Program during the year ended October 31, 2023.
Note 7. Line of credit
The Fund had access to a revolving credit facility, which expired on October 26, 2023, with a syndicate of banks led by JPMorgan Chase Bank, N.A., Citibank, N.A. and Wells Fargo Bank, N.A. whereby the Fund had the ability to borrow for the temporary funding of shareholder redemptions or for other temporary or emergency purposes. In connection with the pending liquidation and dissolution of the Fund, the Fund did not require access to the credit facility and, therefore, was not added as a potential borrower under the amended and restated credit facility agreement, dated October 26, 2023. Pursuant to an October 27, 2022 amendment and restatement, the credit facility, which was an agreement between the Fund and certain other funds managed by the Investment Manager or an affiliated investment manager, severally and not jointly, permitted aggregate borrowings up to $950 million. Interest was charged to each participating fund based on its borrowings at a rate equal to the higher of (i) the federal funds effective rate, (ii) the secured overnight financing rate plus 0.10% and (iii) the overnight bank funding rate plus, in each case, 1.00%. Each borrowing under the credit facility matures no later than 60 days after the date of borrowing. The Fund also paid a commitment fee equal to its pro rata share of the unused amount of the credit facility at a rate of 0.15% per annum. The commitment fee is included in other expenses in the Statement of Operations. Prior to the October 27, 2022 amendment and restatement, the Fund had access to a revolving credit facility with a syndicate of banks led by JPMorgan Chase Bank, N.A., Citibank, N.A. and Wells Fargo Bank, N.A. which permitted collective borrowings up to $950 million. Interest was charged to each participating fund based on its borrowings at a rate equal to the higher of (i) the federal funds effective rate, (ii) the secured overnight financing rate plus 0.11448% and (iii) the overnight bank funding rate plus, in each case, 1.00%.
The Fund had no borrowings during the year ended October 31, 2023.
Note 8. Significant risks
Market risk
The Fund may incur losses due to declines in the value of one or more securities in which it invests. These declines may be due to factors affecting a particular issuer, or the result of, among other things, political, regulatory, market, economic or social developments affecting the relevant market(s) more generally. In addition, turbulence in financial markets and reduced liquidity in equity, credit and/or fixed income markets may negatively affect many issuers, which could adversely affect the Fund’s ability to price or value hard-to-value assets in thinly traded and closed markets and could cause significant redemptions and operational challenges. Global economies and financial markets are increasingly interconnected, and conditions and events in one country, region or financial market may adversely impact issuers in a different country, region or financial market. These risks may be magnified if certain events or developments adversely interrupt the global supply chain; in these and other circumstances, such risks might affect companies worldwide. As a result, local, regional or global events such as terrorism, war, other conflicts, natural disasters, disease/virus outbreaks and epidemics or other public health issues, recessions, depressions or other events – or the potential for such events – could have a significant negative impact on global economic and market conditions.
Money market fund investment risk
An investment in a money market fund is not a bank deposit and is not insured or guaranteed by any bank, the FDIC or any other government agency. Certain money market funds float their net asset value while others seek to preserve the value of investments at a stable net asset value (typically, $1.00 per share). An investment in a money market fund, even an investment in a fund seeking to maintain a stable net asset value per share, is not guaranteed and it is possible for the Fund to lose money by investing in these and other types of money market funds. In addition to the fees and expenses that the Fund directly bears, the Fund indirectly bears the fees and expenses of any money market funds in which it invests, including affiliated money market funds. By investing in a money market fund, the Fund will be exposed to the investment risks of the money market fund in direct proportion to such investment. To the extent the Fund invests in instruments such as derivatives, the Fund may hold investments, which may be significant, in money market fund shares to cover its obligations resulting from the Fund’s investments in such instruments. Money market funds and the securities they invest in are subject to comprehensive regulations. The enactment of new legislation or regulations, as well as changes in interpretation and enforcement of current laws, may affect the manner of operation, performance and/or yield of money market funds.
| 24 | Columbia Connecticut Intermediate Municipal Bond Fund | Annual Report 2023 |
Notes to Financial Statements (continued)
October 31, 2023
Non-diversification risk
A non-diversified fund is permitted to invest a greater percentage of its total assets in fewer issuers than a diversified fund. This increases the risk that a change in the value of any one investment held by the Fund could affect the overall value of the Fund more than it would affect that of a diversified fund holding a greater number of investments. Accordingly, the Fund’s value will likely be more volatile than the value of a more diversified fund.
Note 9. Subsequent events
Management has evaluated the events and transactions that have occurred through the date the financial statements were issued. Other than as noted in Note 1 above, there were no items requiring adjustment of the financial statements or additional disclosure.
Note 10. Information regarding pending and settled legal proceedings
Ameriprise Financial and certain of its affiliates are involved in the normal course of business in legal proceedings which include regulatory inquiries, arbitration and litigation, including class actions concerning matters arising in connection with the conduct of their activities as part of a diversified financial services firm. Ameriprise Financial believes that the Fund is not currently the subject of, and that neither Ameriprise Financial nor any of its affiliates are the subject of, any pending legal, arbitration or regulatory proceedings that are likely to have a material adverse effect on the Fund or the ability of Ameriprise Financial or its affiliates to perform under their contracts with the Fund. Ameriprise Financial is required to make quarterly (10-Q), annual (10-K) and, as necessary, 8-K filings with the Securities and Exchange Commission (SEC) on legal and regulatory matters that relate to Ameriprise Financial and its affiliates. Copies of these filings may be obtained by accessing the SEC website at www.sec.gov.
There can be no assurance that these matters, or the adverse publicity associated with them, will not result in increased Fund redemptions, reduced sale of Fund shares or other adverse consequences to the Fund. Further, although we believe proceedings are not likely to have a material adverse effect on the Fund or the ability of Ameriprise Financial or its affiliates to perform under their contracts with the Fund, these proceedings are subject to uncertainties and, as such, we are unable to estimate the possible loss or range of loss that may result. An adverse outcome in one or more of these proceedings could result in adverse judgments, settlements, fines, penalties or other relief that could have a material adverse effect on the consolidated financial condition or results of operations of Ameriprise Financial or one or more of its affiliates that provide services to the Fund.
Columbia Connecticut Intermediate Municipal Bond Fund | Annual Report 2023
| 25 |
Report of Independent Registered Public Accounting Firm
To the Board of Trustees of Columbia Funds Series Trust I and Shareholders of Columbia Connecticut Intermediate Municipal Bond Fund
Opinion on the Financial Statements
We have audited the accompanying statement of assets and liabilities, including the portfolio of investments, of Columbia Connecticut Intermediate Municipal Bond Fund (one of the funds constituting Columbia Funds Series Trust I, referred to hereafter as the "Fund") as of October 31, 2023, the related statement of operations for the year ended October 31, 2023, the statement of changes in net assets for each of the two years in the period ended October 31, 2023, including the related notes, and the financial highlights for each of the five years in the period ended October 31, 2023 (collectively referred to as the "financial statements"). In our opinion, the financial statements present fairly, in all material respects, the financial position of the Fund as of October 31, 2023, the results of its operations for the year then ended, the changes in its net assets for each of the two years in the period ended October 31, 2023 and the financial highlights for each of the five years in the period ended October 31, 2023 in conformity with accounting principles generally accepted in the United States of America.
Basis for Opinion
These financial statements are the responsibility of the Fund’s management. Our responsibility is to express an opinion on the Fund’s financial statements based on our audits. We are a public accounting firm registered with the Public Company Accounting Oversight Board (United States) (PCAOB) and are required to be independent with respect to the Fund in accordance with the U.S. federal securities laws and the applicable rules and regulations of the Securities and Exchange Commission and the PCAOB.
We conducted our audits of these financial statements in accordance with the standards of the PCAOB. Those standards require that we plan and perform the audit to obtain reasonable assurance about whether the financial statements are free of material misstatement, whether due to error or fraud.
Our audits included performing procedures to assess the risks of material misstatement of the financial statements, whether due to error or fraud, and performing procedures that respond to those risks. Such procedures included examining, on a test basis, evidence regarding the amounts and disclosures in the financial statements. Our audits also included evaluating the accounting principles used and significant estimates made by management, as well as evaluating the overall presentation of the financial statements. Our procedures included confirmation of securities owned as of October 31, 2023 by correspondence with the custodian and transfer agent. We believe that our audits provide a reasonable basis for our opinion.
/s/PricewaterhouseCoopers LLP
Minneapolis, Minnesota
December 20, 2023
We have served as the auditor of one or more investment companies within the Columbia Funds Complex since 1977.
| 26 | Columbia Connecticut Intermediate Municipal Bond Fund | Annual Report 2023 |
Federal Income Tax Information
(Unaudited)
The Fund hereby designates the following tax attributes for the fiscal year ended October 31, 2023. Shareholders will be notified in early 2024 of the amounts for use in preparing 2023 income tax returns.
Exempt-
interest
dividends | |
| 99.65% | |
Exempt-interest dividends. The percentage of net investment income distributed during the fiscal year that qualifies as exempt-interest dividends for federal income tax purposes. A portion of the income may be subject to federal alternative minimum tax.
TRUSTEES AND OFFICERS
(Unaudited)
The Board oversees the Fund’s operations and appoints officers who are responsible for day-to-day business decisions based on policies set by the Board. The following table provides basic biographical information about the Fund’s Trustees as of the printing of this report, including their principal occupations during the past five years, although specific titles for individuals may have varied over the period. The year set forth beneath Length of Service in the table below is the year in which the Trustee was first appointed or elected as Trustee to any Fund currently in the Columbia Funds Complex or a predecessor thereof. Under current Board policy, each Trustee generally serves until December 31 of the year such Trustee turns seventy-five (75).
Independent trustees
Name,
address,
year of birth | Position held
with the Columbia Funds and
length of service | Principal occupation(s)
during past five years
and other relevant
professional experience | Number of
Funds in the
Columbia Funds
Complex*
overseen | Other directorships
held by Trustee
during the past five years
and other relevant Board experience |
George S. Batejan
c/o Columbia Management
Investment Advisers, LLC
290 Congress Street
Boston, MA 02210
1954 | Trustee since 2017 | Executive Vice President, Global Head of Technology and Operations, Janus Capital Group, Inc., 2010-2016 | 170 | Former Chairman of the Board, NICSA (National Investment Company Services Association) (Executive Committee, Nominating Committee and Governance Committee), 2014-2016; former Director, Intech Investment Management, 2011-2016; former Board Member, Metro Denver Chamber of Commerce, 2015-2016; former Advisory Board Member, University of Colorado Business School, 2015-2018; former Board Member, Chase Bank International, 1993-1994 |
Columbia Connecticut Intermediate Municipal Bond Fund | Annual Report 2023
| 27 |
TRUSTEES AND OFFICERS (continued)
(Unaudited)
Independent trustees (continued)
Name,
address,
year of birth | Position held
with the Columbia Funds and
length of service | Principal occupation(s)
during past five years
and other relevant
professional experience | Number of
Funds in the
Columbia Funds
Complex*
overseen | Other directorships
held by Trustee
during the past five years
and other relevant Board experience |
Kathleen Blatz
c/o Columbia Management
Investment Advisers, LLC
290 Congress Street
Boston, MA 02210
1954 | Trustee since 2006 | Attorney, specializing in arbitration and mediation; Chief Justice, Minnesota Supreme Court, 1998-2006; Associate Justice, Minnesota Supreme Court, 1996-1998; Fourth Judicial District Court Judge, Hennepin County, 1994-1996; Attorney in private practice and public service, 1984-1993; State Representative, Minnesota House of Representatives, 1979-1993, which included service on the Tax and Financial Institutions and Insurance Committees; Member and Interim Chair, Minnesota Sports Facilities Authority, January-July 2017; Interim President and Chief Executive Officer, Blue Cross and Blue Shield of Minnesota (health care insurance), February-July 2018, April-October 2021 | 170 | Former Trustee, Blue Cross and Blue Shield of Minnesota, 2009-2021 (Chair of the Business Development Committee, 2014-2017; Chair of the Governance Committee, 2017-2019); former Member and Chair of the Board, Minnesota Sports Facilities Authority, January 2017-July 2017; former Director, Robina Foundation, 2009-2020 (Chair, 2014-2020); Director, Richard M. Schulze Family Foundation, since 2021 |
Pamela G. Carlton
c/o Columbia Management
Investment Advisers, LLC
290 Congress Street
Boston, MA 02210
1954 | Chair since 2023; Trustee since 2007 | President, Springboard – Partners in Cross Cultural Leadership (consulting company), since 2003; Managing Director of US Equity Research, JP Morgan Chase, 1999-2003; Director of US Equity Research, Chase Asset Management, 1996-1999; Co-Director Latin America Research, 1993-1996, COO Global Research, 1992-1996, Co-Director of US Research, 1991-1992, Investment Banker, 1982-1991, Morgan Stanley; Attorney, Cleary Gottlieb Steen & Hamilton LLP, 1980-1982 | 170 | Trustee, New York Presbyterian Hospital Board, since 1996; Director, DR Bank (Audit Committee) since 2017; Director, Evercore Inc. (Audit Committee, Nominating and Governance Committee), since 2019; Director, Apollo Commercial Real Estate Finance, Inc. (Chair, Nominating and Governance Committee) (financial services), since 2021; the Governing Council of the Independent Directors Council (IDC), since 2021 |
Janet Langford Carrig
c/o Columbia Management
Investment Advisers, LLC
290 Congress Street
Boston, MA 02210
1957 | Trustee since 1996 | Senior Vice President, General Counsel and Corporate Secretary, ConocoPhillips (independent energy company), September 2007-October 2018 | 170 | Director, EQT Corporation (natural gas producer), since 2019; former Director, Whiting Petroleum Corporation (independent oil and gas company), 2020-2022 |
J. Kevin Connaughton
c/o Columbia Management
Investment Advisers, LLC
290 Congress Street
Boston, MA 02210
1964 | Trustee since 2020 | CEO and President, RhodeWay Financial (non-profit financial planning firm), since December 2022; Member, FINRA National Adjudicatory Council, since January 2020; Adjunct Professor of Finance, Bentley University since January 2018; Consultant to Independent Trustees of CFVIT and CFST I from March 2016 to June 2020 with respect to CFVIT and to December 2020 with respect to CFST I; Managing Director and General Manager of Mutual Fund Products, Columbia Management Investment Advisers, LLC, May 2010-February 2015; President, Columbia Funds, 2008-2015; and senior officer of Columbia Funds and affiliated funds, 2003-2015 | 168 | Former Director, The Autism Project, March 2015-December 2021; former Member of the Investment Committee, St. Michael’s College, November 2015-February 2020; former Trustee, St. Michael’s College, June 2017-September 2019; former Trustee, New Century Portfolios (former mutual fund complex), January 2015-December 2017 |
| 28 | Columbia Connecticut Intermediate Municipal Bond Fund | Annual Report 2023 |
TRUSTEES AND OFFICERS (continued)
(Unaudited)
Independent trustees (continued)
Name,
address,
year of birth | Position held
with the Columbia Funds and
length of service | Principal occupation(s)
during past five years
and other relevant
professional experience | Number of
Funds in the
Columbia Funds
Complex*
overseen | Other directorships
held by Trustee
during the past five years
and other relevant Board experience |
Olive M. Darragh
c/o Columbia Management
Investment Advisers, LLC
290 Congress Street
Boston, MA 02210
1962 | Trustee since 2020 | Managing Director of Darragh Inc. (strategy and talent management consulting firm), since 2010; Founder and CEO, Zolio, Inc. (investment management talent identification platform), since 2004; Consultant to Independent Trustees of CFVIT and CFST I from June 2019 to June 2020 with respect to CFVIT and to December 2020 with respect to CFST I; Partner, Tudor Investments, 2004-2010; Senior Partner, McKinsey & Company (consulting), 1990-2004; Touche Ross CPA, 1985-1988 | 168 | Treasurer, Edinburgh University US Trust Board, since January 2023; Member, HBS Community Action Partners Board, since September 2022; former Director, University of Edinburgh Business School (Member of US Board), 2004-2019; former Director, Boston Public Library Foundation, 2008-2017 |
Patricia M. Flynn
c/o Columbia Management
Investment Advisers, LLC
290 Congress Street
Boston, MA 02210
1950 | Trustee since 2004 | Professor Emeritus of Economics and Management, Bentley University, since 2023; Professor of Economics and Management, Bentley University, 1976-2023; Dean, McCallum Graduate School of Business, Bentley University, 1992-2002 | 170 | Former Trustee, MA Taxpayers Foundation, 1997-2022; former Director, The MA Business Roundtable, 2003-2019; former Chairperson, Innovation Index Advisory Committee, MA Technology Collaborative, 1997-2020 |
Brian J. Gallagher
c/o Columbia Management
Investment Advisers, LLC
290 Congress Street
Boston, MA 02210
1954 | Trustee since 2017 | Retired; Partner with Deloitte & Touche LLP and its predecessors, 1977-2016 | 170 | Trustee, Catholic Schools Foundation, since 2004 |
Douglas A. Hacker
c/o Columbia Management
Investment Advisers, LLC
290 Congress Street
Boston, MA 02210
1955 | Trustee since 1996 | Independent business executive, since May 2006; Executive Vice President – Strategy of United Airlines, December 2002 - May 2006; President of UAL Loyalty Services (airline marketing company), September 2001-December 2002; Executive Vice President and Chief Financial Officer of United Airlines, July 1999-September 2001 | 170 | Director, SpartanNash Company since November 2013 (Chair of the Board, since May 2021) (food distributor); Director, Aircastle Limited (Chair of Audit Committee) (aircraft leasing), since August 2006; former Director, Nash Finch Company (food distributor), 2005-2013; former Director, SeaCube Container Leasing Ltd. (container leasing), 2010-2013; and former Director, Travelport Worldwide Limited (travel information technology), 2014-2019 |
Nancy T. Lukitsh
c/o Columbia Management
Investment Advisers, LLC
290 Congress Street
Boston, MA 02210
1956 | Trustee since 2011 | Senior Vice President, Partner and Director of Marketing, Wellington Management Company, LLP (investment adviser), 1997-2010; Chair, Wellington Management Portfolios (commingled non-U.S. investment pools), 2007-2010; Director, Wellington Trust Company, NA and other Wellington affiliates, 1997-2010 | 168 | None |
Columbia Connecticut Intermediate Municipal Bond Fund | Annual Report 2023
| 29 |
TRUSTEES AND OFFICERS (continued)
(Unaudited)
Independent trustees (continued)
Name,
address,
year of birth | Position held
with the Columbia Funds and
length of service | Principal occupation(s)
during past five years
and other relevant
professional experience | Number of
Funds in the
Columbia Funds
Complex*
overseen | Other directorships
held by Trustee
during the past five years
and other relevant Board experience |
David M. Moffett
c/o Columbia Management
Investment Advisers, LLC
290 Congress Street
Boston, MA 02210
1952 | Trustee since 2011 | Retired; former Chief Executive Officer of Freddie Mac and Chief Financial Officer of U.S. Bank | 168 | Director, CSX Corporation (transportation suppliers); Director, PayPal Holdings Inc. (payment and data processing services); Trustee, University of Oklahoma Foundation; former Director, eBay Inc. (online trading community), 2007-2015; and former Director, CIT Bank, CIT Group Inc. (commercial and consumer finance), 2010-2016; former Senior Adviser to The Carlyle Group (financial services), March 2008-September 2008; former Governance Consultant to Bridgewater Associates, January 2013-December 2015 |
Catherine James Paglia
c/o Columbia Management
Investment Advisers, LLC
290 Congress Street
Boston, MA 02210
1952 | Trustee since 2004 | Director, Enterprise Asset Management, Inc. (private real estate and asset management company), since September 1998; Managing Director and Partner, Interlaken Capital, Inc., 1989-1997; Vice President, 1982-1985, Principal, 1985-1987, Managing Director, 1987-1989, Morgan Stanley; Vice President, Investment Banking, 1980-1982, Associate, Investment Banking, 1976-1980, Dean Witter Reynolds, Inc. | 170 | Director, Valmont Industries, Inc. (irrigation systems manufacturer), since 2012; Trustee, Carleton College (on the Investment Committee), since 1987; Trustee, Carnegie Endowment for International Peace (on the Investment Committee), since 2009 |
Natalie A. Trunow
c/o Columbia Management
Investment Advisers, LLC
290 Congress Street
Boston, MA 02210
1967 | Trustee since 2020 | Chief Executive Officer, Millennial Portfolio Solutions LLC (asset management and consulting services), January 2016-January 2021; Non-executive Member of the Investment Committee and Valuation Committee, Sarona Asset Management Inc. (private equity firm) since September 2019; Advisor, Horizon Investments (asset management and consulting services), August 2018-January 2022; Advisor, Paradigm Asset Management, November 2016-January 2022; Consultant to Independent Trustees of CFVIT and CFST I from September 2016 to June 2020 with respect to CFVIT and to December 2020 with respect to CFST I; Director of Investments/Consultant, Casey Family Programs, April 2016-November 2016; Senior Vice President and Chief Investment Officer, Calvert Investments, August 2008-January 2016; Section Head and Portfolio Manager, General Motors Asset Management, June 1997-August 2008 | 168 | Independent Director, Investment Committee, Health Services for Children with Special Needs, Inc., 2010-2021; Independent Director, (Executive Committee and Chair, Audit Committee), Consumer Credit Counseling Services (formerly Guidewell Financial Solutions), since 2016; Independent Director, (Investment Committee), Sarona Asset Management, since 2019 |
| 30 | Columbia Connecticut Intermediate Municipal Bond Fund | Annual Report 2023 |
TRUSTEES AND OFFICERS (continued)
(Unaudited)
Independent trustees (continued)
Name,
address,
year of birth | Position held
with the Columbia Funds and
length of service | Principal occupation(s)
during past five years
and other relevant
professional experience | Number of
Funds in the
Columbia Funds
Complex*
overseen | Other directorships
held by Trustee
during the past five years
and other relevant Board experience |
Sandra L. Yeager
c/o Columbia Management
Investment Advisers, LLC
290 Congress Street
Boston, MA 02210
1964 | Trustee since 2017 | Retired; President and founder, Hanoverian Capital, LLC (SEC registered investment advisor firm), 2008-2016; Managing Director, DuPont Capital, 2006-2008; Managing Director, Morgan Stanley Investment Management, 2004-2006; Senior Vice President, Alliance Bernstein, 1990-2004 | 170 | Former Director, NAPE (National Alliance for Partnerships in Equity) Education Foundation, October 2016-October 2020; Advisory Board, Jennersville YMCA, since 2022 |
Interested trustee affiliated with Investment Manager**
Name,
address,
year of birth | Position held with the Columbia Funds and length of service | Principal occupation(s) during the
past five years and other relevant
professional experience | Number of
Funds in the
Columbia Funds
Complex* overseen | Other directorships
held by Trustee
during the past
five years and
other relevant Board experience |
Daniel J. Beckman
c/o Columbia Management
Investment Advisers, LLC
290 Congress Street
Boston, MA 02210
1962 | Trustee since November 2021 and President since June 2021 | Vice President – Head of North America Product, Columbia Management Investment Advisers, LLC, since April 2015; President and Principal Executive Officer of the Columbia Funds, since June 2021; officer of Columbia Funds and affiliated funds, 2020-2021; Co-President and Principal Executive Officer, Columbia Acorn/Wanger Funds, since July 2021 | 170 | Director, Ameriprise Trust Company, since October 2016; Director, Columbia Management Investment Distributors, Inc. since November 2018; Board of Governors, Columbia Wanger Asset Management, LLC since, January 2022; Director, Columbia Threadneedle Canada, Inc., since December 2022 |
| * | The term “Columbia Funds Complex” as used herein includes Columbia Seligman Premium Technology Growth Fund, Tri-Continental Corporation and each series of Columbia Funds Series Trust (CFST), Columbia Funds Series Trust I (CFST I), Columbia Funds Series Trust II (CFST II), Columbia ETF Trust I (CET I), Columbia ETF Trust II (CET II), Columbia Funds Variable Insurance Trust (CFVIT) and Columbia Funds Variable Series Trust II (CFVST II). Messrs. Batejan, Beckman, Gallagher and Hacker and Mses. Blatz, Carlton, Carrig, Flynn, Paglia, and Yeager serve as directors of Columbia Seligman Premium Technology Growth Fund and Tri-Continental Corporation. |
| ** | Interested person (as defined under the 1940 Act) by reason of being an officer, director, security holder and/or employee of the Investment Manager or Ameriprise Financial. |
The Statement of Additional Information has additional information about the Fund’s Board members and is available, without charge, upon request by calling 800.345.6611, visiting columbiathreadneedleus.com/investor/ or contacting your financial intermediary.
Columbia Connecticut Intermediate Municipal Bond Fund | Annual Report 2023
| 31 |
TRUSTEES AND OFFICERS (continued)
(Unaudited)
The Board has appointed officers who are responsible for day-to-day business decisions based on policies it has established. The officers serve at the pleasure of the Board. The following table provides basic information about the Officers of the Fund as of the printing of this report, including principal occupations during the past five years, although their specific titles may have varied over the period. In addition to Mr. Beckman, who is President and Principal Executive Officer, the Fund’s other officers are:
Fund officers
Name,
address and
year of birth | Position and year
first appointed to
position for any Fund
in the Columbia
Funds Complex or a
predecessor thereof | Principal occupation(s) during past five years |
Michael G. Clarke
290 Congress Street
Boston, MA 02210
1969 | Chief Financial Officer and Principal Financial Officer (2009) and Senior Vice President (2019) | Senior Vice President and North America Head of Operations & Investor Services, Columbia Management Investment Advisers, LLC, since June 2023 (previously Senior Vice President and Head of Global Operations, March 2022 – June 2023, Vice President, Head of North America Operations, and Co-Head of Global Operations, June 2019 - February 2022 and Vice President – Accounting and Tax, May 2010 - May 2019); senior officer of Columbia Funds and affiliated funds, since 2002. Director, Ameriprise Trust Company, since June 2023. |
Joseph Beranek
5890 Ameriprise Financial Center
Minneapolis, MN 55474
1965 | Treasurer and Chief Accounting Officer (Principal Accounting Officer) (2019) and Principal Financial Officer (2020), CFST, CFST I, CFST II, CFVIT and CFVST II; Assistant Treasurer, CET I and CET II | Vice President – Mutual Fund Accounting and Financial Reporting, Columbia Management Investment Advisers, LLC, since December 2018 and March 2017, respectively. |
Marybeth Pilat
290 Congress Street
Boston, MA 02210
1968 | Treasurer and Chief Accounting Officer (Principal Accounting Officer) and Principal Financial Officer (2020) for CET I and CET II; Assistant Treasurer, CFST, CFST I, CFST II, CFVIT and CFVST II | Vice President – Product Pricing and Administration, Columbia Management Investment Advisers, LLC, since May 2017. |
William F. Truscott
290 Congress Street
Boston, MA 02210
1960 | Senior Vice President (2001) | Formerly, Trustee/Director of Columbia Funds Complex or legacy funds, November 2001 - January 1, 2021; Chief Executive Officer, Global Asset Management, Ameriprise Financial, Inc., since September 2012; Chairman of the Board and President, Columbia Management Investment Advisers, LLC, since July 2004 and February 2012, respectively; Chairman of the Board and Chief Executive Officer, Columbia Management Investment Distributors, Inc., since November 2008 and February 2012, respectively; Chairman of the Board and Director, Threadneedle Asset Management Holdings, Sàrl, since March 2013 and December 2008, respectively; senior executive of various entities affiliated with Columbia Threadneedle. |
Christopher O. Petersen
5228 Ameriprise Financial Center
Minneapolis, MN 55474
1970 | Senior Vice President and Assistant Secretary (2021) | Formerly, Trustee/Director of funds within the Columbia Funds Complex, July 1, 2020 - November 22, 2021; Senior Vice President and Assistant General Counsel, Ameriprise Financial, Inc., since September 2021 (previously Vice President and Lead Chief Counsel, January 2015 - September 2021); formerly, President and Principal Executive Officer of the Columbia Funds, 2015 - 2021; officer of Columbia Funds and affiliated funds, since 2007. |
Thomas P. McGuire
290 Congress Street
Boston, MA 02210
1972 | Senior Vice President and Chief Compliance Officer (2012) | Vice President – Asset Management Compliance, Ameriprise Financial, Inc., since May 2010; Chief Compliance Officer, Columbia Acorn/Wanger Funds, since December 2015; formerly, Chief Compliance Officer, Ameriprise Certificate Company, September 2010 – September 2020. |
Ryan C. Larrenaga
290 Congress Street
Boston, MA 02210
1970 | Senior Vice President (2017), Chief Legal Officer (2017), and Secretary (2015) | Vice President and Chief Counsel, Ameriprise Financial, Inc., since August 2018 (previously Vice President and Group Counsel, August 2011 - August 2018); Chief Legal Officer, Columbia Acorn/Wanger Funds, since September 2020; officer of Columbia Funds and affiliated funds, since 2005. |
| 32 | Columbia Connecticut Intermediate Municipal Bond Fund | Annual Report 2023 |
TRUSTEES AND OFFICERS (continued)
(Unaudited)
Fund officers (continued)
Name,
address and
year of birth | Position and year
first appointed to
position for any Fund
in the Columbia
Funds Complex or a
predecessor thereof | Principal occupation(s) during past five years |
Michael E. DeFao
290 Congress Street
Boston, MA 02210
1968 | Vice President (2011) and Assistant Secretary (2010) | Vice President and Chief Counsel, Ameriprise Financial, Inc., since May 2010; Vice President, Chief Legal Officer and Assistant Secretary, Columbia Management Investment Advisers, LLC, since October 2021 (previously Vice President and Assistant Secretary, May 2010 – September 2021). |
Lyn Kephart-Strong
5903 Ameriprise Financial Center
Minneapolis, MN 55474
1960 | Vice President (2015) | Vice President, Global Investment Operations Services, Columbia Management Investment Advisers, LLC, since 2010; Director (since January 2007) and President (since October 2014), Columbia Management Investment Services Corp.; Director (since December 2017) and President (since January 2017), Ameriprise Trust Company. |
Approval of Management Agreement
(Unaudited)
Columbia Management Investment Advisers, LLC (the Investment Manager, and together with its domestic and global affiliates, Columbia Threadneedle Investments), a wholly-owned subsidiary of Ameriprise Financial, Inc. (Ameriprise Financial), serves as the investment manager to Columbia Connecticut Intermediate Municipal Bond Fund (the Fund). Under a management agreement (the Management Agreement), the Investment Manager provides investment advice and other services to the Fund and other funds distributed by Columbia Management Investment Distributors, Inc. (collectively, the Funds).
On an annual basis, the Fund’s Board of Trustees (the Board), including the independent Board members (the Independent Trustees), considers renewal of the Management Agreement. The Investment Manager prepared detailed reports for the Board and its Contracts Committee (including its Contracts Subcommittee) in February, March, April, May and June 2023, including reports providing the results of analyses performed by a third-party data provider, Broadridge Financial Solutions, Inc. (Broadridge), and comprehensive responses by the Investment Manager to written requests for information by independent legal counsel to the Independent Trustees (Independent Legal Counsel), to assist the Board in making this determination. In addition, throughout the year, the Board (or its committees or subcommittees) regularly meets with portfolio management teams and senior management personnel and reviews information prepared by the Investment Manager addressing the services the Investment Manager provides and Fund performance. The Board also accords appropriate weight to the work, deliberations and conclusions of the various committees (including their subcommittees), such as the Contracts Committee, the Investment Review Committee, the Audit Committee and the Compliance Committee in determining whether to continue the Management Agreement.
The Board, at its June 22, 2023 Board meeting (the June Meeting), considered the renewal of the Management Agreement for an additional one-year term. At the June Meeting, Independent Legal Counsel reviewed with the Independent Trustees various factors relevant to the Board’s consideration of advisory agreements and the Board’s legal responsibilities related to such consideration. The Independent Trustees considered all information that they, their legal counsel or the Investment Manager believed reasonably necessary to evaluate and to approve the continuation of the Management Agreement. Among other things, the information and factors considered included the following:
| • | Information on the investment performance of the Fund relative to the performance of a group of mutual funds determined to be comparable to the Fund by Broadridge, as well as performance relative to one or more benchmarks; |
Columbia Connecticut Intermediate Municipal Bond Fund | Annual Report 2023
| 33 |
Approval of Management Agreement (continued)
(Unaudited)
| • | Information on the Fund’s management fees and total expenses, including information comparing the Fund’s expenses to those of a group of comparable mutual funds, as determined by Broadridge; |
| • | The Investment Manager’s agreement to contractually limit or cap total operating expenses for the Fund so that total operating expenses (excluding certain fees and expenses, such as transaction costs and certain other investment related expenses, interest, taxes, acquired fund fees and expenses and infrequent and/or unusual expenses) would not exceed a specified annual rate, as a percentage of the Fund’s net assets; |
| • | Terms of the Management Agreement; |
| • | Descriptions of other agreements and arrangements with affiliates of the Investment Manager relating to the operations of the Fund, including agreements with respect to the provision of transfer agency and shareholder services to the Fund; |
| • | Descriptions of various services performed by the Investment Manager under the Management Agreement, including portfolio management and portfolio trading practices; |
| • | Information regarding any recently negotiated management fees of similarly-managed portfolios of other institutional clients of the Investment Manager; |
| • | Information regarding the resources of the Investment Manager, including information regarding senior management, portfolio managers and other personnel; |
| • | Information regarding the capabilities of the Investment Manager with respect to compliance monitoring services; |
| • | The profitability to the Investment Manager and its affiliates from their relationships with the Fund; and |
| • | Report provided by the Board’s independent fee consultant, JDL Consultants, LLC (JDL). |
Following an analysis and discussion of the foregoing, and the factors identified below, the Board, including all of the Independent Trustees, approved the renewal of the Management Agreement.
Nature, extent and quality of services provided by the Investment Manager
The Board analyzed various reports and presentations it had received detailing the services performed by the Investment Manager, as well as its history, expertise, resources and relative capabilities, and the qualifications of its personnel.
The Board specifically considered the many developments during recent years concerning the services provided by the Investment Manager. Among other things, the Board noted the organization and depth of the equity and credit research departments. The Board further observed the enhancements to the investment risk management department’s processes, systems and oversight over the past several years. The Board also took into account the broad scope of services provided by the Investment Manager to the Fund, including, among other services, investment, risk and compliance oversight. The Board also took into account the information it received concerning the Investment Manager’s ability to attract and retain key portfolio management personnel and that it has sufficient resources to provide competitive and adequate compensation to investment personnel.
In connection with the Board’s evaluation of the overall package of services provided by the Investment Manager, the Board also considered the nature, quality and range of administrative services provided to the Fund by the Investment Manager, as well as the achievements in 2022 in the performance of administrative services, and noted the various enhancements anticipated for 2023. In evaluating the quality of services provided under the Management Agreement, the Board also took into account the organization and strength of the Fund’s and its service providers’ compliance programs. The Board also reviewed the financial condition of the Investment Manager and its affiliates and each entity’s ability to carry out its responsibilities under the Management Agreement and the Fund’s other service agreements.
In addition, the Board discussed the acceptability of the terms of the Management Agreement, noting that no changes were proposed from the form of agreement previously approved. The Board also noted the wide array of legal and compliance services provided to the Fund under the Management Agreement.
| 34 | Columbia Connecticut Intermediate Municipal Bond Fund | Annual Report 2023 |
Approval of Management Agreement (continued)
(Unaudited)
After reviewing these and related factors (including investment performance as discussed below), the Board concluded, within the context of their overall conclusions, that the nature, extent and quality of the services provided to the Fund under the Management Agreement supported the continuation of the Management Agreement.
Investment performance
The Board carefully reviewed the investment performance of the Fund, including detailed reports providing the results of analyses performed by each of the Investment Manager, Broadridge and JDL collectively showing, for various periods (including since manager inception): (i) the performance of the Fund, (ii) the Fund’s performance relative to peers and benchmarks and (iii) the net assets of the Fund. The Board observed that the Fund’s performance for certain periods ranked above median based on information provided by Broadridge.
The Board also reviewed a description of the third-party data provider’s methodology for identifying the Fund’s peer groups for purposes of performance and expense comparisons.
The Board also considered the Investment Manager’s performance and reputation generally. After reviewing these and related factors, the Board concluded, within the context of their overall conclusions, that the performance of the Fund and the Investment Manager, in light of other considerations, supported the continuation of the Management Agreement.
Comparative fees, costs of services provided and the profits realized by the Investment Manager and its affiliates from their relationships with the Fund
The Board reviewed comparative fees and the costs of services provided under the Management Agreement. The Board members considered detailed comparative information set forth in an annual report on fees and expenses, including, among other things, data (based on analyses conducted by Broadridge and JDL) showing a comparison of the Fund’s expenses with median expenses paid by funds in its comparative peer universe, as well as data showing the Fund’s contribution to the Investment Manager’s profitability.
The Board considered the reports of JDL, which assisted in the Board’s analysis of the Funds’ performance and expenses and the reasonableness of the Funds’ fee rates. The Board accorded particular weight to the notion that a primary objective of the level of fees is to achieve a rational pricing model applied consistently across the various product lines in the Fund family, while assuring that the overall fees for each Fund (with certain exceptions) are generally in line with the current “pricing philosophy” such that Fund total expense ratios, in general, approximate or are lower than the median expense ratios of funds in the same Lipper comparison universe. The Board took into account that the Fund’s total expense ratio (after considering proposed expense caps/waivers) approximated the peer universe’s median expense ratio.
After reviewing these and related factors, the Board concluded, within the context of their overall conclusions, that the levels of management fees and expenses of the Fund, in light of other considerations, supported the continuation of the Management Agreement.
The Board also considered the profitability of the Investment Manager and its affiliates in connection with the Investment Manager providing management services to the Fund. With respect to the profitability of the Investment Manager and its affiliates, the Independent Trustees referred to information discussing the profitability to the Investment Manager and Ameriprise Financial from managing, operating and distributing the Funds. The Board considered that the profitability generated by the Investment Manager in 2022 had declined from 2021 levels, due to a variety of factors, including the decreased assets under management of the Funds. It also took into account the indirect economic benefits flowing to the Investment Manager or its affiliates in connection with managing or distributing the Funds, such as the enhanced ability to offer various other financial products to Ameriprise Financial customers, soft dollar benefits and overall reputational advantages. The Board noted that the fees paid by the Fund should permit the Investment Manager to offer competitive compensation to its personnel, make necessary investments in its business and earn an appropriate profit. After reviewing these and related factors, the Board concluded, within the context of their overall conclusions, that the costs of services provided and the profitability to the Investment Manager and its affiliates from their relationships with the Fund supported the continuation of the Management Agreement.
Columbia Connecticut Intermediate Municipal Bond Fund | Annual Report 2023
| 35 |
Approval of Management Agreement (continued)
(Unaudited)
Economies of scale
The Board considered the potential existence of economies of scale in the provision by the Investment Manager of services to the Fund, and whether those economies of scale were shared with the Fund through breakpoints in investment management fees or other means, such as expense limitation arrangements and additional investments by the Investment Manager in investment, trading, compliance and other resources. The Board considered the economies of scale that might be realized as the Fund’s net asset level grows and took note of the extent to which Fund shareholders might also benefit from such growth. In this regard, the Board took into account that management fees decline as Fund assets exceed various breakpoints, all of which have not been surpassed. The Board observed that the Management Agreement provided for breakpoints in the management fee rate schedule that allow opportunities for shareholders to realize lower fees as Fund assets grow and that there are additional opportunities through other means for sharing economies of scale with shareholders.
Conclusion
The Board reviewed all of the above considerations in reaching its decision to approve the continuation of the Management Agreement. In reaching its conclusions, no single factor was determinative.
On June 22, 2023, the Board, including all of the Independent Trustees, determined that fees payable under the Management Agreement were fair and reasonable in light of the extent and quality of services provided and approved the renewal of the Management Agreement.
| 36 | Columbia Connecticut Intermediate Municipal Bond Fund | Annual Report 2023 |
[THIS PAGE INTENTIONALLY LEFT BLANK]
[THIS PAGE INTENTIONALLY LEFT BLANK]
[THIS PAGE INTENTIONALLY LEFT BLANK]
Columbia Connecticut Intermediate Municipal Bond Fund
P.O. Box 219104
Kansas City, MO 64121-9104
Please read and consider the investment objectives, risks, charges and expenses for any fund carefully before investing. For a prospectus and summary prospectus, which contains this and other important information about the Fund, go to
columbiathreadneedleus.com/investor/. The Fund is distributed by Columbia Management Investment Distributors, Inc., member FINRA, and managed by Columbia Management Investment Advisers, LLC.
Columbia Threadneedle Investments (Columbia Threadneedle) is the global brand name of the Columbia and Threadneedle group of companies. All rights reserved.
© 2023 Columbia Management Investment Advisers, LLC.
columbiathreadneedleus.com/investor/
Item 2. Code of Ethics.
(a) | The registrant has adopted a code of ethics that applies to the registrant’s principal executive officer, principal financial officer, principal accounting officer or controller, or persons performing similar functions, regardless of whether these individuals are employed by the registrant or a third party. |
(b) | During the period covered by this report, there were not any amendments to a provision of the code of ethics that applies to the registrant’s principal executive officer, principal financial officer, principal accounting officer or controller, or persons performing similar functions, regardless of whether these individuals are employed by the registrant or a third party, and that relates to any element of the code of ethics definition enumerated in paragraph (b) of this Item. |
(c) | During the period covered by this report, there were no waivers, including any implicit waivers, from a provision of the code of ethics to the registrant’s principal executive officer, principal financial officer, principal accounting officer or controller, or persons performing similar functions, regardless of whether these individuals are employed by the registrant or a third party that relates to one or more of the items set forth in paragraph (b) of this Item. |
Item 3. Audit Committee Financial Expert.
The registrant’s Board of Trustees has determined that David M. Moffett, Brian J. Gallagher, J. Kevin Connaughton, Sandra L. Yeager, and Douglas A. Hacker, each of whom are members of the registrant’s Board of Trustees and Audit Committee, each qualify as an audit committee financial expert. Mr. Moffett, Mr. Gallagher, Mr. Connaughton, Ms. Yeager, and Mr. Hacker are each independent trustees, as defined in paragraph (a)(2) of this item’s instructions.
Item 4. Principal Accountant Fees and Services.
Fee information below is disclosed for the six series of the registrant whose reports to stockholders are included in this annual filing.
(a) Audit Fees. Aggregate Audit Fees billed by the principal accountant for professional services rendered during the fiscal years ended October 31, 2023 and October 31, 2022 are approximately as follows:
| |
2023 | 2022 |
$180,500 | $177,000 |
Audit Fees include amounts related to the audit of the registrant’s annual financial statements or services that are normally provided by the accountant in connection with statutory and regulatory filings or engagements for those fiscal years.
(b) Audit-Related Fees. Aggregate Audit-Related Fees billed to the registrant by the principal accountant for professional services rendered during the fiscal years ended October 31, 2023 and October 31, 2022 are approximately as follows:
Audit-Related Fees, if any, include amounts for assurance and related services by the principal accountant that are reasonably related to the performance of the audit of the registrant’s financial statements and are not reported in Audit Fees above.
During the fiscal years ended October 31, 2023 and October 31, 2022, there were no Audit-Related Fees billed by the registrant’s principal accountant to the registrant’s investment adviser (not including any sub-adviser whose role is primarily portfolio management and is subcontracted with or overseen by another investment adviser) and any entity controlling, controlled by, or under common control with the adviser that provides ongoing services to the registrant for an engagement that related directly to the operations and financial reporting of the registrant.
(c) Tax Fees. Aggregate Tax Fees billed by the principal accountant to the registrant for professional services rendered during the fiscal years ended October 31, 2023 and October 31, 2022 are approximately as follows:
| |
2023 | 2022 |
$75,000 | $78,000 |
Tax Fees include amounts for the review of annual tax returns, the review of required shareholder distribution calculations and typically include amounts for professional services by the principal accountant for tax compliance, tax advice and tax planning.
During the fiscal years ended October 31, 2023 and October 31, 2022, there were no Tax Fees billed by the registrant’s principal accountant to the registrant’s investment adviser (not including any sub-adviser whose role is primarily portfolio management and is subcontracted with or overseen by another investment adviser) and any entity controlling, controlled by, or under common control with the adviser that provides ongoing services to the registrant for an engagement that related directly to the operations and financial reporting of the registrant.
(d) All Other Fees. Aggregate All Other Fees billed by the principal accountant to the registrant for professional services rendered during the fiscal years ended October 31, 2023 and October 31, 2022 are approximately as follows:
All Other Fees, if any, include amounts for products and services provided by the principal accountant, other than the services reported in paragraphs (a) through (c) above.
Aggregate All Other Fees billed by the registrant’s principal accountant to the registrant’s investment adviser (not including any sub-adviser whose role is primarily portfolio management and is subcontracted with or overseen by another investment adviser) and any entity controlling, controlled by, or under common control with the adviser that provides ongoing services to the registrant for an engagement that related directly to the operations and financial reporting of the registrant during the fiscal years ended October 31, 2023 and October 31, 2022 are approximately as follows:
| |
2023 | 2022 |
$557,000 | $535,000 |
In fiscal years 2023 and 2022, All Other Fees primarily consists of fees billed for internal control examinations of the registrant’s transfer agent and investment adviser.
(e)(1) Audit Committee Pre-Approval Policies and Procedures
The registrant’s Audit Committee is required to pre-approve the engagement of the registrant’s independent auditors to provide audit and non-audit services to the registrant and non-audit services to its investment adviser (excluding any sub-adviser whose role is primarily portfolio management and is sub-contracted or overseen by another investment adviser (the “Adviser”) or any entity controlling, controlled by or under common control with the Adviser that provides ongoing services to the Fund (a “Control Affiliate”) if the engagement relates directly to the operations and financial reporting of the registrant.
The Audit Committee has adopted a Policy for Engagement of Independent Auditors for Audit and Non-Audit Services (the “Policy”). The Policy sets forth the understanding of the Audit Committee regarding the engagement of the registrant’s independent accountants to provide (i) audit and permissible audit-related, tax and other services to the registrant (“Fund Services”); (ii) non-audit services to the registrant’s Adviser and any Control Affiliates, that relates directly to the operations and financial reporting of a Fund (“Fund-related Adviser Services”); and (iii) certain other audit and non-audit services to the registrant’s Adviser and its Control Affiliates. A service will require specific pre-approval by the Audit Committee if it is to be provided by the Fund’s independent auditor; provided, however, that pre-approval of non-audit services to the Fund, the Adviser or Control Affiliates may be waived if certain de minimis requirements set forth in the SEC’s rules are met.
Under the Policy, the Audit Committee may delegate pre-approval authority to any pre-designated member or members who are independent board members. The member(s) to whom such authority is delegated must report, for informational purposes only, any pre-approval decisions to the Audit Committee at its next regular meeting. The Audit Committee's responsibilities with respect to the pre-approval of services performed by the independent auditor may not be delegated to management.
On an annual basis, at a regularly scheduled Audit Committee meeting, the Fund’s Treasurer or other Fund officer shall submit to the Audit Committee a schedule of the types of Fund Services and Fund-related Adviser Services that are subject to specific pre-approval. This schedule will provide a description of each type of service that is subject to specific pre-approval, along with total projected fees for each service. The pre-approval will generally cover a one-year period. The Audit Committee will review and approve the types of services and the projected fees for the next one-year period and may add to, or subtract from, the list of pre-approved services from time to time, based on subsequent determinations. This specific approval acknowledges that the Audit Committee is in agreement with the specific types of services that the independent auditor will be permitted to perform and the projected fees for each service.
The Fund’s Treasurer or other Fund officer shall report to the Audit Committee at each of its regular meetings regarding all Fund Services or Fund-related Adviser Services provided since the last such report was rendered, including a description of the services, by category, with forecasted fees for the annual reporting period, proposed changes requiring specific pre-approval and a description of services provided by the independent auditor, by category, with actual fees during the current reporting period.
*****
(e)(2) None, or 0%, of the Audit-Related Fees, Tax Fees and All Other Fees paid by the Fund or affiliated entities relating directly to the operations and financial reporting of the Registrant disclosed above were approved by the audit committee pursuant to paragraphs (c)(7)(i)(C) of Rule 2-01 of Regulation S-X (which permits audit committee approval after the start of the engagement with respect to services other than audit, review or attest services, if certain conditions are satisfied).
(f) Not applicable.
(g) The aggregate non-audit fees billed by the registrant’s accountant for services rendered to the registrant, and rendered to the registrant’s investment adviser (not including any sub-adviser whose role is primarily portfolio management and is subcontracted with or overseen by another investment adviser), and any entity controlling, controlled by, or under common control with the adviser that provides ongoing services to the registrant for the fiscal years ended October 31, 2023 and October 31, 2022 are approximately as follows:
| |
2023 | 2022 |
$632,000 | $613,000 |
(h) The registrant’s Audit Committee of the Board of Directors has considered whether the provision of non-audit services that were rendered to the registrant’s adviser (not including any sub-adviser whose role is primarily portfolio management and is subcontracted with or overseen by another investment adviser), and any entity controlling, controlled by, or under common control with the investment adviser that provides ongoing services to the registrant that were not pre-approved pursuant to paragraph (c)(7)(ii) of Rule 2-01 of Regulation S-X, is compatible with maintaining the principal accountant’s independence.
(i) Not applicable.
(j) Not applicable.
Item 5. Audit Committee of Listed Registrants.
Not applicable.
Item 6. Investments
(a) | The registrant’s “Schedule I – Investments in securities of unaffiliated issuers” (as set forth in 17 CFR 210.12-12) is included in Item 1 of this Form N-CSR. |
Item 7. Disclosure of Proxy Voting Policies and Procedures for Closed-End Management Investment Companies.
Not applicable.
Item 8. Portfolio Managers of Closed-End Management Investment Companies.
Not applicable.
Item 9. Purchases of Equity Securities by Closed-End Management Investment Company and Affiliated Purchasers.
Not applicable.
Item 10. Submission of Matters to a Vote of Security Holders.
There were no material changes to the procedures by which shareholders may recommend nominees to the registrant's board of directors.
Item 11. Controls and Procedures.
(a) | The registrant’s principal executive officer and principal financial officer, based on their evaluation of the registrant’s disclosure controls and procedures as of a date within 90 days of the filing of this report, have concluded that such controls and procedures are adequately designed to ensure that information required to be disclosed by the registrant in Form N-CSR is accumulated and communicated to the registrant’s management, including the principal executive officer and principal financial officer, or persons performing similar functions, as appropriate to allow timely decisions regarding required disclosure. |
(b) | There was no change in the registrant's internal control over financial reporting that occurred during the period covered by this report that has materially affected, or is reasonably likely to materially affect, the registrant's internal control over financial reporting. |
Item 12. Disclosure of Securities Lending Activities for Closed-End Management Investment Companies
Not applicable.
Item 13. Exhibits.
(a)(1) Code of ethics required to be disclosed under Item 2 of Form N-CSR attached hereto as Exhibit 99.CODE ETH.
(a)(2) Certifications pursuant to Rule 30a-2(a) under the Investment Company Act of 1940 (17 CFR 270.30a-2(a)) attached hereto as Exhibit 99.CERT.
(b) Certification pursuant to Rule 30a-2(b) under the Investment Company Act of 1940 (17 CFR 270.30a-2(b)) attached hereto as Exhibit 99.906CERT.
SIGNATURES
Pursuant to the requirements of the Securities Exchange Act of 1934 and the Investment Company Act of 1940, the registrant has duly caused this report to be signed on its behalf by the undersigned, thereunto duly authorized.
(registrant) | Columbia Funds Series Trust I |
| |
By (Signature and Title) | /s/ Daniel J. Beckman |
| Daniel J. Beckman, President and Principal Executive Officer |
| |
Date | December 20, 2023 |
| |
| |
Pursuant to the requirements of the Securities Exchange Act of 1934 and the Investment Company Act of 1940, this report has been signed below by the following persons on behalf of the registrant and in the capacities and on the dates indicated.
By (Signature and Title) | /s/ Daniel J. Beckman |
| Daniel J. Beckman, President and Principal Executive Officer |
| |
Date | December 20, 2023 |
By (Signature and Title) | /s/ Michael G. Clarke |
| Michael G. Clarke, Chief Financial Officer, |
| Principal Financial Officer and Senior Vice President |
| |
Date | December 20, 2023 |
By (Signature and Title) | /s/ Joseph Beranek |
| Joseph Beranek, Treasurer, Chief Accounting |
| Officer and Principal Financial Officer |
| |
Date | December 20, 2023 |