UNITED STATES
SECURITIES AND EXCHANGE COMMISSION
Washington, D.C. 20549
FORM N-CSR
CERTIFIED SHAREHOLDER REPORT OF REGISTERED MANAGEMENT INVESTMENT COMPANIES
Investment Company Act file number 811-04367
Columbia Funds Series Trust I
(Exact name of registrant as specified in charter)
290 Congress Street
Boston, MA 02210
(Address of principal executive offices) (Zip code)
Daniel J. Beckman
c/o Columbia Management Investment Advisers, LLC
290 Congress Street
Boston, MA 02210
Ryan C. Larrenaga, Esq.
c/o Columbia Management Investment Advisers, LLC
290 Congress Street
Boston, MA 02210
(Name and address of agent for service)
Registrant's telephone number, including area code: (800) 345-6611
Date of fiscal year end: August 31
Date of reporting period: August 31, 2023
Form N-CSR is to be used by management investment companies to file reports with the Commission not later than 10 days after the transmission to stockholders of any report that is required to be transmitted to stockholders under Rule 30e-1 under the Investment Company Act of 1940 (17 CFR 270.30e-1). The Commission may use the information provided on Form N-CSR in its regulatory, disclosure review, inspection, and policymaking roles.
A registrant is required to disclose the information specified by Form N-CSR, and the Commission will make this information public. A registrant is not required to respond to the collection of information contained in Form N-CSR unless the Form displays a currently valid Office of Management and Budget ("OMB") control number. Please direct comments concerning the accuracy of the information collection burden estimate and any suggestions for reducing the burden to Secretary, Securities and Exchange Commission, 100 F Street, NE, Washington, DC 20549. The OMB has reviewed this collection of information under the clearance requirements of 44 U.S.C. § 3507.
Item 1. Reports to Stockholders.

Annual Report
August 31, 2023
Not FDIC or NCUA Insured • No Financial Institution Guarantee • May Lose Value
If you elect to receive the shareholder report for Columbia Balanced Fund (the Fund) in paper, mailed to you, the Fund mails one shareholder report to each shareholder address, unless such shareholder elects to receive shareholder reports from the Fund electronically via e-mail or by having a paper notice mailed to you (Postcard Notice) that your Fund’s shareholder report is available at the Columbia funds’ website (columbiathreadneedleus.com/investor/). If you would like more than one report in paper to be mailed to you, or would like to elect to receive reports via e-mail or access them through Postcard Notice, please call shareholder services at 800.345.6611 and additional reports will be sent to you.
Proxy voting policies and procedures
The policy of the Board of Trustees is to vote the proxies of the companies in which the Fund holds investments consistent with the procedures as stated in the Statement of Additional Information (SAI). You may obtain a copy of the SAI without charge by calling 800.345.6611; contacting your financial intermediary; visiting columbiathreadneedleus.com/investor/; or searching the website of the Securities and Exchange Commission (SEC) at sec.gov. Information regarding how the Fund voted proxies relating to portfolio securities is filed with the SEC by August 31st for the most recent 12-month period ending June 30th of that year, and is available without charge by visiting columbiathreadneedleus.com/investor/, or searching the website of the SEC at sec.gov.
Quarterly schedule of investments
The Fund files a complete schedule of portfolio holdings with the SEC for the first and third quarters of each fiscal year on Form N-PORT. The Fund’s Form N-PORT filings are available on the SEC’s website at sec.gov. The Fund’s complete schedule of portfolio holdings, as filed on Form N-PORT, is available on columbiathreadneedleus.com/investor/ or can also be obtained without charge, upon request, by calling 800.345.6611.
Additional Fund information
For more information about the Fund, please visit columbiathreadneedleus.com/investor/ or call 800.345.6611. Customer Service Representatives are available to answer your questions Monday through Friday from 8 a.m. to 7 p.m. Eastern time.
Fund investment manager
Columbia Management Investment Advisers, LLC (the Investment Manager)
290 Congress Street
Boston, MA 02210
Fund distributor
Columbia Management Investment Distributors, Inc.
290 Congress Street
Boston, MA 02210
Fund transfer agent
Columbia Management Investment Services Corp.
P.O. Box 219104
Kansas City, MO 64121-9104
Columbia Balanced Fund | Annual Report 2023
Fund at a Glance
(Unaudited)
Investment objective
The Fund seeks high total return by investing in common stocks and debt securities.
Portfolio management
Guy Pope, CFA
Lead Portfolio Manager
Managed Fund since 1997
Jason Callan
Portfolio Manager
Managed Fund since 2018
Gregory Liechty
Portfolio Manager
Managed Fund since 2011
Ronald Stahl, CFA
Portfolio Manager
Managed Fund since 2005
| Average annual total returns (%) (for the period ended August 31, 2023) |
| | | Inception | 1 Year | 5 Years | 10 Years |
| Class A | Excluding sales charges | 11/01/02 | 9.99 | 7.42 | 8.09 |
| | Including sales charges | | 3.67 | 6.16 | 7.46 |
| Advisor Class | 11/08/12 | 10.26 | 7.69 | 8.37 |
| Class C | Excluding sales charges | 10/13/03 | 9.18 | 6.62 | 7.29 |
| | Including sales charges | | 8.18 | 6.62 | 7.29 |
| Institutional Class | 10/01/91 | 10.27 | 7.69 | 8.37 |
| Institutional 2 Class | 03/07/11 | 10.30 | 7.73 | 8.44 |
| Institutional 3 Class | 11/08/12 | 10.35 | 7.78 | 8.49 |
| Class R | 09/27/10 | 9.72 | 7.15 | 7.83 |
| Blended Benchmark | | 9.04 | 7.14 | 8.41 |
| S&P 500 Index | | 15.94 | 11.12 | 12.81 |
| Bloomberg U.S. Aggregate Bond Index | | -1.19 | 0.49 | 1.48 |
Returns for Class A shares are shown with and without the maximum initial sales charge of 5.75%. Returns for Class C shares are shown with and without the 1.00% contingent deferred sales charge for the first year only. The Fund’s other share classes are not subject to sales charges and have limited eligibility. Please see the Fund’s prospectus for details. Performance for different share classes will vary based on differences in sales charges and fees associated with each share class. All results shown assume reinvestment of distributions during the period. Returns do not reflect the deduction of taxes that a shareholder may pay on Fund distributions or on the redemption of Fund shares. Performance results reflect the effect of any fee waivers or reimbursements of Fund expenses by Columbia Management Investment Advisers, LLC and/or any of its affiliates. Absent these fee waivers or expense reimbursement arrangements, performance results would have been lower.
The performance information shown represents past performance and is not a guarantee of future results. The investment return and principal value of your investment will fluctuate so that your shares, when redeemed, may be worth more or less than their original cost. Current performance may be lower or higher than the performance information shown. You may obtain performance information current to the most recent month-end by contacting your financial intermediary, visiting columbiathreadneedle.com/investor/ or calling 800.345.6611.
The Blended Benchmark is a weighted custom composite consisting of 60% S&P 500 Index and 40% Bloomberg U.S. Aggregate Bond Index.
The S&P 500 Index, an unmanaged index, measures the performance of 500 widely held, large-capitalization U.S. stocks and is frequently used as a general measure of market performance.
The Bloomberg U.S. Aggregate Bond Index is a broad-based benchmark that measures the investment-grade, U.S. dollar-denominated, fixed-rate taxable bond market, including Treasuries, government-related and corporate securities, mortgage-backed securities (agency fixed-rate and hybrid adjustable-rate mortgage passthroughs), asset-backed securities, and commercial mortgage-backed securities.
Indices are not available for investment, are not professionally managed and do not reflect sales charges, fees, brokerage commissions, taxes or other expenses of investing. Securities in the Fund may not match those in an index.
Columbia Balanced Fund | Annual Report 2023
| 3 |
Fund at a Glance (continued)
(Unaudited)
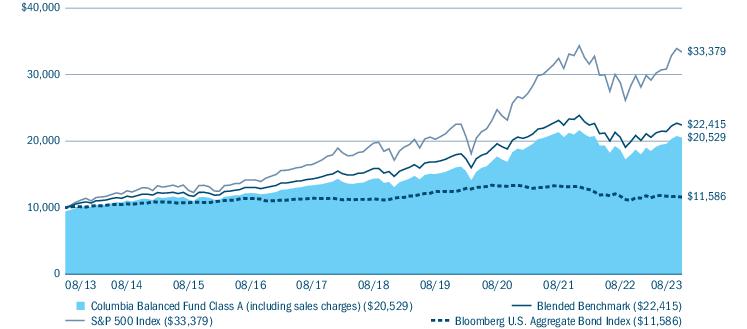
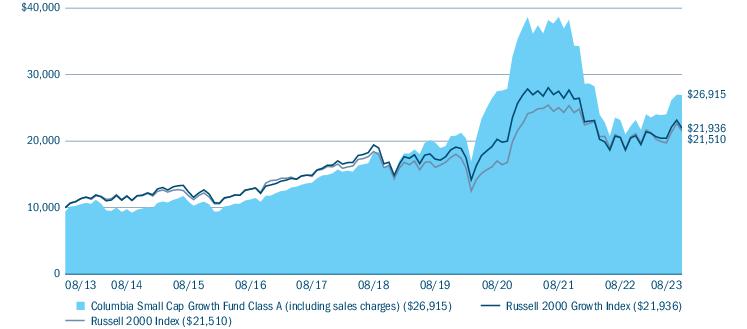
Performance of a hypothetical $10,000 investment (August 31, 2013 — August 31, 2023)
The chart above shows the change in value of a hypothetical $10,000 investment in Class A shares of Columbia Balanced Fund during the stated time period, and does not reflect the deduction of taxes that a shareholder may pay on Fund distributions or on the redemption of Fund shares.
| Portfolio breakdown (%) (at August 31, 2023) |
| Asset-Backed Securities — Non-Agency | 5.9 |
| Commercial Mortgage-Backed Securities - Non-Agency | 3.9 |
| Common Stocks | 52.3 |
| Convertible Bonds | 0.0(a) |
| Corporate Bonds & Notes | 6.6 |
| Exchange-Traded Equity Funds | 1.6 |
| Foreign Government Obligations | 0.0(a) |
| Money Market Funds | 9.3 |
| Residential Mortgage-Backed Securities - Agency | 11.7 |
| Residential Mortgage-Backed Securities - Non-Agency | 8.4 |
| Senior Loans | 0.0(a) |
| U.S. Treasury Obligations | 0.3 |
| Total | 100.0 |
Percentages indicated are based upon total investments excluding investments in derivatives, if any. The Fund’s portfolio composition is subject to change.
| 4 | Columbia Balanced Fund | Annual Report 2023 |
Manager Discussion of Fund Performance
(Unaudited)
For the 12-month period that ended August 31, 2023, Class A shares of Columbia Balanced Fund returned 9.99% excluding sales charges. The Fund’s Blended Benchmark returned 9.04%. During the same 12-month period, the Fund’s equity benchmark, the S&P 500 Index, returned 15.94% while the Fund’s fixed-income benchmark, the Bloomberg U.S. Aggregate Bond Index, returned -1.19%.
Market overview
The broad U.S. equity market delivered strong gains during the annual period, despite continued concerns about a future economic slowdown and a series of rate hikes by the U.S. Federal Reserve (Fed) that tapered from aggressive to more measured by period-end to tame stubborn inflation. Market momentum picked up as the period progressed as better-than-feared earnings drove equity gains. The period, however, was far from smooth.
In March 2023, the failure of a pair of U.S. banks and the collapse of European giant Credit Suisse led to fears of a financial crisis. In response, the Fed created a lending facility to support bank liquidity while the market began to price in multiple cuts in the federal funds target rate over the second half of 2023. At its March 2023 meeting, the Fed raised the federal funds target rate by another quarter-point to a range of 4.75% to 5.0%. The rate hike was generally welcomed by investors as a signal that the Fed viewed the financial system as remaining on stable footing.
Inflation continued to decline as the period progressed. Through August 2023, the rate of year-over-year U.S. inflation had decelerated to 3.7%, a meaningful reduction from the four decade high of 9.1% in June 2022, though still higher than the Fed’s 2% inflation target. Nonetheless, with the economy displaying surprising resilience and employment remaining historically robust, the Fed implemented additional 25 basis point increases at its early May and late July meetings, bringing the federal funds target rate to the 5.25% to 5.50% range. (A basis point is 1/100 of a percent.)
Sentiment remained quite positive through the latter months of the period, as the Fed slowed its pace of rate hikes in response to cooling inflation. Investors were further encouraged by the fact that economic growth and corporate earnings — while slowing — did not decline to the extent that the markets had anticipated in late 2022. These factors combined to fuel an impressive gain for equities, but the majority of the positive return was generated by a small group of mega-cap technology-related stocks. Much of the relative strength in this area came from companies expected to benefit from the evolution of artificial intelligence (AI). The growth style strongly outpaced value as a result, with returns of 21.94% and 8.59%, respectively, for the Russell 1000 Growth Index and the Russell 1000 Value Index. The small-cap Russell 2000 Index, which is less influenced by AI-related trends and is more sensitive to concerns about the banking sector, returned 4.65%, unable to keep pace with the rally in large caps.
Within fixed income, sector performance was mixed for the performance period. Lower quality outperformed on an excess return basis, with high yield, emerging markets and investment grade BBB credit performing the best. Asset-backed securities (ABS) and investment-grade corporates produced positive absolute and excess returns over the period. In securitized bonds, agency mortgage-backed securities (MBS) and commercial mortgage-backed securities (CMBS) produced both negative absolute and excess returns. Within the investment-grade corporate market, lower rated securities generated positive excess returns relative to treasuries and outperformed higher quality securities over the period.
The Fund’s notable contributors during the period
| • | The strong performance of the Fund’s equity segment during the period was led by performance of its holdings in the information technology, communication services, industrials, financials and health care sectors. |
| • | Top individual contributors to the performance of the Fund’s equity segment included: |
| ○ | NVIDIA Corp., a semiconductor company that is a leading supplier of artificial intelligence hardware and software; |
| ○ | Microsoft Corp., a multinational technology company that develops and supports software, services, devices and solutions worldwide; and |
| ○ | Eli Lilly & Co., a drug manufacturer that develops and markets human pharmaceuticals worldwide. |
| • | The fixed-income segment of the Fund benefited from owning sectors such as non-agency mortgages, ABS and CMBS, which had positive absolute returns during the period. |
Columbia Balanced Fund | Annual Report 2023
| 5 |
Manager Discussion of Fund Performance (continued)
(Unaudited)
| • | Security selection within the fixed-income segment was positive within the ABS and CMBS sectors. Investment-grade corporate and ABS had positive total returns and excess returns during the reporting period. |
| • | The fixed-income portion of the Fund also benefited from its exposure to high-yield securities as high yield significantly outperformed investment grade during the reporting period. |
The Fund’s notable detractors during the period
| • | The largest detracting areas for the equity portion of the Fund during the period included the real estate, materials and utilities sectors. |
| • | Holdings that detracted most from Fund performance within the equity segment included: |
| ○ | American Tower Corp., a real estate investment trust that owns and operates wireless and broadcast communications infrastructure in several countries worldwide; |
| ○ | CVS Health Corp., a healthcare company which owns CVS Pharmacy, CVS Caremark and Aetna, among many other brands; and |
| ○ | International Flavors & Fragrances, Inc., a chemical company that produces flavors, fragrances and active ingredients for cosmetics. |
| ○ | The Fund’s positions in CVS Health and International Flavors & Fragrances were sold in the second half of the period. |
| • | The fixed-income portion of the Fund was long duration versus its benchmark, which negatively impacted performance in the fixed-income segment of the Fund as interest rates rose during the reporting period. |
| ○ | Compared to August 31, 2022, the 2-year Treasury yield increased 140 basis points (bps) from 3.45% to 4.85% while the 10-year Treasury yield rose 94 bps from 3.15% to 4.09%. The slope of the yield curve flattened. The yield difference between the 10-year Treasury and the 2-year Treasury was -76 bps in August 2023 versus -30 bps in the prior year. |
| • | Agency MBS generated both negative total returns and negative excess returns. The Fund added to them during the year and was overweight, which had a negative impact on performance. We continue to favor agency MBS due to the improved technical situation and cheap valuations versus long term averages. |
| • | Investment-grade corporates significantly outperformed treasuries during the period. The Fund had less exposure to the investment-grade corporate sector versus the benchmark as we believed other sectors were more attractive, which ultimately weighed on relative performance. Security selection within the sector, as noted above, contributed positively to performance. |
Market risk may affect a single issuer, sector of the economy, industry or the market as a whole. There are risks associated with fixed-income investments, including credit risk, interest rate risk, and prepayment and extension risk. In general, bond prices rise when interest rates fall and vice versa. This effect is usually more pronounced for longer term securities. A rise in interest rates may result in a price decline of fixed-income instruments held by the Fund, negatively impacting its performance and NAV. Falling rates may result in the Fund investing in lower yielding debt instruments, lowering the Fund’s income and yield. These risks may be heightened for longer maturity and duration securities. Foreign investments subject the Fund to risks, including political, economic, market, social and others within a particular country, as well as to currency instabilities and less stringent financial and accounting standards generally applicable to U.S. issuers. Investing in derivatives is a specialized activity that involves special risks that subject the Fund to significant loss potential, including when used as leverage, and may result in greater fluctuation in Fund value. See the Fund’s prospectus for more information on these and other risks.
The views expressed in this report reflect the current views of the respective parties who contributed to this report. These views are not guarantees of future performance and involve certain risks, uncertainties and assumptions that are difficult to predict, so actual outcomes and results may differ significantly from the views expressed. These views are subject to change at any time based upon economic, market or other conditions and the respective parties disclaim any responsibility to update such views. These views may not be relied on as investment advice and, because investment decisions for a Columbia fund are based on numerous factors, may not be relied on as an indication of trading intent on behalf of any particular Columbia fund. References to specific securities should not be construed as a recommendation or investment advice.
| 6 | Columbia Balanced Fund | Annual Report 2023 |
Understanding Your Fund’s Expenses
(Unaudited)
As an investor, you incur two types of costs. There are shareholder transaction costs, which generally include sales charges on purchases and may include redemption fees. There are also ongoing fund costs, which generally include management fees, distribution and/or service fees, and other fund expenses. The following information is intended to help you understand your ongoing costs (in dollars) of investing in the Fund and to help you compare these costs with the ongoing costs of investing in other mutual funds.
Analyzing your Fund’s expenses
To illustrate these ongoing costs, we have provided examples and calculated the expenses paid by investors in each share class of the Fund during the period. The actual and hypothetical information in the table is based on an initial investment of $1,000 at the beginning of the period indicated and held for the entire period. Expense information is calculated two ways and each method provides you with different information. The amount listed in the “Actual” column is calculated using the Fund’s actual operating expenses and total return for the period. You may use the Actual information, together with the amount invested, to estimate the expenses that you paid over the period. Simply divide your account value by $1,000 (for example, an $8,600 account value divided by $1,000 = 8.6), then multiply the results by the expenses paid during the period under the “Actual” column. The amount listed in the “Hypothetical” column assumes a 5% annual rate of return before expenses (which is not the Fund’s actual return) and then applies the Fund’s actual expense ratio for the period to the hypothetical return. You should not use the hypothetical account values and expenses to estimate either your actual account balance at the end of the period or the expenses you paid during the period. See “Compare with other funds” below for details on how to use the hypothetical data.
Compare with other funds
Since all mutual funds are required to include the same hypothetical calculations about expenses in shareholder reports, you can use this information to compare the ongoing cost of investing in the Fund with other funds. To do so, compare the hypothetical example with the 5% hypothetical examples that appear in the shareholder reports of other funds. As you compare hypothetical examples of other funds, it is important to note that hypothetical examples are meant to highlight the ongoing costs of investing in a fund only and do not reflect any transaction costs, such as sales charges, or redemption or exchange fees. Therefore, the hypothetical calculations are useful in comparing ongoing costs only, and will not help you determine the relative total costs of owning different funds. If transaction costs were included in these calculations, your costs would be higher.
| March 1, 2023 — August 31, 2023 |
| | Account value at the
beginning of the
period ($) | Account value at the
end of the
period ($) | Expenses paid during
the period ($) | Fund’s annualized
expense ratio (%) |
| | Actual | Hypothetical | Actual | Hypothetical | Actual | Hypothetical | Actual |
| Class A | 1,000.00 | 1,000.00 | 1,110.50 | 1,020.52 | 4.95 | 4.74 | 0.93 |
| Advisor Class | 1,000.00 | 1,000.00 | 1,111.70 | 1,021.78 | 3.62 | 3.47 | 0.68 |
| Class C | 1,000.00 | 1,000.00 | 1,106.10 | 1,016.74 | 8.92 | 8.54 | 1.68 |
| Institutional Class | 1,000.00 | 1,000.00 | 1,111.70 | 1,021.78 | 3.62 | 3.47 | 0.68 |
| Institutional 2 Class | 1,000.00 | 1,000.00 | 1,112.00 | 1,021.98 | 3.41 | 3.26 | 0.64 |
| Institutional 3 Class | 1,000.00 | 1,000.00 | 1,112.20 | 1,022.23 | 3.14 | 3.01 | 0.59 |
| Class R | 1,000.00 | 1,000.00 | 1,109.20 | 1,019.26 | 6.27 | 6.01 | 1.18 |
Expenses paid during the period are equal to the annualized expense ratio for each class as indicated above, multiplied by the average account value over the period and then multiplied by the number of days in the Fund’s most recent fiscal half year and divided by 365.
Expenses do not include fees and expenses incurred indirectly by the Fund from its investment in underlying funds, including affiliated and non-affiliated pooled investment vehicles, such as mutual funds and exchange-traded funds.
Columbia Balanced Fund | Annual Report 2023
| 7 |
Portfolio of Investments
August 31, 2023
(Percentages represent value of investments compared to net assets)
Investments in securities
| Asset-Backed Securities — Non-Agency 6.6% |
| Issuer | Coupon
Rate | | Principal
Amount ($) | Value ($) |
| ACHV ABS TRUST(a) |
| Series 2023-3PL Class A |
| 08/19/2030 | 6.600% | | 11,684,950 | 11,692,873 |
| Subordinated Series 2023-3PL Class B |
| 08/19/2030 | 7.170% | | 2,550,000 | 2,559,274 |
| ACM Auto Trust(a) |
| Subordinated Series 2022-1A Class C |
| 04/20/2029 | 5.480% | | 5,819,762 | 5,807,482 |
| Affirm Asset Securitization Trust(a) |
| Series 2022-A Class 1A |
| 05/17/2027 | 4.300% | | 4,225,000 | 4,133,751 |
| ALM Ltd.(a),(b) |
| Series 2022-20A Class A2 |
3-month Term SOFR + 2.000%
Floor 2.000%
07/15/2037 | 7.308% | | 8,450,000 | 8,462,979 |
| American Credit Acceptance Receivables Trust(a) |
| Series 2020-1 Class D |
| 03/13/2026 | 2.390% | | 5,169,581 | 5,134,828 |
| Subordinated Series 2021-1 Class C |
| 03/15/2027 | 0.830% | | 1,867,974 | 1,852,201 |
| Subordinated Series 2021-2 Class E |
| 07/13/2027 | 2.540% | | 3,850,000 | 3,640,453 |
| Subordinated Series 2023-3 Class C |
| 10/12/2029 | 6.440% | | 10,050,000 | 10,064,812 |
| Apidos CLO XI(a),(b) |
| Series 2012-11A Class BR3 |
3-month Term SOFR + 1.912%
Floor 1.650%
04/17/2034 | 7.220% | | 12,575,000 | 12,436,713 |
| Apidos CLO XXVIII(a),(b) |
| Series 2017-28A Class A1B |
3-month Term SOFR + 1.412%
Floor 1.150%
01/20/2031 | 6.738% | | 5,925,000 | 5,838,945 |
| Aqua Finance Trust(a) |
| Series 2021-A Class A |
| 07/17/2046 | 1.540% | | 3,199,795 | 2,824,833 |
| ARES XLVII CLO Ltd.(a),(b) |
| Series 2018-47A Class B |
3-month Term SOFR + 1.712%
Floor 1.450%
04/15/2030 | 7.020% | | 3,450,000 | 3,382,708 |
| Avant Loans Funding Trust(a) |
| Subordinated Series 2021-REV1 Class C |
| 07/15/2030 | 2.300% | | 2,100,000 | 1,970,773 |
| Asset-Backed Securities — Non-Agency (continued) |
| Issuer | Coupon
Rate | | Principal
Amount ($) | Value ($) |
| Bain Capital Credit CLO Ltd.(a),(b) |
| Series 2021-7A Class B |
3-month Term SOFR + 1.912%
Floor 1.650%
01/22/2035 | 7.257% | | 15,750,000 | 15,418,982 |
| Ballyrock CLO Ltd.(a),(b) |
| Series 2018-1A Class A1 |
3-month Term SOFR + 1.262%
04/20/2031 | 6.588% | | 3,302,019 | 3,289,019 |
| Barings CLO Ltd.(a),(b) |
| Series 2018-4A Class B |
3-month Term SOFR + 1.962%
Floor 1.700%
10/15/2030 | 7.270% | | 22,000,000 | 21,760,464 |
| Basswood Park CLO Ltd.(a),(b) |
| Series 2021-1A Class A |
3-month Term SOFR + 1.262%
Floor 1.000%
04/20/2034 | 6.588% | | 6,725,000 | 6,630,978 |
| Carbone CLO Ltd.(a),(b) |
| Series 2017-1A Class A1 |
3-month Term SOFR + 1.402%
Floor 1.140%
01/20/2031 | 6.728% | | 11,058,395 | 11,042,427 |
| Carlyle CLO Ltd.(a),(b) |
| Series C17A Class CR |
3-month Term SOFR + 3.062%
Floor 2.800%
04/30/2031 | 8.431% | | 1,925,000 | 1,853,956 |
| Carlyle Group LP(a),(b) |
| Series 2017-5A Class A2 |
3-month Term SOFR + 1.662%
01/20/2030 | 6.988% | | 2,000,000 | 1,960,570 |
| Carmax Auto Owner Trust |
| Subordinated Series 2021-1 Class C |
| 12/15/2026 | 0.940% | | 1,650,000 | 1,510,399 |
| Cascade Funding Mortgage Trust(a) |
| CMO Series 2021-GRN1 Class A |
| 03/20/2041 | 1.100% | | 2,565,801 | 2,386,350 |
| Crossroads Asset Trust(a) |
| Subordinated Series 2021-A Class B |
| 06/20/2025 | 1.120% | | 141,613 | 141,297 |
| Drive Auto Receivables Trust |
| Subordinated Series 2020-2 Class D |
| 05/15/2028 | 3.050% | | 1,875,000 | 1,844,868 |
| Subordinated Series 2021-2 Class D |
| 03/15/2029 | 1.390% | | 22,110,000 | 20,730,099 |
The accompanying Notes to Financial Statements are an integral part of this statement.
| 8 | Columbia Balanced Fund | Annual Report 2023 |
Portfolio of Investments (continued)
August 31, 2023
| Asset-Backed Securities — Non-Agency (continued) |
| Issuer | Coupon
Rate | | Principal
Amount ($) | Value ($) |
| Dryden CLO Ltd.(a),(b) |
| Series 2018-55A Class A1 |
3-month Term SOFR + 1.282%
04/15/2031 | 6.590% | | 8,367,571 | 8,340,627 |
| Dryden Senior Loan Fund(a),(b) |
| Series 2016-42A Class BR |
3-month Term SOFR + 1.812%
07/15/2030 | 7.120% | | 6,025,000 | 5,953,652 |
| DT Auto Owner Trust(a) |
| Series 2019-3A Class D |
| 04/15/2025 | 2.960% | | 2,920,918 | 2,907,300 |
| Series 2020-2A Class D |
| 03/16/2026 | 4.730% | | 3,235,000 | 3,198,753 |
| Subordinated Series 2020-1A Class D |
| 11/17/2025 | 2.550% | | 6,847,579 | 6,726,506 |
| Subordinated Series 2020-3A Class D |
| 06/15/2026 | 1.840% | | 6,125,000 | 5,833,189 |
| Exeter Automobile Receivables Trust(a) |
| Series 2019-4A Class D |
| 09/15/2025 | 2.580% | | 3,785,656 | 3,727,717 |
| Subordinated Series 2020-1A Class D |
| 12/15/2025 | 2.730% | | 3,657,356 | 3,588,282 |
| Subordinated Series 2020-2A Class D |
| 04/15/2026 | 4.730% | | 1,695,962 | 1,685,172 |
| Exeter Automobile Receivables Trust |
| Subordinated Series 2020-3A Class D |
| 07/15/2026 | 1.730% | | 3,482,812 | 3,426,564 |
| Subordinated Series 2021-1A Class D |
| 11/16/2026 | 1.080% | | 7,752,000 | 7,381,414 |
| Subordinated Series 2021-3A Class D |
| 06/15/2027 | 1.550% | | 25,630,000 | 23,665,907 |
| Ford Credit Auto Owner Trust(a) |
| Series 2021-2 Class A |
| 05/15/2034 | 1.530% | | 15,305,000 | 13,580,523 |
| Series 2022-1 Class A |
| 11/15/2034 | 3.880% | | 21,500,000 | 20,405,826 |
| Foundation Finance Trust(a) |
| Series 2019-1A Class A |
| 11/15/2034 | 3.860% | | 593,220 | 585,478 |
| Foursight Capital Automobile Receivables Trust(a) |
| Subordinated Series 2021-1 Class D |
| 03/15/2027 | 1.320% | | 5,075,000 | 4,839,728 |
| Freed ABS Trust(a) |
| Subordinated Series 2021-1CP Class C |
| 03/20/2028 | 2.830% | | 325,790 | 323,974 |
| GLS Auto Receivables Issuer Trust(a) |
| Subordinated Series 2019-4A Class C |
| 08/15/2025 | 3.060% | | 2,444,458 | 2,419,958 |
| Asset-Backed Securities — Non-Agency (continued) |
| Issuer | Coupon
Rate | | Principal
Amount ($) | Value ($) |
| Subordinated Series 2020-1A Class C |
| 11/17/2025 | 2.720% | | 4,198,024 | 4,158,854 |
| GoldentTree Loan Management US CLO 1 Ltd.(a),(b) |
| Series 2021-10A Class A |
3-month Term SOFR + 1.362%
Floor 1.100%
07/20/2034 | 6.688% | | 9,175,000 | 9,116,647 |
| Hertz Vehicle Financing LLC(a) |
| Series 2021-1A Class A |
| 12/26/2025 | 1.210% | | 9,606,000 | 9,120,934 |
| Hilton Grand Vacations Trust(a) |
| Series 2018-AA Class A |
| 02/25/2032 | 3.540% | | 856,909 | 831,798 |
| Series 2019-AA Class A |
| 07/25/2033 | 2.340% | | 2,034,921 | 1,896,182 |
| LendingPoint Asset Securitization Trust(a) |
| Subordinated Series 2020-REV1 Class B |
| 10/15/2028 | 4.494% | | 10,200,000 | 10,084,681 |
| LL ABS Trust(a) |
| Series 2021-1A Class A |
| 05/15/2029 | 1.070% | | 885,203 | 865,485 |
| Madison Park Funding XLVIII Ltd.(a),(b) |
| Series 2021-48A Class A |
3-month Term SOFR + 1.412%
Floor 1.150%
04/19/2033 | 6.732% | | 3,025,000 | 3,011,506 |
| Madison Park Funding XXXIII Ltd.(a),(b) |
| Series 2019-33A Class BR |
3-month Term SOFR + 1.800%
Floor 1.800%
10/15/2032 | 7.108% | | 16,325,000 | 15,937,722 |
| Magnetite XII Ltd.(a),(b) |
| Series 2015-12A Class ARR |
3-month Term SOFR + 1.362%
Floor 1.100%
10/15/2031 | 6.670% | | 13,830,000 | 13,797,278 |
| MVW Owner Trust(a) |
| Series 2017-1A Class A |
| 12/20/2034 | 2.420% | | 1,731,982 | 1,687,451 |
| Octagon Investment Partners 39 Ltd.(a),(b) |
| Series 2018-3A Class B |
3-month Term SOFR + 2.112%
Floor 1.650%
10/20/2030 | 7.438% | | 22,575,000 | 22,269,583 |
| OHA Credit Funding Ltd.(a),(b) |
| Series 2021-8A Class A |
3-month Term SOFR + 1.452%
Floor 1.190%
01/18/2034 | 6.762% | | 4,025,000 | 4,011,709 |
The accompanying Notes to Financial Statements are an integral part of this statement.
Columbia Balanced Fund | Annual Report 2023
| 9 |
Portfolio of Investments (continued)
August 31, 2023
| Asset-Backed Securities — Non-Agency (continued) |
| Issuer | Coupon
Rate | | Principal
Amount ($) | Value ($) |
| OneMain Financial Issuance Trust(a) |
| Series 2023-2A Class A1 |
| 09/15/2036 | 5.840% | | 22,150,000 | 22,223,033 |
| Pagaya AI Debt Trust(a) |
| Series 2022-1 Class A |
| 10/15/2029 | 2.030% | | 8,351,309 | 8,168,673 |
| Series 2023-5 Class A |
| 04/15/2031 | 7.179% | | 7,775,000 | 7,803,058 |
| Subordinated Series 2022-1 Class B |
| 10/15/2029 | 3.344% | | 4,324,428 | 4,043,279 |
| Palmer Square Loan Funding Ltd.(a),(b) |
| Series 2021-4A Class B |
3-month Term SOFR + 2.012%
Floor 1.750%
10/15/2029 | 7.320% | | 10,000,000 | 9,879,290 |
| Race Point IX CLO Ltd.(a),(b) |
| Series 2015-9A Class A2R |
3-month Term SOFR + 0.712%
Floor 1.450%
10/15/2030 | 6.020% | | 12,200,000 | 11,821,141 |
| Redding Ridge Asset Management Ltd.(a),(b) |
| Series 2018-4A Class A2 |
3-month Term SOFR + 1.812%
04/15/2030 | 7.120% | | 3,000,000 | 2,974,449 |
| Research-Driven Pagaya Motor Asset Trust IV(a) |
| Series 2021-2A Class A |
| 03/25/2030 | 2.650% | | 4,021,731 | 3,561,169 |
| Santander Consumer Auto Receivables Trust(a) |
| Subordinated Series 2021-AA Class C |
| 11/16/2026 | 1.030% | | 1,275,000 | 1,181,807 |
| Subordinated Series 2021-AA Class D |
| 01/15/2027 | 1.570% | | 1,050,000 | 963,544 |
| Santander Drive Auto Receivables Trust |
| Series 2020-2 Class D |
| 09/15/2026 | 2.220% | | 3,667,919 | 3,614,043 |
| Subordinated Series 2020-3 Class D |
| 11/16/2026 | 1.640% | | 34,975,341 | 34,203,998 |
| SCF Equipment Leasing LLC(a) |
| Series 2019-2A Class B |
| 08/20/2026 | 2.760% | | 8,025,000 | 7,868,042 |
| Series 2020-1A Class C |
| 08/21/2028 | 2.600% | | 4,850,000 | 4,554,313 |
| Sierra Timeshare Receivables Funding LLC(a) |
| Series 2018-3A Class A |
| 09/20/2035 | 3.690% | | 381,927 | 374,213 |
| Theorem Funding Trust(a) |
| Subordinated Series 2021-1A Class B |
| 12/15/2027 | 1.840% | | 4,200,000 | 4,116,797 |
| Asset-Backed Securities — Non-Agency (continued) |
| Issuer | Coupon
Rate | | Principal
Amount ($) | Value ($) |
| Upstart Pass-Through Trust(a) |
| Series 2021-ST10 Class A |
| 01/20/2030 | 2.250% | | 8,998,836 | 8,733,378 |
| Series 2021-ST2 Class A |
| 04/20/2027 | 2.500% | | 520,678 | 503,413 |
| Series 2021-ST7 Class A |
| 09/20/2029 | 1.850% | | 1,145,166 | 1,113,808 |
| Series 2021-ST9 Class A |
| 11/20/2029 | 1.700% | | 961,052 | 930,674 |
| Upstart Securitization Trust(a) |
| Series 2020-2 Class A |
| 11/20/2030 | 2.309% | | 936,015 | 924,608 |
| Subordinated Series 2021-2 Class B |
| 06/20/2031 | 1.750% | | 2,270,652 | 2,230,149 |
| Subordinated Series 2021-3 Class B |
| 07/20/2031 | 1.660% | | 2,844,000 | 2,770,153 |
| VSE Voi Mortgage LLC(a) |
| Series 2018-A Class A |
| 02/20/2036 | 3.560% | | 995,445 | 962,704 |
Total Asset-Backed Securities — Non-Agency
(Cost $539,964,649) | 529,272,170 |
|
| Commercial Mortgage-Backed Securities - Non-Agency 4.4% |
| | | | |
| AMSR Trust(a) |
| Subordinated Series 2020-SFR2 Class C |
| 07/17/2037 | 2.533% | | 2,799,000 | 2,606,515 |
| Ashford Hospitality Trust(a),(b) |
| Series 2018-KEYS Class B |
1-month Term SOFR + 1.497%
Floor 1.450%
05/15/2035 | 6.808% | | 16,800,000 | 16,412,004 |
| BBCMS Trust(a),(b) |
| Subordinated Series 2018-BXH Class B |
1-month Term SOFR + 1.364%
Floor 1.250%
10/15/2037 | 6.675% | | 7,370,000 | 7,130,563 |
| Subordinated Series 2018-BXH Class C |
1-month Term SOFR + 1.614%
Floor 1.500%
10/15/2037 | 6.925% | | 3,975,000 | 3,865,752 |
| BB-UBS Trust(a) |
| Series 2012-SHOW Class A |
| 11/05/2036 | 3.430% | | 8,475,000 | 7,748,115 |
| BHMS Mortgage Trust(a),(b) |
| Series 2018-ATLS Class A |
1-month Term SOFR + 1.364%
Floor 1.250%
07/15/2035 | 6.675% | | 14,823,000 | 14,433,793 |
The accompanying Notes to Financial Statements are an integral part of this statement.
| 10 | Columbia Balanced Fund | Annual Report 2023 |
Portfolio of Investments (continued)
August 31, 2023
| Commercial Mortgage-Backed Securities - Non-Agency (continued) |
| Issuer | Coupon
Rate | | Principal
Amount ($) | Value ($) |
| BPR Trust(a),(b) |
| Subordinated Series 2021-TY Class D |
1-month Term SOFR + 2.464%
Floor 2.350%
09/15/2038 | 7.775% | | 6,000,000 | 5,583,136 |
| BX Commercial Mortgage Trust(a),(b) |
| Series 2019-XL Class C |
1-month Term SOFR + 1.364%
Floor 1.250%
10/15/2036 | 6.675% | | 6,056,250 | 6,010,919 |
| BX Mortgage Trust(a),(b) |
| Series 2021-PAC Class D |
1-month Term SOFR + 1.412%
Floor 1.298%
10/15/2036 | 6.723% | | 14,175,000 | 13,586,301 |
| BX Trust(a) |
| Series 2023-LIFE Class A |
| 02/15/2028 | 5.045% | | 7,225,000 | 6,838,767 |
| BX Trust(a),(b) |
| Subordinated Series 2019-ATL Class C |
1-month USD LIBOR + 1.587%
Floor 1.587%
10/15/2036 | 7.012% | | 4,422,000 | 4,245,461 |
| Subordinated Series 2019-ATL Class D |
1-month USD LIBOR + 1.887%
Floor 1.887%
10/15/2036 | 7.312% | | 3,895,000 | 3,671,468 |
| Citigroup Commercial Mortgage Trust(a),(c) |
| Subordinated Series 2020-420K Class C |
| 11/10/2042 | 3.422% | | 2,500,000 | 1,888,198 |
| Subordinated Series 2020-420K Class D |
| 11/10/2042 | 3.422% | | 2,250,000 | 1,605,824 |
| CLNY Trust(a),(b) |
| Subordinated Series 2019-IKPR Class D |
1-month USD LIBOR + 2.025%
Floor 2.025%
11/15/2038 | 7.456% | | 11,925,000 | 11,061,153 |
| COMM Mortgage Trust(a),(c) |
| Subordinated Series 2020-CBM Class D |
| 02/10/2037 | 3.754% | | 2,925,000 | 2,696,969 |
| COMM Mortgage Trust(a) |
| Subordinated Series 2020-CX Class B |
| 11/10/2046 | 2.446% | | 3,275,000 | 2,547,956 |
| Extended Stay America Trust(a),(b) |
| Series 2021-ESH Class E |
1-month Term SOFR + 2.964%
Floor 2.850%
07/15/2038 | 8.275% | | 1,837,044 | 1,804,925 |
| Commercial Mortgage-Backed Securities - Non-Agency (continued) |
| Issuer | Coupon
Rate | | Principal
Amount ($) | Value ($) |
| Series 2021-ESH Class F |
1-month Term SOFR + 3.814%
Floor 3.700%
07/15/2038 | 9.125% | | 1,908,617 | 1,846,646 |
| FirstKey Homes Trust(a) |
| Subordinated Series 2020-SFR1 Class D |
| 08/17/2037 | 2.241% | | 4,225,000 | 3,856,920 |
| Subordinated Series 2020-SFR2 Class D |
| 10/19/2037 | 1.968% | | 18,600,000 | 16,883,030 |
| GS Mortgage Securities Corp. II(a),(c) |
| Series 2023-SHIP Class A |
| 09/15/2038 | 4.466% | | 6,825,000 | 6,542,125 |
| GS Mortgage Securities Corp. Trust(a) |
| Series 2017-485L Class A |
| 02/10/2037 | 3.721% | | 3,835,000 | 3,333,095 |
| GS Mortgage Securities Corp. Trust(a),(b) |
| Subordinated CMO Series 2021-IP Class D |
1-month Term SOFR + 2.214%
Floor 2.100%
10/15/2036 | 7.525% | | 5,425,000 | 4,965,392 |
| Home Partners of America Trust(a) |
| Subordinated Series 2019-2 Class D |
| 10/19/2039 | 3.121% | | 6,410,403 | 5,605,611 |
| Subordinated Series 2021-2 Class B |
| 12/17/2026 | 2.302% | | 41,015,717 | 36,261,249 |
| JPMorgan Chase Commercial Mortgage Securities Trust(a),(c) |
| Subordinated Series 2021-2NU Class B |
| 01/05/2040 | 2.077% | | 3,800,000 | 2,996,495 |
| Subordinated Series 2021-2NU Class C |
| 01/05/2040 | 2.077% | | 1,500,000 | 1,139,285 |
| KKR Industrial Portfolio Trust(a),(b) |
| Subordinated Series 2021-KDIP Class D |
1-month Term SOFR + 1.364%
Floor 1.250%
12/15/2037 | 6.675% | | 1,921,415 | 1,893,641 |
| Life Mortgage Trust(a),(b) |
| Subordinated Series 2021-BMR Class D |
1-month Term SOFR + 1.514%
Floor 1.400%
03/15/2038 | 6.825% | | 4,472,514 | 4,326,449 |
| Morgan Stanley Bank of America Merrill Lynch Trust |
| Series 2016-C29 Class A3 |
| 05/15/2049 | 3.058% | | 5,928,750 | 5,610,546 |
| Series 2017-C34 Class A3 |
| 11/15/2052 | 3.276% | | 14,135,000 | 12,903,810 |
| Morgan Stanley Capital I Trust(a),(c) |
| Series 2019-MEAD Class D |
| 11/10/2036 | 3.283% | | 7,392,500 | 6,118,161 |
The accompanying Notes to Financial Statements are an integral part of this statement.
Columbia Balanced Fund | Annual Report 2023
| 11 |
Portfolio of Investments (continued)
August 31, 2023
| Commercial Mortgage-Backed Securities - Non-Agency (continued) |
| Issuer | Coupon
Rate | | Principal
Amount ($) | Value ($) |
| One New York Plaza Trust(a),(b) |
| Subordinated Series 2020-1NYP Class C |
1-month Term SOFR + 2.314%
Floor 2.200%
01/15/2036 | 7.625% | | 6,950,000 | 6,050,869 |
| Subordinated Series 2020-1NYP Class D |
1-month Term SOFR + 2.864%
Floor 2.750%
01/15/2036 | 8.175% | | 2,600,000 | 2,027,817 |
| Progress Residential Trust(a) |
| Series 2019-SFR3 Class C |
| 09/17/2036 | 2.721% | | 4,750,000 | 4,577,251 |
| Series 2019-SFR3 Class D |
| 09/17/2036 | 2.871% | | 7,049,000 | 6,778,862 |
| Series 2019-SFR4 Class C |
| 10/17/2036 | 3.036% | | 17,766,000 | 17,094,006 |
| Series 2020-SFR1 Class C |
| 04/17/2037 | 2.183% | | 2,075,000 | 1,932,763 |
| Series 2020-SFR1 Class D |
| 04/17/2037 | 2.383% | | 4,200,000 | 3,909,400 |
| Subordinated Series 2020-SFR2 Class C |
| 06/17/2037 | 3.077% | | 600,000 | 565,524 |
| Subordinated Series 2020-SFR2 Class D |
| 06/17/2037 | 3.874% | | 775,000 | 737,454 |
| Subordinated Series 2021-SFR8 Class D |
| 10/17/2038 | 2.082% | | 11,910,000 | 10,310,863 |
| RBS Commercial Funding, Inc., Trust(a),(c) |
| Series 2013-GSP Class A |
| 01/15/2032 | 3.961% | | 7,141,000 | 6,943,405 |
| SFO Commercial Mortgage Trust(a),(b) |
| Subordinated Series 2021-555 Class E |
1-month Term SOFR + 3.014%
Floor 2.900%
05/15/2038 | 8.325% | | 3,025,000 | 2,219,512 |
| SPGN TFLM Mortgage Trust(a),(b) |
| Series 2022 Class A |
1-month Term SOFR + 1.550%
Floor 1.550%
02/15/2039 | 6.861% | | 21,925,000 | 20,798,599 |
| STAR Trust(a),(b) |
| Subordinated Series 2022-SFR3 Class B |
1-month Term SOFR + 1.950%
Floor 1.950%
05/17/2024 | 7.261% | | 12,100,000 | 12,019,868 |
| Tricon American Homes(a) |
| Series 2020-SFR1 Class C |
| 07/17/2038 | 2.249% | | 4,100,000 | 3,701,863 |
| Tricon American Homes Trust(a) |
| Subordinated Series 2020-SFR2 Class D |
| 11/17/2039 | 2.281% | | 6,775,000 | 5,784,122 |
| Commercial Mortgage-Backed Securities - Non-Agency (continued) |
| Issuer | Coupon
Rate | | Principal
Amount ($) | Value ($) |
| Wells Fargo Commercial Mortgage Trust |
| Series 2015-C28 Class A3 |
| 05/15/2048 | 3.290% | | 6,512,659 | 6,311,257 |
| Wells Fargo Commercial Mortgage Trust(a),(b) |
| Series 2020-SDAL Class D |
1-month Term SOFR + 2.204%
Floor 2.090%, Cap 4.500%
02/15/2037 | 7.515% | | 3,400,000 | 3,281,876 |
| Series 2021-FCMT Class A |
1-month Term SOFR + 1.314%
Floor 1.200%
05/15/2031 | 6.625% | | 4,750,000 | 4,532,957 |
| Series 2021-FCMT Class D |
1-month Term SOFR + 3.614%
Floor 3.500%
05/15/2031 | 8.925% | | 3,925,000 | 3,542,463 |
Total Commercial Mortgage-Backed Securities - Non-Agency
(Cost $383,690,095) | 351,141,005 |
| Common Stocks 58.8% |
| Issuer | Shares | Value ($) |
| Communication Services 7.7% |
| Entertainment 1.2% |
| Endeavor Group Holdings, Inc., Class A(d) | 1,509,940 | 33,052,587 |
| Take-Two Interactive Software, Inc.(d) | 467,585 | 66,490,587 |
| Total | | 99,543,174 |
| Interactive Media & Services 5.4% |
| Alphabet, Inc., Class A(d) | 877,491 | 119,487,950 |
| Alphabet, Inc., Class C(d) | 832,980 | 114,409,803 |
| Match Group, Inc.(d) | 545,763 | 25,579,912 |
| Meta Platforms, Inc., Class A(d) | 388,062 | 114,823,665 |
| Pinterest, Inc., Class A(d) | 955,839 | 26,276,014 |
| ZoomInfo Technologies, Inc.(d) | 1,491,523 | 26,877,244 |
| Total | | 427,454,588 |
| Media 0.5% |
| Comcast Corp., Class A | 856,813 | 40,064,576 |
| Wireless Telecommunication Services 0.6% |
| T-Mobile US, Inc.(d) | 350,042 | 47,693,222 |
| Total Communication Services | 614,755,560 |
| Consumer Discretionary 4.2% |
| Automobiles 0.8% |
| Tesla, Inc.(d) | 257,692 | 66,505,151 |
The accompanying Notes to Financial Statements are an integral part of this statement.
| 12 | Columbia Balanced Fund | Annual Report 2023 |
Portfolio of Investments (continued)
August 31, 2023
| Common Stocks (continued) |
| Issuer | Shares | Value ($) |
| Broadline Retail 2.5% |
| Amazon.com, Inc.(d) | 1,422,354 | 196,299,076 |
| Hotels, Restaurants & Leisure 0.2% |
| McDonald’s Corp. | 66,375 | 18,661,331 |
| Specialty Retail 0.3% |
| Lowe’s Companies, Inc. | 84,615 | 19,502,065 |
| Textiles, Apparel & Luxury Goods 0.4% |
| Tapestry, Inc. | 970,220 | 32,327,731 |
| Total Consumer Discretionary | 333,295,354 |
| Consumer Staples 3.5% |
| Consumer Staples Distribution & Retail 1.3% |
| Dollar Tree, Inc.(d) | 40,293 | 4,930,252 |
| Sysco Corp. | 270,216 | 18,820,544 |
| Walmart, Inc. | 497,164 | 80,843,838 |
| Total | | 104,594,634 |
| Food Products 0.6% |
| Mondelez International, Inc., Class A | 610,900 | 43,532,734 |
| Household Products 0.8% |
| Procter & Gamble Co. (The) | 415,116 | 64,069,003 |
| Personal Care Products 0.8% |
| Coty, Inc., Class A(d) | 2,137,453 | 24,708,957 |
| Kenvue, Inc. | 1,788,829 | 41,232,508 |
| Total | | 65,941,465 |
| Total Consumer Staples | 278,137,836 |
| Energy 2.3% |
| Oil, Gas & Consumable Fuels 2.3% |
| Canadian Natural Resources Ltd. | 844,408 | 54,624,754 |
| Chevron Corp. | 530,038 | 85,389,122 |
| EOG Resources, Inc. | 337,607 | 43,423,012 |
| Total | | 183,436,888 |
| Total Energy | 183,436,888 |
| Financials 7.4% |
| Banks 1.4% |
| Bank of America Corp. | 916,297 | 26,270,235 |
| JPMorgan Chase & Co. | 408,854 | 59,827,606 |
| Wells Fargo & Co. | 650,012 | 26,838,995 |
| Total | | 112,936,836 |
| Common Stocks (continued) |
| Issuer | Shares | Value ($) |
| Capital Markets 1.6% |
| BlackRock, Inc. | 104,823 | 73,432,704 |
| MSCI, Inc. | 22,575 | 12,272,222 |
| S&P Global, Inc. | 102,736 | 40,155,393 |
| Total | | 125,860,319 |
| Consumer Finance 0.3% |
| American Express Co. | 133,221 | 21,047,586 |
| Financial Services 3.6% |
| Berkshire Hathaway, Inc., Class B(d) | 363,358 | 130,881,552 |
| MasterCard, Inc., Class A | 191,857 | 79,167,872 |
| Visa, Inc., Class A | 326,909 | 80,315,003 |
| Total | | 290,364,427 |
| Insurance 0.5% |
| Aon PLC, Class A | 115,207 | 38,408,862 |
| Total Financials | 588,618,030 |
| Health Care 8.3% |
| Biotechnology 1.8% |
| AbbVie, Inc. | 441,306 | 64,854,330 |
| BioMarin Pharmaceutical, Inc.(d) | 296,205 | 27,067,213 |
| Vertex Pharmaceuticals, Inc.(d) | 158,640 | 55,260,657 |
| Total | | 147,182,200 |
| Health Care Equipment & Supplies 1.8% |
| Abbott Laboratories | 252,282 | 25,959,818 |
| Boston Scientific Corp.(d) | 627,237 | 33,833,164 |
| GE HealthCare Technologies, Inc. | 264,708 | 18,648,678 |
| Medtronic PLC | 760,096 | 61,947,824 |
| Total | | 140,389,484 |
| Health Care Providers & Services 1.6% |
| Elevance Health, Inc. | 166,280 | 73,497,423 |
| UnitedHealth Group, Inc. | 108,009 | 51,474,929 |
| Total | | 124,972,352 |
| Life Sciences Tools & Services 1.5% |
| Danaher Corp. | 128,434 | 34,035,010 |
| IQVIA Holdings, Inc.(d) | 151,366 | 33,698,613 |
| Thermo Fisher Scientific, Inc. | 90,690 | 50,523,399 |
| Total | | 118,257,022 |
The accompanying Notes to Financial Statements are an integral part of this statement.
Columbia Balanced Fund | Annual Report 2023
| 13 |
Portfolio of Investments (continued)
August 31, 2023
| Common Stocks (continued) |
| Issuer | Shares | Value ($) |
| Pharmaceuticals 1.6% |
| Eli Lilly & Co. | 215,684 | 119,532,073 |
| Johnson & Johnson | 75,342 | 12,181,294 |
| Total | | 131,713,367 |
| Total Health Care | 662,514,425 |
| Industrials 5.4% |
| Aerospace & Defense 0.9% |
| RTX Corp. | 857,787 | 73,803,994 |
| Electrical Equipment 0.6% |
| Emerson Electric Co. | 520,653 | 51,154,157 |
| Ground Transportation 1.8% |
| Uber Technologies, Inc.(d) | 1,485,939 | 70,180,899 |
| Union Pacific Corp. | 332,807 | 73,407,240 |
| Total | | 143,588,139 |
| Industrial Conglomerates 1.2% |
| General Electric Co. | 489,425 | 56,019,585 |
| Honeywell International, Inc. | 191,525 | 35,995,209 |
| Total | | 92,014,794 |
| Machinery 0.9% |
| Parker-Hannifin Corp. | 172,646 | 71,976,117 |
| Total Industrials | 432,537,201 |
| Information Technology 17.0% |
| Electronic Equipment, Instruments & Components 1.1% |
| TE Connectivity Ltd. | 455,590 | 60,315,560 |
| Zebra Technologies Corp., Class A(d) | 88,547 | 24,351,310 |
| Total | | 84,666,870 |
| IT Services 1.3% |
| Accenture PLC, Class A | 151,578 | 49,076,409 |
| International Business Machines Corp. | 382,383 | 56,145,296 |
| Total | | 105,221,705 |
| Semiconductors & Semiconductor Equipment 4.3% |
| Advanced Micro Devices, Inc.(d) | 230,093 | 24,325,432 |
| Entegris, Inc. | 198,029 | 20,054,397 |
| Lam Research Corp. | 86,907 | 61,043,477 |
| Marvell Technology, Inc. | 361,899 | 21,080,617 |
| Common Stocks (continued) |
| Issuer | Shares | Value ($) |
| NVIDIA Corp. | 371,849 | 183,526,074 |
| QUALCOMM, Inc. | 294,514 | 33,730,688 |
| Total | | 343,760,685 |
| Software 6.5% |
| Adobe, Inc.(d) | 129,992 | 72,709,725 |
| Intuit, Inc. | 170,589 | 92,426,826 |
| Microsoft Corp. | 998,433 | 327,246,400 |
| Palo Alto Networks, Inc.(d) | 108,411 | 26,376,397 |
| Total | | 518,759,348 |
| Technology Hardware, Storage & Peripherals 3.8% |
| Apple, Inc. | 1,581,945 | 297,200,007 |
| Total Information Technology | 1,349,608,615 |
| Materials 1.5% |
| Chemicals 0.7% |
| Sherwin-Williams Co. (The) | 196,941 | 53,512,808 |
| Containers & Packaging 0.4% |
| Avery Dennison Corp. | 182,233 | 34,329,053 |
| Metals & Mining 0.4% |
| Newmont Corp. | 836,547 | 32,976,683 |
| Total Materials | 120,818,544 |
| Real Estate 0.7% |
| Specialized REITs 0.7% |
| American Tower Corp. | 320,304 | 58,077,521 |
| Total Real Estate | 58,077,521 |
| Utilities 0.8% |
| Electric Utilities 0.2% |
| American Electric Power Co., Inc. | 245,743 | 19,266,251 |
| Multi-Utilities 0.6% |
| DTE Energy Co. | 212,356 | 21,953,364 |
| Public Service Enterprise Group, Inc. | 391,101 | 23,888,449 |
| Total | | 45,841,813 |
| Total Utilities | 65,108,064 |
Total Common Stocks
(Cost $2,636,558,853) | 4,686,908,038 |
The accompanying Notes to Financial Statements are an integral part of this statement.
| 14 | Columbia Balanced Fund | Annual Report 2023 |
Portfolio of Investments (continued)
August 31, 2023
| Convertible Bonds 0.0% |
| Issuer | Coupon
Rate | | Principal
Amount ($) | Value ($) |
| Cable and Satellite 0.0% |
| DISH Network Corp. |
| Subordinated |
| 08/15/2026 | 3.375% | | 438,000 | 264,990 |
Total Convertible Bonds
(Cost $421,363) | 264,990 |
|
| Corporate Bonds & Notes 7.4% |
| | | | |
| Aerospace & Defense 0.4% |
| BAE Systems PLC(a) |
| 04/15/2030 | 3.400% | | 7,500,000 | 6,690,869 |
| Boeing Co. (The) |
| 05/01/2040 | 5.705% | | 12,700,000 | 12,337,176 |
| Bombardier, Inc.(a) |
| 04/15/2027 | 7.875% | | 285,000 | 284,249 |
| L3Harris Technologies, Inc. |
| 07/31/2033 | 5.400% | | 1,981,000 | 1,984,601 |
| Raytheon Technologies Corp. |
| 03/15/2032 | 2.375% | | 7,268,000 | 5,843,046 |
| 02/27/2033 | 5.150% | | 5,869,000 | 5,796,137 |
| Spirit AeroSystems, Inc. |
| 06/15/2028 | 4.600% | | 129,000 | 104,388 |
| Spirit AeroSystems, Inc.(a) |
| 11/30/2029 | 9.375% | | 135,000 | 140,796 |
| TransDigm, Inc.(a) |
| 03/15/2026 | 6.250% | | 1,044,000 | 1,037,246 |
| 08/15/2028 | 6.750% | | 250,000 | 251,164 |
| 12/15/2030 | 6.875% | | 254,000 | 256,090 |
| TransDigm, Inc. |
| 11/15/2027 | 5.500% | | 369,000 | 350,260 |
| Total | 35,076,022 |
| Airlines 0.0% |
| Air Canada(a) |
| 08/15/2026 | 3.875% | | 183,000 | 168,988 |
| American Airlines, Inc./AAdvantage Loyalty IP Ltd.(a) |
| 04/20/2026 | 5.500% | | 758,244 | 744,147 |
| 04/20/2029 | 5.750% | | 237,298 | 226,820 |
| Hawaiian Brand Intellectual Property Ltd./Miles Loyalty Ltd.(a) |
| 01/20/2026 | 5.750% | | 288,390 | 266,623 |
| United Airlines, Inc.(a) |
| 04/15/2026 | 4.375% | | 245,000 | 231,024 |
| 04/15/2029 | 4.625% | | 252,000 | 224,377 |
| Total | 1,861,979 |
| Automotive 0.1% |
| Ford Motor Co. |
| 02/12/2032 | 3.250% | | 200,000 | 156,072 |
| Corporate Bonds & Notes (continued) |
| Issuer | Coupon
Rate | | Principal
Amount ($) | Value ($) |
| Ford Motor Credit Co. LLC |
| 02/10/2025 | 2.300% | | 210,000 | 196,896 |
| 06/16/2025 | 5.125% | | 68,000 | 66,249 |
| 11/13/2025 | 3.375% | | 481,000 | 447,730 |
| 03/06/2026 | 6.950% | | 200,000 | 200,448 |
| 01/09/2027 | 4.271% | | 350,000 | 323,736 |
| 05/28/2027 | 4.950% | | 355,000 | 332,631 |
| 08/17/2027 | 4.125% | | 277,000 | 251,422 |
| 11/04/2027 | 7.350% | | 172,000 | 175,206 |
| 02/16/2028 | 2.900% | | 162,000 | 138,072 |
| 06/10/2030 | 7.200% | | 204,000 | 207,071 |
| 11/13/2030 | 4.000% | | 194,000 | 164,154 |
| IHO Verwaltungs GmbH(a),(e) |
| 09/15/2026 | 4.750% | | 264,544 | 247,753 |
| KAR Auction Services, Inc.(a) |
| 06/01/2025 | 5.125% | | 354,000 | 345,564 |
| Panther BF Aggregator 2 LP/Finance Co., Inc.(a) |
| 05/15/2026 | 6.250% | | 93,000 | 92,269 |
| 05/15/2027 | 8.500% | | 406,000 | 410,558 |
| Total | 3,755,831 |
| Banking 1.8% |
| Bank of America Corp.(f) |
| 04/23/2040 | 4.078% | | 33,000,000 | 27,726,174 |
| Citigroup, Inc.(f) |
| 01/25/2033 | 3.057% | | 13,268,000 | 10,928,903 |
| Goldman Sachs Group, Inc. (The)(f) |
| 02/24/2033 | 3.102% | | 11,000,000 | 9,153,293 |
| HSBC Holdings PLC(f) |
| 05/24/2032 | 2.804% | | 20,800,000 | 16,609,441 |
| JPMorgan Chase & Co.(f) |
| Subordinated |
| 05/13/2031 | 2.956% | | 36,185,000 | 30,725,649 |
| Morgan Stanley(f) |
| 01/22/2031 | 2.699% | | 14,800,000 | 12,464,429 |
| 07/21/2034 | 5.424% | | 2,239,000 | 2,200,401 |
| PNC Financial Services Group, Inc. (The)(f) |
| 06/12/2029 | 5.582% | | 7,946,000 | 7,879,184 |
| US Bancorp(f) |
| 06/12/2034 | 5.836% | | 2,567,000 | 2,560,689 |
| Wells Fargo & Co.(f) |
| 04/24/2034 | 5.389% | | 24,350,000 | 23,721,503 |
| Total | 143,969,666 |
| Brokerage/Asset Managers/Exchanges 0.0% |
| AG TTMT Escrow Issuer LLC(a) |
| 09/30/2027 | 8.625% | | 229,000 | 235,998 |
| Hightower Holding LLC(a) |
| 04/15/2029 | 6.750% | | 293,000 | 254,361 |
The accompanying Notes to Financial Statements are an integral part of this statement.
Columbia Balanced Fund | Annual Report 2023
| 15 |
Portfolio of Investments (continued)
August 31, 2023
| Corporate Bonds & Notes (continued) |
| Issuer | Coupon
Rate | | Principal
Amount ($) | Value ($) |
| NFP Corp.(a) |
| 08/15/2028 | 4.875% | | 235,000 | 210,500 |
| 08/15/2028 | 6.875% | | 742,000 | 653,811 |
| 10/01/2030 | 7.500% | | 212,000 | 206,041 |
| Total | 1,560,711 |
| Building Materials 0.0% |
| American Builders & Contractors Supply Co., Inc.(a) |
| 11/15/2029 | 3.875% | | 123,000 | 105,722 |
| Beacon Roofing Supply, Inc.(a) |
| 11/15/2026 | 4.500% | | 310,000 | 291,752 |
| 05/15/2029 | 4.125% | | 186,000 | 160,502 |
| 08/01/2030 | 6.500% | | 125,000 | 123,586 |
| Interface, Inc.(a) |
| 12/01/2028 | 5.500% | | 145,000 | 124,536 |
| James Hardie International Finance DAC(a) |
| 01/15/2028 | 5.000% | | 238,000 | 225,018 |
| SRS Distribution, Inc.(a) |
| 07/01/2028 | 4.625% | | 142,000 | 127,111 |
| 07/01/2029 | 6.125% | | 276,000 | 241,747 |
| 12/01/2029 | 6.000% | | 481,000 | 413,940 |
| Standard Industries, Inc.(a) |
| 02/15/2027 | 5.000% | | 61,000 | 57,943 |
| White Cap Buyer LLC(a) |
| 10/15/2028 | 6.875% | | 404,000 | 369,886 |
| Total | 2,241,743 |
| Cable and Satellite 0.2% |
| CCO Holdings LLC/Capital Corp.(a) |
| 05/01/2027 | 5.125% | | 426,000 | 400,552 |
| 02/01/2028 | 5.000% | | 151,000 | 139,158 |
| 03/01/2030 | 4.750% | | 877,000 | 753,836 |
| 08/15/2030 | 4.500% | | 682,000 | 574,459 |
| 03/01/2031 | 7.375% | | 103,000 | 102,364 |
| 02/01/2032 | 4.750% | | 277,000 | 229,827 |
| Comcast Corp. |
| 05/15/2064 | 5.500% | | 3,800,000 | 3,702,426 |
| CSC Holdings LLC(a) |
| 02/01/2028 | 5.375% | | 258,000 | 211,688 |
| 02/01/2029 | 6.500% | | 361,000 | 298,471 |
| 01/15/2030 | 5.750% | | 335,000 | 185,395 |
| 12/01/2030 | 4.125% | | 298,000 | 212,477 |
| 02/15/2031 | 3.375% | | 233,000 | 160,135 |
| DISH DBS Corp.(a) |
| 12/01/2028 | 5.750% | | 388,000 | 302,004 |
| DISH DBS Corp. |
| 06/01/2029 | 5.125% | | 324,000 | 174,994 |
| DISH Network Corp.(a) |
| 11/15/2027 | 11.750% | | 544,000 | 552,358 |
| Corporate Bonds & Notes (continued) |
| Issuer | Coupon
Rate | | Principal
Amount ($) | Value ($) |
| Radiate Holdco LLC/Finance, Inc.(a) |
| 09/15/2026 | 4.500% | | 316,000 | 246,143 |
| 09/15/2028 | 6.500% | | 75,000 | 40,828 |
| Sirius XM Radio, Inc.(a) |
| 09/01/2026 | 3.125% | | 204,000 | 183,921 |
| 07/01/2029 | 5.500% | | 289,000 | 260,408 |
| Time Warner Cable LLC |
| 05/01/2037 | 6.550% | | 9,210,000 | 8,739,849 |
| Videotron Ltd.(a) |
| 06/15/2029 | 3.625% | | 197,000 | 169,342 |
| Virgin Media Finance PLC(a) |
| 07/15/2030 | 5.000% | | 299,000 | 242,601 |
| Virgin Media Secured Finance PLC(a) |
| 05/15/2029 | 5.500% | | 303,000 | 277,310 |
| 08/15/2030 | 4.500% | | 192,000 | 161,842 |
| VZ Secured Financing BV(a) |
| 01/15/2032 | 5.000% | | 387,000 | 315,556 |
| Ziggo Bond Co. BV(a) |
| 02/28/2030 | 5.125% | | 241,000 | 186,761 |
| Ziggo Bond Finance BV(a) |
| 01/15/2027 | 6.000% | | 332,000 | 308,046 |
| Ziggo BV(a) |
| 01/15/2030 | 4.875% | | 425,000 | 356,920 |
| Total | 19,489,671 |
| Chemicals 0.1% |
| Avient Corp.(a) |
| 08/01/2030 | 7.125% | | 217,000 | 217,159 |
| Axalta Coating Systems LLC(a) |
| 02/15/2029 | 3.375% | | 119,000 | 100,872 |
| Axalta Coating Systems LLC/Dutch Holding B BV(a) |
| 06/15/2027 | 4.750% | | 553,000 | 520,384 |
| Cheever Escrow Issuer LLC(a) |
| 10/01/2027 | 7.125% | | 209,000 | 197,110 |
| Element Solutions, Inc.(a) |
| 09/01/2028 | 3.875% | | 387,000 | 340,117 |
| HB Fuller Co. |
| 10/15/2028 | 4.250% | | 516,000 | 459,252 |
| Herens Holdco Sarl(a) |
| 05/15/2028 | 4.750% | | 256,000 | 196,392 |
| INEOS Quattro Finance 2 Plc(a) |
| 01/15/2026 | 3.375% | | 162,000 | 148,080 |
| Ingevity Corp.(a) |
| 11/01/2028 | 3.875% | | 267,000 | 226,814 |
| Innophos Holdings, Inc.(a) |
| 02/15/2028 | 9.375% | | 278,000 | 272,266 |
The accompanying Notes to Financial Statements are an integral part of this statement.
| 16 | Columbia Balanced Fund | Annual Report 2023 |
Portfolio of Investments (continued)
August 31, 2023
| Corporate Bonds & Notes (continued) |
| Issuer | Coupon
Rate | | Principal
Amount ($) | Value ($) |
| Iris Holdings, Inc.(a),(e) |
| 02/15/2026 | 8.750% | | 135,000 | 127,039 |
| Olympus Water US Holding Corp.(a) |
| 10/01/2028 | 4.250% | | 467,000 | 386,085 |
| 11/15/2028 | 9.750% | | 318,000 | 320,614 |
| 10/01/2029 | 6.250% | | 181,000 | 145,663 |
| SPCM SA(a) |
| 03/15/2027 | 3.125% | | 133,000 | 118,052 |
| WR Grace Holdings LLC(a) |
| 06/15/2027 | 4.875% | | 427,000 | 398,452 |
| 08/15/2029 | 5.625% | | 606,000 | 511,568 |
| 03/01/2031 | 7.375% | | 127,000 | 125,466 |
| Total | 4,811,385 |
| Construction Machinery 0.1% |
| H&E Equipment Services, Inc.(a) |
| 12/15/2028 | 3.875% | | 106,000 | 92,574 |
| Herc Holdings, Inc.(a) |
| 07/15/2027 | 5.500% | | 117,000 | 112,444 |
| John Deere Capital Corp. |
| 07/14/2028 | 4.950% | | 5,500,000 | 5,518,514 |
| Ritchie Bros Holdings, Inc.(a) |
| 03/15/2028 | 6.750% | | 54,000 | 54,675 |
| 03/15/2031 | 7.750% | | 224,000 | 231,632 |
| United Rentals North America, Inc. |
| 01/15/2030 | 5.250% | | 198,000 | 188,246 |
| Total | 6,198,085 |
| Consumer Cyclical Services 0.0% |
| Arches Buyer, Inc.(a) |
| 06/01/2028 | 4.250% | | 436,000 | 379,522 |
| 12/01/2028 | 6.125% | | 378,000 | 324,493 |
| Match Group, Inc.(a) |
| 02/15/2029 | 5.625% | | 191,000 | 180,894 |
| Staples, Inc.(a) |
| 04/15/2026 | 7.500% | | 117,000 | 96,486 |
| Uber Technologies, Inc.(a) |
| 05/15/2025 | 7.500% | | 359,000 | 363,259 |
| 01/15/2028 | 6.250% | | 247,000 | 245,041 |
| 08/15/2029 | 4.500% | | 448,000 | 410,193 |
| Total | 1,999,888 |
| Consumer Products 0.0% |
| CD&R Smokey Buyer, Inc.(a) |
| 07/15/2025 | 6.750% | | 473,000 | 459,521 |
| Mattel, Inc.(a) |
| 04/01/2026 | 3.375% | | 113,000 | 105,293 |
| 04/01/2029 | 3.750% | | 222,000 | 197,307 |
| Corporate Bonds & Notes (continued) |
| Issuer | Coupon
Rate | | Principal
Amount ($) | Value ($) |
| Newell Brands, Inc. |
| 09/15/2027 | 6.375% | | 79,000 | 77,560 |
| 09/15/2029 | 6.625% | | 111,000 | 109,944 |
| Prestige Brands, Inc.(a) |
| 01/15/2028 | 5.125% | | 399,000 | 378,330 |
| Scotts Miracle-Gro Co. (The) |
| 04/01/2031 | 4.000% | | 65,000 | 51,117 |
| 02/01/2032 | 4.375% | | 136,000 | 107,315 |
| Spectrum Brands, Inc.(a) |
| 10/01/2029 | 5.000% | | 131,000 | 120,338 |
| 07/15/2030 | 5.500% | | 159,000 | 148,230 |
| Total | 1,754,955 |
| Diversified Manufacturing 0.0% |
| Chart Industries, Inc.(a) |
| 01/01/2030 | 7.500% | | 136,000 | 139,468 |
| 01/01/2031 | 9.500% | | 47,000 | 50,710 |
| Emerald Debt Merger Sub LLC(a) |
| 12/15/2030 | 6.625% | | 351,000 | 345,890 |
| Gates Global LLC/Co.(a) |
| 01/15/2026 | 6.250% | | 524,000 | 521,042 |
| Madison IAQ LLC(a) |
| 06/30/2028 | 4.125% | | 152,000 | 134,633 |
| 06/30/2029 | 5.875% | | 213,000 | 179,349 |
| Resideo Funding, Inc.(a) |
| 09/01/2029 | 4.000% | | 554,000 | 465,708 |
| Vertical Holdco GmbH(a) |
| 07/15/2028 | 7.625% | | 237,000 | 220,224 |
| Vertical US Newco, Inc.(a) |
| 07/15/2027 | 5.250% | | 391,000 | 366,173 |
| WESCO Distribution, Inc.(a) |
| 06/15/2025 | 7.125% | | 268,000 | 269,931 |
| 06/15/2028 | 7.250% | | 287,000 | 292,509 |
| Total | 2,985,637 |
| Electric 0.6% |
| Clearway Energy Operating LLC(a) |
| 03/15/2028 | 4.750% | | 368,000 | 339,978 |
| 02/15/2031 | 3.750% | | 479,000 | 394,349 |
| 01/15/2032 | 3.750% | | 102,000 | 83,579 |
| Edison International |
| 11/15/2028 | 5.250% | | 6,940,000 | 6,782,996 |
| Emera US Finance LP |
| 06/15/2046 | 4.750% | | 8,500,000 | 6,655,384 |
| Exelon Corp. |
| 03/15/2052 | 4.100% | | 4,430,000 | 3,412,012 |
| Indiana Michigan Power Co. |
| 03/15/2037 | 6.050% | | 2,500,000 | 2,560,845 |
The accompanying Notes to Financial Statements are an integral part of this statement.
Columbia Balanced Fund | Annual Report 2023
| 17 |
Portfolio of Investments (continued)
August 31, 2023
| Corporate Bonds & Notes (continued) |
| Issuer | Coupon
Rate | | Principal
Amount ($) | Value ($) |
| Leeward Renewable Energy Operations LLC(a) |
| 07/01/2029 | 4.250% | | 80,000 | 70,173 |
| NextEra Energy Operating Partners LP(a) |
| 09/15/2027 | 4.500% | | 340,000 | 315,810 |
| NRG Energy, Inc.(a) |
| 02/15/2029 | 3.375% | | 190,000 | 156,612 |
| 06/15/2029 | 5.250% | | 154,000 | 138,653 |
| 02/15/2031 | 3.625% | | 272,000 | 212,767 |
| 02/15/2032 | 3.875% | | 483,000 | 373,622 |
| Ohio Edison Co.(a) |
| 01/15/2033 | 5.500% | | 7,000,000 | 6,917,408 |
| Pacific Gas and Electric Co. |
| 01/15/2053 | 6.750% | | 7,861,000 | 7,649,067 |
| PG&E Corp. |
| 07/01/2030 | 5.250% | | 220,000 | 195,485 |
| Progress Energy, Inc. |
| 03/01/2031 | 7.750% | | 5,000,000 | 5,602,083 |
| Southern Co. (The) |
| 07/01/2046 | 4.400% | | 8,250,000 | 6,792,585 |
| Vistra Operations Co. LLC(a) |
| 09/01/2026 | 5.500% | | 75,000 | 72,324 |
| 02/15/2027 | 5.625% | | 354,000 | 340,651 |
| 07/31/2027 | 5.000% | | 379,000 | 356,811 |
| Total | 49,423,194 |
| Environmental 0.0% |
| Clean Harbors, Inc.(a) |
| 02/01/2031 | 6.375% | | 39,000 | 38,801 |
| GFL Environmental, Inc.(a) |
| 12/15/2026 | 5.125% | | 319,000 | 308,628 |
| Waste Pro USA, Inc.(a) |
| 02/15/2026 | 5.500% | | 447,000 | 423,413 |
| Total | 770,842 |
| Finance Companies 0.0% |
| Navient Corp. |
| 06/25/2025 | 6.750% | | 200,000 | 199,092 |
| OneMain Finance Corp. |
| 01/15/2029 | 9.000% | | 149,000 | 151,043 |
| 09/15/2030 | 4.000% | | 214,000 | 166,658 |
| Provident Funding Associates LP/Finance Corp.(a) |
| 06/15/2025 | 6.375% | | 247,000 | 218,443 |
| Quicken Loans LLC/Co-Issuer, Inc.(a) |
| 03/01/2031 | 3.875% | | 353,000 | 287,927 |
| Rocket Mortgage LLC/Co-Issuer, Inc.(a) |
| 10/15/2033 | 4.000% | | 587,000 | 465,688 |
| Corporate Bonds & Notes (continued) |
| Issuer | Coupon
Rate | | Principal
Amount ($) | Value ($) |
| Springleaf Finance Corp. |
| 03/15/2024 | 6.125% | | 221,000 | 220,614 |
| 11/15/2029 | 5.375% | | 23,000 | 19,905 |
| Total | 1,729,370 |
| Food and Beverage 0.3% |
| Bacardi Ltd.(a) |
| 05/15/2038 | 5.150% | | 8,350,000 | 7,688,771 |
| Bacardi Ltd./Bacardi-Martini BV(a) |
| 06/15/2043 | 5.900% | | 2,756,000 | 2,715,903 |
| Constellation Brands, Inc. |
| 05/01/2033 | 4.900% | | 6,200,000 | 5,976,126 |
| Darling Ingredients, Inc.(a) |
| 06/15/2030 | 6.000% | | 275,000 | 268,791 |
| FAGE International SA/USA Dairy Industry, Inc.(a) |
| 08/15/2026 | 5.625% | | 464,000 | 445,473 |
| Pilgrim’s Pride Corp. |
| 04/15/2031 | 4.250% | | 515,000 | 445,837 |
| 03/01/2032 | 3.500% | | 556,000 | 447,316 |
| Post Holdings, Inc.(a) |
| 03/01/2027 | 5.750% | | 182,000 | 177,779 |
| 01/15/2028 | 5.625% | | 152,000 | 145,794 |
| 04/15/2030 | 4.625% | | 322,000 | 285,139 |
| 09/15/2031 | 4.500% | | 115,000 | 99,112 |
| Primo Water Holdings, Inc.(a) |
| 04/30/2029 | 4.375% | | 621,000 | 545,304 |
| Simmons Foods, Inc./Prepared Foods, Inc./Pet Food, Inc./Feed(a) |
| 03/01/2029 | 4.625% | | 314,000 | 261,807 |
| US Foods, Inc.(a) |
| 04/15/2025 | 6.250% | | 58,000 | 58,163 |
| 02/15/2029 | 4.750% | | 269,000 | 245,724 |
| 06/01/2030 | 4.625% | | 175,000 | 156,068 |
| Total | 19,963,107 |
| Gaming 0.0% |
| Boyd Gaming Corp. |
| 12/01/2027 | 4.750% | | 240,000 | 225,106 |
| Boyd Gaming Corp.(a) |
| 06/15/2031 | 4.750% | | 166,000 | 146,254 |
| Caesars Entertainment, Inc.(a) |
| 10/15/2029 | 4.625% | | 594,000 | 519,531 |
| 02/15/2030 | 7.000% | | 396,000 | 397,620 |
| CDI Escrow Issuer, Inc.(a) |
| 04/01/2030 | 5.750% | | 110,000 | 102,300 |
| Churchill Downs, Inc.(a) |
| 05/01/2031 | 6.750% | | 121,000 | 118,365 |
The accompanying Notes to Financial Statements are an integral part of this statement.
| 18 | Columbia Balanced Fund | Annual Report 2023 |
Portfolio of Investments (continued)
August 31, 2023
| Corporate Bonds & Notes (continued) |
| Issuer | Coupon
Rate | | Principal
Amount ($) | Value ($) |
| Colt Merger Sub, Inc.(a) |
| 07/01/2025 | 5.750% | | 310,000 | 310,356 |
| 07/01/2025 | 6.250% | | 516,000 | 512,343 |
| 07/01/2027 | 8.125% | | 269,000 | 273,155 |
| International Game Technology PLC(a) |
| 04/15/2026 | 4.125% | | 122,000 | 115,724 |
| Light & Wonder International, Inc.(a) |
| 09/01/2031 | 7.500% | | 55,000 | 55,758 |
| Midwest Gaming Borrower LLC(a) |
| 05/01/2029 | 4.875% | | 261,000 | 227,175 |
| Scientific Games Holdings LP/US FinCo, Inc.(a) |
| 03/01/2030 | 6.625% | | 434,000 | 382,541 |
| Total | 3,386,228 |
| Health Care 0.4% |
| Acadia Healthcare Co., Inc.(a) |
| 07/01/2028 | 5.500% | | 318,000 | 301,508 |
| 04/15/2029 | 5.000% | | 161,000 | 148,416 |
| AdaptHealth LLC(a) |
| 03/01/2030 | 5.125% | | 325,000 | 269,469 |
| Avantor Funding, Inc.(a) |
| 07/15/2028 | 4.625% | | 283,000 | 262,692 |
| 11/01/2029 | 3.875% | | 339,000 | 297,454 |
| Catalent Pharma Solutions, Inc.(a) |
| 04/01/2030 | 3.500% | | 229,000 | 193,300 |
| Charles River Laboratories International, Inc.(a) |
| 05/01/2028 | 4.250% | | 160,000 | 146,953 |
| 03/15/2029 | 3.750% | | 122,000 | 107,795 |
| CHS/Community Health Systems, Inc.(a) |
| 03/15/2027 | 5.625% | | 75,000 | 66,017 |
| 04/15/2029 | 6.875% | | 240,000 | 146,947 |
| 05/15/2030 | 5.250% | | 587,000 | 462,284 |
| CVS Health Corp. |
| 03/25/2048 | 5.050% | | 14,000,000 | 12,293,348 |
| HCA, Inc. |
| 03/15/2052 | 4.625% | | 12,500,000 | 10,025,838 |
| IQVIA, Inc.(a) |
| 05/15/2027 | 5.000% | | 210,000 | 202,331 |
| 05/15/2030 | 6.500% | | 104,000 | 104,846 |
| Mozart Debt Merger Sub, Inc.(a) |
| 04/01/2029 | 3.875% | | 58,000 | 50,518 |
| 10/01/2029 | 5.250% | | 635,000 | 563,876 |
| Select Medical Corp.(a) |
| 08/15/2026 | 6.250% | | 811,000 | 803,356 |
| Tenet Healthcare Corp. |
| 02/01/2027 | 6.250% | | 370,000 | 364,555 |
| 11/01/2027 | 5.125% | | 237,000 | 225,810 |
| 10/01/2028 | 6.125% | | 271,000 | 261,017 |
| 01/15/2030 | 4.375% | | 186,000 | 165,425 |
| Corporate Bonds & Notes (continued) |
| Issuer | Coupon
Rate | | Principal
Amount ($) | Value ($) |
| 06/15/2030 | 6.125% | | 179,000 | 173,712 |
| Tenet Healthcare Corp.(a) |
| 05/15/2031 | 6.750% | | 225,000 | 224,311 |
| Total | 27,861,778 |
| Healthcare Insurance 0.3% |
| Centene Corp. |
| 10/15/2030 | 3.000% | | 12,000,000 | 9,987,399 |
| UnitedHealth Group, Inc. |
| 04/15/2063 | 5.200% | | 10,000,000 | 9,567,908 |
| Total | 19,555,307 |
| Home Construction 0.0% |
| Meritage Homes Corp. |
| 06/01/2025 | 6.000% | | 302,000 | 301,312 |
| Meritage Homes Corp.(a) |
| 04/15/2029 | 3.875% | | 276,000 | 240,978 |
| Taylor Morrison Communities, Inc.(a) |
| 06/15/2027 | 5.875% | | 70,000 | 68,785 |
| 08/01/2030 | 5.125% | | 201,000 | 185,122 |
| Total | 796,197 |
| Independent Energy 0.1% |
| Baytex Energy Corp.(a) |
| 04/30/2030 | 8.500% | | 219,000 | 221,944 |
| Callon Petroleum Co. |
| 07/01/2026 | 6.375% | | 478,000 | 471,127 |
| Callon Petroleum Co.(a) |
| 06/15/2030 | 7.500% | | 160,000 | 158,199 |
| Centennial Resource Production LLC(a) |
| 04/01/2027 | 6.875% | | 51,000 | 50,900 |
| CNX Resources Corp.(a) |
| 03/14/2027 | 7.250% | | 31,000 | 30,967 |
| 01/15/2029 | 6.000% | | 176,000 | 167,555 |
| 01/15/2031 | 7.375% | | 120,000 | 119,811 |
| Colgate Energy Partners III LLC(a) |
| 07/01/2029 | 5.875% | | 502,000 | 484,336 |
| CrownRock LP/Finance, Inc.(a) |
| 10/15/2025 | 5.625% | | 329,000 | 323,742 |
| 05/01/2029 | 5.000% | | 267,000 | 247,713 |
| Endeavor Energy Resources LP/Finance, Inc.(a) |
| 01/30/2028 | 5.750% | | 346,000 | 338,563 |
| Hilcorp Energy I LP/Finance Co.(a) |
| 11/01/2028 | 6.250% | | 379,000 | 364,312 |
| 02/01/2029 | 5.750% | | 103,000 | 96,452 |
| 04/15/2030 | 6.000% | | 131,000 | 121,807 |
| 04/15/2032 | 6.250% | | 121,000 | 111,235 |
The accompanying Notes to Financial Statements are an integral part of this statement.
Columbia Balanced Fund | Annual Report 2023
| 19 |
Portfolio of Investments (continued)
August 31, 2023
| Corporate Bonds & Notes (continued) |
| Issuer | Coupon
Rate | | Principal
Amount ($) | Value ($) |
| Matador Resources Co. |
| 09/15/2026 | 5.875% | | 425,000 | 414,556 |
| Matador Resources Co.(a) |
| 04/15/2028 | 6.875% | | 129,000 | 128,986 |
| SM Energy Co. |
| 09/15/2026 | 6.750% | | 253,000 | 251,797 |
| Southwestern Energy Co. |
| 02/01/2032 | 4.750% | | 725,000 | 641,855 |
| Total | 4,745,857 |
| Integrated Energy 0.0% |
| Cenovus Energy, Inc. |
| 02/15/2052 | 3.750% | | 3,500,000 | 2,454,628 |
| Leisure 0.1% |
| Carnival Corp.(a) |
| 03/01/2027 | 5.750% | | 502,000 | 472,500 |
| 08/01/2028 | 4.000% | | 341,000 | 305,026 |
| 05/01/2029 | 6.000% | | 274,000 | 247,167 |
| 08/15/2029 | 7.000% | | 90,000 | 91,320 |
| Carnival Holdings Bermuda Ltd.(a) |
| 05/01/2028 | 10.375% | | 181,000 | 196,946 |
| Cedar Fair LP/Canada’s Wonderland Co./Magnum Management Corp./Millennium Operations LLC(a) |
| 05/01/2025 | 5.500% | | 139,000 | 137,942 |
| Cedar Fair LP/Canada’s Wonderland Co./Magnum Management Corp./Millennium Operations LLC |
| 10/01/2028 | 6.500% | | 359,000 | 346,642 |
| Cinemark USA, Inc.(a) |
| 05/01/2025 | 8.750% | | 54,000 | 54,729 |
| 03/15/2026 | 5.875% | | 411,000 | 395,939 |
| 07/15/2028 | 5.250% | | 9,000 | 7,991 |
| Live Nation Entertainment, Inc.(a) |
| 03/15/2026 | 5.625% | | 291,000 | 282,626 |
| 05/15/2027 | 6.500% | | 204,000 | 203,673 |
| 10/15/2027 | 4.750% | | 109,000 | 101,544 |
| NCL Corp., Ltd.(a) |
| 03/15/2026 | 5.875% | | 127,000 | 119,626 |
| NCL Finance Ltd.(a) |
| 03/15/2028 | 6.125% | | 78,000 | 70,318 |
| Royal Caribbean Cruises Ltd.(a) |
| 07/01/2026 | 4.250% | | 392,000 | 365,820 |
| 08/31/2026 | 5.500% | | 33,000 | 31,685 |
| 07/15/2027 | 5.375% | | 63,000 | 59,318 |
| 04/01/2028 | 5.500% | | 70,000 | 65,662 |
| 01/15/2030 | 7.250% | | 274,000 | 278,352 |
| Royal Caribbean Cruises Ltd. |
| 03/15/2028 | 3.700% | | 208,000 | 180,738 |
| Six Flags Entertainment Corp.(a) |
| 05/15/2031 | 7.250% | | 271,000 | 259,891 |
| Corporate Bonds & Notes (continued) |
| Issuer | Coupon
Rate | | Principal
Amount ($) | Value ($) |
| Viking Cruises Ltd.(a) |
| 09/15/2027 | 5.875% | | 240,000 | 224,347 |
| 07/15/2031 | 9.125% | | 81,000 | 83,706 |
| Total | 4,583,508 |
| Life Insurance 0.2% |
| Corebridge Financial, Inc. |
| 04/05/2052 | 4.400% | | 3,200,000 | 2,471,787 |
| Five Corners Funding Trust III(a) |
| 02/15/2033 | 5.791% | | 7,000,000 | 7,072,523 |
| MetLife, Inc. |
| 07/15/2052 | 5.000% | | 4,193,000 | 3,815,095 |
| Voya Financial, Inc. |
| 06/15/2046 | 4.800% | | 4,028,000 | 3,188,277 |
| Total | 16,547,682 |
| Lodging 0.0% |
| Hilton Domestic Operating Co., Inc.(a) |
| 05/01/2028 | 5.750% | | 230,000 | 225,565 |
| Media and Entertainment 0.3% |
| Clear Channel Outdoor Holdings, Inc.(a) |
| 04/15/2028 | 7.750% | | 312,000 | 244,220 |
| 09/15/2028 | 9.000% | | 35,000 | 35,175 |
| 06/01/2029 | 7.500% | | 290,000 | 217,541 |
| Clear Channel Worldwide Holdings, Inc.(a) |
| 08/15/2027 | 5.125% | | 559,000 | 500,702 |
| iHeartCommunications, Inc. |
| 05/01/2026 | 6.375% | | 40,481 | 35,318 |
| 05/01/2027 | 8.375% | | 551,365 | 381,364 |
| iHeartCommunications, Inc.(a) |
| 08/15/2027 | 5.250% | | 170,000 | 134,414 |
| 01/15/2028 | 4.750% | | 318,000 | 244,837 |
| Meta Platforms, Inc. |
| 05/15/2063 | 5.750% | | 5,000,000 | 5,042,542 |
| Outfront Media Capital LLC/Corp.(a) |
| 08/15/2027 | 5.000% | | 287,000 | 259,735 |
| 01/15/2029 | 4.250% | | 125,000 | 102,972 |
| 03/15/2030 | 4.625% | | 252,000 | 205,098 |
| Roblox Corp.(a) |
| 05/01/2030 | 3.875% | | 381,000 | 316,193 |
| Scripps Escrow II, Inc.(a) |
| 01/15/2029 | 3.875% | | 46,000 | 36,954 |
| 01/15/2031 | 5.375% | | 88,000 | 63,542 |
| Scripps Escrow, Inc.(a) |
| 07/15/2027 | 5.875% | | 71,000 | 57,397 |
The accompanying Notes to Financial Statements are an integral part of this statement.
| 20 | Columbia Balanced Fund | Annual Report 2023 |
Portfolio of Investments (continued)
August 31, 2023
| Corporate Bonds & Notes (continued) |
| Issuer | Coupon
Rate | | Principal
Amount ($) | Value ($) |
| Univision Communications, Inc.(a) |
| 08/15/2028 | 8.000% | | 50,000 | 50,011 |
| 05/01/2029 | 4.500% | | 157,000 | 135,156 |
| 06/30/2030 | 7.375% | | 290,000 | 280,872 |
| Warnermedia Holdings, Inc. |
| 03/15/2062 | 5.391% | | 17,947,000 | 14,222,476 |
| Total | 22,566,519 |
| Metals and Mining 0.1% |
| Allegheny Technologies, Inc. |
| 10/01/2029 | 4.875% | | 189,000 | 170,880 |
| 10/01/2031 | 5.125% | | 301,000 | 266,809 |
| Constellium NV(a) |
| 02/15/2026 | 5.875% | | 275,000 | 270,412 |
| Constellium SE(a) |
| 06/15/2028 | 5.625% | | 595,000 | 563,045 |
| 04/15/2029 | 3.750% | | 849,000 | 728,291 |
| Hudbay Minerals, Inc.(a) |
| 04/01/2026 | 4.500% | | 803,000 | 757,808 |
| 04/01/2029 | 6.125% | | 274,000 | 257,570 |
| Kaiser Aluminum Corp.(a) |
| 03/01/2028 | 4.625% | | 187,000 | 165,597 |
| 06/01/2031 | 4.500% | | 349,000 | 282,038 |
| Novelis Corp.(a) |
| 11/15/2026 | 3.250% | | 177,000 | 160,301 |
| 01/30/2030 | 4.750% | | 420,000 | 375,887 |
| 08/15/2031 | 3.875% | | 170,000 | 141,087 |
| Total | 4,139,725 |
| Midstream 0.5% |
| Cheniere Energy Partners LP |
| 10/01/2029 | 4.500% | | 122,000 | 112,634 |
| Cheniere Energy, Inc. |
| 10/15/2028 | 4.625% | | 87,000 | 81,927 |
| CNX Midstream Partners LP(a) |
| 04/15/2030 | 4.750% | | 220,000 | 190,074 |
| Delek Logistics Partners LP/Finance Corp. |
| 05/15/2025 | 6.750% | | 194,000 | 192,663 |
| DT Midstream, Inc.(a) |
| 06/15/2029 | 4.125% | | 199,000 | 176,323 |
| 06/15/2031 | 4.375% | | 232,000 | 200,965 |
| EQM Midstream Partners LP |
| 08/01/2024 | 4.000% | | 141,000 | 137,582 |
| EQM Midstream Partners LP(a) |
| 07/01/2025 | 6.000% | | 358,000 | 354,635 |
| 06/01/2027 | 7.500% | | 91,000 | 91,819 |
| 07/01/2027 | 6.500% | | 202,000 | 200,554 |
| 06/01/2030 | 7.500% | | 109,000 | 111,753 |
| 01/15/2031 | 4.750% | | 604,000 | 533,764 |
| Corporate Bonds & Notes (continued) |
| Issuer | Coupon
Rate | | Principal
Amount ($) | Value ($) |
| Holly Energy Partners LP/Finance Corp.(a) |
| 04/15/2027 | 6.375% | | 236,000 | 235,457 |
| 02/01/2028 | 5.000% | | 267,000 | 251,218 |
| Kinder Morgan Energy Partners LP |
| 03/01/2044 | 5.500% | | 8,000,000 | 7,140,087 |
| MPLX LP |
| 02/15/2049 | 5.500% | | 5,500,000 | 4,898,244 |
| NuStar Logistics LP |
| 06/01/2026 | 6.000% | | 220,000 | 216,802 |
| 04/28/2027 | 5.625% | | 245,000 | 237,675 |
| 10/01/2030 | 6.375% | | 246,000 | 237,515 |
| Plains All American Pipeline LP/Finance Corp. |
| 01/15/2037 | 6.650% | | 10,060,000 | 10,209,777 |
| TransMontaigne Partners LP/TLP Finance Corp. |
| 02/15/2026 | 6.125% | | 235,000 | 202,267 |
| Venture Global Calcasieu Pass LLC(a) |
| 08/15/2029 | 3.875% | | 308,000 | 266,682 |
| 08/15/2031 | 4.125% | | 514,000 | 436,636 |
| 11/01/2033 | 3.875% | | 267,000 | 216,877 |
| Western Midstream Operating LP |
| 04/01/2033 | 6.150% | | 4,559,000 | 4,535,898 |
| Western Midstream Operating LP(f) |
| 02/01/2050 | 5.250% | | 6,375,000 | 5,151,486 |
| Williams Companies, Inc. (The) |
| 09/15/2045 | 5.100% | | 7,500,000 | 6,603,016 |
| Total | 43,224,330 |
| Oil Field Services 0.0% |
| Archrock Partners LP/Finance Corp.(a) |
| 04/01/2028 | 6.250% | | 169,000 | 161,484 |
| Nabors Industries Ltd.(a) |
| 01/15/2026 | 7.250% | | 321,000 | 308,968 |
| Nabors Industries, Inc.(a) |
| 05/15/2027 | 7.375% | | 15,000 | 14,632 |
| Transocean Titan Financing Ltd.(a) |
| 02/01/2028 | 8.375% | | 197,000 | 203,240 |
| USA Compression Partners LP/Finance Corp. |
| 09/01/2027 | 6.875% | | 161,000 | 157,130 |
| Venture Global LNG, Inc.(a) |
| 06/01/2028 | 8.125% | | 272,000 | 274,685 |
| 06/01/2031 | 8.375% | | 198,000 | 199,780 |
| Total | 1,319,919 |
| Other Industry 0.0% |
| Picasso Finance Sub, Inc.(a) |
| 06/15/2025 | 6.125% | | 219,000 | 217,285 |
The accompanying Notes to Financial Statements are an integral part of this statement.
Columbia Balanced Fund | Annual Report 2023
| 21 |
Portfolio of Investments (continued)
August 31, 2023
| Corporate Bonds & Notes (continued) |
| Issuer | Coupon
Rate | | Principal
Amount ($) | Value ($) |
| Other REIT 0.0% |
| Blackstone Mortgage Trust, Inc.(a) |
| 01/15/2027 | 3.750% | | 175,000 | 149,660 |
| Ladder Capital Finance Holdings LLLP/Corp.(a) |
| 10/01/2025 | 5.250% | | 498,000 | 478,568 |
| 02/01/2027 | 4.250% | | 169,000 | 152,871 |
| 06/15/2029 | 4.750% | | 510,000 | 428,842 |
| Park Intermediate Holdings LLC/Domestic Property/Finance Co-Issuer(a) |
| 10/01/2028 | 5.875% | | 276,000 | 255,584 |
| Park Intermediate Holdings LLC/PK Domestic Property LLC/Finance Co-Issuer(a) |
| 05/15/2029 | 4.875% | | 239,000 | 207,997 |
| RHP Hotel Properties LP/Finance Corp.(a) |
| 07/15/2028 | 7.250% | | 64,000 | 64,441 |
| RLJ Lodging Trust LP(a) |
| 07/01/2026 | 3.750% | | 138,000 | 126,698 |
| 09/15/2029 | 4.000% | | 129,000 | 108,152 |
| Total | 1,972,813 |
| Packaging 0.0% |
| Ardagh Metal Packaging Finance USA LLC/PLC(a) |
| 06/15/2027 | 6.000% | | 354,000 | 346,026 |
| 09/01/2029 | 4.000% | | 672,000 | 545,651 |
| Ardagh Packaging Finance PLC/Holdings USA, Inc.(a) |
| 08/15/2026 | 4.125% | | 226,000 | 211,139 |
| Ball Corp. |
| 06/15/2029 | 6.000% | | 273,000 | 269,175 |
| Canpack SA/US LLC(a) |
| 11/15/2029 | 3.875% | | 428,000 | 346,678 |
| Clydesdale Acquisition Holdings, Inc.(a) |
| 04/15/2029 | 6.625% | | 140,000 | 133,311 |
| Sealed Air Corp.(a) |
| 02/01/2028 | 6.125% | | 38,000 | 37,428 |
| Trivium Packaging Finance BV(a) |
| 08/15/2026 | 5.500% | | 388,000 | 366,541 |
| Total | 2,255,949 |
| Pharmaceuticals 0.7% |
| 1375209 BC Ltd.(a) |
| 01/30/2028 | 9.000% | | 42,000 | 42,056 |
| AbbVie, Inc. |
| 11/06/2042 | 4.400% | | 9,000,000 | 7,857,350 |
| Amgen, Inc. |
| 03/02/2053 | 5.650% | | 26,200,000 | 25,973,498 |
| Bausch Health Companies, Inc.(a) |
| 02/01/2027 | 6.125% | | 130,000 | 85,501 |
| 08/15/2027 | 5.750% | | 170,000 | 104,994 |
| 06/01/2028 | 4.875% | | 216,000 | 128,248 |
| 09/30/2028 | 11.000% | | 75,000 | 53,677 |
| Corporate Bonds & Notes (continued) |
| Issuer | Coupon
Rate | | Principal
Amount ($) | Value ($) |
| 10/15/2030 | 14.000% | | 14,000 | 8,437 |
| Grifols Escrow Issuer SA(a) |
| 10/15/2028 | 4.750% | | 211,000 | 185,204 |
| Organon Finance 1 LLC(a) |
| 04/30/2028 | 4.125% | | 144,000 | 130,272 |
| 04/30/2031 | 5.125% | | 355,000 | 302,144 |
| Pfizer Investment Enterprises Pte., Ltd. |
| 05/19/2063 | 5.340% | | 19,500,000 | 19,202,932 |
| Total | 54,074,313 |
| Property & Casualty 0.1% |
| Alliant Holdings Intermediate LLC/Co-Issuer(a) |
| 10/15/2027 | 4.250% | | 451,000 | 410,572 |
| 10/15/2027 | 6.750% | | 721,000 | 681,353 |
| 04/15/2028 | 6.750% | | 463,000 | 456,037 |
| 11/01/2029 | 5.875% | | 197,000 | 173,546 |
| AssuredPartners, Inc.(a) |
| 08/15/2025 | 7.000% | | 120,000 | 118,697 |
| 01/15/2029 | 5.625% | | 372,000 | 323,404 |
| Berkshire Hathaway Finance Corp. |
| 03/15/2052 | 3.850% | | 3,160,000 | 2,510,029 |
| BroadStreet Partners, Inc.(a) |
| 04/15/2029 | 5.875% | | 417,000 | 366,942 |
| HUB International Ltd.(a) |
| 05/01/2026 | 7.000% | | 295,000 | 294,496 |
| 12/01/2029 | 5.625% | | 558,000 | 493,489 |
| HUB International, Ltd.(a) |
| 06/15/2030 | 7.250% | | 360,000 | 366,411 |
| Radian Group, Inc. |
| 03/15/2027 | 4.875% | | 160,000 | 151,352 |
| USI, Inc.(a) |
| 05/01/2025 | 6.875% | | 232,000 | 232,157 |
| Total | 6,578,485 |
| Railroads 0.0% |
| CSX Corp. |
| 03/15/2044 | 4.100% | | 3,200,000 | 2,660,382 |
| Restaurants 0.1% |
| 1011778 BC ULC/New Red Finance, Inc.(a) |
| 01/15/2028 | 3.875% | | 359,000 | 326,392 |
| 10/15/2030 | 4.000% | | 117,000 | 99,148 |
| IRB Holding Corp.(a) |
| 06/15/2025 | 7.000% | | 361,000 | 361,863 |
| McDonald’s Corp. |
| 08/14/2053 | 5.450% | | 6,285,000 | 6,284,434 |
| Total | 7,071,837 |
The accompanying Notes to Financial Statements are an integral part of this statement.
| 22 | Columbia Balanced Fund | Annual Report 2023 |
Portfolio of Investments (continued)
August 31, 2023
| Corporate Bonds & Notes (continued) |
| Issuer | Coupon
Rate | | Principal
Amount ($) | Value ($) |
| Retailers 0.2% |
| Asbury Automotive Group, Inc.(a) |
| 11/15/2029 | 4.625% | | 248,000 | 219,097 |
| 02/15/2032 | 5.000% | | 270,000 | 232,109 |
| Group 1 Automotive, Inc.(a) |
| 08/15/2028 | 4.000% | | 237,000 | 210,388 |
| Hanesbrands, Inc.(a) |
| 02/15/2031 | 9.000% | | 305,000 | 306,140 |
| L Brands, Inc.(a) |
| 07/01/2025 | 9.375% | | 33,000 | 34,508 |
| 10/01/2030 | 6.625% | | 406,000 | 396,967 |
| L Brands, Inc. |
| 06/15/2029 | 7.500% | | 143,000 | 144,205 |
| LCM Investments Holdings II LLC(a) |
| 08/01/2031 | 8.250% | | 145,000 | 145,209 |
| Lithia Motors, Inc.(a) |
| 01/15/2031 | 4.375% | | 120,000 | 102,361 |
| Lowe’s Companies, Inc. |
| 09/15/2062 | 5.800% | | 14,000,000 | 13,521,346 |
| PetSmart, Inc./Finance Corp.(a) |
| 02/15/2028 | 4.750% | | 263,000 | 235,958 |
| 02/15/2029 | 7.750% | | 217,000 | 207,150 |
| Wolverine World Wide, Inc.(a) |
| 08/15/2029 | 4.000% | | 333,000 | 249,236 |
| Total | 16,004,674 |
| Supermarkets 0.0% |
| Albertsons Companies LLC/Safeway, Inc./New Albertsons LP/Albertsons LLC(a) |
| 03/15/2026 | 7.500% | | 95,000 | 96,581 |
| 02/15/2028 | 5.875% | | 158,000 | 153,362 |
| Albertsons Companies, Inc./Safeway, Inc./New Albertsons LP/Albertsons LLC(a) |
| 03/15/2026 | 3.250% | | 130,000 | 120,965 |
| Total | 370,908 |
| Technology 0.3% |
| Black Knight InfoServ LLC(a) |
| 09/01/2028 | 3.625% | | 254,000 | 234,336 |
| Boxer Parent Co., Inc.(a) |
| 10/02/2025 | 7.125% | | 88,000 | 88,089 |
| Broadcom, Inc.(a) |
| 02/15/2051 | 3.750% | | 11,432,000 | 8,165,067 |
| Camelot Finance SA(a) |
| 11/01/2026 | 4.500% | | 118,000 | 110,697 |
| Central Parent LLC/CDK Global II LLC/Financing, Co., Inc.(a) |
| 06/15/2029 | 8.000% | | 44,000 | 44,299 |
| Central Parent, Inc./CDK Global, Inc.(a) |
| 06/15/2029 | 7.250% | | 119,000 | 117,429 |
| Corporate Bonds & Notes (continued) |
| Issuer | Coupon
Rate | | Principal
Amount ($) | Value ($) |
| Clarivate Science Holdings Corp.(a) |
| 07/01/2028 | 3.875% | | 160,000 | 141,418 |
| 07/01/2029 | 4.875% | | 466,000 | 405,084 |
| Cloud Software Group, Inc.(a) |
| 09/30/2029 | 9.000% | | 604,000 | 539,925 |
| CommScope Technologies LLC(a) |
| 06/15/2025 | 6.000% | | 168,000 | 153,775 |
| Condor Merger Sub, Inc.(a) |
| 02/15/2030 | 7.375% | | 544,000 | 475,930 |
| Dun & Bradstreet Corp. (The)(a) |
| 12/15/2029 | 5.000% | | 233,000 | 209,140 |
| Entegris Escrow Corp.(a) |
| 06/15/2030 | 5.950% | | 489,000 | 468,278 |
| Gartner, Inc.(a) |
| 10/01/2030 | 3.750% | | 260,000 | 224,560 |
| HealthEquity, Inc.(a) |
| 10/01/2029 | 4.500% | | 165,000 | 146,337 |
| Helios Software Holdings, Inc.(a) |
| 05/01/2028 | 4.625% | | 176,000 | 152,284 |
| ION Trading Technologies Sarl(a) |
| 05/15/2028 | 5.750% | | 200,000 | 175,500 |
| Iron Mountain, Inc.(a) |
| 09/15/2027 | 4.875% | | 91,000 | 85,646 |
| 03/15/2028 | 5.250% | | 159,000 | 149,094 |
| 07/15/2028 | 5.000% | | 350,000 | 323,796 |
| 07/15/2030 | 5.250% | | 167,000 | 150,672 |
| Logan Merger Sub, Inc.(a) |
| 09/01/2027 | 5.500% | | 532,000 | 311,618 |
| Minerva Merger Sub, Inc.(a) |
| 02/15/2030 | 6.500% | | 409,000 | 355,312 |
| NCR Corp.(a) |
| 09/01/2027 | 5.750% | | 154,000 | 155,386 |
| 10/01/2028 | 5.000% | | 499,000 | 458,263 |
| 04/15/2029 | 5.125% | | 513,000 | 467,881 |
| 10/01/2030 | 5.250% | | 18,000 | 16,178 |
| Neptune Bidco US, Inc.(a) |
| 04/15/2029 | 9.290% | | 604,000 | 564,158 |
| NXP BV/Funding LLC/USA, Inc. |
| 05/01/2030 | 3.400% | | 9,500,000 | 8,348,232 |
| Picard Midco, Inc.(a) |
| 03/31/2029 | 6.500% | | 439,000 | 392,949 |
| Seagate HDD Cayman(a) |
| 12/15/2029 | 8.250% | | 118,000 | 123,797 |
| 07/15/2031 | 8.500% | | 132,000 | 138,726 |
| Sensata Technologies BV(a) |
| 09/01/2030 | 5.875% | | 207,000 | 195,866 |
| Shift4 Payments LLC/Finance Sub, Inc.(a) |
| 11/01/2026 | 4.625% | | 354,000 | 332,833 |
The accompanying Notes to Financial Statements are an integral part of this statement.
Columbia Balanced Fund | Annual Report 2023
| 23 |
Portfolio of Investments (continued)
August 31, 2023
| Corporate Bonds & Notes (continued) |
| Issuer | Coupon
Rate | | Principal
Amount ($) | Value ($) |
| Synaptics, Inc.(a) |
| 06/15/2029 | 4.000% | | 71,000 | 60,448 |
| Tempo Acquisition LLC/Finance Corp.(a) |
| 06/01/2025 | 5.750% | | 284,000 | 279,427 |
| Verscend Escrow Corp.(a) |
| 08/15/2026 | 9.750% | | 409,000 | 407,216 |
| ZoomInfo Technologies LLC/Finance Corp.(a) |
| 02/01/2029 | 3.875% | | 575,000 | 489,047 |
| Total | 25,658,693 |
| Transportation Services 0.1% |
| ERAC USA Finance LLC(a) |
| 10/15/2037 | 7.000% | | 5,050,000 | 5,703,784 |
| Wireless 0.2% |
| Altice France Holding SA(a) |
| 02/15/2028 | 6.000% | | 547,000 | 241,435 |
| Altice France SA(a) |
| 02/01/2027 | 8.125% | | 209,000 | 176,484 |
| 01/15/2028 | 5.500% | | 582,000 | 436,556 |
| 07/15/2029 | 5.125% | | 200,000 | 140,975 |
| American Tower Corp. |
| 08/15/2029 | 3.800% | | 3,613,000 | 3,284,391 |
| Sprint Corp. |
| 03/01/2026 | 7.625% | | 282,000 | 292,407 |
| T-Mobile US, Inc. |
| 01/15/2053 | 5.650% | | 6,765,000 | 6,592,106 |
| Vmed O2 UK Financing I PLC(a) |
| 01/31/2031 | 4.250% | | 165,000 | 135,179 |
| 07/15/2031 | 4.750% | | 331,000 | 276,672 |
| Total | 11,576,205 |
| Wirelines 0.1% |
| AT&T, Inc. |
| 09/15/2053 | 3.500% | | 4,000,000 | 2,632,432 |
| Frontier Communications Holdings LLC(a) |
| 05/15/2030 | 8.750% | | 163,000 | 158,345 |
| 03/15/2031 | 8.625% | | 233,000 | 224,005 |
| Iliad Holding SAS(a) |
| 10/15/2026 | 6.500% | | 339,000 | 322,908 |
| 10/15/2028 | 7.000% | | 505,000 | 469,794 |
| Total | 3,807,484 |
Total Corporate Bonds & Notes
(Cost $640,899,758) | 586,952,141 |
| Exchange-Traded Equity Funds 1.8% |
| | Shares | Value ($) |
| International Mid Large Cap 1.8% |
| iShares Core MSCI EAFE ETF | 2,163,578 | 144,765,004 |
Total Exchange-Traded Equity Funds
(Cost $145,112,086) | 144,765,004 |
| Foreign Government Obligations(g) 0.0% |
| Issuer | Coupon
Rate | | Principal
Amount ($) | Value ($) |
| Canada 0.0% |
| NOVA Chemicals Corp.(a) |
| 06/01/2024 | 4.875% | | 145,000 | 142,643 |
| 06/01/2027 | 5.250% | | 217,000 | 192,814 |
| 05/15/2029 | 4.250% | | 290,000 | 235,481 |
| Total | 570,938 |
Total Foreign Government Obligations
(Cost $635,394) | 570,938 |
|
| Residential Mortgage-Backed Securities - Agency 13.1% |
| | | | |
| Federal Home Loan Mortgage Corp. |
07/01/2029-
09/01/2043 | 3.500% | | 546,136 | 519,595 |
10/01/2031-
10/01/2039 | 6.000% | | 103,980 | 105,443 |
06/01/2032-
07/01/2032 | 7.000% | | 100,203 | 101,967 |
12/01/2036-
01/01/2039 | 5.500% | | 49,302 | 50,233 |
| 03/01/2038 | 6.500% | | 1,200 | 1,220 |
10/01/2038-
05/01/2041 | 5.000% | | 111,330 | 111,396 |
05/01/2039-
10/01/2040 | 4.500% | | 320,448 | 312,257 |
| 12/01/2051 | 2.500% | | 29,574,868 | 24,529,643 |
| CMO Series 1614 Class MZ |
| 11/15/2023 | 6.500% | | 60 | 60 |
| Federal Home Loan Mortgage Corp.(b) |
12-month Term SOFR + 1.709%
Cap 11.199%
08/01/2036 | 4.852% | | 4,967 | 5,037 |
| Federal Home Loan Mortgage Corp.(h) |
| 01/01/2038 | 6.000% | | 147,400 | 152,263 |
| 05/01/2038 | 5.500% | | 66,940 | 67,875 |
11/01/2039-
06/01/2041 | 4.500% | | 795,091 | 775,529 |
| 05/01/2041 | 5.000% | | 201,102 | 199,028 |
01/01/2043-
06/01/2046 | 3.500% | | 524,979 | 481,067 |
The accompanying Notes to Financial Statements are an integral part of this statement.
| 24 | Columbia Balanced Fund | Annual Report 2023 |
Portfolio of Investments (continued)
August 31, 2023
| Residential Mortgage-Backed Securities - Agency (continued) |
| Issuer | Coupon
Rate | | Principal
Amount ($) | Value ($) |
| Federal National Mortgage Association(h) |
12/01/2025-
03/01/2046 | 3.500% | | 3,998,771 | 3,726,414 |
07/01/2027-
02/01/2031 | 3.000% | | 1,089,418 | 1,032,604 |
10/01/2043-
02/01/2044 | 4.500% | | 509,425 | 493,115 |
| 08/01/2044 | 4.000% | | 128,772 | 122,309 |
| Federal National Mortgage Association |
01/01/2026-
05/01/2027 | 3.500% | | 233,422 | 227,572 |
01/01/2029-
06/01/2044 | 4.000% | | 465,333 | 451,068 |
| 06/01/2031 | 7.000% | | 43,771 | 44,414 |
07/01/2032-
03/01/2037 | 6.500% | | 121,856 | 124,153 |
06/01/2037-
02/01/2038 | 5.500% | | 51,196 | 51,992 |
05/01/2040-
06/01/2044 | 4.500% | | 761,895 | 740,126 |
| 08/01/2043 | 3.000% | | 97,468 | 86,229 |
| Federal National Mortgage Association(c) |
| Series 2006-M2 Class A2A |
| 10/25/2032 | 5.271% | | 157,532 | 155,530 |
| Uniform Mortgage-Backed Security TBA(i) |
09/18/2038-
09/14/2053 | 3.000% | | 277,525,000 | 240,195,167 |
09/18/2038-
09/14/2053 | 3.500% | | 165,550,000 | 149,613,556 |
| 09/14/2053 | 2.000% | | 51,775,000 | 41,223,821 |
| 09/14/2053 | 2.500% | | 124,975,000 | 103,524,212 |
| 09/14/2053 | 4.000% | | 264,300,000 | 243,940,641 |
| 09/14/2053 | 4.500% | | 126,175,000 | 119,629,672 |
| 09/14/2053 | 5.000% | | 115,450,000 | 111,943,658 |
Total Residential Mortgage-Backed Securities - Agency
(Cost $1,052,730,039) | 1,044,738,866 |
|
| Residential Mortgage-Backed Securities - Non-Agency 9.4% |
| | | | |
| 510 Asset Backed Trust(a),(c) |
| CMO Series 2021-NPL2 Class A1 |
| 06/25/2061 | 2.116% | | 6,977,015 | 6,627,746 |
| Ajax Mortgage Loan Trust(a),(c) |
| CMO Series 2021-A Class A1 |
| 09/25/2065 | 1.065% | | 13,646,614 | 11,611,635 |
| CMO Series 2021-B Class A |
| 06/25/2066 | 2.239% | | 6,431,972 | 6,101,013 |
| Angel Oak Mortgage Trust(a),(c) |
| CMO Series 2020-6 Class A3 |
| 05/25/2065 | 1.775% | | 718,177 | 628,431 |
| CMO Series 2020-6 Class M1 |
| 05/25/2065 | 2.805% | | 2,575,000 | 1,957,339 |
| Residential Mortgage-Backed Securities - Non-Agency (continued) |
| Issuer | Coupon
Rate | | Principal
Amount ($) | Value ($) |
| CMO Series 2020-R1 Class A1 |
| 04/25/2053 | 0.990% | | 3,250,435 | 2,912,249 |
| CMO Series 2022-6 Class A1 |
| 07/25/2067 | 4.300% | | 26,522,811 | 25,035,459 |
| Bellemeade Re Ltd.(a),(b) |
| CMO Series 2021-1A Class M1C |
30-day Average SOFR + 2.950%
Floor 2.950%
03/25/2031 | 8.238% | | 5,337,000 | 5,360,630 |
| CMO Series 2021-3A Class M1A |
30-day Average SOFR + 1.000%
Floor 1.000%
09/25/2031 | 6.288% | | 6,062,465 | 6,062,604 |
| BRAVO Residential Funding Trust(a),(c) |
| CMO Series 2020-NQM1 Class A1 |
| 05/25/2060 | 1.449% | | 964,586 | 901,903 |
| CMO Series 2020-RPL1 Class A1 |
| 05/26/2059 | 2.500% | | 3,333,859 | 3,144,736 |
| CMO Series 2021-A Class A1 |
| 10/25/2059 | 1.991% | | 7,268,114 | 6,978,631 |
| CMO Series 2021-B Class A1 |
| 04/01/2069 | 2.115% | | 5,002,852 | 4,791,671 |
| CMO Series 2021-NQM1 Class A1 |
| 02/25/2049 | 0.941% | | 6,747,143 | 5,897,658 |
| CMO Series 2021-NQM1 Class A3 |
| 02/25/2049 | 1.332% | | 2,733,188 | 2,359,523 |
| CMO Series 2021-NQM2 Class A3 |
| 03/25/2060 | 1.435% | | 1,546,352 | 1,441,769 |
| CMO Series 2022-NQM3 Class A1 |
| 07/25/2062 | 5.108% | | 6,354,099 | 6,250,630 |
| Subordinated CMO Series 2021-NQM2 Class B1 |
| 03/25/2060 | 3.044% | | 2,725,000 | 2,281,722 |
| CHNGE Mortgage Trust(a),(c) |
| CMO Series 2022-1 Class A1 |
| 01/25/2067 | 3.007% | | 12,868,312 | 11,419,454 |
| CMO Series 2022-NQM1 Class A1 |
| 06/25/2067 | 5.528% | | 5,407,207 | 5,209,803 |
| CIM Trust(a),(c) |
| CMO Series 2021-NR1 Class A1 |
| 07/25/2055 | 2.569% | | 4,031,665 | 3,914,652 |
| CMO Series 2021-NR2 Class A1 |
| 07/25/2059 | 2.568% | | 3,488,572 | 3,360,168 |
| COLT Mortgage Loan Trust(a),(c) |
| CMO Series 2020-2 Class A1 |
| 03/25/2065 | 1.853% | | 55,847 | 55,273 |
| CMO Series 2021-HX1 Class M1 |
| 10/25/2066 | 2.355% | | 3,250,000 | 1,942,769 |
The accompanying Notes to Financial Statements are an integral part of this statement.
Columbia Balanced Fund | Annual Report 2023
| 25 |
Portfolio of Investments (continued)
August 31, 2023
| Residential Mortgage-Backed Securities - Non-Agency (continued) |
| Issuer | Coupon
Rate | | Principal
Amount ($) | Value ($) |
| CMO Series 2022-1 Class A1 |
| 12/27/2066 | 2.284% | | 13,992,561 | 11,850,798 |
| CMO Series 2022-4 Class A1 |
| 03/25/2067 | 4.301% | | 11,934,528 | 11,228,956 |
| COLT Mortgage Loan Trust(a) |
| CMO Series 2021-2R Class A1 |
| 07/27/2054 | 0.798% | | 2,036,637 | 1,763,085 |
| Connecticut Avenue Securities Trust(a),(b) |
| CMO Series 2020-R01 Class 1M2 |
30-day Average SOFR + 2.164%
01/25/2040 | 7.452% | | 2,692,354 | 2,708,347 |
| CMO Series 2022-R04 Class 1M2 |
30-day Average SOFR + 3.100%
03/25/2042 | 8.388% | | 7,200,000 | 7,317,189 |
| Credit Suisse Mortgage Trust(a),(c) |
| CMO Series 2021-AFC1 Class A1 |
| 03/25/2056 | 0.830% | | 4,125,574 | 3,080,891 |
| CMO Series 2021-NQM1 Class A3 |
| 05/25/2065 | 1.199% | | 1,400,184 | 1,171,886 |
| CMO Series 2021-NQM1 Class M1 |
| 05/25/2065 | 2.130% | | 1,075,000 | 685,146 |
| CMO Series 2021-RPL1 Class A1 |
| 09/27/2060 | 1.668% | | 9,711,896 | 9,028,125 |
| CMO Series 2021-RPL2 Class M1 |
| 01/25/2060 | 2.750% | | 4,775,000 | 3,400,680 |
| CMO Series 2021-RPL2 Class M2 |
| 01/25/2060 | 3.250% | | 2,525,000 | 1,745,205 |
| CMO Series 2022-ATH3 Class A1 |
| 08/25/2067 | 4.991% | | 6,339,885 | 6,092,693 |
| CSMC Trust(a),(c) |
| CMO Series 2018-RPL9 Class A |
| 09/25/2057 | 3.850% | | 9,133,600 | 8,513,381 |
| CMO Series 2021-RPL4 Class A1 |
| 12/27/2060 | 1.796% | | 6,881,613 | 6,448,646 |
| Subordinated CMO Series 2020-RPL3 Class A1 |
| 03/25/2060 | 2.691% | | 4,695,284 | 4,632,416 |
| Subordinated CMO Series 2020-RPL4 Class A1 |
| 01/25/2060 | 2.000% | | 3,848,180 | 3,306,437 |
| CSMC Trust(a) |
| CMO Series 2019-AFC1 Class A1 |
| 07/25/2049 | 2.573% | | 2,497,282 | 2,285,185 |
| Eagle Re Ltd.(a),(b) |
| CMO Series 2021-1 Class M1C |
30-day Average SOFR + 2.700%
Floor 2.700%
10/25/2033 | 7.769% | | 2,253,600 | 2,270,052 |
| Residential Mortgage-Backed Securities - Non-Agency (continued) |
| Issuer | Coupon
Rate | | Principal
Amount ($) | Value ($) |
| CMO Series 2021-2 Class M1B |
30-day Average SOFR + 2.050%
Floor 2.050%
04/25/2034 | 7.338% | | 11,950,000 | 11,992,051 |
| Ellington Financial Mortgage Trust(a),(c) |
| CMO Series 2019-2 Class A3 |
| 11/25/2059 | 3.046% | | 648,531 | 597,455 |
| CMO Series 2020-1 Class A1 |
| 05/25/2065 | 2.006% | | 169,608 | 160,511 |
| CMO Series 2022-2 Class A1 |
| 04/25/2067 | 4.299% | | 32,112,404 | 30,082,196 |
| Equifirst Mortgage Loan Trust(c) |
| CMO Series 2003-1 Class IF1 |
| 12/25/2032 | 4.010% | | 22,649 | 20,566 |
| Freddie Mac STACR REMIC Trust(a),(b) |
| CMO Series 2020-DNA1 Class M2 |
30-day Average SOFR + 1.814%
01/25/2050 | 7.102% | | 2,450,074 | 2,450,068 |
| CMO Series 2021-DNA1 Class M2 |
30-day Average SOFR + 1.800%
01/25/2051 | 7.088% | | 3,044,722 | 3,048,856 |
| CMO Series 2021-DNA5 Class M2 |
30-day Average SOFR + 1.650%
01/25/2034 | 6.938% | | 2,554,310 | 2,553,839 |
| CMO Series 2022-DNA3 Class M1B |
30-day Average SOFR + 2.900%
04/25/2042 | 8.188% | | 7,000,000 | 7,097,754 |
| CMO Series 2022-DNA4 Class M1A |
30-day Average SOFR + 2.200%
05/25/2042 | 7.488% | | 14,988,991 | 15,161,259 |
| Subordinated CMO Series 2022-DNA6 Class M1A |
30-day Average SOFR + 2.150%
09/25/2042 | 7.438% | | 2,919,229 | 2,944,674 |
| Freddie Mac STACR Trust(a),(b) |
| CMO Series 2019-DNA4 Class M2 |
30-day Average SOFR + 2.064%
10/25/2049 | 7.352% | | 301,718 | 302,095 |
| Freddie Mac Structured Agency Credit Risk Debt Notes(a),(b) |
| CMO Series 2022-DNA2 Class M1B |
30-day Average SOFR + 2.400%
02/25/2042 | 7.688% | | 16,150,000 | 16,111,240 |
| CMO Series 2022-DNA5 Class M1A |
30-day Average SOFR + 2.950%
06/25/2042 | 8.238% | | 10,495,273 | 10,751,349 |
| Subordinated CMO Series 2021-DNA7 Class M1 |
30-day Average SOFR + 0.850%
11/25/2041 | 6.138% | | 21,106,323 | 20,897,193 |
| GCAT Trust(a),(c) |
| CMO Series 2019-RPL1 Class A1 |
| 10/25/2068 | 2.650% | | 4,690,411 | 4,387,088 |
The accompanying Notes to Financial Statements are an integral part of this statement.
| 26 | Columbia Balanced Fund | Annual Report 2023 |
Portfolio of Investments (continued)
August 31, 2023
| Residential Mortgage-Backed Securities - Non-Agency (continued) |
| Issuer | Coupon
Rate | | Principal
Amount ($) | Value ($) |
| CMO Series 2021-CM2 Class A1 |
| 08/25/2066 | 2.352% | | 17,236,676 | 15,446,658 |
| CMO Series 2022-NQM3 Class A1 |
| 04/25/2067 | 4.349% | | 32,565,212 | 30,702,277 |
| Genworth Mortgage Insurance Corp.(a),(b) |
| CMO Series 2021-3 Class M1A |
30-day Average SOFR + 1.900%
Floor 1.900%
02/25/2034 | 6.969% | | 983,894 | 988,868 |
| GS Mortgage-Backed Securities Trust(a),(c) |
| CMO Series 2020-NQM1 Class A1 |
| 09/27/2060 | 1.382% | | 2,032,012 | 1,826,510 |
| Home Re Ltd.(a),(b) |
| CMO Series 2021-1 Class M1B |
1-month Term SOFR + 1.664%
07/25/2033 | 6.979% | | 729,870 | 729,713 |
| Homeward Opportunities Fund I Trust(a),(c) |
| CMO Series 2020-2 Class A3 |
| 05/25/2065 | 3.196% | | 3,450,000 | 3,191,013 |
| Homeward Opportunities Fund Trust(a),(f) |
| CMO Series 2020-BPL1 Class A1 |
| 08/25/2025 | 3.228% | | 272,715 | 267,222 |
| Imperial Fund Mortgage Trust(a),(c) |
| CMO Series 2021-NQM2 Class A3 |
| 09/25/2056 | 1.516% | | 5,568,410 | 4,316,575 |
| Legacy Mortgage Asset Trust(a),(c) |
| CMO Series 2021-GS1 Class A1 |
| 10/25/2066 | 1.892% | | 7,004,984 | 6,633,235 |
| CMO Series 2021-GS2 Class A1 |
| 04/25/2061 | 1.750% | | 13,646,116 | 12,729,132 |
| MetLife Securitization Trust(a),(c) |
| CMO Series 2018-1A Class A |
| 03/25/2057 | 3.750% | | 2,292,687 | 2,134,115 |
| MFA Trust(a),(c) |
| CMO Series 2020-NQM3 Class M1 |
| 01/26/2065 | 2.654% | | 2,925,000 | 2,378,052 |
| CMO Series 2021-NQM1 Class A1 |
| 04/25/2065 | 1.153% | | 3,706,964 | 3,265,082 |
| CMO Series 2022-NQM2 Class A1 |
| 05/25/2067 | 4.000% | | 31,125,732 | 28,952,477 |
| MFRA Trust(a),(c) |
| CMO Series 2021-INV1 Class A1 |
| 01/25/2056 | 0.852% | | 1,288,036 | 1,153,483 |
| CMO Series 2021-INV1 Class A2 |
| 01/25/2056 | 1.057% | | 266,863 | 239,585 |
| CMO Series 2021-INV1 Class A3 |
| 01/25/2056 | 1.262% | | 411,732 | 369,249 |
| Residential Mortgage-Backed Securities - Non-Agency (continued) |
| Issuer | Coupon
Rate | | Principal
Amount ($) | Value ($) |
| Mill City Mortgage Loan Trust(a),(c) |
| CMO Series 2018-3 Class A1 |
| 08/25/2058 | 3.482% | | 4,205,058 | 4,026,212 |
| CMO Series 2021-NMR1 Class M1 |
| 11/25/2060 | 1.850% | | 7,225,000 | 6,072,357 |
| New Residential Mortgage Loan Trust(a) |
| CMO Series 2016-3A Class A1 |
| 09/25/2056 | 3.750% | | 763,465 | 707,300 |
| NRZ Excess Spread-Collateralized Notes(a) |
| Series 2020-PLS1 Class A |
| 12/25/2025 | 3.844% | | 2,253,877 | 2,101,593 |
| Oaktown Re VI Ltd.(a),(b) |
| CMO Series 2021-1A Class M1B |
30-day Average SOFR + 2.050%
Floor 2.050%
10/25/2033 | 7.338% | | 4,005,922 | 4,007,610 |
| OBX Trust(a),(b) |
| CMO Series 2020-EXP3 Class 2A1A |
1-month USD LIBOR + 0.950%
01/25/2060 | 6.329% | | 634,974 | 629,211 |
| Oceanview Mortgage Loan Trust(a) |
| CMO Series 2020-1 Class A1A |
| 05/28/2050 | 1.733% | | 1,723,239 | 1,541,966 |
| Preston Ridge Partners Mortgage(a),(c) |
| CMO Series 2021-4 Class A1 |
| 04/25/2026 | 1.867% | | 13,630,321 | 12,649,937 |
| Preston Ridge Partners Mortgage Trust(a),(c) |
| CMO Series 2020-6 Class A1 |
| 11/25/2025 | 2.363% | | 3,306,151 | 3,156,962 |
| CMO Series 2021-1 Class A1 |
| 01/25/2026 | 2.115% | | 5,569,466 | 5,299,256 |
| CMO Series 2021-10 Class A1 |
| 10/25/2026 | 2.487% | | 7,809,804 | 7,255,315 |
| CMO Series 2021-2 Class A1 |
| 03/25/2026 | 2.115% | | 4,304,706 | 4,075,751 |
| CMO Series 2021-3 Class A1 |
| 04/25/2026 | 1.867% | | 7,024,856 | 6,635,036 |
| CMO Series 2021-9 Class A1 |
| 10/25/2026 | 2.363% | | 12,282,805 | 11,544,478 |
| Pretium Mortgage Credit Partners LLC(a),(c) |
| CMO Series 2021-NPL6 Class A1 |
| 07/25/2051 | 2.487% | | 15,911,946 | 15,203,009 |
| PRKCM Trust(a),(c) |
| CMO Series 2021-AFC2 Class A3 |
| 11/25/2056 | 2.893% | | 12,941,000 | 7,843,714 |
| CMO Series 2021-AFC2 Class M1 |
| 11/25/2056 | 3.443% | | 9,528,000 | 5,934,583 |
| Subordinated CMO Series 2021-AFC2 Class B1 |
| 11/25/2056 | 3.701% | | 8,383,000 | 5,054,622 |
The accompanying Notes to Financial Statements are an integral part of this statement.
Columbia Balanced Fund | Annual Report 2023
| 27 |
Portfolio of Investments (continued)
August 31, 2023
| Residential Mortgage-Backed Securities - Non-Agency (continued) |
| Issuer | Coupon
Rate | | Principal
Amount ($) | Value ($) |
| PRPM LLC(a),(c) |
| CMO Series 2021-RPL1 Class A1 |
| 07/25/2051 | 1.319% | | 3,628,918 | 3,194,506 |
| Radnor Re Ltd.(a),(b) |
| Subordinated CMO Series 2021-2 Class M1A |
30-day Average SOFR + 1.850%
Floor 1.850%
11/25/2031 | 7.138% | | 1,635,375 | 1,635,010 |
| Subordinated CMO Series 2021-2 Class M1B |
30-day Average SOFR + 3.700%
Floor 3.700%
11/25/2031 | 8.988% | | 4,775,000 | 4,757,573 |
| Residential Mortgage Loan Trust(a),(c) |
| CMO Series 2020-1 Class A3 |
| 01/26/2060 | 2.684% | | 713,654 | 674,162 |
| Starwood Mortgage Residential Trust(a),(c) |
| CMO Series 2019-INV1 Class A3 |
| 09/27/2049 | 2.916% | | 3,470,593 | 3,282,798 |
| CMO Series 2020-2 Class A3 |
| 04/25/2060 | 3.000% | | 4,728,698 | 4,551,917 |
| CMO Series 2020-INV1 Class A3 |
| 11/25/2055 | 1.593% | | 828,391 | 747,020 |
| CMO Series 2021-4 Class M1 |
| 08/25/2056 | 2.400% | | 3,475,000 | 2,169,152 |
| Toorak Mortgage Corp., Ltd.(a),(c) |
| CMO Series 2021-1 Class A1 |
| 06/25/2024 | 2.240% | | 4,817,656 | 4,779,565 |
| Towd Point HE Trust(a),(c) |
| CMO Series 2021-HE1 Class M2 |
| 02/25/2063 | 2.500% | | 2,800,000 | 2,393,181 |
| Towd Point Mortgage Trust(a),(c) |
| CMO Series 2018-1 Class A1 |
| 01/25/2058 | 3.000% | | 802,884 | 770,969 |
| CMO Series 2018-6 Class A1A |
| 03/25/2058 | 3.750% | | 3,086,158 | 2,986,211 |
| Towd Point Mortgage Trust(a),(b) |
| CMO Series 2019-HY1 Class A1 |
1-month Term SOFR + 1.114%
10/25/2048 | 6.429% | | 2,579,418 | 2,572,036 |
| CMO Series 2019-HY2 Class A1 |
1-month Term SOFR + 1.114%
05/25/2058 | 6.429% | | 3,034,163 | 3,056,609 |
| VCAT Asset Securitization LLC(a),(c) |
| CMO Series 2021-NPL6 Class A1 |
| 09/25/2051 | 1.917% | | 22,835,823 | 21,101,278 |
| VCAT LLC(a),(c) |
| CMO Series 2021-NPL1 Class A1 |
| 12/26/2050 | 2.289% | | 686,240 | 662,534 |
| Residential Mortgage-Backed Securities - Non-Agency (continued) |
| Issuer | Coupon
Rate | | Principal
Amount ($) | Value ($) |
| Vericrest Opportunity Loan Transferee(a),(c) |
| CMO Series 2021-NP11 Class A1 |
| 08/25/2051 | 1.868% | | 11,362,538 | 10,517,949 |
| Vericrest Opportunity Loan Transferee XCII LLC(a),(c) |
| CMO Series 2021-NPL1 Class A1 |
| 02/27/2051 | 1.893% | | 7,325,179 | 6,757,188 |
| Vericrest Opportunity Loan Transferee XCIII LLC(a),(c) |
| CMO Series 2021-NPL2 Class A1 |
| 02/27/2051 | 1.893% | | 6,559,762 | 6,156,509 |
| Vericrest Opportunity Loan Transferee XCIV LLC(a),(c) |
| CMO Series 2021-NPL3 Class A1 |
| 02/27/2051 | 2.240% | | 7,775,551 | 7,434,538 |
| Vericrest Opportunity Loan Transferee XCIX LLC(a),(c) |
| CMO Series 2021-NPL8 Class A1 |
| 04/25/2051 | 2.116% | | 4,924,887 | 4,646,725 |
| Vericrest Opportunity Loan Transferee XCVI LLC(a),(c) |
| CMO Series 2021-NPL5 Class A1 |
| 03/27/2051 | 2.116% | | 4,445,220 | 4,206,123 |
| Vericrest Opportunity Loan Transferee XCVII LLC(a),(c) |
| CMO Series 2021-NPL6 Class A1 |
| 04/25/2051 | 2.240% | | 19,307,588 | 18,026,007 |
| Vericrest Opportunity Loan Trust CI LLC(a),(c) |
| CMO Series 2021-NP10 Class A1 |
| 05/25/2051 | 1.992% | | 14,907,444 | 13,573,277 |
| Verus Securitization Trust(a),(c) |
| CMO Series 2019-4 Class A3 |
| 11/25/2059 | 3.000% | | 3,134,570 | 2,972,312 |
| CMO Series 2020-1 Class M1 |
| 01/25/2060 | 3.021% | | 6,350,000 | 5,124,132 |
| CMO Series 2020-2 Class A1 |
| 05/25/2060 | 2.226% | | 489,728 | 476,991 |
| CMO Series 2020-INV1 Class A1 |
| 03/25/2060 | 1.977% | | 147,792 | 144,827 |
| CMO Series 2021-R1 Class A2 |
| 10/25/2063 | 1.057% | | 1,013,342 | 915,884 |
| CMO Series 2021-R1 Class A3 |
| 10/25/2063 | 1.262% | | 1,291,194 | 1,166,449 |
| CMO Series 2022-1 Class A1 |
| 01/25/2067 | 2.724% | | 22,019,461 | 19,342,676 |
| CMO Series 2022-4 Class A1 |
| 04/25/2067 | 4.474% | | 2,772,539 | 2,646,823 |
| CMO Series 2023-INV1 Class A1 |
| 02/25/2068 | 5.999% | | 19,655,950 | 19,419,200 |
| Visio Trust(a),(c) |
| CMO Series 2019-2 Class A3 |
| 11/25/2054 | 3.076% | | 1,579,752 | 1,459,824 |
The accompanying Notes to Financial Statements are an integral part of this statement.
| 28 | Columbia Balanced Fund | Annual Report 2023 |
Portfolio of Investments (continued)
August 31, 2023
| Residential Mortgage-Backed Securities - Non-Agency (continued) |
| Issuer | Coupon
Rate | | Principal
Amount ($) | Value ($) |
| Visio Trust(a) |
| CMO Series 2020-1R Class A2 |
| 11/25/2055 | 1.567% | | 943,062 | 855,640 |
| CMO Series 2020-1R Class A3 |
| 11/25/2055 | 1.873% | | 1,073,106 | 977,303 |
Total Residential Mortgage-Backed Securities - Non-Agency
(Cost $810,792,729) | 747,551,836 |
|
| Senior Loans 0.0% |
| Borrower | Coupon
Rate | | Principal
Amount ($) | Value ($) |
| Chemicals 0.0% |
| WR Grace Holdings LLC(b),(j) |
| Term Loan |
1-month USD LIBOR + 3.750%
Floor 0.500%
09/22/2028 | 9.313% | | 211,775 | 211,290 |
| Consumer Cyclical Services 0.0% |
| 8th Avenue Food & Provisions, Inc.(b),(j) |
| 2nd Lien Term Loan |
1-month USD LIBOR + 7.750%
10/01/2026 | 13.196% | | 32,969 | 22,110 |
| Media and Entertainment 0.0% |
| Cengage Learning, Inc.(b),(j) |
| Tranche B 1st Lien Term Loan |
3-month USD LIBOR + 4.750%
Floor 1.000%
07/14/2026 | 10.323% | | 349,323 | 348,051 |
| Technology 0.0% |
| Ascend Learning LLC(b),(j) |
| 1st Lien Term Loan |
1-month Term SOFR + 3.500%
Floor 0.500%
12/11/2028 | 8.931% | | 322,045 | 309,279 |
| 2nd Lien Term Loan |
1-month Term SOFR + 5.750%
Floor 0.500%
12/10/2029 | 11.181% | | 150,000 | 127,938 |
| Senior Loans (continued) |
| Borrower | Coupon
Rate | | Principal
Amount ($) | Value ($) |
| DCert Buyer, Inc.(b),(j) |
| 2nd Lien Term Loan |
1-month USD LIBOR + 7.000%
02/19/2029 | 12.331% | | 233,000 | 217,079 |
| UKG, Inc.(b),(j) |
| 1st Lien Term Loan |
3-month Term SOFR + 3.250%
Floor 0.500%
05/04/2026 | 8.618% | | 148,641 | 148,470 |
| 2nd Lien Term Loan |
3-month Term SOFR + 5.250%
Floor 0.500%
05/03/2027 | 10.618% | | 291,000 | 288,975 |
| Total | 1,091,741 |
Total Senior Loans
(Cost $1,728,806) | 1,673,192 |
|
| U.S. Treasury Obligations 0.4% |
| Issuer | Coupon
Rate | | Principal
Amount ($) | Value ($) |
| U.S. Treasury(h) |
| 02/15/2045 | 2.500% | | 38,125,000 | 27,974,219 |
Total U.S. Treasury Obligations
(Cost $35,914,294) | 27,974,219 |
| Money Market Funds 10.5% |
| | Shares | Value ($) |
| Columbia Short-Term Cash Fund, 5.476%(k),(l) | 833,529,174 | 833,279,115 |
Total Money Market Funds
(Cost $833,148,771) | 833,279,115 |
Total Investments in Securities
(Cost: $7,081,596,837) | 8,955,091,514 |
| Other Assets & Liabilities, Net | | (985,014,869) |
| Net Assets | 7,970,076,645 |
At August 31, 2023, securities and/or cash totaling $24,751,738 were pledged as collateral.
The accompanying Notes to Financial Statements are an integral part of this statement.
Columbia Balanced Fund | Annual Report 2023
| 29 |
Portfolio of Investments (continued)
August 31, 2023
Investments in derivatives
| Long futures contracts |
| Description | Number of
contracts | Expiration
date | Trading
currency | Notional
amount | Value/Unrealized
appreciation ($) | Value/Unrealized
depreciation ($) |
| U.S. Treasury 10-Year Note | 2,215 | 12/2023 | USD | 245,934,219 | 1,877,561 | — |
| U.S. Treasury 2-Year Note | 1,250 | 12/2023 | USD | 254,755,860 | 381,966 | — |
| U.S. Treasury 5-Year Note | 3,350 | 12/2023 | USD | 358,188,281 | 2,001,849 | — |
| Total | | | | | 4,261,376 | — |
| Short futures contracts |
| Description | Number of
contracts | Expiration
date | Trading
currency | Notional
amount | Value/Unrealized
appreciation ($) | Value/Unrealized
depreciation ($) |
| U.S. Treasury Ultra Bond | (200) | 12/2023 | USD | (25,893,750) | — | (362,887) |
Notes to Portfolio of Investments
| (a) | Represents privately placed and other securities and instruments exempt from Securities and Exchange Commission registration (collectively, private placements), such as Section 4(a)(2) and Rule 144A eligible securities, which are often sold only to qualified institutional buyers. At August 31, 2023, the total value of these securities amounted to $1,637,027,098, which represents 20.54% of total net assets. |
| (b) | Variable rate security. The interest rate shown was the current rate as of August 31, 2023. |
| (c) | Variable or floating rate security, the interest rate of which adjusts periodically based on changes in current interest rates and prepayments on the underlying pool of assets. The interest rate shown was the current rate as of August 31, 2023. |
| (d) | Non-income producing investment. |
| (e) | Payment-in-kind security. Interest can be paid by issuing additional par of the security or in cash. |
| (f) | Represents a variable rate security with a step coupon where the rate adjusts according to a schedule for a series of periods, typically lower for an initial period and then increasing to a higher coupon rate thereafter. The interest rate shown was the current rate as of August 31, 2023. |
| (g) | Principal and interest may not be guaranteed by a governmental entity. |
| (h) | This security or a portion of this security has been pledged as collateral in connection with derivative contracts. |
| (i) | Represents a security purchased on a when-issued basis. |
| (j) | The stated interest rate represents the weighted average interest rate at August 31, 2023 of contracts within the senior loan facility. Interest rates on contracts are primarily determined either weekly, monthly or quarterly by reference to the indicated base lending rate and spread and the reset period. These base lending rates are primarily the LIBOR and other short-term rates. Base lending rates may be subject to a floor or minimum rate. The interest rate for senior loans purchased on a when-issued or delayed delivery basis will be determined upon settlement, therefore no interest rate is disclosed. Senior loans often require prepayments from excess cash flows or permit the borrowers to repay at their election. The degree to which borrowers repay cannot be predicted with accuracy. As a result, remaining maturities of senior loans may be less than the stated maturities. Generally, the Fund is contractually obligated to receive approval from the agent bank and/or borrower prior to the disposition of a senior loan. |
| (k) | The rate shown is the seven-day current annualized yield at August 31, 2023. |
| (l) | As defined in the Investment Company Act of 1940, as amended, an affiliated company is one in which the Fund owns 5% or more of the company’s outstanding voting securities, or a company which is under common ownership or control with the Fund. The value of the holdings and transactions in these affiliated companies during the year ended August 31, 2023 are as follows: |
| Affiliated issuers | Beginning
of period($) | Purchases($) | Sales($) | Net change in
unrealized
appreciation
(depreciation)($) | End of
period($) | Realized gain
(loss)($) | Dividends($) | End of
period shares |
| Columbia Short-Term Cash Fund, 5.476% |
| | 626,292,933 | 2,264,112,384 | (2,057,331,191) | 204,989 | 833,279,115 | (90,729) | 26,863,033 | 833,529,174 |
Abbreviation Legend
| CMO | Collateralized Mortgage Obligation |
| LIBOR | London Interbank Offered Rate |
| SOFR | Secured Overnight Financing Rate |
| TBA | To Be Announced |
Currency Legend
The accompanying Notes to Financial Statements are an integral part of this statement.
| 30 | Columbia Balanced Fund | Annual Report 2023 |
Portfolio of Investments (continued)
August 31, 2023
Fair value measurements
The Fund categorizes its fair value measurements according to a three-level hierarchy that maximizes the use of observable inputs and minimizes the use of unobservable inputs by prioritizing that the most observable input be used when available. Observable inputs are those that market participants would use in pricing an investment based on market data obtained from sources independent of the reporting entity. Unobservable inputs are those that reflect the Fund’s assumptions about the information market participants would use in pricing an investment. An investment’s level within the fair value hierarchy is based on the lowest level of any input that is deemed significant to the asset’s or liability’s fair value measurement. The input levels are not necessarily an indication of the risk or liquidity associated with investments at that level. For example, certain U.S. government securities are generally high quality and liquid, however, they are reflected as Level 2 because the inputs used to determine fair value may not always be quoted prices in an active market.
Fair value inputs are summarized in the three broad levels listed below:
| ■ | Level 1 — Valuations based on quoted prices for investments in active markets that the Fund has the ability to access at the measurement date. Valuation adjustments are not applied to Level 1 investments. |
| ■ | Level 2 — Valuations based on other significant observable inputs (including quoted prices for similar securities, interest rates, prepayment speeds, credit risks, etc.). |
| ■ | Level 3 — Valuations based on significant unobservable inputs (including the Fund’s own assumptions and judgment in determining the fair value of investments). |
Inputs that are used in determining fair value of an investment may include price information, credit data, volatility statistics, and other factors. These inputs can be either observable or unobservable. The availability of observable inputs can vary between investments, and is affected by various factors such as the type of investment, and the volume and level of activity for that investment or similar investments in the marketplace. The inputs will be considered by the Investment Manager, along with any other relevant factors in the calculation of an investment’s fair value. The Fund uses prices and inputs that are current as of the measurement date, which may include periods of market dislocations. During these periods, the availability of prices and inputs may be reduced for many investments. This condition could cause an investment to be reclassified between the various levels within the hierarchy.
Investments falling into the Level 3 category are primarily supported by quoted prices from brokers and dealers participating in the market for those investments. However, these may be classified as Level 3 investments due to lack of market transparency and corroboration to support these quoted prices. Additionally, valuation models may be used as the pricing source for any remaining investments classified as Level 3. These models may rely on one or more significant unobservable inputs and/or significant assumptions by the Investment Manager. Inputs used in valuations may include, but are not limited to, financial statement analysis, capital account balances, discount rates and estimated cash flows, and comparable company data.
The Fund’s Board of Trustees (the Board) has designated the Investment Manager, through its Valuation Committee (the Committee), as valuation designee, responsible for determining the fair value of the assets of the Fund for which market quotations are not readily available using valuation procedures approved by the Board. The Committee consists of voting and non-voting members from various groups within the Investment Manager’s organization, including operations and accounting, trading and investments, compliance, risk management and legal.
The Committee meets at least monthly to review and approve valuation matters, which may include a description of specific valuation determinations, data regarding pricing information received from approved pricing vendors and brokers and the results of Board-approved valuation policies and procedures (the Policies). The Policies address, among other things, instances when market quotations are or are not readily available, including recommendations of third party pricing vendors and a determination of appropriate pricing methodologies; events that require specific valuation determinations and assessment of fair value techniques; securities with a potential for stale pricing, including those that are illiquid, restricted, or in default; and the effectiveness of third party pricing vendors, including periodic reviews of vendors. The Committee meets more frequently, as needed, to discuss additional valuation matters, which may include the need to review back-testing results, review time-sensitive information or approve related valuation actions. Representatives of Columbia Management Investment Advisers, LLC report to the Board at each of its regularly scheduled meetings to discuss valuation matters and actions during the period, similar to those described earlier.
The following table is a summary of the inputs used to value the Fund’s investments at August 31, 2023:
| | Level 1 ($) | Level 2 ($) | Level 3 ($) | Total ($) |
| Investments in Securities | | | | |
| Asset-Backed Securities — Non-Agency | — | 529,272,170 | — | 529,272,170 |
| Commercial Mortgage-Backed Securities - Non-Agency | — | 351,141,005 | — | 351,141,005 |
| Common Stocks | | | | |
| Communication Services | 614,755,560 | — | — | 614,755,560 |
| Consumer Discretionary | 333,295,354 | — | — | 333,295,354 |
| Consumer Staples | 278,137,836 | — | — | 278,137,836 |
| Energy | 183,436,888 | — | — | 183,436,888 |
| Financials | 588,618,030 | — | — | 588,618,030 |
| Health Care | 662,514,425 | — | — | 662,514,425 |
| Industrials | 432,537,201 | — | — | 432,537,201 |
| Information Technology | 1,349,608,615 | — | — | 1,349,608,615 |
| Materials | 120,818,544 | — | — | 120,818,544 |
| Real Estate | 58,077,521 | — | — | 58,077,521 |
| Utilities | 65,108,064 | — | — | 65,108,064 |
| Total Common Stocks | 4,686,908,038 | — | — | 4,686,908,038 |
| Convertible Bonds | — | 264,990 | — | 264,990 |
| Corporate Bonds & Notes | — | 586,952,141 | — | 586,952,141 |
| Exchange-Traded Equity Funds | 144,765,004 | — | — | 144,765,004 |
| Foreign Government Obligations | — | 570,938 | — | 570,938 |
| Residential Mortgage-Backed Securities - Agency | — | 1,044,738,866 | — | 1,044,738,866 |
| Residential Mortgage-Backed Securities - Non-Agency | — | 747,551,836 | — | 747,551,836 |
| Senior Loans | — | 1,673,192 | — | 1,673,192 |
The accompanying Notes to Financial Statements are an integral part of this statement.
Columbia Balanced Fund | Annual Report 2023
| 31 |
Portfolio of Investments (continued)
August 31, 2023
Fair value measurements (continued)
| | Level 1 ($) | Level 2 ($) | Level 3 ($) | Total ($) |
| U.S. Treasury Obligations | — | 27,974,219 | — | 27,974,219 |
| Money Market Funds | 833,279,115 | — | — | 833,279,115 |
| Total Investments in Securities | 5,664,952,157 | 3,290,139,357 | — | 8,955,091,514 |
| Investments in Derivatives | | | | |
| Asset | | | | |
| Futures Contracts | 4,261,376 | — | — | 4,261,376 |
| Liability | | | | |
| Futures Contracts | (362,887) | — | — | (362,887) |
| Total | 5,668,850,646 | 3,290,139,357 | — | 8,958,990,003 |
See the Portfolio of Investments for all investment classifications not indicated in the table.
The Fund’s assets assigned to the Level 2 input category are generally valued using the market approach, in which a security’s value is determined through reference to prices and information from market transactions for similar or identical assets.
Derivative instruments are valued at unrealized appreciation (depreciation).
The accompanying Notes to Financial Statements are an integral part of this statement.
| 32 | Columbia Balanced Fund | Annual Report 2023 |
Statement of Assets and Liabilities
August 31, 2023
| Assets | |
| Investments in securities, at value | |
| Unaffiliated issuers (cost $6,248,448,066) | $8,121,812,399 |
| Affiliated issuers (cost $833,148,771) | 833,279,115 |
| Cash | 11,555 |
| Cash collateral held at broker for: | |
| TBA | 6,671,160 |
| Receivable for: | |
| Investments sold | 20,562,627 |
| Capital shares sold | 13,921,072 |
| Dividends | 10,247,303 |
| Interest | 15,554,673 |
| Foreign tax reclaims | 2,549 |
| Variation margin for futures contracts | 862,657 |
| Trustees’ fees | 402,104 |
| Prepaid expenses | 70,093 |
| Total assets | 9,023,397,307 |
| Liabilities | |
| Payable for: | |
| Investments purchased | 14,156,802 |
| Investments purchased on a delayed delivery basis | 1,017,272,754 |
| Capital shares redeemed | 20,258,464 |
| Variation margin for futures contracts | 113,191 |
| Management services fees | 124,874 |
| Distribution and/or service fees | 53,019 |
| Transfer agent fees | 656,600 |
| Trustees’ fees | 533,050 |
| Other expenses | 151,908 |
| Total liabilities | 1,053,320,662 |
| Net assets applicable to outstanding capital stock | $7,970,076,645 |
| Represented by | |
| Paid in capital | 6,116,295,568 |
| Total distributable earnings (loss) | 1,853,781,077 |
| Total - representing net assets applicable to outstanding capital stock | $7,970,076,645 |
The accompanying Notes to Financial Statements are an integral part of this statement.
Columbia Balanced Fund | Annual Report 2023
| 33 |
Statement of Assets and Liabilities (continued)
August 31, 2023
| Class A | |
| Net assets | $3,260,575,303 |
| Shares outstanding | 70,973,084 |
| Net asset value per share | $45.94 |
| Maximum sales charge | 5.75% |
| Maximum offering price per share (calculated by dividing the net asset value per share by 1.0 minus the maximum sales charge for Class A shares) | $48.74 |
| Advisor Class | |
| Net assets | $348,301,076 |
| Shares outstanding | 7,505,710 |
| Net asset value per share | $46.40 |
| Class C | |
| Net assets | $1,057,268,210 |
| Shares outstanding | 23,149,191 |
| Net asset value per share | $45.67 |
| Institutional Class | |
| Net assets | $2,126,401,083 |
| Shares outstanding | 46,392,820 |
| Net asset value per share | $45.83 |
| Institutional 2 Class | |
| Net assets | $376,116,452 |
| Shares outstanding | 8,198,978 |
| Net asset value per share | $45.87 |
| Institutional 3 Class | |
| Net assets | $672,954,675 |
| Shares outstanding | 14,495,686 |
| Net asset value per share | $46.42 |
| Class R | |
| Net assets | $128,459,846 |
| Shares outstanding | 2,796,348 |
| Net asset value per share | $45.94 |
The accompanying Notes to Financial Statements are an integral part of this statement.
| 34 | Columbia Balanced Fund | Annual Report 2023 |
Statement of Operations
Year Ended August 31, 2023
| Net investment income | |
| Income: | |
| Dividends — unaffiliated issuers | $62,209,724 |
| Dividends — affiliated issuers | 26,863,033 |
| Interest | 105,017,143 |
| Interfund lending | 5,095 |
| Foreign taxes withheld | (382,007) |
| Total income | 193,712,988 |
| Expenses: | |
| Management services fees | 43,256,415 |
| Distribution and/or service fees | |
| Class A | 7,591,288 |
| Class C | 10,993,529 |
| Class R | 584,270 |
| Transfer agent fees | |
| Class A | 2,887,713 |
| Advisor Class | 304,673 |
| Class C | 1,046,532 |
| Institutional Class | 1,905,878 |
| Institutional 2 Class | 189,838 |
| Institutional 3 Class | 46,017 |
| Class R | 111,113 |
| Trustees’ fees | 154,619 |
| Custodian fees | 69,371 |
| Printing and postage fees | 332,148 |
| Registration fees | 244,310 |
| Accounting services fees | 40,290 |
| Legal fees | 109,820 |
| Interest on collateral | 5,553 |
| Compensation of chief compliance officer | 1,423 |
| Other | 128,996 |
| Total expenses | 70,003,796 |
| Expense reduction | (1,548) |
| Total net expenses | 70,002,248 |
| Net investment income | 123,710,740 |
| Realized and unrealized gain (loss) — net | |
| Net realized gain (loss) on: | |
| Investments — unaffiliated issuers | 50,806,005 |
| Investments — affiliated issuers | (90,729) |
| Foreign currency translations | (4,092) |
| Futures contracts | (72,188,138) |
| Net realized loss | (21,476,954) |
| Net change in unrealized appreciation (depreciation) on: | |
| Investments — unaffiliated issuers | 606,470,443 |
| Investments — affiliated issuers | 204,989 |
| Futures contracts | 5,155,439 |
| Net change in unrealized appreciation (depreciation) | 611,830,871 |
| Net realized and unrealized gain | 590,353,917 |
| Net increase in net assets resulting from operations | $714,064,657 |
The accompanying Notes to Financial Statements are an integral part of this statement.
Columbia Balanced Fund | Annual Report 2023
| 35 |
Statement of Changes in Net Assets
| | Year Ended
August 31, 2023 | Year Ended
August 31, 2022 |
| Operations | | |
| Net investment income | $123,710,740 | $69,557,213 |
| Net realized gain (loss) | (21,476,954) | 366,340,581 |
| Net change in unrealized appreciation (depreciation) | 611,830,871 | (1,592,887,976) |
| Net increase (decrease) in net assets resulting from operations | 714,064,657 | (1,156,990,182) |
| Distributions to shareholders | | |
| Net investment income and net realized gains | | |
| Class A | (151,598,393) | (301,333,013) |
| Advisor Class | (16,366,002) | (33,598,968) |
| Class C | (49,203,951) | (124,430,082) |
| Institutional Class | (106,371,782) | (217,188,113) |
| Institutional 2 Class | (17,896,926) | (37,022,415) |
| Institutional 3 Class | (32,783,519) | (64,433,085) |
| Class R | (5,538,146) | (11,695,427) |
| Total distributions to shareholders | (379,758,719) | (789,701,103) |
| Increase (decrease) in net assets from capital stock activity | (207,709,778) | 464,141,127 |
| Total increase (decrease) in net assets | 126,596,160 | (1,482,550,158) |
| Net assets at beginning of year | 7,843,480,485 | 9,326,030,643 |
| Net assets at end of year | $7,970,076,645 | $7,843,480,485 |
The accompanying Notes to Financial Statements are an integral part of this statement.
| 36 | Columbia Balanced Fund | Annual Report 2023 |
Statement of Changes in Net Assets (continued)
| | Year Ended | Year Ended |
| | August 31, 2023 | August 31, 2022 |
| | Shares | Dollars ($) | Shares | Dollars ($) |
| Capital stock activity |
| Class A | | | | |
| Shares sold | 9,889,780 | 427,053,306 | 10,083,787 | 492,333,678 |
| Distributions reinvested | 3,433,923 | 144,182,959 | 5,680,179 | 286,850,006 |
| Shares redeemed | (12,517,474) | (536,105,993) | (10,295,565) | (500,840,484) |
| Net increase | 806,229 | 35,130,272 | 5,468,401 | 278,343,200 |
| Advisor Class | | | | |
| Shares sold | 1,380,704 | 60,447,868 | 1,822,291 | 91,396,595 |
| Distributions reinvested | 385,563 | 16,360,955 | 659,706 | 33,574,129 |
| Shares redeemed | (1,814,698) | (78,332,853) | (1,838,487) | (89,442,525) |
| Net increase (decrease) | (48,431) | (1,524,030) | 643,510 | 35,528,199 |
| Class C | | | | |
| Shares sold | 3,071,533 | 132,829,863 | 3,488,168 | 172,317,393 |
| Distributions reinvested | 1,145,341 | 47,683,439 | 2,369,562 | 119,709,620 |
| Shares redeemed | (9,072,273) | (388,335,030) | (7,425,517) | (358,773,357) |
| Net decrease | (4,855,399) | (207,821,728) | (1,567,787) | (66,746,344) |
| Institutional Class | | | | |
| Shares sold | 8,067,723 | 348,851,453 | 8,968,338 | 439,290,675 |
| Distributions reinvested | 2,182,350 | 91,453,065 | 3,732,782 | 187,780,068 |
| Shares redeemed | (11,726,716) | (501,126,432) | (9,666,031) | (465,381,836) |
| Net increase (decrease) | (1,476,643) | (60,821,914) | 3,035,089 | 161,688,907 |
| Institutional 2 Class | | | | |
| Shares sold | 2,657,821 | 114,514,298 | 1,749,381 | 85,011,500 |
| Distributions reinvested | 426,525 | 17,889,108 | 734,813 | 37,002,816 |
| Shares redeemed | (2,472,914) | (105,318,869) | (3,051,743) | (149,515,640) |
| Net increase (decrease) | 611,432 | 27,084,537 | (567,549) | (27,501,324) |
| Institutional 3 Class | | | | |
| Shares sold | 3,019,530 | 132,328,830 | 3,081,999 | 152,927,781 |
| Distributions reinvested | 681,459 | 28,931,123 | 1,122,400 | 57,108,962 |
| Shares redeemed | (3,862,364) | (169,612,515) | (2,590,162) | (127,143,105) |
| Net increase (decrease) | (161,375) | (8,352,562) | 1,614,237 | 82,893,638 |
| Class R | | | | |
| Shares sold | 484,049 | 20,892,199 | 363,397 | 17,819,827 |
| Distributions reinvested | 129,339 | 5,427,366 | 225,446 | 11,406,732 |
| Shares redeemed | (413,850) | (17,723,918) | (606,040) | (29,291,708) |
| Net increase (decrease) | 199,538 | 8,595,647 | (17,197) | (65,149) |
| Total net increase (decrease) | (4,924,649) | (207,709,778) | 8,608,704 | 464,141,127 |
The accompanying Notes to Financial Statements are an integral part of this statement.
Columbia Balanced Fund | Annual Report 2023
| 37 |
The following table is intended to help you understand the Fund’s financial performance. Certain information reflects financial results for a single share of a class held for the periods shown. Per share net investment income (loss) amounts are calculated based on average shares outstanding during the period. Total return assumes reinvestment of all dividends and distributions, if any. Total return does not reflect payment of sales charges, if any. Total return and portfolio turnover are not annualized for periods of less than one year. The ratios of expenses and net investment income are annualized for periods of less than one year. The portfolio turnover rate is calculated without regard to purchase and sales transactions of short-term instruments and certain derivatives, if any. If such transactions were included, the Fund’s portfolio turnover rate may be higher.
| | Net asset value,
beginning of
period | Net
investment
income
(loss) | Net
realized
and
unrealized
gain (loss) | Total from
investment
operations | Distributions
from net
investment
income | Distributions
from net
realized
gains | Total
distributions to
shareholders |
| Class A |
| Year Ended 8/31/2023 | $43.97 | 0.71 | 3.46 | 4.17 | (0.64) | (1.56) | (2.20) |
| Year Ended 8/31/2022 | $54.93 | 0.40 | (6.73) | (6.33) | (0.34) | (4.29) | (4.63) |
| Year Ended 8/31/2021 | $47.73 | 0.36 | 9.19 | 9.55 | (0.37) | (1.98) | (2.35) |
| Year Ended 8/31/2020 | $42.24 | 0.53 | 6.67 | 7.20 | (0.63) | (1.08) | (1.71) |
| Year Ended 8/31/2019 | $42.53 | 0.63 | 1.19 | 1.82 | (0.60) | (1.51) | (2.11) |
| Advisor Class |
| Year Ended 8/31/2023 | $44.39 | 0.82 | 3.49 | 4.31 | (0.74) | (1.56) | (2.30) |
| Year Ended 8/31/2022 | $55.42 | 0.52 | (6.79) | (6.27) | (0.47) | (4.29) | (4.76) |
| Year Ended 8/31/2021 | $48.13 | 0.49 | 9.27 | 9.76 | (0.49) | (1.98) | (2.47) |
| Year Ended 8/31/2020 | $42.58 | 0.64 | 6.72 | 7.36 | (0.73) | (1.08) | (1.81) |
| Year Ended 8/31/2019 | $42.86 | 0.73 | 1.21 | 1.94 | (0.71) | (1.51) | (2.22) |
| Class C |
| Year Ended 8/31/2023 | $43.72 | 0.38 | 3.44 | 3.82 | (0.31) | (1.56) | (1.87) |
| Year Ended 8/31/2022 | $54.68 | 0.03 | (6.69) | (6.66) | (0.01) | (4.29) | (4.30) |
| Year Ended 8/31/2021 | $47.56 | (0.02) | 9.16 | 9.14 | (0.04) | (1.98) | (2.02) |
| Year Ended 8/31/2020 | $42.08 | 0.21 | 6.65 | 6.86 | (0.30) | (1.08) | (1.38) |
| Year Ended 8/31/2019 | $42.38 | 0.32 | 1.19 | 1.51 | (0.30) | (1.51) | (1.81) |
| Institutional Class |
| Year Ended 8/31/2023 | $43.87 | 0.81 | 3.45 | 4.26 | (0.74) | (1.56) | (2.30) |
| Year Ended 8/31/2022 | $54.83 | 0.52 | (6.72) | (6.20) | (0.47) | (4.29) | (4.76) |
| Year Ended 8/31/2021 | $47.65 | 0.48 | 9.17 | 9.65 | (0.49) | (1.98) | (2.47) |
| Year Ended 8/31/2020 | $42.17 | 0.64 | 6.65 | 7.29 | (0.73) | (1.08) | (1.81) |
| Year Ended 8/31/2019 | $42.47 | 0.73 | 1.19 | 1.92 | (0.71) | (1.51) | (2.22) |
| Institutional 2 Class |
| Year Ended 8/31/2023 | $43.91 | 0.83 | 3.45 | 4.28 | (0.76) | (1.56) | (2.32) |
| Year Ended 8/31/2022 | $54.87 | 0.53 | (6.71) | (6.18) | (0.49) | (4.29) | (4.78) |
| Year Ended 8/31/2021 | $47.68 | 0.50 | 9.18 | 9.68 | (0.51) | (1.98) | (2.49) |
| Year Ended 8/31/2020 | $42.20 | 0.66 | 6.65 | 7.31 | (0.75) | (1.08) | (1.83) |
| Year Ended 8/31/2019 | $42.50 | 0.75 | 1.19 | 1.94 | (0.73) | (1.51) | (2.24) |
The accompanying Notes to Financial Statements are an integral part of this statement.
| 38 | Columbia Balanced Fund | Annual Report 2023 |
Financial Highlights (continued)
| | Net
asset
value,
end of
period | Total
return | Total gross
expense
ratio to
average
net assets(a) | Total net
expense
ratio to
average
net assets(a),(b) | Net investment
income (loss)
ratio to
average
net assets | Portfolio
turnover | Net
assets,
end of
period
(000’s) |
| Class A |
| Year Ended 8/31/2023 | $45.94 | 9.99% | 0.93%(c) | 0.93%(c),(d) | 1.64% | 171% | $3,260,575 |
| Year Ended 8/31/2022 | $43.97 | (12.57%) | 0.92%(c),(e) | 0.92%(c),(d),(e) | 0.81% | 121% | $3,085,213 |
| Year Ended 8/31/2021 | $54.93 | 20.72% | 0.93%(c) | 0.93%(c),(d) | 0.71% | 124% | $3,553,866 |
| Year Ended 8/31/2020 | $47.73 | 17.59% | 0.95% | 0.95%(d) | 1.23% | 140% | $2,954,559 |
| Year Ended 8/31/2019 | $42.24 | 4.79% | 0.95% | 0.95% | 1.55% | 119% | $2,685,001 |
| Advisor Class |
| Year Ended 8/31/2023 | $46.40 | 10.26% | 0.68%(c) | 0.68%(c),(d) | 1.89% | 171% | $348,301 |
| Year Ended 8/31/2022 | $44.39 | (12.36%) | 0.67%(c),(e) | 0.67%(c),(d),(e) | 1.06% | 121% | $335,333 |
| Year Ended 8/31/2021 | $55.42 | 21.03% | 0.68%(c) | 0.68%(c),(d) | 0.95% | 124% | $382,964 |
| Year Ended 8/31/2020 | $48.13 | 17.89% | 0.70% | 0.70%(d) | 1.48% | 140% | $253,954 |
| Year Ended 8/31/2019 | $42.58 | 5.04% | 0.70% | 0.70% | 1.80% | 119% | $248,877 |
| Class C |
| Year Ended 8/31/2023 | $45.67 | 9.18% | 1.68%(c) | 1.68%(c),(d) | 0.88% | 171% | $1,057,268 |
| Year Ended 8/31/2022 | $43.72 | (13.23%) | 1.67%(c),(e) | 1.67%(c),(d),(e) | 0.05% | 121% | $1,224,470 |
| Year Ended 8/31/2021 | $54.68 | 19.82% | 1.68%(c) | 1.68%(c),(d) | (0.04%) | 124% | $1,616,952 |
| Year Ended 8/31/2020 | $47.56 | 16.73% | 1.70% | 1.70%(d) | 0.48% | 140% | $1,512,696 |
| Year Ended 8/31/2019 | $42.08 | 4.00% | 1.70% | 1.70% | 0.80% | 119% | $1,443,468 |
| Institutional Class |
| Year Ended 8/31/2023 | $45.83 | 10.27% | 0.68%(c) | 0.68%(c),(d) | 1.89% | 171% | $2,126,401 |
| Year Ended 8/31/2022 | $43.87 | (12.36%) | 0.67%(c),(e) | 0.67%(c),(d),(e) | 1.06% | 121% | $2,100,254 |
| Year Ended 8/31/2021 | $54.83 | 21.01% | 0.68%(c) | 0.68%(c),(d) | 0.96% | 124% | $2,458,182 |
| Year Ended 8/31/2020 | $47.65 | 17.90% | 0.70% | 0.70%(d) | 1.48% | 140% | $1,876,178 |
| Year Ended 8/31/2019 | $42.17 | 5.04% | 0.70% | 0.70% | 1.80% | 119% | $1,672,560 |
| Institutional 2 Class |
| Year Ended 8/31/2023 | $45.87 | 10.30% | 0.64%(c) | 0.64%(c) | 1.93% | 171% | $376,116 |
| Year Ended 8/31/2022 | $43.91 | (12.32%) | 0.64%(c),(e) | 0.64%(c),(e) | 1.09% | 121% | $333,148 |
| Year Ended 8/31/2021 | $54.87 | 21.07% | 0.64%(c) | 0.64%(c) | 1.00% | 124% | $447,431 |
| Year Ended 8/31/2020 | $47.68 | 17.95% | 0.65% | 0.65% | 1.52% | 140% | $286,454 |
| Year Ended 8/31/2019 | $42.20 | 5.09% | 0.65% | 0.65% | 1.84% | 119% | $245,737 |
The accompanying Notes to Financial Statements are an integral part of this statement.
Columbia Balanced Fund | Annual Report 2023
| 39 |
Financial Highlights (continued)
| | Net asset value,
beginning of
period | Net
investment
income
(loss) | Net
realized
and
unrealized
gain (loss) | Total from
investment
operations | Distributions
from net
investment
income | Distributions
from net
realized
gains | Total
distributions to
shareholders |
| Institutional 3 Class |
| Year Ended 8/31/2023 | $44.41 | 0.86 | 3.49 | 4.35 | (0.78) | (1.56) | (2.34) |
| Year Ended 8/31/2022 | $55.44 | 0.57 | (6.79) | (6.22) | (0.52) | (4.29) | (4.81) |
| Year Ended 8/31/2021 | $48.15 | 0.53 | 9.27 | 9.80 | (0.53) | (1.98) | (2.51) |
| Year Ended 8/31/2020 | $42.60 | 0.68 | 6.72 | 7.40 | (0.77) | (1.08) | (1.85) |
| Year Ended 8/31/2019 | $42.88 | 0.78 | 1.20 | 1.98 | (0.75) | (1.51) | (2.26) |
| Class R |
| Year Ended 8/31/2023 | $43.97 | 0.60 | 3.46 | 4.06 | (0.53) | (1.56) | (2.09) |
| Year Ended 8/31/2022 | $54.92 | 0.27 | (6.71) | (6.44) | (0.22) | (4.29) | (4.51) |
| Year Ended 8/31/2021 | $47.73 | 0.23 | 9.18 | 9.41 | (0.24) | (1.98) | (2.22) |
| Year Ended 8/31/2020 | $42.23 | 0.42 | 6.68 | 7.10 | (0.52) | (1.08) | (1.60) |
| Year Ended 8/31/2019 | $42.53 | 0.53 | 1.18 | 1.71 | (0.50) | (1.51) | (2.01) |
| Notes to Financial Highlights |
| (a) | In addition to the fees and expenses that the Fund bears directly, the Fund indirectly bears a pro rata share of the fees and expenses of any other funds in which it invests. Such indirect expenses are not included in the Fund’s reported expense ratios. |
| (b) | Total net expenses include the impact of certain fee waivers/expense reimbursements made by the Investment Manager and certain of its affiliates, if applicable. |
| (c) | Ratios include interest on collateral expense which is less than 0.01%. |
| (d) | The benefits derived from expense reductions had an impact of less than 0.01%. |
| (e) | Ratios include interfund lending expense which is less than 0.01%. |
The accompanying Notes to Financial Statements are an integral part of this statement.
| 40 | Columbia Balanced Fund | Annual Report 2023 |
Financial Highlights (continued)
| | Net
asset
value,
end of
period | Total
return | Total gross
expense
ratio to
average
net assets(a) | Total net
expense
ratio to
average
net assets(a),(b) | Net investment
income (loss)
ratio to
average
net assets | Portfolio
turnover | Net
assets,
end of
period
(000’s) |
| Institutional 3 Class |
| Year Ended 8/31/2023 | $46.42 | 10.35% | 0.60%(c) | 0.60%(c) | 1.98% | 171% | $672,955 |
| Year Ended 8/31/2022 | $44.41 | (12.27%) | 0.59%(c),(e) | 0.59%(c),(e) | 1.15% | 121% | $650,889 |
| Year Ended 8/31/2021 | $55.44 | 21.13% | 0.59%(c) | 0.59%(c) | 1.05% | 124% | $723,074 |
| Year Ended 8/31/2020 | $48.15 | 18.00% | 0.61% | 0.61% | 1.56% | 140% | $573,567 |
| Year Ended 8/31/2019 | $42.60 | 5.14% | 0.61% | 0.61% | 1.90% | 119% | $377,342 |
| Class R |
| Year Ended 8/31/2023 | $45.94 | 9.72% | 1.18%(c) | 1.18%(c),(d) | 1.39% | 171% | $128,460 |
| Year Ended 8/31/2022 | $43.97 | (12.78%) | 1.17%(c),(e) | 1.17%(c),(d),(e) | 0.56% | 121% | $114,174 |
| Year Ended 8/31/2021 | $54.92 | 20.40% | 1.18%(c) | 1.18%(c),(d) | 0.47% | 124% | $143,562 |
| Year Ended 8/31/2020 | $47.73 | 17.32% | 1.20% | 1.20%(d) | 0.98% | 140% | $134,948 |
| Year Ended 8/31/2019 | $42.23 | 4.50% | 1.20% | 1.20% | 1.30% | 119% | $127,735 |
The accompanying Notes to Financial Statements are an integral part of this statement.
Columbia Balanced Fund | Annual Report 2023
| 41 |
Notes to Financial Statements
August 31, 2023
Note 1. Organization
Columbia Balanced Fund (the Fund), a series of Columbia Funds Series Trust I (the Trust), is a diversified fund. The Trust is registered under the Investment Company Act of 1940, as amended (the 1940 Act), as an open-end management investment company organized as a Massachusetts business trust.
Fund shares
The Trust may issue an unlimited number of shares (without par value). The Fund offers each of the share classes listed in the Statement of Assets and Liabilities. Although all share classes generally have identical voting, dividend and liquidation rights, each share class votes separately when required by the Trust’s organizational documents or by law. Each share class has its own expense and sales charge structure. Different share classes may have different minimum initial investment amounts and pay different net investment income distribution amounts to the extent the expenses of distributing such share classes vary. Distributions to shareholders in a liquidation will be proportional to the net asset value of each share class.
As described in the Fund’s prospectus, Class A and Class C shares are offered to the general public for investment. Class C shares automatically convert to Class A shares after 8 years. Advisor Class, Institutional Class, Institutional 2 Class, Institutional 3 Class and Class R shares are available for purchase through authorized investment professionals to omnibus retirement plans or to institutional investors and to certain other investors as also described in the Fund’s prospectus.
Note 2. Summary of significant accounting policies
Basis of preparation
The Fund is an investment company that applies the accounting and reporting guidance in the Financial Accounting Standards Board (FASB) Accounting Standards Codification Topic 946, Financial Services - Investment Companies (ASC 946). The financial statements are prepared in accordance with U.S. generally accepted accounting principles (GAAP), which requires management to make certain estimates and assumptions that affect the reported amounts of assets and liabilities, the disclosure of contingent assets and liabilities at the date of the financial statements and the reported amounts of income and expenses during the reporting period. Actual results could differ from those estimates.
The following is a summary of significant accounting policies followed by the Fund in the preparation of its financial statements.
Security valuation
Equity securities listed on an exchange are valued at the closing price or last trade price on their primary exchange at the close of business of the New York Stock Exchange. Securities with a closing price not readily available or not listed on any exchange are valued at the mean between the closing bid and ask prices. Listed preferred stocks convertible into common stocks are valued using an evaluated price from a pricing service.
Debt securities generally are valued based on prices obtained from pricing services, which are intended to reflect market transactions for normal, institutional-size trading units of similar securities. The services may use various pricing techniques that take into account, as applicable, factors such as yield, quality, coupon rate, maturity, type of issue, trading characteristics and other data, as well as approved independent broker-dealer quotes. Debt securities for which quotations are not readily available or not believed to be reflective of market value may also be valued based upon a bid quote from an approved independent broker-dealer. Debt securities maturing in 60 days or less are valued primarily at amortized market value, unless this method results in a valuation that management believes does not approximate fair value.
Asset- and mortgage-backed securities are generally valued by pricing services, which utilize pricing models that incorporate the securities’ cash flow and loan performance data. These models also take into account available market data, including trades, market quotations, and benchmark yield curves for identical or similar securities. Factors used to identify similar securities may include, but are not limited to, issuer, collateral type, vintage, prepayment speeds, collateral performance, credit ratings, credit enhancement and expected life. Asset-backed securities for which quotations are readily available may also be valued based upon an over-the-counter or exchange bid quote from an approved independent broker-dealer. Debt securities maturing in 60 days or less are valued primarily at amortized market value, unless this method results in a valuation that management believes does not approximate fair value.
| 42 | Columbia Balanced Fund | Annual Report 2023 |
Notes to Financial Statements (continued)
August 31, 2023
Senior loan securities for which reliable market quotations are readily available are generally valued by pricing services at the average of the bids received.
Foreign equity securities are valued based on the closing price or last trade price on their primary exchange at the close of business of the New York Stock Exchange. If any foreign equity security closing prices are not readily available, the securities are valued at the mean of the latest quoted bid and ask prices on such exchanges or markets. Foreign currency exchange rates are determined at the scheduled closing time of the New York Stock Exchange. Many securities markets and exchanges outside the U.S. close prior to the close of the New York Stock Exchange; therefore, the closing prices for securities in such markets or on such exchanges may not fully reflect events that occur after such close but before the close of the New York Stock Exchange. In those situations, foreign securities will be fair valued pursuant to a policy approved by the Board of Trustees. Under the policy, the Fund may utilize a third-party pricing service to determine these fair values. The third-party pricing service takes into account multiple factors, including, but not limited to, movements in the U.S. securities markets, certain depositary receipts, futures contracts and foreign exchange rates that have occurred subsequent to the close of the foreign exchange or market, to determine a good faith estimate that reasonably reflects the current market conditions as of the close of the New York Stock Exchange. The fair value of a security is likely to be different from the quoted or published price, if available.
Investments in open-end investment companies (other than exchange-traded funds (ETFs)), are valued at the latest net asset value reported by those companies as of the valuation time.
Futures and options on futures contracts are valued based upon the settlement price at the close of regular trading on their principal exchanges or, in the absence of a settlement price, at the mean of the latest quoted bid and ask prices.
Investments for which market quotations are not readily available, or that have quotations which management believes are not reflective of market value or reliable, are valued at fair value as determined in good faith under procedures approved by the Board of Trustees. If a security or class of securities (such as foreign securities) is valued at fair value, such value is likely to be different from the quoted or published price for the security, if available.
The determination of fair value often requires significant judgment. To determine fair value, management may use assumptions including but not limited to future cash flows and estimated risk premiums. Multiple inputs from various sources may be used to determine fair value.
GAAP requires disclosure regarding the inputs and valuation techniques used to measure fair value and any changes in valuation inputs or techniques. In addition, investments shall be disclosed by major category. This information is disclosed following the Fund’s Portfolio of Investments.
Foreign currency transactions and translations
The values of all assets and liabilities denominated in foreign currencies are generally translated into U.S. dollars at exchange rates determined at the close of regular trading on the New York Stock Exchange. Net realized and unrealized gains (losses) on foreign currency transactions and translations include gains (losses) arising from the fluctuation in exchange rates between trade and settlement dates on securities transactions, gains (losses) arising from the disposition of foreign currency and currency gains (losses) between the accrual and payment dates on dividends, interest income and foreign withholding taxes.
For financial statement purposes, the Fund does not distinguish that portion of gains (losses) on investments which is due to changes in foreign exchange rates from that which is due to changes in market prices of the investments. Such fluctuations are included with the net realized and unrealized gains (losses) on investments in the Statement of Operations.
Derivative instruments
The Fund invests in certain derivative instruments, as detailed below, in seeking to meet its investment objectives. Derivatives are instruments whose values depend on, or are derived from, in whole or in part, the value of one or more securities, currencies, commodities, indices, or other assets or instruments. Derivatives may be used to increase investment flexibility (including to maintain cash reserves while maintaining desired exposure to certain assets), for risk management (hedging) purposes, to facilitate trading, to reduce transaction costs and to pursue higher investment returns. The Fund may
Columbia Balanced Fund | Annual Report 2023
| 43 |
Notes to Financial Statements (continued)
August 31, 2023
also use derivative instruments to mitigate certain investment risks, such as foreign currency exchange rate risk, interest rate risk and credit risk. Derivatives may involve various risks, including the potential inability of the counterparty to fulfill its obligations under the terms of the contract, the potential for an illiquid secondary market (making it difficult for the Fund to sell or terminate, including at favorable prices) and the potential for market movements which may expose the Fund to gains or losses in excess of the amount shown in the Statement of Assets and Liabilities. The notional amounts of derivative instruments, if applicable, are not recorded in the financial statements.
A derivative instrument may suffer a marked-to-market loss if the value of the contract decreases due to an unfavorable change in the market rates or values of the underlying instrument. Losses can also occur if the counterparty does not perform its obligations under the contract. The Fund’s risk of loss from counterparty credit risk on over-the-counter derivatives is generally limited to the aggregate unrealized gain netted against any collateral held by the Fund and the amount of any variation margin held by the counterparty, plus any replacement costs or related amounts. With exchange-traded or centrally cleared derivatives, there is reduced counterparty credit risk to the Fund since the clearinghouse or central counterparty (CCP) provides some protection in the case of clearing member default. The clearinghouse or CCP stands between the buyer and the seller of the contract; therefore, failure of the clearinghouse or CCP may pose additional counterparty credit risk. However, credit risk still exists in exchange-traded or centrally cleared derivatives with respect to initial and variation margin that is held in a broker’s customer account. While clearing brokers are required to segregate customer margin from their own assets, in the event that a clearing broker becomes insolvent or goes into bankruptcy and at that time there is a shortfall in the aggregate amount of margin held by the clearing broker for all its clients and such shortfall is remedied by the CCP or otherwise, U.S. bankruptcy laws will typically allocate that shortfall on a pro-rata basis across all the clearing broker’s customers (including the Fund), potentially resulting in losses to the Fund.
In order to better define its contractual rights and to secure rights that will help the Fund mitigate its counterparty risk, the Fund may enter into an International Swaps and Derivatives Association, Inc. Master Agreement (ISDA Master Agreement) or similar agreement with its derivatives counterparties. An ISDA Master Agreement is an agreement between the Fund and a counterparty that governs over-the-counter derivatives and foreign exchange forward contracts and contains, among other things, collateral posting terms and netting provisions in the event of a default and/or termination event. Under an ISDA Master Agreement, the Fund may, under certain circumstances, offset with the counterparty certain derivative instruments’ payables and/or receivables with collateral held and/or posted and create one single net payment. The provisions of the ISDA Master Agreement typically permit a single net payment in the event of default (close-out netting), including the bankruptcy or insolvency of the counterparty. Note, however, that bankruptcy or insolvency laws of a particular jurisdiction may impose restrictions on or prohibitions against the right of offset or netting in bankruptcy, insolvency or other events.
Collateral (margin) requirements differ by type of derivative. Margin requirements are established by the clearinghouse or CCP for exchange-traded and centrally cleared derivatives. Brokers can ask for margin in excess of the minimum in certain circumstances. Collateral terms for most over-the-counter derivatives are subject to regulatory requirements to exchange variation margin with trading counterparties and may have contract specific margin terms as well. For over-the-counter derivatives traded under an ISDA Master Agreement, the collateral requirements are typically calculated by netting the marked-to-market amount for each transaction under such agreement and comparing that amount to the value of any variation margin currently pledged by the Fund and/or the counterparty. Generally, the amount of collateral due from or to a party has to exceed a minimum transfer amount threshold (e.g., $250,000) before a transfer has to be made. To the extent amounts due to the Fund from its counterparties are not fully collateralized, contractually or otherwise, the Fund bears the risk of loss from counterparty nonperformance. The Fund may also pay interest expense on cash collateral received from the broker or receive interest income on cash collateral pledged to the broker. The Fund attempts to mitigate counterparty risk by only entering into agreements with counterparties that it believes have the financial resources to honor their obligations and by monitoring the financial stability of those counterparties.
Certain ISDA Master Agreements allow counterparties of over-the-counter derivatives transactions to terminate derivatives contracts prior to maturity in the event the Fund’s net asset value declines by a stated percentage over a specified time period or if the Fund fails to meet certain terms of the ISDA Master Agreement, which would cause the Fund to accelerate payment of any net liability owed to the counterparty. The Fund also has termination rights if the counterparty fails to meet certain terms of the ISDA Master Agreement. In determining whether to exercise such termination rights, the Fund would consider, in addition to counterparty credit risk, whether termination would result in a net liability owed from the counterparty.
| 44 | Columbia Balanced Fund | Annual Report 2023 |
Notes to Financial Statements (continued)
August 31, 2023
For financial reporting purposes, the Fund does not offset derivative assets and derivative liabilities that are subject to netting arrangements in the Statement of Assets and Liabilities.
Futures contracts
Futures contracts are exchange-traded and represent commitments for the future purchase or sale of an asset at a specified price on a specified date. The Fund bought and sold futures contracts to manage the duration and yield curve exposure of the Fund versus the benchmark and to manage exposure to movements in interest rates. These instruments may be used for other purposes in future periods. Upon entering into futures contracts, the Fund bears risks that it may not achieve the anticipated benefits of the futures contracts and may realize a loss. Additional risks include counterparty credit risk, the possibility of an illiquid market, and that a change in the value of the contract or option may not correlate with changes in the value of the underlying asset.
Upon entering into a futures contract, the Fund deposits cash or securities with the broker, known as a futures commission merchant (FCM), in an amount sufficient to meet the initial margin requirement. The initial margin deposit must be maintained at an established level over the life of the contract. Cash deposited as initial margin is recorded in the Statement of Assets and Liabilities as margin deposits. Securities deposited as initial margin are designated in the Portfolio of Investments. Subsequent payments (variation margin) are made or received by the Fund each day. The variation margin payments are equal to the daily change in the contract value and are recorded as variation margin receivable or payable and are offset in unrealized gains or losses. The Fund generally expects to earn interest income on its margin deposits. The Fund recognizes a realized gain or loss when the contract is closed or expires. Futures contracts involve, to varying degrees, risk of loss in excess of the variation margin disclosed in the Statement of Assets and Liabilities.
Effects of derivative transactions in the financial statements
The following tables are intended to provide additional information about the effect of derivatives on the financial statements of the Fund, including: the fair value of derivatives by risk category and the location of those fair values in the Statement of Assets and Liabilities; and the impact of derivative transactions over the period in the Statement of Operations, including realized and unrealized gains (losses). The derivative instrument schedules following the Portfolio of Investments present additional information regarding derivative instruments outstanding at the end of the period, if any.
The following table is a summary of the fair value of derivative instruments (not considered to be hedging instruments for accounting disclosure purposes) at August 31, 2023:
| | Asset derivatives | |
Risk exposure
category | Statement
of assets and liabilities
location | Fair value ($) |
| Interest rate risk | Component of total distributable earnings (loss) — unrealized appreciation on futures contracts | 4,261,376* |
| | Liability derivatives | |
Risk exposure
category | Statement
of assets and liabilities
location | Fair value ($) |
| Interest rate risk | Component of total distributable earnings (loss) — unrealized depreciation on futures contracts | 362,887* |
| * | Includes cumulative appreciation (depreciation) as reported in the tables following the Portfolio of Investments. Only the current day’s variation margin for futures and centrally cleared swaps, if any, is reported in receivables or payables in the Statement of Assets and Liabilities. |
Columbia Balanced Fund | Annual Report 2023
| 45 |
Notes to Financial Statements (continued)
August 31, 2023
The following table indicates the effect of derivative instruments (not considered to be hedging instruments for accounting disclosure purposes) in the Statement of Operations for the year ended August 31, 2023:
| Amount of realized gain (loss) on derivatives recognized in income |
| Risk exposure category | Futures
contracts
($) |
| Interest rate risk | (72,188,138) |
| |
| Change in unrealized appreciation (depreciation) on derivatives recognized in income |
| Risk exposure category | Futures
contracts
($) |
| Interest rate risk | 5,155,439 |
The following table is a summary of the average daily outstanding volume by derivative instrument for the year ended August 31, 2023:
| Derivative instrument | Average notional
amounts ($) |
| Futures contracts — long | 798,160,675 |
| Futures contracts — short | 203,132,698 |
Investments in senior loans
The Fund may invest in senior loan assignments. When the Fund purchases an assignment of a senior loan, the Fund typically has direct rights against the borrower; provided, however, that the Fund’s rights may be more limited than the lender from which it acquired the assignment and the Fund may be able to enforce its rights only through an administrative agent. Although certain senior loan assignments are secured by collateral, the Fund could experience delays or limitations in realizing such collateral or have its interest subordinated to other indebtedness of the obligor. In the event that the administrator or collateral agent of a loan becomes insolvent or enters into receivership or bankruptcy, the Fund may incur costs and delays in realizing payment or may suffer a loss of principal and/or interest. The risk of loss is greater for unsecured or subordinated loans. In addition, senior loan assignments are vulnerable to market, economic or other conditions or events that may reduce the demand for senior loan assignments and certain senior loan assignments which were liquid when purchased, may become illiquid.
The Fund may enter into senior loan assignments where all or a portion of the loan may be unfunded. The Fund is obligated to fund these commitments at the borrower’s discretion. These commitments, if any, are generally traded and priced in the same manner as other senior loan securities and are disclosed as unfunded senior loan commitments in the Fund’s Portfolio of Investments with a corresponding payable for investments purchased. The Fund designates cash or liquid securities to cover these commitments.
Asset- and mortgage-backed securities
The Fund may invest in asset-backed and mortgage-backed securities. The maturity dates shown represent the original maturity of the underlying obligation. Actual maturity may vary based upon prepayment activity on these obligations. All, or a portion, of the obligation may be prepaid at any time because the underlying asset may be prepaid. As a result, decreasing market interest rates could result in an increased level of prepayment. An increased prepayment rate will have the effect of shortening the maturity of the security. Unless otherwise noted, the coupon rates presented are fixed rates.
Delayed delivery securities
The Fund may trade securities on other than normal settlement terms, including securities purchased or sold on a “when-issued” or "forward commitment" basis. This may increase risk to the Fund since the other party to the transaction may fail to deliver, which could cause the Fund to subsequently invest at less advantageous prices. The Fund designates cash or liquid securities in an amount equal to the delayed delivery commitment.
| 46 | Columbia Balanced Fund | Annual Report 2023 |
Notes to Financial Statements (continued)
August 31, 2023
To be announced securities
The Fund may trade securities on a To Be Announced (TBA) basis. As with other delayed-delivery transactions, a seller agrees to issue a TBA security at a future date. However, the seller does not specify the particular securities to be delivered. Instead, the Fund agrees to accept any security that meets specified terms.
In some cases, Master Securities Forward Transaction Agreements (MSFTAs) may be used to govern transactions of certain forward-settling agency mortgage-backed securities, such as delayed-delivery and TBAs, between the Fund and counterparty. The MSFTA maintains provisions for, among other things, initiation and confirmation, payment and transfer, events of default, termination, and maintenance of collateral relating to such transactions.
Mortgage dollar roll transactions
The Fund may enter into mortgage “dollar rolls” in which the Fund sells securities for delivery in the current month and simultaneously contracts with the same counterparty to repurchase similar but not identical securities (same type, coupon and maturity) on a specified future date. These transactions may increase the Fund’s portfolio turnover rate. During the roll period, the Fund loses the right to receive principal and interest paid on the securities sold. However, the Fund may benefit because it receives negotiated amounts in the form of reductions of the purchase price for the future purchase plus the interest earned on the cash proceeds of the securities sold until the settlement date of the forward purchase. The Fund records the incremental difference between the forward purchase and sale of each forward roll as a realized gain or loss. Unless any realized gains exceed the income, capital appreciation, and gain or loss due to mortgage prepayments that would have been realized on the securities sold as part of the mortgage dollar roll, the use of this technique may diminish the investment performance of the Fund compared to what the performance would have been without the use of mortgage dollar rolls. Mortgage dollar rolls involve the risk that the market value of the securities the Fund is obligated to repurchase may decline below the repurchase price, or that the counterparty may default on its obligations. All cash proceeds will be invested in instruments that are permissible investments for the Fund. The Fund identifies cash or liquid securities in an amount equal to the forward purchase price. The Fund does not currently enter into mortgage dollar rolls that are accounted for as financing transactions.
Security transactions
Security transactions are accounted for on the trade date. Cost is determined and gains (losses) are based upon the specific identification method for both financial statement and federal income tax purposes.
The trade date for senior loans purchased in the primary market is the date on which the loan is allocated. The trade date for senior loans purchased in the secondary market is the date on which the transaction is entered into.
Income recognition
Interest income is recorded on an accrual basis. Market premiums and discounts, including original issue discounts, are amortized and accreted, respectively, over the expected life of the security on all debt securities, unless otherwise noted. The Fund classifies gains and losses realized on prepayments received on mortgage-backed securities as adjustments to interest income. For convertible securities, premiums attributable to the conversion feature are not amortized.
The Fund may place a debt security on non-accrual status and reduce related interest income when it becomes probable that the interest will not be collected and the amount of uncollectible interest can be reasonably estimated. The Fund may also adjust accrual rates when it becomes probable the full interest will not be collected and a partial payment will be received. A defaulted debt security is removed from non-accrual status when the issuer resumes interest payments or when collectability of interest is reasonably assured.
Corporate actions and dividend income are generally recorded net of any non-reclaimable tax withholdings, on the ex-dividend date or upon receipt of an ex-dividend notification in the case of certain foreign securities.
The Fund may receive distributions from holdings in equity securities, business development companies (BDCs), exchange-traded funds (ETFs), limited partnerships (LPs), other regulated investment companies (RICs), and real estate investment trusts (REITs), which report information as to the tax character of their distributions annually. These distributions are allocated to dividend income, capital gain and return of capital based on actual information reported. Return of capital is
Columbia Balanced Fund | Annual Report 2023
| 47 |
Notes to Financial Statements (continued)
August 31, 2023
recorded as a reduction of the cost basis of securities held. If the Fund no longer owns the applicable securities, return of capital is recorded as a realized gain. With respect to REITs, to the extent actual information has not yet been reported, estimates for return of capital are made by Columbia Management Investment Advisers, LLC (the Investment Manager), a wholly-owned subsidiary of Ameriprise Financial, Inc. (Ameriprise Financial). The Investment Manager’s estimates are subsequently adjusted when the actual character of the distributions is disclosed by the REITs, which could result in a proportionate change in return of capital to shareholders.
Awards from class action litigation are recorded as a reduction of cost basis if the Fund still owns the applicable securities on the payment date. If the Fund no longer owns the applicable securities on the payment date, the proceeds are recorded as realized gains.
The value of additional securities received as an income payment through a payment-in-kind, if any, is recorded as interest income and increases the cost basis of such securities.
The Fund may receive other income from senior loans, including amendment fees, consent fees and commitment fees. These fees are recorded as income when received by the Fund. These amounts are included in Interest Income in the Statement of Operations.
Expenses
General expenses of the Trust are allocated to the Fund and other funds of the Trust based upon relative net assets or other expense allocation methodologies determined by the nature of the expense. Expenses directly attributable to the Fund are charged to the Fund. Expenses directly attributable to a specific class of shares are charged to that share class.
Determination of class net asset value
All income, expenses (other than class-specific expenses, which are charged to that share class, as shown in the Statement of Operations) and realized and unrealized gains (losses) are allocated to each class of the Fund on a daily basis, based on the relative net assets of each class, for purposes of determining the net asset value of each class.
Federal income tax status
The Fund intends to qualify each year as a regulated investment company under Subchapter M of the Internal Revenue Code, as amended, and will distribute substantially all of its investment company taxable income and net capital gain, if any, for its tax year, and as such will not be subject to federal income taxes. In addition, the Fund intends to distribute in each calendar year substantially all of its ordinary income, capital gain net income and certain other amounts, if any, such that the Fund should not be subject to federal excise tax. Therefore, no federal income or excise tax provision is recorded.
Foreign taxes
The Fund may be subject to foreign taxes on income, gains on investments or currency repatriation, a portion of which may be recoverable. The Fund will accrue such taxes and recoveries, as applicable, based upon its current interpretation of tax rules and regulations that exist in the markets in which it invests.
Realized gains in certain countries may be subject to foreign taxes at the Fund level, based on statutory rates. The Fund accrues for such foreign taxes on realized and unrealized gains at the appropriate rate for each jurisdiction, as applicable. The amount, if any, is disclosed as a liability in the Statement of Assets and Liabilities.
Distributions to shareholders
Distributions from net investment income, if any, are declared and paid each calendar quarter. Net realized capital gains, if any, are distributed at least annually. Income distributions and capital gain distributions are determined in accordance with federal income tax regulations, which may differ from GAAP.
| 48 | Columbia Balanced Fund | Annual Report 2023 |
Notes to Financial Statements (continued)
August 31, 2023
Guarantees and indemnifications
Under the Trust’s organizational documents and, in some cases, by contract, its officers and trustees are indemnified against certain liabilities arising out of the performance of their duties to the Trust or its funds. In addition, certain of the Fund’s contracts with its service providers contain general indemnification clauses. The Fund’s maximum exposure under these arrangements is unknown since the amount of any future claims that may be made against the Fund cannot be determined, and the Fund has no historical basis for predicting the likelihood of any such claims.
Recent accounting pronouncements and regulatory updates
Tailored Shareholder Reports
In October 2022, the Securities and Exchange Commission (SEC) adopted a final rule relating to Tailored Shareholder Reports for Mutual Funds and Exchange-Traded Funds; Fee Information in Investment Company Advertisements. The rule and form amendments will, among other things, require the Fund to transmit concise and visually engaging shareholder reports that highlight key information. The amendments will require that funds tag information in a structured data format and that certain more in-depth information be made available online and available for delivery free of charge to investors on request. The amendments became effective January 24, 2023. There is an 18-month transition period after the effective date of the amendments.
Note 3. Fees and other transactions with affiliates
Management services fees
The Fund has entered into a Management Agreement with Columbia Management Investment Advisers, LLC (the Investment Manager), a wholly-owned subsidiary of Ameriprise Financial, Inc. (Ameriprise Financial). Under the Management Agreement, the Investment Manager provides the Fund with investment research and advice, as well as administrative and accounting services. The management services fee is an annual fee that is equal to a percentage of the Fund’s daily net assets that declines from 0.72% to 0.5075% as the Fund’s net assets increase. The effective management services fee rate for the year ended August 31, 2023 was 0.5738% of the Fund’s average daily net assets.
Compensation of board members
Members of the Board of Trustees who are not officers or employees of the Investment Manager or Ameriprise Financial are compensated for their services to the Fund as disclosed in the Statement of Operations. Under a Deferred Compensation Plan (the Deferred Plan), these members of the Board of Trustees may elect to defer payment of up to 100% of their compensation. Deferred amounts are treated as though equivalent dollar amounts had been invested in shares of certain funds managed by the Investment Manager. The Fund’s liability for these amounts is adjusted for market value changes and remains in the Fund until distributed in accordance with the Deferred Plan. All amounts payable under the Deferred Plan constitute a general unsecured obligation of the Fund. The expense for the Deferred Plan, which includes Trustees’ fees deferred during the current period as well as any gains or losses on the Trustees’ deferred compensation balances as a result of market fluctuations, is included in "Trustees’ fees" in the Statement of Operations.
Compensation of Chief Compliance Officer
The Board of Trustees has appointed a Chief Compliance Officer for the Fund in accordance with federal securities regulations. As disclosed in the Statement of Operations, a portion of the Chief Compliance Officer’s total compensation is allocated to the Fund, along with other allocations to affiliated registered investment companies managed by the Investment Manager and its affiliates, based on relative net assets.
Transfer agency fees
Under a Transfer and Dividend Disbursing Agent Agreement, Columbia Management Investment Services Corp. (the Transfer Agent), an affiliate of the Investment Manager and a wholly-owned subsidiary of Ameriprise Financial, is responsible for providing transfer agency services to the Fund. The Transfer Agent has contracted with SS&C GIDS, Inc. (SS&C GIDS) to
Columbia Balanced Fund | Annual Report 2023
| 49 |
Notes to Financial Statements (continued)
August 31, 2023
serve as sub-transfer agent. Prior to January 1, 2023, SS&C GIDS was known as DST Asset Manager Solutions, Inc. The Transfer Agent pays the fees of SS&C GIDS for services as sub-transfer agent and SS&C GIDS is not entitled to reimbursement for such fees from the Fund (with the exception of out-of-pocket fees).
The Fund pays the Transfer Agent a monthly transfer agency fee based on the number or the average value of accounts, depending on the type of account. In addition, the Fund pays the Transfer Agent a fee for shareholder services based on the number of accounts or on a percentage of the average aggregate value of the Fund’s shares maintained in omnibus accounts up to the lesser of the amount charged by the financial intermediary or a cap established by the Board of Trustees from time to time.
The Transfer Agent also receives compensation from the Fund for various shareholder services and reimbursements for certain out-of-pocket fees. Total transfer agency fees for Institutional 2 Class and Institutional 3 Class shares are subject to an annual limitation of not more than 0.07% and 0.02%, respectively, of the average daily net assets attributable to each share class.
For the year ended August 31, 2023, the Fund’s effective transfer agency fee rates as a percentage of average daily net assets of each class were as follows:
| | Effective rate (%) |
| Class A | 0.10 |
| Advisor Class | 0.10 |
| Class C | 0.10 |
| Institutional Class | 0.10 |
| Institutional 2 Class | 0.06 |
| Institutional 3 Class | 0.01 |
| Class R | 0.10 |
An annual minimum account balance fee of $20 may apply to certain accounts with a value below the applicable share class’s initial minimum investment requirements to reduce the impact of small accounts on transfer agency fees. These minimum account balance fees are remitted to the Fund and recorded as part of expense reductions in the Statement of Operations. For the year ended August 31, 2023, these minimum account balance fees reduced total expenses of the Fund by $1,548.
Distribution and service fees
The Fund has entered into an agreement with Columbia Management Investment Distributors, Inc. (the Distributor), an affiliate of the Investment Manager and a wholly-owned subsidiary of Ameriprise Financial, for distribution and shareholder services. The Board of Trustees has approved, and the Fund has adopted, distribution and shareholder service plans (the Plans) applicable to certain share classes, which set the distribution and service fees for the Fund. These fees are calculated daily and are intended to compensate the Distributor and/or eligible selling and/or servicing agents for selling shares of the Fund and providing services to investors.
Under the Plans, the Fund pays a monthly service fee to the Distributor at the maximum annual rate of 0.25% of the average daily net assets attributable to Class A and Class C shares of the Fund. Also under the Plans, the Fund pays a monthly distribution fee to the Distributor at the maximum annual rates of 0.10%, 0.75% and 0.50% of the average daily net assets attributable to Class A, Class C and Class R shares of the Fund, respectively.
Although the Fund may pay distribution and service fees up to a maximum annual rate of 0.35% of the Fund’s average daily net assets attributable to Class A shares (comprised of up to 0.10% for distribution services and up to 0.25% for shareholder services), the Fund currently limits such fees to an aggregate fee of not more than 0.25% of the Fund’s average daily net assets attributable to Class A shares.
| 50 | Columbia Balanced Fund | Annual Report 2023 |
Notes to Financial Statements (continued)
August 31, 2023
Sales charges (unaudited)
Sales charges, including front-end charges and contingent deferred sales charges (CDSCs), received by the Distributor for distributing Fund shares for the year ended August 31, 2023, if any, are listed below:
| | Front End (%) | CDSC (%) | Amount ($) |
| Class A | 5.75 | 0.50 - 1.00(a) | 2,575,935 |
| Class C | — | 1.00(b) | 58,375 |
| (a) | This charge is imposed on certain investments of between $1 million and $50 million redeemed within 18 months after purchase, as follows: 1.00% if redeemed within 12 months after purchase, and 0.50% if redeemed more than 12, but less than 18, months after purchase, with certain limited exceptions. |
| (b) | This charge applies to redemptions within 12 months after purchase, with certain limited exceptions. |
The Fund’s other share classes are not subject to sales charges.
Expenses waived/reimbursed by the Investment Manager and its affiliates
The Investment Manager and certain of its affiliates have contractually agreed to waive fees and/or reimburse expenses (excluding certain fees and expenses described below) for the period(s) disclosed below, unless sooner terminated at the sole discretion of the Board of Trustees, so that the Fund’s net operating expenses, after giving effect to fees waived/expenses reimbursed and any balance credits and/or overdraft charges from the Fund’s custodian, do not exceed the following annual rate(s) as a percentage of the classes’ average daily net assets:
| | Fee rate(s) contractual
through
December 31, 2023 |
| Class A | 1.08% |
| Advisor Class | 0.83 |
| Class C | 1.83 |
| Institutional Class | 0.83 |
| Institutional 2 Class | 0.80 |
| Institutional 3 Class | 0.75 |
| Class R | 1.33 |
Under the agreement governing these fee waivers and/or expense reimbursement arrangements, the following fees and expenses are excluded from the waiver/reimbursement commitment, and therefore will be paid by the Fund, if applicable: taxes (including foreign transaction taxes), expenses associated with investments in affiliated and non-affiliated pooled investment vehicles (including mutual funds and exchange-traded funds), transaction costs and brokerage commissions, costs related to any securities lending program, dividend expenses associated with securities sold short, inverse floater program fees and expenses, transaction charges and interest on borrowed money, interest, costs associated with shareholder meetings, infrequent and/or unusual expenses and any other expenses the exclusion of which is specifically approved by the Board of Trustees. This agreement may be modified or amended only with approval from the Investment Manager, certain of its affiliates and the Fund. Any fees waived and/or expenses reimbursed under the expense reimbursement arrangements described above are not recoverable by the Investment Manager or its affiliates in future periods.
Note 4. Federal tax information
The timing and character of income and capital gain distributions are determined in accordance with income tax regulations, which may differ from GAAP because of temporary or permanent book to tax differences.
At August 31, 2023, these differences were primarily due to differing treatment for deferral/reversal of wash sale losses, derivative investments, tax straddles, principal and/or interest from fixed income securities, capital loss carryforwards, trustees’ deferred compensation, foreign currency transactions and distribution reclassifications. To the extent these differences were permanent, reclassifications were made among the components of the Fund’s net assets. Temporary differences do not require reclassifications.
Columbia Balanced Fund | Annual Report 2023
| 51 |
Notes to Financial Statements (continued)
August 31, 2023
The following reclassifications were made:
Undistributed net
investment
income ($) | Accumulated
net realized
(loss) ($) | Paid in
capital ($) |
| (119,074) | 119,074 | — |
Net investment income (loss) and net realized gains (losses), as disclosed in the Statement of Operations, and net assets were not affected by this reclassification.
The tax character of distributions paid during the years indicated was as follows:
| Year Ended August 31, 2023 | Year Ended August 31, 2022 |
Ordinary
income ($) | Long-term
capital gains ($) | Total ($) | Ordinary
income ($) | Long-term
capital gains ($) | Total ($) |
| 111,946,209 | 267,812,510 | 379,758,719 | 198,579,497 | 591,121,606 | 789,701,103 |
Short-term capital gain distributions, if any, are considered ordinary income distributions for tax purposes.
At August 31, 2023, the components of distributable earnings on a tax basis were as follows:
Undistributed
ordinary income ($) | Undistributed
long-term
capital gains ($) | Capital loss
carryforwards ($) | Net unrealized
appreciation ($) |
| 29,427,075 | — | (24,438,463) | 1,849,313,886 |
At August 31, 2023, the cost of all investments for federal income tax purposes along with the aggregate gross unrealized appreciation and depreciation based on that cost was:
Federal
tax cost ($) | Gross unrealized
appreciation ($) | Gross unrealized
(depreciation) ($) | Net unrealized
appreciation ($) |
| 7,109,676,117 | 2,062,514,313 | (213,200,427) | 1,849,313,886 |
Tax cost of investments and unrealized appreciation/(depreciation) may also include timing differences that do not constitute adjustments to tax basis.
The following capital loss carryforwards, determined at August 31, 2023, may be available to reduce future net realized gains on investments, if any, to the extent permitted by the Internal Revenue Code. In addition, for the year ended August 31, 2023, capital loss carryforwards utilized, if any, were as follows:
No expiration
short-term ($) | No expiration
long-term ($) | Total ($) | Utilized ($) |
| (24,438,463) | — | (24,438,463) | — |
Management of the Fund has concluded that there are no significant uncertain tax positions in the Fund that would require recognition in the financial statements. However, management’s conclusion may be subject to review and adjustment at a later date based on factors including, but not limited to, new tax laws, regulations, and administrative interpretations (including relevant court decisions). Generally, the Fund’s federal tax returns for the prior three fiscal years remain subject to examination by the Internal Revenue Service.
Note 5. Portfolio information
The cost of purchases and proceeds from sales of securities, excluding short-term investments and derivatives, if any, aggregated to $13,354,917,890 and $13,697,479,444, respectively, for the year ended August 31, 2023, of which $10,945,780,809 and $10,464,232,766, respectively, were U.S. government securities. The amount of purchase and sale activity impacts the portfolio turnover rate reported in the Financial Highlights.
| 52 | Columbia Balanced Fund | Annual Report 2023 |
Notes to Financial Statements (continued)
August 31, 2023
Note 6. Affiliated money market fund
The Fund invests in Columbia Short-Term Cash Fund, an affiliated money market fund established for the exclusive use by the Fund and other affiliated funds (the Affiliated MMF). The income earned by the Fund from such investments is included as Dividends - affiliated issuers in the Statement of Operations. As an investing fund, the Fund indirectly bears its proportionate share of the expenses of the Affiliated MMF. The Affiliated MMF prices its shares with a floating net asset value. The Securities and Exchange Commission has adopted amendments to money market fund rules requiring institutional prime money market funds like the Affiliated MMF to be subject, by October 2, 2024, to a liquidity fee if daily net redemptions exceed 5% of net assets and, by April 2, 2024, to a discretionary liquidity fee up to 2% if the imposition of such a fee is determined to be in the best interest of the Affiliated MMF.
Note 7. Interfund lending
Pursuant to an exemptive order granted by the Securities and Exchange Commission, the Fund participates in a program (the Interfund Program) allowing each participating Columbia Fund (each, a Participating Fund) to lend money directly to and, except for closed-end funds and money market funds, borrow money directly from other Participating Funds for temporary purposes. The amounts eligible for borrowing and lending under the Interfund Program are subject to certain restrictions.
Interfund loans are subject to the risk that the borrowing fund could be unable to repay the loan when due, and a delay in repayment to the lending fund could result in lost opportunities and/or additional lending costs. The exemptive order is subject to conditions intended to mitigate conflicts of interest arising from the Investment Manager’s relationship with each Participating Fund.
The Fund’s activity in the Interfund Program during the year ended August 31, 2023 was as follows:
| Borrower or lender | Average loan
balance ($) | Weighted average
interest rate (%) | Number of days
with outstanding loans |
| Lender | 2,815,385 | 4.87 | 13 |
Interest income earned by the Fund is recorded as interfund lending in the Statement of Operations. The Fund had no outstanding interfund loans at August 31, 2023.
Note 8. Line of credit
The Fund has access to a revolving credit facility with a syndicate of banks led by JPMorgan Chase Bank, N.A., Citibank, N.A. and Wells Fargo Bank, N.A. whereby the Fund may borrow for the temporary funding of shareholder redemptions or for other temporary or emergency purposes. Pursuant to an October 27, 2022 amendment and restatement, the credit facility, which is an agreement between the Fund and certain other funds managed by the Investment Manager or an affiliated investment manager, severally and not jointly, permits aggregate borrowings up to $950 million. Interest is currently charged to each participating fund based on its borrowings at a rate equal to the higher of (i) the federal funds effective rate, (ii) the secured overnight financing rate plus 0.10% and (iii) the overnight bank funding rate plus, in each case, 1.00%. Each borrowing under the credit facility matures no later than 60 days after the date of borrowing. The Fund also pays a commitment fee equal to its pro rata share of the unused amount of the credit facility at a rate of 0.15% per annum. The commitment fee is included in other expenses in the Statement of Operations. This agreement expires annually in October unless extended or renewed. Prior to the October 27, 2022 amendment and restatement, the Fund had access to a revolving credit facility with a syndicate of banks led by JPMorgan Chase Bank, N.A., Citibank, N.A. and Wells Fargo Bank, N.A. which permitted collective borrowings up to $950 million. Interest was charged to each participating fund based on its borrowings at a rate equal to the higher of (i) the federal funds effective rate, (ii) the secured overnight financing rate plus 0.11448% and (iii) the overnight bank funding rate plus, in each case, 1.00%.
The Fund had no borrowings during the year ended August 31, 2023.
Columbia Balanced Fund | Annual Report 2023
| 53 |
Notes to Financial Statements (continued)
August 31, 2023
Note 9. Significant risks
Credit risk
Credit risk is the risk that the value of debt instruments in the Fund’s portfolio may decline because the issuer defaults or otherwise becomes unable or unwilling, or is perceived to be unable or unwilling, to honor its financial obligations, such as making payments to the Fund when due. Credit rating agencies assign credit ratings to certain debt instruments to indicate their credit risk. Lower-rated or unrated debt instruments held by the Fund may present increased credit risk as compared to higher-rated debt instruments.
Derivatives risk
Losses involving derivative instruments may be substantial, because a relatively small movement in the underlying reference (which is generally the price, rate or other economic indicator associated with a security(ies), commodity, currency, index or other instrument or asset) may result in a substantial loss for the Fund. In addition to the potential for increased losses, the use of derivative instruments may lead to increased volatility within the Fund. Derivatives will typically increase the Fund’s exposure to principal risks to which it is otherwise exposed, and may expose the Fund to additional risks, including correlation risk, counterparty risk, hedging risk, leverage risk, liquidity risk and pricing risk.
Interest rate risk
Interest rate risk is the risk of losses attributable to changes in interest rates. In general, if interest rates rise, the values of debt instruments tend to fall, and if interest rates fall, the values of debt instruments tend to rise. Actions by governments and central banking authorities can result in increases or decreases in interest rates. Higher periods of inflation could lead such authorities to raise interest rates. Increasing interest rates may negatively affect the value of debt securities held by the Fund, resulting in a negative impact on the Fund’s performance and net asset value per share. In general, the longer the maturity or duration of a debt security, the greater its sensitivity to changes in interest rates. The Fund is subject to the risk that the income generated by its investments may not keep pace with inflation.
Liquidity risk
Liquidity risk is the risk associated with a lack of marketability of investments which may make it difficult to sell the investment at a desirable time or price. Changing regulatory, market or other conditions or environments (for example, the interest rate or credit environments) may adversely affect the liquidity of the Fund’s investments. The Fund may have to accept a lower selling price for the holding, sell other investments, or forego another, more appealing investment opportunity. Generally, the less liquid the market at the time the Fund sells a portfolio investment, the greater the risk of loss or decline of value to the Fund. A less liquid market can lead to an increase in Fund redemptions, which may negatively impact Fund performance and net asset value per share, including, for example, if the Fund is forced to sell securities in a down market.
Market risk
The Fund may incur losses due to declines in the value of one or more securities in which it invests. These declines may be due to factors affecting a particular issuer, or the result of, among other things, political, regulatory, market, economic or social developments affecting the relevant market(s) more generally. In addition, turbulence in financial markets and reduced liquidity in equity, credit and/or fixed income markets may negatively affect many issuers, which could adversely affect the Fund’s ability to price or value hard-to-value assets in thinly traded and closed markets and could cause significant redemptions and operational challenges. Global economies and financial markets are increasingly interconnected, and conditions and events in one country, region or financial market may adversely impact issuers in a different country, region or financial market. These risks may be magnified if certain events or developments adversely interrupt the global supply chain; in these and other circumstances, such risks might affect companies worldwide. As a result, local, regional or global events such as terrorism, war, natural disasters, disease/virus outbreaks and epidemics or other public health issues, recessions, depressions or other events – or the potential for such events – could have a significant negative impact on global economic and market conditions.
The large-scale invasion of Ukraine by Russia in February 2022 has resulted in sanctions and market disruptions, including declines in regional and global stock markets, unusual volatility in global commodity markets and significant devaluations of Russian currency. The extent and duration of the military action are impossible to predict but could be significant. Market
| 54 | Columbia Balanced Fund | Annual Report 2023 |
Notes to Financial Statements (continued)
August 31, 2023
disruption caused by the Russian military action, and any counter-measures or responses thereto (including international sanctions, a downgrade in the country’s credit rating, purchasing and financing restrictions, boycotts, tariffs, changes in consumer or purchaser preferences, cyberattacks and espionage) could have severe adverse impacts on regional and/or global securities and commodities markets, including markets for oil and natural gas. These impacts may include reduced market liquidity, distress in credit markets, further disruption of global supply chains, increased risk of inflation, restricted cross-border payments and limited access to investments and/or assets in certain international markets and/or issuers. These developments and other related events could negatively impact Fund performance.
Mortgage- and other asset-backed securities risk
The value of any mortgage-backed and other asset-backed securities including collateralized debt obligations, if any, held by the Fund may be affected by, among other things, changes or perceived changes in: interest rates; factors concerning the interests in and structure of the issuer or the originator of the mortgages or other assets; the creditworthiness of the entities that provide any supporting letters of credit, surety bonds or other credit enhancements; or the market’s assessment of the quality of underlying assets. Payment of principal and interest on some mortgage-backed securities (but not the market value of the securities themselves) may be guaranteed by the full faith and credit of a particular U.S. Government agency, authority, enterprise or instrumentality, and some, but not all, are also insured or guaranteed by the U.S. Government. Mortgage-backed securities issued by non-governmental issuers (such as commercial banks, savings and loan institutions, private mortgage insurance companies, mortgage bankers and other secondary market issuers) may entail greater risk than obligations guaranteed by the U.S. Government. Mortgage- and other asset-backed securities are subject to liquidity risk and prepayment risk. A decline or flattening of housing values may cause delinquencies in mortgages (especially sub-prime or non-prime mortgages) underlying mortgage-backed securities and thereby adversely affect the ability of the mortgage-backed securities issuer to make principal and/or interest payments to mortgage-backed securities holders, including the Fund. Rising or high interest rates tend to extend the duration of mortgage- and other asset-backed securities, making their prices more volatile and more sensitive to changes in interest rates.
Shareholder concentration risk
At August 31, 2023, affiliated shareholders of record owned 37.7% of the outstanding shares of the Fund in one or more accounts. Fund shares sold to or redeemed by concentrated accounts may have a significant effect on the operations of the Fund. In the case of a large redemption, the Fund may be forced to sell investments at inopportune times, including its liquid positions, which may result in Fund losses and the Fund holding a higher percentage of less liquid positions. Large redemptions could result in decreased economies of scale and increased operating expenses for non-redeeming Fund shareholders.
Note 10. Subsequent events
Management has evaluated the events and transactions that have occurred through the date the financial statements were issued and noted no items requiring adjustment of the financial statements or additional disclosure.
Note 11. Information regarding pending and settled legal proceedings
Ameriprise Financial and certain of its affiliates are involved in the normal course of business in legal proceedings which include regulatory inquiries, arbitration and litigation, including class actions concerning matters arising in connection with the conduct of their activities as part of a diversified financial services firm. Ameriprise Financial believes that the Fund is not currently the subject of, and that neither Ameriprise Financial nor any of its affiliates are the subject of, any pending legal, arbitration or regulatory proceedings that are likely to have a material adverse effect on the Fund or the ability of Ameriprise Financial or its affiliates to perform under their contracts with the Fund. Ameriprise Financial is required to make quarterly (10-Q), annual (10-K) and, as necessary, 8-K filings with the Securities and Exchange Commission (SEC) on legal and regulatory matters that relate to Ameriprise Financial and its affiliates. Copies of these filings may be obtained by accessing the SEC website at www.sec.gov.
There can be no assurance that these matters, or the adverse publicity associated with them, will not result in increased Fund redemptions, reduced sale of Fund shares or other adverse consequences to the Fund. Further, although we believe proceedings are not likely to have a material adverse effect on the Fund or the ability of Ameriprise Financial or its affiliates to perform under their contracts with the Fund, these proceedings are subject to uncertainties and, as such, we are unable to
Columbia Balanced Fund | Annual Report 2023
| 55 |
Notes to Financial Statements (continued)
August 31, 2023
estimate the possible loss or range of loss that may result. An adverse outcome in one or more of these proceedings could result in adverse judgments, settlements, fines, penalties or other relief that could have a material adverse effect on the consolidated financial condition or results of operations of Ameriprise Financial or one or more of its affiliates that provide services to the Fund.
| 56 | Columbia Balanced Fund | Annual Report 2023 |
Report of Independent Registered Public Accounting Firm
To the Board of Trustees of Columbia Funds Series Trust I and Shareholders of Columbia Balanced Fund
Opinion on the Financial Statements
We have audited the accompanying statement of assets and liabilities, including the portfolio of investments, of Columbia Balanced Fund (one of the funds constituting Columbia Funds Series Trust I, referred to hereafter as the "Fund") as of August 31, 2023, the related statement of operations for the year ended August 31, 2023, the statement of changes in net assets for each of the two years in the period ended August 31, 2023, including the related notes, and the financial highlights for each of the five years in the period ended August 31, 2023 (collectively referred to as the "financial statements"). In our opinion, the financial statements present fairly, in all material respects, the financial position of the Fund as of August 31, 2023, the results of its operations for the year then ended, the changes in its net assets for each of the two years in the period ended August 31, 2023 and the financial highlights for each of the five years in the period ended August 31, 2023 in conformity with accounting principles generally accepted in the United States of America.
Basis for Opinion
These financial statements are the responsibility of the Fund’s management. Our responsibility is to express an opinion on the Fund’s financial statements based on our audits. We are a public accounting firm registered with the Public Company Accounting Oversight Board (United States) (PCAOB) and are required to be independent with respect to the Fund in accordance with the U.S. federal securities laws and the applicable rules and regulations of the Securities and Exchange Commission and the PCAOB.
We conducted our audits of these financial statements in accordance with the standards of the PCAOB. Those standards require that we plan and perform the audit to obtain reasonable assurance about whether the financial statements are free of material misstatement, whether due to error or fraud.
Our audits included performing procedures to assess the risks of material misstatement of the financial statements, whether due to error or fraud, and performing procedures that respond to those risks. Such procedures included examining, on a test basis, evidence regarding the amounts and disclosures in the financial statements. Our audits also included evaluating the accounting principles used and significant estimates made by management, as well as evaluating the overall presentation of the financial statements. Our procedures included confirmation of securities owned as of August 31, 2023 by correspondence with the custodian, transfer agent, brokers and agent banks; when replies were not received from brokers, we performed other auditing procedures. We believe that our audits provide a reasonable basis for our opinion.
/s/PricewaterhouseCoopers LLP
Minneapolis, Minnesota
October 23, 2023
We have served as the auditor of one or more investment companies within the Columbia Funds Complex since 1977.
Columbia Balanced Fund | Annual Report 2023
| 57 |
Federal Income Tax Information
(Unaudited)
The Fund hereby designates the following tax attributes for the fiscal year ended August 31, 2023. Shareholders will be notified in early 2024 of the amounts for use in preparing 2023 income tax returns.
Qualified
dividend
income | Dividends
received
deduction | Section
199A
dividends |
| 54.53% | 49.50% | 0.80% |
Qualified dividend income. For taxable, non-corporate shareholders, the percentage of ordinary income distributed during the fiscal year that represents qualified dividend income subject to reduced tax rates.
Dividends received deduction. The percentage of ordinary income distributed during the fiscal year that qualifies for the corporate dividends received deduction.
Section 199A dividends. For taxable, non-corporate shareholders, the percentage of ordinary income distributed during the fiscal year that represents Section 199A dividends potentially eligible for a 20% deduction.
TRUSTEES AND OFFICERS
(Unaudited)
The Board oversees the Fund’s operations and appoints officers who are responsible for day-to-day business decisions based on policies set by the Board. The following table provides basic biographical information about the Fund’s Trustees as of the printing of this report, including their principal occupations during the past five years, although specific titles for individuals may have varied over the period. The year set forth beneath Length of Service in the table below is the year in which the Trustee was first appointed or elected as Trustee to any Fund currently in the Columbia Funds Complex or a predecessor thereof. Under current Board policy, each Trustee generally serves until December 31 of the year such Trustee turns seventy-five (75).
Independent trustees
Name,
address,
year of birth | Position held
with the Columbia Funds and
length of service | Principal occupation(s)
during past five years
and other relevant
professional experience | Number of
Funds in the
Columbia Funds
Complex*
overseen | Other directorships
held by Trustee
during the past five years
and other relevant Board experience |
George S. Batejan
c/o Columbia Management
Investment Advisers, LLC
290 Congress Street
Boston, MA 02210
1954 | Trustee since 2017 | Executive Vice President, Global Head of Technology and Operations, Janus Capital Group, Inc., 2010-2016 | 173 | Former Chairman of the Board, NICSA (National Investment Company Services Association) (Executive Committee, Nominating Committee and Governance Committee), 2014-2016; former Director, Intech Investment Management, 2011-2016; former Board Member, Metro Denver Chamber of Commerce, 2015-2016; former Advisory Board Member, University of Colorado Business School, 2015-2018; former Board Member, Chase Bank International, 1993-1994 |
| 58 | Columbia Balanced Fund | Annual Report 2023 |
TRUSTEES AND OFFICERS (continued)
(Unaudited)
Independent trustees (continued)
Name,
address,
year of birth | Position held
with the Columbia Funds and
length of service | Principal occupation(s)
during past five years
and other relevant
professional experience | Number of
Funds in the
Columbia Funds
Complex*
overseen | Other directorships
held by Trustee
during the past five years
and other relevant Board experience |
Kathleen Blatz
c/o Columbia Management
Investment Advisers, LLC
290 Congress Street
Boston, MA 02210
1954 | Trustee since 2006 | Attorney, specializing in arbitration and mediation; Chief Justice, Minnesota Supreme Court, 1998-2006; Associate Justice, Minnesota Supreme Court, 1996-1998; Fourth Judicial District Court Judge, Hennepin County, 1994-1996; Attorney in private practice and public service, 1984-1993; State Representative, Minnesota House of Representatives, 1979-1993, which included service on the Tax and Financial Institutions and Insurance Committees; Member and Interim Chair, Minnesota Sports Facilities Authority, January-July 2017; Interim President and Chief Executive Officer, Blue Cross and Blue Shield of Minnesota (health care insurance), February-July 2018, April-October 2021 | 173 | Former Trustee, Blue Cross and Blue Shield of Minnesota, 2009-2021 (Chair of the Business Development Committee, 2014-2017; Chair of the Governance Committee, 2017-2019); former Member and Chair of the Board, Minnesota Sports Facilities Authority, January 2017-July 2017; former Director, Robina Foundation, 2009-2020 (Chair, 2014-2020); Director, Richard M. Schulze Family Foundation, since 2021 |
Pamela G. Carlton
c/o Columbia Management
Investment Advisers, LLC
290 Congress Street
Boston, MA 02210
1954 | Chair since 2023; Trustee since 2007 | President, Springboard – Partners in Cross Cultural Leadership (consulting company), since 2003; Managing Director of US Equity Research, JP Morgan Chase, 1999-2003; Director of US Equity Research, Chase Asset Management, 1996-1999; Co-Director Latin America Research, 1993-1996, COO Global Research, 1992-1996, Co-Director of US Research, 1991-1992, Investment Banker, 1982-1991, Morgan Stanley; Attorney, Cleary Gottlieb Steen & Hamilton LLP, 1980-1982 | 173 | Trustee, New York Presbyterian Hospital Board, since 1996; Director, DR Bank (Audit Committee) since 2017; Director, Evercore Inc. (Audit Committee, Nominating and Governance Committee), since 2019; Director, Apollo Commercial Real Estate Finance, Inc. (Chair, Nominating and Governance Committee) (financial services), since 2021; the Governing Council of the Independent Directors Council (IDC), since 2021 |
Janet Langford Carrig
c/o Columbia Management
Investment Advisers, LLC
290 Congress Street
Boston, MA 02210
1957 | Trustee since 1996 | Senior Vice President, General Counsel and Corporate Secretary, ConocoPhillips (independent energy company), September 2007-October 2018 | 173 | Director, EQT Corporation (natural gas producer), since 2019; former Director, Whiting Petroleum Corporation (independent oil and gas company), 2020-2022 |
J. Kevin Connaughton
c/o Columbia Management
Investment Advisers, LLC
290 Congress Street
Boston, MA 02210
1964 | Trustee since 2020 | CEO and President, RhodeWay Financial (non-profit financial planning firm), since December 2022; Member, FINRA National Adjudicatory Council, since January 2020; Adjunct Professor of Finance, Bentley University since January 2018; Consultant to Independent Trustees of CFVIT and CFST I from March 2016 to June 2020 with respect to CFVIT and to December 2020 with respect to CFST I; Managing Director and General Manager of Mutual Fund Products, Columbia Management Investment Advisers, LLC, May 2010-February 2015; President, Columbia Funds, 2008-2015; and senior officer of Columbia Funds and affiliated funds, 2003-2015 | 171 | Former Director, The Autism Project, March 2015-December 2021; former Member of the Investment Committee, St. Michael’s College, November 2015-February 2020; former Trustee, St. Michael’s College, June 2017-September 2019; former Trustee, New Century Portfolios (former mutual fund complex), January 2015-December 2017 |
Columbia Balanced Fund | Annual Report 2023
| 59 |
TRUSTEES AND OFFICERS (continued)
(Unaudited)
Independent trustees (continued)
Name,
address,
year of birth | Position held
with the Columbia Funds and
length of service | Principal occupation(s)
during past five years
and other relevant
professional experience | Number of
Funds in the
Columbia Funds
Complex*
overseen | Other directorships
held by Trustee
during the past five years
and other relevant Board experience |
Olive M. Darragh
c/o Columbia Management
Investment Advisers, LLC
290 Congress Street
Boston, MA 02210
1962 | Trustee since 2020 | Managing Director of Darragh Inc. (strategy and talent management consulting firm), since 2010; Founder and CEO, Zolio, Inc. (investment management talent identification platform), since 2004; Consultant to Independent Trustees of CFVIT and CFST I from June 2019 to June 2020 with respect to CFVIT and to December 2020 with respect to CFST I; Partner, Tudor Investments, 2004-2010; Senior Partner, McKinsey & Company (consulting), 1990-2004; Touche Ross CPA, 1985-1988 | 171 | Treasurer, Edinburgh University US Trust Board, since January 2023; Member, HBS Community Action Partners Board, since September 2022; former Director, University of Edinburgh Business School (Member of US Board), 2004-2019; former Director, Boston Public Library Foundation, 2008-2017 |
Patricia M. Flynn
c/o Columbia Management
Investment Advisers, LLC
290 Congress Street
Boston, MA 02210
1950 | Trustee since 2004 | Professor of Economics and Management, Bentley University, since 2002; Dean, McCallum Graduate School of Business, Bentley University, 1992-2002 | 173 | Former Trustee, MA Taxpayers Foundation, 1997-2022; former Director, The MA Business Roundtable, 2003-2019; former Chairperson, Innovation Index Advisory Committee, MA Technology Collaborative, 1997-2020 |
Brian J. Gallagher
c/o Columbia Management
Investment Advisers, LLC
290 Congress Street
Boston, MA 02210
1954 | Trustee since 2017 | Retired; Partner with Deloitte & Touche LLP and its predecessors, 1977-2016 | 173 | Trustee, Catholic Schools Foundation, since 2004 |
Douglas A. Hacker
c/o Columbia Management
Investment Advisers, LLC
290 Congress Street
Boston, MA 02210
1955 | Trustee since 1996 | Independent business executive, since May 2006; Executive Vice President – Strategy of United Airlines, December 2002 - May 2006; President of UAL Loyalty Services (airline marketing company), September 2001-December 2002; Executive Vice President and Chief Financial Officer of United Airlines, July 1999-September 2001 | 173 | Director, SpartanNash Company since November 2013 (Chair of the Board, since May 2021) (food distributor); Director, Aircastle Limited (Chair of Audit Committee) (aircraft leasing), since August 2006; former Director, Nash Finch Company (food distributor), 2005-2013; former Director, SeaCube Container Leasing Ltd. (container leasing), 2010-2013; and former Director, Travelport Worldwide Limited (travel information technology), 2014-2019 |
Nancy T. Lukitsh
c/o Columbia Management
Investment Advisers, LLC
290 Congress Street
Boston, MA 02210
1956 | Trustee since 2011 | Senior Vice President, Partner and Director of Marketing, Wellington Management Company, LLP (investment adviser), 1997-2010; Chair, Wellington Management Portfolios (commingled non-U.S. investment pools), 2007-2010; Director, Wellington Trust Company, NA and other Wellington affiliates, 1997-2010 | 171 | None |
| 60 | Columbia Balanced Fund | Annual Report 2023 |
TRUSTEES AND OFFICERS (continued)
(Unaudited)
Independent trustees (continued)
Name,
address,
year of birth | Position held
with the Columbia Funds and
length of service | Principal occupation(s)
during past five years
and other relevant
professional experience | Number of
Funds in the
Columbia Funds
Complex*
overseen | Other directorships
held by Trustee
during the past five years
and other relevant Board experience |
David M. Moffett
c/o Columbia Management
Investment Advisers, LLC
290 Congress Street
Boston, MA 02210
1952 | Trustee since 2011 | Retired; former Chief Executive Officer of Freddie Mac and Chief Financial Officer of U.S. Bank | 171 | Director, CSX Corporation (transportation suppliers); Director, PayPal Holdings Inc. (payment and data processing services); Trustee, University of Oklahoma Foundation; former Director, eBay Inc. (online trading community), 2007-2015; and former Director, CIT Bank, CIT Group Inc. (commercial and consumer finance), 2010-2016; former Senior Adviser to The Carlyle Group (financial services), March 2008-September 2008; former Governance Consultant to Bridgewater Associates, January 2013-December 2015 |
Catherine James Paglia
c/o Columbia Management
Investment Advisers, LLC
290 Congress Street
Boston, MA 02210
1952 | Trustee since 2004 | Director, Enterprise Asset Management, Inc. (private real estate and asset management company), since September 1998; Managing Director and Partner, Interlaken Capital, Inc., 1989-1997; Vice President, 1982-1985, Principal, 1985-1987, Managing Director, 1987-1989, Morgan Stanley; Vice President, Investment Banking, 1980-1982, Associate, Investment Banking, 1976-1980, Dean Witter Reynolds, Inc. | 173 | Director, Valmont Industries, Inc. (irrigation systems manufacturer), since 2012; Trustee, Carleton College (on the Investment Committee), since 1987; Trustee, Carnegie Endowment for International Peace (on the Investment Committee), since 2009 |
Natalie A. Trunow
c/o Columbia Management
Investment Advisers, LLC
290 Congress Street
Boston, MA 02210
1967 | Trustee since 2020 | Chief Executive Officer, Millennial Portfolio Solutions LLC (asset management and consulting services), January 2016-January 2021; Non-executive Member of the Investment Committee and Valuation Committee, Sarona Asset Management Inc. (private equity firm) since September 2019; Advisor, Horizon Investments (asset management and consulting services), August 2018-January 2022; Advisor, Paradigm Asset Management, November 2016-January 2022; Consultant to Independent Trustees of CFVIT and CFST I from September 2016 to June 2020 with respect to CFVIT and to December 2020 with respect to CFST I; Director of Investments/Consultant, Casey Family Programs, April 2016-November 2016; Senior Vice President and Chief Investment Officer, Calvert Investments, August 2008-January 2016; Section Head and Portfolio Manager, General Motors Asset Management, June 1997-August 2008 | 171 | Independent Director, Investment Committee, Health Services for Children with Special Needs, Inc., 2010-2021; Independent Director, (Executive Committee and Chair, Audit Committee), Consumer Credit Counseling Services (formerly Guidewell Financial Solutions), since 2016; Independent Director, (Investment Committee), Sarona Asset Management, since 2019 |
Columbia Balanced Fund | Annual Report 2023
| 61 |
TRUSTEES AND OFFICERS (continued)
(Unaudited)
Independent trustees (continued)
Name,
address,
year of birth | Position held
with the Columbia Funds and
length of service | Principal occupation(s)
during past five years
and other relevant
professional experience | Number of
Funds in the
Columbia Funds
Complex*
overseen | Other directorships
held by Trustee
during the past five years
and other relevant Board experience |
Sandra L. Yeager
c/o Columbia Management
Investment Advisers, LLC
290 Congress Street
Boston, MA 02210
1964 | Trustee since 2017 | Retired; President and founder, Hanoverian Capital, LLC (SEC registered investment advisor firm), 2008-2016; Managing Director, DuPont Capital, 2006-2008; Managing Director, Morgan Stanley Investment Management, 2004-2006; Senior Vice President, Alliance Bernstein, 1990-2004 | 173 | Former Director, NAPE (National Alliance for Partnerships in Equity) Education Foundation, October 2016-October 2020; Advisory Board, Jennersville YMCA, since 2022 |
Interested trustee affiliated with Investment Manager**
Name,
address,
year of birth | Position held with the Columbia Funds and length of service | Principal occupation(s) during the
past five years and other relevant
professional experience | Number of
Funds in the
Columbia Funds
Complex* overseen | Other directorships
held by Trustee
during the past
five years and
other relevant Board experience |
Daniel J. Beckman
c/o Columbia Management
Investment Advisers, LLC
290 Congress Street
Boston, MA 02210
1962 | Trustee since November 2021 and President since June 2021 | Vice President – Head of North America Product, Columbia Management Investment Advisers, LLC, since April 2015; President and Principal Executive Officer of the Columbia Funds, since June 2021; officer of Columbia Funds and affiliated funds, 2020-2021 | 173 | Director, Ameriprise Trust Company, since October 2016; Director, Columbia Management Investment Distributors, Inc. since November 2018; Board of Governors, Columbia Wanger Asset Management, LLC since, January 2022; Director, Columbia Threadneedle Canada, Inc., since December 2022 |
| * | The term “Columbia Funds Complex” as used herein includes Columbia Seligman Premium Technology Growth Fund, Tri-Continental Corporation and each series of Columbia Funds Series Trust (CFST), Columbia Funds Series Trust I (CFST I), Columbia Funds Series Trust II (CFST II), Columbia ETF Trust I (CET I), Columbia ETF Trust II (CET II), Columbia Funds Variable Insurance Trust (CFVIT) and Columbia Funds Variable Series Trust II (CFVST II). Messrs. Batejan, Beckman, Gallagher and Hacker and Mses. Blatz, Carlton, Carrig, Flynn, Paglia, and Yeager serve as directors of Columbia Seligman Premium Technology Growth Fund and Tri-Continental Corporation. |
| ** | Interested person (as defined under the 1940 Act) by reason of being an officer, director, security holder and/or employee of the Investment Manager or Ameriprise Financial. |
The Statement of Additional Information has additional information about the Fund’s Board members and is available, without charge, upon request by calling 800.345.6611, visiting columbiathreadneedleus.com/investor/ or contacting your financial intermediary.
| 62 | Columbia Balanced Fund | Annual Report 2023 |
TRUSTEES AND OFFICERS (continued)
(Unaudited)
The Board has appointed officers who are responsible for day-to-day business decisions based on policies it has established. The officers serve at the pleasure of the Board. The following table provides basic information about the Officers of the Fund as of the printing of this report, including principal occupations during the past five years, although their specific titles may have varied over the period. In addition to Mr. Beckman, who is President and Principal Executive Officer, the Fund’s other officers are:
Fund officers
Name,
address and
year of birth | Position and year
first appointed to
position for any Fund
in the Columbia
Funds Complex or a
predecessor thereof | Principal occupation(s) during past five years |
Michael G. Clarke
290 Congress Street
Boston, MA 02210
1969 | Chief Financial Officer and Principal Financial Officer (2009) and Senior Vice President (2019) | Senior Vice President and North America Head of Operations & Investor Services, Columbia Management Investment Advisers, LLC, since June 2023 (previously Senior Vice President and Head of Global Operations, March 2022 – June 2023, Vice President, Head of North America Operations, and Co-Head of Global Operations, June 2019 - February 2022 and Vice President – Accounting and Tax, May 2010 - May 2019); senior officer of Columbia Funds and affiliated funds, since 2002. Director, Ameriprise Trust Company, since June 2023. |
Joseph Beranek
5890 Ameriprise Financial Center
Minneapolis, MN 55474
1965 | Treasurer and Chief Accounting Officer (Principal Accounting Officer) (2019) and Principal Financial Officer (2020), CFST, CFST I, CFST II, CFVIT and CFVST II; Assistant Treasurer, CET I and CET II | Vice President – Mutual Fund Accounting and Financial Reporting, Columbia Management Investment Advisers, LLC, since December 2018 and March 2017, respectively. |
Marybeth Pilat
290 Congress Street
Boston, MA 02210
1968 | Treasurer and Chief Accounting Officer (Principal Accounting Officer) and Principal Financial Officer (2020) for CET I and CET II; Assistant Treasurer, CFST, CFST I, CFST II, CFVIT and CFVST II | Vice President – Product Pricing and Administration, Columbia Management Investment Advisers, LLC, since May 2017. |
William F. Truscott
290 Congress Street
Boston, MA 02210
1960 | Senior Vice President (2001) | Formerly, Trustee/Director of Columbia Funds Complex or legacy funds, November 2001 - January 1, 2021; Chief Executive Officer, Global Asset Management, Ameriprise Financial, Inc., since September 2012; Chairman of the Board and President, Columbia Management Investment Advisers, LLC, since July 2004 and February 2012, respectively; Chairman of the Board and Chief Executive Officer, Columbia Management Investment Distributors, Inc., since November 2008 and February 2012, respectively; Chairman of the Board and Director, Threadneedle Asset Management Holdings, Sàrl, since March 2013 and December 2008, respectively; senior executive of various entities affiliated with Columbia Threadneedle. |
Christopher O. Petersen
5228 Ameriprise Financial Center
Minneapolis, MN 55474
1970 | Senior Vice President and Assistant Secretary (2021) | Formerly, Trustee/Director of funds within the Columbia Funds Complex, July 1, 2020 - November 22, 2021; Senior Vice President and Assistant General Counsel, Ameriprise Financial, Inc., since September 2021 (previously Vice President and Lead Chief Counsel, January 2015 - September 2021); formerly, President and Principal Executive Officer of the Columbia Funds, 2015 - 2021; officer of Columbia Funds and affiliated funds, since 2007. |
Thomas P. McGuire
290 Congress Street
Boston, MA 02210
1972 | Senior Vice President and Chief Compliance Officer (2012) | Vice President – Asset Management Compliance, Ameriprise Financial, Inc., since May 2010; Chief Compliance Officer, Columbia Acorn/Wanger Funds, since December 2015; formerly, Chief Compliance Officer, Ameriprise Certificate Company, September 2010 – September 2020. |
Ryan C. Larrenaga
290 Congress Street
Boston, MA 02210
1970 | Senior Vice President (2017), Chief Legal Officer (2017), and Secretary (2015) | Vice President and Chief Counsel, Ameriprise Financial, Inc., since August 2018 (previously Vice President and Group Counsel, August 2011 - August 2018); Chief Legal Officer, Columbia Acorn/Wanger Funds, since September 2020; officer of Columbia Funds and affiliated funds, since 2005. |
Columbia Balanced Fund | Annual Report 2023
| 63 |
TRUSTEES AND OFFICERS (continued)
(Unaudited)
Fund officers (continued)
Name,
address and
year of birth | Position and year
first appointed to
position for any Fund
in the Columbia
Funds Complex or a
predecessor thereof | Principal occupation(s) during past five years |
Michael E. DeFao
290 Congress Street
Boston, MA 02210
1968 | Vice President (2011) and Assistant Secretary (2010) | Vice President and Chief Counsel, Ameriprise Financial, Inc., since May 2010; Vice President, Chief Legal Officer and Assistant Secretary, Columbia Management Investment Advisers, LLC, since October 2021 (previously Vice President and Assistant Secretary, May 2010 – September 2021). |
Lyn Kephart-Strong
5903 Ameriprise Financial Center
Minneapolis, MN 55474
1960 | Vice President (2015) | Vice President, Global Investment Operations Services, Columbia Management Investment Advisers, LLC, since 2010; Director (since January 2007) and President (since October 2014), Columbia Management Investment Services Corp.; Director (since December 2017) and President (since January 2017), Ameriprise Trust Company. |
Liquidity Risk Management Program
(Unaudited)
Pursuant to Rule 22e-4 under the 1940 Act, the Fund has adopted a liquidity risk management program (Program). The Program’s principal objectives include assessing, managing and periodically reviewing the Fund’s liquidity risk. Liquidity risk is defined as the risk that the Fund could not meet redemption requests without significant dilution of remaining investors’ interests in the Fund.
The Board has appointed the Investment Manager as the program administrator for the Fund’s Program. The Investment Manager has delegated oversight of the Program to its Liquidity Risk Management Committee (the Committee). At a Board meeting during the fiscal period, the Committee provided the Board with a report addressing the operations of the Program and assessing its adequacy and effectiveness of implementation for the period January 1, 2022 through December 31, 2022, including:
| • | the Fund had sufficient liquidity to both meet redemptions and operate effectively on behalf of shareholders; |
| • | there were no material changes to the Program during the period; |
| • | the implementation of the Program was effective to manage the Fund’s liquidity risk; and |
| • | the Program operated adequately during the period. |
There can be no assurance that the Program will achieve its objectives in the future. Please refer to the Fund’s prospectus for more information regarding the Fund’s exposure to liquidity risk and other principal risks to which an investment in the Fund may be subject.
| 64 | Columbia Balanced Fund | Annual Report 2023 |
Approval of Management Agreement
(Unaudited)
Columbia Management Investment Advisers, LLC (the Investment Manager, and together with its domestic and global affiliates, Columbia Threadneedle Investments), a wholly-owned subsidiary of Ameriprise Financial, Inc. (Ameriprise Financial), serves as the investment manager to Columbia Balanced Fund (the Fund). Under a management agreement (the Management Agreement), the Investment Manager provides investment advice and other services to the Fund and other funds distributed by Columbia Management Investment Distributors, Inc. (collectively, the Funds).
On an annual basis, the Fund’s Board of Trustees (the Board), including the independent Board members (the Independent Trustees), considers renewal of the Management Agreement. The Investment Manager prepared detailed reports for the Board and its Contracts Committee (including its Contracts Subcommittee) in February, March, April, May and June 2023, including reports providing the results of analyses performed by a third-party data provider, Broadridge Financial Solutions, Inc. (Broadridge), and comprehensive responses by the Investment Manager to written requests for information by independent legal counsel to the Independent Trustees (Independent Legal Counsel), to assist the Board in making this determination. In addition, throughout the year, the Board (or its committees or subcommittees) regularly meets with portfolio management teams and senior management personnel and reviews information prepared by the Investment Manager addressing the services the Investment Manager provides and Fund performance. The Board also accords appropriate weight to the work, deliberations and conclusions of the various committees (including their subcommittees), such as the Contracts Committee, the Investment Review Committee, the Audit Committee and the Compliance Committee in determining whether to continue the Management Agreement.
The Board, at its June 22, 2023 Board meeting (the June Meeting), considered the renewal of the Management Agreement for an additional one-year term. At the June Meeting, Independent Legal Counsel reviewed with the Independent Trustees various factors relevant to the Board’s consideration of advisory agreements and the Board’s legal responsibilities related to such consideration. The Independent Trustees considered all information that they, their legal counsel or the Investment Manager believed reasonably necessary to evaluate and to approve the continuation of the Management Agreement. Among other things, the information and factors considered included the following:
| • | Information on the investment performance of the Fund relative to the performance of a group of mutual funds determined to be comparable to the Fund by Broadridge, as well as performance relative to one or more benchmarks; |
| • | Information on the Fund’s management fees and total expenses, including information comparing the Fund’s expenses to those of a group of comparable mutual funds, as determined by Broadridge; |
| • | The Investment Manager’s agreement to contractually limit or cap total operating expenses for the Fund so that total operating expenses (excluding certain fees and expenses, such as transaction costs and certain other investment related expenses, interest, taxes, acquired fund fees and expenses and infrequent and/or unusual expenses) would not exceed a specified annual rate, as a percentage of the Fund’s net assets; |
| • | Terms of the Management Agreement; |
| • | Descriptions of other agreements and arrangements with affiliates of the Investment Manager relating to the operations of the Fund, including agreements with respect to the provision of transfer agency and shareholder services to the Fund; |
| • | Descriptions of various services performed by the Investment Manager under the Management Agreement, including portfolio management and portfolio trading practices; |
| • | Information regarding any recently negotiated management fees of similarly-managed portfolios of other institutional clients of the Investment Manager; |
| • | Information regarding the resources of the Investment Manager, including information regarding senior management, portfolio managers and other personnel; |
| • | Information regarding the capabilities of the Investment Manager with respect to compliance monitoring services; |
| • | The profitability to the Investment Manager and its affiliates from their relationships with the Fund; and |
| • | Report provided by the Board’s independent fee consultant, JDL Consultants, LLC (JDL). |
Columbia Balanced Fund | Annual Report 2023
| 65 |
Approval of Management Agreement (continued)
(Unaudited)
Following an analysis and discussion of the foregoing, and the factors identified below, the Board, including all of the Independent Trustees, approved the renewal of the Management Agreement.
Nature, extent and quality of services provided by the Investment Manager
The Board analyzed various reports and presentations it had received detailing the services performed by the Investment Manager, as well as its history, expertise, resources and relative capabilities, and the qualifications of its personnel.
The Board specifically considered the many developments during recent years concerning the services provided by the Investment Manager. Among other things, the Board noted the organization and depth of the equity and credit research departments. The Board further observed the enhancements to the investment risk management department’s processes, systems and oversight over the past several years. The Board also took into account the broad scope of services provided by the Investment Manager to the Fund, including, among other services, investment, risk and compliance oversight. The Board also took into account the information it received concerning the Investment Manager’s ability to attract and retain key portfolio management personnel and that it has sufficient resources to provide competitive and adequate compensation to investment personnel.
In connection with the Board’s evaluation of the overall package of services provided by the Investment Manager, the Board also considered the nature, quality and range of administrative services provided to the Fund by the Investment Manager, as well as the achievements in 2022 in the performance of administrative services, and noted the various enhancements anticipated for 2023. In evaluating the quality of services provided under the Management Agreement, the Board also took into account the organization and strength of the Fund’s and its service providers’ compliance programs. The Board also reviewed the financial condition of the Investment Manager and its affiliates and each entity’s ability to carry out its responsibilities under the Management Agreement and the Fund’s other service agreements.
In addition, the Board discussed the acceptability of the terms of the Management Agreement, noting that no changes were proposed from the form of agreement previously approved. The Board also noted the wide array of legal and compliance services provided to the Fund under the Management Agreement.
After reviewing these and related factors (including investment performance as discussed below), the Board concluded, within the context of their overall conclusions, that the nature, extent and quality of the services provided to the Fund under the Management Agreement supported the continuation of the Management Agreement.
Investment performance
The Board carefully reviewed the investment performance of the Fund, including detailed reports providing the results of analyses performed by each of the Investment Manager, Broadridge and JDL collectively showing, for various periods (including since manager inception): (i) the performance of the Fund, (ii) the Fund’s performance relative to peers and benchmarks and (iii) the net assets of the Fund. The Board observed that the Fund’s performance for certain periods ranked above median based on information provided by Broadridge.
The Board also reviewed a description of the third-party data provider’s methodology for identifying the Fund’s peer groups for purposes of performance and expense comparisons.
The Board also considered the Investment Manager’s performance and reputation generally. After reviewing these and related factors, the Board concluded, within the context of their overall conclusions, that the performance of the Fund and the Investment Manager, in light of other considerations, supported the continuation of the Management Agreement.
Comparative fees, costs of services provided and the profits realized by the Investment Manager and its affiliates from their relationships with the Fund
The Board reviewed comparative fees and the costs of services provided under the Management Agreement. The Board members considered detailed comparative information set forth in an annual report on fees and expenses, including, among other things, data (based on analyses conducted by Broadridge and JDL) showing a comparison of the Fund’s expenses with median expenses paid by funds in its comparative peer universe, as well as data showing the Fund’s contribution to the
| 66 | Columbia Balanced Fund | Annual Report 2023 |
Approval of Management Agreement (continued)
(Unaudited)
Investment Manager’s profitability. The Board reviewed the fees charged to comparable institutional or other accounts/vehicles managed by the Investment Manager and discussed differences in how the products are managed and operated, thus explaining many of the differences in fees.
The Board considered the reports of JDL, which assisted in the Board’s analysis of the Funds’ performance and expenses and the reasonableness of the Funds’ fee rates. The Board accorded particular weight to the notion that a primary objective of the level of fees is to achieve a rational pricing model applied consistently across the various product lines in the Fund family, while assuring that the overall fees for each Fund (with certain exceptions) are generally in line with the current “pricing philosophy” such that Fund total expense ratios, in general, approximate or are lower than the median expense ratios of funds in the same Lipper comparison universe. The Board took into account that the Fund’s total expense ratio (after considering proposed expense caps/waivers) approximated the peer universe’s median expense ratio.
After reviewing these and related factors, the Board concluded, within the context of their overall conclusions, that the levels of management fees and expenses of the Fund, in light of other considerations, supported the continuation of the Management Agreement.
The Board also considered the profitability of the Investment Manager and its affiliates in connection with the Investment Manager providing management services to the Fund. With respect to the profitability of the Investment Manager and its affiliates, the Independent Trustees referred to information discussing the profitability to the Investment Manager and Ameriprise Financial from managing, operating and distributing the Funds. The Board considered that the profitability generated by the Investment Manager in 2022 had declined from 2021 levels, due to a variety of factors, including the decreased assets under management of the Funds. It also took into account the indirect economic benefits flowing to the Investment Manager or its affiliates in connection with managing or distributing the Funds, such as the enhanced ability to offer various other financial products to Ameriprise Financial customers, soft dollar benefits and overall reputational advantages. The Board noted that the fees paid by the Fund should permit the Investment Manager to offer competitive compensation to its personnel, make necessary investments in its business and earn an appropriate profit. After reviewing these and related factors, the Board concluded, within the context of their overall conclusions, that the costs of services provided and the profitability to the Investment Manager and its affiliates from their relationships with the Fund supported the continuation of the Management Agreement.
Economies of scale
The Board considered the potential existence of economies of scale in the provision by the Investment Manager of services to the Fund, and whether those economies of scale were shared with the Fund through breakpoints in investment management fees or other means, such as expense limitation arrangements and additional investments by the Investment Manager in investment, trading, compliance and other resources. The Board considered the economies of scale that might be realized as the Fund’s net asset level grows and took note of the extent to which Fund shareholders might also benefit from such growth. In this regard, the Board took into account that management fees decline as Fund assets exceed various breakpoints, all of which have not been surpassed. The Board observed that the Management Agreement provided for breakpoints in the management fee rate schedule that allow opportunities for shareholders to realize lower fees as Fund assets grow and that there are additional opportunities through other means for sharing economies of scale with shareholders.
Conclusion
The Board reviewed all of the above considerations in reaching its decision to approve the continuation of the Management Agreement. In reaching its conclusions, no single factor was determinative.
On June 22, 2023, the Board, including all of the Independent Trustees, determined that fees payable under the Management Agreement were fair and reasonable in light of the extent and quality of services provided and approved the renewal of the Management Agreement.
Columbia Balanced Fund | Annual Report 2023
| 67 |
Columbia Balanced Fund
P.O. Box 219104
Kansas City, MO 64121-9104
Please read and consider the investment objectives, risks, charges and expenses for any fund carefully before investing. For a prospectus and summary prospectus, which contains this and other important information about the Fund, go to
columbiathreadneedleus.com/investor/. The Fund is distributed by Columbia Management Investment Distributors, Inc., member FINRA, and managed by Columbia Management Investment Advisers, LLC.
Columbia Threadneedle Investments (Columbia Threadneedle) is the global brand name of the Columbia and Threadneedle group of companies. All rights reserved.
© 2023 Columbia Management Investment Advisers, LLC.
columbiathreadneedleus.com/investor/

Annual Report
August 31, 2023
Multisector Bond SMA Completion Portfolio
Not FDIC or NCUA Insured • No Financial Institution Guarantee • May Lose Value
Multisector Bond SMA Completion Portfolio (the Fund) mails one shareholder report to each shareholder address, unless such shareholder elected to receive shareholder reports from the Fund electronically. If you would like more than one report, please call shareholder services at 800.345.6611 and additional reports will be sent to you.
Proxy voting policies and procedures
The policy of the Board of Trustees is to vote the proxies of the companies in which the Fund holds investments consistent with the procedures as stated in the Statement of Additional Information (SAI). You may obtain a copy of the SAI without charge by calling 800.345.6611; contacting your financial intermediary; visiting columbiathreadneedleus.com/investment-products/managed-accounts/; or searching the website of the Securities and Exchange Commission (SEC) at sec.gov. Information regarding how the Fund voted proxies relating to portfolio securities is filed with the SEC by August 31st for the most recent 12-month period ending June 30th of that year, and is available without charge by visiting columbiathreadneedleus.com/investment-products/managed-accounts/, or searching the website of the SEC at sec.gov.
Quarterly schedule of investments
The Fund files a complete schedule of portfolio holdings with the SEC for the first and third quarters of each fiscal year on Form N-PORT. The Fund’s Form N-PORT filings are available on the SEC’s website at sec.gov. The Fund’s complete schedule of portfolio holdings, as filed on Form N-PORT, is available on columbiathreadneedleus.com/investor/ or can also be obtained without charge, upon request, by calling 800.345.6611.
Additional Fund information
For more information about the Fund, please visit columbiathreadneedleus.com/investment-products/managed-accounts/ or call 800.345.6611. Customer Service Representatives are available to answer your questions Monday through Friday from 8 a.m. to 7 p.m. Eastern time.
Fund investment manager
Columbia Management Investment Advisers, LLC (the Investment Manager)
290 Congress Street
Boston, MA 02210
Fund distributor
Columbia Management Investment Distributors, Inc.
290 Congress Street
Boston, MA 02210
Fund transfer agent
Columbia Management Investment Services Corp.
P.O. Box 219104
Kansas City, MO 64121-9104
Multisector Bond SMA Completion Portfolio | Annual Report 2023
Fund at a Glance
(Unaudited)
Investment objective
The Fund seeks total return, consisting of current income and capital appreciation.
The Fund is intended to be used as part of a broader separately managed account (SMA) program. The objective of the Fund is intended to be evaluated in the context of the broader SMA program. The Fund is not designed to be used as a stand-alone investment.
Portfolio management
Gene Tannuzzo, CFA
Lead Portfolio Manager
Managed Fund since 2019
Jason Callan
Portfolio Manager
Managed Fund since 2019
Alex Christensen, CFA
Portfolio Manager
Managed Fund since 2021
| Average annual total returns (%) (for the period ended August 31, 2023) |
| | | Inception | 1 Year | Life |
| Multisector Bond SMA Completion Portfolio | 10/29/19 | 12.58 | 3.39 |
| Bloomberg U.S. Aggregate Bond Index | | -1.19 | -1.63 |
All results shown assume reinvestment of distributions during the period. Returns do not reflect the deduction of taxes that a shareholder may pay on Fund distributions or on the redemption of Fund shares. Performance results reflect the effect of any fee waivers or reimbursements of Fund expenses by Columbia Management Investment Advisers, LLC and/or any of its affiliates. Absent these fee waivers or expense reimbursement arrangements, performance results would have been lower.
The performance information shown represents past performance and is not a guarantee of future results. The investment return and principal value of your investment will fluctuate so that your shares, when redeemed, may be worth more or less than their original cost. Current performance may be lower or higher than the performance information shown. You may obtain performance information current to the most recent month-end by contacting your financial intermediary, visiting columbiathreadneedleus.com/investment-products/managed-accounts/ or calling 800.345.6611.
The Fund is only offered to SMA clients as described in the Fund’s prospectus. The Fund’s performance does not reflect any payments to SMA program sponsors or the Investment Manager of any applicable fees by clients in SMA programs and will differ from the performance of a participant’s overall SMA. For more information about your SMA’s performance, please contact your SMA program sponsor or financial intermediary.
The Bloomberg U.S. Aggregate Bond Index is a broad-based benchmark that measures the investment grade, U.S. dollar-denominated, fixed-rate taxable bond market, including Treasuries, government-related and corporate securities, mortgage-backed securities (agency fixed-rate and hybrid adjustable-rate mortgage passthroughs), asset-backed securities, and commercial mortgage-backed securities.
Indices are not available for investment, are not professionally managed and do not reflect sales charges, fees, brokerage commissions, taxes or other expenses of investing. Securities in the Fund may not match those in an index.
Multisector Bond SMA Completion Portfolio | Annual Report 2023
| 3 |
Fund at a Glance (continued)
(Unaudited)
Performance of a hypothetical $10,000 investment (October 29, 2019 — August 31, 2023)
The chart above shows the change in value of a hypothetical $10,000 investment in Multisector Bond SMA Completion Portfolio during the stated time period, and does not reflect the deduction of taxes that a shareholder may pay on Fund distributions or on the sale of Fund shares.
| Portfolio breakdown (%) (at August 31, 2023) |
| Money Market Funds(a) | 27.8 |
| Residential Mortgage-Backed Securities - Agency | 48.3 |
| Treasury Bills | 23.9 |
| Total | 100.0 |
| (a) | Includes investments in Money Market Funds, including investing for the purpose of covering obligations relating to the Fund’s investment in derivatives. For a description of the Fund’s investments in derivatives, see Investments in derivatives following the Portfolio of Investments and the derivative instruments discussion in Note 2 to the Notes to Financial Statements. |
Percentages indicated are based upon total investments excluding investments in derivatives, if any. The Fund’s portfolio composition is subject to change.
| Quality breakdown (%) (at August 31, 2023) |
| AAA rating | 100.0 |
| Total | 100.0 |
Percentages indicated are based upon total fixed income investments.
Bond ratings apply to the underlying holdings of the Fund and not the Fund itself and are divided into categories ranging from highest to lowest credit quality, determined by using the middle rating of Moody’s, S&P and Fitch, after dropping the highest and lowest available ratings. When ratings are available from only two rating agencies, the lower rating is used. When a rating is available from only one rating agency, that rating is used. If a security is not rated but has a rating by Kroll and/or DBRS, the same methodology is applied to those bonds that would otherwise be not rated. When a bond is not rated by any rating agency, it is designated as “Not rated.” Credit quality ratings assigned by a rating agency are subjective opinions, not statements of fact, and are subject to change, including daily. The ratings assigned by credit rating agencies are but one of the considerations that the Investment Manager and/or Fund’s subadviser incorporates into its credit analysis process, along with such other issuer-specific factors as cash flows, capital structure and leverage ratios, ability to de-leverage (repay) through free cash flow, quality of management, market positioning and access to capital, as well as such security-specific factors as the terms of the security (e.g., interest rate and time to maturity) and the amount and type of any collateral.
| 4 | Multisector Bond SMA Completion Portfolio | Annual Report 2023 |
Fund at a Glance (continued)
(Unaudited)
| Derivative breakdown (%) (at August 31, 2023)(a) |
| | Asset | Liability | Net |
| Long futures contracts | 0.15 | — | 0.15 |
| Short futures contracts | 0.02 | (0.15) | (0.13) |
| Swap contracts | 3.72 | — | 3.72 |
(a) Futures contracts and swap contracts are based upon unrealized appreciation (depreciation) as a percentage of net assets. For a description of the Fund’s investments in derivatives, see Investments in derivatives following the Portfolio of Investments, and Note 2 of the Notes to Financial Statements.
Multisector Bond SMA Completion Portfolio | Annual Report 2023
| 5 |
Manager Discussion of Fund Performance
(Unaudited)
The Fund is intended to be used as part of a broader separately managed account (SMA) program. The objective of the Fund is intended to be evaluated in the context of the broader SMA program. The Fund is not designed to be used as a stand-alone investment.
For the 12-month period that ended August 31, 2023, Multisector Bond SMA Completion Portfolio returned 12.58%. The Fund outperformed its benchmark, the Bloomberg U.S. Aggregate Bond Index, which returned -1.19% for the same period.
Market overview
During the annual period, the benchmark, which measures the broad U.S. investment-grade bond market, produced negative returns, spurred by persistently sticky inflation, which, in turn, emboldened an already hawkish U.S. Federal Reserve (Fed).
As the annual period began in September 2022, the 10-year U.S. Treasury yield rose to 4.00% for the first time since 2007. Amid the sharp selloff in government bonds, interest rate volatility also spiked and led to the worst month for agency mortgage-backed securities in that sector’s history. Bonds staged a recovery in the fourth quarter of 2022 and into January 2023. Signs that inflation may have peaked and other encouraging economic data raised hopes the Fed may be approaching the end of its series of sharp interest rate hikes. However, sentiment reversed course in February 2023 as fresh economic data showed that prices did not decelerate as much as consensus expected, and many more jobs had been created to start the new year. Both of these signals were red flags for the Fed, which had downshifted the pace of its hikes earlier in the month. Corporate earnings added noise to the picture as more companies began missing estimates, and management teams turned increasingly cautious. As the market accepted that the Fed might still have a way to go in its tightening cycle, yields climbed and credit spreads widened. Interest rate expectations took another turn in mid-March following clear signs of stress in the banking sector. Yields tumbled across the curve, or spectrum of maturities, when regulators shut down two regional U.S. banks. The Fed looked through this financial sector instability and hiked interest rates for the ninth consecutive time, raising the targeted federal funds rate to a range of 4.75% to 5.00%.
In the second quarter of 2023, the benchmark fell modestly. While April was a positive month for fixed-income markets, led by a recovery from the indiscriminate selloff in the prior month, May saw a tenth interest rate hike by the Fed and the potential of a U.S. federal debt crisis. There was then a pause by the Fed in June, but one accompanied by expectations of further interest rate hikes later in the year. As a result, U.S. Treasury yields moved higher along maturities. In each of the last two months of the annual period, the benchmark posted slightly negative returns. In July, consensus quickly shifted to expect a soft landing and a belief that recession was not imminent. The Fed followed up its June pause by hiking interest rates 25 basis points. (A basis point is 1/100 of a percentage point.) In August, headwinds emerged for U.S. Treasuries, including the announcement of a sharp increase in upcoming issuance, uncertainty around foreign buying following a shift in the Bank of Japan’s monetary stimulus, a rally in energy prices and poor summer liquidity. Fitch Ratings downgraded U.S. debt from its AAA status at the beginning of the month, but market reaction was muted.
All told, yields rose across the U.S. Treasury yield curve. The bellwether 10-year U.S. Treasury yield was up 94 basis points during the annual period. Throughout, the two-year to 10-year portion of the U.S. Treasury yield curve remained inverted, meaning 10-year U.S. Treasury yields were lower than those of two-year U.S. Treasury yields, historically a foreshadow of a recession. In fact, the U.S. Treasury yield curve briefly touched some of its most inverted levels since the early 1980s in July 2023 before steepening just a bit. Globally, the scenario was similar, with government bond yields moving higher as most global central banks, both of developed and emerging markets, continued to tighten monetary policy through most of the annual period, moving to pausing cycles as inflation figures started to edge lower.
U.S. Treasuries and securitized bonds as a whole, including mortgage-backed securities, commercial mortgage-backed securities and asset-backed securities, were among the worst performing fixed-income sectors during the annual period, posting negative absolute returns. Treasury inflation-protected securities also performed poorly, as inflation levels, while persistently high, did fall significantly from the previous year. Conversely, leveraged loans, high-yield corporate bonds and sovereign emerging markets debt were among the strongest performing fixed-income sectors during the annual period, generating solidly positive total returns. Municipal bonds and U.S. investment-grade corporate bonds outperformed both the benchmark and U.S. Treasuries but posted only modestly positive absolute returns for the annual period.
| 6 | Multisector Bond SMA Completion Portfolio | Annual Report 2023 |
Manager Discussion of Fund Performance (continued)
(Unaudited)
The Fund’s notable contributors during the period
| • | Relative to the benchmark, the Fund’s exposure to credit across the quality spectrum boosted its results most, as both investment-grade and high-yield credit sectors outperformed duration-equivalent U.S. Treasuries during the annual period. |
| • | Allocations to sectors that are not components of the benchmark, including high-yield corporate credit, generated significant added value. |
| • | Security selection among investment-grade corporate bonds contributed positively to relative results. |
| ○ | Selection was especially beneficial in April 2023 amid the fallout of the regional banking crisis. For example, ahead of the Silicon Valley Bank failure, the Fund had no exposure at all to what we deemed to be higher risk regional banks due to their relative valuation versus the larger domestic investment banks. |
| ○ | Overweighted positions in industrials- and utilities-related investment-grade corporate bonds, which meaningfully outperformed financials-related issues within the sector, proved particularly prudent as well. |
| • | The Fund’s duration positioning contributed positively to its relative performance. |
| ○ | The Fund held a shorter duration stance than that of the benchmark during an annual period when interest rates rose. |
The Fund’s notable detractors during the period
| • | The Fund had no notable detractors during the period. |
The Fund experienced significant turnover during the period. The portfolio in general can have a volatile turnover pattern since it is used as a mechanism to capture all trades that cannot be completed in the underlying SMAs. This also requires the use of a lot of derivatives, which need to be rolled frequently. Additionally, the Fund required a higher level of rebalancing trades during the period due to an increase in client activity and flows.
This Fund is designed for the exclusive use of shareholders with strategic income SMAs. All portfolio construction, securities analysis and risk management actions are implemented for the combined portfolio experience toward the SMA’s overall objective of seeking total return, consisting of current income and capital appreciation. To that end, the portfolio’s positioning at any given time is intended to complement accompanying SMA holdings in a manner consistent with the overall strategic income investment strategy.
Derivatives usage
The Fund used U.S. Treasury futures, interest rate swaps and options on interest rate swaps to manage its interest rate exposure, i.e., to express a shorter-than-benchmark duration stance. The Fund also used credit default swap indices and commercial mortgage backed securities (CMBX) indices to hedge and express investment views in the high-yield corporate credit and commercial mortgage-backed securities bond markets, respectively. On a stand-alone basis, these derivatives had a positive impact on Fund performance during the period.
Market risk may affect a single issuer, sector of the economy, industry or the market as a whole. Mortgage- and asset-backed securities are affected by interest rates, financial health of issuers/originators, creditworthiness of entities providing credit enhancements and the value of underlying assets. Fixed-income securities present issuer default risk. Non-investment-grade (high-yield or junk) securities present greater price volatility and more risk to principal and income than higher rated securities. A rise in interest rates may result in a price decline of fixed-income instruments held by the Fund, negatively impacting its performance and NAV. Falling rates may result in the Fund investing in lower yielding debt instruments, lowering the Fund’s income and yield. These risks may be heightened for longer maturity and duration securities. Floating rate loans typically present greater risk than other fixed-income investments as they are generally subject to legal or contractual resale restrictions, may trade less frequently and experience value impairments during liquidation. Prepayment and extension risk exists because the timing of payments on a loan, bond or other investment may accelerate when interest rates fall or decelerate when interest rates rise which may reduce investment opportunities and potential returns. Foreign investments subject the Fund to risks, including political, economic, market, social and others within a particular country, as well as to currency instabilities and less stringent financial and accounting standards generally applicable to U.S. issuers. Risks are enhanced for emerging market and sovereign debt issuers. Investing in derivatives is a
Multisector Bond SMA Completion Portfolio | Annual Report 2023
| 7 |
Manager Discussion of Fund Performance (continued)
(Unaudited)
specialized activity that involves special risks that subject the Fund to significant loss potential, including when used as leverage, and may result in greater fluctuation in Fund value. Liquidity risk is associated with the difficulty of selling underlying investments at a desirable time or price. See the Fund’s prospectus for more information on these and other risks.
The views expressed in this report reflect the current views of the respective parties who have contributed to this report. These views are not guarantees of future performance and involve certain risks, uncertainties and assumptions that are difficult to predict, so actual outcomes and results may differ significantly from the views expressed. These views are subject to change at any time based upon economic, market or other conditions and the respective parties disclaim any responsibility to update such views. These views may not be relied on as investment advice and, because investment decisions for a Columbia fund are based on numerous factors, may not be relied on as an indication of trading intent on behalf of any particular Columbia fund. References to specific securities should not be construed as a recommendation or investment advice.
| 8 | Multisector Bond SMA Completion Portfolio | Annual Report 2023 |
Understanding Your Fund’s Expenses
(Unaudited)
As an investor, you incur two types of costs. There are shareholder transaction costs, which may include redemption fees. There are also ongoing fund costs, which generally include management fees, distribution and/or service fees, and other fund expenses. The following information is intended to help you understand your ongoing costs (in dollars) of investing in the Fund and to help you compare these costs with the ongoing costs of investing in other mutual funds.
Analyzing your Fund’s expenses
To illustrate these ongoing costs, we have provided examples and calculated the expenses paid by investors of the Fund during the period. The actual and hypothetical information in the table is based on an initial investment of $1,000 at the beginning of the period indicated and held for the entire period. Expense information is calculated two ways and each method provides you with different information. The amount listed in the “Actual” column is calculated using the Fund’s actual operating expenses and total return for the period. You may use the Actual information, together with the amount invested, to estimate the expenses that you paid over the period. Simply divide your account value by $1,000 (for example, an $8,600 account value divided by $1,000 = 8.6), then multiply the results by the expenses paid during the period under the “Actual” column. The amount listed in the “Hypothetical” column assumes a 5% annual rate of return before expenses (which is not the Fund’s actual return) and then applies the Fund’s actual expense ratio for the period to the hypothetical return. You should not use the hypothetical account values and expenses to estimate either your actual account balance at the end of the period or the expenses you paid during the period. See “Compare with other funds” below for details on how to use the hypothetical data.
Compare with other funds
Since all mutual funds are required to include the same hypothetical calculations about expenses in shareholder reports, you can use this information to compare the ongoing cost of investing in the Fund with other funds. To do so, compare the hypothetical example with the 5% hypothetical examples that appear in the shareholder reports of other funds. As you compare hypothetical examples of other funds, it is important to note that hypothetical examples are meant to highlight the ongoing costs of investing in a fund only and do not reflect any transaction costs, such as redemption or exchange fees. Therefore, the hypothetical calculations are useful in comparing ongoing costs only, and will not help you determine the relative total costs of owning different funds. If transaction costs were included in these calculations, your costs would be higher.
| March 1, 2023 — August 31, 2023 |
| | Account value at the
beginning of the
period ($) | Account value at the
end of the
period ($) | Expenses paid during
the period ($) | Fund’s annualized
expense ratio (%) |
| | Actual | Hypothetical | Actual | Hypothetical | Actual | Hypothetical | Actual |
| Multisector Bond SMA Completion Portfolio | 1,000.00 | 1,000.00 | 1,046.30 | 1,025.21 | 0.00 | 0.00 | 0.00 |
Expenses paid during the period are equal to the annualized expense ratio as indicated above, multiplied by the average account value over the period and then multiplied by the number of days in the Fund’s most recent fiscal half year and divided by 365.
Expenses do not include fees and expenses incurred indirectly by the Fund from its investment in underlying funds, including affiliated and non-affiliated pooled investment vehicles, such as mutual funds and exchange-traded funds.
Had Columbia Management Investment Advisers, LLC and/or certain of its affiliates not waived/reimbursed certain fees and expenses, account value at the end of the period would have been reduced.
Multisector Bond SMA Completion Portfolio | Annual Report 2023
| 9 |
Portfolio of Investments
August 31, 2023
(Percentages represent value of investments compared to net assets)
Investments in securities
| Residential Mortgage-Backed Securities - Agency 85.2% |
| Issuer | Coupon
Rate | | Principal
Amount ($) | Value ($) |
| Uniform Mortgage-Backed Security TBA(a) |
| 09/14/2053 | 3.500% | | 400,000 | 357,516 |
| 09/14/2053 | 4.000% | | 750,000 | 692,227 |
| 09/14/2053 | 4.500% | | 500,000 | 474,062 |
| 09/14/2053 | 5.000% | | 500,000 | 484,814 |
Total Residential Mortgage-Backed Securities - Agency
(Cost $2,020,184) | 2,008,619 |
|
| Treasury Bills 42.2% |
| Issuer | Yield | | Principal
Amount ($) | Value ($) |
| United States 42.2% |
| U.S. Treasury Bills |
| 10/05/2023 | 5.180% | | 1,000,000 | 995,055 |
Total Treasury Bills
(Cost $995,868) | 995,055 |
| Money Market Funds 49.1% |
| | Shares | Value ($) |
| Columbia Short-Term Cash Fund, 5.476%(b),(c) | 1,158,448 | 1,158,101 |
Total Money Market Funds
(Cost $1,157,708) | 1,158,101 |
Total Investments in Securities
(Cost: $4,173,760) | 4,161,775 |
| Other Assets & Liabilities, Net | | (1,803,387) |
| Net Assets | 2,358,388 |
At August 31, 2023, securities and/or cash totaling $253,096 were pledged as collateral.
Investments in derivatives
| Long futures contracts |
| Description | Number of
contracts | Expiration
date | Trading
currency | Notional
amount | Value/Unrealized
appreciation ($) | Value/Unrealized
depreciation ($) |
| U.S. Treasury 5-Year Note | 11 | 12/2023 | USD | 1,176,141 | 3,453 | — |
| Short futures contracts |
| Description | Number of
contracts | Expiration
date | Trading
currency | Notional
amount | Value/Unrealized
appreciation ($) | Value/Unrealized
depreciation ($) |
| U.S. Treasury Ultra Bond | (2) | 12/2023 | USD | (258,938) | 372 | — |
| U.S. Treasury Ultra Bond | (2) | 12/2023 | USD | (258,938) | — | (3,472) |
| Total | | | | | 372 | (3,472) |
| Cleared credit default swap contracts - sell protection |
Reference
entity | Counterparty | Maturity
date | Receive
fixed
rate
(%) | Payment
frequency | Implied
credit
spread
(%)* | Notional
currency | Notional
amount | Value
($) | Upfront
payments
($) | Upfront
receipts
($) | Unrealized
appreciation
($) | Unrealized
depreciation
($) |
| Markit CDX Emerging Markets Index, Series 39 | Morgan Stanley | 06/20/2028 | 1.000 | Quarterly | 2.026 | USD | 1,000,000 | 26,888 | — | — | 26,888 | — |
| Markit CDX North America High Yield Index, Series 40 | Morgan Stanley | 06/20/2028 | 5.000 | Quarterly | 4.252 | USD | 1,500,000 | 60,954 | — | — | 60,954 | — |
| Total | | | | | | | | 87,842 | — | — | 87,842 | — |
The accompanying Notes to Financial Statements are an integral part of this statement.
| 10 | Multisector Bond SMA Completion Portfolio | Annual Report 2023 |
Portfolio of Investments (continued)
August 31, 2023
* Implied credit spreads, represented in absolute terms, utilized in determining the market value of credit default swap agreements on corporate or sovereign issues as of period end serve as an indicator of the current status of the payment/performance risk and represent the likelihood or risk of default for the credit derivative. The implied credit spread of a particular referenced entity reflects the cost of buying/selling protection and may include upfront payments required to be made to enter into the agreement. Wider credit spreads represent a deterioration of the referenced entity’s credit soundness and a greater likelihood or risk of default or other credit event occurring as defined under the terms of the agreement.
Notes to Portfolio of Investments
| (a) | Represents a security purchased on a when-issued basis. |
| (b) | The rate shown is the seven-day current annualized yield at August 31, 2023. |
| (c) | As defined in the Investment Company Act of 1940, as amended, an affiliated company is one in which the Fund owns 5% or more of the company’s outstanding voting securities, or a company which is under common ownership or control with the Fund. The value of the holdings and transactions in these affiliated companies during the year ended August 31, 2023 are as follows: |
| Affiliated issuers | Beginning
of period($) | Purchases($) | Sales($) | Net change in
unrealized
appreciation
(depreciation)($) | End of
period($) | Realized gain
(loss)($) | Dividends($) | End of
period shares |
| Columbia Short-Term Cash Fund, 5.476% |
| | 2,543,132 | 3,018,659 | (4,403,838) | 148 | 1,158,101 | 226 | 53,673 | 1,158,448 |
Abbreviation Legend
Currency Legend
Fair value measurements
The Fund categorizes its fair value measurements according to a three-level hierarchy that maximizes the use of observable inputs and minimizes the use of unobservable inputs by prioritizing that the most observable input be used when available. Observable inputs are those that market participants would use in pricing an investment based on market data obtained from sources independent of the reporting entity. Unobservable inputs are those that reflect the Fund’s assumptions about the information market participants would use in pricing an investment. An investment’s level within the fair value hierarchy is based on the lowest level of any input that is deemed significant to the asset’s or liability’s fair value measurement. The input levels are not necessarily an indication of the risk or liquidity associated with investments at that level. For example, certain U.S. government securities are generally high quality and liquid, however, they are reflected as Level 2 because the inputs used to determine fair value may not always be quoted prices in an active market.
Fair value inputs are summarized in the three broad levels listed below:
| ■ | Level 1 — Valuations based on quoted prices for investments in active markets that the Fund has the ability to access at the measurement date. Valuation adjustments are not applied to Level 1 investments. |
| ■ | Level 2 — Valuations based on other significant observable inputs (including quoted prices for similar securities, interest rates, prepayment speeds, credit risks, etc.). |
| ■ | Level 3 — Valuations based on significant unobservable inputs (including the Fund’s own assumptions and judgment in determining the fair value of investments). |
Inputs that are used in determining fair value of an investment may include price information, credit data, volatility statistics, and other factors. These inputs can be either observable or unobservable. The availability of observable inputs can vary between investments, and is affected by various factors such as the type of investment, and the volume and level of activity for that investment or similar investments in the marketplace. The inputs will be considered by the Investment Manager, along with any other relevant factors in the calculation of an investment’s fair value. The Fund uses prices and inputs that are current as of the measurement date, which may include periods of market dislocations. During these periods, the availability of prices and inputs may be reduced for many investments. This condition could cause an investment to be reclassified between the various levels within the hierarchy.
Investments falling into the Level 3 category are primarily supported by quoted prices from brokers and dealers participating in the market for those investments. However, these may be classified as Level 3 investments due to lack of market transparency and corroboration to support these quoted prices. Additionally, valuation models may be used as the pricing source for any remaining investments classified as Level 3. These models may rely on one or more significant unobservable inputs and/or significant assumptions by the Investment Manager. Inputs used in valuations may include, but are not limited to, financial statement analysis, capital account balances, discount rates and estimated cash flows, and comparable company data.
The Fund’s Board of Trustees (the Board) has designated the Investment Manager, through its Valuation Committee (the Committee), as valuation designee, responsible for determining the fair value of the assets of the Fund for which market quotations are not readily available using valuation procedures approved by the Board. The Committee consists of voting and non-voting members from various groups within the Investment Manager’s organization, including operations and accounting, trading and investments, compliance, risk management and legal.
The Committee meets at least monthly to review and approve valuation matters, which may include a description of specific valuation determinations, data regarding pricing information received from approved pricing vendors and brokers and the results of Board-approved valuation policies and procedures (the Policies). The Policies address, among other things, instances when market quotations are or are not readily available, including recommendations of third party pricing vendors and a determination of appropriate pricing methodologies; events that require specific valuation determinations and assessment of fair value techniques; securities with a potential for stale pricing, including those that are illiquid, restricted, or
The accompanying Notes to Financial Statements are an integral part of this statement.
Multisector Bond SMA Completion Portfolio | Annual Report 2023
| 11 |
Portfolio of Investments (continued)
August 31, 2023
Fair value measurements (continued)
in default; and the effectiveness of third party pricing vendors, including periodic reviews of vendors. The Committee meets more frequently, as needed, to discuss additional valuation matters, which may include the need to review back-testing results, review time-sensitive information or approve related valuation actions. Representatives of Columbia Management Investment Advisers, LLC report to the Board at each of its regularly scheduled meetings to discuss valuation matters and actions during the period, similar to those described earlier.
The following table is a summary of the inputs used to value the Fund’s investments at August 31, 2023:
| | Level 1 ($) | Level 2 ($) | Level 3 ($) | Total ($) |
| Investments in Securities | | | | |
| Residential Mortgage-Backed Securities - Agency | — | 2,008,619 | — | 2,008,619 |
| Treasury Bills | — | 995,055 | — | 995,055 |
| Money Market Funds | 1,158,101 | — | — | 1,158,101 |
| Total Investments in Securities | 1,158,101 | 3,003,674 | — | 4,161,775 |
| Investments in Derivatives | | | | |
| Asset | | | | |
| Futures Contracts | 3,825 | — | — | 3,825 |
| Swap Contracts | — | 87,842 | — | 87,842 |
| Liability | | | | |
| Futures Contracts | (3,472) | — | — | (3,472) |
| Total | 1,158,454 | 3,091,516 | — | 4,249,970 |
See the Portfolio of Investments for all investment classifications not indicated in the table.
The Fund’s assets assigned to the Level 2 input category are generally valued using the market approach, in which a security’s value is determined through reference to prices and information from market transactions for similar or identical assets.
Derivative instruments are valued at unrealized appreciation (depreciation).
The accompanying Notes to Financial Statements are an integral part of this statement.
| 12 | Multisector Bond SMA Completion Portfolio | Annual Report 2023 |
Statement of Assets and Liabilities
August 31, 2023
| Assets | |
| Investments in securities, at value | |
| Unaffiliated issuers (cost $3,016,052) | $3,003,674 |
| Affiliated issuers (cost $1,157,708) | 1,158,101 |
| Margin deposits on: | |
| Futures contracts | 10,094 |
| Swap contracts | 243,002 |
| Receivable for: | |
| Dividends | 5,137 |
| Interest | 3,304 |
| Variation margin for futures contracts | 1,430 |
| Trustees’ fees | 6,659 |
| Expense reimbursement due from Investment Manager | 304 |
| Prepaid expenses | 2,926 |
| Total assets | 4,434,631 |
| Liabilities | |
| Payable for: | |
| Investments purchased on a delayed delivery basis | 2,023,490 |
| Variation margin for futures contracts | 1,234 |
| Variation margin for swap contracts | 4,387 |
| Transfer agent fees | 10 |
| Trustees’ fees | 20,629 |
| Other expenses | 26,493 |
| Total liabilities | 2,076,243 |
| Net assets applicable to outstanding capital stock | $2,358,388 |
| Represented by | |
| Paid in capital | 3,646,051 |
| Total distributable earnings (loss) | (1,287,663) |
| Total - representing net assets applicable to outstanding capital stock | $2,358,388 |
| Shares outstanding | 188,602 |
| Net asset value per share | 12.50 |
The accompanying Notes to Financial Statements are an integral part of this statement.
Multisector Bond SMA Completion Portfolio | Annual Report 2023
| 13 |
Statement of Operations
Year Ended August 31, 2023
| Net investment income | |
| Income: | |
| Dividends — affiliated issuers | $53,673 |
| Interest | 50,960 |
| Total income | 104,633 |
| Expenses: | |
| Transfer agent fees | 134 |
| Trustees’ fees | 15,267 |
| Custodian fees | 17,418 |
| Printing and postage fees | 6,894 |
| Registration fees | 34,142 |
| Accounting services fees | 43,445 |
| Legal fees | 12,849 |
| Other | 5,516 |
| Total expenses | 135,665 |
| Fees waived or expenses reimbursed by Investment Manager and its affiliates | (135,787) |
| Total net expenses | (122) |
| Net investment income | 104,755 |
| Realized and unrealized gain (loss) — net | |
| Net realized gain (loss) on: | |
| Investments — unaffiliated issuers | (56,743) |
| Investments — affiliated issuers | 226 |
| Futures contracts | (13,645) |
| Swap contracts | 17,713 |
| Net realized loss | (52,449) |
| Net change in unrealized appreciation (depreciation) on: | |
| Investments — unaffiliated issuers | 7,878 |
| Investments — affiliated issuers | 148 |
| Futures contracts | 353 |
| Swap contracts | 230,695 |
| Net change in unrealized appreciation (depreciation) | 239,074 |
| Net realized and unrealized gain | 186,625 |
| Net increase in net assets resulting from operations | $291,380 |
The accompanying Notes to Financial Statements are an integral part of this statement.
| 14 | Multisector Bond SMA Completion Portfolio | Annual Report 2023 |
Statement of Changes in Net Assets
| | Year Ended
August 31, 2023 | Year Ended
August 31, 2022 |
| Operations | | |
| Net investment income | $104,755 | $368,732 |
| Net realized loss | (52,449) | (1,177,937) |
| Net change in unrealized appreciation (depreciation) | 239,074 | (344,448) |
| Net increase (decrease) in net assets resulting from operations | 291,380 | (1,153,653) |
| Distributions to shareholders | | |
| Net investment income and net realized gains | (100,230) | (549,674) |
| Total distributions to shareholders | (100,230) | (549,674) |
| Decrease in net assets from capital stock activity | (839,714) | (17,569,714) |
| Total decrease in net assets | (648,564) | (19,273,041) |
| Net assets at beginning of year | 3,006,952 | 22,279,993 |
| Net assets at end of year | $2,358,388 | $3,006,952 |
| | Year Ended | Year Ended |
| | August 31, 2023 | August 31, 2022 |
| | Shares | Dollars ($) | Shares | Dollars ($) |
| Capital stock activity |
| | | | | |
| Shares sold | — | — | 1,212,097 | 15,118,959 |
| Distributions reinvested | 8,197 | 100,230 | 44,574 | 549,674 |
| Shares redeemed | (79,245) | (939,944) | (2,748,178) | (33,238,347) |
| Total net decrease | (71,048) | (839,714) | (1,491,507) | (17,569,714) |
The accompanying Notes to Financial Statements are an integral part of this statement.
Multisector Bond SMA Completion Portfolio | Annual Report 2023
| 15 |
The following table is intended to help you understand the Fund’s financial performance. Certain information reflects financial results for a single share held for the periods shown. Per share net investment income (loss) amounts are calculated based on average shares outstanding during the period. Total return assumes reinvestment of all dividends and distributions, if any. Total return does not reflect payment of sales charges, if any. Total return and portfolio turnover are not annualized for periods of less than one year. The ratios of expenses and net investment income are annualized for periods of less than one year. The portfolio turnover rate is calculated without regard to purchase and sales transactions of short-term instruments and certain derivatives, if any. If such transactions were included, the Fund’s portfolio turnover rate may be higher.
| | Year Ended August 31, |
| 2023 | 2022 | 2021 | 2020 (a) |
| Per share data | | | | |
| Net asset value, beginning of period | $11.58 | $12.72 | $11.73 | $12.00 |
| Income from investment operations: | | | | |
| Net investment income | 0.52 | 0.21 | 0.05 | 0.12 |
| Net realized and unrealized gain (loss) | 0.92 | (0.99) | 0.99 | (0.26) |
| Total from investment operations | 1.44 | (0.78) | 1.04 | (0.14) |
| Less distributions to shareholders from: | | | | |
| Net investment income | (0.52) | (0.27) | (0.05) | (0.13) |
| Net realized gains | — | (0.09) | — | — |
| Total distributions to shareholders | (0.52) | (0.36) | (0.05) | (0.13) |
| Net asset value, end of period | $12.50 | $11.58 | $12.72 | $11.73 |
| Total return | 12.58% | (6.21%) | 8.91% | (1.16%) |
| Ratios to average net assets | | | | |
| Total gross expenses(b) | 5.56% | 0.62%(c) | 3.72%(c) | 5.21% |
| Total net expenses(b),(d) | (0.01)%(e) | 0.00%(c) | 0.00%(c),(f) | 0.00% |
| Net investment income | 4.30% | 1.66% | 0.37% | 1.28% |
| Supplemental data | | | | |
| Portfolio turnover | 1,205% | 372% | 15% | 0% |
| Net assets, end of period (in thousands) | $2,358 | $3,007 | $22,280 | $2,054 |
| Notes to Financial Highlights |
| (a) | The Fund commenced operations on October 29, 2019. Per share data and total return reflect activity from that date. |
| (b) | In addition to the fees and expenses that the Fund bears directly, the Fund indirectly bears a pro rata share of the fees and expenses of any other funds in which it invests. Such indirect expenses are not included in the Fund’s reported expense ratios. |
| (c) | Ratios include interest on collateral expense. For the periods indicated below, if interest on collateral expense had been excluded, expenses would have been lower by: |
| Class | 8/31/2022 | 8/31/2021 |
| No Class | 0.01% | less than 0.01% |
| (d) | Total net expenses include the impact of certain fee waivers/expense reimbursements made by the Investment Manager and certain of its affiliates, if applicable. |
| (e) | Total net expenses include the impact of an expense reimbursement by the Investment Manager of indirect expenses related to investments in underlying funds. Had indirect expenses been incurred directly, the total net expense ratio would have been 0.00%. |
| (f) | Rounds to zero. |
The accompanying Notes to Financial Statements are an integral part of this statement.
| 16 | Multisector Bond SMA Completion Portfolio | Annual Report 2023 |
Notes to Financial Statements
August 31, 2023
Note 1. Organization
Multisector Bond SMA Completion Portfolio (the Fund), a series of Columbia Funds Series Trust I (the Trust), is a non-diversified fund. The Trust is registered under the Investment Company Act of 1940, as amended (the 1940 Act), as an open-end management investment company organized as a Massachusetts business trust.
Fund shares
The Trust may issue an unlimited number of shares (without par value). Shares of the Fund may only be purchased and held by or on behalf of separately managed account (SMA) clients.
Note 2. Summary of significant accounting policies
Basis of preparation
The Fund is an investment company that applies the accounting and reporting guidance in the Financial Accounting Standards Board (FASB) Accounting Standards Codification Topic 946, Financial Services - Investment Companies (ASC 946). The financial statements are prepared in accordance with U.S. generally accepted accounting principles (GAAP), which requires management to make certain estimates and assumptions that affect the reported amounts of assets and liabilities, the disclosure of contingent assets and liabilities at the date of the financial statements and the reported amounts of income and expenses during the reporting period. Actual results could differ from those estimates.
The following is a summary of significant accounting policies followed by the Fund in the preparation of its financial statements.
Security valuation
Debt securities generally are valued based on prices obtained from pricing services, which are intended to reflect market transactions for normal, institutional-size trading units of similar securities. The services may use various pricing techniques that take into account, as applicable, factors such as yield, quality, coupon rate, maturity, type of issue, trading characteristics and other data, as well as approved independent broker-dealer quotes. Debt securities for which quotations are not readily available or not believed to be reflective of market value may also be valued based upon a bid quote from an approved independent broker-dealer. Debt securities maturing in 60 days or less are valued primarily at amortized market value, unless this method results in a valuation that management believes does not approximate fair value.
Asset- and mortgage-backed securities are generally valued by pricing services, which utilize pricing models that incorporate the securities’ cash flow and loan performance data. These models also take into account available market data, including trades, market quotations, and benchmark yield curves for identical or similar securities. Factors used to identify similar securities may include, but are not limited to, issuer, collateral type, vintage, prepayment speeds, collateral performance, credit ratings, credit enhancement and expected life. Asset-backed securities for which quotations are readily available may also be valued based upon an over-the-counter or exchange bid quote from an approved independent broker-dealer. Debt securities maturing in 60 days or less are valued primarily at amortized market value, unless this method results in a valuation that management believes does not approximate fair value.
Investments in open-end investment companies (other than exchange-traded funds (ETFs)), are valued at the latest net asset value reported by those companies as of the valuation time.
Futures and options on futures contracts are valued based upon the settlement price at the close of regular trading on their principal exchanges or, in the absence of a settlement price, at the mean of the latest quoted bid and ask prices.
Swap transactions are valued through an independent pricing service or broker, or if neither is available, through an internal model based upon observable inputs.
Investments for which market quotations are not readily available, or that have quotations which management believes are not reflective of market value or reliable, are valued at fair value as determined in good faith under procedures approved by the Board of Trustees. If a security or class of securities (such as foreign securities) is valued at fair value, such value is likely to be different from the quoted or published price for the security, if available.
Multisector Bond SMA Completion Portfolio | Annual Report 2023
| 17 |
Notes to Financial Statements (continued)
August 31, 2023
The determination of fair value often requires significant judgment. To determine fair value, management may use assumptions including but not limited to future cash flows and estimated risk premiums. Multiple inputs from various sources may be used to determine fair value.
GAAP requires disclosure regarding the inputs and valuation techniques used to measure fair value and any changes in valuation inputs or techniques. In addition, investments shall be disclosed by major category. This information is disclosed following the Fund’s Portfolio of Investments.
Derivative instruments
The Fund invests in certain derivative instruments, as detailed below, in seeking to meet its investment objectives. Derivatives are instruments whose values depend on, or are derived from, in whole or in part, the value of one or more securities, currencies, commodities, indices, or other assets or instruments. Derivatives may be used to increase investment flexibility (including to maintain cash reserves while maintaining desired exposure to certain assets), for risk management (hedging) purposes, to facilitate trading, to reduce transaction costs and to pursue higher investment returns. The Fund may also use derivative instruments to mitigate certain investment risks, such as foreign currency exchange rate risk, interest rate risk and credit risk. Derivatives may involve various risks, including the potential inability of the counterparty to fulfill its obligations under the terms of the contract, the potential for an illiquid secondary market (making it difficult for the Fund to sell or terminate, including at favorable prices) and the potential for market movements which may expose the Fund to gains or losses in excess of the amount shown in the Statement of Assets and Liabilities. The notional amounts of derivative instruments, if applicable, are not recorded in the financial statements.
A derivative instrument may suffer a marked-to-market loss if the value of the contract decreases due to an unfavorable change in the market rates or values of the underlying instrument. Losses can also occur if the counterparty does not perform its obligations under the contract. The Fund’s risk of loss from counterparty credit risk on over-the-counter derivatives is generally limited to the aggregate unrealized gain netted against any collateral held by the Fund and the amount of any variation margin held by the counterparty, plus any replacement costs or related amounts. With exchange-traded or centrally cleared derivatives, there is reduced counterparty credit risk to the Fund since the clearinghouse or central counterparty (CCP) provides some protection in the case of clearing member default. The clearinghouse or CCP stands between the buyer and the seller of the contract; therefore, failure of the clearinghouse or CCP may pose additional counterparty credit risk. However, credit risk still exists in exchange-traded or centrally cleared derivatives with respect to initial and variation margin that is held in a broker’s customer account. While clearing brokers are required to segregate customer margin from their own assets, in the event that a clearing broker becomes insolvent or goes into bankruptcy and at that time there is a shortfall in the aggregate amount of margin held by the clearing broker for all its clients and such shortfall is remedied by the CCP or otherwise, U.S. bankruptcy laws will typically allocate that shortfall on a pro-rata basis across all the clearing broker’s customers (including the Fund), potentially resulting in losses to the Fund.
In order to better define its contractual rights and to secure rights that will help the Fund mitigate its counterparty risk, the Fund may enter into an International Swaps and Derivatives Association, Inc. Master Agreement (ISDA Master Agreement) or similar agreement with its derivatives counterparties. An ISDA Master Agreement is an agreement between the Fund and a counterparty that governs over-the-counter derivatives and foreign exchange forward contracts and contains, among other things, collateral posting terms and netting provisions in the event of a default and/or termination event. Under an ISDA Master Agreement, the Fund may, under certain circumstances, offset with the counterparty certain derivative instruments’ payables and/or receivables with collateral held and/or posted and create one single net payment. The provisions of the ISDA Master Agreement typically permit a single net payment in the event of default (close-out netting), including the bankruptcy or insolvency of the counterparty. Note, however, that bankruptcy or insolvency laws of a particular jurisdiction may impose restrictions on or prohibitions against the right of offset or netting in bankruptcy, insolvency or other events.
Collateral (margin) requirements differ by type of derivative. Margin requirements are established by the clearinghouse or CCP for exchange-traded and centrally cleared derivatives. Brokers can ask for margin in excess of the minimum in certain circumstances. Collateral terms for most over-the-counter derivatives are subject to regulatory requirements to exchange variation margin with trading counterparties and may have contract specific margin terms as well. For over-the-counter derivatives traded under an ISDA Master Agreement, the collateral requirements are typically calculated by netting the marked-to-market amount for each transaction under such agreement and comparing that amount to the value of any variation margin currently pledged by the Fund and/or the counterparty. Generally, the amount of collateral due from or to a
| 18 | Multisector Bond SMA Completion Portfolio | Annual Report 2023 |
Notes to Financial Statements (continued)
August 31, 2023
party has to exceed a minimum transfer amount threshold (e.g., $250,000) before a transfer has to be made. To the extent amounts due to the Fund from its counterparties are not fully collateralized, contractually or otherwise, the Fund bears the risk of loss from counterparty nonperformance. The Fund may also pay interest expense on cash collateral received from the broker or receive interest income on cash collateral pledged to the broker. The Fund attempts to mitigate counterparty risk by only entering into agreements with counterparties that it believes have the financial resources to honor their obligations and by monitoring the financial stability of those counterparties.
Certain ISDA Master Agreements allow counterparties of over-the-counter derivatives transactions to terminate derivatives contracts prior to maturity in the event the Fund’s net asset value declines by a stated percentage over a specified time period or if the Fund fails to meet certain terms of the ISDA Master Agreement, which would cause the Fund to accelerate payment of any net liability owed to the counterparty. The Fund also has termination rights if the counterparty fails to meet certain terms of the ISDA Master Agreement. In determining whether to exercise such termination rights, the Fund would consider, in addition to counterparty credit risk, whether termination would result in a net liability owed from the counterparty.
For financial reporting purposes, the Fund does not offset derivative assets and derivative liabilities that are subject to netting arrangements in the Statement of Assets and Liabilities.
Futures contracts
Futures contracts are exchange-traded and represent commitments for the future purchase or sale of an asset at a specified price on a specified date. The Fund bought and sold futures contracts to manage the duration and yield curve exposure of the Fund versus the benchmark and to manage exposure to movements in interest rates. These instruments may be used for other purposes in future periods. Upon entering into futures contracts, the Fund bears risks that it may not achieve the anticipated benefits of the futures contracts and may realize a loss. Additional risks include counterparty credit risk, the possibility of an illiquid market, and that a change in the value of the contract or option may not correlate with changes in the value of the underlying asset.
Upon entering into a futures contract, the Fund deposits cash or securities with the broker, known as a futures commission merchant (FCM), in an amount sufficient to meet the initial margin requirement. The initial margin deposit must be maintained at an established level over the life of the contract. Cash deposited as initial margin is recorded in the Statement of Assets and Liabilities as margin deposits. Securities deposited as initial margin are designated in the Portfolio of Investments. Subsequent payments (variation margin) are made or received by the Fund each day. The variation margin payments are equal to the daily change in the contract value and are recorded as variation margin receivable or payable and are offset in unrealized gains or losses. The Fund generally expects to earn interest income on its margin deposits. The Fund recognizes a realized gain or loss when the contract is closed or expires. Futures contracts involve, to varying degrees, risk of loss in excess of the variation margin disclosed in the Statement of Assets and Liabilities.
Swap contracts
Swap contracts are negotiated in the over-the-counter market and are entered into bilaterally or centrally cleared (centrally cleared swap contract). In a centrally cleared swap contract, immediately following execution of the swap contract with a broker, the swap contract is novated to a central counterparty (the CCP) and the CCP becomes the Fund’s counterparty to the centrally cleared swap contract. The Fund is required to deposit initial margin with the futures commission merchant (FCM), which pledges it through to the CCP in the form of cash or securities in an amount that varies depending on the size and risk profile of the particular swap contract. Securities deposited as initial margin are designated in the Portfolio of Investments and cash deposited is recorded in the Statement of Assets and Liabilities as margin deposits. For a bilateral swap contract, the Fund has credit exposure to the broker, but exchanges daily variation margin with the broker based on the mark-to-market value of the swap contract to minimize that exposure. For centrally cleared swap contracts, the Fund has minimal credit exposure to the FCM because the CCP stands between the Fund and the relevant buyer/seller on the other side of the contract. Swap contracts are marked-to-market daily and changes in value are recorded as unrealized appreciation (depreciation). The daily change in valuation of centrally cleared swap contracts, if any, is recorded as a receivable or payable for variation margin in the Statement of Assets and Liabilities.
Multisector Bond SMA Completion Portfolio | Annual Report 2023
| 19 |
Notes to Financial Statements (continued)
August 31, 2023
Entering into these contracts involves, to varying degrees, elements of interest, liquidity and counterparty credit risk in excess of the amounts recognized in the Statement of Assets and Liabilities. Such risks involve the possibility that there may be unfavorable changes in interest rates, market conditions or other conditions, that it may be difficult to initiate a swap transaction or liquidate a position at an advantageous time or price which may result in significant losses, and that the bilateral counterparty, FCM or CCP, as applicable, may not fulfill its obligation under the contract.
Credit default swap contracts
The Fund entered into credit default swap contracts to increase or decrease its credit exposure to an index and to manage credit risk exposure. These instruments may be used for other purposes in future periods. Credit default swap contracts are transactions in which one party pays fixed periodic payments to a counterparty in consideration for an agreement from the counterparty to make a specific payment should a specified credit event(s) take place. Although specified credit events are contract specific, credit events are typically bankruptcy, failure to pay, restructuring, obligation acceleration, obligation default, or repudiation/moratorium.
As the purchaser of a credit default swap contract, the Fund purchases protection by paying a periodic interest rate on the notional amount to the counterparty. The interest amount is accrued daily as a component of unrealized appreciation (depreciation) and is recorded as a realized loss upon payment. If a credit event as specified in the contract occurs, the Fund may have the option either to deliver the reference obligation to the seller in exchange for a cash payment of its par amount, or to receive a net cash settlement equal to the par amount less an agreed-upon value of the reference obligation as of the date of the credit event. The difference between the value of the obligation or cash delivered and the notional amount received will be recorded as a realized gain (loss).
As the seller of a credit default swap contract, the Fund sells protection to a buyer and will generally receive a periodic interest rate on a notional amount. The interest amount is accrued daily as a component of unrealized appreciation (depreciation) and is recorded as a realized gain upon receipt of the payment. If a credit event as specified in the contract with the counterparty occurs, the Fund may either be required to accept the reference obligation from the buyer in exchange for a cash payment of its notional amount, or to pay the buyer a net cash settlement equal to the notional amount less an agreed-upon value of the reference obligation (recovery value) as of the date of the credit event. The difference between the value of the obligation or cash received and the notional amount paid will be recorded as a realized gain (loss). The maximum potential amount of undiscounted future payments the Fund could be required to make as the seller of protection under a credit default swap contract is equal to the notional amount of the reference obligation. These potential amounts may be partially offset by any recovery values of the respective reference obligations or upfront receipts upon entering into the agreement. The notional amounts and market values of all credit default swap contracts in which the Fund is the seller of protection, if any, are disclosed in the Credit Default Swap Contracts Outstanding schedule following the Portfolio of Investments.
As a protection seller, the Fund bears the risk of loss from the credit events specified in the contract with the counterparty. For credit default swap contracts on credit indices, quoted market prices and resulting market values serve as an indicator of the current status of the payment/performance risk. Increasing market values, in absolute terms when compared to the notional amount of the swap, represent a deterioration of the reference entity’s credit soundness and a greater likelihood or risk of default or other credit event occurring as defined under the terms of the contract.
Any upfront payment or receipt by the Fund upon entering into a credit default swap contract is recorded as an asset or liability, respectively, and amortized daily as a component of realized gain (loss) in the Statement of Operations. Credit default swap contracts are valued daily, and the change in value is recorded as unrealized appreciation (depreciation) until the termination of the swap, at which time a realized gain (loss) is recorded.
Credit default swap contracts can involve greater risks than if a fund had invested in the reference obligation directly since, in addition to general market risks, credit default swaps are subject to counterparty credit risk, leverage risk, hedging risk, correlation risk and liquidity risk.
| 20 | Multisector Bond SMA Completion Portfolio | Annual Report 2023 |
Notes to Financial Statements (continued)
August 31, 2023
Effects of derivative transactions in the financial statements
The following tables are intended to provide additional information about the effect of derivatives on the financial statements of the Fund, including: the fair value of derivatives by risk category and the location of those fair values in the Statement of Assets and Liabilities; and the impact of derivative transactions over the period in the Statement of Operations, including realized and unrealized gains (losses). The derivative instrument schedules following the Portfolio of Investments present additional information regarding derivative instruments outstanding at the end of the period, if any.
The following table is a summary of the fair value of derivative instruments (not considered to be hedging instruments for accounting disclosure purposes) at August 31, 2023:
| | Asset derivatives | |
Risk exposure
category | Statement
of assets and liabilities
location | Fair value ($) |
| Credit risk | Component of total distributable earnings (loss) — unrealized appreciation on swap contracts | 87,842* |
| Interest rate risk | Component of total distributable earnings (loss) — unrealized appreciation on futures contracts | 3,825* |
| Total | | 91,667 |
| | Liability derivatives | |
Risk exposure
category | Statement
of assets and liabilities
location | Fair value ($) |
| Interest rate risk | Component of total distributable earnings (loss) — unrealized depreciation on futures contracts | 3,472* |
| * | Includes cumulative appreciation (depreciation) as reported in the tables following the Portfolio of Investments. Only the current day’s variation margin for futures and centrally cleared swaps, if any, is reported in receivables or payables in the Statement of Assets and Liabilities. |
The following table indicates the effect of derivative instruments (not considered to be hedging instruments for accounting disclosure purposes) in the Statement of Operations for the year ended August 31, 2023:
| Amount of realized gain (loss) on derivatives recognized in income |
| Risk exposure category | Futures
contracts
($) | Swap
contracts
($) | Total
($) |
| Credit risk | — | 17,713 | 17,713 |
| Interest rate risk | (13,645) | — | (13,645) |
| Total | (13,645) | 17,713 | 4,068 |
| |
| Change in unrealized appreciation (depreciation) on derivatives recognized in income |
| Risk exposure category | Futures
contracts
($) | Swap
contracts
($) | Total
($) |
| Credit risk | — | 230,695 | 230,695 |
| Interest rate risk | 353 | — | 353 |
| Total | 353 | 230,695 | 231,048 |
The following table is a summary of the average daily outstanding volume by derivative instrument for the year ended August 31, 2023:
| Derivative instrument | Average notional
amounts ($) |
| Futures contracts — long | 390,712 |
| Futures contracts — short | 466,110 |
| Credit default swap contracts — sell protection | 2,631,397 |
Multisector Bond SMA Completion Portfolio | Annual Report 2023
| 21 |
Notes to Financial Statements (continued)
August 31, 2023
Asset- and mortgage-backed securities
The Fund may invest in asset-backed and mortgage-backed securities. The maturity dates shown represent the original maturity of the underlying obligation. Actual maturity may vary based upon prepayment activity on these obligations. All, or a portion, of the obligation may be prepaid at any time because the underlying asset may be prepaid. As a result, decreasing market interest rates could result in an increased level of prepayment. An increased prepayment rate will have the effect of shortening the maturity of the security. Unless otherwise noted, the coupon rates presented are fixed rates.
Delayed delivery securities
The Fund may trade securities on other than normal settlement terms, including securities purchased or sold on a “when-issued” or "forward commitment" basis. This may increase risk to the Fund since the other party to the transaction may fail to deliver, which could cause the Fund to subsequently invest at less advantageous prices. The Fund designates cash or liquid securities in an amount equal to the delayed delivery commitment.
To be announced securities
The Fund may trade securities on a To Be Announced (TBA) basis. As with other delayed-delivery transactions, a seller agrees to issue a TBA security at a future date. However, the seller does not specify the particular securities to be delivered. Instead, the Fund agrees to accept any security that meets specified terms.
In some cases, Master Securities Forward Transaction Agreements (MSFTAs) may be used to govern transactions of certain forward-settling agency mortgage-backed securities, such as delayed-delivery and TBAs, between the Fund and counterparty. The MSFTA maintains provisions for, among other things, initiation and confirmation, payment and transfer, events of default, termination, and maintenance of collateral relating to such transactions.
Mortgage dollar roll transactions
The Fund may enter into mortgage “dollar rolls” in which the Fund sells securities for delivery in the current month and simultaneously contracts with the same counterparty to repurchase similar but not identical securities (same type, coupon and maturity) on a specified future date. These transactions may increase the Fund’s portfolio turnover rate. During the roll period, the Fund loses the right to receive principal and interest paid on the securities sold. However, the Fund may benefit because it receives negotiated amounts in the form of reductions of the purchase price for the future purchase plus the interest earned on the cash proceeds of the securities sold until the settlement date of the forward purchase. The Fund records the incremental difference between the forward purchase and sale of each forward roll as a realized gain or loss. Unless any realized gains exceed the income, capital appreciation, and gain or loss due to mortgage prepayments that would have been realized on the securities sold as part of the mortgage dollar roll, the use of this technique may diminish the investment performance of the Fund compared to what the performance would have been without the use of mortgage dollar rolls. Mortgage dollar rolls involve the risk that the market value of the securities the Fund is obligated to repurchase may decline below the repurchase price, or that the counterparty may default on its obligations. All cash proceeds will be invested in instruments that are permissible investments for the Fund. The Fund identifies cash or liquid securities in an amount equal to the forward purchase price. The Fund does not currently enter into mortgage dollar rolls that are accounted for as financing transactions.
Offsetting of assets and liabilities
The following table presents the Fund’s gross and net amount of assets and liabilities available for offset under netting arrangements as well as any related collateral received or pledged by the Fund as of August 31, 2023:
| | Morgan
Stanley ($) |
| Liabilities | |
| Centrally cleared credit default swap contracts (a) | 4,387 |
| Total financial and derivative net assets | (4,387) |
| Total collateral received (pledged) (b) | (4,387) |
| Net amount (c) | — |
| 22 | Multisector Bond SMA Completion Portfolio | Annual Report 2023 |
Notes to Financial Statements (continued)
August 31, 2023
| (a) | Centrally cleared swaps are included within payable/receivable for variation margin in the Statement of Assets and Liabilities. |
| (b) | In some instances, the actual collateral received and/or pledged may be more than the amount shown due to overcollateralization. |
| (c) | Represents the net amount due from/(to) counterparties in the event of default. |
Security transactions
Security transactions are accounted for on the trade date. Cost is determined and gains (losses) are based upon the specific identification method for both financial statement and federal income tax purposes.
Income recognition
Interest income is recorded on an accrual basis. Market premiums and discounts, including original issue discounts, are amortized and accreted, respectively, over the expected life of the security on all debt securities, unless otherwise noted. The Fund classifies gains and losses realized on prepayments received on mortgage-backed securities as adjustments to interest income.
The Fund may place a debt security on non-accrual status and reduce related interest income when it becomes probable that the interest will not be collected and the amount of uncollectible interest can be reasonably estimated. The Fund may also adjust accrual rates when it becomes probable the full interest will not be collected and a partial payment will be received. A defaulted debt security is removed from non-accrual status when the issuer resumes interest payments or when collectability of interest is reasonably assured.
Dividend income is recorded on the ex-dividend date.
Expenses
General expenses of the Trust are allocated to the Fund and other funds of the Trust based upon relative net assets or other expense allocation methodologies determined by the nature of the expense. Expenses directly attributable to the Fund are charged to the Fund.
Determination of net asset value
The net asset value per share of the Fund is computed by dividing the value of the net assets of the Fund by the total number of outstanding shares of that Fund, rounded to the nearest cent, at the close of regular trading (ordinarily 4:00 p.m. Eastern Time) every day the New York Stock Exchange is open.
Federal income tax status
The Fund intends to qualify each year as a regulated investment company under Subchapter M of the Internal Revenue Code, as amended, and will distribute substantially all of its investment company taxable income and net capital gain, if any, for its tax year, and as such will not be subject to federal income taxes. In addition, the Fund intends to distribute in each calendar year substantially all of its ordinary income, capital gain net income and certain other amounts, if any, such that the Fund should not be subject to federal excise tax. Therefore, no federal income or excise tax provision is recorded.
Distributions to shareholders
Distributions from net investment income, if any, are declared and paid monthly. Net realized capital gains, if any, are distributed at least annually. Income distributions and capital gain distributions are determined in accordance with federal income tax regulations, which may differ from GAAP.
Guarantees and indemnifications
Under the Trust’s organizational documents and, in some cases, by contract, its officers and trustees are indemnified against certain liabilities arising out of the performance of their duties to the Trust or its funds. In addition, certain of the Fund’s contracts with its service providers contain general indemnification clauses. The Fund’s maximum exposure under these arrangements is unknown since the amount of any future claims that may be made against the Fund cannot be determined, and the Fund has no historical basis for predicting the likelihood of any such claims.
Multisector Bond SMA Completion Portfolio | Annual Report 2023
| 23 |
Notes to Financial Statements (continued)
August 31, 2023
Recent accounting pronouncements and regulatory updates
Tailored Shareholder Reports
In October 2022, the Securities and Exchange Commission (SEC) adopted a final rule relating to Tailored Shareholder Reports for Mutual Funds and Exchange-Traded Funds; Fee Information in Investment Company Advertisements. The rule and form amendments will, among other things, require the Fund to transmit concise and visually engaging shareholder reports that highlight key information. The amendments will require that funds tag information in a structured data format and that certain more in-depth information be made available online and available for delivery free of charge to investors on request. The amendments became effective January 24, 2023. There is an 18-month transition period after the effective date of the amendments.
Note 3. Fees and other transactions with affiliates
Management services fees
The Fund does not pay a management fee to Columbia Management Investment Advisers, LLC (the Investment Manager), a wholly-owned subsidiary of Ameriprise Financial, Inc. (Ameriprise Financial). However, Fund shares may only be purchased and held by or on behalf of SMAs where the Investment Manager has an agreement with the SMA program sponsor (the Program Sponsor), or directly with the SMA client, to provide investment management services to the Program Sponsor or the SMA. SMAs pay a fee directly, or indirectly through Program Sponsors, to the Investment Manager for providing investment management services to the Program Sponsor or the SMA, including on assets that may be invested in the Fund.
Compensation of board members
Members of the Board of Trustees who are not officers or employees of the Investment Manager or Ameriprise Financial are compensated for their services to the Fund as disclosed in the Statement of Operations. Under a Deferred Compensation Plan (the Deferred Plan), these members of the Board of Trustees may elect to defer payment of up to 100% of their compensation. Deferred amounts are treated as though equivalent dollar amounts had been invested in shares of certain funds managed by the Investment Manager. The Fund’s liability for these amounts is adjusted for market value changes and remains in the Fund until distributed in accordance with the Deferred Plan. All amounts payable under the Deferred Plan constitute a general unsecured obligation of the Fund. The expense for the Deferred Plan, which includes Trustees’ fees deferred during the current period as well as any gains or losses on the Trustees’ deferred compensation balances as a result of market fluctuations, is included in "Trustees’ fees" in the Statement of Operations.
Compensation of Chief Compliance Officer
The Board of Trustees has appointed a Chief Compliance Officer for the Fund in accordance with federal securities regulations. As disclosed in the Statement of Operations, a portion of the Chief Compliance Officer’s total compensation is allocated to the Fund, along with other allocations to affiliated registered investment companies managed by the Investment Manager and its affiliates, based on relative net assets.
Transfer agency fees
Under a Transfer and Dividend Disbursing Agent Agreement, Columbia Management Investment Services Corp. (the Transfer Agent), an affiliate of the Investment Manager and a wholly-owned subsidiary of Ameriprise Financial, is responsible for providing transfer agency services to the Fund. The Transfer Agent has contracted with SS&C GIDS, Inc. (SS&C GIDS) to serve as sub-transfer agent. Prior to January 1, 2023, SS&C GIDS was known as DST Asset Manager Solutions, Inc. The Transfer Agent pays the fees of SS&C GIDS for services as sub-transfer agent and SS&C GIDS is not entitled to reimbursement for such fees from the Fund (with the exception of out-of-pocket fees).
The Fund pays the Transfer Agent a monthly transfer agency fee based on the number or the average value of accounts, depending on the type of account. In addition, the Fund pays the Transfer Agent a fee for shareholder services based on the number of accounts or on a percentage of the average aggregate value of the Fund’s shares maintained in omnibus accounts up to the lesser of the amount charged by the financial intermediary or a cap established by the Board of Trustees from time to time.
| 24 | Multisector Bond SMA Completion Portfolio | Annual Report 2023 |
Notes to Financial Statements (continued)
August 31, 2023
The Transfer Agent also receives compensation from the Fund for various shareholder services and reimbursements for certain out-of-pocket fees.
For the year ended August 31, 2023, the Fund’s effective transfer agency fee rate as a percentage of average daily net assets was 0.01%.
Distribution and service fees
The Fund has an agreement with Columbia Management Investment Distributors, Inc. (the Distributor), an affiliate of the Investment Manager and a wholly-owned subsidiary of Ameriprise Financial, for distribution and shareholder services. The Fund does not pay the Distributor a fee for the distribution services it provides to the Fund.
Expenses waived/reimbursed by the Investment Manager and its affiliates
The Investment Manager and certain of its affiliates have contractually agreed to waive fees and/or reimburse expenses (excluding certain fees and expenses described below), through December 31, 2023, unless sooner terminated at the sole discretion of the Board of Trustees, so that the Fund’s net operating expenses, including indirect expenses of the underlying funds, after giving effect to fees waived/expenses reimbursed and any balance credits and/or overdraft charges from the Fund’s custodian, do not exceed the annual rate of 0.00% of the Fund’s average daily net assets.
Under the agreement governing this fee waiver and/or expense reimbursement arrangement, the following fees and expenses are excluded from the waiver/reimbursement commitment, and therefore will be paid by the Fund, if applicable: taxes (including foreign transaction taxes), transaction costs and brokerage commissions, costs related to any securities lending program, dividend expenses associated with securities sold short, inverse floater program fees and expenses, transaction charges and interest on borrowed money, costs associated with shareholder meetings, infrequent and/or unusual expenses and any other expenses the exclusion of which is specifically approved by the Board of Trustees. This agreement may be modified or amended only with approval from the Investment Manager, certain of its affiliates and the Fund. Any fees waived and/or expenses reimbursed under the expense reimbursement arrangements described above are not recoverable by the Investment Manager or its affiliates in future periods.
Note 4. Federal tax information
The timing and character of income and capital gain distributions are determined in accordance with income tax regulations, which may differ from GAAP because of temporary or permanent book to tax differences.
At August 31, 2023, these differences were primarily due to differing treatment for derivative investments and capital loss carryforwards. To the extent these differences were permanent, reclassifications were made among the components of the Fund’s net assets. Temporary differences do not require reclassifications.
The following reclassifications were made:
Undistributed net
investment
income ($) | Accumulated
net realized
(loss) ($) | Paid in
capital ($) |
| (1) | 1 | — |
Net investment income (loss) and net realized gains (losses), as disclosed in the Statement of Operations, and net assets were not affected by this reclassification.
The tax character of distributions paid during the years indicated was as follows:
| Year Ended August 31, 2023 | Year Ended August 31, 2022 |
Ordinary
income ($) | Long-term
capital gains ($) | Total ($) | Ordinary
income ($) | Long-term
capital gains ($) | Total ($) |
| 100,230 | — | 100,230 | 541,741 | 7,933 | 549,674 |
Short-term capital gain distributions, if any, are considered ordinary income distributions for tax purposes.
Multisector Bond SMA Completion Portfolio | Annual Report 2023
| 25 |
Notes to Financial Statements (continued)
August 31, 2023
At August 31, 2023, the components of distributable earnings on a tax basis were as follows:
Undistributed
ordinary income ($) | Undistributed
long-term
capital gains ($) | Capital loss
carryforwards ($) | Net unrealized
appreciation ($) |
| 784 | — | (1,360,832) | 72,385 |
At August 31, 2023, the cost of all investments for federal income tax purposes along with the aggregate gross unrealized appreciation and depreciation based on that cost was:
Federal
tax cost ($) | Gross unrealized
appreciation ($) | Gross unrealized
(depreciation) ($) | Net unrealized
appreciation ($) |
| 4,177,585 | 84,764 | (12,379) | 72,385 |
Tax cost of investments and unrealized appreciation/(depreciation) may also include timing differences that do not constitute adjustments to tax basis.
The following capital loss carryforwards, determined at August 31, 2023, may be available to reduce future net realized gains on investments, if any, to the extent permitted by the Internal Revenue Code. In addition, for the year ended August 31, 2023, capital loss carryforwards utilized, if any, were as follows:
No expiration
short-term ($) | No expiration
long-term ($) | Total ($) | Utilized ($) |
| (1,355,932) | (4,900) | (1,360,832) | — |
Management of the Fund has concluded that there are no significant uncertain tax positions in the Fund that would require recognition in the financial statements. However, management’s conclusion may be subject to review and adjustment at a later date based on factors including, but not limited to, new tax laws, regulations, and administrative interpretations (including relevant court decisions). Generally, the Fund’s federal tax returns for the prior three fiscal years remain subject to examination by the Internal Revenue Service.
Note 5. Portfolio information
The cost of purchases and proceeds from sales of securities, excluding short-term investments and derivatives, if any, aggregated to $23,642,268 and $22,494,342, respectively, for the year ended August 31, 2023, of which $23,642,268 and $22,494,342, respectively, were U.S. government securities. The amount of purchase and sale activity impacts the portfolio turnover rate reported in the Financial Highlights.
Note 6. Affiliated money market fund
The Fund invests significantly in Columbia Short-Term Cash Fund, an affiliated money market fund established for the exclusive use by the Fund and other affiliated funds (the Affiliated MMF). The income earned by the Fund from such investments is included as Dividends - affiliated issuers in the Statement of Operations. As an investing fund, the Fund indirectly bears its proportionate share of the expenses of the Affiliated MMF. The Affiliated MMF prices its shares with a floating net asset value. The Securities and Exchange Commission has adopted amendments to money market fund rules requiring institutional prime money market funds like the Affiliated MMF to be subject, by October 2, 2024, to a liquidity fee if daily net redemptions exceed 5% of net assets and, by April 2, 2024, to a discretionary liquidity fee up to 2% if the imposition of such a fee is determined to be in the best interest of the Affiliated MMF.
Note 7. Interfund lending
Pursuant to an exemptive order granted by the Securities and Exchange Commission, the Fund participates in a program (the Interfund Program) allowing each participating Columbia Fund (each, a Participating Fund) to lend money directly to and, except for closed-end funds and money market funds, borrow money directly from other Participating Funds for temporary purposes. The amounts eligible for borrowing and lending under the Interfund Program are subject to certain restrictions.
| 26 | Multisector Bond SMA Completion Portfolio | Annual Report 2023 |
Notes to Financial Statements (continued)
August 31, 2023
Interfund loans are subject to the risk that the borrowing fund could be unable to repay the loan when due, and a delay in repayment to the lending fund could result in lost opportunities and/or additional lending costs. The exemptive order is subject to conditions intended to mitigate conflicts of interest arising from the Investment Manager’s relationship with each Participating Fund.
The Fund did not borrow or lend money under the Interfund Program during the year ended August 31, 2023.
Note 8. Line of credit
The Fund has access to a revolving credit facility with a syndicate of banks led by JPMorgan Chase Bank, N.A., Citibank, N.A. and Wells Fargo Bank, N.A. whereby the Fund may borrow for the temporary funding of shareholder redemptions or for other temporary or emergency purposes. Pursuant to an October 27, 2022 amendment and restatement, the credit facility, which is an agreement between the Fund and certain other funds managed by the Investment Manager or an affiliated investment manager, severally and not jointly, permits aggregate borrowings up to $950 million. Interest is currently charged to each participating fund based on its borrowings at a rate equal to the higher of (i) the federal funds effective rate, (ii) the secured overnight financing rate plus 0.10% and (iii) the overnight bank funding rate plus, in each case, 1.00%. Each borrowing under the credit facility matures no later than 60 days after the date of borrowing. The Fund also pays a commitment fee equal to its pro rata share of the unused amount of the credit facility at a rate of 0.15% per annum. The commitment fee is included in other expenses in the Statement of Operations. This agreement expires annually in October unless extended or renewed. Prior to the October 27, 2022 amendment and restatement, the Fund had access to a revolving credit facility with a syndicate of banks led by JPMorgan Chase Bank, N.A., Citibank, N.A. and Wells Fargo Bank, N.A. which permitted collective borrowings up to $950 million. Interest was charged to each participating fund based on its borrowings at a rate equal to the higher of (i) the federal funds effective rate, (ii) the secured overnight financing rate plus 0.11448% and (iii) the overnight bank funding rate plus, in each case, 1.00%.
The Fund had no borrowings during the year ended August 31, 2023.
Note 9. Significant risks
Completion funds risk
Investors should be aware that the investments made by the Fund and the results achieved by the Fund at any given time are not expected to be the same as those made by other funds for which the Investment Manager serves as investment adviser, including funds with names, investment objectives and policies similar to the Fund. This may be attributable to a wide variety of factors, including, but not limited to, the use of a differentiated investment strategy. The Fund is intended to be used as part of a broader SMA program. The performance and objectives of the Fund should be evaluated in the context of the broader SMA program. The Fund is not designed to be used as a stand-alone investment. Please contact your SMA program sponsor or financial intermediary for more information.
Credit risk
Credit risk is the risk that the value of debt instruments in the Fund’s portfolio may decline because the issuer defaults or otherwise becomes unable or unwilling, or is perceived to be unable or unwilling, to honor its financial obligations, such as making payments to the Fund when due. Credit rating agencies assign credit ratings to certain debt instruments to indicate their credit risk. Lower-rated or unrated debt instruments held by the Fund may present increased credit risk as compared to higher-rated debt instruments.
Derivatives risk
Losses involving derivative instruments may be substantial, because a relatively small movement in the underlying reference (which is generally the price, rate or other economic indicator associated with a security(ies), commodity, currency, index or other instrument or asset) may result in a substantial loss for the Fund. In addition to the potential for increased losses, the use of derivative instruments may lead to increased volatility within the Fund. Derivatives will typically increase the Fund’s exposure to principal risks to which it is otherwise exposed, and may expose the Fund to additional risks, including correlation risk, counterparty risk, hedging risk, leverage risk, liquidity risk and pricing risk.
Multisector Bond SMA Completion Portfolio | Annual Report 2023
| 27 |
Notes to Financial Statements (continued)
August 31, 2023
Interest rate risk
Interest rate risk is the risk of losses attributable to changes in interest rates. In general, if interest rates rise, the values of debt instruments tend to fall, and if interest rates fall, the values of debt instruments tend to rise. Actions by governments and central banking authorities can result in increases or decreases in interest rates. Higher periods of inflation could lead such authorities to raise interest rates. Increasing interest rates may negatively affect the value of debt securities held by the Fund, resulting in a negative impact on the Fund’s performance and net asset value per share. In general, the longer the maturity or duration of a debt security, the greater its sensitivity to changes in interest rates. The Fund is subject to the risk that the income generated by its investments may not keep pace with inflation.
Leverage risk
Leverage occurs when the Fund increases its assets available for investment using borrowings, short sales, derivatives, or similar instruments or techniques. The use of leverage may produce volatility and may exaggerate changes in the Fund’s net asset value and in the return on the Fund’s portfolio, which may increase the risk that the Fund will lose more than it has invested. Because short sales involve borrowing securities and then selling them, the Fund’s short sales effectively leverage the Fund’s assets. The Fund’s assets that are used as collateral to secure the Fund’s obligations to return the securities sold short may decrease in value while the short positions are outstanding, which may force the Fund to use its other assets to increase the collateral. Leverage can create an interest expense that may lower the Fund’s overall returns. Leverage presents the opportunity for increased net income and capital gains, but may also exaggerate the Fund’s volatility and risk of loss. There can be no guarantee that a leveraging strategy will be successful.
Liquidity risk
Liquidity risk is the risk associated with a lack of marketability of investments which may make it difficult to sell the investment at a desirable time or price. Changing regulatory, market or other conditions or environments (for example, the interest rate or credit environments) may adversely affect the liquidity of the Fund’s investments. The Fund may have to accept a lower selling price for the holding, sell other investments, or forego another, more appealing investment opportunity. Generally, the less liquid the market at the time the Fund sells a portfolio investment, the greater the risk of loss or decline of value to the Fund. A less liquid market can lead to an increase in Fund redemptions, which may negatively impact Fund performance and net asset value per share, including, for example, if the Fund is forced to sell securities in a down market.
Market risk
The Fund may incur losses due to declines in the value of one or more securities in which it invests. These declines may be due to factors affecting a particular issuer, or the result of, among other things, political, regulatory, market, economic or social developments affecting the relevant market(s) more generally. In addition, turbulence in financial markets and reduced liquidity in equity, credit and/or fixed income markets may negatively affect many issuers, which could adversely affect the Fund’s ability to price or value hard-to-value assets in thinly traded and closed markets and could cause significant redemptions and operational challenges. Global economies and financial markets are increasingly interconnected, and conditions and events in one country, region or financial market may adversely impact issuers in a different country, region or financial market. These risks may be magnified if certain events or developments adversely interrupt the global supply chain; in these and other circumstances, such risks might affect companies worldwide. As a result, local, regional or global events such as terrorism, war, natural disasters, disease/virus outbreaks and epidemics or other public health issues, recessions, depressions or other events – or the potential for such events – could have a significant negative impact on global economic and market conditions.
The large-scale invasion of Ukraine by Russia in February 2022 has resulted in sanctions and market disruptions, including declines in regional and global stock markets, unusual volatility in global commodity markets and significant devaluations of Russian currency. The extent and duration of the military action are impossible to predict but could be significant. Market disruption caused by the Russian military action, and any counter-measures or responses thereto (including international sanctions, a downgrade in the country’s credit rating, purchasing and financing restrictions, boycotts, tariffs, changes in consumer or purchaser preferences, cyberattacks and espionage) could have severe adverse impacts on regional and/or global securities and commodities markets, including markets for oil and natural gas. These impacts may include reduced
| 28 | Multisector Bond SMA Completion Portfolio | Annual Report 2023 |
Notes to Financial Statements (continued)
August 31, 2023
market liquidity, distress in credit markets, further disruption of global supply chains, increased risk of inflation, restricted cross-border payments and limited access to investments and/or assets in certain international markets and/or issuers. These developments and other related events could negatively impact Fund performance.
Money market fund investment risk
An investment in a money market fund is not a bank deposit and is not insured or guaranteed by any bank, the FDIC or any other government agency. Certain money market funds float their net asset value while others seek to preserve the value of investments at a stable net asset value (typically, $1.00 per share). An investment in a money market fund, even an investment in a fund seeking to maintain a stable net asset value per share, is not guaranteed and it is possible for the Fund to lose money by investing in these and other types of money market funds. If the liquidity of a money market fund’s portfolio deteriorates below certain levels, the money market fund may suspend redemptions (i.e., impose a redemption gate) and thereby prevent the Fund from selling its investment in the money market fund or impose a fee of up to 2% on amounts the Fund redeems from the money market fund (i.e., impose a liquidity fee). These measures may result in an investment loss or prohibit the Fund from redeeming shares when the Investment Manager would otherwise redeem shares. In addition to the fees and expenses that the Fund directly bears, the Fund indirectly bears the fees and expenses of any money market funds in which it invests, including affiliated money market funds. By investing in a money market fund, the Fund will be exposed to the investment risks of the money market fund in direct proportion to such investment. To the extent the Fund invests in instruments such as derivatives, the Fund may hold investments, which may be significant, in money market fund shares to cover its obligations resulting from the Fund’s investments in such instruments. Money market funds and the securities they invest in are subject to comprehensive regulations. The enactment of new legislation or regulations, as well as changes in interpretation and enforcement of current laws, may affect the manner of operation, performance and/or yield of money market funds.
Mortgage- and other asset-backed securities risk
The value of any mortgage-backed and other asset-backed securities including collateralized debt obligations, if any, held by the Fund may be affected by, among other things, changes or perceived changes in: interest rates; factors concerning the interests in and structure of the issuer or the originator of the mortgages or other assets; the creditworthiness of the entities that provide any supporting letters of credit, surety bonds or other credit enhancements; or the market’s assessment of the quality of underlying assets. Payment of principal and interest on some mortgage-backed securities (but not the market value of the securities themselves) may be guaranteed by the full faith and credit of a particular U.S. Government agency, authority, enterprise or instrumentality, and some, but not all, are also insured or guaranteed by the U.S. Government. Mortgage-backed securities issued by non-governmental issuers (such as commercial banks, savings and loan institutions, private mortgage insurance companies, mortgage bankers and other secondary market issuers) may entail greater risk than obligations guaranteed by the U.S. Government. Mortgage- and other asset-backed securities are subject to liquidity risk and prepayment risk. A decline or flattening of housing values may cause delinquencies in mortgages (especially sub-prime or non-prime mortgages) underlying mortgage-backed securities and thereby adversely affect the ability of the mortgage-backed securities issuer to make principal and/or interest payments to mortgage-backed securities holders, including the Fund. Rising or high interest rates tend to extend the duration of mortgage- and other asset-backed securities, making their prices more volatile and more sensitive to changes in interest rates.
Non-diversification risk
A non-diversified fund is permitted to invest a greater percentage of its total assets in fewer issuers than a diversified fund. This increases the risk that a change in the value of any one investment held by the Fund could affect the overall value of the Fund more than it would affect that of a diversified fund holding a greater number of investments. Accordingly, the Fund’s value will likely be more volatile than the value of a more diversified fund.
Regulatory Risk – U.S. Banking Law
Following the conversion of Ameriprise National Trust Bank into a federal savings bank in May 2019, Ameriprise Financial, Inc. continues to be subject to ongoing supervision by the Board of Governors for the Federal Reserve System as well as applicable U.S. federal banking laws, including the Home Owners Loan Act and certain parts of the Bank Holding Company Act, including Section 13 thereof commonly referred to as the Volcker Rule). These laws impose limits on the amount and duration of any proprietary capital held in the Fund by the Investment Manager, Ameriprise Financial, Inc. or certain of their
Multisector Bond SMA Completion Portfolio | Annual Report 2023
| 29 |
Notes to Financial Statements (continued)
August 31, 2023
controlled affiliates or products. The Investment Manager and/or its affiliates own 25% or more of the outstanding shares of the Fund and because of such holding the Fund may become subject to U.S. federal banking law restrictions on proprietary trading, which would limit the Fund’s ability to purchase and sell securities on a short-term basis and thus could have a negative impact on the Fund’s ability to implement its investment objective. Reducing the seed capital in the Fund to address these trading restrictions may result in the Fund being too small to efficiently engage in certain investment strategies, which could also have a negative impact on the Fund’s performance. In addition, if the Investment Manager and/or its affiliates reduce their interest in the Fund, the Fund may be subject to additional transaction costs and adverse tax consequences. Moreover, the resulting reduced size of the Fund could threaten its ongoing economic viability and consequently lead to its liquidation.
Shareholder concentration risk
At August 31, 2023, affiliated shareholders of record owned 100.0% of the outstanding shares of the Fund in one or more accounts. Fund shares sold to or redeemed by concentrated accounts may have a significant effect on the operations of the Fund. In the case of a large redemption, the Fund may be forced to sell investments at inopportune times, including its liquid positions, which may result in Fund losses and the Fund holding a higher percentage of less liquid positions. Large redemptions could result in decreased economies of scale and increased operating expenses for non-redeeming Fund shareholders.
Note 10. Subsequent events
Management has evaluated the events and transactions that have occurred through the date the financial statements were issued and noted no items requiring adjustment of the financial statements or additional disclosure.
Note 11. Information regarding pending and settled legal proceedings
Ameriprise Financial and certain of its affiliates are involved in the normal course of business in legal proceedings which include regulatory inquiries, arbitration and litigation, including class actions concerning matters arising in connection with the conduct of their activities as part of a diversified financial services firm. Ameriprise Financial believes that the Fund is not currently the subject of, and that neither Ameriprise Financial nor any of its affiliates are the subject of, any pending legal, arbitration or regulatory proceedings that are likely to have a material adverse effect on the Fund or the ability of Ameriprise Financial or its affiliates to perform under their contracts with the Fund. Ameriprise Financial is required to make quarterly (10-Q), annual (10-K) and, as necessary, 8-K filings with the Securities and Exchange Commission (SEC) on legal and regulatory matters that relate to Ameriprise Financial and its affiliates. Copies of these filings may be obtained by accessing the SEC website at www.sec.gov.
There can be no assurance that these matters, or the adverse publicity associated with them, will not result in increased Fund redemptions, reduced sale of Fund shares or other adverse consequences to the Fund. Further, although we believe proceedings are not likely to have a material adverse effect on the Fund or the ability of Ameriprise Financial or its affiliates to perform under their contracts with the Fund, these proceedings are subject to uncertainties and, as such, we are unable to estimate the possible loss or range of loss that may result. An adverse outcome in one or more of these proceedings could result in adverse judgments, settlements, fines, penalties or other relief that could have a material adverse effect on the consolidated financial condition or results of operations of Ameriprise Financial or one or more of its affiliates that provide services to the Fund.
| 30 | Multisector Bond SMA Completion Portfolio | Annual Report 2023 |
Report of Independent Registered Public Accounting Firm
To the Board of Trustees of Columbia Funds Series Trust I and Shareholders of Multisector Bond SMA Completion Portfolio
Opinion on the Financial Statements
We have audited the accompanying statement of assets and liabilities, including the portfolio of investments, of Multisector Bond SMA Completion Portfolio (one of the funds constituting Columbia Funds Series Trust I, referred to hereafter as the "Fund") as of August 31, 2023, the related statement of operations for the year ended August 31, 2023, the statement of changes in net assets for each of the two years in the period ended August 31, 2023, including the related notes, and the financial highlights for each of the three years in the period ended August 31, 2023 and for the period October 29, 2019 (commencement of operations) through August 31, 2020 (collectively referred to as the “financial statements”). In our opinion, the financial statements present fairly, in all material respects, the financial position of the Fund as of August 31, 2023, the results of its operations for the year then ended, the changes in its net assets for each of the two years in the period ended August 31, 2023 and the financial highlights for each of the three years in the period ended August 31, 2023 and for the period October 29, 2019 (commencement of operations) through August 31, 2020 in conformity with accounting principles generally accepted in the United States of America.
Basis for Opinion
These financial statements are the responsibility of the Fund’s management. Our responsibility is to express an opinion on the Fund’s financial statements based on our audits. We are a public accounting firm registered with the Public Company Accounting Oversight Board (United States) (PCAOB) and are required to be independent with respect to the Fund in accordance with the U.S. federal securities laws and the applicable rules and regulations of the Securities and Exchange Commission and the PCAOB.
We conducted our audits of these financial statements in accordance with the standards of the PCAOB. Those standards require that we plan and perform the audit to obtain reasonable assurance about whether the financial statements are free of material misstatement, whether due to error or fraud.
Our audits included performing procedures to assess the risks of material misstatement of the financial statements, whether due to error or fraud, and performing procedures that respond to those risks. Such procedures included examining, on a test basis, evidence regarding the amounts and disclosures in the financial statements. Our audits also included evaluating the accounting principles used and significant estimates made by management, as well as evaluating the overall presentation of the financial statements. Our procedures included confirmation of securities owned as of August 31, 2023 by correspondence with the custodian, transfer agent and brokers; when replies were not received from brokers, we performed other auditing procedures. We believe that our audits provide a reasonable basis for our opinion.
/s/PricewaterhouseCoopers LLP
Minneapolis, Minnesota
October 23, 2023
We have served as the auditor of one or more investment companies within the Columbia Funds Complex since 1977.
Multisector Bond SMA Completion Portfolio | Annual Report 2023
| 31 |
TRUSTEES AND OFFICERS
(Unaudited)
The Board oversees the Fund’s operations and appoints officers who are responsible for day-to-day business decisions based on policies set by the Board. The following table provides basic biographical information about the Fund’s Trustees as of the printing of this report, including their principal occupations during the past five years, although specific titles for individuals may have varied over the period. The year set forth beneath Length of Service in the table below is the year in which the Trustee was first appointed or elected as Trustee to any Fund currently in the Columbia Funds Complex or a predecessor thereof. Under current Board policy, each Trustee generally serves until December 31 of the year such Trustee turns seventy-five (75).
Independent trustees
Name,
address,
year of birth | Position held
with the Columbia Funds and
length of service | Principal occupation(s)
during past five years
and other relevant
professional experience | Number of
Funds in the
Columbia Funds
Complex*
overseen | Other directorships
held by Trustee
during the past five years
and other relevant Board experience |
George S. Batejan
c/o Columbia Management
Investment Advisers, LLC
290 Congress Street
Boston, MA 02210
1954 | Trustee since 2017 | Executive Vice President, Global Head of Technology and Operations, Janus Capital Group, Inc., 2010-2016 | 173 | Former Chairman of the Board, NICSA (National Investment Company Services Association) (Executive Committee, Nominating Committee and Governance Committee), 2014-2016; former Director, Intech Investment Management, 2011-2016; former Board Member, Metro Denver Chamber of Commerce, 2015-2016; former Advisory Board Member, University of Colorado Business School, 2015-2018; former Board Member, Chase Bank International, 1993-1994 |
Kathleen Blatz
c/o Columbia Management
Investment Advisers, LLC
290 Congress Street
Boston, MA 02210
1954 | Trustee since 2006 | Attorney, specializing in arbitration and mediation; Chief Justice, Minnesota Supreme Court, 1998-2006; Associate Justice, Minnesota Supreme Court, 1996-1998; Fourth Judicial District Court Judge, Hennepin County, 1994-1996; Attorney in private practice and public service, 1984-1993; State Representative, Minnesota House of Representatives, 1979-1993, which included service on the Tax and Financial Institutions and Insurance Committees; Member and Interim Chair, Minnesota Sports Facilities Authority, January-July 2017; Interim President and Chief Executive Officer, Blue Cross and Blue Shield of Minnesota (health care insurance), February-July 2018, April-October 2021 | 173 | Former Trustee, Blue Cross and Blue Shield of Minnesota, 2009-2021 (Chair of the Business Development Committee, 2014-2017; Chair of the Governance Committee, 2017-2019); former Member and Chair of the Board, Minnesota Sports Facilities Authority, January 2017-July 2017; former Director, Robina Foundation, 2009-2020 (Chair, 2014-2020); Director, Richard M. Schulze Family Foundation, since 2021 |
| 32 | Multisector Bond SMA Completion Portfolio | Annual Report 2023 |
TRUSTEES AND OFFICERS (continued)
(Unaudited)
Independent trustees (continued)
Name,
address,
year of birth | Position held
with the Columbia Funds and
length of service | Principal occupation(s)
during past five years
and other relevant
professional experience | Number of
Funds in the
Columbia Funds
Complex*
overseen | Other directorships
held by Trustee
during the past five years
and other relevant Board experience |
Pamela G. Carlton
c/o Columbia Management
Investment Advisers, LLC
290 Congress Street
Boston, MA 02210
1954 | Chair since 2023; Trustee since 2007 | President, Springboard – Partners in Cross Cultural Leadership (consulting company), since 2003; Managing Director of US Equity Research, JP Morgan Chase, 1999-2003; Director of US Equity Research, Chase Asset Management, 1996-1999; Co-Director Latin America Research, 1993-1996, COO Global Research, 1992-1996, Co-Director of US Research, 1991-1992, Investment Banker, 1982-1991, Morgan Stanley; Attorney, Cleary Gottlieb Steen & Hamilton LLP, 1980-1982 | 173 | Trustee, New York Presbyterian Hospital Board, since 1996; Director, DR Bank (Audit Committee) since 2017; Director, Evercore Inc. (Audit Committee, Nominating and Governance Committee), since 2019; Director, Apollo Commercial Real Estate Finance, Inc. (Chair, Nominating and Governance Committee) (financial services), since 2021; the Governing Council of the Independent Directors Council (IDC), since 2021 |
Janet Langford Carrig
c/o Columbia Management
Investment Advisers, LLC
290 Congress Street
Boston, MA 02210
1957 | Trustee since 1996 | Senior Vice President, General Counsel and Corporate Secretary, ConocoPhillips (independent energy company), September 2007-October 2018 | 173 | Director, EQT Corporation (natural gas producer), since 2019; former Director, Whiting Petroleum Corporation (independent oil and gas company), 2020-2022 |
J. Kevin Connaughton
c/o Columbia Management
Investment Advisers, LLC
290 Congress Street
Boston, MA 02210
1964 | Trustee since 2020 | CEO and President, RhodeWay Financial (non-profit financial planning firm), since December 2022; Member, FINRA National Adjudicatory Council, since January 2020; Adjunct Professor of Finance, Bentley University since January 2018; Consultant to Independent Trustees of CFVIT and CFST I from March 2016 to June 2020 with respect to CFVIT and to December 2020 with respect to CFST I; Managing Director and General Manager of Mutual Fund Products, Columbia Management Investment Advisers, LLC, May 2010-February 2015; President, Columbia Funds, 2008-2015; and senior officer of Columbia Funds and affiliated funds, 2003-2015 | 171 | Former Director, The Autism Project, March 2015-December 2021; former Member of the Investment Committee, St. Michael’s College, November 2015-February 2020; former Trustee, St. Michael’s College, June 2017-September 2019; former Trustee, New Century Portfolios (former mutual fund complex), January 2015-December 2017 |
Olive M. Darragh
c/o Columbia Management
Investment Advisers, LLC
290 Congress Street
Boston, MA 02210
1962 | Trustee since 2020 | Managing Director of Darragh Inc. (strategy and talent management consulting firm), since 2010; Founder and CEO, Zolio, Inc. (investment management talent identification platform), since 2004; Consultant to Independent Trustees of CFVIT and CFST I from June 2019 to June 2020 with respect to CFVIT and to December 2020 with respect to CFST I; Partner, Tudor Investments, 2004-2010; Senior Partner, McKinsey & Company (consulting), 1990-2004; Touche Ross CPA, 1985-1988 | 171 | Treasurer, Edinburgh University US Trust Board, since January 2023; Member, HBS Community Action Partners Board, since September 2022; former Director, University of Edinburgh Business School (Member of US Board), 2004-2019; former Director, Boston Public Library Foundation, 2008-2017 |
Multisector Bond SMA Completion Portfolio | Annual Report 2023
| 33 |
TRUSTEES AND OFFICERS (continued)
(Unaudited)
Independent trustees (continued)
Name,
address,
year of birth | Position held
with the Columbia Funds and
length of service | Principal occupation(s)
during past five years
and other relevant
professional experience | Number of
Funds in the
Columbia Funds
Complex*
overseen | Other directorships
held by Trustee
during the past five years
and other relevant Board experience |
Patricia M. Flynn
c/o Columbia Management
Investment Advisers, LLC
290 Congress Street
Boston, MA 02210
1950 | Trustee since 2004 | Professor of Economics and Management, Bentley University, since 2002; Dean, McCallum Graduate School of Business, Bentley University, 1992-2002 | 173 | Former Trustee, MA Taxpayers Foundation, 1997-2022; former Director, The MA Business Roundtable, 2003-2019; former Chairperson, Innovation Index Advisory Committee, MA Technology Collaborative, 1997-2020 |
Brian J. Gallagher
c/o Columbia Management
Investment Advisers, LLC
290 Congress Street
Boston, MA 02210
1954 | Trustee since 2017 | Retired; Partner with Deloitte & Touche LLP and its predecessors, 1977-2016 | 173 | Trustee, Catholic Schools Foundation, since 2004 |
Douglas A. Hacker
c/o Columbia Management
Investment Advisers, LLC
290 Congress Street
Boston, MA 02210
1955 | Trustee since 1996 | Independent business executive, since May 2006; Executive Vice President – Strategy of United Airlines, December 2002 - May 2006; President of UAL Loyalty Services (airline marketing company), September 2001-December 2002; Executive Vice President and Chief Financial Officer of United Airlines, July 1999-September 2001 | 173 | Director, SpartanNash Company since November 2013 (Chair of the Board, since May 2021) (food distributor); Director, Aircastle Limited (Chair of Audit Committee) (aircraft leasing), since August 2006; former Director, Nash Finch Company (food distributor), 2005-2013; former Director, SeaCube Container Leasing Ltd. (container leasing), 2010-2013; and former Director, Travelport Worldwide Limited (travel information technology), 2014-2019 |
Nancy T. Lukitsh
c/o Columbia Management
Investment Advisers, LLC
290 Congress Street
Boston, MA 02210
1956 | Trustee since 2011 | Senior Vice President, Partner and Director of Marketing, Wellington Management Company, LLP (investment adviser), 1997-2010; Chair, Wellington Management Portfolios (commingled non-U.S. investment pools), 2007-2010; Director, Wellington Trust Company, NA and other Wellington affiliates, 1997-2010 | 171 | None |
| 34 | Multisector Bond SMA Completion Portfolio | Annual Report 2023 |
TRUSTEES AND OFFICERS (continued)
(Unaudited)
Independent trustees (continued)
Name,
address,
year of birth | Position held
with the Columbia Funds and
length of service | Principal occupation(s)
during past five years
and other relevant
professional experience | Number of
Funds in the
Columbia Funds
Complex*
overseen | Other directorships
held by Trustee
during the past five years
and other relevant Board experience |
David M. Moffett
c/o Columbia Management
Investment Advisers, LLC
290 Congress Street
Boston, MA 02210
1952 | Trustee since 2011 | Retired; former Chief Executive Officer of Freddie Mac and Chief Financial Officer of U.S. Bank | 171 | Director, CSX Corporation (transportation suppliers); Director, PayPal Holdings Inc. (payment and data processing services); Trustee, University of Oklahoma Foundation; former Director, eBay Inc. (online trading community), 2007-2015; and former Director, CIT Bank, CIT Group Inc. (commercial and consumer finance), 2010-2016; former Senior Adviser to The Carlyle Group (financial services), March 2008-September 2008; former Governance Consultant to Bridgewater Associates, January 2013-December 2015 |
Catherine James Paglia
c/o Columbia Management
Investment Advisers, LLC
290 Congress Street
Boston, MA 02210
1952 | Trustee since 2004 | Director, Enterprise Asset Management, Inc. (private real estate and asset management company), since September 1998; Managing Director and Partner, Interlaken Capital, Inc., 1989-1997; Vice President, 1982-1985, Principal, 1985-1987, Managing Director, 1987-1989, Morgan Stanley; Vice President, Investment Banking, 1980-1982, Associate, Investment Banking, 1976-1980, Dean Witter Reynolds, Inc. | 173 | Director, Valmont Industries, Inc. (irrigation systems manufacturer), since 2012; Trustee, Carleton College (on the Investment Committee), since 1987; Trustee, Carnegie Endowment for International Peace (on the Investment Committee), since 2009 |
Natalie A. Trunow
c/o Columbia Management
Investment Advisers, LLC
290 Congress Street
Boston, MA 02210
1967 | Trustee since 2020 | Chief Executive Officer, Millennial Portfolio Solutions LLC (asset management and consulting services), January 2016-January 2021; Non-executive Member of the Investment Committee and Valuation Committee, Sarona Asset Management Inc. (private equity firm) since September 2019; Advisor, Horizon Investments (asset management and consulting services), August 2018-January 2022; Advisor, Paradigm Asset Management, November 2016-January 2022; Consultant to Independent Trustees of CFVIT and CFST I from September 2016 to June 2020 with respect to CFVIT and to December 2020 with respect to CFST I; Director of Investments/Consultant, Casey Family Programs, April 2016-November 2016; Senior Vice President and Chief Investment Officer, Calvert Investments, August 2008-January 2016; Section Head and Portfolio Manager, General Motors Asset Management, June 1997-August 2008 | 171 | Independent Director, Investment Committee, Health Services for Children with Special Needs, Inc., 2010-2021; Independent Director, (Executive Committee and Chair, Audit Committee), Consumer Credit Counseling Services (formerly Guidewell Financial Solutions), since 2016; Independent Director, (Investment Committee), Sarona Asset Management, since 2019 |
Multisector Bond SMA Completion Portfolio | Annual Report 2023
| 35 |
TRUSTEES AND OFFICERS (continued)
(Unaudited)
Independent trustees (continued)
Name,
address,
year of birth | Position held
with the Columbia Funds and
length of service | Principal occupation(s)
during past five years
and other relevant
professional experience | Number of
Funds in the
Columbia Funds
Complex*
overseen | Other directorships
held by Trustee
during the past five years
and other relevant Board experience |
Sandra L. Yeager
c/o Columbia Management
Investment Advisers, LLC
290 Congress Street
Boston, MA 02210
1964 | Trustee since 2017 | Retired; President and founder, Hanoverian Capital, LLC (SEC registered investment advisor firm), 2008-2016; Managing Director, DuPont Capital, 2006-2008; Managing Director, Morgan Stanley Investment Management, 2004-2006; Senior Vice President, Alliance Bernstein, 1990-2004 | 173 | Former Director, NAPE (National Alliance for Partnerships in Equity) Education Foundation, October 2016-October 2020; Advisory Board, Jennersville YMCA, since 2022 |
Interested trustee affiliated with Investment Manager**
Name,
address,
year of birth | Position held with the Columbia Funds and length of service | Principal occupation(s) during the
past five years and other relevant
professional experience | Number of
Funds in the
Columbia Funds
Complex* overseen | Other directorships
held by Trustee
during the past
five years and
other relevant Board experience |
Daniel J. Beckman
c/o Columbia Management
Investment Advisers, LLC
290 Congress Street
Boston, MA 02210
1962 | Trustee since November 2021 and President since June 2021 | Vice President – Head of North America Product, Columbia Management Investment Advisers, LLC, since April 2015; President and Principal Executive Officer of the Columbia Funds, since June 2021; officer of Columbia Funds and affiliated funds, 2020-2021 | 173 | Director, Ameriprise Trust Company, since October 2016; Director, Columbia Management Investment Distributors, Inc. since November 2018; Board of Governors, Columbia Wanger Asset Management, LLC since, January 2022; Director, Columbia Threadneedle Canada, Inc., since December 2022 |
| * | The term “Columbia Funds Complex” as used herein includes Columbia Seligman Premium Technology Growth Fund, Tri-Continental Corporation and each series of Columbia Funds Series Trust (CFST), Columbia Funds Series Trust I (CFST I), Columbia Funds Series Trust II (CFST II), Columbia ETF Trust I (CET I), Columbia ETF Trust II (CET II), Columbia Funds Variable Insurance Trust (CFVIT) and Columbia Funds Variable Series Trust II (CFVST II). Messrs. Batejan, Beckman, Gallagher and Hacker and Mses. Blatz, Carlton, Carrig, Flynn, Paglia, and Yeager serve as directors of Columbia Seligman Premium Technology Growth Fund and Tri-Continental Corporation. |
| ** | Interested person (as defined under the 1940 Act) by reason of being an officer, director, security holder and/or employee of the Investment Manager or Ameriprise Financial. |
The Statement of Additional Information has additional information about the Fund’s Board members and is available, without charge, upon request by calling 800.345.6611, visiting columbiathreadneedleus.com/investor/ or contacting your financial intermediary.
| 36 | Multisector Bond SMA Completion Portfolio | Annual Report 2023 |
TRUSTEES AND OFFICERS (continued)
(Unaudited)
The Board has appointed officers who are responsible for day-to-day business decisions based on policies it has established. The officers serve at the pleasure of the Board. The following table provides basic information about the Officers of the Fund as of the printing of this report, including principal occupations during the past five years, although their specific titles may have varied over the period. In addition to Mr. Beckman, who is President and Principal Executive Officer, the Fund’s other officers are:
Fund officers
Name,
address and
year of birth | Position and year
first appointed to
position for any Fund
in the Columbia
Funds Complex or a
predecessor thereof | Principal occupation(s) during past five years |
Michael G. Clarke
290 Congress Street
Boston, MA 02210
1969 | Chief Financial Officer and Principal Financial Officer (2009) and Senior Vice President (2019) | Senior Vice President and North America Head of Operations & Investor Services, Columbia Management Investment Advisers, LLC, since June 2023 (previously Senior Vice President and Head of Global Operations, March 2022 – June 2023, Vice President, Head of North America Operations, and Co-Head of Global Operations, June 2019 - February 2022 and Vice President – Accounting and Tax, May 2010 - May 2019); senior officer of Columbia Funds and affiliated funds, since 2002. Director, Ameriprise Trust Company, since June 2023. |
Joseph Beranek
5890 Ameriprise Financial Center
Minneapolis, MN 55474
1965 | Treasurer and Chief Accounting Officer (Principal Accounting Officer) (2019) and Principal Financial Officer (2020), CFST, CFST I, CFST II, CFVIT and CFVST II; Assistant Treasurer, CET I and CET II | Vice President – Mutual Fund Accounting and Financial Reporting, Columbia Management Investment Advisers, LLC, since December 2018 and March 2017, respectively. |
Marybeth Pilat
290 Congress Street
Boston, MA 02210
1968 | Treasurer and Chief Accounting Officer (Principal Accounting Officer) and Principal Financial Officer (2020) for CET I and CET II; Assistant Treasurer, CFST, CFST I, CFST II, CFVIT and CFVST II | Vice President – Product Pricing and Administration, Columbia Management Investment Advisers, LLC, since May 2017. |
William F. Truscott
290 Congress Street
Boston, MA 02210
1960 | Senior Vice President (2001) | Formerly, Trustee/Director of Columbia Funds Complex or legacy funds, November 2001 - January 1, 2021; Chief Executive Officer, Global Asset Management, Ameriprise Financial, Inc., since September 2012; Chairman of the Board and President, Columbia Management Investment Advisers, LLC, since July 2004 and February 2012, respectively; Chairman of the Board and Chief Executive Officer, Columbia Management Investment Distributors, Inc., since November 2008 and February 2012, respectively; Chairman of the Board and Director, Threadneedle Asset Management Holdings, Sàrl, since March 2013 and December 2008, respectively; senior executive of various entities affiliated with Columbia Threadneedle. |
Christopher O. Petersen
5228 Ameriprise Financial Center
Minneapolis, MN 55474
1970 | Senior Vice President and Assistant Secretary (2021) | Formerly, Trustee/Director of funds within the Columbia Funds Complex, July 1, 2020 - November 22, 2021; Senior Vice President and Assistant General Counsel, Ameriprise Financial, Inc., since September 2021 (previously Vice President and Lead Chief Counsel, January 2015 - September 2021); formerly, President and Principal Executive Officer of the Columbia Funds, 2015 - 2021; officer of Columbia Funds and affiliated funds, since 2007. |
Thomas P. McGuire
290 Congress Street
Boston, MA 02210
1972 | Senior Vice President and Chief Compliance Officer (2012) | Vice President – Asset Management Compliance, Ameriprise Financial, Inc., since May 2010; Chief Compliance Officer, Columbia Acorn/Wanger Funds, since December 2015; formerly, Chief Compliance Officer, Ameriprise Certificate Company, September 2010 – September 2020. |
Ryan C. Larrenaga
290 Congress Street
Boston, MA 02210
1970 | Senior Vice President (2017), Chief Legal Officer (2017), and Secretary (2015) | Vice President and Chief Counsel, Ameriprise Financial, Inc., since August 2018 (previously Vice President and Group Counsel, August 2011 - August 2018); Chief Legal Officer, Columbia Acorn/Wanger Funds, since September 2020; officer of Columbia Funds and affiliated funds, since 2005. |
Multisector Bond SMA Completion Portfolio | Annual Report 2023
| 37 |
TRUSTEES AND OFFICERS (continued)
(Unaudited)
Fund officers (continued)
Name,
address and
year of birth | Position and year
first appointed to
position for any Fund
in the Columbia
Funds Complex or a
predecessor thereof | Principal occupation(s) during past five years |
Michael E. DeFao
290 Congress Street
Boston, MA 02210
1968 | Vice President (2011) and Assistant Secretary (2010) | Vice President and Chief Counsel, Ameriprise Financial, Inc., since May 2010; Vice President, Chief Legal Officer and Assistant Secretary, Columbia Management Investment Advisers, LLC, since October 2021 (previously Vice President and Assistant Secretary, May 2010 – September 2021). |
Lyn Kephart-Strong
5903 Ameriprise Financial Center
Minneapolis, MN 55474
1960 | Vice President (2015) | Vice President, Global Investment Operations Services, Columbia Management Investment Advisers, LLC, since 2010; Director (since January 2007) and President (since October 2014), Columbia Management Investment Services Corp.; Director (since December 2017) and President (since January 2017), Ameriprise Trust Company. |
| 38 | Multisector Bond SMA Completion Portfolio | Annual Report 2023 |
Liquidity Risk Management Program
(Unaudited)
Pursuant to Rule 22e-4 under the 1940 Act, the Fund has adopted a liquidity risk management program (Program). The Program’s principal objectives include assessing, managing and periodically reviewing the Fund’s liquidity risk. Liquidity risk is defined as the risk that the Fund could not meet redemption requests without significant dilution of remaining investors’ interests in the Fund.
The Board has appointed the Investment Manager as the program administrator for the Fund’s Program. The Investment Manager has delegated oversight of the Program to its Liquidity Risk Management Committee (the Committee). At a Board meeting during the fiscal period, the Committee provided the Board with a report addressing the operations of the Program and assessing its adequacy and effectiveness of implementation for the period January 1, 2022 through December 31, 2022, including:
| • | the Fund had sufficient liquidity to both meet redemptions and operate effectively on behalf of shareholders; |
| • | there were no material changes to the Program during the period; |
| • | the implementation of the Program was effective to manage the Fund’s liquidity risk; and |
| • | the Program operated adequately during the period. |
There can be no assurance that the Program will achieve its objectives in the future. Please refer to the Fund’s prospectus for more information regarding the Fund’s exposure to liquidity risk and other principal risks to which an investment in the Fund may be subject.
Approval of Management Agreement
(Unaudited)
Columbia Management Investment Advisers, LLC (the Investment Manager, and together with its domestic and global affiliates, Columbia Threadneedle Investments), a wholly-owned subsidiary of Ameriprise Financial, Inc. (Ameriprise Financial), serves as the investment manager to Multisector Bond SMA Completion Portfolio (the Fund). Under a management agreement (the Management Agreement), the Investment Manager provides investment advice and other services to the Fund and other funds distributed by Columbia Management Investment Distributors, Inc. (collectively, the Funds).
On an annual basis, the Fund’s Board of Trustees (the Board), including the independent Board members (the Independent Trustees), considers renewal of the Management Agreement. The Investment Manager prepared detailed reports for the Board and its Contracts Committee (including its Contracts Subcommittee) in February, March, April, May and June 2023, including comprehensive responses by the Investment Manager to written requests for information by independent legal counsel to the Independent Trustees (Independent Legal Counsel), to assist the Board in making this determination. In addition, throughout the year, the Board (or its committees or subcommittees) regularly meets with portfolio management teams and senior management personnel and reviews information prepared by the Investment Manager addressing the services the Investment Manager provides and Fund performance. The Board also accords appropriate weight to the work, deliberations and conclusions of the various committees (including their subcommittees), such as the Contracts Committee, the Investment Review Committee, the Audit Committee and the Compliance Committee in determining whether to continue the Management Agreement.
The Board, at its June 22, 2023 Board meeting (the June Meeting), considered the renewal of the Management Agreement for an additional one-year term. At the June Meeting, Independent Legal Counsel reviewed with the Independent Trustees various factors relevant to the Board’s consideration of advisory agreements and the Board’s legal responsibilities related to such consideration. The Independent Trustees considered all information that they, their legal counsel or the Investment Manager believed reasonably necessary to evaluate and to approve the continuation of the Management Agreement. Among other things, the information and factors considered included the following:
| • | Information on the investment performance of the Fund, as well as performance relative to a benchmark; |
Multisector Bond SMA Completion Portfolio | Annual Report 2023
| 39 |
Approval of Management Agreement (continued)
(Unaudited)
| • | Information on the Fund’s management fees and total expenses; |
| • | The Investment Manager’s agreement to contractually limit or cap total operating expenses for the Fund so that total operating expenses (excluding certain fees and expenses, such as transaction costs and certain other investment related expenses, interest, taxes, and infrequent and/or unusual expenses) would not exceed a specified annual rate, as a percentage of the Fund’s net assets; |
| • | Terms of the Management Agreement; |
| • | Descriptions of other agreements and arrangements with affiliates of the Investment Manager relating to the operations of the Fund, including agreements with respect to the provision of transfer agency and shareholder services to the Fund; |
| • | Descriptions of various services performed by the Investment Manager under the Management Agreement, including portfolio management and portfolio trading practices; |
| • | Information regarding the resources of the Investment Manager, including information regarding senior management, portfolio managers and other personnel; |
| • | Information regarding the capabilities of the Investment Manager with respect to compliance monitoring services; and |
| • | The profitability to the Investment Manager and its affiliates from their relationships with the Fund. |
Following an analysis and discussion of the foregoing, and the factors identified below, the Board, including all of the Independent Trustees, approved the renewal of the Management Agreement.
Nature, extent and quality of services provided by the Investment Manager
The Board analyzed various reports and presentations it had received detailing the services performed by the Investment Manager, as well as its history, expertise, resources and relative capabilities, and the qualifications of its personnel.
The Board specifically considered the many developments during recent years concerning the services provided by the Investment Manager. Among other things, the Board noted the organization and depth of the equity and credit research departments. The Board further observed the enhancements to the investment risk management department’s processes, systems and oversight over the past several years. The Board also took into account the broad scope of services provided by the Investment Manager to the Fund, including, among other services, investment, risk and compliance oversight. The Board also took into account the information it received concerning the Investment Manager’s ability to attract and retain key portfolio management personnel and that it has sufficient resources to provide competitive and adequate compensation to investment personnel.
In connection with the Board’s evaluation of the overall package of services provided by the Investment Manager, the Board also considered the nature, quality and range of administrative services provided to the Fund by the Investment Manager, as well as the achievements in 2022 in the performance of administrative services, and noted the various enhancements anticipated for 2023. In evaluating the quality of services provided under the Management Agreement, the Board also took into account the organization and strength of the Fund’s and its service providers’ compliance programs. The Board also reviewed the financial condition of the Investment Manager and its affiliates and each entity’s ability to carry out its responsibilities under the Management Agreement and the Fund’s other service agreements.
In addition, the Board discussed the acceptability of the terms of the Management Agreement, noting that no changes were proposed from the form of agreement previously approved. The Board also noted the wide array of legal and compliance services provided to the Fund under the Management Agreement.
After reviewing these and related factors (including investment performance as discussed below), the Board concluded, within the context of their overall conclusions, that the nature, extent and quality of the services provided to the Fund under the Management Agreement supported the continuation of the Management Agreement.
| 40 | Multisector Bond SMA Completion Portfolio | Annual Report 2023 |
Approval of Management Agreement (continued)
(Unaudited)
Investment performance
The Board carefully reviewed the investment performance of the Fund, including detailed reports providing the results of analysis performed by the Investment Manager showing, for various periods (including since manager inception): (i) the performance of the Fund, (ii) the Fund’s performance relative to a benchmark and (iii) the net assets of the Fund. The Board considered that the Fund is held exclusively by separately managed account (SMA) clients of Columbia Threadneedle Investments and noted the contribution of the performance of the Fund to meeting the investment objectives of such SMA clients.
The Board also considered the Investment Manager’s performance and reputation generally. After reviewing these and related factors, the Board concluded, within the context of their overall conclusions, that the performance of the Fund and the Investment Manager, in light of other considerations, supported the continuation of the Management Agreement.
Comparative fees, costs of services provided and the profits realized by the Investment Manager and its affiliates from their relationships with the Fund
The Board reviewed comparative fees and the costs of services provided under the Management Agreement. The Board members considered detailed comparative information set forth in an annual report on fees and expenses, including, among other things, data showing the Fund’s contribution to the Investment Manager’s profitability.
The Board accorded particular weight to the notion that a primary objective of the level of fees is to achieve a rational pricing model applied consistently across the various product lines in the Fund family, while assuring that the overall fees for each Fund (with certain exceptions) are generally in line with the current “pricing philosophy” such that Fund total expense ratios, in general, approximate or are lower than the median expense ratios of funds in the same Lipper comparison universe. The Board considered that the Fund is held exclusively by SMA clients of Columbia Threadneedle Investments, that the Fund does not pay management fees, and that Columbia Threadneedle Investments collects management fees from SMA clients directly or indirectly through SMA program sponsors.
After reviewing these and related factors, the Board concluded, within the context of their overall conclusions, that the levels of management fees and expenses of the Fund, in light of other considerations, supported the continuation of the Management Agreement.
The Board also considered the profitability of the Investment Manager and its affiliates in connection with the Investment Manager providing management services to the Fund. With respect to the profitability of the Investment Manager and its affiliates, the Independent Trustees referred to information discussing the profitability to the Investment Manager and Ameriprise Financial from managing, operating and distributing the Funds. The Board considered that the profitability generated by the Investment Manager in 2022 had declined from 2021 levels, due to a variety of factors, including the decreased assets under management of the Funds. It also took into account the indirect economic benefits flowing to the Investment Manager or its affiliates in connection with managing or distributing the Funds, such as the enhanced ability to offer various other financial products to Ameriprise Financial customers, soft dollar benefits and overall reputational advantages. The Board noted that the fees paid by the Fund should permit the Investment Manager to offer competitive compensation to its personnel, make necessary investments in its business and earn an appropriate profit. After reviewing these and related factors, the Board concluded, within the context of their overall conclusions, that the costs of services provided and the profitability to the Investment Manager and its affiliates from their relationships with the Fund supported the continuation of the Management Agreement.
Economies of scale
Because the Fund does not pay management fees, the Board did not believe it necessary to consider potential economies of scale associated with the growth of the Fund.
Conclusion
The Board reviewed all of the above considerations in reaching its decision to approve the continuation of the Management Agreement. In reaching its conclusions, no single factor was determinative.
Multisector Bond SMA Completion Portfolio | Annual Report 2023
| 41 |
Approval of Management Agreement (continued)
(Unaudited)
On June 22, 2023, the Board, including all of the Independent Trustees, determined that fees payable under the Management Agreement (which there were none) were fair and reasonable in light of the extent and quality of services provided and approved the renewal of the Management Agreement.
| 42 | Multisector Bond SMA Completion Portfolio | Annual Report 2023 |
[THIS PAGE INTENTIONALLY LEFT BLANK]
Multisector Bond SMA Completion Portfolio
P.O. Box 219104
Kansas City, MO 64121-9104
Please read and consider the investment objectives, risks, charges and expenses for any fund carefully before investing. For a prospectus and summary prospectus, which contains this and other important information about the Fund, go to
columbiathreadneedleus.com/investment-products/managed-accounts/. The Fund is distributed by Columbia Management Investment Distributors, Inc., member FINRA, and managed by Columbia Management Investment Advisers, LLC.
Columbia Threadneedle Investments (Columbia Threadneedle) is the global brand name of the Columbia and Threadneedle group of companies. All rights reserved.
© 2023 Columbia Management Investment Advisers, LLC.
columbiathreadneedleus.com/investment-products/managed-accounts/

Annual Report
August 31, 2023
Overseas SMA Completion Portfolio
Not FDIC or NCUA Insured • No Financial Institution Guarantee • May Lose Value
Overseas SMA Completion Portfolio (the Fund) mails one shareholder report to each shareholder address, unless such shareholder elected to receive shareholder reports from the Fund electronically. If you would like more than one report, please call shareholder services at 800.345.6611 and additional reports will be sent to you.
Proxy voting policies and procedures
The policy of the Board of Trustees is to vote the proxies of the companies in which the Fund holds investments consistent with the procedures as stated in the Statement of Additional Information (SAI). You may obtain a copy of the SAI without charge by calling 800.345.6611; contacting your financial intermediary; visiting columbiathreadneedleus.com/investment-products/managed-accounts/; or searching the website of the Securities and Exchange Commission (SEC) at sec.gov. Information regarding how the Fund voted proxies relating to portfolio securities is filed with the SEC by August 31st for the most recent 12-month period ending June 30th of that year, and is available without charge by visiting columbiathreadneedleus.com/investment-products/managed-accounts/, or searching the website of the SEC at sec.gov.
Quarterly schedule of investments
The Fund files a complete schedule of portfolio holdings with the SEC for the first and third quarters of each fiscal year on Form N-PORT. The Fund’s Form N-PORT filings are available on the SEC’s website at sec.gov. The Fund’s complete schedule of portfolio holdings, as filed on Form N-PORT, is available on columbiathreadneedleus.com/investor/ or can also be obtained without charge, upon request, by calling 800.345.6611.
Additional Fund information
For more information about the Fund, please visit columbiathreadneedleus.com/investment-products/managed-accounts/ or call 800.345.6611. Customer Service Representatives are available to answer your questions Monday through Friday from 8 a.m. to 7 p.m. Eastern time.
Fund investment manager
Columbia Management Investment Advisers, LLC (the Investment Manager)
290 Congress Street
Boston, MA 02210
Fund distributor
Columbia Management Investment Distributors, Inc.
290 Congress Street
Boston, MA 02210
Fund transfer agent
Columbia Management Investment Services Corp.
P.O. Box 219104
Kansas City, MO 64121-9104
Overseas SMA Completion Portfolio | Annual Report 2023
Fund at a Glance
(Unaudited)
Investment objective
The Fund seeks long-term capital appreciation.
The Fund is intended to be used as part of a broader separately managed account (SMA) program. The objective of the Fund is intended to be evaluated in the context of the broader SMA program. The Fund is not designed to be used as a stand-alone investment.
Portfolio management
Fred Copper, CFA
Co-Portfolio Manager
Managed Fund since 2019
Daisuke Nomoto, CMA (SAAJ)
Co-Portfolio Manager
Managed Fund since 2019
Morningstar style boxTM
The Morningstar Style Box is based on a fund’s portfolio holdings. For equity funds, the vertical axis shows the market capitalization of the stocks owned, and the horizontal axis shows investment style (value, blend, or growth). Information shown is based on the most recent data provided by Morningstar.
© 2023 Morningstar, Inc. All rights reserved. The Morningstar information contained herein: (1) is proprietary to Morningstar and/or its content providers; (2) may not be copied or distributed; and (3) is not warranted to be accurate, complete or timely. Neither Morningstar nor its content providers are responsible for any damages or losses arising from any use of this information.
| Average annual total returns (%) (for the period ended August 31, 2023) |
| | | Inception | 1 Year | Life |
| Overseas SMA Completion Portfolio | 09/12/19 | 16.82 | 4.34 |
| MSCI EAFE Value Index (Net) | | 20.74 | 5.00 |
All results shown assume reinvestment of distributions during the period. Returns do not reflect the deduction of taxes that a shareholder may pay on Fund distributions or on the redemption of Fund shares. Performance results reflect the effect of any fee waivers or reimbursements of Fund expenses by Columbia Management Investment Advisers, LLC and/or any of its affiliates. Absent these fee waivers or expense reimbursement arrangements, performance results would have been lower.
The performance information shown represents past performance and is not a guarantee of future results. The investment return and principal value of your investment will fluctuate so that your shares, when redeemed, may be worth more or less than their original cost. Current performance may be lower or higher than the performance information shown. You may obtain performance information current to the most recent month-end by contacting your financial intermediary, visiting columbiathreadneedleus.com/investment-products/managed-accounts/ or calling 800.345.6611.
The Fund is only offered to SMA clients as described in the Fund’s prospectus. The Fund’s performance does not reflect any payments to SMA program sponsors or the Investment Manager of any applicable fees by clients in SMA programs and will differ from the performance of a participant’s overall SMA. For more information about your SMA’s performance, please contact your SMA program sponsor or financial intermediary.
The MSCI EAFE Value Index (Net) is a subset of the MSCI EAFE Index (Net), and constituents of the index include securities from Europe, Australasia and the Far East. The index generally represents approximately 50% of the free-float adjusted market capitalization of the MSCI EAFE Index (Net), and consists of those securities classified by MSCI Inc. as most representing the value style, such as, higher book value-to-price ratios, higher forward earnings-to-price ratios, higher dividend yields and lower forecasted growth rates than securities representing the growth style.
Indices are not available for investment, are not professionally managed and do not reflect sales charges, fees, brokerage commissions, taxes (except the MSCI EAFE Value Index (Net) which reflects reinvested dividends net of withholding taxes) or other expenses of investing. Securities in the Fund may not match those in an index.
Overseas SMA Completion Portfolio | Annual Report 2023
| 3 |
Fund at a Glance (continued)
(Unaudited)
Performance of a hypothetical $10,000 investment (September 12, 2019 — August 31, 2023)
The chart above shows the change in value of a hypothetical $10,000 investment in Overseas SMA Completion Portfolio during the stated time period, and does not reflect the deduction of taxes that a shareholder may pay on Fund distributions or on the sale of Fund shares.
| Equity sector breakdown (%) (at August 31, 2023) |
| Communication Services | 6.0 |
| Consumer Discretionary | 9.9 |
| Consumer Staples | 7.7 |
| Energy | 8.1 |
| Financials | 29.9 |
| Health Care | 2.9 |
| Industrials | 16.3 |
| Information Technology | 8.6 |
| Materials | 4.2 |
| Utilities | 6.4 |
| Total | 100.0 |
Percentages indicated are based upon total equity investments. The Fund’s portfolio composition is subject to change.
| Country breakdown (%) (at August 31, 2023) |
| Australia | 4.1 |
| China | 2.7 |
| France | 3.2 |
| Germany | 5.4 |
| Greece | 3.2 |
| Ireland | 2.8 |
| Israel | 4.3 |
| Japan | 29.7 |
| Netherlands | 5.8 |
| Norway | 2.0 |
| Singapore | 7.1 |
| South Korea | 2.4 |
| Spain | 2.5 |
| Sweden | 0.6 |
| Taiwan | 3.2 |
| United Kingdom | 14.9 |
| United States(a) | 6.1 |
| Total | 100.0 |
| (a) | Includes investments in Money Market Funds. |
Country breakdown is based primarily on issuer’s place of organization/incorporation. Percentages indicated are based upon total investments, excluding investments in derivatives, if any. The Fund’s portfolio composition is subject to change.
| 4 | Overseas SMA Completion Portfolio | Annual Report 2023 |
Manager Discussion of Fund Performance
(Unaudited)
The Fund is intended to be used as part of a broader separately managed account (SMA) program. The objective of the Fund is intended to be evaluated in the context of the broader SMA program. The Fund is not designed to be used as a stand-alone investment.
For the 12-month period that ended August 31, 2023, Overseas SMA Completion Portfolio returned 16.82%. The Fund underperformed its benchmark, the MSCI EAFE Value Index (Net), which returned 20.74% for the same time period.
Market overview
Developed international equity markets delivered robust positive results over the one-year period ending August 31, 2023. As measured by groupings within the MSCI EAFE Index, eight of 11 economic sectors produced double-digit returns, with only real estate finishing with negative results. Stocks within the industrial, information technology, consumer discretionary and financials sectors were the best performers, up more than 20% in U.S. dollar terms. As measured by a comparison of the MSCI EAFE and S&P 500 indexes in U.S. dollar terms, international developed markets slightly outperformed.
In contrast to the final results, the period began and ended with downturns. After a significant decline in the first part of the period, developed international equities began an uneven but steady advance. Bits of good news sprinkled around the globe helped, such as the extremely warm winter across Europe, which allayed concerns of energy shortages resulting from the loss of Russian supplies after the invasion of Ukraine. More good news was the abandonment of the zero-COVID policy in China, allowing for activity to begin to normalize after the prolonged period of rolling lockdowns across much of the country. Europe began to see a few hints of falling inflation, particularly in Italy and Spain. Japanese and Australian retail sales rebounded (somewhat counter-intuitively after the Reserve Bank of Australia resumed rate hikes in May), as did business confidence in New Zealand.
U.S. dollar strength, which had eroded returns significantly for U.S. investors over the previous 12-month period, began weakening early during the current period and also provided a boost. As comparison, the MSCI EAFE Index lost about 7% measured in local currencies over the 12 months ending August 31, 2022, while the index fell nearly 20% when measured in U.S. dollar terms. But for the 12 months of the current reporting period, it gained more than 17% in U.S. dollar terms while delivering about 13% measured in local currencies.
Headwinds throughout the period included disappointing progress with China’s post-COVID lockdown rebound, which proved far less robust than hoped for, due in no small part to signs of a technology cold war as the U.S. escalated restrictions on sales of chipmaking equipment. A property slump, high local government debt and increasing consumer pessimism added to the overall economic worries, as did factory activity contracting over the last three months of the period.
China’s halting rebound was particularly influential in driving the month-long dip that concluded the reporting period, but it did not monopolize investor worries. Mounting inflationary pressures forced central banks globally into the unfortunate position of needing to tighten monetary policy despite deteriorating economic conditions. Stubbornly high inflation in Germany and the U.K., for example, prompted speculation that European Central Bank policymakers will become more aggressive and raise rates in August and September. On the energy front, reports surfaced that oil traders have indicated worries about oversupply and expectations for weak economic growth. And even though the war in Ukraine commanded less headline attention, its continuation continued to contribute uncertainty throughout the period.
The Fund’s notable detractors during the period
| • | The Fund underperformed its benchmark by a wide margin, primarily because of individual stock selection. Selection within the health care, communication services and information technology sectors meaningfully outweighed strong results within materials and energy. Similarly, from a geographic perspective, weak results within the United Kingdom and Singapore more than offset strong results within Japan. |
| • | Allocations from sector and country perspectives also detracted in aggregate. Exposures that detracted the most, based on a stock’s corporate domicile, were an overweight to Norway and underweights to Germany and Italy. A small allocation to China, through ownership of a water utility, also detracted. From a sector perspective, overweights to information technology, consumer staples and communication services hurt relative results. |
Overseas SMA Completion Portfolio | Annual Report 2023
| 5 |
Manager Discussion of Fund Performance (continued)
(Unaudited)
| • | Key individual detractors included U.S. oil and natural gas producer Diversified Energy Co. PLC, which fell on concerns over growing debt, Norwegian salmon farmer Leroy Seafood Group ASA, which disappointed investors by lowering its harvest guidance and Singapore-based electronics technology manufacturer Venture Corp., Ltd., which worried investors with expectations for weakening demand. |
The Fund’s notable contributors during the period
| • | On the upside, the Fund did benefit meaningfully from a relative lack of exposure to real estate stocks. |
| • | From a country perspective, the Fund’s overweight to Greece was a positive (via ownership of bank Piraeus Financial Holdings SA). |
| • | Please note that sector and country allocations are largely a byproduct of the Fund’s bottom-up stock selection process. |
This Fund is designed for the exclusive use of shareholders with international equity SMAs. All portfolio construction, securities analysis and risk management are implemented for the combined portfolio experience toward the SMA’s overall objective of seeking long-term capital appreciation. To that end, the portfolio’s positioning at any given time is intended to complement accompanying SMA holdings in a manner consistent with the overall international equity investment strategy.
Market risk may affect a single issuer, sector of the economy, industry or the market as a whole. Value securities may be unprofitable if the market fails to recognize their intrinsic worth or the portfolio manager misgauged that worth. International investing involves certain risks and volatility due to potential political, economic or currency instabilities and different financial and accounting standards. Risks are enhanced for emerging market issuers. Investing in derivatives is a specialized activity that involves special risks that subject the Fund to significant loss potential, including when used as leverage, and may result in greater fluctuation in Fund value. See the Fund’s prospectus for information on these and other risks.
The views expressed in this report reflect the current views of the respective parties who contributed to this report. These views are not guarantees of future performance and involve certain risks, uncertainties and assumptions that are difficult to predict, so actual outcomes and results may differ significantly from the views expressed. These views are subject to change at any time based upon economic, market or other conditions and the respective parties disclaim any responsibility to update such views. These views may not be relied on as investment advice and, because investment decisions for a Columbia fund are based on numerous factors, may not be relied on as an indication of trading intent on behalf of any particular Columbia fund. References to specific securities should not be construed as a recommendation or investment advice.
| 6 | Overseas SMA Completion Portfolio | Annual Report 2023 |
Understanding Your Fund’s Expenses
(Unaudited)
As an investor, you incur two types of costs. There are shareholder transaction costs, which may include redemption fees. There are also ongoing fund costs, which generally include management fees, distribution and/or service fees, and other fund expenses. The following information is intended to help you understand your ongoing costs (in dollars) of investing in the Fund and to help you compare these costs with the ongoing costs of investing in other mutual funds.
Analyzing your Fund’s expenses
To illustrate these ongoing costs, we have provided examples and calculated the expenses paid by investors of the Fund during the period. The actual and hypothetical information in the table is based on an initial investment of $1,000 at the beginning of the period indicated and held for the entire period. Expense information is calculated two ways and each method provides you with different information. The amount listed in the “Actual” column is calculated using the Fund’s actual operating expenses and total return for the period. You may use the Actual information, together with the amount invested, to estimate the expenses that you paid over the period. Simply divide your account value by $1,000 (for example, an $8,600 account value divided by $1,000 = 8.6), then multiply the results by the expenses paid during the period under the “Actual” column. The amount listed in the “Hypothetical” column assumes a 5% annual rate of return before expenses (which is not the Fund’s actual return) and then applies the Fund’s actual expense ratio for the period to the hypothetical return. You should not use the hypothetical account values and expenses to estimate either your actual account balance at the end of the period or the expenses you paid during the period. See “Compare with other funds” below for details on how to use the hypothetical data.
Compare with other funds
Since all mutual funds are required to include the same hypothetical calculations about expenses in shareholder reports, you can use this information to compare the ongoing cost of investing in the Fund with other funds. To do so, compare the hypothetical example with the 5% hypothetical examples that appear in the shareholder reports of other funds. As you compare hypothetical examples of other funds, it is important to note that hypothetical examples are meant to highlight the ongoing costs of investing in a fund only and do not reflect any transaction costs, such as redemption or exchange fees. Therefore, the hypothetical calculations are useful in comparing ongoing costs only, and will not help you determine the relative total costs of owning different funds. If transaction costs were included in these calculations, your costs would be higher.
| March 1, 2023 — August 31, 2023 |
| | Account value at the
beginning of the
period ($) | Account value at the
end of the
period ($) | Expenses paid during
the period ($) | Fund’s annualized
expense ratio (%) |
| | Actual | Hypothetical | Actual | Hypothetical | Actual | Hypothetical | Actual |
| Overseas SMA Completion Portfolio | 1,000.00 | 1,000.00 | 1,021.40 | 1,025.21 | 0.00 | 0.00 | 0.00 |
Expenses paid during the period are equal to the annualized expense ratio as indicated above, multiplied by the average account value over the period and then multiplied by the number of days in the Fund’s most recent fiscal half year and divided by 365.
Expenses do not include fees and expenses incurred indirectly by the Fund from its investment in underlying funds, including affiliated and non-affiliated pooled investment vehicles, such as mutual funds and exchange-traded funds.
Had Columbia Management Investment Advisers, LLC and/or certain of its affiliates not waived/reimbursed certain fees and expenses, account value at the end of the period would have been reduced.
Overseas SMA Completion Portfolio | Annual Report 2023
| 7 |
Portfolio of Investments
August 31, 2023
(Percentages represent value of investments compared to net assets)
Investments in securities
| Common Stocks 99.5% |
| Issuer | Shares | Value ($) |
| Australia 4.1% |
| Northern Star Resources Ltd. | 36,371 | 278,680 |
| China 2.7% |
| Guangdong Investment Ltd. | 232,000 | 181,105 |
| France 3.2% |
| Eiffage SA | 2,181 | 215,555 |
| Germany 5.5% |
| Duerr AG | 5,481 | 163,380 |
| E.ON SE | 9,175 | 112,941 |
| KION Group AG | 2,254 | 89,983 |
| Total | 366,304 |
| Greece 3.2% |
| Piraeus Financial Holdings SA(a) | 62,712 | 216,081 |
| Ireland 2.9% |
| Amarin Corp. PLC, ADR(a) | 1,181 | 1,240 |
| Bank of Ireland Group PLC | 19,266 | 191,846 |
| Total | 193,086 |
| Israel 4.3% |
| Bank Hapoalim BM | 20,465 | 169,433 |
| Bezeq Israeli Telecommunication Corp., Ltd. | 89,477 | 121,106 |
| Total | 290,539 |
| Japan 30.1% |
| Dai-ichi Life Holdings, Inc. | 13,400 | 249,047 |
| Daiwabo Holdings Co., Ltd. | 14,700 | 297,968 |
| Kinden Corp. | 9,000 | 123,688 |
| Koito Manufacturing Co., Ltd. | 6,800 | 115,400 |
| MatsukiyoCocokara & Co. | 4,400 | 259,074 |
| Mebuki Financial Group, Inc. | 55,500 | 153,425 |
| Sankyo Co., Ltd. | 2,400 | 104,515 |
| Shimamura Co., Ltd. | 2,400 | 247,377 |
| Ship Healthcare Holdings, Inc. | 9,000 | 152,701 |
| Takuma Co., Ltd. | 6,500 | 71,938 |
| Toppan Printing Co., Ltd. | 4,800 | 115,949 |
| Tsuruha Holdings, Inc. | 1,700 | 124,375 |
| Total | 2,015,457 |
| Common Stocks (continued) |
| Issuer | Shares | Value ($) |
| Netherlands 5.8% |
| ASR Nederland NV | 8,942 | 390,985 |
| Norway 2.0% |
| Leroy Seafood Group ASA | 32,228 | 133,036 |
| Singapore 7.2% |
| BW LPG Ltd. | 16,935 | 205,174 |
| Venture Corp., Ltd. | 28,500 | 276,238 |
| Total | 481,412 |
| South Korea 2.4% |
| Hyundai Home Shopping Network Corp. | 862 | 28,438 |
| Youngone Corp. | 3,350 | 135,962 |
| Total | 164,400 |
| Spain 2.5% |
| Endesa SA | 6,422 | 133,372 |
| Tecnicas Reunidas SA(a) | 3,569 | 32,872 |
| Total | 166,244 |
| Sweden 0.6% |
| Stillfront Group AB(a) | 25,106 | 41,244 |
| Taiwan 3.3% |
| Fubon Financial Holding Co., Ltd. | 110,195 | 219,747 |
| United Kingdom 15.1% |
| BT Group PLC | 165,593 | 242,248 |
| Crest Nicholson Holdings PLC | 12,437 | 28,438 |
| DCC PLC | 5,584 | 305,541 |
| John Wood Group PLC(a) | 16,015 | 32,331 |
| Just Group PLC | 191,313 | 182,736 |
| TP Icap Group PLC | 104,977 | 219,691 |
| Total | 1,010,985 |
| United States 4.6% |
| Diversified Energy Co. PLC | 233,334 | 270,610 |
| Insmed, Inc.(a) | 1,305 | 28,567 |
| Sage Therapeutics, Inc.(a) | 430 | 8,600 |
| Total | 307,777 |
Total Common Stocks
(Cost $6,571,338) | 6,672,637 |
|
The accompanying Notes to Financial Statements are an integral part of this statement.
| 8 | Overseas SMA Completion Portfolio | Annual Report 2023 |
Portfolio of Investments (continued)
August 31, 2023
| Money Market Funds 1.6% |
| | Shares | Value ($) |
| Columbia Short-Term Cash Fund, 5.476%(b),(c) | 106,912 | 106,880 |
Total Money Market Funds
(Cost $106,860) | 106,880 |
Total Investments in Securities
(Cost $6,678,198) | 6,779,517 |
| Other Assets & Liabilities, Net | | (74,522) |
| Net Assets | $6,704,995 |
Notes to Portfolio of Investments
| (a) | Non-income producing investment. |
| (b) | The rate shown is the seven-day current annualized yield at August 31, 2023. |
| (c) | As defined in the Investment Company Act of 1940, as amended, an affiliated company is one in which the Fund owns 5% or more of the company’s outstanding voting securities, or a company which is under common ownership or control with the Fund. The value of the holdings and transactions in these affiliated companies during the year ended August 31, 2023 are as follows: |
| Affiliated issuers | Beginning
of period($) | Purchases($) | Sales($) | Net change in
unrealized
appreciation
(depreciation)($) | End of
period($) | Realized gain
(loss)($) | Dividends($) | End of
period shares |
| Columbia Short-Term Cash Fund, 5.476% |
| | 223,418 | 2,525,013 | (2,641,571) | 20 | 106,880 | (4) | 10,569 | 106,912 |
Abbreviation Legend
| ADR | American Depositary Receipt |
Fair value measurements
The Fund categorizes its fair value measurements according to a three-level hierarchy that maximizes the use of observable inputs and minimizes the use of unobservable inputs by prioritizing that the most observable input be used when available. Observable inputs are those that market participants would use in pricing an investment based on market data obtained from sources independent of the reporting entity. Unobservable inputs are those that reflect the Fund’s assumptions about the information market participants would use in pricing an investment. An investment’s level within the fair value hierarchy is based on the lowest level of any input that is deemed significant to the asset’s or liability’s fair value measurement. The input levels are not necessarily an indication of the risk or liquidity associated with investments at that level. For example, certain U.S. government securities are generally high quality and liquid, however, they are reflected as Level 2 because the inputs used to determine fair value may not always be quoted prices in an active market.
Fair value inputs are summarized in the three broad levels listed below:
| ■ | Level 1 — Valuations based on quoted prices for investments in active markets that the Fund has the ability to access at the measurement date. Valuation adjustments are not applied to Level 1 investments. |
| ■ | Level 2 — Valuations based on other significant observable inputs (including quoted prices for similar securities, interest rates, prepayment speeds, credit risks, etc.). |
| ■ | Level 3 — Valuations based on significant unobservable inputs (including the Fund’s own assumptions and judgment in determining the fair value of investments). |
Inputs that are used in determining fair value of an investment may include price information, credit data, volatility statistics, and other factors. These inputs can be either observable or unobservable. The availability of observable inputs can vary between investments, and is affected by various factors such as the type of investment, and the volume and level of activity for that investment or similar investments in the marketplace. The inputs will be considered by the Investment Manager, along with any other relevant factors in the calculation of an investment’s fair value. The Fund uses prices and inputs that are current as of the measurement date, which may include periods of market dislocations. During these periods, the availability of prices and inputs may be reduced for many investments. This condition could cause an investment to be reclassified between the various levels within the hierarchy.
Foreign equity securities actively traded in markets where there is a significant delay in the local close relative to the New York Stock Exchange are classified as Level 2. The values of these securities may include an adjustment to reflect the impact of market movements following the close of local trading, as described in Note 2 to the financial statements – Security valuation.
Investments falling into the Level 3 category are primarily supported by quoted prices from brokers and dealers participating in the market for those investments. However, these may be classified as Level 3 investments due to lack of market transparency and corroboration to support these quoted prices. Additionally, valuation models may be used as the pricing source for any remaining investments classified as Level 3. These models may rely on one or more significant unobservable inputs and/or significant assumptions by the Investment Manager. Inputs used in valuations may include, but are not limited to, financial statement analysis, capital account balances, discount rates and estimated cash flows, and comparable company data.
The accompanying Notes to Financial Statements are an integral part of this statement.
Overseas SMA Completion Portfolio | Annual Report 2023
| 9 |
Portfolio of Investments (continued)
August 31, 2023
Fair value measurements (continued)
The Fund’s Board of Trustees (the Board) has designated the Investment Manager, through its Valuation Committee (the Committee), as valuation designee, responsible for determining the fair value of the assets of the Fund for which market quotations are not readily available using valuation procedures approved by the Board. The Committee consists of voting and non-voting members from various groups within the Investment Manager’s organization, including operations and accounting, trading and investments, compliance, risk management and legal.
The Committee meets at least monthly to review and approve valuation matters, which may include a description of specific valuation determinations, data regarding pricing information received from approved pricing vendors and brokers and the results of Board-approved valuation policies and procedures (the Policies). The Policies address, among other things, instances when market quotations are or are not readily available, including recommendations of third party pricing vendors and a determination of appropriate pricing methodologies; events that require specific valuation determinations and assessment of fair value techniques; securities with a potential for stale pricing, including those that are illiquid, restricted, or in default; and the effectiveness of third party pricing vendors, including periodic reviews of vendors. The Committee meets more frequently, as needed, to discuss additional valuation matters, which may include the need to review back-testing results, review time-sensitive information or approve related valuation actions. Representatives of Columbia Management Investment Advisers, LLC report to the Board at each of its regularly scheduled meetings to discuss valuation matters and actions during the period, similar to those described earlier.
The following table is a summary of the inputs used to value the Fund’s investments at August 31, 2023:
| | Level 1 ($) | Level 2 ($) | Level 3 ($) | Total ($) |
| Investments in Securities | | | | |
| Common Stocks | | | | |
| Australia | — | 278,680 | — | 278,680 |
| China | — | 181,105 | — | 181,105 |
| France | — | 215,555 | — | 215,555 |
| Germany | — | 366,304 | — | 366,304 |
| Greece | — | 216,081 | — | 216,081 |
| Ireland | 1,240 | 191,846 | — | 193,086 |
| Israel | — | 290,539 | — | 290,539 |
| Japan | — | 2,015,457 | — | 2,015,457 |
| Netherlands | — | 390,985 | — | 390,985 |
| Norway | — | 133,036 | — | 133,036 |
| Singapore | — | 481,412 | — | 481,412 |
| South Korea | — | 164,400 | — | 164,400 |
| Spain | — | 166,244 | — | 166,244 |
| Sweden | — | 41,244 | — | 41,244 |
| Taiwan | — | 219,747 | — | 219,747 |
| United Kingdom | — | 1,010,985 | — | 1,010,985 |
| United States | 37,167 | 270,610 | — | 307,777 |
| Total Common Stocks | 38,407 | 6,634,230 | — | 6,672,637 |
| Money Market Funds | 106,880 | — | — | 106,880 |
| Total Investments in Securities | 145,287 | 6,634,230 | — | 6,779,517 |
See the Portfolio of Investments for all investment classifications not indicated in the table.
The Fund’s assets assigned to the Level 2 input category are generally valued using the market approach, in which a security’s value is determined through reference to prices and information from market transactions for similar or identical assets. These assets include certain foreign securities for which a third party statistical pricing service may be employed for purposes of fair market valuation. The model utilized by such third party statistical pricing service takes into account a security’s correlation to available market data including, but not limited to, intraday index, ADR, and exchange-traded fund movements.
The accompanying Notes to Financial Statements are an integral part of this statement.
| 10 | Overseas SMA Completion Portfolio | Annual Report 2023 |
Statement of Assets and Liabilities
August 31, 2023
| Assets | |
| Investments in securities, at value | |
| Unaffiliated issuers (cost $6,571,338) | $6,672,637 |
| Affiliated issuers (cost $106,860) | 106,880 |
| Receivable for: | |
| Dividends | 32,535 |
| Foreign tax reclaims | 10,126 |
| Trustees’ fees | 7,900 |
| Expense reimbursement due from Investment Manager | 314 |
| Prepaid expenses | 2,976 |
| Total assets | 6,833,368 |
| Liabilities | |
| Payable for: | |
| Investments purchased | 88,574 |
| Transfer agent fees | 8 |
| Trustees’ fees | 22,133 |
| Accounting services fees | 15,045 |
| Other expenses | 2,613 |
| Total liabilities | 128,373 |
| Net assets applicable to outstanding capital stock | $6,704,995 |
| Represented by | |
| Paid in capital | 7,164,354 |
| Total distributable earnings (loss) | (459,359) |
| Total - representing net assets applicable to outstanding capital stock | $6,704,995 |
| Shares outstanding | 539,722 |
| Net asset value per share | 12.42 |
The accompanying Notes to Financial Statements are an integral part of this statement.
Overseas SMA Completion Portfolio | Annual Report 2023
| 11 |
Statement of Operations
Year Ended August 31, 2023
| Net investment income | |
| Income: | |
| Dividends — unaffiliated issuers | $248,018 |
| Dividends — affiliated issuers | 10,569 |
| Foreign taxes withheld | (24,297) |
| Total income | 234,290 |
| Expenses: | |
| Transfer agent fees | 308 |
| Trustees’ fees | 15,607 |
| Custodian fees | 12,691 |
| Printing and postage fees | 7,756 |
| Registration fees | 30,216 |
| Accounting services fees | 33,624 |
| Legal fees | 11,904 |
| Interest on interfund lending | 81 |
| Compensation of chief compliance officer | 1 |
| Other | 5,439 |
| Total expenses | 117,627 |
| Fees waived or expenses reimbursed by Investment Manager and its affiliates | (117,546) |
| Total net expenses | 81 |
| Net investment income | 234,209 |
| Realized and unrealized gain (loss) — net | |
| Net realized gain (loss) on: | |
| Investments — unaffiliated issuers | (211,637) |
| Investments — affiliated issuers | (4) |
| Foreign currency translations | (1,714) |
| Futures contracts | 5,726 |
| Net realized loss | (207,629) |
| Net change in unrealized appreciation (depreciation) on: | |
| Investments — unaffiliated issuers | 740,059 |
| Investments — affiliated issuers | 20 |
| Foreign currency translations | 1,252 |
| Futures contracts | 9,395 |
| Net change in unrealized appreciation (depreciation) | 750,726 |
| Net realized and unrealized gain | 543,097 |
| Net increase in net assets resulting from operations | $777,306 |
The accompanying Notes to Financial Statements are an integral part of this statement.
| 12 | Overseas SMA Completion Portfolio | Annual Report 2023 |
Statement of Changes in Net Assets
| | Year Ended
August 31, 2023 | Year Ended
August 31, 2022 |
| Operations | | |
| Net investment income | $234,209 | $244,520 |
| Net realized loss | (207,629) | (431,230) |
| Net change in unrealized appreciation (depreciation) | 750,726 | (1,905,004) |
| Net increase (decrease) in net assets resulting from operations | 777,306 | (2,091,714) |
| Distributions to shareholders | | |
| Net investment income and net realized gains | (201,999) | (487,293) |
| Total distributions to shareholders | (201,999) | (487,293) |
| Increase (decrease) in net assets from capital stock activity | 1,206,675 | (520,215) |
| Total increase (decrease) in net assets | 1,781,982 | (3,099,222) |
| Net assets at beginning of year | 4,923,013 | 8,022,235 |
| Net assets at end of year | $6,704,995 | $4,923,013 |
| | Year Ended | Year Ended |
| | August 31, 2023 | August 31, 2022 |
| | Shares | Dollars ($) | Shares | Dollars ($) |
| Capital stock activity |
| | | | | |
| Shares sold | 166,199 | 2,044,621 | 189,016 | 2,457,612 |
| Distributions reinvested | 17,519 | 201,999 | 36,122 | 487,293 |
| Shares redeemed | (89,677) | (1,039,945) | (292,218) | (3,465,120) |
| Total net increase (decrease) | 94,041 | 1,206,675 | (67,080) | (520,215) |
The accompanying Notes to Financial Statements are an integral part of this statement.
Overseas SMA Completion Portfolio | Annual Report 2023
| 13 |
The following table is intended to help you understand the Fund’s financial performance. Certain information reflects financial results for a single share held for the periods shown. Per share net investment income (loss) amounts are calculated based on average shares outstanding during the period. Total return assumes reinvestment of all dividends and distributions, if any. Total return does not reflect payment of sales charges, if any. Total return and portfolio turnover are not annualized for periods of less than one year. The ratios of expenses and net investment income are annualized for periods of less than one year. The portfolio turnover rate is calculated without regard to purchase and sales transactions of short-term instruments and certain derivatives, if any. If such transactions were included, the Fund’s portfolio turnover rate may be higher.
| | Year Ended August 31, |
| 2023 | 2022 | 2021 | 2020 (a) |
| Per share data | | | | |
| Net asset value, beginning of period | $11.05 | $15.65 | $12.14 | $12.00 |
| Income from investment operations: | | | | |
| Net investment income | 0.51 | 0.45 | 0.41 | 0.31 |
| Net realized and unrealized gain (loss) | 1.31 | (4.10) | 3.30 | 0.01 |
| Total from investment operations | 1.82 | (3.65) | 3.71 | 0.32 |
| Less distributions to shareholders from: | | | | |
| Net investment income | (0.45) | (0.51) | (0.19) | (0.18) |
| Net realized gains | — | (0.44) | (0.01) | — |
| Total distributions to shareholders | (0.45) | (0.95) | (0.20) | (0.18) |
| Net asset value, end of period | $12.42 | $11.05 | $15.65 | $12.14 |
| Total return | 16.82% | (24.44%) | 30.77% | 2.57% |
| Ratios to average net assets | | | | |
| Total gross expenses(b) | 2.15%(c) | 1.60%(d),(e) | 1.73% | 5.92% |
| Total net expenses(b),(f) | 0.00%(c),(g) | 0.00%(d),(e) | 0.00%(g) | 0.00%(g) |
| Net investment income | 4.29% | 3.39% | 2.81% | 2.79% |
| Supplemental data | | | | |
| Portfolio turnover | 33% | 53% | 33% | 47% |
| Net assets, end of period (in thousands) | $6,705 | $4,923 | $8,022 | $2,296 |
| Notes to Financial Highlights |
| (a) | The Fund commenced operations on September 12, 2019. Per share data and total return reflect activity from that date. |
| (b) | In addition to the fees and expenses that the Fund bears directly, the Fund indirectly bears a pro rata share of the fees and expenses of any other funds in which it invests. Such indirect expenses are not included in the Fund’s reported expense ratios. |
| (c) | Ratios include interfund lending expense which is less than 0.01%. |
| (d) | Ratios include interest on collateral expense which is less than 0.01%. |
| (e) | Ratios include line of credit interest expense which is less than 0.01%. |
| (f) | Total net expenses include the impact of certain fee waivers/expense reimbursements made by the Investment Manager and certain of its affiliates, if applicable. |
| (g) | Rounds to zero. |
The accompanying Notes to Financial Statements are an integral part of this statement.
| 14 | Overseas SMA Completion Portfolio | Annual Report 2023 |
Notes to Financial Statements
August 31, 2023
Note 1. Organization
Overseas SMA Completion Portfolio (the Fund), a series of Columbia Funds Series Trust I (the Trust), is a non-diversified fund. The Trust is registered under the Investment Company Act of 1940, as amended (the 1940 Act), as an open-end management investment company organized as a Massachusetts business trust.
Fund shares
The Trust may issue an unlimited number of shares (without par value). Shares of the Fund may only be purchased and held by or on behalf of separately managed account (SMA) clients.
Note 2. Summary of significant accounting policies
Basis of preparation
The Fund is an investment company that applies the accounting and reporting guidance in the Financial Accounting Standards Board (FASB) Accounting Standards Codification Topic 946, Financial Services - Investment Companies (ASC 946). The financial statements are prepared in accordance with U.S. generally accepted accounting principles (GAAP), which requires management to make certain estimates and assumptions that affect the reported amounts of assets and liabilities, the disclosure of contingent assets and liabilities at the date of the financial statements and the reported amounts of income and expenses during the reporting period. Actual results could differ from those estimates.
The following is a summary of significant accounting policies followed by the Fund in the preparation of its financial statements.
Security valuation
Equity securities listed on an exchange are valued at the closing price or last trade price on their primary exchange at the close of business of the New York Stock Exchange. Securities with a closing price not readily available or not listed on any exchange are valued at the mean between the closing bid and ask prices. Listed preferred stocks convertible into common stocks are valued using an evaluated price from a pricing service.
Foreign equity securities are valued based on the closing price or last trade price on their primary exchange at the close of business of the New York Stock Exchange. If any foreign equity security closing prices are not readily available, the securities are valued at the mean of the latest quoted bid and ask prices on such exchanges or markets. Foreign currency exchange rates are determined at the scheduled closing time of the New York Stock Exchange. Many securities markets and exchanges outside the U.S. close prior to the close of the New York Stock Exchange; therefore, the closing prices for securities in such markets or on such exchanges may not fully reflect events that occur after such close but before the close of the New York Stock Exchange. In those situations, foreign securities will be fair valued pursuant to a policy approved by the Board of Trustees. Under the policy, the Fund may utilize a third-party pricing service to determine these fair values. The third-party pricing service takes into account multiple factors, including, but not limited to, movements in the U.S. securities markets, certain depositary receipts, futures contracts and foreign exchange rates that have occurred subsequent to the close of the foreign exchange or market, to determine a good faith estimate that reasonably reflects the current market conditions as of the close of the New York Stock Exchange. The fair value of a security is likely to be different from the quoted or published price, if available.
Investments in open-end investment companies (other than exchange-traded funds (ETFs)), are valued at the latest net asset value reported by those companies as of the valuation time.
Investments for which market quotations are not readily available, or that have quotations which management believes are not reflective of market value or reliable, are valued at fair value as determined in good faith under procedures approved by the Board of Trustees. If a security or class of securities (such as foreign securities) is valued at fair value, such value is likely to be different from the quoted or published price for the security, if available.
The determination of fair value often requires significant judgment. To determine fair value, management may use assumptions including but not limited to future cash flows and estimated risk premiums. Multiple inputs from various sources may be used to determine fair value.
Overseas SMA Completion Portfolio | Annual Report 2023
| 15 |
Notes to Financial Statements (continued)
August 31, 2023
GAAP requires disclosure regarding the inputs and valuation techniques used to measure fair value and any changes in valuation inputs or techniques. In addition, investments shall be disclosed by major category. This information is disclosed following the Fund’s Portfolio of Investments.
Foreign currency transactions and translations
The values of all assets and liabilities denominated in foreign currencies are generally translated into U.S. dollars at exchange rates determined at the close of regular trading on the New York Stock Exchange. Net realized and unrealized gains (losses) on foreign currency transactions and translations include gains (losses) arising from the fluctuation in exchange rates between trade and settlement dates on securities transactions, gains (losses) arising from the disposition of foreign currency and currency gains (losses) between the accrual and payment dates on dividends, interest income and foreign withholding taxes.
For financial statement purposes, the Fund does not distinguish that portion of gains (losses) on investments which is due to changes in foreign exchange rates from that which is due to changes in market prices of the investments. Such fluctuations are included with the net realized and unrealized gains (losses) on investments in the Statement of Operations.
Derivative instruments
The Fund invests in certain derivative instruments, as detailed below, in seeking to meet its investment objectives. Derivatives are instruments whose values depend on, or are derived from, in whole or in part, the value of one or more securities, currencies, commodities, indices, or other assets or instruments. Derivatives may be used to increase investment flexibility (including to maintain cash reserves while maintaining desired exposure to certain assets), for risk management (hedging) purposes, to facilitate trading, to reduce transaction costs and to pursue higher investment returns. The Fund may also use derivative instruments to mitigate certain investment risks, such as foreign currency exchange rate risk, interest rate risk and credit risk. Derivatives may involve various risks, including the potential inability of the counterparty to fulfill its obligations under the terms of the contract, the potential for an illiquid secondary market (making it difficult for the Fund to sell or terminate, including at favorable prices) and the potential for market movements which may expose the Fund to gains or losses in excess of the amount shown in the Statement of Assets and Liabilities. The notional amounts of derivative instruments, if applicable, are not recorded in the financial statements.
A derivative instrument may suffer a marked-to-market loss if the value of the contract decreases due to an unfavorable change in the market rates or values of the underlying instrument. Losses can also occur if the counterparty does not perform its obligations under the contract. The Fund’s risk of loss from counterparty credit risk on over-the-counter derivatives is generally limited to the aggregate unrealized gain netted against any collateral held by the Fund and the amount of any variation margin held by the counterparty, plus any replacement costs or related amounts. With exchange-traded or centrally cleared derivatives, there is reduced counterparty credit risk to the Fund since the clearinghouse or central counterparty (CCP) provides some protection in the case of clearing member default. The clearinghouse or CCP stands between the buyer and the seller of the contract; therefore, failure of the clearinghouse or CCP may pose additional counterparty credit risk. However, credit risk still exists in exchange-traded or centrally cleared derivatives with respect to initial and variation margin that is held in a broker’s customer account. While clearing brokers are required to segregate customer margin from their own assets, in the event that a clearing broker becomes insolvent or goes into bankruptcy and at that time there is a shortfall in the aggregate amount of margin held by the clearing broker for all its clients and such shortfall is remedied by the CCP or otherwise, U.S. bankruptcy laws will typically allocate that shortfall on a pro-rata basis across all the clearing broker’s customers (including the Fund), potentially resulting in losses to the Fund.
In order to better define its contractual rights and to secure rights that will help the Fund mitigate its counterparty risk, the Fund may enter into an International Swaps and Derivatives Association, Inc. Master Agreement (ISDA Master Agreement) or similar agreement with its derivatives counterparties. An ISDA Master Agreement is an agreement between the Fund and a counterparty that governs over-the-counter derivatives and foreign exchange forward contracts and contains, among other things, collateral posting terms and netting provisions in the event of a default and/or termination event. Under an ISDA Master Agreement, the Fund may, under certain circumstances, offset with the counterparty certain derivative instruments’ payables and/or receivables with collateral held and/or posted and create one single net payment. The provisions of the
| 16 | Overseas SMA Completion Portfolio | Annual Report 2023 |
Notes to Financial Statements (continued)
August 31, 2023
ISDA Master Agreement typically permit a single net payment in the event of default (close-out netting), including the bankruptcy or insolvency of the counterparty. Note, however, that bankruptcy or insolvency laws of a particular jurisdiction may impose restrictions on or prohibitions against the right of offset or netting in bankruptcy, insolvency or other events.
Collateral (margin) requirements differ by type of derivative. Margin requirements are established by the clearinghouse or CCP for exchange-traded and centrally cleared derivatives. Brokers can ask for margin in excess of the minimum in certain circumstances. Collateral terms for most over-the-counter derivatives are subject to regulatory requirements to exchange variation margin with trading counterparties and may have contract specific margin terms as well. For over-the-counter derivatives traded under an ISDA Master Agreement, the collateral requirements are typically calculated by netting the marked-to-market amount for each transaction under such agreement and comparing that amount to the value of any variation margin currently pledged by the Fund and/or the counterparty. Generally, the amount of collateral due from or to a party has to exceed a minimum transfer amount threshold (e.g., $250,000) before a transfer has to be made. To the extent amounts due to the Fund from its counterparties are not fully collateralized, contractually or otherwise, the Fund bears the risk of loss from counterparty nonperformance. The Fund may also pay interest expense on cash collateral received from the broker or receive interest income on cash collateral pledged to the broker. The Fund attempts to mitigate counterparty risk by only entering into agreements with counterparties that it believes have the financial resources to honor their obligations and by monitoring the financial stability of those counterparties.
Certain ISDA Master Agreements allow counterparties of over-the-counter derivatives transactions to terminate derivatives contracts prior to maturity in the event the Fund’s net asset value declines by a stated percentage over a specified time period or if the Fund fails to meet certain terms of the ISDA Master Agreement, which would cause the Fund to accelerate payment of any net liability owed to the counterparty. The Fund also has termination rights if the counterparty fails to meet certain terms of the ISDA Master Agreement. In determining whether to exercise such termination rights, the Fund would consider, in addition to counterparty credit risk, whether termination would result in a net liability owed from the counterparty.
For financial reporting purposes, the Fund does not offset derivative assets and derivative liabilities that are subject to netting arrangements in the Statement of Assets and Liabilities.
Futures contracts
Futures contracts are exchange-traded and represent commitments for the future purchase or sale of an asset at a specified price on a specified date. The Fund bought and sold futures contracts to maintain appropriate equity market exposure while keeping sufficient cash to accommodate daily redemptions. These instruments may be used for other purposes in future periods. Upon entering into futures contracts, the Fund bears risks that it may not achieve the anticipated benefits of the futures contracts and may realize a loss. Additional risks include counterparty credit risk, the possibility of an illiquid market, and that a change in the value of the contract or option may not correlate with changes in the value of the underlying asset.
Upon entering into a futures contract, the Fund deposits cash or securities with the broker, known as a futures commission merchant (FCM), in an amount sufficient to meet the initial margin requirement. The initial margin deposit must be maintained at an established level over the life of the contract. Cash deposited as initial margin is recorded in the Statement of Assets and Liabilities as margin deposits. Securities deposited as initial margin are designated in the Portfolio of Investments. Subsequent payments (variation margin) are made or received by the Fund each day. The variation margin payments are equal to the daily change in the contract value and are recorded as variation margin receivable or payable and are offset in unrealized gains or losses. The Fund generally expects to earn interest income on its margin deposits. The Fund recognizes a realized gain or loss when the contract is closed or expires. Futures contracts involve, to varying degrees, risk of loss in excess of the variation margin disclosed in the Statement of Assets and Liabilities.
Effects of derivative transactions in the financial statements
The following tables are intended to provide additional information about the effect of derivatives on the financial statements of the Fund, including: the fair value of derivatives by risk category and the location of those fair values in the Statement of Assets and Liabilities; and the impact of derivative transactions over the period in the Statement of Operations, including realized and unrealized gains (losses). The derivative instrument schedules following the Portfolio of Investments present additional information regarding derivative instruments outstanding at the end of the period, if any.
Overseas SMA Completion Portfolio | Annual Report 2023
| 17 |
Notes to Financial Statements (continued)
August 31, 2023
The following table indicates the effect of derivative instruments (not considered to be hedging instruments for accounting disclosure purposes) in the Statement of Operations for the year ended August 31, 2023:
| Amount of realized gain (loss) on derivatives recognized in income |
| Risk exposure category | Futures
contracts
($) |
| Equity risk | 5,726 |
| |
| Change in unrealized appreciation (depreciation) on derivatives recognized in income |
| Risk exposure category | Futures
contracts
($) |
| Equity risk | 9,395 |
The following table is a summary of the average daily outstanding volume by derivative instrument for the year ended August 31, 2023:
| Derivative instrument | Average notional
amounts ($) |
| Futures contracts — long | 166,382 |
Security transactions
Security transactions are accounted for on the trade date. Cost is determined and gains (losses) are based upon the specific identification method for both financial statement and federal income tax purposes.
Income recognition
Corporate actions and dividend income are generally recorded net of any non-reclaimable tax withholdings, on the ex-dividend date or upon receipt of an ex-dividend notification in the case of certain foreign securities.
The Fund may receive distributions from holdings in equity securities, business development companies (BDCs), exchange-traded funds (ETFs), limited partnerships (LPs), other regulated investment companies (RICs), and real estate investment trusts (REITs), which report information as to the tax character of their distributions annually. These distributions are allocated to dividend income, capital gain and return of capital based on actual information reported. Return of capital is recorded as a reduction of the cost basis of securities held. If the Fund no longer owns the applicable securities, return of capital is recorded as a realized gain. With respect to REITs, to the extent actual information has not yet been reported, estimates for return of capital are made by Columbia Management Investment Advisers, LLC (the Investment Manager), a wholly-owned subsidiary of Ameriprise Financial, Inc. (Ameriprise Financial). The Investment Manager’s estimates are subsequently adjusted when the actual character of the distributions is disclosed by the REITs, which could result in a proportionate change in return of capital to shareholders.
Awards from class action litigation are recorded as a reduction of cost basis if the Fund still owns the applicable securities on the payment date. If the Fund no longer owns the applicable securities on the payment date, the proceeds are recorded as realized gains.
Expenses
General expenses of the Trust are allocated to the Fund and other funds of the Trust based upon relative net assets or other expense allocation methodologies determined by the nature of the expense. Expenses directly attributable to the Fund are charged to the Fund.
Determination of net asset value
The net asset value per share of the Fund is computed by dividing the value of the net assets of the Fund by the total number of outstanding shares of that Fund, rounded to the nearest cent, at the close of regular trading (ordinarily 4:00 p.m. Eastern Time) every day the New York Stock Exchange is open.
| 18 | Overseas SMA Completion Portfolio | Annual Report 2023 |
Notes to Financial Statements (continued)
August 31, 2023
Federal income tax status
The Fund intends to qualify each year as a regulated investment company under Subchapter M of the Internal Revenue Code, as amended, and will distribute substantially all of its investment company taxable income and net capital gain, if any, for its tax year, and as such will not be subject to federal income taxes. In addition, the Fund intends to distribute in each calendar year substantially all of its ordinary income, capital gain net income and certain other amounts, if any, such that the Fund should not be subject to federal excise tax. Therefore, no federal income or excise tax provision is recorded.
Foreign taxes
The Fund may be subject to foreign taxes on income, gains on investments or currency repatriation, a portion of which may be recoverable. The Fund will accrue such taxes and recoveries, as applicable, based upon its current interpretation of tax rules and regulations that exist in the markets in which it invests.
Realized gains in certain countries may be subject to foreign taxes at the Fund level, based on statutory rates. The Fund accrues for such foreign taxes on realized and unrealized gains at the appropriate rate for each jurisdiction, as applicable. The amount, if any, is disclosed as a liability in the Statement of Assets and Liabilities.
Distributions to shareholders
Distributions from net investment income, if any, are declared and paid annually. Net realized capital gains, if any, are distributed at least annually. Income distributions and capital gain distributions are determined in accordance with federal income tax regulations, which may differ from GAAP.
Guarantees and indemnifications
Under the Trust’s organizational documents and, in some cases, by contract, its officers and trustees are indemnified against certain liabilities arising out of the performance of their duties to the Trust or its funds. In addition, certain of the Fund’s contracts with its service providers contain general indemnification clauses. The Fund’s maximum exposure under these arrangements is unknown since the amount of any future claims that may be made against the Fund cannot be determined, and the Fund has no historical basis for predicting the likelihood of any such claims.
Recent accounting pronouncements and regulatory updates
Tailored Shareholder Reports
In October 2022, the Securities and Exchange Commission (SEC) adopted a final rule relating to Tailored Shareholder Reports for Mutual Funds and Exchange-Traded Funds; Fee Information in Investment Company Advertisements. The rule and form amendments will, among other things, require the Fund to transmit concise and visually engaging shareholder reports that highlight key information. The amendments will require that funds tag information in a structured data format and that certain more in-depth information be made available online and available for delivery free of charge to investors on request. The amendments became effective January 24, 2023. There is an 18-month transition period after the effective date of the amendments.
Note 3. Fees and other transactions with affiliates
Management services fees
The Fund does not pay a management fee to Columbia Management Investment Advisers, LLC (the Investment Manager), a wholly-owned subsidiary of Ameriprise Financial, Inc. (Ameriprise Financial). However, Fund shares may only be purchased and held by or on behalf of SMAs where the Investment Manager has an agreement with the SMA program sponsor (the Program Sponsor), or directly with the SMA client, to provide investment management services to the Program Sponsor or the SMA. SMAs pay a fee directly, or indirectly through Program Sponsors, to the Investment Manager for providing investment management services to the Program Sponsor or the SMA, including on assets that may be invested in the Fund.
Overseas SMA Completion Portfolio | Annual Report 2023
| 19 |
Notes to Financial Statements (continued)
August 31, 2023
Compensation of board members
Members of the Board of Trustees who are not officers or employees of the Investment Manager or Ameriprise Financial are compensated for their services to the Fund as disclosed in the Statement of Operations. Under a Deferred Compensation Plan (the Deferred Plan), these members of the Board of Trustees may elect to defer payment of up to 100% of their compensation. Deferred amounts are treated as though equivalent dollar amounts had been invested in shares of certain funds managed by the Investment Manager. The Fund’s liability for these amounts is adjusted for market value changes and remains in the Fund until distributed in accordance with the Deferred Plan. All amounts payable under the Deferred Plan constitute a general unsecured obligation of the Fund. The expense for the Deferred Plan, which includes Trustees’ fees deferred during the current period as well as any gains or losses on the Trustees’ deferred compensation balances as a result of market fluctuations, is included in "Trustees’ fees" in the Statement of Operations.
Compensation of Chief Compliance Officer
The Board of Trustees has appointed a Chief Compliance Officer for the Fund in accordance with federal securities regulations. As disclosed in the Statement of Operations, a portion of the Chief Compliance Officer’s total compensation is allocated to the Fund, along with other allocations to affiliated registered investment companies managed by the Investment Manager and its affiliates, based on relative net assets.
Transfer agency fees
Under a Transfer and Dividend Disbursing Agent Agreement, Columbia Management Investment Services Corp. (the Transfer Agent), an affiliate of the Investment Manager and a wholly-owned subsidiary of Ameriprise Financial, is responsible for providing transfer agency services to the Fund. The Transfer Agent has contracted with SS&C GIDS, Inc. (SS&C GIDS) to serve as sub-transfer agent. Prior to January 1, 2023, SS&C GIDS was known as DST Asset Manager Solutions, Inc. The Transfer Agent pays the fees of SS&C GIDS for services as sub-transfer agent and SS&C GIDS is not entitled to reimbursement for such fees from the Fund (with the exception of out-of-pocket fees).
The Fund pays the Transfer Agent a monthly transfer agency fee based on the number or the average value of accounts, depending on the type of account. In addition, the Fund pays the Transfer Agent a fee for shareholder services based on the number of accounts or on a percentage of the average aggregate value of the Fund’s shares maintained in omnibus accounts up to the lesser of the amount charged by the financial intermediary or a cap established by the Board of Trustees from time to time.
The Transfer Agent also receives compensation from the Fund for various shareholder services and reimbursements for certain out-of-pocket fees.
For the year ended August 31, 2023, the Fund’s effective transfer agency fee rate as a percentage of average daily net assets was 0.01%.
Distribution and service fees
The Fund has an agreement with Columbia Management Investment Distributors, Inc. (the Distributor), an affiliate of the Investment Manager and a wholly-owned subsidiary of Ameriprise Financial, for distribution and shareholder services. The Fund does not pay the Distributor a fee for the distribution services it provides to the Fund.
Expenses waived/reimbursed by the Investment Manager and its affiliates
The Investment Manager and certain of its affiliates have contractually agreed to waive fees and/or reimburse expenses (excluding certain fees and expenses described below), through December 31, 2023, unless sooner terminated at the sole discretion of the Board of Trustees, so that the Fund’s net operating expenses, including indirect expenses of the underlying funds, after giving effect to fees waived/expenses reimbursed and any balance credits and/or overdraft charges from the Fund’s custodian, do not exceed the annual rate of 0.00% of the Fund’s average daily net assets.
Under the agreement governing this fee waiver and/or expense reimbursement arrangement, the following fees and expenses are excluded from the waiver/reimbursement commitment, and therefore will be paid by the Fund, if applicable: taxes (including foreign transaction taxes), transaction costs and brokerage commissions, costs related to any
| 20 | Overseas SMA Completion Portfolio | Annual Report 2023 |
Notes to Financial Statements (continued)
August 31, 2023
securities lending program, dividend expenses associated with securities sold short, inverse floater program fees and expenses, transaction charges and interest on borrowed money, costs associated with shareholder meetings, infrequent and/or unusual expenses and any other expenses the exclusion of which is specifically approved by the Board of Trustees. This agreement may be modified or amended only with approval from the Investment Manager, certain of its affiliates and the Fund. Any fees waived and/or expenses reimbursed under the expense reimbursement arrangements described above are not recoverable by the Investment Manager or its affiliates in future periods.
Note 4. Federal tax information
The timing and character of income and capital gain distributions are determined in accordance with income tax regulations, which may differ from GAAP because of temporary or permanent book to tax differences.
At August 31, 2023, these differences were primarily due to differing treatment for deferral/reversal of wash sale losses, passive foreign investment company (pfic) holdings, capital loss carryforwards and foreign currency transactions. To the extent these differences were permanent, reclassifications were made among the components of the Fund’s net assets. Temporary differences do not require reclassifications.
The following reclassifications were made:
Undistributed net
investment
income ($) | Accumulated
net realized
(loss) ($) | Paid in
capital ($) |
| 13,995 | (13,995) | — |
Net investment income (loss) and net realized gains (losses), as disclosed in the Statement of Operations, and net assets were not affected by this reclassification.
The tax character of distributions paid during the years indicated was as follows:
| Year Ended August 31, 2023 | Year Ended August 31, 2022 |
Ordinary
income ($) | Long-term
capital gains ($) | Total ($) | Ordinary
income ($) | Long-term
capital gains ($) | Total ($) |
| 201,999 | — | 201,999 | 258,438 | 228,855 | 487,293 |
Short-term capital gain distributions, if any, are considered ordinary income distributions for tax purposes.
At August 31, 2023, the components of distributable earnings on a tax basis were as follows:
Undistributed
ordinary income ($) | Undistributed
long-term
capital gains ($) | Capital loss
carryforwards ($) | Net unrealized
appreciation ($) |
| 200,508 | — | (690,998) | 31,493 |
At August 31, 2023, the cost of all investments for federal income tax purposes along with the aggregate gross unrealized appreciation and depreciation based on that cost was:
Federal
tax cost ($) | Gross unrealized
appreciation ($) | Gross unrealized
(depreciation) ($) | Net unrealized
appreciation ($) |
| 6,748,024 | 691,249 | (659,756) | 31,493 |
Tax cost of investments and unrealized appreciation/(depreciation) may also include timing differences that do not constitute adjustments to tax basis.
Overseas SMA Completion Portfolio | Annual Report 2023
| 21 |
Notes to Financial Statements (continued)
August 31, 2023
The following capital loss carryforwards, determined at August 31, 2023, may be available to reduce future net realized gains on investments, if any, to the extent permitted by the Internal Revenue Code. In addition, for the year ended August 31, 2023, capital loss carryforwards utilized, if any, were as follows:
No expiration
short-term ($) | No expiration
long-term ($) | Total ($) | Utilized ($) |
| (379,916) | (311,082) | (690,998) | — |
Management of the Fund has concluded that there are no significant uncertain tax positions in the Fund that would require recognition in the financial statements. However, management’s conclusion may be subject to review and adjustment at a later date based on factors including, but not limited to, new tax laws, regulations, and administrative interpretations (including relevant court decisions). Generally, the Fund’s federal tax returns for the prior three fiscal years remain subject to examination by the Internal Revenue Service.
Note 5. Portfolio information
The cost of purchases and proceeds from sales of securities, excluding short-term investments and derivatives, if any, aggregated to $3,184,387 and $1,716,140, respectively, for the year ended August 31, 2023. The amount of purchase and sale activity impacts the portfolio turnover rate reported in the Financial Highlights.
Note 6. Affiliated money market fund
The Fund invests in Columbia Short-Term Cash Fund, an affiliated money market fund established for the exclusive use by the Fund and other affiliated funds (the Affiliated MMF). The income earned by the Fund from such investments is included as Dividends - affiliated issuers in the Statement of Operations. As an investing fund, the Fund indirectly bears its proportionate share of the expenses of the Affiliated MMF. The Affiliated MMF prices its shares with a floating net asset value. The Securities and Exchange Commission has adopted amendments to money market fund rules requiring institutional prime money market funds like the Affiliated MMF to be subject, by October 2, 2024, to a liquidity fee if daily net redemptions exceed 5% of net assets and, by April 2, 2024, to a discretionary liquidity fee up to 2% if the imposition of such a fee is determined to be in the best interest of the Affiliated MMF.
Note 7. Interfund lending
Pursuant to an exemptive order granted by the Securities and Exchange Commission, the Fund participates in a program (the Interfund Program) allowing each participating Columbia Fund (each, a Participating Fund) to lend money directly to and, except for closed-end funds and money market funds, borrow money directly from other Participating Funds for temporary purposes. The amounts eligible for borrowing and lending under the Interfund Program are subject to certain restrictions.
Interfund loans are subject to the risk that the borrowing fund could be unable to repay the loan when due, and a delay in repayment to the lending fund could result in lost opportunities and/or additional lending costs. The exemptive order is subject to conditions intended to mitigate conflicts of interest arising from the Investment Manager’s relationship with each Participating Fund.
The Fund’s activity in the Interfund Program during the year ended August 31, 2023 was as follows:
| Borrower or lender | Average loan
balance ($) | Weighted average
interest rate (%) | Number of days
with outstanding loans |
| Borrower | 300,000 | 4.85 | 2 |
Interest expense incurred by the Fund is recorded as interfund lending in the Statement of Operations. The Fund had no outstanding interfund loans at August 31, 2023.
Note 8. Line of credit
The Fund has access to a revolving credit facility with a syndicate of banks led by JPMorgan Chase Bank, N.A., Citibank, N.A. and Wells Fargo Bank, N.A. whereby the Fund may borrow for the temporary funding of shareholder redemptions or for other temporary or emergency purposes. Pursuant to an October 27, 2022 amendment and restatement, the credit facility, which is
| 22 | Overseas SMA Completion Portfolio | Annual Report 2023 |
Notes to Financial Statements (continued)
August 31, 2023
an agreement between the Fund and certain other funds managed by the Investment Manager or an affiliated investment manager, severally and not jointly, permits aggregate borrowings up to $950 million. Interest is currently charged to each participating fund based on its borrowings at a rate equal to the higher of (i) the federal funds effective rate, (ii) the secured overnight financing rate plus 0.10% and (iii) the overnight bank funding rate plus, in each case, 1.00%. Each borrowing under the credit facility matures no later than 60 days after the date of borrowing. The Fund also pays a commitment fee equal to its pro rata share of the unused amount of the credit facility at a rate of 0.15% per annum. The commitment fee is included in other expenses in the Statement of Operations. This agreement expires annually in October unless extended or renewed. Prior to the October 27, 2022 amendment and restatement, the Fund had access to a revolving credit facility with a syndicate of banks led by JPMorgan Chase Bank, N.A., Citibank, N.A. and Wells Fargo Bank, N.A. which permitted collective borrowings up to $950 million. Interest was charged to each participating fund based on its borrowings at a rate equal to the higher of (i) the federal funds effective rate, (ii) the secured overnight financing rate plus 0.11448% and (iii) the overnight bank funding rate plus, in each case, 1.00%.
The Fund had no borrowings during the year ended August 31, 2023.
Note 9. Significant risks
Completion funds risk
Investors should be aware that the investments made by the Fund and the results achieved by the Fund at any given time are not expected to be the same as those made by other funds for which the Investment Manager serves as investment adviser, including funds with names, investment objectives and policies similar to the Fund. This may be attributable to a wide variety of factors, including, but not limited to, the use of a differentiated investment strategy. The Fund is intended to be used as part of a broader SMA program. The performance and objectives of the Fund should be evaluated in the context of the broader SMA program. The Fund is not designed to be used as a stand-alone investment. Please contact your SMA program sponsor or financial intermediary for more information.
Financial sector risk
The Fund is more susceptible to the particular risks that may affect companies in the financial services sector than if it were invested in a wider variety of companies in unrelated sectors. Companies in the financial services sector are subject to certain risks, including the risk of regulatory change, decreased liquidity in credit markets and unstable interest rates. Such companies may have concentrated portfolios, such as a high level of loans to one or more industries or sectors, which makes them vulnerable to economic conditions that affect such industries or sectors. Performance of such companies may be affected by competitive pressures and exposure to investments, agreements and counterparties, including credit products that, under certain circumstances, may lead to losses (e.g., subprime loans). Companies in the financial services sector are subject to extensive governmental regulation that may limit the amount and types of loans and other financial commitments they can make, and interest rates and fees that they may charge. In addition, profitability of such companies is largely dependent upon the availability and the cost of capital.
Foreign securities and emerging market countries risk
Investing in foreign securities may involve heightened risks relative to investments in U.S. securities. Investing in foreign securities subjects the Fund to the risks associated with the issuer’s country of organization and places of business operations, including risks associated with political, regulatory, economic, social, diplomatic and other conditions or events occurring in the country or region, which may result in significant market volatility. In addition, certain foreign securities may be more volatile and less liquid than U.S. securities. Investing in emerging markets may increase these risks and expose the Fund to elevated risks associated with increased inflation, deflation or currency devaluation. To the extent that the Fund concentrates its investment exposure to any one or a few specific countries, the Fund will be particularly susceptible to the risks associated with the conditions, events or other factors impacting those countries or regions and may, therefore, have a greater risk than that of a fund that is more geographically diversified. The financial information and disclosure made available by issuers of emerging market securities may be considerably less reliable than publicly available information about other foreign securities. The Public Company Accounting Oversight Board, which regulates auditors of U.S. public companies, is unable to inspect audit work papers in certain foreign countries. Investors in foreign countries often have limited rights and
Overseas SMA Completion Portfolio | Annual Report 2023
| 23 |
Notes to Financial Statements (continued)
August 31, 2023
few practical remedies to pursue shareholder claims, including class actions or fraud claims, and the ability of the U.S. Securities and Exchange Commission, the U.S. Department of Justice and other authorities to bring and enforce actions against foreign issuers or foreign persons is limited.
Geographic focus risk
The Fund may be particularly susceptible to risks related to economic, political, regulatory or other events or conditions affecting issuers and countries within the specific geographic regions in which the Fund invests. The Fund’s net asset value may be more volatile than the net asset value of a more geographically diversified fund.
Asia Pacific Region. The Fund is particularly susceptible to economic, political, regulatory or other events or conditions affecting issuers and countries in the Asia Pacific region. Many of the countries in the region are considered underdeveloped or developing, including from a political, economic and/or social perspective, and may have relatively unstable governments and economies based on limited business, industries and/or natural resources or commodities. Events in any one country within the region may impact other countries in the region or the region as a whole. As a result, events in the region will generally have a greater effect on the Fund than if the Fund were more geographically diversified. This could result in increased volatility in the value of the Fund’s investments and losses for the Fund. Also, securities of some companies in the region can be less liquid than U.S. or other foreign securities, potentially making it difficult for the Fund to sell such securities at a desirable time and price.
Europe. The Fund is particularly susceptible to risks related to economic, political, regulatory or other events or conditions, including acts of war or other conflicts in the region, affecting issuers and countries in Europe. Countries in Europe are often closely connected and interdependent, and events in one European country can have an adverse impact on, and potentially spread to, other European countries. In addition, significant private or public debt problems in a single European Union (EU) country can pose economic risks to the EU as a whole. As a result, the Fund’s net asset value may be more volatile than the net asset value of a more geographically diversified fund. If securities of issuers in Europe fall out of favor, it may cause the Fund to underperform other funds that do not focus their investments in this region of the world. Uncertainty caused by the departure of the United Kingdom (UK) from the EU, which occurred in January 2020, could have negative impacts on the UK and EU, as well as other European economies and the broader global economy. These could include negative impacts on currencies and financial markets as well as increased volatility and illiquidity, and potentially lower economic growth in markets in Europe, which could adversely affect the value of your investment in the Fund.
Japan. The Fund is particularly susceptible to the social, political, economic, regulatory and other conditions or events that may affect Japan’s economy. The Japanese economy is heavily dependent upon international trade, including, among other things, the export of finished goods and the import of oil and other commodities and raw materials. Because of its trade dependence, the Japanese economy is particularly exposed to the risks of currency fluctuation, foreign trade policy and regional and global economic disruption, including the risk of increased tariffs, embargoes, and other trade limitations or factors. Strained relationships between Japan and its neighboring countries, including China, South Korea and North Korea, based on historical grievances, territorial disputes, and defense concerns, may also cause uncertainty in Japanese markets. As a result, additional tariffs, other trade barriers, or boycotts may have an adverse impact on the Japanese economy. Japanese government policy has been characterized by economic regulation, intervention, protectionism and large government deficits. The Japanese economy is also challenged by an unstable financial services sector, highly leveraged corporate balance sheets and extensive cross-ownership among major corporations. Structural social and labor market changes, including an aging workforce, population decline and traditional aversion to labor mobility may adversely affect Japan’s economic competitiveness and growth potential. The potential for natural disasters, such as earthquakes, volcanic eruptions, typhoons and tsunamis, could also have significant negative effects on Japan’s economy. As a result of the Fund’s investment in Japanese securities, the Fund’s net asset value may be more volatile than the net asset value of a more geographically diversified fund. If securities of issuers in Japan fall out of favor, it may cause the Fund to underperform other funds that do not focus their investments in Japan.
Market risk
The Fund may incur losses due to declines in the value of one or more securities in which it invests. These declines may be due to factors affecting a particular issuer, or the result of, among other things, political, regulatory, market, economic or social developments affecting the relevant market(s) more generally. In addition, turbulence in financial markets and reduced
| 24 | Overseas SMA Completion Portfolio | Annual Report 2023 |
Notes to Financial Statements (continued)
August 31, 2023
liquidity in equity, credit and/or fixed income markets may negatively affect many issuers, which could adversely affect the Fund’s ability to price or value hard-to-value assets in thinly traded and closed markets and could cause significant redemptions and operational challenges. Global economies and financial markets are increasingly interconnected, and conditions and events in one country, region or financial market may adversely impact issuers in a different country, region or financial market. These risks may be magnified if certain events or developments adversely interrupt the global supply chain; in these and other circumstances, such risks might affect companies worldwide. As a result, local, regional or global events such as terrorism, war, natural disasters, disease/virus outbreaks and epidemics or other public health issues, recessions, depressions or other events – or the potential for such events – could have a significant negative impact on global economic and market conditions.
The large-scale invasion of Ukraine by Russia in February 2022 has resulted in sanctions and market disruptions, including declines in regional and global stock markets, unusual volatility in global commodity markets and significant devaluations of Russian currency. The extent and duration of the military action are impossible to predict but could be significant. Market disruption caused by the Russian military action, and any counter-measures or responses thereto (including international sanctions, a downgrade in the country’s credit rating, purchasing and financing restrictions, boycotts, tariffs, changes in consumer or purchaser preferences, cyberattacks and espionage) could have severe adverse impacts on regional and/or global securities and commodities markets, including markets for oil and natural gas. These impacts may include reduced market liquidity, distress in credit markets, further disruption of global supply chains, increased risk of inflation, restricted cross-border payments and limited access to investments and/or assets in certain international markets and/or issuers. These developments and other related events could negatively impact Fund performance.
Non-diversification risk
A non-diversified fund is permitted to invest a greater percentage of its total assets in fewer issuers than a diversified fund. This increases the risk that a change in the value of any one investment held by the Fund could affect the overall value of the Fund more than it would affect that of a diversified fund holding a greater number of investments. Accordingly, the Fund’s value will likely be more volatile than the value of a more diversified fund.
Regulatory Risk – U.S. Banking Law
Following the conversion of Ameriprise National Trust Bank into a federal savings bank in May 2019, Ameriprise Financial, Inc. continues to be subject to ongoing supervision by the Board of Governors for the Federal Reserve System as well as applicable U.S. federal banking laws, including the Home Owners Loan Act and certain parts of the Bank Holding Company Act, including Section 13 thereof commonly referred to as the Volcker Rule). These laws impose limits on the amount and duration of any proprietary capital held in the Fund by the Investment Manager, Ameriprise Financial, Inc. or certain of their controlled affiliates or products. The Investment Manager and/or its affiliates own 25% or more of the outstanding shares of the Fund and because of such holding the Fund may become subject to U.S. federal banking law restrictions on proprietary trading, which would limit the Fund’s ability to purchase and sell securities on a short-term basis and thus could have a negative impact on the Fund’s ability to implement its investment objective. Reducing the seed capital in the Fund to address these trading restrictions may result in the Fund being too small to efficiently engage in certain investment strategies, which could also have a negative impact on the Fund’s performance. In addition, if the Investment Manager and/or its affiliates reduce their interest in the Fund, the Fund may be subject to additional transaction costs and adverse tax consequences. Moreover, the resulting reduced size of the Fund could threaten its ongoing economic viability and consequently lead to its liquidation.
Shareholder concentration risk
At August 31, 2023, one unaffiliated shareholder of record owned 49.5% of the outstanding shares of the Fund in one or more accounts. The Fund has no knowledge about whether any portion of those shares was owned beneficially. Affiliated shareholders of record owned 35.5% of the outstanding shares of the Fund in one or more accounts. Fund shares sold to or redeemed by concentrated accounts may have a significant effect on the operations of the Fund. In the case of a large redemption, the Fund may be forced to sell investments at inopportune times, including its liquid positions, which may result in Fund losses and the Fund holding a higher percentage of less liquid positions. Large redemptions could result in decreased economies of scale and increased operating expenses for non-redeeming Fund shareholders.
Overseas SMA Completion Portfolio | Annual Report 2023
| 25 |
Notes to Financial Statements (continued)
August 31, 2023
Small- and mid-cap company risk
Investments in small- and mid-capitalization companies (small- and mid-cap companies) often involve greater risks than investments in larger, more established companies (larger companies) because small- and mid-cap companies tend to have less predictable earnings and may lack the management experience, financial resources, product diversification and competitive strengths of larger companies. Securities of small- and mid-cap companies may be less liquid and more volatile than the securities of larger companies.
Note 10. Subsequent events
Management has evaluated the events and transactions that have occurred through the date the financial statements were issued and noted no items requiring adjustment of the financial statements or additional disclosure.
Note 11. Information regarding pending and settled legal proceedings
Ameriprise Financial and certain of its affiliates are involved in the normal course of business in legal proceedings which include regulatory inquiries, arbitration and litigation, including class actions concerning matters arising in connection with the conduct of their activities as part of a diversified financial services firm. Ameriprise Financial believes that the Fund is not currently the subject of, and that neither Ameriprise Financial nor any of its affiliates are the subject of, any pending legal, arbitration or regulatory proceedings that are likely to have a material adverse effect on the Fund or the ability of Ameriprise Financial or its affiliates to perform under their contracts with the Fund. Ameriprise Financial is required to make quarterly (10-Q), annual (10-K) and, as necessary, 8-K filings with the Securities and Exchange Commission (SEC) on legal and regulatory matters that relate to Ameriprise Financial and its affiliates. Copies of these filings may be obtained by accessing the SEC website at www.sec.gov.
There can be no assurance that these matters, or the adverse publicity associated with them, will not result in increased Fund redemptions, reduced sale of Fund shares or other adverse consequences to the Fund. Further, although we believe proceedings are not likely to have a material adverse effect on the Fund or the ability of Ameriprise Financial or its affiliates to perform under their contracts with the Fund, these proceedings are subject to uncertainties and, as such, we are unable to estimate the possible loss or range of loss that may result. An adverse outcome in one or more of these proceedings could result in adverse judgments, settlements, fines, penalties or other relief that could have a material adverse effect on the consolidated financial condition or results of operations of Ameriprise Financial or one or more of its affiliates that provide services to the Fund.
| 26 | Overseas SMA Completion Portfolio | Annual Report 2023 |
Report of Independent Registered Public Accounting Firm
To the Board of Trustees of Columbia Funds Series Trust I and Shareholders of Overseas SMA Completion Portfolio
Opinion on the Financial Statements
We have audited the accompanying statement of assets and liabilities, including the portfolio of investments, of Overseas SMA Completion Portfolio (one of the funds constituting Columbia Funds Series Trust I, referred to hereafter as the "Fund") as of August 31, 2023, the related statement of operations for the year ended August 31, 2023, the statement of changes in net assets for each of the two years in the period ended August 31, 2023, including the related notes, and the financial highlights for each of the three years in the period ended August 31, 2023 and for the period September 12, 2019 (commencement of operations) through August 31, 2020 (collectively referred to as the “financial statements”). In our opinion, the financial statements present fairly, in all material respects, the financial position of the Fund as of August 31, 2023, the results of its operations for the year then ended, the changes in its net assets for each of the two years in the period ended August 31, 2023 and the financial highlights for each of the three years in the period ended August 31, 2023 and for the period September 12, 2019 (commencement of operations) through August 31, 2020 in conformity with accounting principles generally accepted in the United States of America.
Basis for Opinion
These financial statements are the responsibility of the Fund’s management. Our responsibility is to express an opinion on the Fund’s financial statements based on our audits. We are a public accounting firm registered with the Public Company Accounting Oversight Board (United States) (PCAOB) and are required to be independent with respect to the Fund in accordance with the U.S. federal securities laws and the applicable rules and regulations of the Securities and Exchange Commission and the PCAOB.
We conducted our audits of these financial statements in accordance with the standards of the PCAOB. Those standards require that we plan and perform the audit to obtain reasonable assurance about whether the financial statements are free of material misstatement, whether due to error or fraud.
Our audits included performing procedures to assess the risks of material misstatement of the financial statements, whether due to error or fraud, and performing procedures that respond to those risks. Such procedures included examining, on a test basis, evidence regarding the amounts and disclosures in the financial statements. Our audits also included evaluating the accounting principles used and significant estimates made by management, as well as evaluating the overall presentation of the financial statements. Our procedures included confirmation of securities owned as of August 31, 2023 by correspondence with the custodian, transfer agent and the broker; when replies were not received from the broker, we performed other auditing procedures. We believe that our audits provide a reasonable basis for our opinion.
/s/PricewaterhouseCoopers LLP
Minneapolis, Minnesota
October 23, 2023
We have served as the auditor of one or more investment companies within the Columbia Funds Complex since 1977.
Overseas SMA Completion Portfolio | Annual Report 2023
| 27 |
Federal Income Tax Information
(Unaudited)
The Fund hereby designates the following tax attributes for the fiscal year ended August 31, 2023. Shareholders will be notified in early 2024 of the amounts for use in preparing 2023 income tax returns.
Qualified
dividend
income | Foreign
taxes paid
to foreign
countries | Foreign
taxes paid
per share
to foreign
countries | Foreign
source
income | Foreign
source
income
per share |
| 84.17% | $16,819 | $0.03 | $247,747 | $0.46 |
Qualified dividend income. For taxable, non-corporate shareholders, the percentage of ordinary income distributed during the fiscal year that represents qualified dividend income subject to reduced tax rates.
Foreign taxes. The Fund makes the election to pass through to shareholders the foreign taxes paid. Eligible shareholders may claim a foreign tax credit. These taxes, and the corresponding foreign source income, are provided in the table above.
TRUSTEES AND OFFICERS
(Unaudited)
The Board oversees the Fund’s operations and appoints officers who are responsible for day-to-day business decisions based on policies set by the Board. The following table provides basic biographical information about the Fund’s Trustees as of the printing of this report, including their principal occupations during the past five years, although specific titles for individuals may have varied over the period. The year set forth beneath Length of Service in the table below is the year in which the Trustee was first appointed or elected as Trustee to any Fund currently in the Columbia Funds Complex or a predecessor thereof. Under current Board policy, each Trustee generally serves until December 31 of the year such Trustee turns seventy-five (75).
Independent trustees
Name,
address,
year of birth | Position held
with the Columbia Funds and
length of service | Principal occupation(s)
during past five years
and other relevant
professional experience | Number of
Funds in the
Columbia Funds
Complex*
overseen | Other directorships
held by Trustee
during the past five years
and other relevant Board experience |
George S. Batejan
c/o Columbia Management
Investment Advisers, LLC
290 Congress Street
Boston, MA 02210
1954 | Trustee since 2017 | Executive Vice President, Global Head of Technology and Operations, Janus Capital Group, Inc., 2010-2016 | 173 | Former Chairman of the Board, NICSA (National Investment Company Services Association) (Executive Committee, Nominating Committee and Governance Committee), 2014-2016; former Director, Intech Investment Management, 2011-2016; former Board Member, Metro Denver Chamber of Commerce, 2015-2016; former Advisory Board Member, University of Colorado Business School, 2015-2018; former Board Member, Chase Bank International, 1993-1994 |
| 28 | Overseas SMA Completion Portfolio | Annual Report 2023 |
TRUSTEES AND OFFICERS (continued)
(Unaudited)
Independent trustees (continued)
Name,
address,
year of birth | Position held
with the Columbia Funds and
length of service | Principal occupation(s)
during past five years
and other relevant
professional experience | Number of
Funds in the
Columbia Funds
Complex*
overseen | Other directorships
held by Trustee
during the past five years
and other relevant Board experience |
Kathleen Blatz
c/o Columbia Management
Investment Advisers, LLC
290 Congress Street
Boston, MA 02210
1954 | Trustee since 2006 | Attorney, specializing in arbitration and mediation; Chief Justice, Minnesota Supreme Court, 1998-2006; Associate Justice, Minnesota Supreme Court, 1996-1998; Fourth Judicial District Court Judge, Hennepin County, 1994-1996; Attorney in private practice and public service, 1984-1993; State Representative, Minnesota House of Representatives, 1979-1993, which included service on the Tax and Financial Institutions and Insurance Committees; Member and Interim Chair, Minnesota Sports Facilities Authority, January-July 2017; Interim President and Chief Executive Officer, Blue Cross and Blue Shield of Minnesota (health care insurance), February-July 2018, April-October 2021 | 173 | Former Trustee, Blue Cross and Blue Shield of Minnesota, 2009-2021 (Chair of the Business Development Committee, 2014-2017; Chair of the Governance Committee, 2017-2019); former Member and Chair of the Board, Minnesota Sports Facilities Authority, January 2017-July 2017; former Director, Robina Foundation, 2009-2020 (Chair, 2014-2020); Director, Richard M. Schulze Family Foundation, since 2021 |
Pamela G. Carlton
c/o Columbia Management
Investment Advisers, LLC
290 Congress Street
Boston, MA 02210
1954 | Chair since 2023; Trustee since 2007 | President, Springboard – Partners in Cross Cultural Leadership (consulting company), since 2003; Managing Director of US Equity Research, JP Morgan Chase, 1999-2003; Director of US Equity Research, Chase Asset Management, 1996-1999; Co-Director Latin America Research, 1993-1996, COO Global Research, 1992-1996, Co-Director of US Research, 1991-1992, Investment Banker, 1982-1991, Morgan Stanley; Attorney, Cleary Gottlieb Steen & Hamilton LLP, 1980-1982 | 173 | Trustee, New York Presbyterian Hospital Board, since 1996; Director, DR Bank (Audit Committee) since 2017; Director, Evercore Inc. (Audit Committee, Nominating and Governance Committee), since 2019; Director, Apollo Commercial Real Estate Finance, Inc. (Chair, Nominating and Governance Committee) (financial services), since 2021; the Governing Council of the Independent Directors Council (IDC), since 2021 |
Janet Langford Carrig
c/o Columbia Management
Investment Advisers, LLC
290 Congress Street
Boston, MA 02210
1957 | Trustee since 1996 | Senior Vice President, General Counsel and Corporate Secretary, ConocoPhillips (independent energy company), September 2007-October 2018 | 173 | Director, EQT Corporation (natural gas producer), since 2019; former Director, Whiting Petroleum Corporation (independent oil and gas company), 2020-2022 |
J. Kevin Connaughton
c/o Columbia Management
Investment Advisers, LLC
290 Congress Street
Boston, MA 02210
1964 | Trustee since 2020 | CEO and President, RhodeWay Financial (non-profit financial planning firm), since December 2022; Member, FINRA National Adjudicatory Council, since January 2020; Adjunct Professor of Finance, Bentley University since January 2018; Consultant to Independent Trustees of CFVIT and CFST I from March 2016 to June 2020 with respect to CFVIT and to December 2020 with respect to CFST I; Managing Director and General Manager of Mutual Fund Products, Columbia Management Investment Advisers, LLC, May 2010-February 2015; President, Columbia Funds, 2008-2015; and senior officer of Columbia Funds and affiliated funds, 2003-2015 | 171 | Former Director, The Autism Project, March 2015-December 2021; former Member of the Investment Committee, St. Michael’s College, November 2015-February 2020; former Trustee, St. Michael’s College, June 2017-September 2019; former Trustee, New Century Portfolios (former mutual fund complex), January 2015-December 2017 |
Overseas SMA Completion Portfolio | Annual Report 2023
| 29 |
TRUSTEES AND OFFICERS (continued)
(Unaudited)
Independent trustees (continued)
Name,
address,
year of birth | Position held
with the Columbia Funds and
length of service | Principal occupation(s)
during past five years
and other relevant
professional experience | Number of
Funds in the
Columbia Funds
Complex*
overseen | Other directorships
held by Trustee
during the past five years
and other relevant Board experience |
Olive M. Darragh
c/o Columbia Management
Investment Advisers, LLC
290 Congress Street
Boston, MA 02210
1962 | Trustee since 2020 | Managing Director of Darragh Inc. (strategy and talent management consulting firm), since 2010; Founder and CEO, Zolio, Inc. (investment management talent identification platform), since 2004; Consultant to Independent Trustees of CFVIT and CFST I from June 2019 to June 2020 with respect to CFVIT and to December 2020 with respect to CFST I; Partner, Tudor Investments, 2004-2010; Senior Partner, McKinsey & Company (consulting), 1990-2004; Touche Ross CPA, 1985-1988 | 171 | Treasurer, Edinburgh University US Trust Board, since January 2023; Member, HBS Community Action Partners Board, since September 2022; former Director, University of Edinburgh Business School (Member of US Board), 2004-2019; former Director, Boston Public Library Foundation, 2008-2017 |
Patricia M. Flynn
c/o Columbia Management
Investment Advisers, LLC
290 Congress Street
Boston, MA 02210
1950 | Trustee since 2004 | Professor of Economics and Management, Bentley University, since 2002; Dean, McCallum Graduate School of Business, Bentley University, 1992-2002 | 173 | Former Trustee, MA Taxpayers Foundation, 1997-2022; former Director, The MA Business Roundtable, 2003-2019; former Chairperson, Innovation Index Advisory Committee, MA Technology Collaborative, 1997-2020 |
Brian J. Gallagher
c/o Columbia Management
Investment Advisers, LLC
290 Congress Street
Boston, MA 02210
1954 | Trustee since 2017 | Retired; Partner with Deloitte & Touche LLP and its predecessors, 1977-2016 | 173 | Trustee, Catholic Schools Foundation, since 2004 |
Douglas A. Hacker
c/o Columbia Management
Investment Advisers, LLC
290 Congress Street
Boston, MA 02210
1955 | Trustee since 1996 | Independent business executive, since May 2006; Executive Vice President – Strategy of United Airlines, December 2002 - May 2006; President of UAL Loyalty Services (airline marketing company), September 2001-December 2002; Executive Vice President and Chief Financial Officer of United Airlines, July 1999-September 2001 | 173 | Director, SpartanNash Company since November 2013 (Chair of the Board, since May 2021) (food distributor); Director, Aircastle Limited (Chair of Audit Committee) (aircraft leasing), since August 2006; former Director, Nash Finch Company (food distributor), 2005-2013; former Director, SeaCube Container Leasing Ltd. (container leasing), 2010-2013; and former Director, Travelport Worldwide Limited (travel information technology), 2014-2019 |
Nancy T. Lukitsh
c/o Columbia Management
Investment Advisers, LLC
290 Congress Street
Boston, MA 02210
1956 | Trustee since 2011 | Senior Vice President, Partner and Director of Marketing, Wellington Management Company, LLP (investment adviser), 1997-2010; Chair, Wellington Management Portfolios (commingled non-U.S. investment pools), 2007-2010; Director, Wellington Trust Company, NA and other Wellington affiliates, 1997-2010 | 171 | None |
| 30 | Overseas SMA Completion Portfolio | Annual Report 2023 |
TRUSTEES AND OFFICERS (continued)
(Unaudited)
Independent trustees (continued)
Name,
address,
year of birth | Position held
with the Columbia Funds and
length of service | Principal occupation(s)
during past five years
and other relevant
professional experience | Number of
Funds in the
Columbia Funds
Complex*
overseen | Other directorships
held by Trustee
during the past five years
and other relevant Board experience |
David M. Moffett
c/o Columbia Management
Investment Advisers, LLC
290 Congress Street
Boston, MA 02210
1952 | Trustee since 2011 | Retired; former Chief Executive Officer of Freddie Mac and Chief Financial Officer of U.S. Bank | 171 | Director, CSX Corporation (transportation suppliers); Director, PayPal Holdings Inc. (payment and data processing services); Trustee, University of Oklahoma Foundation; former Director, eBay Inc. (online trading community), 2007-2015; and former Director, CIT Bank, CIT Group Inc. (commercial and consumer finance), 2010-2016; former Senior Adviser to The Carlyle Group (financial services), March 2008-September 2008; former Governance Consultant to Bridgewater Associates, January 2013-December 2015 |
Catherine James Paglia
c/o Columbia Management
Investment Advisers, LLC
290 Congress Street
Boston, MA 02210
1952 | Trustee since 2004 | Director, Enterprise Asset Management, Inc. (private real estate and asset management company), since September 1998; Managing Director and Partner, Interlaken Capital, Inc., 1989-1997; Vice President, 1982-1985, Principal, 1985-1987, Managing Director, 1987-1989, Morgan Stanley; Vice President, Investment Banking, 1980-1982, Associate, Investment Banking, 1976-1980, Dean Witter Reynolds, Inc. | 173 | Director, Valmont Industries, Inc. (irrigation systems manufacturer), since 2012; Trustee, Carleton College (on the Investment Committee), since 1987; Trustee, Carnegie Endowment for International Peace (on the Investment Committee), since 2009 |
Natalie A. Trunow
c/o Columbia Management
Investment Advisers, LLC
290 Congress Street
Boston, MA 02210
1967 | Trustee since 2020 | Chief Executive Officer, Millennial Portfolio Solutions LLC (asset management and consulting services), January 2016-January 2021; Non-executive Member of the Investment Committee and Valuation Committee, Sarona Asset Management Inc. (private equity firm) since September 2019; Advisor, Horizon Investments (asset management and consulting services), August 2018-January 2022; Advisor, Paradigm Asset Management, November 2016-January 2022; Consultant to Independent Trustees of CFVIT and CFST I from September 2016 to June 2020 with respect to CFVIT and to December 2020 with respect to CFST I; Director of Investments/Consultant, Casey Family Programs, April 2016-November 2016; Senior Vice President and Chief Investment Officer, Calvert Investments, August 2008-January 2016; Section Head and Portfolio Manager, General Motors Asset Management, June 1997-August 2008 | 171 | Independent Director, Investment Committee, Health Services for Children with Special Needs, Inc., 2010-2021; Independent Director, (Executive Committee and Chair, Audit Committee), Consumer Credit Counseling Services (formerly Guidewell Financial Solutions), since 2016; Independent Director, (Investment Committee), Sarona Asset Management, since 2019 |
Overseas SMA Completion Portfolio | Annual Report 2023
| 31 |
TRUSTEES AND OFFICERS (continued)
(Unaudited)
Independent trustees (continued)
Name,
address,
year of birth | Position held
with the Columbia Funds and
length of service | Principal occupation(s)
during past five years
and other relevant
professional experience | Number of
Funds in the
Columbia Funds
Complex*
overseen | Other directorships
held by Trustee
during the past five years
and other relevant Board experience |
Sandra L. Yeager
c/o Columbia Management
Investment Advisers, LLC
290 Congress Street
Boston, MA 02210
1964 | Trustee since 2017 | Retired; President and founder, Hanoverian Capital, LLC (SEC registered investment advisor firm), 2008-2016; Managing Director, DuPont Capital, 2006-2008; Managing Director, Morgan Stanley Investment Management, 2004-2006; Senior Vice President, Alliance Bernstein, 1990-2004 | 173 | Former Director, NAPE (National Alliance for Partnerships in Equity) Education Foundation, October 2016-October 2020; Advisory Board, Jennersville YMCA, since 2022 |
Interested trustee affiliated with Investment Manager**
Name,
address,
year of birth | Position held with the Columbia Funds and length of service | Principal occupation(s) during the
past five years and other relevant
professional experience | Number of
Funds in the
Columbia Funds
Complex* overseen | Other directorships
held by Trustee
during the past
five years and
other relevant Board experience |
Daniel J. Beckman
c/o Columbia Management
Investment Advisers, LLC
290 Congress Street
Boston, MA 02210
1962 | Trustee since November 2021 and President since June 2021 | Vice President – Head of North America Product, Columbia Management Investment Advisers, LLC, since April 2015; President and Principal Executive Officer of the Columbia Funds, since June 2021; officer of Columbia Funds and affiliated funds, 2020-2021 | 173 | Director, Ameriprise Trust Company, since October 2016; Director, Columbia Management Investment Distributors, Inc. since November 2018; Board of Governors, Columbia Wanger Asset Management, LLC since, January 2022; Director, Columbia Threadneedle Canada, Inc., since December 2022 |
| * | The term “Columbia Funds Complex” as used herein includes Columbia Seligman Premium Technology Growth Fund, Tri-Continental Corporation and each series of Columbia Funds Series Trust (CFST), Columbia Funds Series Trust I (CFST I), Columbia Funds Series Trust II (CFST II), Columbia ETF Trust I (CET I), Columbia ETF Trust II (CET II), Columbia Funds Variable Insurance Trust (CFVIT) and Columbia Funds Variable Series Trust II (CFVST II). Messrs. Batejan, Beckman, Gallagher and Hacker and Mses. Blatz, Carlton, Carrig, Flynn, Paglia, and Yeager serve as directors of Columbia Seligman Premium Technology Growth Fund and Tri-Continental Corporation. |
| ** | Interested person (as defined under the 1940 Act) by reason of being an officer, director, security holder and/or employee of the Investment Manager or Ameriprise Financial. |
The Statement of Additional Information has additional information about the Fund’s Board members and is available, without charge, upon request by calling 800.345.6611, visiting columbiathreadneedleus.com/investor/ or contacting your financial intermediary.
| 32 | Overseas SMA Completion Portfolio | Annual Report 2023 |
TRUSTEES AND OFFICERS (continued)
(Unaudited)
The Board has appointed officers who are responsible for day-to-day business decisions based on policies it has established. The officers serve at the pleasure of the Board. The following table provides basic information about the Officers of the Fund as of the printing of this report, including principal occupations during the past five years, although their specific titles may have varied over the period. In addition to Mr. Beckman, who is President and Principal Executive Officer, the Fund’s other officers are:
Fund officers
Name,
address and
year of birth | Position and year
first appointed to
position for any Fund
in the Columbia
Funds Complex or a
predecessor thereof | Principal occupation(s) during past five years |
Michael G. Clarke
290 Congress Street
Boston, MA 02210
1969 | Chief Financial Officer and Principal Financial Officer (2009) and Senior Vice President (2019) | Senior Vice President and North America Head of Operations & Investor Services, Columbia Management Investment Advisers, LLC, since June 2023 (previously Senior Vice President and Head of Global Operations, March 2022 – June 2023, Vice President, Head of North America Operations, and Co-Head of Global Operations, June 2019 - February 2022 and Vice President – Accounting and Tax, May 2010 - May 2019); senior officer of Columbia Funds and affiliated funds, since 2002. Director, Ameriprise Trust Company, since June 2023. |
Joseph Beranek
5890 Ameriprise Financial Center
Minneapolis, MN 55474
1965 | Treasurer and Chief Accounting Officer (Principal Accounting Officer) (2019) and Principal Financial Officer (2020), CFST, CFST I, CFST II, CFVIT and CFVST II; Assistant Treasurer, CET I and CET II | Vice President – Mutual Fund Accounting and Financial Reporting, Columbia Management Investment Advisers, LLC, since December 2018 and March 2017, respectively. |
Marybeth Pilat
290 Congress Street
Boston, MA 02210
1968 | Treasurer and Chief Accounting Officer (Principal Accounting Officer) and Principal Financial Officer (2020) for CET I and CET II; Assistant Treasurer, CFST, CFST I, CFST II, CFVIT and CFVST II | Vice President – Product Pricing and Administration, Columbia Management Investment Advisers, LLC, since May 2017. |
William F. Truscott
290 Congress Street
Boston, MA 02210
1960 | Senior Vice President (2001) | Formerly, Trustee/Director of Columbia Funds Complex or legacy funds, November 2001 - January 1, 2021; Chief Executive Officer, Global Asset Management, Ameriprise Financial, Inc., since September 2012; Chairman of the Board and President, Columbia Management Investment Advisers, LLC, since July 2004 and February 2012, respectively; Chairman of the Board and Chief Executive Officer, Columbia Management Investment Distributors, Inc., since November 2008 and February 2012, respectively; Chairman of the Board and Director, Threadneedle Asset Management Holdings, Sàrl, since March 2013 and December 2008, respectively; senior executive of various entities affiliated with Columbia Threadneedle. |
Christopher O. Petersen
5228 Ameriprise Financial Center
Minneapolis, MN 55474
1970 | Senior Vice President and Assistant Secretary (2021) | Formerly, Trustee/Director of funds within the Columbia Funds Complex, July 1, 2020 - November 22, 2021; Senior Vice President and Assistant General Counsel, Ameriprise Financial, Inc., since September 2021 (previously Vice President and Lead Chief Counsel, January 2015 - September 2021); formerly, President and Principal Executive Officer of the Columbia Funds, 2015 - 2021; officer of Columbia Funds and affiliated funds, since 2007. |
Thomas P. McGuire
290 Congress Street
Boston, MA 02210
1972 | Senior Vice President and Chief Compliance Officer (2012) | Vice President – Asset Management Compliance, Ameriprise Financial, Inc., since May 2010; Chief Compliance Officer, Columbia Acorn/Wanger Funds, since December 2015; formerly, Chief Compliance Officer, Ameriprise Certificate Company, September 2010 – September 2020. |
Ryan C. Larrenaga
290 Congress Street
Boston, MA 02210
1970 | Senior Vice President (2017), Chief Legal Officer (2017), and Secretary (2015) | Vice President and Chief Counsel, Ameriprise Financial, Inc., since August 2018 (previously Vice President and Group Counsel, August 2011 - August 2018); Chief Legal Officer, Columbia Acorn/Wanger Funds, since September 2020; officer of Columbia Funds and affiliated funds, since 2005. |
Overseas SMA Completion Portfolio | Annual Report 2023
| 33 |
TRUSTEES AND OFFICERS (continued)
(Unaudited)
Fund officers (continued)
Name,
address and
year of birth | Position and year
first appointed to
position for any Fund
in the Columbia
Funds Complex or a
predecessor thereof | Principal occupation(s) during past five years |
Michael E. DeFao
290 Congress Street
Boston, MA 02210
1968 | Vice President (2011) and Assistant Secretary (2010) | Vice President and Chief Counsel, Ameriprise Financial, Inc., since May 2010; Vice President, Chief Legal Officer and Assistant Secretary, Columbia Management Investment Advisers, LLC, since October 2021 (previously Vice President and Assistant Secretary, May 2010 – September 2021). |
Lyn Kephart-Strong
5903 Ameriprise Financial Center
Minneapolis, MN 55474
1960 | Vice President (2015) | Vice President, Global Investment Operations Services, Columbia Management Investment Advisers, LLC, since 2010; Director (since January 2007) and President (since October 2014), Columbia Management Investment Services Corp.; Director (since December 2017) and President (since January 2017), Ameriprise Trust Company. |
Liquidity Risk Management Program
(Unaudited)
Pursuant to Rule 22e-4 under the 1940 Act, the Fund has adopted a liquidity risk management program (Program). The Program’s principal objectives include assessing, managing and periodically reviewing the Fund’s liquidity risk. Liquidity risk is defined as the risk that the Fund could not meet redemption requests without significant dilution of remaining investors’ interests in the Fund.
The Board has appointed the Investment Manager as the program administrator for the Fund’s Program. The Investment Manager has delegated oversight of the Program to its Liquidity Risk Management Committee (the Committee). At a Board meeting during the fiscal period, the Committee provided the Board with a report addressing the operations of the Program and assessing its adequacy and effectiveness of implementation for the period January 1, 2022 through December 31, 2022, including:
| • | the Fund had sufficient liquidity to both meet redemptions and operate effectively on behalf of shareholders; |
| • | there were no material changes to the Program during the period; |
| • | the implementation of the Program was effective to manage the Fund’s liquidity risk; and |
| • | the Program operated adequately during the period. |
There can be no assurance that the Program will achieve its objectives in the future. Please refer to the Fund’s prospectus for more information regarding the Fund’s exposure to liquidity risk and other principal risks to which an investment in the Fund may be subject.
| 34 | Overseas SMA Completion Portfolio | Annual Report 2023 |
Approval of Management Agreement
(Unaudited)
Columbia Management Investment Advisers, LLC (the Investment Manager, and together with its domestic and global affiliates, Columbia Threadneedle Investments), a wholly-owned subsidiary of Ameriprise Financial, Inc. (Ameriprise Financial), serves as the investment manager to Overseas SMA Completion Portfolio (the Fund). Under a management agreement (the Management Agreement), the Investment Manager provides investment advice and other services to the Fund and other funds distributed by Columbia Management Investment Distributors, Inc. (collectively, the Funds).
On an annual basis, the Fund’s Board of Trustees (the Board), including the independent Board members (the Independent Trustees), considers renewal of the Management Agreement. The Investment Manager prepared detailed reports for the Board and its Contracts Committee (including its Contracts Subcommittee) in February, March, April, May and June 2023, including comprehensive responses by the Investment Manager to written requests for information by independent legal counsel to the Independent Trustees (Independent Legal Counsel), to assist the Board in making this determination. In addition, throughout the year, the Board (or its committees or subcommittees) regularly meets with portfolio management teams and senior management personnel and reviews information prepared by the Investment Manager addressing the services the Investment Manager provides and Fund performance. The Board also accords appropriate weight to the work, deliberations and conclusions of the various committees (including their subcommittees), such as the Contracts Committee, the Investment Review Committee, the Audit Committee and the Compliance Committee in determining whether to continue the Management Agreement.
The Board, at its June 22, 2023 Board meeting (the June Meeting), considered the renewal of the Management Agreement for an additional one-year term. At the June Meeting, Independent Legal Counsel reviewed with the Independent Trustees various factors relevant to the Board’s consideration of advisory agreements and the Board’s legal responsibilities related to such consideration. The Independent Trustees considered all information that they, their legal counsel or the Investment Manager believed reasonably necessary to evaluate and to approve the continuation of the Management Agreement. Among other things, the information and factors considered included the following:
| • | Information on the investment performance of the Fund, as well as performance relative to a benchmark; |
| • | Information on the Fund’s management fees and total expenses; |
| • | The Investment Manager’s agreement to contractually limit or cap total operating expenses for the Fund so that total operating expenses (excluding certain fees and expenses, such as transaction costs and certain other investment related expenses, interest, taxes, and infrequent and/or unusual expenses) would not exceed a specified annual rate, as a percentage of the Fund’s net assets; |
| • | Terms of the Management Agreement; |
| • | Descriptions of other agreements and arrangements with affiliates of the Investment Manager relating to the operations of the Fund, including agreements with respect to the provision of transfer agency and shareholder services to the Fund; |
| • | Descriptions of various services performed by the Investment Manager under the Management Agreement, including portfolio management and portfolio trading practices; |
| • | Information regarding the resources of the Investment Manager, including information regarding senior management, portfolio managers and other personnel; |
| • | Information regarding the capabilities of the Investment Manager with respect to compliance monitoring services; and |
| • | The profitability to the Investment Manager and its affiliates from their relationships with the Fund. |
Following an analysis and discussion of the foregoing, and the factors identified below, the Board, including all of the Independent Trustees, approved the renewal of the Management Agreement.
Nature, extent and quality of services provided by the Investment Manager
The Board analyzed various reports and presentations it had received detailing the services performed by the Investment Manager, as well as its history, expertise, resources and relative capabilities, and the qualifications of its personnel.
Overseas SMA Completion Portfolio | Annual Report 2023
| 35 |
Approval of Management Agreement (continued)
(Unaudited)
The Board specifically considered the many developments during recent years concerning the services provided by the Investment Manager. Among other things, the Board noted the organization and depth of the equity and credit research departments. The Board further observed the enhancements to the investment risk management department’s processes, systems and oversight over the past several years. The Board also took into account the broad scope of services provided by the Investment Manager to the Fund, including, among other services, investment, risk and compliance oversight. The Board also took into account the information it received concerning the Investment Manager’s ability to attract and retain key portfolio management personnel and that it has sufficient resources to provide competitive and adequate compensation to investment personnel.
In connection with the Board’s evaluation of the overall package of services provided by the Investment Manager, the Board also considered the nature, quality and range of administrative services provided to the Fund by the Investment Manager, as well as the achievements in 2022 in the performance of administrative services, and noted the various enhancements anticipated for 2023. In evaluating the quality of services provided under the Management Agreement, the Board also took into account the organization and strength of the Fund’s and its service providers’ compliance programs. The Board also reviewed the financial condition of the Investment Manager and its affiliates and each entity’s ability to carry out its responsibilities under the Management Agreement and the Fund’s other service agreements.
In addition, the Board discussed the acceptability of the terms of the Management Agreement, noting that no changes were proposed from the form of agreement previously approved. The Board also noted the wide array of legal and compliance services provided to the Fund under the Management Agreement.
After reviewing these and related factors (including investment performance as discussed below), the Board concluded, within the context of their overall conclusions, that the nature, extent and quality of the services provided to the Fund under the Management Agreement supported the continuation of the Management Agreement.
Investment performance
The Board carefully reviewed the investment performance of the Fund, including detailed reports providing the results of analysis performed by the Investment Manager showing, for various periods (including since manager inception): (i) the performance of the Fund, (ii) the Fund’s performance relative to a benchmark and (iii) the net assets of the Fund. The Board considered that the Fund is held exclusively by separately managed account (SMA) clients of Columbia Threadneedle Investments and noted the contribution of the performance of the Fund to meeting the investment objectives of such SMA clients.
The Board also considered the Investment Manager’s performance and reputation generally. After reviewing these and related factors, the Board concluded, within the context of their overall conclusions, that the performance of the Fund and the Investment Manager, in light of other considerations, supported the continuation of the Management Agreement.
Comparative fees, costs of services provided and the profits realized by the Investment Manager and its affiliates from their relationships with the Fund
The Board reviewed comparative fees and the costs of services provided under the Management Agreement. The Board members considered detailed comparative information set forth in an annual report on fees and expenses, including, among other things, data showing the Fund’s contribution to the Investment Manager’s profitability.
The Board accorded particular weight to the notion that a primary objective of the level of fees is to achieve a rational pricing model applied consistently across the various product lines in the Fund family, while assuring that the overall fees for each Fund (with certain exceptions) are generally in line with the current “pricing philosophy” such that Fund total expense ratios, in general, approximate or are lower than the median expense ratios of funds in the same Lipper comparison universe. The Board considered that the Fund is held exclusively by SMA clients of Columbia Threadneedle Investments, that the Fund does not pay management fees, and that Columbia Threadneedle Investments collects management fees from SMA clients directly or indirectly through SMA program sponsors.
| 36 | Overseas SMA Completion Portfolio | Annual Report 2023 |
Approval of Management Agreement (continued)
(Unaudited)
After reviewing these and related factors, the Board concluded, within the context of their overall conclusions, that the levels of management fees and expenses of the Fund, in light of other considerations, supported the continuation of the Management Agreement.
The Board also considered the profitability of the Investment Manager and its affiliates in connection with the Investment Manager providing management services to the Fund. With respect to the profitability of the Investment Manager and its affiliates, the Independent Trustees referred to information discussing the profitability to the Investment Manager and Ameriprise Financial from managing, operating and distributing the Funds. The Board considered that the profitability generated by the Investment Manager in 2022 had declined from 2021 levels, due to a variety of factors, including the decreased assets under management of the Funds. It also took into account the indirect economic benefits flowing to the Investment Manager or its affiliates in connection with managing or distributing the Funds, such as the enhanced ability to offer various other financial products to Ameriprise Financial customers, soft dollar benefits and overall reputational advantages. The Board noted that the fees paid by the Fund should permit the Investment Manager to offer competitive compensation to its personnel, make necessary investments in its business and earn an appropriate profit. After reviewing these and related factors, the Board concluded, within the context of their overall conclusions, that the costs of services provided and the profitability to the Investment Manager and its affiliates from their relationships with the Fund supported the continuation of the Management Agreement.
Economies of scale
Because the Fund does not pay management fees, the Board did not believe it necessary to consider potential economies of scale associated with the growth of the Fund.
Conclusion
The Board reviewed all of the above considerations in reaching its decision to approve the continuation of the Management Agreement. In reaching its conclusions, no single factor was determinative.
On June 22, 2023, the Board, including all of the Independent Trustees, determined that fees payable under the Management Agreement (which there were none) were fair and reasonable in light of the extent and quality of services provided and approved the renewal of the Management Agreement.
Overseas SMA Completion Portfolio | Annual Report 2023
| 37 |
[THIS PAGE INTENTIONALLY LEFT BLANK]
[THIS PAGE INTENTIONALLY LEFT BLANK]
Overseas SMA Completion Portfolio
P.O. Box 219104
Kansas City, MO 64121-9104
Please read and consider the investment objectives, risks, charges and expenses for any fund carefully before investing. For a prospectus and summary prospectus, which contains this and other important information about the Fund, go to
columbiathreadneedleus.com/investment-products/managed-accounts/. The Fund is distributed by Columbia Management Investment Distributors, Inc., member FINRA, and managed by Columbia Management Investment Advisers, LLC.
Columbia Threadneedle Investments (Columbia Threadneedle) is the global brand name of the Columbia and Threadneedle group of companies. All rights reserved.
© 2023 Columbia Management Investment Advisers, LLC.
columbiathreadneedleus.com/investment-products/managed-accounts/

Annual Report
August 31, 2023
Multi-Manager International Equity Strategies Fund
Not FDIC or NCUA Insured • No Financial Institution Guarantee • May Lose Value
| 3 |
| 6 |
| 10 |
| 11 |
| 21 |
| 22 |
| 23 |
| 24 |
| 26 |
| 35 |
| 36 |
| 36 |
| 42 |
| 43 |
If you elect to receive the shareholder report for Multi-Manager International Equity Strategies Fund (the Fund) in paper, mailed to you, the Fund mails one shareholder report to each shareholder address, unless such shareholder elects to receive shareholder reports from the Fund electronically via e-mail or by having a paper notice mailed to you (Postcard Notice) that your Fund’s shareholder report is available at the Columbia funds’ website (columbiathreadneedleus.com/investor/). If you would like more than one report in paper to be mailed to you, or would like to elect to receive reports via e-mail or access them through Postcard Notice, please call shareholder services at 800.345.6611 and additional reports will be sent to you.
Proxy voting policies and procedures
The policy of the Board of Trustees is to vote the proxies of the companies in which the Fund holds investments consistent with the procedures as stated in the Statement of Additional Information (SAI). You may obtain a copy of the SAI without charge by calling 800.345.6611; contacting your financial intermediary; visiting columbiathreadneedleus.com/investor/; or searching the website of the Securities and Exchange Commission (SEC) at sec.gov. Information regarding how the Fund voted proxies relating to portfolio securities is filed with the SEC by August 31st for the most recent 12-month period ending June 30th of that year, and is available without charge by visiting columbiathreadneedleus.com/investor/, or searching the website of the SEC at sec.gov.
Quarterly schedule of investments
The Fund files a complete schedule of portfolio holdings with the SEC for the first and third quarters of each fiscal year on Form N-PORT. The Fund’s Form N-PORT filings are available on the SEC’s website at sec.gov. The Fund’s complete schedule of portfolio holdings, as filed on Form N-PORT, is available on columbiathreadneedleus.com/investor/ or can also be obtained without charge, upon request, by calling 800.345.6611.
Additional Fund information
For more information about the Fund, please visit columbiathreadneedleus.com/investor/ or call 800.345.6611. Customer Service Representatives are available to answer your questions Monday through Friday from 8 a.m. to 7 p.m. Eastern time.
Fund investment manager
Columbia Management Investment Advisers, LLC (the Investment Manager)
290 Congress Street
Boston, MA 02210
Fund distributor
Columbia Management Investment Distributors, Inc.
290 Congress Street
Boston, MA 02210
Fund transfer agent
Columbia Management Investment Services Corp.
P.O. Box 219104
Kansas City, MO 64121-9104
Multi-Manager International Equity Strategies Fund | Annual Report 2023
Fund at a Glance
(Unaudited)
Investment objective
The Fund seeks long-term capital appreciation.
Portfolio management
Arrowstreet Capital, Limited Partnership (Arrowstreet)
Derek Vance, CFA
Christopher Malloy, Ph.D.
John Campbell, Ph.D.*
Manolis Liodakis, Ph.D., M.B.A.
Peter Rathjens, Ph.D.
*John Campbell has announced his intention to retire from Arrowstreet, effective December 31, 2023. As a result, effective January 1, 2024, Julia Yuan will be added to the Arrowstreet portfolio management team.
Baillie Gifford Overseas Limited
Donald Farquharson, CFA
Andrew Stobart
Jenny Davis
Tom Walsh, CFA
Chris Davies
Steve Vaughan, CFA
Causeway Capital Management LLC
Sarah Ketterer, M.B.A.
Harry Hartford
Conor Muldoon, CFA, M.B.A
Alessandro Valentini, CFA, M.B.A.
Jonathan Eng, M.B.A.
Ellen Lee, M.B.A.
| Average annual total returns (%) (for the period ended August 31, 2023) |
| | | Inception | 1 Year | 5 Years | Life |
| Institutional Class | 05/17/18 | 23.04 | 5.20 | 4.24 |
| Institutional 3 Class* | 12/18/19 | 23.28 | 5.32 | 4.36 |
| MSCI EAFE Index (Net) | | 17.92 | 4.14 | 3.18 |
All results shown assume reinvestment of distributions during the period. Returns do not reflect the deduction of taxes that a shareholder may pay on Fund distributions or on the redemption of Fund shares. Performance results reflect the effect of any fee waivers or reimbursements of Fund expenses by Columbia Management Investment Advisers, LLC and/or any of its affiliates. Absent these fee waivers or expense reimbursement arrangements, performance results would have been lower.
The performance information shown represents past performance and is not a guarantee of future results. The investment return and principal value of your investment will fluctuate so that your shares, when redeemed, may be worth more or less than their original cost. Current performance may be lower or higher than the performance information shown. You may obtain performance information current to the most recent month-end by contacting your financial intermediary, visiting columbiathreadneedleus.com/investor/ or calling 800.345.6611.
*The returns shown for periods prior to the share class inception date (including returns for the Life of the Fund, if shown, which are since Fund inception) include the returns of the Fund’s oldest share class. These returns are adjusted to reflect any higher class-related operating expenses of the newer share classes, as applicable. Please visit columbiathreadneedleus.com/investor/investment-products/mutual-funds/appended-performance for more information
The MSCI EAFE Index (Net) is a free float-adjusted market capitalization index that is designed to measure the equity market performance of developed markets, excluding the U.S. and Canada. The index is compiled from a composite of securities markets of Europe, Australasia and the Far East and is widely recognized by investors in foreign markets as the measurement index for portfolios of non-North American securities.
Indices are not available for investment, are not professionally managed and do not reflect sales charges, fees, brokerage commissions, taxes (except the MSCI EAFE Index (Net), which reflects reinvested dividends net of withholding taxes) or other expenses of investing. Securities in the Fund may not match those in an index.
Multi-Manager International Equity Strategies Fund | Annual Report 2023
| 3 |
Fund at a Glance (continued)
(Unaudited)
Performance of a hypothetical $10,000 investment (May 17, 2018 — August 31, 2023)
The chart above shows the change in value of a hypothetical $10,000 investment in Institutional Class shares of Multi-Manager International Equity Strategies Fund during the stated time period, and does not reflect the deduction of taxes that a shareholder may pay on Fund distributions or on the redemption of Fund shares.
| Equity sector breakdown (%) (at August 31, 2023) |
| Communication Services | 4.4 |
| Consumer Discretionary | 11.8 |
| Consumer Staples | 8.1 |
| Energy | 7.4 |
| Financials | 17.0 |
| Health Care | 9.6 |
| Industrials | 17.7 |
| Information Technology | 15.2 |
| Materials | 5.4 |
| Real Estate | 0.1 |
| Utilities | 3.3 |
| Total | 100.0 |
Percentages indicated are based upon total equity investments. The Fund’s portfolio composition is subject to change.
| 4 | Multi-Manager International Equity Strategies Fund | Annual Report 2023 |
Fund at a Glance (continued)
(Unaudited)
| Country breakdown (%) (at August 31, 2023) |
| Australia | 0.1 |
| Austria | 0.2 |
| Belgium | 0.9 |
| Brazil | 2.6 |
| Canada | 2.5 |
| China | 2.5 |
| Denmark | 2.0 |
| Finland | 0.7 |
| France | 9.6 |
| Germany | 10.6 |
| Hong Kong | 1.6 |
| India | 0.7 |
| Ireland | 3.1 |
| Israel | 0.2 |
| Italy | 4.2 |
| Japan | 17.0 |
| Luxembourg | 0.0(a) |
| Netherlands | 7.7 |
| Norway | 0.5 |
| Panama | 0.3 |
| Portugal | 0.0(a) |
| Russian Federation | 0.0(a) |
| Singapore | 0.4 |
| South Africa | 0.4 |
| South Korea | 3.3 |
| Spain | 2.5 |
| Sweden | 1.7 |
| Switzerland | 4.1 |
| Taiwan | 1.2 |
| Turkey | 0.2 |
| United Kingdom | 15.4 |
| United States(b) | 3.8 |
| Total | 100.0 |
| (a) | Rounds to zero. |
| (b) | Includes investments in Money Market Funds. |
Country breakdown is based primarily on issuer’s place of organization/incorporation. Percentages indicated are based upon total investments, excluding investments in derivatives, if any. The Fund’s portfolio composition is subject to change.
Multi-Manager International Equity Strategies Fund | Annual Report 2023
| 5 |
Manager Discussion of Fund Performance
(Unaudited)
The Fund is currently managed by three independent investment management firms, and each invests a portion of the portfolio’s assets. As of August 31, 2023, Arrowstreet Capital, Limited Partnership (Arrowstreet), Baillie Gifford Overseas Limited (Baillie Gifford) and Causeway Capital Management LLC (Causeway) managed approximately 29.7%, 33.8% and 36.5% of the portfolio, respectively.
For the 12-month period that ended August 31, 2023, Institutional Class shares of Multi-Manager International Equity Strategies Fund returned 23.04%. The Fund’s benchmark, the MSCI EAFE Index (Net) returned 17.92%.
Market overview
Global equity markets delivered outsized gains during the one-year period ending August 31, 2023, and bounced back after 2022 proved challenging. Macro pressures weighed on the market to start the year-long period, as they did at the end, and equities sold off during both the start and the end of the period. However, the market did advance steadily in the interim as macro pressures eased and the world broadly re-opened following the COVID-19 pandemic. Most notably China abandoned its zero-COVID policy to start 2023, allowing for activity to begin to normalize after the prolonged period of rolling lockdowns across much of the country. Europe benefitted from falling inflation particularly in Italy and Spain, and warm weather during the winter alleviated concerns of energy shortages resulting from the loss of Russian supplies after the invasion of Ukraine. The consumer recovered and business confidence strengthened in the Asia Pacific region. Fluctuations in the U.S. dollar, which had eroded returns significantly for U.S. investors over the previous 12-month period, proved favorable and provided a boost.
While a resilient consumer and easing fears of a recession drove broad swaths of the market recovery, the world’s introduction to consumer-facing artificial intelligence (AI) products powered by large-language models (LLMs) resonated and drove technology outperformance. An LLM is a sophisticated AI system that uses advanced computer science techniques to process large amounts of text data and patterns in language, enabling human-like responses to queries. Almost as if programmed by lines of code, the steady cadence of new product releases from the world’s leading technology companies drove investor enthusiasm, especially for large-cap technology companies.
The uneven recovery of the Chinese economy, in addition to increased escalation of the decades-in-the-making technology cold war between the United States and China, did cause some market angst. Elsewhere in the world, declining property values, elevated local government debt and contraction in industrial activity did weigh on the economic outlook as well.
Arrowstreet
Our portion of the Fund’s portfolio outperformed the benchmark during the period.
As a quantitatively oriented manager, the primary determinant of our strategy’s success or failure tends to be the forecast power of our expected return models: our basket model and our stock model. Our basket model seeks to predict the relative returns of each of several hundred country sector baskets across the globe. The stock model seeks to predict the relative return of any individual stock in excess of its country sector basket return. The basket model tends to be more influential in affecting our country and sector allocations, while the stock model tends to be more influential in determining which particular stocks will be used to increase our exposure in any basket. Both our stock model and basket model were positive during the period. In terms of signals within our models, our indirect value signals within our stock model performed best, while indirect momentum underperformed. Within our basket model, our high frequency and value signals outperformed while our price momentum signal underperformed.
Notable contributors in our portion of the Fund during the period
| • | The industrials sector was the most significant sector-level contributor in our portion of the Fund during the period, primarily due to an opportunistic allocation to the Turkish industrials basket. |
| ○ | Positive selection and overweight positioning to the Japanese industrials basket additionally increased outperformance. |
| • | The financials sector was another sector-level contributor, largely driven by an opportunistic allocation to the Turkish financials basket. |
| 6 | Multi-Manager International Equity Strategies Fund | Annual Report 2023 |
Manager Discussion of Fund Performance (continued)
(Unaudited)
| ○ | Positive selection and overweight positioning to the German and Swedish financials baskets further contributed to sector-level effects. |
| ○ | Underweight positioning to the Hong Kong and Australian financials baskets increased sector-level effects. |
| • | The consumer staples sector was another notable sector-level contributor, primarily driven by underweight positioning to the Swiss and U.K. consumer staples baskets. |
| • | From a geographic perspective, Japan was the most notable country-level contributor, in large part as a result of positive selection paired with overweight positioning to the Japanese industrials, energy and materials baskets. Positive selection and underweight positioning to the Japanese consumer discretionary basket further contributed positively to country-level effects. |
| ○ | Turkey was a significant country-level contributor, primarily as a result of the above mentioned results from the Turkish industrials and financials baskets. |
| ○ | Germany was another country-level contributor, largely because of positive selection plus overweight positioning to the German financials and health care baskets. Positive selection within the German consumer discretionary basket aided country-level results. |
| • | Individual contributors included Turkish airline company Turk Hava Yollari AO, Swiss multinational food products manufacturer Nestlé SA and Japanese auto maker Honda Motor Co. |
Notable detractors in our portion of the Fund during the period
| • | Communication services was the only sector-level detractor, primarily driven by overweight positioning to the Swedish and Belgian communication services baskets. |
| • | Geographically, France was the most notable country-level detractor, mainly as a result of underweight positioning to the French industrials and consumer discretionary baskets. Negative selection and underweight positioning to the French materials basket weighed on results. |
| ○ | Russia was another significant country-level detractor, mainly due to our exposure to the Russian energy basket. |
| ○ | Belgium was another notable country-level detractor, largely because of overweight positioning to the Belgian communication services and consumer staples baskets. |
| • | Individual detractors in our portion of the portfolio included Swedish multinational telecommunications company Telia Co. AB, Swiss multinational healthcare company Roche Holding AG and Japanese bank holding and financial services company Mitsubishi UFJ Financial Group. |
Baillie Gifford
Our portion of the Fund is compared to the MSCI ACWI ex USA Growth Index (Net), against which it outperformed during the 12-month period.
Notable contributors in our portion of the Fund during the period
| • | Stock selection drove our portion of the Fund to outperform its benchmark during the period. |
| • | Our allocation towards certain high growth companies helped drive performance. |
| • | An underweight towards emerging markets also helped performance. |
| ○ | In particular our holdings towards certain Latin American stocks such as MercadoLibre, Inc. and Copa Holdings SA contributed positively to performance. |
| • | The exposure towards certain high-quality European industrials companies also helped performance, with the likes of Irish cement business, CRH PLC, positively contributing to performance over the period. Another Irish industrial which rebounded following continued fundamental strength was Kingspan Group PLC, a leader in insulation materials. |
Multi-Manager International Equity Strategies Fund | Annual Report 2023
| 7 |
Manager Discussion of Fund Performance (continued)
(Unaudited)
| • | Our portion of the portfolio is constructed from the bottom up, based on the attractions of individual companies with sector and country positions purely an outcome of stock selection. That said, the largest relative sector contributors were software and services, transportation and consumer discretionary. The three countries which contributed most positively were Ireland, Brazil and Germany. |
| • | The three stocks which made the largest contribution to return on a relative basis were MercadoLibre, CRH and SAP SE. |
| ○ | MercadoLibre is Latin America’s leading e-commerce and fintech player. |
| ○ | CRH, as mentioned earlier, is an Irish building materials business which supplies a wide range of product for the construction industry. |
| ○ | SAP is a leading German enterprise software business. |
Notable detractors in our portion of the Fund during the period
| • | The pharmaceuticals, capital goods and commercial and professional services industries were the major detractors to performance over the period. |
| • | The stocks which detracted on a relative basis to performance in our portion of the Fund were Novo Nordisk, Adyen NV and Aker Carbon Capture ASA. |
| ○ | Novo Nordisk, a Danish pharmaceutical company, was not held in our portion of the Fund but has been a strong performer for the benchmark. |
| ○ | Adyen is a Dutch payments company. |
| ○ | Aker Carbon Capture is a Norwegian pure-play carbon capture business. |
| • | The three countries which detracted most from relative performance were France, Japan and the Netherlands. |
Causeway
Our portion of the Fund’s portfolio is compared to the MSCI EAFE Value Index (Net), which it outperformed during the period.
Notable contributors in our portion of the Fund during the period
| • | The top sector drivers of relative performance during the period were the industrials, financials and information technology sectors, due primarily to stock selection in all three sectors. We currently maintain an overweight position in industrials and information technology and an underweight position in financials. |
| • | Top individual contributors during the period included Rolls-Royce Holdings PLC, UniCredit SpA and Sands China Ltd. |
| ○ | Rolls-Royce is a jet engine manufacturer in the United Kingdom. |
| ○ | UniCredit is an Italian commercial bank operating throughout Western, Central, and Eastern Europe. |
| ○ | Sands China is an integrated resort developer and operator in Macau. We exited the position due to relative value considerations. |
| • | The top three country-level alpha drivers were Italy, Hong Kong and the Netherlands. We currently maintain overweight positions in Italy and the Netherlands, and an underweight position in Hong Kong. |
Notable detractors in our portion of the Fund during the period
| • | The bottom sector drivers of relative performance during the period were the consumer staples, health care and energy sectors, due primarily to stock selection in health care and an overweight position in consumer staples. Our underweight position in energy produced positive results relative to the index. We currently maintain an overweight position in the health care sector as well. |
| • | Top individual detractors during the period included Roche Holding AG, FANUC Corp. and Reckitt Benckiser Group PLC. |
| ○ | Roche is a premier Swiss pharmaceutical and diagnostics company. |
| 8 | Multi-Manager International Equity Strategies Fund | Annual Report 2023 |
Manager Discussion of Fund Performance (continued)
(Unaudited)
| ○ | FANUC is a market-leading Japanese robotics and automation services provider. |
| ○ | Reckitt Benckiser is a leading household and personal care products company based in the United Kingdom, with home care, consumer health, and nutrition segments. |
| • | The bottom three country-level detractors from relative performance were Switzerland, Germany and Canada. We currently maintain underweight positions in Switzerland and Germany, and an overweight position in Canada. |
Market risk may affect a single issuer, sector of the economy, industry or the market as a whole. The Fund is managed by multiple advisers independently of one another, which may result in contradicting trades (i.e., with no net benefit to the Fund), while increasing transaction costs. Foreign investments subject the Fund to risks, including political, economic, market, social and others within a particular country, as well as to currency instabilities and less stringent financial and accounting standards generally applicable to U.S. issuers. Risks are enhanced for emerging market issuers. Value securities may be unprofitable if the market fails to recognize their intrinsic worth or the portfolio manager misgauged that worth. Growth securities, at times, may not perform as well as value securities or the stock market in general and may be out of favor with investors. The Fund may invest significantly in issuers within a particular sector, which may be negatively affected by market, economic or other conditions, making the Fund more vulnerable to unfavorable developments in the sector. Investments selected using quantitative methods may perform differently from the market as a whole. There can be no assurance that these methodologies will enable the Fund to achieve its objective. Investing in derivatives is a specialized activity that involves special risks, which may result in significant losses. See the Fund’s prospectus for more information on these and other risks.
The views expressed in this report reflect the current views of the respective parties who have contributed to this report. These views are not guarantees of future performance and involve certain risks, uncertainties and assumptions that are difficult to predict, so actual outcomes and results may differ significantly from the views expressed. These views are subject to change at any time based upon economic, market or other conditions and the respective parties disclaim any responsibility to update such views. These views may not be relied on as investment advice and, because investment decisions for a Columbia fund are based on numerous factors, may not be relied on as an indication of trading intent on behalf of any particular Columbia fund. References to specific securities should not be construed as a recommendation or investment advice.
Multi-Manager International Equity Strategies Fund | Annual Report 2023
| 9 |
Understanding Your Fund’s Expenses
(Unaudited)
As an investor, you incur two types of costs. There are shareholder transaction costs, which may include redemption fees. There are also ongoing fund costs, which generally include management fees, distribution and/or service fees, and other fund expenses. The following information is intended to help you understand your ongoing costs (in dollars) of investing in the Fund and to help you compare these costs with the ongoing costs of investing in other mutual funds.
Analyzing your Fund’s expenses
To illustrate these ongoing costs, we have provided examples and calculated the expenses paid by investors in each share class of the Fund during the period. The actual and hypothetical information in the table is based on an initial investment of $1,000 at the beginning of the period indicated and held for the entire period. Expense information is calculated two ways and each method provides you with different information. The amount listed in the “Actual” column is calculated using the Fund’s actual operating expenses and total return for the period. You may use the Actual information, together with the amount invested, to estimate the expenses that you paid over the period. Simply divide your account value by $1,000 (for example, an $8,600 account value divided by $1,000 = 8.6), then multiply the results by the expenses paid during the period under the “Actual” column. The amount listed in the “Hypothetical” column assumes a 5% annual rate of return before expenses (which is not the Fund’s actual return) and then applies the Fund’s actual expense ratio for the period to the hypothetical return. You should not use the hypothetical account values and expenses to estimate either your actual account balance at the end of the period or the expenses you paid during the period. See “Compare with other funds” below for details on how to use the hypothetical data.
Compare with other funds
Since all mutual funds are required to include the same hypothetical calculations about expenses in shareholder reports, you can use this information to compare the ongoing cost of investing in the Fund with other funds. To do so, compare the hypothetical example with the 5% hypothetical examples that appear in the shareholder reports of other funds. As you compare hypothetical examples of other funds, it is important to note that hypothetical examples are meant to highlight the ongoing costs of investing in a fund only and do not reflect any transaction costs, such as redemption or exchange fees. Therefore, the hypothetical calculations are useful in comparing ongoing costs only, and will not help you determine the relative total costs of owning different funds. If transaction costs were included in these calculations, your costs would be higher.
| March 1, 2023 — August 31, 2023 |
| | Account value at the
beginning of the
period ($) | Account value at the
end of the
period ($) | Expenses paid during
the period ($) | Fund’s annualized
expense ratio (%) |
| | Actual | Hypothetical | Actual | Hypothetical | Actual | Hypothetical | Actual |
| Institutional Class | 1,000.00 | 1,000.00 | 1,060.40 | 1,020.27 | 5.09 | 4.99 | 0.98 |
| Institutional 3 Class | 1,000.00 | 1,000.00 | 1,062.10 | 1,021.07 | 4.26 | 4.18 | 0.82 |
Expenses paid during the period are equal to the annualized expense ratio for each class as indicated above, multiplied by the average account value over the period and then multiplied by the number of days in the Fund’s most recent fiscal half year and divided by 365.
Expenses do not include fees and expenses incurred indirectly by the Fund from its investment in underlying funds, including affiliated and non-affiliated pooled investment vehicles, such as mutual funds and exchange-traded funds.
Had Columbia Management Investment Advisers, LLC and/or certain of its affiliates not waived/reimbursed certain fees and expenses, account value at the end of the period would have been reduced.
The Fund is offered only through certain wrap fee programs sponsored and/or managed by Ameriprise Financial, Inc. or its affiliates. Participants in wrap fee programs pay other fees that are not included in the above table. Please refer to the wrap program documents for information about the fees charged.
| 10 | Multi-Manager International Equity Strategies Fund | Annual Report 2023 |
Portfolio of Investments
August 31, 2023
(Percentages represent value of investments compared to net assets)
Investments in securities
| Common Stocks 97.2% |
| Issuer | Shares | Value ($) |
| Australia 0.1% |
| Aurizon Holdings Ltd. | 25,745 | 60,680 |
| Estia Health | 285,413 | 560,348 |
| GrainCorp Ltd. | 89,318 | 420,678 |
| Treasury Wine Estates Ltd. | 138,024 | 1,039,439 |
| Total | 2,081,145 |
| Austria 0.2% |
| Erste Group Bank AG | 14,525 | 518,163 |
| Erste Group Bank AG | 1,942 | 70,130 |
| OMV AG | 63,123 | 2,923,098 |
| Wienerberger AG | 40,580 | 1,117,024 |
| Total | 4,628,415 |
| Belgium 0.9% |
| Anheuser-Busch InBev SA/NV | 329,863 | 18,723,684 |
| Proximus SADP | 143,898 | 1,087,584 |
| Total | 19,811,268 |
| Brazil 2.4% |
| Banco Bradesco SA, ADR | 1,693,454 | 5,063,427 |
| MercadoLibre, Inc.(a) | 29,605 | 40,628,718 |
| Petroleo Brasileiro SA, ADR | 457,463 | 6,427,355 |
| Petroleo Brasileiro SA, ADR | 341,818 | 4,423,125 |
| Total | 56,542,625 |
| Canada 2.4% |
| AbCellera Biologics, Inc.(a) | 289,836 | 1,579,606 |
| Alimentation Couche-Tard, Inc. | 199,345 | 10,424,599 |
| Canadian Pacific Kansas City Ltd. | 111,839 | 8,877,924 |
| Constellation Software, Inc. | 5,743 | 11,796,527 |
| Lumine Group, Inc.(a),(b) | 323,086 | 5,504,322 |
| Shopify, Inc., Class A(a) | 148,262 | 9,857,940 |
| Topicus.com, Inc.(a) | 120,138 | 9,149,053 |
| Total | 57,189,971 |
| China 2.5% |
| Agricultural Bank of China Ltd., Class H | 3,074,000 | 1,053,628 |
| Alibaba Group Holding Ltd.(a) | 563,032 | 6,534,631 |
| Alibaba Group Holding Ltd., ADR(a) | 10,761 | 999,697 |
| ANE Cayman, Inc.(a) | 82,500 | 58,490 |
| Common Stocks (continued) |
| Issuer | Shares | Value ($) |
| Baidu, Inc. Class A(a) | 43,550 | 777,770 |
| Bank of Chongqing Co., Ltd., Class H | 176,500 | 90,403 |
| Beijing Capital International Airport Co., Ltd., Class H(a) | 4,806,000 | 2,516,539 |
| China Communications Services Corp., Ltd., Class H | 290,000 | 130,561 |
| China Construction Bank Corp., Class H | 2,032,000 | 1,087,223 |
| China Energy Engineering Corp., Ltd., Class H | 412,000 | 47,738 |
| China Merchants Bank Co., Ltd., Class H | 331,500 | 1,312,681 |
| China Minsheng Banking Corp. Ltd., Class H | 553,500 | 177,775 |
| China Railway Signal & Communication Corp., Ltd., Class H | 3,197,000 | 1,058,973 |
| Guangzhou Automobile Group Co., Ltd., Class H | 94,000 | 49,499 |
| Industrial & Commercial Bank of China Ltd., Class H | 805,000 | 369,074 |
| Kingboard Chemical Holdings Ltd. | 84,000 | 190,617 |
| Linklogis, Inc., Class B(b) | 209,000 | 47,171 |
| Meituan, Class B(a) | 323,070 | 5,346,536 |
| PDD Holdings, Inc., ADR(a) | 366 | 36,223 |
| Ping An Insurance Group Co. of China Ltd., Class H | 1,018,500 | 6,097,911 |
| Sany Heavy Equipment International Holdings Co., Ltd. | 151,000 | 235,286 |
| Silergy Corp. | 405,000 | 3,620,678 |
| Tencent Holdings Ltd. | 408,100 | 16,911,814 |
| Tencent Holdings Ltd., ADR | 24,370 | 1,009,283 |
| Tencent Music Entertainment Group, ADR(a) | 982,141 | 6,698,202 |
| WuXi Biologics Cayman, Inc.(a) | 397,000 | 2,238,129 |
| Total | 58,696,532 |
| Denmark 2.0% |
| Ambu A/S(a) | 232,944 | 2,814,973 |
| AP Moller - Maersk A/S, Class A | 778 | 1,390,348 |
| Chr. Hansen Holding A/S | 73,318 | 4,780,669 |
| DSV A/S | 75,386 | 14,315,771 |
| Novo Nordisk A/S, ADR | 19,980 | 3,708,688 |
| Novo Nordisk A/S, Class B | 62,756 | 11,575,579 |
| Novozymes AS, Class B | 186,656 | 8,079,554 |
| Total | 46,665,582 |
The accompanying Notes to Financial Statements are an integral part of this statement.
Multi-Manager International Equity Strategies Fund | Annual Report 2023
| 11 |
Portfolio of Investments (continued)
August 31, 2023
| Common Stocks (continued) |
| Issuer | Shares | Value ($) |
| Finland 0.7% |
| KONE OYJ, Class B | 200,988 | 9,142,786 |
| Nordea Bank | 181,450 | 1,986,792 |
| Nordea Bank Abp | 522,777 | 5,727,159 |
| Nordea Bank Abp | 9,170 | 100,909 |
| Total | 16,957,646 |
| France 9.6% |
| Air Liquide SA | 48,107 | 8,691,790 |
| Alstom SA | 700,168 | 19,308,133 |
| AXA SA | 504,546 | 15,159,025 |
| BNP Paribas SA | 163,863 | 10,596,635 |
| Carrefour SA | 457,759 | 8,749,478 |
| Christian Dior SE | 743 | 609,978 |
| Credit Agricole SA | 66,932 | 843,697 |
| Danone SA | 576,306 | 33,594,490 |
| Dassault Systemes SE | 374,631 | 14,846,810 |
| Edenred | 246,809 | 15,727,477 |
| Engie SA | 742,015 | 11,949,585 |
| Kering SA | 36,257 | 19,387,701 |
| Nexans SA | 46,809 | 3,850,323 |
| Orange SA | 609,272 | 6,840,087 |
| Sanofi | 165,125 | 17,586,468 |
| Sanofi, ADR | 19,861 | 1,056,208 |
| Sartorius Stedim Biotech | 23,204 | 6,580,911 |
| TotalEnergies SE | 143,735 | 9,016,337 |
| TotalEnergies SE, ADR | 114,229 | 7,186,146 |
| Valeo SE | 266,034 | 5,171,246 |
| VINCI SA | 75,803 | 8,443,551 |
| Total | 225,196,076 |
| Germany 10.1% |
| Allianz SE, Registered Shares | 107,793 | 26,202,229 |
| Bayer AG, Registered Shares | 191,553 | 10,480,348 |
| Bayerische Motoren Werke AG | 139,061 | 14,626,317 |
| Beiersdorf AG | 16,006 | 2,095,749 |
| BioNTech SE, ADR(a) | 45,853 | 5,545,003 |
| Continental AG | 5,345 | 396,483 |
| Deutsche Boerse AG | 86,603 | 15,374,109 |
| Deutsche Lufthansa AG, Registered Shares(a) | 25,012 | 223,366 |
| Common Stocks (continued) |
| Issuer | Shares | Value ($) |
| Deutsche Telekom AG, Registered Shares | 1,160,295 | 24,834,404 |
| DHL Group | 71,586 | 3,338,273 |
| E.ON SE | 301,974 | 3,717,199 |
| Fresenius SE & Co. KGaA | 54,215 | 1,738,089 |
| Henkel AG & Co. KGaA | 37,852 | 2,615,883 |
| Mercedes-Benz Group AG, Registered Shares | 143,853 | 10,526,408 |
| Muenchener Rueckversicherungs-Gesellschaft AG in Muenchen, Registered Shares | 22,622 | 8,780,935 |
| Rational AG | 17,883 | 13,622,358 |
| RWE AG | 279,670 | 11,515,879 |
| SAP SE | 436,109 | 60,839,132 |
| SAP SE, ADR | 31,771 | 4,438,091 |
| Scout24 SE | 255,610 | 17,608,061 |
| Volkswagen AG | 403 | 57,591 |
| Total | 238,575,907 |
| Hong Kong 1.6% |
| AIA Group Ltd. | 2,423,000 | 21,923,934 |
| ASMPT Ltd. | 116,500 | 1,165,805 |
| BYD Electronic International Co., Ltd. | 564,000 | 2,612,168 |
| China Taiping Insurance Holdings Co., Ltd. | 317,800 | 334,364 |
| CK Hutchison Holdings Ltd. | 245,500 | 1,337,974 |
| Hong Kong Exchanges and Clearing Ltd. | 192,380 | 7,456,306 |
| Jardine Matheson Holdings Ltd. | 33,100 | 1,573,681 |
| Lenovo Group Ltd. | 528,000 | 596,813 |
| WH Group Ltd. | 350,000 | 180,248 |
| Total | 37,181,293 |
| India 0.7% |
| HDFC Bank Ltd., ADR | 251,103 | 15,646,228 |
| Ireland 3.1% |
| CRH PLC | 374,528 | 21,524,707 |
| Kingspan Group PLC | 211,331 | 17,856,298 |
| Ryanair Holdings PLC, ADR(a) | 333,262 | 33,076,253 |
| Total | 72,457,258 |
| Israel 0.2% |
| Bank Hapoalim BM | 53,255 | 440,906 |
| Bank Leumi Le-Israel BM | 80,660 | 626,125 |
| Bezeq Israeli Telecommunication Corp., Ltd. | 92,275 | 124,894 |
| Check Point Software Technologies Ltd.(a) | 28,507 | 3,836,757 |
| Israel Chemicals Ltd. | 15,793 | 94,376 |
The accompanying Notes to Financial Statements are an integral part of this statement.
| 12 | Multi-Manager International Equity Strategies Fund | Annual Report 2023 |
Portfolio of Investments (continued)
August 31, 2023
| Common Stocks (continued) |
| Issuer | Shares | Value ($) |
| Mizrahi Tefahot Bank Ltd. | 7,805 | 256,631 |
| Wix.com Ltd.(a) | 2,458 | 242,777 |
| Total | 5,622,466 |
| Italy 4.1% |
| Assicurazioni Generali SpA | 288,262 | 5,970,765 |
| Azimut Holding SpA | 35,172 | 813,619 |
| Banca Mediolanum SpA | 21,469 | 195,934 |
| Enel SpA | 3,921,335 | 26,331,076 |
| ENI SpA | 833,106 | 12,881,487 |
| ENI SpA, ADR | 76,442 | 2,366,644 |
| FinecoBank Banca Fineco SpA | 714,867 | 9,770,393 |
| Intesa Sanpaolo SpA | 1,012,972 | 2,705,041 |
| Mediobanca Banca di Credito Finanziario SpA | 23,525 | 307,109 |
| Poste Italiane SpA | 25,199 | 279,732 |
| Technoprobe SpA(a) | 613,654 | 5,136,302 |
| UniCredit SpA | 1,259,449 | 30,684,104 |
| Total | 97,442,206 |
| Japan 16.9% |
| Advantest Corp. | 15,600 | 1,952,662 |
| Aeon Co., Ltd. | 20,300 | 420,701 |
| AGC, Inc. | 43,000 | 1,508,586 |
| Air Water, Inc. | 1,100 | 13,836 |
| Aisin Corp. | 6,300 | 210,249 |
| Alfresa Holdings Corp. | 20,900 | 356,919 |
| Asahi Group Holdings Ltd. | 80,600 | 3,135,773 |
| Asahi Yukizai Corp. | 10,000 | 277,391 |
| Astellas Pharma, Inc. | 166,000 | 2,511,641 |
| Awa Bank Ltd. (The) | 5,200 | 80,789 |
| Bandai Namco Holdings, Inc. | 17,500 | 405,953 |
| Brother Industries Ltd. | 50,700 | 858,025 |
| Canon, Inc. | 233,100 | 5,737,539 |
| Chori Co., Ltd. | 18,000 | 352,781 |
| Chubu Electric Power Co., Inc. | 282,500 | 3,765,327 |
| Dai Nippon Toryo Co., Ltd. | 13,700 | 91,007 |
| Daicel Corp. | 248,800 | 2,076,946 |
| Dai-ichi Life Holdings, Inc. | 238,900 | 4,440,102 |
| Daiken Corp. | 8,300 | 173,227 |
| Daikin Industries Ltd. | 1,600 | 276,574 |
| Denso Corp. | 206,573 | 14,099,152 |
| Common Stocks (continued) |
| Issuer | Shares | Value ($) |
| Disco Corp. | 11,800 | 2,332,204 |
| East Japan Railway Co. | 40,900 | 2,312,451 |
| Electric Power Development Co., Ltd. | 176,800 | 2,753,663 |
| ENEOS Holdings, Inc. | 164,400 | 617,344 |
| Enomoto Co., Ltd. | 31,700 | 382,267 |
| FANUC Corp. | 948,950 | 26,989,427 |
| Fast Retailing Co., Ltd. | 7,600 | 1,743,526 |
| FCC Co., Ltd. | 28,300 | 373,431 |
| FUJIFILM Holdings Corp. | 88,100 | 5,206,398 |
| Fujitsu Ltd. | 34,200 | 4,274,724 |
| Furukawa Electric Co., Ltd. | 47,300 | 812,470 |
| Hakuhodo DY Holdings, Inc. | 30,300 | 287,468 |
| Hitachi Ltd. | 46,000 | 3,057,263 |
| Hokkaido Electric Power Co., Inc.(a) | 43,200 | 198,451 |
| Honda Motor Co., Ltd. | 468,900 | 15,153,157 |
| Honda Motor Co., Ltd. ADR | 26,379 | 852,833 |
| Hoya Corp. | 14,300 | 1,586,599 |
| Idemitsu Kosan Co., Ltd. | 10,500 | 223,506 |
| Inpex Corp. | 1,039,000 | 14,549,979 |
| ITOCHU Corp. | 23,600 | 885,693 |
| ITOCHU ENEX Co., Ltd. | 44,900 | 454,366 |
| ITOCHU Techno-Solutions Corp. | 3,900 | 115,797 |
| Iwaki Co., Ltd. | 32,400 | 420,413 |
| Japan Exchange Group, Inc. | 420,503 | 7,336,831 |
| Japan Petroleum Exploration Co., Ltd. | 4,700 | 154,570 |
| Japan Post Holdings Co., Ltd. | 123,300 | 945,298 |
| Japan Post Insurance Co., Ltd. | 8,500 | 136,825 |
| JFE Holdings, Inc. | 31,200 | 492,901 |
| Kajima Corp. | 126,700 | 2,116,239 |
| Kao Corp. | 84,700 | 3,271,762 |
| Kawasaki Heavy Industries Ltd. | 30,300 | 776,306 |
| KDDI Corp. | 72,000 | 2,140,375 |
| Keyence Corp. | 26,000 | 10,794,467 |
| Kirin Holdings Co., Ltd. | 310,300 | 4,356,382 |
| Kissei Pharmaceutical Co., Ltd. | 28,300 | 660,907 |
| Konoike Transport Co., Ltd. | 7,600 | 106,407 |
| Kyocera Corp. | 90,100 | 4,621,202 |
| Kyocera Corp., ADR | 14,888 | 762,638 |
| Macnica Fuji Electronics Holdings, Inc. | 57,500 | 2,690,343 |
The accompanying Notes to Financial Statements are an integral part of this statement.
Multi-Manager International Equity Strategies Fund | Annual Report 2023
| 13 |
Portfolio of Investments (continued)
August 31, 2023
| Common Stocks (continued) |
| Issuer | Shares | Value ($) |
| Mazda Motor Corp. | 28,200 | 293,813 |
| Mebuki Financial Group, Inc. | 367,600 | 1,016,197 |
| Megmilk Snow Brand Co., Ltd. | 37,500 | 613,497 |
| Mitsubishi Corp. | 139,600 | 6,885,763 |
| Mitsubishi Electric Corp. | 466,100 | 6,072,387 |
| Mitsubishi Heavy Industries Ltd. | 16,500 | 934,430 |
| Mitsubishi Motors Corp. | 128,900 | 504,198 |
| Mitsubishi Pencil Co., Ltd. | 28,900 | 382,573 |
| Mitsui & Co., Ltd. | 156,800 | 5,840,067 |
| Mitsui Chemicals, Inc. | 38,100 | 1,032,845 |
| Mitsui OSK Lines Ltd. | 119,000 | 3,295,222 |
| Mixi, Inc. | 36,300 | 605,879 |
| MonotaRO Co., Ltd | 596,580 | 7,045,777 |
| MS&AD Insurance Group Holdings, Inc. | 32,100 | 1,152,764 |
| Murata Manufacturing Co., Ltd. | 358,800 | 20,072,453 |
| NEC Corp. | 10,600 | 558,735 |
| NGK Insulators Ltd. | 66,800 | 886,183 |
| Nidec Corp. | 118,644 | 6,173,576 |
| Nihon M&A Center Holdings, Inc. | 1,109,500 | 6,163,079 |
| Nintendo Co., Ltd. | 176,950 | 7,587,066 |
| Nippon Express Holdings, Inc. | 3,800 | 197,332 |
| Nippon Sanso Holdings Corp. | 60,900 | 1,468,431 |
| Nippon Steel Corp. | 31,300 | 740,193 |
| Nippon Telegraph & Telephone Corp. | 4,365,000 | 5,039,987 |
| Nippon Yusen KK | 193,100 | 5,137,309 |
| Nissan Motor Co., Ltd. | 102,900 | 437,553 |
| Nitto Denko Corp. | 34,700 | 2,367,322 |
| Nomura Holdings, Inc. | 125,100 | 484,339 |
| Obic Co., Ltd. | 3,200 | 556,378 |
| Okinawa Electric Power Co., Inc. (The)(a) | 900 | 7,069 |
| Okumura Corp. | 48,500 | 1,516,281 |
| Oriental Land Co., Ltd. | 22,100 | 796,069 |
| ORIX Corp. | 159,400 | 2,971,962 |
| Osaka Gas Co., Ltd. | 86,300 | 1,377,730 |
| Otsuka Corp. | 1,900 | 84,679 |
| Otsuka Holdings Co., Ltd. | 16,500 | 626,864 |
| Panasonic Holdings Corp. | 230,400 | 2,651,917 |
| Press Kogyo Co., Ltd. | 149,800 | 688,049 |
| Qol Holdings Co., Ltd. | 27,500 | 362,984 |
| Common Stocks (continued) |
| Issuer | Shares | Value ($) |
| Recruit Holdings Co., Ltd. | 177,800 | 6,333,681 |
| Ricoh Co., Ltd. | 104,200 | 848,854 |
| Rohm Co., Ltd. | 3,600 | 300,268 |
| San-Ai Obbli Co., Ltd. | 38,500 | 442,753 |
| Sanshin Electronics Co., Ltd. | 4,600 | 68,311 |
| SCSK Corp. | 15,000 | 260,016 |
| Sega Sammy Holdings, Inc. | 53,200 | 1,061,702 |
| Seikitokyu Kogyo Co., Ltd. | 91,700 | 1,047,302 |
| Seiko Epson Corp. | 176,800 | 2,768,405 |
| Seino Holdings Corp. | 12,100 | 176,264 |
| Seven & I Holdings Co., Ltd. | 3,900 | 160,022 |
| Shibaura Mechatronics Corp. | 5,500 | 968,567 |
| Shikoku Electric Power Co., Inc.(a) | 86,700 | 624,357 |
| Shimadzu Corp. | 4,000 | 117,547 |
| Shimano, Inc. | 51,533 | 7,559,393 |
| Shin-Etsu Chemical Co., Ltd. | 248,000 | 7,904,694 |
| Shiseido Co., Ltd. | 236,047 | 9,578,604 |
| SMC Corp. | 19,688 | 9,570,751 |
| Socionext, Inc. | 1,000 | 123,730 |
| SoftBank Corp. | 2,400 | 27,525 |
| Sojitz Corp. | 139,600 | 2,999,251 |
| Sompo Holdings, Inc. | 46,700 | 2,032,267 |
| Sony Group Corp. | 167,123 | 13,903,382 |
| Starzen Co., Ltd. | 2,300 | 40,606 |
| Subaru Corp. | 121,800 | 2,341,409 |
| Sumco Corp. | 329,500 | 4,400,719 |
| Sumitomo Chemical Co., Ltd. | 193,000 | 534,287 |
| Sumitomo Corp. | 25,800 | 530,614 |
| Sumitomo Forestry Co., Ltd. | 2,600 | 73,167 |
| Sumitomo Mitsui Financial Group, Inc. | 131,200 | 5,998,001 |
| Suntory Beverage & Food Ltd. | 44,100 | 1,418,892 |
| Suzuken Co., Ltd. | 64,600 | 1,914,878 |
| Suzuki Motor Corp. | 10,400 | 408,641 |
| Taisho Pharmaceutical Holdings Co., Ltd. | 4,800 | 198,287 |
| Takara Standard Co., Ltd. | 14,500 | 193,232 |
| Takeda Pharmaceutical Co., Ltd. | 431,500 | 13,335,537 |
| Tama Home Co., Ltd. | 12,900 | 314,344 |
| Terumo Corp. | 4,200 | 127,081 |
| Tokai Rika Co., Ltd. | 4,600 | 71,918 |
The accompanying Notes to Financial Statements are an integral part of this statement.
| 14 | Multi-Manager International Equity Strategies Fund | Annual Report 2023 |
Portfolio of Investments (continued)
August 31, 2023
| Common Stocks (continued) |
| Issuer | Shares | Value ($) |
| Tokio Marine Holdings, Inc. | 9,200 | 203,030 |
| Tokyo Electric Power Co. Holdings, Inc.(a) | 419,600 | 1,838,262 |
| Tokyo Electron Ltd. | 72,500 | 10,768,111 |
| Tokyo Gas Co., Ltd. | 160,200 | 3,707,117 |
| Toppan Printing Co., Ltd. | 11,400 | 275,378 |
| Toray Industries, Inc. | 530,900 | 2,862,440 |
| Tosoh Corp. | 6,600 | 85,403 |
| Toyo Seikan Group Holdings Ltd. | 32,300 | 584,580 |
| Toyoda Gosei Co., Ltd. | 3,600 | 77,655 |
| Toyota Tsusho Corp. | 10,600 | 631,003 |
| Trend Micro, Inc. | 3,500 | 148,546 |
| Tsubakimoto Chain Co. | 6,200 | 163,659 |
| Wakita & Co., Ltd. | 4,400 | 40,498 |
| Yamaha Motor Co., Ltd. | 13,200 | 341,567 |
| Yamaichi Electronics Co., Ltd. | 6,800 | 85,779 |
| Yamazen Corp. | 87,200 | 683,441 |
| Yokogawa Electric Corp. | 9,900 | 196,029 |
| Yuasa Trading Co., Ltd. | 14,000 | 410,900 |
| Total | 398,203,672 |
| Luxembourg 0.0% |
| Tenaris SA | 20,192 | 322,463 |
| Netherlands 7.7% |
| Adyen NV(a) | 9,876 | 8,246,671 |
| Akzo Nobel NV | 211,848 | 17,198,564 |
| ASML Holding NV | 50,545 | 33,234,761 |
| ASML Holding NV | 9,231 | 6,097,352 |
| EXOR NV | 95,894 | 8,486,333 |
| IMCD NV | 97,523 | 13,432,060 |
| ING Groep NV | 1,369,802 | 19,408,730 |
| Koninklijke Philips NV(a) | 752,189 | 16,902,880 |
| Prosus NV(a) | 89,067 | 6,143,342 |
| Shell PLC | 442,757 | 13,537,417 |
| Shell PLC | 728,482 | 22,564,436 |
| Stellantis NV | 381,518 | 7,072,222 |
| Stellantis NV | 198,845 | 3,691,211 |
| Stellantis NV | 234,021 | 4,341,090 |
| Wolters Kluwer NV, ADR | 2,199 | 264,957 |
| Total | 180,622,026 |
| Common Stocks (continued) |
| Issuer | Shares | Value ($) |
| Norway 0.5% |
| Aker Carbon Capture ASA(a) | 3,549,096 | 4,087,671 |
| Equinor ASA | 52,687 | 1,618,083 |
| Equinor ASA, ADR | 96,750 | 2,957,647 |
| Telenor ASA | 379 | 4,058 |
| Yara International ASA | 92,137 | 3,358,334 |
| Total | 12,025,793 |
| Panama 0.3% |
| Copa Holdings SA, Class A | 65,481 | 6,659,418 |
| Portugal 0.0% |
| Galp Energia SGPS SA | 20,927 | 288,838 |
| Jeronimo Martins SGPS SA | 14,252 | 363,312 |
| Total | 652,150 |
| Russian Federation —% |
| Gazprom PJSC(c),(d),(e),(f) | 1,247,200 | 0 |
| Lukoil PJSC(c),(d),(e),(f) | 31,251 | — |
| MMC Norilsk Nickel PJSC(a),(c),(d),(f) | 20,201 | — |
| MMC Norilsk Nickel PJSC, ADR(a),(c),(d),(f) | 5 | — |
| Rosneft Oil Co. PJSC(c),(d),(e),(f) | 563,548 | 0 |
| Sberbank of Russia PJSC(c),(d),(e),(f),(g) | 436,630 | — |
| Total | 0 |
| Singapore 0.4% |
| United Overseas Bank Ltd. | 356,200 | 7,482,824 |
| Yangzijiang Shipbuilding Holdings Ltd. | 1,939,500 | 2,423,905 |
| Total | 9,906,729 |
| South Africa 0.4% |
| Discovery Ltd.(a) | 1,273,365 | 9,893,611 |
| South Korea 3.3% |
| Coupang, Inc.(a) | 411,587 | 7,811,921 |
| Hana Financial Group, Inc. | 44,584 | 1,332,288 |
| Samsung Electronics Co., Ltd. | 630,917 | 31,909,415 |
| Samsung Electronics Co., Ltd. GDR | 16,519 | 20,820,339 |
| SK Hynix, Inc. | 170,250 | 15,654,522 |
| Total | 77,528,485 |
The accompanying Notes to Financial Statements are an integral part of this statement.
Multi-Manager International Equity Strategies Fund | Annual Report 2023
| 15 |
Portfolio of Investments (continued)
August 31, 2023
| Common Stocks (continued) |
| Issuer | Shares | Value ($) |
| Spain 2.4% |
| Aena SME SA | 81,734 | 12,848,344 |
| Amadeus IT Group SA, Class A | 334,142 | 22,926,631 |
| Banco Bilbao Vizcaya Argentaria SA | 282,661 | 2,230,163 |
| Banco Bilbao Vizcaya Argentaria SA, ADR | 37,847 | 300,505 |
| Banco Santander SA | 780,667 | 3,047,419 |
| Banco Santander SA, ADR | 86,717 | 335,595 |
| Iberdrola SA | 717,764 | 8,514,643 |
| Industria de Diseno Textil SA | 45,883 | 1,757,840 |
| Mapfre SA | 150,458 | 318,251 |
| Repsol SA | 317,486 | 4,907,098 |
| Repsol SA, ADR | 4,279 | 65,961 |
| Total | 57,252,450 |
| Sweden 1.7% |
| Atlas Copco AB, Class B | 1,472,016 | 16,946,791 |
| Epiroc AB, Class B | 725,960 | 11,882,870 |
| Essity AB, Class B | 117,642 | 2,746,493 |
| H & M Hennes & Mauritz AB | 191,402 | 2,922,325 |
| MIPS AB | 91,097 | 3,365,041 |
| Swedbank AB, Class A | 146,318 | 2,589,496 |
| Total | 40,453,016 |
| Switzerland 4.1% |
| Cie Financiere Richemont SA, Class A, Registered Shares | 141,744 | 20,105,197 |
| Nestle SA, Registered Shares | 4,474 | 538,828 |
| Nestlé SA, Registered Shares | 145,078 | 17,444,095 |
| Novartis AG, Registered Shares | 249,170 | 25,076,910 |
| Swatch Group AG (The) | 15,549 | 4,365,232 |
| Swatch Group AG (The), Registered Shares | 8,846 | 471,300 |
| Swiss Re AG | 116,463 | 11,309,447 |
| UBS AG | 215,225 | 5,700,600 |
| Wizz Air Holdings PLC(a) | 100,392 | 2,859,433 |
| Zurich Insurance Group AG | 18,152 | 8,511,349 |
| Total | 96,382,391 |
| Taiwan 1.2% |
| Sea Ltd. ADR(a) | 99,931 | 3,760,404 |
| Taiwan Semiconductor Manufacturing Co., Ltd. | 1,472,400 | 25,300,187 |
| Total | 29,060,591 |
| Common Stocks (continued) |
| Issuer | Shares | Value ($) |
| Turkey 0.2% |
| Haci Omer Sabanci Holding AS | 735,390 | 1,644,259 |
| KOC Holding AS | 83,500 | 443,064 |
| Turkiye Garanti Bankasi AS | 619,004 | 1,162,137 |
| Turkiye Is Bankasi AS | 1,687,416 | 1,328,416 |
| Total | 4,577,876 |
| United Kingdom 15.4% |
| Anglo American PLC | 166,636 | 4,431,132 |
| AstraZeneca PLC | 126,197 | 16,951,126 |
| AstraZeneca PLC | 7,140 | 971,999 |
| AstraZeneca PLC, ADR | 136 | 9,223 |
| Barclays Bank PLC | 10,607,657 | 19,758,455 |
| Barclays Bank PLC, ADR | 236,383 | 1,775,236 |
| BP PLC | 5,015,198 | 30,990,348 |
| BP PLC, ADR | 393,422 | 14,627,430 |
| British American Tobacco PLC | 390,468 | 12,934,013 |
| Compass Group PLC | 416,179 | 10,494,679 |
| Diageo PLC | 377,356 | 15,453,868 |
| Experian PLC | 362,273 | 12,651,883 |
| GSK PLC | 934,896 | 16,375,588 |
| GSK PLC, ADR | 405,404 | 14,241,842 |
| HSBC Holdings PLC, ADR | 84,524 | 3,154,436 |
| Legal & General Group PLC | 2,375,965 | 6,564,553 |
| NatWest Group PLC | 1,419,738 | 4,128,715 |
| Oxford Nanopore Technologies PLC(a) | 1,129,319 | 3,404,879 |
| Prudential PLC | 1,726,852 | 21,031,444 |
| Reckitt Benckiser Group PLC | 326,326 | 23,549,559 |
| RELX PLC | 261,931 | 8,537,581 |
| RELX PLC | 261,856 | 8,524,127 |
| Rio Tinto PLC | 562,563 | 34,645,268 |
| Rolls-Royce Holdings PLC(a) | 19,159,232 | 53,747,869 |
| Segro PLC | 242,371 | 2,259,448 |
| Shell PLC, ADR | 135,542 | 8,415,803 |
| Unilever PLC | 227,517 | 11,619,126 |
| Total | 361,249,630 |
The accompanying Notes to Financial Statements are an integral part of this statement.
| 16 | Multi-Manager International Equity Strategies Fund | Annual Report 2023 |
Portfolio of Investments (continued)
August 31, 2023
| Common Stocks (continued) |
| Issuer | Shares | Value ($) |
| United States 2.1% |
| Roche Holding AG, Genusschein Shares | 137,539 | 40,366,104 |
| Spotify Technology SA(a) | 35,378 | 5,447,150 |
| Tenaris SA, ADR | 72,659 | 2,320,002 |
| Total | 48,133,256 |
Total Common Stocks
(Cost $2,032,484,924) | 2,287,618,175 |
|
| Exchange-Traded Equity Funds 0.2% |
| | Shares | Value ($) |
| United States 0.2% |
| iShares MSCI EAFE ETF | 1,023 | 73,175 |
| Vanguard FTSE Developed Markets ETF | 90,094 | 4,121,801 |
| Total | 4,194,976 |
Total Exchange-Traded Equity Funds
(Cost $4,119,671) | 4,194,976 |
| Preferred Stocks 0.6% |
| Issuer | | Shares | Value ($) |
| Brazil 0.2% |
| Petroleo Brasileiro SA | | 783,100 | 5,061,950 |
| Germany 0.4% |
| BMW AG | | 2,878 | 276,523 |
| Volkswagen AG | | 67,423 | 8,251,387 |
| Total | 8,527,910 |
Total Preferred Stocks
(Cost $13,780,664) | 13,589,860 |
| Rights 0.0% |
| Issuer | Shares | Value ($) |
| Canada 0.0% |
| Constellation Software, Inc.(a) | 5,743 | 3,188 |
Total Rights
(Cost $—) | 3,188 |
|
| Warrants 0.0% |
| | |
| Canada —% |
| Constellation Software, Inc.(a),(c),(f) | 5,743 | 0 |
| Switzerland 0.0% |
| Cie Financiere Richemont SA(a) | 43,768 | 41,868 |
Total Warrants
(Cost $11,703) | 41,868 |
|
| Money Market Funds 1.5% |
| | Shares | Value ($) |
| Columbia Short-Term Cash Fund, 5.476%(h),(i) | 35,791,995 | 35,781,258 |
Total Money Market Funds
(Cost $35,774,564) | 35,781,258 |
Total Investments in Securities
(Cost $2,086,171,526) | 2,341,229,325 |
| Other Assets & Liabilities, Net | | 12,539,356 |
| Net Assets | $2,353,768,681 |
Notes to Portfolio of Investments
| (a) | Non-income producing investment. |
| (b) | Represents privately placed and other securities and instruments exempt from Securities and Exchange Commission registration (collectively, private placements), such as Section 4(a)(2) and Rule 144A eligible securities, which are often sold only to qualified institutional buyers. At August 31, 2023, the total value of these securities amounted to $5,551,493, which represents 0.24% of total net assets. |
| (c) | Represents fair value as determined in good faith under procedures approved by the Board of Trustees. At August 31, 2023, the total value of these securities amounted to $0, which represents less than 0.01% of total net assets. |
The accompanying Notes to Financial Statements are an integral part of this statement.
Multi-Manager International Equity Strategies Fund | Annual Report 2023
| 17 |
Portfolio of Investments (continued)
August 31, 2023
Notes to Portfolio of Investments (continued)
| (d) | Denotes a restricted security, which is subject to legal or contractual restrictions on resale under federal securities laws. Disposal of a restricted investment may involve time-consuming negotiations and expenses, and prompt sale at an acceptable price may be difficult to achieve. Private placement securities are generally considered to be restricted, although certain of those securities may be traded between qualified institutional investors under the provisions of Section 4(a)(2) and Rule 144A. The Fund will not incur any registration costs upon such a trade. These securities are valued at fair value determined in good faith under consistently applied procedures approved by the Fund’s Board of Trustees. At August 31, 2023, the total market value of these securities amounted to $0, which represents less than 0.01% of total net assets. Additional information on these securities is as follows: |
| Security | Acquisition
Dates | Shares | Cost ($) | Value ($) |
| Gazprom PJSC | 11/11/2020-06/10/2021 | 1,247,200 | 3,820,620 | — |
| Lukoil PJSC | 03/30/2020-12/29/2021 | 31,251 | 2,094,074 | — |
| MMC Norilsk Nickel PJSC | 08/07/2019-11/22/2021 | 20,201 | 4,978,804 | — |
| MMC Norilsk Nickel PJSC, ADR | 08/07/2019-11/22/2021 | 5 | 123 | — |
| Rosneft Oil Co. PJSC | 03/31/2020-03/16/2021 | 563,548 | 3,458,257 | — |
| Sberbank of Russia PJSC | 03/29/2021-04/08/2021 | 436,630 | 1,642,454 | — |
| | | | 15,994,332 | — |
| (e) | As a result of sanctions and restricted cross-border payments, certain income and/or principal has not been recognized by the Fund. The Fund will continue to monitor the net realizable value and record the income when it is considered collectible. |
| (f) | Valuation based on significant unobservable inputs. |
| (g) | On May 25, 2022, the Office of Foreign Assets Control (OFAC) license permitting the holding of the Sberbank position expired, and the position is now considered blocked property. As such the security has been segregated on the Fund’s books and records and cannot be sold or transferred at this time. |
| (h) | The rate shown is the seven-day current annualized yield at August 31, 2023. |
| (i) | As defined in the Investment Company Act of 1940, as amended, an affiliated company is one in which the Fund owns 5% or more of the company’s outstanding voting securities, or a company which is under common ownership or control with the Fund. The value of the holdings and transactions in these affiliated companies during the year ended August 31, 2023 are as follows: |
| Affiliated issuers | Beginning
of period($) | Purchases($) | Sales($) | Net change in
unrealized
appreciation
(depreciation)($) | End of
period($) | Realized gain
(loss)($) | Dividends($) | End of
period shares |
| Columbia Short-Term Cash Fund, 5.476% |
| | 72,917,032 | 596,927,492 | (634,064,214) | 948 | 35,781,258 | 8,598 | 1,778,638 | 35,791,995 |
Abbreviation Legend
| ADR | American Depositary Receipt |
| GDR | Global Depositary Receipt |
Fair value measurements
The Fund categorizes its fair value measurements according to a three-level hierarchy that maximizes the use of observable inputs and minimizes the use of unobservable inputs by prioritizing that the most observable input be used when available. Observable inputs are those that market participants would use in pricing an investment based on market data obtained from sources independent of the reporting entity. Unobservable inputs are those that reflect the Fund’s assumptions about the information market participants would use in pricing an investment. An investment’s level within the fair value hierarchy is based on the lowest level of any input that is deemed significant to the asset’s or liability’s fair value measurement. The input levels are not necessarily an indication of the risk or liquidity associated with investments at that level. For example, certain U.S. government securities are generally high quality and liquid, however, they are reflected as Level 2 because the inputs used to determine fair value may not always be quoted prices in an active market.
Fair value inputs are summarized in the three broad levels listed below:
| ■ | Level 1 — Valuations based on quoted prices for investments in active markets that the Fund has the ability to access at the measurement date. Valuation adjustments are not applied to Level 1 investments. |
| ■ | Level 2 — Valuations based on other significant observable inputs (including quoted prices for similar securities, interest rates, prepayment speeds, credit risks, etc.). |
| ■ | Level 3 — Valuations based on significant unobservable inputs (including the Fund’s own assumptions and judgment in determining the fair value of investments). |
Inputs that are used in determining fair value of an investment may include price information, credit data, volatility statistics, and other factors. These inputs can be either observable or unobservable. The availability of observable inputs can vary between investments, and is affected by various factors such as the type of investment, and the volume and level of activity for that investment or similar investments in the marketplace. The inputs will be considered by the Investment Manager, along with any other relevant factors in the calculation of an investment’s fair value. The Fund uses prices and inputs that are current as of the measurement date, which may include periods of market dislocations. During these periods, the availability of prices and inputs may be reduced for many investments. This condition could cause an investment to be reclassified between the various levels within the hierarchy.
The accompanying Notes to Financial Statements are an integral part of this statement.
| 18 | Multi-Manager International Equity Strategies Fund | Annual Report 2023 |
Portfolio of Investments (continued)
August 31, 2023
Fair value measurements (continued)
Foreign equity securities actively traded in markets where there is a significant delay in the local close relative to the New York Stock Exchange are classified as Level 2. The values of these securities may include an adjustment to reflect the impact of market movements following the close of local trading, as described in Note 2 to the financial statements – Security valuation.
Investments falling into the Level 3 category are primarily supported by quoted prices from brokers and dealers participating in the market for those investments. However, these may be classified as Level 3 investments due to lack of market transparency and corroboration to support these quoted prices. Additionally, valuation models may be used as the pricing source for any remaining investments classified as Level 3. These models may rely on one or more significant unobservable inputs and/or significant assumptions by the Investment Manager. Inputs used in valuations may include, but are not limited to, financial statement analysis, capital account balances, discount rates and estimated cash flows, and comparable company data.
The Fund’s Board of Trustees (the Board) has designated the Investment Manager, through its Valuation Committee (the Committee), as valuation designee, responsible for determining the fair value of the assets of the Fund for which market quotations are not readily available using valuation procedures approved by the Board. The Committee consists of voting and non-voting members from various groups within the Investment Manager’s organization, including operations and accounting, trading and investments, compliance, risk management and legal.
The Committee meets at least monthly to review and approve valuation matters, which may include a description of specific valuation determinations, data regarding pricing information received from approved pricing vendors and brokers and the results of Board-approved valuation policies and procedures (the Policies). The Policies address, among other things, instances when market quotations are or are not readily available, including recommendations of third party pricing vendors and a determination of appropriate pricing methodologies; events that require specific valuation determinations and assessment of fair value techniques; securities with a potential for stale pricing, including those that are illiquid, restricted, or in default; and the effectiveness of third party pricing vendors, including periodic reviews of vendors. The Committee meets more frequently, as needed, to discuss additional valuation matters, which may include the need to review back-testing results, review time-sensitive information or approve related valuation actions. Representatives of Columbia Management Investment Advisers, LLC report to the Board at each of its regularly scheduled meetings to discuss valuation matters and actions during the period, similar to those described earlier.
The following table is a summary of the inputs used to value the Fund’s investments at August 31, 2023:
| | Level 1 ($) | Level 2 ($) | Level 3 ($) | Total ($) |
| Investments in Securities | | | | |
| Common Stocks | | | | |
| Australia | — | 2,081,145 | — | 2,081,145 |
| Austria | — | 4,628,415 | — | 4,628,415 |
| Belgium | — | 19,811,268 | — | 19,811,268 |
| Brazil | 56,542,625 | — | — | 56,542,625 |
| Canada | 57,189,971 | — | — | 57,189,971 |
| China | 7,734,122 | 50,962,410 | — | 58,696,532 |
| Denmark | 3,708,688 | 42,956,894 | — | 46,665,582 |
| Finland | — | 16,957,646 | — | 16,957,646 |
| France | 8,242,354 | 216,953,722 | — | 225,196,076 |
| Germany | 9,983,094 | 228,592,813 | — | 238,575,907 |
| Hong Kong | — | 37,181,293 | — | 37,181,293 |
| India | 15,646,228 | — | — | 15,646,228 |
| Ireland | 33,076,253 | 39,381,005 | — | 72,457,258 |
| Israel | 4,079,534 | 1,542,932 | — | 5,622,466 |
| Italy | 2,366,644 | 95,075,562 | — | 97,442,206 |
| Japan | 852,833 | 397,350,839 | — | 398,203,672 |
| Luxembourg | — | 322,463 | — | 322,463 |
| Netherlands | 10,438,442 | 170,183,584 | — | 180,622,026 |
| Norway | 2,957,647 | 9,068,146 | — | 12,025,793 |
| Panama | 6,659,418 | — | — | 6,659,418 |
| Portugal | — | 652,150 | — | 652,150 |
| Russian Federation | — | — | 0* | 0* |
| Singapore | — | 9,906,729 | — | 9,906,729 |
| South Africa | — | 9,893,611 | — | 9,893,611 |
| South Korea | 7,811,921 | 69,716,564 | — | 77,528,485 |
| Spain | 636,100 | 56,616,350 | — | 57,252,450 |
| Sweden | — | 40,453,016 | — | 40,453,016 |
| Switzerland | — | 96,382,391 | — | 96,382,391 |
| Taiwan | 3,760,404 | 25,300,187 | — | 29,060,591 |
| Turkey | — | 4,577,876 | — | 4,577,876 |
The accompanying Notes to Financial Statements are an integral part of this statement.
Multi-Manager International Equity Strategies Fund | Annual Report 2023
| 19 |
Portfolio of Investments (continued)
August 31, 2023
Fair value measurements (continued)
| | Level 1 ($) | Level 2 ($) | Level 3 ($) | Total ($) |
| United Kingdom | 42,223,970 | 319,025,660 | — | 361,249,630 |
| United States | 7,767,152 | 40,366,104 | — | 48,133,256 |
| Total Common Stocks | 281,677,400 | 2,005,940,775 | 0* | 2,287,618,175 |
| Exchange-Traded Equity Funds | 4,194,976 | — | — | 4,194,976 |
| Preferred Stocks | | | | |
| Brazil | 5,061,950 | — | — | 5,061,950 |
| Germany | — | 8,527,910 | — | 8,527,910 |
| Total Preferred Stocks | 5,061,950 | 8,527,910 | — | 13,589,860 |
| Rights | | | | |
| Canada | 3,188 | — | — | 3,188 |
| Total Rights | 3,188 | — | — | 3,188 |
| Warrants | | | | |
| Canada | — | — | 0* | 0* |
| Switzerland | — | 41,868 | — | 41,868 |
| Total Warrants | — | 41,868 | 0* | 41,868 |
| Money Market Funds | 35,781,258 | — | — | 35,781,258 |
| Total Investments in Securities | 326,718,772 | 2,014,510,553 | 0* | 2,341,229,325 |
See the Portfolio of Investments for all investment classifications not indicated in the table.
The Fund’s assets assigned to the Level 2 input category are generally valued using the market approach, in which a security’s value is determined through reference to prices and information from market transactions for similar or identical assets. These assets include certain foreign securities for which a third party statistical pricing service may be employed for purposes of fair market valuation. The model utilized by such third party statistical pricing service takes into account a security’s correlation to available market data including, but not limited to, intraday index, ADR, and exchange-traded fund movements.
The Fund does not hold any significant investments (greater than one percent of net assets) categorized as Level 3.
The accompanying Notes to Financial Statements are an integral part of this statement.
| 20 | Multi-Manager International Equity Strategies Fund | Annual Report 2023 |
Statement of Assets and Liabilities
August 31, 2023
| Assets | |
| Investments in securities, at value | |
| Unaffiliated issuers (cost $2,050,396,962) | $2,305,448,067 |
| Affiliated issuers (cost $35,774,564) | 35,781,258 |
| Foreign currency (cost $928,728) | 924,106 |
| Receivable for: | |
| Investments sold | 4,155,804 |
| Capital shares sold | 3,021,990 |
| Dividends | 6,102,563 |
| Foreign tax reclaims | 9,027,491 |
| Trustees’ fees | 56,781 |
| Expense reimbursement due from Investment Manager | 883 |
| Prepaid expenses | 21,779 |
| Total assets | 2,364,540,722 |
| Liabilities | |
| Due to custodian | 24,940 |
| Payable for: | |
| Investments purchased | 8,083,582 |
| Capital shares redeemed | 2,042,199 |
| Management services fees | 50,782 |
| Transfer agent fees | 283,016 |
| Trustees’ fees | 104,107 |
| Other expenses | 183,415 |
| Total liabilities | 10,772,041 |
| Net assets applicable to outstanding capital stock | $2,353,768,681 |
| Represented by | |
| Paid in capital | 2,195,425,142 |
| Total distributable earnings (loss) | 158,343,539 |
| Total - representing net assets applicable to outstanding capital stock | $2,353,768,681 |
| Institutional Class | |
| Net assets | $2,353,765,873 |
| Shares outstanding | 209,396,981 |
| Net asset value per share | $11.24 |
| Institutional 3 Class | |
| Net assets | $2,808 |
| Shares outstanding | 249 |
| Net asset value per share | $11.28 |
The accompanying Notes to Financial Statements are an integral part of this statement.
Multi-Manager International Equity Strategies Fund | Annual Report 2023
| 21 |
Statement of Operations
Year Ended August 31, 2023
| Net investment income | |
| Income: | |
| Dividends — unaffiliated issuers | $76,039,820 |
| Dividends — affiliated issuers | 1,778,638 |
| Interfund lending | 255 |
| Foreign taxes withheld | (7,330,905) |
| Total income | 70,487,808 |
| Expenses: | |
| Management services fees | 18,008,084 |
| Transfer agent fees | |
| Institutional Class | 3,499,311 |
| Institutional 3 Class | 1 |
| Trustees’ fees | 57,148 |
| Custodian fees | 334,335 |
| Printing and postage fees | 247,610 |
| Registration fees | 116,953 |
| Accounting services fees | 87,630 |
| Legal fees | 41,410 |
| Interest on interfund lending | 1,587 |
| Compensation of chief compliance officer | 441 |
| Other | 200,872 |
| Total expenses | 22,595,382 |
| Fees waived or expenses reimbursed by Investment Manager and its affiliates | (77,584) |
| Total net expenses | 22,517,798 |
| Net investment income | 47,970,010 |
| Realized and unrealized gain (loss) — net | |
| Net realized gain (loss) on: | |
| Investments — unaffiliated issuers | (38,102,713) |
| Investments — affiliated issuers | 8,598 |
| Foreign currency translations | (1,514,573) |
| Net realized loss | (39,608,688) |
| Net change in unrealized appreciation (depreciation) on: | |
| Investments — unaffiliated issuers | 471,845,496 |
| Investments — affiliated issuers | 948 |
| Foreign currency translations | 806,653 |
| Net change in unrealized appreciation (depreciation) | 472,653,097 |
| Net realized and unrealized gain | 433,044,409 |
| Net increase in net assets resulting from operations | $481,014,419 |
The accompanying Notes to Financial Statements are an integral part of this statement.
| 22 | Multi-Manager International Equity Strategies Fund | Annual Report 2023 |
Statement of Changes in Net Assets
| | Year Ended
August 31, 2023 | Year Ended
August 31, 2022 |
| Operations | | |
| Net investment income | $47,970,010 | $56,311,926 |
| Net realized loss | (39,608,688) | (52,434,209) |
| Net change in unrealized appreciation (depreciation) | 472,653,097 | (702,781,171) |
| Net increase (decrease) in net assets resulting from operations | 481,014,419 | (698,903,454) |
| Distributions to shareholders | | |
| Net investment income and net realized gains | | |
| Institutional Class | (53,998,519) | (90,994,416) |
| Institutional 3 Class | (64) | (100) |
| Total distributions to shareholders | (53,998,583) | (90,994,516) |
| Increase (decrease) in net assets from capital stock activity | (310,005,226) | 495,046,513 |
| Total increase (decrease) in net assets | 117,010,610 | (294,851,457) |
| Net assets at beginning of year | 2,236,758,071 | 2,531,609,528 |
| Net assets at end of year | $2,353,768,681 | $2,236,758,071 |
| | Year Ended | Year Ended |
| | August 31, 2023 | August 31, 2022 |
| | Shares | Dollars ($) | Shares | Dollars ($) |
| Capital stock activity |
| Institutional Class | | | | |
| Shares sold | 31,488,200 | 333,842,940 | 78,383,736 | 910,675,109 |
| Distributions reinvested | 5,526,972 | 53,998,519 | 7,919,444 | 90,994,416 |
| Shares redeemed | (66,536,731) | (697,846,685) | (47,240,328) | (506,623,012) |
| Net increase (decrease) | (29,521,559) | (310,005,226) | 39,062,852 | 495,046,513 |
| Total net increase (decrease) | (29,521,559) | (310,005,226) | 39,062,852 | 495,046,513 |
The accompanying Notes to Financial Statements are an integral part of this statement.
Multi-Manager International Equity Strategies Fund | Annual Report 2023
| 23 |
The following table is intended to help you understand the Fund’s financial performance. Certain information reflects financial results for a single share of a class held for the periods shown. Per share net investment income (loss) amounts are calculated based on average shares outstanding during the period. Total return assumes reinvestment of all dividends and distributions, if any. Total return does not reflect payment of sales charges, if any. Total return and portfolio turnover are not annualized for periods of less than one year. The ratios of expenses and net investment income are annualized for periods of less than one year. The portfolio turnover rate is calculated without regard to purchase and sales transactions of short-term instruments and certain derivatives, if any. If such transactions were included, the Fund’s portfolio turnover rate may be higher.
| | Net asset value,
beginning of
period | Net
investment
income | Net
realized
and
unrealized
gain (loss) | Total from
investment
operations | Distributions
from net
investment
income | Distributions
from net
realized
gains | Total
distributions to
shareholders |
| Institutional Class |
| Year Ended 8/31/2023 | $9.36 | 0.22 | 1.90 | 2.12 | (0.24) | — | (0.24) |
| Year Ended 8/31/2022 | $12.67 | 0.24 | (3.17) | (2.93) | (0.14) | (0.24) | (0.38) |
| Year Ended 8/31/2021 | $10.02 | 0.15 | 2.65 | 2.80 | (0.15) | — | (0.15) |
| Year Ended 8/31/2020 | $9.06 | 0.11 | 1.10 | 1.21 | (0.25) | — | (0.25) |
| Year Ended 8/31/2019 | $9.67 | 0.23 | (0.77) | (0.54) | (0.07) | — | (0.07) |
| Institutional 3 Class |
| Year Ended 8/31/2023 | $9.39 | 0.24 | 1.91 | 2.15 | (0.26) | — | (0.26) |
| Year Ended 8/31/2022 | $12.69 | 0.26 | (3.16) | (2.90) | (0.16) | (0.24) | (0.40) |
| Year Ended 8/31/2021 | $10.05 | 0.17 | 2.63 | 2.80 | (0.16) | — | (0.16) |
| Year Ended 8/31/2020(e) | $10.04 | 0.10 | (0.09)(f) | 0.01 | — | — | — |
| Notes to Financial Highlights |
| (a) | In addition to the fees and expenses that the Fund bears directly, the Fund indirectly bears a pro rata share of the fees and expenses of any other funds in which it invests. Such indirect expenses are not included in the Fund’s reported expense ratios. |
| (b) | Total net expenses include the impact of certain fee waivers/expense reimbursements made by the Investment Manager and certain of its affiliates, if applicable. |
| (c) | Ratios include interfund lending expense which is less than 0.01%. |
| (d) | Ratios include line of credit interest expense which is less than 0.01%. |
| (e) | Institutional 3 Class shares commenced operations on December 18, 2019. Per share data and total return reflect activity from that date. |
| (f) | Calculation of the net gain (loss) per share (both realized and unrealized) does not correlate to the aggregate realized and unrealized gain (loss) presented in the Statement of Operations due to timing of Fund shares sold and redeemed in relation to fluctuations in the market value of the portfolio. |
The accompanying Notes to Financial Statements are an integral part of this statement.
| 24 | Multi-Manager International Equity Strategies Fund | Annual Report 2023 |
Financial Highlights (continued)
| | Net
asset
value,
end of
period | Total
return | Total gross
expense
ratio to
average
net assets(a) | Total net
expense
ratio to
average
net assets(a),(b) | Net investment
income
ratio to
average
net assets | Portfolio
turnover | Net
assets,
end of
period
(000’s) |
| Institutional Class |
| Year Ended 8/31/2023 | $11.24 | 23.04% | 0.99%(c) | 0.98%(c) | 2.09% | 43% | $2,353,766 |
| Year Ended 8/31/2022 | $9.36 | (23.66%) | 0.96%(c) | 0.96%(c) | 2.20% | 59% | $2,236,756 |
| Year Ended 8/31/2021 | $12.67 | 28.10% | 0.99%(c) | 0.99%(c) | 1.24% | 82% | $2,531,606 |
| Year Ended 8/31/2020 | $10.02 | 13.34% | 1.00%(c),(d) | 0.98%(c),(d) | 1.22% | 89% | $2,045,267 |
| Year Ended 8/31/2019 | $9.06 | (5.53%) | 1.02%(c) | 1.02%(c) | 2.54% | 63% | $1,901,132 |
| Institutional 3 Class |
| Year Ended 8/31/2023 | $11.28 | 23.28% | 0.83%(c) | 0.83%(c) | 2.28% | 43% | $3 |
| Year Ended 8/31/2022 | $9.39 | (23.42%) | 0.80%(c) | 0.80%(c) | 2.34% | 59% | $2 |
| Year Ended 8/31/2021 | $12.69 | 28.07% | 0.83%(c) | 0.81%(c) | 1.43% | 82% | $3 |
| Year Ended 8/31/2020(e) | $10.05 | 0.10% | 0.86%(c) | 0.84%(c) | 1.57% | 89% | $3 |
The accompanying Notes to Financial Statements are an integral part of this statement.
Multi-Manager International Equity Strategies Fund | Annual Report 2023
| 25 |
Notes to Financial Statements
August 31, 2023
Note 1. Organization
Multi-Manager International Equity Strategies Fund (the Fund), a series of Columbia Funds Series Trust I (the Trust), is a diversified fund. The Trust is registered under the Investment Company Act of 1940, as amended (the 1940 Act), as an open-end management investment company organized as a Massachusetts business trust.
Fund shares
The Trust may issue an unlimited number of shares (without par value). The Fund is offered only through certain wrap fee programs sponsored and/or managed by Ameriprise Financial, Inc. (Ameriprise Financial) or its affiliates. The Fund offers each of the share classes listed in the Statement of Assets and Liabilities which are not subject to any front-end sales charge or contingent deferred sales charge.
Note 2. Summary of significant accounting policies
Basis of preparation
The Fund is an investment company that applies the accounting and reporting guidance in the Financial Accounting Standards Board (FASB) Accounting Standards Codification Topic 946, Financial Services - Investment Companies (ASC 946). The financial statements are prepared in accordance with U.S. generally accepted accounting principles (GAAP), which requires management to make certain estimates and assumptions that affect the reported amounts of assets and liabilities, the disclosure of contingent assets and liabilities at the date of the financial statements and the reported amounts of income and expenses during the reporting period. Actual results could differ from those estimates.
The following is a summary of significant accounting policies followed by the Fund in the preparation of its financial statements.
Security valuation
Equity securities listed on an exchange are valued at the closing price or last trade price on their primary exchange at the close of business of the New York Stock Exchange. Securities with a closing price not readily available or not listed on any exchange are valued at the mean between the closing bid and ask prices. Listed preferred stocks convertible into common stocks are valued using an evaluated price from a pricing service.
Foreign equity securities are valued based on the closing price or last trade price on their primary exchange at the close of business of the New York Stock Exchange. If any foreign equity security closing prices are not readily available, the securities are valued at the mean of the latest quoted bid and ask prices on such exchanges or markets. Foreign currency exchange rates are determined at the scheduled closing time of the New York Stock Exchange. Many securities markets and exchanges outside the U.S. close prior to the close of the New York Stock Exchange; therefore, the closing prices for securities in such markets or on such exchanges may not fully reflect events that occur after such close but before the close of the New York Stock Exchange. In those situations, foreign securities will be fair valued pursuant to a policy approved by the Board of Trustees. Under the policy, the Fund may utilize a third-party pricing service to determine these fair values. The third-party pricing service takes into account multiple factors, including, but not limited to, movements in the U.S. securities markets, certain depositary receipts, futures contracts and foreign exchange rates that have occurred subsequent to the close of the foreign exchange or market, to determine a good faith estimate that reasonably reflects the current market conditions as of the close of the New York Stock Exchange. The fair value of a security is likely to be different from the quoted or published price, if available.
Investments in open-end investment companies (other than exchange-traded funds (ETFs)), are valued at the latest net asset value reported by those companies as of the valuation time.
Investments for which market quotations are not readily available, or that have quotations which management believes are not reflective of market value or reliable, are valued at fair value as determined in good faith under procedures approved by the Board of Trustees. If a security or class of securities (such as foreign securities) is valued at fair value, such value is likely to be different from the quoted or published price for the security, if available.
| 26 | Multi-Manager International Equity Strategies Fund | Annual Report 2023 |
Notes to Financial Statements (continued)
August 31, 2023
The determination of fair value often requires significant judgment. To determine fair value, management may use assumptions including but not limited to future cash flows and estimated risk premiums. Multiple inputs from various sources may be used to determine fair value.
GAAP requires disclosure regarding the inputs and valuation techniques used to measure fair value and any changes in valuation inputs or techniques. In addition, investments shall be disclosed by major category. This information is disclosed following the Fund’s Portfolio of Investments.
Foreign currency transactions and translations
The values of all assets and liabilities denominated in foreign currencies are generally translated into U.S. dollars at exchange rates determined at the close of regular trading on the New York Stock Exchange. Net realized and unrealized gains (losses) on foreign currency transactions and translations include gains (losses) arising from the fluctuation in exchange rates between trade and settlement dates on securities transactions, gains (losses) arising from the disposition of foreign currency and currency gains (losses) between the accrual and payment dates on dividends, interest income and foreign withholding taxes.
For financial statement purposes, the Fund does not distinguish that portion of gains (losses) on investments which is due to changes in foreign exchange rates from that which is due to changes in market prices of the investments. Such fluctuations are included with the net realized and unrealized gains (losses) on investments in the Statement of Operations.
Security transactions
Security transactions are accounted for on the trade date. Cost is determined and gains (losses) are based upon the specific identification method for both financial statement and federal income tax purposes.
Income recognition
Corporate actions and dividend income are generally recorded net of any non-reclaimable tax withholdings, on the ex-dividend date or upon receipt of an ex-dividend notification in the case of certain foreign securities.
The Fund may receive distributions from holdings in equity securities, business development companies (BDCs), exchange-traded funds (ETFs), limited partnerships (LPs), other regulated investment companies (RICs), and real estate investment trusts (REITs), which report information as to the tax character of their distributions annually. These distributions are allocated to dividend income, capital gain and return of capital based on actual information reported. Return of capital is recorded as a reduction of the cost basis of securities held. If the Fund no longer owns the applicable securities, return of capital is recorded as a realized gain. With respect to REITs, to the extent actual information has not yet been reported, estimates for return of capital are made by Columbia Management Investment Advisers, LLC (the Investment Manager), a wholly-owned subsidiary of Ameriprise Financial, Inc. (Ameriprise Financial). The Investment Manager’s estimates are subsequently adjusted when the actual character of the distributions is disclosed by the REITs, which could result in a proportionate change in return of capital to shareholders.
Awards from class action litigation are recorded as a reduction of cost basis if the Fund still owns the applicable securities on the payment date. If the Fund no longer owns the applicable securities on the payment date, the proceeds are recorded as realized gains.
Expenses
General expenses of the Trust are allocated to the Fund and other funds of the Trust based upon relative net assets or other expense allocation methodologies determined by the nature of the expense. Expenses directly attributable to the Fund are charged to the Fund. Expenses directly attributable to a specific class of shares are charged to that share class.
Determination of class net asset value
All income, expenses (other than class-specific expenses, which are charged to that share class, as shown in the Statement of Operations) and realized and unrealized gains (losses) are allocated to each class of the Fund on a daily basis, based on the relative net assets of each class, for purposes of determining the net asset value of each class.
Multi-Manager International Equity Strategies Fund | Annual Report 2023
| 27 |
Notes to Financial Statements (continued)
August 31, 2023
Federal income tax status
The Fund intends to qualify each year as a regulated investment company under Subchapter M of the Internal Revenue Code, as amended, and will distribute substantially all of its investment company taxable income and net capital gain, if any, for its tax year, and as such will not be subject to federal income taxes. In addition, the Fund intends to distribute in each calendar year substantially all of its ordinary income, capital gain net income and certain other amounts, if any, such that the Fund should not be subject to federal excise tax. Therefore, no federal income or excise tax provision is recorded.
Foreign taxes
The Fund may be subject to foreign taxes on income, gains on investments or currency repatriation, a portion of which may be recoverable. The Fund will accrue such taxes and recoveries, as applicable, based upon its current interpretation of tax rules and regulations that exist in the markets in which it invests.
Realized gains in certain countries may be subject to foreign taxes at the Fund level, based on statutory rates. The Fund accrues for such foreign taxes on realized and unrealized gains at the appropriate rate for each jurisdiction, as applicable. The amount, if any, is disclosed as a liability in the Statement of Assets and Liabilities.
Distributions to shareholders
Distributions from net investment income, if any, are declared and paid annually. Net realized capital gains, if any, are distributed at least annually. Income distributions and capital gain distributions are determined in accordance with federal income tax regulations, which may differ from GAAP.
Guarantees and indemnifications
Under the Trust’s organizational documents and, in some cases, by contract, its officers and trustees are indemnified against certain liabilities arising out of the performance of their duties to the Trust or its funds. In addition, certain of the Fund’s contracts with its service providers contain general indemnification clauses. The Fund’s maximum exposure under these arrangements is unknown since the amount of any future claims that may be made against the Fund cannot be determined, and the Fund has no historical basis for predicting the likelihood of any such claims.
Recent accounting pronouncements and regulatory updates
Tailored Shareholder Reports
In October 2022, the Securities and Exchange Commission (SEC) adopted a final rule relating to Tailored Shareholder Reports for Mutual Funds and Exchange-Traded Funds; Fee Information in Investment Company Advertisements. The rule and form amendments will, among other things, require the Fund to transmit concise and visually engaging shareholder reports that highlight key information. The amendments will require that funds tag information in a structured data format and that certain more in-depth information be made available online and available for delivery free of charge to investors on request. The amendments became effective January 24, 2023. There is an 18-month transition period after the effective date of the amendments.
Note 3. Fees and other transactions with affiliates
Management services fees
The Fund has entered into a Management Agreement with Columbia Management Investment Advisers, LLC (the Investment Manager), a wholly-owned subsidiary of Ameriprise Financial, Inc. (Ameriprise Financial). Under the Management Agreement, the Investment Manager provides the Fund with investment research and advice, as well as administrative and accounting services. The Investment Manager is responsible for the ultimate oversight of investments made by the Fund. The Fund’s subadvisers (see Subadvisory agreements below) have the primary responsibility for the day-to-day portfolio management of the Fund. The management services fee is an annual fee that is equal to a percentage of the Fund’s daily net assets that declines from 0.87% to 0.67% as the Fund’s net assets increase. The effective management services fee rate for the year ended August 31, 2023 was 0.79% of the Fund’s average daily net assets.
| 28 | Multi-Manager International Equity Strategies Fund | Annual Report 2023 |
Notes to Financial Statements (continued)
August 31, 2023
Subadvisory agreements
The Investment Manager has entered into Subadvisory Agreements with Arrowstreet Capital, Limited Partnership, Baillie Gifford Overseas Limited and Causeway Capital Management LLC, each of which subadvises a portion of the assets of the Fund. New investments in the Fund, net of any redemptions, are allocated in accordance with the Investment Manager’s determination. Each subadviser’s proportionate share of the investments in the Fund may also vary due to market fluctuations. The Investment Manager compensates each subadviser to manage the investment of the Fund’s assets.
Compensation of board members
Members of the Board of Trustees who are not officers or employees of the Investment Manager or Ameriprise Financial are compensated for their services to the Fund as disclosed in the Statement of Operations. Under a Deferred Compensation Plan (the Deferred Plan), these members of the Board of Trustees may elect to defer payment of up to 100% of their compensation. Deferred amounts are treated as though equivalent dollar amounts had been invested in shares of certain funds managed by the Investment Manager. The Fund’s liability for these amounts is adjusted for market value changes and remains in the Fund until distributed in accordance with the Deferred Plan. All amounts payable under the Deferred Plan constitute a general unsecured obligation of the Fund. The expense for the Deferred Plan, which includes Trustees’ fees deferred during the current period as well as any gains or losses on the Trustees’ deferred compensation balances as a result of market fluctuations, is included in "Trustees’ fees" in the Statement of Operations.
Compensation of Chief Compliance Officer
The Board of Trustees has appointed a Chief Compliance Officer for the Fund in accordance with federal securities regulations. As disclosed in the Statement of Operations, a portion of the Chief Compliance Officer’s total compensation is allocated to the Fund, along with other allocations to affiliated registered investment companies managed by the Investment Manager and its affiliates, based on relative net assets.
Transfer agency fees
Under a Transfer and Dividend Disbursing Agent Agreement, Columbia Management Investment Services Corp. (the Transfer Agent), an affiliate of the Investment Manager and a wholly-owned subsidiary of Ameriprise Financial, is responsible for providing transfer agency services to the Fund. The Transfer Agent has contracted with SS&C GIDS, Inc. (SS&C GIDS) to serve as sub-transfer agent. Prior to January 1, 2023, SS&C GIDS was known as DST Asset Manager Solutions, Inc. The Transfer Agent pays the fees of SS&C GIDS for services as sub-transfer agent and SS&C GIDS is not entitled to reimbursement for such fees from the Fund (with the exception of out-of-pocket fees).
The Fund pays the Transfer Agent a monthly transfer agency fee based on the number or the average value of accounts, depending on the type of account. In addition, the Fund pays the Transfer Agent a fee for shareholder services based on the number of accounts or on a percentage of the average aggregate value of the Fund’s shares maintained in omnibus accounts up to the lesser of the amount charged by the financial intermediary or a cap established by the Board of Trustees from time to time.
The Transfer Agent also receives compensation from the Fund for various shareholder services and reimbursements for certain out-of-pocket fees. Total transfer agency fees for Institutional 3 Class shares are subject to an annual limitation of not more than 0.02% of the average daily net assets attributable to Institutional 3 Class shares.
For the year ended August 31, 2023, the Fund’s effective transfer agency fee rates as a percentage of average daily net assets of each class were as follows:
| | Effective rate (%) |
| Institutional Class | 0.15 |
| Institutional 3 Class | 0.02 |
Multi-Manager International Equity Strategies Fund | Annual Report 2023
| 29 |
Notes to Financial Statements (continued)
August 31, 2023
Distribution and service fees
The Fund has an agreement with Columbia Management Investment Distributors, Inc. (the Distributor), an affiliate of the Investment Manager and a wholly-owned subsidiary of Ameriprise Financial, for distribution and shareholder services. The Fund does not pay the Distributor a fee for the distribution services it provides to the Fund.
Expenses waived/reimbursed by the Investment Manager and its affiliates
The Investment Manager and certain of its affiliates have contractually agreed to waive fees and/or reimburse expenses (excluding certain fees and expenses described below) for the period(s) disclosed below, unless sooner terminated at the sole discretion of the Board of Trustees, so that the Fund’s net operating expenses, after giving effect to fees waived/expenses reimbursed and any balance credits and/or overdraft charges from the Fund’s custodian, do not exceed the following annual rate(s) as a percentage of the classes’ average daily net assets:
| | January 1, 2023
through
December 31, 2023 | Prior to
January 1, 2023 |
| Institutional Class | 0.99% | 0.99% |
| Institutional 3 Class | 0.85 | 0.87 |
Under the agreement governing these fee waivers and/or expense reimbursement arrangements, the following fees and expenses are excluded from the waiver/reimbursement commitment, and therefore will be paid by the Fund, if applicable: taxes (including foreign transaction taxes), expenses associated with investments in affiliated and non-affiliated pooled investment vehicles (including mutual funds and exchange-traded funds), transaction costs and brokerage commissions, costs related to any securities lending program, dividend expenses associated with securities sold short, inverse floater program fees and expenses, transaction charges and interest on borrowed money, interest, costs associated with shareholder meetings, infrequent and/or unusual expenses and any other expenses the exclusion of which is specifically approved by the Board of Trustees. This agreement may be modified or amended only with approval from the Investment Manager, certain of its affiliates and the Fund. In addition to the contractual agreement, the Investment Manager and certain of its affiliates have voluntarily agreed to waive fees and/or reimburse Fund expenses (excluding certain fees and expenses described above) so that Fund level expenses (expenses directly attributable to the Fund and not to a specific share class) are waived proportionately across all share classes. This arrangement may be revised or discontinued at any time. Any fees waived and/or expenses reimbursed under the expense reimbursement arrangements described above are not recoverable by the Investment Manager or its affiliates in future periods.
Note 4. Federal tax information
The timing and character of income and capital gain distributions are determined in accordance with income tax regulations, which may differ from GAAP because of temporary or permanent book to tax differences.
At August 31, 2023, these differences were primarily due to differing treatment for deferral/reversal of wash sale losses, passive foreign investment company (pfic) holdings, capital loss carryforwards, trustees’ deferred compensation, non-deductible expenses and foreign currency transactions. To the extent these differences were permanent, reclassifications were made among the components of the Fund’s net assets. Temporary differences do not require reclassifications.
The following reclassifications were made:
Undistributed net
investment
income ($) | Accumulated
net realized
(loss) ($) | Paid in
capital ($) |
| 635,400 | (635,400) | — |
Net investment income (loss) and net realized gains (losses), as disclosed in the Statement of Operations, and net assets were not affected by this reclassification.
| 30 | Multi-Manager International Equity Strategies Fund | Annual Report 2023 |
Notes to Financial Statements (continued)
August 31, 2023
The tax character of distributions paid during the years indicated was as follows:
| Year Ended August 31, 2023 | Year Ended August 31, 2022 |
Ordinary
income ($) | Long-term
capital gains ($) | Total ($) | Ordinary
income ($) | Long-term
capital gains ($) | Total ($) |
| 53,998,583 | — | 53,998,583 | 81,782,319 | 9,212,197 | 90,994,516 |
Short-term capital gain distributions, if any, are considered ordinary income distributions for tax purposes.
At August 31, 2023, the components of distributable earnings on a tax basis were as follows:
Undistributed
ordinary income ($) | Undistributed
long-term
capital gains ($) | Capital loss
carryforwards ($) | Net unrealized
appreciation ($) |
| 45,060,536 | — | (81,789,722) | 195,050,918 |
At August 31, 2023, the cost of all investments for federal income tax purposes along with the aggregate gross unrealized appreciation and depreciation based on that cost was:
Federal
tax cost ($) | Gross unrealized
appreciation ($) | Gross unrealized
(depreciation) ($) | Net unrealized
appreciation ($) |
| 2,146,178,407 | 316,774,627 | (121,723,709) | 195,050,918 |
Tax cost of investments and unrealized appreciation/(depreciation) may also include timing differences that do not constitute adjustments to tax basis.
The following capital loss carryforwards, determined at August 31, 2023, may be available to reduce future net realized gains on investments, if any, to the extent permitted by the Internal Revenue Code. In addition, for the year ended August 31, 2023, capital loss carryforwards utilized, if any, were as follows:
No expiration
short-term ($) | No expiration
long-term ($) | Total ($) | Utilized ($) |
| (61,670,453) | (20,119,269) | (81,789,722) | — |
Management of the Fund has concluded that there are no significant uncertain tax positions in the Fund that would require recognition in the financial statements. However, management’s conclusion may be subject to review and adjustment at a later date based on factors including, but not limited to, new tax laws, regulations, and administrative interpretations (including relevant court decisions). Generally, the Fund’s federal tax returns for the prior three fiscal years remain subject to examination by the Internal Revenue Service.
Note 5. Portfolio information
The cost of purchases and proceeds from sales of securities, excluding short-term investments and derivatives, if any, aggregated to $967,665,376 and $1,245,897,416, respectively, for the year ended August 31, 2023. The amount of purchase and sale activity impacts the portfolio turnover rate reported in the Financial Highlights.
Brokerage commissions paid to brokers affiliated with the Investment Manager of the Fund were $22,577 for the year ended August 31, 2023.
Note 6. Affiliated money market fund
The Fund invests in Columbia Short-Term Cash Fund, an affiliated money market fund established for the exclusive use by the Fund and other affiliated funds (the Affiliated MMF). The income earned by the Fund from such investments is included as Dividends - affiliated issuers in the Statement of Operations. As an investing fund, the Fund indirectly bears its proportionate share of the expenses of the Affiliated MMF. The Affiliated MMF prices its shares with a floating net asset value. The Securities and Exchange Commission has adopted amendments to money market fund rules requiring institutional prime
Multi-Manager International Equity Strategies Fund | Annual Report 2023
| 31 |
Notes to Financial Statements (continued)
August 31, 2023
money market funds like the Affiliated MMF to be subject, by October 2, 2024, to a liquidity fee if daily net redemptions exceed 5% of net assets and, by April 2, 2024, to a discretionary liquidity fee up to 2% if the imposition of such a fee is determined to be in the best interest of the Affiliated MMF.
Note 7. Interfund lending
Pursuant to an exemptive order granted by the Securities and Exchange Commission, the Fund participates in a program (the Interfund Program) allowing each participating Columbia Fund (each, a Participating Fund) to lend money directly to and, except for closed-end funds and money market funds, borrow money directly from other Participating Funds for temporary purposes. The amounts eligible for borrowing and lending under the Interfund Program are subject to certain restrictions.
Interfund loans are subject to the risk that the borrowing fund could be unable to repay the loan when due, and a delay in repayment to the lending fund could result in lost opportunities and/or additional lending costs. The exemptive order is subject to conditions intended to mitigate conflicts of interest arising from the Investment Manager’s relationship with each Participating Fund.
The Fund’s activity in the Interfund Program during the year ended August 31, 2023 was as follows:
| Borrower or lender | Average loan
balance ($) | Weighted average
interest rate (%) | Number of days
with outstanding loans |
| Borrower | 2,800,000 | 5.10 | 4 |
| Lender | 1,800,000 | 5.10 | 1 |
Interest income earned and interest expense incurred by the Fund is recorded as interfund lending in the Statement of Operations. The Fund had no outstanding interfund loans at August 31, 2023.
Note 8. Line of credit
The Fund has access to a revolving credit facility with a syndicate of banks led by JPMorgan Chase Bank, N.A., Citibank, N.A. and Wells Fargo Bank, N.A. whereby the Fund may borrow for the temporary funding of shareholder redemptions or for other temporary or emergency purposes. Pursuant to an October 27, 2022 amendment and restatement, the credit facility, which is an agreement between the Fund and certain other funds managed by the Investment Manager or an affiliated investment manager, severally and not jointly, permits aggregate borrowings up to $950 million. Interest is currently charged to each participating fund based on its borrowings at a rate equal to the higher of (i) the federal funds effective rate, (ii) the secured overnight financing rate plus 0.10% and (iii) the overnight bank funding rate plus, in each case, 1.00%. Each borrowing under the credit facility matures no later than 60 days after the date of borrowing. The Fund also pays a commitment fee equal to its pro rata share of the unused amount of the credit facility at a rate of 0.15% per annum. The commitment fee is included in other expenses in the Statement of Operations. This agreement expires annually in October unless extended or renewed. Prior to the October 27, 2022 amendment and restatement, the Fund had access to a revolving credit facility with a syndicate of banks led by JPMorgan Chase Bank, N.A., Citibank, N.A. and Wells Fargo Bank, N.A. which permitted collective borrowings up to $950 million. Interest was charged to each participating fund based on its borrowings at a rate equal to the higher of (i) the federal funds effective rate, (ii) the secured overnight financing rate plus 0.11448% and (iii) the overnight bank funding rate plus, in each case, 1.00%.
The Fund had no borrowings during the year ended August 31, 2023.
Note 9. Significant risks
Foreign securities and emerging market countries risk
Investing in foreign securities may involve heightened risks relative to investments in U.S. securities. Investing in foreign securities subjects the Fund to the risks associated with the issuer’s country of organization and places of business operations, including risks associated with political, regulatory, economic, social, diplomatic and other conditions or events occurring in the country or region, which may result in significant market volatility. In addition, certain foreign securities may be more volatile and less liquid than U.S. securities. Investing in emerging markets may increase these risks and expose the Fund to elevated risks associated with increased inflation, deflation or currency devaluation. To the extent that the Fund
| 32 | Multi-Manager International Equity Strategies Fund | Annual Report 2023 |
Notes to Financial Statements (continued)
August 31, 2023
concentrates its investment exposure to any one or a few specific countries, the Fund will be particularly susceptible to the risks associated with the conditions, events or other factors impacting those countries or regions and may, therefore, have a greater risk than that of a fund that is more geographically diversified. The financial information and disclosure made available by issuers of emerging market securities may be considerably less reliable than publicly available information about other foreign securities. The Public Company Accounting Oversight Board, which regulates auditors of U.S. public companies, is unable to inspect audit work papers in certain foreign countries. Investors in foreign countries often have limited rights and few practical remedies to pursue shareholder claims, including class actions or fraud claims, and the ability of the U.S. Securities and Exchange Commission, the U.S. Department of Justice and other authorities to bring and enforce actions against foreign issuers or foreign persons is limited.
Geographic focus risk
The Fund may be particularly susceptible to risks related to economic, political, regulatory or other events or conditions affecting issuers and countries within the specific geographic regions in which the Fund invests. The Fund’s net asset value may be more volatile than the net asset value of a more geographically diversified fund.
Asia Pacific Region. The Fund is particularly susceptible to economic, political, regulatory or other events or conditions affecting issuers and countries in the Asia Pacific region. Many of the countries in the region are considered underdeveloped or developing, including from a political, economic and/or social perspective, and may have relatively unstable governments and economies based on limited business, industries and/or natural resources or commodities. Events in any one country within the region may impact other countries in the region or the region as a whole. As a result, events in the region will generally have a greater effect on the Fund than if the Fund were more geographically diversified. This could result in increased volatility in the value of the Fund’s investments and losses for the Fund. Also, securities of some companies in the region can be less liquid than U.S. or other foreign securities, potentially making it difficult for the Fund to sell such securities at a desirable time and price.
Europe. The Fund is particularly susceptible to risks related to economic, political, regulatory or other events or conditions, including acts of war or other conflicts in the region, affecting issuers and countries in Europe. Countries in Europe are often closely connected and interdependent, and events in one European country can have an adverse impact on, and potentially spread to, other European countries. In addition, significant private or public debt problems in a single European Union (EU) country can pose economic risks to the EU as a whole. As a result, the Fund’s net asset value may be more volatile than the net asset value of a more geographically diversified fund. If securities of issuers in Europe fall out of favor, it may cause the Fund to underperform other funds that do not focus their investments in this region of the world. Uncertainty caused by the departure of the United Kingdom (UK) from the EU, which occurred in January 2020, could have negative impacts on the UK and EU, as well as other European economies and the broader global economy. These could include negative impacts on currencies and financial markets as well as increased volatility and illiquidity, and potentially lower economic growth in markets in Europe, which could adversely affect the value of your investment in the Fund.
Market risk
The Fund may incur losses due to declines in the value of one or more securities in which it invests. These declines may be due to factors affecting a particular issuer, or the result of, among other things, political, regulatory, market, economic or social developments affecting the relevant market(s) more generally. In addition, turbulence in financial markets and reduced liquidity in equity, credit and/or fixed income markets may negatively affect many issuers, which could adversely affect the Fund’s ability to price or value hard-to-value assets in thinly traded and closed markets and could cause significant redemptions and operational challenges. Global economies and financial markets are increasingly interconnected, and conditions and events in one country, region or financial market may adversely impact issuers in a different country, region or financial market. These risks may be magnified if certain events or developments adversely interrupt the global supply chain; in these and other circumstances, such risks might affect companies worldwide. As a result, local, regional or global events such as terrorism, war, natural disasters, disease/virus outbreaks and epidemics or other public health issues, recessions, depressions or other events – or the potential for such events – could have a significant negative impact on global economic and market conditions.
Multi-Manager International Equity Strategies Fund | Annual Report 2023
| 33 |
Notes to Financial Statements (continued)
August 31, 2023
The large-scale invasion of Ukraine by Russia in February 2022 has resulted in sanctions and market disruptions, including declines in regional and global stock markets, unusual volatility in global commodity markets and significant devaluations of Russian currency. The extent and duration of the military action are impossible to predict but could be significant. Market disruption caused by the Russian military action, and any counter-measures or responses thereto (including international sanctions, a downgrade in the country’s credit rating, purchasing and financing restrictions, boycotts, tariffs, changes in consumer or purchaser preferences, cyberattacks and espionage) could have severe adverse impacts on regional and/or global securities and commodities markets, including markets for oil and natural gas. These impacts may include reduced market liquidity, distress in credit markets, further disruption of global supply chains, increased risk of inflation, restricted cross-border payments and limited access to investments and/or assets in certain international markets and/or issuers. These developments and other related events could negatively impact Fund performance.
Shareholder concentration risk
At August 31, 2023, affiliated shareholders of record owned 100.0% of the outstanding shares of the Fund in one or more accounts. Fund shares sold to or redeemed by concentrated accounts may have a significant effect on the operations of the Fund. In the case of a large redemption, the Fund may be forced to sell investments at inopportune times, including its liquid positions, which may result in Fund losses and the Fund holding a higher percentage of less liquid positions. Large redemptions could result in decreased economies of scale and increased operating expenses for non-redeeming Fund shareholders.
Note 10. Subsequent events
Management has evaluated the events and transactions that have occurred through the date the financial statements were issued and noted no items requiring adjustment of the financial statements or additional disclosure.
Note 11. Information regarding pending and settled legal proceedings
Ameriprise Financial and certain of its affiliates are involved in the normal course of business in legal proceedings which include regulatory inquiries, arbitration and litigation, including class actions concerning matters arising in connection with the conduct of their activities as part of a diversified financial services firm. Ameriprise Financial believes that the Fund is not currently the subject of, and that neither Ameriprise Financial nor any of its affiliates are the subject of, any pending legal, arbitration or regulatory proceedings that are likely to have a material adverse effect on the Fund or the ability of Ameriprise Financial or its affiliates to perform under their contracts with the Fund. Ameriprise Financial is required to make quarterly (10-Q), annual (10-K) and, as necessary, 8-K filings with the Securities and Exchange Commission (SEC) on legal and regulatory matters that relate to Ameriprise Financial and its affiliates. Copies of these filings may be obtained by accessing the SEC website at www.sec.gov.
There can be no assurance that these matters, or the adverse publicity associated with them, will not result in increased Fund redemptions, reduced sale of Fund shares or other adverse consequences to the Fund. Further, although we believe proceedings are not likely to have a material adverse effect on the Fund or the ability of Ameriprise Financial or its affiliates to perform under their contracts with the Fund, these proceedings are subject to uncertainties and, as such, we are unable to estimate the possible loss or range of loss that may result. An adverse outcome in one or more of these proceedings could result in adverse judgments, settlements, fines, penalties or other relief that could have a material adverse effect on the consolidated financial condition or results of operations of Ameriprise Financial or one or more of its affiliates that provide services to the Fund.
| 34 | Multi-Manager International Equity Strategies Fund | Annual Report 2023 |
Report of Independent Registered Public Accounting Firm
To the Board of Trustees of Columbia Funds Series Trust I and Shareholders of Multi-Manager International Equity Strategies Fund
Opinion on the Financial Statements
We have audited the accompanying statement of assets and liabilities, including the portfolio of investments, of Multi-Manager International Equity Strategies Fund (one of the funds constituting Columbia Funds Series Trust I, referred to hereafter as the "Fund") as of August 31, 2023, the related statement of operations for the year ended August 31, 2023, the statement of changes in net assets for each of the two years in the period ended August 31, 2023, including the related notes, and the financial highlights for each of the periods indicated therein (collectively referred to as the "financial statements"). In our opinion, the financial statements present fairly, in all material respects, the financial position of the Fund as of August 31, 2023, the results of its operations for the year then ended, the changes in its net assets for each of the two years in the period ended August 31, 2023 and the financial highlights for each of the periods indicated therein in conformity with accounting principles generally accepted in the United States of America.
Basis for Opinion
These financial statements are the responsibility of the Fund’s management. Our responsibility is to express an opinion on the Fund’s financial statements based on our audits. We are a public accounting firm registered with the Public Company Accounting Oversight Board (United States) (PCAOB) and are required to be independent with respect to the Fund in accordance with the U.S. federal securities laws and the applicable rules and regulations of the Securities and Exchange Commission and the PCAOB.
We conducted our audits of these financial statements in accordance with the standards of the PCAOB. Those standards require that we plan and perform the audit to obtain reasonable assurance about whether the financial statements are free of material misstatement, whether due to error or fraud.
Our audits included performing procedures to assess the risks of material misstatement of the financial statements, whether due to error or fraud, and performing procedures that respond to those risks. Such procedures included examining, on a test basis, evidence regarding the amounts and disclosures in the financial statements. Our audits also included evaluating the accounting principles used and significant estimates made by management, as well as evaluating the overall presentation of the financial statements. Our procedures included confirmation of securities owned as of August 31, 2023 by correspondence with the custodian, transfer agent and brokers; when replies were not received from brokers, we performed other auditing procedures. We believe that our audits provide a reasonable basis for our opinion.
/s/PricewaterhouseCoopers LLP
Minneapolis, Minnesota
October 23, 2023
We have served as the auditor of one or more investment companies within the Columbia Funds Complex since 1977.
Multi-Manager International Equity Strategies Fund | Annual Report 2023
| 35 |
Federal Income Tax Information
(Unaudited)
The Fund hereby designates the following tax attributes for the fiscal year ended August 31, 2023. Shareholders will be notified in early 2024 of the amounts for use in preparing 2023 income tax returns.
Qualified
dividend
income | Foreign
taxes paid
to foreign
countries | Foreign
taxes paid
per share
to foreign
countries | Foreign
source
income | Foreign
source
income
per share |
| 100.00% | $7,328,045 | $0.03 | $75,950,108 | $0.36 |
Qualified dividend income. For taxable, non-corporate shareholders, the percentage of ordinary income distributed during the fiscal year that represents qualified dividend income subject to reduced tax rates.
Foreign taxes. The Fund makes the election to pass through to shareholders the foreign taxes paid. Eligible shareholders may claim a foreign tax credit. These taxes, and the corresponding foreign source income, are provided in the table above.
TRUSTEES AND OFFICERS
(Unaudited)
The Board oversees the Fund’s operations and appoints officers who are responsible for day-to-day business decisions based on policies set by the Board. The following table provides basic biographical information about the Fund’s Trustees as of the printing of this report, including their principal occupations during the past five years, although specific titles for individuals may have varied over the period. The year set forth beneath Length of Service in the table below is the year in which the Trustee was first appointed or elected as Trustee to any Fund currently in the Columbia Funds Complex or a predecessor thereof. Under current Board policy, each Trustee generally serves until December 31 of the year such Trustee turns seventy-five (75).
Independent trustees
Name,
address,
year of birth | Position held
with the Columbia Funds and
length of service | Principal occupation(s)
during past five years
and other relevant
professional experience | Number of
Funds in the
Columbia Funds
Complex*
overseen | Other directorships
held by Trustee
during the past five years
and other relevant Board experience |
George S. Batejan
c/o Columbia Management
Investment Advisers, LLC
290 Congress Street
Boston, MA 02210
1954 | Trustee since 2017 | Executive Vice President, Global Head of Technology and Operations, Janus Capital Group, Inc., 2010-2016 | 173 | Former Chairman of the Board, NICSA (National Investment Company Services Association) (Executive Committee, Nominating Committee and Governance Committee), 2014-2016; former Director, Intech Investment Management, 2011-2016; former Board Member, Metro Denver Chamber of Commerce, 2015-2016; former Advisory Board Member, University of Colorado Business School, 2015-2018; former Board Member, Chase Bank International, 1993-1994 |
| 36 | Multi-Manager International Equity Strategies Fund | Annual Report 2023 |
TRUSTEES AND OFFICERS (continued)
(Unaudited)
Independent trustees (continued)
Name,
address,
year of birth | Position held
with the Columbia Funds and
length of service | Principal occupation(s)
during past five years
and other relevant
professional experience | Number of
Funds in the
Columbia Funds
Complex*
overseen | Other directorships
held by Trustee
during the past five years
and other relevant Board experience |
Kathleen Blatz
c/o Columbia Management
Investment Advisers, LLC
290 Congress Street
Boston, MA 02210
1954 | Trustee since 2006 | Attorney, specializing in arbitration and mediation; Chief Justice, Minnesota Supreme Court, 1998-2006; Associate Justice, Minnesota Supreme Court, 1996-1998; Fourth Judicial District Court Judge, Hennepin County, 1994-1996; Attorney in private practice and public service, 1984-1993; State Representative, Minnesota House of Representatives, 1979-1993, which included service on the Tax and Financial Institutions and Insurance Committees; Member and Interim Chair, Minnesota Sports Facilities Authority, January-July 2017; Interim President and Chief Executive Officer, Blue Cross and Blue Shield of Minnesota (health care insurance), February-July 2018, April-October 2021 | 173 | Former Trustee, Blue Cross and Blue Shield of Minnesota, 2009-2021 (Chair of the Business Development Committee, 2014-2017; Chair of the Governance Committee, 2017-2019); former Member and Chair of the Board, Minnesota Sports Facilities Authority, January 2017-July 2017; former Director, Robina Foundation, 2009-2020 (Chair, 2014-2020); Director, Richard M. Schulze Family Foundation, since 2021 |
Pamela G. Carlton
c/o Columbia Management
Investment Advisers, LLC
290 Congress Street
Boston, MA 02210
1954 | Chair since 2023; Trustee since 2007 | President, Springboard – Partners in Cross Cultural Leadership (consulting company), since 2003; Managing Director of US Equity Research, JP Morgan Chase, 1999-2003; Director of US Equity Research, Chase Asset Management, 1996-1999; Co-Director Latin America Research, 1993-1996, COO Global Research, 1992-1996, Co-Director of US Research, 1991-1992, Investment Banker, 1982-1991, Morgan Stanley; Attorney, Cleary Gottlieb Steen & Hamilton LLP, 1980-1982 | 173 | Trustee, New York Presbyterian Hospital Board, since 1996; Director, DR Bank (Audit Committee) since 2017; Director, Evercore Inc. (Audit Committee, Nominating and Governance Committee), since 2019; Director, Apollo Commercial Real Estate Finance, Inc. (Chair, Nominating and Governance Committee) (financial services), since 2021; the Governing Council of the Independent Directors Council (IDC), since 2021 |
Janet Langford Carrig
c/o Columbia Management
Investment Advisers, LLC
290 Congress Street
Boston, MA 02210
1957 | Trustee since 1996 | Senior Vice President, General Counsel and Corporate Secretary, ConocoPhillips (independent energy company), September 2007-October 2018 | 173 | Director, EQT Corporation (natural gas producer), since 2019; former Director, Whiting Petroleum Corporation (independent oil and gas company), 2020-2022 |
J. Kevin Connaughton
c/o Columbia Management
Investment Advisers, LLC
290 Congress Street
Boston, MA 02210
1964 | Trustee since 2020 | CEO and President, RhodeWay Financial (non-profit financial planning firm), since December 2022; Member, FINRA National Adjudicatory Council, since January 2020; Adjunct Professor of Finance, Bentley University since January 2018; Consultant to Independent Trustees of CFVIT and CFST I from March 2016 to June 2020 with respect to CFVIT and to December 2020 with respect to CFST I; Managing Director and General Manager of Mutual Fund Products, Columbia Management Investment Advisers, LLC, May 2010-February 2015; President, Columbia Funds, 2008-2015; and senior officer of Columbia Funds and affiliated funds, 2003-2015 | 171 | Former Director, The Autism Project, March 2015-December 2021; former Member of the Investment Committee, St. Michael’s College, November 2015-February 2020; former Trustee, St. Michael’s College, June 2017-September 2019; former Trustee, New Century Portfolios (former mutual fund complex), January 2015-December 2017 |
Multi-Manager International Equity Strategies Fund | Annual Report 2023
| 37 |
TRUSTEES AND OFFICERS (continued)
(Unaudited)
Independent trustees (continued)
Name,
address,
year of birth | Position held
with the Columbia Funds and
length of service | Principal occupation(s)
during past five years
and other relevant
professional experience | Number of
Funds in the
Columbia Funds
Complex*
overseen | Other directorships
held by Trustee
during the past five years
and other relevant Board experience |
Olive M. Darragh
c/o Columbia Management
Investment Advisers, LLC
290 Congress Street
Boston, MA 02210
1962 | Trustee since 2020 | Managing Director of Darragh Inc. (strategy and talent management consulting firm), since 2010; Founder and CEO, Zolio, Inc. (investment management talent identification platform), since 2004; Consultant to Independent Trustees of CFVIT and CFST I from June 2019 to June 2020 with respect to CFVIT and to December 2020 with respect to CFST I; Partner, Tudor Investments, 2004-2010; Senior Partner, McKinsey & Company (consulting), 1990-2004; Touche Ross CPA, 1985-1988 | 171 | Treasurer, Edinburgh University US Trust Board, since January 2023; Member, HBS Community Action Partners Board, since September 2022; former Director, University of Edinburgh Business School (Member of US Board), 2004-2019; former Director, Boston Public Library Foundation, 2008-2017 |
Patricia M. Flynn
c/o Columbia Management
Investment Advisers, LLC
290 Congress Street
Boston, MA 02210
1950 | Trustee since 2004 | Professor of Economics and Management, Bentley University, since 2002; Dean, McCallum Graduate School of Business, Bentley University, 1992-2002 | 173 | Former Trustee, MA Taxpayers Foundation, 1997-2022; former Director, The MA Business Roundtable, 2003-2019; former Chairperson, Innovation Index Advisory Committee, MA Technology Collaborative, 1997-2020 |
Brian J. Gallagher
c/o Columbia Management
Investment Advisers, LLC
290 Congress Street
Boston, MA 02210
1954 | Trustee since 2017 | Retired; Partner with Deloitte & Touche LLP and its predecessors, 1977-2016 | 173 | Trustee, Catholic Schools Foundation, since 2004 |
Douglas A. Hacker
c/o Columbia Management
Investment Advisers, LLC
290 Congress Street
Boston, MA 02210
1955 | Trustee since 1996 | Independent business executive, since May 2006; Executive Vice President – Strategy of United Airlines, December 2002 - May 2006; President of UAL Loyalty Services (airline marketing company), September 2001-December 2002; Executive Vice President and Chief Financial Officer of United Airlines, July 1999-September 2001 | 173 | Director, SpartanNash Company since November 2013 (Chair of the Board, since May 2021) (food distributor); Director, Aircastle Limited (Chair of Audit Committee) (aircraft leasing), since August 2006; former Director, Nash Finch Company (food distributor), 2005-2013; former Director, SeaCube Container Leasing Ltd. (container leasing), 2010-2013; and former Director, Travelport Worldwide Limited (travel information technology), 2014-2019 |
Nancy T. Lukitsh
c/o Columbia Management
Investment Advisers, LLC
290 Congress Street
Boston, MA 02210
1956 | Trustee since 2011 | Senior Vice President, Partner and Director of Marketing, Wellington Management Company, LLP (investment adviser), 1997-2010; Chair, Wellington Management Portfolios (commingled non-U.S. investment pools), 2007-2010; Director, Wellington Trust Company, NA and other Wellington affiliates, 1997-2010 | 171 | None |
| 38 | Multi-Manager International Equity Strategies Fund | Annual Report 2023 |
TRUSTEES AND OFFICERS (continued)
(Unaudited)
Independent trustees (continued)
Name,
address,
year of birth | Position held
with the Columbia Funds and
length of service | Principal occupation(s)
during past five years
and other relevant
professional experience | Number of
Funds in the
Columbia Funds
Complex*
overseen | Other directorships
held by Trustee
during the past five years
and other relevant Board experience |
David M. Moffett
c/o Columbia Management
Investment Advisers, LLC
290 Congress Street
Boston, MA 02210
1952 | Trustee since 2011 | Retired; former Chief Executive Officer of Freddie Mac and Chief Financial Officer of U.S. Bank | 171 | Director, CSX Corporation (transportation suppliers); Director, PayPal Holdings Inc. (payment and data processing services); Trustee, University of Oklahoma Foundation; former Director, eBay Inc. (online trading community), 2007-2015; and former Director, CIT Bank, CIT Group Inc. (commercial and consumer finance), 2010-2016; former Senior Adviser to The Carlyle Group (financial services), March 2008-September 2008; former Governance Consultant to Bridgewater Associates, January 2013-December 2015 |
Catherine James Paglia
c/o Columbia Management
Investment Advisers, LLC
290 Congress Street
Boston, MA 02210
1952 | Trustee since 2004 | Director, Enterprise Asset Management, Inc. (private real estate and asset management company), since September 1998; Managing Director and Partner, Interlaken Capital, Inc., 1989-1997; Vice President, 1982-1985, Principal, 1985-1987, Managing Director, 1987-1989, Morgan Stanley; Vice President, Investment Banking, 1980-1982, Associate, Investment Banking, 1976-1980, Dean Witter Reynolds, Inc. | 173 | Director, Valmont Industries, Inc. (irrigation systems manufacturer), since 2012; Trustee, Carleton College (on the Investment Committee), since 1987; Trustee, Carnegie Endowment for International Peace (on the Investment Committee), since 2009 |
Natalie A. Trunow
c/o Columbia Management
Investment Advisers, LLC
290 Congress Street
Boston, MA 02210
1967 | Trustee since 2020 | Chief Executive Officer, Millennial Portfolio Solutions LLC (asset management and consulting services), January 2016-January 2021; Non-executive Member of the Investment Committee and Valuation Committee, Sarona Asset Management Inc. (private equity firm) since September 2019; Advisor, Horizon Investments (asset management and consulting services), August 2018-January 2022; Advisor, Paradigm Asset Management, November 2016-January 2022; Consultant to Independent Trustees of CFVIT and CFST I from September 2016 to June 2020 with respect to CFVIT and to December 2020 with respect to CFST I; Director of Investments/Consultant, Casey Family Programs, April 2016-November 2016; Senior Vice President and Chief Investment Officer, Calvert Investments, August 2008-January 2016; Section Head and Portfolio Manager, General Motors Asset Management, June 1997-August 2008 | 171 | Independent Director, Investment Committee, Health Services for Children with Special Needs, Inc., 2010-2021; Independent Director, (Executive Committee and Chair, Audit Committee), Consumer Credit Counseling Services (formerly Guidewell Financial Solutions), since 2016; Independent Director, (Investment Committee), Sarona Asset Management, since 2019 |
Multi-Manager International Equity Strategies Fund | Annual Report 2023
| 39 |
TRUSTEES AND OFFICERS (continued)
(Unaudited)
Independent trustees (continued)
Name,
address,
year of birth | Position held
with the Columbia Funds and
length of service | Principal occupation(s)
during past five years
and other relevant
professional experience | Number of
Funds in the
Columbia Funds
Complex*
overseen | Other directorships
held by Trustee
during the past five years
and other relevant Board experience |
Sandra L. Yeager
c/o Columbia Management
Investment Advisers, LLC
290 Congress Street
Boston, MA 02210
1964 | Trustee since 2017 | Retired; President and founder, Hanoverian Capital, LLC (SEC registered investment advisor firm), 2008-2016; Managing Director, DuPont Capital, 2006-2008; Managing Director, Morgan Stanley Investment Management, 2004-2006; Senior Vice President, Alliance Bernstein, 1990-2004 | 173 | Former Director, NAPE (National Alliance for Partnerships in Equity) Education Foundation, October 2016-October 2020; Advisory Board, Jennersville YMCA, since 2022 |
Interested trustee affiliated with Investment Manager**
Name,
address,
year of birth | Position held with the Columbia Funds and length of service | Principal occupation(s) during the
past five years and other relevant
professional experience | Number of
Funds in the
Columbia Funds
Complex* overseen | Other directorships
held by Trustee
during the past
five years and
other relevant Board experience |
Daniel J. Beckman
c/o Columbia Management
Investment Advisers, LLC
290 Congress Street
Boston, MA 02210
1962 | Trustee since November 2021 and President since June 2021 | Vice President – Head of North America Product, Columbia Management Investment Advisers, LLC, since April 2015; President and Principal Executive Officer of the Columbia Funds, since June 2021; officer of Columbia Funds and affiliated funds, 2020-2021 | 173 | Director, Ameriprise Trust Company, since October 2016; Director, Columbia Management Investment Distributors, Inc. since November 2018; Board of Governors, Columbia Wanger Asset Management, LLC since, January 2022; Director, Columbia Threadneedle Canada, Inc., since December 2022 |
| * | The term “Columbia Funds Complex” as used herein includes Columbia Seligman Premium Technology Growth Fund, Tri-Continental Corporation and each series of Columbia Funds Series Trust (CFST), Columbia Funds Series Trust I (CFST I), Columbia Funds Series Trust II (CFST II), Columbia ETF Trust I (CET I), Columbia ETF Trust II (CET II), Columbia Funds Variable Insurance Trust (CFVIT) and Columbia Funds Variable Series Trust II (CFVST II). Messrs. Batejan, Beckman, Gallagher and Hacker and Mses. Blatz, Carlton, Carrig, Flynn, Paglia, and Yeager serve as directors of Columbia Seligman Premium Technology Growth Fund and Tri-Continental Corporation. |
| ** | Interested person (as defined under the 1940 Act) by reason of being an officer, director, security holder and/or employee of the Investment Manager or Ameriprise Financial. |
The Statement of Additional Information has additional information about the Fund’s Board members and is available, without charge, upon request by calling 800.345.6611, visiting columbiathreadneedleus.com/investor/ or contacting your financial intermediary.
| 40 | Multi-Manager International Equity Strategies Fund | Annual Report 2023 |
TRUSTEES AND OFFICERS (continued)
(Unaudited)
The Board has appointed officers who are responsible for day-to-day business decisions based on policies it has established. The officers serve at the pleasure of the Board. The following table provides basic information about the Officers of the Fund as of the printing of this report, including principal occupations during the past five years, although their specific titles may have varied over the period. In addition to Mr. Beckman, who is President and Principal Executive Officer, the Fund’s other officers are:
Fund officers
Name,
address and
year of birth | Position and year
first appointed to
position for any Fund
in the Columbia
Funds Complex or a
predecessor thereof | Principal occupation(s) during past five years |
Michael G. Clarke
290 Congress Street
Boston, MA 02210
1969 | Chief Financial Officer and Principal Financial Officer (2009) and Senior Vice President (2019) | Senior Vice President and North America Head of Operations & Investor Services, Columbia Management Investment Advisers, LLC, since June 2023 (previously Senior Vice President and Head of Global Operations, March 2022 – June 2023, Vice President, Head of North America Operations, and Co-Head of Global Operations, June 2019 - February 2022 and Vice President – Accounting and Tax, May 2010 - May 2019); senior officer of Columbia Funds and affiliated funds, since 2002. Director, Ameriprise Trust Company, since June 2023. |
Joseph Beranek
5890 Ameriprise Financial Center
Minneapolis, MN 55474
1965 | Treasurer and Chief Accounting Officer (Principal Accounting Officer) (2019) and Principal Financial Officer (2020), CFST, CFST I, CFST II, CFVIT and CFVST II; Assistant Treasurer, CET I and CET II | Vice President – Mutual Fund Accounting and Financial Reporting, Columbia Management Investment Advisers, LLC, since December 2018 and March 2017, respectively. |
Marybeth Pilat
290 Congress Street
Boston, MA 02210
1968 | Treasurer and Chief Accounting Officer (Principal Accounting Officer) and Principal Financial Officer (2020) for CET I and CET II; Assistant Treasurer, CFST, CFST I, CFST II, CFVIT and CFVST II | Vice President – Product Pricing and Administration, Columbia Management Investment Advisers, LLC, since May 2017. |
William F. Truscott
290 Congress Street
Boston, MA 02210
1960 | Senior Vice President (2001) | Formerly, Trustee/Director of Columbia Funds Complex or legacy funds, November 2001 - January 1, 2021; Chief Executive Officer, Global Asset Management, Ameriprise Financial, Inc., since September 2012; Chairman of the Board and President, Columbia Management Investment Advisers, LLC, since July 2004 and February 2012, respectively; Chairman of the Board and Chief Executive Officer, Columbia Management Investment Distributors, Inc., since November 2008 and February 2012, respectively; Chairman of the Board and Director, Threadneedle Asset Management Holdings, Sàrl, since March 2013 and December 2008, respectively; senior executive of various entities affiliated with Columbia Threadneedle. |
Christopher O. Petersen
5228 Ameriprise Financial Center
Minneapolis, MN 55474
1970 | Senior Vice President and Assistant Secretary (2021) | Formerly, Trustee/Director of funds within the Columbia Funds Complex, July 1, 2020 - November 22, 2021; Senior Vice President and Assistant General Counsel, Ameriprise Financial, Inc., since September 2021 (previously Vice President and Lead Chief Counsel, January 2015 - September 2021); formerly, President and Principal Executive Officer of the Columbia Funds, 2015 - 2021; officer of Columbia Funds and affiliated funds, since 2007. |
Thomas P. McGuire
290 Congress Street
Boston, MA 02210
1972 | Senior Vice President and Chief Compliance Officer (2012) | Vice President – Asset Management Compliance, Ameriprise Financial, Inc., since May 2010; Chief Compliance Officer, Columbia Acorn/Wanger Funds, since December 2015; formerly, Chief Compliance Officer, Ameriprise Certificate Company, September 2010 – September 2020. |
Ryan C. Larrenaga
290 Congress Street
Boston, MA 02210
1970 | Senior Vice President (2017), Chief Legal Officer (2017), and Secretary (2015) | Vice President and Chief Counsel, Ameriprise Financial, Inc., since August 2018 (previously Vice President and Group Counsel, August 2011 - August 2018); Chief Legal Officer, Columbia Acorn/Wanger Funds, since September 2020; officer of Columbia Funds and affiliated funds, since 2005. |
Multi-Manager International Equity Strategies Fund | Annual Report 2023
| 41 |
TRUSTEES AND OFFICERS (continued)
(Unaudited)
Fund officers (continued)
Name,
address and
year of birth | Position and year
first appointed to
position for any Fund
in the Columbia
Funds Complex or a
predecessor thereof | Principal occupation(s) during past five years |
Michael E. DeFao
290 Congress Street
Boston, MA 02210
1968 | Vice President (2011) and Assistant Secretary (2010) | Vice President and Chief Counsel, Ameriprise Financial, Inc., since May 2010; Vice President, Chief Legal Officer and Assistant Secretary, Columbia Management Investment Advisers, LLC, since October 2021 (previously Vice President and Assistant Secretary, May 2010 – September 2021). |
Lyn Kephart-Strong
5903 Ameriprise Financial Center
Minneapolis, MN 55474
1960 | Vice President (2015) | Vice President, Global Investment Operations Services, Columbia Management Investment Advisers, LLC, since 2010; Director (since January 2007) and President (since October 2014), Columbia Management Investment Services Corp.; Director (since December 2017) and President (since January 2017), Ameriprise Trust Company. |
Liquidity Risk Management Program
(Unaudited)
Pursuant to Rule 22e-4 under the 1940 Act, the Fund has adopted a liquidity risk management program (Program). The Program’s principal objectives include assessing, managing and periodically reviewing the Fund’s liquidity risk. Liquidity risk is defined as the risk that the Fund could not meet redemption requests without significant dilution of remaining investors’ interests in the Fund.
The Board has appointed the Investment Manager as the program administrator for the Fund’s Program. The Investment Manager has delegated oversight of the Program to its Liquidity Risk Management Committee (the Committee). At a Board meeting during the fiscal period, the Committee provided the Board with a report addressing the operations of the Program and assessing its adequacy and effectiveness of implementation for the period January 1, 2022 through December 31, 2022, including:
| • | the Fund had sufficient liquidity to both meet redemptions and operate effectively on behalf of shareholders; |
| • | there were no material changes to the Program during the period; |
| • | the implementation of the Program was effective to manage the Fund’s liquidity risk; and |
| • | the Program operated adequately during the period. |
There can be no assurance that the Program will achieve its objectives in the future. Please refer to the Fund’s prospectus for more information regarding the Fund’s exposure to liquidity risk and other principal risks to which an investment in the Fund may be subject.
| 42 | Multi-Manager International Equity Strategies Fund | Annual Report 2023 |
Approval of Management and SubadvisoryAgreements
(Unaudited)
Columbia Management Investment Advisers, LLC (the Investment Manager, and together with its domestic and global affiliates, Columbia Threadneedle Investments), a wholly-owned subsidiary of Ameriprise Financial, Inc. (Ameriprise Financial), serves as the investment manager to Multi-Manager International Equity Strategies Fund (the Fund). Under a management agreement (the Management Agreement), the Investment Manager provides investment advice and other services to the Fund and other funds distributed by Columbia Management Investment Distributors, Inc. (collectively, the Funds). In addition, under the subadvisory agreements (the Subadvisory Agreements) between the Investment Manager and each of Arrowstreet Capital, Limited Partnership (Arrowstreet), Baillie Gifford Overseas Limited (Baillie Gifford), Causeway Capital Management LLC (Causeway) and Threadneedle International Limited (Threadneedle), an affiliate of the Investment Manager (collectively, the Subadvisers), the Subadvisers have been retained to perform portfolio management and related services for the Fund. Although Threadneedle is not currently providing such services, the Investment Manager may in the future reallocate Fund assets to be managed by Threadneedle.
On an annual basis, the Fund’s Board of Trustees (the Board), including the independent Board members (the Independent Trustees), considers renewal of the Management Agreement and the Subadvisory Agreements (together, the Advisory Agreements). The Investment Manager prepared detailed reports for the Board and its Contracts Committee (including its Contracts Subcommittee) in February, March, April, May and June 2023, including reports providing the results of analyses performed by a third-party data provider, Broadridge Financial Solutions, Inc. (Broadridge), and comprehensive responses by the Investment Manager to written requests for information by independent legal counsel to the Independent Trustees (Independent Legal Counsel), to assist the Board in making this determination. In addition, throughout the year, the Board (or its committees or subcommittees) regularly meets with portfolio management teams and senior management personnel and reviews information prepared by the Investment Manager addressing the services the Investment Manager provides and Fund performance. The Board also accords appropriate weight to the work, deliberations and conclusions of the various committees (including their subcommittees), such as the Contracts Committee, the Investment Review Committee, the Audit Committee and the Compliance Committee in determining whether to continue the Advisory Agreements.
The Board, at its June 22, 2023 Board meeting (the June 2023 Meeting), considered the renewal of each of the Advisory Agreements for additional one-year terms. At the June 2023 Meeting, Independent Legal Counsel reviewed with the Independent Trustees various factors relevant to the Board’s consideration of advisory and subadvisory agreements and the Board’s legal responsibilities related to such consideration. The Independent Trustees considered all information that they, their legal counsel or the Investment Manager believed reasonably necessary to evaluate and to approve the continuation of each of the Advisory Agreements. Among other things, the information and factors considered included the following:
| • | Information on the investment performance of the Fund relative to the performance of a group of mutual funds determined to be comparable to the Fund by Broadridge, as well as performance relative to one or more benchmarks; |
| • | Information on the Fund’s management fees and total expenses, including information comparing the Fund’s expenses to those of a group of comparable mutual funds, as determined by Broadridge; |
| • | The Investment Manager’s agreement to contractually limit or cap total operating expenses for the Fund so that total operating expenses (excluding certain fees and expenses, such as transaction costs and certain other investment related expenses, interest, taxes, acquired fund fees and expenses and infrequent and/or unusual expenses) would not exceed a specified annual rate, as a percentage of the Fund’s net assets; |
| • | Terms of the Advisory Agreements; |
| • | Subadvisory fees payable by the Investment Manager under the Subadvisory Agreements; |
| • | Descriptions of other agreements and arrangements with affiliates of the Investment Manager relating to the operations of the Fund, including agreements with respect to the provision of transfer agency and shareholder services to the Fund; |
| • | Descriptions of various services performed by the Investment Manager and the Subadvisers under the Advisory Agreements, including portfolio management and portfolio trading practices; |
Multi-Manager International Equity Strategies Fund | Annual Report 2023
| 43 |
Approval of Management and Subadvisory
Agreements (continued)
(Unaudited)
| • | Information regarding any recently negotiated management fees of similarly-managed portfolios of other institutional clients of the Investment Manager; |
| • | Information regarding the resources of the Investment Manager and Subadvisers, including information regarding senior management, portfolio managers and other personnel; |
| • | Information regarding the capabilities of the Investment Manager and the Subadvisers with respect to compliance monitoring services; |
| • | The profitability to the Investment Manager and its affiliates from their relationships with the Fund; and |
| • | Report provided by the Board’s independent fee consultant, JDL Consultants, LLC (JDL). |
Following an analysis and discussion of the foregoing, and the factors identified below, the Board, including all of the Independent Trustees, approved the renewal of each of the Advisory Agreements.
Nature, extent and quality of services provided by the Investment Manager and the Subadvisers
The Board analyzed various reports and presentations it had received detailing the services performed by the Investment Manager and the Subadvisers, as well as their history, expertise, resources and relative capabilities, and the qualifications of their personnel.
The Board specifically considered the many developments during recent years concerning the services provided by the Investment Manager, including, in particular, detailed information regarding the process employed for selecting and overseeing affiliated and unaffiliated subadvisers. With respect to the Investment Manager, the Board also noted the organization and depth of the equity and credit research departments. The Board further observed the enhancements to the investment risk management department’s processes, systems and oversight over the past several years. The Board also took into account the broad scope of services provided by the Investment Manager to each subadvised Fund, including, among other services, investment, risk and compliance oversight. The Board also took into account the information it received concerning the Investment Manager’s ability to attract and retain key portfolio management personnel and that it has sufficient resources to provide competitive and adequate compensation to investment personnel.
In connection with the Board’s evaluation of the overall package of services provided by the Investment Manager, the Board also considered the nature, quality and range of administrative services provided to the Fund by the Investment Manager, as well as the achievements in 2022 in the performance of administrative services, and noted the various enhancements anticipated for 2023. In evaluating the quality of services provided under the Advisory Agreements, the Board also took into account the organization and strength of the Fund’s and its service providers’ compliance programs. The Board also reviewed the financial condition of the Investment Manager and its affiliates and each entity’s ability to carry out its responsibilities under the Management Agreement and the Fund’s other service agreements.
In addition, the Board discussed the acceptability of the terms of the Management Agreement (including the relatively broad scope of services required to be performed by the Investment Manager in addition to monitoring each Subadviser), noting that no changes were proposed from the forms of agreements previously approved. The Board also noted the wide array of legal and compliance services provided to the Fund under the Management Agreement.
The Board considered each Subadviser’s organizational strength and resources, portfolio management team depth and capabilities and investment process. The Board also considered each Subadviser’s capability and wherewithal to carry out its responsibilities under the applicable Subadvisory Agreement. In addition, the Board discussed the acceptability of the terms of the Subadvisory Agreements, including the scope of services required to be performed. The Board noted that the terms of the Subadvisory Agreements are generally consistent with the terms of other subadvisory agreements for subadvisers who manage other funds managed by the Investment Manager. It was observed that no changes were recommended to the Subadvisory Agreements. The Board took into account the Investment Manager’s representation that each Subadviser was in a position to provide quality services to the Fund. In this regard, the Board further observed the various services provided by the Investment Manager’s subadvisory oversight team.
| 44 | Multi-Manager International Equity Strategies Fund | Annual Report 2023 |
Approval of Management and Subadvisory
Agreements (continued)
(Unaudited)
After reviewing these and related factors (including investment performance as discussed below), the Board concluded, within the context of their overall conclusions, that the nature, extent and quality of the services provided to the Fund under the Advisory Agreements supported the continuation of the Management Agreement and each of the Subadvisory Agreements.
Investment performance
The Board carefully reviewed the investment performance of the Fund, including detailed reports providing the results of analyses performed by each of the Investment Manager, Broadridge and JDL collectively showing, for various periods (including since manager inception): (i) the performance of the Fund, (ii) the Fund’s performance relative to peers and benchmarks and (iii) the net assets of the Fund. The Board observed that the Fund’s performance for certain periods ranked above median based on information provided by Broadridge.
Additionally, the Board reviewed the performance of each of Arrowstreet, Baillie Gifford and Causeway and the Investment Manager’s process for monitoring such Subadvisers’ performance. The Board considered, in particular, management’s rationale for recommending the continued retention of Arrowstreet, Baillie Gifford and Causeway and management’s representations that the Investment Manager’s profitability is not the key factor driving their recommendation to select, renew or terminate Arrowstreet, Baillie Gifford and Causeway.
The Board also reviewed a description of the third-party data provider’s methodology for identifying the Fund’s peer groups for purposes of performance and expense comparisons.
The Board also considered the Investment Manager’s and Subadvisers’ performance and reputation generally, and the Investment Manager’s evaluation of the contribution of Arrowstreet, Baillie Gifford and Causeway to the Fund’s investment mandate. After reviewing these and related factors, the Board concluded, within the context of their overall conclusions, that the performance of the Fund, the Investment Manager and the Subadvisers, in light of other considerations, supported the continuation of the Management Agreement and each of the Subadvisory Agreements.
Comparative fees, costs of services provided and the profits realized by the Investment Manager and its affiliates from their relationships with the Fund
The Board reviewed comparative fees and the costs of services provided under each of the Advisory Agreements. The Board members considered detailed comparative information set forth in an annual report on fees and expenses, including, among other things, data (based on analyses conducted by Broadridge and JDL) showing a comparison of the Fund’s expenses with median expenses paid by funds in its comparative peer universe, as well as data showing the Fund’s contribution to the Investment Manager’s profitability.
The Board considered the reports of JDL, which assisted in the Board’s analysis of the Funds’ performance and expenses and the reasonableness of the Funds’ fee rates. The Board accorded particular weight to the notion that a primary objective of the level of fees is to achieve a rational pricing model applied consistently across the various product lines in the Fund family, while assuring that the overall fees for each Fund (with certain exceptions) are generally in line with the current “pricing philosophy” such that Fund total expense ratios, in general, approximate or are lower than the median expense ratios of funds in the same Lipper comparison universe. The Board took into account that the Fund’s total expense ratio (after considering proposed expense caps/waivers) was slightly below the peer universe’s median expense ratio shown in the reports.
Additionally, the Board reviewed the level of subadvisory fees paid to each Subadviser, noting that the fees are paid by the Investment Manager and do not impact the fees paid by the Fund. The Board also reviewed advisory fee rates charged by other comparable mutual funds employing each of Arrowstreet, Baillie Gifford and Causeway to provide comparable subadvisory services. After reviewing these and related factors, the Board concluded, within the context of their overall conclusions, that the levels of management fees, subadvisory fees and expenses of the Fund, in light of other considerations, supported the continuation of the Management Agreement and each of the Subadvisory Agreements.
Multi-Manager International Equity Strategies Fund | Annual Report 2023
| 45 |
Approval of Management and Subadvisory
Agreements (continued)
(Unaudited)
The Board also considered the profitability of the Investment Manager and its affiliates in connection with the Investment Manager providing management services to the Fund. Because the Subadvisory Agreements with each of Arrowstreet, Baillie Gifford and Causeway were negotiated at arms-length by the Investment Manager, which is responsible for payments to the Subadvisers thereunder, the Board did not consider the profitability to each of Arrowstreet, Baillie Gifford and Causeway from its relationship with the Fund. With respect to the profitability of the Investment Manager and its affiliates, the Independent Trustees referred to information discussing the profitability to the Investment Manager and Ameriprise Financial from managing, operating and distributing the Funds. The Board considered that the profitability generated by the Investment Manager in 2022 had declined from 2021 levels, due to a variety of factors, including the decreased assets under management of the Funds. It also took into account the indirect economic benefits flowing to the Investment Manager or its affiliates in connection with managing or distributing the Funds, such as the enhanced ability to offer various other financial products to Ameriprise Financial customers, soft dollar benefits and overall reputational advantages. The Board noted that the fees paid by the Fund should permit the Investment Manager to offer competitive compensation to its personnel, make necessary investments in its business and earn an appropriate profit. After reviewing these and related factors, the Board concluded, within the context of their overall conclusions, that the costs of services provided and the profitability to the Investment Manager and its affiliates from their relationships with the Fund supported the continuation of the Management Agreement and each of the Subadvisory Agreements.
Economies of scale
The Board considered the potential existence of economies of scale in the provision by the Investment Manager of services to the Fund, and whether those economies of scale were shared with the Fund through breakpoints in investment management fees or other means, such as expense limitation arrangements and additional investments by the Investment Manager in investment, trading, compliance and other resources. The Board considered the economies of scale that might be realized as the Fund’s net asset level grows and took note of the extent to which Fund shareholders might also benefit from such growth. In this regard, the Board took into account that management fees decline as Fund assets exceed various breakpoints, all of which have not been surpassed. The Board observed that the Management Agreement provided for breakpoints in the management fee rate schedule that allow opportunities for shareholders to realize lower fees as Fund assets grow and that there are additional opportunities through other means for sharing economies of scale with shareholders. The Board also noted that the breakpoints in the Subadvisory Agreements did not occur at the same levels as the breakpoints in the Management Agreement. In this regard, the Board noted the potential challenges of seeking to tailor the Management Agreement breakpoints to those of a subadvisory agreement in this context.
Conclusion
The Board reviewed all of the above considerations in reaching its decision to approve the continuation of the Management Agreement and each of the Subadvisory Agreements. In reaching its conclusions, no single factor was determinative.
On June 22, 2023, the Board, including all of the Independent Trustees, determined that fees payable under each of the Advisory Agreements were fair and reasonable in light of the extent and quality of services provided and approved the renewal of each of the Advisory Agreements.
APPROVAL OF SUBADVISORY AGREEMENT AMENDMENT
At its meeting on March 10, 2023, the Board, including the Independent Trustees, approved an amendment to the Subadvisory Agreement between the Investment Manager and Causeway (the Causeway Subadvisory Agreement) for the purpose of reducing the fees payable thereunder by the Investment Manager to Causeway.
The Independent Trustees considered how the amendment to the Causeway Subadvisory Agreement would reduce the subadvisory fee rate paid to Causeway by the Investment Manager under the current Causeway Subadvisory Agreement. The Independent Trustees also considered that the Investment Manager had confirmed that there would not be any change to the nature or quality of the subadvisory services provided as a result of entering into the amendment, and that the Causeway Subadvisory Agreement, as amended, was substantially similar to the current Causeway Subadvisory Agreement in place except for the reduced fee. The Independent Trustees reviewed the performance of the Fund as well as the level of
| 46 | Multi-Manager International Equity Strategies Fund | Annual Report 2023 |
Approval of Management and Subadvisory
Agreements (continued)
(Unaudited)
management fees paid by the Fund. The Independent Trustees noted that no management fees were proposed to change and that the level of services provided by the Investment Manager was also not proposed to change. The Independent Trustees also noted that the Contracts Committee, as part of the 2023 15(c) process, would review the continued reasonableness of each Fund’s management fee, including taking into account the reduced subadvisory fee levels.
The Independent Trustees noted the discussion, which is described below, relating to the renewal and approval of the advisory and subadvisory agreements for the Fund at the Contracts Committee and Board meetings in June 2022 (the June 2022 Meeting) and, in that connection, the discussion by Independent Legal Counsel of the Board’s responsibilities pursuant to Sections 15(c) and 36(b) of the Investment Company Act of 1940, as amended (the 1940 Act) and the factors that should be considered in determining whether to approve or renew an investment management agreement. The Independent Trustees considered that they should apply these factors in considering the amendment to the Causeway Subadvisory Agreement. The Independent Trustees also considered that they should take into account the variety of written materials and oral presentations they received at their meetings in November 2022, as well as all of the information previously considered at the June 2022 Meeting regarding the proposed 15(c) renewal of the existing Funds’ advisory and subadvisory agreements.
After considering the factors described above relating to the amendment of the Causeway Subadvisory Agreement, and taking into account all of the factors considered, as described below, as part of the approval of the continuance of the current Causeway Subadvisory Agreement in June 2022, the Board, including all of the Independent Trustees, approved the proposed amendment to the Causeway Subadvisory Agreement.
General conclusions in connection with the Trustees’ previous approval of the continuance of the Fund’s existing advisory agreements
On an annual basis, the Board, including the Independent Trustees, considers renewal of the Management Agreement and the Subadvisory Agreements. The Investment Manager prepared detailed reports for the Board and its Contracts Committee (including its Contracts Subcommittee) in November 2021 and March, April and June 2022, including reports providing the results of analyses performed by an independent third-party data provider, Broadridge, and comprehensive responses to written requests for information by Independent Legal Counsel to the Investment Manager, to assist the Board in making this determination. In addition, throughout the year, the Board (or its committees or subcommittees) regularly meets with portfolio management teams and senior management personnel and reviews information prepared by the Investment Manager addressing the services the Investment Manager provides and Fund performance. The Board also accords appropriate weight to the work, deliberations and conclusions of the various committees, such as the Contracts Committee, the Investment Review Committee, the Audit Committee and the Compliance Committee in determining whether to continue the Advisory Agreements.
The Board, at its June 23, 2022 Board meeting, considered the renewal of each of the Advisory Agreements for additional one-year terms. At the June 2022 Meeting, Independent Legal Counsel reviewed with the Independent Trustees various factors relevant to the Board’s consideration of advisory and subadvisory agreements and the Board’s legal responsibilities related to such consideration. The Independent Trustees considered all information that they, their legal counsel or the Investment Manager believed reasonably necessary to evaluate and to approve the continuation of each of the Advisory Agreements. Among other things, the information and factors considered included the following:
| • | Information on the investment performance of the Fund relative to the performance of a group of mutual funds determined to be comparable to the Fund by Broadridge, as well as performance relative to benchmarks; |
| • | Information on the Fund’s management fees and total expenses, including information comparing the Fund’s expenses to those of a group of comparable mutual funds, as determined by Broadridge; |
| • | The Investment Manager’s agreement to contractually limit or cap total operating expenses for the Fund so that total operating expenses (excluding certain fees and expenses, such as transaction costs and certain other investment related expenses, interest, taxes, acquired fund fees and expenses and infrequent and/or unusual expenses) would not exceed a specified annual rate, as a percentage of the Fund’s net assets; |
Multi-Manager International Equity Strategies Fund | Annual Report 2023
| 47 |
Approval of Management and Subadvisory
Agreements (continued)
(Unaudited)
| • | Terms of the Advisory Agreements; |
| • | Subadvisory fees payable by the Investment Manager under the Subadvisory Agreements; |
| • | Descriptions of other agreements and arrangements with affiliates of the Investment Manager relating to the operations of the Fund, including agreements with respect to the provision of transfer agency and shareholder services to the Fund; |
| • | Descriptions of various services performed by the Investment Manager and the Subadvisers under the Advisory Agreements, including portfolio management and portfolio trading practices; |
| • | Information regarding any recently negotiated management fees of similarly-managed portfolios of other institutional clients of the Investment Manager; |
| • | Information regarding the resources of the Investment Manager and Subadvisers, including information regarding senior management, portfolio managers and other personnel; |
| • | Information regarding the capabilities of the Investment Manager and the Subadvisers with respect to compliance monitoring services; |
| • | The profitability to the Investment Manager and its affiliates from their relationships with the Fund; and |
| • | Report provided by the Board’s independent fee consultant, JDL. |
Following an analysis and discussion of the foregoing, and the factors identified below, the Board, including all of the Independent Trustees, approved the renewal of each of the Advisory Agreements.
Nature, extent and quality of services provided by the Investment Manager and the Subadvisers
The Board analyzed various reports and presentations it had received detailing the services performed by the Investment Manager and the Subadvisers, as well as their history, expertise, resources and relative capabilities, and the qualifications of their personnel.
The Board specifically considered the many developments during recent years concerning the services provided by the Investment Manager, including, in particular, detailed information regarding the process employed for selecting and overseeing affiliated and unaffiliated Subadvisers. With respect to the Investment Manager, the Board also noted the organization and depth of the equity and credit research departments. The Board further observed the enhancements to the investment risk management department’s processes, systems and oversight, over the past several years, as well as planned 2022 initiatives in this regard. The Board also took into account the broad scope of services provided by the Investment Manager to each subadvised Fund, including, among other services, investment, risk and compliance oversight. The Board also took into account the information it received concerning the Investment Manager’s ability to attract and retain key portfolio management personnel and that it has sufficient resources to provide competitive and adequate compensation to investment personnel. The Board also observed that the Investment Manager has been able to effectively manage, operate and distribute the Funds through the COVID-19 pandemic period with no disruptions in services provided. The Board also considered added personnel and resources obtained by Columbia Threadneedle through Ameriprise Financial’s acquisition of BMO Financial Group’s Europe, Middle East, and Africa (EMEA) asset management business.
In connection with the Board’s evaluation of the overall package of services provided by the Investment Manager, the Board also considered the nature, quality and range of administrative services provided to the Fund by the Investment Manager, as well as the achievements in 2021 in the performance of administrative services, and noted the various enhancements anticipated for 2022. In evaluating the quality of services provided under the Advisory Agreements, the Board also took into account the organization and strength of the Fund’s and its service providers’ compliance programs. The Board also reviewed the financial condition of the Investment Manager and its affiliates and each entity’s ability to carry out its responsibilities under the Management Agreement and the Fund’s other service agreements.
| 48 | Multi-Manager International Equity Strategies Fund | Annual Report 2023 |
Approval of Management and Subadvisory
Agreements (continued)
(Unaudited)
In addition, the Board discussed the acceptability of the terms of the Management Agreement (including the relatively broad scope of services required to be performed by the Investment Manager in addition to monitoring each Subadviser), noting that no changes were proposed from the forms of agreements previously approved. The Board also noted the wide array of legal and compliance services provided to the Fund under the Management Agreement.
The Board considered each Subadviser’s organizational strength and resources, portfolio management team depth and capabilities and investment process. The Board also considered each Subadviser’s capability and wherewithal to carry out its responsibilities under the applicable Subadvisory Agreement. In addition, the Board discussed the acceptability of the terms of the Subadvisory Agreements, including the scope of services required to be performed. The Board noted that the terms of the Subadvisory Agreements are generally consistent with the terms of other subadvisory agreements for subadvisers who manage other funds managed by the Investment Manager. It was observed that no changes were recommended to the Subadvisory Agreements. The Board took into account the Investment Manager’s representation that each Subadviser was in a position to provide quality services to the Fund. In this regard, the Board further observed the various services provided by the Investment Manager’s subadvisory oversight team and their significant resources added in recent years.
After reviewing these and related factors (including investment performance as discussed below), the Board concluded, within the context of their overall conclusions, that the nature, extent and quality of the services provided to the Fund under the Advisory Agreements supported the continuation of the Management Agreement and the Subadvisory Agreements.
Investment performance
In this connection, the Board carefully reviewed the investment performance of the Fund, including detailed reports providing the results of analyses performed by each of the Investment Manager, Broadridge and JDL collectively showing, for various periods (including since manager inception): (i) the performance of the Fund, (ii) the performance of a benchmark index, (iii) the percentage ranking of the Fund among its comparison group, (iv) the Fund’s performance relative to peers and benchmarks and (v) the net assets of the Fund. The Board observed that the Fund’s performance for certain periods ranked above median based on information provided by Broadridge.
Additionally, the Board reviewed the performance of each of Arrowstreet, Baillie Gifford and Causeway and the Investment Manager’s process for monitoring such Subadvisers’ performance. The Board considered, in particular, management’s rationale for recommending the continued retention of each Subadviser and management’s representations that the Investment Manager’s profitability is not the key factor driving their recommendation to select, renew or terminate Arrowstreet, Baillie Gifford and Causeway.
The Board also reviewed a description of the third-party data provider’s methodology for identifying the Fund’s peer groups for purposes of performance and expense comparisons.
The Board also considered the Investment Manager’s and Subadvisers’ performance and reputation generally and the Investment Manager’s evaluation of each Subadviser’s contribution to the Fund’s broader investment mandate. After reviewing these and related factors, the Board concluded, within the context of their overall conclusions, that the performance of the Fund, the Investment Manager and the Subadvisers, in light of other considerations, supported the continuation of the Management Agreement and the Subadvisory Agreements.
Comparative fees, costs of services provided and the profits realized by the Investment Manager and its affiliates from their relationships with the Fund
The Board reviewed comparative fees and the costs of services provided under each of the Advisory Agreements. The Board members considered detailed comparative information set forth in an annual report on fees and expenses, including, among other things, data (based on analyses conducted by Broadridge and JDL) showing a comparison of the Fund’s expenses with median expenses paid by funds in its comparative peer universe, as well as data showing the Fund’s contribution to the Investment Manager’s profitability.
Multi-Manager International Equity Strategies Fund | Annual Report 2023
| 49 |
Approval of Management and Subadvisory
Agreements (continued)
(Unaudited)
The Board considered the reports of JDL, which assisted in the Board’s analysis of the Funds’ performance and expenses and the reasonableness of the Funds’ fee rates. The Board accorded particular weight to the notion that a primary objective of the level of fees is to achieve a rational pricing model applied consistently across the various product lines in the Fund family, while assuring that the overall fees for each Fund (with certain exceptions) are generally in line with the current "pricing philosophy" such that Fund total expense ratios, in general, approximate or are lower than the median expense ratios of funds in the same Lipper comparison universe. The Board took into account that the Fund’s total expense ratio (after considering proposed expense caps/waivers) approximated the peer universe’s median expense ratio.
Additionally, the Board reviewed the level of subadvisory fees paid to each Subadviser, noting that the fees are paid by the Investment Manager and do not impact the fees paid by the Fund. The Board also reviewed advisory fee rates charged by other comparable mutual funds employing each of Arrowstreet, Baillie Gifford and Causeway to provide comparable subadvisory services. After reviewing these and related factors, the Board concluded, within the context of their overall conclusions, that the levels of management fees, subadvisory fees and expenses of the Fund, in light of other considerations, supported the continuation of each of the Management Agreement and the Subadvisory Agreements.
The Board also considered the profitability of the Investment Manager and its affiliates in connection with the Investment Manager providing management services to the Fund. Because the Subadvisory Agreements with each of Arrowstreet, Baillie Gifford and Causeway were negotiated at arms-length by the Investment Manager, which is responsible for payments to the Subadvisers thereunder, the Board did not consider the profitability to each of Arrowstreet, Baillie Gifford and Causeway from its relationship with the Fund. With respect to the profitability of the Investment Manager and its affiliates, the Independent Trustees referred to information discussing the profitability to the Investment Manager and Ameriprise Financial from managing, operating and distributing the Funds. The Board considered that in 2021 the Board had considered 2020 profitability and that the 2022 information showed that the profitability generated by the Investment Manager in 2021 increased from 2020 levels, due to a variety of factors, including the increased assets under management of the Funds. It also took into account the indirect economic benefits flowing to the Investment Manager or its affiliates in connection with managing or distributing the Funds, such as the enhanced ability to offer various other financial products to Ameriprise Financial customers, soft dollar benefits and overall reputational advantages. The Board noted that the fees paid by the Fund should permit the Investment Manager to offer competitive compensation to its personnel, make necessary investments in its business and earn an appropriate profit. After reviewing these and related factors, the Board concluded, within the context of their overall conclusions, that the costs of services provided and the profitability to the Investment Manager and its affiliates from their relationships with the Fund supported the continuation of the Management Agreement and the Subadvisory Agreements.
Economies of scale
The Board considered the potential existence of economies of scale in the provision by the Investment Manager of services to the Fund, to groups of related funds and to the Investment Manager as a whole, and whether those economies of scale were shared with the Fund through breakpoints in investment management fees or other means, such as expense limitation arrangements and additional investments by the Investment Manager in investment, trading, compliance and other resources. The Board considered the economies of scale that might be realized as the Fund’s net asset level grows and took note of the extent to which Fund shareholders might also benefit from such growth. In this regard, the Board took into account that management fees decline as Fund assets exceed various breakpoints, all of which have not been surpassed. The Board observed that the Management Agreement provided for breakpoints in the management fee rate schedule that allow opportunities for shareholders to realize lower fees as Fund assets grow and that there are additional opportunities through other means for sharing economies of scale with shareholders. The Board also noted that the breakpoints in the Subadvisory Agreements did not occur at the same levels as the breakpoints in the Management Agreement. In this regard, the Board noted the potential challenges of seeking to tailor the Management Agreement breakpoints to those of a subadvisory agreement in this context.
| 50 | Multi-Manager International Equity Strategies Fund | Annual Report 2023 |
Approval of Management and Subadvisory
Agreements (continued)
(Unaudited)
Conclusion
The Board reviewed all of the above considerations in reaching its decision to approve the continuation of the Management Agreement and the Subadvisory Agreements. In reaching its conclusions, no single factor was determinative.
On June 23, 2022, the Board, including all of the Independent Trustees, determined that fees payable under each of the Advisory Agreements were fair and reasonable in light of the extent and quality of services provided and approved the renewal of each of the Advisory Agreements.
Multi-Manager International Equity Strategies Fund | Annual Report 2023
| 51 |
Multi-Manager International Equity Strategies Fund
P.O. Box 219104
Kansas City, MO 64121-9104
Please read and consider the investment objectives, risks, charges and expenses for any fund carefully before investing. For a prospectus and summary prospectus, which contains this and other important information about the Fund, go to
columbiathreadneedleus.com/investor/. The Fund is distributed by Columbia Management Investment Distributors, Inc., member FINRA, and managed by Columbia Management Investment Advisers, LLC.
Columbia Threadneedle Investments (Columbia Threadneedle) is the global brand name of the Columbia and Threadneedle group of companies. All rights reserved.
© 2023 Columbia Management Investment Advisers, LLC.
columbiathreadneedleus.com/investor/

Annual Report
August 31, 2023
Multi-Manager Small Cap Equity Strategies Fund
Not FDIC or NCUA Insured • No Financial Institution Guarantee • May Lose Value
| 3 |
| 5 |
| 10 |
| 11 |
| 27 |
| 28 |
| 29 |
| 30 |
| 32 |
| 40 |
| 41 |
| 41 |
| 47 |
| 48 |
If you elect to receive the shareholder report for Multi-Manager Small Cap Equity Strategies Fund (the Fund) in paper, mailed to you, the Fund mails one shareholder report to each shareholder address, unless such shareholder elects to receive shareholder reports from the Fund electronically via e-mail or by having a paper notice mailed to you (Postcard Notice) that your Fund’s shareholder report is available at the Columbia funds’ website (columbiathreadneedleus.com/investor/). If you would like more than one report in paper to be mailed to you, or would like to elect to receive reports via e-mail or access them through Postcard Notice, please call shareholder services at 800.345.6611 and additional reports will be sent to you.
Proxy voting policies and procedures
The policy of the Board of Trustees is to vote the proxies of the companies in which the Fund holds investments consistent with the procedures as stated in the Statement of Additional Information (SAI). You may obtain a copy of the SAI without charge by calling 800.345.6611; contacting your financial intermediary; visiting columbiathreadneedleus.com/investor/; or searching the website of the Securities and Exchange Commission (SEC) at sec.gov. Information regarding how the Fund voted proxies relating to portfolio securities is filed with the SEC by August 31st for the most recent 12-month period ending June 30th of that year, and is available without charge by visiting columbiathreadneedleus.com/investor/, or searching the website of the SEC at sec.gov.
Quarterly schedule of investments
The Fund files a complete schedule of portfolio holdings with the SEC for the first and third quarters of each fiscal year on Form N-PORT. The Fund’s Form N-PORT filings are available on the SEC’s website at sec.gov. The Fund’s complete schedule of portfolio holdings, as filed on Form N-PORT, is available on columbiathreadneedleus.com/investor/ or can also be obtained without charge, upon request, by calling 800.345.6611.
Additional Fund information
For more information about the Fund, please visit columbiathreadneedleus.com/investor/ or call 800.345.6611. Customer Service Representatives are available to answer your questions Monday through Friday from 8 a.m. to 7 p.m. Eastern time.
Fund investment manager
Columbia Management Investment Advisers, LLC (the Investment Manager)
290 Congress Street
Boston, MA 02210
Fund distributor
Columbia Management Investment Distributors, Inc.
290 Congress Street
Boston, MA 02210
Fund transfer agent
Columbia Management Investment Services Corp.
P.O. Box 219104
Kansas City, MO 64121-9104
Multi-Manager Small Cap Equity Strategies Fund | Annual Report 2023
Fund at a Glance
(Unaudited)
Investment objective
The Fund seeks long-term capital appreciation.
Portfolio management
Columbia Management Investment Advisers, LLC
Jarl Ginsberg, CFA, CAIA
Christian Stadlinger, Ph.D., CFA
Conestoga Capital Advisors, LLC
Robert Mitchell
Joseph Monahan, CFA
Hotchkis and Wiley Capital Management, LLC
Judd Peters, CFA
Ryan Thomes, CFA
J.P. Morgan Investment Management Inc.
Eytan Shapiro, CFA
Matthew Cohen
Jacobs Levy Equity Management, Inc.
Bruce Jacobs, Ph.D.
Kenneth Levy, CFA
Morningstar style boxTM
The Morningstar Style Box is based on a fund’s portfolio holdings. For equity funds, the vertical axis shows the market capitalization of the stocks owned, and the horizontal axis shows investment style (value, blend, or growth). Information shown is based on the most recent data provided by Morningstar.
© 2023 Morningstar, Inc. All rights reserved. The Morningstar information contained herein: (1) is proprietary to Morningstar and/or its content providers; (2) may not be copied or distributed; and (3) is not warranted to be accurate, complete or timely. Neither Morningstar nor its content providers are responsible for any damages or losses arising from any use of this information.
| Average annual total returns (%) (for the period ended August 31, 2023) |
| | | Inception | 1 Year | 5 Years | 10 Years |
| Institutional Class* | 01/03/17 | 5.83 | 3.89 | 8.17 |
| Institutional 3 Class* | 12/18/19 | 6.05 | 4.03 | 8.25 |
| Russell 2000 Index | | 4.65 | 3.14 | 7.96 |
All results shown assume reinvestment of distributions during the period. Returns do not reflect the deduction of taxes that a shareholder may pay on Fund distributions or on the redemption of Fund shares. Performance results reflect the effect of any fee waivers or reimbursements of Fund expenses by Columbia Management Investment Advisers, LLC and/or any of its affiliates. Absent these fee waivers or expense reimbursement arrangements, performance results would have been lower.
The performance information shown represents past performance and is not a guarantee of future results. The investment return and principal value of your investment will fluctuate so that your shares, when redeemed, may be worth more or less than their original cost. Current performance may be lower or higher than the performance information shown. You may obtain performance information current to the most recent month-end by contacting your financial intermediary, visiting columbiathreadneedleus.com/investor/ or calling 800.345.6611.
| * | The returns shown for periods prior to the share class inception date (including returns for the Life of the Fund, if shown, which are since Fund inception) include the returns of the Fund’s oldest share class. Returns shown for periods prior to the inception date of each class include the returns of the Fund’s Class A shares through January 2, 2017, and for Institutional 3 Class shares, include the returns of the Fund’s Institutional Class shares for the period from January 3, 2017 through the inception date of the class. Class A shares were offered prior to the Fund’s Institutional Class shares but have since been merged into the Fund’s Institutional Class shares. These returns are adjusted to reflect any higher class-related operating expenses of the newer share classes, as applicable. Please visit columbiathreadneedleus.com/investor/investment-products/mutual-funds/appended-performance for more information. |
The Russell 2000 Index measures the performance of the small-cap segment of the U.S. equity universe. The Russell 2000 is a subset of the Russell 3000 Index representing approximately 10% of the total market capitalization of that index. It includes the securities of approximately 2,000 of the smallest companies in the Russell 3000 Index based on a combination of their market capitalization and current index membership.
Indices are not available for investment, are not professionally managed and do not reflect sales charges, fees, brokerage commissions, taxes or other expenses of investing. Securities in the Fund may not match those in an index.
Multi-Manager Small Cap Equity Strategies Fund | Annual Report 2023
| 3 |
Fund at a Glance (continued)
(Unaudited)
Performance of a hypothetical $10,000 investment (August 31, 2013 — August 31, 2023)
The chart above shows the change in value of a hypothetical $10,000 investment in Institutional Class shares of Multi-Manager Small Cap Equity Strategies Fund during the stated time period, and does not reflect the deduction of taxes that a shareholder may pay on Fund distributions or on the redemption of Fund shares.
| Portfolio breakdown (%) (at August 31, 2023) |
| Common Stocks | 97.9 |
| Exchange-Traded Equity Funds | 0.4 |
| Money Market Funds | 1.7 |
| Total | 100.0 |
Percentages indicated are based upon total investments excluding investments in derivatives, if any. The Fund’s portfolio composition is subject to change.
| Equity sector breakdown (%) (at August 31, 2023) |
| Communication Services | 0.8 |
| Consumer Discretionary | 10.7 |
| Consumer Staples | 2.6 |
| Energy | 6.8 |
| Financials | 17.5 |
| Health Care | 11.5 |
| Industrials | 24.3 |
| Information Technology | 15.0 |
| Materials | 3.8 |
| Real Estate | 4.9 |
| Utilities | 2.1 |
| Total | 100.0 |
Percentages indicated are based upon total equity investments. The Fund’s portfolio composition is subject to change.
| 4 | Multi-Manager Small Cap Equity Strategies Fund | Annual Report 2023 |
Manager Discussion of Fund Performance
(Unaudited)
The Fund is currently managed by four independent investment management firms and by Columbia Management Investment Advisers, LLC (CMIA) and each invests a portion of the portfolio’s assets. As of August 31, 2023, CMIA, Conestoga Capital Advisors, LLC (Conestoga), Hotchkis and Wiley Capital Management, LLC (Hotchkis & Wiley), J.P. Morgan Investment Management Inc. (JPMIM) and Jacobs Levy Equity Management Inc. (Jacobs Levy) managed approximately 19.8%, 20.5%, 20.6%, 19.8% and 19.3% of the portfolio, respectively.
For the 12-month period that ended August 31, 2023, Institutional Class shares of Multi-Manager Small Cap Equity Strategies Fund returned 5.83%. The Fund’s benchmark, the Russell 2000 Index, returned 4.65%.
Market overview
The broad U.S. equity market delivered strong gains during the annual period, despite continued concerns about a future economic slowdown and a series of rate hikes by the U.S. Federal Reserve (Fed) that tapered from aggressive to more measured by period-end to tame stubborn inflation. Momentum picked up as the period progressed as better-than-feared earnings drove equity gains. The period, however, was far from smooth.
In March 2023, the failure of a pair of U.S. banks and the collapse of European giant Credit Suisse led to fears of a financial crisis. In response, the Fed created a lending facility to support bank liquidity while the market began to price in multiple cuts in the federal funds target rate over the second half of 2023. At its March 2023 meeting the Fed raised the federal funds target rate by another quarter-point to a range of 4.75% to 5.0%. The rate hike was generally welcomed by investors as a signal that the Fed viewed the financial system as remaining on stable footing.
Inflation continued to decline as the period progressed. Through August 2023, the rate of year-over-year U.S. inflation had decelerated to 3.7%, a meaningful reduction from the four decade high of 9.1% in June 2022, though still higher than the Fed’s 2% inflation target. Nonetheless, with the economy displaying surprising resilience and employment remaining historically robust, the Fed implemented additional 25 basis point increases at its early May and late July meetings, bringing the federal funds target rate to the 5.25% to 5.50% range.
Sentiment remained quite positive through the latter months of the period, as the Fed slowed its pace of rate hikes in response to cooling inflation. Investors were further encouraged by the fact that economic growth and corporate earnings — while slowing — did not decline to the extent that the markets had anticipated in late 2022. These factors combined to fuel an impressive gain for equities, but the majority of the positive return was generated by a small group of mega-cap technology-related stocks. Much of the relative strength in this area came from companies expected to benefit from the evolution of artificial intelligence (AI). The growth style strongly outpaced value as a result. Small-cap stocks, which are less influenced by AI-related trends and more sensitive to concerns in the banking sector, were unable to keep pace with the rally in large caps.
CMIA
Our portion of the Fund’s portfolio is compared against the Russell 2000 Value Index, which we outperformed during the 12-month period.
Notable contributors in our portion of the Fund during the period
| • | The largest contribution to returns in our portion of the Fund came from the industrials, consumer discretionary, materials and information technology sectors. |
| • | Top individual contributors included: |
| ○ | International Game Technology PLC, an electronic casino gaming equipment and services company; |
| ○ | APi Group Corp, a life safety, security and specialty services company; |
| ○ | EMCOR Group, Inc., an electrical and mechanical construction company; |
| ○ | KB Home, a homebuilding company; and |
| ○ | Tanger Factory Outlet Centers, Inc., an outlet shopping center real estate investment trust. |
Multi-Manager Small Cap Equity Strategies Fund | Annual Report 2023
| 5 |
Manager Discussion of Fund Performance (continued)
(Unaudited)
Notable detractors in our portion of the Fund during the period
| • | Areas that weighed most on performance in our portion of the Fund included the financials, health care and utilities sectors. |
| • | Holdings that detracted most from performance included: |
| ○ | United Natural Foods, Inc., a specialty foods distributor; |
| ○ | Bloom Energy Corp., a manufacturer of solid-oxide fuel cell systems for power generation; |
| ○ | Hannon Armstrong Sustainable Infrastructure Capital, Inc., a company that provides capital and services to the energy efficiency, renewable energy, and other sustainable infrastructure markets in the United States; |
| ○ | UMB Financial Corp., a bank holding company; and |
| ○ | Sunrun, Inc., a company which designs and sells residential solar energy systems. |
| ○ | We sold our positions in United Natural Foods and Sunrun. |
Conestoga
Our portion of the Fund’s portfolio is compared to the Russell 2000 Growth Index, which we outperformed during the 12-month period.
Notable contributors in our portion of the Fund during the period
| • | The top contributing market sectors to relative performance in our portion of the Fund were the industrials, health care and real estate sectors. |
| • | Top individual contributors to performance during the period included: |
| ○ | AAON, Inc., a leading provider of semi-custom HVAC equipment; |
| ○ | SPS Commerce, Inc., a provider of supply chain management software; and |
| ○ | Axon Enterprise, Inc., a public safety technology company. |
Notable detractors in our portion of the Fund during the period
| • | Technology was the only sector that detracted from performance in our portion of the Fund relative to the benchmark. Though it underperformed the benchmark in the sector, technology delivered positive absolute performance for our portion of the portfolio. |
| • | Top individual detractors in our portion of the Fund included: |
| ○ | Omnicell, Inc., a provider of medication control solutions and medication adherence packaging; |
| ○ | Simulations Plus, Inc., a leading provider of simulation software and consulting services to the pharma/biotech industry; and |
| ○ | Definitive Healthcare Corp., a leading provider of healthcare commercial intelligence software. |
Hotchkis & Wiley
Our portion of the Fund’s portfolio is compared to the Russell 2000 Value Index, which we outperformed during the 12-month period.
Notable contributors in our portion of the Fund during the period
| • | The financials sector represented the largest positive contributor to relative performance over the period, driven by strong stock selection. We had no exposure to regional banks that failed and limited exposure to those that were perceived to be at risk of failure. |
| 6 | Multi-Manager Small Cap Equity Strategies Fund | Annual Report 2023 |
Manager Discussion of Fund Performance (continued)
(Unaudited)
| • | An underweight exposure to the health care sector, particularly biotechnology, helped relative performance as this was among the worst-performing market segments. |
| • | Our industrials exposure helped, both the overweight allocation and positive stock selection. |
| • | The largest contributors were an eclectic mix of businesses that outperformed expectations. |
| ○ | Super Micro Computer, Inc. provides compute platforms that are application optimized, high-performance, and high-efficiency server and storage systems. We exited the position on valuation and strategy parameters (the market cap became too large). |
| ○ | SiriusPoint Ltd operates as an insurance and reinsurance company. We continue to hold a modest position. |
| ○ | Tidewater, Inc. produces offshore supply vessels and marine support services for offshore exploration and production companies. We exited the position as it approached our estimate of intrinsic value. |
Notable detractors in our portion of the Fund during the period
| • | The three largest detractors were the materials, real estate and utilities sectors. Combined, however, the three sectors detracted less than 50 basis points from relative performance. (A basis point is 1/100 of a percent.) |
| ○ | The portfolio was slightly overweight in the materials sector, which had a nominally positive effect, but stock selection in the sector was negative. |
| ○ | The portfolio was significantly underweight in the real estate sector, which helped relative performance, but this was offset by negative stock selection in the sector. |
| ○ | The underweight position in utilities and negative stock selection had a total effect of negative 5 basis points for the period. |
| • | Individual holdings that detracted most during the period included: |
| ○ | HomeStreet, Inc., a financial services company operating primarily in the western United States. |
| ○ | Emergent BioSolutions, Inc. is one of the very few biotechnology companies owned in the portfolio. The company makes medical countermeasures for biological and chemical threats (it has the only FDA approved anthrax vaccine) as well as emerging infectious diseases. |
| ○ | Telos Corp. offers IT services with its primary service being security solutions, which it sells to various federal government agencies and to corporate customers. |
JPMIM
Our portion of the Fund’s portfolio is compared against the Russell 2000 Value Index, which we underperformed during the 12-month period.
Notable detractors in our portion of the Fund during the period
| • | The health care and information technology sectors weighed most on performance during the period, driven primarily by stock selection. |
| • | A modest sector overweight in the health care also detracted. |
| • | Holdings that detracted most during the period included: |
| ○ | Cano Health, Inc., a value-based health care services provider; |
| ○ | Wolfspeed, Inc., a semiconductor device company that develops and manufactures silicon carbide and solutions for high power applications; and |
| ○ | Petco Health & Wellness Co., Inc., a supplier of pet products. |
| ○ | We exited our positions in Cano Health and Wolfspeed. |
Multi-Manager Small Cap Equity Strategies Fund | Annual Report 2023
| 7 |
Manager Discussion of Fund Performance (continued)
(Unaudited)
Notable contributors in our portion of the Fund during the period
| • | Stock selection within the industrials, financials and consumer discretionary sectors contributed most to performance in our portion of the Fund. |
| • | Top individual contributors included: |
| ○ | Saia, Inc., a leader in less-than-truckload shipping and logistics; |
| ○ | Remitly Global, Inc., a provider of remittance and other digital financial services for the underbanked; and |
| ○ | MSA Safety, Inc., a leading supplier of firefighting breathing apparatus and protective equipment. |
Jacobs Levy
Our portion of the Fund’s portfolio is compared against the Russell 2000 Value Index, which it underperformed during the 12-month period.
Notable detractors in our portion of the Fund during the period
The three market sectors that detracted the most during the reporting period (on a relative basis) were the consumer discretionary, health care and energy sectors. Security selection was negative in those three sectors.
| • | An overweight to health care and an underweight to energy detracted. |
| • | Absolute total return for the portfolio was negative in consumer discretionary and health care, but positive in energy. |
| • | The three stocks that detracted the most from relative performance were Emergent BioSolutions, Inc., Telephone and Data Systems, Inc. and Herbalife Nutrition Ltd. |
| ○ | Emergent BioSolutions engages in the development, manufacture, and commercialization of medical countermeasures. It offers products for civilian and military populations that address accidental, intentional, and naturally occurring public health threats. |
| ○ | Telephone and Data Systems is a diversified telecommunications company, which engages in the provision of communications services, retail wireless connections, broadband, video, and voice connections. We liquidated the position in May 2023. |
| ○ | Herbalife Nutrition engages in the provision of health and wellness products. We liquidated the position in July 2023. |
Notable contributors in our portion of the Fund during the period
The three strongest-contributing market sectors during the reporting period (on a relative basis) were the financials, industrials, and utilities sectors. Security selection was positive in those three sectors.
| • | An overweight to industrials and an underweight to utilities helped, while the overweight to financials detracted. |
| • | Absolute total return for our portion of the portfolio was positive in industrials and utilities, but negative in financials. |
| • | The three stocks that contributed the most to relative performance in our portion of the portfolio were Boise Cascade Co., American Equity Investment Life Holding Co. and Nutanix, Inc. |
| ○ | Boise Cascade engages in the manufacture and distribution of engineered wood products and plywood. |
| ○ | American Equity Investment Life Holding engages in the development and sale of fixed index and fixed rate annuity products. It focuses on the following portfolios: commercial mortgage loans, agricultural mortgage loans, and residential mortgage loans. We reduced and then liquidated our holding during late June/first half of July. |
| ○ | Nutanix engages in the provision of a cloud platform leveraging web-scale engineering and consumer-grade design. The firm also provides software solutions and cloud services to customers’ enterprise infrastructure. |
| 8 | Multi-Manager Small Cap Equity Strategies Fund | Annual Report 2023 |
Manager Discussion of Fund Performance (continued)
(Unaudited)
Market risk may affect a single issuer, sector of the economy, industry or the market as a whole. Foreign investments subject the Fund to risks, including political, economic, market, social and others within a particular country, as well as to currency instabilities and less stringent financial and accounting standards generally applicable to U.S. issuers. Investments in small-cap companies involve risks and volatility greater than investments in larger, more established companies. The Fund may invest significantly in issuers within a particular sector, which may be negatively affected by market, economic or other conditions, making the Fund more vulnerable to unfavorable developments in the sector. The Fund is managed by multiple advisers independently of one another, which may result in contradicting trades (i.e., with no net benefit to the Fund), while increasing transaction costs. Market or other (e.g., interest rate) environments may adversely affect the liquidity of fund investments, negatively impacting their price. Generally, the less liquid the market at the time the Fund sells a holding, the greater the risk of loss or decline of value to the Fund.
The views expressed in this report reflect the current views of the respective parties who have contributed to this report. These views are not guarantees of future performance and involve certain risks, uncertainties and assumptions that are difficult to predict, so actual outcomes and results may differ significantly from the views expressed. These views are subject to change at any time based upon economic, market or other conditions and the respective parties disclaim any responsibility to update such views. These views may not be relied on as investment advice and, because investment decisions for a Columbia fund are based on numerous factors, may not be relied on as an indication of trading intent on behalf of any particular Columbia fund. References to specific securities should not be construed as a recommendation or investment advice.
Multi-Manager Small Cap Equity Strategies Fund | Annual Report 2023
| 9 |
Understanding Your Fund’s Expenses
(Unaudited)
As an investor, you incur two types of costs. There are shareholder transaction costs, which may include redemption fees. There are also ongoing fund costs, which generally include management fees, distribution and/or service fees, and other fund expenses. The following information is intended to help you understand your ongoing costs (in dollars) of investing in the Fund and to help you compare these costs with the ongoing costs of investing in other mutual funds.
Analyzing your Fund’s expenses
To illustrate these ongoing costs, we have provided examples and calculated the expenses paid by investors in each share class of the Fund during the period. The actual and hypothetical information in the table is based on an initial investment of $1,000 at the beginning of the period indicated and held for the entire period. Expense information is calculated two ways and each method provides you with different information. The amount listed in the “Actual” column is calculated using the Fund’s actual operating expenses and total return for the period. You may use the Actual information, together with the amount invested, to estimate the expenses that you paid over the period. Simply divide your account value by $1,000 (for example, an $8,600 account value divided by $1,000 = 8.6), then multiply the results by the expenses paid during the period under the “Actual” column. The amount listed in the “Hypothetical” column assumes a 5% annual rate of return before expenses (which is not the Fund’s actual return) and then applies the Fund’s actual expense ratio for the period to the hypothetical return. You should not use the hypothetical account values and expenses to estimate either your actual account balance at the end of the period or the expenses you paid during the period. See “Compare with other funds” below for details on how to use the hypothetical data.
Compare with other funds
Since all mutual funds are required to include the same hypothetical calculations about expenses in shareholder reports, you can use this information to compare the ongoing cost of investing in the Fund with other funds. To do so, compare the hypothetical example with the 5% hypothetical examples that appear in the shareholder reports of other funds. As you compare hypothetical examples of other funds, it is important to note that hypothetical examples are meant to highlight the ongoing costs of investing in a fund only and do not reflect any transaction costs, such as redemption or exchange fees. Therefore, the hypothetical calculations are useful in comparing ongoing costs only, and will not help you determine the relative total costs of owning different funds. If transaction costs were included in these calculations, your costs would be higher.
| March 1, 2023 — August 31, 2023 |
| | Account value at the
beginning of the
period ($) | Account value at the
end of the
period ($) | Expenses paid during
the period ($) | Fund’s annualized
expense ratio (%) |
| | Actual | Hypothetical | Actual | Hypothetical | Actual | Hypothetical | Actual |
| Institutional Class | 1,000.00 | 1,000.00 | 1,004.00 | 1,020.21 | 5.00 | 5.04 | 0.99 |
| Institutional 3 Class | 1,000.00 | 1,000.00 | 1,005.40 | 1,021.12 | 4.09 | 4.13 | 0.81 |
Expenses paid during the period are equal to the annualized expense ratio for each class as indicated above, multiplied by the average account value over the period and then multiplied by the number of days in the Fund’s most recent fiscal half year and divided by 365.
Expenses do not include fees and expenses incurred indirectly by the Fund from its investment in underlying funds, including affiliated and non-affiliated pooled investment vehicles, such as mutual funds and exchange-traded funds.
Had Columbia Management Investment Advisers, LLC and/or certain of its affiliates not waived/reimbursed certain fees and expenses, account value at the end of the period would have been reduced.
The Fund is offered only through certain wrap fee programs sponsored and/or managed by Ameriprise Financial, Inc. or its affiliates. Participants in wrap fee programs pay other fees that are not included in the above table. Please refer to the wrap program documents for information about the fees charged.
| 10 | Multi-Manager Small Cap Equity Strategies Fund | Annual Report 2023 |
Portfolio of Investments
August 31, 2023
(Percentages represent value of investments compared to net assets)
Investments in securities
| Common Stocks 98.1% |
| Issuer | Shares | Value ($) |
| Communication Services 0.8% |
| Diversified Telecommunication Services 0.0% |
| Bandwidth, Inc., Class A(a) | 25,162 | 361,578 |
| Entertainment 0.0% |
| Playtika Holding Corp.(a) | 13,430 | 131,077 |
| Interactive Media & Services 0.2% |
| DHI Group, Inc.(a) | 13,137 | 49,526 |
| Outbrain, Inc.(a) | 19,134 | 109,255 |
| TrueCar, Inc.(a) | 56,528 | 135,102 |
| Ziff Davis, Inc.(a) | 23,137 | 1,542,081 |
| Total | | 1,835,964 |
| Media 0.6% |
| Emerald Holding, Inc.(a) | 94,500 | 398,790 |
| Nexstar Media Group, Inc., Class A | 15,529 | 2,528,121 |
| PubMatic, Inc., Class A(a) | 17,000 | 236,300 |
| Scholastic Corp. | 31,110 | 1,351,729 |
| Stagwell, Inc.(a) | 315,888 | 1,721,590 |
| TEGNA, Inc. | 73,100 | 1,208,343 |
| WideOpenWest, Inc.(a) | 71,268 | 577,271 |
| Total | | 8,022,144 |
| Wireless Telecommunication Services 0.0% |
| Spok Holdings, Inc. | 6,437 | 91,663 |
| Total Communication Services | 10,442,426 |
| Consumer Discretionary 10.5% |
| Auto Components 1.7% |
| Adient PLC(a) | 144,575 | 5,663,003 |
| American Axle & Manufacturing Holdings, Inc.(a) | 158,085 | 1,193,542 |
| Atmus Filtration Technologies, Inc.(a) | 25,300 | 583,165 |
| Cooper-Standard Holding, Inc.(a) | 4,800 | 71,712 |
| Dana, Inc. | 205,022 | 3,302,904 |
| Fox Factory Holding Corp.(a) | 75,381 | 8,352,969 |
| Goodyear Tire & Rubber Co. (The)(a) | 184,099 | 2,376,718 |
| LCI Industries | 12,322 | 1,543,700 |
| Phinia, Inc.(a) | 3,800 | 105,640 |
| Stoneridge, Inc.(a) | 28,517 | 586,024 |
| Total | | 23,779,377 |
| Common Stocks (continued) |
| Issuer | Shares | Value ($) |
| Automobiles 0.1% |
| Winnebago Industries, Inc. | 19,404 | 1,258,349 |
| Broadline Retail 0.4% |
| 1stdibs.com, Inc.(a) | 12,559 | 56,264 |
| Global-e Online Ltd.(a) | 62,939 | 2,494,273 |
| Kohl’s Corp. | 24,500 | 652,680 |
| Macy’s, Inc. | 118,424 | 1,448,326 |
| Total | | 4,651,543 |
| Diversified Consumer Services 0.4% |
| 2U, Inc.(a) | 171,436 | 543,452 |
| Adtalem Global Education, Inc.(a) | 29,100 | 1,276,035 |
| Bright Horizons Family Solutions, Inc.(a) | 23,727 | 2,240,303 |
| Chegg, Inc.(a) | 80,399 | 820,874 |
| Graham Holdings Co., Class B | 1,100 | 644,963 |
| Grand Canyon Education, Inc.(a) | 878 | 102,946 |
| Total | | 5,628,573 |
| Hotels, Restaurants & Leisure 2.3% |
| Bloomin’ Brands, Inc. | 33,200 | 931,592 |
| Bluegreen Vacations Holding Corp. | 6,378 | 228,715 |
| Boyd Gaming Corp. | 48,081 | 3,215,176 |
| Brinker International, Inc.(a) | 75,176 | 2,460,511 |
| Cava Group, Inc.(a) | 15,261 | 677,741 |
| Dave & Buster’s Entertainment, Inc.(a) | 13,300 | 522,291 |
| Denny’s Corp.(a) | 54,800 | 522,244 |
| Dine Brands Global, Inc. | 15,500 | 849,090 |
| El Pollo Loco Holdings, Inc. | 60,500 | 575,355 |
| International Game Technology PLC | 122,425 | 3,920,049 |
| Life Time Group Holdings, Inc.(a) | 116,865 | 2,010,078 |
| Light & Wonder, Inc.(a) | 42,623 | 3,267,905 |
| Marriott Vacations Worldwide Corp. | 12,532 | 1,362,103 |
| Papa John’s International, Inc. | 28,072 | 2,125,050 |
| Planet Fitness, Inc., Class A(a) | 30,641 | 1,862,973 |
| Red Rock Resorts, Inc., Class A | 36,204 | 1,590,442 |
| SeaWorld Entertainment, Inc.(a) | 5,900 | 287,330 |
| Six Flags Entertainment Corp.(a) | 80,302 | 1,843,734 |
| Texas Roadhouse, Inc. | 26,283 | 2,736,060 |
The accompanying Notes to Financial Statements are an integral part of this statement.
Multi-Manager Small Cap Equity Strategies Fund | Annual Report 2023
| 11 |
Portfolio of Investments (continued)
August 31, 2023
| Common Stocks (continued) |
| Issuer | Shares | Value ($) |
| Travel + Leisure Co. | 21,600 | 868,320 |
| Xponential Fitness, Inc., Class A(a) | 18,776 | 406,688 |
| Total | | 32,263,447 |
| Household Durables 2.1% |
| Beazer Homes USA, Inc.(a) | 14,242 | 417,433 |
| Century Communities, Inc. | 9,700 | 720,225 |
| GoPro, Inc., Class A(a) | 386,029 | 1,403,215 |
| Green Brick Partners, Inc.(a) | 5,600 | 276,976 |
| Helen of Troy Ltd.(a) | 12,301 | 1,512,039 |
| Hooker Furnishings Corp. | 8,043 | 173,166 |
| KB Home | 150,972 | 7,669,378 |
| Landsea Homes Corp.(a) | 32,448 | 314,421 |
| La-Z-Boy, Inc. | 30,400 | 937,840 |
| M/I Homes, Inc.(a) | 13,438 | 1,319,343 |
| Meritage Homes Corp. | 7,458 | 1,036,960 |
| Sonos, Inc.(a) | 131,190 | 1,807,798 |
| Taylor Morrison Home Corp., Class A(a) | 134,950 | 6,396,630 |
| Tri Pointe Homes, Inc.(a) | 151,035 | 4,697,189 |
| Universal Electronics, Inc.(a) | 28,807 | 256,382 |
| VOXX International Corp.(a) | 12,406 | 107,188 |
| Total | | 29,046,183 |
| Leisure Products 0.3% |
| Funko, Inc., Class A(a) | 180,154 | 1,255,673 |
| JAKKS Pacific, Inc.(a) | 34,633 | 681,578 |
| Johnson Outdoors, Inc., Class A | 20,800 | 1,162,928 |
| Latham Group, Inc.(a) | 44,560 | 164,872 |
| Vista Outdoor, Inc.(a) | 42,400 | 1,240,200 |
| Total | | 4,505,251 |
| Specialty Retail 2.7% |
| 1-800-Flowers.com, Inc., Class A(a) | 79,468 | 598,394 |
| Aaron’s Co., Inc. (The) | 140,312 | 1,693,566 |
| Advance Auto Parts, Inc. | 8,700 | 598,734 |
| American Eagle Outfitters, Inc. | 116,395 | 1,974,059 |
| Asbury Automotive Group, Inc.(a) | 4,000 | 920,000 |
| Barnes & Noble Education, Inc.(a) | 23,297 | 29,587 |
| Burlington Stores, Inc.(a) | 8,063 | 1,308,303 |
| Cato Corp. (The), Class A | 51,700 | 400,675 |
| Children’s Place, Inc. (The)(a) | 28,543 | 756,675 |
| Common Stocks (continued) |
| Issuer | Shares | Value ($) |
| Designer Brands, Inc. | 65,700 | 690,507 |
| Floor & Decor Holdings, Inc., Class A(a) | 20,334 | 2,027,300 |
| Genesco, Inc.(a) | 62,443 | 2,140,546 |
| Group 1 Automotive, Inc. | 16,681 | 4,410,790 |
| Haverty Furniture Companies, Inc. | 30,700 | 960,910 |
| Hibbett, Inc. | 60,156 | 2,785,824 |
| Lands’ End, Inc.(a) | 34,923 | 268,907 |
| Leslie’s, Inc.(a) | 162,101 | 1,014,752 |
| Lithia Motors, Inc., Class A | 9,053 | 2,788,505 |
| LL Flooring Holdings, Inc.(a) | 156,700 | 540,615 |
| MarineMax, Inc.(a) | 23,800 | 791,826 |
| National Vision Holdings, Inc.(a) | 24,405 | 446,856 |
| OneWater Marine, Inc., Class A(a) | 34,300 | 895,573 |
| Petco Health & Wellness Co., Inc.(a) | 217,793 | 1,108,566 |
| PetMed Express, Inc. | 45,300 | 510,531 |
| Revolve Group, Inc.(a) | 16,000 | 234,400 |
| Signet Jewelers Ltd. | 33,667 | 2,525,025 |
| Sleep Number Corp.(a) | 13,400 | 342,772 |
| Sonic Automotive, Inc., Class A | 58,500 | 3,119,220 |
| Stitch Fix, Inc., Class A(a) | 64,718 | 284,112 |
| Tilly’s, Inc.(a) | 23,640 | 212,524 |
| Urban Outfitters, Inc.(a) | 6,300 | 209,223 |
| Zumiez, Inc.(a) | 14,700 | 279,153 |
| Total | | 36,868,430 |
| Textiles, Apparel & Luxury Goods 0.5% |
| Carter’s, Inc. | 8,200 | 586,874 |
| G-III Apparel Group Ltd.(a) | 146,629 | 2,910,586 |
| Hanesbrands, Inc. | 119,300 | 626,325 |
| Kontoor Brands, Inc. | 15,200 | 696,008 |
| Lakeland Industries, Inc. | 24,700 | 346,294 |
| Movado Group, Inc. | 20,633 | 564,312 |
| Oxford Industries, Inc. | 2,900 | 292,871 |
| Steven Madden Ltd. | 20,600 | 710,700 |
| Unifi, Inc.(a) | 29,966 | 207,964 |
| Vera Bradley, Inc.(a) | 54,353 | 389,711 |
| Total | | 7,331,645 |
| Total Consumer Discretionary | 145,332,798 |
The accompanying Notes to Financial Statements are an integral part of this statement.
| 12 | Multi-Manager Small Cap Equity Strategies Fund | Annual Report 2023 |
Portfolio of Investments (continued)
August 31, 2023
| Common Stocks (continued) |
| Issuer | Shares | Value ($) |
| Consumer Staples 2.5% |
| Beverages 0.0% |
| Duckhorn Portfolio, Inc. (The)(a) | 24,767 | 308,101 |
| Consumer Staples Distribution & Retail 0.7% |
| Andersons, Inc. (The) | 30,203 | 1,551,226 |
| Grocery Outlet Holding Corp.(a) | 72,601 | 2,239,741 |
| Natural Grocers by Vitamin Cottage, Inc. | 23,400 | 295,074 |
| Performance Food Group, Inc.(a) | 29,168 | 1,812,208 |
| The Chefs’ Warehouse(a) | 115,525 | 3,297,083 |
| Total | | 9,195,332 |
| Food Products 0.8% |
| B&G Foods, Inc. | 50,900 | 651,011 |
| Cal-Maine Foods, Inc. | 7,000 | 334,530 |
| Freshpet, Inc.(a) | 41,769 | 3,153,977 |
| Hain Celestial Group, Inc. (The)(a) | 27,695 | 293,290 |
| Hostess Brands, Inc.(a) | 99,100 | 2,822,368 |
| TreeHouse Foods, Inc.(a) | 68,251 | 3,175,037 |
| Total | | 10,430,213 |
| Household Products 0.3% |
| Central Garden & Pet Co.(a) | 14,500 | 640,030 |
| Energizer Holdings, Inc. | 27,300 | 937,755 |
| WD-40 Co. | 15,000 | 3,223,050 |
| Total | | 4,800,835 |
| Personal Care Products 0.6% |
| BellRing Brands, Inc.(a) | 43,017 | 1,785,206 |
| Edgewell Personal Care Co. | 24,000 | 925,440 |
| elf Beauty, Inc.(a) | 22,507 | 3,121,946 |
| Herbalife Ltd.(a) | 50,700 | 761,514 |
| Medifast, Inc. | 12,600 | 1,062,684 |
| Nature’s Sunshine Products, Inc.(a) | 6,077 | 102,154 |
| Nu Skin Enterprises, Inc., Class A | 18,700 | 446,743 |
| Usana Health Sciences, Inc.(a) | 10,200 | 655,758 |
| Total | | 8,861,445 |
| Tobacco 0.1% |
| Vector Group Ltd. | 136,372 | 1,460,544 |
| Total Consumer Staples | 35,056,470 |
| Common Stocks (continued) |
| Issuer | Shares | Value ($) |
| Energy 6.6% |
| Energy Equipment & Services 2.1% |
| Atlas Energy Solutions, Inc., Class A | 5,825 | 124,014 |
| Bristow Group, Inc.(a) | 9,916 | 274,673 |
| Cactus, Inc., Class A | 84,667 | 4,516,138 |
| Diamond Offshore Drilling, Inc.(a) | 131,400 | 1,953,918 |
| Dril-Quip, Inc.(a) | 47,700 | 1,315,566 |
| Expro Group Holdings NV(a) | 50,449 | 1,186,056 |
| Forum Energy Technologies, Inc.(a) | 34,400 | 814,592 |
| Helix Energy Solutions Group, Inc.(a) | 184,370 | 1,869,512 |
| Helmerich & Payne, Inc. | 40,379 | 1,614,756 |
| Liberty Energy, Inc., Class A | 60,600 | 966,570 |
| National Energy Services Reunited Corp.(a) | 151,800 | 690,690 |
| Newpark Resources, Inc.(a) | 177,700 | 1,062,646 |
| NexTier Oilfield Solutions, Inc.(a) | 55,800 | 592,038 |
| Oil States International, Inc.(a) | 14,845 | 116,385 |
| Patterson-UTI Energy, Inc. | 167,521 | 2,368,747 |
| Precision Drilling Corp.(a) | 17,300 | 1,140,416 |
| ProPetro Holding Corp.(a) | 79,800 | 769,272 |
| Solaris Oilfield Infrastructure, Inc., Class A | 90,100 | 947,852 |
| TechnipFMC PLC | 184,604 | 3,514,860 |
| Transocean Ltd.(a) | 412,698 | 3,375,870 |
| Total | | 29,214,571 |
| Oil, Gas & Consumable Fuels 4.5% |
| Baytex Energy Corp.(a) | 341,088 | 1,388,228 |
| Berry Corp. | 133,200 | 1,141,524 |
| California Resources Corp. | 95,357 | 5,324,735 |
| Callon Petroleum Co.(a) | 15,300 | 600,219 |
| Centrus Energy Corp. Class A(a) | 7,159 | 339,766 |
| Chord Energy Corp. | 30,012 | 4,846,938 |
| Civitas Resources, Inc. | 52,845 | 4,344,916 |
| CONSOL Energy, Inc. | 11,609 | 998,838 |
| Crescent Energy Co., Class A | 81,200 | 1,106,756 |
| CVR Energy, Inc. | 29,329 | 959,058 |
| DHT Holdings, Inc. | 63,006 | 582,806 |
| Dorian LPG Ltd. | 48,732 | 1,257,286 |
| Equitrans Midstream Corp. | 119,900 | 1,151,040 |
| Golar LNG Ltd. | 120,132 | 2,654,917 |
| Gulfport Energy Corp.(a) | 19,231 | 2,269,258 |
The accompanying Notes to Financial Statements are an integral part of this statement.
Multi-Manager Small Cap Equity Strategies Fund | Annual Report 2023
| 13 |
Portfolio of Investments (continued)
August 31, 2023
| Common Stocks (continued) |
| Issuer | Shares | Value ($) |
| Kinetik Holdings, Inc. | 14,500 | 509,095 |
| Kosmos Energy Ltd.(a) | 174,700 | 1,271,816 |
| Matador Resources Co. | 57,193 | 3,631,756 |
| Murphy Oil Corp. | 72,191 | 3,277,471 |
| Northern Oil and Gas, Inc. | 33,700 | 1,409,671 |
| Par Pacific Holdings, Inc.(a) | 81,129 | 2,786,781 |
| Permian Resources Corp. | 219,556 | 3,113,304 |
| REX American Resources Corp.(a) | 37,270 | 1,471,792 |
| Scorpio Tankers, Inc. | 49,613 | 2,505,953 |
| SM Energy Co. | 118,997 | 5,034,763 |
| Talos Energy, Inc.(a) | 201,625 | 3,471,983 |
| Teekay Tankers Ltd., Class A | 37,597 | 1,529,446 |
| Vertex Energy, Inc.(a) | 144,100 | 610,984 |
| Vital Energy, Inc.(a) | 20,600 | 1,241,974 |
| World Kinect Corp. | 105,867 | 2,318,487 |
| Total | | 63,151,561 |
| Total Energy | 92,366,132 |
| Financials 17.2% |
| Banks 9.7% |
| 1st Source Corp. | 5,100 | 227,919 |
| Amalgamated Financial Corp. | 11,630 | 208,410 |
| Amerant Bancorp, Inc. | 3,426 | 64,306 |
| Ameris Bancorp | 90,397 | 3,683,678 |
| Associated Banc-Corp. | 93,156 | 1,614,393 |
| Atlantic Union Bankshares Corp. | 105,338 | 3,127,485 |
| Axos Financial, Inc.(a) | 72,152 | 3,109,030 |
| Banc of California, Inc. | 47,591 | 596,315 |
| Bancorp, Inc. (The)(a) | 104,741 | 3,845,042 |
| Bank of Marin Bancorp | 44,800 | 843,136 |
| BankUnited, Inc. | 131,264 | 3,445,680 |
| Bankwell Financial Group, Inc. | 3,209 | 83,498 |
| Baycom Corp. | 23,667 | 456,063 |
| BCB Bancorp, Inc. | 29,110 | 331,272 |
| Berkshire Hills Bancorp, Inc. | 57,383 | 1,199,305 |
| Bridgewater Bancshares, Inc.(a) | 19,000 | 198,740 |
| Brookline Bancorp, Inc. | 92,100 | 881,397 |
| Byline Bancorp, Inc. | 18,969 | 401,763 |
| Cadence Bank | 32,450 | 742,456 |
| Cambridge Bancorp | 10,200 | 542,742 |
| Common Stocks (continued) |
| Issuer | Shares | Value ($) |
| Camden National Corp. | 18,400 | 603,336 |
| Capital Bancorp, Inc. | 7,307 | 139,929 |
| Capital City Bank Group, Inc. | 9,628 | 293,750 |
| Capitol Federal Financial, Inc. | 47,800 | 271,026 |
| Capstar Financial Holdings, Inc. | 16,137 | 210,749 |
| Carter Bankshares, Inc.(a) | 11,773 | 168,472 |
| Cathay General Bancorp | 98,570 | 3,512,049 |
| Central Pacific Financial Corp. | 110,587 | 1,876,661 |
| Central Valley Community Bancorp | 18,600 | 271,932 |
| Civista Bancshares, Inc. | 19,700 | 334,703 |
| CNB Financial Corp. | 20,900 | 380,589 |
| Columbia Banking System, Inc. | 40,700 | 833,536 |
| Community Bank System, Inc. | 43,774 | 2,081,454 |
| Community Trust Bancorp, Inc. | 36,289 | 1,288,259 |
| ConnectOne Bancorp, Inc. | 67,600 | 1,292,512 |
| CrossFirst Bankshares, Inc.(a) | 34,900 | 375,175 |
| Customers Bancorp, Inc.(a) | 85,742 | 3,012,974 |
| CVB Financial Corp. | 38,600 | 673,956 |
| Dime Community Bancshares, Inc. | 38,500 | 820,435 |
| Eagle Bancorp, Inc. | 44,700 | 1,075,482 |
| Eastern Bankshares, Inc. | 28,253 | 380,285 |
| FB Financial Corp. | 38,098 | 1,157,417 |
| Financial Institutions, Inc. | 26,325 | 460,688 |
| First BanCorp | 214,385 | 2,971,376 |
| First Busey Corp. | 24,900 | 502,980 |
| First Business Financial Services, Inc. | 9,780 | 308,363 |
| First Financial Bankshares, Inc. | 31,709 | 910,682 |
| First Financial Corp. | 31,974 | 1,174,085 |
| First Foundation, Inc. | 158,386 | 1,244,914 |
| First Hawaiian, Inc. | 54,200 | 1,024,922 |
| First Internet Bancorp | 54,763 | 1,054,735 |
| First Interstate Bancsystem, Inc. | 18,100 | 468,971 |
| First Merchants Corp. | 23,631 | 705,149 |
| First Mid Bancshares, Inc. | 20,700 | 578,979 |
| First of Long Island Corp. (The) | 47,800 | 624,268 |
| Five Star Bancorp | 2,415 | 52,792 |
| Flushing Financial Corp. | 61,200 | 864,144 |
| FS Bancorp, Inc. | 10,740 | 318,441 |
| Great Southern Bancorp, Inc. | 15,478 | 781,175 |
The accompanying Notes to Financial Statements are an integral part of this statement.
| 14 | Multi-Manager Small Cap Equity Strategies Fund | Annual Report 2023 |
Portfolio of Investments (continued)
August 31, 2023
| Common Stocks (continued) |
| Issuer | Shares | Value ($) |
| Guaranty Bancshares, Inc. | 6,392 | 184,537 |
| Hancock Whitney Corp. | 67,055 | 2,766,019 |
| Hanmi Financial Corp. | 99,909 | 1,730,424 |
| HarborOne Bancorp, Inc. | 46,157 | 460,185 |
| Heartland Financial U.S.A., Inc. | 21,050 | 644,972 |
| Heritage Commerce Corp. | 1,246 | 10,803 |
| Heritage Financial Corp. | 17,600 | 303,072 |
| Hilltop Holdings, Inc. | 34,200 | 1,039,338 |
| Home Bancorp, Inc. | 10,389 | 339,305 |
| HomeStreet, Inc. | 116,571 | 1,101,596 |
| HomeTrust Bancshares, Inc. | 12,929 | 295,428 |
| Hope Bancorp, Inc. | 119,300 | 1,153,631 |
| Horizon Bancorp, Inc. | 110,891 | 1,240,870 |
| Independent Bank Corp. | 50,370 | 2,720,987 |
| Independent Bank Corp. | 79,874 | 1,524,795 |
| Independent Bank Group, Inc. | 15,000 | 633,000 |
| Investar Holding Corp. | 15,700 | 205,670 |
| Kearny Financial Corp. | 89,300 | 661,713 |
| Lakeland Bancorp, Inc. | 41,500 | 560,665 |
| Live Oak Bancshares, Inc. | 24,179 | 781,949 |
| Luther Burbank Corp. | 41,400 | 376,326 |
| Macatawa Bank Corp. | 17,671 | 161,866 |
| Mercantile Bank Corp. | 25,089 | 837,471 |
| Midland States Bancorp, Inc. | 50,526 | 1,121,677 |
| MidWestOne Financial Group, Inc. | 16,100 | 343,896 |
| NBT Bancorp, Inc. | 3,747 | 128,972 |
| New York Community Bancorp, Inc. | 275,712 | 3,385,743 |
| Northeast Bank | 7,600 | 322,924 |
| Northeast Community Bancorp, Inc. | 25,700 | 407,602 |
| Northfield Bancorp, Inc. | 52,600 | 554,404 |
| Northrim BanCorp, Inc. | 8,200 | 340,546 |
| OceanFirst Financial Corp. | 65,775 | 1,109,624 |
| OFG Bancorp | 45,777 | 1,380,634 |
| Old Second Bancorp, Inc. | 23,123 | 334,590 |
| Pacific Premier Bancorp, Inc. | 26,400 | 607,728 |
| PacWest Bancorp | 126,800 | 1,008,060 |
| Parke Bancorp, Inc. | 14,400 | 248,688 |
| Pathward Financial, Inc. | 23,013 | 1,133,851 |
| PCB Bancorp | 23,900 | 383,595 |
| Common Stocks (continued) |
| Issuer | Shares | Value ($) |
| Peapack-Gladstone Financial Corp. | 17,106 | 466,481 |
| Pinnacle Financial Partners, Inc. | 16,856 | 1,121,935 |
| Popular, Inc. | 19,100 | 1,304,148 |
| Preferred Bank | 23,584 | 1,464,802 |
| Premier Financial Corp. | 39,500 | 744,180 |
| Primis Financial Corp. | 52,770 | 468,598 |
| Provident Bancorp, Inc.(a) | 12,429 | 122,053 |
| Provident Financial Services, Inc. | 60,100 | 990,448 |
| QCR Holdings, Inc. | 17,460 | 915,952 |
| RBB Bancorp | 33,392 | 455,133 |
| Renasant Corp. | 93,322 | 2,599,018 |
| Sandy Spring Bancorp, Inc. | 37,200 | 827,328 |
| Shore Bancshares, Inc. | 16,647 | 184,449 |
| Sierra Bancorp | 29,960 | 595,605 |
| Simmons First National Corp., Class A | 48,000 | 855,360 |
| SmartFinancial, Inc. | 7,457 | 169,796 |
| South Plains Financial, Inc. | 7,664 | 201,027 |
| South State Corp. | 37,508 | 2,711,828 |
| Southern First Bancshares, Inc.(a) | 11,654 | 327,594 |
| Synovus Financial Corp. | 9,500 | 294,120 |
| Territorial Bancorp, Inc. | 12,700 | 130,429 |
| Texas Capital Bancshares, Inc.(a) | 64,163 | 4,006,338 |
| Third Coast Bancshares, Inc.(a) | 6,822 | 128,390 |
| Towne Bank | 21,000 | 495,600 |
| Triumph Financial, Inc.(a) | 32,555 | 2,091,008 |
| TrustCo Bank Corp. | 29,460 | 838,726 |
| Trustmark Corp. | 30,298 | 698,066 |
| UMB Financial Corp. | 72,720 | 4,596,631 |
| Univest Corporation of Pennsylvania | 34,116 | 613,747 |
| Valley National Bancorp | 98,100 | 900,558 |
| Veritex Holdings, Inc. | 42,458 | 798,635 |
| Washington Federal, Inc. | 28,144 | 764,954 |
| Washington Trust Bancorp, Inc. | 26,000 | 728,000 |
| Western Alliance Bancorp | 76,742 | 3,837,867 |
| Wintrust Financial Corp. | 7,400 | 574,314 |
| WSFS Financial Corp. | 70,586 | 2,774,030 |
| Zions Bancorp | 17,700 | 628,350 |
| Total | | 134,676,629 |
The accompanying Notes to Financial Statements are an integral part of this statement.
Multi-Manager Small Cap Equity Strategies Fund | Annual Report 2023
| 15 |
Portfolio of Investments (continued)
August 31, 2023
| Common Stocks (continued) |
| Issuer | Shares | Value ($) |
| Capital Markets 1.4% |
| Diamond Hill Investment Group, Inc. | 3,300 | 556,908 |
| Evercore, Inc., Class A | 28,829 | 4,037,501 |
| Federated Hermes, Inc., Class B | 33,700 | 1,171,412 |
| GCM Grosvenor, Inc., Class A | 3,850 | 29,414 |
| Hamilton Lane, Inc., Class A | 9,258 | 859,050 |
| Houlihan Lokey, Inc., Class A | 36,155 | 3,808,568 |
| Janus Henderson Group PLC | 40,200 | 1,104,294 |
| Perella Weinberg Partners | 82,600 | 869,778 |
| Stifel Financial Corp. | 36,738 | 2,388,705 |
| StoneX Group, Inc.(a) | 16,489 | 1,547,987 |
| Virtu Financial, Inc. Class A | 66,500 | 1,246,210 |
| Virtus Investment Partners, Inc. | 5,700 | 1,180,470 |
| Total | | 18,800,297 |
| Consumer Finance 1.1% |
| Bread Financial Holdings, Inc. | 48,552 | 1,824,584 |
| Enova International, Inc.(a) | 56,153 | 2,832,919 |
| Ezcorp, Inc., Class A(a) | 119,480 | 1,004,827 |
| Green Dot Corp., Class A(a) | 39,539 | 586,759 |
| LendingClub Corp.(a) | 19,629 | 136,618 |
| Navient Corp. | 224,619 | 3,964,525 |
| PRA Group, Inc.(a) | 35,105 | 683,845 |
| PROG Holdings, Inc.(a) | 60,371 | 2,070,725 |
| Regional Management Corp. | 5,213 | 143,253 |
| SLM Corp. | 121,549 | 1,730,858 |
| Total | | 14,978,913 |
| Financial Services 1.8% |
| A-Mark Precious Metals, Inc. | 22,703 | 774,626 |
| AvidXchange Holdings, Inc.(a) | 163,147 | 1,677,151 |
| Banco Latinoamericano de Comercio Exterior SA, Class E | 4,396 | 103,746 |
| Enact Holdings, Inc. | 46,500 | 1,332,690 |
| Essent Group Ltd. | 23,800 | 1,195,236 |
| Euronet Worldwide, Inc.(a) | 2,400 | 209,664 |
| Flywire Corp.(a) | 52,289 | 1,808,154 |
| Jackson Financial, Inc., Class A | 66,968 | 2,517,997 |
| Merchants Bancorp | 23,388 | 682,228 |
| MGIC Investment Corp. | 245,133 | 4,309,438 |
| NMI Holdings, Inc., Class A(a) | 43,500 | 1,244,970 |
| Common Stocks (continued) |
| Issuer | Shares | Value ($) |
| Ocwen Financial Corp.(a) | 3,703 | 112,053 |
| Paysafe Ltd.(a) | 11,303 | 148,069 |
| PennyMac Financial Services, Inc. | 17,043 | 1,223,176 |
| Radian Group, Inc. | 163,207 | 4,419,646 |
| Remitly Global, Inc.(a) | 144,888 | 3,643,933 |
| Waterstone Financial, Inc. | 13,791 | 171,146 |
| Total | | 25,573,923 |
| Insurance 2.6% |
| Ambac Financial Group, Inc.(a) | 44,400 | 571,872 |
| AMERISAFE, Inc. | 39,028 | 2,021,650 |
| Argo Group International Holdings Ltd. | 93,845 | 2,791,889 |
| Assured Guaranty Ltd. | 15,500 | 912,020 |
| Axis Capital Holdings Ltd. | 16,900 | 927,134 |
| Brighthouse Financial, Inc.(a) | 26,491 | 1,315,543 |
| CNO Financial Group, Inc. | 224,071 | 5,243,261 |
| Donegal Group, Inc., Class A | 9,551 | 139,540 |
| eHealth, Inc.(a) | 18,672 | 146,015 |
| Employers Holdings, Inc. | 60,077 | 2,356,821 |
| Enstar Group Ltd.(a) | 4,700 | 1,190,463 |
| Hanover Insurance Group, Inc. (The) | 16,522 | 1,763,228 |
| Horace Mann Educators Corp. | 46,807 | 1,341,489 |
| James River Group Holdings Ltd. | 36,728 | 534,760 |
| Kemper Corp. | 25,700 | 1,207,129 |
| Lincoln National Corp. | 63,440 | 1,627,870 |
| Mercury General Corp. | 61,073 | 1,747,299 |
| Oscar Health, Inc., Class A(a) | 46,179 | 289,542 |
| ProAssurance Corp. | 116,438 | 2,058,624 |
| Reinsurance Group of America, Inc. | 16,420 | 2,276,140 |
| Safety Insurance Group, Inc. | 9,000 | 619,830 |
| Selectquote, Inc.(a) | 225,177 | 274,716 |
| SiriusPoint Ltd.(a) | 75,500 | 835,030 |
| Skyward Specialty Insurance Group, Inc.(a) | 43,540 | 1,058,893 |
| Stewart Information Services Corp. | 26,900 | 1,246,008 |
| United Fire Group, Inc. | 18,206 | 359,933 |
| Universal Insurance Holdings, Inc. | 37,187 | 470,787 |
| White Mountains Insurance Group Ltd. | 800 | 1,270,952 |
| Total | | 36,598,438 |
The accompanying Notes to Financial Statements are an integral part of this statement.
| 16 | Multi-Manager Small Cap Equity Strategies Fund | Annual Report 2023 |
Portfolio of Investments (continued)
August 31, 2023
| Common Stocks (continued) |
| Issuer | Shares | Value ($) |
| Mortgage Real Estate Investment Trusts (REITS) 0.6% |
| Apollo Commercial Real Estate Finance, Inc. | 53,400 | 583,128 |
| Blackstone Mortgage Trust, Inc. | 101,529 | 2,235,669 |
| BrightSpire Capital, Inc. | 42,900 | 298,584 |
| Claros Mortgage Trust, Inc. | 25,100 | 285,889 |
| Granite Point Mortgage Trust, Inc. | 110,300 | 589,002 |
| Great Ajax Corp. | 53,261 | 359,512 |
| Hannon Armstrong Sustainable Infrastructure Capital, Inc. | 76,593 | 1,713,385 |
| Starwood Property Trust, Inc. | 86,456 | 1,766,296 |
| TPG RE Finance Trust, Inc. | 84,100 | 632,432 |
| Total | | 8,463,897 |
| Total Financials | 239,092,097 |
| Health Care 11.3% |
| Biotechnology 4.1% |
| 2seventy bio, Inc.(a) | 71,849 | 372,896 |
| 89Bio, Inc.(a) | 47,049 | 806,420 |
| ACELYRIN, Inc.(a) | 66,774 | 1,691,385 |
| Agios Pharmaceuticals, Inc.(a) | 78,601 | 2,156,025 |
| Alector, Inc.(a) | 73,629 | 401,278 |
| Allogene Therapeutics, Inc.(a) | 122,992 | 478,439 |
| Amicus Therapeutics, Inc.(a) | 267,893 | 3,434,388 |
| AnaptysBio, Inc.(a) | 44,360 | 873,005 |
| Anika Therapeutics, Inc.(a) | 15,142 | 270,285 |
| Apellis Pharmaceuticals, Inc.(a) | 19,170 | 809,166 |
| Arcus Biosciences, Inc.(a) | 9,377 | 192,228 |
| Arrowhead Pharmaceuticals, Inc.(a) | 65,878 | 1,820,868 |
| Atara Biotherapeutics, Inc.(a) | 168,596 | 246,150 |
| Biohaven Ltd.(a) | 14,931 | 273,088 |
| bluebird bio, Inc.(a) | 247,341 | 932,476 |
| Blueprint Medicines Corp.(a) | 43,174 | 2,152,656 |
| C4 Therapeutics, Inc.(a) | 68,966 | 200,001 |
| CareDx, Inc.(a) | 136,433 | 1,270,191 |
| Century Therapeutics, Inc.(a) | 18,400 | 45,632 |
| Clementia Pharmaceuticals, Inc.(a),(b),(c),(d) | 134,864 | 0 |
| Coherus Biosciences, Inc.(a) | 167,188 | 891,112 |
| Deciphera Pharmaceuticals, Inc.(a) | 31,534 | 442,737 |
| Emergent BioSolutions, Inc.(a) | 253,372 | 1,188,315 |
| Enanta Pharmaceuticals, Inc.(a) | 22,069 | 327,725 |
| Common Stocks (continued) |
| Issuer | Shares | Value ($) |
| Exelixis, Inc.(a) | 128,920 | 2,886,519 |
| Fate Therapeutics, Inc.(a) | 236,948 | 594,739 |
| FibroGen, Inc.(a) | 283,932 | 272,575 |
| Halozyme Therapeutics, Inc.(a) | 82,176 | 3,497,411 |
| Heron Therapeutics, Inc.(a) | 270,739 | 444,012 |
| Ideaya Biosciences, Inc.(a) | 23,296 | 683,971 |
| Immunocore Holdings PLC, ADR(a) | 9,600 | 540,192 |
| Insmed, Inc.(a) | 32,500 | 711,425 |
| Ironwood Pharmaceuticals, Inc.(a) | 106,200 | 934,560 |
| iTeos Therapeutics, Inc.(a) | 45,887 | 553,627 |
| Kodiak Sciences, Inc.(a) | 21,052 | 46,314 |
| Lyell Immunopharma, Inc.(a) | 49,642 | 118,644 |
| MacroGenics, Inc.(a) | 26,889 | 125,303 |
| Natera, Inc.(a) | 54,912 | 3,224,982 |
| Nurix Therapeutics, Inc.(a) | 57,613 | 489,710 |
| Olema Pharmaceuticals, Inc.(a) | 3,100 | 31,465 |
| PMV Pharmaceuticals, Inc.(a) | 80,295 | 579,730 |
| PTC Therapeutics, Inc.(a) | 44,516 | 1,758,382 |
| REGENXBIO, Inc.(a) | 125,469 | 2,220,801 |
| Relay Therapeutics, Inc.(a) | 92,971 | 950,164 |
| Revolution Medicines, Inc.(a) | 97,849 | 3,323,931 |
| Sage Therapeutics, Inc.(a) | 43,295 | 865,900 |
| Stoke Therapeutics, Inc.(a) | 18,668 | 104,914 |
| Sutro Biopharma, Inc.(a) | 105,570 | 501,457 |
| Tango Therapeutics, Inc.(a) | 28,860 | 187,301 |
| Travere Therapeutics, Inc.(a) | 85,281 | 1,217,813 |
| Twist Bioscience Corp.(a) | 98,768 | 2,171,908 |
| Vanda Pharmaceuticals, Inc.(a) | 137,219 | 712,167 |
| Vericel Corp.(a) | 128,884 | 4,231,262 |
| Verve Therapeutics, Inc.(a) | 43,891 | 564,877 |
| Vir Biotechnology, Inc.(a) | 28,919 | 366,115 |
| Y-mAbs Therapeutics, Inc.(a) | 43,188 | 218,963 |
| Total | | 56,407,600 |
| Health Care Equipment & Supplies 3.0% |
| Angiodynamics, Inc.(a) | 68,031 | 546,289 |
| Bioventus, Inc., Class A(a) | 2,019 | 7,268 |
| CONMED Corp. | 32,763 | 3,651,764 |
| Cue Health, Inc.(a) | 30,345 | 16,386 |
| Establishment Labs Holdings, Inc.(a) | 22,208 | 1,340,697 |
The accompanying Notes to Financial Statements are an integral part of this statement.
Multi-Manager Small Cap Equity Strategies Fund | Annual Report 2023
| 17 |
Portfolio of Investments (continued)
August 31, 2023
| Common Stocks (continued) |
| Issuer | Shares | Value ($) |
| Haemonetics Corp.(a) | 31,227 | 2,801,999 |
| Inari Medical, Inc.(a) | 38,940 | 2,594,183 |
| Inogen, Inc.(a) | 58,700 | 364,527 |
| iRhythm Technologies, Inc.(a) | 31,117 | 3,216,564 |
| LeMaitre Vascular, Inc. | 103,216 | 5,966,917 |
| LivaNova PLC(a) | 14,675 | 815,196 |
| Merit Medical Systems, Inc.(a) | 115,235 | 7,522,541 |
| Neogen Corp.(a) | 341,583 | 7,897,399 |
| OraSure Technologies, Inc.(a) | 69,290 | 447,613 |
| Outset Medical, Inc.(a) | 120,968 | 1,646,375 |
| Shockwave Medical, Inc.(a) | 6,585 | 1,451,268 |
| Varex Imaging Corp.(a) | 42,744 | 840,775 |
| Zimvie, Inc.(a) | 91,775 | 1,082,945 |
| Total | | 42,210,706 |
| Health Care Providers & Services 0.7% |
| Acadia Healthcare Co., Inc.(a) | 27,318 | 2,106,218 |
| Accolade, Inc.(a) | 166,299 | 2,243,374 |
| Castle Biosciences, Inc.(a) | 29,731 | 592,539 |
| Cross Country Healthcare, Inc.(a) | 21,261 | 547,683 |
| National HealthCare Corp. | 11,400 | 751,830 |
| National Research Corp., Class A | 41,603 | 1,739,005 |
| OPKO Health, Inc.(a) | 60,716 | 111,110 |
| Premier, Inc. | 44,600 | 960,238 |
| Select Medical Holdings Corp. | 23,500 | 686,435 |
| Tenet Healthcare Corp.(a) | 3,447 | 267,349 |
| Total | | 10,005,781 |
| Health Care Technology 1.2% |
| American Well Corp., Class A(a) | 112,156 | 159,262 |
| Computer Programs & Systems, Inc.(a) | 62,830 | 1,022,244 |
| Definitive Healthcare Corp.(a) | 248,380 | 2,334,772 |
| Evolent Health, Inc., Class A(a) | 142,592 | 3,637,522 |
| Health Catalyst, Inc.(a) | 170,541 | 1,993,624 |
| HealthStream, Inc. | 21,094 | 443,607 |
| Simulations Plus, Inc. | 122,484 | 5,449,313 |
| Veradigm, Inc.(a) | 169,837 | 2,272,419 |
| Total | | 17,312,763 |
| Common Stocks (continued) |
| Issuer | Shares | Value ($) |
| Life Sciences Tools & Services 1.6% |
| Azenta, Inc.(a) | 71,181 | 4,016,744 |
| Codexis, Inc.(a) | 67,899 | 118,144 |
| Mesa Laboratories, Inc. | 32,159 | 4,610,314 |
| NanoString Technologies, Inc.(a) | 49,157 | 125,842 |
| Personalis, Inc.(a) | 107,898 | 196,375 |
| Quanterix Corp.(a) | 3,959 | 106,101 |
| Repligen Corp.(a) | 29,690 | 5,163,388 |
| Seer, Inc.(a) | 60,802 | 159,909 |
| Stevanato Group SpA | 227,320 | 7,283,333 |
| Total | | 21,780,150 |
| Pharmaceuticals 0.7% |
| Amneal Pharmaceuticals, Inc.(a) | 52,677 | 215,449 |
| Arvinas, Inc.(a) | 53,404 | 1,506,527 |
| Atea Pharmaceuticals, Inc.(a) | 41,338 | 138,896 |
| Athira Pharma, Inc.(a) | 14,800 | 33,004 |
| Cara Therapeutics, Inc.(a) | 141,928 | 364,755 |
| Intra-Cellular Therapies, Inc.(a) | 48,935 | 2,716,871 |
| Nektar Therapeutics(a) | 489,934 | 291,511 |
| NGM Biopharmaceuticals, Inc.(a) | 77,911 | 147,252 |
| Nuvation Bio, Inc.(a) | 47,944 | 78,628 |
| Phibro Animal Health Corp., Class A | 42,300 | 590,085 |
| Prestige Consumer Healthcare, Inc.(a) | 23,829 | 1,389,945 |
| Revance Therapeutics, Inc.(a) | 115,968 | 2,044,516 |
| SIGA Technologies, Inc. | 34,100 | 156,519 |
| Zevra Therapeutics, Inc.(a) | 9,243 | 46,862 |
| Total | | 9,720,820 |
| Total Health Care | 157,437,820 |
| Industrials 23.9% |
| Aerospace & Defense 1.7% |
| AerSale Corp.(a) | 70,736 | 1,047,600 |
| Axon Enterprise, Inc.(a) | 22,000 | 4,684,020 |
| Hexcel Corp. | 46,639 | 3,418,639 |
| Kaman Corp. | 31,072 | 696,945 |
| Mercury Systems, Inc.(a) | 113,778 | 4,465,786 |
| Moog, Inc., Class A | 40,485 | 4,702,738 |
| National Presto Industries, Inc. | 10,700 | 800,895 |
The accompanying Notes to Financial Statements are an integral part of this statement.
| 18 | Multi-Manager Small Cap Equity Strategies Fund | Annual Report 2023 |
Portfolio of Investments (continued)
August 31, 2023
| Common Stocks (continued) |
| Issuer | Shares | Value ($) |
| Parsons Corp.(a) | 50,620 | 2,886,352 |
| V2X, Inc.(a) | 15,800 | 794,898 |
| Total | | 23,497,873 |
| Air Freight & Logistics 0.1% |
| Forward Air Corp. | 10,400 | 736,528 |
| Radiant Logistics, Inc.(a) | 4,198 | 28,336 |
| Total | | 764,864 |
| Building Products 3.6% |
| AAON, Inc. | 228,595 | 14,415,232 |
| Advanced Drainage Systems, Inc. | 22,076 | 2,829,260 |
| Armstrong World Industries, Inc. | 12,300 | 942,057 |
| AZZ, Inc. | 29,500 | 1,448,450 |
| CSW Industrials, Inc. | 8,625 | 1,549,309 |
| Insteel Industries, Inc. | 42,261 | 1,468,570 |
| JELD-WEN Holding, Inc.(a) | 185,654 | 2,799,662 |
| Quanex Building Products Corp. | 21,948 | 592,157 |
| Resideo Technologies, Inc.(a) | 151,307 | 2,551,036 |
| Simpson Manufacturing Co., Inc. | 96,296 | 15,384,249 |
| Trex Company, Inc.(a) | 80,855 | 5,770,622 |
| Total | | 49,750,604 |
| Commercial Services & Supplies 2.6% |
| ABM Industries, Inc. | 97,312 | 4,419,911 |
| ACCO Brands Corp. | 155,300 | 827,749 |
| ACV Auctions, Inc., Class A(a) | 165,609 | 2,783,887 |
| Brady Corp., Class A | 18,200 | 918,008 |
| BrightView Holdings, Inc.(a) | 32,234 | 266,898 |
| Brink’s Co. (The) | 18,300 | 1,387,323 |
| Casella Waste Systems, Inc., Class A(a) | 184,227 | 14,511,561 |
| CoreCivic, Inc.(a) | 92,306 | 993,213 |
| Ennis, Inc. | 26,400 | 562,320 |
| Enviri Corp.(a) | 129,104 | 961,825 |
| Healthcare Services Group, Inc. | 63,600 | 734,580 |
| Interface, Inc. | 137,707 | 1,422,513 |
| MillerKnoll, Inc. | 56,300 | 1,075,330 |
| MSA Safety, Inc. | 23,390 | 4,272,885 |
| Quad/Graphics, Inc.(a) | 50,800 | 259,588 |
| Steelcase, Inc., Class A | 145,417 | 1,318,932 |
| Total | | 36,716,523 |
| Common Stocks (continued) |
| Issuer | Shares | Value ($) |
| Construction & Engineering 2.0% |
| API Group Corp.(a) | 139,763 | 3,934,328 |
| Argan, Inc. | 9,862 | 418,938 |
| Construction Partners, Inc., Class A(a) | 201,589 | 7,005,218 |
| EMCOR Group, Inc. | 28,333 | 6,353,675 |
| Fluor Corp.(a) | 62,204 | 2,176,518 |
| Great Lakes Dredge & Dock Corp.(a) | 10,071 | 88,927 |
| Limbach Holdings, Inc.(a) | 7,205 | 260,317 |
| MasTec, Inc.(a) | 17,977 | 1,788,532 |
| Matrix Service Co.(a) | 19,879 | 165,194 |
| Primoris Services Corp. | 29,985 | 1,060,569 |
| Tutor Perini Corp.(a) | 251,342 | 2,234,430 |
| Valmont Industries, Inc. | 8,789 | 2,228,012 |
| Total | | 27,714,658 |
| Electrical Equipment 1.0% |
| Babcock & Wilcox Enterprises, Inc.(a) | 14,192 | 74,508 |
| Bloom Energy Corp., Class A(a) | 250,587 | 3,756,299 |
| GrafTech International Ltd. | 200,100 | 708,354 |
| NEXTracker, Inc., Class A(a) | 57,086 | 2,404,462 |
| Powell Industries, Inc. | 20,270 | 1,702,072 |
| Preformed Line Products Co. | 1,800 | 305,082 |
| Shoals Technologies Group, Inc., Class A(a) | 126,218 | 2,483,970 |
| Thermon(a) | 31,100 | 854,628 |
| Vicor Corp.(a) | 20,571 | 1,394,097 |
| Total | | 13,683,472 |
| Ground Transportation 0.8% |
| ArcBest Corp. | 45,173 | 4,769,817 |
| Covenant Logistics Group, Inc., Class A | 21,155 | 1,040,191 |
| Heartland Express, Inc. | 129,000 | 1,946,610 |
| Marten Transport Ltd. | 27,700 | 581,700 |
| PAM Transportation Services, Inc.(a) | 16,700 | 385,102 |
| Saia, Inc.(a) | 5,662 | 2,413,145 |
| TuSimple Holdings, Inc., Class A(a) | 79,791 | 99,739 |
| Total | | 11,236,304 |
The accompanying Notes to Financial Statements are an integral part of this statement.
Multi-Manager Small Cap Equity Strategies Fund | Annual Report 2023
| 19 |
Portfolio of Investments (continued)
August 31, 2023
| Common Stocks (continued) |
| Issuer | Shares | Value ($) |
| Machinery 4.8% |
| AGCO Corp. | 13,073 | 1,693,346 |
| Astec Industries, Inc. | 24,561 | 1,346,434 |
| Barnes Group, Inc. | 22,000 | 864,600 |
| Chart Industries, Inc.(a) | 15,517 | 2,802,060 |
| Columbus McKinnon Corp. | 22,700 | 855,109 |
| Douglas Dynamics, Inc. | 115,000 | 3,481,050 |
| Enerpac Tool Group Corp. | 26,700 | 699,540 |
| ESCO Technologies, Inc. | 54,437 | 5,825,303 |
| Federal Signal Corp. | 47,175 | 2,875,316 |
| Flowserve Corp. | 30,000 | 1,187,100 |
| Gates Industrial Corp. PLC(a) | 64,100 | 787,148 |
| Greenbrier Companies, Inc. (The) | 27,732 | 1,180,274 |
| Helios Technologies, Inc. | 111,846 | 6,473,646 |
| Hillenbrand, Inc. | 72,158 | 3,495,334 |
| Hillman Solutions Corp.(a) | 412,255 | 3,730,908 |
| ITT, Inc. | 34,931 | 3,572,743 |
| John Bean Technologies Corp. | 64,763 | 7,118,101 |
| Manitowoc Co., Inc. (The)(a) | 88,904 | 1,504,256 |
| Miller Industries, Inc. | 11,600 | 464,000 |
| Mueller Industries, Inc. | 10,200 | 787,032 |
| Mueller Water Products, Inc., Class A | 59,200 | 835,904 |
| Omega Flex, Inc. | 20,724 | 1,734,599 |
| Oshkosh Corp. | 11,587 | 1,203,078 |
| Park-Ohio Holdings Corp. | 8,620 | 161,280 |
| Proto Labs, Inc.(a) | 42,613 | 1,257,083 |
| RBC Bearings, Inc.(a) | 31,517 | 7,265,929 |
| REV Group, Inc. | 31,466 | 427,308 |
| Titan International, Inc.(a) | 81,906 | 1,031,197 |
| Trinity Industries, Inc. | 57,111 | 1,431,773 |
| Wabash National Corp. | 38,200 | 861,410 |
| Total | | 66,952,861 |
| Marine Transportation 0.1% |
| Matson, Inc. | 9,700 | 852,436 |
| Passenger Airlines 0.1% |
| Hawaiian Holdings, Inc.(a) | 88,886 | 762,642 |
| JetBlue Airways Corp.(a) | 185,867 | 1,100,332 |
| Total | | 1,862,974 |
| Common Stocks (continued) |
| Issuer | Shares | Value ($) |
| Professional Services 3.4% |
| Alight, Inc., Class A(a) | 232,200 | 1,774,008 |
| Barrett Business Services, Inc. | 7,323 | 700,665 |
| BGSF, Inc. | 15,300 | 146,574 |
| Concentrix Corp. | 15,300 | 1,221,399 |
| Conduent, Inc.(a) | 203,878 | 640,177 |
| ExlService Holdings, Inc.(a) | 80,749 | 2,360,293 |
| Exponent, Inc. | 113,751 | 10,221,665 |
| Heidrick & Struggles International, Inc. | 68,114 | 1,804,340 |
| HireRight Holdings Corp.(a) | 28,169 | 294,929 |
| ICF International, Inc. | 27,607 | 3,728,601 |
| KBR, Inc. | 87,686 | 5,394,443 |
| Kelly Services, Inc., Class A | 76,122 | 1,407,496 |
| Kforce, Inc. | 14,600 | 914,690 |
| Korn/Ferry International | 22,400 | 1,141,952 |
| ManpowerGroup, Inc. | 15,800 | 1,246,146 |
| Mistras Group, Inc.(a) | 11,500 | 61,410 |
| Paycor HCM, Inc.(a) | 271,672 | 6,376,142 |
| RCM Technologies, Inc.(a) | 16,200 | 332,748 |
| Resources Connection, Inc. | 105,590 | 1,637,701 |
| Science Applications International Corp. | 28,485 | 3,351,545 |
| TrueBlue, Inc.(a) | 102,887 | 1,556,680 |
| TTEC Holdings, Inc. | 29,400 | 874,944 |
| Verra Mobility Corp.(a) | 37,500 | 667,125 |
| Total | | 47,855,673 |
| Trading Companies & Distributors 3.7% |
| Air Lease Corp. | 51,946 | 2,117,319 |
| Applied Industrial Technologies, Inc. | 35,040 | 5,409,125 |
| Beacon Roofing Supply, Inc.(a) | 38,619 | 3,083,727 |
| BlueLinx Holdings, Inc.(a) | 1,666 | 148,707 |
| Boise Cascade Co. | 33,384 | 3,651,208 |
| Core & Main, Inc., Class A(a) | 92,504 | 3,037,831 |
| DXP Enterprises, Inc.(a) | 3,184 | 113,255 |
| FTAI Aviation Ltd. | 117,169 | 4,330,566 |
| Global Industrial Co. | 16,277 | 550,814 |
| GMS, Inc.(a) | 26,681 | 1,850,061 |
| Herc Holdings Inc | 22,097 | 2,875,704 |
| MRC Global, Inc.(a) | 20,200 | 188,264 |
| NOW, Inc.(a) | 106,121 | 1,185,372 |
The accompanying Notes to Financial Statements are an integral part of this statement.
| 20 | Multi-Manager Small Cap Equity Strategies Fund | Annual Report 2023 |
Portfolio of Investments (continued)
August 31, 2023
| Common Stocks (continued) |
| Issuer | Shares | Value ($) |
| Rush Enterprises, Inc., Class A | 88,136 | 3,649,691 |
| SiteOne Landscape Supply, Inc.(a) | 63,767 | 10,916,273 |
| Titan Machinery, Inc.(a) | 20,100 | 623,502 |
| Transcat, Inc.(a) | 40,063 | 4,084,823 |
| WESCO International, Inc. | 18,498 | 2,993,901 |
| Total | | 50,810,143 |
| Total Industrials | 331,698,385 |
| Information Technology 14.7% |
| Communications Equipment 0.7% |
| Cambium Networks Corp.(a) | 38,700 | 356,427 |
| Ciena Corp.(a) | 22,440 | 1,121,551 |
| Comtech Telecommunications Corp. | 39,193 | 393,890 |
| Digi International, Inc.(a) | 134,676 | 4,495,485 |
| DZS, Inc.(a) | 14,218 | 32,986 |
| Extreme Networks, Inc.(a) | 59,459 | 1,632,149 |
| NETGEAR, Inc.(a) | 56,310 | 742,166 |
| Ribbon Communications, Inc.(a) | 158,716 | 469,799 |
| Total | | 9,244,453 |
| Electronic Equipment, Instruments & Components 2.3% |
| Avnet, Inc. | 25,700 | 1,304,275 |
| Belden, Inc. | 12,600 | 1,183,140 |
| Benchmark Electronics, Inc. | 41,014 | 1,055,700 |
| Coherent Corp.(a) | 24,500 | 921,935 |
| Daktronics, Inc.(a) | 45,085 | 376,910 |
| ePlus, Inc.(a) | 15,200 | 1,008,976 |
| FARO Technologies, Inc.(a) | 54,980 | 871,983 |
| Itron, Inc.(a) | 15,900 | 1,087,719 |
| Kimball Electronics, Inc.(a) | 31,400 | 947,966 |
| Knowles Corp.(a) | 81,827 | 1,311,687 |
| Littelfuse, Inc. | 7,109 | 1,898,672 |
| nLight, Inc.(a) | 39,565 | 451,437 |
| Novanta, Inc.(a) | 58,684 | 9,799,054 |
| PC Connection, Inc. | 11,600 | 616,192 |
| Plexus Corp.(a) | 12,376 | 1,256,783 |
| Sanmina Corp.(a) | 21,300 | 1,186,410 |
| Scansource, Inc.(a) | 43,154 | 1,414,588 |
| TTM Technologies, Inc.(a) | 89,000 | 1,326,100 |
| Common Stocks (continued) |
| Issuer | Shares | Value ($) |
| Vishay Intertechnology, Inc. | 93,888 | 2,576,287 |
| Vontier Corp. | 36,800 | 1,155,888 |
| Total | | 31,751,702 |
| IT Services 0.5% |
| Brightcove, Inc.(a) | 10,010 | 38,539 |
| DigitalOcean Holdings, Inc.(a) | 41,391 | 1,119,627 |
| DXC Technology Co.(a) | 26,154 | 542,434 |
| Edgio, Inc.(a) | 21,299 | 18,402 |
| Globant SA(a) | 6,964 | 1,423,929 |
| Kyndryl Holdings, Inc.(a) | 34,357 | 579,946 |
| Squarespace, Inc., Class A(a) | 81,781 | 2,465,697 |
| Unisys Corp.(a) | 97,370 | 392,401 |
| Total | | 6,580,975 |
| Semiconductors & Semiconductor Equipment 1.6% |
| Allegro MicroSystems, Inc.(a) | 50,950 | 1,948,837 |
| Axcelis Technologies, Inc.(a) | 4,442 | 853,530 |
| AXT, Inc.(a) | 13,800 | 35,880 |
| Cirrus Logic, Inc.(a) | 22,037 | 1,807,915 |
| Credo Technology Group Holding Ltd.(a) | 103,310 | 1,700,483 |
| Diodes, Inc.(a) | 27,500 | 2,250,875 |
| Maxeon Solar Technologies, Ltd.(a) | 11,153 | 175,771 |
| MaxLinear, Inc.(a) | 27,700 | 650,950 |
| MKS Instruments, Inc. | 15,464 | 1,549,957 |
| Onto Innovation, Inc.(a) | 4,615 | 641,393 |
| Photronics, Inc.(a) | 35,700 | 848,232 |
| Power Integrations, Inc. | 20,139 | 1,692,079 |
| Rambus, Inc.(a) | 74,751 | 4,221,189 |
| Semtech Corp.(a) | 48,500 | 1,268,275 |
| SMART Global Holdings, Inc.(a) | 76,778 | 1,983,176 |
| Ultra Clean Holdings, Inc.(a) | 36,418 | 1,280,457 |
| Total | | 22,908,999 |
| Software 9.0% |
| ACI Worldwide, Inc.(a) | 52,200 | 1,267,416 |
| Adeia, Inc. | 118,061 | 1,187,694 |
| Altair Engineering, Inc., Class A(a) | 118,663 | 7,888,716 |
| Blackbaud, Inc.(a) | 23,796 | 1,811,114 |
| Blackline, Inc.(a) | 113,288 | 6,804,077 |
| Box, Inc., Class A(a) | 109,745 | 2,906,048 |
The accompanying Notes to Financial Statements are an integral part of this statement.
Multi-Manager Small Cap Equity Strategies Fund | Annual Report 2023
| 21 |
Portfolio of Investments (continued)
August 31, 2023
| Common Stocks (continued) |
| Issuer | Shares | Value ($) |
| Cerence, Inc.(a) | 102,499 | 2,675,224 |
| Clear Secure, Inc., Class A | 71,849 | 1,561,997 |
| Clearwater Analytics Holdings, Inc., Class A(a) | 300,485 | 5,453,803 |
| Confluent, Inc., Class A(a) | 90,738 | 3,002,520 |
| Consensus Cloud Solutions, Inc.(a) | 26,958 | 860,769 |
| CS Disco, Inc.(a) | 30,673 | 291,393 |
| CyberArk Software Ltd.(a) | 21,920 | 3,639,597 |
| Descartes Systems Group, Inc. (The)(a) | 143,485 | 10,755,636 |
| Dropbox, Inc., Class A(a) | 68,416 | 1,901,281 |
| Ebix, Inc. | 47,000 | 784,900 |
| Elastic NV(a) | 24,916 | 1,541,802 |
| Envestnet, Inc.(a) | 43,739 | 2,389,462 |
| Everbridge, Inc.(a) | 19,229 | 477,071 |
| EverCommerce, Inc.(a) | 42,385 | 448,009 |
| Five9, Inc.(a) | 31,687 | 2,293,188 |
| Gitlab, Inc., Class A(a) | 18,713 | 886,435 |
| HashiCorp, Inc., Class A(a) | 92,423 | 2,695,055 |
| Informatica, Inc., Class A(a) | 13,014 | 272,643 |
| JFrog Ltd.(a) | 56,761 | 1,628,473 |
| LiveRamp Holdings, Inc.(a) | 80,999 | 2,619,508 |
| Model N, Inc.(a) | 207,745 | 5,609,115 |
| NCR Corp.(a) | 46,200 | 1,421,112 |
| New Relic, Inc.(a) | 26,042 | 2,216,435 |
| Nutanix, Inc., Class A(a) | 64,504 | 2,006,074 |
| ON24, Inc. | 16,959 | 116,339 |
| PowerSchool Holdings, Inc., Class A(a) | 31,743 | 702,155 |
| Progress Software Corp. | 32,286 | 1,964,280 |
| PROS Holdings, Inc.(a) | 164,400 | 5,895,384 |
| Q2 Holdings, Inc.(a) | 104,190 | 3,585,178 |
| SecureWorks Corp., Class A(a) | 9,127 | 62,976 |
| SentinelOne, Inc., Class A(a) | 122,047 | 2,029,642 |
| Smartsheet, Inc., Class A(a) | 59,710 | 2,491,698 |
| SolarWinds Corp.(a) | 62,979 | 670,726 |
| SPS Commerce, Inc.(a) | 75,845 | 14,117,030 |
| Telos Corp.(a) | 239,200 | 624,312 |
| Upland Software, Inc.(a) | 89,824 | 318,875 |
| Vertex, Inc.(a) | 248,930 | 5,573,543 |
| Common Stocks (continued) |
| Issuer | Shares | Value ($) |
| Workiva, Inc., Class A(a) | 61,771 | 6,909,086 |
| Xperi, Inc.(a) | 55,665 | 656,847 |
| Total | | 125,014,638 |
| Technology Hardware, Storage & Peripherals 0.6% |
| CPI Card Group, Inc.(a) | 25,700 | 531,219 |
| Quantum Corp.(a) | 42,013 | 26,048 |
| Super Micro Computer, Inc.(a) | 21,466 | 5,904,867 |
| Turtle Beach Corp.(a) | 34,732 | 377,537 |
| Xerox Holdings Corp. | 114,401 | 1,817,832 |
| Total | | 8,657,503 |
| Total Information Technology | 204,158,270 |
| Materials 3.7% |
| Chemicals 1.9% |
| AdvanSix, Inc. | 26,300 | 870,004 |
| Alto Ingredients, Inc.(a) | 249,600 | 901,056 |
| American Vanguard Corp. | 16,679 | 230,504 |
| Avient Corp. | 68,547 | 2,749,420 |
| Balchem Corp. | 51,682 | 7,261,321 |
| Cabot Corp. | 42,702 | 3,094,187 |
| Chase Corp. | 2,400 | 303,600 |
| Core Molding Technologies, Inc.(a) | 5,748 | 155,828 |
| Ecovyst, Inc.(a) | 227,762 | 2,332,283 |
| Hawkins, Inc. | 7,000 | 435,330 |
| HB Fuller Co. | 30,421 | 2,206,435 |
| Ingevity Corp.(a) | 20,000 | 1,077,800 |
| Innospec, Inc. | 8,800 | 945,296 |
| Minerals Technologies, Inc. | 22,000 | 1,344,200 |
| NewMarket Corp. | 1,000 | 469,640 |
| Rayonier Advanced Materials, Inc.(a) | 116,966 | 412,890 |
| Trinseo PLC | 132,879 | 1,399,216 |
| Valhi, Inc. | 1,578 | 20,893 |
| Total | | 26,209,903 |
| Containers & Packaging 0.3% |
| Myers Industries, Inc. | 45,100 | 848,331 |
| O-I Glass, Inc.(a) | 163,975 | 3,256,544 |
| TriMas Corp. | 33,400 | 875,080 |
| Total | | 4,979,955 |
The accompanying Notes to Financial Statements are an integral part of this statement.
| 22 | Multi-Manager Small Cap Equity Strategies Fund | Annual Report 2023 |
Portfolio of Investments (continued)
August 31, 2023
| Common Stocks (continued) |
| Issuer | Shares | Value ($) |
| Metals & Mining 1.3% |
| Alpha Metallurgical Resources, Inc. | 3,092 | 627,181 |
| ATI, Inc.(a) | 34,375 | 1,558,219 |
| Compass Minerals International, Inc. | 26,200 | 789,930 |
| Constellium SE(a) | 104,946 | 1,889,028 |
| Kaiser Aluminum Corp. | 12,647 | 960,160 |
| Lifezone Metals Ltd.(a) | 22,700 | 324,610 |
| Materion Corp. | 25,587 | 2,783,610 |
| MP Materials Corp.(a) | 7,250 | 151,815 |
| Olympic Steel, Inc. | 20,432 | 1,093,521 |
| Ryerson Holding Corp. | 56,484 | 1,758,912 |
| Schnitzer Steel Industries, Inc., Class A | 38,948 | 1,293,074 |
| SunCoke Energy, Inc. | 76,175 | 708,427 |
| Tredegar Corp. | 118,400 | 595,552 |
| Warrior Met Coal, Inc. | 67,958 | 2,688,418 |
| Worthington Industries, Inc. | 6,200 | 466,674 |
| Total | | 17,689,131 |
| Paper & Forest Products 0.2% |
| Clearwater Paper Corp.(a) | 23,322 | 892,999 |
| Mercer International, Inc. | 148,200 | 1,347,138 |
| Sylvamo Corp. | 12,700 | 530,479 |
| Total | | 2,770,616 |
| Total Materials | 51,649,605 |
| Real Estate 4.8% |
| Diversified REITs 0.1% |
| Armada Hoffler Properties, Inc. | 27,131 | 309,022 |
| CTO Realty Growth, Inc. | 7,962 | 140,290 |
| Empire State Realty Trust, Inc., Class A | 165,100 | 1,441,323 |
| Total | | 1,890,635 |
| Hotel & Resort REITs 1.2% |
| Apple Hospitality REIT, Inc. | 298,625 | 4,485,347 |
| Braemar Hotels & Resorts, Inc. | 172,000 | 467,840 |
| Chatham Lodging Trust | 40,311 | 394,242 |
| Park Hotels & Resorts, Inc. | 91,300 | 1,171,379 |
| Pebblebrook Hotel Trust | 153,220 | 2,217,093 |
| RLJ Lodging Trust | 330,945 | 3,306,141 |
| Common Stocks (continued) |
| Issuer | Shares | Value ($) |
| Sunstone Hotel Investors, Inc. | 284,902 | 2,558,420 |
| Xenia Hotels & Resorts, Inc. | 177,852 | 2,098,654 |
| Total | | 16,699,116 |
| Industrial REITs 0.6% |
| First Industrial Realty Trust, Inc. | 44,797 | 2,326,756 |
| STAG Industrial, Inc. | 63,578 | 2,322,505 |
| Terreno Realty Corp. | 68,952 | 4,198,487 |
| Total | | 8,847,748 |
| Office REITs 0.4% |
| Equity Commonwealth | 161,953 | 3,081,966 |
| SL Green Realty Corp. | 77,100 | 3,026,946 |
| Total | | 6,108,912 |
| Real Estate Management & Development 1.4% |
| Compass, Inc.(a) | 164,877 | 593,557 |
| Cushman & Wakefield PLC(a) | 136,500 | 1,254,435 |
| DigitalBridge Group, Inc. | 112,600 | 1,961,492 |
| Douglas Elliman, Inc. | 280,412 | 703,834 |
| FirstService Corp. | 60,770 | 9,184,170 |
| Forestar Group, Inc.(a) | 36,593 | 1,043,267 |
| Marcus & Millichap, Inc. | 37,600 | 1,252,080 |
| Opendoor Technologies, Inc.(a) | 175,723 | 685,320 |
| RE/MAX Holdings, Inc., Class A | 64,400 | 1,043,280 |
| Seritage Growth Properties, Class A(a) | 129,700 | 979,235 |
| Total | | 18,700,670 |
| Residential REITs 0.1% |
| Centerspace | 19,818 | 1,283,017 |
| Retail REITs 0.7% |
| Alexander’s, Inc. | 5,500 | 1,054,625 |
| Kite Realty Group Trust | 170,855 | 3,856,197 |
| NetSTREIT Corp. | 70,919 | 1,200,659 |
| Tanger Factory Outlet Centers, Inc. | 155,100 | 3,606,075 |
| Total | | 9,717,556 |
| Specialized REITs 0.3% |
| CubeSmart | 38,544 | 1,607,670 |
| Rayonier, Inc. | 75,700 | 2,263,430 |
| Total | | 3,871,100 |
| Total Real Estate | 67,118,754 |
The accompanying Notes to Financial Statements are an integral part of this statement.
Multi-Manager Small Cap Equity Strategies Fund | Annual Report 2023
| 23 |
Portfolio of Investments (continued)
August 31, 2023
| Common Stocks (continued) |
| Issuer | Shares | Value ($) |
| Utilities 2.1% |
| Electric Utilities 0.7% |
| Allete, Inc. | 19,100 | 1,048,590 |
| NRG Energy, Inc. | 50,533 | 1,897,514 |
| Otter Tail Corp. | 15,000 | 1,235,550 |
| PNM Resources, Inc. | 26,900 | 1,191,939 |
| Portland General Electric Co. | 95,494 | 4,188,367 |
| Total | | 9,561,960 |
| Gas Utilities 0.9% |
| New Jersey Resources Corp. | 62,909 | 2,652,872 |
| Northwest Natural Holding Co. | 37,667 | 1,479,560 |
| ONE Gas, Inc. | 91,882 | 6,658,689 |
| Southwest Gas Holdings, Inc. | 19,000 | 1,176,670 |
| Spire, Inc. | 18,000 | 1,051,380 |
| Total | | 13,019,171 |
| Independent Power and Renewable Electricity Producers 0.3% |
| Clearway Energy, Inc., Class C | 49,884 | 1,235,627 |
| Vistra Corp. | 82,246 | 2,584,169 |
| Total | | 3,819,796 |
| Multi-Utilities 0.2% |
| Avista Corp. | 28,700 | 955,423 |
| Black Hills Corp. | 18,700 | 1,028,500 |
| NorthWestern Corp. | 19,600 | 987,840 |
| Total | | 2,971,763 |
| Total Utilities | 29,372,690 |
Total Common Stocks
(Cost $1,351,013,773) | 1,363,725,447 |
|
| Exchange-Traded Equity Funds 0.4% |
| | Shares | Value ($) |
| Sector 0.4% |
| SPDR S&P Biotech ETF | 65,985 | 5,226,012 |
Total Exchange-Traded Equity Funds
(Cost $5,469,042) | 5,226,012 |
|
| Money Market Funds 1.6% |
| | |
| Columbia Short-Term Cash Fund, 5.476%(e),(f) | 23,221,818 | 23,214,851 |
Total Money Market Funds
(Cost $23,213,994) | 23,214,851 |
Total Investments in Securities
(Cost: $1,379,696,809) | 1,392,166,310 |
| Other Assets & Liabilities, Net | | (2,006,705) |
| Net Assets | 1,390,159,605 |
Notes to Portfolio of Investments
| (a) | Non-income producing investment. |
| (b) | Represents fair value as determined in good faith under procedures approved by the Board of Trustees. At August 31, 2023, the total value of these securities amounted to $0, which represents less than 0.01% of total net assets. |
| (c) | Denotes a restricted security, which is subject to legal or contractual restrictions on resale under federal securities laws. Disposal of a restricted investment may involve time-consuming negotiations and expenses, and prompt sale at an acceptable price may be difficult to achieve. Private placement securities are generally considered to be restricted, although certain of those securities may be traded between qualified institutional investors under the provisions of Section 4(a)(2) and Rule 144A. The Fund will not incur any registration costs upon such a trade. These securities are valued at fair value determined in good faith under consistently applied procedures approved by the Fund’s Board of Trustees. At August 31, 2023, the total market value of these securities amounted to $0, which represents less than 0.01% of total net assets. Additional information on these securities is as follows: |
| Security | Acquisition
Dates | Shares | Cost ($) | Value ($) |
| Clementia Pharmaceuticals, Inc. | 04/23/2019 | 134,864 | — | — |
The accompanying Notes to Financial Statements are an integral part of this statement.
| 24 | Multi-Manager Small Cap Equity Strategies Fund | Annual Report 2023 |
Portfolio of Investments (continued)
August 31, 2023
Notes to Portfolio of Investments (continued)
| (d) | Valuation based on significant unobservable inputs. |
| (e) | The rate shown is the seven-day current annualized yield at August 31, 2023. |
| (f) | As defined in the Investment Company Act of 1940, as amended, an affiliated company is one in which the Fund owns 5% or more of the company’s outstanding voting securities, or a company which is under common ownership or control with the Fund. The value of the holdings and transactions in these affiliated companies during the year ended August 31, 2023 are as follows: |
| Affiliated issuers | Beginning
of period($) | Purchases($) | Sales($) | Net change in
unrealized
appreciation
(depreciation)($) | End of
period($) | Realized gain
(loss)($) | Dividends($) | End of
period shares |
| Columbia Short-Term Cash Fund, 5.476% |
| | 14,327,819 | 431,656,644 | (422,770,596) | 984 | 23,214,851 | 2,261 | 1,136,693 | 23,221,818 |
Abbreviation Legend
| ADR | American Depositary Receipt |
Fair value measurements
The Fund categorizes its fair value measurements according to a three-level hierarchy that maximizes the use of observable inputs and minimizes the use of unobservable inputs by prioritizing that the most observable input be used when available. Observable inputs are those that market participants would use in pricing an investment based on market data obtained from sources independent of the reporting entity. Unobservable inputs are those that reflect the Fund’s assumptions about the information market participants would use in pricing an investment. An investment’s level within the fair value hierarchy is based on the lowest level of any input that is deemed significant to the asset’s or liability’s fair value measurement. The input levels are not necessarily an indication of the risk or liquidity associated with investments at that level. For example, certain U.S. government securities are generally high quality and liquid, however, they are reflected as Level 2 because the inputs used to determine fair value may not always be quoted prices in an active market.
Fair value inputs are summarized in the three broad levels listed below:
| ■ | Level 1 — Valuations based on quoted prices for investments in active markets that the Fund has the ability to access at the measurement date. Valuation adjustments are not applied to Level 1 investments. |
| ■ | Level 2 — Valuations based on other significant observable inputs (including quoted prices for similar securities, interest rates, prepayment speeds, credit risks, etc.). |
| ■ | Level 3 — Valuations based on significant unobservable inputs (including the Fund’s own assumptions and judgment in determining the fair value of investments). |
Inputs that are used in determining fair value of an investment may include price information, credit data, volatility statistics, and other factors. These inputs can be either observable or unobservable. The availability of observable inputs can vary between investments, and is affected by various factors such as the type of investment, and the volume and level of activity for that investment or similar investments in the marketplace. The inputs will be considered by the Investment Manager, along with any other relevant factors in the calculation of an investment’s fair value. The Fund uses prices and inputs that are current as of the measurement date, which may include periods of market dislocations. During these periods, the availability of prices and inputs may be reduced for many investments. This condition could cause an investment to be reclassified between the various levels within the hierarchy.
Foreign equity securities actively traded in markets where there is a significant delay in the local close relative to the New York Stock Exchange are classified as Level 2. The values of these securities may include an adjustment to reflect the impact of market movements following the close of local trading, as described in Note 2 to the financial statements – Security valuation.
Investments falling into the Level 3 category are primarily supported by quoted prices from brokers and dealers participating in the market for those investments. However, these may be classified as Level 3 investments due to lack of market transparency and corroboration to support these quoted prices. Additionally, valuation models may be used as the pricing source for any remaining investments classified as Level 3. These models may rely on one or more significant unobservable inputs and/or significant assumptions by the Investment Manager. Inputs used in valuations may include, but are not limited to, financial statement analysis, capital account balances, discount rates and estimated cash flows, and comparable company data.
The Fund’s Board of Trustees (the Board) has designated the Investment Manager, through its Valuation Committee (the Committee), as valuation designee, responsible for determining the fair value of the assets of the Fund for which market quotations are not readily available using valuation procedures approved by the Board. The Committee consists of voting and non-voting members from various groups within the Investment Manager’s organization, including operations and accounting, trading and investments, compliance, risk management and legal.
The Committee meets at least monthly to review and approve valuation matters, which may include a description of specific valuation determinations, data regarding pricing information received from approved pricing vendors and brokers and the results of Board-approved valuation policies and procedures (the Policies). The Policies address, among other things, instances when market quotations are or are not readily available, including recommendations of third party pricing vendors and a determination of appropriate pricing methodologies; events that require specific valuation determinations and assessment of fair value techniques; securities with a potential for stale pricing, including those that are illiquid, restricted, or in default; and the effectiveness of third party pricing vendors, including periodic reviews of vendors. The Committee meets more frequently, as needed, to discuss additional valuation matters, which may include the need to review back-testing results, review time-sensitive information or approve related valuation actions. Representatives of Columbia Management Investment Advisers, LLC report to the Board at each of its regularly scheduled meetings to discuss valuation matters and actions during the period, similar to those described earlier.
The accompanying Notes to Financial Statements are an integral part of this statement.
Multi-Manager Small Cap Equity Strategies Fund | Annual Report 2023
| 25 |
Portfolio of Investments (continued)
August 31, 2023
Fair value measurements (continued)
The following table is a summary of the inputs used to value the Fund’s investments at August 31, 2023:
| | Level 1 ($) | Level 2 ($) | Level 3 ($) | Total ($) |
| Investments in Securities | | | | |
| Common Stocks | | | | |
| Communication Services | 10,442,426 | — | — | 10,442,426 |
| Consumer Discretionary | 145,332,798 | — | — | 145,332,798 |
| Consumer Staples | 35,056,470 | — | — | 35,056,470 |
| Energy | 91,675,442 | 690,690 | — | 92,366,132 |
| Financials | 239,092,097 | — | — | 239,092,097 |
| Health Care | 157,437,820 | — | 0* | 157,437,820 |
| Industrials | 331,698,385 | — | — | 331,698,385 |
| Information Technology | 204,158,270 | — | — | 204,158,270 |
| Materials | 51,649,605 | — | — | 51,649,605 |
| Real Estate | 67,118,754 | — | — | 67,118,754 |
| Utilities | 29,372,690 | — | — | 29,372,690 |
| Total Common Stocks | 1,363,034,757 | 690,690 | 0* | 1,363,725,447 |
| Exchange-Traded Equity Funds | 5,226,012 | — | — | 5,226,012 |
| Money Market Funds | 23,214,851 | — | — | 23,214,851 |
| Total Investments in Securities | 1,391,475,620 | 690,690 | 0* | 1,392,166,310 |
See the Portfolio of Investments for all investment classifications not indicated in the table.
The Fund’s assets assigned to the Level 2 input category are generally valued using the market approach, in which a security’s value is determined through reference to prices and information from market transactions for similar or identical assets. These assets include certain foreign securities for which a third party statistical pricing service may be employed for purposes of fair market valuation. The model utilized by such third party statistical pricing service takes into account a security’s correlation to available market data including, but not limited to, intraday index, ADR, and exchange-traded fund movements.
The Fund does not hold any significant investments (greater than one percent of net assets) categorized as Level 3.
The accompanying Notes to Financial Statements are an integral part of this statement.
| 26 | Multi-Manager Small Cap Equity Strategies Fund | Annual Report 2023 |
Statement of Assets and Liabilities
August 31, 2023
| Assets | |
| Investments in securities, at value | |
| Unaffiliated issuers (cost $1,356,482,815) | $1,368,951,459 |
| Affiliated issuers (cost $23,213,994) | 23,214,851 |
| Receivable for: | |
| Investments sold | 5,438,274 |
| Capital shares sold | 1,685,249 |
| Dividends | 1,260,298 |
| Foreign tax reclaims | 4,386 |
| Trustees’ fees | 126,318 |
| Expense reimbursement due from Investment Manager | 6,599 |
| Prepaid expenses | 15,429 |
| Total assets | 1,400,702,863 |
| Liabilities | |
| Payable for: | |
| Investments purchased | 8,611,982 |
| Capital shares redeemed | 1,246,433 |
| Management services fees | 31,372 |
| Transfer agent fees | 340,830 |
| Trustees’ fees | 160,121 |
| Other expenses | 152,520 |
| Total liabilities | 10,543,258 |
| Net assets applicable to outstanding capital stock | $1,390,159,605 |
| Represented by | |
| Paid in capital | 1,374,396,311 |
| Total distributable earnings (loss) | 15,763,294 |
| Total - representing net assets applicable to outstanding capital stock | $1,390,159,605 |
| Institutional Class | |
| Net assets | $1,390,157,176 |
| Shares outstanding | 93,022,353 |
| Net asset value per share | $14.94 |
| Institutional 3 Class | |
| Net assets | $2,429 |
| Shares outstanding | 163 |
| Net asset value per share(a) | $14.94 |
| (a) | Net asset value per share rounds to this amount due to fractional shares outstanding. |
The accompanying Notes to Financial Statements are an integral part of this statement.
Multi-Manager Small Cap Equity Strategies Fund | Annual Report 2023
| 27 |
Statement of Operations
Year Ended August 31, 2023
| Net investment income | |
| Income: | |
| Dividends — unaffiliated issuers | $20,275,084 |
| Dividends — affiliated issuers | 1,136,693 |
| Foreign taxes withheld | (41,860) |
| Total income | 21,369,917 |
| Expenses: | |
| Management services fees | 11,732,407 |
| Transfer agent fees | |
| Institutional Class | 4,181,825 |
| Institutional 3 Class | 1 |
| Trustees’ fees | 41,250 |
| Custodian fees | 84,938 |
| Printing and postage fees | 392,774 |
| Registration fees | 89,876 |
| Accounting services fees | 55,090 |
| Legal fees | 30,514 |
| Interest on interfund lending | 31 |
| Compensation of chief compliance officer | 242 |
| Other | 28,680 |
| Total expenses | 16,637,628 |
| Fees waived or expenses reimbursed by Investment Manager and its affiliates | (2,517,366) |
| Total net expenses | 14,120,262 |
| Net investment income | 7,249,655 |
| Realized and unrealized gain (loss) — net | |
| Net realized gain (loss) on: | |
| Investments — unaffiliated issuers | 19,798,083 |
| Investments — affiliated issuers | 2,261 |
| Net realized gain | 19,800,344 |
| Net change in unrealized appreciation (depreciation) on: | |
| Investments — unaffiliated issuers | 7,109,275 |
| Investments — affiliated issuers | 984 |
| Net change in unrealized appreciation (depreciation) | 7,110,259 |
| Net realized and unrealized gain | 26,910,603 |
| Net increase in net assets resulting from operations | $34,160,258 |
The accompanying Notes to Financial Statements are an integral part of this statement.
| 28 | Multi-Manager Small Cap Equity Strategies Fund | Annual Report 2023 |
Statement of Changes in Net Assets
| | Year Ended
August 31, 2023 | Year Ended
August 31, 2022 |
| Operations | | |
| Net investment income | $7,249,655 | $1,845,505 |
| Net realized gain | 19,800,344 | 138,601,938 |
| Net change in unrealized appreciation (depreciation) | 7,110,259 | (363,318,981) |
| Net increase (decrease) in net assets resulting from operations | 34,160,258 | (222,871,538) |
| Distributions to shareholders | | |
| Net investment income and net realized gains | | |
| Institutional Class | (116,769,104) | (213,409,162) |
| Institutional 3 Class | (235) | (529) |
| Total distributions to shareholders | (116,769,339) | (213,409,691) |
| Increase in net assets from capital stock activity | 187,664,754 | 237,772,579 |
| Total increase (decrease) in net assets | 105,055,673 | (198,508,650) |
| Net assets at beginning of year | 1,285,103,932 | 1,483,612,582 |
| Net assets at end of year | $1,390,159,605 | $1,285,103,932 |
| | Year Ended | Year Ended |
| | August 31, 2023 | August 31, 2022 |
| | Shares | Dollars ($) | Shares | Dollars ($) |
| Capital stock activity |
| Institutional Class | | | | |
| Shares sold | 46,047,183 | 694,404,386 | 21,496,910 | 377,218,941 |
| Distributions reinvested | 8,364,549 | 116,769,104 | 11,448,989 | 213,409,162 |
| Shares redeemed | (44,014,091) | (623,508,736) | (18,945,152) | (352,855,524) |
| Net increase | 10,397,641 | 187,664,754 | 14,000,747 | 237,772,579 |
| Total net increase | 10,397,641 | 187,664,754 | 14,000,747 | 237,772,579 |
The accompanying Notes to Financial Statements are an integral part of this statement.
Multi-Manager Small Cap Equity Strategies Fund | Annual Report 2023
| 29 |
The following table is intended to help you understand the Fund’s financial performance. Certain information reflects financial results for a single share of a class held for the periods shown. Per share net investment income (loss) amounts are calculated based on average shares outstanding during the period. Total return assumes reinvestment of all dividends and distributions, if any. Total return does not reflect payment of sales charges, if any. Total return and portfolio turnover are not annualized for periods of less than one year. The ratios of expenses and net investment income are annualized for periods of less than one year. The portfolio turnover rate is calculated without regard to purchase and sales transactions of short-term instruments and certain derivatives, if any. If such transactions were included, the Fund’s portfolio turnover rate may be higher.
| | Net asset value,
beginning of
period | Net
investment
income
(loss) | Net
realized
and
unrealized
gain (loss) | Total from
investment
operations | Distributions
from net
investment
income | Distributions
from net
realized
gains | Total
distributions to
shareholders |
| Institutional Class |
| Year Ended 8/31/2023 | $15.55 | 0.07 | 0.74 | 0.81 | (0.05) | (1.37) | (1.42) |
| Year Ended 8/31/2022 | $21.62 | 0.02 | (2.85) | (2.83) | (0.01) | (3.23) | (3.24) |
| Year Ended 8/31/2021 | $14.76 | 0.00(d) | 6.92 | 6.92 | (0.06) | — | (0.06) |
| Year Ended 8/31/2020 | $14.39 | 0.04 | 0.80 | 0.84 | (0.05) | (0.42) | (0.47) |
| Year Ended 8/31/2019 | $17.75 | 0.03 | (2.37) | (2.34) | (0.02) | (1.00) | (1.02) |
| Institutional 3 Class |
| Year Ended 8/31/2023 | $15.55 | 0.10 | 0.74 | 0.84 | (0.08) | (1.37) | (1.45) |
| Year Ended 8/31/2022 | $21.58 | 0.05 | (2.83) | (2.78) | (0.02) | (3.23) | (3.25) |
| Year Ended 8/31/2021 | $14.73 | 0.03 | 6.90 | 6.93 | (0.08) | — | (0.08) |
| Year Ended 8/31/2020(e) | $15.37 | 0.04 | (0.68)(f) | (0.64) | — | — | — |
| Notes to Financial Highlights |
| (a) | In addition to the fees and expenses that the Fund bears directly, the Fund indirectly bears a pro rata share of the fees and expenses of any other funds in which it invests. Such indirect expenses are not included in the Fund’s reported expense ratios. |
| (b) | Total net expenses include the impact of certain fee waivers/expense reimbursements made by the Investment Manager and certain of its affiliates, if applicable. |
| (c) | Ratios include interfund lending expense which is less than 0.01%. |
| (d) | Rounds to zero. |
| (e) | Institutional 3 Class shares commenced operations on December 18, 2019. Per share data and total return reflect activity from that date. |
| (f) | Calculation of the net gain (loss) per share (both realized and unrealized) does not correlate to the aggregate realized and unrealized gain (loss) presented in the Statement of Operations due to timing of Fund shares sold and redeemed in relation to fluctuations in the market value of the portfolio. |
The accompanying Notes to Financial Statements are an integral part of this statement.
| 30 | Multi-Manager Small Cap Equity Strategies Fund | Annual Report 2023 |
Financial Highlights (continued)
| | Net
asset
value,
end of
period | Total
return | Total gross
expense
ratio to
average
net assets(a) | Total net
expense
ratio to
average
net assets(a),(b) | Net investment
income (loss)
ratio to
average
net assets | Portfolio
turnover | Net
assets,
end of
period
(000’s) |
| Institutional Class |
| Year Ended 8/31/2023 | $14.94 | 5.83% | 1.17%(c) | 0.99%(c) | 0.51% | 74% | $1,390,157 |
| Year Ended 8/31/2022 | $15.55 | (15.57%) | 1.17%(c) | 0.99%(c) | 0.13% | 59% | $1,285,101 |
| Year Ended 8/31/2021 | $21.62 | 46.94% | 1.13% | 0.99% | 0.01% | 59% | $1,483,609 |
| Year Ended 8/31/2020 | $14.76 | 5.76% | 1.09% | 0.99% | 0.26% | 83% | $1,167,589 |
| Year Ended 8/31/2019 | $14.39 | (12.85%) | 1.06% | 1.05% | 0.22% | 97% | $1,664,350 |
| Institutional 3 Class |
| Year Ended 8/31/2023 | $14.94 | 6.05% | 0.89%(c) | 0.81%(c) | 0.67% | 74% | $2 |
| Year Ended 8/31/2022 | $15.55 | (15.33%) | 0.84%(c) | 0.81%(c) | 0.30% | 59% | $3 |
| Year Ended 8/31/2021 | $21.58 | 47.18% | 0.86% | 0.81% | 0.16% | 59% | $4 |
| Year Ended 8/31/2020(e) | $14.73 | (4.16%) | 0.86% | 0.81% | 0.38% | 83% | $2 |
The accompanying Notes to Financial Statements are an integral part of this statement.
Multi-Manager Small Cap Equity Strategies Fund | Annual Report 2023
| 31 |
Notes to Financial Statements
August 31, 2023
Note 1. Organization
Multi-Manager Small Cap Equity Strategies Fund (the Fund), a series of Columbia Funds Series Trust I (the Trust), is a diversified fund. The Trust is registered under the Investment Company Act of 1940, as amended (the 1940 Act), as an open-end management investment company organized as a Massachusetts business trust.
Fund shares
The Trust may issue an unlimited number of shares (without par value). The Fund is offered only through certain wrap fee programs sponsored and/or managed by Ameriprise Financial, Inc. (Ameriprise Financial) or its affiliates. The Fund offers each of the share classes listed in the Statement of Assets and Liabilities which are not subject to any front-end sales charge or contingent deferred sales charge.
Note 2. Summary of significant accounting policies
Basis of preparation
The Fund is an investment company that applies the accounting and reporting guidance in the Financial Accounting Standards Board (FASB) Accounting Standards Codification Topic 946, Financial Services - Investment Companies (ASC 946). The financial statements are prepared in accordance with U.S. generally accepted accounting principles (GAAP), which requires management to make certain estimates and assumptions that affect the reported amounts of assets and liabilities, the disclosure of contingent assets and liabilities at the date of the financial statements and the reported amounts of income and expenses during the reporting period. Actual results could differ from those estimates.
The following is a summary of significant accounting policies followed by the Fund in the preparation of its financial statements.
Security valuation
Equity securities listed on an exchange are valued at the closing price or last trade price on their primary exchange at the close of business of the New York Stock Exchange. Securities with a closing price not readily available or not listed on any exchange are valued at the mean between the closing bid and ask prices. Listed preferred stocks convertible into common stocks are valued using an evaluated price from a pricing service.
Foreign equity securities are valued based on the closing price or last trade price on their primary exchange at the close of business of the New York Stock Exchange. If any foreign equity security closing prices are not readily available, the securities are valued at the mean of the latest quoted bid and ask prices on such exchanges or markets. Foreign currency exchange rates are determined at the scheduled closing time of the New York Stock Exchange. Many securities markets and exchanges outside the U.S. close prior to the close of the New York Stock Exchange; therefore, the closing prices for securities in such markets or on such exchanges may not fully reflect events that occur after such close but before the close of the New York Stock Exchange. In those situations, foreign securities will be fair valued pursuant to a policy approved by the Board of Trustees. Under the policy, the Fund may utilize a third-party pricing service to determine these fair values. The third-party pricing service takes into account multiple factors, including, but not limited to, movements in the U.S. securities markets, certain depositary receipts, futures contracts and foreign exchange rates that have occurred subsequent to the close of the foreign exchange or market, to determine a good faith estimate that reasonably reflects the current market conditions as of the close of the New York Stock Exchange. The fair value of a security is likely to be different from the quoted or published price, if available.
Investments in open-end investment companies (other than exchange-traded funds (ETFs)), are valued at the latest net asset value reported by those companies as of the valuation time.
Investments for which market quotations are not readily available, or that have quotations which management believes are not reflective of market value or reliable, are valued at fair value as determined in good faith under procedures approved by the Board of Trustees. If a security or class of securities (such as foreign securities) is valued at fair value, such value is likely to be different from the quoted or published price for the security, if available.
| 32 | Multi-Manager Small Cap Equity Strategies Fund | Annual Report 2023 |
Notes to Financial Statements (continued)
August 31, 2023
The determination of fair value often requires significant judgment. To determine fair value, management may use assumptions including but not limited to future cash flows and estimated risk premiums. Multiple inputs from various sources may be used to determine fair value.
GAAP requires disclosure regarding the inputs and valuation techniques used to measure fair value and any changes in valuation inputs or techniques. In addition, investments shall be disclosed by major category. This information is disclosed following the Fund’s Portfolio of Investments.
Security transactions
Security transactions are accounted for on the trade date. Cost is determined and gains (losses) are based upon the specific identification method for both financial statement and federal income tax purposes.
Income recognition
Corporate actions and dividend income are generally recorded net of any non-reclaimable tax withholdings, on the ex-dividend date or upon receipt of an ex-dividend notification in the case of certain foreign securities.
The Fund may receive distributions from holdings in equity securities, business development companies (BDCs), exchange-traded funds (ETFs), limited partnerships (LPs), other regulated investment companies (RICs), and real estate investment trusts (REITs), which report information as to the tax character of their distributions annually. These distributions are allocated to dividend income, capital gain and return of capital based on actual information reported. Return of capital is recorded as a reduction of the cost basis of securities held. If the Fund no longer owns the applicable securities, return of capital is recorded as a realized gain. With respect to REITs, to the extent actual information has not yet been reported, estimates for return of capital are made by Columbia Management Investment Advisers, LLC (the Investment Manager), a wholly-owned subsidiary of Ameriprise Financial, Inc. (Ameriprise Financial). The Investment Manager’s estimates are subsequently adjusted when the actual character of the distributions is disclosed by the REITs, which could result in a proportionate change in return of capital to shareholders.
Awards from class action litigation are recorded as a reduction of cost basis if the Fund still owns the applicable securities on the payment date. If the Fund no longer owns the applicable securities on the payment date, the proceeds are recorded as realized gains.
Expenses
General expenses of the Trust are allocated to the Fund and other funds of the Trust based upon relative net assets or other expense allocation methodologies determined by the nature of the expense. Expenses directly attributable to the Fund are charged to the Fund. Expenses directly attributable to a specific class of shares are charged to that share class.
Determination of class net asset value
All income, expenses (other than class-specific expenses, which are charged to that share class, as shown in the Statement of Operations) and realized and unrealized gains (losses) are allocated to each class of the Fund on a daily basis, based on the relative net assets of each class, for purposes of determining the net asset value of each class.
Federal income tax status
The Fund intends to qualify each year as a regulated investment company under Subchapter M of the Internal Revenue Code, as amended, and will distribute substantially all of its investment company taxable income and net capital gain, if any, for its tax year, and as such will not be subject to federal income taxes. In addition, the Fund intends to distribute in each calendar year substantially all of its ordinary income, capital gain net income and certain other amounts, if any, such that the Fund should not be subject to federal excise tax. Therefore, no federal income or excise tax provision is recorded.
Foreign taxes
The Fund may be subject to foreign taxes on income, gains on investments or currency repatriation, a portion of which may be recoverable. The Fund will accrue such taxes and recoveries, as applicable, based upon its current interpretation of tax rules and regulations that exist in the markets in which it invests.
Multi-Manager Small Cap Equity Strategies Fund | Annual Report 2023
| 33 |
Notes to Financial Statements (continued)
August 31, 2023
Realized gains in certain countries may be subject to foreign taxes at the Fund level, based on statutory rates. The Fund accrues for such foreign taxes on realized and unrealized gains at the appropriate rate for each jurisdiction, as applicable. The amount, if any, is disclosed as a liability in the Statement of Assets and Liabilities.
Distributions to shareholders
Distributions from net investment income, if any, are declared and paid annually. Net realized capital gains, if any, are distributed at least annually. Income distributions and capital gain distributions are determined in accordance with federal income tax regulations, which may differ from GAAP.
Guarantees and indemnifications
Under the Trust’s organizational documents and, in some cases, by contract, its officers and trustees are indemnified against certain liabilities arising out of the performance of their duties to the Trust or its funds. In addition, certain of the Fund’s contracts with its service providers contain general indemnification clauses. The Fund’s maximum exposure under these arrangements is unknown since the amount of any future claims that may be made against the Fund cannot be determined, and the Fund has no historical basis for predicting the likelihood of any such claims.
Recent accounting pronouncements and regulatory updates
Tailored Shareholder Reports
In October 2022, the Securities and Exchange Commission (SEC) adopted a final rule relating to Tailored Shareholder Reports for Mutual Funds and Exchange-Traded Funds; Fee Information in Investment Company Advertisements. The rule and form amendments will, among other things, require the Fund to transmit concise and visually engaging shareholder reports that highlight key information. The amendments will require that funds tag information in a structured data format and that certain more in-depth information be made available online and available for delivery free of charge to investors on request. The amendments became effective January 24, 2023. There is an 18-month transition period after the effective date of the amendments.
Note 3. Fees and other transactions with affiliates
Management services fees
The Fund has entered into a Management Agreement with Columbia Management Investment Advisers, LLC (the Investment Manager), a wholly-owned subsidiary of Ameriprise Financial, Inc. (Ameriprise Financial). Under the Management Agreement, the Investment Manager provides the Fund with investment research and advice, as well as administrative and accounting services. The Investment Manager is responsible for the ultimate oversight of investments made by the Fund. The Fund’s subadvisers (see Subadvisory agreements below) have the primary responsibility for the day-to-day portfolio management of their portion of the Fund. The management services fee is an annual fee that is equal to a percentage of the Fund’s daily net assets that declines from 0.87% to 0.75% as the Fund’s net assets increase. The effective management services fee rate for the year ended August 31, 2023 was 0.82% of the Fund’s average daily net assets.
Subadvisory agreements
The Investment Manager has entered into Subadvisory Agreements with Conestoga Capital Advisors, LLC, Hotchkis and Wiley Capital Management, LLC, J.P. Morgan Investment Management Inc. and Jacobs Levy Equity Management, Inc., each of which subadvises a portion of the assets of the Fund. New investments in the Fund, net of any redemptions, are allocated in accordance with the Investment Manager’s determination. Each subadviser’s proportionate share of investments in the Fund will vary due to market fluctuations. The Investment Manager compensates each subadviser to manage the investment of the Fund’s assets.
Compensation of board members
Members of the Board of Trustees who are not officers or employees of the Investment Manager or Ameriprise Financial are compensated for their services to the Fund as disclosed in the Statement of Operations. Under a Deferred Compensation Plan (the Deferred Plan), these members of the Board of Trustees may elect to defer payment of up to 100% of their compensation. Deferred amounts are treated as though equivalent dollar amounts had been invested in shares of certain
| 34 | Multi-Manager Small Cap Equity Strategies Fund | Annual Report 2023 |
Notes to Financial Statements (continued)
August 31, 2023
funds managed by the Investment Manager. The Fund’s liability for these amounts is adjusted for market value changes and remains in the Fund until distributed in accordance with the Deferred Plan. All amounts payable under the Deferred Plan constitute a general unsecured obligation of the Fund. The expense for the Deferred Plan, which includes Trustees’ fees deferred during the current period as well as any gains or losses on the Trustees’ deferred compensation balances as a result of market fluctuations, is included in "Trustees’ fees" in the Statement of Operations.
Compensation of Chief Compliance Officer
The Board of Trustees has appointed a Chief Compliance Officer for the Fund in accordance with federal securities regulations. As disclosed in the Statement of Operations, a portion of the Chief Compliance Officer’s total compensation is allocated to the Fund, along with other allocations to affiliated registered investment companies managed by the Investment Manager and its affiliates, based on relative net assets.
Transfer agency fees
Under a Transfer and Dividend Disbursing Agent Agreement, Columbia Management Investment Services Corp. (the Transfer Agent), an affiliate of the Investment Manager and a wholly-owned subsidiary of Ameriprise Financial, is responsible for providing transfer agency services to the Fund. The Transfer Agent has contracted with SS&C GIDS, Inc. (SS&C GIDS) to serve as sub-transfer agent. Prior to January 1, 2023, SS&C GIDS was known as DST Asset Manager Solutions, Inc. The Transfer Agent pays the fees of SS&C GIDS for services as sub-transfer agent and SS&C GIDS is not entitled to reimbursement for such fees from the Fund (with the exception of out-of-pocket fees).
The Fund pays the Transfer Agent a monthly transfer agency fee based on the number or the average value of accounts, depending on the type of account. In addition, the Fund pays the Transfer Agent a fee for shareholder services based on the number of accounts or on a percentage of the average aggregate value of the Fund’s shares maintained in omnibus accounts up to the lesser of the amount charged by the financial intermediary or a cap established by the Board of Trustees from time to time.
The Transfer Agent also receives compensation from the Fund for various shareholder services and reimbursements for certain out-of-pocket fees. Total transfer agency fees for Institutional 3 Class shares are subject to an annual limitation of not more than 0.02% of the average daily net assets attributable to Institutional 3 Class shares.
For the year ended August 31, 2023, the Fund’s effective transfer agency fee rates as a percentage of average daily net assets of each class were as follows:
| | Effective rate (%) |
| Institutional Class | 0.29 |
| Institutional 3 Class | 0.02 |
Distribution and service fees
The Fund has an agreement with Columbia Management Investment Distributors, Inc. (the Distributor), an affiliate of the Investment Manager and a wholly-owned subsidiary of Ameriprise Financial, for distribution and shareholder services. The Fund does not pay the Distributor a fee for the distribution services it provides to the Fund.
Multi-Manager Small Cap Equity Strategies Fund | Annual Report 2023
| 35 |
Notes to Financial Statements (continued)
August 31, 2023
Expenses waived/reimbursed by the Investment Manager and its affiliates
The Investment Manager and certain of its affiliates have contractually agreed to waive fees and/or reimburse expenses (excluding certain fees and expenses described below) for the period(s) disclosed below, unless sooner terminated at the sole discretion of the Board of Trustees, so that the Fund’s net operating expenses, after giving effect to fees waived/expenses reimbursed and any balance credits and/or overdraft charges from the Fund’s custodian, do not exceed the following annual rate(s) as a percentage of the classes’ average daily net assets:
| | Fee rate(s) contractual
through
December 31, 2023 |
| Institutional Class | 0.99% |
| Institutional 3 Class | 0.81 |
Under the agreement governing these fee waivers and/or expense reimbursement arrangements, the following fees and expenses are excluded from the waiver/reimbursement commitment, and therefore will be paid by the Fund, if applicable: taxes (including foreign transaction taxes), expenses associated with investments in affiliated and non-affiliated pooled investment vehicles (including mutual funds and exchange-traded funds), transaction costs and brokerage commissions, costs related to any securities lending program, dividend expenses associated with securities sold short, inverse floater program fees and expenses, transaction charges and interest on borrowed money, interest, costs associated with shareholder meetings, infrequent and/or unusual expenses and any other expenses the exclusion of which is specifically approved by the Board of Trustees. This agreement may be modified or amended only with approval from the Investment Manager, certain of its affiliates and the Fund. Any fees waived and/or expenses reimbursed under the expense reimbursement arrangements described above are not recoverable by the Investment Manager or its affiliates in future periods.
Note 4. Federal tax information
The timing and character of income and capital gain distributions are determined in accordance with income tax regulations, which may differ from GAAP because of temporary or permanent book to tax differences.
At August 31, 2023, these differences were primarily due to differing treatment for deferral/reversal of wash sale losses, passive foreign investment company (pfic) holdings, trustees’ deferred compensation, non-deductible expenses, earnings and profits distributed to shareholders on the redemption of shares and miscellaneous adjustments. To the extent these differences were permanent, reclassifications were made among the components of the Fund’s net assets. Temporary differences do not require reclassifications.
The following reclassifications were made:
Undistributed net
investment
income ($) | Accumulated
net realized
(loss) ($) | Paid in
capital ($) |
| 204,457 | (451,551) | 247,094 |
Net investment income (loss) and net realized gains (losses), as disclosed in the Statement of Operations, and net assets were not affected by this reclassification.
The tax character of distributions paid during the years indicated was as follows:
| Year Ended August 31, 2023 | Year Ended August 31, 2022 |
Ordinary
income ($) | Long-term
capital gains ($) | Total ($) | Ordinary
income ($) | Long-term
capital gains ($) | Total ($) |
| 3,539,843 | 113,229,496 | 116,769,339 | 84,087,244 | 129,322,447 | 213,409,691 |
Short-term capital gain distributions, if any, are considered ordinary income distributions for tax purposes.
| 36 | Multi-Manager Small Cap Equity Strategies Fund | Annual Report 2023 |
Notes to Financial Statements (continued)
August 31, 2023
At August 31, 2023, the components of distributable earnings on a tax basis were as follows:
Undistributed
ordinary income ($) | Undistributed
long-term
capital gains ($) | Capital loss
carryforwards ($) | Net unrealized
(depreciation) ($) |
| 6,361,273 | 21,485,011 | — | (11,924,681) |
At August 31, 2023, the cost of all investments for federal income tax purposes along with the aggregate gross unrealized appreciation and depreciation based on that cost was:
Federal
tax cost ($) | Gross unrealized
appreciation ($) | Gross unrealized
(depreciation) ($) | Net unrealized
(depreciation) ($) |
| 1,404,090,991 | 122,011,231 | (133,935,912) | (11,924,681) |
Tax cost of investments and unrealized appreciation/(depreciation) may also include timing differences that do not constitute adjustments to tax basis.
Management of the Fund has concluded that there are no significant uncertain tax positions in the Fund that would require recognition in the financial statements. However, management’s conclusion may be subject to review and adjustment at a later date based on factors including, but not limited to, new tax laws, regulations, and administrative interpretations (including relevant court decisions). Generally, the Fund’s federal tax returns for the prior three fiscal years remain subject to examination by the Internal Revenue Service.
Note 5. Portfolio information
The cost of purchases and proceeds from sales of securities, excluding short-term investments and derivatives, if any, aggregated to $1,115,750,843 and $1,042,166,436, respectively, for the year ended August 31, 2023. The amount of purchase and sale activity impacts the portfolio turnover rate reported in the Financial Highlights.
Brokerage commissions paid to brokers affiliated with the Investment Manager of the Fund were $43,532 for the year ended August 31, 2023.
Note 6. Affiliated money market fund
The Fund invests in Columbia Short-Term Cash Fund, an affiliated money market fund established for the exclusive use by the Fund and other affiliated funds (the Affiliated MMF). The income earned by the Fund from such investments is included as Dividends - affiliated issuers in the Statement of Operations. As an investing fund, the Fund indirectly bears its proportionate share of the expenses of the Affiliated MMF. The Affiliated MMF prices its shares with a floating net asset value. The Securities and Exchange Commission has adopted amendments to money market fund rules requiring institutional prime money market funds like the Affiliated MMF to be subject, by October 2, 2024, to a liquidity fee if daily net redemptions exceed 5% of net assets and, by April 2, 2024, to a discretionary liquidity fee up to 2% if the imposition of such a fee is determined to be in the best interest of the Affiliated MMF.
Note 7. Interfund lending
Pursuant to an exemptive order granted by the Securities and Exchange Commission, the Fund participates in a program (the Interfund Program) allowing each participating Columbia Fund (each, a Participating Fund) to lend money directly to and, except for closed-end funds and money market funds, borrow money directly from other Participating Funds for temporary purposes. The amounts eligible for borrowing and lending under the Interfund Program are subject to certain restrictions.
Interfund loans are subject to the risk that the borrowing fund could be unable to repay the loan when due, and a delay in repayment to the lending fund could result in lost opportunities and/or additional lending costs. The exemptive order is subject to conditions intended to mitigate conflicts of interest arising from the Investment Manager’s relationship with each Participating Fund.
Multi-Manager Small Cap Equity Strategies Fund | Annual Report 2023
| 37 |
Notes to Financial Statements (continued)
August 31, 2023
The Fund’s activity in the Interfund Program during the year ended August 31, 2023 was as follows:
| Borrower or lender | Average loan
balance ($) | Weighted average
interest rate (%) | Number of days
with outstanding loans |
| Borrower | 200,000 | 5.60 | 1 |
Interest expense incurred by the Fund is recorded as interfund lending in the Statement of Operations. The Fund had no outstanding interfund loans at August 31, 2023.
Note 8. Line of credit
The Fund has access to a revolving credit facility with a syndicate of banks led by JPMorgan Chase Bank, N.A., Citibank, N.A. and Wells Fargo Bank, N.A. whereby the Fund may borrow for the temporary funding of shareholder redemptions or for other temporary or emergency purposes. Pursuant to an October 27, 2022 amendment and restatement, the credit facility, which is an agreement between the Fund and certain other funds managed by the Investment Manager or an affiliated investment manager, severally and not jointly, permits aggregate borrowings up to $950 million. Interest is currently charged to each participating fund based on its borrowings at a rate equal to the higher of (i) the federal funds effective rate, (ii) the secured overnight financing rate plus 0.10% and (iii) the overnight bank funding rate plus, in each case, 1.00%. Each borrowing under the credit facility matures no later than 60 days after the date of borrowing. The Fund also pays a commitment fee equal to its pro rata share of the unused amount of the credit facility at a rate of 0.15% per annum. The commitment fee is included in other expenses in the Statement of Operations. This agreement expires annually in October unless extended or renewed. Prior to the October 27, 2022 amendment and restatement, the Fund had access to a revolving credit facility with a syndicate of banks led by JPMorgan Chase Bank, N.A., Citibank, N.A. and Wells Fargo Bank, N.A. which permitted collective borrowings up to $950 million. Interest was charged to each participating fund based on its borrowings at a rate equal to the higher of (i) the federal funds effective rate, (ii) the secured overnight financing rate plus 0.11448% and (iii) the overnight bank funding rate plus, in each case, 1.00%.
The Fund had no borrowings during the year ended August 31, 2023.
Note 9. Significant risks
Industrials sector risk
The Fund is more susceptible to the particular risks that may affect companies in the industrials sector than if it were invested in a wider variety of companies in unrelated sectors. Companies in the industrials sector are subject to certain risks, including changes in supply and demand for their specific product or service and for industrial sector products in general, including decline in demand for such products due to rapid technological developments and frequent new product introduction. Performance of such companies may be affected by factors including government regulation, world events, economic conditions and risks for environmental damage and product liability claims.
Market risk
The Fund may incur losses due to declines in the value of one or more securities in which it invests. These declines may be due to factors affecting a particular issuer, or the result of, among other things, political, regulatory, market, economic or social developments affecting the relevant market(s) more generally. In addition, turbulence in financial markets and reduced liquidity in equity, credit and/or fixed income markets may negatively affect many issuers, which could adversely affect the Fund’s ability to price or value hard-to-value assets in thinly traded and closed markets and could cause significant redemptions and operational challenges. Global economies and financial markets are increasingly interconnected, and conditions and events in one country, region or financial market may adversely impact issuers in a different country, region or financial market. These risks may be magnified if certain events or developments adversely interrupt the global supply chain; in these and other circumstances, such risks might affect companies worldwide. As a result, local, regional or global events such as terrorism, war, natural disasters, disease/virus outbreaks and epidemics or other public health issues, recessions, depressions or other events – or the potential for such events – could have a significant negative impact on global economic and market conditions.
| 38 | Multi-Manager Small Cap Equity Strategies Fund | Annual Report 2023 |
Notes to Financial Statements (continued)
August 31, 2023
The large-scale invasion of Ukraine by Russia in February 2022 has resulted in sanctions and market disruptions, including declines in regional and global stock markets, unusual volatility in global commodity markets and significant devaluations of Russian currency. The extent and duration of the military action are impossible to predict but could be significant. Market disruption caused by the Russian military action, and any counter-measures or responses thereto (including international sanctions, a downgrade in the country’s credit rating, purchasing and financing restrictions, boycotts, tariffs, changes in consumer or purchaser preferences, cyberattacks and espionage) could have severe adverse impacts on regional and/or global securities and commodities markets, including markets for oil and natural gas. These impacts may include reduced market liquidity, distress in credit markets, further disruption of global supply chains, increased risk of inflation, restricted cross-border payments and limited access to investments and/or assets in certain international markets and/or issuers. These developments and other related events could negatively impact Fund performance.
Shareholder concentration risk
At August 31, 2023, affiliated shareholders of record owned 100.0% of the outstanding shares of the Fund in one or more accounts. Fund shares sold to or redeemed by concentrated accounts may have a significant effect on the operations of the Fund. In the case of a large redemption, the Fund may be forced to sell investments at inopportune times, including its liquid positions, which may result in Fund losses and the Fund holding a higher percentage of less liquid positions. Large redemptions could result in decreased economies of scale and increased operating expenses for non-redeeming Fund shareholders.
Small- and mid-cap company risk
Investments in small- and mid-capitalization companies (small- and mid-cap companies) often involve greater risks than investments in larger, more established companies (larger companies) because small- and mid-cap companies tend to have less predictable earnings and may lack the management experience, financial resources, product diversification and competitive strengths of larger companies. Securities of small- and mid-cap companies may be less liquid and more volatile than the securities of larger companies.
Note 10. Subsequent events
Management has evaluated the events and transactions that have occurred through the date the financial statements were issued and noted no items requiring adjustment of the financial statements or additional disclosure.
Note 11. Information regarding pending and settled legal proceedings
Ameriprise Financial and certain of its affiliates are involved in the normal course of business in legal proceedings which include regulatory inquiries, arbitration and litigation, including class actions concerning matters arising in connection with the conduct of their activities as part of a diversified financial services firm. Ameriprise Financial believes that the Fund is not currently the subject of, and that neither Ameriprise Financial nor any of its affiliates are the subject of, any pending legal, arbitration or regulatory proceedings that are likely to have a material adverse effect on the Fund or the ability of Ameriprise Financial or its affiliates to perform under their contracts with the Fund. Ameriprise Financial is required to make quarterly (10-Q), annual (10-K) and, as necessary, 8-K filings with the Securities and Exchange Commission (SEC) on legal and regulatory matters that relate to Ameriprise Financial and its affiliates. Copies of these filings may be obtained by accessing the SEC website at www.sec.gov.
There can be no assurance that these matters, or the adverse publicity associated with them, will not result in increased Fund redemptions, reduced sale of Fund shares or other adverse consequences to the Fund. Further, although we believe proceedings are not likely to have a material adverse effect on the Fund or the ability of Ameriprise Financial or its affiliates to perform under their contracts with the Fund, these proceedings are subject to uncertainties and, as such, we are unable to estimate the possible loss or range of loss that may result. An adverse outcome in one or more of these proceedings could result in adverse judgments, settlements, fines, penalties or other relief that could have a material adverse effect on the consolidated financial condition or results of operations of Ameriprise Financial or one or more of its affiliates that provide services to the Fund.
Multi-Manager Small Cap Equity Strategies Fund | Annual Report 2023
| 39 |
Report of Independent Registered Public Accounting Firm
To the Board of Trustees of Columbia Funds Series Trust I and Shareholders of Multi-Manager Small Cap Equity Strategies Fund
Opinion on the Financial Statements
We have audited the accompanying statement of assets and liabilities, including the portfolio of investments, of Multi-Manager Small Cap Equity Strategies Fund (one of the funds constituting Columbia Funds Series Trust I, referred to hereafter as the "Fund") as of August 31, 2023, the related statement of operations for the year ended August 31, 2023, the statement of changes in net assets for each of the two years in the period ended August 31, 2023, including the related notes, and the financial highlights for each of the periods indicated therein (collectively referred to as the "financial statements"). In our opinion, the financial statements present fairly, in all material respects, the financial position of the Fund as of August 31, 2023, the results of its operations for the year then ended, the changes in its net assets for each of the two years in the period ended August 31, 2023 and the financial highlights for each of the periods indicated therein in conformity with accounting principles generally accepted in the United States of America.
Basis for Opinion
These financial statements are the responsibility of the Fund’s management. Our responsibility is to express an opinion on the Fund’s financial statements based on our audits. We are a public accounting firm registered with the Public Company Accounting Oversight Board (United States) (PCAOB) and are required to be independent with respect to the Fund in accordance with the U.S. federal securities laws and the applicable rules and regulations of the Securities and Exchange Commission and the PCAOB.
We conducted our audits of these financial statements in accordance with the standards of the PCAOB. Those standards require that we plan and perform the audit to obtain reasonable assurance about whether the financial statements are free of material misstatement, whether due to error or fraud.
Our audits included performing procedures to assess the risks of material misstatement of the financial statements, whether due to error or fraud, and performing procedures that respond to those risks. Such procedures included examining, on a test basis, evidence regarding the amounts and disclosures in the financial statements. Our audits also included evaluating the accounting principles used and significant estimates made by management, as well as evaluating the overall presentation of the financial statements. Our procedures included confirmation of securities owned as of August 31, 2023 by correspondence with the custodian, transfer agent and brokers; when replies were not received from brokers, we performed other auditing procedures. We believe that our audits provide a reasonable basis for our opinion.
/s/PricewaterhouseCoopers LLP
Minneapolis, Minnesota
October 23, 2023
We have served as the auditor of one or more investment companies within the Columbia Funds Complex since 1977.
| 40 | Multi-Manager Small Cap Equity Strategies Fund | Annual Report 2023 |
Federal Income Tax Information
(Unaudited)
The Fund hereby designates the following tax attributes for the fiscal year ended August 31, 2023. Shareholders will be notified in early 2024 of the amounts for use in preparing 2023 income tax returns.
Qualified
dividend
income | Dividends
received
deduction | Capital
gain
dividend |
| 100.00% | 100.00% | $22,802,862 |
Qualified dividend income. For taxable, non-corporate shareholders, the percentage of ordinary income distributed during the fiscal year that represents qualified dividend income subject to reduced tax rates.
Dividends received deduction. The percentage of ordinary income distributed during the fiscal year that qualifies for the corporate dividends received deduction.
Capital gain dividend. The Fund designates as a capital gain dividend the amount reflected above, or if subsequently determined to be different, the net capital gain of such fiscal period.
TRUSTEES AND OFFICERS
(Unaudited)
The Board oversees the Fund’s operations and appoints officers who are responsible for day-to-day business decisions based on policies set by the Board. The following table provides basic biographical information about the Fund’s Trustees as of the printing of this report, including their principal occupations during the past five years, although specific titles for individuals may have varied over the period. The year set forth beneath Length of Service in the table below is the year in which the Trustee was first appointed or elected as Trustee to any Fund currently in the Columbia Funds Complex or a predecessor thereof. Under current Board policy, each Trustee generally serves until December 31 of the year such Trustee turns seventy-five (75).
Independent trustees
Name,
address,
year of birth | Position held
with the Columbia Funds and
length of service | Principal occupation(s)
during past five years
and other relevant
professional experience | Number of
Funds in the
Columbia Funds
Complex*
overseen | Other directorships
held by Trustee
during the past five years
and other relevant Board experience |
George S. Batejan
c/o Columbia Management
Investment Advisers, LLC
290 Congress Street
Boston, MA 02210
1954 | Trustee since 2017 | Executive Vice President, Global Head of Technology and Operations, Janus Capital Group, Inc., 2010-2016 | 173 | Former Chairman of the Board, NICSA (National Investment Company Services Association) (Executive Committee, Nominating Committee and Governance Committee), 2014-2016; former Director, Intech Investment Management, 2011-2016; former Board Member, Metro Denver Chamber of Commerce, 2015-2016; former Advisory Board Member, University of Colorado Business School, 2015-2018; former Board Member, Chase Bank International, 1993-1994 |
Multi-Manager Small Cap Equity Strategies Fund | Annual Report 2023
| 41 |
TRUSTEES AND OFFICERS (continued)
(Unaudited)
Independent trustees (continued)
Name,
address,
year of birth | Position held
with the Columbia Funds and
length of service | Principal occupation(s)
during past five years
and other relevant
professional experience | Number of
Funds in the
Columbia Funds
Complex*
overseen | Other directorships
held by Trustee
during the past five years
and other relevant Board experience |
Kathleen Blatz
c/o Columbia Management
Investment Advisers, LLC
290 Congress Street
Boston, MA 02210
1954 | Trustee since 2006 | Attorney, specializing in arbitration and mediation; Chief Justice, Minnesota Supreme Court, 1998-2006; Associate Justice, Minnesota Supreme Court, 1996-1998; Fourth Judicial District Court Judge, Hennepin County, 1994-1996; Attorney in private practice and public service, 1984-1993; State Representative, Minnesota House of Representatives, 1979-1993, which included service on the Tax and Financial Institutions and Insurance Committees; Member and Interim Chair, Minnesota Sports Facilities Authority, January-July 2017; Interim President and Chief Executive Officer, Blue Cross and Blue Shield of Minnesota (health care insurance), February-July 2018, April-October 2021 | 173 | Former Trustee, Blue Cross and Blue Shield of Minnesota, 2009-2021 (Chair of the Business Development Committee, 2014-2017; Chair of the Governance Committee, 2017-2019); former Member and Chair of the Board, Minnesota Sports Facilities Authority, January 2017-July 2017; former Director, Robina Foundation, 2009-2020 (Chair, 2014-2020); Director, Richard M. Schulze Family Foundation, since 2021 |
Pamela G. Carlton
c/o Columbia Management
Investment Advisers, LLC
290 Congress Street
Boston, MA 02210
1954 | Chair since 2023; Trustee since 2007 | President, Springboard – Partners in Cross Cultural Leadership (consulting company), since 2003; Managing Director of US Equity Research, JP Morgan Chase, 1999-2003; Director of US Equity Research, Chase Asset Management, 1996-1999; Co-Director Latin America Research, 1993-1996, COO Global Research, 1992-1996, Co-Director of US Research, 1991-1992, Investment Banker, 1982-1991, Morgan Stanley; Attorney, Cleary Gottlieb Steen & Hamilton LLP, 1980-1982 | 173 | Trustee, New York Presbyterian Hospital Board, since 1996; Director, DR Bank (Audit Committee) since 2017; Director, Evercore Inc. (Audit Committee, Nominating and Governance Committee), since 2019; Director, Apollo Commercial Real Estate Finance, Inc. (Chair, Nominating and Governance Committee) (financial services), since 2021; the Governing Council of the Independent Directors Council (IDC), since 2021 |
Janet Langford Carrig
c/o Columbia Management
Investment Advisers, LLC
290 Congress Street
Boston, MA 02210
1957 | Trustee since 1996 | Senior Vice President, General Counsel and Corporate Secretary, ConocoPhillips (independent energy company), September 2007-October 2018 | 173 | Director, EQT Corporation (natural gas producer), since 2019; former Director, Whiting Petroleum Corporation (independent oil and gas company), 2020-2022 |
J. Kevin Connaughton
c/o Columbia Management
Investment Advisers, LLC
290 Congress Street
Boston, MA 02210
1964 | Trustee since 2020 | CEO and President, RhodeWay Financial (non-profit financial planning firm), since December 2022; Member, FINRA National Adjudicatory Council, since January 2020; Adjunct Professor of Finance, Bentley University since January 2018; Consultant to Independent Trustees of CFVIT and CFST I from March 2016 to June 2020 with respect to CFVIT and to December 2020 with respect to CFST I; Managing Director and General Manager of Mutual Fund Products, Columbia Management Investment Advisers, LLC, May 2010-February 2015; President, Columbia Funds, 2008-2015; and senior officer of Columbia Funds and affiliated funds, 2003-2015 | 171 | Former Director, The Autism Project, March 2015-December 2021; former Member of the Investment Committee, St. Michael’s College, November 2015-February 2020; former Trustee, St. Michael’s College, June 2017-September 2019; former Trustee, New Century Portfolios (former mutual fund complex), January 2015-December 2017 |
| 42 | Multi-Manager Small Cap Equity Strategies Fund | Annual Report 2023 |
TRUSTEES AND OFFICERS (continued)
(Unaudited)
Independent trustees (continued)
Name,
address,
year of birth | Position held
with the Columbia Funds and
length of service | Principal occupation(s)
during past five years
and other relevant
professional experience | Number of
Funds in the
Columbia Funds
Complex*
overseen | Other directorships
held by Trustee
during the past five years
and other relevant Board experience |
Olive M. Darragh
c/o Columbia Management
Investment Advisers, LLC
290 Congress Street
Boston, MA 02210
1962 | Trustee since 2020 | Managing Director of Darragh Inc. (strategy and talent management consulting firm), since 2010; Founder and CEO, Zolio, Inc. (investment management talent identification platform), since 2004; Consultant to Independent Trustees of CFVIT and CFST I from June 2019 to June 2020 with respect to CFVIT and to December 2020 with respect to CFST I; Partner, Tudor Investments, 2004-2010; Senior Partner, McKinsey & Company (consulting), 1990-2004; Touche Ross CPA, 1985-1988 | 171 | Treasurer, Edinburgh University US Trust Board, since January 2023; Member, HBS Community Action Partners Board, since September 2022; former Director, University of Edinburgh Business School (Member of US Board), 2004-2019; former Director, Boston Public Library Foundation, 2008-2017 |
Patricia M. Flynn
c/o Columbia Management
Investment Advisers, LLC
290 Congress Street
Boston, MA 02210
1950 | Trustee since 2004 | Professor of Economics and Management, Bentley University, since 2002; Dean, McCallum Graduate School of Business, Bentley University, 1992-2002 | 173 | Former Trustee, MA Taxpayers Foundation, 1997-2022; former Director, The MA Business Roundtable, 2003-2019; former Chairperson, Innovation Index Advisory Committee, MA Technology Collaborative, 1997-2020 |
Brian J. Gallagher
c/o Columbia Management
Investment Advisers, LLC
290 Congress Street
Boston, MA 02210
1954 | Trustee since 2017 | Retired; Partner with Deloitte & Touche LLP and its predecessors, 1977-2016 | 173 | Trustee, Catholic Schools Foundation, since 2004 |
Douglas A. Hacker
c/o Columbia Management
Investment Advisers, LLC
290 Congress Street
Boston, MA 02210
1955 | Trustee since 1996 | Independent business executive, since May 2006; Executive Vice President – Strategy of United Airlines, December 2002 - May 2006; President of UAL Loyalty Services (airline marketing company), September 2001-December 2002; Executive Vice President and Chief Financial Officer of United Airlines, July 1999-September 2001 | 173 | Director, SpartanNash Company since November 2013 (Chair of the Board, since May 2021) (food distributor); Director, Aircastle Limited (Chair of Audit Committee) (aircraft leasing), since August 2006; former Director, Nash Finch Company (food distributor), 2005-2013; former Director, SeaCube Container Leasing Ltd. (container leasing), 2010-2013; and former Director, Travelport Worldwide Limited (travel information technology), 2014-2019 |
Nancy T. Lukitsh
c/o Columbia Management
Investment Advisers, LLC
290 Congress Street
Boston, MA 02210
1956 | Trustee since 2011 | Senior Vice President, Partner and Director of Marketing, Wellington Management Company, LLP (investment adviser), 1997-2010; Chair, Wellington Management Portfolios (commingled non-U.S. investment pools), 2007-2010; Director, Wellington Trust Company, NA and other Wellington affiliates, 1997-2010 | 171 | None |
Multi-Manager Small Cap Equity Strategies Fund | Annual Report 2023
| 43 |
TRUSTEES AND OFFICERS (continued)
(Unaudited)
Independent trustees (continued)
Name,
address,
year of birth | Position held
with the Columbia Funds and
length of service | Principal occupation(s)
during past five years
and other relevant
professional experience | Number of
Funds in the
Columbia Funds
Complex*
overseen | Other directorships
held by Trustee
during the past five years
and other relevant Board experience |
David M. Moffett
c/o Columbia Management
Investment Advisers, LLC
290 Congress Street
Boston, MA 02210
1952 | Trustee since 2011 | Retired; former Chief Executive Officer of Freddie Mac and Chief Financial Officer of U.S. Bank | 171 | Director, CSX Corporation (transportation suppliers); Director, PayPal Holdings Inc. (payment and data processing services); Trustee, University of Oklahoma Foundation; former Director, eBay Inc. (online trading community), 2007-2015; and former Director, CIT Bank, CIT Group Inc. (commercial and consumer finance), 2010-2016; former Senior Adviser to The Carlyle Group (financial services), March 2008-September 2008; former Governance Consultant to Bridgewater Associates, January 2013-December 2015 |
Catherine James Paglia
c/o Columbia Management
Investment Advisers, LLC
290 Congress Street
Boston, MA 02210
1952 | Trustee since 2004 | Director, Enterprise Asset Management, Inc. (private real estate and asset management company), since September 1998; Managing Director and Partner, Interlaken Capital, Inc., 1989-1997; Vice President, 1982-1985, Principal, 1985-1987, Managing Director, 1987-1989, Morgan Stanley; Vice President, Investment Banking, 1980-1982, Associate, Investment Banking, 1976-1980, Dean Witter Reynolds, Inc. | 173 | Director, Valmont Industries, Inc. (irrigation systems manufacturer), since 2012; Trustee, Carleton College (on the Investment Committee), since 1987; Trustee, Carnegie Endowment for International Peace (on the Investment Committee), since 2009 |
Natalie A. Trunow
c/o Columbia Management
Investment Advisers, LLC
290 Congress Street
Boston, MA 02210
1967 | Trustee since 2020 | Chief Executive Officer, Millennial Portfolio Solutions LLC (asset management and consulting services), January 2016-January 2021; Non-executive Member of the Investment Committee and Valuation Committee, Sarona Asset Management Inc. (private equity firm) since September 2019; Advisor, Horizon Investments (asset management and consulting services), August 2018-January 2022; Advisor, Paradigm Asset Management, November 2016-January 2022; Consultant to Independent Trustees of CFVIT and CFST I from September 2016 to June 2020 with respect to CFVIT and to December 2020 with respect to CFST I; Director of Investments/Consultant, Casey Family Programs, April 2016-November 2016; Senior Vice President and Chief Investment Officer, Calvert Investments, August 2008-January 2016; Section Head and Portfolio Manager, General Motors Asset Management, June 1997-August 2008 | 171 | Independent Director, Investment Committee, Health Services for Children with Special Needs, Inc., 2010-2021; Independent Director, (Executive Committee and Chair, Audit Committee), Consumer Credit Counseling Services (formerly Guidewell Financial Solutions), since 2016; Independent Director, (Investment Committee), Sarona Asset Management, since 2019 |
| 44 | Multi-Manager Small Cap Equity Strategies Fund | Annual Report 2023 |
TRUSTEES AND OFFICERS (continued)
(Unaudited)
Independent trustees (continued)
Name,
address,
year of birth | Position held
with the Columbia Funds and
length of service | Principal occupation(s)
during past five years
and other relevant
professional experience | Number of
Funds in the
Columbia Funds
Complex*
overseen | Other directorships
held by Trustee
during the past five years
and other relevant Board experience |
Sandra L. Yeager
c/o Columbia Management
Investment Advisers, LLC
290 Congress Street
Boston, MA 02210
1964 | Trustee since 2017 | Retired; President and founder, Hanoverian Capital, LLC (SEC registered investment advisor firm), 2008-2016; Managing Director, DuPont Capital, 2006-2008; Managing Director, Morgan Stanley Investment Management, 2004-2006; Senior Vice President, Alliance Bernstein, 1990-2004 | 173 | Former Director, NAPE (National Alliance for Partnerships in Equity) Education Foundation, October 2016-October 2020; Advisory Board, Jennersville YMCA, since 2022 |
Interested trustee affiliated with Investment Manager**
Name,
address,
year of birth | Position held with the Columbia Funds and length of service | Principal occupation(s) during the
past five years and other relevant
professional experience | Number of
Funds in the
Columbia Funds
Complex* overseen | Other directorships
held by Trustee
during the past
five years and
other relevant Board experience |
Daniel J. Beckman
c/o Columbia Management
Investment Advisers, LLC
290 Congress Street
Boston, MA 02210
1962 | Trustee since November 2021 and President since June 2021 | Vice President – Head of North America Product, Columbia Management Investment Advisers, LLC, since April 2015; President and Principal Executive Officer of the Columbia Funds, since June 2021; officer of Columbia Funds and affiliated funds, 2020-2021 | 173 | Director, Ameriprise Trust Company, since October 2016; Director, Columbia Management Investment Distributors, Inc. since November 2018; Board of Governors, Columbia Wanger Asset Management, LLC since, January 2022; Director, Columbia Threadneedle Canada, Inc., since December 2022 |
| * | The term “Columbia Funds Complex” as used herein includes Columbia Seligman Premium Technology Growth Fund, Tri-Continental Corporation and each series of Columbia Funds Series Trust (CFST), Columbia Funds Series Trust I (CFST I), Columbia Funds Series Trust II (CFST II), Columbia ETF Trust I (CET I), Columbia ETF Trust II (CET II), Columbia Funds Variable Insurance Trust (CFVIT) and Columbia Funds Variable Series Trust II (CFVST II). Messrs. Batejan, Beckman, Gallagher and Hacker and Mses. Blatz, Carlton, Carrig, Flynn, Paglia, and Yeager serve as directors of Columbia Seligman Premium Technology Growth Fund and Tri-Continental Corporation. |
| ** | Interested person (as defined under the 1940 Act) by reason of being an officer, director, security holder and/or employee of the Investment Manager or Ameriprise Financial. |
The Statement of Additional Information has additional information about the Fund’s Board members and is available, without charge, upon request by calling 800.345.6611, visiting columbiathreadneedleus.com/investor/ or contacting your financial intermediary.
Multi-Manager Small Cap Equity Strategies Fund | Annual Report 2023
| 45 |
TRUSTEES AND OFFICERS (continued)
(Unaudited)
The Board has appointed officers who are responsible for day-to-day business decisions based on policies it has established. The officers serve at the pleasure of the Board. The following table provides basic information about the Officers of the Fund as of the printing of this report, including principal occupations during the past five years, although their specific titles may have varied over the period. In addition to Mr. Beckman, who is President and Principal Executive Officer, the Fund’s other officers are:
Fund officers
Name,
address and
year of birth | Position and year
first appointed to
position for any Fund
in the Columbia
Funds Complex or a
predecessor thereof | Principal occupation(s) during past five years |
Michael G. Clarke
290 Congress Street
Boston, MA 02210
1969 | Chief Financial Officer and Principal Financial Officer (2009) and Senior Vice President (2019) | Senior Vice President and North America Head of Operations & Investor Services, Columbia Management Investment Advisers, LLC, since June 2023 (previously Senior Vice President and Head of Global Operations, March 2022 – June 2023, Vice President, Head of North America Operations, and Co-Head of Global Operations, June 2019 - February 2022 and Vice President – Accounting and Tax, May 2010 - May 2019); senior officer of Columbia Funds and affiliated funds, since 2002. Director, Ameriprise Trust Company, since June 2023. |
Joseph Beranek
5890 Ameriprise Financial Center
Minneapolis, MN 55474
1965 | Treasurer and Chief Accounting Officer (Principal Accounting Officer) (2019) and Principal Financial Officer (2020), CFST, CFST I, CFST II, CFVIT and CFVST II; Assistant Treasurer, CET I and CET II | Vice President – Mutual Fund Accounting and Financial Reporting, Columbia Management Investment Advisers, LLC, since December 2018 and March 2017, respectively. |
Marybeth Pilat
290 Congress Street
Boston, MA 02210
1968 | Treasurer and Chief Accounting Officer (Principal Accounting Officer) and Principal Financial Officer (2020) for CET I and CET II; Assistant Treasurer, CFST, CFST I, CFST II, CFVIT and CFVST II | Vice President – Product Pricing and Administration, Columbia Management Investment Advisers, LLC, since May 2017. |
William F. Truscott
290 Congress Street
Boston, MA 02210
1960 | Senior Vice President (2001) | Formerly, Trustee/Director of Columbia Funds Complex or legacy funds, November 2001 - January 1, 2021; Chief Executive Officer, Global Asset Management, Ameriprise Financial, Inc., since September 2012; Chairman of the Board and President, Columbia Management Investment Advisers, LLC, since July 2004 and February 2012, respectively; Chairman of the Board and Chief Executive Officer, Columbia Management Investment Distributors, Inc., since November 2008 and February 2012, respectively; Chairman of the Board and Director, Threadneedle Asset Management Holdings, Sàrl, since March 2013 and December 2008, respectively; senior executive of various entities affiliated with Columbia Threadneedle. |
Christopher O. Petersen
5228 Ameriprise Financial Center
Minneapolis, MN 55474
1970 | Senior Vice President and Assistant Secretary (2021) | Formerly, Trustee/Director of funds within the Columbia Funds Complex, July 1, 2020 - November 22, 2021; Senior Vice President and Assistant General Counsel, Ameriprise Financial, Inc., since September 2021 (previously Vice President and Lead Chief Counsel, January 2015 - September 2021); formerly, President and Principal Executive Officer of the Columbia Funds, 2015 - 2021; officer of Columbia Funds and affiliated funds, since 2007. |
Thomas P. McGuire
290 Congress Street
Boston, MA 02210
1972 | Senior Vice President and Chief Compliance Officer (2012) | Vice President – Asset Management Compliance, Ameriprise Financial, Inc., since May 2010; Chief Compliance Officer, Columbia Acorn/Wanger Funds, since December 2015; formerly, Chief Compliance Officer, Ameriprise Certificate Company, September 2010 – September 2020. |
Ryan C. Larrenaga
290 Congress Street
Boston, MA 02210
1970 | Senior Vice President (2017), Chief Legal Officer (2017), and Secretary (2015) | Vice President and Chief Counsel, Ameriprise Financial, Inc., since August 2018 (previously Vice President and Group Counsel, August 2011 - August 2018); Chief Legal Officer, Columbia Acorn/Wanger Funds, since September 2020; officer of Columbia Funds and affiliated funds, since 2005. |
| 46 | Multi-Manager Small Cap Equity Strategies Fund | Annual Report 2023 |
TRUSTEES AND OFFICERS (continued)
(Unaudited)
Fund officers (continued)
Name,
address and
year of birth | Position and year
first appointed to
position for any Fund
in the Columbia
Funds Complex or a
predecessor thereof | Principal occupation(s) during past five years |
Michael E. DeFao
290 Congress Street
Boston, MA 02210
1968 | Vice President (2011) and Assistant Secretary (2010) | Vice President and Chief Counsel, Ameriprise Financial, Inc., since May 2010; Vice President, Chief Legal Officer and Assistant Secretary, Columbia Management Investment Advisers, LLC, since October 2021 (previously Vice President and Assistant Secretary, May 2010 – September 2021). |
Lyn Kephart-Strong
5903 Ameriprise Financial Center
Minneapolis, MN 55474
1960 | Vice President (2015) | Vice President, Global Investment Operations Services, Columbia Management Investment Advisers, LLC, since 2010; Director (since January 2007) and President (since October 2014), Columbia Management Investment Services Corp.; Director (since December 2017) and President (since January 2017), Ameriprise Trust Company. |
Liquidity Risk Management Program
(Unaudited)
Pursuant to Rule 22e-4 under the 1940 Act, the Fund has adopted a liquidity risk management program (Program). The Program’s principal objectives include assessing, managing and periodically reviewing the Fund’s liquidity risk. Liquidity risk is defined as the risk that the Fund could not meet redemption requests without significant dilution of remaining investors’ interests in the Fund.
The Board has appointed the Investment Manager as the program administrator for the Fund’s Program. The Investment Manager has delegated oversight of the Program to its Liquidity Risk Management Committee (the Committee). At a Board meeting during the fiscal period, the Committee provided the Board with a report addressing the operations of the Program and assessing its adequacy and effectiveness of implementation for the period January 1, 2022 through December 31, 2022, including:
| • | the Fund had sufficient liquidity to both meet redemptions and operate effectively on behalf of shareholders; |
| • | there were no material changes to the Program during the period; |
| • | the implementation of the Program was effective to manage the Fund’s liquidity risk; and |
| • | the Program operated adequately during the period. |
There can be no assurance that the Program will achieve its objectives in the future. Please refer to the Fund’s prospectus for more information regarding the Fund’s exposure to liquidity risk and other principal risks to which an investment in the Fund may be subject.
Multi-Manager Small Cap Equity Strategies Fund | Annual Report 2023
| 47 |
Approval of Management and SubadvisoryAgreements
(Unaudited)
Columbia Management Investment Advisers, LLC (the Investment Manager, and together with its domestic and global affiliates, Columbia Threadneedle Investments), a wholly-owned subsidiary of Ameriprise Financial, Inc. (Ameriprise Financial), serves as the investment manager to Multi-Manager Small Cap Equity Strategies Fund (the Fund). Under a management agreement (the Management Agreement), the Investment Manager provides investment advice and other services to the Fund and other funds distributed by Columbia Management Investment Distributors, Inc. (collectively, the Funds). In addition, under the subadvisory agreements (the Subadvisory Agreements) between the Investment Manager and each of Conestoga Capital Advisors, LLC, Hotchkis and Wiley Capital Management, LLC, J.P. Morgan Investment Management Inc. and Jacobs Levy Equity Management, Inc. (collectively, the Subadvisers), the Subadvisers provide portfolio management and related services for the Fund.
On an annual basis, the Fund’s Board of Trustees (the Board), including the independent Board members (the Independent Trustees), considers renewal of the Management Agreement and the Subadvisory Agreements (together, the Advisory Agreements). The Investment Manager prepared detailed reports for the Board and its Contracts Committee (including its Contracts Subcommittee) in February, March, April, May and June 2023, including reports providing the results of analyses performed by a third-party data provider, Broadridge Financial Solutions, Inc. (Broadridge), and comprehensive responses by the Investment Manager to written requests for information by independent legal counsel to the Independent Trustees (Independent Legal Counsel), to assist the Board in making this determination. In addition, throughout the year, the Board (or its committees or subcommittees) regularly meets with portfolio management teams and senior management personnel and reviews information prepared by the Investment Manager addressing the services the Investment Manager provides and Fund performance. The Board also accords appropriate weight to the work, deliberations and conclusions of the various committees (including their subcommittees), such as the Contracts Committee, the Investment Review Committee, the Audit Committee and the Compliance Committee in determining whether to continue the Advisory Agreements.
The Board, at its June 22, 2023 Board meeting (the June Meeting), considered the renewal of each of the Advisory Agreements for additional one-year terms. At the June Meeting, Independent Legal Counsel reviewed with the Independent Trustees various factors relevant to the Board’s consideration of advisory and subadvisory agreements and the Board’s legal responsibilities related to such consideration. The Independent Trustees considered all information that they, their legal counsel or the Investment Manager believed reasonably necessary to evaluate and to approve the continuation of each of the Advisory Agreements. Among other things, the information and factors considered included the following:
| • | Information on the investment performance of the Fund relative to the performance of a group of mutual funds determined to be comparable to the Fund by Broadridge, as well as performance relative to one or more benchmarks; |
| • | Information on the Fund’s management fees and total expenses, including information comparing the Fund’s expenses to those of a group of comparable mutual funds, as determined by Broadridge; |
| • | The Investment Manager’s agreement to contractually limit or cap total operating expenses for the Fund so that total operating expenses (excluding certain fees and expenses, such as transaction costs and certain other investment related expenses, interest, taxes, acquired fund fees and expenses and infrequent and/or unusual expenses) would not exceed a specified annual rate, as a percentage of the Fund’s net assets; |
| • | Terms of the Advisory Agreements; |
| • | Subadvisory fees payable by the Investment Manager under the Subadvisory Agreements; |
| • | Descriptions of other agreements and arrangements with affiliates of the Investment Manager relating to the operations of the Fund, including agreements with respect to the provision of transfer agency and shareholder services to the Fund; |
| • | Descriptions of various services performed by the Investment Manager and the Subadvisers under the Advisory Agreements, including portfolio management and portfolio trading practices; |
| • | Information regarding any recently negotiated management fees of similarly-managed portfolios of other institutional clients of the Investment Manager; |
| 48 | Multi-Manager Small Cap Equity Strategies Fund | Annual Report 2023 |
Approval of Management and Subadvisory
Agreements (continued)
(Unaudited)
| • | Information regarding the resources of the Investment Manager and Subadvisers, including information regarding senior management, portfolio managers and other personnel; |
| • | Information regarding the capabilities of the Investment Manager and the Subadvisers with respect to compliance monitoring services; |
| • | The profitability to the Investment Manager and its affiliates from their relationships with the Fund; and |
| • | Report provided by the Board’s independent fee consultant, JDL Consultants, LLC (JDL). |
Following an analysis and discussion of the foregoing, and the factors identified below, the Board, including all of the Independent Trustees, approved the renewal of each of the Advisory Agreements.
Nature, extent and quality of services provided by the Investment Manager and the Subadvisers
The Board analyzed various reports and presentations it had received detailing the services performed by the Investment Manager and the Subadvisers, as well as their history, expertise, resources and relative capabilities, and the qualifications of their personnel.
The Board specifically considered the many developments during recent years concerning the services provided by the Investment Manager, including, in particular, detailed information regarding the process employed for selecting and overseeing affiliated and unaffiliated subadvisers. With respect to the Investment Manager, the Board also noted the organization and depth of the equity and credit research departments. The Board further observed the enhancements to the investment risk management department’s processes, systems and oversight over the past several years. The Board also took into account the broad scope of services provided by the Investment Manager to each subadvised Fund, including, among other services, investment, risk and compliance oversight. The Board also took into account the information it received concerning the Investment Manager’s ability to attract and retain key portfolio management personnel and that it has sufficient resources to provide competitive and adequate compensation to investment personnel.
In connection with the Board’s evaluation of the overall package of services provided by the Investment Manager, the Board also considered the nature, quality and range of administrative services provided to the Fund by the Investment Manager, as well as the achievements in 2022 in the performance of administrative services, and noted the various enhancements anticipated for 2023. In evaluating the quality of services provided under the Advisory Agreements, the Board also took into account the organization and strength of the Fund’s and its service providers’ compliance programs. The Board also reviewed the financial condition of the Investment Manager and its affiliates and each entity’s ability to carry out its responsibilities under the Management Agreement and the Fund’s other service agreements.
In addition, the Board discussed the acceptability of the terms of the Management Agreement (including the relatively broad scope of services required to be performed by the Investment Manager in addition to monitoring each Subadviser), noting that no changes were proposed from the forms of agreements previously approved. The Board also noted the wide array of legal and compliance services provided to the Fund under the Management Agreement.
The Board considered each Subadviser’s organizational strength and resources, portfolio management team depth and capabilities and investment process. The Board also considered each Subadviser’s capability and wherewithal to carry out its responsibilities under the applicable Subadvisory Agreement. In addition, the Board discussed the acceptability of the terms of the Subadvisory Agreements, including the scope of services required to be performed. The Board noted that the terms of the Subadvisory Agreements are generally consistent with the terms of other subadvisory agreements for subadvisers who manage other funds managed by the Investment Manager. It was observed that no changes were recommended to the Subadvisory Agreements. The Board took into account the Investment Manager’s representation that each Subadviser was in a position to provide quality services to the Fund. In this regard, the Board further observed the various services provided by the Investment Manager’s subadvisory oversight team.
Multi-Manager Small Cap Equity Strategies Fund | Annual Report 2023
| 49 |
Approval of Management and Subadvisory
Agreements (continued)
(Unaudited)
After reviewing these and related factors (including investment performance as discussed below), the Board concluded, within the context of their overall conclusions, that the nature, extent and quality of the services provided to the Fund under the Advisory Agreements supported the continuation of the Management Agreement and each of the Subadvisory Agreements.
Investment performance
The Board carefully reviewed the investment performance of the Fund, including detailed reports providing the results of analyses performed by each of the Investment Manager, Broadridge and JDL collectively showing, for various periods (including since manager inception): (i) the performance of the Fund, (ii) the Fund’s performance relative to peers and benchmarks and (iii) the net assets of the Fund. The Board observed that Fund performance was well within the range of that of its peers.
Additionally, the Board reviewed the performance of each of the Subadvisers and the Investment Manager’s process for monitoring such Subadvisers’ performance. The Board considered, in particular, management’s rationale for recommending the continued retention of each Subadviser and management’s representations that the Investment Manager’s profitability is not the key factor driving their recommendation to select, renew or terminate the Subadvisers.
The Board also reviewed a description of the third-party data provider’s methodology for identifying the Fund’s peer groups for purposes of performance and expense comparisons.
The Board also considered the Investment Manager’s and Subadvisers’ performance and reputation generally, and the Investment Manager’s evaluation of the contribution of each Subadviser to the Fund’s investment mandate. After reviewing these and related factors, the Board concluded, within the context of their overall conclusions, that the performance of the Fund, the Investment Manager and the Subadvisers, in light of other considerations, supported the continuation of the Management Agreement and each of the Subadvisory Agreements.
Comparative fees, costs of services provided and the profits realized by the Investment Manager and its affiliates from their relationships with the Fund
The Board reviewed comparative fees and the costs of services provided under each of the Advisory Agreements. The Board members considered detailed comparative information set forth in an annual report on fees and expenses, including, among other things, data (based on analyses conducted by Broadridge and JDL) showing a comparison of the Fund’s expenses with median expenses paid by funds in its comparative peer universe, as well as data showing the Fund’s contribution to the Investment Manager’s profitability.
The Board considered the reports of JDL, which assisted in the Board’s analysis of the Funds’ performance and expenses and the reasonableness of the Funds’ fee rates. The Board accorded particular weight to the notion that a primary objective of the level of fees is to achieve a rational pricing model applied consistently across the various product lines in the Fund family, while assuring that the overall fees for each Fund (with certain exceptions) are generally in line with the current “pricing philosophy” such that Fund total expense ratios, in general, approximate or are lower than the median expense ratios of funds in the same Lipper comparison universe. The Board took into account that the Fund’s total expense ratio (after considering proposed expense caps/waivers) approximated the peer universe’s median expense ratio.
Additionally, the Board reviewed the level of subadvisory fees paid to each Subadviser, noting that the fees are paid by the Investment Manager and do not impact the fees paid by the Fund. The Board also reviewed advisory fee rates charged by other comparable mutual funds employing each Subadviser. After reviewing these and related factors, the Board concluded, within the context of their overall conclusions, that the levels of management fees, subadvisory fees and expenses of the Fund, in light of other considerations, supported the continuation of the Management Agreement and each of the Subadvisory Agreements.
| 50 | Multi-Manager Small Cap Equity Strategies Fund | Annual Report 2023 |
Approval of Management and Subadvisory
Agreements (continued)
(Unaudited)
The Board also considered the profitability of the Investment Manager and its affiliates in connection with the Investment Manager providing management services to the Fund. Because the Subadvisory Agreements were negotiated at arms-length by the Investment Manager, which is responsible for payments to the Subadvisers thereunder, the Board did not consider the profitability to each Subadviser from its relationship with the Fund. With respect to the profitability of the Investment Manager and its affiliates, the Independent Trustees referred to information discussing the profitability to the Investment Manager and Ameriprise Financial from managing, operating and distributing the Funds. The Board considered that the profitability generated by the Investment Manager in 2022 had declined from 2021 levels, due to a variety of factors, including the decreased assets under management of the Funds. It also took into account the indirect economic benefits flowing to the Investment Manager or its affiliates in connection with managing or distributing the Funds, such as the enhanced ability to offer various other financial products to Ameriprise Financial customers, soft dollar benefits and overall reputational advantages. The Board noted that the fees paid by the Fund should permit the Investment Manager to offer competitive compensation to its personnel, make necessary investments in its business and earn an appropriate profit. After reviewing these and related factors, the Board concluded, within the context of their overall conclusions, that the costs of services provided and the profitability to the Investment Manager and its affiliates from their relationships with the Fund supported the continuation of the Management Agreement and each of the Subadvisory Agreements.
Economies of scale
The Board considered the potential existence of economies of scale in the provision by the Investment Manager of services to the Fund, and whether those economies of scale were shared with the Fund through breakpoints in investment management fees or other means, such as expense limitation arrangements and additional investments by the Investment Manager in investment, trading, compliance and other resources. The Board considered the economies of scale that might be realized as the Fund’s net asset level grows and took note of the extent to which Fund shareholders might also benefit from such growth. In this regard, the Board took into account that management fees decline as Fund assets exceed various breakpoints, all of which have not been surpassed.The Board observed that the Management Agreement provided for breakpoints in the management fee rate schedule that allow opportunities for shareholders to realize lower fees as Fund assets grow and that there are additional opportunities through other means for sharing economies of scale with shareholders. The Board also noted that the breakpoints in the Subadvisory Agreements did not occur at the same levels as the breakpoints in the Management Agreement. In this regard, the Board noted the potential challenges of seeking to tailor the Management Agreement breakpoints to those of a subadvisory agreement in this context.
Conclusion
The Board reviewed all of the above considerations in reaching its decision to approve the continuation of the Management Agreement and each of the Subadvisory Agreements. In reaching its conclusions, no single factor was determinative.
On June 22, 2023, the Board, including all of the Independent Trustees, determined that fees payable under each of the Advisory Agreements were fair and reasonable in light of the extent and quality of services provided and approved the renewal of each of the Advisory Agreements.
Multi-Manager Small Cap Equity Strategies Fund | Annual Report 2023
| 51 |
Multi-Manager Small Cap Equity Strategies Fund
P.O. Box 219104
Kansas City, MO 64121-9104
Please read and consider the investment objectives, risks, charges and expenses for any fund carefully before investing. For a prospectus and summary prospectus, which contains this and other important information about the Fund, go to
columbiathreadneedleus.com/investor/. The Fund is distributed by Columbia Management Investment Distributors, Inc., member FINRA, and managed by Columbia Management Investment Advisers, LLC.
Columbia Threadneedle Investments (Columbia Threadneedle) is the global brand name of the Columbia and Threadneedle group of companies. All rights reserved.
© 2023 Columbia Management Investment Advisers, LLC.
columbiathreadneedleus.com/investor/

Annual Report
August 31, 2023
Multi-Manager Total Return Bond Strategies Fund
Not FDIC or NCUA Insured • No Financial Institution Guarantee • May Lose Value
| 3 |
| 6 |
| 10 |
| 11 |
| 90 |
| 91 |
| 92 |
| 94 |
| 96 |
| 113 |
| 114 |
| 114 |
| 120 |
| 121 |
If you elect to receive the shareholder report for Multi-Manager Total Return Bond Strategies Fund (the Fund) in paper, mailed to you, the Fund mails one shareholder report to each shareholder address, unless such shareholder elects to receive shareholder reports from the Fund electronically via e-mail or by having a paper notice mailed to you (Postcard Notice) that your Fund’s shareholder report is available at the Columbia funds’ website (columbiathreadneedleus.com/investor/). If you would like more than one report in paper to be mailed to you, or would like to elect to receive reports via e-mail or access them through Postcard Notice, please call shareholder services at 800.345.6611 and additional reports will be sent to you.
Proxy voting policies and procedures
The policy of the Board of Trustees is to vote the proxies of the companies in which the Fund holds investments consistent with the procedures as stated in the Statement of Additional Information (SAI). You may obtain a copy of the SAI without charge by calling 800.345.6611; contacting your financial intermediary; visiting columbiathreadneedleus.com/investor/; or searching the website of the Securities and Exchange Commission (SEC) at sec.gov. Information regarding how the Fund voted proxies relating to portfolio securities is filed with the SEC by August 31st for the most recent 12-month period ending June 30th of that year, and is available without charge by visiting columbiathreadneedleus.com/investor/, or searching the website of the SEC at sec.gov.
Quarterly schedule of investments
The Fund files a complete schedule of portfolio holdings with the SEC for the first and third quarters of each fiscal year on Form N-PORT. The Fund’s Form N-PORT filings are available on the SEC’s website at sec.gov. The Fund’s complete schedule of portfolio holdings, as filed on Form N-PORT, is available on columbiathreadneedleus.com/investor/ or can also be obtained without charge, upon request, by calling 800.345.6611.
Additional Fund information
For more information about the Fund, please visit columbiathreadneedleus.com/investor/ or call 800.345.6611. Customer Service Representatives are available to answer your questions Monday through Friday from 8 a.m. to 7 p.m. Eastern time.
Fund investment manager
Columbia Management Investment Advisers, LLC (the Investment Manager)
290 Congress Street
Boston, MA 02210
Fund distributor
Columbia Management Investment Distributors, Inc.
290 Congress Street
Boston, MA 02210
Fund transfer agent
Columbia Management Investment Services Corp.
P.O. Box 219104
Kansas City, MO 64121-9104
Multi-Manager Total Return Bond Strategies Fund | Annual Report 2023
Fund at a Glance
(Unaudited)
Investment objective
The Fund seeks total return, consisting of capital appreciation and current income.
Portfolio management
Loomis, Sayles & Company, L.P.
Christopher Harms
Clifton Rowe, CFA
Daniel Conklin, CFA
PGIM, Inc.
Michael Collins, CFA*
Robert Tipp, CFA
Richard Piccirillo
Gregory Peters
* Michael Collins, Managing Director and Senior Portfolio Manager of PGIM, has announced that he will retire from PGIM in April 2024.
TCW Investment Management Company LLC
Stephen Kane, CFA
Laird Landmann*
Bryan Whalen, CFA
Jerry Cudzil
Ruben Hovhannisyan, CFA
* Effective December 31, 2023, Laird Landmann will no longer serve as a portfolio manager for the Fund.
Voya Investment Management Co. LLC
Matthew Toms, CFA
Randall Parrish, CFA
David Goodson
| Average annual total returns (%) (for the period ended August 31, 2023) |
| | | Inception | 1 Year | 5 Years | 10 Years |
| Institutional Class* | 01/03/17 | -0.87 | 0.54 | 1.48 |
| Institutional 3 Class* | 12/18/19 | -0.86 | 0.56 | 1.49 |
| Bloomberg U.S. Aggregate Bond Index | | -1.19 | 0.49 | 1.48 |
All results shown assume reinvestment of distributions during the period. Returns do not reflect the deduction of taxes that a shareholder may pay on Fund distributions or on the redemption of Fund shares. Performance results reflect the effect of any fee waivers or reimbursements of Fund expenses by Columbia Management Investment Advisers, LLC and/or any of its affiliates. Absent these fee waivers or expense reimbursement arrangements, performance results would have been lower.
The performance information shown represents past performance and is not a guarantee of future results. The investment return and principal value of your investment will fluctuate so that your shares, when redeemed, may be worth more or less than their original cost. Current performance may be lower or higher than the performance information shown. You may obtain performance information current to the most recent month-end by contacting your financial intermediary, visiting columbiathreadneedleus.com/investor/ or calling 800.345.6611.
| * | The returns shown for periods prior to the share class inception date (including returns for the Life of the Fund, if shown, which are since Fund inception) include the returns of the Fund’s oldest share class. Returns shown for periods prior to the inception date of each class include the returns of the Fund’s Class A shares through January 2, 2017, and for Institutional 3 Class shares, include the returns of the Fund’s Institutional Class shares for the period from January 3, 2017 through the inception date of the class. Class A shares were offered prior to the Fund’s Institutional Class shares but have since been merged into the Fund’s Institutional Class shares. These returns are adjusted to reflect any higher class-related operating expenses of the newer share classes, as applicable. Please visit columbiathreadneedleus.com/investor/investment-products/mutual-funds/appended-performance for more information. |
The Bloomberg U.S. Aggregate Bond Index is a broad-based benchmark that measures the investment-grade, U.S. dollar-denominated, fixed-rate taxable bond market, including Treasuries, government-related and corporate securities, mortgage-backed securities (agency fixed-rate and hybrid adjustable-rate mortgage passthroughs), asset-backed securities, and commercial mortgage-backed securities.
Indices are not available for investment, are not professionally managed and do not reflect sales charges, fees, brokerage commissions, taxes or other expenses of investing. Securities in the Fund may not match those in an index.
Multi-Manager Total Return Bond Strategies Fund | Annual Report 2023
| 3 |
Fund at a Glance (continued)
(Unaudited)
Performance of a hypothetical $10,000 investment (August 31, 2013 — August 31, 2023)
The chart above shows the change in value of a hypothetical $10,000 investment in Institutional Class shares of Multi-Manager Total Return Bond Strategies Fund during the stated time period, and does not reflect the deduction of taxes that a shareholder may pay on Fund distributions or on the redemption of Fund shares.
| Portfolio breakdown (%) (at August 31, 2023) |
| Asset-Backed Securities — Non-Agency | 10.8 |
| Commercial Mortgage-Backed Securities - Agency | 0.7 |
| Commercial Mortgage-Backed Securities - Non-Agency | 5.7 |
| Common Stocks | 0.0(a) |
| Convertible Bonds | 0.0(a) |
| Corporate Bonds & Notes | 27.3 |
| Foreign Government Obligations | 1.3 |
| Inflation-Indexed Bonds | 0.3 |
| Money Market Funds | 8.3 |
| Municipal Bonds | 0.3 |
| Residential Mortgage-Backed Securities - Agency | 25.4 |
| Residential Mortgage-Backed Securities - Non-Agency | 3.8 |
| Senior Loans | 0.5 |
| Treasury Bills | 0.6 |
| U.S. Government & Agency Obligations | 0.1 |
| U.S. Treasury Obligations | 14.9 |
| Total | 100.0 |
Percentages indicated are based upon total investments excluding investments in derivatives, if any. The Fund’s portfolio composition is subject to change.
| Quality breakdown (%) (at August 31, 2023) |
| AAA rating | 23.1 |
| AA rating | 39.5 |
| A rating | 12.1 |
| BBB rating | 16.7 |
| BB rating | 3.2 |
| B rating | 2.4 |
| CCC rating | 0.6 |
| CC rating | 0.3 |
| C rating | 0.1 |
| Not rated | 2.0 |
| Total | 100.0 |
Percentages indicated are based upon total fixed income investments.
Bond ratings apply to the underlying holdings of the Fund and not the Fund itself and are divided into categories ranging from highest to lowest credit quality, determined by using the middle rating of Moody’s, S&P and Fitch, after dropping the highest and lowest available ratings. When ratings are available from only two rating agencies, the lower rating is used. When a rating is available from only one rating agency, that rating is used. If a security is not rated but has a rating by Kroll and/or DBRS, the same methodology is applied to those bonds that would otherwise be not rated. When a bond is not rated by any rating agency, it is designated as “Not rated.” Credit quality ratings assigned by a rating agency are subjective opinions, not statements of fact, and are subject to change, including daily. The ratings assigned by credit rating agencies are but one of the considerations that the Investment Manager and/or Fund’s subadviser incorporates into its credit analysis process, along with such other issuer-specific factors as cash flows, capital structure and leverage ratios, ability to de-leverage (repay) through free cash flow, quality of management, market positioning and access to capital, as well as such security-specific factors as the terms of the security (e.g., interest rate and time to maturity) and the amount and type of any collateral.
| 4 | Multi-Manager Total Return Bond Strategies Fund | Annual Report 2023 |
Fund at a Glance (continued)
(Unaudited)
| Derivative breakdown (%) (at August 31, 2023)(a) |
| | Asset | Liability | Net |
| Forward foreign currency exchange contracts | 0.00(b) | — | 0.00(b) |
| Long futures contracts | 0.13 | — | 0.13 |
| Short futures contracts | — | (0.02) | (0.02) |
| Swap contracts | 0.01 | (0.00)(b) | 0.01 |
(a) Forward foreign currency exchange contracts, futures contracts and swap contracts are based upon unrealized appreciation (depreciation) as a percentage of net assets. For a description of the Fund’s investments in derivatives, see Investments in derivatives following the Portfolio of Investments, and Note 2 of the Notes to Financial Statements.
(b) Rounds to zero.
Multi-Manager Total Return Bond Strategies Fund | Annual Report 2023
| 5 |
Manager Discussion of Fund Performance
(Unaudited)
The Fund is currently managed by four independent money management firms, and each invests a portion of the portfolio’s assets. As of August 31, 2023, Loomis, Sayles & Company, L.P. (Loomis Sayles), PGIM, Inc. (PGIM), TCW Investment Management Company LLC (TCW) and Voya Investment Management Co. LLC (Voya) managed 20.6%, 27.1%, 26.7% and 25.6% of the portfolio, respectively.
For the 12-month period that ended August 31, 2023, Institutional Class shares of Multi-Manager Total Return Bond Strategies Fund returned -0.87%. The Fund’s benchmark, the Bloomberg U.S. Aggregate Bond Index, returned -1.19%.
Market overview
Fixed-income markets recovered in late 2022 and into the beginning of 2023 before giving back performance in the wake of regional bank failure. The period was largely marked by an overhang of uncertainty and economic negatives, including interest rate volatility and COVID-era supply/demand imbalances. Steep losses that predominated during the first half of the period showed signs of dissipating in the second half of the period. Despite a series of rolling crises including a string of regional bank failures, the debt ceiling debate, ongoing recession concerns, and still high inflation, the U.S. economy avoided the worst of potential outcomes and fixed-income returns skewed largely positive over the last six months of the period.
Against the backdrop of historic lows in unemployment and still high inflation, the U.S. Federal Reserve (Fed) continued on its monetary tightening path, raising interest rates by an additional 300 basis points (bps) in a succession of rate hikes over the reporting period. Although the Fed raised interest rates by 25 bps and indicated that its inflation fight is not yet over, the main signal from the July Federal Open Market Committee meeting was that the end of the rate hiking cycle was likely close.
A sharply higher federal funds target rate, coupled with macroeconomic uncertainty, led to enormous volatility being priced into developed market interest rates, with sharply higher front-end rates and lower long-dated yields. From -0.30% on August 31, 2022, the U.S. 10-year/2-year Treasury spread declined to -0.76% as of August 31, 2023, while the U.S. 2-year Treasury yield rose by 140 bps to end the period at 4.85%.
Despite elevated volatility, U.S. investment-grade corporate spreads tightened over the period as expectations for an economic hard landing moderated and fundamentals remained solid. U.S. high-yield bonds posted gains over the reporting period amid limited new issuance, resilient economic data and an ongoing supply deficit. Securitized credit spreads were mixed, with high-quality collateralized loan obligation (CLO) spreads tightening over the period and commercial mortgage-backed securities (CMBS) spreads widening as the commercial real estate sector remained challenged. After posting steep losses in 2022, the emerging markets sector posted positive total returns and spreads tightened through the first part of 2023 as headwinds turned to tailwinds. Meanwhile, agency mortgage-backed securities (MBS) underperformed versus U.S. Treasuries over the period as elevated interest-rate volatility weighed on the sector over the first half of the period.
Loomis Sayles
Our portion of the Fund outperformed the benchmark during the period.
Notable contributors in our portion of the Fund during the period
| • | Sector allocation generated the greatest positive contribution to excess return in our portion of the Fund. In general, being tilted into risk sectors positively impacted excess return during this period. Our portion of the Fund continued to be underweighted in government securities, including U.S. Treasuries, and overweight in corporate bonds. |
| • | Our overweight to the investment-grade corporate asset class proved beneficial, as investment-grade spreads tightened and the sector outperformed. Within the sector, holdings of securities in the banking, capital goods and consumer cyclical names bolstered performance. |
| • | Securitized credit provided additional contribution, as consumer related asset-backed securities (ABS) and non-agency CMBS were favorable contributors to excess return. |
| • | The portfolio continues to keep duration positioning fairly in line with the benchmark, so while interest rates increased during the period, the impact on relative returns was muted. |
| 6 | Multi-Manager Total Return Bond Strategies Fund | Annual Report 2023 |
Manager Discussion of Fund Performance (continued)
(Unaudited)
Notable detractors in our portion of the Fund during the period
| • | Although our portion of the Fund was underweight to the government-related asset classes, security selection within governments was negative. |
| • | Specifically, within agency pass-throughs, underweights to Ginnie Maes detracted, as Ginnie Maes outperformed Fannie Maes, and underweights to the lower end of the coupon stack detracted as lower coupons outperformed higher coupons. |
| • | Industry and issue selection weighed on excess return. |
| • | Agency CMBS and collateralized mortgage obligation (CMO) exposures also contributed to negative excess returns, as did a slight overweight to real estate investment trusts (REITs). |
PGIM
Our portion of the Fund outperformed the benchmark during the period.
Notable contributors in our portion of the Fund during the period
| • | Overall sector allocation contributed to performance in our portion of the Fund. |
| • | Overweights to high yield and CLOs, along with an underweight to MBS, added to performance. |
| • | Overall security selection was also positive for the period. Positioning in investment-grade corporates and CLOs was positive. |
| • | Within credit, positioning in foreign non-corporate and banking added to performance. |
| • | Our yield curve positioning contributed as rates sold off and the curve flattened. |
| • | Overweight positions in JPMorgan, Bausch Health Companies and Citigroup were positive. |
Notable detractors in our portion of the Fund during the period
| • | An underweight to the agency sector slightly detracted from results in our portion of the Fund. |
| • | Positioning within U.S. Treasuries weighed on performance. |
| • | Within credit, positioning in media and entertainment and cable and satellite detracted from performance during the period. |
| • | A slightly short duration position in U.S. rates for most of the period limited results relative to the benchmark. |
| • | With regard to specific issuers, overweight positions in Sinclair Television Group and Digicel Group hurt performance. |
TCW
Our portion of the Fund underperformed the benchmark during the period.
Notable detractors in our portion of the Fund during the period
| • | Detracting from both absolute and relative performance was duration positioning in our portion of the portfolio. Duration remained longer than the benchmark throughout the period while also extending as U.S. Treasury yields continued to rise. Given both the magnitude and pace of the Fed’s rate hiking cycle, this duration positioning was the largest headwind to returns during the period. |
| • | A yield curve-steepening bias also detracted, given the sustained overweight to the front-end of the curve, where rates increased by 137 bps. Consistent with both a value-based approach and in recognition that an inverted yield curve is |
Multi-Manager Total Return Bond Strategies Fund | Annual Report 2023
| 7 |
Manager Discussion of Fund Performance (continued)
(Unaudited)
| | not a long-term equilibrium condition, our portion of the portfolio increased its overweight to the 2-year key rate duration, which negatively impacted returns during the period. Informing this positioning is our belief that current U.S. Treasury rates are above long-term equilibrium levels, and that an eventual pivot in Fed policy may lead to a steepening of the curve. |
| • | The sustained overweight to agency MBS exposure weighed on returns, given the sector’s underperformance during the year relative to both U.S. Treasuries and corporates. |
Notable contributors in our portion of the Fund during the period
| • | Portfolio performance benefited from an overweight to corporate credit throughout the majority of the period, given the significant amount of yield spread tightening among corporates (both investment grade and high yield), which resulted in outperformance relative to comparable U.S. Treasuries during the period. Despite a modest trimming of the position in recent months to a relative underweight on improved valuations, exposure to this high-performing asset class contributed to returns during period. |
| • | An emphasis on more defensive sectors, including the communications and non-cyclicals sectors, was positive as these sectors outperformed the broader corporate universe. |
| • | Issuer selection among more defensive sectors was also favorable, including in pharmaceuticals, food/beverage and wireless names. |
| • | The largest contributor to returns, however, was issue selection among banking holdings, owing to a combination of outperformance from senior bonds of U.S. global systemically important banks (G-SIBs) amid the volatility in March, and relative value trading in names that experienced outsized volatility, whereby positions that were built at substantial discounts quickly appreciated to trade at a premium. |
Voya
Our portion of the Fund outperformed the benchmark during the period.
Notable contributors in our portion of the Fund during the period
| • | Our overweight in high-yield securities added most to performance, followed by security selection in agency mortgages where we source CMOs and investment-grade corporates where we favor BBB financials. |
| • | Our overweight to non-agency residential MBS and security selection in ABS (primarily high-quality CLOs) also contributed positively. |
Notable detractors in our portion of the Fund during the period
| • | Our overweight to CMBS modestly detracted as the sector continued to struggle to receive financing amid higher rates. |
| • | In aggregate, duration and yield curve positioning detracted during the period as the yield curve increased its inversion. However, positive security selection within U.S. Treasuries, which reflects our overall strategy, helped to mute this impact. |
Derivatives usage in the Fund
Each of the subadvisors used derivative instruments during the period to manage duration and yield curve positioning. Taken on a stand-alone basis, the usage of these derivatives had a negative impact on overall Fund performance.
Market risk may affect a single issuer, sector of the economy, industry or the market as a whole. Mortgage- and asset-backed securities are affected by interest rates, financial health of issuers/originators, creditworthiness of entities providing credit enhancements and the value of underlying assets. Fixed-income securities present issuer default risk. Non-investment-grade (high-yield or junk) securities present greater price volatility and more risk to principal and income than higher rated securities. A rise in interest rates may result in a price decline of fixed-income instruments held by the Fund, negatively impacting its performance and NAV. Falling rates may result in the Fund investing in lower yielding debt instruments, lowering the Fund’s income and yield. These risks may be heightened for longer maturity and duration securities. Prepayment and extension risk exists because the timing of payments on a loan, bond or other investment may accelerate when interest rates fall or decelerate when interest rates rise which may reduce investment
| 8 | Multi-Manager Total Return Bond Strategies Fund | Annual Report 2023 |
Manager Discussion of Fund Performance (continued)
(Unaudited)
opportunities and potential returns. Investing in derivatives is a specialized activity that involves special risks that subject the Fund to significant loss potential, including when used as leverage, and may result in greater fluctuation in fund value. The Fund is managed by multiple advisers independently of one another, which may result in contradicting trades (i.e., with no net benefit to the Fund), while increasing transaction costs. Market or other (e.g., interest rate) environments may adversely affect the liquidity of fund investments, negatively impacting their price. Generally, the less liquid the market at the time the Fund sells a holding, the greater the risk of loss or decline of value to the Fund. See the Fund’s prospectus for more information on these and other risks.
The views expressed in this report reflect the current views of the respective parties who have contributed to this report. These views are not guarantees of future performance and involve certain risks, uncertainties and assumptions that are difficult to predict, so actual outcomes and results may differ significantly from the views expressed. These views are subject to change at any time based upon economic, market or other conditions and the respective parties disclaim any responsibility to update such views. These views may not be relied on as investment advice and, because investment decisions for a Columbia fund are based on numerous factors, may not be relied on as an indication of trading intent on behalf of any particular Columbia fund. References to specific securities should not be construed as a recommendation or investment advice.
Multi-Manager Total Return Bond Strategies Fund | Annual Report 2023
| 9 |
Understanding Your Fund’s Expenses
(Unaudited)
As an investor, you incur two types of costs. There are shareholder transaction costs, which may include redemption fees. There are also ongoing fund costs, which generally include management fees, distribution and/or service fees, and other fund expenses. The following information is intended to help you understand your ongoing costs (in dollars) of investing in the Fund and to help you compare these costs with the ongoing costs of investing in other mutual funds.
Analyzing your Fund’s expenses
To illustrate these ongoing costs, we have provided examples and calculated the expenses paid by investors in each share class of the Fund during the period. The actual and hypothetical information in the table is based on an initial investment of $1,000 at the beginning of the period indicated and held for the entire period. Expense information is calculated two ways and each method provides you with different information. The amount listed in the “Actual” column is calculated using the Fund’s actual operating expenses and total return for the period. You may use the Actual information, together with the amount invested, to estimate the expenses that you paid over the period. Simply divide your account value by $1,000 (for example, an $8,600 account value divided by $1,000 = 8.6), then multiply the results by the expenses paid during the period under the “Actual” column. The amount listed in the “Hypothetical” column assumes a 5% annual rate of return before expenses (which is not the Fund’s actual return) and then applies the Fund’s actual expense ratio for the period to the hypothetical return. You should not use the hypothetical account values and expenses to estimate either your actual account balance at the end of the period or the expenses you paid during the period. See “Compare with other funds” below for details on how to use the hypothetical data.
Compare with other funds
Since all mutual funds are required to include the same hypothetical calculations about expenses in shareholder reports, you can use this information to compare the ongoing cost of investing in the Fund with other funds. To do so, compare the hypothetical example with the 5% hypothetical examples that appear in the shareholder reports of other funds. As you compare hypothetical examples of other funds, it is important to note that hypothetical examples are meant to highlight the ongoing costs of investing in a fund only and do not reflect any transaction costs, such as redemption or exchange fees. Therefore, the hypothetical calculations are useful in comparing ongoing costs only, and will not help you determine the relative total costs of owning different funds. If transaction costs were included in these calculations, your costs would be higher.
| March 1, 2023 — August 31, 2023 |
| | Account value at the
beginning of the
period ($) | Account value at the
end of the
period ($) | Expenses paid during
the period ($) | Fund’s annualized
expense ratio (%) |
| | Actual | Hypothetical | Actual | Hypothetical | Actual | Hypothetical | Actual |
| Institutional Class | 1,000.00 | 1,000.00 | 1,012.30 | 1,022.74 | 2.49 | 2.50 | 0.49 |
| Institutional 3 Class | 1,000.00 | 1,000.00 | 1,012.30 | 1,022.89 | 2.33 | 2.35 | 0.46 |
Expenses paid during the period are equal to the annualized expense ratio for each class as indicated above, multiplied by the average account value over the period and then multiplied by the number of days in the Fund’s most recent fiscal half year and divided by 365.
Expenses do not include fees and expenses incurred indirectly by the Fund from its investment in underlying funds, including affiliated and non-affiliated pooled investment vehicles, such as mutual funds and exchange-traded funds.
Had Columbia Management Investment Advisers, LLC and/or certain of its affiliates not waived/reimbursed certain fees and expenses, account value at the end of the period would have been reduced.
The Fund is offered only through certain wrap fee programs sponsored and/or managed by Ameriprise Financial, Inc. or its affiliates. Participants in wrap fee programs pay other fees that are not included in the above table. Please refer to the wrap program documents for information about the fees charged.
| 10 | Multi-Manager Total Return Bond Strategies Fund | Annual Report 2023 |
Portfolio of Investments
August 31, 2023
(Percentages represent value of investments compared to net assets)
Investments in securities
| Asset-Backed Securities — Non-Agency 11.6% |
| Issuer | Coupon
Rate | | Principal
Amount ($) | Value ($) |
| AB BSL CLO 4 Ltd.(a),(b) |
| Series 2023-4A Class A |
3-month Term SOFR + 2.000%
Floor 2.000%
04/20/2036 | 6.957% | | 2,350,000 | 2,361,553 |
| Affirm Asset Securitization Trust(a) |
| Series 2022-A Class A |
| 05/17/2027 | 4.300% | | 525,000 | 513,661 |
| Series 2023-A Class A |
| 01/18/2028 | 6.610% | | 575,000 | 578,597 |
| AGL CLO 11 Ltd.(a),(b) |
| Series 2021-11A Class AJ |
3-month Term SOFR + 1.612%
Floor 1.350%
04/15/2034 | 6.920% | | 12,200,000 | 11,959,465 |
| AGL CLO 12 Ltd.(a),(b) |
| Series 2021-12A Class C |
3-month Term SOFR + 2.112%
Floor 1.850%
07/20/2034 | 7.438% | | 1,000,000 | 985,117 |
| AGL CLO Ltd.(a),(b) |
| Series 2021-13A Class A1 |
3-month Term SOFR + 1.422%
Floor 1.160%
10/20/2034 | 6.748% | | 5,250,000 | 5,212,893 |
| AIG CLO(a),(b) |
| Series 2021-1A Class C |
3-month Term SOFR + 2.012%
Floor 1.750%
04/22/2034 | 7.357% | | 1,750,000 | 1,712,223 |
| AIG CLO Ltd.(a),(b) |
| Series 2019-2A Class AR |
3-month Term SOFR + 1.362%
Floor 1.100%
10/25/2033 | 6.713% | | 12,500,000 | 12,434,275 |
| Series 2021-2A Class A |
3-month Term SOFR + 1.432%
Floor 1.170%
07/20/2034 | 6.758% | | 6,950,000 | 6,903,039 |
| AIMCO CLO Ltd.(a),(b) |
| Series 2020-11A Class AR |
3-month Term SOFR + 1.392%
Floor 1.130%
10/17/2034 | 6.700% | | 4,000,000 | 3,973,280 |
| Allegro CLO VII Ltd.(a),(b) |
| Series 2018-1A Class A |
3-month Term SOFR + 1.362%
Floor 1.100%
06/13/2031 | 6.670% | | 7,500,000 | 7,459,147 |
| Asset-Backed Securities — Non-Agency (continued) |
| Issuer | Coupon
Rate | | Principal
Amount ($) | Value ($) |
| American Credit Acceptance Receivables Trust(a) |
| Subordinated Series 2020-4 Class C |
| 12/14/2026 | 1.310% | | 560,180 | 555,520 |
| Subordinated Series 2022-4 Class C |
| 02/15/2029 | 7.860% | | 580,000 | 584,360 |
| Subordinated Series 2023-3 Class C |
| 10/12/2029 | 6.440% | | 2,750,000 | 2,754,053 |
| Americredit Automobile Receivables Trust |
| Subordinated Series 2022-1 Class B |
| 04/19/2027 | 2.770% | | 2,175,000 | 2,055,336 |
| Subordinated Series 2023-1 Class B |
| 03/20/2028 | 5.570% | | 3,130,000 | 3,089,043 |
| AmeriCredit Automobile Receivables Trust |
| Series 2020-1 Class D |
| 12/18/2025 | 1.800% | | 950,000 | 916,174 |
| Series 2020-2 Class D |
| 03/18/2026 | 2.130% | | 500,000 | 471,439 |
| Series 2021-2 Class B |
| 01/19/2027 | 0.690% | | 2,380,000 | 2,260,775 |
| Series 2022-2 Class A3 |
| 04/18/2028 | 4.380% | | 2,090,000 | 2,060,930 |
| Subordinated Series 2019-1 Class D |
| 03/18/2025 | 3.620% | | 1,963,219 | 1,961,495 |
| Subordinated Series 2019-3 Class D |
| 09/18/2025 | 2.580% | | 1,450,000 | 1,423,385 |
| Subordinated Series 2020-2 Class B |
| 02/18/2026 | 0.970% | | 145,181 | 144,514 |
| Subordinated Series 2021-2 Class C |
| 01/19/2027 | 1.010% | | 2,905,000 | 2,672,713 |
| Subordinated Series 2021-3 Class C |
| 08/18/2027 | 1.410% | | 3,080,000 | 2,785,542 |
| AMMC CLO Ltd.(a),(b) |
| Series 2023-26A Class A1 |
3-month Term SOFR + 1.950%
Floor 1.950%
04/15/2036 | 7.093% | | 2,200,000 | 2,205,575 |
| Anchorage Capital CLO Ltd.(a),(b) |
| Series 2013-1A Class A1R |
3-month Term SOFR + 1.512%
10/13/2030 | 6.813% | | 4,343,877 | 4,335,871 |
| Series 2016-8A Class AR2 |
3-month Term SOFR + 1.462%
Floor 1.200%
10/27/2034 | 6.819% | | 11,500,000 | 11,354,421 |
The accompanying Notes to Financial Statements are an integral part of this statement.
Multi-Manager Total Return Bond Strategies Fund | Annual Report 2023
| 11 |
Portfolio of Investments (continued)
August 31, 2023
| Asset-Backed Securities — Non-Agency (continued) |
| Issuer | Coupon
Rate | | Principal
Amount ($) | Value ($) |
| Series 2021-21A Class B |
3-month Term SOFR + 2.012%
Floor 1.750%
10/20/2034 | 7.338% | | 10,000,000 | 9,859,190 |
| Apidos CLO XXII(a),(b) |
| Series 2015-22A Class A1R |
3-month Term SOFR + 1.322%
Floor 1.060%
04/20/2031 | 6.648% | | 6,380,723 | 6,369,117 |
| Apidos CLO XXIV(a),(b) |
| Series 2016-24A |
3-month Term SOFR + 2.312%
Floor 2.050%
10/20/2030 | 7.638% | | 2,900,000 | 2,849,908 |
| Applebee’s Funding LLC/IHOP Funding LLC(a) |
| Series 2019-1A Class AII |
| 06/07/2049 | 4.723% | | 495,000 | 454,678 |
| Series 2023-1A Class A2 |
| 03/05/2053 | 7.824% | | 2,750,000 | 2,747,922 |
| Aqua Finance Trust(a) |
| Series 2020-AA Class A |
| 07/17/2046 | 1.900% | | 518,558 | 481,528 |
| Series 2021-A Class A |
| 07/17/2046 | 1.540% | | 1,762,510 | 1,555,973 |
| Ares LXI CLO Ltd.(a),(b) |
| Series 2021-61A Class A |
3-month Term SOFR + 1.412%
Floor 1.150%
10/20/2034 | 6.738% | | 6,718,000 | 6,664,605 |
| ArrowMark Colorado Holdings(a),(b) |
| Series 2017-6A Class A1 |
3-month Term SOFR + 1.542%
07/15/2029 | 6.850% | | 1,262,443 | 1,259,212 |
| Atlas Senior Loan Fund XXI Ltd.(a),(b) |
| Series 2023-21A Class A1 |
3-month Term SOFR + 2.200%
Floor 2.200%
07/20/2035 | 7.526% | | 7,500,000 | 7,519,650 |
| Atrium XII(a),(b) |
| Series 2012A Class AR |
3-month Term SOFR + 1.092%
04/22/2027 | 6.437% | | 8,111,518 | 8,087,248 |
| Avis Budget Rental Car Funding AESOP LLC(a) |
| Series 2020-1A Class A |
| 08/20/2026 | 2.330% | | 115,000 | 107,833 |
| Series 2020-2A Class A |
| 02/20/2027 | 2.020% | | 1,600,000 | 1,464,521 |
| Series 2023-2A Class A |
| 10/20/2027 | 5.200% | | 1,270,000 | 1,247,407 |
| Asset-Backed Securities — Non-Agency (continued) |
| Issuer | Coupon
Rate | | Principal
Amount ($) | Value ($) |
| Series 2023-3A Class A |
| 02/22/2028 | 5.440% | | 10,380,000 | 10,282,486 |
| Bain Capital Credit CLO Ltd.(a),(b) |
| Series 2019-3A Class AR |
3-month Term SOFR + 1.422%
Floor 1.160%
10/21/2034 | 6.755% | | 17,250,000 | 17,127,145 |
| Balboa Bay Loan Funding Ltd.(a),(b) |
| Series 2020-1A Class AR |
3-month Term SOFR + 1.382%
Floor 1.120%
01/20/2032 | 6.708% | | 13,750,000 | 13,687,039 |
| Barings CLO Ltd.(a),(b) |
| Series 2020-2A Class AR |
3-month Term SOFR + 1.272%
Floor 1.010%
10/15/2033 | 6.580% | | 7,500,000 | 7,457,190 |
| Series 2020-4A Class A |
3-month Term SOFR + 1.482%
Floor 1.220%
01/20/2032 | 6.808% | | 6,500,000 | 6,483,691 |
| Battalion CLO XII Ltd.(a),(b) |
| Series 2018-12A Class A1 |
3-month Term SOFR + 1.332%
Floor 1.070%
05/17/2031 | 6.708% | | 2,962,808 | 2,946,761 |
| Beacon Container Finance II LLC(a) |
| Series 2021-1A Class A |
| 10/22/2046 | 2.250% | | 1,960,000 | 1,688,011 |
| Benefit Street Partners CLO X Ltd.(a),(b) |
| Series 2016-10A Class BRR |
3-month Term SOFR + 2.412%
Floor 2.150%
04/20/2034 | 7.738% | | 2,810,000 | 2,759,457 |
| BHG Securitization Trust(a) |
| Series 2022-C Class A |
| 10/17/2035 | 5.320% | | 576,938 | 572,013 |
| BlueMountain CLO XXVIII Ltd.(a),(b) |
| Series 2021-28A Class C |
3-month Term SOFR + 2.262%
Floor 2.000%
04/15/2034 | 7.570% | | 1,300,000 | 1,267,097 |
| BlueMountain CLO XXXI Ltd.(a),(b) |
| Series 2021-31A Class A2 |
3-month Term SOFR + 1.662%
Floor 1.400%
04/19/2034 | 6.982% | | 3,600,000 | 3,512,743 |
| BlueMountain Fuji US CLO II Ltd.(a),(b) |
| Series 2017-2A Class A1AR |
3-month Term SOFR + 1.262%
10/20/2030 | 6.588% | | 10,829,434 | 10,802,100 |
The accompanying Notes to Financial Statements are an integral part of this statement.
| 12 | Multi-Manager Total Return Bond Strategies Fund | Annual Report 2023 |
Portfolio of Investments (continued)
August 31, 2023
| Asset-Backed Securities — Non-Agency (continued) |
| Issuer | Coupon
Rate | | Principal
Amount ($) | Value ($) |
| Bojangles Issuer LLC(a) |
| Series 2020-1A Class A2 |
| 10/20/2050 | 3.832% | | 1,576,000 | 1,446,830 |
| Canyon Capital CLO Ltd.(a),(b) |
| Series 2019-1A Class A1R |
3-month Term SOFR + 1.362%
Floor 1.100%
04/15/2032 | 6.670% | | 17,500,000 | 17,359,597 |
| CARDS II Trust(a) |
| Subordinated Series 2021-1A Class B |
| 04/15/2027 | 0.931% | | 2,850,000 | 2,754,616 |
| Carlyle Global Market Strategies CLO Ltd.(a),(b) |
| Series 2013-3A Class A1AR |
3-month Term SOFR + 1.362%
Floor 1.100%
10/15/2030 | 6.670% | | 3,564,159 | 3,552,657 |
| Series 2014-3RA Class A1A |
3-month Term SOFR + 1.312%
07/27/2031 | 6.669% | | 21,572,361 | 21,466,808 |
| Carlyle US CLO Ltd.(a),(b) |
| Series 2017-2A Class A2R |
3-month Term SOFR + 1.862%
Floor 1.600%
07/20/2031 | 7.188% | | 2,100,000 | 2,071,432 |
| Series 2020-1A Class BR |
3-month Term SOFR + 2.262%
Floor 2.000%
07/20/2034 | 7.588% | | 1,250,000 | 1,205,726 |
| Carmax Auto Owner Trust |
| Series 2023-2 Class A3 |
| 01/18/2028 | 5.050% | | 3,835,000 | 3,810,629 |
| Series 2023-3 Class A3 |
| 05/15/2028 | 5.280% | | 1,165,000 | 1,165,084 |
| Subordinated Series 2023-3 Class B |
| 02/15/2029 | 5.470% | | 3,040,000 | 3,037,079 |
| CarNow Auto Receivables Trust(a) |
| Series 2023-1A Class A |
| 12/16/2024 | 6.620% | | 292,842 | 292,903 |
| Carvana Auto Receivables Trust |
| Series 2021-P4 Class A3 |
| 01/11/2027 | 1.310% | | 5,432,859 | 5,218,070 |
| Subordinated Series 2021-N4 Class C |
| 09/11/2028 | 1.720% | | 820,094 | 779,835 |
| Carvana Auto Receivables Trust(a) |
| Series 2023-N1 Class A |
| 04/12/2027 | 6.360% | | 2,813,823 | 2,825,415 |
| Series 2023-P1 Class A3 |
| 12/10/2027 | 5.980% | | 5,395,000 | 5,387,686 |
| Series 2023-P3 Class A4 |
| 07/10/2029 | 5.710% | | 280,000 | 280,343 |
| Asset-Backed Securities — Non-Agency (continued) |
| Issuer | Coupon
Rate | | Principal
Amount ($) | Value ($) |
| Chancelight, Inc.(a),(b) |
| Series 2012-2 Class A |
30-day Average SOFR + 0.844%
Floor 0.730%
04/25/2039 | 6.132% | | 244,633 | 243,772 |
| Chesapeake Funding II LLC(a) |
| Series 2023-1A Class A1 |
| 05/15/2035 | 5.650% | | 2,987,411 | 2,978,743 |
| CIFC Funding IV Ltd.(a),(b) |
| Series 2015-4A Class BR2 |
3-month Term SOFR + 2.162%
Floor 1.900%
04/20/2034 | 7.488% | | 6,300,000 | 6,129,157 |
| CIFC Funding Ltd.(a),(b) |
| Series 2014-5A Class BR2 |
3-month Term SOFR + 2.062%
Floor 1.800%
10/17/2031 | 7.370% | | 1,800,000 | 1,780,663 |
| Series 2019-6A Class A2 |
3-month Term SOFR + 2.012%
Floor 1.750%
01/16/2033 | 7.320% | | 2,000,000 | 1,999,988 |
| CIT Education Loan Trust(a),(b) |
| Series 2007-1 Class B |
3-month USD LIBOR + 0.300%
Floor 0.300%
06/25/2042 | 5.842% | | 355,296 | 331,260 |
| CLI Funding VIII LLC(a) |
| Series 2022-1A Class A1 |
| 01/18/2047 | 2.720% | | 2,594,400 | 2,220,447 |
| Commonbond Student Loan Trust(a) |
| Series 2018-CGS Class B |
| 02/25/2046 | 4.250% | | 132,669 | 125,257 |
| Series 2019-AGS Class A1 |
| 01/25/2047 | 2.540% | | 1,267,781 | 1,134,694 |
| Series 2020-AGS Class A |
| 08/25/2050 | 1.980% | | 990,953 | 848,293 |
| Credit Acceptance Auto Loan Trust(a) |
| Series 2020-3A Class B |
| 12/17/2029 | 1.770% | | 2,105,000 | 2,077,231 |
| Series 2021-3A Class A |
| 05/15/2030 | 1.000% | | 1,582,169 | 1,550,025 |
| Series 2022-3A Class A |
| 10/15/2032 | 6.570% | | 6,030,000 | 6,042,726 |
| Series 2023-1A Class A |
| 03/15/2033 | 6.480% | | 4,080,000 | 4,089,585 |
| Subordinated Series 2023-2A Class B |
| 07/15/2033 | 6.610% | | 1,215,000 | 1,200,909 |
| Subordinated Series 2023-3A Class C |
| 12/15/2033 | 7.620% | | 695,000 | 695,788 |
The accompanying Notes to Financial Statements are an integral part of this statement.
Multi-Manager Total Return Bond Strategies Fund | Annual Report 2023
| 13 |
Portfolio of Investments (continued)
August 31, 2023
| Asset-Backed Securities — Non-Agency (continued) |
| Issuer | Coupon
Rate | | Principal
Amount ($) | Value ($) |
| Crown Point CLO Ltd.(a),(b) |
| Series 2021-11A Class A |
3-month Term SOFR + 1.382%
Floor 1.120%
01/17/2034 | 6.690% | | 14,250,000 | 14,123,431 |
| DataBank Issuer LLC(a) |
| Series 2023-1 Class A2 |
| 02/25/2053 | 5.116% | | 3,400,000 | 3,200,959 |
| DB Master Finance LLC(a) |
| Series 2017-1A Class A2II |
| 11/20/2047 | 4.030% | | 1,181,250 | 1,087,452 |
| Series 2019-1A Class A23 |
| 05/20/2049 | 4.352% | | 1,152,000 | 1,058,084 |
| Series 2019-1A Class A2II |
| 05/20/2049 | 4.021% | | 624,000 | 575,583 |
| Subordinated Series 2021-1A Class A23 |
| 11/20/2051 | 2.791% | | 4,323,000 | 3,435,984 |
| DLLMT LLC(a) |
| Subordinated Series 2023-1A Class A3 |
| 03/22/2027 | 5.340% | | 4,175,000 | 4,134,079 |
| Domino’s Pizza Master Issuer LLC(a) |
| Series 2018-1A Class A2I |
| 07/25/2048 | 4.116% | | 1,428,750 | 1,362,785 |
| Series 2021-1A Class A2II |
| 04/25/2051 | 3.151% | | 3,128,000 | 2,564,413 |
| Donlen Fleet Lease Funding 2 LLC(a) |
| Series 2021-2 Class A2 |
| 12/11/2034 | 0.560% | | 1,385,656 | 1,360,251 |
| Drive Auto Receivables Trust |
| Subordinated Series 2021-3 Class B |
| 05/15/2026 | 1.110% | | 1,522,259 | 1,510,998 |
| Driven Brands Funding LLC(a) |
| Series 2019-1A Class A2 |
| 04/20/2049 | 4.641% | | 1,719,000 | 1,631,807 |
| Dryden 86 CLO Ltd.(a),(b) |
| Series 2020-86A Class CR |
3-month Term SOFR + 2.262%
Floor 2.000%
07/17/2034 | 7.570% | | 3,000,000 | 2,912,994 |
| Dryden CLO Ltd.(a),(b) |
| Series 2019-75A Class CR2 |
3-month Term SOFR + 2.062%
Floor 1.800%
04/15/2034 | 7.370% | | 5,000,000 | 4,790,510 |
| DT Auto Owner Trust(a) |
| Series 2020-2A Class C |
| 03/16/2026 | 3.280% | | 288,496 | 287,085 |
| Series 2021-2A Class B |
| 01/15/2027 | 0.810% | | 315,210 | 314,493 |
| Asset-Backed Securities — Non-Agency (continued) |
| Issuer | Coupon
Rate | | Principal
Amount ($) | Value ($) |
| Subordinated Series 2021-4A Class C |
| 09/15/2027 | 1.500% | | 2,550,000 | 2,411,561 |
| Subordinated Series 2022-2A Class B |
| 01/15/2027 | 4.220% | | 4,445,000 | 4,365,289 |
| Subordinated Series 2022-3A Class B |
| 07/17/2028 | 6.740% | | 3,155,000 | 3,173,998 |
| Subordinated Series 2023-2A Class B |
| 02/15/2029 | 5.410% | | 2,525,000 | 2,491,893 |
| Eaton Vance CLO Ltd.(a),(b) |
| Series 2019-1A Class AR |
3-month Term SOFR + 1.362%
Floor 1.100%
04/15/2031 | 6.670% | | 4,670,000 | 4,641,859 |
| ELFI Graduate Loan Program LLC(a) |
| Series 2019-A Class A |
| 03/25/2044 | 2.540% | | 701,108 | 635,233 |
| ELFI Graduate Loan Program LLC(a),(c) |
| Subordinated Series 2019-A Class B |
| 03/25/2044 | 2.940% | | 325,946 | 285,415 |
| Ellington CLO II Ltd.(a),(b) |
| Series 2017-2A Class A |
3-month Term SOFR + 1.962%
Floor 1.700%
02/15/2029 | 7.326% | | 2,725,560 | 2,722,791 |
| Elmwood CLO II Ltd.(a),(b) |
| Series 2019-2A Class AR |
3-month Term SOFR + 1.412%
Floor 1.150%
04/20/2034 | 6.738% | | 27,250,000 | 27,103,477 |
| Elmwood CLO VII Ltd.(a),(b) |
| Series 2020-4A Class A |
3-month Term SOFR + 1.652%
Floor 1.390%
01/17/2034 | 6.960% | | 2,000,000 | 2,000,004 |
| Enterprise Fleet Financing LLC(a) |
| Series 2022-3 Class A2 |
| 07/20/2029 | 4.380% | | 1,066,432 | 1,048,601 |
| Series 2023-2 Class A2 |
| 04/22/2030 | 5.560% | | 2,855,000 | 2,839,515 |
| Exeter Automobile Receivables Trust |
| Subordinated Series 2020-3A Class D |
| 07/15/2026 | 1.730% | | 369,040 | 363,080 |
| Subordinated Series 2021-3A Class B |
| 01/15/2026 | 0.690% | | 318,163 | 317,304 |
| Subordinated Series 2021-4 Class B |
| 05/15/2026 | 1.050% | | 1,760,027 | 1,747,147 |
| Subordinated Series 2023-1A Class B |
| 04/15/2027 | 5.720% | | 2,580,000 | 2,564,161 |
The accompanying Notes to Financial Statements are an integral part of this statement.
| 14 | Multi-Manager Total Return Bond Strategies Fund | Annual Report 2023 |
Portfolio of Investments (continued)
August 31, 2023
| Asset-Backed Securities — Non-Agency (continued) |
| Issuer | Coupon
Rate | | Principal
Amount ($) | Value ($) |
| Subordinated Series 2023-2A Class B |
| 09/15/2027 | 5.610% | | 2,450,000 | 2,429,586 |
| Subordinated Series 2023-3A Class B |
| 09/15/2027 | 6.110% | | 900,000 | 900,879 |
| SubordinatedSeries 2022-5A Class B |
| 03/15/2027 | 5.970% | | 4,890,000 | 4,869,483 |
| Flagship Credit Auto Trust(a) |
| Series 2020-2 Class C |
| 04/15/2026 | 3.800% | | 39,454 | 39,361 |
| Series 2022-4 Class A3 |
| 06/15/2027 | 6.320% | | 3,475,000 | 3,515,520 |
| Subordinated Series 2020-4 Class C |
| 02/16/2027 | 1.280% | | 585,000 | 566,879 |
| Subordinated Series 2021-2 Class B |
| 06/15/2027 | 0.930% | | 1,800,000 | 1,751,529 |
| Subordinated Series 2023-2 Class C |
| 05/15/2029 | 5.810% | | 3,240,000 | 3,177,809 |
| Flatiron CLO 21 Ltd.(a),(b) |
| Series 2021-1A Class C |
3-month Term SOFR + 2.112%
Floor 1.850%
07/19/2034 | 7.432% | | 2,000,000 | 1,951,416 |
| Ford Credit Auto Owner Trust(a) |
| Series 2018-1 Class A |
| 07/15/2031 | 3.190% | | 7,110,000 | 6,871,262 |
| Series 2021-1 Class A |
| 10/17/2033 | 1.370% | | 3,415,000 | 3,086,658 |
| Series 2023-2 Class A |
| 02/15/2036 | 5.280% | | 7,005,000 | 7,045,759 |
| Subordinated Series 2021-2 Class C |
| 05/15/2034 | 2.110% | | 3,900,000 | 3,395,644 |
| Subordinated Series 2021-2 Class D |
| 05/15/2034 | 2.600% | | 2,300,000 | 1,983,622 |
| Subordinated Series 2023-1 Class C |
| 08/15/2035 | 5.580% | | 3,900,000 | 3,789,462 |
| Ford Credit Floorplan Master Owner Trust(a) |
| Series 2023-1 Class A1 |
| 05/15/2028 | 4.920% | | 2,165,000 | 2,134,361 |
| Foursight Capital Automobile Receivables Trust(a) |
| Series 2022-1 Class A3 |
| 12/15/2026 | 1.830% | | 2,405,000 | 2,345,148 |
| Series 2022-2 Class A3 |
| 06/15/2027 | 4.590% | | 2,130,000 | 2,087,492 |
| Frontier Issuer LLC(a) |
| Series 2023-1 Class A2 |
| 08/20/2053 | 6.600% | | 4,475,000 | 4,335,847 |
| Asset-Backed Securities — Non-Agency (continued) |
| Issuer | Coupon
Rate | | Principal
Amount ($) | Value ($) |
| Galaxy XXII CLO Ltd.(a),(b) |
| Series 2016-22A Class ARR |
3-month Term SOFR + 1.462%
Floor 1.200%
04/16/2034 | 6.770% | | 3,200,000 | 3,168,950 |
| GECU Auto Receivables Trust(a) |
| Series 2023-1A Class A3 |
| 08/15/2028 | 5.630% | | 2,500,000 | 2,493,558 |
| Global SC Finance II SRL(a) |
| Series 2014-1A Class A2 |
| 07/17/2029 | 3.090% | | 351,031 | 342,273 |
| GLS Auto Receivables Issuer Trust(a) |
| Subordinated Series 2020-4A Class C |
| 11/17/2025 | 1.140% | | 440,264 | 436,345 |
| Subordinated Series 2021-3A Class B |
| 11/17/2025 | 0.780% | | 923,939 | 916,801 |
| Subordinated Series 2021-4A Class B |
| 04/15/2026 | 1.530% | | 5,855,000 | 5,753,540 |
| GM Financial Automobile Leasing Trust |
| Series 2023-2 Class A3 |
| 07/20/2026 | 5.050% | | 1,790,000 | 1,777,424 |
| Subordinated Series 2022-3 Class C |
| 08/20/2026 | 5.130% | | 2,350,000 | 2,309,128 |
| GM Financial Consumer Automobile Receivables Trust |
| Series 2020-2 Class A3 |
| 12/16/2024 | 1.490% | | 27,640 | 27,605 |
| Goal Capital Funding Trust(b) |
| Series 2006-1 Class B |
3-month USD LIBOR + 0.712%
Floor 0.450%
08/25/2042 | 5.846% | | 451,110 | 408,696 |
| GoodLeap Sustainable Home Solutions Trust(a) |
| Series 2021-3CS Class A |
| 05/20/2048 | 2.100% | | 2,847,889 | 2,171,977 |
| Greenwood Park CLO Ltd.(a),(b) |
| Series 2018-1A Class A2 |
3-month Term SOFR + 1.272%
Floor 1.010%
04/15/2031 | 6.580% | | 15,000,000 | 14,947,275 |
| Greywolf CLO III Ltd.(a),(b) |
| Series 2020-3RA Class A1R |
3-month USD LIBOR + 1.290%
Floor 1.290%
04/15/2033 | 6.636% | | 6,500,000 | 6,453,974 |
| Greywolf CLO VII Ltd.(a),(b) |
| Series 2018-2A Class A1 |
3-month Term SOFR + 1.440%
Floor 1.180%
10/20/2031 | 6.766% | | 6,250,000 | 6,223,888 |
The accompanying Notes to Financial Statements are an integral part of this statement.
Multi-Manager Total Return Bond Strategies Fund | Annual Report 2023
| 15 |
Portfolio of Investments (continued)
August 31, 2023
| Asset-Backed Securities — Non-Agency (continued) |
| Issuer | Coupon
Rate | | Principal
Amount ($) | Value ($) |
| Helios Issuer LLC(a) |
| Series 2020-AA Class A |
| 06/20/2047 | 2.980% | | 1,004,864 | 899,527 |
| Henderson Receivables LLC(a) |
| Series 2013-3A Class A |
| 01/17/2073 | 4.080% | | 1,444,094 | 1,280,364 |
| Series 2014-2A Class A |
| 01/17/2073 | 3.610% | | 1,733,125 | 1,465,983 |
| Hertz Vehicle Financing III LLC(a) |
| Series 2023-3A Class A |
| 02/25/2028 | 5.940% | | 4,660,000 | 4,662,738 |
| Hilton Grand Vacations Trust(a) |
| Subordinated Series 2022-2A Class C |
| 01/25/2037 | 5.570% | | 232,740 | 222,137 |
| HPS Loan Management Ltd.(a),(b) |
| Series 2010-A16 Class A1RR |
3-month Term SOFR + 1.402%
Floor 1.140%
04/20/2034 | 6.728% | | 9,750,000 | 9,632,230 |
| Series 2021-16A Class A1 |
3-month Term SOFR + 1.402%
Floor 1.140%
01/23/2035 | 6.747% | | 7,300,000 | 7,209,232 |
| Hyundai Auto Lease Securitization Trust(a) |
| Series 2023-B Class A3 |
| 06/15/2026 | 5.150% | | 2,390,000 | 2,376,963 |
| ICG US CLO Ltd.(a),(b) |
| Series 2014-3A Class A1RR |
3-month Term SOFR + 1.292%
04/25/2031 | 6.643% | | 6,411,989 | 6,387,117 |
| JG Wentworth XLIII LLC(a) |
| Series 2019-1A Class A |
| 08/17/2071 | 3.820% | | 954,267 | 829,114 |
| JPMorgan Chase Bank NA(a) |
| Series 2021-3 Class E |
| 02/26/2029 | 2.102% | | 288,989 | 276,834 |
| Subordinated Series 2021-1 Class D |
| 09/25/2028 | 1.174% | | 202,698 | 197,254 |
| Subordinated Series 2021-2 Class D |
| 12/26/2028 | 1.138% | | 465,732 | 448,798 |
| Kayne CLO Ltd.(a),(b) |
| Series 2019-6A Class A2 |
3-month Term SOFR + 2.112%
Floor 1.850%
01/20/2033 | 7.438% | | 1,500,000 | 1,474,886 |
| Kayne Ltd.(a),(b) |
| Series 2018-1A Class CR |
3-month Term SOFR + 2.012%
Floor 1.750%
07/15/2031 | 7.320% | | 1,820,000 | 1,795,432 |
| Asset-Backed Securities — Non-Agency (continued) |
| Issuer | Coupon
Rate | | Principal
Amount ($) | Value ($) |
| Series 2021-10A Class C |
3-month Term SOFR + 2.012%
Floor 1.750%
04/23/2034 | 7.357% | | 1,600,000 | 1,547,214 |
| KKR CLO Ltd.(a),(b) |
| Series 2032A Class A1 |
3-month Term SOFR + 1.582%
Floor 1.320%
01/15/2032 | 6.890% | | 17,000,000 | 16,949,765 |
| Lending Funding Trust(a) |
| Series 2020-2A Class A |
| 04/21/2031 | 2.320% | | 700,000 | 626,212 |
| Lendmark Funding Trust(a) |
| Series 2021-1A Class A |
| 11/20/2031 | 1.900% | | 5,000,000 | 4,368,224 |
| Subordinated Series 2021-1A Class B |
| 11/20/2031 | 2.470% | | 200,000 | 169,871 |
| Subordinated Series 2021-1A Class C |
| 11/20/2031 | 3.410% | | 100,000 | 81,028 |
| Loanpal Solar Loan Ltd.(a) |
| Series 2020-2GF Class A |
| 07/20/2047 | 2.750% | | 1,381,829 | 1,048,695 |
| Logan CLO I Ltd.(a),(b) |
| Series 2021-1A Class A |
3-month Term SOFR + 1.422%
Floor 1.160%
07/20/2034 | 6.748% | | 15,000,000 | 14,932,305 |
| M&T Equipment Notes(a) |
| Series 2023-1A Class A3 |
| 07/15/2030 | 5.740% | | 2,115,000 | 2,108,453 |
| Madison Park Funding LIX Ltd.(a),(b) |
| Series 2021-59A Class A |
3-month Term SOFR + 1.402%
Floor 1.140%
01/18/2034 | 6.712% | | 12,500,000 | 12,423,462 |
| Madison Park Funding XLVIII Ltd.(a),(b) |
| Series 2021-48A Class A |
3-month Term SOFR + 1.412%
Floor 1.150%
04/19/2033 | 6.732% | | 6,500,000 | 6,471,004 |
| Series 2021-48A Class C |
3-month Term SOFR + 2.262%
Floor 2.000%
04/19/2033 | 7.582% | | 1,520,000 | 1,497,743 |
| Madison Park Funding XXI Ltd.(a),(b) |
| Series 2016-21A Class AARR |
3-month Term SOFR + 1.342%
Floor 1.080%
10/15/2032 | 6.650% | | 17,000,000 | 16,857,557 |
The accompanying Notes to Financial Statements are an integral part of this statement.
| 16 | Multi-Manager Total Return Bond Strategies Fund | Annual Report 2023 |
Portfolio of Investments (continued)
August 31, 2023
| Asset-Backed Securities — Non-Agency (continued) |
| Issuer | Coupon
Rate | | Principal
Amount ($) | Value ($) |
| Series 2016-21A Class ABRR |
3-month Term SOFR + 1.662%
Floor 1.400%
10/15/2032 | 6.970% | | 1,750,000 | 1,726,449 |
| Madison Park Funding XXXVIII Ltd.(a),(b) |
| Series 2021-38A Class A |
3-month Term SOFR + 1.382%
Floor 1.120%
07/17/2034 | 6.690% | | 15,000,000 | 14,864,565 |
| Magnetite XVII Ltd.(a),(b) |
| Series 2016-17A Class AR |
3-month Term SOFR + 1.362%
07/20/2031 | 6.688% | | 1,050,000 | 1,045,814 |
| Marathon CLO Ltd.(a),(b) |
| Series 2020-15A Class A1S |
3-month Term SOFR + 1.962%
Floor 1.700%
11/15/2031 | 7.326% | | 20,500,000 | 20,489,217 |
| Mariner Finance Issuance Trust(a) |
| Series 2019-AA Class A |
| 07/20/2032 | 2.960% | | 95,062 | 94,592 |
| Series 2020-AA Class A |
| 08/21/2034 | 2.190% | | 985,336 | 950,857 |
| Marlette Funding Trust(a) |
| Series 2021-1A Class C |
| 06/16/2031 | 1.410% | | 554,832 | 546,649 |
| Series 2022-3A Class A |
| 11/15/2032 | 5.180% | | 3,410,172 | 3,397,900 |
| Massachusetts Educational Financing Authority |
| Series 2018-A Class A |
| 05/25/2033 | 3.850% | | 1,302,984 | 1,259,749 |
| Merlin Aviation Holdings DAC(a) |
| Series 2016-1 Class A |
| 12/15/2032 | 4.500% | | 376,186 | 326,341 |
| MF1 Ltd.(a),(b) |
| Series 2021-FL6 Class D |
1-month Term SOFR + 2.664%
Floor 2.550%
07/16/2036 | 7.976% | | 7,000,000 | 6,604,121 |
| Series 2022-FL8 Class A |
30-day Average SOFR + 1.350%
Floor 1.350%
02/19/2037 | 6.588% | | 1,025,000 | 1,010,454 |
| MidOcean Credit CLO VIII(a),(b) |
| Series 2018-8A Class B |
3-month Term SOFR + 1.912%
02/20/2031 | 7.291% | | 6,600,000 | 6,536,937 |
| Mid-State Capital Corp. Trust(a) |
| Series 2006-1 Class A |
| 10/15/2040 | 5.787% | | 535,503 | 513,235 |
| Asset-Backed Securities — Non-Agency (continued) |
| Issuer | Coupon
Rate | | Principal
Amount ($) | Value ($) |
| Mill City Solar Loan Ltd.(a) |
| Series 2019-1A Class A |
| 03/20/2043 | 4.340% | | 979,556 | 866,056 |
| Series 2019-2GS Class A |
| 07/20/2043 | 3.690% | | 1,039,723 | 881,701 |
| Mosaic Solar Loan Trust(a) |
| Series 2018-1A Class A |
| 06/22/2043 | 4.010% | | 486,178 | 442,217 |
| Series 2019-1A Class A |
| 12/21/2043 | 4.370% | | 1,005,785 | 920,279 |
| Series 2020-2A Class A |
| 08/20/2046 | 1.440% | | 1,813,415 | 1,487,490 |
| Series 2023-3A Class A |
| 11/20/2053 | 5.910% | | 2,882,216 | 2,854,490 |
| Subordinated Series 2018-2GS Class B |
| 02/22/2044 | 4.740% | | 619,173 | 545,960 |
| Subordinated Series 2020-2A Class B |
| 08/20/2046 | 2.210% | | 1,156,380 | 913,535 |
| Subordinated Series 2021-2A Class B |
| 04/21/2047 | 2.090% | | 925,605 | 672,059 |
| Mosaic Solar Loans LLC(a) |
| Series 2017-2A Class A |
| 06/22/2043 | 3.820% | | 511,657 | 462,708 |
| Navient Private Education Refi Loan Trust(a) |
| Series 2020-BA Class A2 |
| 01/15/2069 | 2.120% | | 1,064,717 | 971,425 |
| Series 2020-DA Class A |
| 05/15/2069 | 1.690% | | 5,339,706 | 4,844,580 |
| Series 2020-FA Class A |
| 07/15/2069 | 1.220% | | 700,487 | 625,885 |
| Series 2020-GA Class A |
| 09/16/2069 | 1.170% | | 1,302,347 | 1,149,652 |
| Series 2020-HA Class A |
| 01/15/2069 | 1.310% | | 626,553 | 570,888 |
| Series 2021-A Class A |
| 05/15/2069 | 0.840% | | 684,315 | 594,200 |
| Series 2021-BA Class A |
| 07/15/2069 | 0.940% | | 1,373,261 | 1,197,823 |
| Navient Student Loan Trust(b) |
| Series 2014-3 Class A |
30-day Average SOFR + 0.734%
Floor 0.620%
03/25/2083 | 6.022% | | 3,607,112 | 3,567,512 |
| Series 2014-4 Class A |
30-day Average SOFR + 0.734%
Floor 0.620%
03/25/2083 | 6.022% | | 1,582,754 | 1,562,979 |
The accompanying Notes to Financial Statements are an integral part of this statement.
Multi-Manager Total Return Bond Strategies Fund | Annual Report 2023
| 17 |
Portfolio of Investments (continued)
August 31, 2023
| Asset-Backed Securities — Non-Agency (continued) |
| Issuer | Coupon
Rate | | Principal
Amount ($) | Value ($) |
| Nelnet Student Loan Trust(a),(b) |
| Series 2006-1 Class A6 |
3-month USD LIBOR + 0.450%
08/23/2036 | 6.089% | | 4,940,230 | 4,792,182 |
| Series 2014-4A Class A2 |
30-day Average SOFR + 1.064%
Floor 0.950%
11/25/2048 | 6.352% | | 3,927,374 | 3,924,958 |
| Neuberger Berman CLO XVII Ltd.(a),(b) |
| Series 2014-17A Class CR2 |
3-month Term SOFR + 2.262%
Floor 2.000%
04/22/2029 | 7.607% | | 2,000,000 | 1,960,160 |
| Neuberger Berman Loan Advisers CLO Ltd.(a),(b) |
| Series 2019-33A Class CR |
3-month Term SOFR + 2.162%
Floor 1.900%
10/16/2033 | 7.470% | | 2,000,000 | 1,963,392 |
| Series 2021-40A Class C |
3-month Term SOFR + 2.012%
Floor 1.750%
04/16/2033 | 7.320% | | 4,650,000 | 4,548,170 |
| New Economy Assets Phase 1 Sponsor LLC(a) |
| Series 2021-1 Class A1 |
| 10/20/2061 | 1.910% | | 5,030,000 | 4,337,168 |
| Oaktree CLO Ltd.(a),(b) |
| Series 2019-1A Class A1R |
3-month Term SOFR + 1.372%
Floor 1.110%
04/22/2030 | 6.717% | | 9,800,000 | 9,709,781 |
| OCP CLO Ltd.(a),(b) |
| Series 2020-18A Class CR |
3-month Term SOFR + 2.212%
Floor 1.950%
07/20/2032 | 7.538% | | 500,000 | 488,666 |
| Octagon 61 Ltd.(a),(b) |
| Series 2023-2A Class A |
3-month Term SOFR + 1.850%
Floor 1.850%
04/20/2036 | 6.919% | | 1,550,000 | 1,551,883 |
| Octagon Investment Partners 32 Ltd.(a),(b) |
| Series 2017-1A Class A2R |
3-month Term SOFR + 1.462%
Floor 1.200%
07/15/2029 | 6.770% | | 7,400,000 | 7,272,602 |
| Octagon Investment Partners 46 Ltd.(a),(b) |
| Series 2020-2A Class AR |
3-month Term SOFR + 1.422%
Floor 1.160%
07/15/2036 | 6.730% | | 7,900,000 | 7,815,644 |
| Asset-Backed Securities — Non-Agency (continued) |
| Issuer | Coupon
Rate | | Principal
Amount ($) | Value ($) |
| OHA Credit Funding Ltd.(a),(b) |
| Series 2021-8A Class C |
3-month Term SOFR + 2.162%
Floor 1.900%
01/18/2034 | 7.472% | | 1,350,000 | 1,329,876 |
| OHA Credit Partners VII Ltd.(a),(b) |
| Series 2012-7A Class CR3 |
3-month Term SOFR + 2.062%
Floor 1.800%
02/19/2034 | 7.441% | | 5,000,000 | 4,883,885 |
| OneMain Direct Auto Receivables Trust(a) |
| Series 2019-1A Class A |
| 09/14/2027 | 3.630% | | 6,900,000 | 6,662,415 |
| Subordinated Series 2019-1A Class B |
| 11/14/2028 | 3.950% | | 1,500,000 | 1,417,669 |
| Subordinated Series 2019-1A Class D |
| 04/14/2031 | 4.680% | | 2,900,000 | 2,710,718 |
| Subordinated Series 2021-1A Class C |
| 07/14/2028 | 1.420% | | 7,367,000 | 6,630,202 |
| Subordinated Series 2021-1A Class D |
| 11/14/2030 | 1.620% | | 900,000 | 765,333 |
| Subordinated Series 2023-1A Class C |
| 02/14/2031 | 6.140% | | 3,100,000 | 2,997,537 |
| OneMain Financial Issuance Trust(a) |
| Series 2020-2A Class A |
| 09/14/2035 | 1.750% | | 2,700,000 | 2,433,490 |
| Series 2022-S1 Class A |
| 05/14/2035 | 4.130% | | 7,275,000 | 7,002,177 |
| Subordinated Series 2022-2 Class D |
| 10/14/2034 | 6.550% | | 6,280,000 | 6,054,169 |
| Subordinated Series 2023-2A Class C |
| 09/15/2036 | 6.740% | | 1,500,000 | 1,507,178 |
| Subordinated Series 2023-2A Class D |
| 09/15/2036 | 7.520% | | 1,600,000 | 1,616,451 |
| Oscar US Funding XII LLC(a) |
| Series 2021-1A Class A4 |
| 04/10/2028 | 1.000% | | 2,050,000 | 1,919,045 |
| OZLM Funding IV Ltd.(a),(b) |
| Series 2013-4A |
3-month Term SOFR + 1.512%
Floor 1.250%
10/22/2030 | 6.857% | | 9,145,155 | 9,113,549 |
| Pagaya AI Debt Trust(a) |
| Series 2022-1 Class A |
| 10/15/2029 | 2.030% | | 992,420 | 970,717 |
The accompanying Notes to Financial Statements are an integral part of this statement.
| 18 | Multi-Manager Total Return Bond Strategies Fund | Annual Report 2023 |
Portfolio of Investments (continued)
August 31, 2023
| Asset-Backed Securities — Non-Agency (continued) |
| Issuer | Coupon
Rate | | Principal
Amount ($) | Value ($) |
| Palmer Square CLO Ltd.(a),(b) |
| Series 2014-1A Class A1R2 |
3-month Term SOFR + 1.392%
Floor 1.130%
01/17/2031 | 6.700% | | 6,362,495 | 6,352,372 |
| Series 2020-3A Class BR |
3-month Term SOFR + 2.212%
Floor 1.950%
11/15/2031 | 7.576% | | 2,000,000 | 1,965,374 |
| Park Avenue Institutional Advisers CLO Ltd.(a),(b) |
| Series 2016-1R Class A1R |
3-month Term SOFR + 1.462%
Floor 1.200%
08/23/2031 | 6.839% | | 8,480,000 | 8,459,580 |
| Series 2017-1A Class A1R |
3-month Term SOFR + 1.502%
Floor 1.240%
02/14/2034 | 6.871% | | 5,000,000 | 4,963,805 |
| Series 2019-2A Class A1 |
3-month Term SOFR + 1.442%
Floor 1.180%
10/15/2034 | 6.750% | | 15,000,000 | 14,845,695 |
| Planet Fitness Master Issuer LLC(a) |
| Series 2018-1A Class A2II |
| 09/05/2048 | 4.666% | | 3,838,575 | 3,687,719 |
| Prestige Auto Receivables Trust(a) |
| Subordinated Series 2021-1A Class C |
| 02/15/2028 | 1.530% | | 2,525,000 | 2,365,237 |
| Subordinated Series 2023-1A Class C |
| 02/15/2028 | 5.650% | | 2,460,000 | 2,417,947 |
| Primose Funding LLC(a) |
| Series 2019-1A Class A2 |
| 07/30/2049 | 4.475% | | 1,451,250 | 1,352,759 |
| Regional Management Issuance Trust(a) |
| Series 2022-1 Class A |
| 03/15/2032 | 3.070% | | 2,800,000 | 2,612,231 |
| Rockford Tower CLO Ltd.(a),(b) |
| Series 2021-1A Class B |
3-month Term SOFR + 1.912%
Floor 1.650%
07/20/2034 | 7.238% | | 7,900,000 | 7,727,551 |
| Series 2021-3A Class B |
3-month Term SOFR + 2.012%
Floor 1.750%
10/20/2034 | 7.338% | | 10,000,000 | 9,758,530 |
| Santander Bank Auto Credit-Linked Notes(a) |
| Subordinated Series 2022-A Class C |
| 05/15/2032 | 7.375% | | 763,695 | 748,397 |
| Santander Consumer Auto Receivables Trust(a) |
| Series 2020-AA Class C |
| 02/17/2026 | 3.710% | | 454,029 | 452,603 |
| Asset-Backed Securities — Non-Agency (continued) |
| Issuer | Coupon
Rate | | Principal
Amount ($) | Value ($) |
| Santander Drive Auto Receivables Trust |
| Series 2020-2 Class D |
| 09/15/2026 | 2.220% | | 440,780 | 434,306 |
| Series 2023-2 Class A3 |
| 07/15/2027 | 5.210% | | 1,855,000 | 1,844,365 |
| Subordinated Series 2020-3 Class D |
| 11/16/2026 | 1.640% | | 2,444,649 | 2,390,735 |
| Subordinated Series 2020-4 Class C |
| 01/15/2026 | 1.010% | | 21,833 | 21,802 |
| Subordinated Series 2020-4 Class D |
| 01/15/2027 | 1.480% | | 1,800,000 | 1,750,002 |
| Subordinated Series 2022-3 Class B |
| 08/16/2027 | 4.130% | | 3,710,000 | 3,617,346 |
| Subordinated Series 2022-4 Class B |
| 11/15/2027 | 4.420% | | 3,505,000 | 3,434,662 |
| Subordinated Series 2022-5 Class B |
| 03/15/2027 | 4.430% | | 1,880,000 | 1,847,163 |
| Subordinated Series 2023-1 Class C |
| 05/15/2030 | 5.090% | | 810,000 | 791,498 |
| Subordinated Series 2023-3 Class C |
| 11/15/2030 | 5.770% | | 1,160,000 | 1,156,976 |
| Subordinated Series 2023-4 Class B |
| 12/15/2028 | 5.770% | | 2,410,000 | 2,419,631 |
| SCF Equipment Leasing LLC(a) |
| Series 2022-1A Class A3 |
| 07/20/2029 | 2.920% | | 2,440,000 | 2,355,420 |
| SFS Auto Receivables Securitization Trust(a) |
| Series 2023-1A Class A3 |
| 10/20/2028 | 5.470% | | 2,915,000 | 2,900,784 |
| Shackleton VR CLO Ltd.(a),(b) |
| Series 2014-5RA Class A |
3-month Term SOFR + 1.362%
Floor 1.100%
05/07/2031 | 6.732% | | 10,928,041 | 10,852,670 |
| Sixth Street CLO XVI Ltd.(a),(b) |
| Series 2020-16A Class A1A |
3-month Term SOFR + 1.582%
Floor 1.320%
10/20/2032 | 6.908% | | 25,250,000 | 25,252,803 |
| SLM Student Loan Trust(b) |
| Series 2008-2 Class B |
90-day Average SOFR + 1.462%
Floor 1.200%
01/25/2083 | 6.455% | | 1,165,000 | 1,105,937 |
| Series 2008-3 Class B |
90-day Average SOFR + 1.462%
Floor 1.200%
04/26/2083 | 6.455% | | 1,165,000 | 1,017,895 |
The accompanying Notes to Financial Statements are an integral part of this statement.
Multi-Manager Total Return Bond Strategies Fund | Annual Report 2023
| 19 |
Portfolio of Investments (continued)
August 31, 2023
| Asset-Backed Securities — Non-Agency (continued) |
| Issuer | Coupon
Rate | | Principal
Amount ($) | Value ($) |
| Series 2008-4 Class B |
90-day Average SOFR + 2.112%
Floor 1.850%
04/25/2073 | 7.105% | | 1,165,000 | 1,121,994 |
| Series 2008-5 Class B |
90-day Average SOFR + 2.112%
Floor 1.850%
07/25/2073 | 7.105% | | 4,060,000 | 3,925,794 |
| Series 2008-6 Class A4 |
90-day Average SOFR + 1.362%
Floor 1.100%
07/25/2024 | 6.416% | | 3,296,407 | 3,260,067 |
| Series 2008-6 Class B |
90-day Average SOFR + 2.112%
Floor 1.850%
07/26/2083 | 7.105% | | 1,165,000 | 1,097,673 |
| Series 2008-7 Class B |
90-day Average SOFR + 2.112%
Floor 1.850%
07/26/2083 | 7.105% | | 1,165,000 | 1,069,966 |
| Series 2012-2 Class A |
30-day Average SOFR + 0.814%
Floor 0.700%
01/25/2029 | 6.102% | | 4,136,126 | 3,973,307 |
| Series 2012-7 Class A3 |
30-day Average SOFR + 0.764%
Floor 0.650%
05/26/2026 | 6.052% | | 2,029,987 | 1,948,840 |
| SMB Private Education Loan Trust(a) |
| Series 2020-PTA Class A2A |
| 09/15/2054 | 1.600% | | 2,196,027 | 1,956,655 |
| SoFi Professional Loan Program LLC(a) |
| Series 2017-D Class A2FX |
| 09/25/2040 | 2.650% | | 203,046 | 194,255 |
| Series 2018-A Class A2B |
| 02/25/2042 | 2.950% | | 59,089 | 57,171 |
| Series 2019-A Class BFX |
| 06/15/2048 | 4.110% | | 2,500,000 | 2,214,618 |
| Subordinated Series 2018-B Class BFX |
| 08/25/2047 | 3.830% | | 2,700,000 | 2,432,852 |
| Subordinated Series 2019-B Class BFX |
| 08/17/2048 | 3.730% | | 2,500,000 | 2,216,139 |
| SoFi Professional Loan Program Trust(a) |
| Subordinated Series 2020-B Class BFX |
| 05/15/2046 | 2.730% | | 2,200,000 | 1,639,168 |
| Sonic Capital LLC(a) |
| Series 2020-1A Class A2I |
| 01/20/2050 | 3.845% | | 1,843,000 | 1,666,294 |
| Asset-Backed Securities — Non-Agency (continued) |
| Issuer | Coupon
Rate | | Principal
Amount ($) | Value ($) |
| Sound Point CLO II Ltd.(a),(b) |
| Series 2013-1A Class A1R |
3-month Term SOFR + 1.332%
Floor 1.070%
01/26/2031 | 6.682% | | 5,876,907 | 5,842,080 |
| Sunnova Helios XI Issuer LLC(a) |
| Series 2023-A Class A |
| 05/20/2050 | 5.300% | | 4,666,370 | 4,480,097 |
| Sunnova Sol II Issuer LLC(a) |
| Series 2020-2A Class A |
| 11/01/2055 | 2.730% | | 2,775,145 | 2,136,703 |
| Sunnova Sol III Issuer LLC(a) |
| Series 2021-1 Class A |
| 04/28/2056 | 2.580% | | 2,358,986 | 1,838,545 |
| Sunrun Athena Issuer LLC(a) |
| Series 2018-1 Class A |
| 04/30/2049 | 5.310% | | 1,774,338 | 1,648,945 |
| Sunrun Callisto Issuer LLC(a) |
| Series 2019-1A Class A |
| 06/30/2054 | 3.980% | | 1,352,583 | 1,194,632 |
| Sunrun Iris Issuer LLC(a) |
| Series 2023-1A Class A |
| 01/30/2059 | 5.750% | | 1,742,197 | 1,687,637 |
| Symphony CLO XVIII Ltd.(a),(b) |
| Series 2016-18A Class A1RR |
3-month Term SOFR + 1.362%
Floor 1.100%
07/23/2033 | 6.707% | | 6,250,000 | 6,215,706 |
| Taco Bell Funding LLC(a) |
| Series 2021-1A Class A2I |
| 08/25/2051 | 1.946% | | 2,456,250 | 2,128,893 |
| TCI-Flatiron CLO Ltd.(a),(b) |
| Series 2018-1A Class CR |
3-month Term SOFR + 2.012%
Floor 1.750%
01/29/2032 | 7.381% | | 2,300,000 | 2,241,297 |
| TCW CLO Ltd.(a),(b) |
| Series 2017-1A Class A1RR |
3-month Term SOFR + 1.442%
Floor 1.180%
10/29/2034 | 6.811% | | 21,750,000 | 21,544,462 |
| Series 2017-1A Class BRR |
3-month Term SOFR + 1.962%
Floor 1.700%
10/29/2034 | 7.331% | | 6,500,000 | 6,351,475 |
| Series 2021-1A Class C |
3-month Term SOFR + 2.162%
Floor 1.900%
03/18/2034 | 7.488% | | 3,150,000 | 3,043,725 |
The accompanying Notes to Financial Statements are an integral part of this statement.
| 20 | Multi-Manager Total Return Bond Strategies Fund | Annual Report 2023 |
Portfolio of Investments (continued)
August 31, 2023
| Asset-Backed Securities — Non-Agency (continued) |
| Issuer | Coupon
Rate | | Principal
Amount ($) | Value ($) |
| Telos CLO Ltd.(a),(b) |
| Series 2013-4A Class AR |
3-month Term SOFR + 1.502%
Floor 1.240%
01/17/2030 | 6.810% | | 8,562,730 | 8,517,648 |
| Texas Debt Capital CLO Ltd.(a),(b) |
| Series 2023-1A Class A |
3-month Term SOFR + 1.800%
Floor 1.800%
04/20/2036 | 6.622% | | 4,050,000 | 4,059,817 |
| Textainer Marine Containers VII Ltd.(a) |
| Series 2021-2A Class A |
| 04/20/2046 | 2.230% | | 3,578,672 | 3,069,759 |
| THL Credit Wind River CLO Ltd.(a),(b) |
| Series 2019-1A Class AR |
3-month Term SOFR + 1.422%
Floor 1.160%
07/20/2034 | 6.748% | | 10,000,000 | 9,883,540 |
| TIAA CLO I Ltd.(a),(b) |
| Series 2016-1A Class AR |
3-month Term SOFR + 1.462%
Floor 1.200%
07/20/2031 | 6.788% | | 6,750,000 | 6,723,574 |
| Tikehau US CLO IV Ltd.(a),(b) |
| Series 2023-1A Class A1 |
3-month Term SOFR + 2.200%
Floor 2.200%
07/15/2034 | 7.466% | | 28,000,000 | 28,407,064 |
| Toyota Auto Loan Extended Note Trust(a) |
| Series 2020-1A Class A |
| 05/25/2033 | 1.350% | | 1,405,000 | 1,309,056 |
| Trafigura Securitisation Finance PLC(a) |
| Subordinated Series 2021-1A Class B |
| 01/15/2025 | 1.780% | | 1,550,000 | 1,441,705 |
| Tralee CLO VI Ltd.(a),(b) |
| Series 2019-6A Class A1R |
3-month Term SOFR + 1.432%
Floor 1.170%
10/25/2032 | 6.783% | | 25,000,000 | 24,725,550 |
| Tralee CLO VII Ltd(a),(b) |
| Series 2021-7A Class A1 |
3-month Term SOFR + 1.582%
Floor 1.320%
04/25/2034 | 6.933% | | 9,250,000 | 9,141,349 |
| Trestles CLO V LTD.(a),(b) |
| Series 2021-5A Class B1 |
3-month Term SOFR + 1.912%
Floor 1.650%
10/20/2034 | 7.238% | | 6,800,000 | 6,666,421 |
| Asset-Backed Securities — Non-Agency (continued) |
| Issuer | Coupon
Rate | | Principal
Amount ($) | Value ($) |
| Trinitas CLO VII Ltd.(a),(b) |
| Series 2017-7A Class A1R |
3-month Term SOFR + 1.462%
Floor 1.200%
01/25/2035 | 6.813% | | 4,000,000 | 3,933,776 |
| Trinitas CLO XX Ltd.(a),(b) |
| Series 2022-20A Class A1 |
3-month Term SOFR + 1.530%
Floor 1.530%
07/20/2035 | 6.856% | | 13,250,000 | 13,137,229 |
| Triton Container Finance VIII LLC(a) |
| Series 2021-1A Class A |
| 03/20/2046 | 1.860% | | 2,542,667 | 2,137,333 |
| United Auto Credit Securitization Trust(a) |
| Series 2022-1 Class B |
| 03/10/2025 | 2.100% | | 44,788 | 44,755 |
| Subordinated Series 2022-2 Class C |
| 05/10/2027 | 5.810% | | 1,995,000 | 1,970,004 |
| Upstart Securitization Trust(a) |
| Series 2023-1 Class A |
| 02/20/2033 | 6.590% | | 1,285,374 | 1,281,171 |
| Venture CLO Ltd.(a),(b) |
| Series 2017-28AA Class A1R |
3-month Term SOFR + 1.472%
Floor 1.210%
10/20/2034 | 6.798% | | 12,500,000 | 12,365,687 |
| Venture XXVII CLO Ltd.(a),(b) |
| Series 2017-27A Class CR |
3-month Term SOFR + 2.562%
07/20/2030 | 7.888% | | 4,100,000 | 3,945,705 |
| Voya CLO Ltd.(a),(b) |
| Series 2013-1A Class A1AR |
3-month Term SOFR + 1.472%
Floor 1.210%
10/15/2030 | 6.780% | | 6,285,540 | 6,276,376 |
| Series 2016-1A Class A1R |
3-month Term SOFR + 1.332%
Floor 1.070%
01/20/2031 | 6.658% | | 9,243,411 | 9,219,045 |
| Wachovia Student Loan Trust(a),(b) |
| Series 2006-1 Class A6 |
90-day Average SOFR + 0.432%
Floor 0.170%
04/25/2040 | 5.486% | | 3,894,311 | 3,715,424 |
| Wellfleet CLO Ltd.(a),(b) |
| Series 2019-1A Class A1R |
3-month Term SOFR + 1.382%
Floor 1.120%
07/20/2032 | 6.708% | | 15,000,000 | 14,851,800 |
The accompanying Notes to Financial Statements are an integral part of this statement.
Multi-Manager Total Return Bond Strategies Fund | Annual Report 2023
| 21 |
Portfolio of Investments (continued)
August 31, 2023
| Asset-Backed Securities — Non-Agency (continued) |
| Issuer | Coupon
Rate | | Principal
Amount ($) | Value ($) |
| Wendy’s Funding LLC(a) |
| Series 2018-1A Class A2II |
| 03/15/2048 | 3.884% | | 945,000 | 858,007 |
| Series 2019-1A Class A2I |
| 06/15/2049 | 3.783% | | 3,122,250 | 2,889,326 |
| Series 2021-1A Class A2II |
| 06/15/2051 | 2.775% | | 5,012,700 | 3,968,449 |
| Westlake Automobile Receivables Trust(a) |
| Series 2021-2A Class C |
| 07/15/2026 | 0.890% | | 1,650,000 | 1,594,543 |
| Subordinated Series 2020-3A Class C |
| 11/17/2025 | 1.240% | | 89,021 | 88,348 |
| Subordinated Series 2021-2A Class B |
| 07/15/2026 | 0.620% | | 1,501,707 | 1,490,065 |
| Subordinated Series 2021-3 Class C |
| 01/15/2027 | 1.580% | | 6,225,000 | 5,939,333 |
| Subordinated Series 2023-1A Class C |
| 08/15/2028 | 5.740% | | 1,200,000 | 1,184,058 |
| Subordinated Series 2023-2A Class B |
| 03/15/2028 | 6.140% | | 3,550,000 | 3,562,138 |
| Subordinated Series 2023-3A Class C |
| 09/15/2028 | 6.020% | | 4,530,000 | 4,540,893 |
| Wheels Fleet Lease Funding 1 LLC(a) |
| Series 2023-1A Class A |
| 04/18/2038 | 5.800% | | 5,360,000 | 5,346,930 |
| Wind River CLO Ltd.(a),(b) |
| Series 2016-1A Class A1R2 |
3-month Term SOFR + 1.472%
Floor 1.210%
10/15/2034 | 6.780% | | 4,250,000 | 4,199,863 |
| World Omni Automobile Lease Securitization Trust |
| Series 2023-A Class A3 |
| 09/15/2026 | 5.070% | | 2,420,000 | 2,406,282 |
| World Omni Select Auto Trust |
| Subordinated Series 2021-A Class B |
| 08/16/2027 | 0.850% | | 2,170,000 | 2,040,726 |
| York CLO-4 Ltd.(a),(b) |
| Series 2016-2A Class A1R |
3-month Term SOFR + 1.352%
04/20/2032 | 6.678% | | 10,230,859 | 10,202,038 |
| Zais CLO 7 Ltd.(a),(b) |
| Series 2017-2A Class A |
3-month Term SOFR + 1.552%
04/15/2030 | 6.860% | | 2,508,537 | 2,496,907 |
| Zais CLO 9 Ltd.(a),(b) |
| Series 2018-2A Class A |
3-month Term SOFR + 1.462%
Floor 1.200%
07/20/2031 | 6.788% | | 12,433,077 | 12,316,766 |
| Asset-Backed Securities — Non-Agency (continued) |
| Issuer | Coupon
Rate | | Principal
Amount ($) | Value ($) |
| Zaxby’s Funding LLC(a) |
| Series 2021-1A Class A2 |
| 07/30/2051 | 3.238% | | 5,537,000 | 4,666,251 |
Total Asset-Backed Securities — Non-Agency
(Cost $1,342,541,336) | 1,313,618,530 |
|
| Commercial Mortgage-Backed Securities - Agency 0.8% |
| | | | |
| Federal Home Loan Mortgage Corp. Multifamily ML Certificates(c),(d) |
| Series 2021-ML08 Class XUS |
| 07/25/2037 | 1.869% | | 7,718,058 | 1,024,904 |
| Federal Home Loan Mortgage Corp. Multifamily Structured Pass-Through Certificates(c),(d) |
| CMO Series K055 Class X1 |
| 03/25/2026 | 1.474% | | 1,968,209 | 54,938 |
| CMO Series K057 Class X1 |
| 07/25/2026 | 1.298% | | 2,321,001 | 61,190 |
| CMO Series K059 Class X1 |
| 09/25/2026 | 0.422% | | 6,933,310 | 50,996 |
| CMO Series K060 Class X1 |
| 10/25/2026 | 0.187% | | 25,232,340 | 56,013 |
| CMO Series K152 Class X1 |
| 01/25/2031 | 1.100% | | 3,993,811 | 201,366 |
| Series 20K129 Class X1 (FHLMC) |
| 05/25/2031 | 1.142% | | 12,580,346 | 732,687 |
| Series 20K141 Class X1 (FHLMC) |
| 02/25/2032 | 0.407% | | 7,248,696 | 157,998 |
| Series 20K142 Class X1 (FHLMC) |
| 12/25/2031 | 0.403% | | 17,575,120 | 372,926 |
| Series 20K143 Class X1 (FHLMC) |
| 04/25/2055 | 0.450% | | 7,941,757 | 198,015 |
| Series 20K144 Class X1 (FHLMC) |
| 04/25/2032 | 0.436% | | 10,390,832 | 254,641 |
| Series K069 Class X1 |
| 09/25/2027 | 0.473% | | 36,171,721 | 451,134 |
| Series K091 Class X1 |
| 03/25/2029 | 0.706% | | 39,175,301 | 1,047,978 |
| Series K095 Class X1 |
| 06/25/2029 | 1.084% | | 74,914,784 | 3,264,532 |
| Series K106 Class X1 |
| 01/25/2030 | 1.477% | | 99,426,170 | 6,786,850 |
| Series K131 Class X1 (FHLMC) |
| 07/25/2031 | 0.830% | | 12,793,677 | 578,946 |
| Series K137 Class X1 |
| 11/25/2031 | 0.298% | | 274,709,367 | 3,541,718 |
| Series K145 Class X1 |
| 06/25/2055 | 0.430% | | 4,658,140 | 110,670 |
The accompanying Notes to Financial Statements are an integral part of this statement.
| 22 | Multi-Manager Total Return Bond Strategies Fund | Annual Report 2023 |
Portfolio of Investments (continued)
August 31, 2023
| Commercial Mortgage-Backed Securities - Agency (continued) |
| Issuer | Coupon
Rate | | Principal
Amount ($) | Value ($) |
| Series K146 Class X1 |
| 06/25/2032 | 0.352% | | 15,764,888 | 293,867 |
| Series K147 Class X1 |
| 06/25/2032 | 0.488% | | 12,184,133 | 335,045 |
| Series K149 Class X1 (FHLMC) |
| 08/25/2032 | 0.403% | | 20,968,520 | 454,017 |
| Series K-150 Class X1 (FHLMC) |
| 09/25/2032 | 0.446% | | 26,969,347 | 680,455 |
| Series K-1516 Class X1 |
| 05/25/2035 | 1.629% | | 14,630,116 | 1,675,135 |
| Series K-1517 Class X1 |
| 07/25/2035 | 1.436% | | 19,939,843 | 2,086,553 |
| Series K1521 Class X1 |
| 08/25/2036 | 1.095% | | 23,367,527 | 1,827,787 |
| Series K728 Class X1 |
| 08/25/2024 | 0.506% | | 251,728,512 | 837,803 |
| Series K729 Class X1 |
| 10/25/2024 | 0.465% | | 157,498,851 | 405,780 |
| Series K735 Class X1 |
| 05/25/2026 | 1.094% | | 12,580,684 | 255,423 |
| Federal Home Loan Mortgage Corp. Multifamily Structured Pass-Through Certificates |
| Series K056 Class A2 |
| 05/25/2026 | 2.525% | | 6,137,000 | 5,752,546 |
| Series K074 Class A2 |
| 01/25/2028 | 3.600% | | 8,660,000 | 8,226,626 |
| Series K155 Class A3 |
| 04/25/2033 | 3.750% | | 6,935,000 | 6,360,306 |
| Federal Home Loan Mortgage Corp. Multifamily Structured Pass-Through Certificates(c) |
| Series K157 Class A3 |
| 08/25/2033 | 3.990% | | 6,145,000 | 5,700,327 |
| Series Q006 Class APT1 |
| 07/25/2026 | 2.673% | | 3,408,813 | 3,209,715 |
| Federal National Mortgage Association |
| 11/01/2031 | 3.400% | | 1,500,000 | 1,325,818 |
| 02/01/2033 | 3.400% | | 3,970,853 | 3,562,287 |
| 07/01/2033 | 3.670% | | 8,000,000 | 7,302,576 |
| 03/01/2035 | 2.510% | | 3,000,000 | 2,397,646 |
| 04/01/2040 | 2.455% | | 3,495,000 | 2,424,138 |
| Federal National Mortgage Association(c),(d) |
| Series 2020-M43 Class X1 |
| 08/25/2034 | 2.027% | | 34,166,740 | 3,126,376 |
| Government National Mortgage Association(c),(d) |
| CMO Series 2011-38 Class IO |
| 04/16/2053 | 0.530% | | 889,635 | 6,809 |
| CMO Series 2013-162 Class IO |
| 09/16/2046 | 0.057% | | 16,673,273 | 19,478 |
| CMO Series 2014-134 Class IA |
| 01/16/2055 | 0.147% | | 11,811,189 | 53,624 |
| Commercial Mortgage-Backed Securities - Agency (continued) |
| Issuer | Coupon
Rate | | Principal
Amount ($) | Value ($) |
| CMO Series 2015-101 Class IO |
| 03/16/2052 | 0.280% | | 2,905,409 | 30,944 |
| CMO Series 2015-114 |
| 03/15/2057 | 0.356% | | 1,279,748 | 18,836 |
| CMO Series 2015-120 Class IO |
| 03/16/2057 | 0.620% | | 6,647,872 | 119,993 |
| CMO Series 2015-125 Class IB |
| 01/16/2055 | 0.948% | | 7,150,972 | 180,227 |
| CMO Series 2015-125 Class IO |
| 07/16/2055 | 0.617% | | 17,908,999 | 254,892 |
| CMO Series 2015-146 Class IC |
| 07/16/2055 | 0.201% | | 5,465,372 | 33,409 |
| CMO Series 2015-171 Class IO |
| 11/16/2055 | 0.840% | | 4,685,142 | 132,638 |
| CMO Series 2015-174 Class IO |
| 11/16/2055 | 0.415% | | 5,714,308 | 110,471 |
| CMO Series 2015-21 Class IO |
| 07/16/2056 | 0.710% | | 3,001,277 | 74,677 |
| CMO Series 2015-29 Class EI |
| 09/16/2049 | 0.696% | | 4,975,171 | 79,350 |
| CMO Series 2015-41 Class IO |
| 09/16/2056 | 0.277% | | 1,171,535 | 12,220 |
| CMO Series 2015-6 Class IO |
| 02/16/2051 | 0.477% | | 2,023,449 | 21,626 |
| CMO Series 2015-70 Class IO |
| 12/16/2049 | 0.569% | | 5,638,772 | 99,515 |
| CMO Series 2016-39 Class IO |
| 01/16/2056 | 0.684% | | 3,552,112 | 95,385 |
| CMO Series 2022-17 Class IO |
| 06/16/2064 | 0.802% | | 6,302,839 | 380,597 |
| CMO Series 2022-4 Class IO |
| 03/16/2064 | 0.860% | | 15,508,060 | 1,001,358 |
| CMO Series 2022-43 Class IO |
| 09/16/2061 | 0.740% | | 12,904,547 | 721,322 |
| Series 2014-101 Class IO |
| 04/16/2056 | 0.595% | | 9,515,034 | 131,177 |
| Series 2016-152 Class IO |
| 08/15/2058 | 0.730% | | 11,554,135 | 402,570 |
| Series 2017-168 Class IO |
| 12/16/2059 | 0.577% | | 16,741,512 | 564,624 |
| Series 2018-110 Class IA |
| 11/16/2059 | 0.642% | | 20,165,286 | 724,190 |
| Series 2018-2 Class IO |
| 12/16/2059 | 0.706% | | 7,223,718 | 302,459 |
| Series 2020-108 Class IO |
| 06/16/2062 | 0.847% | | 8,895,354 | 510,686 |
The accompanying Notes to Financial Statements are an integral part of this statement.
Multi-Manager Total Return Bond Strategies Fund | Annual Report 2023
| 23 |
Portfolio of Investments (continued)
August 31, 2023
| Commercial Mortgage-Backed Securities - Agency (continued) |
| Issuer | Coupon
Rate | | Principal
Amount ($) | Value ($) |
| Series 2021-106 Class IO |
| 04/16/2063 | 0.859% | | 9,511,927 | 623,373 |
| Series 2021-132 Class BI |
| 04/16/2063 | 0.923% | | 12,153,980 | 807,924 |
| Series 2021-133 Class IO |
| 07/16/2063 | 0.880% | | 11,975,086 | 794,842 |
| Series 2021-144 Class IO |
| 04/16/2063 | 0.825% | | 12,035,290 | 742,036 |
| Series 2021-145 Class IO |
| 07/16/2061 | 0.771% | | 2,533,924 | 137,849 |
| Series 2021-151 Class IO |
| 04/16/2063 | 0.917% | | 10,746,596 | 748,710 |
| Series 2021-163 Class IO |
| 03/16/2064 | 0.801% | | 11,224,372 | 683,175 |
| Series 2021-186 Class IO |
| 05/16/2063 | 0.765% | | 12,537,901 | 707,376 |
| Series 2021-52 Class IO |
| 04/16/2063 | 0.719% | | 10,477,352 | 574,689 |
| Series 2022-132 Class IO |
| 10/16/2064 | 0.539% | | 10,976,881 | 515,109 |
| Series 2022-166 Class IO |
| 04/16/2065 | 0.792% | | 12,919,018 | 752,833 |
| Series 2022-92 Class EI |
| 02/16/2064 | 0.809% | | 11,209,863 | 676,604 |
| Government National Mortgage Association(b) |
| CMO Series 2013-H08 Class FA |
1-month Term SOFR + 0.464%
Floor 0.350%, Cap 10.550%
03/20/2063 | 5.605% | | 98,992 | 98,335 |
Total Commercial Mortgage-Backed Securities - Agency
(Cost $121,777,710) | 91,133,660 |
|
| Commercial Mortgage-Backed Securities - Non-Agency 6.1% |
| | | | |
| Arbor Multifamily Mortgage Securities Trust(a) |
| Series 2021-MF2 Class A4 |
| 06/15/2054 | 2.252% | | 18,000,000 | 14,360,902 |
| Arbor Realty Commercial Real Estate Notes Ltd.(a),(b) |
| Series 2021-FL3 Class A |
1-month Term SOFR + 1.184%
Floor 1.070%
08/15/2034 | 6.495% | | 5,200,000 | 5,120,403 |
| Series 2021-FL4 Class A |
1-month Term SOFR + 1.464%
Floor 1.464%
11/15/2036 | 6.775% | | 5,000,000 | 4,955,452 |
| Series 2021-FL4 Class D |
1-month Term SOFR + 3.014%
Floor 2.900%
11/15/2036 | 8.325% | | 3,250,000 | 3,094,106 |
| Commercial Mortgage-Backed Securities - Non-Agency (continued) |
| Issuer | Coupon
Rate | | Principal
Amount ($) | Value ($) |
| Series 2022-FL1 Class A |
30-day Average SOFR + 1.450%
Floor 1.450%
01/15/2037 | 6.639% | | 5,100,000 | 5,054,545 |
| AREIT LLC(a),(b) |
| Series 2023-CRE8 Class A |
1-month Term SOFR + 2.112%
Floor 2.112%
02/17/2028 | 7.212% | | 3,000,000 | 2,990,001 |
| AREIT Trust(a),(b) |
| Series 2022-CRE6 Class A |
30-day Average SOFR + 1.250%
Floor 1.250%
01/16/2037 | 6.472% | | 1,304,581 | 1,286,232 |
| BAMLL Commercial Mortgage Securities Trust(a) |
| Series 2019-BPR Class AM |
| 11/05/2032 | 3.287% | | 6,325,000 | 5,836,910 |
| Banc of America Merrill Lynch Commercial Mortgage, Inc.(c),(d) |
| Series 2019-BN18 Class XA |
| 05/15/2062 | 1.033% | | 59,350,605 | 2,326,627 |
| BANK(c),(d) |
| Series 2017-BNK8 Class XA |
| 11/15/2050 | 0.848% | | 26,690,234 | 637,315 |
| BANK(c) |
| Series 2021-BN37 Class A5 |
| 11/15/2064 | 2.618% | | 5,605,000 | 4,544,278 |
| Series 2022-BNK40 Class A4 |
| 03/15/2064 | 3.507% | | 2,945,000 | 2,535,584 |
| BANK(a) |
| Subordinated Series 2017-BNK6 Class D |
| 07/15/2060 | 3.100% | | 2,380,000 | 1,618,624 |
| BBCMS Mortgage Trust(a) |
| Series 2016-ETC Class A |
| 08/14/2036 | 2.937% | | 13,500,000 | 11,991,432 |
| Subordinated Series 2016-ETC Class B |
| 08/14/2036 | 3.189% | | 900,000 | 765,490 |
| Subordinated Series 2016-ETC Class C |
| 08/14/2036 | 3.391% | | 770,000 | 617,463 |
| BBCMS Mortgage Trust(c),(d) |
| Series 2018-C2 Class XA |
| 12/15/2051 | 0.919% | | 60,593,594 | 1,866,349 |
| BBCMS Mortgage Trust(a),(b) |
| Series 2020-BID Class A |
1-month Term SOFR + 2.254%
Floor 2.140%
10/15/2037 | 7.565% | | 3,850,000 | 3,666,060 |
| BBCMS Mortgage Trust |
| Series 2021-C12 Class A5 |
| 11/15/2054 | 2.689% | | 5,580,000 | 4,565,728 |
The accompanying Notes to Financial Statements are an integral part of this statement.
| 24 | Multi-Manager Total Return Bond Strategies Fund | Annual Report 2023 |
Portfolio of Investments (continued)
August 31, 2023
| Commercial Mortgage-Backed Securities - Non-Agency (continued) |
| Issuer | Coupon
Rate | | Principal
Amount ($) | Value ($) |
| BBCMS Mortgage Trust(c) |
| Series 2023-C20 Class A5 |
| 07/15/2056 | 5.576% | | 2,100,000 | 2,125,837 |
| BBCMS Mortgage Trust(a),(c) |
| Subordinated Series 2016-ETC Class D |
| 08/14/2036 | 3.729% | | 2,790,000 | 2,134,177 |
| BB-UBS Trust(a) |
| Series 2012-TFT Class A |
| 06/05/2030 | 2.892% | | 2,228,986 | 1,966,782 |
| BDS Ltd.(a),(b) |
| Series 2021-FL8 Class B |
1-month Term SOFR + 1.464%
Floor 1.350%
01/18/2036 | 6.776% | | 1,000,000 | 985,155 |
| Benchmark Mortgage Trust(c),(d) |
| 03/15/2053 | 1.537% | | 25,286,740 | 1,350,330 |
| Series 2019-B10 Class XA |
| 03/15/2062 | 1.356% | | 28,296,676 | 1,350,479 |
| Series 2020-B20 Class XA |
| 10/15/2053 | 1.727% | | 14,449,810 | 1,006,555 |
| Benchmark Mortgage Trust |
| Series 2021-B26 Class A4 |
| 06/15/2054 | 2.295% | | 10,600,000 | 8,567,008 |
| Series 2021-B31 Class A5 |
| 12/15/2054 | 2.669% | | 4,440,000 | 3,625,063 |
| Benchmark Mortgage Trust(c) |
| Series 2023-V2 Class A3 |
| 05/15/2055 | 5.812% | | 17,305,000 | 17,303,499 |
| BIG Commercial Mortgage Trust(a),(b) |
| Subordinated Series 2022-BIG Class C |
1-month Term SOFR + 2.340%
Floor 2.340%
02/15/2039 | 7.651% | | 420,000 | 401,407 |
| BMD2 Re-Remic Trust(a),(e) |
| Series 2019-FRR1 Class 3AB |
| 05/25/2052 | 0.000% | | 2,821,000 | 1,868,759 |
| Subordinated Series 2019-FRR1 Class 2C |
| 05/25/2052 | 0.000% | | 14,258,000 | 12,139,465 |
| BOCA Commercial Mortgage Trust(a),(b) |
| Series 2022-BOCA Class A |
1-month Term SOFR + 1.770%
Floor 1.770%
05/15/2039 | 7.080% | | 1,000,000 | 993,030 |
| BPR Trust(a),(b) |
| Series 2021-NRD Class A |
1-month USD LIBOR + 1.525%
Floor 1.525%
12/15/2023 | 6.836% | | 3,045,000 | 2,941,535 |
| Commercial Mortgage-Backed Securities - Non-Agency (continued) |
| Issuer | Coupon
Rate | | Principal
Amount ($) | Value ($) |
| Series 2022-OANA Class A |
1-month Term SOFR + 1.898%
Floor 1.898%
04/15/2037 | 7.209% | | 2,300,000 | 2,258,444 |
| BX Commercial Mortgage Trust(a),(b) |
| Series 2020-VKNG Class A |
1-month Term SOFR + 1.044%
Floor 1.045%
10/15/2037 | 6.355% | | 5,757,641 | 5,697,904 |
| Series 2021-VOLT Class G |
1-month Term SOFR + 2.964%
Floor 2.850%
09/15/2036 | 8.275% | | 3,000,000 | 2,761,080 |
| Series 2022-CSMO Class A |
1-month Term SOFR + 2.115%
Floor 2.115%
06/15/2027 | 7.425% | | 5,918,000 | 5,921,701 |
| Series 2023-VLT2 Class A |
1-month Term SOFR + 2.281%
Floor 2.281%
06/15/2040 | 7.592% | | 5,500,000 | 5,498,339 |
| Subordinated Series 2019-XL Class E |
1-month Term SOFR + 1.914%
Floor 1.800%
10/15/2036 | 7.225% | | 1,700,000 | 1,682,798 |
| Subordinated Series 2021-21M Class E |
1-month Term SOFR + 2.285%
Floor 2.171%
10/15/2036 | 7.596% | | 2,048,782 | 1,946,600 |
| Subordinated Series 2021-IRON Class E |
1-month Term SOFR + 2.464%
Floor 2.350%
02/15/2038 | 7.775% | | 3,000,000 | 2,795,259 |
| Subordinated Series 2021-MFM1 Class D |
1-month Term SOFR + 1.614%
Floor 1.500%
01/15/2034 | 6.925% | | 452,123 | 440,902 |
| Subordinated Series 2021-SOAR Class F |
1-month Term SOFR + 2.464%
Floor 2.350%
06/15/2038 | 7.775% | | 16,548,817 | 15,928,848 |
| Subordinated Series 2022-CSMO Class B |
1-month Term SOFR + 3.141%
Floor 3.141%
06/15/2027 | 8.451% | | 3,490,000 | 3,482,372 |
| BX Commercial Mortgage Trust(a),(c) |
| Subordinated Series 2020-VIV3 Class B |
| 03/09/2044 | 3.662% | | 5,780,000 | 4,906,343 |
| BX Trust(a) |
| Series 2019-OC11 Class A |
| 12/09/2041 | 3.202% | | 1,115,000 | 957,628 |
The accompanying Notes to Financial Statements are an integral part of this statement.
Multi-Manager Total Return Bond Strategies Fund | Annual Report 2023
| 25 |
Portfolio of Investments (continued)
August 31, 2023
| Commercial Mortgage-Backed Securities - Non-Agency (continued) |
| Issuer | Coupon
Rate | | Principal
Amount ($) | Value ($) |
| BX Trust(a),(b) |
| Series 2021-ARIA Class A |
1-month Term SOFR + 1.014%
10/15/2036 | 6.324% | | 5,618,000 | 5,473,476 |
| Series 2021-LGCY Class D |
1-month Term SOFR + 0.114%
Floor 1.302%
10/15/2036 | 6.727% | | 590,000 | 567,605 |
| Series 2023-DELC Class A |
1-month Term SOFR + 2.690%
Floor 2.690%
05/15/2038 | 8.001% | | 2,000,000 | 2,000,624 |
| Subordinated Series 2022-LBA6 Class D |
1-month Term SOFR + 2.000%
Floor 2.000%
01/15/2039 | 7.311% | | 750,000 | 725,540 |
| Subordinated Series 2022-VAMF Class E |
1-month USD LIBOR + 2.700%
Floor 2.700%
01/15/2039 | 8.011% | | 5,000,000 | 4,765,773 |
| BXHPP Trust(a),(b) |
| Series 2021-FILM Class A |
1-month Term SOFR + 0.764%
Floor 0.650%
08/15/2036 | 6.075% | | 7,000,000 | 6,587,912 |
| CAMB Commercial Mortgage Trust(a) |
| Series 2021-CX2 Class A |
| 11/10/2046 | 2.700% | | 7,200,000 | 5,707,562 |
| Cantor Commercial Real Estate Lending(c),(d) |
| Series 2019-CF2 Class XA |
| 11/15/2052 | 1.324% | | 43,639,133 | 2,129,206 |
| Cantor Commercial Real Estate Lending |
| Series 2019-CF3 Class A3 |
| 01/15/2053 | 2.752% | | 16,100,000 | 13,637,217 |
| CD Mortgage Trust |
| Series 2016-CD1 Class A3 |
| 08/10/2049 | 2.459% | | 14,750,906 | 13,492,617 |
| Series 2017-CD6 Class A4 |
| 11/13/2050 | 3.190% | | 20,000,000 | 18,225,548 |
| CD Mortgage Trust(c),(d) |
| Series 2019-CD8 Class XA |
| 08/15/2057 | 1.542% | | 46,595,060 | 2,824,788 |
| CFCRE Commercial Mortgage Trust |
| Series 2016-C4 Class A4 |
| 05/10/2058 | 3.283% | | 5,900,000 | 5,496,160 |
| CFCRE Commercial Mortgage Trust(c),(d) |
| Series 2016-C4 Class XA |
| 05/10/2058 | 1.765% | | 53,200,492 | 1,641,389 |
| Commercial Mortgage-Backed Securities - Non-Agency (continued) |
| Issuer | Coupon
Rate | | Principal
Amount ($) | Value ($) |
| Citigroup Commercial Mortgage Trust |
| Series 2015-GC35 Class A3 |
| 11/10/2048 | 3.549% | | 10,000,000 | 9,361,315 |
| Series 2019-C7 Class A4 |
| 12/15/2072 | 3.102% | | 3,985,000 | 3,445,485 |
| Series 2019-GC43 Class A3 |
| 11/10/2052 | 2.782% | | 10,000,000 | 8,421,368 |
| Citigroup Commercial Mortgage Trust(a),(b) |
| Series 2021-PRM2 Class F |
1-month Term SOFR + 3.864%
Floor 3.750%
10/15/2036 | 9.175% | | 1,500,000 | 1,419,614 |
| Citigroup Commercial Mortgage Trust(a),(c) |
| Subordinated Series 2016-C2 Class E |
| 08/10/2049 | 4.539% | | 2,420,000 | 1,523,618 |
| Subordinated Series 2023-SMRT Class C |
| 06/10/2028 | 6.048% | | 1,000,000 | 957,498 |
| CityLine Commercial Mortgage Trust(a),(c) |
| Subordinated Series 2016-CLNE Class B |
| 11/10/2031 | 2.871% | | 3,600,000 | 3,255,798 |
| Subordinated Series 2016-CLNE Class C |
| 11/10/2031 | 2.871% | | 1,350,000 | 1,193,941 |
| COMM Mortgage Trust(a),(c) |
| Subordinated Series 2013-CR10 Class E |
| 08/10/2046 | 4.824% | | 969,901 | 826,834 |
| Subordinated Series 2020-CBM Class F |
| 02/10/2037 | 3.754% | | 2,513,000 | 2,232,402 |
| Commercial Mortgage Pass-Through Certificates(a) |
| Series 2012-LTRT Class A2 |
| 10/05/2030 | 3.400% | | 3,343,672 | 2,787,954 |
| Commercial Mortgage Pass-Through Certificates(c) |
| Subordinated Series 2019-BN24 Class C |
| 11/15/2062 | 3.635% | | 1,000,000 | 700,862 |
| Commercial Mortgage Trust |
| Series 2013-CR13 Class A3 |
| 11/12/2046 | 3.928% | | 298,754 | 298,205 |
| Series 2014-UBS2 Class A5 |
| 03/10/2047 | 3.961% | | 1,165,000 | 1,154,149 |
| Series 2014-UBS4 Class A5 |
| 08/10/2047 | 3.694% | | 5,000,000 | 4,848,239 |
| Series 2014-UBS6 Class A4 |
| 12/10/2047 | 3.378% | | 2,932,863 | 2,847,182 |
| Series 2015-DC1 Class A5 |
| 02/10/2048 | 3.350% | | 790,000 | 755,827 |
| Series 2015-LC19 Class A4 |
| 02/10/2048 | 3.183% | | 835,000 | 801,680 |
| Series 2015-PC1 Class A5 |
| 07/10/2050 | 3.902% | | 2,755,000 | 2,648,564 |
The accompanying Notes to Financial Statements are an integral part of this statement.
| 26 | Multi-Manager Total Return Bond Strategies Fund | Annual Report 2023 |
Portfolio of Investments (continued)
August 31, 2023
| Commercial Mortgage-Backed Securities - Non-Agency (continued) |
| Issuer | Coupon
Rate | | Principal
Amount ($) | Value ($) |
| Series 2016-COR1 Class A3 |
| 10/10/2049 | 2.826% | | 8,410,989 | 7,799,536 |
| Credit Suisse Mortgage Capital Certificates OA LLC(a) |
| Series 2014-USA Class A2 |
| 09/15/2037 | 3.953% | | 14,800,000 | 12,881,229 |
| CSAIL Commercial Mortgage Trust |
| Series 2019-C18 Class A4 |
| 12/15/2052 | 2.968% | | 3,345,000 | 2,857,241 |
| CSAIL Commercial Mortgage Trust(a) |
| Subordinated Series 2020-C19 Class E |
| 03/15/2053 | 2.500% | | 800,000 | 283,836 |
| CSWF Trust(a),(b) |
| Subordinated Series 2021-SOP2 Class E |
1-month Term SOFR + 3.581%
Floor 3.367%
06/15/2034 | 8.892% | | 16,000,000 | 12,591,758 |
| DBGS Mortgage Trust(a),(b) |
| Series 2018-BIOD Class E |
1-month Term SOFR + 2.064%
Floor 1.700%
05/15/2035 | 7.375% | | 2,741,288 | 2,682,316 |
| Series 2018-BIOD Class F |
1-month Term SOFR + 2.364%
Floor 2.000%
05/15/2035 | 7.675% | | 10,782,400 | 10,426,047 |
| DBJPM Mortgage Trust(c),(d) |
| Series 2020-C9 Class XA |
| 09/15/2053 | 1.824% | | 46,210,420 | 2,783,725 |
| DBUBS Mortgage Trust(a) |
| Series 2017-BRBK Class A |
| 10/10/2034 | 3.452% | | 2,800,000 | 2,564,409 |
| DBWF Mortgage Trust(a),(c) |
| Series 2016-85T Class D |
| 12/10/2036 | 3.935% | | 2,000,000 | 1,390,749 |
| Series 2016-85T Class E |
| 12/10/2036 | 3.935% | | 2,000,000 | 1,194,338 |
| DC Commercial Mortgage Trust(a) |
| Series 2023-DC Class A |
| 09/10/2040 | 6.314% | | 7,175,000 | 7,259,433 |
| Extended Stay America Trust(a),(b) |
| Series 2021-ESH Class A |
1-month Term SOFR + 1.194%
Floor 1.080%
07/15/2038 | 6.505% | | 1,908,617 | 1,890,224 |
| Series 2021-ESH Class E |
1-month Term SOFR + 2.964%
Floor 2.850%
07/15/2038 | 8.275% | | 2,862,926 | 2,812,870 |
| Commercial Mortgage-Backed Securities - Non-Agency (continued) |
| Issuer | Coupon
Rate | | Principal
Amount ($) | Value ($) |
| FirstKey Homes Trust(a) |
| Series 2020-SFR1 Class A |
| 08/17/2037 | 1.339% | | 6,152,886 | 5,628,878 |
| Subordinated Series 2020-SFR2 Class E |
| 10/19/2037 | 2.668% | | 3,432,000 | 3,136,927 |
| GAM Investments(a) |
| Subordinated Series 2021-F Class A |
| 09/27/2051 | 0.000% | | 2,186,000 | 1,874,217 |
| Subordinated Series 2021-F Class C |
| 09/27/2051 | 1.079% | | 1,778,000 | 1,505,939 |
| Subordinated Series 2021-F Class D |
| 09/27/2051 | 0.000% | | 1,777,000 | 1,433,268 |
| Subordinated Series 2021-F Class E |
| 09/27/2051 | 0.000% | | 1,798,000 | 1,561,409 |
| Subordinated Series 2021-F Class G |
| 09/27/2051 | 0.000% | | 1,797,000 | 1,549,079 |
| Subordinated Series 2021-F Class H |
| 09/27/2051 | 0.000% | | 1,510,000 | 909,953 |
| GAM Investments(a),(c) |
| Subordinated Series 2021-F Class F |
| 09/27/2051 | 2.420% | | 2,364,000 | 1,727,386 |
| GAM Re-REMIC Trust(a),(f) |
| Series 2021-FRR1 Class 1B |
| 07/28/2027 | 0.000% | | 2,690,000 | 1,895,893 |
| Series 2021-FRR1 Class 2B |
| 12/29/2027 | 0.000% | | 4,900,000 | 3,332,722 |
| GAM Resecuritization Trust(a),(c) |
| Series 2022-FRR3 Class BK71 |
| 01/29/2052 | 2.020% | | 3,736,000 | 2,848,438 |
| Series 2022-FRR3 Class CK71 |
| 01/29/2052 | 1.400% | | 1,245,000 | 870,782 |
| GAM Resecuritization Trust(a),(f) |
| Series 2022-FRR3 Class D728 |
| 01/29/2052 | 0.000% | | 1,446,000 | 1,274,828 |
| Subordinated Series 2022-FRR3 Class BK89 |
| 01/29/2052 | 0.000% | | 2,169,000 | 1,333,197 |
| GAM Resecuritization Trust(a),(e) |
| Subordinated Series 2022-FRR3 Class BK61 |
| 11/27/2049 | 0.000% | | 2,543,000 | 1,867,281 |
| Subordinated Series 2022-FRR3 Class C728 |
| 08/27/2050 | 0.000% | | 1,446,000 | 1,297,205 |
| Subordinated Series 2022-FRR3 Class CK47 |
| 05/27/2048 | 0.000% | | 1,474,000 | 1,244,991 |
| Subordinated Series 2022-FRR3 Class CK61 |
| 11/27/2049 | 0.000% | | 1,784,000 | 1,241,397 |
| Subordinated Series 2022-FRR3 Class DK41 |
| 10/27/2047 | 0.000% | | 1,165,000 | 1,040,555 |
The accompanying Notes to Financial Statements are an integral part of this statement.
Multi-Manager Total Return Bond Strategies Fund | Annual Report 2023
| 27 |
Portfolio of Investments (continued)
August 31, 2023
| Commercial Mortgage-Backed Securities - Non-Agency (continued) |
| Issuer | Coupon
Rate | | Principal
Amount ($) | Value ($) |
| Subordinated Series 2022-FRR3 Class DK47 |
| 05/27/2048 | 0.000% | | 1,473,000 | 1,223,745 |
| Great Wolf Trust(a),(b) |
| Subordinated Series 2019-WOLF Class D |
1-month Term SOFR + 2.047%
Floor 1.933%
12/15/2036 | 7.151% | | 5,335,000 | 5,274,252 |
| Greystone Commercial Capital Trust(a),(b) |
| Series 2021-3 Class A |
1-month Term SOFR + 2.344%
Floor 2.230%
08/01/2024 | 7.658% | | 8,500,000 | 8,401,676 |
| Greystone CRE Notes Ltd.(a),(b) |
| Series 2019-FL2 Class A |
1-month Term SOFR + 1.364%
Floor 1.180%
09/15/2037 | 6.675% | | 5,920,953 | 5,895,596 |
| GS Mortgage Securities Corp II(a),(c) |
| Series 2017-375H Class A |
| 09/10/2037 | 3.591% | | 5,000,000 | 4,429,770 |
| GS Mortgage Securities Corp. II(a) |
| Series 2012-BWTR Class A |
| 11/05/2034 | 2.954% | | 3,857,000 | 2,802,565 |
| GS Mortgage Securities Corp. Trust(a),(b) |
| Series 2021-ARDN Class A |
1-month Term SOFR + 1.364%
Floor 1.250%
11/15/2036 | 6.675% | | 2,000,000 | 1,943,475 |
| GS Mortgage Securities Trust(a),(c) |
| Series 2013-PEMB Class A |
| 03/05/2033 | 3.668% | | 1,625,000 | 1,423,163 |
| GS Mortgage Securities Trust |
| Series 2016-GS2 Class A3 |
| 05/10/2049 | 2.791% | | 4,386,124 | 4,071,030 |
| Series 2017-GS7 Class A3 |
| 08/10/2050 | 3.167% | | 10,000,000 | 9,163,269 |
| Series 2017-GS8 Class A3 |
| 11/10/2050 | 3.205% | | 20,000,000 | 18,137,686 |
| Series 2020-GC45 Class A5 |
| 02/13/2053 | 2.911% | | 1,810,000 | 1,556,698 |
| HGI CRE CLO Ltd.(a),(b) |
| Series 2022-FL3 Class A |
30-day Average SOFR + 1.700%
Floor 1.700%
04/20/2037 | 6.913% | | 1,000,000 | 991,086 |
| Hudson Yards Mortgage Trust(a) |
| Series 2019-30HY Class A |
| 07/10/2039 | 3.228% | | 2,160,000 | 1,863,974 |
| Commercial Mortgage-Backed Securities - Non-Agency (continued) |
| Issuer | Coupon
Rate | | Principal
Amount ($) | Value ($) |
| Hudsons Bay Simon JV Trust(a) |
| Series 2015-HB10 Class A10 |
| 08/05/2034 | 4.155% | | 1,820,000 | 1,556,214 |
| Series 2015-HB7 Class A7 |
| 08/05/2034 | 3.914% | | 2,520,000 | 2,203,473 |
| IMT Trust(a) |
| Series 2017-APTS Class AFX |
| 06/15/2034 | 3.478% | | 5,410,000 | 5,283,009 |
| INTOWN Mortgage Trust(a),(b) |
| Subordinated Series 2022-STAY Class D |
1-month Term SOFR + 4.134%
Floor 4.134%
08/15/2037 | 9.444% | | 2,500,000 | 2,493,728 |
| JPMBB Commercial Mortgage Securities Trust |
| Series 2014-C26 Class A3 |
| 01/15/2048 | 3.231% | | 259,329 | 252,845 |
| Series 2015-C30 Class A5 |
| 07/15/2048 | 3.822% | | 4,200,000 | 3,965,101 |
| JPMBB Commercial Mortgage Securities Trust(a),(c) |
| Subordinated Series 2013-C17 Class F |
| 01/15/2047 | 3.867% | | 1,080,000 | 654,397 |
| Subordinated Series 2014-C19 Class D |
| 04/15/2047 | 4.782% | | 874,000 | 797,280 |
| JPMCC_17-JP6 |
| Series 20 17-JP6 Class A5 |
| 07/15/2050 | 3.490% | | 4,872,000 | 4,395,690 |
| JPMDB Commercial Mortgage Securities Trust |
| Series 2016-C4 Class A2 |
| 12/15/2049 | 2.882% | | 7,133,334 | 6,519,024 |
| Series 2019-COR6 Class A3 |
| 11/13/2052 | 2.795% | | 7,500,000 | 6,422,617 |
| JPMorgan Chase Commercial Mortgage Securities Trust(a) |
| Series 2018-WPT Class AFX |
| 07/05/2033 | 4.248% | | 13,000,000 | 11,754,346 |
| Series 2019-OSB Class A |
| 06/05/2039 | 3.397% | | 2,110,000 | 1,815,552 |
| JPMorgan Chase Commercial Mortgage Securities Trust(a),(b) |
| Series 2021-HTL5 Class A |
1-month Term SOFR + 1.229%
Floor 1.115%
11/15/2038 | 6.540% | | 7,080,000 | 6,956,215 |
| Series 2022-ACB Class E |
30-day Average SOFR + 3.350%
Floor 3.350%
03/15/2039 | 8.539% | | 6,450,000 | 6,180,375 |
| Subordinated Series 2021-NYAH Class E |
1-month USD LIBOR + 1.840%
Floor 1.840%
06/15/2038 | 7.266% | | 600,000 | 518,658 |
The accompanying Notes to Financial Statements are an integral part of this statement.
| 28 | Multi-Manager Total Return Bond Strategies Fund | Annual Report 2023 |
Portfolio of Investments (continued)
August 31, 2023
| Commercial Mortgage-Backed Securities - Non-Agency (continued) |
| Issuer | Coupon
Rate | | Principal
Amount ($) | Value ($) |
| Subordinated Series 2021-NYAH Class H |
1-month USD LIBOR + 3.390%
Floor 3.390%
06/15/2038 | 8.727% | | 3,500,000 | 2,892,902 |
| Ladder Capital Commercial Mortgage(a) |
| Series 2017-LC26 Class A4 |
| 07/12/2050 | 3.551% | | 4,500,000 | 4,139,903 |
| LAQ Mortgage Trust(a),(b) |
| Series 2023-LAQ Class A |
1-month Term SOFR + 2.091%
Floor 2.091%
03/15/2036 | 7.402% | | 2,696,019 | 2,684,224 |
| Life Mortgage Trust(a),(b) |
| Series 2022-BMR2 Class A1 |
1-month Term SOFR + 1.295%
Floor 1.295%
05/15/2039 | 6.606% | | 5,000,000 | 4,912,531 |
| Subordinated Series 2021-BMR Class F |
1-month Term SOFR + 2.464%
Floor 2.350%
03/15/2038 | 7.775% | | 1,867,643 | 1,778,507 |
| LSTAR Commercial Mortgage Trust(a) |
| Series 2017-5 Class A4 |
| 03/10/2050 | 3.390% | | 800,000 | 773,154 |
| LSTAR Commercial Mortgage Trust(a),(c) |
| Subordinated Series 2016-4 Class F |
| 03/10/2049 | 4.760% | | 8,000,000 | 5,444,994 |
| Med Trust(a),(b) |
| Series 2021-MDLN Class A |
1-month Term SOFR + 1.064%
Floor 0.950%
11/15/2038 | 6.375% | | 5,254,781 | 5,122,913 |
| MHP MHIL(a),(b) |
| Subordinated Series 2022 Class E |
30-day Average SOFR + 2.611%
Floor 2.611%
01/15/2027 | 7.921% | | 2,914,976 | 2,769,320 |
| MKT Mortgage Trust(a) |
| Series 2020-525M Class A |
| 02/12/2040 | 2.694% | | 1,575,000 | 1,112,091 |
| Morgan Stanley Bank of America Merrill Lynch Trust |
| Series 2013-C12 Class A4 |
| 10/15/2046 | 4.259% | | 447,065 | 445,811 |
| Series 2015-C21 Class A3 |
| 03/15/2048 | 3.077% | | 441,584 | 429,350 |
| Series 2016-C29 Class ASB |
| 05/15/2049 | 3.140% | | 519,267 | 499,365 |
| Morgan Stanley Capital I Trust |
| Series 2016-UB11 Class A3 |
| 08/15/2049 | 2.531% | | 8,300,158 | 7,500,357 |
| Commercial Mortgage-Backed Securities - Non-Agency (continued) |
| Issuer | Coupon
Rate | | Principal
Amount ($) | Value ($) |
| Morgan Stanley Capital I Trust(c),(d) |
| Series 2021-L5 Class XA |
| 05/15/2054 | 1.416% | | 13,548,955 | 860,794 |
| PFP Ltd.(a),(b) |
| Series 2023-10 Class A |
1-month Term SOFR + 2.365%
Floor 2.365%
09/16/2038 | 7.814% | | 3,200,000 | 3,201,892 |
| Progress Residential Trust(a) |
| Subordinated Series 2021-SFR1 Class G |
| 04/17/2038 | 3.861% | | 3,830,000 | 3,395,562 |
| RBS Commercial Funding, Inc., Trust(a),(c) |
| Series 2013-GSP Class A |
| 01/15/2032 | 3.961% | | 1,180,000 | 1,147,349 |
| RFM Re-REMIC Trust(a),(f) |
| Series 2022-FRR1 Class AB55 |
| 03/28/2049 | 0.000% | | 1,150,000 | 917,554 |
| Series 2022-FRR1 Class CK55 |
| 03/28/2049 | 0.000% | | 360,000 | 274,764 |
| Series 2022-FRR1 Class CK60 |
| 11/08/2049 | 0.000% | | 450,000 | 325,015 |
| RFM Re-REMIC Trust(a),(c) |
| Series 2022-FRR1 Class AB60 |
| 11/08/2049 | 2.470% | | 970,000 | 795,415 |
| Series 2022-FRR1 Class AB64 |
| 03/01/2050 | 2.314% | | 1,460,000 | 1,179,216 |
| SCOTT Trust(a) |
| Series 2023-SFS Class A |
| 03/15/2040 | 5.910% | | 3,340,000 | 3,279,232 |
| SG Commercial Mortgage Securities Trust |
| Series 2016-C5 Class A4 |
| 10/10/2048 | 3.055% | | 5,120,000 | 4,667,415 |
| SPGN TFLM Mortgage Trust(a),(b) |
| Series 2022 Class A |
1-month Term SOFR + 1.550%
Floor 1.550%
02/15/2039 | 6.861% | | 5,670,000 | 5,378,703 |
| SREIT Trust(a),(b) |
| Subordinated Series 2021-PALM Class E |
1-month Term SOFR + 2.024%
Floor 1.910%
10/15/2034 | 7.247% | | 6,275,000 | 5,897,087 |
| Starwood Retail Property Trust(a),(b) |
| Series 2014-STAR Class A |
Prime Rate + -0.882%
Floor 1.220%
11/15/2027 | 7.618% | | 2,248,546 | 1,607,710 |
The accompanying Notes to Financial Statements are an integral part of this statement.
Multi-Manager Total Return Bond Strategies Fund | Annual Report 2023
| 29 |
Portfolio of Investments (continued)
August 31, 2023
| Commercial Mortgage-Backed Securities - Non-Agency (continued) |
| Issuer | Coupon
Rate | | Principal
Amount ($) | Value ($) |
| StorageMart Commercial Mortgage Trust(a),(b) |
| Subordinated Series 2022-MINI Class C |
1-month Term SOFR + 1.550%
Floor 1.550%
01/15/2039 | 6.861% | | 1,350,000 | 1,295,811 |
| UBS Commercial Mortgage Trust |
| Series 2018-C10 Class A3 |
| 05/15/2051 | 4.048% | | 5,500,000 | 5,123,665 |
| Wells Fargo Commercial Mortgage Trust |
| Series 2015-LC20 Class A4 |
| 04/15/2050 | 2.925% | | 1,965,000 | 1,887,029 |
| Series 2015-SG1 Class A4 |
| 09/15/2048 | 3.789% | | 9,036,083 | 8,632,991 |
| Series 2017-C39 Class A4 |
| 09/15/2050 | 3.157% | | 10,065,000 | 9,211,740 |
| Series 2018-C45 Class A3 |
| 06/15/2051 | 3.920% | | 17,326,158 | 15,948,972 |
| Series 2021-C61 Class A4 |
| 11/15/2054 | 2.658% | | 7,990,000 | 6,536,868 |
| Wells Fargo Commercial Mortgage Trust(c),(d) |
| Series 2021-C59 Class XA |
| 04/15/2054 | 1.658% | | 20,434,250 | 1,618,339 |
| Series 2021-C60 Class XA |
| 08/15/2054 | 1.654% | | 4,082,454 | 320,554 |
| Wells Fargo Commercial Mortgage Trust(c) |
| Series 2022-C62 Class A4 |
| 04/15/2055 | 4.000% | | 5,330,000 | 4,778,938 |
| WFRBS Commercial Mortgage Trust(a) |
| Subordinated Series 2014-C21 Class D |
| 08/15/2047 | 3.497% | | 700,000 | 530,578 |
| WF-RBS Commercial Mortgage Trust |
| Series 2014-C24 Class A3 |
| 11/15/2047 | 3.428% | | 509,995 | 494,955 |
| WF-RBS Commercial Mortgage Trust(a),(c) |
| Subordinated Series 2013-C14 Class D |
| 06/15/2046 | 3.958% | | 940,000 | 497,280 |
| WSTN Trust(a),(c) |
| Series 2023-MAUI Class A |
| 07/05/2037 | 6.518% | | 2,500,000 | 2,486,953 |
Total Commercial Mortgage-Backed Securities - Non-Agency
(Cost $757,624,819) | 692,363,120 |
| Common Stocks 0.0% |
| Issuer | Shares | Value ($) |
| Communication Services 0.0% |
| Media 0.0% |
| Intelsat Jackson Holdings SA(g),(h),(i) | 2,500,000 | 2 |
| Intelsat Jackson Holdings SA(g),(h),(i) | 832,000 | 1 |
| Intelsat Jackson Holdings SA(g),(h),(i) | 6,033,000 | 6 |
| Intelsat Jackson Series A, CVR(g),(h),(i) | 9,311 | 0 |
| Intelsat Jackson Series B, CVR(g),(h),(i) | 9,311 | 0 |
| Total | | 9 |
| Total Communication Services | 9 |
| Energy 0.0% |
| Oil, Gas & Consumable Fuels 0.0% |
| Prairie Provident Resources, Inc.(h),(i) | 1,728 | 143 |
| Total Energy | 143 |
| Financials 0.0% |
| Financial Services 0.0% |
| Intelsat Emergence SA(h) | 88,937 | 2,005,529 |
| Total Financials | 2,005,529 |
Total Common Stocks
(Cost $3,030,179) | 2,005,681 |
| Convertible Bonds 0.0% |
| Issuer | Coupon
Rate | | Principal
Amount ($) | Value ($) |
| Banking 0.0% |
| HSBC Holdings PLC(j),(k) |
| | 4.600% | | 1,292,000 | 1,000,680 |
| Lloyds Banking Group PLC(j),(k) |
| | 8.000% | | 3,207,000 | 2,910,150 |
| Total | 3,910,830 |
| Midstream 0.0% |
| Enbridge, Inc.(k) |
| 01/15/2083 | 7.375% | | 1,056,000 | 1,036,791 |
| Wireless 0.0% |
| Digicel Group 0.5 Ltd.(a),(l) |
| Subordinated |
| 12/30/2049 | 7.000% | | 18,727 | 1,779 |
Total Convertible Bonds
(Cost $5,253,803) | 4,949,400 |
|
The accompanying Notes to Financial Statements are an integral part of this statement.
| 30 | Multi-Manager Total Return Bond Strategies Fund | Annual Report 2023 |
Portfolio of Investments (continued)
August 31, 2023
| Corporate Bonds & Notes 29.5% |
| Issuer | Coupon
Rate | | Principal
Amount ($) | Value ($) |
| Aerospace & Defense 0.3% |
| BAE Systems PLC(a) |
| 04/15/2030 | 3.400% | | 690,000 | 615,560 |
| Boeing Co. (The) |
| 02/04/2024 | 1.433% | | 5,100,000 | 5,001,554 |
| 05/01/2025 | 4.875% | | 761,000 | 750,336 |
| 02/01/2028 | 3.250% | | 794,000 | 727,700 |
| 05/01/2030 | 5.150% | | 1,160,000 | 1,140,947 |
| 02/01/2031 | 3.625% | | 4,203,000 | 3,752,398 |
| 02/01/2035 | 3.250% | | 1,240,000 | 995,242 |
| 11/01/2048 | 3.850% | | 245,000 | 178,412 |
| 05/01/2050 | 5.805% | | 1,085,000 | 1,055,999 |
| 08/01/2059 | 3.950% | | 3,500,000 | 2,495,590 |
| 05/01/2060 | 5.930% | | 1,047,000 | 1,011,428 |
| Bombardier, Inc.(a) |
| 03/15/2025 | 7.500% | | 1,225,000 | 1,226,736 |
| 04/15/2027 | 7.875% | | 6,175,000 | 6,158,737 |
| 02/01/2029 | 7.500% | | 1,200,000 | 1,177,170 |
| Embraer Netherlands Finance BV(a) |
| 07/28/2030 | 7.000% | | 1,225,000 | 1,239,686 |
| HEICO Corp. |
| 08/01/2028 | 5.250% | | 1,749,000 | 1,734,533 |
| Lockheed Martin Corp. |
| 02/15/2034 | 4.750% | | 490,000 | 483,430 |
| 02/15/2055 | 5.200% | | 1,009,000 | 1,003,933 |
| 11/15/2063 | 5.900% | | 493,000 | 540,843 |
| Northrop Grumman Corp. |
| 03/15/2053 | 4.950% | | 74,000 | 69,335 |
| Raytheon Technologies Corp. |
| 02/27/2033 | 5.150% | | 680,000 | 671,558 |
| Textron, Inc. |
| 03/01/2024 | 4.300% | | 665,000 | 659,396 |
| 03/01/2025 | 3.875% | | 289,000 | 281,404 |
| United Technologies Corp. |
| 11/16/2038 | 4.450% | | 1,043,000 | 923,857 |
| 06/01/2042 | 4.500% | | 2,249,000 | 1,962,182 |
| Total | 35,857,966 |
| Airlines 0.3% |
| American Airlines Pass-Through Trust |
| Series 2015-2 Class AA |
| 09/22/2027 | 3.600% | | 102,265 | 95,198 |
| Series 2016-1 Class AA |
| 07/15/2029 | 3.575% | | 522,843 | 484,369 |
| Series 2016-2 Class AA |
| 06/15/2028 | 3.200% | | 528,326 | 478,214 |
| Series 2017-2 Class AA |
| 10/15/2029 | 3.350% | | 1,822,013 | 1,635,572 |
| Series 2019-1 Class AA |
| 08/15/2033 | 3.150% | | 375,096 | 325,868 |
| Corporate Bonds & Notes (continued) |
| Issuer | Coupon
Rate | | Principal
Amount ($) | Value ($) |
| Delta Air Lines Pass-Through Trust |
| 06/10/2028 | 2.000% | | 5,539,173 | 4,885,142 |
| 06/10/2028 | 2.500% | | 872,521 | 764,811 |
| Delta Air Lines, Inc./SkyMiles IP Ltd.(a) |
| 10/20/2028 | 4.750% | | 7,285,382 | 6,992,293 |
| Mileage Plus Holdings LLC/Intellectual Property Assets Ltd.(a) |
| 06/20/2027 | 6.500% | | 720,053 | 718,508 |
| Southwest Airlines Co. |
| 06/15/2027 | 5.125% | | 1,665,000 | 1,644,156 |
| U.S. Airways Pass-Through Trust |
| 10/01/2024 | 5.900% | | 747,042 | 744,756 |
| 06/03/2025 | 4.625% | | 1,922,154 | 1,842,924 |
| United Airlines Pass-Through Trust |
| Series 2016-2 Class A |
| 04/07/2030 | 3.100% | | 242,567 | 210,186 |
| Series 2023-1 Class A |
| 01/15/2036 | 5.800% | | 6,000,000 | 5,981,905 |
| United Airlines, Inc.(a) |
| 04/15/2029 | 4.625% | | 840,000 | 747,924 |
| United Airlines, Inc. Pass-Through Trust |
| 10/15/2027 | 5.875% | | 1,503,599 | 1,497,130 |
| Total | 29,048,956 |
| Apartment REIT 0.1% |
| American Homes 4 Rent LP |
| 07/15/2031 | 2.375% | | 393,000 | 310,972 |
| 04/15/2032 | 3.625% | | 907,000 | 776,067 |
| 07/15/2051 | 3.375% | | 1,735,000 | 1,113,303 |
| 04/15/2052 | 4.300% | | 1,360,000 | 1,048,446 |
| Invitation Homes Operating Partnership LP |
| 11/15/2028 | 2.300% | | 1,377,000 | 1,170,687 |
| 08/15/2030 | 5.450% | | 726,000 | 711,053 |
| 08/15/2031 | 2.000% | | 1,630,000 | 1,247,068 |
| 08/15/2033 | 5.500% | | 370,000 | 358,358 |
| 01/15/2034 | 2.700% | | 1,390,000 | 1,058,322 |
| Total | 7,794,276 |
| Automotive 0.9% |
| Adient Global Holdings Ltd.(a) |
| 08/15/2026 | 4.875% | | 2,700,000 | 2,598,817 |
| American Axle & Manufacturing, Inc. |
| 03/15/2026 | 6.250% | | 782,000 | 761,453 |
| 04/01/2027 | 6.500% | | 875,000 | 830,036 |
| American Honda Finance Corp. |
| 01/12/2028 | 4.700% | | 1,414,000 | 1,395,887 |
| 07/07/2028 | 5.125% | | 6,616,000 | 6,622,147 |
| 04/17/2030 | 4.600% | | 1,360,000 | 1,322,659 |
| Aptiv PLC |
| 12/01/2051 | 3.100% | | 1,905,000 | 1,159,724 |
The accompanying Notes to Financial Statements are an integral part of this statement.
Multi-Manager Total Return Bond Strategies Fund | Annual Report 2023
| 31 |
Portfolio of Investments (continued)
August 31, 2023
| Corporate Bonds & Notes (continued) |
| Issuer | Coupon
Rate | | Principal
Amount ($) | Value ($) |
| BMW US Capital LLC(a) |
| 08/11/2033 | 5.150% | | 7,391,000 | 7,322,206 |
| BorgWarner, Inc.(a) |
| 10/01/2025 | 5.000% | | 126,000 | 123,890 |
| Daimler Truck Finance North America LLC(a) |
| 09/20/2028 | 5.400% | | 2,315,000 | 2,307,367 |
| Dana, Inc. |
| 06/15/2028 | 5.625% | | 800,000 | 752,747 |
| Denso Corp.(a) |
| 09/16/2026 | 1.239% | | 4,070,000 | 3,599,056 |
| Ford Motor Co. |
| 08/19/2032 | 6.100% | | 1,335,000 | 1,273,497 |
| 01/15/2043 | 4.750% | | 2,600,000 | 1,944,247 |
| Ford Motor Credit Co. LLC |
| 01/09/2024 | 3.810% | | 2,585,000 | 2,559,693 |
| 03/06/2026 | 6.950% | | 1,425,000 | 1,428,194 |
| 05/12/2028 | 6.800% | | 450,000 | 449,693 |
| 05/03/2029 | 5.113% | | 1,405,000 | 1,292,107 |
| General Motors Co. |
| 10/01/2025 | 6.125% | | 529,000 | 531,531 |
| 04/01/2035 | 5.000% | | 5,365,000 | 4,791,780 |
| 04/01/2038 | 5.150% | | 1,550,000 | 1,350,647 |
| 10/02/2043 | 6.250% | | 723,000 | 679,634 |
| 04/01/2045 | 5.200% | | 1,500,000 | 1,231,839 |
| General Motors Financial Co., Inc. |
| 07/13/2025 | 4.300% | | 1,060,000 | 1,029,560 |
| 10/10/2025 | 6.050% | | 6,770,000 | 6,778,956 |
| 03/01/2026 | 5.250% | | 2,260,000 | 2,226,582 |
| 06/23/2028 | 5.800% | | 1,850,000 | 1,834,493 |
| 04/06/2030 | 5.850% | | 708,000 | 692,141 |
| 06/21/2030 | 3.600% | | 1,710,000 | 1,468,570 |
| Harley-Davidson Financial Services, Inc.(a) |
| 06/08/2025 | 3.350% | | 1,155,000 | 1,097,280 |
| 03/10/2028 | 6.500% | | 6,355,000 | 6,377,241 |
| Hyundai Capital America(a) |
| 06/26/2025 | 5.800% | | 5,620,000 | 5,623,302 |
| 06/26/2028 | 5.680% | | 1,106,000 | 1,099,619 |
| 09/15/2028 | 2.100% | | 1,460,000 | 1,227,865 |
| 06/26/2030 | 5.700% | | 2,780,000 | 2,737,176 |
| Hyundai Capital Services, Inc.(a) |
| 04/24/2025 | 2.125% | | 3,320,000 | 3,127,163 |
| Kia Corp.(a) |
| 04/16/2024 | 1.000% | | 1,405,000 | 1,363,678 |
| LKQ Corp.(a) |
| 06/15/2028 | 5.750% | | 3,405,000 | 3,378,046 |
| Mercedes-Benz Finance North America LLC(a) |
| 08/03/2028 | 5.100% | | 3,505,000 | 3,493,425 |
| PACCAR Financial Corp. |
| 08/10/2028 | 4.950% | | 2,890,000 | 2,902,727 |
| Corporate Bonds & Notes (continued) |
| Issuer | Coupon
Rate | | Principal
Amount ($) | Value ($) |
| Toyota Motor Credit Corp. |
| 01/13/2027 | 1.900% | | 400,000 | 361,832 |
| 09/20/2027 | 4.550% | | 1,642,000 | 1,616,936 |
| 05/17/2030 | 4.550% | | 7,560,000 | 7,363,319 |
| Volkswagen Group of America Finance LLC(a) |
| 05/13/2025 | 3.350% | | 1,685,000 | 1,621,736 |
| ZF North America Capital, Inc.(a) |
| 04/14/2030 | 7.125% | | 1,350,000 | 1,366,255 |
| Total | 105,116,753 |
| Banking 9.0% |
| ABN AMRO Bank NV(a),(k) |
| Subordinated |
| 03/13/2037 | 3.324% | | 1,441,000 | 1,112,085 |
| AIB Group PLC(a),(k) |
| 10/14/2026 | 7.583% | | 4,320,000 | 4,427,754 |
| Ally Financial, Inc. |
| 11/15/2027 | 7.100% | | 4,885,000 | 4,949,937 |
| Ally Financial, Inc.(k) |
| 06/13/2029 | 6.992% | | 195,000 | 194,670 |
| American Express Co.(k) |
| 05/01/2026 | 4.990% | | 525,000 | 517,569 |
| 07/27/2029 | 5.282% | | 10,190,000 | 10,078,549 |
| 05/01/2034 | 5.043% | | 3,415,000 | 3,281,524 |
| American Express Co. |
| 03/04/2027 | 2.550% | | 2,865,000 | 2,605,099 |
| ANZ New Zealand International Ltd.(a) |
| 02/18/2025 | 2.166% | | 3,390,000 | 3,220,543 |
| 08/14/2028 | 5.355% | | 4,940,000 | 4,923,871 |
| ASB Bank Ltd.(a),(k) |
| Subordinated |
| 06/17/2032 | 5.284% | | 3,715,000 | 3,578,346 |
| Banco Santander SA |
| 05/28/2025 | 2.746% | | 3,000,000 | 2,839,398 |
| Subordinated |
| 08/08/2033 | 6.921% | | 4,000,000 | 4,001,524 |
| Banco Santander SA(k) |
| Subordinated |
| 11/22/2032 | 3.225% | | 1,000,000 | 783,985 |
| Bank of America Corp.(j),(k) |
| | 4.375% | | 3,901,000 | 3,339,817 |
| Bank of America Corp.(k) |
| 03/11/2027 | 1.658% | | 1,775,000 | 1,603,279 |
| 07/22/2027 | 1.734% | | 13,410,000 | 12,000,358 |
| 04/27/2028 | 4.376% | | 1,208,000 | 1,158,431 |
| 03/05/2029 | 3.970% | | 2,159,000 | 2,014,253 |
| 06/14/2029 | 2.087% | | 11,335,000 | 9,663,931 |
| 02/07/2030 | 3.974% | | 3,850,000 | 3,543,463 |
| 07/23/2030 | 3.194% | | 33,500,000 | 29,413,015 |
| 02/13/2031 | 2.496% | | 8,712,000 | 7,240,261 |
The accompanying Notes to Financial Statements are an integral part of this statement.
| 32 | Multi-Manager Total Return Bond Strategies Fund | Annual Report 2023 |
Portfolio of Investments (continued)
August 31, 2023
| Corporate Bonds & Notes (continued) |
| Issuer | Coupon
Rate | | Principal
Amount ($) | Value ($) |
| 07/23/2031 | 1.898% | | 425,000 | 335,038 |
| 03/11/2032 | 2.651% | | 5,426,000 | 4,448,147 |
| 04/22/2032 | 2.687% | | 2,464,000 | 2,013,900 |
| 07/21/2032 | 2.299% | | 785,000 | 618,995 |
| 10/20/2032 | 2.572% | | 9,960,000 | 7,981,982 |
| 02/04/2033 | 2.972% | | 1,928,000 | 1,586,296 |
| 04/27/2033 | 4.571% | | 1,143,000 | 1,058,439 |
| 04/25/2034 | 5.288% | | 11,046,000 | 10,781,019 |
| 06/19/2041 | 2.676% | | 3,113,000 | 2,143,610 |
| Subordinated |
| 09/21/2036 | 2.482% | | 1,671,000 | 1,270,208 |
| 03/08/2037 | 3.846% | | 1,279,000 | 1,083,018 |
| Bank of America Corp. |
| Subordinated |
| 01/22/2025 | 4.000% | | 795,000 | 775,190 |
| 04/21/2025 | 3.950% | | 2,500,000 | 2,421,549 |
| 03/03/2026 | 4.450% | | 2,000,000 | 1,944,410 |
| Bank of America NA |
| 08/18/2026 | 5.526% | | 5,575,000 | 5,603,672 |
| Bank of Ireland Group PLC(a) |
| 11/25/2023 | 4.500% | | 3,780,000 | 3,760,782 |
| Bank of Ireland Group PLC(a),(k) |
| 09/16/2026 | 6.253% | | 3,560,000 | 3,556,974 |
| Bank of New York Mellon Corp. (The)(k) |
| 04/26/2027 | 4.947% | | 5,615,000 | 5,525,572 |
| Bank of New Zealand(a) |
| 02/21/2025 | 2.000% | | 3,915,000 | 3,703,337 |
| 01/27/2027 | 2.285% | | 2,140,000 | 1,935,395 |
| Bank of Nova Scotia (The)(k) |
| Subordinated |
| 05/04/2037 | 4.588% | | 3,588,000 | 3,092,693 |
| Banque Federative du Credit Mutuel SA(a) |
| 01/26/2026 | 4.935% | | 2,208,000 | 2,161,358 |
| 07/13/2028 | 5.790% | | 2,215,000 | 2,222,536 |
| Barclays PLC |
| 03/16/2025 | 3.650% | | 270,000 | 260,519 |
| Subordinated |
| 05/09/2028 | 4.836% | | 995,000 | 921,346 |
| Barclays PLC(k) |
| 05/07/2025 | 3.932% | | 4,045,000 | 3,985,303 |
| 06/24/2031 | 2.645% | | 3,175,000 | 2,528,027 |
| 03/10/2032 | 2.667% | | 12,020,000 | 9,401,902 |
| BNP Paribas SA(a),(k) |
| 06/09/2026 | 2.219% | | 1,570,000 | 1,463,189 |
| 01/13/2027 | 1.323% | | 580,000 | 521,778 |
| 09/30/2028 | 1.904% | | 3,535,000 | 3,029,706 |
| 06/12/2029 | 5.335% | | 7,450,000 | 7,338,921 |
| 04/19/2032 | 2.871% | | 3,775,000 | 3,068,712 |
| 01/20/2033 | 3.132% | | 7,920,000 | 6,453,854 |
| Corporate Bonds & Notes (continued) |
| Issuer | Coupon
Rate | | Principal
Amount ($) | Value ($) |
| BPCE SA(a) |
| 01/11/2028 | 3.250% | | 460,000 | 417,162 |
| Subordinated |
| 10/22/2023 | 5.700% | | 545,000 | 543,929 |
| 07/11/2024 | 4.625% | | 4,200,000 | 4,127,690 |
| 07/21/2024 | 5.150% | | 3,363,000 | 3,315,765 |
| Canadian Imperial Bank of Commerce |
| 04/28/2028 | 5.001% | | 4,280,000 | 4,192,195 |
| Capital One Financial Corp.(k) |
| 12/06/2024 | 1.343% | | 8,945,000 | 8,807,543 |
| 11/02/2027 | 1.878% | | 883,000 | 774,160 |
| 06/08/2029 | 6.312% | | 7,675,000 | 7,670,878 |
| 03/01/2030 | 3.273% | | 2,685,000 | 2,303,714 |
| 06/08/2034 | 6.377% | | 1,100,000 | 1,086,480 |
| Citigroup, Inc.(j),(k) |
| | 4.700% | | 10,225,000 | 9,199,752 |
| | 5.000% | | 1,100,000 | 1,052,556 |
| Citigroup, Inc.(k) |
| 04/08/2026 | 3.106% | | 4,210,000 | 4,029,028 |
| 06/09/2027 | 1.462% | | 3,220,000 | 2,867,260 |
| 02/24/2028 | 3.070% | | 1,445,000 | 1,326,911 |
| 11/05/2030 | 2.976% | | 14,780,000 | 12,707,787 |
| 01/29/2031 | 2.666% | | 5,550,000 | 4,646,279 |
| 06/03/2031 | 2.572% | | 5,105,000 | 4,216,040 |
| 05/01/2032 | 2.561% | | 8,810,000 | 7,087,166 |
| 01/25/2033 | 3.057% | | 9,150,000 | 7,536,890 |
| Subordinated |
| 05/25/2034 | 6.174% | | 4,690,000 | 4,679,491 |
| Citigroup, Inc. |
| 05/01/2026 | 3.400% | | 1,300,000 | 1,230,215 |
| Subordinated |
| 06/10/2025 | 4.400% | | 4,250,000 | 4,144,100 |
| 05/18/2046 | 4.750% | | 395,000 | 330,351 |
| Citizens Bank NA(k) |
| 08/09/2028 | 4.575% | | 829,000 | 772,648 |
| Citizens Financial Group, Inc. |
| 02/06/2030 | 2.500% | | 1,496,000 | 1,201,609 |
| Citizens Financial Group, Inc.(k) |
| Subordinated |
| 05/21/2037 | 5.641% | | 6,608,000 | 5,830,776 |
| Comerica Bank |
| 07/23/2024 | 2.500% | | 2,375,000 | 2,276,417 |
| Commonwealth Bank of Australia(a) |
| Subordinated |
| 09/12/2039 | 3.743% | | 435,000 | 323,063 |
| Cooperatieve Rabobank UA(a),(k) |
| 06/24/2026 | 1.339% | | 970,000 | 893,759 |
| 02/24/2027 | 1.106% | | 2,500,000 | 2,227,790 |
| 02/28/2029 | 5.564% | | 2,240,000 | 2,213,798 |
The accompanying Notes to Financial Statements are an integral part of this statement.
Multi-Manager Total Return Bond Strategies Fund | Annual Report 2023
| 33 |
Portfolio of Investments (continued)
August 31, 2023
| Corporate Bonds & Notes (continued) |
| Issuer | Coupon
Rate | | Principal
Amount ($) | Value ($) |
| Credit Suisse AG |
| 02/21/2025 | 3.700% | | 855,000 | 824,768 |
| 08/07/2026 | 1.250% | | 289,000 | 253,681 |
| 07/09/2027 | 5.000% | | 2,861,000 | 2,787,490 |
| Credit Suisse Group AG(a),(k) |
| 09/11/2025 | 2.593% | | 430,000 | 414,600 |
| 06/05/2026 | 2.193% | | 3,297,000 | 3,068,554 |
| 07/15/2026 | 6.373% | | 2,485,000 | 2,495,436 |
| 02/02/2027 | 1.305% | | 4,520,000 | 4,022,579 |
| 05/14/2032 | 3.091% | | 6,040,000 | 4,972,138 |
| 08/12/2033 | 6.537% | | 19,300,000 | 20,053,447 |
| 11/15/2033 | 9.016% | | 9,258,000 | 11,211,973 |
| Credit Suisse Group AG(a) |
| 01/09/2028 | 4.282% | | 1,005,000 | 939,884 |
| Danske Bank A/S(a) |
| 09/12/2023 | 3.875% | | 1,350,000 | 1,348,948 |
| Danske Bank A/S(a),(k) |
| 09/10/2025 | 0.976% | | 5,665,000 | 5,356,880 |
| Deutsche Bank AG(k) |
| 07/13/2027 | 7.146% | | 5,490,000 | 5,569,455 |
| 01/07/2028 | 2.552% | | 484,000 | 427,323 |
| Subordinated |
| 01/14/2032 | 3.729% | | 2,000,000 | 1,544,114 |
| 02/10/2034 | 7.079% | | 420,000 | 399,387 |
| Discover Bank |
| 03/13/2026 | 4.250% | | 789,000 | 749,807 |
| Discover Financial Services |
| 11/06/2024 | 3.950% | | 1,495,000 | 1,455,405 |
| DNB Bank ASA(a),(k) |
| 09/16/2026 | 1.127% | | 3,950,000 | 3,570,941 |
| Federation des Caisses Desjardins du Quebec(a) |
| 03/14/2028 | 5.700% | | 2,210,000 | 2,213,917 |
| Fifth Third Bancorp(k) |
| 07/27/2029 | 6.339% | | 13,142,000 | 13,296,601 |
| First Horizon Bank |
| Subordinated |
| 05/01/2030 | 5.750% | | 2,367,000 | 2,196,252 |
| Goldman Sachs Group Inc (The)(k) |
| 01/27/2032 | 1.992% | | 1,805,000 | 1,405,834 |
| Goldman Sachs Group Inc. (The)(k) |
| 08/10/2026 | 5.798% | | 11,345,000 | 11,306,436 |
| Goldman Sachs Group, Inc. (The)(j),(k) |
| | 3.650% | | 2,135,000 | 1,744,380 |
| Goldman Sachs Group, Inc. (The) |
| 12/06/2023 | 1.217% | | 7,505,000 | 7,415,240 |
| Subordinated |
| 05/22/2045 | 5.150% | | 2,100,000 | 1,931,568 |
| Corporate Bonds & Notes (continued) |
| Issuer | Coupon
Rate | | Principal
Amount ($) | Value ($) |
| Goldman Sachs Group, Inc. (The)(k) |
| 09/29/2025 | 3.272% | | 4,160,000 | 4,036,683 |
| 03/09/2027 | 1.431% | | 11,330,000 | 10,157,212 |
| 02/24/2028 | 2.640% | | 4,585,000 | 4,148,109 |
| 04/22/2032 | 2.615% | | 12,585,000 | 10,187,563 |
| 07/21/2032 | 2.383% | | 18,125,000 | 14,305,815 |
| HSBC Holdings PLC(k) |
| 11/07/2025 | 2.633% | | 1,148,000 | 1,100,766 |
| 03/10/2026 | 2.999% | | 929,000 | 886,606 |
| 06/04/2026 | 2.099% | | 1,983,000 | 1,848,192 |
| 05/24/2027 | 1.589% | | 3,379,000 | 3,004,071 |
| 08/14/2027 | 5.887% | | 10,480,000 | 10,448,063 |
| 09/22/2028 | 2.013% | | 11,579,000 | 9,942,920 |
| 08/17/2029 | 2.206% | | 8,265,000 | 6,922,529 |
| 05/24/2032 | 2.804% | | 1,055,000 | 842,450 |
| 03/09/2044 | 6.332% | | 2,935,000 | 2,956,614 |
| HSBC Holdings PLC(j),(k) |
| Junior Subordinated |
| | 6.000% | | 877,000 | 786,388 |
| Huntington Bancshares, Inc.(k) |
| 08/21/2029 | 6.208% | | 8,172,000 | 8,225,408 |
| Subordinated |
| 08/15/2036 | 2.487% | | 626,000 | 461,794 |
| Huntington National Bank (The) |
| 01/10/2030 | 5.650% | | 2,367,000 | 2,308,737 |
| Intesa Sanpaolo SpA(a),(k) |
| 06/20/2054 | 7.778% | | 4,518,000 | 4,439,948 |
| Subordinated |
| 06/01/2032 | 4.198% | | 1,100,000 | 839,134 |
| JPMorgan Chase & Co.(j),(k) |
| | 4.000% | | 4,500,000 | 4,131,926 |
| | 4.600% | | 7,625,000 | 7,161,619 |
| | 5.000% | | 1,290,000 | 1,262,984 |
| JPMorgan Chase & Co.(k) |
| 06/23/2025 | 0.969% | | 4,760,000 | 4,561,698 |
| 12/10/2025 | 1.561% | | 2,540,000 | 2,398,990 |
| 02/24/2026 | 2.595% | | 383,000 | 365,734 |
| 02/04/2027 | 1.040% | | 4,299,000 | 3,841,759 |
| 04/22/2027 | 1.578% | | 11,910,000 | 10,695,261 |
| 09/22/2027 | 1.470% | | 1,797,000 | 1,587,095 |
| 02/24/2028 | 2.947% | | 4,610,000 | 4,227,974 |
| 01/23/2029 | 3.509% | | 10,345,000 | 9,534,930 |
| 04/23/2029 | 4.005% | | 3,180,000 | 2,981,453 |
| 06/01/2029 | 2.069% | | 1,446,000 | 1,240,068 |
| 12/05/2029 | 4.452% | | 1,150,000 | 1,095,919 |
| 10/15/2030 | 2.739% | | 1,990,000 | 1,705,507 |
| 02/04/2032 | 1.953% | | 3,030,000 | 2,387,659 |
| 04/22/2032 | 2.580% | | 6,030,000 | 4,934,070 |
| 11/08/2032 | 2.545% | | 8,145,000 | 6,567,966 |
| 01/25/2033 | 2.963% | | 2,380,000 | 1,972,888 |
| 06/01/2034 | 5.350% | | 5,635,000 | 5,573,495 |
| 11/15/2048 | 3.964% | | 2,475,000 | 1,960,980 |
The accompanying Notes to Financial Statements are an integral part of this statement.
| 34 | Multi-Manager Total Return Bond Strategies Fund | Annual Report 2023 |
Portfolio of Investments (continued)
August 31, 2023
| Corporate Bonds & Notes (continued) |
| Issuer | Coupon
Rate | | Principal
Amount ($) | Value ($) |
| JPMorgan Chase & Co. |
| Subordinated |
| 09/10/2024 | 3.875% | | 5,440,000 | 5,329,524 |
| KeyBank NA |
| 11/15/2027 | 5.850% | | 3,050,000 | 2,945,022 |
| Subordinated |
| 08/08/2032 | 4.900% | | 563,000 | 465,226 |
| KeyCorp |
| 10/01/2029 | 2.550% | | 677,000 | 535,668 |
| KeyCorp(k) |
| 06/01/2033 | 4.789% | | 2,111,000 | 1,819,377 |
| Lloyds Banking Group PLC |
| 03/12/2024 | 3.900% | | 2,600,000 | 2,570,642 |
| Subordinated |
| 11/04/2024 | 4.500% | | 5,560,000 | 5,436,580 |
| Lloyds Banking Group PLC(k) |
| 05/11/2027 | 1.627% | | 1,175,000 | 1,049,216 |
| 08/07/2027 | 5.985% | | 6,010,000 | 6,003,685 |
| 03/06/2029 | 5.871% | | 1,134,000 | 1,125,794 |
| 08/11/2033 | 4.976% | | 3,245,000 | 2,999,234 |
| Macquarie Group Ltd.(a),(k) |
| 10/14/2025 | 1.201% | | 1,295,000 | 1,225,450 |
| 01/14/2033 | 2.871% | | 6,005,000 | 4,707,004 |
| 06/15/2034 | 5.887% | | 3,720,000 | 3,618,110 |
| Mizuho Financial Group, Inc.(k) |
| 07/06/2029 | 5.778% | | 4,740,000 | 4,745,577 |
| 07/06/2034 | 5.748% | | 2,635,000 | 2,609,844 |
| Morgan Stanley(k) |
| 01/22/2025 | 0.791% | | 1,115,000 | 1,090,415 |
| 05/30/2025 | 0.790% | | 14,562,000 | 13,962,555 |
| 07/22/2025 | 2.720% | | 720,000 | 698,721 |
| 10/21/2025 | 1.164% | | 4,545,000 | 4,286,322 |
| 04/28/2026 | 2.188% | | 828,000 | 780,670 |
| 05/04/2027 | 1.593% | | 4,188,000 | 3,754,452 |
| 07/20/2027 | 1.512% | | 962,000 | 853,985 |
| 01/21/2028 | 2.475% | | 998,000 | 900,239 |
| 07/22/2028 | 3.591% | | 7,821,000 | 7,232,563 |
| 10/18/2028 | 6.296% | | 447,000 | 457,996 |
| 01/24/2029 | 3.772% | | 4,315,000 | 4,000,650 |
| 04/20/2029 | 5.164% | | 1,478,000 | 1,449,776 |
| 07/20/2029 | 5.449% | | 2,410,000 | 2,395,626 |
| 01/23/2030 | 4.431% | | 2,885,000 | 2,737,820 |
| 02/13/2032 | 1.794% | | 1,825,000 | 1,402,920 |
| 04/28/2032 | 1.928% | | 5,704,000 | 4,397,183 |
| 07/21/2032 | 2.239% | | 9,590,000 | 7,523,911 |
| 10/20/2032 | 2.511% | | 1,560,000 | 1,242,993 |
| 01/21/2033 | 2.943% | | 3,610,000 | 2,960,380 |
| 10/18/2033 | 6.342% | | 1,684,000 | 1,764,308 |
| 04/21/2034 | 5.250% | | 9,790,000 | 9,502,930 |
| 07/21/2034 | 5.424% | | 3,752,000 | 3,687,318 |
| 04/22/2039 | 4.457% | | 299,000 | 263,362 |
| Corporate Bonds & Notes (continued) |
| Issuer | Coupon
Rate | | Principal
Amount ($) | Value ($) |
| Subordinated |
| 09/16/2036 | 2.484% | | 3,240,000 | 2,441,034 |
| 04/20/2037 | 5.297% | | 2,079,000 | 1,935,035 |
| 01/19/2038 | 5.948% | | 5,506,000 | 5,358,010 |
| Morgan Stanley |
| 01/27/2026 | 3.875% | | 6,556,000 | 6,309,101 |
| 07/27/2026 | 3.125% | | 990,000 | 926,699 |
| Subordinated |
| 09/08/2026 | 4.350% | | 9,045,000 | 8,710,052 |
| National Australia Bank Ltd. |
| 06/13/2028 | 4.900% | | 3,405,000 | 3,364,064 |
| National Bank of Canada(k) |
| 06/09/2025 | 3.750% | | 7,465,000 | 7,320,853 |
| Nationwide Building Society(a),(k) |
| 02/16/2028 | 2.972% | | 2,610,000 | 2,356,330 |
| NatWest Group PLC(k) |
| 09/13/2029 | 5.808% | | 1,267,000 | 1,256,210 |
| Nordea Bank Abp(a) |
| 09/30/2026 | 1.500% | | 2,540,000 | 2,240,283 |
| Northern Trust Corp.(k) |
| Subordinated |
| 05/08/2032 | 3.375% | | 1,817,000 | 1,620,962 |
| Northern Trust Corp. |
| Subordinated |
| 11/02/2032 | 6.125% | | 1,384,000 | 1,412,943 |
| PNC Financial Services Group, Inc. (The)(j),(k) |
| | 6.000% | | 706,000 | 628,823 |
| | 6.250% | | 3,775,000 | 3,337,437 |
| PNC Financial Services Group, Inc. (The)(k) |
| 06/12/2029 | 5.582% | | 11,935,000 | 11,834,641 |
| 10/28/2033 | 6.037% | | 3,770,000 | 3,830,933 |
| 01/24/2034 | 5.068% | | 1,415,000 | 1,341,362 |
| 08/18/2034 | 5.939% | | 1,293,000 | 1,308,194 |
| Royal Bank of Canada |
| 08/01/2028 | 5.200% | | 7,500,000 | 7,454,127 |
| Royal Bank of Scotland Group PLC(k) |
| 03/22/2025 | 4.269% | | 4,405,000 | 4,355,553 |
| Santander Holdings USA, Inc.(k) |
| 06/12/2029 | 6.565% | | 4,610,000 | 4,589,094 |
| Santander UK Group Holdings PLC(k) |
| 11/15/2024 | 4.796% | | 7,820,000 | 7,794,830 |
| 03/15/2025 | 1.089% | | 7,385,000 | 7,156,867 |
| 08/21/2026 | 1.532% | | 445,000 | 403,504 |
| 06/14/2027 | 1.673% | | 1,762,000 | 1,550,107 |
| Societe Generale SA(a) |
| 03/28/2024 | 3.875% | | 5,055,000 | 4,987,978 |
| 01/22/2025 | 2.625% | | 445,000 | 423,726 |
The accompanying Notes to Financial Statements are an integral part of this statement.
Multi-Manager Total Return Bond Strategies Fund | Annual Report 2023
| 35 |
Portfolio of Investments (continued)
August 31, 2023
| Corporate Bonds & Notes (continued) |
| Issuer | Coupon
Rate | | Principal
Amount ($) | Value ($) |
| Societe Generale SA(a),(k) |
| 01/19/2028 | 2.797% | | 4,285,000 | 3,842,110 |
| 06/09/2032 | 2.889% | | 480,000 | 376,737 |
| 01/21/2033 | 3.337% | | 2,590,000 | 2,083,837 |
| State Street Corp. |
| 08/03/2026 | 5.272% | | 5,665,000 | 5,666,688 |
| Sumitomo Mitsui Financial Group, Inc. |
| 07/13/2030 | 5.852% | | 7,900,000 | 7,983,096 |
| Sumitomo Mitsui Trust Bank Ltd.(a) |
| 03/10/2025 | 2.550% | | 1,045,000 | 995,278 |
| SunTrust Capital III(b) |
| Junior Subordinated |
3-month USD LIBOR + 0.650%
03/15/2028 | 6.202% | | 783,000 | 710,183 |
| Svenska Handelsbanken AB(a) |
| 06/15/2028 | 5.500% | | 5,710,000 | 5,627,847 |
| Swedbank AB(a) |
| 06/15/2026 | 5.472% | | 5,630,000 | 5,599,194 |
| Synchrony Bank |
| 08/22/2025 | 5.400% | | 3,625,000 | 3,503,277 |
| Synchrony Financial |
| 06/13/2025 | 4.875% | | 2,185,000 | 2,105,124 |
| Toronto-Dominion Bank (The) |
| 07/17/2028 | 5.523% | | 3,905,000 | 3,920,944 |
| Truist Financial Corp.(j),(k) |
| | 4.800% | | 880,000 | 775,341 |
| | 5.100% | | 1,302,000 | 1,146,023 |
| Truist Financial Corp.(k) |
| 03/02/2027 | 1.267% | | 340,000 | 303,292 |
| 01/26/2034 | 5.122% | | 2,445,000 | 2,292,439 |
| 06/08/2034 | 5.867% | | 11,540,000 | 11,442,697 |
| Subordinated |
| 07/28/2033 | 4.916% | | 1,044,000 | 931,222 |
| U.S. Bancorp(j),(k) |
| Junior Subordinated |
| | 5.300% | | 2,980,000 | 2,534,666 |
| UBS Group AG(a),(k) |
| 05/12/2026 | 4.488% | | 980,000 | 952,834 |
| 01/30/2027 | 1.364% | | 912,000 | 814,683 |
| 08/10/2027 | 1.494% | | 960,000 | 844,062 |
| 05/12/2028 | 4.751% | | 573,000 | 549,895 |
| UBS Group AG(a),(b) |
SOFR + 1.580%
05/12/2026 | 6.880% | | 3,055,000 | 3,073,553 |
| UniCredit SpA(a),(k) |
| 09/22/2026 | 2.569% | | 5,195,000 | 4,762,582 |
| US Bancorp(k) |
| 06/12/2034 | 5.836% | | 6,580,000 | 6,563,822 |
| Corporate Bonds & Notes (continued) |
| Issuer | Coupon
Rate | | Principal
Amount ($) | Value ($) |
| Subordinated |
| 07/22/2033 | 4.967% | | 2,847,000 | 2,594,178 |
| Wells Fargo & Co.(k) |
| 02/11/2026 | 2.164% | | 1,691,000 | 1,599,063 |
| 04/30/2026 | 2.188% | | 1,537,000 | 1,445,620 |
| 08/15/2026 | 4.540% | | 254,000 | 247,994 |
| 03/24/2028 | 3.526% | | 1,405,000 | 1,307,623 |
| 05/22/2028 | 3.584% | | 1,700,000 | 1,577,940 |
| 06/02/2028 | 2.393% | | 10,530,000 | 9,364,921 |
| 07/25/2028 | 4.808% | | 14,890,000 | 14,446,923 |
| 02/11/2031 | 2.572% | | 6,775,000 | 5,655,768 |
| 03/02/2033 | 3.350% | | 15,345,000 | 12,927,303 |
| 07/25/2033 | 4.897% | | 2,740,000 | 2,578,004 |
| 04/24/2034 | 5.389% | | 5,642,000 | 5,496,375 |
| 07/25/2034 | 5.557% | | 8,209,000 | 8,102,135 |
| 04/30/2041 | 3.068% | | 5,012,000 | 3,588,116 |
| 04/04/2051 | 5.013% | | 1,130,000 | 1,019,266 |
| Total | 1,012,672,711 |
| Brokerage/Asset Managers/Exchanges 0.3% |
| Ares Finance Co. IV LLC(a) |
| 02/01/2052 | 3.650% | | 3,415,000 | 2,162,763 |
| BlackRock, Inc. |
| 05/25/2033 | 4.750% | | 832,000 | 807,486 |
| Blackstone Holdings Finance Co. LLC(a) |
| 08/05/2028 | 1.625% | | 643,000 | 540,059 |
| 01/30/2032 | 2.000% | | 1,965,000 | 1,470,993 |
| Blue Owl Finance LLC(a) |
| 02/15/2032 | 4.375% | | 2,540,000 | 2,042,562 |
| Brookfield Finance, Inc. |
| 06/02/2026 | 4.250% | | 964,000 | 927,324 |
| Charles Schwab Corp. (The)(j),(k) |
| | 4.000% | | 748,000 | 563,112 |
| Charles Schwab Corp. (The)(k) |
| 05/19/2029 | 5.643% | | 1,318,000 | 1,315,605 |
| 08/24/2034 | 6.136% | | 2,430,000 | 2,473,020 |
| CI Financial Corp. |
| 06/15/2051 | 4.100% | | 684,000 | 413,869 |
| CME Group, Inc. |
| 03/15/2032 | 2.650% | | 1,334,000 | 1,118,373 |
| Depository Trust & Clearing Corp. (The)(a),(j),(k) |
| | 3.375% | | 673,000 | 499,196 |
| Hunt Companies, Inc.(a) |
| 04/15/2029 | 5.250% | | 2,150,000 | 1,647,607 |
| Intercontinental Exchange, Inc. |
| 06/15/2030 | 2.100% | | 809,000 | 666,651 |
| 09/15/2032 | 1.850% | | 4,767,000 | 3,628,128 |
| 09/15/2040 | 2.650% | | 775,000 | 540,532 |
| Jane Street Group/JSG Finance, Inc.(a) |
| 11/15/2029 | 4.500% | | 1,000,000 | 876,687 |
The accompanying Notes to Financial Statements are an integral part of this statement.
| 36 | Multi-Manager Total Return Bond Strategies Fund | Annual Report 2023 |
Portfolio of Investments (continued)
August 31, 2023
| Corporate Bonds & Notes (continued) |
| Issuer | Coupon
Rate | | Principal
Amount ($) | Value ($) |
| Jefferies Financial Group, Inc. |
| 07/21/2028 | 5.875% | | 3,660,000 | 3,620,147 |
| Jefferies Group LLC |
| 01/20/2043 | 6.500% | | 600,000 | 598,581 |
| Nomura Holdings, Inc. |
| 07/12/2028 | 6.070% | | 7,560,000 | 7,594,592 |
| 07/14/2031 | 2.608% | | 1,100,000 | 864,477 |
| Stifel Financial Corp. |
| 05/15/2030 | 4.000% | | 3,755,000 | 3,265,830 |
| Total | 37,637,594 |
| Building Materials 0.1% |
| Cemex SAB de CV(a),(j),(k) |
| | 5.125% | | 1,525,000 | 1,413,458 |
| Ferguson Finance PLC(a) |
| 04/20/2032 | 4.650% | | 1,200,000 | 1,118,894 |
| Fortune Brands Home & Security, Inc. |
| 03/25/2052 | 4.500% | | 2,795,000 | 2,150,429 |
| Fortune Brands Innovations, Inc. |
| 06/01/2033 | 5.875% | | 764,000 | 761,532 |
| Martin Marietta Materials, Inc. |
| 03/15/2030 | 2.500% | | 3,380,000 | 2,838,961 |
| Standard Industries, Inc.(a) |
| 07/15/2030 | 4.375% | | 3,295,000 | 2,824,154 |
| 01/15/2031 | 3.375% | | 1,335,000 | 1,064,873 |
| Summit Materials LLC/Finance Corp.(a) |
| 01/15/2029 | 5.250% | | 500,000 | 468,126 |
| Total | 12,640,427 |
| Cable and Satellite 0.7% |
| Cable One, Inc.(a) |
| 11/15/2030 | 4.000% | | 695,000 | 543,742 |
| CCO Holdings LLC/Capital Corp.(a) |
| 06/01/2029 | 5.375% | | 100,000 | 91,025 |
| 02/01/2031 | 4.250% | | 1,725,000 | 1,414,814 |
| CCO Holdings LLC/Holdings Capital Corp.(a) |
| 01/15/2034 | 4.250% | | 1,125,000 | 861,480 |
| Charter Communications Operating LLC/Capital |
| 01/15/2029 | 2.250% | | 616,000 | 511,059 |
| 10/23/2035 | 6.384% | | 1,775,000 | 1,721,008 |
| 10/23/2045 | 6.484% | | 4,170,000 | 3,828,479 |
| 04/01/2048 | 5.750% | | 1,360,000 | 1,145,254 |
| 03/01/2050 | 4.800% | | 4,625,000 | 3,413,276 |
| 04/01/2051 | 3.700% | | 2,305,000 | 1,428,166 |
| 06/01/2052 | 3.900% | | 3,420,000 | 2,183,049 |
| 04/01/2053 | 5.250% | | 2,265,000 | 1,790,365 |
| 04/01/2061 | 3.850% | | 941,000 | 561,716 |
| Corporate Bonds & Notes (continued) |
| Issuer | Coupon
Rate | | Principal
Amount ($) | Value ($) |
| Comcast Corp. |
| 10/15/2025 | 3.950% | | 3,095,000 | 3,014,184 |
| 11/15/2027 | 5.350% | | 628,000 | 636,764 |
| 02/01/2030 | 2.650% | | 723,000 | 628,380 |
| 01/15/2031 | 1.950% | | 1,347,000 | 1,089,066 |
| 03/01/2038 | 3.900% | | 822,000 | 699,561 |
| 02/01/2050 | 3.450% | | 1,900,000 | 1,385,780 |
| 05/15/2064 | 5.500% | | 3,173,000 | 3,091,526 |
| Cox Communications, Inc.(a) |
| 08/15/2024 | 3.150% | | 780,000 | 759,472 |
| 09/15/2028 | 5.450% | | 4,420,000 | 4,399,136 |
| 06/15/2031 | 2.600% | | 1,975,000 | 1,594,617 |
| CSC Holdings LLC |
| 06/01/2024 | 5.250% | | 2,513,000 | 2,384,445 |
| CSC Holdings LLC(a) |
| 04/15/2027 | 5.500% | | 3,550,000 | 3,064,296 |
| 02/01/2028 | 5.375% | | 1,193,000 | 978,852 |
| 04/01/2028 | 7.500% | | 600,000 | 380,113 |
| 05/15/2028 | 11.250% | | 600,000 | 591,683 |
| 02/01/2029 | 6.500% | | 3,914,000 | 3,236,059 |
| 01/15/2030 | 5.750% | | 1,275,000 | 705,607 |
| 12/01/2030 | 4.625% | | 4,725,000 | 2,470,808 |
| DISH DBS Corp. |
| 11/15/2024 | 5.875% | | 2,000,000 | 1,861,288 |
| 07/01/2026 | 7.750% | | 2,039,000 | 1,523,566 |
| DISH Network Corp.(a) |
| 11/15/2027 | 11.750% | | 1,925,000 | 1,954,575 |
| Intelsat Jackson Holdings SA(a) |
| 03/15/2030 | 6.500% | | 5,833,000 | 5,355,853 |
| Sirius XM Radio, Inc.(a) |
| 07/01/2029 | 5.500% | | 1,485,000 | 1,338,085 |
| Time Warner Cable LLC |
| 05/01/2037 | 6.550% | | 235,000 | 223,004 |
| 11/15/2040 | 5.875% | | 3,890,000 | 3,371,279 |
| 09/01/2041 | 5.500% | | 7,444,000 | 6,104,198 |
| Viasat, Inc.(a) |
| 09/15/2025 | 5.625% | | 1,425,000 | 1,348,480 |
| 04/15/2027 | 5.625% | | 1,415,000 | 1,272,922 |
| VZ Secured Financing BV(a) |
| 01/15/2032 | 5.000% | | 3,250,000 | 2,650,015 |
| Ziggo BV(a) |
| 01/15/2030 | 4.875% | | 500,000 | 419,906 |
| Total | 78,026,953 |
| Chemicals 0.3% |
| Braskem Netherlands Finance BV(a) |
| 01/31/2030 | 4.500% | | 400,000 | 335,204 |
| Cabot Corp. |
| 07/01/2029 | 4.000% | | 1,810,000 | 1,668,119 |
The accompanying Notes to Financial Statements are an integral part of this statement.
Multi-Manager Total Return Bond Strategies Fund | Annual Report 2023
| 37 |
Portfolio of Investments (continued)
August 31, 2023
| Corporate Bonds & Notes (continued) |
| Issuer | Coupon
Rate | | Principal
Amount ($) | Value ($) |
| Celanese US Holdings LLC |
| 11/15/2033 | 6.700% | | 2,075,000 | 2,083,999 |
| CF Industries, Inc. |
| 03/15/2034 | 5.150% | | 3,125,000 | 2,950,015 |
| 06/01/2043 | 4.950% | | 1,700,000 | 1,433,960 |
| Ecolab, Inc. |
| 08/18/2055 | 2.750% | | 333,000 | 203,982 |
| EverArc Escrow Sarl(a) |
| 10/30/2029 | 5.000% | | 300,000 | 246,508 |
| FMC Corp. |
| 05/18/2026 | 5.150% | | 490,000 | 485,545 |
| 10/01/2049 | 4.500% | | 340,000 | 253,409 |
| 05/18/2053 | 6.375% | | 2,695,000 | 2,583,735 |
| GC Treasury Center Co., Ltd.(a) |
| 03/18/2031 | 2.980% | | 750,000 | 595,698 |
| 03/30/2032 | 4.400% | | 950,000 | 821,378 |
| Huntsman International LLC |
| 06/15/2031 | 2.950% | | 7,375,000 | 5,887,198 |
| Ingevity Corp.(a) |
| 11/01/2028 | 3.875% | | 1,510,000 | 1,282,730 |
| International Flavors & Fragrances, Inc.(a) |
| 11/01/2030 | 2.300% | | 5,075,000 | 3,936,676 |
| 11/15/2040 | 3.268% | | 365,000 | 242,871 |
| 12/01/2050 | 3.468% | | 470,000 | 291,983 |
| International Flavors & Fragrances, Inc. |
| 09/26/2048 | 5.000% | | 3,400,000 | 2,702,544 |
| LYB International Finance III LLC |
| 05/01/2050 | 4.200% | | 1,505,000 | 1,116,145 |
| LyondellBasell Industries NV |
| 04/15/2024 | 5.750% | | 713,000 | 711,162 |
| Mosaic Co. (The) |
| 11/15/2043 | 5.625% | | 985,000 | 909,774 |
| Nutrien Ltd. |
| 11/07/2025 | 5.950% | | 496,000 | 498,986 |
| 12/01/2036 | 5.875% | | 141,000 | 139,967 |
| 03/27/2053 | 5.800% | | 182,000 | 177,765 |
| Olin Corp. |
| 02/01/2030 | 5.000% | | 1,560,000 | 1,431,368 |
| Sasol Financing USA LLC |
| 03/27/2024 | 5.875% | | 600,000 | 593,341 |
| Total | 33,584,062 |
| Construction Machinery 0.3% |
| Ashtead Capital, Inc.(a) |
| 10/15/2033 | 5.950% | | 1,170,000 | 1,149,375 |
| Caterpillar Financial Services Corp. |
| 08/11/2025 | 5.150% | | 5,670,000 | 5,670,737 |
| Corporate Bonds & Notes (continued) |
| Issuer | Coupon
Rate | | Principal
Amount ($) | Value ($) |
| CNH Industrial Capital LLC |
| 05/23/2025 | 3.950% | | 5,880,000 | 5,711,287 |
| H&E Equipment Services, Inc.(a) |
| 12/15/2028 | 3.875% | | 5,359,000 | 4,680,246 |
| John Deere Capital Corp. |
| 01/20/2028 | 4.750% | | 1,208,000 | 1,203,202 |
| 07/14/2028 | 4.950% | | 2,470,000 | 2,478,314 |
| 06/10/2030 | 4.700% | | 6,712,000 | 6,627,280 |
| Maxim Crane Works Holdings Capital LLC(a) |
| 09/01/2028 | 11.500% | | 975,000 | 977,853 |
| OT Merger Corp.(a) |
| 10/15/2029 | 7.875% | | 350,000 | 230,699 |
| Ritchie Bros Holdings, Inc.(a) |
| 03/15/2028 | 6.750% | | 200,000 | 202,501 |
| United Rentals North America, Inc. |
| 01/15/2030 | 5.250% | | 3,000,000 | 2,852,211 |
| 02/15/2031 | 3.875% | | 1,664,000 | 1,426,433 |
| Total | 33,210,138 |
| Consumer Cyclical Services 0.1% |
| ADT Security Corp. (The)(a) |
| 08/01/2029 | 4.125% | | 1,645,000 | 1,436,012 |
| Allied Universal Holdco LLC/Finance Corp.(a) |
| 07/15/2026 | 6.625% | | 2,300,000 | 2,189,514 |
| 06/01/2029 | 6.000% | | 1,300,000 | 996,109 |
| Allied Universal Holdco LLC/Finance Corp./Atlas Luxco 4 Sarl(a) |
| 06/01/2028 | 4.625% | | 1,910,000 | 1,607,616 |
| 06/01/2028 | 4.625% | | 990,000 | 841,399 |
| ANGI Group LLC(a) |
| 08/15/2028 | 3.875% | | 1,820,000 | 1,460,847 |
| CBRE Services, Inc. |
| 08/15/2034 | 5.950% | | 1,495,000 | 1,481,451 |
| Expedia Group, Inc.(a) |
| 05/01/2025 | 6.250% | | 1,094,000 | 1,098,480 |
| Match Group Holdings II LLC(a) |
| 10/01/2031 | 3.625% | | 1,785,000 | 1,455,859 |
| WASH Multifamily Acquisition, Inc.(a) |
| 04/15/2026 | 5.750% | | 600,000 | 559,376 |
| Total | 13,126,663 |
| Consumer Products 0.1% |
| Brunswick Corp. |
| 09/15/2032 | 4.400% | | 490,000 | 420,615 |
| Central Garden & Pet Co. |
| 10/15/2030 | 4.125% | | 985,000 | 847,354 |
| Energizer Holdings, Inc.(a) |
| 03/31/2029 | 4.375% | | 1,335,000 | 1,143,003 |
The accompanying Notes to Financial Statements are an integral part of this statement.
| 38 | Multi-Manager Total Return Bond Strategies Fund | Annual Report 2023 |
Portfolio of Investments (continued)
August 31, 2023
| Corporate Bonds & Notes (continued) |
| Issuer | Coupon
Rate | | Principal
Amount ($) | Value ($) |
| Estee Lauder Companies, Inc. (The) |
| 05/15/2033 | 4.650% | | 676,000 | 654,382 |
| Kenvue, Inc.(a) |
| 03/22/2028 | 5.050% | | 705,000 | 706,764 |
| 03/22/2033 | 4.900% | | 1,706,000 | 1,696,014 |
| 03/22/2043 | 5.100% | | 849,000 | 831,706 |
| 03/22/2063 | 5.200% | | 1,243,000 | 1,216,499 |
| Mead Johnson Nutrition Co. |
| 11/15/2025 | 4.125% | | 616,000 | 599,760 |
| Scotts Miracle-Gro Co. (The) |
| 12/15/2026 | 5.250% | | 235,000 | 222,550 |
| Spectrum Brands, Inc.(a) |
| 07/15/2030 | 5.500% | | 643,000 | 599,446 |
| SWF Escrow Issuer Corp.(a) |
| 10/01/2029 | 6.500% | | 950,000 | 617,048 |
| Tempur Sealy International, Inc.(a) |
| 04/15/2029 | 4.000% | | 1,500,000 | 1,288,287 |
| 10/15/2031 | 3.875% | | 405,000 | 325,581 |
| Whirlpool Corp. |
| 03/01/2033 | 5.500% | | 2,215,000 | 2,196,694 |
| Total | 13,365,703 |
| Diversified Manufacturing 0.1% |
| Amsted Industries, Inc.(a) |
| 05/15/2030 | 4.625% | | 1,685,000 | 1,485,376 |
| Chart Industries, Inc.(a) |
| 01/01/2030 | 7.500% | | 475,000 | 487,114 |
| Emerald Debt Merger Sub LLC(a) |
| 12/15/2030 | 6.625% | | 890,000 | 877,043 |
| General Electric Co.(b) |
3-month Term SOFR + 0.742%
08/15/2036 | 6.106% | | 5,380,000 | 4,777,253 |
| Griffon Corp. |
| 03/01/2028 | 5.750% | | 525,000 | 489,569 |
| Ingersoll Rand, Inc. |
| 08/14/2033 | 5.700% | | 4,085,000 | 4,140,911 |
| Otis Worldwide Corp. |
| 08/16/2028 | 5.250% | | 1,180,000 | 1,188,035 |
| Trane Technologies Financing Ltd. |
| 03/03/2033 | 5.250% | | 585,000 | 584,021 |
| Valmont Industries, Inc. |
| 10/01/2054 | 5.250% | | 2,050,000 | 1,752,771 |
| Total | 15,782,093 |
| Electric 2.3% |
| AEP Texas Central Co.(a) |
| 10/01/2025 | 3.850% | | 1,828,000 | 1,753,065 |
| Corporate Bonds & Notes (continued) |
| Issuer | Coupon
Rate | | Principal
Amount ($) | Value ($) |
| AEP Texas Central Co. |
| 02/15/2033 | 6.650% | | 1,385,000 | 1,468,454 |
| AEP Transmission Co. LLC |
| 08/15/2051 | 2.750% | | 1,095,000 | 677,706 |
| AES Corp. (The)(a) |
| 07/15/2025 | 3.300% | | 2,730,000 | 2,593,671 |
| AES Corp. (The) |
| 01/15/2026 | 1.375% | | 662,000 | 595,017 |
| 06/01/2028 | 5.450% | | 2,822,000 | 2,769,216 |
| 01/15/2031 | 2.450% | | 1,522,000 | 1,208,841 |
| Alabama Power Co. |
| 12/01/2023 | 3.550% | | 964,000 | 957,980 |
| Ameren Corp. |
| 02/15/2026 | 3.650% | | 590,000 | 564,235 |
| American Electric Power Co., Inc.(k) |
| 08/15/2025 | 5.699% | | 5,700,000 | 5,703,632 |
| 02/15/2062 | 3.875% | | 3,891,000 | 3,143,306 |
| American Transmission Systems, Inc.(a) |
| 01/15/2032 | 2.650% | | 2,893,000 | 2,370,195 |
| 09/01/2044 | 5.000% | | 749,000 | 673,732 |
| Appalachian Power Co. |
| 03/01/2049 | 4.500% | | 432,000 | 349,963 |
| Arizona Public Service Co. |
| 12/15/2032 | 6.350% | | 5,330,000 | 5,613,185 |
| 08/15/2048 | 4.200% | | 570,000 | 437,737 |
| Avangrid, Inc. |
| 04/15/2025 | 3.200% | | 1,614,000 | 1,545,282 |
| 06/01/2029 | 3.800% | | 655,000 | 594,065 |
| Black Hills Corp. |
| 11/30/2023 | 4.250% | | 286,000 | 284,325 |
| 10/15/2029 | 3.050% | | 488,000 | 419,663 |
| 05/01/2033 | 4.350% | | 241,000 | 213,098 |
| Calpine Corp.(a) |
| 02/15/2028 | 4.500% | | 2,250,000 | 2,083,955 |
| 03/15/2028 | 5.125% | | 575,000 | 523,967 |
| 02/01/2029 | 4.625% | | 2,000,000 | 1,738,353 |
| 02/01/2031 | 5.000% | | 4,045,000 | 3,424,079 |
| Cleveland Electric Illuminating Co. (The)(a) |
| 04/01/2028 | 3.500% | | 3,293,000 | 3,029,100 |
| Cleveland Electric Illuminating Co. (The) |
| 12/15/2036 | 5.950% | | 1,279,000 | 1,262,317 |
| CMS Energy Corp. |
| 02/15/2027 | 2.950% | | 80,000 | 73,408 |
| CMS Energy Corp.(k) |
| 06/01/2050 | 4.750% | | 2,514,000 | 2,192,809 |
| 12/01/2050 | 3.750% | | 386,000 | 291,561 |
| Commonwealth Edison Co. |
| 08/15/2047 | 3.750% | | 409,000 | 312,500 |
The accompanying Notes to Financial Statements are an integral part of this statement.
Multi-Manager Total Return Bond Strategies Fund | Annual Report 2023
| 39 |
Portfolio of Investments (continued)
August 31, 2023
| Corporate Bonds & Notes (continued) |
| Issuer | Coupon
Rate | | Principal
Amount ($) | Value ($) |
| Connecticut Light and Power Co. (The) |
| 01/15/2053 | 5.250% | | 743,000 | 725,712 |
| Consolidated Edison Co. of New York, Inc. |
| 03/01/2035 | 5.300% | | 171,000 | 166,843 |
| 06/15/2046 | 3.850% | | 1,310,000 | 1,002,894 |
| 06/15/2047 | 3.875% | | 1,640,000 | 1,258,623 |
| 12/01/2056 | 4.300% | | 308,000 | 242,912 |
| Consumers Energy Co. |
| 02/15/2029 | 4.900% | | 1,566,000 | 1,554,690 |
| Dominion Energy, Inc.(j),(k) |
| | 4.350% | | 198,000 | 167,197 |
| | 4.650% | | 5,000,000 | 4,539,293 |
| Dominion Energy, Inc. |
| 08/15/2026 | 2.850% | | 750,000 | 697,439 |
| 11/15/2032 | 5.375% | | 1,551,000 | 1,527,001 |
| DTE Energy Co. |
| 10/01/2026 | 2.850% | | 10,155,000 | 9,394,588 |
| Duke Energy Carolinas LLC |
| 04/15/2031 | 2.550% | | 370,000 | 313,365 |
| 12/15/2041 | 4.250% | | 14,000 | 11,833 |
| 09/30/2042 | 4.000% | | 617,000 | 499,436 |
| 06/01/2045 | 3.750% | | 157,000 | 119,550 |
| 03/15/2046 | 3.875% | | 46,000 | 35,410 |
| 01/15/2053 | 5.350% | | 3,972,000 | 3,867,606 |
| Duke Energy Corp.(j),(k) |
| | 4.875% | | 213,000 | 207,209 |
| Duke Energy Corp. |
| 04/15/2024 | 3.750% | | 3,373,000 | 3,331,870 |
| 09/01/2026 | 2.650% | | 4,710,000 | 4,357,632 |
| 09/01/2046 | 3.750% | | 1,416,000 | 1,038,705 |
| Duke Energy Florida LLC |
| 12/15/2031 | 2.400% | | 1,234,000 | 1,005,913 |
| 11/15/2052 | 5.950% | | 739,000 | 772,861 |
| Duke Energy Indiana LLC |
| 10/01/2049 | 3.250% | | 436,000 | 297,027 |
| 04/01/2053 | 5.400% | | 676,000 | 658,018 |
| Duke Energy Ohio, Inc. |
| 06/01/2030 | 2.125% | | 430,000 | 353,885 |
| 06/15/2046 | 3.700% | | 3,050,000 | 2,233,416 |
| 04/01/2053 | 5.650% | | 307,000 | 306,449 |
| Duke Energy Progress LLC |
| 03/15/2033 | 5.250% | | 1,570,000 | 1,570,786 |
| 05/15/2042 | 4.100% | | 1,437,000 | 1,183,249 |
| 03/15/2043 | 4.100% | | 475,000 | 386,621 |
| 03/30/2044 | 4.375% | | 770,000 | 650,686 |
| 08/15/2045 | 4.200% | | 329,000 | 265,945 |
| 10/15/2046 | 3.700% | | 312,000 | 231,734 |
| 09/15/2047 | 3.600% | | 940,000 | 697,061 |
| Duquesne Light Holdings, Inc.(a) |
| 10/01/2030 | 2.532% | | 463,000 | 369,232 |
| Corporate Bonds & Notes (continued) |
| Issuer | Coupon
Rate | | Principal
Amount ($) | Value ($) |
| Edison International |
| 08/15/2025 | 4.700% | | 5,675,000 | 5,550,634 |
| Enel Finance America LLC(a) |
| 10/14/2027 | 7.100% | | 276,000 | 288,372 |
| Enel Finance International NV(a) |
| 04/06/2028 | 3.500% | | 2,370,000 | 2,156,382 |
| Entergy Arkansas LLC |
| 01/15/2033 | 5.150% | | 480,000 | 475,652 |
| 04/01/2049 | 4.200% | | 941,000 | 753,024 |
| 06/15/2051 | 2.650% | | 212,000 | 126,083 |
| 06/15/2052 | 3.350% | | 317,000 | 216,738 |
| Entergy Corp. |
| 09/15/2025 | 0.900% | | 3,770,000 | 3,424,224 |
| 06/15/2030 | 2.800% | | 348,000 | 293,692 |
| 06/15/2031 | 2.400% | | 801,000 | 639,426 |
| Entergy Louisiana LLC |
| 10/01/2026 | 2.400% | | 2,409,000 | 2,207,055 |
| Entergy Mississippi LLC |
| 09/01/2033 | 5.000% | | 1,039,000 | 1,007,242 |
| 06/01/2049 | 3.850% | | 1,178,000 | 880,448 |
| Entergy Texas, Inc. |
| 03/30/2029 | 4.000% | | 348,000 | 325,602 |
| 09/01/2053 | 5.800% | | 358,000 | 361,066 |
| Evergy Kansas Central, Inc. |
| 03/15/2053 | 5.700% | | 1,315,000 | 1,311,587 |
| Evergy Metro, Inc. |
| 06/01/2030 | 2.250% | | 572,000 | 473,343 |
| Eversource Energy |
| 08/15/2025 | 0.800% | | 662,000 | 604,046 |
| 08/15/2026 | 1.400% | | 752,000 | 669,528 |
| 03/01/2027 | 2.900% | | 1,335,000 | 1,229,315 |
| 07/01/2027 | 4.600% | | 2,675,000 | 2,602,931 |
| 03/01/2028 | 5.450% | | 1,024,000 | 1,027,692 |
| 05/15/2033 | 5.125% | | 703,000 | 679,910 |
| Exelon Corp. |
| 03/15/2028 | 5.150% | | 1,648,000 | 1,637,137 |
| 03/15/2033 | 5.300% | | 2,000,000 | 1,973,403 |
| 04/15/2046 | 4.450% | | 1,050,000 | 866,882 |
| FirstEnergy Transmission LLC(a) |
| 09/15/2028 | 2.866% | | 3,224,000 | 2,829,206 |
| Florida Power & Light Co. |
| 05/15/2030 | 4.625% | | 677,000 | 663,224 |
| 05/15/2033 | 4.800% | | 474,000 | 462,920 |
| 12/04/2051 | 2.875% | | 359,000 | 234,832 |
| Georgia Power Co. |
| 09/15/2024 | 2.200% | | 848,000 | 816,683 |
| 05/16/2028 | 4.650% | | 575,000 | 560,927 |
| Gulf Power Co. |
| 10/01/2044 | 4.550% | | 1,350,000 | 1,150,442 |
The accompanying Notes to Financial Statements are an integral part of this statement.
| 40 | Multi-Manager Total Return Bond Strategies Fund | Annual Report 2023 |
Portfolio of Investments (continued)
August 31, 2023
| Corporate Bonds & Notes (continued) |
| Issuer | Coupon
Rate | | Principal
Amount ($) | Value ($) |
| Inkia Energy Ltd.(a) |
| 11/09/2027 | 5.875% | | 330,000 | 316,771 |
| Interstate Power and Light Co. |
| 11/30/2051 | 3.100% | | 3,194,000 | 2,018,081 |
| Interstate Power and Light, Co. |
| 12/01/2024 | 3.250% | | 552,000 | 536,059 |
| IPALCO Enterprises, Inc. |
| 05/01/2030 | 4.250% | | 1,590,000 | 1,432,047 |
| ITC Holdings Corp.(a) |
| 06/01/2033 | 5.400% | | 1,805,000 | 1,770,382 |
| Jersey Central Power & Light Co.(a) |
| 04/01/2024 | 4.700% | | 1,600,000 | 1,585,228 |
| 01/15/2026 | 4.300% | | 2,000,000 | 1,938,995 |
| 03/01/2032 | 2.750% | | 336,000 | 273,180 |
| Jersey Central Power & Light Co. |
| 06/01/2037 | 6.150% | | 1,985,000 | 2,028,350 |
| Kansas City Power & Light Co. |
| 08/15/2025 | 3.650% | | 665,000 | 641,403 |
| Kentucky Utilities Co. |
| 04/15/2033 | 5.450% | | 494,000 | 498,594 |
| Louisville Gas and Electric Co. |
| 04/15/2033 | 5.450% | | 494,000 | 499,001 |
| Metropolitan Edison Co.(a) |
| 01/15/2029 | 4.300% | | 1,928,000 | 1,824,214 |
| Mississippi Power Co. |
| 03/15/2042 | 4.250% | | 414,000 | 338,222 |
| Mong Duong Finance Holdings BV(a) |
| 05/07/2029 | 5.125% | | 300,000 | 271,415 |
| Monongahela Power Co.(a) |
| 05/15/2027 | 3.550% | | 617,000 | 577,998 |
| Narragansett Electric Co. (The)(a) |
| 04/09/2030 | 3.395% | | 2,179,000 | 1,931,414 |
| National Rural Utilities Cooperative Finance Corp. |
| 02/07/2024 | 2.950% | | 3,765,000 | 3,717,783 |
| 03/15/2030 | 2.400% | | 1,347,000 | 1,136,005 |
| 04/15/2032 | 2.750% | | 1,233,000 | 1,010,135 |
| 12/15/2032 | 4.150% | | 309,000 | 282,372 |
| 01/15/2033 | 5.800% | | 864,000 | 891,757 |
| National Rural Utilities Cooperative Finance Corp.(b) |
3-month Term SOFR + 3.172%
04/30/2043 | 8.541% | | 1,147,000 | 1,126,294 |
| National Rural Utilities Cooperative Finance Corp.(k) |
| 09/15/2053 | 7.125% | | 824,000 | 835,475 |
| Subordinated |
| 04/20/2046 | 5.250% | | 1,687,000 | 1,602,730 |
| New England Power Co.(a) |
| 10/06/2050 | 2.807% | | 3,670,000 | 2,284,663 |
| Corporate Bonds & Notes (continued) |
| Issuer | Coupon
Rate | | Principal
Amount ($) | Value ($) |
| New York State Electric & Gas Corp.(a) |
| 08/15/2033 | 5.850% | | 1,084,000 | 1,104,001 |
| NextEra Energy Capital Holdings, Inc. |
| 09/01/2024 | 4.255% | | 1,137,000 | 1,118,284 |
| 03/01/2025 | 6.051% | | 1,522,000 | 1,528,301 |
| 01/15/2027 | 1.875% | | 1,155,000 | 1,032,627 |
| NextEra Energy Capital Holdings, Inc.(k) |
| 03/15/2082 | 3.800% | | 1,497,000 | 1,266,526 |
| NRG Energy, Inc.(a),(j),(k) |
| | 10.250% | | 600,000 | 586,095 |
| NRG Energy, Inc.(a) |
| 12/02/2025 | 2.000% | | 560,000 | 508,263 |
| 12/02/2027 | 2.450% | | 2,420,000 | 2,055,161 |
| 02/15/2029 | 3.375% | | 542,000 | 446,757 |
| 06/15/2029 | 5.250% | | 1,875,000 | 1,688,141 |
| 02/15/2032 | 3.875% | | 1,125,000 | 870,238 |
| NRG Energy, Inc. |
| 01/15/2027 | 6.625% | | 954,000 | 941,982 |
| NSTAR Electric Co. |
| 08/15/2031 | 1.950% | | 524,000 | 413,836 |
| Oncor Electric Delivery Co. LLC |
| 09/15/2032 | 4.550% | | 1,238,000 | 1,178,483 |
| Pacific Gas and Electric Co. |
| 07/01/2030 | 4.550% | | 5,735,000 | 5,153,603 |
| 04/15/2042 | 4.450% | | 562,000 | 416,181 |
| 03/15/2045 | 4.300% | | 948,000 | 662,741 |
| 01/15/2053 | 6.750% | | 450,000 | 437,868 |
| PacifiCorp |
| 03/15/2051 | 3.300% | | 680,000 | 434,402 |
| 12/01/2053 | 5.350% | | 1,667,000 | 1,438,731 |
| 05/15/2054 | 5.500% | | 1,079,000 | 954,132 |
| PECO Energy Co. |
| 06/15/2033 | 4.900% | | 790,000 | 776,767 |
| 05/15/2052 | 4.600% | | 2,500,000 | 2,194,890 |
| Pennsylvania Electric Co.(a) |
| 03/30/2026 | 5.150% | | 883,000 | 869,118 |
| 03/15/2028 | 3.250% | | 1,990,000 | 1,812,876 |
| Public Service Co. of Colorado |
| 04/01/2053 | 5.250% | | 2,815,000 | 2,597,574 |
| Public Service Co. of New Hampshire |
| 01/15/2053 | 5.150% | | 170,000 | 165,471 |
| Public Service Electric and Gas Co. |
| 08/01/2033 | 5.200% | | 1,023,000 | 1,032,587 |
| 03/01/2046 | 3.800% | | 109,000 | 86,264 |
| 08/01/2053 | 5.450% | | 812,000 | 823,755 |
| Public Service Enterprise Group, Inc. |
| 08/15/2025 | 0.800% | | 642,000 | 586,218 |
| 11/15/2027 | 5.850% | | 895,000 | 912,062 |
| 08/15/2030 | 1.600% | | 466,000 | 366,470 |
| 11/15/2031 | 2.450% | | 2,062,000 | 1,658,082 |
The accompanying Notes to Financial Statements are an integral part of this statement.
Multi-Manager Total Return Bond Strategies Fund | Annual Report 2023
| 41 |
Portfolio of Investments (continued)
August 31, 2023
| Corporate Bonds & Notes (continued) |
| Issuer | Coupon
Rate | | Principal
Amount ($) | Value ($) |
| San Diego Gas & Electric Co. |
| 08/15/2028 | 4.950% | | 1,148,000 | 1,138,453 |
| South Carolina Electric & Gas Co. |
| 05/15/2033 | 5.300% | | 676,000 | 678,583 |
| Southern California Edison Co. |
| 03/01/2028 | 5.300% | | 3,740,000 | 3,756,167 |
| 12/01/2053 | 5.875% | | 2,120,000 | 2,109,936 |
| Southern Co. (The) |
| 07/01/2036 | 4.250% | | 595,000 | 518,369 |
| Southern Co. (The)(k) |
| 01/15/2051 | 4.000% | | 1,166,000 | 1,083,335 |
| 09/15/2051 | 3.750% | | 1,122,000 | 968,332 |
| Junior Subordinated |
| 08/01/2027 | 5.113% | | 932,000 | 925,827 |
| Southwestern Electric Power Co. |
| 03/15/2026 | 1.650% | | 1,096,000 | 997,382 |
| 10/01/2026 | 2.750% | | 6,450,000 | 5,953,597 |
| 04/01/2033 | 5.300% | | 700,000 | 685,265 |
| Tampa Electric Co. |
| 05/15/2044 | 4.350% | | 434,000 | 353,720 |
| Toledo Edison Co. (The) |
| 05/15/2037 | 6.150% | | 951,000 | 981,448 |
| Tucson Electric Power Co. |
| 12/01/2048 | 4.850% | | 259,000 | 221,032 |
| 06/15/2050 | 4.000% | | 2,690,000 | 2,014,026 |
| Virginia Electric & Power Co. |
| 03/15/2027 | 3.500% | | 1,446,000 | 1,366,435 |
| Virginia Electric and Power Co. |
| 04/01/2053 | 5.450% | | 955,000 | 924,296 |
| 08/15/2053 | 5.700% | | 683,000 | 678,314 |
| Vistra Corp.(a),(j),(k) |
| | 7.000% | | 425,000 | 395,270 |
| | 8.000% | | 4,650,000 | 4,459,273 |
| Vistra Operations Co. LLC(a) |
| 07/15/2024 | 3.550% | | 2,505,000 | 2,437,296 |
| 05/13/2025 | 5.125% | | 5,190,000 | 5,063,935 |
| 02/15/2027 | 5.625% | | 2,200,000 | 2,117,042 |
| 07/31/2027 | 5.000% | | 2,000,000 | 1,882,909 |
| 05/01/2029 | 4.375% | | 4,060,000 | 3,578,374 |
| Vistra Operations Co., LLC(a) |
| 01/30/2027 | 3.700% | | 885,000 | 813,430 |
| WEC Energy Group, Inc. |
| 09/27/2025 | 5.000% | | 304,000 | 301,155 |
| 10/01/2027 | 5.150% | | 426,000 | 424,688 |
| 10/15/2027 | 1.375% | | 1,094,000 | 941,555 |
| 12/15/2028 | 2.200% | | 746,000 | 644,321 |
| Wisconsin Electric Power Co. |
| 06/15/2028 | 1.700% | | 680,000 | 584,996 |
| Corporate Bonds & Notes (continued) |
| Issuer | Coupon
Rate | | Principal
Amount ($) | Value ($) |
| Wisconsin Public Service Corp. |
| 12/01/2042 | 3.671% | | 814,000 | 607,237 |
| Xcel Energy, Inc. |
| 08/15/2033 | 5.450% | | 5,555,000 | 5,466,566 |
| Total | 257,970,375 |
| Environmental 0.1% |
| Waste Connections, Inc. |
| 04/01/2050 | 3.050% | | 885,000 | 598,533 |
| Waste Management, Inc. |
| 02/15/2030 | 4.625% | | 2,553,000 | 2,495,508 |
| 02/15/2033 | 4.625% | | 831,000 | 798,877 |
| 02/15/2034 | 4.875% | | 446,000 | 435,474 |
| Waste Pro USA, Inc.(a) |
| 02/15/2026 | 5.500% | | 1,650,000 | 1,562,933 |
| Total | 5,891,325 |
| Finance Companies 0.8% |
| AerCap Ireland Capital DAC/Global Aviation Trust |
| 02/15/2024 | 3.150% | | 3,225,000 | 3,179,548 |
| 10/01/2025 | 4.450% | | 1,889,000 | 1,829,252 |
| 10/29/2026 | 2.450% | | 445,000 | 400,286 |
| 10/29/2028 | 3.000% | | 5,655,000 | 4,901,150 |
| 01/30/2032 | 3.300% | | 2,913,000 | 2,367,898 |
| Air Lease Corp. |
| 03/01/2025 | 3.250% | | 2,500,000 | 2,395,300 |
| 07/01/2025 | 3.375% | | 2,750,000 | 2,621,282 |
| 01/15/2026 | 2.875% | | 2,075,000 | 1,939,270 |
| 08/15/2026 | 1.875% | | 2,285,000 | 2,044,092 |
| 12/01/2027 | 3.625% | | 465,000 | 427,165 |
| Aircastle Ltd.(a) |
| 01/26/2028 | 2.850% | | 3,335,000 | 2,870,615 |
| 07/18/2028 | 6.500% | | 1,925,000 | 1,912,087 |
| Ares Capital Corp. |
| 03/01/2025 | 4.250% | | 210,000 | 202,043 |
| 06/15/2028 | 2.875% | | 3,285,000 | 2,775,440 |
| Aviation Capital Group LLC(a) |
| 12/15/2024 | 5.500% | | 1,030,000 | 1,013,985 |
| 09/20/2026 | 1.950% | | 605,000 | 532,251 |
| Avolon Holdings Funding Ltd.(a) |
| 07/01/2024 | 3.950% | | 750,000 | 732,249 |
| 02/15/2025 | 2.875% | | 2,905,000 | 2,740,895 |
| 02/21/2026 | 2.125% | | 383,000 | 344,158 |
| 11/18/2027 | 2.528% | | 4,243,000 | 3,621,879 |
| Bain Capital Specialty Finance, Inc. |
| 10/13/2026 | 2.550% | | 3,250,000 | 2,810,633 |
| Barings BDC, Inc. |
| 11/23/2026 | 3.300% | | 1,230,000 | 1,086,228 |
| Blackstone Private Credit Fund |
| 12/15/2026 | 2.625% | | 6,625,000 | 5,699,925 |
The accompanying Notes to Financial Statements are an integral part of this statement.
| 42 | Multi-Manager Total Return Bond Strategies Fund | Annual Report 2023 |
Portfolio of Investments (continued)
August 31, 2023
| Corporate Bonds & Notes (continued) |
| Issuer | Coupon
Rate | | Principal
Amount ($) | Value ($) |
| Blackstone Secured Lending Fund |
| 09/30/2028 | 2.850% | | 2,850,000 | 2,353,693 |
| Blue Owl Credit Income Corp. |
| 09/16/2027 | 7.750% | | 1,978,000 | 1,968,536 |
| Blue Owl Credit Income Corp.(a) |
| 06/13/2028 | 7.950% | | 4,690,000 | 4,705,144 |
| FirstCash, Inc.(a) |
| 01/01/2030 | 5.625% | | 1,500,000 | 1,363,204 |
| FS KKR Capital Corp. |
| 10/12/2028 | 3.125% | | 2,650,000 | 2,165,942 |
| Golub Capital BDC, Inc. |
| 08/24/2026 | 2.500% | | 4,625,000 | 4,064,803 |
| Hercules Capital, Inc. |
| 01/20/2027 | 3.375% | | 3,675,000 | 3,250,743 |
| Main Street Capital Corp. |
| 07/14/2026 | 3.000% | | 3,770,000 | 3,340,694 |
| Morgan Stanley Direct Lending Fund |
| 02/11/2027 | 4.500% | | 2,360,000 | 2,203,991 |
| Navient Corp. |
| 03/15/2027 | 5.000% | | 1,555,000 | 1,416,435 |
| Owl Rock Capital Corp. |
| 07/22/2025 | 3.750% | | 1,075,000 | 1,007,564 |
| 01/15/2026 | 4.250% | | 1,370,000 | 1,284,853 |
| Owl Rock Technology Finance Corp.(a) |
| 12/15/2025 | 4.750% | | 6,155,000 | 5,685,518 |
| Park Aerospace Holdings Ltd.(a) |
| 02/15/2024 | 5.500% | | 379,000 | 377,126 |
| Quicken Loans LLC/Co-Issuer, Inc.(a) |
| 03/01/2031 | 3.875% | | 1,490,000 | 1,215,327 |
| Sixth Street Specialty Lending, Inc. |
| 08/14/2028 | 6.950% | | 3,096,000 | 3,086,315 |
| SMBC Aviation Capital Finance DAC(a) |
| 07/25/2033 | 5.700% | | 2,181,000 | 2,117,875 |
| Springleaf Finance Corp. |
| 03/15/2024 | 6.125% | | 2,600,000 | 2,595,460 |
| Total | 92,650,854 |
| Food and Beverage 0.7% |
| Anheuser-Busch Companies LLC/InBev Worldwide, Inc. |
| 02/01/2046 | 4.900% | | 9,323,000 | 8,665,466 |
| Anheuser-Busch InBev Worldwide, Inc. |
| 01/23/2039 | 5.450% | | 840,000 | 852,383 |
| B&G Foods, Inc. |
| 04/01/2025 | 5.250% | | 2,200,000 | 2,148,365 |
| Bacardi Ltd.(a) |
| 05/15/2048 | 5.300% | | 1,060,000 | 972,295 |
| Corporate Bonds & Notes (continued) |
| Issuer | Coupon
Rate | | Principal
Amount ($) | Value ($) |
| Cargill Inc.(a) |
| 11/10/2031 | 2.125% | | 1,346,000 | 1,083,648 |
| Cargill, Inc.(a) |
| 04/22/2025 | 3.500% | | 2,449,000 | 2,379,353 |
| 06/24/2026 | 4.500% | | 2,000,000 | 1,972,787 |
| 04/23/2030 | 2.125% | | 750,000 | 629,484 |
| 02/02/2031 | 1.700% | | 826,000 | 654,184 |
| Coca-Cola Europacific Partners PLC(a) |
| 05/03/2024 | 0.800% | | 6,295,000 | 6,080,593 |
| Constellation Brands, Inc. |
| 12/01/2025 | 4.750% | | 578,000 | 569,215 |
| JBS SA/Food Co./Finance, Inc. |
| 02/01/2028 | 5.125% | | 2,025,000 | 1,968,280 |
| 02/02/2029 | 3.000% | | 1,955,000 | 1,678,925 |
| 12/01/2031 | 3.750% | | 3,055,000 | 2,537,524 |
| 05/15/2032 | 3.000% | | 3,255,000 | 2,537,030 |
| 12/01/2052 | 6.500% | | 5,270,000 | 5,011,088 |
| Kraft Heinz Foods Co. |
| 01/26/2039 | 6.875% | | 796,000 | 871,842 |
| 10/01/2039 | 4.625% | | 950,000 | 836,470 |
| 02/09/2040 | 6.500% | | 1,215,000 | 1,284,484 |
| 06/01/2046 | 4.375% | | 1,445,000 | 1,195,173 |
| Kraft Heinz Foods Co. (The) |
| 07/15/2045 | 5.200% | | 1,205,000 | 1,108,099 |
| Mars, Inc.(a) |
| 04/01/2039 | 3.875% | | 1,040,000 | 872,143 |
| 07/16/2040 | 2.375% | | 964,000 | 643,840 |
| Molson Coors Brewing Co. |
| 07/15/2046 | 4.200% | | 415,000 | 328,591 |
| Nestle Holdings, Inc.(a) |
| 10/01/2027 | 4.125% | | 1,167,000 | 1,133,308 |
| 09/15/2030 | 1.250% | | 1,147,000 | 906,917 |
| 09/24/2038 | 3.900% | | 950,000 | 840,510 |
| Pilgrim’s Pride Corp. |
| 04/15/2031 | 4.250% | | 2,000,000 | 1,731,405 |
| 03/01/2032 | 3.500% | | 6,479,000 | 5,212,517 |
| 07/01/2033 | 6.250% | | 625,000 | 620,060 |
| Post Holdings, Inc.(a) |
| 03/01/2027 | 5.750% | | 2,676,000 | 2,613,932 |
| 12/15/2029 | 5.500% | | 2,210,000 | 2,043,725 |
| 04/15/2030 | 4.625% | | 2,684,000 | 2,376,749 |
| Primo Water Holdings, Inc.(a) |
| 04/30/2029 | 4.375% | | 1,610,000 | 1,413,750 |
| Simmons Foods, Inc./Prepared Foods, Inc./Pet Food, Inc./Feed(a) |
| 03/01/2029 | 4.625% | | 1,800,000 | 1,500,806 |
| Smithfield Foods, Inc.(a) |
| 02/01/2027 | 4.250% | | 2,500,000 | 2,325,309 |
| 10/15/2030 | 3.000% | | 2,020,000 | 1,588,920 |
| Triton Water Holdings, Inc.(a) |
| 04/01/2029 | 6.250% | | 2,615,000 | 2,240,842 |
The accompanying Notes to Financial Statements are an integral part of this statement.
Multi-Manager Total Return Bond Strategies Fund | Annual Report 2023
| 43 |
Portfolio of Investments (continued)
August 31, 2023
| Corporate Bonds & Notes (continued) |
| Issuer | Coupon
Rate | | Principal
Amount ($) | Value ($) |
| Viterra Finance BV(a) |
| 04/21/2026 | 2.000% | | 1,125,000 | 1,016,323 |
| Total | 74,446,335 |
| Foreign Agencies 0.0% |
| PT Bank Mandiri Persero Tbk(a) |
| 04/11/2024 | 3.750% | | 850,000 | 838,391 |
| Gaming 0.3% |
| Caesars Entertainment, Inc.(a) |
| 10/15/2029 | 4.625% | | 1,375,000 | 1,202,618 |
| 02/15/2030 | 7.000% | | 950,000 | 953,886 |
| CCM Merger, Inc.(a) |
| 05/01/2026 | 6.375% | | 1,225,000 | 1,188,632 |
| Colt Merger Sub, Inc.(a) |
| 07/01/2025 | 6.250% | | 175,000 | 173,760 |
| GLP Capital LP/Financing II, Inc. |
| 06/01/2025 | 5.250% | | 540,000 | 530,491 |
| 04/15/2026 | 5.375% | | 3,840,000 | 3,760,087 |
| 01/15/2029 | 5.300% | | 765,000 | 722,313 |
| 01/15/2030 | 4.000% | | 3,500,000 | 3,058,381 |
| 01/15/2031 | 4.000% | | 240,000 | 205,614 |
| 01/15/2032 | 3.250% | | 48,000 | 38,690 |
| Golden Entertainment, Inc.(a) |
| 04/15/2026 | 7.625% | | 1,720,000 | 1,716,001 |
| International Game Technology PLC(a) |
| 02/15/2025 | 6.500% | | 975,000 | 976,096 |
| 01/15/2027 | 6.250% | | 400,000 | 396,293 |
| MGM Resorts International |
| 05/01/2025 | 6.750% | | 1,150,000 | 1,151,830 |
| 09/01/2026 | 4.625% | | 188,000 | 177,097 |
| 04/15/2027 | 5.500% | | 1,500,000 | 1,434,406 |
| Penn National Gaming, Inc.(a) |
| 07/01/2029 | 4.125% | | 2,110,000 | 1,726,253 |
| Premier Entertainment Sub LLC/Finance Corp.(a) |
| 09/01/2031 | 5.875% | | 2,575,000 | 1,987,716 |
| VICI Properties LP |
| 02/15/2030 | 4.950% | | 70,000 | 65,826 |
| 05/15/2032 | 5.125% | | 3,725,000 | 3,453,402 |
| 05/15/2052 | 5.625% | | 1,245,000 | 1,096,821 |
| VICI Properties LP/Note Co., Inc.(a) |
| 06/15/2025 | 4.625% | | 220,000 | 213,060 |
| 09/01/2026 | 4.500% | | 2,740,000 | 2,597,479 |
| 02/01/2027 | 5.750% | | 820,000 | 804,136 |
| 02/15/2027 | 3.750% | | 2,000,000 | 1,837,821 |
| 01/15/2028 | 4.500% | | 146,000 | 135,749 |
| 02/15/2029 | 3.875% | | 1,370,000 | 1,209,400 |
| 08/15/2030 | 4.125% | | 694,000 | 606,931 |
| Corporate Bonds & Notes (continued) |
| Issuer | Coupon
Rate | | Principal
Amount ($) | Value ($) |
| Wynn Resorts Finance LLC/Capital Corp.(a) |
| 10/01/2029 | 5.125% | | 1,000,000 | 896,129 |
| Total | 34,316,918 |
| Health Care 1.3% |
| Abbott Laboratories |
| 11/30/2046 | 4.900% | | 205,000 | 199,677 |
| Barnabas Health, Inc. |
| 07/01/2028 | 4.000% | | 3,200,000 | 2,980,781 |
| Becton Dickinson and Co. |
| 12/15/2024 | 3.734% | | 44,000 | 42,945 |
| 02/13/2028 | 4.693% | | 1,459,000 | 1,433,455 |
| 08/22/2032 | 4.298% | | 2,913,000 | 2,720,368 |
| 05/15/2044 | 4.875% | | 1,555,000 | 1,314,393 |
| Catalent Pharma Solutions, Inc.(a) |
| 02/15/2029 | 3.125% | | 1,000,000 | 842,930 |
| Cigna Corp. |
| 03/01/2027 | 3.400% | | 2,190,000 | 2,057,671 |
| 08/15/2038 | 4.800% | | 429,000 | 394,122 |
| 07/15/2046 | 4.800% | | 2,070,000 | 1,832,730 |
| 03/15/2051 | 3.400% | | 1,215,000 | 847,582 |
| CommonSpirit Health |
| 10/01/2025 | 1.547% | | 3,000,000 | 2,754,039 |
| 11/01/2042 | 4.350% | | 120,000 | 100,478 |
| CVS Health Corp. |
| 07/20/2025 | 3.875% | | 1,002,000 | 971,912 |
| 02/21/2030 | 5.125% | | 3,805,000 | 3,745,961 |
| 09/15/2031 | 2.125% | | 903,000 | 711,979 |
| 02/21/2033 | 5.250% | | 328,000 | 320,702 |
| 06/01/2033 | 5.300% | | 531,000 | 520,073 |
| 07/20/2035 | 4.875% | | 720,000 | 669,939 |
| 03/25/2038 | 4.780% | | 8,665,000 | 7,765,861 |
| 04/01/2040 | 4.125% | | 1,899,000 | 1,544,604 |
| 08/21/2040 | 2.700% | | 996,000 | 666,303 |
| 07/20/2045 | 5.125% | | 176,000 | 156,705 |
| 03/25/2048 | 5.050% | | 8,683,000 | 7,624,510 |
| 06/01/2053 | 5.875% | | 4,125,000 | 4,025,694 |
| 06/01/2063 | 6.000% | | 777,000 | 760,657 |
| DaVita, Inc.(a) |
| 06/01/2030 | 4.625% | | 2,495,000 | 2,140,224 |
| 02/15/2031 | 3.750% | | 1,335,000 | 1,062,994 |
| Dentsply Sirona, Inc. |
| 06/01/2030 | 3.250% | | 1,347,000 | 1,155,382 |
| Duke University Health System, Inc. |
| 06/01/2047 | 3.920% | | 875,000 | 709,506 |
| Embecta Corp.(a) |
| 02/15/2030 | 5.000% | | 1,500,000 | 1,233,504 |
| Fresenius Medical Care US Finance III, Inc.(a) |
| 12/01/2026 | 1.875% | | 3,564,000 | 3,110,545 |
| GE HealthCare Technologies, Inc. |
| 11/15/2024 | 5.550% | | 5,095,000 | 5,080,987 |
The accompanying Notes to Financial Statements are an integral part of this statement.
| 44 | Multi-Manager Total Return Bond Strategies Fund | Annual Report 2023 |
Portfolio of Investments (continued)
August 31, 2023
| Corporate Bonds & Notes (continued) |
| Issuer | Coupon
Rate | | Principal
Amount ($) | Value ($) |
| HCA, Inc. |
| 02/01/2025 | 5.375% | | 2,900,000 | 2,881,590 |
| 04/15/2025 | 5.250% | | 1,659,000 | 1,644,859 |
| 06/15/2025 | 7.690% | | 750,000 | 772,014 |
| 06/15/2026 | 5.250% | | 3,135,000 | 3,096,418 |
| 02/15/2027 | 4.500% | | 679,000 | 656,228 |
| 03/15/2027 | 3.125% | | 687,000 | 631,315 |
| 12/01/2027 | 7.050% | | 10,000 | 10,399 |
| 06/15/2029 | 4.125% | | 3,850,000 | 3,554,682 |
| 09/01/2030 | 3.500% | | 3,874,000 | 3,383,520 |
| 07/15/2031 | 2.375% | | 1,580,000 | 1,248,764 |
| 03/15/2032 | 3.625% | | 1,605,000 | 1,380,609 |
| 06/15/2047 | 5.500% | | 2,515,000 | 2,285,598 |
| 06/15/2049 | 5.250% | | 3,225,000 | 2,814,135 |
| 07/15/2051 | 3.500% | | 1,697,000 | 1,130,326 |
| IQVIA, Inc.(a) |
| 05/15/2028 | 5.700% | | 7,875,000 | 7,860,106 |
| Laboratory Corp. of America Holdings |
| 11/01/2023 | 4.000% | | 330,000 | 328,729 |
| 09/01/2024 | 3.250% | | 2,561,000 | 2,494,428 |
| Legacy LifePoint Health LLC(a) |
| 02/15/2027 | 4.375% | | 1,575,000 | 1,362,745 |
| Mayo Clinic |
| 11/15/2052 | 4.128% | | 750,000 | 632,165 |
| McKesson Corp. |
| 02/15/2026 | 5.250% | | 1,088,000 | 1,083,730 |
| 08/15/2026 | 1.300% | | 1,820,000 | 1,630,342 |
| 07/15/2033 | 5.100% | | 11,330,000 | 11,239,646 |
| Medtronic Global Holdings SCA |
| 03/30/2033 | 4.500% | | 1,465,000 | 1,415,484 |
| Memorial Sloan-Kettering Cancer Center |
| 07/01/2052 | 4.125% | | 1,130,000 | 940,440 |
| ModivCare Escrow Issuer, Inc.(a) |
| 10/01/2029 | 5.000% | | 2,800,000 | 2,065,919 |
| Mozart Debt Merger Sub, Inc.(a) |
| 04/01/2029 | 3.875% | | 4,030,000 | 3,510,136 |
| 10/01/2029 | 5.250% | | 2,475,000 | 2,197,783 |
| New York and Presbyterian Hospital (The) |
| 08/01/2116 | 4.763% | | 785,000 | 659,090 |
| 08/01/2119 | 3.954% | | 305,000 | 214,821 |
| NYU Langone Hospitals |
| 07/01/2043 | 5.750% | | 705,000 | 710,661 |
| Providence Service Corp. (The)(a) |
| 11/15/2025 | 5.875% | | 600,000 | 569,376 |
| RegionalCare Hospital Partners Holdings, Inc./LifePoint Health, Inc.(a) |
| 12/01/2026 | 9.750% | | 2,875,000 | 2,689,304 |
| Corporate Bonds & Notes (continued) |
| Issuer | Coupon
Rate | | Principal
Amount ($) | Value ($) |
| Tenet Healthcare Corp. |
| 11/01/2027 | 5.125% | | 1,450,000 | 1,381,539 |
| 10/01/2028 | 6.125% | | 2,725,000 | 2,624,620 |
| 06/01/2029 | 4.250% | | 425,000 | 379,575 |
| 01/15/2030 | 4.375% | | 1,300,000 | 1,156,195 |
| Texas Health Resources |
| 11/15/2055 | 4.330% | | 700,000 | 598,698 |
| Thermo Fisher Scientific, Inc. |
| 08/10/2030 | 4.977% | | 1,705,000 | 1,699,975 |
| 08/10/2033 | 5.086% | | 4,593,000 | 4,614,830 |
| 08/10/2043 | 5.404% | | 684,000 | 691,315 |
| Universal Health Services, Inc. |
| 09/01/2026 | 1.650% | | 2,485,000 | 2,207,051 |
| 10/15/2030 | 2.650% | | 2,485,000 | 1,999,086 |
| Total | 145,947,459 |
| Healthcare Insurance 0.4% |
| Aetna, Inc. |
| 06/15/2036 | 6.625% | | 624,000 | 669,471 |
| Centene Corp. |
| 12/15/2027 | 4.250% | | 4,010,000 | 3,748,796 |
| 07/15/2028 | 2.450% | | 3,832,000 | 3,277,947 |
| 12/15/2029 | 4.625% | | 850,000 | 781,575 |
| 10/15/2030 | 3.000% | | 8,031,000 | 6,684,066 |
| 08/01/2031 | 2.625% | | 625,000 | 496,832 |
| Elevance Health, Inc. |
| 02/08/2026 | 4.900% | | 596,000 | 588,267 |
| Health Care Service Corp., a Mutual Legal Reserve Co.(a) |
| 06/01/2025 | 1.500% | | 577,000 | 533,211 |
| Humana, Inc. |
| 02/03/2027 | 1.350% | | 901,000 | 792,730 |
| Molina Healthcare, Inc.(a) |
| 11/15/2030 | 3.875% | | 1,500,000 | 1,279,694 |
| UnitedHealth Group, Inc. |
| 05/15/2032 | 4.200% | | 1,374,000 | 1,297,506 |
| 08/15/2039 | 3.500% | | 617,000 | 504,150 |
| 05/15/2040 | 2.750% | | 366,000 | 263,380 |
| 05/15/2041 | 3.050% | | 190,000 | 141,753 |
| 07/15/2045 | 4.750% | | 443,000 | 411,811 |
| 10/15/2047 | 3.750% | | 473,000 | 372,739 |
| 05/15/2051 | 3.250% | | 3,750,000 | 2,659,340 |
| 02/15/2053 | 5.875% | | 625,000 | 667,610 |
| 04/15/2053 | 5.050% | | 10,458,000 | 9,981,455 |
| 02/15/2063 | 6.050% | | 562,000 | 611,329 |
| 04/15/2063 | 5.200% | | 3,953,000 | 3,782,194 |
| Wellpoint, Inc. |
| 08/15/2024 | 3.500% | | 1,928,000 | 1,887,608 |
| Total | 41,433,464 |
The accompanying Notes to Financial Statements are an integral part of this statement.
Multi-Manager Total Return Bond Strategies Fund | Annual Report 2023
| 45 |
Portfolio of Investments (continued)
August 31, 2023
| Corporate Bonds & Notes (continued) |
| Issuer | Coupon
Rate | | Principal
Amount ($) | Value ($) |
| Healthcare REIT 0.2% |
| Diversified Healthcare Trust |
| 06/15/2025 | 9.750% | | 1,062,000 | 1,045,013 |
| 03/01/2031 | 4.375% | | 1,500,000 | 1,131,972 |
| Healthcare Realty Holdings LP |
| 01/15/2028 | 3.625% | | 435,000 | 392,064 |
| 03/15/2030 | 2.400% | | 995,000 | 781,584 |
| 03/15/2031 | 2.050% | | 400,000 | 297,215 |
| Healthcare Trust of America Holdings LP |
| 02/15/2030 | 3.100% | | 1,246,000 | 1,062,456 |
| 03/15/2031 | 2.000% | | 3,185,000 | 2,454,637 |
| Healthpeak OP LLC |
| 12/15/2032 | 5.250% | | 3,716,000 | 3,593,747 |
| MPT Operating Partnership LP/Finance Corp. |
| 03/15/2031 | 3.500% | | 1,850,000 | 1,198,729 |
| Omega Healthcare Investors, Inc. |
| 01/15/2025 | 4.500% | | 975,000 | 950,679 |
| Physicians Realty LP |
| 03/15/2027 | 4.300% | | 380,000 | 363,625 |
| 01/15/2028 | 3.950% | | 77,000 | 70,575 |
| 11/01/2031 | 2.625% | | 1,750,000 | 1,358,462 |
| Sabra Health Care LP |
| 12/01/2031 | 3.200% | | 574,000 | 437,905 |
| Senior Housing Properties Trust |
| 05/01/2024 | 4.750% | | 1,100,000 | 1,043,410 |
| Ventas Realty LP |
| 09/30/2043 | 5.700% | | 225,000 | 206,532 |
| Welltower, Inc. |
| 06/01/2031 | 2.800% | | 8,255,000 | 6,801,910 |
| Total | 23,190,515 |
| Home Construction 0.2% |
| Ashton Woods USA LLC/Finance Co.(a) |
| 01/15/2028 | 6.625% | | 1,700,000 | 1,625,982 |
| Brookfield Residential Properties, Inc./US Corp.(a) |
| 09/15/2027 | 6.250% | | 1,560,000 | 1,443,481 |
| 02/15/2030 | 4.875% | | 2,575,000 | 2,148,020 |
| Century Communities, Inc. |
| 06/01/2027 | 6.750% | | 2,375,000 | 2,368,495 |
| Empire Communities Corp.(a) |
| 12/15/2025 | 7.000% | | 4,225,000 | 4,088,506 |
| KB Home |
| 06/15/2031 | 4.000% | | 1,075,000 | 905,204 |
| M/I Homes, Inc. |
| 02/01/2028 | 4.950% | | 650,000 | 603,864 |
| Mattamy Group Corp.(a) |
| 03/01/2030 | 4.625% | | 4,500,000 | 3,978,880 |
| Corporate Bonds & Notes (continued) |
| Issuer | Coupon
Rate | | Principal
Amount ($) | Value ($) |
| MDC Holdings, Inc. |
| 08/06/2061 | 3.966% | | 3,540,000 | 2,063,233 |
| Meritage Homes Corp. |
| 06/06/2027 | 5.125% | | 2,000,000 | 1,921,284 |
| PulteGroup, Inc. |
| 03/01/2026 | 5.500% | | 737,000 | 735,626 |
| Taylor Morrison Communities, Inc.(a) |
| 01/15/2028 | 5.750% | | 2,000,000 | 1,938,097 |
| 08/01/2030 | 5.125% | | 614,000 | 565,497 |
| Total | 24,386,169 |
| Independent Energy 0.6% |
| Aker BP ASA(a) |
| 01/15/2030 | 3.750% | | 300,000 | 265,436 |
| 06/13/2033 | 6.000% | | 1,250,000 | 1,250,084 |
| Antero Resources Corp.(a) |
| 02/01/2029 | 7.625% | | 600,000 | 613,631 |
| 03/01/2030 | 5.375% | | 920,000 | 861,068 |
| Ascent Resources Utica Holdings LLC/ARU Finance Corp.(a) |
| 11/01/2026 | 7.000% | | 600,000 | 596,522 |
| 11/01/2027 | 9.000% | | 150,000 | 188,644 |
| 12/31/2028 | 8.250% | | 2,500,000 | 2,502,810 |
| Canadian Natural Resources Ltd. |
| 06/30/2033 | 6.450% | | 730,000 | 751,386 |
| Chesapeake Energy Corp.(a) |
| 02/01/2026 | 5.500% | | 2,000,000 | 1,955,931 |
| CNX Resources Corp.(a) |
| 03/14/2027 | 7.250% | | 1,475,000 | 1,473,452 |
| ConocoPhillips Co. |
| 03/15/2042 | 3.758% | | 1,928,000 | 1,562,042 |
| 05/15/2053 | 5.300% | | 682,000 | 666,284 |
| 03/15/2054 | 5.550% | | 7,011,000 | 7,031,104 |
| 09/15/2063 | 5.700% | | 1,370,000 | 1,379,648 |
| Continental Resources, Inc. |
| 06/01/2024 | 3.800% | | 1,683,000 | 1,652,964 |
| Coterra Energy, Inc. |
| 05/15/2027 | 3.900% | | 1,552,000 | 1,474,390 |
| Crescent Energy Finance LLC(a) |
| 05/01/2026 | 7.250% | | 892,000 | 880,581 |
| Devon Energy Corp. |
| 09/15/2024 | 5.250% | | 78,000 | 77,544 |
| 07/15/2041 | 5.600% | | 1,875,000 | 1,739,489 |
| Diamondback Energy, Inc. |
| 12/01/2026 | 3.250% | | 1,905,000 | 1,791,289 |
| 03/24/2031 | 3.125% | | 3,565,000 | 3,063,375 |
| 03/15/2033 | 6.250% | | 543,000 | 561,213 |
| 03/15/2052 | 4.250% | | 1,449,000 | 1,087,730 |
| 03/15/2053 | 6.250% | | 536,000 | 534,253 |
The accompanying Notes to Financial Statements are an integral part of this statement.
| 46 | Multi-Manager Total Return Bond Strategies Fund | Annual Report 2023 |
Portfolio of Investments (continued)
August 31, 2023
| Corporate Bonds & Notes (continued) |
| Issuer | Coupon
Rate | | Principal
Amount ($) | Value ($) |
| Energean Israel Finance Ltd.(a) |
| 03/30/2024 | 4.500% | | 850,000 | 841,706 |
| 03/30/2026 | 4.875% | | 1,321,000 | 1,239,084 |
| 03/30/2028 | 5.375% | | 2,950,000 | 2,684,535 |
| Hilcorp Energy I LP/Finance Co.(a) |
| 04/15/2030 | 6.000% | | 825,000 | 767,103 |
| 02/01/2031 | 6.000% | | 1,560,000 | 1,435,146 |
| 04/15/2032 | 6.250% | | 2,350,000 | 2,160,346 |
| Lundin Energy Finance BV(a) |
| 07/15/2026 | 2.000% | | 5,128,000 | 4,603,855 |
| 07/15/2031 | 3.100% | | 1,575,000 | 1,297,389 |
| Occidental Petroleum Corp. |
| 07/15/2027 | 8.500% | | 213,000 | 230,255 |
| 09/01/2030 | 6.625% | | 513,000 | 529,454 |
| 01/01/2031 | 6.125% | | 600,000 | 604,896 |
| 05/01/2031 | 7.500% | | 556,000 | 602,049 |
| Ovintiv, Inc. |
| 05/15/2028 | 5.650% | | 5,513,000 | 5,478,883 |
| 07/15/2033 | 6.250% | | 543,000 | 541,829 |
| 07/15/2053 | 7.100% | | 475,000 | 491,484 |
| Pioneer Natural Resources Co. |
| 03/29/2026 | 5.100% | | 3,350,000 | 3,323,974 |
| Santos Finance Ltd.(a) |
| 04/29/2031 | 3.649% | | 652,000 | 537,130 |
| Southwestern Energy Co. |
| 02/01/2032 | 4.750% | | 1,550,000 | 1,372,241 |
| Total | 62,702,229 |
| Integrated Energy 0.1% |
| BP Capital Markets America, Inc. |
| 09/11/2033 | 4.893% | | 605,000 | 588,904 |
| 06/04/2051 | 2.939% | | 1,396,000 | 912,544 |
| BP Capital Markets PLC(j),(k) |
| | 4.375% | | 5,000,000 | 4,771,939 |
| | 4.875% | | 825,000 | 750,293 |
| Cenovus Energy, Inc. |
| 06/15/2047 | 5.400% | | 711,000 | 638,898 |
| 02/15/2052 | 3.750% | | 3,750,000 | 2,629,959 |
| Chevron Corp. |
| 05/11/2050 | 3.078% | | 1,540,000 | 1,093,856 |
| Exxon Mobil Corp. |
| 04/15/2051 | 3.452% | | 2,735,000 | 2,034,182 |
| Reliance Industries Ltd.(a) |
| 01/12/2052 | 3.625% | | 1,300,000 | 886,364 |
| Total Capital International SA |
| 06/29/2041 | 2.986% | | 560,000 | 410,096 |
| Total | 14,717,035 |
| Corporate Bonds & Notes (continued) |
| Issuer | Coupon
Rate | | Principal
Amount ($) | Value ($) |
| Leisure 0.1% |
| AMC Entertainment Holdings, Inc.(a),(l) |
| 06/15/2026 | 12.000% | | 95,233 | 66,056 |
| Carnival Corp.(a) |
| 03/01/2027 | 5.750% | | 1,450,000 | 1,364,792 |
| NCL Corp., Ltd.(a) |
| 03/15/2026 | 5.875% | | 700,000 | 659,356 |
| NCL Finance Ltd.(a) |
| 03/15/2028 | 6.125% | | 975,000 | 878,974 |
| Royal Caribbean Cruises Ltd.(a) |
| 01/15/2029 | 9.250% | | 750,000 | 799,302 |
| 01/15/2030 | 7.250% | | 300,000 | 304,765 |
| Viking Cruises Ltd.(a) |
| 09/15/2027 | 5.875% | | 1,575,000 | 1,472,276 |
| Total | 5,545,521 |
| Life Insurance 1.1% |
| AIG Global Funding(a) |
| 09/22/2025 | 0.900% | | 3,545,000 | 3,221,583 |
| Allianz SE(a),(k),(m) |
| 09/06/2053 | 6.350% | | 5,200,000 | 5,199,844 |
| Athene Global Funding(a) |
| 06/29/2026 | 1.608% | | 2,930,000 | 2,571,447 |
| 03/08/2027 | 3.205% | | 1,430,000 | 1,282,714 |
| 03/24/2028 | 2.500% | | 1,620,000 | 1,383,997 |
| 08/19/2028 | 1.985% | | 4,380,000 | 3,622,496 |
| 01/07/2029 | 2.717% | | 320,000 | 268,108 |
| Brighthouse Financial Global Funding(a) |
| 01/13/2025 | 1.750% | | 3,210,000 | 3,024,817 |
| Brighthouse Financial, Inc.(a) |
| 12/15/2023 | 1.200% | | 4,580,000 | 4,512,276 |
| CNO Global Funding(a) |
| 01/06/2029 | 2.650% | | 5,235,000 | 4,458,300 |
| Corebridge Financial, Inc. |
| 04/05/2032 | 3.900% | | 3,087,000 | 2,697,005 |
| Corebridge Financial, Inc.(k) |
| 12/15/2052 | 6.875% | | 2,438,000 | 2,356,362 |
| Equitable Financial Life Global Funding(a) |
| 12/02/2025 | 5.500% | | 4,165,000 | 4,124,508 |
| F&G Annuities & Life, Inc.(a) |
| 01/13/2028 | 7.400% | | 1,770,000 | 1,802,273 |
| F&G Global Funding(a) |
| 07/07/2025 | 5.150% | | 4,475,000 | 4,348,738 |
| 09/20/2028 | 2.000% | | 2,160,000 | 1,782,732 |
| Five Corners Funding Trust III(a) |
| 02/15/2033 | 5.791% | | 2,165,000 | 2,187,430 |
The accompanying Notes to Financial Statements are an integral part of this statement.
Multi-Manager Total Return Bond Strategies Fund | Annual Report 2023
| 47 |
Portfolio of Investments (continued)
August 31, 2023
| Corporate Bonds & Notes (continued) |
| Issuer | Coupon
Rate | | Principal
Amount ($) | Value ($) |
| GA Global Funding Trust(a) |
| 12/08/2023 | 1.250% | | 2,260,000 | 2,225,284 |
| 01/06/2027 | 2.250% | | 5,780,000 | 5,104,183 |
| Great-West Lifeco US Finance 2020 LP(a) |
| 08/12/2025 | 0.904% | | 4,190,000 | 3,785,789 |
| Hill City Funding Trust(a) |
| 08/15/2041 | 4.046% | | 2,750,000 | 1,847,130 |
| Jackson Financial, Inc. |
| 11/23/2051 | 4.000% | | 1,720,000 | 1,145,054 |
| Jackson National Life Global Funding(a) |
| 01/12/2025 | 1.750% | | 4,800,000 | 4,497,953 |
| 04/12/2028 | 5.250% | | 1,200,000 | 1,136,629 |
| Lincoln National Corp. |
| 06/15/2040 | 7.000% | | 930,000 | 976,362 |
| MassMutual Global Funding II(a) |
| 06/14/2028 | 5.050% | | 3,535,000 | 3,506,751 |
| MetLife, Inc. |
| 07/15/2033 | 5.375% | | 3,535,000 | 3,517,910 |
| Metropolitan Life Global Funding I(a) |
| 08/25/2029 | 4.300% | | 4,965,000 | 4,710,848 |
| New York Life Global Funding(a) |
| 06/13/2028 | 4.900% | | 2,105,000 | 2,074,103 |
| 08/01/2031 | 1.850% | | 3,755,000 | 2,933,904 |
| 01/28/2033 | 4.550% | | 2,191,000 | 2,073,416 |
| New York Life Insurance Co.(a) |
| Subordinated |
| 05/15/2050 | 3.750% | | 2,545,000 | 1,897,013 |
| Northwestern Mutual Global Funding(a) |
| 06/01/2028 | 1.700% | | 1,265,000 | 1,082,016 |
| 06/12/2028 | 4.900% | | 5,740,000 | 5,677,791 |
| Pine Street Trust II(a) |
| 02/15/2049 | 5.568% | | 1,890,000 | 1,637,905 |
| Protective Life Global Funding(a) |
| 01/13/2025 | 1.646% | | 3,990,000 | 3,771,757 |
| 07/06/2027 | 4.714% | | 5,445,000 | 5,296,666 |
| Prudential Financial, Inc.(k) |
| 03/01/2053 | 6.750% | | 175,000 | 172,903 |
| Reliance Standard Life Global Funding II(a) |
| 09/19/2023 | 3.850% | | 1,465,000 | 1,461,862 |
| 05/07/2025 | 2.750% | | 4,340,000 | 4,081,296 |
| RGA Global Funding(a) |
| 01/18/2029 | 2.700% | | 3,655,000 | 3,153,339 |
| Teachers Insurance & Annuity Association of America(a) |
| Subordinated |
| 09/15/2044 | 4.900% | | 2,040,000 | 1,823,780 |
| 05/15/2047 | 4.270% | | 4,785,000 | 3,858,648 |
| 05/15/2050 | 3.300% | | 3,980,000 | 2,696,656 |
| Total | 124,991,578 |
| Corporate Bonds & Notes (continued) |
| Issuer | Coupon
Rate | | Principal
Amount ($) | Value ($) |
| Lodging 0.1% |
| Hyatt Hotels Corp. |
| 01/30/2027 | 5.750% | | 2,780,000 | 2,786,067 |
| Marriott International, Inc. |
| 10/15/2032 | 3.500% | | 3,400,000 | 2,887,843 |
| Total | 5,673,910 |
| Media and Entertainment 0.4% |
| AMC Networks, Inc. |
| 04/01/2024 | 5.000% | | 1,300,000 | 1,287,036 |
| Banijay Entertainment SASU(a) |
| 03/01/2025 | 5.375% | | 285,000 | 279,101 |
| Diamond Sports Group LLC/Finance Co.(a),(n) |
| 08/15/2026 | 0.000% | | 9,733,000 | 283,905 |
| Discovery Communications LLC |
| 05/15/2049 | 5.300% | | 1,063,000 | 865,491 |
| 09/15/2055 | 4.000% | | 1,298,000 | 845,700 |
| Gray Television, Inc.(a) |
| 07/15/2026 | 5.875% | | 900,000 | 820,771 |
| 05/15/2027 | 7.000% | | 1,460,000 | 1,308,694 |
| Interpublic Group of Companies, Inc. (The) |
| 04/15/2024 | 4.200% | | 333,000 | 328,238 |
| Meta Platforms, Inc. |
| 08/15/2027 | 3.500% | | 773,000 | 736,395 |
| 08/15/2052 | 4.450% | | 4,133,000 | 3,503,386 |
| 05/15/2053 | 5.600% | | 4,215,000 | 4,229,364 |
| 08/15/2062 | 4.650% | | 266,000 | 226,003 |
| 05/15/2063 | 5.750% | | 2,469,000 | 2,490,007 |
| Prosus NV(a) |
| 01/19/2052 | 4.987% | | 2,505,000 | 1,679,019 |
| Take-Two Interactive Software, Inc. |
| 03/28/2028 | 4.950% | | 3,880,000 | 3,821,502 |
| Viacom, Inc. |
| 03/15/2043 | 4.375% | | 1,067,000 | 734,993 |
| 09/01/2043 | 5.850% | | 1,510,000 | 1,249,156 |
| 04/01/2044 | 5.250% | | 161,000 | 120,571 |
| ViacomCBS, Inc. |
| 01/15/2031 | 4.950% | | 1,468,000 | 1,311,163 |
| 05/19/2032 | 4.200% | | 699,000 | 581,484 |
| 05/19/2050 | 4.950% | | 957,000 | 699,398 |
| Walt Disney Co. (The) |
| 03/15/2033 | 6.550% | | 1,000,000 | 1,104,684 |
| Warnermedia Holdings, Inc. |
| 03/15/2027 | 3.755% | | 2,401,000 | 2,250,634 |
| 03/15/2032 | 4.279% | | 30,000 | 26,470 |
| 03/15/2042 | 5.050% | | 6,975,000 | 5,737,204 |
| 03/15/2052 | 5.141% | | 15,833,000 | 12,613,653 |
| 03/15/2062 | 5.391% | | 713,000 | 565,032 |
| Total | 49,699,054 |
The accompanying Notes to Financial Statements are an integral part of this statement.
| 48 | Multi-Manager Total Return Bond Strategies Fund | Annual Report 2023 |
Portfolio of Investments (continued)
August 31, 2023
| Corporate Bonds & Notes (continued) |
| Issuer | Coupon
Rate | | Principal
Amount ($) | Value ($) |
| Metals and Mining 0.3% |
| Anglo American Capital PLC(a) |
| 03/17/2028 | 2.250% | | 530,000 | 456,715 |
| 05/02/2033 | 5.500% | | 1,299,000 | 1,255,094 |
| AngloGold Ashanti Holdings PLC |
| 10/01/2030 | 3.750% | | 2,075,000 | 1,720,343 |
| BHP Billiton Finance USA Ltd. |
| 02/28/2033 | 4.900% | | 1,349,000 | 1,329,266 |
| Cleveland-Cliffs, Inc.(a) |
| 04/15/2030 | 6.750% | | 1,295,000 | 1,233,725 |
| First Quantum Minerals Ltd.(a) |
| 04/01/2025 | 7.500% | | 2,200,000 | 2,195,356 |
| Freeport-McMoRan, Inc. |
| 11/14/2034 | 5.400% | | 5,000,000 | 4,735,068 |
| Glencore Funding LLC(a) |
| 03/12/2024 | 4.125% | | 1,375,000 | 1,362,304 |
| Hecla Mining Co. |
| 02/15/2028 | 7.250% | | 675,000 | 661,762 |
| Kinross Gold Corp. |
| 07/15/2027 | 4.500% | | 1,239,000 | 1,193,914 |
| Newmont Corp. |
| 10/01/2030 | 2.250% | | 10,077,000 | 8,187,002 |
| Northern Star Resources Ltd.(a) |
| 04/11/2033 | 6.125% | | 2,105,000 | 2,030,402 |
| Novelis Corp.(a) |
| 01/30/2030 | 4.750% | | 1,390,000 | 1,244,005 |
| Nucor Corp. |
| 05/23/2027 | 4.300% | | 690,000 | 669,163 |
| 05/01/2028 | 3.950% | | 1,500,000 | 1,425,979 |
| Rain Carbon, Inc.(a) |
| 09/01/2029 | 12.250% | | 975,000 | 1,004,279 |
| Rain CII Carbon LLC/Corp.(a) |
| 04/01/2025 | 7.250% | | 39,000 | 38,327 |
| Rio Tinto Finance USA PLC |
| 03/09/2033 | 5.000% | | 687,000 | 682,460 |
| 03/09/2053 | 5.125% | | 1,270,000 | 1,226,908 |
| Southern Copper Corp. |
| 04/23/2025 | 3.875% | | 600,000 | 581,750 |
| Steel Dynamics, Inc. |
| 06/15/2025 | 2.400% | | 491,000 | 462,320 |
| 10/15/2027 | 1.650% | | 747,000 | 641,472 |
| 01/15/2031 | 3.250% | | 1,510,000 | 1,315,638 |
| Teck Resources Ltd. |
| 08/15/2040 | 6.000% | | 342,000 | 323,215 |
| Total | 35,976,467 |
| Corporate Bonds & Notes (continued) |
| Issuer | Coupon
Rate | | Principal
Amount ($) | Value ($) |
| Midstream 1.1% |
| AmeriGas Partners LP/Finance Corp. |
| 08/20/2026 | 5.875% | | 2,300,000 | 2,180,820 |
| Antero Midstream Partners LP/Finance Corp.(a) |
| 01/15/2028 | 5.750% | | 1,300,000 | 1,244,449 |
| Cheniere Energy Partners LP(a) |
| 06/30/2033 | 5.950% | | 741,000 | 739,750 |
| Colonial Enterprises, Inc.(a) |
| 05/15/2030 | 3.250% | | 3,505,000 | 3,090,726 |
| Colorado Interstate Gas Co. LLC/Issuing Corp.(a) |
| 08/15/2026 | 4.150% | | 2,290,000 | 2,185,522 |
| Columbia Pipelines Operating Co. LLC(a) |
| 08/15/2030 | 5.927% | | 1,205,000 | 1,215,435 |
| 11/15/2033 | 6.036% | | 6,590,000 | 6,660,184 |
| Crestwood Midstream Partners LP/Finance Corp.(a) |
| 05/01/2027 | 5.625% | | 1,375,000 | 1,334,844 |
| DT Midstream, Inc.(a) |
| 06/15/2031 | 4.375% | | 1,600,000 | 1,385,968 |
| EIG Pearl Holdings Sarl(a) |
| 08/31/2036 | 3.545% | | 1,400,000 | 1,163,539 |
| 08/31/2036 | 3.545% | | 900,000 | 747,989 |
| Enbridge, Inc. |
| 03/08/2033 | 5.700% | | 5,418,000 | 5,420,557 |
| Enbridge, Inc.(k) |
| 07/15/2080 | 5.750% | | 1,213,000 | 1,101,510 |
| 01/15/2083 | 7.625% | | 1,056,000 | 1,060,446 |
| Energy Transfer LP |
| 02/15/2033 | 5.750% | | 873,000 | 867,007 |
| Energy Transfer Operating LP |
| 01/15/2024 | 5.875% | | 2,481,000 | 2,479,278 |
| 04/15/2047 | 5.300% | | 2,079,000 | 1,762,585 |
| 05/15/2050 | 5.000% | | 3,530,000 | 2,904,826 |
| Energy Transfer Partners LP |
| 03/15/2035 | 4.900% | | 134,000 | 122,280 |
| 06/15/2038 | 5.800% | | 646,000 | 610,687 |
| 10/01/2043 | 5.950% | | 280,000 | 256,012 |
| 03/15/2045 | 5.150% | | 2,220,000 | 1,868,773 |
| 06/15/2048 | 6.000% | | 173,000 | 159,771 |
| Energy Transfer Partners LP/Regency Finance Corp. |
| 11/01/2023 | 4.500% | | 2,409,000 | 2,402,816 |
| EnLink Midstream LLC(a) |
| 09/01/2030 | 6.500% | | 1,325,000 | 1,328,821 |
| Enterprise Products Operating LLC |
| 02/15/2024 | 3.900% | | 500,000 | 495,454 |
| 05/15/2046 | 4.900% | | 1,400,000 | 1,241,583 |
| Enterprise Products Operating LLC(b) |
3-month Term SOFR + 3.248%
08/16/2077 | 8.619% | | 324,000 | 319,462 |
The accompanying Notes to Financial Statements are an integral part of this statement.
Multi-Manager Total Return Bond Strategies Fund | Annual Report 2023
| 49 |
Portfolio of Investments (continued)
August 31, 2023
| Corporate Bonds & Notes (continued) |
| Issuer | Coupon
Rate | | Principal
Amount ($) | Value ($) |
| Galaxy Pipeline Assets Bidco Ltd.(a) |
| 03/31/2034 | 2.160% | | 758,470 | 638,379 |
| 09/30/2040 | 2.940% | | 427,433 | 336,972 |
| Greensaif Pipelines Bidco Sarl(a) |
| 02/23/2038 | 6.129% | | 975,000 | 978,268 |
| 02/23/2042 | 6.510% | | 975,000 | 984,929 |
| Kinder Morgan Energy Partners LP |
| 09/01/2024 | 4.250% | | 482,000 | 474,302 |
| 03/15/2032 | 7.750% | | 635,000 | 702,182 |
| 09/01/2039 | 6.500% | | 1,000,000 | 1,006,878 |
| Kinder Morgan, Inc. |
| 06/01/2045 | 5.550% | | 578,000 | 522,872 |
| Magellan Midstream Partners LP |
| 09/15/2046 | 4.250% | | 320,000 | 235,835 |
| MPLX LP |
| 12/01/2024 | 4.875% | | 325,000 | 320,852 |
| 06/01/2025 | 4.875% | | 200,000 | 196,866 |
| 03/01/2026 | 1.750% | | 335,000 | 305,134 |
| 03/15/2028 | 4.000% | | 2,434,000 | 2,284,981 |
| 03/01/2047 | 5.200% | | 1,500,000 | 1,292,669 |
| NGPL PipeCo LLC(a) |
| 08/15/2027 | 4.875% | | 412,000 | 394,778 |
| Northern Natural Gas Co.(a) |
| 10/16/2051 | 3.400% | | 496,000 | 327,050 |
| ONEOK Partners LP |
| 02/01/2041 | 6.125% | | 274,000 | 264,562 |
| 09/15/2043 | 6.200% | | 721,000 | 699,081 |
| ONEOK, Inc. |
| 01/15/2026 | 5.850% | | 504,000 | 506,584 |
| 11/01/2026 | 5.550% | | 2,875,000 | 2,876,349 |
| 09/01/2033 | 6.050% | | 4,230,000 | 4,263,565 |
| 07/13/2047 | 4.950% | | 2,050,000 | 1,685,180 |
| 03/15/2050 | 4.500% | | 6,830,000 | 5,126,980 |
| Plains All American Pipeline LP/Finance Corp. |
| 10/15/2025 | 4.650% | | 1,807,000 | 1,761,503 |
| 09/15/2030 | 3.800% | | 650,000 | 575,453 |
| 06/01/2042 | 5.150% | | 2,185,000 | 1,806,376 |
| Rockies Express Pipeline LLC(a) |
| 07/15/2029 | 4.950% | | 2,435,000 | 2,233,946 |
| 05/15/2030 | 4.800% | | 1,500,000 | 1,323,092 |
| Sabine Pass Liquefaction LLC |
| 03/15/2027 | 5.000% | | 2,472,000 | 2,430,140 |
| 03/15/2028 | 4.200% | | 177,000 | 167,728 |
| 05/15/2030 | 4.500% | | 1,067,000 | 1,004,303 |
| Southern Natural Gas Co. LLC |
| 02/15/2031 | 7.350% | | 2,910,000 | 3,038,032 |
| Sunoco Logistics Partners Operations LP |
| 04/01/2044 | 5.300% | | 1,239,000 | 1,053,092 |
| 05/15/2045 | 5.350% | | 25,000 | 21,362 |
| 10/01/2047 | 5.400% | | 4,041,000 | 3,480,064 |
| Corporate Bonds & Notes (continued) |
| Issuer | Coupon
Rate | | Principal
Amount ($) | Value ($) |
| Tallgrass Energy Partners LP/Finance Corp.(a) |
| 10/01/2025 | 7.500% | | 1,875,000 | 1,882,624 |
| 01/15/2028 | 5.500% | | 142,000 | 131,866 |
| Targa Resources Corp. |
| 04/15/2052 | 4.950% | | 472,000 | 383,078 |
| 07/01/2052 | 6.250% | | 753,000 | 723,546 |
| 02/15/2053 | 6.500% | | 5,065,000 | 5,064,610 |
| Targa Resources Partners LP/Finance Corp. |
| 02/01/2031 | 4.875% | | 825,000 | 758,736 |
| TMS Issuer Sarl(a) |
| 08/23/2032 | 5.780% | | 1,030,000 | 1,045,744 |
| Transcontinental Gas Pipe Line Co. LLC |
| 05/15/2030 | 3.250% | | 242,000 | 213,544 |
| 03/15/2048 | 4.600% | | 4,875,000 | 4,067,574 |
| TransMontaigne Partners LP/TLP Finance Corp. |
| 02/15/2026 | 6.125% | | 1,500,000 | 1,291,069 |
| Venture Global Calcasieu Pass LLC(a) |
| 08/15/2029 | 3.875% | | 750,000 | 649,389 |
| 08/15/2031 | 4.125% | | 3,250,000 | 2,760,829 |
| Western Gas Partners LP |
| 03/01/2048 | 5.300% | | 2,930,000 | 2,398,106 |
| Williams Companies, Inc. (The) |
| 01/15/2025 | 3.900% | | 1,050,000 | 1,024,048 |
| 09/15/2025 | 4.000% | | 2,327,000 | 2,253,023 |
| 03/15/2032 | 8.750% | | 3,486,000 | 4,081,217 |
| Williams Companies., Inc. (The) |
| 03/02/2026 | 5.400% | | 3,250,000 | 3,245,132 |
| Williams Partners LP |
| 03/04/2024 | 4.300% | | 2,787,000 | 2,763,480 |
| 03/04/2044 | 5.400% | | 263,000 | 237,154 |
| Total | 126,646,202 |
| Natural Gas 0.2% |
| Boston Gas Co.(a) |
| 08/01/2027 | 3.150% | | 1,472,000 | 1,335,767 |
| CenterPoint Energy Resources Corp. |
| 03/01/2033 | 5.400% | | 660,000 | 660,141 |
| KeySpan Corp. |
| 11/15/2030 | 8.000% | | 670,000 | 733,245 |
| KeySpan Gas East Corp.(a) |
| 03/06/2033 | 5.994% | | 4,625,000 | 4,584,111 |
| NiSource, Inc. |
| 02/15/2031 | 1.700% | | 605,000 | 467,469 |
| 06/30/2033 | 5.400% | | 930,000 | 921,316 |
| ONE Gas, Inc. |
| 03/11/2024 | 1.100% | | 696,000 | 678,432 |
| Piedmont Natural Gas Co., Inc. |
| 06/15/2033 | 5.400% | | 455,000 | 448,271 |
The accompanying Notes to Financial Statements are an integral part of this statement.
| 50 | Multi-Manager Total Return Bond Strategies Fund | Annual Report 2023 |
Portfolio of Investments (continued)
August 31, 2023
| Corporate Bonds & Notes (continued) |
| Issuer | Coupon
Rate | | Principal
Amount ($) | Value ($) |
| Sempra Energy |
| 08/01/2033 | 5.500% | | 918,000 | 910,445 |
| Sempra Energy(k) |
| 04/01/2052 | 4.125% | | 5,768,000 | 4,669,915 |
| South Jersey Industries, Inc. |
| Junior Subordinated |
| 04/15/2031 | 5.020% | | 1,422,000 | 1,074,682 |
| Southern Co. Gas Capital Corp. |
| 09/15/2032 | 5.150% | | 5,715,000 | 5,578,640 |
| 03/15/2041 | 5.875% | | 1,940,000 | 1,911,633 |
| 05/30/2047 | 4.400% | | 443,000 | 356,969 |
| Southwest Gas Corp. |
| 08/15/2051 | 3.180% | | 2,930,000 | 1,807,248 |
| Washington Gas Light Co. |
| 09/15/2049 | 3.650% | | 587,000 | 419,407 |
| Total | 26,557,691 |
| Office REIT 0.1% |
| Alexandria Real Estate Equities, Inc. |
| 03/15/2052 | 3.550% | | 174,000 | 118,755 |
| 04/15/2053 | 5.150% | | 169,000 | 150,710 |
| Hudson Pacific Properties LP |
| 11/01/2027 | 3.950% | | 3,580,000 | 2,839,479 |
| 02/15/2028 | 5.950% | | 4,505,000 | 3,806,725 |
| 04/01/2029 | 4.650% | | 310,000 | 236,376 |
| 01/15/2030 | 3.250% | | 1,205,000 | 818,254 |
| Kilroy Realty LP |
| 11/15/2033 | 2.650% | | 1,875,000 | 1,302,017 |
| Office Properties Income Trust |
| 02/01/2027 | 2.400% | | 1,455,000 | 989,924 |
| 10/15/2031 | 3.450% | | 3,195,000 | 1,615,535 |
| Piedmont Operating Partnership LP |
| 08/15/2030 | 3.150% | | 1,675,000 | 1,209,441 |
| 04/01/2032 | 2.750% | | 2,339,000 | 1,574,830 |
| Total | 14,662,046 |
| Oil Field Services 0.0% |
| Archrock Partners LP/Finance Corp.(a) |
| 04/01/2028 | 6.250% | | 300,000 | 286,659 |
| Schlumberger Holdings Corp.(a) |
| 05/17/2028 | 3.900% | | 2,053,000 | 1,944,718 |
| Schlumberger Investment SA |
| 06/26/2030 | 2.650% | | 817,000 | 706,443 |
| Venture Global LNG, Inc.(a) |
| 06/01/2031 | 8.375% | | 1,335,000 | 1,346,999 |
| Total | 4,284,819 |
| Corporate Bonds & Notes (continued) |
| Issuer | Coupon
Rate | | Principal
Amount ($) | Value ($) |
| Other Financial Institutions 0.2% |
| Five Point Operating Co. LP/Capital Corp.(a) |
| 11/15/2025 | 7.875% | | 2,350,000 | 2,199,810 |
| Greystone Commercial Capital Trust(a),(b),(g),(i) |
1-month USD LIBOR + 2.270%
05/31/2025 | 7.606% | | 9,200,000 | 8,694,000 |
| Howard Hughes Corp. (The)(a) |
| 08/01/2028 | 5.375% | | 500,000 | 451,470 |
| 02/01/2031 | 4.375% | | 750,000 | 598,008 |
| Icahn Enterprises LP/Finance Corp. |
| 05/15/2026 | 6.250% | | 900,000 | 834,042 |
| 05/15/2027 | 5.250% | | 1,242,000 | 1,090,445 |
| LeasePlan Corp NV(a) |
| 10/24/2024 | 2.875% | | 3,440,000 | 3,299,324 |
| Nationstar Mortgage Holdings Inc.(a) |
| 08/15/2028 | 5.500% | | 1,050,000 | 955,537 |
| Nationstar Mortgage Holdings, Inc.(a) |
| 12/15/2030 | 5.125% | | 800,000 | 678,703 |
| ORIX Corp. |
| 12/04/2024 | 3.250% | | 1,560,000 | 1,507,663 |
| Total | 20,309,002 |
| Other Industry 0.1% |
| Adtalem Global Education, Inc.(a) |
| 03/01/2028 | 5.500% | | 315,000 | 294,555 |
| AECOM |
| 03/15/2027 | 5.125% | | 710,000 | 682,041 |
| Gohl Capital Ltd.(a) |
| 01/24/2027 | 4.250% | | 1,050,000 | 979,998 |
| Massachusetts Institute of Technology |
| 07/01/2114 | 4.678% | | 1,768,000 | 1,592,761 |
| 07/01/2116 | 3.885% | | 1,850,000 | 1,380,633 |
| Northwestern University |
| 12/01/2057 | 3.662% | | 1,350,000 | 1,054,677 |
| PowerTeam Services LLC(a) |
| 12/04/2025 | 9.033% | | 594,000 | 556,289 |
| President and Fellows of Harvard College |
| 07/15/2046 | 3.150% | | 3,031,000 | 2,244,051 |
| 07/15/2056 | 3.300% | | 2,230,000 | 1,608,397 |
| Trustees of the University of Pennsylvania (The) |
| 09/01/2112 | 4.674% | | 1,620,000 | 1,380,837 |
| University of Southern California |
| 10/01/2039 | 3.028% | | 4,525,000 | 3,613,402 |
| Total | 15,387,641 |
The accompanying Notes to Financial Statements are an integral part of this statement.
Multi-Manager Total Return Bond Strategies Fund | Annual Report 2023
| 51 |
Portfolio of Investments (continued)
August 31, 2023
| Corporate Bonds & Notes (continued) |
| Issuer | Coupon
Rate | | Principal
Amount ($) | Value ($) |
| Other REIT 0.2% |
| American Assets Trust LP |
| 02/01/2031 | 3.375% | | 3,115,000 | 2,408,616 |
| CubeSmart LP |
| 12/15/2028 | 2.250% | | 1,179,000 | 1,000,501 |
| Extra Space Storage LP |
| 12/15/2027 | 3.875% | | 160,000 | 149,152 |
| 04/01/2029 | 3.900% | | 563,000 | 515,367 |
| 06/15/2029 | 4.000% | | 570,000 | 521,022 |
| 10/15/2030 | 2.200% | | 2,043,000 | 1,629,764 |
| 10/15/2031 | 2.400% | | 670,000 | 525,796 |
| 03/15/2032 | 2.350% | | 3,369,000 | 2,618,087 |
| Host Hotels & Resorts LP |
| 06/15/2025 | 4.000% | | 1,050,000 | 1,013,925 |
| 02/01/2026 | 4.500% | | 520,000 | 501,555 |
| Ladder Capital Finance Holdings LLLP/Corp.(a) |
| 06/15/2029 | 4.750% | | 1,745,000 | 1,467,312 |
| Lexington Realty Trust |
| 10/01/2031 | 2.375% | | 3,805,000 | 2,878,008 |
| Park Intermediate Holdings LLC/Domestic Property/Finance Co-Issuer(a) |
| 06/01/2025 | 7.500% | | 2,150,000 | 2,158,099 |
| Public Storage Operating Co. |
| 08/01/2053 | 5.350% | | 2,380,000 | 2,318,781 |
| Rexford Industrial Realty LP |
| 09/01/2031 | 2.150% | | 3,832,000 | 2,957,527 |
| WP Carey, Inc. |
| 04/01/2033 | 2.250% | | 4,080,000 | 3,037,343 |
| XHR LP(a) |
| 06/01/2029 | 4.875% | | 1,335,000 | 1,159,664 |
| Total | 26,860,519 |
| Packaging 0.2% |
| Amcor Flexibles North America, Inc. |
| 05/17/2025 | 4.000% | | 2,085,000 | 2,022,411 |
| Ardagh Packaging Finance PLC/Holdings USA, Inc.(a) |
| 08/15/2027 | 5.250% | | 3,000,000 | 2,571,871 |
| Ball Corp. |
| 03/15/2026 | 4.875% | | 600,000 | 582,692 |
| 06/15/2029 | 6.000% | | 1,800,000 | 1,774,782 |
| Berry Global Escrow Corp.(a) |
| 07/15/2026 | 4.875% | | 1,680,000 | 1,625,662 |
| Berry Global, Inc. |
| 01/15/2026 | 1.570% | | 3,261,000 | 2,964,398 |
| 01/15/2027 | 1.650% | | 1,273,000 | 1,104,092 |
| Pactiv Evergreen Group Issuer LLC/Inc.(a) |
| 10/15/2028 | 4.375% | | 2,500,000 | 2,230,718 |
| Reynolds Group Issuer, Inc./LLC(a) |
| 10/15/2027 | 4.000% | | 650,000 | 584,187 |
| Corporate Bonds & Notes (continued) |
| Issuer | Coupon
Rate | | Principal
Amount ($) | Value ($) |
| Sealed Air Corp.(a) |
| 10/15/2026 | 1.573% | | 857,000 | 753,621 |
| 02/01/2028 | 6.125% | | 225,000 | 221,614 |
| Trivium Packaging Finance BV(a) |
| 08/15/2027 | 8.500% | | 280,000 | 266,342 |
| Total | 16,702,390 |
| Paper 0.0% |
| Cascades, Inc./USA(a) |
| 01/15/2028 | 5.375% | | 945,000 | 887,087 |
| Celulosa Arauco y Constitucion SA |
| 11/02/2027 | 3.875% | | 700,000 | 639,787 |
| Celulosa Arauco y Constitucion SA(a) |
| 04/30/2029 | 4.250% | | 500,000 | 452,073 |
| Suzano Austria GmbH |
| 01/15/2029 | 6.000% | | 275,000 | 273,061 |
| 01/15/2030 | 5.000% | | 825,000 | 766,555 |
| 01/15/2031 | 3.750% | | 1,000,000 | 847,516 |
| Weyerhaeuser Co. |
| 05/15/2026 | 4.750% | | 481,000 | 473,363 |
| Total | 4,339,442 |
| Pharmaceuticals 1.0% |
| AbbVie, Inc. |
| 11/21/2026 | 2.950% | | 838,000 | 784,074 |
| 03/15/2035 | 4.550% | | 4,650,000 | 4,394,470 |
| 05/14/2035 | 4.500% | | 2,175,000 | 2,045,966 |
| 05/14/2036 | 4.300% | | 1,926,000 | 1,766,064 |
| 11/21/2039 | 4.050% | | 6,640,000 | 5,693,166 |
| 10/01/2042 | 4.625% | | 1,000,000 | 887,191 |
| 05/14/2045 | 4.700% | | 1,365,000 | 1,225,372 |
| 11/21/2049 | 4.250% | | 3,160,000 | 2,660,643 |
| Amgen, Inc. |
| 03/02/2033 | 5.250% | | 4,001,000 | 3,978,271 |
| 03/02/2043 | 5.600% | | 11,054,000 | 10,850,011 |
| 01/15/2052 | 3.000% | | 4,360,000 | 2,833,258 |
| 02/22/2052 | 4.200% | | 345,000 | 274,555 |
| 03/02/2053 | 5.650% | | 1,136,000 | 1,126,179 |
| 09/01/2053 | 2.770% | | 890,000 | 532,249 |
| 02/22/2062 | 4.400% | | 724,000 | 573,155 |
| 03/02/2063 | 5.750% | | 4,173,000 | 4,116,276 |
| Bausch Health Companies, Inc.(a) |
| 01/30/2028 | 5.000% | | 1,100,000 | 490,394 |
| 02/15/2029 | 5.000% | | 100,000 | 42,381 |
| 02/15/2029 | 6.250% | | 3,475,000 | 1,520,789 |
| 01/30/2030 | 5.250% | | 1,200,000 | 506,882 |
| 02/15/2031 | 5.250% | | 1,200,000 | 508,454 |
| Bayer US Finance II LLC(a) |
| 12/15/2025 | 4.250% | | 1,445,000 | 1,399,289 |
| 12/15/2028 | 4.375% | | 5,945,000 | 5,647,257 |
| 07/15/2034 | 4.200% | | 229,000 | 201,298 |
| 06/25/2038 | 4.625% | | 1,515,000 | 1,300,771 |
The accompanying Notes to Financial Statements are an integral part of this statement.
| 52 | Multi-Manager Total Return Bond Strategies Fund | Annual Report 2023 |
Portfolio of Investments (continued)
August 31, 2023
| Corporate Bonds & Notes (continued) |
| Issuer | Coupon
Rate | | Principal
Amount ($) | Value ($) |
| 07/15/2044 | 4.400% | | 2,799,000 | 2,204,255 |
| 06/25/2048 | 4.875% | | 3,505,000 | 2,984,192 |
| Bayer US Finance LLC(a) |
| 10/08/2024 | 3.375% | | 520,000 | 505,447 |
| Bristol Myers Squibb Co. |
| 06/15/2039 | 4.125% | | 1,346,000 | 1,188,132 |
| Bristol-Myers Squibb Co. |
| 08/15/2025 | 3.875% | | 74,000 | 71,490 |
| 05/15/2044 | 4.625% | | 555,000 | 502,627 |
| 11/15/2047 | 4.350% | | 2,060,000 | 1,775,367 |
| CSL Finance PLC(a) |
| 04/27/2029 | 4.050% | | 926,000 | 877,080 |
| 04/27/2032 | 4.250% | | 432,000 | 404,568 |
| 04/27/2052 | 4.750% | | 567,000 | 509,343 |
| 04/27/2062 | 4.950% | | 402,000 | 356,861 |
| Eli Lilly & Co. |
| 02/27/2053 | 4.875% | | 496,000 | 487,590 |
| Grifols Escrow Issuer SA(a) |
| 10/15/2028 | 4.750% | | 1,732,000 | 1,520,254 |
| Jazz Securities DAC(a) |
| 01/15/2029 | 4.375% | | 963,000 | 864,418 |
| Johnson & Johnson |
| 03/03/2037 | 3.625% | | 2,280,000 | 2,018,365 |
| 01/15/2038 | 3.400% | | 2,790,000 | 2,367,049 |
| Kevlar SpA(a) |
| 09/01/2029 | 6.500% | | 2,300,000 | 1,993,668 |
| Merck & Co., Inc. |
| 05/17/2033 | 4.500% | | 717,000 | 698,365 |
| 05/17/2044 | 4.900% | | 694,000 | 672,982 |
| 05/17/2053 | 5.000% | | 1,377,000 | 1,343,482 |
| 05/17/2063 | 5.150% | | 1,027,000 | 1,000,148 |
| Mylan NV |
| 06/15/2046 | 5.250% | | 290,000 | 229,433 |
| Mylan, Inc. |
| 04/15/2048 | 5.200% | | 3,250,000 | 2,528,718 |
| Organon Finance 1 LLC(a) |
| 04/30/2028 | 4.125% | | 1,550,000 | 1,402,240 |
| 04/30/2031 | 5.125% | | 1,725,000 | 1,468,164 |
| Pfizer Investment Enterprises Pte., Ltd. |
| 05/19/2030 | 4.650% | | 793,000 | 780,525 |
| 05/19/2033 | 4.750% | | 3,358,000 | 3,304,147 |
| 05/19/2043 | 5.110% | | 178,000 | 173,248 |
| 05/19/2053 | 5.300% | | 6,164,000 | 6,165,394 |
| 05/19/2063 | 5.340% | | 2,339,000 | 2,303,367 |
| Royalty Pharma PLC |
| 09/02/2025 | 1.200% | | 385,000 | 350,706 |
| 09/02/2027 | 1.750% | | 489,000 | 421,899 |
| 09/02/2030 | 2.200% | | 2,243,000 | 1,788,088 |
| Corporate Bonds & Notes (continued) |
| Issuer | Coupon
Rate | | Principal
Amount ($) | Value ($) |
| Shire Acquisitions Investments Ireland DAC |
| 09/23/2023 | 2.875% | | 1,050,000 | 1,047,969 |
| Viatris, Inc. |
| 06/22/2030 | 2.700% | | 1,117,000 | 906,585 |
| 06/22/2040 | 3.850% | | 5,453,000 | 3,814,081 |
| 06/22/2050 | 4.000% | | 2,010,000 | 1,330,243 |
| Total | 107,718,905 |
| Property & Casualty 0.5% |
| Alleghany Corp. |
| 05/15/2030 | 3.625% | | 379,000 | 350,014 |
| 09/15/2044 | 4.900% | | 38,000 | 34,985 |
| 08/15/2051 | 3.250% | | 1,259,000 | 878,297 |
| American International Group, Inc. |
| 04/01/2026 | 3.900% | | 165,000 | 159,168 |
| 03/27/2033 | 5.125% | | 1,277,000 | 1,232,515 |
| Aon Corp./Global Holdings PLC |
| 12/02/2031 | 2.600% | | 4,495,000 | 3,688,087 |
| Arch Capital Finance LLC |
| 12/15/2046 | 5.031% | | 970,000 | 850,814 |
| Arthur J. Gallagher & Co. |
| 03/09/2052 | 3.050% | | 6,725,000 | 4,220,484 |
| 03/02/2053 | 5.750% | | 1,607,000 | 1,572,382 |
| Assurant, Inc. |
| 09/27/2023 | 4.200% | | 386,000 | 383,172 |
| 02/22/2030 | 3.700% | | 1,174,000 | 1,014,156 |
| Assured Guaranty US Holdings, Inc. |
| 09/15/2028 | 6.125% | | 1,225,000 | 1,238,555 |
| Berkshire Hathaway Finance Corp. |
| 03/15/2052 | 3.850% | | 994,000 | 789,547 |
| Berkshire Hathaway, Inc. |
| 03/15/2026 | 3.125% | | 4,674,000 | 4,479,637 |
| CNA Financial Corp. |
| 08/15/2027 | 3.450% | | 3,828,000 | 3,574,780 |
| Fairfax Financial Holdings Ltd. |
| 03/03/2031 | 3.375% | | 6,300,000 | 5,282,030 |
| Farmers Exchange Capital(a) |
| Subordinated |
| 07/15/2028 | 7.050% | | 800,000 | 804,546 |
| 07/15/2048 | 7.200% | | 1,290,000 | 1,292,832 |
| Farmers Exchange Capital II(a),(k) |
| Subordinated |
| 11/01/2053 | 6.151% | | 2,700,000 | 2,587,322 |
| Farmers Insurance Exchange(a) |
| 05/01/2024 | 8.625% | | 1,165,000 | 1,178,257 |
| Hartford Financial Services Group Inc. (The)(a),(b) |
3-month USD LIBOR + 2.125%
02/12/2047 | 7.751% | | 2,265,000 | 1,938,721 |
The accompanying Notes to Financial Statements are an integral part of this statement.
Multi-Manager Total Return Bond Strategies Fund | Annual Report 2023
| 53 |
Portfolio of Investments (continued)
August 31, 2023
| Corporate Bonds & Notes (continued) |
| Issuer | Coupon
Rate | | Principal
Amount ($) | Value ($) |
| Hartford Financial Services Group, Inc. (The) |
| 10/15/2036 | 5.950% | | 283,000 | 287,977 |
| Intact Financial Corp.(a) |
| 09/22/2032 | 5.459% | | 1,198,000 | 1,180,523 |
| Liberty Mutual Group, Inc.(a) |
| 10/15/2050 | 3.951% | | 2,080,000 | 1,487,399 |
| 05/15/2060 | 3.950% | | 1,525,000 | 1,025,560 |
| Markel Corp. |
| 05/20/2049 | 5.000% | | 5,095,000 | 4,468,677 |
| Nationwide Mutual Insurance Co.(a),(b) |
| Subordinated |
3-month USD LIBOR + 2.290%
12/15/2024 | 7.842% | | 5,725,000 | 5,724,582 |
| Old Republic International Corp. |
| 06/11/2051 | 3.850% | | 825,000 | 574,041 |
| PartnerRe Finance B LLC(k) |
| 10/01/2050 | 4.500% | | 2,694,000 | 2,272,143 |
| Trustage Financial Group, Inc.(a) |
| 04/15/2032 | 4.625% | | 2,135,000 | 1,829,316 |
| Willis North America, Inc. |
| 09/15/2029 | 2.950% | | 2,000,000 | 1,733,377 |
| WR Berkley Corp. |
| 05/12/2050 | 4.000% | | 1,480,000 | 1,124,827 |
| Total | 59,258,723 |
| Railroads 0.1% |
| Burlington Northern Santa Fe LLC |
| 03/15/2043 | 4.450% | | 360,000 | 318,960 |
| 09/01/2043 | 5.150% | | 897,000 | 868,995 |
| 08/01/2046 | 3.900% | | 1,163,000 | 930,848 |
| 04/15/2054 | 5.200% | | 1,391,000 | 1,368,874 |
| Canadian Pacific Railway Co. |
| 05/01/2050 | 3.500% | | 3,280,000 | 2,408,344 |
| CSX Corp. |
| 05/30/2042 | 4.750% | | 482,000 | 436,133 |
| Norfolk Southern Corp. |
| 08/01/2030 | 5.050% | | 708,000 | 700,775 |
| 08/01/2054 | 5.350% | | 6,370,000 | 6,196,056 |
| Union Pacific Corp. |
| 10/01/2051 | 3.799% | | 876,000 | 691,129 |
| 08/15/2059 | 3.950% | | 201,000 | 155,290 |
| 03/20/2060 | 3.839% | | 738,000 | 565,281 |
| Total | 14,640,685 |
| Refining 0.1% |
| Cosan Luxembourg SA(a) |
| 06/27/2030 | 7.500% | | 750,000 | 751,291 |
| Corporate Bonds & Notes (continued) |
| Issuer | Coupon
Rate | | Principal
Amount ($) | Value ($) |
| Marathon Petroleum Corp. |
| 12/15/2026 | 5.125% | | 578,000 | 575,315 |
| 03/01/2041 | 6.500% | | 136,000 | 138,890 |
| Phillips 66 |
| 12/01/2027 | 4.950% | | 3,910,000 | 3,867,383 |
| Phillips 66 Co. |
| 02/15/2045 | 4.680% | | 1,300,000 | 1,096,937 |
| Valero Energy Corp. |
| 12/01/2031 | 2.800% | | 3,235,000 | 2,654,449 |
| Total | 9,084,265 |
| Restaurants 0.0% |
| Brinker International, Inc.(a) |
| 10/01/2024 | 5.000% | | 1,850,000 | 1,820,918 |
| Fertitta Entertainment LLC/Finance Co., Inc.(a) |
| 01/15/2029 | 4.625% | | 1,500,000 | 1,298,076 |
| 01/15/2030 | 6.750% | | 705,000 | 582,432 |
| McDonald’s Corp. |
| 09/01/2049 | 3.625% | | 910,000 | 686,723 |
| 08/14/2053 | 5.450% | | 716,000 | 715,935 |
| Total | 5,104,084 |
| Retail REIT 0.0% |
| Brixmor Operating Partnership LP |
| 08/16/2031 | 2.500% | | 915,000 | 719,276 |
| Kimco Realty Corp. |
| 02/01/2033 | 4.600% | | 3,780,000 | 3,469,526 |
| Kite Realty Group LP |
| 10/01/2026 | 4.000% | | 320,000 | 291,946 |
| Realty Income Corp. |
| 08/15/2027 | 3.950% | | 193,000 | 184,038 |
| Total | 4,664,786 |
| Retailers 0.4% |
| Amazon.com, Inc. |
| 08/22/2027 | 3.150% | | 646,000 | 607,503 |
| 12/01/2027 | 4.550% | | 461,000 | 458,964 |
| 05/12/2031 | 2.100% | | 791,000 | 656,274 |
| 05/12/2041 | 2.875% | | 1,257,000 | 941,231 |
| 04/13/2062 | 4.100% | | 424,000 | 351,398 |
| Asbury Automotive Group, Inc. |
| 03/01/2030 | 4.750% | | 1,535,000 | 1,346,249 |
| AutoNation, Inc. |
| 11/15/2024 | 3.500% | | 2,185,000 | 2,116,127 |
| 10/01/2025 | 4.500% | | 2,465,000 | 2,388,285 |
| AutoZone, Inc. |
| 04/21/2026 | 3.125% | | 415,000 | 393,579 |
| 01/15/2031 | 1.650% | | 1,175,000 | 913,003 |
The accompanying Notes to Financial Statements are an integral part of this statement.
| 54 | Multi-Manager Total Return Bond Strategies Fund | Annual Report 2023 |
Portfolio of Investments (continued)
August 31, 2023
| Corporate Bonds & Notes (continued) |
| Issuer | Coupon
Rate | | Principal
Amount ($) | Value ($) |
| Dick’s Sporting Goods, Inc. |
| 01/15/2052 | 4.100% | | 2,690,000 | 1,745,343 |
| Dollar General Corp. |
| 07/05/2033 | 5.450% | | 6,218,000 | 6,027,671 |
| Gap Inc. (The)(a) |
| 10/01/2029 | 3.625% | | 1,550,000 | 1,179,378 |
| Hanesbrands, Inc.(a) |
| 05/15/2026 | 4.875% | | 1,475,000 | 1,378,989 |
| Kontoor Brands, Inc.(a) |
| 11/15/2029 | 4.125% | | 475,000 | 403,649 |
| L Brands, Inc. |
| 07/01/2036 | 6.750% | | 1,495,000 | 1,378,208 |
| Lowe’s Companies, Inc. |
| 07/01/2053 | 5.750% | | 730,000 | 722,048 |
| 04/01/2062 | 4.450% | | 539,000 | 420,505 |
| 04/01/2063 | 5.850% | | 555,000 | 541,229 |
| Macy’s Retail Holdings LLC |
| 12/15/2034 | 4.500% | | 1,600,000 | 1,140,103 |
| Magic MergeCo, Inc.(a) |
| 05/01/2029 | 7.875% | | 1,400,000 | 967,353 |
| Rent-A-Center, Inc.(a) |
| 02/15/2029 | 6.375% | | 300,000 | 272,483 |
| Sally Holdings LLC/Capital, Inc. |
| 12/01/2025 | 5.625% | | 2,000,000 | 1,985,756 |
| Sonic Automotive Inc.(a) |
| 11/15/2031 | 4.875% | | 1,620,000 | 1,346,630 |
| Target Corp. |
| 01/15/2033 | 4.400% | | 2,090,000 | 1,995,185 |
| 01/15/2053 | 4.800% | | 696,000 | 639,183 |
| Tractor Supply Co. |
| 11/01/2030 | 1.750% | | 3,885,000 | 3,039,320 |
| 05/15/2033 | 5.250% | | 1,275,000 | 1,246,914 |
| Walgreens Boots Alliance Inc. |
| 11/17/2023 | 0.950% | | 5,730,000 | 5,672,291 |
| Walmart, Inc. |
| 04/15/2030 | 4.000% | | 1,766,000 | 1,705,321 |
| Total | 43,980,172 |
| Supermarkets 0.1% |
| Ahold Finance U.S.A. LLC |
| 05/01/2029 | 6.875% | | 1,800,000 | 1,923,697 |
| Albertsons Companies LLC/Safeway, Inc./New Albertsons LP/Albertsons LLC(a) |
| 03/15/2029 | 3.500% | | 1,520,000 | 1,316,107 |
| C&S Group Enterprises LLC(a) |
| 12/15/2028 | 5.000% | | 2,700,000 | 2,092,645 |
| Total | 5,332,449 |
| Corporate Bonds & Notes (continued) |
| Issuer | Coupon
Rate | | Principal
Amount ($) | Value ($) |
| Supranational 0.1% |
| Inter-American Development Bank |
| 10/15/2025 | 6.800% | | 2,500,000 | 2,584,949 |
| 07/15/2027 | 6.750% | | 4,000,000 | 4,262,493 |
| International Bank for Reconstruction & Development(f) |
| 09/17/2030 | 0.000% | | 1,550,000 | 1,115,556 |
| Total | 7,962,998 |
| Technology 1.5% |
| Advanced Micro Devices, Inc. |
| 06/01/2032 | 3.924% | | 1,784,000 | 1,662,201 |
| 06/01/2052 | 4.393% | | 2,361,000 | 2,067,107 |
| Apple, Inc. |
| 05/11/2050 | 2.650% | | 5,095,000 | 3,392,666 |
| 08/05/2061 | 2.850% | | 560,000 | 362,307 |
| 08/08/2062 | 4.100% | | 351,000 | 294,001 |
| Avnet, Inc. |
| 03/15/2028 | 6.250% | | 4,468,000 | 4,502,994 |
| 06/01/2032 | 5.500% | | 2,876,000 | 2,723,803 |
| Black Knight InfoServ LLC(a) |
| 09/01/2028 | 3.625% | | 1,500,000 | 1,383,873 |
| Boxer Parent Co., Inc.(a) |
| 03/01/2026 | 9.125% | | 2,500,000 | 2,504,631 |
| Broadcom, Inc. |
| 10/15/2024 | 3.625% | | 320,000 | 312,967 |
| Broadcom, Inc.(a) |
| 04/15/2029 | 4.000% | | 2,765,000 | 2,551,038 |
| 04/15/2034 | 3.469% | | 1,400,000 | 1,143,584 |
| 11/15/2035 | 3.137% | | 5,511,000 | 4,201,170 |
| 11/15/2036 | 3.187% | | 8,519,000 | 6,402,906 |
| 05/15/2037 | 4.926% | | 4,155,000 | 3,737,496 |
| CDW LLC/Finance Corp. |
| 05/01/2025 | 4.125% | | 2,500,000 | 2,420,077 |
| 12/01/2028 | 3.276% | | 5,270,000 | 4,620,180 |
| CommScope, Inc.(a) |
| 09/01/2029 | 4.750% | | 1,500,000 | 1,114,438 |
| Concentrix Corp. |
| 08/02/2028 | 6.600% | | 935,000 | 915,565 |
| 08/02/2033 | 6.850% | | 2,218,000 | 2,123,497 |
| Corning, Inc. |
| 11/15/2079 | 5.450% | | 171,000 | 153,259 |
| DXC Technology Co. |
| 09/15/2028 | 2.375% | | 5,845,000 | 4,822,280 |
| Equifax, Inc. |
| 06/01/2028 | 5.100% | | 7,960,000 | 7,787,980 |
| Fidelity National Information Services, Inc. |
| 03/01/2041 | 3.100% | | 2,890,000 | 2,007,876 |
The accompanying Notes to Financial Statements are an integral part of this statement.
Multi-Manager Total Return Bond Strategies Fund | Annual Report 2023
| 55 |
Portfolio of Investments (continued)
August 31, 2023
| Corporate Bonds & Notes (continued) |
| Issuer | Coupon
Rate | | Principal
Amount ($) | Value ($) |
| Fiserv, Inc. |
| 07/01/2024 | 2.750% | | 699,000 | 681,523 |
| 03/02/2033 | 5.600% | | 5,455,000 | 5,478,850 |
| 08/21/2033 | 5.625% | | 7,565,000 | 7,619,926 |
| Flex Ltd. |
| 01/15/2028 | 6.000% | | 2,560,000 | 2,587,801 |
| Global Payments, Inc. |
| 11/15/2024 | 1.500% | | 3,215,000 | 3,047,307 |
| 03/01/2026 | 1.200% | | 2,536,000 | 2,266,797 |
| 08/15/2052 | 5.950% | | 3,440,000 | 3,268,418 |
| Hewlett Packard Enterprise Co. |
| 07/01/2028 | 5.250% | | 5,420,000 | 5,374,223 |
| HP, Inc. |
| 06/17/2031 | 2.650% | | 909,000 | 733,527 |
| Intel Corp. |
| 08/05/2027 | 3.750% | | 749,000 | 715,854 |
| 02/10/2030 | 5.125% | | 1,202,000 | 1,202,711 |
| 08/12/2041 | 2.800% | | 1,687,000 | 1,169,315 |
| 08/12/2061 | 3.200% | | 671,000 | 418,959 |
| 02/10/2063 | 5.900% | | 1,545,000 | 1,548,088 |
| International Business Machines Corp. |
| 07/27/2027 | 4.150% | | 790,000 | 763,259 |
| 05/15/2029 | 3.500% | | 928,000 | 855,540 |
| KLA Corp. |
| 07/15/2062 | 5.250% | | 895,000 | 867,964 |
| Leidos, Inc. |
| 02/15/2031 | 2.300% | | 845,000 | 669,413 |
| Microchip Technology, Inc. |
| 09/01/2023 | 2.670% | | 5,040,000 | 5,039,557 |
| 02/15/2024 | 0.972% | | 345,000 | 337,125 |
| Micron Technology, Inc. |
| 11/01/2029 | 6.750% | | 5,040,000 | 5,241,055 |
| Microsoft Corp. |
| 03/17/2052 | 2.921% | | 2,813,000 | 1,993,763 |
| 03/17/2062 | 3.041% | | 4,290,000 | 2,962,675 |
| NCR Corp.(a) |
| 04/15/2029 | 5.125% | | 990,000 | 902,929 |
| 10/01/2030 | 5.250% | | 325,000 | 292,094 |
| NetApp, Inc. |
| 06/22/2025 | 1.875% | | 1,845,000 | 1,727,838 |
| NXP BV/Funding LLC |
| 03/01/2026 | 5.350% | | 1,056,000 | 1,049,231 |
| NXP BV/Funding LLC/USA, Inc. |
| 05/01/2030 | 3.400% | | 342,000 | 300,536 |
| 11/30/2051 | 3.250% | | 600,000 | 386,750 |
| Open Text Corp.(a) |
| 12/01/2027 | 6.900% | | 650,000 | 659,313 |
| Open Text Holdings, Inc.(a) |
| 12/01/2031 | 4.125% | | 1,645,000 | 1,365,645 |
| Corporate Bonds & Notes (continued) |
| Issuer | Coupon
Rate | | Principal
Amount ($) | Value ($) |
| Oracle Corp. |
| 11/15/2027 | 3.250% | | 2,409,000 | 2,231,904 |
| 03/25/2028 | 2.300% | | 903,000 | 794,606 |
| 11/09/2029 | 6.150% | | 997,000 | 1,036,920 |
| 11/09/2032 | 6.250% | | 3,200,000 | 3,348,508 |
| 11/15/2037 | 3.800% | | 3,892,000 | 3,130,895 |
| 03/25/2041 | 3.650% | | 2,929,000 | 2,208,929 |
| 04/01/2050 | 3.600% | | 6,281,000 | 4,324,178 |
| 03/25/2051 | 3.950% | | 3,413,000 | 2,488,911 |
| 02/06/2053 | 5.550% | | 1,855,000 | 1,723,964 |
| 05/15/2055 | 4.375% | | 73,000 | 55,993 |
| PayPal Holdings, Inc. |
| 10/01/2026 | 2.650% | | 964,000 | 897,982 |
| 10/01/2029 | 2.850% | | 204,000 | 180,098 |
| 06/01/2030 | 2.300% | | 1,435,000 | 1,206,086 |
| 06/01/2062 | 5.250% | | 3,394,000 | 3,229,991 |
| Qorvo, Inc.(a) |
| 12/15/2024 | 1.750% | | 1,200,000 | 1,128,237 |
| QUALCOMM, Inc. |
| 05/20/2053 | 6.000% | | 2,378,000 | 2,560,255 |
| S&P Global, Inc. |
| 03/01/2029 | 2.700% | | 1,348,000 | 1,204,654 |
| 08/15/2030 | 1.250% | | 592,000 | 465,607 |
| 03/01/2032 | 2.900% | | 505,000 | 432,449 |
| Seagate HDD(a) |
| 12/01/2032 | 9.625% | | 776,475 | 860,793 |
| TD SYNNEX Corp. |
| 08/09/2026 | 1.750% | | 314,000 | 276,821 |
| Tempo Acquisition LLC/Finance Corp.(a) |
| 06/01/2025 | 5.750% | | 1,550,000 | 1,525,044 |
| Tencent Holdings Ltd.(a) |
| 04/22/2051 | 3.840% | | 2,760,000 | 1,889,927 |
| Texas Instruments, Inc. |
| 03/14/2033 | 4.900% | | 1,083,000 | 1,086,828 |
| 03/14/2053 | 5.000% | | 1,016,000 | 986,923 |
| 05/18/2063 | 5.050% | | 2,676,000 | 2,563,453 |
| VMware, Inc. |
| 08/15/2026 | 1.400% | | 1,441,000 | 1,277,441 |
| Western Union Co. (The) |
| 03/15/2026 | 1.350% | | 140,000 | 125,211 |
| Total | 167,978,490 |
| Tobacco 0.4% |
| Altria Group, Inc. |
| 05/06/2030 | 3.400% | | 1,280,000 | 1,125,688 |
| 02/04/2041 | 3.400% | | 3,910,000 | 2,660,425 |
| BAT Capital Corp. |
| 08/15/2027 | 3.557% | | 409,000 | 379,298 |
| 03/25/2028 | 2.259% | | 1,930,000 | 1,660,898 |
| 03/25/2031 | 2.726% | | 1,790,000 | 1,416,771 |
| 08/02/2033 | 6.421% | | 898,000 | 895,993 |
The accompanying Notes to Financial Statements are an integral part of this statement.
| 56 | Multi-Manager Total Return Bond Strategies Fund | Annual Report 2023 |
Portfolio of Investments (continued)
August 31, 2023
| Corporate Bonds & Notes (continued) |
| Issuer | Coupon
Rate | | Principal
Amount ($) | Value ($) |
| 08/15/2037 | 4.390% | | 742,000 | 586,545 |
| 09/25/2040 | 3.734% | | 562,000 | 391,561 |
| 08/02/2043 | 7.079% | | 1,245,000 | 1,237,811 |
| 08/15/2047 | 4.540% | | 5,800,000 | 4,216,283 |
| 09/06/2049 | 4.758% | | 309,000 | 228,928 |
| 03/16/2052 | 5.650% | | 2,530,000 | 2,114,441 |
| 08/02/2053 | 7.081% | | 6,976,000 | 6,864,095 |
| BAT International Finance PLC |
| 03/16/2028 | 4.448% | | 8,000,000 | 7,588,112 |
| Imperial Brands Finance PLC(a) |
| 07/26/2024 | 3.125% | | 2,000,000 | 1,945,829 |
| 07/21/2025 | 4.250% | | 2,000,000 | 1,934,373 |
| Philip Morris International, Inc. |
| 02/15/2030 | 5.125% | | 2,810,000 | 2,777,769 |
| 02/15/2033 | 5.375% | | 2,552,000 | 2,519,499 |
| Reynolds American, Inc. |
| 06/12/2025 | 4.450% | | 1,325,000 | 1,296,205 |
| 08/04/2041 | 7.000% | | 1,127,000 | 1,093,793 |
| 09/15/2043 | 6.150% | | 501,000 | 458,413 |
| 08/15/2045 | 5.850% | | 4,327,000 | 3,752,697 |
| Vector Group Ltd.(a) |
| 02/01/2029 | 5.750% | | 3,250,000 | 2,832,443 |
| Total | 49,977,870 |
| Transportation Services 0.3% |
| Element Fleet Management Corp.(a) |
| 06/15/2025 | 3.850% | | 2,795,000 | 2,671,641 |
| 06/26/2026 | 6.271% | | 2,990,000 | 3,002,767 |
| ERAC USA Finance LLC(a) |
| 11/01/2025 | 3.800% | | 2,500,000 | 2,408,808 |
| 12/01/2026 | 3.300% | | 3,435,000 | 3,204,220 |
| 03/15/2042 | 5.625% | | 1,689,000 | 1,658,297 |
| 11/01/2046 | 4.200% | | 1,041,000 | 847,933 |
| 05/01/2053 | 5.400% | | 793,000 | 775,029 |
| FedEx Corp. Pass-Through Trust |
| Series 2020-1 Class AA |
| 02/20/2034 | 1.875% | | 618,772 | 498,831 |
| Penske Truck Leasing Co. LP/Finance Corp.(a) |
| 11/15/2025 | 1.200% | | 842,000 | 757,956 |
| 05/01/2028 | 5.550% | | 1,380,000 | 1,352,837 |
| 08/01/2028 | 6.050% | | 2,990,000 | 2,991,194 |
| 06/15/2030 | 6.200% | | 2,234,000 | 2,241,091 |
| Penske Truck Leasing Co. LP/PTL Finance Corp.(a) |
| 06/15/2026 | 1.700% | | 1,236,000 | 1,100,928 |
| Penske Truck Leasing Co., LP/Finance Corp.(a) |
| 07/15/2025 | 4.000% | | 905,000 | 871,141 |
| Ryder System, Inc. |
| 06/01/2028 | 5.250% | | 3,425,000 | 3,380,267 |
| Triton Container International Ltd.(a) |
| 04/15/2026 | 2.050% | | 617,000 | 549,709 |
| 06/15/2031 | 3.150% | | 558,000 | 429,074 |
| Corporate Bonds & Notes (continued) |
| Issuer | Coupon
Rate | | Principal
Amount ($) | Value ($) |
| TTX Co.(a) |
| 01/15/2025 | 3.600% | | 1,620,000 | 1,572,882 |
| 12/01/2052 | 5.650% | | 415,000 | 425,058 |
| XPO, Inc.(a) |
| 06/01/2028 | 6.250% | | 575,000 | 563,486 |
| 06/01/2031 | 7.125% | | 275,000 | 276,834 |
| Total | 31,579,983 |
| Wireless 0.8% |
| American Tower Corp. |
| 02/15/2024 | 5.000% | | 665,000 | 661,869 |
| 03/15/2027 | 3.650% | | 684,000 | 641,988 |
| 04/15/2031 | 2.700% | | 4,545,000 | 3,713,252 |
| 09/15/2031 | 2.300% | | 477,000 | 373,145 |
| 03/15/2033 | 5.650% | | 4,176,000 | 4,159,730 |
| 07/15/2033 | 5.550% | | 6,619,000 | 6,551,950 |
| Crown Castle International Corp. |
| 07/15/2026 | 1.050% | | 401,000 | 353,755 |
| 03/15/2027 | 2.900% | | 684,000 | 628,024 |
| 04/01/2031 | 2.100% | | 368,000 | 289,893 |
| 07/15/2031 | 2.500% | | 238,000 | 191,890 |
| 04/01/2041 | 2.900% | | 1,652,000 | 1,112,775 |
| Crown Castle, Inc. |
| 09/01/2028 | 4.800% | | 434,000 | 421,355 |
| 05/01/2033 | 5.100% | | 3,195,000 | 3,072,649 |
| Digicel Group 0.5 Ltd.(a),(l) |
| 04/01/2025 | 8.000% | | 103,826 | 17,650 |
| Digicel Holdings Bermuda Ltd./International Finance Ltd.(a) |
| 05/25/2024 | 8.750% | | 700,000 | 639,894 |
| Digicel International Finance Ltd./Holdings(a),(l) |
| 12/31/2025 | 13.000% | | 860,640 | 618,341 |
| Digicel International Finance Ltd./Holdings(a) |
| Subordinated |
| 12/31/2026 | 8.000% | | 500,000 | 24,259 |
| Digicel International Finance Ltd./Holdings Bermuda Ltd.(a) |
| 05/25/2024 | 8.750% | | 2,425,000 | 2,211,280 |
| Digicel Ltd.(a) |
| 12/01/2023 | 6.750% | | 1,300,000 | 64,768 |
| Millicom International Cellular SA(a) |
| 04/27/2031 | 4.500% | | 500,000 | 394,250 |
| Sprint Capital Corp. |
| 11/15/2028 | 6.875% | | 1,766,000 | 1,865,884 |
| 03/15/2032 | 8.750% | | 3,140,000 | 3,741,406 |
| Sprint Corp. |
| 09/15/2023 | 7.875% | | 3,000,000 | 3,001,661 |
| 06/15/2024 | 7.125% | | 5,225,000 | 5,270,117 |
| Sprint Spectrum Co. I/II/III LLC(a) |
| 03/20/2025 | 4.738% | | 2,241,312 | 2,213,160 |
| 03/20/2028 | 5.152% | | 7,861,250 | 7,791,570 |
The accompanying Notes to Financial Statements are an integral part of this statement.
Multi-Manager Total Return Bond Strategies Fund | Annual Report 2023
| 57 |
Portfolio of Investments (continued)
August 31, 2023
| Corporate Bonds & Notes (continued) |
| Issuer | Coupon
Rate | | Principal
Amount ($) | Value ($) |
| T-Mobile US, Inc. |
| 02/15/2026 | 2.250% | | 99,000 | 91,615 |
| 04/15/2027 | 3.750% | | 3,514,000 | 3,327,761 |
| 02/01/2028 | 4.750% | | 961,000 | 934,109 |
| 02/15/2028 | 2.050% | | 1,548,000 | 1,351,454 |
| 02/15/2029 | 2.625% | | 597,000 | 517,207 |
| 04/15/2029 | 3.375% | | 3,200,000 | 2,869,972 |
| 04/15/2030 | 3.875% | | 5,642,000 | 5,138,468 |
| 02/15/2031 | 2.550% | | 2,165,000 | 1,783,325 |
| 04/15/2031 | 3.500% | | 1,692,000 | 1,477,374 |
| 07/15/2033 | 5.050% | | 6,275,000 | 6,055,379 |
| 04/15/2040 | 4.375% | | 3,970,000 | 3,406,988 |
| 02/15/2041 | 3.000% | | 3,880,000 | 2,735,078 |
| 04/15/2050 | 4.500% | | 332,000 | 274,178 |
| 01/15/2054 | 5.750% | | 440,000 | 434,659 |
| 09/15/2062 | 5.800% | | 1,266,000 | 1,227,395 |
| Vmed O2 UK Financing I PLC(a) |
| 07/15/2031 | 4.750% | | 1,580,000 | 1,320,669 |
| Vodafone Group PLC |
| 06/19/2049 | 4.875% | | 3,150,000 | 2,669,834 |
| 02/10/2063 | 5.750% | | 550,000 | 510,780 |
| Total | 86,152,760 |
| Wirelines 0.5% |
| AT&T, Inc. |
| 02/15/2034 | 5.400% | | 4,106,000 | 3,986,868 |
| 05/15/2035 | 4.500% | | 759,000 | 673,757 |
| 03/01/2037 | 5.250% | | 2,205,000 | 2,087,442 |
| 08/15/2037 | 4.900% | | 584,000 | 528,417 |
| 03/01/2039 | 4.850% | | 1,086,000 | 964,970 |
| 06/01/2041 | 3.500% | | 659,000 | 483,013 |
| 09/15/2053 | 3.500% | | 10,356,000 | 6,815,366 |
| 09/15/2055 | 3.550% | | 4,271,000 | 2,787,092 |
| 12/01/2057 | 3.800% | | 531,000 | 357,511 |
| 09/15/2059 | 3.650% | | 6,015,000 | 3,892,497 |
| Bell Canada |
| 05/11/2033 | 5.100% | | 6,094,000 | 5,877,815 |
| C&W Senior Financing DAC(a) |
| 09/15/2027 | 6.875% | | 385,000 | 357,027 |
| Front Range BidCo, Inc.(a) |
| 03/01/2027 | 4.000% | | 1,500,000 | 1,123,197 |
| Frontier Communications Corp.(a) |
| 05/01/2028 | 5.000% | | 269,000 | 230,535 |
| Frontier Communications Holdings LLC(a) |
| 05/15/2030 | 8.750% | | 650,000 | 631,437 |
| 03/15/2031 | 8.625% | | 2,458,000 | 2,363,108 |
| GCI LLC(a) |
| 10/15/2028 | 4.750% | | 1,480,000 | 1,284,168 |
| Iliad Holding SAS(a) |
| 10/15/2026 | 6.500% | | 550,000 | 523,892 |
| 10/15/2028 | 7.000% | | 500,000 | 465,143 |
| Corporate Bonds & Notes (continued) |
| Issuer | Coupon
Rate | | Principal
Amount ($) | Value ($) |
| Level 3 Financing, Inc.(a) |
| 03/01/2027 | 3.400% | | 1,925,000 | 1,775,739 |
| Northwest Fiber LLC/Finance Sub, Inc.(a) |
| 04/30/2027 | 4.750% | | 450,000 | 393,913 |
| Qwest Corp. |
| 09/15/2025 | 7.250% | | 3,978,000 | 3,817,941 |
| Telecom Italia Capital SA |
| 06/04/2038 | 7.721% | | 1,550,000 | 1,433,089 |
| Total Play Telecomunicaciones SA de CV(a) |
| 09/20/2028 | 6.375% | | 1,270,000 | 581,653 |
| Verizon Communications, Inc. |
| 02/15/2025 | 3.376% | | 2,527,000 | 2,450,902 |
| 12/03/2029 | 4.016% | | 530,000 | 492,203 |
| 01/20/2031 | 1.750% | | 555,000 | 431,658 |
| 03/21/2031 | 2.550% | | 552,000 | 454,265 |
| 03/15/2032 | 2.355% | | 4,020,000 | 3,179,200 |
| 08/10/2033 | 4.500% | | 307,000 | 283,649 |
| 11/01/2034 | 4.400% | | 3,565,000 | 3,225,756 |
| 03/22/2041 | 3.400% | | 2,127,000 | 1,579,516 |
| Total | 55,532,739 |
Total Corporate Bonds & Notes
(Cost $3,632,293,315) | 3,332,960,555 |
|
| Foreign Government Obligations(o),(p) 1.4% |
| | | | |
| Australia 0.0% |
| NBN Co., Ltd.(a) |
| 05/05/2026 | 1.450% | | 581,000 | 524,190 |
| 01/08/2027 | 1.625% | | 1,230,000 | 1,094,190 |
| Total | 1,618,380 |
| Azerbaijan 0.0% |
| Southern Gas Corridor CJSC(a) |
| 03/24/2026 | 6.875% | | 450,000 | 454,351 |
| Bermuda 0.0% |
| Bermuda Government International Bond(a) |
| 08/20/2030 | 2.375% | | 1,105,000 | 905,904 |
| Brazil 0.0% |
| Brazil Minas SPE via State of Minas Gerais(a) |
| 02/15/2028 | 5.333% | | 1,450,000 | 1,419,838 |
| Brazilian Government International Bond |
| 06/12/2030 | 3.875% | | 800,000 | 708,533 |
| 10/20/2033 | 6.000% | | 350,000 | 340,787 |
| Total | 2,469,158 |
| Canada 0.0% |
| Province of British Columbia |
| 09/01/2036 | 7.250% | | 2,000,000 | 2,495,718 |
The accompanying Notes to Financial Statements are an integral part of this statement.
| 58 | Multi-Manager Total Return Bond Strategies Fund | Annual Report 2023 |
Portfolio of Investments (continued)
August 31, 2023
| Foreign Government Obligations(o),(p) (continued) |
| Issuer | Coupon
Rate | | Principal
Amount ($) | Value ($) |
| Province of Manitoba |
| 06/22/2026 | 2.125% | | 300,000 | 279,026 |
| Province of Quebec(k) |
| 03/02/2026 | 7.485% | | 230,000 | 241,736 |
| Total | 3,016,480 |
| Chile 0.0% |
| Chile Government International Bond |
| 01/27/2032 | 2.550% | | 448,000 | 376,132 |
| 01/31/2034 | 3.500% | | 850,000 | 737,405 |
| Corporación Nacional del Cobre de Chile(a) |
| 11/04/2044 | 4.875% | | 200,000 | 170,479 |
| Empresa Nacional del Petroleo(a) |
| 08/05/2026 | 3.750% | | 750,000 | 705,464 |
| 11/06/2029 | 5.250% | | 450,000 | 428,350 |
| Total | 2,417,830 |
| Colombia 0.1% |
| Colombia Government International Bond |
| 03/15/2029 | 4.500% | | 950,000 | 847,500 |
| 01/30/2030 | 3.000% | | 315,000 | 250,385 |
| 04/20/2033 | 8.000% | | 200,000 | 207,117 |
| Ecopetrol SA |
| 01/19/2029 | 8.625% | | 5,830,000 | 5,942,548 |
| 04/29/2030 | 6.875% | | 2,000,000 | 1,864,916 |
| 01/13/2033 | 8.875% | | 3,764,000 | 3,807,775 |
| Total | 12,920,241 |
| Dominican Republic 0.1% |
| Dominican Republic International Bond(a) |
| 01/27/2025 | 5.500% | | 100,000 | 98,807 |
| 01/27/2025 | 5.500% | | 100,000 | 98,807 |
| 07/19/2028 | 6.000% | | 1,400,000 | 1,353,263 |
| 07/19/2028 | 6.000% | | 275,000 | 265,820 |
| 02/22/2029 | 5.500% | | 2,655,000 | 2,483,149 |
| 02/22/2029 | 5.500% | | 161,000 | 150,579 |
| 01/30/2030 | 4.500% | | 628,000 | 547,311 |
| 09/23/2032 | 4.875% | | 750,000 | 635,841 |
| Total | 5,633,577 |
| France 0.0% |
| Dexia Credit Local SA(a) |
| 09/26/2023 | 3.250% | | 1,500,000 | 1,497,629 |
| Guatemala 0.0% |
| Guatemala Government Bond(a) |
| 08/10/2029 | 5.250% | | 450,000 | 428,450 |
| 10/07/2033 | 3.700% | | 794,000 | 640,410 |
| Total | 1,068,860 |
| Foreign Government Obligations(o),(p) (continued) |
| Issuer | Coupon
Rate | | Principal
Amount ($) | Value ($) |
| Hungary 0.0% |
| Hungary Government International Bond(a) |
| 09/22/2031 | 2.125% | | 1,400,000 | 1,076,726 |
| India 0.1% |
| Export-Import Bank of India(a) |
| 08/05/2026 | 3.375% | | 860,000 | 812,123 |
| 02/01/2028 | 3.875% | | 1,025,000 | 960,265 |
| 01/13/2031 | 2.250% | | 1,030,000 | 817,628 |
| Indian Railway Finance Corp., Ltd.(a) |
| 01/21/2032 | 3.570% | | 1,110,000 | 949,745 |
| Power Finance Corp., Ltd.(a) |
| 12/06/2028 | 6.150% | | 546,000 | 552,959 |
| Total | 4,092,720 |
| Indonesia 0.1% |
| Freeport Indonesia PT(a) |
| 04/14/2032 | 5.315% | | 1,045,000 | 972,092 |
| Indonesia Asahan Aluminium PT/Mineral Industri Persero(a) |
| 05/15/2030 | 5.450% | | 560,000 | 539,167 |
| Indonesia Government International Bond(a) |
| 01/17/2038 | 7.750% | | 1,000,000 | 1,228,391 |
| Lembaga Pembiayaan Ekspor Indonesia(a) |
| 04/06/2024 | 3.875% | | 1,450,000 | 1,429,301 |
| Perusahaan Penerbit SBSN Indonesia III(a) |
| 06/23/2030 | 2.800% | | 1,000,000 | 869,162 |
| PT Pertamina Persero(a) |
| 08/25/2030 | 3.100% | | 1,424,000 | 1,228,329 |
| 05/20/2043 | 5.625% | | 250,000 | 233,112 |
| PT Perusahaan Listrik Negara(a) |
| 05/15/2027 | 4.125% | | 5,000,000 | 4,755,893 |
| 05/21/2028 | 5.450% | | 850,000 | 844,390 |
| Total | 12,099,837 |
| Israel 0.0% |
| Israel Electric Corp., Ltd.(a) |
| 08/14/2028 | 4.250% | | 2,200,000 | 2,051,353 |
| Italy 0.1% |
| Cassa Depositi e Prestiti SpA(a) |
| 05/05/2026 | 5.750% | | 1,200,000 | 1,183,910 |
| Republic of Italy Government International Bond |
| 10/17/2029 | 2.875% | | 1,700,000 | 1,484,074 |
| 06/15/2033 | 5.375% | | 8,270,000 | 8,121,582 |
| Total | 10,789,566 |
| Japan 0.0% |
| Japan Bank for International Cooperation |
| 05/23/2024 | 2.500% | | 600,000 | 586,491 |
The accompanying Notes to Financial Statements are an integral part of this statement.
Multi-Manager Total Return Bond Strategies Fund | Annual Report 2023
| 59 |
Portfolio of Investments (continued)
August 31, 2023
| Foreign Government Obligations(o),(p) (continued) |
| Issuer | Coupon
Rate | | Principal
Amount ($) | Value ($) |
| Japan Finance Organization for Municipalities(a) |
| 03/12/2024 | 3.000% | | 400,000 | 394,467 |
| Total | 980,958 |
| Kazakhstan 0.0% |
| KazMunayGas National Co. JSC(a) |
| 04/19/2027 | 4.750% | | 300,000 | 282,231 |
| 04/24/2030 | 5.375% | | 962,000 | 876,183 |
| KazTransGas JSC(a) |
| 09/26/2027 | 4.375% | | 200,000 | 184,184 |
| Total | 1,342,598 |
| Marshall Islands 0.0% |
| Nakilat, Inc.(a) |
| 12/31/2033 | 6.067% | | 1,004,171 | 1,034,549 |
| Mexico 0.4% |
| Comision Federal de Electricidad(a) |
| 05/15/2029 | 4.688% | | 3,647,000 | 3,321,231 |
| Mexico City Airport Trust(a) |
| 10/31/2026 | 4.250% | | 1,435,000 | 1,370,830 |
| 04/30/2028 | 3.875% | | 420,000 | 387,959 |
| 10/31/2046 | 5.500% | | 667,000 | 555,337 |
| 07/31/2047 | 5.500% | | 4,424,000 | 3,649,546 |
| Mexico Government International Bond |
| 04/22/2029 | 4.500% | | 1,500,000 | 1,448,028 |
| 05/24/2031 | 2.659% | | 2,368,000 | 1,961,218 |
| 04/27/2032 | 4.750% | | 250,000 | 237,029 |
| 05/19/2033 | 4.875% | | 300,000 | 284,270 |
| 05/04/2053 | 6.338% | | 340,000 | 340,364 |
| 05/24/2061 | 3.771% | | 550,000 | 361,672 |
| 04/19/2071 | 3.750% | | 750,000 | 481,706 |
| Pemex Project Funding Master Trust |
| 06/15/2038 | 6.625% | | 50,000 | 32,814 |
| Petroleos Mexicanos |
| 03/13/2027 | 6.500% | | 11,947,000 | 10,473,363 |
| 02/12/2028 | 5.350% | | 276,000 | 221,786 |
| 01/23/2029 | 6.500% | | 625,000 | 508,269 |
| 01/28/2031 | 5.950% | | 3,798,000 | 2,758,287 |
| 02/16/2032 | 6.700% | | 4,723,000 | 3,572,024 |
| 06/15/2035 | 6.625% | | 2,215,000 | 1,517,492 |
| 01/23/2045 | 6.375% | | 940,000 | 570,055 |
| 01/23/2046 | 5.625% | | 300,000 | 171,973 |
| 09/21/2047 | 6.750% | | 3,752,000 | 2,319,084 |
| 01/28/2060 | 6.950% | | 50,000 | 31,009 |
| Petroleos Mexicanos(a) |
| 02/07/2033 | 10.000% | | 1,375,000 | 1,245,402 |
| Total | 37,820,748 |
| Foreign Government Obligations(o),(p) (continued) |
| Issuer | Coupon
Rate | | Principal
Amount ($) | Value ($) |
| Morocco 0.0% |
| Morocco Government International Bond(a) |
| 12/15/2027 | 2.375% | | 1,300,000 | 1,134,510 |
| 12/15/2050 | 4.000% | | 350,000 | 229,582 |
| OCP SA(a) |
| 06/23/2031 | 3.750% | | 350,000 | 289,214 |
| Total | 1,653,306 |
| Netherlands 0.0% |
| Equate Petrochemical BV(a) |
| 04/28/2028 | 2.625% | | 700,000 | 617,300 |
| Norway 0.0% |
| Equinor ASA |
| 04/06/2030 | 3.125% | | 826,000 | 749,138 |
| Oman 0.0% |
| Oman Government International Bond(a) |
| 01/17/2028 | 5.625% | | 600,000 | 593,346 |
| Panama 0.0% |
| Banco Nacional de Panama(a) |
| 08/11/2030 | 2.500% | | 875,000 | 692,862 |
| 08/11/2030 | 2.500% | | 600,000 | 475,106 |
| Panama Government International Bond |
| 03/16/2025 | 3.750% | | 200,000 | 193,825 |
| 01/23/2030 | 3.160% | | 1,315,000 | 1,144,247 |
| 09/29/2032 | 2.252% | | 200,000 | 151,861 |
| 01/19/2033 | 3.298% | | 650,000 | 535,266 |
| 02/14/2035 | 6.400% | | 200,000 | 205,398 |
| Total | 3,398,565 |
| Paraguay 0.0% |
| Paraguay Government International Bond(a) |
| 04/28/2031 | 4.950% | | 730,000 | 689,776 |
| Peru 0.1% |
| Corporación Financiera de Desarrollo SA(a) |
| 09/28/2027 | 2.400% | | 600,000 | 522,289 |
| Peruvian Government International Bond |
| 06/20/2030 | 2.844% | | 700,000 | 605,845 |
| 01/23/2031 | 2.783% | | 1,120,000 | 950,611 |
| 12/01/2032 | 1.862% | | 100,000 | 75,547 |
| 03/14/2037 | 6.550% | | 1,785,000 | 1,944,972 |
| 12/01/2060 | 2.780% | | 600,000 | 352,345 |
| Petroleos del Peru SA(a) |
| 06/19/2032 | 4.750% | | 2,100,000 | 1,559,512 |
| Total | 6,011,121 |
The accompanying Notes to Financial Statements are an integral part of this statement.
| 60 | Multi-Manager Total Return Bond Strategies Fund | Annual Report 2023 |
Portfolio of Investments (continued)
August 31, 2023
| Foreign Government Obligations(o),(p) (continued) |
| Issuer | Coupon
Rate | | Principal
Amount ($) | Value ($) |
| Philippines 0.0% |
| Philippine Government International Bond |
| 05/05/2030 | 2.457% | | 800,000 | 682,012 |
| 01/15/2032 | 6.375% | | 400,000 | 435,659 |
| 10/23/2034 | 6.375% | | 275,000 | 301,687 |
| Total | 1,419,358 |
| Poland 0.0% |
| Bank Gospodarstwa Krajowego(a) |
| 05/22/2033 | 5.375% | | 2,825,000 | 2,760,913 |
| Republic of Poland Government International Bond |
| 11/16/2032 | 5.750% | | 159,000 | 165,373 |
| 10/04/2033 | 4.875% | | 790,000 | 766,634 |
| Total | 3,692,920 |
| Qatar 0.0% |
| Qatar Energy(a) |
| 07/12/2031 | 2.250% | | 500,000 | 411,343 |
| Romania 0.1% |
| Romanian Government International Bond(a) |
| 02/17/2028 | 6.625% | | 200,000 | 206,431 |
| 02/14/2031 | 3.000% | | 2,100,000 | 1,732,233 |
| 05/25/2034 | 6.000% | | 5,488,000 | 5,351,698 |
| 12/02/2040 | 2.625% | EUR | 500,000 | 333,548 |
| Total | 7,623,910 |
| Russian Federation 0.0% |
| Russian Foreign Bond - Eurobond(a),(n) |
| 06/23/2027 | 0.000% | | 800,000 | 415,782 |
| Saudi Arabia 0.0% |
| Gaci First Investment Co.(a) |
| 10/13/2032 | 5.250% | | 300,000 | 300,255 |
| Saudi Government International Bond(a) |
| 10/22/2030 | 3.250% | | 505,000 | 453,946 |
| 02/02/2061 | 3.450% | | 575,000 | 381,770 |
| Total | 1,135,971 |
| Serbia 0.1% |
| Serbia International Bond(a) |
| 12/01/2030 | 2.125% | | 6,640,000 | 5,058,181 |
| 09/26/2033 | 6.500% | | 2,800,000 | 2,755,504 |
| Total | 7,813,685 |
| South Africa 0.1% |
| Eskom Holdings SOC Ltd.(a) |
| 02/11/2025 | 7.125% | | 950,000 | 936,872 |
| Foreign Government Obligations(o),(p) (continued) |
| Issuer | Coupon
Rate | | Principal
Amount ($) | Value ($) |
| Republic of South Africa Government International Bond |
| 10/12/2028 | 4.300% | | 525,000 | 463,436 |
| 09/30/2029 | 4.850% | | 3,275,000 | 2,886,819 |
| 06/22/2030 | 5.875% | | 510,000 | 463,357 |
| South Africa Government International Bond |
| 01/17/2024 | 4.665% | | 1,100,000 | 1,089,143 |
| Total | 5,839,627 |
| Ukraine 0.0% |
| Ukraine Government International Bond(a) |
| 09/01/2024 | 7.750% | | 2,410,000 | 792,631 |
| 02/01/2026 | 8.994% | | 1,000,000 | 298,131 |
| 09/01/2027 | 7.750% | | 3,050,000 | 863,156 |
| 11/01/2030 | 9.750% | | 3,850,000 | 1,127,279 |
| Total | 3,081,197 |
| United Arab Emirates 0.0% |
| DP World Ltd.(a) |
| 07/02/2037 | 6.850% | | 300,000 | 321,339 |
| Finance Department Government of Sharjah(a) |
| 11/23/2032 | 6.500% | | 202,000 | 205,912 |
| Total | 527,251 |
| United States 0.1% |
| Antares Holdings LP(a) |
| 07/15/2027 | 3.750% | | 4,605,000 | 3,962,566 |
| 08/11/2028 | 7.950% | | 290,000 | 290,840 |
| BOC Aviation USA Corp.(a) |
| 04/29/2024 | 1.625% | | 2,015,000 | 1,958,960 |
| Citgo Holding, Inc.(a) |
| 08/01/2024 | 9.250% | | 25,000 | 25,013 |
| DAE Funding LLC(a) |
| 08/01/2024 | 1.550% | | 1,910,000 | 1,822,085 |
| Total | 8,059,464 |
| Virgin Islands 0.0% |
| Sinopec Group Overseas Development Ltd.(a) |
| 04/28/2025 | 3.250% | | 400,000 | 385,703 |
| 04/28/2025 | 3.250% | | 300,000 | 289,278 |
| Total | 674,981 |
Total Foreign Government Obligations
(Cost $181,863,254) | 157,699,506 |
|
The accompanying Notes to Financial Statements are an integral part of this statement.
Multi-Manager Total Return Bond Strategies Fund | Annual Report 2023
| 61 |
Portfolio of Investments (continued)
August 31, 2023
| Inflation-Indexed Bonds 0.4% |
| Issuer | Coupon
Rate | | Principal
Amount ($) | Value ($) |
| United States 0.4% |
| U.S. Treasury Inflation-Indexed Bond |
| 04/15/2028 | 1.250% | | 18,820,234 | 18,120,616 |
| 01/15/2033 | 1.125% | | 8,236,236 | 7,679,553 |
| 07/15/2033 | 1.375% | | 13,788,272 | 13,203,745 |
| Total | 39,003,914 |
Total Inflation-Indexed Bonds
(Cost $40,326,513) | 39,003,914 |
|
| Municipal Bonds 0.3% |
| Issue Description | Coupon
Rate | | Principal
Amount ($) | Value ($) |
| Higher Education 0.1% |
| University of California |
| Refunding Revenue Bonds |
| Taxable General |
| Series 2017AX |
| 07/01/2025 | 3.063% | | 5,700,000 | 5,495,662 |
| University of Michigan |
| Revenue Bonds |
| Taxable |
| Series 2022A |
| 04/01/2122 | 4.454% | | 4,020,000 | 3,320,862 |
| University of Virginia |
| Refunding Revenue Bonds |
| Taxable |
| Series 2021B |
| 11/01/2051 | 2.584% | | 2,020,000 | 1,320,774 |
| Revenue Bonds |
| Taxable |
| Series 2017C |
| 09/01/2117 | 4.179% | | 725,000 | 560,348 |
| Total | 10,697,646 |
| Hospital 0.1% |
| California Health Facilities Financing Authority |
| Refunding Revenue Bonds |
| Cedars-Sinai Health System |
| Series 2021 |
| 08/15/2051 | 3.000% | | 1,785,000 | 1,332,597 |
| Regents of the University of California Medical Center |
| Revenue Bonds |
| Taxable |
| Series 2020N |
| 05/15/2060 | 3.256% | | 5,525,000 | 3,721,384 |
| Total | 5,053,981 |
| Municipal Bonds (continued) |
| Issue Description | Coupon
Rate | | Principal
Amount ($) | Value ($) |
| Local General Obligation 0.0% |
| City of New York |
| Unlimited General Obligation Bonds |
| Series 2010 (BAM) |
| 03/01/2036 | 5.968% | | 3,100,000 | 3,282,367 |
| Sales Tax 0.0% |
| Puerto Rico Sales Tax Financing Corp.(q) |
| Revenue Bonds |
| Series 2019A1 |
| 07/01/2058 | 5.000% | | 2,740,000 | 2,652,061 |
| Special Non Property Tax 0.1% |
| New York City Transitional Finance Authority |
| Refunding Revenue Bonds |
| Future Tax Secured |
| Subordinated Series 2020B-3 |
| 08/01/2035 | 2.000% | | 3,000,000 | 2,153,011 |
| Revenue Bonds |
| Future Tax Secured |
| Subordinated Series 2020D-3 |
| 11/01/2032 | 2.400% | | 1,045,000 | 849,619 |
| New York City Transitional Finance Authority Future Tax |
| Secured Revenue Bonds |
| Build America Bonds |
| Series 2010 |
| 08/01/2037 | 5.508% | | 1,245,000 | 1,274,054 |
| State of Illinois |
| Revenue Bonds |
| Taxable Sales Tax |
| Series 2013 |
| 06/15/2028 | 3.350% | | 2,500,000 | 2,274,006 |
| Total | 6,550,690 |
| Transportation 0.0% |
| Metropolitan Transportation Authority |
| Revenue Bonds |
| Taxable Green Bonds |
| Series 2020C-2 |
| 11/15/2049 | 5.175% | | 810,000 | 747,335 |
| Turnpike / Bridge / Toll Road 0.0% |
| Bay Area Toll Authority |
| Revenue Bonds |
| Series 2009 (BAM) |
| 04/01/2049 | 6.263% | | 1,920,000 | 2,201,947 |
| Pennsylvania Turnpike Commission |
| Revenue Bonds |
| Build America Bonds |
| Series 2009 |
| 12/01/2039 | 6.105% | | 1,620,000 | 1,757,275 |
The accompanying Notes to Financial Statements are an integral part of this statement.
| 62 | Multi-Manager Total Return Bond Strategies Fund | Annual Report 2023 |
Portfolio of Investments (continued)
August 31, 2023
| Municipal Bonds (continued) |
| Issue Description | Coupon
Rate | | Principal
Amount ($) | Value ($) |
| Texas Private Activity Bond Surface Transportation Corp. |
| Revenue Bonds |
| Taxable North Tarrant Express Managed Lanes Project |
| Series 2019 |
| 12/31/2049 | 3.922% | | 875,000 | 705,952 |
| Total | 4,665,174 |
Total Municipal Bonds
(Cost $40,002,332) | 33,649,254 |
|
| Residential Mortgage-Backed Securities - Agency(r) 27.5% |
| Issuer | Coupon
Rate | | Principal
Amount ($) | Value ($) |
| Fannie Mae REMICS |
| CMO Series 2011-84 Class Z |
| 09/25/2041 | 5.250% | | 1,172,572 | 1,169,259 |
| Federal Home Loan Mortgage Corp. |
08/01/2024-
02/01/2025 | 8.000% | | 1,436 | 1,433 |
10/01/2028-
07/01/2032 | 7.000% | | 93,660 | 95,473 |
03/01/2031-
06/01/2052 | 3.000% | | 91,678,512 | 79,615,983 |
10/01/2031-
07/01/2037 | 6.000% | | 331,755 | 341,579 |
04/01/2033-
12/01/2052 | 5.500% | | 16,322,952 | 16,139,688 |
05/01/2033-
05/01/2052 | 3.500% | | 56,718,386 | 51,455,507 |
10/01/2039-
09/01/2052 | 5.000% | | 14,612,696 | 14,190,194 |
09/01/2040-
10/01/2052 | 4.000% | | 40,849,261 | 37,965,484 |
09/01/2040-
04/01/2053 | 4.500% | | 20,636,578 | 19,622,479 |
06/01/2050-
10/01/2052 | 2.500% | | 307,732,607 | 255,788,988 |
12/01/2050-
04/01/2052 | 2.000% | | 45,740,347 | 36,472,024 |
| CMO Series 2060 Class Z |
| 05/15/2028 | 6.500% | | 45,521 | 45,952 |
| CMO Series 2310 Class Z |
| 04/15/2031 | 6.000% | | 42,017 | 42,579 |
| CMO Series 2725 Class TA |
| 12/15/2033 | 4.500% | | 1,525,000 | 1,477,989 |
| CMO Series 2882 Class ZC |
| 11/15/2034 | 6.000% | | 2,550,206 | 2,533,163 |
| CMO Series 2953 Class LZ |
| 03/15/2035 | 6.000% | | 2,340,271 | 2,379,465 |
| CMO Series 3028 Class ZE |
| 09/15/2035 | 5.500% | | 152,351 | 148,167 |
| Residential Mortgage-Backed Securities - Agency(r) (continued) |
| Issuer | Coupon
Rate | | Principal
Amount ($) | Value ($) |
| CMO Series 3032 Class PZ |
| 09/15/2035 | 5.800% | | 366,573 | 376,287 |
| CMO Series 3071 Class ZP |
| 11/15/2035 | 5.500% | | 7,998,679 | 8,020,976 |
| CMO Series 3121 Class EZ |
| 03/15/2036 | 6.000% | | 87,896 | 88,715 |
| CMO Series 3181 Class AZ |
| 07/15/2036 | 6.500% | | 28,650 | 29,510 |
| CMO Series 353 Class 300 |
| 12/15/2046 | 3.000% | | 5,441,599 | 4,802,844 |
| CMO Series 3740 Class BA |
| 10/15/2040 | 4.000% | | 1,119,143 | 1,055,875 |
| CMO Series 3747 Class HY |
| 10/15/2040 | 4.500% | | 2,991,000 | 2,893,292 |
| CMO Series 3753 Class KZ |
| 11/15/2040 | 4.500% | | 5,358,825 | 5,191,322 |
| CMO Series 3769 Class ZC |
| 12/15/2040 | 4.500% | | 2,674,064 | 2,592,854 |
| CMO Series 3841 Class JZ |
| 04/15/2041 | 5.000% | | 232,128 | 230,494 |
| CMO Series 3888 Class ZG |
| 07/15/2041 | 4.000% | | 522,550 | 494,553 |
| CMO Series 3926 Class NY |
| 09/15/2041 | 4.000% | | 433,423 | 410,350 |
| CMO Series 3928 Class MB |
| 09/15/2041 | 4.500% | | 1,024,987 | 992,154 |
| CMO Series 3934 Class CB |
| 10/15/2041 | 4.000% | | 2,621,398 | 2,469,626 |
| CMO Series 3982 Class TZ |
| 01/15/2042 | 4.000% | | 1,060,247 | 995,502 |
| CMO Series 4027 Class AB |
| 12/15/2040 | 4.000% | | 1,202,578 | 1,141,194 |
| CMO Series 4057 Class ZB |
| 06/15/2042 | 3.500% | | 5,875,514 | 5,358,214 |
| CMO Series 4057 Class ZL |
| 06/15/2042 | 3.500% | | 6,431,215 | 5,732,637 |
| CMO Series 4077 Class KM |
| 11/15/2041 | 3.500% | | 24,960 | 24,505 |
| CMO Series 4091 Class KB |
| 08/15/2042 | 3.000% | | 6,500,000 | 5,633,679 |
| CMO Series 4182 Class QN |
| 02/15/2033 | 3.000% | | 105,753 | 104,229 |
| CMO Series 4361 Class VB |
| 02/15/2038 | 3.000% | | 2,577,896 | 2,524,032 |
| CMO Series 4421 Class PB |
| 12/15/2044 | 4.000% | | 5,941,237 | 5,369,061 |
The accompanying Notes to Financial Statements are an integral part of this statement.
Multi-Manager Total Return Bond Strategies Fund | Annual Report 2023
| 63 |
Portfolio of Investments (continued)
August 31, 2023
| Residential Mortgage-Backed Securities - Agency(r) (continued) |
| Issuer | Coupon
Rate | | Principal
Amount ($) | Value ($) |
| CMO Series 4440 Class ZX |
| 01/15/2045 | 4.000% | | 12,196,459 | 11,041,671 |
| CMO Series 4463 Class ZA |
| 04/15/2045 | 4.000% | | 4,626,743 | 4,297,667 |
| CMO Series 4495 Class PA |
| 09/15/2043 | 3.500% | | 125,334 | 119,283 |
| CMO Series 4682 Class HZ |
| 04/15/2047 | 3.500% | | 3,129,777 | 2,822,045 |
| CMO Series 4771 Class HZ |
| 03/15/2048 | 3.500% | | 9,695,495 | 8,505,518 |
| CMO Series 4774 Class KA |
| 12/15/2045 | 4.500% | | 131,372 | 129,477 |
| CMO Series 4787 Class PY |
| 05/15/2048 | 4.000% | | 1,086,278 | 1,001,475 |
| CMO Series 4793 Class CD |
| 06/15/2048 | 3.000% | | 818,666 | 720,598 |
| CMO Series 4839 Class A |
| 04/15/2051 | 4.000% | | 2,677,557 | 2,511,532 |
| CMO Series 4941 Class CZ |
| 11/25/2049 | 3.000% | | 1,116,125 | 920,058 |
| Federal Home Loan Mortgage Corp.(b),(d) |
-1.0 x 30-day Average SOFR + 6.214%
Cap 6.100%
11/15/2043 | 1.026% | | 12,370,235 | 806,202 |
| CMO Series 2013-4258 Class SJ |
-1.0 x 30-day Average SOFR + 6.764%
Cap 6.650%
10/15/2043 | 1.576% | | 2,995,254 | 398,836 |
| CMO Series 2014-4313 Class MS |
-1.0 x 30-day Average SOFR + 6.264%
Cap 6.150%
04/15/2039 | 1.076% | | 4,333,120 | 281,840 |
| CMO Series 3404 Class AS |
-1.0 x 30-day Average SOFR + 6.009%
Cap 5.895%
01/15/2038 | 0.821% | | 1,532,833 | 88,593 |
| CMO Series 3578 Class DI |
-1.0 x 30-day Average SOFR + 6.764%
Cap 6.650%
04/15/2036 | 1.576% | | 2,242,951 | 132,715 |
| CMO Series 3833 Class LI |
-1.0 x 30-day Average SOFR + 0.514%
10/15/2040 | 0.000% | | 5,797,578 | 303,227 |
| Residential Mortgage-Backed Securities - Agency(r) (continued) |
| Issuer | Coupon
Rate | | Principal
Amount ($) | Value ($) |
| CMO Series 3892 Class SC |
-1.0 x 30-day Average SOFR + 6.064%
Cap 5.950%
07/15/2041 | 0.876% | | 3,507,052 | 213,876 |
| CMO Series 3997 Class SK |
-1.0 x 30-day Average SOFR + 6.714%
Cap 6.600%
11/15/2041 | 1.526% | | 6,609,588 | 296,539 |
| CMO Series 4087 Class SC |
-1.0 x 30-day Average SOFR + 5.664%
Cap 5.550%
07/15/2042 | 0.476% | | 4,255,403 | 195,415 |
| CMO Series 4281 Class SA |
-1.0 x 30-day Average SOFR + 6.214%
Cap 6.100%
12/15/2043 | 1.026% | | 6,806,306 | 393,024 |
| CMO Series 4635 Class SE |
-1.0 x 30-day Average SOFR + 6.214%
Cap 6.100%
12/15/2046 | 1.026% | | 10,753,002 | 565,676 |
| CMO Series 4910 Class SG |
-1.0 x 30-day Average SOFR + 6.164%
Cap 6.050%
09/25/2049 | 0.877% | | 15,769,230 | 1,877,073 |
| Federal Home Loan Mortgage Corp.(s) |
| 08/01/2052 | 4.500% | | 10,991,078 | 10,421,530 |
| Federal Home Loan Mortgage Corp.(b) |
| CMO Series 2380 Class F |
30-day Average SOFR + 0.564%
Floor 0.450%, Cap 8.500%
11/15/2031 | 5.753% | | 73,531 | 73,346 |
| CMO Series 2557 Class FG |
30-day Average SOFR + 0.514%
Floor 0.400%, Cap 8.000%
01/15/2033 | 5.703% | | 165,548 | 165,024 |
| CMO Series 2962 Class PF |
30-day Average SOFR + 0.364%
Floor 0.250%, Cap 7.000%
03/15/2035 | 5.553% | | 70,252 | 69,754 |
The accompanying Notes to Financial Statements are an integral part of this statement.
| 64 | Multi-Manager Total Return Bond Strategies Fund | Annual Report 2023 |
Portfolio of Investments (continued)
August 31, 2023
| Residential Mortgage-Backed Securities - Agency(r) (continued) |
| Issuer | Coupon
Rate | | Principal
Amount ($) | Value ($) |
| CMO Series 2981 Class FU |
30-day Average SOFR + 0.314%
Floor 0.200%, Cap 8.000%
05/15/2030 | 5.503% | | 185,574 | 183,529 |
| CMO Series 3065 Class EB |
-3.0 x 30-day Average SOFR + 20.004%
Cap 19.890%
11/15/2035 | 4.439% | | 302,837 | 299,663 |
| CMO Series 3081 Class GC |
-3.7 x 30-day Average SOFR + 23.948%
Cap 23.833%
12/15/2035 | 4.923% | | 497,831 | 477,470 |
| CMO Series 3085 Class FV |
30-day Average SOFR + 0.814%
Floor 0.700%, Cap 8.000%
08/15/2035 | 6.003% | | 431,626 | 432,656 |
| CMO Series 3564 Class FC |
30-day Average SOFR + 1.364%
Floor 1.250%, Cap 6.500%
01/15/2037 | 6.443% | | 154,560 | 153,332 |
| CMO Series 3680 Class FA |
30-day Average SOFR + 1.114%
Floor 1.000%, Cap 6.000%
06/15/2040 | 6.000% | | 483,353 | 480,351 |
| CMO Series 3852 Class QN |
-3.6 x 30-day Average SOFR + 27.325%
Cap 5.500%
05/15/2041 | 5.500% | | 19,792 | 18,676 |
| CMO Series 4048 Class FJ |
30-day Average SOFR + 0.514%
Floor 0.400%, Cap 9,999.000%
07/15/2037 | 5.618% | | 748,940 | 740,195 |
| CMO Series 5115 Class FD |
30-day Average SOFR + 0.250%
Floor 0.250%, Cap 4.000%
08/15/2043 | 4.000% | | 6,794,269 | 6,414,700 |
| Federal Home Loan Mortgage Corp.(d) |
| CMO Series 303 Class C21 |
| 01/15/2043 | 4.000% | | 10,290,819 | 1,737,618 |
| CMO Series 303 Class C30 |
| 12/15/2042 | 4.500% | | 6,653,895 | 1,069,020 |
| Residential Mortgage-Backed Securities - Agency(r) (continued) |
| Issuer | Coupon
Rate | | Principal
Amount ($) | Value ($) |
| CMO Series 364 Class C15 |
| 12/15/2046 | 3.500% | | 4,189,659 | 682,784 |
| CMO Series 4146 Class IA |
| 12/15/2032 | 3.500% | | 4,652,381 | 478,891 |
| CMO Series 4186 Class IB |
| 03/15/2033 | 3.000% | | 4,793,634 | 429,429 |
| CMO Series 4627 Class PI |
| 05/15/2044 | 3.500% | | 1,443,682 | 47,377 |
| CMO Series 4698 Class BI |
| 07/15/2047 | 5.000% | | 11,680,670 | 2,009,165 |
| CMO Series 5048 Class HI |
| 01/15/2042 | 4.500% | | 3,001,736 | 481,003 |
| CMO Series 5078 Class NI |
| 06/15/2042 | 4.000% | | 2,740,000 | 525,534 |
| Federal Home Loan Mortgage Corp.(c),(d) |
| CMO Series 351 Class 213 |
| 02/15/2046 | 4.118% | | 286,906 | 52,784 |
| CMO Series 364 Class 141 |
| 12/15/2046 | 2.772% | | 329,517 | 46,247 |
| CMO Series 364 Class 151 |
| 12/15/2046 | 3.381% | | 325,758 | 51,724 |
| CMO Series 364 Class 158 |
| 12/15/2046 | 3.799% | | 175,171 | 30,720 |
| CMO Series 364 Class 167 |
| 12/15/2046 | 2.550% | | 308,882 | 36,840 |
| CMO Series 364 Class C23 |
| 12/15/2046 | 2.932% | | 4,067,777 | 570,347 |
| CMO Series 364 Class C24 |
| 12/15/2046 | 3.458% | | 2,297,939 | 377,333 |
| CMO Series 364 Class C25 |
| 12/15/2046 | 4.025% | | 711,404 | 133,665 |
| CMO Series 368 Class C15 |
| 01/25/2048 | 3.246% | | 4,565,366 | 571,535 |
| CMO Series 5094 Class IO |
| 12/15/2048 | 1.508% | | 13,473,573 | 929,334 |
| Federal Home Loan Mortgage Corp. Multifamily Structured Pass-Through Certificates(c),(d) |
| CMO Series K051 Class X1 |
| 09/25/2025 | 0.632% | | 16,616,683 | 139,185 |
| CMO Series K058 Class X1 |
| 08/25/2026 | 1.039% | | 2,320,970 | 50,956 |
| CMO Series KW02 Class X1 |
| 12/25/2026 | 0.416% | | 10,256,280 | 33,946 |
The accompanying Notes to Financial Statements are an integral part of this statement.
Multi-Manager Total Return Bond Strategies Fund | Annual Report 2023
| 65 |
Portfolio of Investments (continued)
August 31, 2023
| Residential Mortgage-Backed Securities - Agency(r) (continued) |
| Issuer | Coupon
Rate | | Principal
Amount ($) | Value ($) |
| Federal Home Loan Mortgage Corp. REMICS(b),(d) |
| CMO Series 204236 Class IS |
-1.0 x 30-day Average SOFR + 6.114%
Cap 6.000%
08/15/2043 | 0.926% | | 10,828,423 | 806,057 |
| CMO Series 204419 Class BS |
-1.0 x 30-day Average SOFR + 6.164%
Cap 6.050%
05/15/2053 | 0.976% | | 26,408,832 | 2,608,635 |
| CMO Series 204461 Class SA |
-1.0 x 30-day Average SOFR + 6.314%
Cap 6.200%
04/15/2045 | 1.126% | | 6,308,132 | 560,019 |
| CMO Series 204839 Class WS |
-1.0 x 30-day Average SOFR + 6.214%
Cap 6.100%
08/15/2056 | 1.026% | | 38,473,957 | 4,553,593 |
| Federal Home Loan Mortgage Corp. REMICS(d) |
| CMO Series 204695 Class OI |
| 06/15/2047 | 4.000% | | 3,049,027 | 514,676 |
| CMO Series 204864 Class IU |
| 12/15/2048 | 4.500% | | 2,726,491 | 497,278 |
| CMO Series 205012 Class MI |
| 09/25/2050 | 4.000% | | 9,784,990 | 1,903,958 |
| CMO Series 205038 Class ID |
| 11/25/2050 | 3.500% | | 31,758,318 | 5,473,759 |
| CMO Series 4257 Class IK |
| 12/15/2042 | 4.000% | | 3,660,028 | 639,658 |
| CMO Series 4999 Class IA |
| 08/25/2050 | 4.500% | | 10,231,490 | 2,017,936 |
| CMO Series 5043 Class IO |
| 11/25/2050 | 5.000% | | 17,098,583 | 3,895,794 |
| CMO Series 5058 Class NI |
| 06/25/2050 | 3.000% | | 15,607,009 | 2,743,846 |
| CMO Series 5079 Class DI |
| 02/25/2051 | 6.500% | | 10,709,229 | 2,143,722 |
| CMO Series 5088 Class IB |
| 03/25/2051 | 2.500% | | 25,594,161 | 4,204,857 |
| CMO Series 5095 Class AI |
| 04/25/2051 | 3.500% | | 22,458,145 | 3,871,490 |
| CMO Series 5113 Class MI |
| 06/25/2051 | 3.500% | | 18,271,077 | 3,528,068 |
| CMO Series 5115 Class GI |
| 09/25/2050 | 3.000% | | 11,074,112 | 1,985,047 |
| Residential Mortgage-Backed Securities - Agency(r) (continued) |
| Issuer | Coupon
Rate | | Principal
Amount ($) | Value ($) |
| CMO Series 5153 Class JI |
| 10/25/2051 | 3.500% | | 8,831,606 | 1,575,511 |
| CMO Series 5217 Class PI |
| 04/25/2052 | 3.500% | | 5,891,994 | 691,444 |
| Federal Home Loan Mortgage Corp. REMICS |
| CMO Series 3843 Class JZ |
| 04/15/2041 | 5.100% | | 1,033,121 | 1,002,715 |
| CMO Series 4372 Class Z |
| 08/15/2044 | 3.000% | | 2,959,522 | 2,592,328 |
| CMO Series 4402 Class YB |
| 10/15/2044 | 3.000% | | 2,604,563 | 2,285,014 |
| CMO Series 4612 Class HZ |
| 08/15/2046 | 2.500% | | 7,134,885 | 5,566,845 |
| CMO Series 4753 Class VZ |
| 12/15/2047 | 3.000% | | 1,182,098 | 909,115 |
| CMO Series 4755 Class Z |
| 02/15/2048 | 3.000% | | 1,182,098 | 991,396 |
| Federal Home Loan Mortgage Corp. REMICS(c),(d) |
| CMO Series 5065 Class EI |
| 11/25/2044 | 5.407% | | 1,439,912 | 316,842 |
| Federal National Mortgage Association |
| 06/01/2024 | 9.000% | | 6 | 6 |
02/01/2025-
08/01/2027 | 8.000% | | 6,720 | 6,757 |
03/01/2026-
07/01/2038 | 7.000% | | 300,595 | 309,493 |
04/01/2027-
06/01/2032 | 7.500% | | 21,090 | 21,485 |
05/01/2029-
12/01/2052 | 6.000% | | 10,720,640 | 10,777,916 |
08/01/2029-
07/01/2052 | 3.000% | | 241,559,784 | 209,426,612 |
01/01/2031-
06/01/2053 | 2.500% | | 265,691,287 | 221,817,987 |
03/01/2033-
07/01/2053 | 5.500% | | 11,731,575 | 11,602,901 |
10/01/2033-
12/01/2052 | 3.500% | | 84,892,032 | 76,938,736 |
07/01/2039-
12/01/2052 | 5.000% | | 83,377,188 | 80,926,938 |
08/01/2040-
04/01/2052 | 2.000% | | 251,664,398 | 201,906,619 |
10/01/2040-
06/01/2056 | 4.500% | | 58,106,073 | 55,204,316 |
02/01/2041-
12/01/2052 | 4.000% | | 108,076,378 | 100,882,010 |
| 02/01/2051 | 1.500% | | 35,126,280 | 26,571,190 |
| 06/01/2053 | 6.500% | | 3,469,625 | 3,523,985 |
| CMO Series 2003-22 Class Z |
| 04/25/2033 | 6.000% | | 85,163 | 85,843 |
| CMO Series 2003-33 Class PT |
| 05/25/2033 | 4.500% | | 3,906 | 3,780 |
The accompanying Notes to Financial Statements are an integral part of this statement.
| 66 | Multi-Manager Total Return Bond Strategies Fund | Annual Report 2023 |
Portfolio of Investments (continued)
August 31, 2023
| Residential Mortgage-Backed Securities - Agency(r) (continued) |
| Issuer | Coupon
Rate | | Principal
Amount ($) | Value ($) |
| CMO Series 2007-50 Class DZ |
| 06/25/2037 | 5.500% | | 417,416 | 418,937 |
| CMO Series 2010-139 Class HA |
| 11/25/2040 | 4.000% | | 1,420,886 | 1,327,082 |
| CMO Series 2010-37 Class A1 |
| 05/25/2035 | 5.410% | | 53,127 | 52,595 |
| CMO Series 2011-18 Class ZK |
| 03/25/2041 | 4.000% | | 3,048,970 | 2,878,665 |
| CMO Series 2011-53 Class WT |
| 06/25/2041 | 4.500% | | 276,908 | 265,650 |
| CMO Series 2011-87 Class GB |
| 09/25/2041 | 4.500% | | 7,000,000 | 6,749,981 |
| CMO Series 2012-121 Class GZ |
| 11/25/2042 | 3.500% | | 10,249,653 | 9,332,928 |
| CMO Series 2012-68 Class ZA |
| 07/25/2042 | 3.500% | | 8,027,333 | 7,367,312 |
| CMO Series 2012-94 |
| 09/25/2042 | 3.500% | | 9,414,199 | 8,578,038 |
| CMO Series 2013-106 Class LA |
| 08/25/2041 | 4.000% | | 1,571,645 | 1,481,861 |
| CMO Series 2013-16 Class GD |
| 03/25/2033 | 3.000% | | 1,069,080 | 1,041,574 |
| CMO Series 2013-66 Class AP |
| 05/25/2043 | 6.000% | | 38,654 | 36,616 |
| CMO Series 2016-9 Class A |
| 09/25/2043 | 3.000% | | 595 | 592 |
| CMO Series 2018-38 Class PA |
| 06/25/2047 | 3.500% | | 459,894 | 433,535 |
| CMO Series 2018-55 Class PA |
| 01/25/2047 | 3.500% | | 1,220,718 | 1,169,651 |
| CMO Series 2018-64 Class ET |
| 09/25/2048 | 3.000% | | 2,671,708 | 2,369,635 |
| CMO Series 2018-94D Class KD |
| 12/25/2048 | 3.500% | | 729,669 | 680,881 |
| CMO Series 2019-9 Class DZ |
| 03/25/2049 | 4.000% | | 3,359,004 | 3,089,403 |
| CMO Series 98-17 Class Z |
| 04/18/2028 | 6.500% | | 30,211 | 29,883 |
| Federal National Mortgage Association(s) |
11/01/2050-
06/01/2051 | 1.500% | | 5,253,060 | 3,967,417 |
| 04/01/2051 | 2.000% | | 18,564,758 | 14,801,591 |
| 02/01/2052 | 3.000% | | 13,348,864 | 11,507,008 |
| 05/01/2052 | 3.500% | | 19,008,754 | 17,002,846 |
| Residential Mortgage-Backed Securities - Agency(r) (continued) |
| Issuer | Coupon
Rate | | Principal
Amount ($) | Value ($) |
| Federal National Mortgage Association(b) |
| CMO Series 2002-59 Class HF |
30-day Average SOFR + 0.464%
Floor 0.350%, Cap 8.000%
08/17/2032 | 5.686% | | 10,866 | 10,857 |
| CMO Series 2004-93 Class FC |
30-day Average SOFR + 0.314%
Floor 0.200%, Cap 8.000%
12/25/2034 | 5.602% | | 263,007 | 260,292 |
| CMO Series 2006-71 Class SH |
-2.6 x 30-day Average SOFR + 15.852%
Cap 15.738%
05/25/2035 | 1.983% | | 132,339 | 118,961 |
| CMO Series 2007-90 Class F |
30-day Average SOFR + 0.604%
Floor 0.490%, Cap 7.000%
09/25/2037 | 5.892% | | 11,038 | 10,939 |
| CMO Series 2007-W7 Class 1A4 |
-6.0 x 30-day Average SOFR + 39.294%
Cap 39.180%
07/25/2037 | 7.569% | | 40,406 | 45,565 |
| CMO Series 2008-15 Class AS |
-5.0 x 30-day Average SOFR + 33.114%
Cap 33.000%
08/25/2036 | 6.677% | | 228,977 | 262,716 |
| CMO Series 2010-142 Class HS |
-2.0 x 30-day Average SOFR + 10.114%
Cap 10.000%
12/24/2040 | 0.000% | | 452,249 | 268,623 |
| CMO Series 2010-150 Class FL |
30-day Average SOFR + 0.664%
Floor 0.550%, Cap 7.000%
10/25/2040 | 5.952% | | 98,302 | 97,440 |
| CMO Series 2012-1 Class FA |
30-day Average SOFR + 0.614%
Floor 0.500%, Cap 6.500%
02/25/2042 | 5.902% | | 753,349 | 731,026 |
| CMO Series 2012-115 Class MT |
-3.0 x 30-day Average SOFR + 13.614%
Cap 4.500%
10/25/2042 | 0.000% | | 310,600 | 192,970 |
The accompanying Notes to Financial Statements are an integral part of this statement.
Multi-Manager Total Return Bond Strategies Fund | Annual Report 2023
| 67 |
Portfolio of Investments (continued)
August 31, 2023
| Residential Mortgage-Backed Securities - Agency(r) (continued) |
| Issuer | Coupon
Rate | | Principal
Amount ($) | Value ($) |
| CMO Series 2016-32 Class GT |
30-day Average SOFR + 17.485%
Cap 4.500%
01/25/2043 | 0.000% | | 32,299 | 19,336 |
| Federal National Mortgage Association(b),(d) |
| CMO Series 2004-29 Class PS |
-1.0 x 30-day Average SOFR + 7.714%
Cap 7.600%
05/25/2034 | 2.427% | | 1,007,570 | 104,493 |
| CMO Series 2006-43 Class SJ |
-1.0 x 30-day Average SOFR + 6.704%
Cap 6.590%
06/25/2036 | 1.417% | | 734,141 | 60,770 |
| CMO Series 2009-100 Class SA |
-1.0 x 30-day Average SOFR + 6.314%
Cap 6.200%
12/25/2039 | 1.027% | | 2,343,056 | 206,850 |
| CMO Series 2009-87 Class NS |
-1.0 x 30-day Average SOFR + 6.364%
Cap 6.250%
11/25/2039 | 1.077% | | 3,668,767 | 226,359 |
| CMO Series 2010-131 Class SA |
-1.0 x 30-day Average SOFR + 6.714%
Cap 6.600%
11/25/2040 | 1.427% | | 3,132,093 | 302,657 |
| CMO Series 2010-21 Class SA |
-1.0 x 30-day Average SOFR + 6.364%
Cap 6.250%
03/25/2040 | 1.077% | | 5,623,914 | 363,975 |
| CMO Series 2010-57 Class SA |
-1.0 x 30-day Average SOFR + 6.564%
Cap 6.450%
06/25/2040 | 1.277% | | 1,390,419 | 107,319 |
| CMO Series 2011-131 Class ST |
-1.0 x 30-day Average SOFR + 6.654%
Cap 6.540%
12/25/2041 | 1.367% | | 17,674,367 | 1,925,725 |
| CMO Series 2011-47 Class GS |
-1.0 x 30-day Average SOFR + 6.044%
Cap 5.930%
06/25/2041 | 0.757% | | 4,629,446 | 281,464 |
| Residential Mortgage-Backed Securities - Agency(r) (continued) |
| Issuer | Coupon
Rate | | Principal
Amount ($) | Value ($) |
| CMO Series 2012-17 Class MS |
-1.0 x 30-day Average SOFR + 6.814%
Cap 6.700%
03/25/2027 | 1.527% | | 1,069,482 | 16,114 |
| CMO Series 2013-10 Class SJ |
-1.0 x 30-day Average SOFR + 6.264%
Cap 6.150%
02/25/2043 | 0.977% | | 3,954,749 | 321,278 |
| CMO Series 2013-19 Class KS |
-1.0 x 30-day Average SOFR + 6.314%
Cap 6.200%
10/25/2041 | 1.027% | | 3,778,146 | 209,990 |
| CMO Series 2013-34 Class SC |
-1.0 x 30-day Average SOFR + 6.264%
Cap 6.150%
04/25/2043 | 0.977% | | 11,189,382 | 1,077,737 |
| CMO Series 2014-40 Class HS |
-1.0 x 30-day Average SOFR + 6.814%
Cap 6.700%
07/25/2044 | 1.527% | | 2,881,880 | 411,145 |
| CMO Series 2014-52 Class SL |
-1.0 x 30-day Average SOFR + 6.214%
Cap 6.100%
09/25/2044 | 0.927% | | 4,972,793 | 483,536 |
| CMO Series 2015-81 Class SD |
-1.0 x 30-day Average SOFR + 6.814%
Cap 6.700%
01/25/2037 | 1.527% | | 3,302,434 | 219,204 |
| CMO Series 2016-19 Class SA |
-1.0 x 30-day Average SOFR + 6.214%
Cap 6.100%
04/25/2046 | 0.927% | | 4,355,619 | 270,892 |
| CMO Series 2016-32 Class SA |
-1.0 x 30-day Average SOFR + 6.214%
Cap 6.100%
10/25/2034 | 0.927% | | 1,982,299 | 121,101 |
| CMO Series 2016-60 Class QS |
-1.0 x 30-day Average SOFR + 6.214%
Cap 6.100%
09/25/2046 | 0.927% | | 5,722,477 | 391,333 |
The accompanying Notes to Financial Statements are an integral part of this statement.
| 68 | Multi-Manager Total Return Bond Strategies Fund | Annual Report 2023 |
Portfolio of Investments (continued)
August 31, 2023
| Residential Mortgage-Backed Securities - Agency(r) (continued) |
| Issuer | Coupon
Rate | | Principal
Amount ($) | Value ($) |
| CMO Series 2016-60 Class SD |
-1.0 x 30-day Average SOFR + 6.214%
Cap 6.100%
09/25/2046 | 0.927% | | 19,224,243 | 1,244,201 |
| CMO Series 2016-60 Class SE |
-1.0 x 30-day Average SOFR + 6.364%
Cap 6.250%
09/25/2046 | 1.077% | | 5,559,317 | 341,249 |
| CMO Series 2016-82 Class SG |
-1.0 x 30-day Average SOFR + 6.214%
Cap 6.100%
11/25/2046 | 0.927% | | 7,831,590 | 462,419 |
| CMO Series 2016-88 Class BS |
-1.0 x 30-day Average SOFR + 6.214%
Cap 6.100%
12/25/2046 | 0.927% | | 13,262,505 | 959,029 |
| CMO Series 2016-93 Class SL |
-1.0 x 30-day Average SOFR + 6.764%
Cap 6.650%
12/25/2046 | 1.477% | | 3,529,708 | 233,514 |
| CMO Series 2017-26 Class SA |
-1.0 x 30-day Average SOFR + 6.264%
Cap 6.150%
04/25/2047 | 0.977% | | 5,288,464 | 305,694 |
| CMO Series 2017-57 Class SD |
-1.0 x 30-day Average SOFR + 4.064%
Cap 2.750%
08/25/2047 | 0.000% | | 5,896,148 | 95,745 |
| CMO Series 2018-43 Class SE |
-1.0 x 30-day Average SOFR + 6.364%
Cap 6.250%
09/25/2038 | 1.077% | | 4,257,971 | 304,552 |
| CMO Series 2018-61 Class SA |
-1.0 x 30-day Average SOFR + 6.314%
Cap 6.200%
08/25/2048 | 1.027% | | 3,066,826 | 215,729 |
| CMO Series 2019-35 Class SH |
-1.0 x 30-day Average SOFR + 6.264%
Cap 6.150%
07/25/2049 | 0.977% | | 12,662,389 | 759,637 |
| Residential Mortgage-Backed Securities - Agency(r) (continued) |
| Issuer | Coupon
Rate | | Principal
Amount ($) | Value ($) |
| CMO Series 2019-39 Class SB |
-1.0 x 30-day Average SOFR + 6.214%
Cap 6.100%
08/25/2049 | 0.927% | | 11,178,291 | 691,769 |
| Federal National Mortgage Association(d) |
| CMO Series 2013-16 Class MI |
| 03/25/2043 | 4.000% | | 3,691,035 | 391,880 |
| CMO Series 2013-23 Class AI |
| 03/25/2043 | 5.000% | | 4,779,623 | 825,453 |
| CMO Series 2013-35 Class IB |
| 04/25/2033 | 3.000% | | 5,539,731 | 520,551 |
| CMO Series 2013-41 Class HI |
| 02/25/2033 | 3.000% | | 6,227,963 | 405,692 |
| CMO Series 2015-54 Class GI |
| 07/25/2045 | 5.500% | | 17,687,087 | 3,008,261 |
| CMO Series 2020-42 Class AI |
| 06/25/2050 | 2.500% | | 18,797,738 | 2,050,256 |
| CMO Series 2020-72 Class LI |
| 12/25/2040 | 5.000% | | 5,332,056 | 1,063,027 |
| CMO Series 2021-33 Class AI |
| 05/25/2047 | 2.500% | | 34,811,197 | 4,138,289 |
| CMO Series 20434 Class C24 |
| 06/25/2053 | 4.500% | | 32,509,078 | 7,461,753 |
| CMO Series 385 Class 8 |
| 12/25/2037 | 5.500% | | 1,852,322 | 372,378 |
| CMO Series 426 Class C58 |
| 03/25/2052 | 3.000% | | 37,812,346 | 6,284,132 |
| CMO Series 427 Class C17 |
| 01/25/2035 | 3.000% | | 11,464,951 | 1,140,500 |
| Federal National Mortgage Association(c),(d) |
| CMO Series 2021-24 Class IO |
| 03/25/2059 | 1.142% | | 8,096,054 | 479,513 |
| Federal National Mortgage Association REMICS |
| CMO Series 2010-136 Class CY |
| 12/25/2040 | 4.000% | | 1,647,224 | 1,557,730 |
| CMO Series 2012-105 Class Z |
| 10/25/2042 | 3.500% | | 2,709,781 | 2,467,251 |
| CMO Series 2013-18 Class ZA |
| 03/25/2043 | 3.000% | | 3,569,542 | 3,166,205 |
| CMO Series 2013-70 Class JZ |
| 07/25/2043 | 3.000% | | 13,425,476 | 11,414,290 |
| CMO Series 2018-11 Class BX |
| 12/25/2047 | 4.000% | | 8,887,102 | 8,182,139 |
| CMO Series 2019-70 Class CB |
| 12/25/2049 | 3.500% | | 2,717,240 | 2,437,944 |
The accompanying Notes to Financial Statements are an integral part of this statement.
Multi-Manager Total Return Bond Strategies Fund | Annual Report 2023
| 69 |
Portfolio of Investments (continued)
August 31, 2023
| Residential Mortgage-Backed Securities - Agency(r) (continued) |
| Issuer | Coupon
Rate | | Principal
Amount ($) | Value ($) |
| CMO Series 2020-46 Class JG |
| 07/25/2050 | 2.000% | | 2,162,823 | 1,728,192 |
| Federal National Mortgage Association REMICS(d) |
| CMO Series 2013-10 Class GI |
| 02/25/2033 | 3.000% | | 7,863,224 | 667,766 |
| CMO Series 2017-54 Class ID |
| 07/25/2047 | 4.000% | | 2,510,057 | 431,189 |
| CMO Series 2020-99 Class IB |
| 05/25/2050 | 3.500% | | 10,715,792 | 1,934,373 |
| CMO Series 2021-1 Class IB |
| 02/25/2061 | 3.500% | | 13,968,855 | 2,484,714 |
| CMO Series 2021-74 Class LI |
| 11/25/2051 | 3.500% | | 21,865,092 | 4,213,423 |
| CMO Series 2022-38 Class IH |
| 07/25/2052 | 4.500% | | 2,777,777 | 668,418 |
| CMO Series 2022-5 Class LI |
| 02/25/2052 | 3.000% | | 30,143,630 | 3,907,600 |
| Federal National Mortgage Association REMICS(b),(d) |
| CMO Series 2017-14 Class DS |
-1.0 x 30-day Average SOFR + 6.164%
Cap 6.050%
03/25/2047 | 0.877% | | 8,874,562 | 853,379 |
| CMO Series 2017-38 Class S |
-1.0 x 30-day Average SOFR + 6.214%
Cap 6.100%
05/25/2047 | 0.927% | | 4,242,757 | 392,517 |
| CMO Series 2018-45 Class SM |
-1.0 x 30-day Average SOFR + 6.314%
Cap 6.200%
06/25/2048 | 1.027% | | 11,525,592 | 1,206,432 |
| CMO Series 3908 Class XS |
-1.0 x 30-day Average SOFR + 6.564%
Cap 6.450%
06/15/2039 | 1.376% | | 8,778,012 | 755,276 |
| Government National Mortgage Association |
05/15/2040-
10/20/2048 | 5.000% | | 2,299,144 | 2,274,553 |
05/20/2041-
12/20/2052 | 4.500% | | 8,947,801 | 8,487,186 |
02/15/2042-
08/20/2052 | 4.000% | | 16,718,982 | 15,448,925 |
03/20/2046-
05/20/2050 | 3.500% | | 34,306,678 | 31,494,380 |
12/20/2046-
06/20/2052 | 3.000% | | 70,273,499 | 61,948,271 |
08/20/2051-
04/20/2052 | 2.500% | | 30,522,998 | 25,986,113 |
| Residential Mortgage-Backed Securities - Agency(r) (continued) |
| Issuer | Coupon
Rate | | Principal
Amount ($) | Value ($) |
| 04/20/2053 | 5.500% | | 16,697,230 | 16,528,583 |
| CMO Series 2005-45 Class ZA |
| 06/16/2035 | 6.000% | | 1,631,414 | 1,670,723 |
| CMO Series 2009-104 Class YD |
| 11/20/2039 | 5.000% | | 1,321,402 | 1,295,965 |
| CMO Series 2009-55 Class LX |
| 07/20/2039 | 5.000% | | 1,623,615 | 1,604,619 |
| CMO Series 2009-67 Class DB |
| 08/20/2039 | 5.000% | | 1,803,335 | 1,768,807 |
| CMO Series 2010-108 Class WL |
| 04/16/2040 | 4.000% | | 1,811,227 | 1,737,085 |
| CMO Series 2010-120 Class AY |
| 09/20/2040 | 4.000% | | 1,667,902 | 1,596,698 |
| CMO Series 2010-135 Class PE |
| 10/16/2040 | 4.000% | | 3,744,885 | 3,593,659 |
| CMO Series 2014-3 Class EP |
| 02/16/2043 | 2.750% | | 5,057,875 | 4,631,643 |
| CMO Series 2016-111 Class PB |
| 08/20/2046 | 2.500% | | 1,097,000 | 787,541 |
| CMO Series 2018-1 Class LZ |
| 01/20/2048 | 3.000% | | 4,377,185 | 3,467,462 |
| CMO Series 2018-115 Class DE |
| 08/20/2048 | 3.500% | | 1,512,963 | 1,377,920 |
| CMO Series 2018-147 Class BZ |
| 10/20/2048 | 3.500% | | 4,061,788 | 3,743,582 |
| CMO Series 2018-53 Class AL |
| 11/20/2045 | 3.500% | | 733,755 | 691,362 |
| Government National Mortgage Association(b) |
1-year CMT + 1.136%
03/20/2066 | 6.286% | | 104,019 | 103,953 |
1-year CMT + 0.715%
04/20/2066 | 5.864% | | 266,350 | 265,334 |
| CMO Series 2006-37 Class AS |
-6.0 x 1-month Term SOFR + 39.774%
Cap 39.660%
07/20/2036 | 7.089% | | 508,635 | 600,362 |
| CMO Series 2010-H03 Class FA |
1-month Term SOFR + 0.664%
Floor 0.550%, Cap 10.690%
03/20/2060 | 5.698% | | 286,245 | 285,074 |
| CMO Series 2010-H26 Class LF |
1-month USD LIBOR + 0.350%
Floor 0.350%, Cap 13.898%
08/20/2058 | 5.605% | | 116,263 | 115,763 |
The accompanying Notes to Financial Statements are an integral part of this statement.
| 70 | Multi-Manager Total Return Bond Strategies Fund | Annual Report 2023 |
Portfolio of Investments (continued)
August 31, 2023
| Residential Mortgage-Backed Securities - Agency(r) (continued) |
| Issuer | Coupon
Rate | | Principal
Amount ($) | Value ($) |
| CMO Series 2011-114 Class KF |
1-month Term SOFR + 0.564%
Floor 0.450%, Cap 6.500%
03/20/2041 | 5.879% | | 40,736 | 40,609 |
| CMO Series 2012-H20 Class BA |
1-month Term SOFR + 0.814%
Floor 0.700%, Cap 10.500%
09/20/2062 | 5.815% | | 47,346 | 47,097 |
| CMO Series 2012-H21 Class CF |
1-month Term SOFR + 0.814%
Floor 0.700%
05/20/2061 | 4.871% | | 1,667 | 1,595 |
| CMO Series 2012-H21 Class DF |
1-month Term SOFR + 0.764%
Floor 0.650%
05/20/2061 | 4.871% | | 1,485 | 1,463 |
| CMO Series 2012-H25 Class FA |
1-month Term SOFR + 0.814%
Floor 0.700%
12/20/2061 | 4.700% | | 26,091 | 25,692 |
| CMO Series 2013-115 Class EF |
1-month Term SOFR + 0.364%
Floor 0.250%, Cap 6.500%
04/16/2028 | 5.677% | | 34,113 | 34,096 |
| CMO Series 2013-H02 Class FD |
1-month Term SOFR + 0.454%
Floor 0.340%, Cap 10.500%
12/20/2062 | 5.595% | | 84,836 | 84,137 |
| CMO Series 2013-H05 Class FB |
1-month Term SOFR + 0.514%
Floor 0.400%
02/20/2062 | 4.963% | | 1,895 | 1,850 |
| CMO Series 2013-H08 Class BF |
1-month Term SOFR + 0.514%
Floor 0.400%, Cap 10.000%
03/20/2063 | 5.655% | | 626,016 | 618,898 |
| CMO Series 2013-H14 Class FD |
1-month Term SOFR + 0.584%
Floor 0.470%, Cap 11.000%
06/20/2063 | 5.725% | | 430,520 | 427,847 |
| CMO Series 2013-H17 Class FA |
1-month Term SOFR + 0.664%
Floor 0.550%, Cap 11.000%
07/20/2063 | 5.805% | | 74,973 | 74,650 |
| CMO Series 2013-H18 Class EA |
1-month Term SOFR + 0.614%
Floor 0.500%, Cap 10.190%
07/20/2063 | 5.755% | | 108,492 | 108,125 |
| Residential Mortgage-Backed Securities - Agency(r) (continued) |
| Issuer | Coupon
Rate | | Principal
Amount ($) | Value ($) |
| CMO Series 2013-H19 Class FC |
1-month Term SOFR + 0.714%
Floor 0.600%, Cap 11.000%
08/20/2063 | 5.855% | | 586,504 | 584,790 |
| CMO Series 2015-H26 Class FC |
1-month Term SOFR + 0.714%
Floor 0.600%, Cap 11.000%
08/20/2065 | 5.818% | | 61,045 | 60,874 |
| CMO Series 2017-H03 Class FB |
1-month Term SOFR + 0.764%
Floor 0.650%, Cap 15.000%
06/20/2066 | 5.868% | | 1,336,911 | 1,333,757 |
| CMO Series 2018-H04 Class FM |
1-month Term SOFR + 0.414%
Floor 0.300%, Cap 11.000%
03/20/2068 | 5.518% | | 1,596,401 | 1,580,841 |
| CMO Series 2019-H01 Class FL |
1-month Term SOFR + 0.564%
Floor 0.450%, Cap 11.000%
12/20/2068 | 5.668% | | 360,237 | 359,659 |
| CMO Series 2019-H10 Class FM |
1-month Term SOFR + 0.514%
Floor 0.400%, Cap 11.000%
05/20/2069 | 5.618% | | 1,396,655 | 1,386,420 |
| CMO Series 2020-H13 Class FM |
1-month Term SOFR + 0.514%
Floor 0.400%, Cap 11.000%
08/20/2070 | 5.618% | | 2,033,577 | 2,010,482 |
| CMO Series 2022-H01 Class FE |
1-month Term SOFR + 0.614%
Floor 0.500%, Cap 99.000%
01/20/2072 | 5.255% | | 10,925,198 | 10,801,092 |
| CMO Series 2022-H09 Class EF |
30-day Average SOFR + 0.450%
Floor 0.450%, Cap 11.000%
04/20/2072 | 5.688% | | 5,284,784 | 5,242,997 |
| CMO Series 2022-H09 Class GF |
30-day Average SOFR + 0.700%
Floor 0.700%
04/20/2072 | 5.322% | | 3,212,599 | 3,179,343 |
| CMO Series 2022-H22 Class FE |
30-day Average SOFR + 1.040%
Floor 1.040%, Cap 7.500%
09/20/2072 | 4.798% | | 2,640,090 | 2,621,552 |
The accompanying Notes to Financial Statements are an integral part of this statement.
Multi-Manager Total Return Bond Strategies Fund | Annual Report 2023
| 71 |
Portfolio of Investments (continued)
August 31, 2023
| Residential Mortgage-Backed Securities - Agency(r) (continued) |
| Issuer | Coupon
Rate | | Principal
Amount ($) | Value ($) |
| Government National Mortgage Association(b),(d) |
| CMO Series 2010-31 Class ES |
-1.0 x 1-month Term SOFR + 5.114%
Cap 5.000%
03/20/2040 | 0.000% | | 6,631,300 | 320,722 |
| CMO Series 2011-13 Class S |
-1.0 x 1-month Term SOFR + 6.064%
Cap 5.950%
01/16/2041 | 0.523% | | 4,421,535 | 261,365 |
| CMO Series 2011-30 Class SB |
-1.0 x 1-month Term SOFR + 6.714%
Cap 6.600%
02/20/2041 | 1.172% | | 2,174,143 | 169,850 |
| CMO Series 2015-155 Class SA |
-1.0 x 1-month Term SOFR + 5.814%
Cap 5.700%
10/20/2045 | 0.272% | | 2,828,350 | 228,127 |
| CMO Series 2017-93 Class CS |
-1.0 x 1-month Term SOFR + 6.314%
Cap 6.200%
06/20/2047 | 0.772% | | 8,768,259 | 935,719 |
| CMO Series 2019-123 Class SP |
-1.0 x 1-month Term SOFR + 6.214%
Cap 6.100%
10/20/2049 | 0.672% | | 11,929,216 | 704,974 |
| CMO Series 2019-13 Class SA |
-1.0 x 1-month Term SOFR + 6.214%
Cap 6.100%
01/20/2049 | 0.672% | | 9,118,812 | 846,156 |
| CMO Series 2019-6 Class SJ |
-1.0 x 1-month Term SOFR + 6.214%
Cap 6.100%
01/20/2049 | 0.672% | | 7,463,109 | 477,910 |
| CMO Series 2019-86 Class SG |
-1.0 x 1-month Term SOFR + 5.714%
Cap 5.600%
07/20/2049 | 0.172% | | 3,754,920 | 198,334 |
| Government National Mortgage Association(c) |
| CMO Series 2010-H17 Class XQ |
| 07/20/2060 | 5.140% | | 1,262 | 962 |
| CMO Series 2017-H04 Class DA |
| 12/20/2066 | 4.394% | | 433 | 422 |
| Residential Mortgage-Backed Securities - Agency(r) (continued) |
| Issuer | Coupon
Rate | | Principal
Amount ($) | Value ($) |
| Series 2003-72 Class Z |
| 11/16/2045 | 5.386% | | 262,060 | 253,553 |
| Government National Mortgage Association(d) |
| CMO Series 2013-3 Class IT |
| 01/20/2043 | 5.000% | | 3,117,745 | 643,384 |
| CMO Series 2016-88 Class PI |
| 07/20/2046 | 4.000% | | 5,812,001 | 928,384 |
| CMO Series 2016-89 Class HI |
| 07/20/2046 | 3.500% | | 2,234,118 | 349,896 |
| CMO Series 2017-101 Class AI |
| 07/20/2047 | 4.000% | | 3,891,943 | 530,492 |
| CMO Series 2017-52 Class AI |
| 04/20/2047 | 6.000% | | 2,921,783 | 475,119 |
| CMO Series 2017-68 Class TI |
| 05/20/2047 | 5.500% | | 1,159,216 | 179,853 |
| CMO Series 2017-88 Class JI |
| 09/20/2046 | 5.500% | | 1,846,057 | 342,455 |
| CMO Series 2019-108 Class MI |
| 07/20/2049 | 3.500% | | 7,722,207 | 1,077,210 |
| CMO Series 2019-99 Class AI |
| 08/16/2049 | 4.000% | | 5,160,741 | 1,105,472 |
| CMO Series 2020-134 Class AI |
| 09/20/2050 | 3.000% | | 9,656,300 | 1,291,534 |
| CMO Series 2020-34 Class IO |
| 12/20/2039 | 5.000% | | 8,441,536 | 1,656,722 |
| Government National Mortgage Association(c),(d) |
| CMO Series 2014-150 Class IO |
| 07/16/2056 | 0.378% | | 10,929,989 | 174,832 |
| CMO Series 2014-H05 Class AI |
| 02/20/2064 | 1.430% | | 4,213,276 | 163,125 |
| CMO Series 2014-H14 Class BI |
| 06/20/2064 | 1.663% | | 4,868,770 | 165,046 |
| CMO Series 2014-H15 Class HI |
| 05/20/2064 | 1.432% | | 4,033,105 | 125,966 |
| CMO Series 2014-H20 Class HI |
| 10/20/2064 | 1.313% | | 1,457,791 | 79,021 |
| CMO Series 2015-163 Class IO |
| 12/16/2057 | 0.740% | | 1,592,455 | 49,783 |
| CMO Series 2015-189 Class IG |
| 01/16/2057 | 0.623% | | 6,394,277 | 159,446 |
| CMO Series 2015-30 Class IO |
| 07/16/2056 | 0.690% | | 2,491,337 | 76,741 |
| CMO Series 2015-32 Class IO |
| 09/16/2049 | 0.579% | | 3,772,877 | 71,187 |
| CMO Series 2015-73 Class IO |
| 11/16/2055 | 0.439% | | 1,467,636 | 20,559 |
The accompanying Notes to Financial Statements are an integral part of this statement.
| 72 | Multi-Manager Total Return Bond Strategies Fund | Annual Report 2023 |
Portfolio of Investments (continued)
August 31, 2023
| Residential Mortgage-Backed Securities - Agency(r) (continued) |
| Issuer | Coupon
Rate | | Principal
Amount ($) | Value ($) |
| CMO Series 2015-9 Class IO |
| 02/16/2049 | 0.522% | | 6,689,627 | 107,622 |
| CMO Series 2015-H22 Class BI |
| 09/20/2065 | 1.796% | | 1,810,268 | 61,922 |
| CMO Series 2016-72 Class IO |
| 12/16/2055 | 0.768% | | 6,689,849 | 185,381 |
| CMO Series 2020-171 Class IO |
| 10/16/2060 | 0.958% | | 6,039,352 | 404,047 |
| CMO Series 2020-32 Class IA |
| 03/16/2047 | 3.965% | | 7,866,073 | 1,248,955 |
| CMO Series 2021-33 Class IO |
| 10/16/2062 | 0.841% | | 7,849,020 | 481,982 |
| CMO Series 2021-40 Class IO |
| 02/16/2063 | 0.824% | | 6,893,799 | 421,069 |
| CMO Series 2021-H03 Class IO |
| 04/20/2070 | 0.000% | | 13,859,348 | 49,497 |
| CMO Series 2021-H08 Class IA |
| 01/20/2068 | 0.008% | | 1,817,188 | 9,770 |
| Government National Mortgage Association TBA(m) |
| 09/21/2053 | 2.500% | | 35,325,000 | 30,051,088 |
| 09/21/2053 | 4.500% | | 33,190,000 | 31,629,033 |
| 09/21/2053 | 5.000% | | 14,125,000 | 13,744,563 |
| 09/21/2053 | 5.500% | | 41,681,000 | 41,257,677 |
| Seasoned Credit Risk Transfer Trust |
| CMO Series 2018-2 Class MV (FHLMC) |
| 11/25/2057 | 3.500% | | 3,993,030 | 3,630,189 |
| Uniform Mortgage-Backed Security TBA(m) |
09/14/2053-
10/12/2053 | 2.500% | | 147,002,000 | 121,777,847 |
09/14/2053-
10/12/2053 | 3.000% | | 103,371,000 | 89,120,548 |
| 09/14/2053 | 3.500% | | 31,775,000 | 28,400,147 |
09/14/2053-
10/12/2053 | 4.000% | | 94,100,000 | 86,884,336 |
09/14/2053-
10/12/2053 | 4.500% | | 133,861,000 | 126,971,820 |
09/14/2053-
10/12/2053 | 5.000% | | 126,368,000 | 122,544,105 |
09/14/2053-
10/12/2053 | 5.500% | | 202,581,000 | 200,007,490 |
| 09/14/2053 | 6.000% | | 14,701,000 | 14,739,475 |
| 10/12/2053 | 2.000% | | 89,275,000 | 71,165,427 |
Total Residential Mortgage-Backed Securities - Agency
(Cost $3,305,456,832) | 3,108,961,640 |
|
| Residential Mortgage-Backed Securities - Non-Agency(o) 4.1% |
| | | | |
| ACE Securities Corp. Home Equity Loan Trust(b) |
| CMO Series 2006-OP1 Class A2D |
1-month Term SOFR + 0.594%
Floor 0.240%
04/25/2036 | 5.909% | | 7,396,675 | 6,550,754 |
| Residential Mortgage-Backed Securities - Non-Agency(o) (continued) |
| Issuer | Coupon
Rate | | Principal
Amount ($) | Value ($) |
| Ajax Mortgage Loan Trust(a),(c) |
| CMO Series 2019-F Class A1 |
| 07/25/2059 | 2.860% | | 4,449,751 | 4,163,671 |
| Angel Oak Mortgage Trust(a),(c) |
| CMO Series 2022-6 Class A1 |
| 07/25/2067 | 4.300% | | 16,938,745 | 15,988,850 |
| Arroyo Mortgage Trust(a) |
| CMO Series 2022-1 Class A3 |
| 12/25/2056 | 3.650% | | 1,000,000 | 717,695 |
| Banc of America Funding Trust |
| CMO Series 2006-3 Class 4A14 |
| 03/25/2036 | 6.000% | | 345,104 | 271,500 |
| CMO Series 2006-3 Class 5A3 |
| 03/25/2036 | 5.500% | | 332,774 | 284,229 |
| Banc of America Funding Trust(t) |
| CMO Series 2006-D Class 3A1 |
| 05/20/2036 | 4.393% | | 645,795 | 560,186 |
| Banc of America Funding Trust(b) |
| CMO Series 2007-C Class 7A1 |
1-month Term SOFR + 0.534%
Floor 0.420%
05/20/2047 | 5.849% | | 1,393,034 | 1,235,755 |
| Bayview MSR Opportunity Master Fund Trust(a),(b) |
| CMO Series 2022-2 Class AF |
30-day Average SOFR + 0.850%
12/25/2051 | 6.138% | | 2,204,734 | 2,014,831 |
| Bayview MSR Opportunity Master Fund Trust(a),(c) |
| Subordinated CMO Series 2021-5 Class B1 |
| 11/25/2051 | 3.487% | | 960,309 | 767,599 |
| Subordinated CMO Series 2022-2 Class B3A |
| 12/25/2051 | 3.404% | | 1,449,528 | 1,030,517 |
| Bellemeade Re Ltd.(a),(b) |
| CMO Series 2019-1A Class M2 |
1-month Term SOFR + 2.814%
Floor 2.700%
03/25/2029 | 8.129% | | 1,769,729 | 1,782,229 |
| CMO Series 2021-3A Class M1C |
30-day Average SOFR + 1.550%
Floor 1.550%
09/25/2031 | 6.838% | | 2,200,000 | 2,146,191 |
| CMO Series 2022-1 Class M1C |
30-day Average SOFR + 3.700%
Floor 3.700%
01/26/2032 | 8.996% | | 2,500,000 | 2,514,371 |
| BRAVO Residential Funding Trust(a),(c) |
| CMO Series 2021-B Class A1 |
| 04/01/2069 | 2.115% | | 8,259,900 | 7,911,232 |
The accompanying Notes to Financial Statements are an integral part of this statement.
Multi-Manager Total Return Bond Strategies Fund | Annual Report 2023
| 73 |
Portfolio of Investments (continued)
August 31, 2023
| Residential Mortgage-Backed Securities - Non-Agency(o) (continued) |
| Issuer | Coupon
Rate | | Principal
Amount ($) | Value ($) |
| BVRT Financing Trust(a),(b),(g),(i) |
| CMO Series 2021-4F Class A |
1-month USD LIBOR + 0.000%
09/14/2026 | 2.050% | | 2,174,708 | 2,174,708 |
| Carrington Mortgage Loan Trust(b) |
| CMO Series 2006-NC3 Class A3 |
1-month Term SOFR + 0.264%
Floor 0.150%, Cap 12.500%
08/25/2036 | 5.729% | | 1,346,103 | 1,258,631 |
| CMO Series 2006-NC3 Class A4 |
1-month Term SOFR + 0.354%
Floor 0.240%, Cap 12.500%
08/25/2036 | 5.909% | | 9,300,000 | 7,333,195 |
| Chase Mortgage Finance Corp.(a),(c) |
| Subordinated CMO Series 2019-1 Class B2 |
| 03/25/2050 | 3.892% | | 919,031 | 775,748 |
| Subordinated Series 2016-SH1 Class M2 |
| 04/25/2045 | 3.750% | | 195,269 | 173,872 |
| CIM Group(a),(c) |
| CMO Series 2020-R7 Class A1A |
| 12/27/2061 | 2.250% | | 6,036,618 | 5,151,683 |
| CIM Trust(a),(c) |
| CMO Series 2019-J2 Class B1 |
| 10/25/2049 | 3.770% | | 815,830 | 705,446 |
| CMO Series 2019-R5 Class M2 |
| 09/25/2059 | 3.250% | | 1,100,000 | 963,391 |
| CMO Series 2020-R6 Class A1A |
| 12/25/2060 | 2.250% | | 3,917,766 | 3,341,119 |
| CMO Series 2021-NR2 Class A1 |
| 07/25/2059 | 2.568% | | 4,723,715 | 4,549,849 |
| CMO Series 2021-R3 Class A1A |
| 06/25/2057 | 1.951% | | 7,694,058 | 6,648,560 |
| CMO Series 2022-I1 Class A1 |
| 02/25/2067 | 4.350% | | 6,047,129 | 5,794,829 |
| CMO Series 2023-NR2 Class A1 |
| 06/25/2062 | 6.000% | | 6,115,850 | 5,747,134 |
| CMO Series 2023-R1 Class A1A |
| 04/25/2062 | 5.400% | | 12,657,618 | 11,984,426 |
| CMO Series 2023-R3 Class A1A |
| 01/25/2063 | 4.500% | | 10,803,942 | 9,852,076 |
| Citicorp Mortgage Securities Trust |
| CMO Series 2007-8 Class 1A3 |
| 09/25/2037 | 6.000% | | 205,577 | 199,558 |
| Citigroup Mortgage Loan Trust(a),(c) |
| CMO Series 2022-A Class A1 |
| 09/25/2062 | 6.170% | | 2,217,395 | 2,186,233 |
| Citigroup Mortgage Loan Trust, Inc.(a),(c) |
| Subordinated CMO Series 2021-J2 Class B3W |
| 07/25/2051 | 2.769% | | 469,666 | 331,265 |
| Residential Mortgage-Backed Securities - Non-Agency(o) (continued) |
| Issuer | Coupon
Rate | | Principal
Amount ($) | Value ($) |
| Connecticut Avenue Securities Trust(a),(b) |
| CMO Series 2019-R01 Class 2M2 |
30-day Average SOFR + 2.564%
07/25/2031 | 7.852% | | 133,506 | 134,006 |
| CMO Series 2020-R02 Class 2M2 |
30-day Average SOFR + 2.114%
01/25/2040 | 7.402% | | 232,610 | 234,022 |
| CMO Series 2020-SBT1 Class 1M2 |
30-day Average SOFR + 3.764%
02/25/2040 | 9.052% | | 1,500,000 | 1,548,858 |
| CMO Series 2020-SBT1 Class 2M2 |
30-day Average SOFR + 3.764%
02/25/2040 | 9.052% | | 3,500,000 | 3,624,930 |
| CMO Series 2022-R07 Class 1M2 |
30-day Average SOFR + 4.650%
06/25/2042 | 9.938% | | 2,700,000 | 2,885,795 |
| CMO Series 2023-R01 Class 1M2 |
30-day Average SOFR + 3.750%
12/25/2042 | 9.038% | | 3,750,000 | 3,900,440 |
| Subordinated CMO Series 2019-R05 Class 1B1 |
30-day Average SOFR + 4.214%
07/25/2039 | 9.502% | | 1,556,835 | 1,603,540 |
| Subordinated CMO Series 2020-R02 Class 2B1 |
30-day Average SOFR + 3.114%
01/25/2040 | 8.402% | | 5,250,000 | 5,145,689 |
| Subordinated CMO Series 2022-R02 Class 2B1 |
30-day Average SOFR + 4.500%
01/25/2042 | 9.788% | | 1,000,000 | 1,014,940 |
| Subordinated CMO Series 2022-R04 Class 1B1 |
30-day Average SOFR + 5.250%
03/25/2042 | 10.538% | | 750,000 | 791,250 |
| Countrywide Home Loan Mortgage Pass-Through Trust(c) |
| CMO Series 2007-HY5 Class 1A1 |
| 09/25/2047 | 4.715% | | 292,807 | 222,796 |
| Credit Suisse Mortgage Capital Trust(a),(c) |
| CMO Series 2021-RP11 Class PT |
| 10/25/2061 | 3.783% | | 7,677,930 | 5,645,192 |
| Credit Suisse Mortgage Trust(a),(c) |
| CMO Series 2022-ATH2 Class A1 |
| 05/25/2067 | 4.570% | | 6,570,575 | 6,260,296 |
The accompanying Notes to Financial Statements are an integral part of this statement.
| 74 | Multi-Manager Total Return Bond Strategies Fund | Annual Report 2023 |
Portfolio of Investments (continued)
August 31, 2023
| Residential Mortgage-Backed Securities - Non-Agency(o) (continued) |
| Issuer | Coupon
Rate | | Principal
Amount ($) | Value ($) |
| CMO Series 2022-ATH3 Class A3 |
| 08/25/2067 | 6.567% | | 1,496,547 | 1,470,021 |
| CMO Series 2022-JR1 Class A1 |
| 10/25/2066 | 4.267% | | 4,508,213 | 4,378,236 |
| Credit-Based Asset Servicing & Securitization LLC(c) |
| CMO Series 2007-CB1 Class AF3 |
| 01/25/2037 | 5.737% | | 3,385,752 | 1,040,898 |
| CSMC Trust(a),(c) |
| CMO Series 2018-RPL9 Class A |
| 09/25/2057 | 3.850% | | 5,082,319 | 4,737,203 |
| CMO Series 2020-RPL2 Class A12 |
| 02/25/2060 | 3.511% | | 3,308,522 | 3,310,291 |
| CMO Series 2020-RPL6 Class A1 |
| 03/25/2059 | 2.688% | | 2,460,758 | 2,413,675 |
| CMO Series 2021-NQM6 Class A1 |
| 07/25/2066 | 1.174% | | 8,102,384 | 6,402,725 |
| CMO Series 2022-RPL4 Class A1 |
| 04/25/2062 | 3.904% | | 2,631,918 | 2,438,087 |
| CSMCM Trust(a) |
| CMO Series 2021-RP11 Class CERT |
| 10/27/2061 | 3.778% | | 317,412 | 233,476 |
| CSMCM Trust Certificates(a),(c) |
| CMO Series 2018-RPL4 Class CERT |
| 07/25/2050 | 3.735% | | 1,442,360 | 1,259,429 |
| Deephaven Residential Mortgage Trust(a),(c) |
| CMO Series 2021-4 Class M1 |
| 11/25/2066 | 3.257% | | 2,000,000 | 1,440,748 |
| Domino’s Pizza Master Issuer LLC(a) |
| CMO Series 2015-1A Class A2II |
| 10/25/2045 | 4.474% | | 1,865,000 | 1,786,489 |
| Downey Savings & Loan Association Mortgage Loan Trust(b) |
| CMO Series 2005-AR6 Class 2A1A |
1-month Term SOFR + 0.694%
Floor 0.290%, Cap 11.000%
10/19/2045 | 6.009% | | 1,119,819 | 949,158 |
| CMO Series 2006-AR2 Class 2A1A |
1-month Term SOFR + 0.314%
Floor 0.200%
10/19/2036 | 5.829% | | 1,810,683 | 1,238,778 |
| First Franklin Mortgage Loan Trust(b) |
| CMO Series 2006-FF18 Class A2D |
1-month Term SOFR + 0.324%
Floor 0.210%
12/25/2037 | 5.849% | | 1,208,107 | 1,035,652 |
| CMO Series 2007-FF2 Class A2B |
1-month Term SOFR + 0.214%
Floor 0.100%
03/25/2037 | 5.629% | | 3,240,560 | 1,512,863 |
| Residential Mortgage-Backed Securities - Non-Agency(o) (continued) |
| Issuer | Coupon
Rate | | Principal
Amount ($) | Value ($) |
| First Horizon Mortgage Pass-Through Trust(c) |
| CMO Series 2007-AR1 Class 1A1 |
| 05/25/2037 | 4.010% | | 197,345 | 83,133 |
| Flagstar Mortgage Trust(a),(c) |
| Subordinated CMO Series 2018-5 Class B3 |
| 09/25/2048 | 4.456% | | 895,969 | 800,093 |
| Subordinated CMO Series 2019-2 Class B1 |
| 12/25/2049 | 4.032% | | 860,840 | 747,135 |
| Subordinated CMO Series 2019-2 Class B2 |
| 12/25/2049 | 4.032% | | 920,685 | 790,782 |
| Subordinated CMO Series 2021-12 Class B2 |
| 11/25/2051 | 2.982% | | 1,248,606 | 925,871 |
| Freddie Mac STACR Remic Trust(a),(b) |
| CMO Series 2020-DNA2 Class B1 |
30-day Average SOFR + 2.614%
Floor 2.500%
02/25/2050 | 7.902% | | 2,700,000 | 2,701,698 |
| Freddie Mac STACR REMIC Trust(a),(b) |
| CMO Series 2020-DNA2 Class M2 |
30-day Average SOFR + 1.964%
02/25/2050 | 7.252% | | 1,072,717 | 1,080,041 |
| CMO Series 2020-HQA1 Class M2 |
30-day Average SOFR + 2.014%
01/25/2050 | 7.302% | | 35,130 | 35,246 |
| CMO Series 2020-HQA2 Class M2 |
30-day Average SOFR + 3.214%
03/25/2050 | 8.502% | | 1,250,013 | 1,288,217 |
| CMO Series 2021-DNA5 Class M2 |
30-day Average SOFR + 1.650%
01/25/2034 | 6.938% | | 1,083,856 | 1,083,656 |
| CMO Series 2021-HQA1 Class B1 |
30-day Average SOFR + 3.000%
08/25/2033 | 8.288% | | 6,500,000 | 6,410,988 |
| CMO Series 2021-HQA1 Class M2 |
30-day Average SOFR + 2.250%
08/25/2033 | 7.538% | | 10,909,164 | 10,821,459 |
| CMO Series 2021-HQA3 Class M2 |
30-day Average SOFR + 2.100%
09/25/2041 | 7.388% | | 2,410,000 | 2,345,743 |
| CMO Series 2021-HQA4 Class M2 |
30-day Average SOFR + 2.350%
12/25/2041 | 7.638% | | 3,000,000 | 2,933,450 |
The accompanying Notes to Financial Statements are an integral part of this statement.
Multi-Manager Total Return Bond Strategies Fund | Annual Report 2023
| 75 |
Portfolio of Investments (continued)
August 31, 2023
| Residential Mortgage-Backed Securities - Non-Agency(o) (continued) |
| Issuer | Coupon
Rate | | Principal
Amount ($) | Value ($) |
| CMO Series 2022-DNA1 Class M2 |
30-day Average SOFR + 2.500%
01/25/2042 | 7.788% | | 4,875,000 | 4,783,586 |
| CMO Series 2022-DNA3 Class M1B |
30-day Average SOFR + 2.900%
04/25/2042 | 8.188% | | 3,940,000 | 3,995,022 |
| Subordinated CMO Series 2021-DNA3 Class B1 |
30-day Average SOFR + 3.500%
10/25/2033 | 8.788% | | 2,025,000 | 2,070,856 |
| Subordinated CMO Series 2021-DNA6 Class B1 |
30-day Average SOFR + 3.400%
10/25/2041 | 8.688% | | 2,000,000 | 2,003,305 |
| Subordinated CMO Series 2021-DNA7 Class M2 |
30-day Average SOFR + 1.800%
11/25/2041 | 7.088% | | 960,000 | 938,778 |
| Subordinated CMO Series 2021-HQA3 Class B1 |
30-day Average SOFR + 3.350%
09/25/2041 | 8.638% | | 820,000 | 813,850 |
| Subordinated CMO Series 2022-DNA6 Class M2 |
30-day Average SOFR + 5.750%
09/25/2042 | 11.038% | | 6,000,000 | 6,516,677 |
| Freddie Mac Structured Agency Credit Risk Debt Notes(a),(b) |
| CMO Series 2020-HQA5 Class M2 |
30-day Average SOFR + 2.600%
11/25/2050 | 7.888% | | 4,393,016 | 4,454,730 |
| CMO Series 2022-DNA2 Class M1B |
30-day Average SOFR + 2.400%
02/25/2042 | 7.688% | | 5,000,000 | 4,988,000 |
| Subordinated CMO Series 2020-HQA5 Class B1 |
30-day Average SOFR + 4.000%
11/25/2050 | 9.288% | | 1,805,000 | 1,879,116 |
| Subordinated CMO Series 2021-DNA7 Class B1 |
30-day Average SOFR + 3.650%
11/25/2041 | 8.719% | | 710,000 | 716,642 |
| Galton Funding Mortgage Trust(a),(c) |
| CMO Series 2019-1 Class B1 |
| 02/25/2059 | 4.250% | | 1,586,367 | 1,450,715 |
| CMO Series 2019-1 Class B2 |
| 02/25/2059 | 4.500% | | 890,865 | 817,389 |
| Residential Mortgage-Backed Securities - Non-Agency(o) (continued) |
| Issuer | Coupon
Rate | | Principal
Amount ($) | Value ($) |
| Subordinated CMO Series 2018-2 Class B2 |
| 10/25/2058 | 4.750% | | 467,341 | 438,235 |
| GCAT LLC(a),(c) |
| CMO Series 2021-1 Class A1 |
| 11/25/2049 | 2.487% | | 5,918,725 | 5,377,294 |
| Genworth Mortgage Insurance Corp.(a),(b) |
| CMO Series 2021-3 Class M1B |
30-day Average SOFR + 2.900%
Floor 2.900%
02/25/2034 | 7.969% | | 1,000,000 | 989,489 |
| GS Mortgage-Backed Securities Corp. Trust(a),(c) |
| CMO Series 2019-PJ3 Class A1 |
| 03/25/2050 | 3.500% | | 17,901 | 16,086 |
| GS Mortgage-Backed Securities Trust(a),(c) |
| CMO Series 2023-PJ4 Class A3 |
| 01/25/2054 | 6.000% | | 2,500,000 | 2,468,457 |
| Subordinated CMO Series 2021-GR3 Class B3 |
| 04/25/2052 | 3.385% | | 990,283 | 731,616 |
| GSAMP Trust(b) |
| CMO Series 2004-OPT Class M1 |
1-month Term SOFR + 0.984%
Floor 0.580%
11/25/2034 | 6.299% | | 883,083 | 833,440 |
| GSR Mortgage Loan Trust(c) |
| CMO Series 2006-AR2 Class 2A1 |
| 04/25/2036 | 3.574% | | 924,701 | 621,606 |
| HarborView Mortgage Loan Trust(b) |
| CMO Series 2006-10 Class 1A1A |
1-month Term SOFR + 0.314%
Floor 0.200%
11/19/2036 | 5.829% | | 5,560,667 | 4,365,426 |
| HSI Asset Securitization Corp. Trust(b) |
| CMO Series 2006-OPT1 Class M1 |
1-month Term SOFR + 0.654%
Floor 0.360%
12/25/2035 | 5.969% | | 738,808 | 729,057 |
| JPMorgan Alternative Loan Trust(b) |
| CMO Series 2007-S1 Class A1 |
1-month Term SOFR + 0.674%
Floor 0.280%, Cap 11.500%
04/25/2047 | 5.989% | | 2,344,974 | 2,198,633 |
| JPMorgan Mortgage Acquisition Trust(b) |
| CMO Series 2007-CH5 Class A5 |
1-month Term SOFR + 0.374%
Floor 0.260%
06/25/2037 | 5.949% | | 354,388 | 352,407 |
| JPMorgan Mortgage Trust(a),(c) |
| CMO Series 2018-5 Class A13 |
| 10/25/2048 | 3.500% | | 888,698 | 754,581 |
The accompanying Notes to Financial Statements are an integral part of this statement.
| 76 | Multi-Manager Total Return Bond Strategies Fund | Annual Report 2023 |
Portfolio of Investments (continued)
August 31, 2023
| Residential Mortgage-Backed Securities - Non-Agency(o) (continued) |
| Issuer | Coupon
Rate | | Principal
Amount ($) | Value ($) |
| CMO Series 2018-6 Class 1A10 |
| 12/25/2048 | 3.500% | | 137,629 | 119,644 |
| CMO Series 2019-1 Class A3 |
| 05/25/2049 | 4.000% | | 248,207 | 225,652 |
| CMO Series 2019-2 Class A3 |
| 08/25/2049 | 4.000% | | 79,887 | 73,526 |
| CMO Series 2019-5 Class A3 |
| 11/25/2049 | 4.000% | | 188,412 | 171,407 |
| CMO Series 2019-8 Class A15 |
| 03/25/2050 | 3.500% | | 140,981 | 122,352 |
| CMO Series 2019-9 Class B2A |
| 05/25/2050 | 3.418% | | 1,391,533 | 1,150,055 |
| CMO Series 2019-HYB1 Class B1 |
| 10/25/2049 | 4.670% | | 942,469 | 874,487 |
| CMO Series 2019-INV2 Class A3 |
| 02/25/2050 | 3.500% | | 132,389 | 115,494 |
| CMO Series 2019-LTV2 Class A18 |
| 12/25/2049 | 4.000% | | 2,978 | 2,953 |
| CMO Series 2019-LTV3 Class B3 |
| 03/25/2050 | 4.381% | | 1,567,057 | 1,373,546 |
| CMO Series 2020-1 Class A15 |
| 06/25/2050 | 3.500% | | 426,719 | 370,826 |
| CMO Series 2020-2 Class A15 |
| 07/25/2050 | 3.500% | | 273,664 | 234,271 |
| CMO Series 2020-5 Class A15 |
| 12/25/2050 | 3.000% | | 202,548 | 167,021 |
| CMO Series 2020-5 Class B1 |
| 12/25/2050 | 3.578% | | 931,585 | 779,033 |
| CMO Series 2021-13 Class A3 |
| 04/25/2052 | 2.500% | | 9,830,079 | 7,794,946 |
| Subordinated CMO Series 2017-1 Class B4 |
| 01/25/2047 | 3.450% | | 400,154 | 341,238 |
| Subordinated CMO Series 2017-3 Class B1 |
| 08/25/2047 | 3.750% | | 1,194,647 | 1,064,927 |
| Subordinated CMO Series 2017-6 Class B2 |
| 12/25/2048 | 3.780% | | 518,475 | 448,406 |
| Subordinated CMO Series 2018-8 Class B1 |
| 01/25/2049 | 4.042% | | 1,072,824 | 945,377 |
| Subordinated CMO Series 2018-8 Class B2 |
| 01/25/2049 | 4.042% | | 894,020 | 782,195 |
| Subordinated CMO Series 2019-2 Class B2 |
| 08/25/2049 | 4.465% | | 2,098,028 | 1,895,711 |
| Subordinated CMO Series 2019-6 Class B1 |
| 12/25/2049 | 4.242% | | 921,508 | 822,229 |
| Subordinated CMO Series 2019-8 Class B3A |
| 03/25/2050 | 3.423% | | 1,846,131 | 1,507,233 |
| Residential Mortgage-Backed Securities - Non-Agency(o) (continued) |
| Issuer | Coupon
Rate | | Principal
Amount ($) | Value ($) |
| Subordinated CMO Series 2019-LTV1 Class B2 |
| 06/25/2049 | 4.611% | | 1,505,453 | 1,382,538 |
| Subordinated CMO Series 2019-LTV2 Class B2 |
| 12/25/2049 | 4.676% | | 1,109,048 | 1,026,633 |
| Subordinated CMO Series 2019-LTV2 Class B3 |
| 12/25/2049 | 4.676% | | 924,207 | 849,095 |
| Subordinated CMO Series 2020-8 Class B2 |
| 03/25/2051 | 3.515% | | 1,850,329 | 1,515,644 |
| Subordinated CMO Series 2022-LTV2 Class A1 |
| 11/25/2052 | 3.304% | | 1,555,389 | 1,169,691 |
| JPMorgan Mortgage Trust(a),(b) |
| CMO Series 2018-7FRB Class A1 |
1-month Term SOFR + 0.864%
04/25/2046 | 6.163% | | 506,091 | 477,124 |
| JPMorgan Trust(a),(c) |
| Subordinated CMO Series 2015-3 Class B3 |
| 05/25/2045 | 3.593% | | 424,189 | 380,855 |
| Legacy Mortgage Asset Trust(a),(c) |
| CMO Series 2019-PR1 Class A1 |
| 09/25/2059 | 6.858% | | 6,190,935 | 6,132,940 |
| CMO Series 2020-GS1 Class A1 |
| 10/25/2059 | 2.882% | | 2,972,541 | 2,971,631 |
| CMO Series 2020-GS2 Class A1 |
| 03/25/2060 | 2.750% | | 10,816,431 | 10,764,780 |
| CMO Series 2020-SL1 Class A |
| 01/25/2060 | 2.734% | | 299,406 | 297,308 |
| CMO Series 2021-GS1 Class A1 |
| 10/25/2066 | 1.892% | | 960,150 | 909,196 |
| CMO Series 2021-SL1 Class A |
| 09/25/2060 | 1.991% | | 609,609 | 601,711 |
| CMO Series 2021-SL2 Class A |
| 10/25/2068 | 1.875% | | 245,818 | 227,161 |
| Lehman XS Trust(b) |
| CMO Series 2005-5N Class 3A1A |
1-month Term SOFR + 0.414%
Floor 0.300%
11/25/2035 | 6.029% | | 342,052 | 334,464 |
| CMO Series 2006-2N Class 1A1 |
1-month Term SOFR + 0.634%
Floor 0.260%
02/25/2046 | 5.949% | | 1,087,008 | 952,086 |
| loanDepot GMSR Master Trust(a),(b) |
| Series 2018-GT1 Class A |
1-month Term SOFR + 2.914%
Floor 2.800%
10/16/2023 | 8.227% | | 1,300,000 | 1,124,998 |
The accompanying Notes to Financial Statements are an integral part of this statement.
Multi-Manager Total Return Bond Strategies Fund | Annual Report 2023
| 77 |
Portfolio of Investments (continued)
August 31, 2023
| Residential Mortgage-Backed Securities - Non-Agency(o) (continued) |
| Issuer | Coupon
Rate | | Principal
Amount ($) | Value ($) |
| Long Beach Mortgage Loan Trust(b) |
| CMO Series 2006-10 Class 1A |
1-month Term SOFR + 0.414%
Floor 0.150%
11/25/2036 | 5.729% | | 3,600,642 | 2,586,545 |
| CMO Series 2006-11 Class 2A2 |
1-month Term SOFR + 0.214%
Floor 0.100%
12/25/2036 | 5.629% | | 29,297,026 | 10,341,663 |
| MASTR Alternative Loan Trust |
| CMO Series 2004-12 Class 4A1 |
| 12/25/2034 | 5.500% | | 344,524 | 331,675 |
| Mello Mortgage Capital Acceptance Trust(a),(c) |
| Subordinated CMO Series 2021-INV1 Class B3 |
| 06/25/2051 | 2.970% | | 1,936,621 | 1,364,029 |
| Merrill Lynch First Franklin Mortgage Loan Trust(b) |
| CMO Series 2007-1 Class A2D |
1-month Term SOFR + 0.454%
Floor 0.340%
04/25/2037 | 5.769% | | 15,916,838 | 6,068,303 |
| MortgageIT Trust(b) |
| CMO Series 2005-5 Class A1 |
1-month Term SOFR + 0.634%
Floor 0.260%, Cap 11.500%
12/25/2035 | 5.949% | | 425,298 | 406,207 |
| New Residential Mortgage Loan Trust(a),(b) |
| CMO Series 2018-4A Class A1S |
1-month Term SOFR + 0.864%
Floor 0.750%
01/25/2048 | 6.179% | | 884,544 | 865,023 |
| Oaktown Re VI Ltd.(a),(b) |
| CMO Series 2021-1A Class M1B |
30-day Average SOFR + 2.050%
Floor 2.050%
10/25/2033 | 7.338% | | 694,866 | 695,159 |
| CMO Series 2021-1A Class M1C |
30-day Average SOFR + 3.000%
Floor 3.000%
10/25/2033 | 8.288% | | 2,250,000 | 2,283,498 |
| Oaktown Re VII Ltd.(a),(b) |
| CMO Series 2021-2 Class M1B |
30-day Average SOFR + 2.900%
Floor 2.900%
04/25/2034 | 7.969% | | 2,200,000 | 2,201,571 |
| CMO Series 2021-2 Class M1C |
30-day Average SOFR + 3.350%
Floor 3.350%
04/25/2034 | 8.419% | | 2,000,000 | 1,929,287 |
| Residential Mortgage-Backed Securities - Non-Agency(o) (continued) |
| Issuer | Coupon
Rate | | Principal
Amount ($) | Value ($) |
| OBX Trust(a),(c) |
| CMO Series 2019-EXP1 Class 1A3 |
| 01/25/2059 | 4.000% | | 44,177 | 41,933 |
| CMO Series 2019-INV2 Class A25 |
| 05/27/2049 | 4.000% | | 86,959 | 78,851 |
| Opteum Mortgage Acceptance Corp. Asset Backed Pass-Through Certificates(b) |
| CMO Series 2005-4 Class M2 |
1-month Term SOFR + 0.864%
Floor 0.500%
11/25/2035 | 6.179% | | 11,526,000 | 11,020,300 |
| Preston Ridge Partners Mortgage Trust(a),(c) |
| CMO Series 2022-4 Class A1 |
| 08/25/2027 | 5.000% | | 2,986,014 | 2,883,975 |
| Pretium Mortgage Credit Partners LLC(a),(c) |
| CMO Series 2021-RN2 Class A1 |
| 07/25/2051 | 1.744% | | 5,856,613 | 5,457,861 |
| CMO Series 2022-RN2 Class A1 |
| 06/25/2052 | 5.000% | | 7,925,275 | 7,512,046 |
| CMO Series 2022-RN2 Class A2 |
| 06/25/2052 | 6.500% | | 13,780,000 | 12,918,663 |
| CMO Series 2022-RN3 Class A1 |
| 08/25/2052 | 5.000% | | 9,318,195 | 8,841,741 |
| Radnor RE Ltd.(a),(b) |
| CMO Series 2021-1 Class M1C |
30-day Average SOFR + 2.700%
Floor 2.700%
12/27/2033 | 7.288% | | 3,000,000 | 3,034,060 |
| RALI Trust(c) |
| CMO Series 2005-QA4 Class A41 |
| 04/25/2035 | 4.225% | | 10,356 | 10,226 |
| RALI Trust(c),(d) |
| CMO Series 2006-QS18 Class 1AV |
| 12/25/2036 | 0.464% | | 19,802,509 | 324,793 |
| CMO Series 2007-QS1 Class 2AV |
| 01/25/2037 | 0.158% | | 20,878,349 | 104,623 |
| Rathlin Residential(a),(b) |
| CMO Series 2021-1A Class A |
1-month EURIBOR + 2.000%
09/27/2075 | 5.632% | EUR | 2,400,834 | 2,516,060 |
| RFMSI Trust(c) |
| CMO Series 2005-SA5 Class 1A |
| 11/25/2035 | 3.618% | | 592,642 | 363,429 |
| CMO Series 2006-SA4 Class 2A1 |
| 11/25/2036 | 5.251% | | 144,386 | 122,101 |
| Seasoned Credit Risk Transfer Trust(c) |
| CMO Series 2017-3SC Class HT (FHLMC) |
| 07/25/2056 | 3.250% | | 16,853,098 | 14,406,478 |
The accompanying Notes to Financial Statements are an integral part of this statement.
| 78 | Multi-Manager Total Return Bond Strategies Fund | Annual Report 2023 |
Portfolio of Investments (continued)
August 31, 2023
| Residential Mortgage-Backed Securities - Non-Agency(o) (continued) |
| Issuer | Coupon
Rate | | Principal
Amount ($) | Value ($) |
| Seasoned Credit Risk Transfer Trust |
| CMO Series 2017-4 Class M45T |
| 06/25/2057 | 4.500% | | 2,313,211 | 2,221,450 |
| CMO Series 2018-2 Class HT (FHLMC) |
| 11/25/2057 | 3.000% | | 264,169 | 223,708 |
| CMO Series 2018-3 Class HT (FHLMC) |
| 08/25/2057 | 3.000% | | 291,733 | 245,516 |
| CMO Series 2018-4 Class HT (FHLMC) |
| 03/25/2058 | 3.000% | | 243,138 | 204,495 |
| CMO Series 2019-1 Class HT (FHLMC) |
| 07/25/2058 | 3.000% | | 978,624 | 827,994 |
| CMO Series 2019-2 Class HT (FHLMC) |
| 08/25/2058 | 3.000% | | 180,322 | 152,670 |
| CMO Series 2019-3 Class HT (FHLMC) |
| 10/25/2058 | 3.000% | | 72,109 | 61,076 |
| Sequoia Mortgage Trust(a),(c) |
| CMO Series 2019-4 Class A19 |
| 11/25/2049 | 3.500% | | 145,982 | 124,147 |
| CMO Series 2019-CH2 Class A1 |
| 08/25/2049 | 4.500% | | 32,030 | 30,938 |
| CMO Series 2021-5 Class A19 |
| 07/25/2051 | 2.500% | | 660,588 | 502,357 |
| Subordinated CMO Series 2015-1 Class B1 |
| 01/25/2045 | 3.920% | | 281,170 | 264,246 |
| Subordinated CMO Series 2018-6 Class B1 |
| 07/25/2048 | 4.162% | | 1,092,687 | 982,494 |
| Subordinated CMO Series 2019-2 Class B2 |
| 06/25/2049 | 4.261% | | 1,763,934 | 1,582,576 |
| Subordinated CMO Series 2020-3 Class B2 |
| 04/25/2050 | 3.323% | | 980,169 | 786,497 |
| Starwood Mortgage Residential Trust(a),(c) |
| CMO Series 2021-3 Class A1 |
| 06/25/2056 | 1.127% | | 5,572,290 | 4,447,085 |
| Structured Adjustable Rate Mortgage Loan Trust(c) |
| CMO Series 2004-20 Class 1A2 |
| 01/25/2035 | 5.036% | | 330,406 | 304,609 |
| CMO Series 2006-5 Class 1A1 |
| 06/25/2036 | 4.540% | | 645,085 | 583,115 |
| Texas Capital Bank NA(a),(b) |
| CMO Series 2021 Class NOTE |
3-month USD LIBOR + 4.500%
09/30/2024 | 10.038% | | 5,338,182 | 5,285,336 |
| Toorak Mortgage Corp., Ltd.(a),(c) |
| CMO Series 2022-INV2 Class A1 |
| 06/25/2057 | 4.350% | | 5,781,189 | 5,494,236 |
| Towd Point HE Trust(a) |
| CMO Series 2023-1 Class A1A |
| 02/25/2063 | 6.875% | | 1,010,178 | 1,009,013 |
| Residential Mortgage-Backed Securities - Non-Agency(o) (continued) |
| Issuer | Coupon
Rate | | Principal
Amount ($) | Value ($) |
| Verus Securitization Trust(a),(c) |
| CMO Series 2022-INV1 Class A3 |
| 08/25/2067 | 5.830% | | 1,802,228 | 1,746,845 |
| WaMu Asset-Backed Certificates Trust(b) |
| CMO Series 2007-HE1 Class 2A3 |
1-month Term SOFR + 0.264%
Floor 0.150%
01/25/2037 | 5.729% | | 3,257,148 | 1,482,483 |
| WaMu Mortgage Pass-Through Certificates Trust(c) |
| CMO Series 2003-AR8 Class A |
| 08/25/2033 | 5.626% | | 191,917 | 182,620 |
| CMO Series 2004-AR4 Class A6 |
| 06/25/2034 | 5.059% | | 1,523,281 | 1,426,610 |
| CMO Series 2004-AR7 Class A6 |
| 07/25/2034 | 5.010% | | 743,160 | 693,765 |
| CMO Series 2007-HY1 Class 3A3 |
| 02/25/2037 | 3.715% | | 2,135,004 | 1,781,419 |
| CMO Series 2007-HY3 Class 1A1 |
| 03/25/2037 | 3.479% | | 393,357 | 312,304 |
| WaMu Mortgage Pass-Through Certificates Trust(b) |
| CMO Series 2005-AR11 Class A1A |
1-month Term SOFR + 0.754%
Floor 0.320%, Cap 10.500%
08/25/2045 | 6.069% | | 552,331 | 516,736 |
| CMO Series 2005-AR17 Class A1A1 |
1-month Term SOFR + 0.654%
Floor 0.270%, Cap 10.500%
12/25/2045 | 5.969% | | 1,889,188 | 1,689,498 |
| CMO Series 2005-AR2 Class 2A1A |
1-month Term SOFR + 0.734%
Floor 0.310%, Cap 10.500%
01/25/2045 | 6.049% | | 468,805 | 456,651 |
| CMO Series 2005-AR8 Class 2A1A |
1-month Term SOFR + 0.694%
Floor 0.290%, Cap 10.500%
07/25/2045 | 6.009% | | 1,741,249 | 1,602,644 |
| CMO Series 2005-AR9 Class A1A |
1-month Term SOFR + 0.754%
Floor 0.320%, Cap 10.500%
07/25/2045 | 6.069% | | 425,952 | 397,217 |
| CMO Series 2006-AR4 Class 1A1A |
1-year MTA + 0.940%
Floor 0.940%
05/25/2046 | 5.370% | | 1,094,643 | 1,006,680 |
| CMO Series 2006-AR5 Class A12A |
1-year MTA + 0.980%
Floor 0.980%
06/25/2046 | 5.410% | | 323,396 | 290,052 |
The accompanying Notes to Financial Statements are an integral part of this statement.
Multi-Manager Total Return Bond Strategies Fund | Annual Report 2023
| 79 |
Portfolio of Investments (continued)
August 31, 2023
| Residential Mortgage-Backed Securities - Non-Agency(o) (continued) |
| Issuer | Coupon
Rate | | Principal
Amount ($) | Value ($) |
| CMO Series 2007-OC2 Class A3 |
1-month Term SOFR + 0.734%
Floor 0.310%
06/25/2037 | 6.049% | | 1,686,735 | 1,552,240 |
| Wells Fargo Mortgage-Backed Securities Trust(a),(c) |
| CMO Series 2019-1 Class A1 |
| 11/25/2048 | 3.936% | | 42,689 | 39,484 |
| Subordinated CMO Series 2018-1 Class B3 |
| 07/25/2047 | 3.660% | | 1,059,543 | 875,118 |
| Subordinated CMO Series 2020-1 Class B3 |
| 12/25/2049 | 3.369% | | 1,875,550 | 1,483,476 |
Total Residential Mortgage-Backed Securities - Non-Agency
(Cost $500,559,391) | 467,203,205 |
|
| Senior Loans 0.5% |
| Borrower | Coupon
Rate | | Principal
Amount ($) | Value ($) |
| Aerospace & Defense 0.0% |
| TransDigm, Inc.(b),(u) |
| Tranche 1 Term Loan |
1-month Term SOFR + 3.250%
08/24/2028 | 8.492% | | 696,914 | 697,228 |
| Airlines 0.0% |
| United AirLines, Inc.(b),(u) |
| Tranche B Term Loan |
3-month USD LIBOR + 3.750%
Floor 0.750%
04/21/2028 | 9.292% | | 857,068 | 858,140 |
| Brokerage/Asset Managers/Exchanges 0.0% |
| Deerfield Dakota Holdings LLC(b),(u) |
| 1st Lien Term Loan |
1-month Term SOFR + 3.750%
Floor 1.000%
04/09/2027 | 8.992% | | 716,432 | 690,561 |
| Cable and Satellite 0.1% |
| Charter Communications Operating LLC(b),(u) |
| Tranche B2 Term Loan |
1-month Term SOFR + 1.750%
02/01/2027 | 7.116% | | 241,228 | 239,993 |
| CSC Holdings LLC(b),(u) |
| Term Loan |
3-month USD LIBOR + 2.500%
04/15/2027 | 7.925% | | 3,106,490 | 2,807,491 |
1-month Term SOFR + 4.500%
01/18/2028 | 9.810% | | 1,927,587 | 1,815,150 |
| Senior Loans (continued) |
| Borrower | Coupon
Rate | | Principal
Amount ($) | Value ($) |
| DirectTV Financing LLC(b),(u) |
| Term Loan |
1-month USD LIBOR + 5.000%
Floor 0.750%
08/02/2027 | 10.446% | | 1,221,625 | 1,206,074 |
| Intelsat Jackson Holdings SA(b),(s),(u) |
| Term Loan |
3-month Term SOFR + 4.250%
Floor 0.500%
02/01/2029 | 9.082% | | 641,376 | 641,023 |
| Virgin Media Bristol LLC(b),(u) |
| Tranche N Term Loan |
1-month USD LIBOR + 2.500%
01/31/2028 | 7.925% | | 1,250,000 | 1,214,375 |
| Tranche Y Term Loan |
1-month Term SOFR + 3.250%
03/31/2031 | 8.311% | | 350,000 | 345,562 |
| Total | 8,269,668 |
| Chemicals 0.0% |
| Chemours Company (The)(b),(u) |
| Tranche B3 Term Loan |
1-month Term SOFR + 3.500%
08/18/2028 | 8.831% | | 1,039,117 | 1,022,231 |
| Consumer Cyclical Services 0.0% |
| 8th Avenue Food & Provisions, Inc.(b),(s),(u) |
| 1st Lien Term Loan |
1-month Term SOFR + 3.750%
10/01/2025 | 9.196% | | 64,289 | 61,219 |
| Amentum Government Services Holdings LLC(b),(i),(u) |
| Tranche 1 1st Lien Term Loan |
1-month USD LIBOR + 4.000%
01/29/2027 | 9.446% | | 308,897 | 305,808 |
| Arches Buyer, Inc.(b),(u) |
| Term Loan |
1-month Term SOFR + 3.250%
Floor 0.500%
12/06/2027 | 8.681% | | 255,462 | 248,076 |
| Pre-Paid Legal Services, Inc.(b),(u) |
| 1st Lien Term Loan |
1-month USD LIBOR + 3.750%
Floor 0.500%
12/15/2028 | 9.196% | | 501,431 | 492,501 |
| Prime Security Services Borrower LLC(b),(u) |
| Tranche B1 1st Lien Term Loan |
1-month USD LIBOR + 2.750%
Floor 0.750%
09/23/2026 | 8.182% | | 448,554 | 448,460 |
The accompanying Notes to Financial Statements are an integral part of this statement.
| 80 | Multi-Manager Total Return Bond Strategies Fund | Annual Report 2023 |
Portfolio of Investments (continued)
August 31, 2023
| Senior Loans (continued) |
| Borrower | Coupon
Rate | | Principal
Amount ($) | Value ($) |
| Safe Fleet Holdings LLC(b),(u) |
| Term Loan |
1-month Term SOFR + 3.750%
Floor 0.500%
02/23/2029 | 9.168% | | 168,518 | 168,517 |
| Spin Holdco, Inc.(b),(u) |
| Term Loan |
1-month USD LIBOR + 4.000%
Floor 0.750%
03/04/2028 | 9.230% | | 725,560 | 605,843 |
| TruGreen LP(b),(u) |
| 1st Lien Term Loan |
1-month USD LIBOR + 4.000%
Floor 0.750%
11/02/2027 | 9.431% | | 286,051 | 271,869 |
| Total | 2,602,293 |
| Consumer Products 0.0% |
| Acuity Specialty Products, Inc.(b),(u) |
| 1st Lien Term Loan |
3-month USD LIBOR + 4.000%
Floor 1.000%
08/12/2024 | 9.242% | | 279,128 | 256,798 |
| Osmosis Buyer Ltd.(b),(u) |
| Tranche B Term Loan |
1-month USD LIBOR + 3.750%
Floor 0.500%
07/31/2028 | 9.062% | | 341,110 | 339,708 |
| Total | 596,506 |
| Diversified Manufacturing 0.0% |
| Filtration Group Corp.(b),(u) |
| Term Loan |
1-month Term SOFR + 4.250%
Floor 0.500%
10/21/2028 | 9.696% | | 187,735 | 188,165 |
| Environmental 0.0% |
| Patriot Container Corp.(b),(u) |
| 1st Lien Term Loan |
1-month USD LIBOR + 3.750%
Floor 1.000%
03/20/2025 | 9.181% | | 64,288 | 60,109 |
| Finance Companies 0.0% |
| Avolon Borrower 1 LLC(b),(u) |
| Tranche B4 Term Loan |
1-month USD LIBOR + 1.500%
Floor 0.750%
02/12/2027 | 6.914% | | 857,784 | 856,394 |
| Senior Loans (continued) |
| Borrower | Coupon
Rate | | Principal
Amount ($) | Value ($) |
| Tranche B5 Term Loan |
1-month USD LIBOR + 2.250%
Floor 0.500%
12/01/2027 | 7.664% | | 1,959,799 | 1,957,349 |
| Tranche B6 Term Loan |
1-month Term SOFR + 2.500%
Floor 0.500%
06/22/2028 | 7.814% | | 175,812 | 175,856 |
| Total | 2,989,599 |
| Food and Beverage 0.0% |
| City Brewing Company LLC(b),(u) |
| 1st Lien Term Loan |
1-month Term SOFR + 3.500%
Floor 0.750%
04/05/2028 | 9.070% | | 322,431 | 208,429 |
| H-Food Holdings LLC/Hearthside Food Solutions LLC(b),(u) |
| Term Loan |
3-month USD LIBOR + 3.688%
05/23/2025 | 9.269% | | 60,694 | 54,799 |
| Hostess Brands LLC(b),(u) |
| Tranche B 1st Lien Term Loan |
1-month Term SOFR + 2.500%
06/30/2030 | 7.742% | | 705,208 | 703,445 |
| Naked Juice LLC(b),(u) |
| 1st Lien Term Loan |
3-month Term SOFR + 3.250%
Floor 0.500%
01/24/2029 | 8.592% | | 1,548,991 | 1,465,733 |
| 2nd Lien Term Loan |
1-month Term SOFR + 6.000%
Floor 0.500%
01/24/2030 | 11.342% | | 251,405 | 201,662 |
| Total | 2,634,068 |
| Gaming 0.0% |
| Churchill Downs, Inc.(b),(u) |
| Tranche B Term Loan |
3-month USD LIBOR + 2.000%
03/17/2028 | 7.431% | | 99,745 | 99,745 |
| Fertitta Entertainment LLC(b),(u) |
| Tranche B Term Loan |
1-month Term SOFR + 4.000%
Floor 0.500%
01/27/2029 | 9.331% | | 540,929 | 535,146 |
| Light and Wonder International, Inc.(b),(u) |
| Tranche B Term Loan |
1-month Term SOFR + 3.000%
Floor 0.500%
04/14/2029 | 8.412% | | 454,202 | 453,716 |
| Total | 1,088,607 |
The accompanying Notes to Financial Statements are an integral part of this statement.
Multi-Manager Total Return Bond Strategies Fund | Annual Report 2023
| 81 |
Portfolio of Investments (continued)
August 31, 2023
| Senior Loans (continued) |
| Borrower | Coupon
Rate | | Principal
Amount ($) | Value ($) |
| Health Care 0.0% |
| Avantor Funding, Inc.(b),(u) |
| Tranche B5 Term Loan |
1-month USD LIBOR + 2.250%
Floor 0.500%
11/08/2027 | 7.681% | | 492,264 | 492,348 |
| Bausch & Lomb Corp.(b),(u) |
| Term Loan |
1-month Term SOFR + 3.250%
Floor 0.500%
05/10/2027 | 8.592% | | 217,918 | 212,770 |
| Gainwell Acquisition Corp.(b),(u) |
| Tranche B 1st Lien Term Loan |
1-month USD LIBOR + 4.000%
Floor 0.750%
10/01/2027 | 9.342% | | 738,636 | 726,405 |
| ICON PLC(b),(u) |
| Term Loan |
3-month Term SOFR + 2.250%
Floor 0.500%
07/03/2028 | 7.753% | | 529,456 | 529,514 |
3-month USD LIBOR + 2.250%
07/03/2028 | 7.753% | | 131,914 | 131,929 |
| Medline Borrower LP(b),(u) |
| Term Loan |
1-month USD LIBOR + 3.250%
Floor 0.500%
10/23/2028 | 8.696% | | 493,750 | 493,182 |
| Total | 2,586,148 |
| Leisure 0.0% |
| Formula One Management Ltd.(b),(u) |
| Tranche B 1st Lien Term Loan |
1-month Term SOFR + 3.000%
Floor 0.500%
01/15/2030 | 8.331% | | 52,090 | 52,220 |
| William Morris Endeavor Entertainment LLC(b),(u) |
| Tranche B1 1st Lien Term Loan |
3-month USD LIBOR + 2.750%
05/18/2025 | 8.196% | | 538,079 | 536,820 |
| Total | 589,040 |
| Lodging 0.0% |
| Hilton Worldwide Finance LLC(b),(u) |
| Tranche B2 Term Loan |
3-month USD LIBOR + 1.750%
06/22/2026 | 7.165% | | 111,786 | 111,675 |
| Senior Loans (continued) |
| Borrower | Coupon
Rate | | Principal
Amount ($) | Value ($) |
| Media and Entertainment 0.0% |
| Diamond Sports Group LLC(b),(u) |
| 1st Lien Term Loan |
1-month Term SOFR + 8.000%
Floor 1.000%
05/25/2026 | 13.298% | | 331,326 | 207,079 |
| Diamond Sports Group LLC(n),(u) |
| 2nd Lien Term Loan |
| 08/24/2026 | 0.000% | | 4,770,042 | 115,006 |
| MH Sub I LLC/Micro Holding Corp.(b),(u) |
| 1st Lien Term Loan |
1-month Term SOFR + 4.250%
Floor 0.500%
05/03/2028 | 9.581% | | 276,651 | 265,646 |
| Total | 587,731 |
| Other Financial Institutions 0.0% |
| Trans Union LLC(b),(u) |
| Tranche B6 Term Loan |
1-month USD LIBOR + 2.250%
Floor 0.500%
12/01/2028 | 7.696% | | 817,253 | 816,460 |
| Other Industry 0.0% |
| Adtalem Global Education, Inc.(b),(u) |
| Tranche B Term Loan |
1-month USD LIBOR + 4.000%
Floor 0.750%
08/12/2028 | 5.250% | | 432,404 | 432,270 |
| Artera Services LLC(b),(u) |
| 1st Lien Term Loan |
3-month USD LIBOR + 3.250%
Floor 1.000%
03/06/2025 | 8.592% | | 446,746 | 415,336 |
| Total | 847,606 |
| Packaging 0.0% |
| Berry Global, Inc.(b),(u) |
| Tranche Z Term Loan |
1-month USD LIBOR + 1.750%
07/01/2026 | 7.293% | | 2,017,774 | 2,016,907 |
| Paper 0.0% |
| Mativ Holdings, Inc.(b),(s),(u) |
| Delayed Draw Term Loan |
1-month Term SOFR + 2.500%
05/06/2027 | 7.930% | | 376,702 | 367,284 |
| Pharmaceuticals 0.1% |
| Elanco Animal Health, Inc.(b),(u) |
| Term Loan |
1-month USD LIBOR + 1.750%
08/01/2027 | 7.168% | | 1,851,391 | 1,832,303 |
The accompanying Notes to Financial Statements are an integral part of this statement.
| 82 | Multi-Manager Total Return Bond Strategies Fund | Annual Report 2023 |
Portfolio of Investments (continued)
August 31, 2023
| Senior Loans (continued) |
| Borrower | Coupon
Rate | | Principal
Amount ($) | Value ($) |
| Grifols Worldwide Operations Ltd.(b),(u) |
| Tranche B Term Loan |
1-month USD LIBOR + 2.000%
11/15/2027 | 7.481% | | 1,353,536 | 1,335,602 |
| Horizon Therapeutics USA, Inc.(b),(u) |
| Tranche B2 Term Loan |
1-month USD LIBOR + 1.750%
Floor 0.500%
03/15/2028 | 7.180% | | 1,988,167 | 1,985,403 |
| Jazz Pharmaceuticals PLC(b),(u) |
| Term Loan |
1-month USD LIBOR + 3.500%
Floor 0.500%
05/05/2028 | 8.946% | | 1,200,582 | 1,200,582 |
| Organon & Co.(b),(u) |
| Term Loan |
1-month USD LIBOR + 3.000%
Floor 0.500%
06/02/2028 | 8.431% | | 3,008,899 | 3,011,727 |
| Total | 9,365,617 |
| Property & Casualty 0.0% |
| Acrisure LLC(b),(u) |
| 1st Lien Term Loan |
1-month USD LIBOR + 3.500%
02/15/2027 | 8.946% | | 903,283 | 884,414 |
| AmWINS Group, Inc.(b),(u) |
| Term Loan |
1-month USD LIBOR + 2.250%
Floor 0.750%
02/19/2028 | 7.696% | | 1,634,615 | 1,632,571 |
| Total | 2,516,985 |
| Railroads 0.0% |
| Genesee & Wyoming, Inc.(b),(s),(u) |
| Term Loan |
3-month USD LIBOR + 2.000%
12/30/2026 | 7.342% | | 90,799 | 90,783 |
| Restaurants 0.0% |
| 1011778 BC ULC(b),(u) |
| Tranche B4 Term Loan |
1-month USD LIBOR + 1.750%
11/19/2026 | 7.196% | | 542,204 | 538,441 |
| KFC Holding Co./Yum! Brands(b),(u) |
| Tranche B Term Loan |
1-month USD LIBOR + 1.750%
03/15/2028 | 7.176% | | 365,383 | 364,773 |
| Total | 903,214 |
| Senior Loans (continued) |
| Borrower | Coupon
Rate | | Principal
Amount ($) | Value ($) |
| Retailers 0.1% |
| Great Outdoors Group LLC(b),(u) |
| Tranche B2 Term Loan |
1-month USD LIBOR + 3.750%
Floor 0.750%
03/06/2028 | 9.196% | | 1,571,003 | 1,564,624 |
| Michaels Companies, Inc. (The)(b),(u) |
| Tranche B Term Loan |
1-month USD LIBOR + 4.250%
Floor 0.750%
04/15/2028 | 9.753% | | 1,960,000 | 1,813,667 |
| Total | 3,378,291 |
| Technology 0.1% |
| athenahealth Group, Inc.(b),(u) |
| Term Loan |
1-month Term SOFR + 3.500%
Floor 0.500%
02/15/2029 | 8.820% | | 1,400,934 | 1,382,833 |
| Central Parent, Inc.(b),(u) |
| 1st Lien Term Loan |
1-month Term SOFR + 4.250%
Floor 0.500%
07/06/2029 | 9.492% | | 427,765 | 427,868 |
| Coherent Corp.(b),(u) |
| Tranche B Term Loan |
1-month USD LIBOR + 2.750%
Floor 0.500%
07/02/2029 | 8.196% | | 133,928 | 133,459 |
| CommScope, Inc.(b),(u) |
| Term Loan |
3-month USD LIBOR + 3.250%
04/06/2026 | 8.696% | | 1,699,032 | 1,558,013 |
| DTI Holdco, Inc.(b),(u) |
| 1st Lien Term Loan |
1-month Term SOFR + 4.750%
Floor 0.750%
04/26/2029 | 10.119% | | 87,301 | 84,308 |
| Entegris, Inc.(b),(s),(u) |
| Tranche B Term Loan |
1-month Term SOFR + 2.750%
07/06/2029 | 7.990% | | 268,115 | 268,450 |
| Gen Digital, Inc.(b),(u) |
| Tranche A Term Loan |
1-month Term SOFR + 1.500%
09/10/2027 | 6.931% | | 605,520 | 597,576 |
| Hudson River Trading LLC(b),(u) |
| Term Loan |
1-month Term SOFR + 3.000%
03/20/2028 | 8.312% | | 398,979 | 392,995 |
The accompanying Notes to Financial Statements are an integral part of this statement.
Multi-Manager Total Return Bond Strategies Fund | Annual Report 2023
| 83 |
Portfolio of Investments (continued)
August 31, 2023
| Senior Loans (continued) |
| Borrower | Coupon
Rate | | Principal
Amount ($) | Value ($) |
| Open Text Corp.(b),(u) |
| Term Loan |
1-month Term SOFR + 1.750%
05/30/2025 | 7.181% | | 344,125 | 344,125 |
1-month Term SOFR + 2.750%
01/31/2030 | 8.181% | | 366,792 | 366,998 |
| Oracle Corp.(b),(u) |
| Tranche 1 Term Loan |
1-month Term SOFR + 1.600%
08/16/2027 | 6.083% | | 1,730,353 | 1,713,049 |
| Peraton Corp.(b),(u) |
| Tranche B 1st Lien Term Loan |
1-month USD LIBOR + 3.750%
Floor 0.750%
02/01/2028 | 9.181% | | 837,216 | 828,190 |
| Project Alpha Intermediate Holding, Inc.(b),(u) |
| Term Loan |
1-month USD LIBOR + 4.000%
04/26/2024 | 9.446% | | 282,107 | 281,635 |
| Proofpoint, Inc.(b),(u) |
| 1st Lien Term Loan |
1-month USD LIBOR + 3.250%
Floor 0.500%
08/31/2028 | 8.696% | | 159,040 | 157,326 |
| RealPage, Inc.(b),(u) |
| 1st Lien Term Loan |
1-month USD LIBOR + 3.000%
Floor 0.500%
04/24/2028 | 8.446% | | 133,640 | 132,015 |
| Renaissance Holding Corp.(b),(u) |
| 1st Lien Term Loan |
3-month USD LIBOR + 4.750%
04/05/2030 | 9.992% | | 352,024 | 352,190 |
| Total | 9,021,030 |
| Wireless 0.1% |
| Digicel International Finance Ltd.(b),(u) |
| Tranche B 1st Lien Term Loan |
3-month USD LIBOR + 3.250%
05/28/2024 | 5.010% | | 2,711,195 | 2,462,660 |
| SBA Senior Finance II LLC(b),(u) |
| Term Loan |
3-month USD LIBOR + 1.750%
04/11/2025 | 7.190% | | 707,750 | 707,792 |
| Total | 3,170,452 |
| Wirelines 0.0% |
| Frontier Communications Holdings LLC(b),(u) |
| Tranche B Term Loan |
1-month USD LIBOR + 3.750%
Floor 0.750%
05/01/2028 | 9.196% | | 208,799 | 202,709 |
| Senior Loans (continued) |
| Borrower | Coupon
Rate | | Principal
Amount ($) | Value ($) |
| Zayo Group Holdings, Inc.(b),(u) |
| Term Loan |
1-month Term SOFR + 4.325%
Floor 0.500%
03/09/2027 | 9.656% | | 303,491 | 242,717 |
1-month USD LIBOR + 3.000%
03/09/2027 | 8.446% | | 1,613,487 | 1,287,514 |
| Total | 1,732,940 |
Total Senior Loans
(Cost $62,073,457) | 59,799,338 |
|
| Treasury Bills 0.6% |
| Issuer | Yield | | Principal
Amount ($) | Value ($) |
| United States 0.6% |
| U.S. Treasury Bills(v) |
| 09/14/2023 | 5.140% | | 2,000,000 | 1,996,068 |
| 10/19/2023 | 5.200% | | 2,000,000 | 1,986,138 |
| U.S. Treasury Bills |
| 09/19/2023 | 5.370% | | 59,000,000 | 58,835,649 |
| 09/26/2023 | 5.380% | | 8,000,000 | 7,969,450 |
| Total | 70,787,305 |
Total Treasury Bills
(Cost $70,797,278) | 70,787,305 |
|
| U.S. Government & Agency Obligations 0.1% |
| Issuer | Coupon
Rate | | Principal
Amount ($) | Value ($) |
| Federal National Mortgage Association(f) |
| STRIPS |
| 05/15/2030 | 0.000% | | 295,000 | 218,673 |
| Residual Funding Corp.(f) |
| STRIPS |
| 01/15/2030 | 0.000% | | 7,351,000 | 5,456,301 |
| 04/15/2030 | 0.000% | | 425,000 | 311,614 |
| Resolution Funding Corp.(f) |
| STRIPS |
| 04/15/2030 | 0.000% | | 3,000,000 | 2,211,351 |
| Tennessee Valley Authority Principal STRIP(f) |
| 09/15/2024 | 0.000% | | 445,000 | 418,577 |
Total U.S. Government & Agency Obligations
(Cost $9,462,928) | 8,616,516 |
|
| U.S. Treasury Obligations 16.1% |
| | | | |
| U.S. Treasury |
| 01/15/2024 | 0.125% | | 20,000,000 | 19,615,625 |
| 06/30/2025 | 4.625% | | 16,840,000 | 16,745,933 |
| 07/31/2025 | 4.750% | | 44,968,000 | 44,845,041 |
| 08/31/2025 | 5.000% | | 110,640,000 | 110,946,853 |
The accompanying Notes to Financial Statements are an integral part of this statement.
| 84 | Multi-Manager Total Return Bond Strategies Fund | Annual Report 2023 |
Portfolio of Investments (continued)
August 31, 2023
| U.S. Treasury Obligations (continued) |
| Issuer | Coupon
Rate | | Principal
Amount ($) | Value ($) |
| 07/15/2026 | 4.500% | | 111,000 | 110,809 |
| 08/15/2026 | 4.375% | | 72,986,000 | 72,649,580 |
| 03/31/2028 | 3.625% | | 11,375,000 | 11,057,744 |
| 04/30/2028 | 3.500% | | 116,935,000 | 113,061,528 |
| 05/31/2028 | 3.625% | | 22,975,000 | 22,346,777 |
| 07/31/2028 | 4.125% | | 206,896,200 | 205,700,081 |
| 08/31/2028 | 4.375% | | 180,850,000 | 181,952,055 |
| 12/31/2029 | 3.875% | | 11,000,000 | 10,777,422 |
| 07/31/2030 | 4.000% | | 50,640,700 | 50,039,342 |
| 02/15/2033 | 3.500% | | 7,805,000 | 7,433,043 |
| 05/15/2033 | 3.375% | | 58,110,000 | 54,750,516 |
| 08/15/2033 | 3.875% | | 72,975,900 | 71,664,614 |
| 11/15/2040 | 1.375% | | 28,825,000 | 18,393,953 |
| 08/15/2041 | 1.750% | | 80,675,000 | 54,190,910 |
| 02/15/2042 | 2.375% | | 39,690,000 | 29,519,437 |
| 05/15/2042 | 3.250% | | 52,060,000 | 44,446,225 |
| 11/15/2042 | 2.750% | | 32,165,000 | 25,204,293 |
| 02/15/2043 | 3.875% | | 6,000,000 | 5,581,875 |
| 05/15/2043 | 3.875% | | 94,059,400 | 87,475,242 |
| 08/15/2043 | 4.375% | | 138,031,000 | 137,664,355 |
| 08/15/2049 | 2.250% | | 7,360,000 | 5,005,950 |
| 05/15/2050 | 1.250% | | 20,680,000 | 10,808,531 |
| 11/15/2050 | 1.625% | | 31,720,000 | 18,338,125 |
| 05/15/2053 | 3.625% | | 99,936,000 | 90,129,780 |
| 08/15/2053 | 4.000% | | 107,460,000 | 106,016,006 |
| U.S. Treasury(v) |
| 05/15/2041 | 2.250% | | 115,850,000 | 85,330,766 |
| 11/15/2041 | 2.000% | | 96,071,000 | 67,219,678 |
| 08/15/2043 | 3.625% | | 8,830,000 | 7,886,294 |
| U.S. Treasury(f) |
| STRIPS |
| 11/15/2038 | 0.000% | | 2,860,000 | 1,458,377 |
| 02/15/2039 | 0.000% | | 2,670,000 | 1,345,847 |
| 05/15/2039 | 0.000% | | 4,595,000 | 2,286,012 |
| 02/15/2040 | 0.000% | | 5,735,000 | 2,741,823 |
| U.S. Treasury Obligations (continued) |
| Issuer | Coupon
Rate | | Principal
Amount ($) | Value ($) |
| 11/15/2040 | 0.000% | | 3,590,000 | 1,651,120 |
| 02/15/2041 | 0.000% | | 5,100,000 | 2,312,133 |
| 05/15/2041 | 0.000% | | 7,485,000 | 3,352,754 |
| 08/15/2041 | 0.000% | | 4,455,000 | 1,969,075 |
| 11/15/2041 | 0.000% | | 3,500,000 | 1,527,148 |
| 05/15/2042 | 0.000% | | 400,000 | 170,219 |
| 08/15/2042 | 0.000% | | 5,510,000 | 2,317,429 |
| 05/15/2043 | 0.000% | | 18,965,000 | 7,707,495 |
| 11/15/2043 | 0.000% | | 9,279,000 | 3,682,603 |
| 02/15/2044 | 0.000% | | 980,000 | 385,186 |
| 08/15/2044 | 0.000% | | 1,255,000 | 484,303 |
| 02/15/2045 | 0.000% | | 8,770,000 | 3,420,643 |
| 02/15/2045 | 0.000% | | 695,000 | 262,715 |
Total U.S. Treasury Obligations
(Cost $1,964,758,447) | 1,823,983,265 |
| Money Market Funds 9.0% |
| | Shares | Value ($) |
| Columbia Short-Term Cash Fund, 5.476%(w),(x) | 1,015,314,050 | 1,015,009,456 |
Total Money Market Funds
(Cost $1,014,947,670) | 1,015,009,456 |
Total Investments in Securities
(Cost: $13,052,769,264) | 12,221,744,345 |
| Other Assets & Liabilities, Net | | (903,262,579) |
| Net Assets | 11,318,481,766 |
At August 31, 2023, securities and/or cash totaling $56,639,473 were pledged as collateral.
Investments in derivatives
| Forward foreign currency exchange contracts |
Currency to
be sold | Currency to
be purchased | Counterparty | Settlement
date | Unrealized
appreciation ($) | Unrealized
depreciation ($) |
| 572,247 EUR | 625,418 USD | State Street | 09/29/2023 | 4,183 | — |
| Long futures contracts |
| Description | Number of
contracts | Expiration
date | Trading
currency | Notional
amount | Value/Unrealized
appreciation ($) | Value/Unrealized
depreciation ($) |
| U.S. Long Bond | 389 | 12/2023 | USD | 47,336,438 | 611,817 | — |
| U.S. Long Bond | 224 | 12/2023 | USD | 27,258,000 | 361,402 | — |
| U.S. Treasury 10-Year Note | 2,312 | 12/2023 | USD | 256,704,250 | 2,168,019 | — |
| U.S. Treasury 10-Year Note | 515 | 12/2023 | USD | 57,181,094 | 466,075 | — |
| U.S. Treasury 2-Year Note | 2,322 | 12/2023 | USD | 473,234,486 | 1,107,619 | — |
| U.S. Treasury 2-Year Note | 2,124 | 12/2023 | USD | 432,881,157 | 820,303 | — |
The accompanying Notes to Financial Statements are an integral part of this statement.
Multi-Manager Total Return Bond Strategies Fund | Annual Report 2023
| 85 |
Portfolio of Investments (continued)
August 31, 2023
| Long futures contracts (continued) |
| Description | Number of
contracts | Expiration
date | Trading
currency | Notional
amount | Value/Unrealized
appreciation ($) | Value/Unrealized
depreciation ($) |
| U.S. Treasury 2-Year Note | 1,034 | 12/2023 | USD | 210,734,047 | 356,019 | — |
| U.S. Treasury 2-Year Note | 620 | 12/2023 | USD | 126,358,907 | 280,706 | — |
| U.S. Treasury 5-Year Note | 1,791 | 12/2023 | USD | 191,497,078 | 1,271,841 | — |
| U.S. Treasury 5-Year Note | 872 | 12/2023 | USD | 93,235,875 | 543,727 | — |
| U.S. Treasury 5-Year Note | 169 | 12/2023 | USD | 18,069,797 | 11,951 | — |
| U.S. Treasury Ultra 10-Year Note | 405 | 12/2023 | USD | 47,024,297 | 526,412 | — |
| U.S. Treasury Ultra 10-Year Note | 163 | 12/2023 | USD | 18,925,828 | 170,393 | — |
| U.S. Treasury Ultra 10-Year Note | 163 | 12/2023 | USD | 18,925,828 | 161,443 | — |
| U.S. Treasury Ultra 10-Year Note | 79 | 12/2023 | USD | 9,172,641 | 4,802 | — |
| U.S. Treasury Ultra Bond | 1,197 | 12/2023 | USD | 154,974,094 | 2,713,599 | — |
| U.S. Treasury Ultra Bond | 973 | 12/2023 | USD | 125,973,094 | 2,176,431 | — |
| U.S. Treasury Ultra Bond | 146 | 12/2023 | USD | 18,902,438 | 625,977 | — |
| U.S. Treasury Ultra Bond | 73 | 12/2023 | USD | 9,451,219 | 314,390 | — |
| U.S. Treasury Ultra Bond | 40 | 12/2023 | USD | 5,178,750 | 145,536 | — |
| Total | | | | | 14,838,462 | — |
| Short futures contracts |
| Description | Number of
contracts | Expiration
date | Trading
currency | Notional
amount | Value/Unrealized
appreciation ($) | Value/Unrealized
depreciation ($) |
| U.S. Long Bond | (516) | 12/2023 | USD | (62,790,750) | — | (1,099,544) |
| U.S. Treasury 5-Year Note | (843) | 12/2023 | USD | (90,135,141) | — | (554,829) |
| U.S. Treasury Ultra 10-Year Note | (321) | 12/2023 | USD | (37,271,109) | — | (379,344) |
| Total | | | | | — | (2,033,717) |
| Cleared interest rate swap contracts |
| Fund receives | Fund pays | Payment
frequency | Counterparty | Maturity
date | Notional
currency | Notional
amount | Value
($) | Upfront
payments
($) | Upfront
receipts
($) | Unrealized
appreciation
($) | Unrealized
depreciation
($) |
| SOFR | Fixed rate of 3.520% | Receives Annually, Pays Annually | Citi | 12/20/2053 | USD | 15,356,000 | (82,640) | — | — | — | (82,640) |
| Fixed rate of 5.384% | SOFR | Receives Annually, Pays Annually | JPMorgan | 08/31/2024 | USD | 427,680,000 | 120,119 | — | — | 120,119 | — |
| Fixed rate of 4.946% | SOFR | Receives Annually, Pays Annually | JPMorgan | 03/08/2025 | USD | 33,920,000 | (78,794) | — | — | — | (78,794) |
| Fixed rate of 5.088% | SOFR | Receives Annually, Pays Annually | JPMorgan | 03/10/2025 | USD | 107,139,000 | 42,833 | — | — | 42,833 | — |
| SOFR | Fixed rate of 4.805% | Receives Annually, Pays Annually | JPMorgan | 08/31/2025 | USD | 220,530,000 | (126,438) | — | — | — | (126,438) |
| Total | | | | | | | (124,920) | — | — | 162,952 | (287,872) |
| Cleared credit default swap contracts - sell protection |
Reference
entity | Counterparty | Maturity
date | Receive
fixed
rate
(%) | Payment
frequency | Implied
credit
spread
(%)* | Notional
currency | Notional
amount | Value
($) | Upfront
payments
($) | Upfront
receipts
($) | Unrealized
appreciation
($) | Unrealized
depreciation
($) |
| Markit CDX North America High Yield Index, Series 40 | JPMorgan | 06/20/2028 | 5.000 | Quarterly | 4.252 | USD | 131,460,000 | 865,215 | — | — | 865,215 | — |
* Implied credit spreads, represented in absolute terms, utilized in determining the market value of credit default swap agreements on corporate or sovereign issues as of period end serve as an indicator of the current status of the payment/performance risk and represent the likelihood or risk of default for the credit derivative. The implied credit spread of a particular referenced entity reflects the cost of buying/selling protection and may include upfront payments required to be made to enter into the agreement. Wider credit spreads represent a deterioration of the referenced entity’s credit soundness and a greater likelihood or risk of default or other credit event occurring as defined under the terms of the agreement.
The accompanying Notes to Financial Statements are an integral part of this statement.
| 86 | Multi-Manager Total Return Bond Strategies Fund | Annual Report 2023 |
Portfolio of Investments (continued)
August 31, 2023
| Reference index and values for swap contracts as of period end |
| Reference index | | Reference rate |
| SOFR | Secured Overnight Financing Rate | 5.310% |
Notes to Portfolio of Investments
| (a) | Represents privately placed and other securities and instruments exempt from Securities and Exchange Commission registration (collectively, private placements), such as Section 4(a)(2) and Rule 144A eligible securities, which are often sold only to qualified institutional buyers. At August 31, 2023, the total value of these securities amounted to $3,009,130,650, which represents 26.59% of total net assets. |
| (b) | Variable rate security. The interest rate shown was the current rate as of August 31, 2023. |
| (c) | Variable or floating rate security, the interest rate of which adjusts periodically based on changes in current interest rates and prepayments on the underlying pool of assets. The interest rate shown was the current rate as of August 31, 2023. |
| (d) | Represents interest only securities which have the right to receive the monthly interest payments on an underlying pool of mortgage loans. |
| (e) | Represents principal only securities which have the right to receive the principal portion only on an underlying pool of mortgage loans. |
| (f) | Zero coupon bond. |
| (g) | Represents fair value as determined in good faith under procedures approved by the Board of Trustees. At August 31, 2023, the total value of these securities amounted to $10,868,717, which represents 0.10% of total net assets. |
| (h) | Non-income producing investment. |
| (i) | Valuation based on significant unobservable inputs. |
| (j) | Perpetual security with no specified maturity date. |
| (k) | Represents a variable rate security with a step coupon where the rate adjusts according to a schedule for a series of periods, typically lower for an initial period and then increasing to a higher coupon rate thereafter. The interest rate shown was the current rate as of August 31, 2023. |
| (l) | Payment-in-kind security. Interest can be paid by issuing additional par of the security or in cash. |
| (m) | Represents a security purchased on a when-issued basis. |
| (n) | Represents a security in default. |
| (o) | Principal amounts are denominated in United States Dollars unless otherwise noted. |
| (p) | Principal and interest may not be guaranteed by a governmental entity. |
| (q) | Municipal obligations include debt obligations issued by or on behalf of territories, possessions, or sovereign nations within the territorial boundaries of the United States. At August 31, 2023, the total value of these securities amounted to $2,652,061, which represents 0.02% of total net assets. |
| (r) | Includes comparable securities held to satisfy future delivery requirements of the following open forward sale commitments at August 31, 2023: |
| Security description | Principal
amount ($) | Settlement
date | Proceeds
receivable ($) | Value ($) |
| Uniform Mortgage-Backed Security TBA | | | | |
| 09/14/2053 4.500% | (5,500,000) | 09/14/2023 | (5,221,562) | (5,214,688) |
| Uniform Mortgage-Backed Security TBA | | | | |
| 10/12/2053 4.500% | (7,000,000) | 10/12/2023 | (6,641,797) | (6,641,250) |
| Uniform Mortgage-Backed Security TBA | | | | |
| 10/12/2053 5.000% | (2,000,000) | 10/12/2023 | (1,939,766) | (1,940,195) |
| Uniform Mortgage-Backed Security TBA | | | | |
| 10/12/2053 5.500% | (1,500,000) | 10/12/2023 | (1,481,836) | (1,480,547) |
| Total | | | | (15,276,680) |
| (s) | Represents a security purchased on a forward commitment basis. |
| (t) | Represents a variable rate security where the coupon adjusts periodically through an auction process. |
| (u) | The stated interest rate represents the weighted average interest rate at August 31, 2023 of contracts within the senior loan facility. Interest rates on contracts are primarily determined either weekly, monthly or quarterly by reference to the indicated base lending rate and spread and the reset period. These base lending rates are primarily the LIBOR and other short-term rates. Base lending rates may be subject to a floor or minimum rate. The interest rate for senior loans purchased on a when-issued or delayed delivery basis will be determined upon settlement, therefore no interest rate is disclosed. Senior loans often require prepayments from excess cash flows or permit the borrowers to repay at their election. The degree to which borrowers repay cannot be predicted with accuracy. As a result, remaining maturities of senior loans may be less than the stated maturities. Generally, the Fund is contractually obligated to receive approval from the agent bank and/or borrower prior to the disposition of a senior loan. |
| (v) | This security or a portion of this security has been pledged as collateral in connection with derivative contracts. |
| (w) | The rate shown is the seven-day current annualized yield at August 31, 2023. |
The accompanying Notes to Financial Statements are an integral part of this statement.
Multi-Manager Total Return Bond Strategies Fund | Annual Report 2023
| 87 |
Portfolio of Investments (continued)
August 31, 2023
Notes to Portfolio of Investments (continued)
| (x) | As defined in the Investment Company Act of 1940, as amended, an affiliated company is one in which the Fund owns 5% or more of the company’s outstanding voting securities, or a company which is under common ownership or control with the Fund. The value of the holdings and transactions in these affiliated companies during the year ended August 31, 2023 are as follows: |
| Affiliated issuers | Beginning
of period($) | Purchases($) | Sales($) | Net change in
unrealized
appreciation
(depreciation)($) | End of
period($) | Realized gain
(loss)($) | Dividends($) | End of
period shares |
| Columbia Short-Term Cash Fund, 5.476% |
| | 1,202,908,828 | 7,365,366,360 | (7,553,317,841) | 52,109 | 1,015,009,456 | 255,261 | 44,637,187 | 1,015,314,050 |
Abbreviation Legend
| BAM | Build America Mutual Assurance Co. |
| BIG | Bond Investors Guarantee |
| CMO | Collateralized Mortgage Obligation |
| CMT | Constant Maturity Treasury |
| CVR | Contingent Value Rights |
| EURIBOR | Euro Interbank Offered Rate |
| FHLMC | Federal Home Loan Mortgage Corporation |
| LIBOR | London Interbank Offered Rate |
| MTA | Monthly Treasury Average |
| SOFR | Secured Overnight Financing Rate |
| STRIPS | Separate Trading of Registered Interest and Principal Securities |
| TBA | To Be Announced |
Currency Legend
Fair value measurements
The Fund categorizes its fair value measurements according to a three-level hierarchy that maximizes the use of observable inputs and minimizes the use of unobservable inputs by prioritizing that the most observable input be used when available. Observable inputs are those that market participants would use in pricing an investment based on market data obtained from sources independent of the reporting entity. Unobservable inputs are those that reflect the Fund’s assumptions about the information market participants would use in pricing an investment. An investment’s level within the fair value hierarchy is based on the lowest level of any input that is deemed significant to the asset’s or liability’s fair value measurement. The input levels are not necessarily an indication of the risk or liquidity associated with investments at that level. For example, certain U.S. government securities are generally high quality and liquid, however, they are reflected as Level 2 because the inputs used to determine fair value may not always be quoted prices in an active market.
Fair value inputs are summarized in the three broad levels listed below:
| ■ | Level 1 — Valuations based on quoted prices for investments in active markets that the Fund has the ability to access at the measurement date. Valuation adjustments are not applied to Level 1 investments. |
| ■ | Level 2 — Valuations based on other significant observable inputs (including quoted prices for similar securities, interest rates, prepayment speeds, credit risks, etc.). |
| ■ | Level 3 — Valuations based on significant unobservable inputs (including the Fund’s own assumptions and judgment in determining the fair value of investments). |
Inputs that are used in determining fair value of an investment may include price information, credit data, volatility statistics, and other factors. These inputs can be either observable or unobservable. The availability of observable inputs can vary between investments, and is affected by various factors such as the type of investment, and the volume and level of activity for that investment or similar investments in the marketplace. The inputs will be considered by the Investment Manager, along with any other relevant factors in the calculation of an investment’s fair value. The Fund uses prices and inputs that are current as of the measurement date, which may include periods of market dislocations. During these periods, the availability of prices and inputs may be reduced for many investments. This condition could cause an investment to be reclassified between the various levels within the hierarchy.
Foreign equity securities actively traded in markets where there is a significant delay in the local close relative to the New York Stock Exchange are classified as Level 2. The values of these securities may include an adjustment to reflect the impact of market movements following the close of local trading, as described in Note 2 to the financial statements – Security valuation.
The accompanying Notes to Financial Statements are an integral part of this statement.
| 88 | Multi-Manager Total Return Bond Strategies Fund | Annual Report 2023 |
Portfolio of Investments (continued)
August 31, 2023
Fair value measurements (continued)
Investments falling into the Level 3 category are primarily supported by quoted prices from brokers and dealers participating in the market for those investments. However, these may be classified as Level 3 investments due to lack of market transparency and corroboration to support these quoted prices. Additionally, valuation models may be used as the pricing source for any remaining investments classified as Level 3. These models may rely on one or more significant unobservable inputs and/or significant assumptions by the Investment Manager. Inputs used in valuations may include, but are not limited to, financial statement analysis, capital account balances, discount rates and estimated cash flows, and comparable company data.
The Fund’s Board of Trustees (the Board) has designated the Investment Manager, through its Valuation Committee (the Committee), as valuation designee, responsible for determining the fair value of the assets of the Fund for which market quotations are not readily available using valuation procedures approved by the Board. The Committee consists of voting and non-voting members from various groups within the Investment Manager’s organization, including operations and accounting, trading and investments, compliance, risk management and legal.
The Committee meets at least monthly to review and approve valuation matters, which may include a description of specific valuation determinations, data regarding pricing information received from approved pricing vendors and brokers and the results of Board-approved valuation policies and procedures (the Policies). The Policies address, among other things, instances when market quotations are or are not readily available, including recommendations of third party pricing vendors and a determination of appropriate pricing methodologies; events that require specific valuation determinations and assessment of fair value techniques; securities with a potential for stale pricing, including those that are illiquid, restricted, or in default; and the effectiveness of third party pricing vendors, including periodic reviews of vendors. The Committee meets more frequently, as needed, to discuss additional valuation matters, which may include the need to review back-testing results, review time-sensitive information or approve related valuation actions. Representatives of Columbia Management Investment Advisers, LLC report to the Board at each of its regularly scheduled meetings to discuss valuation matters and actions during the period, similar to those described earlier.
The following table is a summary of the inputs used to value the Fund’s investments at August 31, 2023:
| | Level 1 ($) | Level 2 ($) | Level 3 ($) | Total ($) |
| Investments in Securities | | | | |
| Asset-Backed Securities — Non-Agency | — | 1,313,618,530 | — | 1,313,618,530 |
| Commercial Mortgage-Backed Securities - Agency | — | 91,133,660 | — | 91,133,660 |
| Commercial Mortgage-Backed Securities - Non-Agency | — | 692,363,120 | — | 692,363,120 |
| Common Stocks | | | | |
| Communication Services | — | — | 9 | 9 |
| Energy | — | — | 143 | 143 |
| Financials | — | 2,005,529 | — | 2,005,529 |
| Total Common Stocks | — | 2,005,529 | 152 | 2,005,681 |
| Convertible Bonds | — | 4,949,400 | — | 4,949,400 |
| Corporate Bonds & Notes | — | 3,324,266,555 | 8,694,000 | 3,332,960,555 |
| Foreign Government Obligations | — | 157,699,506 | — | 157,699,506 |
| Inflation-Indexed Bonds | — | 39,003,914 | — | 39,003,914 |
| Municipal Bonds | — | 33,649,254 | — | 33,649,254 |
| Residential Mortgage-Backed Securities - Agency | — | 3,108,961,640 | — | 3,108,961,640 |
| Residential Mortgage-Backed Securities - Non-Agency | — | 465,028,497 | 2,174,708 | 467,203,205 |
| Senior Loans | — | 59,493,530 | 305,808 | 59,799,338 |
| Treasury Bills | — | 70,787,305 | — | 70,787,305 |
| U.S. Government & Agency Obligations | — | 8,616,516 | — | 8,616,516 |
| U.S. Treasury Obligations | — | 1,823,983,265 | — | 1,823,983,265 |
| Money Market Funds | 1,015,009,456 | — | — | 1,015,009,456 |
| Total Investments in Securities | 1,015,009,456 | 11,195,560,221 | 11,174,668 | 12,221,744,345 |
| Forward Sale Commitments | — | (15,276,680) | — | (15,276,680) |
| Investments in Derivatives | | | | |
| Asset | | | | |
| Forward Foreign Currency Exchange Contracts | — | 4,183 | — | 4,183 |
| Futures Contracts | 14,838,462 | — | — | 14,838,462 |
| Swap Contracts | — | 1,028,167 | — | 1,028,167 |
| Liability | | | | |
| Futures Contracts | (2,033,717) | — | — | (2,033,717) |
| Swap Contracts | — | (287,872) | — | (287,872) |
| Total | 1,027,814,201 | 11,181,028,019 | 11,174,668 | 12,220,016,888 |
See the Portfolio of Investments for all investment classifications not indicated in the table.
The Fund’s assets assigned to the Level 2 input category are generally valued using the market approach, in which a security’s value is determined through reference to prices and information from market transactions for similar or identical assets. These assets include certain foreign securities for which a third party statistical pricing service may be employed for purposes of fair market valuation. The model utilized by such third party statistical pricing service takes into account a security’s correlation to available market data including, but not limited to, intraday index, ADR, and exchange-traded fund movements.
Derivative instruments are valued at unrealized appreciation (depreciation).
The Fund does not hold any significant investments (greater than one percent of net assets) categorized as Level 3.
The accompanying Notes to Financial Statements are an integral part of this statement.
Multi-Manager Total Return Bond Strategies Fund | Annual Report 2023
| 89 |
Statement of Assets and Liabilities
August 31, 2023
| Assets | |
| Investments in securities, at value | |
| Unaffiliated issuers (cost $12,037,821,594) | $11,206,734,889 |
| Affiliated issuers (cost $1,014,947,670) | 1,015,009,456 |
| Cash | 2,037,809 |
| Foreign currency (cost $1,917,963) | 1,930,114 |
| Cash collateral held at broker for: | |
| TBA | 3,854,495 |
| Margin deposits on: | |
| Futures contracts | 19,776,946 |
| Swap contracts | 3,532,952 |
| Unrealized appreciation on forward foreign currency exchange contracts | 4,183 |
| Receivable for: | |
| Investments sold | 32,023,365 |
| Investments sold on a delayed delivery basis | 409,429,283 |
| Capital shares sold | 56,048,014 |
| Dividends | 4,908,521 |
| Interest | 75,353,877 |
| Foreign tax reclaims | 283,712 |
| Variation margin for futures contracts | 2,979,749 |
| Variation margin for swap contracts | 173,655 |
| Trustees’ fees | 480,755 |
| Expense reimbursement due from Investment Manager | 1,761 |
| Prepaid expenses | 87,594 |
| Total assets | 12,834,651,130 |
| Liabilities | |
| Forward sale commitments, at value (proceeds receivable $15,284,961) | 15,276,680 |
| Payable for: | |
| Investments purchased | 34,752,240 |
| Investments purchased on a delayed delivery basis | 1,410,870,295 |
| Capital shares redeemed | 12,840,649 |
| Distributions to shareholders | 40,234,376 |
| Variation margin for futures contracts | 431,384 |
| Variation margin for swap contracts | 373,128 |
| Interest on forward sale commitments | 109,618 |
| Management services fees | 136,447 |
| Transfer agent fees | 323,690 |
| Trustees’ fees | 642,724 |
| Other expenses | 178,133 |
| Total liabilities | 1,516,169,364 |
| Net assets applicable to outstanding capital stock | $11,318,481,766 |
| Represented by | |
| Paid in capital | 13,227,549,996 |
| Total distributable earnings (loss) | (1,909,068,230) |
| Total - representing net assets applicable to outstanding capital stock | $11,318,481,766 |
| Institutional Class | |
| Net assets | $11,318,473,416 |
| Shares outstanding | 1,329,175,322 |
| Net asset value per share | $8.52 |
| Institutional 3 Class | |
| Net assets | $8,350 |
| Shares outstanding | 978 |
| Net asset value per share | $8.54 |
The accompanying Notes to Financial Statements are an integral part of this statement.
| 90 | Multi-Manager Total Return Bond Strategies Fund | Annual Report 2023 |
Statement of Operations
Year Ended August 31, 2023
| Net investment income | |
| Income: | |
| Dividends — unaffiliated issuers | $54,199 |
| Dividends — affiliated issuers | 44,637,187 |
| Interest | 413,388,531 |
| Interfund lending | 33,916 |
| Foreign taxes withheld | (72,092) |
| Total income | 458,041,741 |
| Expenses: | |
| Management services fees | 46,411,385 |
| Transfer agent fees | |
| Institutional Class | 4,399,211 |
| Institutional 3 Class | 1 |
| Trustees’ fees | 204,619 |
| Custodian fees | 197,781 |
| Printing and postage fees | 291,402 |
| Registration fees | 294,384 |
| Accounting services fees | 51,167 |
| Legal fees | 147,253 |
| Interest on collateral | 155,568 |
| Compensation of chief compliance officer | 1,971 |
| Other | 162,308 |
| Total expenses | 52,317,050 |
| Fees waived or expenses reimbursed by Investment Manager and its affiliates | (1,056,414) |
| Total net expenses | 51,260,636 |
| Net investment income | 406,781,105 |
| Realized and unrealized gain (loss) — net | |
| Net realized gain (loss) on: | |
| Investments — unaffiliated issuers | (374,927,840) |
| Investments — affiliated issuers | 255,261 |
| Foreign currency translations | 4,079 |
| Forward foreign currency exchange contracts | (11,809) |
| Futures contracts | (154,419,393) |
| Swap contracts | (7,867,471) |
| Net realized loss | (536,967,173) |
| Net change in unrealized appreciation (depreciation) on: | |
| Investments — unaffiliated issuers | 1,347,395 |
| Investments — affiliated issuers | 52,109 |
| Foreign currency translations | 89,279 |
| Forward sale commitments | 8,281 |
| Forward foreign currency exchange contracts | (20,382) |
| Futures contracts | 22,103,451 |
| Swap contracts | 4,097,891 |
| Net change in unrealized appreciation (depreciation) | 27,678,024 |
| Net realized and unrealized loss | (509,289,149) |
| Net decrease in net assets resulting from operations | $(102,508,044) |
The accompanying Notes to Financial Statements are an integral part of this statement.
Multi-Manager Total Return Bond Strategies Fund | Annual Report 2023
| 91 |
Statement of Changes in Net Assets
| | Year Ended
August 31, 2023 | Year Ended
August 31, 2022 |
| Operations | | |
| Net investment income | $406,781,105 | $226,585,063 |
| Net realized loss | (536,967,173) | (517,719,951) |
| Net change in unrealized appreciation (depreciation) | 27,678,024 | (1,105,323,702) |
| Net decrease in net assets resulting from operations | (102,508,044) | (1,396,458,590) |
| Distributions to shareholders | | |
| Net investment income and net realized gains | | |
| Institutional Class | (411,107,260) | (261,010,283) |
| Institutional 3 Class | (333) | (236) |
| Total distributions to shareholders | (411,107,593) | (261,010,519) |
| Increase in net assets from capital stock activity | 1,183,203,035 | 1,442,995,396 |
| Total increase (decrease) in net assets | 669,587,398 | (214,473,713) |
| Net assets at beginning of year | 10,648,894,368 | 10,863,368,081 |
| Net assets at end of year | $11,318,481,766 | $10,648,894,368 |
| | Year Ended | Year Ended |
| | August 31, 2023 | August 31, 2022 |
| | Shares | Dollars ($) | Shares | Dollars ($) |
| Capital stock activity |
| Institutional Class | | | | |
| Shares sold | 302,000,638 | 2,599,700,537 | 319,164,611 | 3,047,317,715 |
| Distributions reinvested | 47,701,668 | 411,107,260 | 26,909,143 | 261,010,283 |
| Shares redeemed | (211,931,844) | (1,827,604,762) | (193,550,074) | (1,865,332,602) |
| Net increase | 137,770,462 | 1,183,203,035 | 152,523,680 | 1,442,995,396 |
| Total net increase | 137,770,462 | 1,183,203,035 | 152,523,680 | 1,442,995,396 |
The accompanying Notes to Financial Statements are an integral part of this statement.
| 92 | Multi-Manager Total Return Bond Strategies Fund | Annual Report 2023 |
[THIS PAGE INTENTIONALLY LEFT BLANK]
Multi-Manager Total Return Bond Strategies Fund | Annual Report 2023
| 93 |
The following table is intended to help you understand the Fund’s financial performance. Certain information reflects financial results for a single share of a class held for the periods shown. Per share net investment income (loss) amounts are calculated based on average shares outstanding during the period. Total return assumes reinvestment of all dividends and distributions, if any. Total return does not reflect payment of sales charges, if any. Total return and portfolio turnover are not annualized for periods of less than one year. The ratios of expenses and net investment income are annualized for periods of less than one year. The portfolio turnover rate is calculated without regard to purchase and sales transactions of short-term instruments and certain derivatives, if any. If such transactions were included, the Fund’s portfolio turnover rate may be higher.
| | Net asset value,
beginning of
period | Net
investment
income | Net
realized
and
unrealized
gain (loss) | Total from
investment
operations | Distributions
from net
investment
income | Distributions
from net
realized
gains | Total
distributions to
shareholders |
| Institutional Class |
| Year Ended 8/31/2023 | $8.94 | 0.34 | (0.42) | (0.08) | (0.34) | — | (0.34) |
| Year Ended 8/31/2022 | $10.46 | 0.21 | (1.49) | (1.28) | (0.20) | (0.04) | (0.24) |
| Year Ended 8/31/2021 | $10.76 | 0.19 | (0.05) | 0.14 | (0.20) | (0.24) | (0.44) |
| Year Ended 8/31/2020 | $10.38 | 0.27 | 0.42 | 0.69 | (0.28) | (0.03) | (0.31) |
| Year Ended 8/31/2019 | $9.80 | 0.30 | 0.59 | 0.89 | (0.31) | — | (0.31) |
| Institutional 3 Class |
| Year Ended 8/31/2023 | $8.96 | 0.34 | (0.42) | (0.08) | (0.34) | — | (0.34) |
| Year Ended 8/31/2022 | $10.47 | 0.21 | (1.48) | (1.27) | (0.20) | (0.04) | (0.24) |
| Year Ended 8/31/2021 | $10.77 | 0.20 | (0.06) | 0.14 | (0.20) | (0.24) | (0.44) |
| Year Ended 8/31/2020(e) | $10.23 | 0.19 | 0.53 | 0.72 | (0.18) | — | (0.18) |
| Notes to Financial Highlights |
| (a) | In addition to the fees and expenses that the Fund bears directly, the Fund indirectly bears a pro rata share of the fees and expenses of any other funds in which it invests. Such indirect expenses are not included in the Fund’s reported expense ratios. |
| (b) | Total net expenses include the impact of certain fee waivers/expense reimbursements made by the Investment Manager and certain of its affiliates, if applicable. |
| (c) | Ratios include interest on collateral expense which is less than 0.01%. |
| (d) | Ratios include interfund lending expense which is less than 0.01%. |
| (e) | Institutional 3 Class shares commenced operations on December 18, 2019. Per share data and total return reflect activity from that date. |
The accompanying Notes to Financial Statements are an integral part of this statement.
| 94 | Multi-Manager Total Return Bond Strategies Fund | Annual Report 2023 |
Financial Highlights (continued)
| | Net
asset
value,
end of
period | Total
return | Total gross
expense
ratio to
average
net assets(a) | Total net
expense
ratio to
average
net assets(a),(b) | Net investment
income
ratio to
average
net assets | Portfolio
turnover | Net
assets,
end of
period
(000’s) |
| Institutional Class |
| Year Ended 8/31/2023 | $8.52 | (0.87%) | 0.50%(c) | 0.49%(c) | 3.90% | 290% | $11,318,473 |
| Year Ended 8/31/2022 | $8.94 | (12.40%) | 0.50%(c) | 0.49%(c) | 2.15% | 284% | $10,648,886 |
| Year Ended 8/31/2021 | $10.46 | 1.36% | 0.50%(c) | 0.49%(c) | 1.86% | 232% | $10,863,358 |
| Year Ended 8/31/2020 | $10.76 | 6.77% | 0.51% | 0.49% | 2.59% | 184% | $9,404,198 |
| Year Ended 8/31/2019 | $10.38 | 9.33% | 0.52%(d) | 0.52%(d) | 3.05% | 219% | $8,398,508 |
| Institutional 3 Class |
| Year Ended 8/31/2023 | $8.54 | (0.86%) | 0.46%(c) | 0.46%(c) | 3.92% | 290% | $8 |
| Year Ended 8/31/2022 | $8.96 | (12.28%) | 0.46%(c) | 0.46%(c) | 2.16% | 284% | $9 |
| Year Ended 8/31/2021 | $10.47 | 1.37% | 0.47%(c) | 0.45%(c) | 1.89% | 232% | $10 |
| Year Ended 8/31/2020(e) | $10.77 | 7.11% | 0.48% | 0.46% | 2.53% | 184% | $11 |
The accompanying Notes to Financial Statements are an integral part of this statement.
Multi-Manager Total Return Bond Strategies Fund | Annual Report 2023
| 95 |
Notes to Financial Statements
August 31, 2023
Note 1. Organization
Multi-Manager Total Return Bond Strategies Fund (the Fund), a series of Columbia Funds Series Trust I (the Trust), is a diversified fund. The Trust is registered under the Investment Company Act of 1940, as amended (the 1940 Act), as an open-end management investment company organized as a Massachusetts business trust.
Fund shares
The Trust may issue an unlimited number of shares (without par value). The Fund is offered only through certain wrap fee programs sponsored and/or managed by Ameriprise Financial, Inc. (Ameriprise Financial) or its affiliates. The Fund offers each of the share classes listed in the Statement of Assets and Liabilities which are not subject to any front-end sales charge or contingent deferred sales charge.
Note 2. Summary of significant accounting policies
Basis of preparation
The Fund is an investment company that applies the accounting and reporting guidance in the Financial Accounting Standards Board (FASB) Accounting Standards Codification Topic 946, Financial Services - Investment Companies (ASC 946). The financial statements are prepared in accordance with U.S. generally accepted accounting principles (GAAP), which requires management to make certain estimates and assumptions that affect the reported amounts of assets and liabilities, the disclosure of contingent assets and liabilities at the date of the financial statements and the reported amounts of income and expenses during the reporting period. Actual results could differ from those estimates.
The following is a summary of significant accounting policies followed by the Fund in the preparation of its financial statements.
Security valuation
Equity securities listed on an exchange are valued at the closing price or last trade price on their primary exchange at the close of business of the New York Stock Exchange. Securities with a closing price not readily available or not listed on any exchange are valued at the mean between the closing bid and ask prices. Listed preferred stocks convertible into common stocks are valued using an evaluated price from a pricing service.
Debt securities generally are valued based on prices obtained from pricing services, which are intended to reflect market transactions for normal, institutional-size trading units of similar securities. The services may use various pricing techniques that take into account, as applicable, factors such as yield, quality, coupon rate, maturity, type of issue, trading characteristics and other data, as well as approved independent broker-dealer quotes. Debt securities for which quotations are not readily available or not believed to be reflective of market value may also be valued based upon a bid quote from an approved independent broker-dealer. Debt securities maturing in 60 days or less are valued primarily at amortized market value, unless this method results in a valuation that management believes does not approximate fair value.
Asset- and mortgage-backed securities are generally valued by pricing services, which utilize pricing models that incorporate the securities’ cash flow and loan performance data. These models also take into account available market data, including trades, market quotations, and benchmark yield curves for identical or similar securities. Factors used to identify similar securities may include, but are not limited to, issuer, collateral type, vintage, prepayment speeds, collateral performance, credit ratings, credit enhancement and expected life. Asset-backed securities for which quotations are readily available may also be valued based upon an over-the-counter or exchange bid quote from an approved independent broker-dealer. Debt securities maturing in 60 days or less are valued primarily at amortized market value, unless this method results in a valuation that management believes does not approximate fair value.
Senior loan securities for which reliable market quotations are readily available are generally valued by pricing services at the average of the bids received.
Foreign equity securities are valued based on the closing price or last trade price on their primary exchange at the close of business of the New York Stock Exchange. If any foreign equity security closing prices are not readily available, the securities are valued at the mean of the latest quoted bid and ask prices on such exchanges or markets. Foreign currency exchange
| 96 | Multi-Manager Total Return Bond Strategies Fund | Annual Report 2023 |
Notes to Financial Statements (continued)
August 31, 2023
rates are determined at the scheduled closing time of the New York Stock Exchange. Many securities markets and exchanges outside the U.S. close prior to the close of the New York Stock Exchange; therefore, the closing prices for securities in such markets or on such exchanges may not fully reflect events that occur after such close but before the close of the New York Stock Exchange. In those situations, foreign securities will be fair valued pursuant to a policy approved by the Board of Trustees. Under the policy, the Fund may utilize a third-party pricing service to determine these fair values. The third-party pricing service takes into account multiple factors, including, but not limited to, movements in the U.S. securities markets, certain depositary receipts, futures contracts and foreign exchange rates that have occurred subsequent to the close of the foreign exchange or market, to determine a good faith estimate that reasonably reflects the current market conditions as of the close of the New York Stock Exchange. The fair value of a security is likely to be different from the quoted or published price, if available.
Investments in open-end investment companies (other than exchange-traded funds (ETFs)), are valued at the latest net asset value reported by those companies as of the valuation time.
Forward foreign currency exchange contracts are marked-to-market based upon foreign currency exchange rates provided by a pricing service.
Futures and options on futures contracts are valued based upon the settlement price at the close of regular trading on their principal exchanges or, in the absence of a settlement price, at the mean of the latest quoted bid and ask prices.
Swap transactions are valued through an independent pricing service or broker, or if neither is available, through an internal model based upon observable inputs.
Investments for which market quotations are not readily available, or that have quotations which management believes are not reflective of market value or reliable, are valued at fair value as determined in good faith under procedures approved by the Board of Trustees. If a security or class of securities (such as foreign securities) is valued at fair value, such value is likely to be different from the quoted or published price for the security, if available.
The determination of fair value often requires significant judgment. To determine fair value, management may use assumptions including but not limited to future cash flows and estimated risk premiums. Multiple inputs from various sources may be used to determine fair value.
GAAP requires disclosure regarding the inputs and valuation techniques used to measure fair value and any changes in valuation inputs or techniques. In addition, investments shall be disclosed by major category. This information is disclosed following the Fund’s Portfolio of Investments.
Foreign currency transactions and translations
The values of all assets and liabilities denominated in foreign currencies are generally translated into U.S. dollars at exchange rates determined at the close of regular trading on the New York Stock Exchange. Net realized and unrealized gains (losses) on foreign currency transactions and translations include gains (losses) arising from the fluctuation in exchange rates between trade and settlement dates on securities transactions, gains (losses) arising from the disposition of foreign currency and currency gains (losses) between the accrual and payment dates on dividends, interest income and foreign withholding taxes.
For financial statement purposes, the Fund does not distinguish that portion of gains (losses) on investments which is due to changes in foreign exchange rates from that which is due to changes in market prices of the investments. Such fluctuations are included with the net realized and unrealized gains (losses) on investments in the Statement of Operations.
Derivative instruments
The Fund invests in certain derivative instruments, as detailed below, in seeking to meet its investment objectives. Derivatives are instruments whose values depend on, or are derived from, in whole or in part, the value of one or more securities, currencies, commodities, indices, or other assets or instruments. Derivatives may be used to increase investment flexibility (including to maintain cash reserves while maintaining desired exposure to certain assets), for risk management (hedging) purposes, to facilitate trading, to reduce transaction costs and to pursue higher investment returns. The Fund may
Multi-Manager Total Return Bond Strategies Fund | Annual Report 2023
| 97 |
Notes to Financial Statements (continued)
August 31, 2023
also use derivative instruments to mitigate certain investment risks, such as foreign currency exchange rate risk, interest rate risk and credit risk. Derivatives may involve various risks, including the potential inability of the counterparty to fulfill its obligations under the terms of the contract, the potential for an illiquid secondary market (making it difficult for the Fund to sell or terminate, including at favorable prices) and the potential for market movements which may expose the Fund to gains or losses in excess of the amount shown in the Statement of Assets and Liabilities. The notional amounts of derivative instruments, if applicable, are not recorded in the financial statements.
A derivative instrument may suffer a marked-to-market loss if the value of the contract decreases due to an unfavorable change in the market rates or values of the underlying instrument. Losses can also occur if the counterparty does not perform its obligations under the contract. The Fund’s risk of loss from counterparty credit risk on over-the-counter derivatives is generally limited to the aggregate unrealized gain netted against any collateral held by the Fund and the amount of any variation margin held by the counterparty, plus any replacement costs or related amounts. With exchange-traded or centrally cleared derivatives, there is reduced counterparty credit risk to the Fund since the clearinghouse or central counterparty (CCP) provides some protection in the case of clearing member default. The clearinghouse or CCP stands between the buyer and the seller of the contract; therefore, failure of the clearinghouse or CCP may pose additional counterparty credit risk. However, credit risk still exists in exchange-traded or centrally cleared derivatives with respect to initial and variation margin that is held in a broker’s customer account. While clearing brokers are required to segregate customer margin from their own assets, in the event that a clearing broker becomes insolvent or goes into bankruptcy and at that time there is a shortfall in the aggregate amount of margin held by the clearing broker for all its clients and such shortfall is remedied by the CCP or otherwise, U.S. bankruptcy laws will typically allocate that shortfall on a pro-rata basis across all the clearing broker’s customers (including the Fund), potentially resulting in losses to the Fund.
In order to better define its contractual rights and to secure rights that will help the Fund mitigate its counterparty risk, the Fund may enter into an International Swaps and Derivatives Association, Inc. Master Agreement (ISDA Master Agreement) or similar agreement with its derivatives counterparties. An ISDA Master Agreement is an agreement between the Fund and a counterparty that governs over-the-counter derivatives and foreign exchange forward contracts and contains, among other things, collateral posting terms and netting provisions in the event of a default and/or termination event. Under an ISDA Master Agreement, the Fund may, under certain circumstances, offset with the counterparty certain derivative instruments’ payables and/or receivables with collateral held and/or posted and create one single net payment. The provisions of the ISDA Master Agreement typically permit a single net payment in the event of default (close-out netting), including the bankruptcy or insolvency of the counterparty. Note, however, that bankruptcy or insolvency laws of a particular jurisdiction may impose restrictions on or prohibitions against the right of offset or netting in bankruptcy, insolvency or other events.
Collateral (margin) requirements differ by type of derivative. Margin requirements are established by the clearinghouse or CCP for exchange-traded and centrally cleared derivatives. Brokers can ask for margin in excess of the minimum in certain circumstances. Collateral terms for most over-the-counter derivatives are subject to regulatory requirements to exchange variation margin with trading counterparties and may have contract specific margin terms as well. For over-the-counter derivatives traded under an ISDA Master Agreement, the collateral requirements are typically calculated by netting the marked-to-market amount for each transaction under such agreement and comparing that amount to the value of any variation margin currently pledged by the Fund and/or the counterparty. Generally, the amount of collateral due from or to a party has to exceed a minimum transfer amount threshold (e.g., $250,000) before a transfer has to be made. To the extent amounts due to the Fund from its counterparties are not fully collateralized, contractually or otherwise, the Fund bears the risk of loss from counterparty nonperformance. The Fund may also pay interest expense on cash collateral received from the broker or receive interest income on cash collateral pledged to the broker. The Fund attempts to mitigate counterparty risk by only entering into agreements with counterparties that it believes have the financial resources to honor their obligations and by monitoring the financial stability of those counterparties.
Certain ISDA Master Agreements allow counterparties of over-the-counter derivatives transactions to terminate derivatives contracts prior to maturity in the event the Fund’s net asset value declines by a stated percentage over a specified time period or if the Fund fails to meet certain terms of the ISDA Master Agreement, which would cause the Fund to accelerate payment of any net liability owed to the counterparty. The Fund also has termination rights if the counterparty fails to meet certain terms of the ISDA Master Agreement. In determining whether to exercise such termination rights, the Fund would consider, in addition to counterparty credit risk, whether termination would result in a net liability owed from the counterparty.
| 98 | Multi-Manager Total Return Bond Strategies Fund | Annual Report 2023 |
Notes to Financial Statements (continued)
August 31, 2023
For financial reporting purposes, the Fund does not offset derivative assets and derivative liabilities that are subject to netting arrangements in the Statement of Assets and Liabilities.
Forward foreign currency exchange contracts
Forward foreign currency exchange contracts are over-the-counter agreements between two parties to buy and sell a currency at a set price on a future date. The Fund utilized forward foreign currency exchange contracts to hedge the currency exposure associated with some or all of the Fund’s securities, to shift foreign currency exposure back to U.S. dollars and to shift investment exposure from one currency to another. These instruments may be used for other purposes in future periods.
The values of forward foreign currency exchange contracts fluctuate daily with changes in foreign currency exchange rates. Changes in the value of these contracts are recorded as unrealized appreciation or depreciation until the contract is exercised or has expired. The Fund will realize a gain or loss when the forward foreign currency exchange contract is closed or expires. Non-deliverable forward foreign currency exchange contracts are settled with the counterparty in U.S. dollars without delivery of foreign currency.
The use of forward foreign currency exchange contracts does not eliminate fluctuations in the prices of the Fund’s portfolio securities. The risks of forward foreign currency exchange contracts include movement in the values of the foreign currencies relative to the U.S. dollar (or other foreign currencies) and the possibility that counterparties will not complete their contractual obligations, which may be in excess of the amount reflected, if any, in the Statement of Assets and Liabilities.
Futures contracts
Futures contracts are exchange-traded and represent commitments for the future purchase or sale of an asset at a specified price on a specified date. The Fund bought and sold futures contracts to produce incremental earnings, to manage the duration and yield curve exposure of the Fund versus the benchmark, to manage exposure to movements in interest rates, to manage exposure to the securities market and to hedge against market volatility. These instruments may be used for other purposes in future periods. Upon entering into futures contracts, the Fund bears risks that it may not achieve the anticipated benefits of the futures contracts and may realize a loss. Additional risks include counterparty credit risk, the possibility of an illiquid market, and that a change in the value of the contract or option may not correlate with changes in the value of the underlying asset.
Upon entering into a futures contract, the Fund deposits cash or securities with the broker, known as a futures commission merchant (FCM), in an amount sufficient to meet the initial margin requirement. The initial margin deposit must be maintained at an established level over the life of the contract. Cash deposited as initial margin is recorded in the Statement of Assets and Liabilities as margin deposits. Securities deposited as initial margin are designated in the Portfolio of Investments. Subsequent payments (variation margin) are made or received by the Fund each day. The variation margin payments are equal to the daily change in the contract value and are recorded as variation margin receivable or payable and are offset in unrealized gains or losses. The Fund generally expects to earn interest income on its margin deposits. The Fund recognizes a realized gain or loss when the contract is closed or expires. Futures contracts involve, to varying degrees, risk of loss in excess of the variation margin disclosed in the Statement of Assets and Liabilities.
Swap contracts
Swap contracts are negotiated in the over-the-counter market and are entered into bilaterally or centrally cleared (centrally cleared swap contract). In a centrally cleared swap contract, immediately following execution of the swap contract with a broker, the swap contract is novated to a central counterparty (the CCP) and the CCP becomes the Fund’s counterparty to the centrally cleared swap contract. The Fund is required to deposit initial margin with the futures commission merchant (FCM), which pledges it through to the CCP in the form of cash or securities in an amount that varies depending on the size and risk profile of the particular swap contract. Securities deposited as initial margin are designated in the Portfolio of Investments and cash deposited is recorded in the Statement of Assets and Liabilities as margin deposits. For a bilateral swap contract, the Fund has credit exposure to the broker, but exchanges daily variation margin with the broker based on the mark-to-market value of the swap contract to minimize that exposure. For centrally cleared swap contracts, the Fund has minimal credit exposure to the FCM because the CCP stands between the Fund and the relevant buyer/seller on the other side of the
Multi-Manager Total Return Bond Strategies Fund | Annual Report 2023
| 99 |
Notes to Financial Statements (continued)
August 31, 2023
contract. Swap contracts are marked-to-market daily and changes in value are recorded as unrealized appreciation (depreciation). The daily change in valuation of centrally cleared swap contracts, if any, is recorded as a receivable or payable for variation margin in the Statement of Assets and Liabilities.
Entering into these contracts involves, to varying degrees, elements of interest, liquidity and counterparty credit risk in excess of the amounts recognized in the Statement of Assets and Liabilities. Such risks involve the possibility that there may be unfavorable changes in interest rates, market conditions or other conditions, that it may be difficult to initiate a swap transaction or liquidate a position at an advantageous time or price which may result in significant losses, and that the bilateral counterparty, FCM or CCP, as applicable, may not fulfill its obligation under the contract.
Credit default swap contracts
The Fund entered into credit default swap contracts to increase or decrease its credit exposure to an index, to increase or decrease its credit exposure to a specific debt security or a basket of debt securities, as a protection buyer, to reduce overall credit exposure and to manage credit risk exposure. These instruments may be used for other purposes in future periods. Credit default swap contracts are transactions in which one party pays fixed periodic payments to a counterparty in consideration for an agreement from the counterparty to make a specific payment should a specified credit event(s) take place. Although specified credit events are contract specific, credit events are typically bankruptcy, failure to pay, restructuring, obligation acceleration, obligation default, or repudiation/moratorium.
As the purchaser of a credit default swap contract, the Fund purchases protection by paying a periodic interest rate on the notional amount to the counterparty. The interest amount is accrued daily as a component of unrealized appreciation (depreciation) and is recorded as a realized loss upon payment. If a credit event as specified in the contract occurs, the Fund may have the option either to deliver the reference obligation to the seller in exchange for a cash payment of its par amount, or to receive a net cash settlement equal to the par amount less an agreed-upon value of the reference obligation as of the date of the credit event. The difference between the value of the obligation or cash delivered and the notional amount received will be recorded as a realized gain (loss).
As the seller of a credit default swap contract, the Fund sells protection to a buyer and will generally receive a periodic interest rate on a notional amount. The interest amount is accrued daily as a component of unrealized appreciation (depreciation) and is recorded as a realized gain upon receipt of the payment. If a credit event as specified in the contract with the counterparty occurs, the Fund may either be required to accept the reference obligation from the buyer in exchange for a cash payment of its notional amount, or to pay the buyer a net cash settlement equal to the notional amount less an agreed-upon value of the reference obligation (recovery value) as of the date of the credit event. The difference between the value of the obligation or cash received and the notional amount paid will be recorded as a realized gain (loss). The maximum potential amount of undiscounted future payments the Fund could be required to make as the seller of protection under a credit default swap contract is equal to the notional amount of the reference obligation. These potential amounts may be partially offset by any recovery values of the respective reference obligations or upfront receipts upon entering into the agreement. The notional amounts and market values of all credit default swap contracts in which the Fund is the seller of protection, if any, are disclosed in the Credit Default Swap Contracts Outstanding schedule following the Portfolio of Investments.
As a protection seller, the Fund bears the risk of loss from the credit events specified in the contract with the counterparty. For credit default swap contracts on credit indices, quoted market prices and resulting market values serve as an indicator of the current status of the payment/performance risk. Increasing market values, in absolute terms when compared to the notional amount of the swap, represent a deterioration of the reference entity’s credit soundness and a greater likelihood or risk of default or other credit event occurring as defined under the terms of the contract.
Any upfront payment or receipt by the Fund upon entering into a credit default swap contract is recorded as an asset or liability, respectively, and amortized daily as a component of realized gain (loss) in the Statement of Operations. Credit default swap contracts are valued daily, and the change in value is recorded as unrealized appreciation (depreciation) until the termination of the swap, at which time a realized gain (loss) is recorded.
| 100 | Multi-Manager Total Return Bond Strategies Fund | Annual Report 2023 |
Notes to Financial Statements (continued)
August 31, 2023
Credit default swap contracts can involve greater risks than if a fund had invested in the reference obligation directly since, in addition to general market risks, credit default swaps are subject to counterparty credit risk, leverage risk, hedging risk, correlation risk and liquidity risk.
Interest rate and inflation rate swap contracts
The Fund entered into interest rate swap transactions and/or inflation rate swap contracts to produce incremental earnings, to manage interest rate and market risk exposure to produce incremental earnings, to gain exposure to or protect itself from market rate changes and to hedge the portfolio risk associated with some or all of the Fund’s securities. These instruments may be used for other purposes in future periods. An interest rate swap or inflation rate swap, as applicable, is an agreement between two parties where there are two flows and payments are made between the two counterparties and the payments are dependent upon changes in an interest rate, inflation rate or inflation index calculated on a nominal amount. Interest rate swaps are agreements between two parties that involve the exchange of one type of interest rate for another type of interest rate cash flow on specified dates in the future, based on a predetermined, specified notional amount. Certain interest rate swaps are considered forward-starting, whereby the accrual for the exchange of cash flows does not begin until a specified date in the future. The net cash flow for a standard interest rate swap transaction is generally the difference between a floating market interest rate versus a fixed interest rate.
Interest rate swaps are valued daily and unrealized appreciation (depreciation) is recorded. Certain interest rate swaps may accrue periodic interest on a daily basis as a component of unrealized appreciation (depreciation); the Fund will realize a gain or loss upon the payment or receipt of accrued interest. The Fund will realize a gain or a loss when the interest rate swap is terminated.
Effects of derivative transactions in the financial statements
The following tables are intended to provide additional information about the effect of derivatives on the financial statements of the Fund, including: the fair value of derivatives by risk category and the location of those fair values in the Statement of Assets and Liabilities; and the impact of derivative transactions over the period in the Statement of Operations, including realized and unrealized gains (losses). The derivative instrument schedules following the Portfolio of Investments present additional information regarding derivative instruments outstanding at the end of the period, if any.
The following table is a summary of the fair value of derivative instruments (not considered to be hedging instruments for accounting disclosure purposes) at August 31, 2023:
| | Asset derivatives | |
Risk exposure
category | Statement
of assets and liabilities
location | Fair value ($) |
| Credit risk | Component of total distributable earnings (loss) — unrealized appreciation on swap contracts | 865,215* |
| Foreign exchange risk | Unrealized appreciation on forward foreign currency exchange contracts | 4,183 |
| Interest rate risk | Component of total distributable earnings (loss) — unrealized appreciation on futures contracts | 14,838,462* |
| Interest rate risk | Component of total distributable earnings (loss) — unrealized appreciation on swap contracts | 162,952* |
| Total | | 15,870,812 |
| | Liability derivatives | |
Risk exposure
category | Statement
of assets and liabilities
location | Fair value ($) |
| Interest rate risk | Component of total distributable earnings (loss) — unrealized depreciation on futures contracts | 2,033,717* |
| Interest rate risk | Component of total distributable earnings (loss) — unrealized depreciation on swap contracts | 287,872* |
| Total | | 2,321,589 |
| * | Includes cumulative appreciation (depreciation) as reported in the tables following the Portfolio of Investments. Only the current day’s variation margin for futures and centrally cleared swaps, if any, is reported in receivables or payables in the Statement of Assets and Liabilities. |
Multi-Manager Total Return Bond Strategies Fund | Annual Report 2023
| 101 |
Notes to Financial Statements (continued)
August 31, 2023
The following table indicates the effect of derivative instruments (not considered to be hedging instruments for accounting disclosure purposes) in the Statement of Operations for the year ended August 31, 2023:
| Amount of realized gain (loss) on derivatives recognized in income |
| Risk exposure category | Forward
foreign
currency
exchange
contracts
($) | Futures
contracts
($) | Swap
contracts
($) | Total
($) |
| Credit risk | — | — | (4,007,307) | (4,007,307) |
| Equity risk | — | (154,631) | — | (154,631) |
| Foreign exchange risk | (11,809) | — | — | (11,809) |
| Interest rate risk | — | (154,264,762) | (3,860,164) | (158,124,926) |
| Total | (11,809) | (154,419,393) | (7,867,471) | (162,298,673) |
| |
| Change in unrealized appreciation (depreciation) on derivatives recognized in income |
| Risk exposure category | Forward
foreign
currency
exchange
contracts
($) | Futures
contracts
($) | Swap
contracts
($) | Total
($) |
| Credit risk | — | — | (330,810) | (330,810) |
| Foreign exchange risk | (20,382) | — | — | (20,382) |
| Interest rate risk | — | 22,103,451 | 4,428,701 | 26,532,152 |
| Total | (20,382) | 22,103,451 | 4,097,891 | 26,180,960 |
The following table is a summary of the average daily outstanding volume by derivative instrument for the year ended August 31, 2023:
| Derivative instrument | Average notional
amounts ($) |
| Futures contracts — long | 2,238,474,703 |
| Futures contracts — short | 251,268,605 |
| Credit default swap contracts — buy protection | 31,545,406 |
| Credit default swap contracts — sell protection | 10,533,753 |
| Derivative instrument | Average unrealized
appreciation ($) | Average unrealized
depreciation ($) |
| Forward foreign currency exchange contracts | 7,585 | (5,393) |
| Interest rate swap contracts | 3,545,350 | (5,970,094) |
Investments in senior loans
The Fund may invest in senior loan assignments. When the Fund purchases an assignment of a senior loan, the Fund typically has direct rights against the borrower; provided, however, that the Fund’s rights may be more limited than the lender from which it acquired the assignment and the Fund may be able to enforce its rights only through an administrative agent. Although certain senior loan assignments are secured by collateral, the Fund could experience delays or limitations in realizing such collateral or have its interest subordinated to other indebtedness of the obligor. In the event that the administrator or collateral agent of a loan becomes insolvent or enters into receivership or bankruptcy, the Fund may incur costs and delays in realizing payment or may suffer a loss of principal and/or interest. The risk of loss is greater for unsecured or subordinated loans. In addition, senior loan assignments are vulnerable to market, economic or other conditions or events that may reduce the demand for senior loan assignments and certain senior loan assignments which were liquid when purchased, may become illiquid.
| 102 | Multi-Manager Total Return Bond Strategies Fund | Annual Report 2023 |
Notes to Financial Statements (continued)
August 31, 2023
The Fund may enter into senior loan assignments where all or a portion of the loan may be unfunded. The Fund is obligated to fund these commitments at the borrower’s discretion. These commitments, if any, are generally traded and priced in the same manner as other senior loan securities and are disclosed as unfunded senior loan commitments in the Fund’s Portfolio of Investments with a corresponding payable for investments purchased. The Fund designates cash or liquid securities to cover these commitments.
Asset- and mortgage-backed securities
The Fund may invest in asset-backed and mortgage-backed securities. The maturity dates shown represent the original maturity of the underlying obligation. Actual maturity may vary based upon prepayment activity on these obligations. All, or a portion, of the obligation may be prepaid at any time because the underlying asset may be prepaid. As a result, decreasing market interest rates could result in an increased level of prepayment. An increased prepayment rate will have the effect of shortening the maturity of the security. Unless otherwise noted, the coupon rates presented are fixed rates.
Delayed delivery securities
The Fund may trade securities on other than normal settlement terms, including securities purchased or sold on a “when-issued” or "forward commitment" basis. This may increase risk to the Fund since the other party to the transaction may fail to deliver, which could cause the Fund to subsequently invest at less advantageous prices. The Fund designates cash or liquid securities in an amount equal to the delayed delivery commitment.
To be announced securities
The Fund may trade securities on a To Be Announced (TBA) basis. As with other delayed-delivery transactions, a seller agrees to issue a TBA security at a future date. However, the seller does not specify the particular securities to be delivered. Instead, the Fund agrees to accept any security that meets specified terms.
In some cases, Master Securities Forward Transaction Agreements (MSFTAs) may be used to govern transactions of certain forward-settling agency mortgage-backed securities, such as delayed-delivery and TBAs, between the Fund and counterparty. The MSFTA maintains provisions for, among other things, initiation and confirmation, payment and transfer, events of default, termination, and maintenance of collateral relating to such transactions.
Forward sale commitments
The Fund may enter into forward sale commitments to hedge its portfolio positions or to sell mortgage-backed securities it owns under delayed delivery arrangements. Proceeds of forward sale commitments are not received until the contractual settlement date. While a forward sale commitment is outstanding, equivalent deliverable securities or an offsetting forward purchase commitment deliverable on or before the sale commitment date are used to satisfy the commitment.
Unsettled forward sale commitments are valued at the current market value of the underlying securities, generally according to the procedures described under “Security Valuation” above. The forward sale commitment is “marked-to-market” daily and the change in market value is recorded by the Fund as an unrealized gain or loss. If the forward sale commitment is closed through the acquisition of an offsetting purchase commitment, the Fund realizes a gain or loss. If the Fund delivers securities under the commitment, the Fund realizes a gain or a loss from the sale of the securities based upon the market price established at the date the commitment was entered into.
Mortgage dollar roll transactions
The Fund may enter into mortgage “dollar rolls” in which the Fund sells securities for delivery in the current month and simultaneously contracts with the same counterparty to repurchase similar but not identical securities (same type, coupon and maturity) on a specified future date. These transactions may increase the Fund’s portfolio turnover rate. During the roll period, the Fund loses the right to receive principal and interest paid on the securities sold. However, the Fund may benefit because it receives negotiated amounts in the form of reductions of the purchase price for the future purchase plus the interest earned on the cash proceeds of the securities sold until the settlement date of the forward purchase. The Fund records the incremental difference between the forward purchase and sale of each forward roll as a realized gain or loss. Unless any realized gains exceed the income, capital appreciation, and gain or loss due to mortgage prepayments that would have been realized on the securities sold as part of the mortgage dollar roll, the use of this technique may diminish the
Multi-Manager Total Return Bond Strategies Fund | Annual Report 2023
| 103 |
Notes to Financial Statements (continued)
August 31, 2023
investment performance of the Fund compared to what the performance would have been without the use of mortgage dollar rolls. Mortgage dollar rolls involve the risk that the market value of the securities the Fund is obligated to repurchase may decline below the repurchase price, or that the counterparty may default on its obligations. All cash proceeds will be invested in instruments that are permissible investments for the Fund. The Fund identifies cash or liquid securities in an amount equal to the forward purchase price. The Fund does not currently enter into mortgage dollar rolls that are accounted for as financing transactions.
Treasury inflation protected securities
The Fund may invest in treasury inflation protected securities (TIPS). The principal amount of TIPS is adjusted periodically and is increased for inflation or decreased for deflation based on a monthly published index. These adjustments are recorded as interest income in the Statement of Operations. Coupon payments are based on the adjusted principal at the time the interest is paid.
Interest only and principal only securities
The Fund may invest in Interest Only (IO) or Principal Only (PO) securities. IOs are stripped securities entitled to receive all of the security’s interest, but none of its principal. IOs are particularly sensitive to changes in interest rates and therefore subject to greater fluctuations in price than typical interest bearing debt securities. IOs are also subject to credit risk because the Fund may not receive all or part of the interest payments if the issuer, obligor, guarantor or counterparty defaults on its obligation. Payments received for IOs are included in interest income in the Statement of Operations. Because no principal will be received at the maturity of an IO, adjustments are made to the cost of the security on a monthly basis until maturity. These adjustments are included in interest income in the Statement of Operations. POs are stripped securities entitled to receive the principal from the underlying obligation, but not the interest. POs are particularly sensitive to changes in interest rates and therefore are subject to fluctuations in price. POs are also subject to credit risk because the Fund may not receive all or part of its principal if the issuer, obligor, guarantor or counterparty defaults on its obligation. The Fund may also invest in IO or PO stripped mortgage-backed securities. Payments received for POs are treated as reductions to the cost and par value of the securities.
Offsetting of assets and liabilities
The following table presents the Fund’s gross and net amount of assets and liabilities available for offset under netting arrangements as well as any related collateral received or pledged by the Fund as of August 31, 2023:
| | Citi ($) | JPMorgan ($) | State
Street ($) | Total ($) |
| Assets | | | | |
| Centrally cleared interest rate swap contracts (a) | - | 173,655 | - | 173,655 |
| Forward foreign currency exchange contracts | - | - | 4,183 | 4,183 |
| Total assets | - | 173,655 | 4,183 | 177,838 |
| Liabilities | | | | |
| Centrally cleared credit default swap contracts (a) | - | 215,471 | - | 215,471 |
| Centrally cleared interest rate swap contracts (a) | 71,016 | 86,641 | - | 157,657 |
| Total liabilities | 71,016 | 302,112 | - | 373,128 |
| Total financial and derivative net assets | (71,016) | (128,457) | 4,183 | (195,290) |
| Total collateral received (pledged) (b) | (71,016) | (128,457) | - | (199,473) |
| Net amount (c) | - | - | 4,183 | 4,183 |
| (a) | Centrally cleared swaps are included within payable/receivable for variation margin in the Statement of Assets and Liabilities. |
| (b) | In some instances, the actual collateral received and/or pledged may be more than the amount shown due to overcollateralization. |
| (c) | Represents the net amount due from/(to) counterparties in the event of default. |
Security transactions
Security transactions are accounted for on the trade date. Cost is determined and gains (losses) are based upon the specific identification method for both financial statement and federal income tax purposes.
| 104 | Multi-Manager Total Return Bond Strategies Fund | Annual Report 2023 |
Notes to Financial Statements (continued)
August 31, 2023
The trade date for senior loans purchased in the primary market is the date on which the loan is allocated. The trade date for senior loans purchased in the secondary market is the date on which the transaction is entered into.
Income recognition
Interest income is recorded on an accrual basis. Market premiums and discounts, including original issue discounts, are amortized and accreted, respectively, over the expected life of the security on all debt securities, unless otherwise noted. The Fund classifies gains and losses realized on prepayments received on mortgage-backed securities as adjustments to interest income. For convertible securities, premiums attributable to the conversion feature are not amortized.
The Fund may place a debt security on non-accrual status and reduce related interest income when it becomes probable that the interest will not be collected and the amount of uncollectible interest can be reasonably estimated. The Fund may also adjust accrual rates when it becomes probable the full interest will not be collected and a partial payment will be received. A defaulted debt security is removed from non-accrual status when the issuer resumes interest payments or when collectability of interest is reasonably assured.
Corporate actions and dividend income are generally recorded net of any non-reclaimable tax withholdings, on the ex-dividend date or upon receipt of an ex-dividend notification in the case of certain foreign securities.
The Fund may receive distributions from holdings in equity securities, business development companies (BDCs), exchange-traded funds (ETFs), limited partnerships (LPs), other regulated investment companies (RICs), and real estate investment trusts (REITs), which report information as to the tax character of their distributions annually. These distributions are allocated to dividend income, capital gain and return of capital based on actual information reported. Return of capital is recorded as a reduction of the cost basis of securities held. If the Fund no longer owns the applicable securities, return of capital is recorded as a realized gain. With respect to REITs, to the extent actual information has not yet been reported, estimates for return of capital are made by Columbia Management Investment Advisers, LLC (the Investment Manager), a wholly-owned subsidiary of Ameriprise Financial, Inc. (Ameriprise Financial). The Investment Manager’s estimates are subsequently adjusted when the actual character of the distributions is disclosed by the REITs, which could result in a proportionate change in return of capital to shareholders.
Awards from class action litigation are recorded as a reduction of cost basis if the Fund still owns the applicable securities on the payment date. If the Fund no longer owns the applicable securities on the payment date, the proceeds are recorded as realized gains.
The value of additional securities received as an income payment through a payment-in-kind, if any, is recorded as interest income and increases the cost basis of such securities.
The Fund may receive other income from senior loans, including amendment fees, consent fees and commitment fees. These fees are recorded as income when received by the Fund. These amounts are included in Interest Income in the Statement of Operations.
Expenses
General expenses of the Trust are allocated to the Fund and other funds of the Trust based upon relative net assets or other expense allocation methodologies determined by the nature of the expense. Expenses directly attributable to the Fund are charged to the Fund. Expenses directly attributable to a specific class of shares are charged to that share class.
Determination of class net asset value
All income, expenses (other than class-specific expenses, which are charged to that share class, as shown in the Statement of Operations) and realized and unrealized gains (losses) are allocated to each class of the Fund on a daily basis, based on the relative net assets of each class, for purposes of determining the net asset value of each class.
Multi-Manager Total Return Bond Strategies Fund | Annual Report 2023
| 105 |
Notes to Financial Statements (continued)
August 31, 2023
Federal income tax status
The Fund intends to qualify each year as a regulated investment company under Subchapter M of the Internal Revenue Code, as amended, and will distribute substantially all of its investment company taxable income and net capital gain, if any, for its tax year, and as such will not be subject to federal income taxes. In addition, the Fund intends to distribute in each calendar year substantially all of its ordinary income, capital gain net income and certain other amounts, if any, such that the Fund should not be subject to federal excise tax. Therefore, no federal income or excise tax provision is recorded.
Foreign taxes
The Fund may be subject to foreign taxes on income, gains on investments or currency repatriation, a portion of which may be recoverable. The Fund will accrue such taxes and recoveries, as applicable, based upon its current interpretation of tax rules and regulations that exist in the markets in which it invests.
Realized gains in certain countries may be subject to foreign taxes at the Fund level, based on statutory rates. The Fund accrues for such foreign taxes on realized and unrealized gains at the appropriate rate for each jurisdiction, as applicable. The amount, if any, is disclosed as a liability in the Statement of Assets and Liabilities.
Distributions to shareholders
Distributions from net investment income, if any, are declared daily and paid monthly. Net realized capital gains, if any, are distributed at least annually. Income distributions and capital gain distributions are determined in accordance with federal income tax regulations, which may differ from GAAP.
Guarantees and indemnifications
Under the Trust’s organizational documents and, in some cases, by contract, its officers and trustees are indemnified against certain liabilities arising out of the performance of their duties to the Trust or its funds. In addition, certain of the Fund’s contracts with its service providers contain general indemnification clauses. The Fund’s maximum exposure under these arrangements is unknown since the amount of any future claims that may be made against the Fund cannot be determined, and the Fund has no historical basis for predicting the likelihood of any such claims.
Recent accounting pronouncements and regulatory updates
Tailored Shareholder Reports
In October 2022, the Securities and Exchange Commission (SEC) adopted a final rule relating to Tailored Shareholder Reports for Mutual Funds and Exchange-Traded Funds; Fee Information in Investment Company Advertisements. The rule and form amendments will, among other things, require the Fund to transmit concise and visually engaging shareholder reports that highlight key information. The amendments will require that funds tag information in a structured data format and that certain more in-depth information be made available online and available for delivery free of charge to investors on request. The amendments became effective January 24, 2023. There is an 18-month transition period after the effective date of the amendments.
Note 3. Fees and other transactions with affiliates
Management services fees
The Fund has entered into a Management Agreement with Columbia Management Investment Advisers, LLC (the Investment Manager), a wholly-owned subsidiary of Ameriprise Financial, Inc. (Ameriprise Financial). Under the Management Agreement, the Investment Manager provides the Fund with investment research and advice, as well as administrative and accounting services. The Investment Manager is responsible for the ultimate oversight of investments made by the Fund. The Fund’s subadvisers (see Subadvisory agreements below) have the primary responsibility for the day-to-day portfolio management of the Fund. The management services fee is an annual fee that is equal to a percentage of the Fund’s daily net assets that declines from 0.50% to 0.34% as the Fund’s net assets increase. The effective management services fee rate for the year ended August 31, 2023 was 0.44% of the Fund’s average daily net assets.
| 106 | Multi-Manager Total Return Bond Strategies Fund | Annual Report 2023 |
Notes to Financial Statements (continued)
August 31, 2023
Subadvisory agreements
The Investment Manager has entered into Subadvisory Agreements with Loomis, Sayles & Company, L.P., PGIM, Inc., the asset management arm of Prudential Financial (PGIM Fixed Income), TCW Investment Management Company LLC and Voya Investment Management Co. LLC, each of which subadvises a portion of the assets of the Fund. New investments in the Fund, net of any redemptions, are allocated in accordance with the Investment Manager’s determination. Each subadviser’s proportionate share of investments in the Fund may also vary due to market fluctuations. The Investment Manager compensates each subadviser to manage the investment of the Fund’s assets.
Compensation of board members
Members of the Board of Trustees who are not officers or employees of the Investment Manager or Ameriprise Financial are compensated for their services to the Fund as disclosed in the Statement of Operations. Under a Deferred Compensation Plan (the Deferred Plan), these members of the Board of Trustees may elect to defer payment of up to 100% of their compensation. Deferred amounts are treated as though equivalent dollar amounts had been invested in shares of certain funds managed by the Investment Manager. The Fund’s liability for these amounts is adjusted for market value changes and remains in the Fund until distributed in accordance with the Deferred Plan. All amounts payable under the Deferred Plan constitute a general unsecured obligation of the Fund. The expense for the Deferred Plan, which includes Trustees’ fees deferred during the current period as well as any gains or losses on the Trustees’ deferred compensation balances as a result of market fluctuations, is included in "Trustees’ fees" in the Statement of Operations.
Compensation of Chief Compliance Officer
The Board of Trustees has appointed a Chief Compliance Officer for the Fund in accordance with federal securities regulations. As disclosed in the Statement of Operations, a portion of the Chief Compliance Officer’s total compensation is allocated to the Fund, along with other allocations to affiliated registered investment companies managed by the Investment Manager and its affiliates, based on relative net assets.
Transfer agency fees
Under a Transfer and Dividend Disbursing Agent Agreement, Columbia Management Investment Services Corp. (the Transfer Agent), an affiliate of the Investment Manager and a wholly-owned subsidiary of Ameriprise Financial, is responsible for providing transfer agency services to the Fund. The Transfer Agent has contracted with SS&C GIDS, Inc. (SS&C GIDS) to serve as sub-transfer agent. Prior to January 1, 2023, SS&C GIDS was known as DST Asset Manager Solutions, Inc. The Transfer Agent pays the fees of SS&C GIDS for services as sub-transfer agent and SS&C GIDS is not entitled to reimbursement for such fees from the Fund (with the exception of out-of-pocket fees).
The Fund pays the Transfer Agent a monthly transfer agency fee based on the number or the average value of accounts, depending on the type of account. In addition, the Fund pays the Transfer Agent a fee for shareholder services based on the number of accounts or on a percentage of the average aggregate value of the Fund’s shares maintained in omnibus accounts up to the lesser of the amount charged by the financial intermediary or a cap established by the Board of Trustees from time to time.
The Transfer Agent also receives compensation from the Fund for various shareholder services and reimbursements for certain out-of-pocket fees. Total transfer agency fees for Institutional 3 Class shares are subject to an annual limitation of not more than 0.02% of the average daily net assets attributable to Institutional 3 Class shares.
For the year ended August 31, 2023, the Fund’s effective transfer agency fee rates as a percentage of average daily net assets of each class were as follows:
| | Effective rate (%) |
| Institutional Class | 0.04 |
| Institutional 3 Class | 0.02 |
Multi-Manager Total Return Bond Strategies Fund | Annual Report 2023
| 107 |
Notes to Financial Statements (continued)
August 31, 2023
Distribution and service fees
The Fund has an agreement with Columbia Management Investment Distributors, Inc. (the Distributor), an affiliate of the Investment Manager and a wholly-owned subsidiary of Ameriprise Financial, for distribution and shareholder services. The Fund does not pay the Distributor a fee for the distribution services it provides to the Fund.
Expenses waived/reimbursed by the Investment Manager and its affiliates
The Investment Manager and certain of its affiliates have contractually agreed to waive fees and/or reimburse expenses (excluding certain fees and expenses described below) for the period(s) disclosed below, unless sooner terminated at the sole discretion of the Board of Trustees, so that the Fund’s net operating expenses, after giving effect to fees waived/expenses reimbursed and any balance credits and/or overdraft charges from the Fund’s custodian, do not exceed the following annual rate(s) as a percentage of the classes’ average daily net assets:
| | Fee rate(s) contractual
through
December 31, 2023 |
| Institutional Class | 0.49% |
| Institutional 3 Class | 0.47 |
Under the agreement governing these fee waivers and/or expense reimbursement arrangements, the following fees and expenses are excluded from the waiver/reimbursement commitment, and therefore will be paid by the Fund, if applicable: taxes (including foreign transaction taxes), expenses associated with investments in affiliated and non-affiliated pooled investment vehicles (including mutual funds and exchange-traded funds), transaction costs and brokerage commissions, costs related to any securities lending program, dividend expenses associated with securities sold short, inverse floater program fees and expenses, transaction charges and interest on borrowed money, interest, costs associated with shareholder meetings, infrequent and/or unusual expenses and any other expenses the exclusion of which is specifically approved by the Board of Trustees. This agreement may be modified or amended only with approval from the Investment Manager, certain of its affiliates and the Fund. Any fees waived and/or expenses reimbursed under the expense reimbursement arrangements described above are not recoverable by the Investment Manager or its affiliates in future periods.
Note 4. Federal tax information
The timing and character of income and capital gain distributions are determined in accordance with income tax regulations, which may differ from GAAP because of temporary or permanent book to tax differences.
At August 31, 2023, these differences were primarily due to differing treatment for deferral/reversal of wash sale losses, derivative investments, swap investments, tax straddles, principal and/or interest from fixed income securities, defaulted securities/troubled debt, capital loss carryforwards, trustees’ deferred compensation, non-deductible expenses, distributions, foreign currency transactions and miscellaneous adjustments. To the extent these differences were permanent, reclassifications were made among the components of the Fund’s net assets. Temporary differences do not require reclassifications.
The following reclassifications were made:
Undistributed net
investment
income ($) | Accumulated
net realized
(loss) ($) | Paid in
capital ($) |
| 2,345,798 | (2,345,797) | (1) |
Net investment income (loss) and net realized gains (losses), as disclosed in the Statement of Operations, and net assets were not affected by this reclassification.
| 108 | Multi-Manager Total Return Bond Strategies Fund | Annual Report 2023 |
Notes to Financial Statements (continued)
August 31, 2023
The tax character of distributions paid during the years indicated was as follows:
| Year Ended August 31, 2023 | Year Ended August 31, 2022 |
Ordinary
income ($) | Long-term
capital gains ($) | Total ($) | Ordinary
income ($) | Long-term
capital gains ($) | Total ($) |
| 411,107,593 | — | 411,107,593 | 222,977,263 | 38,033,256 | 261,010,519 |
Short-term capital gain distributions, if any, are considered ordinary income distributions for tax purposes.
At August 31, 2023, the components of distributable earnings on a tax basis were as follows:
Undistributed
ordinary income ($) | Undistributed
long-term
capital gains ($) | Capital loss
carryforwards ($) | Net unrealized
(depreciation) ($) |
| 50,309,208 | — | (1,048,005,142) | (870,521,033) |
At August 31, 2023, the cost of all investments for federal income tax purposes along with the aggregate gross unrealized appreciation and depreciation based on that cost was:
Federal
tax cost ($) | Gross unrealized
appreciation ($) | Gross unrealized
(depreciation) ($) | Net unrealized
(depreciation) ($) |
| 13,090,537,921 | 44,350,245 | (914,871,278) | (870,521,033) |
Tax cost of investments and unrealized appreciation/(depreciation) may also include timing differences that do not constitute adjustments to tax basis.
The following capital loss carryforwards, determined at August 31, 2023, may be available to reduce future net realized gains on investments, if any, to the extent permitted by the Internal Revenue Code. In addition, for the year ended August 31, 2023, capital loss carryforwards utilized, if any, were as follows:
No expiration
short-term ($) | No expiration
long-term ($) | Total ($) | Utilized ($) |
| (607,003,484) | (441,001,658) | (1,048,005,142) | — |
Management of the Fund has concluded that there are no significant uncertain tax positions in the Fund that would require recognition in the financial statements. However, management’s conclusion may be subject to review and adjustment at a later date based on factors including, but not limited to, new tax laws, regulations, and administrative interpretations (including relevant court decisions). Generally, the Fund’s federal tax returns for the prior three fiscal years remain subject to examination by the Internal Revenue Service.
Note 5. Portfolio information
The cost of purchases and proceeds from sales of securities, excluding short-term investments and derivatives, if any, aggregated to $31,120,373,970 and $29,978,184,228, respectively, for the year ended August 31, 2023, of which $27,201,229,186 and $26,050,745,730, respectively, were U.S. government securities. The amount of purchase and sale activity impacts the portfolio turnover rate reported in the Financial Highlights.
Note 6. Affiliated money market fund
The Fund invests in Columbia Short-Term Cash Fund, an affiliated money market fund established for the exclusive use by the Fund and other affiliated funds (the Affiliated MMF). The income earned by the Fund from such investments is included as Dividends - affiliated issuers in the Statement of Operations. As an investing fund, the Fund indirectly bears its proportionate share of the expenses of the Affiliated MMF. The Affiliated MMF prices its shares with a floating net asset value. The Securities and Exchange Commission has adopted amendments to money market fund rules requiring institutional prime money market funds like the Affiliated MMF to be subject, by October 2, 2024, to a liquidity fee if daily net redemptions exceed 5% of net assets and, by April 2, 2024, to a discretionary liquidity fee up to 2% if the imposition of such a fee is determined to be in the best interest of the Affiliated MMF.
Multi-Manager Total Return Bond Strategies Fund | Annual Report 2023
| 109 |
Notes to Financial Statements (continued)
August 31, 2023
Note 7. Interfund lending
Pursuant to an exemptive order granted by the Securities and Exchange Commission, the Fund participates in a program (the Interfund Program) allowing each participating Columbia Fund (each, a Participating Fund) to lend money directly to and, except for closed-end funds and money market funds, borrow money directly from other Participating Funds for temporary purposes. The amounts eligible for borrowing and lending under the Interfund Program are subject to certain restrictions.
Interfund loans are subject to the risk that the borrowing fund could be unable to repay the loan when due, and a delay in repayment to the lending fund could result in lost opportunities and/or additional lending costs. The exemptive order is subject to conditions intended to mitigate conflicts of interest arising from the Investment Manager’s relationship with each Participating Fund.
The Fund’s activity in the Interfund Program during the year ended August 31, 2023 was as follows:
| Borrower or lender | Average loan
balance ($) | Weighted average
interest rate (%) | Number of days
with outstanding loans |
| Lender | 15,093,333 | 5.07 | 15 |
Interest income earned by the Fund is recorded as interfund lending in the Statement of Operations. The Fund had no outstanding interfund loans at August 31, 2023.
Note 8. Line of credit
The Fund has access to a revolving credit facility with a syndicate of banks led by JPMorgan Chase Bank, N.A., Citibank, N.A. and Wells Fargo Bank, N.A. whereby the Fund may borrow for the temporary funding of shareholder redemptions or for other temporary or emergency purposes. Pursuant to an October 27, 2022 amendment and restatement, the credit facility, which is an agreement between the Fund and certain other funds managed by the Investment Manager or an affiliated investment manager, severally and not jointly, permits aggregate borrowings up to $950 million. Interest is currently charged to each participating fund based on its borrowings at a rate equal to the higher of (i) the federal funds effective rate, (ii) the secured overnight financing rate plus 0.10% and (iii) the overnight bank funding rate plus, in each case, 1.00%. Each borrowing under the credit facility matures no later than 60 days after the date of borrowing. The Fund also pays a commitment fee equal to its pro rata share of the unused amount of the credit facility at a rate of 0.15% per annum. The commitment fee is included in other expenses in the Statement of Operations. This agreement expires annually in October unless extended or renewed. Prior to the October 27, 2022 amendment and restatement, the Fund had access to a revolving credit facility with a syndicate of banks led by JPMorgan Chase Bank, N.A., Citibank, N.A. and Wells Fargo Bank, N.A. which permitted collective borrowings up to $950 million. Interest was charged to each participating fund based on its borrowings at a rate equal to the higher of (i) the federal funds effective rate, (ii) the secured overnight financing rate plus 0.11448% and (iii) the overnight bank funding rate plus, in each case, 1.00%.
The Fund had no borrowings during the year ended August 31, 2023.
Note 9. Significant risks
Credit risk
Credit risk is the risk that the value of debt instruments in the Fund’s portfolio may decline because the issuer defaults or otherwise becomes unable or unwilling, or is perceived to be unable or unwilling, to honor its financial obligations, such as making payments to the Fund when due. Credit rating agencies assign credit ratings to certain debt instruments to indicate their credit risk. Lower-rated or unrated debt instruments held by the Fund may present increased credit risk as compared to higher-rated debt instruments.
Derivatives risk
Losses involving derivative instruments may be substantial, because a relatively small movement in the underlying reference (which is generally the price, rate or other economic indicator associated with a security(ies), commodity, currency, index or other instrument or asset) may result in a substantial loss for the Fund. In addition to the potential for increased losses, the
| 110 | Multi-Manager Total Return Bond Strategies Fund | Annual Report 2023 |
Notes to Financial Statements (continued)
August 31, 2023
use of derivative instruments may lead to increased volatility within the Fund. Derivatives will typically increase the Fund’s exposure to principal risks to which it is otherwise exposed, and may expose the Fund to additional risks, including correlation risk, counterparty risk, hedging risk, leverage risk, liquidity risk and pricing risk.
Interest rate risk
Interest rate risk is the risk of losses attributable to changes in interest rates. In general, if interest rates rise, the values of debt instruments tend to fall, and if interest rates fall, the values of debt instruments tend to rise. Actions by governments and central banking authorities can result in increases or decreases in interest rates. Higher periods of inflation could lead such authorities to raise interest rates. Increasing interest rates may negatively affect the value of debt securities held by the Fund, resulting in a negative impact on the Fund’s performance and net asset value per share. In general, the longer the maturity or duration of a debt security, the greater its sensitivity to changes in interest rates. The Fund is subject to the risk that the income generated by its investments may not keep pace with inflation.
Liquidity risk
Liquidity risk is the risk associated with a lack of marketability of investments which may make it difficult to sell the investment at a desirable time or price. Changing regulatory, market or other conditions or environments (for example, the interest rate or credit environments) may adversely affect the liquidity of the Fund’s investments. The Fund may have to accept a lower selling price for the holding, sell other investments, or forego another, more appealing investment opportunity. Generally, the less liquid the market at the time the Fund sells a portfolio investment, the greater the risk of loss or decline of value to the Fund. A less liquid market can lead to an increase in Fund redemptions, which may negatively impact Fund performance and net asset value per share, including, for example, if the Fund is forced to sell securities in a down market.
Market risk
The Fund may incur losses due to declines in the value of one or more securities in which it invests. These declines may be due to factors affecting a particular issuer, or the result of, among other things, political, regulatory, market, economic or social developments affecting the relevant market(s) more generally. In addition, turbulence in financial markets and reduced liquidity in equity, credit and/or fixed income markets may negatively affect many issuers, which could adversely affect the Fund’s ability to price or value hard-to-value assets in thinly traded and closed markets and could cause significant redemptions and operational challenges. Global economies and financial markets are increasingly interconnected, and conditions and events in one country, region or financial market may adversely impact issuers in a different country, region or financial market. These risks may be magnified if certain events or developments adversely interrupt the global supply chain; in these and other circumstances, such risks might affect companies worldwide. As a result, local, regional or global events such as terrorism, war, natural disasters, disease/virus outbreaks and epidemics or other public health issues, recessions, depressions or other events – or the potential for such events – could have a significant negative impact on global economic and market conditions.
The large-scale invasion of Ukraine by Russia in February 2022 has resulted in sanctions and market disruptions, including declines in regional and global stock markets, unusual volatility in global commodity markets and significant devaluations of Russian currency. The extent and duration of the military action are impossible to predict but could be significant. Market disruption caused by the Russian military action, and any counter-measures or responses thereto (including international sanctions, a downgrade in the country’s credit rating, purchasing and financing restrictions, boycotts, tariffs, changes in consumer or purchaser preferences, cyberattacks and espionage) could have severe adverse impacts on regional and/or global securities and commodities markets, including markets for oil and natural gas. These impacts may include reduced market liquidity, distress in credit markets, further disruption of global supply chains, increased risk of inflation, restricted cross-border payments and limited access to investments and/or assets in certain international markets and/or issuers. These developments and other related events could negatively impact Fund performance.
Mortgage- and other asset-backed securities risk
The value of any mortgage-backed and other asset-backed securities including collateralized debt obligations, if any, held by the Fund may be affected by, among other things, changes or perceived changes in: interest rates; factors concerning the interests in and structure of the issuer or the originator of the mortgages or other assets; the creditworthiness of the entities that provide any supporting letters of credit, surety bonds or other credit enhancements; or the market’s assessment of the
Multi-Manager Total Return Bond Strategies Fund | Annual Report 2023
| 111 |
Notes to Financial Statements (continued)
August 31, 2023
quality of underlying assets. Payment of principal and interest on some mortgage-backed securities (but not the market value of the securities themselves) may be guaranteed by the full faith and credit of a particular U.S. Government agency, authority, enterprise or instrumentality, and some, but not all, are also insured or guaranteed by the U.S. Government. Mortgage-backed securities issued by non-governmental issuers (such as commercial banks, savings and loan institutions, private mortgage insurance companies, mortgage bankers and other secondary market issuers) may entail greater risk than obligations guaranteed by the U.S. Government. Mortgage- and other asset-backed securities are subject to liquidity risk and prepayment risk. A decline or flattening of housing values may cause delinquencies in mortgages (especially sub-prime or non-prime mortgages) underlying mortgage-backed securities and thereby adversely affect the ability of the mortgage-backed securities issuer to make principal and/or interest payments to mortgage-backed securities holders, including the Fund. Rising or high interest rates tend to extend the duration of mortgage- and other asset-backed securities, making their prices more volatile and more sensitive to changes in interest rates.
Shareholder concentration risk
At August 31, 2023, affiliated shareholders of record owned 100.0% of the outstanding shares of the Fund in one or more accounts. Fund shares sold to or redeemed by concentrated accounts may have a significant effect on the operations of the Fund. In the case of a large redemption, the Fund may be forced to sell investments at inopportune times, including its liquid positions, which may result in Fund losses and the Fund holding a higher percentage of less liquid positions. Large redemptions could result in decreased economies of scale and increased operating expenses for non-redeeming Fund shareholders.
Note 10. Subsequent events
Management has evaluated the events and transactions that have occurred through the date the financial statements were issued and noted no items requiring adjustment of the financial statements or additional disclosure.
Note 11. Information regarding pending and settled legal proceedings
Ameriprise Financial and certain of its affiliates are involved in the normal course of business in legal proceedings which include regulatory inquiries, arbitration and litigation, including class actions concerning matters arising in connection with the conduct of their activities as part of a diversified financial services firm. Ameriprise Financial believes that the Fund is not currently the subject of, and that neither Ameriprise Financial nor any of its affiliates are the subject of, any pending legal, arbitration or regulatory proceedings that are likely to have a material adverse effect on the Fund or the ability of Ameriprise Financial or its affiliates to perform under their contracts with the Fund. Ameriprise Financial is required to make quarterly (10-Q), annual (10-K) and, as necessary, 8-K filings with the Securities and Exchange Commission (SEC) on legal and regulatory matters that relate to Ameriprise Financial and its affiliates. Copies of these filings may be obtained by accessing the SEC website at www.sec.gov.
There can be no assurance that these matters, or the adverse publicity associated with them, will not result in increased Fund redemptions, reduced sale of Fund shares or other adverse consequences to the Fund. Further, although we believe proceedings are not likely to have a material adverse effect on the Fund or the ability of Ameriprise Financial or its affiliates to perform under their contracts with the Fund, these proceedings are subject to uncertainties and, as such, we are unable to estimate the possible loss or range of loss that may result. An adverse outcome in one or more of these proceedings could result in adverse judgments, settlements, fines, penalties or other relief that could have a material adverse effect on the consolidated financial condition or results of operations of Ameriprise Financial or one or more of its affiliates that provide services to the Fund.
| 112 | Multi-Manager Total Return Bond Strategies Fund | Annual Report 2023 |
Report of Independent Registered Public Accounting Firm
To the Board of Trustees of Columbia Funds Series Trust I and Shareholders of Multi-Manager Total Return Bond Strategies Fund
Opinion on the Financial Statements
We have audited the accompanying statement of assets and liabilities, including the portfolio of investments, of Multi-Manager Total Return Bond Strategies Fund (one of the funds constituting Columbia Funds Series Trust I, referred to hereafter as the "Fund") as of August 31, 2023, the related statement of operations for the year ended August 31, 2023, the statement of changes in net assets for each of the two years in the period ended August 31, 2023, including the related notes, and the financial highlights for each of the periods indicated therein (collectively referred to as the "financial statements"). In our opinion, the financial statements present fairly, in all material respects, the financial position of the Fund as of August 31, 2023, the results of its operations for the year then ended, the changes in its net assets for each of the two years in the period ended August 31, 2023 and the financial highlights for each of the periods indicated therein in conformity with accounting principles generally accepted in the United States of America.
Basis for Opinion
These financial statements are the responsibility of the Fund’s management. Our responsibility is to express an opinion on the Fund’s financial statements based on our audits. We are a public accounting firm registered with the Public Company Accounting Oversight Board (United States) (PCAOB) and are required to be independent with respect to the Fund in accordance with the U.S. federal securities laws and the applicable rules and regulations of the Securities and Exchange Commission and the PCAOB.
We conducted our audits of these financial statements in accordance with the standards of the PCAOB. Those standards require that we plan and perform the audit to obtain reasonable assurance about whether the financial statements are free of material misstatement, whether due to error or fraud.
Our audits included performing procedures to assess the risks of material misstatement of the financial statements, whether due to error or fraud, and performing procedures that respond to those risks. Such procedures included examining, on a test basis, evidence regarding the amounts and disclosures in the financial statements. Our audits also included evaluating the accounting principles used and significant estimates made by management, as well as evaluating the overall presentation of the financial statements. Our procedures included confirmation of securities owned as of August 31, 2023 by correspondence with the custodian, transfer agent, brokers and agent banks; when replies were not received from brokers, we performed other auditing procedures. We believe that our audits provide a reasonable basis for our opinion.
/s/PricewaterhouseCoopers LLP
Minneapolis, Minnesota
October 23, 2023
We have served as the auditor of one or more investment companies within the Columbia Funds Complex since 1977.
Multi-Manager Total Return Bond Strategies Fund | Annual Report 2023
| 113 |
Federal Income Tax Information
(Unaudited)
The Fund hereby designates the following tax attributes for the fiscal year ended August 31, 2023. Shareholders will be notified in early 2024 of the amounts for use in preparing 2023 income tax returns.
Section
163(j)
Interest
Dividends | |
| 99.18% | |
Section 163(j) Interest Dividends. The percentage of ordinary income distributed during the fiscal year that shareholders may treat as interest income for purposes of IRC Section 163(j), subject to holding period requirements and other limitations.
TRUSTEES AND OFFICERS
(Unaudited)
The Board oversees the Fund’s operations and appoints officers who are responsible for day-to-day business decisions based on policies set by the Board. The following table provides basic biographical information about the Fund’s Trustees as of the printing of this report, including their principal occupations during the past five years, although specific titles for individuals may have varied over the period. The year set forth beneath Length of Service in the table below is the year in which the Trustee was first appointed or elected as Trustee to any Fund currently in the Columbia Funds Complex or a predecessor thereof. Under current Board policy, each Trustee generally serves until December 31 of the year such Trustee turns seventy-five (75).
Independent trustees
Name,
address,
year of birth | Position held
with the Columbia Funds and
length of service | Principal occupation(s)
during past five years
and other relevant
professional experience | Number of
Funds in the
Columbia Funds
Complex*
overseen | Other directorships
held by Trustee
during the past five years
and other relevant Board experience |
George S. Batejan
c/o Columbia Management
Investment Advisers, LLC
290 Congress Street
Boston, MA 02210
1954 | Trustee since 2017 | Executive Vice President, Global Head of Technology and Operations, Janus Capital Group, Inc., 2010-2016 | 173 | Former Chairman of the Board, NICSA (National Investment Company Services Association) (Executive Committee, Nominating Committee and Governance Committee), 2014-2016; former Director, Intech Investment Management, 2011-2016; former Board Member, Metro Denver Chamber of Commerce, 2015-2016; former Advisory Board Member, University of Colorado Business School, 2015-2018; former Board Member, Chase Bank International, 1993-1994 |
| 114 | Multi-Manager Total Return Bond Strategies Fund | Annual Report 2023 |
TRUSTEES AND OFFICERS (continued)
(Unaudited)
Independent trustees (continued)
Name,
address,
year of birth | Position held
with the Columbia Funds and
length of service | Principal occupation(s)
during past five years
and other relevant
professional experience | Number of
Funds in the
Columbia Funds
Complex*
overseen | Other directorships
held by Trustee
during the past five years
and other relevant Board experience |
Kathleen Blatz
c/o Columbia Management
Investment Advisers, LLC
290 Congress Street
Boston, MA 02210
1954 | Trustee since 2006 | Attorney, specializing in arbitration and mediation; Chief Justice, Minnesota Supreme Court, 1998-2006; Associate Justice, Minnesota Supreme Court, 1996-1998; Fourth Judicial District Court Judge, Hennepin County, 1994-1996; Attorney in private practice and public service, 1984-1993; State Representative, Minnesota House of Representatives, 1979-1993, which included service on the Tax and Financial Institutions and Insurance Committees; Member and Interim Chair, Minnesota Sports Facilities Authority, January-July 2017; Interim President and Chief Executive Officer, Blue Cross and Blue Shield of Minnesota (health care insurance), February-July 2018, April-October 2021 | 173 | Former Trustee, Blue Cross and Blue Shield of Minnesota, 2009-2021 (Chair of the Business Development Committee, 2014-2017; Chair of the Governance Committee, 2017-2019); former Member and Chair of the Board, Minnesota Sports Facilities Authority, January 2017-July 2017; former Director, Robina Foundation, 2009-2020 (Chair, 2014-2020); Director, Richard M. Schulze Family Foundation, since 2021 |
Pamela G. Carlton
c/o Columbia Management
Investment Advisers, LLC
290 Congress Street
Boston, MA 02210
1954 | Chair since 2023; Trustee since 2007 | President, Springboard – Partners in Cross Cultural Leadership (consulting company), since 2003; Managing Director of US Equity Research, JP Morgan Chase, 1999-2003; Director of US Equity Research, Chase Asset Management, 1996-1999; Co-Director Latin America Research, 1993-1996, COO Global Research, 1992-1996, Co-Director of US Research, 1991-1992, Investment Banker, 1982-1991, Morgan Stanley; Attorney, Cleary Gottlieb Steen & Hamilton LLP, 1980-1982 | 173 | Trustee, New York Presbyterian Hospital Board, since 1996; Director, DR Bank (Audit Committee) since 2017; Director, Evercore Inc. (Audit Committee, Nominating and Governance Committee), since 2019; Director, Apollo Commercial Real Estate Finance, Inc. (Chair, Nominating and Governance Committee) (financial services), since 2021; the Governing Council of the Independent Directors Council (IDC), since 2021 |
Janet Langford Carrig
c/o Columbia Management
Investment Advisers, LLC
290 Congress Street
Boston, MA 02210
1957 | Trustee since 1996 | Senior Vice President, General Counsel and Corporate Secretary, ConocoPhillips (independent energy company), September 2007-October 2018 | 173 | Director, EQT Corporation (natural gas producer), since 2019; former Director, Whiting Petroleum Corporation (independent oil and gas company), 2020-2022 |
J. Kevin Connaughton
c/o Columbia Management
Investment Advisers, LLC
290 Congress Street
Boston, MA 02210
1964 | Trustee since 2020 | CEO and President, RhodeWay Financial (non-profit financial planning firm), since December 2022; Member, FINRA National Adjudicatory Council, since January 2020; Adjunct Professor of Finance, Bentley University since January 2018; Consultant to Independent Trustees of CFVIT and CFST I from March 2016 to June 2020 with respect to CFVIT and to December 2020 with respect to CFST I; Managing Director and General Manager of Mutual Fund Products, Columbia Management Investment Advisers, LLC, May 2010-February 2015; President, Columbia Funds, 2008-2015; and senior officer of Columbia Funds and affiliated funds, 2003-2015 | 171 | Former Director, The Autism Project, March 2015-December 2021; former Member of the Investment Committee, St. Michael’s College, November 2015-February 2020; former Trustee, St. Michael’s College, June 2017-September 2019; former Trustee, New Century Portfolios (former mutual fund complex), January 2015-December 2017 |
Multi-Manager Total Return Bond Strategies Fund | Annual Report 2023
| 115 |
TRUSTEES AND OFFICERS (continued)
(Unaudited)
Independent trustees (continued)
Name,
address,
year of birth | Position held
with the Columbia Funds and
length of service | Principal occupation(s)
during past five years
and other relevant
professional experience | Number of
Funds in the
Columbia Funds
Complex*
overseen | Other directorships
held by Trustee
during the past five years
and other relevant Board experience |
Olive M. Darragh
c/o Columbia Management
Investment Advisers, LLC
290 Congress Street
Boston, MA 02210
1962 | Trustee since 2020 | Managing Director of Darragh Inc. (strategy and talent management consulting firm), since 2010; Founder and CEO, Zolio, Inc. (investment management talent identification platform), since 2004; Consultant to Independent Trustees of CFVIT and CFST I from June 2019 to June 2020 with respect to CFVIT and to December 2020 with respect to CFST I; Partner, Tudor Investments, 2004-2010; Senior Partner, McKinsey & Company (consulting), 1990-2004; Touche Ross CPA, 1985-1988 | 171 | Treasurer, Edinburgh University US Trust Board, since January 2023; Member, HBS Community Action Partners Board, since September 2022; former Director, University of Edinburgh Business School (Member of US Board), 2004-2019; former Director, Boston Public Library Foundation, 2008-2017 |
Patricia M. Flynn
c/o Columbia Management
Investment Advisers, LLC
290 Congress Street
Boston, MA 02210
1950 | Trustee since 2004 | Professor of Economics and Management, Bentley University, since 2002; Dean, McCallum Graduate School of Business, Bentley University, 1992-2002 | 173 | Former Trustee, MA Taxpayers Foundation, 1997-2022; former Director, The MA Business Roundtable, 2003-2019; former Chairperson, Innovation Index Advisory Committee, MA Technology Collaborative, 1997-2020 |
Brian J. Gallagher
c/o Columbia Management
Investment Advisers, LLC
290 Congress Street
Boston, MA 02210
1954 | Trustee since 2017 | Retired; Partner with Deloitte & Touche LLP and its predecessors, 1977-2016 | 173 | Trustee, Catholic Schools Foundation, since 2004 |
Douglas A. Hacker
c/o Columbia Management
Investment Advisers, LLC
290 Congress Street
Boston, MA 02210
1955 | Trustee since 1996 | Independent business executive, since May 2006; Executive Vice President – Strategy of United Airlines, December 2002 - May 2006; President of UAL Loyalty Services (airline marketing company), September 2001-December 2002; Executive Vice President and Chief Financial Officer of United Airlines, July 1999-September 2001 | 173 | Director, SpartanNash Company since November 2013 (Chair of the Board, since May 2021) (food distributor); Director, Aircastle Limited (Chair of Audit Committee) (aircraft leasing), since August 2006; former Director, Nash Finch Company (food distributor), 2005-2013; former Director, SeaCube Container Leasing Ltd. (container leasing), 2010-2013; and former Director, Travelport Worldwide Limited (travel information technology), 2014-2019 |
Nancy T. Lukitsh
c/o Columbia Management
Investment Advisers, LLC
290 Congress Street
Boston, MA 02210
1956 | Trustee since 2011 | Senior Vice President, Partner and Director of Marketing, Wellington Management Company, LLP (investment adviser), 1997-2010; Chair, Wellington Management Portfolios (commingled non-U.S. investment pools), 2007-2010; Director, Wellington Trust Company, NA and other Wellington affiliates, 1997-2010 | 171 | None |
| 116 | Multi-Manager Total Return Bond Strategies Fund | Annual Report 2023 |
TRUSTEES AND OFFICERS (continued)
(Unaudited)
Independent trustees (continued)
Name,
address,
year of birth | Position held
with the Columbia Funds and
length of service | Principal occupation(s)
during past five years
and other relevant
professional experience | Number of
Funds in the
Columbia Funds
Complex*
overseen | Other directorships
held by Trustee
during the past five years
and other relevant Board experience |
David M. Moffett
c/o Columbia Management
Investment Advisers, LLC
290 Congress Street
Boston, MA 02210
1952 | Trustee since 2011 | Retired; former Chief Executive Officer of Freddie Mac and Chief Financial Officer of U.S. Bank | 171 | Director, CSX Corporation (transportation suppliers); Director, PayPal Holdings Inc. (payment and data processing services); Trustee, University of Oklahoma Foundation; former Director, eBay Inc. (online trading community), 2007-2015; and former Director, CIT Bank, CIT Group Inc. (commercial and consumer finance), 2010-2016; former Senior Adviser to The Carlyle Group (financial services), March 2008-September 2008; former Governance Consultant to Bridgewater Associates, January 2013-December 2015 |
Catherine James Paglia
c/o Columbia Management
Investment Advisers, LLC
290 Congress Street
Boston, MA 02210
1952 | Trustee since 2004 | Director, Enterprise Asset Management, Inc. (private real estate and asset management company), since September 1998; Managing Director and Partner, Interlaken Capital, Inc., 1989-1997; Vice President, 1982-1985, Principal, 1985-1987, Managing Director, 1987-1989, Morgan Stanley; Vice President, Investment Banking, 1980-1982, Associate, Investment Banking, 1976-1980, Dean Witter Reynolds, Inc. | 173 | Director, Valmont Industries, Inc. (irrigation systems manufacturer), since 2012; Trustee, Carleton College (on the Investment Committee), since 1987; Trustee, Carnegie Endowment for International Peace (on the Investment Committee), since 2009 |
Natalie A. Trunow
c/o Columbia Management
Investment Advisers, LLC
290 Congress Street
Boston, MA 02210
1967 | Trustee since 2020 | Chief Executive Officer, Millennial Portfolio Solutions LLC (asset management and consulting services), January 2016-January 2021; Non-executive Member of the Investment Committee and Valuation Committee, Sarona Asset Management Inc. (private equity firm) since September 2019; Advisor, Horizon Investments (asset management and consulting services), August 2018-January 2022; Advisor, Paradigm Asset Management, November 2016-January 2022; Consultant to Independent Trustees of CFVIT and CFST I from September 2016 to June 2020 with respect to CFVIT and to December 2020 with respect to CFST I; Director of Investments/Consultant, Casey Family Programs, April 2016-November 2016; Senior Vice President and Chief Investment Officer, Calvert Investments, August 2008-January 2016; Section Head and Portfolio Manager, General Motors Asset Management, June 1997-August 2008 | 171 | Independent Director, Investment Committee, Health Services for Children with Special Needs, Inc., 2010-2021; Independent Director, (Executive Committee and Chair, Audit Committee), Consumer Credit Counseling Services (formerly Guidewell Financial Solutions), since 2016; Independent Director, (Investment Committee), Sarona Asset Management, since 2019 |
Multi-Manager Total Return Bond Strategies Fund | Annual Report 2023
| 117 |
TRUSTEES AND OFFICERS (continued)
(Unaudited)
Independent trustees (continued)
Name,
address,
year of birth | Position held
with the Columbia Funds and
length of service | Principal occupation(s)
during past five years
and other relevant
professional experience | Number of
Funds in the
Columbia Funds
Complex*
overseen | Other directorships
held by Trustee
during the past five years
and other relevant Board experience |
Sandra L. Yeager
c/o Columbia Management
Investment Advisers, LLC
290 Congress Street
Boston, MA 02210
1964 | Trustee since 2017 | Retired; President and founder, Hanoverian Capital, LLC (SEC registered investment advisor firm), 2008-2016; Managing Director, DuPont Capital, 2006-2008; Managing Director, Morgan Stanley Investment Management, 2004-2006; Senior Vice President, Alliance Bernstein, 1990-2004 | 173 | Former Director, NAPE (National Alliance for Partnerships in Equity) Education Foundation, October 2016-October 2020; Advisory Board, Jennersville YMCA, since 2022 |
Interested trustee affiliated with Investment Manager**
Name,
address,
year of birth | Position held with the Columbia Funds and length of service | Principal occupation(s) during the
past five years and other relevant
professional experience | Number of
Funds in the
Columbia Funds
Complex* overseen | Other directorships
held by Trustee
during the past
five years and
other relevant Board experience |
Daniel J. Beckman
c/o Columbia Management
Investment Advisers, LLC
290 Congress Street
Boston, MA 02210
1962 | Trustee since November 2021 and President since June 2021 | Vice President – Head of North America Product, Columbia Management Investment Advisers, LLC, since April 2015; President and Principal Executive Officer of the Columbia Funds, since June 2021; officer of Columbia Funds and affiliated funds, 2020-2021 | 173 | Director, Ameriprise Trust Company, since October 2016; Director, Columbia Management Investment Distributors, Inc. since November 2018; Board of Governors, Columbia Wanger Asset Management, LLC since, January 2022; Director, Columbia Threadneedle Canada, Inc., since December 2022 |
| * | The term “Columbia Funds Complex” as used herein includes Columbia Seligman Premium Technology Growth Fund, Tri-Continental Corporation and each series of Columbia Funds Series Trust (CFST), Columbia Funds Series Trust I (CFST I), Columbia Funds Series Trust II (CFST II), Columbia ETF Trust I (CET I), Columbia ETF Trust II (CET II), Columbia Funds Variable Insurance Trust (CFVIT) and Columbia Funds Variable Series Trust II (CFVST II). Messrs. Batejan, Beckman, Gallagher and Hacker and Mses. Blatz, Carlton, Carrig, Flynn, Paglia, and Yeager serve as directors of Columbia Seligman Premium Technology Growth Fund and Tri-Continental Corporation. |
| ** | Interested person (as defined under the 1940 Act) by reason of being an officer, director, security holder and/or employee of the Investment Manager or Ameriprise Financial. |
The Statement of Additional Information has additional information about the Fund’s Board members and is available, without charge, upon request by calling 800.345.6611, visiting columbiathreadneedleus.com/investor/ or contacting your financial intermediary.
| 118 | Multi-Manager Total Return Bond Strategies Fund | Annual Report 2023 |
TRUSTEES AND OFFICERS (continued)
(Unaudited)
The Board has appointed officers who are responsible for day-to-day business decisions based on policies it has established. The officers serve at the pleasure of the Board. The following table provides basic information about the Officers of the Fund as of the printing of this report, including principal occupations during the past five years, although their specific titles may have varied over the period. In addition to Mr. Beckman, who is President and Principal Executive Officer, the Fund’s other officers are:
Fund officers
Name,
address and
year of birth | Position and year
first appointed to
position for any Fund
in the Columbia
Funds Complex or a
predecessor thereof | Principal occupation(s) during past five years |
Michael G. Clarke
290 Congress Street
Boston, MA 02210
1969 | Chief Financial Officer and Principal Financial Officer (2009) and Senior Vice President (2019) | Senior Vice President and North America Head of Operations & Investor Services, Columbia Management Investment Advisers, LLC, since June 2023 (previously Senior Vice President and Head of Global Operations, March 2022 – June 2023, Vice President, Head of North America Operations, and Co-Head of Global Operations, June 2019 - February 2022 and Vice President – Accounting and Tax, May 2010 - May 2019); senior officer of Columbia Funds and affiliated funds, since 2002. Director, Ameriprise Trust Company, since June 2023. |
Joseph Beranek
5890 Ameriprise Financial Center
Minneapolis, MN 55474
1965 | Treasurer and Chief Accounting Officer (Principal Accounting Officer) (2019) and Principal Financial Officer (2020), CFST, CFST I, CFST II, CFVIT and CFVST II; Assistant Treasurer, CET I and CET II | Vice President – Mutual Fund Accounting and Financial Reporting, Columbia Management Investment Advisers, LLC, since December 2018 and March 2017, respectively. |
Marybeth Pilat
290 Congress Street
Boston, MA 02210
1968 | Treasurer and Chief Accounting Officer (Principal Accounting Officer) and Principal Financial Officer (2020) for CET I and CET II; Assistant Treasurer, CFST, CFST I, CFST II, CFVIT and CFVST II | Vice President – Product Pricing and Administration, Columbia Management Investment Advisers, LLC, since May 2017. |
William F. Truscott
290 Congress Street
Boston, MA 02210
1960 | Senior Vice President (2001) | Formerly, Trustee/Director of Columbia Funds Complex or legacy funds, November 2001 - January 1, 2021; Chief Executive Officer, Global Asset Management, Ameriprise Financial, Inc., since September 2012; Chairman of the Board and President, Columbia Management Investment Advisers, LLC, since July 2004 and February 2012, respectively; Chairman of the Board and Chief Executive Officer, Columbia Management Investment Distributors, Inc., since November 2008 and February 2012, respectively; Chairman of the Board and Director, Threadneedle Asset Management Holdings, Sàrl, since March 2013 and December 2008, respectively; senior executive of various entities affiliated with Columbia Threadneedle. |
Christopher O. Petersen
5228 Ameriprise Financial Center
Minneapolis, MN 55474
1970 | Senior Vice President and Assistant Secretary (2021) | Formerly, Trustee/Director of funds within the Columbia Funds Complex, July 1, 2020 - November 22, 2021; Senior Vice President and Assistant General Counsel, Ameriprise Financial, Inc., since September 2021 (previously Vice President and Lead Chief Counsel, January 2015 - September 2021); formerly, President and Principal Executive Officer of the Columbia Funds, 2015 - 2021; officer of Columbia Funds and affiliated funds, since 2007. |
Thomas P. McGuire
290 Congress Street
Boston, MA 02210
1972 | Senior Vice President and Chief Compliance Officer (2012) | Vice President – Asset Management Compliance, Ameriprise Financial, Inc., since May 2010; Chief Compliance Officer, Columbia Acorn/Wanger Funds, since December 2015; formerly, Chief Compliance Officer, Ameriprise Certificate Company, September 2010 – September 2020. |
Ryan C. Larrenaga
290 Congress Street
Boston, MA 02210
1970 | Senior Vice President (2017), Chief Legal Officer (2017), and Secretary (2015) | Vice President and Chief Counsel, Ameriprise Financial, Inc., since August 2018 (previously Vice President and Group Counsel, August 2011 - August 2018); Chief Legal Officer, Columbia Acorn/Wanger Funds, since September 2020; officer of Columbia Funds and affiliated funds, since 2005. |
Multi-Manager Total Return Bond Strategies Fund | Annual Report 2023
| 119 |
TRUSTEES AND OFFICERS (continued)
(Unaudited)
Fund officers (continued)
Name,
address and
year of birth | Position and year
first appointed to
position for any Fund
in the Columbia
Funds Complex or a
predecessor thereof | Principal occupation(s) during past five years |
Michael E. DeFao
290 Congress Street
Boston, MA 02210
1968 | Vice President (2011) and Assistant Secretary (2010) | Vice President and Chief Counsel, Ameriprise Financial, Inc., since May 2010; Vice President, Chief Legal Officer and Assistant Secretary, Columbia Management Investment Advisers, LLC, since October 2021 (previously Vice President and Assistant Secretary, May 2010 – September 2021). |
Lyn Kephart-Strong
5903 Ameriprise Financial Center
Minneapolis, MN 55474
1960 | Vice President (2015) | Vice President, Global Investment Operations Services, Columbia Management Investment Advisers, LLC, since 2010; Director (since January 2007) and President (since October 2014), Columbia Management Investment Services Corp.; Director (since December 2017) and President (since January 2017), Ameriprise Trust Company. |
Liquidity Risk Management Program
(Unaudited)
Pursuant to Rule 22e-4 under the 1940 Act, the Fund has adopted a liquidity risk management program (Program). The Program’s principal objectives include assessing, managing and periodically reviewing the Fund’s liquidity risk. Liquidity risk is defined as the risk that the Fund could not meet redemption requests without significant dilution of remaining investors’ interests in the Fund.
The Board has appointed the Investment Manager as the program administrator for the Fund’s Program. The Investment Manager has delegated oversight of the Program to its Liquidity Risk Management Committee (the Committee). At a Board meeting during the fiscal period, the Committee provided the Board with a report addressing the operations of the Program and assessing its adequacy and effectiveness of implementation for the period January 1, 2022 through December 31, 2022, including:
| • | the Fund had sufficient liquidity to both meet redemptions and operate effectively on behalf of shareholders; |
| • | there were no material changes to the Program during the period; |
| • | the implementation of the Program was effective to manage the Fund’s liquidity risk; and |
| • | the Program operated adequately during the period. |
There can be no assurance that the Program will achieve its objectives in the future. Please refer to the Fund’s prospectus for more information regarding the Fund’s exposure to liquidity risk and other principal risks to which an investment in the Fund may be subject.
| 120 | Multi-Manager Total Return Bond Strategies Fund | Annual Report 2023 |
Approval of Subadvisory Agreement Amendment
(Unaudited)
Columbia Management Investment Advisers, LLC (the Investment Manager, and together with its domestic and global affiliates, Columbia Threadneedle Investments), a wholly-owned subsidiary of Ameriprise Financial, Inc. (Ameriprise Financial), serves as the investment manager to Multi-Manager Total Return Bond Strategies Fund (the Fund). Under a management agreement (the Management Agreement), the Investment Manager provides investment advice and other services to the Fund and other funds distributed by Columbia Management Investment Distributors, Inc. (collectively, the Funds). In addition, under the subadvisory agreements (the Subadvisory Agreements) between the Investment Manager and each of Loomis, Sayles & Company, L.P., PGIM, Inc., TCW Investment Management Company LLC and Voya Investment Management Co. LLC (collectively, the Subadvisers), the Subadvisers provide portfolio management and related services for the Fund.
On an annual basis, the Fund’s Board of Trustees (the Board), including the independent Board members (the Independent Trustees), considers renewal of the Management Agreement and the Subadvisory Agreements (together, the Advisory Agreements). The Investment Manager prepared detailed reports for the Board and its Contracts Committee (including its Contracts Subcommittee) in February, March, April, May and June 2023, including reports providing the results of analyses performed by a third-party data provider, Broadridge Financial Solutions, Inc. (Broadridge), and comprehensive responses by the Investment Manager to written requests for information by independent legal counsel to the Independent Trustees (Independent Legal Counsel), to assist the Board in making this determination. In addition, throughout the year, the Board (or its committees or subcommittees) regularly meets with portfolio management teams and senior management personnel and reviews information prepared by the Investment Manager addressing the services the Investment Manager provides and Fund performance. The Board also accords appropriate weight to the work, deliberations and conclusions of the various committees (including their subcommittees), such as the Contracts Committee, the Investment Review Committee, the Audit Committee and the Compliance Committee in determining whether to continue the Advisory Agreements.
The Board, at its June 22, 2023 Board meeting (the June Meeting), considered the renewal of each of the Advisory Agreements for additional one-year terms. At the June Meeting, Independent Legal Counsel reviewed with the Independent Trustees various factors relevant to the Board’s consideration of advisory and subadvisory agreements and the Board’s legal responsibilities related to such consideration. The Independent Trustees considered all information that they, their legal counsel or the Investment Manager believed reasonably necessary to evaluate and to approve the continuation of each of the Advisory Agreements. Among other things, the information and factors considered included the following:
| • | Information on the investment performance of the Fund relative to the performance of a group of mutual funds determined to be comparable to the Fund by Broadridge, as well as performance relative to one or more benchmarks; |
| • | Information on the Fund’s management fees and total expenses, including information comparing the Fund’s expenses to those of a group of comparable mutual funds, as determined by Broadridge; |
| • | The Investment Manager’s agreement to contractually limit or cap total operating expenses for the Fund so that total operating expenses (excluding certain fees and expenses, such as transaction costs and certain other investment related expenses, interest, taxes, acquired fund fees and expenses and infrequent and/or unusual expenses) would not exceed a specified annual rate, as a percentage of the Fund’s net assets; |
| • | Terms of the Advisory Agreements; |
| • | Subadvisory fees payable by the Investment Manager under the Subadvisory Agreements; |
| • | Descriptions of other agreements and arrangements with affiliates of the Investment Manager relating to the operations of the Fund, including agreements with respect to the provision of transfer agency and shareholder services to the Fund; |
| • | Descriptions of various services performed by the Investment Manager and the Subadvisers under the Advisory Agreements, including portfolio management and portfolio trading practices; |
| • | Information regarding any recently negotiated management fees of similarly-managed portfolios of other institutional clients of the Investment Manager; |
| • | Information regarding the resources of the Investment Manager and Subadvisers, including information regarding senior management, portfolio managers and other personnel; |
Multi-Manager Total Return Bond Strategies Fund | Annual Report 2023
| 121 |
Approval of Subadvisory Agreement Amendment (continued)
(Unaudited)
| • | Information regarding the capabilities of the Investment Manager and the Subadvisers with respect to compliance monitoring services; |
| • | The profitability to the Investment Manager and its affiliates from their relationships with the Fund; and |
| • | Report provided by the Board’s independent fee consultant, JDL Consultants, LLC (JDL). |
Following an analysis and discussion of the foregoing, and the factors identified below, the Board, including all of the Independent Trustees, approved the renewal of each of the Advisory Agreements.
Nature, extent and quality of services provided by the Investment Manager and the Subadvisers
The Board analyzed various reports and presentations it had received detailing the services performed by the Investment Manager and the Subadvisers, as well as their history, expertise, resources and relative capabilities, and the qualifications of their personnel.
The Board specifically considered the many developments during recent years concerning the services provided by the Investment Manager, including, in particular, detailed information regarding the process employed for selecting and overseeing affiliated and unaffiliated subadvisers. With respect to the Investment Manager, the Board also noted the organization and depth of the equity and credit research departments. The Board further observed the enhancements to the investment risk management department’s processes, systems and oversight over the past several years. The Board also took into account the broad scope of services provided by the Investment Manager to each subadvised Fund, including, among other services, investment, risk and compliance oversight. The Board also took into account the information it received concerning the Investment Manager’s ability to attract and retain key portfolio management personnel and that it has sufficient resources to provide competitive and adequate compensation to investment personnel.
In connection with the Board’s evaluation of the overall package of services provided by the Investment Manager, the Board also considered the nature, quality and range of administrative services provided to the Fund by the Investment Manager, as well as the achievements in 2022 in the performance of administrative services, and noted the various enhancements anticipated for 2023. In evaluating the quality of services provided under the Advisory Agreements, the Board also took into account the organization and strength of the Fund’s and its service providers’ compliance programs. The Board also reviewed the financial condition of the Investment Manager and its affiliates and each entity’s ability to carry out its responsibilities under the Management Agreement and the Fund’s other service agreements.
In addition, the Board discussed the acceptability of the terms of the Management Agreement (including the relatively broad scope of services required to be performed by the Investment Manager in addition to monitoring each Subadviser), noting that no changes were proposed from the forms of agreements previously approved. The Board also noted the wide array of legal and compliance services provided to the Fund under the Management Agreement.
The Board considered each Subadviser’s organizational strength and resources, portfolio management team depth and capabilities and investment process. The Board also considered each Subadviser’s capability and wherewithal to carry out its responsibilities under the applicable Subadvisory Agreement. In addition, the Board discussed the acceptability of the terms of the Subadvisory Agreements, including the scope of services required to be performed. The Board noted that the terms of the Subadvisory Agreements are generally consistent with the terms of other subadvisory agreements for subadvisers who manage other funds managed by the Investment Manager. It was observed that no changes were recommended to the Subadvisory Agreements. The Board took into account the Investment Manager’s representation that each Subadviser was in a position to provide quality services to the Fund. In this regard, the Board further observed the various services provided by the Investment Manager’s subadvisory oversight team.
After reviewing these and related factors (including investment performance as discussed below), the Board concluded, within the context of their overall conclusions, that the nature, extent and quality of the services provided to the Fund under the Advisory Agreements supported the continuation of the Management Agreement and each of the Subadvisory Agreements.
| 122 | Multi-Manager Total Return Bond Strategies Fund | Annual Report 2023 |
Approval of Subadvisory Agreement Amendment (continued)
(Unaudited)
Investment performance
The Board carefully reviewed the investment performance of the Fund, including detailed reports providing the results of analyses performed by each of the Investment Manager, Broadridge and JDL collectively showing, for various periods (including since manager inception): (i) the performance of the Fund, (ii) the Fund’s performance relative to peers and benchmarks and (iii) the net assets of the Fund. The Board observed that Fund performance was well within the range of that of its peers.
Additionally, the Board reviewed the performance of each of the Subadvisers and the Investment Manager’s process for monitoring such Subadvisers’ performance. The Board considered, in particular, management’s rationale for recommending the continued retention of each Subadviser and management’s representations that the Investment Manager’s profitability is not the key factor driving their recommendation to select, renew or terminatethe Subadvisers.
The Board also reviewed a description of the third-party data provider’s methodology for identifying the Fund’s peer groups for purposes of performance and expense comparisons.
The Board also considered the Investment Manager’s and Subadvisers’ performance and reputation generally, and the Investment Manager’s evaluation of the contribution of each Subadviser to the Fund’s investment mandate. After reviewing these and related factors, the Board concluded, within the context of their overall conclusions, that the performance of the Fund, the Investment Manager and the Subadvisers, in light of other considerations, supported the continuation of the Management Agreement and each of the Subadvisory Agreements.
Comparative fees, costs of services provided and the profits realized by the Investment Manager and its affiliates from their relationships with the Fund
The Board reviewed comparative fees and the costs of services provided under each of the Advisory Agreements. The Board members considered detailed comparative information set forth in an annual report on fees and expenses, including, among other things, data (based on analyses conducted by Broadridge and JDL) showing a comparison of the Fund’s expenses with median expenses paid by funds in its comparative peer universe, as well as data showing the Fund’s contribution to the Investment Manager’s profitability.
The Board considered the reports of JDL, which assisted in the Board’s analysis of the Funds’ performance and expenses and the reasonableness of the Funds’ fee rates. The Board accorded particular weight to the notion that a primary objective of the level of fees is to achieve a rational pricing model applied consistently across the various product lines in the Fund family, while assuring that the overall fees for each Fund (with certain exceptions) are generally in line with the current “pricing philosophy” such that Fund total expense ratios, in general, approximate or are lower than the median expense ratios of funds in the same Lipper comparison universe. The Board took into account that the Fund’s total expense ratio (after considering proposed expense caps/waivers) approximated the peer universe’s median expense ratio.
Additionally, the Board reviewed the level of subadvisory fees paid to each Subadviser, noting that the fees are paid by the Investment Manager and do not impact the fees paid by the Fund. The Board also reviewed advisory fee rates charged by other comparable mutual funds employing each Subadviser. After reviewing these and related factors, the Board concluded, within the context of their overall conclusions, that the levels of management fees, subadvisory fees and expenses of the Fund, in light of other considerations, supported the continuation of the Management Agreement and each of the Subadvisory Agreements.
The Board also considered the profitability of the Investment Manager and its affiliates in connection with the Investment Manager providing management services to the Fund. Because the Subadvisory Agreements were negotiated at arms-length by the Investment Manager, which is responsible for payments to the Subadvisers thereunder, the Board did not consider the profitability to each Subadviser from its relationship with the Fund. With respect to the profitability of the Investment Manager and its affiliates, the Independent Trustees referred to information discussing the profitability to the Investment Manager and Ameriprise Financial from managing, operating and distributing the Funds. The Board considered that the profitability generated by the Investment Manager in 2022 had declined from 2021 levels, due to a variety of factors, including the decreased assets under management of the Funds. It also took into account the indirect economic benefits flowing to the Investment Manager or its affiliates in connection with managing or distributing the Funds, such as the enhanced ability to
Multi-Manager Total Return Bond Strategies Fund | Annual Report 2023
| 123 |
Approval of Subadvisory Agreement Amendment (continued)
(Unaudited)
offer various other financial products to Ameriprise Financial customers, soft dollar benefits and overall reputational advantages. The Board noted that the fees paid by the Fund should permit the Investment Manager to offer competitive compensation to its personnel, make necessary investments in its business and earn an appropriate profit. After reviewing these and related factors, the Board concluded, within the context of their overall conclusions, that the costs of services provided and the profitability to the Investment Manager and its affiliates from their relationships with the Fund supported the continuation of the Management Agreement and each of the Subadvisory Agreements.
Economies of scale
The Board considered the potential existence of economies of scale in the provision by the Investment Manager of services to the Fund, and whether those economies of scale were shared with the Fund through breakpoints in investment management fees or other means, such as expense limitation arrangements and additional investments by the Investment Manager in investment, trading, compliance and other resources. The Board considered the economies of scale that might be realized as the Fund’s net asset level grows and took note of the extent to which Fund shareholders might also benefit from such growth. In this regard, the Board took into account that management fees decline as Fund assets exceed various breakpoints, all of which have not been surpassed.The Board observed that the Management Agreement provided for breakpoints in the management fee rate schedule that allow opportunities for shareholders to realize lower fees as Fund assets grow and that there are additional opportunities through other means for sharing economies of scale with shareholders. The Board also noted that the breakpoints in the Subadvisory Agreements did not occur at the same levels as the breakpoints in the Management Agreement. In this regard, the Board noted the potential challenges of seeking to tailor the Management Agreement breakpoints to those of a subadvisory agreement in this context.
Conclusion
The Board reviewed all of the above considerations in reaching its decision to approve the continuation of the Management Agreement and each of the Subadvisory Agreements. In reaching its conclusions, no single factor was determinative.
On June 22, 2023, the Board, including all of the Independent Trustees, determined that fees payable under each of the Advisory Agreements were fair and reasonable in light of the extent and quality of services provided and approved the renewal of each of the Advisory Agreements.
| 124 | Multi-Manager Total Return Bond Strategies Fund | Annual Report 2023 |
[THIS PAGE INTENTIONALLY LEFT BLANK]
[THIS PAGE INTENTIONALLY LEFT BLANK]
[THIS PAGE INTENTIONALLY LEFT BLANK]
Multi-Manager Total Return Bond Strategies Fund
P.O. Box 219104
Kansas City, MO 64121-9104
Please read and consider the investment objectives, risks, charges and expenses for any fund carefully before investing. For a prospectus and summary prospectus, which contains this and other important information about the Fund, go to
columbiathreadneedleus.com/investor/. The Fund is distributed by Columbia Management Investment Distributors, Inc., member FINRA, and managed by Columbia Management Investment Advisers, LLC.
Columbia Threadneedle Investments (Columbia Threadneedle) is the global brand name of the Columbia and Threadneedle group of companies. All rights reserved.
© 2023 Columbia Management Investment Advisers, LLC.
columbiathreadneedleus.com/investor/

Annual Report
August 31, 2023
Columbia Global Technology Growth Fund
Not FDIC or NCUA Insured • No Financial Institution Guarantee • May Lose Value
If you elect to receive the shareholder report for Columbia Global Technology Growth Fund (the Fund) in paper, mailed to you, the Fund mails one shareholder report to each shareholder address, unless such shareholder elects to receive shareholder reports from the Fund electronically via e-mail or by having a paper notice mailed to you (Postcard Notice) that your Fund’s shareholder report is available at the Columbia funds’ website (columbiathreadneedleus.com/investor/). If you would like more than one report in paper to be mailed to you, or would like to elect to receive reports via e-mail or access them through Postcard Notice, please call shareholder services at 800.345.6611 and additional reports will be sent to you.
Proxy voting policies and procedures
The policy of the Board of Trustees is to vote the proxies of the companies in which the Fund holds investments consistent with the procedures as stated in the Statement of Additional Information (SAI). You may obtain a copy of the SAI without charge by calling 800.345.6611; contacting your financial intermediary; visiting columbiathreadneedleus.com/investor/; or searching the website of the Securities and Exchange Commission (SEC) at sec.gov. Information regarding how the Fund voted proxies relating to portfolio securities is filed with the SEC by August 31st for the most recent 12-month period ending June 30th of that year, and is available without charge by visiting columbiathreadneedleus.com/investor/, or searching the website of the SEC at sec.gov.
Quarterly schedule of investments
The Fund files a complete schedule of portfolio holdings with the SEC for the first and third quarters of each fiscal year on Form N-PORT. The Fund’s Form N-PORT filings are available on the SEC’s website at sec.gov. The Fund’s complete schedule of portfolio holdings, as filed on Form N-PORT, is available on columbiathreadneedleus.com/investor/ or can also be obtained without charge, upon request, by calling 800.345.6611.
Additional Fund information
For more information about the Fund, please visit columbiathreadneedleus.com/investor/ or call 800.345.6611. Customer Service Representatives are available to answer your questions Monday through Friday from 8 a.m. to 7 p.m. Eastern time.
Fund investment manager
Columbia Management Investment Advisers, LLC (the Investment Manager)
290 Congress Street
Boston, MA 02210
Fund distributor
Columbia Management Investment Distributors, Inc.
290 Congress Street
Boston, MA 02210
Fund transfer agent
Columbia Management Investment Services Corp.
P.O. Box 219104
Kansas City, MO 64121-9104
Columbia Global Technology Growth Fund | Annual Report 2023
Fund at a Glance
(Unaudited)
Investment objective
The Fund seeks capital appreciation by investing, under normal market conditions, at least 80% of its total net assets (plus any borrowings for investment purposes) in stocks of technology companies that may benefit from technological improvements, advancements or developments.
Portfolio management
Rahul Narang
Portfolio Manager
Managed Fund since 2012
Morningstar style boxTM
The Morningstar Style Box is based on a fund’s portfolio holdings. For equity funds, the vertical axis shows the market capitalization of the stocks owned, and the horizontal axis shows investment style (value, blend, or growth). Information shown is based on the most recent data provided by Morningstar.
© 2023 Morningstar, Inc. All rights reserved. The Morningstar information contained herein: (1) is proprietary to Morningstar and/or its content providers; (2) may not be copied or distributed; and (3) is not warranted to be accurate, complete or timely. Neither Morningstar nor its content providers are responsible for any damages or losses arising from any use of this information.
| Average annual total returns (%) (for the period ended August 31, 2023) |
| | | Inception | 1 Year | 5 Years | 10 Years |
| Class A | Excluding sales charges | 11/01/02 | 28.98 | 14.87 | 19.55 |
| | Including sales charges | | 21.57 | 13.52 | 18.85 |
| Advisor Class | 11/08/12 | 29.31 | 15.16 | 19.85 |
| Class C | Excluding sales charges | 10/13/03 | 28.00 | 14.02 | 18.66 |
| | Including sales charges | | 27.00 | 14.02 | 18.66 |
| Institutional Class | 11/09/00 | 29.30 | 15.16 | 19.85 |
| Institutional 2 Class | 11/08/12 | 29.36 | 15.23 | 19.96 |
| Institutional 3 Class* | 03/01/16 | 29.42 | 15.29 | 19.97 |
| S&P Global 1200 Information Technology Index (Net) | | 30.65 | 17.41 | 19.21 |
Returns for Class A shares are shown with and without the maximum initial sales charge of 5.75%. Returns for Class C shares are shown with and without the 1.00% contingent deferred sales charge for the first year only. The Fund’s other share classes are not subject to sales charges and have limited eligibility. Please see the Fund’s prospectus for details. Performance for different share classes will vary based on differences in sales charges and fees associated with each share class. All results shown assume reinvestment of distributions during the period. Returns do not reflect the deduction of taxes that a shareholder may pay on Fund distributions or on the redemption of Fund shares. Performance results reflect the effect of any fee waivers or reimbursements of Fund expenses by Columbia Management Investment Advisers, LLC and/or any of its affiliates. Absent these fee waivers or expense reimbursement arrangements, performance results would have been lower.
The performance information shown represents past performance and is not a guarantee of future results. The investment return and principal value of your investment will fluctuate so that your shares, when redeemed, may be worth more or less than their original cost. Current performance may be lower or higher than the performance information shown. You may obtain performance information current to the most recent month-end by contacting your financial intermediary, visiting columbiathreadneedleus.com/investor/ or calling 800.345.6611.
| * | The returns shown for periods prior to the share class inception date (including returns for the Life of the Fund, if shown, which are since Fund inception) include the returns of the Fund’s oldest share class. These returns are adjusted to reflect any higher class-related operating expenses of the newer share classes, as applicable. Please visit columbiathreadneedleus.com/investor/investment-products/mutual-funds/appended-performance for more information. |
The Fund’s performance prior to July 2014 reflects returns achieved pursuant to different principal investment strategies. If the Fund’s current strategies had been in place for the prior periods, results shown may have been different.
The S&P Global 1200 Information Technology Index (Net) is a float-adjusted, market-cap-weighted index consisting of all members of the S&P Global 1200 that are classified within the GICS Information Technology sector.
Indices are not available for investment, are not professionally managed and do not reflect sales charges, fees, brokerage commissions, taxes or other expenses of investing. Securities in the Fund may not match those in an index.
Columbia Global Technology Growth Fund | Annual Report 2023
| 3 |
Fund at a Glance (continued)
(Unaudited)
Performance of a hypothetical $10,000 investment (August 31, 2013 — August 31, 2023)
The chart above shows the change in value of a hypothetical $10,000 investment in Class A shares of Columbia Global Technology Growth Fund during the stated time period, and does not reflect the deduction of taxes that a shareholder may pay on Fund distributions or on the redemption of Fund shares.
| Equity sector breakdown (%) (at August 31, 2023) |
| Communication Services | 9.5 |
| Consumer Discretionary | 5.4 |
| Financials | 6.3 |
| Health Care | 0.2 |
| Industrials | 1.5 |
| Information Technology | 76.6 |
| Real Estate | 0.5 |
| Total | 100.0 |
Percentages indicated are based upon total equity investments. The Fund’s portfolio composition is subject to change.
| Equity sub-industry breakdown (%) (at August 31, 2023) |
| Information Technology | |
| Application Software | 11.5 |
| Communications Equipment | 2.1 |
| Electronic Components | 0.6 |
| Electronic Equipment & Instruments | 0.9 |
| Electronic Manufacturing Services | 0.4 |
| Internet Services & Infrastructure | 2.4 |
| IT Consulting & Other Services | 1.5 |
| Semiconductor Materials & Equipment | 8.0 |
| Semiconductors | 21.7 |
| Systems Software | 14.6 |
| Technology Distributors | 0.5 |
| Technology Hardware, Storage & Peripherals | 12.4 |
| Total | 76.6 |
Percentages indicated are based upon total equity investments. The Fund’s portfolio composition is subject to change.
| 4 | Columbia Global Technology Growth Fund | Annual Report 2023 |
Fund at a Glance (continued)
(Unaudited)
| Country breakdown (%) (at August 31, 2023) |
| Canada | 0.6 |
| China | 0.1 |
| France | 0.2 |
| Germany | 0.5 |
| Ireland | 1.2 |
| Israel | 0.2 |
| Japan | 0.6 |
| Netherlands | 3.8 |
| Norway | 0.1 |
| South Korea | 0.9 |
| Taiwan | 1.5 |
| United Kingdom | 0.2 |
| United States(a) | 90.1 |
| Total | 100.0 |
| (a) | Includes investments in Money Market Funds. |
Country breakdown is based primarily on issuer’s place of organization/incorporation. Percentages indicated are based upon total investments excluding investments in derivatives, if any. The Fund’s portfolio composition is subject to change.
The Fund may use place of organization/incorporation or other factors in determining whether an issuer is domestic (U.S.) or foreign for purposes of its investment policies. At August 31, 2023, the Fund invested at least 40% of its net assets in foreign companies in accordance with its principal investment strategy.
Columbia Global Technology Growth Fund | Annual Report 2023
| 5 |
Manager Discussion of Fund Performance
(Unaudited)
For the 12-month period that ended August 31, 2023, Class A shares of Columbia Global Technology Growth Fund returned 28.98% excluding sales charges. The Fund’s benchmark, the S&P Global 1200 Information Technology Index (Net) returned 30.65%.
Market overview
Global equity markets delivered outsized gains during the one-year period ending August 31, 2023 and bounced back after 2022 proved challenging. Macro pressures weighed on the market to start the year-long period, as they did at the end, and equities sold off during both periods. However, the market did advance steadily in the interim as macro pressures eased and the last remaining pockets of the world broadly re-opened following the COVID-19 pandemic. Most notably, China abandoned its zero-COVID policy to start 2023, allowing for activity to begin to normalize after the prolonged period of rolling lockdowns across much of the country. Europe benefited from falling inflation, particularly in Italy and Spain, and warm weather during the winter allayed concerns of energy shortages resulting from the loss of Russian supplies after the invasion of Ukraine. The consumer recovered and business confidence strengthened in Asia Pacific. Fluctuations in the US dollar, which had eroded returns significantly for U.S. investors over the previous 12-month period, proved favorable and also provided a boost.
While a resilient consumer and easing fears of a recession drove broad swaths of the market recovery, the world’s introduction to consumer-facing artificial intelligence (AI) products powered by large-language models (LLMs) resonated and drove technology outperformance. An LLM is a sophisticated AI system that uses advanced computer science techniques to process large amounts of text data and patterns in language, enabling human-like responses to queries. Almost as if programmed by lines of code, the steady cadence of new product releases from the world’s leading technology companies drove investor enthusiasm, especially for large-cap technology companies. Of note, during the second quarter of 2023, core holding NVIDIA Corp. became the first semiconductor company to exceed $1 trillion in equity market capitalization, while Apple became the first publicly traded company to exceed $3 trillion in equity value.
The uneven recovery of the Chinese economy, in addition to increased escalation of the decades-in-the-making technology cold war between the United States and China, did cause some market angst. Elsewhere in the world, declining property values, elevated local government debt and contraction in industrial activity did weigh on the economic outlook as well.
The Fund’s notable detractors during the period
| • | Areas that detracted most from Fund performance during the period included certain positions in the software, cyber-security and payments and ecommerce industries. |
| • | The largest individual detractors during the period included Fund holdings in Tesla, Inc., Fidelity National Information Services, Inc., Atlassian Corp., CrowdStrike Holdings, Inc. and PayPal Holdings, Inc. |
| • | The market fretted over Tesla’s ability to execute during the period, especially considering the potential for increased managerial distraction following CEO Elon Musk’s acquisition of social media giant Twitter and his involvement with several other disruptive technology start-ups. Separately, Tesla offered price discounts to customers in key growth market China and combatted persistent supply chain problems which weighed on production and the ability to procure import components such as electronic batteries. Despite the short-term frustration, the company’s new innovative factories could represent a competitive advantage once fully ramped, especially as AI is further integrated into the production process. |
| • | Shares of Fidelity National Information Services declined as macro pressures and increasing challenges at its key Merchant segment led to a forward outlook that fell short of market expectations. The stock’s underperformance during the period can also be attributed to fears of potential contagion effects that arose from the regional US banking crisis early in 2023. |
| • | Shares of Atlassian dropped during the period after the company reported a slew of underwhelming quarterly earnings. Most reported metrics fell below elevated market expectations. The company remains a leader in the continuous software development industry, and strong product leadership makes the company a must-have platform for IT departments and business support teams. |
| • | Shares of leading artificial intelligence cybersecurity company CrowdStrike Holdings underperformed. The company reported new customer subscription levels that came in below expectations, due in part to elongating customer buying |
| 6 | Columbia Global Technology Growth Fund | Annual Report 2023 |
Manager Discussion of Fund Performance (continued)
(Unaudited)
| | cycles that remained persistent. The company, still in hyper-growth mode, has executed well with impressive product innovation, and is among the most desirable offerings in the industry to combat the ever-increasing threat of cybersecurity attacks. |
| • | Despite holding an investor event where the company laid out a roadmap for product enhancements, the stock of PayPal Holdings languished during the period as execution risk remained substantial. Increased competitive intensity weighed on the company’s ability to gain market share at checkout and served as an overhang on the stock. The company has since named a new CEO which could represent an opportunity to provide a reinvigorated strategic direction. |
The Fund’s notable contributors during the period
| • | The largest contributor to Fund performance came from the Fund’s holdings in the semiconductors and semiconductor equipment industry. Fund holdings within the software, technology hardware, and interactive media industries also contributed notably to Fund results during the period. |
| • | The top absolute contributors to Fund performance included NVIDIA, Microsoft Corp., Broadcom, Inc., Lam Research Corp. and Apple, Inc. |
| • | Shares of leading semiconductor provider NVIDIA continued its years-long ascension as the market further appreciated the company’s near open-ended growth story. NVIDIA provides innovative semiconductors used to power the most advanced and compute-intensive workloads, including for AI. The company reported superlative quarterly results during the period, smashing market expectations and dazzling investors with very strong demand trends. |
| • | Microsoft grabbed investor attention as a result of its association with start-up OpenAI. OpenAI released the wildly popular ChatGPT, an LLM chatbot that took the world by storm after its release at the end of 2022. Strong quarterly earnings results and bullish commentary about all things AI established Microsoft as one of the leading AI trend setters of the 21st century. The company’s dominant position in cloud computing further strengthens its competitive advantage in AI, which will be integrated throughout its sprawling enterprise and consumer portfolio and change how the world works and lives. |
| • | Broadcom reported strong quarterly results and its management guided to an accelerating revenue profile, driven by contract wins for its custom silicon offerings for AI. In addition to the emerging AI story and the company’s history of consolidating the market, shares of Broadcom also benefited from favorable shareholder capital returns in the form of increased share buybacks and strong dividend growth. |
| • | Semiconductor capital equipment company Lam Research outperformed during the period, as the company provided reassuring commentary related to its ability to take market share while generating strong cash flow — the majority of which is to be returned to shareholders in the form of dividends and share repurchases. |
| • | Apple performed well during the period as it became the first publicly traded company to exceed $3 trillion in equity value. Apple’s thriving app ecosystem and nearly $100 billion in annualized services revenue have strengthened the company’s already formidable competitive moat and offers the potential for accelerating high-margin revenue growth. |
Market risk may affect a single issuer, sector of the economy, industry or the market as a whole. The products of technology companies may be subject to severe competition and rapid obsolescence, and technology stocks may be subject to greater price fluctuations. Growth securities, at times, may not perform as well as value securities or the stock market in general and may be out of favor with investors. Foreign investments subject the Fund to risks, including political, economic, market, social and others within a particular country, as well as to currency instabilities and less stringent financial and accounting standards generally applicable to U.S. issuers. See the Fund’s prospectus for more information on these and other risks.
The views expressed in this report reflect the current views of the respective parties who contributed to this report. These views are not guarantees of future performance and involve certain risks, uncertainties and assumptions that are difficult to predict, so actual outcomes and results may differ significantly from the views expressed. These views are subject to change at any time based upon economic, market or other conditions and the respective parties disclaim any responsibility to update such views. These views may not be relied on as investment advice and, because investment decisions for a Columbia fund are based on numerous factors, may not be relied on as an indication of trading intent on behalf of any particular Columbia fund. References to specific securities should not be construed as a recommendation or investment advice.
Columbia Global Technology Growth Fund | Annual Report 2023
| 7 |
Understanding Your Fund’s Expenses
(Unaudited)
As an investor, you incur two types of costs. There are shareholder transaction costs, which generally include sales charges on purchases and may include redemption fees. There are also ongoing fund costs, which generally include management fees, distribution and/or service fees, and other fund expenses. The following information is intended to help you understand your ongoing costs (in dollars) of investing in the Fund and to help you compare these costs with the ongoing costs of investing in other mutual funds.
Analyzing your Fund’s expenses
To illustrate these ongoing costs, we have provided examples and calculated the expenses paid by investors in each share class of the Fund during the period. The actual and hypothetical information in the table is based on an initial investment of $1,000 at the beginning of the period indicated and held for the entire period. Expense information is calculated two ways and each method provides you with different information. The amount listed in the “Actual” column is calculated using the Fund’s actual operating expenses and total return for the period. You may use the Actual information, together with the amount invested, to estimate the expenses that you paid over the period. Simply divide your account value by $1,000 (for example, an $8,600 account value divided by $1,000 = 8.6), then multiply the results by the expenses paid during the period under the “Actual” column. The amount listed in the “Hypothetical” column assumes a 5% annual rate of return before expenses (which is not the Fund’s actual return) and then applies the Fund’s actual expense ratio for the period to the hypothetical return. You should not use the hypothetical account values and expenses to estimate either your actual account balance at the end of the period or the expenses you paid during the period. See “Compare with other funds” below for details on how to use the hypothetical data.
Compare with other funds
Since all mutual funds are required to include the same hypothetical calculations about expenses in shareholder reports, you can use this information to compare the ongoing cost of investing in the Fund with other funds. To do so, compare the hypothetical example with the 5% hypothetical examples that appear in the shareholder reports of other funds. As you compare hypothetical examples of other funds, it is important to note that hypothetical examples are meant to highlight the ongoing costs of investing in a fund only and do not reflect any transaction costs, such as sales charges, or redemption or exchange fees. Therefore, the hypothetical calculations are useful in comparing ongoing costs only, and will not help you determine the relative total costs of owning different funds. If transaction costs were included in these calculations, your costs would be higher.
| March 1, 2023 — August 31, 2023 |
| | Account value at the
beginning of the
period ($) | Account value at the
end of the
period ($) | Expenses paid during
the period ($) | Fund’s annualized
expense ratio (%) |
| | Actual | Hypothetical | Actual | Hypothetical | Actual | Hypothetical | Actual |
| Class A | 1,000.00 | 1,000.00 | 1,284.80 | 1,019.26 | 6.80 | 6.01 | 1.18 |
| Advisor Class | 1,000.00 | 1,000.00 | 1,286.50 | 1,020.47 | 5.42 | 4.79 | 0.94 |
| Class C | 1,000.00 | 1,000.00 | 1,280.00 | 1,015.48 | 11.09 | 9.80 | 1.93 |
| Institutional Class | 1,000.00 | 1,000.00 | 1,286.30 | 1,020.47 | 5.42 | 4.79 | 0.94 |
| Institutional 2 Class | 1,000.00 | 1,000.00 | 1,286.80 | 1,020.77 | 5.07 | 4.48 | 0.88 |
| Institutional 3 Class | 1,000.00 | 1,000.00 | 1,287.20 | 1,021.02 | 4.78 | 4.23 | 0.83 |
Expenses paid during the period are equal to the annualized expense ratio for each class as indicated above, multiplied by the average account value over the period and then multiplied by the number of days in the Fund’s most recent fiscal half year and divided by 365.
Expenses do not include fees and expenses incurred indirectly by the Fund from its investment in underlying funds, including affiliated and non-affiliated pooled investment vehicles, such as mutual funds and exchange-traded funds.
| 8 | Columbia Global Technology Growth Fund | Annual Report 2023 |
Portfolio of Investments
August 31, 2023
(Percentages represent value of investments compared to net assets)
Investments in securities
| Common Stocks 98.4% |
| Issuer | Shares | Value ($) |
| Canada 0.6% |
| Shopify, Inc., Class A(a) | 233,870 | 15,550,016 |
| China 0.1% |
| Alibaba Group Holding Ltd., ADR(a) | 15,011 | 1,394,522 |
| Tencent Holdings Ltd. | 30,700 | 1,272,219 |
| Total | 2,666,741 |
| France 0.2% |
| Capgemini SE | 26,956 | 5,030,563 |
| Germany 0.5% |
| SAP SE, ADR | 91,229 | 12,743,779 |
| Ireland 1.2% |
| Accenture PLC, Class A | 92,550 | 29,964,914 |
| Israel 0.1% |
| Global-e Online Ltd.(a) | 86,025 | 3,409,171 |
| Japan 0.6% |
| Keyence Corp. | 32,500 | 13,493,084 |
| Netherlands 3.8% |
| ASML Holding NV | 83,297 | 55,020,167 |
| NXP Semiconductors NV | 129,601 | 26,661,518 |
| STMicroelectronics NV, Registered Shares | 288,020 | 13,611,825 |
| Total | 95,293,510 |
| Norway 0.1% |
| SmartCraft ASA(a) | 1,512,821 | 3,016,621 |
| South Korea 0.9% |
| Samsung Electronics Co., Ltd. | 457,633 | 23,145,360 |
| Taiwan 1.5% |
| Taiwan Semiconductor Manufacturing Co., Ltd., ADR | 401,908 | 37,606,532 |
| United Kingdom 0.2% |
| RELX PLC | 14,835 | 483,543 |
| Sage Group PLC (The) | 299,085 | 3,675,340 |
| Total | 4,158,883 |
| Common Stocks (continued) |
| Issuer | Shares | Value ($) |
| United States 88.6% |
| Activision Blizzard, Inc. | 172,996 | 15,913,902 |
| Adobe, Inc.(a) | 74,778 | 41,826,327 |
| Advanced Micro Devices, Inc.(a) | 295,203 | 31,208,861 |
| Airbnb, Inc., Class A(a) | 52,967 | 6,967,809 |
| Akamai Technologies, Inc.(a) | 50,052 | 5,259,965 |
| Alphabet, Inc., Class A(a) | 829,204 | 112,912,709 |
| Amazon.com, Inc.(a) | 589,363 | 81,337,988 |
| Amphenol Corp., Class A | 124,984 | 11,046,086 |
| Analog Devices, Inc. | 146,452 | 26,622,045 |
| ANSYS, Inc.(a) | 41,267 | 13,158,808 |
| Apple, Inc. | 1,376,021 | 258,513,065 |
| Applied Materials, Inc. | 281,119 | 42,943,738 |
| Arista Networks, Inc.(a) | 69,281 | 13,525,730 |
| Atlassian Corp., Class A(a) | 64,686 | 13,199,825 |
| Autodesk, Inc.(a) | 40,427 | 8,972,368 |
| Automatic Data Processing, Inc. | 40,626 | 10,343,786 |
| BILL Holdings, Inc.(a) | 46,334 | 5,342,310 |
| Block, Inc., Class A(a) | 61,860 | 3,566,229 |
| Booking Holdings, Inc.(a) | 4,391 | 13,634,187 |
| Broadcom, Inc. | 116,624 | 107,631,123 |
| Cadence Design Systems, Inc.(a) | 84,351 | 20,281,354 |
| CDW Corp. | 51,449 | 10,863,456 |
| Cisco Systems, Inc. | 422,856 | 24,250,792 |
| Comcast Corp., Class A | 100,730 | 4,710,135 |
| Corning, Inc. | 119,660 | 3,927,241 |
| CoStar Group, Inc.(a) | 73,937 | 6,062,095 |
| Crowdstrike Holdings, Inc., Class A(a) | 119,956 | 19,556,427 |
| Datadog, Inc., Class A(a) | 5,396 | 520,606 |
| Electronic Arts, Inc. | 51,242 | 6,148,015 |
| Endeavor Group Holdings, Inc., Class A(a) | 153,559 | 3,361,407 |
| EPAM Systems, Inc.(a) | 3,161 | 818,667 |
| Fidelity National Information Services, Inc. | 95,972 | 5,360,996 |
| Fiserv, Inc.(a) | 80,884 | 9,818,509 |
| Flywire Corp.(a) | 166,277 | 5,749,859 |
| Fortinet, Inc.(a) | 258,710 | 15,576,929 |
| Gartner, Inc.(a) | 2,820 | 986,098 |
The accompanying Notes to Financial Statements are an integral part of this statement.
Columbia Global Technology Growth Fund | Annual Report 2023
| 9 |
Portfolio of Investments (continued)
August 31, 2023
| Common Stocks (continued) |
| Issuer | Shares | Value ($) |
| Global Payments, Inc. | 60,434 | 7,656,383 |
| HP, Inc. | 141,189 | 4,194,725 |
| HubSpot, Inc.(a) | 15,003 | 8,199,440 |
| Intel Corp. | 321,438 | 11,295,331 |
| Intuit, Inc. | 67,055 | 36,331,070 |
| Keysight Technologies, Inc.(a) | 61,307 | 8,172,223 |
| KLA Corp. | 29,507 | 14,808,678 |
| Lam Research Corp. | 118,709 | 83,381,202 |
| Marvell Technology, Inc. | 561,724 | 32,720,423 |
| MasterCard, Inc., Class A | 118,097 | 48,731,546 |
| Match Group, Inc.(a) | 72,944 | 3,418,885 |
| Meta Platforms, Inc., Class A(a) | 124,420 | 36,814,634 |
| Microchip Technology, Inc. | 147,022 | 12,032,280 |
| Micron Technology, Inc. | 140,195 | 9,805,238 |
| Microsoft Corp. | 749,409 | 245,626,294 |
| MongoDB, Inc.(a) | 32,143 | 12,256,126 |
| Motorola Solutions, Inc. | 51,603 | 14,633,063 |
| MSCI, Inc. | 11,301 | 6,143,450 |
| NetApp, Inc. | 161,030 | 12,351,001 |
| Netflix, Inc.(a) | 39,778 | 17,250,923 |
| NVIDIA Corp. | 384,601 | 189,819,824 |
| Oracle Corp. | 273,838 | 32,967,357 |
| Palo Alto Networks, Inc.(a) | 76,650 | 18,648,945 |
| Paycom Software, Inc. | 25,092 | 7,398,125 |
| PayPal Holdings, Inc.(a) | 3,908 | 244,289 |
| QUALCOMM, Inc. | 145,029 | 16,610,171 |
| Salesforce, Inc.(a) | 118,393 | 26,219,314 |
| SBA Communications Corp. | 24,625 | 5,529,051 |
| ServiceNow, Inc.(a) | 43,303 | 25,498,105 |
| Shift4 Payments, Inc., Class A(a) | 62,829 | 3,568,059 |
| Common Stocks (continued) |
| Issuer | Shares | Value ($) |
| Snowflake, Inc., Class A(a) | 74,089 | 11,620,860 |
| Splunk, Inc.(a) | 34,567 | 4,191,594 |
| Synopsys, Inc.(a) | 155,580 | 71,394,106 |
| Take-Two Interactive Software, Inc.(a) | 35,995 | 5,118,489 |
| TE Connectivity Ltd. | 75,030 | 9,933,222 |
| Tesla, Inc.(a) | 69,406 | 17,912,300 |
| Texas Instruments, Inc. | 100,871 | 16,952,380 |
| T-Mobile US, Inc.(a) | 73,262 | 9,981,947 |
| Trade Desk, Inc. (The), Class A(a) | 104,010 | 8,323,920 |
| Tyler Technologies, Inc.(a) | 13,386 | 5,333,384 |
| Uber Technologies, Inc.(a) | 407,459 | 19,244,289 |
| Veeva Systems Inc., Class A(a) | 26,639 | 5,559,559 |
| VeriSign, Inc.(a) | 72,975 | 15,163,475 |
| Visa, Inc., Class A | 259,118 | 63,660,110 |
| Visteon Corp.(a) | 58,849 | 8,195,900 |
| Walt Disney Co. (The)(a) | 75,587 | 6,325,120 |
| Western Digital Corp.(a) | 98,274 | 4,422,330 |
| Workday, Inc., Class A(a) | 24,313 | 5,944,529 |
| Total | 2,203,523,116 |
Total Common Stocks
(Cost $775,744,986) | 2,449,602,290 |
|
| Money Market Funds 1.5% |
| | Shares | Value ($) |
| Columbia Short-Term Cash Fund, 5.476%(b),(c) | 36,792,268 | 36,781,231 |
Total Money Market Funds
(Cost $36,774,757) | 36,781,231 |
Total Investments in Securities
(Cost $812,519,743) | 2,486,383,521 |
| Other Assets & Liabilities, Net | | 2,036,641 |
| Net Assets | $2,488,420,162 |
The accompanying Notes to Financial Statements are an integral part of this statement.
| 10 | Columbia Global Technology Growth Fund | Annual Report 2023 |
Portfolio of Investments (continued)
August 31, 2023
Notes to Portfolio of Investments
| (a) | Non-income producing investment. |
| (b) | The rate shown is the seven-day current annualized yield at August 31, 2023. |
| (c) | As defined in the Investment Company Act of 1940, as amended, an affiliated company is one in which the Fund owns 5% or more of the company’s outstanding voting securities, or a company which is under common ownership or control with the Fund. The value of the holdings and transactions in these affiliated companies during the year ended August 31, 2023 are as follows: |
| Affiliated issuers | Beginning
of period($) | Purchases($) | Sales($) | Net change in
unrealized
appreciation
(depreciation)($) | End of
period($) | Realized gain
(loss)($) | Dividends($) | End of
period shares |
| Columbia Short-Term Cash Fund, 5.476% |
| | 28,853,973 | 218,741,208 | (210,817,434) | 3,484 | 36,781,231 | 1,812 | 1,271,510 | 36,792,268 |
Abbreviation Legend
| ADR | American Depositary Receipt |
Fair value measurements
The Fund categorizes its fair value measurements according to a three-level hierarchy that maximizes the use of observable inputs and minimizes the use of unobservable inputs by prioritizing that the most observable input be used when available. Observable inputs are those that market participants would use in pricing an investment based on market data obtained from sources independent of the reporting entity. Unobservable inputs are those that reflect the Fund’s assumptions about the information market participants would use in pricing an investment. An investment’s level within the fair value hierarchy is based on the lowest level of any input that is deemed significant to the asset’s or liability’s fair value measurement. The input levels are not necessarily an indication of the risk or liquidity associated with investments at that level. For example, certain U.S. government securities are generally high quality and liquid, however, they are reflected as Level 2 because the inputs used to determine fair value may not always be quoted prices in an active market.
Fair value inputs are summarized in the three broad levels listed below:
| ■ | Level 1 — Valuations based on quoted prices for investments in active markets that the Fund has the ability to access at the measurement date. Valuation adjustments are not applied to Level 1 investments. |
| ■ | Level 2 — Valuations based on other significant observable inputs (including quoted prices for similar securities, interest rates, prepayment speeds, credit risks, etc.). |
| ■ | Level 3 — Valuations based on significant unobservable inputs (including the Fund’s own assumptions and judgment in determining the fair value of investments). |
Inputs that are used in determining fair value of an investment may include price information, credit data, volatility statistics, and other factors. These inputs can be either observable or unobservable. The availability of observable inputs can vary between investments, and is affected by various factors such as the type of investment, and the volume and level of activity for that investment or similar investments in the marketplace. The inputs will be considered by the Investment Manager, along with any other relevant factors in the calculation of an investment’s fair value. The Fund uses prices and inputs that are current as of the measurement date, which may include periods of market dislocations. During these periods, the availability of prices and inputs may be reduced for many investments. This condition could cause an investment to be reclassified between the various levels within the hierarchy.
Foreign equity securities actively traded in markets where there is a significant delay in the local close relative to the New York Stock Exchange are classified as Level 2. The values of these securities may include an adjustment to reflect the impact of market movements following the close of local trading, as described in Note 2 to the financial statements – Security valuation.
Investments falling into the Level 3 category are primarily supported by quoted prices from brokers and dealers participating in the market for those investments. However, these may be classified as Level 3 investments due to lack of market transparency and corroboration to support these quoted prices. Additionally, valuation models may be used as the pricing source for any remaining investments classified as Level 3. These models may rely on one or more significant unobservable inputs and/or significant assumptions by the Investment Manager. Inputs used in valuations may include, but are not limited to, financial statement analysis, capital account balances, discount rates and estimated cash flows, and comparable company data.
The Fund’s Board of Trustees (the Board) has designated the Investment Manager, through its Valuation Committee (the Committee), as valuation designee, responsible for determining the fair value of the assets of the Fund for which market quotations are not readily available using valuation procedures approved by the Board. The Committee consists of voting and non-voting members from various groups within the Investment Manager’s organization, including operations and accounting, trading and investments, compliance, risk management and legal.
The Committee meets at least monthly to review and approve valuation matters, which may include a description of specific valuation determinations, data regarding pricing information received from approved pricing vendors and brokers and the results of Board-approved valuation policies and procedures (the Policies). The Policies address, among other things, instances when market quotations are or are not readily available, including recommendations of third party pricing vendors and a determination of appropriate pricing methodologies; events that require specific valuation determinations and assessment of fair value techniques; securities with a potential for stale pricing, including those that are illiquid, restricted, or in default; and the effectiveness of third party pricing vendors, including periodic reviews of vendors. The Committee meets more frequently, as needed, to discuss additional valuation matters, which may include the need to review back-testing results, review time-sensitive information or approve related valuation actions. Representatives of Columbia Management Investment Advisers, LLC report to the Board at each of its regularly scheduled meetings to discuss valuation matters and actions during the period, similar to those described earlier.
The accompanying Notes to Financial Statements are an integral part of this statement.
Columbia Global Technology Growth Fund | Annual Report 2023
| 11 |
Portfolio of Investments (continued)
August 31, 2023
Fair value measurements (continued)
The following table is a summary of the inputs used to value the Fund’s investments at August 31, 2023:
| | Level 1 ($) | Level 2 ($) | Level 3 ($) | Total ($) |
| Investments in Securities | | | | |
| Common Stocks | | | | |
| Canada | 15,550,016 | — | — | 15,550,016 |
| China | 1,394,522 | 1,272,219 | — | 2,666,741 |
| France | — | 5,030,563 | — | 5,030,563 |
| Germany | 12,743,779 | — | — | 12,743,779 |
| Ireland | 29,964,914 | — | — | 29,964,914 |
| Israel | 3,409,171 | — | — | 3,409,171 |
| Japan | — | 13,493,084 | — | 13,493,084 |
| Netherlands | 95,293,510 | — | — | 95,293,510 |
| Norway | — | 3,016,621 | — | 3,016,621 |
| South Korea | — | 23,145,360 | — | 23,145,360 |
| Taiwan | 37,606,532 | — | — | 37,606,532 |
| United Kingdom | — | 4,158,883 | — | 4,158,883 |
| United States | 2,203,523,116 | — | — | 2,203,523,116 |
| Total Common Stocks | 2,399,485,560 | 50,116,730 | — | 2,449,602,290 |
| Money Market Funds | 36,781,231 | — | — | 36,781,231 |
| Total Investments in Securities | 2,436,266,791 | 50,116,730 | — | 2,486,383,521 |
See the Portfolio of Investments for all investment classifications not indicated in the table.
The Fund’s assets assigned to the Level 2 input category are generally valued using the market approach, in which a security’s value is determined through reference to prices and information from market transactions for similar or identical assets. These assets include certain foreign securities for which a third party statistical pricing service may be employed for purposes of fair market valuation. The model utilized by such third party statistical pricing service takes into account a security’s correlation to available market data including, but not limited to, intraday index, ADR, and exchange-traded fund movements.
The accompanying Notes to Financial Statements are an integral part of this statement.
| 12 | Columbia Global Technology Growth Fund | Annual Report 2023 |
Statement of Assets and Liabilities
August 31, 2023
| Assets | |
| Investments in securities, at value | |
| Unaffiliated issuers (cost $775,744,986) | $2,449,602,290 |
| Affiliated issuers (cost $36,774,757) | 36,781,231 |
| Receivable for: | |
| Investments sold | 2,012,076 |
| Capital shares sold | 2,129,341 |
| Dividends | 1,296,763 |
| Foreign tax reclaims | 65,926 |
| Trustees’ fees | 126,746 |
| Prepaid expenses | 25,567 |
| Total assets | 2,492,039,940 |
| Liabilities | |
| Foreign currency (cost $7,878) | 7,881 |
| Payable for: | |
| Investments purchased | 1,451,659 |
| Capital shares redeemed | 1,632,589 |
| Management services fees | 54,255 |
| Distribution and/or service fees | 8,684 |
| Transfer agent fees | 224,367 |
| Trustees’ fees | 177,171 |
| Other expenses | 63,172 |
| Total liabilities | 3,619,778 |
| Net assets applicable to outstanding capital stock | $2,488,420,162 |
| Represented by | |
| Paid in capital | 782,565,596 |
| Total distributable earnings (loss) | 1,705,854,566 |
| Total - representing net assets applicable to outstanding capital stock | $2,488,420,162 |
| Class A | |
| Net assets | $625,053,520 |
| Shares outstanding | 10,048,246 |
| Net asset value per share | $62.21 |
| Maximum sales charge | 5.75% |
| Maximum offering price per share (calculated by dividing the net asset value per share by 1.0 minus the maximum sales charge for Class A shares) | $66.01 |
| Advisor Class | |
| Net assets | $108,155,831 |
| Shares outstanding | 1,626,267 |
| Net asset value per share | $66.51 |
| Class C | |
| Net assets | $162,519,934 |
| Shares outstanding | 3,030,261 |
| Net asset value per share | $53.63 |
| Institutional Class | |
| Net assets | $955,376,317 |
| Shares outstanding | 14,583,171 |
| Net asset value per share | $65.51 |
| Institutional 2 Class | |
| Net assets | $193,554,081 |
| Shares outstanding | 2,885,211 |
| Net asset value per share | $67.08 |
| Institutional 3 Class | |
| Net assets | $443,760,479 |
| Shares outstanding | 6,586,603 |
| Net asset value per share | $67.37 |
The accompanying Notes to Financial Statements are an integral part of this statement.
Columbia Global Technology Growth Fund | Annual Report 2023
| 13 |
Statement of Operations
Year Ended August 31, 2023
| Net investment income | |
| Income: | |
| Dividends — unaffiliated issuers | $16,775,299 |
| Dividends — affiliated issuers | 1,271,510 |
| Foreign taxes withheld | (499,150) |
| Total income | 17,547,659 |
| Expenses: | |
| Management services fees | 16,913,487 |
| Distribution and/or service fees | |
| Class A | 1,322,361 |
| Class C | 1,441,809 |
| Transfer agent fees | |
| Class A | 594,232 |
| Advisor Class | 98,115 |
| Class C | 162,013 |
| Institutional Class | 894,201 |
| Institutional 2 Class | 88,939 |
| Institutional 3 Class | 24,695 |
| Trustees’ fees | 54,276 |
| Custodian fees | 36,865 |
| Printing and postage fees | 106,906 |
| Registration fees | 134,434 |
| Accounting services fees | 30,768 |
| Legal fees | 39,037 |
| Compensation of chief compliance officer | 365 |
| Other | 52,302 |
| Total expenses | 21,994,805 |
| Expense reduction | (460) |
| Total net expenses | 21,994,345 |
| Net investment loss | (4,446,686) |
| Realized and unrealized gain (loss) — net | |
| Net realized gain (loss) on: | |
| Investments — unaffiliated issuers | 56,843,407 |
| Investments — affiliated issuers | 1,812 |
| Foreign currency translations | 1,175 |
| Net realized gain | 56,846,394 |
| Net change in unrealized appreciation (depreciation) on: | |
| Investments — unaffiliated issuers | 497,120,002 |
| Investments — affiliated issuers | 3,484 |
| Foreign currency translations | 6,902 |
| Net change in unrealized appreciation (depreciation) | 497,130,388 |
| Net realized and unrealized gain | 553,976,782 |
| Net increase in net assets resulting from operations | $549,530,096 |
The accompanying Notes to Financial Statements are an integral part of this statement.
| 14 | Columbia Global Technology Growth Fund | Annual Report 2023 |
Statement of Changes in Net Assets
| | Year Ended
August 31, 2023 | Year Ended
August 31, 2022 |
| Operations | | |
| Net investment loss | $(4,446,686) | $(10,523,430) |
| Net realized gain | 56,846,394 | 86,415,602 |
| Net change in unrealized appreciation (depreciation) | 497,130,388 | (820,659,300) |
| Net increase (decrease) in net assets resulting from operations | 549,530,096 | (744,767,128) |
| Distributions to shareholders | | |
| Net investment income and net realized gains | | |
| Class A | (15,587,900) | (30,250,343) |
| Advisor Class | (2,386,035) | (5,648,183) |
| Class C | (5,046,799) | (9,216,658) |
| Institutional Class | (22,467,282) | (58,805,302) |
| Institutional 2 Class | (4,364,437) | (9,361,729) |
| Institutional 3 Class | (10,547,931) | (19,242,649) |
| Total distributions to shareholders | (60,400,384) | (132,524,864) |
| Decrease in net assets from capital stock activity | (161,139,874) | (189,662,493) |
| Total increase (decrease) in net assets | 327,989,838 | (1,066,954,485) |
| Net assets at beginning of year | 2,160,430,324 | 3,227,384,809 |
| Net assets at end of year | $2,488,420,162 | $2,160,430,324 |
The accompanying Notes to Financial Statements are an integral part of this statement.
Columbia Global Technology Growth Fund | Annual Report 2023
| 15 |
Statement of Changes in Net Assets (continued)
| | Year Ended | Year Ended |
| | August 31, 2023 | August 31, 2022 |
| | Shares | Dollars ($) | Shares | Dollars ($) |
| Capital stock activity |
| Class A | | | | |
| Shares sold | 1,548,809 | 81,355,344 | 1,621,216 | 97,434,247 |
| Distributions reinvested | 311,437 | 14,017,782 | 403,671 | 26,932,912 |
| Shares redeemed | (2,258,385) | (118,177,699) | (2,211,457) | (129,855,926) |
| Net decrease | (398,139) | (22,804,573) | (186,570) | (5,488,767) |
| Advisor Class | | | | |
| Shares sold | 566,466 | 31,663,955 | 424,128 | 27,391,632 |
| Distributions reinvested | 47,968 | 2,304,404 | 77,045 | 5,460,919 |
| Shares redeemed | (605,150) | (32,663,039) | (921,483) | (59,197,248) |
| Net increase (decrease) | 9,284 | 1,305,320 | (420,310) | (26,344,697) |
| Class C | | | | |
| Shares sold | 277,908 | 12,683,420 | 295,862 | 16,031,913 |
| Distributions reinvested | 122,951 | 4,797,557 | 147,721 | 8,650,536 |
| Shares redeemed | (868,424) | (37,928,945) | (948,069) | (49,328,340) |
| Net decrease | (467,565) | (20,447,968) | (504,486) | (24,645,891) |
| Institutional Class | | | | |
| Shares sold | 2,545,848 | 139,783,376 | 3,589,971 | 218,299,110 |
| Distributions reinvested | 421,361 | 19,938,807 | 625,016 | 43,657,376 |
| Shares redeemed | (3,926,739) | (205,161,213) | (8,331,772) | (494,807,490) |
| Net decrease | (959,530) | (45,439,030) | (4,116,785) | (232,851,004) |
| Institutional 2 Class | | | | |
| Shares sold | 805,090 | 45,269,348 | 514,999 | 32,257,304 |
| Distributions reinvested | 90,090 | 4,363,940 | 131,098 | 9,361,729 |
| Shares redeemed | (865,275) | (47,816,036) | (1,016,556) | (67,563,321) |
| Net increase (decrease) | 29,905 | 1,817,252 | (370,459) | (25,944,288) |
| Institutional 3 Class | | | | |
| Shares sold | 1,335,685 | 76,884,977 | 4,106,347 | 249,400,923 |
| Distributions reinvested | 150,883 | 7,337,420 | 267,546 | 19,169,684 |
| Shares redeemed | (3,009,027) | (159,793,272) | (2,293,150) | (142,958,453) |
| Net increase (decrease) | (1,522,459) | (75,570,875) | 2,080,743 | 125,612,154 |
| Total net decrease | (3,308,504) | (161,139,874) | (3,517,867) | (189,662,493) |
The accompanying Notes to Financial Statements are an integral part of this statement.
| 16 | Columbia Global Technology Growth Fund | Annual Report 2023 |
[THIS PAGE INTENTIONALLY LEFT BLANK]
Columbia Global Technology Growth Fund | Annual Report 2023
| 17 |
The following table is intended to help you understand the Fund’s financial performance. Certain information reflects financial results for a single share of a class held for the periods shown. Per share net investment income (loss) amounts are calculated based on average shares outstanding during the period. Total return assumes reinvestment of all dividends and distributions, if any. Total return does not reflect payment of sales charges, if any. Total return and portfolio turnover are not annualized for periods of less than one year. The ratios of expenses and net investment income are annualized for periods of less than one year. The portfolio turnover rate is calculated without regard to purchase and sales transactions of short-term instruments and certain derivatives, if any. If such transactions were included, the Fund’s portfolio turnover rate may be higher.
| | Net asset value,
beginning of
period | Net
investment
income
(loss) | Net
realized
and
unrealized
gain (loss) | Total from
investment
operations | Distributions
from net
realized
gains | Total
distributions to
shareholders |
| Class A |
| Year Ended 8/31/2023 | $49.88 | (0.18) | 14.05 | 13.87 | (1.54) | (1.54) |
| Year Ended 8/31/2022 | $68.96 | (0.31) | (15.91) | (16.22) | (2.86) | (2.86) |
| Year Ended 8/31/2021 | $52.81 | (0.34) | 17.02 | 16.68 | (0.53) | (0.53) |
| Year Ended 8/31/2020 | $35.69 | (0.14) | 17.76 | 17.62 | (0.50) | (0.50) |
| Year Ended 8/31/2019 | $36.28 | (0.05) | 1.10 | 1.05 | (1.64) | (1.64) |
| Advisor Class |
| Year Ended 8/31/2023 | $53.08 | (0.06) | 15.03 | 14.97 | (1.54) | (1.54) |
| Year Ended 8/31/2022 | $73.19 | (0.18) | (16.90) | (17.08) | (3.03) | (3.03) |
| Year Ended 8/31/2021 | $55.95 | (0.20) | 18.04 | 17.84 | (0.60) | (0.60) |
| Year Ended 8/31/2020 | $37.69 | (0.04) | 18.80 | 18.76 | (0.50) | (0.50) |
| Year Ended 8/31/2019 | $38.21 | 0.04 | 1.16 | 1.20 | (1.72) | (1.72) |
| Class C |
| Year Ended 8/31/2023 | $43.55 | (0.49) | 12.11 | 11.62 | (1.54) | (1.54) |
| Year Ended 8/31/2022 | $60.51 | (0.67) | (13.93) | (14.60) | (2.36) | (2.36) |
| Year Ended 8/31/2021 | $46.75 | (0.69) | 14.98 | 14.29 | (0.53) | (0.53) |
| Year Ended 8/31/2020 | $31.88 | (0.40) | 15.77 | 15.37 | (0.50) | (0.50) |
| Year Ended 8/31/2019 | $32.54 | (0.27) | 0.99 | 0.72 | (1.38) | (1.38) |
| Institutional Class |
| Year Ended 8/31/2023 | $52.31 | (0.06) | 14.80 | 14.74 | (1.54) | (1.54) |
| Year Ended 8/31/2022 | $72.17 | (0.17) | (16.66) | (16.83) | (3.03) | (3.03) |
| Year Ended 8/31/2021 | $55.18 | (0.20) | 17.79 | 17.59 | (0.60) | (0.60) |
| Year Ended 8/31/2020 | $37.17 | (0.04) | 18.55 | 18.51 | (0.50) | (0.50) |
| Year Ended 8/31/2019 | $37.72 | 0.03 | 1.15 | 1.18 | (1.73) | (1.73) |
| Institutional 2 Class |
| Year Ended 8/31/2023 | $53.50 | (0.03) | 15.15 | 15.12 | (1.54) | (1.54) |
| Year Ended 8/31/2022 | $73.74 | (0.14) | (17.03) | (17.17) | (3.07) | (3.07) |
| Year Ended 8/31/2021 | $56.36 | (0.17) | 18.18 | 18.01 | (0.63) | (0.63) |
| Year Ended 8/31/2020 | $37.94 | (0.01) | 18.93 | 18.92 | (0.50) | (0.50) |
| Year Ended 8/31/2019 | $38.45 | 0.06 | 1.18 | 1.24 | (1.75) | (1.75) |
The accompanying Notes to Financial Statements are an integral part of this statement.
| 18 | Columbia Global Technology Growth Fund | Annual Report 2023 |
Financial Highlights (continued)
| | Net
asset
value,
end of
period | Total
return | Total gross
expense
ratio to
average
net assets(a) | Total net
expense
ratio to
average
net assets(a),(b) | Net investment
income (loss)
ratio to
average
net assets | Portfolio
turnover | Net
assets,
end of
period
(000’s) |
| Class A |
| Year Ended 8/31/2023 | $62.21 | 28.98% | 1.19% | 1.19%(c) | (0.35%) | 7% | $625,054 |
| Year Ended 8/31/2022 | $49.88 | (24.57%) | 1.18% | 1.18%(c) | (0.52%) | 8% | $521,027 |
| Year Ended 8/31/2021 | $68.96 | 31.80% | 1.18% | 1.18%(c) | (0.57%) | 18% | $733,206 |
| Year Ended 8/31/2020 | $52.81 | 49.88% | 1.22% | 1.22%(c) | (0.35%) | 12% | $542,684 |
| Year Ended 8/31/2019 | $35.69 | 4.08% | 1.24% | 1.24% | (0.16%) | 40% | $333,217 |
| Advisor Class |
| Year Ended 8/31/2023 | $66.51 | 29.31% | 0.94% | 0.94%(c) | (0.10%) | 7% | $108,156 |
| Year Ended 8/31/2022 | $53.08 | (24.38%) | 0.92% | 0.92%(c) | (0.27%) | 8% | $85,831 |
| Year Ended 8/31/2021 | $73.19 | 32.12% | 0.93% | 0.93%(c) | (0.32%) | 18% | $149,110 |
| Year Ended 8/31/2020 | $55.95 | 50.26% | 0.97% | 0.97%(c) | (0.10%) | 12% | $228,489 |
| Year Ended 8/31/2019 | $37.69 | 4.33% | 0.99% | 0.99% | 0.11% | 40% | $135,472 |
| Class C |
| Year Ended 8/31/2023 | $53.63 | 28.00% | 1.94% | 1.94%(c) | (1.10%) | 7% | $162,520 |
| Year Ended 8/31/2022 | $43.55 | (25.12%) | 1.92% | 1.92%(c) | (1.27%) | 8% | $152,317 |
| Year Ended 8/31/2021 | $60.51 | 30.80% | 1.93% | 1.93%(c) | (1.32%) | 18% | $242,186 |
| Year Ended 8/31/2020 | $46.75 | 48.77% | 1.97% | 1.97%(c) | (1.10%) | 12% | $207,808 |
| Year Ended 8/31/2019 | $31.88 | 3.31% | 1.99% | 1.99% | (0.90%) | 40% | $139,366 |
| Institutional Class |
| Year Ended 8/31/2023 | $65.51 | 29.30% | 0.94% | 0.94%(c) | (0.10%) | 7% | $955,376 |
| Year Ended 8/31/2022 | $52.31 | (24.38%) | 0.92% | 0.92%(c) | (0.27%) | 8% | $813,076 |
| Year Ended 8/31/2021 | $72.17 | 32.11% | 0.93% | 0.93%(c) | (0.32%) | 18% | $1,418,896 |
| Year Ended 8/31/2020 | $55.18 | 50.29% | 0.97% | 0.97%(c) | (0.10%) | 12% | $1,143,613 |
| Year Ended 8/31/2019 | $37.17 | 4.32% | 0.99% | 0.99% | 0.09% | 40% | $693,232 |
| Institutional 2 Class |
| Year Ended 8/31/2023 | $67.08 | 29.36% | 0.88% | 0.88% | (0.05%) | 7% | $193,554 |
| Year Ended 8/31/2022 | $53.50 | (24.33%) | 0.87% | 0.87% | (0.22%) | 8% | $152,756 |
| Year Ended 8/31/2021 | $73.74 | 32.20% | 0.87% | 0.87% | (0.26%) | 18% | $237,884 |
| Year Ended 8/31/2020 | $56.36 | 50.35% | 0.90% | 0.90% | (0.03%) | 12% | $184,262 |
| Year Ended 8/31/2019 | $37.94 | 4.42% | 0.92% | 0.92% | 0.17% | 40% | $130,115 |
The accompanying Notes to Financial Statements are an integral part of this statement.
Columbia Global Technology Growth Fund | Annual Report 2023
| 19 |
Financial Highlights (continued)
| | Net asset value,
beginning of
period | Net
investment
income
(loss) | Net
realized
and
unrealized
gain (loss) | Total from
investment
operations | Distributions
from net
realized
gains | Total
distributions to
shareholders |
| Institutional 3 Class |
| Year Ended 8/31/2023 | $53.70 | 0.00(d) | 15.21 | 15.21 | (1.54) | (1.54) |
| Year Ended 8/31/2022 | $74.00 | (0.11) | (17.09) | (17.20) | (3.10) | (3.10) |
| Year Ended 8/31/2021 | $56.55 | (0.14) | 18.25 | 18.11 | (0.66) | (0.66) |
| Year Ended 8/31/2020 | $38.04 | 0.01 | 19.00 | 19.01 | (0.50) | (0.50) |
| Year Ended 8/31/2019 | $38.55 | 0.08 | 1.18 | 1.26 | (1.77) | (1.77) |
| Notes to Financial Highlights |
| (a) | In addition to the fees and expenses that the Fund bears directly, the Fund indirectly bears a pro rata share of the fees and expenses of any other funds in which it invests. Such indirect expenses are not included in the Fund’s reported expense ratios. |
| (b) | Total net expenses include the impact of certain fee waivers/expense reimbursements made by the Investment Manager and certain of its affiliates, if applicable. |
| (c) | The benefits derived from expense reductions had an impact of less than 0.01%. |
| (d) | Rounds to zero. |
The accompanying Notes to Financial Statements are an integral part of this statement.
| 20 | Columbia Global Technology Growth Fund | Annual Report 2023 |
Financial Highlights (continued)
| | Net
asset
value,
end of
period | Total
return | Total gross
expense
ratio to
average
net assets(a) | Total net
expense
ratio to
average
net assets(a),(b) | Net investment
income (loss)
ratio to
average
net assets | Portfolio
turnover | Net
assets,
end of
period
(000’s) |
| Institutional 3 Class |
| Year Ended 8/31/2023 | $67.37 | 29.42% | 0.83% | 0.83% | 0.00%(d) | 7% | $443,760 |
| Year Ended 8/31/2022 | $53.70 | (24.29%) | 0.82% | 0.82% | (0.16%) | 8% | $435,424 |
| Year Ended 8/31/2021 | $74.00 | 32.27% | 0.82% | 0.82% | (0.21%) | 18% | $446,103 |
| Year Ended 8/31/2020 | $56.55 | 50.46% | 0.85% | 0.85% | 0.02% | 12% | $250,485 |
| Year Ended 8/31/2019 | $38.04 | 4.47% | 0.87% | 0.87% | 0.22% | 40% | $102,746 |
The accompanying Notes to Financial Statements are an integral part of this statement.
Columbia Global Technology Growth Fund | Annual Report 2023
| 21 |
Notes to Financial Statements
August 31, 2023
Note 1. Organization
Columbia Global Technology Growth Fund (the Fund), a series of Columbia Funds Series Trust I (the Trust), is a diversified fund. The Trust is registered under the Investment Company Act of 1940, as amended (the 1940 Act), as an open-end management investment company organized as a Massachusetts business trust.
Fund shares
The Trust may issue an unlimited number of shares (without par value). The Fund offers each of the share classes listed in the Statement of Assets and Liabilities. Although all share classes generally have identical voting, dividend and liquidation rights, each share class votes separately when required by the Trust’s organizational documents or by law. Each share class has its own expense and sales charge structure. Different share classes may have different minimum initial investment amounts and pay different net investment income distribution amounts to the extent the expenses of distributing such share classes vary. Distributions to shareholders in a liquidation will be proportional to the net asset value of each share class.
As described in the Fund’s prospectus, Class A and Class C shares are offered to the general public for investment. Class C shares automatically convert to Class A shares after 8 years. Advisor Class, Institutional Class, Institutional 2 Class and Institutional 3 Class shares are available for purchase through authorized investment professionals to omnibus retirement plans or to institutional investors and to certain other investors as also described in the Fund’s prospectus.
Note 2. Summary of significant accounting policies
Basis of preparation
The Fund is an investment company that applies the accounting and reporting guidance in the Financial Accounting Standards Board (FASB) Accounting Standards Codification Topic 946, Financial Services - Investment Companies (ASC 946). The financial statements are prepared in accordance with U.S. generally accepted accounting principles (GAAP), which requires management to make certain estimates and assumptions that affect the reported amounts of assets and liabilities, the disclosure of contingent assets and liabilities at the date of the financial statements and the reported amounts of income and expenses during the reporting period. Actual results could differ from those estimates.
The following is a summary of significant accounting policies followed by the Fund in the preparation of its financial statements.
Security valuation
Equity securities listed on an exchange are valued at the closing price or last trade price on their primary exchange at the close of business of the New York Stock Exchange. Securities with a closing price not readily available or not listed on any exchange are valued at the mean between the closing bid and ask prices. Listed preferred stocks convertible into common stocks are valued using an evaluated price from a pricing service.
Foreign equity securities are valued based on the closing price or last trade price on their primary exchange at the close of business of the New York Stock Exchange. If any foreign equity security closing prices are not readily available, the securities are valued at the mean of the latest quoted bid and ask prices on such exchanges or markets. Foreign currency exchange rates are determined at the scheduled closing time of the New York Stock Exchange. Many securities markets and exchanges outside the U.S. close prior to the close of the New York Stock Exchange; therefore, the closing prices for securities in such markets or on such exchanges may not fully reflect events that occur after such close but before the close of the New York Stock Exchange. In those situations, foreign securities will be fair valued pursuant to a policy approved by the Board of Trustees. Under the policy, the Fund may utilize a third-party pricing service to determine these fair values. The third-party pricing service takes into account multiple factors, including, but not limited to, movements in the U.S. securities markets, certain depositary receipts, futures contracts and foreign exchange rates that have occurred subsequent to the close of the foreign exchange or market, to determine a good faith estimate that reasonably reflects the current market conditions as of the close of the New York Stock Exchange. The fair value of a security is likely to be different from the quoted or published price, if available.
Investments in open-end investment companies (other than exchange-traded funds (ETFs)), are valued at the latest net asset value reported by those companies as of the valuation time.
| 22 | Columbia Global Technology Growth Fund | Annual Report 2023 |
Notes to Financial Statements (continued)
August 31, 2023
Investments for which market quotations are not readily available, or that have quotations which management believes are not reflective of market value or reliable, are valued at fair value as determined in good faith under procedures approved by the Board of Trustees. If a security or class of securities (such as foreign securities) is valued at fair value, such value is likely to be different from the quoted or published price for the security, if available.
The determination of fair value often requires significant judgment. To determine fair value, management may use assumptions including but not limited to future cash flows and estimated risk premiums. Multiple inputs from various sources may be used to determine fair value.
GAAP requires disclosure regarding the inputs and valuation techniques used to measure fair value and any changes in valuation inputs or techniques. In addition, investments shall be disclosed by major category. This information is disclosed following the Fund’s Portfolio of Investments.
Foreign currency transactions and translations
The values of all assets and liabilities denominated in foreign currencies are generally translated into U.S. dollars at exchange rates determined at the close of regular trading on the New York Stock Exchange. Net realized and unrealized gains (losses) on foreign currency transactions and translations include gains (losses) arising from the fluctuation in exchange rates between trade and settlement dates on securities transactions, gains (losses) arising from the disposition of foreign currency and currency gains (losses) between the accrual and payment dates on dividends, interest income and foreign withholding taxes.
For financial statement purposes, the Fund does not distinguish that portion of gains (losses) on investments which is due to changes in foreign exchange rates from that which is due to changes in market prices of the investments. Such fluctuations are included with the net realized and unrealized gains (losses) on investments in the Statement of Operations.
Security transactions
Security transactions are accounted for on the trade date. Cost is determined and gains (losses) are based upon the specific identification method for both financial statement and federal income tax purposes.
Income recognition
Corporate actions and dividend income are generally recorded net of any non-reclaimable tax withholdings, on the ex-dividend date or upon receipt of an ex-dividend notification in the case of certain foreign securities.
The Fund may receive distributions from holdings in equity securities, business development companies (BDCs), exchange-traded funds (ETFs), limited partnerships (LPs), other regulated investment companies (RICs), and real estate investment trusts (REITs), which report information as to the tax character of their distributions annually. These distributions are allocated to dividend income, capital gain and return of capital based on actual information reported. Return of capital is recorded as a reduction of the cost basis of securities held. If the Fund no longer owns the applicable securities, return of capital is recorded as a realized gain. With respect to REITs, to the extent actual information has not yet been reported, estimates for return of capital are made by Columbia Management Investment Advisers, LLC (the Investment Manager), a wholly-owned subsidiary of Ameriprise Financial, Inc. (Ameriprise Financial). The Investment Manager’s estimates are subsequently adjusted when the actual character of the distributions is disclosed by the REITs, which could result in a proportionate change in return of capital to shareholders.
Awards from class action litigation are recorded as a reduction of cost basis if the Fund still owns the applicable securities on the payment date. If the Fund no longer owns the applicable securities on the payment date, the proceeds are recorded as realized gains.
Expenses
General expenses of the Trust are allocated to the Fund and other funds of the Trust based upon relative net assets or other expense allocation methodologies determined by the nature of the expense. Expenses directly attributable to the Fund are charged to the Fund. Expenses directly attributable to a specific class of shares are charged to that share class.
Columbia Global Technology Growth Fund | Annual Report 2023
| 23 |
Notes to Financial Statements (continued)
August 31, 2023
Determination of class net asset value
All income, expenses (other than class-specific expenses, which are charged to that share class, as shown in the Statement of Operations) and realized and unrealized gains (losses) are allocated to each class of the Fund on a daily basis, based on the relative net assets of each class, for purposes of determining the net asset value of each class.
Federal income tax status
The Fund intends to qualify each year as a regulated investment company under Subchapter M of the Internal Revenue Code, as amended, and will distribute substantially all of its investment company taxable income and net capital gain, if any, for its tax year, and as such will not be subject to federal income taxes. In addition, the Fund intends to distribute in each calendar year substantially all of its ordinary income, capital gain net income and certain other amounts, if any, such that the Fund should not be subject to federal excise tax. Therefore, no federal income or excise tax provision is recorded.
Foreign taxes
The Fund may be subject to foreign taxes on income, gains on investments or currency repatriation, a portion of which may be recoverable. The Fund will accrue such taxes and recoveries, as applicable, based upon its current interpretation of tax rules and regulations that exist in the markets in which it invests.
Realized gains in certain countries may be subject to foreign taxes at the Fund level, based on statutory rates. The Fund accrues for such foreign taxes on realized and unrealized gains at the appropriate rate for each jurisdiction, as applicable. The amount, if any, is disclosed as a liability in the Statement of Assets and Liabilities.
Distributions to shareholders
Distributions from net investment income, if any, are declared and paid annually. Net realized capital gains, if any, are distributed at least annually. Income distributions and capital gain distributions are determined in accordance with federal income tax regulations, which may differ from GAAP.
Guarantees and indemnifications
Under the Trust’s organizational documents and, in some cases, by contract, its officers and trustees are indemnified against certain liabilities arising out of the performance of their duties to the Trust or its funds. In addition, certain of the Fund’s contracts with its service providers contain general indemnification clauses. The Fund’s maximum exposure under these arrangements is unknown since the amount of any future claims that may be made against the Fund cannot be determined, and the Fund has no historical basis for predicting the likelihood of any such claims.
Recent accounting pronouncements and regulatory updates
Tailored Shareholder Reports
In October 2022, the Securities and Exchange Commission (SEC) adopted a final rule relating to Tailored Shareholder Reports for Mutual Funds and Exchange-Traded Funds; Fee Information in Investment Company Advertisements. The rule and form amendments will, among other things, require the Fund to transmit concise and visually engaging shareholder reports that highlight key information. The amendments will require that funds tag information in a structured data format and that certain more in-depth information be made available online and available for delivery free of charge to investors on request. The amendments became effective January 24, 2023. There is an 18-month transition period after the effective date of the amendments.
Note 3. Fees and other transactions with affiliates
Management services fees
The Fund has entered into a Management Agreement with Columbia Management Investment Advisers, LLC (the Investment Manager), a wholly-owned subsidiary of Ameriprise Financial, Inc. (Ameriprise Financial). Under the Management Agreement, the Investment Manager provides the Fund with investment research and advice, as well as administrative and accounting
| 24 | Columbia Global Technology Growth Fund | Annual Report 2023 |
Notes to Financial Statements (continued)
August 31, 2023
services. The management services fee is an annual fee that is equal to a percentage of the Fund’s daily net assets that declines from 0.87% to 0.75% as the Fund’s net assets increase. The effective management services fee rate for the year ended August 31, 2023 was 0.81% of the Fund’s average daily net assets.
Compensation of board members
Members of the Board of Trustees who are not officers or employees of the Investment Manager or Ameriprise Financial are compensated for their services to the Fund as disclosed in the Statement of Operations. Under a Deferred Compensation Plan (the Deferred Plan), these members of the Board of Trustees may elect to defer payment of up to 100% of their compensation. Deferred amounts are treated as though equivalent dollar amounts had been invested in shares of certain funds managed by the Investment Manager. The Fund’s liability for these amounts is adjusted for market value changes and remains in the Fund until distributed in accordance with the Deferred Plan. All amounts payable under the Deferred Plan constitute a general unsecured obligation of the Fund. The expense for the Deferred Plan, which includes Trustees’ fees deferred during the current period as well as any gains or losses on the Trustees’ deferred compensation balances as a result of market fluctuations, is included in "Trustees’ fees" in the Statement of Operations.
Compensation of Chief Compliance Officer
The Board of Trustees has appointed a Chief Compliance Officer for the Fund in accordance with federal securities regulations. As disclosed in the Statement of Operations, a portion of the Chief Compliance Officer’s total compensation is allocated to the Fund, along with other allocations to affiliated registered investment companies managed by the Investment Manager and its affiliates, based on relative net assets.
Transfer agency fees
Under a Transfer and Dividend Disbursing Agent Agreement, Columbia Management Investment Services Corp. (the Transfer Agent), an affiliate of the Investment Manager and a wholly-owned subsidiary of Ameriprise Financial, is responsible for providing transfer agency services to the Fund. The Transfer Agent has contracted with SS&C GIDS, Inc. (SS&C GIDS) to serve as sub-transfer agent. Prior to January 1, 2023, SS&C GIDS was known as DST Asset Manager Solutions, Inc. The Transfer Agent pays the fees of SS&C GIDS for services as sub-transfer agent and SS&C GIDS is not entitled to reimbursement for such fees from the Fund (with the exception of out-of-pocket fees).
The Fund pays the Transfer Agent a monthly transfer agency fee based on the number or the average value of accounts, depending on the type of account. In addition, the Fund pays the Transfer Agent a fee for shareholder services based on the number of accounts or on a percentage of the average aggregate value of the Fund’s shares maintained in omnibus accounts up to the lesser of the amount charged by the financial intermediary or a cap established by the Board of Trustees from time to time.
The Transfer Agent also receives compensation from the Fund for various shareholder services and reimbursements for certain out-of-pocket fees. Total transfer agency fees for Institutional 2 Class and Institutional 3 Class shares are subject to an annual limitation of not more than 0.07% and 0.02%, respectively, of the average daily net assets attributable to each share class.
For the year ended August 31, 2023, the Fund’s effective transfer agency fee rates as a percentage of average daily net assets of each class were as follows:
| | Effective rate (%) |
| Class A | 0.11 |
| Advisor Class | 0.11 |
| Class C | 0.11 |
| Institutional Class | 0.11 |
| Institutional 2 Class | 0.06 |
| Institutional 3 Class | 0.01 |
Columbia Global Technology Growth Fund | Annual Report 2023
| 25 |
Notes to Financial Statements (continued)
August 31, 2023
An annual minimum account balance fee of $20 may apply to certain accounts with a value below the applicable share class’s initial minimum investment requirements to reduce the impact of small accounts on transfer agency fees. These minimum account balance fees are remitted to the Fund and recorded as part of expense reductions in the Statement of Operations. For the year ended August 31, 2023, these minimum account balance fees reduced total expenses of the Fund by $460.
Distribution and service fees
The Fund has entered into an agreement with Columbia Management Investment Distributors, Inc. (the Distributor), an affiliate of the Investment Manager and a wholly-owned subsidiary of Ameriprise Financial, for distribution and shareholder services. The Board of Trustees has approved, and the Fund has adopted, distribution and shareholder service plans (the Plans) applicable to certain share classes, which set the distribution and service fees for the Fund. These fees are calculated daily and are intended to compensate the Distributor and/or eligible selling and/or servicing agents for selling shares of the Fund and providing services to investors.
Under the Plans, the Fund pays a monthly service fee to the Distributor at the maximum annual rate of 0.25% of the average daily net assets attributable to Class A and Class C shares of the Fund. Also under the Plans, the Fund pays a monthly distribution fee to the Distributor at the maximum annual rates of 0.10% and 0.75% of the average daily net assets attributable to Class A and Class C shares of the Fund, respectively.
Although the Fund may pay distribution and service fees up to a maximum annual rate of 0.35% of the Fund’s average daily net assets attributable to Class A shares (comprised of up to 0.10% for distribution services and up to 0.25% for shareholder services), the Fund currently limits such fees to an aggregate fee of not more than 0.25% of the Fund’s average daily net assets attributable to Class A shares.
Sales charges (unaudited)
Sales charges, including front-end charges and contingent deferred sales charges (CDSCs), received by the Distributor for distributing Fund shares for the year ended August 31, 2023, if any, are listed below:
| | Front End (%) | CDSC (%) | Amount ($) |
| Class A | 5.75 | 0.50 - 1.00(a) | 754,526 |
| Class C | — | 1.00(b) | 5,440 |
| (a) | This charge is imposed on certain investments of between $1 million and $50 million redeemed within 18 months after purchase, as follows: 1.00% if redeemed within 12 months after purchase, and 0.50% if redeemed more than 12, but less than 18, months after purchase, with certain limited exceptions. |
| (b) | This charge applies to redemptions within 12 months after purchase, with certain limited exceptions. |
The Fund’s other share classes are not subject to sales charges.
Expenses waived/reimbursed by the Investment Manager and its affiliates
The Investment Manager and certain of its affiliates have contractually agreed to waive fees and/or reimburse expenses (excluding certain fees and expenses described below) for the period(s) disclosed below, unless sooner terminated at the sole discretion of the Board of Trustees, so that the Fund’s net operating expenses, after giving effect to fees waived/expenses reimbursed and any balance credits and/or overdraft charges from the Fund’s custodian, do not exceed the following annual rate(s) as a percentage of the classes’ average daily net assets:
| | January 1, 2023
through
December 31, 2023 | Prior to
January 1, 2023 |
| Class A | 1.33% | 1.37% |
| Advisor Class | 1.08 | 1.12 |
| Class C | 2.08 | 2.12 |
| Institutional Class | 1.08 | 1.12 |
| Institutional 2 Class | 1.04 | 1.07 |
| Institutional 3 Class | 0.99 | 1.02 |
| 26 | Columbia Global Technology Growth Fund | Annual Report 2023 |
Notes to Financial Statements (continued)
August 31, 2023
Under the agreement governing these fee waivers and/or expense reimbursement arrangements, the following fees and expenses are excluded from the waiver/reimbursement commitment, and therefore will be paid by the Fund, if applicable: taxes (including foreign transaction taxes), expenses associated with investments in affiliated and non-affiliated pooled investment vehicles (including mutual funds and exchange-traded funds), transaction costs and brokerage commissions, costs related to any securities lending program, dividend expenses associated with securities sold short, inverse floater program fees and expenses, transaction charges and interest on borrowed money, interest, costs associated with shareholder meetings, infrequent and/or unusual expenses and any other expenses the exclusion of which is specifically approved by the Board of Trustees. This agreement may be modified or amended only with approval from the Investment Manager, certain of its affiliates and the Fund. Any fees waived and/or expenses reimbursed under the expense reimbursement arrangements described above are not recoverable by the Investment Manager or its affiliates in future periods.
Note 4. Federal tax information
The timing and character of income and capital gain distributions are determined in accordance with income tax regulations, which may differ from GAAP because of temporary or permanent book to tax differences.
At August 31, 2023, these differences were primarily due to differing treatment for deferral/reversal of wash sale losses, late-year ordinary losses, trustees’ deferred compensation, foreign currency transactions, net operating loss reclassification and earnings and profits distributed to shareholders on the redemption of shares. To the extent these differences were permanent, reclassifications were made among the components of the Fund’s net assets. Temporary differences do not require reclassifications.
The following reclassifications were made:
Excess of distributions
over net investment
income ($) | Accumulated
net realized
gain ($) | Paid in
capital ($) |
| 6,605,330 | (3,552,176) | (3,053,154) |
Net investment income (loss) and net realized gains (losses), as disclosed in the Statement of Operations, and net assets were not affected by this reclassification.
The tax character of distributions paid during the years indicated was as follows:
| Year Ended August 31, 2023 | Year Ended August 31, 2022 |
Ordinary
income ($) | Long-term
capital gains ($) | Total ($) | Ordinary
income ($) | Long-term
capital gains ($) | Total ($) |
| — | 60,400,384 | 60,400,384 | 34,587,710 | 97,937,154 | 132,524,864 |
Short-term capital gain distributions, if any, are considered ordinary income distributions for tax purposes.
At August 31, 2023, the components of distributable earnings on a tax basis were as follows:
Undistributed
ordinary income ($) | Undistributed
long-term
capital gains ($) | Capital loss
carryforwards ($) | Net unrealized
appreciation ($) |
| — | 39,892,446 | — | 1,669,609,590 |
At August 31, 2023, the cost of all investments for federal income tax purposes along with the aggregate gross unrealized appreciation and depreciation based on that cost was:
Federal
tax cost ($) | Gross unrealized
appreciation ($) | Gross unrealized
(depreciation) ($) | Net unrealized
appreciation ($) |
| 816,773,931 | 1,694,372,704 | (24,763,114) | 1,669,609,590 |
Columbia Global Technology Growth Fund | Annual Report 2023
| 27 |
Notes to Financial Statements (continued)
August 31, 2023
Tax cost of investments and unrealized appreciation/(depreciation) may also include timing differences that do not constitute adjustments to tax basis.
Under current tax rules, regulated investment companies can elect to treat certain late-year ordinary losses incurred and post-October capital losses (capital losses realized after October 31) as arising on the first day of the following taxable year. As of August 31, 2023, the Fund will elect to treat the following late-year ordinary losses and post-October capital losses as arising on September 1, 2023.
Late year
ordinary losses ($) | Post-October
capital losses ($) |
| 3,474,756 | — |
Management of the Fund has concluded that there are no significant uncertain tax positions in the Fund that would require recognition in the financial statements. However, management’s conclusion may be subject to review and adjustment at a later date based on factors including, but not limited to, new tax laws, regulations, and administrative interpretations (including relevant court decisions). Generally, the Fund’s federal tax returns for the prior three fiscal years remain subject to examination by the Internal Revenue Service.
Note 5. Portfolio information
The cost of purchases and proceeds from sales of securities, excluding short-term investments and derivatives, if any, aggregated to $137,867,095 and $372,930,216, respectively, for the year ended August 31, 2023. The amount of purchase and sale activity impacts the portfolio turnover rate reported in the Financial Highlights.
Note 6. Affiliated money market fund
The Fund invests in Columbia Short-Term Cash Fund, an affiliated money market fund established for the exclusive use by the Fund and other affiliated funds (the Affiliated MMF). The income earned by the Fund from such investments is included as Dividends - affiliated issuers in the Statement of Operations. As an investing fund, the Fund indirectly bears its proportionate share of the expenses of the Affiliated MMF. The Affiliated MMF prices its shares with a floating net asset value. The Securities and Exchange Commission has adopted amendments to money market fund rules requiring institutional prime money market funds like the Affiliated MMF to be subject, by October 2, 2024, to a liquidity fee if daily net redemptions exceed 5% of net assets and, by April 2, 2024, to a discretionary liquidity fee up to 2% if the imposition of such a fee is determined to be in the best interest of the Affiliated MMF.
Note 7. Interfund lending
Pursuant to an exemptive order granted by the Securities and Exchange Commission, the Fund participates in a program (the Interfund Program) allowing each participating Columbia Fund (each, a Participating Fund) to lend money directly to and, except for closed-end funds and money market funds, borrow money directly from other Participating Funds for temporary purposes. The amounts eligible for borrowing and lending under the Interfund Program are subject to certain restrictions.
Interfund loans are subject to the risk that the borrowing fund could be unable to repay the loan when due, and a delay in repayment to the lending fund could result in lost opportunities and/or additional lending costs. The exemptive order is subject to conditions intended to mitigate conflicts of interest arising from the Investment Manager’s relationship with each Participating Fund.
The Fund did not borrow or lend money under the Interfund Program during the year ended August 31, 2023.
Note 8. Line of credit
The Fund has access to a revolving credit facility with a syndicate of banks led by JPMorgan Chase Bank, N.A., Citibank, N.A. and Wells Fargo Bank, N.A. whereby the Fund may borrow for the temporary funding of shareholder redemptions or for other temporary or emergency purposes. Pursuant to an October 27, 2022 amendment and restatement, the credit facility, which is an agreement between the Fund and certain other funds managed by the Investment Manager or an affiliated investment manager, severally and not jointly, permits aggregate borrowings up to $950 million. Interest is currently charged to each
| 28 | Columbia Global Technology Growth Fund | Annual Report 2023 |
Notes to Financial Statements (continued)
August 31, 2023
participating fund based on its borrowings at a rate equal to the higher of (i) the federal funds effective rate, (ii) the secured overnight financing rate plus 0.10% and (iii) the overnight bank funding rate plus, in each case, 1.00%. Each borrowing under the credit facility matures no later than 60 days after the date of borrowing. The Fund also pays a commitment fee equal to its pro rata share of the unused amount of the credit facility at a rate of 0.15% per annum. The commitment fee is included in other expenses in the Statement of Operations. This agreement expires annually in October unless extended or renewed. Prior to the October 27, 2022 amendment and restatement, the Fund had access to a revolving credit facility with a syndicate of banks led by JPMorgan Chase Bank, N.A., Citibank, N.A. and Wells Fargo Bank, N.A. which permitted collective borrowings up to $950 million. Interest was charged to each participating fund based on its borrowings at a rate equal to the higher of (i) the federal funds effective rate, (ii) the secured overnight financing rate plus 0.11448% and (iii) the overnight bank funding rate plus, in each case, 1.00%.
The Fund had no borrowings during the year ended August 31, 2023.
Note 9. Significant risks
Information technology sector risk
The Fund is more susceptible to the particular risks that may affect companies in the information technology sector than if it were invested in a wider variety of companies in unrelated sectors. Companies in the information technology sector are subject to certain risks, including the risk that new services, equipment or technologies will not be accepted by consumers and businesses or will become rapidly obsolete. Performance of such companies may be affected by factors including obtaining and protecting patents (or the failure to do so) and significant competitive pressures, including aggressive pricing of their products or services, new market entrants, competition for market share and short product cycles due to an accelerated rate of technological developments. Such competitive pressures may lead to limited earnings and/or falling profit margins. As a result, the value of their securities may fall or fail to rise. In addition, many information technology sector companies have limited operating histories and prices of these companies’ securities historically have been more volatile than other securities, especially over the short term. Some companies in the information technology sector are facing increased government and regulatory scrutiny and may be subject to adverse government or regulatory action, which could negatively impact the value of their securities.
Market risk
The Fund may incur losses due to declines in the value of one or more securities in which it invests. These declines may be due to factors affecting a particular issuer, or the result of, among other things, political, regulatory, market, economic or social developments affecting the relevant market(s) more generally. In addition, turbulence in financial markets and reduced liquidity in equity, credit and/or fixed income markets may negatively affect many issuers, which could adversely affect the Fund’s ability to price or value hard-to-value assets in thinly traded and closed markets and could cause significant redemptions and operational challenges. Global economies and financial markets are increasingly interconnected, and conditions and events in one country, region or financial market may adversely impact issuers in a different country, region or financial market. These risks may be magnified if certain events or developments adversely interrupt the global supply chain; in these and other circumstances, such risks might affect companies worldwide. As a result, local, regional or global events such as terrorism, war, natural disasters, disease/virus outbreaks and epidemics or other public health issues, recessions, depressions or other events – or the potential for such events – could have a significant negative impact on global economic and market conditions.
The large-scale invasion of Ukraine by Russia in February 2022 has resulted in sanctions and market disruptions, including declines in regional and global stock markets, unusual volatility in global commodity markets and significant devaluations of Russian currency. The extent and duration of the military action are impossible to predict but could be significant. Market disruption caused by the Russian military action, and any counter-measures or responses thereto (including international sanctions, a downgrade in the country’s credit rating, purchasing and financing restrictions, boycotts, tariffs, changes in consumer or purchaser preferences, cyberattacks and espionage) could have severe adverse impacts on regional and/or global securities and commodities markets, including markets for oil and natural gas. These impacts may include reduced market liquidity, distress in credit markets, further disruption of global supply chains, increased risk of inflation, restricted cross-border payments and limited access to investments and/or assets in certain international markets and/or issuers. These developments and other related events could negatively impact Fund performance.
Columbia Global Technology Growth Fund | Annual Report 2023
| 29 |
Notes to Financial Statements (continued)
August 31, 2023
Note 10. Subsequent events
Management has evaluated the events and transactions that have occurred through the date the financial statements were issued and noted no items requiring adjustment of the financial statements or additional disclosure.
Note 11. Information regarding pending and settled legal proceedings
Ameriprise Financial and certain of its affiliates are involved in the normal course of business in legal proceedings which include regulatory inquiries, arbitration and litigation, including class actions concerning matters arising in connection with the conduct of their activities as part of a diversified financial services firm. Ameriprise Financial believes that the Fund is not currently the subject of, and that neither Ameriprise Financial nor any of its affiliates are the subject of, any pending legal, arbitration or regulatory proceedings that are likely to have a material adverse effect on the Fund or the ability of Ameriprise Financial or its affiliates to perform under their contracts with the Fund. Ameriprise Financial is required to make quarterly (10-Q), annual (10-K) and, as necessary, 8-K filings with the Securities and Exchange Commission (SEC) on legal and regulatory matters that relate to Ameriprise Financial and its affiliates. Copies of these filings may be obtained by accessing the SEC website at www.sec.gov.
There can be no assurance that these matters, or the adverse publicity associated with them, will not result in increased Fund redemptions, reduced sale of Fund shares or other adverse consequences to the Fund. Further, although we believe proceedings are not likely to have a material adverse effect on the Fund or the ability of Ameriprise Financial or its affiliates to perform under their contracts with the Fund, these proceedings are subject to uncertainties and, as such, we are unable to estimate the possible loss or range of loss that may result. An adverse outcome in one or more of these proceedings could result in adverse judgments, settlements, fines, penalties or other relief that could have a material adverse effect on the consolidated financial condition or results of operations of Ameriprise Financial or one or more of its affiliates that provide services to the Fund.
| 30 | Columbia Global Technology Growth Fund | Annual Report 2023 |
Report of Independent Registered Public Accounting Firm
To the Board of Trustees of Columbia Funds Series Trust I and Shareholders of Columbia Global Technology Growth Fund
Opinion on the Financial Statements
We have audited the accompanying statement of assets and liabilities, including the portfolio of investments, of Columbia Global Technology Growth Fund (one of the funds constituting Columbia Funds Series Trust I, referred to hereafter as the "Fund") as of August 31, 2023, the related statement of operations for the year ended August 31, 2023, the statement of changes in net assets for each of the two years in the period ended August 31, 2023, including the related notes, and the financial highlights for each of the five years in the period ended August 31, 2023 (collectively referred to as the "financial statements"). In our opinion, the financial statements present fairly, in all material respects, the financial position of the Fund as of August 31, 2023, the results of its operations for the year then ended, the changes in its net assets for each of the two years in the period ended August 31, 2023 and the financial highlights for each of the five years in the period ended August 31, 2023 in conformity with accounting principles generally accepted in the United States of America.
Basis for Opinion
These financial statements are the responsibility of the Fund’s management. Our responsibility is to express an opinion on the Fund’s financial statements based on our audits. We are a public accounting firm registered with the Public Company Accounting Oversight Board (United States) (PCAOB) and are required to be independent with respect to the Fund in accordance with the U.S. federal securities laws and the applicable rules and regulations of the Securities and Exchange Commission and the PCAOB.
We conducted our audits of these financial statements in accordance with the standards of the PCAOB. Those standards require that we plan and perform the audit to obtain reasonable assurance about whether the financial statements are free of material misstatement, whether due to error or fraud.
Our audits included performing procedures to assess the risks of material misstatement of the financial statements, whether due to error or fraud, and performing procedures that respond to those risks. Such procedures included examining, on a test basis, evidence regarding the amounts and disclosures in the financial statements. Our audits also included evaluating the accounting principles used and significant estimates made by management, as well as evaluating the overall presentation of the financial statements. Our procedures included confirmation of securities owned as of August 31, 2023 by correspondence with the custodian, transfer agent and the broker; when replies were not received from the broker, we performed other auditing procedures. We believe that our audits provide a reasonable basis for our opinion.
/s/PricewaterhouseCoopers LLP
Minneapolis, Minnesota
October 23, 2023
We have served as the auditor of one or more investment companies within the Columbia Funds Complex since 1977.
Columbia Global Technology Growth Fund | Annual Report 2023
| 31 |
Federal Income Tax Information
(Unaudited)
The Fund hereby designates the following tax attributes for the fiscal year ended August 31, 2023. Shareholders will be notified in early 2024 of the amounts for use in preparing 2023 income tax returns.
Capital
gain
dividend | |
| $45,785,602 | |
Capital gain dividend. The Fund designates as a capital gain dividend the amount reflected above, or if subsequently determined to be different, the net capital gain of such fiscal period.
TRUSTEES AND OFFICERS
(Unaudited)
The Board oversees the Fund’s operations and appoints officers who are responsible for day-to-day business decisions based on policies set by the Board. The following table provides basic biographical information about the Fund’s Trustees as of the printing of this report, including their principal occupations during the past five years, although specific titles for individuals may have varied over the period. The year set forth beneath Length of Service in the table below is the year in which the Trustee was first appointed or elected as Trustee to any Fund currently in the Columbia Funds Complex or a predecessor thereof. Under current Board policy, each Trustee generally serves until December 31 of the year such Trustee turns seventy-five (75).
Independent trustees
Name,
address,
year of birth | Position held
with the Columbia Funds and
length of service | Principal occupation(s)
during past five years
and other relevant
professional experience | Number of
Funds in the
Columbia Funds
Complex*
overseen | Other directorships
held by Trustee
during the past five years
and other relevant Board experience |
George S. Batejan
c/o Columbia Management
Investment Advisers, LLC
290 Congress Street
Boston, MA 02210
1954 | Trustee since 2017 | Executive Vice President, Global Head of Technology and Operations, Janus Capital Group, Inc., 2010-2016 | 173 | Former Chairman of the Board, NICSA (National Investment Company Services Association) (Executive Committee, Nominating Committee and Governance Committee), 2014-2016; former Director, Intech Investment Management, 2011-2016; former Board Member, Metro Denver Chamber of Commerce, 2015-2016; former Advisory Board Member, University of Colorado Business School, 2015-2018; former Board Member, Chase Bank International, 1993-1994 |
| 32 | Columbia Global Technology Growth Fund | Annual Report 2023 |
TRUSTEES AND OFFICERS (continued)
(Unaudited)
Independent trustees (continued)
Name,
address,
year of birth | Position held
with the Columbia Funds and
length of service | Principal occupation(s)
during past five years
and other relevant
professional experience | Number of
Funds in the
Columbia Funds
Complex*
overseen | Other directorships
held by Trustee
during the past five years
and other relevant Board experience |
Kathleen Blatz
c/o Columbia Management
Investment Advisers, LLC
290 Congress Street
Boston, MA 02210
1954 | Trustee since 2006 | Attorney, specializing in arbitration and mediation; Chief Justice, Minnesota Supreme Court, 1998-2006; Associate Justice, Minnesota Supreme Court, 1996-1998; Fourth Judicial District Court Judge, Hennepin County, 1994-1996; Attorney in private practice and public service, 1984-1993; State Representative, Minnesota House of Representatives, 1979-1993, which included service on the Tax and Financial Institutions and Insurance Committees; Member and Interim Chair, Minnesota Sports Facilities Authority, January-July 2017; Interim President and Chief Executive Officer, Blue Cross and Blue Shield of Minnesota (health care insurance), February-July 2018, April-October 2021 | 173 | Former Trustee, Blue Cross and Blue Shield of Minnesota, 2009-2021 (Chair of the Business Development Committee, 2014-2017; Chair of the Governance Committee, 2017-2019); former Member and Chair of the Board, Minnesota Sports Facilities Authority, January 2017-July 2017; former Director, Robina Foundation, 2009-2020 (Chair, 2014-2020); Director, Richard M. Schulze Family Foundation, since 2021 |
Pamela G. Carlton
c/o Columbia Management
Investment Advisers, LLC
290 Congress Street
Boston, MA 02210
1954 | Chair since 2023; Trustee since 2007 | President, Springboard – Partners in Cross Cultural Leadership (consulting company), since 2003; Managing Director of US Equity Research, JP Morgan Chase, 1999-2003; Director of US Equity Research, Chase Asset Management, 1996-1999; Co-Director Latin America Research, 1993-1996, COO Global Research, 1992-1996, Co-Director of US Research, 1991-1992, Investment Banker, 1982-1991, Morgan Stanley; Attorney, Cleary Gottlieb Steen & Hamilton LLP, 1980-1982 | 173 | Trustee, New York Presbyterian Hospital Board, since 1996; Director, DR Bank (Audit Committee) since 2017; Director, Evercore Inc. (Audit Committee, Nominating and Governance Committee), since 2019; Director, Apollo Commercial Real Estate Finance, Inc. (Chair, Nominating and Governance Committee) (financial services), since 2021; the Governing Council of the Independent Directors Council (IDC), since 2021 |
Janet Langford Carrig
c/o Columbia Management
Investment Advisers, LLC
290 Congress Street
Boston, MA 02210
1957 | Trustee since 1996 | Senior Vice President, General Counsel and Corporate Secretary, ConocoPhillips (independent energy company), September 2007-October 2018 | 173 | Director, EQT Corporation (natural gas producer), since 2019; former Director, Whiting Petroleum Corporation (independent oil and gas company), 2020-2022 |
J. Kevin Connaughton
c/o Columbia Management
Investment Advisers, LLC
290 Congress Street
Boston, MA 02210
1964 | Trustee since 2020 | CEO and President, RhodeWay Financial (non-profit financial planning firm), since December 2022; Member, FINRA National Adjudicatory Council, since January 2020; Adjunct Professor of Finance, Bentley University since January 2018; Consultant to Independent Trustees of CFVIT and CFST I from March 2016 to June 2020 with respect to CFVIT and to December 2020 with respect to CFST I; Managing Director and General Manager of Mutual Fund Products, Columbia Management Investment Advisers, LLC, May 2010-February 2015; President, Columbia Funds, 2008-2015; and senior officer of Columbia Funds and affiliated funds, 2003-2015 | 171 | Former Director, The Autism Project, March 2015-December 2021; former Member of the Investment Committee, St. Michael’s College, November 2015-February 2020; former Trustee, St. Michael’s College, June 2017-September 2019; former Trustee, New Century Portfolios (former mutual fund complex), January 2015-December 2017 |
Columbia Global Technology Growth Fund | Annual Report 2023
| 33 |
TRUSTEES AND OFFICERS (continued)
(Unaudited)
Independent trustees (continued)
Name,
address,
year of birth | Position held
with the Columbia Funds and
length of service | Principal occupation(s)
during past five years
and other relevant
professional experience | Number of
Funds in the
Columbia Funds
Complex*
overseen | Other directorships
held by Trustee
during the past five years
and other relevant Board experience |
Olive M. Darragh
c/o Columbia Management
Investment Advisers, LLC
290 Congress Street
Boston, MA 02210
1962 | Trustee since 2020 | Managing Director of Darragh Inc. (strategy and talent management consulting firm), since 2010; Founder and CEO, Zolio, Inc. (investment management talent identification platform), since 2004; Consultant to Independent Trustees of CFVIT and CFST I from June 2019 to June 2020 with respect to CFVIT and to December 2020 with respect to CFST I; Partner, Tudor Investments, 2004-2010; Senior Partner, McKinsey & Company (consulting), 1990-2004; Touche Ross CPA, 1985-1988 | 171 | Treasurer, Edinburgh University US Trust Board, since January 2023; Member, HBS Community Action Partners Board, since September 2022; former Director, University of Edinburgh Business School (Member of US Board), 2004-2019; former Director, Boston Public Library Foundation, 2008-2017 |
Patricia M. Flynn
c/o Columbia Management
Investment Advisers, LLC
290 Congress Street
Boston, MA 02210
1950 | Trustee since 2004 | Professor of Economics and Management, Bentley University, since 2002; Dean, McCallum Graduate School of Business, Bentley University, 1992-2002 | 173 | Former Trustee, MA Taxpayers Foundation, 1997-2022; former Director, The MA Business Roundtable, 2003-2019; former Chairperson, Innovation Index Advisory Committee, MA Technology Collaborative, 1997-2020 |
Brian J. Gallagher
c/o Columbia Management
Investment Advisers, LLC
290 Congress Street
Boston, MA 02210
1954 | Trustee since 2017 | Retired; Partner with Deloitte & Touche LLP and its predecessors, 1977-2016 | 173 | Trustee, Catholic Schools Foundation, since 2004 |
Douglas A. Hacker
c/o Columbia Management
Investment Advisers, LLC
290 Congress Street
Boston, MA 02210
1955 | Trustee since 1996 | Independent business executive, since May 2006; Executive Vice President – Strategy of United Airlines, December 2002 - May 2006; President of UAL Loyalty Services (airline marketing company), September 2001-December 2002; Executive Vice President and Chief Financial Officer of United Airlines, July 1999-September 2001 | 173 | Director, SpartanNash Company since November 2013 (Chair of the Board, since May 2021) (food distributor); Director, Aircastle Limited (Chair of Audit Committee) (aircraft leasing), since August 2006; former Director, Nash Finch Company (food distributor), 2005-2013; former Director, SeaCube Container Leasing Ltd. (container leasing), 2010-2013; and former Director, Travelport Worldwide Limited (travel information technology), 2014-2019 |
Nancy T. Lukitsh
c/o Columbia Management
Investment Advisers, LLC
290 Congress Street
Boston, MA 02210
1956 | Trustee since 2011 | Senior Vice President, Partner and Director of Marketing, Wellington Management Company, LLP (investment adviser), 1997-2010; Chair, Wellington Management Portfolios (commingled non-U.S. investment pools), 2007-2010; Director, Wellington Trust Company, NA and other Wellington affiliates, 1997-2010 | 171 | None |
| 34 | Columbia Global Technology Growth Fund | Annual Report 2023 |
TRUSTEES AND OFFICERS (continued)
(Unaudited)
Independent trustees (continued)
Name,
address,
year of birth | Position held
with the Columbia Funds and
length of service | Principal occupation(s)
during past five years
and other relevant
professional experience | Number of
Funds in the
Columbia Funds
Complex*
overseen | Other directorships
held by Trustee
during the past five years
and other relevant Board experience |
David M. Moffett
c/o Columbia Management
Investment Advisers, LLC
290 Congress Street
Boston, MA 02210
1952 | Trustee since 2011 | Retired; former Chief Executive Officer of Freddie Mac and Chief Financial Officer of U.S. Bank | 171 | Director, CSX Corporation (transportation suppliers); Director, PayPal Holdings Inc. (payment and data processing services); Trustee, University of Oklahoma Foundation; former Director, eBay Inc. (online trading community), 2007-2015; and former Director, CIT Bank, CIT Group Inc. (commercial and consumer finance), 2010-2016; former Senior Adviser to The Carlyle Group (financial services), March 2008-September 2008; former Governance Consultant to Bridgewater Associates, January 2013-December 2015 |
Catherine James Paglia
c/o Columbia Management
Investment Advisers, LLC
290 Congress Street
Boston, MA 02210
1952 | Trustee since 2004 | Director, Enterprise Asset Management, Inc. (private real estate and asset management company), since September 1998; Managing Director and Partner, Interlaken Capital, Inc., 1989-1997; Vice President, 1982-1985, Principal, 1985-1987, Managing Director, 1987-1989, Morgan Stanley; Vice President, Investment Banking, 1980-1982, Associate, Investment Banking, 1976-1980, Dean Witter Reynolds, Inc. | 173 | Director, Valmont Industries, Inc. (irrigation systems manufacturer), since 2012; Trustee, Carleton College (on the Investment Committee), since 1987; Trustee, Carnegie Endowment for International Peace (on the Investment Committee), since 2009 |
Natalie A. Trunow
c/o Columbia Management
Investment Advisers, LLC
290 Congress Street
Boston, MA 02210
1967 | Trustee since 2020 | Chief Executive Officer, Millennial Portfolio Solutions LLC (asset management and consulting services), January 2016-January 2021; Non-executive Member of the Investment Committee and Valuation Committee, Sarona Asset Management Inc. (private equity firm) since September 2019; Advisor, Horizon Investments (asset management and consulting services), August 2018-January 2022; Advisor, Paradigm Asset Management, November 2016-January 2022; Consultant to Independent Trustees of CFVIT and CFST I from September 2016 to June 2020 with respect to CFVIT and to December 2020 with respect to CFST I; Director of Investments/Consultant, Casey Family Programs, April 2016-November 2016; Senior Vice President and Chief Investment Officer, Calvert Investments, August 2008-January 2016; Section Head and Portfolio Manager, General Motors Asset Management, June 1997-August 2008 | 171 | Independent Director, Investment Committee, Health Services for Children with Special Needs, Inc., 2010-2021; Independent Director, (Executive Committee and Chair, Audit Committee), Consumer Credit Counseling Services (formerly Guidewell Financial Solutions), since 2016; Independent Director, (Investment Committee), Sarona Asset Management, since 2019 |
Columbia Global Technology Growth Fund | Annual Report 2023
| 35 |
TRUSTEES AND OFFICERS (continued)
(Unaudited)
Independent trustees (continued)
Name,
address,
year of birth | Position held
with the Columbia Funds and
length of service | Principal occupation(s)
during past five years
and other relevant
professional experience | Number of
Funds in the
Columbia Funds
Complex*
overseen | Other directorships
held by Trustee
during the past five years
and other relevant Board experience |
Sandra L. Yeager
c/o Columbia Management
Investment Advisers, LLC
290 Congress Street
Boston, MA 02210
1964 | Trustee since 2017 | Retired; President and founder, Hanoverian Capital, LLC (SEC registered investment advisor firm), 2008-2016; Managing Director, DuPont Capital, 2006-2008; Managing Director, Morgan Stanley Investment Management, 2004-2006; Senior Vice President, Alliance Bernstein, 1990-2004 | 173 | Former Director, NAPE (National Alliance for Partnerships in Equity) Education Foundation, October 2016-October 2020; Advisory Board, Jennersville YMCA, since 2022 |
Interested trustee affiliated with Investment Manager**
Name,
address,
year of birth | Position held with the Columbia Funds and length of service | Principal occupation(s) during the
past five years and other relevant
professional experience | Number of
Funds in the
Columbia Funds
Complex* overseen | Other directorships
held by Trustee
during the past
five years and
other relevant Board experience |
Daniel J. Beckman
c/o Columbia Management
Investment Advisers, LLC
290 Congress Street
Boston, MA 02210
1962 | Trustee since November 2021 and President since June 2021 | Vice President – Head of North America Product, Columbia Management Investment Advisers, LLC, since April 2015; President and Principal Executive Officer of the Columbia Funds, since June 2021; officer of Columbia Funds and affiliated funds, 2020-2021 | 173 | Director, Ameriprise Trust Company, since October 2016; Director, Columbia Management Investment Distributors, Inc. since November 2018; Board of Governors, Columbia Wanger Asset Management, LLC since, January 2022; Director, Columbia Threadneedle Canada, Inc., since December 2022 |
| * | The term “Columbia Funds Complex” as used herein includes Columbia Seligman Premium Technology Growth Fund, Tri-Continental Corporation and each series of Columbia Funds Series Trust (CFST), Columbia Funds Series Trust I (CFST I), Columbia Funds Series Trust II (CFST II), Columbia ETF Trust I (CET I), Columbia ETF Trust II (CET II), Columbia Funds Variable Insurance Trust (CFVIT) and Columbia Funds Variable Series Trust II (CFVST II). Messrs. Batejan, Beckman, Gallagher and Hacker and Mses. Blatz, Carlton, Carrig, Flynn, Paglia, and Yeager serve as directors of Columbia Seligman Premium Technology Growth Fund and Tri-Continental Corporation. |
| ** | Interested person (as defined under the 1940 Act) by reason of being an officer, director, security holder and/or employee of the Investment Manager or Ameriprise Financial. |
The Statement of Additional Information has additional information about the Fund’s Board members and is available, without charge, upon request by calling 800.345.6611, visiting columbiathreadneedleus.com/investor/ or contacting your financial intermediary.
| 36 | Columbia Global Technology Growth Fund | Annual Report 2023 |
TRUSTEES AND OFFICERS (continued)
(Unaudited)
The Board has appointed officers who are responsible for day-to-day business decisions based on policies it has established. The officers serve at the pleasure of the Board. The following table provides basic information about the Officers of the Fund as of the printing of this report, including principal occupations during the past five years, although their specific titles may have varied over the period. In addition to Mr. Beckman, who is President and Principal Executive Officer, the Fund’s other officers are:
Fund officers
Name,
address and
year of birth | Position and year
first appointed to
position for any Fund
in the Columbia
Funds Complex or a
predecessor thereof | Principal occupation(s) during past five years |
Michael G. Clarke
290 Congress Street
Boston, MA 02210
1969 | Chief Financial Officer and Principal Financial Officer (2009) and Senior Vice President (2019) | Senior Vice President and North America Head of Operations & Investor Services, Columbia Management Investment Advisers, LLC, since June 2023 (previously Senior Vice President and Head of Global Operations, March 2022 – June 2023, Vice President, Head of North America Operations, and Co-Head of Global Operations, June 2019 - February 2022 and Vice President – Accounting and Tax, May 2010 - May 2019); senior officer of Columbia Funds and affiliated funds, since 2002. Director, Ameriprise Trust Company, since June 2023. |
Joseph Beranek
5890 Ameriprise Financial Center
Minneapolis, MN 55474
1965 | Treasurer and Chief Accounting Officer (Principal Accounting Officer) (2019) and Principal Financial Officer (2020), CFST, CFST I, CFST II, CFVIT and CFVST II; Assistant Treasurer, CET I and CET II | Vice President – Mutual Fund Accounting and Financial Reporting, Columbia Management Investment Advisers, LLC, since December 2018 and March 2017, respectively. |
Marybeth Pilat
290 Congress Street
Boston, MA 02210
1968 | Treasurer and Chief Accounting Officer (Principal Accounting Officer) and Principal Financial Officer (2020) for CET I and CET II; Assistant Treasurer, CFST, CFST I, CFST II, CFVIT and CFVST II | Vice President – Product Pricing and Administration, Columbia Management Investment Advisers, LLC, since May 2017. |
William F. Truscott
290 Congress Street
Boston, MA 02210
1960 | Senior Vice President (2001) | Formerly, Trustee/Director of Columbia Funds Complex or legacy funds, November 2001 - January 1, 2021; Chief Executive Officer, Global Asset Management, Ameriprise Financial, Inc., since September 2012; Chairman of the Board and President, Columbia Management Investment Advisers, LLC, since July 2004 and February 2012, respectively; Chairman of the Board and Chief Executive Officer, Columbia Management Investment Distributors, Inc., since November 2008 and February 2012, respectively; Chairman of the Board and Director, Threadneedle Asset Management Holdings, Sàrl, since March 2013 and December 2008, respectively; senior executive of various entities affiliated with Columbia Threadneedle. |
Christopher O. Petersen
5228 Ameriprise Financial Center
Minneapolis, MN 55474
1970 | Senior Vice President and Assistant Secretary (2021) | Formerly, Trustee/Director of funds within the Columbia Funds Complex, July 1, 2020 - November 22, 2021; Senior Vice President and Assistant General Counsel, Ameriprise Financial, Inc., since September 2021 (previously Vice President and Lead Chief Counsel, January 2015 - September 2021); formerly, President and Principal Executive Officer of the Columbia Funds, 2015 - 2021; officer of Columbia Funds and affiliated funds, since 2007. |
Thomas P. McGuire
290 Congress Street
Boston, MA 02210
1972 | Senior Vice President and Chief Compliance Officer (2012) | Vice President – Asset Management Compliance, Ameriprise Financial, Inc., since May 2010; Chief Compliance Officer, Columbia Acorn/Wanger Funds, since December 2015; formerly, Chief Compliance Officer, Ameriprise Certificate Company, September 2010 – September 2020. |
Ryan C. Larrenaga
290 Congress Street
Boston, MA 02210
1970 | Senior Vice President (2017), Chief Legal Officer (2017), and Secretary (2015) | Vice President and Chief Counsel, Ameriprise Financial, Inc., since August 2018 (previously Vice President and Group Counsel, August 2011 - August 2018); Chief Legal Officer, Columbia Acorn/Wanger Funds, since September 2020; officer of Columbia Funds and affiliated funds, since 2005. |
Columbia Global Technology Growth Fund | Annual Report 2023
| 37 |
TRUSTEES AND OFFICERS (continued)
(Unaudited)
Fund officers (continued)
Name,
address and
year of birth | Position and year
first appointed to
position for any Fund
in the Columbia
Funds Complex or a
predecessor thereof | Principal occupation(s) during past five years |
Michael E. DeFao
290 Congress Street
Boston, MA 02210
1968 | Vice President (2011) and Assistant Secretary (2010) | Vice President and Chief Counsel, Ameriprise Financial, Inc., since May 2010; Vice President, Chief Legal Officer and Assistant Secretary, Columbia Management Investment Advisers, LLC, since October 2021 (previously Vice President and Assistant Secretary, May 2010 – September 2021). |
Lyn Kephart-Strong
5903 Ameriprise Financial Center
Minneapolis, MN 55474
1960 | Vice President (2015) | Vice President, Global Investment Operations Services, Columbia Management Investment Advisers, LLC, since 2010; Director (since January 2007) and President (since October 2014), Columbia Management Investment Services Corp.; Director (since December 2017) and President (since January 2017), Ameriprise Trust Company. |
Liquidity Risk Management Program
(Unaudited)
Pursuant to Rule 22e-4 under the 1940 Act, the Fund has adopted a liquidity risk management program (Program). The Program’s principal objectives include assessing, managing and periodically reviewing the Fund’s liquidity risk. Liquidity risk is defined as the risk that the Fund could not meet redemption requests without significant dilution of remaining investors’ interests in the Fund.
The Board has appointed the Investment Manager as the program administrator for the Fund’s Program. The Investment Manager has delegated oversight of the Program to its Liquidity Risk Management Committee (the Committee). At a Board meeting during the fiscal period, the Committee provided the Board with a report addressing the operations of the Program and assessing its adequacy and effectiveness of implementation for the period January 1, 2022 through December 31, 2022, including:
| • | the Fund had sufficient liquidity to both meet redemptions and operate effectively on behalf of shareholders; |
| • | there were no material changes to the Program during the period; |
| • | the implementation of the Program was effective to manage the Fund’s liquidity risk; and |
| • | the Program operated adequately during the period. |
There can be no assurance that the Program will achieve its objectives in the future. Please refer to the Fund’s prospectus for more information regarding the Fund’s exposure to liquidity risk and other principal risks to which an investment in the Fund may be subject.
| 38 | Columbia Global Technology Growth Fund | Annual Report 2023 |
Approval of Management Agreement
(Unaudited)
Columbia Management Investment Advisers, LLC (the Investment Manager, and together with its domestic and global affiliates, Columbia Threadneedle Investments), a wholly-owned subsidiary of Ameriprise Financial, Inc. (Ameriprise Financial), serves as the investment manager to Columbia Global Technology Growth Fund (the Fund). Under a management agreement (the Management Agreement), the Investment Manager provides investment advice and other services to the Fund and other funds distributed by Columbia Management Investment Distributors, Inc. (collectively, the Funds).
On an annual basis, the Fund’s Board of Trustees (the Board), including the independent Board members (the Independent Trustees), considers renewal of the Management Agreement. The Investment Manager prepared detailed reports for the Board and its Contracts Committee (including its Contracts Subcommittee) in February, March, April, May and June 2023, including reports providing the results of analyses performed by a third-party data provider, Broadridge Financial Solutions, Inc. (Broadridge), and comprehensive responses by the Investment Manager to written requests for information by independent legal counsel to the Independent Trustees (Independent Legal Counsel), to assist the Board in making this determination. In addition, throughout the year, the Board (or its committees or subcommittees) regularly meets with portfolio management teams and senior management personnel and reviews information prepared by the Investment Manager addressing the services the Investment Manager provides and Fund performance. The Board also accords appropriate weight to the work, deliberations and conclusions of the various committees (including their subcommittees), such as the Contracts Committee, the Investment Review Committee, the Audit Committee and the Compliance Committee in determining whether to continue the Management Agreement.
The Board, at its June 22, 2023 Board meeting (the June Meeting), considered the renewal of the Management Agreement for an additional one-year term. At the June Meeting, Independent Legal Counsel reviewed with the Independent Trustees various factors relevant to the Board’s consideration of advisory agreements and the Board’s legal responsibilities related to such consideration. The Independent Trustees considered all information that they, their legal counsel or the Investment Manager believed reasonably necessary to evaluate and to approve the continuation of the Management Agreement. Among other things, the information and factors considered included the following:
| • | Information on the investment performance of the Fund relative to the performance of a group of mutual funds determined to be comparable to the Fund by Broadridge, as well as performance relative to one or more benchmarks; |
| • | Information on the Fund’s management fees and total expenses, including information comparing the Fund’s expenses to those of a group of comparable mutual funds, as determined by Broadridge; |
| • | The Investment Manager’s agreement to contractually limit or cap total operating expenses for the Fund so that total operating expenses (excluding certain fees and expenses, such as transaction costs and certain other investment related expenses, interest, taxes, acquired fund fees and expenses and infrequent and/or unusual expenses) would not exceed a specified annual rate, as a percentage of the Fund’s net assets; |
| • | Terms of the Management Agreement; |
| • | Descriptions of other agreements and arrangements with affiliates of the Investment Manager relating to the operations of the Fund, including agreements with respect to the provision of transfer agency and shareholder services to the Fund; |
| • | Descriptions of various services performed by the Investment Manager under the Management Agreement, including portfolio management and portfolio trading practices; |
| • | Information regarding any recently negotiated management fees of similarly-managed portfolios of other institutional clients of the Investment Manager; |
| • | Information regarding the resources of the Investment Manager, including information regarding senior management, portfolio managers and other personnel; |
| • | Information regarding the capabilities of the Investment Manager with respect to compliance monitoring services; |
| • | The profitability to the Investment Manager and its affiliates from their relationships with the Fund; and |
| • | Report provided by the Board’s independent fee consultant, JDL Consultants, LLC (JDL). |
Columbia Global Technology Growth Fund | Annual Report 2023
| 39 |
Approval of Management Agreement (continued)
(Unaudited)
Following an analysis and discussion of the foregoing, and the factors identified below, the Board, including all of the Independent Trustees, approved the renewal of the Management Agreement.
Nature, extent and quality of services provided by the Investment Manager
The Board analyzed various reports and presentations it had received detailing the services performed by the Investment Manager, as well as its history, expertise, resources and relative capabilities, and the qualifications of its personnel.
The Board specifically considered the many developments during recent years concerning the services provided by the Investment Manager. Among other things, the Board noted the organization and depth of the equity and credit research departments. The Board further observed the enhancements to the investment risk management department’s processes, systems and oversight over the past several years. The Board also took into account the broad scope of services provided by the Investment Manager to the Fund, including, among other services, investment, risk and compliance oversight. The Board also took into account the information it received concerning the Investment Manager’s ability to attract and retain key portfolio management personnel and that it has sufficient resources to provide competitive and adequate compensation to investment personnel.
In connection with the Board’s evaluation of the overall package of services provided by the Investment Manager, the Board also considered the nature, quality and range of administrative services provided to the Fund by the Investment Manager, as well as the achievements in 2022 in the performance of administrative services, and noted the various enhancements anticipated for 2023. In evaluating the quality of services provided under the Management Agreement, the Board also took into account the organization and strength of the Fund’s and its service providers’ compliance programs. The Board also reviewed the financial condition of the Investment Manager and its affiliates and each entity’s ability to carry out its responsibilities under the Management Agreement and the Fund’s other service agreements.
In addition, the Board discussed the acceptability of the terms of the Management Agreement, noting that no changes were proposed from the form of agreement previously approved. The Board also noted the wide array of legal and compliance services provided to the Fund under the Management Agreement.
After reviewing these and related factors (including investment performance as discussed below), the Board concluded, within the context of their overall conclusions, that the nature, extent and quality of the services provided to the Fund under the Management Agreement supported the continuation of the Management Agreement.
Investment performance
The Board carefully reviewed the investment performance of the Fund, including detailed reports providing the results of analyses performed by each of the Investment Manager, Broadridge and JDL collectively showing, for various periods (including since manager inception): (i) the performance of the Fund, (ii) the Fund’s performance relative to peers and benchmarks and (iii) the net assets of the Fund. The Board observed that the Fund’s performance for certain periods ranked above median based on information provided by Broadridge.
The Board also reviewed a description of the third-party data provider’s methodology for identifying the Fund’s peer groups for purposes of performance and expense comparisons.
The Board also considered the Investment Manager’s performance and reputation generally. After reviewing these and related factors, the Board concluded, within the context of their overall conclusions, that the performance of the Fund and the Investment Manager, in light of other considerations, supported the continuation of the Management Agreement.
Comparative fees, costs of services provided and the profits realized by the Investment Manager and its affiliates from their relationships with the Fund
The Board reviewed comparative fees and the costs of services provided under the Management Agreement. The Board members considered detailed comparative information set forth in an annual report on fees and expenses, including, among other things, data (based on analyses conducted by Broadridge and JDL) showing a comparison of the Fund’s expenses with median expenses paid by funds in its comparative peer universe, as well as data showing the Fund’s contribution to the Investment Manager’s profitability.
| 40 | Columbia Global Technology Growth Fund | Annual Report 2023 |
Approval of Management Agreement (continued)
(Unaudited)
The Board considered the reports of JDL, which assisted in the Board’s analysis of the Funds’ performance and expenses and the reasonableness of the Funds’ fee rates. The Board accorded particular weight to the notion that a primary objective of the level of fees is to achieve a rational pricing model applied consistently across the various product lines in the Fund family, while assuring that the overall fees for each Fund (with certain exceptions) are generally in line with the current “pricing philosophy” such that Fund total expense ratios, in general, approximate or are lower than the median expense ratios of funds in the same Lipper comparison universe. The Board took into account that the Fund’s total expense ratio (after considering proposed expense caps/waivers) approximated the peer universe’s median expense ratio.
After reviewing these and related factors, the Board concluded, within the context of their overall conclusions, that the levels of management fees and expenses of the Fund, in light of other considerations, supported the continuation of the Management Agreement.
The Board also considered the profitability of the Investment Manager and its affiliates in connection with the Investment Manager providing management services to the Fund. With respect to the profitability of the Investment Manager and its affiliates, the Independent Trustees referred to information discussing the profitability to the Investment Manager and Ameriprise Financial from managing, operating and distributing the Funds. The Board considered that the profitability generated by the Investment Manager in 2022 had declined from 2021 levels, due to a variety of factors, including the decreased assets under management of the Funds. It also took into account the indirect economic benefits flowing to the Investment Manager or its affiliates in connection with managing or distributing the Funds, such as the enhanced ability to offer various other financial products to Ameriprise Financial customers, soft dollar benefits and overall reputational advantages. The Board noted that the fees paid by the Fund should permit the Investment Manager to offer competitive compensation to its personnel, make necessary investments in its business and earn an appropriate profit. After reviewing these and related factors, the Board concluded, within the context of their overall conclusions, that the costs of services provided and the profitability to the Investment Manager and its affiliates from their relationships with the Fund supported the continuation of the Management Agreement.
Economies of scale
The Board considered the potential existence of economies of scale in the provision by the Investment Manager of services to the Fund, and whether those economies of scale were shared with the Fund through breakpoints in investment management fees or other means, such as expense limitation arrangements and additional investments by the Investment Manager in investment, trading, compliance and other resources. The Board considered the economies of scale that might be realized as the Fund’s net asset level grows and took note of the extent to which Fund shareholders might also benefit from such growth. In this regard, the Board took into account that management fees decline as Fund assets exceed various breakpoints, all of which have not been surpassed.The Board observed that the Management Agreement provided for breakpoints in the management fee rate schedule that allow opportunities for shareholders to realize lower fees as Fund assets grow and that there are additional opportunities through other means for sharing economies of scale with shareholders.
Conclusion
The Board reviewed all of the above considerations in reaching its decision to approve the continuation of the Management Agreement. In reaching its conclusions, no single factor was determinative.
On June 22, 2023, the Board, including all of the Independent Trustees, determined that fees payable under the Management Agreement were fair and reasonable in light of the extent and quality of services provided and approved the renewal of the Management Agreement.
Columbia Global Technology Growth Fund | Annual Report 2023
| 41 |
[THIS PAGE INTENTIONALLY LEFT BLANK]
[THIS PAGE INTENTIONALLY LEFT BLANK]
Columbia Global Technology Growth Fund
P.O. Box 219104
Kansas City, MO 64121-9104
Please read and consider the investment objectives, risks, charges and expenses for any fund carefully before investing. For a prospectus and summary prospectus, which contains this and other important information about the Fund, go to
columbiathreadneedleus.com/investor/. The Fund is distributed by Columbia Management Investment Distributors, Inc., member FINRA, and managed by Columbia Management Investment Advisers, LLC.
Columbia Threadneedle Investments (Columbia Threadneedle) is the global brand name of the Columbia and Threadneedle group of companies. All rights reserved.
© 2023 Columbia Management Investment Advisers, LLC.
columbiathreadneedleus.com/investor/

Annual Report
August 31, 2023
Columbia International Dividend Income Fund
Not FDIC or NCUA Insured • No Financial Institution Guarantee • May Lose Value
If you elect to receive the shareholder report for Columbia International Dividend Income Fund (the Fund) in paper, mailed to you, the Fund mails one shareholder report to each shareholder address, unless such shareholder elects to receive shareholder reports from the Fund electronically via e-mail or by having a paper notice mailed to you (Postcard Notice) that your Fund’s shareholder report is available at the Columbia funds’ website (columbiathreadneedleus.com/investor/). If you would like more than one report in paper to be mailed to you, or would like to elect to receive reports via e-mail or access them through Postcard Notice, please call shareholder services at 800.345.6611 and additional reports will be sent to you.
Proxy voting policies and procedures
The policy of the Board of Trustees is to vote the proxies of the companies in which the Fund holds investments consistent with the procedures as stated in the Statement of Additional Information (SAI). You may obtain a copy of the SAI without charge by calling 800.345.6611; contacting your financial intermediary; visiting columbiathreadneedleus.com/investor/; or searching the website of the Securities and Exchange Commission (SEC) at sec.gov. Information regarding how the Fund voted proxies relating to portfolio securities is filed with the SEC by August 31st for the most recent 12-month period ending June 30th of that year, and is available without charge by visiting columbiathreadneedleus.com/investor/, or searching the website of the SEC at sec.gov.
Quarterly schedule of investments
The Fund files a complete schedule of portfolio holdings with the SEC for the first and third quarters of each fiscal year on Form N-PORT. The Fund’s Form N-PORT filings are available on the SEC’s website at sec.gov. The Fund’s complete schedule of portfolio holdings, as filed on Form N-PORT, is available on columbiathreadneedleus.com/investor/ or can also be obtained without charge, upon request, by calling 800.345.6611.
Additional Fund information
For more information about the Fund, please visit columbiathreadneedleus.com/investor/ or call 800.345.6611. Customer Service Representatives are available to answer your questions Monday through Friday from 8 a.m. to 7 p.m. Eastern time.
Fund investment manager
Columbia Management Investment Advisers, LLC (the Investment Manager)
290 Congress Street
Boston, MA 02210
Fund distributor
Columbia Management Investment Distributors, Inc.
290 Congress Street
Boston, MA 02210
Fund transfer agent
Columbia Management Investment Services Corp.
P.O. Box 219104
Kansas City, MO 64121-9104
Columbia International Dividend Income Fund | Annual Report 2023
Fund at a Glance
(Unaudited)
Investment objective
The Fund seeks total return, consisting of current income and capital appreciation.
Portfolio management
Jonathan Crown
Co-Portfolio Manager
Managed Fund since 2016
Georgina Hellyer, CFA
Co-Portfolio Manager
Managed Fund since 2018
Morningstar style boxTM
The Morningstar Style Box is based on a fund’s portfolio holdings. For equity funds, the vertical axis shows the market capitalization of the stocks owned, and the horizontal axis shows investment style (value, blend, or growth). Information shown is based on the most recent data provided by Morningstar.
© 2023 Morningstar, Inc. All rights reserved. The Morningstar information contained herein: (1) is proprietary to Morningstar and/or its content providers; (2) may not be copied or distributed; and (3) is not warranted to be accurate, complete or timely. Neither Morningstar nor its content providers are responsible for any damages or losses arising from any use of this information.
| Average annual total returns (%) (for the period ended August 31, 2023) |
| | | Inception | 1 Year | 5 Years | 10 Years |
| Class A | Excluding sales charges | 11/01/02 | 16.17 | 4.19 | 4.59 |
| | Including sales charges | | 9.49 | 2.96 | 3.97 |
| Advisor Class | 03/19/13 | 16.41 | 4.45 | 4.85 |
| Class C | Excluding sales charges | 10/13/03 | 15.28 | 3.41 | 3.81 |
| | Including sales charges | | 14.28 | 3.41 | 3.81 |
| Institutional Class | 11/09/00 | 16.39 | 4.44 | 4.85 |
| Institutional 2 Class* | 01/08/14 | 16.56 | 4.59 | 5.00 |
| Institutional 3 Class | 07/15/09 | 16.65 | 4.64 | 5.07 |
| Class R | 09/27/10 | 15.85 | 3.92 | 4.32 |
| MSCI ACWI ex USA Index (Net) | | 11.89 | 3.33 | 4.38 |
| MSCI ACWI ex USA Value Index (Net) | | 14.61 | 2.86 | 3.41 |
Returns for Class A shares are shown with and without the maximum initial sales charge of 5.75%. Returns for Class C shares are shown with and without the 1.00% contingent deferred sales charge for the first year only. The Fund’s other share classes are not subject to sales charges and have limited eligibility. Please see the Fund’s prospectus for details. Performance for different share classes will vary based on differences in sales charges and fees associated with each share class. All results shown assume reinvestment of distributions during the period. Returns do not reflect the deduction of taxes that a shareholder may pay on Fund distributions or on the redemption of Fund shares. Performance results reflect the effect of any fee waivers or reimbursements of Fund expenses by Columbia Management Investment Advisers, LLC and/or any of its affiliates. Absent these fee waivers or expense reimbursement arrangements, performance results would have been lower.
The performance information shown represents past performance and is not a guarantee of future results. The investment return and principal value of your investment will fluctuate so that your shares, when redeemed, may be worth more or less than their original cost. Current performance may be lower or higher than the performance information shown. You may obtain performance information current to the most recent month-end by contacting your financial intermediary, visiting columbiathreadneedleus.com/investor/ or calling 800.345.6611.
The Fund’s performance prior to September 2020 reflects returns achieved according to different principal investment strategies. If the Fund’s current strategies had been in place for the prior periods, results shown may have been different.
| * | The returns shown for periods prior to the share class inception date (including returns for the Life of the Fund, if shown, which are since Fund inception) include the returns of the Fund’s oldest share class. These returns are adjusted to reflect any higher class-related operating expenses of the newer share classes, as applicable. Please visit columbiathreadneedleus.com/investor/investment-products/mutual-funds/appended-performance for more information. |
The MSCI ACWI ex USA Index (Net) captures a large- and mid-cap representation across 22 of 23 developed market countries (excluding the United States) and 24 emerging market countries. The index covers approximately 85% of the global equity opportunity set outside the United States.
The MSCI ACWI ex USA Value Index (Net) captures large- and mid-cap securities exhibiting overall value style characteristics across 22 developed and 24 emerging market countries.
Indices are not available for investment, are not professionally managed and do not reflect sales charges, fees, brokerage commissions, taxes (except the MSCI ACWI ex USA Index (Net) and MSCI ACWI ex USA Value Index (Net) which reflect reinvested dividends net of withholding taxes) or other expenses of investing. Securities in the Fund may not match those in an index.
Columbia International Dividend Income Fund | Annual Report 2023
| 3 |
Fund at a Glance (continued)
(Unaudited)
Performance of a hypothetical $10,000 investment (August 31, 2013 — August 31, 2023)
The chart above shows the change in value of a hypothetical $10,000 investment in Class A shares of Columbia International Dividend Income Fund during the stated time period, and does not reflect the deduction of taxes that a shareholder may pay on Fund distributions or on the redemption of Fund shares.
| 4 | Columbia International Dividend Income Fund | Annual Report 2023 |
Fund at a Glance (continued)
(Unaudited)
| Equity sector breakdown (%) (at August 31, 2023) |
| Communication Services | 9.2 |
| Consumer Discretionary | 6.8 |
| Consumer Staples | 9.1 |
| Energy | 7.0 |
| Financials | 18.4 |
| Health Care | 9.1 |
| Industrials | 14.8 |
| Information Technology | 10.8 |
| Materials | 11.2 |
| Utilities | 3.6 |
| Total | 100.0 |
Percentages indicated are based upon total equity investments. The Fund’s portfolio composition is subject to change.
| Country breakdown (%) (at August 31, 2023) |
| Australia | 1.5 |
| Canada | 7.1 |
| China | 1.2 |
| Denmark | 2.2 |
| Finland | 1.1 |
| France | 10.2 |
| Germany | 13.7 |
| Hong Kong | 3.7 |
| Indonesia | 1.4 |
| Ireland | 1.4 |
| Japan | 9.4 |
| Netherlands | 3.7 |
| Norway | 1.6 |
| Singapore | 1.7 |
| South Korea | 2.8 |
| Spain | 3.0 |
| Sweden | 1.2 |
| Switzerland | 5.0 |
| Taiwan | 3.6 |
| United Kingdom | 15.0 |
| United States(a) | 9.5 |
| Total | 100.0 |
| (a) | Includes investments in Money Market Funds. |
Country breakdown is based primarily on issuer’s place of organization/incorporation. Percentages indicated are based upon total investments, excluding investments in derivatives, if any. The Fund’s portfolio composition is subject to change.
Columbia International Dividend Income Fund | Annual Report 2023
| 5 |
Manager Discussion of Fund Performance
(Unaudited)
For the 12-month period that ended August 31, 2023, Class A shares of Columbia International Dividend Income Fund returned 16.17% excluding sales charges. The Fund’s benchmark, the unmanaged MSCI ACWI ex USA Index (Net), returned 11.89% for the same period. The Fund’s secondary benchmark, the MSCI ACWI ex USA Value Index (Net), returned 14.61%.
Market overview
Entering the period, global equities were supported by signs of slower inflation along with a slightly less restrictive policy trajectory from leading global central banks, most notably the U.S. Federal Reserve (Fed) and European Central Bank. In addition, Europe’s efforts to stockpile and reduce consumption of natural gas proved more successful than expected, helping to ease the region’s energy crisis stemming from Russia’s invasion of Ukraine. As 2022 drew to a close, the Chinese government began to unwind its zero-COVID policy which had put a damper on global economic activity, further boosting sentiment.
International equities opened 2023 on a strong note, reflecting hopes that central banks were largely finished raising interest rates. In addition, a string of better-than-expected economic data points fueled optimism that the United States may be able to avoid a recession. However, the investment backdrop soon grew more challenging, with persistent inflation fueling concerns that leading central banks would feel compelled to continue hiking rates. In March, the failure of several U.S. banks along with the collapse of European financial giant Credit Suisse spurred fears of a banking crisis similar to that seen in 2008-2009. The Fed responded by instituting a special lending facility to support bank liquidity, and at its March 2023 meeting increased the target for its benchmark overnight lending rate by a quarter-point. The rate hike was generally interpreted by markets as signaling that the Fed viewed the financial system as remaining on sound footing.
As the period progressed, declining inflation data led investors to expect central bank tightening to end at some point in 2023. In addition, surprisingly resilient global growth raised hopes that the world economy would experience a soft landing rather than a recession. As a result, most global stock indices finished the 12-month period ended August 31, 2023 with meaningful gains. China’s equity market was a notable exception as the economic recovery there has remained weaker than expected despite the government’s easing of restrictions on activity.
The Fund’s notable contributors during the period
| • | Positive contributions to the Fund’s performance relative to the benchmark over the period were driven by security selection while sector allocation detracted modestly. |
| • | Selection within consumer discretionary led positive contributions to relative performance. |
| ○ | In this vein, Spanish multinational apparel company Inditex, best known for the Zara fashion brand, is the largest “fast fashion” company in the world. Despite post-pandemic supply chain challenges, Inditex has continued to successfully execute the production of hundreds of millions of garments annually in response to the latest consumer preferences and deliver them weekly to thousands of stores around the world. |
| ○ | Athletic apparel company Adidas was another significant contributor. Sentiment with respect to the stock was boosted by optimism over a new CEO who previously drove a turnaround at Puma and a shift in its marketing strategy to reemphasize wholesale distribution. In addition, the company has moved past the inventory overhang created by its severing of ties with a prominent musician, is rolling out innovative new athletic shoe models and is seeing strong consumer demand around the globe for some of its classic shoes. |
| • | Within financials, positive contributions were highlighted by French multinational bank BNP Paribas. In February, BNP Paribas strengthened its financial position and ability to make future strategic acquisitions with the well-timed sale of a large U.S. regional bank. The bank also posted quarterly results that exceeded expectations during the period. |
| • | Another leading contributor was 3i, a British private equity business with a stable of portfolio companies. The company’s most notable holding is Dutch-French value retail chain Action, with more than 2000 stores located across Europe. A “non-food discounter,” Action has thrived by offering a changing variety of thousands of products while managing procurement costs to keep prices low under the credo “more than you expect for less than you imagine". We took advantage of stock price strength to exit our position in private equity firm 3i. |
| 6 | Columbia International Dividend Income Fund | Annual Report 2023 |
Manager Discussion of Fund Performance (continued)
(Unaudited)
| • | Within utilities, E.ON led contributions as the German multinational electric utility was able to get through the winter without a major disruption in natural gas supplies. The stock price was also supported during the period by an improved outlook with respect to the rate of return regulations under which German utilities operate. Longer term, the company is viewed as well-positioned to benefit from investments in clean energy under the European Union’s Green Deal initiative. |
| • | In country terms, the Fund’s underweight to China was a significant positive contributor, more than offsetting the negative impact of an overweight to Hong Kong. |
The Fund’s notable detractors during the period
| • | In sector terms, selection within energy was the only material detractor from relative performance. |
| ○ | Most notably, Canada-based TC Energy develops and operates energy infrastructure in Canada, the United States, and Mexico. Results for the company’s pipeline business were negatively impacted during the period by the unexpected weakness in natural gas prices. |
| ○ | Similarly, sentiment with respect to shares of the Norway-headquartered exploration and production company Equinor softened along with natural gas prices. |
Market risk may affect a single issuer, sector of the economy, industry or the market as a whole. International investing involves certain risks and volatility due to potential political, economic or currency instabilities and different financial and accounting standards. Risks are enhanced for emerging market issuers. Value securities may be unprofitable if the market fails to recognize their intrinsic worth or the portfolio manager misgauged that worth. See the Fund’s prospectus for more information on these and other risks.
The views expressed in this report reflect the current views of the respective parties who contributed to this report. These views are not guarantees of future performance and involve certain risks, uncertainties and assumptions that are difficult to predict, so actual outcomes and results may differ significantly from the views expressed. These views are subject to change at any time based upon economic, market or other conditions and the respective parties disclaim any responsibility to update such views. These views may not be relied on as investment advice and, because investment decisions for a Columbia fund are based on numerous factors, may not be relied on as an indication of trading intent on behalf of any particular Columbia fund. References to specific securities should not be construed as a recommendation or investment advice.
Columbia International Dividend Income Fund | Annual Report 2023
| 7 |
Understanding Your Fund’s Expenses
(Unaudited)
As an investor, you incur two types of costs. There are shareholder transaction costs, which generally include sales charges on purchases and may include redemption fees. There are also ongoing fund costs, which generally include management fees, distribution and/or service fees, and other fund expenses. The following information is intended to help you understand your ongoing costs (in dollars) of investing in the Fund and to help you compare these costs with the ongoing costs of investing in other mutual funds.
Analyzing your Fund’s expenses
To illustrate these ongoing costs, we have provided examples and calculated the expenses paid by investors in each share class of the Fund during the period. The actual and hypothetical information in the table is based on an initial investment of $1,000 at the beginning of the period indicated and held for the entire period. Expense information is calculated two ways and each method provides you with different information. The amount listed in the “Actual” column is calculated using the Fund’s actual operating expenses and total return for the period. You may use the Actual information, together with the amount invested, to estimate the expenses that you paid over the period. Simply divide your account value by $1,000 (for example, an $8,600 account value divided by $1,000 = 8.6), then multiply the results by the expenses paid during the period under the “Actual” column. The amount listed in the “Hypothetical” column assumes a 5% annual rate of return before expenses (which is not the Fund’s actual return) and then applies the Fund’s actual expense ratio for the period to the hypothetical return. You should not use the hypothetical account values and expenses to estimate either your actual account balance at the end of the period or the expenses you paid during the period. See “Compare with other funds” below for details on how to use the hypothetical data.
Compare with other funds
Since all mutual funds are required to include the same hypothetical calculations about expenses in shareholder reports, you can use this information to compare the ongoing cost of investing in the Fund with other funds. To do so, compare the hypothetical example with the 5% hypothetical examples that appear in the shareholder reports of other funds. As you compare hypothetical examples of other funds, it is important to note that hypothetical examples are meant to highlight the ongoing costs of investing in a fund only and do not reflect any transaction costs, such as sales charges, or redemption or exchange fees. Therefore, the hypothetical calculations are useful in comparing ongoing costs only, and will not help you determine the relative total costs of owning different funds. If transaction costs were included in these calculations, your costs would be higher.
| March 1, 2023 — August 31, 2023 |
| | Account value at the
beginning of the
period ($) | Account value at the
end of the
period ($) | Expenses paid during
the period ($) | Fund’s annualized
expense ratio (%) |
| | Actual | Hypothetical | Actual | Hypothetical | Actual | Hypothetical | Actual |
| Class A | 1,000.00 | 1,000.00 | 1,053.70 | 1,018.80 | 6.57 | 6.46 | 1.27 |
| Advisor Class | 1,000.00 | 1,000.00 | 1,055.00 | 1,020.06 | 5.28 | 5.19 | 1.02 |
| Class C | 1,000.00 | 1,000.00 | 1,049.50 | 1,015.02 | 10.44 | 10.26 | 2.02 |
| Institutional Class | 1,000.00 | 1,000.00 | 1,054.80 | 1,020.06 | 5.28 | 5.19 | 1.02 |
| Institutional 2 Class | 1,000.00 | 1,000.00 | 1,055.10 | 1,020.77 | 4.56 | 4.48 | 0.88 |
| Institutional 3 Class | 1,000.00 | 1,000.00 | 1,055.80 | 1,021.02 | 4.30 | 4.23 | 0.83 |
| Class R | 1,000.00 | 1,000.00 | 1,051.90 | 1,017.54 | 7.86 | 7.73 | 1.52 |
Expenses paid during the period are equal to the annualized expense ratio for each class as indicated above, multiplied by the average account value over the period and then multiplied by the number of days in the Fund’s most recent fiscal half year and divided by 365.
Expenses do not include fees and expenses incurred indirectly by the Fund from its investment in underlying funds, including affiliated and non-affiliated pooled investment vehicles, such as mutual funds and exchange-traded funds.
Had Columbia Management Investment Advisers, LLC and/or certain of its affiliates not waived/reimbursed certain fees and expenses, account value at the end of the period would have been reduced.
| 8 | Columbia International Dividend Income Fund | Annual Report 2023 |
Portfolio of Investments
August 31, 2023
(Percentages represent value of investments compared to net assets)
Investments in securities
| Common Stocks 95.1% |
| Issuer | Shares | Value ($) |
| Australia 1.5% |
| Telstra Corp., Ltd. | 3,099,965 | 8,041,676 |
| Canada 7.0% |
| Canadian National Railway Co. | 92,476 | 10,416,554 |
| Manulife Financial Corp. | 491,222 | 9,081,354 |
| Nutrien Ltd. | 171,049 | 10,834,876 |
| TC Energy Corp. | 214,214 | 7,736,562 |
| Total | 38,069,346 |
| China 1.2% |
| NetEase, Inc., ADR | 64,496 | 6,674,046 |
| Denmark 2.2% |
| Novo Nordisk A/S, Class B | 38,759 | 7,149,243 |
| Tryg AS | 259,262 | 4,946,535 |
| Total | 12,095,778 |
| Finland 1.1% |
| UPM-Kymmene OYJ | 173,614 | 5,941,510 |
| France 10.1% |
| AXA SA | 374,218 | 11,243,336 |
| BNP Paribas SA | 210,149 | 13,589,842 |
| Cie de Saint-Gobain | 90,928 | 5,915,062 |
| Schneider Electric SE | 54,783 | 9,390,264 |
| TotalEnergies SE | 231,949 | 14,549,903 |
| Total | 54,688,407 |
| Germany 13.6% |
| Adidas AG | 54,088 | 10,794,342 |
| Deutsche Telekom AG, Registered Shares | 568,684 | 12,171,843 |
| E.ON SE | 806,217 | 9,924,261 |
| Evonik Industries AG | 390,396 | 7,480,042 |
| Muenchener Rueckversicherungs-Gesellschaft AG in Muenchen, Registered Shares | 14,654 | 5,688,083 |
| SAP SE | 99,165 | 13,833,956 |
| Siemens AG, Registered Shares | 91,908 | 13,807,415 |
| Total | 73,699,942 |
| Common Stocks (continued) |
| Issuer | Shares | Value ($) |
| Hong Kong 3.7% |
| AIA Group Ltd. | 1,173,400 | 10,617,228 |
| Hong Kong Exchanges and Clearing Ltd. | 240,400 | 9,317,476 |
| Total | 19,934,704 |
| Indonesia 1.4% |
| PT Bank Rakyat Indonesia Persero Tbk | 21,001,952 | 7,650,929 |
| Ireland 1.4% |
| CRH PLC | 127,096 | 7,312,299 |
| Japan 9.4% |
| Japan Exchange Group, Inc. | 396,500 | 6,918,033 |
| Rohm Co., Ltd. | 32,700 | 2,727,433 |
| SMC Corp. | 24,800 | 12,055,802 |
| Tokyo Electron Ltd. | 30,300 | 4,500,328 |
| Toyota Motor Corp. | 978,500 | 16,858,687 |
| Yahoo! Japan Corp. | 2,496,100 | 7,495,453 |
| Total | 50,555,736 |
| Netherlands 3.7% |
| Akzo Nobel NV | 101,476 | 8,238,177 |
| ING Groep NV | 455,332 | 6,451,601 |
| Shell PLC | 176,876 | 5,478,663 |
| Total | 20,168,441 |
| Norway 1.6% |
| Equinor ASA | 275,599 | 8,463,985 |
| Singapore 1.7% |
| DBS Group Holdings Ltd. | 373,600 | 9,195,657 |
| South Korea 2.8% |
| Samsung Electronics Co., Ltd. | 300,040 | 15,174,898 |
| Spain 3.0% |
| Iberdrola SA | 729,467 | 8,653,473 |
| Industria de Diseno Textil SA | 192,243 | 7,365,089 |
| Total | 16,018,562 |
| Sweden 1.2% |
| Sandvik AB | 351,517 | 6,647,825 |
The accompanying Notes to Financial Statements are an integral part of this statement.
Columbia International Dividend Income Fund | Annual Report 2023
| 9 |
Portfolio of Investments (continued)
August 31, 2023
| Common Stocks (continued) |
| Issuer | Shares | Value ($) |
| Switzerland 5.0% |
| Nestlé SA, Registered Shares | 160,504 | 19,298,908 |
| Novartis AG, ADR | 76,921 | 7,729,022 |
| Total | 27,027,930 |
| Taiwan 3.5% |
| MediaTek, Inc. | 213,000 | 4,697,386 |
| Taiwan Semiconductor Manufacturing Co., Ltd. | 841,000 | 14,450,868 |
| Total | 19,148,254 |
| United Kingdom 14.9% |
| Anglo American PLC | 449,405 | 11,950,437 |
| BT Group PLC | 5,551,058 | 8,120,717 |
| Diageo PLC | 213,348 | 8,737,245 |
| Experian PLC | 319,608 | 11,161,867 |
| GSK PLC | 570,551 | 9,993,740 |
| Reckitt Benckiser Group PLC | 142,542 | 10,286,650 |
| RELX PLC | 210,272 | 6,844,927 |
| Unilever PLC | 167,692 | 8,579,150 |
| WPP PLC | 504,362 | 4,888,985 |
| Total | 80,563,718 |
| Common Stocks (continued) |
| Issuer | Shares | Value ($) |
| United States 5.1% |
| Linde PLC | 14,443 | 5,590,019 |
| Medtronic PLC | 99,758 | 8,130,277 |
| Roche Holding AG, Genusschein Shares | 47,417 | 13,916,340 |
| Total | 27,636,636 |
Total Common Stocks
(Cost $481,164,949) | 514,710,279 |
|
| Money Market Funds 4.3% |
| | Shares | Value ($) |
| Columbia Short-Term Cash Fund, 5.476%(a),(b) | 23,431,385 | 23,424,355 |
Total Money Market Funds
(Cost $23,420,748) | 23,424,355 |
Total Investments in Securities
(Cost $504,585,697) | 538,134,634 |
| Other Assets & Liabilities, Net | | 3,076,448 |
| Net Assets | $541,211,082 |
Notes to Portfolio of Investments
| (a) | The rate shown is the seven-day current annualized yield at August 31, 2023. |
| (b) | As defined in the Investment Company Act of 1940, as amended, an affiliated company is one in which the Fund owns 5% or more of the company’s outstanding voting securities, or a company which is under common ownership or control with the Fund. The value of the holdings and transactions in these affiliated companies during the year ended August 31, 2023 are as follows: |
| Affiliated issuers | Beginning
of period($) | Purchases($) | Sales($) | Net change in
unrealized
appreciation
(depreciation)($) | End of
period($) | Realized gain
(loss)($) | Dividends($) | End of
period shares |
| Columbia Short-Term Cash Fund, 5.476% |
| | 12,957,576 | 121,201,855 | (110,737,331) | 2,255 | 23,424,355 | 4,263 | 507,923 | 23,431,385 |
Abbreviation Legend
| ADR | American Depositary Receipt |
Fair value measurements
The Fund categorizes its fair value measurements according to a three-level hierarchy that maximizes the use of observable inputs and minimizes the use of unobservable inputs by prioritizing that the most observable input be used when available. Observable inputs are those that market participants would use in pricing an investment based on market data obtained from sources independent of the reporting entity. Unobservable inputs are those that reflect the Fund’s assumptions about the information market participants would use in pricing an investment. An investment’s level within the fair value hierarchy is based on the lowest level of any input that is deemed significant to the asset’s or liability’s fair value measurement. The input levels are not necessarily an indication of the risk or liquidity associated with investments at that level. For example, certain U.S. government securities are generally high quality and liquid, however, they are reflected as Level 2 because the inputs used to determine fair value may not always be quoted prices in an active market.
Fair value inputs are summarized in the three broad levels listed below:
The accompanying Notes to Financial Statements are an integral part of this statement.
| 10 | Columbia International Dividend Income Fund | Annual Report 2023 |
Portfolio of Investments (continued)
August 31, 2023
Fair value measurements (continued)
| ■ | Level 1 — Valuations based on quoted prices for investments in active markets that the Fund has the ability to access at the measurement date. Valuation adjustments are not applied to Level 1 investments. |
| ■ | Level 2 — Valuations based on other significant observable inputs (including quoted prices for similar securities, interest rates, prepayment speeds, credit risks, etc.). |
| ■ | Level 3 — Valuations based on significant unobservable inputs (including the Fund’s own assumptions and judgment in determining the fair value of investments). |
Inputs that are used in determining fair value of an investment may include price information, credit data, volatility statistics, and other factors. These inputs can be either observable or unobservable. The availability of observable inputs can vary between investments, and is affected by various factors such as the type of investment, and the volume and level of activity for that investment or similar investments in the marketplace. The inputs will be considered by the Investment Manager, along with any other relevant factors in the calculation of an investment’s fair value. The Fund uses prices and inputs that are current as of the measurement date, which may include periods of market dislocations. During these periods, the availability of prices and inputs may be reduced for many investments. This condition could cause an investment to be reclassified between the various levels within the hierarchy.
Foreign equity securities actively traded in markets where there is a significant delay in the local close relative to the New York Stock Exchange are classified as Level 2. The values of these securities may include an adjustment to reflect the impact of market movements following the close of local trading, as described in Note 2 to the financial statements – Security valuation.
Investments falling into the Level 3 category are primarily supported by quoted prices from brokers and dealers participating in the market for those investments. However, these may be classified as Level 3 investments due to lack of market transparency and corroboration to support these quoted prices. Additionally, valuation models may be used as the pricing source for any remaining investments classified as Level 3. These models may rely on one or more significant unobservable inputs and/or significant assumptions by the Investment Manager. Inputs used in valuations may include, but are not limited to, financial statement analysis, capital account balances, discount rates and estimated cash flows, and comparable company data.
The Fund’s Board of Trustees (the Board) has designated the Investment Manager, through its Valuation Committee (the Committee), as valuation designee, responsible for determining the fair value of the assets of the Fund for which market quotations are not readily available using valuation procedures approved by the Board. The Committee consists of voting and non-voting members from various groups within the Investment Manager’s organization, including operations and accounting, trading and investments, compliance, risk management and legal.
The Committee meets at least monthly to review and approve valuation matters, which may include a description of specific valuation determinations, data regarding pricing information received from approved pricing vendors and brokers and the results of Board-approved valuation policies and procedures (the Policies). The Policies address, among other things, instances when market quotations are or are not readily available, including recommendations of third party pricing vendors and a determination of appropriate pricing methodologies; events that require specific valuation determinations and assessment of fair value techniques; securities with a potential for stale pricing, including those that are illiquid, restricted, or in default; and the effectiveness of third party pricing vendors, including periodic reviews of vendors. The Committee meets more frequently, as needed, to discuss additional valuation matters, which may include the need to review back-testing results, review time-sensitive information or approve related valuation actions. Representatives of Columbia Management Investment Advisers, LLC report to the Board at each of its regularly scheduled meetings to discuss valuation matters and actions during the period, similar to those described earlier.
The following table is a summary of the inputs used to value the Fund’s investments at August 31, 2023:
| | Level 1 ($) | Level 2 ($) | Level 3 ($) | Total ($) |
| Investments in Securities | | | | |
| Common Stocks | | | | |
| Australia | — | 8,041,676 | — | 8,041,676 |
| Canada | 38,069,346 | — | — | 38,069,346 |
| China | 6,674,046 | — | — | 6,674,046 |
| Denmark | — | 12,095,778 | — | 12,095,778 |
| Finland | — | 5,941,510 | — | 5,941,510 |
| France | — | 54,688,407 | — | 54,688,407 |
| Germany | — | 73,699,942 | — | 73,699,942 |
| Hong Kong | — | 19,934,704 | — | 19,934,704 |
| Indonesia | — | 7,650,929 | — | 7,650,929 |
| Ireland | — | 7,312,299 | — | 7,312,299 |
| Japan | — | 50,555,736 | — | 50,555,736 |
| Netherlands | — | 20,168,441 | — | 20,168,441 |
| Norway | — | 8,463,985 | — | 8,463,985 |
| Singapore | — | 9,195,657 | — | 9,195,657 |
| South Korea | — | 15,174,898 | — | 15,174,898 |
| Spain | — | 16,018,562 | — | 16,018,562 |
| Sweden | — | 6,647,825 | — | 6,647,825 |
| Switzerland | 7,729,022 | 19,298,908 | — | 27,027,930 |
| Taiwan | — | 19,148,254 | — | 19,148,254 |
| United Kingdom | — | 80,563,718 | — | 80,563,718 |
| United States | 13,720,296 | 13,916,340 | — | 27,636,636 |
| Total Common Stocks | 66,192,710 | 448,517,569 | — | 514,710,279 |
| Money Market Funds | 23,424,355 | — | — | 23,424,355 |
| Total Investments in Securities | 89,617,065 | 448,517,569 | — | 538,134,634 |
See the Portfolio of Investments for all investment classifications not indicated in the table.
The accompanying Notes to Financial Statements are an integral part of this statement.
Columbia International Dividend Income Fund | Annual Report 2023
| 11 |
Portfolio of Investments (continued)
August 31, 2023
Fair value measurements (continued)
The Fund’s assets assigned to the Level 2 input category are generally valued using the market approach, in which a security’s value is determined through reference to prices and information from market transactions for similar or identical assets. These assets include certain foreign securities for which a third party statistical pricing service may be employed for purposes of fair market valuation. The model utilized by such third party statistical pricing service takes into account a security’s correlation to available market data including, but not limited to, intraday index, ADR, and exchange-traded fund movements.
The accompanying Notes to Financial Statements are an integral part of this statement.
| 12 | Columbia International Dividend Income Fund | Annual Report 2023 |
Statement of Assets and Liabilities
August 31, 2023
| Assets | |
| Investments in securities, at value | |
| Unaffiliated issuers (cost $481,164,949) | $514,710,279 |
| Affiliated issuers (cost $23,420,748) | 23,424,355 |
| Receivable for: | |
| Capital shares sold | 66,056 |
| Dividends | 1,583,055 |
| Foreign tax reclaims | 1,801,830 |
| Trustees’ fees | 187,953 |
| Expense reimbursement due from Investment Manager | 1,128 |
| Prepaid expenses | 7,130 |
| Total assets | 541,781,786 |
| Liabilities | |
| Payable for: | |
| Capital shares redeemed | 259,820 |
| Management services fees | 11,434 |
| Distribution and/or service fees | 608 |
| Transfer agent fees | 41,215 |
| Trustees’ fees | 208,954 |
| Other expenses | 48,673 |
| Total liabilities | 570,704 |
| Net assets applicable to outstanding capital stock | $541,211,082 |
| Represented by | |
| Paid in capital | 499,291,686 |
| Total distributable earnings (loss) | 41,919,396 |
| Total - representing net assets applicable to outstanding capital stock | $541,211,082 |
The accompanying Notes to Financial Statements are an integral part of this statement.
Columbia International Dividend Income Fund | Annual Report 2023
| 13 |
Statement of Assets and Liabilities (continued)
August 31, 2023
| Class A | |
| Net assets | $80,500,408 |
| Shares outstanding | 4,363,907 |
| Net asset value per share | $18.45 |
| Maximum sales charge | 5.75% |
| Maximum offering price per share (calculated by dividing the net asset value per share by 1.0 minus the maximum sales charge for Class A shares) | $19.58 |
| Advisor Class | |
| Net assets | $20,566,858 |
| Shares outstanding | 1,103,465 |
| Net asset value per share | $18.64 |
| Class C | |
| Net assets | $1,655,379 |
| Shares outstanding | 97,267 |
| Net asset value per share | $17.02 |
| Institutional Class | |
| Net assets | $331,734,487 |
| Shares outstanding | 17,910,240 |
| Net asset value per share | $18.52 |
| Institutional 2 Class | |
| Net assets | $34,789,334 |
| Shares outstanding | 1,884,366 |
| Net asset value per share | $18.46 |
| Institutional 3 Class | |
| Net assets | $71,436,768 |
| Shares outstanding | 3,862,229 |
| Net asset value per share | $18.50 |
| Class R | |
| Net assets | $527,848 |
| Shares outstanding | 28,672 |
| Net asset value per share | $18.41 |
The accompanying Notes to Financial Statements are an integral part of this statement.
| 14 | Columbia International Dividend Income Fund | Annual Report 2023 |
Statement of Operations
Year Ended August 31, 2023
| Net investment income | |
| Income: | |
| Dividends — unaffiliated issuers | $17,853,975 |
| Dividends — affiliated issuers | 507,923 |
| Interfund lending | 163 |
| Foreign taxes withheld | (1,886,791) |
| Total income | 16,475,270 |
| Expenses: | |
| Management services fees | 3,762,658 |
| Distribution and/or service fees | |
| Class A | 194,039 |
| Class C | 14,652 |
| Class R | 1,445 |
| Transfer agent fees | |
| Class A | 195,096 |
| Advisor Class | 29,212 |
| Class C | 3,685 |
| Institutional Class | 811,304 |
| Institutional 2 Class | 10,157 |
| Institutional 3 Class | 3,472 |
| Class R | 707 |
| Trustees’ fees | 24,233 |
| Custodian fees | 62,088 |
| Printing and postage fees | 53,744 |
| Registration fees | 117,776 |
| Accounting services fees | 94,675 |
| Legal fees | 18,104 |
| Compensation of chief compliance officer | 90 |
| Other | 18,495 |
| Total expenses | 5,415,632 |
| Fees waived or expenses reimbursed by Investment Manager and its affiliates | (294,206) |
| Expense reduction | (55,765) |
| Total net expenses | 5,065,661 |
| Net investment income | 11,409,609 |
| Realized and unrealized gain (loss) — net | |
| Net realized gain (loss) on: | |
| Investments — unaffiliated issuers | 9,523,768 |
| Investments — affiliated issuers | 4,263 |
| Foreign currency translations | (110,072) |
| Net realized gain | 9,417,959 |
| Net change in unrealized appreciation (depreciation) on: | |
| Investments — unaffiliated issuers | 50,022,535 |
| Investments — affiliated issuers | 2,255 |
| Foreign currency translations | 163,075 |
| Net change in unrealized appreciation (depreciation) | 50,187,865 |
| Net realized and unrealized gain | 59,605,824 |
| Net increase in net assets resulting from operations | $71,015,433 |
The accompanying Notes to Financial Statements are an integral part of this statement.
Columbia International Dividend Income Fund | Annual Report 2023
| 15 |
Statement of Changes in Net Assets
| | Year Ended
August 31, 2023 | Year Ended
August 31, 2022 |
| Operations | | |
| Net investment income | $11,409,609 | $10,089,162 |
| Net realized gain (loss) | 9,417,959 | (3,267,936) |
| Net change in unrealized appreciation (depreciation) | 50,187,865 | (102,459,404) |
| Net increase (decrease) in net assets resulting from operations | 71,015,433 | (95,638,178) |
| Distributions to shareholders | | |
| Net investment income and net realized gains | | |
| Class A | (1,603,226) | (6,997,862) |
| Advisor Class | (293,645) | (88,243) |
| Class C | (21,016) | (98,059) |
| Institutional Class | (7,431,876) | (31,742,875) |
| Institutional 2 Class | (408,931) | (297,512) |
| Institutional 3 Class | (1,415,310) | (3,793,474) |
| Class R | (5,006) | (8,699) |
| Total distributions to shareholders | (11,179,010) | (43,026,724) |
| Increase in net assets from capital stock activity | 39,107,918 | 78,972,472 |
| Total increase (decrease) in net assets | 98,944,341 | (59,692,430) |
| Net assets at beginning of year | 442,266,741 | 501,959,171 |
| Net assets at end of year | $541,211,082 | $442,266,741 |
The accompanying Notes to Financial Statements are an integral part of this statement.
| 16 | Columbia International Dividend Income Fund | Annual Report 2023 |
Statement of Changes in Net Assets (continued)
| | Year Ended | Year Ended |
| | August 31, 2023 | August 31, 2022 |
| | Shares | Dollars ($) | Shares | Dollars ($) |
| Capital stock activity |
| Class A | | | | |
| Shares sold | 508,728 | 8,934,122 | 715,307 | 13,769,011 |
| Distributions reinvested | 86,343 | 1,493,565 | 333,971 | 6,501,856 |
| Shares redeemed | (622,930) | (10,991,239) | (484,762) | (9,281,657) |
| Net increase (decrease) | (27,859) | (563,552) | 564,516 | 10,989,210 |
| Advisor Class | | | | |
| Shares sold | 952,944 | 17,165,564 | 280,694 | 5,372,578 |
| Distributions reinvested | 16,319 | 293,595 | 4,687 | 88,019 |
| Shares redeemed | (153,538) | (2,804,765) | (22,122) | (404,467) |
| Net increase | 815,725 | 14,654,394 | 263,259 | 5,056,130 |
| Class C | | | | |
| Shares sold | 23,160 | 384,562 | 80,731 | 1,436,401 |
| Distributions reinvested | 1,310 | 21,016 | 5,454 | 98,059 |
| Shares redeemed | (29,269) | (448,813) | (27,149) | (456,370) |
| Net increase (decrease) | (4,799) | (43,235) | 59,036 | 1,078,090 |
| Institutional Class | | | | |
| Shares sold | 839,836 | 14,914,305 | 2,241,537 | 44,297,229 |
| Distributions reinvested | 414,584 | 7,179,572 | 1,579,441 | 30,850,576 |
| Shares redeemed | (1,948,895) | (34,483,776) | (2,466,694) | (46,580,101) |
| Net increase (decrease) | (694,475) | (12,389,899) | 1,354,284 | 28,567,704 |
| Institutional 2 Class | | | | |
| Shares sold | 1,329,300 | 24,877,218 | 1,199,470 | 23,185,790 |
| Distributions reinvested | 23,809 | 408,780 | 16,250 | 297,288 |
| Shares redeemed | (598,488) | (9,781,505) | (142,313) | (2,544,162) |
| Net increase | 754,621 | 15,504,493 | 1,073,407 | 20,938,916 |
| Institutional 3 Class | | | | |
| Shares sold | 1,501,345 | 26,894,743 | 2,115,335 | 37,705,293 |
| Distributions reinvested | 81,037 | 1,415,256 | 194,484 | 3,793,098 |
| Shares redeemed | (381,422) | (6,757,809) | (1,601,196) | (29,166,554) |
| Net increase | 1,200,960 | 21,552,190 | 708,623 | 12,331,837 |
| Class R | | | | |
| Shares sold | 22,101 | 406,037 | 4,872 | 83,553 |
| Distributions reinvested | 282 | 5,006 | 446 | 8,699 |
| Shares redeemed | (971) | (17,516) | (4,308) | (81,667) |
| Net increase | 21,412 | 393,527 | 1,010 | 10,585 |
| Total net increase | 2,065,585 | 39,107,918 | 4,024,135 | 78,972,472 |
The accompanying Notes to Financial Statements are an integral part of this statement.
Columbia International Dividend Income Fund | Annual Report 2023
| 17 |
The following table is intended to help you understand the Fund’s financial performance. Certain information reflects financial results for a single share of a class held for the periods shown. Per share net investment income (loss) amounts are calculated based on average shares outstanding during the period. Total return assumes reinvestment of all dividends and distributions, if any. Total return does not reflect payment of sales charges, if any. Total return and portfolio turnover are not annualized for periods of less than one year. The ratios of expenses and net investment income are annualized for periods of less than one year. The portfolio turnover rate is calculated without regard to purchase and sales transactions of short-term instruments and certain derivatives, if any. If such transactions were included, the Fund’s portfolio turnover rate may be higher.
| | Net asset value,
beginning of
period | Net
investment
income | Net
realized
and
unrealized
gain (loss) | Total from
investment
operations | Distributions
from net
investment
income | Distributions
from net
realized
gains | Total
distributions to
shareholders |
| Class A |
| Year Ended 8/31/2023 | $16.22 | 0.37 | 2.23 | 2.60 | (0.37) | — | (0.37) |
| Year Ended 8/31/2022 | $21.61 | 0.35(d) | (3.97) | (3.62) | (0.42) | (1.35) | (1.77) |
| Year Ended 8/31/2021 | $17.70 | 0.30 | 4.20 | 4.50 | (0.20) | (0.39) | (0.59) |
| Year Ended 8/31/2020 | $17.88 | 0.37 | 0.07 | 0.44 | (0.42) | (0.20) | (0.62) |
| Year Ended 8/31/2019 | $18.83 | 0.45 | (0.54) | (0.09) | (0.49) | (0.37) | (0.86) |
| Advisor Class |
| Year Ended 8/31/2023 | $16.39 | 0.56 | 2.10 | 2.66 | (0.41) | — | (0.41) |
| Year Ended 8/31/2022 | $21.81 | 0.45(d) | (4.05) | (3.60) | (0.47) | (1.35) | (1.82) |
| Year Ended 8/31/2021 | $17.86 | 0.36 | 4.23 | 4.59 | (0.25) | (0.39) | (0.64) |
| Year Ended 8/31/2020 | $18.04 | 0.40 | 0.08 | 0.48 | (0.46) | (0.20) | (0.66) |
| Year Ended 8/31/2019 | $18.99 | 0.51 | (0.55) | (0.04) | (0.54) | (0.37) | (0.91) |
| Class C |
| Year Ended 8/31/2023 | $14.98 | 0.21 | 2.06 | 2.27 | (0.23) | — | (0.23) |
| Year Ended 8/31/2022 | $20.07 | 0.24(d) | (3.71) | (3.47) | (0.27) | (1.35) | (1.62) |
| Year Ended 8/31/2021 | $16.50 | 0.11 | 3.95 | 4.06 | (0.10) | (0.39) | (0.49) |
| Year Ended 8/31/2020 | $16.70 | 0.22 | 0.06 | 0.28 | (0.28) | (0.20) | (0.48) |
| Year Ended 8/31/2019 | $17.63 | 0.29 | (0.49) | (0.20) | (0.36) | (0.37) | (0.73) |
| Institutional Class |
| Year Ended 8/31/2023 | $16.29 | 0.41 | 2.23 | 2.64 | (0.41) | — | (0.41) |
| Year Ended 8/31/2022 | $21.69 | 0.40(d) | (3.98) | (3.58) | (0.47) | (1.35) | (1.82) |
| Year Ended 8/31/2021 | $17.76 | 0.35 | 4.22 | 4.57 | (0.25) | (0.39) | (0.64) |
| Year Ended 8/31/2020 | $17.95 | 0.41 | 0.06 | 0.47 | (0.46) | (0.20) | (0.66) |
| Year Ended 8/31/2019 | $18.90 | 0.50 | (0.54) | (0.04) | (0.54) | (0.37) | (0.91) |
| Institutional 2 Class |
| Year Ended 8/31/2023 | $16.24 | 0.44 | 2.21 | 2.65 | (0.43) | — | (0.43) |
| Year Ended 8/31/2022 | $21.63 | 0.55(d) | (4.09) | (3.54) | (0.50) | (1.35) | (1.85) |
| Year Ended 8/31/2021 | $17.72 | 0.38 | 4.20 | 4.58 | (0.28) | (0.39) | (0.67) |
| Year Ended 8/31/2020 | $17.90 | 0.44 | 0.07 | 0.51 | (0.49) | (0.20) | (0.69) |
| Year Ended 8/31/2019 | $18.85 | 0.56 | (0.58) | (0.02) | (0.56) | (0.37) | (0.93) |
The accompanying Notes to Financial Statements are an integral part of this statement.
| 18 | Columbia International Dividend Income Fund | Annual Report 2023 |
Financial Highlights (continued)
| | Net
asset
value,
end of
period | Total
return | Total gross
expense
ratio to
average
net assets(a) | Total net
expense
ratio to
average
net assets(a),(b) | Net investment
income
ratio to
average
net assets | Portfolio
turnover | Net
assets,
end of
period
(000’s) |
| Class A |
| Year Ended 8/31/2023 | $18.45 | 16.17% | 1.35% | 1.27%(c) | 2.07% | 31% | $80,500 |
| Year Ended 8/31/2022 | $16.22 | (18.02%) | 1.34%(e) | 1.26%(c),(e) | 1.82% | 34% | $71,242 |
| Year Ended 8/31/2021 | $21.61 | 25.78% | 1.34%(e),(f) | 1.24%(c),(e),(f) | 1.51% | 28% | $82,701 |
| Year Ended 8/31/2020 | $17.70 | 2.65% | 1.38%(e) | 1.24%(c),(e) | 2.09% | 91% | $71,493 |
| Year Ended 8/31/2019 | $17.88 | (0.16%) | 1.44% | 1.25% | 2.56% | 56% | $78,887 |
| Advisor Class |
| Year Ended 8/31/2023 | $18.64 | 16.41% | 1.10% | 1.02%(c) | 3.07% | 31% | $20,567 |
| Year Ended 8/31/2022 | $16.39 | (17.78%) | 1.12%(e) | 1.02%(c),(e) | 2.50% | 34% | $4,715 |
| Year Ended 8/31/2021 | $21.81 | 26.08% | 1.09%(e),(f) | 0.99%(c),(e),(f) | 1.77% | 28% | $534 |
| Year Ended 8/31/2020 | $17.86 | 2.90% | 1.12%(e) | 0.98%(c),(e) | 2.16% | 91% | $293 |
| Year Ended 8/31/2019 | $18.04 | 0.10% | 1.19% | 1.00% | 2.84% | 56% | $1,027 |
| Class C |
| Year Ended 8/31/2023 | $17.02 | 15.28% | 2.10% | 2.02%(c) | 1.29% | 31% | $1,655 |
| Year Ended 8/31/2022 | $14.98 | (18.61%) | 2.10%(e) | 2.01%(c),(e) | 1.37% | 34% | $1,529 |
| Year Ended 8/31/2021 | $20.07 | 24.86% | 2.09%(e),(f) | 1.99%(c),(e),(f) | 0.62% | 28% | $864 |
| Year Ended 8/31/2020 | $16.50 | 1.83% | 2.13%(e) | 1.98%(c),(e) | 1.30% | 91% | $1,100 |
| Year Ended 8/31/2019 | $16.70 | (0.86%) | 2.19% | 2.00% | 1.72% | 56% | $1,745 |
| Institutional Class |
| Year Ended 8/31/2023 | $18.52 | 16.39% | 1.10% | 1.02%(c) | 2.30% | 31% | $331,734 |
| Year Ended 8/31/2022 | $16.29 | (17.78%) | 1.09%(e) | 1.01%(c),(e) | 2.06% | 34% | $303,028 |
| Year Ended 8/31/2021 | $21.69 | 26.11% | 1.09%(e),(f) | 0.99%(c),(e),(f) | 1.76% | 28% | $374,189 |
| Year Ended 8/31/2020 | $17.76 | 2.86% | 1.13%(e) | 0.99%(c),(e) | 2.34% | 91% | $325,493 |
| Year Ended 8/31/2019 | $17.95 | 0.10% | 1.19% | 1.00% | 2.83% | 56% | $354,127 |
| Institutional 2 Class |
| Year Ended 8/31/2023 | $18.46 | 16.56% | 0.91% | 0.88% | 2.52% | 31% | $34,789 |
| Year Ended 8/31/2022 | $16.24 | (17.66%) | 0.92%(e) | 0.88%(e) | 3.06% | 34% | $18,344 |
| Year Ended 8/31/2021 | $21.63 | 26.23% | 0.91%(e),(f) | 0.86%(e),(f) | 1.88% | 28% | $1,219 |
| Year Ended 8/31/2020 | $17.72 | 3.07% | 0.90%(e) | 0.86%(e) | 2.49% | 91% | $873 |
| Year Ended 8/31/2019 | $17.90 | 0.23% | 0.91% | 0.87% | 3.13% | 56% | $1,337 |
The accompanying Notes to Financial Statements are an integral part of this statement.
Columbia International Dividend Income Fund | Annual Report 2023
| 19 |
Financial Highlights (continued)
| | Net asset value,
beginning of
period | Net
investment
income | Net
realized
and
unrealized
gain (loss) | Total from
investment
operations | Distributions
from net
investment
income | Distributions
from net
realized
gains | Total
distributions to
shareholders |
| Institutional 3 Class |
| Year Ended 8/31/2023 | $16.27 | 0.47 | 2.20 | 2.67 | (0.44) | — | (0.44) |
| Year Ended 8/31/2022 | $21.67 | 0.43(d) | (3.97) | (3.54) | (0.51) | (1.35) | (1.86) |
| Year Ended 8/31/2021 | $17.75 | 0.39 | 4.21 | 4.60 | (0.29) | (0.39) | (0.68) |
| Year Ended 8/31/2020 | $17.94 | 0.45 | 0.06 | 0.51 | (0.50) | (0.20) | (0.70) |
| Year Ended 8/31/2019 | $18.89 | 0.51 | (0.52) | (0.01) | (0.57) | (0.37) | (0.94) |
| Class R |
| Year Ended 8/31/2023 | $16.19 | 0.40 | 2.14 | 2.54 | (0.32) | — | (0.32) |
| Year Ended 8/31/2022 | $21.57 | 0.31(d) | (3.97) | (3.66) | (0.37) | (1.35) | (1.72) |
| Year Ended 8/31/2021 | $17.67 | 0.26 | 4.19 | 4.45 | (0.16) | (0.39) | (0.55) |
| Year Ended 8/31/2020 | $17.85 | 0.32 | 0.07 | 0.39 | (0.37) | (0.20) | (0.57) |
| Year Ended 8/31/2019 | $18.80 | 0.25 | (0.38) | (0.13) | (0.45) | (0.37) | (0.82) |
| Notes to Financial Highlights |
| (a) | In addition to the fees and expenses that the Fund bears directly, the Fund indirectly bears a pro rata share of the fees and expenses of any other funds in which it invests. Such indirect expenses are not included in the Fund’s reported expense ratios. |
| (b) | Total net expenses include the impact of certain fee waivers/expense reimbursements made by the Investment Manager and certain of its affiliates, if applicable. |
| (c) | The benefits derived from expense reductions had an impact of: |
| Class | 8/31/2023 | 8/31/2022 | 8/31/2021 | 8/31/2020 | 8/31/2019 |
| Class A | 0.01% | 0.01% | 0.01% | 0.02% | —% |
| Advisor Class | 0.01% | 0.00% | 0.01% | 0.03% | —% |
| Class C | 0.01% | 0.01% | 0.02% | 0.02% | —% |
| Institutional Class | 0.01% | 0.01% | 0.01% | 0.02% | —% |
| Class R | 0.01% | 0.01% | 0.01% | 0.02% | —% |
| (d) | Net investment income per share includes European Union tax reclaims. The effect of these reclaims amounted to $0.01 per share. |
| (e) | Ratios include interfund lending expense which is less than 0.01%. |
| (f) | Ratios include line of credit interest expense which is less than 0.01%. |
The accompanying Notes to Financial Statements are an integral part of this statement.
| 20 | Columbia International Dividend Income Fund | Annual Report 2023 |
Financial Highlights (continued)
| | Net
asset
value,
end of
period | Total
return | Total gross
expense
ratio to
average
net assets(a) | Total net
expense
ratio to
average
net assets(a),(b) | Net investment
income
ratio to
average
net assets | Portfolio
turnover | Net
assets,
end of
period
(000’s) |
| Institutional 3 Class |
| Year Ended 8/31/2023 | $18.50 | 16.65% | 0.86% | 0.83% | 2.65% | 31% | $71,437 |
| Year Ended 8/31/2022 | $16.27 | (17.63%) | 0.85%(e) | 0.82%(e) | 2.24% | 34% | $43,292 |
| Year Ended 8/31/2021 | $21.67 | 26.30% | 0.86%(e),(f) | 0.81%(e),(f) | 1.95% | 28% | $42,318 |
| Year Ended 8/31/2020 | $17.75 | 3.07% | 0.85%(e) | 0.81%(e) | 2.58% | 91% | $36,384 |
| Year Ended 8/31/2019 | $17.94 | 0.29% | 0.85% | 0.81% | 2.87% | 56% | $47,630 |
| Class R |
| Year Ended 8/31/2023 | $18.41 | 15.85% | 1.60% | 1.52%(c) | 2.23% | 31% | $528 |
| Year Ended 8/31/2022 | $16.19 | (18.22%) | 1.59%(e) | 1.50%(c),(e) | 1.61% | 34% | $118 |
| Year Ended 8/31/2021 | $21.57 | 25.48% | 1.59%(e),(f) | 1.49%(c),(e),(f) | 1.28% | 28% | $135 |
| Year Ended 8/31/2020 | $17.67 | 2.37% | 1.63%(e) | 1.49%(c),(e) | 1.84% | 91% | $104 |
| Year Ended 8/31/2019 | $17.85 | (0.41%) | 1.70% | 1.50% | 1.41% | 56% | $117 |
The accompanying Notes to Financial Statements are an integral part of this statement.
Columbia International Dividend Income Fund | Annual Report 2023
| 21 |
Notes to Financial Statements
August 31, 2023
Note 1. Organization
Columbia International Dividend Income Fund (the Fund), a series of Columbia Funds Series Trust I (the Trust), is a diversified fund. The Trust is registered under the Investment Company Act of 1940, as amended (the 1940 Act), as an open-end management investment company organized as a Massachusetts business trust.
Fund shares
The Trust may issue an unlimited number of shares (without par value). The Fund offers each of the share classes listed in the Statement of Assets and Liabilities. Although all share classes generally have identical voting, dividend and liquidation rights, each share class votes separately when required by the Trust’s organizational documents or by law. Each share class has its own expense and sales charge structure. Different share classes may have different minimum initial investment amounts and pay different net investment income distribution amounts to the extent the expenses of distributing such share classes vary. Distributions to shareholders in a liquidation will be proportional to the net asset value of each share class.
As described in the Fund’s prospectus, Class A and Class C shares are offered to the general public for investment. Class C shares automatically convert to Class A shares after 8 years. Advisor Class, Institutional Class, Institutional 2 Class, Institutional 3 Class and Class R shares are available for purchase through authorized investment professionals to omnibus retirement plans or to institutional investors and to certain other investors as also described in the Fund’s prospectus.
Note 2. Summary of significant accounting policies
Basis of preparation
The Fund is an investment company that applies the accounting and reporting guidance in the Financial Accounting Standards Board (FASB) Accounting Standards Codification Topic 946, Financial Services - Investment Companies (ASC 946). The financial statements are prepared in accordance with U.S. generally accepted accounting principles (GAAP), which requires management to make certain estimates and assumptions that affect the reported amounts of assets and liabilities, the disclosure of contingent assets and liabilities at the date of the financial statements and the reported amounts of income and expenses during the reporting period. Actual results could differ from those estimates.
The following is a summary of significant accounting policies followed by the Fund in the preparation of its financial statements.
Security valuation
Foreign equity securities are valued based on the closing price or last trade price on their primary exchange at the close of business of the New York Stock Exchange. If any foreign equity security closing prices are not readily available, the securities are valued at the mean of the latest quoted bid and ask prices on such exchanges or markets. Foreign currency exchange rates are determined at the scheduled closing time of the New York Stock Exchange. Many securities markets and exchanges outside the U.S. close prior to the close of the New York Stock Exchange; therefore, the closing prices for securities in such markets or on such exchanges may not fully reflect events that occur after such close but before the close of the New York Stock Exchange. In those situations, foreign securities will be fair valued pursuant to a policy approved by the Board of Trustees. Under the policy, the Fund may utilize a third-party pricing service to determine these fair values. The third-party pricing service takes into account multiple factors, including, but not limited to, movements in the U.S. securities markets, certain depositary receipts, futures contracts and foreign exchange rates that have occurred subsequent to the close of the foreign exchange or market, to determine a good faith estimate that reasonably reflects the current market conditions as of the close of the New York Stock Exchange. The fair value of a security is likely to be different from the quoted or published price, if available.
Investments in open-end investment companies (other than exchange-traded funds (ETFs)), are valued at the latest net asset value reported by those companies as of the valuation time.
Investments for which market quotations are not readily available, or that have quotations which management believes are not reflective of market value or reliable, are valued at fair value as determined in good faith under procedures approved by the Board of Trustees. If a security or class of securities (such as foreign securities) is valued at fair value, such value is likely to be different from the quoted or published price for the security, if available.
| 22 | Columbia International Dividend Income Fund | Annual Report 2023 |
Notes to Financial Statements (continued)
August 31, 2023
The determination of fair value often requires significant judgment. To determine fair value, management may use assumptions including but not limited to future cash flows and estimated risk premiums. Multiple inputs from various sources may be used to determine fair value.
GAAP requires disclosure regarding the inputs and valuation techniques used to measure fair value and any changes in valuation inputs or techniques. In addition, investments shall be disclosed by major category. This information is disclosed following the Fund’s Portfolio of Investments.
Foreign currency transactions and translations
The values of all assets and liabilities denominated in foreign currencies are generally translated into U.S. dollars at exchange rates determined at the close of regular trading on the New York Stock Exchange. Net realized and unrealized gains (losses) on foreign currency transactions and translations include gains (losses) arising from the fluctuation in exchange rates between trade and settlement dates on securities transactions, gains (losses) arising from the disposition of foreign currency and currency gains (losses) between the accrual and payment dates on dividends, interest income and foreign withholding taxes.
For financial statement purposes, the Fund does not distinguish that portion of gains (losses) on investments which is due to changes in foreign exchange rates from that which is due to changes in market prices of the investments. Such fluctuations are included with the net realized and unrealized gains (losses) on investments in the Statement of Operations.
Security transactions
Security transactions are accounted for on the trade date. Cost is determined and gains (losses) are based upon the specific identification method for both financial statement and federal income tax purposes.
Income recognition
Corporate actions and dividend income are generally recorded net of any non-reclaimable tax withholdings, on the ex-dividend date or upon receipt of an ex-dividend notification in the case of certain foreign securities.
The Fund may receive distributions from holdings in equity securities, business development companies (BDCs), exchange-traded funds (ETFs), limited partnerships (LPs), other regulated investment companies (RICs), and real estate investment trusts (REITs), which report information as to the tax character of their distributions annually. These distributions are allocated to dividend income, capital gain and return of capital based on actual information reported. Return of capital is recorded as a reduction of the cost basis of securities held. If the Fund no longer owns the applicable securities, return of capital is recorded as a realized gain. With respect to REITs, to the extent actual information has not yet been reported, estimates for return of capital are made by Columbia Management Investment Advisers, LLC (the Investment Manager), a wholly-owned subsidiary of Ameriprise Financial, Inc. (Ameriprise Financial). The Investment Manager’s estimates are subsequently adjusted when the actual character of the distributions is disclosed by the REITs, which could result in a proportionate change in return of capital to shareholders.
Awards from class action litigation are recorded as a reduction of cost basis if the Fund still owns the applicable securities on the payment date. If the Fund no longer owns the applicable securities on the payment date, the proceeds are recorded as realized gains.
Expenses
General expenses of the Trust are allocated to the Fund and other funds of the Trust based upon relative net assets or other expense allocation methodologies determined by the nature of the expense. Expenses directly attributable to the Fund are charged to the Fund. Expenses directly attributable to a specific class of shares are charged to that share class.
Determination of class net asset value
All income, expenses (other than class-specific expenses, which are charged to that share class, as shown in the Statement of Operations) and realized and unrealized gains (losses) are allocated to each class of the Fund on a daily basis, based on the relative net assets of each class, for purposes of determining the net asset value of each class.
Columbia International Dividend Income Fund | Annual Report 2023
| 23 |
Notes to Financial Statements (continued)
August 31, 2023
Federal income tax status
The Fund intends to qualify each year as a regulated investment company under Subchapter M of the Internal Revenue Code, as amended, and will distribute substantially all of its investment company taxable income and net capital gain, if any, for its tax year, and as such will not be subject to federal income taxes. In addition, the Fund intends to distribute in each calendar year substantially all of its ordinary income, capital gain net income and certain other amounts, if any, such that the Fund should not be subject to federal excise tax. Therefore, no federal income or excise tax provision is recorded.
Foreign taxes
The Fund may be subject to foreign taxes on income, gains on investments or currency repatriation, a portion of which may be recoverable. The Fund will accrue such taxes and recoveries, as applicable, based upon its current interpretation of tax rules and regulations that exist in the markets in which it invests.
Realized gains in certain countries may be subject to foreign taxes at the Fund level, based on statutory rates. The Fund accrues for such foreign taxes on realized and unrealized gains at the appropriate rate for each jurisdiction, as applicable. The amount, if any, is disclosed as a liability in the Statement of Assets and Liabilities.
Distributions to shareholders
Distributions from net investment income, if any, are declared and paid each calendar quarter. Net realized capital gains, if any, are distributed at least annually. Income distributions and capital gain distributions are determined in accordance with federal income tax regulations, which may differ from GAAP.
Guarantees and indemnifications
Under the Trust’s organizational documents and, in some cases, by contract, its officers and trustees are indemnified against certain liabilities arising out of the performance of their duties to the Trust or its funds. In addition, certain of the Fund’s contracts with its service providers contain general indemnification clauses. The Fund’s maximum exposure under these arrangements is unknown since the amount of any future claims that may be made against the Fund cannot be determined, and the Fund has no historical basis for predicting the likelihood of any such claims.
Recent accounting pronouncements and regulatory updates
Tailored Shareholder Reports
In October 2022, the Securities and Exchange Commission (SEC) adopted a final rule relating to Tailored Shareholder Reports for Mutual Funds and Exchange-Traded Funds; Fee Information in Investment Company Advertisements. The rule and form amendments will, among other things, require the Fund to transmit concise and visually engaging shareholder reports that highlight key information. The amendments will require that funds tag information in a structured data format and that certain more in-depth information be made available online and available for delivery free of charge to investors on request. The amendments became effective January 24, 2023. There is an 18-month transition period after the effective date of the amendments.
Note 3. Fees and other transactions with affiliates
Management services fees
The Fund has entered into a Management Agreement with Columbia Management Investment Advisers, LLC (the Investment Manager), a wholly-owned subsidiary of Ameriprise Financial, Inc. (Ameriprise Financial). Under the Management Agreement, the Investment Manager provides the Fund with investment research and advice, as well as administrative and accounting services. The management services fee is an annual fee that is equal to a percentage of the Fund’s daily net assets that declines from 0.77% to 0.57% as the Fund’s net assets increase. The effective management services fee rate for the year ended August 31, 2023 was 0.77% of the Fund’s average daily net assets.
| 24 | Columbia International Dividend Income Fund | Annual Report 2023 |
Notes to Financial Statements (continued)
August 31, 2023
Participating Affiliates
The Investment Manager and its investment advisory affiliates (Participating Affiliates) around the world may coordinate in providing services to their clients. From time to time the Investment Manager (or any affiliated investment subadviser to the Fund, as the case may be) may engage its Participating Affiliates to provide a variety of services such as investment research, investment monitoring, trading and discretionary investment management (including portfolio management) to certain accounts managed by the Investment Manager, including the Fund. These Participating Affiliates provide services to the Investment Manager (or any affiliated investment subadviser to the Fund, as the case may be) either pursuant to subadvisory agreements, delegation agreements, personnel-sharing agreements or similar inter-company or other arrangements or relationships, and the Fund pays no additional fees and expenses as a result of any such arrangements.
These Participating Affiliates, like the Investment Manager, are direct or indirect subsidiaries of Ameriprise Financial and are registered with the appropriate respective regulators in their home jurisdictions and, where required, the Securities and Exchange Commission and the Commodity Futures Trading Commission in the United States.
Pursuant to some of these arrangements or relationships, certain personnel of these Participating Affiliates may serve as "associated persons" of the Investment Manager and, in this capacity, subject to the oversight and supervision of the Investment Manager and consistent with the investment objectives, policies and limitations set forth in the Fund’s prospectus and Statement of Additional Information (SAI), provide such services to the Fund.
Compensation of board members
Members of the Board of Trustees who are not officers or employees of the Investment Manager or Ameriprise Financial are compensated for their services to the Fund as disclosed in the Statement of Operations. Under a Deferred Compensation Plan (the Deferred Plan), these members of the Board of Trustees may elect to defer payment of up to 100% of their compensation. Deferred amounts are treated as though equivalent dollar amounts had been invested in shares of certain funds managed by the Investment Manager. The Fund’s liability for these amounts is adjusted for market value changes and remains in the Fund until distributed in accordance with the Deferred Plan. All amounts payable under the Deferred Plan constitute a general unsecured obligation of the Fund. The expense for the Deferred Plan, which includes Trustees’ fees deferred during the current period as well as any gains or losses on the Trustees’ deferred compensation balances as a result of market fluctuations, is included in "Trustees’ fees" in the Statement of Operations.
Compensation of Chief Compliance Officer
The Board of Trustees has appointed a Chief Compliance Officer for the Fund in accordance with federal securities regulations. As disclosed in the Statement of Operations, a portion of the Chief Compliance Officer’s total compensation is allocated to the Fund, along with other allocations to affiliated registered investment companies managed by the Investment Manager and its affiliates, based on relative net assets.
Transfer agency fees
Under a Transfer and Dividend Disbursing Agent Agreement, Columbia Management Investment Services Corp. (the Transfer Agent), an affiliate of the Investment Manager and a wholly-owned subsidiary of Ameriprise Financial, is responsible for providing transfer agency services to the Fund. The Transfer Agent has contracted with SS&C GIDS, Inc. (SS&C GIDS) to serve as sub-transfer agent. Prior to January 1, 2023, SS&C GIDS was known as DST Asset Manager Solutions, Inc. The Transfer Agent pays the fees of SS&C GIDS for services as sub-transfer agent and SS&C GIDS is not entitled to reimbursement for such fees from the Fund (with the exception of out-of-pocket fees).
The Fund pays the Transfer Agent a monthly transfer agency fee based on the number or the average value of accounts, depending on the type of account. In addition, the Fund pays the Transfer Agent a fee for shareholder services based on the number of accounts or on a percentage of the average aggregate value of the Fund’s shares maintained in omnibus accounts up to the lesser of the amount charged by the financial intermediary or a cap established by the Board of Trustees from time to time.
Columbia International Dividend Income Fund | Annual Report 2023
| 25 |
Notes to Financial Statements (continued)
August 31, 2023
The Transfer Agent also receives compensation from the Fund for various shareholder services and reimbursements for certain out-of-pocket fees. Total transfer agency fees for Institutional 2 Class and Institutional 3 Class shares are subject to an annual limitation of not more than 0.07% and 0.02%, respectively, of the average daily net assets attributable to each share class.
For the year ended August 31, 2023, the Fund’s effective transfer agency fee rates as a percentage of average daily net assets of each class were as follows:
| | Effective rate (%) |
| Class A | 0.25 |
| Advisor Class | 0.24 |
| Class C | 0.25 |
| Institutional Class | 0.25 |
| Institutional 2 Class | 0.06 |
| Institutional 3 Class | 0.01 |
| Class R | 0.24 |
An annual minimum account balance fee of $20 may apply to certain accounts with a value below the applicable share class’s initial minimum investment requirements to reduce the impact of small accounts on transfer agency fees. These minimum account balance fees are remitted to the Fund and recorded as part of expense reductions in the Statement of Operations. For the year ended August 31, 2023, these minimum account balance fees reduced total expenses of the Fund by $55,765.
Distribution and service fees
The Fund has entered into an agreement with Columbia Management Investment Distributors, Inc. (the Distributor), an affiliate of the Investment Manager and a wholly-owned subsidiary of Ameriprise Financial, for distribution and shareholder services. The Board of Trustees has approved, and the Fund has adopted, distribution and shareholder service plans (the Plans) applicable to certain share classes, which set the distribution and service fees for the Fund. These fees are calculated daily and are intended to compensate the Distributor and/or eligible selling and/or servicing agents for selling shares of the Fund and providing services to investors.
Under the Plans, the Fund pays a monthly service fee to the Distributor at the maximum annual rate of 0.25% of the average daily net assets attributable to Class A and Class C shares of the Fund. Also under the Plans, the Fund pays a monthly distribution fee to the Distributor at the maximum annual rates of 0.75% and 0.50% of the average daily net assets attributable to Class C and Class R shares of the Fund, respectively.
Sales charges (unaudited)
Sales charges, including front-end charges and contingent deferred sales charges (CDSCs), received by the Distributor for distributing Fund shares for the year ended August 31, 2023, if any, are listed below:
| | Front End (%) | CDSC (%) | Amount ($) |
| Class A | 5.75 | 0.50 - 1.00(a) | 68,229 |
| Class C | — | 1.00(b) | 218 |
| (a) | This charge is imposed on certain investments of between $1 million and $50 million redeemed within 18 months after purchase, as follows: 1.00% if redeemed within 12 months after purchase, and 0.50% if redeemed more than 12, but less than 18, months after purchase, with certain limited exceptions. |
| (b) | This charge applies to redemptions within 12 months after purchase, with certain limited exceptions. |
The Fund’s other share classes are not subject to sales charges.
| 26 | Columbia International Dividend Income Fund | Annual Report 2023 |
Notes to Financial Statements (continued)
August 31, 2023
Expenses waived/reimbursed by the Investment Manager and its affiliates
The Investment Manager and certain of its affiliates have contractually agreed to waive fees and/or reimburse expenses (excluding certain fees and expenses described below) for the period(s) disclosed below, unless sooner terminated at the sole discretion of the Board of Trustees, so that the Fund’s net operating expenses, after giving effect to fees waived/expenses reimbursed and any balance credits and/or overdraft charges from the Fund’s custodian, do not exceed the following annual rate(s) as a percentage of the classes’ average daily net assets:
| | Fee rate(s) contractual
through
December 31, 2023 |
| Class A | 1.27% |
| Advisor Class | 1.02 |
| Class C | 2.02 |
| Institutional Class | 1.02 |
| Institutional 2 Class | 0.88 |
| Institutional 3 Class | 0.83 |
| Class R | 1.52 |
Under the agreement governing these fee waivers and/or expense reimbursement arrangements, the following fees and expenses are excluded from the waiver/reimbursement commitment, and therefore will be paid by the Fund, if applicable: taxes (including foreign transaction taxes), expenses associated with investments in affiliated and non-affiliated pooled investment vehicles (including mutual funds and exchange-traded funds), transaction costs and brokerage commissions, costs related to any securities lending program, dividend expenses associated with securities sold short, inverse floater program fees and expenses, transaction charges and interest on borrowed money, interest, costs associated with shareholder meetings, infrequent and/or unusual expenses and any other expenses the exclusion of which is specifically approved by the Board of Trustees. This agreement may be modified or amended only with approval from the Investment Manager, certain of its affiliates and the Fund. Any fees waived and/or expenses reimbursed under the expense reimbursement arrangements described above are not recoverable by the Investment Manager or its affiliates in future periods.
Note 4. Federal tax information
The timing and character of income and capital gain distributions are determined in accordance with income tax regulations, which may differ from GAAP because of temporary or permanent book to tax differences.
At August 31, 2023, these differences were primarily due to differing treatment for deferral/reversal of wash sale losses, trustees’ deferred compensation, foreign currency transactions and passive foreign investment company (pfic) holdings. To the extent these differences were permanent, reclassifications were made among the components of the Fund’s net assets. Temporary differences do not require reclassifications.
The following reclassifications were made:
Undistributed net
investment
income ($) | Accumulated
net realized
gain ($) | Paid in
capital ($) |
| 2,741,069 | (2,741,069) | — |
Net investment income (loss) and net realized gains (losses), as disclosed in the Statement of Operations, and net assets were not affected by this reclassification.
Columbia International Dividend Income Fund | Annual Report 2023
| 27 |
Notes to Financial Statements (continued)
August 31, 2023
The tax character of distributions paid during the years indicated was as follows:
| Year Ended August 31, 2023 | Year Ended August 31, 2022 |
Ordinary
income ($) | Long-term
capital gains ($) | Total ($) | Ordinary
income ($) | Long-term
capital gains ($) | Total ($) |
| 11,179,010 | — | 11,179,010 | 28,074,412 | 14,952,312 | 43,026,724 |
Short-term capital gain distributions, if any, are considered ordinary income distributions for tax purposes.
At August 31, 2023, the components of distributable earnings on a tax basis were as follows:
Undistributed
ordinary income ($) | Undistributed
long-term
capital gains ($) | Capital loss
carryforwards ($) | Net unrealized
appreciation ($) |
| 6,203,442 | 3,375,553 | — | 32,579,784 |
At August 31, 2023, the cost of all investments for federal income tax purposes along with the aggregate gross unrealized appreciation and depreciation based on that cost was:
Federal
tax cost ($) | Gross unrealized
appreciation ($) | Gross unrealized
(depreciation) ($) | Net unrealized
appreciation ($) |
| 505,554,850 | 63,191,200 | (30,611,416) | 32,579,784 |
Tax cost of investments and unrealized appreciation/(depreciation) may also include timing differences that do not constitute adjustments to tax basis.
Management of the Fund has concluded that there are no significant uncertain tax positions in the Fund that would require recognition in the financial statements. However, management’s conclusion may be subject to review and adjustment at a later date based on factors including, but not limited to, new tax laws, regulations, and administrative interpretations (including relevant court decisions). Generally, the Fund’s federal tax returns for the prior three fiscal years remain subject to examination by the Internal Revenue Service.
Note 5. Portfolio information
The cost of purchases and proceeds from sales of securities, excluding short-term investments and derivatives, if any, aggregated to $175,970,603 and $147,357,889, respectively, for the year ended August 31, 2023. The amount of purchase and sale activity impacts the portfolio turnover rate reported in the Financial Highlights.
Brokerage commissions paid to brokers affiliated with the Investment Manager of the Fund were $2,747 for the year ended August 31, 2023.
Note 6. Affiliated money market fund
The Fund invests in Columbia Short-Term Cash Fund, an affiliated money market fund established for the exclusive use by the Fund and other affiliated funds (the Affiliated MMF). The income earned by the Fund from such investments is included as Dividends - affiliated issuers in the Statement of Operations. As an investing fund, the Fund indirectly bears its proportionate share of the expenses of the Affiliated MMF. The Affiliated MMF prices its shares with a floating net asset value. The Securities and Exchange Commission has adopted amendments to money market fund rules requiring institutional prime money market funds like the Affiliated MMF to be subject, by October 2, 2024, to a liquidity fee if daily net redemptions exceed 5% of net assets and, by April 2, 2024, to a discretionary liquidity fee up to 2% if the imposition of such a fee is determined to be in the best interest of the Affiliated MMF.
| 28 | Columbia International Dividend Income Fund | Annual Report 2023 |
Notes to Financial Statements (continued)
August 31, 2023
Note 7. Interfund lending
Pursuant to an exemptive order granted by the Securities and Exchange Commission, the Fund participates in a program (the Interfund Program) allowing each participating Columbia Fund (each, a Participating Fund) to lend money directly to and, except for closed-end funds and money market funds, borrow money directly from other Participating Funds for temporary purposes. The amounts eligible for borrowing and lending under the Interfund Program are subject to certain restrictions.
Interfund loans are subject to the risk that the borrowing fund could be unable to repay the loan when due, and a delay in repayment to the lending fund could result in lost opportunities and/or additional lending costs. The exemptive order is subject to conditions intended to mitigate conflicts of interest arising from the Investment Manager’s relationship with each Participating Fund.
The Fund’s activity in the Interfund Program during the year ended August 31, 2023 was as follows:
| Borrower or lender | Average loan
balance ($) | Weighted average
interest rate (%) | Number of days
with outstanding loans |
| Lender | 1,000,000 | 5.85 | 1 |
Interest income earned by the Fund is recorded as interfund lending in the Statement of Operations. The Fund had no outstanding interfund loans at August 31, 2023.
Note 8. Line of credit
The Fund has access to a revolving credit facility with a syndicate of banks led by JPMorgan Chase Bank, N.A., Citibank, N.A. and Wells Fargo Bank, N.A. whereby the Fund may borrow for the temporary funding of shareholder redemptions or for other temporary or emergency purposes. Pursuant to an October 27, 2022 amendment and restatement, the credit facility, which is an agreement between the Fund and certain other funds managed by the Investment Manager or an affiliated investment manager, severally and not jointly, permits aggregate borrowings up to $950 million. Interest is currently charged to each participating fund based on its borrowings at a rate equal to the higher of (i) the federal funds effective rate, (ii) the secured overnight financing rate plus 0.10% and (iii) the overnight bank funding rate plus, in each case, 1.00%. Each borrowing under the credit facility matures no later than 60 days after the date of borrowing. The Fund also pays a commitment fee equal to its pro rata share of the unused amount of the credit facility at a rate of 0.15% per annum. The commitment fee is included in other expenses in the Statement of Operations. This agreement expires annually in October unless extended or renewed. Prior to the October 27, 2022 amendment and restatement, the Fund had access to a revolving credit facility with a syndicate of banks led by JPMorgan Chase Bank, N.A., Citibank, N.A. and Wells Fargo Bank, N.A. which permitted collective borrowings up to $950 million. Interest was charged to each participating fund based on its borrowings at a rate equal to the higher of (i) the federal funds effective rate, (ii) the secured overnight financing rate plus 0.11448% and (iii) the overnight bank funding rate plus, in each case, 1.00%.
The Fund had no borrowings during the year ended August 31, 2023.
Note 9. Significant risks
Foreign securities and emerging market countries risk
Investing in foreign securities may involve heightened risks relative to investments in U.S. securities. Investing in foreign securities subjects the Fund to the risks associated with the issuer’s country of organization and places of business operations, including risks associated with political, regulatory, economic, social, diplomatic and other conditions or events occurring in the country or region, which may result in significant market volatility. In addition, certain foreign securities may be more volatile and less liquid than U.S. securities. Investing in emerging markets may increase these risks and expose the Fund to elevated risks associated with increased inflation, deflation or currency devaluation. To the extent that the Fund concentrates its investment exposure to any one or a few specific countries, the Fund will be particularly susceptible to the risks associated with the conditions, events or other factors impacting those countries or regions and may, therefore, have a greater risk than that of a fund that is more geographically diversified. The financial information and disclosure made available by issuers of emerging market securities may be considerably less reliable than publicly available information about other foreign securities. The Public Company Accounting Oversight Board, which regulates auditors of U.S. public companies, is
Columbia International Dividend Income Fund | Annual Report 2023
| 29 |
Notes to Financial Statements (continued)
August 31, 2023
unable to inspect audit work papers in certain foreign countries. Investors in foreign countries often have limited rights and few practical remedies to pursue shareholder claims, including class actions or fraud claims, and the ability of the U.S. Securities and Exchange Commission, the U.S. Department of Justice and other authorities to bring and enforce actions against foreign issuers or foreign persons is limited.
Geographic focus risk
The Fund may be particularly susceptible to risks related to economic, political, regulatory or other events or conditions affecting issuers and countries within the specific geographic regions in which the Fund invests. The Fund’s net asset value may be more volatile than the net asset value of a more geographically diversified fund.
Asia Pacific Region. The Fund is particularly susceptible to economic, political, regulatory or other events or conditions affecting issuers and countries in the Asia Pacific region. Many of the countries in the region are considered underdeveloped or developing, including from a political, economic and/or social perspective, and may have relatively unstable governments and economies based on limited business, industries and/or natural resources or commodities. Events in any one country within the region may impact other countries in the region or the region as a whole. As a result, events in the region will generally have a greater effect on the Fund than if the Fund were more geographically diversified. This could result in increased volatility in the value of the Fund’s investments and losses for the Fund. Also, securities of some companies in the region can be less liquid than U.S. or other foreign securities, potentially making it difficult for the Fund to sell such securities at a desirable time and price.
Europe. The Fund is particularly susceptible to risks related to economic, political, regulatory or other events or conditions, including acts of war or other conflicts in the region, affecting issuers and countries in Europe. Countries in Europe are often closely connected and interdependent, and events in one European country can have an adverse impact on, and potentially spread to, other European countries. In addition, significant private or public debt problems in a single European Union (EU) country can pose economic risks to the EU as a whole. As a result, the Fund’s net asset value may be more volatile than the net asset value of a more geographically diversified fund. If securities of issuers in Europe fall out of favor, it may cause the Fund to underperform other funds that do not focus their investments in this region of the world. Uncertainty caused by the departure of the United Kingdom (UK) from the EU, which occurred in January 2020, could have negative impacts on the UK and EU, as well as other European economies and the broader global economy. These could include negative impacts on currencies and financial markets as well as increased volatility and illiquidity, and potentially lower economic growth in markets in Europe, which could adversely affect the value of your investment in the Fund.
Market risk
The Fund may incur losses due to declines in the value of one or more securities in which it invests. These declines may be due to factors affecting a particular issuer, or the result of, among other things, political, regulatory, market, economic or social developments affecting the relevant market(s) more generally. In addition, turbulence in financial markets and reduced liquidity in equity, credit and/or fixed income markets may negatively affect many issuers, which could adversely affect the Fund’s ability to price or value hard-to-value assets in thinly traded and closed markets and could cause significant redemptions and operational challenges. Global economies and financial markets are increasingly interconnected, and conditions and events in one country, region or financial market may adversely impact issuers in a different country, region or financial market. These risks may be magnified if certain events or developments adversely interrupt the global supply chain; in these and other circumstances, such risks might affect companies worldwide. As a result, local, regional or global events such as terrorism, war, natural disasters, disease/virus outbreaks and epidemics or other public health issues, recessions, depressions or other events – or the potential for such events – could have a significant negative impact on global economic and market conditions.
The large-scale invasion of Ukraine by Russia in February 2022 has resulted in sanctions and market disruptions, including declines in regional and global stock markets, unusual volatility in global commodity markets and significant devaluations of Russian currency. The extent and duration of the military action are impossible to predict but could be significant. Market disruption caused by the Russian military action, and any counter-measures or responses thereto (including international sanctions, a downgrade in the country’s credit rating, purchasing and financing restrictions, boycotts, tariffs, changes in consumer or purchaser preferences, cyberattacks and espionage) could have severe adverse impacts on regional and/or global securities and commodities markets, including markets for oil and natural gas. These impacts may include reduced
| 30 | Columbia International Dividend Income Fund | Annual Report 2023 |
Notes to Financial Statements (continued)
August 31, 2023
market liquidity, distress in credit markets, further disruption of global supply chains, increased risk of inflation, restricted cross-border payments and limited access to investments and/or assets in certain international markets and/or issuers. These developments and other related events could negatively impact Fund performance.
Note 10. Subsequent events
Management has evaluated the events and transactions that have occurred through the date the financial statements were issued and noted no items requiring adjustment of the financial statements or additional disclosure.
Note 11. Information regarding pending and settled legal proceedings
Ameriprise Financial and certain of its affiliates are involved in the normal course of business in legal proceedings which include regulatory inquiries, arbitration and litigation, including class actions concerning matters arising in connection with the conduct of their activities as part of a diversified financial services firm. Ameriprise Financial believes that the Fund is not currently the subject of, and that neither Ameriprise Financial nor any of its affiliates are the subject of, any pending legal, arbitration or regulatory proceedings that are likely to have a material adverse effect on the Fund or the ability of Ameriprise Financial or its affiliates to perform under their contracts with the Fund. Ameriprise Financial is required to make quarterly (10-Q), annual (10-K) and, as necessary, 8-K filings with the Securities and Exchange Commission (SEC) on legal and regulatory matters that relate to Ameriprise Financial and its affiliates. Copies of these filings may be obtained by accessing the SEC website at www.sec.gov.
There can be no assurance that these matters, or the adverse publicity associated with them, will not result in increased Fund redemptions, reduced sale of Fund shares or other adverse consequences to the Fund. Further, although we believe proceedings are not likely to have a material adverse effect on the Fund or the ability of Ameriprise Financial or its affiliates to perform under their contracts with the Fund, these proceedings are subject to uncertainties and, as such, we are unable to estimate the possible loss or range of loss that may result. An adverse outcome in one or more of these proceedings could result in adverse judgments, settlements, fines, penalties or other relief that could have a material adverse effect on the consolidated financial condition or results of operations of Ameriprise Financial or one or more of its affiliates that provide services to the Fund.
Columbia International Dividend Income Fund | Annual Report 2023
| 31 |
Report of Independent Registered Public Accounting Firm
To the Board of Trustees of Columbia Funds Series Trust I and Shareholders of Columbia International Dividend Income Fund
Opinion on the Financial Statements
We have audited the accompanying statement of assets and liabilities, including the portfolio of investments, of Columbia International Dividend Income Fund (one of the funds constituting Columbia Funds Series Trust I, referred to hereafter as the "Fund") as of August 31, 2023, the related statement of operations for the year ended August 31, 2023, the statement of changes in net assets for each of the two years in the period ended August 31, 2023, including the related notes, and the financial highlights for each of the five years in the period ended August 31, 2023 (collectively referred to as the "financial statements"). In our opinion, the financial statements present fairly, in all material respects, the financial position of the Fund as of August 31, 2023, the results of its operations for the year then ended, the changes in its net assets for each of the two years in the period ended August 31, 2023 and the financial highlights for each of the five years in the period ended August 31, 2023 in conformity with accounting principles generally accepted in the United States of America.
Basis for Opinion
These financial statements are the responsibility of the Fund’s management. Our responsibility is to express an opinion on the Fund’s financial statements based on our audits. We are a public accounting firm registered with the Public Company Accounting Oversight Board (United States) (PCAOB) and are required to be independent with respect to the Fund in accordance with the U.S. federal securities laws and the applicable rules and regulations of the Securities and Exchange Commission and the PCAOB.
We conducted our audits of these financial statements in accordance with the standards of the PCAOB. Those standards require that we plan and perform the audit to obtain reasonable assurance about whether the financial statements are free of material misstatement, whether due to error or fraud.
Our audits included performing procedures to assess the risks of material misstatement of the financial statements, whether due to error or fraud, and performing procedures that respond to those risks. Such procedures included examining, on a test basis, evidence regarding the amounts and disclosures in the financial statements. Our audits also included evaluating the accounting principles used and significant estimates made by management, as well as evaluating the overall presentation of the financial statements. Our procedures included confirmation of securities owned as of August 31, 2023 by correspondence with the custodian and transfer agent. We believe that our audits provide a reasonable basis for our opinion.
/s/PricewaterhouseCoopers LLP
Minneapolis, Minnesota
October 23, 2023
We have served as the auditor of one or more investment companies within the Columbia Funds Complex since 1977.
| 32 | Columbia International Dividend Income Fund | Annual Report 2023 |
Federal Income Tax Information
(Unaudited)
The Fund hereby designates the following tax attributes for the fiscal year ended August 31, 2023. Shareholders will be notified in early 2024 of the amounts for use in preparing 2023 income tax returns.
Qualified
dividend
income | Capital
gain
dividend | Foreign
taxes paid
to foreign
countries | Foreign
taxes paid
per share
to foreign
countries | Foreign
source
income | Foreign
source
income
per share |
| 97.02% | $3,544,331 | $1,886,790 | $0.06 | $17,853,897 | $0.61 |
Qualified dividend income. For taxable, non-corporate shareholders, the percentage of ordinary income distributed during the fiscal year that represents qualified dividend income subject to reduced tax rates.
Capital gain dividend. The Fund designates as a capital gain dividend the amount reflected above, or if subsequently determined to be different, the net capital gain of such fiscal period.
Foreign taxes. The Fund makes the election to pass through to shareholders the foreign taxes paid. Eligible shareholders may claim a foreign tax credit. These taxes, and the corresponding foreign source income, are provided in the table above.
TRUSTEES AND OFFICERS
(Unaudited)
The Board oversees the Fund’s operations and appoints officers who are responsible for day-to-day business decisions based on policies set by the Board. The following table provides basic biographical information about the Fund’s Trustees as of the printing of this report, including their principal occupations during the past five years, although specific titles for individuals may have varied over the period. The year set forth beneath Length of Service in the table below is the year in which the Trustee was first appointed or elected as Trustee to any Fund currently in the Columbia Funds Complex or a predecessor thereof. Under current Board policy, each Trustee generally serves until December 31 of the year such Trustee turns seventy-five (75).
Independent trustees
Name,
address,
year of birth | Position held
with the Columbia Funds and
length of service | Principal occupation(s)
during past five years
and other relevant
professional experience | Number of
Funds in the
Columbia Funds
Complex*
overseen | Other directorships
held by Trustee
during the past five years
and other relevant Board experience |
George S. Batejan
c/o Columbia Management
Investment Advisers, LLC
290 Congress Street
Boston, MA 02210
1954 | Trustee since 2017 | Executive Vice President, Global Head of Technology and Operations, Janus Capital Group, Inc., 2010-2016 | 173 | Former Chairman of the Board, NICSA (National Investment Company Services Association) (Executive Committee, Nominating Committee and Governance Committee), 2014-2016; former Director, Intech Investment Management, 2011-2016; former Board Member, Metro Denver Chamber of Commerce, 2015-2016; former Advisory Board Member, University of Colorado Business School, 2015-2018; former Board Member, Chase Bank International, 1993-1994 |
Columbia International Dividend Income Fund | Annual Report 2023
| 33 |
TRUSTEES AND OFFICERS (continued)
(Unaudited)
Independent trustees (continued)
Name,
address,
year of birth | Position held
with the Columbia Funds and
length of service | Principal occupation(s)
during past five years
and other relevant
professional experience | Number of
Funds in the
Columbia Funds
Complex*
overseen | Other directorships
held by Trustee
during the past five years
and other relevant Board experience |
Kathleen Blatz
c/o Columbia Management
Investment Advisers, LLC
290 Congress Street
Boston, MA 02210
1954 | Trustee since 2006 | Attorney, specializing in arbitration and mediation; Chief Justice, Minnesota Supreme Court, 1998-2006; Associate Justice, Minnesota Supreme Court, 1996-1998; Fourth Judicial District Court Judge, Hennepin County, 1994-1996; Attorney in private practice and public service, 1984-1993; State Representative, Minnesota House of Representatives, 1979-1993, which included service on the Tax and Financial Institutions and Insurance Committees; Member and Interim Chair, Minnesota Sports Facilities Authority, January-July 2017; Interim President and Chief Executive Officer, Blue Cross and Blue Shield of Minnesota (health care insurance), February-July 2018, April-October 2021 | 173 | Former Trustee, Blue Cross and Blue Shield of Minnesota, 2009-2021 (Chair of the Business Development Committee, 2014-2017; Chair of the Governance Committee, 2017-2019); former Member and Chair of the Board, Minnesota Sports Facilities Authority, January 2017-July 2017; former Director, Robina Foundation, 2009-2020 (Chair, 2014-2020); Director, Richard M. Schulze Family Foundation, since 2021 |
Pamela G. Carlton
c/o Columbia Management
Investment Advisers, LLC
290 Congress Street
Boston, MA 02210
1954 | Chair since 2023; Trustee since 2007 | President, Springboard – Partners in Cross Cultural Leadership (consulting company), since 2003; Managing Director of US Equity Research, JP Morgan Chase, 1999-2003; Director of US Equity Research, Chase Asset Management, 1996-1999; Co-Director Latin America Research, 1993-1996, COO Global Research, 1992-1996, Co-Director of US Research, 1991-1992, Investment Banker, 1982-1991, Morgan Stanley; Attorney, Cleary Gottlieb Steen & Hamilton LLP, 1980-1982 | 173 | Trustee, New York Presbyterian Hospital Board, since 1996; Director, DR Bank (Audit Committee) since 2017; Director, Evercore Inc. (Audit Committee, Nominating and Governance Committee), since 2019; Director, Apollo Commercial Real Estate Finance, Inc. (Chair, Nominating and Governance Committee) (financial services), since 2021; the Governing Council of the Independent Directors Council (IDC), since 2021 |
Janet Langford Carrig
c/o Columbia Management
Investment Advisers, LLC
290 Congress Street
Boston, MA 02210
1957 | Trustee since 1996 | Senior Vice President, General Counsel and Corporate Secretary, ConocoPhillips (independent energy company), September 2007-October 2018 | 173 | Director, EQT Corporation (natural gas producer), since 2019; former Director, Whiting Petroleum Corporation (independent oil and gas company), 2020-2022 |
J. Kevin Connaughton
c/o Columbia Management
Investment Advisers, LLC
290 Congress Street
Boston, MA 02210
1964 | Trustee since 2020 | CEO and President, RhodeWay Financial (non-profit financial planning firm), since December 2022; Member, FINRA National Adjudicatory Council, since January 2020; Adjunct Professor of Finance, Bentley University since January 2018; Consultant to Independent Trustees of CFVIT and CFST I from March 2016 to June 2020 with respect to CFVIT and to December 2020 with respect to CFST I; Managing Director and General Manager of Mutual Fund Products, Columbia Management Investment Advisers, LLC, May 2010-February 2015; President, Columbia Funds, 2008-2015; and senior officer of Columbia Funds and affiliated funds, 2003-2015 | 171 | Former Director, The Autism Project, March 2015-December 2021; former Member of the Investment Committee, St. Michael’s College, November 2015-February 2020; former Trustee, St. Michael’s College, June 2017-September 2019; former Trustee, New Century Portfolios (former mutual fund complex), January 2015-December 2017 |
| 34 | Columbia International Dividend Income Fund | Annual Report 2023 |
TRUSTEES AND OFFICERS (continued)
(Unaudited)
Independent trustees (continued)
Name,
address,
year of birth | Position held
with the Columbia Funds and
length of service | Principal occupation(s)
during past five years
and other relevant
professional experience | Number of
Funds in the
Columbia Funds
Complex*
overseen | Other directorships
held by Trustee
during the past five years
and other relevant Board experience |
Olive M. Darragh
c/o Columbia Management
Investment Advisers, LLC
290 Congress Street
Boston, MA 02210
1962 | Trustee since 2020 | Managing Director of Darragh Inc. (strategy and talent management consulting firm), since 2010; Founder and CEO, Zolio, Inc. (investment management talent identification platform), since 2004; Consultant to Independent Trustees of CFVIT and CFST I from June 2019 to June 2020 with respect to CFVIT and to December 2020 with respect to CFST I; Partner, Tudor Investments, 2004-2010; Senior Partner, McKinsey & Company (consulting), 1990-2004; Touche Ross CPA, 1985-1988 | 171 | Treasurer, Edinburgh University US Trust Board, since January 2023; Member, HBS Community Action Partners Board, since September 2022; former Director, University of Edinburgh Business School (Member of US Board), 2004-2019; former Director, Boston Public Library Foundation, 2008-2017 |
Patricia M. Flynn
c/o Columbia Management
Investment Advisers, LLC
290 Congress Street
Boston, MA 02210
1950 | Trustee since 2004 | Professor of Economics and Management, Bentley University, since 2002; Dean, McCallum Graduate School of Business, Bentley University, 1992-2002 | 173 | Former Trustee, MA Taxpayers Foundation, 1997-2022; former Director, The MA Business Roundtable, 2003-2019; former Chairperson, Innovation Index Advisory Committee, MA Technology Collaborative, 1997-2020 |
Brian J. Gallagher
c/o Columbia Management
Investment Advisers, LLC
290 Congress Street
Boston, MA 02210
1954 | Trustee since 2017 | Retired; Partner with Deloitte & Touche LLP and its predecessors, 1977-2016 | 173 | Trustee, Catholic Schools Foundation, since 2004 |
Douglas A. Hacker
c/o Columbia Management
Investment Advisers, LLC
290 Congress Street
Boston, MA 02210
1955 | Trustee since 1996 | Independent business executive, since May 2006; Executive Vice President – Strategy of United Airlines, December 2002 - May 2006; President of UAL Loyalty Services (airline marketing company), September 2001-December 2002; Executive Vice President and Chief Financial Officer of United Airlines, July 1999-September 2001 | 173 | Director, SpartanNash Company since November 2013 (Chair of the Board, since May 2021) (food distributor); Director, Aircastle Limited (Chair of Audit Committee) (aircraft leasing), since August 2006; former Director, Nash Finch Company (food distributor), 2005-2013; former Director, SeaCube Container Leasing Ltd. (container leasing), 2010-2013; and former Director, Travelport Worldwide Limited (travel information technology), 2014-2019 |
Nancy T. Lukitsh
c/o Columbia Management
Investment Advisers, LLC
290 Congress Street
Boston, MA 02210
1956 | Trustee since 2011 | Senior Vice President, Partner and Director of Marketing, Wellington Management Company, LLP (investment adviser), 1997-2010; Chair, Wellington Management Portfolios (commingled non-U.S. investment pools), 2007-2010; Director, Wellington Trust Company, NA and other Wellington affiliates, 1997-2010 | 171 | None |
Columbia International Dividend Income Fund | Annual Report 2023
| 35 |
TRUSTEES AND OFFICERS (continued)
(Unaudited)
Independent trustees (continued)
Name,
address,
year of birth | Position held
with the Columbia Funds and
length of service | Principal occupation(s)
during past five years
and other relevant
professional experience | Number of
Funds in the
Columbia Funds
Complex*
overseen | Other directorships
held by Trustee
during the past five years
and other relevant Board experience |
David M. Moffett
c/o Columbia Management
Investment Advisers, LLC
290 Congress Street
Boston, MA 02210
1952 | Trustee since 2011 | Retired; former Chief Executive Officer of Freddie Mac and Chief Financial Officer of U.S. Bank | 171 | Director, CSX Corporation (transportation suppliers); Director, PayPal Holdings Inc. (payment and data processing services); Trustee, University of Oklahoma Foundation; former Director, eBay Inc. (online trading community), 2007-2015; and former Director, CIT Bank, CIT Group Inc. (commercial and consumer finance), 2010-2016; former Senior Adviser to The Carlyle Group (financial services), March 2008-September 2008; former Governance Consultant to Bridgewater Associates, January 2013-December 2015 |
Catherine James Paglia
c/o Columbia Management
Investment Advisers, LLC
290 Congress Street
Boston, MA 02210
1952 | Trustee since 2004 | Director, Enterprise Asset Management, Inc. (private real estate and asset management company), since September 1998; Managing Director and Partner, Interlaken Capital, Inc., 1989-1997; Vice President, 1982-1985, Principal, 1985-1987, Managing Director, 1987-1989, Morgan Stanley; Vice President, Investment Banking, 1980-1982, Associate, Investment Banking, 1976-1980, Dean Witter Reynolds, Inc. | 173 | Director, Valmont Industries, Inc. (irrigation systems manufacturer), since 2012; Trustee, Carleton College (on the Investment Committee), since 1987; Trustee, Carnegie Endowment for International Peace (on the Investment Committee), since 2009 |
Natalie A. Trunow
c/o Columbia Management
Investment Advisers, LLC
290 Congress Street
Boston, MA 02210
1967 | Trustee since 2020 | Chief Executive Officer, Millennial Portfolio Solutions LLC (asset management and consulting services), January 2016-January 2021; Non-executive Member of the Investment Committee and Valuation Committee, Sarona Asset Management Inc. (private equity firm) since September 2019; Advisor, Horizon Investments (asset management and consulting services), August 2018-January 2022; Advisor, Paradigm Asset Management, November 2016-January 2022; Consultant to Independent Trustees of CFVIT and CFST I from September 2016 to June 2020 with respect to CFVIT and to December 2020 with respect to CFST I; Director of Investments/Consultant, Casey Family Programs, April 2016-November 2016; Senior Vice President and Chief Investment Officer, Calvert Investments, August 2008-January 2016; Section Head and Portfolio Manager, General Motors Asset Management, June 1997-August 2008 | 171 | Independent Director, Investment Committee, Health Services for Children with Special Needs, Inc., 2010-2021; Independent Director, (Executive Committee and Chair, Audit Committee), Consumer Credit Counseling Services (formerly Guidewell Financial Solutions), since 2016; Independent Director, (Investment Committee), Sarona Asset Management, since 2019 |
| 36 | Columbia International Dividend Income Fund | Annual Report 2023 |
TRUSTEES AND OFFICERS (continued)
(Unaudited)
Independent trustees (continued)
Name,
address,
year of birth | Position held
with the Columbia Funds and
length of service | Principal occupation(s)
during past five years
and other relevant
professional experience | Number of
Funds in the
Columbia Funds
Complex*
overseen | Other directorships
held by Trustee
during the past five years
and other relevant Board experience |
Sandra L. Yeager
c/o Columbia Management
Investment Advisers, LLC
290 Congress Street
Boston, MA 02210
1964 | Trustee since 2017 | Retired; President and founder, Hanoverian Capital, LLC (SEC registered investment advisor firm), 2008-2016; Managing Director, DuPont Capital, 2006-2008; Managing Director, Morgan Stanley Investment Management, 2004-2006; Senior Vice President, Alliance Bernstein, 1990-2004 | 173 | Former Director, NAPE (National Alliance for Partnerships in Equity) Education Foundation, October 2016-October 2020; Advisory Board, Jennersville YMCA, since 2022 |
Interested trustee affiliated with Investment Manager**
Name,
address,
year of birth | Position held with the Columbia Funds and length of service | Principal occupation(s) during the
past five years and other relevant
professional experience | Number of
Funds in the
Columbia Funds
Complex* overseen | Other directorships
held by Trustee
during the past
five years and
other relevant Board experience |
Daniel J. Beckman
c/o Columbia Management
Investment Advisers, LLC
290 Congress Street
Boston, MA 02210
1962 | Trustee since November 2021 and President since June 2021 | Vice President – Head of North America Product, Columbia Management Investment Advisers, LLC, since April 2015; President and Principal Executive Officer of the Columbia Funds, since June 2021; officer of Columbia Funds and affiliated funds, 2020-2021 | 173 | Director, Ameriprise Trust Company, since October 2016; Director, Columbia Management Investment Distributors, Inc. since November 2018; Board of Governors, Columbia Wanger Asset Management, LLC since, January 2022; Director, Columbia Threadneedle Canada, Inc., since December 2022 |
| * | The term “Columbia Funds Complex” as used herein includes Columbia Seligman Premium Technology Growth Fund, Tri-Continental Corporation and each series of Columbia Funds Series Trust (CFST), Columbia Funds Series Trust I (CFST I), Columbia Funds Series Trust II (CFST II), Columbia ETF Trust I (CET I), Columbia ETF Trust II (CET II), Columbia Funds Variable Insurance Trust (CFVIT) and Columbia Funds Variable Series Trust II (CFVST II). Messrs. Batejan, Beckman, Gallagher and Hacker and Mses. Blatz, Carlton, Carrig, Flynn, Paglia, and Yeager serve as directors of Columbia Seligman Premium Technology Growth Fund and Tri-Continental Corporation. |
| ** | Interested person (as defined under the 1940 Act) by reason of being an officer, director, security holder and/or employee of the Investment Manager or Ameriprise Financial. |
The Statement of Additional Information has additional information about the Fund’s Board members and is available, without charge, upon request by calling 800.345.6611, visiting columbiathreadneedleus.com/investor/ or contacting your financial intermediary.
Columbia International Dividend Income Fund | Annual Report 2023
| 37 |
TRUSTEES AND OFFICERS (continued)
(Unaudited)
The Board has appointed officers who are responsible for day-to-day business decisions based on policies it has established. The officers serve at the pleasure of the Board. The following table provides basic information about the Officers of the Fund as of the printing of this report, including principal occupations during the past five years, although their specific titles may have varied over the period. In addition to Mr. Beckman, who is President and Principal Executive Officer, the Fund’s other officers are:
Fund officers
Name,
address and
year of birth | Position and year
first appointed to
position for any Fund
in the Columbia
Funds Complex or a
predecessor thereof | Principal occupation(s) during past five years |
Michael G. Clarke
290 Congress Street
Boston, MA 02210
1969 | Chief Financial Officer and Principal Financial Officer (2009) and Senior Vice President (2019) | Senior Vice President and North America Head of Operations & Investor Services, Columbia Management Investment Advisers, LLC, since June 2023 (previously Senior Vice President and Head of Global Operations, March 2022 – June 2023, Vice President, Head of North America Operations, and Co-Head of Global Operations, June 2019 - February 2022 and Vice President – Accounting and Tax, May 2010 - May 2019); senior officer of Columbia Funds and affiliated funds, since 2002. Director, Ameriprise Trust Company, since June 2023. |
Joseph Beranek
5890 Ameriprise Financial Center
Minneapolis, MN 55474
1965 | Treasurer and Chief Accounting Officer (Principal Accounting Officer) (2019) and Principal Financial Officer (2020), CFST, CFST I, CFST II, CFVIT and CFVST II; Assistant Treasurer, CET I and CET II | Vice President – Mutual Fund Accounting and Financial Reporting, Columbia Management Investment Advisers, LLC, since December 2018 and March 2017, respectively. |
Marybeth Pilat
290 Congress Street
Boston, MA 02210
1968 | Treasurer and Chief Accounting Officer (Principal Accounting Officer) and Principal Financial Officer (2020) for CET I and CET II; Assistant Treasurer, CFST, CFST I, CFST II, CFVIT and CFVST II | Vice President – Product Pricing and Administration, Columbia Management Investment Advisers, LLC, since May 2017. |
William F. Truscott
290 Congress Street
Boston, MA 02210
1960 | Senior Vice President (2001) | Formerly, Trustee/Director of Columbia Funds Complex or legacy funds, November 2001 - January 1, 2021; Chief Executive Officer, Global Asset Management, Ameriprise Financial, Inc., since September 2012; Chairman of the Board and President, Columbia Management Investment Advisers, LLC, since July 2004 and February 2012, respectively; Chairman of the Board and Chief Executive Officer, Columbia Management Investment Distributors, Inc., since November 2008 and February 2012, respectively; Chairman of the Board and Director, Threadneedle Asset Management Holdings, Sàrl, since March 2013 and December 2008, respectively; senior executive of various entities affiliated with Columbia Threadneedle. |
Christopher O. Petersen
5228 Ameriprise Financial Center
Minneapolis, MN 55474
1970 | Senior Vice President and Assistant Secretary (2021) | Formerly, Trustee/Director of funds within the Columbia Funds Complex, July 1, 2020 - November 22, 2021; Senior Vice President and Assistant General Counsel, Ameriprise Financial, Inc., since September 2021 (previously Vice President and Lead Chief Counsel, January 2015 - September 2021); formerly, President and Principal Executive Officer of the Columbia Funds, 2015 - 2021; officer of Columbia Funds and affiliated funds, since 2007. |
Thomas P. McGuire
290 Congress Street
Boston, MA 02210
1972 | Senior Vice President and Chief Compliance Officer (2012) | Vice President – Asset Management Compliance, Ameriprise Financial, Inc., since May 2010; Chief Compliance Officer, Columbia Acorn/Wanger Funds, since December 2015; formerly, Chief Compliance Officer, Ameriprise Certificate Company, September 2010 – September 2020. |
Ryan C. Larrenaga
290 Congress Street
Boston, MA 02210
1970 | Senior Vice President (2017), Chief Legal Officer (2017), and Secretary (2015) | Vice President and Chief Counsel, Ameriprise Financial, Inc., since August 2018 (previously Vice President and Group Counsel, August 2011 - August 2018); Chief Legal Officer, Columbia Acorn/Wanger Funds, since September 2020; officer of Columbia Funds and affiliated funds, since 2005. |
| 38 | Columbia International Dividend Income Fund | Annual Report 2023 |
TRUSTEES AND OFFICERS (continued)
(Unaudited)
Fund officers (continued)
Name,
address and
year of birth | Position and year
first appointed to
position for any Fund
in the Columbia
Funds Complex or a
predecessor thereof | Principal occupation(s) during past five years |
Michael E. DeFao
290 Congress Street
Boston, MA 02210
1968 | Vice President (2011) and Assistant Secretary (2010) | Vice President and Chief Counsel, Ameriprise Financial, Inc., since May 2010; Vice President, Chief Legal Officer and Assistant Secretary, Columbia Management Investment Advisers, LLC, since October 2021 (previously Vice President and Assistant Secretary, May 2010 – September 2021). |
Lyn Kephart-Strong
5903 Ameriprise Financial Center
Minneapolis, MN 55474
1960 | Vice President (2015) | Vice President, Global Investment Operations Services, Columbia Management Investment Advisers, LLC, since 2010; Director (since January 2007) and President (since October 2014), Columbia Management Investment Services Corp.; Director (since December 2017) and President (since January 2017), Ameriprise Trust Company. |
Columbia International Dividend Income Fund | Annual Report 2023
| 39 |
Liquidity Risk Management Program
(Unaudited)
Pursuant to Rule 22e-4 under the 1940 Act, the Fund has adopted a liquidity risk management program (Program). The Program’s principal objectives include assessing, managing and periodically reviewing the Fund’s liquidity risk. Liquidity risk is defined as the risk that the Fund could not meet redemption requests without significant dilution of remaining investors’ interests in the Fund.
The Board has appointed the Investment Manager as the program administrator for the Fund’s Program. The Investment Manager has delegated oversight of the Program to its Liquidity Risk Management Committee (the Committee). At a Board meeting during the fiscal period, the Committee provided the Board with a report addressing the operations of the Program and assessing its adequacy and effectiveness of implementation for the period January 1, 2022 through December 31, 2022, including:
| • | the Fund had sufficient liquidity to both meet redemptions and operate effectively on behalf of shareholders; |
| • | there were no material changes to the Program during the period; |
| • | the implementation of the Program was effective to manage the Fund’s liquidity risk; and |
| • | the Program operated adequately during the period. |
There can be no assurance that the Program will achieve its objectives in the future. Please refer to the Fund’s prospectus for more information regarding the Fund’s exposure to liquidity risk and other principal risks to which an investment in the Fund may be subject.
Approval of Management Agreement
(Unaudited)
Columbia Management Investment Advisers, LLC (the Investment Manager, and together with its domestic and global affiliates, Columbia Threadneedle Investments), a wholly-owned subsidiary of Ameriprise Financial, Inc. (Ameriprise Financial), serves as the investment manager to Columbia International Dividend Income Fund (the Fund). Under a management agreement (the Management Agreement), the Investment Manager provides investment advice and other services to the Fund and other funds distributed by Columbia Management Investment Distributors, Inc. (collectively, the Funds).
On an annual basis, the Fund’s Board of Trustees (the Board), including the independent Board members (the Independent Trustees), considers renewal of the Management Agreement. The Investment Manager prepared detailed reports for the Board and its Contracts Committee (including its Contracts Subcommittee) in February, March, April, May and June 2023, including reports providing the results of analyses performed by a third-party data provider, Broadridge Financial Solutions, Inc. (Broadridge), and comprehensive responses by the Investment Manager to written requests for information by independent legal counsel to the Independent Trustees (Independent Legal Counsel), to assist the Board in making this determination. In addition, throughout the year, the Board (or its committees or subcommittees) regularly meets with portfolio management teams and senior management personnel and reviews information prepared by the Investment Manager addressing the services the Investment Manager provides and Fund performance. The Board also accords appropriate weight to the work, deliberations and conclusions of the various committees (including their subcommittees), such as the Contracts Committee, the Investment Review Committee, the Audit Committee and the Compliance Committee in determining whether to continue the Management Agreement.
The Board, at its June 22, 2023 Board meeting (the June Meeting), considered the renewal of the Management Agreement for an additional one-year term. At the June Meeting, Independent Legal Counsel reviewed with the Independent Trustees various factors relevant to the Board’s consideration of advisory agreements and the Board’s legal responsibilities related to such consideration. The Independent Trustees considered all information that they, their legal counsel or the Investment Manager believed reasonably necessary to evaluate and to approve the continuation of the Management Agreement. Among other things, the information and factors considered included the following:
| 40 | Columbia International Dividend Income Fund | Annual Report 2023 |
Approval of Management Agreement (continued)
(Unaudited)
| • | Information on the investment performance of the Fund relative to the performance of a group of mutual funds determined to be comparable to the Fund by Broadridge, as well as performance relative to one or more benchmarks; |
| • | Information on the Fund’s management fees and total expenses, including information comparing the Fund’s expenses to those of a group of comparable mutual funds, as determined by Broadridge; |
| • | The Investment Manager’s agreement to contractually limit or cap total operating expenses for the Fund so that total operating expenses (excluding certain fees and expenses, such as transaction costs and certain other investment related expenses, interest, taxes, acquired fund fees and expenses and infrequent and/or unusual expenses) would not exceed a specified annual rate, as a percentage of the Fund’s net assets; |
| • | Terms of the Management Agreement; |
| • | Descriptions of other agreements and arrangements with affiliates of the Investment Manager relating to the operations of the Fund, including agreements with respect to the provision of transfer agency and shareholder services to the Fund; |
| • | Descriptions of various services performed by the Investment Manager under the Management Agreement, including portfolio management and portfolio trading practices; |
| • | Information regarding any recently negotiated management fees of similarly-managed portfolios of other institutional clients of the Investment Manager; |
| • | Information regarding the resources of the Investment Manager, including information regarding senior management, portfolio managers and other personnel; |
| • | Information regarding the capabilities of the Investment Manager with respect to compliance monitoring services; |
| • | The profitability to the Investment Manager and its affiliates from their relationships with the Fund; and |
| • | Report provided by the Board’s independent fee consultant, JDL Consultants, LLC (JDL). |
Following an analysis and discussion of the foregoing, and the factors identified below, the Board, including all of the Independent Trustees, approved the renewal of the Management Agreement.
Nature, extent and quality of services provided by the Investment Manager
The Board analyzed various reports and presentations it had received detailing the services performed by the Investment Manager, as well as its history, expertise, resources and relative capabilities, and the qualifications of its personnel.
The Board specifically considered the many developments during recent years concerning the services provided by the Investment Manager. Among other things, the Board noted the organization and depth of the equity and credit research departments. The Board further observed the enhancements to the investment risk management department’s processes, systems and oversight over the past several years. The Board also took into account the broad scope of services provided by the Investment Manager to the Fund, including, among other services, investment, risk and compliance oversight. The Board also took into account the information it received concerning the Investment Manager’s ability to attract and retain key portfolio management personnel and that it has sufficient resources to provide competitive and adequate compensation to investment personnel.
In connection with the Board’s evaluation of the overall package of services provided by the Investment Manager, the Board also considered the nature, quality and range of administrative services provided to the Fund by the Investment Manager, as well as the achievements in 2022 in the performance of administrative services, and noted the various enhancements anticipated for 2023. In evaluating the quality of services provided under the Management Agreement, the Board also took into account the organization and strength of the Fund’s and its service providers’ compliance programs. The Board also reviewed the financial condition of the Investment Manager and its affiliates and each entity’s ability to carry out its responsibilities under the Management Agreement and the Fund’s other service agreements.
Columbia International Dividend Income Fund | Annual Report 2023
| 41 |
Approval of Management Agreement (continued)
(Unaudited)
In addition, the Board discussed the acceptability of the terms of the Management Agreement, noting that no changes were proposed from the form of agreement previously approved. The Board also noted the wide array of legal and compliance services provided to the Fund under the Management Agreement.
After reviewing these and related factors (including investment performance as discussed below), the Board concluded, within the context of their overall conclusions, that the nature, extent and quality of the services provided to the Fund under the Management Agreement supported the continuation of the Management Agreement.
Investment performance
The Board carefully reviewed the investment performance of the Fund, including detailed reports providing the results of analyses performed by each of the Investment Manager, Broadridge and JDL collectively showing, for various periods (including since manager inception): (i) the performance of the Fund, (ii) the Fund’s performance relative to peers and benchmarks and (iii) the net assets of the Fund. The Board observed that Fund performance was well within the range of that of its peers.
The Board also reviewed a description of the third-party data provider’s methodology for identifying the Fund’s peer groups for purposes of performance and expense comparisons.
The Board also considered the Investment Manager’s performance and reputation generally. After reviewing these and related factors, the Board concluded, within the context of their overall conclusions, that the performance of the Fund and the Investment Manager, in light of other considerations, supported the continuation of the Management Agreement.
Comparative fees, costs of services provided and the profits realized by the Investment Manager and its affiliates from their relationships with the Fund
The Board reviewed comparative fees and the costs of services provided under the Management Agreement. The Board members considered detailed comparative information set forth in an annual report on fees and expenses, including, among other things, data (based on analyses conducted by Broadridge and JDL) showing a comparison of the Fund’s expenses with median expenses paid by funds in its comparative peer universe, as well as data showing the Fund’s contribution to the Investment Manager’s profitability.
The Board considered the reports of JDL, which assisted in the Board’s analysis of the Funds’ performance and expenses and the reasonableness of the Funds’ fee rates. The Board accorded particular weight to the notion that a primary objective of the level of fees is to achieve a rational pricing model applied consistently across the various product lines in the Fund family, while assuring that the overall fees for each Fund (with certain exceptions) are generally in line with the current “pricing philosophy” such that Fund total expense ratios, in general, approximate or are lower than the median expense ratios of funds in the same Lipper comparison universe. The Board took into account that the Fund’s total expense ratio (after considering proposed expense caps/waivers) approximated the peer universe’s median expense ratio.
After reviewing these and related factors, the Board concluded, within the context of their overall conclusions, that the levels of management fees and expenses of the Fund, in light of other considerations, supported the continuation of the Management Agreement.
The Board also considered the profitability of the Investment Manager and its affiliates in connection with the Investment Manager providing management services to the Fund. With respect to the profitability of the Investment Manager and its affiliates, the Independent Trustees referred to information discussing the profitability to the Investment Manager and Ameriprise Financial from managing, operating and distributing the Funds. The Board considered that the profitability generated by the Investment Manager in 2022 had declined from 2021 levels, due to a variety of factors, including the decreased assets under management of the Funds. It also took into account the indirect economic benefits flowing to the Investment Manager or its affiliates in connection with managing or distributing the Funds, such as the enhanced ability to offer various other financial products to Ameriprise Financial customers, soft dollar benefits and overall reputational advantages. The Board noted that the fees paid by the Fund should permit the Investment Manager to offer competitive compensation to its personnel, make necessary investments in its business and earn an appropriate profit. After reviewing
| 42 | Columbia International Dividend Income Fund | Annual Report 2023 |
Approval of Management Agreement (continued)
(Unaudited)
these and related factors, the Board concluded, within the context of their overall conclusions, that the costs of services provided and the profitability to the Investment Manager and its affiliates from their relationships with the Fund supported the continuation of the Management Agreement.
Economies of scale
The Board considered the potential existence of economies of scale in the provision by the Investment Manager of services to the Fund, and whether those economies of scale were shared with the Fund through breakpoints in investment management fees or other means, such as expense limitation arrangements and additional investments by the Investment Manager in investment, trading, compliance and other resources. The Board considered the economies of scale that might be realized as the Fund’s net asset level grows and took note of the extent to which Fund shareholders might also benefit from such growth. In this regard, the Board took into account that management fees decline as Fund assets exceed various breakpoints, all of which have not been surpassed. The Board observed that the Management Agreement provided for breakpoints in the management fee rate schedule that allow opportunities for shareholders to realize lower fees as Fund assets grow and that there are additional opportunities through other means for sharing economies of scale with shareholders.
Conclusion
The Board reviewed all of the above considerations in reaching its decision to approve the continuation of the Management Agreement. In reaching its conclusions, no single factor was determinative.
On June 22, 2023, the Board, including all of the Independent Trustees, determined that fees payable under the Management Agreement were fair and reasonable in light of the extent and quality of services provided and approved the renewal of the Management Agreement.
Columbia International Dividend Income Fund | Annual Report 2023
| 43 |
Columbia International Dividend Income Fund
P.O. Box 219104
Kansas City, MO 64121-9104
Please read and consider the investment objectives, risks, charges and expenses for any fund carefully before investing. For a prospectus and summary prospectus, which contains this and other important information about the Fund, go to
columbiathreadneedleus.com/investor/. The Fund is distributed by Columbia Management Investment Distributors, Inc., member FINRA, and managed by Columbia Management Investment Advisers, LLC.
Columbia Threadneedle Investments (Columbia Threadneedle) is the global brand name of the Columbia and Threadneedle group of companies. All rights reserved.
© 2023 Columbia Management Investment Advisers, LLC.
columbiathreadneedleus.com/investor/

Annual Report
August 31, 2023
Columbia Strategic Income Fund
Not FDIC or NCUA Insured • No Financial Institution Guarantee • May Lose Value
If you elect to receive the shareholder report for Columbia Strategic Income Fund (the Fund) in paper, mailed to you, the Fund mails one shareholder report to each shareholder address, unless such shareholder elects to receive shareholder reports from the Fund electronically via e-mail or by having a paper notice mailed to you (Postcard Notice) that your Fund’s shareholder report is available at the Columbia funds’ website (columbiathreadneedleus.com/investor/). If you would like more than one report in paper to be mailed to you, or would like to elect to receive reports via e-mail or access them through Postcard Notice, please call shareholder services at 800.345.6611 and additional reports will be sent to you.
Proxy voting policies and procedures
The policy of the Board of Trustees is to vote the proxies of the companies in which the Fund holds investments consistent with the procedures as stated in the Statement of Additional Information (SAI). You may obtain a copy of the SAI without charge by calling 800.345.6611; contacting your financial intermediary; visiting columbiathreadneedleus.com/investor/; or searching the website of the Securities and Exchange Commission (SEC) at sec.gov. Information regarding how the Fund voted proxies relating to portfolio securities is filed with the SEC by August 31st for the most recent 12-month period ending June 30th of that year, and is available without charge by visiting columbiathreadneedleus.com/investor/, or searching the website of the SEC at sec.gov.
Quarterly schedule of investments
The Fund files a complete schedule of portfolio holdings with the SEC for the first and third quarters of each fiscal year on Form N-PORT. The Fund’s Form N-PORT filings are available on the SEC’s website at sec.gov. The Fund’s complete schedule of portfolio holdings, as filed on Form N-PORT, is available on columbiathreadneedleus.com/investor/ or can also be obtained without charge, upon request, by calling 800.345.6611.
Additional Fund information
For more information about the Fund, please visit columbiathreadneedleus.com/investor/ or call 800.345.6611. Customer Service Representatives are available to answer your questions Monday through Friday from 8 a.m. to 7 p.m. Eastern time.
Fund investment manager
Columbia Management Investment Advisers, LLC (the Investment Manager)
290 Congress Street
Boston, MA 02210
Fund distributor
Columbia Management Investment Distributors, Inc.
290 Congress Street
Boston, MA 02210
Fund transfer agent
Columbia Management Investment Services Corp.
P.O. Box 219104
Kansas City, MO 64121-9104
Columbia Strategic Income Fund | Annual Report 2023
Fund at a Glance
(Unaudited)
Investment objective
The Fund seeks total return, consisting of current income and capital appreciation.
Portfolio management
Gene Tannuzzo, CFA
Lead Portfolio Manager
Managed Fund since 2010
Jason Callan
Portfolio Manager
Managed Fund since 2017
Alex Christensen, CFA
Portfolio Manager
Managed Fund since 2021
| Average annual total returns (%) (for the period ended August 31, 2023) |
| | | Inception | 1 Year | 5 Years | 10 Years |
| Class A | Excluding sales charges | 04/21/77 | 1.56 | 1.88 | 2.94 |
| | Including sales charges | | -3.27 | 0.90 | 2.45 |
| Advisor Class | 11/08/12 | 1.80 | 2.11 | 3.19 |
| Class C | Excluding sales charges | 07/01/97 | 0.81 | 1.11 | 2.17 |
| | Including sales charges | | -0.16 | 1.11 | 2.17 |
| Institutional Class | 01/29/99 | 1.80 | 2.10 | 3.20 |
| Institutional 2 Class | 03/07/11 | 1.84 | 2.16 | 3.26 |
| Institutional 3 Class | 06/13/13 | 1.89 | 2.21 | 3.30 |
| Class R | 09/27/10 | 1.30 | 1.62 | 2.67 |
| Bloomberg U.S. Aggregate Bond Index | | -1.19 | 0.49 | 1.48 |
| ICE BofA US Cash Pay High Yield Constrained Index | | 7.06 | 3.15 | 4.38 |
| FTSE Non-U.S. World Government Bond (All Maturities) Index - Unhedged | | -0.02 | -3.76 | -1.66 |
| JPMorgan Emerging Markets Bond Index-Global | | 4.96 | 0.84 | 2.80 |
Returns for Class A shares are shown with and without the maximum initial sales charge of 4.75%. Returns for Class C shares are shown with and without the 1.00% contingent deferred sales charge for the first year only. The Fund’s other share classes are not subject to sales charges and have limited eligibility. Please see the Fund’s prospectus for details. Performance for different share classes will vary based on differences in sales charges and fees associated with each share class. All results shown assume reinvestment of distributions during the period. Returns do not reflect the deduction of taxes that a shareholder may pay on Fund distributions or on the redemption of Fund shares. Performance results reflect the effect of any fee waivers or reimbursements of Fund expenses by Columbia Management Investment Advisers, LLC and/or any of its affiliates. Absent these fee waivers or expense reimbursement arrangements, performance results would have been lower.
The performance information shown represents past performance and is not a guarantee of future results. The investment return and principal value of your investment will fluctuate so that your shares, when redeemed, may be worth more or less than their original cost. Current performance may be lower or higher than the performance information shown. You may obtain performance information current to the most recent month-end by contacting your financial intermediary, visiting columbiathreadneedleus.com/investor/ or calling 800.345.6611.
The Fund’s performance prior to August 29, 2014 reflects returns achieved pursuant to different principal investment strategies. If the Fund’s current strategies had been in place for the prior periods, results shown may have been different.
The Bloomberg U.S. Aggregate Bond Index is a market value-weighted index that tracks the daily price, coupon, pay-downs and total return performance of fixed-rate, publicly placed, dollar-denominated and non-convertible investment-grade debt issues with at least $250 million par amount outstanding and with at least one year to final maturity.
The ICE BofA US Cash Pay High Yield Constrained Index tracks the performance of U.S. dollar-denominated below investment-grade corporate debt, currently in a coupon paying period, that is publicly issued in the U.S. domestic market. Effective July 1, 2022 the ICE BofA US Cash Pay High Yield Constrained Index now includes transaction costs.
The FTSE Non-U.S. World Government Bond (All Maturities) Index — Unhedged is calculated on a market-weighted basis and includes all fixed-rate bonds with a remaining maturity of one year or longer and with amounts outstanding of at least the equivalent of U.S. $25 million, while excluding floating or variable rate bonds.
The JPMorgan Emerging Markets Bond Index — Global is based on U.S. dollar-denominated debt instruments issued by emerging market sovereign and quasi-sovereign entities, such as Brady bonds, Eurobonds and loans, and reflects reinvestment of all distributions and changes in market prices.
Indices are not available for investment, are not professionally managed and do not reflect sales charges, fees, brokerage commissions, taxes, other expenses of investing or, for ICE BofA US Cash Pay High Yield Constrained Index for periods prior to July 2022, transaction costs. Securities in the Fund may not match those in an index.
Columbia Strategic Income Fund | Annual Report 2023
| 3 |
Fund at a Glance (continued)
(Unaudited)
Performance of a hypothetical $10,000 investment (August 31, 2013 — August 31, 2023)
The chart above shows the change in value of a hypothetical $10,000 investment in Class A shares of Columbia Strategic Income Fund during the stated time period, and does not reflect the deduction of taxes that a shareholder may pay on Fund distributions or on the redemption of Fund shares.
| 4 | Columbia Strategic Income Fund | Annual Report 2023 |
Fund at a Glance (continued)
(Unaudited)
| Portfolio breakdown (%) (at August 31, 2023) |
| Asset-Backed Securities — Non-Agency | 5.1 |
| Call Option Contracts Purchased | 0.0(a) |
| Commercial Mortgage-Backed Securities - Non-Agency | 2.3 |
| Common Stocks | 0.0(a) |
| Convertible Bonds | 0.1 |
| Convertible Preferred Stocks | 0.0(a) |
| Corporate Bonds & Notes | 34.5 |
| Foreign Government Obligations | 6.0 |
| Money Market Funds | 4.7 |
| Residential Mortgage-Backed Securities - Agency | 27.0 |
| Residential Mortgage-Backed Securities - Non-Agency | 13.8 |
| Rights | 0.0(a) |
| Senior Loans | 6.4 |
| U.S. Government & Agency Obligations | 0.1 |
| Total | 100.0 |
Percentages indicated are based upon total investments including option contracts purchased and excluding all other investments in derivatives, if any. The Fund’s portfolio composition is subject to change.
| Quality breakdown (%) (at August 31, 2023) |
| AAA rating | 21.4 |
| AA rating | 10.0 |
| A rating | 8.9 |
| BBB rating | 19.4 |
| BB rating | 16.6 |
| B rating | 16.3 |
| CCC rating | 2.5 |
| CC rating | 0.0(a) |
| Not rated | 4.9 |
| Total | 100.0 |
Percentages indicated are based upon total fixed income investments.
Bond ratings apply to the underlying holdings of the Fund and not the Fund itself and are divided into categories ranging from highest to lowest credit quality, determined by using the middle rating of Moody’s, S&P and Fitch, after dropping the highest and lowest available ratings. When ratings are available from only two rating agencies, the lower rating is used. When a rating is available from only one rating agency, that rating is used. If a security is not rated but has a rating by Kroll and/or DBRS, the same methodology is applied to those bonds that would otherwise be not rated. When a bond is not rated by any rating agency, it is designated as “Not rated.” Credit quality ratings assigned by a rating agency are subjective opinions, not statements of fact, and are subject to change, including daily. The ratings assigned by credit rating agencies are but one of the considerations that the Investment Manager and/or Fund’s subadviser incorporates into its credit analysis process, along with such other issuer-specific factors as cash flows, capital structure and leverage ratios, ability to de-leverage (repay) through free cash flow, quality of management, market positioning and access to capital, as well as such security-specific factors as the terms of the security (e.g., interest rate and time to maturity) and the amount and type of any collateral.
Columbia Strategic Income Fund | Annual Report 2023
| 5 |
Manager Discussion of Fund Performance
(Unaudited)
For the 12-month period that ended August 31, 2023, Class A shares of Columbia Strategic Income Fund returned 1.56% excluding sales charges. The Fund’s benchmark, the Bloomberg U.S. Aggregate Bond Index, returned -1.19% for the same period.
Market overview
During the annual period, the Fund’s benchmark, which measures the broad U.S. investment-grade bond market, produced negative returns, spurred by persistently sticky inflation, which, in turn, emboldened an already hawkish U.S. Federal Reserve (Fed).
As the annual period began in September 2022, the 10-year U.S. Treasury yield rose to 4.00% for the first time since 2007. Amid the sharp selloff in government bonds, interest rate volatility also spiked and led to the worst month for agency mortgage-backed securities in that sector’s history. Bonds staged a recovery in the fourth quarter of 2022 and into January 2023. Signs that inflation may have peaked and other encouraging economic data raised hopes the Fed may be approaching the end of its series of sharp interest rate hikes. However, sentiment reversed course in February 2023 as fresh economic data showed that prices did not decelerate as much as consensus expected, and many more jobs had been created to start the new year. Both of these signals were red flags for the Fed, which had downshifted the pace of its hikes earlier in the month. Corporate earnings added noise to the picture as more companies began missing estimates, and management teams turned increasingly cautious. As the market accepted that the Fed might still have a way to go in its tightening cycle, yields climbed and credit spreads widened. Interest rate expectations took another turn in mid-March following clear signs of stress in the banking sector. Yields tumbled across the curve, or spectrum of maturities, when regulators shut down two regional U.S. banks. The Fed looked through this financial sector instability and hiked interest rates for the ninth consecutive time, raising the targeted federal funds rate to a range of 4.75% to 5.00%.
In the second quarter of 2023, the benchmark fell modestly. While April was a positive month for fixed-income markets, led by a recovery from the indiscriminate selloff in the prior month, May saw a tenth interest rate hike by the Fed and the potential of a U.S. federal debt crisis. There was then a pause by the Fed in June, but one accompanied by expectations of further interest rate hikes later in the year. As a result, U.S. Treasury yields moved higher along maturities. In each of the last two months of the annual period, the benchmark posted slightly negative returns. In July, consensus quickly shifted to expect a soft landing and a belief that recession was not imminent. The Fed followed up its June pause by hiking interest rates 25 basis points. (A basis point is 1/100 of a percentage point.) In August, headwinds emerged for U.S. Treasuries, including the announcement of a sharp increase in upcoming issuance, uncertainty around foreign buying following a shift in the Bank of Japan’s monetary stimulus, a rally in energy prices and poor summer liquidity. Fitch Ratings downgraded U.S. debt from its AAA status at the beginning of the month, but market reaction was muted.
All told, yields rose across the U.S. Treasury yield curve. The bellwether 10-year U.S. Treasury yield was up 94 basis points during the annual period. Throughout, the two-year to 10-year portion of the U.S. Treasury yield curve remained inverted, meaning 10-year U.S. Treasury yields were lower than two-year U.S. Treasury yields, historically a foreshadow of a recession. In fact, the U.S. Treasury yield curve briefly touched some of its most inverted levels since the early 1980s in July 2023 before steepening just a bit. Globally, the scenario was similar, with government bond yields moving higher as most global central banks, both of developed and emerging markets, continued to tighten monetary policy through most of the annual period, moving to pausing cycles as inflation figures started to edge lower.
U.S. Treasuries and securitized bonds as a whole, including mortgage-backed securities, commercial mortgage-backed securities and asset-backed securities, were among the worst performing fixed-income sectors during the annual period, posting negative absolute returns. Treasury inflation-protected securities also performed poorly, as inflation levels, while persistently high, did fall significantly from the previous year. Conversely, leveraged loans, high-yield corporate bonds and sovereign emerging markets debt were among the strongest performing fixed-income sectors during the annual period, generating solidly positive total returns. Municipal bonds and U.S. investment-grade corporate bonds outperformed both the benchmark and U.S. Treasuries but posted only modestly positive absolute returns for the annual period.
The Fund experienced increased portfolio turnover during the period, as compared to the previous reporting period, due to increased trading as a result of elevated market volatility.
| 6 | Columbia Strategic Income Fund | Annual Report 2023 |
Manager Discussion of Fund Performance (continued)
(Unaudited)
The Fund’s notable contributors during the period
| • | Relative to the benchmark, the Fund’s exposure to credit across the quality spectrum boosted its results most, as both investment-grade and high-yield credit sectors outperformed duration-equivalent U.S. Treasuries during the annual period. |
| • | Allocations to several sectors that are not components of the benchmark, including non-agency mortgage-backed securities, high-yield corporate credit and floating rate loans, generated significant added value, each outperforming the benchmark during the annual period. |
| • | Security selection among investment-grade corporate bonds contributed positively to relative results. |
| ○ | Selection was especially beneficial in April 2023 amid the fallout of the regional banking crisis. For example, ahead of the Silicon Valley Bank failure, the Fund had no exposure at all to what we deemed to be higher risk regional banks due to their relative valuation versus the larger domestic investment banks. |
| ○ | Overweighted positions in industrials- and utilities-related investment-grade corporate bonds, which meaningfully outperformed financials-related issues within the sector, proved particularly prudent as well. |
| • | The Fund’s duration positioning contributed positively to its relative performance. |
| ○ | The Fund held a shorter duration stance than that of the benchmark during an annual period when interest rates rose. |
| ○ | The Fund’s duration was actively adjusted throughout the annual period but averaged a duration of approximately 1.25 years shorter than that of the benchmark. |
The Fund’s notable detractors during the period
| • | Having an overweighted allocation to agency mortgage-backed securities detracted from the Fund’s relative results, as this sector underperformed the benchmark during the annual period. However, the effect of such positioning was mitigated by a focus on higher coupons, which outpaced lower coupons. |
| • | Similarly, exposure to commercial mortgage-backed securities dampened the Fund’s relative results, as the sector performed weakly during the annual period. |
Derivatives usage
The Fund utilized derivatives as a means to hedge exposures to better balance risks among four risk factors: credit, duration, currency and inflation. We used U.S. Treasury futures, interest rate swaps and options on interest rate swaps to manage its interest rate exposure, i.e., to express a shorter-than-benchmark duration stance. We also used credit default swap indices and commercial mortgage-backed securities (CMBX) indices to hedge and express investment views in the high-yield corporate credit and commercial mortgage-backed securities bond markets, respectively. On a stand-alone basis, these derivatives had a negative impact on Fund performance during the period.
Market risk may affect a single issuer, sector of the economy, industry or the market as a whole. Mortgage- and asset-backed securities are affected by interest rates, financial health of issuers/originators, creditworthiness of entities providing credit enhancements and the value of underlying assets. Fixed-income securities present issuer default risk. Non-investment-grade (high-yield or junk) securities present greater price volatility and more risk to principal and income than higher rated securities. A rise in interest rates may result in a price decline of fixed-income instruments held by the Fund, negatively impacting its performance and NAV. Falling rates may result in the Fund investing in lower yielding debt instruments, lowering the Fund’s income and yield. These risks may be heightened for longer maturity and duration securities. Floating rate loans typically present greater risk than other fixed-income investments as they are generally subject to legal or contractual resale restrictions, may trade less frequently and experience value impairments during liquidation. Prepayment and extension risk exists because the timing of payments on a loan, bond or other investment may accelerate when interest rates fall or decelerate when interest rates rise which may reduce investment opportunities and potential returns. Foreign investments subject the Fund to risks, including political, economic, market, social and others within a particular country, as well as to currency instabilities and less stringent financial and accounting standards generally applicable to U.S. issuers. Risks are enhanced for emerging market and sovereign debt issuers. Investing in derivatives is a
Columbia Strategic Income Fund | Annual Report 2023
| 7 |
Manager Discussion of Fund Performance (continued)
(Unaudited)
specialized activity that involves special risks that subject the Fund to significant loss potential, including when used as leverage, and may result in greater fluctuation in Fund value. Liquidity risk is associated with the difficulty of selling underlying investments at a desirable time or price. See the Fund’s prospectus for more information on these and other risks.
The views expressed in this report reflect the current views of the respective parties who have contributed to this report. These views are not guarantees of future performance and involve certain risks, uncertainties and assumptions that are difficult to predict, so actual outcomes and results may differ significantly from the views expressed. These views are subject to change at any time based upon economic, market or other conditions and the respective parties disclaim any responsibility to update such views. These views may not be relied on as investment advice and, because investment decisions for a Columbia fund are based on numerous factors, may not be relied on as an indication of trading intent on behalf of any particular Columbia fund. References to specific securities should not be construed as a recommendation or investment advice.
| 8 | Columbia Strategic Income Fund | Annual Report 2023 |
Understanding Your Fund’s Expenses
(Unaudited)
As an investor, you incur two types of costs. There are shareholder transaction costs, which generally include sales charges on purchases and may include redemption fees. There are also ongoing fund costs, which generally include management fees, distribution and/or service fees, and other fund expenses. The following information is intended to help you understand your ongoing costs (in dollars) of investing in the Fund and to help you compare these costs with the ongoing costs of investing in other mutual funds.
Analyzing your Fund’s expenses
To illustrate these ongoing costs, we have provided examples and calculated the expenses paid by investors in each share class of the Fund during the period. The actual and hypothetical information in the table is based on an initial investment of $1,000 at the beginning of the period indicated and held for the entire period. Expense information is calculated two ways and each method provides you with different information. The amount listed in the “Actual” column is calculated using the Fund’s actual operating expenses and total return for the period. You may use the Actual information, together with the amount invested, to estimate the expenses that you paid over the period. Simply divide your account value by $1,000 (for example, an $8,600 account value divided by $1,000 = 8.6), then multiply the results by the expenses paid during the period under the “Actual” column. The amount listed in the “Hypothetical” column assumes a 5% annual rate of return before expenses (which is not the Fund’s actual return) and then applies the Fund’s actual expense ratio for the period to the hypothetical return. You should not use the hypothetical account values and expenses to estimate either your actual account balance at the end of the period or the expenses you paid during the period. See “Compare with other funds” below for details on how to use the hypothetical data.
Compare with other funds
Since all mutual funds are required to include the same hypothetical calculations about expenses in shareholder reports, you can use this information to compare the ongoing cost of investing in the Fund with other funds. To do so, compare the hypothetical example with the 5% hypothetical examples that appear in the shareholder reports of other funds. As you compare hypothetical examples of other funds, it is important to note that hypothetical examples are meant to highlight the ongoing costs of investing in a fund only and do not reflect any transaction costs, such as sales charges, or redemption or exchange fees. Therefore, the hypothetical calculations are useful in comparing ongoing costs only, and will not help you determine the relative total costs of owning different funds. If transaction costs were included in these calculations, your costs would be higher.
| March 1, 2023 — August 31, 2023 |
| | Account value at the
beginning of the
period ($) | Account value at the
end of the
period ($) | Expenses paid during
the period ($) | Fund’s annualized
expense ratio (%) |
| | Actual | Hypothetical | Actual | Hypothetical | Actual | Hypothetical | Actual |
| Class A | 1,000.00 | 1,000.00 | 1,025.70 | 1,020.52 | 4.75 | 4.74 | 0.93 |
| Advisor Class | 1,000.00 | 1,000.00 | 1,027.10 | 1,021.78 | 3.47 | 3.47 | 0.68 |
| Class C | 1,000.00 | 1,000.00 | 1,021.90 | 1,016.74 | 8.56 | 8.54 | 1.68 |
| Institutional Class | 1,000.00 | 1,000.00 | 1,027.10 | 1,021.78 | 3.47 | 3.47 | 0.68 |
| Institutional 2 Class | 1,000.00 | 1,000.00 | 1,027.30 | 1,021.98 | 3.27 | 3.26 | 0.64 |
| Institutional 3 Class | 1,000.00 | 1,000.00 | 1,027.60 | 1,022.23 | 3.02 | 3.01 | 0.59 |
| Class R | 1,000.00 | 1,000.00 | 1,024.80 | 1,019.26 | 6.02 | 6.01 | 1.18 |
Expenses paid during the period are equal to the annualized expense ratio for each class as indicated above, multiplied by the average account value over the period and then multiplied by the number of days in the Fund’s most recent fiscal half year and divided by 365.
Expenses do not include fees and expenses incurred indirectly by the Fund from its investment in underlying funds, including affiliated and non-affiliated pooled investment vehicles, such as mutual funds and exchange-traded funds.
Columbia Strategic Income Fund | Annual Report 2023
| 9 |
Portfolio of Investments
August 31, 2023
(Percentages represent value of investments compared to net assets)
Investments in securities
| Asset-Backed Securities — Non-Agency 6.2% |
| Issuer | Coupon
Rate | | Principal
Amount ($) | Value ($) |
| ARES XLIV CLO Ltd.(a),(b) |
| Series 2017-44A Class DR |
3-month Term SOFR + 7.132%
Floor 6.870%
04/15/2034 | 12.440% | | 15,000,000 | 14,234,430 |
| Bain Capital Credit CLO Ltd.(a),(b) |
| Series 2021-5A Class E |
3-month Term SOFR + 6.762%
Floor 6.500%
10/23/2034 | 12.107% | | 8,600,000 | 7,954,630 |
| Series 2021-6A Class E |
3-month Term SOFR + 6.762%
Floor 6.500%
10/21/2034 | 12.095% | | 11,450,000 | 10,632,424 |
| Series 2021-7A Class E |
3-month Term SOFR + 7.012%
Floor 6.750%
01/22/2035 | 12.357% | | 15,350,000 | 14,413,926 |
| Ballyrock CLO Ltd.(a),(b) |
| Series 2021-18A Class D |
3-month Term SOFR + 6.762%
Floor 6.500%
01/15/2035 | 12.070% | | 13,050,000 | 12,455,716 |
| Barings CLO Ltd.(a),(b) |
| Series 2021-2A Class E |
3-month Term SOFR + 6.512%
Floor 6.250%
07/15/2034 | 11.820% | | 8,350,000 | 7,869,408 |
| Exeter Automobile Receivables Trust |
| Subordinated Series 2023-3A Class B |
| 09/15/2027 | 6.110% | | 5,100,000 | 5,104,980 |
| Subordinated Series 2023-4A Class B |
| 10/15/2027 | 6.310% | | 12,500,000 | 12,538,670 |
| LendingPoint Asset Securitization Trust(a) |
| Subordinated Series 2021-A Class C |
| 12/15/2028 | 2.750% | | 12,305,392 | 12,055,190 |
| Subordinated Series 2022-A Class C |
| 06/15/2029 | 2.820% | | 7,760,000 | 7,575,409 |
| Madison Park Funding LXII Ltd.(a),(b) |
| Series 2022-62A Class AR |
3-month Term SOFR + 1.850%
Floor 1.850%
07/17/2036 | 7.158% | | 49,500,000 | 49,598,951 |
| Madison Park Funding XXII Ltd.(a),(b) |
| Series 2016-22A Class DR |
3-month Term SOFR + 3.762%
Floor 3.500%
01/15/2033 | 9.070% | | 10,900,000 | 10,731,061 |
| Asset-Backed Securities — Non-Agency (continued) |
| Issuer | Coupon
Rate | | Principal
Amount ($) | Value ($) |
| Marlette Funding Trust(a) |
| Series 2023-2A Class A |
| 06/15/2033 | 6.040% | | 7,511,104 | 7,487,586 |
| Netcredit Combined Receivables LLC(a),(c) |
| Series 2023-A Class A |
| 12/20/2027 | 7.780% | | 12,748,398 | 12,660,753 |
| Octagon 55 Ltd.(a),(b) |
| Series 2021-1A Class E |
3-month Term SOFR + 6.762%
Floor 6.500%
07/20/2034 | 12.088% | | 9,700,000 | 8,982,530 |
| Octagon Investment Partners 48 Ltd.(a),(b) |
| Series 2020-3A Class ER |
3-month Term SOFR + 6.962%
Floor 6.700%
10/20/2034 | 12.288% | | 12,750,000 | 12,201,329 |
| Pagaya AI Debt Selection Trust(a) |
| Subordinated Series 2021-3 Class B |
| 05/15/2029 | 1.740% | | 15,549,154 | 15,151,234 |
| Pagaya AI Debt Trust(a) |
| Series 2022-2 Class A |
| 01/15/2030 | 4.970% | | 3,893,538 | 3,856,167 |
| Subordinated Series 2022-1 Class B |
| 10/15/2029 | 3.344% | | 14,298,109 | 13,368,530 |
| Subordinated Series 2022-3 Class B |
| 03/15/2030 | 8.050% | | 13,933,610 | 13,962,373 |
| Pagaya AI Debt Trust(a),(d) |
| Subordinated Series 2023-5 Class AB |
| 04/15/2031 | 7.277% | | 18,670,000 | 18,706,478 |
| Santander Revolving Auto Loan Trust(a) |
| Series 2019-A Class A |
| 01/26/2032 | 2.510% | | 11,987,000 | 11,449,232 |
| Theorem Funding Trust(a) |
| Series 2022-3A Class A |
| 04/15/2029 | 7.600% | | 11,096,679 | 11,108,622 |
| Upstart Pass-Through Trust(a) |
| Series 2020-ST6 Class A |
| 01/20/2027 | 3.000% | | 2,586,048 | 2,530,483 |
| Upstart Securitization Trust(a) |
| Series 2023-2 Class A |
| 06/20/2033 | 6.770% | | 14,136,224 | 14,040,156 |
Total Asset-Backed Securities — Non-Agency
(Cost $316,153,802) | 310,670,268 |
|
The accompanying Notes to Financial Statements are an integral part of this statement.
| 10 | Columbia Strategic Income Fund | Annual Report 2023 |
Portfolio of Investments (continued)
August 31, 2023
| Commercial Mortgage-Backed Securities - Non-Agency 2.8% |
| Issuer | Coupon
Rate | | Principal
Amount ($) | Value ($) |
| BFLD Trust(a),(b) |
| Subordinated Series 2019-DPLO Class E |
1-month Term SOFR + 2.354%
Floor 2.240%
10/15/2034 | 7.665% | | 6,510,000 | 6,371,931 |
| Braemar Hotels & Resorts Trust(a),(b) |
| Series 2018-PRME Class E |
1-month Term SOFR + 2.447%
Floor 2.400%
06/15/2035 | 7.825% | | 8,700,000 | 8,354,083 |
| Subordinated Series 2018-PRME Class D |
1-month Term SOFR + 1.847%
Floor 1.925%
06/15/2035 | 7.225% | | 13,700,000 | 13,282,768 |
| CLNY Trust(a),(b) |
| Subordinated Series 2019-IKPR Class E |
1-month USD LIBOR + 2.721%
Floor 2.721%
11/15/2038 | 8.152% | | 8,490,000 | 7,819,487 |
| Subordinated Series 2019-IKPR Class F |
1-month USD LIBOR + 3.417%
Floor 3.417%
11/15/2038 | 8.848% | | 12,035,000 | 10,929,063 |
| Cold Storage Trust(a),(b) |
| Subordinated Series 2020-ICE5 Class F |
1-month Term SOFR + 3.607%
Floor 3.492%
11/15/2037 | 8.917% | | 2,801,523 | 2,751,628 |
| COMM Mortgage Trust(a),(d) |
| Subordinated Series 2020-CBM Class F |
| 02/10/2037 | 3.754% | | 4,000,000 | 3,553,366 |
| Credit Suisse Mortgage Capital Certificates OA LLC(a) |
| Subordinated Series 2014-USA Class E |
| 09/15/2037 | 4.373% | | 7,525,000 | 3,916,135 |
| Subordinated Series 2014-USA Class F |
| 09/15/2037 | 4.373% | | 19,910,000 | 7,771,769 |
| GS Mortgage Securities Corp. II(a),(d) |
| Series 2023-SHIP Class A |
| 09/15/2038 | 4.466% | | 5,750,000 | 5,511,681 |
| Hilton USA Trust(a),(d) |
| Subordinated Series 2016-HHV Class F |
| 11/05/2038 | 4.333% | | 16,690,000 | 14,749,596 |
| Hilton USA Trust(a) |
| Subordinated Series 2016-SFP Class E |
| 11/05/2035 | 5.519% | | 11,500,000 | 3,707,005 |
| Morgan Stanley Capital I Trust(a),(d) |
| Series 2019-MEAD Class E |
| 11/10/2036 | 3.283% | | 15,500,000 | 12,011,816 |
| Progress Residential Trust(a) |
| Series 2020-SFR1 Class F |
| 04/17/2037 | 3.431% | | 17,000,000 | 15,903,673 |
| Commercial Mortgage-Backed Securities - Non-Agency (continued) |
| Issuer | Coupon
Rate | | Principal
Amount ($) | Value ($) |
| Subordinated Series 2020-SFR2 Class F |
| 06/17/2037 | 6.152% | | 12,000,000 | 11,708,804 |
| SFO Commercial Mortgage Trust(a),(b) |
| Series 2021-555 Class A |
1-month Term SOFR + 1.264%
Floor 1.150%
05/15/2038 | 6.575% | | 4,850,000 | 4,389,850 |
| Wells Fargo Commercial Mortgage Trust(a),(b) |
| Subordinated Series 2017-SMP Class D |
1-month Term SOFR + 1.822%
Floor 1.650%
12/15/2034 | 7.133% | | 9,790,000 | 8,824,998 |
Total Commercial Mortgage-Backed Securities - Non-Agency
(Cost $166,811,223) | 141,557,653 |
| Common Stocks 0.0% |
| Issuer | Shares | Value ($) |
| Communication Services 0.0% |
| Media 0.0% |
| iHeartMedia, Inc., Class A(e) | 11,995 | 43,302 |
| Total Communication Services | 43,302 |
| Consumer Discretionary 0.0% |
| Broadline Retail 0.0% |
| Belk, Inc.(e) | 50 | 483 |
| Total Consumer Discretionary | 483 |
| Energy 0.0% |
| Energy Equipment & Services 0.0% |
| Covia Holdings Corp.(e) | 74,466 | 1,123,171 |
| McDermott International Ltd.(e) | 47,856 | 8,231 |
| Total | | 1,131,402 |
| Oil, Gas & Consumable Fuels 0.0% |
| New Frontera Holdings(e) | 14,302 | 1,037 |
| Southcross Energy Partners LLC(e) | 14,393 | 201 |
| Southcross Energy Partners LLC, Class A(c),(e) | 272,263 | 10,891 |
| Total | | 12,129 |
| Total Energy | 1,143,531 |
| Financials 0.0% |
| Financial Services 0.0% |
| Windstream Services LLC(e) | 11,272 | 120,233 |
| Total Financials | 120,233 |
The accompanying Notes to Financial Statements are an integral part of this statement.
Columbia Strategic Income Fund | Annual Report 2023
| 11 |
Portfolio of Investments (continued)
August 31, 2023
| Common Stocks (continued) |
| Issuer | Shares | Value ($) |
| Industrials 0.0% |
| Machinery 0.0% |
| TNT Crane and Rigging, Inc.(e) | 23,468 | 164,276 |
| Total Industrials | 164,276 |
| Information Technology 0.0% |
| Communications Equipment 0.0% |
| Riverbed Technology, Inc.(e) | 13,308 | 5,855 |
| Software 0.0% |
| Avaya Holdings Corp.(e) | 8,492 | 110,396 |
| Avaya Holdings Corp.(e) | 40,919 | 531,947 |
| Total | | 642,343 |
| Total Information Technology | 648,198 |
Total Common Stocks
(Cost $2,262,176) | 2,120,023 |
| Convertible Bonds 0.2% |
| Issuer | Coupon
Rate | | Principal
Amount ($) | Value ($) |
| Cable and Satellite 0.2% |
| DISH Network Corp. |
| Subordinated |
| 08/15/2026 | 3.375% | | 15,230,000 | 9,214,150 |
Total Convertible Bonds
(Cost $12,449,701) | 9,214,150 |
| Convertible Preferred Stocks 0.0% |
| Issuer | | Shares | Value ($) |
| Information Technology 0.0% |
| Communications Equipment 0.0% |
| Riverbed Technology, Inc.(c) | 7.000% | 14,204 | 3,622 |
| Total Information Technology | 3,622 |
Total Convertible Preferred Stocks
(Cost $307,751) | 3,622 |
| Corporate Bonds & Notes(f) 42.0% |
| Issuer | Coupon
Rate | | Principal
Amount ($) | Value ($) |
| Aerospace & Defense 1.7% |
| BAE Systems PLC(a) |
| 02/15/2031 | 1.900% | | 12,470,000 | 9,895,917 |
| Boeing Co. (The) |
| 08/01/2059 | 3.950% | | 22,683,000 | 16,173,564 |
| 05/01/2060 | 5.930% | | 7,549,000 | 7,292,524 |
| Corporate Bonds & Notes(f) (continued) |
| Issuer | Coupon
Rate | | Principal
Amount ($) | Value ($) |
| Bombardier, Inc.(a) |
| 04/15/2027 | 7.875% | | 2,516,000 | 2,509,374 |
| Howmet Aerospace, Inc. |
| 01/15/2029 | 3.000% | | 5,006,000 | 4,316,819 |
| L3Harris Technologies, Inc. |
| 07/31/2033 | 5.400% | | 3,597,000 | 3,603,539 |
| Raytheon Technologies Corp. |
| 03/15/2032 | 2.375% | | 17,366,000 | 13,961,246 |
| 02/27/2033 | 5.150% | | 10,232,000 | 10,104,970 |
| Spirit AeroSystems, Inc.(a) |
| 11/30/2029 | 9.375% | | 1,320,000 | 1,376,672 |
| TransDigm, Inc.(a) |
| 03/15/2026 | 6.250% | | 8,643,000 | 8,587,087 |
| 08/15/2028 | 6.750% | | 8,917,000 | 8,958,517 |
| Total | 86,780,229 |
| Airlines 0.4% |
| Air Canada(a) |
| 08/15/2026 | 3.875% | | 2,022,000 | 1,867,176 |
| American Airlines, Inc.(a) |
| 07/15/2025 | 11.750% | | 2,307,000 | 2,526,561 |
| American Airlines, Inc./AAdvantage Loyalty IP Ltd.(a) |
| 04/20/2026 | 5.500% | | 10,672,840 | 10,474,417 |
| 04/20/2029 | 5.750% | | 1,412,465 | 1,350,094 |
| Hawaiian Brand Intellectual Property Ltd./Miles Loyalty Ltd.(a) |
| 01/20/2026 | 5.750% | | 3,627,955 | 3,354,132 |
| United Airlines, Inc.(a) |
| 04/15/2026 | 4.375% | | 1,693,000 | 1,596,422 |
| Total | 21,168,802 |
| Automotive 0.8% |
| American Axle & Manufacturing, Inc. |
| 04/01/2027 | 6.500% | | 1,411,000 | 1,338,492 |
| Clarios Global LP/US Finance Co.(a) |
| 05/15/2028 | 6.750% | | 3,435,000 | 3,437,981 |
| Ford Motor Co. |
| 02/12/2032 | 3.250% | | 3,984,000 | 3,108,958 |
| 01/15/2043 | 4.750% | | 4,953,000 | 3,703,790 |
| Ford Motor Credit Co. LLC |
| 09/08/2024 | 3.664% | | 3,700,000 | 3,588,457 |
| 06/16/2025 | 5.125% | | 4,449,000 | 4,334,448 |
| 11/13/2025 | 3.375% | | 1,036,000 | 964,342 |
| 06/10/2026 | 6.950% | | 1,957,000 | 1,960,726 |
| 08/17/2027 | 4.125% | | 4,839,000 | 4,392,171 |
| 11/04/2027 | 7.350% | | 1,788,000 | 1,821,330 |
| 02/16/2028 | 2.900% | | 1,231,000 | 1,049,176 |
| 06/10/2030 | 7.200% | | 983,000 | 997,796 |
| 11/13/2030 | 4.000% | | 498,000 | 421,384 |
The accompanying Notes to Financial Statements are an integral part of this statement.
| 12 | Columbia Strategic Income Fund | Annual Report 2023 |
Portfolio of Investments (continued)
August 31, 2023
| Corporate Bonds & Notes(f) (continued) |
| Issuer | Coupon
Rate | | Principal
Amount ($) | Value ($) |
| Goodyear Tire & Rubber Co. (The) |
| 07/15/2029 | 5.000% | | 2,172,000 | 1,927,861 |
| IHO Verwaltungs GmbH(a),(g) |
| 09/15/2026 | 4.750% | | 565,000 | 529,138 |
| 05/15/2029 | 6.375% | | 643,000 | 595,892 |
| KAR Auction Services, Inc.(a) |
| 06/01/2025 | 5.125% | | 986,000 | 962,502 |
| Panther BF Aggregator 2 LP/Finance Co., Inc.(a) |
| 05/15/2026 | 6.250% | | 606,000 | 601,238 |
| 05/15/2027 | 8.500% | | 3,927,000 | 3,971,084 |
| ZF North America Capital, Inc.(a) |
| 04/14/2030 | 7.125% | | 1,287,000 | 1,302,496 |
| Total | 41,009,262 |
| Banking 6.4% |
| Ally Financial, Inc. |
| 05/21/2024 | 3.875% | | 771,000 | 756,246 |
| Subordinated |
| 11/20/2025 | 5.750% | | 4,431,000 | 4,302,580 |
| Bank of America Corp.(h) |
| 10/22/2030 | 2.884% | | 41,540,000 | 35,602,075 |
| 10/24/2031 | 1.922% | | 47,155,000 | 36,939,250 |
| 10/20/2032 | 2.572% | | 21,833,000 | 17,497,050 |
| 02/04/2033 | 2.972% | | 1,580,000 | 1,299,973 |
| Subordinated |
| 09/21/2036 | 2.482% | | 1,984,000 | 1,508,134 |
| Citigroup, Inc.(h) |
| 01/25/2033 | 3.057% | | 21,931,000 | 18,064,649 |
| Goldman Sachs Group, Inc. (The)(h) |
| 07/21/2032 | 2.383% | | 15,497,000 | 12,231,570 |
| 10/21/2032 | 2.650% | | 3,816,000 | 3,061,967 |
| HSBC Holdings PLC(h) |
| 05/24/2032 | 2.804% | | 19,086,000 | 15,240,759 |
| 11/22/2032 | 2.871% | | 30,632,000 | 24,352,845 |
| Subordinated |
| 06/20/2034 | 6.547% | | 9,300,000 | 9,100,604 |
| JPMorgan Chase & Co.(h) |
| 10/15/2030 | 2.739% | | 3,517,000 | 3,014,205 |
| 04/22/2032 | 2.580% | | 15,414,000 | 12,612,564 |
| 11/08/2032 | 2.545% | | 47,135,000 | 38,008,729 |
| Morgan Stanley(h) |
| 07/21/2032 | 2.239% | | 7,279,000 | 5,710,798 |
| 07/21/2034 | 5.424% | | 3,891,000 | 3,823,922 |
| Subordinated |
| 09/16/2036 | 2.484% | | 2,990,000 | 2,252,683 |
| PNC Financial Services Group, Inc. (The)(h) |
| 06/12/2029 | 5.582% | | 2,293,000 | 2,273,719 |
| 08/18/2034 | 5.939% | | 7,106,000 | 7,189,501 |
| Corporate Bonds & Notes(f) (continued) |
| Issuer | Coupon
Rate | | Principal
Amount ($) | Value ($) |
| US Bancorp(h) |
| 06/12/2034 | 5.836% | | 4,283,000 | 4,272,469 |
| Wells Fargo & Co.(h) |
| 07/25/2029 | 5.574% | | 4,453,000 | 4,433,142 |
| 10/30/2030 | 2.879% | | 21,295,000 | 18,218,274 |
| 02/11/2031 | 2.572% | | 42,203,000 | 35,231,054 |
| 07/25/2034 | 5.557% | | 3,760,000 | 3,711,052 |
| Total | 320,709,814 |
| Brokerage/Asset Managers/Exchanges 0.3% |
| AG Issuer LLC(a) |
| 03/01/2028 | 6.250% | | 57,000 | 54,651 |
| AG TTMT Escrow Issuer LLC(a) |
| 09/30/2027 | 8.625% | | 3,743,000 | 3,857,384 |
| Hightower Holding LLC(a) |
| 04/15/2029 | 6.750% | | 2,280,000 | 1,979,325 |
| NFP Corp.(a) |
| 08/15/2028 | 4.875% | | 2,419,000 | 2,166,807 |
| 08/15/2028 | 6.875% | | 6,226,000 | 5,486,017 |
| 10/01/2030 | 7.500% | | 2,568,000 | 2,495,818 |
| Total | 16,040,002 |
| Building Materials 0.5% |
| American Builders & Contractors Supply Co., Inc.(a) |
| 01/15/2028 | 4.000% | | 3,600,000 | 3,266,238 |
| Beacon Roofing Supply, Inc.(a) |
| 11/15/2026 | 4.500% | | 2,420,000 | 2,277,546 |
| 05/15/2029 | 4.125% | | 1,447,000 | 1,248,639 |
| 08/01/2030 | 6.500% | | 1,195,000 | 1,181,487 |
| James Hardie International Finance DAC(a) |
| 01/15/2028 | 5.000% | | 1,493,000 | 1,411,565 |
| SRS Distribution, Inc.(a) |
| 07/01/2028 | 4.625% | | 3,231,000 | 2,892,223 |
| 07/01/2029 | 6.125% | | 2,178,000 | 1,907,696 |
| 12/01/2029 | 6.000% | | 3,593,000 | 3,092,074 |
| Standard Industries, Inc.(a) |
| 01/15/2028 | 4.750% | | 4,654,000 | 4,284,164 |
| White Cap Buyer LLC(a) |
| 10/15/2028 | 6.875% | | 2,829,000 | 2,590,119 |
| Total | 24,151,751 |
| Cable and Satellite 2.2% |
| CCO Holdings LLC/Capital Corp.(a) |
| 05/01/2027 | 5.125% | | 3,596,000 | 3,381,184 |
| 02/01/2028 | 5.000% | | 2,860,000 | 2,635,711 |
| 06/01/2029 | 5.375% | | 1,545,000 | 1,406,340 |
| 03/01/2030 | 4.750% | | 1,653,000 | 1,420,857 |
| 08/15/2030 | 4.500% | | 4,927,000 | 4,150,087 |
| 02/01/2031 | 4.250% | | 866,000 | 710,278 |
| 02/01/2032 | 4.750% | | 2,722,000 | 2,258,448 |
The accompanying Notes to Financial Statements are an integral part of this statement.
Columbia Strategic Income Fund | Annual Report 2023
| 13 |
Portfolio of Investments (continued)
August 31, 2023
| Corporate Bonds & Notes(f) (continued) |
| Issuer | Coupon
Rate | | Principal
Amount ($) | Value ($) |
| CCO Holdings LLC/Capital Corp. |
| 05/01/2032 | 4.500% | | 9,589,000 | 7,772,654 |
| Charter Communications Operating LLC/Capital |
| 05/01/2047 | 5.375% | | 4,290,000 | 3,422,206 |
| 12/01/2061 | 4.400% | | 11,338,000 | 7,461,953 |
| 06/30/2062 | 3.950% | | 14,232,000 | 8,567,616 |
| 04/01/2063 | 5.500% | | 8,090,000 | 6,360,350 |
| CSC Holdings LLC(a) |
| 12/01/2030 | 4.125% | | 2,708,000 | 1,930,829 |
| 12/01/2030 | 4.625% | | 5,962,000 | 3,117,663 |
| 02/15/2031 | 3.375% | | 9,019,000 | 6,198,541 |
| DIRECTV Holdings LLC/Financing Co., Inc.(a) |
| 08/15/2027 | 5.875% | | 2,147,000 | 1,900,806 |
| DISH DBS Corp. |
| 06/01/2029 | 5.125% | | 9,845,000 | 5,317,338 |
| DISH Network Corp.(a) |
| 11/15/2027 | 11.750% | | 495,000 | 502,605 |
| Radiate Holdco LLC/Finance, Inc.(a) |
| 09/15/2026 | 4.500% | | 4,656,000 | 3,626,708 |
| Sirius XM Radio, Inc.(a) |
| 09/01/2026 | 3.125% | | 2,513,000 | 2,265,656 |
| 08/01/2027 | 5.000% | | 574,000 | 530,450 |
| 07/15/2028 | 4.000% | | 2,580,000 | 2,234,790 |
| 07/01/2029 | 5.500% | | 1,278,000 | 1,151,564 |
| 07/01/2030 | 4.125% | | 2,187,000 | 1,781,844 |
| Videotron Ltd.(a) |
| 06/15/2029 | 3.625% | | 18,114,000 | 15,570,883 |
| Virgin Media Finance PLC(a) |
| 07/15/2030 | 5.000% | | 4,644,000 | 3,768,023 |
| Virgin Media Secured Finance PLC(a) |
| 05/15/2029 | 5.500% | | 2,577,000 | 2,358,506 |
| VZ Secured Financing BV(a) |
| 01/15/2032 | 5.000% | | 5,066,000 | 4,130,762 |
| Ziggo Bond Co. BV(a) |
| 02/28/2030 | 5.125% | | 1,818,000 | 1,408,843 |
| Ziggo BV(a) |
| 01/15/2030 | 4.875% | | 5,065,000 | 4,253,643 |
| Total | 111,597,138 |
| Chemicals 1.0% |
| Avient Corp.(a) |
| 08/01/2030 | 7.125% | | 2,176,000 | 2,177,599 |
| Axalta Coating Systems LLC(a) |
| 02/15/2029 | 3.375% | | 2,983,000 | 2,528,591 |
| Axalta Coating Systems LLC/Dutch Holding B BV(a) |
| 06/15/2027 | 4.750% | | 1,456,000 | 1,370,126 |
| Braskem Netherlands Finance BV(a) |
| 01/10/2028 | 4.500% | | 500,000 | 451,968 |
| 01/31/2030 | 4.500% | | 9,000,000 | 7,542,086 |
| Corporate Bonds & Notes(f) (continued) |
| Issuer | Coupon
Rate | | Principal
Amount ($) | Value ($) |
| Cheever Escrow Issuer LLC(a) |
| 10/01/2027 | 7.125% | | 2,350,000 | 2,216,309 |
| Element Solutions, Inc.(a) |
| 09/01/2028 | 3.875% | | 4,241,000 | 3,727,228 |
| HB Fuller Co. |
| 10/15/2028 | 4.250% | | 3,430,000 | 3,052,781 |
| Herens Holdco Sarl(a) |
| 05/15/2028 | 4.750% | | 2,382,000 | 1,827,364 |
| Illuminate Buyer LLC/Holdings IV, Inc.(a) |
| 07/01/2028 | 9.000% | | 2,058,000 | 1,910,374 |
| INEOS Quattro Finance 2 Plc(a) |
| 01/15/2026 | 3.375% | | 1,561,000 | 1,426,869 |
| Ingevity Corp.(a) |
| 11/01/2028 | 3.875% | | 3,234,000 | 2,747,250 |
| Innophos Holdings, Inc.(a) |
| 02/15/2028 | 9.375% | | 1,917,000 | 1,877,457 |
| Iris Holdings, Inc.(a),(g) |
| 02/15/2026 | 8.750% | | 1,047,000 | 985,258 |
| Olympus Water US Holding Corp.(a) |
| 10/01/2028 | 4.250% | | 3,005,000 | 2,484,336 |
| 11/15/2028 | 9.750% | | 3,978,000 | 4,010,701 |
| SPCM SA(a) |
| 03/15/2027 | 3.125% | | 1,001,000 | 888,494 |
| Unifrax Escrow Issuer Corp.(a) |
| 09/30/2028 | 5.250% | | 1,453,000 | 980,624 |
| WR Grace Holdings LLC(a) |
| 06/15/2027 | 4.875% | | 5,646,000 | 5,268,528 |
| 08/15/2029 | 5.625% | | 4,085,000 | 3,448,439 |
| 03/01/2031 | 7.375% | | 612,000 | 604,606 |
| Total | 51,526,988 |
| Construction Machinery 0.5% |
| H&E Equipment Services, Inc.(a) |
| 12/15/2028 | 3.875% | | 6,880,000 | 6,008,601 |
| Herc Holdings, Inc.(a) |
| 07/15/2027 | 5.500% | | 1,295,000 | 1,244,567 |
| John Deere Capital Corp. |
| 07/14/2028 | 4.950% | | 9,120,000 | 9,150,700 |
| Ritchie Bros Holdings, Inc.(a) |
| 03/15/2028 | 6.750% | | 4,714,000 | 4,772,940 |
| 03/15/2031 | 7.750% | | 611,000 | 631,818 |
| United Rentals North America, Inc. |
| 07/15/2030 | 4.000% | | 897,000 | 785,949 |
| 01/15/2032 | 3.750% | | 997,000 | 836,557 |
| Total | 23,431,132 |
The accompanying Notes to Financial Statements are an integral part of this statement.
| 14 | Columbia Strategic Income Fund | Annual Report 2023 |
Portfolio of Investments (continued)
August 31, 2023
| Corporate Bonds & Notes(f) (continued) |
| Issuer | Coupon
Rate | | Principal
Amount ($) | Value ($) |
| Consumer Cyclical Services 0.6% |
| APX Group, Inc.(a) |
| 07/15/2029 | 5.750% | | 685,000 | 590,437 |
| Arches Buyer, Inc.(a) |
| 06/01/2028 | 4.250% | | 3,340,000 | 2,907,346 |
| 12/01/2028 | 6.125% | | 3,159,000 | 2,711,833 |
| ASGN, Inc.(a) |
| 05/15/2028 | 4.625% | | 2,024,000 | 1,827,520 |
| Match Group, Inc.(a) |
| 12/15/2027 | 5.000% | | 644,000 | 604,297 |
| 06/01/2028 | 4.625% | | 6,664,000 | 6,145,191 |
| Staples, Inc.(a) |
| 04/15/2026 | 7.500% | | 1,174,000 | 968,162 |
| Uber Technologies, Inc.(a) |
| 05/15/2025 | 7.500% | | 2,461,000 | 2,490,193 |
| 09/15/2027 | 7.500% | | 605,000 | 618,449 |
| 08/15/2029 | 4.500% | | 11,992,000 | 10,979,998 |
| Total | 29,843,426 |
| Consumer Products 0.3% |
| CD&R Smokey Buyer, Inc.(a) |
| 07/15/2025 | 6.750% | | 4,962,000 | 4,820,593 |
| Mattel, Inc.(a) |
| 12/15/2027 | 5.875% | | 1,314,000 | 1,288,599 |
| Newell Brands, Inc. |
| 09/15/2027 | 6.375% | | 879,000 | 862,972 |
| 09/15/2029 | 6.625% | | 1,242,000 | 1,230,180 |
| Newell, Inc. |
| 04/01/2026 | 4.700% | | 1,093,000 | 1,047,103 |
| Prestige Brands, Inc.(a) |
| 01/15/2028 | 5.125% | | 934,000 | 885,615 |
| Scotts Miracle-Gro Co. (The) |
| 04/01/2031 | 4.000% | | 1,855,000 | 1,458,803 |
| Spectrum Brands, Inc.(a) |
| 10/01/2029 | 5.000% | | 2,915,000 | 2,677,756 |
| 07/15/2030 | 5.500% | | 751,000 | 700,130 |
| Total | 14,971,751 |
| Diversified Manufacturing 0.7% |
| Carrier Global Corp. |
| 02/15/2030 | 2.722% | | 16,226,000 | 13,906,615 |
| Chart Industries, Inc.(a) |
| 01/01/2030 | 7.500% | | 1,355,000 | 1,389,555 |
| 01/01/2031 | 9.500% | | 465,000 | 501,704 |
| Emerald Debt Merger Sub LLC(a) |
| 12/15/2030 | 6.625% | | 1,996,000 | 1,966,942 |
| Gates Global LLC/Co.(a) |
| 01/15/2026 | 6.250% | | 2,554,000 | 2,539,583 |
| Corporate Bonds & Notes(f) (continued) |
| Issuer | Coupon
Rate | | Principal
Amount ($) | Value ($) |
| Madison IAQ LLC(a) |
| 06/30/2028 | 4.125% | | 1,254,000 | 1,110,727 |
| 06/30/2029 | 5.875% | | 2,297,000 | 1,934,104 |
| Resideo Funding, Inc.(a) |
| 09/01/2029 | 4.000% | | 3,026,000 | 2,543,738 |
| Vertical Holdco GmbH(a) |
| 07/15/2028 | 7.625% | | 195,000 | 181,197 |
| Vertical US Newco, Inc.(a) |
| 07/15/2027 | 5.250% | | 3,262,000 | 3,054,877 |
| WESCO Distribution, Inc.(a) |
| 06/15/2025 | 7.125% | | 3,205,000 | 3,228,095 |
| 06/15/2028 | 7.250% | | 1,539,000 | 1,568,541 |
| Total | 33,925,678 |
| Electric 2.0% |
| AEP Texas, Inc. |
| 01/15/2050 | 3.450% | | 7,720,000 | 5,331,143 |
| Calpine Corp.(a) |
| 02/15/2028 | 4.500% | | 2,035,000 | 1,884,822 |
| Clearway Energy Operating LLC(a) |
| 02/15/2031 | 3.750% | | 8,532,000 | 7,024,189 |
| 01/15/2032 | 3.750% | | 4,484,000 | 3,674,180 |
| Duke Energy Corp. |
| 09/01/2046 | 3.750% | | 7,780,000 | 5,707,009 |
| Duke Energy Ohio, Inc. |
| 04/01/2053 | 5.650% | | 2,319,000 | 2,314,836 |
| Edison International |
| 11/15/2028 | 5.250% | | 8,462,000 | 8,270,564 |
| Emera US Finance LP |
| 06/15/2046 | 4.750% | | 15,730,000 | 12,316,375 |
| FirstEnergy Corp. |
| 03/01/2050 | 3.400% | | 2,732,000 | 1,810,144 |
| Georgia Power Co. |
| 03/15/2042 | 4.300% | | 3,993,000 | 3,339,628 |
| Leeward Renewable Energy Operations LLC(a) |
| 07/01/2029 | 4.250% | | 3,086,000 | 2,706,911 |
| NextEra Energy Operating Partners LP(a) |
| 07/15/2024 | 4.250% | | 2,319,000 | 2,273,480 |
| 09/15/2027 | 4.500% | | 8,245,000 | 7,658,382 |
| NRG Energy, Inc. |
| 01/15/2028 | 5.750% | | 1,251,000 | 1,183,455 |
| NRG Energy, Inc.(a) |
| 02/15/2029 | 3.375% | | 1,229,000 | 1,013,033 |
| 06/15/2029 | 5.250% | | 3,389,000 | 3,051,258 |
| 02/15/2032 | 3.875% | | 4,995,000 | 3,863,856 |
| Pacific Gas and Electric Co. |
| 07/01/2050 | 4.950% | | 18,875,000 | 14,606,433 |
The accompanying Notes to Financial Statements are an integral part of this statement.
Columbia Strategic Income Fund | Annual Report 2023
| 15 |
Portfolio of Investments (continued)
August 31, 2023
| Corporate Bonds & Notes(f) (continued) |
| Issuer | Coupon
Rate | | Principal
Amount ($) | Value ($) |
| Pattern Energy Operations LP/Inc.(a) |
| 08/15/2028 | 4.500% | | 1,034,000 | 942,911 |
| PG&E Corp. |
| 07/01/2028 | 5.000% | | 1,596,000 | 1,468,982 |
| TerraForm Power Operating LLC(a) |
| 01/31/2028 | 5.000% | | 1,141,000 | 1,040,058 |
| 01/15/2030 | 4.750% | | 4,591,000 | 3,957,471 |
| Vistra Operations Co. LLC(a) |
| 09/01/2026 | 5.500% | | 2,613,000 | 2,519,759 |
| 02/15/2027 | 5.625% | | 3,311,000 | 3,186,148 |
| 07/31/2027 | 5.000% | | 1,280,000 | 1,205,061 |
| Total | 102,350,088 |
| Environmental 0.3% |
| Clean Harbors, Inc.(a) |
| 02/01/2031 | 6.375% | | 372,000 | 370,101 |
| GFL Environmental, Inc.(a) |
| 06/01/2025 | 4.250% | | 1,809,000 | 1,749,337 |
| 08/01/2025 | 3.750% | | 2,533,000 | 2,417,847 |
| 12/15/2026 | 5.125% | | 1,425,000 | 1,378,670 |
| 08/01/2028 | 4.000% | | 2,000,000 | 1,784,262 |
| 09/01/2028 | 3.500% | | 2,070,000 | 1,828,289 |
| Waste Pro USA, Inc.(a) |
| 02/15/2026 | 5.500% | | 5,139,000 | 4,867,826 |
| Total | 14,396,332 |
| Finance Companies 0.7% |
| Navient Corp. |
| 09/25/2023 | 7.250% | | 524,000 | 523,994 |
| 03/25/2024 | 6.125% | | 2,057,000 | 2,049,077 |
| 06/25/2025 | 6.750% | | 878,000 | 874,013 |
| OneMain Finance Corp. |
| 01/15/2029 | 9.000% | | 1,425,000 | 1,444,538 |
| 09/15/2030 | 4.000% | | 2,162,000 | 1,683,713 |
| Provident Funding Associates LP/Finance Corp.(a) |
| 06/15/2025 | 6.375% | | 2,662,000 | 2,354,237 |
| Quicken Loans LLC/Co-Issuer, Inc.(a) |
| 03/01/2029 | 3.625% | | 4,226,000 | 3,597,143 |
| 03/01/2031 | 3.875% | | 3,811,000 | 3,108,464 |
| Rocket Mortgage LLC/Co-Issuer, Inc.(a) |
| 10/15/2033 | 4.000% | | 19,824,000 | 15,727,092 |
| Springleaf Finance Corp. |
| 03/15/2024 | 6.125% | | 4,023,000 | 4,015,975 |
| 11/15/2029 | 5.375% | | 169,000 | 146,257 |
| Total | 35,524,503 |
| Food and Beverage 1.4% |
| Bacardi Ltd.(a) |
| 05/15/2048 | 5.300% | | 17,883,000 | 16,403,356 |
| Corporate Bonds & Notes(f) (continued) |
| Issuer | Coupon
Rate | | Principal
Amount ($) | Value ($) |
| Constellation Brands, Inc. |
| 05/01/2033 | 4.900% | | 13,867,000 | 13,366,281 |
| Darling Ingredients, Inc.(a) |
| 04/15/2027 | 5.250% | | 2,845,000 | 2,768,584 |
| FAGE International SA/USA Dairy Industry, Inc.(a) |
| 08/15/2026 | 5.625% | | 10,218,000 | 9,810,012 |
| Grupo Bimbo SAB de CV(a) |
| 06/27/2024 | 3.875% | | 2,166,000 | 2,128,230 |
| Lamb Weston Holdings, Inc.(a) |
| 05/15/2028 | 4.875% | | 893,000 | 843,586 |
| 01/31/2030 | 4.125% | | 2,124,000 | 1,869,490 |
| 01/31/2032 | 4.375% | | 2,110,000 | 1,831,771 |
| Pilgrim’s Pride Corp.(a) |
| 09/30/2027 | 5.875% | | 3,370,000 | 3,337,225 |
| Post Holdings, Inc.(a) |
| 03/01/2027 | 5.750% | | 2,432,000 | 2,375,591 |
| 01/15/2028 | 5.625% | | 3,361,000 | 3,223,783 |
| 04/15/2030 | 4.625% | | 1,287,000 | 1,139,671 |
| 09/15/2031 | 4.500% | | 2,918,000 | 2,514,865 |
| Primo Water Holdings, Inc.(a) |
| 04/30/2029 | 4.375% | | 2,296,000 | 2,016,130 |
| Simmons Foods, Inc./Prepared Foods, Inc./Pet Food, Inc./Feed(a) |
| 03/01/2029 | 4.625% | | 3,639,000 | 3,034,129 |
| Triton Water Holdings, Inc.(a) |
| 04/01/2029 | 6.250% | | 2,915,000 | 2,497,917 |
| US Foods, Inc.(a) |
| 04/15/2025 | 6.250% | | 177,000 | 177,499 |
| 02/15/2029 | 4.750% | | 967,000 | 883,326 |
| 06/01/2030 | 4.625% | | 1,757,000 | 1,566,918 |
| Total | 71,788,364 |
| Gaming 0.9% |
| Boyd Gaming Corp. |
| 12/01/2027 | 4.750% | | 1,260,000 | 1,181,808 |
| Boyd Gaming Corp.(a) |
| 06/15/2031 | 4.750% | | 2,548,000 | 2,244,917 |
| Caesars Entertainment, Inc.(a) |
| 10/15/2029 | 4.625% | | 5,516,000 | 4,824,467 |
| 02/15/2030 | 7.000% | | 3,769,000 | 3,784,417 |
| Churchill Downs, Inc.(a) |
| 01/15/2028 | 4.750% | | 2,333,000 | 2,152,022 |
| 05/01/2031 | 6.750% | | 1,149,000 | 1,123,979 |
| Colt Merger Sub, Inc.(a) |
| 07/01/2025 | 5.750% | | 4,172,000 | 4,176,796 |
| 07/01/2025 | 6.250% | | 5,374,000 | 5,335,918 |
| 07/01/2027 | 8.125% | | 2,714,000 | 2,755,921 |
| International Game Technology PLC(a) |
| 02/15/2025 | 6.500% | | 359,000 | 359,403 |
| 04/15/2026 | 4.125% | | 1,446,000 | 1,371,609 |
The accompanying Notes to Financial Statements are an integral part of this statement.
| 16 | Columbia Strategic Income Fund | Annual Report 2023 |
Portfolio of Investments (continued)
August 31, 2023
| Corporate Bonds & Notes(f) (continued) |
| Issuer | Coupon
Rate | | Principal
Amount ($) | Value ($) |
| Light & Wonder International, Inc.(a) |
| 09/01/2031 | 7.500% | | 659,000 | 668,076 |
| MGM Resorts International |
| 05/01/2025 | 6.750% | | 200,000 | 200,318 |
| Midwest Gaming Borrower LLC(a) |
| 05/01/2029 | 4.875% | | 4,992,000 | 4,345,044 |
| Penn National Gaming, Inc.(a) |
| 01/15/2027 | 5.625% | | 658,000 | 624,316 |
| Scientific Games Holdings LP/US FinCo, Inc.(a) |
| 03/01/2030 | 6.625% | | 3,087,000 | 2,720,974 |
| Scientific Games International, Inc.(a) |
| 05/15/2028 | 7.000% | | 1,446,000 | 1,447,033 |
| 11/15/2029 | 7.250% | | 2,450,000 | 2,455,798 |
| Wynn Las Vegas LLC/Capital Corp.(a) |
| 03/01/2025 | 5.500% | | 983,000 | 970,134 |
| Total | 42,742,950 |
| Health Care 2.2% |
| Acadia Healthcare Co., Inc.(a) |
| 07/01/2028 | 5.500% | | 2,220,000 | 2,104,865 |
| 04/15/2029 | 5.000% | | 2,387,000 | 2,200,437 |
| AdaptHealth LLC(a) |
| 03/01/2030 | 5.125% | | 2,450,000 | 2,031,380 |
| Avantor Funding, Inc.(a) |
| 07/15/2028 | 4.625% | | 1,819,000 | 1,688,472 |
| 11/01/2029 | 3.875% | | 4,553,000 | 3,995,008 |
| Becton Dickinson Euro Finance SARL |
| 08/13/2041 | 1.336% | EUR | 1,835,000 | 1,253,893 |
| Catalent Pharma Solutions, Inc.(a) |
| 02/15/2029 | 3.125% | | 586,000 | 493,957 |
| 04/01/2030 | 3.500% | | 2,595,000 | 2,190,456 |
| Charles River Laboratories International, Inc.(a) |
| 05/01/2028 | 4.250% | | 455,000 | 417,896 |
| 03/15/2029 | 3.750% | | 1,124,000 | 993,133 |
| 03/15/2031 | 4.000% | | 975,000 | 844,120 |
| CHS/Community Health Systems, Inc.(a) |
| 04/15/2029 | 6.875% | | 2,712,000 | 1,660,501 |
| 05/15/2030 | 5.250% | | 5,131,000 | 4,040,852 |
| 02/15/2031 | 4.750% | | 3,273,000 | 2,458,230 |
| CVS Health Corp. |
| 07/20/2045 | 5.125% | | 13,098,000 | 11,662,057 |
| 03/25/2048 | 5.050% | | 11,250,000 | 9,878,583 |
| GE HealthCare Technologies, Inc. |
| 11/15/2027 | 5.650% | | 3,336,000 | 3,375,774 |
| HCA, Inc. |
| 02/01/2029 | 5.875% | | 2,135,000 | 2,147,938 |
| 03/15/2052 | 4.625% | | 21,977,000 | 17,627,027 |
| Indigo Merger Sub, Inc.(a) |
| 07/15/2026 | 2.875% | | 1,424,000 | 1,300,444 |
| Corporate Bonds & Notes(f) (continued) |
| Issuer | Coupon
Rate | | Principal
Amount ($) | Value ($) |
| IQVIA, Inc.(a) |
| 10/15/2026 | 5.000% | | 823,000 | 795,023 |
| 05/15/2027 | 5.000% | | 1,864,000 | 1,795,927 |
| 05/15/2030 | 6.500% | | 993,000 | 1,001,079 |
| Mozart Debt Merger Sub, Inc.(a) |
| 04/01/2029 | 3.875% | | 3,661,000 | 3,188,736 |
| 10/01/2029 | 5.250% | | 8,372,000 | 7,434,277 |
| Select Medical Corp.(a) |
| 08/15/2026 | 6.250% | | 4,045,000 | 4,006,876 |
| Surgery Center Holdings, Inc.(a) |
| 07/01/2025 | 6.750% | | 917,000 | 914,814 |
| 04/15/2027 | 10.000% | | 799,000 | 813,557 |
| Tenet Healthcare Corp. |
| 02/01/2027 | 6.250% | | 3,922,000 | 3,864,286 |
| 11/01/2027 | 5.125% | | 2,761,000 | 2,630,640 |
| 10/01/2028 | 6.125% | | 3,102,000 | 2,987,733 |
| 01/15/2030 | 4.375% | | 1,872,000 | 1,664,921 |
| Tenet Healthcare Corp.(a) |
| 05/15/2031 | 6.750% | | 2,237,000 | 2,230,147 |
| US Acute Care Solutions LLC(a) |
| 03/01/2026 | 6.375% | | 2,468,000 | 2,149,857 |
| Total | 107,842,896 |
| Healthcare Insurance 0.8% |
| Aetna, Inc. |
| 11/15/2042 | 4.125% | | 2,786,000 | 2,210,935 |
| 08/15/2047 | 3.875% | | 1,833,000 | 1,372,196 |
| Centene Corp. |
| 10/15/2030 | 3.000% | | 29,371,000 | 24,444,990 |
| 08/01/2031 | 2.625% | | 7,507,000 | 5,967,546 |
| UnitedHealth Group, Inc. |
| 02/15/2030 | 5.300% | | 2,790,000 | 2,846,551 |
| 04/15/2063 | 5.200% | | 1,005,000 | 961,575 |
| Total | 37,803,793 |
| Home Construction 0.2% |
| Meritage Homes Corp. |
| 06/06/2027 | 5.125% | | 2,373,000 | 2,279,604 |
| Meritage Homes Corp.(a) |
| 04/15/2029 | 3.875% | | 4,221,000 | 3,685,388 |
| Shea Homes LP/Funding Corp. |
| 02/15/2028 | 4.750% | | 2,763,000 | 2,542,515 |
| Taylor Morrison Communities, Inc.(a) |
| 01/15/2028 | 5.750% | | 1,294,000 | 1,253,949 |
| Taylor Morrison Communities, Inc./Holdings II(a) |
| 03/01/2024 | 5.625% | | 695,000 | 695,000 |
| Total | 10,456,456 |
The accompanying Notes to Financial Statements are an integral part of this statement.
Columbia Strategic Income Fund | Annual Report 2023
| 17 |
Portfolio of Investments (continued)
August 31, 2023
| Corporate Bonds & Notes(f) (continued) |
| Issuer | Coupon
Rate | | Principal
Amount ($) | Value ($) |
| Independent Energy 0.9% |
| Baytex Energy Corp.(a) |
| 04/30/2030 | 8.500% | | 2,063,000 | 2,090,736 |
| Callon Petroleum Co.(a) |
| 08/01/2028 | 8.000% | | 4,111,000 | 4,165,999 |
| Centennial Resource Production LLC(a) |
| 04/01/2027 | 6.875% | | 723,000 | 721,588 |
| CNX Resources Corp.(a) |
| 03/14/2027 | 7.250% | | 224,000 | 223,765 |
| 01/15/2029 | 6.000% | | 1,638,000 | 1,559,403 |
| Colgate Energy Partners III LLC(a) |
| 07/01/2029 | 5.875% | | 8,555,000 | 8,253,968 |
| CrownRock LP/Finance, Inc.(a) |
| 10/15/2025 | 5.625% | | 617,000 | 607,140 |
| 05/01/2029 | 5.000% | | 3,825,000 | 3,548,705 |
| Hilcorp Energy I LP/Finance Co.(a) |
| 11/01/2028 | 6.250% | | 2,935,000 | 2,821,255 |
| 02/01/2029 | 5.750% | | 3,120,000 | 2,921,653 |
| Matador Resources Co. |
| 09/15/2026 | 5.875% | | 3,620,000 | 3,531,038 |
| Matador Resources Co.(a) |
| 04/15/2028 | 6.875% | | 1,212,000 | 1,211,870 |
| Occidental Petroleum Corp. |
| 09/01/2030 | 6.625% | | 4,862,000 | 5,017,941 |
| 01/01/2031 | 6.125% | | 1,470,000 | 1,481,996 |
| Southwestern Energy Co. |
| 02/01/2029 | 5.375% | | 938,000 | 889,264 |
| 02/01/2032 | 4.750% | | 7,949,000 | 7,037,381 |
| Total | 46,083,702 |
| Integrated Energy 0.1% |
| Cenovus Energy, Inc. |
| 02/15/2052 | 3.750% | | 4,960,000 | 3,478,558 |
| Leisure 0.6% |
| Carnival Corp.(a) |
| 03/01/2026 | 7.625% | | 3,212,000 | 3,201,127 |
| 03/01/2027 | 5.750% | | 1,069,000 | 1,006,181 |
| 08/15/2029 | 7.000% | | 2,146,000 | 2,177,470 |
| Carnival Holdings Bermuda Ltd.(a) |
| 05/01/2028 | 10.375% | | 3,079,000 | 3,350,250 |
| Cedar Fair LP/Canada’s Wonderland Co./Magnum Management Corp./Millennium Op |
| 04/15/2027 | 5.375% | | 633,000 | 597,534 |
| Cedar Fair LP/Canada’s Wonderland Co./Magnum Management Corp./Millennium Operations LLC(a) |
| 05/01/2025 | 5.500% | | 684,000 | 678,795 |
| Corporate Bonds & Notes(f) (continued) |
| Issuer | Coupon
Rate | | Principal
Amount ($) | Value ($) |
| Cedar Fair LP/Canada’s Wonderland Co./Magnum Management Corp./Millennium Operations LLC |
| 10/01/2028 | 6.500% | | 782,000 | 755,082 |
| Cinemark USA, Inc.(a) |
| 03/15/2026 | 5.875% | | 3,120,000 | 3,005,666 |
| Live Nation Entertainment, Inc.(a) |
| 03/15/2026 | 5.625% | | 639,000 | 620,612 |
| NCL Corp., Ltd.(a) |
| 02/15/2027 | 5.875% | | 1,143,000 | 1,107,573 |
| Royal Caribbean Cruises Ltd.(a) |
| 08/31/2026 | 5.500% | | 1,855,000 | 1,781,110 |
| 07/15/2027 | 5.375% | | 556,000 | 523,504 |
| 01/15/2029 | 9.250% | | 595,000 | 634,113 |
| 01/15/2030 | 7.250% | | 6,027,000 | 6,122,732 |
| Six Flags Entertainment Corp.(a) |
| 05/15/2031 | 7.250% | | 2,037,000 | 1,953,497 |
| Viking Cruises Ltd.(a) |
| 09/15/2027 | 5.875% | | 2,281,000 | 2,132,230 |
| 07/15/2031 | 9.125% | | 960,000 | 992,068 |
| Total | 30,639,544 |
| Life Insurance 0.7% |
| Five Corners Funding Trust(a) |
| 11/15/2023 | 4.419% | | 10,756,000 | 10,713,370 |
| Peachtree Corners Funding Trust(a) |
| 02/15/2025 | 3.976% | | 25,683,000 | 24,810,078 |
| Voya Financial, Inc. |
| 06/15/2046 | 4.800% | | 89,000 | 70,446 |
| Total | 35,593,894 |
| Lodging 0.1% |
| Hilton Domestic Operating Co., Inc.(a) |
| 05/01/2025 | 5.375% | | 966,000 | 957,334 |
| Wyndham Hotels & Resorts, Inc.(a) |
| 08/15/2028 | 4.375% | | 1,955,000 | 1,790,985 |
| Total | 2,748,319 |
| Media and Entertainment 1.6% |
| Cengage Learning, Inc.(a) |
| 06/15/2024 | 9.500% | | 616,000 | 618,040 |
| Clear Channel International BV(a) |
| 08/01/2025 | 6.625% | | 2,445,000 | 2,423,058 |
| Clear Channel Outdoor Holdings, Inc.(a) |
| 09/15/2028 | 9.000% | | 1,894,000 | 1,903,460 |
| 06/01/2029 | 7.500% | | 3,783,000 | 2,837,791 |
| Clear Channel Worldwide Holdings, Inc.(a) |
| 08/15/2027 | 5.125% | | 5,106,000 | 4,573,496 |
The accompanying Notes to Financial Statements are an integral part of this statement.
| 18 | Columbia Strategic Income Fund | Annual Report 2023 |
Portfolio of Investments (continued)
August 31, 2023
| Corporate Bonds & Notes(f) (continued) |
| Issuer | Coupon
Rate | | Principal
Amount ($) | Value ($) |
| iHeartCommunications, Inc. |
| 05/01/2026 | 6.375% | | 2,975,936 | 2,596,355 |
| iHeartCommunications, Inc.(a) |
| 08/15/2027 | 5.250% | | 7,572,000 | 5,986,961 |
| Meta Platforms, Inc. |
| 05/15/2063 | 5.750% | | 9,914,000 | 9,998,352 |
| Netflix, Inc. |
| 05/15/2029 | 4.625% | EUR | 3,491,000 | 3,861,499 |
| Outfront Media Capital LLC/Corp.(a) |
| 08/15/2027 | 5.000% | | 3,572,000 | 3,232,660 |
| 01/15/2029 | 4.250% | | 811,000 | 668,080 |
| 03/15/2030 | 4.625% | | 2,185,000 | 1,778,333 |
| Playtika Holding Corp.(a) |
| 03/15/2029 | 4.250% | | 5,545,000 | 4,796,839 |
| Roblox Corp.(a) |
| 05/01/2030 | 3.875% | | 5,315,000 | 4,410,933 |
| Univision Communications, Inc.(a) |
| 08/15/2028 | 8.000% | | 592,000 | 592,126 |
| 05/01/2029 | 4.500% | | 2,385,000 | 2,053,172 |
| 06/30/2030 | 7.375% | | 1,319,000 | 1,277,482 |
| Warnermedia Holdings, Inc. |
| 03/15/2062 | 5.391% | | 35,375,000 | 28,033,659 |
| Total | 81,642,296 |
| Metals and Mining 0.5% |
| Allegheny Technologies, Inc. |
| 10/01/2029 | 4.875% | | 818,000 | 739,576 |
| 10/01/2031 | 5.125% | | 3,121,000 | 2,766,484 |
| Constellium SE(a) |
| 06/15/2028 | 5.625% | | 2,490,000 | 2,356,274 |
| 04/15/2029 | 3.750% | | 8,908,000 | 7,641,480 |
| Hudbay Minerals, Inc.(a) |
| 04/01/2026 | 4.500% | | 1,464,000 | 1,381,607 |
| 04/01/2029 | 6.125% | | 6,673,000 | 6,272,860 |
| Kaiser Aluminum Corp.(a) |
| 06/01/2031 | 4.500% | | 1,804,000 | 1,457,869 |
| Novelis Corp.(a) |
| 11/15/2026 | 3.250% | | 1,369,000 | 1,239,843 |
| 01/30/2030 | 4.750% | | 2,010,000 | 1,798,885 |
| 08/15/2031 | 3.875% | | 1,651,000 | 1,370,206 |
| Total | 27,025,084 |
| Midstream 2.7% |
| CNX Midstream Partners LP(a) |
| 04/15/2030 | 4.750% | | 2,202,000 | 1,902,470 |
| DCP Midstream Operating LP |
| 04/01/2044 | 5.600% | | 1,252,000 | 1,162,301 |
| Delek Logistics Partners LP/Finance Corp. |
| 05/15/2025 | 6.750% | | 1,292,000 | 1,283,094 |
| Corporate Bonds & Notes(f) (continued) |
| Issuer | Coupon
Rate | | Principal
Amount ($) | Value ($) |
| DT Midstream, Inc.(a) |
| 06/15/2029 | 4.125% | | 1,588,000 | 1,407,042 |
| 06/15/2031 | 4.375% | | 2,964,000 | 2,567,505 |
| EQM Midstream Partners LP(a) |
| 07/01/2025 | 6.000% | | 2,976,000 | 2,948,025 |
| 07/01/2027 | 6.500% | | 1,236,000 | 1,227,152 |
| 01/15/2029 | 4.500% | | 1,639,000 | 1,488,234 |
| 01/15/2031 | 4.750% | | 5,225,000 | 4,617,412 |
| EQM Midstream Partners LP |
| 07/15/2048 | 6.500% | | 5,051,000 | 4,583,733 |
| Galaxy Pipeline Assets Bidco Ltd.(a) |
| 03/31/2036 | 2.625% | | 12,000,000 | 9,498,119 |
| 09/30/2040 | 3.250% | | 3,925,000 | 2,945,560 |
| Greensaif Pipelines Bidco Sarl(a) |
| 02/23/2038 | 6.129% | | 2,912,000 | 2,921,760 |
| Holly Energy Partners LP/Finance Corp.(a) |
| 04/15/2027 | 6.375% | | 1,936,000 | 1,931,543 |
| 02/01/2028 | 5.000% | | 1,667,000 | 1,568,464 |
| Kinder Morgan, Inc. |
| 02/15/2046 | 5.050% | | 3,954,000 | 3,329,024 |
| 08/01/2052 | 5.450% | | 10,844,000 | 9,685,664 |
| MPLX LP |
| 03/14/2052 | 4.950% | | 3,790,000 | 3,121,844 |
| NuStar Logistics LP |
| 10/01/2025 | 5.750% | | 4,717,000 | 4,636,665 |
| 06/01/2026 | 6.000% | | 1,944,000 | 1,915,743 |
| 04/28/2027 | 5.625% | | 1,573,000 | 1,525,973 |
| Plains All American Pipeline LP/Finance Corp. |
| 06/15/2044 | 4.700% | | 26,497,000 | 20,752,896 |
| TransMontaigne Partners LP/TLP Finance Corp. |
| 02/15/2026 | 6.125% | | 2,648,000 | 2,279,167 |
| Venture Global Calcasieu Pass LLC(a) |
| 08/15/2029 | 3.875% | | 4,429,000 | 3,834,857 |
| 08/15/2031 | 4.125% | | 8,868,000 | 7,533,241 |
| 11/01/2033 | 3.875% | | 14,638,000 | 11,890,037 |
| Western Midstream Operating LP(h) |
| 02/01/2050 | 5.250% | | 9,650,000 | 7,797,935 |
| Williams Companies, Inc. (The) |
| 08/15/2028 | 5.300% | | 15,596,000 | 15,522,432 |
| Total | 135,877,892 |
| Natural Gas 0.2% |
| NiSource, Inc. |
| 05/15/2047 | 4.375% | | 9,643,000 | 7,899,814 |
| Oil Field Services 0.2% |
| Nabors Industries Ltd.(a) |
| 01/15/2026 | 7.250% | | 1,523,000 | 1,465,913 |
| 01/15/2028 | 7.500% | | 1,217,000 | 1,122,562 |
The accompanying Notes to Financial Statements are an integral part of this statement.
Columbia Strategic Income Fund | Annual Report 2023
| 19 |
Portfolio of Investments (continued)
August 31, 2023
| Corporate Bonds & Notes(f) (continued) |
| Issuer | Coupon
Rate | | Principal
Amount ($) | Value ($) |
| Nabors Industries, Inc.(a) |
| 05/15/2027 | 7.375% | | 1,151,000 | 1,122,797 |
| Transocean Titan Financing Ltd.(a) |
| 02/01/2028 | 8.375% | | 2,888,000 | 2,979,484 |
| Venture Global LNG, Inc.(a) |
| 06/01/2031 | 8.375% | | 1,014,000 | 1,023,114 |
| Total | 7,713,870 |
| Other Industry 0.0% |
| Booz Allen Hamilton, Inc.(a) |
| 09/01/2028 | 3.875% | | 1,358,000 | 1,232,315 |
| Hillenbrand, Inc. |
| 03/01/2031 | 3.750% | | 1,167,000 | 981,375 |
| Total | 2,213,690 |
| Other REIT 0.4% |
| Blackstone Mortgage Trust, Inc.(a) |
| 01/15/2027 | 3.750% | | 2,997,000 | 2,563,026 |
| Digital Dutch Finco BV(a) |
| 03/15/2030 | 1.500% | EUR | 3,469,000 | 3,023,396 |
| Ladder Capital Finance Holdings LLLP/Corp.(a) |
| 10/01/2025 | 5.250% | | 3,838,000 | 3,688,237 |
| 02/01/2027 | 4.250% | | 1,293,000 | 1,169,602 |
| 06/15/2029 | 4.750% | | 5,315,000 | 4,469,207 |
| Park Intermediate Holdings LLC/Domestic Property/Finance Co-Issuer(a) |
| 10/01/2028 | 5.875% | | 1,816,000 | 1,681,668 |
| Park Intermediate Holdings LLC/PK Domestic Property LLC/Finance Co-Issuer(a) |
| 05/15/2029 | 4.875% | | 1,571,000 | 1,367,213 |
| RHP Hotel Properties LP/Finance Corp.(a) |
| 07/15/2028 | 7.250% | | 616,000 | 620,247 |
| 02/15/2029 | 4.500% | | 860,000 | 754,953 |
| RLJ Lodging Trust LP(a) |
| 07/01/2026 | 3.750% | | 1,102,000 | 1,011,749 |
| Service Properties Trust |
| 03/15/2024 | 4.650% | | 957,000 | 943,785 |
| Total | 21,293,083 |
| Packaging 0.4% |
| Ardagh Metal Packaging Finance USA LLC/PLC(a) |
| 06/15/2027 | 6.000% | | 2,547,000 | 2,489,628 |
| 09/01/2029 | 4.000% | | 5,819,000 | 4,724,917 |
| Ardagh Packaging Finance PLC/Holdings USA, Inc.(a) |
| 08/15/2026 | 4.125% | | 1,940,000 | 1,812,432 |
| Ball Corp. |
| 06/15/2029 | 6.000% | | 2,135,000 | 2,105,089 |
| Berry Global, Inc.(a) |
| 04/15/2028 | 5.500% | | 115,000 | 112,974 |
| Corporate Bonds & Notes(f) (continued) |
| Issuer | Coupon
Rate | | Principal
Amount ($) | Value ($) |
| Canpack SA/Eastern PA Land Investment Holding LLC(a) |
| 11/01/2025 | 3.125% | | 1,018,000 | 947,443 |
| Canpack SA/US LLC(a) |
| 11/15/2029 | 3.875% | | 3,538,000 | 2,865,759 |
| Sealed Air Corp.(a) |
| 02/01/2028 | 6.125% | | 356,000 | 350,643 |
| Trivium Packaging Finance BV(a) |
| 08/15/2026 | 5.500% | | 3,592,000 | 3,393,340 |
| 08/15/2027 | 8.500% | | 1,408,000 | 1,339,321 |
| Total | 20,141,546 |
| Pharmaceuticals 2.2% |
| 1375209 BC Ltd.(a) |
| 01/30/2028 | 9.000% | | 443,000 | 443,589 |
| Amgen, Inc. |
| 03/02/2063 | 5.750% | | 54,615,000 | 53,872,620 |
| Bausch Health Companies, Inc.(a) |
| 02/01/2027 | 6.125% | | 2,070,000 | 1,361,442 |
| 06/01/2028 | 4.875% | | 2,868,000 | 1,702,855 |
| 09/30/2028 | 11.000% | | 789,000 | 564,681 |
| 10/15/2030 | 14.000% | | 156,000 | 94,012 |
| Grifols Escrow Issuer SA(a) |
| 10/15/2028 | 4.750% | | 1,726,000 | 1,514,987 |
| Jazz Securities DAC(a) |
| 01/15/2029 | 4.375% | | 1,660,000 | 1,490,066 |
| Organon Finance 1 LLC(a) |
| 04/30/2028 | 4.125% | | 2,484,000 | 2,247,202 |
| 04/30/2031 | 5.125% | | 3,943,000 | 3,355,925 |
| Pfizer Investment Enterprises Pte., Ltd. |
| 05/19/2033 | 4.750% | | 17,916,000 | 17,628,677 |
| 05/19/2043 | 5.110% | | 3,181,000 | 3,096,079 |
| 05/19/2063 | 5.340% | | 23,393,000 | 23,036,625 |
| Total | 110,408,760 |
| Property & Casualty 0.9% |
| Alliant Holdings Intermediate LLC/Co-Issuer(a) |
| 10/15/2027 | 4.250% | | 1,693,000 | 1,541,237 |
| 10/15/2027 | 6.750% | | 3,396,000 | 3,209,257 |
| 04/15/2028 | 6.750% | | 7,004,000 | 6,898,670 |
| 11/01/2029 | 5.875% | | 2,406,000 | 2,119,551 |
| AssuredPartners, Inc.(a) |
| 08/15/2025 | 7.000% | | 1,488,000 | 1,471,843 |
| 01/15/2029 | 5.625% | | 2,393,000 | 2,080,393 |
| Berkshire Hathaway Finance Corp. |
| 03/15/2052 | 3.850% | | 8,417,000 | 6,685,732 |
| BroadStreet Partners, Inc.(a) |
| 04/15/2029 | 5.875% | | 3,525,000 | 3,101,844 |
| GTCR AP Finance, Inc.(a) |
| 05/15/2027 | 8.000% | | 1,091,000 | 1,078,876 |
The accompanying Notes to Financial Statements are an integral part of this statement.
| 20 | Columbia Strategic Income Fund | Annual Report 2023 |
Portfolio of Investments (continued)
August 31, 2023
| Corporate Bonds & Notes(f) (continued) |
| Issuer | Coupon
Rate | | Principal
Amount ($) | Value ($) |
| HUB International Ltd.(a) |
| 05/01/2026 | 7.000% | | 3,699,000 | 3,692,682 |
| HUB International, Ltd.(a) |
| 06/15/2030 | 7.250% | | 8,556,000 | 8,708,375 |
| Ryan Specialty Group LLC(a) |
| 02/01/2030 | 4.375% | | 388,000 | 347,621 |
| USI, Inc.(a) |
| 05/01/2025 | 6.875% | | 1,534,000 | 1,535,039 |
| Total | 42,471,120 |
| Railroads 0.3% |
| Norfolk Southern Corp. |
| 08/01/2030 | 5.050% | | 13,160,000 | 13,025,707 |
| Restaurants 0.6% |
| 1011778 BC ULC/New Red Finance, Inc.(a) |
| 04/15/2025 | 5.750% | | 2,011,000 | 1,996,487 |
| 01/15/2028 | 3.875% | | 3,236,000 | 2,942,073 |
| Fertitta Entertainment LLC/Finance Co., Inc.(a) |
| 01/15/2029 | 4.625% | | 1,305,000 | 1,129,326 |
| 01/15/2030 | 6.750% | | 1,172,000 | 968,241 |
| IRB Holding Corp.(a) |
| 06/15/2025 | 7.000% | | 3,646,000 | 3,654,713 |
| McDonald’s Corp. |
| 08/14/2053 | 5.450% | | 14,563,000 | 14,561,690 |
| Yum! Brands, Inc. |
| 04/01/2032 | 5.375% | | 2,405,000 | 2,258,027 |
| Total | 27,510,557 |
| Retailers 1.1% |
| Asbury Automotive Group, Inc.(a) |
| 11/15/2029 | 4.625% | | 701,000 | 619,301 |
| 02/15/2032 | 5.000% | | 701,000 | 602,625 |
| Group 1 Automotive, Inc.(a) |
| 08/15/2028 | 4.000% | | 999,000 | 886,827 |
| Hanesbrands, Inc.(a) |
| 05/15/2026 | 4.875% | | 645,000 | 603,015 |
| 02/15/2031 | 9.000% | | 2,469,000 | 2,478,230 |
| L Brands, Inc.(a) |
| 07/01/2025 | 9.375% | | 485,000 | 507,162 |
| L Brands, Inc. |
| 02/01/2028 | 5.250% | | 1,053,000 | 1,010,070 |
| 11/01/2035 | 6.875% | | 2,968,000 | 2,774,935 |
| LCM Investments Holdings II LLC(a) |
| 05/01/2029 | 4.875% | | 3,325,000 | 2,888,929 |
| 08/01/2031 | 8.250% | | 1,725,000 | 1,727,485 |
| Lithia Motors, Inc.(a) |
| 01/15/2031 | 4.375% | | 1,325,000 | 1,130,238 |
| Corporate Bonds & Notes(f) (continued) |
| Issuer | Coupon
Rate | | Principal
Amount ($) | Value ($) |
| Lowe’s Companies, Inc. |
| 04/01/2062 | 4.450% | | 5,099,000 | 3,978,028 |
| 09/15/2062 | 5.800% | | 30,874,000 | 29,818,431 |
| PetSmart, Inc./Finance Corp.(a) |
| 02/15/2028 | 4.750% | | 2,066,000 | 1,853,571 |
| 02/15/2029 | 7.750% | | 2,190,000 | 2,090,589 |
| Wolverine World Wide, Inc.(a) |
| 08/15/2029 | 4.000% | | 3,442,000 | 2,576,187 |
| Total | 55,545,623 |
| Supermarkets 0.1% |
| Albertsons Companies LLC/Safeway, Inc./New Albertsons LP/Albertsons LLC(a) |
| 03/15/2026 | 7.500% | | 1,085,000 | 1,103,050 |
| Albertsons Companies, Inc./Safeway, Inc./New Albertsons LP/Albertsons LLC(a) |
| 03/15/2026 | 3.250% | | 2,743,000 | 2,552,362 |
| Total | 3,655,412 |
| Technology 2.2% |
| Black Knight InfoServ LLC(a) |
| 09/01/2028 | 3.625% | | 2,302,000 | 2,123,784 |
| Block, Inc. |
| 06/01/2026 | 2.750% | | 1,714,000 | 1,559,918 |
| 06/01/2031 | 3.500% | | 1,723,000 | 1,414,020 |
| Boxer Parent Co., Inc.(a) |
| 10/02/2025 | 7.125% | | 447,000 | 447,453 |
| Broadcom, Inc.(a) |
| 11/15/2036 | 3.187% | | 18,394,000 | 13,824,985 |
| Camelot Finance SA(a) |
| 11/01/2026 | 4.500% | | 924,000 | 866,816 |
| Central Parent LLC/CDK Global II LLC/Financing, Co., Inc.(a) |
| 06/15/2029 | 8.000% | | 534,000 | 537,628 |
| Central Parent, Inc./CDK Global, Inc.(a) |
| 06/15/2029 | 7.250% | | 1,434,000 | 1,415,066 |
| Clarivate Science Holdings Corp.(a) |
| 07/01/2028 | 3.875% | | 1,277,000 | 1,128,689 |
| 07/01/2029 | 4.875% | | 4,288,000 | 3,727,464 |
| Cloud Software Group, Inc.(a) |
| 09/30/2029 | 9.000% | | 3,855,000 | 3,446,045 |
| CommScope Technologies LLC(a) |
| 06/15/2025 | 6.000% | | 1,385,000 | 1,267,729 |
| Condor Merger Sub, Inc.(a) |
| 02/15/2030 | 7.375% | | 4,064,000 | 3,555,480 |
| Entegris Escrow Corp.(a) |
| 04/15/2029 | 4.750% | | 2,603,000 | 2,421,633 |
| 06/15/2030 | 5.950% | | 3,323,000 | 3,182,185 |
| Gartner, Inc.(a) |
| 07/01/2028 | 4.500% | | 1,484,000 | 1,384,335 |
The accompanying Notes to Financial Statements are an integral part of this statement.
Columbia Strategic Income Fund | Annual Report 2023
| 21 |
Portfolio of Investments (continued)
August 31, 2023
| Corporate Bonds & Notes(f) (continued) |
| Issuer | Coupon
Rate | | Principal
Amount ($) | Value ($) |
| HealthEquity, Inc.(a) |
| 10/01/2029 | 4.500% | | 3,147,000 | 2,791,041 |
| Helios Software Holdings, Inc.(a) |
| 05/01/2028 | 4.625% | | 2,367,000 | 2,048,040 |
| ION Trading Technologies Sarl(a) |
| 05/15/2028 | 5.750% | | 2,087,000 | 1,831,344 |
| Iron Mountain, Inc.(a) |
| 09/15/2027 | 4.875% | | 4,523,000 | 4,256,862 |
| 09/15/2029 | 4.875% | | 664,000 | 600,394 |
| 07/15/2030 | 5.250% | | 2,592,000 | 2,338,574 |
| Logan Merger Sub, Inc.(a) |
| 09/01/2027 | 5.500% | | 5,973,000 | 3,498,677 |
| Minerva Merger Sub, Inc.(a) |
| 02/15/2030 | 6.500% | | 4,425,000 | 3,844,149 |
| NCR Corp.(a) |
| 10/01/2028 | 5.000% | | 3,666,000 | 3,366,717 |
| 04/15/2029 | 5.125% | | 4,746,000 | 4,328,586 |
| 09/01/2029 | 6.125% | | 1,130,000 | 1,159,809 |
| 10/01/2030 | 5.250% | | 1,296,000 | 1,164,782 |
| Neptune Bidco US, Inc.(a) |
| 04/15/2029 | 9.290% | | 3,439,000 | 3,212,151 |
| NXP BV/Funding LLC/USA, Inc. |
| 05/01/2030 | 3.400% | | 2,210,000 | 1,942,062 |
| 01/15/2033 | 5.000% | | 7,610,000 | 7,218,830 |
| Picard Midco, Inc.(a) |
| 03/31/2029 | 6.500% | | 5,805,000 | 5,196,052 |
| PTC, Inc.(a) |
| 02/15/2025 | 3.625% | | 349,000 | 336,815 |
| 02/15/2028 | 4.000% | | 1,072,000 | 984,988 |
| Seagate HDD Cayman(a) |
| 12/15/2029 | 8.250% | | 1,142,000 | 1,198,104 |
| 07/15/2031 | 8.500% | | 1,269,000 | 1,333,663 |
| Sensata Technologies BV(a) |
| 09/01/2030 | 5.875% | | 2,018,000 | 1,909,454 |
| Shift4 Payments LLC/Finance Sub, Inc.(a) |
| 11/01/2026 | 4.625% | | 5,103,000 | 4,797,879 |
| Synaptics, Inc.(a) |
| 06/15/2029 | 4.000% | | 2,355,000 | 2,005,014 |
| Tempo Acquisition LLC/Finance Corp.(a) |
| 06/01/2025 | 5.750% | | 725,000 | 713,327 |
| Verscend Escrow Corp.(a) |
| 08/15/2026 | 9.750% | | 2,565,000 | 2,553,811 |
| ZoomInfo Technologies LLC/Finance Corp.(a) |
| 02/01/2029 | 3.875% | | 6,273,000 | 5,335,292 |
| Total | 112,269,647 |
| Corporate Bonds & Notes(f) (continued) |
| Issuer | Coupon
Rate | | Principal
Amount ($) | Value ($) |
| Transportation Services 0.4% |
| Adani Ports & Special Economic Zone Ltd.(a) |
| 07/03/2029 | 4.375% | | 2,464,000 | 1,960,352 |
| ERAC USA Finance LLC(a) |
| 05/01/2028 | 4.600% | | 19,268,000 | 18,748,857 |
| Total | 20,709,209 |
| Wireless 1.1% |
| Altice France Holding SA(a) |
| 02/15/2028 | 6.000% | | 3,633,000 | 1,603,536 |
| Altice France SA(a) |
| 02/01/2027 | 8.125% | | 1,139,000 | 961,797 |
| 01/15/2028 | 5.500% | | 871,000 | 653,334 |
| 07/15/2029 | 5.125% | | 5,232,000 | 3,687,902 |
| 10/15/2029 | 5.500% | | 1,316,000 | 945,694 |
| American Tower Corp. |
| 08/15/2029 | 3.800% | | 6,411,000 | 5,827,907 |
| Millicom International Cellular SA(a) |
| 03/25/2029 | 6.250% | | 2,700,000 | 2,475,120 |
| SBA Communications Corp. |
| 02/15/2027 | 3.875% | | 1,176,000 | 1,087,869 |
| 02/01/2029 | 3.125% | | 5,224,000 | 4,472,085 |
| Sprint Capital Corp. |
| 11/15/2028 | 6.875% | | 3,098,000 | 3,273,221 |
| Sprint Corp. |
| 06/15/2024 | 7.125% | | 831,000 | 838,176 |
| T-Mobile US, Inc. |
| 02/15/2031 | 2.875% | | 23,582,000 | 19,845,931 |
| 04/15/2031 | 3.500% | | 7,900,000 | 6,897,904 |
| Vmed O2 UK Financing I PLC(a) |
| 01/31/2031 | 4.250% | | 931,000 | 762,738 |
| 07/15/2031 | 4.750% | | 3,870,000 | 3,234,803 |
| Total | 56,568,017 |
| Wirelines 0.8% |
| AT&T, Inc. |
| 03/01/2029 | 4.350% | | 3,871,000 | 3,661,612 |
| 12/01/2057 | 3.800% | | 4,530,000 | 3,049,951 |
| CenturyLink, Inc.(a) |
| 02/15/2027 | 4.000% | | 747,000 | 470,445 |
| Frontier Communications Holdings LLC(a) |
| 05/15/2030 | 8.750% | | 822,000 | 798,525 |
| 03/15/2031 | 8.625% | | 2,232,000 | 2,145,833 |
| Iliad Holding SAS(a) |
| 10/15/2026 | 6.500% | | 5,813,000 | 5,537,063 |
| 10/15/2028 | 7.000% | | 4,689,000 | 4,362,109 |
The accompanying Notes to Financial Statements are an integral part of this statement.
| 22 | Columbia Strategic Income Fund | Annual Report 2023 |
Portfolio of Investments (continued)
August 31, 2023
| Corporate Bonds & Notes(f) (continued) |
| Issuer | Coupon
Rate | | Principal
Amount ($) | Value ($) |
| Verizon Communications, Inc. |
| 03/21/2031 | 2.550% | | 26,416,000 | 21,738,893 |
| Total | 41,764,431 |
Total Corporate Bonds & Notes
(Cost $2,291,915,808) | 2,104,341,130 |
|
| Foreign Government Obligations(f),(i) 7.3% |
| | | | |
| Angola 0.2% |
| Angolan Government International Bond(a) |
| 11/26/2029 | 8.000% | | 10,040,000 | 8,298,054 |
| Argentina 0.0% |
| Argentine Republic Government International Bond |
| 07/09/2029 | 1.000% | | 9,405 | 3,043 |
| Argentine Republic Government International Bond(h) |
| 07/09/2030 | 0.750% | | 85,626 | 28,738 |
| 07/09/2035 | 3.625% | | 156,873 | 46,323 |
| Total | 78,104 |
| Azerbaijan 0.1% |
| Republic of Azerbaijan International Bond(a) |
| 09/01/2032 | 3.500% | | 6,524,000 | 5,478,607 |
| Brazil 0.2% |
| Brazilian Government International Bond |
| 06/12/2030 | 3.875% | | 2,024,000 | 1,792,588 |
| 01/07/2041 | 5.625% | | 11,000,000 | 9,646,260 |
| Total | 11,438,848 |
| Canada 0.2% |
| MEGlobal Canada ULC(a) |
| 05/18/2025 | 5.000% | | 4,950,000 | 4,858,076 |
| NOVA Chemicals Corp.(a) |
| 05/01/2025 | 5.000% | | 2,058,000 | 1,958,904 |
| 06/01/2027 | 5.250% | | 3,264,000 | 2,900,202 |
| 05/15/2029 | 4.250% | | 2,216,000 | 1,799,402 |
| Total | 11,516,584 |
| Colombia 0.2% |
| Colombia Government International Bond |
| 06/15/2045 | 5.000% | | 5,000,000 | 3,505,823 |
| 05/15/2049 | 5.200% | | 7,147,000 | 5,023,912 |
| Total | 8,529,735 |
| Dominican Republic 0.4% |
| Dominican Republic International Bond(a) |
| 01/25/2027 | 5.950% | | 4,475,000 | 4,381,137 |
| 01/30/2030 | 4.500% | | 2,295,000 | 2,000,127 |
| 09/23/2032 | 4.875% | | 500,000 | 423,894 |
| 04/30/2044 | 7.450% | | 7,900,000 | 7,602,919 |
| Foreign Government Obligations(f),(i) (continued) |
| Issuer | Coupon
Rate | | Principal
Amount ($) | Value ($) |
| 01/27/2045 | 6.850% | | 4,881,000 | 4,372,179 |
| Total | 18,780,256 |
| Egypt 0.3% |
| Egypt Government International Bond(a) |
| 04/16/2030 | 5.625% | EUR | 6,600,000 | 3,924,455 |
| 02/16/2031 | 5.875% | | 1,000,000 | 543,061 |
| 05/29/2032 | 7.625% | | 8,162,000 | 4,683,928 |
| 01/31/2047 | 8.500% | | 5,700,000 | 3,010,243 |
| 02/21/2048 | 7.903% | | 3,000,000 | 1,522,286 |
| 03/01/2049 | 8.700% | | 965,000 | 509,490 |
| Total | 14,193,463 |
| Hungary 0.3% |
| Hungary Government International Bond(a) |
| 09/22/2031 | 2.125% | | 20,100,000 | 15,458,702 |
| India 0.7% |
| Export-Import Bank of India(a) |
| 01/15/2030 | 3.250% | | 6,200,000 | 5,390,544 |
| India Government Bond |
| 02/06/2033 | 7.260% | INR | 1,972,730,000 | 23,978,769 |
| Indian Railway Finance Corp., Ltd.(a) |
| 02/10/2031 | 2.800% | | 7,000,000 | 5,751,613 |
| Total | 35,120,926 |
| Indonesia 0.8% |
| Indonesia Asahan Aluminium Persero PT(a) |
| 05/15/2050 | 5.800% | | 6,000,000 | 5,145,656 |
| Indonesia Government International Bond(a) |
| 01/15/2045 | 5.125% | | 3,600,000 | 3,488,691 |
| Indonesia Treasury Bond |
| 04/15/2027 | 5.125% | IDR | 227,007,000,000 | 14,460,067 |
| 04/15/2039 | 8.375% | IDR | 68,305,000,000 | 5,188,741 |
| PT Pertamina Persero(a) |
| 05/30/2044 | 6.450% | | 10,066,000 | 10,187,718 |
| Total | 38,470,873 |
| Ivory Coast 0.2% |
| Ivory Coast Government International Bond(a) |
| 01/30/2032 | 4.875% | EUR | 9,275,000 | 7,773,150 |
| 06/15/2033 | 6.125% | | 3,847,000 | 3,290,889 |
| Total | 11,064,039 |
| Malaysia 0.1% |
| Petronas Capital Ltd.(a) |
| 04/21/2030 | 3.500% | | 4,800,000 | 4,363,714 |
The accompanying Notes to Financial Statements are an integral part of this statement.
Columbia Strategic Income Fund | Annual Report 2023
| 23 |
Portfolio of Investments (continued)
August 31, 2023
| Foreign Government Obligations(f),(i) (continued) |
| Issuer | Coupon
Rate | | Principal
Amount ($) | Value ($) |
| Mexico 1.2% |
| Mexico Government International Bond |
| 04/16/2030 | 3.250% | | 4,000,000 | 3,541,667 |
| 05/29/2031 | 7.750% | MXN | 446,370,000 | 23,871,456 |
| 08/14/2041 | 4.280% | | 300,000 | 242,298 |
| Petroleos Mexicanos |
| 03/13/2027 | 6.500% | | 12,689,000 | 11,123,839 |
| 02/12/2028 | 5.350% | | 7,594,000 | 6,102,335 |
| 01/28/2031 | 5.950% | | 2,235,000 | 1,623,162 |
| 02/16/2032 | 6.700% | | 12,449,000 | 9,415,228 |
| 09/21/2047 | 6.750% | | 522,000 | 322,644 |
| 01/23/2050 | 7.690% | | 7,750,000 | 5,185,207 |
| Total | 61,427,836 |
| Oman 0.2% |
| Oman Government International Bond(a) |
| 01/17/2048 | 6.750% | | 6,506,000 | 6,301,103 |
| Oman Sovereign Sukuk Co.(a) |
| 06/01/2024 | 4.397% | | 500,000 | 492,419 |
| Total | 6,793,522 |
| Panama 0.1% |
| Panama Government International Bond |
| 01/19/2033 | 3.298% | | 6,779,000 | 5,582,413 |
| Paraguay 0.1% |
| Paraguay Government International Bond(a) |
| 03/27/2027 | 4.700% | | 2,000,000 | 1,934,111 |
| 08/11/2044 | 6.100% | | 2,939,000 | 2,721,414 |
| Total | 4,655,525 |
| Qatar 0.4% |
| Qatar Government International Bond(a) |
| 04/16/2030 | 3.750% | | 2,000,000 | 1,896,911 |
| 03/14/2049 | 4.817% | | 15,614,000 | 14,560,667 |
| Qatar Petroleum(a) |
| 07/12/2031 | 2.250% | | 6,077,000 | 4,999,457 |
| Total | 21,457,035 |
| Romania 0.2% |
| Romanian Government International Bond(a) |
| 01/28/2050 | 3.375% | EUR | 12,000,000 | 8,150,300 |
| 02/14/2051 | 4.000% | | 2,246,000 | 1,536,044 |
| Total | 9,686,344 |
| Saudi Arabia 0.4% |
| Saudi Arabian Oil Co.(a) |
| 11/24/2030 | 2.250% | | 15,163,000 | 12,467,973 |
| Foreign Government Obligations(f),(i) (continued) |
| Issuer | Coupon
Rate | | Principal
Amount ($) | Value ($) |
| Saudi Government International Bond(a) |
| 10/22/2030 | 3.250% | | 3,000,000 | 2,696,710 |
| 04/17/2049 | 5.000% | | 5,000,000 | 4,466,168 |
| Total | 19,630,851 |
| South Africa 0.2% |
| Republic of South Africa Government Bond |
| 01/31/2030 | 8.000% | ZAR | 219,595,663 | 10,414,184 |
| South Korea 0.5% |
| Korea Treasury Bond |
| 03/10/2028 | 3.250% | KRW | 31,900,000,000 | 24,002,670 |
| Ukraine 0.0% |
| Ukraine Government International Bond(a) |
| 09/25/2034 | 7.375% | | 6,567,000 | 1,742,636 |
| United Arab Emirates 0.3% |
| DP World Crescent Ltd.(a) |
| 07/18/2029 | 3.875% | | 5,600,000 | 5,209,999 |
| DP World Ltd.(a) |
| 09/25/2048 | 5.625% | | 6,091,000 | 5,620,089 |
| DP World PLC(a) |
| 07/02/2037 | 6.850% | | 3,650,000 | 3,909,628 |
| 09/30/2049 | 4.700% | | 2,000,000 | 1,648,266 |
| Total | 16,387,982 |
Total Foreign Government Obligations
(Cost $407,018,299) | 364,572,903 |
|
| Residential Mortgage-Backed Securities - Agency 32.9% |
| | | | |
| Federal Home Loan Mortgage Corp. |
| 05/01/2052 | 3.000% | | 60,544,833 | 52,559,249 |
07/01/2052-
08/01/2052 | 4.000% | | 60,668,515 | 56,428,470 |
| Federal Home Loan Mortgage Corp.(j) |
| CMO Series 304 Class C69 |
| 12/15/2042 | 4.000% | | 2,367,692 | 453,200 |
| CMO Series 390 Class C30 |
| 08/15/2052 | 2.500% | | 71,159,316 | 10,883,227 |
| CMO Series 4147 Class CI |
| 01/15/2041 | 3.500% | | 1,593,875 | 57,278 |
| Federal Home Loan Mortgage Corp.(b),(j) |
| CMO Series 318 Class S1 |
-1.0 x 30-day Average SOFR + 6.064%
Cap 5.950%
11/15/2043 | 0.876% | | 4,377,354 | 390,989 |
The accompanying Notes to Financial Statements are an integral part of this statement.
| 24 | Columbia Strategic Income Fund | Annual Report 2023 |
Portfolio of Investments (continued)
August 31, 2023
| Residential Mortgage-Backed Securities - Agency (continued) |
| Issuer | Coupon
Rate | | Principal
Amount ($) | Value ($) |
| CMO Series 4620 Class AS |
-1.0 x 30-day Average SOFR + 0.554%
11/15/2042 | 0.000% | | 8,057,692 | 419,022 |
| CMO Series 4903 Class SA |
-1.0 x 30-day Average SOFR + 6.164%
Cap 6.050%
08/25/2049 | 0.877% | | 24,610,843 | 2,431,108 |
| CMO STRIPS Series 326 Class S1 |
-1.0 x 30-day Average SOFR + 6.114%
Cap 6.000%
03/15/2044 | 0.926% | | 787,769 | 70,375 |
| Federal Home Loan Mortgage Corp.(d),(j) |
| CMO Series 4515 Class SA |
| 08/15/2038 | 0.000% | | 3,738,058 | 142,088 |
| Federal Home Loan Mortgage Corp. REMICS(j) |
| CMO Series 5051 Class KI |
| 12/25/2050 | 2.500% | | 35,844,980 | 5,643,928 |
| CMO Series 5192 Class PI |
| 10/25/2051 | 2.500% | | 60,562,045 | 6,825,827 |
| CMO Series 5198 Class KI |
| 02/25/2052 | 3.000% | | 41,412,467 | 7,783,780 |
| Federal National Mortgage Association |
08/01/2032-
04/01/2052 | 3.000% | | 92,855,333 | 80,848,747 |
| 05/01/2052 | 3.500% | | 159,050,868 | 144,089,629 |
| Federal National Mortgage Association(d),(j) |
| CMO Series 2006-5 Class N1 |
| 08/25/2034 | 0.000% | | 2,757,060 | 28 |
| Federal National Mortgage Association(j) |
| CMO Series 2012-129 Class IC |
| 01/25/2041 | 3.500% | | 885,732 | 38,349 |
| CMO Series 2012-131 Class MI |
| 01/25/2040 | 3.500% | | 1,089,962 | 39,137 |
| CMO Series 2012-133 Class EI |
| 07/25/2031 | 3.500% | | 205,385 | 1,977 |
| CMO Series 2013-1 Class AI |
| 02/25/2043 | 3.500% | | 1,636,925 | 220,991 |
| Federal National Mortgage Association(b),(j) |
| CMO Series 2013-101 Class CS |
-1.0 x 30-day Average SOFR + 6.014%
Cap 5.900%
10/25/2043 | 0.727% | | 6,196,832 | 552,049 |
| Residential Mortgage-Backed Securities - Agency (continued) |
| Issuer | Coupon
Rate | | Principal
Amount ($) | Value ($) |
| CMO Series 2014-93 Class ES |
-1.0 x 30-day Average SOFR + 6.264%
Cap 6.150%
01/25/2045 | 0.977% | | 10,606,776 | 1,131,849 |
| CMO Series 2016-26 Class SA |
-1.0 x 30-day Average SOFR + 6.164%
Cap 6.050%
05/25/2046 | 0.877% | | 9,774,730 | 1,218,079 |
| CMO Series 2016-31 Class VS |
-1.0 x 30-day Average SOFR + 6.114%
Cap 6.000%
06/25/2046 | 0.827% | | 6,195,619 | 559,922 |
| CMO Series 2016-42 Class SB |
-1.0 x 30-day Average SOFR + 6.114%
Cap 6.000%
07/25/2046 | 0.827% | | 21,983,511 | 2,307,024 |
| CMO Series 2017-47 Class SE |
-1.0 x 30-day Average SOFR + 6.214%
Cap 6.100%
06/25/2047 | 0.927% | | 7,108,709 | 991,389 |
| CMO Series 2017-56 Class SB |
-1.0 x 30-day Average SOFR + 6.264%
Cap 6.150%
07/25/2047 | 0.977% | | 23,572,788 | 2,813,921 |
| CMO Series 2018-76 Class SN |
-1.0 x 30-day Average SOFR + 6.264%
Cap 6.150%
10/25/2048 | 0.977% | | 7,751,160 | 867,270 |
| CMO Series 2019-67 Class SE |
-1.0 x 30-day Average SOFR + 6.164%
Cap 6.050%
11/25/2049 | 0.877% | | 21,484,191 | 2,764,356 |
| CMO Series 2019-8 Class SG |
-1.0 x 30-day Average SOFR + 6.114%
Cap 6.000%
03/25/2049 | 0.827% | | 22,209,743 | 1,944,134 |
| Federal National Mortgage Association REMICS(j) |
| CMO Series 2020-77 Class IL |
| 11/25/2050 | 2.500% | | 34,451,230 | 4,919,918 |
| Freddie Mac REMICS(j) |
| CMO Series 5287 Class NI |
| 05/25/2051 | 3.500% | | 40,149,299 | 7,716,828 |
The accompanying Notes to Financial Statements are an integral part of this statement.
Columbia Strategic Income Fund | Annual Report 2023
| 25 |
Portfolio of Investments (continued)
August 31, 2023
| Residential Mortgage-Backed Securities - Agency (continued) |
| Issuer | Coupon
Rate | | Principal
Amount ($) | Value ($) |
| Government National Mortgage Association |
| 08/15/2031 | 7.000% | | 12,681 | 12,815 |
| 04/15/2034 | 5.000% | | 82,643 | 82,512 |
| Government National Mortgage Association(j) |
| CMO Series 2014-190 Class AI |
| 12/20/2038 | 3.500% | | 6,710,333 | 522,122 |
| CMO Series 2020-138 Class GI |
| 09/20/2050 | 3.000% | | 34,392,954 | 5,050,471 |
| CMO Series 2020-191 Class UG |
| 12/20/2050 | 3.500% | | 41,447,711 | 6,649,974 |
| CMO Series 2021-140 Class IW |
| 08/20/2051 | 3.500% | | 48,144,678 | 7,987,982 |
| CMO Series 2021-57 Class KI |
| 03/20/2051 | 3.500% | | 44,829,866 | 7,259,278 |
| CMO Series 2021-89 Class IO |
| 05/20/2051 | 3.000% | | 50,762,212 | 7,309,104 |
| Government National Mortgage Association(b),(j) |
| CMO Series 2016-20 Class SQ |
-1.0 x 1-month Term SOFR + 6.214%
Cap 6.100%
02/20/2046 | 0.672% | | 9,735,163 | 823,860 |
| CMO Series 2017-129 Class SA |
-1.0 x 1-month Term SOFR + 6.314%
Cap 6.200%
08/20/2047 | 0.772% | | 7,648,884 | 698,894 |
| CMO Series 2017-133 Class SM |
-1.0 x 1-month Term SOFR + 6.364%
Cap 6.250%
09/20/2047 | 0.822% | | 8,659,506 | 707,553 |
| CMO Series 2017-141 Class ES |
-1.0 x 1-month Term SOFR + 6.314%
Cap 6.200%
09/20/2047 | 0.772% | | 11,596,286 | 1,218,073 |
| CMO Series 2018-124 Class SA |
-1.0 x 1-month Term SOFR + 6.314%
Cap 6.200%
09/20/2048 | 0.772% | | 13,819,527 | 1,106,389 |
| CMO Series 2018-155 Class ES |
-1.0 x 1-month Term SOFR + 6.214%
Cap 6.100%
11/20/2048 | 0.672% | | 11,082,587 | 856,780 |
| Residential Mortgage-Backed Securities - Agency (continued) |
| Issuer | Coupon
Rate | | Principal
Amount ($) | Value ($) |
| CMO Series 2018-168 Class SA |
-1.0 x 1-month Term SOFR + 6.214%
Cap 6.100%
12/20/2048 | 0.672% | | 9,655,361 | 950,154 |
| CMO Series 2018-67 Class SP |
-1.0 x 1-month Term SOFR + 6.314%
Cap 6.200%
05/20/2048 | 0.772% | | 8,535,734 | 707,370 |
| CMO Series 2019-152 Class BS |
-1.0 x 1-month Term SOFR + 6.164%
Cap 6.050%
12/20/2049 | 0.622% | | 22,361,977 | 1,855,400 |
| CMO Series 2019-23 Class LS |
-1.0 x 1-month Term SOFR + 6.164%
Cap 6.050%
02/20/2049 | 0.622% | | 6,560,640 | 601,800 |
| CMO Series 2019-23 Class QS |
-1.0 x 1-month Term SOFR + 6.164%
Cap 6.050%
02/20/2049 | 0.622% | | 18,735,095 | 1,714,031 |
| CMO Series 2019-29 Class DS |
-1.0 x 1-month Term SOFR + 6.164%
Cap 6.050%
03/20/2049 | 0.622% | | 15,487,551 | 1,052,289 |
| CMO Series 2019-41 Class AS |
-1.0 x 1-month Term SOFR + 6.164%
Cap 6.050%
03/20/2049 | 0.622% | | 15,140,702 | 1,368,688 |
| CMO Series 2019-5 Class SH |
-1.0 x 1-month Term SOFR + 6.264%
Cap 6.150%
01/20/2049 | 0.722% | | 10,249,146 | 963,531 |
| CMO Series 2019-59 Class JS |
-1.0 x 1-month Term SOFR + 6.264%
Cap 6.150%
05/20/2049 | 0.722% | | 9,812,553 | 920,047 |
| CMO Series 2020-101 Class SA |
-1.0 x 1-month Term SOFR + 6.314%
Cap 6.200%
07/20/2050 | 0.772% | | 59,141,569 | 6,509,399 |
The accompanying Notes to Financial Statements are an integral part of this statement.
| 26 | Columbia Strategic Income Fund | Annual Report 2023 |
Portfolio of Investments (continued)
August 31, 2023
| Residential Mortgage-Backed Securities - Agency (continued) |
| Issuer | Coupon
Rate | | Principal
Amount ($) | Value ($) |
| CMO Series 2020-61 Class SM |
-1.0 x 1-month Term SOFR + 6.714%
Cap 6.600%
07/20/2043 | 1.172% | | 39,946,341 | 4,728,025 |
| CMO Series 2021-155 Class SG |
-1.0 x 1-month Term SOFR + 6.414%
Cap 6.300%
09/20/2051 | 0.872% | | 47,207,955 | 5,139,558 |
| CMO Series 2022-90 Class SD |
-1.0 x 1-month Term SOFR + 6.164%
Cap 6.050%
05/20/2050 | 0.622% | | 44,126,986 | 4,511,296 |
| CMO Series 2023-66 Class SK |
-1.0 x 1-month Term SOFR + 6.314%
Cap 6.200%
07/20/2050 | 0.772% | | 77,919,920 | 7,852,302 |
| CMO Series 2023-75 Class SB |
-1.0 x 1-month Term SOFR + 6.164%
Cap 6.050%
06/20/2050 | 0.622% | | 84,800,513 | 8,727,703 |
| Government National Mortgage Association TBA(k) |
| 09/21/2053 | 3.000% | | 32,000,000 | 28,133,750 |
| Uniform Mortgage-Backed Security TBA(k) |
09/18/2038-
09/14/2053 | 3.000% | | 59,000,000 | 52,016,641 |
| 09/14/2053 | 3.500% | | 268,000,000 | 239,535,468 |
| 09/14/2053 | 4.000% | | 140,000,000 | 129,215,625 |
| 09/14/2053 | 4.500% | | 350,000,000 | 331,843,750 |
| 09/14/2053 | 5.000% | | 395,000,000 | 383,003,419 |
Total Residential Mortgage-Backed Securities - Agency
(Cost $1,730,329,447) | 1,648,750,191 |
|
| Residential Mortgage-Backed Securities - Non-Agency 16.8% |
| | | | |
| 510 Asset Backed Trust(a),(d) |
| CMO Series 2021-NPL2 Class A1 |
| 06/25/2061 | 2.116% | | 13,889,903 | 13,194,576 |
| Bellemeade Re Ltd.(a),(b) |
| CMO Series 2019-2A Class M2 |
1-month Term SOFR + 3.214%
Floor 3.100%
04/25/2029 | 8.529% | | 10,208,580 | 10,391,153 |
| CMO Series 2019-4A Class M1C |
1-month Term SOFR + 2.614%
Floor 2.500%
10/25/2029 | 7.929% | | 7,482,567 | 7,501,292 |
| Residential Mortgage-Backed Securities - Non-Agency (continued) |
| Issuer | Coupon
Rate | | Principal
Amount ($) | Value ($) |
| CMO Series 2020-3A Class M2 |
30-day Average SOFR + 4.964%
Floor 4.850%
10/25/2030 | 10.252% | | 13,800,000 | 14,408,955 |
| CMO Series 2020-4A Class M2B |
1-month Term SOFR + 3.714%
Floor 3.600%
06/25/2030 | 9.029% | | 1,959,367 | 1,959,150 |
| CMO Series 2021-1A Class M1C |
30-day Average SOFR + 2.950%
Floor 2.950%
03/25/2031 | 8.238% | | 15,000,000 | 15,066,414 |
| BRAVO Residential Funding Trust(a),(d) |
| CMO Series 2021-A Class A1 |
| 10/25/2059 | 1.991% | | 9,452,128 | 9,075,658 |
| CMO Series 2021-B Class A1 |
| 04/01/2069 | 2.115% | | 12,958,207 | 12,411,213 |
| BVRT Financing Trust(a),(b),(c) |
| CMO Series 2021-3F Class M2 |
30-day Average SOFR + 2.900%
Floor 2.900%
07/12/2033 | 4.187% | | 20,000,000 | 20,000,000 |
| CMO Series 2021-CRT1 Class M4 |
1-month USD LIBOR + 3.500%
Floor 3.500%
07/10/2032 | 3.589% | | 41,000,000 | 39,448,970 |
| CAFL Issuer LLC(a),(d) |
| CMO Series 2021-RTL1 Class A1 |
| 03/28/2029 | 2.239% | | 9,360,000 | 8,605,405 |
| CIM Trust(a),(d) |
| CMO Series 2021-NR4 Class A1 |
| 10/25/2061 | 2.816% | | 9,619,918 | 9,069,676 |
| Citigroup Mortgage Loan Trust, Inc.(a),(d) |
| CMO Series 2010-6 Class 2A2 |
| 09/25/2035 | 4.942% | | 131,895 | 128,748 |
| Citigroup Mortgage Loan Trust, Inc.(a) |
| Subordinated CMO Series 2014-C Class B1 |
| 02/25/2054 | 4.250% | | 1,948,740 | 1,876,120 |
| Connecticut Avenue Securities Trust(a),(b) |
| CMO Series 2019-HRP1 Class M2 |
30-day Average SOFR + 2.264%
11/25/2039 | 7.552% | | 5,523,312 | 5,550,502 |
The accompanying Notes to Financial Statements are an integral part of this statement.
Columbia Strategic Income Fund | Annual Report 2023
| 27 |
Portfolio of Investments (continued)
August 31, 2023
| Residential Mortgage-Backed Securities - Non-Agency (continued) |
| Issuer | Coupon
Rate | | Principal
Amount ($) | Value ($) |
| Subordinated CMO Series 2022-R01 Class 1B2 |
30-day Average SOFR + 6.000%
12/25/2041 | 11.288% | | 34,900,000 | 34,724,833 |
| Subordinated CMO Series 2022-R07 Class 1B2 |
30-day Average SOFR + 12.000%
06/25/2042 | 17.288% | | 11,850,000 | 13,840,568 |
| CSMC Trust(a),(d) |
| CMO Series 2020-RPL2 Class A12 |
| 02/25/2060 | 3.511% | | 6,947,897 | 6,951,610 |
| CTS Corp.(a) |
| CMO Series 2015-6R Class 3A2 |
| 02/27/2036 | 3.750% | | 1,856,016 | 1,782,817 |
| Eagle Re Ltd.(a),(b) |
| CMO Series 2021-1 Class M1C |
30-day Average SOFR + 2.700%
Floor 2.700%
10/25/2033 | 7.769% | | 9,804,123 | 9,875,694 |
| Subordinated CMO Series 2020-1 Class M1B |
1-month Term SOFR + 1.564%
01/25/2030 | 6.879% | | 13,928,491 | 13,929,374 |
| Fannie Mae Connecticut Avenue Securities(a),(b) |
| Subordinated CMO Series 2021-R02 Class 2B1 |
30-day Average SOFR + 3.300%
11/25/2041 | 8.588% | | 9,800,000 | 9,800,012 |
| Freddie Mac STACR(b) |
| CMO Series 2020-CS02 Class M4 |
1-month USD LIBOR + 0.000%
06/25/2033 | 4.617% | | 9,328,624 | 8,791,600 |
| Freddie Mac STACR REMIC Trust(a),(b) |
| CMO Series 2021-HQA1 Class M2 |
30-day Average SOFR + 2.250%
08/25/2033 | 7.538% | | 9,096,565 | 9,023,432 |
| CMO Series 2022-HQA1 Class M2 |
30-day Average SOFR + 5.250%
03/25/2042 | 10.538% | | 17,250,000 | 18,149,156 |
| Subordinated CMO Series 2020-DNA4 Class B1 |
30-day Average SOFR + 6.114%
08/25/2050 | 11.402% | | 16,160,792 | 17,967,190 |
| Subordinated CMO Series 2020-DNA6 Class B1 |
30-day Average SOFR + 3.000%
12/25/2050 | 8.288% | | 15,400,000 | 15,283,340 |
| Residential Mortgage-Backed Securities - Non-Agency (continued) |
| Issuer | Coupon
Rate | | Principal
Amount ($) | Value ($) |
| Subordinated CMO Series 2021-DNA1 Class B1 |
30-day Average SOFR + 2.650%
01/25/2051 | 7.938% | | 10,400,000 | 10,130,463 |
| Subordinated CMO Series 2021-DNA5 Class B1 |
30-day Average SOFR + 3.050%
01/25/2034 | 8.338% | | 15,700,000 | 15,622,082 |
| Subordinated CMO Series 2021-HQA1 Class B2 |
30-day Average SOFR + 5.000%
08/25/2033 | 10.288% | | 21,450,000 | 20,673,130 |
| Freddie Mac Structured Agency Credit Risk Debt Notes(a),(b) |
| CMO Series 2019-CS03 Class M2 |
30-day Average SOFR + 0.114%
10/25/2032 | 5.402% | | 10,268,134 | 9,759,178 |
| CMO Series 2020-HQA5 Class M2 |
30-day Average SOFR + 2.600%
11/25/2050 | 7.888% | | 9,884,914 | 10,023,778 |
| Subordinated CMO Series 2020-HQA5 Class B1 |
30-day Average SOFR + 4.000%
11/25/2050 | 9.288% | | 18,650,000 | 19,415,795 |
| Subordinated CMO Series 2022-DNA2 Class B1 |
30-day Average SOFR + 4.750%
02/25/2042 | 10.038% | | 19,550,000 | 19,894,100 |
| Subordinated CMO Series 2022-DNA2 Class B2 |
30-day Average SOFR + 8.500%
02/25/2042 | 13.788% | | 16,300,000 | 16,910,272 |
| Home Re Ltd.(a),(b) |
| CMO Series 2018-1 Class M2 |
1-month Term SOFR + 3.114%
10/25/2028 | 8.429% | | 4,667,746 | 4,695,951 |
| Mortgage Acquisition Trust I LLC(a),(c) |
| CMO Series 2021-1 Class PT |
| 11/29/2023 | 3.500% | | 6,089,584 | 5,526,298 |
| New York Mortgage Trust(a),(d) |
| CMO Series 2021-BPL1 Class A1 |
| 05/25/2026 | 2.239% | | 17,198,032 | 17,060,011 |
| NRZ Excess Spread-Collateralized Notes(a) |
| Series 2020-PLS1 Class A |
| 12/25/2025 | 3.844% | | 5,507,210 | 5,135,115 |
The accompanying Notes to Financial Statements are an integral part of this statement.
| 28 | Columbia Strategic Income Fund | Annual Report 2023 |
Portfolio of Investments (continued)
August 31, 2023
| Residential Mortgage-Backed Securities - Non-Agency (continued) |
| Issuer | Coupon
Rate | | Principal
Amount ($) | Value ($) |
| Oaktown Re III Ltd.(a),(b) |
| CMO Series 2019-1A Class M1B |
30-day Average SOFR + 2.064%
Floor 1.950%
07/25/2029 | 7.352% | | 3,506,448 | 3,500,712 |
| Oaktown Re VI Ltd.(a),(b) |
| CMO Series 2021-1A Class M1C |
30-day Average SOFR + 3.000%
Floor 3.000%
10/25/2033 | 8.288% | | 9,800,000 | 9,945,903 |
| PMT Credit Risk Transfer Trust(a),(b) |
| Series 2019-2R Class A |
1-month USD LIBOR + 2.750%
Floor 2.750%
05/25/2025 | 9.193% | | 5,005,323 | 4,979,000 |
| PNMAC GMSR Issuer Trust(a),(b) |
| CMO Series 2018-GT1 Class A |
1-month Term SOFR + 2.964%
Floor 2.850%
02/25/2025 | 8.279% | | 56,500,000 | 56,438,737 |
| CMO Series 2018-GT2 Class A |
1-month Term SOFR + 2.764%
08/25/2025 | 8.079% | | 76,300,000 | 75,786,120 |
| Point Securitization Trust(a),(d) |
| CMO Series 2021-1 Class A1 |
| 02/25/2052 | 3.228% | | 19,579,062 | 18,470,973 |
| Preston Ridge Partners Mortgage(a),(d) |
| CMO Series 2021-4 Class A1 |
| 04/25/2026 | 1.867% | | 12,516,304 | 11,616,048 |
| Preston Ridge Partners Mortgage Trust(a),(d) |
| CMO Series 2021-1 Class A1 |
| 01/25/2026 | 2.115% | | 3,085,577 | 2,935,876 |
| CMO Series 2021-2 Class A1 |
| 03/25/2026 | 2.115% | | 9,883,916 | 9,358,219 |
| CMO Series 2021-3 Class A1 |
| 04/25/2026 | 1.867% | | 10,091,262 | 9,531,282 |
| CMO Series 2023-RCF1 Class M1 |
| 06/25/2053 | 4.000% | | 11,431,000 | 9,515,556 |
| Pretium Mortgage Credit Partners(a),(d) |
| CMO Series 2022-NPL1 Class A1 |
| 01/25/2052 | 2.981% | | 16,444,700 | 15,340,798 |
| Pretium Mortgage Credit Partners I LLC(a),(d) |
| CMO Series 2021-NPL1 Class A1 |
| 09/27/2060 | 2.240% | | 6,225,970 | 6,015,523 |
| Residential Mortgage-Backed Securities - Non-Agency (continued) |
| Issuer | Coupon
Rate | | Principal
Amount ($) | Value ($) |
| Pretium Mortgage Credit Partners LLC(a),(d) |
| CMO Series 2021-RN2 Class A1 |
| 07/25/2051 | 1.744% | | 8,887,080 | 8,281,996 |
| Radnor Re Ltd.(a),(b) |
| CMO Series 2021-1 Class M2 |
30-day Average SOFR + 3.150%
12/27/2033 | 8.788% | | 18,984,000 | 18,867,953 |
| Stonnington Mortgage Trust(a),(c),(d),(l) |
| CMO Series 2020-1 Class A |
| 07/28/2024 | 3.500% | | 863,353 | 850,402 |
| Toorak Mortgage Corp., Ltd.(a),(d) |
| CMO Series 2021-1 Class A1 |
| 06/25/2024 | 2.240% | | 12,459,455 | 12,360,943 |
| Triangle Re Ltd.(a),(b) |
| CMO Series 2021-2 Class M1C |
1-month Term SOFR + 4.614%
Floor 4.500%
10/25/2033 | 9.929% | | 19,500,000 | 20,304,535 |
| CMO Series 2021-2 Class M2 |
1-month Term SOFR + 5.614%
Floor 5.500%
10/25/2033 | 10.929% | | 10,750,000 | 11,241,224 |
| VCAT Asset Securitization LLC(a),(d) |
| CMO Series 2021-NPL6 Class A1 |
| 09/25/2051 | 1.917% | | 17,692,620 | 16,348,738 |
| VCAT LLC(a),(d) |
| CMO Series 2021-NPL5 Class A1 |
| 08/25/2051 | 1.868% | | 19,706,657 | 18,759,404 |
| Vericrest Opportunity Loan Transferee(a),(d) |
| CMO Series 2021-NPL4 Class A1 |
| 03/27/2051 | 2.240% | | 7,099,650 | 6,799,889 |
| Verus Securitization Trust(a),(d) |
| Subordinated CMO Series 2019-INV3 Class B1 |
| 11/25/2059 | 3.731% | | 7,300,000 | 5,973,760 |
| Visio Trust(a),(d) |
| CMO Series 2019-2 Class M1 |
| 11/25/2054 | 3.260% | | 4,200,000 | 3,523,873 |
| Subordinated CMO Series 2019-2 Class B1 |
| 11/25/2054 | 3.910% | | 3,600,000 | 3,040,475 |
Total Residential Mortgage-Backed Securities - Non-Agency
(Cost $842,856,340) | 843,441,570 |
The accompanying Notes to Financial Statements are an integral part of this statement.
Columbia Strategic Income Fund | Annual Report 2023
| 29 |
Portfolio of Investments (continued)
August 31, 2023
| Rights 0.0% |
| Issuer | Shares | Value ($) |
| Communication Services 0.0% |
| Entertainment 0.0% |
| Cineworld Group PLC(e) | 31,901 | 690,859 |
| Total Communication Services | 690,859 |
Total Rights
(Cost $391,321) | 690,859 |
| Senior Loans 7.8% |
| Borrower | Coupon
Rate | | Principal
Amount ($) | Value ($) |
| Aerospace & Defense 0.1% |
| TransDigm, Inc.(b),(m) |
| Tranche 1 Term Loan |
1-month Term SOFR + 3.250%
08/24/2028 | 8.492% | | 2,534,567 | 2,535,708 |
| Airlines 0.1% |
| AAdvantage Loyalty IP Ltd./American Airlines, Inc.(b),(m) |
| Term Loan |
3-month Term SOFR + 4.750%
Floor 0.750%
04/20/2028 | 10.338% | | 3,030,292 | 3,144,413 |
| Air Canada(b),(m) |
| Term Loan |
1-month USD LIBOR + 3.500%
Floor 0.750%
08/11/2028 | 9.128% | | 1,000,000 | 999,820 |
| United AirLines, Inc.(b),(m) |
| Tranche B Term Loan |
3-month USD LIBOR + 3.750%
Floor 0.750%
04/21/2028 | 9.292% | | 1,613,081 | 1,615,097 |
| WestJet Airlines Ltd.(b),(m) |
| Term Loan |
1-month Term SOFR + 3.000%
Floor 1.000%
12/11/2026 | 8.415% | | 1,433,079 | 1,403,028 |
| Total | 7,162,358 |
| Automotive 0.1% |
| American Axle & Manufacturing, Inc.(b),(m) |
| Tranche B Term Loan |
1-month Term SOFR + 3.500%
Floor 0.500%
12/13/2029 | 8.769% | | 557,729 | 555,465 |
| Clarios Global LP(b),(m) |
| 1st Lien Term Loan |
1-month Term SOFR + 3.750%
05/06/2030 | 9.081% | | 2,136,721 | 2,130,717 |
| Senior Loans (continued) |
| Borrower | Coupon
Rate | | Principal
Amount ($) | Value ($) |
| First Brands Group LLC(b),(m) |
| 1st Lien Term Loan |
1-month USD LIBOR + 5.000%
Floor 1.000%
03/30/2027 | 10.881% | | 374,858 | 369,235 |
6-month Term SOFR + 5.000%
Floor 1.000%
03/30/2027 | 10.881% | | 2,619,990 | 2,580,690 |
| Total | 5,636,107 |
| Brokerage/Asset Managers/Exchanges 0.2% |
| AlixPartners LLP(b),(m) |
| Term Loan |
1-month USD LIBOR + 2.750%
Floor 0.500%
02/04/2028 | 8.196% | | 1,461,289 | 1,459,053 |
| Allspring Buyer LLC(b),(m) |
| Term Loan |
3-month USD LIBOR + 3.250%
Floor 0.500%
11/01/2028 | 8.753% | | 1,314,012 | 1,310,964 |
| Citadel Securities LP(b),(m) |
| Term Loan |
1-month Term SOFR + 2.500%
07/29/2030 | 7.946% | | 2,927,563 | 2,912,925 |
| Hightower Holding LLC (b),(m) |
| Term Loan |
3-month USD LIBOR + 4.000%
Floor 0.750%
04/21/2028 | 9.351% | | 500,000 | 492,915 |
| Russell Investments US Institutional Holdco, Inc.(b),(m) |
| Term Loan |
1-month USD LIBOR + 3.500%
Floor 1.000%
05/30/2025 | 8.931% | | 1,427,861 | 1,317,559 |
| VFH Parent LLC(b),(m) |
| Term Loan |
1-month Term SOFR + 3.000%
01/13/2029 | 8.420% | | 2,265,430 | 2,247,306 |
| Total | 9,740,722 |
| Building Materials 0.3% |
| Cornerstone Building Brands, Inc.(b),(m) |
| Tranche B Term Loan |
1-month USD LIBOR + 3.250%
04/12/2028 | 8.660% | | 1,388,752 | 1,351,575 |
| Covia Holdings LLC(b),(m) |
| Term Loan |
3-month USD LIBOR + 4.000%
Floor 1.000%
07/31/2026 | 9.530% | | 1,750,241 | 1,735,661 |
The accompanying Notes to Financial Statements are an integral part of this statement.
| 30 | Columbia Strategic Income Fund | Annual Report 2023 |
Portfolio of Investments (continued)
August 31, 2023
| Senior Loans (continued) |
| Borrower | Coupon
Rate | | Principal
Amount ($) | Value ($) |
| CPG International LLC(b),(m) |
| Term Loan |
1-month Term SOFR + 2.500%
Floor 0.500%
04/28/2029 | 7.931% | | 750,000 | 748,125 |
| Hunter Douglas Holding BV(b),(m) |
| Tranche B1 Term Loan |
1-month Term SOFR + 3.500%
Floor 0.500%
02/26/2029 | 8.891% | | 2,179,418 | 2,115,408 |
| LBM Acquisition LLC(b),(m) |
| 1st Lien Term Loan |
1-month USD LIBOR + 3.750%
Floor 0.750%
12/17/2027 | 9.181% | | 1,000,000 | 971,700 |
| Park River Holdings, Inc.(b),(m) |
| 1st Lien Term Loan |
3-month USD LIBOR + 3.250%
Floor 0.750%
12/28/2027 | 8.522% | | 1,257,182 | 1,209,183 |
| QUIKRETE Holdings, Inc.(b),(m) |
| 1st Lien Term Loan |
3-month USD LIBOR + 2.625%
02/01/2027 | 8.071% | | 2,176,703 | 2,173,743 |
| SRS Distribution, Inc.(b),(m) |
| Term Loan |
1-month Term SOFR + 3.500%
Floor 0.500%
06/02/2028 | 8.946% | | 1,960,000 | 1,931,835 |
| Standard Building Solutions, Inc.(b),(m) |
| Term Loan |
1-month USD LIBOR + 2.500%
Floor 0.500%
09/22/2028 | 7.929% | | 1,000,000 | 1,000,310 |
| White Cap Supply Holdings LLC(b),(m) |
| Term Loan |
1-month Term SOFR + 3.750%
Floor 0.500%
10/19/2027 | 9.081% | | 1,850,544 | 1,847,454 |
| Total | 15,084,994 |
| Cable and Satellite 0.2% |
| CSC Holdings LLC(b),(m) |
| Term Loan |
1-month Term SOFR + 4.500%
01/18/2028 | 9.810% | | 1,439,363 | 1,355,405 |
| DirectTV Financing LLC(b),(m) |
| Term Loan |
1-month USD LIBOR + 5.000%
Floor 0.750%
08/02/2027 | 10.446% | | 2,295,263 | 2,266,044 |
| Senior Loans (continued) |
| Borrower | Coupon
Rate | | Principal
Amount ($) | Value ($) |
| Iridium Satellite LLC(b),(m) |
| Tranche B2 Term Loan |
1-month Term SOFR + 2.500%
Floor 1.000%
11/04/2026 | 7.931% | | 2,178,650 | 2,179,565 |
| Radiate Holdco LLC(b),(m) |
| Tranche B Term Loan |
1-month USD LIBOR + 3.250%
Floor 0.750%
09/25/2026 | 8.696% | | 1,637,073 | 1,337,047 |
| Telesat Canada(b),(m) |
| Tranche B5 Term Loan |
3-month USD LIBOR + 2.750%
12/07/2026 | 8.434% | | 2,179,765 | 1,553,083 |
| Virgin Media Bristol LLC(b),(m) |
| Tranche N Term Loan |
1-month USD LIBOR + 2.500%
01/31/2028 | 7.925% | | 1,175,000 | 1,141,512 |
| Tranche Q Term Loan |
1-month USD LIBOR + 3.250%
01/31/2029 | 8.675% | | 1,000,000 | 987,500 |
| Total | 10,820,156 |
| Chemicals 0.4% |
| Ascend Performance Materials Operations LLC(b),(m) |
| Term Loan |
6-month Term SOFR + 4.750%
Floor 0.750%
08/27/2026 | 9.715% | | 1,165,869 | 1,136,174 |
| ColourOz Investment 1 GmbH(g),(m),(n) |
| Tranche C 1st Lien Term Loan |
| 09/21/2023 | 0.000% | | 353,558 | 233,727 |
| ColourOz Investment 2 LLC(g),(m),(n) |
| Tranche B2 1st Lien Term Loan |
| 09/21/2023 | 0.000% | | 2,138,732 | 1,413,852 |
| Herens Holdco SARL(b),(m) |
| Tranche B Term Loan |
3-month Term SOFR + 3.925%
Floor 0.750%
07/03/2028 | 9.267% | | 1,062,856 | 929,616 |
| Ineos Quattro Holdings UK Ltd.(b),(m) |
| Tranche B Term Loan |
1-month USD LIBOR + 2.750%
Floor 0.500%
01/29/2026 | 8.196% | | 1,960,000 | 1,945,300 |
| Tranche B Term Loan |
1-month Term SOFR + 3.750%
03/14/2030 | 9.181% | | 396,777 | 394,297 |
| Ineos US Finance LLC(b),(m) |
| Term Loan |
1-month Term SOFR + 3.750%
11/08/2027 | 9.181% | | 1,678,448 | 1,670,761 |
The accompanying Notes to Financial Statements are an integral part of this statement.
Columbia Strategic Income Fund | Annual Report 2023
| 31 |
Portfolio of Investments (continued)
August 31, 2023
| Senior Loans (continued) |
| Borrower | Coupon
Rate | | Principal
Amount ($) | Value ($) |
| Tranche B Term Loan |
1-month Term SOFR + 3.500%
02/18/2030 | 9.062% | | 652,344 | 647,289 |
| Innophos Holdings, Inc.(b),(m) |
| Term Loan |
1-month USD LIBOR + 3.250%
02/05/2027 | 8.696% | | 604,687 | 602,988 |
| Messer Industries GmbH(b),(m) |
| Tranche B1 Term Loan |
3-month USD LIBOR + 2.500%
03/02/2026 | 8.003% | | 1,003,958 | 1,003,265 |
| Nouryon Finance BV(b),(m) |
| Term Loan |
3-month Term SOFR + 4.000%
04/03/2028 | 9.318% | | 1,183,109 | 1,177,194 |
1-month Term SOFR + 4.000%
04/03/2028 | 9.347% | | 1,131,236 | 1,126,518 |
| Olympus Water US Holding Corp.(b),(m) |
| Term Loan |
1-month Term SOFR + 5.000%
Floor 0.500%
11/09/2028 | 10.268% | | 777,347 | 777,020 |
| PMHC II, Inc.(b),(m) |
| Term Loan |
3-month Term SOFR + 4.250%
Floor 0.500%
04/23/2029 | 9.698% | | 1,123,412 | 1,046,941 |
| Sparta US Holdco LLC(b),(m) |
| 1st Lien Term Loan |
1-month USD LIBOR + 3.250%
Floor 0.750%
08/02/2028 | 8.682% | | 982,531 | 975,781 |
| Tronox Pigments(b),(m),(o) |
| Tranche B Term Loan |
1-month Term SOFR + 3.500%
08/16/2028 | 8.813% | | 478,290 | 474,105 |
| Windsor Holdings III LLC(b),(m) |
| Tranche B Term Loan |
3-month Term SOFR + 4.500%
08/01/2030 | 9.818% | | 1,317,357 | 1,311,600 |
| WR Grace Holdings LLC(b),(m) |
| Term Loan |
1-month USD LIBOR + 3.750%
Floor 0.500%
09/22/2028 | 9.313% | | 1,250,000 | 1,247,138 |
| Total | 18,113,566 |
| Senior Loans (continued) |
| Borrower | Coupon
Rate | | Principal
Amount ($) | Value ($) |
| Construction Machinery 0.0% |
| Columbus McKinnon Corp.(b),(m) |
| Term Loan |
3-month USD LIBOR + 2.750%
Floor 0.500%
05/14/2028 | 8.230% | | 1,184,307 | 1,184,307 |
| Consumer Cyclical Services 0.5% |
| 8th Avenue Food & Provisions, Inc.(b),(m) |
| 1st Lien Term Loan |
1-month Term SOFR + 3.750%
10/01/2025 | 9.196% | | 870,351 | 828,791 |
| 2nd Lien Term Loan |
1-month USD LIBOR + 7.750%
10/01/2026 | 13.196% | | 1,686,397 | 1,130,948 |
| Allied Universal Holdco LLC(b),(m) |
| Term Loan |
1-month USD LIBOR + 3.750%
Floor 0.500%
05/12/2028 | 9.181% | | 2,389,978 | 2,320,526 |
| Amentum Government Services Holdings LLC(b),(c),(m) |
| Tranche 1 1st Lien Term Loan |
1-month USD LIBOR + 4.000%
01/29/2027 | 9.446% | | 953,938 | 944,399 |
| Amentum Government Services Holdings LLC(b),(m) |
| Tranche 3 1st Lien Term Loan |
6-month Term SOFR + 4.000%
Floor 0.500%
02/15/2029 | 9.314% | | 1,146,223 | 1,119,481 |
| Arches Buyer, Inc.(b),(m),(o) |
| Term Loan |
1-month Term SOFR + 3.250%
Floor 0.500%
12/06/2027 | 8.681% | | 2,959,293 | 2,873,740 |
| Cast & Crew LLC(b),(m) |
| 1st Lien Term Loan |
1-month Term SOFR + 3.750%
Floor 0.500%
12/29/2028 | 9.081% | | 1,378,868 | 1,345,375 |
| Conservice Midco LLC(b),(m) |
| 1st Lien Term Loan |
1-month USD LIBOR + 4.250%
05/13/2027 | 9.719% | | 1,922,597 | 1,921,021 |
| Corporation Service Co.(b),(m),(o) |
| Tranche B Term Loan |
1-month Term SOFR + 3.250%
Floor 0.500%
11/02/2029 | 8.681% | | 1,128,715 | 1,128,952 |
The accompanying Notes to Financial Statements are an integral part of this statement.
| 32 | Columbia Strategic Income Fund | Annual Report 2023 |
Portfolio of Investments (continued)
August 31, 2023
| Senior Loans (continued) |
| Borrower | Coupon
Rate | | Principal
Amount ($) | Value ($) |
| Cushman & Wakefield(b),(m) |
| Tranche B Term Loan |
1-month Term SOFR + 4.250%
Floor 0.500%
01/31/2030 | 9.331% | | 806,923 | 819,027 |
| Go Daddy Operating Co. LLC(b),(m) |
| Term Loan |
1-month Term SOFR + 3.000%
11/09/2029 | 7.831% | | 511,835 | 512,475 |
| Prime Security Services Borrower LLC(b),(m) |
| Tranche B1 1st Lien Term Loan |
1-month USD LIBOR + 2.750%
Floor 0.750%
09/23/2026 | 8.182% | | 1,684,957 | 1,684,603 |
| Signal Parent, Inc.(b),(m) |
| Term Loan |
1-month USD LIBOR + 3.500%
Floor 0.750%
04/03/2028 | 8.931% | | 1,834,422 | 1,540,915 |
| Sotheby’s(b),(m) |
| Term Loan |
3-month USD LIBOR + 4.500%
Floor 0.500%
01/15/2027 | 10.070% | | 1,350,260 | 1,312,560 |
| TruGreen LP(b),(m) |
| 1st Lien Term Loan |
1-month USD LIBOR + 4.000%
Floor 0.750%
11/02/2027 | 9.431% | | 1,079,509 | 1,025,987 |
| Uber Technologies, Inc.(b),(m) |
| Term Loan |
1-month Term SOFR + 2.750%
03/03/2030 | 8.018% | | 1,564,392 | 1,566,082 |
| WaterBridge Midstream Operating LLC(b),(m) |
| Term Loan |
3-month USD LIBOR + 5.750%
Floor 1.000%
06/22/2026 | 11.363% | | 1,142,504 | 1,144,949 |
| WW International, Inc.(b),(m) |
| Term Loan |
1-month USD LIBOR + 3.500%
Floor 0.500%
04/13/2028 | 8.946% | | 1,171,875 | 876,949 |
| Total | 24,096,780 |
| Consumer Products 0.2% |
| Bombardier Recreational Products, Inc. (b),(m),(o) |
| Term Loan |
1-month Term SOFR + 3.500%
Floor 0.500%
12/13/2029 | 8.831% | | 1,947,145 | 1,947,553 |
| Senior Loans (continued) |
| Borrower | Coupon
Rate | | Principal
Amount ($) | Value ($) |
| Bombardier Recreational Products, Inc. (b),(m) |
| Term Loan |
1-month USD LIBOR + 2.000%
05/24/2027 | 7.431% | | 497,423 | 493,568 |
| Kronos Acquisition Holdings, Inc.(b),(m) |
| Tranche B1 Term Loan |
1-month USD LIBOR + 3.750%
Floor 0.500%
12/22/2026 | 9.253% | | 1,000,000 | 986,110 |
| Osmosis Buyer Ltd.(b),(m) |
| Tranche B Term Loan |
1-month USD LIBOR + 3.750%
Floor 0.500%
07/31/2028 | 9.062% | | 750,000 | 746,917 |
| Serta Simmons Bedding LLC(c),(l),(m),(n) |
| 1st Lien Term Loan |
| 11/08/2023 | 0.000% | | 1,120,761 | 28,019 |
| SRAM LLC(b),(m) |
| Term Loan |
1-month USD LIBOR + 2.750%
Floor 0.500%
05/18/2028 | 8.196% | | 1,597,765 | 1,592,445 |
| SWF Holdings I Corp.(b),(m) |
| 1st Lien Term Loan |
3-month USD LIBOR + 4.000%
Floor 0.750%
10/06/2028 | 9.446% | | 1,549,282 | 1,285,904 |
| Thor Industries, Inc.(b),(m) |
| Tranche B1 Term Loan |
1-month USD LIBOR + 3.000%
02/01/2026 | 8.446% | | 371,950 | 371,486 |
| Topgolf Callaway Brands Corp.(b),(m) |
| Term Loan |
1-month Term SOFR + 3.500%
Floor 0.100%
03/15/2030 | 8.931% | | 1,632,205 | 1,630,458 |
| Weber-Stephen Products LLC(b),(m) |
| Tranche B Term Loan |
1-month USD LIBOR + 3.250%
Floor 0.750%
10/30/2027 | 8.696% | | 2,414,869 | 2,173,382 |
| Total | 11,255,842 |
| Diversified Manufacturing 0.3% |
| Barnes Group, Inc.(b),(m),(o) |
| Tranche B Term Loan |
1-month Term SOFR + 3.000%
08/09/2030 | 8.431% | | 946,790 | 947,575 |
The accompanying Notes to Financial Statements are an integral part of this statement.
Columbia Strategic Income Fund | Annual Report 2023
| 33 |
Portfolio of Investments (continued)
August 31, 2023
| Senior Loans (continued) |
| Borrower | Coupon
Rate | | Principal
Amount ($) | Value ($) |
| Brookfield WEC Holdings, Inc.(b),(m) |
| 1st Lien Term Loan |
1-month USD LIBOR + 2.750%
Floor 0.500%
08/01/2025 | 8.196% | | 2,145,390 | 2,142,021 |
| DXP Enterprises, Inc.(b),(m) |
| Term Loan |
3-month Term SOFR + 5.250%
Floor 1.000%
12/23/2027 | 10.444% | | 1,477,700 | 1,472,159 |
| Emrld Borrower LP(b),(m) |
| Tranche B Term Loan |
1-month Term SOFR + 3.000%
05/31/2030 | 8.331% | | 2,348,067 | 2,349,547 |
| Filtration Group Corp.(b),(m) |
| Term Loan |
1-month USD LIBOR + 3.500%
Floor 0.500%
10/21/2028 | 8.946% | | 615,419 | 611,831 |
| Term Loan |
1-month Term SOFR + 4.250%
Floor 0.500%
10/21/2028 | 9.696% | | 2,036,344 | 2,041,007 |
| Gates Global LLC(b),(m) |
| Tranche B3 Term Loan |
1-month USD LIBOR + 2.500%
Floor 0.750%
03/31/2027 | 7.931% | | 1,493,012 | 1,489,906 |
| Husky Injection Molding Systems Ltd.(b),(m) |
| Term Loan |
3-month USD LIBOR + 3.000%
03/28/2025 | 8.731% | | 497,375 | 493,725 |
| Madison IAQ LLC(b),(m) |
| Term Loan |
3-month USD LIBOR + 3.250%
06/21/2028 | 8.302% | | 1,651,127 | 1,640,808 |
| TK Elevator Midco GmbH(b),(m) |
| Tranche B1 Term Loan |
6-month USD LIBOR + 3.500%
Floor 0.500%
07/30/2027 | 9.381% | | 1,263,234 | 1,260,784 |
| Vertiv Group Corp.(b),(m) |
| Tranche B Term Loan |
1-month USD LIBOR + 2.750%
03/02/2027 | 8.182% | | 1,439,189 | 1,437,793 |
| Total | 15,887,156 |
| Electric 0.1% |
| Calpine Construction Finance Co. LP(b),(m) |
| Tranche B Term Loan |
1-month Term SOFR + 2.250%
07/31/2030 | 7.581% | | 730,665 | 725,185 |
| Senior Loans (continued) |
| Borrower | Coupon
Rate | | Principal
Amount ($) | Value ($) |
| Calpine Corp.(b),(m) |
| Term Loan |
1-month USD LIBOR + 2.500%
12/16/2027 | 7.946% | | 717,949 | 716,872 |
| Carroll County Energy LLC(b),(m) |
| Term Loan |
3-month USD LIBOR + 3.500%
02/13/2026 | 8.842% | | 388,805 | 379,249 |
| Constellation Renewables LLC(b),(m) |
| Term Loan |
1-month USD LIBOR + 2.500%
Floor 1.000%
12/15/2027 | 8.184% | | 2,609,840 | 2,591,362 |
| Generation Bridge Northeast LLC(b),(m) |
| Tranche B Term Loan |
1-month Term SOFR + 4.250%
08/22/2029 | 9.564% | | 436,250 | 435,159 |
| Nautilus Power LLC(b),(m) |
| Term Loan |
3-month Term SOFR + 5.250%
Floor 2.000%
11/16/2026 | 10.753% | | 477,345 | 356,815 |
| New Frontera Holdings LLC(b),(m) |
| 1st Lien Term Loan |
1-month USD LIBOR + 13.000%
07/28/2026 | 18.650% | | 217,161 | 217,161 |
| 2nd Lien Term Loan |
1-month USD LIBOR + 1.500%
07/28/2028 | 7.150% | | 75,277 | 33,498 |
| PG&E Corp.(b),(m) |
| Term Loan |
1-month USD LIBOR + 3.000%
Floor 1.000%
06/23/2025 | 8.446% | | 1,916,586 | 1,912,868 |
| Total | 7,368,169 |
| Environmental 0.1% |
| EnergySolutions LLC(b),(m) |
| Term Loan |
3-month USD LIBOR + 3.750%
Floor 1.000%
05/09/2025 | 9.288% | | 1,094,778 | 1,086,567 |
| GFL Environmental, Inc.(b),(m) |
| Term Loan |
1-month Term SOFR + 3.000%
Floor 0.500%
05/31/2027 | 8.469% | | 831,363 | 833,549 |
| Rockwood Service Corp.(b),(m) |
| Term Loan |
1-month USD LIBOR + 4.000%
01/23/2027 | 9.446% | | 1,291,257 | 1,293,414 |
| Total | 3,213,530 |
The accompanying Notes to Financial Statements are an integral part of this statement.
| 34 | Columbia Strategic Income Fund | Annual Report 2023 |
Portfolio of Investments (continued)
August 31, 2023
| Senior Loans (continued) |
| Borrower | Coupon
Rate | | Principal
Amount ($) | Value ($) |
| Finance Companies 0.0% |
| Avolon Borrower 1 LLC(b),(m) |
| Tranche B6 Term Loan |
1-month Term SOFR + 2.500%
Floor 0.500%
06/22/2028 | 7.814% | | 738,417 | 738,602 |
| Food and Beverage 0.1% |
| Aramark Intermediate HoldCo Corp.(b),(m) |
| Tranche B6 Term Loan |
1-month Term SOFR + 2.500%
06/22/2030 | 7.946% | | 1,000,000 | 997,500 |
| Del Monte Foods, Inc.(b),(m) |
| 1st Lien Term Loan |
1-month Term SOFR + 4.250%
Floor 0.500%
05/16/2029 | 9.670% | | 1,708,404 | 1,665,694 |
| Naked Juice LLC(b),(m) |
| 1st Lien Term Loan |
3-month Term SOFR + 3.250%
Floor 0.500%
01/24/2029 | 8.592% | | 297,000 | 281,036 |
| Primary Products Finance LLC(b),(m) |
| Tranche B Term Loan |
3-month Term SOFR + 4.000%
Floor 0.500%
04/01/2029 | 9.397% | | 1,949,442 | 1,944,217 |
| Triton Water Holdings, Inc.(b),(m) |
| 1st Lien Term Loan |
3-month USD LIBOR + 3.250%
Floor 0.500%
03/31/2028 | 8.753% | | 1,354,911 | 1,330,266 |
| Utz Quality Foods(b),(m) |
| 1st Lien Term Loan |
1-month Term SOFR + 3.000%
01/20/2028 | 8.446% | | 997,443 | 997,722 |
| Total | 7,216,435 |
| Gaming 0.4% |
| Caesars Entertainment, Inc.(b),(m) |
| Tranche B Term Loan |
1-month Term SOFR + 3.250%
Floor 0.500%
02/06/2030 | 8.681% | | 1,602,817 | 1,602,624 |
| Entain PLC(b),(m),(o) |
| Tranche B2 Term Loan |
1-month Term SOFR + 3.500%
Floor 0.500%
10/31/2029 | 8.885% | | 2,022,110 | 2,024,638 |
| Senior Loans (continued) |
| Borrower | Coupon
Rate | | Principal
Amount ($) | Value ($) |
| Fertitta Entertainment LLC(b),(m) |
| Tranche B Term Loan |
1-month Term SOFR + 4.000%
Floor 0.500%
01/27/2029 | 9.331% | | 2,131,156 | 2,108,374 |
| Flutter Entertainment PLC(b),(m) |
| Term Loan |
3-month USD LIBOR + 2.250%
07/21/2026 | 7.753% | | 2,399,055 | 2,397,016 |
| Tranche B Term Loan |
1-month Term SOFR + 3.250%
07/22/2028 | 8.753% | | 422,628 | 422,603 |
| HRNI Holdings LLC(b),(m) |
| Tranche B Term Loan |
1-month USD LIBOR + 4.250%
Floor 0.750%
12/11/2028 | 9.769% | | 2,887,939 | 2,807,308 |
| Light and Wonder International, Inc.(b),(m) |
| Tranche B Term Loan |
1-month Term SOFR + 3.000%
Floor 0.500%
04/14/2029 | 8.412% | | 1,325,161 | 1,323,743 |
| Ontario Gaming GTA LP(b),(m) |
| Tranche B 1st Lien Term Loan |
1-month Term SOFR + 4.250%
Floor 0.500%
08/01/2030 | 9.622% | | 412,108 | 412,883 |
| PCI Gaming Authority(b),(m) |
| Tranche B Term Loan |
3-month USD LIBOR + 2.500%
05/29/2026 | 7.946% | | 1,188,266 | 1,188,052 |
| Penn Entertainment, Inc.(b),(m) |
| Tranche B Term Loan |
1-month Term SOFR + 2.750%
Floor 0.500%
05/03/2029 | 8.181% | | 1,000,000 | 999,790 |
| Scientific Games Holdings LP(b),(m) |
| 1st Lien Term Loan |
1-month Term SOFR + 3.500%
Floor 0.500%
04/04/2029 | 8.768% | | 2,478,077 | 2,463,357 |
| Total | 17,750,388 |
| Health Care 0.3% |
| CHG Healthcare Services, Inc.(b),(m) |
| 1st Lien Term Loan |
1-month USD LIBOR + 3.250%
Floor 0.500%
09/29/2028 | 8.696% | | 767,120 | 761,849 |
The accompanying Notes to Financial Statements are an integral part of this statement.
Columbia Strategic Income Fund | Annual Report 2023
| 35 |
Portfolio of Investments (continued)
August 31, 2023
| Senior Loans (continued) |
| Borrower | Coupon
Rate | | Principal
Amount ($) | Value ($) |
| Element Materials Technology Group US Holdings, Inc.(b),(m),(o) |
| Tranche B 1st Lien Delayed Draw Term Loan |
1-month Term SOFR + 4.250%
Floor 0.500%
06/22/2029 | 9.592% | | 538,572 | 526,454 |
| Tranche B 1st Lien Term Loan |
1-month Term SOFR + 4.250%
Floor 0.500%
06/22/2029 | 9.592% | | 1,166,905 | 1,140,650 |
| Envision Healthcare Corp.(m),(n) |
| Term Loan |
| 03/31/2027 | 0.000% | | 313,006 | 573 |
| 03/31/2027 | 0.000% | | 666,800 | 164,479 |
| 03/31/2027 | 0.000% | | 113,206 | 129,863 |
| ICON PLC(b),(m) |
| Term Loan |
3-month Term SOFR + 2.250%
Floor 0.500%
07/03/2028 | 7.753% | | 1,338,254 | 1,338,401 |
3-month USD LIBOR + 2.250%
07/03/2028 | 7.753% | | 333,427 | 333,464 |
| Medline Borrower LP(b),(m),(o) |
| Term Loan |
1-month USD LIBOR + 3.250%
Floor 0.500%
10/23/2028 | 8.696% | | 4,144,160 | 4,139,394 |
| Phoenix Guarantor, Inc.(b),(m) |
| Tranche B1 1st Lien Term Loan |
1-month USD LIBOR + 3.250%
03/05/2026 | 8.696% | | 949,921 | 943,043 |
| Pluto Acquisition I, Inc.(b),(m) |
| 1st Lien Term Loan |
1-month Term SOFR + 4.000%
06/22/2026 | 9.684% | | 1,921,657 | 1,623,801 |
| Surgery Center Holdings, Inc.(b),(m) |
| Term Loan |
1-month USD LIBOR + 3.750%
Floor 0.750%
08/31/2026 | 9.178% | | 2,000,000 | 2,002,360 |
| Upstream Newco, Inc.(b),(m) |
| 1st Lien Term Loan |
1-month Term SOFR + 4.250%
11/20/2026 | 9.753% | | 1,997,455 | 1,905,102 |
| Total | 15,009,433 |
| Independent Energy 0.1% |
| Hamilton Projects Acquiror LLC(b),(m) |
| Term Loan |
3-month USD LIBOR + 4.500%
Floor 1.000%
06/17/2027 | 9.946% | | 1,575,138 | 1,559,386 |
| Senior Loans (continued) |
| Borrower | Coupon
Rate | | Principal
Amount ($) | Value ($) |
| Parkway Generation LLC(b),(m) |
| Tranche B Term Loan |
1-month Term SOFR + 4.750%
Floor 0.750%
02/18/2029 | 10.196% | | 2,343,990 | 2,322,214 |
| Tranche C Term Loan |
3-month Term SOFR + 4.750%
Floor 0.750%
02/18/2029 | 10.196% | | 309,019 | 306,149 |
| Total | 4,187,749 |
| Leisure 0.3% |
| Alterra Mountain Co.(b),(m) |
| Tranche B2 Term Loan |
1-month USD LIBOR + 3.500%
Floor 0.500%
08/17/2028 | 8.946% | | 1,880,218 | 1,881,402 |
| Tranche B3 Term Loan |
1-month Term SOFR + 3.750%
05/31/2030 | 9.181% | | 430,306 | 429,768 |
| Carnival Corp.(b),(m) |
| Term Loan |
1-month Term SOFR + 3.000%
Floor 0.750%
08/08/2027 | 8.317% | | 355,241 | 354,619 |
| Tranche B Term Loan |
1-month USD LIBOR + 3.250%
Floor 0.750%
10/18/2028 | 8.696% | | 2,367,468 | 2,360,815 |
| Cinemark USA, Inc.(b),(m) |
| Term Loan |
1-month Term SOFR + 3.750%
Floor 0.500%
05/24/2030 | 9.054% | | 1,900,893 | 1,894,563 |
| Crown Finance US, Inc.(b),(m) |
| Term Loan |
1-month Term SOFR + 8.500%
07/31/2028 | 14.381% | | 794,893 | 799,114 |
| Formula One Management Ltd.(b),(m),(o) |
| Tranche B 1st Lien Term Loan |
1-month Term SOFR + 3.000%
Floor 0.500%
01/15/2030 | 8.331% | | 2,409,923 | 2,415,948 |
| Life Time, Inc.(b),(m) |
| Term Loan |
1-month Term SOFR + 4.750%
Floor 0.500%
01/15/2026 | 10.611% | | 1,170,726 | 1,175,117 |
The accompanying Notes to Financial Statements are an integral part of this statement.
| 36 | Columbia Strategic Income Fund | Annual Report 2023 |
Portfolio of Investments (continued)
August 31, 2023
| Senior Loans (continued) |
| Borrower | Coupon
Rate | | Principal
Amount ($) | Value ($) |
| NAI Entertainment Holdings LLC(b),(m) |
| Tranche B Term Loan |
1-month USD LIBOR + 2.500%
Floor 1.000%
05/08/2025 | 10.000% | | 2,019,184 | 1,877,841 |
| UFC Holdings LLC(b),(m) |
| Tranche B3 1st Lien Term Loan |
3-month USD LIBOR + 2.750%
Floor 0.750%
04/29/2026 | 8.369% | | 2,632,855 | 2,632,302 |
| William Morris Endeavor Entertainment LLC(b),(m) |
| Tranche B1 1st Lien Term Loan |
3-month USD LIBOR + 2.750%
05/18/2025 | 8.196% | | 1,309,234 | 1,306,171 |
| Total | 17,127,660 |
| Lodging 0.1% |
| Four Seasons Holdings, Inc.(b),(m) |
| 1st Lien Term Loan |
1-month Term SOFR + 2.500%
Floor 0.500%
11/30/2029 | 7.931% | | 1,512,290 | 1,512,925 |
| Hilton Grand Vacations Borrower LLC(b),(m) |
| Term Loan |
1-month USD LIBOR + 3.000%
Floor 0.500%
08/02/2028 | 8.446% | | 2,222,605 | 2,222,605 |
| Playa Resorts Holding BV(b),(m) |
| Term Loan |
1-month Term SOFR + 4.250%
01/05/2029 | 9.564% | | 1,270,772 | 1,269,044 |
| Travel + Leisure Co.(b),(m) |
| Term Loan |
1-month Term SOFR + 4.000%
Floor 0.500%
12/14/2029 | 9.354% | | 737,531 | 737,531 |
| Total | 5,742,105 |
| Media and Entertainment 0.6% |
| AppLovin Corp.(b),(m) |
| Term Loan |
3-month Term SOFR + 3.100%
Floor 0.500%
10/25/2028 | 8.431% | | 1,600,215 | 1,596,214 |
| Cengage Learning, Inc.(b),(m) |
| Tranche B 1st Lien Term Loan |
3-month USD LIBOR + 4.750%
Floor 1.000%
07/14/2026 | 10.323% | | 1,948,269 | 1,941,178 |
| Senior Loans (continued) |
| Borrower | Coupon
Rate | | Principal
Amount ($) | Value ($) |
| Clear Channel Outdoor Holdings, Inc.(b),(m) |
| Tranche B Term Loan |
3-month USD LIBOR + 3.500%
08/21/2026 | 9.144% | | 94,915 | 92,661 |
| CMG Media Corp.(b),(m) |
| Tranche B 1st Lien Term Loan |
3-month USD LIBOR + 3.500%
12/17/2026 | 8.842% | | 1,068,690 | 990,547 |
| Creative Artists Agency LLC(b),(m) |
| Tranche B Term Loan |
1-month Term SOFR + 3.500%
11/27/2028 | 8.831% | | 1,963,851 | 1,961,396 |
| Cumulus Media New Holdings, Inc.(b),(m) |
| Term Loan |
3-month USD LIBOR + 3.750%
Floor 1.000%
03/31/2026 | 9.434% | | 1,418,469 | 1,122,960 |
| Diamond Sports Group LLC(m),(n) |
| 2nd Lien Term Loan |
| 08/24/2026 | 0.000% | | 1,693,519 | 40,831 |
| Dotdash Meredith, Inc.(b),(m) |
| Tranche B Term Loan |
1-month Term SOFR + 4.000%
Floor 0.500%
12/01/2028 | 9.418% | | 1,869,139 | 1,796,709 |
| E.W. Scripps Co. (The)(b),(m) |
| Tranche B2 Term Loan |
1-month USD LIBOR + 2.563%
05/01/2026 | 8.008% | | 2,913,030 | 2,883,900 |
| Emerald X, Inc.(b),(m) |
| Term Loan |
1-month Term SOFR + 5.000%
05/22/2026 | 7.814% | | 1,311,178 | 1,309,867 |
| Gray Television, Inc.(b),(m) |
| Tranche E Term Loan |
1-month Term SOFR + 2.500%
01/02/2026 | 7.933% | | 1,701,415 | 1,690,067 |
| iHeartCommunications, Inc.(b),(m) |
| Term Loan |
1-month USD LIBOR + 3.000%
05/01/2026 | 8.446% | | 1,108,872 | 987,073 |
| Lions Gate Capital Holdings LLC(b),(m) |
| Tranche B Term Loan |
3-month USD LIBOR + 2.250%
03/24/2025 | 7.681% | | 1,462,956 | 1,458,845 |
| Nexstar Media, Inc.(b),(m) |
| Tranche B4 Term Loan |
3-month USD LIBOR + 2.500%
09/18/2026 | 7.946% | | 1,099,833 | 1,101,307 |
The accompanying Notes to Financial Statements are an integral part of this statement.
Columbia Strategic Income Fund | Annual Report 2023
| 37 |
Portfolio of Investments (continued)
August 31, 2023
| Senior Loans (continued) |
| Borrower | Coupon
Rate | | Principal
Amount ($) | Value ($) |
| Nielsen Consumer, Inc.(b),(c),(m) |
| Term Loan |
1-month USD LIBOR + 3.750%
03/06/2028 | 9.081% | | 1,975,875 | 1,886,960 |
| Playtika Holding Corp.(b),(m) |
| Tranche B1 Term Loan |
1-month USD LIBOR + 2.750%
03/13/2028 | 8.196% | | 2,593,155 | 2,589,188 |
| Pug LLC(b),(m) |
| Tranche B Term Loan |
1-month USD LIBOR + 3.500%
02/12/2027 | 8.946% | | 1,106,891 | 1,048,779 |
| Sinclair Television Group, Inc.(b),(m) |
| Tranche B3 Term Loan |
1-month USD LIBOR + 3.000%
04/01/2028 | 8.446% | | 1,227,904 | 921,370 |
| Univision Communications, Inc.(b),(m) |
| 1st Lien Term Loan |
1-month USD LIBOR + 3.250%
Floor 0.750%
03/15/2026 | 8.696% | | 980,000 | 980,000 |
1-month USD LIBOR + 3.250%
Floor 0.750%
01/31/2029 | 8.696% | | 1,234,375 | 1,217,402 |
1-month Term SOFR + 4.250%
Floor 0.500%
06/24/2029 | 9.492% | | 198,000 | 197,071 |
| Total | 27,814,325 |
| Midstream 0.2% |
| AL GCX Holdings LLC(b),(m) |
| Term Loan |
3-month Term SOFR + 3.750%
Floor 0.500%
05/17/2029 | 8.931% | | 1,115,852 | 1,115,852 |
| CQP Holdco LP(b),(m) |
| Term Loan |
1-month USD LIBOR + 3.500%
Floor 0.500%
06/05/2028 | 8.931% | | 1,364,595 | 1,365,836 |
| GIP III Stetson I LP(b),(m) |
| Term Loan |
3-month USD LIBOR + 4.250%
07/18/2025 | 9.681% | | 1,298,025 | 1,297,752 |
| ITT Holdings LLC(b),(m) |
| Term Loan |
1-month Term SOFR + 2.750%
Floor 0.500%
07/10/2028 | 8.196% | | 1,538,991 | 1,535,790 |
| Senior Loans (continued) |
| Borrower | Coupon
Rate | | Principal
Amount ($) | Value ($) |
| Oryx Midstream Services Permian Basin LLC(b),(m) |
| Term Loan |
1-month Term SOFR + 3.250%
Floor 0.500%
10/05/2028 | 8.682% | | 1,116,291 | 1,115,209 |
| Traverse Midstream Partners LLC(b),(m) |
| Term Loan |
3-month Term SOFR + 3.750%
02/16/2028 | 9.216% | | 1,674,101 | 1,671,171 |
| Total | 8,101,610 |
| Oil Field Services 0.0% |
| ChampionX Corp.(b),(m) |
| Tranche B1 Term Loan |
1-month Term SOFR + 3.250%
Floor 0.500%
06/07/2029 | 8.666% | | 1,000,000 | 1,001,560 |
| Lealand Finance Co. BV(b),(c),(m) |
| Term Loan |
1-month USD LIBOR + 3.000%
06/28/2024 | 8.446% | | 8,649 | 6,054 |
| Lealand Finance Co. BV(b),(g),(m) |
| Term Loan |
3-month USD LIBOR + 1.000%
06/30/2025 | 6.446% | | 117,956 | 60,158 |
| MRC Global, Inc.(b),(m) |
| Term Loan |
3-month USD LIBOR + 3.000%
09/20/2024 | 8.446% | | 1,022,677 | 996,261 |
| Total | 2,064,033 |
| Other Financial Institutions 0.1% |
| 19th Holdings Golf LLC(b),(m) |
| Term Loan |
1-month Term SOFR + 3.250%
Floor 0.500%
02/07/2029 | 8.666% | | 750,000 | 733,125 |
| FinCo I LLC(b),(m) |
| Term Loan |
1-month Term SOFR + 3.000%
06/27/2029 | 8.369% | | 943,475 | 943,079 |
| Freeport LNG Investments LLP(b),(m) |
| Tranche B Term Loan |
1-month USD LIBOR + 3.500%
Floor 0.500%
12/21/2028 | 9.088% | | 1,460,071 | 1,445,295 |
| IGT Holding IV AB(b),(m) |
| Tranche B2 Term Loan |
3-month USD LIBOR + 3.400%
Floor 0.500%
03/31/2028 | 8.712% | | 1,819,730 | 1,807,592 |
The accompanying Notes to Financial Statements are an integral part of this statement.
| 38 | Columbia Strategic Income Fund | Annual Report 2023 |
Portfolio of Investments (continued)
August 31, 2023
| Senior Loans (continued) |
| Borrower | Coupon
Rate | | Principal
Amount ($) | Value ($) |
| Trans Union LLC(b),(m) |
| Tranche B6 Term Loan |
1-month USD LIBOR + 2.250%
Floor 0.500%
12/01/2028 | 7.696% | | 1,102,302 | 1,101,233 |
| Total | 6,030,324 |
| Other Industry 0.1% |
| APi Group, Inc.(b),(m) |
| Term Loan |
1-month USD LIBOR + 2.500%
10/01/2026 | 7.946% | | 1,083,625 | 1,085,175 |
| Hillman Group, Inc. (The)(b),(m) |
| Term Loan |
1-month USD LIBOR + 2.750%
Floor 0.500%
07/14/2028 | 8.196% | | 1,595,163 | 1,593,505 |
| Vericast Corp.(b),(m) |
| Term Loan |
1-month Term SOFR + 7.750%
Floor 1.000%
06/16/2026 | 13.253% | | 461,257 | 418,590 |
| WireCo WorldGroup, Inc.(b),(m) |
| Term Loan |
1-month USD LIBOR + 4.250%
Floor 0.500%
11/13/2028 | 9.678% | | 1,173,394 | 1,168,501 |
| Total | 4,265,771 |
| Packaging 0.2% |
| Charter Next Generation, Inc.(b),(m) |
| 1st Lien Term Loan |
1-month Term SOFR + 3.750%
Floor 0.750%
12/01/2027 | 9.196% | | 2,500,189 | 2,481,038 |
| Clydesdale Acquisition Holdings, Inc.(b),(m) |
| Tranche B 1st Lien Term Loan |
1-month Term SOFR + 4.175%
Floor 0.500%
04/13/2029 | 9.606% | | 1,500,000 | 1,488,750 |
| Graham Packaging Co., Inc.(b),(m),(o) |
| Term Loan |
1-month USD LIBOR + 3.000%
Floor 0.750%
08/04/2027 | 8.446% | | 2,132,635 | 2,126,514 |
| Mauser Packaging Solutions Holding Co.(b),(m) |
| Term Loan |
1-month Term SOFR + 4.000%
08/14/2026 | 9.318% | | 500,000 | 500,140 |
| Senior Loans (continued) |
| Borrower | Coupon
Rate | | Principal
Amount ($) | Value ($) |
| Pactiv Evergreen, Inc.(b),(m) |
| Tranche B3 Term Loan |
1-month USD LIBOR + 3.250%
Floor 0.500%
09/24/2028 | 8.696% | | 1,150,016 | 1,149,246 |
| Tosca Services LLC(b),(m) |
| Term Loan |
1-month Term SOFR + 3.500%
Floor 0.750%
08/18/2027 | 9.131% | | 975,000 | 770,981 |
| Total | 8,516,669 |
| Pharmaceuticals 0.1% |
| Elanco Animal Health, Inc.(b),(m) |
| Term Loan |
1-month USD LIBOR + 1.750%
08/01/2027 | 7.168% | | 1,134,458 | 1,122,762 |
| Jazz Pharmaceuticals PLC(b),(m) |
| Term Loan |
1-month USD LIBOR + 3.500%
Floor 0.500%
05/05/2028 | 8.946% | | 2,424,792 | 2,424,792 |
| Organon & Co.(b),(m) |
| Term Loan |
1-month USD LIBOR + 3.000%
Floor 0.500%
06/02/2028 | 8.431% | | 1,439,164 | 1,440,517 |
| Sunshine Luxembourg VII SARL(b),(m) |
| Tranche B3 Term Loan |
1-month USD LIBOR + 3.750%
Floor 0.750%
10/01/2026 | 9.092% | | 2,108,695 | 2,109,875 |
| Total | 7,097,946 |
| Property & Casualty 0.2% |
| Asurion LLC(b),(m) |
| Tranche B4 2nd Lien Term Loan |
1-month USD LIBOR + 5.250%
01/20/2029 | 10.696% | | 1,644,019 | 1,437,152 |
| Tranche B8 Term Loan |
1-month USD LIBOR + 3.250%
12/23/2026 | 8.788% | | 821,593 | 797,972 |
| Hub International Ltd.(b),(m) |
| Term Loan |
1-month Term SOFR + 4.250%
Floor 0.750%
06/20/2030 | 9.584% | | 2,522,154 | 2,528,988 |
| Sedgwick Claims Management Services, Inc.(b),(m) |
| Term Loan |
1-month Term SOFR + 3.750%
02/24/2028 | 9.081% | | 2,203,791 | 2,205,753 |
The accompanying Notes to Financial Statements are an integral part of this statement.
Columbia Strategic Income Fund | Annual Report 2023
| 39 |
Portfolio of Investments (continued)
August 31, 2023
| Senior Loans (continued) |
| Borrower | Coupon
Rate | | Principal
Amount ($) | Value ($) |
| USI, Inc.(b),(m) |
| Term Loan |
3-month USD LIBOR + 3.250%
12/02/2026 | 8.788% | | 972,333 | 972,333 |
1-month Term SOFR + 3.750%
Floor 0.500%
11/22/2029 | 8.992% | | 1,690,397 | 1,690,820 |
| Total | 9,633,018 |
| Restaurants 0.2% |
| 1011778 BC ULC(b),(m) |
| Tranche B4 Term Loan |
1-month USD LIBOR + 1.750%
11/19/2026 | 7.196% | | 2,581,293 | 2,563,379 |
| Carrols Restaurant Group, Inc.(b),(m) |
| Term Loan |
1-month Term SOFR + 3.250%
04/30/2026 | 8.681% | | 1,081,713 | 1,043,517 |
| Dave & Buster’s, Inc.(b),(m),(o) |
| Tranche B Term Loan |
1-month Term SOFR + 3.750%
Floor 0.500%
06/29/2029 | 9.188% | | 1,897,325 | 1,896,851 |
| IRB Holding Corp.(b),(m) |
| Tranche B Term Loan |
1-month Term SOFR + 3.000%
Floor 0.750%
12/15/2027 | 8.366% | | 1,162,777 | 1,155,626 |
| Whatabrands LLC(b),(m) |
| Tranche B Term Loan |
1-month USD LIBOR + 3.250%
Floor 0.500%
08/03/2028 | 8.696% | | 2,175,108 | 2,172,672 |
| Total | 8,832,045 |
| Retailers 0.1% |
| Great Outdoors Group LLC(b),(m) |
| Tranche B2 Term Loan |
1-month USD LIBOR + 3.750%
Floor 0.750%
03/06/2028 | 9.196% | | 3,050,716 | 3,038,330 |
| Harbor Freight Tools USA, Inc.(b),(m) |
| Term Loan |
1-month USD LIBOR + 2.750%
Floor 0.500%
10/19/2027 | 8.196% | | 1,429,210 | 1,421,293 |
| PetSmart LLC(b),(m) |
| Term Loan |
1-month Term SOFR + 3.750%
Floor 0.750%
02/11/2028 | 9.181% | | 1,935,139 | 1,929,101 |
| Senior Loans (continued) |
| Borrower | Coupon
Rate | | Principal
Amount ($) | Value ($) |
| Restoration Hardware, Inc.(b),(m) |
| Term Loan |
1-month Term SOFR + 3.250%
Floor 0.500%
10/20/2028 | 8.681% | | 994,988 | 966,382 |
| Total | 7,355,106 |
| Technology 1.9% |
| Adeia, Inc.(b),(m) |
| Tranche B Term Loan |
1-month USD LIBOR + 3.500%
06/08/2028 | 8.946% | | 2,717,822 | 2,716,137 |
| Ascend Learning LLC(b),(m) |
| 1st Lien Term Loan |
1-month Term SOFR + 3.500%
Floor 0.500%
12/11/2028 | 8.931% | | 1,888,426 | 1,813,569 |
| 2nd Lien Term Loan |
1-month Term SOFR + 5.750%
Floor 0.500%
12/10/2029 | 11.181% | | 1,753,172 | 1,495,315 |
| athenahealth Group, Inc.(b),(m) |
| Term Loan |
1-month Term SOFR + 3.500%
Floor 0.500%
02/15/2029 | 8.820% | | 1,884,552 | 1,860,204 |
| Atlas CC Acquisition Corp.(b),(m) |
| Tranche B 1st Lien Term Loan |
3-month Term SOFR + 4.250%
Floor 0.750%
05/25/2028 | 9.934% | | 1,702,916 | 1,559,020 |
| Tranche C 1st Lien Term Loan |
3-month Term SOFR + 4.250%
Floor 0.750%
05/25/2028 | 9.934% | | 346,356 | 317,089 |
| Avaya, Inc.(b),(g),(m) |
| Term Loan |
1-month Term SOFR + 8.500%
Floor 1.000%
08/01/2028 | 13.831% | | 1,267,065 | 1,050,080 |
| Camelot U.S. Acquisition LLC(b),(m) |
| Term Loan |
1-month USD LIBOR + 3.000%
10/30/2026 | 8.446% | | 1,117,666 | 1,117,386 |
1-month USD LIBOR + 3.000%
Floor 1.000%
10/30/2026 | 8.446% | | 865,659 | 865,279 |
| Central Parent, Inc.(b),(m) |
| 1st Lien Term Loan |
1-month Term SOFR + 4.250%
Floor 0.500%
07/06/2029 | 9.492% | | 2,964,163 | 2,964,875 |
The accompanying Notes to Financial Statements are an integral part of this statement.
| 40 | Columbia Strategic Income Fund | Annual Report 2023 |
Portfolio of Investments (continued)
August 31, 2023
| Senior Loans (continued) |
| Borrower | Coupon
Rate | | Principal
Amount ($) | Value ($) |
| Cloud Software Group, Inc.(b),(m) |
| Tranche B 1st Lien Term Loan |
1-month Term SOFR + 4.500%
Floor 0.500%
03/30/2029 | 9.842% | | 1,470,385 | 1,414,142 |
| Cloudera, Inc.(b),(m) |
| 1st Lien Term Loan |
1-month USD LIBOR + 3.750%
Floor 0.500%
10/08/2028 | 9.181% | | 1,547,711 | 1,513,863 |
| Coherent Corp.(b),(m) |
| Tranche B Term Loan |
1-month USD LIBOR + 2.750%
Floor 0.500%
07/02/2029 | 8.196% | | 1,909,062 | 1,902,381 |
| CoreLogic, Inc.(b),(m) |
| 1st Lien Term Loan |
1-month USD LIBOR + 3.500%
Floor 0.500%
06/02/2028 | 8.946% | | 1,957,594 | 1,821,267 |
| Cornerstone OnDemand, Inc.(b),(m) |
| 1st Lien Term Loan |
1-month USD LIBOR + 3.750%
Floor 0.500%
10/16/2028 | 9.253% | | 991,417 | 941,430 |
| Cyxtera DC Holdings, Inc.(m),(n) |
| 1st Lien Term Loan |
| 05/01/2024 | 0.000% | | 928,759 | 555,398 |
| Cyxtera DC Holdings, Inc.(b),(m),(p) |
| Debtor In Possession Term Loan |
1-month Term SOFR + 8.500%
Floor 1.000%
12/07/2023 | 13.870% | | 305,056 | 305,184 |
| Dawn Acquisition LLC(b),(m) |
| Term Loan |
3-month USD LIBOR + 3.750%
12/31/2025 | 9.253% | | 2,774,824 | 2,284,596 |
| DCert Buyer, Inc.(b),(m) |
| 1st Lien Term Loan |
6-month Term SOFR + 4.000%
10/16/2026 | 9.331% | | 2,556,173 | 2,544,951 |
| Dun & Bradstreet Corp. (The)(b),(m) |
| Term Loan |
1-month USD LIBOR + 2.750%
02/06/2026 | 8.170% | | 1,929,189 | 1,928,649 |
| Tranche B2 Term Loan |
1-month Term SOFR + 3.000%
01/18/2029 | 8.320% | | 489,972 | 489,237 |
| Senior Loans (continued) |
| Borrower | Coupon
Rate | | Principal
Amount ($) | Value ($) |
| Endurance International Group Holdings, Inc.(b),(m) |
| Term Loan |
1-month USD LIBOR + 3.500%
Floor 0.750%
02/10/2028 | 8.792% | | 2,102,162 | 2,002,309 |
| Entegris, Inc.(b),(m) |
| Tranche B Term Loan |
1-month Term SOFR + 2.750%
07/06/2029 | 7.990% | | 1,532,175 | 1,534,090 |
| Everi Holdings, Inc.(b),(m) |
| Tranche B Term Loan |
1-month USD LIBOR + 2.500%
08/03/2028 | 7.946% | | 1,845,620 | 1,841,301 |
| Gen Digital, Inc.(b),(m) |
| Tranche B Term Loan |
1-month Term SOFR + 2.000%
Floor 0.500%
09/12/2029 | 7.431% | | 2,644,861 | 2,639,571 |
| GoTo Group, Inc.(b),(m) |
| 1st Lien Term Loan |
1-month USD LIBOR + 4.750%
08/31/2027 | 10.269% | | 2,432,508 | 1,559,091 |
| Helios Software Holdings, Inc./ION Corporate Solutions Finance SARL(b),(m),(o) |
| Term Loan |
1-month Term SOFR + 4.250%
07/18/2030 | 9.660% | | 1,625,172 | 1,608,417 |
| Idemia Group SAS(b),(m) |
| Tranche B4 Term Loan |
1-month Term SOFR + 4.750%
Floor 0.750%
09/30/2028 | 10.149% | | 1,758,505 | 1,757,415 |
| Idera, Inc.(b),(m),(o) |
| Tranche B1 1st Lien Term Loan |
3-month USD LIBOR + 3.750%
Floor 0.750%
03/02/2028 | 9.272% | | 1,709,086 | 1,688,149 |
| Informatica LLC(b),(m) |
| Term Loan |
1-month USD LIBOR + 2.750%
10/27/2028 | 8.196% | | 2,246,583 | 2,239,574 |
| Ingram Micro, Inc.(b),(m) |
| Term Loan |
1-month USD LIBOR + 3.500%
Floor 0.500%
06/30/2028 | 9.038% | | 1,311,813 | 1,308,940 |
| ION Trading Finance Ltd.(b),(m) |
| Term Loan |
1-month USD LIBOR + 4.750%
04/01/2028 | 10.092% | | 1,268,029 | 1,240,551 |
| Loyalty Ventures, Inc.(c),(m),(n) |
| Tranche B Term Loan |
| 11/03/2027 | 0.000% | | 1,604,304 | 16,043 |
The accompanying Notes to Financial Statements are an integral part of this statement.
Columbia Strategic Income Fund | Annual Report 2023
| 41 |
Portfolio of Investments (continued)
August 31, 2023
| Senior Loans (continued) |
| Borrower | Coupon
Rate | | Principal
Amount ($) | Value ($) |
| Lummus Technology Holdings V LLC(b),(m) |
| Tranche B Term Loan |
1-month USD LIBOR + 3.500%
Floor 1.000%
06/30/2027 | 8.946% | | 1,857,199 | 1,846,297 |
| McAfee Corp.(b),(m) |
| Tranche B1 Term Loan |
1-month Term SOFR + 3.750%
Floor 0.500%
03/01/2029 | 9.168% | | 2,778,807 | 2,723,231 |
| Mitchell International, Inc.(b),(m) |
| 1st Lien Term Loan |
1-month USD LIBOR + 3.750%
Floor 0.500%
10/15/2028 | 9.196% | | 1,141,645 | 1,123,093 |
| Mitnick Corporate Purchaser, Inc.(b),(m) |
| Term Loan |
1-month Term SOFR + 4.500%
Floor 0.500%
05/02/2029 | 9.969% | | 786,141 | 752,077 |
| MKS Instruments, Inc.(b),(m) |
| Tranche B Term Loan |
1-month Term SOFR + 2.750%
Floor 0.500%
08/17/2029 | 8.179% | | 1,169,957 | 1,168,249 |
| Monotype Imaging Holdings, Inc.(b),(c),(m) |
| 1st Lien Term Loan |
3-month USD LIBOR + 5.000%
Floor 0.750%
10/09/2026 | 10.342% | | 1,418,484 | 1,418,484 |
| Natel Engineering Co., Inc.(b),(m) |
| Term Loan |
3-month USD LIBOR + 6.250%
Floor 1.000%
04/30/2026 | 11.679% | | 2,447,311 | 1,872,193 |
| NCR Corp.(b),(m) |
| Term Loan |
3-month USD LIBOR + 2.500%
08/28/2026 | 7.946% | | 1,444,171 | 1,439,666 |
| Neptune BidCo US, Inc.(b),(m) |
| Tranche A 1st Lien Term Loan |
1-month Term SOFR + 4.750%
10/11/2028 | 10.148% | | 936,600 | 842,359 |
| Nielsen Consumer, Inc.(b),(m) |
| Term Loan |
1-month Term SOFR + 6.250%
Floor 0.500%
03/06/2028 | 11.581% | | 307,628 | 299,938 |
| Open Text Corp.(b),(m),(o) |
| Term Loan |
1-month Term SOFR + 2.750%
01/31/2030 | 8.181% | | 2,376,573 | 2,377,903 |
| Senior Loans (continued) |
| Borrower | Coupon
Rate | | Principal
Amount ($) | Value ($) |
| Peraton Corp.(b),(m) |
| Tranche B 1st Lien Term Loan |
1-month USD LIBOR + 3.750%
Floor 0.750%
02/01/2028 | 9.181% | | 1,592,044 | 1,574,882 |
| Tranche B1 2nd Lien Term Loan |
1-month USD LIBOR + 7.750%
Floor 0.750%
02/01/2029 | 13.233% | | 1,000,000 | 978,330 |
| Presidio Holdings, Inc.(b),(m) |
| Term Loan |
1-month Term SOFR + 3.500%
01/22/2027 | 8.968% | | 2,452,979 | 2,449,913 |
| Proofpoint, Inc.(b),(m) |
| 1st Lien Term Loan |
1-month USD LIBOR + 3.250%
Floor 0.500%
08/31/2028 | 8.696% | | 1,970,000 | 1,948,763 |
| Rackspace Technology Global, Inc.(b),(m) |
| Tranche B 1st Lien Term Loan |
3-month USD LIBOR + 2.750%
Floor 0.750%
02/15/2028 | 8.177% | | 1,212,001 | 537,826 |
| Riverbed Technology LLC(b),(m) |
| Term Loan |
1-month Term SOFR + 4.500%
07/01/2028 | 9.747% | | 669,954 | 397,785 |
| Sabre GLBL, Inc.(b),(m) |
| Tranche B Term Loan |
1-month Term SOFR + 4.250%
Floor 0.500%
06/30/2028 | 9.681% | | 209,158 | 182,595 |
| Tranche B1 Term Loan |
1-month USD LIBOR + 3.500%
Floor 0.500%
12/17/2027 | 8.946% | | 624,947 | 547,142 |
| Tranche B2 Term Loan |
1-month USD LIBOR + 3.500%
Floor 0.500%
12/17/2027 | 8.946% | | 974,056 | 852,786 |
| Sitel Group(b),(m) |
| Term Loan |
1-month USD LIBOR + 3.750%
Floor 0.500%
08/28/2028 | 9.081% | | 171,680 | 169,448 |
| Sophia LP(b),(m) |
| Tranche B 1st Lien Term Loan |
1-month USD LIBOR + 3.500%
Floor 0.500%
10/07/2027 | 9.038% | | 2,145,289 | 2,140,376 |
The accompanying Notes to Financial Statements are an integral part of this statement.
| 42 | Columbia Strategic Income Fund | Annual Report 2023 |
Portfolio of Investments (continued)
August 31, 2023
| Senior Loans (continued) |
| Borrower | Coupon
Rate | | Principal
Amount ($) | Value ($) |
| Sovos Compliance LLC(b),(m) |
| 1st Lien Term Loan |
1-month USD LIBOR + 4.500%
Floor 0.500%
08/11/2028 | 9.946% | | 2,780,699 | 2,703,368 |
| SS&C Technologies Holdings, Inc.(b),(m) |
| Tranche B3 Term Loan |
1-month USD LIBOR + 1.750%
04/16/2025 | 7.196% | | 149,021 | 149,006 |
| Tranche B4 Term Loan |
1-month USD LIBOR + 1.750%
04/16/2025 | 7.196% | | 140,717 | 140,703 |
| Tranche B5 Term Loan |
3-month USD LIBOR + 1.750%
04/16/2025 | 7.196% | | 1,277,301 | 1,276,764 |
| Tempo Acquisition LLC(b),(m) |
| Tranche B1 Term Loan |
1-month Term SOFR + 3.000%
Floor 0.500%
08/31/2028 | 8.331% | | 2,610,308 | 2,613,570 |
| UKG, Inc.(b),(m) |
| 1st Lien Term Loan |
3-month Term SOFR + 3.250%
Floor 0.500%
05/04/2026 | 8.618% | | 957,925 | 956,823 |
3-month USD LIBOR + 3.750%
05/04/2026 | 9.219% | | 1,176,943 | 1,176,449 |
| 2nd Lien Term Loan |
3-month Term SOFR + 5.250%
Floor 0.500%
05/03/2027 | 10.618% | | 1,147,411 | 1,139,425 |
| Veritas US, Inc.(b),(m) |
| Tranche B Term Loan |
3-month USD LIBOR + 5.000%
Floor 1.000%
09/01/2025 | 10.446% | | 1,294,013 | 1,088,226 |
| Verscend Holdings Corp.(b),(m) |
| Tranche B1 Term Loan |
1-month USD LIBOR + 4.000%
08/27/2025 | 9.446% | | 2,454,889 | 2,451,821 |
| Virtusa Corp.(b),(m) |
| Tranche B1 Term Loan |
1-month Term SOFR + 3.750%
Floor 0.750%
02/15/2029 | 9.181% | | 1,700,042 | 1,681,443 |
| Total | 93,916,437 |
| Transportation Services 0.1% |
| Dynasty Acquisition Co.(b),(m),(o) |
| Tranche B1 Term Loan |
1-month Term SOFR + 4.000%
08/24/2028 | 9.315% | | 873,458 | 871,501 |
| Senior Loans (continued) |
| Borrower | Coupon
Rate | | Principal
Amount ($) | Value ($) |
| Tranche B2 Term Loan |
1-month Term SOFR + 4.000%
08/24/2028 | 9.315% | | 374,339 | 373,501 |
| First Student Bidco, Inc.(b),(m) |
| Tranche B Term Loan |
1-month USD LIBOR + 3.000%
Floor 0.500%
07/21/2028 | 8.501% | | 898,303 | 874,022 |
1-month Term SOFR + 4.000%
Floor 0.500%
07/21/2028 | 9.342% | | 753,736 | 742,158 |
| Tranche C Term Loan |
1-month USD LIBOR + 3.000%
Floor 0.500%
07/21/2028 | 8.501% | | 336,710 | 327,609 |
1-month Term SOFR + 4.000%
Floor 0.500%
07/21/2028 | 9.342% | | 52,608 | 51,800 |
| Total | 3,240,591 |
| Wireless 0.1% |
| Altice France SA(b),(m) |
| Tranche B14 Term Loan |
1-month Term SOFR + 5.500%
08/15/2028 | 10.808% | | 1,899,003 | 1,658,076 |
| Crown Subsea Communications Holding, Inc.(b),(m) |
| Term Loan |
1-month Term SOFR + 5.000%
Floor 0.750%
04/27/2027 | 10.433% | | 1,000,000 | 1,000,940 |
| SBA Senior Finance II LLC(b),(m) |
| Term Loan |
3-month USD LIBOR + 1.750%
04/11/2025 | 7.190% | | 1,408,351 | 1,408,436 |
| Total | 4,067,452 |
Total Senior Loans
(Cost $403,460,355) | 390,807,094 |
|
| U.S. Government & Agency Obligations 0.1% |
| Issuer | Coupon
Rate | | Principal
Amount ($) | Value ($) |
| Federal Farm Credit Banks Funding Corp. |
| 10/20/2026 | 1.140% | | 2,000,000 | 1,780,068 |
| 11/30/2026 | 1.540% | | 2,500,000 | 2,250,363 |
Total U.S. Government & Agency Obligations
(Cost $4,500,000) | 4,030,431 |
| Call Option Contracts Purchased 0.0% |
| | | | | Value ($) |
| (Cost $7,452,160) | 760,283 |
The accompanying Notes to Financial Statements are an integral part of this statement.
Columbia Strategic Income Fund | Annual Report 2023
| 43 |
Portfolio of Investments (continued)
August 31, 2023
| Money Market Funds 5.7% |
| | Shares | Value ($) |
| Columbia Short-Term Cash Fund, 5.476%(q),(r) | 284,861,183 | 284,775,725 |
Total Money Market Funds
(Cost $284,700,197) | 284,775,725 |
Total Investments in Securities
(Cost: $6,470,608,580) | 6,105,735,902 |
| Other Assets & Liabilities, Net | | (1,091,850,327) |
| Net Assets | 5,013,885,575 |
At August 31, 2023, securities and/or cash totaling $40,240,294 were pledged as collateral.
Investments in derivatives
| Forward foreign currency exchange contracts |
Currency to
be sold | Currency to
be purchased | Counterparty | Settlement
date | Unrealized
appreciation ($) | Unrealized
depreciation ($) |
| 23,722,000 EUR | 25,994,331 USD | Citi | 09/22/2023 | 250,275 | — |
| 199,300,000 ZAR | 10,380,208 USD | HSBC | 09/22/2023 | — | (157,409) |
| Total | | | | 250,275 | (157,409) |
| Long futures contracts |
| Description | Number of
contracts | Expiration
date | Trading
currency | Notional
amount | Value/Unrealized
appreciation ($) | Value/Unrealized
depreciation ($) |
| 3-Month SOFR | 6,350 | 03/2024 | USD | 1,501,775,000 | 97,965 | — |
| U.S. Treasury 5-Year Note | 9,572 | 12/2023 | USD | 1,023,456,188 | 5,995,892 | — |
| Total | | | | | 6,093,857 | — |
| Short futures contracts |
| Description | Number of
contracts | Expiration
date | Trading
currency | Notional
amount | Value/Unrealized
appreciation ($) | Value/Unrealized
depreciation ($) |
| 3-Month SOFR | (6,350) | 03/2025 | USD | (1,521,301,250) | — | (1,673,772) |
| U.S. Long Bond | (1,312) | 12/2023 | USD | (159,654,000) | — | (2,278,487) |
| U.S. Treasury 10-Year Note | (4,795) | 12/2023 | USD | (532,394,844) | — | (3,196,021) |
| U.S. Treasury 2-Year Note | (2,455) | 12/2023 | USD | (500,340,509) | — | (897,946) |
| U.S. Treasury Ultra Bond | (1,158) | 12/2023 | USD | (149,924,813) | — | (2,010,750) |
| Total | | | | | — | (10,056,976) |
| Call option contracts purchased |
| Description | Counterparty | Trading
currency | Notional
amount | Number of
contracts | Exercise
price/Rate | Expiration
date | Cost ($) | Value ($) |
| 10-Year OTC interest rate swap with Citi to receive exercise rate and pay SOFR | Citi | USD | 232,880,000 | 232,880,000 | 3.30 | 11/14/2023 | 7,452,160 | 760,283 |
The accompanying Notes to Financial Statements are an integral part of this statement.
| 44 | Columbia Strategic Income Fund | Annual Report 2023 |
Portfolio of Investments (continued)
August 31, 2023
| Cleared interest rate swap contracts |
| Fund receives | Fund pays | Payment
frequency | Counterparty | Maturity
date | Notional
currency | Notional
amount | Value
($) | Upfront
payments
($) | Upfront
receipts
($) | Unrealized
appreciation
($) | Unrealized
depreciation
($) |
| Fixed rate of 6.230% | 28-Day MXN TIIE-Banxico | Receives Monthly, Pays Monthly | Morgan Stanley | 01/09/2026 | MXN | 580,000,000 | (2,624,960) | — | — | — | (2,624,960) |
| Fixed rate of 5.985% | 28-Day MXN TIIE-Banxico | Receives Monthly, Pays Monthly | Morgan Stanley | 01/21/2026 | MXN | 211,000,000 | (1,054,886) | — | — | — | (1,054,886) |
| SOFR plus 0.262% | Fixed rate of 1.781% | Receives Quarterly, Pays SemiAnnually | Morgan Stanley | 08/09/2049 | USD | 53,500,000 | 18,819,370 | — | — | 18,819,370 | — |
| Total | | | | | | | 15,139,524 | — | — | 18,819,370 | (3,679,846) |
| Credit default swap contracts - buy protection |
Reference
entity | Counterparty | Maturity
date | Pay
fixed
rate
(%) | Payment
frequency | Notional
currency | Notional
amount | Value
($) | Periodic
payments
receivable
(payable)
($) | Upfront
payments
($) | Upfront
receipts
($) | Unrealized
appreciation
($) | Unrealized
depreciation
($) |
| Markit CMBX North America Index, Series 11 BBB- | Citi | 11/18/2054 | 3.000 | Monthly | USD | 13,000,000 | 2,597,881 | (7,583) | 3,261,842 | — | — | (671,544) |
| Markit CMBX North America Index, Series 12 BBB- | Citi | 08/17/2061 | 3.000 | Monthly | USD | 11,100,000 | 2,968,183 | (6,475) | 3,014,096 | — | — | (52,388) |
| Markit CMBX North America Index, Series 11 BBB- | Goldman Sachs International | 11/18/2054 | 3.000 | Monthly | USD | 4,400,000 | 879,284 | (2,567) | 662,124 | — | 214,593 | — |
| Markit CMBX North America Index, Series 11 BBB- | JPMorgan | 11/18/2054 | 3.000 | Monthly | USD | 4,400,000 | 879,283 | (2,567) | 146,387 | — | 730,329 | — |
| Markit CMBX North America Index, Series 16 BBB- | Morgan Stanley | 04/17/2065 | 3.000 | Monthly | USD | 11,150,000 | 2,687,472 | (6,504) | 2,588,757 | — | 92,211 | — |
| Total | | | | | | | 10,012,103 | (25,696) | 9,673,206 | — | 1,037,133 | (723,932) |
| Cleared credit default swap contracts - buy protection |
Reference
entity | Counterparty | Maturity
date | Pay
fixed
rate
(%) | Payment
frequency | Notional
currency | Notional
amount | Value
($) | Upfront
payments
($) | Upfront
receipts
($) | Unrealized
appreciation
($) | Unrealized
depreciation
($) |
| Markit CDX North America High Yield Index, Series 40 | Morgan Stanley | 06/20/2028 | 5.000 | Quarterly | USD | 73,184,000 | (2,764,207) | — | — | — | (2,764,207) |
| Credit default swap contracts - sell protection |
Reference
entity | Counterparty | Maturity
date | Receive
fixed
rate
(%) | Payment
frequency | Implied
credit
spread
(%)* | Notional
currency | Notional
amount | Value
($) | Periodic
payments
receivable
(payable)
($) | Upfront
payments
($) | Upfront
receipts
($) | Unrealized
appreciation
($) | Unrealized
depreciation
($) |
| Markit CMBX North America Index, Series 10 BBB- | Citi | 11/17/2059 | 3.000 | Monthly | 14.554 | USD | 11,500,000 | (3,103,087) | 6,708 | — | (2,463,634) | — | (632,745) |
| Markit CMBX North America Index, Series 10 BBB- | Citi | 11/17/2059 | 3.000 | Monthly | 14.554 | USD | 18,000,000 | (4,857,006) | 10,500 | — | (2,115,722) | — | (2,730,784) |
| Markit CMBX North America Index, Series 10 BBB- | JPMorgan | 11/17/2059 | 3.000 | Monthly | 14.554 | USD | 9,500,000 | (2,563,420) | 5,541 | — | (2,015,447) | — | (542,432) |
| Markit CMBX North America Index, Series 10 BBB- | JPMorgan | 11/17/2059 | 3.000 | Monthly | 14.554 | USD | 9,500,000 | (2,563,420) | 5,542 | — | (1,561,233) | — | (996,645) |
The accompanying Notes to Financial Statements are an integral part of this statement.
Columbia Strategic Income Fund | Annual Report 2023
| 45 |
Portfolio of Investments (continued)
August 31, 2023
| Credit default swap contracts - sell protection (continued) |
Reference
entity | Counterparty | Maturity
date | Receive
fixed
rate
(%) | Payment
frequency | Implied
credit
spread
(%)* | Notional
currency | Notional
amount | Value
($) | Periodic
payments
receivable
(payable)
($) | Upfront
payments
($) | Upfront
receipts
($) | Unrealized
appreciation
($) | Unrealized
depreciation
($) |
| Markit CMBX North America Index, Series 10 BBB- | JPMorgan | 11/17/2059 | 3.000 | Monthly | 14.554 | USD | 10,000,000 | (2,698,337) | 5,833 | — | (1,582,498) | — | (1,110,006) |
| Markit CMBX North America Index, Series 10 BBB- | Morgan Stanley | 11/17/2059 | 3.000 | Monthly | 14.554 | USD | 8,000,000 | (2,158,669) | 4,666 | — | (1,536,034) | — | (617,969) |
| Markit CMBX North America Index, Series 8 BBB- | Morgan Stanley | 10/17/2057 | 3.000 | Monthly | 23.645 | USD | 5,000,000 | (949,364) | 2,916 | — | (1,008,888) | 62,440 | — |
| Total | | | | | | | | (18,893,303) | 41,706 | — | (12,283,456) | 62,440 | (6,630,581) |
* Implied credit spreads, represented in absolute terms, utilized in determining the market value of credit default swap agreements on corporate or sovereign issues as of period end serve as an indicator of the current status of the payment/performance risk and represent the likelihood or risk of default for the credit derivative. The implied credit spread of a particular referenced entity reflects the cost of buying/selling protection and may include upfront payments required to be made to enter into the agreement. Wider credit spreads represent a deterioration of the referenced entity’s credit soundness and a greater likelihood or risk of default or other credit event occurring as defined under the terms of the agreement.
| Reference index and values for swap contracts as of period end |
| Reference index | | Reference rate |
| 28-Day MXN TIIE-Banxico | Interbank Equilibrium Interest Rate | 11.507% |
| SOFR | Secured Overnight Financing Rate | 5.310% |
Notes to Portfolio of Investments
| (a) | Represents privately placed and other securities and instruments exempt from Securities and Exchange Commission registration (collectively, private placements), such as Section 4(a)(2) and Rule 144A eligible securities, which are often sold only to qualified institutional buyers. At August 31, 2023, the total value of these securities amounted to $2,499,531,717, which represents 49.85% of total net assets. |
| (b) | Variable rate security. The interest rate shown was the current rate as of August 31, 2023. |
| (c) | Valuation based on significant unobservable inputs. |
| (d) | Variable or floating rate security, the interest rate of which adjusts periodically based on changes in current interest rates and prepayments on the underlying pool of assets. The interest rate shown was the current rate as of August 31, 2023. |
| (e) | Non-income producing investment. |
| (f) | Principal amounts are denominated in United States Dollars unless otherwise noted. |
| (g) | Payment-in-kind security. Interest can be paid by issuing additional par of the security or in cash. |
| (h) | Represents a variable rate security with a step coupon where the rate adjusts according to a schedule for a series of periods, typically lower for an initial period and then increasing to a higher coupon rate thereafter. The interest rate shown was the current rate as of August 31, 2023. |
| (i) | Principal and interest may not be guaranteed by a governmental entity. |
| (j) | Represents interest only securities which have the right to receive the monthly interest payments on an underlying pool of mortgage loans. |
| (k) | Represents a security purchased on a when-issued basis. |
| (l) | Represents fair value as determined in good faith under procedures approved by the Board of Trustees. At August 31, 2023, the total value of these securities amounted to $878,421, which represents 0.02% of total net assets. |
| (m) | The stated interest rate represents the weighted average interest rate at August 31, 2023 of contracts within the senior loan facility. Interest rates on contracts are primarily determined either weekly, monthly or quarterly by reference to the indicated base lending rate and spread and the reset period. These base lending rates are primarily the LIBOR and other short-term rates. Base lending rates may be subject to a floor or minimum rate. The interest rate for senior loans purchased on a when-issued or delayed delivery basis will be determined upon settlement, therefore no interest rate is disclosed. Senior loans often require prepayments from excess cash flows or permit the borrowers to repay at their election. The degree to which borrowers repay cannot be predicted with accuracy. As a result, remaining maturities of senior loans may be less than the stated maturities. Generally, the Fund is contractually obligated to receive approval from the agent bank and/or borrower prior to the disposition of a senior loan. |
| (n) | Represents a security in default. |
| (o) | Represents a security purchased on a forward commitment basis. |
| (p) | The borrower filed for protection under Chapter 11 of the U.S. Federal Bankruptcy Code. |
| (q) | The rate shown is the seven-day current annualized yield at August 31, 2023. |
The accompanying Notes to Financial Statements are an integral part of this statement.
| 46 | Columbia Strategic Income Fund | Annual Report 2023 |
Portfolio of Investments (continued)
August 31, 2023
Notes to Portfolio of Investments (continued)
| (r) | As defined in the Investment Company Act of 1940, as amended, an affiliated company is one in which the Fund owns 5% or more of the company’s outstanding voting securities, or a company which is under common ownership or control with the Fund. The value of the holdings and transactions in these affiliated companies during the year ended August 31, 2023 are as follows: |
| Affiliated issuers | Beginning
of period($) | Purchases($) | Sales($) | Net change in
unrealized
appreciation
(depreciation)($) | End of
period($) | Realized gain
(loss)($) | Dividends($) | End of
period shares |
| Columbia Short-Term Cash Fund, 5.476% |
| | 336,082,546 | 1,737,155,299 | (1,788,502,419) | 40,299 | 284,775,725 | (4,873) | 12,085,524 | 284,861,183 |
Abbreviation Legend
| CMO | Collateralized Mortgage Obligation |
| LIBOR | London Interbank Offered Rate |
| SOFR | Secured Overnight Financing Rate |
| STRIPS | Separate Trading of Registered Interest and Principal Securities |
| TBA | To Be Announced |
Currency Legend
| EUR | Euro |
| IDR | Indonesian Rupiah |
| INR | Indian Rupee |
| KRW | South Korean Won |
| MXN | Mexican Peso |
| USD | US Dollar |
| ZAR | South African Rand |
Fair value measurements
The Fund categorizes its fair value measurements according to a three-level hierarchy that maximizes the use of observable inputs and minimizes the use of unobservable inputs by prioritizing that the most observable input be used when available. Observable inputs are those that market participants would use in pricing an investment based on market data obtained from sources independent of the reporting entity. Unobservable inputs are those that reflect the Fund’s assumptions about the information market participants would use in pricing an investment. An investment’s level within the fair value hierarchy is based on the lowest level of any input that is deemed significant to the asset’s or liability’s fair value measurement. The input levels are not necessarily an indication of the risk or liquidity associated with investments at that level. For example, certain U.S. government securities are generally high quality and liquid, however, they are reflected as Level 2 because the inputs used to determine fair value may not always be quoted prices in an active market.
Fair value inputs are summarized in the three broad levels listed below:
| ■ | Level 1 — Valuations based on quoted prices for investments in active markets that the Fund has the ability to access at the measurement date. Valuation adjustments are not applied to Level 1 investments. |
| ■ | Level 2 — Valuations based on other significant observable inputs (including quoted prices for similar securities, interest rates, prepayment speeds, credit risks, etc.). |
| ■ | Level 3 — Valuations based on significant unobservable inputs (including the Fund’s own assumptions and judgment in determining the fair value of investments). |
Inputs that are used in determining fair value of an investment may include price information, credit data, volatility statistics, and other factors. These inputs can be either observable or unobservable. The availability of observable inputs can vary between investments, and is affected by various factors such as the type of investment, and the volume and level of activity for that investment or similar investments in the marketplace. The inputs will be considered by the Investment Manager, along with any other relevant factors in the calculation of an investment’s fair value. The Fund uses prices and inputs that are current as of the measurement date, which may include periods of market dislocations. During these periods, the availability of prices and inputs may be reduced for many investments. This condition could cause an investment to be reclassified between the various levels within the hierarchy.
Foreign equity securities actively traded in markets where there is a significant delay in the local close relative to the New York Stock Exchange are classified as Level 2. The values of these securities may include an adjustment to reflect the impact of market movements following the close of local trading, as described in Note 2 to the financial statements – Security valuation.
Investments falling into the Level 3 category are primarily supported by quoted prices from brokers and dealers participating in the market for those investments. However, these may be classified as Level 3 investments due to lack of market transparency and corroboration to support these quoted prices. Additionally, valuation models may be used as the pricing source for any remaining investments classified as Level 3. These models may rely on one or more significant unobservable inputs and/or significant assumptions by the Investment Manager. Inputs used in valuations may include, but are not limited to, financial statement analysis, capital account balances, discount rates and estimated cash flows, and comparable company data.
The accompanying Notes to Financial Statements are an integral part of this statement.
Columbia Strategic Income Fund | Annual Report 2023
| 47 |
Portfolio of Investments (continued)
August 31, 2023
Fair value measurements (continued)
The Fund’s Board of Trustees (the Board) has designated the Investment Manager, through its Valuation Committee (the Committee), as valuation designee, responsible for determining the fair value of the assets of the Fund for which market quotations are not readily available using valuation procedures approved by the Board. The Committee consists of voting and non-voting members from various groups within the Investment Manager’s organization, including operations and accounting, trading and investments, compliance, risk management and legal.
The Committee meets at least monthly to review and approve valuation matters, which may include a description of specific valuation determinations, data regarding pricing information received from approved pricing vendors and brokers and the results of Board-approved valuation policies and procedures (the Policies). The Policies address, among other things, instances when market quotations are or are not readily available, including recommendations of third party pricing vendors and a determination of appropriate pricing methodologies; events that require specific valuation determinations and assessment of fair value techniques; securities with a potential for stale pricing, including those that are illiquid, restricted, or in default; and the effectiveness of third party pricing vendors, including periodic reviews of vendors. The Committee meets more frequently, as needed, to discuss additional valuation matters, which may include the need to review back-testing results, review time-sensitive information or approve related valuation actions. Representatives of Columbia Management Investment Advisers, LLC report to the Board at each of its regularly scheduled meetings to discuss valuation matters and actions during the period, similar to those described earlier.
The following table is a summary of the inputs used to value the Fund’s investments at August 31, 2023:
| | Level 1 ($) | Level 2 ($) | Level 3 ($) | Total ($) |
| Investments in Securities | | | | |
| Asset-Backed Securities — Non-Agency | — | 298,009,515 | 12,660,753 | 310,670,268 |
| Commercial Mortgage-Backed Securities - Non-Agency | — | 141,557,653 | — | 141,557,653 |
| Common Stocks | | | | |
| Communication Services | 43,302 | — | — | 43,302 |
| Consumer Discretionary | — | 483 | — | 483 |
| Energy | — | 1,132,640 | 10,891 | 1,143,531 |
| Financials | — | 120,233 | — | 120,233 |
| Industrials | — | 164,276 | — | 164,276 |
| Information Technology | — | 648,198 | — | 648,198 |
| Total Common Stocks | 43,302 | 2,065,830 | 10,891 | 2,120,023 |
| Convertible Bonds | — | 9,214,150 | — | 9,214,150 |
| Convertible Preferred Stocks | | | | |
| Information Technology | — | — | 3,622 | 3,622 |
| Total Convertible Preferred Stocks | — | — | 3,622 | 3,622 |
| Corporate Bonds & Notes | — | 2,104,341,130 | — | 2,104,341,130 |
| Foreign Government Obligations | — | 364,572,903 | — | 364,572,903 |
| Residential Mortgage-Backed Securities - Agency | — | 1,648,750,191 | — | 1,648,750,191 |
| Residential Mortgage-Backed Securities - Non-Agency | — | 777,615,900 | 65,825,670 | 843,441,570 |
| Rights | | | | |
| Communication Services | — | 690,859 | — | 690,859 |
| Total Rights | — | 690,859 | — | 690,859 |
| Senior Loans | — | 386,507,135 | 4,299,959 | 390,807,094 |
| U.S. Government & Agency Obligations | — | 4,030,431 | — | 4,030,431 |
| Call Option Contracts Purchased | — | 760,283 | — | 760,283 |
| Money Market Funds | 284,775,725 | — | — | 284,775,725 |
| Total Investments in Securities | 284,819,027 | 5,738,115,980 | 82,800,895 | 6,105,735,902 |
| Investments in Derivatives | | | | |
| Asset | | | | |
| Forward Foreign Currency Exchange Contracts | — | 250,275 | — | 250,275 |
| Futures Contracts | 6,093,857 | — | — | 6,093,857 |
| Swap Contracts | — | 19,918,943 | — | 19,918,943 |
| Liability | | | | |
| Forward Foreign Currency Exchange Contracts | — | (157,409) | — | (157,409) |
| Futures Contracts | (10,056,976) | — | — | (10,056,976) |
| Swap Contracts | — | (13,798,566) | — | (13,798,566) |
| Total | 280,855,908 | 5,744,329,223 | 82,800,895 | 6,107,986,026 |
See the Portfolio of Investments for all investment classifications not indicated in the table.
The Fund’s assets assigned to the Level 2 input category are generally valued using the market approach, in which a security’s value is determined through reference to prices and information from market transactions for similar or identical assets. These assets include certain foreign securities for which a third party statistical pricing service may be employed for purposes of fair market valuation. The model utilized by such third party statistical pricing service takes into account a security’s correlation to available market data including, but not limited to, intraday index, ADR, and exchange-traded fund movements.
Forward foreign currency exchange contracts, futures contracts and swap contracts are valued at unrealized appreciation (depreciation).
The accompanying Notes to Financial Statements are an integral part of this statement.
| 48 | Columbia Strategic Income Fund | Annual Report 2023 |
Portfolio of Investments (continued)
August 31, 2023
Fair value measurements (continued)
The following table is a reconciliation of Level 3 assets for which significant observable and unobservable inputs were used to determine fair value:
| | Balance
as of
08/31/2022
($) | Increase
(decrease)
in accrued
discounts/
premiums
($) | Realized
gain (loss)
($) | Change
in unrealized
appreciation
(depreciation)(a)
($) | Purchases
($) | Sales
($) | Transfers
into
Level 3
($) | Transfers
out of
Level 3
($) | Balance
as of
08/31/2023
($) |
| Asset-Backed Securities — Non-Agency | 25,190,027 | 89,376 | 174 | 66,358 | 20,293,358 | (19,043,578) | — | (13,934,962) | 12,660,753 |
| Common Stocks | 20,852 | — | 33,162 | (9,529) | — | (33,162) | — | (432) | 10,891 |
| Convertible Preferred Stocks | — | — | — | (67,398) | — | — | 71,020 | — | 3,622 |
| Foreign Government Obligations | 3,409,784 | 353,080 | (7,083,470) | 7,652,936 | — | (4,332,330) | — | — | — |
| Residential Mortgage-Backed Securities - Non-Agency | 130,050,179 | — | 36 | (501,101) | — | (63,723,444) | — | — | 65,825,670 |
| Senior Loans | 9,641,379 | 8,037 | (342,069) | (899,710) | — | (4,139,137) | 5,650,318 | (5,618,859) | 4,299,959 |
| Warrants | 83,965 | — | — | 119,950 | — | (203,915) | — | — | — |
| Total | 168,396,186 | 450,493 | (7,392,167) | 6,361,506 | 20,293,358 | (91,475,566) | 5,721,338 | (19,554,253) | 82,800,895 |
(a) Change in unrealized appreciation (depreciation) relating to securities held at August 31, 2023 was $(2,285,215), which is comprised of Asset-Backed Securities — Non-Agency of $29,620, Common Stocks of $(9,529), Convertible Preferred Stocks of $(67,398), Residential Mortgage-Backed Securities — Non-Agency of $(1,099,699) and Senior Loans of $(1,138,209).
The Fund’s assets assigned to the Level 3 category are valued utilizing the valuation technique deemed the most appropriate in the circumstances.
Certain common stocks, residential mortgage backed securities, asset backed securities, convertible preferred stocks and senior loans classified as Level 3 securities are valued using the market approach. To determine fair value for these securities, management considered various factors which may have included, but were not limited to, single market quotations from broker dealers and the estimates of future distributions from the company. The appropriateness of fair values for these securities is monitored on an ongoing basis which may include results of back testing, manual price reviews and other control procedures. Significant increases (decreases) to any of these inputs would have resulted in a significantly higher (lower) fair value measurement.
Financial assets were transferred from Level 2 to Level 3 due to utilizing a single market quotation from a broker dealer. As a result, management concluded that the market input(s) were generally unobservable.
Financial assets were transferred from Level 3 to Level 2 as observable market inputs were utilized and management determined that there was sufficient, reliable, and observable market data to value these assets as of period end.
The accompanying Notes to Financial Statements are an integral part of this statement.
Columbia Strategic Income Fund | Annual Report 2023
| 49 |
Statement of Assets and Liabilities
August 31, 2023
| Assets | |
| Investments in securities, at value | |
| Unaffiliated issuers (cost $6,178,456,223) | $5,820,199,894 |
| Affiliated issuers (cost $284,700,197) | 284,775,725 |
| Option contracts purchased (cost $7,452,160) | 760,283 |
| Cash | 636,297 |
| Foreign currency (cost $834,926) | 834,852 |
| Cash collateral held at broker for: | |
| Swap contracts | 9,224,000 |
| TBA | 4,059,086 |
| Margin deposits on: | |
| Futures contracts | 16,867,372 |
| Swap contracts | 10,089,836 |
| Unrealized appreciation on forward foreign currency exchange contracts | 250,275 |
| Unrealized appreciation on swap contracts | 1,099,573 |
| Upfront payments on swap contracts | 9,673,206 |
| Receivable for: | |
| Investments sold | 13,259,118 |
| Investments sold on a delayed delivery basis | 2,912,012 |
| Capital shares sold | 5,431,063 |
| Dividends | 1,441,685 |
| Interest | 45,239,810 |
| Foreign tax reclaims | 67,831 |
| Variation margin for futures contracts | 1,518,589 |
| Variation margin for swap contracts | 121,802 |
| Trustees’ fees | 390,953 |
| Prepaid expenses | 47,761 |
| Total assets | 6,228,901,023 |
| Liabilities | |
| Unrealized depreciation on forward foreign currency exchange contracts | 157,409 |
| Unrealized depreciation on swap contracts | 7,354,513 |
| Upfront receipts on swap contracts | 12,283,456 |
| Payable for: | |
| Investments purchased | 1,775,366 |
| Investments purchased on a delayed delivery basis | 1,181,586,254 |
| Capital shares redeemed | 7,801,132 |
| Variation margin for futures contracts | 2,655,572 |
| Variation margin for swap contracts | 159,634 |
| Foreign capital gains taxes deferred | 16,071 |
| Management services fees | 76,539 |
| Distribution and/or service fees | 11,288 |
| Transfer agent fees | 432,744 |
| Trustees’ fees | 531,637 |
| Other expenses | 173,833 |
| Total liabilities | 1,215,015,448 |
| Net assets applicable to outstanding capital stock | $5,013,885,575 |
| Represented by | |
| Paid in capital | 5,927,754,090 |
| Total distributable earnings (loss) | (913,868,515) |
| Total - representing net assets applicable to outstanding capital stock | $5,013,885,575 |
The accompanying Notes to Financial Statements are an integral part of this statement.
| 50 | Columbia Strategic Income Fund | Annual Report 2023 |
Statement of Assets and Liabilities (continued)
August 31, 2023
| Class A | |
| Net assets | $933,577,284 |
| Shares outstanding | 44,185,578 |
| Net asset value per share | $21.13 |
| Maximum sales charge | 4.75% |
| Maximum offering price per share (calculated by dividing the net asset value per share by 1.0 minus the maximum sales charge for Class A shares) | $22.18 |
| Advisor Class | |
| Net assets | $245,265,228 |
| Shares outstanding | 11,864,073 |
| Net asset value per share | $20.67 |
| Class C | |
| Net assets | $171,092,404 |
| Shares outstanding | 8,100,761 |
| Net asset value per share | $21.12 |
| Institutional Class | |
| Net assets | $2,832,856,069 |
| Shares outstanding | 136,837,419 |
| Net asset value per share | $20.70 |
| Institutional 2 Class | |
| Net assets | $405,285,553 |
| Shares outstanding | 19,560,213 |
| Net asset value per share | $20.72 |
| Institutional 3 Class | |
| Net assets | $410,866,097 |
| Shares outstanding | 19,914,391 |
| Net asset value per share | $20.63 |
| Class R | |
| Net assets | $14,942,940 |
| Shares outstanding | 701,668 |
| Net asset value per share | $21.30 |
The accompanying Notes to Financial Statements are an integral part of this statement.
Columbia Strategic Income Fund | Annual Report 2023
| 51 |
Statement of Operations
Year Ended August 31, 2023
| Net investment income | |
| Income: | |
| Dividends — affiliated issuers | $12,085,524 |
| Interest | 286,758,402 |
| Interfund lending | 3,522 |
| Foreign taxes withheld | (458,267) |
| Total income | 298,389,181 |
| Expenses: | |
| Management services fees | 27,914,133 |
| Distribution and/or service fees | |
| Class A | 2,376,973 |
| Class C | 1,861,929 |
| Class R | 66,818 |
| Transfer agent fees | |
| Class A | 931,053 |
| Advisor Class | 243,148 |
| Class C | 182,422 |
| Institutional Class | 2,764,018 |
| Institutional 2 Class | 208,212 |
| Institutional 3 Class | 32,742 |
| Class R | 13,078 |
| Trustees’ fees | 113,184 |
| Custodian fees | 176,681 |
| Printing and postage fees | 279,178 |
| Registration fees | 271,127 |
| Accounting services fees | 57,171 |
| Legal fees | 87,878 |
| Interest on collateral | 472,840 |
| Compensation of chief compliance officer | 958 |
| Other | 92,980 |
| Total expenses | 38,146,523 |
| Expense reduction | (3,103) |
| Total net expenses | 38,143,420 |
| Net investment income | 260,245,761 |
| Realized and unrealized gain (loss) — net | |
| Net realized gain (loss) on: | |
| Investments — unaffiliated issuers | (295,488,165) |
| Investments — affiliated issuers | (4,873) |
| Foreign currency translations | (2,249,973) |
| Forward foreign currency exchange contracts | (5,228,649) |
| Futures contracts | 1,370,843 |
| Option contracts purchased | (46,638,214) |
| Option contracts written | 7,476,386 |
| Swap contracts | (21,959,264) |
| Net realized loss | (362,721,909) |
| Net change in unrealized appreciation (depreciation) on: | |
| Investments — unaffiliated issuers | 199,078,506 |
| Investments — affiliated issuers | 40,299 |
| Foreign currency translations | 38,945 |
| Forward foreign currency exchange contracts | 235,844 |
| Futures contracts | (11,241,011) |
| Option contracts purchased | 6,275,954 |
| Swap contracts | (33,960,477) |
| Foreign capital gains tax | (16,071) |
| Net change in unrealized appreciation (depreciation) | 160,451,989 |
| Net realized and unrealized loss | (202,269,920) |
| Net increase in net assets resulting from operations | $57,975,841 |
The accompanying Notes to Financial Statements are an integral part of this statement.
| 52 | Columbia Strategic Income Fund | Annual Report 2023 |
Statement of Changes in Net Assets
| | Year Ended
August 31, 2023 | Year Ended
August 31, 2022 |
| Operations | | |
| Net investment income | $260,245,761 | $226,062,515 |
| Net realized loss | (362,721,909) | (192,292,349) |
| Net change in unrealized appreciation (depreciation) | 160,451,989 | (701,091,736) |
| Net increase (decrease) in net assets resulting from operations | 57,975,841 | (667,321,570) |
| Distributions to shareholders | | |
| Net investment income and net realized gains | | |
| Class A | (45,862,924) | (47,487,869) |
| Advisor Class | (12,817,501) | (15,554,372) |
| Class C | (7,571,149) | (8,968,170) |
| Institutional Class | (145,715,320) | (169,394,995) |
| Institutional 2 Class | (19,456,428) | (22,844,906) |
| Institutional 3 Class | (22,033,485) | (23,213,250) |
| Class R | (611,037) | (621,845) |
| Total distributions to shareholders | (254,067,844) | (288,085,407) |
| Decrease in net assets from capital stock activity | (475,268,339) | (18,610,193) |
| Total decrease in net assets | (671,360,342) | (974,017,170) |
| Net assets at beginning of year | 5,685,245,917 | 6,659,263,087 |
| Net assets at end of year | $5,013,885,575 | $5,685,245,917 |
The accompanying Notes to Financial Statements are an integral part of this statement.
Columbia Strategic Income Fund | Annual Report 2023
| 53 |
Statement of Changes in Net Assets (continued)
| | Year Ended | Year Ended |
| | August 31, 2023 | August 31, 2022 |
| | Shares | Dollars ($) | Shares | Dollars ($) |
| Capital stock activity |
| Class A | | | | |
| Shares sold | 6,050,412 | 128,300,745 | 6,104,860 | 144,592,287 |
| Fund reorganization | — | — | 2,720,908 | 66,623,684 |
| Distributions reinvested | 2,026,317 | 42,791,899 | 1,888,726 | 44,513,990 |
| Shares redeemed | (11,331,356) | (238,721,659) | (10,572,480) | (246,319,310) |
| Net increase (decrease) | (3,254,627) | (67,629,015) | 142,014 | 9,410,651 |
| Advisor Class | | | | |
| Shares sold | 2,858,154 | 59,545,498 | 5,007,338 | 117,004,721 |
| Fund reorganization | — | — | 1,900,358 | 45,591,874 |
| Distributions reinvested | 617,619 | 12,762,540 | 671,814 | 15,512,875 |
| Shares redeemed | (5,560,482) | (114,626,561) | (8,659,199) | (198,789,671) |
| Net decrease | (2,084,709) | (42,318,523) | (1,079,689) | (20,680,201) |
| Class C | | | | |
| Shares sold | 1,266,456 | 26,885,346 | 1,530,437 | 36,814,745 |
| Distributions reinvested | 329,635 | 6,959,367 | 345,221 | 8,170,975 |
| Shares redeemed | (3,331,237) | (70,438,172) | (3,341,253) | (77,668,623) |
| Net decrease | (1,735,146) | (36,593,459) | (1,465,595) | (32,682,903) |
| Institutional Class | | | | |
| Shares sold | 52,531,053 | 1,091,229,779 | 56,071,862 | 1,303,611,260 |
| Distributions reinvested | 6,077,575 | 125,786,754 | 6,175,424 | 142,981,414 |
| Shares redeemed | (72,656,181) | (1,503,828,463) | (69,146,186) | (1,570,804,397) |
| Net decrease | (14,047,553) | (286,811,930) | (6,898,900) | (124,211,723) |
| Institutional 2 Class | | | | |
| Shares sold | 7,880,443 | 163,847,060 | 11,818,805 | 277,874,908 |
| Distributions reinvested | 932,057 | 19,305,845 | 980,927 | 22,684,813 |
| Shares redeemed | (8,546,647) | (177,443,939) | (12,718,682) | (286,111,305) |
| Net increase | 265,853 | 5,708,966 | 81,050 | 14,448,416 |
| Institutional 3 Class | | | | |
| Shares sold | 5,299,189 | 109,538,540 | 12,181,340 | 287,282,196 |
| Distributions reinvested | 554,042 | 11,428,153 | 601,991 | 13,870,044 |
| Shares redeemed | (8,313,100) | (171,245,534) | (7,294,797) | (164,066,674) |
| Net increase (decrease) | (2,459,869) | (50,278,841) | 5,488,534 | 137,085,566 |
| Class R | | | | |
| Shares sold | 238,374 | 5,072,856 | 173,196 | 4,209,736 |
| Distributions reinvested | 28,608 | 609,069 | 25,880 | 617,786 |
| Shares redeemed | (141,822) | (3,027,462) | (289,197) | (6,807,521) |
| Net increase (decrease) | 125,160 | 2,654,463 | (90,121) | (1,979,999) |
| Total net decrease | (23,190,891) | (475,268,339) | (3,822,707) | (18,610,193) |
The accompanying Notes to Financial Statements are an integral part of this statement.
| 54 | Columbia Strategic Income Fund | Annual Report 2023 |
[THIS PAGE INTENTIONALLY LEFT BLANK]
Columbia Strategic Income Fund | Annual Report 2023
| 55 |
The following table is intended to help you understand the Fund’s financial performance. Certain information reflects financial results for a single share of a class held for the periods shown. Per share net investment income (loss) amounts are calculated based on average shares outstanding during the period. Total return assumes reinvestment of all dividends and distributions, if any. Total return does not reflect payment of sales charges, if any. Total return and portfolio turnover are not annualized for periods of less than one year. The ratios of expenses and net investment income are annualized for periods of less than one year. The portfolio turnover rate is calculated without regard to purchase and sales transactions of short-term instruments and certain derivatives, if any. If such transactions were included, the Fund’s portfolio turnover rate may be higher.
| | Net asset value,
beginning of
period | Net
investment
income | Net
realized
and
unrealized
gain (loss) | Total from
investment
operations | Distributions
from net
investment
income | Distributions
from net
realized
gains | Total
distributions to
shareholders |
| Class A |
| Year Ended 8/31/2023 | $21.84 | 1.06 | (0.74) | 0.32 | (1.03) | — | (1.03) |
| Year Ended 8/31/2022 | $25.20 | 0.78 | (3.15) | (2.37) | (0.71) | (0.28) | (0.99) |
| Year Ended 8/31/2021(e) | $24.32 | 0.79 | 0.86 | 1.65 | (0.77) | — | (0.77) |
| Year Ended 8/31/2020(e) | $24.06 | 0.84 | 0.26 | 1.10 | (0.84) | — | (0.84) |
| Year Ended 8/31/2019(e) | $23.57 | 1.00 | 0.57 | 1.57 | (0.92) | (0.16) | (1.08) |
| Advisor Class |
| Year Ended 8/31/2023 | $21.39 | 1.09 | (0.73) | 0.36 | (1.08) | — | (1.08) |
| Year Ended 8/31/2022 | $24.70 | 0.82 | (3.08) | (2.26) | (0.77) | (0.28) | (1.05) |
| Year Ended 8/31/2021(e) | $23.85 | 0.83 | 0.85 | 1.68 | (0.83) | — | (0.83) |
| Year Ended 8/31/2020(e) | $23.62 | 0.88 | 0.23 | 1.11 | (0.88) | — | (0.88) |
| Year Ended 8/31/2019(e) | $23.16 | 1.04 | 0.54 | 1.58 | (0.96) | (0.16) | (1.12) |
| Class C |
| Year Ended 8/31/2023 | $21.83 | 0.90 | (0.74) | 0.16 | (0.87) | — | (0.87) |
| Year Ended 8/31/2022 | $25.19 | 0.60 | (3.15) | (2.55) | (0.53) | (0.28) | (0.81) |
| Year Ended 8/31/2021(e) | $24.31 | 0.60 | 0.86 | 1.46 | (0.58) | — | (0.58) |
| Year Ended 8/31/2020(e) | $24.06 | 0.64 | 0.29 | 0.93 | (0.68) | — | (0.68) |
| Year Ended 8/31/2019(e) | $23.57 | 0.80 | 0.57 | 1.37 | (0.72) | (0.16) | (0.88) |
| Institutional Class |
| Year Ended 8/31/2023 | $21.42 | 1.09 | (0.73) | 0.36 | (1.08) | — | (1.08) |
| Year Ended 8/31/2022 | $24.73 | 0.82 | (3.09) | (2.27) | (0.76) | (0.28) | (1.04) |
| Year Ended 8/31/2021(e) | $23.88 | 0.84 | 0.84 | 1.68 | (0.83) | — | (0.83) |
| Year Ended 8/31/2020(e) | $23.65 | 0.88 | 0.23 | 1.11 | (0.88) | — | (0.88) |
| Year Ended 8/31/2019(e) | $23.18 | 1.04 | 0.55 | 1.59 | (0.96) | (0.16) | (1.12) |
| Institutional 2 Class |
| Year Ended 8/31/2023 | $21.44 | 1.11 | (0.74) | 0.37 | (1.09) | — | (1.09) |
| Year Ended 8/31/2022 | $24.75 | 0.83 | (3.09) | (2.26) | (0.77) | (0.28) | (1.05) |
| Year Ended 8/31/2021(e) | $23.90 | 0.85 | 0.83 | 1.68 | (0.83) | — | (0.83) |
| Year Ended 8/31/2020(e) | $23.66 | 0.88 | 0.28 | 1.16 | (0.92) | — | (0.92) |
| Year Ended 8/31/2019(e) | $23.19 | 1.04 | 0.55 | 1.59 | (0.96) | (0.16) | (1.12) |
| Institutional 3 Class |
| Year Ended 8/31/2023 | $21.35 | 1.11 | (0.73) | 0.38 | (1.10) | — | (1.10) |
| Year Ended 8/31/2022 | $24.66 | 0.84 | (3.09) | (2.25) | (0.78) | (0.28) | (1.06) |
| Year Ended 8/31/2021(e) | $23.81 | 0.86 | 0.84 | 1.70 | (0.85) | — | (0.85) |
| Year Ended 8/31/2020(e) | $23.58 | 0.88 | 0.27 | 1.15 | (0.92) | — | (0.92) |
| Year Ended 8/31/2019(e) | $23.12 | 1.04 | 0.58 | 1.62 | (1.00) | (0.16) | (1.16) |
The accompanying Notes to Financial Statements are an integral part of this statement.
| 56 | Columbia Strategic Income Fund | Annual Report 2023 |
Financial Highlights (continued)
| | Net
asset
value,
end of
period | Total
return | Total gross
expense
ratio to
average
net assets(a) | Total net
expense
ratio to
average
net assets(a),(b) | Net investment
income
ratio to
average
net assets | Portfolio
turnover | Net
assets,
end of
period
(000’s) |
| Class A |
| Year Ended 8/31/2023 | $21.13 | 1.56% | 0.94%(c) | 0.94%(c),(d) | 5.02% | 295% | $933,577 |
| Year Ended 8/31/2022 | $21.84 | (9.64%) | 0.92%(c) | 0.92%(c),(d) | 3.30% | 136% | $1,036,081 |
| Year Ended 8/31/2021(e) | $25.20 | 6.84% | 0.92%(c) | 0.92%(c),(d) | 3.17% | 126% | $1,191,823 |
| Year Ended 8/31/2020(e) | $24.32 | 4.84% | 0.93%(c) | 0.93%(c),(d) | 3.51% | 173% | $1,101,890 |
| Year Ended 8/31/2019(e) | $24.06 | 6.75% | 0.95%(c) | 0.95%(c) | 4.20% | 179% | $1,101,847 |
| Advisor Class |
| Year Ended 8/31/2023 | $20.67 | 1.80% | 0.69%(c) | 0.69%(c),(d) | 5.26% | 295% | $245,265 |
| Year Ended 8/31/2022 | $21.39 | (9.40%) | 0.67%(c) | 0.67%(c),(d) | 3.54% | 136% | $298,389 |
| Year Ended 8/31/2021(e) | $24.70 | 7.16% | 0.67%(c) | 0.67%(c),(d) | 3.39% | 126% | $371,251 |
| Year Ended 8/31/2020(e) | $23.85 | 5.02% | 0.68%(c) | 0.68%(c),(d) | 3.76% | 173% | $194,094 |
| Year Ended 8/31/2019(e) | $23.62 | 6.96% | 0.70%(c) | 0.70%(c) | 4.42% | 179% | $285,983 |
| Class C |
| Year Ended 8/31/2023 | $21.12 | 0.81% | 1.69%(c) | 1.69%(c),(d) | 4.26% | 295% | $171,092 |
| Year Ended 8/31/2022 | $21.83 | (10.31%) | 1.67%(c) | 1.67%(c),(d) | 2.53% | 136% | $214,760 |
| Year Ended 8/31/2021(e) | $25.19 | 6.01% | 1.67%(c) | 1.67%(c),(d) | 2.42% | 126% | $284,727 |
| Year Ended 8/31/2020(e) | $24.31 | 4.06% | 1.69%(c) | 1.69%(c),(d) | 2.76% | 173% | $280,497 |
| Year Ended 8/31/2019(e) | $24.06 | 5.97% | 1.70%(c) | 1.70%(c) | 3.45% | 179% | $282,018 |
| Institutional Class |
| Year Ended 8/31/2023 | $20.70 | 1.80% | 0.69%(c) | 0.69%(c),(d) | 5.27% | 295% | $2,832,856 |
| Year Ended 8/31/2022 | $21.42 | (9.39%) | 0.67%(c) | 0.67%(c),(d) | 3.54% | 136% | $3,231,980 |
| Year Ended 8/31/2021(e) | $24.73 | 7.11% | 0.67%(c) | 0.67%(c),(d) | 3.41% | 126% | $3,902,593 |
| Year Ended 8/31/2020(e) | $23.88 | 5.02% | 0.68%(c) | 0.68%(c),(d) | 3.76% | 173% | $3,083,643 |
| Year Ended 8/31/2019(e) | $23.65 | 6.96% | 0.70%(c) | 0.70%(c) | 4.44% | 179% | $2,843,762 |
| Institutional 2 Class |
| Year Ended 8/31/2023 | $20.72 | 1.84% | 0.64%(c) | 0.64%(c) | 5.32% | 295% | $405,286 |
| Year Ended 8/31/2022 | $21.44 | (9.35%) | 0.63%(c) | 0.63%(c) | 3.60% | 136% | $413,637 |
| Year Ended 8/31/2021(e) | $24.75 | 7.23% | 0.63%(c) | 0.63%(c) | 3.44% | 126% | $475,594 |
| Year Ended 8/31/2020(e) | $23.90 | 5.06% | 0.64%(c) | 0.64%(c) | 3.80% | 173% | $287,777 |
| Year Ended 8/31/2019(e) | $23.66 | 7.00% | 0.66%(c) | 0.66%(c) | 4.49% | 179% | $287,753 |
| Institutional 3 Class |
| Year Ended 8/31/2023 | $20.63 | 1.89% | 0.60%(c) | 0.60%(c) | 5.36% | 295% | $410,866 |
| Year Ended 8/31/2022 | $21.35 | (9.34%) | 0.59%(c) | 0.59%(c) | 3.67% | 136% | $477,713 |
| Year Ended 8/31/2021(e) | $24.66 | 7.26% | 0.59%(c) | 0.59%(c) | 3.50% | 126% | $416,355 |
| Year Ended 8/31/2020(e) | $23.81 | 5.13% | 0.60%(c) | 0.60%(c) | 3.84% | 173% | $322,913 |
| Year Ended 8/31/2019(e) | $23.58 | 7.08% | 0.60%(c) | 0.60%(c) | 4.55% | 179% | $192,494 |
The accompanying Notes to Financial Statements are an integral part of this statement.
Columbia Strategic Income Fund | Annual Report 2023
| 57 |
Financial Highlights (continued)
| | Net asset value,
beginning of
period | Net
investment
income | Net
realized
and
unrealized
gain (loss) | Total from
investment
operations | Distributions
from net
investment
income | Distributions
from net
realized
gains | Total
distributions to
shareholders |
| Class R |
| Year Ended 8/31/2023 | $22.01 | 1.02 | (0.76) | 0.26 | (0.97) | — | (0.97) |
| Year Ended 8/31/2022 | $25.38 | 0.72 | (3.16) | (2.44) | (0.65) | (0.28) | (0.93) |
| Year Ended 8/31/2021(e) | $24.49 | 0.73 | 0.86 | 1.59 | (0.70) | — | (0.70) |
| Year Ended 8/31/2020(e) | $24.23 | 0.80 | 0.26 | 1.06 | (0.80) | — | (0.80) |
| Year Ended 8/31/2019(e) | $23.73 | 0.92 | 0.58 | 1.50 | (0.84) | (0.16) | (1.00) |
| Notes to Financial Highlights |
| (a) | In addition to the fees and expenses that the Fund bears directly, the Fund indirectly bears a pro rata share of the fees and expenses of any other funds in which it invests. Such indirect expenses are not included in the Fund’s reported expense ratios. |
| (b) | Total net expenses include the impact of certain fee waivers/expense reimbursements made by the Investment Manager and certain of its affiliates, if applicable. |
| (c) | Ratios include interest on collateral expense. For the periods indicated below, if interest on collateral expense had been excluded, expenses would have been lower by: |
| Class | 8/31/2023 | 8/31/2022 | 8/31/2021 | 8/31/2020 | 8/31/2019 |
| Class A | 0.01% | 0.01% | less than 0.01% | less than 0.01% | less than 0.01% |
| Advisor Class | 0.01% | 0.01% | less than 0.01% | less than 0.01% | 0.01% |
| Class C | 0.01% | 0.01% | less than 0.01% | less than 0.01% | less than 0.01% |
| Institutional Class | 0.01% | 0.01% | less than 0.01% | less than 0.01% | less than 0.01% |
| Institutional 2 Class | 0.01% | 0.01% | less than 0.01% | less than 0.01% | less than 0.01% |
| Institutional 3 Class | 0.01% | 0.01% | less than 0.01% | less than 0.01% | less than 0.01% |
| Class R | 0.01% | 0.01% | less than 0.01% | less than 0.01% | less than 0.01% |
| (d) | The benefits derived from expense reductions had an impact of less than 0.01%. |
| (e) | Per share amounts have been adjusted on a retroactive basis to reflect a 4 to 1 reverse stock split completed after the close of business on September 11, 2020. |
The accompanying Notes to Financial Statements are an integral part of this statement.
| 58 | Columbia Strategic Income Fund | Annual Report 2023 |
Financial Highlights (continued)
| | Net
asset
value,
end of
period | Total
return | Total gross
expense
ratio to
average
net assets(a) | Total net
expense
ratio to
average
net assets(a),(b) | Net investment
income
ratio to
average
net assets | Portfolio
turnover | Net
assets,
end of
period
(000’s) |
| Class R |
| Year Ended 8/31/2023 | $21.30 | 1.30% | 1.19%(c) | 1.19%(c),(d) | 4.80% | 295% | $14,943 |
| Year Ended 8/31/2022 | $22.01 | (9.83%) | 1.17%(c) | 1.17%(c),(d) | 3.02% | 136% | $12,686 |
| Year Ended 8/31/2021(e) | $25.38 | 6.62% | 1.17%(c) | 1.17%(c),(d) | 2.89% | 126% | $16,920 |
| Year Ended 8/31/2020(e) | $24.49 | 4.38% | 1.18%(c) | 1.18%(c),(d) | 3.26% | 173% | $8,053 |
| Year Ended 8/31/2019(e) | $24.23 | 6.62% | 1.20%(c) | 1.20%(c) | 3.95% | 179% | $9,287 |
The accompanying Notes to Financial Statements are an integral part of this statement.
Columbia Strategic Income Fund | Annual Report 2023
| 59 |
Notes to Financial Statements
August 31, 2023
Note 1. Organization
Columbia Strategic Income Fund (the Fund), a series of Columbia Funds Series Trust I (the Trust), is a diversified fund. The Trust is registered under the Investment Company Act of 1940, as amended (the 1940 Act), as an open-end management investment company organized as a Massachusetts business trust.
Fund shares
The Trust may issue an unlimited number of shares (without par value). The Fund offers each of the share classes listed in the Statement of Assets and Liabilities. Although all share classes generally have identical voting, dividend and liquidation rights, each share class votes separately when required by the Trust’s organizational documents or by law. Each share class has its own expense and sales charge structure. Different share classes may have different minimum initial investment amounts and pay different net investment income distribution amounts to the extent the expenses of distributing such share classes vary. Distributions to shareholders in a liquidation will be proportional to the net asset value of each share class.
As described in the Fund’s prospectus, Class A and Class C shares are offered to the general public for investment. Class C shares automatically convert to Class A shares after 8 years. Advisor Class, Institutional Class, Institutional 2 Class, Institutional 3 Class and Class R shares are available for purchase through authorized investment professionals to omnibus retirement plans or to institutional investors and to certain other investors as also described in the Fund’s prospectus.
Note 2. Summary of significant accounting policies
Basis of preparation
The Fund is an investment company that applies the accounting and reporting guidance in the Financial Accounting Standards Board (FASB) Accounting Standards Codification Topic 946, Financial Services - Investment Companies (ASC 946). The financial statements are prepared in accordance with U.S. generally accepted accounting principles (GAAP), which requires management to make certain estimates and assumptions that affect the reported amounts of assets and liabilities, the disclosure of contingent assets and liabilities at the date of the financial statements and the reported amounts of income and expenses during the reporting period. Actual results could differ from those estimates.
The following is a summary of significant accounting policies followed by the Fund in the preparation of its financial statements.
Security valuation
Equity securities listed on an exchange are valued at the closing price or last trade price on their primary exchange at the close of business of the New York Stock Exchange. Securities with a closing price not readily available or not listed on any exchange are valued at the mean between the closing bid and ask prices. Listed preferred stocks convertible into common stocks are valued using an evaluated price from a pricing service.
Debt securities generally are valued based on prices obtained from pricing services, which are intended to reflect market transactions for normal, institutional-size trading units of similar securities. The services may use various pricing techniques that take into account, as applicable, factors such as yield, quality, coupon rate, maturity, type of issue, trading characteristics and other data, as well as approved independent broker-dealer quotes. Debt securities for which quotations are not readily available or not believed to be reflective of market value may also be valued based upon a bid quote from an approved independent broker-dealer. Debt securities maturing in 60 days or less are valued primarily at amortized market value, unless this method results in a valuation that management believes does not approximate fair value.
Asset- and mortgage-backed securities are generally valued by pricing services, which utilize pricing models that incorporate the securities’ cash flow and loan performance data. These models also take into account available market data, including trades, market quotations, and benchmark yield curves for identical or similar securities. Factors used to identify similar securities may include, but are not limited to, issuer, collateral type, vintage, prepayment speeds, collateral performance, credit ratings, credit enhancement and expected life. Asset-backed securities for which quotations are readily available may also be valued based upon an over-the-counter or exchange bid quote from an approved independent broker-dealer. Debt securities maturing in 60 days or less are valued primarily at amortized market value, unless this method results in a valuation that management believes does not approximate fair value.
| 60 | Columbia Strategic Income Fund | Annual Report 2023 |
Notes to Financial Statements (continued)
August 31, 2023
Senior loan securities for which reliable market quotations are readily available are generally valued by pricing services at the average of the bids received.
Foreign equity securities are valued based on the closing price or last trade price on their primary exchange at the close of business of the New York Stock Exchange. If any foreign equity security closing prices are not readily available, the securities are valued at the mean of the latest quoted bid and ask prices on such exchanges or markets. Foreign currency exchange rates are determined at the scheduled closing time of the New York Stock Exchange. Many securities markets and exchanges outside the U.S. close prior to the close of the New York Stock Exchange; therefore, the closing prices for securities in such markets or on such exchanges may not fully reflect events that occur after such close but before the close of the New York Stock Exchange. In those situations, foreign securities will be fair valued pursuant to a policy approved by the Board of Trustees. Under the policy, the Fund may utilize a third-party pricing service to determine these fair values. The third-party pricing service takes into account multiple factors, including, but not limited to, movements in the U.S. securities markets, certain depositary receipts, futures contracts and foreign exchange rates that have occurred subsequent to the close of the foreign exchange or market, to determine a good faith estimate that reasonably reflects the current market conditions as of the close of the New York Stock Exchange. The fair value of a security is likely to be different from the quoted or published price, if available.
Investments in open-end investment companies (other than exchange-traded funds (ETFs)), are valued at the latest net asset value reported by those companies as of the valuation time.
Forward foreign currency exchange contracts are marked-to-market based upon foreign currency exchange rates provided by a pricing service.
Futures and options on futures contracts are valued based upon the settlement price at the close of regular trading on their principal exchanges or, in the absence of a settlement price, at the mean of the latest quoted bid and ask prices.
Option contracts are valued at the mean of the latest quoted bid and ask prices on their primary exchanges. Option contracts, including over-the-counter option contracts, with no readily available market quotations are valued using mid-market evaluations from independent third-party vendors.
Swap transactions are valued through an independent pricing service or broker, or if neither is available, through an internal model based upon observable inputs.
Investments for which market quotations are not readily available, or that have quotations which management believes are not reflective of market value or reliable, are valued at fair value as determined in good faith under procedures approved by the Board of Trustees. If a security or class of securities (such as foreign securities) is valued at fair value, such value is likely to be different from the quoted or published price for the security, if available.
The determination of fair value often requires significant judgment. To determine fair value, management may use assumptions including but not limited to future cash flows and estimated risk premiums. Multiple inputs from various sources may be used to determine fair value.
GAAP requires disclosure regarding the inputs and valuation techniques used to measure fair value and any changes in valuation inputs or techniques. In addition, investments shall be disclosed by major category. This information is disclosed following the Fund’s Portfolio of Investments.
Foreign currency transactions and translations
The values of all assets and liabilities denominated in foreign currencies are generally translated into U.S. dollars at exchange rates determined at the close of regular trading on the New York Stock Exchange. Net realized and unrealized gains (losses) on foreign currency transactions and translations include gains (losses) arising from the fluctuation in exchange rates between trade and settlement dates on securities transactions, gains (losses) arising from the disposition of foreign currency and currency gains (losses) between the accrual and payment dates on dividends, interest income and foreign withholding taxes.
Columbia Strategic Income Fund | Annual Report 2023
| 61 |
Notes to Financial Statements (continued)
August 31, 2023
For financial statement purposes, the Fund does not distinguish that portion of gains (losses) on investments which is due to changes in foreign exchange rates from that which is due to changes in market prices of the investments. Such fluctuations are included with the net realized and unrealized gains (losses) on investments in the Statement of Operations.
Derivative instruments
The Fund invests in certain derivative instruments, as detailed below, in seeking to meet its investment objectives. Derivatives are instruments whose values depend on, or are derived from, in whole or in part, the value of one or more securities, currencies, commodities, indices, or other assets or instruments. Derivatives may be used to increase investment flexibility (including to maintain cash reserves while maintaining desired exposure to certain assets), for risk management (hedging) purposes, to facilitate trading, to reduce transaction costs and to pursue higher investment returns. The Fund may also use derivative instruments to mitigate certain investment risks, such as foreign currency exchange rate risk, interest rate risk and credit risk. Derivatives may involve various risks, including the potential inability of the counterparty to fulfill its obligations under the terms of the contract, the potential for an illiquid secondary market (making it difficult for the Fund to sell or terminate, including at favorable prices) and the potential for market movements which may expose the Fund to gains or losses in excess of the amount shown in the Statement of Assets and Liabilities. The notional amounts of derivative instruments, if applicable, are not recorded in the financial statements.
A derivative instrument may suffer a marked-to-market loss if the value of the contract decreases due to an unfavorable change in the market rates or values of the underlying instrument. Losses can also occur if the counterparty does not perform its obligations under the contract. The Fund’s risk of loss from counterparty credit risk on over-the-counter derivatives is generally limited to the aggregate unrealized gain netted against any collateral held by the Fund and the amount of any variation margin held by the counterparty, plus any replacement costs or related amounts. With exchange-traded or centrally cleared derivatives, there is reduced counterparty credit risk to the Fund since the clearinghouse or central counterparty (CCP) provides some protection in the case of clearing member default. The clearinghouse or CCP stands between the buyer and the seller of the contract; therefore, failure of the clearinghouse or CCP may pose additional counterparty credit risk. However, credit risk still exists in exchange-traded or centrally cleared derivatives with respect to initial and variation margin that is held in a broker’s customer account. While clearing brokers are required to segregate customer margin from their own assets, in the event that a clearing broker becomes insolvent or goes into bankruptcy and at that time there is a shortfall in the aggregate amount of margin held by the clearing broker for all its clients and such shortfall is remedied by the CCP or otherwise, U.S. bankruptcy laws will typically allocate that shortfall on a pro-rata basis across all the clearing broker’s customers (including the Fund), potentially resulting in losses to the Fund.
In order to better define its contractual rights and to secure rights that will help the Fund mitigate its counterparty risk, the Fund may enter into an International Swaps and Derivatives Association, Inc. Master Agreement (ISDA Master Agreement) or similar agreement with its derivatives counterparties. An ISDA Master Agreement is an agreement between the Fund and a counterparty that governs over-the-counter derivatives and foreign exchange forward contracts and contains, among other things, collateral posting terms and netting provisions in the event of a default and/or termination event. Under an ISDA Master Agreement, the Fund may, under certain circumstances, offset with the counterparty certain derivative instruments’ payables and/or receivables with collateral held and/or posted and create one single net payment. The provisions of the ISDA Master Agreement typically permit a single net payment in the event of default (close-out netting), including the bankruptcy or insolvency of the counterparty. Note, however, that bankruptcy or insolvency laws of a particular jurisdiction may impose restrictions on or prohibitions against the right of offset or netting in bankruptcy, insolvency or other events.
Collateral (margin) requirements differ by type of derivative. Margin requirements are established by the clearinghouse or CCP for exchange-traded and centrally cleared derivatives. Brokers can ask for margin in excess of the minimum in certain circumstances. Collateral terms for most over-the-counter derivatives are subject to regulatory requirements to exchange variation margin with trading counterparties and may have contract specific margin terms as well. For over-the-counter derivatives traded under an ISDA Master Agreement, the collateral requirements are typically calculated by netting the marked-to-market amount for each transaction under such agreement and comparing that amount to the value of any variation margin currently pledged by the Fund and/or the counterparty. Generally, the amount of collateral due from or to a party has to exceed a minimum transfer amount threshold (e.g., $250,000) before a transfer has to be made. To the extent amounts due to the Fund from its counterparties are not fully collateralized, contractually or otherwise, the Fund bears the risk of loss from counterparty nonperformance. The Fund may also pay interest expense on cash collateral received from the
| 62 | Columbia Strategic Income Fund | Annual Report 2023 |
Notes to Financial Statements (continued)
August 31, 2023
broker or receive interest income on cash collateral pledged to the broker. The Fund attempts to mitigate counterparty risk by only entering into agreements with counterparties that it believes have the financial resources to honor their obligations and by monitoring the financial stability of those counterparties.
Certain ISDA Master Agreements allow counterparties of over-the-counter derivatives transactions to terminate derivatives contracts prior to maturity in the event the Fund’s net asset value declines by a stated percentage over a specified time period or if the Fund fails to meet certain terms of the ISDA Master Agreement, which would cause the Fund to accelerate payment of any net liability owed to the counterparty. The Fund also has termination rights if the counterparty fails to meet certain terms of the ISDA Master Agreement. In determining whether to exercise such termination rights, the Fund would consider, in addition to counterparty credit risk, whether termination would result in a net liability owed from the counterparty.
For financial reporting purposes, the Fund does not offset derivative assets and derivative liabilities that are subject to netting arrangements in the Statement of Assets and Liabilities.
Forward foreign currency exchange contracts
Forward foreign currency exchange contracts are over-the-counter agreements between two parties to buy and sell a currency at a set price on a future date. The Fund utilized forward foreign currency exchange contracts to hedge the currency exposure associated with some or all of the Fund’s securities. These instruments may be used for other purposes in future periods.
The values of forward foreign currency exchange contracts fluctuate daily with changes in foreign currency exchange rates. Changes in the value of these contracts are recorded as unrealized appreciation or depreciation until the contract is exercised or has expired. The Fund will realize a gain or loss when the forward foreign currency exchange contract is closed or expires. Non-deliverable forward foreign currency exchange contracts are settled with the counterparty in U.S. dollars without delivery of foreign currency.
The use of forward foreign currency exchange contracts does not eliminate fluctuations in the prices of the Fund’s portfolio securities. The risks of forward foreign currency exchange contracts include movement in the values of the foreign currencies relative to the U.S. dollar (or other foreign currencies) and the possibility that counterparties will not complete their contractual obligations, which may be in excess of the amount reflected, if any, in the Statement of Assets and Liabilities.
Futures contracts
Futures contracts are exchange-traded and represent commitments for the future purchase or sale of an asset at a specified price on a specified date. The Fund bought and sold futures contracts to manage the duration and yield curve exposure of the Fund versus the benchmark. These instruments may be used for other purposes in future periods. Upon entering into futures contracts, the Fund bears risks that it may not achieve the anticipated benefits of the futures contracts and may realize a loss. Additional risks include counterparty credit risk, the possibility of an illiquid market, and that a change in the value of the contract or option may not correlate with changes in the value of the underlying asset.
Upon entering into a futures contract, the Fund deposits cash or securities with the broker, known as a futures commission merchant (FCM), in an amount sufficient to meet the initial margin requirement. The initial margin deposit must be maintained at an established level over the life of the contract. Cash deposited as initial margin is recorded in the Statement of Assets and Liabilities as margin deposits. Securities deposited as initial margin are designated in the Portfolio of Investments. Subsequent payments (variation margin) are made or received by the Fund each day. The variation margin payments are equal to the daily change in the contract value and are recorded as variation margin receivable or payable and are offset in unrealized gains or losses. The Fund generally expects to earn interest income on its margin deposits. The Fund recognizes a realized gain or loss when the contract is closed or expires. Futures contracts involve, to varying degrees, risk of loss in excess of the variation margin disclosed in the Statement of Assets and Liabilities.
Options contracts
Options are contracts which entitle the holder to purchase or sell securities or other identified assets at a specified price, or in the case of index option contracts, to receive or pay the difference between the index value and the strike price of the index option contract. Option contracts can be either exchange-traded or over-the-counter. The Fund purchased and has written option contracts to manage exposure to fluctuations in interest rates. These instruments may be used for other
Columbia Strategic Income Fund | Annual Report 2023
| 63 |
Notes to Financial Statements (continued)
August 31, 2023
purposes in future periods. Completion of transactions for option contracts traded in the over-the-counter market depends upon the performance of the other party. Collateral may be collected or posted by the Fund to secure over-the-counter option contract trades. Collateral held or posted by the Fund for such option contract trades must be returned to the broker or the Fund upon closure, exercise or expiration of the contract.
Options contracts purchased are recorded as investments. When the Fund writes an options contract, the premium received is recorded as an asset and an amount equivalent to the premium is recorded as a liability in the Statement of Assets and Liabilities and is subsequently adjusted to reflect the current fair value of the option written. Changes in the fair value of the written option are recorded as unrealized appreciation or depreciation until the contract is exercised or has expired. The Fund realizes a gain or loss when the option contract is closed or expires. When option contracts are exercised, the proceeds on sales for a written call or purchased put option contract, or the purchase cost for a written put or purchased call option contract, is adjusted by the amount of premium received or paid.
For over-the-counter options purchased, the Fund bears the risk of loss of the amount of the premiums paid plus the positive change in market values net of any collateral held by the Fund should the counterparty fail to perform under the contracts. Option contracts written by the Fund do not typically give rise to significant counterparty credit risk, as options written generally obligate the Fund and not the counterparty to perform. The risk in writing a call option contract is that the Fund gives up the opportunity for profit if the market price of the security increases above the strike price and the option contract is exercised. The risk in writing a put option contract is that the Fund may incur a loss if the market price of the security decreases below the strike price and the option contract is exercised. Exercise of a written option could result in the Fund purchasing or selling a security or foreign currency when it otherwise would not, or at a price different from the current market value. In purchasing and writing options, the Fund bears the risk of an unfavorable change in the value of the underlying instrument or the risk that the Fund may not be able to enter into a closing transaction due to an illiquid market.
Interest rate swaption contracts
Interest rate swaption contracts entered into by the Fund typically represent an option that gives the purchaser the right, but not the obligation, to enter into an interest rate swap contract on a future date. Each interest rate swaption contract will specify if the buyer is entitled to receive the fixed or floating rate if the interest rate is exercised. Changes in the value of a purchased interest rate swaption contracts are reported as unrealized appreciation or depreciation on options in the Statement of Assets and Liabilities. Gain or loss is recognized in the Statement of Operations when the interest rate swaption contract is closed or expires.
When the Fund writes an interest rate swaption contract, the premium received is recorded as an asset and an amount equivalent to the premium is recorded as a liability in the Statement of Assets and Liabilities and is subsequently adjusted to reflect the current fair value of the interest rate swaption contract written. Premiums received from writing interest rate swaption contracts that expire unexercised are recorded by the Fund on the expiration date as realized gains from options written in the Statement of Operations. The difference between the premium and the amount paid on effecting a closing purchase transaction, including brokerage commissions, is also recorded as realized gain, or if the premium is less than the amount paid for the closing purchase, as realized loss. These amounts are reflected as net realized gain (loss) on options written in the Statement of Operations.
Swap contracts
Swap contracts are negotiated in the over-the-counter market and are entered into bilaterally or centrally cleared (centrally cleared swap contract). In a centrally cleared swap contract, immediately following execution of the swap contract with a broker, the swap contract is novated to a central counterparty (the CCP) and the CCP becomes the Fund’s counterparty to the centrally cleared swap contract. The Fund is required to deposit initial margin with the futures commission merchant (FCM), which pledges it through to the CCP in the form of cash or securities in an amount that varies depending on the size and risk profile of the particular swap contract. Securities deposited as initial margin are designated in the Portfolio of Investments and cash deposited is recorded in the Statement of Assets and Liabilities as margin deposits. For a bilateral swap contract, the Fund has credit exposure to the broker, but exchanges daily variation margin with the broker based on the mark-to-market value of the swap contract to minimize that exposure. For centrally cleared swap contracts, the Fund has minimal credit exposure to the FCM because the CCP stands between the Fund and the relevant buyer/seller on the other side of the
| 64 | Columbia Strategic Income Fund | Annual Report 2023 |
Notes to Financial Statements (continued)
August 31, 2023
contract. Swap contracts are marked-to-market daily and changes in value are recorded as unrealized appreciation (depreciation). The daily change in valuation of centrally cleared swap contracts, if any, is recorded as a receivable or payable for variation margin in the Statement of Assets and Liabilities.
Entering into these contracts involves, to varying degrees, elements of interest, liquidity and counterparty credit risk in excess of the amounts recognized in the Statement of Assets and Liabilities. Such risks involve the possibility that there may be unfavorable changes in interest rates, market conditions or other conditions, that it may be difficult to initiate a swap transaction or liquidate a position at an advantageous time or price which may result in significant losses, and that the bilateral counterparty, FCM or CCP, as applicable, may not fulfill its obligation under the contract.
Credit default swap contracts
The Fund entered into credit default swap contracts to increase or decrease its credit exposure to an index. These instruments may be used for other purposes in future periods. Credit default swap contracts are transactions in which one party pays fixed periodic payments to a counterparty in consideration for an agreement from the counterparty to make a specific payment should a specified credit event(s) take place. Although specified credit events are contract specific, credit events are typically bankruptcy, failure to pay, restructuring, obligation acceleration, obligation default, or repudiation/moratorium.
As the purchaser of a credit default swap contract, the Fund purchases protection by paying a periodic interest rate on the notional amount to the counterparty. The interest amount is accrued daily as a component of unrealized appreciation (depreciation) and is recorded as a realized loss upon payment. If a credit event as specified in the contract occurs, the Fund may have the option either to deliver the reference obligation to the seller in exchange for a cash payment of its par amount, or to receive a net cash settlement equal to the par amount less an agreed-upon value of the reference obligation as of the date of the credit event. The difference between the value of the obligation or cash delivered and the notional amount received will be recorded as a realized gain (loss).
As the seller of a credit default swap contract, the Fund sells protection to a buyer and will generally receive a periodic interest rate on a notional amount. The interest amount is accrued daily as a component of unrealized appreciation (depreciation) and is recorded as a realized gain upon receipt of the payment. If a credit event as specified in the contract with the counterparty occurs, the Fund may either be required to accept the reference obligation from the buyer in exchange for a cash payment of its notional amount, or to pay the buyer a net cash settlement equal to the notional amount less an agreed-upon value of the reference obligation (recovery value) as of the date of the credit event. The difference between the value of the obligation or cash received and the notional amount paid will be recorded as a realized gain (loss). The maximum potential amount of undiscounted future payments the Fund could be required to make as the seller of protection under a credit default swap contract is equal to the notional amount of the reference obligation. These potential amounts may be partially offset by any recovery values of the respective reference obligations or upfront receipts upon entering into the agreement. The notional amounts and market values of all credit default swap contracts in which the Fund is the seller of protection, if any, are disclosed in the Credit Default Swap Contracts Outstanding schedule following the Portfolio of Investments.
As a protection seller, the Fund bears the risk of loss from the credit events specified in the contract with the counterparty. For credit default swap contracts on credit indices, quoted market prices and resulting market values serve as an indicator of the current status of the payment/performance risk. Increasing market values, in absolute terms when compared to the notional amount of the swap, represent a deterioration of the reference entity’s credit soundness and a greater likelihood or risk of default or other credit event occurring as defined under the terms of the contract.
Any upfront payment or receipt by the Fund upon entering into a credit default swap contract is recorded as an asset or liability, respectively, and amortized daily as a component of realized gain (loss) in the Statement of Operations. Credit default swap contracts are valued daily, and the change in value is recorded as unrealized appreciation (depreciation) until the termination of the swap, at which time a realized gain (loss) is recorded.
Credit default swap contracts can involve greater risks than if a fund had invested in the reference obligation directly since, in addition to general market risks, credit default swaps are subject to counterparty credit risk, leverage risk, hedging risk, correlation risk and liquidity risk.
Columbia Strategic Income Fund | Annual Report 2023
| 65 |
Notes to Financial Statements (continued)
August 31, 2023
Interest rate and inflation rate swap contracts
The Fund entered into interest rate swap transactions and/or inflation rate swap contracts to manage duration and yield curve exposure. These instruments may be used for other purposes in future periods. An interest rate swap or inflation rate swap, as applicable, is an agreement between two parties where there are two flows and payments are made between the two counterparties and the payments are dependent upon changes in an interest rate, inflation rate or inflation index calculated on a nominal amount. Interest rate swaps are agreements between two parties that involve the exchange of one type of interest rate for another type of interest rate cash flow on specified dates in the future, based on a predetermined, specified notional amount. Certain interest rate swaps are considered forward-starting, whereby the accrual for the exchange of cash flows does not begin until a specified date in the future. The net cash flow for a standard interest rate swap transaction is generally the difference between a floating market interest rate versus a fixed interest rate.
Interest rate swaps are valued daily and unrealized appreciation (depreciation) is recorded. Certain interest rate swaps may accrue periodic interest on a daily basis as a component of unrealized appreciation (depreciation); the Fund will realize a gain or loss upon the payment or receipt of accrued interest. The Fund will realize a gain or a loss when the interest rate swap is terminated.
Effects of derivative transactions in the financial statements
The following tables are intended to provide additional information about the effect of derivatives on the financial statements of the Fund, including: the fair value of derivatives by risk category and the location of those fair values in the Statement of Assets and Liabilities; and the impact of derivative transactions over the period in the Statement of Operations, including realized and unrealized gains (losses). The derivative instrument schedules following the Portfolio of Investments present additional information regarding derivative instruments outstanding at the end of the period, if any.
The following table is a summary of the fair value of derivative instruments (not considered to be hedging instruments for accounting disclosure purposes) at August 31, 2023:
| | Asset derivatives | |
Risk exposure
category | Statement
of assets and liabilities
location | Fair value ($) |
| Credit risk | Component of total distributable earnings (loss) — unrealized appreciation on swap contracts | 1,099,573* |
| Credit risk | Upfront payments on swap contracts | 9,673,206 |
| Foreign exchange risk | Unrealized appreciation on forward foreign currency exchange contracts | 250,275 |
| Interest rate risk | Component of total distributable earnings (loss) — unrealized appreciation on futures contracts | 6,093,857* |
| Interest rate risk | Investments, at value — Option contracts purchased | 760,283 |
| Interest rate risk | Component of total distributable earnings (loss) — unrealized appreciation on swap contracts | 18,819,370* |
| Total | | 36,696,564 |
| | Liability derivatives | |
Risk exposure
category | Statement
of assets and liabilities
location | Fair value ($) |
| Credit risk | Component of total distributable earnings (loss) — unrealized depreciation on swap contracts | 10,118,720* |
| Credit risk | Upfront receipts on swap contracts | 12,283,456 |
| Foreign exchange risk | Unrealized depreciation on forward foreign currency exchange contracts | 157,409 |
| Interest rate risk | Component of total distributable earnings (loss) — unrealized depreciation on futures contracts | 10,056,976* |
| Interest rate risk | Component of total distributable earnings (loss) — unrealized depreciation on swap contracts | 3,679,846* |
| Total | | 36,296,407 |
| * | Includes cumulative appreciation (depreciation) as reported in the tables following the Portfolio of Investments. Only the current day’s variation margin for futures and centrally cleared swaps, if any, is reported in receivables or payables in the Statement of Assets and Liabilities. |
| 66 | Columbia Strategic Income Fund | Annual Report 2023 |
Notes to Financial Statements (continued)
August 31, 2023
The following table indicates the effect of derivative instruments (not considered to be hedging instruments for accounting disclosure purposes) in the Statement of Operations for the year ended August 31, 2023:
| Amount of realized gain (loss) on derivatives recognized in income |
| Risk exposure category | Forward
foreign
currency
exchange
contracts
($) | Futures
contracts
($) | Option
contracts
purchased
($) | Option
contracts
written
($) | Swap
contracts
($) | Total
($) |
| Credit risk | — | — | — | — | (21,448,378) | (21,448,378) |
| Foreign exchange risk | (5,228,649) | — | — | — | — | (5,228,649) |
| Interest rate risk | — | 1,370,843 | (46,638,214) | 7,476,386 | (510,886) | (38,301,871) |
| Total | (5,228,649) | 1,370,843 | (46,638,214) | 7,476,386 | (21,959,264) | (64,978,898) |
| Change in unrealized appreciation (depreciation) on derivatives recognized in income |
| Risk exposure category | Forward
foreign
currency
exchange
contracts
($) | Futures
contracts
($) | Option
contracts
purchased
($) | Swap
contracts
($) | Total
($) |
| Credit risk | — | — | — | (39,823,388) | (39,823,388) |
| Foreign exchange risk | 235,844 | — | — | — | 235,844 |
| Interest rate risk | — | (11,241,011) | 6,275,954 | 5,862,911 | 897,854 |
| Total | 235,844 | (11,241,011) | 6,275,954 | (33,960,477) | (38,689,690) |
The following table is a summary of the average daily outstanding volume by derivative instrument for the year ended August 31, 2023:
| Derivative instrument | Average notional
amounts ($) |
| Futures contracts — long | 624,529,668 |
| Futures contracts — short | 2,154,253,293 |
| Credit default swap contracts — buy protection | 481,424,510 |
| Credit default swap contracts — sell protection | 93,483,836 |
| Derivative instrument | Average
value ($) |
| Option contracts purchased | 11,178,137 |
| Option contracts written | (3,723,613) |
| Derivative instrument | Average unrealized
appreciation ($) | Average unrealized
depreciation ($) |
| Forward foreign currency exchange contracts | 549,409 | (654,360) |
| Interest rate swap contracts | 16,104,330 | (3,455,175) |
Investments in senior loans
The Fund may invest in senior loan assignments. When the Fund purchases an assignment of a senior loan, the Fund typically has direct rights against the borrower; provided, however, that the Fund’s rights may be more limited than the lender from which it acquired the assignment and the Fund may be able to enforce its rights only through an administrative agent. Although certain senior loan assignments are secured by collateral, the Fund could experience delays or limitations in realizing such collateral or have its interest subordinated to other indebtedness of the obligor. In the event that the administrator or collateral agent of a loan becomes insolvent or enters into receivership or bankruptcy, the Fund may incur costs and delays in realizing payment or may suffer a loss of principal and/or interest. The risk of loss is greater for
Columbia Strategic Income Fund | Annual Report 2023
| 67 |
Notes to Financial Statements (continued)
August 31, 2023
unsecured or subordinated loans. In addition, senior loan assignments are vulnerable to market, economic or other conditions or events that may reduce the demand for senior loan assignments and certain senior loan assignments which were liquid when purchased, may become illiquid.
The Fund may enter into senior loan assignments where all or a portion of the loan may be unfunded. The Fund is obligated to fund these commitments at the borrower’s discretion. These commitments, if any, are generally traded and priced in the same manner as other senior loan securities and are disclosed as unfunded senior loan commitments in the Fund’s Portfolio of Investments with a corresponding payable for investments purchased. The Fund designates cash or liquid securities to cover these commitments.
Asset- and mortgage-backed securities
The Fund may invest in asset-backed and mortgage-backed securities. The maturity dates shown represent the original maturity of the underlying obligation. Actual maturity may vary based upon prepayment activity on these obligations. All, or a portion, of the obligation may be prepaid at any time because the underlying asset may be prepaid. As a result, decreasing market interest rates could result in an increased level of prepayment. An increased prepayment rate will have the effect of shortening the maturity of the security. Unless otherwise noted, the coupon rates presented are fixed rates.
Delayed delivery securities
The Fund may trade securities on other than normal settlement terms, including securities purchased or sold on a “when-issued” or "forward commitment" basis. This may increase risk to the Fund since the other party to the transaction may fail to deliver, which could cause the Fund to subsequently invest at less advantageous prices. The Fund designates cash or liquid securities in an amount equal to the delayed delivery commitment.
To be announced securities
The Fund may trade securities on a To Be Announced (TBA) basis. As with other delayed-delivery transactions, a seller agrees to issue a TBA security at a future date. However, the seller does not specify the particular securities to be delivered. Instead, the Fund agrees to accept any security that meets specified terms.
In some cases, Master Securities Forward Transaction Agreements (MSFTAs) may be used to govern transactions of certain forward-settling agency mortgage-backed securities, such as delayed-delivery and TBAs, between the Fund and counterparty. The MSFTA maintains provisions for, among other things, initiation and confirmation, payment and transfer, events of default, termination, and maintenance of collateral relating to such transactions.
Mortgage dollar roll transactions
The Fund may enter into mortgage “dollar rolls” in which the Fund sells securities for delivery in the current month and simultaneously contracts with the same counterparty to repurchase similar but not identical securities (same type, coupon and maturity) on a specified future date. These transactions may increase the Fund’s portfolio turnover rate. During the roll period, the Fund loses the right to receive principal and interest paid on the securities sold. However, the Fund may benefit because it receives negotiated amounts in the form of reductions of the purchase price for the future purchase plus the interest earned on the cash proceeds of the securities sold until the settlement date of the forward purchase. The Fund records the incremental difference between the forward purchase and sale of each forward roll as a realized gain or loss. Unless any realized gains exceed the income, capital appreciation, and gain or loss due to mortgage prepayments that would have been realized on the securities sold as part of the mortgage dollar roll, the use of this technique may diminish the investment performance of the Fund compared to what the performance would have been without the use of mortgage dollar rolls. Mortgage dollar rolls involve the risk that the market value of the securities the Fund is obligated to repurchase may decline below the repurchase price, or that the counterparty may default on its obligations. All cash proceeds will be invested in instruments that are permissible investments for the Fund. The Fund identifies cash or liquid securities in an amount equal to the forward purchase price. The Fund does not currently enter into mortgage dollar rolls that are accounted for as financing transactions.
| 68 | Columbia Strategic Income Fund | Annual Report 2023 |
Notes to Financial Statements (continued)
August 31, 2023
Interest only and principal only securities
The Fund may invest in Interest Only (IO) or Principal Only (PO) securities. IOs are stripped securities entitled to receive all of the security’s interest, but none of its principal. IOs are particularly sensitive to changes in interest rates and therefore subject to greater fluctuations in price than typical interest bearing debt securities. IOs are also subject to credit risk because the Fund may not receive all or part of the interest payments if the issuer, obligor, guarantor or counterparty defaults on its obligation. Payments received for IOs are included in interest income in the Statement of Operations. Because no principal will be received at the maturity of an IO, adjustments are made to the cost of the security on a monthly basis until maturity. These adjustments are included in interest income in the Statement of Operations. POs are stripped securities entitled to receive the principal from the underlying obligation, but not the interest. POs are particularly sensitive to changes in interest rates and therefore are subject to fluctuations in price. POs are also subject to credit risk because the Fund may not receive all or part of its principal if the issuer, obligor, guarantor or counterparty defaults on its obligation. The Fund may also invest in IO or PO stripped mortgage-backed securities. Payments received for POs are treated as reductions to the cost and par value of the securities.
Offsetting of assets and liabilities
The following table presents the Fund’s gross and net amount of assets and liabilities available for offset under netting arrangements as well as any related collateral received or pledged by the Fund as of August 31, 2023:
| | Citi ($) (a) | Citi ($) (a) | Goldman
Sachs
International ($) | HSBC ($) | JPMorgan ($) | Morgan
Stanley ($) (a) | Morgan
Stanley ($) (a) | Total ($) |
| Assets | | | | | | | | |
| Centrally cleared credit default swap contracts (b) | - | - | - | - | - | - | 119,953 | 119,953 |
| Centrally cleared interest rate swap contracts (b) | - | - | - | - | - | - | 1,849 | 1,849 |
| Forward foreign currency exchange contracts | 250,275 | - | - | - | - | - | - | 250,275 |
| Call option contracts purchased | 760,283 | - | - | - | - | - | - | 760,283 |
| OTC credit default swap contracts (c) | - | 6,275,938 | 876,717 | - | 876,716 | 2,743,408 | - | 10,772,779 |
| Total assets | 1,010,558 | 6,275,938 | 876,717 | - | 876,716 | 2,743,408 | 121,802 | 11,905,139 |
| Liabilities | | | | | | | | |
| Centrally cleared interest rate swap contracts (b) | - | - | - | - | - | - | 159,634 | 159,634 |
| Forward foreign currency exchange contracts | - | - | - | 157,409 | - | - | - | 157,409 |
| OTC credit default swap contracts (c) | - | 8,666,817 | - | - | 7,808,261 | 3,162,891 | - | 19,637,969 |
| Total liabilities | - | 8,666,817 | - | 157,409 | 7,808,261 | 3,162,891 | 159,634 | 19,955,012 |
| Total financial and derivative net assets | 1,010,558 | (2,390,879) | 876,717 | (157,409) | (6,931,545) | (419,483) | (37,832) | (8,049,873) |
| Total collateral received (pledged) (d) | 588,008 | (2,241,000) | 876,717 | - | (6,600,000) | (383,000) | (37,832) | (7,797,107) |
| Net amount (e) | 422,550 | (149,879) | - | (157,409) | (331,545) | (36,483) | - | (252,766) |
| (a) | Exposure can only be netted across transactions governed under the same master agreement with the same legal entity. |
| (b) | Centrally cleared swaps are included within payable/receivable for variation margin in the Statement of Assets and Liabilities. |
| (c) | Over-the-Counter (OTC) swap contracts are presented at market value plus periodic payments receivable (payable), which is comprised of unrealized appreciation, unrealized depreciation, upfront payments and upfront receipts. |
| (d) | In some instances, the actual collateral received and/or pledged may be more than the amount shown due to overcollateralization. |
| (e) | Represents the net amount due from/(to) counterparties in the event of default. |
Columbia Strategic Income Fund | Annual Report 2023
| 69 |
Notes to Financial Statements (continued)
August 31, 2023
Security transactions
Security transactions are accounted for on the trade date. Cost is determined and gains (losses) are based upon the specific identification method for both financial statement and federal income tax purposes.
The trade date for senior loans purchased in the primary market is the date on which the loan is allocated. The trade date for senior loans purchased in the secondary market is the date on which the transaction is entered into.
Income recognition
Interest income is recorded on an accrual basis. Market premiums and discounts, including original issue discounts, are amortized and accreted, respectively, over the expected life of the security on all debt securities, unless otherwise noted. The Fund classifies gains and losses realized on prepayments received on mortgage-backed securities as adjustments to interest income. For convertible securities, premiums attributable to the conversion feature are not amortized.
The Fund may place a debt security on non-accrual status and reduce related interest income when it becomes probable that the interest will not be collected and the amount of uncollectible interest can be reasonably estimated. The Fund may also adjust accrual rates when it becomes probable the full interest will not be collected and a partial payment will be received. A defaulted debt security is removed from non-accrual status when the issuer resumes interest payments or when collectability of interest is reasonably assured.
Corporate actions and dividend income are generally recorded net of any non-reclaimable tax withholdings, on the ex-dividend date or upon receipt of an ex-dividend notification in the case of certain foreign securities.
The Fund may receive distributions from holdings in equity securities, business development companies (BDCs), exchange-traded funds (ETFs), limited partnerships (LPs), other regulated investment companies (RICs), and real estate investment trusts (REITs), which report information as to the tax character of their distributions annually. These distributions are allocated to dividend income, capital gain and return of capital based on actual information reported. Return of capital is recorded as a reduction of the cost basis of securities held. If the Fund no longer owns the applicable securities, return of capital is recorded as a realized gain. With respect to REITs, to the extent actual information has not yet been reported, estimates for return of capital are made by Columbia Management Investment Advisers, LLC (the Investment Manager), a wholly-owned subsidiary of Ameriprise Financial, Inc. (Ameriprise Financial). The Investment Manager’s estimates are subsequently adjusted when the actual character of the distributions is disclosed by the REITs, which could result in a proportionate change in return of capital to shareholders.
Awards from class action litigation are recorded as a reduction of cost basis if the Fund still owns the applicable securities on the payment date. If the Fund no longer owns the applicable securities on the payment date, the proceeds are recorded as realized gains.
The value of additional securities received as an income payment through a payment-in-kind, if any, is recorded as interest income and increases the cost basis of such securities.
The Fund may receive other income from senior loans, including amendment fees, consent fees and commitment fees. These fees are recorded as income when received by the Fund. These amounts are included in Interest Income in the Statement of Operations.
Expenses
General expenses of the Trust are allocated to the Fund and other funds of the Trust based upon relative net assets or other expense allocation methodologies determined by the nature of the expense. Expenses directly attributable to the Fund are charged to the Fund. Expenses directly attributable to a specific class of shares are charged to that share class.
Determination of class net asset value
All income, expenses (other than class-specific expenses, which are charged to that share class, as shown in the Statement of Operations) and realized and unrealized gains (losses) are allocated to each class of the Fund on a daily basis, based on the relative net assets of each class, for purposes of determining the net asset value of each class.
| 70 | Columbia Strategic Income Fund | Annual Report 2023 |
Notes to Financial Statements (continued)
August 31, 2023
Federal income tax status
The Fund intends to qualify each year as a regulated investment company under Subchapter M of the Internal Revenue Code, as amended, and will distribute substantially all of its investment company taxable income and net capital gain, if any, for its tax year, and as such will not be subject to federal income taxes. In addition, the Fund intends to distribute in each calendar year substantially all of its ordinary income, capital gain net income and certain other amounts, if any, such that the Fund should not be subject to federal excise tax. Therefore, no federal income or excise tax provision is recorded.
Foreign taxes
The Fund may be subject to foreign taxes on income, gains on investments or currency repatriation, a portion of which may be recoverable. The Fund will accrue such taxes and recoveries, as applicable, based upon its current interpretation of tax rules and regulations that exist in the markets in which it invests.
Realized gains in certain countries may be subject to foreign taxes at the Fund level, based on statutory rates. The Fund accrues for such foreign taxes on realized and unrealized gains at the appropriate rate for each jurisdiction, as applicable. The amount, if any, is disclosed as a liability in the Statement of Assets and Liabilities.
Distributions to shareholders
Distributions from net investment income, if any, are declared and paid monthly. Net realized capital gains, if any, are distributed at least annually. Income distributions and capital gain distributions are determined in accordance with federal income tax regulations, which may differ from GAAP.
Guarantees and indemnifications
Under the Trust’s organizational documents and, in some cases, by contract, its officers and trustees are indemnified against certain liabilities arising out of the performance of their duties to the Trust or its funds. In addition, certain of the Fund’s contracts with its service providers contain general indemnification clauses. The Fund’s maximum exposure under these arrangements is unknown since the amount of any future claims that may be made against the Fund cannot be determined, and the Fund has no historical basis for predicting the likelihood of any such claims.
Recent accounting pronouncements and regulatory updates
Tailored Shareholder Reports
In October 2022, the Securities and Exchange Commission (SEC) adopted a final rule relating to Tailored Shareholder Reports for Mutual Funds and Exchange-Traded Funds; Fee Information in Investment Company Advertisements. The rule and form amendments will, among other things, require the Fund to transmit concise and visually engaging shareholder reports that highlight key information. The amendments will require that funds tag information in a structured data format and that certain more in-depth information be made available online and available for delivery free of charge to investors on request. The amendments became effective January 24, 2023. There is an 18-month transition period after the effective date of the amendments.
Note 3. Fees and other transactions with affiliates
Management services fees
The Fund has entered into a Management Agreement with Columbia Management Investment Advisers, LLC (the Investment Manager), a wholly-owned subsidiary of Ameriprise Financial, Inc. (Ameriprise Financial). Under the Management Agreement, the Investment Manager provides the Fund with investment research and advice, as well as administrative and accounting services. The management services fee is an annual fee that is equal to a percentage of the Fund’s daily net assets that declines from 0.60% to 0.393% as the Fund’s net assets increase. The effective management services fee rate for the year ended August 31, 2023 was 0.557% of the Fund’s average daily net assets.
Columbia Strategic Income Fund | Annual Report 2023
| 71 |
Notes to Financial Statements (continued)
August 31, 2023
Compensation of board members
Members of the Board of Trustees who are not officers or employees of the Investment Manager or Ameriprise Financial are compensated for their services to the Fund as disclosed in the Statement of Operations. Under a Deferred Compensation Plan (the Deferred Plan), these members of the Board of Trustees may elect to defer payment of up to 100% of their compensation. Deferred amounts are treated as though equivalent dollar amounts had been invested in shares of certain funds managed by the Investment Manager. The Fund’s liability for these amounts is adjusted for market value changes and remains in the Fund until distributed in accordance with the Deferred Plan. All amounts payable under the Deferred Plan constitute a general unsecured obligation of the Fund. The expense for the Deferred Plan, which includes Trustees’ fees deferred during the current period as well as any gains or losses on the Trustees’ deferred compensation balances as a result of market fluctuations, is included in "Trustees’ fees" in the Statement of Operations.
Compensation of Chief Compliance Officer
The Board of Trustees has appointed a Chief Compliance Officer for the Fund in accordance with federal securities regulations. As disclosed in the Statement of Operations, a portion of the Chief Compliance Officer’s total compensation is allocated to the Fund, along with other allocations to affiliated registered investment companies managed by the Investment Manager and its affiliates, based on relative net assets.
Transfer agency fees
Under a Transfer and Dividend Disbursing Agent Agreement, Columbia Management Investment Services Corp. (the Transfer Agent), an affiliate of the Investment Manager and a wholly-owned subsidiary of Ameriprise Financial, is responsible for providing transfer agency services to the Fund. The Transfer Agent has contracted with SS&C GIDS, Inc. (SS&C GIDS) to serve as sub-transfer agent. Prior to January 1, 2023, SS&C GIDS was known as DST Asset Manager Solutions, Inc. The Transfer Agent pays the fees of SS&C GIDS for services as sub-transfer agent and SS&C GIDS is not entitled to reimbursement for such fees from the Fund (with the exception of out-of-pocket fees).
The Fund pays the Transfer Agent a monthly transfer agency fee based on the number or the average value of accounts, depending on the type of account. In addition, the Fund pays the Transfer Agent a fee for shareholder services based on the number of accounts or on a percentage of the average aggregate value of the Fund’s shares maintained in omnibus accounts up to the lesser of the amount charged by the financial intermediary or a cap established by the Board of Trustees from time to time.
The Transfer Agent also receives compensation from the Fund for various shareholder services and reimbursements for certain out-of-pocket fees. Total transfer agency fees for Institutional 2 Class and Institutional 3 Class shares are subject to an annual limitation of not more than 0.07% and 0.02%, respectively, of the average daily net assets attributable to each share class.
For the year ended August 31, 2023, the Fund’s effective transfer agency fee rates as a percentage of average daily net assets of each class were as follows:
| | Effective rate (%) |
| Class A | 0.10 |
| Advisor Class | 0.10 |
| Class C | 0.10 |
| Institutional Class | 0.10 |
| Institutional 2 Class | 0.06 |
| Institutional 3 Class | 0.01 |
| Class R | 0.10 |
An annual minimum account balance fee of $20 may apply to certain accounts with a value below the applicable share class’s initial minimum investment requirements to reduce the impact of small accounts on transfer agency fees. These minimum account balance fees are remitted to the Fund and recorded as part of expense reductions in the Statement of Operations. For the year ended August 31, 2023, these minimum account balance fees reduced total expenses of the Fund by $3,103.
| 72 | Columbia Strategic Income Fund | Annual Report 2023 |
Notes to Financial Statements (continued)
August 31, 2023
Distribution and service fees
The Fund has entered into an agreement with Columbia Management Investment Distributors, Inc. (the Distributor), an affiliate of the Investment Manager and a wholly-owned subsidiary of Ameriprise Financial, for distribution and shareholder services. The Board of Trustees has approved, and the Fund has adopted, distribution and shareholder service plans (the Plans) applicable to certain share classes, which set the distribution and service fees for the Fund. These fees are calculated daily and are intended to compensate the Distributor and/or eligible selling and/or servicing agents for selling shares of the Fund and providing services to investors.
Under the Plans, the Fund pays a monthly service fee to the Distributor at the maximum annual rate of 0.25% of the average daily net assets attributable to Class A and Class C shares of the Fund. Also under the Plans, the Fund pays a monthly distribution fee to the Distributor at the maximum annual rates of 0.75% and 0.50% of the average daily net assets attributable to Class C and Class R shares of the Fund, respectively.
Sales charges (unaudited)
Sales charges, including front-end charges and contingent deferred sales charges (CDSCs), received by the Distributor for distributing Fund shares for the year ended August 31, 2023, if any, are listed below:
| | Front End (%) | CDSC (%) | Amount ($) |
| Class A | 4.75 | 0.50 - 1.00(a) | 649,510 |
| Class C | — | 1.00(b) | 17,432 |
| (a) | This charge is imposed on certain investments of between $1 million and $50 million redeemed within 18 months after purchase, as follows: 1.00% if redeemed within 12 months after purchase, and 0.50% if redeemed more than 12, but less than 18, months after purchase, with certain limited exceptions. |
| (b) | This charge applies to redemptions within 12 months after purchase, with certain limited exceptions. |
The Fund’s other share classes are not subject to sales charges.
Expenses waived/reimbursed by the Investment Manager and its affiliates
The Investment Manager and certain of its affiliates have contractually agreed to waive fees and/or reimburse expenses (excluding certain fees and expenses described below) for the period(s) disclosed below, unless sooner terminated at the sole discretion of the Board of Trustees, so that the Fund’s net operating expenses, after giving effect to fees waived/expenses reimbursed and any balance credits and/or overdraft charges from the Fund’s custodian, do not exceed the following annual rate(s) as a percentage of the classes’ average daily net assets:
| | January 1, 2023
through
December 31, 2023 | Prior to
January 1, 2023 |
| Class A | 0.96% | 0.98% |
| Advisor Class | 0.71 | 0.73 |
| Class C | 1.71 | 1.73 |
| Institutional Class | 0.71 | 0.73 |
| Institutional 2 Class | 0.67 | 0.70 |
| Institutional 3 Class | 0.62 | 0.65 |
| Class R | 1.21 | 1.23 |
Under the agreement governing these fee waivers and/or expense reimbursement arrangements, the following fees and expenses are excluded from the waiver/reimbursement commitment, and therefore will be paid by the Fund, if applicable: taxes (including foreign transaction taxes), expenses associated with investments in affiliated and non-affiliated pooled investment vehicles (including mutual funds and exchange-traded funds), transaction costs and brokerage commissions, costs related to any securities lending program, dividend expenses associated with securities sold short, inverse floater program fees and expenses, transaction charges and interest on borrowed money, interest, costs associated with shareholder meetings, infrequent and/or unusual expenses and any other expenses the exclusion of which is
Columbia Strategic Income Fund | Annual Report 2023
| 73 |
Notes to Financial Statements (continued)
August 31, 2023
specifically approved by the Board of Trustees. This agreement may be modified or amended only with approval from the Investment Manager, certain of its affiliates and the Fund. Any fees waived and/or expenses reimbursed under the expense reimbursement arrangements described above are not recoverable by the Investment Manager or its affiliates in future periods.
Note 4. Federal tax information
The timing and character of income and capital gain distributions are determined in accordance with income tax regulations, which may differ from GAAP because of temporary or permanent book to tax differences.
At August 31, 2023, these differences were primarily due to differing treatment for deferral/reversal of wash sale losses, foreign currency transactions, derivative investments, swap investments, tax straddles, investments in partnerships and/or grantor trusts, principal and/or interest from fixed income securities, defaulted securities/troubled debt, capital loss carryforwards, trustees’ deferred compensation, passive foreign investment company (pfic) holdings, foreign capital gains tax and miscellaneous adjustments. To the extent these differences were permanent, reclassifications were made among the components of the Fund’s net assets. Temporary differences do not require reclassifications.
The following reclassifications were made:
Undistributed net
investment
income ($) | Accumulated
net realized
(loss) ($) | Paid in
capital ($) |
| (19,442,683) | 19,442,684 | (1) |
Net investment income (loss) and net realized gains (losses), as disclosed in the Statement of Operations, and net assets were not affected by this reclassification.
The tax character of distributions paid during the years indicated was as follows:
| Year Ended August 31, 2023 | Year Ended August 31, 2022 |
Ordinary
income ($) | Long-term
capital gains ($) | Total ($) | Ordinary
income ($) | Long-term
capital gains ($) | Total ($) |
| 254,067,844 | — | 254,067,844 | 243,209,871 | 44,875,536 | 288,085,407 |
Short-term capital gain distributions, if any, are considered ordinary income distributions for tax purposes.
At August 31, 2023, the components of distributable earnings on a tax basis were as follows:
Undistributed
ordinary income ($) | Undistributed
long-term
capital gains ($) | Capital loss
carryforwards ($) | Net unrealized
(depreciation) ($) |
| 10,075,762 | — | (541,037,926) | (382,357,158) |
At August 31, 2023, the cost of all investments for federal income tax purposes along with the aggregate gross unrealized appreciation and depreciation based on that cost was:
Federal
tax cost ($) | Gross unrealized
appreciation ($) | Gross unrealized
(depreciation) ($) | Net unrealized
(depreciation) ($) |
| 6,487,732,934 | 37,567,278 | (419,924,436) | (382,357,158) |
Tax cost of investments and unrealized appreciation/(depreciation) may also include timing differences that do not constitute adjustments to tax basis.
| 74 | Columbia Strategic Income Fund | Annual Report 2023 |
Notes to Financial Statements (continued)
August 31, 2023
The following capital loss carryforwards, determined at August 31, 2023, may be available to reduce future net realized gains on investments, if any, to the extent permitted by the Internal Revenue Code. In addition, for the year ended August 31, 2023, capital loss carryforwards utilized, if any, were as follows:
No expiration
short-term ($) | No expiration
long-term ($) | Total ($) | Utilized ($) |
| (168,577,382) | (372,460,544) | (541,037,926) | — |
Management of the Fund has concluded that there are no significant uncertain tax positions in the Fund that would require recognition in the financial statements. However, management’s conclusion may be subject to review and adjustment at a later date based on factors including, but not limited to, new tax laws, regulations, and administrative interpretations (including relevant court decisions). Generally, the Fund’s federal tax returns for the prior three fiscal years remain subject to examination by the Internal Revenue Service.
Note 5. Portfolio information
The cost of purchases and proceeds from sales of securities, excluding short-term investments and derivatives, if any, aggregated to $17,140,815,106 and $17,075,874,428, respectively, for the year ended August 31, 2023, of which $15,180,659,824 and $14,852,519,470, respectively, were U.S. government securities. The amount of purchase and sale activity impacts the portfolio turnover rate reported in the Financial Highlights.
Note 6. Affiliated money market fund
The Fund invests in Columbia Short-Term Cash Fund, an affiliated money market fund established for the exclusive use by the Fund and other affiliated funds (the Affiliated MMF). The income earned by the Fund from such investments is included as Dividends - affiliated issuers in the Statement of Operations. As an investing fund, the Fund indirectly bears its proportionate share of the expenses of the Affiliated MMF. The Affiliated MMF prices its shares with a floating net asset value. The Securities and Exchange Commission has adopted amendments to money market fund rules requiring institutional prime money market funds like the Affiliated MMF to be subject, by October 2, 2024, to a liquidity fee if daily net redemptions exceed 5% of net assets and, by April 2, 2024, to a discretionary liquidity fee up to 2% if the imposition of such a fee is determined to be in the best interest of the Affiliated MMF.
Note 7. Interfund lending
Pursuant to an exemptive order granted by the Securities and Exchange Commission, the Fund participates in a program (the Interfund Program) allowing each participating Columbia Fund (each, a Participating Fund) to lend money directly to and, except for closed-end funds and money market funds, borrow money directly from other Participating Funds for temporary purposes. The amounts eligible for borrowing and lending under the Interfund Program are subject to certain restrictions.
Interfund loans are subject to the risk that the borrowing fund could be unable to repay the loan when due, and a delay in repayment to the lending fund could result in lost opportunities and/or additional lending costs. The exemptive order is subject to conditions intended to mitigate conflicts of interest arising from the Investment Manager’s relationship with each Participating Fund.
The Fund’s activity in the Interfund Program during the year ended August 31, 2023 was as follows:
| Borrower or lender | Average loan
balance ($) | Weighted average
interest rate (%) | Number of days
with outstanding loans |
| Lender | 2,023,077 | 4.92 | 13 |
Interest income earned by the Fund is recorded as interfund lending in the Statement of Operations. The Fund had no outstanding interfund loans at August 31, 2023.
Columbia Strategic Income Fund | Annual Report 2023
| 75 |
Notes to Financial Statements (continued)
August 31, 2023
Note 8. Line of credit
The Fund has access to a revolving credit facility with a syndicate of banks led by JPMorgan Chase Bank, N.A., Citibank, N.A. and Wells Fargo Bank, N.A. whereby the Fund may borrow for the temporary funding of shareholder redemptions or for other temporary or emergency purposes. Pursuant to an October 27, 2022 amendment and restatement, the credit facility, which is an agreement between the Fund and certain other funds managed by the Investment Manager or an affiliated investment manager, severally and not jointly, permits aggregate borrowings up to $950 million. Interest is currently charged to each participating fund based on its borrowings at a rate equal to the higher of (i) the federal funds effective rate, (ii) the secured overnight financing rate plus 0.10% and (iii) the overnight bank funding rate plus, in each case, 1.00%. Each borrowing under the credit facility matures no later than 60 days after the date of borrowing. The Fund also pays a commitment fee equal to its pro rata share of the unused amount of the credit facility at a rate of 0.15% per annum. The commitment fee is included in other expenses in the Statement of Operations. This agreement expires annually in October unless extended or renewed. Prior to the October 27, 2022 amendment and restatement, the Fund had access to a revolving credit facility with a syndicate of banks led by JPMorgan Chase Bank, N.A., Citibank, N.A. and Wells Fargo Bank, N.A. which permitted collective borrowings up to $950 million. Interest was charged to each participating fund based on its borrowings at a rate equal to the higher of (i) the federal funds effective rate, (ii) the secured overnight financing rate plus 0.11448% and (iii) the overnight bank funding rate plus, in each case, 1.00%.
The Fund had no borrowings during the year ended August 31, 2023.
Note 9. Fund reorganization
At the close of business on December 10, 2021, the Fund acquired the assets and assumed the identified liabilities of BMO Strategic Income Fund (the Acquired Fund), a series of BMO Funds Inc. The reorganization was completed after shareholders of the Acquired Fund approved a plan of reorganization at a shareholder meeting held on November 23, 2021. The purpose of the reorganization was to combine two funds with comparable investment objectives and strategies.
The aggregate net assets of the Fund immediately before the reorganization were $6,878,447,698 and the combined net assets immediately after the reorganization were $6,990,663,256.
The reorganization was accomplished by a tax-free exchange of 11,715,409 shares of the Acquired Fund valued at $112,215,558 (including $348,590 of unrealized appreciation/(depreciation)).
In exchange for the Acquired Fund’s shares, the Fund issued the following number of shares:
| | Shares |
| Class A | 2,720,908 |
| Advisor Class | 1,900,358 |
For financial reporting purposes, net assets received and shares issued by the Fund were recorded at fair value; however, the Acquired Fund’s cost of investments was carried forward.
The Fund’s financial statements reflect both the operations of the Fund for the period prior to the reorganization and the combined Fund for the period subsequent to the reorganization. Because the combined investment portfolios have been managed as a single integrated portfolio since the reorganization was completed, it is not practicable to separate the amounts of revenue and earnings of the Acquired Fund that have been included in the combined Fund’s Statement of Operations since the reorganization was completed.
Assuming the reorganization had been completed on September 1, 2021, the Fund’s pro-forma results of operations for the year ended August 31, 2022 would have been approximately:
| | ($) |
| Net investment income | 226,993,000 |
| Net realized loss | (190,398,000) |
| Net change in unrealized appreciation/(depreciation) | (705,646,000) |
| Net decrease in net assets from operations | (669,051,000) |
| 76 | Columbia Strategic Income Fund | Annual Report 2023 |
Notes to Financial Statements (continued)
August 31, 2023
Note 10. Significant risks
Credit risk
Credit risk is the risk that the value of debt instruments in the Fund’s portfolio may decline because the issuer defaults or otherwise becomes unable or unwilling, or is perceived to be unable or unwilling, to honor its financial obligations, such as making payments to the Fund when due. Credit rating agencies assign credit ratings to certain debt instruments to indicate their credit risk. Lower-rated or unrated debt instruments held by the Fund may present increased credit risk as compared to higher-rated debt instruments.
Derivatives risk
Losses involving derivative instruments may be substantial, because a relatively small movement in the underlying reference (which is generally the price, rate or other economic indicator associated with a security(ies), commodity, currency, index or other instrument or asset) may result in a substantial loss for the Fund. In addition to the potential for increased losses, the use of derivative instruments may lead to increased volatility within the Fund. Derivatives will typically increase the Fund’s exposure to principal risks to which it is otherwise exposed, and may expose the Fund to additional risks, including correlation risk, counterparty risk, hedging risk, leverage risk, liquidity risk and pricing risk.
High-yield investments risk
Securities and other debt instruments held by the Fund that are rated below investment grade (commonly called "high-yield" or "junk" bonds) and unrated debt instruments of comparable quality expose the Fund to a greater risk of loss of principal and income than a fund that invests solely or primarily in investment grade debt instruments. In addition, these investments have greater price fluctuations, are less liquid and are more likely to experience a default than higher-rated debt instruments. High-yield debt instruments are considered to be predominantly speculative with respect to the issuer’s capacity to pay interest and repay principal.
Interest rate risk
Interest rate risk is the risk of losses attributable to changes in interest rates. In general, if interest rates rise, the values of debt instruments tend to fall, and if interest rates fall, the values of debt instruments tend to rise. Actions by governments and central banking authorities can result in increases or decreases in interest rates. Higher periods of inflation could lead such authorities to raise interest rates. Increasing interest rates may negatively affect the value of debt securities held by the Fund, resulting in a negative impact on the Fund’s performance and net asset value per share. In general, the longer the maturity or duration of a debt security, the greater its sensitivity to changes in interest rates. The Fund is subject to the risk that the income generated by its investments may not keep pace with inflation.
Liquidity risk
Liquidity risk is the risk associated with a lack of marketability of investments which may make it difficult to sell the investment at a desirable time or price. Changing regulatory, market or other conditions or environments (for example, the interest rate or credit environments) may adversely affect the liquidity of the Fund’s investments. The Fund may have to accept a lower selling price for the holding, sell other investments, or forego another, more appealing investment opportunity. Generally, the less liquid the market at the time the Fund sells a portfolio investment, the greater the risk of loss or decline of value to the Fund. A less liquid market can lead to an increase in Fund redemptions, which may negatively impact Fund performance and net asset value per share, including, for example, if the Fund is forced to sell securities in a down market.
Market risk
The Fund may incur losses due to declines in the value of one or more securities in which it invests. These declines may be due to factors affecting a particular issuer, or the result of, among other things, political, regulatory, market, economic or social developments affecting the relevant market(s) more generally. In addition, turbulence in financial markets and reduced liquidity in equity, credit and/or fixed income markets may negatively affect many issuers, which could adversely affect the Fund’s ability to price or value hard-to-value assets in thinly traded and closed markets and could cause significant redemptions and operational challenges. Global economies and financial markets are increasingly interconnected, and conditions and events in one country, region or financial market may adversely impact issuers in a different country, region or
Columbia Strategic Income Fund | Annual Report 2023
| 77 |
Notes to Financial Statements (continued)
August 31, 2023
financial market. These risks may be magnified if certain events or developments adversely interrupt the global supply chain; in these and other circumstances, such risks might affect companies worldwide. As a result, local, regional or global events such as terrorism, war, natural disasters, disease/virus outbreaks and epidemics or other public health issues, recessions, depressions or other events – or the potential for such events – could have a significant negative impact on global economic and market conditions.
The large-scale invasion of Ukraine by Russia in February 2022 has resulted in sanctions and market disruptions, including declines in regional and global stock markets, unusual volatility in global commodity markets and significant devaluations of Russian currency. The extent and duration of the military action are impossible to predict but could be significant. Market disruption caused by the Russian military action, and any counter-measures or responses thereto (including international sanctions, a downgrade in the country’s credit rating, purchasing and financing restrictions, boycotts, tariffs, changes in consumer or purchaser preferences, cyberattacks and espionage) could have severe adverse impacts on regional and/or global securities and commodities markets, including markets for oil and natural gas. These impacts may include reduced market liquidity, distress in credit markets, further disruption of global supply chains, increased risk of inflation, restricted cross-border payments and limited access to investments and/or assets in certain international markets and/or issuers. These developments and other related events could negatively impact Fund performance.
Mortgage- and other asset-backed securities risk
The value of any mortgage-backed and other asset-backed securities including collateralized debt obligations, if any, held by the Fund may be affected by, among other things, changes or perceived changes in: interest rates; factors concerning the interests in and structure of the issuer or the originator of the mortgages or other assets; the creditworthiness of the entities that provide any supporting letters of credit, surety bonds or other credit enhancements; or the market’s assessment of the quality of underlying assets. Payment of principal and interest on some mortgage-backed securities (but not the market value of the securities themselves) may be guaranteed by the full faith and credit of a particular U.S. Government agency, authority, enterprise or instrumentality, and some, but not all, are also insured or guaranteed by the U.S. Government. Mortgage-backed securities issued by non-governmental issuers (such as commercial banks, savings and loan institutions, private mortgage insurance companies, mortgage bankers and other secondary market issuers) may entail greater risk than obligations guaranteed by the U.S. Government. Mortgage- and other asset-backed securities are subject to liquidity risk and prepayment risk. A decline or flattening of housing values may cause delinquencies in mortgages (especially sub-prime or non-prime mortgages) underlying mortgage-backed securities and thereby adversely affect the ability of the mortgage-backed securities issuer to make principal and/or interest payments to mortgage-backed securities holders, including the Fund. Rising or high interest rates tend to extend the duration of mortgage- and other asset-backed securities, making their prices more volatile and more sensitive to changes in interest rates.
Shareholder concentration risk
At August 31, 2023, affiliated shareholders of record owned 24.6% of the outstanding shares of the Fund in one or more accounts. Fund shares sold to or redeemed by concentrated accounts may have a significant effect on the operations of the Fund. In the case of a large redemption, the Fund may be forced to sell investments at inopportune times, including its liquid positions, which may result in Fund losses and the Fund holding a higher percentage of less liquid positions. Large redemptions could result in decreased economies of scale and increased operating expenses for non-redeeming Fund shareholders.
Note 11. Subsequent events
Management has evaluated the events and transactions that have occurred through the date the financial statements were issued and noted no items requiring adjustment of the financial statements or additional disclosure.
Note 12. Information regarding pending and settled legal proceedings
Ameriprise Financial and certain of its affiliates are involved in the normal course of business in legal proceedings which include regulatory inquiries, arbitration and litigation, including class actions concerning matters arising in connection with the conduct of their activities as part of a diversified financial services firm. Ameriprise Financial believes that the Fund is not currently the subject of, and that neither Ameriprise Financial nor any of its affiliates are the subject of, any pending legal, arbitration or regulatory proceedings that are likely to have a material adverse effect on the Fund or the ability of Ameriprise
| 78 | Columbia Strategic Income Fund | Annual Report 2023 |
Notes to Financial Statements (continued)
August 31, 2023
Financial or its affiliates to perform under their contracts with the Fund. Ameriprise Financial is required to make quarterly (10-Q), annual (10-K) and, as necessary, 8-K filings with the Securities and Exchange Commission (SEC) on legal and regulatory matters that relate to Ameriprise Financial and its affiliates. Copies of these filings may be obtained by accessing the SEC website at www.sec.gov.
There can be no assurance that these matters, or the adverse publicity associated with them, will not result in increased Fund redemptions, reduced sale of Fund shares or other adverse consequences to the Fund. Further, although we believe proceedings are not likely to have a material adverse effect on the Fund or the ability of Ameriprise Financial or its affiliates to perform under their contracts with the Fund, these proceedings are subject to uncertainties and, as such, we are unable to estimate the possible loss or range of loss that may result. An adverse outcome in one or more of these proceedings could result in adverse judgments, settlements, fines, penalties or other relief that could have a material adverse effect on the consolidated financial condition or results of operations of Ameriprise Financial or one or more of its affiliates that provide services to the Fund.
Columbia Strategic Income Fund | Annual Report 2023
| 79 |
Report of Independent Registered Public Accounting Firm
To the Board of Trustees of Columbia Funds Series Trust I and Shareholders of Columbia Strategic Income Fund
Opinion on the Financial Statements
We have audited the accompanying statement of assets and liabilities, including the portfolio of investments, of Columbia Strategic Income Fund (one of the funds constituting Columbia Funds Series Trust I, referred to hereafter as the "Fund") as of August 31, 2023, the related statement of operations for the year ended August 31, 2023, the statement of changes in net assets for each of the two years in the period ended August 31, 2023, including the related notes, and the financial highlights for each of the five years in the period ended August 31, 2023 (collectively referred to as the "financial statements"). In our opinion, the financial statements present fairly, in all material respects, the financial position of the Fund as of August 31, 2023, the results of its operations for the year then ended, the changes in its net assets for each of the two years in the period ended August 31, 2023 and the financial highlights for each of the five years in the period ended August 31, 2023 in conformity with accounting principles generally accepted in the United States of America.
Basis for Opinion
These financial statements are the responsibility of the Fund’s management. Our responsibility is to express an opinion on the Fund’s financial statements based on our audits. We are a public accounting firm registered with the Public Company Accounting Oversight Board (United States) (PCAOB) and are required to be independent with respect to the Fund in accordance with the U.S. federal securities laws and the applicable rules and regulations of the Securities and Exchange Commission and the PCAOB.
We conducted our audits of these financial statements in accordance with the standards of the PCAOB. Those standards require that we plan and perform the audit to obtain reasonable assurance about whether the financial statements are free of material misstatement, whether due to error or fraud.
Our audits included performing procedures to assess the risks of material misstatement of the financial statements, whether due to error or fraud, and performing procedures that respond to those risks. Such procedures included examining, on a test basis, evidence regarding the amounts and disclosures in the financial statements. Our audits also included evaluating the accounting principles used and significant estimates made by management, as well as evaluating the overall presentation of the financial statements. Our procedures included confirmation of securities owned as of August 31, 2023 by correspondence with the custodian, transfer agent, brokers and agent banks; when replies were not received from brokers, we performed other auditing procedures. We believe that our audits provide a reasonable basis for our opinion.
/s/PricewaterhouseCoopers LLP
Minneapolis, Minnesota
October 23, 2023
We have served as the auditor of one or more investment companies within the Columbia Funds Complex since 1977.
| 80 | Columbia Strategic Income Fund | Annual Report 2023 |
TRUSTEES AND OFFICERS
(Unaudited)
The Board oversees the Fund’s operations and appoints officers who are responsible for day-to-day business decisions based on policies set by the Board. The following table provides basic biographical information about the Fund’s Trustees as of the printing of this report, including their principal occupations during the past five years, although specific titles for individuals may have varied over the period. The year set forth beneath Length of Service in the table below is the year in which the Trustee was first appointed or elected as Trustee to any Fund currently in the Columbia Funds Complex or a predecessor thereof. Under current Board policy, each Trustee generally serves until December 31 of the year such Trustee turns seventy-five (75).
Independent trustees
Name,
address,
year of birth | Position held
with the Columbia Funds and
length of service | Principal occupation(s)
during past five years
and other relevant
professional experience | Number of
Funds in the
Columbia Funds
Complex*
overseen | Other directorships
held by Trustee
during the past five years
and other relevant Board experience |
George S. Batejan
c/o Columbia Management
Investment Advisers, LLC
290 Congress Street
Boston, MA 02210
1954 | Trustee since 2017 | Executive Vice President, Global Head of Technology and Operations, Janus Capital Group, Inc., 2010-2016 | 173 | Former Chairman of the Board, NICSA (National Investment Company Services Association) (Executive Committee, Nominating Committee and Governance Committee), 2014-2016; former Director, Intech Investment Management, 2011-2016; former Board Member, Metro Denver Chamber of Commerce, 2015-2016; former Advisory Board Member, University of Colorado Business School, 2015-2018; former Board Member, Chase Bank International, 1993-1994 |
Kathleen Blatz
c/o Columbia Management
Investment Advisers, LLC
290 Congress Street
Boston, MA 02210
1954 | Trustee since 2006 | Attorney, specializing in arbitration and mediation; Chief Justice, Minnesota Supreme Court, 1998-2006; Associate Justice, Minnesota Supreme Court, 1996-1998; Fourth Judicial District Court Judge, Hennepin County, 1994-1996; Attorney in private practice and public service, 1984-1993; State Representative, Minnesota House of Representatives, 1979-1993, which included service on the Tax and Financial Institutions and Insurance Committees; Member and Interim Chair, Minnesota Sports Facilities Authority, January-July 2017; Interim President and Chief Executive Officer, Blue Cross and Blue Shield of Minnesota (health care insurance), February-July 2018, April-October 2021 | 173 | Former Trustee, Blue Cross and Blue Shield of Minnesota, 2009-2021 (Chair of the Business Development Committee, 2014-2017; Chair of the Governance Committee, 2017-2019); former Member and Chair of the Board, Minnesota Sports Facilities Authority, January 2017-July 2017; former Director, Robina Foundation, 2009-2020 (Chair, 2014-2020); Director, Richard M. Schulze Family Foundation, since 2021 |
Columbia Strategic Income Fund | Annual Report 2023
| 81 |
TRUSTEES AND OFFICERS (continued)
(Unaudited)
Independent trustees (continued)
Name,
address,
year of birth | Position held
with the Columbia Funds and
length of service | Principal occupation(s)
during past five years
and other relevant
professional experience | Number of
Funds in the
Columbia Funds
Complex*
overseen | Other directorships
held by Trustee
during the past five years
and other relevant Board experience |
Pamela G. Carlton
c/o Columbia Management
Investment Advisers, LLC
290 Congress Street
Boston, MA 02210
1954 | Chair since 2023; Trustee since 2007 | President, Springboard – Partners in Cross Cultural Leadership (consulting company), since 2003; Managing Director of US Equity Research, JP Morgan Chase, 1999-2003; Director of US Equity Research, Chase Asset Management, 1996-1999; Co-Director Latin America Research, 1993-1996, COO Global Research, 1992-1996, Co-Director of US Research, 1991-1992, Investment Banker, 1982-1991, Morgan Stanley; Attorney, Cleary Gottlieb Steen & Hamilton LLP, 1980-1982 | 173 | Trustee, New York Presbyterian Hospital Board, since 1996; Director, DR Bank (Audit Committee) since 2017; Director, Evercore Inc. (Audit Committee, Nominating and Governance Committee), since 2019; Director, Apollo Commercial Real Estate Finance, Inc. (Chair, Nominating and Governance Committee) (financial services), since 2021; the Governing Council of the Independent Directors Council (IDC), since 2021 |
Janet Langford Carrig
c/o Columbia Management
Investment Advisers, LLC
290 Congress Street
Boston, MA 02210
1957 | Trustee since 1996 | Senior Vice President, General Counsel and Corporate Secretary, ConocoPhillips (independent energy company), September 2007-October 2018 | 173 | Director, EQT Corporation (natural gas producer), since 2019; former Director, Whiting Petroleum Corporation (independent oil and gas company), 2020-2022 |
J. Kevin Connaughton
c/o Columbia Management
Investment Advisers, LLC
290 Congress Street
Boston, MA 02210
1964 | Trustee since 2020 | CEO and President, RhodeWay Financial (non-profit financial planning firm), since December 2022; Member, FINRA National Adjudicatory Council, since January 2020; Adjunct Professor of Finance, Bentley University since January 2018; Consultant to Independent Trustees of CFVIT and CFST I from March 2016 to June 2020 with respect to CFVIT and to December 2020 with respect to CFST I; Managing Director and General Manager of Mutual Fund Products, Columbia Management Investment Advisers, LLC, May 2010-February 2015; President, Columbia Funds, 2008-2015; and senior officer of Columbia Funds and affiliated funds, 2003-2015 | 171 | Former Director, The Autism Project, March 2015-December 2021; former Member of the Investment Committee, St. Michael’s College, November 2015-February 2020; former Trustee, St. Michael’s College, June 2017-September 2019; former Trustee, New Century Portfolios (former mutual fund complex), January 2015-December 2017 |
Olive M. Darragh
c/o Columbia Management
Investment Advisers, LLC
290 Congress Street
Boston, MA 02210
1962 | Trustee since 2020 | Managing Director of Darragh Inc. (strategy and talent management consulting firm), since 2010; Founder and CEO, Zolio, Inc. (investment management talent identification platform), since 2004; Consultant to Independent Trustees of CFVIT and CFST I from June 2019 to June 2020 with respect to CFVIT and to December 2020 with respect to CFST I; Partner, Tudor Investments, 2004-2010; Senior Partner, McKinsey & Company (consulting), 1990-2004; Touche Ross CPA, 1985-1988 | 171 | Treasurer, Edinburgh University US Trust Board, since January 2023; Member, HBS Community Action Partners Board, since September 2022; former Director, University of Edinburgh Business School (Member of US Board), 2004-2019; former Director, Boston Public Library Foundation, 2008-2017 |
| 82 | Columbia Strategic Income Fund | Annual Report 2023 |
TRUSTEES AND OFFICERS (continued)
(Unaudited)
Independent trustees (continued)
Name,
address,
year of birth | Position held
with the Columbia Funds and
length of service | Principal occupation(s)
during past five years
and other relevant
professional experience | Number of
Funds in the
Columbia Funds
Complex*
overseen | Other directorships
held by Trustee
during the past five years
and other relevant Board experience |
Patricia M. Flynn
c/o Columbia Management
Investment Advisers, LLC
290 Congress Street
Boston, MA 02210
1950 | Trustee since 2004 | Professor of Economics and Management, Bentley University, since 2002; Dean, McCallum Graduate School of Business, Bentley University, 1992-2002 | 173 | Former Trustee, MA Taxpayers Foundation, 1997-2022; former Director, The MA Business Roundtable, 2003-2019; former Chairperson, Innovation Index Advisory Committee, MA Technology Collaborative, 1997-2020 |
Brian J. Gallagher
c/o Columbia Management
Investment Advisers, LLC
290 Congress Street
Boston, MA 02210
1954 | Trustee since 2017 | Retired; Partner with Deloitte & Touche LLP and its predecessors, 1977-2016 | 173 | Trustee, Catholic Schools Foundation, since 2004 |
Douglas A. Hacker
c/o Columbia Management
Investment Advisers, LLC
290 Congress Street
Boston, MA 02210
1955 | Trustee since 1996 | Independent business executive, since May 2006; Executive Vice President – Strategy of United Airlines, December 2002 - May 2006; President of UAL Loyalty Services (airline marketing company), September 2001-December 2002; Executive Vice President and Chief Financial Officer of United Airlines, July 1999-September 2001 | 173 | Director, SpartanNash Company since November 2013 (Chair of the Board, since May 2021) (food distributor); Director, Aircastle Limited (Chair of Audit Committee) (aircraft leasing), since August 2006; former Director, Nash Finch Company (food distributor), 2005-2013; former Director, SeaCube Container Leasing Ltd. (container leasing), 2010-2013; and former Director, Travelport Worldwide Limited (travel information technology), 2014-2019 |
Nancy T. Lukitsh
c/o Columbia Management
Investment Advisers, LLC
290 Congress Street
Boston, MA 02210
1956 | Trustee since 2011 | Senior Vice President, Partner and Director of Marketing, Wellington Management Company, LLP (investment adviser), 1997-2010; Chair, Wellington Management Portfolios (commingled non-U.S. investment pools), 2007-2010; Director, Wellington Trust Company, NA and other Wellington affiliates, 1997-2010 | 171 | None |
Columbia Strategic Income Fund | Annual Report 2023
| 83 |
TRUSTEES AND OFFICERS (continued)
(Unaudited)
Independent trustees (continued)
Name,
address,
year of birth | Position held
with the Columbia Funds and
length of service | Principal occupation(s)
during past five years
and other relevant
professional experience | Number of
Funds in the
Columbia Funds
Complex*
overseen | Other directorships
held by Trustee
during the past five years
and other relevant Board experience |
David M. Moffett
c/o Columbia Management
Investment Advisers, LLC
290 Congress Street
Boston, MA 02210
1952 | Trustee since 2011 | Retired; former Chief Executive Officer of Freddie Mac and Chief Financial Officer of U.S. Bank | 171 | Director, CSX Corporation (transportation suppliers); Director, PayPal Holdings Inc. (payment and data processing services); Trustee, University of Oklahoma Foundation; former Director, eBay Inc. (online trading community), 2007-2015; and former Director, CIT Bank, CIT Group Inc. (commercial and consumer finance), 2010-2016; former Senior Adviser to The Carlyle Group (financial services), March 2008-September 2008; former Governance Consultant to Bridgewater Associates, January 2013-December 2015 |
Catherine James Paglia
c/o Columbia Management
Investment Advisers, LLC
290 Congress Street
Boston, MA 02210
1952 | Trustee since 2004 | Director, Enterprise Asset Management, Inc. (private real estate and asset management company), since September 1998; Managing Director and Partner, Interlaken Capital, Inc., 1989-1997; Vice President, 1982-1985, Principal, 1985-1987, Managing Director, 1987-1989, Morgan Stanley; Vice President, Investment Banking, 1980-1982, Associate, Investment Banking, 1976-1980, Dean Witter Reynolds, Inc. | 173 | Director, Valmont Industries, Inc. (irrigation systems manufacturer), since 2012; Trustee, Carleton College (on the Investment Committee), since 1987; Trustee, Carnegie Endowment for International Peace (on the Investment Committee), since 2009 |
Natalie A. Trunow
c/o Columbia Management
Investment Advisers, LLC
290 Congress Street
Boston, MA 02210
1967 | Trustee since 2020 | Chief Executive Officer, Millennial Portfolio Solutions LLC (asset management and consulting services), January 2016-January 2021; Non-executive Member of the Investment Committee and Valuation Committee, Sarona Asset Management Inc. (private equity firm) since September 2019; Advisor, Horizon Investments (asset management and consulting services), August 2018-January 2022; Advisor, Paradigm Asset Management, November 2016-January 2022; Consultant to Independent Trustees of CFVIT and CFST I from September 2016 to June 2020 with respect to CFVIT and to December 2020 with respect to CFST I; Director of Investments/Consultant, Casey Family Programs, April 2016-November 2016; Senior Vice President and Chief Investment Officer, Calvert Investments, August 2008-January 2016; Section Head and Portfolio Manager, General Motors Asset Management, June 1997-August 2008 | 171 | Independent Director, Investment Committee, Health Services for Children with Special Needs, Inc., 2010-2021; Independent Director, (Executive Committee and Chair, Audit Committee), Consumer Credit Counseling Services (formerly Guidewell Financial Solutions), since 2016; Independent Director, (Investment Committee), Sarona Asset Management, since 2019 |
| 84 | Columbia Strategic Income Fund | Annual Report 2023 |
TRUSTEES AND OFFICERS (continued)
(Unaudited)
Independent trustees (continued)
Name,
address,
year of birth | Position held
with the Columbia Funds and
length of service | Principal occupation(s)
during past five years
and other relevant
professional experience | Number of
Funds in the
Columbia Funds
Complex*
overseen | Other directorships
held by Trustee
during the past five years
and other relevant Board experience |
Sandra L. Yeager
c/o Columbia Management
Investment Advisers, LLC
290 Congress Street
Boston, MA 02210
1964 | Trustee since 2017 | Retired; President and founder, Hanoverian Capital, LLC (SEC registered investment advisor firm), 2008-2016; Managing Director, DuPont Capital, 2006-2008; Managing Director, Morgan Stanley Investment Management, 2004-2006; Senior Vice President, Alliance Bernstein, 1990-2004 | 173 | Former Director, NAPE (National Alliance for Partnerships in Equity) Education Foundation, October 2016-October 2020; Advisory Board, Jennersville YMCA, since 2022 |
Interested trustee affiliated with Investment Manager**
Name,
address,
year of birth | Position held with the Columbia Funds and length of service | Principal occupation(s) during the
past five years and other relevant
professional experience | Number of
Funds in the
Columbia Funds
Complex* overseen | Other directorships
held by Trustee
during the past
five years and
other relevant Board experience |
Daniel J. Beckman
c/o Columbia Management
Investment Advisers, LLC
290 Congress Street
Boston, MA 02210
1962 | Trustee since November 2021 and President since June 2021 | Vice President – Head of North America Product, Columbia Management Investment Advisers, LLC, since April 2015; President and Principal Executive Officer of the Columbia Funds, since June 2021; officer of Columbia Funds and affiliated funds, 2020-2021 | 173 | Director, Ameriprise Trust Company, since October 2016; Director, Columbia Management Investment Distributors, Inc. since November 2018; Board of Governors, Columbia Wanger Asset Management, LLC since, January 2022; Director, Columbia Threadneedle Canada, Inc., since December 2022 |
| * | The term “Columbia Funds Complex” as used herein includes Columbia Seligman Premium Technology Growth Fund, Tri-Continental Corporation and each series of Columbia Funds Series Trust (CFST), Columbia Funds Series Trust I (CFST I), Columbia Funds Series Trust II (CFST II), Columbia ETF Trust I (CET I), Columbia ETF Trust II (CET II), Columbia Funds Variable Insurance Trust (CFVIT) and Columbia Funds Variable Series Trust II (CFVST II). Messrs. Batejan, Beckman, Gallagher and Hacker and Mses. Blatz, Carlton, Carrig, Flynn, Paglia, and Yeager serve as directors of Columbia Seligman Premium Technology Growth Fund and Tri-Continental Corporation. |
| ** | Interested person (as defined under the 1940 Act) by reason of being an officer, director, security holder and/or employee of the Investment Manager or Ameriprise Financial. |
The Statement of Additional Information has additional information about the Fund’s Board members and is available, without charge, upon request by calling 800.345.6611, visiting columbiathreadneedleus.com/investor/ or contacting your financial intermediary.
Columbia Strategic Income Fund | Annual Report 2023
| 85 |
TRUSTEES AND OFFICERS (continued)
(Unaudited)
The Board has appointed officers who are responsible for day-to-day business decisions based on policies it has established. The officers serve at the pleasure of the Board. The following table provides basic information about the Officers of the Fund as of the printing of this report, including principal occupations during the past five years, although their specific titles may have varied over the period. In addition to Mr. Beckman, who is President and Principal Executive Officer, the Fund’s other officers are:
Fund officers
Name,
address and
year of birth | Position and year
first appointed to
position for any Fund
in the Columbia
Funds Complex or a
predecessor thereof | Principal occupation(s) during past five years |
Michael G. Clarke
290 Congress Street
Boston, MA 02210
1969 | Chief Financial Officer and Principal Financial Officer (2009) and Senior Vice President (2019) | Senior Vice President and North America Head of Operations & Investor Services, Columbia Management Investment Advisers, LLC, since June 2023 (previously Senior Vice President and Head of Global Operations, March 2022 – June 2023, Vice President, Head of North America Operations, and Co-Head of Global Operations, June 2019 - February 2022 and Vice President – Accounting and Tax, May 2010 - May 2019); senior officer of Columbia Funds and affiliated funds, since 2002. Director, Ameriprise Trust Company, since June 2023. |
Joseph Beranek
5890 Ameriprise Financial Center
Minneapolis, MN 55474
1965 | Treasurer and Chief Accounting Officer (Principal Accounting Officer) (2019) and Principal Financial Officer (2020), CFST, CFST I, CFST II, CFVIT and CFVST II; Assistant Treasurer, CET I and CET II | Vice President – Mutual Fund Accounting and Financial Reporting, Columbia Management Investment Advisers, LLC, since December 2018 and March 2017, respectively. |
Marybeth Pilat
290 Congress Street
Boston, MA 02210
1968 | Treasurer and Chief Accounting Officer (Principal Accounting Officer) and Principal Financial Officer (2020) for CET I and CET II; Assistant Treasurer, CFST, CFST I, CFST II, CFVIT and CFVST II | Vice President – Product Pricing and Administration, Columbia Management Investment Advisers, LLC, since May 2017. |
William F. Truscott
290 Congress Street
Boston, MA 02210
1960 | Senior Vice President (2001) | Formerly, Trustee/Director of Columbia Funds Complex or legacy funds, November 2001 - January 1, 2021; Chief Executive Officer, Global Asset Management, Ameriprise Financial, Inc., since September 2012; Chairman of the Board and President, Columbia Management Investment Advisers, LLC, since July 2004 and February 2012, respectively; Chairman of the Board and Chief Executive Officer, Columbia Management Investment Distributors, Inc., since November 2008 and February 2012, respectively; Chairman of the Board and Director, Threadneedle Asset Management Holdings, Sàrl, since March 2013 and December 2008, respectively; senior executive of various entities affiliated with Columbia Threadneedle. |
Christopher O. Petersen
5228 Ameriprise Financial Center
Minneapolis, MN 55474
1970 | Senior Vice President and Assistant Secretary (2021) | Formerly, Trustee/Director of funds within the Columbia Funds Complex, July 1, 2020 - November 22, 2021; Senior Vice President and Assistant General Counsel, Ameriprise Financial, Inc., since September 2021 (previously Vice President and Lead Chief Counsel, January 2015 - September 2021); formerly, President and Principal Executive Officer of the Columbia Funds, 2015 - 2021; officer of Columbia Funds and affiliated funds, since 2007. |
Thomas P. McGuire
290 Congress Street
Boston, MA 02210
1972 | Senior Vice President and Chief Compliance Officer (2012) | Vice President – Asset Management Compliance, Ameriprise Financial, Inc., since May 2010; Chief Compliance Officer, Columbia Acorn/Wanger Funds, since December 2015; formerly, Chief Compliance Officer, Ameriprise Certificate Company, September 2010 – September 2020. |
Ryan C. Larrenaga
290 Congress Street
Boston, MA 02210
1970 | Senior Vice President (2017), Chief Legal Officer (2017), and Secretary (2015) | Vice President and Chief Counsel, Ameriprise Financial, Inc., since August 2018 (previously Vice President and Group Counsel, August 2011 - August 2018); Chief Legal Officer, Columbia Acorn/Wanger Funds, since September 2020; officer of Columbia Funds and affiliated funds, since 2005. |
| 86 | Columbia Strategic Income Fund | Annual Report 2023 |
TRUSTEES AND OFFICERS (continued)
(Unaudited)
Fund officers (continued)
Name,
address and
year of birth | Position and year
first appointed to
position for any Fund
in the Columbia
Funds Complex or a
predecessor thereof | Principal occupation(s) during past five years |
Michael E. DeFao
290 Congress Street
Boston, MA 02210
1968 | Vice President (2011) and Assistant Secretary (2010) | Vice President and Chief Counsel, Ameriprise Financial, Inc., since May 2010; Vice President, Chief Legal Officer and Assistant Secretary, Columbia Management Investment Advisers, LLC, since October 2021 (previously Vice President and Assistant Secretary, May 2010 – September 2021). |
Lyn Kephart-Strong
5903 Ameriprise Financial Center
Minneapolis, MN 55474
1960 | Vice President (2015) | Vice President, Global Investment Operations Services, Columbia Management Investment Advisers, LLC, since 2010; Director (since January 2007) and President (since October 2014), Columbia Management Investment Services Corp.; Director (since December 2017) and President (since January 2017), Ameriprise Trust Company. |
Columbia Strategic Income Fund | Annual Report 2023
| 87 |
Liquidity Risk Management Program
(Unaudited)
Pursuant to Rule 22e-4 under the 1940 Act, the Fund has adopted a liquidity risk management program (Program). The Program’s principal objectives include assessing, managing and periodically reviewing the Fund’s liquidity risk. Liquidity risk is defined as the risk that the Fund could not meet redemption requests without significant dilution of remaining investors’ interests in the Fund.
The Board has appointed the Investment Manager as the program administrator for the Fund’s Program. The Investment Manager has delegated oversight of the Program to its Liquidity Risk Management Committee (the Committee). At a Board meeting during the fiscal period, the Committee provided the Board with a report addressing the operations of the Program and assessing its adequacy and effectiveness of implementation for the period January 1, 2022 through December 31, 2022, including:
| • | the Fund had sufficient liquidity to both meet redemptions and operate effectively on behalf of shareholders; |
| • | there were no material changes to the Program during the period; |
| • | the implementation of the Program was effective to manage the Fund’s liquidity risk; and |
| • | the Program operated adequately during the period. |
There can be no assurance that the Program will achieve its objectives in the future. Please refer to the Fund’s prospectus for more information regarding the Fund’s exposure to liquidity risk and other principal risks to which an investment in the Fund may be subject.
Approval of Management Agreement
(Unaudited)
Columbia Management Investment Advisers, LLC (the Investment Manager, and together with its domestic and global affiliates, Columbia Threadneedle Investments), a wholly-owned subsidiary of Ameriprise Financial, Inc. (Ameriprise Financial), serves as the investment manager to Columbia Strategic Income Fund (the Fund). Under a management agreement (the Management Agreement), the Investment Manager provides investment advice and other services to the Fund and other funds distributed by Columbia Management Investment Distributors, Inc. (collectively, the Funds).
On an annual basis, the Fund’s Board of Trustees (the Board), including the independent Board members (the Independent Trustees), considers renewal of the Management Agreement. The Investment Manager prepared detailed reports for the Board and its Contracts Committee (including its Contracts Subcommittee) in February, March, April, May and June 2023, including reports providing the results of analyses performed by a third-party data provider, Broadridge Financial Solutions, Inc. (Broadridge), and comprehensive responses by the Investment Manager to written requests for information by independent legal counsel to the Independent Trustees (Independent Legal Counsel), to assist the Board in making this determination. In addition, throughout the year, the Board (or its committees or subcommittees) regularly meets with portfolio management teams and senior management personnel and reviews information prepared by the Investment Manager addressing the services the Investment Manager provides and Fund performance. The Board also accords appropriate weight to the work, deliberations and conclusions of the various committees (including their subcommittees), such as the Contracts Committee, the Investment Review Committee, the Audit Committee and the Compliance Committee in determining whether to continue the Management Agreement.
The Board, at its June 22, 2023 Board meeting (the June Meeting), considered the renewal of the Management Agreement for an additional one-year term. At the June Meeting, Independent Legal Counsel reviewed with the Independent Trustees various factors relevant to the Board’s consideration of advisory agreements and the Board’s legal responsibilities related to such consideration. The Independent Trustees considered all information that they, their legal counsel or the Investment Manager believed reasonably necessary to evaluate and to approve the continuation of the Management Agreement. Among other things, the information and factors considered included the following:
| 88 | Columbia Strategic Income Fund | Annual Report 2023 |
Approval of Management Agreement (continued)
(Unaudited)
| • | Information on the investment performance of the Fund relative to the performance of a group of mutual funds determined to be comparable to the Fund by Broadridge, as well as performance relative to one or more benchmarks; |
| • | Information on the Fund’s management fees and total expenses, including information comparing the Fund’s expenses to those of a group of comparable mutual funds, as determined by Broadridge; |
| • | The Investment Manager’s agreement to contractually limit or cap total operating expenses for the Fund so that total operating expenses (excluding certain fees and expenses, such as transaction costs and certain other investment related expenses, interest, taxes, acquired fund fees and expenses and infrequent and/or unusual expenses) would not exceed a specified annual rate, as a percentage of the Fund’s net assets; |
| • | Terms of the Management Agreement; |
| • | Descriptions of other agreements and arrangements with affiliates of the Investment Manager relating to the operations of the Fund, including agreements with respect to the provision of transfer agency and shareholder services to the Fund; |
| • | Descriptions of various services performed by the Investment Manager under the Management Agreement, including portfolio management and portfolio trading practices; |
| • | Information regarding any recently negotiated management fees of similarly-managed portfolios of other institutional clients of the Investment Manager; |
| • | Information regarding the resources of the Investment Manager, including information regarding senior management, portfolio managers and other personnel; |
| • | Information regarding the capabilities of the Investment Manager with respect to compliance monitoring services; |
| • | The profitability to the Investment Manager and its affiliates from their relationships with the Fund; and |
| • | Report provided by the Board’s independent fee consultant, JDL Consultants, LLC (JDL). |
Following an analysis and discussion of the foregoing, and the factors identified below, the Board, including all of the Independent Trustees, approved the renewal of the Management Agreement.
Nature, extent and quality of services provided by the Investment Manager
The Board analyzed various reports and presentations it had received detailing the services performed by the Investment Manager, as well as its history, expertise, resources and relative capabilities, and the qualifications of its personnel.
The Board specifically considered the many developments during recent years concerning the services provided by the Investment Manager. Among other things, the Board noted the organization and depth of the equity and credit research departments. The Board further observed the enhancements to the investment risk management department’s processes, systems and oversight over the past several years. The Board also took into account the broad scope of services provided by the Investment Manager to the Fund, including, among other services, investment, risk and compliance oversight. The Board also took into account the information it received concerning the Investment Manager’s ability to attract and retain key portfolio management personnel and that it has sufficient resources to provide competitive and adequate compensation to investment personnel.
In connection with the Board’s evaluation of the overall package of services provided by the Investment Manager, the Board also considered the nature, quality and range of administrative services provided to the Fund by the Investment Manager, as well as the achievements in 2022 in the performance of administrative services, and noted the various enhancements anticipated for 2023. In evaluating the quality of services provided under the Management Agreement, the Board also took into account the organization and strength of the Fund’s and its service providers’ compliance programs. The Board also reviewed the financial condition of the Investment Manager and its affiliates and each entity’s ability to carry out its responsibilities under the Management Agreement and the Fund’s other service agreements.
Columbia Strategic Income Fund | Annual Report 2023
| 89 |
Approval of Management Agreement (continued)
(Unaudited)
In addition, the Board discussed the acceptability of the terms of the Management Agreement, noting that no changes were proposed from the form of agreement previously approved. The Board also noted the wide array of legal and compliance services provided to the Fund under the Management Agreement.
After reviewing these and related factors (including investment performance as discussed below), the Board concluded, within the context of their overall conclusions, that the nature, extent and quality of the services provided to the Fund under the Management Agreement supported the continuation of the Management Agreement.
Investment performance
The Board carefully reviewed the investment performance of the Fund, including detailed reports providing the results of analyses performed by each of the Investment Manager, Broadridge and JDL collectively showing, for various periods (including since manager inception): (i) the performance of the Fund, (ii) the Fund’s performance relative to peers and benchmarks and (iii) the net assets of the Fund. The Board observed that Fund performance was well within the range of that of its peers.
The Board also reviewed a description of the third-party data provider’s methodology for identifying the Fund’s peer groups for purposes of performance and expense comparisons.
The Board also considered the Investment Manager’s performance and reputation generally. After reviewing these and related factors, the Board concluded, within the context of their overall conclusions, that the performance of the Fund and the Investment Manager, in light of other considerations, supported the continuation of the Management Agreement.
Comparative fees, costs of services provided and the profits realized by the Investment Manager and its affiliates from their relationships with the Fund
The Board reviewed comparative fees and the costs of services provided under the Management Agreement. The Board members considered detailed comparative information set forth in an annual report on fees and expenses, including, among other things, data (based on analyses conducted by Broadridge and JDL) showing a comparison of the Fund’s expenses with median expenses paid by funds in its comparative peer universe, as well as data showing the Fund’s contribution to the Investment Manager’s profitability.
The Board considered the reports of JDL, which assisted in the Board’s analysis of the Funds’ performance and expenses and the reasonableness of the Funds’ fee rates. The Board accorded particular weight to the notion that a primary objective of the level of fees is to achieve a rational pricing model applied consistently across the various product lines in the Fund family, while assuring that the overall fees for each Fund (with certain exceptions) are generally in line with the current “pricing philosophy” such that Fund total expense ratios, in general, approximate or are lower than the median expense ratios of funds in the same Lipper comparison universe. The Board took into account that the Fund’s total expense ratio (after considering proposed expense caps/waivers) approximated the peer universe’s median expense ratio.
After reviewing these and related factors, the Board concluded, within the context of their overall conclusions, that the levels of management fees and expenses of the Fund, in light of other considerations, supported the continuation of the Management Agreement.
The Board also considered the profitability of the Investment Manager and its affiliates in connection with the Investment Manager providing management services to the Fund. With respect to the profitability of the Investment Manager and its affiliates, the Independent Trustees referred to information discussing the profitability to the Investment Manager and Ameriprise Financial from managing, operating and distributing the Funds. The Board considered that the profitability generated by the Investment Manager in 2022 had declined from 2021 levels, due to a variety of factors, including the decreased assets under management of the Funds. It also took into account the indirect economic benefits flowing to the Investment Manager or its affiliates in connection with managing or distributing the Funds, such as the enhanced ability to offer various other financial products to Ameriprise Financial customers, soft dollar benefits and overall reputational advantages. The Board noted that the fees paid by the Fund should permit the Investment Manager to offer competitive compensation to its personnel, make necessary investments in its business and earn an appropriate profit. After reviewing
| 90 | Columbia Strategic Income Fund | Annual Report 2023 |
Approval of Management Agreement (continued)
(Unaudited)
these and related factors, the Board concluded, within the context of their overall conclusions, that the costs of services provided and the profitability to the Investment Manager and its affiliates from their relationships with the Fund supported the continuation of the Management Agreement.
Economies of scale
The Board considered the potential existence of economies of scale in the provision by the Investment Manager of services to the Fund, and whether those economies of scale were shared with the Fund through breakpoints in investment management fees or other means, such as expense limitation arrangements and additional investments by the Investment Manager in investment, trading, compliance and other resources. The Board considered the economies of scale that might be realized as the Fund’s net asset level grows and took note of the extent to which Fund shareholders might also benefit from such growth. In this regard, the Board took into account that management fees decline as Fund assets exceed various breakpoints, all of which have not been surpassed. The Board observed that the Management Agreement provided for breakpoints in the management fee rate schedule that allow opportunities for shareholders to realize lower fees as Fund assets grow and that there are additional opportunities through other means for sharing economies of scale with shareholders.
Conclusion
The Board reviewed all of the above considerations in reaching its decision to approve the continuation of the Management Agreement. In reaching its conclusions, no single factor was determinative.
On June 22, 2023, the Board, including all of the Independent Trustees, determined that fees payable under the Management Agreement were fair and reasonable in light of the extent and quality of services provided and approved the renewal of the Management Agreement.
Columbia Strategic Income Fund | Annual Report 2023
| 91 |
Columbia Strategic Income Fund
P.O. Box 219104
Kansas City, MO 64121-9104
Please read and consider the investment objectives, risks, charges and expenses for any fund carefully before investing. For a prospectus and summary prospectus, which contains this and other important information about the Fund, go to
columbiathreadneedleus.com/investor/. The Fund is distributed by Columbia Management Investment Distributors, Inc., member FINRA, and managed by Columbia Management Investment Advisers, LLC.
Columbia Threadneedle Investments (Columbia Threadneedle) is the global brand name of the Columbia and Threadneedle group of companies. All rights reserved.
© 2023 Columbia Management Investment Advisers, LLC.
columbiathreadneedleus.com/investor/

Annual Report
August 31, 2023
Columbia Small Cap Growth Fund
Not FDIC or NCUA Insured • No Financial Institution Guarantee • May Lose Value
If you elect to receive the shareholder report for Columbia Small Cap Growth Fund (the Fund) in paper, mailed to you, the Fund mails one shareholder report to each shareholder address, unless such shareholder elects to receive shareholder reports from the Fund electronically via e-mail or by having a paper notice mailed to you (Postcard Notice) that your Fund’s shareholder report is available at the Columbia funds’ website (columbiathreadneedleus.com/investor/). If you would like more than one report in paper to be mailed to you, or would like to elect to receive reports via e-mail or access them through Postcard Notice, please call shareholder services at 800.345.6611 and additional reports will be sent to you.
Proxy voting policies and procedures
The policy of the Board of Trustees is to vote the proxies of the companies in which the Fund holds investments consistent with the procedures as stated in the Statement of Additional Information (SAI). You may obtain a copy of the SAI without charge by calling 800.345.6611; contacting your financial intermediary; visiting columbiathreadneedleus.com/investor/; or searching the website of the Securities and Exchange Commission (SEC) at sec.gov. Information regarding how the Fund voted proxies relating to portfolio securities is filed with the SEC by August 31st for the most recent 12-month period ending June 30th of that year, and is available without charge by visiting columbiathreadneedleus.com/investor/, or searching the website of the SEC at sec.gov.
Quarterly schedule of investments
The Fund files a complete schedule of portfolio holdings with the SEC for the first and third quarters of each fiscal year on Form N-PORT. The Fund’s Form N-PORT filings are available on the SEC’s website at sec.gov. The Fund’s complete schedule of portfolio holdings, as filed on Form N-PORT, is available on columbiathreadneedleus.com/investor/ or can also be obtained without charge, upon request, by calling 800.345.6611.
Additional Fund information
For more information about the Fund, please visit columbiathreadneedleus.com/investor/ or call 800.345.6611. Customer Service Representatives are available to answer your questions Monday through Friday from 8 a.m. to 7 p.m. Eastern time.
Fund investment manager
Columbia Management Investment Advisers, LLC (the Investment Manager)
290 Congress Street
Boston, MA 02210
Fund distributor
Columbia Management Investment Distributors, Inc.
290 Congress Street
Boston, MA 02210
Fund transfer agent
Columbia Management Investment Services Corp.
P.O. Box 219104
Kansas City, MO 64121-9104
Columbia Small Cap Growth Fund | Annual Report 2023
Fund at a Glance
(Unaudited)
Investment objective
The Fund seeks long-term capital appreciation.
Portfolio management
Daniel Cole, CFA
Co-Portfolio Manager
Managed Fund since 2015
Wayne Collette, CFA
Co-Portfolio Manager
Managed Fund since 2006
Dana Kelley, CFA
Co-Portfolio Manager
Managed Fund since 2022
Morningstar style boxTM
The Morningstar Style Box is based on a fund’s portfolio holdings. For equity funds, the vertical axis shows the market capitalization of the stocks owned, and the horizontal axis shows investment style (value, blend, or growth). Information shown is based on the most recent data provided by Morningstar.
© 2023 Morningstar, Inc. All rights reserved. The Morningstar information contained herein: (1) is proprietary to Morningstar and/or its content providers; (2) may not be copied or distributed; and (3) is not warranted to be accurate, complete or timely. Neither Morningstar nor its content providers are responsible for any damages or losses arising from any use of this information.
| Average annual total returns (%) (for the period ended August 31, 2023) |
| | | Inception | 1 Year | 5 Years | 10 Years |
| Class A | Excluding sales charges | 11/01/05 | 16.25 | 7.97 | 11.06 |
| | Including sales charges | | 9.55 | 6.70 | 10.41 |
| Advisor Class | 11/08/12 | 16.53 | 8.24 | 11.33 |
| Class C | Excluding sales charges | 11/01/05 | 15.41 | 7.16 | 10.23 |
| | Including sales charges | | 14.41 | 7.16 | 10.23 |
| Institutional Class | 10/01/96 | 16.54 | 8.24 | 11.34 |
| Institutional 2 Class | 02/28/13 | 16.65 | 8.35 | 11.49 |
| Institutional 3 Class | 07/15/09 | 16.78 | 8.41 | 11.52 |
| Class R | 09/27/10 | 16.01 | 7.71 | 10.78 |
| Russell 2000 Growth Index | | 6.78 | 2.46 | 8.17 |
| Russell 2000 Index | | 4.65 | 3.14 | 7.96 |
Returns for Class A shares are shown with and without the maximum initial sales charge of 5.75%. Returns for Class C shares are shown with and without the 1.00% contingent deferred sales charge for the first year only. The Fund’s other share classes are not subject to sales charges and have limited eligibility. Please see the Fund’s prospectus for details. Performance for different share classes will vary based on differences in sales charges and fees associated with each share class. All results shown assume reinvestment of distributions during the period. Returns do not reflect the deduction of taxes that a shareholder may pay on Fund distributions or on the redemption of Fund shares. Performance results reflect the effect of any fee waivers or reimbursements of Fund expenses by Columbia Management Investment Advisers, LLC and/or any of its affiliates. Absent these fee waivers or expense reimbursement arrangements, performance results would have been lower.
The performance information shown represents past performance and is not a guarantee of future results. The investment return and principal value of your investment will fluctuate so that your shares, when redeemed, may be worth more or less than their original cost. Current performance may be lower or higher than the performance information shown. You may obtain performance information current to the most recent month-end by contacting your financial intermediary, visiting columbiathreadneedleus.com/investor/ or calling 800.345.6611.
The Russell 2000 Growth Index, an unmanaged index, measures the performance of those Russell 2000 Index companies with higher price-to-book ratios and higher forecasted growth values.
The Russell 2000 Index measures the performance of the small-cap segment of the U.S. equity universe. The Russell 2000 is a subset of the Russell 3000 Index representing approximately 10% of the total market capitalization of that index. It includes approximately 2,000 of the smallest securities based on a combination of their market capitalization and current index membership.
Indices are not available for investment, are not professionally managed and do not reflect sales charges, fees, brokerage commissions, taxes or other expenses of investing. Securities in the Fund may not match those in an index.
Columbia Small Cap Growth Fund | Annual Report 2023
| 3 |
Fund at a Glance (continued)
(Unaudited)
Performance of a hypothetical $10,000 investment (August 31, 2013 — August 31, 2023)
The chart above shows the change in value of a hypothetical $10,000 investment in Class A shares of Columbia Small Cap Growth Fund during the stated time period, and does not reflect the deduction of taxes that a shareholder may pay on Fund distributions or on the redemption of Fund shares.
| Portfolio breakdown (%) (at August 31, 2023) |
| Common Stocks | 94.4 |
| Money Market Funds | 5.6 |
| Total | 100.0 |
Percentages indicated are based upon total investments excluding investments in derivatives, if any. The Fund’s portfolio composition is subject to change.
| Equity sector breakdown (%) (at August 31, 2023) |
| Communication Services | 4.1 |
| Consumer Discretionary | 11.7 |
| Consumer Staples | 1.7 |
| Energy | 7.4 |
| Financials | 1.2 |
| Health Care | 21.8 |
| Industrials | 28.6 |
| Information Technology | 18.9 |
| Materials | 4.6 |
| Total | 100.0 |
Percentages indicated are based upon total equity investments. The Fund’s portfolio composition is subject to change.
| 4 | Columbia Small Cap Growth Fund | Annual Report 2023 |
Manager Discussion of Fund Performance
(Unaudited)
For the 12-month period ended August 31, 2023, Class A shares of Columbia Small Cap Growth Fund returned 16.25% excluding sales charges. The Fund outperformed its primary benchmark, the Russell 2000 Growth Index, which returned 6.78% for the same period. The Fund outperformed the broader small-cap market, as measured by the Russell 2000 Index, which returned 4.65% during the period.
Market overview
Markets advanced over the 12-month period that ended August 31, 2023, amidst conflicting economic data that kept investors focused on the path of the U.S. Federal Reserve (Fed) interest rate hikes and the debate over a soft versus hard economic landing. After a dismal first half in 2022, U.S. markets showed signs of optimism in the second half of the year, as oil prices rolled over from their June highs and investors got more hopeful over a slowing in the Fed’s interest rate raising trajectory. Company earnings, consumer spending and the jobs market showed resilience despite historically high inflation numbers and the stubbornly persisting prospects of an impending recession kept being pushed out further into the future. Geopolitical concerns also helped to fuel investor uncertainty as the Russia-Ukraine conflict continued. Coming into 2023, markets rebounded on renewed hope of a Fed pivot in interest rates, which led to many oversold companies picking up steam. In March 2023, the sudden failure of two large US banks led to a major sell-off in the financial sector, making investors jittery about the U.S. financial system. However, government measures contained any prolonged contagion from the banking crisis. As the first half of 2023 progressed, the gains in the market were largely a reflection of a handful of highly valued mega cap tech focused companies poised to benefit from advances in artificial intelligence (AI), particularly in generative AI and large language models. Towards the end of the period however, markets pulled back in an environment of rating agency downgrades of U.S. debt, signs of depletion in U.S. household savings and slowing economic data out of China.
The Fed raised interest rates seven times between September 2022 and August 2023, bringing the target rate up from a range of 2.25%-2.50% to 5.25%-5.50% by August 31, 2023. Annual inflation, as measured by Consumer Price Index, was 3.7% in August, much lower than its June 2022 peak of 9.1% but still well above the Fed’s 2% target rate. The labor market stayed resilient, with the unemployment rate staying at 3.7%, while personal spending increased 3.3% from last year.
Consumer staples, energy, information technology and industrials have been the best performing sectors in the benchmark. While consumer staples have been driven up by household and personal products, the energy sector was helped mostly by energy equipment and services names. Technology hardware names drove gains in the information technology sector. Capital goods names, especially among building products, construction, and engineering, drove gains in the industrials sector. Four out of the ten sectors ended in the red: utilities, real estate, communication services and health care.
The Fund experienced increased turnover during the reporting period, largely a result of elevated market volatility during the period.
The Fund’s notable contributors during the period
| • | Stock selection within the industrials sector was the single biggest contributor during the period. Also contributing was selection among food and beverage names in the consumer staples sector. Holdings among health care and communication services names worked well. |
| • | The Fund’s overweight to industrials and health care and underweight to energy and utilities also worked favorably. |
| • | Vertiv Holdings Inc. operates as a holding company that provides digital equipment, services, and solutions to data centers, through its subsidiaries. The company had strong revenues and sales growth during the period. We believe that this was driven by the demand and growth acceleration potential in data center infrastructure necessary to meet the rapidly growing market for computing capacity, which is being propelled by the rapid advances in the field of AI. |
| • | Axon Enterprise Inc. is the sole provider of Tasers and market leading provider of law enforcement technology including body and vehicle cameras. They have leveraged their position in Tasers to expand deeper into the law enforcement space (cloud-based software for evidence-management, virtual de-escalation training, records management systems and computer-aided dispatch). Their monopolistic position and expansions into judiciary, corrections, federal agencies, etc., has expanded their market. Law enforcement budgets have been stable, giving Axon the advantage of consistent |
Columbia Small Cap Growth Fund | Annual Report 2023
| 5 |
Manager Discussion of Fund Performance (continued)
(Unaudited)
| | demand strength. During the period, revenue certainty along with international contract wins and strong revenue forecasts helped to separate them from an uncertain and challenging macro environment. We sold the Fund’s position in Axon before the close of the reporting period. |
| • | FTAI Aviation Ltd is an aerospace company that owns and maintains commercial jet engines. It has exclusive agreements with three aircraft manufacturers to repair aircraft engines and lease aircraft to the airlines while repairs are underway. The airline industry has durable demand characteristics with supply and demand for aircrafts favorable for manufacturers, coupled with the constant requirement to have airplanes running and repaired. We believe that the exclusivity of the company’s agreements with the manufacturers is an added advantage, all allowing for high and consistent returns. |
The Fund’s notable detractors during the period
| • | Some selections in the financials and materials sector were unfavorable. |
| • | The Fund’s underweight to consumer staples also had a slightly negative impact. |
| • | Advanced Drainage Systems is a company that designs, manufactures, and markets drainage products (it is the largest maker of high-density polyethylene pipes in the country) and provides services that deliver solutions for the most persistent and challenging water management problems. After doing well initially during the period, the stock suffered multiple contractions as management had to lower guidance due to inventory challenges that delayed purchases and hurt outlook. |
| • | Five9 Inc. (Five9) is a leader in cloud contact center software that offers real-time and historical reporting, recording, quality monitoring, workforce, and customer relationship management integrations. Investor sentiment toward this name was impacted by its prospects in an environment of AI dominance. AI’s large language models have the ability to accurately answer a significant amount of customer questions. Five9 has a seat-based model which leaves its human seats vulnerable to replacement by AI seats which would worsen its total addressable market and growth rates. |
| • | Paylocity Holding Corp. provides cloud-based payroll and human capital management software, including time and attendance, benefits, hiring, retirement, and everything in between. Despite strong initial performance in the period, towards the end of 2022, the company gave back some gains as it got expensive in the run-up and as investors sold out on winners. |
| • | The Fund no longer holds positions in Advanced Drainage Systems, Five9 and Paylocity Holding Corp. |
Market risk may affect a single issuer, sector of the economy, industry or the market as a whole. Foreign investments subject the Fund to risks, including political, economic, market, social and others within a particular country, as well as to currency instabilities and less stringent financial and accounting standards generally applicable to U.S. issuers. Investments in small-cap companies involve risks and volatility greater than investments in larger, more established companies. Growth securities, at times, may not perform as well as value securities or the stock market in general and may be out of favor with investors. The Fund may invest significantly in issuers within a particular sector, which may be negatively affected by market, economic or other conditions, making the Fund more vulnerable to unfavorable developments in the sector. See the Fund’s prospectus for more information on these and other risks.
The views expressed in this report reflect the current views of the respective parties who contributed to this report. These views are not guarantees of future performance and involve certain risks, uncertainties and assumptions that are difficult to predict, so actual outcomes and results may differ significantly from the views expressed. These views are subject to change at any time based upon economic, market or other conditions and the respective parties disclaim any responsibility to update such views. These views may not be relied on as investment advice and, because investment decisions for a Columbia fund are based on numerous factors, may not be relied on as an indication of trading intent on behalf of any particular Columbia fund. References to specific securities should not be construed as a recommendation or investment advice.
| 6 | Columbia Small Cap Growth Fund | Annual Report 2023 |
Understanding Your Fund’s Expenses
(Unaudited)
As an investor, you incur two types of costs. There are shareholder transaction costs, which generally include sales charges on purchases and may include redemption fees. There are also ongoing fund costs, which generally include management fees, distribution and/or service fees, and other fund expenses. The following information is intended to help you understand your ongoing costs (in dollars) of investing in the Fund and to help you compare these costs with the ongoing costs of investing in other mutual funds.
Analyzing your Fund’s expenses
To illustrate these ongoing costs, we have provided examples and calculated the expenses paid by investors in each share class of the Fund during the period. The actual and hypothetical information in the table is based on an initial investment of $1,000 at the beginning of the period indicated and held for the entire period. Expense information is calculated two ways and each method provides you with different information. The amount listed in the “Actual” column is calculated using the Fund’s actual operating expenses and total return for the period. You may use the Actual information, together with the amount invested, to estimate the expenses that you paid over the period. Simply divide your account value by $1,000 (for example, an $8,600 account value divided by $1,000 = 8.6), then multiply the results by the expenses paid during the period under the “Actual” column. The amount listed in the “Hypothetical” column assumes a 5% annual rate of return before expenses (which is not the Fund’s actual return) and then applies the Fund’s actual expense ratio for the period to the hypothetical return. You should not use the hypothetical account values and expenses to estimate either your actual account balance at the end of the period or the expenses you paid during the period. See “Compare with other funds” below for details on how to use the hypothetical data.
Compare with other funds
Since all mutual funds are required to include the same hypothetical calculations about expenses in shareholder reports, you can use this information to compare the ongoing cost of investing in the Fund with other funds. To do so, compare the hypothetical example with the 5% hypothetical examples that appear in the shareholder reports of other funds. As you compare hypothetical examples of other funds, it is important to note that hypothetical examples are meant to highlight the ongoing costs of investing in a fund only and do not reflect any transaction costs, such as sales charges, or redemption or exchange fees. Therefore, the hypothetical calculations are useful in comparing ongoing costs only, and will not help you determine the relative total costs of owning different funds. If transaction costs were included in these calculations, your costs would be higher.
| March 1, 2023 — August 31, 2023 |
| | Account value at the
beginning of the
period ($) | Account value at the
end of the
period ($) | Expenses paid during
the period ($) | Fund’s annualized
expense ratio (%) |
| | Actual | Hypothetical | Actual | Hypothetical | Actual | Hypothetical | Actual |
| Class A | 1,000.00 | 1,000.00 | 1,144.40 | 1,018.80 | 6.86 | 6.46 | 1.27 |
| Advisor Class | 1,000.00 | 1,000.00 | 1,145.60 | 1,020.06 | 5.52 | 5.19 | 1.02 |
| Class C | 1,000.00 | 1,000.00 | 1,139.60 | 1,015.02 | 10.89 | 10.26 | 2.02 |
| Institutional Class | 1,000.00 | 1,000.00 | 1,145.90 | 1,020.06 | 5.52 | 5.19 | 1.02 |
| Institutional 2 Class | 1,000.00 | 1,000.00 | 1,146.20 | 1,020.62 | 4.92 | 4.63 | 0.91 |
| Institutional 3 Class | 1,000.00 | 1,000.00 | 1,147.30 | 1,020.87 | 4.65 | 4.38 | 0.86 |
| Class R | 1,000.00 | 1,000.00 | 1,143.40 | 1,017.54 | 8.21 | 7.73 | 1.52 |
Expenses paid during the period are equal to the annualized expense ratio for each class as indicated above, multiplied by the average account value over the period and then multiplied by the number of days in the Fund’s most recent fiscal half year and divided by 365.
Expenses do not include fees and expenses incurred indirectly by the Fund from its investment in underlying funds, including affiliated and non-affiliated pooled investment vehicles, such as mutual funds and exchange-traded funds.
Had Columbia Management Investment Advisers, LLC and/or certain of its affiliates not waived/reimbursed certain fees and expenses, account value at the end of the period would have been reduced.
Columbia Small Cap Growth Fund | Annual Report 2023
| 7 |
Portfolio of Investments
August 31, 2023
(Percentages represent value of investments compared to net assets)
Investments in securities
| Common Stocks 94.9% |
| Issuer | Shares | Value ($) |
| Communication Services 3.9% |
| Entertainment 3.9% |
| Atlanta Braves Holdings, Inc., Class C(a) | 418,497 | 15,417,430 |
| Endeavor Group Holdings, Inc., Class A(a) | 647,520 | 14,174,213 |
| World Wrestling Entertainment, Inc., Class A | 400,988 | 38,715,391 |
| Total | | 68,307,034 |
| Total Communication Services | 68,307,034 |
| Consumer Discretionary 11.1% |
| Diversified Consumer Services 0.9% |
| WW International, Inc.(a) | 1,622,285 | 15,752,387 |
| Hotels, Restaurants & Leisure 5.8% |
| Bowlero Corp.(a) | 1,775,247 | 19,527,717 |
| Churchill Downs, Inc. | 140,286 | 17,575,030 |
| Kura Sushi USA, Inc., Class A(a) | 247,009 | 21,581,176 |
| Planet Fitness, Inc., Class A(a) | 314,118 | 19,098,375 |
| Texas Roadhouse, Inc. | 150,315 | 15,647,792 |
| Xponential Fitness, Inc., Class A(a) | 451,435 | 9,778,082 |
| Total | | 103,208,172 |
| Household Durables 1.0% |
| TopBuild Corp.(a) | 58,954 | 17,101,376 |
| Specialty Retail 0.5% |
| Advance Auto Parts, Inc. | 126,694 | 8,719,081 |
| Textiles, Apparel & Luxury Goods 2.9% |
| Crocs, Inc.(a) | 112,490 | 10,949,776 |
| On Holding AG, Class A(a) | 1,438,884 | 41,483,026 |
| Total | | 52,432,802 |
| Total Consumer Discretionary | 197,213,818 |
| Consumer Staples 1.6% |
| Beverages 1.6% |
| Celsius Holdings, Inc.(a) | 145,638 | 28,550,874 |
| Total Consumer Staples | 28,550,874 |
| Energy 7.0% |
| Energy Equipment & Services 2.8% |
| ChampionX Corp. | 647,238 | 23,358,819 |
| TechnipFMC PLC | 1,393,342 | 26,529,232 |
| Total | | 49,888,051 |
| Common Stocks (continued) |
| Issuer | Shares | Value ($) |
| Oil, Gas & Consumable Fuels 4.2% |
| Antero Resources Corp.(a) | 767,386 | 21,233,571 |
| Matador Resources Co. | 278,157 | 17,662,970 |
| Northern Oil and Gas, Inc. | 847,069 | 35,432,896 |
| Total | | 74,329,437 |
| Total Energy | 124,217,488 |
| Financials 1.1% |
| Capital Markets 1.1% |
| B Riley Financial, Inc. | 386,434 | 19,787,353 |
| Total Financials | 19,787,353 |
| Health Care 20.7% |
| Biotechnology 5.6% |
| Abcam PLC, ADR(a) | 1,108,211 | 25,067,733 |
| ACELYRIN, Inc.(a) | 238,456 | 6,040,090 |
| Arcus Biosciences, Inc.(a) | 652,045 | 13,366,922 |
| Natera, Inc.(a) | 692,004 | 40,641,395 |
| PTC Therapeutics, Inc.(a) | 232,374 | 9,178,773 |
| Syndax Pharmaceuticals, Inc.(a) | 299,217 | 5,538,507 |
| Total | | 99,833,420 |
| Health Care Equipment & Supplies 3.2% |
| Glaukos Corp.(a) | 126,087 | 9,474,177 |
| ICU Medical, Inc.(a) | 153,736 | 22,296,332 |
| Inspire Medical Systems, Inc.(a) | 112,069 | 25,426,215 |
| Total | | 57,196,724 |
| Health Care Providers & Services 5.0% |
| Addus HomeCare Corp.(a) | 191,294 | 16,776,484 |
| Chemed Corp. | 91,027 | 46,554,849 |
| Tenet Healthcare Corp.(a) | 165,118 | 12,806,552 |
| Universal Health Services, Inc., Class B | 86,694 | 11,677,682 |
| Total | | 87,815,567 |
| Health Care Technology 0.5% |
| GoodRx Holdings, Inc., Class A(a) | 1,370,610 | 8,950,083 |
| Life Sciences Tools & Services 6.4% |
| BioLife Solutions, Inc.(a) | 599,755 | 7,922,764 |
| Bio-Techne Corp. | 606,370 | 47,539,408 |
| Caris Life Sciences, Inc.(a),(b),(c),(d) | 2,777,778 | 8,972,223 |
The accompanying Notes to Financial Statements are an integral part of this statement.
| 8 | Columbia Small Cap Growth Fund | Annual Report 2023 |
Portfolio of Investments (continued)
August 31, 2023
| Common Stocks (continued) |
| Issuer | Shares | Value ($) |
| DNA Script(a),(b),(c),(d) | 11,675 | 3,326,992 |
| MaxCyte, Inc.(a) | 902,952 | 3,304,804 |
| Olink Holding AB ADR(a) | 369,851 | 6,113,637 |
| Repligen Corp.(a) | 203,984 | 35,474,857 |
| Total | | 112,654,685 |
| Total Health Care | 366,450,479 |
| Industrials 27.1% |
| Aerospace & Defense 2.2% |
| Curtiss-Wright Corp. | 188,490 | 39,204,035 |
| Air Freight & Logistics 1.3% |
| Forward Air Corp. | 317,101 | 22,457,093 |
| Building Products 1.6% |
| AAON, Inc. | 175,360 | 11,058,201 |
| Simpson Manufacturing Co., Inc. | 108,959 | 17,407,290 |
| Total | | 28,465,491 |
| Commercial Services & Supplies 1.2% |
| Casella Waste Systems, Inc., Class A(a) | 274,643 | 21,633,629 |
| Electrical Equipment 4.8% |
| Atkore, Inc.(a) | 110,028 | 16,941,011 |
| nVent Electric PLC | 165,092 | 9,334,302 |
| Vertiv Holdings Co. | 1,510,915 | 59,514,942 |
| Total | | 85,790,255 |
| Ground Transportation 2.7% |
| Saia, Inc.(a) | 31,641 | 13,485,394 |
| XPO, Inc.(a) | 465,948 | 34,773,699 |
| Total | | 48,259,093 |
| Machinery 1.8% |
| RBC Bearings, Inc.(a) | 139,788 | 32,226,726 |
| Professional Services 2.6% |
| Exponent, Inc. | 115,017 | 10,335,428 |
| FTI Consulting, Inc.(a) | 189,917 | 35,290,377 |
| Total | | 45,625,805 |
| Common Stocks (continued) |
| Issuer | Shares | Value ($) |
| Trading Companies & Distributors 8.9% |
| Core & Main, Inc., Class A(a) | 905,830 | 29,747,457 |
| FTAI Aviation Ltd. | 1,592,207 | 58,847,971 |
| SiteOne Landscape Supply, Inc.(a) | 282,919 | 48,432,903 |
| Xometry, Inc., Class A(a) | 1,054,097 | 20,080,548 |
| Total | | 157,108,879 |
| Total Industrials | 480,771,006 |
| Information Technology 18.0% |
| Communications Equipment 0.9% |
| Harmonic, Inc.(a) | 1,539,313 | 16,439,863 |
| Electronic Equipment, Instruments & Components 0.6% |
| 908 Devices, Inc.(a) | 1,484,864 | 10,676,172 |
| Semiconductors & Semiconductor Equipment 6.7% |
| Allegro MicroSystems, Inc.(a) | 423,127 | 16,184,608 |
| Axcelis Technologies, Inc.(a) | 174,143 | 33,461,577 |
| Lattice Semiconductor Corp.(a) | 119,928 | 11,664,197 |
| Onto Innovation, Inc.(a) | 199,153 | 27,678,284 |
| Rambus, Inc.(a) | 528,987 | 29,871,896 |
| Total | | 118,860,562 |
| Software 8.7% |
| BILL Holdings, Inc.(a) | 119,117 | 13,734,190 |
| LiveVox Holdings, Inc.(a) | 1,796,210 | 5,783,796 |
| Procore Technologies, Inc.(a) | 604,152 | 40,810,468 |
| Smartsheet, Inc., Class A(a) | 581,056 | 24,247,467 |
| SPS Commerce, Inc.(a) | 71,970 | 13,395,776 |
| Tenable Holdings, Inc.(a) | 503,835 | 22,858,994 |
| Workiva, Inc., Class A(a) | 287,906 | 32,202,286 |
| Total | | 153,032,977 |
| Technology Hardware, Storage & Peripherals 1.1% |
| Super Micro Computer, Inc.(a) | 69,190 | 19,032,785 |
| Total Information Technology | 318,042,359 |
| Materials 4.4% |
| Chemicals 1.1% |
| Balchem Corp. | 139,096 | 19,542,988 |
| Construction Materials 1.6% |
| Summit Materials, Inc., Class A(a) | 729,987 | 27,308,814 |
The accompanying Notes to Financial Statements are an integral part of this statement.
Columbia Small Cap Growth Fund | Annual Report 2023
| 9 |
Portfolio of Investments (continued)
August 31, 2023
| Common Stocks (continued) |
| Issuer | Shares | Value ($) |
| Metals & Mining 1.7% |
| Alamos Gold, Inc., Class A | 1,074,215 | 13,792,921 |
| Osisko Gold Royalties Ltd. | 789,718 | 10,542,735 |
| Triple Flag Precious Metals Corp. | 471,956 | 6,484,675 |
| Total | | 30,820,331 |
| Total Materials | 77,672,133 |
Total Common Stocks
(Cost $1,448,196,063) | 1,681,012,544 |
|
| Money Market Funds 5.7% |
| | Shares | Value ($) |
| Columbia Short-Term Cash Fund, 5.476%(e),(f) | 100,351,767 | 100,321,662 |
Total Money Market Funds
(Cost $100,304,139) | 100,321,662 |
Total Investments in Securities
(Cost: $1,548,500,202) | 1,781,334,206 |
| Other Assets & Liabilities, Net | | (9,778,276) |
| Net Assets | 1,771,555,930 |
Notes to Portfolio of Investments
| (a) | Non-income producing investment. |
| (b) | Represents fair value as determined in good faith under procedures approved by the Board of Trustees. At August 31, 2023, the total value of these securities amounted to $12,299,215, which represents 0.69% of total net assets. |
| (c) | Denotes a restricted security, which is subject to legal or contractual restrictions on resale under federal securities laws. Disposal of a restricted investment may involve time-consuming negotiations and expenses, and prompt sale at an acceptable price may be difficult to achieve. Private placement securities are generally considered to be restricted, although certain of those securities may be traded between qualified institutional investors under the provisions of Section 4(a)(2) and Rule 144A. The Fund will not incur any registration costs upon such a trade. These securities are valued at fair value determined in good faith under consistently applied procedures approved by the Fund’s Board of Trustees. At August 31, 2023, the total market value of these securities amounted to $12,299,215, which represents 0.69% of total net assets. Additional information on these securities is as follows: |
| Security | Acquisition
Dates | Shares | Cost ($) | Value ($) |
| Caris Life Sciences, Inc. | 05/11/2021 | 2,777,778 | 22,520,810 | 8,972,223 |
| DNA Script | 10/01/2021 | 11,675 | 10,180,303 | 3,326,992 |
| | | | 32,701,113 | 12,299,215 |
| (d) | Valuation based on significant unobservable inputs. |
| (e) | The rate shown is the seven-day current annualized yield at August 31, 2023. |
| (f) | As defined in the Investment Company Act of 1940, as amended, an affiliated company is one in which the Fund owns 5% or more of the company’s outstanding voting securities, or a company which is under common ownership or control with the Fund. The value of the holdings and transactions in these affiliated companies during the year ended August 31, 2023 are as follows: |
| Affiliated issuers | Beginning
of period($) | Purchases($) | Sales($) | Net change in
unrealized
appreciation
(depreciation)($) | End of
period($) | Realized gain
(loss)($) | Dividends($) | End of
period shares |
| Columbia Short-Term Cash Fund, 5.476% |
| | 13,473,261 | 1,049,461,280 | (962,629,563) | 16,684 | 100,321,662 | 17,603 | 2,916,731 | 100,351,767 |
Abbreviation Legend
| ADR | American Depositary Receipt |
Fair value measurements
The Fund categorizes its fair value measurements according to a three-level hierarchy that maximizes the use of observable inputs and minimizes the use of unobservable inputs by prioritizing that the most observable input be used when available. Observable inputs are those that market participants would use in pricing an investment based on market data obtained from sources independent of the reporting entity. Unobservable inputs are those that reflect the Fund’s assumptions about the information market participants would use in pricing an investment. An investment’s level within the fair value hierarchy is based on the lowest level of any input that is deemed significant to the asset’s or liability’s fair value measurement. The input levels are not necessarily an indication of the risk or liquidity associated with investments at that level. For example, certain U.S. government securities are generally high quality and liquid, however, they are reflected as Level 2 because the inputs used to determine fair value may not always be quoted prices in an active market.
Fair value inputs are summarized in the three broad levels listed below:
The accompanying Notes to Financial Statements are an integral part of this statement.
| 10 | Columbia Small Cap Growth Fund | Annual Report 2023 |
Portfolio of Investments (continued)
August 31, 2023
Fair value measurements (continued)
| ■ | Level 1 — Valuations based on quoted prices for investments in active markets that the Fund has the ability to access at the measurement date. Valuation adjustments are not applied to Level 1 investments. |
| ■ | Level 2 — Valuations based on other significant observable inputs (including quoted prices for similar securities, interest rates, prepayment speeds, credit risks, etc.). |
| ■ | Level 3 — Valuations based on significant unobservable inputs (including the Fund’s own assumptions and judgment in determining the fair value of investments). |
Inputs that are used in determining fair value of an investment may include price information, credit data, volatility statistics, and other factors. These inputs can be either observable or unobservable. The availability of observable inputs can vary between investments, and is affected by various factors such as the type of investment, and the volume and level of activity for that investment or similar investments in the marketplace. The inputs will be considered by the Investment Manager, along with any other relevant factors in the calculation of an investment’s fair value. The Fund uses prices and inputs that are current as of the measurement date, which may include periods of market dislocations. During these periods, the availability of prices and inputs may be reduced for many investments. This condition could cause an investment to be reclassified between the various levels within the hierarchy.
Investments falling into the Level 3 category are primarily supported by quoted prices from brokers and dealers participating in the market for those investments. However, these may be classified as Level 3 investments due to lack of market transparency and corroboration to support these quoted prices. Additionally, valuation models may be used as the pricing source for any remaining investments classified as Level 3. These models may rely on one or more significant unobservable inputs and/or significant assumptions by the Investment Manager. Inputs used in valuations may include, but are not limited to, financial statement analysis, capital account balances, discount rates and estimated cash flows, and comparable company data.
The Fund’s Board of Trustees (the Board) has designated the Investment Manager, through its Valuation Committee (the Committee), as valuation designee, responsible for determining the fair value of the assets of the Fund for which market quotations are not readily available using valuation procedures approved by the Board. The Committee consists of voting and non-voting members from various groups within the Investment Manager’s organization, including operations and accounting, trading and investments, compliance, risk management and legal.
The Committee meets at least monthly to review and approve valuation matters, which may include a description of specific valuation determinations, data regarding pricing information received from approved pricing vendors and brokers and the results of Board-approved valuation policies and procedures (the Policies). The Policies address, among other things, instances when market quotations are or are not readily available, including recommendations of third party pricing vendors and a determination of appropriate pricing methodologies; events that require specific valuation determinations and assessment of fair value techniques; securities with a potential for stale pricing, including those that are illiquid, restricted, or in default; and the effectiveness of third party pricing vendors, including periodic reviews of vendors. The Committee meets more frequently, as needed, to discuss additional valuation matters, which may include the need to review back-testing results, review time-sensitive information or approve related valuation actions. Representatives of Columbia Management Investment Advisers, LLC report to the Board at each of its regularly scheduled meetings to discuss valuation matters and actions during the period, similar to those described earlier.
The following table is a summary of the inputs used to value the Fund’s investments at August 31, 2023:
| | Level 1 ($) | Level 2 ($) | Level 3 ($) | Total ($) |
| Investments in Securities | | | | |
| Common Stocks | | | | |
| Communication Services | 68,307,034 | — | — | 68,307,034 |
| Consumer Discretionary | 197,213,818 | — | — | 197,213,818 |
| Consumer Staples | 28,550,874 | — | — | 28,550,874 |
| Energy | 124,217,488 | — | — | 124,217,488 |
| Financials | 19,787,353 | — | — | 19,787,353 |
| Health Care | 354,151,264 | — | 12,299,215 | 366,450,479 |
| Industrials | 480,771,006 | — | — | 480,771,006 |
| Information Technology | 318,042,359 | — | — | 318,042,359 |
| Materials | 77,672,133 | — | — | 77,672,133 |
| Total Common Stocks | 1,668,713,329 | — | 12,299,215 | 1,681,012,544 |
| Money Market Funds | 100,321,662 | — | — | 100,321,662 |
| Total Investments in Securities | 1,769,034,991 | — | 12,299,215 | 1,781,334,206 |
See the Portfolio of Investments for all investment classifications not indicated in the table.
The Fund does not hold any significant investments (greater than one percent of net assets) categorized as Level 3.
The accompanying Notes to Financial Statements are an integral part of this statement.
Columbia Small Cap Growth Fund | Annual Report 2023
| 11 |
Statement of Assets and Liabilities
August 31, 2023
| Assets | |
| Investments in securities, at value | |
| Unaffiliated issuers (cost $1,448,196,063) | $1,681,012,544 |
| Affiliated issuers (cost $100,304,139) | 100,321,662 |
| Receivable for: | |
| Investments sold | 4,460,001 |
| Capital shares sold | 2,909,058 |
| Dividends | 776,152 |
| Foreign tax reclaims | 2,478 |
| Trustees’ fees | 157,302 |
| Expense reimbursement due from Investment Manager | 249 |
| Prepaid expenses | 22,860 |
| Total assets | 1,789,662,306 |
| Liabilities | |
| Payable for: | |
| Investments purchased | 15,583,811 |
| Capital shares redeemed | 1,954,322 |
| Management services fees | 39,553 |
| Distribution and/or service fees | 3,396 |
| Transfer agent fees | 249,665 |
| Trustees’ fees | 203,065 |
| Other expenses | 72,564 |
| Total liabilities | 18,106,376 |
| Net assets applicable to outstanding capital stock | $1,771,555,930 |
| Represented by | |
| Paid in capital | 1,987,433,662 |
| Total distributable earnings (loss) | (215,877,732) |
| Total - representing net assets applicable to outstanding capital stock | $1,771,555,930 |
The accompanying Notes to Financial Statements are an integral part of this statement.
| 12 | Columbia Small Cap Growth Fund | Annual Report 2023 |
Statement of Assets and Liabilities (continued)
August 31, 2023
| Class A | |
| Net assets | $363,076,994 |
| Shares outstanding | 17,687,972 |
| Net asset value per share | $20.53 |
| Maximum sales charge | 5.75% |
| Maximum offering price per share (calculated by dividing the net asset value per share by 1.0 minus the maximum sales charge for Class A shares) | $21.78 |
| Advisor Class | |
| Net assets | $60,891,434 |
| Shares outstanding | 2,496,322 |
| Net asset value per share | $24.39 |
| Class C | |
| Net assets | $28,937,711 |
| Shares outstanding | 1,991,427 |
| Net asset value per share | $14.53 |
| Institutional Class | |
| Net assets | $876,678,490 |
| Shares outstanding | 38,752,633 |
| Net asset value per share | $22.62 |
| Institutional 2 Class | |
| Net assets | $48,816,589 |
| Shares outstanding | 2,117,434 |
| Net asset value per share | $23.05 |
| Institutional 3 Class | |
| Net assets | $385,265,343 |
| Shares outstanding | 16,431,974 |
| Net asset value per share | $23.45 |
| Class R | |
| Net assets | $7,889,369 |
| Shares outstanding | 398,921 |
| Net asset value per share | $19.78 |
The accompanying Notes to Financial Statements are an integral part of this statement.
Columbia Small Cap Growth Fund | Annual Report 2023
| 13 |
Statement of Operations
Year Ended August 31, 2023
| Net investment income | |
| Income: | |
| Dividends — unaffiliated issuers | $5,197,866 |
| Dividends — affiliated issuers | 2,916,731 |
| Interfund lending | 1,684 |
| Foreign taxes withheld | (14,103) |
| Total income | 8,102,178 |
| Expenses: | |
| Management services fees | 12,705,278 |
| Distribution and/or service fees | |
| Class A | 842,831 |
| Class C | 268,188 |
| Class R | 35,696 |
| Transfer agent fees | |
| Class A | 605,202 |
| Advisor Class | 103,579 |
| Class C | 48,140 |
| Institutional Class | 1,325,810 |
| Institutional 2 Class | 26,736 |
| Institutional 3 Class | 22,977 |
| Class R | 12,794 |
| Trustees’ fees | 44,728 |
| Custodian fees | 18,542 |
| Printing and postage fees | 138,005 |
| Registration fees | 195,127 |
| Accounting services fees | 30,090 |
| Legal fees | 32,037 |
| Compensation of chief compliance officer | 280 |
| Other | 49,398 |
| Total expenses | 16,505,438 |
| Fees waived or expenses reimbursed by Investment Manager and its affiliates | (1,883) |
| Expense reduction | (4,023) |
| Total net expenses | 16,499,532 |
| Net investment loss | (8,397,354) |
| Realized and unrealized gain (loss) — net | |
| Net realized gain (loss) on: | |
| Investments — unaffiliated issuers | (90,268,743) |
| Investments — affiliated issuers | 17,603 |
| Net realized loss | (90,251,140) |
| Net change in unrealized appreciation (depreciation) on: | |
| Investments — unaffiliated issuers | 339,361,414 |
| Investments — affiliated issuers | 16,684 |
| Net change in unrealized appreciation (depreciation) | 339,378,098 |
| Net realized and unrealized gain | 249,126,958 |
| Net increase in net assets resulting from operations | $240,729,604 |
The accompanying Notes to Financial Statements are an integral part of this statement.
| 14 | Columbia Small Cap Growth Fund | Annual Report 2023 |
Statement of Changes in Net Assets
| | Year Ended
August 31, 2023 | Year Ended
August 31, 2022 |
| Operations | | |
| Net investment loss | $(8,397,354) | $(19,984,208) |
| Net realized loss | (90,251,140) | (351,142,830) |
| Net change in unrealized appreciation (depreciation) | 339,378,098 | (892,663,748) |
| Net increase (decrease) in net assets resulting from operations | 240,729,604 | (1,263,790,786) |
| Distributions to shareholders | | |
| Net investment income and net realized gains | | |
| Class A | — | (57,492,433) |
| Advisor Class | — | (12,410,914) |
| Class C | — | (5,910,264) |
| Institutional Class | — | (136,485,916) |
| Institutional 2 Class | — | (17,426,341) |
| Institutional 3 Class | — | (45,889,170) |
| Class R | — | (1,203,822) |
| Total distributions to shareholders | — | (276,818,860) |
| Decrease in net assets from capital stock activity | (89,910,601) | (204,178,262) |
| Total increase (decrease) in net assets | 150,819,003 | (1,744,787,908) |
| Net assets at beginning of year | 1,620,736,927 | 3,365,524,835 |
| Net assets at end of year | $1,771,555,930 | $1,620,736,927 |
The accompanying Notes to Financial Statements are an integral part of this statement.
Columbia Small Cap Growth Fund | Annual Report 2023
| 15 |
Statement of Changes in Net Assets (continued)
| | Year Ended | Year Ended |
| | August 31, 2023 | August 31, 2022 |
| | Shares | Dollars ($) | Shares | Dollars ($) |
| Capital stock activity |
| Class A | | | | |
| Shares sold | 1,232,451 | 22,509,300 | 2,473,026 | 56,656,316 |
| Distributions reinvested | — | — | 1,898,399 | 50,307,569 |
| Shares redeemed | (3,414,251) | (61,392,155) | (4,844,423) | (110,340,811) |
| Net decrease | (2,181,800) | (38,882,855) | (472,998) | (3,376,926) |
| Advisor Class | | | | |
| Shares sold | 453,224 | 9,882,759 | 600,209 | 16,430,183 |
| Distributions reinvested | — | — | 384,942 | 12,071,778 |
| Shares redeemed | (1,016,655) | (21,563,984) | (2,747,685) | (77,859,742) |
| Net decrease | (563,431) | (11,681,225) | (1,762,534) | (49,357,781) |
| Class C | | | | |
| Shares sold | 281,286 | 3,624,056 | 515,889 | 8,935,276 |
| Distributions reinvested | — | — | 294,340 | 5,595,396 |
| Shares redeemed | (514,601) | (6,531,728) | (669,130) | (10,484,224) |
| Net increase (decrease) | (233,315) | (2,907,672) | 141,099 | 4,046,448 |
| Institutional Class | | | | |
| Shares sold | 15,442,801 | 309,921,778 | 21,144,653 | 530,673,815 |
| Distributions reinvested | — | — | 3,767,302 | 109,553,154 |
| Shares redeemed | (16,344,521) | (319,065,786) | (31,695,388) | (761,043,563) |
| Net decrease | (901,720) | (9,144,008) | (6,783,433) | (120,816,594) |
| Institutional 2 Class | | | | |
| Shares sold | 222,828 | 4,684,183 | 275,940 | 6,876,592 |
| Distributions reinvested | — | — | 588,823 | 17,417,388 |
| Shares redeemed | (894,824) | (17,762,474) | (4,642,383) | (118,704,973) |
| Net decrease | (671,996) | (13,078,291) | (3,777,620) | (94,410,993) |
| Institutional 3 Class | | | | |
| Shares sold | 3,537,387 | 75,015,482 | 6,466,302 | 170,183,577 |
| Distributions reinvested | — | — | 1,434,744 | 43,114,069 |
| Shares redeemed | (4,330,735) | (88,847,809) | (5,955,910) | (153,259,675) |
| Net increase (decrease) | (793,348) | (13,832,327) | 1,945,136 | 60,037,971 |
| Class R | | | | |
| Shares sold | 84,916 | 1,508,186 | 87,559 | 1,903,952 |
| Distributions reinvested | — | — | 46,933 | 1,203,822 |
| Shares redeemed | (106,597) | (1,892,409) | (154,475) | (3,408,161) |
| Net decrease | (21,681) | (384,223) | (19,983) | (300,387) |
| Total net decrease | (5,367,291) | (89,910,601) | (10,730,333) | (204,178,262) |
The accompanying Notes to Financial Statements are an integral part of this statement.
| 16 | Columbia Small Cap Growth Fund | Annual Report 2023 |
[THIS PAGE INTENTIONALLY LEFT BLANK]
Columbia Small Cap Growth Fund | Annual Report 2023
| 17 |
The following table is intended to help you understand the Fund’s financial performance. Certain information reflects financial results for a single share of a class held for the periods shown. Per share net investment income (loss) amounts are calculated based on average shares outstanding during the period. Total return assumes reinvestment of all dividends and distributions, if any. Total return does not reflect payment of sales charges, if any. Total return and portfolio turnover are not annualized for periods of less than one year. The ratios of expenses and net investment income are annualized for periods of less than one year. The portfolio turnover rate is calculated without regard to purchase and sales transactions of short-term instruments and certain derivatives, if any. If such transactions were included, the Fund’s portfolio turnover rate may be higher.
| | Net asset value,
beginning of
period | Net
investment
income
(loss) | Net
realized
and
unrealized
gain (loss) | Total from
investment
operations | Distributions
from net
realized
gains | Total
distributions to
shareholders |
| Class A |
| Year Ended 8/31/2023 | $17.66 | (0.14) | 3.01 | 2.87 | — | — |
| Year Ended 8/31/2022 | $32.70 | (0.25) | (11.90) | (12.15) | (2.89) | (2.89) |
| Year Ended 8/31/2021 | $25.05 | (0.31) | 10.14 | 9.83 | (2.18) | (2.18) |
| Year Ended 8/31/2020 | $19.72 | (0.18) | 7.28 | 7.10 | (1.77) | (1.77) |
| Year Ended 8/31/2019 | $22.05 | (0.15) | 1.12 | 0.97 | (3.30) | (3.30) |
| Advisor Class |
| Year Ended 8/31/2023 | $20.93 | (0.11) | 3.57 | 3.46 | — | — |
| Year Ended 8/31/2022 | $38.14 | (0.23) | (14.03) | (14.26) | (2.95) | (2.95) |
| Year Ended 8/31/2021 | $28.90 | (0.28) | 11.76 | 11.48 | (2.24) | (2.24) |
| Year Ended 8/31/2020 | $22.48 | (0.15) | 8.38 | 8.23 | (1.81) | (1.81) |
| Year Ended 8/31/2019 | $24.61 | (0.11) | 1.33 | 1.22 | (3.35) | (3.35) |
| Class C |
| Year Ended 8/31/2023 | $12.59 | (0.19) | 2.13 | 1.94 | — | — |
| Year Ended 8/31/2022 | $24.22 | (0.30) | (8.60) | (8.90) | (2.73) | (2.73) |
| Year Ended 8/31/2021 | $19.01 | (0.41) | 7.63 | 7.22 | (2.01) | (2.01) |
| Year Ended 8/31/2020 | $15.34 | (0.25) | 5.54 | 5.29 | (1.62) | (1.62) |
| Year Ended 8/31/2019 | $17.93 | (0.22) | 0.78 | 0.56 | (3.15) | (3.15) |
| Institutional Class |
| Year Ended 8/31/2023 | $19.41 | (0.10) | 3.31 | 3.21 | — | — |
| Year Ended 8/31/2022 | $35.61 | (0.21) | (13.04) | (13.25) | (2.95) | (2.95) |
| Year Ended 8/31/2021 | $27.10 | (0.26) | 11.01 | 10.75 | (2.24) | (2.24) |
| Year Ended 8/31/2020 | $21.20 | (0.14) | 7.85 | 7.71 | (1.81) | (1.81) |
| Year Ended 8/31/2019 | $23.42 | (0.11) | 1.24 | 1.13 | (3.35) | (3.35) |
| Institutional 2 Class |
| Year Ended 8/31/2023 | $19.76 | (0.08) | 3.37 | 3.29 | — | — |
| Year Ended 8/31/2022 | $36.17 | (0.20) | (13.24) | (13.44) | (2.97) | (2.97) |
| Year Ended 8/31/2021 | $27.49 | (0.24) | 11.18 | 10.94 | (2.26) | (2.26) |
| Year Ended 8/31/2020 | $21.47 | (0.13) | 7.98 | 7.85 | (1.83) | (1.83) |
| Year Ended 8/31/2019 | $23.68 | (0.09) | 1.26 | 1.17 | (3.38) | (3.38) |
The accompanying Notes to Financial Statements are an integral part of this statement.
| 18 | Columbia Small Cap Growth Fund | Annual Report 2023 |
Financial Highlights (continued)
| | Net
asset
value,
end of
period | Total
return | Total gross
expense
ratio to
average
net assets(a) | Total net
expense
ratio to
average
net assets(a),(b) | Net investment
income (loss)
ratio to
average
net assets | Portfolio
turnover | Net
assets,
end of
period
(000’s) |
| Class A |
| Year Ended 8/31/2023 | $20.53 | 16.25% | 1.28% | 1.28%(c) | (0.76%) | 118% | $363,077 |
| Year Ended 8/31/2022 | $17.66 | (40.10%) | 1.24%(d) | 1.24%(c),(d) | (1.07%) | 56% | $350,816 |
| Year Ended 8/31/2021 | $32.70 | 40.63% | 1.21% | 1.21%(c) | (1.03%) | 50% | $665,217 |
| Year Ended 8/31/2020 | $25.05 | 39.06% | 1.29%(d),(e) | 1.29%(c),(d),(e) | (0.89%) | 76% | $414,360 |
| Year Ended 8/31/2019 | $19.72 | 7.76% | 1.33%(d) | 1.33%(d) | (0.79%) | 113% | $265,473 |
| Advisor Class |
| Year Ended 8/31/2023 | $24.39 | 16.53% | 1.03% | 1.03%(c) | (0.51%) | 118% | $60,891 |
| Year Ended 8/31/2022 | $20.93 | (39.96%) | 0.99%(d) | 0.99%(c),(d) | (0.82%) | 56% | $64,035 |
| Year Ended 8/31/2021 | $38.14 | 40.97% | 0.96% | 0.96%(c) | (0.80%) | 50% | $183,909 |
| Year Ended 8/31/2020 | $28.90 | 39.42% | 1.04%(d),(e) | 1.04%(c),(d),(e) | (0.66%) | 76% | $83,934 |
| Year Ended 8/31/2019 | $22.48 | 8.05% | 1.07%(d) | 1.07%(d) | (0.54%) | 113% | $20,203 |
| Class C |
| Year Ended 8/31/2023 | $14.53 | 15.41% | 2.03% | 2.03%(c) | (1.51%) | 118% | $28,938 |
| Year Ended 8/31/2022 | $12.59 | (40.57%) | 1.99%(d) | 1.99%(c),(d) | (1.82%) | 56% | $28,016 |
| Year Ended 8/31/2021 | $24.22 | 39.58% | 1.96% | 1.96%(c) | (1.79%) | 50% | $50,471 |
| Year Ended 8/31/2020 | $19.01 | 38.03% | 2.04%(d),(e) | 2.04%(c),(d),(e) | (1.65%) | 76% | $20,142 |
| Year Ended 8/31/2019 | $15.34 | 6.93% | 2.08%(d) | 2.08%(d) | (1.54%) | 113% | $8,887 |
| Institutional Class |
| Year Ended 8/31/2023 | $22.62 | 16.54% | 1.03% | 1.03%(c) | (0.51%) | 118% | $876,678 |
| Year Ended 8/31/2022 | $19.41 | (39.96%) | 0.99%(d) | 0.99%(c),(d) | (0.82%) | 56% | $769,677 |
| Year Ended 8/31/2021 | $35.61 | 41.00% | 0.96% | 0.96%(c) | (0.79%) | 50% | $1,653,559 |
| Year Ended 8/31/2020 | $27.10 | 39.35% | 1.04%(d),(e) | 1.04%(c),(d),(e) | (0.65%) | 76% | $773,636 |
| Year Ended 8/31/2019 | $21.20 | 8.08% | 1.08%(d) | 1.08%(d) | (0.54%) | 113% | $283,781 |
| Institutional 2 Class |
| Year Ended 8/31/2023 | $23.05 | 16.65% | 0.91% | 0.91% | (0.39%) | 118% | $48,817 |
| Year Ended 8/31/2022 | $19.76 | (39.89%) | 0.88%(d) | 0.88%(d) | (0.72%) | 56% | $55,108 |
| Year Ended 8/31/2021 | $36.17 | 41.11% | 0.88% | 0.88% | (0.72%) | 50% | $237,521 |
| Year Ended 8/31/2020 | $27.49 | 39.50% | 0.96%(d),(e) | 0.96%(d),(e) | (0.58%) | 76% | $104,108 |
| Year Ended 8/31/2019 | $21.47 | 8.16% | 0.97%(d) | 0.97%(d) | (0.45%) | 113% | $26,190 |
The accompanying Notes to Financial Statements are an integral part of this statement.
Columbia Small Cap Growth Fund | Annual Report 2023
| 19 |
Financial Highlights (continued)
| | Net asset value,
beginning of
period | Net
investment
income
(loss) | Net
realized
and
unrealized
gain (loss) | Total from
investment
operations | Distributions
from net
realized
gains | Total
distributions to
shareholders |
| Institutional 3 Class |
| Year Ended 8/31/2023 | $20.08 | (0.07) | 3.44 | 3.37 | — | — |
| Year Ended 8/31/2022 | $36.71 | (0.17) | (13.48) | (13.65) | (2.98) | (2.98) |
| Year Ended 8/31/2021 | $27.87 | (0.23) | 11.34 | 11.11 | (2.27) | (2.27) |
| Year Ended 8/31/2020 | $21.75 | (0.12) | 8.08 | 7.96 | (1.84) | (1.84) |
| Year Ended 8/31/2019 | $23.93 | (0.08) | 1.29 | 1.21 | (3.39) | (3.39) |
| Class R |
| Year Ended 8/31/2023 | $17.05 | (0.18) | 2.91 | 2.73 | — | — |
| Year Ended 8/31/2022 | $31.70 | (0.30) | (11.51) | (11.81) | (2.84) | (2.84) |
| Year Ended 8/31/2021 | $24.35 | (0.38) | 9.86 | 9.48 | (2.13) | (2.13) |
| Year Ended 8/31/2020 | $19.22 | (0.23) | 7.08 | 6.85 | (1.72) | (1.72) |
| Year Ended 8/31/2019 | $21.57 | (0.19) | 1.09 | 0.90 | (3.25) | (3.25) |
| Notes to Financial Highlights |
| (a) | In addition to the fees and expenses that the Fund bears directly, the Fund indirectly bears a pro rata share of the fees and expenses of any other funds in which it invests. Such indirect expenses are not included in the Fund’s reported expense ratios. |
| (b) | Total net expenses include the impact of certain fee waivers/expense reimbursements made by the Investment Manager and certain of its affiliates, if applicable. |
| (c) | The benefits derived from expense reductions had an impact of less than 0.01%. |
| (d) | Ratios include interfund lending expense which is less than 0.01%. |
| (e) | Ratios include line of credit interest expense which is less than 0.01%. |
The accompanying Notes to Financial Statements are an integral part of this statement.
| 20 | Columbia Small Cap Growth Fund | Annual Report 2023 |
Financial Highlights (continued)
| | Net
asset
value,
end of
period | Total
return | Total gross
expense
ratio to
average
net assets(a) | Total net
expense
ratio to
average
net assets(a),(b) | Net investment
income (loss)
ratio to
average
net assets | Portfolio
turnover | Net
assets,
end of
period
(000’s) |
| Institutional 3 Class |
| Year Ended 8/31/2023 | $23.45 | 16.78% | 0.86% | 0.86% | (0.34%) | 118% | $385,265 |
| Year Ended 8/31/2022 | $20.08 | (39.88%) | 0.84%(d) | 0.84%(d) | (0.66%) | 56% | $345,912 |
| Year Ended 8/31/2021 | $36.71 | 41.18% | 0.83% | 0.83% | (0.67%) | 50% | $560,880 |
| Year Ended 8/31/2020 | $27.87 | 39.55% | 0.90%(d),(e) | 0.90%(d),(e) | (0.52%) | 76% | $163,142 |
| Year Ended 8/31/2019 | $21.75 | 8.26% | 0.92%(d) | 0.92%(d) | (0.38%) | 113% | $66,685 |
| Class R |
| Year Ended 8/31/2023 | $19.78 | 16.01% | 1.53% | 1.53%(c) | (1.01%) | 118% | $7,889 |
| Year Ended 8/31/2022 | $17.05 | (40.26%) | 1.49%(d) | 1.49%(c),(d) | (1.32%) | 56% | $7,173 |
| Year Ended 8/31/2021 | $31.70 | 40.27% | 1.46% | 1.46%(c) | (1.30%) | 50% | $13,968 |
| Year Ended 8/31/2020 | $24.35 | 38.67% | 1.54%(d),(e) | 1.54%(c),(d),(e) | (1.16%) | 76% | $4,674 |
| Year Ended 8/31/2019 | $19.22 | 7.53% | 1.58%(d) | 1.58%(d) | (1.03%) | 113% | $1,511 |
The accompanying Notes to Financial Statements are an integral part of this statement.
Columbia Small Cap Growth Fund | Annual Report 2023
| 21 |
Notes to Financial Statements
August 31, 2023
Note 1. Organization
Columbia Small Cap Growth Fund (the Fund), a series of Columbia Funds Series Trust I (the Trust), is a diversified fund. The Trust is registered under the Investment Company Act of 1940, as amended (the 1940 Act), as an open-end management investment company organized as a Massachusetts business trust.
Fund shares
The Trust may issue an unlimited number of shares (without par value). The Fund offers each of the share classes listed in the Statement of Assets and Liabilities. Although all share classes generally have identical voting, dividend and liquidation rights, each share class votes separately when required by the Trust’s organizational documents or by law. Each share class has its own expense and sales charge structure. Different share classes may have different minimum initial investment amounts and pay different net investment income distribution amounts to the extent the expenses of distributing such share classes vary. Distributions to shareholders in a liquidation will be proportional to the net asset value of each share class.
As described in the Fund’s prospectus, Class A and Class C shares are offered to the general public for investment. Class C shares automatically convert to Class A shares after 8 years. Advisor Class, Institutional Class, Institutional 2 Class, Institutional 3 Class and Class R shares are available for purchase through authorized investment professionals to omnibus retirement plans or to institutional investors and to certain other investors as also described in the Fund’s prospectus.
Note 2. Summary of significant accounting policies
Basis of preparation
The Fund is an investment company that applies the accounting and reporting guidance in the Financial Accounting Standards Board (FASB) Accounting Standards Codification Topic 946, Financial Services - Investment Companies (ASC 946). The financial statements are prepared in accordance with U.S. generally accepted accounting principles (GAAP), which requires management to make certain estimates and assumptions that affect the reported amounts of assets and liabilities, the disclosure of contingent assets and liabilities at the date of the financial statements and the reported amounts of income and expenses during the reporting period. Actual results could differ from those estimates.
The following is a summary of significant accounting policies followed by the Fund in the preparation of its financial statements.
Security valuation
Equity securities listed on an exchange are valued at the closing price or last trade price on their primary exchange at the close of business of the New York Stock Exchange. Securities with a closing price not readily available or not listed on any exchange are valued at the mean between the closing bid and ask prices. Listed preferred stocks convertible into common stocks are valued using an evaluated price from a pricing service.
Foreign equity securities are valued based on the closing price or last trade price on their primary exchange at the close of business of the New York Stock Exchange. If any foreign equity security closing prices are not readily available, the securities are valued at the mean of the latest quoted bid and ask prices on such exchanges or markets. Foreign currency exchange rates are determined at the scheduled closing time of the New York Stock Exchange. Many securities markets and exchanges outside the U.S. close prior to the close of the New York Stock Exchange; therefore, the closing prices for securities in such markets or on such exchanges may not fully reflect events that occur after such close but before the close of the New York Stock Exchange. In those situations, foreign securities will be fair valued pursuant to a policy approved by the Board of Trustees. Under the policy, the Fund may utilize a third-party pricing service to determine these fair values. The third-party pricing service takes into account multiple factors, including, but not limited to, movements in the U.S. securities markets, certain depositary receipts, futures contracts and foreign exchange rates that have occurred subsequent to the close of the foreign exchange or market, to determine a good faith estimate that reasonably reflects the current market conditions as of the close of the New York Stock Exchange. The fair value of a security is likely to be different from the quoted or published price, if available.
Investments in open-end investment companies (other than exchange-traded funds (ETFs)), are valued at the latest net asset value reported by those companies as of the valuation time.
| 22 | Columbia Small Cap Growth Fund | Annual Report 2023 |
Notes to Financial Statements (continued)
August 31, 2023
Investments for which market quotations are not readily available, or that have quotations which management believes are not reflective of market value or reliable, are valued at fair value as determined in good faith under procedures approved by the Board of Trustees. If a security or class of securities (such as foreign securities) is valued at fair value, such value is likely to be different from the quoted or published price for the security, if available.
The determination of fair value often requires significant judgment. To determine fair value, management may use assumptions including but not limited to future cash flows and estimated risk premiums. Multiple inputs from various sources may be used to determine fair value.
GAAP requires disclosure regarding the inputs and valuation techniques used to measure fair value and any changes in valuation inputs or techniques. In addition, investments shall be disclosed by major category. This information is disclosed following the Fund’s Portfolio of Investments.
Security transactions
Security transactions are accounted for on the trade date. Cost is determined and gains (losses) are based upon the specific identification method for both financial statement and federal income tax purposes.
Income recognition
Corporate actions and dividend income are generally recorded net of any non-reclaimable tax withholdings, on the ex-dividend date or upon receipt of an ex-dividend notification in the case of certain foreign securities.
The Fund may receive distributions from holdings in equity securities, business development companies (BDCs), exchange-traded funds (ETFs), limited partnerships (LPs), other regulated investment companies (RICs), and real estate investment trusts (REITs), which report information as to the tax character of their distributions annually. These distributions are allocated to dividend income, capital gain and return of capital based on actual information reported. Return of capital is recorded as a reduction of the cost basis of securities held. If the Fund no longer owns the applicable securities, return of capital is recorded as a realized gain. With respect to REITs, to the extent actual information has not yet been reported, estimates for return of capital are made by Columbia Management Investment Advisers, LLC (the Investment Manager), a wholly-owned subsidiary of Ameriprise Financial, Inc. (Ameriprise Financial). The Investment Manager’s estimates are subsequently adjusted when the actual character of the distributions is disclosed by the REITs, which could result in a proportionate change in return of capital to shareholders.
Awards from class action litigation are recorded as a reduction of cost basis if the Fund still owns the applicable securities on the payment date. If the Fund no longer owns the applicable securities on the payment date, the proceeds are recorded as realized gains.
Expenses
General expenses of the Trust are allocated to the Fund and other funds of the Trust based upon relative net assets or other expense allocation methodologies determined by the nature of the expense. Expenses directly attributable to the Fund are charged to the Fund. Expenses directly attributable to a specific class of shares are charged to that share class.
Determination of class net asset value
All income, expenses (other than class-specific expenses, which are charged to that share class, as shown in the Statement of Operations) and realized and unrealized gains (losses) are allocated to each class of the Fund on a daily basis, based on the relative net assets of each class, for purposes of determining the net asset value of each class.
Federal income tax status
The Fund intends to qualify each year as a regulated investment company under Subchapter M of the Internal Revenue Code, as amended, and will distribute substantially all of its investment company taxable income and net capital gain, if any, for its tax year, and as such will not be subject to federal income taxes. In addition, the Fund intends to distribute in each calendar year substantially all of its ordinary income, capital gain net income and certain other amounts, if any, such that the Fund should not be subject to federal excise tax. Therefore, no federal income or excise tax provision is recorded.
Columbia Small Cap Growth Fund | Annual Report 2023
| 23 |
Notes to Financial Statements (continued)
August 31, 2023
Foreign taxes
The Fund may be subject to foreign taxes on income, gains on investments or currency repatriation, a portion of which may be recoverable. The Fund will accrue such taxes and recoveries, as applicable, based upon its current interpretation of tax rules and regulations that exist in the markets in which it invests.
Realized gains in certain countries may be subject to foreign taxes at the Fund level, based on statutory rates. The Fund accrues for such foreign taxes on realized and unrealized gains at the appropriate rate for each jurisdiction, as applicable. The amount, if any, is disclosed as a liability in the Statement of Assets and Liabilities.
Distributions to shareholders
Distributions from net investment income, if any, are declared and paid annually. Net realized capital gains, if any, are distributed at least annually. Income distributions and capital gain distributions are determined in accordance with federal income tax regulations, which may differ from GAAP.
Guarantees and indemnifications
Under the Trust’s organizational documents and, in some cases, by contract, its officers and trustees are indemnified against certain liabilities arising out of the performance of their duties to the Trust or its funds. In addition, certain of the Fund’s contracts with its service providers contain general indemnification clauses. The Fund’s maximum exposure under these arrangements is unknown since the amount of any future claims that may be made against the Fund cannot be determined, and the Fund has no historical basis for predicting the likelihood of any such claims.
Recent accounting pronouncements and regulatory updates
Tailored Shareholder Reports
In October 2022, the Securities and Exchange Commission (SEC) adopted a final rule relating to Tailored Shareholder Reports for Mutual Funds and Exchange-Traded Funds; Fee Information in Investment Company Advertisements. The rule and form amendments will, among other things, require the Fund to transmit concise and visually engaging shareholder reports that highlight key information. The amendments will require that funds tag information in a structured data format and that certain more in-depth information be made available online and available for delivery free of charge to investors on request. The amendments became effective January 24, 2023. There is an 18-month transition period after the effective date of the amendments.
Note 3. Fees and other transactions with affiliates
Management services fees
The Fund has entered into a Management Agreement with Columbia Management Investment Advisers, LLC (the Investment Manager), a wholly-owned subsidiary of Ameriprise Financial, Inc. (Ameriprise Financial). Under the Management Agreement, the Investment Manager provides the Fund with investment research and advice, as well as administrative and accounting services. The management services fee is an annual fee that is equal to a percentage of the Fund’s daily net assets that declines from 0.87% to 0.75% as the Fund’s net assets increase. The effective management services fee rate for the year ended August 31, 2023 was 0.82% of the Fund’s average daily net assets.
Compensation of board members
Members of the Board of Trustees who are not officers or employees of the Investment Manager or Ameriprise Financial are compensated for their services to the Fund as disclosed in the Statement of Operations. Under a Deferred Compensation Plan (the Deferred Plan), these members of the Board of Trustees may elect to defer payment of up to 100% of their compensation. Deferred amounts are treated as though equivalent dollar amounts had been invested in shares of certain funds managed by the Investment Manager. The Fund’s liability for these amounts is adjusted for market value changes and remains in the Fund until distributed in accordance with the Deferred Plan. All amounts payable under the Deferred Plan constitute a general unsecured obligation of the Fund. The expense for the Deferred Plan, which includes Trustees’ fees deferred during the current period as well as any gains or losses on the Trustees’ deferred compensation balances as a result of market fluctuations, is included in "Trustees’ fees" in the Statement of Operations.
| 24 | Columbia Small Cap Growth Fund | Annual Report 2023 |
Notes to Financial Statements (continued)
August 31, 2023
Compensation of Chief Compliance Officer
The Board of Trustees has appointed a Chief Compliance Officer for the Fund in accordance with federal securities regulations. As disclosed in the Statement of Operations, a portion of the Chief Compliance Officer’s total compensation is allocated to the Fund, along with other allocations to affiliated registered investment companies managed by the Investment Manager and its affiliates, based on relative net assets.
Transfer agency fees
Under a Transfer and Dividend Disbursing Agent Agreement, Columbia Management Investment Services Corp. (the Transfer Agent), an affiliate of the Investment Manager and a wholly-owned subsidiary of Ameriprise Financial, is responsible for providing transfer agency services to the Fund. The Transfer Agent has contracted with SS&C GIDS, Inc. (SS&C GIDS) to serve as sub-transfer agent. Prior to January 1, 2023, SS&C GIDS was known as DST Asset Manager Solutions, Inc. The Transfer Agent pays the fees of SS&C GIDS for services as sub-transfer agent and SS&C GIDS is not entitled to reimbursement for such fees from the Fund (with the exception of out-of-pocket fees).
The Fund pays the Transfer Agent a monthly transfer agency fee based on the number or the average value of accounts, depending on the type of account. In addition, the Fund pays the Transfer Agent a fee for shareholder services based on the number of accounts or on a percentage of the average aggregate value of the Fund’s shares maintained in omnibus accounts up to the lesser of the amount charged by the financial intermediary or a cap established by the Board of Trustees from time to time.
The Transfer Agent also receives compensation from the Fund for various shareholder services and reimbursements for certain out-of-pocket fees. Total transfer agency fees for Institutional 2 Class and Institutional 3 Class shares are subject to an annual limitation of not more than 0.07% and 0.02%, respectively, of the average daily net assets attributable to each share class.
For the year ended August 31, 2023, the Fund’s effective transfer agency fee rates as a percentage of average daily net assets of each class were as follows:
| | Effective rate (%) |
| Class A | 0.18 |
| Advisor Class | 0.18 |
| Class C | 0.18 |
| Institutional Class | 0.18 |
| Institutional 2 Class | 0.06 |
| Institutional 3 Class | 0.01 |
| Class R | 0.18 |
An annual minimum account balance fee of $20 may apply to certain accounts with a value below the applicable share class’s initial minimum investment requirements to reduce the impact of small accounts on transfer agency fees. These minimum account balance fees are remitted to the Fund and recorded as part of expense reductions in the Statement of Operations. For the year ended August 31, 2023, these minimum account balance fees reduced total expenses of the Fund by $4,023.
Distribution and service fees
The Fund has entered into an agreement with Columbia Management Investment Distributors, Inc. (the Distributor), an affiliate of the Investment Manager and a wholly-owned subsidiary of Ameriprise Financial, for distribution and shareholder services. The Board of Trustees has approved, and the Fund has adopted, distribution and shareholder service plans (the Plans) applicable to certain share classes, which set the distribution and service fees for the Fund. These fees are calculated daily and are intended to compensate the Distributor and/or eligible selling and/or servicing agents for selling shares of the Fund and providing services to investors.
Columbia Small Cap Growth Fund | Annual Report 2023
| 25 |
Notes to Financial Statements (continued)
August 31, 2023
Under the Plans, the Fund pays a monthly service fee to the Distributor at the maximum annual rate of 0.25% of the average daily net assets attributable to Class A and Class C shares of the Fund. Also under the Plans, the Fund pays a monthly distribution fee to the Distributor at the maximum annual rates of 0.10%, 0.75% and 0.50% of the average daily net assets attributable to Class A, Class C and Class R shares of the Fund, respectively.
Although the Fund may pay distribution and service fees up to a maximum annual rate of 0.35% of the Fund’s average daily net assets attributable to Class A shares (comprised of up to 0.10% for distribution services and up to 0.25% for shareholder services), the Fund currently limits such fees to an aggregate fee of not more than 0.25% of the Fund’s average daily net assets attributable to Class A shares.
Sales charges (unaudited)
Sales charges, including front-end charges and contingent deferred sales charges (CDSCs), received by the Distributor for distributing Fund shares for the year ended August 31, 2023, if any, are listed below:
| | Front End (%) | CDSC (%) | Amount ($) |
| Class A | 5.75 | 0.50 - 1.00(a) | 165,971 |
| Class C | — | 1.00(b) | 1,496 |
| (a) | This charge is imposed on certain investments of between $1 million and $50 million redeemed within 18 months after purchase, as follows: 1.00% if redeemed within 12 months after purchase, and 0.50% if redeemed more than 12, but less than 18, months after purchase, with certain limited exceptions. |
| (b) | This charge applies to redemptions within 12 months after purchase, with certain limited exceptions. |
The Fund’s other share classes are not subject to sales charges.
Expenses waived/reimbursed by the Investment Manager and its affiliates
The Investment Manager and certain of its affiliates have contractually agreed to waive fees and/or reimburse expenses (excluding certain fees and expenses described below) for the period(s) disclosed below, unless sooner terminated at the sole discretion of the Board of Trustees, so that the Fund’s net operating expenses, after giving effect to fees waived/expenses reimbursed and any balance credits and/or overdraft charges from the Fund’s custodian, do not exceed the following annual rate(s) as a percentage of the classes’ average daily net assets:
| | Voluntary
expense cap effective
April 1, 2023 | Contractual
expense cap
January 1, 2023
through
March 31, 2023 | Contractual
expense cap
prior to
January 1, 2023 |
| Class A | 1.28% | 1.30% | 1.30% |
| Advisor Class | 1.03 | 1.05 | 1.05 |
| Class C | 2.03 | 2.05 | 2.05 |
| Institutional Class | 1.03 | 1.05 | 1.05 |
| Institutional 2 Class | 0.91 | 0.93 | 0.96 |
| Institutional 3 Class | 0.86 | 0.88 | 0.92 |
| Class R | 1.53 | 1.55 | 1.55 |
Under the agreement governing these fee waivers and/or expense reimbursement arrangements, the following fees and expenses are excluded from the waiver/reimbursement commitment, and therefore will be paid by the Fund, if applicable: taxes (including foreign transaction taxes), expenses associated with investments in affiliated and non-affiliated pooled investment vehicles (including mutual funds and exchange-traded funds), transaction costs and brokerage commissions, costs related to any securities lending program, dividend expenses associated with securities sold short, inverse floater program fees and expenses, transaction charges and interest on borrowed money, interest, costs associated with shareholder meetings, infrequent and/or unusual expenses and any other expenses the exclusion of which is specifically approved by the Board of Trustees. This agreement may be modified or amended only with approval from the Investment Manager, certain of its affiliates and the Fund. Any fees waived and/or expenses reimbursed under the expense reimbursement arrangements described above are not recoverable by the Investment Manager or its affiliates in future periods.
| 26 | Columbia Small Cap Growth Fund | Annual Report 2023 |
Notes to Financial Statements (continued)
August 31, 2023
Note 4. Federal tax information
The timing and character of income and capital gain distributions are determined in accordance with income tax regulations, which may differ from GAAP because of temporary or permanent book to tax differences.
At August 31, 2023, these differences were primarily due to differing treatment for deferral/reversal of wash sale losses, passive foreign investment company (pfic) holdings, late-year ordinary losses, capital loss carryforwards, trustees’ deferred compensation, net operating loss reclassification and miscellaneous adjustments. To the extent these differences were permanent, reclassifications were made among the components of the Fund’s net assets. Temporary differences do not require reclassifications.
The following reclassifications were made:
Excess of distributions
over net investment
income ($) | Accumulated
net realized
(loss) ($) | Paid in
capital ($) |
| 14,371,041 | 36,646 | (14,407,687) |
Net investment income (loss) and net realized gains (losses), as disclosed in the Statement of Operations, and net assets were not affected by this reclassification.
The tax character of distributions paid during the years indicated was as follows:
| Year Ended August 31, 2023 | Year Ended August 31, 2022 |
Ordinary
income ($) | Long-term
capital gains ($) | Total ($) | Ordinary
income ($) | Long-term
capital gains ($) | Total ($) |
| — | — | — | 88,786,002 | 188,032,858 | 276,818,860 |
Short-term capital gain distributions, if any, are considered ordinary income distributions for tax purposes.
At August 31, 2023, the components of distributable earnings on a tax basis were as follows:
Undistributed
ordinary income ($) | Undistributed
long-term
capital gains ($) | Capital loss
carryforwards ($) | Net unrealized
appreciation ($) |
| — | — | (440,117,055) | 230,685,741 |
At August 31, 2023, the cost of all investments for federal income tax purposes along with the aggregate gross unrealized appreciation and depreciation based on that cost was:
Federal
tax cost ($) | Gross unrealized
appreciation ($) | Gross unrealized
(depreciation) ($) | Net unrealized
appreciation ($) |
| 1,550,648,465 | 320,553,612 | (89,867,871) | 230,685,741 |
Tax cost of investments and unrealized appreciation/(depreciation) may also include timing differences that do not constitute adjustments to tax basis.
The following capital loss carryforwards, determined at August 31, 2023, may be available to reduce future net realized gains on investments, if any, to the extent permitted by the Internal Revenue Code. In addition, for the year ended August 31, 2023, capital loss carryforwards utilized, if any, were as follows:
No expiration
short-term ($) | No expiration
long-term ($) | Total ($) | Utilized ($) |
| (335,204,282) | (104,912,773) | (440,117,055) | — |
Columbia Small Cap Growth Fund | Annual Report 2023
| 27 |
Notes to Financial Statements (continued)
August 31, 2023
Under current tax rules, regulated investment companies can elect to treat certain late-year ordinary losses incurred and post-October capital losses (capital losses realized after October 31) as arising on the first day of the following taxable year. As of August 31, 2023, the Fund will elect to treat the following late-year ordinary losses and post-October capital losses as arising on September 1, 2023.
Late year
ordinary losses ($) | Post-October
capital losses ($) |
| 6,246,774 | — |
Management of the Fund has concluded that there are no significant uncertain tax positions in the Fund that would require recognition in the financial statements. However, management’s conclusion may be subject to review and adjustment at a later date based on factors including, but not limited to, new tax laws, regulations, and administrative interpretations (including relevant court decisions). Generally, the Fund’s federal tax returns for the prior three fiscal years remain subject to examination by the Internal Revenue Service.
Note 5. Portfolio information
The cost of purchases and proceeds from sales of securities, excluding short-term investments and derivatives, if any, aggregated to $1,773,365,341 and $1,916,413,611, respectively, for the year ended August 31, 2023. The amount of purchase and sale activity impacts the portfolio turnover rate reported in the Financial Highlights.
Note 6. Affiliated money market fund
The Fund invests in Columbia Short-Term Cash Fund, an affiliated money market fund established for the exclusive use by the Fund and other affiliated funds (the Affiliated MMF). The income earned by the Fund from such investments is included as Dividends - affiliated issuers in the Statement of Operations. As an investing fund, the Fund indirectly bears its proportionate share of the expenses of the Affiliated MMF. The Affiliated MMF prices its shares with a floating net asset value. The Securities and Exchange Commission has adopted amendments to money market fund rules requiring institutional prime money market funds like the Affiliated MMF to be subject, by October 2, 2024, to a liquidity fee if daily net redemptions exceed 5% of net assets and, by April 2, 2024, to a discretionary liquidity fee up to 2% if the imposition of such a fee is determined to be in the best interest of the Affiliated MMF.
Note 7. Interfund lending
Pursuant to an exemptive order granted by the Securities and Exchange Commission, the Fund participates in a program (the Interfund Program) allowing each participating Columbia Fund (each, a Participating Fund) to lend money directly to and, except for closed-end funds and money market funds, borrow money directly from other Participating Funds for temporary purposes. The amounts eligible for borrowing and lending under the Interfund Program are subject to certain restrictions.
Interfund loans are subject to the risk that the borrowing fund could be unable to repay the loan when due, and a delay in repayment to the lending fund could result in lost opportunities and/or additional lending costs. The exemptive order is subject to conditions intended to mitigate conflicts of interest arising from the Investment Manager’s relationship with each Participating Fund.
The Fund’s activity in the Interfund Program during the year ended August 31, 2023 was as follows:
| Borrower or lender | Average loan
balance ($) | Weighted average
interest rate (%) | Number of days
with outstanding loans |
| Lender | 2,028,571 | 4.63 | 7 |
Interest income earned by the Fund is recorded as interfund lending in the Statement of Operations. The Fund had no outstanding interfund loans at August 31, 2023.
| 28 | Columbia Small Cap Growth Fund | Annual Report 2023 |
Notes to Financial Statements (continued)
August 31, 2023
Note 8. Line of credit
The Fund has access to a revolving credit facility with a syndicate of banks led by JPMorgan Chase Bank, N.A., Citibank, N.A. and Wells Fargo Bank, N.A. whereby the Fund may borrow for the temporary funding of shareholder redemptions or for other temporary or emergency purposes. Pursuant to an October 27, 2022 amendment and restatement, the credit facility, which is an agreement between the Fund and certain other funds managed by the Investment Manager or an affiliated investment manager, severally and not jointly, permits aggregate borrowings up to $950 million. Interest is currently charged to each participating fund based on its borrowings at a rate equal to the higher of (i) the federal funds effective rate, (ii) the secured overnight financing rate plus 0.10% and (iii) the overnight bank funding rate plus, in each case, 1.00%. Each borrowing under the credit facility matures no later than 60 days after the date of borrowing. The Fund also pays a commitment fee equal to its pro rata share of the unused amount of the credit facility at a rate of 0.15% per annum. The commitment fee is included in other expenses in the Statement of Operations. This agreement expires annually in October unless extended or renewed. Prior to the October 27, 2022 amendment and restatement, the Fund had access to a revolving credit facility with a syndicate of banks led by JPMorgan Chase Bank, N.A., Citibank, N.A. and Wells Fargo Bank, N.A. which permitted collective borrowings up to $950 million. Interest was charged to each participating fund based on its borrowings at a rate equal to the higher of (i) the federal funds effective rate, (ii) the secured overnight financing rate plus 0.11448% and (iii) the overnight bank funding rate plus, in each case, 1.00%.
The Fund had no borrowings during the year ended August 31, 2023.
Note 9. Significant risks
Health care sector risk
The Fund is more susceptible to the particular risks that may affect companies in the health care sector than if it were invested in a wider variety of companies in unrelated sectors. Companies in the health care sector are subject to certain risks, including restrictions on government reimbursement for medical expenses, government approval of medical products and services, competitive pricing pressures, and the rising cost of medical products and services (especially for companies dependent upon a relatively limited number of products or services). Performance of such companies may be affected by factors including government regulation, obtaining and protecting patents (or the failure to do so), product liability and other similar litigation as well as product obsolescence.
Industrials sector risk
The Fund is more susceptible to the particular risks that may affect companies in the industrials sector than if it were invested in a wider variety of companies in unrelated sectors. Companies in the industrials sector are subject to certain risks, including changes in supply and demand for their specific product or service and for industrial sector products in general, including decline in demand for such products due to rapid technological developments and frequent new product introduction. Performance of such companies may be affected by factors including government regulation, world events, economic conditions and risks for environmental damage and product liability claims.
Market risk
The Fund may incur losses due to declines in the value of one or more securities in which it invests. These declines may be due to factors affecting a particular issuer, or the result of, among other things, political, regulatory, market, economic or social developments affecting the relevant market(s) more generally. In addition, turbulence in financial markets and reduced liquidity in equity, credit and/or fixed income markets may negatively affect many issuers, which could adversely affect the Fund’s ability to price or value hard-to-value assets in thinly traded and closed markets and could cause significant redemptions and operational challenges. Global economies and financial markets are increasingly interconnected, and conditions and events in one country, region or financial market may adversely impact issuers in a different country, region or financial market. These risks may be magnified if certain events or developments adversely interrupt the global supply chain; in these and other circumstances, such risks might affect companies worldwide. As a result, local, regional or global events such as terrorism, war, natural disasters, disease/virus outbreaks and epidemics or other public health issues, recessions, depressions or other events – or the potential for such events – could have a significant negative impact on global economic and market conditions.
Columbia Small Cap Growth Fund | Annual Report 2023
| 29 |
Notes to Financial Statements (continued)
August 31, 2023
The large-scale invasion of Ukraine by Russia in February 2022 has resulted in sanctions and market disruptions, including declines in regional and global stock markets, unusual volatility in global commodity markets and significant devaluations of Russian currency. The extent and duration of the military action are impossible to predict but could be significant. Market disruption caused by the Russian military action, and any counter-measures or responses thereto (including international sanctions, a downgrade in the country’s credit rating, purchasing and financing restrictions, boycotts, tariffs, changes in consumer or purchaser preferences, cyberattacks and espionage) could have severe adverse impacts on regional and/or global securities and commodities markets, including markets for oil and natural gas. These impacts may include reduced market liquidity, distress in credit markets, further disruption of global supply chains, increased risk of inflation, restricted cross-border payments and limited access to investments and/or assets in certain international markets and/or issuers. These developments and other related events could negatively impact Fund performance.
Shareholder concentration risk
At August 31, 2023, affiliated shareholders of record owned 23.7% of the outstanding shares of the Fund in one or more accounts. Fund shares sold to or redeemed by concentrated accounts may have a significant effect on the operations of the Fund. In the case of a large redemption, the Fund may be forced to sell investments at inopportune times, including its liquid positions, which may result in Fund losses and the Fund holding a higher percentage of less liquid positions. Large redemptions could result in decreased economies of scale and increased operating expenses for non-redeeming Fund shareholders.
Small- and mid-cap company risk
Investments in small- and mid-capitalization companies (small- and mid-cap companies) often involve greater risks than investments in larger, more established companies (larger companies) because small- and mid-cap companies tend to have less predictable earnings and may lack the management experience, financial resources, product diversification and competitive strengths of larger companies. Securities of small- and mid-cap companies may be less liquid and more volatile than the securities of larger companies.
Note 10. Subsequent events
Management has evaluated the events and transactions that have occurred through the date the financial statements were issued and noted no items requiring adjustment of the financial statements or additional disclosure.
Note 11. Information regarding pending and settled legal proceedings
Ameriprise Financial and certain of its affiliates are involved in the normal course of business in legal proceedings which include regulatory inquiries, arbitration and litigation, including class actions concerning matters arising in connection with the conduct of their activities as part of a diversified financial services firm. Ameriprise Financial believes that the Fund is not currently the subject of, and that neither Ameriprise Financial nor any of its affiliates are the subject of, any pending legal, arbitration or regulatory proceedings that are likely to have a material adverse effect on the Fund or the ability of Ameriprise Financial or its affiliates to perform under their contracts with the Fund. Ameriprise Financial is required to make quarterly (10-Q), annual (10-K) and, as necessary, 8-K filings with the Securities and Exchange Commission (SEC) on legal and regulatory matters that relate to Ameriprise Financial and its affiliates. Copies of these filings may be obtained by accessing the SEC website at www.sec.gov.
There can be no assurance that these matters, or the adverse publicity associated with them, will not result in increased Fund redemptions, reduced sale of Fund shares or other adverse consequences to the Fund. Further, although we believe proceedings are not likely to have a material adverse effect on the Fund or the ability of Ameriprise Financial or its affiliates to perform under their contracts with the Fund, these proceedings are subject to uncertainties and, as such, we are unable to estimate the possible loss or range of loss that may result. An adverse outcome in one or more of these proceedings could result in adverse judgments, settlements, fines, penalties or other relief that could have a material adverse effect on the consolidated financial condition or results of operations of Ameriprise Financial or one or more of its affiliates that provide services to the Fund.
| 30 | Columbia Small Cap Growth Fund | Annual Report 2023 |
Report of Independent Registered Public Accounting Firm
To the Board of Trustees of Columbia Funds Series Trust I and Shareholders of Columbia Small Cap Growth Fund
Opinion on the Financial Statements
We have audited the accompanying statement of assets and liabilities, including the portfolio of investments, of Columbia Small Cap Growth Fund (one of the funds constituting Columbia Funds Series Trust I, referred to hereafter as the "Fund") as of August 31, 2023, the related statement of operations for the year ended August 31, 2023, the statement of changes in net assets for each of the two years in the period ended August 31, 2023, including the related notes, and the financial highlights for each of the five years in the period ended August 31, 2023 (collectively referred to as the "financial statements"). In our opinion, the financial statements present fairly, in all material respects, the financial position of the Fund as of August 31, 2023, the results of its operations for the year then ended, the changes in its net assets for each of the two years in the period ended August 31, 2023 and the financial highlights for each of the five years in the period ended August 31, 2023 in conformity with accounting principles generally accepted in the United States of America.
Basis for Opinion
These financial statements are the responsibility of the Fund’s management. Our responsibility is to express an opinion on the Fund’s financial statements based on our audits. We are a public accounting firm registered with the Public Company Accounting Oversight Board (United States) (PCAOB) and are required to be independent with respect to the Fund in accordance with the U.S. federal securities laws and the applicable rules and regulations of the Securities and Exchange Commission and the PCAOB.
We conducted our audits of these financial statements in accordance with the standards of the PCAOB. Those standards require that we plan and perform the audit to obtain reasonable assurance about whether the financial statements are free of material misstatement, whether due to error or fraud.
Our audits included performing procedures to assess the risks of material misstatement of the financial statements, whether due to error or fraud, and performing procedures that respond to those risks. Such procedures included examining, on a test basis, evidence regarding the amounts and disclosures in the financial statements. Our audits also included evaluating the accounting principles used and significant estimates made by management, as well as evaluating the overall presentation of the financial statements. Our procedures included confirmation of securities owned as of August 31, 2023 by correspondence with the custodian, transfer agent and brokers; when replies were not received from brokers, we performed other auditing procedures. We believe that our audits provide a reasonable basis for our opinion.
/s/PricewaterhouseCoopers LLP
Minneapolis, Minnesota
October 23, 2023
We have served as the auditor of one or more investment companies within the Columbia Funds Complex since 1977.
Columbia Small Cap Growth Fund | Annual Report 2023
| 31 |
TRUSTEES AND OFFICERS
(Unaudited)
The Board oversees the Fund’s operations and appoints officers who are responsible for day-to-day business decisions based on policies set by the Board. The following table provides basic biographical information about the Fund’s Trustees as of the printing of this report, including their principal occupations during the past five years, although specific titles for individuals may have varied over the period. The year set forth beneath Length of Service in the table below is the year in which the Trustee was first appointed or elected as Trustee to any Fund currently in the Columbia Funds Complex or a predecessor thereof. Under current Board policy, each Trustee generally serves until December 31 of the year such Trustee turns seventy-five (75).
Independent trustees
Name,
address,
year of birth | Position held
with the Columbia Funds and
length of service | Principal occupation(s)
during past five years
and other relevant
professional experience | Number of
Funds in the
Columbia Funds
Complex*
overseen | Other directorships
held by Trustee
during the past five years
and other relevant Board experience |
George S. Batejan
c/o Columbia Management
Investment Advisers, LLC
290 Congress Street
Boston, MA 02210
1954 | Trustee since 2017 | Executive Vice President, Global Head of Technology and Operations, Janus Capital Group, Inc., 2010-2016 | 173 | Former Chairman of the Board, NICSA (National Investment Company Services Association) (Executive Committee, Nominating Committee and Governance Committee), 2014-2016; former Director, Intech Investment Management, 2011-2016; former Board Member, Metro Denver Chamber of Commerce, 2015-2016; former Advisory Board Member, University of Colorado Business School, 2015-2018; former Board Member, Chase Bank International, 1993-1994 |
Kathleen Blatz
c/o Columbia Management
Investment Advisers, LLC
290 Congress Street
Boston, MA 02210
1954 | Trustee since 2006 | Attorney, specializing in arbitration and mediation; Chief Justice, Minnesota Supreme Court, 1998-2006; Associate Justice, Minnesota Supreme Court, 1996-1998; Fourth Judicial District Court Judge, Hennepin County, 1994-1996; Attorney in private practice and public service, 1984-1993; State Representative, Minnesota House of Representatives, 1979-1993, which included service on the Tax and Financial Institutions and Insurance Committees; Member and Interim Chair, Minnesota Sports Facilities Authority, January-July 2017; Interim President and Chief Executive Officer, Blue Cross and Blue Shield of Minnesota (health care insurance), February-July 2018, April-October 2021 | 173 | Former Trustee, Blue Cross and Blue Shield of Minnesota, 2009-2021 (Chair of the Business Development Committee, 2014-2017; Chair of the Governance Committee, 2017-2019); former Member and Chair of the Board, Minnesota Sports Facilities Authority, January 2017-July 2017; former Director, Robina Foundation, 2009-2020 (Chair, 2014-2020); Director, Richard M. Schulze Family Foundation, since 2021 |
| 32 | Columbia Small Cap Growth Fund | Annual Report 2023 |
TRUSTEES AND OFFICERS (continued)
(Unaudited)
Independent trustees (continued)
Name,
address,
year of birth | Position held
with the Columbia Funds and
length of service | Principal occupation(s)
during past five years
and other relevant
professional experience | Number of
Funds in the
Columbia Funds
Complex*
overseen | Other directorships
held by Trustee
during the past five years
and other relevant Board experience |
Pamela G. Carlton
c/o Columbia Management
Investment Advisers, LLC
290 Congress Street
Boston, MA 02210
1954 | Chair since 2023; Trustee since 2007 | President, Springboard – Partners in Cross Cultural Leadership (consulting company), since 2003; Managing Director of US Equity Research, JP Morgan Chase, 1999-2003; Director of US Equity Research, Chase Asset Management, 1996-1999; Co-Director Latin America Research, 1993-1996, COO Global Research, 1992-1996, Co-Director of US Research, 1991-1992, Investment Banker, 1982-1991, Morgan Stanley; Attorney, Cleary Gottlieb Steen & Hamilton LLP, 1980-1982 | 173 | Trustee, New York Presbyterian Hospital Board, since 1996; Director, DR Bank (Audit Committee) since 2017; Director, Evercore Inc. (Audit Committee, Nominating and Governance Committee), since 2019; Director, Apollo Commercial Real Estate Finance, Inc. (Chair, Nominating and Governance Committee) (financial services), since 2021; the Governing Council of the Independent Directors Council (IDC), since 2021 |
Janet Langford Carrig
c/o Columbia Management
Investment Advisers, LLC
290 Congress Street
Boston, MA 02210
1957 | Trustee since 1996 | Senior Vice President, General Counsel and Corporate Secretary, ConocoPhillips (independent energy company), September 2007-October 2018 | 173 | Director, EQT Corporation (natural gas producer), since 2019; former Director, Whiting Petroleum Corporation (independent oil and gas company), 2020-2022 |
J. Kevin Connaughton
c/o Columbia Management
Investment Advisers, LLC
290 Congress Street
Boston, MA 02210
1964 | Trustee since 2020 | CEO and President, RhodeWay Financial (non-profit financial planning firm), since December 2022; Member, FINRA National Adjudicatory Council, since January 2020; Adjunct Professor of Finance, Bentley University since January 2018; Consultant to Independent Trustees of CFVIT and CFST I from March 2016 to June 2020 with respect to CFVIT and to December 2020 with respect to CFST I; Managing Director and General Manager of Mutual Fund Products, Columbia Management Investment Advisers, LLC, May 2010-February 2015; President, Columbia Funds, 2008-2015; and senior officer of Columbia Funds and affiliated funds, 2003-2015 | 171 | Former Director, The Autism Project, March 2015-December 2021; former Member of the Investment Committee, St. Michael’s College, November 2015-February 2020; former Trustee, St. Michael’s College, June 2017-September 2019; former Trustee, New Century Portfolios (former mutual fund complex), January 2015-December 2017 |
Olive M. Darragh
c/o Columbia Management
Investment Advisers, LLC
290 Congress Street
Boston, MA 02210
1962 | Trustee since 2020 | Managing Director of Darragh Inc. (strategy and talent management consulting firm), since 2010; Founder and CEO, Zolio, Inc. (investment management talent identification platform), since 2004; Consultant to Independent Trustees of CFVIT and CFST I from June 2019 to June 2020 with respect to CFVIT and to December 2020 with respect to CFST I; Partner, Tudor Investments, 2004-2010; Senior Partner, McKinsey & Company (consulting), 1990-2004; Touche Ross CPA, 1985-1988 | 171 | Treasurer, Edinburgh University US Trust Board, since January 2023; Member, HBS Community Action Partners Board, since September 2022; former Director, University of Edinburgh Business School (Member of US Board), 2004-2019; former Director, Boston Public Library Foundation, 2008-2017 |
Columbia Small Cap Growth Fund | Annual Report 2023
| 33 |
TRUSTEES AND OFFICERS (continued)
(Unaudited)
Independent trustees (continued)
Name,
address,
year of birth | Position held
with the Columbia Funds and
length of service | Principal occupation(s)
during past five years
and other relevant
professional experience | Number of
Funds in the
Columbia Funds
Complex*
overseen | Other directorships
held by Trustee
during the past five years
and other relevant Board experience |
Patricia M. Flynn
c/o Columbia Management
Investment Advisers, LLC
290 Congress Street
Boston, MA 02210
1950 | Trustee since 2004 | Professor of Economics and Management, Bentley University, since 2002; Dean, McCallum Graduate School of Business, Bentley University, 1992-2002 | 173 | Former Trustee, MA Taxpayers Foundation, 1997-2022; former Director, The MA Business Roundtable, 2003-2019; former Chairperson, Innovation Index Advisory Committee, MA Technology Collaborative, 1997-2020 |
Brian J. Gallagher
c/o Columbia Management
Investment Advisers, LLC
290 Congress Street
Boston, MA 02210
1954 | Trustee since 2017 | Retired; Partner with Deloitte & Touche LLP and its predecessors, 1977-2016 | 173 | Trustee, Catholic Schools Foundation, since 2004 |
Douglas A. Hacker
c/o Columbia Management
Investment Advisers, LLC
290 Congress Street
Boston, MA 02210
1955 | Trustee since 1996 | Independent business executive, since May 2006; Executive Vice President – Strategy of United Airlines, December 2002 - May 2006; President of UAL Loyalty Services (airline marketing company), September 2001-December 2002; Executive Vice President and Chief Financial Officer of United Airlines, July 1999-September 2001 | 173 | Director, SpartanNash Company since November 2013 (Chair of the Board, since May 2021) (food distributor); Director, Aircastle Limited (Chair of Audit Committee) (aircraft leasing), since August 2006; former Director, Nash Finch Company (food distributor), 2005-2013; former Director, SeaCube Container Leasing Ltd. (container leasing), 2010-2013; and former Director, Travelport Worldwide Limited (travel information technology), 2014-2019 |
Nancy T. Lukitsh
c/o Columbia Management
Investment Advisers, LLC
290 Congress Street
Boston, MA 02210
1956 | Trustee since 2011 | Senior Vice President, Partner and Director of Marketing, Wellington Management Company, LLP (investment adviser), 1997-2010; Chair, Wellington Management Portfolios (commingled non-U.S. investment pools), 2007-2010; Director, Wellington Trust Company, NA and other Wellington affiliates, 1997-2010 | 171 | None |
| 34 | Columbia Small Cap Growth Fund | Annual Report 2023 |
TRUSTEES AND OFFICERS (continued)
(Unaudited)
Independent trustees (continued)
Name,
address,
year of birth | Position held
with the Columbia Funds and
length of service | Principal occupation(s)
during past five years
and other relevant
professional experience | Number of
Funds in the
Columbia Funds
Complex*
overseen | Other directorships
held by Trustee
during the past five years
and other relevant Board experience |
David M. Moffett
c/o Columbia Management
Investment Advisers, LLC
290 Congress Street
Boston, MA 02210
1952 | Trustee since 2011 | Retired; former Chief Executive Officer of Freddie Mac and Chief Financial Officer of U.S. Bank | 171 | Director, CSX Corporation (transportation suppliers); Director, PayPal Holdings Inc. (payment and data processing services); Trustee, University of Oklahoma Foundation; former Director, eBay Inc. (online trading community), 2007-2015; and former Director, CIT Bank, CIT Group Inc. (commercial and consumer finance), 2010-2016; former Senior Adviser to The Carlyle Group (financial services), March 2008-September 2008; former Governance Consultant to Bridgewater Associates, January 2013-December 2015 |
Catherine James Paglia
c/o Columbia Management
Investment Advisers, LLC
290 Congress Street
Boston, MA 02210
1952 | Trustee since 2004 | Director, Enterprise Asset Management, Inc. (private real estate and asset management company), since September 1998; Managing Director and Partner, Interlaken Capital, Inc., 1989-1997; Vice President, 1982-1985, Principal, 1985-1987, Managing Director, 1987-1989, Morgan Stanley; Vice President, Investment Banking, 1980-1982, Associate, Investment Banking, 1976-1980, Dean Witter Reynolds, Inc. | 173 | Director, Valmont Industries, Inc. (irrigation systems manufacturer), since 2012; Trustee, Carleton College (on the Investment Committee), since 1987; Trustee, Carnegie Endowment for International Peace (on the Investment Committee), since 2009 |
Natalie A. Trunow
c/o Columbia Management
Investment Advisers, LLC
290 Congress Street
Boston, MA 02210
1967 | Trustee since 2020 | Chief Executive Officer, Millennial Portfolio Solutions LLC (asset management and consulting services), January 2016-January 2021; Non-executive Member of the Investment Committee and Valuation Committee, Sarona Asset Management Inc. (private equity firm) since September 2019; Advisor, Horizon Investments (asset management and consulting services), August 2018-January 2022; Advisor, Paradigm Asset Management, November 2016-January 2022; Consultant to Independent Trustees of CFVIT and CFST I from September 2016 to June 2020 with respect to CFVIT and to December 2020 with respect to CFST I; Director of Investments/Consultant, Casey Family Programs, April 2016-November 2016; Senior Vice President and Chief Investment Officer, Calvert Investments, August 2008-January 2016; Section Head and Portfolio Manager, General Motors Asset Management, June 1997-August 2008 | 171 | Independent Director, Investment Committee, Health Services for Children with Special Needs, Inc., 2010-2021; Independent Director, (Executive Committee and Chair, Audit Committee), Consumer Credit Counseling Services (formerly Guidewell Financial Solutions), since 2016; Independent Director, (Investment Committee), Sarona Asset Management, since 2019 |
Columbia Small Cap Growth Fund | Annual Report 2023
| 35 |
TRUSTEES AND OFFICERS (continued)
(Unaudited)
Independent trustees (continued)
Name,
address,
year of birth | Position held
with the Columbia Funds and
length of service | Principal occupation(s)
during past five years
and other relevant
professional experience | Number of
Funds in the
Columbia Funds
Complex*
overseen | Other directorships
held by Trustee
during the past five years
and other relevant Board experience |
Sandra L. Yeager
c/o Columbia Management
Investment Advisers, LLC
290 Congress Street
Boston, MA 02210
1964 | Trustee since 2017 | Retired; President and founder, Hanoverian Capital, LLC (SEC registered investment advisor firm), 2008-2016; Managing Director, DuPont Capital, 2006-2008; Managing Director, Morgan Stanley Investment Management, 2004-2006; Senior Vice President, Alliance Bernstein, 1990-2004 | 173 | Former Director, NAPE (National Alliance for Partnerships in Equity) Education Foundation, October 2016-October 2020; Advisory Board, Jennersville YMCA, since 2022 |
Interested trustee affiliated with Investment Manager**
Name,
address,
year of birth | Position held with the Columbia Funds and length of service | Principal occupation(s) during the
past five years and other relevant
professional experience | Number of
Funds in the
Columbia Funds
Complex* overseen | Other directorships
held by Trustee
during the past
five years and
other relevant Board experience |
Daniel J. Beckman
c/o Columbia Management
Investment Advisers, LLC
290 Congress Street
Boston, MA 02210
1962 | Trustee since November 2021 and President since June 2021 | Vice President – Head of North America Product, Columbia Management Investment Advisers, LLC, since April 2015; President and Principal Executive Officer of the Columbia Funds, since June 2021; officer of Columbia Funds and affiliated funds, 2020-2021 | 173 | Director, Ameriprise Trust Company, since October 2016; Director, Columbia Management Investment Distributors, Inc. since November 2018; Board of Governors, Columbia Wanger Asset Management, LLC since, January 2022; Director, Columbia Threadneedle Canada, Inc., since December 2022 |
| * | The term “Columbia Funds Complex” as used herein includes Columbia Seligman Premium Technology Growth Fund, Tri-Continental Corporation and each series of Columbia Funds Series Trust (CFST), Columbia Funds Series Trust I (CFST I), Columbia Funds Series Trust II (CFST II), Columbia ETF Trust I (CET I), Columbia ETF Trust II (CET II), Columbia Funds Variable Insurance Trust (CFVIT) and Columbia Funds Variable Series Trust II (CFVST II). Messrs. Batejan, Beckman, Gallagher and Hacker and Mses. Blatz, Carlton, Carrig, Flynn, Paglia, and Yeager serve as directors of Columbia Seligman Premium Technology Growth Fund and Tri-Continental Corporation. |
| ** | Interested person (as defined under the 1940 Act) by reason of being an officer, director, security holder and/or employee of the Investment Manager or Ameriprise Financial. |
The Statement of Additional Information has additional information about the Fund’s Board members and is available, without charge, upon request by calling 800.345.6611, visiting columbiathreadneedleus.com/investor/ or contacting your financial intermediary.
| 36 | Columbia Small Cap Growth Fund | Annual Report 2023 |
TRUSTEES AND OFFICERS (continued)
(Unaudited)
The Board has appointed officers who are responsible for day-to-day business decisions based on policies it has established. The officers serve at the pleasure of the Board. The following table provides basic information about the Officers of the Fund as of the printing of this report, including principal occupations during the past five years, although their specific titles may have varied over the period. In addition to Mr. Beckman, who is President and Principal Executive Officer, the Fund’s other officers are:
Fund officers
Name,
address and
year of birth | Position and year
first appointed to
position for any Fund
in the Columbia
Funds Complex or a
predecessor thereof | Principal occupation(s) during past five years |
Michael G. Clarke
290 Congress Street
Boston, MA 02210
1969 | Chief Financial Officer and Principal Financial Officer (2009) and Senior Vice President (2019) | Senior Vice President and North America Head of Operations & Investor Services, Columbia Management Investment Advisers, LLC, since June 2023 (previously Senior Vice President and Head of Global Operations, March 2022 – June 2023, Vice President, Head of North America Operations, and Co-Head of Global Operations, June 2019 - February 2022 and Vice President – Accounting and Tax, May 2010 - May 2019); senior officer of Columbia Funds and affiliated funds, since 2002. Director, Ameriprise Trust Company, since June 2023. |
Joseph Beranek
5890 Ameriprise Financial Center
Minneapolis, MN 55474
1965 | Treasurer and Chief Accounting Officer (Principal Accounting Officer) (2019) and Principal Financial Officer (2020), CFST, CFST I, CFST II, CFVIT and CFVST II; Assistant Treasurer, CET I and CET II | Vice President – Mutual Fund Accounting and Financial Reporting, Columbia Management Investment Advisers, LLC, since December 2018 and March 2017, respectively. |
Marybeth Pilat
290 Congress Street
Boston, MA 02210
1968 | Treasurer and Chief Accounting Officer (Principal Accounting Officer) and Principal Financial Officer (2020) for CET I and CET II; Assistant Treasurer, CFST, CFST I, CFST II, CFVIT and CFVST II | Vice President – Product Pricing and Administration, Columbia Management Investment Advisers, LLC, since May 2017. |
William F. Truscott
290 Congress Street
Boston, MA 02210
1960 | Senior Vice President (2001) | Formerly, Trustee/Director of Columbia Funds Complex or legacy funds, November 2001 - January 1, 2021; Chief Executive Officer, Global Asset Management, Ameriprise Financial, Inc., since September 2012; Chairman of the Board and President, Columbia Management Investment Advisers, LLC, since July 2004 and February 2012, respectively; Chairman of the Board and Chief Executive Officer, Columbia Management Investment Distributors, Inc., since November 2008 and February 2012, respectively; Chairman of the Board and Director, Threadneedle Asset Management Holdings, Sàrl, since March 2013 and December 2008, respectively; senior executive of various entities affiliated with Columbia Threadneedle. |
Christopher O. Petersen
5228 Ameriprise Financial Center
Minneapolis, MN 55474
1970 | Senior Vice President and Assistant Secretary (2021) | Formerly, Trustee/Director of funds within the Columbia Funds Complex, July 1, 2020 - November 22, 2021; Senior Vice President and Assistant General Counsel, Ameriprise Financial, Inc., since September 2021 (previously Vice President and Lead Chief Counsel, January 2015 - September 2021); formerly, President and Principal Executive Officer of the Columbia Funds, 2015 - 2021; officer of Columbia Funds and affiliated funds, since 2007. |
Thomas P. McGuire
290 Congress Street
Boston, MA 02210
1972 | Senior Vice President and Chief Compliance Officer (2012) | Vice President – Asset Management Compliance, Ameriprise Financial, Inc., since May 2010; Chief Compliance Officer, Columbia Acorn/Wanger Funds, since December 2015; formerly, Chief Compliance Officer, Ameriprise Certificate Company, September 2010 – September 2020. |
Ryan C. Larrenaga
290 Congress Street
Boston, MA 02210
1970 | Senior Vice President (2017), Chief Legal Officer (2017), and Secretary (2015) | Vice President and Chief Counsel, Ameriprise Financial, Inc., since August 2018 (previously Vice President and Group Counsel, August 2011 - August 2018); Chief Legal Officer, Columbia Acorn/Wanger Funds, since September 2020; officer of Columbia Funds and affiliated funds, since 2005. |
Columbia Small Cap Growth Fund | Annual Report 2023
| 37 |
TRUSTEES AND OFFICERS (continued)
(Unaudited)
Fund officers (continued)
Name,
address and
year of birth | Position and year
first appointed to
position for any Fund
in the Columbia
Funds Complex or a
predecessor thereof | Principal occupation(s) during past five years |
Michael E. DeFao
290 Congress Street
Boston, MA 02210
1968 | Vice President (2011) and Assistant Secretary (2010) | Vice President and Chief Counsel, Ameriprise Financial, Inc., since May 2010; Vice President, Chief Legal Officer and Assistant Secretary, Columbia Management Investment Advisers, LLC, since October 2021 (previously Vice President and Assistant Secretary, May 2010 – September 2021). |
Lyn Kephart-Strong
5903 Ameriprise Financial Center
Minneapolis, MN 55474
1960 | Vice President (2015) | Vice President, Global Investment Operations Services, Columbia Management Investment Advisers, LLC, since 2010; Director (since January 2007) and President (since October 2014), Columbia Management Investment Services Corp.; Director (since December 2017) and President (since January 2017), Ameriprise Trust Company. |
Liquidity Risk Management Program
(Unaudited)
Pursuant to Rule 22e-4 under the 1940 Act, the Fund has adopted a liquidity risk management program (Program). The Program’s principal objectives include assessing, managing and periodically reviewing the Fund’s liquidity risk. Liquidity risk is defined as the risk that the Fund could not meet redemption requests without significant dilution of remaining investors’ interests in the Fund.
The Board has appointed the Investment Manager as the program administrator for the Fund’s Program. The Investment Manager has delegated oversight of the Program to its Liquidity Risk Management Committee (the Committee). At a Board meeting during the fiscal period, the Committee provided the Board with a report addressing the operations of the Program and assessing its adequacy and effectiveness of implementation for the period January 1, 2022 through December 31, 2022, including:
| • | the Fund had sufficient liquidity to both meet redemptions and operate effectively on behalf of shareholders; |
| • | there were no material changes to the Program during the period; |
| • | the implementation of the Program was effective to manage the Fund’s liquidity risk; and |
| • | the Program operated adequately during the period. |
There can be no assurance that the Program will achieve its objectives in the future. Please refer to the Fund’s prospectus for more information regarding the Fund’s exposure to liquidity risk and other principal risks to which an investment in the Fund may be subject.
| 38 | Columbia Small Cap Growth Fund | Annual Report 2023 |
Approval of Management Agreement
(Unaudited)
Columbia Management Investment Advisers, LLC (the Investment Manager, and together with its domestic and global affiliates, Columbia Threadneedle Investments), a wholly-owned subsidiary of Ameriprise Financial, Inc. (Ameriprise Financial), serves as the investment manager to Columbia Small Cap Growth Fund (the Fund). Under a management agreement (the Management Agreement), the Investment Manager provides investment advice and other services to the Fund and other funds distributed by Columbia Management Investment Distributors, Inc. (collectively, the Funds).
On an annual basis, the Fund’s Board of Trustees (the Board), including the independent Board members (the Independent Trustees), considers renewal of the Management Agreement. The Investment Manager prepared detailed reports for the Board and its Contracts Committee (including its Contracts Subcommittee) in February, March, April, May and June 2023, including reports providing the results of analyses performed by a third-party data provider, Broadridge Financial Solutions, Inc. (Broadridge), and comprehensive responses by the Investment Manager to written requests for information by independent legal counsel to the Independent Trustees (Independent Legal Counsel), to assist the Board in making this determination. In addition, throughout the year, the Board (or its committees or subcommittees) regularly meets with portfolio management teams and senior management personnel and reviews information prepared by the Investment Manager addressing the services the Investment Manager provides and Fund performance. The Board also accords appropriate weight to the work, deliberations and conclusions of the various committees (including their subcommittees), such as the Contracts Committee, the Investment Review Committee, the Audit Committee and the Compliance Committee in determining whether to continue the Management Agreement.
The Board, at its June 22, 2023 Board meeting (the June Meeting), considered the renewal of the Management Agreement for an additional one-year term. At the June Meeting, Independent Legal Counsel reviewed with the Independent Trustees various factors relevant to the Board’s consideration of advisory agreements and the Board’s legal responsibilities related to such consideration. The Independent Trustees considered all information that they, their legal counsel or the Investment Manager believed reasonably necessary to evaluate and to approve the continuation of the Management Agreement. Among other things, the information and factors considered included the following:
| • | Information on the investment performance of the Fund relative to the performance of a group of mutual funds determined to be comparable to the Fund by Broadridge, as well as performance relative to one or more benchmarks; |
| • | Information on the Fund’s management fees and total expenses, including information comparing the Fund’s expenses to those of a group of comparable mutual funds, as determined by Broadridge; |
| • | The Investment Manager’s agreement to contractually limit or cap total operating expenses for the Fund so that total operating expenses (excluding certain fees and expenses, such as transaction costs and certain other investment related expenses, interest, taxes, acquired fund fees and expenses and infrequent and/or unusual expenses) would not exceed a specified annual rate, as a percentage of the Fund’s net assets; |
| • | Terms of the Management Agreement; |
| • | Descriptions of other agreements and arrangements with affiliates of the Investment Manager relating to the operations of the Fund, including agreements with respect to the provision of transfer agency and shareholder services to the Fund; |
| • | Descriptions of various services performed by the Investment Manager under the Management Agreement, including portfolio management and portfolio trading practices; |
| • | Information regarding any recently negotiated management fees of similarly-managed portfolios of other institutional clients of the Investment Manager; |
| • | Information regarding the resources of the Investment Manager, including information regarding senior management, portfolio managers and other personnel; |
| • | Information regarding the capabilities of the Investment Manager with respect to compliance monitoring services; |
| • | The profitability to the Investment Manager and its affiliates from their relationships with the Fund; and |
| • | Report provided by the Board’s independent fee consultant, JDL Consultants, LLC (JDL). |
Columbia Small Cap Growth Fund | Annual Report 2023
| 39 |
Approval of Management Agreement (continued)
(Unaudited)
Following an analysis and discussion of the foregoing, and the factors identified below, the Board, including all of the Independent Trustees, approved the renewal of the Management Agreement.
Nature, extent and quality of services provided by the Investment Manager
The Board analyzed various reports and presentations it had received detailing the services performed by the Investment Manager, as well as its history, expertise, resources and relative capabilities, and the qualifications of its personnel.
The Board specifically considered the many developments during recent years concerning the services provided by the Investment Manager. Among other things, the Board noted the organization and depth of the equity and credit research departments. The Board further observed the enhancements to the investment risk management department’s processes, systems and oversight over the past several years. The Board also took into account the broad scope of services provided by the Investment Manager to the Fund, including, among other services, investment, risk and compliance oversight. The Board also took into account the information it received concerning the Investment Manager’s ability to attract and retain key portfolio management personnel and that it has sufficient resources to provide competitive and adequate compensation to investment personnel.
In connection with the Board’s evaluation of the overall package of services provided by the Investment Manager, the Board also considered the nature, quality and range of administrative services provided to the Fund by the Investment Manager, as well as the achievements in 2022 in the performance of administrative services, and noted the various enhancements anticipated for 2023. In evaluating the quality of services provided under the Management Agreement, the Board also took into account the organization and strength of the Fund’s and its service providers’ compliance programs. The Board also reviewed the financial condition of the Investment Manager and its affiliates and each entity’s ability to carry out its responsibilities under the Management Agreement and the Fund’s other service agreements.
In addition, the Board discussed the acceptability of the terms of the Management Agreement, noting that no changes were proposed from the form of agreement previously approved. The Board also noted the wide array of legal and compliance services provided to the Fund under the Management Agreement.
After reviewing these and related factors (including investment performance as discussed below), the Board concluded, within the context of their overall conclusions, that the nature, extent and quality of the services provided to the Fund under the Management Agreement supported the continuation of the Management Agreement.
Investment performance
The Board carefully reviewed the investment performance of the Fund, including detailed reports providing the results of analyses performed by each of the Investment Manager, Broadridge and JDL collectively showing, for various periods (including since manager inception): (i) the performance of the Fund, (ii) the Fund’s performance relative to peers and benchmarks and (iii) the net assets of the Fund. The Board observed the Fund’s underperformance for certain periods, noting that appropriate steps (such as changes to the Fund’s portfolio management team) had been taken to help improve the Fund’s performance.
The Board also reviewed a description of the third-party data provider’s methodology for identifying the Fund’s peer groups for purposes of performance and expense comparisons.
The Board also considered the Investment Manager’s performance and reputation generally, and the Investment Manager’s willingness to take steps intended to improve performance. After reviewing these and related factors, the Board concluded, within the context of their overall conclusions, that the performance of the Fund and the Investment Manager, in light of other considerations, supported the continuation of the Management Agreement.
Comparative fees, costs of services provided and the profits realized by the Investment Manager and its affiliates from their relationships with the Fund
The Board reviewed comparative fees and the costs of services provided under the Management Agreement. The Board members considered detailed comparative information set forth in an annual report on fees and expenses, including, among other things, data (based on analyses conducted by Broadridge and JDL) showing a comparison of the Fund’s expenses with
| 40 | Columbia Small Cap Growth Fund | Annual Report 2023 |
Approval of Management Agreement (continued)
(Unaudited)
median expenses paid by funds in its comparative peer universe, as well as data showing the Fund’s contribution to the Investment Manager’s profitability. The Board reviewed the fees charged to comparable institutional or other accounts/vehicles managed by the Investment Manager and discussed differences in how the products are managed and operated, thus explaining many of the differences in fees.
The Board considered the reports of JDL, which assisted in the Board’s analysis of the Funds’ performance and expenses and the reasonableness of the Funds’ fee rates. The Board accorded particular weight to the notion that a primary objective of the level of fees is to achieve a rational pricing model applied consistently across the various product lines in the Fund family, while assuring that the overall fees for each Fund (with certain exceptions) are generally in line with the current “pricing philosophy” such that Fund total expense ratios, in general, approximate or are lower than the median expense ratios of funds in the same Lipper comparison universe. The Board took into account that the Fund’s total expense ratio (after considering proposed expense caps/waivers) approximated the peer universe’s median expense ratio.
After reviewing these and related factors, the Board concluded, within the context of their overall conclusions, that the levels of management fees and expenses of the Fund, in light of other considerations, supported the continuation of the Management Agreement.
The Board also considered the profitability of the Investment Manager and its affiliates in connection with the Investment Manager providing management services to the Fund. With respect to the profitability of the Investment Manager and its affiliates, the Independent Trustees referred to information discussing the profitability to the Investment Manager and Ameriprise Financial from managing, operating and distributing the Funds. The Board considered that the profitability generated by the Investment Manager in 2022 had declined from 2021 levels, due to a variety of factors, including the decreased assets under management of the Funds. It also took into account the indirect economic benefits flowing to the Investment Manager or its affiliates in connection with managing or distributing the Funds, such as the enhanced ability to offer various other financial products to Ameriprise Financial customers, soft dollar benefits and overall reputational advantages. The Board noted that the fees paid by the Fund should permit the Investment Manager to offer competitive compensation to its personnel, make necessary investments in its business and earn an appropriate profit. After reviewing these and related factors, the Board concluded, within the context of their overall conclusions, that the costs of services provided and the profitability to the Investment Manager and its affiliates from their relationships with the Fund supported the continuation of the Management Agreement.
Economies of scale
The Board considered the potential existence of economies of scale in the provision by the Investment Manager of services to the Fund, and whether those economies of scale were shared with the Fund through breakpoints in investment management fees or other means, such as expense limitation arrangements and additional investments by the Investment Manager in investment, trading, compliance and other resources. The Board considered the economies of scale that might be realized as the Fund’s net asset level grows and took note of the extent to which Fund shareholders might also benefit from such growth. In this regard, the Board took into account that management fees decline as Fund assets exceed various breakpoints, all of which have not been surpassed. The Board observed that the Management Agreement provided for breakpoints in the management fee rate schedule that allow opportunities for shareholders to realize lower fees as Fund assets grow and that there are additional opportunities through other means for sharing economies of scale with shareholders.
Conclusion
The Board reviewed all of the above considerations in reaching its decision to approve the continuation of the Management Agreement. In reaching its conclusions, no single factor was determinative.
On June 22, 2023, the Board, including all of the Independent Trustees, determined that fees payable under the Management Agreement were fair and reasonable in light of the extent and quality of services provided and approved the renewal of the Management Agreement.
Columbia Small Cap Growth Fund | Annual Report 2023
| 41 |
[THIS PAGE INTENTIONALLY LEFT BLANK]
[THIS PAGE INTENTIONALLY LEFT BLANK]
Columbia Small Cap Growth Fund
P.O. Box 219104
Kansas City, MO 64121-9104
Please read and consider the investment objectives, risks, charges and expenses for any fund carefully before investing. For a prospectus and summary prospectus, which contains this and other important information about the Fund, go to
columbiathreadneedleus.com/investor/. The Fund is distributed by Columbia Management Investment Distributors, Inc., member FINRA, and managed by Columbia Management Investment Advisers, LLC.
Columbia Threadneedle Investments (Columbia Threadneedle) is the global brand name of the Columbia and Threadneedle group of companies. All rights reserved.
© 2023 Columbia Management Investment Advisers, LLC.
columbiathreadneedleus.com/investor/

Annual Report
August 31, 2023
Multi-Manager Alternative Strategies Fund
Not FDIC or NCUA Insured • No Financial Institution Guarantee • May Lose Value
| 3 |
| 6 |
| 11 |
| 12 |
| 51 |
| 52 |
| 53 |
| 54 |
| 55 |
| 75 |
| 76 |
| 76 |
| 82 |
| 83 |
If you elect to receive the shareholder report for Multi-Manager Alternative Strategies Fund (the Fund) in paper, mailed to you, the Fund mails one shareholder report to each shareholder address, unless such shareholder elects to receive shareholder reports from the Fund electronically via e-mail or by having a paper notice mailed to you (Postcard Notice) that your Fund’s shareholder report is available at the Columbia funds’ website (columbiathreadneedleus.com/investor/). If you would like more than one report in paper to be mailed to you, or would like to elect to receive reports via e-mail or access them through Postcard Notice, please call shareholder services at 800.345.6611 and additional reports will be sent to you.
Proxy voting policies and procedures
The policy of the Board of Trustees is to vote the proxies of the companies in which the Fund holds investments consistent with the procedures as stated in the Statement of Additional Information (SAI). You may obtain a copy of the SAI without charge by calling 800.345.6611; contacting your financial intermediary; visiting columbiathreadneedleus.com/investor/; or searching the website of the Securities and Exchange Commission (SEC) at sec.gov. Information regarding how the Fund voted proxies relating to portfolio securities is filed with the SEC by August 31st for the most recent 12-month period ending June 30th of that year, and is available without charge by visiting columbiathreadneedleus.com/investor/, or searching the website of the SEC at sec.gov.
Quarterly schedule of investments
The Fund files a complete schedule of portfolio holdings with the SEC for the first and third quarters of each fiscal year on Form N-PORT. The Fund’s Form N-PORT filings are available on the SEC’s website at sec.gov. The Fund’s complete schedule of portfolio holdings, as filed on Form N-PORT, is available on columbiathreadneedleus.com/investor/or can also be obtained without charge, upon request, by calling 800.345.6611.
Additional Fund information
For more information about the Fund, please visit columbiathreadneedleus.com/investor/ or call 800.345.6611. Customer Service Representatives are available to answer your questions Monday through Friday from 8 a.m. to 7 p.m. Eastern time.
You may obtain the current net asset value (NAV) of Fund shares at no cost by calling 800.345.6611 or by sending an e-mail to serviceinquiries@columbiathreadneedle.com.
Fund investment manager
Columbia Management Investment Advisers, LLC (the Investment Manager)
290 Congress Street
Boston, MA 02210
Fund distributor
Columbia Management Investment Distributors, Inc.
290 Congress Street
Boston, MA 02210
Fund transfer agent
Columbia Management Investment Services Corp.
P.O. Box 219104
Kansas City, MO 64121-9104
Multi-Manager Alternative Strategies Fund | Annual Report 2023
Fund at a Glance
(Unaudited)
Investment objective
The Fund seeks capital appreciation with an emphasis on absolute (positive) returns.
Portfolio management
AlphaSimplex Group, LLC
Alexander Healy, Ph.D.
Kathryn Kaminski, Ph.D., CAIA
Philippe Lüdi, Ph.D., CFA
John Perry, Ph.D.
Robert Rickard
Crabel Capital Management, LLC
Michael Pomada
Grant Jaffarian
Manulife Investment Management (US) LLC
Christopher Chapman, CFA
Thomas Goggins
Bradley Lutz, CFA
Kisoo Park
TCW Investment Management Company LLC
Stephen Kane, CFA
Laird Landmann*
Bryan Whalen, CFA
Jerry Cudzil
Ruben Hovhannisyan, CFA
Steve Purdy
* Effective December 31, 2023, Laird Landmann will no longer serve as a portfolio manager for the Fund.
| Average annual total returns (%) (for the period ended August 31, 2023) |
| | | Inception | 1 Year | 5 Years | 10 Years |
| Institutional Class* | 01/03/17 | 1.14 | 2.95 | 1.54 |
| FTSE Three-Month U.S. Treasury Bill Index | | 4.44 | 1.68 | 1.07 |
All results shown assume reinvestment of distributions during the period. Returns do not reflect the deduction of taxes that a shareholder may pay on Fund distributions or on the redemption of Fund shares. Performance results reflect the effect of any fee waivers or reimbursements of Fund expenses by Columbia Management Investment Advisers, LLC and/or any of its affiliates. Absent these fee waivers or expense reimbursement arrangements, performance results would have been lower.
The performance information shown represents past performance and is not a guarantee of future results. The investment return and principal value of your investment will fluctuate so that your shares, when redeemed, may be worth more or less than their original cost. Current performance may be lower or higher than the performance information shown. You may obtain performance information current to the most recent month-end by contacting your financial intermediary, visiting columbiathreadneedleus.com/investor/ or calling 800.345.6611.
| * | The returns shown for periods prior to the share class inception date (including returns for the Life of the Fund, if shown, which are since Fund inception) include the returns of the Fund’s oldest share class. Returns shown for periods prior to the inception date of the Fund’s Institutional Class shares include the returns of the Fund’s Class A shares through January 2, 2017. Class A shares were offered prior to the Fund’s Institutional Class shares but have since been merged into the Fund’s Institutional Class shares. These returns are adjusted to reflect any higher class-related operating expenses of the newer share classes, as applicable. Please visit columbiathreadneedleus.com/investor/investment-products/mutual-funds/appended-performance for more information. |
The FTSE Three-Month U.S. Treasury Bill Index, an unmanaged index, is representative of the performance of three-month Treasury bills.
Indices are not available for investment, are not professionally managed and do not reflect sales charges, fees, brokerage commissions, taxes or other expenses of investing. Securities in the Fund may not match those in an index.
Multi-Manager Alternative Strategies Fund | Annual Report 2023
| 3 |
Fund at a Glance (continued)
(Unaudited)
Performance of a hypothetical $10,000 investment (August 31, 2013 — August 31, 2023)
The chart above shows the change in value of a hypothetical $10,000 investment in Institutional Class shares of Multi-Manager Alternative Strategies Fund during the stated time period, and does not reflect the deduction of taxes that a shareholder may pay on Fund distributions or on the redemption of Fund shares.
| 4 | Multi-Manager Alternative Strategies Fund | Annual Report 2023 |
Fund at a Glance (continued)
(Unaudited)
| Portfolio breakdown (%) (at August 31, 2023) |
| Asset-Backed Securities — Non-Agency | 3.0 |
| Commercial Mortgage-Backed Securities - Agency | 0.4 |
| Commercial Mortgage-Backed Securities - Non-Agency | 2.8 |
| Common Stocks | 0.0(a) |
| Convertible Bonds | 0.8 |
| Convertible Preferred Stocks | 0.2 |
| Corporate Bonds & Notes | 18.7 |
| Foreign Government Obligations | 6.9 |
| Inflation-Indexed Bonds | 0.2 |
| Money Market Funds(b) | 46.1 |
| Municipal Bonds | 0.6 |
| Preferred Debt | 0.1 |
| Residential Mortgage-Backed Securities - Agency | 7.4 |
| Residential Mortgage-Backed Securities - Non-Agency | 9.0 |
| Rights | 0.1 |
| Senior Loans | 0.2 |
| Treasury Bills | 1.1 |
| U.S. Treasury Obligations | 2.4 |
| Total | 100.0 |
| (a) | Rounds to zero. |
| (b) | Includes investments in Money Market Funds, including investing for the purpose of covering obligations relating to the Fund’s investment in derivatives. For a description of the Fund’s investments in derivatives, see Investments in derivatives following the Consolidated Portfolio of Investments and the derivative instruments discussion in Note 2 to the Notes to Consolidated Financial Statements. |
Percentages indicated are based upon total investments excluding investments in derivatives, if any. The Fund’s portfolio composition is subject to change.
| Derivative breakdown (%) (at August 31, 2023)(a) |
| | Asset | Liability | Net |
| Forward foreign currency exchange contracts | 0.35 | (0.39) | (0.04) |
| Long futures contracts | 0.32 | (0.11) | 0.21 |
| Short futures contracts | 0.09 | (0.36) | (0.27) |
| Swap contracts | — | (0.00)(b) | (0.00)(b) |
(a) Forward foreign currency exchange contracts, futures contracts and swap contracts are based upon unrealized appreciation (depreciation) as a percentage of net assets. For a description of the Fund’s investments in derivatives, see Investments in derivatives following the Consolidated Portfolio of Investments, and Note 2 of the Notes to Consolidated Financial Statements.
(b) Rounds to zero.
Multi-Manager Alternative Strategies Fund | Annual Report 2023
| 5 |
Manager Discussion of Fund Performance
(Unaudited)
The Fund is currently managed by four independent money management firms and each invests a portion of the portfolio’s assets. As of August 31, 2023, AlphaSimplex Group, LLC (AlphaSimplex), Crabel Capital Management, LLC (Crabel), Manulife Investment Management (US) LLC (Manulife) and TCW Investment Management Company, LLC (TCW) managed approximately 15%, 15%, 30%, and 40% of the portfolio, respectively. Water Island Capital,LLC (Water Island) managed a portion of the Fund’s assets during the reporting period, but was terminated as a subadviser to the Fund, effective August 25, 2023.
For the 12-month period that ended August 31, 2023, Institutional Class shares of Multi-Manager Alternative Strategies Fund returned 1.14%. The Fund’s benchmark, the FTSE Three-Month U.S. Treasury Bill Index, returned 4.44%.
Market overview
During the period of September 2022 through August 2023, inflation was the strongest theme in global markets. Although core inflation was persistent over the period, markets cycled between periods of risk-on and risk-off sentiment, leading to corrections in various markets.
The U.S. Federal Reserve (Fed) initiated its aggressive tightening measures in March 2022. Over the 12-month period that ended August 31, 2023, volatility mounted as the Fed took the federal funds target rate from 2.5% to 5.5%. Momentum early in the period gave way to a more measured pace (25 basis points (bps) at each meeting in 2023 through August, with the exception of a pause in June). Policy tightening continued even as the global banking system became enveloped in volatility in March 2023 with three U.S. banks and one European bank collapsing. This persistence, not only by the Fed, but by central banks globally, was driven by massive inflation, and was given cover by resilient employment and economic growth. Data later in the period, however, revealed cracks in the ongoing narratives of a robust labor market and consumer resilience, dispelling the growing notion of a “soft landing”.
In this environment, bond yields generally moved higher globally, putting downward pressure on bond prices. Short-term yields rose the most, reflecting interest rate hikes and resulting in a deeper inversion of the yield curve (where short-term bond yields are higher than long-term bond yields). Performance was mixed, with government bonds in the U.S. and eurozone along with mortgage-backed securities (MBS) declining the most, while risk assets such as high-yield corporates and equities, held up best.
While returns for the broader credit market were generally unimpressive, equities nonetheless seemed to deliver strong gains in the first half of 2023. Upon closer inspection, it appeared much of the performance was generated by a handful of mega-cap heavy hitters, and it was accompanied by a healthy dose of volatility along the way.
In this environment, the landscape for event-driven investing has also faced heightened volatility. Antitrust regulators around the globe have attempted to block several large mergers and acquisitions transactions, in turn driving correlated volatility in deal spreads throughout the investment universe.
AlphaSimplex
Our portion of the Fund is compared to the SG Trend Index, which underperformed over the 12-month period that ended August 31, 2023. Our strategy is designed to emphasize absolute risk and return and, as such, is not managed relative to a benchmark. The SG Trend Index, which reflects a peer group of diversified, primarily trend-following investment managers, may be used as a benchmark for performance analysis. The strategy’s emphasis on liquidity and its active approach to risk management may frequently cause the portfolio’s performance to diverge from that of the SG Trend Index.
Notable detractors in our portion of the Fund during the period
| • | Losses in our portion of the Fund were driven by commodities during the period, with additional losses in fixed income and currencies. |
| • | In commodities, energies drove losses, as prices in these assets whipsawed over the year. |
| • | Precious metals, especially silver, also led to losses. |
| • | Fixed-income losses came primarily from international developed markets, especially Australian and Canadian bonds. |
| • | Currencies losses came primarily from international developed market currencies. |
| 6 | Multi-Manager Alternative Strategies Fund | Annual Report 2023 |
Manager Discussion of Fund Performance (continued)
(Unaudited)
| • | Within equities, short positions detracted from performance over the period. |
| • | At the model level, the basic multi-trend models detracted from performance. |
| • | The top detractors from performance over the period were silver, Brent crude oil and crude oil. |
Notable contributors in our portion of the Fund during the period
| • | During the reporting period, equities contributed some small gains. |
| • | Short positions in short-term rates markets also contributed positively, as did long positions in emerging market currencies (especially the Mexican peso). |
| • | Within equities, gains from some long positions, especially the NASDAQ 100 and Japanese equities, outweighed losses from short positions. |
| • | At the model level, the adaptive trend and short-horizon approaches contributed positively. Increasing short-term rates continue to increase the contribution of the cash portion of the portfolio. |
| • | The top individual contributors to performance in our portion of the Fund over the period were the Mexican Peso, sugar and the NASDAQ 100. |
Crabel
Our portion of the Fund is compared to the SG Trend Index, which outperformed over the 12-month period that ended August 31, 2023.
Notable detractors in our portion of the Fund during the period
| • | The commodities sector was the strongest detractor from performance in our portion of the Fund during the period. |
| ○ | Some of the largest commodity markets, including gold, crude oil, soybeans, corn, gasoline, heating oil and copper, were all very challenging, driven by market behavior such as sharp market reversals and tape-driven moves, sometimes in line with, but often against, market fundamentals. The continued war in Ukraine, along with inflationary concerns, fueled uncertainty and inconsistent market directionality in commodities. |
| • | Having a modestly faster (less long-term) strategy composition detracted within our portion of the Fund. With key trends such as rising yields continuing, efforts to fade the long-term move with shorter term strategies proved difficult. |
| • | Less exposure to the fixed-income sector, relative to the SG Trend Index, weighed on relative results, as the fixed-income sector proved the most rewarding sector during the period. |
Notable contributors in our portion of the Fund during the period
| • | The best performing sector for our portion of the Fund during the period was the fixed-income sector. |
| ○ | Good returns within fixed income were a function of steadily rising yields globally. While the 30-year U.S. Treasury Bond proved the most valuable individual market, the Long Gilt and German Schatz were also among the best performing markets, suggesting that the benefits of geographical diversification were useful during the period. |
| • | The design of our portion of the Fund enables us to respond quickly to adverse sharp market movements. As an example, quick risk mitigating strategy design helped in March 2023, attention to smaller foreign exchange markets added performance, and position modifying logic, most impactfully synthetic market construction and trading, boosted returns. |
| • | Diversification, particularly across the fixed-income sector and non-G7 currency pairs, among other markets, aided performance. Further, diversification across approximately 200 markets in our portion of the Fund is likely higher than that of the benchmark, which further contributed to performance during the period. |
Multi-Manager Alternative Strategies Fund | Annual Report 2023
| 7 |
Manager Discussion of Fund Performance (continued)
(Unaudited)
Manulife
Our portion of the Fund outperformed the Bloomberg Multiverse Index, the benchmark against which our performance is compared.
Notable contributors in our portion of the Fund during the period
| • | The largest contributor to relative performance was our shorter duration profile across developed market economies, particularly in the U.S. and eurozone, where interest rates rose sharply higher over the period. |
| • | Relative to the Bloomberg Multiverse Index, our portion of the Fund benefited from overweight positions in high-yield corporate, non-agency MBS, equities, and hard currency emerging market credit allocations. |
| • | From a security selection perspective, positioning within investment-grade corporates and commercial mortgage-backed securities (CMBS), favoring warehouse/cold storage space and medical research facilities, were the primary contributors. |
| • | From a foreign exchange and currency management perspective, underweight exposure to the Japanese yen and Chinese renminbi were the largest contributors. |
| • | From a local rate and country allocation perspective, the top contributors were relative underweights to the United Kingdom, where a combination of rising inflation and diminishing growth hurt, and overweight local positions in Indonesia and Malaysia that benefited from continued global growth. |
Notable detractors in our portion of the Fund during the period
| • | The largest detractors to relative performance were from an exposure to convertible bonds combined with an overweight to CMBS and asset-backed securities (ABS). |
| • | From a security selection perspective, negative performance came from positioning within our hard currency emerging market credit and agency MBS allocations. |
| • | Lastly, from a currency standpoint, underweight exposure to the euro served as a material detractor as it appreciated relative to the U.S. dollar. |
| • | From a local rate and country allocation perspective, top detractors were our underweight to China and Japan, where monetary policy remained accommodative, along with our overweight to the domestic U.S. market, where yields moved sharply high during the period. |
TCW
Our portion of the Fund underperformed the FTSE Three-Month U.S. Treasury Bill Index during the period.
Notable detractors in our portion of the Fund during the period
| • | Detracting from both absolute and relative performance was the portfolio’s duration position, which remained longer than the Index throughout the period while also extending as Treasury yields continued to rise. Given both the magnitude and pace of the Fed’s hiking cycle, this duration positioning was the largest headwind to returns. |
| • | Exposure to agency MBS also weighed on returns, given the sector’s underperformance during the period relative to Treasuries and corporates. Our portion of the portfolio took advantage of historically attractive valuations to increase the allocation throughout the period, which despite producing a near term headwind, bodes well for prospective returns, especially in a recessionary environment and flight to quality, credit-risk free assets. |
Notable contributors in our portion of the Fund during the period
| • | The largest contributor to portfolio performance was the exposure to corporate credit, given the significant amount of yield spread tightening among corporates (both investment grade and high yield), and resultant outperformance relative to comparable U.S. Treasuries during the period. Despite a modest trimming of the position in recent months in line with a value-oriented discipline, exposure to this high-performing asset class drove positive returns during the period. |
| 8 | Multi-Manager Alternative Strategies Fund | Annual Report 2023 |
Manager Discussion of Fund Performance (continued)
(Unaudited)
| • | An emphasis on more defensive sectors, including communications and non-cyclicals, was positive, as these sectors outperformed the broader corporate universe. Issue selection among these sectors was also favorable, including in pharmaceuticals, food/beverage and wireless names. |
| • | Driving contributions from an issue selection standpoint, however, was banking holdings, owing to a combination of outperformance from senior bonds of U.S. global systemically important banks (G-SIBs) amid volatility in March 2023, and relative value trading in names that experienced outsized volatility, whereby positions that were built at substantial discounts quickly appreciated to trade at a premium. |
Water Island Capital
We managed a portion of the Fund’s assets from the start of the reporting period through August 25, 2023. During that time period, our portion of the Fund underperformed the Fund’s benchmark, the FTSE Three-Month US Treasury Bill Index.
As an absolute return strategy, our goal for our sleeve of the fund was to generate a level of positive return above the risk-free rate regardless of market conditions. Our sleeve’s underperformance relative to the risk-free benchmark during the period under review can primarily be attributed to event selection, as the portfolio experienced an increased number of broken deals during the period, as well as heightened volatility in deals undergoing protracted regulatory reviews, which weighed on the positive contributions of successes the portfolio realized elsewhere.
Notable detractors in our portion of the Fund during the period
| • | On a sector basis, the worst performers in our portion of the Fund were the financials, information technology and consumer discretionary sectors. |
| • | The top detractor for our portion of the Fund was our position in the failed acquisition of First Horizon Corp by Toronto-Dominion Bank (TD). Eventually, in May 2023, First Horizon and TD mutually agreed to terminate the merger due to uncertainty as to when the deal might gain the lagging regulatory approvals, driving First Horizon shares even lower. |
| • | Other top detractors included the failed acquisition of Tegna by Standard General and the failed acquisition of Rogers by DuPont. Tegna is a US broadcast television company which agreed to be acquired by investment firm Standard General. The U.S. Federal Communications Commission (“FCC”) designated the deal for a judicial review based on concerns it could raise prices for consumers. Such hearings are notoriously lengthy and have historically led deals to collapse. Standard General attempted to push a faster timeline in the courts because it feared that when the deal’s termination date arrived, should they attempt to extend the timeline, they would not be able to secure financing at rates comparable to when the deal was originally announced. After Standard General exhausted all appeals and was unsuccessful, the companies agreed to terminate the merger. |
| • | The Rogers transaction experienced an extended regulatory review at the State Administration for Market Regulation (SAMR) in China. In November 2022, when the deal’s termination date was reached with SAMR approval still outstanding, in a move that caught many arbitrageurs by surprise, DuPont opted to walk away rather than agree to extend the timeline. Speculation around DuPont’s reasons for walking away and year-end tax-loss harvesting drove event-driven investors to exit their positions en masse, which exacerbated the price reaction of Rogers shares, leading them to trade at depressed levels. |
Notable contributors in our portion of the Fund during the period
| • | During the period under review, both of the portfolio’s sub-strategy sleeves – merger arbitrage and credit opportunities – generated positive returns, though the merger arbitrage sleeve comprised the bulk of the portfolio for the period and was thus responsible for most of the performance in our portion of the Fund. |
| • | Cash holdings in our portion of the Fund also contributed positively to performance over the period. |
| • | The top performing sectors were communication services, industrials and health care, each driven primarily by the successful completion of idiosyncratic merger arbitrage investments in deals within those sectors. |
Multi-Manager Alternative Strategies Fund | Annual Report 2023
| 9 |
Manager Discussion of Fund Performance (continued)
(Unaudited)
| • | The portfolio’s top performing investment overall was the Activision/Microsoft deal. This deal was struck in January 2022, when Microsoft reached an agreement to acquire video game developer Activision Blizzard for $75.1 billion in cash. |
| • | Other top contributors included the acquisition of X (formerly known as Twitter) by Elon Musk and the acquisition of Change Healthcare by UnitedHealth Group. Both of these deals encountered stumbling blocks that led to spread volatility on their paths to completion. |
Derivatives usage in the Fund
Each of the subadvisors employs derivative instruments in order to pursue their respective investment objectives. Taken on a stand-alone basis, the usage of these derivatives had a negative impact on overall Fund performance.
Market risk may affect a single issuer, sector of the economy, industry or the market as a whole. Social impact investing may increase risk due to the limitations and constraints involved in investment selection and, as a result, the Fund may under perform other funds that do not consider the social impact. Fixed-income securities present issuer default risk. A rise in interest rates may result in a price decline of fixed-income instruments held by the Fund, negatively impacting its performance and NAV. Falling rates may result in the Fund investing in lower yielding debt instruments, lowering the Fund’s income and yield. These risks may be heightened for longer maturity and duration securities. Non-investment-grade (high-yield or junk) securities present greater price volatility and more risk to principal and income than higher rated securities. Prepayment and extension risk exists because the timing of payments on a loan, bond or other investment may accelerate when interest rates fall or decelerate when interest rates rise which may reduce investment opportunities and potential returns. The Fund invests substantially in municipal securities and will be affected by tax, legislative, regulatory, demographic or political changes, as well as changes impacting a state’s financial, economic or other conditions. A relatively small number of tax-exempt issuers may necessitate the Fund investing more heavily in a single issuer and, therefore, be more exposed to the risk of loss than a fund that invests more broadly. The Fund may invest significantly in issuers within a particular sector, which may be negatively affected by market, economic or other conditions, making the Fund more vulnerable to unfavorable developments in the sector. Market or other (e.g., interest rate) environments may adversely affect the liquidity of fund investments, negatively impacting their price. Generally, the less liquid the market at the time the Fund sells a holding, the greater the risk of loss or decline of value to the Fund. As a non-diversified fund, fewer investments could have a greater effect on performance. See the Fund’s prospectus for more information on these and other risks.
The views expressed in this report reflect the current views of the respective parties who have contributed to this report. These views are not guarantees of future performance and involve certain risks, uncertainties and assumptions that are difficult to predict, so actual outcomes and results may differ significantly from the views expressed. These views are subject to change at any time based upon economic, market or other conditions and the respective parties disclaim any responsibility to update such views. These views may not be relied on as investment advice and, because investment decisions for a Columbia fund are based on numerous factors, may not be relied on as an indication of trading intent on behalf of any particular Columbia fund. References to specific securities should not be construed as a recommendation or investment advice.
| 10 | Multi-Manager Alternative Strategies Fund | Annual Report 2023 |
Understanding Your Fund’s Expenses
(Unaudited)
As an investor, you incur two types of costs. There are shareholder transaction costs, which may include redemption fees. There are also ongoing fund costs, which generally include management fees, distribution and/or service fees, and other fund expenses. The following information is intended to help you understand your ongoing costs (in dollars) of investing in the Fund and to help you compare these costs with the ongoing costs of investing in other mutual funds.
Analyzing your Fund’s expenses
To illustrate these ongoing costs, we have provided examples and calculated the expenses paid by investors in each share class of the Fund during the period. The actual and hypothetical information in the table is based on an initial investment of $1,000 at the beginning of the period indicated and held for the entire period. Expense information is calculated two ways and each method provides you with different information. The amount listed in the “Actual” column is calculated using the Fund’s actual operating expenses and total return for the period. You may use the Actual information, together with the amount invested, to estimate the expenses that you paid over the period. Simply divide your account value by $1,000 (for example, an $8,600 account value divided by $1,000 = 8.6), then multiply the results by the expenses paid during the period under the “Actual” column. The amount listed in the “Hypothetical” column assumes a 5% annual rate of return before expenses (which is not the Fund’s actual return) and then applies the Fund’s actual expense ratio for the period to the hypothetical return. You should not use the hypothetical account values and expenses to estimate either your actual account balance at the end of the period or the expenses you paid during the period. See “Compare with other funds” below for details on how to use the hypothetical data.
Compare with other funds
Since all mutual funds are required to include the same hypothetical calculations about expenses in shareholder reports, you can use this information to compare the ongoing cost of investing in the Fund with other funds. To do so, compare the hypothetical example with the 5% hypothetical examples that appear in the shareholder reports of other funds. As you compare hypothetical examples of other funds, it is important to note that hypothetical examples are meant to highlight the ongoing costs of investing in a fund only and do not reflect any transaction costs, such as redemption or exchange fees. Therefore, the hypothetical calculations are useful in comparing ongoing costs only, and will not help you determine the relative total costs of owning different funds. If transaction costs were included in these calculations, your costs would be higher.
| March 1, 2023 — August 31, 2023 |
| | Account value at the
beginning of the
period ($) | Account value at the
end of the
period ($) | Expenses paid during
the period ($) | Fund’s annualized
expense ratio (%) |
| | Actual | Hypothetical | Actual | Hypothetical | Actual | Hypothetical | Actual |
| Institutional Class | 1,000.00 | 1,000.00 | 1,008.80 | 1,018.40 | 6.84 | 6.87 | 1.35 |
Expenses paid during the period are equal to the annualized expense ratio for each class as indicated above, multiplied by the average account value over the period and then multiplied by the number of days in the Fund’s most recent fiscal half year and divided by 365.
Expenses do not include fees and expenses incurred indirectly by the Fund from its investment in underlying funds, including affiliated and non-affiliated pooled investment vehicles, such as mutual funds and exchange-traded funds.
The Fund is offered only through certain wrap fee programs sponsored and/or managed by Ameriprise Financial, Inc. or its affiliates, and to group retirement plan recordkeeping platforms that have an agreement with (i) Columbia Management Investment Distributors, Inc. or an affiliate thereof that specifically authorizes the group retirement plan recordkeeper to offer and/or service Institutional 3 Class shares within such platform, provided also that Fund shares are held in an omnibus account and (ii) Wilshire Associates, appointed or serving as investment manager or consultant to the recordkeeper’s group retirement plan platform. The Fund does not currently offer Institutional 3 Class shares. Participants in wrap fee programs pay other fees that are not included in the above table. Please refer to the wrap program documents for information about the fees charged.
Multi-Manager Alternative Strategies Fund | Annual Report 2023
| 11 |
Consolidated Portfolio of Investments
August 31, 2023
(Percentages represent value of investments compared to net assets)
Investments in securities
| Asset-Backed Securities — Non-Agency 3.1% |
| Issuer | Coupon
Rate | | Principal
Amount ($) | Value ($) |
| AIMCO CLO Ltd.(a),(b) |
| Series 2020-11A Class AR |
3-month Term SOFR + 1.392%
Floor 1.130%
10/17/2034 | 6.700% | | 400,000 | 397,328 |
| Aligned Data Centers Issuer LLC(a) |
| Series 2021-1A Class A2 |
| 08/15/2046 | 1.937% | | 388,000 | 340,461 |
| Allegro CLO XII Ltd.(a),(b) |
| Series 2020-1A Class B |
3-month Term SOFR + 1.962%
Floor 1.700%
01/21/2032 | 7.295% | | 250,000 | 246,185 |
| AMMC CLO Ltd.(a),(b) |
| Series 2016-18A Class BR |
3-month Term SOFR + 1.862%
Floor 1.600%
05/26/2031 | 7.250% | | 250,000 | 246,165 |
| Series 2021-24A Class B |
3-month Term SOFR + 2.012%
Floor 1.750%
01/20/2035 | 7.338% | | 350,000 | 344,998 |
| BlueMountain Fuji US CLO I Ltd.(a),(b) |
| Series 2017-1A Class BR |
3-month Term SOFR + 1.762%
Floor 1.500%
07/20/2029 | 7.088% | | 375,000 | 367,980 |
| Conseco Finance Corp.(c) |
| Series 2096-9 Class M1 |
| 08/15/2027 | 7.630% | | 59,498 | 59,316 |
| Conseco Finance Securitizations Corp.(b) |
| Series 2001-4 Class M1 |
1-month Term SOFR + 1.864%
Floor 1.750%, Cap 15.000%
09/01/2033 | 7.183% | | 341,121 | 334,118 |
| DataBank Issuer LLC(a) |
| Series 2023-1 Class A2 |
| 02/25/2053 | 5.116% | | 130,000 | 122,390 |
| DB Master Finance LLC(a) |
| Series 2019-1A Class A2II |
| 05/20/2049 | 4.021% | | 182,400 | 168,247 |
| Dryden CLO Ltd.(a),(b) |
| Series 2020-85A Class AR |
3-month Term SOFR + 1.412%
Floor 1.150%
10/15/2035 | 6.720% | | 800,000 | 792,613 |
| Asset-Backed Securities — Non-Agency (continued) |
| Issuer | Coupon
Rate | | Principal
Amount ($) | Value ($) |
| Dryden Senior Loan Fund(a),(b) |
| Series 2013-30A Class AR |
3-month Term SOFR + 1.082%
Floor 0.820%
11/15/2028 | 6.446% | | 164,677 | 164,029 |
| Golub Capital Partners CLO 54M LP(a),(b) |
| Series 2021-54A Class A |
3-month Term SOFR + 1.792%
Floor 1.530%
08/05/2033 | 7.162% | | 450,000 | 438,479 |
| J.G. Wentworth XXXVII LLC(a) |
| Subordinated Series 2016-1A Class B |
| 06/17/2069 | 5.190% | | 670,693 | 595,535 |
| JG Wentworth XXII LLC(a) |
| Series 2010-3A Class A |
| 12/15/2048 | 3.820% | | 225,201 | 221,984 |
| LAD Auto Receivables Trust(a) |
| Subordinated Series 2023-2A Class D |
| 02/15/2031 | 6.300% | | 550,000 | 539,206 |
| Lehman XS Trust(b) |
| Series 2006-19 Class A3 |
1-month Term SOFR + 0.614%
Floor 0.250%
12/25/2036 | 5.929% | | 694,246 | 618,946 |
| MVW Owner Trust(a) |
| Series 2018-1A Class A |
| 01/21/2036 | 3.450% | | 20,579 | 20,083 |
| Navient Student Loan Trust(b) |
| Series 2014-1 Class A3 |
30-day Average SOFR + 0.624%
Floor 0.510%
06/25/2031 | 5.912% | | 305,896 | 295,147 |
| OCCU Auto Receivables Trust(a) |
| Series 2022-1 Class A3 |
| 10/15/2027 | 5.500% | | 150,000 | 149,670 |
| OCP CLO Ltd.(a),(b) |
| Series 2021-21A Class B |
3-month Term SOFR + 1.962%
Floor 1.700%
07/20/2034 | 7.288% | | 300,000 | 294,817 |
| OHA Credit Funding Ltd.(a),(b) |
| Series 2020-7A Class AR |
3-month USD LIBOR + 1.300%
Floor 1.300%
02/24/2037 | 6.620% | | 475,000 | 471,094 |
The accompanying Notes to Consolidated Financial Statements are an integral part of this statement.
| 12 | Multi-Manager Alternative Strategies Fund | Annual Report 2023 |
Consolidated Portfolio of Investments (continued)
August 31, 2023
| Asset-Backed Securities — Non-Agency (continued) |
| Issuer | Coupon
Rate | | Principal
Amount ($) | Value ($) |
| Park Avenue Institutional Advisers CLO Ltd.(a),(b) |
| Series 2021-1A Class A2 |
3-month Term SOFR + 2.012%
Floor 1.750%
01/20/2034 | 7.338% | | 250,000 | 245,394 |
| Rockford Tower CLO Ltd.(a),(b) |
| Series 2021-1A Class B |
3-month Term SOFR + 1.912%
Floor 1.650%
07/20/2034 | 7.238% | | 448,279 | 438,493 |
| Sabey Data Center Issuer LLC(a) |
| Series 2020-1 Class A2 |
| 04/20/2045 | 3.812% | | 470,000 | 447,803 |
| Saxon Asset Securities Trust(b) |
| Series 2007-2 Class A2D |
1-month Term SOFR + 0.414%
Floor 0.300%
05/25/2047 | 6.029% | | 567,872 | 397,374 |
| SLM Student Loan Trust(b) |
| Series 2008-2 Class B |
90-day Average SOFR + 1.462%
Floor 1.200%
01/25/2083 | 6.455% | | 740,000 | 702,484 |
| Series 2008-4 Class A4 |
90-day Average SOFR + 1.912%
Floor 1.650%
07/25/2026 | 6.966% | | 226,525 | 226,521 |
| Series 2008-7 Class B |
90-day Average SOFR + 2.112%
Floor 1.850%
07/26/2083 | 7.105% | | 500,000 | 459,213 |
| Series 2012-1 Class A3 |
30-day Average SOFR + 1.064%
Floor 0.950%
09/25/2028 | 6.352% | | 337,262 | 327,466 |
| Subordinated Series 2004-10 Class B |
90-day Average SOFR + 0.632%
Floor 0.370%
01/25/2040 | 5.625% | | 293,932 | 269,968 |
| Subordinated Series 2012-7 Class B |
30-day Average SOFR + 1.914%
Floor 1.800%
09/25/2043 | 7.202% | | 550,000 | 510,271 |
| Taco Bell Funding LLC(a) |
| Series 2016-1A Class A23 |
| 05/25/2046 | 4.970% | | 525,000 | 506,185 |
| TAL Advantage VII LLC(a) |
| Series 2020-1A Class A |
| 09/20/2045 | 2.050% | | 319,125 | 281,977 |
| Asset-Backed Securities — Non-Agency (continued) |
| Issuer | Coupon
Rate | | Principal
Amount ($) | Value ($) |
| Textainer Marine Containers VII Ltd.(a) |
| Series 2021-2A Class A |
| 04/20/2046 | 2.230% | | 630,333 | 540,695 |
| Textainer Marine Containers VIII Ltd.(a) |
| Series 2020-2A Class A |
| 09/20/2045 | 2.100% | | 222,661 | 195,054 |
| Series 2020-3A Class A |
| 09/20/2045 | 2.110% | | 264,450 | 228,194 |
| Tif Funding II LLC(a) |
| Series 2020-1A Class A |
| 08/20/2045 | 2.090% | | 168,300 | 146,920 |
| T-Mobile US Trust(a) |
| Series 2022-1A Class A |
| 05/22/2028 | 4.910% | | 180,000 | 178,469 |
| Vantage Data Centers LLC(a) |
| Series 2020-1A Class A2 |
| 09/15/2045 | 1.645% | | 395,000 | 357,109 |
Total Asset-Backed Securities — Non-Agency
(Cost $14,104,163) | 13,688,381 |
|
| Commercial Mortgage-Backed Securities - Agency 0.4% |
| | | | |
| Federal Home Loan Mortgage Corp. Multifamily Pass-Through REMIC Trust(c),(d) |
| Series 2019-P002 Class X |
| 07/25/2033 | 1.138% | | 705,000 | 54,786 |
| Federal Home Loan Mortgage Corp. Multifamily Structured Pass-Through Certificates(c),(d) |
| CMO Series K057 Class X1 |
| 07/25/2026 | 1.298% | | 3,669,566 | 96,743 |
| Series 2018-K732 Class X3 |
| 05/25/2046 | 2.245% | | 1,350,000 | 51,098 |
| Series K035 Class X3 |
| 12/25/2041 | 2.037% | | 336,973 | 161 |
| Series K039 Class X3 (FHLMC) |
| 08/25/2042 | 2.178% | | 1,520,000 | 38,973 |
| Series K043 Class X3 |
| 02/25/2043 | 1.690% | | 3,951,044 | 82,703 |
| Series K051 Class X3 |
| 10/25/2043 | 1.668% | | 2,100,000 | 65,564 |
| Series K060 Class X3 |
| 12/25/2044 | 1.963% | | 1,350,000 | 72,366 |
| Series K0728 Class X3 |
| 11/25/2045 | 2.019% | | 1,975,000 | 40,086 |
| Series KC07 Class X1 |
| 09/25/2026 | 0.839% | | 3,875,592 | 55,927 |
| Series KL05 Class X1HG |
| 12/25/2027 | 1.368% | | 2,400,000 | 107,567 |
| Series KLU3 Class X1 |
| 01/25/2031 | 2.078% | | 1,590,160 | 159,419 |
The accompanying Notes to Consolidated Financial Statements are an integral part of this statement.
Multi-Manager Alternative Strategies Fund | Annual Report 2023
| 13 |
Consolidated Portfolio of Investments (continued)
August 31, 2023
| Commercial Mortgage-Backed Securities - Agency (continued) |
| Issuer | Coupon
Rate | | Principal
Amount ($) | Value ($) |
| Series KS06 Class X |
| 08/25/2026 | 1.169% | | 2,606,093 | 50,996 |
| Series Q004 Class XFL |
| 05/25/2044 | 0.000% | | 1,390,069 | 42,408 |
| Federal National Mortgage Association(c),(d) |
| Series 2016-M11B Class X2 |
| 07/25/2039 | 3.093% | | 440,147 | 7,391 |
| Series 2016-M4 Class X2 |
| 01/25/2039 | 2.697% | | 328,945 | 4,470 |
| Series 2019-M29 Class X4 |
| 03/25/2029 | 0.700% | | 4,300,000 | 122,717 |
| Freddie Mac Multifamily Structured Pass-Through Certificates(c),(d) |
| Series K096 Class X3 (FHLMC) |
| 07/25/2029 | 2.112% | | 3,390,000 | 319,270 |
| FREMF Mortgage Trust(a),(b) |
| Subordinated Series 2019-KF71 Class B |
1-month USD LIBOR + 2.300%
Floor 2.300%
10/25/2029 | 7.516% | | 291,363 | 265,099 |
| Government National Mortgage Association(c),(d) |
| CMO Series 2014-103 Class IO |
| 05/16/2055 | 0.192% | | 1,053,186 | 6,846 |
| Series 2012-4 Class IO |
| 05/16/2052 | 0.000% | | 1,727,807 | 17 |
Total Commercial Mortgage-Backed Securities - Agency
(Cost $2,160,434) | 1,644,607 |
|
| Commercial Mortgage-Backed Securities - Non-Agency 2.9% |
| | | | |
| 225 Liberty Street Trust(a),(c),(d) |
| Series 2016-225L Class X |
| 02/10/2036 | 1.030% | | 5,000,000 | 89,903 |
| AREIT Trust(a),(b) |
| Subordinated Series 2019-CRE3 Class AS |
1-month Term SOFR + 1.414%
Floor 1.300%
09/14/2036 | 6.727% | | 397,085 | 389,273 |
| BAMLL Commercial Mortgage Securities Trust(a),(c) |
| Series 2018-PARK Class A |
| 08/10/2038 | 4.227% | | 95,000 | 84,464 |
| BDS Ltd.(a),(b) |
| Series 2021-FL8 Class A |
1-month Term SOFR + 1.034%
Floor 0.920%
01/18/2036 | 6.346% | | 304,982 | 302,130 |
| BFLD Trust(a),(b) |
| Series 2020-EYP Class A |
1-month Term SOFR + 1.264%
Floor 1.150%
10/15/2035 | 6.575% | | 480,000 | 403,276 |
| Commercial Mortgage-Backed Securities - Non-Agency (continued) |
| Issuer | Coupon
Rate | | Principal
Amount ($) | Value ($) |
| Series 2021-FPM Class A |
1-month Term SOFR + 1.714%
Floor 1.600%
06/15/2038 | 7.025% | | 288,000 | 274,912 |
| BOCA Commercial Mortgage Trust(a),(b) |
| Subordinated Series 2022-BOCA Class B |
1-month Term SOFR + 2.319%
Floor 2.319%
05/15/2039 | 7.630% | | 100,000 | 98,314 |
| BX Commercial Mortgage Trust(a),(b) |
| Series 2019-XL Class A |
1-month Term SOFR + 1.034%
Floor 0.920%
10/15/2036 | 6.345% | | 363,221 | 362,315 |
| Series 2021-CIP Class A |
1-month Term SOFR + 1.035%
Floor 0.921%
12/15/2038 | 6.346% | | 115,000 | 112,619 |
| Series 2021-VOLT Class A |
1-month Term SOFR + 0.814%
Floor 0.700%
09/15/2036 | 6.125% | | 125,000 | 121,627 |
| Subordinated CMO Series 2021-VOLT Class F |
1-month Term SOFR + 2.514%
Floor 2.400%
09/15/2036 | 7.825% | | 245,000 | 229,629 |
| BX Trust(a) |
| Series 2019-OC11 Class A |
| 12/09/2041 | 3.202% | | 225,000 | 193,243 |
| Series 2022-CLS Class A |
| 10/13/2027 | 5.760% | | 150,000 | 137,980 |
| BX Trust(a),(b) |
| Series 2022-GPA Class A |
1-month Term SOFR + 2.165%
Floor 2.165%
10/15/2039 | 7.476% | | 195,000 | 195,000 |
| Subordinated Series 2021-LBA Class EJV |
1-month USD LIBOR + 2.000%
Floor 2.000%
02/15/2036 | 7.336% | | 240,000 | 226,688 |
| Subordinated Series 2022-GPA Class B |
1-month Term SOFR + 2.664%
Floor 2.664%
10/15/2039 | 7.975% | | 120,000 | 119,925 |
| Subordinated Series 2022-GPA Class D |
1-month Term SOFR + 4.061%
Floor 4.061%
10/15/2039 | 9.372% | | 80,000 | 79,650 |
The accompanying Notes to Consolidated Financial Statements are an integral part of this statement.
| 14 | Multi-Manager Alternative Strategies Fund | Annual Report 2023 |
Consolidated Portfolio of Investments (continued)
August 31, 2023
| Commercial Mortgage-Backed Securities - Non-Agency (continued) |
| Issuer | Coupon
Rate | | Principal
Amount ($) | Value ($) |
| CAMB Commercial Mortgage Trust(a),(b) |
| Series 2019-LIFE Class A |
1-month Term SOFR + 1.184%
Floor 1.070%
12/15/2037 | 6.495% | | 200,000 | 199,001 |
| Citigroup Commercial Mortgage Trust(c),(d) |
| Series 2016-P3 Class XA |
| 04/15/2049 | 1.817% | | 8,922,452 | 246,311 |
| Citigroup Commercial Mortgage Trust(a),(c) |
| Series 2023-SMRT Class A |
| 06/10/2028 | 6.015% | | 135,000 | 133,900 |
| COMM Mortgage Trust(a),(c),(d) |
| Series 2020-CBM Class XCP |
| 02/10/2037 | 0.722% | | 3,134,666 | 21,204 |
| Series 2020-SBX Class X |
| 01/10/2038 | 0.662% | | 11,501,000 | 131,854 |
| Commercial Mortgage Pass-Through Certificates(c),(d) |
| Series 2012-CR3 Class XA |
| 10/15/2045 | 1.373% | | 12,995 | 0 |
| Commercial Mortgage Trust(c),(d) |
| Series 2012-CR4 Class XA |
| 10/15/2045 | 1.289% | | 672,394 | 7 |
| Series 2014-UBS2 Class XA |
| 03/10/2047 | 1.195% | | 3,292,293 | 2,779 |
| CoreVest American Finance Trust(a),(c),(d) |
| Series 2019-1 Class XA |
| 03/15/2052 | 2.454% | | 76,093 | 544 |
| Series 2019-3 Class XA |
| 10/15/2052 | 2.197% | | 167,823 | 4,414 |
| Series 2020-1 Class XA |
| 03/15/2050 | 2.733% | | 554,492 | 32,393 |
| CoreVest American Finance Trust(a) |
| Series 2020-1 Class A2 |
| 03/15/2050 | 2.296% | | 265,000 | 233,399 |
| Credit Suisse Mortgage Capital Certificates(a),(b) |
| Series 2019-ICE4 Class A |
1-month Term SOFR + 1.027%
Floor 0.980%
05/15/2036 | 6.338% | | 214,466 | 214,221 |
| CSAIL Commercial Mortgage Trust(c),(d) |
| Series 2015-C3 Class XA |
| 08/15/2048 | 0.811% | | 8,753,441 | 81,591 |
| CSMC Trust(a),(c),(d) |
| Series 2021-980M Class X |
| 07/15/2031 | 1.109% | | 6,982,000 | 172,927 |
| CSMC Trust(a),(c) |
| Subordinated Series 2021-B33 Class B |
| 10/10/2043 | 3.766% | | 423,000 | 294,012 |
| Commercial Mortgage-Backed Securities - Non-Agency (continued) |
| Issuer | Coupon
Rate | | Principal
Amount ($) | Value ($) |
| Del Amo Fashion Center Trust(a),(c) |
| Subordinated Series 2017-AMO Class C |
| 06/05/2035 | 3.757% | | 420,000 | 329,593 |
| DROP Mortgage Trust(a),(b) |
| Subordinated Series 2021-FILE Class B |
1-month USD LIBOR + 1.700%
Floor 1.700%
10/15/2043 | 7.125% | | 400,000 | 347,471 |
| FirstKey Homes Trust(a) |
| Series 2020-SFR2 Class A |
| 10/19/2037 | 1.266% | | 216,507 | 197,216 |
| Fontainebleau Miami Beach Trust(a) |
| Subordinated Series 2019-FBLU Class B |
| 12/10/2036 | 3.447% | | 435,810 | 416,279 |
| Fontainebleau Miami Beach Trust(a),(c) |
| Subordinated Series 2019-FBLU Class E |
| 12/10/2036 | 4.095% | | 310,000 | 292,285 |
| Grace Trust(a) |
| Subordinated Series 2020-GRCE Class B |
| 12/10/2040 | 2.600% | | 500,000 | 386,874 |
| GS Mortgage Securities Trust(a),(c),(d) |
| Series 2020-UPTN Class XA |
| 02/10/2037 | 0.446% | | 1,750,000 | 7,094 |
| Home Partners of America Trust(a) |
| Series 2019-1 Class B |
| 09/17/2039 | 3.157% | | 78,989 | 72,214 |
| Hudson Yards Mortgage Trust(a),(c) |
| Series 2019-55HY Class F |
| 12/10/2041 | 3.041% | | 85,000 | 59,263 |
| INTOWN Mortgage Trust(a),(b) |
| Subordinated Series 2022-STAY Class B |
1-month Term SOFR + 3.286%
Floor 3.286%
08/15/2037 | 8.596% | | 150,000 | 149,924 |
| JPMBB Commercial Mortgage Securities Trust(c),(d) |
| Series 2014-C21 Class XA |
| 08/15/2047 | 1.090% | | 814,827 | 3,366 |
| Series 2014-C23 Class XA |
| 09/15/2047 | 0.737% | | 2,480,247 | 9,957 |
| Series 2014-C26 Class XA |
| 01/15/2048 | 1.066% | | 4,783,042 | 35,417 |
| JPMorgan Chase Commercial Mortgage Securities Trust(a) |
| Series 2019-OSB Class A |
| 06/05/2039 | 3.397% | | 375,000 | 322,669 |
| JPMorgan Chase Commercial Mortgage Securities Trust(a),(b) |
| Subordinated Series 2022-NLP Class H |
1-month Term SOFR + 5.010%
Floor 5.010%
04/15/2037 | 10.320% | | 224,544 | 195,520 |
The accompanying Notes to Consolidated Financial Statements are an integral part of this statement.
Multi-Manager Alternative Strategies Fund | Annual Report 2023
| 15 |
Consolidated Portfolio of Investments (continued)
August 31, 2023
| Commercial Mortgage-Backed Securities - Non-Agency (continued) |
| Issuer | Coupon
Rate | | Principal
Amount ($) | Value ($) |
| Life Mortgage Trust(a),(b) |
| Series 2022-BMR2 Class A1 |
1-month Term SOFR + 1.295%
Floor 1.295%
05/15/2039 | 6.606% | | 385,000 | 378,265 |
| Series 2022-BMR2 Class B |
1-month Term SOFR + 1.794%
Floor 1.794%
05/15/2039 | 7.104% | | 270,000 | 264,181 |
| Series 2022-BMR2 Class D |
1-month Term SOFR + 2.542%
Floor 2.542%
05/15/2039 | 7.852% | | 215,000 | 205,128 |
| Morgan Stanley Bank of America Merrill Lynch Trust(c),(d) |
| Series 2015-C26 Class XA |
| 10/15/2048 | 1.110% | | 8,945,943 | 100,047 |
| Series 2016-C31 Class XA |
| 11/15/2049 | 1.409% | | 2,094,011 | 62,581 |
| Morgan Stanley Capital I Trust(a),(c) |
| Series 2018-MP Class A |
| 07/11/2040 | 4.276% | | 315,000 | 256,721 |
| MSCG Trust(a),(b) |
| Subordinated Series 2018-SELF Class E |
1-month Term SOFR + 2.197%
Floor 2.150%
10/15/2037 | 7.508% | | 342,702 | 334,936 |
| Natixis Commercial Mortgage Securities Trust(a),(c),(d) |
| Series 2020-2PAC Class XA |
| 12/15/2038 | 1.540% | | 937,398 | 13,019 |
| Series 2020-2PAC Class XB |
| 12/15/2038 | 1.102% | | 2,665,000 | 25,965 |
| Natixis Commercial Mortgage Securities Trust(a),(c) |
| Subordinated Series 2018-ALXA Class E |
| 01/15/2043 | 4.460% | | 60,000 | 41,705 |
| Progress Residential Trust(a) |
| Subordinated Series 2021-SFR9 Class E1 |
| 11/17/2040 | 2.811% | | 910,000 | 734,802 |
| SCOTT Trust(a) |
| Subordinated Series 2023-SFS Class AS |
| 03/15/2040 | 6.204% | | 100,000 | 97,076 |
| SFAVE Commercial Mortgage Securities Trust(a),(c) |
| Series 2015-5AVE Class A2A |
| 01/05/2043 | 3.659% | | 425,000 | 298,608 |
| Series 2015-5AVE Class A2B |
| 01/05/2043 | 4.144% | | 35,000 | 23,743 |
| Subordinated Series 2015-5AVE Class C |
| 01/05/2043 | 4.534% | | 345,000 | 199,001 |
| Commercial Mortgage-Backed Securities - Non-Agency (continued) |
| Issuer | Coupon
Rate | | Principal
Amount ($) | Value ($) |
| SMRT Commercial Mortgage Trust(a),(b) |
| Subordinated Series 2022-MINI Class E |
1-month Term SOFR + 2.700%
Floor 2.700%
01/15/2039 | 8.011% | | 350,000 | 328,929 |
| STWD FL1 Ltd.(a),(b) |
| Series 2019 Class AS |
1-month Term SOFR + 1.514%
Floor 1.400%
07/15/2038 | 6.828% | | 398,000 | 380,150 |
| Tricon American Homes Trust(a) |
| Subordinated Series 2017-SFR2 Class E |
| 01/17/2036 | 4.216% | | 375,000 | 370,831 |
| VMC Finance LLC(a),(b) |
| Series 2021-FL4 Class B |
1-month Term SOFR + 1.914%
Floor 1.800%
06/18/2036 | 7.227% | | 299,000 | 277,106 |
| Wells Fargo Commercial Mortgage Trust(a),(c) |
| Subordinated Series 2019-JDWR Class D |
| 09/15/2031 | 3.437% | | 425,000 | 380,384 |
| WF-RBS Commercial Mortgage Trust(c),(d) |
| Series 2014-C24 Class XA |
| 11/15/2047 | 0.982% | | 2,339,447 | 14,301 |
Total Commercial Mortgage-Backed Securities - Non-Agency
(Cost $14,102,361) | 12,802,126 |
| Common Stocks 0.0% |
| Issuer | Shares | Value ($) |
| Communication Services —% |
| Media —% |
| Intelsat Jackson Holdings SA(e),(f),(g) | 362,000 | 0 |
| Intelsat Jackson Holdings SA(e),(f),(g) | 248,000 | 0 |
| Intelsat Jackson Series A, CVR(e),(f),(g) | 612 | — |
| Intelsat Jackson Series B, CVR(e),(f),(g) | 612 | — |
| Total | | 0 |
| Total Communication Services | 0 |
| Financials 0.0% |
| Financial Services 0.0% |
| Intelsat Emergence SA(f) | 5,865 | 132,256 |
| Total Financials | 132,256 |
Total Common Stocks
(Cost $199,371) | 132,256 |
The accompanying Notes to Consolidated Financial Statements are an integral part of this statement.
| 16 | Multi-Manager Alternative Strategies Fund | Annual Report 2023 |
Consolidated Portfolio of Investments (continued)
August 31, 2023
| Convertible Bonds 0.8% |
| Issuer | Coupon
Rate | | Principal
Amount ($) | Value ($) |
| Airlines 0.2% |
| Air Canada |
| 07/01/2025 | 4.000% | | 110,000 | 140,781 |
| American Airlines Group, Inc. |
| 07/01/2025 | 6.500% | | 375,000 | 427,500 |
| Southwest Airlines Co. |
| 05/01/2025 | 1.250% | | 300,000 | 314,700 |
| Total | 882,981 |
| Cable and Satellite 0.1% |
| Liberty Broadband Corp.(a) |
| 03/31/2053 | 3.125% | | 505,000 | 528,987 |
| Liberty Media Corp.(a) |
| 12/01/2050 | 0.500% | | 105,000 | 112,676 |
| Total | 641,663 |
| Consumer Cyclical Services 0.1% |
| Uber Technologies, Inc.(h) |
| 12/15/2025 | 0.000% | | 280,000 | 262,093 |
| Electric 0.1% |
| CenterPoint Energy, Inc.(a) |
| 08/15/2026 | 4.250% | | 300,000 | 296,700 |
| Emera, Inc.(i) |
| Junior Subordinated |
| 06/15/2076 | 6.750% | | 355,000 | 342,928 |
| Total | 639,628 |
| Leisure 0.1% |
| Carnival Corp.(a) |
| 12/01/2027 | 5.750% | | 280,000 | 411,997 |
| Lodging 0.0% |
| Marriott Vacations Worldwide Corp.(a) |
| 12/15/2027 | 3.250% | | 185,000 | 166,130 |
| Other Utility 0.1% |
| American Water Capital Corp.(a) |
| 06/15/2026 | 3.625% | | 275,000 | 273,790 |
| Retailers 0.1% |
| Burlington Stores, Inc. |
| 04/15/2025 | 2.250% | | 225,000 | 233,859 |
Total Convertible Bonds
(Cost $3,397,314) | 3,512,141 |
| Convertible Preferred Stocks 0.2% |
| Issuer | | Shares | Value ($) |
| Utilities 0.2% |
| Electric Utilities 0.1% |
| NextEra Energy, Inc. | 6.926% | 12,900 | 542,703 |
| Independent Power and Renewable Electricity Producers 0.1% |
| AES Corp. (The) | 6.375% | 4,500 | 319,815 |
| Total Utilities | 862,518 |
Total Convertible Preferred Stocks
(Cost $1,057,183) | 862,518 |
| Corporate Bonds & Notes(j) 19.3% |
| Issuer | Coupon
Rate | | Principal
Amount ($) | Value ($) |
| ABS Other 0.1% |
| American Tower Trust #1(a) |
| 03/15/2028 | 5.490% | | 210,000 | 209,492 |
| SBA Tower Trust(a) |
| 01/15/2028 | 6.599% | | 240,000 | 242,460 |
| Total | 451,952 |
| Aerospace & Defense 0.3% |
| Airbus SE(a) |
| 06/09/2030 | 1.625% | EUR | 100,000 | 95,322 |
| Boeing Co. (The) |
| 02/04/2024 | 1.433% | | 300,000 | 294,209 |
| 05/01/2030 | 5.150% | | 675,000 | 663,913 |
| 05/01/2050 | 5.805% | | 160,000 | 155,723 |
| TransDigm, Inc.(a) |
| 08/15/2028 | 6.750% | | 225,000 | 226,048 |
| Total | 1,435,215 |
| Airlines 0.5% |
| American Airlines Pass-Through Trust |
| Series 2016-2 Class AA |
| 06/15/2028 | 3.200% | | 174,250 | 157,722 |
| American Airlines, Inc./AAdvantage Loyalty IP Ltd.(a) |
| 04/20/2026 | 5.500% | | 197,083 | 193,419 |
| 04/20/2029 | 5.750% | | 280,000 | 267,636 |
| Delta Air Lines Pass-Through Trust |
| 06/10/2028 | 2.500% | | 87,471 | 76,673 |
| Delta Air Lines, Inc. |
| 10/28/2024 | 2.900% | | 105,000 | 101,744 |
| 01/15/2026 | 7.375% | | 80,000 | 82,348 |
| Delta Air Lines, Inc./SkyMiles IP Ltd.(a) |
| 10/20/2028 | 4.750% | | 874,000 | 838,839 |
| JetBlue Pass-Through Trust |
| Series 2020-1 Class A |
| 11/15/2032 | 4.000% | | 334,563 | 306,755 |
The accompanying Notes to Consolidated Financial Statements are an integral part of this statement.
Multi-Manager Alternative Strategies Fund | Annual Report 2023
| 17 |
Consolidated Portfolio of Investments (continued)
August 31, 2023
| Corporate Bonds & Notes(j) (continued) |
| Issuer | Coupon
Rate | | Principal
Amount ($) | Value ($) |
| Singapore Airlines Ltd.(a) |
| 01/19/2029 | 3.375% | | 200,000 | 183,925 |
| Total | 2,209,061 |
| Apartment REIT 0.1% |
| American Homes 4 Rent LP |
| 04/15/2052 | 4.300% | | 215,000 | 165,747 |
| Invitation Homes Operating Partnership LP |
| 01/15/2034 | 2.700% | | 190,000 | 144,663 |
| Total | 310,410 |
| Automotive 0.3% |
| Allison Transmission. Inc.(a) |
| 01/30/2031 | 3.750% | | 100,000 | 83,644 |
| BMW Finance NV(a) |
| 11/14/2024 | 1.000% | EUR | 75,000 | 78,745 |
| Ford Motor Co. |
| 02/12/2032 | 3.250% | | 130,000 | 101,447 |
| Ford Motor Credit Co. LLC |
| 06/14/2024 | 2.748% | GBP | 100,000 | 121,903 |
| 08/01/2026 | 4.542% | | 200,000 | 188,530 |
| 05/28/2027 | 4.950% | | 430,000 | 402,906 |
| 02/16/2028 | 2.900% | | 200,000 | 170,459 |
| 06/17/2031 | 3.625% | | 275,000 | 222,257 |
| Total | 1,369,891 |
| Banking 3.0% |
| American Express Co.(i),(k) |
| | 3.550% | | 85,000 | 70,906 |
| Bank of America Corp.(i),(k) |
| | 4.375% | | 80,000 | 68,492 |
| Bank of America Corp.(i) |
| 10/01/2025 | 3.093% | | 345,000 | 334,298 |
| 02/04/2028 | 2.551% | | 110,000 | 99,507 |
| 06/14/2029 | 2.087% | | 50,000 | 42,629 |
| 10/24/2031 | 1.922% | | 765,000 | 599,269 |
| 04/22/2032 | 2.687% | | 250,000 | 204,332 |
| Bank of Montreal(i) |
| 11/26/2082 | 7.325% | CAD | 300,000 | 216,855 |
| Bank of Nova Scotia (The)(i) |
| 10/27/2082 | 8.625% | | 215,000 | 219,677 |
| Capital One Financial Corp.(i) |
| 11/02/2027 | 1.878% | | 215,000 | 188,499 |
| Citigroup, Inc.(i) |
| 02/24/2028 | 3.070% | | 80,000 | 73,462 |
| 11/05/2030 | 2.976% | | 100,000 | 85,980 |
| 06/03/2031 | 2.572% | | 540,000 | 445,967 |
| 11/03/2032 | 2.520% | | 420,000 | 332,645 |
| 01/25/2033 | 3.057% | | 275,000 | 226,519 |
| Corporate Bonds & Notes(j) (continued) |
| Issuer | Coupon
Rate | | Principal
Amount ($) | Value ($) |
| Comerica, Inc.(i),(k) |
| | 5.625% | | 95,000 | 87,539 |
| Credit Suisse Group AG(a),(i) |
| 09/11/2025 | 2.593% | | 180,000 | 173,554 |
| 02/02/2027 | 1.305% | | 450,000 | 400,478 |
| 04/01/2031 | 4.194% | | 375,000 | 337,855 |
| 05/14/2032 | 3.091% | | 95,000 | 78,204 |
| 11/15/2033 | 9.016% | | 995,000 | 1,205,003 |
| Goldman Sachs Group Inc (The)(i) |
| 01/27/2032 | 1.992% | | 970,000 | 755,489 |
| Goldman Sachs Group, Inc. (The)(a) |
| 05/15/2024 | 1.375% | EUR | 205,000 | 218,189 |
| 01/26/2028 | 0.250% | EUR | 15,000 | 13,810 |
| 11/01/2028 | 2.000% | EUR | 88,000 | 86,546 |
| HSBC Holdings PLC(i) |
| 05/24/2025 | 0.976% | | 40,000 | 38,473 |
| 05/24/2027 | 1.589% | | 125,000 | 111,130 |
| 08/17/2029 | 2.206% | | 215,000 | 180,078 |
| 05/24/2032 | 2.804% | | 215,000 | 171,684 |
| 03/09/2044 | 6.332% | | 310,000 | 312,283 |
| JPMorgan Chase & Co.(i),(k) |
| | 3.650% | | 85,000 | 75,154 |
| JPMorgan Chase & Co.(i) |
| 02/16/2025 | 0.563% | | 250,000 | 243,622 |
| 04/22/2027 | 1.578% | | 285,000 | 255,932 |
| 06/01/2029 | 2.069% | | 105,000 | 90,046 |
| 02/04/2032 | 1.953% | | 460,000 | 362,483 |
| 04/22/2032 | 2.580% | | 340,000 | 278,206 |
| Lloyds Banking Group PLC(i) |
| 11/07/2028 | 3.574% | | 185,000 | 167,942 |
| 08/11/2033 | 4.976% | | 330,000 | 305,007 |
| Macquarie Group Ltd.(a),(i) |
| 06/23/2032 | 2.691% | | 195,000 | 153,232 |
| 01/14/2033 | 2.871% | | 305,000 | 239,073 |
| Morgan Stanley(i) |
| 04/28/2032 | 1.928% | | 265,000 | 204,287 |
| 07/21/2032 | 2.239% | | 215,000 | 168,680 |
| Subordinated |
| 09/16/2036 | 2.484% | | 445,000 | 335,265 |
| PNC Financial Services Group, Inc. (The)(i) |
| 10/28/2033 | 6.037% | | 65,000 | 66,051 |
| 01/24/2034 | 5.068% | | 60,000 | 56,878 |
| Popular, Inc. |
| 03/13/2028 | 7.250% | | 215,000 | 216,376 |
| Santander UK Group Holdings PLC(i) |
| 11/15/2024 | 4.796% | | 90,000 | 89,710 |
| 03/15/2025 | 1.089% | | 300,000 | 290,733 |
| 06/14/2027 | 1.673% | | 110,000 | 96,772 |
The accompanying Notes to Consolidated Financial Statements are an integral part of this statement.
| 18 | Multi-Manager Alternative Strategies Fund | Annual Report 2023 |
Consolidated Portfolio of Investments (continued)
August 31, 2023
| Corporate Bonds & Notes(j) (continued) |
| Issuer | Coupon
Rate | | Principal
Amount ($) | Value ($) |
| Santander UK PLC(a) |
| Subordinated |
| 11/07/2023 | 5.000% | | 115,000 | 114,631 |
| Toronto-Dominion Bank (The)(i) |
| 10/31/2082 | 8.125% | | 230,000 | 231,965 |
| U.S. Bancorp |
| 06/07/2024 | 0.850% | EUR | 350,000 | 367,630 |
| US Bancorp(i),(k) |
| | 3.700% | | 185,000 | 139,144 |
| Wells Fargo & Co.(i) |
| 06/02/2028 | 2.393% | | 160,000 | 142,297 |
| 03/02/2033 | 3.350% | | 1,260,000 | 1,061,479 |
| 07/25/2033 | 4.897% | | 90,000 | 84,679 |
| Total | 13,216,626 |
| Brokerage/Asset Managers/Exchanges 0.1% |
| Intercontinental Exchange, Inc. |
| 09/15/2032 | 1.850% | | 175,000 | 133,191 |
| Jane Street Group/JSG Finance, Inc.(a) |
| 11/15/2029 | 4.500% | | 175,000 | 153,421 |
| Total | 286,612 |
| Building Materials 0.1% |
| Advanced Drainage Systems, Inc.(a) |
| 06/15/2030 | 6.375% | | 70,000 | 69,151 |
| Cemex SAB de CV(a) |
| 07/11/2031 | 3.875% | | 205,000 | 174,593 |
| Total | 243,744 |
| Cable and Satellite 1.0% |
| Cable One, Inc.(a) |
| 11/15/2030 | 4.000% | | 260,000 | 203,414 |
| CCO Holdings LLC/Capital Corp.(a) |
| 02/01/2031 | 4.250% | | 395,000 | 323,972 |
| 06/01/2033 | 4.500% | | 115,000 | 90,873 |
| Charter Communications Operating LLC/Capital |
| 04/01/2031 | 2.800% | | 50,000 | 40,255 |
| 02/01/2032 | 2.300% | | 20,000 | 15,078 |
| 05/01/2047 | 5.375% | | 65,000 | 51,852 |
| 04/01/2048 | 5.750% | | 320,000 | 269,471 |
| 07/01/2049 | 5.125% | | 435,000 | 334,529 |
| 04/01/2053 | 5.250% | | 430,000 | 339,893 |
| CSC Holdings LLC(a) |
| 02/01/2028 | 5.375% | | 275,000 | 225,636 |
| 04/01/2028 | 7.500% | | 80,000 | 50,682 |
| 02/01/2029 | 6.500% | | 85,000 | 70,277 |
| 12/01/2030 | 4.625% | | 55,000 | 28,761 |
| DIRECTV Holdings LLC/Financing Co., Inc.(a) |
| 08/15/2027 | 5.875% | | 150,000 | 132,800 |
| Corporate Bonds & Notes(j) (continued) |
| Issuer | Coupon
Rate | | Principal
Amount ($) | Value ($) |
| Globo Comunicacao e Participacoes SA(a) |
| 01/14/2032 | 5.500% | | 200,000 | 168,047 |
| Intelsat Jackson Holdings SA(a) |
| 03/15/2030 | 6.500% | | 248,000 | 227,713 |
| LCPR Senior Secured Financing DAC(a) |
| 07/15/2029 | 5.125% | | 200,000 | 168,702 |
| SES GLOBAL Americas Holdings GP(a) |
| 03/25/2044 | 5.300% | | 375,000 | 268,340 |
| Sirius XM Radio, Inc.(a) |
| 07/01/2030 | 4.125% | | 310,000 | 252,570 |
| Tele Columbus AG(a) |
| 05/02/2025 | 3.875% | EUR | 100,000 | 68,660 |
| Time Warner Cable LLC |
| 09/01/2041 | 5.500% | | 195,000 | 159,903 |
| Virgin Media Finance PLC(a) |
| 07/15/2030 | 5.000% | | 200,000 | 162,275 |
| Virgin Media Secured Finance PLC(a) |
| 05/15/2029 | 5.500% | | 225,000 | 205,923 |
| 08/15/2030 | 4.500% | | 200,000 | 168,585 |
| VZ Secured Financing BV(a) |
| 01/15/2032 | 5.000% | | 340,000 | 277,232 |
| Total | 4,305,443 |
| Chemicals 0.2% |
| Braskem Netherlands Finance BV(a) |
| 01/31/2030 | 4.500% | | 200,000 | 167,602 |
| EverArc Escrow Sarl(a) |
| 10/30/2029 | 5.000% | | 190,000 | 156,122 |
| International Flavors & Fragrances, Inc.(a) |
| 11/01/2030 | 2.300% | | 455,000 | 352,943 |
| 11/15/2040 | 3.268% | | 5,000 | 3,327 |
| 12/01/2050 | 3.468% | | 25,000 | 15,531 |
| International Flavors & Fragrances, Inc. |
| 06/01/2047 | 4.375% | | 5,000 | 3,584 |
| 09/26/2048 | 5.000% | | 5,000 | 3,974 |
| Unifrax Escrow Issuer Corp.(a) |
| 09/30/2029 | 7.500% | | 155,000 | 80,592 |
| Total | 783,675 |
| Construction Machinery 0.2% |
| OT Merger Corp.(a) |
| 10/15/2029 | 7.875% | | 240,000 | 158,194 |
| United Rentals North America, Inc. |
| 01/15/2028 | 4.875% | | 205,000 | 194,966 |
| 07/15/2030 | 4.000% | | 140,000 | 122,668 |
| 02/15/2031 | 3.875% | | 345,000 | 295,745 |
The accompanying Notes to Consolidated Financial Statements are an integral part of this statement.
Multi-Manager Alternative Strategies Fund | Annual Report 2023
| 19 |
Consolidated Portfolio of Investments (continued)
August 31, 2023
| Corporate Bonds & Notes(j) (continued) |
| Issuer | Coupon
Rate | | Principal
Amount ($) | Value ($) |
| United Rentals North America, Inc.(a) |
| 12/15/2029 | 6.000% | | 170,000 | 168,953 |
| Total | 940,526 |
| Consumer Cyclical Services 0.1% |
| Match Group, Inc.(a) |
| 08/01/2030 | 4.125% | | 150,000 | 129,419 |
| Uber Technologies, Inc.(a) |
| 11/01/2026 | 8.000% | | 145,000 | 147,627 |
| VT Topco, Inc.(a) |
| 08/15/2030 | 8.500% | | 75,000 | 76,045 |
| WASH Multifamily Acquisition, Inc.(a) |
| 04/15/2026 | 5.750% | | 145,000 | 135,182 |
| Total | 488,273 |
| Consumer Products 0.2% |
| Central Garden & Pet Co. |
| 10/15/2030 | 4.125% | | 90,000 | 77,423 |
| Edgewell Personal Care Co.(a) |
| 06/01/2028 | 5.500% | | 75,000 | 70,932 |
| Energizer Holdings, Inc.(a) |
| 12/31/2027 | 6.500% | | 150,000 | 144,913 |
| Natura & Co. Luxembourg Holdings SARL(a) |
| 04/19/2029 | 6.000% | | 200,000 | 184,708 |
| Natura Cosmeticos SA(a) |
| 05/03/2028 | 4.125% | | 200,000 | 174,391 |
| Newell Brands, Inc. |
| 04/01/2046 | 5.750% | | 185,000 | 150,099 |
| Prestige Brands, Inc.(a) |
| 04/01/2031 | 3.750% | | 185,000 | 153,856 |
| Spectrum Brands, Inc.(a) |
| 07/15/2030 | 5.500% | | 85,000 | 79,243 |
| Total | 1,035,565 |
| Diversified Manufacturing 0.0% |
| Johnson Controls International PLC/Tyco Fire & Security Finance SCA |
| 09/15/2027 | 0.375% | EUR | 100,000 | 94,316 |
| Electric 0.7% |
| AES Corp. (The)(a) |
| 07/15/2030 | 3.950% | | 35,000 | 31,167 |
| Alliant Energy Finance LLC(a) |
| 03/01/2032 | 3.600% | | 305,000 | 262,590 |
| DPL, Inc. |
| 07/01/2025 | 4.125% | | 370,000 | 352,677 |
| Duke Energy Progress LLC |
| 03/15/2033 | 5.250% | | 215,000 | 215,108 |
| 12/01/2044 | 4.150% | | 225,000 | 183,916 |
| Corporate Bonds & Notes(j) (continued) |
| Issuer | Coupon
Rate | | Principal
Amount ($) | Value ($) |
| E.ON SE(a) |
| 09/29/2027 | 0.375% | EUR | 65,000 | 62,346 |
| FirstEnergy Corp.(i) |
| 07/15/2027 | 4.150% | | 300,000 | 283,021 |
| FirstEnergy Corp. |
| 11/15/2031 | 7.375% | | 345,000 | 383,807 |
| FirstEnergy Transmission LLC(a) |
| 09/15/2028 | 2.866% | | 229,000 | 200,958 |
| Jersey Central Power & Light Co.(a) |
| 04/01/2024 | 4.700% | | 330,000 | 326,953 |
| Niagara Mohawk Power Corp.(a) |
| 09/16/2052 | 5.783% | | 220,000 | 216,364 |
| NSTAR Electric Co. |
| 05/15/2027 | 3.200% | | 520,000 | 487,168 |
| Southern Co. (The) |
| 07/01/2026 | 3.250% | | 184,000 | 174,073 |
| Southwestern Electric Power Co. |
| 11/01/2051 | 3.250% | | 85,000 | 54,953 |
| Total | 3,235,101 |
| Environmental 0.1% |
| Waste Pro USA, Inc.(a) |
| 02/15/2026 | 5.500% | | 250,000 | 236,808 |
| Finance Companies 0.3% |
| AerCap Ireland Capital DAC/Global Aviation Trust |
| 10/29/2028 | 3.000% | | 250,000 | 216,673 |
| 01/30/2032 | 3.300% | | 344,000 | 279,628 |
| Air Lease Corp. |
| 03/01/2025 | 3.250% | | 160,000 | 153,299 |
| Avolon Holdings Funding Ltd.(a) |
| 07/01/2024 | 3.950% | | 45,000 | 43,935 |
| 02/15/2025 | 2.875% | | 195,000 | 183,984 |
| 11/18/2027 | 2.528% | | 399,000 | 340,592 |
| Park Aerospace Holdings Ltd.(a) |
| 02/15/2024 | 5.500% | | 63,000 | 62,689 |
| Total | 1,280,800 |
| Food and Beverage 0.8% |
| Becle SAB de CV(a) |
| 10/14/2031 | 2.500% | | 205,000 | 160,816 |
| Darling Ingredients, Inc.(a) |
| 06/15/2030 | 6.000% | | 420,000 | 410,517 |
| H-Food Holdings LLC/Hearthside Finance Co., Inc.(a) |
| 06/01/2026 | 8.500% | | 145,000 | 56,858 |
The accompanying Notes to Consolidated Financial Statements are an integral part of this statement.
| 20 | Multi-Manager Alternative Strategies Fund | Annual Report 2023 |
Consolidated Portfolio of Investments (continued)
August 31, 2023
| Corporate Bonds & Notes(j) (continued) |
| Issuer | Coupon
Rate | | Principal
Amount ($) | Value ($) |
| JBS SA/Food Co./Finance, Inc. |
| 12/01/2031 | 3.750% | | 400,000 | 332,245 |
| 01/15/2032 | 3.625% | | 200,000 | 163,947 |
| 04/01/2033 | 5.750% | | 170,000 | 162,778 |
| 12/01/2052 | 6.500% | | 75,000 | 71,315 |
| Kraft Heinz Foods Co. |
| 01/26/2039 | 6.875% | | 220,000 | 240,961 |
| 06/01/2046 | 4.375% | | 305,000 | 252,268 |
| Kraft Heinz Foods Co.(a) |
| 08/01/2039 | 7.125% | | 35,000 | 38,292 |
| MARB BondCo PLC(a) |
| 01/29/2031 | 3.950% | | 200,000 | 155,598 |
| NBM US Holdings, Inc.(a) |
| 05/14/2026 | 7.000% | | 200,000 | 197,388 |
| Pilgrim’s Pride Corp.(a) |
| 09/30/2027 | 5.875% | | 150,000 | 148,541 |
| Pilgrim’s Pride Corp. |
| 04/15/2031 | 4.250% | | 150,000 | 129,855 |
| Post Holdings, Inc.(a) |
| 01/15/2028 | 5.625% | | 315,000 | 302,140 |
| 12/15/2029 | 5.500% | | 225,000 | 208,072 |
| 09/15/2031 | 4.500% | | 65,000 | 56,020 |
| Simmons Foods, Inc./Prepared Foods, Inc./Pet Food, Inc./Feed(a) |
| 03/01/2029 | 4.625% | | 170,000 | 141,743 |
| Triton Water Holdings, Inc.(a) |
| 04/01/2029 | 6.250% | | 310,000 | 265,645 |
| Total | 3,494,999 |
| Gaming 0.4% |
| GLP Capital LP/Financing II, Inc. |
| 04/15/2026 | 5.375% | | 195,000 | 190,942 |
| 06/01/2028 | 5.750% | | 80,000 | 77,716 |
| 01/15/2029 | 5.300% | | 130,000 | 122,746 |
| 01/15/2031 | 4.000% | | 65,000 | 55,687 |
| MGM Resorts International |
| 10/15/2028 | 4.750% | | 20,000 | 18,151 |
| Ontario Gaming GTA LP(a) |
| 08/01/2030 | 8.000% | | 75,000 | 75,834 |
| Penn National Gaming, Inc.(a) |
| 07/01/2029 | 4.125% | | 185,000 | 151,354 |
| Premier Entertainment Sub LLC/Finance Corp.(a) |
| 09/01/2031 | 5.875% | | 159,000 | 122,737 |
| VICI Properties LP |
| 02/15/2030 | 4.950% | | 5,000 | 4,702 |
| 05/15/2032 | 5.125% | | 383,000 | 355,075 |
| 05/15/2052 | 5.625% | | 35,000 | 30,834 |
| Corporate Bonds & Notes(j) (continued) |
| Issuer | Coupon
Rate | | Principal
Amount ($) | Value ($) |
| VICI Properties LP/Note Co., Inc.(a) |
| 09/01/2026 | 4.500% | | 30,000 | 28,439 |
| 02/01/2027 | 5.750% | | 35,000 | 34,323 |
| 02/15/2027 | 3.750% | | 5,000 | 4,595 |
| 01/15/2028 | 4.500% | | 49,000 | 45,560 |
| 02/15/2029 | 3.875% | | 100,000 | 88,277 |
| 12/01/2029 | 4.625% | | 185,000 | 167,713 |
| 08/15/2030 | 4.125% | | 324,000 | 283,351 |
| Total | 1,858,036 |
| Health Care 1.4% |
| 180 Medical, Inc.(a) |
| 10/15/2029 | 3.875% | | 160,000 | 138,868 |
| Baylor Scott & White Holdings |
| 11/15/2026 | 2.650% | | 500,000 | 457,231 |
| Becton Dickinson Euro Finance SARL |
| 06/04/2026 | 1.208% | EUR | 255,000 | 258,269 |
| Cano Health LLC(a) |
| 10/01/2028 | 6.250% | | 55,000 | 18,699 |
| Catalent Pharma Solutions, Inc.(a) |
| 04/01/2030 | 3.500% | | 260,000 | 219,467 |
| CVS Health Corp. |
| 03/25/2048 | 5.050% | | 140,000 | 122,933 |
| Dentsply Sirona, Inc. |
| 06/01/2030 | 3.250% | | 165,000 | 141,528 |
| DH Europe Finance II SARL |
| 03/18/2028 | 0.450% | EUR | 515,000 | 485,378 |
| Embecta Corp.(a) |
| 02/15/2030 | 5.000% | | 270,000 | 222,031 |
| Encompass Health Corp. |
| 04/01/2031 | 4.625% | | 165,000 | 144,491 |
| Hackensack Meridian Health, Inc. |
| 07/01/2057 | 4.500% | | 300,000 | 256,989 |
| HCA, Inc. |
| 09/15/2025 | 7.580% | | 125,000 | 128,201 |
| 12/01/2027 | 7.050% | | 115,000 | 119,592 |
| 09/01/2028 | 5.625% | | 100,000 | 99,770 |
| 06/15/2029 | 4.125% | | 435,000 | 401,633 |
| 09/01/2030 | 3.500% | | 1,099,000 | 959,858 |
| 03/15/2032 | 3.625% | | 13,000 | 11,182 |
| 06/01/2033 | 5.500% | | 205,000 | 201,677 |
| 06/15/2047 | 5.500% | | 84,000 | 76,338 |
| 06/15/2049 | 5.250% | | 230,000 | 200,698 |
| 03/15/2052 | 4.625% | | 100,000 | 80,207 |
| ModivCare Escrow Issuer, Inc.(a) |
| 10/01/2029 | 5.000% | | 125,000 | 92,228 |
| New York and Presbyterian Hospital (The) |
| 08/01/2036 | 3.563% | | 390,000 | 321,764 |
| Option Care Health, Inc.(a) |
| 10/31/2029 | 4.375% | | 160,000 | 141,031 |
The accompanying Notes to Consolidated Financial Statements are an integral part of this statement.
Multi-Manager Alternative Strategies Fund | Annual Report 2023
| 21 |
Consolidated Portfolio of Investments (continued)
August 31, 2023
| Corporate Bonds & Notes(j) (continued) |
| Issuer | Coupon
Rate | | Principal
Amount ($) | Value ($) |
| Prime Healthcare Services, Inc.(a) |
| 11/01/2025 | 7.250% | | 150,000 | 140,752 |
| Providence Service Corp. (The)(a) |
| 11/15/2025 | 5.875% | | 93,000 | 88,253 |
| Rede D’or Finance SARL(a) |
| 01/22/2030 | 4.500% | | 200,000 | 171,912 |
| Tenet Healthcare Corp.(a) |
| 05/15/2031 | 6.750% | | 225,000 | 224,311 |
| Thermo Fisher Scientific, Inc. |
| 09/12/2024 | 0.750% | EUR | 100,000 | 104,946 |
| 01/23/2026 | 1.400% | EUR | 125,000 | 128,222 |
| 03/01/2028 | 0.500% | EUR | 105,000 | 99,263 |
| Total | 6,257,722 |
| Healthcare Insurance 0.4% |
| Centene Corp. |
| 12/15/2027 | 4.250% | | 115,000 | 107,509 |
| 07/15/2028 | 2.450% | | 447,000 | 382,370 |
| 12/15/2029 | 4.625% | | 55,000 | 50,573 |
| 02/15/2030 | 3.375% | | 495,000 | 423,336 |
| 10/15/2030 | 3.000% | | 585,000 | 486,886 |
| 03/01/2031 | 2.500% | | 195,000 | 155,483 |
| Molina Healthcare, Inc.(a) |
| 06/15/2028 | 4.375% | | 200,000 | 183,652 |
| 11/15/2030 | 3.875% | | 210,000 | 179,157 |
| Total | 1,968,966 |
| Healthcare REIT 0.1% |
| Healthcare Realty Holdings LP |
| 01/15/2028 | 3.625% | | 63,000 | 56,782 |
| 03/15/2030 | 2.400% | | 40,000 | 31,420 |
| 03/15/2031 | 2.050% | | 56,000 | 41,610 |
| Healthcare Trust of America Holdings LP |
| 02/15/2030 | 3.100% | | 35,000 | 29,844 |
| 03/15/2031 | 2.000% | | 160,000 | 123,310 |
| Physicians Realty LP |
| 11/01/2031 | 2.625% | | 95,000 | 73,745 |
| Total | 356,711 |
| Home Construction 0.0% |
| China Aoyuan Group, Ltd.(a),(l) |
| 02/08/2024 | 0.000% | | 200,000 | 5,556 |
| Independent Energy 0.9% |
| Aker BP ASA(a) |
| 01/15/2030 | 3.750% | | 210,000 | 185,805 |
| Civitas Resources, Inc.(a) |
| 07/01/2031 | 8.750% | | 270,000 | 279,656 |
| Corporate Bonds & Notes(j) (continued) |
| Issuer | Coupon
Rate | | Principal
Amount ($) | Value ($) |
| Continental Resources, Inc.(a) |
| 01/15/2031 | 5.750% | | 481,000 | 459,616 |
| 04/01/2032 | 2.875% | | 458,000 | 351,124 |
| Encana Corp. |
| 08/15/2034 | 6.500% | | 360,000 | 364,867 |
| 02/01/2038 | 6.500% | | 130,000 | 127,887 |
| EQT Corp. |
| 10/01/2027 | 3.900% | | 69,000 | 64,539 |
| EQT Corp.(a) |
| 05/15/2031 | 3.625% | | 580,000 | 500,708 |
| Medco Oak Tree Pte Ltd.(a) |
| 05/14/2026 | 7.375% | | 440,000 | 431,356 |
| Occidental Petroleum Corp. |
| 04/15/2026 | 3.400% | | 55,000 | 51,555 |
| 08/15/2026 | 3.200% | | 100,000 | 91,681 |
| 09/01/2030 | 6.625% | | 325,000 | 335,424 |
| 01/01/2031 | 6.125% | | 285,000 | 287,326 |
| 05/01/2031 | 7.500% | | 75,000 | 81,212 |
| Petrorio Luxembourg Sarl(a) |
| 06/09/2026 | 6.125% | | 200,000 | 192,219 |
| Southwestern Energy Co.(i) |
| 01/23/2025 | 5.700% | | 4,000 | 3,961 |
| Var Energi ASA(a) |
| 01/15/2028 | 7.500% | | 200,000 | 208,023 |
| Total | 4,016,959 |
| Integrated Energy 0.2% |
| Cenovus Energy, Inc. |
| 02/07/2028 | 3.500% | CAD | 115,000 | 79,547 |
| 06/15/2037 | 5.250% | | 65,000 | 59,523 |
| 11/15/2039 | 6.750% | | 603,000 | 625,516 |
| 06/15/2047 | 5.400% | | 175,000 | 157,253 |
| Total | 921,839 |
| Leisure 0.2% |
| Carnival Corp.(a) |
| 03/01/2027 | 5.750% | | 335,000 | 315,314 |
| Live Nation Entertainment, Inc.(a) |
| 10/15/2027 | 4.750% | | 70,000 | 65,212 |
| Royal Caribbean Cruises Ltd.(a) |
| 08/15/2027 | 11.625% | | 63,000 | 68,709 |
| 04/01/2028 | 5.500% | | 385,000 | 361,140 |
| Total | 810,375 |
| Life Insurance 0.1% |
| Athene Global Funding(a) |
| 03/08/2027 | 3.205% | | 95,000 | 85,215 |
| 08/19/2028 | 1.985% | | 395,000 | 326,687 |
| Total | 411,902 |
The accompanying Notes to Consolidated Financial Statements are an integral part of this statement.
| 22 | Multi-Manager Alternative Strategies Fund | Annual Report 2023 |
Consolidated Portfolio of Investments (continued)
August 31, 2023
| Corporate Bonds & Notes(j) (continued) |
| Issuer | Coupon
Rate | | Principal
Amount ($) | Value ($) |
| Lodging 0.3% |
| Hilton Domestic Operating Co., Inc. |
| 01/15/2030 | 4.875% | | 211,000 | 196,747 |
| Hilton Domestic Operating Co., Inc.(a) |
| 02/15/2032 | 3.625% | | 280,000 | 232,443 |
| Hyatt Hotels Corp.(i) |
| 04/23/2030 | 5.750% | | 256,000 | 256,257 |
| Travel + Leisure Co.(a) |
| 07/31/2026 | 6.625% | | 150,000 | 148,580 |
| 12/01/2029 | 4.500% | | 230,000 | 197,925 |
| Wyndham Hotels & Resorts, Inc.(a) |
| 08/15/2028 | 4.375% | | 255,000 | 233,607 |
| Total | 1,265,559 |
| Media and Entertainment 0.6% |
| Banijay Entertainment SASU(a) |
| 03/01/2025 | 5.375% | | 150,000 | 146,895 |
| Diamond Sports Group LLC/Finance Co.(a),(l) |
| 08/15/2026 | 0.000% | | 211,000 | 6,155 |
| Gray Escrow II, Inc.(a) |
| 11/15/2031 | 5.375% | | 150,000 | 104,632 |
| Meta Platforms, Inc. |
| 05/15/2053 | 5.600% | | 255,000 | 255,869 |
| Netflix, Inc. |
| 02/15/2025 | 5.875% | | 285,000 | 286,364 |
| News Corp.(a) |
| 05/15/2029 | 3.875% | | 370,000 | 325,066 |
| Scripps Escrow II, Inc.(a) |
| 01/15/2031 | 5.375% | | 140,000 | 101,091 |
| Scripps Escrow, Inc.(a) |
| 07/15/2027 | 5.875% | | 30,000 | 24,253 |
| Warnermedia Holdings, Inc. |
| 03/15/2042 | 5.050% | | 305,000 | 250,874 |
| 03/15/2052 | 5.141% | | 813,000 | 647,691 |
| WMG Acquisition Corp(a) |
| 02/15/2031 | 3.000% | | 415,000 | 338,345 |
| Total | 2,487,235 |
| Metals and Mining 0.4% |
| ATI, Inc. |
| 08/15/2030 | 7.250% | | 75,000 | 75,662 |
| Cleveland-Cliffs, Inc.(a) |
| 03/01/2029 | 4.625% | | 400,000 | 354,160 |
| 03/01/2031 | 4.875% | | 345,000 | 299,144 |
| CSN Islands XI Corp.(a) |
| 01/28/2028 | 6.750% | | 215,000 | 202,371 |
| Corporate Bonds & Notes(j) (continued) |
| Issuer | Coupon
Rate | | Principal
Amount ($) | Value ($) |
| Freeport-McMoRan, Inc. |
| 08/01/2030 | 4.625% | | 125,000 | 115,474 |
| 11/14/2034 | 5.400% | | 135,000 | 127,847 |
| 03/15/2043 | 5.450% | | 670,000 | 600,414 |
| Total | 1,775,072 |
| Midstream 0.8% |
| Cheniere Energy Partners LP |
| 03/01/2031 | 4.000% | | 510,000 | 449,691 |
| Columbia Pipelines Operating Co. LLC(a) |
| 11/15/2033 | 6.036% | | 65,000 | 65,692 |
| Enbridge, Inc. |
| 11/15/2029 | 3.125% | | 250,000 | 220,848 |
| 03/08/2033 | 5.700% | | 20,000 | 20,009 |
| Energy Transfer LP(i),(k) |
| | 6.625% | | 336,000 | 269,643 |
| Energy Transfer Operating LP |
| 04/15/2049 | 6.250% | | 80,000 | 76,469 |
| Energy Transfer Partners LP |
| 03/15/2045 | 5.150% | | 245,000 | 206,238 |
| Galaxy Pipeline Assets Bidco Ltd.(a) |
| 03/31/2034 | 2.160% | | 177,420 | 149,329 |
| Global Partners LP/Finance Corp. |
| 01/15/2029 | 6.875% | | 150,000 | 142,283 |
| Kinder Morgan, Inc. |
| 12/01/2034 | 5.300% | | 145,000 | 137,994 |
| NGL Energy Operating LLC/Finance Corp.(a) |
| 02/01/2026 | 7.500% | | 125,000 | 124,494 |
| Rockies Express Pipeline LLC(a) |
| 07/15/2029 | 4.950% | | 100,000 | 91,743 |
| 05/15/2030 | 4.800% | | 100,000 | 88,206 |
| 04/15/2040 | 6.875% | | 100,000 | 90,462 |
| Sunoco LP/Finance Corp. |
| 05/15/2029 | 4.500% | | 225,000 | 203,661 |
| 04/30/2030 | 4.500% | | 47,000 | 41,936 |
| TMS Issuer Sarl(a) |
| 08/23/2032 | 5.780% | | 300,000 | 304,586 |
| TransCanada PipeLines Ltd. |
| 04/15/2030 | 4.100% | | 425,000 | 389,556 |
| Transcontinental Gas Pipe Line Co. LLC |
| 05/15/2030 | 3.250% | | 80,000 | 70,593 |
| TransMontaigne Partners LP/TLP Finance Corp. |
| 02/15/2026 | 6.125% | | 139,000 | 119,639 |
| Venture Global Calcasieu Pass LLC(a) |
| 08/15/2029 | 3.875% | | 225,000 | 194,817 |
| Western Midstream Operating LP(i) |
| 02/01/2030 | 4.050% | | 225,000 | 200,570 |
| Total | 3,658,459 |
The accompanying Notes to Consolidated Financial Statements are an integral part of this statement.
Multi-Manager Alternative Strategies Fund | Annual Report 2023
| 23 |
Consolidated Portfolio of Investments (continued)
August 31, 2023
| Corporate Bonds & Notes(j) (continued) |
| Issuer | Coupon
Rate | | Principal
Amount ($) | Value ($) |
| Natural Gas 0.1% |
| Engie SA(a) |
| 06/21/2027 | 0.375% | EUR | 100,000 | 96,070 |
| KeySpan Gas East Corp.(a) |
| 03/06/2033 | 5.994% | | 170,000 | 168,497 |
| Total | 264,567 |
| Office REIT 0.1% |
| Boston Properties LP |
| 10/01/2026 | 2.750% | | 38,000 | 34,281 |
| Hudson Pacific Properties LP |
| 11/01/2027 | 3.950% | | 170,000 | 134,836 |
| 02/15/2028 | 5.950% | | 30,000 | 25,350 |
| 04/01/2029 | 4.650% | | 30,000 | 22,875 |
| 01/15/2030 | 3.250% | | 55,000 | 37,348 |
| Total | 254,690 |
| Oil Field Services 0.0% |
| Archrock Partners LP/Finance Corp.(a) |
| 04/01/2028 | 6.250% | | 153,000 | 146,196 |
| Other Financial Institutions 0.1% |
| Icahn Enterprises LP/Finance Corp. |
| 09/15/2024 | 4.750% | | 50,000 | 48,356 |
| 05/15/2027 | 5.250% | | 200,000 | 175,595 |
| 02/01/2029 | 4.375% | | 35,000 | 27,692 |
| Sunac China Holdings, Ltd.(a),(l) |
| 01/10/2025 | 0.000% | | 200,000 | 22,882 |
| Total | 274,525 |
| Other Industry 0.2% |
| Adtalem Global Education, Inc.(a) |
| 03/01/2028 | 5.500% | | 84,000 | 78,548 |
| AECOM |
| 03/15/2027 | 5.125% | | 405,000 | 389,052 |
| Duke University |
| 10/01/2046 | 3.299% | | 228,000 | 171,501 |
| Massachusetts Institute of Technology |
| 07/01/2050 | 2.989% | | 190,000 | 136,880 |
| Pike Corp.(a) |
| 09/01/2028 | 5.500% | | 88,000 | 79,332 |
| President and Fellows of Harvard College |
| 10/15/2050 | 2.517% | | 205,000 | 132,870 |
| Total | 988,183 |
| Other REIT 0.2% |
| American Assets Trust LP |
| 02/01/2031 | 3.375% | | 155,000 | 119,851 |
| Corporate Bonds & Notes(j) (continued) |
| Issuer | Coupon
Rate | | Principal
Amount ($) | Value ($) |
| CubeSmart LP |
| 02/15/2032 | 2.500% | | 185,000 | 145,774 |
| Extra Space Storage LP |
| 06/01/2031 | 2.550% | | 35,000 | 28,067 |
| 10/15/2031 | 2.400% | | 30,000 | 23,543 |
| 03/15/2032 | 2.350% | | 170,000 | 132,109 |
| Host Hotels & Resorts LP |
| 12/15/2029 | 3.375% | | 165,000 | 140,754 |
| 09/15/2030 | 3.500% | | 115,000 | 98,103 |
| Lexington Realty Trust |
| 09/15/2030 | 2.700% | | 135,000 | 106,808 |
| Total | 795,009 |
| Packaging 0.6% |
| Ardagh Metal Packaging Finance USA LLC/PLC(a) |
| 09/01/2028 | 3.250% | | 220,000 | 187,070 |
| Ardagh Packaging Finance PLC/Holdings USA, Inc.(a) |
| 08/15/2027 | 5.250% | | 185,000 | 158,599 |
| Ball Corp. |
| 03/15/2026 | 4.875% | | 50,000 | 48,558 |
| 03/15/2028 | 6.875% | | 365,000 | 370,418 |
| 08/15/2030 | 2.875% | | 625,000 | 509,847 |
| Berry Global Escrow Corp.(a) |
| 07/15/2026 | 4.875% | | 51,000 | 49,350 |
| 07/15/2027 | 5.625% | | 125,000 | 122,597 |
| Berry Global, Inc.(a) |
| 04/15/2028 | 5.500% | | 360,000 | 353,659 |
| Clydesdale Acquisition Holdings, Inc.(a) |
| 04/15/2029 | 6.625% | | 75,000 | 71,416 |
| Sealed Air Corp.(a) |
| 09/15/2025 | 5.500% | | 357,000 | 353,277 |
| 04/15/2029 | 5.000% | | 100,000 | 92,747 |
| Trivium Packaging Finance BV(a) |
| 08/15/2026 | 5.500% | | 140,000 | 132,257 |
| Total | 2,449,795 |
| Paper 0.0% |
| Graphic Packaging International LLC(a) |
| 07/15/2027 | 4.750% | | 75,000 | 71,474 |
| Pharmaceuticals 0.4% |
| 1375209 BC Ltd.(a) |
| 01/30/2028 | 9.000% | | 140,000 | 140,186 |
| Allergan Funding SCS |
| 06/01/2024 | 1.250% | EUR | 100,000 | 105,224 |
| 11/15/2028 | 2.625% | EUR | 100,000 | 99,769 |
The accompanying Notes to Consolidated Financial Statements are an integral part of this statement.
| 24 | Multi-Manager Alternative Strategies Fund | Annual Report 2023 |
Consolidated Portfolio of Investments (continued)
August 31, 2023
| Corporate Bonds & Notes(j) (continued) |
| Issuer | Coupon
Rate | | Principal
Amount ($) | Value ($) |
| Amgen, Inc. |
| 03/02/2033 | 5.250% | | 75,000 | 74,574 |
| 03/02/2043 | 5.600% | | 145,000 | 142,324 |
| 03/02/2063 | 5.750% | | 43,000 | 42,416 |
| Bayer US Finance II LLC(a) |
| 12/15/2025 | 4.250% | | 100,000 | 96,837 |
| 12/15/2028 | 4.375% | | 289,000 | 274,526 |
| 06/25/2038 | 4.625% | | 520,000 | 446,469 |
| Grifols Escrow Issuer SA(a) |
| 10/15/2028 | 4.750% | | 245,000 | 215,047 |
| Kevlar SpA(a) |
| 09/01/2029 | 6.500% | | 235,000 | 203,701 |
| Organon Finance 1 LLC(a) |
| 04/30/2031 | 5.125% | | 90,000 | 76,600 |
| Total | 1,917,673 |
| Property & Casualty 0.4% |
| Acrisure LLC/Finance, Inc.(a) |
| 02/15/2029 | 4.250% | | 150,000 | 129,654 |
| 08/01/2029 | 6.000% | | 80,000 | 69,224 |
| Aon Corp. |
| 05/15/2030 | 2.800% | | 230,000 | 197,372 |
| Berkshire Hathaway Finance Corp. |
| 06/19/2039 | 2.375% | GBP | 250,000 | 216,503 |
| Berkshire Hathaway, Inc.(h) |
| 03/12/2025 | 0.000% | EUR | 315,000 | 322,189 |
| Brown & Brown, Inc. |
| 03/17/2052 | 4.950% | | 115,000 | 97,011 |
| Chubb INA Holdings, Inc. |
| 12/15/2024 | 0.300% | EUR | 180,000 | 185,838 |
| Farmers Exchange Capital III(a),(i) |
| Subordinated |
| 10/15/2054 | 5.454% | | 300,000 | 263,426 |
| Nationwide Mutual Insurance Co.(a),(b) |
| Subordinated |
3-month USD LIBOR + 2.290%
12/15/2024 | 7.842% | | 450,000 | 449,967 |
| Total | 1,931,184 |
| Refining 0.0% |
| MC Brazil Downstream Trading SARL(a) |
| 06/30/2031 | 7.250% | | 212,576 | 142,249 |
| Restaurants 0.6% |
| 1011778 BC ULC/New Red Finance, Inc.(a) |
| 01/15/2028 | 3.875% | | 325,000 | 295,480 |
| 02/15/2029 | 3.500% | | 445,000 | 389,678 |
| 10/15/2030 | 4.000% | | 640,000 | 542,348 |
| Corporate Bonds & Notes(j) (continued) |
| Issuer | Coupon
Rate | | Principal
Amount ($) | Value ($) |
| Fertitta Entertainment LLC/Finance Co., Inc.(a) |
| 01/15/2030 | 6.750% | | 270,000 | 223,059 |
| Yum! Brands, Inc.(a) |
| 01/15/2030 | 4.750% | | 360,000 | 331,769 |
| Yum! Brands, Inc. |
| 03/15/2031 | 3.625% | | 550,000 | 466,722 |
| 01/31/2032 | 4.625% | | 300,000 | 268,102 |
| Total | 2,517,158 |
| Retailers 0.1% |
| Magic MergeCo, Inc.(a) |
| 05/01/2029 | 7.875% | | 315,000 | 217,654 |
| MercadoLibre, Inc. |
| 01/14/2026 | 2.375% | | 200,000 | 182,446 |
| Rent-A-Center, Inc.(a) |
| 02/15/2029 | 6.375% | | 200,000 | 181,656 |
| Total | 581,756 |
| Stranded Utility 0.1% |
| Brazos Securitization LLC(a) |
| 09/01/2031 | 5.014% | | 200,000 | 195,672 |
| 09/01/2050 | 5.413% | | 200,000 | 198,560 |
| United Electric Securitization LLC(a) |
| 06/01/2031 | 5.109% | | 100,000 | 98,998 |
| Total | 493,230 |
| Supranational 0.6% |
| Asian Development Bank |
| 10/14/2026 | 3.000% | AUD | 135,000 | 84,326 |
| Asian Infrastructure Investment Bank (The)(a) |
| 12/15/2025 | 0.200% | GBP | 130,000 | 146,077 |
| European Investment Bank(a) |
| 01/20/2032 | 0.250% | EUR | 315,000 | 272,396 |
| Inter-American Development Bank(a) |
| 10/30/2025 | 2.750% | AUD | 120,000 | 75,299 |
| Inter-American Development Bank |
| 01/29/2026 | 2.700% | AUD | 138,000 | 86,181 |
| International Bank for Reconstruction & Development |
| 01/16/2025 | 1.900% | CAD | 285,000 | 202,016 |
| 03/16/2026 | 1.250% | NOK | 1,410,000 | 122,213 |
| 06/22/2026 | 5.000% | NZD | 520,000 | 307,301 |
| 01/19/2027 | 1.800% | CAD | 150,000 | 101,706 |
| 08/08/2034 | 1.200% | EUR | 630,000 | 561,677 |
| International Development Association(a) |
| 02/17/2027 | 1.750% | NOK | 900,000 | 77,390 |
| International Finance Corp. |
| 09/10/2025 | 0.375% | NZD | 270,000 | 145,238 |
| 02/24/2026 | 3.600% | AUD | 330,000 | 210,381 |
The accompanying Notes to Consolidated Financial Statements are an integral part of this statement.
Multi-Manager Alternative Strategies Fund | Annual Report 2023
| 25 |
Consolidated Portfolio of Investments (continued)
August 31, 2023
| Corporate Bonds & Notes(j) (continued) |
| Issuer | Coupon
Rate | | Principal
Amount ($) | Value ($) |
| Nordic Investment Bank |
| 04/10/2024 | 1.875% | NOK | 980,000 | 90,593 |
| 08/23/2027 | 3.000% | NOK | 1,480,000 | 131,720 |
| Total | 2,614,514 |
| Technology 0.8% |
| Broadcom, Inc.(a) |
| 02/15/2033 | 2.600% | | 98,000 | 75,671 |
| CDW LLC/Finance Corp. |
| 04/01/2028 | 4.250% | | 35,000 | 32,354 |
| CommScope, Inc.(a) |
| 09/01/2029 | 4.750% | | 160,000 | 118,873 |
| Dell International LLC/EMC Corp. |
| 07/15/2046 | 8.350% | | 115,000 | 140,939 |
| Everi Holdings, Inc.(a) |
| 07/15/2029 | 5.000% | | 175,000 | 156,072 |
| Fidelity National Information Services, Inc. |
| 05/21/2027 | 1.500% | EUR | 370,000 | 368,253 |
| 12/03/2028 | 1.000% | EUR | 100,000 | 93,494 |
| Fiserv, Inc. |
| 07/01/2027 | 1.125% | EUR | 100,000 | 98,441 |
| Gartner, Inc.(a) |
| 10/01/2030 | 3.750% | | 140,000 | 120,917 |
| MSCI, Inc.(a) |
| 09/01/2030 | 3.625% | | 440,000 | 380,253 |
| 02/15/2031 | 3.875% | | 275,000 | 239,950 |
| 11/01/2031 | 3.625% | | 345,000 | 292,414 |
| 08/15/2033 | 3.250% | | 90,000 | 72,452 |
| NCR Corp.(a) |
| 10/01/2030 | 5.250% | | 215,000 | 193,232 |
| Open Text Corp.(a) |
| 12/01/2027 | 6.900% | | 70,000 | 71,003 |
| Oracle Corp. |
| 04/01/2027 | 2.800% | | 100,000 | 91,835 |
| 11/09/2032 | 6.250% | | 200,000 | 209,282 |
| 11/15/2037 | 3.800% | | 55,000 | 44,244 |
| 11/15/2047 | 4.000% | | 280,000 | 208,843 |
| 03/25/2051 | 3.950% | | 200,000 | 145,849 |
| Tencent Holdings Ltd.(a) |
| 04/22/2041 | 3.680% | | 200,000 | 146,637 |
| Total | 3,301,008 |
| Tobacco 0.2% |
| BAT Capital Corp. |
| 08/15/2047 | 4.540% | | 100,000 | 72,694 |
| 03/16/2052 | 5.650% | | 140,000 | 117,005 |
| Reynolds American, Inc. |
| 08/15/2045 | 5.850% | | 660,000 | 572,401 |
| Total | 762,100 |
| Corporate Bonds & Notes(j) (continued) |
| Issuer | Coupon
Rate | | Principal
Amount ($) | Value ($) |
| Transportation Services 0.0% |
| Hertz Corp (The)(a) |
| 12/01/2029 | 5.000% | | 255,000 | 210,150 |
| Wireless 0.7% |
| American Tower Corp. |
| 05/22/2026 | 1.950% | EUR | 100,000 | 102,068 |
| 01/15/2028 | 0.500% | EUR | 100,000 | 92,387 |
| 06/15/2030 | 2.100% | | 175,000 | 139,811 |
| 04/15/2031 | 2.700% | | 100,000 | 81,700 |
| Cellnex Telecom SA |
| 06/26/2029 | 1.875% | EUR | 100,000 | 92,817 |
| Crown Castle International Corp. |
| 01/15/2031 | 2.250% | | 65,000 | 52,143 |
| SBA Communications Corp. |
| 02/15/2027 | 3.875% | | 605,000 | 559,660 |
| 02/01/2029 | 3.125% | | 305,000 | 261,100 |
| Sprint Corp. |
| 02/15/2025 | 7.625% | | 55,000 | 56,097 |
| Sprint Spectrum Co. I/II/III LLC(a) |
| 03/20/2028 | 5.152% | | 118,750 | 117,697 |
| T-Mobile US, Inc. |
| 04/15/2026 | 2.625% | | 304,000 | 282,485 |
| 04/15/2027 | 3.750% | | 20,000 | 18,940 |
| 02/01/2028 | 4.750% | | 118,000 | 114,698 |
| 02/15/2029 | 2.625% | | 90,000 | 77,971 |
| 04/15/2029 | 3.375% | | 105,000 | 94,171 |
| 02/15/2031 | 2.875% | | 125,000 | 105,196 |
| 04/15/2031 | 3.500% | | 210,000 | 183,362 |
| Vmed O2 UK Financing I PLC(a) |
| 01/31/2031 | 3.250% | EUR | 160,000 | 144,340 |
| 01/31/2031 | 4.250% | | 430,000 | 352,285 |
| Total | 2,928,928 |
| Wirelines 0.2% |
| AT&T, Inc. |
| 03/25/2024 | 0.900% | | 77,000 | 74,922 |
| 12/01/2057 | 3.800% | | 257,000 | 173,032 |
| C&W Senior Financing DAC(a) |
| 09/15/2027 | 6.875% | | 200,000 | 185,468 |
| Frontier Communications Corp.(a) |
| 05/01/2028 | 5.000% | | 200,000 | 171,402 |
| Frontier Communications Holdings LLC(a) |
| 05/01/2029 | 6.750% | | 95,000 | 73,625 |
| 03/15/2031 | 8.625% | | 86,000 | 82,680 |
The accompanying Notes to Consolidated Financial Statements are an integral part of this statement.
| 26 | Multi-Manager Alternative Strategies Fund | Annual Report 2023 |
Consolidated Portfolio of Investments (continued)
August 31, 2023
| Corporate Bonds & Notes(j) (continued) |
| Issuer | Coupon
Rate | | Principal
Amount ($) | Value ($) |
| Northwest Fiber LLC/Finance Sub, Inc.(a) |
| 04/30/2027 | 4.750% | | 90,000 | 78,783 |
| Total | 839,912 |
Total Corporate Bonds & Notes
(Cost $92,354,929) | 84,697,709 |
|
| Foreign Government Obligations(j),(m) 7.2% |
| | | | |
| Australia 0.4% |
| Australia Government Bond(a) |
| 09/21/2026 | 0.500% | AUD | 320,000 | 188,337 |
| 12/21/2030 | 1.000% | AUD | 295,000 | 156,314 |
| New South Wales Treasury Corp.(a) |
| 03/20/2025 | 1.250% | AUD | 330,000 | 204,748 |
| 05/20/2027 | 3.000% | AUD | 325,000 | 203,218 |
| 02/20/2032 | 1.500% | AUD | 790,000 | 403,484 |
| Queensland Treasury Corp.(a) |
| 08/20/2027 | 2.750% | AUD | 290,000 | 179,356 |
| Treasury Corp. of Victoria |
| 11/20/2034 | 2.250% | AUD | 215,000 | 108,321 |
| Western Australian Treasury Corp. |
| 10/22/2030 | 1.500% | AUD | 590,000 | 318,100 |
| Total | 1,761,878 |
| Austria 0.1% |
| Republic of Austria Government Bond(a) |
| 02/20/2029 | 0.500% | EUR | 240,000 | 229,026 |
| Brazil 0.2% |
| Brazil Notas do Tesouro Nacional Series F |
| 01/01/2025 | 10.000% | BRL | 2,175,000 | 443,292 |
| Brazilian Government International Bond |
| 06/12/2030 | 3.875% | | 400,000 | 354,266 |
| Total | 797,558 |
| Canada 0.8% |
| Canadian Government Bond |
| 09/01/2024 | 1.500% | CAD | 205,000 | 146,633 |
| 03/01/2025 | 1.250% | CAD | 1,210,000 | 850,496 |
| 12/01/2030 | 0.500% | CAD | 420,000 | 248,915 |
| 06/01/2033 | 2.750% | CAD | 370,000 | 255,573 |
| CPPIB Capital, Inc.(a) |
| 12/01/2031 | 2.250% | CAD | 155,000 | 98,597 |
| Province of Alberta(a) |
| 04/18/2025 | 0.625% | EUR | 100,000 | 103,402 |
| Province of British Columbia |
| 07/06/2033 | 4.200% | | 205,000 | 199,899 |
| Province of Ontario |
| 12/02/2030 | 1.350% | CAD | 785,000 | 476,866 |
| 06/02/2045 | 3.450% | CAD | 380,000 | 242,355 |
| Foreign Government Obligations(j),(m) (continued) |
| Issuer | Coupon
Rate | | Principal
Amount ($) | Value ($) |
| Province of Quebec |
| 09/01/2023 | 3.000% | CAD | 325,000 | 240,515 |
| Province of Quebec(a) |
| 12/15/2023 | 1.500% | GBP | 105,000 | 131,506 |
| 04/07/2025 | 0.200% | EUR | 105,000 | 107,871 |
| Province of Quebec(n) |
| 09/08/2033 | 4.500% | | 221,000 | 220,156 |
| Total | 3,322,784 |
| Colombia 0.3% |
| Colombia Government International Bond |
| 03/15/2029 | 4.500% | | 200,000 | 178,421 |
| 04/15/2031 | 3.125% | | 580,000 | 447,164 |
| 04/22/2032 | 3.250% | | 215,000 | 161,171 |
| Ecopetrol SA |
| 06/26/2026 | 5.375% | | 50,000 | 48,431 |
| 04/29/2030 | 6.875% | | 110,000 | 102,570 |
| 11/02/2031 | 4.625% | | 105,000 | 82,952 |
| 05/28/2045 | 5.875% | | 55,000 | 38,759 |
| Total | 1,059,468 |
| Dominican Republic 0.0% |
| Dominican Republic International Bond(a) |
| 01/30/2030 | 4.500% | | 200,000 | 174,303 |
| Finland 0.1% |
| Kuntarahoitus Oyj(b) |
3-month NIBOR + 1.250%
01/10/2025 | 5.640% | NOK | 2,000,000 | 191,125 |
| Germany 0.3% |
| Bundesrepublik Deutschland Bundesanleihe(a),(h) |
| 11/15/2027 | 0.000% | EUR | 220,000 | 215,106 |
| 02/15/2031 | 0.000% | EUR | 310,000 | 282,195 |
| 02/15/2032 | 0.000% | EUR | 590,000 | 524,048 |
| 05/15/2035 | 0.000% | EUR | 120,000 | 97,247 |
| Bundesrepublik Deutschland Bundesanleihe(a) |
| 07/04/2042 | 3.250% | EUR | 130,000 | 153,896 |
| Kreditanstalt fuer Wiederaufbau(a) |
| 02/17/2027 | 2.875% | NOK | 620,000 | 55,455 |
| Total | 1,327,947 |
| Greece 0.0% |
| Hellenic Republic Government Bond(a) |
| 04/22/2027 | 2.000% | EUR | 126,000 | 130,352 |
| Guatemala 0.1% |
| Guatemala Government Bond(a) |
| 08/10/2029 | 5.250% | | 200,000 | 190,422 |
The accompanying Notes to Consolidated Financial Statements are an integral part of this statement.
Multi-Manager Alternative Strategies Fund | Annual Report 2023
| 27 |
Consolidated Portfolio of Investments (continued)
August 31, 2023
| Foreign Government Obligations(j),(m) (continued) |
| Issuer | Coupon
Rate | | Principal
Amount ($) | Value ($) |
| Hungary 0.0% |
| Hungary Government International Bond(a) |
| 09/22/2031 | 2.125% | | 200,000 | 153,818 |
| India 0.2% |
| Export-Import Bank of India(a) |
| 02/01/2028 | 3.875% | | 200,000 | 187,369 |
| India Government Bond |
| 06/15/2025 | 5.220% | INR | 19,820,000 | 232,012 |
| 04/08/2026 | 7.270% | INR | 3,500,000 | 42,359 |
| 04/10/2028 | 7.060% | INR | 13,230,000 | 159,169 |
| 07/12/2031 | 6.100% | INR | 7,990,000 | 90,240 |
| 02/06/2033 | 7.260% | INR | 8,560,000 | 104,048 |
| Indian Railway Finance Corp., Ltd.(a) |
| 02/13/2030 | 3.249% | | 200,000 | 173,196 |
| Total | 988,393 |
| Indonesia 1.0% |
| Indonesia Government International Bond(a) |
| 07/18/2024 | 2.150% | EUR | 200,000 | 212,597 |
| Indonesia Government International Bond |
| 10/15/2030 | 3.850% | | 200,000 | 185,040 |
| 01/11/2033 | 4.850% | | 200,000 | 196,128 |
| 03/12/2033 | 1.100% | EUR | 100,000 | 79,383 |
| 03/12/2051 | 3.050% | | 200,000 | 141,835 |
| Indonesia Treasury Bond |
| 06/15/2025 | 6.500% | IDR | 11,190,000,000 | 738,520 |
| 09/15/2026 | 8.375% | IDR | 2,322,000,000 | 161,381 |
| 04/15/2027 | 5.125% | IDR | 1,504,000,000 | 95,803 |
| 05/15/2028 | 6.125% | IDR | 773,000,000 | 50,652 |
| 08/15/2028 | 6.375% | IDR | 8,025,000,000 | 531,731 |
| 03/15/2029 | 9.000% | IDR | 2,298,000,000 | 169,632 |
| 05/15/2031 | 8.750% | IDR | 4,550,000,000 | 339,300 |
| 04/15/2032 | 6.375% | IDR | 5,840,000,000 | 383,033 |
| 05/15/2033 | 6.625% | IDR | 2,025,000,000 | 135,182 |
| 06/15/2035 | 7.500% | IDR | 1,095,000,000 | 77,485 |
| 05/15/2038 | 7.500% | IDR | 1,751,000,000 | 123,932 |
| Perusahaan Penerbit SBSN Indonesia III(a) |
| 03/29/2027 | 4.150% | | 270,000 | 262,089 |
| PT Indonesia Asahan Aluminium Persero(a) |
| 05/15/2025 | 4.750% | | 220,000 | 215,981 |
| PT Pertamina Persero(a) |
| 08/25/2030 | 3.100% | | 200,000 | 172,518 |
| PT Perusahaan Listrik Negara(a) |
| 05/15/2027 | 4.125% | | 280,000 | 266,330 |
| Total | 4,538,552 |
| Ireland 0.0% |
| Ireland Government Bond(a) |
| 05/15/2029 | 1.100% | EUR | 100,000 | 98,847 |
| Foreign Government Obligations(j),(m) (continued) |
| Issuer | Coupon
Rate | | Principal
Amount ($) | Value ($) |
| Israel 0.0% |
| Israel Electric Corp., Ltd.(a) |
| 02/22/2032 | 3.750% | | 200,000 | 168,887 |
| Italy 0.0% |
| Republic of Italy Government International Bond |
| 02/17/2026 | 1.250% | | 200,000 | 180,455 |
| Japan 0.2% |
| Japan Government Five-Year Bond |
| 06/20/2025 | 0.100% | JPY | 91,650,000 | 631,120 |
| 03/20/2027 | 0.005% | JPY | 30,000,000 | 205,478 |
| Total | 836,598 |
| Kazakhstan 0.1% |
| KazMunayGas National Co. JSC(a) |
| 04/24/2030 | 5.375% | | 215,000 | 195,820 |
| Malaysia 0.3% |
| Malaysia Government Bond |
| 03/14/2025 | 3.882% | MYR | 970,000 | 210,757 |
| 07/15/2026 | 3.906% | MYR | 965,000 | 210,452 |
| 11/30/2026 | 3.900% | MYR | 405,000 | 88,352 |
| 11/16/2027 | 3.899% | MYR | 1,300,000 | 283,991 |
| 06/15/2028 | 3.733% | MYR | 375,000 | 81,125 |
| 04/15/2030 | 4.498% | MYR | 930,000 | 209,227 |
| 04/15/2033 | 3.844% | MYR | 1,488,000 | 320,281 |
| 07/05/2034 | 3.828% | MYR | 400,000 | 85,189 |
| Total | 1,489,374 |
| Mauritius 0.1% |
| Greenko Solar Mauritius Ltd.(a) |
| 01/29/2025 | 5.550% | | 200,000 | 193,591 |
| Greenko Wind Projects Mauritius Ltd.(a) |
| 04/06/2025 | 5.500% | | 205,000 | 197,285 |
| Total | 390,876 |
| Mexico 0.6% |
| Mexican Bonos |
| 03/06/2025 | 5.000% | MXN | 14,760,000 | 802,587 |
| 05/26/2033 | 7.500% | MXN | 12,880,000 | 669,227 |
| Mexico Government International Bond |
| 05/24/2031 | 2.659% | | 475,000 | 393,403 |
| 05/29/2031 | 7.750% | MXN | 9,670,000 | 517,143 |
| 02/12/2034 | 3.500% | | 200,000 | 166,078 |
| Petroleos Mexicanos |
| 01/28/2031 | 5.950% | | 137,000 | 99,496 |
| 02/12/2048 | 6.350% | | 19,000 | 11,381 |
| 01/28/2060 | 6.950% | | 70,000 | 43,412 |
| Total | 2,702,727 |
The accompanying Notes to Consolidated Financial Statements are an integral part of this statement.
| 28 | Multi-Manager Alternative Strategies Fund | Annual Report 2023 |
Consolidated Portfolio of Investments (continued)
August 31, 2023
| Foreign Government Obligations(j),(m) (continued) |
| Issuer | Coupon
Rate | | Principal
Amount ($) | Value ($) |
| Netherlands 0.0% |
| Greenko Dutch BV(a) |
| 03/29/2026 | 3.850% | | 188,000 | 169,877 |
| New Zealand 0.4% |
| New Zealand Government Bond |
| 05/15/2024 | 0.500% | NZD | 565,000 | 325,182 |
| 04/15/2025 | 2.750% | NZD | 165,000 | 94,346 |
| 05/15/2026 | 0.500% | NZD | 385,000 | 203,245 |
| New Zealand Government Bond(a) |
| 04/14/2033 | 3.500% | NZD | 975,000 | 520,859 |
| New Zealand Local Government Funding Agency Bond(a) |
| 04/15/2026 | 1.500% | NZD | 230,000 | 124,395 |
| 05/15/2035 | 3.000% | NZD | 350,000 | 162,838 |
| New Zealand Local Government Funding Agency Bond |
| 04/15/2027 | 4.500% | NZD | 310,000 | 180,404 |
| 04/14/2033 | 3.500% | NZD | 305,000 | 155,920 |
| Total | 1,767,189 |
| Norway 0.3% |
| Kommunalbanken AS |
| 07/15/2024 | 5.250% | AUD | 184,000 | 119,988 |
| 07/16/2025 | 4.250% | AUD | 280,000 | 180,797 |
| Norway Government Bond(a) |
| 03/13/2025 | 1.750% | NOK | 3,815,000 | 345,846 |
| 02/17/2027 | 1.750% | NOK | 1,455,000 | 126,972 |
| 09/17/2031 | 1.250% | NOK | 2,925,000 | 227,257 |
| 05/18/2032 | 2.125% | NOK | 4,615,000 | 380,993 |
| Total | 1,381,853 |
| Oman 0.1% |
| Oman Government International Bond(a) |
| 01/17/2028 | 5.625% | | 200,000 | 197,782 |
| Panama 0.0% |
| Panama Government International Bond |
| 01/23/2030 | 3.160% | | 200,000 | 174,030 |
| Peru 0.1% |
| Peruvian Government International Bond |
| 06/20/2030 | 2.844% | | 165,000 | 142,806 |
| 01/23/2031 | 2.783% | | 150,000 | 127,314 |
| Total | 270,120 |
| Philippines 0.5% |
| Philippine Government Bond |
| 08/12/2025 | 2.625% | PHP | 25,680,000 | 424,256 |
| 09/09/2025 | 3.625% | PHP | 9,490,000 | 159,505 |
| 08/22/2028 | 6.125% | PHP | 14,640,000 | 258,579 |
| 09/15/2032 | 6.750% | PHP | 13,280,000 | 240,768 |
| 09/30/2035 | 8.000% | PHP | 4,700,000 | 93,734 |
| Foreign Government Obligations(j),(m) (continued) |
| Issuer | Coupon
Rate | | Principal
Amount ($) | Value ($) |
| Philippine Government International Bond |
| 05/17/2027 | 0.875% | EUR | 535,000 | 516,334 |
| 05/05/2030 | 2.457% | | 300,000 | 255,755 |
| 01/14/2036 | 6.250% | PHP | 10,000,000 | 170,342 |
| Total | 2,119,273 |
| Poland 0.0% |
| Republic of Poland Government International Bond |
| 11/16/2032 | 5.750% | | 28,000 | 29,122 |
| 10/04/2033 | 4.875% | | 155,000 | 150,416 |
| Total | 179,538 |
| Qatar 0.1% |
| Qatar Petroleum(a) |
| 07/12/2031 | 2.250% | | 465,000 | 382,548 |
| QNB Finance Ltd.(a) |
| 03/28/2024 | 3.500% | | 200,000 | 196,995 |
| Total | 579,543 |
| Romania 0.0% |
| Romanian Government International Bond(a) |
| 02/14/2031 | 3.000% | | 200,000 | 164,975 |
| Singapore 0.1% |
| Singapore Government Bond |
| 09/01/2033 | 3.375% | SGD | 320,000 | 241,676 |
| South Africa 0.1% |
| Republic of South Africa Government International Bond |
| 06/22/2030 | 5.875% | | 200,000 | 181,709 |
| South Korea 0.4% |
| Korea Treasury Bond |
| 03/10/2027 | 2.375% | KRW | 1,247,620,000 | 911,403 |
| 06/10/2027 | 2.125% | KRW | 316,190,000 | 226,674 |
| 09/10/2027 | 3.125% | KRW | 232,900,000 | 174,581 |
| 12/10/2029 | 1.375% | KRW | 161,100,000 | 105,793 |
| 12/10/2032 | 4.250% | KRW | 258,380,000 | 203,562 |
| 06/10/2033 | 3.250% | KRW | 319,000,000 | 231,867 |
| Total | 1,853,880 |
| United Arab Emirates 0.1% |
| Abu Dhabi Government International Bond(a) |
| 04/16/2050 | 3.875% | | 200,000 | 161,118 |
| Finance Department Government of Sharjah(a) |
| 11/23/2032 | 6.500% | | 200,000 | 203,873 |
| Total | 364,991 |
The accompanying Notes to Consolidated Financial Statements are an integral part of this statement.
Multi-Manager Alternative Strategies Fund | Annual Report 2023
| 29 |
Consolidated Portfolio of Investments (continued)
August 31, 2023
| Foreign Government Obligations(j),(m) (continued) |
| Issuer | Coupon
Rate | | Principal
Amount ($) | Value ($) |
| United Kingdom 0.1% |
| United Kingdom Gilt(a) |
| 01/31/2024 | 0.125% | GBP | 85,000 | 105,545 |
| 01/31/2025 | 0.250% | GBP | 80,000 | 94,950 |
| 12/07/2027 | 4.250% | GBP | 280,000 | 350,977 |
| Total | 551,472 |
| Uruguay 0.1% |
| Uruguay Government International Bond |
| 01/23/2031 | 4.375% | | 200,000 | 196,864 |
Total Foreign Government Obligations
(Cost $33,139,727) | 31,323,982 |
|
| Inflation-Indexed Bonds 0.2% |
| | | | |
| United States 0.2% |
| U.S. Treasury Inflation-Indexed Bond |
| 04/15/2028 | 1.250% | | 1,103,662 | 1,062,635 |
Total Inflation-Indexed Bonds
(Cost $1,102,874) | 1,062,635 |
|
| Municipal Bonds 0.6% |
| Issue Description | Coupon
Rate | | Principal
Amount ($) | Value ($) |
| Airport 0.0% |
| County of Miami-Dade Aviation |
| Refunding Revenue Bonds |
| Taxable |
| Series 2020B |
| 10/01/2035 | 2.857% | | 85,000 | 68,031 |
| Higher Education 0.2% |
| University of Nebraska Facilities Corp. |
| Refunding Revenue Bonds |
| Taxable |
| Series 2019A |
| 10/01/2049 | 3.037% | | 90,000 | 65,110 |
| University of Texas System (The) |
| Refunding Revenue Bonds |
| Taxable |
| Series 2020B |
| 08/15/2049 | 2.439% | | 350,000 | 225,565 |
| University of Virginia |
| Refunding Revenue Bonds |
| Taxable |
| Series 2020 |
| 09/01/2050 | 2.256% | | 560,000 | 343,508 |
| Municipal Bonds (continued) |
| Issue Description | Coupon
Rate | | Principal
Amount ($) | Value ($) |
| University of Washington |
| Refunding Revenue Bonds |
| Taxable |
| Series 2021B |
| 04/01/2042 | 2.618% | | 230,000 | 159,452 |
| Total | 793,635 |
| Joint Power Authority 0.0% |
| South Carolina Public Service Authority |
| Revenue Bonds |
| Taxable - Santee Cooper |
| Series 2009 |
| 01/01/2030 | 5.740% | | 65,000 | 66,079 |
| Local Appropriation 0.0% |
| Louisiana Local Government Environmental Facilities & Community Development Authority |
| Series 2023 |
| 12/01/2039 | 5.198% | | 210,000 | 209,654 |
| Local General Obligation 0.0% |
| City of Norfolk |
| Unlimited General Obligation Bonds |
| Taxable |
| Series 2021 |
| 10/01/2031 | 1.804% | | 105,000 | 84,750 |
| Municipal Power 0.1% |
| City of San Antonio Electric & Gas Systems |
| Revenue Bonds |
| Series 2010 (BAM) |
| 02/01/2041 | 5.718% | | 60,000 | 62,616 |
| Texas Natural Gas Securitization Finance |
| Series 2023 |
| 04/01/2041 | 5.169% | | 260,000 | 259,072 |
| Total | 321,688 |
| Sales Tax 0.0% |
| Massachusetts School Building Authority |
| Refunding Revenue Bonds |
| Taxable |
| Series 2020C |
| 05/15/2043 | 2.950% | | 75,000 | 54,686 |
| Utah Transit Authority |
| Refunding Revenue Bonds |
| Taxable |
| Series 2019B |
| 12/15/2042 | 3.443% | | 65,000 | 49,918 |
| Total | 104,604 |
The accompanying Notes to Consolidated Financial Statements are an integral part of this statement.
| 30 | Multi-Manager Alternative Strategies Fund | Annual Report 2023 |
Consolidated Portfolio of Investments (continued)
August 31, 2023
| Municipal Bonds (continued) |
| Issue Description | Coupon
Rate | | Principal
Amount ($) | Value ($) |
| Special Non Property Tax 0.0% |
| State Board of Administration Finance Corp. |
| Revenue Bonds |
| Taxable |
| Series 2020A |
| 07/01/2030 | 2.154% | | 152,000 | 125,172 |
| State General Obligation 0.1% |
| Commonwealth of Massachusetts |
| Limited General Obligation Bonds |
| Taxable - Consolidated Loan |
| Series 2019H |
| 09/01/2049 | 2.900% | | 90,000 | 62,105 |
| State of Texas |
| Unlimited General Obligation Bonds |
| Taxable |
| Series 2023 |
| 10/01/2043 | 5.235% | | 250,000 | 250,516 |
| Total | 312,621 |
| Student Loan 0.1% |
| Massachusetts Educational Financing Authority |
| Revenue Bonds |
| Taxable |
| Series 2023A |
| 07/01/2044 | 5.950% | | 235,000 | 225,063 |
| Transportation 0.1% |
| Metropolitan Transportation Authority |
| Revenue Bonds |
| Series 2010 (BAM) |
| 11/15/2031 | 6.548% | | 250,000 | 258,817 |
| Water & Sewer 0.0% |
| Massachusetts Water Resources Authority |
| Revenue Bonds |
| Taxable |
| Series 2019E |
| 08/01/2039 | 3.124% | | 225,000 | 178,573 |
Total Municipal Bonds
(Cost $2,860,166) | 2,748,687 |
| Preferred Debt 0.1% |
| Issuer | Coupon
Rate | | Shares | Value ($) |
| Banking 0.1% |
| Wells Fargo & Co.(i),(k) |
| | 5.850% | | 7,885 | 196,652 |
Total Preferred Debt
(Cost $206,354) | 196,652 |
| Residential Mortgage-Backed Securities - Agency 7.7% |
| Issuer | Coupon
Rate | | Principal
Amount ($) | Value ($) |
| Federal Home Loan Mortgage Corp. |
| 08/01/2052 | 4.500% | | 327,110 | 310,212 |
08/01/2052-
11/01/2052 | 5.000% | | 674,002 | 657,841 |
| 11/01/2052 | 5.500% | | 170,420 | 169,261 |
| Federal National Mortgage Association |
| 09/01/2052 | 4.500% | | 565,637 | 538,495 |
10/01/2052-
12/01/2052 | 5.500% | | 926,973 | 918,594 |
| 11/01/2052 | 5.000% | | 191,297 | 186,596 |
| Federal National Mortgage Association(b) |
| CMO Series 2013-5 Class GF |
30-day Average SOFR + 1.214%
Floor 1.100%, Cap 5.000%
10/25/2042 | 5.000% | | 220,922 | 197,213 |
| Government National Mortgage Association(d) |
| CMO Series 2017-136 Class IO |
| 09/20/2047 | 5.000% | | 566,982 | 118,650 |
| CMO Series 2018-63 Class IO |
| 09/20/2047 | 4.000% | | 756,494 | 119,932 |
| Government National Mortgage Association TBA(n) |
| 09/21/2053 | 4.500% | | 725,000 | 690,902 |
| 09/21/2053 | 5.000% | | 400,000 | 389,227 |
| Uniform Mortgage-Backed Security TBA(n) |
| 09/14/2053 | 2.500% | | 6,200,000 | 5,135,828 |
09/14/2053-
10/12/2053 | 3.000% | | 5,900,000 | 5,085,473 |
09/14/2053-
10/12/2053 | 4.000% | | 1,775,000 | 1,639,207 |
09/14/2053-
10/12/2053 | 5.000% | | 5,025,000 | 4,873,111 |
| 09/14/2053 | 5.500% | | 5,525,000 | 5,455,074 |
| 10/12/2053 | 2.000% | | 4,700,000 | 3,746,598 |
| 10/12/2053 | 4.500% | | 3,575,000 | 3,391,781 |
Total Residential Mortgage-Backed Securities - Agency
(Cost $33,898,563) | 33,623,995 |
|
| Residential Mortgage-Backed Securities - Non-Agency 9.3% |
| | | | |
| ABFC Trust(b) |
| CMO Series 2007-WMC1 Class A1A |
1-month Term SOFR + 1.364%
Floor 1.250%
06/25/2037 | 6.679% | | 627,920 | 428,752 |
| Adjustable Rate Mortgage Trust(b) |
| CMO Series 2005-9 Class 5A3 |
1-month Term SOFR + 0.754%
Floor 0.320%, Cap 11.000%
11/25/2035 | 6.069% | | 90,479 | 89,121 |
| Alternative Loan Trust(c) |
| CMO Series 2005-43 Class 1A |
| 10/25/2035 | 3.544% | | 164,466 | 140,879 |
The accompanying Notes to Consolidated Financial Statements are an integral part of this statement.
Multi-Manager Alternative Strategies Fund | Annual Report 2023
| 31 |
Consolidated Portfolio of Investments (continued)
August 31, 2023
| Residential Mortgage-Backed Securities - Non-Agency (continued) |
| Issuer | Coupon
Rate | | Principal
Amount ($) | Value ($) |
| Alternative Loan Trust(b) |
| CMO Series 2005-59 Class 1A1 |
1-month Term SOFR + 0.774%
Floor 0.660%, Cap 11.000%
11/20/2035 | 6.089% | | 728,496 | 668,840 |
| CMO Series 2007-OH3 Class A1B |
1-month Term SOFR + 0.554%
Floor 0.440%, Cap 10.000%
09/25/2047 | 5.869% | | 442,996 | 396,275 |
| American Home Mortgage Investment Trust(b) |
| CMO Series 2005-1 Class 6A |
6-month Term SOFR + 2.428%
Floor 2.000%
06/25/2045 | 7.876% | | 76,700 | 75,940 |
| Arroyo Mortgage Trust(a),(c) |
| CMO Series 2019-1 Class A1 |
| 01/25/2049 | 3.805% | | 55,285 | 50,708 |
| Banc of America Funding Trust(b) |
| CMO Series 2005-B Class 3M1 |
1-month Term SOFR + 0.789%
Floor 0.450%, Cap 11.000%
04/20/2035 | 6.104% | | 110,803 | 109,681 |
| Banc of America Funding Trust(a),(c) |
| Subordinated CMO Series 2014-R6 Class 2A13 |
| 07/26/2036 | 5.673% | | 500,399 | 490,221 |
| Bear Stearns Mortgage Funding Trust(b) |
| CMO Series 2006-AR3 Class 1A1 |
1-month Term SOFR + 0.294%
Floor 0.180%, Cap 10.500%
10/25/2036 | 5.789% | | 273,754 | 228,716 |
| CMO Series 2006-AR4 Class A1 |
1-month Term SOFR + 0.534%
Floor 0.210%, Cap 10.500%
12/25/2036 | 5.849% | | 382,501 | 357,560 |
| CMO Series 2007-AR3 Class 21A1 |
1-month Term SOFR + 0.414%
Floor 0.150%, Cap 10.500%
04/25/2037 | 5.729% | | 291,585 | 255,234 |
| BRAVO Residential Funding Trust(a),(c) |
| CMO Series 2021-A Class A1 |
| 10/25/2059 | 1.991% | | 751,874 | 721,927 |
| Centex Home Equity Loan Trust(b) |
| CMO Series 2005-A Class M1 |
1-month Term SOFR + 0.834%
Floor 0.480%
01/25/2035 | 6.149% | | 202,677 | 200,157 |
| CMO Series 2005-D Class M4 |
1-month Term SOFR + 1.029%
Floor 0.610%
10/25/2035 | 6.344% | | 190,709 | 190,259 |
| Residential Mortgage-Backed Securities - Non-Agency (continued) |
| Issuer | Coupon
Rate | | Principal
Amount ($) | Value ($) |
| CIM Trust(a),(c) |
| CMO Series 2020-R6 Class A1 |
| 12/25/2060 | 2.250% | | 792,722 | 648,819 |
| CMO Series 2021-R3 Class A1A |
| 06/25/2057 | 1.951% | | 409,023 | 353,444 |
| CMO Series 2023-R3 Class A1A |
| 01/25/2063 | 4.500% | | 624,228 | 569,231 |
| Citigroup Mortgage Loan Trust, Inc.(c) |
| CMO Series 2006-AR2 Class 1A1 |
| 03/25/2036 | 4.416% | | 233,503 | 182,156 |
| Citigroup Mortgage Loan Trust, Inc.(b) |
| CMO Series 2006-WFH3 Class M2 |
1-month Term SOFR + 0.564%
Floor 0.450%
10/25/2036 | 5.879% | | 236,494 | 233,747 |
| COLT Mortgage Loan Trust(a),(c) |
| CMO Series 2022-5 Class A1 |
| 04/25/2067 | 4.550% | | 171,570 | 163,286 |
| Connecticut Avenue Securities Trust(a),(b) |
| CMO Series 2022-R01 Class 1M1 |
30-day Average SOFR + 1.000%
12/25/2041 | 6.288% | | 39,181 | 38,924 |
| CMO Series 2022-R03 Class 1M1 |
30-day Average SOFR + 2.100%
03/25/2042 | 7.388% | | 20,830 | 21,055 |
| CMO Series 2022-R03 Class 1M2 |
30-day Average SOFR + 3.500%
03/25/2042 | 8.788% | | 500,000 | 514,055 |
| CMO Series 2022-R04 Class 1M1 |
30-day Average SOFR + 2.000%
03/25/2042 | 7.288% | | 38,027 | 38,295 |
| CMO Series 2022-R05 Class 2M2 |
30-day Average SOFR + 3.000%
04/25/2042 | 8.288% | | 455,000 | 457,841 |
| CMO Series 2022-R06 Class 1M1 |
30-day Average SOFR + 2.750%
05/25/2042 | 8.038% | | 75,318 | 77,035 |
| CMO Series 2022-R09 Class 2M1 |
30-day Average SOFR + 2.500%
09/25/2042 | 7.788% | | 157,187 | 159,522 |
| CMO Series 2023-R01 Class 1M1 |
30-day Average SOFR + 2.400%
12/25/2042 | 7.688% | | 117,947 | 119,745 |
| CMO Series 2023-R03 Class 2M2 |
30-day Average SOFR + 3.900%
04/25/2043 | 9.188% | | 95,000 | 98,726 |
| CMO Series 2023-R06 Class 1M2 |
30-day Average SOFR + 2.700%
07/25/2043 | 7.988% | | 120,000 | 120,618 |
The accompanying Notes to Consolidated Financial Statements are an integral part of this statement.
| 32 | Multi-Manager Alternative Strategies Fund | Annual Report 2023 |
Consolidated Portfolio of Investments (continued)
August 31, 2023
| Residential Mortgage-Backed Securities - Non-Agency (continued) |
| Issuer | Coupon
Rate | | Principal
Amount ($) | Value ($) |
| Subordinated CMO Series 2022-R01 Class 1B1 |
30-day Average SOFR + 3.150%
12/25/2041 | 8.438% | | 511,000 | 511,631 |
| Countrywide Asset-Backed Certificates(b) |
| CMO Series 2007-13 Class 2A1 |
1-month Term SOFR + 1.014%
Floor 0.900%
10/25/2047 | 6.313% | | 136,137 | 121,038 |
| CMO Series 2007-13 Class 2A2 |
1-month Term SOFR + 0.914%
Floor 0.800%
10/25/2047 | 6.213% | | 270,623 | 240,605 |
| Credit Suisse Mortgage Trust(a),(c) |
| CMO Series 2019-NQM1 Class A1 |
| 10/25/2059 | 2.656% | | 15,374 | 14,685 |
| CSMC Trust(a),(c) |
| CMO Series 2020-RPL6 Class A1 |
| 03/25/2059 | 2.688% | | 616,903 | 605,100 |
| CMO Series 2021-RPL4 Class A1 |
| 12/27/2060 | 1.796% | | 1,280,128 | 1,199,587 |
| CWABS Asset-Backed Certificates Trust(b) |
| CMO Series 2004-10 Class MV4 |
1-month Term SOFR + 1.689%
Floor 1.575%
12/25/2034 | 7.004% | | 845,943 | 780,690 |
| CMO Series 2005-17 Class MV1 |
1-month Term SOFR + 0.574%
Floor 0.460%
05/25/2036 | 5.889% | | 182,785 | 179,512 |
| Domino’s Pizza Master Issuer LLC(a) |
| CMO Series 2015-1A Class A2II |
| 10/25/2045 | 4.474% | | 139,875 | 133,987 |
| Fannie Mae Connecticut Avenue Securities(a),(b) |
| Subordinated CMO Series 2021-R02 Class 2B2 |
30-day Average SOFR + 6.200%
11/25/2041 | 11.488% | | 80,000 | 80,477 |
| First Franklin Mortgage Loan Trust(b) |
| CMO Series 2006-FF4 Class A3 |
1-month Term SOFR + 0.394%
Floor 0.560%
03/25/2036 | 5.709% | | 88,645 | 87,630 |
| First Horizon Mortgage Pass-Through Trust(c) |
| CMO Series 2005-AR4 Class 2A1 |
| 10/25/2035 | 4.353% | | 120,981 | 112,964 |
| First NLC Trust(b) |
| CMO Series 2005-4 Class A4 |
1-month Term SOFR + 0.894%
Floor 0.390%, Cap 14.000%
02/25/2036 | 6.209% | | 254,315 | 244,251 |
| Residential Mortgage-Backed Securities - Non-Agency (continued) |
| Issuer | Coupon
Rate | | Principal
Amount ($) | Value ($) |
| Freddie Mac STACR REMIC Trust(a),(b) |
| CMO Series 2022-DNA1 Class M2 |
30-day Average SOFR + 2.500%
01/25/2042 | 7.788% | | 550,000 | 539,687 |
| CMO Series 2022-DNA3 Class M1A |
30-day Average SOFR + 2.000%
04/25/2042 | 7.288% | | 139,099 | 140,080 |
| CMO Series 2022-DNA4 Class M1A |
30-day Average SOFR + 2.200%
05/25/2042 | 7.488% | | 310,499 | 314,068 |
| CMO Series 2022-DNA4 Class M1B |
30-day Average SOFR + 3.350%
05/25/2042 | 8.638% | | 285,000 | 293,390 |
| CMO Series 2022-DNA7 Class M1A |
30-day Average SOFR + 2.500%
03/25/2052 | 7.788% | | 130,925 | 132,762 |
| CMO Series 2022-HQA1 Class M1B |
30-day Average SOFR + 3.500%
03/25/2042 | 8.788% | | 90,000 | 92,700 |
| CMO Series 2022-HQA3 Class M1B |
30-day Average SOFR + 3.550%
08/25/2042 | 8.838% | | 130,000 | 133,302 |
| Subordinated CMO Series 2022-DNA6 Class M1A |
30-day Average SOFR + 2.150%
09/25/2042 | 7.438% | | 165,167 | 166,607 |
| GCAT Trust(a),(c) |
| CMO Series 2022-NQM4 Class A1 |
| 08/25/2067 | 5.269% | | 91,580 | 89,799 |
| GE-WMC Asset-Backed Pass-Through Certificates(b) |
| CMO Series 2005-1 Class M1 |
1-month Term SOFR + 0.774%
Floor 0.660%
10/25/2035 | 6.089% | | 249,122 | 240,440 |
| GMACM Mortgage Loan Trust(c) |
| CMO Series 2006-AR1 Class 1A1 |
| 04/19/2036 | 3.280% | | 413,679 | 319,629 |
| GS Mortgage-Backed Securities Trust(a),(c) |
| CMO Series 2020-RPL1 Class M2 |
| 07/25/2059 | 3.775% | | 800,000 | 637,253 |
| GSAMP Trust(b) |
| CMO Series 2005-WMC3 Class A2C |
1-month Term SOFR + 0.774%
Floor 0.330%
12/25/2035 | 6.089% | | 792,036 | 766,459 |
| CMO Series 2006-HE7 Class A2D |
1-month Term SOFR + 0.574%
Floor 0.230%
10/25/2046 | 5.889% | | 76,707 | 75,668 |
The accompanying Notes to Consolidated Financial Statements are an integral part of this statement.
Multi-Manager Alternative Strategies Fund | Annual Report 2023
| 33 |
Consolidated Portfolio of Investments (continued)
August 31, 2023
| Residential Mortgage-Backed Securities - Non-Agency (continued) |
| Issuer | Coupon
Rate | | Principal
Amount ($) | Value ($) |
| CMO Series 2007-FM2 Class A1 |
1-month Term SOFR + 0.254%
Floor 0.140%
01/25/2037 | 5.709% | | 762,805 | 441,597 |
| HarborView Mortgage Loan Trust(b) |
| CMO Series 2007-6 Class 1A1A |
1-month Term SOFR + 0.314%
Floor 0.200%, Cap 10.500%
08/19/2037 | 5.829% | | 453,886 | 386,812 |
| Home Equity Mortgage Loan Asset-Backed Trust(b) |
| CMO Series 2005-D Class AII4 |
1-month Term SOFR + 0.814%
Floor 0.350%
03/25/2036 | 6.129% | | 73,256 | 72,210 |
| HSI Asset Securitization Corp. Trust(b) |
| CMO Series 2005-I1 Class 2A4 |
1-month Term SOFR + 0.894%
Floor 0.390%
11/25/2035 | 6.209% | | 510,167 | 462,402 |
| CMO Series 2006-HE2 Class 1A |
1-month Term SOFR + 0.374%
Floor 0.260%
12/25/2036 | 5.689% | | 1,179,891 | 471,791 |
| Impac CMB Trust(b) |
| CMO Series 2004-8 Class 2A1 (FGIC) |
1-month Term SOFR + 0.814%
Floor 0.700%, Cap 11.000%
10/25/2034 | 6.129% | | 180,895 | 179,237 |
| Impac Secured Assets Trust(b) |
| CMO Series 2006-5 Class 1A1C |
1-month Term SOFR + 0.654%
Floor 0.270%, Cap 11.500%
02/25/2037 | 5.969% | | 514,627 | 458,026 |
| IndyMac INDX Mortgage Loan Trust(b) |
| CMO Series 2006-AR2 Class 1A1A |
1-month Term SOFR + 0.554%
Floor 0.220%
04/25/2046 | 5.869% | | 673,301 | 596,543 |
| CMO Series 2006-AR2 Class 1A1B |
1-month Term SOFR + 0.534%
Floor 0.420%
04/25/2046 | 5.849% | | 620,678 | 549,387 |
| JPMorgan Alternative Loan Trust(b) |
| CMO Series 2006-A1 Class 1A1 |
1-month Term SOFR + 0.574%
Floor 0.230%, Cap 11.500%
03/25/2036 | 5.889% | | 239,746 | 219,754 |
| CMO Series 2007-S1 Class A2 |
1-month Term SOFR + 0.794%
Floor 0.340%, Cap 11.500%
04/25/2047 | 6.109% | | 153,651 | 144,477 |
| Residential Mortgage-Backed Securities - Non-Agency (continued) |
| Issuer | Coupon
Rate | | Principal
Amount ($) | Value ($) |
| JPMorgan Mortgage Acquisition Trust(b) |
| CMO Series 2006-FRE1 Class M1 |
1-month Term SOFR + 0.699%
Floor 0.585%
05/25/2035 | 6.014% | | 220,058 | 214,546 |
| CMO Series 2007-HE1 Class AV4 |
1-month Term SOFR + 0.394%
Floor 0.280%
03/25/2047 | 5.989% | | 1,103,000 | 1,015,537 |
| Legacy Mortgage Asset Trust(a),(c) |
| CMO Series 2020-GS2 Class A1 |
| 03/25/2060 | 2.750% | | 601,624 | 598,751 |
| Lehman Mortgage Trust |
| CMO Series 2006-1 Class 1A5 |
| 02/25/2036 | 5.500% | | 519,997 | 259,250 |
| Lehman XS Trust(b) |
| CMO Series 2006-15 Class A4 |
1-month Term SOFR + 0.454%
Floor 0.170%
10/25/2036 | 5.769% | | 689,798 | 617,620 |
| CMO Series 2006-2N Class 2A1 |
1-year MTA + 1.010%
Floor 1.010%
02/25/2036 | 6.450% | | 441,562 | 383,309 |
| CMO Series 2007-16N Class 2A2 |
1-month Term SOFR + 1.814%
Floor 1.700%
09/25/2047 | 7.129% | | 523,851 | 451,854 |
| Long Beach Mortgage Loan Trust(b) |
| CMO Series 2006-10 Class 2A3 |
1-month Term SOFR + 0.434%
Floor 0.160%
11/25/2036 | 5.749% | | 1,538,029 | 471,454 |
| CMO Series 2006-4 Class 1A |
1-month Term SOFR + 0.414%
Floor 0.300%
05/25/2036 | 5.729% | | 987,410 | 567,448 |
| Mastr Asset Backed Securities Trust(b) |
| CMO Series 2005-WF1 Class M6 |
1-month Term SOFR + 1.104%
Floor 0.660%
06/25/2035 | 6.419% | | 672,400 | 665,002 |
| Morgan Stanley ABS Capital I, Inc. Trust(b) |
| CMO Series 2005-WMC1 Class M3 |
1-month Term SOFR + 0.894%
Floor 0.780%
01/25/2035 | 6.209% | | 241,991 | 233,835 |
| CMO Series 2007-HE2 Class A2B |
1-month Term SOFR + 0.204%
Floor 0.090%
01/25/2037 | 5.609% | | 1,208,393 | 531,530 |
The accompanying Notes to Consolidated Financial Statements are an integral part of this statement.
| 34 | Multi-Manager Alternative Strategies Fund | Annual Report 2023 |
Consolidated Portfolio of Investments (continued)
August 31, 2023
| Residential Mortgage-Backed Securities - Non-Agency (continued) |
| Issuer | Coupon
Rate | | Principal
Amount ($) | Value ($) |
| CMO Series 2007-NC3 Class A2D |
1-month Term SOFR + 0.374%
Floor 0.260%
05/25/2037 | 5.949% | | 656,919 | 481,194 |
| Morgan Stanley Mortgage Loan Trust(b) |
| CMO Series 2005-5AR Class 1M6 |
1-month Term SOFR + 1.364%
Floor 0.750%
09/25/2035 | 6.679% | | 500,000 | 480,337 |
| NMLT Trust(a),(c) |
| CMO Series 2021-INV1 Class A1 |
| 05/25/2056 | 1.185% | | 766,922 | 622,247 |
| OBX Trust(a),(c) |
| CMO Series 2021-NQM3 Class A1 |
| 07/25/2061 | 1.054% | | 603,489 | 450,152 |
| Option One Mortgage Loan Trust(b) |
| CMO Series 2005-2 Class M1 |
1-month Term SOFR + 0.774%
Floor 0.660%
05/25/2035 | 6.089% | | 45,495 | 45,347 |
| CMO Series 2007-5 Class 2A2 |
1-month Term SOFR + 0.284%
Floor 0.170%
05/25/2037 | 5.769% | | 861,866 | 467,495 |
| CMO Series 2007-5 Class 2A3 |
1-month Term SOFR + 0.344%
Floor 0.230%
05/25/2037 | 5.889% | | 1,569,108 | 866,436 |
| Series 2006-3 Class 1A1 |
1-month Term SOFR + 0.254%
Floor 0.140%
02/25/2037 | 5.709% | | 922,037 | 591,155 |
| Preston Ridge Partners Mortgage Trust(a),(c) |
| CMO Series 2022-4 Class A2 |
| 08/25/2027 | 5.000% | | 615,000 | 543,293 |
| Pretium Mortgage Credit Partners LLC(a),(c) |
| CMO Series 2022-RN2 Class A2 |
| 06/25/2052 | 6.500% | | 720,000 | 674,995 |
| RALI Series Trust(b) |
| CMO Series 2006-QA6 Class A3 |
1-month Term SOFR + 0.494%
Floor 0.190%
07/25/2036 | 5.809% | | 305,680 | 281,371 |
| CMO Series 2007-QH6 Class A1 |
1-month Term SOFR + 0.494%
Floor 0.190%
07/25/2037 | 5.809% | | 293,124 | 266,323 |
| Residential Mortgage-Backed Securities - Non-Agency (continued) |
| Issuer | Coupon
Rate | | Principal
Amount ($) | Value ($) |
| RALI Trust(b) |
| CMO Series 2006-QO10 Class A1 |
1-month Term SOFR + 0.434%
Floor 0.160%
01/25/2037 | 5.749% | | 588,064 | 502,696 |
| RAMP Trust(b) |
| CMO Series 2006-RZ2 Class M1 |
1-month Term SOFR + 0.609%
Floor 0.330%, Cap 14.000%
05/25/2036 | 5.924% | | 481,759 | 469,282 |
| RFMSI Trust |
| CMO Series 2006-S10 Class 1A1 |
| 10/25/2036 | 6.000% | | 551,347 | 416,099 |
| SG Residential Mortgage Trust(a),(c) |
| CMO Series 2021-2 Class A1 |
| 12/25/2061 | 1.737% | | 894,399 | 729,104 |
| Soundview Home Loan Trust(b) |
| CMO Series 2006-OPT5 Class 1A1 |
1-month Term SOFR + 0.394%
Floor 0.140%
07/25/2036 | 5.709% | | 285,260 | 268,080 |
| Structured Adjustable Rate Mortgage Loan Trust(b) |
| Series 2007-4 Class 1A2 |
1-month Term SOFR + 0.554%
Floor 0.220%
05/25/2037 | 5.869% | | 781,577 | 679,214 |
| Structured Asset Investment Loan Trust(b) |
| CMO Series 2004-6 Class A3 |
1-month Term SOFR + 0.914%
Floor 0.800%
07/25/2034 | 6.229% | | 337,858 | 327,589 |
| Structured Asset Mortgage Investments II Trust(b) |
| CMO Series 2006-AR8 Class A1A |
1-month Term SOFR + 0.514%
Floor 0.200%, Cap 10.500%
10/25/2036 | 5.829% | | 287,955 | 247,425 |
| Structured Asset Securities Corp Mortgage Loan Trust(b) |
| CMO Series 2005-2XS Class M1 |
1-month Term SOFR + 0.819%
Floor 0.470%, Cap 11.000%
02/25/2035 | 6.134% | | 756,186 | 707,468 |
| Thornburg Mortgage Securities Trust(b) |
| CMO Series 2004-3 Class A |
1-month Term SOFR + 0.854%
Floor 0.370%, Cap 11.000%
09/25/2034 | 6.169% | | 317,511 | 288,579 |
| Towd Point Mortgage Trust(a),(c) |
| CMO Series 2017-4 Class A2 |
| 06/25/2057 | 3.000% | | 900,000 | 803,109 |
| Subordinated CMO Series 2017-2 Class B1 |
| 04/25/2057 | 4.177% | | 760,000 | 684,456 |
The accompanying Notes to Consolidated Financial Statements are an integral part of this statement.
Multi-Manager Alternative Strategies Fund | Annual Report 2023
| 35 |
Consolidated Portfolio of Investments (continued)
August 31, 2023
| Residential Mortgage-Backed Securities - Non-Agency (continued) |
| Issuer | Coupon
Rate | | Principal
Amount ($) | Value ($) |
| Towd Point Mortgage Trust(a),(b) |
| CMO Series 2017-5 Class A1 |
1-month Term SOFR + 0.714%
02/25/2057 | 6.029% | | 65,649 | 65,793 |
| CMO Series 2019-HY3 Class M1 |
1-month Term SOFR + 1.614%
Floor 1.500%
10/25/2059 | 6.929% | | 650,000 | 636,699 |
| Verus Securitization Trust(a),(c) |
| CMO Series 2022-1 Class A1 |
| 01/25/2067 | 2.724% | | 155,279 | 136,403 |
| CMO Series 2022-4 Class A2 |
| 04/25/2067 | 4.702% | | 164,299 | 154,111 |
| CMO Series 2022-8 Class A3 |
| 09/25/2067 | 6.127% | | 93,074 | 91,658 |
| CMO Series 2022-INV1 Class A1 |
| 08/25/2067 | 5.041% | | 90,111 | 87,616 |
| WaMu Asset-Backed Certificates Trust(b) |
| CMO Series 2007-HE1 Class 2A4 |
1-month Term SOFR + 0.344%
Floor 0.230%
01/25/2037 | 5.889% | | 1,099,287 | 501,123 |
| WaMu Mortgage Pass-Through Certificates(b) |
| CMO Series 2005-AR8 Class 2AC2 |
1-month Term SOFR + 1.034%
Floor 0.460%, Cap 10.500%
07/25/2045 | 6.349% | | 337,972 | 313,296 |
| WaMu Mortgage Pass-Through Certificates Trust(b) |
| CMO Series 2007-OA4 Class 1A |
1-year MTA + 0.770%
Floor 0.770%
05/25/2047 | 5.200% | | 552,819 | 443,652 |
| Washington Mutual Mortgage Pass-Through Certificates WMALT Trust(b) |
| CMO Series 2006-AR2 Class A1A |
1-year MTA + 0.940%
Floor 0.940%
04/25/2046 | 5.370% | | 210,693 | 174,844 |
Total Residential Mortgage-Backed Securities - Non-Agency
(Cost $43,200,186) | 40,945,783 |
| Rights 0.1% |
| Issuer | Shares | Value ($) |
| Health Care 0.1% |
| Biotechnology 0.1% |
| Albireo Pharma, Inc., CVR(e),(f),(g),(o) | 37,853 | 85,313 |
| Concert Pharmaceuticals, Inc., CVR(e),(f),(g),(o) | 173,147 | 67,112 |
| Total | | 152,425 |
| Rights (continued) |
| Issuer | Shares | Value ($) |
| Health Care Equipment & Supplies 0.0% |
| Abiomed, Inc., CVR(e),(f),(g),(o) | 15,541 | 27,197 |
| Pharmaceuticals 0.0% |
| Amryt Pharma PLC ADR, CVR(e),(f),(g),(o) | 225,430 | 3,742 |
| Amryt Pharma PLC ADR, CVR(e),(f),(g),(o) | 225,430 | 5,613 |
| Cincor Pharma, Inc.(e),(f),(g),(o) | 44,405 | 142,775 |
| Total | | 152,130 |
| Total Health Care | 331,752 |
| Materials 0.0% |
| Paper & Forest Products 0.0% |
| Resolute Forest Products, Inc.(e),(f),(g),(o) | 76,222 | 113,487 |
| Total Materials | 113,487 |
Total Rights
(Cost $389,969) | 445,239 |
| Senior Loans 0.2% |
| Borrower | Coupon
Rate | | Principal
Amount ($) | Value ($) |
| Airlines 0.2% |
| AAdvantage Loyalty IP Ltd./American Airlines, Inc.(b),(p) |
| Term Loan |
1-month USD LIBOR + 4.750%
Floor 0.750%
04/20/2028 | 5.500% | | 194,750 | 202,084 |
| Mileage Plus Holdings LLC/Intellectual Property Assets Ltd.(b),(p) |
| Term Loan |
1-month USD LIBOR + 5.250%
Floor 1.000%
06/21/2027 | 6.250% | | 200,000 | 208,340 |
| United AirLines, Inc.(b),(p) |
| Tranche B Term Loan |
3-month USD LIBOR + 3.750%
Floor 0.750%
04/21/2028 | 9.292% | | 366,958 | 367,417 |
| Total | 777,841 |
| Restaurants 0.0% |
| KFC Holding Co./Yum! Brands(b),(p) |
| Tranche B Term Loan |
1-month USD LIBOR + 1.750%
03/15/2028 | 7.176% | | 75 | 75 |
Total Senior Loans
(Cost $772,497) | 777,916 |
|
The accompanying Notes to Consolidated Financial Statements are an integral part of this statement.
| 36 | Multi-Manager Alternative Strategies Fund | Annual Report 2023 |
Consolidated Portfolio of Investments (continued)
August 31, 2023
| Treasury Bills 1.1% |
| Issuer | Yield | | Principal
Amount ($) | Value ($) |
| United States 1.1% |
| U.S. Treasury Bills |
| 10/03/2023 | 5.260% | | 640,000 | 636,971 |
| 11/02/2023 | 5.320% | | 970,000 | 961,181 |
| 11/21/2023 | 5.350% | | 1,335,000 | 1,319,146 |
| 11/28/2023 | 5.390% | | 430,000 | 424,425 |
| 12/19/2023 | 5.420% | | 1,065,000 | 1,047,877 |
| 12/21/2023 | 5.410% | | 590,000 | 580,370 |
| Total | 4,969,970 |
Total Treasury Bills
(Cost $4,970,479) | 4,969,970 |
|
| U.S. Treasury Obligations 2.5% |
| Issuer | Coupon
Rate | | Principal
Amount ($) | Value ($) |
| U.S. Treasury |
| 02/28/2026 | 0.500% | | 65,000 | 58,688 |
| 01/31/2027 | 1.500% | | 1,050,000 | 952,465 |
| 05/31/2027 | 2.625% | | 345,000 | 323,842 |
| 03/31/2029 | 2.375% | | 580,000 | 525,897 |
| 02/15/2032 | 1.875% | | 396,000 | 332,826 |
| 05/15/2032 | 2.875% | | 2,790,000 | 2,535,412 |
| U.S. Treasury Obligations (continued) |
| Issuer | Coupon
Rate | | Principal
Amount ($) | Value ($) |
| 08/15/2032 | 2.750% | | 1,065,000 | 956,004 |
| 02/15/2033 | 3.500% | | 1,190,000 | 1,133,289 |
| 02/15/2042 | 2.375% | | 655,000 | 487,156 |
| 11/15/2042 | 2.750% | | 175,000 | 137,129 |
| 02/15/2049 | 3.000% | | 1,800,000 | 1,428,469 |
| 02/15/2050 | 2.000% | | 1,243,000 | 795,714 |
| 08/15/2052 | 3.000% | | 550,000 | 438,367 |
| 02/15/2053 | 3.625% | | 880,000 | 792,825 |
Total U.S. Treasury Obligations
(Cost $11,863,253) | 10,898,083 |
| Money Market Funds 47.6% |
| | Shares | Value ($) |
| Columbia Short-Term Cash Fund, 5.476%(q),(r) | 208,772,950 | 208,710,318 |
Total Money Market Funds
(Cost $208,693,757) | 208,710,318 |
Total Investments in Securities
(Cost: $468,473,580) | 453,042,998 |
| Other Assets & Liabilities, Net | | (14,628,380) |
| Net Assets | 438,414,618 |
At August 31, 2023, securities and/or cash totaling $13,820,482 were pledged as collateral.
Investments in derivatives
| Forward foreign currency exchange contracts |
Currency to
be sold | Currency to
be purchased | Counterparty | Settlement
date | Unrealized
appreciation ($) | Unrealized
depreciation ($) |
| 170,000 AUD | 183,977 NZD | ANZ Securities | 09/20/2023 | — | (504) |
| 85,000 AUD | 54,173 USD | ANZ Securities | 09/20/2023 | — | (933) |
| 420,000 EUR | 64,667,904 JPY | ANZ Securities | 09/20/2023 | — | (10,218) |
| 187,046 NZD | 170,000 AUD | ANZ Securities | 09/20/2023 | — | (1,327) |
| 1,033,022 NZD | 638,372 USD | ANZ Securities | 09/20/2023 | 22,360 | — |
| 410,769 NZD | 244,315 USD | ANZ Securities | 09/20/2023 | — | (635) |
| 1,041,714 USD | 1,565,733 AUD | ANZ Securities | 09/20/2023 | — | (26,634) |
| 535,817 USD | 721,301 SGD | ANZ Securities | 09/20/2023 | — | (1,732) |
| 521,293 AUD | 359,207 USD | Barclays | 09/20/2023 | 21,247 | — |
| 175,982 CAD | 133,603 USD | Barclays | 09/20/2023 | 3,332 | — |
| 418,750 EUR | 4,891,733 NOK | Barclays | 09/20/2023 | 5,926 | — |
| 3,925,322 EUR | 4,271,604 USD | Barclays | 09/20/2023 | 12,099 | — |
| 63,728,293 JPY | 420,000 EUR | Barclays | 09/20/2023 | 16,692 | — |
| 8,983,312 NOK | 797,099 EUR | Barclays | 09/20/2023 | 19,603 | — |
| 9,822,313 NOK | 844,939 EUR | Barclays | 09/20/2023 | — | (7,437) |
| 1,033,629 NZD | 633,222 USD | Barclays | 09/20/2023 | 16,849 | — |
| 2,146,248 SGD | 1,622,786 USD | Barclays | 09/20/2023 | 33,602 | — |
| 521,333 USD | 692,842 CAD | Barclays | 09/20/2023 | — | (8,454) |
| 666,561 USD | 602,757 EUR | Barclays | 09/20/2023 | — | (12,488) |
| 838,750 USD | 116,500,026 JPY | Barclays | 09/20/2023 | — | (36,107) |
| 271,258 USD | 4,725,735 MXN | Barclays | 09/20/2023 | 5,171 | — |
| 320,463 USD | 517,615 NZD | Barclays | 09/20/2023 | — | (11,798) |
The accompanying Notes to Consolidated Financial Statements are an integral part of this statement.
Multi-Manager Alternative Strategies Fund | Annual Report 2023
| 37 |
Consolidated Portfolio of Investments (continued)
August 31, 2023
| Forward foreign currency exchange contracts (continued) |
Currency to
be sold | Currency to
be purchased | Counterparty | Settlement
date | Unrealized
appreciation ($) | Unrealized
depreciation ($) |
| 544,993 USD | 737,242 SGD | Barclays | 09/20/2023 | 896 | — |
| 547,300 USD | 733,355 SGD | Barclays | 09/20/2023 | — | (4,289) |
| 266,627 EUR | 3,000,993 NOK | CIBC | 09/20/2023 | — | (6,923) |
| 5,959,209 NOK | 532,578 EUR | CIBC | 09/20/2023 | 17,140 | — |
| 3,597,633 SGD | 2,702,090 USD | CIBC | 09/20/2023 | 38,231 | — |
| 1,475,045 SGD | 1,088,895 USD | CIBC | 09/20/2023 | — | (3,299) |
| 524,235 USD | 714,176 CAD | CIBC | 09/20/2023 | 4,436 | — |
| 260,750 USD | 348,171 CAD | CIBC | 09/20/2023 | — | (3,015) |
| 318,742 USD | 512,376 NZD | CIBC | 09/20/2023 | — | (13,201) |
| 1,518,962 USD | 2,055,687 SGD | CIBC | 09/20/2023 | 3,166 | — |
| 3,229,720 USD | 4,336,281 SGD | CIBC | 09/20/2023 | — | (18,932) |
| 2,372,370 AUD | 1,553,560 USD | Citi | 09/20/2023 | 15,529 | — |
| 3,210,767 CAD | 2,411,363 USD | Citi | 09/20/2023 | 34,584 | — |
| 842,500 EUR | 725,321 GBP | Citi | 09/20/2023 | 4,675 | — |
| 264,515 EUR | 3,073,680 NOK | Citi | 09/20/2023 | 2,209 | — |
| 604,147 EUR | 667,984 USD | Citi | 09/20/2023 | 12,403 | — |
| 85,000 GBP | 145,132 CAD | Citi | 09/20/2023 | — | (251) |
| 324,023,788 JPY | 2,100,000 EUR | Citi | 09/20/2023 | 46,377 | — |
| 353,317,015 JPY | 2,536,164 USD | Citi | 09/20/2023 | 101,939 | — |
| 3,428,874 NOK | 297,020 EUR | Citi | 09/20/2023 | — | (361) |
| 9,610,840 NOK | 906,936 USD | Citi | 09/20/2023 | 2,527 | — |
| 515,328 NZD | 323,295 USD | Citi | 09/20/2023 | 15,995 | — |
| 627,458 NZD | 373,836 USD | Citi | 09/20/2023 | — | (329) |
| 2,143,094 SGD | 1,601,420 USD | Citi | 09/20/2023 | 14,571 | — |
| 340,689 USD | 526,705 AUD | Citi | 09/20/2023 | 779 | — |
| 129,546 USD | 171,254 CAD | Citi | 09/20/2023 | — | (2,775) |
| 2,977,413 USD | 2,721,317 EUR | Citi | 09/20/2023 | — | (24,417) |
| 1,677,500 USD | 232,069,165 JPY | Citi | 09/20/2023 | — | (78,627) |
| 1,876,468 USD | 3,040,957 NZD | Citi | 09/20/2023 | — | (63,085) |
| 541,896 USD | 719,952 SGD | Citi | 09/20/2023 | — | (8,809) |
| 75,100 EUR | 81,986 USD | Citi | 10/13/2023 | 400 | — |
| 8,872 USD | 8,000 EUR | Citi | 10/13/2023 | — | (181) |
| 526,282 AUD | 353,379 USD | Goldman Sachs | 09/20/2023 | 12,184 | — |
| 1,297,387 EUR | 15,264,929 NOK | Goldman Sachs | 09/20/2023 | 28,635 | — |
| 797,855 EUR | 9,002,433 NOK | Goldman Sachs | 09/20/2023 | — | (18,624) |
| 616,900 EUR | 679,352 USD | Goldman Sachs | 09/20/2023 | 9,932 | — |
| 119,595,628 JPY | 838,333 USD | Goldman Sachs | 09/20/2023 | 14,363 | — |
| 4,339,454 MXN | 255,000 USD | Goldman Sachs | 09/20/2023 | 1,166 | — |
| 20,698,551 MXN | 1,180,427 USD | Goldman Sachs | 09/20/2023 | — | (30,324) |
| 8,773,580 NOK | 773,732 EUR | Goldman Sachs | 09/20/2023 | 13,983 | — |
| 14,716,617 NOK | 1,261,875 EUR | Goldman Sachs | 09/20/2023 | — | (15,573) |
| 1,428,660 SGD | 1,067,613 USD | Goldman Sachs | 09/20/2023 | 9,765 | — |
| 1,473,703 SGD | 1,089,147 USD | Goldman Sachs | 09/20/2023 | — | (2,053) |
| 359,111 USD | 527,883 AUD | Goldman Sachs | 09/20/2023 | — | (16,879) |
| 262,117 USD | 357,026 CAD | Goldman Sachs | 09/20/2023 | 2,172 | — |
| 165,849 AUD | 113,035 USD | HSBC | 09/20/2023 | 5,513 | — |
| 123,628 CAD | 85,000 EUR | HSBC | 09/20/2023 | 720 | — |
| 1,390,323 CAD | 1,056,056 USD | HSBC | 09/20/2023 | 26,865 | — |
| 420,625 EUR | 4,936,180 NOK | HSBC | 09/20/2023 | 8,075 | — |
| 42,500 GBP | 73,029 CAD | HSBC | 09/20/2023 | 217 | — |
| 115,171,454 JPY | 838,750 USD | HSBC | 09/20/2023 | 45,260 | — |
| 2,967,618 NOK | 265,952 EUR | HSBC | 09/20/2023 | 9,331 | — |
| 513,926 NZD | 316,912 USD | HSBC | 09/20/2023 | 10,448 | — |
| 1,434,712 SGD | 1,082,474 USD | HSBC | 09/20/2023 | 20,145 | — |
| 739,183 SGD | 544,805 USD | HSBC | 09/20/2023 | — | (2,522) |
| 468,062 USD | 621,335 CAD | HSBC | 09/20/2023 | — | (8,117) |
| 1,676,667 USD | 233,315,611 JPY | HSBC | 09/20/2023 | — | (69,206) |
| 541,896 USD | 718,987 SGD | HSBC | 09/20/2023 | — | (9,523) |
The accompanying Notes to Consolidated Financial Statements are an integral part of this statement.
| 38 | Multi-Manager Alternative Strategies Fund | Annual Report 2023 |
Consolidated Portfolio of Investments (continued)
August 31, 2023
| Forward foreign currency exchange contracts (continued) |
Currency to
be sold | Currency to
be purchased | Counterparty | Settlement
date | Unrealized
appreciation ($) | Unrealized
depreciation ($) |
| 255,864,000 KRW | 200,000 USD | JPMorgan | 09/01/2023 | 6,420 | — |
| 200,000 USD | 259,548,825 KRW | JPMorgan | 09/01/2023 | — | (3,632) |
| 16,476,088 INR | 200,000 USD | JPMorgan | 09/05/2023 | 981 | — |
| 259,493,702 KRW | 200,000 USD | JPMorgan | 09/05/2023 | 3,674 | — |
| 56,949,291 TWD | 1,800,000 USD | JPMorgan | 09/05/2023 | 11,757 | — |
| 200,000 USD | 16,621,733 INR | JPMorgan | 09/05/2023 | 779 | — |
| 200,000 USD | 263,086,952 KRW | JPMorgan | 09/05/2023 | — | (955) |
| 1,799,996 USD | 57,099,710 TWD | JPMorgan | 09/05/2023 | — | (7,030) |
| 171,002,901 CLP | 200,000 USD | JPMorgan | 09/08/2023 | — | (506) |
| 200,000 USD | 173,603,103 CLP | JPMorgan | 09/08/2023 | 3,555 | — |
| 260,665,763 CLP | 300,000 USD | JPMorgan | 09/11/2023 | — | (5,533) |
| 819,446,225 COP | 200,000 USD | JPMorgan | 09/11/2023 | 86 | — |
| 263,010,000 KRW | 200,000 USD | JPMorgan | 09/11/2023 | 1,052 | — |
| 300,000 USD | 258,585,000 CLP | JPMorgan | 09/11/2023 | 3,095 | — |
| 200,000 USD | 817,499,400 COP | JPMorgan | 09/11/2023 | — | (560) |
| 200,000 USD | 268,032,955 KRW | JPMorgan | 09/11/2023 | 2,748 | — |
| 805,879,204 COP | 200,000 USD | JPMorgan | 09/15/2023 | 3,668 | — |
| 100,000 USD | 414,915,878 COP | JPMorgan | 09/15/2023 | 1,084 | — |
| 100,000 USD | 401,976,901 COP | JPMorgan | 09/15/2023 | — | (2,068) |
| 1,071,513,861 INR | 12,900,000 USD | JPMorgan | 09/18/2023 | — | (46,816) |
| 4,203,039,530 KRW | 3,184,948 USD | JPMorgan | 09/18/2023 | 6,374 | — |
| 284,437,282 KRW | 215,058 USD | JPMorgan | 09/18/2023 | — | (49) |
| 267,934,000 KRW | 200,000 USD | JPMorgan | 09/18/2023 | — | (2,627) |
| 3,599,993 USD | 4,812,605,208 KRW | JPMorgan | 09/18/2023 | 39,569 | — |
| 2,095,371 AUD | 1,421,276 USD | JPMorgan | 09/20/2023 | 62,826 | — |
| 316,373 CAD | 240,485 USD | JPMorgan | 09/20/2023 | 6,289 | — |
| 172,998,896 CLP | 200,000 USD | JPMorgan | 09/20/2023 | — | (2,568) |
| 840,000 EUR | 129,209,489 JPY | JPMorgan | 09/20/2023 | — | (21,307) |
| 1,520,765 EUR | 17,917,039 NOK | JPMorgan | 09/20/2023 | 35,813 | — |
| 1,991,808 EUR | 22,572,116 NOK | JPMorgan | 09/20/2023 | — | (37,276) |
| 506,984 EUR | 552,717 USD | JPMorgan | 09/20/2023 | 2,571 | — |
| 924,782 GBP | 1,168,915 USD | JPMorgan | 09/20/2023 | — | (2,683) |
| 175,592,811 JPY | 1,245,222 USD | JPMorgan | 09/20/2023 | 35,451 | — |
| 11,940,907 NOK | 1,063,746 EUR | JPMorgan | 09/20/2023 | 30,632 | — |
| 14,728,996 NOK | 1,260,723 EUR | JPMorgan | 09/20/2023 | — | (17,988) |
| 848,164 NOK | 85,000 USD | JPMorgan | 09/20/2023 | 5,185 | — |
| 1,422,286 NZD | 875,056 USD | JPMorgan | 09/20/2023 | 26,918 | — |
| 1,993,682 SGD | 1,503,076 USD | JPMorgan | 09/20/2023 | 26,859 | — |
| 735,547 SGD | 544,342 USD | JPMorgan | 09/20/2023 | — | (291) |
| 1,041,095 USD | 1,580,247 AUD | JPMorgan | 09/20/2023 | — | (16,606) |
| 377,341 USD | 502,523 CAD | JPMorgan | 09/20/2023 | — | (5,347) |
| 200,000 USD | 172,768,129 CLP | JPMorgan | 09/20/2023 | 2,298 | — |
| 664,691 USD | 612,518 EUR | JPMorgan | 09/20/2023 | — | (26) |
| 1,457,916 USD | 203,156,575 JPY | JPMorgan | 09/20/2023 | — | (58,241) |
| 85,000 USD | 895,039 NOK | JPMorgan | 09/20/2023 | — | (774) |
| 545,315 USD | 739,638 SGD | JPMorgan | 09/20/2023 | 2,348 | — |
| 57,029,249 TWD | 1,800,000 USD | JPMorgan | 09/21/2023 | 8,481 | — |
| 1,799,996 USD | 57,272,423 TWD | JPMorgan | 09/21/2023 | — | (838) |
| 6,400,000 AUD | 5,580,685 CAD | JPMorgan | 09/22/2023 | — | (18,247) |
| 6,358,126 AUD | 3,750,000 EUR | JPMorgan | 09/22/2023 | — | (52,693) |
| 5,209,096 AUD | 2,625,000 GBP | JPMorgan | 09/22/2023 | — | (51,741) |
| 1,400,000 AUD | 1,515,032 NZD | JPMorgan | 09/22/2023 | — | (4,253) |
| 3,400,000 AUD | 2,191,258 USD | JPMorgan | 09/22/2023 | — | (13,159) |
| 5,910,877 CAD | 4,000,000 EUR | JPMorgan | 09/22/2023 | — | (34,718) |
| 6,400,000 CAD | 4,728,241 USD | JPMorgan | 09/22/2023 | — | (9,522) |
| 25,518,048 CNH | 3,500,000 USD | JPMorgan | 09/22/2023 | — | (9,525) |
| 250,000 EUR | 420,291 AUD | JPMorgan | 09/22/2023 | 1,189 | — |
| 5,375,000 EUR | 5,137,484 CHF | JPMorgan | 09/22/2023 | — | (6,511) |
The accompanying Notes to Consolidated Financial Statements are an integral part of this statement.
Multi-Manager Alternative Strategies Fund | Annual Report 2023
| 39 |
Consolidated Portfolio of Investments (continued)
August 31, 2023
| Forward foreign currency exchange contracts (continued) |
Currency to
be sold | Currency to
be purchased | Counterparty | Settlement
date | Unrealized
appreciation ($) | Unrealized
depreciation ($) |
| 1,700,000 EUR | 1,457,492 GBP | JPMorgan | 09/22/2023 | 1,593 | — |
| 5,900,000 EUR | 5,048,193 GBP | JPMorgan | 09/22/2023 | — | (7,349) |
| 300,000 EUR | 114,832,050 HUF | JPMorgan | 09/22/2023 | — | (153) |
| 600,000 EUR | 2,686,673 PLN | JPMorgan | 09/22/2023 | — | (551) |
| 4,250,000 EUR | 4,620,919 USD | JPMorgan | 09/22/2023 | 8,651 | — |
| 750,000 GBP | 838,860 CHF | JPMorgan | 09/22/2023 | 1,212 | — |
| 85,146 GBP | 100,000 EUR | JPMorgan | 09/22/2023 | 652 | — |
| 86,045 GBP | 100,000 EUR | JPMorgan | 09/22/2023 | — | (487) |
| 77,062,218 HUF | 200,000 EUR | JPMorgan | 09/22/2023 | — | (1,337) |
| 7,162,430 ILS | 1,900,000 USD | JPMorgan | 09/22/2023 | 15,364 | — |
| 373,883,840 JPY | 4,000,000 AUD | JPMorgan | 09/22/2023 | 16,683 | — |
| 364,449,400 JPY | 3,400,000 CAD | JPMorgan | 09/22/2023 | 5,208 | — |
| 455,752,275 JPY | 2,750,000 CHF | JPMorgan | 09/22/2023 | — | (22,075) |
| 554,311,870 JPY | 3,500,000 EUR | JPMorgan | 09/22/2023 | — | (21,893) |
| 486,653,370 JPY | 2,625,000 GBP | JPMorgan | 09/22/2023 | — | (28,322) |
| 483,640,640 JPY | 5,600,000 NZD | JPMorgan | 09/22/2023 | 6,231 | — |
| 400,000,000 JPY | 2,757,662 USD | JPMorgan | 09/22/2023 | 924 | — |
| 24,567,888 NOK | 2,125,000 EUR | JPMorgan | 09/22/2023 | — | (5,924) |
| 2,029,248 NOK | 2,089,494 SEK | JPMorgan | 09/22/2023 | 37 | — |
| 29,620,385 NOK | 2,800,000 USD | JPMorgan | 09/22/2023 | 12,456 | — |
| 3,900,000 NZD | 2,322,633 USD | JPMorgan | 09/22/2023 | — | (3,025) |
| 50,534,334 SEK | 4,250,000 EUR | JPMorgan | 09/22/2023 | — | (7,242) |
| 544,390 SEK | 529,248 NOK | JPMorgan | 09/22/2023 | 42 | — |
| 26,105,430 SEK | 2,400,000 USD | JPMorgan | 09/22/2023 | 13,616 | — |
| 52,578,896 TRY | 1,900,000 USD | JPMorgan | 09/22/2023 | — | (43,752) |
| 4,289,132 USD | 3,750,000 CHF | JPMorgan | 09/22/2023 | — | (36,088) |
| 4,783,123 USD | 4,375,000 EUR | JPMorgan | 09/22/2023 | — | (35,199) |
| 4,955,352 USD | 3,875,000 GBP | JPMorgan | 09/22/2023 | — | (46,106) |
| 500,000 USD | 176,466,395 HUF | JPMorgan | 09/22/2023 | 83 | — |
| 5,430,862 USD | 92,500,000 MXN | JPMorgan | 09/22/2023 | — | (22,033) |
| 200,000 USD | 2,123,171 NOK | JPMorgan | 09/22/2023 | — | (191) |
| 4,000,000 USD | 16,387,698 PLN | JPMorgan | 09/22/2023 | — | (31,630) |
| 7,200,000 USD | 9,749,156 SGD | JPMorgan | 09/22/2023 | 19,392 | — |
| 33,946,344 ZAR | 1,800,000 USD | JPMorgan | 09/22/2023 | 5,150 | — |
| 86,630,503 CLP | 100,000 USD | JPMorgan | 09/25/2023 | — | (1,379) |
| 415,813,000 COP | 100,000 USD | JPMorgan | 09/25/2023 | — | (952) |
| 16,633,594 INR | 200,000 USD | JPMorgan | 09/25/2023 | — | (1,010) |
| 4,810,968,000 KRW | 3,600,000 USD | JPMorgan | 09/25/2023 | — | (37,501) |
| 200,000 USD | 822,548,000 COP | JPMorgan | 09/25/2023 | — | (301) |
| 1,318,294,058 KRW | 997,543 USD | JPMorgan | 09/27/2023 | 865 | — |
| 3,711,807,828 KRW | 2,802,465 USD | JPMorgan | 09/27/2023 | — | (3,796) |
| 3,599,993 USD | 4,742,246,860 KRW | JPMorgan | 09/27/2023 | — | (14,684) |
| 412,655,118 COP | 100,000 USD | JPMorgan | 09/28/2023 | — | (80) |
| 85,785,000 CLP | 100,000 USD | JPMorgan | 10/02/2023 | — | (310) |
| 57,230,332 TWD | 1,800,000 USD | JPMorgan | 10/02/2023 | 1,636 | — |
| 1,250,576 AUD | 852,663 USD | Morgan Stanley | 09/20/2023 | 41,902 | — |
| 995,623 CAD | 734,381 USD | Morgan Stanley | 09/20/2023 | — | (2,632) |
| 840,000 EUR | 130,438,224 JPY | Morgan Stanley | 09/20/2023 | — | (12,841) |
| 265,560 EUR | 3,102,029 NOK | Morgan Stanley | 09/20/2023 | 3,742 | — |
| 639,229 EUR | 7,201,299 NOK | Morgan Stanley | 09/20/2023 | — | (15,986) |
| 1,461,254 EUR | 1,605,993 USD | Morgan Stanley | 09/20/2023 | 20,335 | — |
| 170,000 GBP | 29,579,909 JPY | Morgan Stanley | 09/20/2023 | — | (11,576) |
| 29,740,429 JPY | 170,000 GBP | Morgan Stanley | 09/20/2023 | 10,470 | — |
| 2,967,173 NOK | 266,052 EUR | Morgan Stanley | 09/20/2023 | 9,483 | — |
| 4,927,638 NOK | 420,625 EUR | Morgan Stanley | 09/20/2023 | — | (7,271) |
| 3,249,434 NZD | 2,026,889 USD | Morgan Stanley | 09/20/2023 | 89,186 | — |
| 3,332,552 SGD | 2,484,928 USD | Morgan Stanley | 09/20/2023 | 17,347 | — |
| 2,314,498 USD | 3,457,352 AUD | Morgan Stanley | 09/20/2023 | — | (73,063) |
The accompanying Notes to Consolidated Financial Statements are an integral part of this statement.
| 40 | Multi-Manager Alternative Strategies Fund | Annual Report 2023 |
Consolidated Portfolio of Investments (continued)
August 31, 2023
| Forward foreign currency exchange contracts (continued) |
Currency to
be sold | Currency to
be purchased | Counterparty | Settlement
date | Unrealized
appreciation ($) | Unrealized
depreciation ($) |
| 591,913 USD | 784,517 CAD | Morgan Stanley | 09/20/2023 | — | (11,172) |
| 3,302,151 USD | 3,011,407 EUR | Morgan Stanley | 09/20/2023 | — | (34,367) |
| 309,863 USD | 520,345 NZD | Morgan Stanley | 09/20/2023 | 429 | — |
| 959,005 USD | 1,552,083 NZD | Morgan Stanley | 09/20/2023 | — | (33,467) |
| 3,789,616 USD | 5,067,071 SGD | Morgan Stanley | 09/20/2023 | — | (37,715) |
| 689,429 CAD | 521,645 USD | RBC Capital Markets | 09/20/2023 | 11,293 | — |
| 265,560 EUR | 3,094,010 NOK | RBC Capital Markets | 09/20/2023 | 2,987 | — |
| 1,680,000 EUR | 1,824,593 USD | RBC Capital Markets | 09/20/2023 | 1,566 | — |
| 1,365,519 USD | 1,816,000 CAD | RBC Capital Markets | 09/20/2023 | — | (21,220) |
| 840,000 EUR | 127,854,888 JPY | Standard Chartered | 09/20/2023 | — | (30,639) |
| 721,549 GBP | 842,500 EUR | Standard Chartered | 09/20/2023 | 102 | ��� |
| 54,823 USD | 85,000 AUD | Standard Chartered | 09/20/2023 | 283 | — |
| 1,848,818 USD | 1,677,500 EUR | Standard Chartered | 09/20/2023 | — | (28,504) |
| 3,215,988 AUD | 2,162,029 USD | State Street | 09/20/2023 | 77,072 | — |
| 219,884 CAD | 127,500 GBP | State Street | 09/20/2023 | — | (1,241) |
| 85,000 EUR | 124,590 CAD | State Street | 09/20/2023 | — | (9) |
| 840,000 EUR | 128,430,960 JPY | State Street | 09/20/2023 | — | (26,670) |
| 266,627 EUR | 3,009,094 NOK | State Street | 09/20/2023 | — | (6,161) |
| 563,315 EUR | 613,905 USD | State Street | 09/20/2023 | 2,632 | — |
| 119,835,977 JPY | 838,333 USD | State Street | 09/20/2023 | 12,707 | — |
| 937,139 NZD | 567,097 USD | State Street | 09/20/2023 | 8,262 | — |
| 262,117 USD | 356,381 CAD | State Street | 09/20/2023 | 1,694 | — |
| 158,274 USD | 143,777 EUR | State Street | 09/20/2023 | — | (2,257) |
| 85,000 USD | 1,485,418 MXN | State Street | 09/20/2023 | 1,889 | — |
| 85,000 USD | 1,447,368 MXN | State Street | 09/20/2023 | — | (337) |
| 85,000 USD | 855,681 NOK | State Street | 09/20/2023 | — | (4,478) |
| 627,552 USD | 1,039,443 NZD | State Street | 09/20/2023 | — | (7,711) |
| 1,080,373 USD | 1,452,619 SGD | State Street | 09/20/2023 | — | (4,784) |
| 521,182 AUD | 354,046 USD | UBS | 09/20/2023 | 16,159 | — |
| 140,557 CAD | 106,882 USD | UBS | 09/20/2023 | 2,835 | — |
| 463,880 EUR | 5,453,008 NOK | UBS | 09/20/2023 | 9,772 | — |
| 533,173 EUR | 6,001,875 NOK | UBS | 09/20/2023 | — | (13,770) |
| 3,319,921 EUR | 3,603,758 USD | UBS | 09/20/2023 | 1,195 | — |
| 100,727,967 JPY | 705,611 USD | UBS | 09/20/2023 | 11,632 | — |
| 9,775,549 NOK | 872,370 EUR | UBS | 09/20/2023 | 26,730 | — |
| 724,041 SGD | 542,657 USD | UBS | 09/20/2023 | 6,543 | — |
| 346,816 USD | 519,727 AUD | UBS | 09/20/2023 | — | (9,872) |
| 262,117 USD | 356,543 CAD | UBS | 09/20/2023 | 1,814 | — |
| 47,415 USD | 43,236 EUR | UBS | 09/20/2023 | — | (498) |
| Total | | | | 1,523,070 | (1,725,283) |
| Long futures contracts |
| Description | Number of
contracts | Expiration
date | Trading
currency | Notional
amount | Value/Unrealized
appreciation ($) | Value/Unrealized
depreciation ($) |
| 3-Month Euro Euribor | 1 | 09/2024 | EUR | 241,600 | 185 | — |
| 3-Month Lead | 3 | 11/2023 | USD | 166,350 | 2,558 | — |
| 3-Month Zinc | 1 | 11/2023 | USD | 60,763 | — | (544) |
| Brazilian Real | 2 | 09/2023 | USD | 40,210 | — | (582) |
| Brazilian Real | 17 | 09/2023 | USD | 341,785 | — | (3,888) |
| Brent Crude | 9 | 09/2023 | USD | 781,470 | 33,231 | — |
| Brent Crude | 5 | 09/2023 | USD | 434,150 | 18,526 | — |
| Brent Crude | 15 | 09/2023 | USD | 1,302,450 | 16,724 | — |
| Brent Crude | 10 | 10/2023 | USD | 862,300 | 41,850 | — |
| Brent Crude | 6 | 11/2023 | USD | 513,840 | 20,444 | — |
| British Pound | 54 | 09/2023 | USD | 4,274,438 | — | (65,037) |
| CAC40 Index | 12 | 09/2023 | EUR | 879,420 | 3,686 | — |
| CAC40 Index | 9 | 09/2023 | EUR | 659,565 | 362 | — |
The accompanying Notes to Consolidated Financial Statements are an integral part of this statement.
Multi-Manager Alternative Strategies Fund | Annual Report 2023
| 41 |
Consolidated Portfolio of Investments (continued)
August 31, 2023
| Long futures contracts (continued) |
| Description | Number of
contracts | Expiration
date | Trading
currency | Notional
amount | Value/Unrealized
appreciation ($) | Value/Unrealized
depreciation ($) |
| Canola | 7 | 11/2023 | CAD | 113,218 | 1,147 | — |
| Canola | 2 | 01/2024 | CAD | 32,556 | 65 | — |
| Class III Milk | 1 | 10/2023 | USD | 37,780 | — | (602) |
| Cocoa | 12 | 12/2023 | USD | 436,560 | 21,392 | — |
| Cocoa | 6 | 12/2023 | USD | 218,280 | 8,516 | — |
| Cocoa | 4 | 12/2023 | USD | 145,520 | 5,290 | — |
| Cocoa | 2 | 03/2024 | USD | 72,960 | 4,085 | — |
| Cocoa | 1 | 03/2024 | GBP | 29,030 | 2,993 | — |
| Cocoa | 1 | 05/2024 | GBP | 28,440 | 2,854 | — |
| Cotton | 2 | 12/2023 | USD | 87,820 | 3,275 | — |
| Cotton | 3 | 12/2023 | USD | 131,730 | 1,128 | — |
| Cotton | 1 | 03/2024 | USD | 43,865 | 1,498 | — |
| Crude Oil E-mini | 3 | 09/2023 | USD | 125,445 | 5,732 | — |
| Crude Palm Oil | 2 | 11/2023 | MYR | 200,500 | 1,061 | — |
| Crude Palm Oil | 1 | 01/2024 | MYR | 101,525 | 448 | — |
| DAX Index | 6 | 09/2023 | EUR | 2,399,850 | 31,464 | — |
| DAX Index | 1 | 09/2023 | EUR | 399,975 | — | (3,073) |
| DJIA Index E-mini | 9 | 09/2023 | USD | 1,565,595 | — | (34,814) |
| DJIA Index E-mini | 14 | 09/2023 | USD | 2,435,370 | — | (45,120) |
| DJIA Index Micro E-mini | 3 | 09/2023 | USD | 52,187 | — | (1,019) |
| ECX Emissions EUA | 1 | 12/2023 | EUR | 85,760 | — | (4,173) |
| Energy Select Sector Index E-mini | 2 | 09/2023 | USD | 186,280 | 9,807 | — |
| Euro FX | 13 | 09/2023 | USD | 1,763,531 | — | (70,355) |
| Euro FX Micro E-mini | 2 | 09/2023 | USD | 27,131 | — | (633) |
| Euro STOXX 50 Index | 25 | 09/2023 | EUR | 1,078,250 | — | (1,997) |
| Euro STOXX 50 Index | 47 | 09/2023 | EUR | 2,027,110 | — | (4,235) |
| Euro STOXX Banks Index | 19 | 09/2023 | EUR | 106,400 | — | (397) |
| Euro-BTP | 1 | 12/2023 | EUR | 115,460 | 595 | — |
| FCOJ-A | 5 | 11/2023 | USD | 238,913 | 4,286 | — |
| Feeder Cattle | 3 | 10/2023 | USD | 384,038 | 656 | — |
| FTSE 100 Index | 2 | 09/2023 | GBP | 149,250 | — | (755) |
| FTSE 100 Index | 2 | 09/2023 | GBP | 149,250 | — | (1,968) |
| FTSE Taiwan Index | 14 | 09/2023 | USD | 802,200 | 3,733 | — |
| FTSE Taiwan Index | 13 | 09/2023 | USD | 744,900 | 3,712 | — |
| FTSE/JSE Top 40 Index | 1 | 09/2023 | ZAR | 690,210 | — | (1,798) |
| FTSE/MIB Index | 8 | 09/2023 | EUR | 1,155,280 | 25,446 | — |
| FTSE/MIB Index | 6 | 09/2023 | EUR | 866,460 | 7,918 | — |
| FTSE/MIB Index Mini | 2 | 09/2023 | EUR | 57,764 | 2,250 | — |
| Gas Oil | 5 | 10/2023 | USD | 441,625 | 3,870 | — |
| Gas Oil | 17 | 10/2023 | USD | 1,501,525 | — | (29,258) |
| Gas Oil | 4 | 11/2023 | USD | 342,700 | 521 | — |
| Gas Oil | 1 | 12/2023 | USD | 82,925 | — | (276) |
| Gas Oil | 2 | 01/2024 | USD | 163,150 | — | (452) |
| Gold | 7 | 06/2024 | JPY | 63,763,000 | 8,364 | — |
| IBEX 35 Index | 4 | 09/2023 | EUR | 381,428 | 5,895 | — |
| IBEX 35 Index | 4 | 09/2023 | EUR | 381,428 | 5,244 | — |
| IBEX 35 Index Mini | 2 | 09/2023 | EUR | 19,071 | 350 | — |
| Japanese 10-Year Government Bond | 5 | 09/2023 | JPY | 734,100,000 | 3,521 | — |
| JPX-Nikkei Index 400 | 1 | 09/2023 | JPY | 2,107,000 | 493 | — |
| Live Cattle | 23 | 10/2023 | USD | 1,663,590 | 5,829 | — |
| Live Cattle | 8 | 10/2023 | USD | 578,640 | — | (6,498) |
| Live Cattle | 2 | 12/2023 | USD | 147,840 | 2,906 | — |
| Live Cattle | 3 | 02/2024 | USD | 226,620 | 6,223 | — |
| Live Cattle | 2 | 04/2024 | USD | 154,140 | 1,606 | — |
| Mexican Peso | 124 | 09/2023 | USD | 3,642,500 | 110,634 | — |
| Milling Wheat | 1 | 05/2024 | EUR | 12,325 | — | (177) |
| MSCI EAFE Index | 8 | 09/2023 | USD | 843,720 | — | (18,007) |
| NASDAQ 100 Index E-mini | 6 | 09/2023 | USD | 1,864,620 | 62,334 | — |
The accompanying Notes to Consolidated Financial Statements are an integral part of this statement.
| 42 | Multi-Manager Alternative Strategies Fund | Annual Report 2023 |
Consolidated Portfolio of Investments (continued)
August 31, 2023
| Long futures contracts (continued) |
| Description | Number of
contracts | Expiration
date | Trading
currency | Notional
amount | Value/Unrealized
appreciation ($) | Value/Unrealized
depreciation ($) |
| NASDAQ 100 Index E-mini | 7 | 09/2023 | USD | 2,175,390 | 10,471 | — |
| Natural Gas | 5 | 09/2023 | GBP | 132,882 | — | (11,333) |
| Nikkei 225 Index | 6 | 09/2023 | JPY | 195,660,000 | 24,824 | — |
| Nikkei 225 Index | 8 | 09/2023 | JPY | 260,880,000 | 18,090 | — |
| Nikkei 225 Index | 6 | 09/2023 | JPY | 97,800,000 | 18,037 | — |
| Nikkei 225 Index | 1 | 09/2023 | USD | 162,500 | 2,523 | — |
| Nikkei 225 Index | 1 | 09/2023 | JPY | 16,300,000 | — | (293) |
| Nikkei 225 Index Mini | 60 | 09/2023 | JPY | 195,660,000 | 17,963 | — |
| NY Harbor ULSD Heat Oil | 3 | 09/2023 | USD | 392,251 | 12,146 | — |
| NY Harbor ULSD Heat Oil | 11 | 09/2023 | USD | 1,438,252 | 10,859 | — |
| NY Harbor ULSD Heat Oil | 2 | 10/2023 | USD | 255,032 | 3,567 | — |
| NY Harbor ULSD Heat Oil | 2 | 12/2023 | USD | 242,080 | 1,769 | — |
| Oat | 1 | 12/2023 | USD | 24,663 | 2,385 | — |
| OMXS30 Index | 21 | 09/2023 | SEK | 4,596,900 | 278 | — |
| OMXS30 Index | 17 | 09/2023 | SEK | 3,721,300 | — | (331) |
| Platinum | 1 | 10/2023 | USD | 48,720 | — | (442) |
| Platinum | 2 | 06/2024 | JPY | 4,494,000 | 1,789 | — |
| RBOB Gasoline | 8 | 09/2023 | USD | 862,142 | 42,457 | — |
| RBOB Gasoline | 14 | 09/2023 | USD | 1,508,749 | — | (2,438) |
| RBOB Gasoline | 4 | 10/2023 | USD | 416,690 | 9,813 | — |
| RBOB Gasoline | 1 | 11/2023 | USD | 100,939 | 943 | — |
| RBOB Gasoline | 1 | 12/2023 | USD | 99,364 | 687 | — |
| Robusta Coffee | 1 | 11/2023 | USD | 24,890 | — | (321) |
| Russell 2000 Index E-mini | 4 | 09/2023 | USD | 380,320 | — | (18,113) |
| S&P 500 Index E-mini | 15 | 09/2023 | USD | 3,387,000 | 57,662 | — |
| S&P 500 Index E-mini | 14 | 09/2023 | USD | 3,161,200 | 20,150 | — |
| S&P Mid 400 Index E-mini | 1 | 09/2023 | USD | 264,870 | — | (8,201) |
| S&P Mid 400 Index E-mini | 3 | 09/2023 | USD | 794,610 | — | (21,915) |
| S&P/TSX 60 Index | 2 | 09/2023 | CAD | 486,440 | — | (6,456) |
| SGX TSI Iron Ore China 62% | 13 | 10/2023 | USD | 148,408 | 13,887 | — |
| SGX TSI Iron Ore China 62% | 33 | 10/2023 | USD | 376,728 | 11,940 | — |
| Silver | 3 | 12/2023 | USD | 372,180 | 2,000 | — |
| Silver | 2 | 12/2023 | USD | 248,120 | 335 | — |
| Silver | 4 | 12/2023 | USD | 496,240 | — | (11,792) |
| Silver | 2 | 03/2024 | USD | 251,760 | 2,582 | — |
| Soybean | 19 | 11/2023 | USD | 1,300,313 | — | (442) |
| Soybean | 13 | 11/2023 | USD | 889,688 | — | (6,356) |
| Soybean | 8 | 01/2024 | USD | 552,800 | 3,057 | — |
| Soybean | 2 | 03/2024 | USD | 138,525 | — | (342) |
| Soybean Meal | 7 | 12/2023 | USD | 282,800 | — | (4,245) |
| Soybean Meal | 12 | 12/2023 | USD | 484,800 | — | (4,864) |
| Soybean Meal | 3 | 01/2024 | USD | 120,420 | — | (1,027) |
| Soybean Oil | 17 | 12/2023 | USD | 637,296 | 12,047 | — |
| Soybean Oil | 13 | 12/2023 | USD | 487,344 | 2,505 | — |
| Soybean Oil | 3 | 01/2024 | USD | 111,312 | 8,495 | — |
| Soybean Oil | 1 | 03/2024 | USD | 36,726 | 5,092 | — |
| SPI 200 Index | 7 | 09/2023 | AUD | 1,273,125 | 8,203 | — |
| SPI 200 Index | 8 | 09/2023 | AUD | 1,455,000 | 5,024 | — |
| STOXX Europe 600 Bank Index | 1 | 09/2023 | EUR | 7,895 | — | (107) |
| STOXX Europe 600 Index | 18 | 09/2023 | EUR | 413,370 | 9,455 | — |
| STOXX Europe 600 Index | 17 | 09/2023 | EUR | 390,405 | — | (2,570) |
| Sugar #11 | 13 | 09/2023 | USD | 364,874 | 2,962 | — |
| Sugar #11 | 31 | 02/2024 | USD | 882,930 | 15,938 | — |
| Sugar #11 | 3 | 02/2024 | USD | 85,445 | 94 | — |
| Sugar #11 | 2 | 04/2024 | USD | 53,805 | 388 | — |
| Sugar #11 | 1 | 06/2024 | USD | 25,592 | — | (685) |
| Swiss Franc | 2 | 09/2023 | USD | 283,488 | — | (921) |
| Swiss Franc | 18 | 09/2023 | USD | 2,551,388 | — | (75,614) |
The accompanying Notes to Consolidated Financial Statements are an integral part of this statement.
Multi-Manager Alternative Strategies Fund | Annual Report 2023
| 43 |
Consolidated Portfolio of Investments (continued)
August 31, 2023
| Long futures contracts (continued) |
| Description | Number of
contracts | Expiration
date | Trading
currency | Notional
amount | Value/Unrealized
appreciation ($) | Value/Unrealized
depreciation ($) |
| TOPIX Index | 12 | 09/2023 | JPY | 279,660,000 | 86,308 | — |
| TOPIX Index | 13 | 09/2023 | JPY | 302,965,000 | 68,449 | — |
| TOPIX Index Mini | 7 | 09/2023 | JPY | 16,313,500 | 4,774 | — |
| U.S. Treasury 2-Year Note | 116 | 12/2023 | USD | 23,641,344 | 45,373 | — |
| U.S. Treasury 5-Year Note | 266 | 12/2023 | USD | 28,441,219 | 210,388 | — |
| White Sugar #5 | 1 | 09/2023 | USD | 35,760 | 1,079 | — |
| White Sugar #5 | 1 | 11/2023 | USD | 35,155 | 1,919 | — |
| WIG 20 Index | 7 | 09/2023 | PLN | 284,060 | — | (2,792) |
| WTI Crude | 4 | 09/2023 | USD | 334,520 | 12,256 | — |
| WTI Crude | 7 | 09/2023 | USD | 585,410 | 26,269 | — |
| WTI Crude | 14 | 09/2023 | USD | 1,170,820 | 11,856 | — |
| WTI Crude | 8 | 10/2023 | USD | 663,680 | 33,717 | — |
| WTI Crude | 5 | 11/2023 | USD | 411,300 | 17,302 | — |
| WTI Crude | 2 | 12/2023 | USD | 163,160 | 4,137 | — |
| Yen Denominated Nikkei 225 Index | 3 | 09/2023 | JPY | 48,750,000 | 5,785 | — |
| Total | | | | | 1,394,736 | (477,258) |
| Short futures contracts |
| Description | Number of
contracts | Expiration
date | Trading
currency | Notional
amount | Value/Unrealized
appreciation ($) | Value/Unrealized
depreciation ($) |
| 1-Month SOFR | (1) | 01/2024 | USD | (394,177) | — | (43) |
| 30-Day Fed Funds | (1) | 07/2024 | USD | (396,136) | 457 | — |
| 3-Month Aluminum | (6) | 11/2023 | USD | (331,200) | — | (8,494) |
| 3-Month Copper | (2) | 11/2023 | USD | (421,125) | 2,010 | — |
| 3-Month Euro Euribor | (66) | 12/2023 | EUR | (15,863,100) | — | (26,127) |
| 3-Month Euro Euribor | (12) | 03/2024 | EUR | (2,886,900) | 6,971 | — |
| 3-Month Euro Euribor | (4) | 06/2025 | EUR | (970,800) | — | (1,571) |
| 3-Month Euro Euribor | (2) | 09/2025 | EUR | (485,775) | — | (2,243) |
| 3-Month Euro Euribor | (2) | 03/2026 | EUR | (486,300) | 1,632 | — |
| 3-Month Nickel | (1) | 11/2023 | USD | (121,734) | 1,887 | — |
| 3-Month Nickel | (1) | 11/2023 | USD | (121,734) | — | (2,042) |
| 3-Month SOFR | (75) | 03/2024 | USD | (17,737,500) | 21,813 | — |
| 3-Month SOFR | (42) | 09/2024 | USD | (9,987,075) | — | (1,634) |
| 3-Month SONIA | (47) | 03/2024 | GBP | (11,079,075) | — | (72,452) |
| 90-Day AUD Bank Bill | (8) | 12/2023 | AUD | (7,917,034) | — | (5,348) |
| 90-Day AUD Bank Bill | (2) | 06/2024 | AUD | (1,979,210) | — | (418) |
| Australian 10-Year Bond | (13) | 09/2023 | AUD | (1,510,240) | 7,921 | — |
| Australian 10-Year Bond | (22) | 09/2023 | AUD | (2,555,791) | — | (18,983) |
| Australian 10-Year Bond | (48) | 09/2023 | AUD | (5,576,271) | — | (43,057) |
| Australian 3-Year Bond | (31) | 09/2023 | AUD | (3,297,987) | — | (8,730) |
| Australian 3-Year Bond | (82) | 09/2023 | AUD | (8,723,709) | — | (24,344) |
| Australian Dollar | (94) | 09/2023 | USD | (6,089,320) | — | (10,487) |
| Banker’s Acceptance | (18) | 12/2023 | CAD | (4,248,000) | 1,679 | — |
| Banker’s Acceptance | (2) | 06/2024 | CAD | (472,925) | 3,765 | — |
| Canadian Dollar | (60) | 09/2023 | USD | (4,439,100) | 3,885 | — |
| Canadian Dollar | (3) | 09/2023 | USD | (221,955) | 2,672 | — |
| Canadian Government 10-Year Bond | (38) | 12/2023 | CAD | (4,533,780) | — | (16,995) |
| Canadian Government 10-Year Bond | (36) | 12/2023 | CAD | (4,295,160) | — | (28,717) |
| Coffee | (13) | 12/2023 | USD | (753,188) | 16,612 | — |
| Coffee | (4) | 12/2023 | USD | (231,750) | — | (2,672) |
| Coffee | (2) | 03/2024 | USD | (116,738) | 70 | — |
| Consumer Staples Select Sector Index E-mini | (1) | 09/2023 | USD | (73,170) | 1,429 | — |
| Copper | (2) | 12/2023 | USD | (191,100) | — | (3,650) |
| Copper | (5) | 12/2023 | USD | (477,750) | — | (6,533) |
| Copper | (2) | 03/2024 | USD | (192,200) | — | (1,891) |
| Corn | (22) | 12/2023 | USD | (526,075) | 17,727 | — |
| Corn | (32) | 12/2023 | USD | (765,200) | 14,265 | — |
The accompanying Notes to Consolidated Financial Statements are an integral part of this statement.
| 44 | Multi-Manager Alternative Strategies Fund | Annual Report 2023 |
Consolidated Portfolio of Investments (continued)
August 31, 2023
| Short futures contracts (continued) |
| Description | Number of
contracts | Expiration
date | Trading
currency | Notional
amount | Value/Unrealized
appreciation ($) | Value/Unrealized
depreciation ($) |
| Corn | (9) | 03/2024 | USD | (222,300) | 7,355 | — |
| Corn | (10) | 05/2024 | USD | (251,250) | 6,465 | — |
| DAX Index Mini | (1) | 09/2023 | EUR | (79,995) | — | (2,406) |
| Euro FX | (3) | 09/2023 | USD | (406,969) | 215 | — |
| Euro FX | (1) | 09/2023 | USD | (67,831) | — | (232) |
| Euro-Bobl | (4) | 09/2023 | EUR | (464,440) | 3,415 | — |
| Euro-Bobl | (39) | 09/2023 | EUR | (4,528,290) | — | (9,669) |
| Euro-Bobl | (36) | 12/2023 | EUR | (4,228,920) | — | (17,605) |
| Euro-BTP | (34) | 09/2023 | EUR | (3,941,280) | — | (31,614) |
| Euro-Bund | (22) | 09/2023 | EUR | (2,930,180) | — | (13,919) |
| Euro-Bund | (18) | 12/2023 | EUR | (2,387,340) | — | (13,682) |
| Euro-Buxl 30-Year | (7) | 09/2023 | EUR | (936,600) | — | (9,601) |
| Euro-Buxl 30-Year | (8) | 12/2023 | EUR | (1,070,080) | — | (11,286) |
| Euro-OAT | (28) | 09/2023 | EUR | (3,581,480) | — | (14,459) |
| Euro-OAT | (25) | 12/2023 | EUR | (3,186,750) | — | (17,105) |
| Euro-Schatz | (120) | 09/2023 | EUR | (12,614,400) | 13,141 | — |
| Euro-Schatz | (137) | 12/2023 | EUR | (14,450,760) | — | (15,056) |
| FTSE China A50 Index | (34) | 09/2023 | USD | (429,012) | 5,022 | — |
| FTSE China A50 Index | (7) | 09/2023 | USD | (88,326) | 1,660 | — |
| FTSE/JSE Top 40 Index | (2) | 09/2023 | ZAR | (1,380,420) | — | (167) |
| Gold 100 oz. | (9) | 12/2023 | USD | (1,769,310) | — | (40,225) |
| Gold E-micro | (10) | 12/2023 | USD | (196,590) | — | (4,362) |
| Indian Rupee | (28) | 09/2023 | USD | (676,144) | — | (3,201) |
| Japanese Yen | (98) | 09/2023 | USD | (8,442,700) | 133,120 | — |
| Japanese Yen | (2) | 09/2023 | USD | (172,300) | — | (2,096) |
| KLCI Index | (2) | 09/2023 | MYR | (143,150) | — | (110) |
| Korea 3-Year Bond | (189) | 09/2023 | KRW | (19,572,840,000) | 49,759 | — |
| KOSPI 200 Index Mini | (1) | 09/2023 | KRW | (16,747,500) | 208 | — |
| Lean Hogs | (5) | 10/2023 | USD | (165,100) | — | (2,971) |
| Lean Hogs | (1) | 12/2023 | USD | (29,730) | 329 | — |
| Lean Hogs | (2) | 12/2023 | USD | (59,460) | — | (1,224) |
| Lean Hogs | (1) | 02/2024 | USD | (31,480) | — | (62) |
| Long Gilt | (23) | 12/2023 | GBP | (2,198,110) | — | (21,091) |
| Long Gilt | (25) | 12/2023 | GBP | (2,389,250) | — | (28,777) |
| Lumber | (2) | 11/2023 | USD | (27,940) | — | (14) |
| Maize | (3) | 11/2023 | EUR | (31,800) | 198 | — |
| Mexican Peso | (1) | 09/2023 | USD | (29,375) | 234 | — |
| Milling Wheat | (12) | 12/2023 | EUR | (141,900) | 2,690 | — |
| Milling Wheat | (8) | 03/2024 | EUR | (97,200) | 840 | — |
| MSCI Emerging Markets Index | (2) | 09/2023 | USD | (97,930) | 34 | — |
| MSCI Emerging Markets Index | (27) | 09/2023 | USD | (1,322,055) | — | (6,545) |
| MSCI Singapore Index | (7) | 09/2023 | SGD | (198,905) | — | (1,307) |
| MSCI Singapore Index | (7) | 09/2023 | SGD | (198,905) | — | (3,247) |
| Natural Gas | (10) | 09/2023 | USD | (276,800) | 16,040 | — |
| Natural Gas | (10) | 09/2023 | USD | (276,800) | — | (8,416) |
| Natural Gas | (6) | 10/2023 | USD | (188,820) | — | (2,420) |
| Natural Gas | (2) | 11/2023 | USD | (72,220) | — | (1,523) |
| Natural Gas E-mini | (2) | 09/2023 | USD | (13,840) | — | (529) |
| New Zealand Dollar | (57) | 09/2023 | USD | (3,395,775) | 996 | — |
| New Zealand Dollar | (2) | 09/2023 | USD | (119,150) | — | (522) |
| Nickel | (1) | 12/2023 | USD | (122,106) | — | (2,265) |
| Norwegian Krone | (6) | 09/2023 | USD | (1,129,080) | — | (10) |
| Platinum | (2) | 10/2023 | USD | (97,440) | — | (7,626) |
| Primary Aluminum | (14) | 12/2023 | USD | (776,038) | — | (4,537) |
| Rapeseed | (1) | 10/2023 | EUR | (23,438) | — | (1,350) |
| Rapeseed | (1) | 01/2024 | EUR | (24,125) | — | (364) |
| Russell 2000 Index E-mini | (8) | 09/2023 | USD | (760,640) | — | (14,981) |
| Russell 2000 Index Micro E-Mini | (1) | 09/2023 | USD | (9,508) | — | (169) |
The accompanying Notes to Consolidated Financial Statements are an integral part of this statement.
Multi-Manager Alternative Strategies Fund | Annual Report 2023
| 45 |
Consolidated Portfolio of Investments (continued)
August 31, 2023
| Short futures contracts (continued) |
| Description | Number of
contracts | Expiration
date | Trading
currency | Notional
amount | Value/Unrealized
appreciation ($) | Value/Unrealized
depreciation ($) |
| S&P/TSX 60 Index | (5) | 09/2023 | CAD | (1,216,100) | 3,131 | — |
| Short Term Euro-BTP | (33) | 09/2023 | EUR | (3,474,570) | 653 | — |
| Short Term Euro-BTP | (19) | 12/2023 | EUR | (1,995,570) | — | (3,840) |
| South African Rand | (1) | 09/2023 | USD | (26,450) | — | (176) |
| South African Rand | (39) | 09/2023 | USD | (1,031,550) | — | (8,632) |
| Swedish Krona | (13) | 09/2023 | USD | (2,377,960) | 3,658 | — |
| Thai SET50 Index | (21) | 09/2023 | THB | (4,000,920) | 123 | — |
| U.S. Long Bond | (5) | 12/2023 | USD | (608,438) | — | (8,678) |
| U.S. Long Bond | (27) | 12/2023 | USD | (3,285,563) | — | (45,962) |
| U.S. Long Bond | (31) | 12/2023 | USD | (3,772,313) | — | (57,077) |
| U.S. Treasury 10-Year Note | (52) | 12/2023 | USD | (5,773,625) | — | (77,609) |
| U.S. Treasury 10-Year Note | (84) | 12/2023 | USD | (9,326,625) | — | (86,414) |
| U.S. Treasury 2-Year Note | (103) | 12/2023 | USD | (20,991,883) | — | (37,781) |
| U.S. Treasury 2-Year Note | (94) | 12/2023 | USD | (19,157,641) | — | (48,665) |
| U.S. Treasury 5-Year Note | (71) | 12/2023 | USD | (7,591,453) | — | (46,771) |
| U.S. Treasury 5-Year Note | (80) | 12/2023 | USD | (8,553,750) | — | (54,513) |
| U.S. Treasury Ultra 10-Year Note | (38) | 12/2023 | USD | (4,412,156) | — | (54,077) |
| U.S. Treasury Ultra 10-Year Note | (39) | 12/2023 | USD | (4,528,266) | — | (56,199) |
| U.S. Treasury Ultra 10-Year Note | (152) | 12/2023 | USD | (17,648,625) | — | (205,699) |
| U.S. Treasury Ultra Bond | (17) | 12/2023 | USD | (2,200,969) | — | (33,173) |
| U.S. Treasury Ultra Bond | (23) | 12/2023 | USD | (2,977,781) | — | (52,870) |
| U.S. Treasury Ultra Bond | (50) | 12/2023 | USD | (6,473,438) | — | (100,248) |
| Utilities Select Sector Index E-mini | (1) | 09/2023 | USD | (63,390) | 2,179 | — |
| Volatility Index | (2) | 09/2023 | USD | (30,088) | 2,809 | — |
| Volatility Index Mini | (1) | 09/2023 | USD | (1,504) | 173 | — |
| Wheat | (21) | 12/2023 | USD | (632,100) | 24,018 | — |
| Wheat | (15) | 12/2023 | USD | (451,500) | 13,017 | — |
| Wheat | (7) | 12/2023 | USD | (254,538) | 7,459 | — |
| Wheat | (2) | 12/2023 | USD | (72,725) | 1,931 | — |
| Wheat | (3) | 03/2024 | USD | (94,313) | 4,368 | — |
| Zinc | (3) | 12/2023 | USD | (182,513) | 383 | — |
| Total | | | | | 410,418 | (1,581,560) |
| Cleared interest rate swap contracts |
| Fund receives | Fund pays | Payment
frequency | Counterparty | Maturity
date | Notional
currency | Notional
amount | Value
($) | Upfront
payments
($) | Upfront
receipts
($) | Unrealized
appreciation
($) | Unrealized
depreciation
($) |
| SOFR | Fixed rate of 3.520% | Receives Annually, Pays Annually | Citi | 12/20/2053 | USD | 808,000 | (4,348) | — | — | — | (4,348) |
| Reference index and values for swap contracts as of period end |
| Reference index | | Reference rate |
| SOFR | Secured Overnight Financing Rate | 5.310% |
Notes to Consolidated Portfolio of Investments
| (a) | Represents privately placed and other securities and instruments exempt from Securities and Exchange Commission registration (collectively, private placements), such as Section 4(a)(2) and Rule 144A eligible securities, which are often sold only to qualified institutional buyers. At August 31, 2023, the total value of these securities amounted to $87,186,675, which represents 19.89% of total net assets. |
| (b) | Variable rate security. The interest rate shown was the current rate as of August 31, 2023. |
| (c) | Variable or floating rate security, the interest rate of which adjusts periodically based on changes in current interest rates and prepayments on the underlying pool of assets. The interest rate shown was the current rate as of August 31, 2023. |
| (d) | Represents interest only securities which have the right to receive the monthly interest payments on an underlying pool of mortgage loans. |
| (e) | Represents fair value as determined in good faith under procedures approved by the Board of Trustees. At August 31, 2023, the total value of these securities amounted to $445,239, which represents 0.10% of total net assets. |
| (f) | Non-income producing investment. |
The accompanying Notes to Consolidated Financial Statements are an integral part of this statement.
| 46 | Multi-Manager Alternative Strategies Fund | Annual Report 2023 |
Consolidated Portfolio of Investments (continued)
August 31, 2023
Notes to Consolidated Portfolio of Investments (continued)
| (g) | Valuation based on significant unobservable inputs. |
| (h) | Zero coupon bond. |
| (i) | Represents a variable rate security with a step coupon where the rate adjusts according to a schedule for a series of periods, typically lower for an initial period and then increasing to a higher coupon rate thereafter. The interest rate shown was the current rate as of August 31, 2023. |
| (j) | Principal amounts are denominated in United States Dollars unless otherwise noted. |
| (k) | Perpetual security with no specified maturity date. |
| (l) | Represents a security in default. |
| (m) | Principal and interest may not be guaranteed by a governmental entity. |
| (n) | Represents a security purchased on a when-issued basis. |
| (o) | Denotes a restricted security, which is subject to legal or contractual restrictions on resale under federal securities laws. Disposal of a restricted investment may involve time-consuming negotiations and expenses, and prompt sale at an acceptable price may be difficult to achieve. Private placement securities are generally considered to be restricted, although certain of those securities may be traded between qualified institutional investors under the provisions of Section 4(a)(2) and Rule 144A. The Fund will not incur any registration costs upon such a trade. These securities are valued at fair value determined in good faith under consistently applied procedures approved by the Fund’s Board of Trustees. At August 31, 2023, the total market value of these securities amounted to $445,239, which represents 0.10% of total net assets. Additional information on these securities is as follows: |
| Security | Acquisition
Dates | Shares | Cost ($) | Value ($) |
| Abiomed, Inc., CVR | 12/21/2022 | 15,541 | — | 27,197 |
| Albireo Pharma, Inc., CVR | 01/09/2023-01/23/2023 | 37,853 | 80,907 | 85,313 |
| Amryt Pharma PLC ADR, CVR | 01/09/2023 | 225,430 | 4,466 | 3,742 |
| Amryt Pharma PLC ADR, CVR | 01/09/2023 | 225,430 | 4,466 | 5,613 |
| Cincor Pharma, Inc. | 01/09/2023-02/23/2023 | 44,405 | 135,473 | 142,775 |
| Concert Pharmaceuticals, Inc., CVR | 01/19/2023-03/02/2023 | 173,147 | 63,478 | 67,112 |
| Resolute Forest Products, Inc. | 07/06/2022-08/18/2022 | 76,222 | 101,179 | 113,487 |
| | | | 389,969 | 445,239 |
| (p) | The stated interest rate represents the weighted average interest rate at August 31, 2023 of contracts within the senior loan facility. Interest rates on contracts are primarily determined either weekly, monthly or quarterly by reference to the indicated base lending rate and spread and the reset period. These base lending rates are primarily the LIBOR and other short-term rates. Base lending rates may be subject to a floor or minimum rate. The interest rate for senior loans purchased on a when-issued or delayed delivery basis will be determined upon settlement, therefore no interest rate is disclosed. Senior loans often require prepayments from excess cash flows or permit the borrowers to repay at their election. The degree to which borrowers repay cannot be predicted with accuracy. As a result, remaining maturities of senior loans may be less than the stated maturities. Generally, the Fund is contractually obligated to receive approval from the agent bank and/or borrower prior to the disposition of a senior loan. |
| (q) | The rate shown is the seven-day current annualized yield at August 31, 2023. |
| (r) | As defined in the Investment Company Act of 1940, as amended, an affiliated company is one in which the Fund owns 5% or more of the company’s outstanding voting securities, or a company which is under common ownership or control with the Fund. The value of the holdings and transactions in these affiliated companies during the year ended August 31, 2023 are as follows: |
| Affiliated issuers | Beginning
of period($) | Purchases($) | Sales($) | Net change in
unrealized
appreciation
(depreciation)($) | End of
period($) | Realized gain
(loss)($) | Dividends($) | End of
period shares |
| Columbia Short-Term Cash Fund, 5.476% |
| | 186,518,946 | 588,050,977 | (565,885,389) | 25,784 | 208,710,318 | 16,458 | 8,071,486 | 208,772,950 |
Abbreviation Legend
| ADR | American Depositary Receipt |
| BAM | Build America Mutual Assurance Co. |
| CMO | Collateralized Mortgage Obligation |
| CVR | Contingent Value Rights |
| FGIC | Financial Guaranty Insurance Corporation |
| FHLMC | Federal Home Loan Mortgage Corporation |
| LIBOR | London Interbank Offered Rate |
| MTA | Monthly Treasury Average |
| NIBOR | Norwegian Interbank Offered Rate |
| SOFR | Secured Overnight Financing Rate |
The accompanying Notes to Consolidated Financial Statements are an integral part of this statement.
Multi-Manager Alternative Strategies Fund | Annual Report 2023
| 47 |
Consolidated Portfolio of Investments (continued)
August 31, 2023
Abbreviation Legend (continued)
Currency Legend
| AUD | Australian Dollar |
| BRL | Brazilian Real |
| CAD | Canada Dollar |
| CHF | Swiss Franc |
| CLP | Chilean Peso |
| CNH | Yuan Offshore Renminbi |
| COP | Colombian Peso |
| EUR | Euro |
| GBP | British Pound |
| HUF | Hungarian Forint |
| IDR | Indonesian Rupiah |
| ILS | Israeli Shekel |
| INR | Indian Rupee |
| JPY | Japanese Yen |
| KRW | South Korean Won |
| MXN | Mexican Peso |
| MYR | Malaysian Ringgit |
| NOK | Norwegian Krone |
| NZD | New Zealand Dollar |
| PHP | Philippine Peso |
| PLN | Polish Zloty |
| SEK | Swedish Krona |
| SGD | Singapore Dollar |
| THB | Thai Baht |
| TRY | Turkish Lira |
| TWD | New Taiwan Dollar |
| USD | US Dollar |
| ZAR | South African Rand |
Fair value measurements
The Fund categorizes its fair value measurements according to a three-level hierarchy that maximizes the use of observable inputs and minimizes the use of unobservable inputs by prioritizing that the most observable input be used when available. Observable inputs are those that market participants would use in pricing an investment based on market data obtained from sources independent of the reporting entity. Unobservable inputs are those that reflect the Fund’s assumptions about the information market participants would use in pricing an investment. An investment’s level within the fair value hierarchy is based on the lowest level of any input that is deemed significant to the asset’s or liability’s fair value measurement. The input levels are not necessarily an indication of the risk or liquidity associated with investments at that level. For example, certain U.S. government securities are generally high quality and liquid, however, they are reflected as Level 2 because the inputs used to determine fair value may not always be quoted prices in an active market.
Fair value inputs are summarized in the three broad levels listed below:
| ■ | Level 1 — Valuations based on quoted prices for investments in active markets that the Fund has the ability to access at the measurement date. Valuation adjustments are not applied to Level 1 investments. |
| ■ | Level 2 — Valuations based on other significant observable inputs (including quoted prices for similar securities, interest rates, prepayment speeds, credit risks, etc.). |
| ■ | Level 3 — Valuations based on significant unobservable inputs (including the Fund’s own assumptions and judgment in determining the fair value of investments). |
Inputs that are used in determining fair value of an investment may include price information, credit data, volatility statistics, and other factors. These inputs can be either observable or unobservable. The availability of observable inputs can vary between investments, and is affected by various factors such as the type of investment, and the volume and level of activity for that investment or similar investments in the marketplace. The inputs will be considered by the Investment Manager, along with any other relevant factors in the calculation of an investment’s fair value. The Fund uses prices and inputs that are current as of the measurement date, which may include periods of market dislocations. During these periods, the availability of prices and inputs may be reduced for many investments. This condition could cause an investment to be reclassified between the various levels within the hierarchy.
The accompanying Notes to Consolidated Financial Statements are an integral part of this statement.
| 48 | Multi-Manager Alternative Strategies Fund | Annual Report 2023 |
Consolidated Portfolio of Investments (continued)
August 31, 2023
Fair value measurements (continued)
Foreign equity securities actively traded in markets where there is a significant delay in the local close relative to the New York Stock Exchange are classified as Level 2. The values of these securities may include an adjustment to reflect the impact of market movements following the close of local trading, as described in Note 2 to the consolidated financial statements – Security valuation.
Investments falling into the Level 3 category are primarily supported by quoted prices from brokers and dealers participating in the market for those investments. However, these may be classified as Level 3 investments due to lack of market transparency and corroboration to support these quoted prices. Additionally, valuation models may be used as the pricing source for any remaining investments classified as Level 3. These models may rely on one or more significant unobservable inputs and/or significant assumptions by the Investment Manager. Inputs used in valuations may include, but are not limited to, financial statement analysis, capital account balances, discount rates and estimated cash flows, and comparable company data.
The Fund’s Board of Trustees (the Board) has designated the Investment Manager, through its Valuation Committee (the Committee), as valuation designee, responsible for determining the fair value of the assets of the Fund for which market quotations are not readily available using valuation procedures approved by the Board. The Committee consists of voting and non-voting members from various groups within the Investment Manager’s organization, including operations and accounting, trading and investments, compliance, risk management and legal.
The Committee meets at least monthly to review and approve valuation matters, which may include a description of specific valuation determinations, data regarding pricing information received from approved pricing vendors and brokers and the results of Board-approved valuation policies and procedures (the Policies). The Policies address, among other things, instances when market quotations are or are not readily available, including recommendations of third party pricing vendors and a determination of appropriate pricing methodologies; events that require specific valuation determinations and assessment of fair value techniques; securities with a potential for stale pricing, including those that are illiquid, restricted, or in default; and the effectiveness of third party pricing vendors, including periodic reviews of vendors. The Committee meets more frequently, as needed, to discuss additional valuation matters, which may include the need to review back-testing results, review time-sensitive information or approve related valuation actions. Representatives of Columbia Management Investment Advisers, LLC report to the Board at each of its regularly scheduled meetings to discuss valuation matters and actions during the period, similar to those described earlier.
The following table is a summary of the inputs used to value the Fund’s investments at August 31, 2023:
| | Level 1 ($) | Level 2 ($) | Level 3 ($) | Total ($) |
| Investments in Securities | | | | |
| Asset-Backed Securities — Non-Agency | — | 13,688,381 | — | 13,688,381 |
| Commercial Mortgage-Backed Securities - Agency | — | 1,644,607 | — | 1,644,607 |
| Commercial Mortgage-Backed Securities - Non-Agency | — | 12,802,126 | — | 12,802,126 |
| Common Stocks | | | | |
| Communication Services | — | — | 0* | 0* |
| Financials | — | 132,256 | — | 132,256 |
| Total Common Stocks | — | 132,256 | 0* | 132,256 |
| Convertible Bonds | — | 3,512,141 | — | 3,512,141 |
| Convertible Preferred Stocks | | | | |
| Utilities | — | 862,518 | — | 862,518 |
| Total Convertible Preferred Stocks | — | 862,518 | — | 862,518 |
| Corporate Bonds & Notes | — | 84,697,709 | — | 84,697,709 |
| Foreign Government Obligations | — | 31,323,982 | — | 31,323,982 |
| Inflation-Indexed Bonds | — | 1,062,635 | — | 1,062,635 |
| Municipal Bonds | — | 2,748,687 | — | 2,748,687 |
| Preferred Debt | 196,652 | — | — | 196,652 |
| Residential Mortgage-Backed Securities - Agency | — | 33,623,995 | — | 33,623,995 |
| Residential Mortgage-Backed Securities - Non-Agency | — | 40,945,783 | — | 40,945,783 |
| Rights | | | | |
| Health Care | — | — | 331,752 | 331,752 |
| Materials | — | — | 113,487 | 113,487 |
| Total Rights | — | — | 445,239 | 445,239 |
| Senior Loans | — | 777,916 | — | 777,916 |
| Treasury Bills | — | 4,969,970 | — | 4,969,970 |
| U.S. Treasury Obligations | — | 10,898,083 | — | 10,898,083 |
| Money Market Funds | 208,710,318 | — | — | 208,710,318 |
| Total Investments in Securities | 208,906,970 | 243,690,789 | 445,239 | 453,042,998 |
| Investments in Derivatives | | | | |
| Asset | | | | |
| Forward Foreign Currency Exchange Contracts | — | 1,523,070 | — | 1,523,070 |
| Futures Contracts | 1,805,154 | — | — | 1,805,154 |
The accompanying Notes to Consolidated Financial Statements are an integral part of this statement.
Multi-Manager Alternative Strategies Fund | Annual Report 2023
| 49 |
Consolidated Portfolio of Investments (continued)
August 31, 2023
Fair value measurements (continued)
| | Level 1 ($) | Level 2 ($) | Level 3 ($) | Total ($) |
| Liability | | | | |
| Forward Foreign Currency Exchange Contracts | — | (1,725,283) | — | (1,725,283) |
| Futures Contracts | (2,058,818) | — | — | (2,058,818) |
| Swap Contracts | — | (4,348) | — | (4,348) |
| Total | 208,653,306 | 243,484,228 | 445,239 | 452,582,773 |
See the Consolidated Portfolio of Investments for all investment classifications not indicated in the table.
The Fund’s assets assigned to the Level 2 input category are generally valued using the market approach, in which a security’s value is determined through reference to prices and information from market transactions for similar or identical assets. These assets include certain foreign securities for which a third party statistical pricing service may be employed for purposes of fair market valuation. The model utilized by such third party statistical pricing service takes into account a security’s correlation to available market data including, but not limited to, intraday index, ADR, and exchange-traded fund movements.
Derivative instruments are valued at unrealized appreciation (depreciation).
The following table is a reconciliation of Level 3 assets for which significant observable and unobservable inputs were used to determine fair value:
| | Balance
as of
08/31/2022
($) | Increase
(decrease)
in accrued
discounts/
premiums
($) | Realized
gain (loss)
($) | Change
in unrealized
appreciation
(depreciation)(a)
($) | Purchases
($) | Sales
($) | Transfers
into
Level 3
($) | Transfers
out of
Level 3
($) | Balance
as of
08/31/2023
($) |
| Common Stocks | 10,610,268 | — | 200,273 | (95,279) | — | (10,715,262) | — | — | — |
| Residential Mortgage-Backed Securities - Non-Agency | 556,698 | — | — | — | — | — | — | (556,698) | — |
| Rights | 21,310 | — | 59,852 | 33,960 | 389,969 | (59,852) | — | — | 445,239 |
| Senior Loans | 138,649 | (8) | (23,588) | 12,375 | — | (127,428) | — | — | — |
| Common Stocks - Investments Sold Short | (20,890) | — | — | — | 20,890 | — | — | — | — |
| Total | 11,306,035 | (8) | 236,537 | (48,944) | 410,859 | (10,902,542) | — | (556,698) | 445,239 |
(a) Change in unrealized appreciation (depreciation) relating to securities held at August 31, 2023 was $55,271, which is comprised of Rights.
The Fund’s assets assigned to the Level 3 category are valued utilizing the valuation technique deemed the most appropriate in the circumstances. Certain common stocks and rights classified as Level 3 securities are valued using an income approach and considered estimates of future distributions from the company. Significant increases (decreases) to any of these estimates would have resulted in a significantly higher (lower) fair value measurement.
Financial assets were transferred from Level 3 to Level 2 as observable market inputs were utilized and management determined that there was sufficient, reliable and observable market data to value these assets as of period end.
The accompanying Notes to Consolidated Financial Statements are an integral part of this statement.
| 50 | Multi-Manager Alternative Strategies Fund | Annual Report 2023 |
Consolidated Statement of Assets and Liabilities
August 31, 2023
| Assets | |
| Investments in securities, at value | |
| Unaffiliated issuers (cost $259,779,823) | $244,332,680 |
| Affiliated issuers (cost $208,693,757) | 208,710,318 |
| Cash | 2,864 |
| Foreign currency (cost $64,748) | 64,440 |
| Cash collateral held at broker for: | |
| Forward foreign currency exchange contracts | 2,440,000 |
| Margin deposits on: | |
| Futures contracts | 11,197,247 |
| Swap contracts | 183,235 |
| Unrealized appreciation on forward foreign currency exchange contracts | 1,523,070 |
| Receivable for: | |
| Investments sold | 491,529 |
| Investments sold on a delayed delivery basis | 12,874,083 |
| Capital shares sold | 375,202 |
| Dividends | 947,929 |
| Interest | 2,035,170 |
| Foreign tax reclaims | 40,529 |
| Variation margin for futures contracts | 611,218 |
| Trustees’ fees | 95,160 |
| Prepaid expenses | 6,971 |
| Total assets | 485,931,645 |
| Liabilities | |
| Unrealized depreciation on forward foreign currency exchange contracts | 1,725,283 |
| Payable for: | |
| Investments purchased | 444,455 |
| Investments purchased on a delayed delivery basis | 43,573,190 |
| Capital shares redeemed | 534,688 |
| Variation margin for futures contracts | 998,543 |
| Variation margin for swap contracts | 3,737 |
| Foreign capital gains taxes deferred | 1,333 |
| Management services fees | 13,227 |
| Transfer agent fees | 45,184 |
| Trustees’ fees | 116,617 |
| Other expenses | 60,770 |
| Total liabilities | 47,517,027 |
| Net assets applicable to outstanding capital stock | $438,414,618 |
| Represented by | |
| Paid in capital | 522,259,289 |
| Total distributable earnings (loss) | (83,844,671) |
| Total - representing net assets applicable to outstanding capital stock | $438,414,618 |
| Institutional Class | |
| Net assets | $438,414,618 |
| Shares outstanding | 47,689,475 |
| Net asset value per share | $9.19 |
The accompanying Notes to Consolidated Financial Statements are an integral part of this statement.
Multi-Manager Alternative Strategies Fund | Annual Report 2023
| 51 |
Consolidated Statement of Operations
Year Ended August 31, 2023
| Net investment income | |
| Income: | |
| Dividends — unaffiliated issuers | $1,589,031 |
| Dividends — affiliated issuers | 8,071,486 |
| Interest | 11,345,265 |
| Interfund lending | 13,411 |
| Foreign taxes withheld | (48,328) |
| Total income | 20,970,865 |
| Expenses: | |
| Management services fees | 5,679,340 |
| Transfer agent fees | |
| Institutional Class | 589,019 |
| Trustees’ fees | 25,057 |
| Custodian fees | 101,683 |
| Printing and postage fees | 63,606 |
| Registration fees | 46,739 |
| Accounting services fees | 58,895 |
| Legal fees | 18,663 |
| Interest on collateral | 7,826 |
| Dividends and interest on securities sold short | 146,096 |
| Compensation of chief compliance officer | 99 |
| Other | 22,473 |
| Total expenses | 6,759,496 |
| Net investment income | 14,211,369 |
| Realized and unrealized gain (loss) — net | |
| Net realized gain (loss) on: | |
| Investments — unaffiliated issuers | (8,677,082) |
| Investments — affiliated issuers | 16,458 |
| Foreign currency translations | (185,331) |
| Forward foreign currency exchange contracts | 1,713,979 |
| Futures contracts | (1,864,581) |
| Option contracts purchased | (756,315) |
| Option contracts written | (105,297) |
| Securities sold short | (739,497) |
| Swap contracts | (207,803) |
| Net realized loss | (10,805,469) |
| Net change in unrealized appreciation (depreciation) on: | |
| Investments — unaffiliated issuers | 8,298,286 |
| Investments — affiliated issuers | 25,784 |
| Foreign currency translations | 107,154 |
| Forward foreign currency exchange contracts | (2,458,747) |
| Futures contracts | (4,635,150) |
| Option contracts purchased | 134,578 |
| Option contracts written | (14,670) |
| Securities sold short | (11,911) |
| Swap contracts | 233,730 |
| Foreign capital gains tax | (1,333) |
| Net change in unrealized appreciation (depreciation) | 1,677,721 |
| Net realized and unrealized loss | (9,127,748) |
| Net increase in net assets resulting from operations | $5,083,621 |
The accompanying Notes to Consolidated Financial Statements are an integral part of this statement.
| 52 | Multi-Manager Alternative Strategies Fund | Annual Report 2023 |
Consolidated Statement of Changes in Net Assets
| | Year Ended
August 31, 2023 | Year Ended
August 31, 2022 |
| Operations | | |
| Net investment income | $14,211,369 | $2,467,772 |
| Net realized gain (loss) | (10,805,469) | 31,428,278 |
| Net change in unrealized appreciation (depreciation) | 1,677,721 | (20,081,146) |
| Net increase in net assets resulting from operations | 5,083,621 | 13,814,904 |
| Distributions to shareholders | | |
| Net investment income and net realized gains | | |
| Institutional Class | (37,236,968) | (7,521,528) |
| Total distributions to shareholders | (37,236,968) | (7,521,528) |
| Increase (decrease) in net assets from capital stock activity | (63,800,915) | 3,155,658 |
| Total increase (decrease) in net assets | (95,954,262) | 9,449,034 |
| Net assets at beginning of year | 534,368,880 | 524,919,846 |
| Net assets at end of year | $438,414,618 | $534,368,880 |
| | Year Ended | Year Ended |
| | August 31, 2023 | August 31, 2022 |
| | Shares | Dollars ($) | Shares | Dollars ($) |
| Capital stock activity |
| Institutional Class | | | | |
| Shares sold | 10,253,167 | 95,719,139 | 13,339,999 | 128,899,389 |
| Distributions reinvested | 4,119,134 | 37,236,968 | 797,617 | 7,521,528 |
| Shares redeemed | (21,241,847) | (196,757,022) | (13,831,115) | (133,265,259) |
| Net increase (decrease) | (6,869,546) | (63,800,915) | 306,501 | 3,155,658 |
| Total net increase (decrease) | (6,869,546) | (63,800,915) | 306,501 | 3,155,658 |
The accompanying Notes to Consolidated Financial Statements are an integral part of this statement.
Multi-Manager Alternative Strategies Fund | Annual Report 2023
| 53 |
Consolidated Financial Highlights
The following table is intended to help you understand the Fund’s financial performance. Certain information reflects financial results for a single share of a class held for the periods shown. Per share net investment income (loss) amounts are calculated based on average shares outstanding during the period. Total return assumes reinvestment of all dividends and distributions, if any. Total return does not reflect payment of sales charges, if any. Total return and portfolio turnover are not annualized for periods of less than one year. The ratios of expenses and net investment income are annualized for periods of less than one year. The portfolio turnover rate is calculated without regard to purchase and sales transactions of short-term instruments and certain derivatives, if any. If such transactions were included, the Fund’s portfolio turnover rate may be higher.
| Institutional Class | Year Ended August 31, |
| 2023 | 2022 | 2021 | 2020 | 2019 |
| Per share data | | | | | |
| Net asset value, beginning of period | $9.79 | $9.68 | $9.38 | $9.36 | $9.08 |
| Income (loss) from investment operations: | | | | | |
| Net investment income | 0.26(a) | 0.05 | 0.02 | 0.08 | 0.22 |
| Net realized and unrealized gain (loss) | (0.16) | 0.20 | 0.36 | 0.13 | 0.19 |
| Total from investment operations | 0.10 | 0.25 | 0.38 | 0.21 | 0.41 |
| Distributions to shareholders | | | | | |
| Distributions from net investment income | (0.67) | (0.14) | (0.08) | (0.19) | (0.13) |
| Distributions from net realized gains | (0.03) | — | — | — | — |
| Total distributions to shareholders | (0.70) | (0.14) | (0.08) | (0.19) | (0.13) |
| Net asset value, end of period | $9.19 | $9.79 | $9.68 | $9.38 | $9.36 |
| Total return | 1.14% | 2.60% | 4.12% | 2.34% | 4.62% |
| Ratios to average net assets | | | | | |
| Total gross expenses(b) | 1.31%(c),(d) | 1.31%(c),(d) | 1.36%(c),(d) | 1.39%(c) | 1.27%(c) |
| Total net expenses(b),(e) | 1.31%(c),(d) | 1.31%(c),(d) | 1.36%(c),(d) | 1.39%(c) | 1.27%(c) |
| Net investment income | 2.75%(a) | 0.47% | 0.23% | 0.91% | 2.43% |
| Supplemental data | | | | | |
| Net assets, end of period (in thousands) | $438,415 | $534,369 | $524,920 | $480,367 | $502,726 |
| Portfolio turnover | 200% | 171% | 203% | 188% | 226% |
| Notes to Consolidated Financial Highlights |
| (a) | Includes income resulting from special dividends. The effect of these amounted to: |
| Class | Net investment income per share | Net investment income ratio |
| Year Ended 8/31/2023 | | |
| Institutional Class | 0.01 | 0.08% |
| (b) | In addition to the fees and expenses that the Fund bears directly, the Fund indirectly bears a pro rata share of the fees and expenses of any other funds in which it invests. Such indirect expenses are not included in the Fund’s reported expense ratios. |
| (c) | Ratios include dividends and interest on securities sold short. If dividends and interest on securities sold short had been excluded, expenses would have been lower by: |
| Class | 8/31/2023 | 8/31/2022 | 8/31/2021 | 8/31/2020 | 8/31/2019 |
| Institutional Class | 0.03% | 0.04% | 0.10% | 0.10% | —% |
| (d) | Ratios include interest on collateral expense which is less than 0.01%. |
| (e) | Total net expenses include the impact of certain fee waivers/expense reimbursements made by the Investment Manager and certain of its affiliates, if applicable. |
The accompanying Notes to Consolidated Financial Statements are an integral part of this statement.
| 54 | Multi-Manager Alternative Strategies Fund | Annual Report 2023 |
Notes to Consolidated Financial Statements
August 31, 2023
Note 1. Organization
Multi-Manager Alternative Strategies Fund (the Fund), a series of Columbia Funds Series Trust I (the Trust), is a diversified fund. The Trust is registered under the Investment Company Act of 1940, as amended (the 1940 Act), as an open-end management investment company organized as a Massachusetts business trust.
Basis for consolidation
ASGM Offshore Fund, Ltd. and ASMF Offshore Fund, Ltd. (each, a Subsidiary) are each a Cayman Islands exempted company and wholly-owned subsidiary of the Fund. Each Subsidiary acts as an investment vehicle in order to effect certain investment strategies consistent with the Fund’s investment objective and policies as stated in its current prospectus and statement of additional information. In accordance with the Memorandum and Articles of Association of the Subsidiary (the Articles), the Fund owns the sole issued share of each Subsidiary and retains all rights associated with such share, including the right to receive notice of, attend and vote at general meetings of the Subsidiaries, rights in a winding-up or repayment of capital and the right to participate in the profits or assets of the Subsidiaries. The consolidated financial statements (financial statements) include the accounts of the consolidated Fund and each respective Subsidiary. Subsequent references to the Fund within the Notes to Consolidated Financial Statements collectively refer to the Fund and each Subsidiary. All intercompany transactions and balances have been eliminated in the consolidation process.
At August 31, 2023, each Subsidiary’s financial statement information is as follows:
| | ASGM Offshore Fund, Ltd. | ASMF Offshore Fund, Ltd. |
| % of consolidated fund net assets | 1.44% | 2.60% |
| Net assets | $6,294,297 | $11,401,650 |
| Net investment income (loss) | 237,721 | 264,055 |
| Net realized gain (loss) | (3,511,093) | (4,828,024) |
| Net change in unrealized appreciation (depreciation) | (340,948) | 367,432 |
The financial statements present the portfolio holdings, financial position and results of operations of the Fund and the Subsidiaries on a consolidated basis.
Fund shares
The Trust may issue an unlimited number of shares (without par value). The Fund is offered only through certain wrap fee programs sponsored and/or managed by Ameriprise Financial, Inc. (Ameriprise Financial) or its affiliates, and to group retirement plan recordkeeping platforms that have an agreement with (i) Columbia Management Investment Distributors, Inc. or an affiliate thereof that specifically authorizes the group retirement plan recordkeeper to offer and/or service Institutional 3 Class shares within such platform, provided also that Fund shares are held in an omnibus account and (ii) Wilshire Associates, appointed or serving as investment manager or consultant to the recordkeeper’s group retirement platform. The Fund does not currently offer Institutional 3 Class shares. The Fund offers the share class listed in the Consolidated Statement of Assets and Liabilities which is not subject to any front-end sales charge or contingent deferred sales charge.
Note 2. Summary of significant accounting policies
Basis of preparation
The Fund is an investment company that applies the accounting and reporting guidance in the Financial Accounting Standards Board (FASB) Accounting Standards Codification Topic 946, Financial Services - Investment Companies (ASC 946). The financial statements are prepared in accordance with U.S. generally accepted accounting principles (GAAP), which requires management to make certain estimates and assumptions that affect the reported amounts of assets and liabilities, the disclosure of contingent assets and liabilities at the date of the financial statements and the reported amounts of income and expenses during the reporting period. Actual results could differ from those estimates.
The following is a summary of significant accounting policies followed by the Fund in the preparation of its financial statements.
Multi-Manager Alternative Strategies Fund | Annual Report 2023
| 55 |
Notes to Consolidated Financial Statements (continued)
August 31, 2023
Security valuation
Equity securities listed on an exchange are valued at the closing price or last trade price on their primary exchange at the close of business of the New York Stock Exchange. Securities with a closing price not readily available or not listed on any exchange are valued at the mean between the closing bid and ask prices. Listed preferred stocks convertible into common stocks are valued using an evaluated price from a pricing service.
Debt securities generally are valued based on prices obtained from pricing services, which are intended to reflect market transactions for normal, institutional-size trading units of similar securities. The services may use various pricing techniques that take into account, as applicable, factors such as yield, quality, coupon rate, maturity, type of issue, trading characteristics and other data, as well as approved independent broker-dealer quotes. Debt securities for which quotations are not readily available or not believed to be reflective of market value may also be valued based upon a bid quote from an approved independent broker-dealer. Debt securities maturing in 60 days or less are valued primarily at amortized market value, unless this method results in a valuation that management believes does not approximate fair value.
Asset- and mortgage-backed securities are generally valued by pricing services, which utilize pricing models that incorporate the securities’ cash flow and loan performance data. These models also take into account available market data, including trades, market quotations, and benchmark yield curves for identical or similar securities. Factors used to identify similar securities may include, but are not limited to, issuer, collateral type, vintage, prepayment speeds, collateral performance, credit ratings, credit enhancement and expected life. Asset-backed securities for which quotations are readily available may also be valued based upon an over-the-counter or exchange bid quote from an approved independent broker-dealer. Debt securities maturing in 60 days or less are valued primarily at amortized market value, unless this method results in a valuation that management believes does not approximate fair value.
Senior loan securities for which reliable market quotations are readily available are generally valued by pricing services at the average of the bids received.
Foreign equity securities are valued based on the closing price or last trade price on their primary exchange at the close of business of the New York Stock Exchange. If any foreign equity security closing prices are not readily available, the securities are valued at the mean of the latest quoted bid and ask prices on such exchanges or markets. Foreign currency exchange rates are determined at the scheduled closing time of the New York Stock Exchange. Many securities markets and exchanges outside the U.S. close prior to the close of the New York Stock Exchange; therefore, the closing prices for securities in such markets or on such exchanges may not fully reflect events that occur after such close but before the close of the New York Stock Exchange. In those situations, foreign securities will be fair valued pursuant to a policy approved by the Board of Trustees. Under the policy, the Fund may utilize a third-party pricing service to determine these fair values. The third-party pricing service takes into account multiple factors, including, but not limited to, movements in the U.S. securities markets, certain depositary receipts, futures contracts and foreign exchange rates that have occurred subsequent to the close of the foreign exchange or market, to determine a good faith estimate that reasonably reflects the current market conditions as of the close of the New York Stock Exchange. The fair value of a security is likely to be different from the quoted or published price, if available.
Investments in open-end investment companies (other than exchange-traded funds (ETFs)), are valued at the latest net asset value reported by those companies as of the valuation time.
Forward foreign currency exchange contracts are marked-to-market based upon foreign currency exchange rates provided by a pricing service.
Futures and options on futures contracts are valued based upon the settlement price at the close of regular trading on their principal exchanges or, in the absence of a settlement price, at the mean of the latest quoted bid and ask prices.
Swap transactions are valued through an independent pricing service or broker, or if neither is available, through an internal model based upon observable inputs.
| 56 | Multi-Manager Alternative Strategies Fund | Annual Report 2023 |
Notes to Consolidated Financial Statements (continued)
August 31, 2023
Investments for which market quotations are not readily available, or that have quotations which management believes are not reflective of market value or reliable, are valued at fair value as determined in good faith under procedures approved by the Board of Trustees. If a security or class of securities (such as foreign securities) is valued at fair value, such value is likely to be different from the quoted or published price for the security, if available.
The determination of fair value often requires significant judgment. To determine fair value, management may use assumptions including but not limited to future cash flows and estimated risk premiums. Multiple inputs from various sources may be used to determine fair value.
GAAP requires disclosure regarding the inputs and valuation techniques used to measure fair value and any changes in valuation inputs or techniques. In addition, investments shall be disclosed by major category. This information is disclosed following the Fund’s Consolidated Portfolio of Investments.
Foreign currency transactions and translations
The values of all assets and liabilities denominated in foreign currencies are generally translated into U.S. dollars at exchange rates determined at the close of regular trading on the New York Stock Exchange. Net realized and unrealized gains (losses) on foreign currency transactions and translations include gains (losses) arising from the fluctuation in exchange rates between trade and settlement dates on securities transactions, gains (losses) arising from the disposition of foreign currency and currency gains (losses) between the accrual and payment dates on dividends, interest income and foreign withholding taxes.
For financial statement purposes, the Fund does not distinguish that portion of gains (losses) on investments which is due to changes in foreign exchange rates from that which is due to changes in market prices of the investments. Such fluctuations are included with the net realized and unrealized gains (losses) on investments in the Consolidated Statement of Operations.
Derivative instruments
The Fund invests in certain derivative instruments, as detailed below, in seeking to meet its investment objectives. Derivatives are instruments whose values depend on, or are derived from, in whole or in part, the value of one or more securities, currencies, commodities, indices, or other assets or instruments. Derivatives may be used to increase investment flexibility (including to maintain cash reserves while maintaining desired exposure to certain assets), for risk management (hedging) purposes, to facilitate trading, to reduce transaction costs and to pursue higher investment returns. The Fund may also use derivative instruments to mitigate certain investment risks, such as foreign currency exchange rate risk, interest rate risk and credit risk. Derivatives may involve various risks, including the potential inability of the counterparty to fulfill its obligations under the terms of the contract, the potential for an illiquid secondary market (making it difficult for the Fund to sell or terminate, including at favorable prices) and the potential for market movements which may expose the Fund to gains or losses in excess of the amount shown in the Consolidated Statement of Assets and Liabilities. The notional amounts of derivative instruments, if applicable, are not recorded in the financial statements.
A derivative instrument may suffer a marked-to-market loss if the value of the contract decreases due to an unfavorable change in the market rates or values of the underlying instrument. Losses can also occur if the counterparty does not perform its obligations under the contract. The Fund’s risk of loss from counterparty credit risk on over-the-counter derivatives is generally limited to the aggregate unrealized gain netted against any collateral held by the Fund and the amount of any variation margin held by the counterparty, plus any replacement costs or related amounts. With exchange-traded or centrally cleared derivatives, there is reduced counterparty credit risk to the Fund since the clearinghouse or central counterparty (CCP) provides some protection in the case of clearing member default. The clearinghouse or CCP stands between the buyer and the seller of the contract; therefore, failure of the clearinghouse or CCP may pose additional counterparty credit risk. However, credit risk still exists in exchange-traded or centrally cleared derivatives with respect to initial and variation margin that is held in a broker’s customer account. While clearing brokers are required to segregate customer margin from their own assets, in the event that a clearing broker becomes insolvent or goes into bankruptcy and at that time there is a shortfall in the aggregate amount of margin held by the clearing broker for all its clients and such shortfall is remedied by the CCP or otherwise, U.S. bankruptcy laws will typically allocate that shortfall on a pro-rata basis across all the clearing broker’s customers (including the Fund), potentially resulting in losses to the Fund.
Multi-Manager Alternative Strategies Fund | Annual Report 2023
| 57 |
Notes to Consolidated Financial Statements (continued)
August 31, 2023
In order to better define its contractual rights and to secure rights that will help the Fund mitigate its counterparty risk, the Fund may enter into an International Swaps and Derivatives Association, Inc. Master Agreement (ISDA Master Agreement) or similar agreement with its derivatives counterparties. An ISDA Master Agreement is an agreement between the Fund and a counterparty that governs over-the-counter derivatives and foreign exchange forward contracts and contains, among other things, collateral posting terms and netting provisions in the event of a default and/or termination event. Under an ISDA Master Agreement, the Fund may, under certain circumstances, offset with the counterparty certain derivative instruments’ payables and/or receivables with collateral held and/or posted and create one single net payment. The provisions of the ISDA Master Agreement typically permit a single net payment in the event of default (close-out netting), including the bankruptcy or insolvency of the counterparty. Note, however, that bankruptcy or insolvency laws of a particular jurisdiction may impose restrictions on or prohibitions against the right of offset or netting in bankruptcy, insolvency or other events.
Collateral (margin) requirements differ by type of derivative. Margin requirements are established by the clearinghouse or CCP for exchange-traded and centrally cleared derivatives. Brokers can ask for margin in excess of the minimum in certain circumstances. Collateral terms for most over-the-counter derivatives are subject to regulatory requirements to exchange variation margin with trading counterparties and may have contract specific margin terms as well. For over-the-counter derivatives traded under an ISDA Master Agreement, the collateral requirements are typically calculated by netting the marked-to-market amount for each transaction under such agreement and comparing that amount to the value of any variation margin currently pledged by the Fund and/or the counterparty. Generally, the amount of collateral due from or to a party has to exceed a minimum transfer amount threshold (e.g., $250,000) before a transfer has to be made. To the extent amounts due to the Fund from its counterparties are not fully collateralized, contractually or otherwise, the Fund bears the risk of loss from counterparty nonperformance. The Fund may also pay interest expense on cash collateral received from the broker or receive interest income on cash collateral pledged to the broker. The Fund attempts to mitigate counterparty risk by only entering into agreements with counterparties that it believes have the financial resources to honor their obligations and by monitoring the financial stability of those counterparties.
Certain ISDA Master Agreements allow counterparties of over-the-counter derivatives transactions to terminate derivatives contracts prior to maturity in the event the Fund’s net asset value declines by a stated percentage over a specified time period or if the Fund fails to meet certain terms of the ISDA Master Agreement, which would cause the Fund to accelerate payment of any net liability owed to the counterparty. The Fund also has termination rights if the counterparty fails to meet certain terms of the ISDA Master Agreement. In determining whether to exercise such termination rights, the Fund would consider, in addition to counterparty credit risk, whether termination would result in a net liability owed from the counterparty.
For financial reporting purposes, the Fund does not offset derivative assets and derivative liabilities that are subject to netting arrangements in the Consolidated Statement of Assets and Liabilities.
Forward foreign currency exchange contracts
Forward foreign currency exchange contracts are over-the-counter agreements between two parties to buy and sell a currency at a set price on a future date. The Fund utilized forward foreign currency exchange contracts to hedge the currency exposure associated with some or all of the Fund’s securities, to shift foreign currency exposure back to U.S. dollars, to shift investment exposure from one currency to another, to generate total return through long and short positions versus the U.S. dollar and to generate alpha. These instruments may be used for other purposes in future periods.
The values of forward foreign currency exchange contracts fluctuate daily with changes in foreign currency exchange rates. Changes in the value of these contracts are recorded as unrealized appreciation or depreciation until the contract is exercised or has expired. The Fund will realize a gain or loss when the forward foreign currency exchange contract is closed or expires. Non-deliverable forward foreign currency exchange contracts are settled with the counterparty in U.S. dollars without delivery of foreign currency.
The use of forward foreign currency exchange contracts does not eliminate fluctuations in the prices of the Fund’s portfolio securities. The risks of forward foreign currency exchange contracts include movement in the values of the foreign currencies relative to the U.S. dollar (or other foreign currencies) and the possibility that counterparties will not complete their contractual obligations, which may be in excess of the amount reflected, if any, in the Consolidated Statement of Assets and Liabilities.
| 58 | Multi-Manager Alternative Strategies Fund | Annual Report 2023 |
Notes to Consolidated Financial Statements (continued)
August 31, 2023
Futures contracts
Futures contracts are exchange-traded and represent commitments for the future purchase or sale of an asset at a specified price on a specified date. The Fund bought and sold futures contracts to produce incremental earnings, to manage the duration and yield curve exposure of the Fund versus the benchmark, to manage exposure to movements in interest rates, to manage exposure to the securities market, the commodities market, the government bond market, the currency market and to generate alpha. These instruments may be used for other purposes in future periods. Upon entering into futures contracts, the Fund bears risks that it may not achieve the anticipated benefits of the futures contracts and may realize a loss. Additional risks include counterparty credit risk, the possibility of an illiquid market, and that a change in the value of the contract or option may not correlate with changes in the value of the underlying asset.
Upon entering into a futures contract, the Fund deposits cash or securities with the broker, known as a futures commission merchant (FCM), in an amount sufficient to meet the initial margin requirement. The initial margin deposit must be maintained at an established level over the life of the contract. Cash deposited as initial margin is recorded in the Consolidated Statement of Assets and Liabilities as margin deposits. Securities deposited as initial margin are designated in the Consolidated Portfolio of Investments. Subsequent payments (variation margin) are made or received by the Fund each day. The variation margin payments are equal to the daily change in the contract value and are recorded as variation margin receivable or payable and are offset in unrealized gains or losses. The Fund generally expects to earn interest income on its margin deposits. The Fund recognizes a realized gain or loss when the contract is closed or expires. Futures contracts involve, to varying degrees, risk of loss in excess of the variation margin disclosed in the Consolidated Statement of Assets and Liabilities.
Options contracts
Options are contracts which entitle the holder to purchase or sell securities or other identified assets at a specified price, or in the case of index option contracts, to receive or pay the difference between the index value and the strike price of the index option contract. Option contracts can be either exchange-traded or over-the-counter. The Fund purchased and has written option contracts to decrease the Fund’s exposure to equity risk, to increase return on investments, to protect gains and to facilitate buying and selling of securities for investments. These instruments may be used for other purposes in future periods. Completion of transactions for option contracts traded in the over-the-counter market depends upon the performance of the other party. Collateral may be collected or posted by the Fund to secure over-the-counter option contract trades. Collateral held or posted by the Fund for such option contract trades must be returned to the broker or the Fund upon closure, exercise or expiration of the contract.
Options contracts purchased are recorded as investments. When the Fund writes an options contract, the premium received is recorded as an asset and an amount equivalent to the premium is recorded as a liability in the Consolidated Statement of Assets and Liabilities and is subsequently adjusted to reflect the current fair value of the option written. Changes in the fair value of the written option are recorded as unrealized appreciation or depreciation until the contract is exercised or has expired. The Fund realizes a gain or loss when the option contract is closed or expires. When option contracts are exercised, the proceeds on sales for a written call or purchased put option contract, or the purchase cost for a written put or purchased call option contract, is adjusted by the amount of premium received or paid.
For over-the-counter options purchased, the Fund bears the risk of loss of the amount of the premiums paid plus the positive change in market values net of any collateral held by the Fund should the counterparty fail to perform under the contracts. Option contracts written by the Fund do not typically give rise to significant counterparty credit risk, as options written generally obligate the Fund and not the counterparty to perform. The risk in writing a call option contract is that the Fund gives up the opportunity for profit if the market price of the security increases above the strike price and the option contract is exercised. The risk in writing a put option contract is that the Fund may incur a loss if the market price of the security decreases below the strike price and the option contract is exercised. Exercise of a written option could result in the Fund purchasing or selling a security or foreign currency when it otherwise would not, or at a price different from the current market value. In purchasing and writing options, the Fund bears the risk of an unfavorable change in the value of the underlying instrument or the risk that the Fund may not be able to enter into a closing transaction due to an illiquid market.
Multi-Manager Alternative Strategies Fund | Annual Report 2023
| 59 |
Notes to Consolidated Financial Statements (continued)
August 31, 2023
Swap contracts
Swap contracts are negotiated in the over-the-counter market and are entered into bilaterally or centrally cleared (centrally cleared swap contract). In a centrally cleared swap contract, immediately following execution of the swap contract with a broker, the swap contract is novated to a central counterparty (the CCP) and the CCP becomes the Fund’s counterparty to the centrally cleared swap contract. The Fund is required to deposit initial margin with the futures commission merchant (FCM), which pledges it through to the CCP in the form of cash or securities in an amount that varies depending on the size and risk profile of the particular swap contract. Securities deposited as initial margin are designated in the Consolidated Portfolio of Investments and cash deposited is recorded in the Consolidated Statement of Assets and Liabilities as margin deposits. For a bilateral swap contract, the Fund has credit exposure to the broker, but exchanges daily variation margin with the broker based on the mark-to-market value of the swap contract to minimize that exposure. For centrally cleared swap contracts, the Fund has minimal credit exposure to the FCM because the CCP stands between the Fund and the relevant buyer/seller on the other side of the contract. Swap contracts are marked-to-market daily and changes in value are recorded as unrealized appreciation (depreciation). The daily change in valuation of centrally cleared swap contracts, if any, is recorded as a receivable or payable for variation margin in the Consolidated Statement of Assets and Liabilities.
Entering into these contracts involves, to varying degrees, elements of interest, liquidity and counterparty credit risk in excess of the amounts recognized in the Consolidated Statement of Assets and Liabilities. Such risks involve the possibility that there may be unfavorable changes in interest rates, market conditions or other conditions, that it may be difficult to initiate a swap transaction or liquidate a position at an advantageous time or price which may result in significant losses, and that the bilateral counterparty, FCM or CCP, as applicable, may not fulfill its obligation under the contract.
Interest rate and inflation rate swap contracts
The Fund entered into interest rate swap transactions and/or inflation rate swap contracts to gain exposure to or protect itself from market rate changes and to hedge the portfolio risk associated with some or all of the Fund’s securities. These instruments may be used for other purposes in future periods. An interest rate swap or inflation rate swap, as applicable, is an agreement between two parties where there are two flows and payments are made between the two counterparties and the payments are dependent upon changes in an interest rate, inflation rate or inflation index calculated on a nominal amount. Interest rate swaps are agreements between two parties that involve the exchange of one type of interest rate for another type of interest rate cash flow on specified dates in the future, based on a predetermined, specified notional amount. Certain interest rate swaps are considered forward-starting, whereby the accrual for the exchange of cash flows does not begin until a specified date in the future. The net cash flow for a standard interest rate swap transaction is generally the difference between a floating market interest rate versus a fixed interest rate.
Interest rate swaps are valued daily and unrealized appreciation (depreciation) is recorded. Certain interest rate swaps may accrue periodic interest on a daily basis as a component of unrealized appreciation (depreciation); the Fund will realize a gain or loss upon the payment or receipt of accrued interest. The Fund will realize a gain or a loss when the interest rate swap is terminated.
Total return swap contracts
The Fund entered into total return swap contracts to manage long or short exposure to the total return on a specified reference security in return for periodic payments based on a fixed or variable interest rate. These instruments may be used for other purposes in future periods. Total return swap contracts may be used to obtain exposure to an underlying reference security, instrument, or other asset or index or market without owning, taking physical custody of, or short selling any such security, instrument or asset in a market.
Total return swap contracts are valued daily, and the change in value is recorded as unrealized appreciation (depreciation) until the termination of the swap, at which time the Fund will realize a gain (loss). Periodic payments received (or made) by the Fund over the term of the contract are recorded as realized gains (losses). Total return swap contracts are subject to the risk associated with the investment in the underlying reference security, instrument or asset. This risk may be offset if the Fund holds any of the underlying reference security, instrument or asset. Total return swap contracts are subject to the risk that the counterparty may not fulfill its obligations under the contract. This risk is offset by the daily exchange of variation margin with the swap counterparty.
| 60 | Multi-Manager Alternative Strategies Fund | Annual Report 2023 |
Notes to Consolidated Financial Statements (continued)
August 31, 2023
Effects of derivative transactions in the financial statements
The following tables are intended to provide additional information about the effect of derivatives on the financial statements of the Fund, including: the fair value of derivatives by risk category and the location of those fair values in the Consolidated Statement of Assets and Liabilities; and the impact of derivative transactions over the period in the Consolidated Statement of Operations, including realized and unrealized gains (losses). The derivative instrument schedules following the Consolidated Portfolio of Investments present additional information regarding derivative instruments outstanding at the end of the period, if any.
The following table is a summary of the fair value of derivative instruments (not considered to be hedging instruments for accounting disclosure purposes) at August 31, 2023:
| | Asset derivatives | |
Risk exposure
category | Consolidated statement
of assets and liabilities
location | Fair value ($) |
| Equity risk | Component of total distributable earnings (loss) — unrealized appreciation on futures contracts | 537,458* |
| Foreign exchange risk | Unrealized appreciation on forward foreign currency exchange contracts | 1,523,070 |
| Foreign exchange risk | Component of total distributable earnings (loss) — unrealized appreciation on futures contracts | 255,414* |
| Interest rate risk | Component of total distributable earnings (loss) — unrealized appreciation on futures contracts | 371,268* |
| Commodity-related investment risk | Component of total distributable earnings (loss) — unrealized appreciation on futures contracts | 641,014* |
| Total | | 3,328,224 |
| | Liability derivatives | |
Risk exposure
category | Consolidated statement
of assets and liabilities
location | Fair value ($) |
| Equity risk | Component of total distributable earnings (loss) — unrealized depreciation on futures contracts | 202,893* |
| Foreign exchange risk | Unrealized depreciation on forward foreign currency exchange contracts | 1,725,283 |
| Foreign exchange risk | Component of total distributable earnings (loss) — unrealized depreciation on futures contracts | 242,386* |
| Interest rate risk | Component of total distributable earnings (loss) — unrealized depreciation on futures contracts | 1,424,102* |
| Interest rate risk | Component of total distributable earnings (loss) — unrealized depreciation on swap contracts | 4,348* |
| Commodity-related investment risk | Component of total distributable earnings (loss) — unrealized depreciation on futures contracts | 189,437* |
| Total | | 3,788,449 |
| * | Includes cumulative appreciation (depreciation) as reported in the tables following the Consolidated Portfolio of Investments. Only the current day’s variation margin for futures and centrally cleared swaps, if any, is reported in receivables or payables in the Consolidated Statement of Assets and Liabilities. |
Multi-Manager Alternative Strategies Fund | Annual Report 2023
| 61 |
Notes to Consolidated Financial Statements (continued)
August 31, 2023
The following table indicates the effect of derivative instruments (not considered to be hedging instruments for accounting disclosure purposes) in the Consolidated Statement of Operations for the year ended August 31, 2023:
| Amount of realized gain (loss) on derivatives recognized in income |
| Risk exposure category | Forward
foreign
currency
exchange
contracts
($) | Futures
contracts
($) | Option
contracts
purchased
($) | Option
contracts
written
($) | Swap
contracts
($) | Total
($) |
| Commodity-related investment risk | — | (7,989,010) | — | — | — | (7,989,010) |
| Equity risk | — | (2,404,196) | (756,315) | (105,297) | 7,604 | (3,258,204) |
| Foreign exchange risk | 1,713,979 | 1,337,135 | — | — | — | 3,051,114 |
| Interest rate risk | — | 7,191,490 | — | — | (215,407) | 6,976,083 |
| Total | 1,713,979 | (1,864,581) | (756,315) | (105,297) | (207,803) | (1,220,017) |
| |
| Change in unrealized appreciation (depreciation) on derivatives recognized in income |
| Risk exposure category | Forward
foreign
currency
exchange
contracts
($) | Futures
contracts
($) | Option
contracts
purchased
($) | Option
contracts
written
($) | Swap
contracts
($) | Total
($) |
| Commodity-related investment risk | — | 19,102 | — | — | — | 19,102 |
| Equity risk | — | 324,893 | 134,578 | (14,670) | (11,482) | 433,319 |
| Foreign exchange risk | (2,458,747) | (1,927,439) | — | — | — | (4,386,186) |
| Interest rate risk | — | (3,051,706) | — | — | 245,212 | (2,806,494) |
| Total | (2,458,747) | (4,635,150) | 134,578 | (14,670) | 233,730 | (6,740,259) |
The following table is a summary of the average daily outstanding volume by derivative instrument for the year ended August 31, 2023:
| Derivative instrument | Average notional
amounts ($) |
| Futures contracts — long | 143,572,714 |
| Futures contracts — short | 389,885,233 |
| Derivative instrument | Average
value ($) |
| Option contracts purchased | 80,828 |
| Option contracts written | (28,413) |
| Derivative instrument | Average unrealized
appreciation ($) | Average unrealized
depreciation ($) |
| Forward foreign currency exchange contracts | 2,552,137 | (2,604,823) |
| Interest rate swap contracts | 153,515 | (320,494) |
| Total return swap contracts | 744 | (759) |
Investments in senior loans
The Fund may invest in senior loan assignments. When the Fund purchases an assignment of a senior loan, the Fund typically has direct rights against the borrower; provided, however, that the Fund’s rights may be more limited than the lender from which it acquired the assignment and the Fund may be able to enforce its rights only through an administrative agent. Although certain senior loan assignments are secured by collateral, the Fund could experience delays or limitations in realizing such collateral or have its interest subordinated to other indebtedness of the obligor. In the event that the administrator or collateral agent of a loan becomes insolvent or enters into receivership or bankruptcy, the Fund may incur costs and delays in realizing payment or may suffer a loss of principal and/or interest. The risk of loss is greater for
| 62 | Multi-Manager Alternative Strategies Fund | Annual Report 2023 |
Notes to Consolidated Financial Statements (continued)
August 31, 2023
unsecured or subordinated loans. In addition, senior loan assignments are vulnerable to market, economic or other conditions or events that may reduce the demand for senior loan assignments and certain senior loan assignments which were liquid when purchased, may become illiquid.
The Fund may enter into senior loan assignments where all or a portion of the loan may be unfunded. The Fund is obligated to fund these commitments at the borrower’s discretion. These commitments, if any, are generally traded and priced in the same manner as other senior loan securities and are disclosed as unfunded senior loan commitments in the Fund’s Consolidated Portfolio of Investments with a corresponding payable for investments purchased. The Fund designates cash or liquid securities to cover these commitments.
Asset- and mortgage-backed securities
The Fund may invest in asset-backed and mortgage-backed securities. The maturity dates shown represent the original maturity of the underlying obligation. Actual maturity may vary based upon prepayment activity on these obligations. All, or a portion, of the obligation may be prepaid at any time because the underlying asset may be prepaid. As a result, decreasing market interest rates could result in an increased level of prepayment. An increased prepayment rate will have the effect of shortening the maturity of the security. Unless otherwise noted, the coupon rates presented are fixed rates.
Delayed delivery securities
The Fund may trade securities on other than normal settlement terms, including securities purchased or sold on a “when-issued” or "forward commitment" basis. This may increase risk to the Fund since the other party to the transaction may fail to deliver, which could cause the Fund to subsequently invest at less advantageous prices. The Fund designates cash or liquid securities in an amount equal to the delayed delivery commitment.
To be announced securities
The Fund may trade securities on a To Be Announced (TBA) basis. As with other delayed-delivery transactions, a seller agrees to issue a TBA security at a future date. However, the seller does not specify the particular securities to be delivered. Instead, the Fund agrees to accept any security that meets specified terms.
In some cases, Master Securities Forward Transaction Agreements (MSFTAs) may be used to govern transactions of certain forward-settling agency mortgage-backed securities, such as delayed-delivery and TBAs, between the Fund and counterparty. The MSFTA maintains provisions for, among other things, initiation and confirmation, payment and transfer, events of default, termination, and maintenance of collateral relating to such transactions.
Mortgage dollar roll transactions
The Fund may enter into mortgage “dollar rolls” in which the Fund sells securities for delivery in the current month and simultaneously contracts with the same counterparty to repurchase similar but not identical securities (same type, coupon and maturity) on a specified future date. These transactions may increase the Fund’s portfolio turnover rate. During the roll period, the Fund loses the right to receive principal and interest paid on the securities sold. However, the Fund may benefit because it receives negotiated amounts in the form of reductions of the purchase price for the future purchase plus the interest earned on the cash proceeds of the securities sold until the settlement date of the forward purchase. The Fund records the incremental difference between the forward purchase and sale of each forward roll as a realized gain or loss. Unless any realized gains exceed the income, capital appreciation, and gain or loss due to mortgage prepayments that would have been realized on the securities sold as part of the mortgage dollar roll, the use of this technique may diminish the investment performance of the Fund compared to what the performance would have been without the use of mortgage dollar rolls. Mortgage dollar rolls involve the risk that the market value of the securities the Fund is obligated to repurchase may decline below the repurchase price, or that the counterparty may default on its obligations. All cash proceeds will be invested in instruments that are permissible investments for the Fund. The Fund identifies cash or liquid securities in an amount equal to the forward purchase price. The Fund does not currently enter into mortgage dollar rolls that are accounted for as financing transactions.
Multi-Manager Alternative Strategies Fund | Annual Report 2023
| 63 |
Notes to Consolidated Financial Statements (continued)
August 31, 2023
Treasury inflation protected securities
The Fund may invest in treasury inflation protected securities (TIPS). The principal amount of TIPS is adjusted periodically and is increased for inflation or decreased for deflation based on a monthly published index. These adjustments are recorded as interest income in the Consolidated Statement of Operations. Coupon payments are based on the adjusted principal at the time the interest is paid.
Interest only and principal only securities
The Fund may invest in Interest Only (IO) or Principal Only (PO) securities. IOs are stripped securities entitled to receive all of the security’s interest, but none of its principal. IOs are particularly sensitive to changes in interest rates and therefore subject to greater fluctuations in price than typical interest bearing debt securities. IOs are also subject to credit risk because the Fund may not receive all or part of the interest payments if the issuer, obligor, guarantor or counterparty defaults on its obligation. Payments received for IOs are included in interest income in the Consolidated Statement of Operations. Because no principal will be received at the maturity of an IO, adjustments are made to the cost of the security on a monthly basis until maturity. These adjustments are included in interest income in the Consolidated Statement of Operations. POs are stripped securities entitled to receive the principal from the underlying obligation, but not the interest. POs are particularly sensitive to changes in interest rates and therefore are subject to fluctuations in price. POs are also subject to credit risk because the Fund may not receive all or part of its principal if the issuer, obligor, guarantor or counterparty defaults on its obligation. The Fund may also invest in IO or PO stripped mortgage-backed securities. Payments received for POs are treated as reductions to the cost and par value of the securities.
| 64 | Multi-Manager Alternative Strategies Fund | Annual Report 2023 |
Offsetting of assets and liabilities
The following table presents the Fund’s gross and net amount of assets and liabilities available for offset under netting arrangements as well as any related collateral received or pledged by the Fund as of August 31, 2023:
| | ANZ
Securities
($) | Barclays
($) | CIBC
($) | Citi
($) (a) | Citi
($) (a) | Citi
($) (a) | Goldman
Sachs
($) | HSBC
($) | JPMorgan
($)(a) | JPMorgan
($)(a) | Morgan
Stanley
($) | RBC
Capital
Markets
($) | Standard
Chartered
($) | State
Street
($) | UBS
($) | Total
($) |
| Assets | | | | | | | | | | | | | | | | |
| Forward foreign currency exchange contracts | 22,360 | 135,417 | 62,973 | - | 400 | 251,588 | 92,200 | 126,574 | 206,605 | 234,892 | 192,894 | 15,846 | 385 | 104,256 | 76,680 | 1,523,070 |
| Liabilities | | | | | | | | | | | | | | | | |
| Centrally cleared interest rate swap contracts (b) | - | - | - | 3,737 | - | - | - | - | - | - | - | - | - | - | - | 3,737 |
| Forward foreign currency exchange contracts | 41,983 | 80,573 | 45,370 | - | 181 | 178,654 | 83,453 | 89,368 | 646,921 | 160,539 | 240,090 | 21,220 | 59,143 | 53,648 | 24,140 | 1,725,283 |
| Total liabilities | 41,983 | 80,573 | 45,370 | 3,737 | 181 | 178,654 | 83,453 | 89,368 | 646,921 | 160,539 | 240,090 | 21,220 | 59,143 | 53,648 | 24,140 | 1,729,020 |
| Total financial and derivative net assets | (19,623) | 54,844 | 17,603 | (3,737) | 219 | 72,934 | 8,747 | 37,206 | (440,316) | 74,353 | (47,196) | (5,374) | (58,758) | 50,608 | 52,540 | (205,950) |
| Total collateral received (pledged) (c) | - | - | - | (3,737) | - | - | - | - | (440,316) | - | - | - | - | - | - | (444,053) |
| Net amount (d) | (19,623) | 54,844 | 17,603 | - | 219 | 72,934 | 8,747 | 37,206 | - | 74,353 | (47,196) | (5,374) | (58,758) | 50,608 | 52,540 | 238,103 |
| (a) | Exposure can only be netted across transactions governed under the same master agreement with the same legal entity. |
| (b) | Centrally cleared swaps are included within payable/receivable for variation margin on the Statement of Assets and Liabilities. |
| (c) | In some instances, the actual collateral received and/or pledged may be more than the amount shown due to overcollateralization. |
| (d) | Represents the net amount due from/(to) counterparties in the event of default. |
Notes to Consolidated Financial Statements (continued)
August 31, 2023
Multi-Manager Alternative Strategies Fund | Annual Report 2023
| 65 |
Notes to Consolidated Financial Statements (continued)
August 31, 2023
Security transactions
Security transactions are accounted for on the trade date. Cost is determined and gains (losses) are based upon the specific identification method for both financial statement and federal income tax purposes.
The trade date for senior loans purchased in the primary market is the date on which the loan is allocated. The trade date for senior loans purchased in the secondary market is the date on which the transaction is entered into.
Income recognition
Interest income is recorded on an accrual basis. Market premiums and discounts, including original issue discounts, are amortized and accreted, respectively, over the expected life of the security on all debt securities, unless otherwise noted. The Fund classifies gains and losses realized on prepayments received on mortgage-backed securities as adjustments to interest income. For convertible securities, premiums attributable to the conversion feature are not amortized.
The Fund may place a debt security on non-accrual status and reduce related interest income when it becomes probable that the interest will not be collected and the amount of uncollectible interest can be reasonably estimated. The Fund may also adjust accrual rates when it becomes probable the full interest will not be collected and a partial payment will be received. A defaulted debt security is removed from non-accrual status when the issuer resumes interest payments or when collectability of interest is reasonably assured.
Corporate actions and dividend income are generally recorded net of any non-reclaimable tax withholdings, on the ex-dividend date or upon receipt of an ex-dividend notification in the case of certain foreign securities.
The Fund may receive distributions from holdings in equity securities, business development companies (BDCs), exchange-traded funds (ETFs), limited partnerships (LPs), other regulated investment companies (RICs), and real estate investment trusts (REITs), which report information as to the tax character of their distributions annually. These distributions are allocated to dividend income, capital gain and return of capital based on actual information reported. Return of capital is recorded as a reduction of the cost basis of securities held. If the Fund no longer owns the applicable securities, return of capital is recorded as a realized gain. With respect to REITs, to the extent actual information has not yet been reported, estimates for return of capital are made by Columbia Management Investment Advisers, LLC (the Investment Manager), a wholly-owned subsidiary of Ameriprise Financial, Inc. (Ameriprise Financial). The Investment Manager’s estimates are subsequently adjusted when the actual character of the distributions is disclosed by the REITs, which could result in a proportionate change in return of capital to shareholders.
Awards from class action litigation are recorded as a reduction of cost basis if the Fund still owns the applicable securities on the payment date. If the Fund no longer owns the applicable securities on the payment date, the proceeds are recorded as realized gains.
The Fund may receive other income from senior loans, including amendment fees, consent fees and commitment fees. These fees are recorded as income when received by the Fund. These amounts are included in Interest Income in the Consolidated Statement of Operations.
Expenses
General expenses of the Trust are allocated to the Fund and other funds of the Trust based upon relative net assets or other expense allocation methodologies determined by the nature of the expense. Expenses directly attributable to the Fund are charged to the Fund. Expenses directly attributable to a specific class of shares are charged to that share class.
Determination of class net asset value
All income, expenses (other than class-specific expenses, which are charged to that share class, as shown in the Consolidated Statement of Operations) and realized and unrealized gains (losses) are allocated to each class of the Fund on a daily basis, based on the relative net assets of each class, for purposes of determining the net asset value of each class.
| 66 | Multi-Manager Alternative Strategies Fund | Annual Report 2023 |
Notes to Consolidated Financial Statements (continued)
August 31, 2023
Federal income tax status
The Fund intends to qualify each year as a regulated investment company under Subchapter M of the Internal Revenue Code, as amended, and will distribute substantially all of its investment company taxable income and net capital gain, if any, for its tax year, and as such will not be subject to federal income taxes. In addition, the Fund intends to distribute in each calendar year substantially all of its ordinary income, capital gain net income and certain other amounts, if any, such that the Fund should not be subject to federal excise tax. Therefore, no federal income or excise tax provision is recorded.
Foreign taxes
The Fund may be subject to foreign taxes on income, gains on investments or currency repatriation, a portion of which may be recoverable. The Fund will accrue such taxes and recoveries, as applicable, based upon its current interpretation of tax rules and regulations that exist in the markets in which it invests.
Realized gains in certain countries may be subject to foreign taxes at the Fund level, based on statutory rates. The Fund accrues for such foreign taxes on realized and unrealized gains at the appropriate rate for each jurisdiction, as applicable. The amount, if any, is disclosed as a liability in the Consolidated Statement of Assets and Liabilities.
Distributions to shareholders
Distributions from net investment income, if any, are declared and paid annually. Net realized capital gains, if any, are distributed at least annually. Income distributions and capital gain distributions are determined in accordance with federal income tax regulations, which may differ from GAAP.
Guarantees and indemnifications
Under the Trust’s organizational documents and, in some cases, by contract, its officers and trustees are indemnified against certain liabilities arising out of the performance of their duties to the Trust or its funds. In addition, certain of the Fund’s contracts with its service providers contain general indemnification clauses. The Fund’s maximum exposure under these arrangements is unknown since the amount of any future claims that may be made against the Fund cannot be determined, and the Fund has no historical basis for predicting the likelihood of any such claims.
Recent accounting pronouncements and regulatory updates
Tailored Shareholder Reports
In October 2022, the Securities and Exchange Commission (SEC) adopted a final rule relating to Tailored Shareholder Reports for Mutual Funds and Exchange-Traded Funds; Fee Information in Investment Company Advertisements. The rule and form amendments will, among other things, require the Fund to transmit concise and visually engaging shareholder reports that highlight key information. The amendments will require that funds tag information in a structured data format and that certain more in-depth information be made available online and available for delivery free of charge to investors on request. The amendments became effective January 24, 2023. There is an 18-month transition period after the effective date of the amendments.
Note 3. Fees and other transactions with affiliates
Management services fees
The Fund has entered into a Management Agreement with Columbia Management Investment Advisers, LLC (the Investment Manager), a wholly-owned subsidiary of Ameriprise Financial, Inc. (Ameriprise Financial). Under the Management Agreement, the Investment Manager provides the Fund with investment research and advice, as well as administrative and accounting services. The Investment Manager is responsible for the ultimate oversight of investments made by the Fund. The Fund’s subadvisers (see Subadvisory agreements below) have the primary responsibility for the day-to-day portfolio management of the Fund. The management services fee is an annual fee that is equal to a percentage of the Fund’s daily net assets that declines from 1.10% to 0.95% as the Fund’s net assets increase. The effective management services fee rate for the year ended August 31, 2023 was 1.10% of the Fund’s average daily net assets.
Multi-Manager Alternative Strategies Fund | Annual Report 2023
| 67 |
Notes to Consolidated Financial Statements (continued)
August 31, 2023
Subadvisory agreements
The Investment Manager has entered into Subadvisory Agreements with AlphaSimplex Group, LLC, Crabel Capital Management, LLC, Manulife Investment Management (US) LLC and TCW Investment Management Company LLC, each of which subadvises a portion of the assets of the Fund. Prior to August 25, 2023, Water Island Capital, LLC served as a subadviser to the Fund. New investments in the Fund, net of any redemptions, are allocated in accordance with the Investment Manager’s determination. Each subadviser’s proportionate share of investments in the Fund will vary due to market fluctuations. The Investment Manager compensates each subadviser to manage the investment of the Fund’s assets.
Compensation of board members
Members of the Board of Trustees who are not officers or employees of the Investment Manager or Ameriprise Financial are compensated for their services to the Fund as disclosed in the Consolidated Statement of Operations. Under a Deferred Compensation Plan (the Deferred Plan), these members of the Board of Trustees may elect to defer payment of up to 100% of their compensation. Deferred amounts are treated as though equivalent dollar amounts had been invested in shares of certain funds managed by the Investment Manager. The Fund’s liability for these amounts is adjusted for market value changes and remains in the Fund until distributed in accordance with the Deferred Plan. All amounts payable under the Deferred Plan constitute a general unsecured obligation of the Fund. The expense for the Deferred Plan, which includes Trustees’ fees deferred during the current period as well as any gains or losses on the Trustees’ deferred compensation balances as a result of market fluctuations, is included in "Trustees’ fees" in the Consolidated Statement of Operations.
Compensation of Chief Compliance Officer
The Board of Trustees has appointed a Chief Compliance Officer for the Fund in accordance with federal securities regulations. As disclosed in the Consolidated Statement of Operations, a portion of the Chief Compliance Officer’s total compensation is allocated to the Fund, along with other allocations to affiliated registered investment companies managed by the Investment Manager and its affiliates, based on relative net assets.
Transfer agency fees
Under a Transfer and Dividend Disbursing Agent Agreement, Columbia Management Investment Services Corp. (the Transfer Agent), an affiliate of the Investment Manager and a wholly-owned subsidiary of Ameriprise Financial, is responsible for providing transfer agency services to the Fund. The Transfer Agent has contracted with SS&C GIDS, Inc. (SS&C GIDS) to serve as sub-transfer agent. Prior to January 1, 2023, SS&C GIDS was known as DST Asset Manager Solutions, Inc. The Transfer Agent pays the fees of SS&C GIDS for services as sub-transfer agent and SS&C GIDS is not entitled to reimbursement for such fees from the Fund (with the exception of out-of-pocket fees).
The Fund pays the Transfer Agent a monthly transfer agency fee based on the number or the average value of accounts, depending on the type of account. In addition, the Fund pays the Transfer Agent a fee for shareholder services based on the number of accounts or on a percentage of the average aggregate value of the Fund’s shares maintained in omnibus accounts up to the lesser of the amount charged by the financial intermediary or a cap established by the Board of Trustees from time to time.
The Transfer Agent also receives compensation from the Fund for various shareholder services and reimbursements for certain out-of-pocket fees.
For the year ended August 31, 2023, the Fund’s effective transfer agency fee rate as a percentage of average daily net assets was as follows:
| | Effective rate (%) |
| Institutional Class | 0.11 |
Distribution and service fees
The Fund has an agreement with Columbia Management Investment Distributors, Inc. (the Distributor), an affiliate of the Investment Manager and a wholly-owned subsidiary of Ameriprise Financial, for distribution and shareholder services. The Fund does not pay the Distributor a fee for the distribution services it provides to the Fund.
| 68 | Multi-Manager Alternative Strategies Fund | Annual Report 2023 |
Notes to Consolidated Financial Statements (continued)
August 31, 2023
Expenses waived/reimbursed by the Investment Manager and its affiliates
The Investment Manager and certain of its affiliates have contractually agreed to waive fees and/or reimburse expenses (excluding certain fees and expenses described below) for the period(s) disclosed below, unless sooner terminated at the sole discretion of the Board of Trustees, so that the Fund’s net operating expenses, after giving effect to fees waived/expenses reimbursed and any balance credits and/or overdraft charges from the Fund’s custodian, do not exceed the following annual rate(s) as a percentage of the classes’ average daily net assets:
| | Fee rate(s) contractual
through
December 31, 2023 |
| Institutional Class | 1.37% |
Under the agreement governing these fee waivers and/or expense reimbursement arrangements, the following fees and expenses are excluded from the waiver/reimbursement commitment, and therefore will be paid by the Fund, if applicable: taxes (including foreign transaction taxes), expenses associated with investments in affiliated and non-affiliated pooled investment vehicles (including mutual funds and exchange-traded funds), transaction costs and brokerage commissions, costs related to any securities lending program, dividend expenses associated with securities sold short, inverse floater program fees and expenses, transaction charges and interest on borrowed money, interest, costs associated with shareholder meetings, infrequent and/or unusual expenses and any other expenses the exclusion of which is specifically approved by the Board of Trustees. This agreement may be modified or amended only with approval from the Investment Manager, certain of its affiliates and the Fund. Any fees waived and/or expenses reimbursed under the expense reimbursement arrangements described above are not recoverable by the Investment Manager or its affiliates in future periods.
Note 4. Federal tax information
The timing and character of income and capital gain distributions are determined in accordance with income tax regulations, which may differ from GAAP because of temporary or permanent book to tax differences.
At August 31, 2023, these differences were primarily due to differing treatment for deferral/reversal of wash sale losses, foreign currency transactions, derivative investments, tax straddles, investments in partnerships and/or grantor trusts, investments in certain convertible securities, deemed distributions, principal and/or interest from fixed income securities, defaulted securities/troubled debt, late-year ordinary losses, post-October capital losses, trustees’ deferred compensation, non-deductible expenses, investments in commodity subsidiaries, swap investments, passive foreign investment company (pfic) holdings, excess distributions, foreign capital gains tax and miscellaneous adjustments. To the extent these differences were permanent, reclassifications were made among the components of the Fund’s net assets. Temporary differences do not require reclassifications.
The following reclassifications were made:
Excess of distributions
over net investment
income ($) | Accumulated
net realized
gain ($) | Paid in
capital ($) |
| (867,752) | 956,076 | (88,324) |
Net investment income (loss) and net realized gains (losses), as disclosed in the Consolidated Statement of Operations, and net assets were not affected by this reclassification.
The tax character of distributions paid during the years indicated was as follows:
| Year Ended August 31, 2023 | Year Ended August 31, 2022 |
Ordinary
income ($) | Long-term
capital gains ($) | Total ($) | Ordinary
income ($) | Long-term
capital gains ($) | Total ($) |
| 37,236,968 | — | 37,236,968 | 7,521,528 | — | 7,521,528 |
Short-term capital gain distributions, if any, are considered ordinary income distributions for tax purposes.
Multi-Manager Alternative Strategies Fund | Annual Report 2023
| 69 |
Notes to Consolidated Financial Statements (continued)
August 31, 2023
At August 31, 2023, the components of distributable earnings on a tax basis were as follows:
Undistributed
ordinary income ($) | Undistributed
long-term
capital gains ($) | Capital loss
carryforwards ($) | Net unrealized
(depreciation) ($) |
| — | — | — | (58,413,408) |
At August 31, 2023, the cost of all investments for federal income tax purposes along with the aggregate gross unrealized appreciation and depreciation based on that cost was:
Federal
tax cost ($) | Gross unrealized
appreciation ($) | Gross unrealized
(depreciation) ($) | Net unrealized
(depreciation) ($) |
| 513,377,009 | — | (58,413,408) | (58,413,408) |
Tax cost of investments and unrealized appreciation/(depreciation) may also include timing differences that do not constitute adjustments to tax basis.
The following capital loss carryforwards, determined at August 31, 2023, may be available to reduce future net realized gains on investments, if any, to the extent permitted by the Internal Revenue Code. In addition, for the year ended August 31, 2023, capital loss carryforwards utilized, if any, were as follows:
No expiration
short-term ($) | No expiration
long-term ($) | Total ($) | Utilized ($) |
| — | — | — | 8,686,092 |
Under current tax rules, regulated investment companies can elect to treat certain late-year ordinary losses incurred and post-October capital losses (capital losses realized after October 31) as arising on the first day of the following taxable year. As of August 31, 2023, the Fund will elect to treat the following late-year ordinary losses and post-October capital losses as arising on September 1, 2023.
Late year
ordinary losses ($) | Post-October
capital losses ($) |
| 1,770,217 | 16,465,087 |
Management of the Fund has concluded that there are no significant uncertain tax positions in the Fund that would require recognition in the financial statements. However, management’s conclusion may be subject to review and adjustment at a later date based on factors including, but not limited to, new tax laws, regulations, and administrative interpretations (including relevant court decisions). Generally, the Fund’s federal tax returns for the prior three fiscal years remain subject to examination by the Internal Revenue Service.
Note 5. Portfolio information
The cost of purchases and proceeds from sales of securities, excluding short-term investments and derivatives, if any, aggregated to $673,119,897 and $774,772,595, respectively, for the year ended August 31, 2023, of which $353,791,635 and $335,448,737, respectively, were U.S. government securities. The amount of purchase and sale activity impacts the portfolio turnover rate reported in the Consolidated Financial Highlights.
Brokerage commissions paid to brokers affiliated with the Investment Manager of the Fund were $29,192 for the year ended August 31, 2023.
Note 6. Affiliated money market fund
The Fund invests significantly in Columbia Short-Term Cash Fund, an affiliated money market fund established for the exclusive use by the Fund and other affiliated funds (the Affiliated MMF). The income earned by the Fund from such investments is included as Dividends - affiliated issuers in the Consolidated Statement of Operations. As an investing fund, the Fund indirectly bears its proportionate share of the expenses of the Affiliated MMF. The Affiliated MMF prices its shares with a floating net asset value. The Securities and Exchange Commission has adopted amendments to money market fund
| 70 | Multi-Manager Alternative Strategies Fund | Annual Report 2023 |
Notes to Consolidated Financial Statements (continued)
August 31, 2023
rules requiring institutional prime money market funds like the Affiliated MMF to be subject, by October 2, 2024, to a liquidity fee if daily net redemptions exceed 5% of net assets and, by April 2, 2024, to a discretionary liquidity fee up to 2% if the imposition of such a fee is determined to be in the best interest of the Affiliated MMF.
Note 7. Interfund lending
Pursuant to an exemptive order granted by the Securities and Exchange Commission, the Fund participates in a program (the Interfund Program) allowing each participating Columbia Fund (each, a Participating Fund) to lend money directly to and, except for closed-end funds and money market funds, borrow money directly from other Participating Funds for temporary purposes. The amounts eligible for borrowing and lending under the Interfund Program are subject to certain restrictions.
Interfund loans are subject to the risk that the borrowing fund could be unable to repay the loan when due, and a delay in repayment to the lending fund could result in lost opportunities and/or additional lending costs. The exemptive order is subject to conditions intended to mitigate conflicts of interest arising from the Investment Manager’s relationship with each Participating Fund.
The Fund’s activity in the Interfund Program during the year ended August 31, 2023 was as follows:
| Borrower or lender | Average loan
balance ($) | Weighted average
interest rate (%) | Number of days
with outstanding loans |
| Lender | 6,371,429 | 4.94 | 14 |
Interest income earned by the Fund is recorded as interfund lending in the Consolidated Statement of Operations. The Fund had no outstanding interfund loans at August 31, 2023.
Note 8. Line of credit
The Fund has access to a revolving credit facility with a syndicate of banks led by JPMorgan Chase Bank, N.A., Citibank, N.A. and Wells Fargo Bank, N.A. whereby the Fund may borrow for the temporary funding of shareholder redemptions or for other temporary or emergency purposes. Pursuant to an October 27, 2022 amendment and restatement, the credit facility, which is an agreement between the Fund and certain other funds managed by the Investment Manager or an affiliated investment manager, severally and not jointly, permits aggregate borrowings up to $950 million. Interest is currently charged to each participating fund based on its borrowings at a rate equal to the higher of (i) the federal funds effective rate, (ii) the secured overnight financing rate plus 0.10% and (iii) the overnight bank funding rate plus, in each case, 1.00%. Each borrowing under the credit facility matures no later than 60 days after the date of borrowing. The Fund also pays a commitment fee equal to its pro rata share of the unused amount of the credit facility at a rate of 0.15% per annum. The commitment fee is included in other expenses in the Consolidated Statement of Operations. This agreement expires annually in October unless extended or renewed. Prior to the October 27, 2022 amendment and restatement, the Fund had access to a revolving credit facility with a syndicate of banks led by JPMorgan Chase Bank, N.A., Citibank, N.A. and Wells Fargo Bank, N.A. which permitted collective borrowings up to $950 million. Interest was charged to each participating fund based on its borrowings at a rate equal to the higher of (i) the federal funds effective rate, (ii) the secured overnight financing rate plus 0.11448% and (iii) the overnight bank funding rate plus, in each case, 1.00%.
The Fund had no borrowings during the year ended August 31, 2023.
Note 9. Significant risks
Alternative strategies investment risk
An investment in alternative investment strategies (Alternative Strategies) involves risks, which may be significant. Alternative Strategies may include strategies, instruments or other assets, such as derivatives, that seek investment returns uncorrelated with the broad equity and fixed income/debt markets, as well as those providing exposure to other markets (such as commodity markets), including but not limited to absolute (positive) return strategies. Alternative Strategies may fail to achieve their desired performance, market or other exposure, or their returns (or lack thereof) may be more correlated with the broad equity and/or fixed income/debt markets than was anticipated, and the Fund may lose money.
Multi-Manager Alternative Strategies Fund | Annual Report 2023
| 71 |
Notes to Consolidated Financial Statements (continued)
August 31, 2023
Credit risk
Credit risk is the risk that the value of debt instruments in the Fund’s portfolio may decline because the issuer defaults or otherwise becomes unable or unwilling, or is perceived to be unable or unwilling, to honor its financial obligations, such as making payments to the Fund when due. Credit rating agencies assign credit ratings to certain debt instruments to indicate their credit risk. Lower-rated or unrated debt instruments held by the Fund may present increased credit risk as compared to higher-rated debt instruments.
Derivatives risk
Losses involving derivative instruments may be substantial, because a relatively small movement in the underlying reference (which is generally the price, rate or other economic indicator associated with a security(ies), commodity, currency, index or other instrument or asset) may result in a substantial loss for the Fund. In addition to the potential for increased losses, the use of derivative instruments may lead to increased volatility within the Fund. Derivatives will typically increase the Fund’s exposure to principal risks to which it is otherwise exposed, and may expose the Fund to additional risks, including correlation risk, counterparty risk, hedging risk, leverage risk, liquidity risk and pricing risk.
Foreign currency risk
The performance of the Fund may be materially affected positively or negatively by foreign currency strength or weakness relative to the U.S. dollar, particularly if the Fund invests a significant percentage of its assets in foreign securities or other assets denominated in currencies other than the U.S. dollar. Currency rates in foreign countries may fluctuate significantly over short or long periods of time for a number of reasons, including changes in interest rates, imposition of currency controls and economic or political developments in the U.S. or abroad. The Fund may also incur currency conversion costs when converting foreign currencies into U.S. dollars and vice versa.
Interest rate risk
Interest rate risk is the risk of losses attributable to changes in interest rates. In general, if interest rates rise, the values of debt instruments tend to fall, and if interest rates fall, the values of debt instruments tend to rise. Actions by governments and central banking authorities can result in increases or decreases in interest rates. Higher periods of inflation could lead such authorities to raise interest rates. Increasing interest rates may negatively affect the value of debt securities held by the Fund, resulting in a negative impact on the Fund’s performance and net asset value per share. In general, the longer the maturity or duration of a debt security, the greater its sensitivity to changes in interest rates. The Fund is subject to the risk that the income generated by its investments may not keep pace with inflation.
Leverage risk
Leverage occurs when the Fund increases its assets available for investment using borrowings, short sales, derivatives, or similar instruments or techniques. The use of leverage may produce volatility and may exaggerate changes in the Fund’s net asset value and in the return on the Fund’s portfolio, which may increase the risk that the Fund will lose more than it has invested. Because short sales involve borrowing securities and then selling them, the Fund’s short sales effectively leverage the Fund’s assets. The Fund’s assets that are used as collateral to secure the Fund’s obligations to return the securities sold short may decrease in value while the short positions are outstanding, which may force the Fund to use its other assets to increase the collateral. Leverage can create an interest expense that may lower the Fund’s overall returns. Leverage presents the opportunity for increased net income and capital gains, but may also exaggerate the Fund’s volatility and risk of loss. There can be no guarantee that a leveraging strategy will be successful.
Liquidity risk
Liquidity risk is the risk associated with a lack of marketability of investments which may make it difficult to sell the investment at a desirable time or price. Changing regulatory, market or other conditions or environments (for example, the interest rate or credit environments) may adversely affect the liquidity of the Fund’s investments. The Fund may have to accept a lower selling price for the holding, sell other investments, or forego another, more appealing investment opportunity. Generally, the less liquid the market at the time the Fund sells a portfolio investment, the greater the risk of loss or decline of value to the Fund. A less liquid market can lead to an increase in Fund redemptions, which may negatively impact Fund performance and net asset value per share, including, for example, if the Fund is forced to sell securities in a down market.
| 72 | Multi-Manager Alternative Strategies Fund | Annual Report 2023 |
Notes to Consolidated Financial Statements (continued)
August 31, 2023
Market risk
The Fund may incur losses due to declines in the value of one or more securities in which it invests. These declines may be due to factors affecting a particular issuer, or the result of, among other things, political, regulatory, market, economic or social developments affecting the relevant market(s) more generally. In addition, turbulence in financial markets and reduced liquidity in equity, credit and/or fixed income markets may negatively affect many issuers, which could adversely affect the Fund’s ability to price or value hard-to-value assets in thinly traded and closed markets and could cause significant redemptions and operational challenges. Global economies and financial markets are increasingly interconnected, and conditions and events in one country, region or financial market may adversely impact issuers in a different country, region or financial market. These risks may be magnified if certain events or developments adversely interrupt the global supply chain; in these and other circumstances, such risks might affect companies worldwide. As a result, local, regional or global events such as terrorism, war, natural disasters, disease/virus outbreaks and epidemics or other public health issues, recessions, depressions or other events – or the potential for such events – could have a significant negative impact on global economic and market conditions.
The large-scale invasion of Ukraine by Russia in February 2022 has resulted in sanctions and market disruptions, including declines in regional and global stock markets, unusual volatility in global commodity markets and significant devaluations of Russian currency. The extent and duration of the military action are impossible to predict but could be significant. Market disruption caused by the Russian military action, and any counter-measures or responses thereto (including international sanctions, a downgrade in the country’s credit rating, purchasing and financing restrictions, boycotts, tariffs, changes in consumer or purchaser preferences, cyberattacks and espionage) could have severe adverse impacts on regional and/or global securities and commodities markets, including markets for oil and natural gas. These impacts may include reduced market liquidity, distress in credit markets, further disruption of global supply chains, increased risk of inflation, restricted cross-border payments and limited access to investments and/or assets in certain international markets and/or issuers. These developments and other related events could negatively impact Fund performance.
Money market fund investment risk
An investment in a money market fund is not a bank deposit and is not insured or guaranteed by any bank, the FDIC or any other government agency. Certain money market funds float their net asset value while others seek to preserve the value of investments at a stable net asset value (typically, $1.00 per share). An investment in a money market fund, even an investment in a fund seeking to maintain a stable net asset value per share, is not guaranteed and it is possible for the Fund to lose money by investing in these and other types of money market funds. If the liquidity of a money market fund’s portfolio deteriorates below certain levels, the money market fund may suspend redemptions (i.e., impose a redemption gate) and thereby prevent the Fund from selling its investment in the money market fund or impose a fee of up to 2% on amounts the Fund redeems from the money market fund (i.e., impose a liquidity fee). These measures may result in an investment loss or prohibit the Fund from redeeming shares when the Investment Manager would otherwise redeem shares. In addition to the fees and expenses that the Fund directly bears, the Fund indirectly bears the fees and expenses of any money market funds in which it invests, including affiliated money market funds. By investing in a money market fund, the Fund will be exposed to the investment risks of the money market fund in direct proportion to such investment. To the extent the Fund invests in instruments such as derivatives, the Fund may hold investments, which may be significant, in money market fund shares to cover its obligations resulting from the Fund’s investments in such instruments. Money market funds and the securities they invest in are subject to comprehensive regulations. The enactment of new legislation or regulations, as well as changes in interpretation and enforcement of current laws, may affect the manner of operation, performance and/or yield of money market funds.
Mortgage- and other asset-backed securities risk
The value of any mortgage-backed and other asset-backed securities including collateralized debt obligations, if any, held by the Fund may be affected by, among other things, changes or perceived changes in: interest rates; factors concerning the interests in and structure of the issuer or the originator of the mortgages or other assets; the creditworthiness of the entities that provide any supporting letters of credit, surety bonds or other credit enhancements; or the market’s assessment of the quality of underlying assets. Payment of principal and interest on some mortgage-backed securities (but not the market value of the securities themselves) may be guaranteed by the full faith and credit of a particular U.S. Government agency, authority,
Multi-Manager Alternative Strategies Fund | Annual Report 2023
| 73 |
Notes to Consolidated Financial Statements (continued)
August 31, 2023
enterprise or instrumentality, and some, but not all, are also insured or guaranteed by the U.S. Government. Mortgage-backed securities issued by non-governmental issuers (such as commercial banks, savings and loan institutions, private mortgage insurance companies, mortgage bankers and other secondary market issuers) may entail greater risk than obligations guaranteed by the U.S. Government. Mortgage- and other asset-backed securities are subject to liquidity risk and prepayment risk. A decline or flattening of housing values may cause delinquencies in mortgages (especially sub-prime or non-prime mortgages) underlying mortgage-backed securities and thereby adversely affect the ability of the mortgage-backed securities issuer to make principal and/or interest payments to mortgage-backed securities holders, including the Fund. Rising or high interest rates tend to extend the duration of mortgage- and other asset-backed securities, making their prices more volatile and more sensitive to changes in interest rates.
Shareholder concentration risk
At August 31, 2023, affiliated shareholders of record owned 100.0% of the outstanding shares of the Fund in one or more accounts. Fund shares sold to or redeemed by concentrated accounts may have a significant effect on the operations of the Fund. In the case of a large redemption, the Fund may be forced to sell investments at inopportune times, including its liquid positions, which may result in Fund losses and the Fund holding a higher percentage of less liquid positions. Large redemptions could result in decreased economies of scale and increased operating expenses for non-redeeming Fund shareholders.
Note 10. Subsequent events
Management has evaluated the events and transactions that have occurred through the date the financial statements were issued and noted no items requiring adjustment of the financial statements or additional disclosure.
Note 11. Information regarding pending and settled legal proceedings
Ameriprise Financial and certain of its affiliates are involved in the normal course of business in legal proceedings which include regulatory inquiries, arbitration and litigation, including class actions concerning matters arising in connection with the conduct of their activities as part of a diversified financial services firm. Ameriprise Financial believes that the Fund is not currently the subject of, and that neither Ameriprise Financial nor any of its affiliates are the subject of, any pending legal, arbitration or regulatory proceedings that are likely to have a material adverse effect on the Fund or the ability of Ameriprise Financial or its affiliates to perform under their contracts with the Fund. Ameriprise Financial is required to make quarterly (10-Q), annual (10-K) and, as necessary, 8-K filings with the Securities and Exchange Commission (SEC) on legal and regulatory matters that relate to Ameriprise Financial and its affiliates. Copies of these filings may be obtained by accessing the SEC website at www.sec.gov.
There can be no assurance that these matters, or the adverse publicity associated with them, will not result in increased Fund redemptions, reduced sale of Fund shares or other adverse consequences to the Fund. Further, although we believe proceedings are not likely to have a material adverse effect on the Fund or the ability of Ameriprise Financial or its affiliates to perform under their contracts with the Fund, these proceedings are subject to uncertainties and, as such, we are unable to estimate the possible loss or range of loss that may result. An adverse outcome in one or more of these proceedings could result in adverse judgments, settlements, fines, penalties or other relief that could have a material adverse effect on the consolidated financial condition or results of operations of Ameriprise Financial or one or more of its affiliates that provide services to the Fund.
| 74 | Multi-Manager Alternative Strategies Fund | Annual Report 2023 |
Report of Independent Registered Public Accounting Firm
To the Board of Trustees of Columbia Funds Series Trust I and Shareholders of Multi-Manager Alternative Strategies Fund
Opinion on the Financial Statements
We have audited the accompanying consolidated statement of assets and liabilities, including the consolidated portfolio of investments, of Multi-Manager Alternative Strategies Fund and its subsidiaries (one of the funds constituting Columbia Funds Series Trust I, referred to hereafter as the "Fund") as of August 31, 2023, the related consolidated statement of operations for the year ended August 31, 2023, the consolidated statement of changes in net assets for each of the two years in the period ended August 31, 2023, including the related notes, and the consolidated financial highlights for each of the five years in the period ended August 31, 2023 (collectively referred to as the "consolidated financial statements"). In our opinion, the consolidated financial statements present fairly, in all material respects, the financial position of the Fund as of August 31, 2023, the results of its operations for the year then ended, the changes in its net assets for each of the two years in the period ended August 31, 2023 and the consolidated financial highlights for each of the five years in the period ended August 31, 2023 in conformity with accounting principles generally accepted in the United States of America.
Basis for Opinion
These consolidated financial statements are the responsibility of the Fund’s management. Our responsibility is to express an opinion on the Fund’s consolidated financial statements based on our audits. We are a public accounting firm registered with the Public Company Accounting Oversight Board (United States) (PCAOB) and are required to be independent with respect to the Fund in accordance with the U.S. federal securities laws and the applicable rules and regulations of the Securities and Exchange Commission and the PCAOB.
We conducted our audits of these consolidated financial statements in accordance with the standards of the PCAOB. Those standards require that we plan and perform the audit to obtain reasonable assurance about whether the consolidated financial statements are free of material misstatement, whether due to error or fraud.
Our audits included performing procedures to assess the risks of material misstatement of the consolidated financial statements, whether due to error or fraud, and performing procedures that respond to those risks. Such procedures included examining, on a test basis, evidence regarding the amounts and disclosures in the consolidated financial statements. Our audits also included evaluating the accounting principles used and significant estimates made by management, as well as evaluating the overall presentation of the consolidated financial statements. Our procedures included confirmation of securities owned as of August 31, 2023 by correspondence with the custodian, transfer agent, brokers and agent banks; when replies were not received from brokers, we performed other auditing procedures. We believe that our audits provide a reasonable basis for our opinion.
/s/PricewaterhouseCoopers LLP
Minneapolis, Minnesota
October 23, 2023
We have served as the auditor of one or more investment companies within the Columbia Funds Complex since 1977.
Multi-Manager Alternative Strategies Fund | Annual Report 2023
| 75 |
Federal Income Tax Information
(Unaudited)
The Fund hereby designates the following tax attributes for the fiscal year ended August 31, 2023. Shareholders will be notified in early 2024 of the amounts for use in preparing 2023 income tax returns.
Qualified
dividend
income | Dividends
received
deduction | Section
199A
dividends |
| 5.68% | 4.37% | 0.15% |
Qualified dividend income. For taxable, non-corporate shareholders, the percentage of ordinary income distributed during the fiscal year that represents qualified dividend income subject to reduced tax rates.
Dividends received deduction. The percentage of ordinary income distributed during the fiscal year that qualifies for the corporate dividends received deduction.
Section 199A dividends. For taxable, non-corporate shareholders, the percentage of ordinary income distributed during the fiscal year that represents Section 199A dividends potentially eligible for a 20% deduction.
TRUSTEES AND OFFICERS
(Unaudited)
The Board oversees the Fund’s operations and appoints officers who are responsible for day-to-day business decisions based on policies set by the Board. The following table provides basic biographical information about the Fund’s Trustees as of the printing of this report, including their principal occupations during the past five years, although specific titles for individuals may have varied over the period. The year set forth beneath Length of Service in the table below is the year in which the Trustee was first appointed or elected as Trustee to any Fund currently in the Columbia Funds Complex or a predecessor thereof. Under current Board policy, each Trustee generally serves until December 31 of the year such Trustee turns seventy-five (75).
Independent trustees
Name,
address,
year of birth | Position held
with the Columbia Funds and
length of service | Principal occupation(s)
during past five years
and other relevant
professional experience | Number of
Funds in the
Columbia Funds
Complex*
overseen | Other directorships
held by Trustee
during the past five years
and other relevant Board experience |
George S. Batejan
c/o Columbia Management
Investment Advisers, LLC
290 Congress Street
Boston, MA 02210
1954 | Trustee since 2017 | Executive Vice President, Global Head of Technology and Operations, Janus Capital Group, Inc., 2010-2016 | 173 | Former Chairman of the Board, NICSA (National Investment Company Services Association) (Executive Committee, Nominating Committee and Governance Committee), 2014-2016; former Director, Intech Investment Management, 2011-2016; former Board Member, Metro Denver Chamber of Commerce, 2015-2016; former Advisory Board Member, University of Colorado Business School, 2015-2018; former Board Member, Chase Bank International, 1993-1994 |
| 76 | Multi-Manager Alternative Strategies Fund | Annual Report 2023 |
TRUSTEES AND OFFICERS (continued)
(Unaudited)
Independent trustees (continued)
Name,
address,
year of birth | Position held
with the Columbia Funds and
length of service | Principal occupation(s)
during past five years
and other relevant
professional experience | Number of
Funds in the
Columbia Funds
Complex*
overseen | Other directorships
held by Trustee
during the past five years
and other relevant Board experience |
Kathleen Blatz
c/o Columbia Management
Investment Advisers, LLC
290 Congress Street
Boston, MA 02210
1954 | Trustee since 2006 | Attorney, specializing in arbitration and mediation; Chief Justice, Minnesota Supreme Court, 1998-2006; Associate Justice, Minnesota Supreme Court, 1996-1998; Fourth Judicial District Court Judge, Hennepin County, 1994-1996; Attorney in private practice and public service, 1984-1993; State Representative, Minnesota House of Representatives, 1979-1993, which included service on the Tax and Financial Institutions and Insurance Committees; Member and Interim Chair, Minnesota Sports Facilities Authority, January-July 2017; Interim President and Chief Executive Officer, Blue Cross and Blue Shield of Minnesota (health care insurance), February-July 2018, April-October 2021 | 173 | Former Trustee, Blue Cross and Blue Shield of Minnesota, 2009-2021 (Chair of the Business Development Committee, 2014-2017; Chair of the Governance Committee, 2017-2019); former Member and Chair of the Board, Minnesota Sports Facilities Authority, January 2017-July 2017; former Director, Robina Foundation, 2009-2020 (Chair, 2014-2020); Director, Richard M. Schulze Family Foundation, since 2021 |
Pamela G. Carlton
c/o Columbia Management
Investment Advisers, LLC
290 Congress Street
Boston, MA 02210
1954 | Chair since 2023; Trustee since 2007 | President, Springboard – Partners in Cross Cultural Leadership (consulting company), since 2003; Managing Director of US Equity Research, JP Morgan Chase, 1999-2003; Director of US Equity Research, Chase Asset Management, 1996-1999; Co-Director Latin America Research, 1993-1996, COO Global Research, 1992-1996, Co-Director of US Research, 1991-1992, Investment Banker, 1982-1991, Morgan Stanley; Attorney, Cleary Gottlieb Steen & Hamilton LLP, 1980-1982 | 173 | Trustee, New York Presbyterian Hospital Board, since 1996; Director, DR Bank (Audit Committee) since 2017; Director, Evercore Inc. (Audit Committee, Nominating and Governance Committee), since 2019; Director, Apollo Commercial Real Estate Finance, Inc. (Chair, Nominating and Governance Committee) (financial services), since 2021; the Governing Council of the Independent Directors Council (IDC), since 2021 |
Janet Langford Carrig
c/o Columbia Management
Investment Advisers, LLC
290 Congress Street
Boston, MA 02210
1957 | Trustee since 1996 | Senior Vice President, General Counsel and Corporate Secretary, ConocoPhillips (independent energy company), September 2007-October 2018 | 173 | Director, EQT Corporation (natural gas producer), since 2019; former Director, Whiting Petroleum Corporation (independent oil and gas company), 2020-2022 |
J. Kevin Connaughton
c/o Columbia Management
Investment Advisers, LLC
290 Congress Street
Boston, MA 02210
1964 | Trustee since 2020 | CEO and President, RhodeWay Financial (non-profit financial planning firm), since December 2022; Member, FINRA National Adjudicatory Council, since January 2020; Adjunct Professor of Finance, Bentley University since January 2018; Consultant to Independent Trustees of CFVIT and CFST I from March 2016 to June 2020 with respect to CFVIT and to December 2020 with respect to CFST I; Managing Director and General Manager of Mutual Fund Products, Columbia Management Investment Advisers, LLC, May 2010-February 2015; President, Columbia Funds, 2008-2015; and senior officer of Columbia Funds and affiliated funds, 2003-2015 | 171 | Former Director, The Autism Project, March 2015-December 2021; former Member of the Investment Committee, St. Michael’s College, November 2015-February 2020; former Trustee, St. Michael’s College, June 2017-September 2019; former Trustee, New Century Portfolios (former mutual fund complex), January 2015-December 2017 |
Multi-Manager Alternative Strategies Fund | Annual Report 2023
| 77 |
TRUSTEES AND OFFICERS (continued)
(Unaudited)
Independent trustees (continued)
Name,
address,
year of birth | Position held
with the Columbia Funds and
length of service | Principal occupation(s)
during past five years
and other relevant
professional experience | Number of
Funds in the
Columbia Funds
Complex*
overseen | Other directorships
held by Trustee
during the past five years
and other relevant Board experience |
Olive M. Darragh
c/o Columbia Management
Investment Advisers, LLC
290 Congress Street
Boston, MA 02210
1962 | Trustee since 2020 | Managing Director of Darragh Inc. (strategy and talent management consulting firm), since 2010; Founder and CEO, Zolio, Inc. (investment management talent identification platform), since 2004; Consultant to Independent Trustees of CFVIT and CFST I from June 2019 to June 2020 with respect to CFVIT and to December 2020 with respect to CFST I; Partner, Tudor Investments, 2004-2010; Senior Partner, McKinsey & Company (consulting), 1990-2004; Touche Ross CPA, 1985-1988 | 171 | Treasurer, Edinburgh University US Trust Board, since January 2023; Member, HBS Community Action Partners Board, since September 2022; former Director, University of Edinburgh Business School (Member of US Board), 2004-2019; former Director, Boston Public Library Foundation, 2008-2017 |
Patricia M. Flynn
c/o Columbia Management
Investment Advisers, LLC
290 Congress Street
Boston, MA 02210
1950 | Trustee since 2004 | Professor of Economics and Management, Bentley University, since 2002; Dean, McCallum Graduate School of Business, Bentley University, 1992-2002 | 173 | Former Trustee, MA Taxpayers Foundation, 1997-2022; former Director, The MA Business Roundtable, 2003-2019; former Chairperson, Innovation Index Advisory Committee, MA Technology Collaborative, 1997-2020 |
Brian J. Gallagher
c/o Columbia Management
Investment Advisers, LLC
290 Congress Street
Boston, MA 02210
1954 | Trustee since 2017 | Retired; Partner with Deloitte & Touche LLP and its predecessors, 1977-2016 | 173 | Trustee, Catholic Schools Foundation, since 2004 |
Douglas A. Hacker
c/o Columbia Management
Investment Advisers, LLC
290 Congress Street
Boston, MA 02210
1955 | Trustee since 1996 | Independent business executive, since May 2006; Executive Vice President – Strategy of United Airlines, December 2002 - May 2006; President of UAL Loyalty Services (airline marketing company), September 2001-December 2002; Executive Vice President and Chief Financial Officer of United Airlines, July 1999-September 2001 | 173 | Director, SpartanNash Company since November 2013 (Chair of the Board, since May 2021) (food distributor); Director, Aircastle Limited (Chair of Audit Committee) (aircraft leasing), since August 2006; former Director, Nash Finch Company (food distributor), 2005-2013; former Director, SeaCube Container Leasing Ltd. (container leasing), 2010-2013; and former Director, Travelport Worldwide Limited (travel information technology), 2014-2019 |
Nancy T. Lukitsh
c/o Columbia Management
Investment Advisers, LLC
290 Congress Street
Boston, MA 02210
1956 | Trustee since 2011 | Senior Vice President, Partner and Director of Marketing, Wellington Management Company, LLP (investment adviser), 1997-2010; Chair, Wellington Management Portfolios (commingled non-U.S. investment pools), 2007-2010; Director, Wellington Trust Company, NA and other Wellington affiliates, 1997-2010 | 171 | None |
| 78 | Multi-Manager Alternative Strategies Fund | Annual Report 2023 |
TRUSTEES AND OFFICERS (continued)
(Unaudited)
Independent trustees (continued)
Name,
address,
year of birth | Position held
with the Columbia Funds and
length of service | Principal occupation(s)
during past five years
and other relevant
professional experience | Number of
Funds in the
Columbia Funds
Complex*
overseen | Other directorships
held by Trustee
during the past five years
and other relevant Board experience |
David M. Moffett
c/o Columbia Management
Investment Advisers, LLC
290 Congress Street
Boston, MA 02210
1952 | Trustee since 2011 | Retired; former Chief Executive Officer of Freddie Mac and Chief Financial Officer of U.S. Bank | 171 | Director, CSX Corporation (transportation suppliers); Director, PayPal Holdings Inc. (payment and data processing services); Trustee, University of Oklahoma Foundation; former Director, eBay Inc. (online trading community), 2007-2015; and former Director, CIT Bank, CIT Group Inc. (commercial and consumer finance), 2010-2016; former Senior Adviser to The Carlyle Group (financial services), March 2008-September 2008; former Governance Consultant to Bridgewater Associates, January 2013-December 2015 |
Catherine James Paglia
c/o Columbia Management
Investment Advisers, LLC
290 Congress Street
Boston, MA 02210
1952 | Trustee since 2004 | Director, Enterprise Asset Management, Inc. (private real estate and asset management company), since September 1998; Managing Director and Partner, Interlaken Capital, Inc., 1989-1997; Vice President, 1982-1985, Principal, 1985-1987, Managing Director, 1987-1989, Morgan Stanley; Vice President, Investment Banking, 1980-1982, Associate, Investment Banking, 1976-1980, Dean Witter Reynolds, Inc. | 173 | Director, Valmont Industries, Inc. (irrigation systems manufacturer), since 2012; Trustee, Carleton College (on the Investment Committee), since 1987; Trustee, Carnegie Endowment for International Peace (on the Investment Committee), since 2009 |
Natalie A. Trunow
c/o Columbia Management
Investment Advisers, LLC
290 Congress Street
Boston, MA 02210
1967 | Trustee since 2020 | Chief Executive Officer, Millennial Portfolio Solutions LLC (asset management and consulting services), January 2016-January 2021; Non-executive Member of the Investment Committee and Valuation Committee, Sarona Asset Management Inc. (private equity firm) since September 2019; Advisor, Horizon Investments (asset management and consulting services), August 2018-January 2022; Advisor, Paradigm Asset Management, November 2016-January 2022; Consultant to Independent Trustees of CFVIT and CFST I from September 2016 to June 2020 with respect to CFVIT and to December 2020 with respect to CFST I; Director of Investments/Consultant, Casey Family Programs, April 2016-November 2016; Senior Vice President and Chief Investment Officer, Calvert Investments, August 2008-January 2016; Section Head and Portfolio Manager, General Motors Asset Management, June 1997-August 2008 | 171 | Independent Director, Investment Committee, Health Services for Children with Special Needs, Inc., 2010-2021; Independent Director, (Executive Committee and Chair, Audit Committee), Consumer Credit Counseling Services (formerly Guidewell Financial Solutions), since 2016; Independent Director, (Investment Committee), Sarona Asset Management, since 2019 |
Multi-Manager Alternative Strategies Fund | Annual Report 2023
| 79 |
TRUSTEES AND OFFICERS (continued)
(Unaudited)
Independent trustees (continued)
Name,
address,
year of birth | Position held
with the Columbia Funds and
length of service | Principal occupation(s)
during past five years
and other relevant
professional experience | Number of
Funds in the
Columbia Funds
Complex*
overseen | Other directorships
held by Trustee
during the past five years
and other relevant Board experience |
Sandra L. Yeager
c/o Columbia Management
Investment Advisers, LLC
290 Congress Street
Boston, MA 02210
1964 | Trustee since 2017 | Retired; President and founder, Hanoverian Capital, LLC (SEC registered investment advisor firm), 2008-2016; Managing Director, DuPont Capital, 2006-2008; Managing Director, Morgan Stanley Investment Management, 2004-2006; Senior Vice President, Alliance Bernstein, 1990-2004 | 173 | Former Director, NAPE (National Alliance for Partnerships in Equity) Education Foundation, October 2016-October 2020; Advisory Board, Jennersville YMCA, since 2022 |
Interested trustee affiliated with Investment Manager**
Name,
address,
year of birth | Position held with the Columbia Funds and length of service | Principal occupation(s) during the
past five years and other relevant
professional experience | Number of
Funds in the
Columbia Funds
Complex* overseen | Other directorships
held by Trustee
during the past
five years and
other relevant Board experience |
Daniel J. Beckman
c/o Columbia Management
Investment Advisers, LLC
290 Congress Street
Boston, MA 02210
1962 | Trustee since November 2021 and President since June 2021 | Vice President – Head of North America Product, Columbia Management Investment Advisers, LLC, since April 2015; President and Principal Executive Officer of the Columbia Funds, since June 2021; officer of Columbia Funds and affiliated funds, 2020-2021 | 173 | Director, Ameriprise Trust Company, since October 2016; Director, Columbia Management Investment Distributors, Inc. since November 2018; Board of Governors, Columbia Wanger Asset Management, LLC since, January 2022; Director, Columbia Threadneedle Canada, Inc., since December 2022 |
| * | The term “Columbia Funds Complex” as used herein includes Columbia Seligman Premium Technology Growth Fund, Tri-Continental Corporation and each series of Columbia Funds Series Trust (CFST), Columbia Funds Series Trust I (CFST I), Columbia Funds Series Trust II (CFST II), Columbia ETF Trust I (CET I), Columbia ETF Trust II (CET II), Columbia Funds Variable Insurance Trust (CFVIT) and Columbia Funds Variable Series Trust II (CFVST II). Messrs. Batejan, Beckman, Gallagher and Hacker and Mses. Blatz, Carlton, Carrig, Flynn, Paglia, and Yeager serve as directors of Columbia Seligman Premium Technology Growth Fund and Tri-Continental Corporation. |
| ** | Interested person (as defined under the 1940 Act) by reason of being an officer, director, security holder and/or employee of the Investment Manager or Ameriprise Financial. |
The Statement of Additional Information has additional information about the Fund’s Board members and is available, without charge, upon request by calling 800.345.6611, visiting columbiathreadneedleus.com/investor/ or contacting your financial intermediary.
| 80 | Multi-Manager Alternative Strategies Fund | Annual Report 2023 |
TRUSTEES AND OFFICERS (continued)
(Unaudited)
The Board has appointed officers who are responsible for day-to-day business decisions based on policies it has established. The officers serve at the pleasure of the Board. The following table provides basic information about the Officers of the Fund as of the printing of this report, including principal occupations during the past five years, although their specific titles may have varied over the period. In addition to Mr. Beckman, who is President and Principal Executive Officer, the Fund’s other officers are:
Fund officers
Name,
address and
year of birth | Position and year
first appointed to
position for any Fund
in the Columbia
Funds Complex or a
predecessor thereof | Principal occupation(s) during past five years |
Michael G. Clarke
290 Congress Street
Boston, MA 02210
1969 | Chief Financial Officer and Principal Financial Officer (2009) and Senior Vice President (2019) | Senior Vice President and North America Head of Operations & Investor Services, Columbia Management Investment Advisers, LLC, since June 2023 (previously Senior Vice President and Head of Global Operations, March 2022 – June 2023, Vice President, Head of North America Operations, and Co-Head of Global Operations, June 2019 - February 2022 and Vice President – Accounting and Tax, May 2010 - May 2019); senior officer of Columbia Funds and affiliated funds, since 2002. Director, Ameriprise Trust Company, since June 2023. |
Joseph Beranek
5890 Ameriprise Financial Center
Minneapolis, MN 55474
1965 | Treasurer and Chief Accounting Officer (Principal Accounting Officer) (2019) and Principal Financial Officer (2020), CFST, CFST I, CFST II, CFVIT and CFVST II; Assistant Treasurer, CET I and CET II | Vice President – Mutual Fund Accounting and Financial Reporting, Columbia Management Investment Advisers, LLC, since December 2018 and March 2017, respectively. |
Marybeth Pilat
290 Congress Street
Boston, MA 02210
1968 | Treasurer and Chief Accounting Officer (Principal Accounting Officer) and Principal Financial Officer (2020) for CET I and CET II; Assistant Treasurer, CFST, CFST I, CFST II, CFVIT and CFVST II | Vice President – Product Pricing and Administration, Columbia Management Investment Advisers, LLC, since May 2017. |
William F. Truscott
290 Congress Street
Boston, MA 02210
1960 | Senior Vice President (2001) | Formerly, Trustee/Director of Columbia Funds Complex or legacy funds, November 2001 - January 1, 2021; Chief Executive Officer, Global Asset Management, Ameriprise Financial, Inc., since September 2012; Chairman of the Board and President, Columbia Management Investment Advisers, LLC, since July 2004 and February 2012, respectively; Chairman of the Board and Chief Executive Officer, Columbia Management Investment Distributors, Inc., since November 2008 and February 2012, respectively; Chairman of the Board and Director, Threadneedle Asset Management Holdings, Sàrl, since March 2013 and December 2008, respectively; senior executive of various entities affiliated with Columbia Threadneedle. |
Christopher O. Petersen
5228 Ameriprise Financial Center
Minneapolis, MN 55474
1970 | Senior Vice President and Assistant Secretary (2021) | Formerly, Trustee/Director of funds within the Columbia Funds Complex, July 1, 2020 - November 22, 2021; Senior Vice President and Assistant General Counsel, Ameriprise Financial, Inc., since September 2021 (previously Vice President and Lead Chief Counsel, January 2015 - September 2021); formerly, President and Principal Executive Officer of the Columbia Funds, 2015 - 2021; officer of Columbia Funds and affiliated funds, since 2007. |
Thomas P. McGuire
290 Congress Street
Boston, MA 02210
1972 | Senior Vice President and Chief Compliance Officer (2012) | Vice President – Asset Management Compliance, Ameriprise Financial, Inc., since May 2010; Chief Compliance Officer, Columbia Acorn/Wanger Funds, since December 2015; formerly, Chief Compliance Officer, Ameriprise Certificate Company, September 2010 – September 2020. |
Ryan C. Larrenaga
290 Congress Street
Boston, MA 02210
1970 | Senior Vice President (2017), Chief Legal Officer (2017), and Secretary (2015) | Vice President and Chief Counsel, Ameriprise Financial, Inc., since August 2018 (previously Vice President and Group Counsel, August 2011 - August 2018); Chief Legal Officer, Columbia Acorn/Wanger Funds, since September 2020; officer of Columbia Funds and affiliated funds, since 2005. |
Multi-Manager Alternative Strategies Fund | Annual Report 2023
| 81 |
TRUSTEES AND OFFICERS (continued)
(Unaudited)
Fund officers (continued)
Name,
address and
year of birth | Position and year
first appointed to
position for any Fund
in the Columbia
Funds Complex or a
predecessor thereof | Principal occupation(s) during past five years |
Michael E. DeFao
290 Congress Street
Boston, MA 02210
1968 | Vice President (2011) and Assistant Secretary (2010) | Vice President and Chief Counsel, Ameriprise Financial, Inc., since May 2010; Vice President, Chief Legal Officer and Assistant Secretary, Columbia Management Investment Advisers, LLC, since October 2021 (previously Vice President and Assistant Secretary, May 2010 – September 2021). |
Lyn Kephart-Strong
5903 Ameriprise Financial Center
Minneapolis, MN 55474
1960 | Vice President (2015) | Vice President, Global Investment Operations Services, Columbia Management Investment Advisers, LLC, since 2010; Director (since January 2007) and President (since October 2014), Columbia Management Investment Services Corp.; Director (since December 2017) and President (since January 2017), Ameriprise Trust Company. |
Liquidity Risk Management Program
(Unaudited)
Pursuant to Rule 22e-4 under the 1940 Act, the Fund has adopted a liquidity risk management program (Program). The Program’s principal objectives include assessing, managing and periodically reviewing the Fund’s liquidity risk. Liquidity risk is defined as the risk that the Fund could not meet redemption requests without significant dilution of remaining investors’ interests in the Fund.
The Board has appointed the Investment Manager as the program administrator for the Fund’s Program. The Investment Manager has delegated oversight of the Program to its Liquidity Risk Management Committee (the Committee). At a Board meeting during the fiscal period, the Committee provided the Board with a report addressing the operations of the Program and assessing its adequacy and effectiveness of implementation for the period January 1, 2022 through December 31, 2022, including:
| • | the Fund had sufficient liquidity to both meet redemptions and operate effectively on behalf of shareholders; |
| • | there were no material changes to the Program during the period; |
| • | the implementation of the Program was effective to manage the Fund’s liquidity risk; and |
| • | the Program operated adequately during the period. |
There can be no assurance that the Program will achieve its objectives in the future. Please refer to the Fund’s prospectus for more information regarding the Fund’s exposure to liquidity risk and other principal risks to which an investment in the Fund may be subject.
| 82 | Multi-Manager Alternative Strategies Fund | Annual Report 2023 |
Approval of Management and SubadvisoryAgreements
(Unaudited)
Columbia Management Investment Advisers, LLC (the Investment Manager, and together with its domestic and global affiliates, Columbia Threadneedle Investments), a wholly-owned subsidiary of Ameriprise Financial, Inc. (Ameriprise Financial), serves as the investment manager to Multi-Manager Alternative Strategies Fund (the Fund). Under a management agreement (the Management Agreement), the Investment Manager provides investment advice and other services to the Fund and other funds distributed by Columbia Management Investment Distributors, Inc. (collectively, the Funds). In addition, under the subadvisory agreements (the Subadvisory Agreements) between the Investment Manager and each of AlphaSimplex Group, LLC (AlphaSimplex), Crabel Capital Management, LLC (Crabel), Manulife Investment Management (US) LLC (Manulife), TCW Investment Management Company LLC (TCW) and Water Island Capital, LLC (Water Island) (collectively, the Subadvisers), the Subadvisers provide portfolio management and related services for the Fund. On June 22, 2023, the Fund’s Board of Trustees approved the termination of Water Island. Such termination became effective on August 25, 2023.
On an annual basis, the Fund’s Board of Trustees (the Board), including the independent Board members (the Independent Trustees), considers renewal of the Management Agreement and the Subadvisory Agreements (together, the Advisory Agreements). The Investment Manager prepared detailed reports for the Board and its Contracts Committee (including its Contracts Subcommittee) in February, March, April, May and June 2023, including reports providing the results of analyses performed by a third-party data provider, Broadridge Financial Solutions, Inc. (Broadridge), and comprehensive responses by the Investment Manager to written requests for information by independent legal counsel to the Independent Trustees (Independent Legal Counsel) to assist the Board in making this determination. In addition, throughout the year, the Board (or its committees or subcommittees) regularly meets with portfolio management teams and senior management personnel and reviews information prepared by the Investment Manager addressing the services the Investment Manager provides and Fund performance. The Board also accords appropriate weight to the work, deliberations and conclusions of the various committees (including their subcommittees), such as the Contracts Committee, the Investment Review Committee, the Audit Committee and the Compliance Committee in determining whether to continue the Advisory Agreements.
The Board, at its June 22, 2023 Board meeting (the June 2023 Meeting), considered the renewal of each of the Advisory Agreements for additional one-year terms. At the June 2023 Meeting, Independent Legal Counsel reviewed with the Independent Trustees various factors relevant to the Board’s consideration of advisory and subadvisory agreements and the Board’s legal responsibilities related to such consideration. The Independent Trustees considered all information that they, their legal counsel or the Investment Manager believed reasonably necessary to evaluate and to approve the continuation of each of the Advisory Agreements. Among other things, the information and factors considered included the following:
| • | Information on the investment performance of the Fund relative to the performance of a group of mutual funds determined to be comparable to the Fund by Broadridge, as well as performance relative to one or more benchmarks; |
| • | Information on the Fund’s management fees and total expenses, including information comparing the Fund’s expenses to those of a group of comparable mutual funds, as determined by Broadridge; |
| • | The Investment Manager’s agreement to contractually limit or cap total operating expenses for the Fund so that total operating expenses (excluding certain fees and expenses, such as transaction costs and certain other investment related expenses, interest, taxes, acquired fund fees and expenses and infrequent and/or unusual expenses) would not exceed a specified annual rate, as a percentage of the Fund’s net assets; |
| • | Terms of the Advisory Agreements; |
| • | Subadvisory fees payable by the Investment Manager under the Subadvisory Agreements; |
| • | Descriptions of other agreements and arrangements with affiliates of the Investment Manager relating to the operations of the Fund, including agreements with respect to the provision of transfer agency and shareholder services to the Fund; |
| • | Descriptions of various services performed by the Investment Manager and the Subadvisers under the Advisory Agreements, including portfolio management and portfolio trading practices; |
Multi-Manager Alternative Strategies Fund | Annual Report 2023
| 83 |
Approval of Management and Subadvisory
Agreements (continued)
(Unaudited)
| • | Information regarding any recently negotiated management fees of similarly-managed portfolios of other institutional clients of the Investment Manager; |
| • | Information regarding the resources of the Investment Manager and Subadvisers, including information regarding senior management, portfolio managers and other personnel; |
| • | Information regarding the capabilities of the Investment Manager and the Subadvisers with respect to compliance monitoring services; |
| • | The profitability to the Investment Manager and its affiliates from their relationships with the Fund; and |
| • | Report provided by the Board’s independent fee consultant, JDL Consultants, LLC (JDL). |
Following an analysis and discussion of the foregoing, and the factors identified below, the Board, including all of the Independent Trustees, approved the renewal of each of the Advisory Agreements. The Board took into account that the renewal of the Water Island Subadvisory Agreement was only for a brief period given its termination.
Nature, extent and quality of services provided by the Investment Manager and the Subadvisers
The Board analyzed various reports and presentations it had received detailing the services performed by the Investment Manager and the Subadvisers, as well as their history, expertise, resources and relative capabilities, and the qualifications of their personnel.
The Board specifically considered the many developments during recent years concerning the services provided by the Investment Manager, including, in particular, detailed information regarding the process employed for selecting and overseeing affiliated and unaffiliated subadvisers. With respect to the Investment Manager, the Board also noted the organization and depth of the equity and credit research departments. The Board further observed the enhancements to the investment risk management department’s processes, systems and oversight over the past several years. The Board also took into account the broad scope of services provided by the Investment Manager to each subadvised Fund, including, among other services, investment, risk and compliance oversight. The Board also took into account the information it received concerning the Investment Manager’s ability to attract and retain key portfolio management personnel and that it has sufficient resources to provide competitive and adequate compensation to investment personnel.
In connection with the Board’s evaluation of the overall package of services provided by the Investment Manager, the Board also considered the nature, quality and range of administrative services provided to the Fund by the Investment Manager, as well as the achievements in 2022 in the performance of administrative services, and noted the various enhancements anticipated for 2023. In evaluating the quality of services provided under the Advisory Agreements, the Board also took into account the organization and strength of the Fund’s and its service providers’ compliance programs. The Board also reviewed the financial condition of the Investment Manager and its affiliates and each entity’s ability to carry out its responsibilities under the Management Agreement and the Fund’s other service agreements.
In addition, the Board discussed the acceptability of the terms of the Management Agreement (including the relatively broad scope of services required to be performed by the Investment Manager in addition to monitoring each Subadviser), noting that no changes were proposed from the forms of agreements previously approved. The Board also noted the wide array of legal and compliance services provided to the Fund under the Management Agreement.
The Board considered each Subadviser’s organizational strength and resources, portfolio management team depth and capabilities and investment process. The Board also considered each Subadviser’s capability and wherewithal to carry out its responsibilities under the applicable Subadvisory Agreement. In addition, the Board discussed the acceptability of the terms of the Subadvisory Agreements, including the scope of services required to be performed. The Board noted that the terms of the Subadvisory Agreements are generally consistent with the terms of other subadvisory agreements for subadvisers who manage other funds managed by the Investment Manager. It was observed that no changes were
| 84 | Multi-Manager Alternative Strategies Fund | Annual Report 2023 |
Approval of Management and Subadvisory
Agreements (continued)
(Unaudited)
recommended to the Subadvisory Agreements. The Board took into account the Investment Manager’s representation that each Subadviser was in a position to provide quality services to the Fund. In this regard, the Board further observed the various services provided by the Investment Manager’s subadvisory oversight team.
After reviewing these and related factors (including investment performance as discussed below), the Board concluded, within the context of their overall conclusions, that the nature, extent and quality of the services provided to the Fund under the Advisory Agreements supported the continuation of the Management Agreement and each of the Subadvisory Agreements. The Board took into account that the renewal of the Water Island Subadvisory Agreement was only for a brief period given its termination.
Investment performance
The Board carefully reviewed the investment performance of the Fund, including detailed reports providing the results of analyses performed by each of the Investment Manager, Broadridge and JDL collectively showing, for various periods (including since manager inception): (i) the performance of the Fund, (ii) the Fund’s performance relative to peers and benchmarks and (iii) the net assets of the Fund. The Board observed that the Fund’s performance for certain periods ranked above median based on information provided by Broadridge.
Additionally, the Board reviewed the performance of each of the Subadvisers and the Investment Manager’s process for monitoring such Subadvisers’ performance. The Board considered, in particular, management’s rationale for recommending the continued retention of each Subadviser and management’s representations that the Investment Manager’s profitability is not the key factor driving their recommendation to select, renew or terminate a Subadviser.
The Board also reviewed a description of the third-party data provider’s methodology for identifying the Fund’s peer groups for purposes of performance and expense comparisons.
The Board also considered the Investment Manager’s and Subadvisers’ performance and reputation generally, and the Investment Manager’s evaluation of the contribution of each Subadviser to the Fund’s investment mandate. After reviewing these and related factors, the Board concluded, within the context of their overall conclusions, that the performance of the Fund, the Investment Manager and the Subadvisers, in light of other considerations, supported the continuation of the Management Agreement and each of the Subadvisory Agreements. The Board took into account that the renewal of the Water Island Subadvisory Agreement was only for a brief period given its termination.
Comparative fees, costs of services provided and the profits realized by the Investment Manager and its affiliates from their relationships with the Fund
The Board reviewed comparative fees and the costs of services provided under each of the Advisory Agreements. The Board members considered detailed comparative information set forth in an annual report on fees and expenses, including, among other things, data (based on analyses conducted by Broadridge and JDL) showing a comparison of the Fund’s expenses with median expenses paid by funds in its comparative peer universe, as well as data showing the Fund’s contribution to the Investment Manager’s profitability.
The Board considered the reports of JDL, which assisted in the Board’s analysis of the Funds’ performance and expenses and the reasonableness of the Funds’ fee rates. The Board accorded particular weight to the notion that a primary objective of the level of fees is to achieve a rational pricing model applied consistently across the various product lines in the Fund family, while assuring that the overall fees for each Fund (with certain exceptions) are generally in line with the current “pricing philosophy” such that Fund total expense ratios, in general, approximate or are lower than the median expense ratios of funds in the same Lipper comparison universe. The Board took into account that the Fund’s total expense ratio (after considering proposed expense caps/waivers) approximated the peer universe’s median expense ratio.
Additionally, the Board reviewed the level of subadvisory fees paid to each Subadviser, noting that the fees are paid by the Investment Manager and do not impact the fees paid by the Fund. The Board also reviewed advisory fee rates charged by other comparable mutual funds employing each Subadviser. After reviewing these and related factors, the Board concluded,
Multi-Manager Alternative Strategies Fund | Annual Report 2023
| 85 |
Approval of Management and Subadvisory
Agreements (continued)
(Unaudited)
within the context of their overall conclusions, that the levels of management fees, subadvisory fees and expenses of the Fund, in light of other considerations, supported the continuation of the Management Agreement and each of the Subadvisory Agreements. The Board took into account that the renewal of the Water Island Subadvisory Agreement was only for a brief period given its termination.
The Board also considered the profitability of the Investment Manager and its affiliates in connection with the Investment Manager providing management services to the Fund. Because the Subadvisory Agreements were negotiated at arms-length by the Investment Manager, which is responsible for payments to the Subadvisers thereunder, the Board did not consider the profitability to each Subadviser from its relationship with the Fund. With respect to the profitability of the Investment Manager and its affiliates, the Independent Trustees referred to information discussing the profitability to the Investment Manager and Ameriprise Financial from managing, operating and distributing the Funds. The Board considered that the profitability generated by the Investment Manager in 2022 had declined from 2021 levels, due to a variety of factors, including the decreased assets under management of the Funds. It also took into account the indirect economic benefits flowing to the Investment Manager or its affiliates in connection with managing or distributing the Funds, such as the enhanced ability to offer various other financial products to Ameriprise Financial customers, soft dollar benefits and overall reputational advantages. The Board noted that the fees paid by the Fund should permit the Investment Manager to offer competitive compensation to its personnel, make necessary investments in its business and earn an appropriate profit. After reviewing these and related factors, the Board concluded, within the context of their overall conclusions, that the costs of services provided and the profitability to the Investment Manager and its affiliates from their relationships with the Fund supported the continuation of the Management Agreement and each of the Subadvisory Agreements. The Board took into account that the renewal of the Water Island Subadvisory Agreement was only for a brief period given its termination.
Economies of scale
The Board considered the potential existence of economies of scale in the provision by the Investment Manager of services to the Fund, and whether those economies of scale were shared with the Fund through breakpoints in investment management fees or other means, such as expense limitation arrangements and additional investments by the Investment Manager in investment, trading, compliance and other resources. The Board considered the economies of scale that might be realized as the Fund’s net asset level grows and took note of the extent to which Fund shareholders might also benefit from such growth. In this regard, the Board took into account that management fees decline as Fund assets exceed various breakpoints, all of which have not been surpassed. The Board observed that the Management Agreement provided for breakpoints in the management fee rate schedule that allow opportunities for shareholders to realize lower fees as Fund assets grow and that there are additional opportunities through other means for sharing economies of scale with shareholders. The Board also noted that the breakpoints in the Subadvisory Agreements did not occur at the same levels as the breakpoints in the Management Agreement. In this regard, the Board noted the potential challenges of seeking to tailor the Management Agreement breakpoints to those of a subadvisory agreement in this context.
Conclusion
The Board reviewed all of the above considerations in reaching its decision to approve the continuation of the Management Agreement and each of the Subadvisory Agreements. In reaching its conclusions, no single factor was determinative.
On June 22, 2023, the Board, including all of the Independent Trustees, determined that fees payable under each of the Advisory Agreements were fair and reasonable in light of the extent and quality of services provided and approved the renewal of each of the Advisory Agreements. The Board took into account that the renewal of the Water Island Subadvisory Agreement was only for a brief period given its termination.
APPROVAL OF SUBADVISORY AGREEMENT
At its meeting on March 10, 2023, the Board, including the Independent Trustees, unanimously approved the Subadvisory Agreement between the Investment Manager and AlphaSimplex as a result of the upcoming acquisition of AlphaSimplex by Virtus Partners, Inc., a wholly-owned subsidiary of Virtus Investment Partners, Inc. (Virtus).
| 86 | Multi-Manager Alternative Strategies Fund | Annual Report 2023 |
Approval of Management and Subadvisory
Agreements (continued)
(Unaudited)
The Independent Trustees considered that no material portfolio management team, investment strategy/process or compliance-related changes were expected to occur as a result of the transaction. The Independent Trustees considered that AlphaSimplex had confirmed that there would not be any change to the nature or quality of the services provided as a result of the transaction. The Independent Trustees noted that the proposed Subadvisory Agreement was substantially similar to the current subadvisory agreement and that no changes to subadvisory fees were proposed. The Independent Trustees considered the Fund’s performance, specifically noting Columbia Threadneedle’s view that it had met expectations. The Independent Trustees also considered the fees and expenses of the Fund, the subadvisory fees paid to AlphaSimplex and relevant comparisons thereof to those of peers and other Funds. The Independent Trustees also took into account Columbia Threadneedle’s view that the transaction would not adversely impact AlphaSimplex’s financial wherewithal so as to impact the level and quality of services provided to the Fund.
The Independent Trustees noted the discussion, which is described below, relating to the renewal and approval of the advisory and subadvisory agreements for the Fund at the Contracts Committee and Board meetings in June 2022 (the June 2022 Meeting) and, in that connection, the discussion by Independent Legal Counsel of the Board’s responsibilities pursuant to Sections 15(c) and 36(b) of the Investment Company Act of 1940, as amended (the 1940 Act) and the factors that should be considered in determining whether to approve or renew an investment management agreement. Independent legal counsel indicated that the Independent Trustees should apply these factors in considering the Subadvisory Agreement.
Independent legal counsel further indicated that the Independent Trustees should take into account the variety of written materials and oral presentations they received at their meetings in March 2023 as well as all of the information previously considered at the June 2022 Meeting regarding the proposed renewal of the Fund’s then-existing advisory and subadvisory agreements.
After considering the factors described above relating to the Subadvisory Agreement between the Investment Manager and AlphaSimplex, and taking into account all of the factors considered, as described below, as part of the approval of the continuance of the current Subadvisory Agreement in June 2022, the Board, including all of the Independent Trustees, approved the proposed Subadvisory Agreement between the Investment Manager and AlphaSimplex.
General conclusions in connection with the Trustees’ previous approval of the continuance of the fund’s existing advisory agreements
On an annual basis, the Board, including the Independent Trustees, considers renewal of the Management Agreement and the subadvisory agreements. The Investment Manager prepared detailed reports for the Board and its Contracts Committee (including its Contracts Subcommittee) in November 2021 and March, April and June 2022, including reports providing the results of analyses performed by an independent third-party data provider, Broadridge, and comprehensive responses to written requests for information by Independent Legal Counsel to the Investment Manager, to assist the Board in making this determination. In addition, throughout the year, the Board (or its committees or subcommittees) regularly meets with portfolio management teams and senior management personnel and reviews information prepared by the Investment Manager addressing the services the Investment Manager provides and Fund performance. The Board also accords appropriate weight to the work, deliberations and conclusions of the various committees, such as the Contracts Committee, the Investment Review Committee, the Audit Committee and the Compliance Committee in determining whether to continue the Advisory Agreements.
The Board, at the June 2022 Meeting, considered the renewal of the Management Agreement and the Subadvisory Agreements with each of the Subadvisers for additional one-year terms. The Board, at its September 16, 2021 Board meeting, approved the engagement of Crabel as a subadviser to the Fund for an initial two-year term. At the June 2022 Meeting, Independent Legal Counsel reviewed with the Independent Trustees various factors relevant to the Board’s consideration of advisory and subadvisory agreements and the Board’s legal responsibilities related to such consideration. The Independent Trustees considered all information that they, their legal counsel or the Investment Manager believed reasonably necessary to evaluate and to approve the continuation of each of the Advisory Agreements. Among other things, the information and factors considered included the following:
Multi-Manager Alternative Strategies Fund | Annual Report 2023
| 87 |
Approval of Management and Subadvisory
Agreements (continued)
(Unaudited)
| • | Information on the investment performance of the Fund relative to the performance of a group of mutual funds determined to be comparable to the Fund by Broadridge, as well as performance relative to benchmarks; |
| • | Information on the Fund’s management fees and total expenses, including information comparing the Fund’s expenses to those of a group of comparable mutual funds, as determined by Broadridge; |
| • | The Investment Manager’s agreement to contractually limit or cap total operating expenses for the Fund so that total operating expenses (excluding certain fees and expenses, such as transaction costs and certain other investment related expenses, interest, taxes, acquired fund fees and expenses and infrequent and/or unusual expenses) would not exceed a specified annual rate, as a percentage of the Fund’s net assets; |
| • | Terms of the Advisory Agreements; |
| • | Subadvisory fees payable by the Investment Manager under the Subadvisory Agreements; |
| • | Descriptions of other agreements and arrangements with affiliates of the Investment Manager relating to the operations of the Fund, including agreements with respect to the provision of transfer agency and shareholder services to the Fund; |
| • | Descriptions of various services performed by the Investment Manager and the Subadvisers under the Advisory Agreements, including portfolio management and portfolio trading practices; Information regarding any recently negotiated management fees of similarly-managed portfolios of other institutional clients of the Investment Manager; |
| • | Information regarding the resources of the Investment Manager and Subadvisers, including information regarding senior management, portfolio managers and other personnel; |
| • | Information regarding the capabilities of the Investment Manager and the Subadvisers with respect to compliance monitoring services; |
| • | The profitability to the Investment Manager and its affiliates from their relationships with the Fund; and |
| • | Report provided by the Board’s independent fee consultant, JDL. |
Following an analysis and discussion of the foregoing, and the factors identified below, the Board, including all of the Independent Trustees, approved the renewal of each of the Advisory Agreements.
Nature, extent and quality of services provided by the Investment Manager and the Subadvisers
The Board analyzed various reports and presentations it had received detailing the services performed by the Investment Manager and the Subadvisers, as well as their history, expertise, resources and relative capabilities, and the qualifications of their personnel.
The Board specifically considered the many developments during recent years concerning the services provided by the Investment Manager, including, in particular, detailed information regarding the process employed for selecting and overseeing affiliated and unaffiliated Subadvisers. With respect to the Investment Manager, the Board also noted the organization and depth of the equity and credit research departments. The Board further observed the enhancements to the investment risk management department’s processes, systems and oversight, over the past several years, as well as planned 2022 initiatives in this regard. The Board also took into account the broad scope of services provided by the Investment Manager to each subadvised Fund, including, among other services, investment, risk and compliance oversight. The Board also took into account the information it received concerning the Investment Manager’s ability to attract and retain key portfolio management personnel and that it has sufficient resources to provide competitive and adequate compensation to investment personnel. The Board also observed that the Investment Manager has been able to effectively manage, operate and distribute the Funds through the COVID-19 pandemic period with no disruptions in services provided. The Board also considered added personnel and resources obtained by Columbia Threadneedle through Ameriprise Financial’s acquisition of BMO Financial Group’s Europe, Middle East, and Africa (EMEA) asset management business.
| 88 | Multi-Manager Alternative Strategies Fund | Annual Report 2023 |
Approval of Management and Subadvisory
Agreements (continued)
(Unaudited)
In connection with the Board’s evaluation of the overall package of services provided by the Investment Manager, the Board also considered the nature, quality and range of administrative services provided to the Fund by the Investment Manager, as well as the achievements in 2021 in the performance of administrative services, and noted the various enhancements anticipated for 2022. In evaluating the quality of services provided under the Advisory Agreements, the Board also took into account the organization and strength of the Fund’s and its service providers’ compliance programs. The Board also reviewed the financial condition of the Investment Manager and its affiliates and each entity’s ability to carry out its responsibilities under the Management Agreement and the Fund’s other service agreements.
In addition, the Board discussed the acceptability of the terms of the Management Agreement (including the relatively broad scope of services required to be performed by the Investment Manager in addition to monitoring each Subadviser), noting that no changes were proposed from the forms of agreements previously approved. The Board also noted the wide array of legal and compliance services provided to the Fund under the Management Agreement.
The Board considered each Subadviser’s organizational strength and resources, portfolio management team depth and capabilities and investment process. The Board also considered each Subadviser’s capability and wherewithal to carry out its responsibilities under the applicable Subadvisory Agreement. In addition, the Board discussed the acceptability of the terms of the Subadvisory Agreements, including the scope of services required to be performed. The Board noted that the terms of the Subadvisory Agreements are generally consistent with the terms of other subadvisory agreements for subadvisers who manage other funds managed by the Investment Manager. It was observed that no changes were recommended to the Subadvisory Agreements. The Board took into account the Investment Manager’s representation that each Subadviser was in a position to provide quality services to the Fund. In this regard, the Board further observed the various services provided by the Investment Manager’s subadvisory oversight team and their significant resources added in recent years.
After reviewing these and related factors (including investment performance as discussed below), the Board concluded, within the context of their overall conclusions, that the nature, extent and quality of the services provided to the Fund under the Advisory Agreements supported the continuation of the Management Agreement and each of the Subadvisory Agreements.
Investment performance
In this connection, the Board carefully reviewed the investment performance of the Fund, including detailed reports providing the results of analyses performed by each of the Investment Manager, Broadridge and JDL collectively showing, for various periods (including since manager inception): (i) the performance of the Fund, (ii) the performance of a benchmark index, (iii) the percentage ranking of the Fund among its comparison group, (iv) the Fund’s performance relative to peers and benchmarks and (v) the net assets of the Fund. The Board observed the Fund’s underperformance for certain periods, noting that appropriate steps (such as changes to the Fund’s subadvisers) had been taken to help improve the Fund’s performance.
Additionally, the Board reviewed the performance of each of the Subadvisers and the Investment Manager’s process for monitoring such Subadvisers’ performance. The Board considered, in particular, management’s rationale for recommending the continued retention of each Subadviser and management’s representations that the Investment Manager’s profitability is not the key factor driving their recommendation to select, renew or terminate the Subadvisers.
The Board also reviewed a description of the third-party data provider’s methodology for identifying the Fund’s peer groups for purposes of performance and expense comparisons.
The Board also considered the Investment Manager’s and Subadvisers’ performance and reputation generally, the Investment Manager’s evaluation of each Subadviser’s contribution to the Fund’s broader investment mandate and the Investment Manager’s willingness to take steps intended to improve performance. After reviewing these and related factors, the Board concluded, within the context of their overall conclusions, that the performance of the Fund, the Investment Manager and the Subadvisers, in light of other considerations, supported the continuation of the Management Agreement and each of the Subadvisory Agreements.
Multi-Manager Alternative Strategies Fund | Annual Report 2023
| 89 |
Approval of Management and Subadvisory
Agreements (continued)
(Unaudited)
Comparative fees, costs of services provided and the profits realized by the Investment Manager and its affiliates from their relationships with the Fund
The Board reviewed comparative fees and the costs of services provided under each of the Advisory Agreements. The Board members considered detailed comparative information set forth in an annual report on fees and expenses, including, among other things, data (based on analyses conducted by Broadridge and JDL) showing a comparison of the Fund’s expenses with median expenses paid by funds in its comparative peer universe, as well as data showing the Fund’s contribution to the Investment Manager’s profitability.
The Board considered the reports of JDL, which assisted in the Board’s analysis of the Funds’ performance and expenses and the reasonableness of the Funds’ fee rates. The Board accorded particular weight to the notion that a primary objective of the level of fees is to achieve a rational pricing model applied consistently across the various product lines in the Fund family, while assuring that the overall fees for each Fund (with certain exceptions) are generally in line with the current "pricing philosophy" such that Fund total expense ratios, in general, approximate or are lower than the median expense ratios of funds in the same Lipper comparison universe. The Board took into account that the Fund’s total expense ratio (after considering proposed expense caps/waivers) approximated the peer universe’s median expense ratio.
Additionally, the Board reviewed the level of subadvisory fees paid to each Subadviser, noting that the fees are paid by the Investment Manager and do not impact the fees paid by the Fund. The Board also reviewed advisory fee rates charged by other comparable mutual funds employing each Subadviser to provide comparable subadvisory services. After reviewing these and related factors, the Board concluded, within the context of their overall conclusions, that the levels of management fees, subadvisory fees and expenses of the Fund, in light of other considerations, supported the continuation of each of the Management Agreement and the Subadvisory Agreements.
The Board also considered the profitability of the Investment Manager and its affiliates in connection with the Investment Manager providing management services to the Fund. Because the Subadvisory Agreements were negotiated at arms-length by the Investment Manager, which is responsible for payments to the Subadvisers thereunder, the Board did not consider the profitability to each Subadviser from its relationship with the Fund. With respect to the profitability of the Investment Manager and its affiliates, the Independent Trustees referred to information discussing the profitability to the Investment Manager and Ameriprise Financial from managing, operating and distributing the Funds. The Board considered that in 2021 the Board had considered 2020 profitability and that the 2022 information showed that the profitability generated by the Investment Manager in 2021 increased from 2020 levels, due to a variety of factors, including the increased assets under management of the Funds. It also took into account the indirect economic benefits flowing to the Investment Manager or its affiliates in connection with managing or distributing the Funds, such as the enhanced ability to offer various other financial products to Ameriprise Financial customers, soft dollar benefits and overall reputational advantages. The Board noted that the fees paid by the Fund should permit the Investment Manager to offer competitive compensation to its personnel, make necessary investments in its business and earn an appropriate profit. After reviewing these and related factors, the Board concluded, within the context of their overall conclusions, that the costs of services provided and the profitability to the Investment Manager and its affiliates from their relationships with the Fund supported the continuation of the Management Agreement and each of the Subadvisory Agreements.
Economies of scale
The Board considered the potential existence of economies of scale in the provision by the Investment Manager of services to the Fund, to groups of related funds and to the Investment Manager as a whole, and whether those economies of scale were shared with the Fund through breakpoints in investment management fees or other means, such as expense limitation arrangements and additional investments by the Investment Manager in investment, trading, compliance and other resources. The Board considered the economies of scale that might be realized as the Fund’s net asset level grows and took note of the extent to which Fund shareholders might also benefit from such growth. In this regard, the Board took into account that management fees decline as Fund assets exceed various breakpoints, all of which have not been surpassed. The Board observed that the Management Agreement provided for breakpoints in the management fee rate schedule that allow opportunities for shareholders to realize lower fees as Fund assets grow and that there are additional opportunities
| 90 | Multi-Manager Alternative Strategies Fund | Annual Report 2023 |
Approval of Management and Subadvisory
Agreements (continued)
(Unaudited)
through other means for sharing economies of scale with shareholders. The Board also noted that the breakpoints in the Subadvisory Agreements did not occur at the same levels as the breakpoints in the Management Agreement. In this regard, the Board noted the potential challenges of seeking to tailor the Management Agreement breakpoints to those of a subadvisory agreement in this context.
Conclusion
The Board reviewed all of the above considerations in reaching its decision to approve the continuation of the Management Agreement and the Subadvisory Agreements. In reaching its conclusions, no single factor was determinative. On June 23, 2022, the Board, including all of the Independent Trustees, determined that fees payable under each of the Advisory Agreements were fair and reasonable in light of the extent and quality of services provided and approved the renewal of each of the Advisory Agreements.
Multi-Manager Alternative Strategies Fund | Annual Report 2023
| 91 |
Multi-Manager Alternative Strategies Fund
P.O. Box 219104
Kansas City, MO 64121-9104
Please read and consider the investment objectives, risks, charges and expenses for any fund carefully before investing. For a prospectus and summary prospectus, which contains this and other important information about the Fund, go to
columbiathreadneedleus.com/investor/. The Fund is distributed by Columbia Management Investment Distributors, Inc., member FINRA, and managed by Columbia Management Investment Advisers, LLC.
Columbia Threadneedle Investments (Columbia Threadneedle) is the global brand name of the Columbia and Threadneedle group of companies. All rights reserved.
© 2023 Columbia Management Investment Advisers, LLC.
columbiathreadneedleus.com/investor/

Annual Report
August 31, 2023
Columbia Contrarian Core Fund
Not FDIC or NCUA Insured • No Financial Institution Guarantee • May Lose Value
If you elect to receive the shareholder report for Columbia Contrarian Core Fund (the Fund) in paper, mailed to you, the Fund mails one shareholder report to each shareholder address, unless such shareholder elects to receive shareholder reports from the Fund electronically via e-mail or by having a paper notice mailed to you (Postcard Notice) that your Fund’s shareholder report is available at the Columbia funds’ website (columbiathreadneedleus.com/investor/). If you would like more than one report in paper to be mailed to you, or would like to elect to receive reports via e-mail or access them through Postcard Notice, please call shareholder services at 800.345.6611 and additional reports will be sent to you.
Proxy voting policies and procedures
The policy of the Board of Trustees is to vote the proxies of the companies in which the Fund holds investments consistent with the procedures as stated in the Statement of Additional Information (SAI). You may obtain a copy of the SAI without charge by calling 800.345.6611; contacting your financial intermediary; visiting columbiathreadneedleus.com/investor/; or searching the website of the Securities and Exchange Commission (SEC) at sec.gov. Information regarding how the Fund voted proxies relating to portfolio securities is filed with the SEC by August 31st for the most recent 12-month period ending June 30th of that year, and is available without charge by visiting columbiathreadneedleus.com/investor/, or searching the website of the SEC at sec.gov.
Quarterly schedule of investments
The Fund files a complete schedule of portfolio holdings with the SEC for the first and third quarters of each fiscal year on Form N-PORT. The Fund’s Form N-PORT filings are available on the SEC’s website at sec.gov. The Fund’s complete schedule of portfolio holdings, as filed on Form N-PORT, is available on columbiathreadneedleus.com/investor/ or can also be obtained without charge, upon request, by calling 800.345.6611.
Additional Fund information
For more information about the Fund, please visit columbiathreadneedleus.com/investor/ or call 800.345.6611. Customer Service Representatives are available to answer your questions Monday through Friday from 8 a.m. to 7 p.m. Eastern time.
Fund investment manager
Columbia Management Investment Advisers, LLC (the Investment Manager)
290 Congress Street
Boston, MA 02210
Fund distributor
Columbia Management Investment Distributors, Inc.
290 Congress Street
Boston, MA 02210
Fund transfer agent
Columbia Management Investment Services Corp.
P.O. Box 219104
Kansas City, MO 64121-9104
Columbia Contrarian Core Fund | Annual Report 2023
Fund at a Glance
(Unaudited)
Investment objective
The Fund seeks total return, consisting of long-term capital appreciation and current income.
Portfolio management
Guy Pope, CFA
Portfolio Manager
Managed Fund since 2005
Morningstar style boxTM
The Morningstar Style Box is based on a fund’s portfolio holdings. For equity funds, the vertical axis shows the market capitalization of the stocks owned, and the horizontal axis shows investment style (value, blend, or growth). Information shown is based on the most recent data provided by Morningstar.
© 2023 Morningstar, Inc. All rights reserved. The Morningstar information contained herein: (1) is proprietary to Morningstar and/or its content providers; (2) may not be copied or distributed; and (3) is not warranted to be accurate, complete or timely. Neither Morningstar nor its content providers are responsible for any damages or losses arising from any use of this information.
| Average annual total returns (%) (for the period ended August 31, 2023) |
| | | Inception | 1 Year | 5 Years | 10 Years |
| Class A | Excluding sales charges | 11/01/98 | 18.28 | 11.44 | 12.17 |
| | Including sales charges | | 11.47 | 10.13 | 11.50 |
| Advisor Class | 11/08/12 | 18.55 | 11.71 | 12.45 |
| Class C | Excluding sales charges | 12/09/02 | 17.38 | 10.60 | 11.32 |
| | Including sales charges | | 16.38 | 10.60 | 11.32 |
| Institutional Class | 12/14/92 | 18.58 | 11.72 | 12.45 |
| Institutional 2 Class | 11/08/12 | 18.66 | 11.80 | 12.55 |
| Institutional 3 Class | 11/08/12 | 18.70 | 11.86 | 12.61 |
| Class R | 09/27/10 | 17.99 | 11.16 | 11.89 |
| Class V | Excluding sales charges | 02/12/93 | 18.28 | 11.44 | 12.15 |
| | Including sales charges | | 11.50 | 10.13 | 11.49 |
| Russell 1000 Index | | 15.40 | 10.77 | 12.55 |
Returns for Class A and Class V shares are shown with and without the maximum initial sales charge of 5.75%. Returns for Class C shares are shown with and without the 1.00% contingent deferred sales charge for the first year only. The Fund’s other share classes are not subject to sales charges and have limited eligibility. Please see the Fund’s prospectus for details. Performance for different share classes will vary based on differences in sales charges and fees associated with each share class. All results shown assume reinvestment of distributions during the period. Returns do not reflect the deduction of taxes that a shareholder may pay on Fund distributions or on the redemption of Fund shares. Performance results reflect the effect of any fee waivers or reimbursements of Fund expenses by Columbia Management Investment Advisers, LLC and/or any of its affiliates. Absent these fee waivers or expense reimbursement arrangements, performance results would have been lower.
The performance information shown represents past performance and is not a guarantee of future results. The investment return and principal value of your investment will fluctuate so that your shares, when redeemed, may be worth more or less than their original cost. Current performance may be lower or higher than the performance information shown. You may obtain performance information current to the most recent month-end by contacting your financial intermediary, visiting columbiathreadneedleus.com/investor/ or calling 800.345.6611.
The Russell 1000 Index tracks the performance of 1,000 of the largest U.S. companies, based on market capitalization.
Indices are not available for investment, are not professionally managed and do not reflect sales charges, fees, brokerage commissions, taxes or other expenses of investing. Securities in the Fund may not match those in an index.
Columbia Contrarian Core Fund | Annual Report 2023
| 3 |
Fund at a Glance (continued)
(Unaudited)
Performance of a hypothetical $10,000 investment (August 31, 2013 — August 31, 2023)
The chart above shows the change in value of a hypothetical $10,000 investment in Class A shares of Columbia Contrarian Core Fund during the stated time period, and does not reflect the deduction of taxes that a shareholder may pay on Fund distributions or on the redemption of Fund shares.
| Portfolio breakdown (%) (at August 31, 2023) |
| Common Stocks | 97.8 |
| Money Market Funds | 2.2 |
| Total | 100.0 |
Percentages indicated are based upon total investments excluding investments in derivatives, if any. The Fund’s portfolio composition is subject to change.
| Equity sector breakdown (%) (at August 31, 2023) |
| Communication Services | 13.2 |
| Consumer Discretionary | 7.1 |
| Consumer Staples | 5.9 |
| Energy | 3.9 |
| Financials | 12.6 |
| Health Care | 14.0 |
| Industrials | 9.2 |
| Information Technology | 28.9 |
| Materials | 2.6 |
| Real Estate | 1.2 |
| Utilities | 1.4 |
| Total | 100.0 |
Percentages indicated are based upon total equity investments. The Fund’s portfolio composition is subject to change.
| 4 | Columbia Contrarian Core Fund | Annual Report 2023 |
Manager Discussion of Fund Performance
(Unaudited)
For the 12-month period that ended August 31, 2023, Class A shares of Columbia Contrarian Core Fund returned 18.28% excluding sales charges. The Fund’s benchmark, the Russell 1000 Index, returned 15.40%.
Market overview
The broad U.S. equity market delivered strong gains during the annual period, despite continued concerns about a future economic slowdown and a series of rate hikes by the U.S. Federal Reserve (Fed) that tapered from aggressive to more measured by period-end to tame stubborn inflation. Momentum picked up as the period progressed as better-than-feared earnings drove equity gains. The period, however, was far from smooth.
In March 2023, the failure of a pair of U.S. banks and the collapse of European giant Credit Suisse led to fears of a financial crisis. In response, the Fed created a lending facility to support bank liquidity while the market began to price in multiple cuts in the federal funds target rate over the second half of 2023. At its March 2023 meeting the Fed raised the federal funds target rate by another quarter-point to a range of 4.75% to 5.0%. The rate hike was generally welcomed by investors as a signal that the Fed viewed the financial system as remaining on stable footing.
Inflation continued to decline as the period progressed. Through August 2023, the rate of year-over-year U.S. inflation had decelerated to 3.7%, a meaningful reduction from the four-decade high of 9.1% in June 2022, though still higher than the Fed’s 2% inflation target. Nonetheless, with the economy displaying surprising resilience and employment remaining historically robust, the Fed implemented additional 25 basis point increases at its early May and late July meetings, bringing the federal funds target rate to the 5.25% to 5.50% range.
Sentiment remained quite positive through the latter months of the period, as the Fed slowed its pace of rate hikes in response to cooling inflation. Investors were further encouraged by the fact that economic growth and corporate earnings — while slowing — did not decline to the extent that the markets had anticipated in late 2022. These factors combined to fuel an impressive gain for equities, but the majority of the positive return was generated by a small group of mega-cap technology-related stocks. Much of the relative strength in this area comes from companies expected to benefit from the evolution of artificial intelligence (AI). The growth style strongly outpaced value as a result, with returns of 21.94% and 8.59%, respectively, for the Russell 1000 Growth Index and the Russell 1000 Value Index. The small-cap Russell 2000 Index, which is less influenced by AI-related trends and is more sensitive to concerns about the banking sector, returned 4.65%, unable to keep pace with the rally in large caps.
The Fund’s notable contributors during the period
| • | The Fund’s strong performance during the period was led by the performance of its holdings in the information technology, communication services, industrials, financials and health care sectors. |
| • | Top individual contributors to the Fund’s performance included: |
| ○ | NVIDIA Corp., a semiconductor company that is a leading supplier of artificial intelligence hardware and software; |
| ○ | Microsoft Corp., a multinational technology company that develops and supports software, services, devices and solutions worldwide; and |
| ○ | Eli Lilly & Co., a drug manufacturer that develops and markets human pharmaceuticals worldwide. |
The Fund’s notable detractors during the period
| • | The largest detracting areas for the Fund during the period included the real estate, materials and utilities sectors. |
| • | Holdings that detracted most from Fund performance during the period included: |
| ○ | American Tower Corp., a real estate investment trust that owns and operates wireless and broadcast communications infrastructure in several countries worldwide; |
| ○ | CVS Health Corp., a healthcare company which owns CVS Pharmacy, CVS Caremark and Aetna, among many other brands; and |
Columbia Contrarian Core Fund | Annual Report 2023
| 5 |
Manager Discussion of Fund Performance (continued)
(Unaudited)
| ○ | International Flavors & Fragrances, Inc., a chemical company that produces flavors, fragrances and active ingredients for cosmetics. |
| ○ | The Fund’s positions in CVS Health and International Flavors & Fragrances were sold in the second half of the period. |
Market risk may affect a single issuer, sector of the economy, industry or the market as a whole. Foreign investments subject the Fund to risks, including political, economic, market, social and others within a particular country, as well as to currency instabilities and less stringent financial and accounting standards generally applicable to U.S. issuers. Growth securities, at times, may not perform as well as value securities or the stock market in general and may be out of favor with investors. Value securities may be unprofitable if the market fails to recognize their intrinsic worth or the portfolio manager misgauged that worth. The Fund may invest significantly in issuers within a particular sector, which may be negatively affected by market, economic or other conditions, making the Fund more vulnerable to unfavorable developments in the sector. See the Fund’s prospectus for more information on these and other risks.
The views expressed in this report reflect the current views of the respective parties who have contributed to this report. These views are not guarantees of future performance and involve certain risks, uncertainties and assumptions that are difficult to predict, so actual outcomes and results may differ significantly from the views expressed. These views are subject to change at any time based upon economic, market or other conditions and the respective parties disclaim any responsibility to update such views. These views may not be relied on as investment advice and, because investment decisions for a Columbia fund are based on numerous factors, may not be relied on as an indication of trading intent on behalf of any particular Columbia fund. References to specific securities should not be construed as a recommendation or investment advice.
| 6 | Columbia Contrarian Core Fund | Annual Report 2023 |
Understanding Your Fund’s Expenses
(Unaudited)
As an investor, you incur two types of costs. There are shareholder transaction costs, which generally include sales charges on purchases and may include redemption fees. There are also ongoing fund costs, which generally include management fees, distribution and/or service fees, and other fund expenses. The following information is intended to help you understand your ongoing costs (in dollars) of investing in the Fund and to help you compare these costs with the ongoing costs of investing in other mutual funds.
Analyzing your Fund’s expenses
To illustrate these ongoing costs, we have provided examples and calculated the expenses paid by investors in each share class of the Fund during the period. The actual and hypothetical information in the table is based on an initial investment of $1,000 at the beginning of the period indicated and held for the entire period. Expense information is calculated two ways and each method provides you with different information. The amount listed in the “Actual” column is calculated using the Fund’s actual operating expenses and total return for the period. You may use the Actual information, together with the amount invested, to estimate the expenses that you paid over the period. Simply divide your account value by $1,000 (for example, an $8,600 account value divided by $1,000 = 8.6), then multiply the results by the expenses paid during the period under the “Actual” column. The amount listed in the “Hypothetical” column assumes a 5% annual rate of return before expenses (which is not the Fund’s actual return) and then applies the Fund’s actual expense ratio for the period to the hypothetical return. You should not use the hypothetical account values and expenses to estimate either your actual account balance at the end of the period or the expenses you paid during the period. See “Compare with other funds” below for details on how to use the hypothetical data.
Compare with other funds
Since all mutual funds are required to include the same hypothetical calculations about expenses in shareholder reports, you can use this information to compare the ongoing cost of investing in the Fund with other funds. To do so, compare the hypothetical example with the 5% hypothetical examples that appear in the shareholder reports of other funds. As you compare hypothetical examples of other funds, it is important to note that hypothetical examples are meant to highlight the ongoing costs of investing in a fund only and do not reflect any transaction costs, such as sales charges, or redemption or exchange fees. Therefore, the hypothetical calculations are useful in comparing ongoing costs only, and will not help you determine the relative total costs of owning different funds. If transaction costs were included in these calculations, your costs would be higher.
| March 1, 2023 — August 31, 2023 |
| | Account value at the
beginning of the
period ($) | Account value at the
end of the
period ($) | Expenses paid during
the period ($) | Fund’s annualized
expense ratio (%) |
| | Actual | Hypothetical | Actual | Hypothetical | Actual | Hypothetical | Actual |
| Class A | 1,000.00 | 1,000.00 | 1,183.50 | 1,020.32 | 5.34 | 4.94 | 0.97 |
| Advisor Class | 1,000.00 | 1,000.00 | 1,185.10 | 1,021.58 | 3.97 | 3.67 | 0.72 |
| Class C | 1,000.00 | 1,000.00 | 1,179.10 | 1,016.53 | 9.45 | 8.74 | 1.72 |
| Institutional Class | 1,000.00 | 1,000.00 | 1,185.30 | 1,021.58 | 3.97 | 3.67 | 0.72 |
| Institutional 2 Class | 1,000.00 | 1,000.00 | 1,185.70 | 1,021.93 | 3.58 | 3.31 | 0.65 |
| Institutional 3 Class | 1,000.00 | 1,000.00 | 1,185.50 | 1,022.18 | 3.31 | 3.06 | 0.60 |
| Class R | 1,000.00 | 1,000.00 | 1,182.30 | 1,019.06 | 6.71 | 6.21 | 1.22 |
| Class V | 1,000.00 | 1,000.00 | 1,183.50 | 1,020.32 | 5.34 | 4.94 | 0.97 |
Expenses paid during the period are equal to the annualized expense ratio for each class as indicated above, multiplied by the average account value over the period and then multiplied by the number of days in the Fund’s most recent fiscal half year and divided by 365.
Expenses do not include fees and expenses incurred indirectly by the Fund from its investment in underlying funds, including affiliated and non-affiliated pooled investment vehicles, such as mutual funds and exchange-traded funds.
Had Columbia Management Investment Advisers, LLC and/or certain of its affiliates not waived/reimbursed certain fees and expenses, account value at the end of the period would have been reduced.
Columbia Contrarian Core Fund | Annual Report 2023
| 7 |
Portfolio of Investments
August 31, 2023
(Percentages represent value of investments compared to net assets)
Investments in securities
| Common Stocks 97.6% |
| Issuer | Shares | Value ($) |
| Communication Services 12.8% |
| Entertainment 2.1% |
| Endeavor Group Holdings, Inc., Class A(a) | 3,696,578 | 80,918,093 |
| Take-Two Interactive Software, Inc.(a) | 1,133,871 | 161,236,456 |
| Total | | 242,154,549 |
| Interactive Media & Services 8.9% |
| Alphabet, Inc., Class A(a) | 2,132,536 | 290,387,427 |
| Alphabet, Inc., Class C(a) | 2,029,734 | 278,783,965 |
| Match Group, Inc.(a) | 1,306,455 | 61,233,546 |
| Meta Platforms, Inc., Class A(a) | 941,578 | 278,603,514 |
| Pinterest, Inc., Class A(a) | 2,318,772 | 63,743,042 |
| ZoomInfo Technologies, Inc.(a) | 3,578,329 | 64,481,489 |
| Total | | 1,037,232,983 |
| Media 0.8% |
| Comcast Corp., Class A | 2,078,163 | 97,174,902 |
| Wireless Telecommunication Services 1.0% |
| T-Mobile US, Inc.(a) | 849,438 | 115,735,927 |
| Total Communication Services | 1,492,298,361 |
| Consumer Discretionary 6.9% |
| Automobiles 1.4% |
| Tesla, Inc.(a) | 625,270 | 161,369,682 |
| Broadline Retail 4.1% |
| Amazon.com, Inc.(a) | 3,451,412 | 476,329,370 |
| Hotels, Restaurants & Leisure 0.4% |
| McDonald’s Corp. | 157,970 | 44,413,266 |
| Specialty Retail 0.4% |
| Lowe’s Companies, Inc. | 201,380 | 46,414,062 |
| Textiles, Apparel & Luxury Goods 0.6% |
| Tapestry, Inc. | 2,324,001 | 77,435,713 |
| Total Consumer Discretionary | 805,962,093 |
| Common Stocks (continued) |
| Issuer | Shares | Value ($) |
| Consumer Staples 5.8% |
| Consumer Staples Distribution & Retail 2.2% |
| Dollar Tree, Inc.(a) | 96,424 | 11,798,441 |
| Sysco Corp. | 648,279 | 45,152,632 |
| Walmart, Inc. | 1,206,554 | 196,197,746 |
| Total | | 253,148,819 |
| Food Products 0.9% |
| Mondelez International, Inc., Class A | 1,462,001 | 104,182,191 |
| Household Products 1.3% |
| Procter & Gamble Co. (The) | 1,007,013 | 155,422,387 |
| Personal Care Products 1.4% |
| Coty, Inc., Class A(a) | 5,116,546 | 59,147,272 |
| Kenvue, Inc. | 4,278,988 | 98,630,673 |
| Total | | 157,777,945 |
| Total Consumer Staples | 670,531,342 |
| Energy 3.8% |
| Oil, Gas & Consumable Fuels 3.8% |
| Canadian Natural Resources Ltd. | 2,041,668 | 132,075,503 |
| Chevron Corp. | 1,285,990 | 207,172,989 |
| EOG Resources, Inc. | 807,293 | 103,834,026 |
| Total | | 443,082,518 |
| Total Energy | 443,082,518 |
| Financials 12.3% |
| Banks 2.4% |
| Bank of America Corp. | 2,220,715 | 63,667,899 |
| JPMorgan Chase & Co. | 990,313 | 144,912,501 |
| Wells Fargo & Co. | 1,574,439 | 65,008,587 |
| Total | | 273,588,987 |
| Capital Markets 2.6% |
| BlackRock, Inc. | 254,127 | 178,026,129 |
| MSCI, Inc. | 54,128 | 29,425,063 |
| S&P Global, Inc. | 249,228 | 97,413,256 |
| Total | | 304,864,448 |
| Consumer Finance 0.4% |
| American Express Co. | 323,201 | 51,062,526 |
The accompanying Notes to Financial Statements are an integral part of this statement.
| 8 | Columbia Contrarian Core Fund | Annual Report 2023 |
Portfolio of Investments (continued)
August 31, 2023
| Common Stocks (continued) |
| Issuer | Shares | Value ($) |
| Financial Services 6.1% |
| Berkshire Hathaway, Inc., Class B(a) | 881,136 | 317,385,187 |
| MasterCard, Inc., Class A | 465,353 | 192,023,262 |
| Visa, Inc., Class A | 795,075 | 195,334,026 |
| Total | | 704,742,475 |
| Insurance 0.8% |
| Aon PLC, Class A | 279,274 | 93,107,159 |
| Total Financials | 1,427,365,595 |
| Health Care 13.7% |
| Biotechnology 3.0% |
| AbbVie, Inc. | 1,051,555 | 154,536,523 |
| BioMarin Pharmaceutical, Inc.(a) | 709,607 | 64,843,888 |
| Vertex Pharmaceuticals, Inc.(a) | 384,874 | 134,067,009 |
| Total | | 353,447,420 |
| Health Care Equipment & Supplies 2.9% |
| Abbott Laboratories | 604,382 | 62,190,908 |
| Boston Scientific Corp.(a) | 1,501,489 | 80,990,317 |
| GE HealthCare Technologies, Inc. | 641,685 | 45,206,708 |
| Medtronic PLC | 1,820,929 | 148,405,713 |
| Total | | 336,793,646 |
| Health Care Providers & Services 2.6% |
| Elevance Health, Inc. | 398,020 | 175,928,820 |
| UnitedHealth Group, Inc. | 259,126 | 123,494,269 |
| Total | | 299,423,089 |
| Life Sciences Tools & Services 2.5% |
| Danaher Corp. | 307,222 | 81,413,830 |
| IQVIA Holdings, Inc.(a) | 362,342 | 80,668,200 |
| Thermo Fisher Scientific, Inc. | 219,914 | 122,514,089 |
| Total | | 284,596,119 |
| Pharmaceuticals 2.7% |
| Eli Lilly & Co. | 523,232 | 289,975,174 |
| Johnson & Johnson | 180,223 | 29,138,455 |
| Total | | 319,113,629 |
| Total Health Care | 1,593,373,903 |
| Industrials 9.0% |
| Aerospace & Defense 1.5% |
| RTX Corp. | 2,079,125 | 178,887,915 |
| Common Stocks (continued) |
| Issuer | Shares | Value ($) |
| Electrical Equipment 1.1% |
| Emerson Electric Co. | 1,245,006 | 122,321,839 |
| Ground Transportation 3.0% |
| Uber Technologies, Inc.(a) | 3,604,693 | 170,249,650 |
| Union Pacific Corp. | 796,416 | 175,665,477 |
| Total | | 345,915,127 |
| Industrial Conglomerates 1.9% |
| General Electric Co. | 1,187,105 | 135,876,038 |
| Honeywell International, Inc. | 458,426 | 86,156,583 |
| Total | | 222,032,621 |
| Machinery 1.5% |
| Parker-Hannifin Corp. | 425,144 | 177,242,534 |
| Total Industrials | 1,046,400,036 |
| Information Technology 28.2% |
| Electronic Equipment, Instruments & Components 1.8% |
| TE Connectivity Ltd. | 1,103,007 | 146,027,097 |
| Zebra Technologies Corp., Class A(a) | 211,911 | 58,277,644 |
| Total | | 204,304,741 |
| IT Services 2.2% |
| Accenture PLC, Class A | 367,595 | 119,016,233 |
| International Business Machines Corp. | 927,577 | 136,196,131 |
| Total | | 255,212,364 |
| Semiconductors & Semiconductor Equipment 7.2% |
| Advanced Micro Devices, Inc.(a) | 558,278 | 59,021,150 |
| Entegris, Inc. | 480,278 | 48,637,753 |
| Lam Research Corp. | 210,735 | 148,020,264 |
| Marvell Technology, Inc. | 877,855 | 51,135,054 |
| NVIDIA Corp. | 902,234 | 445,297,591 |
| QUALCOMM, Inc. | 714,482 | 81,829,623 |
| Total | | 833,941,435 |
| Software 10.8% |
| Adobe, Inc.(a) | 315,917 | 176,705,015 |
| Intuit, Inc. | 413,535 | 224,057,398 |
| Microsoft Corp. | 2,422,040 | 793,847,830 |
| Palo Alto Networks, Inc.(a) | 262,987 | 63,984,737 |
| Total | | 1,258,594,980 |
The accompanying Notes to Financial Statements are an integral part of this statement.
Columbia Contrarian Core Fund | Annual Report 2023
| 9 |
Portfolio of Investments (continued)
August 31, 2023
| Common Stocks (continued) |
| Issuer | Shares | Value ($) |
| Technology Hardware, Storage & Peripherals 6.2% |
| Apple, Inc. | 3,838,001 | 721,045,248 |
| Total Information Technology | 3,273,098,768 |
| Materials 2.5% |
| Chemicals 1.1% |
| Sherwin-Williams Co. (The) | 477,555 | 129,761,244 |
| Containers & Packaging 0.7% |
| Avery Dennison Corp. | 436,865 | 82,296,629 |
| Metals & Mining 0.7% |
| Newmont Corp. | 2,004,512 | 79,017,863 |
| Total Materials | 291,075,736 |
| Real Estate 1.2% |
| Specialized REITs 1.2% |
| American Tower Corp. | 776,703 | 140,831,788 |
| Total Real Estate | 140,831,788 |
| Utilities 1.4% |
| Electric Utilities 0.4% |
| American Electric Power Co., Inc. | 587,845 | 46,087,048 |
| Common Stocks (continued) |
| Issuer | Shares | Value ($) |
| Multi-Utilities 1.0% |
| DTE Energy Co. | 514,932 | 53,233,670 |
| Public Service Enterprise Group, Inc. | 937,736 | 57,276,915 |
| Total | | 110,510,585 |
| Total Utilities | 156,597,633 |
Total Common Stocks
(Cost $6,385,464,824) | 11,340,617,773 |
|
| Money Market Funds 2.2% |
| | Shares | Value ($) |
| Columbia Short-Term Cash Fund, 5.476%(b),(c) | 255,297,267 | 255,220,678 |
Total Money Market Funds
(Cost $255,183,266) | 255,220,678 |
Total Investments in Securities
(Cost: $6,640,648,090) | 11,595,838,451 |
| Other Assets & Liabilities, Net | | 27,270,749 |
| Net Assets | 11,623,109,200 |
Notes to Portfolio of Investments
| (a) | Non-income producing investment. |
| (b) | The rate shown is the seven-day current annualized yield at August 31, 2023. |
| (c) | As defined in the Investment Company Act of 1940, as amended, an affiliated company is one in which the Fund owns 5% or more of the company’s outstanding voting securities, or a company which is under common ownership or control with the Fund. The value of the holdings and transactions in these affiliated companies during the year ended August 31, 2023 are as follows: |
| Affiliated issuers | Beginning
of period($) | Purchases($) | Sales($) | Net change in
unrealized
appreciation
(depreciation)($) | End of
period($) | Realized gain
(loss)($) | Dividends($) | End of
period shares |
| Columbia Short-Term Cash Fund, 5.476% |
| | 289,176,047 | 2,185,710,546 | (2,219,689,646) | 23,731 | 255,220,678 | (7,171) | 8,250,689 | 255,297,267 |
Fair value measurements
The Fund categorizes its fair value measurements according to a three-level hierarchy that maximizes the use of observable inputs and minimizes the use of unobservable inputs by prioritizing that the most observable input be used when available. Observable inputs are those that market participants would use in pricing an investment based on market data obtained from sources independent of the reporting entity. Unobservable inputs are those that reflect the Fund’s assumptions about the information market participants would use in pricing an investment. An investment’s level within the fair value hierarchy is based on the lowest level of any input that is deemed significant to the asset’s or liability’s fair value measurement. The input levels are not necessarily an indication of the risk or liquidity associated with investments at that level. For example, certain U.S. government securities are generally high quality and liquid, however, they are reflected as Level 2 because the inputs used to determine fair value may not always be quoted prices in an active market.
Fair value inputs are summarized in the three broad levels listed below:
| ■ | Level 1 — Valuations based on quoted prices for investments in active markets that the Fund has the ability to access at the measurement date. Valuation adjustments are not applied to Level 1 investments. |
| ■ | Level 2 — Valuations based on other significant observable inputs (including quoted prices for similar securities, interest rates, prepayment speeds, credit risks, etc.). |
| ■ | Level 3 — Valuations based on significant unobservable inputs (including the Fund’s own assumptions and judgment in determining the fair value of investments). |
The accompanying Notes to Financial Statements are an integral part of this statement.
| 10 | Columbia Contrarian Core Fund | Annual Report 2023 |
Portfolio of Investments (continued)
August 31, 2023
Fair value measurements (continued)
Inputs that are used in determining fair value of an investment may include price information, credit data, volatility statistics, and other factors. These inputs can be either observable or unobservable. The availability of observable inputs can vary between investments, and is affected by various factors such as the type of investment, and the volume and level of activity for that investment or similar investments in the marketplace. The inputs will be considered by the Investment Manager, along with any other relevant factors in the calculation of an investment’s fair value. The Fund uses prices and inputs that are current as of the measurement date, which may include periods of market dislocations. During these periods, the availability of prices and inputs may be reduced for many investments. This condition could cause an investment to be reclassified between the various levels within the hierarchy.
Investments falling into the Level 3 category are primarily supported by quoted prices from brokers and dealers participating in the market for those investments. However, these may be classified as Level 3 investments due to lack of market transparency and corroboration to support these quoted prices. Additionally, valuation models may be used as the pricing source for any remaining investments classified as Level 3. These models may rely on one or more significant unobservable inputs and/or significant assumptions by the Investment Manager. Inputs used in valuations may include, but are not limited to, financial statement analysis, capital account balances, discount rates and estimated cash flows, and comparable company data.
The Fund’s Board of Trustees (the Board) has designated the Investment Manager, through its Valuation Committee (the Committee), as valuation designee, responsible for determining the fair value of the assets of the Fund for which market quotations are not readily available using valuation procedures approved by the Board. The Committee consists of voting and non-voting members from various groups within the Investment Manager’s organization, including operations and accounting, trading and investments, compliance, risk management and legal.
The Committee meets at least monthly to review and approve valuation matters, which may include a description of specific valuation determinations, data regarding pricing information received from approved pricing vendors and brokers and the results of Board-approved valuation policies and procedures (the Policies). The Policies address, among other things, instances when market quotations are or are not readily available, including recommendations of third party pricing vendors and a determination of appropriate pricing methodologies; events that require specific valuation determinations and assessment of fair value techniques; securities with a potential for stale pricing, including those that are illiquid, restricted, or in default; and the effectiveness of third party pricing vendors, including periodic reviews of vendors. The Committee meets more frequently, as needed, to discuss additional valuation matters, which may include the need to review back-testing results, review time-sensitive information or approve related valuation actions. Representatives of Columbia Management Investment Advisers, LLC report to the Board at each of its regularly scheduled meetings to discuss valuation matters and actions during the period, similar to those described earlier.
The following table is a summary of the inputs used to value the Fund’s investments at August 31, 2023:
| | Level 1 ($) | Level 2 ($) | Level 3 ($) | Total ($) |
| Investments in Securities | | | | |
| Common Stocks | | | | |
| Communication Services | 1,492,298,361 | — | — | 1,492,298,361 |
| Consumer Discretionary | 805,962,093 | — | — | 805,962,093 |
| Consumer Staples | 670,531,342 | — | — | 670,531,342 |
| Energy | 443,082,518 | — | — | 443,082,518 |
| Financials | 1,427,365,595 | — | — | 1,427,365,595 |
| Health Care | 1,593,373,903 | — | — | 1,593,373,903 |
| Industrials | 1,046,400,036 | — | — | 1,046,400,036 |
| Information Technology | 3,273,098,768 | — | — | 3,273,098,768 |
| Materials | 291,075,736 | — | — | 291,075,736 |
| Real Estate | 140,831,788 | — | — | 140,831,788 |
| Utilities | 156,597,633 | — | — | 156,597,633 |
| Total Common Stocks | 11,340,617,773 | — | — | 11,340,617,773 |
| Money Market Funds | 255,220,678 | — | — | 255,220,678 |
| Total Investments in Securities | 11,595,838,451 | — | — | 11,595,838,451 |
See the Portfolio of Investments for all investment classifications not indicated in the table.
The accompanying Notes to Financial Statements are an integral part of this statement.
Columbia Contrarian Core Fund | Annual Report 2023
| 11 |
Statement of Assets and Liabilities
August 31, 2023
| Assets | |
| Investments in securities, at value | |
| Unaffiliated issuers (cost $6,385,464,824) | $11,340,617,773 |
| Affiliated issuers (cost $255,183,266) | 255,220,678 |
| Receivable for: | |
| Investments sold | 49,411,407 |
| Capital shares sold | 3,243,561 |
| Dividends | 16,724,985 |
| Foreign tax reclaims | 251,337 |
| Trustees’ fees | 872,660 |
| Expense reimbursement due from Investment Manager | 9,656 |
| Prepaid expenses | 99,131 |
| Total assets | 11,666,451,188 |
| Liabilities | |
| Payable for: | |
| Investments purchased | 33,026,012 |
| Capital shares redeemed | 7,830,174 |
| Management services fees | 194,004 |
| Distribution and/or service fees | 23,946 |
| Transfer agent fees | 1,049,306 |
| Trustees’ fees | 1,050,095 |
| Other expenses | 168,451 |
| Total liabilities | 43,341,988 |
| Net assets applicable to outstanding capital stock | $11,623,109,200 |
| Represented by | |
| Paid in capital | 6,463,811,937 |
| Total distributable earnings (loss) | 5,159,297,263 |
| Total - representing net assets applicable to outstanding capital stock | $11,623,109,200 |
The accompanying Notes to Financial Statements are an integral part of this statement.
| 12 | Columbia Contrarian Core Fund | Annual Report 2023 |
Statement of Assets and Liabilities (continued)
August 31, 2023
| Class A | |
| Net assets | $1,845,562,671 |
| Shares outstanding | 61,803,154 |
| Net asset value per share | $29.86 |
| Maximum sales charge | 5.75% |
| Maximum offering price per share (calculated by dividing the net asset value per share by 1.0 minus the maximum sales charge for Class A shares) | $31.68 |
| Advisor Class | |
| Net assets | $572,425,226 |
| Shares outstanding | 18,435,297 |
| Net asset value per share | $31.05 |
| Class C | |
| Net assets | $304,121,126 |
| Shares outstanding | 12,092,307 |
| Net asset value per share | $25.15 |
| Institutional Class | |
| Net assets | $4,866,117,310 |
| Shares outstanding | 160,889,972 |
| Net asset value per share | $30.25 |
| Institutional 2 Class | |
| Net assets | $810,031,990 |
| Shares outstanding | 26,106,075 |
| Net asset value per share | $31.03 |
| Institutional 3 Class | |
| Net assets | $2,916,211,156 |
| Shares outstanding | 93,884,101 |
| Net asset value per share | $31.06 |
| Class R | |
| Net assets | $122,287,962 |
| Shares outstanding | 4,098,580 |
| Net asset value per share | $29.84 |
| Class V | |
| Net assets | $186,351,759 |
| Shares outstanding | 6,336,301 |
| Net asset value per share | $29.41 |
| Maximum sales charge | 5.75% |
| Maximum offering price per share (calculated by dividing the net asset value per share by 1.0 minus the maximum sales charge for Class V shares) | $31.20 |
The accompanying Notes to Financial Statements are an integral part of this statement.
Columbia Contrarian Core Fund | Annual Report 2023
| 13 |
Statement of Operations
Year Ended August 31, 2023
| Net investment income | |
| Income: | |
| Dividends — unaffiliated issuers | $140,647,676 |
| Dividends — affiliated issuers | 8,250,689 |
| Interfund lending | 4,530 |
| Foreign taxes withheld | (1,184,721) |
| Total income | 147,718,174 |
| Expenses: | |
| Management services fees | 64,886,977 |
| Distribution and/or service fees | |
| Class A | 4,177,186 |
| Class C | 3,245,193 |
| Class R | 551,762 |
| Class V | 424,380 |
| Transfer agent fees | |
| Class A | 2,175,486 |
| Advisor Class | 697,130 |
| Class C | 423,022 |
| Institutional Class | 5,747,369 |
| Institutional 2 Class | 408,675 |
| Institutional 3 Class | 168,385 |
| Class R | 143,699 |
| Class V | 221,032 |
| Trustees’ fees | 209,719 |
| Custodian fees | 50,678 |
| Printing and postage fees | 385,169 |
| Registration fees | 281,380 |
| Accounting services fees | 32,518 |
| Legal fees | 149,425 |
| Compensation of chief compliance officer | 1,955 |
| Other | 174,555 |
| Total expenses | 84,555,695 |
| Fees waived or expenses reimbursed by Investment Manager and its affiliates | (2,371,756) |
| Expense reduction | (5,966) |
| Total net expenses | 82,177,973 |
| Net investment income | 65,540,201 |
| Realized and unrealized gain (loss) — net | |
| Net realized gain (loss) on: | |
| Investments — unaffiliated issuers | 239,482,708 |
| Investments — affiliated issuers | (7,171) |
| Foreign currency translations | (15,240) |
| Net realized gain | 239,460,297 |
| Net change in unrealized appreciation (depreciation) on: | |
| Investments — unaffiliated issuers | 1,549,082,416 |
| Investments — affiliated issuers | 23,731 |
| Foreign currency translations | 2,365 |
| Net change in unrealized appreciation (depreciation) | 1,549,108,512 |
| Net realized and unrealized gain | 1,788,568,809 |
| Net increase in net assets resulting from operations | $1,854,109,010 |
The accompanying Notes to Financial Statements are an integral part of this statement.
| 14 | Columbia Contrarian Core Fund | Annual Report 2023 |
Statement of Changes in Net Assets
| | Year Ended
August 31, 2023 | Year Ended
August 31, 2022 |
| Operations | | |
| Net investment income | $65,540,201 | $61,840,347 |
| Net realized gain | 239,460,297 | 1,156,760,456 |
| Net change in unrealized appreciation (depreciation) | 1,549,108,512 | (2,864,242,888) |
| Net increase (decrease) in net assets resulting from operations | 1,854,109,010 | (1,645,642,085) |
| Distributions to shareholders | | |
| Net investment income and net realized gains | | |
| Class A | (149,270,484) | (248,040,955) |
| Advisor Class | (48,346,525) | (83,993,104) |
| Class C | (35,779,204) | (71,648,177) |
| Institutional Class | (403,323,637) | (648,750,792) |
| Institutional 2 Class | (65,673,680) | (101,640,489) |
| Institutional 3 Class | (238,634,909) | (399,260,986) |
| Class R | (9,716,828) | (16,900,701) |
| Class V | (15,368,822) | (25,882,833) |
| Total distributions to shareholders | (966,114,089) | (1,596,118,037) |
| Increase in net assets from capital stock activity | 170,026,433 | 624,160,386 |
| Total increase (decrease) in net assets | 1,058,021,354 | (2,617,599,736) |
| Net assets at beginning of year | 10,565,087,846 | 13,182,687,582 |
| Net assets at end of year | $11,623,109,200 | $10,565,087,846 |
The accompanying Notes to Financial Statements are an integral part of this statement.
Columbia Contrarian Core Fund | Annual Report 2023
| 15 |
Statement of Changes in Net Assets (continued)
| | Year Ended | Year Ended |
| | August 31, 2023 | August 31, 2022 |
| | Shares | Dollars ($) | Shares | Dollars ($) |
| Capital stock activity |
| Class A | | | | |
| Shares sold | 7,129,742 | 191,743,255 | 7,173,174 | 225,974,029 |
| Distributions reinvested | 5,523,577 | 137,095,179 | 7,052,274 | 228,282,119 |
| Shares redeemed | (10,921,645) | (292,220,451) | (10,586,589) | (331,438,652) |
| Net increase | 1,731,674 | 36,617,983 | 3,638,859 | 122,817,496 |
| Advisor Class | | | | |
| Shares sold | 3,283,219 | 91,587,827 | 3,894,443 | 126,057,847 |
| Distributions reinvested | 1,825,854 | 47,034,007 | 2,426,602 | 81,266,896 |
| Shares redeemed | (6,466,040) | (179,431,587) | (5,207,867) | (168,960,931) |
| Net increase (decrease) | (1,356,967) | (40,809,753) | 1,113,178 | 38,363,812 |
| Class C | | | | |
| Shares sold | 1,174,269 | 26,906,304 | 1,356,379 | 37,187,816 |
| Distributions reinvested | 1,660,206 | 34,897,527 | 2,477,529 | 69,370,813 |
| Shares redeemed | (6,557,509) | (148,608,689) | (5,166,302) | (140,541,479) |
| Net decrease | (3,723,034) | (86,804,858) | (1,332,394) | (33,982,850) |
| Institutional Class | | | | |
| Shares sold | 24,966,941 | 679,174,554 | 18,000,362 | 572,977,701 |
| Distributions reinvested | 15,126,986 | 379,536,090 | 18,595,718 | 608,079,971 |
| Shares redeemed | (33,756,925) | (910,968,627) | (25,901,207) | (821,657,440) |
| Net increase | 6,337,002 | 147,742,017 | 10,694,873 | 359,400,232 |
| Institutional 2 Class | | | | |
| Shares sold | 5,034,882 | 135,545,234 | 2,116,482 | 68,996,293 |
| Distributions reinvested | 2,550,154 | 65,615,470 | 3,036,132 | 101,558,621 |
| Shares redeemed | (4,642,180) | (129,112,789) | (4,780,790) | (156,247,153) |
| Net increase | 2,942,856 | 72,047,915 | 371,824 | 14,307,761 |
| Institutional 3 Class | | | | |
| Shares sold | 15,382,535 | 427,937,880 | 11,315,637 | 364,235,729 |
| Distributions reinvested | 7,428,333 | 191,279,561 | 9,291,200 | 310,976,452 |
| Shares redeemed | (20,526,088) | (581,278,109) | (17,531,135) | (567,306,226) |
| Net increase | 2,284,780 | 37,939,332 | 3,075,702 | 107,905,955 |
| Class R | | | | |
| Shares sold | 522,289 | 14,600,015 | 414,445 | 13,254,917 |
| Distributions reinvested | 388,765 | 9,656,926 | 517,344 | 16,761,949 |
| Shares redeemed | (894,249) | (23,972,778) | (775,349) | (24,498,125) |
| Net increase | 16,805 | 284,163 | 156,440 | 5,518,741 |
| Class V | | | | |
| Shares sold | 142,636 | 3,513,820 | 198,920 | 6,295,381 |
| Distributions reinvested | 458,280 | 11,200,364 | 586,499 | 18,726,926 |
| Shares redeemed | (440,622) | (11,704,550) | (491,137) | (15,193,068) |
| Net increase | 160,294 | 3,009,634 | 294,282 | 9,829,239 |
| Total net increase | 8,393,410 | 170,026,433 | 18,012,764 | 624,160,386 |
The accompanying Notes to Financial Statements are an integral part of this statement.
| 16 | Columbia Contrarian Core Fund | Annual Report 2023 |
[THIS PAGE INTENTIONALLY LEFT BLANK]
Columbia Contrarian Core Fund | Annual Report 2023
| 17 |
The following table is intended to help you understand the Fund’s financial performance. Certain information reflects financial results for a single share of a class held for the periods shown. Per share net investment income (loss) amounts are calculated based on average shares outstanding during the period. Total return assumes reinvestment of all dividends and distributions, if any. Total return does not reflect payment of sales charges, if any. Total return and portfolio turnover are not annualized for periods of less than one year. The ratios of expenses and net investment income are annualized for periods of less than one year. The portfolio turnover rate is calculated without regard to purchase and sales transactions of short-term instruments and certain derivatives, if any. If such transactions were included, the Fund’s portfolio turnover rate may be higher.
| | Net asset value,
beginning of
period | Net
investment
income
(loss) | Net
realized
and
unrealized
gain (loss) | Total from
investment
operations | Distributions
from net
investment
income | Distributions
from net
realized
gains | Total
distributions to
shareholders |
| Class A |
| Year Ended 8/31/2023 | $27.82 | 0.11 | 4.46 | 4.57 | (0.06) | (2.47) | (2.53) |
| Year Ended 8/31/2022 | $36.54 | 0.10 | (4.35) | (4.25) | (0.07) | (4.40) | (4.47) |
| Year Ended 8/31/2021 | $29.79 | 0.09 | 8.94 | 9.03 | (0.17) | (2.11) | (2.28) |
| Year Ended 8/31/2020 | $25.48 | 0.18 | 5.65 | 5.83 | (0.23) | (1.29) | (1.52) |
| Year Ended 8/31/2019 | $27.19 | 0.22 | 0.19 | 0.41 | (0.22) | (1.90) | (2.12) |
| Advisor Class |
| Year Ended 8/31/2023 | $28.84 | 0.18 | 4.64 | 4.82 | (0.14) | (2.47) | (2.61) |
| Year Ended 8/31/2022 | $37.70 | 0.19 | (4.49) | (4.30) | (0.16) | (4.40) | (4.56) |
| Year Ended 8/31/2021 | $30.66 | 0.18 | 9.21 | 9.39 | (0.24) | (2.11) | (2.35) |
| Year Ended 8/31/2020 | $26.19 | 0.25 | 5.80 | 6.05 | (0.29) | (1.29) | (1.58) |
| Year Ended 8/31/2019 | $27.89 | 0.29 | 0.19 | 0.48 | (0.28) | (1.90) | (2.18) |
| Class C |
| Year Ended 8/31/2023 | $23.94 | (0.08) | 3.76 | 3.68 | — | (2.47) | (2.47) |
| Year Ended 8/31/2022 | $32.19 | (0.12) | (3.73) | (3.85) | — | (4.40) | (4.40) |
| Year Ended 8/31/2021 | $26.53 | (0.13) | 7.90 | 7.77 | — | (2.11) | (2.11) |
| Year Ended 8/31/2020 | $22.84 | (0.02) | 5.04 | 5.02 | (0.04) | (1.29) | (1.33) |
| Year Ended 8/31/2019 | $24.57 | 0.04 | 0.15 | 0.19 | (0.02) | (1.90) | (1.92) |
| Institutional Class |
| Year Ended 8/31/2023 | $28.16 | 0.18 | 4.52 | 4.70 | (0.14) | (2.47) | (2.61) |
| Year Ended 8/31/2022 | $36.92 | 0.18 | (4.38) | (4.20) | (0.16) | (4.40) | (4.56) |
| Year Ended 8/31/2021 | $30.07 | 0.18 | 9.02 | 9.20 | (0.24) | (2.11) | (2.35) |
| Year Ended 8/31/2020 | $25.71 | 0.24 | 5.70 | 5.94 | (0.29) | (1.29) | (1.58) |
| Year Ended 8/31/2019 | $27.42 | 0.29 | 0.18 | 0.47 | (0.28) | (1.90) | (2.18) |
| Institutional 2 Class |
| Year Ended 8/31/2023 | $28.82 | 0.21 | 4.63 | 4.84 | (0.16) | (2.47) | (2.63) |
| Year Ended 8/31/2022 | $37.68 | 0.21 | (4.49) | (4.28) | (0.18) | (4.40) | (4.58) |
| Year Ended 8/31/2021 | $30.64 | 0.20 | 9.21 | 9.41 | (0.26) | (2.11) | (2.37) |
| Year Ended 8/31/2020 | $26.17 | 0.27 | 5.80 | 6.07 | (0.31) | (1.29) | (1.60) |
| Year Ended 8/31/2019 | $27.88 | 0.32 | 0.18 | 0.50 | (0.31) | (1.90) | (2.21) |
The accompanying Notes to Financial Statements are an integral part of this statement.
| 18 | Columbia Contrarian Core Fund | Annual Report 2023 |
Financial Highlights (continued)
| | Net
asset
value,
end of
period | Total
return | Total gross
expense
ratio to
average
net assets(a) | Total net
expense
ratio to
average
net assets(a),(b) | Net investment
income (loss)
ratio to
average
net assets | Portfolio
turnover | Net
assets,
end of
period
(000’s) |
| Class A |
| Year Ended 8/31/2023 | $29.86 | 18.28% | 1.00% | 0.98%(c) | 0.41% | 40% | $1,845,563 |
| Year Ended 8/31/2022 | $27.82 | (13.34%) | 0.99% | 0.99%(c) | 0.32% | 49% | $1,671,377 |
| Year Ended 8/31/2021 | $36.54 | 32.15% | 1.00%(d) | 1.00%(c),(d) | 0.29% | 47% | $2,061,801 |
| Year Ended 8/31/2020 | $29.79 | 23.80% | 1.02% | 1.02%(c) | 0.67% | 51% | $1,648,211 |
| Year Ended 8/31/2019 | $25.48 | 2.49% | 1.03%(d) | 1.03%(d) | 0.91% | 53% | $1,568,622 |
| Advisor Class |
| Year Ended 8/31/2023 | $31.05 | 18.55% | 0.75% | 0.73%(c) | 0.66% | 40% | $572,425 |
| Year Ended 8/31/2022 | $28.84 | (13.09%) | 0.74% | 0.74%(c) | 0.57% | 49% | $570,718 |
| Year Ended 8/31/2021 | $37.70 | 32.47% | 0.75%(d) | 0.75%(c),(d) | 0.54% | 47% | $704,253 |
| Year Ended 8/31/2020 | $30.66 | 24.06% | 0.77% | 0.77%(c) | 0.92% | 51% | $586,655 |
| Year Ended 8/31/2019 | $26.19 | 2.74% | 0.78%(d) | 0.78%(d) | 1.16% | 53% | $610,686 |
| Class C |
| Year Ended 8/31/2023 | $25.15 | 17.38% | 1.75% | 1.73%(c) | (0.34%) | 40% | $304,121 |
| Year Ended 8/31/2022 | $23.94 | (13.95%) | 1.74% | 1.74%(c) | (0.44%) | 49% | $378,576 |
| Year Ended 8/31/2021 | $32.19 | 31.14% | 1.75%(d) | 1.75%(c),(d) | (0.45%) | 47% | $552,047 |
| Year Ended 8/31/2020 | $26.53 | 22.85% | 1.77% | 1.77%(c) | (0.08%) | 51% | $548,126 |
| Year Ended 8/31/2019 | $22.84 | 1.73% | 1.78%(d) | 1.78%(d) | 0.16% | 53% | $561,716 |
| Institutional Class |
| Year Ended 8/31/2023 | $30.25 | 18.58% | 0.75% | 0.73%(c) | 0.66% | 40% | $4,866,117 |
| Year Ended 8/31/2022 | $28.16 | (13.09%) | 0.74% | 0.74%(c) | 0.57% | 49% | $4,351,597 |
| Year Ended 8/31/2021 | $36.92 | 32.47% | 0.75%(d) | 0.75%(c),(d) | 0.54% | 47% | $5,311,382 |
| Year Ended 8/31/2020 | $30.07 | 24.08% | 0.77% | 0.77%(c) | 0.92% | 51% | $4,230,127 |
| Year Ended 8/31/2019 | $25.71 | 2.75% | 0.78%(d) | 0.78%(d) | 1.16% | 53% | $3,961,440 |
| Institutional 2 Class |
| Year Ended 8/31/2023 | $31.03 | 18.66% | 0.68% | 0.66% | 0.73% | 40% | $810,032 |
| Year Ended 8/31/2022 | $28.82 | (13.03%) | 0.67% | 0.67% | 0.64% | 49% | $667,505 |
| Year Ended 8/31/2021 | $37.68 | 32.58% | 0.68%(d) | 0.68%(d) | 0.61% | 47% | $858,820 |
| Year Ended 8/31/2020 | $30.64 | 24.19% | 0.69% | 0.69% | 1.00% | 51% | $653,968 |
| Year Ended 8/31/2019 | $26.17 | 2.81% | 0.68%(d) | 0.68%(d) | 1.25% | 53% | $638,213 |
The accompanying Notes to Financial Statements are an integral part of this statement.
Columbia Contrarian Core Fund | Annual Report 2023
| 19 |
Financial Highlights (continued)
| | Net asset value,
beginning of
period | Net
investment
income
(loss) | Net
realized
and
unrealized
gain (loss) | Total from
investment
operations | Distributions
from net
investment
income | Distributions
from net
realized
gains | Total
distributions to
shareholders |
| Institutional 3 Class |
| Year Ended 8/31/2023 | $28.85 | 0.22 | 4.63 | 4.85 | (0.17) | (2.47) | (2.64) |
| Year Ended 8/31/2022 | $37.72 | 0.22 | (4.49) | (4.27) | (0.20) | (4.40) | (4.60) |
| Year Ended 8/31/2021 | $30.67 | 0.22 | 9.21 | 9.43 | (0.27) | (2.11) | (2.38) |
| Year Ended 8/31/2020 | $26.19 | 0.28 | 5.81 | 6.09 | (0.32) | (1.29) | (1.61) |
| Year Ended 8/31/2019 | $27.89 | 0.33 | 0.19 | 0.52 | (0.32) | (1.90) | (2.22) |
| Class R |
| Year Ended 8/31/2023 | $27.80 | 0.04 | 4.47 | 4.51 | — | (2.47) | (2.47) |
| Year Ended 8/31/2022 | $36.52 | 0.02 | (4.34) | (4.32) | — | (4.40) | (4.40) |
| Year Ended 8/31/2021 | $29.78 | 0.01 | 8.94 | 8.95 | (0.10) | (2.11) | (2.21) |
| Year Ended 8/31/2020 | $25.48 | 0.11 | 5.64 | 5.75 | (0.16) | (1.29) | (1.45) |
| Year Ended 8/31/2019 | $27.18 | 0.16 | 0.19 | 0.35 | (0.15) | (1.90) | (2.05) |
| Class V |
| Year Ended 8/31/2023 | $27.44 | 0.11 | 4.39 | 4.50 | (0.06) | (2.47) | (2.53) |
| Year Ended 8/31/2022 | $36.09 | 0.10 | (4.28) | (4.18) | (0.07) | (4.40) | (4.47) |
| Year Ended 8/31/2021 | $29.45 | 0.09 | 8.83 | 8.92 | (0.17) | (2.11) | (2.28) |
| Year Ended 8/31/2020 | $25.22 | 0.17 | 5.58 | 5.75 | (0.23) | (1.29) | (1.52) |
| Year Ended 8/31/2019 | $26.93 | 0.22 | 0.19 | 0.41 | (0.22) | (1.90) | (2.12) |
| Notes to Financial Highlights |
| (a) | In addition to the fees and expenses that the Fund bears directly, the Fund indirectly bears a pro rata share of the fees and expenses of any other funds in which it invests. Such indirect expenses are not included in the Fund’s reported expense ratios. |
| (b) | Total net expenses include the impact of certain fee waivers/expense reimbursements made by the Investment Manager and certain of its affiliates, if applicable. |
| (c) | The benefits derived from expense reductions had an impact of less than 0.01%. |
| (d) | Ratios include interfund lending expense which is less than 0.01%. |
The accompanying Notes to Financial Statements are an integral part of this statement.
| 20 | Columbia Contrarian Core Fund | Annual Report 2023 |
Financial Highlights (continued)
| | Net
asset
value,
end of
period | Total
return | Total gross
expense
ratio to
average
net assets(a) | Total net
expense
ratio to
average
net assets(a),(b) | Net investment
income (loss)
ratio to
average
net assets | Portfolio
turnover | Net
assets,
end of
period
(000’s) |
| Institutional 3 Class |
| Year Ended 8/31/2023 | $31.06 | 18.70% | 0.63% | 0.61% | 0.78% | 40% | $2,916,211 |
| Year Ended 8/31/2022 | $28.85 | (13.00%) | 0.62% | 0.62% | 0.69% | 49% | $2,642,362 |
| Year Ended 8/31/2021 | $37.72 | 32.64% | 0.63%(d) | 0.63%(d) | 0.66% | 47% | $3,338,749 |
| Year Ended 8/31/2020 | $30.67 | 24.26% | 0.64% | 0.64% | 1.05% | 51% | $2,487,886 |
| Year Ended 8/31/2019 | $26.19 | 2.90% | 0.64%(d) | 0.64%(d) | 1.30% | 53% | $2,123,062 |
| Class R |
| Year Ended 8/31/2023 | $29.84 | 17.99% | 1.25% | 1.23%(c) | 0.16% | 40% | $122,288 |
| Year Ended 8/31/2022 | $27.80 | (13.55%) | 1.24% | 1.24%(c) | 0.07% | 49% | $113,472 |
| Year Ended 8/31/2021 | $36.52 | 31.83% | 1.25%(d) | 1.25%(c),(d) | 0.04% | 47% | $143,336 |
| Year Ended 8/31/2020 | $29.78 | 23.47% | 1.27% | 1.27%(c) | 0.42% | 51% | $124,853 |
| Year Ended 8/31/2019 | $25.48 | 2.24% | 1.28%(d) | 1.28%(d) | 0.66% | 53% | $124,951 |
| Class V |
| Year Ended 8/31/2023 | $29.41 | 18.28% | 1.00% | 0.98%(c) | 0.41% | 40% | $186,352 |
| Year Ended 8/31/2022 | $27.44 | (13.32%) | 0.99% | 0.99%(c) | 0.32% | 49% | $169,480 |
| Year Ended 8/31/2021 | $36.09 | 32.14% | 1.00%(d) | 1.00%(c),(d) | 0.29% | 47% | $212,301 |
| Year Ended 8/31/2020 | $29.45 | 23.73% | 1.02% | 1.02%(c) | 0.67% | 51% | $172,192 |
| Year Ended 8/31/2019 | $25.22 | 2.52% | 1.03%(d) | 1.03%(d) | 0.91% | 53% | $150,836 |
The accompanying Notes to Financial Statements are an integral part of this statement.
Columbia Contrarian Core Fund | Annual Report 2023
| 21 |
Notes to Financial Statements
August 31, 2023
Note 1. Organization
Columbia Contrarian Core Fund (the Fund), a series of Columbia Funds Series Trust I (the Trust), is a diversified fund. The Trust is registered under the Investment Company Act of 1940, as amended (the 1940 Act), as an open-end management investment company organized as a Massachusetts business trust.
Fund shares
The Trust may issue an unlimited number of shares (without par value). The Fund offers each of the share classes listed in the Statement of Assets and Liabilities. Although all share classes generally have identical voting, dividend and liquidation rights, each share class votes separately when required by the Trust’s organizational documents or by law. Each share class has its own expense and sales charge structure. Different share classes may have different minimum initial investment amounts and pay different net investment income distribution amounts to the extent the expenses of distributing such share classes vary. Distributions to shareholders in a liquidation will be proportional to the net asset value of each share class.
As described in the Fund’s prospectus, Class A and Class C shares are offered to the general public for investment. Class C shares automatically convert to Class A shares after 8 years. Advisor Class, Institutional Class, Institutional 2 Class, Institutional 3 Class and Class R shares are available for purchase through authorized investment professionals to omnibus retirement plans or to institutional investors and to certain other investors as also described in the Fund’s prospectus. Class V shares are available only to investors who received (and who continuously held) Class V shares in connection with previous fund reorganizations.
Note 2. Summary of significant accounting policies
Basis of preparation
The Fund is an investment company that applies the accounting and reporting guidance in the Financial Accounting Standards Board (FASB) Accounting Standards Codification Topic 946, Financial Services - Investment Companies (ASC 946). The financial statements are prepared in accordance with U.S. generally accepted accounting principles (GAAP), which requires management to make certain estimates and assumptions that affect the reported amounts of assets and liabilities, the disclosure of contingent assets and liabilities at the date of the financial statements and the reported amounts of income and expenses during the reporting period. Actual results could differ from those estimates.
The following is a summary of significant accounting policies followed by the Fund in the preparation of its financial statements.
Security valuation
Equity securities listed on an exchange are valued at the closing price or last trade price on their primary exchange at the close of business of the New York Stock Exchange. Securities with a closing price not readily available or not listed on any exchange are valued at the mean between the closing bid and ask prices. Listed preferred stocks convertible into common stocks are valued using an evaluated price from a pricing service.
Foreign equity securities are valued based on the closing price or last trade price on their primary exchange at the close of business of the New York Stock Exchange. If any foreign equity security closing prices are not readily available, the securities are valued at the mean of the latest quoted bid and ask prices on such exchanges or markets. Foreign currency exchange rates are determined at the scheduled closing time of the New York Stock Exchange. Many securities markets and exchanges outside the U.S. close prior to the close of the New York Stock Exchange; therefore, the closing prices for securities in such markets or on such exchanges may not fully reflect events that occur after such close but before the close of the New York Stock Exchange. In those situations, foreign securities will be fair valued pursuant to a policy approved by the Board of Trustees. Under the policy, the Fund may utilize a third-party pricing service to determine these fair values. The third-party pricing service takes into account multiple factors, including, but not limited to, movements in the U.S. securities markets, certain depositary receipts, futures contracts and foreign exchange rates that have occurred subsequent to the close of the foreign exchange or market, to determine a good faith estimate that reasonably reflects the current market conditions as of the close of the New York Stock Exchange. The fair value of a security is likely to be different from the quoted or published price, if available.
| 22 | Columbia Contrarian Core Fund | Annual Report 2023 |
Notes to Financial Statements (continued)
August 31, 2023
Investments in open-end investment companies (other than exchange-traded funds (ETFs)), are valued at the latest net asset value reported by those companies as of the valuation time.
Investments for which market quotations are not readily available, or that have quotations which management believes are not reflective of market value or reliable, are valued at fair value as determined in good faith under procedures approved by the Board of Trustees. If a security or class of securities (such as foreign securities) is valued at fair value, such value is likely to be different from the quoted or published price for the security, if available.
The determination of fair value often requires significant judgment. To determine fair value, management may use assumptions including but not limited to future cash flows and estimated risk premiums. Multiple inputs from various sources may be used to determine fair value.
GAAP requires disclosure regarding the inputs and valuation techniques used to measure fair value and any changes in valuation inputs or techniques. In addition, investments shall be disclosed by major category. This information is disclosed following the Fund’s Portfolio of Investments.
Foreign currency transactions and translations
The values of all assets and liabilities denominated in foreign currencies are generally translated into U.S. dollars at exchange rates determined at the close of regular trading on the New York Stock Exchange. Net realized and unrealized gains (losses) on foreign currency transactions and translations include gains (losses) arising from the fluctuation in exchange rates between trade and settlement dates on securities transactions, gains (losses) arising from the disposition of foreign currency and currency gains (losses) between the accrual and payment dates on dividends, interest income and foreign withholding taxes.
For financial statement purposes, the Fund does not distinguish that portion of gains (losses) on investments which is due to changes in foreign exchange rates from that which is due to changes in market prices of the investments. Such fluctuations are included with the net realized and unrealized gains (losses) on investments in the Statement of Operations.
Security transactions
Security transactions are accounted for on the trade date. Cost is determined and gains (losses) are based upon the specific identification method for both financial statement and federal income tax purposes.
Income recognition
Corporate actions and dividend income are generally recorded net of any non-reclaimable tax withholdings, on the ex-dividend date or upon receipt of an ex-dividend notification in the case of certain foreign securities.
The Fund may receive distributions from holdings in equity securities, business development companies (BDCs), exchange-traded funds (ETFs), limited partnerships (LPs), other regulated investment companies (RICs), and real estate investment trusts (REITs), which report information as to the tax character of their distributions annually. These distributions are allocated to dividend income, capital gain and return of capital based on actual information reported. Return of capital is recorded as a reduction of the cost basis of securities held. If the Fund no longer owns the applicable securities, return of capital is recorded as a realized gain. With respect to REITs, to the extent actual information has not yet been reported, estimates for return of capital are made by Columbia Management Investment Advisers, LLC (the Investment Manager), a wholly-owned subsidiary of Ameriprise Financial, Inc. (Ameriprise Financial). The Investment Manager’s estimates are subsequently adjusted when the actual character of the distributions is disclosed by the REITs, which could result in a proportionate change in return of capital to shareholders.
Awards from class action litigation are recorded as a reduction of cost basis if the Fund still owns the applicable securities on the payment date. If the Fund no longer owns the applicable securities on the payment date, the proceeds are recorded as realized gains.
Columbia Contrarian Core Fund | Annual Report 2023
| 23 |
Notes to Financial Statements (continued)
August 31, 2023
Expenses
General expenses of the Trust are allocated to the Fund and other funds of the Trust based upon relative net assets or other expense allocation methodologies determined by the nature of the expense. Expenses directly attributable to the Fund are charged to the Fund. Expenses directly attributable to a specific class of shares are charged to that share class.
Determination of class net asset value
All income, expenses (other than class-specific expenses, which are charged to that share class, as shown in the Statement of Operations) and realized and unrealized gains (losses) are allocated to each class of the Fund on a daily basis, based on the relative net assets of each class, for purposes of determining the net asset value of each class.
Federal income tax status
The Fund intends to qualify each year as a regulated investment company under Subchapter M of the Internal Revenue Code, as amended, and will distribute substantially all of its investment company taxable income and net capital gain, if any, for its tax year, and as such will not be subject to federal income taxes. In addition, the Fund intends to distribute in each calendar year substantially all of its ordinary income, capital gain net income and certain other amounts, if any, such that the Fund should not be subject to federal excise tax. Therefore, no federal income or excise tax provision is recorded.
Foreign taxes
The Fund may be subject to foreign taxes on income, gains on investments or currency repatriation, a portion of which may be recoverable. The Fund will accrue such taxes and recoveries, as applicable, based upon its current interpretation of tax rules and regulations that exist in the markets in which it invests.
Realized gains in certain countries may be subject to foreign taxes at the Fund level, based on statutory rates. The Fund accrues for such foreign taxes on realized and unrealized gains at the appropriate rate for each jurisdiction, as applicable. The amount, if any, is disclosed as a liability in the Statement of Assets and Liabilities.
Distributions to shareholders
Distributions from net investment income, if any, are declared and paid annually. Net realized capital gains, if any, are distributed at least annually. Income distributions and capital gain distributions are determined in accordance with federal income tax regulations, which may differ from GAAP.
Guarantees and indemnifications
Under the Trust’s organizational documents and, in some cases, by contract, its officers and trustees are indemnified against certain liabilities arising out of the performance of their duties to the Trust or its funds. In addition, certain of the Fund’s contracts with its service providers contain general indemnification clauses. The Fund’s maximum exposure under these arrangements is unknown since the amount of any future claims that may be made against the Fund cannot be determined, and the Fund has no historical basis for predicting the likelihood of any such claims.
Recent accounting pronouncements and regulatory updates
Tailored Shareholder Reports
In October 2022, the Securities and Exchange Commission (SEC) adopted a final rule relating to Tailored Shareholder Reports for Mutual Funds and Exchange-Traded Funds; Fee Information in Investment Company Advertisements. The rule and form amendments will, among other things, require the Fund to transmit concise and visually engaging shareholder reports that highlight key information. The amendments will require that funds tag information in a structured data format and that certain more in-depth information be made available online and available for delivery free of charge to investors on request. The amendments became effective January 24, 2023. There is an 18-month transition period after the effective date of the amendments.
| 24 | Columbia Contrarian Core Fund | Annual Report 2023 |
Notes to Financial Statements (continued)
August 31, 2023
Note 3. Fees and other transactions with affiliates
Management services fees
The Fund has entered into a Management Agreement with Columbia Management Investment Advisers, LLC (the Investment Manager), a wholly-owned subsidiary of Ameriprise Financial, Inc. (Ameriprise Financial). Under the Management Agreement, the Investment Manager provides the Fund with investment research and advice, as well as administrative and accounting services. The management services fee is an annual fee that is equal to a percentage of the Fund’s daily net assets that declines from 0.77% to 0.555% as the Fund’s net assets increase. The effective management services fee rate for the year ended August 31, 2023 was 0.611% of the Fund’s average daily net assets.
Compensation of board members
Members of the Board of Trustees who are not officers or employees of the Investment Manager or Ameriprise Financial are compensated for their services to the Fund as disclosed in the Statement of Operations. Under a Deferred Compensation Plan (the Deferred Plan), these members of the Board of Trustees may elect to defer payment of up to 100% of their compensation. Deferred amounts are treated as though equivalent dollar amounts had been invested in shares of certain funds managed by the Investment Manager. The Fund’s liability for these amounts is adjusted for market value changes and remains in the Fund until distributed in accordance with the Deferred Plan. All amounts payable under the Deferred Plan constitute a general unsecured obligation of the Fund. The expense for the Deferred Plan, which includes Trustees’ fees deferred during the current period as well as any gains or losses on the Trustees’ deferred compensation balances as a result of market fluctuations, is included in "Trustees’ fees" in the Statement of Operations.
Compensation of Chief Compliance Officer
The Board of Trustees has appointed a Chief Compliance Officer for the Fund in accordance with federal securities regulations. As disclosed in the Statement of Operations, a portion of the Chief Compliance Officer’s total compensation is allocated to the Fund, along with other allocations to affiliated registered investment companies managed by the Investment Manager and its affiliates, based on relative net assets.
Transfer agency fees
Under a Transfer and Dividend Disbursing Agent Agreement, Columbia Management Investment Services Corp. (the Transfer Agent), an affiliate of the Investment Manager and a wholly-owned subsidiary of Ameriprise Financial, is responsible for providing transfer agency services to the Fund. The Transfer Agent has contracted with SS&C GIDS, Inc. (SS&C GIDS) to serve as sub-transfer agent. Prior to January 1, 2023, SS&C GIDS was known as DST Asset Manager Solutions, Inc. The Transfer Agent pays the fees of SS&C GIDS for services as sub-transfer agent and SS&C GIDS is not entitled to reimbursement for such fees from the Fund (with the exception of out-of-pocket fees).
The Fund pays the Transfer Agent a monthly transfer agency fee based on the number or the average value of accounts, depending on the type of account. In addition, the Fund pays the Transfer Agent a fee for shareholder services based on the number of accounts or on a percentage of the average aggregate value of the Fund’s shares maintained in omnibus accounts up to the lesser of the amount charged by the financial intermediary or a cap established by the Board of Trustees from time to time.
The Transfer Agent also receives compensation from the Fund for various shareholder services and reimbursements for certain out-of-pocket fees. Total transfer agency fees for Institutional 2 Class and Institutional 3 Class shares are subject to an annual limitation of not more than 0.07% and 0.02%, respectively, of the average daily net assets attributable to each share class.
Columbia Contrarian Core Fund | Annual Report 2023
| 25 |
Notes to Financial Statements (continued)
August 31, 2023
For the year ended August 31, 2023, the Fund’s effective transfer agency fee rates as a percentage of average daily net assets of each class were as follows:
| | Effective rate (%) |
| Class A | 0.13 |
| Advisor Class | 0.13 |
| Class C | 0.13 |
| Institutional Class | 0.13 |
| Institutional 2 Class | 0.06 |
| Institutional 3 Class | 0.01 |
| Class R | 0.13 |
| Class V | 0.13 |
An annual minimum account balance fee of $20 may apply to certain accounts with a value below the applicable share class’s initial minimum investment requirements to reduce the impact of small accounts on transfer agency fees. These minimum account balance fees are remitted to the Fund and recorded as part of expense reductions in the Statement of Operations. For the year ended August 31, 2023, these minimum account balance fees reduced total expenses of the Fund by $5,966.
Distribution and service fees
The Fund has entered into an agreement with Columbia Management Investment Distributors, Inc. (the Distributor), an affiliate of the Investment Manager and a wholly-owned subsidiary of Ameriprise Financial, for distribution and shareholder services. The Board of Trustees has approved, and the Fund has adopted, distribution and shareholder service plans (the Plans) applicable to certain share classes, which set the distribution and service fees for the Fund. These fees are calculated daily and are intended to compensate the Distributor and/or eligible selling and/or servicing agents for selling shares of the Fund and providing services to investors.
Under the Plans, the Fund pays a monthly service fee to the Distributor at the maximum annual rate of 0.25% of the average daily net assets attributable to Class A and Class C shares of the Fund. Also under the Plans, the Fund pays a monthly distribution fee to the Distributor at the maximum annual rates of 0.10%, 0.75% and 0.50% of the average daily net assets attributable to Class A, Class C and Class R shares of the Fund, respectively.
Although the Fund may pay distribution and service fees up to a maximum annual rate of 0.35% of the Fund’s average daily net assets attributable to Class A shares (comprised of up to 0.10% for distribution services and up to 0.25% for shareholder services), the Fund currently limits such fees to an aggregate fee of not more than 0.25% of the Fund’s average daily net assets attributable to Class A shares.
Shareholder services fees
The Fund has adopted a shareholder services plan that permits it to pay for certain services provided to Class V shareholders by their selling and/or servicing agents. The Fund may pay shareholder servicing fees up to an aggregate annual rate of 0.50% of the Fund’s average daily net assets attributable to Class V shares (comprised of up to 0.25% for shareholder services and up to 0.25% for administrative support services). These fees are currently limited to an aggregate annual rate of not more than 0.25% of the Fund’s average daily net assets attributable to Class V shares.
Sales charges (unaudited)
Sales charges, including front-end charges and contingent deferred sales charges (CDSCs), received by the Distributor for distributing Fund shares for the year ended August 31, 2023, if any, are listed below:
| | Front End (%) | CDSC (%) | Amount ($) |
| Class A | 5.75 | 0.50 - 1.00(a) | 993,407 |
| Class C | — | 1.00(b) | 15,975 |
| Class V | 5.75 | 0.50 - 1.00(a) | 69 |
| 26 | Columbia Contrarian Core Fund | Annual Report 2023 |
Notes to Financial Statements (continued)
August 31, 2023
| (a) | This charge is imposed on certain investments of between $1 million and $50 million redeemed within 18 months after purchase, as follows: 1.00% if redeemed within 12 months after purchase, and 0.50% if redeemed more than 12, but less than 18, months after purchase, with certain limited exceptions. |
| (b) | This charge applies to redemptions within 12 months after purchase, with certain limited exceptions. |
The Fund’s other share classes are not subject to sales charges.
Expenses waived/reimbursed by the Investment Manager and its affiliates
The Investment Manager and certain of its affiliates have contractually agreed to waive fees and/or reimburse expenses (excluding certain fees and expenses described below) for the period(s) disclosed below, unless sooner terminated at the sole discretion of the Board of Trustees, so that the Fund’s net operating expenses, after giving effect to fees waived/expenses reimbursed and any balance credits and/or overdraft charges from the Fund’s custodian, do not exceed the following annual rate(s) as a percentage of the classes’ average daily net assets:
| | January 1, 2023
through
December 31, 2023 | Prior to
January 1, 2023 |
| Class A | 0.97% | 1.03% |
| Advisor Class | 0.72 | 0.78 |
| Class C | 1.72 | 1.78 |
| Institutional Class | 0.72 | 0.78 |
| Institutional 2 Class | 0.65 | 0.71 |
| Institutional 3 Class | 0.60 | 0.66 |
| Class R | 1.22 | 1.28 |
| Class V | 0.97 | 1.03 |
Under the agreement governing these fee waivers and/or expense reimbursement arrangements, the following fees and expenses are excluded from the waiver/reimbursement commitment, and therefore will be paid by the Fund, if applicable: taxes (including foreign transaction taxes), expenses associated with investments in affiliated and non-affiliated pooled investment vehicles (including mutual funds and exchange-traded funds), transaction costs and brokerage commissions, costs related to any securities lending program, dividend expenses associated with securities sold short, inverse floater program fees and expenses, transaction charges and interest on borrowed money, interest, costs associated with shareholder meetings, infrequent and/or unusual expenses and any other expenses the exclusion of which is specifically approved by the Board of Trustees. This agreement may be modified or amended only with approval from the Investment Manager, certain of its affiliates and the Fund. Any fees waived and/or expenses reimbursed under the expense reimbursement arrangements described above are not recoverable by the Investment Manager or its affiliates in future periods.
Note 4. Federal tax information
The timing and character of income and capital gain distributions are determined in accordance with income tax regulations, which may differ from GAAP because of temporary or permanent book to tax differences.
At August 31, 2023, these differences were primarily due to differing treatment for deferral/reversal of wash sale losses, trustees’ deferred compensation and foreign currency transactions. To the extent these differences were permanent, reclassifications were made among the components of the Fund’s net assets. Temporary differences do not require reclassifications.
The following reclassifications were made:
Undistributed net
investment
income ($) | Accumulated
net realized
gain ($) | Paid in
capital ($) |
| (15,240) | 15,241 | (1) |
Net investment income (loss) and net realized gains (losses), as disclosed in the Statement of Operations, and net assets were not affected by this reclassification.
Columbia Contrarian Core Fund | Annual Report 2023
| 27 |
Notes to Financial Statements (continued)
August 31, 2023
The tax character of distributions paid during the years indicated was as follows:
| Year Ended August 31, 2023 | Year Ended August 31, 2022 |
Ordinary
income ($) | Long-term
capital gains ($) | Total ($) | Ordinary
income ($) | Long-term
capital gains ($) | Total ($) |
| 48,273,287 | 917,840,802 | 966,114,089 | 242,751,172 | 1,353,366,865 | 1,596,118,037 |
Short-term capital gain distributions, if any, are considered ordinary income distributions for tax purposes.
At August 31, 2023, the components of distributable earnings on a tax basis were as follows:
Undistributed
ordinary income ($) | Undistributed
long-term
capital gains ($) | Capital loss
carryforwards ($) | Net unrealized
appreciation ($) |
| 41,562,573 | 205,458,702 | — | 4,913,308,252 |
At August 31, 2023, the cost of all investments for federal income tax purposes along with the aggregate gross unrealized appreciation and depreciation based on that cost was:
Federal
tax cost ($) | Gross unrealized
appreciation ($) | Gross unrealized
(depreciation) ($) | Net unrealized
appreciation ($) |
| 6,682,530,199 | 4,996,740,309 | (83,432,057) | 4,913,308,252 |
Tax cost of investments and unrealized appreciation/(depreciation) may also include timing differences that do not constitute adjustments to tax basis.
Management of the Fund has concluded that there are no significant uncertain tax positions in the Fund that would require recognition in the financial statements. However, management’s conclusion may be subject to review and adjustment at a later date based on factors including, but not limited to, new tax laws, regulations, and administrative interpretations (including relevant court decisions). Generally, the Fund’s federal tax returns for the prior three fiscal years remain subject to examination by the Internal Revenue Service.
Note 5. Portfolio information
The cost of purchases and proceeds from sales of securities, excluding short-term investments and derivatives, if any, aggregated to $4,205,734,300 and $4,936,130,486, respectively, for the year ended August 31, 2023. The amount of purchase and sale activity impacts the portfolio turnover rate reported in the Financial Highlights.
Note 6. Affiliated money market fund
The Fund invests in Columbia Short-Term Cash Fund, an affiliated money market fund established for the exclusive use by the Fund and other affiliated funds (the Affiliated MMF). The income earned by the Fund from such investments is included as Dividends - affiliated issuers in the Statement of Operations. As an investing fund, the Fund indirectly bears its proportionate share of the expenses of the Affiliated MMF. The Affiliated MMF prices its shares with a floating net asset value. The Securities and Exchange Commission has adopted amendments to money market fund rules requiring institutional prime money market funds like the Affiliated MMF to be subject, by October 2, 2024, to a liquidity fee if daily net redemptions exceed 5% of net assets and, by April 2, 2024, to a discretionary liquidity fee up to 2% if the imposition of such a fee is determined to be in the best interest of the Affiliated MMF.
Note 7. Interfund lending
Pursuant to an exemptive order granted by the Securities and Exchange Commission, the Fund participates in a program (the Interfund Program) allowing each participating Columbia Fund (each, a Participating Fund) to lend money directly to and, except for closed-end funds and money market funds, borrow money directly from other Participating Funds for temporary purposes. The amounts eligible for borrowing and lending under the Interfund Program are subject to certain restrictions.
| 28 | Columbia Contrarian Core Fund | Annual Report 2023 |
Notes to Financial Statements (continued)
August 31, 2023
Interfund loans are subject to the risk that the borrowing fund could be unable to repay the loan when due, and a delay in repayment to the lending fund could result in lost opportunities and/or additional lending costs. The exemptive order is subject to conditions intended to mitigate conflicts of interest arising from the Investment Manager’s relationship with each Participating Fund.
The Fund’s activity in the Interfund Program during the year ended August 31, 2023 was as follows:
| Borrower or lender | Average loan
balance ($) | Weighted average
interest rate (%) | Number of days
with outstanding loans |
| Lender | 4,885,714 | 5.07 | 7 |
Interest income earned by the Fund is recorded as interfund lending in the Statement of Operations. The Fund had no outstanding interfund loans at August 31, 2023.
Note 8. Line of credit
The Fund has access to a revolving credit facility with a syndicate of banks led by JPMorgan Chase Bank, N.A., Citibank, N.A. and Wells Fargo Bank, N.A. whereby the Fund may borrow for the temporary funding of shareholder redemptions or for other temporary or emergency purposes. Pursuant to an October 27, 2022 amendment and restatement, the credit facility, which is an agreement between the Fund and certain other funds managed by the Investment Manager or an affiliated investment manager, severally and not jointly, permits aggregate borrowings up to $950 million. Interest is currently charged to each participating fund based on its borrowings at a rate equal to the higher of (i) the federal funds effective rate, (ii) the secured overnight financing rate plus 0.10% and (iii) the overnight bank funding rate plus, in each case, 1.00%. Each borrowing under the credit facility matures no later than 60 days after the date of borrowing. The Fund also pays a commitment fee equal to its pro rata share of the unused amount of the credit facility at a rate of 0.15% per annum. The commitment fee is included in other expenses in the Statement of Operations. This agreement expires annually in October unless extended or renewed. Prior to the October 27, 2022 amendment and restatement, the Fund had access to a revolving credit facility with a syndicate of banks led by JPMorgan Chase Bank, N.A., Citibank, N.A. and Wells Fargo Bank, N.A. which permitted collective borrowings up to $950 million. Interest was charged to each participating fund based on its borrowings at a rate equal to the higher of (i) the federal funds effective rate, (ii) the secured overnight financing rate plus 0.11448% and (iii) the overnight bank funding rate plus, in each case, 1.00%.
The Fund had no borrowings during the year ended August 31, 2023.
Note 9. Significant risks
Information technology sector risk
The Fund is more susceptible to the particular risks that may affect companies in the information technology sector than if it were invested in a wider variety of companies in unrelated sectors. Companies in the information technology sector are subject to certain risks, including the risk that new services, equipment or technologies will not be accepted by consumers and businesses or will become rapidly obsolete. Performance of such companies may be affected by factors including obtaining and protecting patents (or the failure to do so) and significant competitive pressures, including aggressive pricing of their products or services, new market entrants, competition for market share and short product cycles due to an accelerated rate of technological developments. Such competitive pressures may lead to limited earnings and/or falling profit margins. As a result, the value of their securities may fall or fail to rise. In addition, many information technology sector companies have limited operating histories and prices of these companies’ securities historically have been more volatile than other securities, especially over the short term. Some companies in the information technology sector are facing increased government and regulatory scrutiny and may be subject to adverse government or regulatory action, which could negatively impact the value of their securities.
Market risk
The Fund may incur losses due to declines in the value of one or more securities in which it invests. These declines may be due to factors affecting a particular issuer, or the result of, among other things, political, regulatory, market, economic or social developments affecting the relevant market(s) more generally. In addition, turbulence in financial markets and reduced
Columbia Contrarian Core Fund | Annual Report 2023
| 29 |
Notes to Financial Statements (continued)
August 31, 2023
liquidity in equity, credit and/or fixed income markets may negatively affect many issuers, which could adversely affect the Fund’s ability to price or value hard-to-value assets in thinly traded and closed markets and could cause significant redemptions and operational challenges. Global economies and financial markets are increasingly interconnected, and conditions and events in one country, region or financial market may adversely impact issuers in a different country, region or financial market. These risks may be magnified if certain events or developments adversely interrupt the global supply chain; in these and other circumstances, such risks might affect companies worldwide. As a result, local, regional or global events such as terrorism, war, natural disasters, disease/virus outbreaks and epidemics or other public health issues, recessions, depressions or other events – or the potential for such events – could have a significant negative impact on global economic and market conditions.
The large-scale invasion of Ukraine by Russia in February 2022 has resulted in sanctions and market disruptions, including declines in regional and global stock markets, unusual volatility in global commodity markets and significant devaluations of Russian currency. The extent and duration of the military action are impossible to predict but could be significant. Market disruption caused by the Russian military action, and any counter-measures or responses thereto (including international sanctions, a downgrade in the country’s credit rating, purchasing and financing restrictions, boycotts, tariffs, changes in consumer or purchaser preferences, cyberattacks and espionage) could have severe adverse impacts on regional and/or global securities and commodities markets, including markets for oil and natural gas. These impacts may include reduced market liquidity, distress in credit markets, further disruption of global supply chains, increased risk of inflation, restricted cross-border payments and limited access to investments and/or assets in certain international markets and/or issuers. These developments and other related events could negatively impact Fund performance.
Shareholder concentration risk
At August 31, 2023, affiliated shareholders of record owned 25.1% of the outstanding shares of the Fund in one or more accounts. Fund shares sold to or redeemed by concentrated accounts may have a significant effect on the operations of the Fund. In the case of a large redemption, the Fund may be forced to sell investments at inopportune times, including its liquid positions, which may result in Fund losses and the Fund holding a higher percentage of less liquid positions. Large redemptions could result in decreased economies of scale and increased operating expenses for non-redeeming Fund shareholders.
Note 10. Subsequent events
Management has evaluated the events and transactions that have occurred through the date the financial statements were issued and noted no items requiring adjustment of the financial statements or additional disclosure.
Note 11. Information regarding pending and settled legal proceedings
Ameriprise Financial and certain of its affiliates are involved in the normal course of business in legal proceedings which include regulatory inquiries, arbitration and litigation, including class actions concerning matters arising in connection with the conduct of their activities as part of a diversified financial services firm. Ameriprise Financial believes that the Fund is not currently the subject of, and that neither Ameriprise Financial nor any of its affiliates are the subject of, any pending legal, arbitration or regulatory proceedings that are likely to have a material adverse effect on the Fund or the ability of Ameriprise Financial or its affiliates to perform under their contracts with the Fund. Ameriprise Financial is required to make quarterly (10-Q), annual (10-K) and, as necessary, 8-K filings with the Securities and Exchange Commission (SEC) on legal and regulatory matters that relate to Ameriprise Financial and its affiliates. Copies of these filings may be obtained by accessing the SEC website at www.sec.gov.
There can be no assurance that these matters, or the adverse publicity associated with them, will not result in increased Fund redemptions, reduced sale of Fund shares or other adverse consequences to the Fund. Further, although we believe proceedings are not likely to have a material adverse effect on the Fund or the ability of Ameriprise Financial or its affiliates to perform under their contracts with the Fund, these proceedings are subject to uncertainties and, as such, we are unable to estimate the possible loss or range of loss that may result. An adverse outcome in one or more of these proceedings could result in adverse judgments, settlements, fines, penalties or other relief that could have a material adverse effect on the consolidated financial condition or results of operations of Ameriprise Financial or one or more of its affiliates that provide services to the Fund.
| 30 | Columbia Contrarian Core Fund | Annual Report 2023 |
Report of Independent Registered Public Accounting Firm
To the Board of Trustees of Columbia Funds Series Trust I and Shareholders of Columbia Contrarian Core Fund
Opinion on the Financial Statements
We have audited the accompanying statement of assets and liabilities, including the portfolio of investments, of Columbia Contrarian Core Fund (one of the funds constituting Columbia Funds Series Trust I, referred to hereafter as the "Fund") as of August 31, 2023, the related statement of operations for the year ended August 31, 2023, the statement of changes in net assets for each of the two years in the period ended August 31, 2023, including the related notes, and the financial highlights for each of the five years in the period ended August 31, 2023 (collectively referred to as the "financial statements"). In our opinion, the financial statements present fairly, in all material respects, the financial position of the Fund as of August 31, 2023, the results of its operations for the year then ended, the changes in its net assets for each of the two years in the period ended August 31, 2023 and the financial highlights for each of the five years in the period ended August 31, 2023 in conformity with accounting principles generally accepted in the United States of America.
Basis for Opinion
These financial statements are the responsibility of the Fund’s management. Our responsibility is to express an opinion on the Fund’s financial statements based on our audits. We are a public accounting firm registered with the Public Company Accounting Oversight Board (United States) (PCAOB) and are required to be independent with respect to the Fund in accordance with the U.S. federal securities laws and the applicable rules and regulations of the Securities and Exchange Commission and the PCAOB.
We conducted our audits of these financial statements in accordance with the standards of the PCAOB. Those standards require that we plan and perform the audit to obtain reasonable assurance about whether the financial statements are free of material misstatement, whether due to error or fraud.
Our audits included performing procedures to assess the risks of material misstatement of the financial statements, whether due to error or fraud, and performing procedures that respond to those risks. Such procedures included examining, on a test basis, evidence regarding the amounts and disclosures in the financial statements. Our audits also included evaluating the accounting principles used and significant estimates made by management, as well as evaluating the overall presentation of the financial statements. Our procedures included confirmation of securities owned as of August 31, 2023 by correspondence with the custodian, transfer agent and brokers; when replies were not received from brokers, we performed other auditing procedures. We believe that our audits provide a reasonable basis for our opinion.
/s/PricewaterhouseCoopers LLP
Minneapolis, Minnesota
October 23, 2023
We have served as the auditor of one or more investment companies within the Columbia Funds Complex since 1977.
Columbia Contrarian Core Fund | Annual Report 2023
| 31 |
Federal Income Tax Information
(Unaudited)
The Fund hereby designates the following tax attributes for the fiscal year ended August 31, 2023. Shareholders will be notified in early 2024 of the amounts for use in preparing 2023 income tax returns.
Qualified
dividend
income | Dividends
received
deduction | Capital
gain
dividend |
| 100.00% | 100.00% | $240,616,923 |
Qualified dividend income. For taxable, non-corporate shareholders, the percentage of ordinary income distributed during the fiscal year that represents qualified dividend income subject to reduced tax rates.
Dividends received deduction. The percentage of ordinary income distributed during the fiscal year that qualifies for the corporate dividends received deduction.
Capital gain dividend. The Fund designates as a capital gain dividend the amount reflected above, or if subsequently determined to be different, the net capital gain of such fiscal period.
TRUSTEES AND OFFICERS
(Unaudited)
The Board oversees the Fund’s operations and appoints officers who are responsible for day-to-day business decisions based on policies set by the Board. The following table provides basic biographical information about the Fund’s Trustees as of the printing of this report, including their principal occupations during the past five years, although specific titles for individuals may have varied over the period. The year set forth beneath Length of Service in the table below is the year in which the Trustee was first appointed or elected as Trustee to any Fund currently in the Columbia Funds Complex or a predecessor thereof. Under current Board policy, each Trustee generally serves until December 31 of the year such Trustee turns seventy-five (75).
Independent trustees
Name,
address,
year of birth | Position held
with the Columbia Funds and
length of service | Principal occupation(s)
during past five years
and other relevant
professional experience | Number of
Funds in the
Columbia Funds
Complex*
overseen | Other directorships
held by Trustee
during the past five years
and other relevant Board experience |
George S. Batejan
c/o Columbia Management
Investment Advisers, LLC
290 Congress Street
Boston, MA 02210
1954 | Trustee since 2017 | Executive Vice President, Global Head of Technology and Operations, Janus Capital Group, Inc., 2010-2016 | 173 | Former Chairman of the Board, NICSA (National Investment Company Services Association) (Executive Committee, Nominating Committee and Governance Committee), 2014-2016; former Director, Intech Investment Management, 2011-2016; former Board Member, Metro Denver Chamber of Commerce, 2015-2016; former Advisory Board Member, University of Colorado Business School, 2015-2018; former Board Member, Chase Bank International, 1993-1994 |
| 32 | Columbia Contrarian Core Fund | Annual Report 2023 |
TRUSTEES AND OFFICERS (continued)
(Unaudited)
Independent trustees (continued)
Name,
address,
year of birth | Position held
with the Columbia Funds and
length of service | Principal occupation(s)
during past five years
and other relevant
professional experience | Number of
Funds in the
Columbia Funds
Complex*
overseen | Other directorships
held by Trustee
during the past five years
and other relevant Board experience |
Kathleen Blatz
c/o Columbia Management
Investment Advisers, LLC
290 Congress Street
Boston, MA 02210
1954 | Trustee since 2006 | Attorney, specializing in arbitration and mediation; Chief Justice, Minnesota Supreme Court, 1998-2006; Associate Justice, Minnesota Supreme Court, 1996-1998; Fourth Judicial District Court Judge, Hennepin County, 1994-1996; Attorney in private practice and public service, 1984-1993; State Representative, Minnesota House of Representatives, 1979-1993, which included service on the Tax and Financial Institutions and Insurance Committees; Member and Interim Chair, Minnesota Sports Facilities Authority, January-July 2017; Interim President and Chief Executive Officer, Blue Cross and Blue Shield of Minnesota (health care insurance), February-July 2018, April-October 2021 | 173 | Former Trustee, Blue Cross and Blue Shield of Minnesota, 2009-2021 (Chair of the Business Development Committee, 2014-2017; Chair of the Governance Committee, 2017-2019); former Member and Chair of the Board, Minnesota Sports Facilities Authority, January 2017-July 2017; former Director, Robina Foundation, 2009-2020 (Chair, 2014-2020); Director, Richard M. Schulze Family Foundation, since 2021 |
Pamela G. Carlton
c/o Columbia Management
Investment Advisers, LLC
290 Congress Street
Boston, MA 02210
1954 | Chair since 2023; Trustee since 2007 | President, Springboard – Partners in Cross Cultural Leadership (consulting company), since 2003; Managing Director of US Equity Research, JP Morgan Chase, 1999-2003; Director of US Equity Research, Chase Asset Management, 1996-1999; Co-Director Latin America Research, 1993-1996, COO Global Research, 1992-1996, Co-Director of US Research, 1991-1992, Investment Banker, 1982-1991, Morgan Stanley; Attorney, Cleary Gottlieb Steen & Hamilton LLP, 1980-1982 | 173 | Trustee, New York Presbyterian Hospital Board, since 1996; Director, DR Bank (Audit Committee) since 2017; Director, Evercore Inc. (Audit Committee, Nominating and Governance Committee), since 2019; Director, Apollo Commercial Real Estate Finance, Inc. (Chair, Nominating and Governance Committee) (financial services), since 2021; the Governing Council of the Independent Directors Council (IDC), since 2021 |
Janet Langford Carrig
c/o Columbia Management
Investment Advisers, LLC
290 Congress Street
Boston, MA 02210
1957 | Trustee since 1996 | Senior Vice President, General Counsel and Corporate Secretary, ConocoPhillips (independent energy company), September 2007-October 2018 | 173 | Director, EQT Corporation (natural gas producer), since 2019; former Director, Whiting Petroleum Corporation (independent oil and gas company), 2020-2022 |
J. Kevin Connaughton
c/o Columbia Management
Investment Advisers, LLC
290 Congress Street
Boston, MA 02210
1964 | Trustee since 2020 | CEO and President, RhodeWay Financial (non-profit financial planning firm), since December 2022; Member, FINRA National Adjudicatory Council, since January 2020; Adjunct Professor of Finance, Bentley University since January 2018; Consultant to Independent Trustees of CFVIT and CFST I from March 2016 to June 2020 with respect to CFVIT and to December 2020 with respect to CFST I; Managing Director and General Manager of Mutual Fund Products, Columbia Management Investment Advisers, LLC, May 2010-February 2015; President, Columbia Funds, 2008-2015; and senior officer of Columbia Funds and affiliated funds, 2003-2015 | 171 | Former Director, The Autism Project, March 2015-December 2021; former Member of the Investment Committee, St. Michael’s College, November 2015-February 2020; former Trustee, St. Michael’s College, June 2017-September 2019; former Trustee, New Century Portfolios (former mutual fund complex), January 2015-December 2017 |
Columbia Contrarian Core Fund | Annual Report 2023
| 33 |
TRUSTEES AND OFFICERS (continued)
(Unaudited)
Independent trustees (continued)
Name,
address,
year of birth | Position held
with the Columbia Funds and
length of service | Principal occupation(s)
during past five years
and other relevant
professional experience | Number of
Funds in the
Columbia Funds
Complex*
overseen | Other directorships
held by Trustee
during the past five years
and other relevant Board experience |
Olive M. Darragh
c/o Columbia Management
Investment Advisers, LLC
290 Congress Street
Boston, MA 02210
1962 | Trustee since 2020 | Managing Director of Darragh Inc. (strategy and talent management consulting firm), since 2010; Founder and CEO, Zolio, Inc. (investment management talent identification platform), since 2004; Consultant to Independent Trustees of CFVIT and CFST I from June 2019 to June 2020 with respect to CFVIT and to December 2020 with respect to CFST I; Partner, Tudor Investments, 2004-2010; Senior Partner, McKinsey & Company (consulting), 1990-2004; Touche Ross CPA, 1985-1988 | 171 | Treasurer, Edinburgh University US Trust Board, since January 2023; Member, HBS Community Action Partners Board, since September 2022; former Director, University of Edinburgh Business School (Member of US Board), 2004-2019; former Director, Boston Public Library Foundation, 2008-2017 |
Patricia M. Flynn
c/o Columbia Management
Investment Advisers, LLC
290 Congress Street
Boston, MA 02210
1950 | Trustee since 2004 | Professor of Economics and Management, Bentley University, since 2002; Dean, McCallum Graduate School of Business, Bentley University, 1992-2002 | 173 | Former Trustee, MA Taxpayers Foundation, 1997-2022; former Director, The MA Business Roundtable, 2003-2019; former Chairperson, Innovation Index Advisory Committee, MA Technology Collaborative, 1997-2020 |
Brian J. Gallagher
c/o Columbia Management
Investment Advisers, LLC
290 Congress Street
Boston, MA 02210
1954 | Trustee since 2017 | Retired; Partner with Deloitte & Touche LLP and its predecessors, 1977-2016 | 173 | Trustee, Catholic Schools Foundation, since 2004 |
Douglas A. Hacker
c/o Columbia Management
Investment Advisers, LLC
290 Congress Street
Boston, MA 02210
1955 | Trustee since 1996 | Independent business executive, since May 2006; Executive Vice President – Strategy of United Airlines, December 2002 - May 2006; President of UAL Loyalty Services (airline marketing company), September 2001-December 2002; Executive Vice President and Chief Financial Officer of United Airlines, July 1999-September 2001 | 173 | Director, SpartanNash Company since November 2013 (Chair of the Board, since May 2021) (food distributor); Director, Aircastle Limited (Chair of Audit Committee) (aircraft leasing), since August 2006; former Director, Nash Finch Company (food distributor), 2005-2013; former Director, SeaCube Container Leasing Ltd. (container leasing), 2010-2013; and former Director, Travelport Worldwide Limited (travel information technology), 2014-2019 |
Nancy T. Lukitsh
c/o Columbia Management
Investment Advisers, LLC
290 Congress Street
Boston, MA 02210
1956 | Trustee since 2011 | Senior Vice President, Partner and Director of Marketing, Wellington Management Company, LLP (investment adviser), 1997-2010; Chair, Wellington Management Portfolios (commingled non-U.S. investment pools), 2007-2010; Director, Wellington Trust Company, NA and other Wellington affiliates, 1997-2010 | 171 | None |
| 34 | Columbia Contrarian Core Fund | Annual Report 2023 |
TRUSTEES AND OFFICERS (continued)
(Unaudited)
Independent trustees (continued)
Name,
address,
year of birth | Position held
with the Columbia Funds and
length of service | Principal occupation(s)
during past five years
and other relevant
professional experience | Number of
Funds in the
Columbia Funds
Complex*
overseen | Other directorships
held by Trustee
during the past five years
and other relevant Board experience |
David M. Moffett
c/o Columbia Management
Investment Advisers, LLC
290 Congress Street
Boston, MA 02210
1952 | Trustee since 2011 | Retired; former Chief Executive Officer of Freddie Mac and Chief Financial Officer of U.S. Bank | 171 | Director, CSX Corporation (transportation suppliers); Director, PayPal Holdings Inc. (payment and data processing services); Trustee, University of Oklahoma Foundation; former Director, eBay Inc. (online trading community), 2007-2015; and former Director, CIT Bank, CIT Group Inc. (commercial and consumer finance), 2010-2016; former Senior Adviser to The Carlyle Group (financial services), March 2008-September 2008; former Governance Consultant to Bridgewater Associates, January 2013-December 2015 |
Catherine James Paglia
c/o Columbia Management
Investment Advisers, LLC
290 Congress Street
Boston, MA 02210
1952 | Trustee since 2004 | Director, Enterprise Asset Management, Inc. (private real estate and asset management company), since September 1998; Managing Director and Partner, Interlaken Capital, Inc., 1989-1997; Vice President, 1982-1985, Principal, 1985-1987, Managing Director, 1987-1989, Morgan Stanley; Vice President, Investment Banking, 1980-1982, Associate, Investment Banking, 1976-1980, Dean Witter Reynolds, Inc. | 173 | Director, Valmont Industries, Inc. (irrigation systems manufacturer), since 2012; Trustee, Carleton College (on the Investment Committee), since 1987; Trustee, Carnegie Endowment for International Peace (on the Investment Committee), since 2009 |
Natalie A. Trunow
c/o Columbia Management
Investment Advisers, LLC
290 Congress Street
Boston, MA 02210
1967 | Trustee since 2020 | Chief Executive Officer, Millennial Portfolio Solutions LLC (asset management and consulting services), January 2016-January 2021; Non-executive Member of the Investment Committee and Valuation Committee, Sarona Asset Management Inc. (private equity firm) since September 2019; Advisor, Horizon Investments (asset management and consulting services), August 2018-January 2022; Advisor, Paradigm Asset Management, November 2016-January 2022; Consultant to Independent Trustees of CFVIT and CFST I from September 2016 to June 2020 with respect to CFVIT and to December 2020 with respect to CFST I; Director of Investments/Consultant, Casey Family Programs, April 2016-November 2016; Senior Vice President and Chief Investment Officer, Calvert Investments, August 2008-January 2016; Section Head and Portfolio Manager, General Motors Asset Management, June 1997-August 2008 | 171 | Independent Director, Investment Committee, Health Services for Children with Special Needs, Inc., 2010-2021; Independent Director, (Executive Committee and Chair, Audit Committee), Consumer Credit Counseling Services (formerly Guidewell Financial Solutions), since 2016; Independent Director, (Investment Committee), Sarona Asset Management, since 2019 |
Columbia Contrarian Core Fund | Annual Report 2023
| 35 |
TRUSTEES AND OFFICERS (continued)
(Unaudited)
Independent trustees (continued)
Name,
address,
year of birth | Position held
with the Columbia Funds and
length of service | Principal occupation(s)
during past five years
and other relevant
professional experience | Number of
Funds in the
Columbia Funds
Complex*
overseen | Other directorships
held by Trustee
during the past five years
and other relevant Board experience |
Sandra L. Yeager
c/o Columbia Management
Investment Advisers, LLC
290 Congress Street
Boston, MA 02210
1964 | Trustee since 2017 | Retired; President and founder, Hanoverian Capital, LLC (SEC registered investment advisor firm), 2008-2016; Managing Director, DuPont Capital, 2006-2008; Managing Director, Morgan Stanley Investment Management, 2004-2006; Senior Vice President, Alliance Bernstein, 1990-2004 | 173 | Former Director, NAPE (National Alliance for Partnerships in Equity) Education Foundation, October 2016-October 2020; Advisory Board, Jennersville YMCA, since 2022 |
Interested trustee affiliated with Investment Manager**
Name,
address,
year of birth | Position held with the Columbia Funds and length of service | Principal occupation(s) during the
past five years and other relevant
professional experience | Number of
Funds in the
Columbia Funds
Complex* overseen | Other directorships
held by Trustee
during the past
five years and
other relevant Board experience |
Daniel J. Beckman
c/o Columbia Management
Investment Advisers, LLC
290 Congress Street
Boston, MA 02210
1962 | Trustee since November 2021 and President since June 2021 | Vice President – Head of North America Product, Columbia Management Investment Advisers, LLC, since April 2015; President and Principal Executive Officer of the Columbia Funds, since June 2021; officer of Columbia Funds and affiliated funds, 2020-2021 | 173 | Director, Ameriprise Trust Company, since October 2016; Director, Columbia Management Investment Distributors, Inc. since November 2018; Board of Governors, Columbia Wanger Asset Management, LLC since, January 2022; Director, Columbia Threadneedle Canada, Inc., since December 2022 |
| * | The term “Columbia Funds Complex” as used herein includes Columbia Seligman Premium Technology Growth Fund, Tri-Continental Corporation and each series of Columbia Funds Series Trust (CFST), Columbia Funds Series Trust I (CFST I), Columbia Funds Series Trust II (CFST II), Columbia ETF Trust I (CET I), Columbia ETF Trust II (CET II), Columbia Funds Variable Insurance Trust (CFVIT) and Columbia Funds Variable Series Trust II (CFVST II). Messrs. Batejan, Beckman, Gallagher and Hacker and Mses. Blatz, Carlton, Carrig, Flynn, Paglia, and Yeager serve as directors of Columbia Seligman Premium Technology Growth Fund and Tri-Continental Corporation. |
| ** | Interested person (as defined under the 1940 Act) by reason of being an officer, director, security holder and/or employee of the Investment Manager or Ameriprise Financial. |
The Statement of Additional Information has additional information about the Fund’s Board members and is available, without charge, upon request by calling 800.345.6611, visiting columbiathreadneedleus.com/investor/ or contacting your financial intermediary.
| 36 | Columbia Contrarian Core Fund | Annual Report 2023 |
TRUSTEES AND OFFICERS (continued)
(Unaudited)
The Board has appointed officers who are responsible for day-to-day business decisions based on policies it has established. The officers serve at the pleasure of the Board. The following table provides basic information about the Officers of the Fund as of the printing of this report, including principal occupations during the past five years, although their specific titles may have varied over the period. In addition to Mr. Beckman, who is President and Principal Executive Officer, the Fund’s other officers are:
Fund officers
Name,
address and
year of birth | Position and year
first appointed to
position for any Fund
in the Columbia
Funds Complex or a
predecessor thereof | Principal occupation(s) during past five years |
Michael G. Clarke
290 Congress Street
Boston, MA 02210
1969 | Chief Financial Officer and Principal Financial Officer (2009) and Senior Vice President (2019) | Senior Vice President and North America Head of Operations & Investor Services, Columbia Management Investment Advisers, LLC, since June 2023 (previously Senior Vice President and Head of Global Operations, March 2022 – June 2023, Vice President, Head of North America Operations, and Co-Head of Global Operations, June 2019 - February 2022 and Vice President – Accounting and Tax, May 2010 - May 2019); senior officer of Columbia Funds and affiliated funds, since 2002. Director, Ameriprise Trust Company, since June 2023. |
Joseph Beranek
5890 Ameriprise Financial Center
Minneapolis, MN 55474
1965 | Treasurer and Chief Accounting Officer (Principal Accounting Officer) (2019) and Principal Financial Officer (2020), CFST, CFST I, CFST II, CFVIT and CFVST II; Assistant Treasurer, CET I and CET II | Vice President – Mutual Fund Accounting and Financial Reporting, Columbia Management Investment Advisers, LLC, since December 2018 and March 2017, respectively. |
Marybeth Pilat
290 Congress Street
Boston, MA 02210
1968 | Treasurer and Chief Accounting Officer (Principal Accounting Officer) and Principal Financial Officer (2020) for CET I and CET II; Assistant Treasurer, CFST, CFST I, CFST II, CFVIT and CFVST II | Vice President – Product Pricing and Administration, Columbia Management Investment Advisers, LLC, since May 2017. |
William F. Truscott
290 Congress Street
Boston, MA 02210
1960 | Senior Vice President (2001) | Formerly, Trustee/Director of Columbia Funds Complex or legacy funds, November 2001 - January 1, 2021; Chief Executive Officer, Global Asset Management, Ameriprise Financial, Inc., since September 2012; Chairman of the Board and President, Columbia Management Investment Advisers, LLC, since July 2004 and February 2012, respectively; Chairman of the Board and Chief Executive Officer, Columbia Management Investment Distributors, Inc., since November 2008 and February 2012, respectively; Chairman of the Board and Director, Threadneedle Asset Management Holdings, Sàrl, since March 2013 and December 2008, respectively; senior executive of various entities affiliated with Columbia Threadneedle. |
Christopher O. Petersen
5228 Ameriprise Financial Center
Minneapolis, MN 55474
1970 | Senior Vice President and Assistant Secretary (2021) | Formerly, Trustee/Director of funds within the Columbia Funds Complex, July 1, 2020 - November 22, 2021; Senior Vice President and Assistant General Counsel, Ameriprise Financial, Inc., since September 2021 (previously Vice President and Lead Chief Counsel, January 2015 - September 2021); formerly, President and Principal Executive Officer of the Columbia Funds, 2015 - 2021; officer of Columbia Funds and affiliated funds, since 2007. |
Thomas P. McGuire
290 Congress Street
Boston, MA 02210
1972 | Senior Vice President and Chief Compliance Officer (2012) | Vice President – Asset Management Compliance, Ameriprise Financial, Inc., since May 2010; Chief Compliance Officer, Columbia Acorn/Wanger Funds, since December 2015; formerly, Chief Compliance Officer, Ameriprise Certificate Company, September 2010 – September 2020. |
Ryan C. Larrenaga
290 Congress Street
Boston, MA 02210
1970 | Senior Vice President (2017), Chief Legal Officer (2017), and Secretary (2015) | Vice President and Chief Counsel, Ameriprise Financial, Inc., since August 2018 (previously Vice President and Group Counsel, August 2011 - August 2018); Chief Legal Officer, Columbia Acorn/Wanger Funds, since September 2020; officer of Columbia Funds and affiliated funds, since 2005. |
Columbia Contrarian Core Fund | Annual Report 2023
| 37 |
TRUSTEES AND OFFICERS (continued)
(Unaudited)
Fund officers (continued)
Name,
address and
year of birth | Position and year
first appointed to
position for any Fund
in the Columbia
Funds Complex or a
predecessor thereof | Principal occupation(s) during past five years |
Michael E. DeFao
290 Congress Street
Boston, MA 02210
1968 | Vice President (2011) and Assistant Secretary (2010) | Vice President and Chief Counsel, Ameriprise Financial, Inc., since May 2010; Vice President, Chief Legal Officer and Assistant Secretary, Columbia Management Investment Advisers, LLC, since October 2021 (previously Vice President and Assistant Secretary, May 2010 – September 2021). |
Lyn Kephart-Strong
5903 Ameriprise Financial Center
Minneapolis, MN 55474
1960 | Vice President (2015) | Vice President, Global Investment Operations Services, Columbia Management Investment Advisers, LLC, since 2010; Director (since January 2007) and President (since October 2014), Columbia Management Investment Services Corp.; Director (since December 2017) and President (since January 2017), Ameriprise Trust Company. |
Liquidity Risk Management Program
(Unaudited)
Pursuant to Rule 22e-4 under the 1940 Act, the Fund has adopted a liquidity risk management program (Program). The Program’s principal objectives include assessing, managing and periodically reviewing the Fund’s liquidity risk. Liquidity risk is defined as the risk that the Fund could not meet redemption requests without significant dilution of remaining investors’ interests in the Fund.
The Board has appointed the Investment Manager as the program administrator for the Fund’s Program. The Investment Manager has delegated oversight of the Program to its Liquidity Risk Management Committee (the Committee). At a Board meeting during the fiscal period, the Committee provided the Board with a report addressing the operations of the Program and assessing its adequacy and effectiveness of implementation for the period January 1, 2022 through December 31, 2022, including:
| • | the Fund had sufficient liquidity to both meet redemptions and operate effectively on behalf of shareholders; |
| • | there were no material changes to the Program during the period; |
| • | the implementation of the Program was effective to manage the Fund’s liquidity risk; and |
| • | the Program operated adequately during the period. |
There can be no assurance that the Program will achieve its objectives in the future. Please refer to the Fund’s prospectus for more information regarding the Fund’s exposure to liquidity risk and other principal risks to which an investment in the Fund may be subject.
| 38 | Columbia Contrarian Core Fund | Annual Report 2023 |
Approval of Management Agreement
(Unaudited)
Columbia Management Investment Advisers, LLC (the Investment Manager, and together with its domestic and global affiliates, Columbia Threadneedle Investments), a wholly-owned subsidiary of Ameriprise Financial, Inc. (Ameriprise Financial), serves as the investment manager to Columbia Contrarian Core Fund (the Fund). Under a management agreement (the Management Agreement), the Investment Manager provides investment advice and other services to the Fund and other funds distributed by Columbia Management Investment Distributors, Inc. (collectively, the Funds).
On an annual basis, the Fund’s Board of Trustees (the Board), including the independent Board members (the Independent Trustees), considers renewal of the Management Agreement. The Investment Manager prepared detailed reports for the Board and its Contracts Committee (including its Contracts Subcommittee) in February, March, April, May and June 2023, including reports providing the results of analyses performed by a third-party data provider, Broadridge Financial Solutions, Inc. (Broadridge), and comprehensive responses by the Investment Manager to written requests for information by independent legal counsel to the Independent Trustees (Independent Legal Counsel), to assist the Board in making this determination. In addition, throughout the year, the Board (or its committees or subcommittees) regularly meets with portfolio management teams and senior management personnel and reviews information prepared by the Investment Manager addressing the services the Investment Manager provides and Fund performance. The Board also accords appropriate weight to the work, deliberations and conclusions of the various committees (including their subcommittees), such as the Contracts Committee, the Investment Review Committee, the Audit Committee and the Compliance Committee in determining whether to continue the Management Agreement.
The Board, at its June 22, 2023 Board meeting (the June Meeting), considered the renewal of the Management Agreement for an additional one-year term. At the June Meeting, Independent Legal Counsel reviewed with the Independent Trustees various factors relevant to the Board’s consideration of advisory agreements and the Board’s legal responsibilities related to such consideration. The Independent Trustees considered all information that they, their legal counsel or the Investment Manager believed reasonably necessary to evaluate and to approve the continuation of the Management Agreement. Among other things, the information and factors considered included the following:
| • | Information on the investment performance of the Fund relative to the performance of a group of mutual funds determined to be comparable to the Fund by Broadridge, as well as performance relative to one or more benchmarks; |
| • | Information on the Fund’s management fees and total expenses, including information comparing the Fund’s expenses to those of a group of comparable mutual funds, as determined by Broadridge; |
| • | The Investment Manager’s agreement to contractually limit or cap total operating expenses for the Fund so that total operating expenses (excluding certain fees and expenses, such as transaction costs and certain other investment related expenses, interest, taxes, acquired fund fees and expenses and infrequent and/or unusual expenses) would not exceed a specified annual rate, as a percentage of the Fund’s net assets; |
| • | Terms of the Management Agreement; |
| • | Descriptions of other agreements and arrangements with affiliates of the Investment Manager relating to the operations of the Fund, including agreements with respect to the provision of transfer agency and shareholder services to the Fund; |
| • | Descriptions of various services performed by the Investment Manager under the Management Agreement, including portfolio management and portfolio trading practices; |
| • | Information regarding any recently negotiated management fees of similarly-managed portfolios of other institutional clients of the Investment Manager; |
| • | Information regarding the resources of the Investment Manager, including information regarding senior management, portfolio managers and other personnel; |
| • | Information regarding the capabilities of the Investment Manager with respect to compliance monitoring services; |
| • | The profitability to the Investment Manager and its affiliates from their relationships with the Fund; and |
| • | Report provided by the Board’s independent fee consultant, JDL Consultants, LLC (JDL). |
Columbia Contrarian Core Fund | Annual Report 2023
| 39 |
Approval of Management Agreement (continued)
(Unaudited)
Following an analysis and discussion of the foregoing, and the factors identified below, the Board, including all of the Independent Trustees, approved the renewal of the Management Agreement.
Nature, extent and quality of services provided by the Investment Manager
The Board analyzed various reports and presentations it had received detailing the services performed by the Investment Manager, as well as its history, expertise, resources and relative capabilities, and the qualifications of its personnel.
The Board specifically considered the many developments during recent years concerning the services provided by the Investment Manager. Among other things, the Board noted the organization and depth of the equity and credit research departments. The Board further observed the enhancements to the investment risk management department’s processes, systems and oversight over the past several years. The Board also took into account the broad scope of services provided by the Investment Manager to the Fund, including, among other services, investment, risk and compliance oversight. The Board also took into account the information it received concerning the Investment Manager’s ability to attract and retain key portfolio management personnel and that it has sufficient resources to provide competitive and adequate compensation to investment personnel.
In connection with the Board’s evaluation of the overall package of services provided by the Investment Manager, the Board also considered the nature, quality and range of administrative services provided to the Fund by the Investment Manager, as well as the achievements in 2022 in the performance of administrative services, and noted the various enhancements anticipated for 2023. In evaluating the quality of services provided under the Management Agreement, the Board also took into account the organization and strength of the Fund’s and its service providers’ compliance programs. The Board also reviewed the financial condition of the Investment Manager and its affiliates and each entity’s ability to carry out its responsibilities under the Management Agreement and the Fund’s other service agreements.
In addition, the Board discussed the acceptability of the terms of the Management Agreement, noting that no changes were proposed from the form of agreement previously approved. The Board also noted the wide array of legal and compliance services provided to the Fund under the Management Agreement.
After reviewing these and related factors (including investment performance as discussed below), the Board concluded, within the context of their overall conclusions, that the nature, extent and quality of the services provided to the Fund under the Management Agreement supported the continuation of the Management Agreement.
Investment performance
The Board carefully reviewed the investment performance of the Fund, including detailed reports providing the results of analyses performed by each of the Investment Manager, Broadridge and JDL collectively showing, for various periods (including since manager inception): (i) the performance of the Fund, (ii) the Fund’s performance relative to peers and benchmarks and (iii) the net assets of the Fund. The Board observed that the Fund’s performance for certain periods ranked above median based on information provided by Broadridge.
The Board also reviewed a description of the third-party data provider’s methodology for identifying the Fund’s peer groups for purposes of performance and expense comparisons.
The Board also considered the Investment Manager’s performance and reputation generally. After reviewing these and related factors, the Board concluded, within the context of their overall conclusions, that the performance of the Fund and the Investment Manager, in light of other considerations, supported the continuation of the Management Agreement.
Comparative fees, costs of services provided and the profits realized by the Investment Manager and its affiliates from their relationships with the Fund
The Board reviewed comparative fees and the costs of services provided under the Management Agreement. The Board members considered detailed comparative information set forth in an annual report on fees and expenses, including, among other things, data (based on analyses conducted by Broadridge and JDL) showing a comparison of the Fund’s expenses with median expenses paid by funds in its comparative peer universe, as well as data showing the Fund’s contribution to the
| 40 | Columbia Contrarian Core Fund | Annual Report 2023 |
Approval of Management Agreement (continued)
(Unaudited)
Investment Manager’s profitability. The Board reviewed the fees charged to comparable institutional or other accounts/vehicles managed by the Investment Manager, including vehicles subadvised by the Investment Manager, and discussed differences in how the products are managed and operated, thus explaining many of the differences in fees.
The Board considered the reports of JDL, which assisted in the Board’s analysis of the Funds’ performance and expenses and the reasonableness of the Funds’ fee rates. The Board accorded particular weight to the notion that a primary objective of the level of fees is to achieve a rational pricing model applied consistently across the various product lines in the Fund family, while assuring that the overall fees for each Fund (with certain exceptions) are generally in line with the current “pricing philosophy” such that Fund total expense ratios, in general, approximate or are lower than the median expense ratios of funds in the same Lipper comparison universe. The Board took into account that the Fund’s total expense ratio (after considering proposed expense caps/waivers) approximated the peer universe’s median expense ratio.
After reviewing these and related factors, the Board concluded, within the context of their overall conclusions, that the levels of management fees and expenses of the Fund, in light of other considerations, supported the continuation of the Management Agreement.
The Board also considered the profitability of the Investment Manager and its affiliates in connection with the Investment Manager providing management services to the Fund. With respect to the profitability of the Investment Manager and its affiliates, the Independent Trustees referred to information discussing the profitability to the Investment Manager and Ameriprise Financial from managing, operating and distributing the Funds. The Board considered that the profitability generated by the Investment Manager in 2022 had declined from 2021 levels, due to a variety of factors, including the decreased assets under management of the Funds. It also took into account the indirect economic benefits flowing to the Investment Manager or its affiliates in connection with managing or distributing the Funds, such as the enhanced ability to offer various other financial products to Ameriprise Financial customers, soft dollar benefits and overall reputational advantages. The Board noted that the fees paid by the Fund should permit the Investment Manager to offer competitive compensation to its personnel, make necessary investments in its business and earn an appropriate profit. After reviewing these and related factors, the Board concluded, within the context of their overall conclusions, that the costs of services provided and the profitability to the Investment Manager and its affiliates from their relationships with the Fund supported the continuation of the Management Agreement.
Economies of scale
The Board considered the potential existence of economies of scale in the provision by the Investment Manager of services to the Fund, and whether those economies of scale were shared with the Fund through breakpoints in investment management fees or other means, such as expense limitation arrangements and additional investments by the Investment Manager in investment, trading, compliance and other resources. The Board considered the economies of scale that might be realized as the Fund’s net asset level grows and took note of the extent to which Fund shareholders might also benefit from such growth. In this regard, the Board took into account that management fees decline as Fund assets exceed various breakpoints, all of which have not been surpassed. The Board observed that the Management Agreement provided for breakpoints in the management fee rate schedule that allow opportunities for shareholders to realize lower fees as Fund assets grow and that there are additional opportunities through other means for sharing economies of scale with shareholders.
Conclusion
The Board reviewed all of the above considerations in reaching its decision to approve the continuation of the Management Agreement. In reaching its conclusions, no single factor was determinative.
On June 22, 2023, the Board, including all of the Independent Trustees, determined that fees payable under the Management Agreement were fair and reasonable in light of the extent and quality of services provided and approved the renewal of the Management Agreement.
Columbia Contrarian Core Fund | Annual Report 2023
| 41 |
[THIS PAGE INTENTIONALLY LEFT BLANK]
[THIS PAGE INTENTIONALLY LEFT BLANK]
Columbia Contrarian Core Fund
P.O. Box 219104
Kansas City, MO 64121-9104
Please read and consider the investment objectives, risks, charges and expenses for any fund carefully before investing. For a prospectus and summary prospectus, which contains this and other important information about the Fund, go to
columbiathreadneedleus.com/investor/. The Fund is distributed by Columbia Management Investment Distributors, Inc., member FINRA, and managed by Columbia Management Investment Advisers, LLC.
Columbia Threadneedle Investments (Columbia Threadneedle) is the global brand name of the Columbia and Threadneedle group of companies. All rights reserved.
© 2023 Columbia Management Investment Advisers, LLC.
columbiathreadneedleus.com/investor/

Annual Report
August 31, 2023
Columbia Emerging Markets Fund
Not FDIC or NCUA Insured • No Financial Institution Guarantee • May Lose Value
If you elect to receive the shareholder report for Columbia Emerging Markets Fund (the Fund) in paper, mailed to you, the Fund mails one shareholder report to each shareholder address, unless such shareholder elects to receive shareholder reports from the Fund electronically via e-mail or by having a paper notice mailed to you (Postcard Notice) that your Fund’s shareholder report is available at the Columbia funds’ website (columbiathreadneedleus.com/investor/). If you would like more than one report in paper to be mailed to you, or would like to elect to receive reports via e-mail or access them through Postcard Notice, please call shareholder services at 800.345.6611 and additional reports will be sent to you.
Proxy voting policies and procedures
The policy of the Board of Trustees is to vote the proxies of the companies in which the Fund holds investments consistent with the procedures as stated in the Statement of Additional Information (SAI). You may obtain a copy of the SAI without charge by calling 800.345.6611; contacting your financial intermediary; visiting columbiathreadneedleus.com/investor/; or searching the website of the Securities and Exchange Commission (SEC) at sec.gov. Information regarding how the Fund voted proxies relating to portfolio securities is filed with the SEC by August 31st for the most recent 12-month period ending June 30th of that year, and is available without charge by visiting columbiathreadneedleus.com/investor/, or searching the website of the SEC at sec.gov.
Quarterly schedule of investments
The Fund files a complete schedule of portfolio holdings with the SEC for the first and third quarters of each fiscal year on Form N-PORT. The Fund’s Form N-PORT filings are available on the SEC’s website at sec.gov. The Fund’s complete schedule of portfolio holdings, as filed on Form N-PORT, is available on columbiathreadneedleus.com/investor/ or can also be obtained without charge, upon request, by calling 800.345.6611.
Additional Fund information
For more information about the Fund, please visit columbiathreadneedleus.com/investor/ or call 800.345.6611. Customer Service Representatives are available to answer your questions Monday through Friday from 8 a.m. to 7 p.m. Eastern time.
Fund investment manager
Columbia Management Investment Advisers, LLC (the Investment Manager)
290 Congress Street
Boston, MA 02210
Fund distributor
Columbia Management Investment Distributors, Inc.
290 Congress Street
Boston, MA 02210
Fund transfer agent
Columbia Management Investment Services Corp.
P.O. Box 219104
Kansas City, MO 64121-9104
Columbia Emerging Markets Fund | Annual Report 2023
Fund at a Glance
(Unaudited)
Investment objective
The Fund seeks long-term capital appreciation.
Portfolio management
Dara White, CFA
Lead Portfolio Manager
Managed Fund since 2008
Robert Cameron
Portfolio Manager
Managed Fund since 2008
Perry Vickery, CFA
Portfolio Manager
Managed Fund since 2017
Derek Lin, CFA
Portfolio Manager
Managed Fund since 2020
Darren Powell, CFA
Portfolio Manager
Managed Fund since 2021
Morningstar style boxTM
The Morningstar Style Box is based on a fund’s portfolio holdings. For equity funds, the vertical axis shows the market capitalization of the stocks owned, and the horizontal axis shows investment style (value, blend, or growth). Information shown is based on the most recent data provided by Morningstar.
© 2023 Morningstar, Inc. All rights reserved. The Morningstar information contained herein: (1) is proprietary to Morningstar and/or its content providers; (2) may not be copied or distributed; and (3) is not warranted to be accurate, complete or timely. Neither Morningstar nor its content providers are responsible for any damages or losses arising from any use of this information.
| Average annual total returns (%) (for the period ended August 31, 2023) |
| | | Inception | 1 Year | 5 Years | 10 Years |
| Class A | Excluding sales charges | 09/28/07 | -1.01 | -0.12 | 2.87 |
| | Including sales charges | | -6.74 | -1.30 | 2.26 |
| Advisor Class | 03/19/13 | -0.82 | 0.11 | 3.13 |
| Class C | Excluding sales charges | 09/28/07 | -1.73 | -0.87 | 2.10 |
| | Including sales charges | | -2.72 | -0.87 | 2.10 |
| Institutional Class | 01/02/98 | -0.83 | 0.11 | 3.12 |
| Institutional 2 Class | 11/08/12 | -0.74 | 0.25 | 3.27 |
| Institutional 3 Class | 11/08/12 | -0.74 | 0.28 | 3.32 |
| Class R | 09/27/10 | -1.29 | -0.37 | 2.61 |
| MSCI Emerging Markets Index (Net) | | 1.25 | 0.98 | 2.99 |
| MSCI EAFE Index (Net) | | 17.92 | 4.14 | 4.93 |
Returns for Class A shares are shown with and without the maximum initial sales charge of 5.75%. Returns for Class C shares are shown with and without the 1.00% contingent deferred sales charge for the first year only. The Fund’s other share classes are not subject to sales charges and have limited eligibility. Please see the Fund’s prospectus for details. Performance for different share classes will vary based on differences in sales charges and fees associated with each share class. All results shown assume reinvestment of distributions during the period. Returns do not reflect the deduction of taxes that a shareholder may pay on Fund distributions or on the redemption of Fund shares. Performance results reflect the effect of any fee waivers or reimbursements of Fund expenses by Columbia Management Investment Advisers, LLC and/or any of its affiliates. Absent these fee waivers or expense reimbursement arrangements, performance results would have been lower.
The performance information shown represents past performance and is not a guarantee of future results. The investment return and principal value of your investment will fluctuate so that your shares, when redeemed, may be worth more or less than their original cost. Current performance may be lower or higher than the performance information shown. You may obtain performance information current to the most recent month-end by contacting your financial intermediary, visiting columbiathreadneedleus.com/investor/ or calling 800.345.6611.
The MSCI Emerging Markets Index (Net) is a free float-adjusted market capitalization index that is designed to measure equity market performance of emerging markets.
The MSCI EAFE Index (Net) is a free float-adjusted market capitalization index that is designed to measure the equity market performance of developed markets, excluding the U.S. and Canada. The index is compiled from a composite of securities markets of Europe, Australasia and the Far East and is widely recognized by investors in foreign markets as the measurement index for portfolios of non-North American securities.
Indices are not available for investment, are not professionally managed and do not reflect sales charges, fees, brokerage commissions, taxes (except the MSCI Emerging Markets Index (Net) and the MSCI EAFE Index (Net) which reflect reinvested dividends net of withholding taxes) or other expenses of investing. Securities in the Fund may not match those in an index.
Columbia Emerging Markets Fund | Annual Report 2023
| 3 |
Fund at a Glance (continued)
(Unaudited)
Performance of a hypothetical $10,000 investment (August 31, 2013 — August 31, 2023)
The chart above shows the change in value of a hypothetical $10,000 investment in Class A shares of Columbia Emerging Markets Fund during the stated time period, and does not reflect the deduction of taxes that a shareholder may pay on Fund distributions or on the redemption of Fund shares.
| Equity sector breakdown (%) (at August 31, 2023) |
| Communication Services | 9.4 |
| Consumer Discretionary | 14.3 |
| Consumer Staples | 8.5 |
| Energy | 4.3 |
| Financials | 26.5 |
| Health Care | 3.7 |
| Industrials | 10.8 |
| Information Technology | 20.8 |
| Materials | 0.7 |
| Real Estate | 1.0 |
| Total | 100.0 |
Percentages indicated are based upon total equity investments. The Fund’s portfolio composition is subject to change.
| Country breakdown (%) (at August 31, 2023) |
| Brazil | 9.0 |
| Canada | 0.8 |
| China | 25.0 |
| Greece | 3.5 |
| Hong Kong | 2.0 |
| Country breakdown (%) (at August 31, 2023) |
| India | 17.3 |
| Indonesia | 6.9 |
| Kazakhstan | 0.6 |
| Malaysia | 0.3 |
| Mexico | 5.1 |
| Philippines | 1.1 |
| Poland | 0.7 |
| Russian Federation | 0.3 |
| Saudi Arabia | 0.5 |
| South Africa | 2.8 |
| South Korea | 11.1 |
| Taiwan | 9.3 |
| Thailand | 0.6 |
| Turkey | 0.8 |
| United States(a) | 2.3 |
| Total | 100.0 |
| (a) | Includes investments in Money Market Funds. |
Country breakdown is based primarily on issuer’s place of organization/incorporation. Percentages indicated are based upon total investments, excluding investments in derivatives, if any. The Fund’s portfolio composition is subject to change.
| 4 | Columbia Emerging Markets Fund | Annual Report 2023 |
Manager Discussion of Fund Performance
(Unaudited)
For the 12-month period that ended August 31, 2023, Class A shares of Columbia Emerging Markets Fund returned -1.01% excluding sales charges. The Fund’s benchmark, the MSCI Emerging Markets Index (Net), returned 1.25% for the same period, while developed international markets returned 17.92% as gauged by the MSCI EAFE Index (Net).
Market overview
Over the period, emerging markets hit lows following the China National Party Congress in late October of 2022, which raised alarm over the extent to which President Xi Jinping appeared determined to further centralize control. Sentiment rebounded early in 2023 on optimism around China’s reopening after the pandemic lockdown. However, markets would soon retreat on fears of financial system instability in the wake of issues with U.S. regional banks which emerged in February, heightened U.S.-China tensions following the spy balloon incident, and stronger-than-expected U.S. economic data which raised the prospect of further tightening of U.S. Federal Reserve policy.
As the period progressed, markets were encouraged by Chinese government efforts to support the ailing property sector and loosen the reins on private enterprise, along with lower-than-expected inflation and the prospect of central bank rate cuts. In addition, headlines around potential commercial applications for generative artificial intelligence boosted information technology stocks. Factors that constrained market sentiment included continued deterioration in relations between the U.S. and China and surprisingly soft Chinese economic activity despite the government’s loosening of pandemic-era restrictions.
The Chinese market, which is by far the biggest constituent of the MSCI Emerging Markets Index (Net), was the most significant constraint on benchmark performance for the 12 months, posting a -7.53% return.
The period saw many positive developments at the individual country level. Korea and Taiwan are benefiting from the semiconductor cycle bottoming as demand begins to rise, while Indonesia has seen key reforms unlock growth. India is on a new growth cycle, expanding its manufacturing sector, investing in infrastructure, digitalising its economy and encouraging foreign direct investment. In Latin America, Brazil has seen receding political and inflationary risks along with interest rate cuts, while Mexico is benefiting from nearshoring by U.S. companies. In emerging Europe, the Greek economy has been a turnaround story with growth returning and debt on a downward trajectory, while Poland’s economy has been boosted by nearshoring and migration.
The Fund’s notable detractors during the period
| • | On the downside, selection within China and Hong Kong weighed most heavily on relative performance, followed by selection within South Africa and Taiwan. |
| • | With respect to individual detractors, Chinese online retailer JD.com, Inc. reported disappointing core revenue growth driven by very weak consumption of goods along with increased competition. |
| • | Similarly, Meituan, a shopping platform for locally sourced consumer products and services, has been negatively impacted by new entrants and anemic Chinese consumer spending. |
| • | Results for Chinese sportswear and sports equipment company Li Ning Co., Ltd. also suffered from the weak consumer demand as well as from increased competition from international brands such as Adidas and Nike. |
| • | Finally, China Tourism Group Duty Free Corp., Ltd., a duty free store operator, has not been immune from the impact of China’s less-than-robust rebound following reopening. |
The Fund’s notable contributors during the period
| • | In country terms, security selection was most beneficial to performance relative to the benchmark within Argentina, India and Indonesia. In terms of allocation effects, positioning with respect to Greece and Saudi Arabia proved most additive. |
| • | With respect to individual stocks, leading contributors included Prio S.A. as the Brazilian oil and gas producer saw its share price boosted by soaring profits driven by improving operational efficiency. |
| • | Shares of MercadoLibre, Inc., a Latin-American online marketplace, rallied following news of accounting irregularities at competitor Americanas, fueling hopes that MercadoLibre will gain significant market share. |
Columbia Emerging Markets Fund | Annual Report 2023
| 5 |
Manager Discussion of Fund Performance (continued)
(Unaudited)
| • | Indonesian bank PT Bank Rakyat Indonesia Persero Tbk outperformed over the period following the release of encouraging earnings reports reflecting strong loan growth. |
| • | Sentiment with respect to NetEase, Inc., a Chinese internet company, was supported by a solid pipeline of games which are expected to support growth. |
Market risk may affect a single issuer, sector of the economy, industry or the market as a whole. International investing involves certain risks and volatility due to potential political, economic or currency instabilities and different financial and accounting standards. Risks are enhanced for emerging market issuers. Investments in small- and mid-cap companies involve risks and volatility greater than investments in larger, more established companies. Value securities may be unprofitable if the market fails to recognize their intrinsic worth or the portfolio manager misgauged that worth. Growth securities, at times, may not perform as well as value securities or the stock market in general and may be out of favor with investors. Certain issuer events, including initial public offerings, business consolidation or restructuring, may present heightened risks to securities from the high degree of uncertainty associated with such events. See the Fund’s prospectus for more information on these and other risks.
The views expressed in this report reflect the current views of the respective parties who contributed to this report. These views are not guarantees of future performance and involve certain risks, uncertainties and assumptions that are difficult to predict, so actual outcomes and results may differ significantly from the views expressed. These views are subject to change at any time based upon economic, market or other conditions and the respective parties disclaim any responsibility to update such views. These views may not be relied on as investment advice and, because investment decisions for a Columbia fund are based on numerous factors, may not be relied on as an indication of trading intent on behalf of any particular Columbia fund. References to specific securities should not be construed as a recommendation or investment advice.
| 6 | Columbia Emerging Markets Fund | Annual Report 2023 |
Understanding Your Fund’s Expenses
(Unaudited)
As an investor, you incur two types of costs. There are shareholder transaction costs, which generally include sales charges on purchases and may include redemption fees. There are also ongoing fund costs, which generally include management fees, distribution and/or service fees, and other fund expenses. The following information is intended to help you understand your ongoing costs (in dollars) of investing in the Fund and to help you compare these costs with the ongoing costs of investing in other mutual funds.
Analyzing your Fund’s expenses
To illustrate these ongoing costs, we have provided examples and calculated the expenses paid by investors in each share class of the Fund during the period. The actual and hypothetical information in the table is based on an initial investment of $1,000 at the beginning of the period indicated and held for the entire period. Expense information is calculated two ways and each method provides you with different information. The amount listed in the “Actual” column is calculated using the Fund’s actual operating expenses and total return for the period. You may use the Actual information, together with the amount invested, to estimate the expenses that you paid over the period. Simply divide your account value by $1,000 (for example, an $8,600 account value divided by $1,000 = 8.6), then multiply the results by the expenses paid during the period under the “Actual” column. The amount listed in the “Hypothetical” column assumes a 5% annual rate of return before expenses (which is not the Fund’s actual return) and then applies the Fund’s actual expense ratio for the period to the hypothetical return. You should not use the hypothetical account values and expenses to estimate either your actual account balance at the end of the period or the expenses you paid during the period. See “Compare with other funds” below for details on how to use the hypothetical data.
Compare with other funds
Since all mutual funds are required to include the same hypothetical calculations about expenses in shareholder reports, you can use this information to compare the ongoing cost of investing in the Fund with other funds. To do so, compare the hypothetical example with the 5% hypothetical examples that appear in the shareholder reports of other funds. As you compare hypothetical examples of other funds, it is important to note that hypothetical examples are meant to highlight the ongoing costs of investing in a fund only and do not reflect any transaction costs, such as sales charges, or redemption or exchange fees. Therefore, the hypothetical calculations are useful in comparing ongoing costs only, and will not help you determine the relative total costs of owning different funds. If transaction costs were included in these calculations, your costs would be higher.
| March 1, 2023 — August 31, 2023 |
| | Account value at the
beginning of the
period ($) | Account value at the
end of the
period ($) | Expenses paid during
the period ($) | Fund’s annualized
expense ratio (%) |
| | Actual | Hypothetical | Actual | Hypothetical | Actual | Hypothetical | Actual |
| Class A | 1,000.00 | 1,000.00 | 1,039.80 | 1,018.00 | 7.35 | 7.27 | 1.43 |
| Advisor Class | 1,000.00 | 1,000.00 | 1,040.50 | 1,019.26 | 6.07 | 6.01 | 1.18 |
| Class C | 1,000.00 | 1,000.00 | 1,035.60 | 1,014.22 | 11.19 | 11.07 | 2.18 |
| Institutional Class | 1,000.00 | 1,000.00 | 1,040.80 | 1,019.26 | 6.07 | 6.01 | 1.18 |
| Institutional 2 Class | 1,000.00 | 1,000.00 | 1,041.30 | 1,019.76 | 5.56 | 5.50 | 1.08 |
| Institutional 3 Class | 1,000.00 | 1,000.00 | 1,041.10 | 1,019.96 | 5.35 | 5.30 | 1.04 |
| Class R | 1,000.00 | 1,000.00 | 1,037.90 | 1,016.74 | 8.63 | 8.54 | 1.68 |
Expenses paid during the period are equal to the annualized expense ratio for each class as indicated above, multiplied by the average account value over the period and then multiplied by the number of days in the Fund’s most recent fiscal half year and divided by 365.
Expenses do not include fees and expenses incurred indirectly by the Fund from its investment in underlying funds, including affiliated and non-affiliated pooled investment vehicles, such as mutual funds and exchange-traded funds.
Had Columbia Management Investment Advisers, LLC and/or certain of its affiliates not waived/reimbursed certain fees and expenses, account value at the end of the period would have been reduced.
Columbia Emerging Markets Fund | Annual Report 2023
| 7 |
Portfolio of Investments
August 31, 2023
(Percentages represent value of investments compared to net assets)
Investments in securities
| Common Stocks 98.0% |
| Issuer | Shares | Value ($) |
| Brazil 9.1% |
| B3 SA - Brasil Bolsa Balcao | 3,647,468 | 9,538,415 |
| Banco BTG Pactual SA | 1,880,092 | 12,327,538 |
| Banco do Brasil SA | 544,656 | 5,214,435 |
| Itaú Unibanco Holding SA, ADR | 2,803,498 | 15,419,239 |
| JBS S/A | 683,293 | 2,555,424 |
| Localiza Rent a Car SA | 1,092,539 | 13,969,885 |
| MercadoLibre, Inc.(a) | 12,197 | 16,738,675 |
| Petroreconcavo S/A | 1,079,224 | 5,060,446 |
| PRIO SA(a) | 1,137,549 | 10,720,694 |
| Sendas Distribuidora S/A | 2,110,327 | 4,939,104 |
| TOTVS SA | 1,142,893 | 6,365,240 |
| WEG SA | 1,147,178 | 8,291,011 |
| Total | 111,140,106 |
| Canada 0.8% |
| Parex Resources, Inc. | 512,724 | 9,702,748 |
| China 25.3% |
| Alibaba Group Holding Ltd.(a) | 1,094,300 | 12,700,605 |
| ANTA Sports Products Ltd. | 425,600 | 4,797,879 |
| Baidu, Inc. Class A(a) | 1,599,500 | 28,565,855 |
| Beijing Oriental Yuhong Waterproof Technology Co., Ltd., Class A | 1,247,447 | 4,922,293 |
| China Animal Healthcare Ltd.(a),(b),(c) | 6,354,000 | 1 |
| China Resources Land Ltd. | 2,064,000 | 8,723,906 |
| China Tourism Group Duty Free Corp., Ltd., Class A | 314,087 | 4,700,740 |
| Eastroc Beverage Group Co., Ltd., Class A | 382,997 | 10,320,413 |
| Full Truck Alliance Co., Ltd., ADR(a) | 774,758 | 5,190,879 |
| Inner Mongolia Yili Industrial Group Co., Ltd., Class A | 3,097,907 | 11,057,622 |
| JD.com, Inc., ADR | 142,464 | 4,731,229 |
| JD.com, Inc., Class A | 366,738 | 6,090,823 |
| Kingdee International Software Group Co., Ltd.(a) | 1,774,000 | 2,741,031 |
| Kweichow Moutai Co., Ltd., Class A | 34,873 | 8,849,607 |
| Li Ning Co., Ltd. | 1,466,000 | 6,928,768 |
| Medlive Technology Co., Ltd.(d) | 2,685,573 | 2,397,293 |
| Meituan, Class B(a) | 1,266,640 | 20,961,822 |
| Midea Group Co., Ltd., Class A | 794,600 | 6,160,509 |
| NetEase, Inc. | 1,089,105 | 22,563,493 |
| Common Stocks (continued) |
| Issuer | Shares | Value ($) |
| New Horizon Health Ltd.(a) | 964,500 | 2,134,735 |
| PDD Holdings, Inc., ADR(a) | 162,381 | 16,070,848 |
| Shenzhen Mindray Bio-Medical Electronics Co., Ltd., Class A | 185,647 | 6,882,651 |
| Shenzhou International Group Holdings Ltd. | 595,200 | 6,098,634 |
| Songcheng Performance Development Co., Ltd., Class A | 5,797,172 | 9,872,700 |
| Sungrow Power Supply Co., Ltd., Class A | 343,624 | 4,702,378 |
| Tencent Holdings Ltd. | 1,519,900 | 62,985,213 |
| Wuliangye Yibin Co., Ltd., Class A | 294,302 | 6,294,169 |
| WuXi Biologics Cayman, Inc.(a) | 1,261,000 | 7,109,020 |
| Zhejiang Sanhua Intelligent Controls Co., Ltd., Class A | 3,287,951 | 13,390,635 |
| Total | 307,945,751 |
| Greece 3.5% |
| Eurobank Ergasias SA(a) | 3,565,829 | 6,181,660 |
| JUMBO SA | 297,818 | 9,210,219 |
| National Bank of Greece SA(a) | 1,917,972 | 13,022,593 |
| OPAP SA | 467,569 | 7,895,178 |
| Piraeus Financial Holdings SA(a) | 1,963,505 | 6,765,479 |
| Total | 43,075,129 |
| Hong Kong 2.0% |
| AIA Group Ltd. | 593,200 | 5,367,428 |
| Hong Kong Exchanges and Clearing Ltd. | 70,500 | 2,732,454 |
| Sands China Ltd.(a) | 2,410,000 | 8,152,312 |
| Techtronic Industries Co., Ltd. | 842,264 | 8,306,985 |
| Total | 24,559,179 |
| India 17.4% |
| APL Apollo Tubes Ltd. | 210,287 | 4,254,493 |
| Apollo Hospitals Enterprise Ltd. | 132,406 | 7,693,575 |
| Astral Ltd. | 331,748 | 7,823,314 |
| AU Small Finance Bank Ltd. | 1,449,110 | 12,649,815 |
| Balkrishna Industries Ltd. | 121,237 | 3,400,494 |
| Cholamandalam Investment and Finance Co., Ltd. | 805,636 | 10,909,470 |
| Dixon Technologies India Ltd.(a) | 77,151 | 4,659,556 |
| Eicher Motors Ltd. | 125,201 | 5,043,392 |
| HDFC Bank Ltd., ADR | 358,460 | 22,335,643 |
| ICICI Bank Ltd., ADR | 1,417,521 | 32,843,962 |
The accompanying Notes to Financial Statements are an integral part of this statement.
| 8 | Columbia Emerging Markets Fund | Annual Report 2023 |
Portfolio of Investments (continued)
August 31, 2023
| Common Stocks (continued) |
| Issuer | Shares | Value ($) |
| IndusInd Bank Ltd. | 1,229,116 | 20,438,554 |
| Larsen & Toubro Ltd. | 705,380 | 23,014,613 |
| Mahindra & Mahindra Ltd. | 489,580 | 9,308,708 |
| Max Healthcare Institute Ltd.(a) | 1,635,425 | 11,652,302 |
| Persistent Systems Ltd. | 59,778 | 3,872,997 |
| Polycab India Ltd. | 83,417 | 5,158,786 |
| Reliance Industries Ltd. | 591,711 | 17,189,827 |
| Reliance Strategic Investments Ltd.(a) | 669,194 | 1,887,473 |
| WNS Holdings Ltd., ADR(a) | 121,559 | 7,943,881 |
| Total | 212,080,855 |
| Indonesia 7.0% |
| Bank Negara Indonesia Persero Tbk PT | 21,784,000 | 13,118,454 |
| PT Astra International Tbk | 23,795,600 | 10,068,031 |
| PT Bank Central Asia Tbk | 45,417,400 | 27,341,532 |
| PT Bank Rakyat Indonesia Persero Tbk | 95,902,429 | 34,936,881 |
| Total | 85,464,898 |
| Kazakhstan 0.6% |
| Kaspi.KZ JSC, GDR, Registered Shares(d) | 75,762 | 7,712,572 |
| Malaysia 0.3% |
| CIMB Group Holdings Bhd | 3,096,000 | 3,753,051 |
| Mexico 5.1% |
| Arca Continental SAB de CV | 733,074 | 7,158,548 |
| Banco del Bajio SA | 988,177 | 3,111,072 |
| Corporación Inmobiliaria Vesta SAB de CV | 861,780 | 3,186,218 |
| Grupo Aeroportuario del Centro Norte SAB de CV | 596,758 | 6,921,140 |
| Grupo Aeroportuario del Pacifico SAB de CV | 503,376 | 9,204,573 |
| Grupo Financiero Banorte SAB de CV, Class O | 2,276,879 | 19,326,864 |
| Wal-Mart de Mexico SAB de CV, Class V | 3,369,721 | 13,284,810 |
| Total | 62,193,225 |
| Philippines 1.2% |
| BDO Unibank, Inc. | 5,706,240 | 14,029,238 |
| Poland 0.7% |
| Dino Polska SA(a) | 93,963 | 8,616,558 |
| Russian Federation 0.3% |
| Detsky Mir PJSC(a),(b),(c),(e) | 5,893,953 | 0 |
| Fix Price Group PLC, GDR(a),(b),(c),(d),(e) | 2,678,663 | 3,857,275 |
| Total | 3,857,275 |
| Common Stocks (continued) |
| Issuer | Shares | Value ($) |
| Saudi Arabia 0.5% |
| Nahdi Medical Co. | 138,495 | 5,599,647 |
| South Africa 2.8% |
| Absa Group Ltd. | 1,046,059 | 10,085,608 |
| Capitec Bank Holdings Ltd. | 94,802 | 7,955,135 |
| Clicks Group Ltd. | 458,070 | 6,633,950 |
| Shoprite Holdings Ltd. | 689,351 | 9,630,473 |
| Total | 34,305,166 |
| South Korea 10.0% |
| Coupang, Inc.(a) | 490,455 | 9,308,836 |
| Samsung Biologics Co., Ltd.(a) | 11,474 | 6,392,420 |
| Samsung Electro-Mechanics Co., Ltd. | 104,478 | 10,684,244 |
| Samsung Electronics Co., Ltd. | 1,149,993 | 58,162,331 |
| Samsung SDI Co., Ltd. | 35,743 | 16,577,655 |
| SK Hynix, Inc. | 220,014 | 20,230,332 |
| Total | 121,355,818 |
| Taiwan 9.4% |
| ASPEED Technology, Inc. | 137,000 | 11,556,950 |
| Chailease Holding Co., Ltd. | 657,594 | 3,665,699 |
| Delta Electronics | 1,340,000 | 14,481,246 |
| Parade Technologies Ltd. | 70,000 | 1,965,286 |
| Taiwan Semiconductor Manufacturing Co., Ltd. | 4,783,048 | 82,186,912 |
| Total | 113,856,093 |
| Thailand 0.6% |
| PTT Exploration & Production PCL | 1,602,000 | 7,252,622 |
| Turkey 0.8% |
| BIM Birlesik Magazalar AS | 376,069 | 3,549,858 |
| KOC Holding AS | 1,151,982 | 6,112,594 |
| Total | 9,662,452 |
| United States 0.6% |
| Globant SA(a) | 37,977 | 7,765,157 |
Total Common Stocks
(Cost $888,118,768) | 1,193,927,540 |
The accompanying Notes to Financial Statements are an integral part of this statement.
Columbia Emerging Markets Fund | Annual Report 2023
| 9 |
Portfolio of Investments (continued)
August 31, 2023
| Preferred Stocks 1.2% |
| Issuer | | Shares | Value ($) |
| South Korea 1.2% |
| Samsung Electronics Co., Ltd. | | 361,629 | 14,761,680 |
Total Preferred Stocks
(Cost $7,719,611) | 14,761,680 |
| Money Market Funds 1.7% |
| | Shares | Value ($) |
| Columbia Short-Term Cash Fund, 5.476%(f),(g) | 20,368,526 | 20,362,415 |
Total Money Market Funds
(Cost $20,361,432) | 20,362,415 |
Total Investments in Securities
(Cost $916,199,811) | 1,229,051,635 |
| Other Assets & Liabilities, Net | | (10,843,983) |
| Net Assets | $1,218,207,652 |
Notes to Portfolio of Investments
| (a) | Non-income producing investment. |
| (b) | Represents fair value as determined in good faith under procedures approved by the Board of Trustees. At August 31, 2023, the total value of these securities amounted to $3,857,276, which represents 0.32% of total net assets. |
| (c) | Valuation based on significant unobservable inputs. |
| (d) | Represents privately placed and other securities and instruments exempt from Securities and Exchange Commission registration (collectively, private placements), such as Section 4(a)(2) and Rule 144A eligible securities, which are often sold only to qualified institutional buyers. At August 31, 2023, the total value of these securities amounted to $13,967,140, which represents 1.15% of total net assets. |
| (e) | Denotes a restricted security, which is subject to legal or contractual restrictions on resale under federal securities laws. Disposal of a restricted investment may involve time-consuming negotiations and expenses, and prompt sale at an acceptable price may be difficult to achieve. Private placement securities are generally considered to be restricted, although certain of those securities may be traded between qualified institutional investors under the provisions of Section 4(a)(2) and Rule 144A. The Fund will not incur any registration costs upon such a trade. These securities are valued at fair value determined in good faith under consistently applied procedures approved by the Fund’s Board of Trustees. At August 31, 2023, the total market value of these securities amounted to $3,857,275, which represents 0.32% of total net assets. Additional information on these securities is as follows: |
| Security | Acquisition
Dates | Shares | Cost ($) | Value ($) |
| Detsky Mir PJSC | 02/08/2017-12/13/2021 | 5,893,953 | 8,677,339 | — |
| Fix Price Group PLC, GDR | 03/05/2021-03/08/2021 | 2,678,663 | 26,134,618 | 3,857,275 |
| | | | 34,811,957 | 3,857,275 |
| (f) | The rate shown is the seven-day current annualized yield at August 31, 2023. |
| (g) | As defined in the Investment Company Act of 1940, as amended, an affiliated company is one in which the Fund owns 5% or more of the company’s outstanding voting securities, or a company which is under common ownership or control with the Fund. The value of the holdings and transactions in these affiliated companies during the year ended August 31, 2023 are as follows: |
| Affiliated issuers | Beginning
of period($) | Purchases($) | Sales($) | Net change in
unrealized
appreciation
(depreciation)($) | End of
period($) | Realized gain
(loss)($) | Dividends($) | End of
period shares |
| Columbia Short-Term Cash Fund, 5.476% |
| | 8,433,007 | 466,194,978 | (454,266,552) | 982 | 20,362,415 | (9,436) | 592,957 | 20,368,526 |
Abbreviation Legend
| ADR | American Depositary Receipt |
| GDR | Global Depositary Receipt |
The accompanying Notes to Financial Statements are an integral part of this statement.
| 10 | Columbia Emerging Markets Fund | Annual Report 2023 |
Portfolio of Investments (continued)
August 31, 2023
Fair value measurements
The Fund categorizes its fair value measurements according to a three-level hierarchy that maximizes the use of observable inputs and minimizes the use of unobservable inputs by prioritizing that the most observable input be used when available. Observable inputs are those that market participants would use in pricing an investment based on market data obtained from sources independent of the reporting entity. Unobservable inputs are those that reflect the Fund’s assumptions about the information market participants would use in pricing an investment. An investment’s level within the fair value hierarchy is based on the lowest level of any input that is deemed significant to the asset’s or liability’s fair value measurement. The input levels are not necessarily an indication of the risk or liquidity associated with investments at that level. For example, certain U.S. government securities are generally high quality and liquid, however, they are reflected as Level 2 because the inputs used to determine fair value may not always be quoted prices in an active market.
Fair value inputs are summarized in the three broad levels listed below:
| ■ | Level 1 — Valuations based on quoted prices for investments in active markets that the Fund has the ability to access at the measurement date. Valuation adjustments are not applied to Level 1 investments. |
| ■ | Level 2 — Valuations based on other significant observable inputs (including quoted prices for similar securities, interest rates, prepayment speeds, credit risks, etc.). |
| ■ | Level 3 — Valuations based on significant unobservable inputs (including the Fund’s own assumptions and judgment in determining the fair value of investments). |
Inputs that are used in determining fair value of an investment may include price information, credit data, volatility statistics, and other factors. These inputs can be either observable or unobservable. The availability of observable inputs can vary between investments, and is affected by various factors such as the type of investment, and the volume and level of activity for that investment or similar investments in the marketplace. The inputs will be considered by the Investment Manager, along with any other relevant factors in the calculation of an investment’s fair value. The Fund uses prices and inputs that are current as of the measurement date, which may include periods of market dislocations. During these periods, the availability of prices and inputs may be reduced for many investments. This condition could cause an investment to be reclassified between the various levels within the hierarchy.
Foreign equity securities actively traded in markets where there is a significant delay in the local close relative to the New York Stock Exchange are classified as Level 2. The values of these securities may include an adjustment to reflect the impact of market movements following the close of local trading, as described in Note 2 to the financial statements – Security valuation.
Investments falling into the Level 3 category are primarily supported by quoted prices from brokers and dealers participating in the market for those investments. However, these may be classified as Level 3 investments due to lack of market transparency and corroboration to support these quoted prices. Additionally, valuation models may be used as the pricing source for any remaining investments classified as Level 3. These models may rely on one or more significant unobservable inputs and/or significant assumptions by the Investment Manager. Inputs used in valuations may include, but are not limited to, financial statement analysis, capital account balances, discount rates and estimated cash flows, and comparable company data.
The Fund’s Board of Trustees (the Board) has designated the Investment Manager, through its Valuation Committee (the Committee), as valuation designee, responsible for determining the fair value of the assets of the Fund for which market quotations are not readily available using valuation procedures approved by the Board. The Committee consists of voting and non-voting members from various groups within the Investment Manager’s organization, including operations and accounting, trading and investments, compliance, risk management and legal.
The Committee meets at least monthly to review and approve valuation matters, which may include a description of specific valuation determinations, data regarding pricing information received from approved pricing vendors and brokers and the results of Board-approved valuation policies and procedures (the Policies). The Policies address, among other things, instances when market quotations are or are not readily available, including recommendations of third party pricing vendors and a determination of appropriate pricing methodologies; events that require specific valuation determinations and assessment of fair value techniques; securities with a potential for stale pricing, including those that are illiquid, restricted, or in default; and the effectiveness of third party pricing vendors, including periodic reviews of vendors. The Committee meets more frequently, as needed, to discuss additional valuation matters, which may include the need to review back-testing results, review time-sensitive information or approve related valuation actions. Representatives of Columbia Management Investment Advisers, LLC report to the Board at each of its regularly scheduled meetings to discuss valuation matters and actions during the period, similar to those described earlier.
The following table is a summary of the inputs used to value the Fund’s investments at August 31, 2023:
| | Level 1 ($) | Level 2 ($) | Level 3 ($) | Total ($) |
| Investments in Securities | | | | |
| Common Stocks | | | | |
| Brazil | 111,140,106 | — | — | 111,140,106 |
| Canada | 9,702,748 | — | — | 9,702,748 |
| China | 25,992,956 | 281,952,794 | 1 | 307,945,751 |
| Greece | — | 43,075,129 | — | 43,075,129 |
| Hong Kong | — | 24,559,179 | — | 24,559,179 |
| India | 63,123,486 | 148,957,369 | — | 212,080,855 |
| Indonesia | — | 85,464,898 | — | 85,464,898 |
| Kazakhstan | — | 7,712,572 | — | 7,712,572 |
| Malaysia | — | 3,753,051 | — | 3,753,051 |
| Mexico | 62,193,225 | — | — | 62,193,225 |
| Philippines | — | 14,029,238 | — | 14,029,238 |
| Poland | — | 8,616,558 | — | 8,616,558 |
| Russian Federation | — | — | 3,857,275 | 3,857,275 |
| Saudi Arabia | — | 5,599,647 | — | 5,599,647 |
| South Africa | — | 34,305,166 | — | 34,305,166 |
| South Korea | 9,308,836 | 112,046,982 | — | 121,355,818 |
| Taiwan | — | 113,856,093 | — | 113,856,093 |
| Thailand | — | 7,252,622 | — | 7,252,622 |
The accompanying Notes to Financial Statements are an integral part of this statement.
Columbia Emerging Markets Fund | Annual Report 2023
| 11 |
Portfolio of Investments (continued)
August 31, 2023
Fair value measurements (continued)
| | Level 1 ($) | Level 2 ($) | Level 3 ($) | Total ($) |
| Turkey | — | 9,662,452 | — | 9,662,452 |
| United States | 7,765,157 | — | — | 7,765,157 |
| Total Common Stocks | 289,226,514 | 900,843,750 | 3,857,276 | 1,193,927,540 |
| Preferred Stocks | | | | |
| South Korea | — | 14,761,680 | — | 14,761,680 |
| Total Preferred Stocks | — | 14,761,680 | — | 14,761,680 |
| Money Market Funds | 20,362,415 | — | — | 20,362,415 |
| Total Investments in Securities | 309,588,929 | 915,605,430 | 3,857,276 | 1,229,051,635 |
See the Portfolio of Investments for all investment classifications not indicated in the table.
The Fund’s assets assigned to the Level 2 input category are generally valued using the market approach, in which a security’s value is determined through reference to prices and information from market transactions for similar or identical assets. These assets include certain foreign securities for which a third party statistical pricing service may be employed for purposes of fair market valuation. The model utilized by such third party statistical pricing service takes into account a security’s correlation to available market data including, but not limited to, intraday index, ADR, and exchange-traded fund movements.
The Fund does not hold any significant investments (greater than one percent of net assets) categorized as Level 3.
The accompanying Notes to Financial Statements are an integral part of this statement.
| 12 | Columbia Emerging Markets Fund | Annual Report 2023 |
Statement of Assets and Liabilities
August 31, 2023
| Assets | |
| Investments in securities, at value | |
| Unaffiliated issuers (cost $895,838,379) | $1,208,689,220 |
| Affiliated issuers (cost $20,361,432) | 20,362,415 |
| Foreign currency (cost $3,147,413) | 1,669,941 |
| Receivable for: | |
| Capital shares sold | 605,798 |
| Dividends | 1,198,480 |
| Foreign tax reclaims | 116,200 |
| Trustees’ fees | 156,832 |
| Expense reimbursement due from Investment Manager | 2,820 |
| Prepaid expenses | 17,503 |
| Total assets | 1,232,819,209 |
| Liabilities | |
| Due to custodian | 5,063 |
| Payable for: | |
| Investments purchased | 8,083,405 |
| Capital shares redeemed | 1,132,063 |
| Foreign capital gains taxes deferred | 4,866,864 |
| Management services fees | 35,167 |
| Distribution and/or service fees | 1,449 |
| Transfer agent fees | 113,432 |
| Trustees’ fees | 196,366 |
| Other expenses | 177,748 |
| Total liabilities | 14,611,557 |
| Net assets applicable to outstanding capital stock | $1,218,207,652 |
| Represented by | |
| Paid in capital | 1,178,205,167 |
| Total distributable earnings (loss) | 40,002,485 |
| Total - representing net assets applicable to outstanding capital stock | $1,218,207,652 |
The accompanying Notes to Financial Statements are an integral part of this statement.
Columbia Emerging Markets Fund | Annual Report 2023
| 13 |
Statement of Assets and Liabilities (continued)
August 31, 2023
| Class A | |
| Net assets | $167,307,620 |
| Shares outstanding | 14,217,825 |
| Net asset value per share | $11.77 |
| Maximum sales charge | 5.75% |
| Maximum offering price per share (calculated by dividing the net asset value per share by 1.0 minus the maximum sales charge for Class A shares) | $12.49 |
| Advisor Class | |
| Net assets | $45,924,947 |
| Shares outstanding | 3,804,116 |
| Net asset value per share | $12.07 |
| Class C | |
| Net assets | $8,090,855 |
| Shares outstanding | 751,544 |
| Net asset value per share | $10.77 |
| Institutional Class | |
| Net assets | $438,829,488 |
| Shares outstanding | 36,627,461 |
| Net asset value per share | $11.98 |
| Institutional 2 Class | |
| Net assets | $93,313,291 |
| Shares outstanding | 7,719,028 |
| Net asset value per share | $12.09 |
| Institutional 3 Class | |
| Net assets | $460,178,245 |
| Shares outstanding | 37,861,402 |
| Net asset value per share | $12.15 |
| Class R | |
| Net assets | $4,563,206 |
| Shares outstanding | 396,498 |
| Net asset value per share | $11.51 |
The accompanying Notes to Financial Statements are an integral part of this statement.
| 14 | Columbia Emerging Markets Fund | Annual Report 2023 |
Statement of Operations
Year Ended August 31, 2023
| Net investment income | |
| Income: | |
| Dividends — unaffiliated issuers | $30,516,612 |
| Dividends — affiliated issuers | 592,957 |
| Foreign taxes withheld | (4,079,908) |
| Total income | 27,029,661 |
| Expenses: | |
| Management services fees | 13,975,758 |
| Distribution and/or service fees | |
| Class A | 456,397 |
| Class C | 89,330 |
| Class R | 23,465 |
| Transfer agent fees | |
| Class A | 277,594 |
| Advisor Class | 74,590 |
| Class C | 13,584 |
| Institutional Class | 769,450 |
| Institutional 2 Class | 73,598 |
| Institutional 3 Class | 32,597 |
| Class R | 7,116 |
| Trustees’ fees | 41,675 |
| Custodian fees | 366,472 |
| Printing and postage fees | 88,246 |
| Registration fees | 123,443 |
| Accounting services fees | 52,381 |
| Legal fees | 29,646 |
| Interest on interfund lending | 85,286 |
| Compensation of chief compliance officer | 266 |
| Other | 212,705 |
| Total expenses | 16,793,599 |
| Fees waived or expenses reimbursed by Investment Manager and its affiliates | (788,253) |
| Fees waived by transfer agent | |
| Institutional 2 Class | (5,622) |
| Expense reduction | (1,708) |
| Total net expenses | 15,998,016 |
| Net investment income | 11,031,645 |
| Realized and unrealized gain (loss) — net | |
| Net realized gain (loss) on: | |
| Investments — unaffiliated issuers | (140,118,607) |
| Investments — affiliated issuers | (9,436) |
| Foreign currency translations | (751,754) |
| Net realized loss | (140,879,797) |
| Net change in unrealized appreciation (depreciation) on: | |
| Investments — unaffiliated issuers | 121,380,032 |
| Investments — affiliated issuers | 982 |
| Foreign currency translations | (1,364,376) |
| Foreign capital gains tax | (1,358) |
| Net change in unrealized appreciation (depreciation) | 120,015,280 |
| Net realized and unrealized loss | (20,864,517) |
| Net decrease in net assets resulting from operations | $(9,832,872) |
The accompanying Notes to Financial Statements are an integral part of this statement.
Columbia Emerging Markets Fund | Annual Report 2023
| 15 |
Statement of Changes in Net Assets
| | Year Ended
August 31, 2023 | Year Ended
August 31, 2022 |
| Operations | | |
| Net investment income | $11,031,645 | $440,257 |
| Net realized loss | (140,879,797) | (98,694,657) |
| Net change in unrealized appreciation (depreciation) | 120,015,280 | (828,376,249) |
| Net decrease in net assets resulting from operations | (9,832,872) | (926,630,649) |
| Distributions to shareholders | | |
| Net investment income and net realized gains | | |
| Class A | — | (4,204,394) |
| Advisor Class | — | (1,411,194) |
| Class C | — | (218,247) |
| Institutional Class | — | (7,979,325) |
| Institutional 2 Class | — | (5,275,351) |
| Institutional 3 Class | — | (11,836,745) |
| Class R | — | (81,634) |
| Return of capital | | |
| Class A | — | (408,081) |
| Advisor Class | — | (128,585) |
| Class C | — | (26,609) |
| Institutional Class | — | (727,061) |
| Institutional 2 Class | — | (467,543) |
| Institutional 3 Class | — | (1,036,205) |
| Class R | — | (8,502) |
| Total distributions to shareholders | — | (33,809,476) |
| Increase (decrease) in net assets from capital stock activity | (287,565,015) | 118,266,067 |
| Total decrease in net assets | (297,397,887) | (842,174,058) |
| Net assets at beginning of year | 1,515,605,539 | 2,357,779,597 |
| Net assets at end of year | $1,218,207,652 | $1,515,605,539 |
The accompanying Notes to Financial Statements are an integral part of this statement.
| 16 | Columbia Emerging Markets Fund | Annual Report 2023 |
Statement of Changes in Net Assets (continued)
| | Year Ended | Year Ended |
| | August 31, 2023 | August 31, 2022 |
| | Shares | Dollars ($) | Shares | Dollars ($) |
| Capital stock activity |
| Class A | | | | |
| Shares sold | 1,560,745 | 18,013,246 | 2,357,203 | 35,630,861 |
| Fund reorganization | — | — | 269,775 | 4,637,897 |
| Distributions reinvested | — | — | 258,838 | 4,467,536 |
| Shares redeemed | (4,676,741) | (53,749,529) | (4,236,227) | (62,139,731) |
| Net decrease | (3,115,996) | (35,736,283) | (1,350,411) | (17,403,437) |
| Advisor Class | | | | |
| Shares sold | 868,747 | 10,296,848 | 7,901,905 | 117,952,439 |
| Fund reorganization | — | — | 9,411,874 | 165,298,388 |
| Distributions reinvested | — | — | 87,134 | 1,536,164 |
| Shares redeemed | (2,800,578) | (32,663,174) | (17,456,431) | (261,311,962) |
| Net increase (decrease) | (1,931,831) | (22,366,326) | (55,518) | 23,475,029 |
| Class C | | | | |
| Shares sold | 60,090 | 634,324 | 143,007 | 2,013,232 |
| Distributions reinvested | — | — | 14,975 | 239,603 |
| Shares redeemed | (285,067) | (2,963,224) | (465,227) | (6,552,094) |
| Net decrease | (224,977) | (2,328,900) | (307,245) | (4,299,259) |
| Institutional Class | | | | |
| Shares sold | 24,485,726 | 286,031,730 | 37,723,359 | 563,198,392 |
| Distributions reinvested | — | — | 338,369 | 5,921,453 |
| Shares redeemed | (30,919,764) | (370,169,933) | (23,369,942) | (329,853,633) |
| Net increase (decrease) | (6,434,038) | (84,138,203) | 14,691,786 | 239,266,212 |
| Institutional 2 Class | | | | |
| Shares sold | 2,484,197 | 29,365,043 | 5,843,799 | 90,934,570 |
| Distributions reinvested | — | — | 325,360 | 5,732,848 |
| Shares redeemed | (9,110,145) | (106,525,467) | (11,926,285) | (167,447,607) |
| Net decrease | (6,625,948) | (77,160,424) | (5,757,126) | (70,780,189) |
| Institutional 3 Class | | | | |
| Shares sold | 14,246,765 | 167,233,276 | 13,440,227 | 198,900,011 |
| Distributions reinvested | — | — | 320,281 | 5,672,176 |
| Shares redeemed | (19,635,232) | (232,789,539) | (17,589,054) | (257,209,551) |
| Net decrease | (5,388,467) | (65,556,263) | (3,828,546) | (52,637,364) |
| Class R | | | | |
| Shares sold | 133,453 | 1,506,743 | 182,414 | 2,680,376 |
| Distributions reinvested | — | — | 4,809 | 81,518 |
| Shares redeemed | (158,918) | (1,785,359) | (139,013) | (2,116,819) |
| Net increase (decrease) | (25,465) | (278,616) | 48,210 | 645,075 |
| Total net increase (decrease) | (23,746,722) | (287,565,015) | 3,441,150 | 118,266,067 |
The accompanying Notes to Financial Statements are an integral part of this statement.
Columbia Emerging Markets Fund | Annual Report 2023
| 17 |
The following table is intended to help you understand the Fund’s financial performance. Certain information reflects financial results for a single share of a class held for the periods shown. Per share net investment income (loss) amounts are calculated based on average shares outstanding during the period. Total return assumes reinvestment of all dividends and distributions, if any. Total return does not reflect payment of sales charges, if any. Total return and portfolio turnover are not annualized for periods of less than one year. The ratios of expenses and net investment income are annualized for periods of less than one year. The portfolio turnover rate is calculated without regard to purchase and sales transactions of short-term instruments and certain derivatives, if any. If such transactions were included, the Fund’s portfolio turnover rate may be higher.
| | Net asset value,
beginning of
period | Net
investment
income
(loss) | Net
realized
and
unrealized
gain (loss) | Total from
investment
operations | Distributions
from net
investment
income | Distributions
from net
realized
gains | Tax
return of
capital | Total
distributions to
shareholders |
| Class A |
| Year Ended 8/31/2023 | $11.89 | 0.06 | (0.18) | (0.12) | — | — | — | — |
| Year Ended 8/31/2022 | $19.06 | (0.04) | (6.88) | (6.92) | (0.16) | (0.07) | (0.02) | (0.25) |
| Year Ended 8/31/2021 | $15.60 | (0.08) | 3.72 | 3.64 | (0.18) | — | — | (0.18) |
| Year Ended 8/31/2020 | $12.15 | (0.04) | 3.51 | 3.47 | (0.02) | — | — | (0.02) |
| Year Ended 8/31/2019 | $12.15 | 0.01 | (0.01) | 0.00(f) | — | — | — | — |
| Advisor Class |
| Year Ended 8/31/2023 | $12.17 | 0.08 | (0.18) | (0.10) | — | — | — | — |
| Year Ended 8/31/2022 | $19.46 | 0.00(f) | (7.02) | (7.02) | (0.18) | (0.07) | (0.02) | (0.27) |
| Year Ended 8/31/2021 | $15.92 | (0.03) | 3.79 | 3.76 | (0.22) | — | — | (0.22) |
| Year Ended 8/31/2020 | $12.39 | (0.01) | 3.59 | 3.58 | (0.05) | — | — | (0.05) |
| Year Ended 8/31/2019 | $12.38 | 0.04 | (0.02) | 0.02 | (0.01) | — | — | (0.01) |
| Class C |
| Year Ended 8/31/2023 | $10.96 | (0.03) | (0.16) | (0.19) | — | — | — | — |
| Year Ended 8/31/2022 | $17.67 | (0.15) | (6.35) | (6.50) | (0.12) | (0.07) | (0.02) | (0.21) |
| Year Ended 8/31/2021 | $14.50 | (0.20) | 3.45 | 3.25 | (0.08) | — | — | (0.08) |
| Year Ended 8/31/2020 | $11.36 | (0.13) | 3.27 | 3.14 | — | — | — | — |
| Year Ended 8/31/2019 | $11.45 | (0.08) | (0.01) | (0.09) | — | — | — | — |
| Institutional Class |
| Year Ended 8/31/2023 | $12.08 | 0.10 | (0.20) | (0.10) | — | — | — | — |
| Year Ended 8/31/2022 | $19.32 | 0.01 | (6.98) | (6.97) | (0.18) | (0.07) | (0.02) | (0.27) |
| Year Ended 8/31/2021 | $15.80 | (0.03) | 3.77 | 3.74 | (0.22) | — | — | (0.22) |
| Year Ended 8/31/2020 | $12.30 | (0.01) | 3.56 | 3.55 | (0.05) | — | — | (0.05) |
| Year Ended 8/31/2019 | $12.29 | 0.05 | (0.03) | 0.02 | (0.01) | — | — | (0.01) |
| Institutional 2 Class |
| Year Ended 8/31/2023 | $12.18 | 0.10 | (0.19) | (0.09) | — | — | — | — |
| Year Ended 8/31/2022 | $19.46 | 0.01 | (7.02) | (7.01) | (0.18) | (0.07) | (0.02) | (0.27) |
| Year Ended 8/31/2021 | $15.92 | (0.02) | 3.79 | 3.77 | (0.23) | — | — | (0.23) |
| Year Ended 8/31/2020 | $12.38 | 0.01 | 3.60 | 3.61 | (0.07) | — | — | (0.07) |
| Year Ended 8/31/2019 | $12.37 | 0.07 | (0.03) | 0.04 | (0.03) | — | — | (0.03) |
The accompanying Notes to Financial Statements are an integral part of this statement.
| 18 | Columbia Emerging Markets Fund | Annual Report 2023 |
Financial Highlights (continued)
| | Net
asset
value,
end of
period | Total
return | Total gross
expense
ratio to
average
net assets(a) | Total net
expense
ratio to
average
net assets(a),(b) | Net investment
income (loss)
ratio to
average
net assets | Portfolio
turnover | Net
assets,
end of
period
(000’s) |
| Class A |
| Year Ended 8/31/2023 | $11.77 | (1.01%) | 1.50%(c) | 1.44%(c),(d) | 0.53% | 44% | $167,308 |
| Year Ended 8/31/2022 | $11.89 | (36.71%) | 1.44%(c),(e) | 1.44%(c),(d),(e) | (0.27%) | 48% | $206,162 |
| Year Ended 8/31/2021 | $19.06 | 23.40% | 1.43%(c) | 1.43%(c),(d) | (0.45%) | 16% | $356,033 |
| Year Ended 8/31/2020 | $15.60 | 28.56% | 1.55%(c) | 1.54%(c),(d) | (0.29%) | 29% | $280,741 |
| Year Ended 8/31/2019 | $12.15 | 0.00% | 1.58%(c) | 1.58%(c) | 0.12% | 38% | $249,512 |
| Advisor Class |
| Year Ended 8/31/2023 | $12.07 | (0.82%) | 1.25%(c) | 1.19%(c),(d) | 0.72% | 44% | $45,925 |
| Year Ended 8/31/2022 | $12.17 | (36.52%) | 1.19%(c),(e) | 1.19%(c),(d),(e) | 0.03% | 48% | $69,818 |
| Year Ended 8/31/2021 | $19.46 | 23.65% | 1.18%(c) | 1.18%(c),(d) | (0.17%) | 16% | $112,719 |
| Year Ended 8/31/2020 | $15.92 | 28.92% | 1.30%(c) | 1.29%(c),(d) | (0.07%) | 29% | $43,986 |
| Year Ended 8/31/2019 | $12.39 | 0.20% | 1.33%(c) | 1.33%(c) | 0.36% | 38% | $23,161 |
| Class C |
| Year Ended 8/31/2023 | $10.77 | (1.73%) | 2.25%(c) | 2.19%(c),(d) | (0.24%) | 44% | $8,091 |
| Year Ended 8/31/2022 | $10.96 | (37.18%) | 2.19%(c),(e) | 2.19%(c),(d),(e) | (1.04%) | 48% | $10,706 |
| Year Ended 8/31/2021 | $17.67 | 22.45% | 2.18%(c) | 2.18%(c),(d) | (1.19%) | 16% | $22,680 |
| Year Ended 8/31/2020 | $14.50 | 27.64% | 2.30%(c) | 2.29%(c),(d) | (1.04%) | 29% | $15,742 |
| Year Ended 8/31/2019 | $11.36 | (0.79%) | 2.33%(c) | 2.33%(c) | (0.69%) | 38% | $14,830 |
| Institutional Class |
| Year Ended 8/31/2023 | $11.98 | (0.83%) | 1.25%(c) | 1.19%(c),(d) | 0.84% | 44% | $438,829 |
| Year Ended 8/31/2022 | $12.08 | (36.52%) | 1.20%(c),(e) | 1.20%(c),(d),(e) | 0.05% | 48% | $520,117 |
| Year Ended 8/31/2021 | $19.32 | 23.70% | 1.18%(c) | 1.18%(c),(d) | (0.18%) | 16% | $547,997 |
| Year Ended 8/31/2020 | $15.80 | 28.89% | 1.30%(c) | 1.29%(c),(d) | (0.04%) | 29% | $260,558 |
| Year Ended 8/31/2019 | $12.30 | 0.20% | 1.33%(c) | 1.33%(c) | 0.41% | 38% | $210,844 |
| Institutional 2 Class |
| Year Ended 8/31/2023 | $12.09 | (0.74%) | 1.15%(c) | 1.09%(c) | 0.81% | 44% | $93,313 |
| Year Ended 8/31/2022 | $12.18 | (36.44%) | 1.09%(c),(e) | 1.09%(c),(e) | 0.04% | 48% | $174,660 |
| Year Ended 8/31/2021 | $19.46 | 23.77% | 1.08%(c) | 1.08%(c) | (0.09%) | 16% | $391,145 |
| Year Ended 8/31/2020 | $15.92 | 29.19% | 1.16%(c) | 1.15%(c) | 0.10% | 29% | $238,994 |
| Year Ended 8/31/2019 | $12.38 | 0.36% | 1.18%(c) | 1.18%(c) | 0.55% | 38% | $161,554 |
The accompanying Notes to Financial Statements are an integral part of this statement.
Columbia Emerging Markets Fund | Annual Report 2023
| 19 |
Financial Highlights (continued)
| | Net asset value,
beginning of
period | Net
investment
income
(loss) | Net
realized
and
unrealized
gain (loss) | Total from
investment
operations | Distributions
from net
investment
income | Distributions
from net
realized
gains | Tax
return of
capital | Total
distributions to
shareholders |
| Institutional 3 Class |
| Year Ended 8/31/2023 | $12.24 | 0.11 | (0.20) | (0.09) | — | — | — | — |
| Year Ended 8/31/2022 | $19.55 | 0.02 | (7.05) | (7.03) | (0.19) | (0.07) | (0.02) | (0.28) |
| Year Ended 8/31/2021 | $15.99 | (0.01) | 3.81 | 3.80 | (0.24) | — | — | (0.24) |
| Year Ended 8/31/2020 | $12.44 | 0.02 | 3.60 | 3.62 | (0.07) | — | — | (0.07) |
| Year Ended 8/31/2019 | $12.43 | 0.07 | (0.02) | 0.05 | (0.04) | — | — | (0.04) |
| Class R |
| Year Ended 8/31/2023 | $11.66 | 0.04 | (0.19) | (0.15) | — | — | — | — |
| Year Ended 8/31/2022 | $18.72 | (0.07) | (6.75) | (6.82) | (0.15) | (0.07) | (0.02) | (0.24) |
| Year Ended 8/31/2021 | $15.34 | (0.13) | 3.66 | 3.53 | (0.15) | — | — | (0.15) |
| Year Ended 8/31/2020 | $11.96 | (0.07) | 3.45 | 3.38 | — | — | — | — |
| Year Ended 8/31/2019 | $11.99 | (0.02) | (0.01) | (0.03) | — | — | — | — |
| Notes to Financial Highlights |
| (a) | In addition to the fees and expenses that the Fund bears directly, the Fund indirectly bears a pro rata share of the fees and expenses of any other funds in which it invests. Such indirect expenses are not included in the Fund’s reported expense ratios. |
| (b) | Total net expenses include the impact of certain fee waivers/expense reimbursements made by the Investment Manager and certain of its affiliates, if applicable. |
| (c) | Ratios include interfund lending expense. For the periods indicated below, if interfund lending expense had been excluded, expenses would have been lower by: |
| Class | 8/31/2023 | 8/31/2022 | 8/31/2021 | 8/31/2020 | 8/31/2019 |
| Class A | 0.01% | less than 0.01% | less than 0.01% | less than 0.01% | less than 0.01% |
| Advisor Class | 0.01% | less than 0.01% | less than 0.01% | less than 0.01% | less than 0.01% |
| Class C | 0.01% | less than 0.01% | less than 0.01% | less than 0.01% | less than 0.01% |
| Institutional Class | 0.01% | less than 0.01% | less than 0.01% | less than 0.01% | less than 0.01% |
| Institutional 2 Class | 0.01% | less than 0.01% | less than 0.01% | less than 0.01% | less than 0.01% |
| Institutional 3 Class | 0.01% | less than 0.01% | less than 0.01% | less than 0.01% | less than 0.01% |
| Class R | 0.01% | less than 0.01% | less than 0.01% | less than 0.01% | less than 0.01% |
| (d) | The benefits derived from expense reductions had an impact of less than 0.01%. |
| (e) | Ratios include line of credit interest expense which is less than 0.01%. |
| (f) | Rounds to zero. |
The accompanying Notes to Financial Statements are an integral part of this statement.
| 20 | Columbia Emerging Markets Fund | Annual Report 2023 |
Financial Highlights (continued)
| | Net
asset
value,
end of
period | Total
return | Total gross
expense
ratio to
average
net assets(a) | Total net
expense
ratio to
average
net assets(a),(b) | Net investment
income (loss)
ratio to
average
net assets | Portfolio
turnover | Net
assets,
end of
period
(000’s) |
| Institutional 3 Class |
| Year Ended 8/31/2023 | $12.15 | (0.74%) | 1.10%(c) | 1.05%(c) | 0.91% | 44% | $460,178 |
| Year Ended 8/31/2022 | $12.24 | (36.41%) | 1.04%(c),(e) | 1.04%(c),(e) | 0.13% | 48% | $529,223 |
| Year Ended 8/31/2021 | $19.55 | 23.84% | 1.03%(c) | 1.03%(c) | (0.03%) | 16% | $920,211 |
| Year Ended 8/31/2020 | $15.99 | 29.18% | 1.11%(c) | 1.10%(c) | 0.16% | 29% | $661,552 |
| Year Ended 8/31/2019 | $12.44 | 0.43% | 1.13%(c) | 1.13%(c) | 0.58% | 38% | $609,791 |
| Class R |
| Year Ended 8/31/2023 | $11.51 | (1.29%) | 1.75%(c) | 1.69%(c),(d) | 0.32% | 44% | $4,563 |
| Year Ended 8/31/2022 | $11.66 | (36.85%) | 1.69%(c),(e) | 1.69%(c),(d),(e) | (0.50%) | 48% | $4,921 |
| Year Ended 8/31/2021 | $18.72 | 23.04% | 1.68%(c) | 1.68%(c),(d) | (0.69%) | 16% | $6,996 |
| Year Ended 8/31/2020 | $15.34 | 28.26% | 1.80%(c) | 1.79%(c),(d) | (0.54%) | 29% | $5,731 |
| Year Ended 8/31/2019 | $11.96 | (0.25%) | 1.83%(c) | 1.83%(c) | (0.16%) | 38% | $7,125 |
The accompanying Notes to Financial Statements are an integral part of this statement.
Columbia Emerging Markets Fund | Annual Report 2023
| 21 |
Notes to Financial Statements
August 31, 2023
Note 1. Organization
Columbia Emerging Markets Fund (the Fund), a series of Columbia Funds Series Trust I (the Trust), is a diversified fund. The Trust is registered under the Investment Company Act of 1940, as amended (the 1940 Act), as an open-end management investment company organized as a Massachusetts business trust.
Fund shares
The Trust may issue an unlimited number of shares (without par value). The Fund offers each of the share classes listed in the Statement of Assets and Liabilities. Although all share classes generally have identical voting, dividend and liquidation rights, each share class votes separately when required by the Trust’s organizational documents or by law. Each share class has its own expense and sales charge structure. Different share classes may have different minimum initial investment amounts and pay different net investment income distribution amounts to the extent the expenses of distributing such share classes vary. Distributions to shareholders in a liquidation will be proportional to the net asset value of each share class.
As described in the Fund’s prospectus, Class A and Class C shares are offered to the general public for investment. Class C shares automatically convert to Class A shares after 8 years. Advisor Class, Institutional Class, Institutional 2 Class, Institutional 3 Class and Class R shares are available for purchase through authorized investment professionals to omnibus retirement plans or to institutional investors and to certain other investors as also described in the Fund’s prospectus.
Note 2. Summary of significant accounting policies
Basis of preparation
The Fund is an investment company that applies the accounting and reporting guidance in the Financial Accounting Standards Board (FASB) Accounting Standards Codification Topic 946, Financial Services - Investment Companies (ASC 946). The financial statements are prepared in accordance with U.S. generally accepted accounting principles (GAAP), which requires management to make certain estimates and assumptions that affect the reported amounts of assets and liabilities, the disclosure of contingent assets and liabilities at the date of the financial statements and the reported amounts of income and expenses during the reporting period. Actual results could differ from those estimates.
The following is a summary of significant accounting policies followed by the Fund in the preparation of its financial statements.
Security valuation
Equity securities listed on an exchange are valued at the closing price or last trade price on their primary exchange at the close of business of the New York Stock Exchange. Securities with a closing price not readily available or not listed on any exchange are valued at the mean between the closing bid and ask prices. Listed preferred stocks convertible into common stocks are valued using an evaluated price from a pricing service.
Foreign equity securities are valued based on the closing price or last trade price on their primary exchange at the close of business of the New York Stock Exchange. If any foreign equity security closing prices are not readily available, the securities are valued at the mean of the latest quoted bid and ask prices on such exchanges or markets. Foreign currency exchange rates are determined at the scheduled closing time of the New York Stock Exchange. Many securities markets and exchanges outside the U.S. close prior to the close of the New York Stock Exchange; therefore, the closing prices for securities in such markets or on such exchanges may not fully reflect events that occur after such close but before the close of the New York Stock Exchange. In those situations, foreign securities will be fair valued pursuant to a policy approved by the Board of Trustees. Under the policy, the Fund may utilize a third-party pricing service to determine these fair values. The third-party pricing service takes into account multiple factors, including, but not limited to, movements in the U.S. securities markets, certain depositary receipts, futures contracts and foreign exchange rates that have occurred subsequent to the close of the foreign exchange or market, to determine a good faith estimate that reasonably reflects the current market conditions as of the close of the New York Stock Exchange. The fair value of a security is likely to be different from the quoted or published price, if available.
Investments in open-end investment companies (other than exchange-traded funds (ETFs)), are valued at the latest net asset value reported by those companies as of the valuation time.
| 22 | Columbia Emerging Markets Fund | Annual Report 2023 |
Notes to Financial Statements (continued)
August 31, 2023
Investments for which market quotations are not readily available, or that have quotations which management believes are not reflective of market value or reliable, are valued at fair value as determined in good faith under procedures approved by the Board of Trustees. If a security or class of securities (such as foreign securities) is valued at fair value, such value is likely to be different from the quoted or published price for the security, if available.
The determination of fair value often requires significant judgment. To determine fair value, management may use assumptions including but not limited to future cash flows and estimated risk premiums. Multiple inputs from various sources may be used to determine fair value.
GAAP requires disclosure regarding the inputs and valuation techniques used to measure fair value and any changes in valuation inputs or techniques. In addition, investments shall be disclosed by major category. This information is disclosed following the Fund’s Portfolio of Investments.
Foreign currency transactions and translations
The values of all assets and liabilities denominated in foreign currencies are generally translated into U.S. dollars at exchange rates determined at the close of regular trading on the New York Stock Exchange. Net realized and unrealized gains (losses) on foreign currency transactions and translations include gains (losses) arising from the fluctuation in exchange rates between trade and settlement dates on securities transactions, gains (losses) arising from the disposition of foreign currency and currency gains (losses) between the accrual and payment dates on dividends, interest income and foreign withholding taxes.
For financial statement purposes, the Fund does not distinguish that portion of gains (losses) on investments which is due to changes in foreign exchange rates from that which is due to changes in market prices of the investments. Such fluctuations are included with the net realized and unrealized gains (losses) on investments in the Statement of Operations.
Security transactions
Security transactions are accounted for on the trade date. Cost is determined and gains (losses) are based upon the specific identification method for both financial statement and federal income tax purposes.
Income recognition
Corporate actions and dividend income are generally recorded net of any non-reclaimable tax withholdings, on the ex-dividend date or upon receipt of an ex-dividend notification in the case of certain foreign securities.
The Fund may receive distributions from holdings in equity securities, business development companies (BDCs), exchange-traded funds (ETFs), limited partnerships (LPs), other regulated investment companies (RICs), and real estate investment trusts (REITs), which report information as to the tax character of their distributions annually. These distributions are allocated to dividend income, capital gain and return of capital based on actual information reported. Return of capital is recorded as a reduction of the cost basis of securities held. If the Fund no longer owns the applicable securities, return of capital is recorded as a realized gain. With respect to REITs, to the extent actual information has not yet been reported, estimates for return of capital are made by Columbia Management Investment Advisers, LLC (the Investment Manager), a wholly-owned subsidiary of Ameriprise Financial, Inc. (Ameriprise Financial). The Investment Manager’s estimates are subsequently adjusted when the actual character of the distributions is disclosed by the REITs, which could result in a proportionate change in return of capital to shareholders.
Awards from class action litigation are recorded as a reduction of cost basis if the Fund still owns the applicable securities on the payment date. If the Fund no longer owns the applicable securities on the payment date, the proceeds are recorded as realized gains.
Expenses
General expenses of the Trust are allocated to the Fund and other funds of the Trust based upon relative net assets or other expense allocation methodologies determined by the nature of the expense. Expenses directly attributable to the Fund are charged to the Fund. Expenses directly attributable to a specific class of shares are charged to that share class.
Columbia Emerging Markets Fund | Annual Report 2023
| 23 |
Notes to Financial Statements (continued)
August 31, 2023
Determination of class net asset value
All income, expenses (other than class-specific expenses, which are charged to that share class, as shown in the Statement of Operations) and realized and unrealized gains (losses) are allocated to each class of the Fund on a daily basis, based on the relative net assets of each class, for purposes of determining the net asset value of each class.
Federal income tax status
The Fund intends to qualify each year as a regulated investment company under Subchapter M of the Internal Revenue Code, as amended, and will distribute substantially all of its investment company taxable income and net capital gain, if any, for its tax year, and as such will not be subject to federal income taxes. In addition, the Fund intends to distribute in each calendar year substantially all of its ordinary income, capital gain net income and certain other amounts, if any, such that the Fund should not be subject to federal excise tax. Therefore, no federal income or excise tax provision is recorded.
Foreign taxes
The Fund may be subject to foreign taxes on income, gains on investments or currency repatriation, a portion of which may be recoverable. The Fund will accrue such taxes and recoveries, as applicable, based upon its current interpretation of tax rules and regulations that exist in the markets in which it invests.
Realized gains in certain countries may be subject to foreign taxes at the Fund level, based on statutory rates. The Fund accrues for such foreign taxes on realized and unrealized gains at the appropriate rate for each jurisdiction, as applicable. The amount, if any, is disclosed as a liability in the Statement of Assets and Liabilities.
Distributions to shareholders
Distributions from net investment income, if any, are declared and paid annually. Net realized capital gains, if any, are distributed at least annually. Income distributions and capital gain distributions are determined in accordance with federal income tax regulations, which may differ from GAAP.
Guarantees and indemnifications
Under the Trust’s organizational documents and, in some cases, by contract, its officers and trustees are indemnified against certain liabilities arising out of the performance of their duties to the Trust or its funds. In addition, certain of the Fund’s contracts with its service providers contain general indemnification clauses. The Fund’s maximum exposure under these arrangements is unknown since the amount of any future claims that may be made against the Fund cannot be determined, and the Fund has no historical basis for predicting the likelihood of any such claims.
Recent accounting pronouncements and regulatory updates
Tailored Shareholder Reports
In October 2022, the Securities and Exchange Commission (SEC) adopted a final rule relating to Tailored Shareholder Reports for Mutual Funds and Exchange-Traded Funds; Fee Information in Investment Company Advertisements. The rule and form amendments will, among other things, require the Fund to transmit concise and visually engaging shareholder reports that highlight key information. The amendments will require that funds tag information in a structured data format and that certain more in-depth information be made available online and available for delivery free of charge to investors on request. The amendments became effective January 24, 2023. There is an 18-month transition period after the effective date of the amendments.
Note 3. Fees and other transactions with affiliates
Management services fees
The Fund has entered into a Management Agreement with Columbia Management Investment Advisers, LLC (the Investment Manager), a wholly-owned subsidiary of Ameriprise Financial, Inc. (Ameriprise Financial). Under the Management Agreement, the Investment Manager provides the Fund with investment research and advice, as well as administrative and accounting
| 24 | Columbia Emerging Markets Fund | Annual Report 2023 |
Notes to Financial Statements (continued)
August 31, 2023
services. The management services fee is an annual fee that is equal to a percentage of the Fund’s daily net assets that declines from 1.10% to 0.70% as the Fund’s net assets increase. The effective management services fee rate for the year ended August 31, 2023 was 1.02% of the Fund’s average daily net assets.
Compensation of board members
Members of the Board of Trustees who are not officers or employees of the Investment Manager or Ameriprise Financial are compensated for their services to the Fund as disclosed in the Statement of Operations. Under a Deferred Compensation Plan (the Deferred Plan), these members of the Board of Trustees may elect to defer payment of up to 100% of their compensation. Deferred amounts are treated as though equivalent dollar amounts had been invested in shares of certain funds managed by the Investment Manager. The Fund’s liability for these amounts is adjusted for market value changes and remains in the Fund until distributed in accordance with the Deferred Plan. All amounts payable under the Deferred Plan constitute a general unsecured obligation of the Fund. The expense for the Deferred Plan, which includes Trustees’ fees deferred during the current period as well as any gains or losses on the Trustees’ deferred compensation balances as a result of market fluctuations, is included in "Trustees’ fees" in the Statement of Operations.
Compensation of Chief Compliance Officer
The Board of Trustees has appointed a Chief Compliance Officer for the Fund in accordance with federal securities regulations. As disclosed in the Statement of Operations, a portion of the Chief Compliance Officer’s total compensation is allocated to the Fund, along with other allocations to affiliated registered investment companies managed by the Investment Manager and its affiliates, based on relative net assets.
Transfer agency fees
Under a Transfer and Dividend Disbursing Agent Agreement, Columbia Management Investment Services Corp. (the Transfer Agent), an affiliate of the Investment Manager and a wholly-owned subsidiary of Ameriprise Financial, is responsible for providing transfer agency services to the Fund. The Transfer Agent has contracted with SS&C GIDS, Inc. (SS&C GIDS) to serve as sub-transfer agent. Prior to January 1, 2023, SS&C GIDS was known as DST Asset Manager Solutions, Inc. The Transfer Agent pays the fees of SS&C GIDS for services as sub-transfer agent and SS&C GIDS is not entitled to reimbursement for such fees from the Fund (with the exception of out-of-pocket fees).
The Fund pays the Transfer Agent a monthly transfer agency fee based on the number or the average value of accounts, depending on the type of account. In addition, the Fund pays the Transfer Agent a fee for shareholder services based on the number of accounts or on a percentage of the average aggregate value of the Fund’s shares maintained in omnibus accounts up to the lesser of the amount charged by the financial intermediary or a cap established by the Board of Trustees from time to time.
The Transfer Agent also receives compensation from the Fund for various shareholder services and reimbursements for certain out-of-pocket fees. Total transfer agency fees for Institutional 2 Class and Institutional 3 Class shares are subject to an annual limitation of not more than 0.07% and 0.02%, respectively, of the average daily net assets attributable to each share class. In addition, effective January 1, 2023 through December 31, 2023, Institutional 2 Class shares are subject to a contractual transfer agency fee annual limitation of not more than 0.05% of the average daily net assets attributable to that share class.
For the year ended August 31, 2023, the Fund’s effective transfer agency fee rates as a percentage of average daily net assets of each class were as follows:
| | Effective rate (%) |
| Class A | 0.15 |
| Advisor Class | 0.15 |
| Class C | 0.15 |
| Institutional Class | 0.15 |
| Institutional 2 Class | 0.05 |
| Institutional 3 Class | 0.01 |
| Class R | 0.15 |
Columbia Emerging Markets Fund | Annual Report 2023
| 25 |
Notes to Financial Statements (continued)
August 31, 2023
An annual minimum account balance fee of $20 may apply to certain accounts with a value below the applicable share class’s initial minimum investment requirements to reduce the impact of small accounts on transfer agency fees. These minimum account balance fees are remitted to the Fund and recorded as part of expense reductions in the Statement of Operations. For the year ended August 31, 2023, these minimum account balance fees reduced total expenses of the Fund by $1,708.
Distribution and service fees
The Fund has entered into an agreement with Columbia Management Investment Distributors, Inc. (the Distributor), an affiliate of the Investment Manager and a wholly-owned subsidiary of Ameriprise Financial, for distribution and shareholder services. The Board of Trustees has approved, and the Fund has adopted, distribution and shareholder service plans (the Plans) applicable to certain share classes, which set the distribution and service fees for the Fund. These fees are calculated daily and are intended to compensate the Distributor and/or eligible selling and/or servicing agents for selling shares of the Fund and providing services to investors.
Under the Plans, the Fund pays a monthly service fee to the Distributor at the maximum annual rate of 0.25% of the average daily net assets attributable to Class A and Class C shares of the Fund. Also under the Plans, the Fund pays a monthly distribution fee to the Distributor at the maximum annual rates of 0.75% and 0.50% of the average daily net assets attributable to Class C and Class R shares of the Fund, respectively.
Sales charges (unaudited)
Sales charges, including front-end charges and contingent deferred sales charges (CDSCs), received by the Distributor for distributing Fund shares for the year ended August 31, 2023, if any, are listed below:
| | Front End (%) | CDSC (%) | Amount ($) |
| Class A | 5.75 | 0.50 - 1.00(a) | 51,963 |
| Class C | — | 1.00(b) | 648 |
| (a) | This charge is imposed on certain investments of between $1 million and $50 million redeemed within 18 months after purchase, as follows: 1.00% if redeemed within 12 months after purchase, and 0.50% if redeemed more than 12, but less than 18, months after purchase, with certain limited exceptions. |
| (b) | This charge applies to redemptions within 12 months after purchase, with certain limited exceptions. |
The Fund’s other share classes are not subject to sales charges.
Expenses waived/reimbursed by the Investment Manager and its affiliates
The Investment Manager and certain of its affiliates have contractually agreed to waive fees and/or reimburse expenses (excluding certain fees and expenses described below) for the period(s) disclosed below, unless sooner terminated at the sole discretion of the Board of Trustees, so that the Fund’s net operating expenses, after giving effect to fees waived/expenses reimbursed and any balance credits and/or overdraft charges from the Fund’s custodian, do not exceed the following annual rate(s) as a percentage of the classes’ average daily net assets:
| | January 1, 2023
through
December 31, 2023 | Prior to
January 1, 2023 |
| Class A | 1.43% | 1.47% |
| Advisor Class | 1.18 | 1.22 |
| Class C | 2.18 | 2.22 |
| Institutional Class | 1.18 | 1.22 |
| Institutional 2 Class | 1.07 | 1.11 |
| Institutional 3 Class | 1.03 | 1.07 |
| Class R | 1.68 | 1.72 |
Under the agreement governing these fee waivers and/or expense reimbursement arrangements, the following fees and expenses are excluded from the waiver/reimbursement commitment, and therefore will be paid by the Fund, if applicable: taxes (including foreign transaction taxes), expenses associated with investments in affiliated and non-affiliated pooled investment vehicles (including mutual funds and exchange-traded funds), transaction costs and brokerage
| 26 | Columbia Emerging Markets Fund | Annual Report 2023 |
Notes to Financial Statements (continued)
August 31, 2023
commissions, costs related to any securities lending program, dividend expenses associated with securities sold short, inverse floater program fees and expenses, transaction charges and interest on borrowed money, interest, costs associated with shareholder meetings, infrequent and/or unusual expenses and any other expenses the exclusion of which is specifically approved by the Board of Trustees. This agreement may be modified or amended only with approval from the Investment Manager, certain of its affiliates and the Fund. In addition to the contractual agreement, the Investment Manager and certain of its affiliates have voluntarily agreed to waive fees and/or reimburse Fund expenses (excluding certain fees and expenses described above) so that Fund level expenses (expenses directly attributable to the Fund and not to a specific share class) are waived proportionately across all share classes. This arrangement may be revised or discontinued at any time. Reflected in the contractual cap commitment, effective January 1, 2023 through December 31, 2023, is the Transfer Agent’s contractual agreement to limit total transfer agency fees to an annual rate of not more than 0.05% for Institutional 2 Class of the average daily net assets attributable to that share class, unless sooner terminated at the sole discretion of the Board of Trustees. Any fees waived and/or expenses reimbursed under the expense reimbursement arrangements described above are not recoverable by the Investment Manager or its affiliates in future periods.
Note 4. Federal tax information
The timing and character of income and capital gain distributions are determined in accordance with income tax regulations, which may differ from GAAP because of temporary or permanent book to tax differences.
At August 31, 2023, these differences were primarily due to differing treatment for deferral/reversal of wash sale losses, foreign currency transactions, passive foreign investment company (pfic) holdings, capital loss carryforwards, trustees’ deferred compensation, net operating loss reclassification, excess distributions and foreign capital gains tax. To the extent these differences were permanent, reclassifications were made among the components of the Fund’s net assets. Temporary differences do not require reclassifications.
The following reclassifications were made:
Excess of distributions
over net investment
income ($) | Accumulated
net realized
(loss) ($) | Paid in
capital ($) |
| 17,015,624 | (7,368,041) | (9,647,583) |
Net investment income (loss) and net realized gains (losses), as disclosed in the Statement of Operations, and net assets were not affected by this reclassification.
The tax character of distributions paid during the years indicated was as follows:
| Year Ended August 31, 2023 | Year Ended August 31, 2022 |
Ordinary
income ($) | Long-term
capital gains ($) | Total ($) | Ordinary
income ($) | Long-term
capital gains ($) | Tax return
of capital ($) | Total ($) |
| — | — | — | 21,951,272 | 9,055,618 | 2,802,586 | 33,809,476 |
Short-term capital gain distributions, if any, are considered ordinary income distributions for tax purposes.
At August 31, 2023, the components of distributable earnings on a tax basis were as follows:
Undistributed
ordinary income ($) | Undistributed
long-term
capital gains ($) | Capital loss
carryforwards ($) | Net unrealized
appreciation ($) |
| — | — | (259,633,782) | 306,191,894 |
At August 31, 2023, the cost of all investments for federal income tax purposes along with the aggregate gross unrealized appreciation and depreciation based on that cost was:
Federal
tax cost ($) | Gross unrealized
appreciation ($) | Gross unrealized
(depreciation) ($) | Net unrealized
appreciation ($) |
| 922,859,741 | 401,657,050 | (95,465,156) | 306,191,894 |
Columbia Emerging Markets Fund | Annual Report 2023
| 27 |
Notes to Financial Statements (continued)
August 31, 2023
Tax cost of investments and unrealized appreciation/(depreciation) may also include timing differences that do not constitute adjustments to tax basis.
The following capital loss carryforwards, determined at August 31, 2023, may be available to reduce future net realized gains on investments, if any, to the extent permitted by the Internal Revenue Code. In addition, for the year ended August 31, 2023, capital loss carryforwards utilized, if any, were as follows:
No expiration
short-term ($) | No expiration
long-term ($) | Total ($) | Utilized ($) |
| (251,094,242) | (8,539,540) | (259,633,782) | — |
Management of the Fund has concluded that there are no significant uncertain tax positions in the Fund that would require recognition in the financial statements. However, management’s conclusion may be subject to review and adjustment at a later date based on factors including, but not limited to, new tax laws, regulations, and administrative interpretations (including relevant court decisions). Generally, the Fund’s federal tax returns for the prior three fiscal years remain subject to examination by the Internal Revenue Service.
Note 5. Portfolio information
The cost of purchases and proceeds from sales of securities, excluding short-term investments and derivatives, if any, aggregated to $587,078,918 and $872,102,624, respectively, for the year ended August 31, 2023. The amount of purchase and sale activity impacts the portfolio turnover rate reported in the Financial Highlights.
Note 6. Affiliated money market fund
The Fund invests in Columbia Short-Term Cash Fund, an affiliated money market fund established for the exclusive use by the Fund and other affiliated funds (the Affiliated MMF). The income earned by the Fund from such investments is included as Dividends - affiliated issuers in the Statement of Operations. As an investing fund, the Fund indirectly bears its proportionate share of the expenses of the Affiliated MMF. The Affiliated MMF prices its shares with a floating net asset value. The Securities and Exchange Commission has adopted amendments to money market fund rules requiring institutional prime money market funds like the Affiliated MMF to be subject, by October 2, 2024, to a liquidity fee if daily net redemptions exceed 5% of net assets and, by April 2, 2024, to a discretionary liquidity fee up to 2% if the imposition of such a fee is determined to be in the best interest of the Affiliated MMF.
Note 7. Interfund lending
Pursuant to an exemptive order granted by the Securities and Exchange Commission, the Fund participates in a program (the Interfund Program) allowing each participating Columbia Fund (each, a Participating Fund) to lend money directly to and, except for closed-end funds and money market funds, borrow money directly from other Participating Funds for temporary purposes. The amounts eligible for borrowing and lending under the Interfund Program are subject to certain restrictions.
Interfund loans are subject to the risk that the borrowing fund could be unable to repay the loan when due, and a delay in repayment to the lending fund could result in lost opportunities and/or additional lending costs. The exemptive order is subject to conditions intended to mitigate conflicts of interest arising from the Investment Manager’s relationship with each Participating Fund.
The Fund’s activity in the Interfund Program during the year ended August 31, 2023 was as follows:
| Borrower or lender | Average loan
balance ($) | Weighted average
interest rate (%) | Number of days
with outstanding loans |
| Borrower | 15,567,568 | 5.07 | 37 |
Interest expense incurred by the Fund is recorded as interfund lending in the Statement of Operations. The Fund had no outstanding interfund loans at August 31, 2023.
| 28 | Columbia Emerging Markets Fund | Annual Report 2023 |
Notes to Financial Statements (continued)
August 31, 2023
Note 8. Line of credit
The Fund has access to a revolving credit facility with a syndicate of banks led by JPMorgan Chase Bank, N.A., Citibank, N.A. and Wells Fargo Bank, N.A. whereby the Fund may borrow for the temporary funding of shareholder redemptions or for other temporary or emergency purposes. Pursuant to an October 27, 2022 amendment and restatement, the credit facility, which is an agreement between the Fund and certain other funds managed by the Investment Manager or an affiliated investment manager, severally and not jointly, permits aggregate borrowings up to $950 million. Interest is currently charged to each participating fund based on its borrowings at a rate equal to the higher of (i) the federal funds effective rate, (ii) the secured overnight financing rate plus 0.10% and (iii) the overnight bank funding rate plus, in each case, 1.00%. Each borrowing under the credit facility matures no later than 60 days after the date of borrowing. The Fund also pays a commitment fee equal to its pro rata share of the unused amount of the credit facility at a rate of 0.15% per annum. The commitment fee is included in other expenses in the Statement of Operations. This agreement expires annually in October unless extended or renewed. Prior to the October 27, 2022 amendment and restatement, the Fund had access to a revolving credit facility with a syndicate of banks led by JPMorgan Chase Bank, N.A., Citibank, N.A. and Wells Fargo Bank, N.A. which permitted collective borrowings up to $950 million. Interest was charged to each participating fund based on its borrowings at a rate equal to the higher of (i) the federal funds effective rate, (ii) the secured overnight financing rate plus 0.11448% and (iii) the overnight bank funding rate plus, in each case, 1.00%.
The Fund had no borrowings during the year ended August 31, 2023.
Note 9. Fund reorganization
At the close of business on December 10, 2021, the Fund acquired the assets and assumed the identified liabilities of BMO LGM Emerging Markets Equity Fund (the Acquired Fund), a series of BMO Funds, Inc. The reorganization was completed after shareholders of the Acquired Fund approved a plan of reorganization at a shareholder meeting held on November 23, 2021. The purpose of the reorganization was to combine two funds with comparable investment objectives and strategies.
The aggregate net assets of the Fund immediately before the reorganization were $2,217,656,191 and the combined net assets immediately after the reorganization were $2,387,592,476.
The reorganization was accomplished by a tax-free exchange of 13,904,828 shares of the Acquired Fund valued at $169,936,285 (including $5,849,889 of unrealized appreciation/(depreciation)).
In exchange for the Acquired Fund’s shares, the Fund issued the following number of shares:
| | Shares |
| Class A | 269,775 |
| Advisor Class | 9,411,874 |
For financial reporting purposes, net assets received and shares issued by the Fund were recorded at fair value; however, the Acquired Fund’s cost of investments was carried forward.
The Fund’s financial statements reflect both the operations of the Fund for the period prior to the reorganization and the combined Fund for the period subsequent to the reorganization. Because the combined investment portfolios have been managed as a single integrated portfolio since the reorganization was completed, it is not practicable to separate the amounts of revenue and earnings of the Acquired Fund that have been included in the combined Fund’s Statement of Operations since the reorganization was completed.
Assuming the reorganization had been completed on September 1, 2021, the Fund’s pro-forma results of operations for the year ended August 31, 2022 would have been approximately:
| | ($) |
| Net investment income | 47,000 |
| Net realized loss | (47,692,000) |
| Net change in unrealized appreciation/(depreciation) | (895,002,000) |
| Net decrease in net assets from operations | (942,647,000) |
Columbia Emerging Markets Fund | Annual Report 2023
| 29 |
Notes to Financial Statements (continued)
August 31, 2023
Note 10. Significant risks
Financial sector risk
The Fund is more susceptible to the particular risks that may affect companies in the financial services sector than if it were invested in a wider variety of companies in unrelated sectors. Companies in the financial services sector are subject to certain risks, including the risk of regulatory change, decreased liquidity in credit markets and unstable interest rates. Such companies may have concentrated portfolios, such as a high level of loans to one or more industries or sectors, which makes them vulnerable to economic conditions that affect such industries or sectors. Performance of such companies may be affected by competitive pressures and exposure to investments, agreements and counterparties, including credit products that, under certain circumstances, may lead to losses (e.g., subprime loans). Companies in the financial services sector are subject to extensive governmental regulation that may limit the amount and types of loans and other financial commitments they can make, and interest rates and fees that they may charge. In addition, profitability of such companies is largely dependent upon the availability and the cost of capital.
Foreign currency risk
The performance of the Fund may be materially affected positively or negatively by foreign currency strength or weakness relative to the U.S. dollar, particularly if the Fund invests a significant percentage of its assets in foreign securities or other assets denominated in currencies other than the U.S. dollar. Currency rates in foreign countries may fluctuate significantly over short or long periods of time for a number of reasons, including changes in interest rates, imposition of currency controls and economic or political developments in the U.S. or abroad. The Fund may also incur currency conversion costs when converting foreign currencies into U.S. dollars and vice versa.
Foreign securities and emerging market countries risk
Investing in foreign securities may involve heightened risks relative to investments in U.S. securities. Investing in foreign securities subjects the Fund to the risks associated with the issuer’s country of organization and places of business operations, including risks associated with political, regulatory, economic, social, diplomatic and other conditions or events occurring in the country or region, which may result in significant market volatility. In addition, certain foreign securities may be more volatile and less liquid than U.S. securities. Investing in emerging markets may increase these risks and expose the Fund to elevated risks associated with increased inflation, deflation or currency devaluation. To the extent that the Fund concentrates its investment exposure to any one or a few specific countries, the Fund will be particularly susceptible to the risks associated with the conditions, events or other factors impacting those countries or regions and may, therefore, have a greater risk than that of a fund that is more geographically diversified. The financial information and disclosure made available by issuers of emerging market securities may be considerably less reliable than publicly available information about other foreign securities. The Public Company Accounting Oversight Board, which regulates auditors of U.S. public companies, is unable to inspect audit work papers in certain foreign countries. Investors in foreign countries often have limited rights and few practical remedies to pursue shareholder claims, including class actions or fraud claims, and the ability of the U.S. Securities and Exchange Commission, the U.S. Department of Justice and other authorities to bring and enforce actions against foreign issuers or foreign persons is limited.
Geographic focus risk
The Fund may be particularly susceptible to risks related to economic, political, regulatory or other events or conditions affecting issuers and countries within the specific geographic regions in which the Fund invests. The Fund’s net asset value may be more volatile than the net asset value of a more geographically diversified fund.
Asia Pacific Region. The Fund is particularly susceptible to economic, political, regulatory or other events or conditions affecting issuers and countries in the Asia Pacific region. Many of the countries in the region are considered underdeveloped or developing, including from a political, economic and/or social perspective, and may have relatively unstable governments and economies based on limited business, industries and/or natural resources or commodities. Events in any one country within the region may impact other countries in the region or the region as a whole. As a result, events in the region will generally have a greater effect on the Fund than if the Fund were more geographically diversified. This could result in
| 30 | Columbia Emerging Markets Fund | Annual Report 2023 |
Notes to Financial Statements (continued)
August 31, 2023
increased volatility in the value of the Fund’s investments and losses for the Fund. Also, securities of some companies in the region can be less liquid than U.S. or other foreign securities, potentially making it difficult for the Fund to sell such securities at a desirable time and price.
Greater China. The Fund is particularly susceptible to economic, political, regulatory or other events or conditions affecting issuers in the Greater China region. The region consists of Hong Kong, The People’s Republic of China and Taiwan, among other countries, and the Fund’s investments in the region are particularly susceptible to risks in that region. The Hong Kong, Taiwanese, and Chinese economies are dependent on the economies of other countries and can be significantly affected by currency fluctuations and increasing competition from other emerging economies in Asia with lower costs. Adverse events in any one country within the region may impact the other countries in the region or Asia as a whole. As a result, adverse events in the region will generally have a greater effect on the Fund than if the Fund were more geographically diversified, which could result in greater volatility in the Fund’s net asset value and losses. Markets in the Greater China region can experience significant volatility due to social, economic, regulatory and political uncertainties. Changes in Chinese government policy and economic growth rates could significantly affect local markets and the entire Greater China region. China has yet to develop comprehensive securities, corporate, or commercial laws, its market is relatively new and less developed, and its economy is experiencing a relative slowdown. Export growth continues to be a major driver of China’s economic growth. As a result, a reduction in spending on Chinese products and services, the institution of additional tariffs or other trade barriers, including as a result of heightened trade tensions between China and the United States, or a downturn in any of the economies of China’s key trading partners may have an adverse impact on the Chinese economy.
Information technology sector risk
The Fund is more susceptible to the particular risks that may affect companies in the information technology sector than if it were invested in a wider variety of companies in unrelated sectors. Companies in the information technology sector are subject to certain risks, including the risk that new services, equipment or technologies will not be accepted by consumers and businesses or will become rapidly obsolete. Performance of such companies may be affected by factors including obtaining and protecting patents (or the failure to do so) and significant competitive pressures, including aggressive pricing of their products or services, new market entrants, competition for market share and short product cycles due to an accelerated rate of technological developments. Such competitive pressures may lead to limited earnings and/or falling profit margins. As a result, the value of their securities may fall or fail to rise. In addition, many information technology sector companies have limited operating histories and prices of these companies’ securities historically have been more volatile than other securities, especially over the short term. Some companies in the information technology sector are facing increased government and regulatory scrutiny and may be subject to adverse government or regulatory action, which could negatively impact the value of their securities.
Market risk
The Fund may incur losses due to declines in the value of one or more securities in which it invests. These declines may be due to factors affecting a particular issuer, or the result of, among other things, political, regulatory, market, economic or social developments affecting the relevant market(s) more generally. In addition, turbulence in financial markets and reduced liquidity in equity, credit and/or fixed income markets may negatively affect many issuers, which could adversely affect the Fund’s ability to price or value hard-to-value assets in thinly traded and closed markets and could cause significant redemptions and operational challenges. Global economies and financial markets are increasingly interconnected, and conditions and events in one country, region or financial market may adversely impact issuers in a different country, region or financial market. These risks may be magnified if certain events or developments adversely interrupt the global supply chain; in these and other circumstances, such risks might affect companies worldwide. As a result, local, regional or global events such as terrorism, war, natural disasters, disease/virus outbreaks and epidemics or other public health issues, recessions, depressions or other events – or the potential for such events – could have a significant negative impact on global economic and market conditions.
The large-scale invasion of Ukraine by Russia in February 2022 has resulted in sanctions and market disruptions, including declines in regional and global stock markets, unusual volatility in global commodity markets and significant devaluations of Russian currency. The extent and duration of the military action are impossible to predict but could be significant. Market disruption caused by the Russian military action, and any counter-measures or responses thereto (including international sanctions, a downgrade in the country’s credit rating, purchasing and financing restrictions, boycotts, tariffs, changes in
Columbia Emerging Markets Fund | Annual Report 2023
| 31 |
Notes to Financial Statements (continued)
August 31, 2023
consumer or purchaser preferences, cyberattacks and espionage) could have severe adverse impacts on regional and/or global securities and commodities markets, including markets for oil and natural gas. These impacts may include reduced market liquidity, distress in credit markets, further disruption of global supply chains, increased risk of inflation, restricted cross-border payments and limited access to investments and/or assets in certain international markets and/or issuers. These developments and other related events could negatively impact Fund performance.
Shareholder concentration risk
At August 31, 2023, one unaffiliated shareholder of record owned 29.7% of the outstanding shares of the Fund in one or more accounts. The Fund has no knowledge about whether any portion of those shares was owned beneficially. Affiliated shareholders of record owned 28.8% of the outstanding shares of the Fund in one or more accounts. Fund shares sold to or redeemed by concentrated accounts may have a significant effect on the operations of the Fund. In the case of a large redemption, the Fund may be forced to sell investments at inopportune times, including its liquid positions, which may result in Fund losses and the Fund holding a higher percentage of less liquid positions. Large redemptions could result in decreased economies of scale and increased operating expenses for non-redeeming Fund shareholders.
Variable interest entity risk
Many Chinese companies to which the Fund seeks investment exposure use a structure known as a variable interest entity (a VIE) to address Chinese restrictions on direct foreign investment in Chinese companies operating in certain sectors. The Fund’s investment exposure to VIEs may pose additional risks because the Fund’s investment is in a holding company domiciled outside of China (a Holding Company) whose interests in the business of the underlying Chinese operating company (the VIE) are established through contracts rather than equity ownership. The VIE structure is a longstanding practice in China that, until recently, was not acknowledged by the Chinese government, creating uncertainty over the possibility that the Chinese government might cease to tolerate VIE structures at any time or impose new restrictions on the structure. In such a scenario, the Chinese operating company could be subject to penalties, including revocation of its business and operating license, or the Holding Company could forfeit its interest in the business of the Chinese operating company. Further, in case of a dispute, the remedies and rights of the Fund may be limited, and such legal uncertainty may be exploited against the interests of the Fund. Control over a VIE may also be jeopardized if a natural person who holds the equity interest in the VIE breaches the terms of the contractual arrangements, is subject to legal proceedings, or if any physical instruments or property of the VIE, such as seals, business registration certificates, financial data and licensing arrangements (sometimes referred to as “chops”), are used without authorization. In the event of such an occurrence, the Fund, as a foreign investor, may have little or no legal recourse. In addition to the risk of government intervention, investments through a VIE structure are subject to the risks that the China-based company (or its officers, directors, or Chinese equity owners) may breach the contractual arrangements, that Chinese law changes in a way that adversely affects the enforceability of the arrangements and that the contracts are otherwise not enforceable under Chinese law, in which case a Fund may suffer significant losses on its investments through a VIE structure with little or no recourse available. Further, the Fund is not a VIE owner/shareholder and cannot exert influence through proxy voting or other means. Foreign companies listed on stock exchanges in the United States, including companies using the VIE structure, could also face delisting or other ramifications for failure to meet the expectations and/or requirements of U.S. regulators. Recently, however, China has proposed the adoption of rules which would affirm that VIEs are legally permissible, though there remains significant uncertainty over how these rules will operate. Any of these risks could reduce the liquidity and value of the Fund’s investments in Holding Companies or render them valueless.
Note 11. Subsequent events
Management has evaluated the events and transactions that have occurred through the date the financial statements were issued and noted no items requiring adjustment of the financial statements or additional disclosure.
Note 12. Information regarding pending and settled legal proceedings
Ameriprise Financial and certain of its affiliates are involved in the normal course of business in legal proceedings which include regulatory inquiries, arbitration and litigation, including class actions concerning matters arising in connection with the conduct of their activities as part of a diversified financial services firm. Ameriprise Financial believes that the Fund is not currently the subject of, and that neither Ameriprise Financial nor any of its affiliates are the subject of, any pending legal,
| 32 | Columbia Emerging Markets Fund | Annual Report 2023 |
Notes to Financial Statements (continued)
August 31, 2023
arbitration or regulatory proceedings that are likely to have a material adverse effect on the Fund or the ability of Ameriprise Financial or its affiliates to perform under their contracts with the Fund. Ameriprise Financial is required to make quarterly (10-Q), annual (10-K) and, as necessary, 8-K filings with the Securities and Exchange Commission (SEC) on legal and regulatory matters that relate to Ameriprise Financial and its affiliates. Copies of these filings may be obtained by accessing the SEC website at www.sec.gov.
There can be no assurance that these matters, or the adverse publicity associated with them, will not result in increased Fund redemptions, reduced sale of Fund shares or other adverse consequences to the Fund. Further, although we believe proceedings are not likely to have a material adverse effect on the Fund or the ability of Ameriprise Financial or its affiliates to perform under their contracts with the Fund, these proceedings are subject to uncertainties and, as such, we are unable to estimate the possible loss or range of loss that may result. An adverse outcome in one or more of these proceedings could result in adverse judgments, settlements, fines, penalties or other relief that could have a material adverse effect on the consolidated financial condition or results of operations of Ameriprise Financial or one or more of its affiliates that provide services to the Fund.
Columbia Emerging Markets Fund | Annual Report 2023
| 33 |
Report of Independent Registered Public Accounting Firm
To the Board of Trustees of Columbia Funds Series Trust I and Shareholders of Columbia Emerging Markets Fund
Opinion on the Financial Statements
We have audited the accompanying statement of assets and liabilities, including the portfolio of investments, of Columbia Emerging Markets Fund (one of the funds constituting Columbia Funds Series Trust I, referred to hereafter as the "Fund") as of August 31, 2023, the related statement of operations for the year ended August 31, 2023, the statement of changes in net assets for each of the two years in the period ended August 31, 2023, including the related notes, and the financial highlights for each of the five years in the period ended August 31, 2023 (collectively referred to as the "financial statements"). In our opinion, the financial statements present fairly, in all material respects, the financial position of the Fund as of August 31, 2023, the results of its operations for the year then ended, the changes in its net assets for each of the two years in the period ended August 31, 2023 and the financial highlights for each of the five years in the period ended August 31, 2023 in conformity with accounting principles generally accepted in the United States of America.
Basis for Opinion
These financial statements are the responsibility of the Fund’s management. Our responsibility is to express an opinion on the Fund’s financial statements based on our audits. We are a public accounting firm registered with the Public Company Accounting Oversight Board (United States) (PCAOB) and are required to be independent with respect to the Fund in accordance with the U.S. federal securities laws and the applicable rules and regulations of the Securities and Exchange Commission and the PCAOB.
We conducted our audits of these financial statements in accordance with the standards of the PCAOB. Those standards require that we plan and perform the audit to obtain reasonable assurance about whether the financial statements are free of material misstatement, whether due to error or fraud.
Our audits included performing procedures to assess the risks of material misstatement of the financial statements, whether due to error or fraud, and performing procedures that respond to those risks. Such procedures included examining, on a test basis, evidence regarding the amounts and disclosures in the financial statements. Our audits also included evaluating the accounting principles used and significant estimates made by management, as well as evaluating the overall presentation of the financial statements. Our procedures included confirmation of securities owned as of August 31, 2023 by correspondence with the custodian, transfer agent and brokers; when replies were not received from brokers, we performed other auditing procedures. We believe that our audits provide a reasonable basis for our opinion.
/s/PricewaterhouseCoopers LLP
Minneapolis, Minnesota
October 23, 2023
We have served as the auditor of one or more investment companies within the Columbia Funds Complex since 1977.
| 34 | Columbia Emerging Markets Fund | Annual Report 2023 |
Federal Income Tax Information
(Unaudited)
The Fund hereby designates the following tax attributes for the fiscal year ended August 31, 2023. Shareholders will be notified in early 2024 of the amounts for use in preparing 2023 income tax returns.
Qualified
dividend
income | Foreign
taxes paid
to foreign
countries | Foreign
taxes paid
per share
to foreign
countries | Foreign
source
income | Foreign
source
income
per share |
| 100.00% | $7,122,767 | $0.07 | $30,516,477 | $0.30 |
Qualified dividend income. For taxable, non-corporate shareholders, the percentage of ordinary income distributed during the fiscal year that represents qualified dividend income subject to reduced tax rates.
Foreign taxes. The Fund makes the election to pass through to shareholders the foreign taxes paid. Eligible shareholders may claim a foreign tax credit. These taxes, and the corresponding foreign source income, are provided in the table above.
TRUSTEES AND OFFICERS
(Unaudited)
The Board oversees the Fund’s operations and appoints officers who are responsible for day-to-day business decisions based on policies set by the Board. The following table provides basic biographical information about the Fund’s Trustees as of the printing of this report, including their principal occupations during the past five years, although specific titles for individuals may have varied over the period. The year set forth beneath Length of Service in the table below is the year in which the Trustee was first appointed or elected as Trustee to any Fund currently in the Columbia Funds Complex or a predecessor thereof. Under current Board policy, each Trustee generally serves until December 31 of the year such Trustee turns seventy-five (75).
Independent trustees
Name,
address,
year of birth | Position held
with the Columbia Funds and
length of service | Principal occupation(s)
during past five years
and other relevant
professional experience | Number of
Funds in the
Columbia Funds
Complex*
overseen | Other directorships
held by Trustee
during the past five years
and other relevant Board experience |
George S. Batejan
c/o Columbia Management
Investment Advisers, LLC
290 Congress Street
Boston, MA 02210
1954 | Trustee since 2017 | Executive Vice President, Global Head of Technology and Operations, Janus Capital Group, Inc., 2010-2016 | 173 | Former Chairman of the Board, NICSA (National Investment Company Services Association) (Executive Committee, Nominating Committee and Governance Committee), 2014-2016; former Director, Intech Investment Management, 2011-2016; former Board Member, Metro Denver Chamber of Commerce, 2015-2016; former Advisory Board Member, University of Colorado Business School, 2015-2018; former Board Member, Chase Bank International, 1993-1994 |
Columbia Emerging Markets Fund | Annual Report 2023
| 35 |
TRUSTEES AND OFFICERS (continued)
(Unaudited)
Independent trustees (continued)
Name,
address,
year of birth | Position held
with the Columbia Funds and
length of service | Principal occupation(s)
during past five years
and other relevant
professional experience | Number of
Funds in the
Columbia Funds
Complex*
overseen | Other directorships
held by Trustee
during the past five years
and other relevant Board experience |
Kathleen Blatz
c/o Columbia Management
Investment Advisers, LLC
290 Congress Street
Boston, MA 02210
1954 | Trustee since 2006 | Attorney, specializing in arbitration and mediation; Chief Justice, Minnesota Supreme Court, 1998-2006; Associate Justice, Minnesota Supreme Court, 1996-1998; Fourth Judicial District Court Judge, Hennepin County, 1994-1996; Attorney in private practice and public service, 1984-1993; State Representative, Minnesota House of Representatives, 1979-1993, which included service on the Tax and Financial Institutions and Insurance Committees; Member and Interim Chair, Minnesota Sports Facilities Authority, January-July 2017; Interim President and Chief Executive Officer, Blue Cross and Blue Shield of Minnesota (health care insurance), February-July 2018, April-October 2021 | 173 | Former Trustee, Blue Cross and Blue Shield of Minnesota, 2009-2021 (Chair of the Business Development Committee, 2014-2017; Chair of the Governance Committee, 2017-2019); former Member and Chair of the Board, Minnesota Sports Facilities Authority, January 2017-July 2017; former Director, Robina Foundation, 2009-2020 (Chair, 2014-2020); Director, Richard M. Schulze Family Foundation, since 2021 |
Pamela G. Carlton
c/o Columbia Management
Investment Advisers, LLC
290 Congress Street
Boston, MA 02210
1954 | Chair since 2023; Trustee since 2007 | President, Springboard – Partners in Cross Cultural Leadership (consulting company), since 2003; Managing Director of US Equity Research, JP Morgan Chase, 1999-2003; Director of US Equity Research, Chase Asset Management, 1996-1999; Co-Director Latin America Research, 1993-1996, COO Global Research, 1992-1996, Co-Director of US Research, 1991-1992, Investment Banker, 1982-1991, Morgan Stanley; Attorney, Cleary Gottlieb Steen & Hamilton LLP, 1980-1982 | 173 | Trustee, New York Presbyterian Hospital Board, since 1996; Director, DR Bank (Audit Committee) since 2017; Director, Evercore Inc. (Audit Committee, Nominating and Governance Committee), since 2019; Director, Apollo Commercial Real Estate Finance, Inc. (Chair, Nominating and Governance Committee) (financial services), since 2021; the Governing Council of the Independent Directors Council (IDC), since 2021 |
Janet Langford Carrig
c/o Columbia Management
Investment Advisers, LLC
290 Congress Street
Boston, MA 02210
1957 | Trustee since 1996 | Senior Vice President, General Counsel and Corporate Secretary, ConocoPhillips (independent energy company), September 2007-October 2018 | 173 | Director, EQT Corporation (natural gas producer), since 2019; former Director, Whiting Petroleum Corporation (independent oil and gas company), 2020-2022 |
J. Kevin Connaughton
c/o Columbia Management
Investment Advisers, LLC
290 Congress Street
Boston, MA 02210
1964 | Trustee since 2020 | CEO and President, RhodeWay Financial (non-profit financial planning firm), since December 2022; Member, FINRA National Adjudicatory Council, since January 2020; Adjunct Professor of Finance, Bentley University since January 2018; Consultant to Independent Trustees of CFVIT and CFST I from March 2016 to June 2020 with respect to CFVIT and to December 2020 with respect to CFST I; Managing Director and General Manager of Mutual Fund Products, Columbia Management Investment Advisers, LLC, May 2010-February 2015; President, Columbia Funds, 2008-2015; and senior officer of Columbia Funds and affiliated funds, 2003-2015 | 171 | Former Director, The Autism Project, March 2015-December 2021; former Member of the Investment Committee, St. Michael’s College, November 2015-February 2020; former Trustee, St. Michael’s College, June 2017-September 2019; former Trustee, New Century Portfolios (former mutual fund complex), January 2015-December 2017 |
| 36 | Columbia Emerging Markets Fund | Annual Report 2023 |
TRUSTEES AND OFFICERS (continued)
(Unaudited)
Independent trustees (continued)
Name,
address,
year of birth | Position held
with the Columbia Funds and
length of service | Principal occupation(s)
during past five years
and other relevant
professional experience | Number of
Funds in the
Columbia Funds
Complex*
overseen | Other directorships
held by Trustee
during the past five years
and other relevant Board experience |
Olive M. Darragh
c/o Columbia Management
Investment Advisers, LLC
290 Congress Street
Boston, MA 02210
1962 | Trustee since 2020 | Managing Director of Darragh Inc. (strategy and talent management consulting firm), since 2010; Founder and CEO, Zolio, Inc. (investment management talent identification platform), since 2004; Consultant to Independent Trustees of CFVIT and CFST I from June 2019 to June 2020 with respect to CFVIT and to December 2020 with respect to CFST I; Partner, Tudor Investments, 2004-2010; Senior Partner, McKinsey & Company (consulting), 1990-2004; Touche Ross CPA, 1985-1988 | 171 | Treasurer, Edinburgh University US Trust Board, since January 2023; Member, HBS Community Action Partners Board, since September 2022; former Director, University of Edinburgh Business School (Member of US Board), 2004-2019; former Director, Boston Public Library Foundation, 2008-2017 |
Patricia M. Flynn
c/o Columbia Management
Investment Advisers, LLC
290 Congress Street
Boston, MA 02210
1950 | Trustee since 2004 | Professor of Economics and Management, Bentley University, since 2002; Dean, McCallum Graduate School of Business, Bentley University, 1992-2002 | 173 | Former Trustee, MA Taxpayers Foundation, 1997-2022; former Director, The MA Business Roundtable, 2003-2019; former Chairperson, Innovation Index Advisory Committee, MA Technology Collaborative, 1997-2020 |
Brian J. Gallagher
c/o Columbia Management
Investment Advisers, LLC
290 Congress Street
Boston, MA 02210
1954 | Trustee since 2017 | Retired; Partner with Deloitte & Touche LLP and its predecessors, 1977-2016 | 173 | Trustee, Catholic Schools Foundation, since 2004 |
Douglas A. Hacker
c/o Columbia Management
Investment Advisers, LLC
290 Congress Street
Boston, MA 02210
1955 | Trustee since 1996 | Independent business executive, since May 2006; Executive Vice President – Strategy of United Airlines, December 2002 - May 2006; President of UAL Loyalty Services (airline marketing company), September 2001-December 2002; Executive Vice President and Chief Financial Officer of United Airlines, July 1999-September 2001 | 173 | Director, SpartanNash Company since November 2013 (Chair of the Board, since May 2021) (food distributor); Director, Aircastle Limited (Chair of Audit Committee) (aircraft leasing), since August 2006; former Director, Nash Finch Company (food distributor), 2005-2013; former Director, SeaCube Container Leasing Ltd. (container leasing), 2010-2013; and former Director, Travelport Worldwide Limited (travel information technology), 2014-2019 |
Nancy T. Lukitsh
c/o Columbia Management
Investment Advisers, LLC
290 Congress Street
Boston, MA 02210
1956 | Trustee since 2011 | Senior Vice President, Partner and Director of Marketing, Wellington Management Company, LLP (investment adviser), 1997-2010; Chair, Wellington Management Portfolios (commingled non-U.S. investment pools), 2007-2010; Director, Wellington Trust Company, NA and other Wellington affiliates, 1997-2010 | 171 | None |
Columbia Emerging Markets Fund | Annual Report 2023
| 37 |
TRUSTEES AND OFFICERS (continued)
(Unaudited)
Independent trustees (continued)
Name,
address,
year of birth | Position held
with the Columbia Funds and
length of service | Principal occupation(s)
during past five years
and other relevant
professional experience | Number of
Funds in the
Columbia Funds
Complex*
overseen | Other directorships
held by Trustee
during the past five years
and other relevant Board experience |
David M. Moffett
c/o Columbia Management
Investment Advisers, LLC
290 Congress Street
Boston, MA 02210
1952 | Trustee since 2011 | Retired; former Chief Executive Officer of Freddie Mac and Chief Financial Officer of U.S. Bank | 171 | Director, CSX Corporation (transportation suppliers); Director, PayPal Holdings Inc. (payment and data processing services); Trustee, University of Oklahoma Foundation; former Director, eBay Inc. (online trading community), 2007-2015; and former Director, CIT Bank, CIT Group Inc. (commercial and consumer finance), 2010-2016; former Senior Adviser to The Carlyle Group (financial services), March 2008-September 2008; former Governance Consultant to Bridgewater Associates, January 2013-December 2015 |
Catherine James Paglia
c/o Columbia Management
Investment Advisers, LLC
290 Congress Street
Boston, MA 02210
1952 | Trustee since 2004 | Director, Enterprise Asset Management, Inc. (private real estate and asset management company), since September 1998; Managing Director and Partner, Interlaken Capital, Inc., 1989-1997; Vice President, 1982-1985, Principal, 1985-1987, Managing Director, 1987-1989, Morgan Stanley; Vice President, Investment Banking, 1980-1982, Associate, Investment Banking, 1976-1980, Dean Witter Reynolds, Inc. | 173 | Director, Valmont Industries, Inc. (irrigation systems manufacturer), since 2012; Trustee, Carleton College (on the Investment Committee), since 1987; Trustee, Carnegie Endowment for International Peace (on the Investment Committee), since 2009 |
Natalie A. Trunow
c/o Columbia Management
Investment Advisers, LLC
290 Congress Street
Boston, MA 02210
1967 | Trustee since 2020 | Chief Executive Officer, Millennial Portfolio Solutions LLC (asset management and consulting services), January 2016-January 2021; Non-executive Member of the Investment Committee and Valuation Committee, Sarona Asset Management Inc. (private equity firm) since September 2019; Advisor, Horizon Investments (asset management and consulting services), August 2018-January 2022; Advisor, Paradigm Asset Management, November 2016-January 2022; Consultant to Independent Trustees of CFVIT and CFST I from September 2016 to June 2020 with respect to CFVIT and to December 2020 with respect to CFST I; Director of Investments/Consultant, Casey Family Programs, April 2016-November 2016; Senior Vice President and Chief Investment Officer, Calvert Investments, August 2008-January 2016; Section Head and Portfolio Manager, General Motors Asset Management, June 1997-August 2008 | 171 | Independent Director, Investment Committee, Health Services for Children with Special Needs, Inc., 2010-2021; Independent Director, (Executive Committee and Chair, Audit Committee), Consumer Credit Counseling Services (formerly Guidewell Financial Solutions), since 2016; Independent Director, (Investment Committee), Sarona Asset Management, since 2019 |
| 38 | Columbia Emerging Markets Fund | Annual Report 2023 |
TRUSTEES AND OFFICERS (continued)
(Unaudited)
Independent trustees (continued)
Name,
address,
year of birth | Position held
with the Columbia Funds and
length of service | Principal occupation(s)
during past five years
and other relevant
professional experience | Number of
Funds in the
Columbia Funds
Complex*
overseen | Other directorships
held by Trustee
during the past five years
and other relevant Board experience |
Sandra L. Yeager
c/o Columbia Management
Investment Advisers, LLC
290 Congress Street
Boston, MA 02210
1964 | Trustee since 2017 | Retired; President and founder, Hanoverian Capital, LLC (SEC registered investment advisor firm), 2008-2016; Managing Director, DuPont Capital, 2006-2008; Managing Director, Morgan Stanley Investment Management, 2004-2006; Senior Vice President, Alliance Bernstein, 1990-2004 | 173 | Former Director, NAPE (National Alliance for Partnerships in Equity) Education Foundation, October 2016-October 2020; Advisory Board, Jennersville YMCA, since 2022 |
Interested trustee affiliated with Investment Manager**
Name,
address,
year of birth | Position held with the Columbia Funds and length of service | Principal occupation(s) during the
past five years and other relevant
professional experience | Number of
Funds in the
Columbia Funds
Complex* overseen | Other directorships
held by Trustee
during the past
five years and
other relevant Board experience |
Daniel J. Beckman
c/o Columbia Management
Investment Advisers, LLC
290 Congress Street
Boston, MA 02210
1962 | Trustee since November 2021 and President since June 2021 | Vice President – Head of North America Product, Columbia Management Investment Advisers, LLC, since April 2015; President and Principal Executive Officer of the Columbia Funds, since June 2021; officer of Columbia Funds and affiliated funds, 2020-2021 | 173 | Director, Ameriprise Trust Company, since October 2016; Director, Columbia Management Investment Distributors, Inc. since November 2018; Board of Governors, Columbia Wanger Asset Management, LLC since, January 2022; Director, Columbia Threadneedle Canada, Inc., since December 2022 |
| * | The term “Columbia Funds Complex” as used herein includes Columbia Seligman Premium Technology Growth Fund, Tri-Continental Corporation and each series of Columbia Funds Series Trust (CFST), Columbia Funds Series Trust I (CFST I), Columbia Funds Series Trust II (CFST II), Columbia ETF Trust I (CET I), Columbia ETF Trust II (CET II), Columbia Funds Variable Insurance Trust (CFVIT) and Columbia Funds Variable Series Trust II (CFVST II). Messrs. Batejan, Beckman, Gallagher and Hacker and Mses. Blatz, Carlton, Carrig, Flynn, Paglia, and Yeager serve as directors of Columbia Seligman Premium Technology Growth Fund and Tri-Continental Corporation. |
| ** | Interested person (as defined under the 1940 Act) by reason of being an officer, director, security holder and/or employee of the Investment Manager or Ameriprise Financial. |
The Statement of Additional Information has additional information about the Fund’s Board members and is available, without charge, upon request by calling 800.345.6611, visiting columbiathreadneedleus.com/investor/ or contacting your financial intermediary.
Columbia Emerging Markets Fund | Annual Report 2023
| 39 |
TRUSTEES AND OFFICERS (continued)
(Unaudited)
The Board has appointed officers who are responsible for day-to-day business decisions based on policies it has established. The officers serve at the pleasure of the Board. The following table provides basic information about the Officers of the Fund as of the printing of this report, including principal occupations during the past five years, although their specific titles may have varied over the period. In addition to Mr. Beckman, who is President and Principal Executive Officer, the Fund’s other officers are:
Fund officers
Name,
address and
year of birth | Position and year
first appointed to
position for any Fund
in the Columbia
Funds Complex or a
predecessor thereof | Principal occupation(s) during past five years |
Michael G. Clarke
290 Congress Street
Boston, MA 02210
1969 | Chief Financial Officer and Principal Financial Officer (2009) and Senior Vice President (2019) | Senior Vice President and North America Head of Operations & Investor Services, Columbia Management Investment Advisers, LLC, since June 2023 (previously Senior Vice President and Head of Global Operations, March 2022 – June 2023, Vice President, Head of North America Operations, and Co-Head of Global Operations, June 2019 - February 2022 and Vice President – Accounting and Tax, May 2010 - May 2019); senior officer of Columbia Funds and affiliated funds, since 2002. Director, Ameriprise Trust Company, since June 2023. |
Joseph Beranek
5890 Ameriprise Financial Center
Minneapolis, MN 55474
1965 | Treasurer and Chief Accounting Officer (Principal Accounting Officer) (2019) and Principal Financial Officer (2020), CFST, CFST I, CFST II, CFVIT and CFVST II; Assistant Treasurer, CET I and CET II | Vice President – Mutual Fund Accounting and Financial Reporting, Columbia Management Investment Advisers, LLC, since December 2018 and March 2017, respectively. |
Marybeth Pilat
290 Congress Street
Boston, MA 02210
1968 | Treasurer and Chief Accounting Officer (Principal Accounting Officer) and Principal Financial Officer (2020) for CET I and CET II; Assistant Treasurer, CFST, CFST I, CFST II, CFVIT and CFVST II | Vice President – Product Pricing and Administration, Columbia Management Investment Advisers, LLC, since May 2017. |
William F. Truscott
290 Congress Street
Boston, MA 02210
1960 | Senior Vice President (2001) | Formerly, Trustee/Director of Columbia Funds Complex or legacy funds, November 2001 - January 1, 2021; Chief Executive Officer, Global Asset Management, Ameriprise Financial, Inc., since September 2012; Chairman of the Board and President, Columbia Management Investment Advisers, LLC, since July 2004 and February 2012, respectively; Chairman of the Board and Chief Executive Officer, Columbia Management Investment Distributors, Inc., since November 2008 and February 2012, respectively; Chairman of the Board and Director, Threadneedle Asset Management Holdings, Sàrl, since March 2013 and December 2008, respectively; senior executive of various entities affiliated with Columbia Threadneedle. |
Christopher O. Petersen
5228 Ameriprise Financial Center
Minneapolis, MN 55474
1970 | Senior Vice President and Assistant Secretary (2021) | Formerly, Trustee/Director of funds within the Columbia Funds Complex, July 1, 2020 - November 22, 2021; Senior Vice President and Assistant General Counsel, Ameriprise Financial, Inc., since September 2021 (previously Vice President and Lead Chief Counsel, January 2015 - September 2021); formerly, President and Principal Executive Officer of the Columbia Funds, 2015 - 2021; officer of Columbia Funds and affiliated funds, since 2007. |
Thomas P. McGuire
290 Congress Street
Boston, MA 02210
1972 | Senior Vice President and Chief Compliance Officer (2012) | Vice President – Asset Management Compliance, Ameriprise Financial, Inc., since May 2010; Chief Compliance Officer, Columbia Acorn/Wanger Funds, since December 2015; formerly, Chief Compliance Officer, Ameriprise Certificate Company, September 2010 – September 2020. |
Ryan C. Larrenaga
290 Congress Street
Boston, MA 02210
1970 | Senior Vice President (2017), Chief Legal Officer (2017), and Secretary (2015) | Vice President and Chief Counsel, Ameriprise Financial, Inc., since August 2018 (previously Vice President and Group Counsel, August 2011 - August 2018); Chief Legal Officer, Columbia Acorn/Wanger Funds, since September 2020; officer of Columbia Funds and affiliated funds, since 2005. |
| 40 | Columbia Emerging Markets Fund | Annual Report 2023 |
TRUSTEES AND OFFICERS (continued)
(Unaudited)
Fund officers (continued)
Name,
address and
year of birth | Position and year
first appointed to
position for any Fund
in the Columbia
Funds Complex or a
predecessor thereof | Principal occupation(s) during past five years |
Michael E. DeFao
290 Congress Street
Boston, MA 02210
1968 | Vice President (2011) and Assistant Secretary (2010) | Vice President and Chief Counsel, Ameriprise Financial, Inc., since May 2010; Vice President, Chief Legal Officer and Assistant Secretary, Columbia Management Investment Advisers, LLC, since October 2021 (previously Vice President and Assistant Secretary, May 2010 – September 2021). |
Lyn Kephart-Strong
5903 Ameriprise Financial Center
Minneapolis, MN 55474
1960 | Vice President (2015) | Vice President, Global Investment Operations Services, Columbia Management Investment Advisers, LLC, since 2010; Director (since January 2007) and President (since October 2014), Columbia Management Investment Services Corp.; Director (since December 2017) and President (since January 2017), Ameriprise Trust Company. |
Liquidity Risk Management Program
(Unaudited)
Pursuant to Rule 22e-4 under the 1940 Act, the Fund has adopted a liquidity risk management program (Program). The Program’s principal objectives include assessing, managing and periodically reviewing the Fund’s liquidity risk. Liquidity risk is defined as the risk that the Fund could not meet redemption requests without significant dilution of remaining investors’ interests in the Fund.
The Board has appointed the Investment Manager as the program administrator for the Fund’s Program. The Investment Manager has delegated oversight of the Program to its Liquidity Risk Management Committee (the Committee). At a Board meeting during the fiscal period, the Committee provided the Board with a report addressing the operations of the Program and assessing its adequacy and effectiveness of implementation for the period January 1, 2022 through December 31, 2022, including:
| • | the Fund had sufficient liquidity to both meet redemptions and operate effectively on behalf of shareholders; |
| • | there were no material changes to the Program during the period; |
| • | the implementation of the Program was effective to manage the Fund’s liquidity risk; and |
| • | the Program operated adequately during the period. |
There can be no assurance that the Program will achieve its objectives in the future. Please refer to the Fund’s prospectus for more information regarding the Fund’s exposure to liquidity risk and other principal risks to which an investment in the Fund may be subject.
Columbia Emerging Markets Fund | Annual Report 2023
| 41 |
Approval of Management Agreement
(Unaudited)
Columbia Management Investment Advisers, LLC (the Investment Manager, and together with its domestic and global affiliates, Columbia Threadneedle Investments), a wholly-owned subsidiary of Ameriprise Financial, Inc. (Ameriprise Financial), serves as the investment manager to Columbia Emerging Markets Fund (the Fund). Under a management agreement (the Management Agreement), the Investment Manager provides investment advice and other services to the Fund and other funds distributed by Columbia Management Investment Distributors, Inc. (collectively, the Funds).
On an annual basis, the Fund’s Board of Trustees (the Board), including the independent Board members (the Independent Trustees), considers renewal of the Management Agreement. The Investment Manager prepared detailed reports for the Board and its Contracts Committee (including its Contracts Subcommittee) in February, March, April, May and June 2023, including reports providing the results of analyses performed by a third-party data provider, Broadridge Financial Solutions, Inc. (Broadridge), and comprehensive responses by the Investment Manager to written requests for information by independent legal counsel to the Independent Trustees (Independent Legal Counsel), to assist the Board in making this determination. In addition, throughout the year, the Board (or its committees or subcommittees) regularly meets with portfolio management teams and senior management personnel and reviews information prepared by the Investment Manager addressing the services the Investment Manager provides and Fund performance. The Board also accords appropriate weight to the work, deliberations and conclusions of the various committees (including their subcommittees), such as the Contracts Committee, the Investment Review Committee, the Audit Committee and the Compliance Committee in determining whether to continue the Management Agreement.
The Board, at its June 22, 2023 Board meeting (the June Meeting), considered the renewal of the Management Agreement for an additional one-year term. At the June Meeting, Independent Legal Counsel reviewed with the Independent Trustees various factors relevant to the Board’s consideration of advisory agreements and the Board’s legal responsibilities related to such consideration. The Independent Trustees considered all information that they, their legal counsel or the Investment Manager believed reasonably necessary to evaluate and to approve the continuation of the Management Agreement. Among other things, the information and factors considered included the following:
| • | Information on the investment performance of the Fund relative to the performance of a group of mutual funds determined to be comparable to the Fund by Broadridge, as well as performance relative to one or more benchmarks; |
| • | Information on the Fund’s management fees and total expenses, including information comparing the Fund’s expenses to those of a group of comparable mutual funds, as determined by Broadridge; |
| • | The Investment Manager’s agreement to contractually limit or cap total operating expenses for the Fund so that total operating expenses (excluding certain fees and expenses, such as transaction costs and certain other investment related expenses, interest, taxes, acquired fund fees and expenses and infrequent and/or unusual expenses) would not exceed a specified annual rate, as a percentage of the Fund’s net assets; |
| • | Terms of the Management Agreement; |
| • | Descriptions of other agreements and arrangements with affiliates of the Investment Manager relating to the operations of the Fund, including agreements with respect to the provision of transfer agency and shareholder services to the Fund; |
| • | Descriptions of various services performed by the Investment Manager under the Management Agreement, including portfolio management and portfolio trading practices; |
| • | Information regarding any recently negotiated management fees of similarly-managed portfolios of other institutional clients of the Investment Manager; |
| • | Information regarding the resources of the Investment Manager, including information regarding senior management, portfolio managers and other personnel; |
| • | Information regarding the capabilities of the Investment Manager with respect to compliance monitoring services; |
| • | The profitability to the Investment Manager and its affiliates from their relationships with the Fund; and |
| • | Report provided by the Board’s independent fee consultant, JDL Consultants, LLC (JDL). |
| 42 | Columbia Emerging Markets Fund | Annual Report 2023 |
Approval of Management Agreement (continued)
(Unaudited)
Following an analysis and discussion of the foregoing, and the factors identified below, the Board, including all of the Independent Trustees, approved the renewal of the Management Agreement.
Nature, extent and quality of services provided by the Investment Manager
The Board analyzed various reports and presentations it had received detailing the services performed by the Investment Manager, as well as its history, expertise, resources and relative capabilities, and the qualifications of its personnel.
The Board specifically considered the many developments during recent years concerning the services provided by the Investment Manager. Among other things, the Board noted the organization and depth of the equity and credit research departments. The Board further observed the enhancements to the investment risk management department’s processes, systems and oversight over the past several years. The Board also took into account the broad scope of services provided by the Investment Manager to the Fund, including, among other services, investment, risk and compliance oversight. The Board also took into account the information it received concerning the Investment Manager’s ability to attract and retain key portfolio management personnel and that it has sufficient resources to provide competitive and adequate compensation to investment personnel.
In connection with the Board’s evaluation of the overall package of services provided by the Investment Manager, the Board also considered the nature, quality and range of administrative services provided to the Fund by the Investment Manager, as well as the achievements in 2022 in the performance of administrative services, and noted the various enhancements anticipated for 2023. In evaluating the quality of services provided under the Management Agreement, the Board also took into account the organization and strength of the Fund’s and its service providers’ compliance programs. The Board also reviewed the financial condition of the Investment Manager and its affiliates and each entity’s ability to carry out its responsibilities under the Management Agreement and the Fund’s other service agreements.
In addition, the Board discussed the acceptability of the terms of the Management Agreement, noting that no changes were proposed from the form of agreement previously approved. The Board also noted the wide array of legal and compliance services provided to the Fund under the Management Agreement.
After reviewing these and related factors (including investment performance as discussed below), the Board concluded, within the context of their overall conclusions, that the nature, extent and quality of the services provided to the Fund under the Management Agreement supported the continuation of the Management Agreement.
Investment performance
The Board carefully reviewed the investment performance of the Fund, including detailed reports providing the results of analyses performed by each of the Investment Manager, Broadridge and JDL collectively showing, for various periods (including since manager inception): (i) the performance of the Fund, (ii) the Fund’s performance relative to peers and benchmarks and (iii) the net assets of the Fund. The Board observed the Fund’s underperformance for certain periods, noting that appropriate steps (such as changes to the Fund’s investment process) had been taken to help improve the Fund’s performance.
The Board also reviewed a description of thethird-party data provider’s methodology for identifying the Fund’s peer groups for purposes of performance and expense comparisons.
The Board also considered the Investment Manager’s performance and reputation generally,and the Investment Manager’s willingness to take steps intended to improve performance. After reviewing these and related factors, the Board concluded, within the context of their overall conclusions, that the performance of the Fund and the Investment Manager, in light of other considerations, supported the continuation of the Management Agreement.
Comparative fees, costs of services provided and the profits realized by the Investment Manager and its affiliates from their relationships with the Fund
The Board reviewed comparative fees and the costs of services provided under the Management Agreement. The Board members considered detailed comparative information set forth in an annual report on fees and expenses, including, among other things, data (based on analyses conducted by Broadridge and JDL) showing a comparison of the Fund’s expenses with
Columbia Emerging Markets Fund | Annual Report 2023
| 43 |
Approval of Management Agreement (continued)
(Unaudited)
median expenses paid by funds in its comparative peer universe, as well as data showing the Fund’s contribution to the Investment Manager’s profitability. The Board reviewed the fees charged to comparable institutional or other accounts/vehicles managed by the Investment Manager and discussed differences in how the products are managed and operated, thus explaining many of the differences in fees.
The Board considered the reports of JDL, which assisted in the Board’s analysis of the Funds’ performance and expenses and the reasonableness of the Funds’ fee rates. The Board accorded particular weight to the notion that a primary objective of the level of fees is to achieve a rational pricing model applied consistently across the various product lines in the Fund family, while assuring that the overall fees for each Fund (with certain exceptions) are generally in line with the current “pricing philosophy” such that Fund total expense ratios, in general, approximate or are lower than the median expense ratios of funds in the same Lipper comparison universe. The Board took into account that the Fund’s total expense ratio (after considering proposed expense caps/waivers) approximated the peer universe’s median expense ratio.
After reviewing these and related factors, the Board concluded, within the context of their overall conclusions, that the levels of management fees and expenses of the Fund, in light of other considerations, supported the continuation of the Management Agreement.
The Board also considered the profitability of the Investment Manager and its affiliates in connection with the Investment Manager providing management services to the Fund. With respect to the profitability of the Investment Manager and its affiliates, the Independent Trustees referred to information discussing the profitability to the Investment Manager and Ameriprise Financial from managing, operating and distributing the Funds. The Board considered that the profitability generated by the Investment Manager in 2022 had declined from 2021 levels, due to a variety of factors, including the decreased assets under management of the Funds. It also took into account the indirect economic benefits flowing to the Investment Manager or its affiliates in connection with managing or distributing the Funds, such as the enhanced ability to offer various other financial products to Ameriprise Financial customers, soft dollar benefits and overall reputational advantages. The Board noted that the fees paid by the Fund should permit the Investment Manager to offer competitive compensation to its personnel, make necessary investments in its business and earn an appropriate profit. After reviewing these and related factors, the Board concluded, within the context of their overall conclusions, that the costs of services provided and the profitability to the Investment Manager and its affiliates from their relationships with the Fund supported the continuation of the Management Agreement.
Economies of scale
The Board considered the potential existence of economies of scale in the provision by the Investment Manager of services to the Fund, and whether those economies of scale were shared with the Fund through breakpoints in investment management fees or other means, such as expense limitation arrangements and additional investments by the Investment Manager in investment, trading, compliance and other resources. The Board considered the economies of scale that might be realized as the Fund’s net asset level grows and took note of the extent to which Fund shareholders might also benefit from such growth. In this regard, the Board took into account that management fees decline as Fund assets exceed various breakpoints, all of which have not been surpassed. The Board observed that the Management Agreement provided for breakpoints in the management fee rate schedule that allow opportunities for shareholders to realize lower fees as Fund assets grow and that there are additional opportunities through other means for sharing economies of scale with shareholders.
Conclusion
The Board reviewed all of the above considerations in reaching its decision to approve the continuation of the Management Agreement. In reaching its conclusions, no single factor was determinative.
On June 22, 2023, the Board, including all of the Independent Trustees, determined that fees payable under the Management Agreement were fair and reasonable in light of the extent and quality of services provided and approved the renewal of the Management Agreement.
| 44 | Columbia Emerging Markets Fund | Annual Report 2023 |
[THIS PAGE INTENTIONALLY LEFT BLANK]
[THIS PAGE INTENTIONALLY LEFT BLANK]
[THIS PAGE INTENTIONALLY LEFT BLANK]
Columbia Emerging Markets Fund
P.O. Box 219104
Kansas City, MO 64121-9104
Please read and consider the investment objectives, risks, charges and expenses for any fund carefully before investing. For a prospectus and summary prospectus, which contains this and other important information about the Fund, go to
columbiathreadneedleus.com/investor/. The Fund is distributed by Columbia Management Investment Distributors, Inc., member FINRA, and managed by Columbia Management Investment Advisers, LLC.
Columbia Threadneedle Investments (Columbia Threadneedle) is the global brand name of the Columbia and Threadneedle group of companies. All rights reserved.
© 2023 Columbia Management Investment Advisers, LLC.
columbiathreadneedleus.com/investor/

Annual Report
August 31, 2023
Columbia Greater China Fund
Not FDIC or NCUA Insured • No Financial Institution Guarantee • May Lose Value
If you elect to receive the shareholder report for Columbia Greater China Fund (the Fund) in paper, mailed to you, the Fund mails one shareholder report to each shareholder address, unless such shareholder elects to receive shareholder reports from the Fund electronically via e-mail or by having a paper notice mailed to you (Postcard Notice) that your Fund’s shareholder report is available at the Columbia funds’ website (columbiathreadneedleus.com/investor/). If you would like more than one report in paper to be mailed to you, or would like to elect to receive reports via e-mail or access them through Postcard Notice, please call shareholder services at 800.345.6611 and additional reports will be sent to you.
Proxy voting policies and procedures
The policy of the Board of Trustees is to vote the proxies of the companies in which the Fund holds investments consistent with the procedures as stated in the Statement of Additional Information (SAI). You may obtain a copy of the SAI without charge by calling 800.345.6611; contacting your financial intermediary; visiting columbiathreadneedleus.com/investor/; or searching the website of the Securities and Exchange Commission (SEC) at sec.gov. Information regarding how the Fund voted proxies relating to portfolio securities is filed with the SEC by August 31st for the most recent 12-month period ending June 30th of that year, and is available without charge by visiting columbiathreadneedleus.com/investor/, or searching the website of the SEC at sec.gov.
Quarterly schedule of investments
The Fund files a complete schedule of portfolio holdings with the SEC for the first and third quarters of each fiscal year on Form N-PORT. The Fund’s Form N-PORT filings are available on the SEC’s website at sec.gov. The Fund’s complete schedule of portfolio holdings, as filed on Form N-PORT, is available on columbiathreadneedleus.com/investor/ or can also be obtained without charge, upon request, by calling 800.345.6611.
Additional Fund information
For more information about the Fund, please visit columbiathreadneedleus.com/investor/ or call 800.345.6611. Customer Service Representatives are available to answer your questions Monday through Friday from 8 a.m. to 7 p.m. Eastern time.
Fund investment manager
Columbia Management Investment Advisers, LLC (the Investment Manager)
290 Congress Street
Boston, MA 02210
Fund distributor
Columbia Management Investment Distributors, Inc.
290 Congress Street
Boston, MA 02210
Fund transfer agent
Columbia Management Investment Services Corp.
P.O. Box 219104
Kansas City, MO 64121-9104
Columbia Greater China Fund | Annual Report 2023
Fund at a Glance
(Unaudited)
Investment objective
The Fund seeks long-term capital appreciation.
Portfolio management
Dara White, CFA
Co-Portfolio Manager
Managed Fund since 2019
Derek Lin, CFA
Co-Portfolio Manager
Managed Fund since 2020
Morningstar style boxTM
The Morningstar Style Box is based on a fund’s portfolio holdings. For equity funds, the vertical axis shows the market capitalization of the stocks owned, and the horizontal axis shows investment style (value, blend, or growth). Information shown is based on the most recent data provided by Morningstar.
© 2023 Morningstar, Inc. All rights reserved. The Morningstar information contained herein: (1) is proprietary to Morningstar and/or its content providers; (2) may not be copied or distributed; and (3) is not warranted to be accurate, complete or timely. Neither Morningstar nor its content providers are responsible for any damages or losses arising from any use of this information.
| Average annual total returns (%) (for the period ended August 31, 2023) |
| | | Inception | 1 Year | 5 Years | 10 Years |
| Class A | Excluding sales charges | 05/16/97 | -15.15 | -4.56 | 2.81 |
| | Including sales charges | | -20.03 | -5.68 | 2.20 |
| Advisor Class | 03/19/13 | -14.91 | -4.31 | 3.07 |
| Class C | Excluding sales charges | 05/16/97 | -15.77 | -5.27 | 2.04 |
| | Including sales charges | | -16.61 | -5.27 | 2.04 |
| Institutional Class | 05/16/97 | -15.01 | -4.33 | 3.05 |
| Institutional 2 Class | 11/08/12 | -14.85 | -4.24 | 3.17 |
| Institutional 3 Class* | 03/01/17 | -14.81 | -4.19 | 3.06 |
| MSCI China Index (Net) | | -7.53 | -3.89 | 2.48 |
| Hang Seng Index | | -7.80 | -7.98 | -1.77 |
Returns for Class A shares are shown with and without the maximum initial sales charge of 5.75%. Returns for Class C shares are shown with and without the 1.00% contingent deferred sales charge for the first year only. The Fund’s other share classes are not subject to sales charges and have limited eligibility. Please see the Fund’s prospectus for details. Performance for different share classes will vary based on differences in sales charges and fees associated with each share class. All results shown assume reinvestment of distributions during the period. Returns do not reflect the deduction of taxes that a shareholder may pay on Fund distributions or on the redemption of Fund shares. Performance results reflect the effect of any fee waivers or reimbursements of Fund expenses by Columbia Management Investment Advisers, LLC and/or any of its affiliates. Absent these fee waivers or expense reimbursement arrangements, performance results would have been lower.
The performance information shown represents past performance and is not a guarantee of future results. The investment return and principal value of your investment will fluctuate so that your shares, when redeemed, may be worth more or less than their original cost. Current performance may be lower or higher than the performance information shown. You may obtain performance information current to the most recent month-end by contacting your financial intermediary, visiting columbiathreadneedleus.com/investor/ or calling 800.345.6611.
| * | The returns shown for periods prior to the share class inception date (including returns for the Life of the Fund, if shown, which are since Fund inception) include the returns of the Fund’s oldest share class. Since the Fund launched more than one share class at its inception, Class A shares were used. These returns are adjusted to reflect any higher class-related operating expenses of the newer share classes, as applicable. Please visit columbiathreadneedleus.com/investor/investment-products/mutual-funds/appended-performance for more information. |
The MSCI China Index (Net) is designed to broadly and fairly represent the full diversity of business activities in China. This index aims to capture 85% of the free float adjusted market capitalization in each industry group.
The Hang Seng Index tracks the performance of approximately 70% of the total market capitalization of the stock exchange of Hong Kong.
Indices are not available for investment, are not professionally managed and do not reflect sales charges, fees, brokerage commissions, taxes (except the MSCI China Index (Net) which reflects reinvested dividends net of withholding taxes) or other expenses of investing. Securities in the Fund may not match those in an index.
Columbia Greater China Fund | Annual Report 2023
| 3 |
Fund at a Glance (continued)
(Unaudited)
Performance of a hypothetical $10,000 investment (August 31, 2013 — August 31, 2023)
The chart above shows the change in value of a hypothetical $10,000 investment in Class A shares of Columbia Greater China Fund during the stated time period, and does not reflect the deduction of taxes that a shareholder may pay on Fund distributions or on the redemption of Fund shares.
| Equity sector breakdown (%) (at August 31, 2023) |
| Communication Services | 25.9 |
| Consumer Discretionary | 33.4 |
| Consumer Staples | 11.9 |
| Financials | 11.8 |
| Health Care | 4.4 |
| Industrials | 7.2 |
| Information Technology | 1.5 |
| Materials | 1.7 |
| Real Estate | 2.2 |
| Total | 100.0 |
Percentages indicated are based upon total equity investments. The Fund’s portfolio composition is subject to change.
| Country breakdown (%) (at August 31, 2023) |
| China | 91.3 |
| Hong Kong | 6.3 |
| United States | 2.4 |
| Total | 100.0 |
Country breakdown is based primarily on issuer’s place of organization/incorporation. Percentages indicated are based upon total investments, excluding investments in derivatives, if any. The Fund’s portfolio composition is subject to change.
| 4 | Columbia Greater China Fund | Annual Report 2023 |
Manager Discussion of Fund Performance
(Unaudited)
For the 12-month period that ended August 31, 2023, Class A shares of Columbia Greater China Fund returned -15.15% excluding sales charges. The Fund’s benchmark, the MSCI China Index (Net), returned -7.53% for the same period. The Hang Seng Index returned -7.80%.
Market overview
Over the period, Chinese equities hit lows following the China National Party Congress in late October of 2022, which raised alarm over the extent to which President Xi Jinping appeared determined to further centralize control. Sentiment rebounded early in 2023 on optimism around China’s reopening. However, markets would soon retreat on fears of financial system instability in the wake of issues with U.S. regional banks which emerged in February, heightened U.S.-China tensions following the spy balloon incident, and stronger-than-expected U.S. economic data which raised the prospect of further tightening of U.S. Federal Reserve (Fed) policy.
As the period progressed, markets were encouraged by Chinese government efforts to support the ailing property sector and loosen the reins on private enterprise, along with lower-than-expected inflation and the prospect of central bank rate cuts. In addition, headlines around potential commercial applications for generative artificial intelligence (AI) boosted information technology stocks. Factors that constrained market sentiment included continued deterioration in relations between the U.S. and China and surprisingly soft Chinese economic activity despite the Chinese government’s loosening of pandemic-era restrictions.
The Fund’s notable detractors during the period
| • | In sector terms, selection within consumer discretionary was by a wide margin the largest constraint on the Fund’s performance relative to the benchmark. |
| • | With respect to individual detractors, Chinese online retailer JD.com, Inc. reported disappointing core revenue growth driven by very weak consumption of goods along with increased competition. |
| • | Similarly, Meituan, a shopping platform for locally sourced consumer products and services, has been negatively impacted by new entrants and anemic Chinese consumer spending. |
| • | Results for Chinese sportswear and sports equipment company Li-Ning Co., Ltd. also suffered from weak consumer demand as well as from increased competition from international brands such as Adidas and Nike. |
| • | Finally, China Tourism Group Duty Free Corp., Ltd., a duty free store operator, has not been immune from the impact of China’s less-than-robust rebound following reopening. |
The Fund’s notable contributors during the period
| • | In sector terms, selection within real estate and industrials proved most beneficial. |
| • | With respect to individual holdings, NetEase, Inc., a Chinese internet company, was supported by a solid pipeline of games which are expected to support growth. |
| • | Shares of Beijing Kingsoft Office Software, Inc. benefited from the company’s strong subscription monetization as well as the growth opportunity from generative AI applications which we believe should drive higher average revenue per user. We sold the Fund’s position in Beijing Kingsoft Office Software, Inc. before the close of the reporting period. |
| • | A lack of exposure to NIO proved additive as sentiment with respect to the electronic vehicle manufacturer suffered from concerns over the broader Chinese economy as well as higher input costs. |
| • | Zhejiang Sanhua Intelligent Controls Co., Ltd. is an industry leader in thermal management systems critical to improving power generation energy efficiency globally and to the manufacture of electronic vehicles. The stock outperformed on strong revenues as well as a book of secured orders which we believe should support growth in coming years. |
Market risk may affect a single issuer, sector of the economy, industry or the market as a whole. International investing involves certain risks and volatility due to potential political, economic or currency instabilities and different financial and accounting standards. Risks are enhanced for emerging market issuers. Concentration in the Greater China region, where issuers tend to be less developed than U.S. issuers, presents increased risk of loss than a fund
Columbia Greater China Fund | Annual Report 2023
| 5 |
Manager Discussion of Fund Performance (continued)
(Unaudited)
that does not concentrate its investments. Investments in small- and mid-cap companies involve risks and volatility greater than investments in larger, more established companies. As a non-diversified fund, fewer investments could have a greater affect on performance. See the Fund’s prospectus for more information on these and other risks.
The views expressed in this report reflect the current views of the respective parties who have contributed to this report. These views are not guarantees of future performance and involve certain risks, uncertainties and assumptions that are difficult to predict, so actual outcomes and results may differ significantly from the views expressed. These views are subject to change at any time based upon economic, market or other conditions and the respective parties disclaim any responsibility to update such views. These views may not be relied on as investment advice and, because investment decisions for a Columbia fund are based on numerous factors, may not be relied on as an indication of trading intent on behalf of any particular Columbia fund. References to specific securities should not be construed as a recommendation or investment advice.
| 6 | Columbia Greater China Fund | Annual Report 2023 |
Understanding Your Fund’s Expenses
(Unaudited)
As an investor, you incur two types of costs. There are shareholder transaction costs, which generally include sales charges on purchases and may include redemption fees. There are also ongoing fund costs, which generally include management fees, distribution and/or service fees, and other fund expenses. The following information is intended to help you understand your ongoing costs (in dollars) of investing in the Fund and to help you compare these costs with the ongoing costs of investing in other mutual funds.
Analyzing your Fund’s expenses
To illustrate these ongoing costs, we have provided examples and calculated the expenses paid by investors in each share class of the Fund during the period. The actual and hypothetical information in the table is based on an initial investment of $1,000 at the beginning of the period indicated and held for the entire period. Expense information is calculated two ways and each method provides you with different information. The amount listed in the “Actual” column is calculated using the Fund’s actual operating expenses and total return for the period. You may use the Actual information, together with the amount invested, to estimate the expenses that you paid over the period. Simply divide your account value by $1,000 (for example, an $8,600 account value divided by $1,000 = 8.6), then multiply the results by the expenses paid during the period under the “Actual” column. The amount listed in the “Hypothetical” column assumes a 5% annual rate of return before expenses (which is not the Fund’s actual return) and then applies the Fund’s actual expense ratio for the period to the hypothetical return. You should not use the hypothetical account values and expenses to estimate either your actual account balance at the end of the period or the expenses you paid during the period. See “Compare with other funds” below for details on how to use the hypothetical data.
Compare with other funds
Since all mutual funds are required to include the same hypothetical calculations about expenses in shareholder reports, you can use this information to compare the ongoing cost of investing in the Fund with other funds. To do so, compare the hypothetical example with the 5% hypothetical examples that appear in the shareholder reports of other funds. As you compare hypothetical examples of other funds, it is important to note that hypothetical examples are meant to highlight the ongoing costs of investing in a fund only and do not reflect any transaction costs, such as sales charges, or redemption or exchange fees. Therefore, the hypothetical calculations are useful in comparing ongoing costs only, and will not help you determine the relative total costs of owning different funds. If transaction costs were included in these calculations, your costs would be higher.
| March 1, 2023 — August 31, 2023 |
| | Account value at the
beginning of the
period ($) | Account value at the
end of the
period ($) | Expenses paid during
the period ($) | Fund’s annualized
expense ratio (%) |
| | Actual | Hypothetical | Actual | Hypothetical | Actual | Hypothetical | Actual |
| Class A | 1,000.00 | 1,000.00 | 898.20 | 1,017.74 | 7.08 | 7.53 | 1.48 |
| Advisor Class | 1,000.00 | 1,000.00 | 899.40 | 1,019.00 | 5.89 | 6.26 | 1.23 |
| Class C | 1,000.00 | 1,000.00 | 894.90 | 1,013.96 | 10.65 | 11.32 | 2.23 |
| Institutional Class | 1,000.00 | 1,000.00 | 899.50 | 1,019.00 | 5.89 | 6.26 | 1.23 |
| Institutional 2 Class | 1,000.00 | 1,000.00 | 899.80 | 1,019.46 | 5.46 | 5.80 | 1.14 |
| Institutional 3 Class | 1,000.00 | 1,000.00 | 900.10 | 1,019.71 | 5.22 | 5.55 | 1.09 |
Expenses paid during the period are equal to the annualized expense ratio for each class as indicated above, multiplied by the average account value over the period and then multiplied by the number of days in the Fund’s most recent fiscal half year and divided by 365.
Expenses do not include fees and expenses incurred indirectly by the Fund from its investment in underlying funds, including affiliated and non-affiliated pooled investment vehicles, such as mutual funds and exchange-traded funds.
Had Columbia Management Investment Advisers, LLC and/or certain of its affiliates not waived/reimbursed certain fees and expenses, account value at the end of the period would have been reduced.
Columbia Greater China Fund | Annual Report 2023
| 7 |
Portfolio of Investments
August 31, 2023
(Percentages represent value of investments compared to net assets)
Investments in securities
| Common Stocks 97.6% |
| Issuer | Shares | Value ($) |
| Communication Services 25.2% |
| Entertainment 5.1% |
| HUYA, Inc. ADR(a) | 54,747 | 146,722 |
| NetEase, Inc. | 224,000 | 4,640,711 |
| Total | | 4,787,433 |
| Interactive Media & Services 20.1% |
| Autohome, Inc., ADR | 16,281 | 470,521 |
| Baidu, Inc. Class A(a) | 207,676 | 3,708,936 |
| Kanzhun Ltd., ADR(a) | 41,765 | 618,122 |
| Kuaishou Technology(a) | 36,600 | 299,605 |
| Tencent Holdings Ltd. | 331,000 | 13,716,761 |
| Total | | 18,813,945 |
| Total Communication Services | 23,601,378 |
| Consumer Discretionary 32.6% |
| Auto Components 0.4% |
| Hesai Group, ADR(a) | 37,244 | 367,971 |
| Broadline Retail 14.5% |
| Alibaba Group Holding Ltd.(a) | 686,468 | 7,967,248 |
| JD.com, Inc., Class A | 118,602 | 1,969,754 |
| PDD Holdings, Inc., ADR(a) | 36,794 | 3,641,502 |
| Total | | 13,578,504 |
| Hotels, Restaurants & Leisure 10.3% |
| Huazhu Group Ltd., ADR(a) | 17,737 | 714,446 |
| Meituan, Class B(a) | 311,970 | 5,162,840 |
| Sands China Ltd.(a) | 427,200 | 1,445,090 |
| Shanghai Jinjiang International Hotels Co., Ltd., Class A | 42,400 | 224,669 |
| Songcheng Performance Development Co., Ltd., Class A | 965,600 | 1,644,436 |
| Trip.com Group Ltd., ADR(a) | 10,671 | 419,477 |
| Total | | 9,610,958 |
| Household Durables 1.4% |
| Gree Electric Appliances, Inc., Class A | 89,330 | 438,604 |
| Midea Group Co., Ltd., Class A | 119,475 | 926,286 |
| Total | | 1,364,890 |
| Common Stocks (continued) |
| Issuer | Shares | Value ($) |
| Specialty Retail 1.9% |
| China Tourism Group Duty Free Corp., Ltd., Class A | 54,800 | 820,157 |
| Topsports International Holdings Ltd. | 1,175,000 | 956,889 |
| Total | | 1,777,046 |
| Textiles, Apparel & Luxury Goods 4.1% |
| ANTA Sports Products Ltd. | 37,400 | 421,618 |
| Li Ning Co., Ltd. | 464,500 | 2,195,370 |
| Shenzhou International Group Holdings Ltd. | 117,600 | 1,204,972 |
| Total | | 3,821,960 |
| Total Consumer Discretionary | 30,521,329 |
| Consumer Staples 11.6% |
| Beverages 7.3% |
| China Resources Beer Holdings Co., Ltd. | 216,000 | 1,268,211 |
| Eastroc Beverage Group Co., Ltd., Class A | 52,520 | 1,415,228 |
| Kweichow Moutai Co., Ltd., Class A | 12,200 | 3,095,954 |
| Wuliangye Yibin Co., Ltd., Class A | 51,033 | 1,091,431 |
| Total | | 6,870,824 |
| Food Products 3.8% |
| China Mengniu Dairy Co., Ltd.(a) | 630,000 | 2,118,354 |
| Inner Mongolia Yili Industrial Group Co., Ltd., Class A | 395,400 | 1,411,335 |
| Total | | 3,529,689 |
| Personal Care Products 0.5% |
| Proya Cosmetics Co., Ltd., Class A | 28,812 | 441,502 |
| Total Consumer Staples | 10,842,015 |
| Financials 11.5% |
| Banks 5.3% |
| China Construction Bank Corp., Class H | 3,043,340 | 1,628,342 |
| China Merchants Bank Co., Ltd., Class H | 473,000 | 1,872,995 |
| Industrial & Commercial Bank of China Ltd., Class H | 3,243,000 | 1,486,842 |
| Total | | 4,988,179 |
| Capital Markets 2.0% |
| East Money Information Co., Ltd., Class A | 177,800 | 387,508 |
| Hong Kong Exchanges and Clearing Ltd. | 37,200 | 1,441,806 |
| Total | | 1,829,314 |
The accompanying Notes to Financial Statements are an integral part of this statement.
| 8 | Columbia Greater China Fund | Annual Report 2023 |
Portfolio of Investments (continued)
August 31, 2023
| Common Stocks (continued) |
| Issuer | Shares | Value ($) |
| Insurance 4.2% |
| AIA Group Ltd. | 256,200 | 2,318,164 |
| Ping An Insurance Group Co. of China Ltd., Class H | 268,000 | 1,604,556 |
| Total | | 3,922,720 |
| Total Financials | 10,740,213 |
| Health Care 4.4% |
| Biotechnology 0.8% |
| BeiGene Ltd., ADR(a) | 1,901 | 394,553 |
| Zai Lab Ltd., ADR(a) | 12,401 | 315,853 |
| Total | | 710,406 |
| Health Care Equipment & Supplies 0.9% |
| Shenzhen Mindray Bio-Medical Electronics Co., Ltd., Class A | 23,000 | 852,699 |
| Health Care Providers & Services 0.5% |
| New Horizon Health Ltd.(a) | 210,000 | 464,795 |
| Health Care Technology 0.4% |
| Medlive Technology Co., Ltd.(b) | 378,484 | 337,856 |
| Life Sciences Tools & Services 1.8% |
| WuXi AppTec Co., Ltd., Class H | 49,578 | 543,288 |
| WuXi Biologics Cayman, Inc.(a) | 204,000 | 1,150,071 |
| Total | | 1,693,359 |
| Pharmaceuticals —% |
| China Animal Healthcare Ltd.(a),(c),(d) | 1,050,000 | 0 |
| Total Health Care | 4,059,115 |
| Industrials 7.0% |
| Electrical Equipment 1.8% |
| Contemporary Amperex Technology Co., Ltd., Class A | 22,780 | 738,690 |
| Sungrow Power Supply Co., Ltd., Class A | 69,200 | 946,979 |
| Total | | 1,685,669 |
| Ground Transportation 1.6% |
| Full Truck Alliance Co., Ltd., ADR(a) | 221,740 | 1,485,658 |
| Machinery 3.6% |
| Shenzhen Inovance Technology Co., Ltd., Class A | 44,975 | 421,555 |
| Techtronic Industries Co., Ltd. | 74,000 | 729,839 |
| Zhejiang Sanhua Intelligent Controls Co., Ltd., Class A | 551,000 | 2,244,024 |
| Total | | 3,395,418 |
| Total Industrials | 6,566,745 |
| Common Stocks (continued) |
| Issuer | Shares | Value ($) |
| Information Technology 1.5% |
| IT Services 0.5% |
| Chindata Group Holdings Ltd., ADR(a) | 57,807 | 483,845 |
| Software 1.0% |
| Glodon Co., Ltd., Class A | 166,880 | 561,738 |
| Kingdee International Software Group Co., Ltd.(a) | 224,000 | 346,105 |
| Total | | 907,843 |
| Total Information Technology | 1,391,688 |
| Materials 1.7% |
| Chemicals 0.3% |
| Skshu Paint Co., Ltd., Class A(a) | 29,534 | 305,745 |
| Construction Materials 1.4% |
| Beijing Oriental Yuhong Waterproof Technology Co., Ltd., Class A | 325,600 | 1,284,783 |
| Total Materials | 1,590,528 |
| Real Estate 2.1% |
| Real Estate Management & Development 2.1% |
| China Resources Land Ltd. | 468,000 | 1,978,095 |
| Total Real Estate | 1,978,095 |
Total Common Stocks
(Cost $76,078,711) | 91,291,106 |
|
| Money Market Funds 2.4% |
| | Shares | Value ($) |
| Columbia Short-Term Cash Fund, 5.476%(e),(f) | 2,247,716 | 2,247,042 |
Total Money Market Funds
(Cost $2,246,973) | 2,247,042 |
Total Investments in Securities
(Cost: $78,325,684) | 93,538,148 |
| Other Assets & Liabilities, Net | | (23,051) |
| Net Assets | 93,515,097 |
The accompanying Notes to Financial Statements are an integral part of this statement.
Columbia Greater China Fund | Annual Report 2023
| 9 |
Portfolio of Investments (continued)
August 31, 2023
Notes to Portfolio of Investments
| (a) | Non-income producing investment. |
| (b) | Represents privately placed and other securities and instruments exempt from Securities and Exchange Commission registration (collectively, private placements), such as Section 4(a)(2) and Rule 144A eligible securities, which are often sold only to qualified institutional buyers. At August 31, 2023, the total value of these securities amounted to $337,856, which represents 0.36% of total net assets. |
| (c) | Represents fair value as determined in good faith under procedures approved by the Board of Trustees. At August 31, 2023, the total value of these securities amounted to $0, which represents less than 0.01% of total net assets. |
| (d) | Valuation based on significant unobservable inputs. |
| (e) | The rate shown is the seven-day current annualized yield at August 31, 2023. |
| (f) | As defined in the Investment Company Act of 1940, as amended, an affiliated company is one in which the Fund owns 5% or more of the company’s outstanding voting securities, or a company which is under common ownership or control with the Fund. The value of the holdings and transactions in these affiliated companies during the year ended August 31, 2023 are as follows: |
| Affiliated issuers | Beginning
of period($) | Purchases($) | Sales($) | Net change in
unrealized
appreciation
(depreciation)($) | End of
period($) | Realized gain
(loss)($) | Dividends($) | End of
period shares |
| Columbia Short-Term Cash Fund, 5.476% |
| | 5,041,311 | 58,074,758 | (60,868,781) | (246) | 2,247,042 | 1,034 | 90,349 | 2,247,716 |
Abbreviation Legend
| ADR | American Depositary Receipt |
Fair value measurements
The Fund categorizes its fair value measurements according to a three-level hierarchy that maximizes the use of observable inputs and minimizes the use of unobservable inputs by prioritizing that the most observable input be used when available. Observable inputs are those that market participants would use in pricing an investment based on market data obtained from sources independent of the reporting entity. Unobservable inputs are those that reflect the Fund’s assumptions about the information market participants would use in pricing an investment. An investment’s level within the fair value hierarchy is based on the lowest level of any input that is deemed significant to the asset’s or liability’s fair value measurement. The input levels are not necessarily an indication of the risk or liquidity associated with investments at that level. For example, certain U.S. government securities are generally high quality and liquid, however, they are reflected as Level 2 because the inputs used to determine fair value may not always be quoted prices in an active market.
Fair value inputs are summarized in the three broad levels listed below:
| ■ | Level 1 — Valuations based on quoted prices for investments in active markets that the Fund has the ability to access at the measurement date. Valuation adjustments are not applied to Level 1 investments. |
| ■ | Level 2 — Valuations based on other significant observable inputs (including quoted prices for similar securities, interest rates, prepayment speeds, credit risks, etc.). |
| ■ | Level 3 — Valuations based on significant unobservable inputs (including the Fund’s own assumptions and judgment in determining the fair value of investments). |
Inputs that are used in determining fair value of an investment may include price information, credit data, volatility statistics, and other factors. These inputs can be either observable or unobservable. The availability of observable inputs can vary between investments, and is affected by various factors such as the type of investment, and the volume and level of activity for that investment or similar investments in the marketplace. The inputs will be considered by the Investment Manager, along with any other relevant factors in the calculation of an investment’s fair value. The Fund uses prices and inputs that are current as of the measurement date, which may include periods of market dislocations. During these periods, the availability of prices and inputs may be reduced for many investments. This condition could cause an investment to be reclassified between the various levels within the hierarchy.
Foreign equity securities actively traded in markets where there is a significant delay in the local close relative to the New York Stock Exchange are classified as Level 2. The values of these securities may include an adjustment to reflect the impact of market movements following the close of local trading, as described in Note 2 to the financial statements – Security valuation.
Investments falling into the Level 3 category are primarily supported by quoted prices from brokers and dealers participating in the market for those investments. However, these may be classified as Level 3 investments due to lack of market transparency and corroboration to support these quoted prices. Additionally, valuation models may be used as the pricing source for any remaining investments classified as Level 3. These models may rely on one or more significant unobservable inputs and/or significant assumptions by the Investment Manager. Inputs used in valuations may include, but are not limited to, financial statement analysis, capital account balances, discount rates and estimated cash flows, and comparable company data.
The Fund’s Board of Trustees (the Board) has designated the Investment Manager, through its Valuation Committee (the Committee), as valuation designee, responsible for determining the fair value of the assets of the Fund for which market quotations are not readily available using valuation procedures approved by the Board. The Committee consists of voting and non-voting members from various groups within the Investment Manager’s organization, including operations and accounting, trading and investments, compliance, risk management and legal.
The Committee meets at least monthly to review and approve valuation matters, which may include a description of specific valuation determinations, data regarding pricing information received from approved pricing vendors and brokers and the results of Board-approved valuation policies and procedures (the Policies). The Policies address, among other things, instances when market quotations are or are not readily available, including recommendations of third party pricing vendors and a determination of appropriate pricing methodologies; events that require specific valuation determinations and assessment of fair value techniques; securities with a potential for stale pricing, including those that are illiquid, restricted, or
The accompanying Notes to Financial Statements are an integral part of this statement.
| 10 | Columbia Greater China Fund | Annual Report 2023 |
Portfolio of Investments (continued)
August 31, 2023
Fair value measurements (continued)
in default; and the effectiveness of third party pricing vendors, including periodic reviews of vendors. The Committee meets more frequently, as needed, to discuss additional valuation matters, which may include the need to review back-testing results, review time-sensitive information or approve related valuation actions. Representatives of Columbia Management Investment Advisers, LLC report to the Board at each of its regularly scheduled meetings to discuss valuation matters and actions during the period, similar to those described earlier.
The following table is a summary of the inputs used to value the Fund’s investments at August 31, 2023:
| | Level 1 ($) | Level 2 ($) | Level 3 ($) | Total ($) |
| Investments in Securities | | | | |
| Common Stocks | | | | |
| Communication Services | 1,235,365 | 22,366,013 | — | 23,601,378 |
| Consumer Discretionary | 5,143,396 | 25,377,933 | — | 30,521,329 |
| Consumer Staples | — | 10,842,015 | — | 10,842,015 |
| Financials | — | 10,740,213 | — | 10,740,213 |
| Health Care | 710,406 | 3,348,709 | 0* | 4,059,115 |
| Industrials | 1,485,658 | 5,081,087 | — | 6,566,745 |
| Information Technology | 483,845 | 907,843 | — | 1,391,688 |
| Materials | — | 1,590,528 | — | 1,590,528 |
| Real Estate | — | 1,978,095 | — | 1,978,095 |
| Total Common Stocks | 9,058,670 | 82,232,436 | 0* | 91,291,106 |
| Money Market Funds | 2,247,042 | — | — | 2,247,042 |
| Total Investments in Securities | 11,305,712 | 82,232,436 | 0* | 93,538,148 |
See the Portfolio of Investments for all investment classifications not indicated in the table.
The Fund’s assets assigned to the Level 2 input category are generally valued using the market approach, in which a security’s value is determined through reference to prices and information from market transactions for similar or identical assets. These assets include certain foreign securities for which a third party statistical pricing service may be employed for purposes of fair market valuation. The model utilized by such third party statistical pricing service takes into account a security’s correlation to available market data including, but not limited to, intraday index, ADR, and exchange-traded fund movements.
The Fund does not hold any significant investments (greater than one percent of net assets) categorized as Level 3.
The accompanying Notes to Financial Statements are an integral part of this statement.
Columbia Greater China Fund | Annual Report 2023
| 11 |
Statement of Assets and Liabilities
August 31, 2023
| Assets | |
| Investments in securities, at value | |
| Unaffiliated issuers (cost $76,078,711) | $91,291,106 |
| Affiliated issuers (cost $2,246,973) | 2,247,042 |
| Receivable for: | |
| Capital shares sold | 45,289 |
| Dividends | 70,815 |
| Trustees’ fees | 83,501 |
| Prepaid expenses | 4,350 |
| Total assets | 93,742,103 |
| Liabilities | |
| Payable for: | |
| Capital shares redeemed | 91,790 |
| Management services fees | 2,464 |
| Distribution and/or service fees | 267 |
| Transfer agent fees | 8,975 |
| Trustees’ fees | 99,793 |
| Accounting services fees | 15,045 |
| Other expenses | 8,672 |
| Total liabilities | 227,006 |
| Net assets applicable to outstanding capital stock | $93,515,097 |
| Represented by | |
| Paid in capital | 103,991,601 |
| Total distributable earnings (loss) | (10,476,504) |
| Total - representing net assets applicable to outstanding capital stock | $93,515,097 |
| Class A | |
| Net assets | $33,862,666 |
| Shares outstanding | 1,022,892 |
| Net asset value per share | $33.10 |
| Maximum sales charge | 5.75% |
| Maximum offering price per share (calculated by dividing the net asset value per share by 1.0 minus the maximum sales charge for Class A shares) | $35.12 |
| Advisor Class | |
| Net assets | $582,190 |
| Shares outstanding | 15,535 |
| Net asset value per share | $37.48 |
| Class C | |
| Net assets | $1,130,089 |
| Shares outstanding | 38,824 |
| Net asset value per share | $29.11 |
| Institutional Class | |
| Net assets | $27,372,797 |
| Shares outstanding | 746,244 |
| Net asset value per share | $36.68 |
| Institutional 2 Class | |
| Net assets | $1,858,643 |
| Shares outstanding | 49,275 |
| Net asset value per share | $37.72 |
| Institutional 3 Class | |
| Net assets | $28,708,712 |
| Shares outstanding | 781,154 |
| Net asset value per share | $36.75 |
The accompanying Notes to Financial Statements are an integral part of this statement.
| 12 | Columbia Greater China Fund | Annual Report 2023 |
Statement of Operations
Year Ended August 31, 2023
| Net investment income | |
| Income: | |
| Dividends — unaffiliated issuers | $1,543,600 |
| Dividends — affiliated issuers | 90,349 |
| Interfund lending | 27 |
| Foreign taxes withheld | (87,742) |
| Total income | 1,546,234 |
| Expenses: | |
| Management services fees | 916,701 |
| Distribution and/or service fees | |
| Class A | 100,041 |
| Class C | 13,634 |
| Transfer agent fees | |
| Class A | 61,375 |
| Advisor Class | 964 |
| Class C | 2,098 |
| Institutional Class | 35,587 |
| Institutional 2 Class | 1,529 |
| Institutional 3 Class | 1,854 |
| Trustees’ fees | 17,426 |
| Custodian fees | 31,013 |
| Printing and postage fees | 15,722 |
| Registration fees | 88,992 |
| Accounting services fees | 33,218 |
| Legal fees | 13,072 |
| Line of credit interest | 6,434 |
| Interest on interfund lending | 580 |
| Compensation of chief compliance officer | 18 |
| Other | 35,570 |
| Total expenses | 1,375,828 |
| Fees waived or expenses reimbursed by Investment Manager and its affiliates | (61,577) |
| Fees waived by transfer agent | |
| Class A | (1,311) |
| Advisor Class | (19) |
| Class C | (49) |
| Institutional Class | (848) |
| Expense reduction | (366) |
| Total net expenses | 1,311,658 |
| Net investment income | 234,576 |
| Realized and unrealized gain (loss) — net | |
| Net realized gain (loss) on: | |
| Investments — unaffiliated issuers | (7,288,803) |
| Investments — affiliated issuers | 1,034 |
| Foreign currency translations | (18,714) |
| Net realized loss | (7,306,483) |
| Net change in unrealized appreciation (depreciation) on: | |
| Investments — unaffiliated issuers | (11,920,493) |
| Investments — affiliated issuers | (246) |
| Foreign currency translations | 18 |
| Net change in unrealized appreciation (depreciation) | (11,920,721) |
| Net realized and unrealized loss | (19,227,204) |
| Net decrease in net assets resulting from operations | $(18,992,628) |
The accompanying Notes to Financial Statements are an integral part of this statement.
Columbia Greater China Fund | Annual Report 2023
| 13 |
Statement of Changes in Net Assets
| | Year Ended
August 31, 2023 | Year Ended
August 31, 2022 |
| Operations | | |
| Net investment income (loss) | $234,576 | $(412,292) |
| Net realized loss | (7,306,483) | (15,314,467) |
| Net change in unrealized appreciation (depreciation) | (11,920,721) | (56,050,989) |
| Net decrease in net assets resulting from operations | (18,992,628) | (71,777,748) |
| Decrease in net assets from capital stock activity | (20,929,914) | (6,138,495) |
| Total decrease in net assets | (39,922,542) | (77,916,243) |
| Net assets at beginning of year | 133,437,639 | 211,353,882 |
| Net assets at end of year | $93,515,097 | $133,437,639 |
The accompanying Notes to Financial Statements are an integral part of this statement.
| 14 | Columbia Greater China Fund | Annual Report 2023 |
Statement of Changes in Net Assets (continued)
| | Year Ended | Year Ended |
| | August 31, 2023 | August 31, 2022 |
| | Shares | Dollars ($) | Shares | Dollars ($) |
| Capital stock activity |
| Class A | | | | |
| Shares sold | 90,865 | 3,061,050 | 254,962 | 11,442,751 |
| Shares redeemed | (250,852) | (8,766,424) | (457,054) | (20,899,443) |
| Net decrease | (159,987) | (5,705,374) | (202,092) | (9,456,692) |
| Advisor Class | | | | |
| Shares sold | 10,351 | 442,474 | 5,986 | 324,200 |
| Shares redeemed | (10,125) | (420,851) | (17,189) | (978,233) |
| Net increase (decrease) | 226 | 21,623 | (11,203) | (654,033) |
| Class C | | | | |
| Shares sold | 7,258 | 228,896 | 14,355 | 574,846 |
| Shares redeemed | (18,881) | (598,063) | (33,041) | (1,455,956) |
| Net decrease | (11,623) | (369,167) | (18,686) | (881,110) |
| Institutional Class | | | | |
| Shares sold | 690,680 | 25,750,689 | 1,413,896 | 73,432,999 |
| Shares redeemed | (1,469,433) | (56,409,794) | (990,458) | (53,556,308) |
| Net increase (decrease) | (778,753) | (30,659,105) | 423,438 | 19,876,691 |
| Institutional 2 Class | | | | |
| Shares sold | 3,553 | 146,078 | 22,085 | 1,323,234 |
| Shares redeemed | (24,461) | (965,585) | (61,369) | (3,559,081) |
| Net decrease | (20,908) | (819,507) | (39,284) | (2,235,847) |
| Institutional 3 Class | | | | |
| Shares sold | 641,077 | 25,774,489 | 116,611 | 6,916,413 |
| Shares redeemed | (229,563) | (9,172,873) | (418,998) | (19,703,917) |
| Net increase (decrease) | 411,514 | 16,601,616 | (302,387) | (12,787,504) |
| Total net decrease | (559,531) | (20,929,914) | (150,214) | (6,138,495) |
The accompanying Notes to Financial Statements are an integral part of this statement.
Columbia Greater China Fund | Annual Report 2023
| 15 |
The following table is intended to help you understand the Fund’s financial performance. Certain information reflects financial results for a single share of a class held for the periods shown. Per share net investment income (loss) amounts are calculated based on average shares outstanding during the period. Total return assumes reinvestment of all dividends and distributions, if any. Total return does not reflect payment of sales charges, if any. Total return and portfolio turnover are not annualized for periods of less than one year. The ratios of expenses and net investment income are annualized for periods of less than one year. The portfolio turnover rate is calculated without regard to purchase and sales transactions of short-term instruments and certain derivatives, if any. If such transactions were included, the Fund’s portfolio turnover rate may be higher.
| | Net asset value,
beginning of
period | Net
investment
income
(loss) | Net
realized
and
unrealized
gain (loss) | Total from
investment
operations | Distributions
from net
realized
gains | Total
distributions to
shareholders |
| Class A |
| Year Ended 8/31/2023 | $39.01 | (0.00)(c) | (5.91) | (5.91) | — | — |
| Year Ended 8/31/2022 | $59.43 | (0.23) | (20.19) | (20.42) | — | — |
| Year Ended 8/31/2021 | $67.81 | (0.51) | (4.70) | (5.21) | (3.17) | (3.17) |
| Year Ended 8/31/2020 | $45.00 | (0.24) | 23.82 | 23.58 | (0.77) | (0.77) |
| Year Ended 8/31/2019 | $47.25 | 0.00(c) | 0.20(h) | 0.20 | (2.45) | (2.45) |
| Advisor Class |
| Year Ended 8/31/2023 | $44.05 | 0.15 | (6.72) | (6.57) | — | — |
| Year Ended 8/31/2022 | $66.94 | (0.16) | (22.73) | (22.89) | — | — |
| Year Ended 8/31/2021 | $75.94 | (0.46) | (5.24) | (5.70) | (3.30) | (3.30) |
| Year Ended 8/31/2020 | $50.19 | 0.00(c) | 26.52 | 26.52 | (0.77) | (0.77) |
| Year Ended 8/31/2019 | $52.25 | (0.12) | 0.51(h) | 0.39 | (2.45) | (2.45) |
| Class C |
| Year Ended 8/31/2023 | $34.56 | (0.25) | (5.20) | (5.45) | — | — |
| Year Ended 8/31/2022 | $53.05 | (0.53) | (17.96) | (18.49) | — | — |
| Year Ended 8/31/2021 | $61.16 | (0.87) | (4.22) | (5.09) | (3.02) | (3.02) |
| Year Ended 8/31/2020 | $40.96 | (0.59) | 21.56 | 20.97 | (0.77) | (0.77) |
| Year Ended 8/31/2019 | $43.57 | (0.41) | 0.25(h) | (0.16) | (2.45) | (2.45) |
| Institutional Class |
| Year Ended 8/31/2023 | $43.16 | 0.14 | (6.62) | (6.48) | — | — |
| Year Ended 8/31/2022 | $65.59 | (0.00)(c) | (22.43) | (22.43) | — | — |
| Year Ended 8/31/2021 | $74.47 | (0.34) | (5.24) | (5.58) | (3.30) | (3.30) |
| Year Ended 8/31/2020 | $49.23 | (0.12) | 26.13 | 26.01 | (0.77) | (0.77) |
| Year Ended 8/31/2019 | $51.30 | 0.08 | 0.30(h) | 0.38 | (2.45) | (2.45) |
The accompanying Notes to Financial Statements are an integral part of this statement.
| 16 | Columbia Greater China Fund | Annual Report 2023 |
Financial Highlights (continued)
| | Net
asset
value,
end of
period | Total
return | Total gross
expense
ratio to
average
net assets(a) | Total net
expense
ratio to
average
net assets(a),(b) | Net investment
income (loss)
ratio to
average
net assets | Portfolio
turnover | Net
assets,
end of
period
(000’s) |
| Class A |
| Year Ended 8/31/2023 | $33.10 | (15.15%) | 1.61%(d),(e) | 1.54%(d),(e),(f),(g) | (0.01%) | 61% | $33,863 |
| Year Ended 8/31/2022 | $39.01 | (34.36%) | 1.50%(d),(e) | 1.50%(d),(e),(f),(g) | (0.47%) | 65% | $46,148 |
| Year Ended 8/31/2021 | $59.43 | (8.26%) | 1.44% | 1.44%(f) | (0.72%) | 19% | $82,311 |
| Year Ended 8/31/2020 | $67.81 | 53.06% | 1.50%(d) | 1.50%(d),(f) | (0.47%) | 27% | $91,892 |
| Year Ended 8/31/2019 | $45.00 | 1.28% | 1.53%(d) | 1.53%(d) | 0.00%(c) | 18% | $65,762 |
| Advisor Class |
| Year Ended 8/31/2023 | $37.48 | (14.91%) | 1.35%(d),(e) | 1.29%(d),(e),(f),(g) | 0.39% | 61% | $582 |
| Year Ended 8/31/2022 | $44.05 | (34.19%) | 1.24%(d),(e) | 1.24%(d),(e),(f),(g) | (0.29%) | 65% | $674 |
| Year Ended 8/31/2021 | $66.94 | (8.03%) | 1.19% | 1.19%(f) | (0.58%) | 19% | $1,775 |
| Year Ended 8/31/2020 | $75.94 | 53.43% | 1.25%(d) | 1.25%(d),(f) | 0.01% | 27% | $3,084 |
| Year Ended 8/31/2019 | $50.19 | 1.53% | 1.29%(d) | 1.29%(d) | (0.23%) | 18% | $1,027 |
| Class C |
| Year Ended 8/31/2023 | $29.11 | (15.77%) | 2.36%(d),(e) | 2.30%(d),(e),(f),(g) | (0.81%) | 61% | $1,130 |
| Year Ended 8/31/2022 | $34.56 | (34.85%) | 2.25%(d),(e) | 2.25%(d),(e),(f),(g) | (1.24%) | 65% | $1,743 |
| Year Ended 8/31/2021 | $53.05 | (8.95%) | 2.19% | 2.19%(f) | (1.38%) | 19% | $3,667 |
| Year Ended 8/31/2020 | $61.16 | 51.91% | 2.25%(d) | 2.25%(d),(f) | (1.28%) | 27% | $2,517 |
| Year Ended 8/31/2019 | $40.96 | 0.53% | 2.28%(d) | 2.28%(d) | (1.02%) | 18% | $2,554 |
| Institutional Class |
| Year Ended 8/31/2023 | $36.68 | (15.01%) | 1.36%(d),(e) | 1.29%(d),(e),(f),(g) | 0.36% | 61% | $27,373 |
| Year Ended 8/31/2022 | $43.16 | (34.20%) | 1.25%(d),(e) | 1.25%(d),(e),(f),(g) | (0.00%)(c) | 65% | $65,817 |
| Year Ended 8/31/2021 | $65.59 | (8.03%) | 1.20% | 1.20%(f) | (0.44%) | 19% | $72,247 |
| Year Ended 8/31/2020 | $74.47 | 53.44% | 1.25%(d) | 1.25%(d),(f) | (0.22%) | 27% | $31,844 |
| Year Ended 8/31/2019 | $49.23 | 1.54% | 1.28%(d) | 1.28%(d) | 0.17% | 18% | $31,244 |
The accompanying Notes to Financial Statements are an integral part of this statement.
Columbia Greater China Fund | Annual Report 2023
| 17 |
Financial Highlights (continued)
| | Net asset value,
beginning of
period | Net
investment
income
(loss) | Net
realized
and
unrealized
gain (loss) | Total from
investment
operations | Distributions
from net
realized
gains | Total
distributions to
shareholders |
| Institutional 2 Class |
| Year Ended 8/31/2023 | $44.30 | 0.09 | (6.67) | (6.58) | — | — |
| Year Ended 8/31/2022 | $67.26 | (0.11) | (22.85) | (22.96) | — | — |
| Year Ended 8/31/2021 | $76.28 | (0.19) | (5.49) | (5.68) | (3.34) | (3.34) |
| Year Ended 8/31/2020 | $50.38 | (0.10) | 26.77 | 26.67 | (0.77) | (0.77) |
| Year Ended 8/31/2019 | $52.38 | 0.16 | 0.29(h) | 0.45 | (2.45) | (2.45) |
| Institutional 3 Class |
| Year Ended 8/31/2023 | $43.14 | 0.22 | (6.61) | (6.39) | — | — |
| Year Ended 8/31/2022 | $65.46 | (0.15) | (22.17) | (22.32) | — | — |
| Year Ended 8/31/2021 | $74.32 | (0.17) | (5.32) | (5.49) | (3.37) | (3.37) |
| Year Ended 8/31/2020 | $49.08 | (0.02) | 26.03 | 26.01 | (0.77) | (0.77) |
| Year Ended 8/31/2019 | $51.08 | 0.20 | 0.25(h) | 0.45 | (2.45) | (2.45) |
| Notes to Financial Highlights |
| (a) | In addition to the fees and expenses that the Fund bears directly, the Fund indirectly bears a pro rata share of the fees and expenses of any other funds in which it invests. Such indirect expenses are not included in the Fund’s reported expense ratios. |
| (b) | Total net expenses include the impact of certain fee waivers/expense reimbursements made by the Investment Manager and certain of its affiliates, if applicable. |
| (c) | Rounds to zero. |
| (d) | Ratios include interfund lending expense which is less than 0.01%. |
| (e) | Ratios include line of credit interest expense. For the periods indicated below, if line of credit interest expense had been excluded, expenses would have been lower by: |
| Class | 8/31/2023 | 8/31/2022 | 8/31/2021 | 8/31/2020 | 8/31/2019 |
| Class A | 0.01% | less than .01% | —% | —% | —% |
| Advisor Class | 0.01% | less than .01% | —% | —% | —% |
| Class C | 0.01% | less than .01% | —% | —% | —% |
| Institutional Class | 0.01% | less than .01% | —% | —% | —% |
| Institutional 2 Class | 0.01% | less than .01% | —% | —% | —% |
| Institutional 3 Class | less than .01% | less than .01% | —% | —% | —% |
| (f) | The benefits derived from expense reductions had an impact of less than 0.01%. |
| (g) | Ratios include the impact of voluntary waivers paid by the Investment Manager. If the Investment Manager had not paid these voluntary waivers, the Fund’s net expense ratio would increase by less than 0.01%. |
| (h) | Calculation of the net gain (loss) per share (both realized and unrealized) does not correlate to the aggregate realized and unrealized gain (loss) presented in the Statement of Operations due to timing of Fund shares sold and redeemed in relation to fluctuations in the market value of the portfolio. |
The accompanying Notes to Financial Statements are an integral part of this statement.
| 18 | Columbia Greater China Fund | Annual Report 2023 |
Financial Highlights (continued)
| | Net
asset
value,
end of
period | Total
return | Total gross
expense
ratio to
average
net assets(a) | Total net
expense
ratio to
average
net assets(a),(b) | Net investment
income (loss)
ratio to
average
net assets | Portfolio
turnover | Net
assets,
end of
period
(000’s) |
| Institutional 2 Class |
| Year Ended 8/31/2023 | $37.72 | (14.85%) | 1.27%(d),(e) | 1.21%(d),(e) | 0.23% | 61% | $1,859 |
| Year Ended 8/31/2022 | $44.30 | (34.14%) | 1.16%(d),(e) | 1.16%(d),(e) | (0.20%) | 65% | $3,109 |
| Year Ended 8/31/2021 | $67.26 | (7.97%) | 1.14% | 1.14% | (0.24%) | 19% | $7,362 |
| Year Ended 8/31/2020 | $76.28 | 53.53% | 1.17%(d) | 1.17%(d) | (0.17%) | 27% | $2,842 |
| Year Ended 8/31/2019 | $50.38 | 1.65% | 1.20%(d) | 1.20%(d) | 0.32% | 18% | $3,001 |
| Institutional 3 Class |
| Year Ended 8/31/2023 | $36.75 | (14.81%) | 1.20%(d),(e) | 1.13%(d),(e) | 0.54% | 61% | $28,709 |
| Year Ended 8/31/2022 | $43.14 | (34.10%) | 1.11%(d),(e) | 1.11%(d),(e) | (0.27%) | 65% | $15,946 |
| Year Ended 8/31/2021 | $65.46 | (7.93%) | 1.08% | 1.08% | (0.22%) | 19% | $43,992 |
| Year Ended 8/31/2020 | $74.32 | 53.60% | 1.12%(d) | 1.12%(d) | (0.04%) | 27% | $31,974 |
| Year Ended 8/31/2019 | $49.08 | 1.69% | 1.14%(d) | 1.14%(d) | 0.42% | 18% | $5,391 |
The accompanying Notes to Financial Statements are an integral part of this statement.
Columbia Greater China Fund | Annual Report 2023
| 19 |
Notes to Financial Statements
August 31, 2023
Note 1. Organization
Columbia Greater China Fund (the Fund), a series of Columbia Funds Series Trust I (the Trust), is a non-diversified fund. The Trust is registered under the Investment Company Act of 1940, as amended (the 1940 Act), as an open-end management investment company organized as a Massachusetts business trust.
Fund shares
The Trust may issue an unlimited number of shares (without par value). The Fund offers each of the share classes listed in the Statement of Assets and Liabilities. Although all share classes generally have identical voting, dividend and liquidation rights, each share class votes separately when required by the Trust’s organizational documents or by law. Each share class has its own expense and sales charge structure. Different share classes may have different minimum initial investment amounts and pay different net investment income distribution amounts to the extent the expenses of distributing such share classes vary. Distributions to shareholders in a liquidation will be proportional to the net asset value of each share class.
As described in the Fund’s prospectus, Class A and Class C shares are offered to the general public for investment. Class C shares automatically convert to Class A shares after 8 years. Advisor Class, Institutional Class, Institutional 2 Class and Institutional 3 Class shares are available for purchase through authorized investment professionals to omnibus retirement plans or to institutional investors and to certain other investors as also described in the Fund’s prospectus.
Note 2. Summary of significant accounting policies
Basis of preparation
The Fund is an investment company that applies the accounting and reporting guidance in the Financial Accounting Standards Board (FASB) Accounting Standards Codification Topic 946, Financial Services - Investment Companies (ASC 946). The financial statements are prepared in accordance with U.S. generally accepted accounting principles (GAAP), which requires management to make certain estimates and assumptions that affect the reported amounts of assets and liabilities, the disclosure of contingent assets and liabilities at the date of the financial statements and the reported amounts of income and expenses during the reporting period. Actual results could differ from those estimates.
The following is a summary of significant accounting policies followed by the Fund in the preparation of its financial statements.
Security valuation
Foreign equity securities are valued based on the closing price or last trade price on their primary exchange at the close of business of the New York Stock Exchange. If any foreign equity security closing prices are not readily available, the securities are valued at the mean of the latest quoted bid and ask prices on such exchanges or markets. Foreign currency exchange rates are determined at the scheduled closing time of the New York Stock Exchange. Many securities markets and exchanges outside the U.S. close prior to the close of the New York Stock Exchange; therefore, the closing prices for securities in such markets or on such exchanges may not fully reflect events that occur after such close but before the close of the New York Stock Exchange. In those situations, foreign securities will be fair valued pursuant to a policy approved by the Board of Trustees. Under the policy, the Fund may utilize a third-party pricing service to determine these fair values. The third-party pricing service takes into account multiple factors, including, but not limited to, movements in the U.S. securities markets, certain depositary receipts, futures contracts and foreign exchange rates that have occurred subsequent to the close of the foreign exchange or market, to determine a good faith estimate that reasonably reflects the current market conditions as of the close of the New York Stock Exchange. The fair value of a security is likely to be different from the quoted or published price, if available.
Investments in open-end investment companies (other than exchange-traded funds (ETFs)), are valued at the latest net asset value reported by those companies as of the valuation time.
Investments for which market quotations are not readily available, or that have quotations which management believes are not reflective of market value or reliable, are valued at fair value as determined in good faith under procedures approved by the Board of Trustees. If a security or class of securities (such as foreign securities) is valued at fair value, such value is likely to be different from the quoted or published price for the security, if available.
| 20 | Columbia Greater China Fund | Annual Report 2023 |
Notes to Financial Statements (continued)
August 31, 2023
The determination of fair value often requires significant judgment. To determine fair value, management may use assumptions including but not limited to future cash flows and estimated risk premiums. Multiple inputs from various sources may be used to determine fair value.
GAAP requires disclosure regarding the inputs and valuation techniques used to measure fair value and any changes in valuation inputs or techniques. In addition, investments shall be disclosed by major category. This information is disclosed following the Fund’s Portfolio of Investments.
Foreign currency transactions and translations
The values of all assets and liabilities denominated in foreign currencies are generally translated into U.S. dollars at exchange rates determined at the close of regular trading on the New York Stock Exchange. Net realized and unrealized gains (losses) on foreign currency transactions and translations include gains (losses) arising from the fluctuation in exchange rates between trade and settlement dates on securities transactions, gains (losses) arising from the disposition of foreign currency and currency gains (losses) between the accrual and payment dates on dividends, interest income and foreign withholding taxes.
For financial statement purposes, the Fund does not distinguish that portion of gains (losses) on investments which is due to changes in foreign exchange rates from that which is due to changes in market prices of the investments. Such fluctuations are included with the net realized and unrealized gains (losses) on investments in the Statement of Operations.
Security transactions
Security transactions are accounted for on the trade date. Cost is determined and gains (losses) are based upon the specific identification method for both financial statement and federal income tax purposes.
Income recognition
Corporate actions and dividend income are generally recorded net of any non-reclaimable tax withholdings, on the ex-dividend date or upon receipt of an ex-dividend notification in the case of certain foreign securities.
The Fund may receive distributions from holdings in equity securities, business development companies (BDCs), exchange-traded funds (ETFs), limited partnerships (LPs), other regulated investment companies (RICs), and real estate investment trusts (REITs), which report information as to the tax character of their distributions annually. These distributions are allocated to dividend income, capital gain and return of capital based on actual information reported. Return of capital is recorded as a reduction of the cost basis of securities held. If the Fund no longer owns the applicable securities, return of capital is recorded as a realized gain. With respect to REITs, to the extent actual information has not yet been reported, estimates for return of capital are made by Columbia Management Investment Advisers, LLC (the Investment Manager), a wholly-owned subsidiary of Ameriprise Financial, Inc. (Ameriprise Financial). The Investment Manager’s estimates are subsequently adjusted when the actual character of the distributions is disclosed by the REITs, which could result in a proportionate change in return of capital to shareholders.
Awards from class action litigation are recorded as a reduction of cost basis if the Fund still owns the applicable securities on the payment date. If the Fund no longer owns the applicable securities on the payment date, the proceeds are recorded as realized gains.
Expenses
General expenses of the Trust are allocated to the Fund and other funds of the Trust based upon relative net assets or other expense allocation methodologies determined by the nature of the expense. Expenses directly attributable to the Fund are charged to the Fund. Expenses directly attributable to a specific class of shares are charged to that share class.
Determination of class net asset value
All income, expenses (other than class-specific expenses, which are charged to that share class, as shown in the Statement of Operations) and realized and unrealized gains (losses) are allocated to each class of the Fund on a daily basis, based on the relative net assets of each class, for purposes of determining the net asset value of each class.
Columbia Greater China Fund | Annual Report 2023
| 21 |
Notes to Financial Statements (continued)
August 31, 2023
Federal income tax status
The Fund intends to qualify each year as a regulated investment company under Subchapter M of the Internal Revenue Code, as amended, and will distribute substantially all of its investment company taxable income and net capital gain, if any, for its tax year, and as such will not be subject to federal income taxes. In addition, the Fund intends to distribute in each calendar year substantially all of its ordinary income, capital gain net income and certain other amounts, if any, such that the Fund should not be subject to federal excise tax. Therefore, no federal income or excise tax provision is recorded.
Foreign taxes
The Fund may be subject to foreign taxes on income, gains on investments or currency repatriation, a portion of which may be recoverable. The Fund will accrue such taxes and recoveries, as applicable, based upon its current interpretation of tax rules and regulations that exist in the markets in which it invests.
Realized gains in certain countries may be subject to foreign taxes at the Fund level, based on statutory rates. The Fund accrues for such foreign taxes on realized and unrealized gains at the appropriate rate for each jurisdiction, as applicable. The amount, if any, is disclosed as a liability in the Statement of Assets and Liabilities.
Distributions to shareholders
Distributions from net investment income, if any, are declared and paid annually. Net realized capital gains, if any, are distributed at least annually. Income distributions and capital gain distributions are determined in accordance with federal income tax regulations, which may differ from GAAP.
Guarantees and indemnifications
Under the Trust’s organizational documents and, in some cases, by contract, its officers and trustees are indemnified against certain liabilities arising out of the performance of their duties to the Trust or its funds. In addition, certain of the Fund’s contracts with its service providers contain general indemnification clauses. The Fund’s maximum exposure under these arrangements is unknown since the amount of any future claims that may be made against the Fund cannot be determined, and the Fund has no historical basis for predicting the likelihood of any such claims.
Recent accounting pronouncements and regulatory updates
Tailored Shareholder Reports
In October 2022, the Securities and Exchange Commission (SEC) adopted a final rule relating to Tailored Shareholder Reports for Mutual Funds and Exchange-Traded Funds; Fee Information in Investment Company Advertisements. The rule and form amendments will, among other things, require the Fund to transmit concise and visually engaging shareholder reports that highlight key information. The amendments will require that funds tag information in a structured data format and that certain more in-depth information be made available online and available for delivery free of charge to investors on request. The amendments became effective January 24, 2023. There is an 18-month transition period after the effective date of the amendments.
Note 3. Fees and other transactions with affiliates
Management services fees
The Fund has entered into a Management Agreement with Columbia Management Investment Advisers, LLC (the Investment Manager), a wholly-owned subsidiary of Ameriprise Financial, Inc. (Ameriprise Financial). Under the Management Agreement, the Investment Manager provides the Fund with investment research and advice, as well as administrative and accounting services. The management services fee is an annual fee that is equal to a percentage of the Fund’s daily net assets that declines from 0.95% to 0.72% as the Fund’s net assets increase. The effective management services fee rate for the year ended August 31, 2023 was 0.95% of the Fund’s average daily net assets.
| 22 | Columbia Greater China Fund | Annual Report 2023 |
Notes to Financial Statements (continued)
August 31, 2023
Compensation of board members
Members of the Board of Trustees who are not officers or employees of the Investment Manager or Ameriprise Financial are compensated for their services to the Fund as disclosed in the Statement of Operations. Under a Deferred Compensation Plan (the Deferred Plan), these members of the Board of Trustees may elect to defer payment of up to 100% of their compensation. Deferred amounts are treated as though equivalent dollar amounts had been invested in shares of certain funds managed by the Investment Manager. The Fund’s liability for these amounts is adjusted for market value changes and remains in the Fund until distributed in accordance with the Deferred Plan. All amounts payable under the Deferred Plan constitute a general unsecured obligation of the Fund. The expense for the Deferred Plan, which includes Trustees’ fees deferred during the current period as well as any gains or losses on the Trustees’ deferred compensation balances as a result of market fluctuations, is included in "Trustees’ fees" in the Statement of Operations.
Compensation of Chief Compliance Officer
The Board of Trustees has appointed a Chief Compliance Officer for the Fund in accordance with federal securities regulations. As disclosed in the Statement of Operations, a portion of the Chief Compliance Officer’s total compensation is allocated to the Fund, along with other allocations to affiliated registered investment companies managed by the Investment Manager and its affiliates, based on relative net assets.
Transfer agency fees
Under a Transfer and Dividend Disbursing Agent Agreement, Columbia Management Investment Services Corp. (the Transfer Agent), an affiliate of the Investment Manager and a wholly-owned subsidiary of Ameriprise Financial, is responsible for providing transfer agency services to the Fund. The Transfer Agent has contracted with SS&C GIDS, Inc. (SS&C GIDS) to serve as sub-transfer agent. Prior to January 1, 2023, SS&C GIDS was known as DST Asset Manager Solutions, Inc. The Transfer Agent pays the fees of SS&C GIDS for services as sub-transfer agent and SS&C GIDS is not entitled to reimbursement for such fees from the Fund (with the exception of out-of-pocket fees).
The Fund pays the Transfer Agent a monthly transfer agency fee based on the number or the average value of accounts, depending on the type of account. In addition, the Fund pays the Transfer Agent a fee for shareholder services based on the number of accounts or on a percentage of the average aggregate value of the Fund’s shares maintained in omnibus accounts up to the lesser of the amount charged by the financial intermediary or a cap established by the Board of Trustees from time to time.
The Transfer Agent also receives compensation from the Fund for various shareholder services and reimbursements for certain out-of-pocket fees. Total transfer agency fees for Institutional 2 Class and Institutional 3 Class shares are subject to an annual limitation of not more than 0.07% and 0.02%, respectively, of the average daily net assets attributable to each share class. In addition, prior to January 1, 2023, Class A, Advisor Class, Class C and Institutional Class shares were subject to a voluntary transfer agency fee waiver of 0.01% of the average daily net assets attributable to these share classes.
For the year ended August 31, 2023, the Fund’s effective transfer agency fee rates as a percentage of average daily net assets of each class were as follows:
| | Effective rate (%) |
| Class A | 0.15 |
| Advisor Class | 0.15 |
| Class C | 0.15 |
| Institutional Class | 0.15 |
| Institutional 2 Class | 0.06 |
| Institutional 3 Class | 0.01 |
An annual minimum account balance fee of $20 may apply to certain accounts with a value below the applicable share class’s initial minimum investment requirements to reduce the impact of small accounts on transfer agency fees. These minimum account balance fees are remitted to the Fund and recorded as part of expense reductions in the Statement of Operations. For the year ended August 31, 2023, these minimum account balance fees reduced total expenses of the Fund by $366.
Columbia Greater China Fund | Annual Report 2023
| 23 |
Notes to Financial Statements (continued)
August 31, 2023
Distribution and service fees
The Fund has entered into an agreement with Columbia Management Investment Distributors, Inc. (the Distributor), an affiliate of the Investment Manager and a wholly-owned subsidiary of Ameriprise Financial, for distribution and shareholder services. The Board of Trustees has approved, and the Fund has adopted, distribution and shareholder service plans (the Plans) applicable to certain share classes, which set the distribution and service fees for the Fund. These fees are calculated daily and are intended to compensate the Distributor and/or eligible selling and/or servicing agents for selling shares of the Fund and providing services to investors.
Under the Plans, the Fund pays a monthly service fee to the Distributor at the maximum annual rate of 0.25% of the average daily net assets attributable to Class A and Class C shares of the Fund. Also under the Plans, the Fund pays a monthly distribution fee to the Distributor at the maximum annual rate of 0.75% of the average daily net assets attributable to Class C shares of the Fund.
Sales charges (unaudited)
Sales charges, including front-end charges and contingent deferred sales charges (CDSCs), received by the Distributor for distributing Fund shares for the year ended August 31, 2023, if any, are listed below:
| | Front End (%) | CDSC (%) | Amount ($) |
| Class A | 5.75 | 0.50 - 1.00(a) | 29,798 |
| Class C | — | 1.00(b) | 78 |
| (a) | This charge is imposed on certain investments of between $1 million and $50 million redeemed within 18 months after purchase, as follows: 1.00% if redeemed within 12 months after purchase, and 0.50% if redeemed more than 12, but less than 18, months after purchase, with certain limited exceptions. |
| (b) | This charge applies to redemptions within 12 months after purchase, with certain limited exceptions. |
The Fund’s other share classes are not subject to sales charges.
Expenses waived/reimbursed by the Investment Manager and its affiliates
The Investment Manager and certain of its affiliates have contractually agreed to waive fees and/or reimburse expenses (excluding certain fees and expenses described below) for the period(s) disclosed below, unless sooner terminated at the sole discretion of the Board of Trustees, so that the Fund’s net operating expenses, after giving effect to fees waived/expenses reimbursed and any balance credits and/or overdraft charges from the Fund’s custodian, do not exceed the following annual rate(s) as a percentage of the classes’ average daily net assets:
| | January 1, 2023
through
December 31, 2023 | Prior to
January 1, 2023 |
| Class A | 1.48% | 1.72% |
| Advisor Class | 1.23 | 1.47 |
| Class C | 2.23 | 2.47 |
| Institutional Class | 1.23 | 1.47 |
| Institutional 2 Class | 1.14 | 1.40 |
| Institutional 3 Class | 1.09 | 1.35 |
Under the agreement governing these fee waivers and/or expense reimbursement arrangements, the following fees and expenses are excluded from the waiver/reimbursement commitment, and therefore will be paid by the Fund, if applicable: taxes (including foreign transaction taxes), expenses associated with investments in affiliated and non-affiliated pooled investment vehicles (including mutual funds and exchange-traded funds), transaction costs and brokerage commissions, costs related to any securities lending program, dividend expenses associated with securities sold short, inverse floater program fees and expenses, transaction charges and interest on borrowed money, interest, costs associated with shareholder meetings, infrequent and/or unusual expenses and any other expenses the exclusion of which is specifically approved by the Board of Trustees. This agreement may be modified or amended only with approval from the Investment Manager, certain of its affiliates and the Fund. Separately, prior to January 1, 2023, the Transfer Agent had voluntarily agreed to waive a portion of the transfer agency fees for Class A, Advisor Class, Class C and Institutional Class fees, as discussed above. The net transfer agency fees were used in calculating the classes’ total expenses for any
| 24 | Columbia Greater China Fund | Annual Report 2023 |
Notes to Financial Statements (continued)
August 31, 2023
waiver/reimbursement commitment under the expense limitation agreement. Any fees waived and/or expenses reimbursed under the expense reimbursement arrangements described above are not recoverable by the Investment Manager or its affiliates in future periods.
Note 4. Federal tax information
The timing and character of income and capital gain distributions are determined in accordance with income tax regulations, which may differ from GAAP because of temporary or permanent book to tax differences.
At August 31, 2023, these differences were primarily due to differing treatment for deferral/reversal of wash sale losses, passive foreign investment company (pfic) holdings, capital loss carryforwards, trustees’ deferred compensation and foreign currency transactions. To the extent these differences were permanent, reclassifications were made among the components of the Fund’s net assets. Temporary differences do not require reclassifications.
The following reclassifications were made:
Undistributed net
investment
income ($) | Accumulated
net realized
(loss) ($) | Paid in
capital ($) |
| 227,923 | (227,923) | — |
Net investment income (loss) and net realized gains (losses), as disclosed in the Statement of Operations, and net assets were not affected by this reclassification.
For the years ended August 31, 2023 and August 31, 2022, there were no distributions.
At August 31, 2023, the components of distributable earnings on a tax basis were as follows:
Undistributed
ordinary income ($) | Undistributed
long-term
capital gains ($) | Capital loss
carryforwards ($) | Net unrealized
appreciation ($) |
| 464,352 | — | (24,050,867) | 13,208,432 |
At August 31, 2023, the cost of all investments for federal income tax purposes along with the aggregate gross unrealized appreciation and depreciation based on that cost was:
Federal
tax cost ($) | Gross unrealized
appreciation ($) | Gross unrealized
(depreciation) ($) | Net unrealized
appreciation ($) |
| 80,329,715 | 19,372,033 | (6,163,601) | 13,208,432 |
Tax cost of investments and unrealized appreciation/(depreciation) may also include timing differences that do not constitute adjustments to tax basis.
The following capital loss carryforwards, determined at August 31, 2023, may be available to reduce future net realized gains on investments, if any, to the extent permitted by the Internal Revenue Code. In addition, for the year ended August 31, 2023, capital loss carryforwards utilized, if any, were as follows:
No expiration
short-term ($) | No expiration
long-term ($) | Total ($) | Utilized ($) |
| (24,050,867) | — | (24,050,867) | — |
Management of the Fund has concluded that there are no significant uncertain tax positions in the Fund that would require recognition in the financial statements. However, management’s conclusion may be subject to review and adjustment at a later date based on factors including, but not limited to, new tax laws, regulations, and administrative interpretations (including relevant court decisions). Generally, the Fund’s federal tax returns for the prior three fiscal years remain subject to examination by the Internal Revenue Service.
Columbia Greater China Fund | Annual Report 2023
| 25 |
Notes to Financial Statements (continued)
August 31, 2023
Note 5. Portfolio information
The cost of purchases and proceeds from sales of securities, excluding short-term investments and derivatives, if any, aggregated to $58,192,640 and $75,981,954, respectively, for the year ended August 31, 2023. The amount of purchase and sale activity impacts the portfolio turnover rate reported in the Financial Highlights.
Note 6. Affiliated money market fund
The Fund invests in Columbia Short-Term Cash Fund, an affiliated money market fund established for the exclusive use by the Fund and other affiliated funds (the Affiliated MMF). The income earned by the Fund from such investments is included as Dividends - affiliated issuers in the Statement of Operations. As an investing fund, the Fund indirectly bears its proportionate share of the expenses of the Affiliated MMF. The Affiliated MMF prices its shares with a floating net asset value. The Securities and Exchange Commission has adopted amendments to money market fund rules requiring institutional prime money market funds like the Affiliated MMF to be subject, by October 2, 2024, to a liquidity fee if daily net redemptions exceed 5% of net assets and, by April 2, 2024, to a discretionary liquidity fee up to 2% if the imposition of such a fee is determined to be in the best interest of the Affiliated MMF.
Note 7. Interfund lending
Pursuant to an exemptive order granted by the Securities and Exchange Commission, the Fund participates in a program (the Interfund Program) allowing each participating Columbia Fund (each, a Participating Fund) to lend money directly to and, except for closed-end funds and money market funds, borrow money directly from other Participating Funds for temporary purposes. The amounts eligible for borrowing and lending under the Interfund Program are subject to certain restrictions.
Interfund loans are subject to the risk that the borrowing fund could be unable to repay the loan when due, and a delay in repayment to the lending fund could result in lost opportunities and/or additional lending costs. The exemptive order is subject to conditions intended to mitigate conflicts of interest arising from the Investment Manager’s relationship with each Participating Fund.
The Fund’s activity in the Interfund Program during the year ended August 31, 2023 was as follows:
| Borrower or lender | Average loan
balance ($) | Weighted average
interest rate (%) | Number of days
with outstanding loans |
| Borrower | 2,400,000 | 4.35 | 2 |
| Lender | 100,000 | 4.86 | 2 |
Interest income earned and interest expense incurred by the Fund is recorded as interfund lending in the Statement of Operations. The Fund had no outstanding interfund loans at August 31, 2023.
Note 8. Line of credit
The Fund has access to a revolving credit facility with a syndicate of banks led by JPMorgan Chase Bank, N.A., Citibank, N.A. and Wells Fargo Bank, N.A. whereby the Fund may borrow for the temporary funding of shareholder redemptions or for other temporary or emergency purposes. Pursuant to an October 27, 2022 amendment and restatement, the credit facility, which is an agreement between the Fund and certain other funds managed by the Investment Manager or an affiliated investment manager, severally and not jointly, permits aggregate borrowings up to $950 million. Interest is currently charged to each participating fund based on its borrowings at a rate equal to the higher of (i) the federal funds effective rate, (ii) the secured overnight financing rate plus 0.10% and (iii) the overnight bank funding rate plus, in each case, 1.00%. Each borrowing under the credit facility matures no later than 60 days after the date of borrowing. The Fund also pays a commitment fee equal to its pro rata share of the unused amount of the credit facility at a rate of 0.15% per annum. The commitment fee is included in other expenses in the Statement of Operations. This agreement expires annually in October unless extended or renewed. Prior to the October 27, 2022 amendment and restatement, the Fund had access to a revolving credit facility with a syndicate of banks led by JPMorgan Chase Bank, N.A., Citibank, N.A. and Wells Fargo Bank, N.A. which permitted collective borrowings up to $950 million. Interest was charged to each participating fund based on its borrowings at a rate equal to the higher of (i) the federal funds effective rate, (ii) the secured overnight financing rate plus 0.11448% and (iii) the overnight bank funding rate plus, in each case, 1.00%.
| 26 | Columbia Greater China Fund | Annual Report 2023 |
Notes to Financial Statements (continued)
August 31, 2023
For the year ended August 31, 2023, the Fund’s borrowing activity was as follows:
Average loan
balance ($) | Weighted average
interest rate (%) | Days
outstanding |
| 15,450,000 | 3.77 | 4 |
Interest expense incurred by the Fund is recorded as a line of credit interest expense in the Statement of Operations. The Fund had no outstanding borrowings at August 31, 2023.
Note 9. Significant risks
Communication services sector risk
The Fund is more susceptible to the particular risks that may affect companies in the communication services sector than if it were invested in a wider variety of companies in unrelated sectors. Companies in the communication services sector are subject to certain risks, including the risk that new services, equipment or technologies will not be accepted by consumers and businesses or will become rapidly obsolete. Performance of such companies may be affected by factors including obtaining and protecting patents (or the failure to do so) and significant competitive pressures, including aggressive pricing of their products or services, new market entrants, competition for market share and short product cycles due to an accelerated rate of technological developments. Such competitive pressures may lead to limited earnings and/or falling profit margins. As a result, the value of their securities may fall or fail to rise. In addition, many communication services sector companies have limited operating histories and prices of these companies’ securities historically have been more volatile than other securities, especially over the short term.
Consumer discretionary sector risk
The Fund is more susceptible to the particular risks that may affect companies in the consumer discretionary sector than if it were invested in a wider variety of companies in unrelated sectors. Companies in the consumer discretionary sector are subject to certain risks, including fluctuations in the performance of the overall domestic and international economies, interest rate changes, increased competition and consumer confidence. Performance of such companies may be affected by factors including reduced disposable household income, reduced consumer spending, changing demographics and consumer tastes.
Foreign securities and emerging market countries risk
Investing in foreign securities may involve heightened risks relative to investments in U.S. securities. Investing in foreign securities subjects the Fund to the risks associated with the issuer’s country of organization and places of business operations, including risks associated with political, regulatory, economic, social, diplomatic and other conditions or events occurring in the country or region, which may result in significant market volatility. In addition, certain foreign securities may be more volatile and less liquid than U.S. securities. Investing in emerging markets may increase these risks and expose the Fund to elevated risks associated with increased inflation, deflation or currency devaluation. To the extent that the Fund concentrates its investment exposure to any one or a few specific countries, the Fund will be particularly susceptible to the risks associated with the conditions, events or other factors impacting those countries or regions and may, therefore, have a greater risk than that of a fund that is more geographically diversified. The financial information and disclosure made available by issuers of emerging market securities may be considerably less reliable than publicly available information about other foreign securities. The Public Company Accounting Oversight Board, which regulates auditors of U.S. public companies, is unable to inspect audit work papers in certain foreign countries. Investors in foreign countries often have limited rights and few practical remedies to pursue shareholder claims, including class actions or fraud claims, and the ability of the U.S. Securities and Exchange Commission, the U.S. Department of Justice and other authorities to bring and enforce actions against foreign issuers or foreign persons is limited.
Geographic focus risk
The Fund may be particularly susceptible to risks related to economic, political, regulatory or other events or conditions affecting issuers and countries within the specific geographic regions in which the Fund invests. The Fund’s net asset value may be more volatile than the net asset value of a more geographically diversified fund.
Columbia Greater China Fund | Annual Report 2023
| 27 |
Notes to Financial Statements (continued)
August 31, 2023
Asia Pacific Region. The Fund is particularly susceptible to economic, political, regulatory or other events or conditions affecting issuers and countries in the Asia Pacific region. Many of the countries in the region are considered underdeveloped or developing, including from a political, economic and/or social perspective, and may have relatively unstable governments and economies based on limited business, industries and/or natural resources or commodities. Events in any one country within the region may impact other countries in the region or the region as a whole. As a result, events in the region will generally have a greater effect on the Fund than if the Fund were more geographically diversified. This could result in increased volatility in the value of the Fund’s investments and losses for the Fund. Also, securities of some companies in the region can be less liquid than U.S. or other foreign securities, potentially making it difficult for the Fund to sell such securities at a desirable time and price.
Greater China. The Fund is particularly susceptible to economic, political, regulatory or other events or conditions affecting issuers in the Greater China region. The region consists of Hong Kong, The People’s Republic of China and Taiwan, among other countries, and the Fund’s investments in the region are particularly susceptible to risks in that region. The Hong Kong, Taiwanese, and Chinese economies are dependent on the economies of other countries and can be significantly affected by currency fluctuations and increasing competition from other emerging economies in Asia with lower costs. Adverse events in any one country within the region may impact the other countries in the region or Asia as a whole. As a result, adverse events in the region will generally have a greater effect on the Fund than if the Fund were more geographically diversified, which could result in greater volatility in the Fund’s net asset value and losses. Markets in the Greater China region can experience significant volatility due to social, economic, regulatory and political uncertainties. Changes in Chinese government policy and economic growth rates could significantly affect local markets and the entire Greater China region. China has yet to develop comprehensive securities, corporate, or commercial laws, its market is relatively new and less developed, and its economy is experiencing a relative slowdown. Export growth continues to be a major driver of China’s economic growth. As a result, a reduction in spending on Chinese products and services, the institution of additional tariffs or other trade barriers, including as a result of heightened trade tensions between China and the United States, or a downturn in any of the economies of China’s key trading partners may have an adverse impact on the Chinese economy.
Market risk
The Fund may incur losses due to declines in the value of one or more securities in which it invests. These declines may be due to factors affecting a particular issuer, or the result of, among other things, political, regulatory, market, economic or social developments affecting the relevant market(s) more generally. In addition, turbulence in financial markets and reduced liquidity in equity, credit and/or fixed income markets may negatively affect many issuers, which could adversely affect the Fund’s ability to price or value hard-to-value assets in thinly traded and closed markets and could cause significant redemptions and operational challenges. Global economies and financial markets are increasingly interconnected, and conditions and events in one country, region or financial market may adversely impact issuers in a different country, region or financial market. These risks may be magnified if certain events or developments adversely interrupt the global supply chain; in these and other circumstances, such risks might affect companies worldwide. As a result, local, regional or global events such as terrorism, war, natural disasters, disease/virus outbreaks and epidemics or other public health issues, recessions, depressions or other events – or the potential for such events – could have a significant negative impact on global economic and market conditions.
The large-scale invasion of Ukraine by Russia in February 2022 has resulted in sanctions and market disruptions, including declines in regional and global stock markets, unusual volatility in global commodity markets and significant devaluations of Russian currency. The extent and duration of the military action are impossible to predict but could be significant. Market disruption caused by the Russian military action, and any counter-measures or responses thereto (including international sanctions, a downgrade in the country’s credit rating, purchasing and financing restrictions, boycotts, tariffs, changes in consumer or purchaser preferences, cyberattacks and espionage) could have severe adverse impacts on regional and/or global securities and commodities markets, including markets for oil and natural gas. These impacts may include reduced market liquidity, distress in credit markets, further disruption of global supply chains, increased risk of inflation, restricted cross-border payments and limited access to investments and/or assets in certain international markets and/or issuers. These developments and other related events could negatively impact Fund performance.
| 28 | Columbia Greater China Fund | Annual Report 2023 |
Notes to Financial Statements (continued)
August 31, 2023
Non-diversification risk
A non-diversified fund is permitted to invest a greater percentage of its total assets in fewer issuers than a diversified fund. This increases the risk that a change in the value of any one investment held by the Fund could affect the overall value of the Fund more than it would affect that of a diversified fund holding a greater number of investments. Accordingly, the Fund’s value will likely be more volatile than the value of a more diversified fund.
Shareholder concentration risk
At August 31, 2023, one unaffiliated shareholder of record owned 47.2% of the outstanding shares of the Fund in one or more accounts. The Fund has no knowledge about whether any portion of those shares was owned beneficially. Fund shares sold to or redeemed by concentrated accounts may have a significant effect on the operations of the Fund. In the case of a large redemption, the Fund may be forced to sell investments at inopportune times, including its liquid positions, which may result in Fund losses and the Fund holding a higher percentage of less liquid positions. Large redemptions could result in decreased economies of scale and increased operating expenses for non-redeeming Fund shareholders.
Variable interest entity risk
Many Chinese companies to which the Fund seeks investment exposure use a structure known as a variable interest entity (a VIE) to address Chinese restrictions on direct foreign investment in Chinese companies operating in certain sectors. The Fund’s investment exposure to VIEs may pose additional risks because the Fund’s investment is in a holding company domiciled outside of China (a Holding Company) whose interests in the business of the underlying Chinese operating company (the VIE) are established through contracts rather than equity ownership. The VIE structure is a longstanding practice in China that, until recently, was not acknowledged by the Chinese government, creating uncertainty over the possibility that the Chinese government might cease to tolerate VIE structures at any time or impose new restrictions on the structure. In such a scenario, the Chinese operating company could be subject to penalties, including revocation of its business and operating license, or the Holding Company could forfeit its interest in the business of the Chinese operating company. Further, in case of dispute, the remedies and rights of the Fund may be limited and such legal uncertainty may be exploited against the interests of the Fund. Control over a VIE may also be jeopardized if a natural person who holds the equity interest in the VIE breaches the terms of the contractual arrangements, is subject to legal proceedings, or if any physical instruments or property of the VIE, such as seals, business registration certificates, financial data and licensing arrangements (sometimes referred to as “chops”), are used without authorization. In the event of such an occurrence, the Fund, as a foreign investor, may have little or no legal recourse. In addition to the risk of government intervention, investments through a VIE structure are subject to the risks that the China-based company (or its officers, directors, or Chinese equity owners) may breach the contractual arrangements, that Chinese law changes in a way that adversely affects the enforceability of the arrangements and that the contracts are otherwise not enforceable under Chinese law, in which case a Fund may suffer significant losses on its investments through a VIE structure with little or no recourse available. Further, the Fund is not a VIE owner/shareholder and cannot exert influence through proxy voting or other means. Foreign companies listed on stock exchanges in the United States, including companies using the VIE structure, could also face delisting or other ramifications for failure to meet the expectations and/or requirements of U.S. regulators. Recently, however, China has proposed the adoption of rules which would affirm that VIEs are legally permissible, though there remains significant uncertainty over how these rules will operate. The Fund invests significantly in Holding Companies (and similar structures) in connection with its 80% investment policy and any of these risks could reduce the liquidity and value of the Fund’s investments in Holding Companies or render them valueless.
Note 10. Subsequent events
Management has evaluated the events and transactions that have occurred through the date the financial statements were issued and noted no items requiring adjustment of the financial statements or additional disclosure.
Note 11. Information regarding pending and settled legal proceedings
Ameriprise Financial and certain of its affiliates are involved in the normal course of business in legal proceedings which include regulatory inquiries, arbitration and litigation, including class actions concerning matters arising in connection with the conduct of their activities as part of a diversified financial services firm. Ameriprise Financial believes that the Fund is not currently the subject of, and that neither Ameriprise Financial nor any of its affiliates are the subject of, any pending legal,
Columbia Greater China Fund | Annual Report 2023
| 29 |
Notes to Financial Statements (continued)
August 31, 2023
arbitration or regulatory proceedings that are likely to have a material adverse effect on the Fund or the ability of Ameriprise Financial or its affiliates to perform under their contracts with the Fund. Ameriprise Financial is required to make quarterly (10-Q), annual (10-K) and, as necessary, 8-K filings with the Securities and Exchange Commission (SEC) on legal and regulatory matters that relate to Ameriprise Financial and its affiliates. Copies of these filings may be obtained by accessing the SEC website at www.sec.gov.
There can be no assurance that these matters, or the adverse publicity associated with them, will not result in increased Fund redemptions, reduced sale of Fund shares or other adverse consequences to the Fund. Further, although we believe proceedings are not likely to have a material adverse effect on the Fund or the ability of Ameriprise Financial or its affiliates to perform under their contracts with the Fund, these proceedings are subject to uncertainties and, as such, we are unable to estimate the possible loss or range of loss that may result. An adverse outcome in one or more of these proceedings could result in adverse judgments, settlements, fines, penalties or other relief that could have a material adverse effect on the consolidated financial condition or results of operations of Ameriprise Financial or one or more of its affiliates that provide services to the Fund.
| 30 | Columbia Greater China Fund | Annual Report 2023 |
Report of Independent Registered Public Accounting Firm
To the Board of Trustees of Columbia Funds Series Trust I and Shareholders of Columbia Greater China Fund
Opinion on the Financial Statements
We have audited the accompanying statement of assets and liabilities, including the portfolio of investments, of Columbia Greater China Fund (one of the funds constituting Columbia Funds Series Trust I, referred to hereafter as the "Fund") as of August 31, 2023, the related statement of operations for the year ended August 31, 2023, the statement of changes in net assets for each of the two years in the period ended August 31, 2023, including the related notes, and the financial highlights for each of the five years in the period ended August 31, 2023 (collectively referred to as the "financial statements"). In our opinion, the financial statements present fairly, in all material respects, the financial position of the Fund as of August 31, 2023, the results of its operations for the year then ended, the changes in its net assets for each of the two years in the period ended August 31, 2023 and the financial highlights for each of the five years in the period ended August 31, 2023 in conformity with accounting principles generally accepted in the United States of America.
Basis for Opinion
These financial statements are the responsibility of the Fund’s management. Our responsibility is to express an opinion on the Fund’s financial statements based on our audits. We are a public accounting firm registered with the Public Company Accounting Oversight Board (United States) (PCAOB) and are required to be independent with respect to the Fund in accordance with the U.S. federal securities laws and the applicable rules and regulations of the Securities and Exchange Commission and the PCAOB.
We conducted our audits of these financial statements in accordance with the standards of the PCAOB. Those standards require that we plan and perform the audit to obtain reasonable assurance about whether the financial statements are free of material misstatement, whether due to error or fraud.
Our audits included performing procedures to assess the risks of material misstatement of the financial statements, whether due to error or fraud, and performing procedures that respond to those risks. Such procedures included examining, on a test basis, evidence regarding the amounts and disclosures in the financial statements. Our audits also included evaluating the accounting principles used and significant estimates made by management, as well as evaluating the overall presentation of the financial statements. Our procedures included confirmation of securities owned as of August 31, 2023 by correspondence with the custodian and transfer agent. We believe that our audits provide a reasonable basis for our opinion.
/s/PricewaterhouseCoopers LLP
Minneapolis, Minnesota
October 23, 2023
We have served as the auditor of one or more investment companies within the Columbia Funds Complex since 1977.
Columbia Greater China Fund | Annual Report 2023
| 31 |
Federal Income Tax Information
(Unaudited)
The Fund hereby designates the following tax attributes for the fiscal year ended August 31, 2023. Shareholders will be notified in early 2024 of the amounts for use in preparing 2023 income tax returns.
Qualified
dividend
income | Foreign
taxes paid
to foreign
countries | Foreign
taxes paid
per share
to foreign
countries | Foreign
source
income | Foreign
source
income
per share |
| 100.00% | $87,742 | $0.03 | $1,543,592 | $0.58 |
Qualified dividend income. For taxable, non-corporate shareholders, the percentage of ordinary income distributed during the fiscal year that represents qualified dividend income subject to reduced tax rates.
Foreign taxes. The Fund makes the election to pass through to shareholders the foreign taxes paid. Eligible shareholders may claim a foreign tax credit. These taxes, and the corresponding foreign source income, are provided in the table above.
TRUSTEES AND OFFICERS
(Unaudited)
The Board oversees the Fund’s operations and appoints officers who are responsible for day-to-day business decisions based on policies set by the Board. The following table provides basic biographical information about the Fund’s Trustees as of the printing of this report, including their principal occupations during the past five years, although specific titles for individuals may have varied over the period. The year set forth beneath Length of Service in the table below is the year in which the Trustee was first appointed or elected as Trustee to any Fund currently in the Columbia Funds Complex or a predecessor thereof. Under current Board policy, each Trustee generally serves until December 31 of the year such Trustee turns seventy-five (75).
Independent trustees
Name,
address,
year of birth | Position held
with the Columbia Funds and
length of service | Principal occupation(s)
during past five years
and other relevant
professional experience | Number of
Funds in the
Columbia Funds
Complex*
overseen | Other directorships
held by Trustee
during the past five years
and other relevant Board experience |
George S. Batejan
c/o Columbia Management
Investment Advisers, LLC
290 Congress Street
Boston, MA 02210
1954 | Trustee since 2017 | Executive Vice President, Global Head of Technology and Operations, Janus Capital Group, Inc., 2010-2016 | 173 | Former Chairman of the Board, NICSA (National Investment Company Services Association) (Executive Committee, Nominating Committee and Governance Committee), 2014-2016; former Director, Intech Investment Management, 2011-2016; former Board Member, Metro Denver Chamber of Commerce, 2015-2016; former Advisory Board Member, University of Colorado Business School, 2015-2018; former Board Member, Chase Bank International, 1993-1994 |
| 32 | Columbia Greater China Fund | Annual Report 2023 |
TRUSTEES AND OFFICERS (continued)
(Unaudited)
Independent trustees (continued)
Name,
address,
year of birth | Position held
with the Columbia Funds and
length of service | Principal occupation(s)
during past five years
and other relevant
professional experience | Number of
Funds in the
Columbia Funds
Complex*
overseen | Other directorships
held by Trustee
during the past five years
and other relevant Board experience |
Kathleen Blatz
c/o Columbia Management
Investment Advisers, LLC
290 Congress Street
Boston, MA 02210
1954 | Trustee since 2006 | Attorney, specializing in arbitration and mediation; Chief Justice, Minnesota Supreme Court, 1998-2006; Associate Justice, Minnesota Supreme Court, 1996-1998; Fourth Judicial District Court Judge, Hennepin County, 1994-1996; Attorney in private practice and public service, 1984-1993; State Representative, Minnesota House of Representatives, 1979-1993, which included service on the Tax and Financial Institutions and Insurance Committees; Member and Interim Chair, Minnesota Sports Facilities Authority, January-July 2017; Interim President and Chief Executive Officer, Blue Cross and Blue Shield of Minnesota (health care insurance), February-July 2018, April-October 2021 | 173 | Former Trustee, Blue Cross and Blue Shield of Minnesota, 2009-2021 (Chair of the Business Development Committee, 2014-2017; Chair of the Governance Committee, 2017-2019); former Member and Chair of the Board, Minnesota Sports Facilities Authority, January 2017-July 2017; former Director, Robina Foundation, 2009-2020 (Chair, 2014-2020); Director, Richard M. Schulze Family Foundation, since 2021 |
Pamela G. Carlton
c/o Columbia Management
Investment Advisers, LLC
290 Congress Street
Boston, MA 02210
1954 | Chair since 2023; Trustee since 2007 | President, Springboard – Partners in Cross Cultural Leadership (consulting company), since 2003; Managing Director of US Equity Research, JP Morgan Chase, 1999-2003; Director of US Equity Research, Chase Asset Management, 1996-1999; Co-Director Latin America Research, 1993-1996, COO Global Research, 1992-1996, Co-Director of US Research, 1991-1992, Investment Banker, 1982-1991, Morgan Stanley; Attorney, Cleary Gottlieb Steen & Hamilton LLP, 1980-1982 | 173 | Trustee, New York Presbyterian Hospital Board, since 1996; Director, DR Bank (Audit Committee) since 2017; Director, Evercore Inc. (Audit Committee, Nominating and Governance Committee), since 2019; Director, Apollo Commercial Real Estate Finance, Inc. (Chair, Nominating and Governance Committee) (financial services), since 2021; the Governing Council of the Independent Directors Council (IDC), since 2021 |
Janet Langford Carrig
c/o Columbia Management
Investment Advisers, LLC
290 Congress Street
Boston, MA 02210
1957 | Trustee since 1996 | Senior Vice President, General Counsel and Corporate Secretary, ConocoPhillips (independent energy company), September 2007-October 2018 | 173 | Director, EQT Corporation (natural gas producer), since 2019; former Director, Whiting Petroleum Corporation (independent oil and gas company), 2020-2022 |
J. Kevin Connaughton
c/o Columbia Management
Investment Advisers, LLC
290 Congress Street
Boston, MA 02210
1964 | Trustee since 2020 | CEO and President, RhodeWay Financial (non-profit financial planning firm), since December 2022; Member, FINRA National Adjudicatory Council, since January 2020; Adjunct Professor of Finance, Bentley University since January 2018; Consultant to Independent Trustees of CFVIT and CFST I from March 2016 to June 2020 with respect to CFVIT and to December 2020 with respect to CFST I; Managing Director and General Manager of Mutual Fund Products, Columbia Management Investment Advisers, LLC, May 2010-February 2015; President, Columbia Funds, 2008-2015; and senior officer of Columbia Funds and affiliated funds, 2003-2015 | 171 | Former Director, The Autism Project, March 2015-December 2021; former Member of the Investment Committee, St. Michael’s College, November 2015-February 2020; former Trustee, St. Michael’s College, June 2017-September 2019; former Trustee, New Century Portfolios (former mutual fund complex), January 2015-December 2017 |
Columbia Greater China Fund | Annual Report 2023
| 33 |
TRUSTEES AND OFFICERS (continued)
(Unaudited)
Independent trustees (continued)
Name,
address,
year of birth | Position held
with the Columbia Funds and
length of service | Principal occupation(s)
during past five years
and other relevant
professional experience | Number of
Funds in the
Columbia Funds
Complex*
overseen | Other directorships
held by Trustee
during the past five years
and other relevant Board experience |
Olive M. Darragh
c/o Columbia Management
Investment Advisers, LLC
290 Congress Street
Boston, MA 02210
1962 | Trustee since 2020 | Managing Director of Darragh Inc. (strategy and talent management consulting firm), since 2010; Founder and CEO, Zolio, Inc. (investment management talent identification platform), since 2004; Consultant to Independent Trustees of CFVIT and CFST I from June 2019 to June 2020 with respect to CFVIT and to December 2020 with respect to CFST I; Partner, Tudor Investments, 2004-2010; Senior Partner, McKinsey & Company (consulting), 1990-2004; Touche Ross CPA, 1985-1988 | 171 | Treasurer, Edinburgh University US Trust Board, since January 2023; Member, HBS Community Action Partners Board, since September 2022; former Director, University of Edinburgh Business School (Member of US Board), 2004-2019; former Director, Boston Public Library Foundation, 2008-2017 |
Patricia M. Flynn
c/o Columbia Management
Investment Advisers, LLC
290 Congress Street
Boston, MA 02210
1950 | Trustee since 2004 | Professor of Economics and Management, Bentley University, since 2002; Dean, McCallum Graduate School of Business, Bentley University, 1992-2002 | 173 | Former Trustee, MA Taxpayers Foundation, 1997-2022; former Director, The MA Business Roundtable, 2003-2019; former Chairperson, Innovation Index Advisory Committee, MA Technology Collaborative, 1997-2020 |
Brian J. Gallagher
c/o Columbia Management
Investment Advisers, LLC
290 Congress Street
Boston, MA 02210
1954 | Trustee since 2017 | Retired; Partner with Deloitte & Touche LLP and its predecessors, 1977-2016 | 173 | Trustee, Catholic Schools Foundation, since 2004 |
Douglas A. Hacker
c/o Columbia Management
Investment Advisers, LLC
290 Congress Street
Boston, MA 02210
1955 | Trustee since 1996 | Independent business executive, since May 2006; Executive Vice President – Strategy of United Airlines, December 2002 - May 2006; President of UAL Loyalty Services (airline marketing company), September 2001-December 2002; Executive Vice President and Chief Financial Officer of United Airlines, July 1999-September 2001 | 173 | Director, SpartanNash Company since November 2013 (Chair of the Board, since May 2021) (food distributor); Director, Aircastle Limited (Chair of Audit Committee) (aircraft leasing), since August 2006; former Director, Nash Finch Company (food distributor), 2005-2013; former Director, SeaCube Container Leasing Ltd. (container leasing), 2010-2013; and former Director, Travelport Worldwide Limited (travel information technology), 2014-2019 |
Nancy T. Lukitsh
c/o Columbia Management
Investment Advisers, LLC
290 Congress Street
Boston, MA 02210
1956 | Trustee since 2011 | Senior Vice President, Partner and Director of Marketing, Wellington Management Company, LLP (investment adviser), 1997-2010; Chair, Wellington Management Portfolios (commingled non-U.S. investment pools), 2007-2010; Director, Wellington Trust Company, NA and other Wellington affiliates, 1997-2010 | 171 | None |
| 34 | Columbia Greater China Fund | Annual Report 2023 |
TRUSTEES AND OFFICERS (continued)
(Unaudited)
Independent trustees (continued)
Name,
address,
year of birth | Position held
with the Columbia Funds and
length of service | Principal occupation(s)
during past five years
and other relevant
professional experience | Number of
Funds in the
Columbia Funds
Complex*
overseen | Other directorships
held by Trustee
during the past five years
and other relevant Board experience |
David M. Moffett
c/o Columbia Management
Investment Advisers, LLC
290 Congress Street
Boston, MA 02210
1952 | Trustee since 2011 | Retired; former Chief Executive Officer of Freddie Mac and Chief Financial Officer of U.S. Bank | 171 | Director, CSX Corporation (transportation suppliers); Director, PayPal Holdings Inc. (payment and data processing services); Trustee, University of Oklahoma Foundation; former Director, eBay Inc. (online trading community), 2007-2015; and former Director, CIT Bank, CIT Group Inc. (commercial and consumer finance), 2010-2016; former Senior Adviser to The Carlyle Group (financial services), March 2008-September 2008; former Governance Consultant to Bridgewater Associates, January 2013-December 2015 |
Catherine James Paglia
c/o Columbia Management
Investment Advisers, LLC
290 Congress Street
Boston, MA 02210
1952 | Trustee since 2004 | Director, Enterprise Asset Management, Inc. (private real estate and asset management company), since September 1998; Managing Director and Partner, Interlaken Capital, Inc., 1989-1997; Vice President, 1982-1985, Principal, 1985-1987, Managing Director, 1987-1989, Morgan Stanley; Vice President, Investment Banking, 1980-1982, Associate, Investment Banking, 1976-1980, Dean Witter Reynolds, Inc. | 173 | Director, Valmont Industries, Inc. (irrigation systems manufacturer), since 2012; Trustee, Carleton College (on the Investment Committee), since 1987; Trustee, Carnegie Endowment for International Peace (on the Investment Committee), since 2009 |
Natalie A. Trunow
c/o Columbia Management
Investment Advisers, LLC
290 Congress Street
Boston, MA 02210
1967 | Trustee since 2020 | Chief Executive Officer, Millennial Portfolio Solutions LLC (asset management and consulting services), January 2016-January 2021; Non-executive Member of the Investment Committee and Valuation Committee, Sarona Asset Management Inc. (private equity firm) since September 2019; Advisor, Horizon Investments (asset management and consulting services), August 2018-January 2022; Advisor, Paradigm Asset Management, November 2016-January 2022; Consultant to Independent Trustees of CFVIT and CFST I from September 2016 to June 2020 with respect to CFVIT and to December 2020 with respect to CFST I; Director of Investments/Consultant, Casey Family Programs, April 2016-November 2016; Senior Vice President and Chief Investment Officer, Calvert Investments, August 2008-January 2016; Section Head and Portfolio Manager, General Motors Asset Management, June 1997-August 2008 | 171 | Independent Director, Investment Committee, Health Services for Children with Special Needs, Inc., 2010-2021; Independent Director, (Executive Committee and Chair, Audit Committee), Consumer Credit Counseling Services (formerly Guidewell Financial Solutions), since 2016; Independent Director, (Investment Committee), Sarona Asset Management, since 2019 |
Columbia Greater China Fund | Annual Report 2023
| 35 |
TRUSTEES AND OFFICERS (continued)
(Unaudited)
Independent trustees (continued)
Name,
address,
year of birth | Position held
with the Columbia Funds and
length of service | Principal occupation(s)
during past five years
and other relevant
professional experience | Number of
Funds in the
Columbia Funds
Complex*
overseen | Other directorships
held by Trustee
during the past five years
and other relevant Board experience |
Sandra L. Yeager
c/o Columbia Management
Investment Advisers, LLC
290 Congress Street
Boston, MA 02210
1964 | Trustee since 2017 | Retired; President and founder, Hanoverian Capital, LLC (SEC registered investment advisor firm), 2008-2016; Managing Director, DuPont Capital, 2006-2008; Managing Director, Morgan Stanley Investment Management, 2004-2006; Senior Vice President, Alliance Bernstein, 1990-2004 | 173 | Former Director, NAPE (National Alliance for Partnerships in Equity) Education Foundation, October 2016-October 2020; Advisory Board, Jennersville YMCA, since 2022 |
Interested trustee affiliated with Investment Manager**
Name,
address,
year of birth | Position held with the Columbia Funds and length of service | Principal occupation(s) during the
past five years and other relevant
professional experience | Number of
Funds in the
Columbia Funds
Complex* overseen | Other directorships
held by Trustee
during the past
five years and
other relevant Board experience |
Daniel J. Beckman
c/o Columbia Management
Investment Advisers, LLC
290 Congress Street
Boston, MA 02210
1962 | Trustee since November 2021 and President since June 2021 | Vice President – Head of North America Product, Columbia Management Investment Advisers, LLC, since April 2015; President and Principal Executive Officer of the Columbia Funds, since June 2021; officer of Columbia Funds and affiliated funds, 2020-2021 | 173 | Director, Ameriprise Trust Company, since October 2016; Director, Columbia Management Investment Distributors, Inc. since November 2018; Board of Governors, Columbia Wanger Asset Management, LLC since, January 2022; Director, Columbia Threadneedle Canada, Inc., since December 2022 |
| * | The term “Columbia Funds Complex” as used herein includes Columbia Seligman Premium Technology Growth Fund, Tri-Continental Corporation and each series of Columbia Funds Series Trust (CFST), Columbia Funds Series Trust I (CFST I), Columbia Funds Series Trust II (CFST II), Columbia ETF Trust I (CET I), Columbia ETF Trust II (CET II), Columbia Funds Variable Insurance Trust (CFVIT) and Columbia Funds Variable Series Trust II (CFVST II). Messrs. Batejan, Beckman, Gallagher and Hacker and Mses. Blatz, Carlton, Carrig, Flynn, Paglia, and Yeager serve as directors of Columbia Seligman Premium Technology Growth Fund and Tri-Continental Corporation. |
| ** | Interested person (as defined under the 1940 Act) by reason of being an officer, director, security holder and/or employee of the Investment Manager or Ameriprise Financial. |
The Statement of Additional Information has additional information about the Fund’s Board members and is available, without charge, upon request by calling 800.345.6611, visiting columbiathreadneedleus.com/investor/ or contacting your financial intermediary.
| 36 | Columbia Greater China Fund | Annual Report 2023 |
TRUSTEES AND OFFICERS (continued)
(Unaudited)
The Board has appointed officers who are responsible for day-to-day business decisions based on policies it has established. The officers serve at the pleasure of the Board. The following table provides basic information about the Officers of the Fund as of the printing of this report, including principal occupations during the past five years, although their specific titles may have varied over the period. In addition to Mr. Beckman, who is President and Principal Executive Officer, the Fund’s other officers are:
Fund officers
Name,
address and
year of birth | Position and year
first appointed to
position for any Fund
in the Columbia
Funds Complex or a
predecessor thereof | Principal occupation(s) during past five years |
Michael G. Clarke
290 Congress Street
Boston, MA 02210
1969 | Chief Financial Officer and Principal Financial Officer (2009) and Senior Vice President (2019) | Senior Vice President and North America Head of Operations & Investor Services, Columbia Management Investment Advisers, LLC, since June 2023 (previously Senior Vice President and Head of Global Operations, March 2022 – June 2023, Vice President, Head of North America Operations, and Co-Head of Global Operations, June 2019 - February 2022 and Vice President – Accounting and Tax, May 2010 - May 2019); senior officer of Columbia Funds and affiliated funds, since 2002. Director, Ameriprise Trust Company, since June 2023. |
Joseph Beranek
5890 Ameriprise Financial Center
Minneapolis, MN 55474
1965 | Treasurer and Chief Accounting Officer (Principal Accounting Officer) (2019) and Principal Financial Officer (2020), CFST, CFST I, CFST II, CFVIT and CFVST II; Assistant Treasurer, CET I and CET II | Vice President – Mutual Fund Accounting and Financial Reporting, Columbia Management Investment Advisers, LLC, since December 2018 and March 2017, respectively. |
Marybeth Pilat
290 Congress Street
Boston, MA 02210
1968 | Treasurer and Chief Accounting Officer (Principal Accounting Officer) and Principal Financial Officer (2020) for CET I and CET II; Assistant Treasurer, CFST, CFST I, CFST II, CFVIT and CFVST II | Vice President – Product Pricing and Administration, Columbia Management Investment Advisers, LLC, since May 2017. |
William F. Truscott
290 Congress Street
Boston, MA 02210
1960 | Senior Vice President (2001) | Formerly, Trustee/Director of Columbia Funds Complex or legacy funds, November 2001 - January 1, 2021; Chief Executive Officer, Global Asset Management, Ameriprise Financial, Inc., since September 2012; Chairman of the Board and President, Columbia Management Investment Advisers, LLC, since July 2004 and February 2012, respectively; Chairman of the Board and Chief Executive Officer, Columbia Management Investment Distributors, Inc., since November 2008 and February 2012, respectively; Chairman of the Board and Director, Threadneedle Asset Management Holdings, Sàrl, since March 2013 and December 2008, respectively; senior executive of various entities affiliated with Columbia Threadneedle. |
Christopher O. Petersen
5228 Ameriprise Financial Center
Minneapolis, MN 55474
1970 | Senior Vice President and Assistant Secretary (2021) | Formerly, Trustee/Director of funds within the Columbia Funds Complex, July 1, 2020 - November 22, 2021; Senior Vice President and Assistant General Counsel, Ameriprise Financial, Inc., since September 2021 (previously Vice President and Lead Chief Counsel, January 2015 - September 2021); formerly, President and Principal Executive Officer of the Columbia Funds, 2015 - 2021; officer of Columbia Funds and affiliated funds, since 2007. |
Thomas P. McGuire
290 Congress Street
Boston, MA 02210
1972 | Senior Vice President and Chief Compliance Officer (2012) | Vice President – Asset Management Compliance, Ameriprise Financial, Inc., since May 2010; Chief Compliance Officer, Columbia Acorn/Wanger Funds, since December 2015; formerly, Chief Compliance Officer, Ameriprise Certificate Company, September 2010 – September 2020. |
Ryan C. Larrenaga
290 Congress Street
Boston, MA 02210
1970 | Senior Vice President (2017), Chief Legal Officer (2017), and Secretary (2015) | Vice President and Chief Counsel, Ameriprise Financial, Inc., since August 2018 (previously Vice President and Group Counsel, August 2011 - August 2018); Chief Legal Officer, Columbia Acorn/Wanger Funds, since September 2020; officer of Columbia Funds and affiliated funds, since 2005. |
Columbia Greater China Fund | Annual Report 2023
| 37 |
TRUSTEES AND OFFICERS (continued)
(Unaudited)
Fund officers (continued)
Name,
address and
year of birth | Position and year
first appointed to
position for any Fund
in the Columbia
Funds Complex or a
predecessor thereof | Principal occupation(s) during past five years |
Michael E. DeFao
290 Congress Street
Boston, MA 02210
1968 | Vice President (2011) and Assistant Secretary (2010) | Vice President and Chief Counsel, Ameriprise Financial, Inc., since May 2010; Vice President, Chief Legal Officer and Assistant Secretary, Columbia Management Investment Advisers, LLC, since October 2021 (previously Vice President and Assistant Secretary, May 2010 – September 2021). |
Lyn Kephart-Strong
5903 Ameriprise Financial Center
Minneapolis, MN 55474
1960 | Vice President (2015) | Vice President, Global Investment Operations Services, Columbia Management Investment Advisers, LLC, since 2010; Director (since January 2007) and President (since October 2014), Columbia Management Investment Services Corp.; Director (since December 2017) and President (since January 2017), Ameriprise Trust Company. |
Liquidity Risk Management Program
(Unaudited)
Pursuant to Rule 22e-4 under the 1940 Act, the Fund has adopted a liquidity risk management program (Program). The Program’s principal objectives include assessing, managing and periodically reviewing the Fund’s liquidity risk. Liquidity risk is defined as the risk that the Fund could not meet redemption requests without significant dilution of remaining investors’ interests in the Fund.
The Board has appointed the Investment Manager as the program administrator for the Fund’s Program. The Investment Manager has delegated oversight of the Program to its Liquidity Risk Management Committee (the Committee). At a Board meeting during the fiscal period, the Committee provided the Board with a report addressing the operations of the Program and assessing its adequacy and effectiveness of implementation for the period January 1, 2022 through December 31, 2022, including:
| • | the Fund had sufficient liquidity to both meet redemptions and operate effectively on behalf of shareholders; |
| • | there were no material changes to the Program during the period; |
| • | the implementation of the Program was effective to manage the Fund’s liquidity risk; and |
| • | the Program operated adequately during the period. |
There can be no assurance that the Program will achieve its objectives in the future. Please refer to the Fund’s prospectus for more information regarding the Fund’s exposure to liquidity risk and other principal risks to which an investment in the Fund may be subject.
| 38 | Columbia Greater China Fund | Annual Report 2023 |
Approval of Management Agreement
(Unaudited)
Columbia Management Investment Advisers, LLC (the Investment Manager, and together with its domestic and global affiliates, Columbia Threadneedle Investments), a wholly-owned subsidiary of Ameriprise Financial, Inc. (Ameriprise Financial), serves as the investment manager to Columbia Greater China Fund (the Fund). Under a management agreement (the Management Agreement), the Investment Manager provides investment advice and other services to the Fund and other funds distributed by Columbia Management Investment Distributors, Inc. (collectively, the Funds).
On an annual basis, the Fund’s Board of Trustees (the Board), including the independent Board members (the Independent Trustees), considers renewal of the Management Agreement. The Investment Manager prepared detailed reports for the Board and its Contracts Committee (including its Contracts Subcommittee) in February, March, April, May and June 2023, including reports providing the results of analyses performed by a third-party data provider, Broadridge Financial Solutions, Inc. (Broadridge), and comprehensive responses by the Investment Manager to written requests for information by independent legal counsel to the Independent Trustees (Independent Legal Counsel), to assist the Board in making this determination. In addition, throughout the year, the Board (or its committees or subcommittees) regularly meets with portfolio management teams and senior management personnel and reviews information prepared by the Investment Manager addressing the services the Investment Manager provides and Fund performance. The Board also accords appropriate weight to the work, deliberations and conclusions of the various committees (including their subcommittees), such as the Contracts Committee, the Investment Review Committee, the Audit Committee and the Compliance Committee in determining whether to continue the Management Agreement.
The Board, at its June 22, 2023 Board meeting (the June Meeting), considered the renewal of the Management Agreement for an additional one-year term. At the June Meeting, Independent Legal Counsel reviewed with the Independent Trustees various factors relevant to the Board’s consideration of advisory agreements and the Board’s legal responsibilities related to such consideration. The Independent Trustees considered all information that they, their legal counsel or the Investment Manager believed reasonably necessary to evaluate and to approve the continuation of the Management Agreement. Among other things, the information and factors considered included the following:
| • | Information on the investment performance of the Fund relative to the performance of a group of mutual funds determined to be comparable to the Fund by Broadridge, as well as performance relative to one or more benchmarks; |
| • | Information on the Fund’s management fees and total expenses, including information comparing the Fund’s expenses to those of a group of comparable mutual funds, as determined by Broadridge; |
| • | The Investment Manager’s agreement to contractually limit or cap total operating expenses for the Fund so that total operating expenses (excluding certain fees and expenses, such as transaction costs and certain other investment related expenses, interest, taxes, acquired fund fees and expenses and infrequent and/or unusual expenses) would not exceed a specified annual rate, as a percentage of the Fund’s net assets; |
| • | Terms of the Management Agreement; |
| • | Descriptions of other agreements and arrangements with affiliates of the Investment Manager relating to the operations of the Fund, including agreements with respect to the provision of transfer agency and shareholder services to the Fund; |
| • | Descriptions of various services performed by the Investment Manager under the Management Agreement, including portfolio management and portfolio trading practices; |
| • | Information regarding any recently negotiated management fees of similarly-managed portfolios of other institutional clients of the Investment Manager; |
| • | Information regarding the resources of the Investment Manager, including information regarding senior management, portfolio managers and other personnel; |
| • | Information regarding the capabilities of the Investment Manager with respect to compliance monitoring services; |
| • | The profitability to the Investment Manager and its affiliates from their relationships with the Fund; and |
| • | Report provided by the Board’s independent fee consultant, JDL Consultants, LLC (JDL). |
Columbia Greater China Fund | Annual Report 2023
| 39 |
Approval of Management Agreement (continued)
(Unaudited)
Following an analysis and discussion of the foregoing, and the factors identified below, the Board, including all of the Independent Trustees, approved the renewal of the Management Agreement.
Nature, extent and quality of services provided by the Investment Manager
The Board analyzed various reports and presentations it had received detailing the services performed by the Investment Manager, as well as its history, expertise, resources and relative capabilities, and the qualifications of its personnel.
The Board specifically considered the many developments during recent years concerning the services provided by the Investment Manager. Among other things, the Board noted the organization and depth of the equity and credit research departments. The Board further observed the enhancements to the investment risk management department’s processes, systems and oversight over the past several years. The Board also took into account the broad scope of services provided by the Investment Manager to the Fund, including, among other services, investment, risk and compliance oversight. The Board also took into account the information it received concerning the Investment Manager’s ability to attract and retain key portfolio management personnel and that it has sufficient resources to provide competitive and adequate compensation to investment personnel.
In connection with the Board’s evaluation of the overall package of services provided by the Investment Manager, the Board also considered the nature, quality and range of administrative services provided to the Fund by the Investment Manager, as well as the achievements in 2022 in the performance of administrative services, and noted the various enhancements anticipated for 2023. In evaluating the quality of services provided under the Management Agreement, the Board also took into account the organization and strength of the Fund’s and its service providers’ compliance programs. The Board also reviewed the financial condition of the Investment Manager and its affiliates and each entity’s ability to carry out its responsibilities under the Management Agreement and the Fund’s other service agreements.
In addition, the Board discussed the acceptability of the terms of the Management Agreement, noting that no changes were proposed from the form of agreement previously approved. The Board also noted the wide array of legal and compliance services provided to the Fund under the Management Agreement.
After reviewing these and related factors (including investment performance as discussed below), the Board concluded, within the context of their overall conclusions, that the nature, extent and quality of the services provided to the Fund under the Management Agreement supported the continuation of the Management Agreement.
Investment performance
The Board carefully reviewed the investment performance of the Fund, including detailed reports providing the results of analyses performed by each of the Investment Manager, Broadridge and JDL collectively showing, for various periods (including since manager inception): (i) the performance of the Fund, (ii) the Fund’s performance relative to peers and benchmarks and (iii) the net assets of the Fund. The Board observed the Fund’s underperformance for certain periods, noting that appropriate steps (such as changes to the Fund’s investment process) had been taken to help improve the Fund’s performance.
The Board also reviewed a description of the third-party data provider’s methodology for identifying the Fund’s peer groups for purposes of performance and expense comparisons.
The Board also considered the Investment Manager’s performance and reputation generally, and the Investment Manager’s willingness to take steps intended to improve performance. After reviewing these and related factors, the Board concluded, within the context of their overall conclusions, that the performance of the Fund and the Investment Manager, in light of other considerations, supported the continuation of the Management Agreement.
| 40 | Columbia Greater China Fund | Annual Report 2023 |
Approval of Management Agreement (continued)
(Unaudited)
Comparative fees, costs of services provided and the profits realized by the Investment Manager and its affiliates from their relationships with the Fund
The Board reviewed comparative fees and the costs of services provided under the Management Agreement. The Board members considered detailed comparative information set forth in an annual report on fees and expenses, including, among other things, data (based on analyses conducted by Broadridge and JDL) showing a comparison of the Fund’s expenses with median expenses paid by funds in its comparative peer universe, as well as data showing the Fund’s contribution to the Investment Manager’s profitability.
The Board considered the reports of JDL, which assisted in the Board’s analysis of the Funds’ performance and expenses and the reasonableness of the Funds’ fee rates. The Board accorded particular weight to the notion that a primary objective of the level of fees is to achieve a rational pricing model applied consistently across the various product lines in the Fund family, while assuring that the overall fees for each Fund (with certain exceptions) are generally in line with the current “pricing philosophy” such that Fund total expense ratios, in general, approximate or are lower than the median expense ratios of funds in the same Lipper comparison universe. The Board took into account that the Fund’s total expense ratio (after considering proposed expense caps/waivers) was slightly below the peer universe’s median expense ratio shown in the reports.
After reviewing these and related factors, the Board concluded, within the context of their overall conclusions, that the levels of management fees and expenses of the Fund, in light of other considerations, supported the continuation of the Management Agreement.
The Board also considered the profitability of the Investment Manager and its affiliates in connection with the Investment Manager providing management services to the Fund. With respect to the profitability of the Investment Manager and its affiliates, the Independent Trustees referred to information discussing the profitability to the Investment Manager and Ameriprise Financial from managing, operating and distributing the Funds. The Board considered that the profitability generated by the Investment Manager in 2022 had declined from 2021 levels, due to a variety of factors, including the decreased assets under management of the Funds. It also took into account the indirect economic benefits flowing to the Investment Manager or its affiliates in connection with managing or distributing the Funds, such as the enhanced ability to offer various other financial products to Ameriprise Financial customers, soft dollar benefits and overall reputational advantages. The Board noted that the fees paid by the Fund should permit the Investment Manager to offer competitive compensation to its personnel, make necessary investments in its business and earn an appropriate profit. After reviewing these and related factors, the Board concluded, within the context of their overall conclusions, that the costs of services provided and the profitability to the Investment Manager and its affiliates from their relationships with the Fund supported the continuation of the Management Agreement.
Economies of scale
The Board considered the potential existence of economies of scale in the provision by the Investment Manager of services to the Fund, and whether those economies of scale were shared with the Fund through breakpoints in investment management fees or other means, such as expense limitation arrangements and additional investments by the Investment Manager in investment, trading, compliance and other resources. The Board considered the economies of scale that might be realized as the Fund’s net asset level grows and took note of the extent to which Fund shareholders might also benefit from such growth. In this regard, the Board took into account that management fees decline as Fund assets exceed various breakpoints, all of which have not been surpassed.The Board observed that the Management Agreement provided for breakpoints in the management fee rate schedule that allow opportunities for shareholders to realize lower fees as Fund assets grow and that there are additional opportunities through other means for sharing economies of scale with shareholders.
Conclusion
The Board reviewed all of the above considerations in reaching its decision to approve the continuation of the Management Agreement. In reaching its conclusions, no single factor was determinative.
Columbia Greater China Fund | Annual Report 2023
| 41 |
Approval of Management Agreement (continued)
(Unaudited)
On June 22, 2023, the Board, including all of the Independent Trustees, determined that fees payable under the Management Agreement were fair and reasonable in light of the extent and quality of services provided and approved the renewal of the Management Agreement.
| 42 | Columbia Greater China Fund | Annual Report 2023 |
[THIS PAGE INTENTIONALLY LEFT BLANK]
Columbia Greater China Fund
P.O. Box 219104
Kansas City, MO 64121-9104
Please read and consider the investment objectives, risks, charges and expenses for any fund carefully before investing. For a prospectus and summary prospectus, which contains this and other important information about the Fund, go to
columbiathreadneedleus.com/investor/. The Fund is distributed by Columbia Management Investment Distributors, Inc., member FINRA, and managed by Columbia Management Investment Advisers, LLC.
Columbia Threadneedle Investments (Columbia Threadneedle) is the global brand name of the Columbia and Threadneedle group of companies. All rights reserved.
© 2023 Columbia Management Investment Advisers, LLC.
columbiathreadneedleus.com/investor/

Annual Report
August 31, 2023
Columbia Select Mid Cap Growth Fund
Not FDIC or NCUA Insured • No Financial Institution Guarantee • May Lose Value
If you elect to receive the shareholder report for Columbia Select Mid Cap Growth Fund (the Fund) in paper, mailed to you, the Fund mails one shareholder report to each shareholder address, unless such shareholder elects to receive shareholder reports from the Fund electronically via e-mail or by having a paper notice mailed to you (Postcard Notice) that your Fund’s shareholder report is available at the Columbia funds’ website (columbiathreadneedleus.com/investor/). If you would like more than one report in paper to be mailed to you, or would like to elect to receive reports via e-mail or access them through Postcard Notice, please call shareholder services at 800.345.6611 and additional reports will be sent to you.
Proxy voting policies and procedures
The policy of the Board of Trustees is to vote the proxies of the companies in which the Fund holds investments consistent with the procedures as stated in the Statement of Additional Information (SAI). You may obtain a copy of the SAI without charge by calling 800.345.6611; contacting your financial intermediary; visiting columbiathreadneedleus.com/investor/; or searching the website of the Securities and Exchange Commission (SEC) at sec.gov. Information regarding how the Fund voted proxies relating to portfolio securities is filed with the SEC by August 31st for the most recent 12-month period ending June 30th of that year, and is available without charge by visiting columbiathreadneedleus.com/investor/, or searching the website of the SEC at sec.gov.
Quarterly schedule of investments
The Fund files a complete schedule of portfolio holdings with the SEC for the first and third quarters of each fiscal year on Form N-PORT. The Fund’s Form N-PORT filings are available on the SEC’s website at sec.gov. The Fund’s complete schedule of portfolio holdings, as filed on Form N-PORT, is available on columbiathreadneedleus.com/investor/ or can also be obtained without charge, upon request, by calling 800.345.6611.
Additional Fund information
For more information about the Fund, please visit columbiathreadneedleus.com/investor/ or call 800.345.6611. Customer Service Representatives are available to answer your questions Monday through Friday from 8 a.m. to 7 p.m. Eastern time.
Fund investment manager
Columbia Management Investment Advisers, LLC (the Investment Manager)
290 Congress Street
Boston, MA 02210
Fund distributor
Columbia Management Investment Distributors, Inc.
290 Congress Street
Boston, MA 02210
Fund transfer agent
Columbia Management Investment Services Corp.
P.O. Box 219104
Kansas City, MO 64121-9104
Columbia Select Mid Cap Growth Fund | Annual Report 2023
Fund at a Glance
(Unaudited)
Investment objective
The Fund seeks significant capital appreciation by investing, under normal market conditions, at least 80% of its net assets (plus any borrowings for investment purposes) in stocks of companies with a market capitalization, at the time of initial purchase, equal to or less than the largest stock in the Russell Midcap Index.
Portfolio management
Daniel Cole, CFA
Co-Portfolio Manager
Managed Fund since 2021
Wayne Collette, CFA
Co-Portfolio Manager
Managed Fund since February 2023
Dana Kelley, CFA
Co-Portfolio Manager
Managed Fund since February 2023
Morningstar style boxTM
The Morningstar Style Box is based on a fund’s portfolio holdings. For equity funds, the vertical axis shows the market capitalization of the stocks owned, and the horizontal axis shows investment style (value, blend, or growth). Information shown is based on the most recent data provided by Morningstar.
© 2023 Morningstar, Inc. All rights reserved. The Morningstar information contained herein: (1) is proprietary to Morningstar and/or its content providers; (2) may not be copied or distributed; and (3) is not warranted to be accurate, complete or timely. Neither Morningstar nor its content providers are responsible for any damages or losses arising from any use of this information.
| Average annual total returns (%) (for the period ended August 31, 2023) |
| | | Inception | 1 Year | 5 Years | 10 Years |
| Class A | Excluding sales charges | 11/01/02 | 11.48 | 7.35 | 9.83 |
| | Including sales charges | | 5.05 | 6.08 | 9.18 |
| Advisor Class | 11/08/12 | 11.75 | 7.62 | 10.11 |
| Class C | Excluding sales charges | 10/13/03 | 10.65 | 6.55 | 9.01 |
| | Including sales charges | | 9.65 | 6.55 | 9.01 |
| Institutional Class | 11/20/85 | 11.74 | 7.62 | 10.11 |
| Institutional 2 Class | 03/07/11 | 11.78 | 7.68 | 10.20 |
| Institutional 3 Class | 07/15/09 | 11.85 | 7.73 | 10.26 |
| Class R | 01/23/06 | 11.13 | 7.08 | 9.56 |
| Class V | Excluding sales charges | 11/01/02 | 11.45 | 7.35 | 9.83 |
| | Including sales charges | | 5.03 | 6.09 | 9.18 |
| Russell Midcap Growth Index | | 13.00 | 7.95 | 11.03 |
| Russell Midcap Index | | 8.38 | 7.35 | 10.04 |
Returns for Class A and Class V shares are shown with and without the maximum initial sales charge of 5.75%. Returns for Class C shares are shown with and without the 1.00% contingent deferred sales charge for the first year only. The Fund’s other share classes are not subject to sales charges and have limited eligibility. Please see the Fund’s prospectus for details. Performance for different share classes will vary based on differences in sales charges and fees associated with each share class. All results shown assume reinvestment of distributions during the period. Returns do not reflect the deduction of taxes that a shareholder may pay on Fund distributions or on the redemption of Fund shares. Performance results reflect the effect of any fee waivers or reimbursements of Fund expenses by Columbia Management Investment Advisers, LLC and/or any of its affiliates. Absent these fee waivers or expense reimbursement arrangements, performance results would have been lower.
The performance information shown represents past performance and is not a guarantee of future results. The investment return and principal value of your investment will fluctuate so that your shares, when redeemed, may be worth more or less than their original cost. Current performance may be lower or higher than the performance information shown. You may obtain performance information current to the most recent month-end by contacting your financial intermediary, visiting columbiathreadneedleus.com/investor/ or calling 800.345.6611.
The Russell Midcap Growth Index, an unmanaged index, measures the performance of those Russell Midcap Index companies with higher price-to-book ratios and forecasted growth values.
The Russell Midcap Index, an unmanaged index, measures the performance of the 800 smallest companies in the Russell 1000 Index, which represents approximately 25% of the total market capitalization or the Russell 1000 Index.
Indices are not available for investment, are not professionally managed and do not reflect sales charges, fees, brokerage commissions, taxes or other expenses of investing. Securities in the Fund may not match those in an index.
Columbia Select Mid Cap Growth Fund | Annual Report 2023
| 3 |
Fund at a Glance (continued)
(Unaudited)
Performance of a hypothetical $10,000 investment (August 31, 2013 — August 31, 2023)
The chart above shows the change in value of a hypothetical $10,000 investment in Class A shares of Columbia Select Mid Cap Growth Fund during the stated time period, and does not reflect the deduction of taxes that a shareholder may pay on Fund distributions or on the redemption of Fund shares.
| Portfolio breakdown (%) (at August 31, 2023) |
| Common Stocks | 96.4 |
| Money Market Funds | 3.6 |
| Total | 100.0 |
Percentages indicated are based upon total investments excluding investments in derivatives, if any. The Fund’s portfolio composition is subject to change.
| Equity sector breakdown (%) (at August 31, 2023) |
| Communication Services | 12.1 |
| Consumer Discretionary | 16.4 |
| Consumer Staples | 0.9 |
| Energy | 5.1 |
| Financials | 2.1 |
| Health Care | 18.9 |
| Industrials | 16.5 |
| Information Technology | 22.9 |
| Materials | 3.2 |
| Real Estate | 1.9 |
| Total | 100.0 |
Percentages indicated are based upon total equity investments. The Fund’s portfolio composition is subject to change.
| 4 | Columbia Select Mid Cap Growth Fund | Annual Report 2023 |
Manager Discussion of Fund Performance
(Unaudited)
For the 12-month period ended August 31, 2023, Class A shares of Columbia Select Mid Cap Growth Fund returned 11.48% excluding sales charges. During the same period, the Fund trailed its benchmark, the Russell Midcap Growth Index, which returned 13.00%. However, the Fund outperformed the broader mid-cap market, as measured by the Russell Midcap Index, which returned 8.38% during the period.
Market overview
Markets advanced over the 12-month period that ended August 31, 2023, amidst conflicting economic data that kept investors focused on the path of the U.S. Federal Reserve (Fed) interest rate hikes and the debate over a soft versus hard economic landing. After a dismal first half in 2022, U.S. markets showed signs of optimism in the second half of the year as oil prices rolled over from their June highs and investors got more hopeful over a slowing in the Fed’s interest rate raising trajectory. Company earnings, consumer spending and the jobs market showed resilience despite historically high inflation numbers, and the stubbornly persisting prospects of an impending recession kept being pushed out further into the future. Geopolitical concerns also helped to fuel investor uncertainty as the Russia-Ukraine conflict continued. Coming into 2023, markets rebounded on renewed hope of a Fed pivot in interest rates, which led to many oversold companies picking up steam. In March 2023, the sudden failure of two large U.S. banks led to a major sell-off in the financial sector, making investors jittery about the U.S. financial system. However, government measures contained any prolonged contagion from the banking crisis. As the first half of 2023 progressed, the gains in the market were largely a reflection of a handful of highly valued mega cap tech focused companies poised to benefit from advances in artificial intelligence, particularly in generative AI and large language models. Towards the end of the period however, markets pulled back in an environment of rating agency downgrades of U.S. debt, signs of depletion in US household savings and slowing economic data out of China.
The Fed raised interest rates seven times between September 2022 and July 2023, bringing the target rate up from a range of 2.25%-2.50% to 5.25%-5.50% by August 31, 2023. Annual inflation, as measured by Consumer Price Index, was 3.7% in August, much lower than its June 2022 peak of 9.1% but still well above the Fed’s 2% target rate. The labor market stayed resilient, with the unemployment rate staying at 3.7%, while personal spending increased 3.3% from last year.
Industrials, consumer discretionary and information technology were the best performing sectors. Industrials was led by transportation and consumer discretionary was led by consumer durables. Information technology was driven up by technology hardware names. Three sectors ended in the red: utilities, communication services and materials.
The Fund experienced an increased level of portfolio turnover as compared to the previous reporting period, driven primarily by opportunistic trading during a period of elevated market volatility.
The Fund’s notable detractors during the period
| • | Selection among information technology names was the primary driver of underperformance, particularly within software and services. Several holdings detracted from performance in the consumer discretionary sector, particularly among our consumer services names. An overweight to the communication services sector was also a drag on performance. |
| • | CrowdStrike Holdings, Inc. is a cybersecurity technology company that provides cloud workload and endpoint security, threat intelligence, and cyberattack response services. During the period, the company was weighed down by weaker than expected growth in new revenue, customer delays in subscription plans, longer sales cycles, an increased scrutiny on budgets and a general deceleration in new customers in a tough market environment. The Fund’s position in CrowdStrike Holdings, Inc. was eliminated during the period. |
| • | Generac Holdings Inc. is a leading energy technology company that provides advanced power grid software solutions, backup, and prime power systems for home and industrial applications, solar + battery storage solutions, virtual power plant platforms and engine and battery-powered tools and equipment. During the period, Generac’s dealer channel slowed orders due to inventory building as Generac’s lead time shrank and those dealers struggled to meet demand for home standby generators due to a shortage of workers to do the installations. This caused Generac to miss earnings and lower guidance. The Fund’s position in Generac Holdings Inc. was eliminated during the period. |
| • | Repligen Corporation is a global life sciences company which engages in providing bio-processing technologies and solutions used in the process of manufacturing biological drugs. During the period, the company reduced its annual |
Columbia Select Mid Cap Growth Fund | Annual Report 2023
| 5 |
Manager Discussion of Fund Performance (continued)
(Unaudited)
| | guidance. The company is facing longer-than-expected headwinds from restrained spending and customer destocking due to demand normalization as the market for its Covid related products has dried up. This cyclical drawdown has been exacerbated by a lack of visibility on the progress of China’s economy as well as persistent fears over biotech funding. |
The Fund’s notable contributors during the period
| • | During the period, the growth style that was out of favor returned as investors hoped for a Fed pivot on interest rate hikes. This led to a resurgence in long duration growth names. Value stocks were also negatively affected because of the banking crisis fallout. |
| • | Selection within media and entertainment in the communication services sector worked favorably along with some positions in the materials sector. An overweight to the health care was also a positive factor. |
| • | West Pharmaceutical Services, Inc. is a designer and manufacturer of injectable pharmaceutical packaging and delivery systems (e.g., syringe plungers, stoppers, and vials), with leading market share and financial returns. West has built a dominant market share in the single vial business. Single vials are a critical component of drug suppliers, given stringent FDA regulations around contamination. West has gained a strong foothold in this space, giving it a massive scale advantage with high barriers to entry, and therefore strong pricing power. The company has had favorable results during the period that was above expectations. |
| • | Five Below, Inc. is an American chain of specialty discount stores that sells products that are priced at less than five dollars and a small assortment of products from $6 to $25. Revenues have been strong with the company continuing to add on new stores to its existing line up and making improvements to its supply chain. After having a weaker initial start in 2022 in the wake of the Covid ripple effects on inventory, they reported better than expected earnings as the year progressed that raised investor confidence in sales re-accelerating. They also articulated initiatives which helped drive greater sales during the holiday season. The Fund’s position in Five Below, Inc. was eliminated during the period. |
| • | XPO, Inc. is a less than truck load (LTL) carrier. XPO historically has underperformed their competitors due to lack of focus and a weak margin structure. However, more recently they have had a CEO change and hired executives from the market leading competitor, who are financially incentivized to improve operations. This new management team has begun to put in place initiatives that will drive a change in culture and significantly improve the margin structure of the business. The market responded favorably to these developments. |
Market risk may affect a single issuer, sector of the economy, industry or the market as a whole. Growth securities, at times, may not perform as well as value securities or the stock market in general and may be out of favor with investors. Foreign investments subject the fund to risks, including political, economic, market, social and others within a particular country, as well as to currency instabilities and less stringent financial and accounting standards generally applicable to U.S. issuers. Investments in mid-cap companies involve risks and volatility greater than investments in larger, more established companies. The fund may invest significantly in issuers within a particular sector, which may be negatively affected by market, economic or other conditions, making the fund more vulnerable to unfavorable developments in the sector. See the Fund’s prospectus for more information on these and other risks.
The views expressed in this report reflect the current views of the respective parties who have contributed to this report. These views are not guarantees of future performance and involve certain risks, uncertainties and assumptions that are difficult to predict, so actual outcomes and results may differ significantly from the views expressed. These views are subject to change at any time based upon economic, market or other conditions and the respective parties disclaim any responsibility to update such views. These views may not be relied on as investment advice and, because investment decisions for a Columbia fund are based on numerous factors, may not be relied on as an indication of trading intent on behalf of any particular Columbia fund. References to specific securities should not be construed as a recommendation or investment advice.
| 6 | Columbia Select Mid Cap Growth Fund | Annual Report 2023 |
Understanding Your Fund’s Expenses
(Unaudited)
As an investor, you incur two types of costs. There are shareholder transaction costs, which generally include sales charges on purchases and may include redemption fees. There are also ongoing fund costs, which generally include management fees, distribution and/or service fees, and other fund expenses. The following information is intended to help you understand your ongoing costs (in dollars) of investing in the Fund and to help you compare these costs with the ongoing costs of investing in other mutual funds.
Analyzing your Fund’s expenses
To illustrate these ongoing costs, we have provided examples and calculated the expenses paid by investors in each share class of the Fund during the period. The actual and hypothetical information in the table is based on an initial investment of $1,000 at the beginning of the period indicated and held for the entire period. Expense information is calculated two ways and each method provides you with different information. The amount listed in the “Actual” column is calculated using the Fund’s actual operating expenses and total return for the period. You may use the Actual information, together with the amount invested, to estimate the expenses that you paid over the period. Simply divide your account value by $1,000 (for example, an $8,600 account value divided by $1,000 = 8.6), then multiply the results by the expenses paid during the period under the “Actual” column. The amount listed in the “Hypothetical” column assumes a 5% annual rate of return before expenses (which is not the Fund’s actual return) and then applies the Fund’s actual expense ratio for the period to the hypothetical return. You should not use the hypothetical account values and expenses to estimate either your actual account balance at the end of the period or the expenses you paid during the period. See “Compare with other funds” below for details on how to use the hypothetical data.
Compare with other funds
Since all mutual funds are required to include the same hypothetical calculations about expenses in shareholder reports, you can use this information to compare the ongoing cost of investing in the Fund with other funds. To do so, compare the hypothetical example with the 5% hypothetical examples that appear in the shareholder reports of other funds. As you compare hypothetical examples of other funds, it is important to note that hypothetical examples are meant to highlight the ongoing costs of investing in a fund only and do not reflect any transaction costs, such as sales charges, or redemption or exchange fees. Therefore, the hypothetical calculations are useful in comparing ongoing costs only, and will not help you determine the relative total costs of owning different funds. If transaction costs were included in these calculations, your costs would be higher.
| March 1, 2023 — August 31, 2023 |
| | Account value at the
beginning of the
period ($) | Account value at the
end of the
period ($) | Expenses paid during
the period ($) | Fund’s annualized
expense ratio (%) |
| | Actual | Hypothetical | Actual | Hypothetical | Actual | Hypothetical | Actual |
| Class A | 1,000.00 | 1,000.00 | 1,092.70 | 1,019.36 | 6.12 | 5.90 | 1.16 |
| Advisor Class | 1,000.00 | 1,000.00 | 1,094.20 | 1,020.62 | 4.80 | 4.63 | 0.91 |
| Class C | 1,000.00 | 1,000.00 | 1,088.40 | 1,015.58 | 10.05 | 9.70 | 1.91 |
| Institutional Class | 1,000.00 | 1,000.00 | 1,094.40 | 1,020.62 | 4.80 | 4.63 | 0.91 |
| Institutional 2 Class | 1,000.00 | 1,000.00 | 1,094.70 | 1,020.87 | 4.54 | 4.38 | 0.86 |
| Institutional 3 Class | 1,000.00 | 1,000.00 | 1,094.90 | 1,021.17 | 4.22 | 4.08 | 0.80 |
| Class R | 1,000.00 | 1,000.00 | 1,091.10 | 1,018.10 | 7.43 | 7.17 | 1.41 |
| Class V | 1,000.00 | 1,000.00 | 1,092.90 | 1,019.36 | 6.12 | 5.90 | 1.16 |
Expenses paid during the period are equal to the annualized expense ratio for each class as indicated above, multiplied by the average account value over the period and then multiplied by the number of days in the Fund’s most recent fiscal half year and divided by 365.
Expenses do not include fees and expenses incurred indirectly by the Fund from its investment in underlying funds, including affiliated and non-affiliated pooled investment vehicles, such as mutual funds and exchange-traded funds.
Columbia Select Mid Cap Growth Fund | Annual Report 2023
| 7 |
Portfolio of Investments
August 31, 2023
(Percentages represent value of investments compared to net assets)
Investments in securities
| Common Stocks 96.8% |
| Issuer | Shares | Value ($) |
| Communication Services 11.7% |
| Entertainment 8.8% |
| Activision Blizzard, Inc. | 244,910 | 22,529,271 |
| Endeavor Group Holdings, Inc., Class A(a) | 898,829 | 19,675,367 |
| Liberty Media Corp.-Liberty Formula One, Class C(a) | 250,079 | 17,202,934 |
| Spotify Technology SA(a) | 107,651 | 16,575,025 |
| Take-Two Interactive Software, Inc.(a) | 277,955 | 39,525,201 |
| Warner Music Group Corp., Class A | 413,198 | 13,759,493 |
| Total | | 129,267,291 |
| Interactive Media & Services 1.0% |
| Pinterest, Inc., Class A(a) | 556,905 | 15,309,319 |
| Media 1.9% |
| Trade Desk, Inc. (The), Class A(a) | 350,473 | 28,048,354 |
| Total Communication Services | 172,624,964 |
| Consumer Discretionary 15.9% |
| Automobiles 0.9% |
| Ferrari NV | 42,775 | 13,591,328 |
| Hotels, Restaurants & Leisure 10.9% |
| Booking Holdings, Inc.(a) | 11,112 | 34,503,093 |
| Churchill Downs, Inc. | 122,150 | 15,302,952 |
| DraftKings, Inc., Class A(a) | 1,395,541 | 41,377,791 |
| Flutter Entertainment PLC(a) | 47,647 | 8,676,261 |
| Hilton Worldwide Holdings, Inc. | 146,769 | 21,817,212 |
| Planet Fitness, Inc., Class A(a) | 280,224 | 17,037,619 |
| Restaurant Brands International, Inc. | 316,026 | 21,948,006 |
| Total | | 160,662,934 |
| Specialty Retail 2.2% |
| Tractor Supply Co. | 147,139 | 32,149,871 |
| Textiles, Apparel & Luxury Goods 1.9% |
| On Holding AG, Class A(a) | 969,644 | 27,954,837 |
| Total Consumer Discretionary | 234,358,970 |
| Consumer Staples 0.9% |
| Beverages 0.9% |
| Monster Beverage Corp.(a) | 232,666 | 13,357,355 |
| Total Consumer Staples | 13,357,355 |
| Common Stocks (continued) |
| Issuer | Shares | Value ($) |
| Energy 4.9% |
| Oil, Gas & Consumable Fuels 4.9% |
| Cameco Corp. | 462,485 | 17,111,945 |
| Coterra Energy, Inc. | 516,191 | 14,551,424 |
| Hess Corp. | 266,164 | 41,122,338 |
| Total | | 72,785,707 |
| Total Energy | 72,785,707 |
| Financials 2.0% |
| Capital Markets 2.0% |
| LPL Financial Holdings, Inc. | 126,870 | 29,254,953 |
| Total Financials | 29,254,953 |
| Health Care 18.3% |
| Biotechnology 1.5% |
| Alnylam Pharmaceuticals, Inc.(a) | 31,886 | 6,307,689 |
| Exact Sciences Corp.(a) | 196,899 | 16,474,539 |
| Total | | 22,782,228 |
| Health Care Equipment & Supplies 3.9% |
| DexCom, Inc.(a) | 217,751 | 21,988,496 |
| IDEXX Laboratories, Inc.(a) | 55,441 | 28,353,082 |
| Insulet Corp.(a) | 37,966 | 7,278,462 |
| Total | | 57,620,040 |
| Health Care Providers & Services 3.7% |
| Cencora, Inc. | 194,281 | 34,189,570 |
| Chemed Corp. | 40,532 | 20,729,686 |
| Total | | 54,919,256 |
| Life Sciences Tools & Services 9.2% |
| Bio-Techne Corp. | 446,321 | 34,991,566 |
| Mettler-Toledo International, Inc.(a) | 9,126 | 11,074,219 |
| Repligen Corp.(a) | 191,805 | 33,356,808 |
| Waters Corp.(a) | 94,063 | 26,412,890 |
| West Pharmaceutical Services, Inc. | 73,171 | 29,773,280 |
| Total | | 135,608,763 |
| Total Health Care | 270,930,287 |
The accompanying Notes to Financial Statements are an integral part of this statement.
| 8 | Columbia Select Mid Cap Growth Fund | Annual Report 2023 |
Portfolio of Investments (continued)
August 31, 2023
| Common Stocks (continued) |
| Issuer | Shares | Value ($) |
| Industrials 16.0% |
| Aerospace & Defense 4.1% |
| HEICO Corp. | 110,120 | 18,578,345 |
| Howmet Aerospace, Inc. | 352,755 | 17,450,790 |
| TransDigm Group, Inc.(a) | 26,845 | 24,263,853 |
| Total | | 60,292,988 |
| Commercial Services & Supplies 2.3% |
| Rollins, Inc. | 863,922 | 34,185,394 |
| Construction & Engineering 0.6% |
| WillScot Mobile Mini Holdings Corp.(a) | 230,742 | 9,465,037 |
| Electrical Equipment 1.3% |
| AMETEK, Inc. | 121,736 | 19,418,109 |
| Ground Transportation 3.4% |
| CSX Corp. | 669,059 | 20,205,582 |
| XPO, Inc.(a) | 391,923 | 29,249,213 |
| Total | | 49,454,795 |
| Trading Companies & Distributors 4.3% |
| Ferguson PLC | 74,838 | 12,090,827 |
| SiteOne Landscape Supply, Inc.(a) | 198,536 | 33,987,378 |
| W.W. Grainger, Inc. | 24,334 | 17,377,883 |
| Total | | 63,456,088 |
| Total Industrials | 236,272,411 |
| Information Technology 22.2% |
| Communications Equipment 2.2% |
| Arista Networks, Inc.(a) | 163,092 | 31,840,451 |
| IT Services 7.2% |
| Cloudflare, Inc.(a) | 679,609 | 44,194,973 |
| MongoDB, Inc.(a) | 102,535 | 39,096,596 |
| Snowflake, Inc., Class A(a) | 146,080 | 22,912,648 |
| Total | | 106,204,217 |
| Semiconductors & Semiconductor Equipment 6.7% |
| Lam Research Corp. | 63,373 | 44,513,195 |
| Lattice Semiconductor Corp.(a) | 301,196 | 29,294,323 |
| Monolithic Power Systems, Inc. | 48,618 | 25,340,188 |
| Total | | 99,147,706 |
| Common Stocks (continued) |
| Issuer | Shares | Value ($) |
| Software 6.1% |
| BILL Holdings, Inc.(a) | 67,124 | 7,739,397 |
| Datadog, Inc., Class A(a) | 220,304 | 21,254,930 |
| Fortinet, Inc.(a) | 405,705 | 24,427,498 |
| HubSpot, Inc.(a) | 47,381 | 25,894,664 |
| Splunk, Inc.(a) | 92,072 | 11,164,651 |
| Total | | 90,481,140 |
| Total Information Technology | 327,673,514 |
| Materials 3.1% |
| Chemicals 1.1% |
| Sherwin-Williams Co. (The) | 59,686 | 16,217,880 |
| Construction Materials 2.0% |
| Vulcan Materials Co. | 138,120 | 30,144,690 |
| Total Materials | 46,362,570 |
| Real Estate 1.8% |
| Real Estate Management & Development 1.8% |
| CoStar Group, Inc.(a) | 330,153 | 27,069,245 |
| Total Real Estate | 27,069,245 |
Total Common Stocks
(Cost $1,282,529,398) | 1,430,689,976 |
|
| Money Market Funds 3.6% |
| | Shares | Value ($) |
| Columbia Short-Term Cash Fund, 5.476%(b),(c) | 52,953,847 | 52,937,961 |
Total Money Market Funds
(Cost $52,930,876) | 52,937,961 |
Total Investments in Securities
(Cost: $1,335,460,274) | 1,483,627,937 |
| Other Assets & Liabilities, Net | | (5,804,586) |
| Net Assets | 1,477,823,351 |
The accompanying Notes to Financial Statements are an integral part of this statement.
Columbia Select Mid Cap Growth Fund | Annual Report 2023
| 9 |
Portfolio of Investments (continued)
August 31, 2023
Notes to Portfolio of Investments
| (a) | Non-income producing investment. |
| (b) | The rate shown is the seven-day current annualized yield at August 31, 2023. |
| (c) | As defined in the Investment Company Act of 1940, as amended, an affiliated company is one in which the Fund owns 5% or more of the company’s outstanding voting securities, or a company which is under common ownership or control with the Fund. The value of the holdings and transactions in these affiliated companies during the year ended August 31, 2023 are as follows: |
| Affiliated issuers | Beginning
of period($) | Purchases($) | Sales($) | Net change in
unrealized
appreciation
(depreciation)($) | End of
period($) | Realized gain
(loss)($) | Dividends($) | End of
period shares |
| Columbia Short-Term Cash Fund, 5.476% |
| | 31,091,075 | 808,733,978 | (786,892,312) | 5,220 | 52,937,961 | (19,266) | 1,752,287 | 52,953,847 |
Fair value measurements
The Fund categorizes its fair value measurements according to a three-level hierarchy that maximizes the use of observable inputs and minimizes the use of unobservable inputs by prioritizing that the most observable input be used when available. Observable inputs are those that market participants would use in pricing an investment based on market data obtained from sources independent of the reporting entity. Unobservable inputs are those that reflect the Fund’s assumptions about the information market participants would use in pricing an investment. An investment’s level within the fair value hierarchy is based on the lowest level of any input that is deemed significant to the asset’s or liability’s fair value measurement. The input levels are not necessarily an indication of the risk or liquidity associated with investments at that level. For example, certain U.S. government securities are generally high quality and liquid, however, they are reflected as Level 2 because the inputs used to determine fair value may not always be quoted prices in an active market.
Fair value inputs are summarized in the three broad levels listed below:
| ■ | Level 1 — Valuations based on quoted prices for investments in active markets that the Fund has the ability to access at the measurement date. Valuation adjustments are not applied to Level 1 investments. |
| ■ | Level 2 — Valuations based on other significant observable inputs (including quoted prices for similar securities, interest rates, prepayment speeds, credit risks, etc.). |
| ■ | Level 3 — Valuations based on significant unobservable inputs (including the Fund’s own assumptions and judgment in determining the fair value of investments). |
Inputs that are used in determining fair value of an investment may include price information, credit data, volatility statistics, and other factors. These inputs can be either observable or unobservable. The availability of observable inputs can vary between investments, and is affected by various factors such as the type of investment, and the volume and level of activity for that investment or similar investments in the marketplace. The inputs will be considered by the Investment Manager, along with any other relevant factors in the calculation of an investment’s fair value. The Fund uses prices and inputs that are current as of the measurement date, which may include periods of market dislocations. During these periods, the availability of prices and inputs may be reduced for many investments. This condition could cause an investment to be reclassified between the various levels within the hierarchy.
Foreign equity securities actively traded in markets where there is a significant delay in the local close relative to the New York Stock Exchange are classified as Level 2. The values of these securities may include an adjustment to reflect the impact of market movements following the close of local trading, as described in Note 2 to the financial statements – Security valuation.
Investments falling into the Level 3 category are primarily supported by quoted prices from brokers and dealers participating in the market for those investments. However, these may be classified as Level 3 investments due to lack of market transparency and corroboration to support these quoted prices. Additionally, valuation models may be used as the pricing source for any remaining investments classified as Level 3. These models may rely on one or more significant unobservable inputs and/or significant assumptions by the Investment Manager. Inputs used in valuations may include, but are not limited to, financial statement analysis, capital account balances, discount rates and estimated cash flows, and comparable company data.
The Fund’s Board of Trustees (the Board) has designated the Investment Manager, through its Valuation Committee (the Committee), as valuation designee, responsible for determining the fair value of the assets of the Fund for which market quotations are not readily available using valuation procedures approved by the Board. The Committee consists of voting and non-voting members from various groups within the Investment Manager’s organization, including operations and accounting, trading and investments, compliance, risk management and legal.
The Committee meets at least monthly to review and approve valuation matters, which may include a description of specific valuation determinations, data regarding pricing information received from approved pricing vendors and brokers and the results of Board-approved valuation policies and procedures (the Policies). The Policies address, among other things, instances when market quotations are or are not readily available, including recommendations of third party pricing vendors and a determination of appropriate pricing methodologies; events that require specific valuation determinations and assessment of fair value techniques; securities with a potential for stale pricing, including those that are illiquid, restricted, or in default; and the effectiveness of third party pricing vendors, including periodic reviews of vendors. The Committee meets more frequently, as needed, to discuss additional valuation matters, which may include the need to review back-testing results, review time-sensitive information or approve related valuation actions. Representatives of Columbia Management Investment Advisers, LLC report to the Board at each of its regularly scheduled meetings to discuss valuation matters and actions during the period, similar to those described earlier.
The following table is a summary of the inputs used to value the Fund’s investments at August 31, 2023:
| | Level 1 ($) | Level 2 ($) | Level 3 ($) | Total ($) |
| Investments in Securities | | | | |
| Common Stocks | | | | |
| Communication Services | 172,624,964 | — | — | 172,624,964 |
| Consumer Discretionary | 225,682,709 | 8,676,261 | — | 234,358,970 |
| Consumer Staples | 13,357,355 | — | — | 13,357,355 |
| Energy | 72,785,707 | — | — | 72,785,707 |
The accompanying Notes to Financial Statements are an integral part of this statement.
| 10 | Columbia Select Mid Cap Growth Fund | Annual Report 2023 |
Portfolio of Investments (continued)
August 31, 2023
Fair value measurements (continued)
| | Level 1 ($) | Level 2 ($) | Level 3 ($) | Total ($) |
| Financials | 29,254,953 | — | — | 29,254,953 |
| Health Care | 270,930,287 | — | — | 270,930,287 |
| Industrials | 236,272,411 | — | — | 236,272,411 |
| Information Technology | 327,673,514 | — | — | 327,673,514 |
| Materials | 46,362,570 | — | — | 46,362,570 |
| Real Estate | 27,069,245 | — | — | 27,069,245 |
| Total Common Stocks | 1,422,013,715 | 8,676,261 | — | 1,430,689,976 |
| Money Market Funds | 52,937,961 | — | — | 52,937,961 |
| Total Investments in Securities | 1,474,951,676 | 8,676,261 | — | 1,483,627,937 |
See the Portfolio of Investments for all investment classifications not indicated in the table.
The Fund’s assets assigned to the Level 2 input category are generally valued using the market approach, in which a security’s value is determined through reference to prices and information from market transactions for similar or identical assets. These assets include certain foreign securities for which a third party statistical pricing service may be employed for purposes of fair market valuation. The model utilized by such third party statistical pricing service takes into account a security’s correlation to available market data including, but not limited to, intraday index, ADR, and exchange-traded fund movements.
The accompanying Notes to Financial Statements are an integral part of this statement.
Columbia Select Mid Cap Growth Fund | Annual Report 2023
| 11 |
Statement of Assets and Liabilities
August 31, 2023
| Assets | |
| Investments in securities, at value | |
| Unaffiliated issuers (cost $1,282,529,398) | $1,430,689,976 |
| Affiliated issuers (cost $52,930,876) | 52,937,961 |
| Receivable for: | |
| Investments sold | 20,473,240 |
| Capital shares sold | 229,796 |
| Dividends | 923,230 |
| Trustees’ fees | 256,574 |
| Prepaid expenses | 18,895 |
| Total assets | 1,505,529,672 |
| Liabilities | |
| Payable for: | |
| Investments purchased | 25,211,330 |
| Capital shares redeemed | 1,952,905 |
| Management services fees | 31,264 |
| Distribution and/or service fees | 5,230 |
| Transfer agent fees | 124,102 |
| Trustees’ fees | 333,390 |
| Other expenses | 48,100 |
| Total liabilities | 27,706,321 |
| Net assets applicable to outstanding capital stock | $1,477,823,351 |
| Represented by | |
| Paid in capital | 1,338,790,096 |
| Total distributable earnings (loss) | 139,033,255 |
| Total - representing net assets applicable to outstanding capital stock | $1,477,823,351 |
The accompanying Notes to Financial Statements are an integral part of this statement.
| 12 | Columbia Select Mid Cap Growth Fund | Annual Report 2023 |
Statement of Assets and Liabilities (continued)
August 31, 2023
| Class A | |
| Net assets | $708,521,610 |
| Shares outstanding | 34,731,869 |
| Net asset value per share | $20.40 |
| Maximum sales charge | 5.75% |
| Maximum offering price per share (calculated by dividing the net asset value per share by 1.0 minus the maximum sales charge for Class A shares) | $21.64 |
| Advisor Class | |
| Net assets | $12,292,407 |
| Shares outstanding | 497,127 |
| Net asset value per share | $24.73 |
| Class C | |
| Net assets | $5,493,894 |
| Shares outstanding | 413,093 |
| Net asset value per share | $13.30 |
| Institutional Class | |
| Net assets | $630,491,670 |
| Shares outstanding | 26,936,074 |
| Net asset value per share | $23.41 |
| Institutional 2 Class | |
| Net assets | $20,097,047 |
| Shares outstanding | 843,870 |
| Net asset value per share | $23.82 |
| Institutional 3 Class | |
| Net assets | $74,690,604 |
| Shares outstanding | 3,127,521 |
| Net asset value per share | $23.88 |
| Class R | |
| Net assets | $5,421,838 |
| Shares outstanding | 291,911 |
| Net asset value per share | $18.57 |
| Class V | |
| Net assets | $20,814,281 |
| Shares outstanding | 1,028,371 |
| Net asset value per share | $20.24 |
| Maximum sales charge | 5.75% |
| Maximum offering price per share (calculated by dividing the net asset value per share by 1.0 minus the maximum sales charge for Class V shares) | $21.47 |
The accompanying Notes to Financial Statements are an integral part of this statement.
Columbia Select Mid Cap Growth Fund | Annual Report 2023
| 13 |
Statement of Operations
Year Ended August 31, 2023
| Net investment income | |
| Income: | |
| Dividends — unaffiliated issuers | $6,396,597 |
| Dividends — affiliated issuers | 1,752,287 |
| Interfund lending | 1,297 |
| Foreign taxes withheld | (17,209) |
| Total income | 8,132,972 |
| Expenses: | |
| Management services fees | 11,035,193 |
| Distribution and/or service fees | |
| Class A | 1,721,173 |
| Class C | 55,375 |
| Class R | 24,751 |
| Class V | 49,346 |
| Transfer agent fees | |
| Class A | 789,787 |
| Advisor Class | 12,101 |
| Class C | 6,359 |
| Institutional Class | 685,345 |
| Institutional 2 Class | 17,472 |
| Institutional 3 Class | 4,573 |
| Class R | 5,672 |
| Class V | 22,636 |
| Trustees’ fees | 44,865 |
| Custodian fees | 15,107 |
| Printing and postage fees | 79,579 |
| Registration fees | 151,040 |
| Accounting services fees | 30,090 |
| Legal fees | 30,576 |
| Compensation of chief compliance officer | 268 |
| Other | 35,295 |
| Total expenses | 14,816,603 |
| Expense reduction | (3,980) |
| Total net expenses | 14,812,623 |
| Net investment loss | (6,679,651) |
| Realized and unrealized gain (loss) — net | |
| Net realized gain (loss) on: | |
| Investments — unaffiliated issuers | 42,927,243 |
| Investments — affiliated issuers | (19,266) |
| Foreign currency translations | 4,229 |
| Net realized gain | 42,912,206 |
| Net change in unrealized appreciation (depreciation) on: | |
| Investments — unaffiliated issuers | 118,485,157 |
| Investments — affiliated issuers | 5,220 |
| Net change in unrealized appreciation (depreciation) | 118,490,377 |
| Net realized and unrealized gain | 161,402,583 |
| Net increase in net assets resulting from operations | $154,722,932 |
The accompanying Notes to Financial Statements are an integral part of this statement.
| 14 | Columbia Select Mid Cap Growth Fund | Annual Report 2023 |
Statement of Changes in Net Assets
| | Year Ended
August 31, 2023 | Year Ended
August 31, 2022 |
| Operations | | |
| Net investment loss | $(6,679,651) | $(12,745,786) |
| Net realized gain | 42,912,206 | 10,612,745 |
| Net change in unrealized appreciation (depreciation) | 118,490,377 | (647,571,881) |
| Net increase (decrease) in net assets resulting from operations | 154,722,932 | (649,704,922) |
| Distributions to shareholders | | |
| Net investment income and net realized gains | | |
| Class A | — | (211,060,179) |
| Advisor Class | — | (2,100,305) |
| Class C | — | (2,510,037) |
| Institutional Class | — | (162,847,839) |
| Institutional 2 Class | — | (8,803,972) |
| Institutional 3 Class | — | (23,347,460) |
| Class R | — | (1,960,122) |
| Class V | — | (6,008,042) |
| Total distributions to shareholders | — | (418,637,956) |
| Increase (decrease) in net assets from capital stock activity | (159,501,203) | 212,842,508 |
| Total decrease in net assets | (4,778,271) | (855,500,370) |
| Net assets at beginning of year | 1,482,601,622 | 2,338,101,992 |
| Net assets at end of year | $1,477,823,351 | $1,482,601,622 |
The accompanying Notes to Financial Statements are an integral part of this statement.
Columbia Select Mid Cap Growth Fund | Annual Report 2023
| 15 |
Statement of Changes in Net Assets (continued)
| | Year Ended | Year Ended |
| | August 31, 2023 | August 31, 2022 |
| | Shares | Dollars ($) | Shares | Dollars ($) |
| Capital stock activity |
| Class A | | | | |
| Shares sold | 861,326 | 16,270,427 | 1,462,100 | 34,861,392 |
| Fund reorganization | — | — | 727,078 | 14,957,282 |
| Distributions reinvested | — | — | 8,139,033 | 203,720,000 |
| Shares redeemed | (5,380,692) | (99,862,583) | (6,554,585) | (143,283,045) |
| Net increase (decrease) | (4,519,366) | (83,592,156) | 3,773,626 | 110,255,629 |
| Advisor Class | | | | |
| Shares sold | 164,270 | 3,742,859 | 139,671 | 3,904,665 |
| Fund reorganization | — | — | 61,087 | 1,517,138 |
| Distributions reinvested | — | — | 35,264 | 1,065,327 |
| Shares redeemed | (110,541) | (2,454,119) | (150,115) | (4,047,003) |
| Net increase | 53,729 | 1,288,740 | 85,907 | 2,440,127 |
| Class C | | | | |
| Shares sold | 64,522 | 801,631 | 105,087 | 1,550,433 |
| Distributions reinvested | — | — | 151,433 | 2,503,191 |
| Shares redeemed | (156,551) | (1,906,851) | (178,899) | (2,489,140) |
| Net increase (decrease) | (92,029) | (1,105,220) | 77,621 | 1,564,484 |
| Institutional Class | | | | |
| Shares sold | 1,341,578 | 29,343,336 | 1,168,096 | 32,137,960 |
| Distributions reinvested | — | — | 5,250,416 | 150,161,894 |
| Shares redeemed | (3,377,891) | (72,355,317) | (4,498,134) | (113,565,009) |
| Net increase (decrease) | (2,036,313) | (43,011,981) | 1,920,378 | 68,734,845 |
| Institutional 2 Class | | | | |
| Shares sold | 347,747 | 7,740,356 | 585,260 | 16,330,560 |
| Distributions reinvested | — | — | 301,920 | 8,776,807 |
| Shares redeemed | (1,143,435) | (25,450,585) | (604,231) | (15,665,304) |
| Net increase (decrease) | (795,688) | (17,710,229) | 282,949 | 9,442,063 |
| Institutional 3 Class | | | | |
| Shares sold | 553,094 | 12,636,963 | 1,129,985 | 33,690,941 |
| Distributions reinvested | — | — | 328,192 | 9,556,950 |
| Shares redeemed | (1,229,776) | (26,537,759) | (1,065,826) | (25,416,292) |
| Net increase (decrease) | (676,682) | (13,900,796) | 392,351 | 17,831,599 |
| Class R | | | | |
| Shares sold | 57,506 | 1,004,159 | 70,282 | 1,493,540 |
| Distributions reinvested | — | — | 81,682 | 1,869,702 |
| Shares redeemed | (84,771) | (1,397,373) | (181,645) | (3,746,730) |
| Net decrease | (27,265) | (393,214) | (29,681) | (383,488) |
| Class V | | | | |
| Shares sold | 5,398 | 96,427 | 26,778 | 657,348 |
| Distributions reinvested | — | — | 209,642 | 5,205,418 |
| Shares redeemed | (62,573) | (1,172,774) | (155,777) | (2,905,517) |
| Net increase (decrease) | (57,175) | (1,076,347) | 80,643 | 2,957,249 |
| Total net increase (decrease) | (8,150,789) | (159,501,203) | 6,583,794 | 212,842,508 |
The accompanying Notes to Financial Statements are an integral part of this statement.
| 16 | Columbia Select Mid Cap Growth Fund | Annual Report 2023 |
[THIS PAGE INTENTIONALLY LEFT BLANK]
Columbia Select Mid Cap Growth Fund | Annual Report 2023
| 17 |
The following table is intended to help you understand the Fund’s financial performance. Certain information reflects financial results for a single share of a class held for the periods shown. Per share net investment income (loss) amounts are calculated based on average shares outstanding during the period. Total return assumes reinvestment of all dividends and distributions, if any. Total return does not reflect payment of sales charges, if any. Total return and portfolio turnover are not annualized for periods of less than one year. The ratios of expenses and net investment income are annualized for periods of less than one year. The portfolio turnover rate is calculated without regard to purchase and sales transactions of short-term instruments and certain derivatives, if any. If such transactions were included, the Fund’s portfolio turnover rate may be higher.
| | Net asset value,
beginning of
period | Net
investment
income
(loss) | Net
realized
and
unrealized
gain (loss) | Total from
investment
operations | Distributions
from net
realized
gains | Total
distributions to
shareholders |
| Class A |
| Year Ended 8/31/2023 | $18.30 | (0.11) | 2.21 | 2.10 | — | — |
| Year Ended 8/31/2022 | $31.98 | (0.18) | (7.46) | (7.64) | (6.04) | (6.04) |
| Year Ended 8/31/2021 | $27.17 | (0.24) | 9.61 | 9.37 | (4.56) | (4.56) |
| Year Ended 8/31/2020 | $23.44 | (0.14) | 6.01 | 5.87 | (2.14) | (2.14) |
| Year Ended 8/31/2019 | $28.83 | (0.07) | 0.09 | 0.02 | (5.41) | (5.41) |
| Advisor Class |
| Year Ended 8/31/2023 | $22.13 | (0.08) | 2.68 | 2.60 | — | — |
| Year Ended 8/31/2022 | $37.34 | (0.15) | (8.97) | (9.12) | (6.09) | (6.09) |
| Year Ended 8/31/2021 | $31.03 | (0.19) | 11.12 | 10.93 | (4.62) | (4.62) |
| Year Ended 8/31/2020 | $26.43 | (0.09) | 6.83 | 6.74 | (2.14) | (2.14) |
| Year Ended 8/31/2019 | $31.71 | (0.02) | 0.20 | 0.18 | (5.46) | (5.46) |
| Class C |
| Year Ended 8/31/2023 | $12.02 | (0.16) | 1.44 | 1.28 | — | — |
| Year Ended 8/31/2022 | $23.12 | (0.24) | (4.97) | (5.21) | (5.89) | (5.89) |
| Year Ended 8/31/2021 | $20.72 | (0.33) | 7.09 | 6.76 | (4.36) | (4.36) |
| Year Ended 8/31/2020 | $18.48 | (0.24) | 4.62 | 4.38 | (2.14) | (2.14) |
| Year Ended 8/31/2019 | $23.99 | (0.20) | (0.04)(e) | (0.24) | (5.27) | (5.27) |
| Institutional Class |
| Year Ended 8/31/2023 | $20.95 | (0.07) | 2.53 | 2.46 | — | — |
| Year Ended 8/31/2022 | $35.68 | (0.15) | (8.49) | (8.64) | (6.09) | (6.09) |
| Year Ended 8/31/2021 | $29.83 | (0.18) | 10.65 | 10.47 | (4.62) | (4.62) |
| Year Ended 8/31/2020 | $25.49 | (0.08) | 6.56 | 6.48 | (2.14) | (2.14) |
| Year Ended 8/31/2019 | $30.80 | (0.01) | 0.16 | 0.15 | (5.46) | (5.46) |
| Institutional 2 Class |
| Year Ended 8/31/2023 | $21.31 | (0.06) | 2.57 | 2.51 | — | — |
| Year Ended 8/31/2022 | $36.18 | (0.13) | (8.64) | (8.77) | (6.10) | (6.10) |
| Year Ended 8/31/2021 | $30.19 | (0.17) | 10.79 | 10.62 | (4.63) | (4.63) |
| Year Ended 8/31/2020 | $25.75 | (0.07) | 6.65 | 6.58 | (2.14) | (2.14) |
| Year Ended 8/31/2019 | $31.06 | 0.00(f) | 0.16 | 0.16 | (5.47) | (5.47) |
The accompanying Notes to Financial Statements are an integral part of this statement.
| 18 | Columbia Select Mid Cap Growth Fund | Annual Report 2023 |
Financial Highlights (continued)
| | Net
asset
value,
end of
period | Total
return | Total gross
expense
ratio to
average
net assets(a) | Total net
expense
ratio to
average
net assets(a),(b) | Net investment
income (loss)
ratio to
average
net assets | Portfolio
turnover | Net
assets,
end of
period
(000’s) |
| Class A |
| Year Ended 8/31/2023 | $20.40 | 11.48% | 1.16% | 1.16%(c) | (0.59%) | 152% | $708,522 |
| Year Ended 8/31/2022 | $18.30 | (28.97%) | 1.13% | 1.13%(c) | (0.81%) | 70% | $718,493 |
| Year Ended 8/31/2021 | $31.98 | 38.29% | 1.11%(d) | 1.11%(c),(d) | (0.83%) | 82% | $1,134,636 |
| Year Ended 8/31/2020 | $27.17 | 26.66% | 1.15% | 1.15%(c) | (0.58%) | 63% | $967,087 |
| Year Ended 8/31/2019 | $23.44 | 2.78% | 1.17% | 1.17% | (0.31%) | 89% | $810,161 |
| Advisor Class |
| Year Ended 8/31/2023 | $24.73 | 11.75% | 0.91% | 0.91%(c) | (0.35%) | 152% | $12,292 |
| Year Ended 8/31/2022 | $22.13 | (28.79%) | 0.88% | 0.88%(c) | (0.56%) | 70% | $9,813 |
| Year Ended 8/31/2021 | $37.34 | 38.65% | 0.86%(d) | 0.86%(c),(d) | (0.58%) | 82% | $13,348 |
| Year Ended 8/31/2020 | $31.03 | 26.95% | 0.90% | 0.90%(c) | (0.33%) | 63% | $8,071 |
| Year Ended 8/31/2019 | $26.43 | 3.08% | 0.92% | 0.92% | (0.06%) | 89% | $17,075 |
| Class C |
| Year Ended 8/31/2023 | $13.30 | 10.65% | 1.91% | 1.91%(c) | (1.34%) | 152% | $5,494 |
| Year Ended 8/31/2022 | $12.02 | (29.50%) | 1.88% | 1.88%(c) | (1.56%) | 70% | $6,073 |
| Year Ended 8/31/2021 | $23.12 | 37.28% | 1.86%(d) | 1.86%(c),(d) | (1.57%) | 82% | $9,886 |
| Year Ended 8/31/2020 | $20.72 | 25.67% | 1.90% | 1.90%(c) | (1.32%) | 63% | $11,759 |
| Year Ended 8/31/2019 | $18.48 | 2.03% | 1.92% | 1.92% | (1.05%) | 89% | $12,863 |
| Institutional Class |
| Year Ended 8/31/2023 | $23.41 | 11.74% | 0.91% | 0.91%(c) | (0.35%) | 152% | $630,492 |
| Year Ended 8/31/2022 | $20.95 | (28.78%) | 0.88% | 0.88%(c) | (0.56%) | 70% | $607,008 |
| Year Ended 8/31/2021 | $35.68 | 38.67% | 0.86%(d) | 0.86%(c),(d) | (0.58%) | 82% | $965,229 |
| Year Ended 8/31/2020 | $29.83 | 26.92% | 0.90% | 0.90%(c) | (0.33%) | 63% | $748,236 |
| Year Ended 8/31/2019 | $25.49 | 3.07% | 0.92% | 0.92% | (0.05%) | 89% | $652,043 |
| Institutional 2 Class |
| Year Ended 8/31/2023 | $23.82 | 11.78% | 0.86% | 0.86% | (0.28%) | 152% | $20,097 |
| Year Ended 8/31/2022 | $21.31 | (28.75%) | 0.83% | 0.83% | (0.51%) | 70% | $34,937 |
| Year Ended 8/31/2021 | $36.18 | 38.73% | 0.82%(d) | 0.82%(d) | (0.53%) | 82% | $49,076 |
| Year Ended 8/31/2020 | $30.19 | 27.05% | 0.84% | 0.84% | (0.26%) | 63% | $43,423 |
| Year Ended 8/31/2019 | $25.75 | 3.11% | 0.84% | 0.84% | 0.02% | 89% | $46,284 |
The accompanying Notes to Financial Statements are an integral part of this statement.
Columbia Select Mid Cap Growth Fund | Annual Report 2023
| 19 |
Financial Highlights (continued)
| | Net asset value,
beginning of
period | Net
investment
income
(loss) | Net
realized
and
unrealized
gain (loss) | Total from
investment
operations | Distributions
from net
realized
gains | Total
distributions to
shareholders |
| Institutional 3 Class |
| Year Ended 8/31/2023 | $21.35 | (0.05) | 2.58 | 2.53 | — | — |
| Year Ended 8/31/2022 | $36.23 | (0.12) | (8.65) | (8.77) | (6.11) | (6.11) |
| Year Ended 8/31/2021 | $30.22 | (0.16) | 10.81 | 10.65 | (4.64) | (4.64) |
| Year Ended 8/31/2020 | $25.77 | (0.06) | 6.65 | 6.59 | (2.14) | (2.14) |
| Year Ended 8/31/2019 | $31.07 | 0.02 | 0.16 | 0.18 | (5.48) | (5.48) |
| Class R |
| Year Ended 8/31/2023 | $16.71 | (0.14) | 2.00 | 1.86 | — | — |
| Year Ended 8/31/2022 | $29.74 | (0.23) | (6.81) | (7.04) | (5.99) | (5.99) |
| Year Ended 8/31/2021 | $25.55 | (0.29) | 8.97 | 8.68 | (4.49) | (4.49) |
| Year Ended 8/31/2020 | $22.22 | (0.18) | 5.65 | 5.47 | (2.14) | (2.14) |
| Year Ended 8/31/2019 | $27.64 | (0.12) | 0.07 | (0.05) | (5.37) | (5.37) |
| Class V |
| Year Ended 8/31/2023 | $18.16 | (0.11) | 2.19 | 2.08 | — | — |
| Year Ended 8/31/2022 | $31.78 | (0.18) | (7.40) | (7.58) | (6.04) | (6.04) |
| Year Ended 8/31/2021 | $27.02 | (0.24) | 9.56 | 9.32 | (4.56) | (4.56) |
| Year Ended 8/31/2020 | $23.33 | (0.14) | 5.97 | 5.83 | (2.14) | (2.14) |
| Year Ended 8/31/2019 | $28.71 | (0.07) | 0.10 | 0.03 | (5.41) | (5.41) |
| Notes to Financial Highlights |
| (a) | In addition to the fees and expenses that the Fund bears directly, the Fund indirectly bears a pro rata share of the fees and expenses of any other funds in which it invests. Such indirect expenses are not included in the Fund’s reported expense ratios. |
| (b) | Total net expenses include the impact of certain fee waivers/expense reimbursements made by the Investment Manager and certain of its affiliates, if applicable. |
| (c) | The benefits derived from expense reductions had an impact of less than 0.01%. |
| (d) | Ratios include interfund lending expense which is less than 0.01%. |
| (e) | Calculation of the net gain (loss) per share (both realized and unrealized) does not correlate to the aggregate realized and unrealized gain (loss) presented in the Statement of Operations due to timing of Fund shares sold and redeemed in relation to fluctuations in the market value of the portfolio. |
| (f) | Rounds to zero. |
The accompanying Notes to Financial Statements are an integral part of this statement.
| 20 | Columbia Select Mid Cap Growth Fund | Annual Report 2023 |
Financial Highlights (continued)
| | Net
asset
value,
end of
period | Total
return | Total gross
expense
ratio to
average
net assets(a) | Total net
expense
ratio to
average
net assets(a),(b) | Net investment
income (loss)
ratio to
average
net assets | Portfolio
turnover | Net
assets,
end of
period
(000’s) |
| Institutional 3 Class |
| Year Ended 8/31/2023 | $23.88 | 11.85% | 0.81% | 0.81% | (0.23%) | 152% | $74,691 |
| Year Ended 8/31/2022 | $21.35 | (28.71%) | 0.78% | 0.78% | (0.46%) | 70% | $81,229 |
| Year Ended 8/31/2021 | $36.23 | 38.80% | 0.77%(d) | 0.77%(d) | (0.48%) | 82% | $123,615 |
| Year Ended 8/31/2020 | $30.22 | 27.07% | 0.79% | 0.79% | (0.22%) | 63% | $95,842 |
| Year Ended 8/31/2019 | $25.77 | 3.18% | 0.79% | 0.79% | 0.08% | 89% | $86,115 |
| Class R |
| Year Ended 8/31/2023 | $18.57 | 11.13% | 1.41% | 1.41%(c) | (0.84%) | 152% | $5,422 |
| Year Ended 8/31/2022 | $16.71 | (29.11%) | 1.38% | 1.38%(c) | (1.06%) | 70% | $5,333 |
| Year Ended 8/31/2021 | $29.74 | 37.94% | 1.36%(d) | 1.36%(c),(d) | (1.08%) | 82% | $10,376 |
| Year Ended 8/31/2020 | $25.55 | 26.31% | 1.40% | 1.40%(c) | (0.82%) | 63% | $7,717 |
| Year Ended 8/31/2019 | $22.22 | 2.56% | 1.42% | 1.42% | (0.55%) | 89% | $10,593 |
| Class V |
| Year Ended 8/31/2023 | $20.24 | 11.45% | 1.16% | 1.16%(c) | (0.60%) | 152% | $20,814 |
| Year Ended 8/31/2022 | $18.16 | (28.96%) | 1.13% | 1.13%(c) | (0.81%) | 70% | $19,715 |
| Year Ended 8/31/2021 | $31.78 | 38.32% | 1.11%(d) | 1.11%(c),(d) | (0.83%) | 82% | $31,936 |
| Year Ended 8/31/2020 | $27.02 | 26.61% | 1.15% | 1.15%(c) | (0.57%) | 63% | $25,875 |
| Year Ended 8/31/2019 | $23.33 | 2.83% | 1.17% | 1.17% | (0.31%) | 89% | $23,279 |
The accompanying Notes to Financial Statements are an integral part of this statement.
Columbia Select Mid Cap Growth Fund | Annual Report 2023
| 21 |
Notes to Financial Statements
August 31, 2023
Note 1. Organization
Columbia Select Mid Cap Growth Fund (the Fund), a series of Columbia Funds Series Trust I (the Trust), is a diversified fund. The Trust is registered under the Investment Company Act of 1940, as amended (the 1940 Act), as an open-end management investment company organized as a Massachusetts business trust.
Fund shares
The Trust may issue an unlimited number of shares (without par value). The Fund offers each of the share classes listed in the Statement of Assets and Liabilities. Although all share classes generally have identical voting, dividend and liquidation rights, each share class votes separately when required by the Trust’s organizational documents or by law. Each share class has its own expense and sales charge structure. Different share classes may have different minimum initial investment amounts and pay different net investment income distribution amounts to the extent the expenses of distributing such share classes vary. Distributions to shareholders in a liquidation will be proportional to the net asset value of each share class.
As described in the Fund’s prospectus, Class A and Class C shares are offered to the general public for investment. Class C shares automatically convert to Class A shares after 8 years. Advisor Class, Institutional Class, Institutional 2 Class, Institutional 3 Class and Class R shares are available for purchase through authorized investment professionals to omnibus retirement plans or to institutional investors and to certain other investors as also described in the Fund’s prospectus. Class V shares are available only to investors who received (and who continuously held) Class V shares in connection with previous fund reorganizations.
Note 2. Summary of significant accounting policies
Basis of preparation
The Fund is an investment company that applies the accounting and reporting guidance in the Financial Accounting Standards Board (FASB) Accounting Standards Codification Topic 946, Financial Services - Investment Companies (ASC 946). The financial statements are prepared in accordance with U.S. generally accepted accounting principles (GAAP), which requires management to make certain estimates and assumptions that affect the reported amounts of assets and liabilities, the disclosure of contingent assets and liabilities at the date of the financial statements and the reported amounts of income and expenses during the reporting period. Actual results could differ from those estimates.
The following is a summary of significant accounting policies followed by the Fund in the preparation of its financial statements.
Security valuation
Equity securities listed on an exchange are valued at the closing price or last trade price on their primary exchange at the close of business of the New York Stock Exchange. Securities with a closing price not readily available or not listed on any exchange are valued at the mean between the closing bid and ask prices. Listed preferred stocks convertible into common stocks are valued using an evaluated price from a pricing service.
Foreign equity securities are valued based on the closing price or last trade price on their primary exchange at the close of business of the New York Stock Exchange. If any foreign equity security closing prices are not readily available, the securities are valued at the mean of the latest quoted bid and ask prices on such exchanges or markets. Foreign currency exchange rates are determined at the scheduled closing time of the New York Stock Exchange. Many securities markets and exchanges outside the U.S. close prior to the close of the New York Stock Exchange; therefore, the closing prices for securities in such markets or on such exchanges may not fully reflect events that occur after such close but before the close of the New York Stock Exchange. In those situations, foreign securities will be fair valued pursuant to a policy approved by the Board of Trustees. Under the policy, the Fund may utilize a third-party pricing service to determine these fair values. The third-party pricing service takes into account multiple factors, including, but not limited to, movements in the U.S. securities markets, certain depositary receipts, futures contracts and foreign exchange rates that have occurred subsequent to the close of the foreign exchange or market, to determine a good faith estimate that reasonably reflects the current market conditions as of the close of the New York Stock Exchange. The fair value of a security is likely to be different from the quoted or published price, if available.
| 22 | Columbia Select Mid Cap Growth Fund | Annual Report 2023 |
Notes to Financial Statements (continued)
August 31, 2023
Investments in open-end investment companies (other than exchange-traded funds (ETFs)), are valued at the latest net asset value reported by those companies as of the valuation time.
Investments for which market quotations are not readily available, or that have quotations which management believes are not reflective of market value or reliable, are valued at fair value as determined in good faith under procedures approved by the Board of Trustees. If a security or class of securities (such as foreign securities) is valued at fair value, such value is likely to be different from the quoted or published price for the security, if available.
The determination of fair value often requires significant judgment. To determine fair value, management may use assumptions including but not limited to future cash flows and estimated risk premiums. Multiple inputs from various sources may be used to determine fair value.
GAAP requires disclosure regarding the inputs and valuation techniques used to measure fair value and any changes in valuation inputs or techniques. In addition, investments shall be disclosed by major category. This information is disclosed following the Fund’s Portfolio of Investments.
Foreign currency transactions and translations
The values of all assets and liabilities denominated in foreign currencies are generally translated into U.S. dollars at exchange rates determined at the close of regular trading on the New York Stock Exchange. Net realized and unrealized gains (losses) on foreign currency transactions and translations include gains (losses) arising from the fluctuation in exchange rates between trade and settlement dates on securities transactions, gains (losses) arising from the disposition of foreign currency and currency gains (losses) between the accrual and payment dates on dividends, interest income and foreign withholding taxes.
For financial statement purposes, the Fund does not distinguish that portion of gains (losses) on investments which is due to changes in foreign exchange rates from that which is due to changes in market prices of the investments. Such fluctuations are included with the net realized and unrealized gains (losses) on investments in the Statement of Operations.
Security transactions
Security transactions are accounted for on the trade date. Cost is determined and gains (losses) are based upon the specific identification method for both financial statement and federal income tax purposes.
Income recognition
Corporate actions and dividend income are generally recorded net of any non-reclaimable tax withholdings, on the ex-dividend date or upon receipt of an ex-dividend notification in the case of certain foreign securities.
The Fund may receive distributions from holdings in equity securities, business development companies (BDCs), exchange-traded funds (ETFs), limited partnerships (LPs), other regulated investment companies (RICs), and real estate investment trusts (REITs), which report information as to the tax character of their distributions annually. These distributions are allocated to dividend income, capital gain and return of capital based on actual information reported. Return of capital is recorded as a reduction of the cost basis of securities held. If the Fund no longer owns the applicable securities, return of capital is recorded as a realized gain. With respect to REITs, to the extent actual information has not yet been reported, estimates for return of capital are made by Columbia Management Investment Advisers, LLC (the Investment Manager), a wholly-owned subsidiary of Ameriprise Financial, Inc. (Ameriprise Financial). The Investment Manager’s estimates are subsequently adjusted when the actual character of the distributions is disclosed by the REITs, which could result in a proportionate change in return of capital to shareholders.
Awards from class action litigation are recorded as a reduction of cost basis if the Fund still owns the applicable securities on the payment date. If the Fund no longer owns the applicable securities on the payment date, the proceeds are recorded as realized gains.
Columbia Select Mid Cap Growth Fund | Annual Report 2023
| 23 |
Notes to Financial Statements (continued)
August 31, 2023
Expenses
General expenses of the Trust are allocated to the Fund and other funds of the Trust based upon relative net assets or other expense allocation methodologies determined by the nature of the expense. Expenses directly attributable to the Fund are charged to the Fund. Expenses directly attributable to a specific class of shares are charged to that share class.
Determination of class net asset value
All income, expenses (other than class-specific expenses, which are charged to that share class, as shown in the Statement of Operations) and realized and unrealized gains (losses) are allocated to each class of the Fund on a daily basis, based on the relative net assets of each class, for purposes of determining the net asset value of each class.
Federal income tax status
The Fund intends to qualify each year as a regulated investment company under Subchapter M of the Internal Revenue Code, as amended, and will distribute substantially all of its investment company taxable income and net capital gain, if any, for its tax year, and as such will not be subject to federal income taxes. In addition, the Fund intends to distribute in each calendar year substantially all of its ordinary income, capital gain net income and certain other amounts, if any, such that the Fund should not be subject to federal excise tax. Therefore, no federal income or excise tax provision is recorded.
Foreign taxes
The Fund may be subject to foreign taxes on income, gains on investments or currency repatriation, a portion of which may be recoverable. The Fund will accrue such taxes and recoveries, as applicable, based upon its current interpretation of tax rules and regulations that exist in the markets in which it invests.
Realized gains in certain countries may be subject to foreign taxes at the Fund level, based on statutory rates. The Fund accrues for such foreign taxes on realized and unrealized gains at the appropriate rate for each jurisdiction, as applicable. The amount, if any, is disclosed as a liability in the Statement of Assets and Liabilities.
Distributions to shareholders
Distributions from net investment income, if any, are declared and paid annually. Net realized capital gains, if any, are distributed at least annually. Income distributions and capital gain distributions are determined in accordance with federal income tax regulations, which may differ from GAAP.
Guarantees and indemnifications
Under the Trust’s organizational documents and, in some cases, by contract, its officers and trustees are indemnified against certain liabilities arising out of the performance of their duties to the Trust or its funds. In addition, certain of the Fund’s contracts with its service providers contain general indemnification clauses. The Fund’s maximum exposure under these arrangements is unknown since the amount of any future claims that may be made against the Fund cannot be determined, and the Fund has no historical basis for predicting the likelihood of any such claims.
Recent accounting pronouncements and regulatory updates
Tailored Shareholder Reports
In October 2022, the Securities and Exchange Commission (SEC) adopted a final rule relating to Tailored Shareholder Reports for Mutual Funds and Exchange-Traded Funds; Fee Information in Investment Company Advertisements. The rule and form amendments will, among other things, require the Fund to transmit concise and visually engaging shareholder reports that highlight key information. The amendments will require that funds tag information in a structured data format and that certain more in-depth information be made available online and available for delivery free of charge to investors on request. The amendments became effective January 24, 2023. There is an 18-month transition period after the effective date of the amendments.
| 24 | Columbia Select Mid Cap Growth Fund | Annual Report 2023 |
Notes to Financial Statements (continued)
August 31, 2023
Note 3. Fees and other transactions with affiliates
Management services fees
The Fund has entered into a Management Agreement with Columbia Management Investment Advisers, LLC (the Investment Manager), a wholly-owned subsidiary of Ameriprise Financial, Inc. (Ameriprise Financial). Under the Management Agreement, the Investment Manager provides the Fund with investment research and advice, as well as administrative and accounting services. The management services fee is an annual fee that is equal to a percentage of the Fund’s daily net assets that declines from 0.82% to 0.65% as the Fund’s net assets increase. The effective management services fee rate for the year ended August 31, 2023 was 0.77% of the Fund’s average daily net assets.
Compensation of board members
Members of the Board of Trustees who are not officers or employees of the Investment Manager or Ameriprise Financial are compensated for their services to the Fund as disclosed in the Statement of Operations. Under a Deferred Compensation Plan (the Deferred Plan), these members of the Board of Trustees may elect to defer payment of up to 100% of their compensation. Deferred amounts are treated as though equivalent dollar amounts had been invested in shares of certain funds managed by the Investment Manager. The Fund’s liability for these amounts is adjusted for market value changes and remains in the Fund until distributed in accordance with the Deferred Plan. All amounts payable under the Deferred Plan constitute a general unsecured obligation of the Fund. The expense for the Deferred Plan, which includes Trustees’ fees deferred during the current period as well as any gains or losses on the Trustees’ deferred compensation balances as a result of market fluctuations, is included in "Trustees’ fees" in the Statement of Operations.
Compensation of Chief Compliance Officer
The Board of Trustees has appointed a Chief Compliance Officer for the Fund in accordance with federal securities regulations. As disclosed in the Statement of Operations, a portion of the Chief Compliance Officer’s total compensation is allocated to the Fund, along with other allocations to affiliated registered investment companies managed by the Investment Manager and its affiliates, based on relative net assets.
Transfer agency fees
Under a Transfer and Dividend Disbursing Agent Agreement, Columbia Management Investment Services Corp. (the Transfer Agent), an affiliate of the Investment Manager and a wholly-owned subsidiary of Ameriprise Financial, is responsible for providing transfer agency services to the Fund. The Transfer Agent has contracted with SS&C GIDS, Inc. (SS&C GIDS) to serve as sub-transfer agent. Prior to January 1, 2023, SS&C GIDS was known as DST Asset Manager Solutions, Inc. The Transfer Agent pays the fees of SS&C GIDS for services as sub-transfer agent and SS&C GIDS is not entitled to reimbursement for such fees from the Fund (with the exception of out-of-pocket fees).
The Fund pays the Transfer Agent a monthly transfer agency fee based on the number or the average value of accounts, depending on the type of account. In addition, the Fund pays the Transfer Agent a fee for shareholder services based on the number of accounts or on a percentage of the average aggregate value of the Fund’s shares maintained in omnibus accounts up to the lesser of the amount charged by the financial intermediary or a cap established by the Board of Trustees from time to time.
The Transfer Agent also receives compensation from the Fund for various shareholder services and reimbursements for certain out-of-pocket fees. Total transfer agency fees for Institutional 2 Class and Institutional 3 Class shares are subject to an annual limitation of not more than 0.07% and 0.02%, respectively, of the average daily net assets attributable to each share class.
Columbia Select Mid Cap Growth Fund | Annual Report 2023
| 25 |
Notes to Financial Statements (continued)
August 31, 2023
For the year ended August 31, 2023, the Fund’s effective transfer agency fee rates as a percentage of average daily net assets of each class were as follows:
| | Effective rate (%) |
| Class A | 0.11 |
| Advisor Class | 0.11 |
| Class C | 0.11 |
| Institutional Class | 0.11 |
| Institutional 2 Class | 0.06 |
| Institutional 3 Class | 0.01 |
| Class R | 0.11 |
| Class V | 0.11 |
An annual minimum account balance fee of $20 may apply to certain accounts with a value below the applicable share class’s initial minimum investment requirements to reduce the impact of small accounts on transfer agency fees. These minimum account balance fees are remitted to the Fund and recorded as part of expense reductions in the Statement of Operations. For the year ended August 31, 2023, these minimum account balance fees reduced total expenses of the Fund by $3,980.
Distribution and service fees
The Fund has entered into an agreement with Columbia Management Investment Distributors, Inc. (the Distributor), an affiliate of the Investment Manager and a wholly-owned subsidiary of Ameriprise Financial, for distribution and shareholder services. The Board of Trustees has approved, and the Fund has adopted, distribution and shareholder service plans (the Plans) applicable to certain share classes, which set the distribution and service fees for the Fund. These fees are calculated daily and are intended to compensate the Distributor and/or eligible selling and/or servicing agents for selling shares of the Fund and providing services to investors.
Under the Plans, the Fund pays a monthly service fee to the Distributor at the maximum annual rate of 0.25% of the average daily net assets attributable to Class A and Class C shares of the Fund. Also under the Plans, the Fund pays a monthly distribution fee to the Distributor at the maximum annual rates of 0.10%, 0.75% and 0.50% of the average daily net assets attributable to Class A, Class C and Class R shares of the Fund, respectively.
Although the Fund may pay distribution and service fees up to a maximum annual rate of 0.35% of the Fund’s average daily net assets attributable to Class A shares (comprised of up to 0.10% for distribution services and up to 0.25% for shareholder services), the Fund currently limits such fees to an aggregate fee of not more than 0.25% of the Fund’s average daily net assets attributable to Class A shares.
Shareholder services fees
The Fund has adopted a shareholder services plan that permits it to pay for certain services provided to Class V shareholders by their selling and/or servicing agents. The Fund may pay shareholder servicing fees up to an aggregate annual rate of 0.50% of the Fund’s average daily net assets attributable to Class V shares (comprised of up to 0.25% for shareholder services and up to 0.25% for administrative support services). These fees are currently limited to an aggregate annual rate of not more than 0.25% of the Fund’s average daily net assets attributable to Class V shares.
Sales charges (unaudited)
Sales charges, including front-end charges and contingent deferred sales charges (CDSCs), received by the Distributor for distributing Fund shares for the year ended August 31, 2023, if any, are listed below:
| | Front End (%) | CDSC (%) | Amount ($) |
| Class A | 5.75 | 0.50 - 1.00(a) | 88,207 |
| Class C | — | 1.00(b) | 421 |
| Class V | 5.75 | 0.50 - 1.00(a) | 1,733 |
| 26 | Columbia Select Mid Cap Growth Fund | Annual Report 2023 |
Notes to Financial Statements (continued)
August 31, 2023
| (a) | This charge is imposed on certain investments of between $1 million and $50 million redeemed within 18 months after purchase, as follows: 1.00% if redeemed within 12 months after purchase, and 0.50% if redeemed more than 12, but less than 18, months after purchase, with certain limited exceptions. |
| (b) | This charge applies to redemptions within 12 months after purchase, with certain limited exceptions. |
The Fund’s other share classes are not subject to sales charges.
Expenses waived/reimbursed by the Investment Manager and its affiliates
The Investment Manager and certain of its affiliates have contractually agreed to waive fees and/or reimburse expenses (excluding certain fees and expenses described below) for the period(s) disclosed below, unless sooner terminated at the sole discretion of the Board of Trustees, so that the Fund’s net operating expenses, after giving effect to fees waived/expenses reimbursed and any balance credits and/or overdraft charges from the Fund’s custodian, do not exceed the following annual rate(s) as a percentage of the classes’ average daily net assets:
| | January 1, 2023
through
December 31, 2023 | Prior to
January 1, 2023 |
| Class A | 1.20% | 1.20% |
| Advisor Class | 0.95 | 0.95 |
| Class C | 1.95 | 1.95 |
| Institutional Class | 0.95 | 0.95 |
| Institutional 2 Class | 0.89 | 0.91 |
| Institutional 3 Class | 0.85 | 0.86 |
| Class R | 1.45 | 1.45 |
| Class V | 1.20 | 1.20 |
Under the agreement governing these fee waivers and/or expense reimbursement arrangements, the following fees and expenses are excluded from the waiver/reimbursement commitment, and therefore will be paid by the Fund, if applicable: taxes (including foreign transaction taxes), expenses associated with investments in affiliated and non-affiliated pooled investment vehicles (including mutual funds and exchange-traded funds), transaction costs and brokerage commissions, costs related to any securities lending program, dividend expenses associated with securities sold short, inverse floater program fees and expenses, transaction charges and interest on borrowed money, interest, costs associated with shareholder meetings, infrequent and/or unusual expenses and any other expenses the exclusion of which is specifically approved by the Board of Trustees. This agreement may be modified or amended only with approval from the Investment Manager, certain of its affiliates and the Fund. Any fees waived and/or expenses reimbursed under the expense reimbursement arrangements described above are not recoverable by the Investment Manager or its affiliates in future periods.
Note 4. Federal tax information
The timing and character of income and capital gain distributions are determined in accordance with income tax regulations, which may differ from GAAP because of temporary or permanent book to tax differences.
At August 31, 2023, these differences were primarily due to differing treatment for deferral/reversal of wash sale losses, late-year ordinary losses, capital loss carryforwards, trustees’ deferred compensation, foreign currency transactions and net operating loss reclassification. To the extent these differences were permanent, reclassifications were made among the components of the Fund’s net assets. Temporary differences do not require reclassifications.
The following reclassifications were made:
Excess of distributions
over net investment
income ($) | Accumulated
net realized
(loss) ($) | Paid in
capital ($) |
| 9,279,286 | (4,228) | (9,275,058) |
Net investment income (loss) and net realized gains (losses), as disclosed in the Statement of Operations, and net assets were not affected by this reclassification.
Columbia Select Mid Cap Growth Fund | Annual Report 2023
| 27 |
Notes to Financial Statements (continued)
August 31, 2023
The tax character of distributions paid during the years indicated was as follows:
| Year Ended August 31, 2023 | Year Ended August 31, 2022 |
Ordinary
income ($) | Long-term
capital gains ($) | Total ($) | Ordinary
income ($) | Long-term
capital gains ($) | Total ($) |
| — | — | — | 99,503,002 | 319,134,954 | 418,637,956 |
Short-term capital gain distributions, if any, are considered ordinary income distributions for tax purposes.
At August 31, 2023, the components of distributable earnings on a tax basis were as follows:
Undistributed
ordinary income ($) | Undistributed
long-term
capital gains ($) | Capital loss
carryforwards ($) | Net unrealized
appreciation ($) |
| — | — | (662,659) | 144,568,351 |
At August 31, 2023, the cost of all investments for federal income tax purposes along with the aggregate gross unrealized appreciation and depreciation based on that cost was:
Federal
tax cost ($) | Gross unrealized
appreciation ($) | Gross unrealized
(depreciation) ($) | Net unrealized
appreciation ($) |
| 1,339,059,586 | 159,923,170 | (15,354,819) | 144,568,351 |
Tax cost of investments and unrealized appreciation/(depreciation) may also include timing differences that do not constitute adjustments to tax basis.
The following capital loss carryforwards, determined at August 31, 2023, may be available to reduce future net realized gains on investments, if any, to the extent permitted by the Internal Revenue Code. In addition, for the year ended August 31, 2023, capital loss carryforwards utilized, if any, were as follows:
No expiration
short-term ($) | No expiration
long-term ($) | Total ($) | Utilized ($) |
| (662,659) | — | (662,659) | — |
Under current tax rules, regulated investment companies can elect to treat certain late-year ordinary losses incurred and post-October capital losses (capital losses realized after October 31) as arising on the first day of the following taxable year. As of August 31, 2023, the Fund will elect to treat the following late-year ordinary losses and post-October capital losses as arising on September 1, 2023.
Late year
ordinary losses ($) | Post-October
capital losses ($) |
| 4,542,225 | — |
Management of the Fund has concluded that there are no significant uncertain tax positions in the Fund that would require recognition in the financial statements. However, management’s conclusion may be subject to review and adjustment at a later date based on factors including, but not limited to, new tax laws, regulations, and administrative interpretations (including relevant court decisions). Generally, the Fund’s federal tax returns for the prior three fiscal years remain subject to examination by the Internal Revenue Service.
Note 5. Portfolio information
The cost of purchases and proceeds from sales of securities, excluding short-term investments and derivatives, if any, aggregated to $2,127,913,080 and $2,302,718,057, respectively, for the year ended August 31, 2023. The amount of purchase and sale activity impacts the portfolio turnover rate reported in the Financial Highlights.
| 28 | Columbia Select Mid Cap Growth Fund | Annual Report 2023 |
Notes to Financial Statements (continued)
August 31, 2023
Note 6. Affiliated money market fund
The Fund invests in Columbia Short-Term Cash Fund, an affiliated money market fund established for the exclusive use by the Fund and other affiliated funds (the Affiliated MMF). The income earned by the Fund from such investments is included as Dividends - affiliated issuers in the Statement of Operations. As an investing fund, the Fund indirectly bears its proportionate share of the expenses of the Affiliated MMF. The Affiliated MMF prices its shares with a floating net asset value. The Securities and Exchange Commission has adopted amendments to money market fund rules requiring institutional prime money market funds like the Affiliated MMF to be subject, by October 2, 2024, to a liquidity fee if daily net redemptions exceed 5% of net assets and, by April 2, 2024, to a discretionary liquidity fee up to 2% if the imposition of such a fee is determined to be in the best interest of the Affiliated MMF.
Note 7. Interfund lending
Pursuant to an exemptive order granted by the Securities and Exchange Commission, the Fund participates in a program (the Interfund Program) allowing each participating Columbia Fund (each, a Participating Fund) to lend money directly to and, except for closed-end funds and money market funds, borrow money directly from other Participating Funds for temporary purposes. The amounts eligible for borrowing and lending under the Interfund Program are subject to certain restrictions.
Interfund loans are subject to the risk that the borrowing fund could be unable to repay the loan when due, and a delay in repayment to the lending fund could result in lost opportunities and/or additional lending costs. The exemptive order is subject to conditions intended to mitigate conflicts of interest arising from the Investment Manager’s relationship with each Participating Fund.
The Fund’s activity in the Interfund Program during the year ended August 31, 2023 was as follows:
| Borrower or lender | Average loan
balance ($) | Weighted average
interest rate (%) | Number of days
with outstanding loans |
| Lender | 2,450,000 | 4.48 | 4 |
Interest income earned by the Fund is recorded as interfund lending in the Statement of Operations. The Fund had no outstanding interfund loans at August 31, 2023.
Note 8. Line of credit
The Fund has access to a revolving credit facility with a syndicate of banks led by JPMorgan Chase Bank, N.A., Citibank, N.A. and Wells Fargo Bank, N.A. whereby the Fund may borrow for the temporary funding of shareholder redemptions or for other temporary or emergency purposes. Pursuant to an October 27, 2022 amendment and restatement, the credit facility, which is an agreement between the Fund and certain other funds managed by the Investment Manager or an affiliated investment manager, severally and not jointly, permits aggregate borrowings up to $950 million. Interest is currently charged to each participating fund based on its borrowings at a rate equal to the higher of (i) the federal funds effective rate, (ii) the secured overnight financing rate plus 0.10% and (iii) the overnight bank funding rate plus, in each case, 1.00%. Each borrowing under the credit facility matures no later than 60 days after the date of borrowing. The Fund also pays a commitment fee equal to its pro rata share of the unused amount of the credit facility at a rate of 0.15% per annum. The commitment fee is included in other expenses in the Statement of Operations. This agreement expires annually in October unless extended or renewed. Prior to the October 27, 2022 amendment and restatement, the Fund had access to a revolving credit facility with a syndicate of banks led by JPMorgan Chase Bank, N.A., Citibank, N.A. and Wells Fargo Bank, N.A. which permitted collective borrowings up to $950 million. Interest was charged to each participating fund based on its borrowings at a rate equal to the higher of (i) the federal funds effective rate, (ii) the secured overnight financing rate plus 0.11448% and (iii) the overnight bank funding rate plus, in each case, 1.00%.
The Fund had no borrowings during the year ended August 31, 2023.
Columbia Select Mid Cap Growth Fund | Annual Report 2023
| 29 |
Notes to Financial Statements (continued)
August 31, 2023
Note 9. Fund reorganization
At the close of business on January 21, 2022, the Fund acquired the assets and assumed the identified liabilities of BMO Mid-Cap Growth Fund (the Acquired Fund), a series of BMO Funds, Inc. The reorganization was completed after shareholders of the Acquired Fund approved a plan of reorganization at a shareholder meeting held on January 7, 2022. The purpose of the reorganization was to combine two funds with comparable investment objectives and strategies.
The aggregate net assets of the Fund immediately before the reorganization were $1,794,349,761 and the combined net assets immediately after the reorganization were $1,810,824,181.
The reorganization was accomplished by a tax-free exchange of 3,006,453 shares of the Acquired Fund valued at $16,474,420 (including $299,571 of unrealized appreciation/(depreciation)).
In exchange for the Acquired Fund’s shares, the Fund issued the following number of shares:
| | Shares |
| Class A | 727,078 |
| Advisor Class | 61,087 |
For financial reporting purposes, net assets received and shares issued by the Fund were recorded at fair value; however, the Acquired Fund’s cost of investments was carried forward.
The Fund’s financial statements reflect both the operations of the Fund for the period prior to the reorganization and the combined Fund for the period subsequent to the reorganization. Because the combined investment portfolios have been managed as a single integrated portfolio since the reorganization was completed, it is not practicable to separate the amounts of revenue and earnings of the Acquired Fund that have been included in the combined Fund’s Statement of Operations since the reorganization was completed.
Assuming the reorganization had been completed on September 1, 2021, the Fund’s pro-forma results of operations for the year ended August 31, 2022 would have been approximately:
| | ($) |
| Net investment loss | (12,840,000) |
| Net realized gain | 16,706,000 |
| Net change in unrealized appreciation/(depreciation) | (654,550,000) |
| Net decrease in net assets from operations | (650,684,000) |
Note 10. Significant risks
Information technology sector risk
The Fund is more susceptible to the particular risks that may affect companies in the information technology sector than if it were invested in a wider variety of companies in unrelated sectors. Companies in the information technology sector are subject to certain risks, including the risk that new services, equipment or technologies will not be accepted by consumers and businesses or will become rapidly obsolete. Performance of such companies may be affected by factors including obtaining and protecting patents (or the failure to do so) and significant competitive pressures, including aggressive pricing of their products or services, new market entrants, competition for market share and short product cycles due to an accelerated rate of technological developments. Such competitive pressures may lead to limited earnings and/or falling profit margins. As a result, the value of their securities may fall or fail to rise. In addition, many information technology sector companies have limited operating histories and prices of these companies’ securities historically have been more volatile than other securities, especially over the short term. Some companies in the information technology sector are facing increased government and regulatory scrutiny and may be subject to adverse government or regulatory action, which could negatively impact the value of their securities.
| 30 | Columbia Select Mid Cap Growth Fund | Annual Report 2023 |
Notes to Financial Statements (continued)
August 31, 2023
Market risk
The Fund may incur losses due to declines in the value of one or more securities in which it invests. These declines may be due to factors affecting a particular issuer, or the result of, among other things, political, regulatory, market, economic or social developments affecting the relevant market(s) more generally. In addition, turbulence in financial markets and reduced liquidity in equity, credit and/or fixed income markets may negatively affect many issuers, which could adversely affect the Fund’s ability to price or value hard-to-value assets in thinly traded and closed markets and could cause significant redemptions and operational challenges. Global economies and financial markets are increasingly interconnected, and conditions and events in one country, region or financial market may adversely impact issuers in a different country, region or financial market. These risks may be magnified if certain events or developments adversely interrupt the global supply chain; in these and other circumstances, such risks might affect companies worldwide. As a result, local, regional or global events such as terrorism, war, natural disasters, disease/virus outbreaks and epidemics or other public health issues, recessions, depressions or other events – or the potential for such events – could have a significant negative impact on global economic and market conditions.
The large-scale invasion of Ukraine by Russia in February 2022 has resulted in sanctions and market disruptions, including declines in regional and global stock markets, unusual volatility in global commodity markets and significant devaluations of Russian currency. The extent and duration of the military action are impossible to predict but could be significant. Market disruption caused by the Russian military action, and any counter-measures or responses thereto (including international sanctions, a downgrade in the country’s credit rating, purchasing and financing restrictions, boycotts, tariffs, changes in consumer or purchaser preferences, cyberattacks and espionage) could have severe adverse impacts on regional and/or global securities and commodities markets, including markets for oil and natural gas. These impacts may include reduced market liquidity, distress in credit markets, further disruption of global supply chains, increased risk of inflation, restricted cross-border payments and limited access to investments and/or assets in certain international markets and/or issuers. These developments and other related events could negatively impact Fund performance.
Shareholder concentration risk
At August 31, 2023, affiliated shareholders of record owned 30.8% of the outstanding shares of the Fund in one or more accounts. Fund shares sold to or redeemed by concentrated accounts may have a significant effect on the operations of the Fund. In the case of a large redemption, the Fund may be forced to sell investments at inopportune times, including its liquid positions, which may result in Fund losses and the Fund holding a higher percentage of less liquid positions. Large redemptions could result in decreased economies of scale and increased operating expenses for non-redeeming Fund shareholders.
Small- and mid-cap company risk
Investments in small- and mid-capitalization companies (small- and mid-cap companies) often involve greater risks than investments in larger, more established companies (larger companies) because small- and mid-cap companies tend to have less predictable earnings and may lack the management experience, financial resources, product diversification and competitive strengths of larger companies. Securities of small- and mid-cap companies may be less liquid and more volatile than the securities of larger companies.
Note 11. Subsequent events
Management has evaluated the events and transactions that have occurred through the date the financial statements were issued and noted no items requiring adjustment of the financial statements or additional disclosure.
Note 12. Information regarding pending and settled legal proceedings
Ameriprise Financial and certain of its affiliates are involved in the normal course of business in legal proceedings which include regulatory inquiries, arbitration and litigation, including class actions concerning matters arising in connection with the conduct of their activities as part of a diversified financial services firm. Ameriprise Financial believes that the Fund is not currently the subject of, and that neither Ameriprise Financial nor any of its affiliates are the subject of, any pending legal, arbitration or regulatory proceedings that are likely to have a material adverse effect on the Fund or the ability of Ameriprise Financial or its affiliates to perform under their contracts with the Fund. Ameriprise Financial is required to make quarterly
Columbia Select Mid Cap Growth Fund | Annual Report 2023
| 31 |
Notes to Financial Statements (continued)
August 31, 2023
(10-Q), annual (10-K) and, as necessary, 8-K filings with the Securities and Exchange Commission (SEC) on legal and regulatory matters that relate to Ameriprise Financial and its affiliates. Copies of these filings may be obtained by accessing the SEC website at www.sec.gov.
There can be no assurance that these matters, or the adverse publicity associated with them, will not result in increased Fund redemptions, reduced sale of Fund shares or other adverse consequences to the Fund. Further, although we believe proceedings are not likely to have a material adverse effect on the Fund or the ability of Ameriprise Financial or its affiliates to perform under their contracts with the Fund, these proceedings are subject to uncertainties and, as such, we are unable to estimate the possible loss or range of loss that may result. An adverse outcome in one or more of these proceedings could result in adverse judgments, settlements, fines, penalties or other relief that could have a material adverse effect on the consolidated financial condition or results of operations of Ameriprise Financial or one or more of its affiliates that provide services to the Fund.
| 32 | Columbia Select Mid Cap Growth Fund | Annual Report 2023 |
Report of Independent Registered Public Accounting Firm
To the Board of Trustees of Columbia Funds Series Trust I and Shareholders of Columbia Select Mid Cap Growth Fund
Opinion on the Financial Statements
We have audited the accompanying statement of assets and liabilities, including the portfolio of investments, of Columbia Select Mid Cap Growth Fund (one of the funds constituting Columbia Funds Series Trust I, referred to hereafter as the "Fund") as of August 31, 2023, the related statement of operations for the year ended August 31, 2023, the statement of changes in net assets for each of the two years in the period ended August 31, 2023, including the related notes, and the financial highlights for each of the five years in the period ended August 31, 2023 (collectively referred to as the "financial statements"). In our opinion, the financial statements present fairly, in all material respects, the financial position of the Fund as of August 31, 2023, the results of its operations for the year then ended, the changes in its net assets for each of the two years in the period ended August 31, 2023 and the financial highlights for each of the five years in the period ended August 31, 2023 in conformity with accounting principles generally accepted in the United States of America.
Basis for Opinion
These financial statements are the responsibility of the Fund’s management. Our responsibility is to express an opinion on the Fund’s financial statements based on our audits. We are a public accounting firm registered with the Public Company Accounting Oversight Board (United States) (PCAOB) and are required to be independent with respect to the Fund in accordance with the U.S. federal securities laws and the applicable rules and regulations of the Securities and Exchange Commission and the PCAOB.
We conducted our audits of these financial statements in accordance with the standards of the PCAOB. Those standards require that we plan and perform the audit to obtain reasonable assurance about whether the financial statements are free of material misstatement, whether due to error or fraud.
Our audits included performing procedures to assess the risks of material misstatement of the financial statements, whether due to error or fraud, and performing procedures that respond to those risks. Such procedures included examining, on a test basis, evidence regarding the amounts and disclosures in the financial statements. Our audits also included evaluating the accounting principles used and significant estimates made by management, as well as evaluating the overall presentation of the financial statements. Our procedures included confirmation of securities owned as of August 31, 2023 by correspondence with the custodian, transfer agent and brokers; when replies were not received from brokers, we performed other auditing procedures. We believe that our audits provide a reasonable basis for our opinion.
/s/PricewaterhouseCoopers LLP
Minneapolis, Minnesota
October 23, 2023
We have served as the auditor of one or more investment companies within the Columbia Funds Complex since 1977.
Columbia Select Mid Cap Growth Fund | Annual Report 2023
| 33 |
TRUSTEES AND OFFICERS
(Unaudited)
The Board oversees the Fund’s operations and appoints officers who are responsible for day-to-day business decisions based on policies set by the Board. The following table provides basic biographical information about the Fund’s Trustees as of the printing of this report, including their principal occupations during the past five years, although specific titles for individuals may have varied over the period. The year set forth beneath Length of Service in the table below is the year in which the Trustee was first appointed or elected as Trustee to any Fund currently in the Columbia Funds Complex or a predecessor thereof. Under current Board policy, each Trustee generally serves until December 31 of the year such Trustee turns seventy-five (75).
Independent trustees
Name,
address,
year of birth | Position held
with the Columbia Funds and
length of service | Principal occupation(s)
during past five years
and other relevant
professional experience | Number of
Funds in the
Columbia Funds
Complex*
overseen | Other directorships
held by Trustee
during the past five years
and other relevant Board experience |
George S. Batejan
c/o Columbia Management
Investment Advisers, LLC
290 Congress Street
Boston, MA 02210
1954 | Trustee since 2017 | Executive Vice President, Global Head of Technology and Operations, Janus Capital Group, Inc., 2010-2016 | 173 | Former Chairman of the Board, NICSA (National Investment Company Services Association) (Executive Committee, Nominating Committee and Governance Committee), 2014-2016; former Director, Intech Investment Management, 2011-2016; former Board Member, Metro Denver Chamber of Commerce, 2015-2016; former Advisory Board Member, University of Colorado Business School, 2015-2018; former Board Member, Chase Bank International, 1993-1994 |
Kathleen Blatz
c/o Columbia Management
Investment Advisers, LLC
290 Congress Street
Boston, MA 02210
1954 | Trustee since 2006 | Attorney, specializing in arbitration and mediation; Chief Justice, Minnesota Supreme Court, 1998-2006; Associate Justice, Minnesota Supreme Court, 1996-1998; Fourth Judicial District Court Judge, Hennepin County, 1994-1996; Attorney in private practice and public service, 1984-1993; State Representative, Minnesota House of Representatives, 1979-1993, which included service on the Tax and Financial Institutions and Insurance Committees; Member and Interim Chair, Minnesota Sports Facilities Authority, January-July 2017; Interim President and Chief Executive Officer, Blue Cross and Blue Shield of Minnesota (health care insurance), February-July 2018, April-October 2021 | 173 | Former Trustee, Blue Cross and Blue Shield of Minnesota, 2009-2021 (Chair of the Business Development Committee, 2014-2017; Chair of the Governance Committee, 2017-2019); former Member and Chair of the Board, Minnesota Sports Facilities Authority, January 2017-July 2017; former Director, Robina Foundation, 2009-2020 (Chair, 2014-2020); Director, Richard M. Schulze Family Foundation, since 2021 |
| 34 | Columbia Select Mid Cap Growth Fund | Annual Report 2023 |
TRUSTEES AND OFFICERS (continued)
(Unaudited)
Independent trustees (continued)
Name,
address,
year of birth | Position held
with the Columbia Funds and
length of service | Principal occupation(s)
during past five years
and other relevant
professional experience | Number of
Funds in the
Columbia Funds
Complex*
overseen | Other directorships
held by Trustee
during the past five years
and other relevant Board experience |
Pamela G. Carlton
c/o Columbia Management
Investment Advisers, LLC
290 Congress Street
Boston, MA 02210
1954 | Chair since 2023; Trustee since 2007 | President, Springboard – Partners in Cross Cultural Leadership (consulting company), since 2003; Managing Director of US Equity Research, JP Morgan Chase, 1999-2003; Director of US Equity Research, Chase Asset Management, 1996-1999; Co-Director Latin America Research, 1993-1996, COO Global Research, 1992-1996, Co-Director of US Research, 1991-1992, Investment Banker, 1982-1991, Morgan Stanley; Attorney, Cleary Gottlieb Steen & Hamilton LLP, 1980-1982 | 173 | Trustee, New York Presbyterian Hospital Board, since 1996; Director, DR Bank (Audit Committee) since 2017; Director, Evercore Inc. (Audit Committee, Nominating and Governance Committee), since 2019; Director, Apollo Commercial Real Estate Finance, Inc. (Chair, Nominating and Governance Committee) (financial services), since 2021; the Governing Council of the Independent Directors Council (IDC), since 2021 |
Janet Langford Carrig
c/o Columbia Management
Investment Advisers, LLC
290 Congress Street
Boston, MA 02210
1957 | Trustee since 1996 | Senior Vice President, General Counsel and Corporate Secretary, ConocoPhillips (independent energy company), September 2007-October 2018 | 173 | Director, EQT Corporation (natural gas producer), since 2019; former Director, Whiting Petroleum Corporation (independent oil and gas company), 2020-2022 |
J. Kevin Connaughton
c/o Columbia Management
Investment Advisers, LLC
290 Congress Street
Boston, MA 02210
1964 | Trustee since 2020 | CEO and President, RhodeWay Financial (non-profit financial planning firm), since December 2022; Member, FINRA National Adjudicatory Council, since January 2020; Adjunct Professor of Finance, Bentley University since January 2018; Consultant to Independent Trustees of CFVIT and CFST I from March 2016 to June 2020 with respect to CFVIT and to December 2020 with respect to CFST I; Managing Director and General Manager of Mutual Fund Products, Columbia Management Investment Advisers, LLC, May 2010-February 2015; President, Columbia Funds, 2008-2015; and senior officer of Columbia Funds and affiliated funds, 2003-2015 | 171 | Former Director, The Autism Project, March 2015-December 2021; former Member of the Investment Committee, St. Michael’s College, November 2015-February 2020; former Trustee, St. Michael’s College, June 2017-September 2019; former Trustee, New Century Portfolios (former mutual fund complex), January 2015-December 2017 |
Olive M. Darragh
c/o Columbia Management
Investment Advisers, LLC
290 Congress Street
Boston, MA 02210
1962 | Trustee since 2020 | Managing Director of Darragh Inc. (strategy and talent management consulting firm), since 2010; Founder and CEO, Zolio, Inc. (investment management talent identification platform), since 2004; Consultant to Independent Trustees of CFVIT and CFST I from June 2019 to June 2020 with respect to CFVIT and to December 2020 with respect to CFST I; Partner, Tudor Investments, 2004-2010; Senior Partner, McKinsey & Company (consulting), 1990-2004; Touche Ross CPA, 1985-1988 | 171 | Treasurer, Edinburgh University US Trust Board, since January 2023; Member, HBS Community Action Partners Board, since September 2022; former Director, University of Edinburgh Business School (Member of US Board), 2004-2019; former Director, Boston Public Library Foundation, 2008-2017 |
Columbia Select Mid Cap Growth Fund | Annual Report 2023
| 35 |
TRUSTEES AND OFFICERS (continued)
(Unaudited)
Independent trustees (continued)
Name,
address,
year of birth | Position held
with the Columbia Funds and
length of service | Principal occupation(s)
during past five years
and other relevant
professional experience | Number of
Funds in the
Columbia Funds
Complex*
overseen | Other directorships
held by Trustee
during the past five years
and other relevant Board experience |
Patricia M. Flynn
c/o Columbia Management
Investment Advisers, LLC
290 Congress Street
Boston, MA 02210
1950 | Trustee since 2004 | Professor of Economics and Management, Bentley University, since 2002; Dean, McCallum Graduate School of Business, Bentley University, 1992-2002 | 173 | Former Trustee, MA Taxpayers Foundation, 1997-2022; former Director, The MA Business Roundtable, 2003-2019; former Chairperson, Innovation Index Advisory Committee, MA Technology Collaborative, 1997-2020 |
Brian J. Gallagher
c/o Columbia Management
Investment Advisers, LLC
290 Congress Street
Boston, MA 02210
1954 | Trustee since 2017 | Retired; Partner with Deloitte & Touche LLP and its predecessors, 1977-2016 | 173 | Trustee, Catholic Schools Foundation, since 2004 |
Douglas A. Hacker
c/o Columbia Management
Investment Advisers, LLC
290 Congress Street
Boston, MA 02210
1955 | Trustee since 1996 | Independent business executive, since May 2006; Executive Vice President – Strategy of United Airlines, December 2002 - May 2006; President of UAL Loyalty Services (airline marketing company), September 2001-December 2002; Executive Vice President and Chief Financial Officer of United Airlines, July 1999-September 2001 | 173 | Director, SpartanNash Company since November 2013 (Chair of the Board, since May 2021) (food distributor); Director, Aircastle Limited (Chair of Audit Committee) (aircraft leasing), since August 2006; former Director, Nash Finch Company (food distributor), 2005-2013; former Director, SeaCube Container Leasing Ltd. (container leasing), 2010-2013; and former Director, Travelport Worldwide Limited (travel information technology), 2014-2019 |
Nancy T. Lukitsh
c/o Columbia Management
Investment Advisers, LLC
290 Congress Street
Boston, MA 02210
1956 | Trustee since 2011 | Senior Vice President, Partner and Director of Marketing, Wellington Management Company, LLP (investment adviser), 1997-2010; Chair, Wellington Management Portfolios (commingled non-U.S. investment pools), 2007-2010; Director, Wellington Trust Company, NA and other Wellington affiliates, 1997-2010 | 171 | None |
| 36 | Columbia Select Mid Cap Growth Fund | Annual Report 2023 |
TRUSTEES AND OFFICERS (continued)
(Unaudited)
Independent trustees (continued)
Name,
address,
year of birth | Position held
with the Columbia Funds and
length of service | Principal occupation(s)
during past five years
and other relevant
professional experience | Number of
Funds in the
Columbia Funds
Complex*
overseen | Other directorships
held by Trustee
during the past five years
and other relevant Board experience |
David M. Moffett
c/o Columbia Management
Investment Advisers, LLC
290 Congress Street
Boston, MA 02210
1952 | Trustee since 2011 | Retired; former Chief Executive Officer of Freddie Mac and Chief Financial Officer of U.S. Bank | 171 | Director, CSX Corporation (transportation suppliers); Director, PayPal Holdings Inc. (payment and data processing services); Trustee, University of Oklahoma Foundation; former Director, eBay Inc. (online trading community), 2007-2015; and former Director, CIT Bank, CIT Group Inc. (commercial and consumer finance), 2010-2016; former Senior Adviser to The Carlyle Group (financial services), March 2008-September 2008; former Governance Consultant to Bridgewater Associates, January 2013-December 2015 |
Catherine James Paglia
c/o Columbia Management
Investment Advisers, LLC
290 Congress Street
Boston, MA 02210
1952 | Trustee since 2004 | Director, Enterprise Asset Management, Inc. (private real estate and asset management company), since September 1998; Managing Director and Partner, Interlaken Capital, Inc., 1989-1997; Vice President, 1982-1985, Principal, 1985-1987, Managing Director, 1987-1989, Morgan Stanley; Vice President, Investment Banking, 1980-1982, Associate, Investment Banking, 1976-1980, Dean Witter Reynolds, Inc. | 173 | Director, Valmont Industries, Inc. (irrigation systems manufacturer), since 2012; Trustee, Carleton College (on the Investment Committee), since 1987; Trustee, Carnegie Endowment for International Peace (on the Investment Committee), since 2009 |
Natalie A. Trunow
c/o Columbia Management
Investment Advisers, LLC
290 Congress Street
Boston, MA 02210
1967 | Trustee since 2020 | Chief Executive Officer, Millennial Portfolio Solutions LLC (asset management and consulting services), January 2016-January 2021; Non-executive Member of the Investment Committee and Valuation Committee, Sarona Asset Management Inc. (private equity firm) since September 2019; Advisor, Horizon Investments (asset management and consulting services), August 2018-January 2022; Advisor, Paradigm Asset Management, November 2016-January 2022; Consultant to Independent Trustees of CFVIT and CFST I from September 2016 to June 2020 with respect to CFVIT and to December 2020 with respect to CFST I; Director of Investments/Consultant, Casey Family Programs, April 2016-November 2016; Senior Vice President and Chief Investment Officer, Calvert Investments, August 2008-January 2016; Section Head and Portfolio Manager, General Motors Asset Management, June 1997-August 2008 | 171 | Independent Director, Investment Committee, Health Services for Children with Special Needs, Inc., 2010-2021; Independent Director, (Executive Committee and Chair, Audit Committee), Consumer Credit Counseling Services (formerly Guidewell Financial Solutions), since 2016; Independent Director, (Investment Committee), Sarona Asset Management, since 2019 |
Columbia Select Mid Cap Growth Fund | Annual Report 2023
| 37 |
TRUSTEES AND OFFICERS (continued)
(Unaudited)
Independent trustees (continued)
Name,
address,
year of birth | Position held
with the Columbia Funds and
length of service | Principal occupation(s)
during past five years
and other relevant
professional experience | Number of
Funds in the
Columbia Funds
Complex*
overseen | Other directorships
held by Trustee
during the past five years
and other relevant Board experience |
Sandra L. Yeager
c/o Columbia Management
Investment Advisers, LLC
290 Congress Street
Boston, MA 02210
1964 | Trustee since 2017 | Retired; President and founder, Hanoverian Capital, LLC (SEC registered investment advisor firm), 2008-2016; Managing Director, DuPont Capital, 2006-2008; Managing Director, Morgan Stanley Investment Management, 2004-2006; Senior Vice President, Alliance Bernstein, 1990-2004 | 173 | Former Director, NAPE (National Alliance for Partnerships in Equity) Education Foundation, October 2016-October 2020; Advisory Board, Jennersville YMCA, since 2022 |
Interested trustee affiliated with Investment Manager**
Name,
address,
year of birth | Position held with the Columbia Funds and length of service | Principal occupation(s) during the
past five years and other relevant
professional experience | Number of
Funds in the
Columbia Funds
Complex* overseen | Other directorships
held by Trustee
during the past
five years and
other relevant Board experience |
Daniel J. Beckman
c/o Columbia Management
Investment Advisers, LLC
290 Congress Street
Boston, MA 02210
1962 | Trustee since November 2021 and President since June 2021 | Vice President – Head of North America Product, Columbia Management Investment Advisers, LLC, since April 2015; President and Principal Executive Officer of the Columbia Funds, since June 2021; officer of Columbia Funds and affiliated funds, 2020-2021 | 173 | Director, Ameriprise Trust Company, since October 2016; Director, Columbia Management Investment Distributors, Inc. since November 2018; Board of Governors, Columbia Wanger Asset Management, LLC since, January 2022; Director, Columbia Threadneedle Canada, Inc., since December 2022 |
| * | The term “Columbia Funds Complex” as used herein includes Columbia Seligman Premium Technology Growth Fund, Tri-Continental Corporation and each series of Columbia Funds Series Trust (CFST), Columbia Funds Series Trust I (CFST I), Columbia Funds Series Trust II (CFST II), Columbia ETF Trust I (CET I), Columbia ETF Trust II (CET II), Columbia Funds Variable Insurance Trust (CFVIT) and Columbia Funds Variable Series Trust II (CFVST II). Messrs. Batejan, Beckman, Gallagher and Hacker and Mses. Blatz, Carlton, Carrig, Flynn, Paglia, and Yeager serve as directors of Columbia Seligman Premium Technology Growth Fund and Tri-Continental Corporation. |
| ** | Interested person (as defined under the 1940 Act) by reason of being an officer, director, security holder and/or employee of the Investment Manager or Ameriprise Financial. |
The Statement of Additional Information has additional information about the Fund’s Board members and is available, without charge, upon request by calling 800.345.6611, visiting columbiathreadneedleus.com/investor/ or contacting your financial intermediary.
| 38 | Columbia Select Mid Cap Growth Fund | Annual Report 2023 |
TRUSTEES AND OFFICERS (continued)
(Unaudited)
The Board has appointed officers who are responsible for day-to-day business decisions based on policies it has established. The officers serve at the pleasure of the Board. The following table provides basic information about the Officers of the Fund as of the printing of this report, including principal occupations during the past five years, although their specific titles may have varied over the period. In addition to Mr. Beckman, who is President and Principal Executive Officer, the Fund’s other officers are:
Fund officers
Name,
address and
year of birth | Position and year
first appointed to
position for any Fund
in the Columbia
Funds Complex or a
predecessor thereof | Principal occupation(s) during past five years |
Michael G. Clarke
290 Congress Street
Boston, MA 02210
1969 | Chief Financial Officer and Principal Financial Officer (2009) and Senior Vice President (2019) | Senior Vice President and North America Head of Operations & Investor Services, Columbia Management Investment Advisers, LLC, since June 2023 (previously Senior Vice President and Head of Global Operations, March 2022 – June 2023, Vice President, Head of North America Operations, and Co-Head of Global Operations, June 2019 - February 2022 and Vice President – Accounting and Tax, May 2010 - May 2019); senior officer of Columbia Funds and affiliated funds, since 2002. Director, Ameriprise Trust Company, since June 2023. |
Joseph Beranek
5890 Ameriprise Financial Center
Minneapolis, MN 55474
1965 | Treasurer and Chief Accounting Officer (Principal Accounting Officer) (2019) and Principal Financial Officer (2020), CFST, CFST I, CFST II, CFVIT and CFVST II; Assistant Treasurer, CET I and CET II | Vice President – Mutual Fund Accounting and Financial Reporting, Columbia Management Investment Advisers, LLC, since December 2018 and March 2017, respectively. |
Marybeth Pilat
290 Congress Street
Boston, MA 02210
1968 | Treasurer and Chief Accounting Officer (Principal Accounting Officer) and Principal Financial Officer (2020) for CET I and CET II; Assistant Treasurer, CFST, CFST I, CFST II, CFVIT and CFVST II | Vice President – Product Pricing and Administration, Columbia Management Investment Advisers, LLC, since May 2017. |
William F. Truscott
290 Congress Street
Boston, MA 02210
1960 | Senior Vice President (2001) | Formerly, Trustee/Director of Columbia Funds Complex or legacy funds, November 2001 - January 1, 2021; Chief Executive Officer, Global Asset Management, Ameriprise Financial, Inc., since September 2012; Chairman of the Board and President, Columbia Management Investment Advisers, LLC, since July 2004 and February 2012, respectively; Chairman of the Board and Chief Executive Officer, Columbia Management Investment Distributors, Inc., since November 2008 and February 2012, respectively; Chairman of the Board and Director, Threadneedle Asset Management Holdings, Sàrl, since March 2013 and December 2008, respectively; senior executive of various entities affiliated with Columbia Threadneedle. |
Christopher O. Petersen
5228 Ameriprise Financial Center
Minneapolis, MN 55474
1970 | Senior Vice President and Assistant Secretary (2021) | Formerly, Trustee/Director of funds within the Columbia Funds Complex, July 1, 2020 - November 22, 2021; Senior Vice President and Assistant General Counsel, Ameriprise Financial, Inc., since September 2021 (previously Vice President and Lead Chief Counsel, January 2015 - September 2021); formerly, President and Principal Executive Officer of the Columbia Funds, 2015 - 2021; officer of Columbia Funds and affiliated funds, since 2007. |
Thomas P. McGuire
290 Congress Street
Boston, MA 02210
1972 | Senior Vice President and Chief Compliance Officer (2012) | Vice President – Asset Management Compliance, Ameriprise Financial, Inc., since May 2010; Chief Compliance Officer, Columbia Acorn/Wanger Funds, since December 2015; formerly, Chief Compliance Officer, Ameriprise Certificate Company, September 2010 – September 2020. |
Ryan C. Larrenaga
290 Congress Street
Boston, MA 02210
1970 | Senior Vice President (2017), Chief Legal Officer (2017), and Secretary (2015) | Vice President and Chief Counsel, Ameriprise Financial, Inc., since August 2018 (previously Vice President and Group Counsel, August 2011 - August 2018); Chief Legal Officer, Columbia Acorn/Wanger Funds, since September 2020; officer of Columbia Funds and affiliated funds, since 2005. |
Columbia Select Mid Cap Growth Fund | Annual Report 2023
| 39 |
TRUSTEES AND OFFICERS (continued)
(Unaudited)
Fund officers (continued)
Name,
address and
year of birth | Position and year
first appointed to
position for any Fund
in the Columbia
Funds Complex or a
predecessor thereof | Principal occupation(s) during past five years |
Michael E. DeFao
290 Congress Street
Boston, MA 02210
1968 | Vice President (2011) and Assistant Secretary (2010) | Vice President and Chief Counsel, Ameriprise Financial, Inc., since May 2010; Vice President, Chief Legal Officer and Assistant Secretary, Columbia Management Investment Advisers, LLC, since October 2021 (previously Vice President and Assistant Secretary, May 2010 – September 2021). |
Lyn Kephart-Strong
5903 Ameriprise Financial Center
Minneapolis, MN 55474
1960 | Vice President (2015) | Vice President, Global Investment Operations Services, Columbia Management Investment Advisers, LLC, since 2010; Director (since January 2007) and President (since October 2014), Columbia Management Investment Services Corp.; Director (since December 2017) and President (since January 2017), Ameriprise Trust Company. |
Liquidity Risk Management Program
(Unaudited)
Pursuant to Rule 22e-4 under the 1940 Act, the Fund has adopted a liquidity risk management program (Program). The Program’s principal objectives include assessing, managing and periodically reviewing the Fund’s liquidity risk. Liquidity risk is defined as the risk that the Fund could not meet redemption requests without significant dilution of remaining investors’ interests in the Fund.
The Board has appointed the Investment Manager as the program administrator for the Fund’s Program. The Investment Manager has delegated oversight of the Program to its Liquidity Risk Management Committee (the Committee). At a Board meeting during the fiscal period, the Committee provided the Board with a report addressing the operations of the Program and assessing its adequacy and effectiveness of implementation for the period January 1, 2022 through December 31, 2022, including:
| • | the Fund had sufficient liquidity to both meet redemptions and operate effectively on behalf of shareholders; |
| • | there were no material changes to the Program during the period; |
| • | the implementation of the Program was effective to manage the Fund’s liquidity risk; and |
| • | the Program operated adequately during the period. |
There can be no assurance that the Program will achieve its objectives in the future. Please refer to the Fund’s prospectus for more information regarding the Fund’s exposure to liquidity risk and other principal risks to which an investment in the Fund may be subject.
| 40 | Columbia Select Mid Cap Growth Fund | Annual Report 2023 |
Approval of Management Agreement
(Unaudited)
Columbia Management Investment Advisers, LLC (the Investment Manager, and together with its domestic and global affiliates, Columbia Threadneedle Investments), a wholly-owned subsidiary of Ameriprise Financial, Inc. (Ameriprise Financial), serves as the investment manager to Columbia Select Mid Cap Growth Fund (the Fund). Under a management agreement (the Management Agreement), the Investment Manager provides investment advice and other services to the Fund and other funds distributed by Columbia Management Investment Distributors, Inc. (collectively, the Funds).
On an annual basis, the Fund’s Board of Trustees (the Board), including the independent Board members (the Independent Trustees), considers renewal of the Management Agreement. The Investment Manager prepared detailed reports for the Board and its Contracts Committee (including its Contracts Subcommittee) in February, March, April, May and June 2023, including reports providing the results of analyses performed by a third-party data provider, Broadridge Financial Solutions, Inc. (Broadridge), and comprehensive responses by the Investment Manager to written requests for information by independent legal counsel to the Independent Trustees (Independent Legal Counsel), to assist the Board in making this determination. In addition, throughout the year, the Board (or its committees or subcommittees) regularly meets with portfolio management teams and senior management personnel and reviews information prepared by the Investment Manager addressing the services the Investment Manager provides and Fund performance. The Board also accords appropriate weight to the work, deliberations and conclusions of the various committees (including their subcommittees), such as the Contracts Committee, the Investment Review Committee, the Audit Committee and the Compliance Committee in determining whether to continue the Management Agreement.
The Board, at its June 22, 2023 Board meeting (the June Meeting), considered the renewal of the Management Agreement for an additional one-year term. At the June Meeting, Independent Legal Counsel reviewed with the Independent Trustees various factors relevant to the Board’s consideration of advisory agreements and the Board’s legal responsibilities related to such consideration. The Independent Trustees considered all information that they, their legal counsel or the Investment Manager believed reasonably necessary to evaluate and to approve the continuation of the Management Agreement. Among other things, the information and factors considered included the following:
| • | Information on the investment performance of the Fund relative to the performance of a group of mutual funds determined to be comparable to the Fund by Broadridge, as well as performance relative to one or more benchmarks; |
| • | Information on the Fund’s management fees and total expenses, including information comparing the Fund’s expenses to those of a group of comparable mutual funds, as determined by Broadridge; |
| • | The Investment Manager’s agreement to contractually limit or cap total operating expenses for the Fund so that total operating expenses (excluding certain fees and expenses, such as transaction costs and certain other investment related expenses, interest, taxes, acquired fund fees and expenses and infrequent and/or unusual expenses) would not exceed a specified annual rate, as a percentage of the Fund’s net assets; |
| • | Terms of the Management Agreement; |
| • | Descriptions of other agreements and arrangements with affiliates of the Investment Manager relating to the operations of the Fund, including agreements with respect to the provision of transfer agency and shareholder services to the Fund; |
| • | Descriptions of various services performed by the Investment Manager under the Management Agreement, including portfolio management and portfolio trading practices; |
| • | Information regarding any recently negotiated management fees of similarly-managed portfolios of other institutional clients of the Investment Manager; |
| • | Information regarding the resources of the Investment Manager, including information regarding senior management, portfolio managers and other personnel; |
| • | Information regarding the capabilities of the Investment Manager with respect to compliance monitoring services; |
| • | The profitability to the Investment Manager and its affiliates from their relationships with the Fund; and |
| • | Report provided by the Board’s independent fee consultant, JDL Consultants, LLC (JDL). |
Columbia Select Mid Cap Growth Fund | Annual Report 2023
| 41 |
Approval of Management Agreement (continued)
(Unaudited)
Following an analysis and discussion of the foregoing, and the factors identified below, the Board, including all of the Independent Trustees, approved the renewal of the Management Agreement.
Nature, extent and quality of services provided by the Investment Manager
The Board analyzed various reports and presentations it had received detailing the services performed by the Investment Manager, as well as its history, expertise, resources and relative capabilities, and the qualifications of its personnel.
The Board specifically considered the many developments during recent years concerning the services provided by the Investment Manager. Among other things, the Board noted the organization and depth of the equity and credit research departments. The Board further observed the enhancements to the investment risk management department’s processes, systems and oversight over the past several years. The Board also took into account the broad scope of services provided by the Investment Manager to the Fund, including, among other services, investment, risk and compliance oversight. The Board also took into account the information it received concerning the Investment Manager’s ability to attract and retain key portfolio management personnel and that it has sufficient resources to provide competitive and adequate compensation to investment personnel.
In connection with the Board’s evaluation of the overall package of services provided by the Investment Manager, the Board also considered the nature, quality and range of administrative services provided to the Fund by the Investment Manager, as well as the achievements in 2022 in the performance of administrative services, and noted the various enhancements anticipated for 2023. In evaluating the quality of services provided under the Management Agreement, the Board also took into account the organization and strength of the Fund’s and its service providers’ compliance programs. The Board also reviewed the financial condition of the Investment Manager and its affiliates and each entity’s ability to carry out its responsibilities under the Management Agreement and the Fund’s other service agreements.
In addition, the Board discussed the acceptability of the terms of the Management Agreement, noting that no changes were proposed from the form of agreement previously approved. The Board also noted the wide array of legal and compliance services provided to the Fund under the Management Agreement.
After reviewing these and related factors (including investment performance as discussed below), the Board concluded, within the context of their overall conclusions, that the nature, extent and quality of the services provided to the Fund under the Management Agreement supported the continuation of the Management Agreement.
Investment performance
The Board carefully reviewed the investment performance of the Fund, including detailed reports providing the results of analyses performed by each of the Investment Manager, Broadridge and JDL collectively showing, for various periods (including since manager inception): (i) the performance of the Fund, (ii) the Fund’s performance relative to peers and benchmarks and (iii) the net assets of the Fund. The Board observed that Fund performance was well within the range of that of its peers.
The Board also reviewed a description of the third-party data provider’s methodology for identifying the Fund’s peer groups for purposes of performance and expense comparisons.
The Board also considered the Investment Manager’s performance and reputation generally. After reviewing these and related factors, the Board concluded, within the context of their overall conclusions, that the performance of the Fund and the Investment Manager, in light of other considerations, supported the continuation of the Management Agreement.
Comparative fees, costs of services provided and the profits realized by the Investment Manager and its affiliates from their relationships with the Fund
The Board reviewed comparative fees and the costs of services provided under the Management Agreement. The Board members considered detailed comparative information set forth in an annual report on fees and expenses, including, among other things, data (based on analyses conducted by Broadridge and JDL) showing a comparison of the Fund’s expenses with median expenses paid by funds in its comparative peer universe, as well as data showing the Fund’s contribution to the
| 42 | Columbia Select Mid Cap Growth Fund | Annual Report 2023 |
Approval of Management Agreement (continued)
(Unaudited)
Investment Manager’s profitability. The Board reviewed the fees charged to comparable institutional or other accounts/vehicles managed by the Investment Manager and discussed differences in how the products are managed and operated, thus explaining many of the differences in fees.
The Board considered the reports of JDL, which assisted in the Board’s analysis of the Funds’ performance and expenses and the reasonableness of the Funds’ fee rates. The Board accorded particular weight to the notion that a primary objective of the level of fees is to achieve a rational pricing model applied consistently across the various product lines in the Fund family, while assuring that the overall fees for each Fund (with certain exceptions) are generally in line with the current “pricing philosophy” such that Fund total expense ratios, in general, approximate or are lower than the median expense ratios of funds in the same Lipper comparison universe. The Board took into account that the Fund’s total expense ratio (after considering proposed expense caps/waivers) approximated the peer universe’s median expense ratio.
After reviewing these and related factors, the Board concluded, within the context of their overall conclusions, that the levels of management fees and expenses of the Fund, in light of other considerations, supported the continuation of the Management Agreement.
The Board also considered the profitability of the Investment Manager and its affiliates in connection with the Investment Manager providing management services to the Fund. With respect to the profitability of the Investment Manager and its affiliates, the Independent Trustees referred to information discussing the profitability to the Investment Manager and Ameriprise Financial from managing, operating and distributing the Funds. The Board considered that the profitability generated by the Investment Manager in 2022 had declined from 2021 levels, due to a variety of factors, including the decreased assets under management of the Funds. It also took into account the indirect economic benefits flowing to the Investment Manager or its affiliates in connection with managing or distributing the Funds, such as the enhanced ability to offer various other financial products to Ameriprise Financial customers, soft dollar benefits and overall reputational advantages. The Board noted that the fees paid by the Fund should permit the Investment Manager to offer competitive compensation to its personnel, make necessary investments in its business and earn an appropriate profit. After reviewing these and related factors, the Board concluded, within the context of their overall conclusions, that the costs of services provided and the profitability to the Investment Manager and its affiliates from their relationships with the Fund supported the continuation of the Management Agreement.
Economies of scale
The Board considered the potential existence of economies of scale in the provision by the Investment Manager of services to the Fund, and whether those economies of scale were shared with the Fund through breakpoints in investment management fees or other means, such as expense limitation arrangements and additional investments by the Investment Manager in investment, trading, compliance and other resources. The Board considered the economies of scale that might be realized as the Fund’s net asset level grows and took note of the extent to which Fund shareholders might also benefit from such growth. In this regard, the Board took into account that management fees decline as Fund assets exceed various breakpoints, all of which have not been surpassed. The Board observed that the Management Agreement provided for breakpoints in the management fee rate schedule that allow opportunities for shareholders to realize lower fees as Fund assets grow and that there are additional opportunities through other means for sharing economies of scale with shareholders.
Conclusion
The Board reviewed all of the above considerations in reaching its decision to approve the continuation of the Management Agreement. In reaching its conclusions, no single factor was determinative.
On June 22, 2023, the Board, including all of the Independent Trustees, determined that fees payable under the Management Agreement were fair and reasonable in light of the extent and quality of services provided and approved the renewal of the Management Agreement.
Columbia Select Mid Cap Growth Fund | Annual Report 2023
| 43 |
Columbia Select Mid Cap Growth Fund
P.O. Box 219104
Kansas City, MO 64121-9104
Please read and consider the investment objectives, risks, charges and expenses for any fund carefully before investing. For a prospectus and summary prospectus, which contains this and other important information about the Fund, go to
columbiathreadneedleus.com/investor/. The Fund is distributed by Columbia Management Investment Distributors, Inc., member FINRA, and managed by Columbia Management Investment Advisers, LLC.
Columbia Threadneedle Investments (Columbia Threadneedle) is the global brand name of the Columbia and Threadneedle group of companies. All rights reserved.
© 2023 Columbia Management Investment Advisers, LLC.
columbiathreadneedleus.com/investor/
Item 2. Code of Ethics.
(a) | The registrant has adopted a code of ethics that applies to the registrant’s principal executive officer, principal financial officer, principal accounting officer or controller, or persons performing similar functions, regardless of whether these individuals are employed by the registrant or a third party. |
(b) | During the period covered by this report, there were not any amendments to a provision of the code of ethics that applies to the registrant’s principal executive officer, principal financial officer, principal accounting officer or controller, or persons performing similar functions, regardless of whether these individuals are employed by the registrant or a third party, and that relates to any element of the code of ethics definition enumerated in paragraph (b) of this Item. |
(c) | During the period covered by this report, there were no waivers, including any implicit waivers, from a provision of the code of ethics to the registrant’s principal executive officer, principal financial officer, principal accounting officer or controller, or persons performing similar functions, regardless of whether these individuals are employed by the registrant or a third party that relates to one or more of the items set forth in paragraph (b) of this Item. |
Item 3. Audit Committee Financial Expert.
The registrant’s Board of Trustees has determined that David M. Moffett, Brian J. Gallagher, J. Kevin Connaughton, Sandra L. Yeager, and Douglas A. Hacker, each of whom are members of the registrant’s Board of Trustees and Audit Committee, each qualify as an audit committee financial expert. Mr. Moffett, Mr. Gallagher, Mr. Connaughton, Ms. Yeager, and Mr. Hacker are each independent trustees, as defined in paragraph (a)(2) of this item’s instructions.
Item 4. Principal Accountant Fees and Services.
Fee information below is disclosed for the fifteen series of the registrant whose reports to stockholders are included in this annual filing.
(a) Audit Fees. Aggregate Audit Fees billed by the principal accountant for professional services rendered during the fiscal years ended August 31, 2023 and August 31, 2022 are approximately as follows:
| |
2023 | 2022 |
$533,000 | $522,500 |
Audit Fees include amounts related to the audit of the registrant’s annual financial statements or services that are normally provided by the accountant in connection with statutory and regulatory filings or engagements for those fiscal years.
(b) Audit-Related Fees. Aggregate Audit-Related Fees billed to the registrant by the principal accountant for professional services rendered during the fiscal years ended August 31, 2023 and August 31, 2022 are approximately as follows:
| |
2023 | 2022 |
$25,000 | $25,000 |
Audit-Related Fees include amounts for assurance and related services by the principal accountant that are reasonably related to the performance of the audit of the registrant’s financial statements and are not reported in Audit Fees above.
During the fiscal years ended August 31, 2023 and August 31, 2022, there were no Audit-Related Fees billed by the registrant’s principal accountant to the registrant’s investment adviser (not including any sub-adviser whose role is primarily portfolio management and is subcontracted with or overseen by another investment adviser) and any entity controlling, controlled by, or under common control with the adviser that provides ongoing services to the registrant for an engagement that related directly to the operations and financial reporting of the registrant.
(c) Tax Fees. Aggregate Tax Fees billed by the principal accountant to the registrant for professional services rendered during the fiscal years ended August 31, 2023 and August 31, 2022 are approximately as follows:
| |
2023 | 2022 |
$193,600 | $245,200 |
Tax Fees include amounts for the review of annual tax returns, the review of required shareholder distribution calculations and typically include amounts for professional services by the principal accountant for tax compliance, tax advice and tax planning. Fiscal years 2023 and 2022 also include Tax Fees for foreign tax filings.
During the fiscal years ended August 31, 2023 and August 31, 2022, there were no Tax Fees billed by the registrant’s principal accountant to the registrant’s investment adviser (not including any sub-adviser whose role is primarily portfolio management and is subcontracted with or overseen by another investment adviser) and any entity controlling, controlled by, or under common control with the adviser that provides ongoing services to the registrant for an engagement that related directly to the operations and financial reporting of the registrant.
(d) All Other Fees. Aggregate All Other Fees billed by the principal accountant to the registrant for professional services rendered during the fiscal years ended August 31, 2023 and August 31, 2022 are approximately as follows:
All Other Fees, if any, include amounts for products and services provided by the principal accountant, other than the services reported in paragraphs (a) through (c) above.
Aggregate All Other Fees billed by the registrant’s principal accountant to the registrant’s investment adviser (not including any sub-adviser whose role is primarily portfolio management and is subcontracted with or overseen by another investment adviser) and any entity controlling, controlled by, or under common control with the adviser that provides ongoing services to the registrant for an engagement that related directly to the operations and financial reporting of the registrant during the fiscal years ended August 31, 2023 and August 31, 2022 are approximately as follows:
| |
2023 | 2022 |
$557,000 | $535,000 |
In fiscal years 2023 and 2022, All Other Fees primarily consists of fees billed for internal control examinations of the registrant’s transfer agent and investment adviser.
(e)(1) Audit Committee Pre-Approval Policies and Procedures
The registrant’s Audit Committee is required to pre-approve the engagement of the registrant’s independent auditors to provide audit and non-audit services to the registrant and non-audit services to its investment adviser (excluding any sub-adviser whose role is primarily portfolio management and is sub-contracted or overseen by another investment adviser (the “Adviser”) or any entity controlling, controlled by or under common control with the Adviser that provides ongoing services to the Fund (a “Control Affiliate”) if the engagement relates directly to the operations and financial reporting of the registrant.
The Audit Committee has adopted a Policy for Engagement of Independent Auditors for Audit and Non-Audit Services (the “Policy”). The Policy sets forth the understanding of the Audit Committee regarding the engagement of the registrant’s independent accountants to provide (i) audit and permissible audit-related, tax and other services to the registrant (“Fund Services”); (ii) non-audit services to the registrant’s Adviser and any Control Affiliates, that relates directly to the operations and financial reporting of a Fund (“Fund-related Adviser Services”); and (iii) certain other audit and non-audit services to the registrant’s Adviser and its Control Affiliates. A service will require specific pre-approval by the Audit Committee if it is to be provided by the Fund’s independent auditor; provided, however, that pre-approval of non-audit services to the Fund, the Adviser or Control Affiliates may be waived if certain de minimis requirements set forth in the SEC’s rules are met.
Under the Policy, the Audit Committee may delegate pre-approval authority to any pre-designated member or members who are independent board members. The member(s) to whom such authority is delegated must report, for informational purposes only, any pre-approval decisions to the Audit Committee at its next regular meeting. The Audit Committee's responsibilities with respect to the pre-approval of services performed by the independent auditor may not be delegated to management.
On an annual basis, at a regularly scheduled Audit Committee meeting, the Fund’s Treasurer or other Fund officer shall submit to the Audit Committee a schedule of the types of Fund Services and Fund-related Adviser Services that are subject to specific pre-approval. This schedule will provide a description of each type of service that is subject to specific pre-approval, along with total projected fees for each service. The pre-approval will generally cover a one-year period. The Audit Committee will review and approve the types of services and the projected fees for the next one-year period and may add to, or subtract from, the list of pre-approved services from time to time, based on subsequent determinations. This specific approval acknowledges that the Audit Committee is in agreement with the specific types of services that the independent auditor will be permitted to perform and the projected fees for each service.
The Fund’s Treasurer or other Fund officer shall report to the Audit Committee at each of its regular meetings regarding all Fund Services or Fund-related Adviser Services provided since the last such report was rendered, including a description of the services, by category, with forecasted fees for the annual reporting period, proposed changes requiring specific pre-approval and a description of services provided by the independent auditor, by category, with actual fees during the current reporting period.
*****
(e)(2) None, or 0%, of the Audit-Related Fees, Tax Fees and All Other Fees paid by the Fund or affiliated entities relating directly to the operations and financial reporting of the Registrant disclosed above were approved by the audit committee pursuant to paragraphs (c)(7)(i)(C) of Rule 2-01 of Regulation S-X (which permits audit committee approval after the start of the engagement with respect to services other than audit, review or attest services, if certain conditions are satisfied).
(f) Not applicable.
(g) The aggregate non-audit fees billed by the registrant’s accountant for services rendered to the registrant, and rendered to the registrant’s investment adviser (not including any sub-adviser whose role is primarily portfolio management and is subcontracted with or overseen by another investment adviser), and any entity controlling, controlled by, or under common control with the adviser that provides ongoing services to the registrant for the fiscal years ended August 31, 2023 and August 31, 2022 are approximately as follows:
| |
2023 | 2022 |
$775,600 | $805,200 |
(h) The registrant’s Audit Committee of the Board of Directors has considered whether the provision of non-audit services that were rendered to the registrant’s adviser (not including any sub-adviser whose role is primarily portfolio management and is subcontracted with or overseen by another investment adviser), and any entity controlling, controlled by, or under common control with the investment adviser that provides ongoing services to the registrant that were not pre-approved pursuant to paragraph (c)(7)(ii) of Rule 2-01 of Regulation S-X, is compatible with maintaining the principal accountant’s independence.
Item 5. Audit Committee of Listed Registrants.
Not applicable.
Item 6. Investments
(a) | The registrant’s “Schedule I – Investments in securities of unaffiliated issuers” (as set forth in 17 CFR 210.12-12) is included in Item 1 of this Form N-CSR. |
Item 7. Disclosure of Proxy Voting Policies and Procedures for Closed-End Management Investment Companies.
Not applicable.
Item 8. Portfolio Managers of Closed-End Management Investment Companies.
Not applicable.
Item 9. Purchases of Equity Securities by Closed-End Management Investment Company and Affiliated Purchasers.
Not applicable.
Item 10. Submission of Matters to a Vote of Security Holders.
There were no material changes to the procedures by which shareholders may recommend nominees to the registrant's board of directors.
Item 11. Controls and Procedures.
(a) | The registrant’s principal executive officer and principal financial officer, based on their evaluation of the registrant’s disclosure controls and procedures as of a date within 90 days of the filing of this report, have concluded that such controls and procedures are adequately designed to ensure that information required to be disclosed by the registrant in Form N-CSR is accumulated and communicated to the registrant’s management, including the principal executive officer and principal financial officer, or persons performing similar functions, as appropriate to allow timely decisions regarding required disclosure. |
(b) | There was no change in the registrant's internal control over financial reporting that occurred during the period covered by this report that has materially affected, or is reasonably likely to materially affect, the registrant's internal control over financial reporting. |
Item 12. Disclosure of Securities Lending Activities for Closed-End Management Investment Companies
Not applicable.
Item 13. Exhibits.
(a)(1) Code of ethics required to be disclosed under Item 2 of Form N-CSR attached hereto as Exhibit 99.CODE ETH.
(a)(2) Certifications pursuant to Rule 30a-2(a) under the Investment Company Act of 1940 (17 CFR 270.30a-2(a)) attached hereto as Exhibit 99.CERT.
(b) Certification pursuant to Rule 30a-2(b) under the Investment Company Act of 1940 (17 CFR 270.30a-2(b)) attached hereto as Exhibit 99.906CERT.
SIGNATURES
Pursuant to the requirements of the Securities Exchange Act of 1934 and the Investment Company Act of 1940, the registrant has duly caused this report to be signed on its behalf by the undersigned, thereunto duly authorized.
(registrant) | Columbia Funds Series Trust I |
| |
By (Signature and Title) | /s/ Daniel J. Beckman |
| Daniel J. Beckman, President and Principal Executive Officer |
| |
Date | October 23, 2023 |
| |
| |
Pursuant to the requirements of the Securities Exchange Act of 1934 and the Investment Company Act of 1940, this report has been signed below by the following persons on behalf of the registrant and in the capacities and on the dates indicated.
By (Signature and Title) | /s/ Daniel J. Beckman |
| Daniel J. Beckman, President and Principal Executive Officer |
| |
Date | October 23, 2023 |
By (Signature and Title) | /s/ Michael G. Clarke |
| Michael G. Clarke, Chief Financial Officer, |
| Principal Financial Officer and Senior Vice President |
| |
Date | October 23, 2023 |
By (Signature and Title) | /s/ Joseph Beranek |
| Joseph Beranek, Treasurer, Chief Accounting |
| Officer and Principal Financial Officer |
| |
Date | October 23, 2023 |