UNITED STATES
SECURITIES AND EXCHANGE COMMISSION
Washington, D.C. 20549
FORM N-CSR
CERTIFIED SHAREHOLDER REPORT OF REGISTERED
MANAGEMENT INVESTMENT COMPANIES
Investment Company Act file number | 811-4367 |
|
Columbia Funds Series Trust I |
(Exact name of registrant as specified in charter) |
|
One Financial Center, Boston, Massachusetts | | 02111 |
(Address of principal executive offices) | | (Zip code) |
|
James R. Bordewick, Jr., Esq. Columbia Management Advisors, LLC One Financial Center Boston, MA 02111 |
(Name and address of agent for service) |
|
Registrant’s telephone number, including area code: | 1-617-426-3750 | |
|
Date of fiscal year end: | May 31, 2006 | |
|
Date of reporting period: | May 31, 2006 | |
| | | | | | | | |
Form N-CSR is to be used by management investment companies to file reports with the Commission not later than 10 days after the transmission to stockholders of any report that is required to be transmitted to stockholders under Rule 30e-1 under the Investment Company Act of 1940 (17 CFR 270.30e-1). The Commission may use the information provided on Form N-CSR in its regulatory, disclosure review, inspection, and policymaking roles.
A registrant is required to disclose the information specified by Form N-CSR, and the Commission will make this information public. A registrant is not required to respond to the collection of information contained in Form N-CSR unless the Form displays a currently valid Office of Management and Budget (“OMB”) control number. Please direct comments concerning the accuracy of the information collection burden estimate and any suggestions for reducing the burden to Secretary, Securities and Exchange Commission, 450 Fifth Street, NW, Washington, DC 20549-0609. The OMB has reviewed this collection of information under the clearance requirements of 44 U.S.C. § 3507.
Item 1. Reports to Stockholders
Columbia Management®
Columbia Strategic Income Fund
Annual Report – May 31, 2006
NOT FDIC-INSURED
May Lose Value
No Bank Guarantee
President's Message
Table of contents
| Performance Information | | | 1 | | |
|
| Understanding Your Expenses | | | 2 | | |
|
| Economic Update | | | 3 | | |
|
| Portfolio Managers' Report | | | 4 | | |
|
| Fund Profile | | | 6 | | |
|
| Investment Portfolio | | | 7 | | |
|
Statement of Assets and
Liabilities | | | 36 | | |
|
| Statement of Operations | | | 37 | | |
|
Statement of Changes in
Net Assets | | | 38 | | |
|
| Financial Highlights | | | 40 | | |
|
| Notes to Financial Statements | | | 45 | | |
|
Report of Independent
Registered Public Accounting
Firm | | | 54 | | |
|
| Fund Governance | | | 55 | | |
|
| Columbia Funds | | | 59 | | |
|
Important Information About
This Report | | | 61 | | |
|
The views expressed in the President's Message reflect the current views of Columbia Funds. These views are not guarantees of future performance and involve certain risks, uncertainties and assumptions that are difficult to predict so actual outcomes and results may differ significantly from the views expressed. These views are subject to change at any time based upon economic, market or other conditions and Columbia Funds disclaims any responsibility to update such views. These views may not be relied on as investment advice and, because investment decisions for a Columbia Fund are based on numerous factors, may not be relied on as an indication of trading intent on behalf of any particular Columbia Fund. References to specific company securities should not be construed as a recommendation or investment advice.
A message to our valued clients
In the mutual fund business, success can be measured a number of different ways. Performance is a key measure—the one that gains the most attention. But fees and service are also important. In that regard, we are pleased to report that Columbia Management has experienced success on all three fronts over the past year. Even more important, our shareholders have benefited from this success.
Because performance ultimately determines investment success, we have devoted considerable energy to improving the performance of all Columbia funds. We are happy to report that we have made considerable progress toward this important goal.1
Columbia has also taken great strides toward making fund operations more cost effective, which has translated into lower expense ratios on many Columbia funds. In this regard, we believe we still have more work to do, and we will continue to explore opportunities for reining in expenses to the benefit of all our shareholders.
On the service front, we have made it easy and convenient for shareholders to do business with us both on the web at www.columbiafunds.com or over the phone at 800-345-6611. In fact, we've recently upgraded our automated phone system with an advanced speech recognition system that allows callers to interact with the system using natural spoken commands.
After secure login, shareholders can buy, sell or exchange funds either online or over the phone. (Buying shares requires that a link has been established between the shareholder's bank account and Columbia.) Up-to-date performance and pricing information is available online and over the phone. At www.columbiafunds.com, shareholders can also update important personal information and get access to prospectuses and fund reports, which reduces paper clutter for shareholders and translates into a reduction of costs for the funds.
At Columbia Management, we think that you'll like what you see as you read the reports for the period ended May 31, 2006. We are committed to continued improvements in an effort to help our shareholders reach their long-term financial goals. And we look forward to continuing to work with you, our valued financial clients, in the years to come.
Sincerely,

Christopher L. Wilson
President, Columbia Funds

1Past performance is no guarantee of future results.
Performance Information – Columbia Strategic Income Fund
Performance data quoted represents past performance and current performance may be lower or higher. Past performance is no guarantee of future results. The investment return and principal value will fluctuate so that shares, when redeemed, may be worth more or less than the original cost. Please visit www.columbiafunds.com for daily and most recent month-end performance updates.
Performance of a $10,000 investment
06/01/96 – 05/31/06 ($)
| sales charge | | without | | with | |
| Class A | | | 18,682 | | | | 17,795 | | |
| Class B | | | 17,339 | | | | 17,339 | | |
| Class C | | | 17,597 | | | | 17,597 | | |
| Class J | | | 18,198 | | | | 17,651 | | |
| Class Z | | | 18,900 | | | | n/a | | |
Growth of a $10,000 Investment 06/01/96 – 05/31/06

The chart above shows the growth in value of a hypothetical $10,000 investment in Class A shares of Columbia Strategic Income Fund during the stated time period. The graph and table do not reflect the deduction of taxes that a shareholder would pay on fund distributions or the redemption of fund shares. The Lehman Brothers Government/Credit Bond Index is an unmanaged index that tracks the performance of U.S. Government and corporate bonds rated investment grade or better, with maturities of at least one year. Unlike the fund, indices are not investments, do not incur fees or expenses and are not professionally managed. It is not possible to invest directly in an index. Securities in the fund may not match those in an index.
Average annual total return as of 05/31/06 (%)
| Share class | | A | | B | | C | | J | | Z | |
| Inception | | 04/21/77 | | 05/15/92 | | 07/01/97 | | 11/02/98 | | 01/29/99 | |
| Sales charge | | without | | with | | without | | with | | without | | with | | without | | with | | without | |
| 1-year | | | 3.24 | | | | -1.67 | | | | 2.48 | | | | -2.31 | | | | 2.79 | | | | 1.83 | | | | 2.88 | | | | -0.21 | | | | 3.51 | | |
| 5-year | | | 8.09 | | | | 7.05 | | | | 7.29 | | | | 6.99 | | | | 7.48 | | | | 7.48 | | | | 7.71 | | | | 7.05 | | | | 8.26 | | |
| 10-year | | | 6.45 | | | | 5.93 | | | | 5.66 | | | �� | 5.66 | | | | 5.81 | | | | 5.81 | | | | 6.17 | | | | 5.85 | | | | 6.57 | | |
Average annual total return as of 03/31/06 (%)
| Share class | | A | | B | | C | | J | | Z | |
| Sales charge | | without | | with | | without | | with | | without | | with | | without | | with | | without | |
| 1-year | | | 3.58 | | | | -1.34 | | | | 2.65 | | | | -2.14 | | | | 2.96 | | | | 2.00 | | | | 3.06 | | | | -0.03 | | | | 3.69 | | |
| 5-year | | | 7.88 | | | | 6.83 | | | | 7.04 | | | | 6.74 | | | | 7.23 | | | | 7.23 | | | | 7.46 | | | | 6.80 | | | | 8.04 | | |
| 10-year | | | 6.49 | | | | 5.97 | | | | 5.68 | | | | 5.68 | | | | 5.84 | | | | 5.84 | | | | 6.20 | | | | 5.88 | | | | 6.61 | | |
The "with sales charge" returns include the maximum initial sales charge of 4.75% for class A shares and 3.00% for class J shares, maximum contingent deferred sales charge of 5.00% for class B shares and 1.00% for class C shares for the first year only. The "without sales charge" returns do not include the effect of sales charges. If they had, returns would be lower.
Performance reflects any voluntary waivers or reimbursements of fund expenses by the advisor or its affiliates. Absent these waivers or reimbursement arrangements, performance would have been lower.
All results shown assume reinvestment of distributions. Class Z shares are sold at net asset value with no Rule 12b-1 fees. Class Z shares have limited eligibility and the investment minimum required may vary. Please see the fund's prospectus for details. Performance for different share classes will vary based on differences in sales charges and fees associated with each class.
The share performance information for classes J and Z (newer class shares) includes returns of the fund's class A shares (the oldest existing fund class) for periods prior to the inception of the newer class shares. These class A share returns are not restated to reflect any expense differential (e.g., Rule 12b-1 fees) between shares and the newer class shares. Had the expense differential been reflected, the returns for periods prior to the inception of class J shares would have been lower and the returns for the class Z shares would have been higher. Class C is a newer class of shares. Its performance information includes returns of the fund's Class B shares for periods prior to the inception of class C shares. Class B shares would have substantially similar annual returns because class B and class C shares have similar expense structures. Class A shares were initially offered on April 21, 1977, class B shares were initially o ffered on May 15, 1992, class C shares initially offered on July 1, 1997, class J shares were initially offered on November 2, 1998 and class Z shares were initially offered on January 29, 1999.
1
Understanding Your Expenses – Columbia Strategic Income Fund
Shareholder expense example
As a fund shareholder, you incur two types of costs. There are transaction costs, which generally include sales charges on purchases and may include redemption or exchange fees. There are also ongoing costs, which generally include investment advisory fees, Rule 12b-1 fees and other fund expenses. The information on this page is intended to help you understand your ongoing costs of investing in the fund and to compare these costs with the ongoing costs of investing in other mutual funds.
Analyzing your fund's expenses by share class
To illustrate these ongoing costs, we have provided an example and calculated the expenses paid by investors in each share class during the period. The information in the following table is based on an initial investment of $1,000, which is invested at the beginning of the reporting period and held for the entire period. Expense information is calculated two ways and each method provides you with different information. The amount listed in the "actual" column is calculated using the fund's actual operating expenses and total return for the period. The amount listed in the "hypothetical" column for each share class assumes that the return each year is 5% before expenses and includes the fund's actual expense ratio. You should not use the hypothetical account values and expenses to estimate either your actual account balance at the end of the period or the expenses you paid during this reporting period.
Estimating your actual expenses
To estimate the expenses that you paid over the period, first you will need your account balance at the end of the period:
g For shareholders who receive their account statements from Columbia Management Services, Inc., your account balance is available online at www.columbiafunds.com or by calling Shareholder Services at 800.345.6611.
g For shareholders who receive their account statements from their brokerage firm, contact your brokerage firm to obtain your account balance.
1. Divide your ending account balance by $1,000. For example, if an account balance was $8,600 at the end of the period, the result would be 8.6.
2. In the section of the table below titled "Expenses paid during the period," locate the amount for your share class. You will find this number is in the column labeled "actual." Multiply this number by the result from step 1. Your answer is an estimate of the expenses you paid on your account during the period.
12/01/05 -05/31/06
| | | Account value at the
beginning of the period ($) | | Account value at the
end of the period ($) | | Expenses paid
during the period ($) | | Fund's annualized
expense ratio (%) | |
| | | Actual | | Hypothetical | | Actual | | Hypothetical | | Actual | | Hypothetical | | | |
| Class A | | | 1,000.00 | | | | 1,000.00 | | | | 1,018.80 | | | | 1,020.04 | | | | 4.93 | | | | 4.94 | | | | 0.98 | | |
| Class B | | | 1,000.00 | | | | 1,000.00 | | | | 1,016.75 | | | | 1,016.31 | | | | 8.70 | | | | 8.70 | | | | 1.73 | | |
| Class C | | | 1,000.00 | | | | 1,000.00 | | | | 1,017.45 | | | | 1,017.05 | | | | 7.95 | | | | 7.95 | | | | 1.58 | | |
| Class J | | | 1,000.00 | | | | 1,000.00 | | | | 1,018.75 | | | | 1,018.15 | | | | 6.84 | | | | 6.84 | | | | 1.36 | | |
| Class Z | | | 1,000.00 | | | | 1,000.00 | | | | 1,020.19 | | | | 1,021.24 | | | | 3.73 | | | | 3.73 | | | | 0.74 | | |
Expenses paid during the period are equal to the annualized expense ratio for the share class, multiplied by the average account value over the period, then multiplied by the number of days in the fund's most recent fiscal half-year and divided by 365.
Had the distributor not waived a portion of expenses for class C, total return would have been reduced.
It is important to note that the expense amounts shown in the table are meant to highlight only ongoing costs of investing in the fund and do not reflect any transaction costs, such as sales charges, redemption or exchange fees. Therefore, the hypothetical examples provided will not help you determine the relative total costs of owning shares of different funds. If these transaction costs were included, your costs would have been higher.
Compare with other funds
Since all mutual funds are required to include the same hypothetical calculations about expenses in shareholder reports, you can use this information to compare the ongoing cost of investing in the fund with other funds. To do so, compare the 5% hypothetical example with the 5% hypothetical examples that appear in the shareholder reports of other funds. As you compare hypothetical examples of other funds, it is important to note that hypothetical examples are meant to highlight the continuing cost of investing in a fund and do not reflect any transaction costs, such as sales charges or redemption or exchange fees.
2
Economic Update – Columbia Strategic Income Fund
The US economy fired on all cylinders during the 12-month period that began June 1, 2005 and ended May 31, 2006. Gross domestic product (GDP) expanded at an estimated annualized rate of approximately 3.6% as job growth and a strong housing market provided strong support for consumer spending. Rising profits freed up cash for business spending, which picked up during the period. Personal income rose.
Yet, these overall measures masked a host of challenges, which led to considerable volatility during the 12-month period. Late last summer, hurricanes Katrina and Rita devastated the Gulf Coast, disrupting the flow of energy products and leaving millions of Americans without homes or jobs. Consumer confidence plummeted in the wake of the storms. The impact on the labor market was actually less than anticipated. However, economic growth fell to a mere 1.7% in the fourth quarter.
In the first half of 2006, the economy regained considerable momentum. GDP growth rebounded to 5.3%. Yet, the once strong housing market began to show signs of slowing. After months of steady rebound, consumer confidence took a dive in May as Americans grew apprehensive about the economy, in general, and the labor market in particular. And inflation edged higher as record-high energy prices took a bigger bite out of household budgets.
After a solid start, bond market sputters
The US bond market delivered positive, but modest returns for the first half of the period, then came to a standstill as interest rates moved higher across the maturity spectrum. The yield on the 10-year US Treasury note, a bellwether for the bond market, rose more than one full percentage point and ended the period at 5.13%. In this environment, the Lehman Brothers Aggregate Bond Index returned negative 0.48% for the 12-month period. High-yield bonds led the fixed-income markets. The Credit Suisse High-Yield Index returned 7.38%.
Eight short-term rate hikes—and more to come?
The Federal Reserve Board (the Fed) raised the federal funds rate, a key short-term rate, from 3.00% to 5.00% in eight consecutive one-quarter point increases. In the wake of Hurricanes Katrina and Rita, some market observers speculated that the Fed might curtail its rate hikes. However, outgoing Fed Chairman Greenspan indicated that inflation was a greater concern than the sustainability of economic growth, and the Fed, under new chairman Ben Bernanke, continued to raise short-term interest rates through the end of the period.
Stocks moved higher
Despite bouts of volatility, the S&P 500 Index—a broad measure of large-company stock market performance—returned a respectable 8.64% for this reporting period. Small- and mid-cap stocks did even better. The Russell 2000 Growth Index and Russell 2000 Value Index both returned 18.22%. Energy stocks led the US stock market as commodity prices continued to climb. Foreign stock markets generally did better than the US market. The MSCI EAFE Index, which tracks stock market performance in industrialized countries outside the United States, returned 28.24%.
The Lehman Brothers Aggregate Bond Index is a market value-weighted index that tracks the performance of fixed-rate, publicly placed, dollar-denominated, and non-convertible investment grade debt issues. Unlike the funds, indices are not investments, do not incur fees or expenses and are not professionally managed. It is not possible to invest directly in an index.
The Credit Suisse High Yield Index is a broad-based, unmanaged index that tracks the performance of high-yield bonds. Unlike the funds, indices are not investments, do not incur fees or expenses and are not professionally managed. It is not possible to invest directly in an index.
The S&P 500 Index is an unmanaged index that tracks the performance of 500 widely held, large-capitalization US stocks. Unlike the funds, indices are not investments, do not incur fees or expenses and are not professionally managed. It is not possible to invest directly in an index.
The Russell 2000 Growth Index, an unmanaged index that tracks the performance of those Russell 2000 companies with higher price-to-book ratios and higher forecasted growth values. Unlike the funds, indices are not investments, do not incur fees or expenses and are not professionally managed. It is not possible to invest directly in an index.
The Russell 2000 Value Index measures the performance of those Russell 2000 companies with lower price-to-book ratios and lower forecasted growth values. Unlike the funds, indices are not investments, do not incur fees or expenses and are not professionally managed. It is not possible to invest directly in an index.
The MSCI EAFE Index (Europe, Australasia, Far East) is a market capitalization index that is designed to measure developed market equity performance, excluding the U.S. and Canada. Unlike the funds, indices are not investments, do not incur fees or expenses and are not professionally managed. It is not possible to invest directly in an index.
Summary
For the 12-month period ended May 31, 2006
g Investment-grade bonds delivered negative returns, as measured by the Lehman Brothers Aggregate Bond Index. High-yield bonds led the fixed-income markets, as measured by the Credit Suisse High Yield Index.
1 year return as of 05/31/06:
-0.48%
 Lehman Index
+7.38%
 Credit Suisse Index
g Despite volatility, the broad stock market, as measured by the S&P 500 Index, returned 8.64%. Small-cap growth stocks were the period's best performers within the US stock market, as measured by the Russell 2000 Growth Index.
+8.64%
 S&P Index
+18.22%
 Russell Index
3
Portfolio Manager's Report – Columbia Strategic Income Fund
Performance data quoted represents past performance and current performance may be lower or higher. Past performance is no guarantee of future results. The investment return and principal value will fluctuate so that shares, when redeemed, may be worth more or less than the original cost. Please visit www.columbiafunds.com for daily and most recent month-end performance updates.
Summary
g For the 12-month period ended May 31, 2006, the fund's class A shares returned 3.24% without sales charge.
g A decision to reduce exposure to emerging markets prior to their decline aided return as did a timely shift away from investments denominated in US dollars.
g A relatively high allocation to high-yield securities also aided the fund's return relative to competing funds.
Holdings discussed
in this report as of 5/31/06 (%)
| Continental Airlines, Inc. | | | 0.2 | | |
| LaBranche & Co., Inc. | | | 0.2 | | |
| MedQuest, Inc. | | | 0.1 | | |
| HCA, Inc. | | | 0.2 | | |
| Abitibi-Consolidated, Inc. | | | 0.1 | | |
Your fund is actively managed and the composition of its portfolio will change over time. Information provided is calculated as a percentage of net assets.
For the 12-month period ended May 31, 2006, class A shares of Columbia Strategic Income Fund returned 3.24% without sales charge. Fund performance exceeded that of the Lehman Brothers Government/Credit Bond Index1, which returned negative 1.10% for the period. The fund also outperformed the 3.19% average return of the Lipper Multi-Sector Income Funds Category.2 A relatively high allocation to high-yield securities contributed to the fund's favorable relative performance Investments in emerging markets, coupled with a timely decision to reduce exposure before the sector declined, also aided the fund's return. Neither sector is represented in the index.
Tactical allocation decisions aided performance
Global economic vitality sparked demand that drove up prices for oil, copper and other industrial commodities and stimulated high levels of business activity in several emerging markets. Fund holdings in South America and Russia, important commodity exporters, responded favorably to elevated prices. However, we began to modify our emerging market holdings in the second half of 2005, becoming more defensive and locking in profits as prices moved higher and yields moved lower. Our shift away from what we believed to be the riskiest emerging markets was not immediately rewarded as emerging market securities continued to appreciate after we reduced the fund's exposure. However, they lost ground later in the period as investors grew concerned about a global slowdown, and our decision ultimately benefited the fund's returns.
Throughout the period the portfolio was positioned for a weaker US dollar, and we grew even more bearish about the dollar's prospects as the period wore on. In general, currency exposure aided performance during the period. Bonds denominated in Canadian dollars, euros and British pounds outperformed US Treasuries, in local currency terms, and a weaker US dollar added to the outperformance. In the US market, yields rose sharply, driving prices lower. Foreign yields also rose, but less dramatically than in the United States, contributing to relative outperformance.
The fund's large stake in the strong performing high-yield sector also played a key role in the period's returns, especially relative to some of its peers. Bonds in the financial, wireless and utility sectors added to performance. Gainers included Continental Airlines, Inc., which benefited from increased passenger traffic and improving financials. LaBranche & Co., Inc., a finance company that reported better-than-expected results during the period, was another strong performer. By contrast, bonds of MedQuest, Inc. struggled following a downgrade. HCA, Inc. suffered amid a challenging environment for healthcare companies, while the inability to pass on higher costs hurt papermaker Abitibi-Consolidated, Inc. In addition, we missed out
1The Lehman Brothers Government/Credit Bond Index is an unmanaged index that tracks the performance of US Government and corporate bonds rated investment grade or better, with maturities of at least one year. Unlike the funds, indices are not investments, do not incur fees or expenses and are not professionally managed. It is not possible to invest directly in an index.
2Lipper Inc., a widely respected data provider in the industry, calculates an average total return (assuming reinvestment of distributions) for mutual funds with investment objectives similar to those of the fund. Lipper makes no adjustments for the effect of sales loads.
4
Columbia Strategic Income Fund
on some stronger performance that lower quality bonds continued to deliver during this reporting period because we raised the portfolio's overall quality. However, we continue to believe that our decision to increase the quality within the fund's high-yield holdings will prove to be prudent going forward.
Finally, US Treasuries were disappointing as the sector sagged under pressure from rising interest rates and concerns regarding the future strength of the economy. However, our focus on shorter-duration Treasuries helped offset the impact of declining prices. Duration is a measure of interest-rate sensitivity.
Looking ahead
We believe that higher gasoline prices, costlier mortgages and more tangible signs of inflation may soon begin eating into consumer spending, which represents more than two-thirds of US economic activity. Under that scenario, US growth could shift lower, while growth in Europe and Japan may continue to look healthy. Significant current account trade and budget deficits should also continue to weigh on the dollar. In addition, global interest rates could begin to rise, cutting into the dollar's current yield advantage. Because US economic activity fuels businesses around the world, a US slowdown could ultimately dampen global economic growth. With these possibilities in mind, we expect to remain defensively positioned in emerging markets, where continued volatility seems likely while valuations remain high compared to issues of developed nations. We have emphasized emerging markets that we judge to be relatively more stable and h ave generally moved out of emerging markets that we believe to be relatively more risky. We expect to continue to maintain a sizeable commitment to high-yield issues. Several years of strong economic growth have left many corporate balance sheets healthier and, in general, better positioned to weather a slowdown in economic activity. Although the sector has been a stellar performer and valuations appear high at this juncture, supply and demand for high-yield issues appears to be reasonably well-aligned.
Portfolio Management
Laura A. Ostrander
g Investment experience since 1985
g With the fund since 2000
Kevin L. Cronk, CFA
g Investment experience since 1994
g With the fund since 2005
Thomas A. LaPointe, CFA
g Investment experience since 1994
g With the fund since 2005
Investing in fixed-income securities may involve certain risks, including the credit quality of individual issuers, possible prepayments, market or economic developments and yield and share price fluctuations due to changes in interest rates. When interest rates go up, bond prices typically drop, and vice versa.
Investing in high-yield or "junk" bonds offers the potential for higher income than investments in investment-grade bonds, but also has a higher degree of risk. Changes in economic conditions or other circumstances may adversely affect a high-yield bond issuer's ability to make timely principal and interest payments. High-yield bonds issued by foreign entities have greater potential risks, including foreign taxation, currency fluctuations, risks associated with possible differences in financial standards and other monetary and political risks.
Investing in emerging markets may involve greater risks than investing in more developed countries. In addition, concentration of investments in a single region may result in greater volatility.
5
Fund Profile – Columbia Strategic Income Fund
Performance data quoted represents past performance and current performance may be lower or higher. Past performance is no guarantee of future results. The investment return and principal value will fluctuate so that shares, when redeemed, may be worth more or less than the original cost. Please visit www.columbiafunds.com for daily and most recent month-end performance updates.
Summary
| 1 year return as of 05/31/06: | |
|
+3.24%
 Class A Shares
-1.10%
 Lehman Brothers Government/Credit Bond Index
Management Style
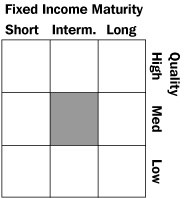
| Quality breakdown as of 05/31/06 (%) | |
| AAA | | | 47.0 | | |
| AA | | | 0.5 | | |
| A | | | 2.7 | | |
| BBB | | | 8.9 | | |
| BB | | | 12.3 | | |
| B | | | 21.5 | | |
| CCC | | | 4.9 | | |
| CC | | | 0.4 | | |
| Non-rated | | | 1.8 | | |
| Portfolio structure as of 05/31/06 (%) | |
Corporate fixed income
bonds and notes | | | 38.5 | | |
Foreign governments
obligations | | | 30.8 | | |
| US government obligations | | | 18.0 | | |
| Mortgage-Backed securities | | | 5.5 | | |
| Asset-Backed securities | | | 2.0 | | |
| US government agencies | | | 1.4 | | |
| Convertible bonds | | | 0.3 | | |
| Municipal bonds (Taxable) | | | 0.2 | | |
Collateralized mortgage
obligations | | | 0.0 | | |
| Common stocks | | | 0.0 | | |
Short-term obligations, net
other assets & liabilities | | | 3.3 | | |
Net asset value per share as of
05/31/06 (%) | |
| Class A | | | 5.88 | | |
| Class B | | | 5.88 | | |
| Class C | | | 5.89 | | |
| Class J | | | 5.87 | | |
| Class Z | | | 5.83 | | |
Distributions declared per share
06/01/05 – 05/31/06 ($) | |
| Class A | | | 0.46 | | |
| Class B | | | 0.42 | | |
| Class C | | | 0.43 | | |
| Class J | | | 0.44 | | |
| Class Z | | | 0.48 | | |
| SEC yields as of 05/31/06 (%) | |
| Class A | | | 5.09 | | |
| Class B | | | 4.57 | | |
| Class C | | | 4.72 | | |
| Class J | | | 4.35 | | |
| Class Z | | | 5.58 | | |
Quality breakdown is calculated as a percentage of investments. Ratings shown in the quality breakdown represent the rating assigned to a particular bond by one of the following nationally-recognized rating agencies: Standard & Poor's, a division of The McGraw-Hill Companies, Inc. Moody's Investors Service, Inc. or Fitch Ratings Ltd. Ratings are relative and subjective and are not absolute standards of quality. The fund's credit quality does not remove market risk. Portfolio structure is calculated as a percentage of net assets. Management Style is determined by Columbia Management, and is based on the investment strategy and process as outlined in the fund's prospectus.
The 30-day SEC yields reflect the portfolio's earning power net of expenses, expressed as an annualized percentage of the public offering price per share at the end of the period.
Management Style is determined by Columbia Management, and is based on the investment strategy and process as outlined in the fund's prospectus.
6
Investment Portfolio – Columbia Strategic Income Fund May 31, 2006
Government & Agency Obligations – 50.2%
| Foreign Government Obligations – 30.8% | | | | Par ($) | | Value ($) | |
| Aries Vermoegensverwaltungs GmbH | |
| | | 6.182% 10/25/07 | | EUR | 2,500,000 | | | | 3,331,642 | | |
| | | 7.750% 10/25/09(a) | | | 2,750,000 | | | | 3,910,419 | | |
| | | 9.600% 10/25/14 | | USD | 750,000 | | | | 925,425 | | |
| Corp. Andina de Fomento | |
| | | 6.375% 06/18/09 | | EUR | 4,350,000 | | | | 5,944,520 | | |
| European Investment Bank | |
| | | 5.500% 12/07/11 | | GBP | 5,250,000 | | | | 10,081,957 | | |
| Federal Republic of Brazil | |
| | | 7.375% 02/03/15 | | EUR | 4,950,000 | | | | 6,866,226 | | |
| | | 8.750% 02/04/25 | | USD | 10,920,000 | | | | 11,602,500 | | |
| | | 11.000% 08/17/40 | | | 4,600,000 | | | | 5,616,600 | | |
| Federal Republic of Germany | |
| | | 4.250% 07/04/14 | | EUR | 12,990,000 | | | | 17,024,744 | | |
| | | 5.000% 07/04/12 | | | 5,010,000 | | | | 6,828,978 | | |
| | | 5.250% 07/04/10 | | | 1,580,000 | | | | 2,146,207 | | |
| | | 6.000% 07/04/07 | | | 10,720,000 | | | | 14,127,766 | | |
| Government of Canada | |
| | | 4.500% 06/01/15 | | CAD | 12,220,000 | | | | 11,128,354 | | |
| | | 10.000% 06/01/08 | | | 18,530,000 | | | | 18,684,094 | | |
| Government of New Zealand | |
| | | 6.000% 07/15/08 | | NZD | 5,200,000 | | | | 3,286,181 | | |
| | | 6.000% 11/15/11 | | | 10,800,000 | | | | 6,897,500 | | |
| Kingdom of Norway | |
| | | 5.500% 05/15/09 | | NOK | 100,170,000 | | | | 17,244,488 | | |
| | | 6.000% 05/16/11 | | | 82,830,000 | | | | 14,814,992 | | |
| Kingdom of Spain | |
| | | 5.500% 07/30/17 | | EUR | 13,410,000 | | | | 19,392,774 | | |
| Kingdom of Sweden | |
| | | 5.000% 01/28/09 | | SEK | 112,860,000 | | | | 16,279,446 | | |
| | | 6.750% 05/05/14 | | | 111,500,000 | | | | 18,503,632 | | |
| New South Wales Treasury Corp. | |
| | | 8.000% 03/01/08 | | AUD | 11,360,000 | | | | 8,839,819 | | |
| Province of Ontario | |
| | | 5.000% 03/08/14 | | CAD | 8,200,000 | | | | 7,592,165 | | |
| Province of Quebec | |
| | | 6.000% 10/01/12 | | | 7,155,000 | | | | 6,965,196 | | |
| | | 6.000% 10/01/29 | | | 4,030,000 | | | | 4,093,880 | | |
| Republic of Bulgaria | |
| | | 8.250% 01/15/15 | | USD | 9,145,000 | | | | 10,458,222 | | |
| | | 8.250% 01/15/15(a) | | | 300,000 | | | | 342,750 | | |
| Republic of Chile | |
| | | 5.500% 01/15/13 | | | 3,171,000 | | | | 3,115,507 | | |
| Republic of Colombia | |
| | | 8.125% 05/21/24 | | | 3,325,000 | | | | 3,491,250 | | |
| | | 9.750% 04/09/11 | | | 5,051,596 | | | | 5,468,353 | | |
| | | 11.375% 01/31/08 | | EUR | 3,285,000 | | | | 4,672,436 | | |
| Republic of France | |
| | | 3.000% 10/25/15 | | | 11,505,000 | | | | 13,626,654 | | |
| | | 4.000% 10/25/09 | | | 10,820,000 | | | | 14,051,251 | | |
| | | 4.000% 04/25/14 | | | 8,220,000 | | | | 10,600,473 | | |
| Republic of Panama | |
| | | 8.875% 09/30/27 | | USD | 7,270,000 | | | | 8,487,725 | | |
| | | 9.375% 07/23/12 | | | 3,600,000 | | | | 4,104,000 | | |
| Republic of Peru | |
| | | 7.500% 10/14/14 | | EUR | 2,855,000 | | | | 3,978,509 | | |
| | | 9.875% 02/06/15 | | USD | 1,100,000 | | | | 1,292,500 | | |
| Republic of Poland | |
| | | 5.750% 03/24/10 | | PLN | 41,730,000 | | | | 13,958,415 | | |
| Republic of South Africa | |
| | | 5.250% 05/16/13 | | EUR | 6,625,000 | | | | 8,772,822 | | |
| | | 6.500% 06/02/14 | | USD | 7,346,000 | | | | 7,502,102 | | |
| | | 13.000% 08/31/10 | | ZAR | 24,000,000 | | | | 4,257,277 | | |
See Accompanying Notes to Financial Statements.
7
Columbia Strategic Income Fund May 31, 2006
Government & Agency Obligations (continued)
| Foreign Government Obligations (continued) | | | | Par ($) | | Value ($) | |
| Republic of Venezuela | |
| | | 5.360% 12/18/07(b)(c) | | USD | 380,920 | | | | 380,920 | | |
| | | 9.250% 09/15/27 | | | 10,295,000 | | | | 12,302,525 | | |
| Russian Federation | |
| | | 5.000% 03/31/30
(7.500% 03/31/07)(d) | | | 13,860,000 | | | | 14,827,428 | | |
| | | 11.000% 07/24/18 | | | 5,752,000 | | | | 8,002,758 | | |
| | | 12.750% 06/24/28 | | | 7,430,000 | | | | 12,640,659 | | |
| Treasury Corp. of Victoria | |
| | | 6.250% 10/15/12 | | AUD | 10,500,000 | | | | 8,032,853 | | |
| United Kingdom Treasury | |
| | | 5.000% 09/07/14 | | GBP | 710,000 | | | | 1,361,667 | | |
| | | 5.750% 12/07/09 | | | 2,550,000 | | | | 4,928,644 | | |
| | | 8.000% 06/07/21 | | | 2,860,000 | | | | 7,326,665 | | |
| | | 9.000% 07/12/11 | | | 5,350,000 | | | | 11,946,011 | | |
| United Mexican States | |
| | | 7.500% 03/08/10 | | EUR | 5,040,000 | | | | 7,177,710 | | |
| | | 8.125% 12/30/19 | | USD | 5,720,000 | | | | 6,406,400 | | |
| | | 8.375% 01/14/11 | | | 11,520,000 | | | | 12,556,800 | | |
| | | 11.375% 09/15/16 | | | 7,590,000 | | | | 10,333,785 | | |
| Foreign Government Obligations Total | | | | | | | | | 478,534,576 | | |
| U.S. Government Agencies – 1.4% | | | | | | | | | | | |
| Federal Farm Credit Bank | |
| | | 5.000% 08/25/10 | | | 8,600,000 | | | | 8,423,734 | | |
| Federal Home Loan Mortgage Corp. | |
| | | 5.125% 10/15/08 | | | 1,280,000 | | | | 1,274,001 | | |
| | | 5.750% 03/15/09 | | | 1,010,000 | | | | 1,020,657 | | |
| | | 6.750% 03/15/31 | | | 406,000 | | | | 467,270 | | |
| Federal National Mortgage Association | |
| | | 2.625% 11/15/06 | | | 394,000 | | | | 389,329 | | |
| | | 3.250% 08/15/08 | | | 8,000,000 | | | | 7,658,536 | | |
| | | 4.375% 07/17/13 | | | 3,003,000 | | | | 2,809,015 | | |
| U.S. Government Agencies Total | | | | | | | | | 22,042,542 | | |
| U.S. Government Obligations – 18.0% | |
| U.S. Treasury Bonds | |
| | | 7.500% 11/15/24 | | | 18,400,000 | | | | 22,981,305 | | |
| | | 8.875% 02/15/19 | | | 21,827,000 | | | | 28,997,519 | | |
| | | 10.375% 11/15/12 | | | 52,000,000 | | | | 55,837,028 | | |
| | | 10.625% 08/15/15 | | | 29,415,000 | | | | 41,139,642 | | |
| | | 12.500% 08/15/14 | | | 52,151,000 | | | | 63,569,201 | | |
| U.S. Treasury Notes | |
| | | 2.750% 06/30/06 | | | 2,550,000 | | | | 2,545,915 | | |
| | | 4.000% 06/15/09 | | | 4,650,000 | | | | 4,517,219 | | |
| | | 5.000% 02/15/11 | | | 29,500,000 | | | | 29,495,398 | | |
| | | 7.000% 07/15/06 | | | 20,000,000 | | | | 20,045,320 | | |
| U.S. Treasury STRIPS | |
| | | (e) 11/15/08 | | | 7,000,000 | | | | 6,193,152 | | |
| | | (e) 11/15/13 | | | 2,250,000 | | | | 1,543,435 | | |
| | | (e) 05/15/23 | | | 4,550,000 | | | | 1,828,354 | | |
| U.S. Government Obligations Total | | | | | | | | | 278,693,488 | | |
| | | Total Government & Agency Obligations (cost of $768,435,010) | | | | | | | 779,270,606 | | |
See Accompanying Notes to Financial Statements.
8
Columbia Strategic Income Fund May 31, 2006
Corporate Fixed-Income Bonds & Notes – 38.6%
| Basic Materials – 3.3% | | | | Par ($) | | Value ($) | |
| Chemicals – 1.7% | |
| Agricultural Chemicals – 0.4% | |
| IMC Global, Inc. | |
| | | 10.875% 08/01/13 | | | 1,610,000 | | | | 1,815,275 | | |
| Terra Capital, Inc. | |
| | | 12.875% 10/15/08 | | | 2,345,000 | | | | 2,685,025 | | |
| UAP Holding Corp. | |
| | | (f) 07/15/12
(10.750% 01/15/08) | | | 1,630,000 | | | | 1,572,950 | | |
| United Agri Products | |
| | | 8.250% 12/15/11 | | | 755,000 | | | | 813,890 | | |
| | | | | | | | | | 6,887,140 | | |
| Chemicals-Diversified – 1.1% | |
| BCP Crystal US Holdings Corp. | |
| | | 9.625% 06/15/14 | | | 1,250,000 | | | | 1,375,000 | | |
| EquiStar Chemicals LP | |
| | | 10.625% 05/01/11 | | | 1,990,000 | | | | 2,159,150 | | |
| Huntsman International LLC | |
| | | 8.125% 01/01/15(a) | | | 1,935,000 | | | | 1,867,275 | | |
| Huntsman LLC | |
| | | 11.500% 07/15/12 | | | 670,000 | | | | 760,450 | | |
| Ineos Group Holdings PLC | |
| | | 7.875% 02/15/16(a) | | EUR | 1,265,000 | | | | 1,543,976 | | |
| | | 8.500% 02/15/16(a) | | USD | 1,510,000 | | | | 1,421,288 | | |
| Innophos Investments Holdings, Inc. | |
| | | PIK,
13.170% 02/15/15(b) | | | 1,190,404 | | | | 1,193,380 | | |
| Lyondell Chemical Co. | |
| | | 9.625% 05/01/07 | | | 2,650,000 | | | | 2,726,187 | | |
| NOVA Chemicals Corp. | |
| | | 6.500% 01/15/12 | | | 2,650,000 | | | | 2,451,250 | | |
| | | 8.405% 11/15/13(b) | | | 1,175,000 | | | | 1,192,625 | | |
| | | | | | | | | | 16,690,581 | | |
| Chemicals-Specialty – 0.2% | |
| Chemtura Corp. | |
| | | 6.875% 06/01/16 | | | 730,000 | | | | 711,750 | | |
| Rhodia SA | |
| | | 8.875% 06/01/11 | | | 2,612,000 | | | | 2,634,855 | | |
| | | | | | | | | | 3,346,605 | | |
| | | Chemicals Total | | | | | | | 26,924,326 | | |
| Forest Products & Paper – 1.0% | |
| Paper & Related Products – 1.0% | |
| Abitibi-Consolidated, Inc. | |
| | | 8.375% 04/01/15 | | | 2,225,000 | | | | 2,124,875 | | |
| Boise Cascade LLC | |
| | | 7.125% 10/15/14 | | | 1,360,000 | | | | 1,237,600 | | |
| | | 7.943% 10/15/12(b) | | | 2,635,000 | | | | 2,654,762 | | |
| Buckeye Technologies, Inc. | |
| | | 8.500% 10/01/13 | | | 1,310,000 | | | | 1,287,075 | | |
| Georgia-Pacific Corp. | |
| | | 8.000% 01/15/24 | | | 3,075,000 | | | | 2,982,750 | | |
| Neenah Paper, Inc. | |
| | | 7.375% 11/15/14 | | | 740,000 | | | | 688,200 | | |
| NewPage Corp. | |
| | | 10.000% 05/01/12 | | | 1,455,000 | | | | 1,553,213 | | |
| | | 12.000% 05/01/13 | | | 630,000 | | | | 680,400 | | |
See Accompanying Notes to Financial Statements.
9
Columbia Strategic Income Fund May 31, 2006
Corporate Fixed-Income Bonds & Notes (continued)
| Basic Materials (continued) | | | | Par ($) | | Value ($) | |
| Forest Products & Paper (continued) | |
| Paper & Related Products (continued) | |
| Norske Skog | |
| | | 7.375% 03/01/14 | | | 1,495,000 | | | | 1,375,400 | | |
| | | 8.625% 06/15/11 | | | 1,080,000 | | | | 1,074,600 | | |
| | | | | | | | | | 15,658,875 | | |
| | | Forest Products & Paper Total | | | | | | | 15,658,875 | | |
| Iron/Steel – 0.2% | |
| Steel-Producers – 0.1% | |
| Steel Dynamics, Inc. | |
| | | 9.500% 03/15/09 | | | 970,000 | | | | 1,011,225 | | |
| | | | | | | | | | 1,011,225 | | |
| Steel-Specialty – 0.1% | |
| UCAR Finance, Inc. | |
| | | 10.250% 02/15/12 | | | 1,240,000 | | | | 1,320,600 | | |
| | | | | | | | | | 1,320,600 | | |
| | | Iron/Steel Total | | | | | | | 2,331,825 | | |
| Metals & Mining – 0.4% | |
| Mining Services – 0.0% | |
| Hudson Bay Mining & Smelting Co., Ltd. | |
| | | 9.625% 01/15/12 | | | 625,000 | | | | 687,500 | | |
| | | | | | | | | | 687,500 | | |
| Non-Ferrous Metals – 0.4% | |
| Codelco, Inc. | |
| | | 5.500% 10/15/13 | | | 6,000,000 | | | | 5,845,740 | | |
| | | | | | | | | | 5,845,740 | | |
| | | Metals & Mining Total | | | | | | | 6,533,240 | | |
| Basic Materials Total | | | | | | | | | 51,448,266 | | |
| Communications – 7.9% | |
| Media – 3.3% | |
| Broadcast Services/Programs – 0.2% | |
| Fisher Communications, Inc. | |
| | | 8.625% 09/15/14 | | | 1,120,000 | | | | 1,167,600 | | |
| Xm Satellite Radio, Inc. | |
| | | 9.750% 05/01/14(a) | | | 1,400,000 | | | | 1,302,000 | | |
| | | | | | | | | | 2,469,600 | | |
| Cable TV – 1.4% | |
| Atlantic Broadband Finance LLC | |
| | | 9.375% 01/15/14 | | | 1,830,000 | | | | 1,756,800 | | |
Charter Communications
Holdings II LLC | |
| | | 10.250% 09/15/10 | | | 3,980,000 | | | | 3,989,950 | | |
Charter Communications
Holdings LLC | |
| | | 9.920% 04/01/14 | | | 5,355,000 | | | | 3,293,325 | | |
See Accompanying Notes to Financial Statements.
10
Columbia Strategic Income Fund May 31, 2006
Corporate Fixed-Income Bonds & Notes (continued)
| Communications (continued) | | | | Par ($) | | Value ($) | |
| Media (continued) | |
| Cable TV (continued) | |
| CSC Holdings, Inc. | |
| | | 7.250% 04/15/12(a) | | | 2,955,000 | | | | 2,918,062 | | |
| | | 7.625% 04/01/11 | | | 2,500,000 | | | | 2,525,000 | | |
| EchoStar DBS Corp. | |
| | | 6.625% 10/01/14 | | | 3,390,000 | | | | 3,212,025 | | |
| Insight Midwest LP | |
| | | 9.750% 10/01/09 | | | 1,665,000 | | | | 1,706,625 | | |
| Telenet Group Holding NV | |
| | | (f) 06/15/14
(11.500% 12/15/08)(a) | | | 2,172,000 | | | | 1,824,480 | | |
| | | | | | | | | | 21,226,267 | | |
| Multimedia – 0.3% | |
| Advanstar Communications, Inc. | |
| | | 15.000% 10/15/11 | | | 1,555,000 | | | | 1,634,694 | | |
| Lamar Media Corp. | |
| | | 6.625% 08/15/15 | | | 1,815,000 | | | | 1,737,862 | | |
| Quebecor Media, Inc. | |
| | | 7.750% 03/15/16(a) | | | 1,985,000 | | | | 2,004,850 | | |
| | | | | | | | | | 5,377,406 | | |
| Publishing-Newspapers – 0.1% | |
| Hollinger, Inc. | |
| | | 11.875% 03/01/11(a) | | | 734,000 | | | | 734,000 | | |
| | | 12.875% 03/01/11(a) | | | 1,636,000 | | | | 1,703,485 | | |
| | | | | | | | | | 2,437,485 | | |
| Publishing-Periodicals – 0.9% | |
| Dex Media East LLC/Dex Media East Finance Co. | |
| | | 9.875% 11/15/09 | | | 1,000,000 | | | | 1,058,750 | | |
| Dex Media West LLC | |
| | | 9.875% 08/15/13 | | | 4,397,000 | | | | 4,803,722 | | |
| Dex Media, Inc. | |
| | | (f) 11/15/13
(9.000% 11/15/08) | | | 1,775,000 | | | | 1,499,875 | | |
| PriMedia, Inc. | |
| | | 8.000% 05/15/13 | | | 3,070,000 | | | | 2,763,000 | | |
| RH Donnelley Corp. | �� |
| | | 8.875% 01/15/16(a) | | | 1,870,000 | | | | 1,874,675 | | |
| WDAC Subsidiary Corp. | |
| | | 8.375% 12/01/14(a) | | | 1,835,000 | | | | 1,800,594 | | |
| | | | | | | | | | 13,800,616 | | |
| Radio – 0.1% | |
| CMP Susquehanna Corp. | |
| | | 9.875% 05/15/14(a) | | | 1,750,000 | | | | 1,706,250 | | |
| | | | | | | | | | 1,706,250 | | |
| Television – 0.3% | |
| LIN Television Corp. | |
| | | 6.500% 05/15/13 | | | 1,795,000 | | | | 1,682,813 | | |
| Sinclair Broadcast Group, Inc. | |
| | | 8.750% 12/15/11 | | | 2,280,000 | | | | 2,385,450 | | |
| | | | | | | | | | 4,068,263 | | |
| | | Media Total | | | | | | | 51,085,887 | | |
See Accompanying Notes to Financial Statements.
11
Columbia Strategic Income Fund May 31, 2006
Corporate Fixed-Income Bonds & Notes (continued)
| Communications (continued) | | | | Par ($) | | Value ($) | |
| Telecommunication Services – 4.6% | |
| Cellular Telecommunications – 1.8% | |
| Digicel Ltd. | |
| | | 9.250% 09/01/12(a) | | | 2,270,000 | | | | 2,392,013 | | |
| Dobson Cellular Systems, Inc. | |
| | | 8.375% 11/01/11 | | | 2,470,000 | | | | 2,565,713 | | |
| | | 9.875% 11/01/12 | | | 2,550,000 | | | | 2,766,750 | | |
| Horizon PCS, Inc. | |
| | | 11.375% 07/15/12 | | | 1,355,000 | | | | 1,536,231 | | |
| iPCS Escrow Co. | |
| | | 11.500% 05/01/12 | | | 750,000 | | | | 845,625 | | |
| Nextel Communications, Inc. | |
| | | 7.375% 08/01/15 | | | 3,645,000 | | | | 3,761,867 | | |
| Nextel Partners, Inc. | |
| | | 8.125% 07/01/11 | | | 1,915,000 | | | | 2,022,719 | | |
| Rogers Cantel, Inc. | |
| | | 9.750% 06/01/16 | | | 2,408,000 | | | | 2,805,320 | | |
| Rogers Wireless, Inc. | |
| | | 8.000% 12/15/12 | | | 1,480,000 | | | | 1,531,800 | | |
| Rural Cellular Corp. | |
| | | 8.250% 03/15/12 | | | 2,380,000 | | | | 2,466,275 | | |
| | | 9.750% 01/15/10 | | | 440,000 | | | | 446,600 | | |
| | | 10.899% 11/01/12(a)(b) | | | 1,680,000 | | | | 1,757,700 | | |
| US Unwired, Inc. | |
| | | 10.000% 06/15/12 | | | 2,540,000 | | | | 2,835,037 | | |
| | | | | | | | | | 27,733,650 | | |
| Satellite Telecommunications – 0.6% | |
| Inmarsat Finance II PLC | |
| | | (f) 11/15/12
(10.375% 11/15/08) | | | 2,855,000 | | | | 2,455,300 | | |
| Intelsat Bermuda, Ltd. | |
| | | 8.250% 01/15/13 | | | 3,910,000 | | | | 3,890,450 | | |
| PanAmSat Corp. | |
| | | 9.000% 08/15/14 | | | 1,346,000 | | | | 1,399,840 | | |
| Zeus Special Subsidiary Ltd. | |
| | | (f) 02/01/15
(9.250% 02/01/10)(a) | | | 1,875,000 | | | | 1,350,000 | | |
| | | | | | | | | | 9,095,590 | | |
| Telecommunication Equipment – 0.1% | |
| Lucent Technologies, Inc. | |
| | | 6.450% 03/15/29 | | | 2,305,000 | | | | 2,011,113 | | |
| | | | | | | | | | 2,011,113 | | |
| Telecommunication Services – 0.5% | |
| Embarq Corp. | |
| | | 7.082% 06/01/16 | | | 840,000 | | | | 842,618 | | |
| | | 7.995% 06/01/36 | | | 840,000 | | | | 845,146 | | |
| Nordic Telephone Co. Holdings ApS | |
| | | 8.250% 05/01/16(a) | | | 1,285,000 | | | | 1,691,881 | | |
| | | 8.875% 05/01/16(a) | | | 600,000 | | | | 624,000 | | |
| Syniverse Technologies, Inc. | |
| | | 7.750% 08/15/13 | | | 1,615,000 | | | | 1,610,962 | | |
| Time Warner Telecom Holdings, Inc. | |
| | | 9.250% 02/15/14 | | | 2,350,000 | | | | 2,508,625 | | |
| | | | | | | | | | 8,123,232 | | |
See Accompanying Notes to Financial Statements.
12
Columbia Strategic Income Fund May 31, 2006
Corporate Fixed-Income Bonds & Notes (continued)
| Communications (continued) | | | | Par ($) | | Value ($) | |
| Telecommunication Services (continued) | |
| Telephone-Integrated – 1.5% | |
| Axtel SA de CV | |
| | | 11.000% 12/15/13 | | | 434,000 | | | | 487,708 | | |
| Cincinnati Bell, Inc. | |
| | | 7.000% 02/15/15 | | | 3,750,000 | | | | 3,637,500 | | |
| Citizens Communications Co. | |
| | | 9.000% 08/15/31 | | | 3,090,000 | | | | 3,232,912 | | |
| NTL Cable PLC | |
| | | 8.750% 04/15/14 | | | 855,000 | | | | 1,128,466 | | |
| Qwest Capital Funding, Inc. | |
| | | 6.875% 07/15/28 | | | 4,190,000 | | | | 3,676,725 | | |
| Qwest Communications International, Inc. | |
| | | 7.500% 02/15/14 | | | 2,630,000 | | | | 2,600,413 | | |
| Qwest Corp. | |
| | | 7.500% 06/15/23 | | | 2,910,000 | | | | 2,793,600 | | |
| | | 8.875% 03/15/12 | | | 2,835,000 | | | | 3,040,537 | | |
| US LEC Corp. | |
| | | 13.620% 10/01/09(b) | | | 1,395,000 | | | | 1,497,881 | | |
| | | | | | | | | | 22,095,742 | | |
| Wireless Equipment – 0.1% | |
| American Towers, Inc. | |
| | | 7.250% 12/01/11 | | | 1,865,000 | | | | 1,911,625 | | |
| | | | | | | | | | 1,911,625 | | |
| | | Telecommunication Services Total | | | | | | | 70,970,952 | | |
| Communications Total | | | | | | | | | 122,056,839 | | |
| Consumer Cyclical – 6.3% | |
| Airlines – 0.2% | |
| Airlines – 0.2% | |
| Continental Airlines, Inc. | |
| | | 7.568% 12/01/06 | | | 2,895,000 | | | | 2,895,000 | | |
| | | | | | | | | | 2,895,000 | | |
| | | Airlines Total | | | | | | | 2,895,000 | | |
| Apparel – 0.5% | |
| Apparel Manufacturers – 0.5% | |
| Broder Brothers Co. | |
| | | 11.250% 10/15/10 | | | 1,315,000 | | | | 1,245,962 | | |
| Levi Strauss & Co. | |
| | | 9.750% 01/15/15 | | | 3,440,000 | | | | 3,569,000 | | |
| Phillips-Van Heusen Corp. | |
| | | 7.250% 02/15/11 | | | 1,230,000 | | | | 1,236,150 | | |
| | | 8.125% 05/01/13 | | | 1,140,000 | | | | 1,179,900 | | |
| | | | | | | | | | 7,231,012 | | |
| | | Apparel Total | | | | | | | 7,231,012 | | |
See Accompanying Notes to Financial Statements.
13
Columbia Strategic Income Fund May 31, 2006
Corporate Fixed-Income Bonds & Notes (continued)
| Consumer Cyclical (continued) | | | | Par ($) | | Value ($) | |
| Auto Manufacturers – 0.1% | |
| Auto-Cars/Light Trucks – 0.1% | |
| General Motors Corp. | |
| | | 8.375% 07/15/33 | | | 1,570,000 | | | | 1,193,200 | | |
| | | | | | | | | | 1,193,200 | | |
| | | Auto Manufacturers Total | | | | | | | 1,193,200 | | |
| Auto Parts & Equipment – 0.6% | |
| Auto/Truck Parts & Equipment-Original – 0.1% | |
| TRW Automotive, Inc. | |
| | | 9.375% 02/15/13 | | | 2,135,000 | | | | 2,305,800 | | |
| | | | | | | | | | 2,305,800 | | |
| Auto/Truck Parts & Equipment-Replacement – 0.2% | |
| Commercial Vehicle Group | |
| | | 8.000% 07/01/13 | | | 1,835,000 | | | | 1,807,475 | | |
| Rexnord Corp. | |
| | | 10.125% 12/15/12 | | | 1,486,000 | | | | 1,634,600 | | |
| | | | | | | | | | 3,442,075 | | |
| Rubber-Tires – 0.3% | |
| Goodyear Tire & Rubber Co. | |
| | | 9.000% 07/01/15 | | | 4,105,000 | | | | 4,187,100 | | |
| | | | | | | | | | 4,187,100 | | |
| | | Auto Parts & Equipment Total | | | | | | | 9,934,975 | | |
| Distribution/Wholesale – 0.1% | |
| Distribution/Wholesale – 0.1% | |
| Buhrmann US, Inc. | |
| | | 7.875% 03/01/15 | | | 1,315,000 | | | | 1,318,288 | | |
| | | | | | | | | | 1,318,288 | | |
| | | Distribution/Wholesale Total | | | | | | | 1,318,288 | | |
| Entertainment – 0.5% | |
| Gambling (Non-Hotel) – 0.1% | |
| Global Cash Access LLC | |
| | | 8.750% 03/15/12 | | | 1,924,000 | | | | 2,039,440 | | |
| | | | | | | | | | 2,039,440 | | |
| Music – 0.3% | |
| Steinway Musical Instruments, Inc. | |
| | | 7.000% 03/01/14(a) | | | 1,635,000 | | | | 1,600,256 | | |
| Warner Music Group | |
| | | 7.375% 04/15/14 | | | 2,455,000 | | | | 2,430,450 | | |
| | | | | | | | | | 4,030,706 | | |
| Resorts/Theme Parks – 0.1% | |
| Six Flags, Inc. | |
| | | 9.625% 06/01/14 | | | 2,030,000 | | | | 2,014,775 | | |
| | | | | | | | | | 2,014,775 | | |
| | | Entertainment Total | | | | | | | 8,084,921 | | |
See Accompanying Notes to Financial Statements.
14
Columbia Strategic Income Fund May 31, 2006
Corporate Fixed-Income Bonds & Notes (continued)
| Consumer Cyclical (continued) | | | | Par ($) | | Value ($) | |
| Home Builders – 0.5% | |
| Building-Residential/Commercial – 0.5% | |
| D.R. Horton, Inc. | |
| | | 9.750% 09/15/10 | | | 3,070,000 | | | | 3,432,346 | | |
| K. Hovnanian Enterprises, Inc. | |
| | | 6.375% 12/15/14 | | | 1,920,000 | | | | 1,740,000 | | |
| | | 8.875% 04/01/12 | | | 1,270,000 | | | | 1,312,862 | | |
| Standard Pacific Corp. | |
| | | 9.250% 04/15/12 | | | 490,000 | | | | 499,800 | | |
| | | | | | | | | | 6,985,008 | | |
| | | Home Builders Total | | | | | | | 6,985,008 | | |
| Home Furnishings – 0.1% | |
| Home Furnishings – 0.1% | |
| Sealy Mattress Co. | |
| | | 8.250% 06/15/14 | | | 1,295,000 | | | | 1,353,275 | | |
| | | | | | | | | | 1,353,275 | | |
| | | Home Furnishings Total | | | | | | | 1,353,275 | | |
| Leisure Time – 0.2% | |
| Leisure & Recreational Products – 0.1% | |
| K2, Inc. | |
| | | 7.375% 07/01/14 | | | 1,540,000 | | | | 1,516,900 | | |
| | | | | | | | | | 1,516,900 | | |
| Recreational Centers – 0.1% | |
| Town Sports International, Inc. | |
| | | (f) 02/01/14
(11.000% 02/01/09) | | | 2,620,000 | | | | 2,079,625 | | |
| | | | | | | | | | 2,079,625 | | |
| | | Leisure Time Total | | | | | | | 3,596,525 | | |
| Lodging – 2.4% | |
| Casino Hotels – 2.3% | |
| CCM Merger, Inc. | |
| | | 8.000% 08/01/13(a) | | | 2,525,000 | | | | 2,430,313 | | |
| Chukchansi Economic Development Authority | |
| | | 8.780% 11/15/12(a)(b) | | | 1,435,000 | | | | 1,463,700 | | |
| Circus & Eldorado/Silver Legacy Capital Corp. | |
| | | 10.125% 03/01/12 | | | 1,780,000 | | | | 1,891,250 | | |
| Eldorado Casino Shreveport/ Shreveport Capital Corp. | |
| | | 10.000% 08/01/12(c) | | | 4,186,621 | | | | 3,349,297 | | |
| Galaxy Entertainment Finance Co., Ltd. | |
| | | 9.875% 12/15/12(a) | | | 1,705,000 | | | | 1,773,200 | | |
| Greektown Holdings LLC | |
| | | 10.750% 12/01/13(a) | | | 2,005,000 | | | | 2,125,300 | | |
| Hard Rock Hotel, Inc. | |
| | | 8.875% 06/01/13 | | | 2,920,000 | | | | 3,168,200 | | |
See Accompanying Notes to Financial Statements.
15
Columbia Strategic Income Fund May 31, 2006
Corporate Fixed-Income Bonds & Notes (continued)
| Consumer Cyclical (continued) | | | | Par ($) | | Value ($) | |
| Lodging (continued) | |
| Casino Hotels (continued) | |
| Inn of the Mountain Gods Resort & Casino | |
| | | 12.000% 11/15/10 | | | 880,000 | | | | 948,200 | | |
| Kerzner International Ltd. | |
| | | 6.750% 10/01/15 | | | 2,940,000 | | | | 3,101,700 | | |
| MGM Mirage | |
| | | 6.000% 10/01/09 | | | 1,750,000 | | | | 1,715,000 | | |
| | | 6.750% 09/01/12 | | | 3,055,000 | | | | 3,005,356 | | |
| | | 8.500% 09/15/10 | | | 1,695,000 | | | | 1,794,581 | | |
| Mohegan Tribal Gaming Authority | |
| | | 6.125% 02/15/13 | | | 1,200,000 | | | | 1,141,500 | | |
| Pinnacle Entertainment, Inc. | |
| | | 8.250% 03/15/12 | | | 3,100,000 | | | | 3,177,500 | | |
| Station Casinos, Inc. | |
| | | 6.000% 04/01/12 | | | 2,355,000 | | | | 2,249,025 | | |
| Wynn Las Vegas LLC | |
| | | 6.625% 12/01/14 | | | 2,745,000 | | | | 2,614,612 | | |
| | | | | | | | | | 35,948,734 | | |
| Hotels & Motels – 0.1% | |
| Hilton Hotels Corp. | |
| | | 7.500% 12/15/17 | | | 1,555,000 | | | | 1,617,446 | | |
| | | | | | | | | | 1,617,446 | | |
| | | Lodging Total | | | | | | | 37,566,180 | | |
| Retail – 1.0% | |
| Retail-Automobiles – 0.2% | |
| Asbury Automotive Group, Inc. | |
| | | 8.000% 03/15/14 | | | 2,235,000 | | | | 2,226,619 | | |
| AutoNation, Inc. | |
| | | 7.000% 04/15/14(a) | | | 745,000 | | | | 737,550 | | |
| | | 7.045% 04/15/13(a)(b) | | | 450,000 | | | | 456,750 | | |
| | | | | | | | | | 3,420,919 | | |
| Retail-Drug Stores – 0.1% | |
| Rite Aid Corp. | |
| | | 7.500% 01/15/15 | | | 1,670,000 | | | | 1,640,775 | | |
| | | | | | | | | | 1,640,775 | | |
| Retail-Home Furnishings – 0.2% | |
| Tempur-Pedic, Inc. | |
| | | 10.250% 08/15/10 | | | 2,411,000 | | | | 2,585,798 | | |
| | | | | | | | | | 2,585,798 | | |
| Retail-Propane Distributors – 0.3% | |
| AmeriGas Partners LP | |
| | | 7.125% 05/20/16 | | | 1,670,000 | | | | 1,607,375 | | |
| Ferrellgas Partners LP | |
| | | 8.750% 06/15/12 | | | 1,720,000 | | | | 1,750,100 | | |
| Inergy LP/Inergy Finance Corp. | |
| | | 8.250% 03/01/16 | | | 1,400,000 | | | | 1,435,000 | | |
| | | | | | | | | | 4,792,475 | | |
See Accompanying Notes to Financial Statements.
16
Columbia Strategic Income Fund May 31, 2006
Corporate Fixed-Income Bonds & Notes (continued)
| Consumer Cyclical (continued) | | | | Par ($) | | Value ($) | |
| Retail (continued) | |
| Retail-Restaurants – 0.2% | |
| Dave & Buster's, Inc. | |
| | | 11.250% 03/15/14(a) | | | 1,300,000 | | | | 1,313,000 | | |
| Landry's Restaurants, Inc. | |
| | | 7.500% 12/15/14 | | | 1,805,000 | | | | 1,701,212 | | |
| | | | | | | | | | 3,014,212 | | |
| | | Retail Total | | | | | | | 15,454,179 | | |
| Textiles – 0.1% | |
| Textile-Products – 0.1% | |
| INVISTA | |
| | | 9.250% 05/01/12(a) | | | 1,440,000 | | | | 1,526,400 | | |
| | | | | | | | | | 1,526,400 | | |
| | | Textiles Total | | | | | | | 1,526,400 | | |
| Consumer Cyclical Total | | | | | | | | | 97,138,963 | | |
| Consumer Non-Cyclical – 5.5% | |
| Agriculture – 0.2% | |
| Tobacco – 0.2% | |
| Alliance One International, Inc. | |
| | | 11.000% 05/15/12 | | | 1,670,000 | | | | 1,592,762 | | |
| Reynolds American, Inc. | |
| | | 7.625% 06/01/16(a) | | | 1,405,000 | | | | 1,401,488 | | |
| | | | | | | | | | 2,994,250 | | |
| | | Agriculture Total | | | | | | | 2,994,250 | | |
| Beverages – 0.2% | |
| Beverages-Non-Alcoholic – 0.1% | |
| Cott Beverages, Inc. | |
| | | 8.000% 12/15/11 | | | 1,730,000 | | | | 1,734,325 | | |
| | | | | | | | | | 1,734,325 | | |
| Beverages-Wine/Spirits – 0.1% | |
| Constellation Brands, Inc. | |
| | | 8.000% 02/15/08 | | | 545,000 | | | | 558,625 | | |
| | | 8.125% 01/15/12 | | | 1,525,000 | | | | 1,578,375 | | |
| | | | | | | | | | 2,137,000 | | |
| | | Beverages Total | | | | | | | 3,871,325 | | |
| Biotechnology – 0.2% | |
| Medical-Biomedical/Gene – 0.2% | |
| Bio-Rad Laboratories, Inc. | |
| | | 7.500% 08/15/13 | | | 2,455,000 | | | | 2,485,687 | | |
| | | | | | | | | | 2,485,687 | | |
| | | Biotechnology Total | | | | | | | 2,485,687 | | |
See Accompanying Notes to Financial Statements.
17
Columbia Strategic Income Fund May 31, 2006
Corporate Fixed-Income Bonds & Notes (continued)
| Consumer Non-Cyclical (continued) | | | | Par ($) | | Value ($) | |
| Commercial Services – 1.8% | |
| Commercial Services – 0.1% | |
| Iron Mountain, Inc. | |
| | | 7.750% 01/15/15 | | | 2,035,000 | | | | 2,035,000 | | |
| | | | | | | | | | 2,035,000 | | |
| Commercial Services-Finance – 0.1% | |
| Dollar Financial Group, Inc. | |
| | | 9.750% 11/15/11 | | | 1,090,000 | | | | 1,171,750 | | |
| | | | | | | | | | 1,171,750 | | |
| Consulting Services – 0.1% | |
| FTI Consulting | |
| | | 7.625% 06/15/13 | | | 1,170,000 | | | | 1,193,400 | | |
| | | | | | | | | | 1,193,400 | | |
| Funeral Services & Related Items – 0.2% | |
| Service Corp. International | |
| | | 6.750% 04/01/16 | | | 850,000 | | | | 804,313 | | |
| | | 7.700% 04/15/09 | | | 1,655,000 | | | | 1,688,100 | | |
| | | | | | | | | | 2,492,413 | | |
| Printing-Commercial – 0.2% | |
| Quebecor World Capital Corp. | |
| | | 8.750% 03/15/16(a) | | | 2,130,000 | | | | 1,998,700 | | |
| | | 10.250% 08/15/11 | | | 1,290,000 | | | | 1,315,800 | | |
| | | | | | | | | | 3,314,500 | | |
| Private Corrections – 0.3% | |
| Corrections Corp. of America | |
| | | 6.250% 03/15/13 | | | 2,560,000 | | | | 2,432,000 | | |
| GEO Group, Inc. | |
| | | 8.250% 07/15/13 | | | 2,290,000 | | | | 2,341,525 | | |
| | | | | | | | | | 4,773,525 | | |
| Rental Auto/Equipment – 0.8% | |
| Ashtead Holdings PLC | |
| | | 8.625% 08/01/15(a) | | | 2,255,000 | | | | 2,297,281 | | |
| Avis Budget Car Rental LLC | |
| | | 7.625% 05/15/14(a) | | | 1,135,000 | | | | 1,146,350 | | |
| | | 7.750% 05/15/16(a) | | | 750,000 | | | | 757,500 | | |
| Hertz Corp. | |
| | | 8.875% 01/01/14(a) | | | 2,055,000 | | | | 2,152,612 | | |
| NationsRent, Inc. | |
| | | 9.500% 10/15/10 | | | 2,710,000 | | | | 2,913,250 | | |
| United Rentals North America, Inc. | |
| | | 6.500% 02/15/12 | | | 2,580,000 | | | | 2,483,250 | | |
| United Rentals, Inc. | |
| | | 7.750% 11/15/13 | | | 765,000 | | | | 755,438 | | |
| | | | | | | | | | 12,505,681 | | |
| | | Commercial Services Total | | | | | | | 27,486,269 | | |
See Accompanying Notes to Financial Statements.
18
Columbia Strategic Income Fund May 31, 2006
Corporate Fixed-Income Bonds & Notes (continued)
| Consumer Non-Cyclical (continued) | | | | Par ($) | | Value ($) | |
| Cosmetics/Personal Care – 0.2% | |
| Cosmetics & Toiletries – 0.2% | |
| DEL Laboratories, Inc. | |
| | | 8.000% 02/01/12 | | | 1,695,000 | | | | 1,419,562 | | |
| Elizabeth Arden, Inc. | |
| | | 7.750% 01/15/14 | | | 2,045,000 | | | | 2,055,225 | | |
| | | | | | | | | | 3,474,787 | | |
| | | Cosmetics/Personal Care Total | | | | | | | 3,474,787 | | |
| Food – 0.5% | |
| Food-Confectionery – 0.1% | |
| Merisant Co. | |
| | | 9.500% 07/15/13 | | | 1,590,000 | | | | 1,089,150 | | |
| | | | | | | | | | 1,089,150 | | |
| Food-Miscellaneous/Diversified – 0.3% | |
| Dole Food Co., Inc. | |
| | | 8.625% 05/01/09 | | | 2,222,000 | | | | 2,188,670 | | |
| Pinnacle Foods Holding Corp. | |
| | | 8.250% 12/01/13 | | | 2,785,000 | | | | 2,757,150 | | |
| Reddy Ice Holdings, Inc. | |
| | | (f) 11/01/12
(10.500% 11/01/08) | | | 1,365,000 | | | | 1,139,775 | | |
| | | | | | | | | | 6,085,595 | | |
| Food-Retail – 0.1% | |
| Stater Brothers Holdings, Inc. | |
| | | 8.125% 06/15/12 | | | 830,000 | | | | 830,000 | | |
| | | | | | | | | | 830,000 | | |
| | | Food Total | | | | | | | 8,004,745 | | |
| Healthcare Services – 1.0% | |
| Dialysis Centers – 0.1% | |
| DaVita, Inc. | |
| | | 7.250% 03/15/15 | | | 1,940,000 | | | | 1,896,350 | | |
| | | | | | | | | | 1,896,350 | | |
| Medical-HMO – 0.1% | |
| Coventry Health Care, Inc. | |
| | | 8.125% 02/15/12 | | | 1,770,000 | | | | 1,849,568 | | |
| | | | | | | | | | 1,849,568 | | |
| Medical-Hospitals – 0.4% | |
| HCA, Inc. | |
| | | 7.875% 02/01/11 | | | 2,270,000 | | | | 2,354,959 | | |
| Tenet Healthcare Corp. | |
| | | 9.875% 07/01/14 | | | 3,770,000 | | | | 3,835,975 | | |
| | | | | | | | | | 6,190,934 | | |
| Medical-Outpatient/Home Medical – 0.1% | |
| Select Medical Corp. | |
| | | 7.625% 02/01/15 | | | 1,190,000 | | | | 1,062,075 | | |
| | | | | | | | | | 1,062,075 | | |
See Accompanying Notes to Financial Statements.
19
Columbia Strategic Income Fund May 31, 2006
Corporate Fixed-Income Bonds & Notes (continued)
| Consumer Non-Cyclical (continued) | | | | Par ($) | | Value ($) | |
| Healthcare Services (continued) | |
| MRI/Medical Diagnostic Imaging – 0.1% | |
| MedQuest, Inc. | |
| | | 11.875% 08/15/12 | | | 980,000 | | | | 886,900 | | |
| MQ Associates, Inc. | |
| | | (f) 08/15/12
(12.250% 08/15/08) | | | 1,135,000 | | | | 442,650 | | |
| | | | | | | | | | 1,329,550 | | |
| Physician Practice Management – 0.2% | |
| US Oncology Holdings, Inc. | |
| | | 10.320% 03/15/15(b) | | | 815,000 | | | | 828,244 | | |
| US Oncology, Inc. | |
| | | 9.000% 08/15/12 | | | 2,525,000 | | | | 2,663,875 | | |
| | | | | | | | | | 3,492,119 | | |
| | | Healthcare Services Total | | | | | | | 15,820,596 | | |
| Household Products/Wares – 0.5% | |
| Consumer Products-Miscellaneous – 0.4% | |
| American Greetings Corp. | |
| | | 7.375% 06/01/16 | | | 1,080,000 | | | | 1,093,500 | | |
| Amscan Holdings, Inc. | |
| | | 8.750% 05/01/14 | | | 1,810,000 | | | | 1,642,575 | | |
| Jostens IH Corp. | |
| | | 7.625% 10/01/12 | | | 1,910,000 | | | | 1,881,350 | | |
| Scotts Co. | |
| | | 6.625% 11/15/13 | | | 2,150,000 | | | | 2,098,937 | | |
| | | | | | | | | | 6,716,362 | | |
| Office Supplies & Forms – 0.1% | |
| ACCO Brands Corp. | |
| | | 7.625% 08/15/15 | | | 1,600,000 | | | | 1,532,000 | | |
| | | | | | | | | | 1,532,000 | | |
| | | Household Products/Wares Total | | | | | | | 8,248,362 | | |
| Pharmaceuticals – 0.9% | |
| Medical-Drugs – 0.3% | |
| Elan Finance PLC | |
| | | 7.750% 11/15/11 | | | 3,050,000 | | | | 2,996,625 | | |
| Warner Chilcott Corp. | |
| | | 8.750% 02/01/15 | | | 1,840,000 | | | | 1,844,600 | | |
| | | | | | | | | | 4,841,225 | | |
| Medical-Generic Drugs – 0.2% | |
| Mylan Laboratories, Inc. | |
| | | 6.375% 08/15/15 | | | 2,545,000 | | | | 2,455,925 | | |
| | | | | | | | | | 2,455,925 | | |
| Medical-Wholesale Drug Distribution – 0.2% | |
| AmerisourceBergen Corp. | |
| | | 5.875% 09/15/15(a) | | | 1,355,000 | | | | 1,307,799 | | |
| Nycomed A/S | |
| | | PIK,
11.750% 09/15/13(a) | | EUR | 1,990,204 | | | | 2,659,622 | | |
| | | | | | | | | | 3,967,421 | | |
See Accompanying Notes to Financial Statements.
20
Columbia Strategic Income Fund May 31, 2006
Corporate Fixed-Income Bonds & Notes (continued)
| Consumer Non-Cyclical (continued) | | | | Par ($) | | Value ($) | |
| Pharmaceuticals (continued) | |
| Pharmacy Services – 0.1% | |
| Omnicare, Inc. | |
| | | 6.750% 12/15/13 | | USD | 980,000 | | | | 950,600 | | |
| | | | | | | | | | 950,600 | | |
| Vitamins & Nutrition Products – 0.1% | |
| NBTY, Inc. | |
| | | 7.125% 10/01/15 | | | 1,520,000 | | | | 1,459,200 | | |
| | | | | | | | | | 1,459,200 | | |
| | | Pharmaceuticals Total | | | | | | | 13,674,371 | | |
| Consumer Non-Cyclical Total | | | | | | | | | 86,060,392 | | |
| Energy – 5.5% | |
| Coal – 0.4% | |
| Coal – 0.4% | |
| Arch Western Finance LLC | |
| | | 6.750% 07/01/13 | | | 2,525,000 | | | | 2,461,875 | | |
| Massey Energy Co. | |
| | | 6.875% 12/15/13(a) | | | 3,120,000 | | | | 2,987,400 | | |
| | | | | | | | | | 5,449,275 | | |
| | | Coal Total | | | | | | | 5,449,275 | | |
| Oil & Gas – 2.2% | |
| Oil & Gas Drilling – 0.1% | |
| Pride International, Inc. | |
| | | 7.375% 07/15/14 | | | 1,530,000 | | | | 1,564,425 | | |
| | | | | | | | | | 1,564,425 | | |
| Oil Companies-Exploration & Production – 1.8% | |
| Chesapeake Energy Corp. | |
| | | 6.375% 06/15/15 | | | 1,355,000 | | | | 1,277,088 | | |
| | | 7.500% 06/15/14 | | | 2,145,000 | | | | 2,187,900 | | |
| Compton Petroleum Corp. | |
| | | 7.625% 12/01/13 | | | 1,820,000 | | | | 1,774,500 | | |
| Delta Petroleum Corp. | |
| | | 7.000% 04/01/15 | | | 565,000 | | | | 519,800 | | |
| El Paso Production Holding Co. | |
| | | 7.750% 06/01/13 | | | 1,500,000 | | | | 1,533,750 | | |
| Forest Oil Corp. | |
| | | 8.000% 12/15/11 | | | 1,300,000 | | | | 1,358,500 | | |
| Magnum Hunter Resources, Inc. | |
| | | 9.600% 03/15/12 | | | 1,592,000 | | | | 1,699,460 | | |
| Newfield Exploration Co. | |
| | | 6.625% 04/15/16 | | | 1,575,000 | | | | 1,508,062 | | |
| PEMEX Finance Ltd. | |
| | | 9.150% 11/15/18 | | | 2,485,000 | | | | 2,870,665 | | |
| | | 10.610% 08/15/17 | | | 1,650,000 | | | | 2,038,125 | | |
| Pemex Project Funding Master Trust | |
| | | 5.430% 12/03/12(a)(b) | | | 6,450,000 | | | | 6,450,000 | | |
| Pogo Producing Co. | |
| | | 6.625% 03/15/15 | | | 1,310,000 | | | | 1,244,500 | | |
| Quicksilver Resources, Inc. | |
| | | 7.125% 04/01/16 | | | 1,065,000 | | | | 1,019,738 | | |
See Accompanying Notes to Financial Statements.
21
Columbia Strategic Income Fund May 31, 2006
Corporate Fixed-Income Bonds & Notes (continued)
| Energy (continued) | | | | Par ($) | | Value ($) | |
| Oil & Gas (continued) | |
| Oil Companies-Exploration & Production (continued) | |
| Whiting Petroleum Corp. | |
| | | 7.250% 05/01/12 | | | 2,575,000 | | | | 2,526,719 | | |
| XTO Energy, Inc. | |
| | | 7.500% 04/15/12 | | | 340,000 | | | | 365,781 | | |
| | | | | | | | | | 28,374,588 | | |
| Oil Refining & Marketing – 0.3% | |
| Premcor Refining Group, Inc. | |
| | | 7.500% 06/15/15 | | | 1,790,000 | | | | 1,861,600 | | |
| Tesoro Petroleum Corp. | |
| | | 6.625% 11/01/15(a) | | | 1,900,000 | | | | 1,833,500 | | |
| | | | | | | | | | 3,695,100 | | |
| | | Oil & Gas Total | | | | | | | 33,634,113 | | |
| Oil & Gas Services – 1.0% | |
| Oil-Field Services – 1.0% | |
| Gazprom | |
| | | 9.625% 03/01/13 | | | 5,760,000 | | | | 6,653,952 | | |
| Gazprom International SA | |
| | | 7.201% 02/01/20 | | | 5,250,000 | | | | 5,378,625 | | |
| Hornbeck Offshore Services, Inc. | |
| | | Series B,
6.125% 12/01/14 | | | 2,205,000 | | | | 2,045,137 | | |
| Newpark Resources, Inc. | |
| | | 8.625% 12/15/07 | | | 1,841,000 | | | | 1,841,000 | | |
| | | | | | | | | | 15,918,714 | | |
| | | Oil & Gas Services Total | | | | | | | 15,918,714 | | |
| Oil, Gas & Consumable Fuels – 0.4% | |
| Oil Company-Integrated – 0.4% | |
| Qatar Petroleum | |
| | | 5.579% 05/30/11(a) | | | 7,000,000 | | | | 6,970,883 | | |
| | | | | | | | | | 6,970,883 | | |
| | | Oil, Gas & Consumable Fuels Total | | | | | | | 6,970,883 | | |
| Pipelines – 1.5% | |
| Pipelines – 1.5% | |
| Atlas Pipeline Partners LP | |
| | | 8.125% 12/15/15(a) | | | 1,365,000 | | | | 1,402,538 | | |
| Colorado Interstate Gas Co. | |
| | | 6.800% 11/15/15(a) | | | 2,695,000 | | | | 2,708,475 | | |
| El Paso Corp. | |
| | | 7.625% 09/01/08(a) | | | 1,000,000 | | | | 1,017,500 | | |
| | | 7.750% 06/15/10(a) | | | 2,390,000 | | | | 2,449,750 | | |
| Northwest Pipeline Corp. | |
| | | 8.125% 03/01/10 | | | 760,000 | | | | 798,950 | | |
| Pacific Energy Partners LP/Pacific Energy Finance Corp. | |
| | | 6.250% 09/15/15 | | | 2,360,000 | | | | 2,194,800 | | |
See Accompanying Notes to Financial Statements.
22
Columbia Strategic Income Fund May 31, 2006
Corporate Fixed-Income Bonds & Notes (continued)
| Energy (continued) | | | | Par ($) | | Value ($) | |
| Pipelines (continued) | |
| Pipelines (continued) | |
| Sonat, Inc. | |
| | | 7.625% 07/15/11 | | | 4,330,000 | | | | 4,389,537 | | |
| Southern Natural Gas Co. | |
| | | 8.875% 03/15/10 | | | 1,375,000 | | | | 1,462,656 | | |
| Williams Companies, Inc. | |
| | | 6.375% 10/01/10(a) | | | 5,180,000 | | | | 5,186,475 | | |
| | | 8.125% 03/15/12 | | | 1,730,000 | | | | 1,831,638 | | |
| | | | | | | | | | 23,442,319 | | |
| | | Pipelines Total | | | | | | | 23,442,319 | | �� |
| Energy Total | | | | | | | | | 85,415,304 | | |
| Financials – 2.6% | |
| Banks – 0.1% | |
| Commercial Banks-Southern US – 0.0% | |
| First Union National Bank | |
| | | 5.800% 12/01/08 | | | 382,000 | | | | 384,142 | | |
| | | | | | | | | | 384,142 | | |
| Super-Regional Banks-US – 0.1% | |
| Bank One Corp. | |
| | | 6.000% 08/01/08 | | | 623,000 | | | | 629,255 | | |
| | | | | | | | | | 629,255 | | |
| | | Banks Total | | | | | | | 1,013,397 | | |
| Diversified Financial Services – 2.2% | |
| Finance-Auto Loans – 0.8% | |
| Ford Motor Credit Co. | |
| | | 7.375% 02/01/11 | | | 3,605,000 | | | | 3,249,248 | | |
| General Motors Acceptance Corp. | |
| | | 6.875% 09/15/11 | | | 4,085,000 | | | | 3,844,955 | | |
| | | 8.000% 11/01/31 | | | 5,180,000 | | | | 4,869,200 | | |
| | | | | | | | | | 11,963,403 | | |
| Finance-Consumer Loans – 0.3% | |
| SLM Corp. | |
| | | 6.500% 06/15/10 | | NZD | 7,865,000 | | | | 4,926,007 | | |
| | | | | | | | | | 4,926,007 | | |
| Finance-Credit Card – 0.0% | |
| American Express Co. | |
| | | 5.500% 09/12/06 | | USD | 325,000 | | | | 325,052 | | |
| | | | | | | | | | 325,052 | | |
| Finance-Investment Banker/Broker – 0.4% | |
| E*Trade Financial Corp. | |
| | | 8.000% 06/15/11 | | | 2,360,000 | | | | 2,448,500 | | |
| JPMorgan Chase & Co. | |
| | | 7.250% 06/01/07 | | | 345,000 | | | | 350,826 | | |
| LaBranche & Co., Inc. | |
| | | 11.000% 05/15/12 | | | 3,395,000 | | | | 3,726,013 | | |
| | | | | | | | | | 6,525,339 | | |
See Accompanying Notes to Financial Statements.
23
Columbia Strategic Income Fund May 31, 2006
Corporate Fixed-Income Bonds & Notes (continued)
| Financials (continued) | | | | Par ($) | | Value ($) | |
| Diversified Financial Services (continued) | |
| Finance-Mortgage Loan/Banker – 0.0% | |
| Countrywide Home Loans, Inc. | |
| | | 5.500% 08/01/06 | | | 541,000 | | | | 541,033 | | |
| | | | | | | | | | 541,033 | | |
| Special Purpose Entity – 0.7% | |
| Dow Jones CDX High Yield Index | |
| | | 8.750% 12/29/10(a) | | | 6,416,550 | | | | 6,668,515 | | |
| ERAP | |
| | | 3.750% 04/25/10 | | EUR | 2,600,000 | | | | 3,339,591 | | |
| Hughes Network Systems LLC/HNS Finance Corp. | |
| | | 9.500% 04/15/14(a) | | USD | 700,000 | | | | 707,000 | | |
| Prudential Funding LLC | |
| | | 6.600% 05/15/08(a) | | | 388,000 | | | | 395,548 | | |
| | | | | | | | | | 11,110,654 | | |
| | | Diversified Financial Services Total | | | | | | | 35,391,488 | | |
| Real Estate Investment Trusts – 0.3% | |
| REITS-Hotels – 0.2% | |
| Host Marriott LP | |
| | | 6.750% 06/01/16(a) | | | 2,715,000 | | | | 2,647,125 | | |
| | | | | | | | | | 2,647,125 | | |
| REITS-Regional Malls – 0.1% | |
| Rouse Co. LP/TRC Co-Issuer, Inc. | |
| | | 6.750% 05/01/13(a) | | | 1,750,000 | | | | 1,738,744 | | |
| | | | | | | | | | 1,738,744 | | |
| | | Real Estate Investment Trusts Total | | | | | | | 4,385,869 | | |
| Financials Total | | | | | | | | | 40,790,754 | | |
| Industrials – 5.4% | |
| Aerospace & Defense – 0.6% | |
| Aerospace/Defense-Equipment – 0.4% | |
| BE Aerospace, Inc. | |
| | | 8.500% 10/01/10 | | | 2,462,000 | | | | 2,615,875 | | |
| Sequa Corp. | |
| | | 8.875% 04/01/08 | | | 1,249,000 | | | | 1,305,205 | | |
| | | 9.000% 08/01/09 | | | 1,165,000 | | | | 1,234,900 | | |
| TransDigm, Inc. | |
| | | 8.375% 07/15/11 | | | 1,510,000 | | | | 1,604,375 | | |
| | | | | | | | | | 6,760,355 | | |
| Electronics-Military – 0.2% | |
| Condor Systems, Inc. | |
| | | 11.875% 05/01/09(c)(g)(h) | | | 4,000,000 | | | | — | | |
| L-3 Communications Corp. | |
| | | 5.875% 01/15/15 | | | 735,000 | | | | 672,525 | | |
| | | 6.375% 10/15/15 | | | 1,665,000 | | | | 1,577,587 | | |
| | | | | | | | | | 2,250,112 | | |
| | | Aerospace & Defense Total | | | | | | | 9,010,467 | | |
See Accompanying Notes to Financial Statements.
24
Columbia Strategic Income Fund May 31, 2006
Corporate Fixed-Income Bonds & Notes (continued)
| Industrials (continued) | | | | Par ($) | | Value ($) | |
| Building Materials – 0.4% | |
| Building & Construction Products-Miscellaneous – 0.2% | |
| Nortek, Inc. | |
| | | 8.500% 09/01/14 | | | 1,200,000 | | | | 1,206,000 | | |
| NTK Holdings, Inc. | |
| | | (f) 03/01/14
(10.750% 09/01/09) | | | 1,405,000 | | | | 1,064,287 | | |
| | | | | | | | | | 2,270,287 | | |
| Building Products-Air & Heating – 0.1% | |
| Goodman Global Holding Co., Inc. | |
| | | 7.875% 12/15/12 | | | 1,715,000 | | | | 1,676,413 | | |
| | | | | | | | | | 1,676,413 | | |
| Building Products-Cement/Aggregation – 0.1% | |
| RMCC Acquisition Co. | |
| | | 9.500% 11/01/12(a) | | | 1,475,000 | | | | 1,534,000 | | |
| | | | | | | | | | 1,534,000 | | |
| | | Building Materials Total | | | | | | | 5,480,700 | | |
| Electronics – 0.1% | |
| Electronic Components-Miscellaneous – 0.1% | |
| Flextronics International Ltd. | |
| | | 6.250% 11/15/14 | | | 2,340,000 | | | | 2,228,850 | | |
| | | | | | | | | | 2,228,850 | | |
| | | Electronics Total | | | | | | | 2,228,850 | | |
| Engineering & Construction – 0.2% | |
| Building & Construction-Miscellaneous – 0.2% | |
| J. Ray McDermott SA | |
| | | 11.500% 12/15/13(a) | | | 2,115,000 | | | | 2,510,928 | | |
| | | | | | | | | | 2,510,928 | | |
| | | Engineering & Construction Total | | | | | | | 2,510,928 | | |
| Environmental Control – 0.6% | |
| Non-Hazardous Waste Disposal – 0.5% | |
| Allied Waste North America, Inc. | |
| | | 7.125% 05/15/16(a) | | | 3,135,000 | | | | 3,056,625 | | |
| | | 7.875% 04/15/13 | | | 5,050,000 | | | | 5,163,625 | | |
| | | | | | | | | | 8,220,250 | | |
| Recycling – 0.1% | |
| Aleris International, Inc. | |
| | | 9.000% 11/15/14 | | | 625,000 | | | | 653,125 | | |
| | | | | | | | | | 653,125 | | |
| | | Environmental Control Total | | | | | | | 8,873,375 | | |
See Accompanying Notes to Financial Statements.
25
Columbia Strategic Income Fund May 31, 2006
Corporate Fixed-Income Bonds & Notes (continued)
| Industrials (continued) | | | | Par ($) | | Value ($) | |
| Machinery-Construction & Mining – 0.1% | |
| Machinery-Construction & Mining – 0.1% | |
| Terex Corp. | |
| | | 7.375% 01/15/14 | | | 1,960,000 | | | | 1,979,600 | | |
| | | | | | | | | | 1,979,600 | | |
| | | Machinery-Construction & Mining Total | | | | | | | 1,979,600 | | |
| Machinery-Diversified – 0.2% | |
| Machinery-General Industry – 0.1% | |
| Douglas Dynamics LLC | |
| | | 7.750% 01/15/12(a) | | | 1,490,000 | | | | 1,430,400 | | |
| Manitowoc Co., Inc. | |
| | | 7.125% 11/01/13 | | | 925,000 | | | | 941,188 | | |
| | | | | | | | | | 2,371,588 | | |
| Machinery-Material Handling – 0.1% | |
| Columbus McKinnon Corp. | |
| | | 8.875% 11/01/13 | | | 1,485,000 | | | | 1,536,975 | | |
| | | | | | | | | | 1,536,975 | | |
| | | Machinery-Diversified Total | | | | | | | 3,908,563 | | |
| Metal Fabricate/Hardware – 0.3% | |
| Metal Processors & Fabrication – 0.3% | |
| Mueller Group, Inc. | |
| | | 10.000% 05/01/12 | | | 1,835,000 | | | | 2,002,444 | | |
| Mueller Holdings, Inc. | |
| | | (f) 04/15/14
(14.750% 04/15/09) | | | 1,593,000 | | | | 1,338,120 | | |
| TriMas Corp. | |
| | | 9.875% 06/15/12 | | | 1,220,000 | | | | 1,171,200 | | |
| | | | | | | | | | 4,511,764 | | |
| | | Metal Fabricate/Hardware Total | | | | | | | 4,511,764 | | |
| Miscellaneous Manufacturing – 0.8% | |
| Diversified Manufacturing Operators – 0.6% | |
| Bombardier, Inc. | |
| | | 6.300% 05/01/14(a) | | | 4,095,000 | | | | 3,700,856 | | |
| J.B. Poindexter & Co. | |
| | | 8.750% 03/15/14 | | | 1,605,000 | | | | 1,340,175 | | |
| Koppers Industries, Inc. | |
| | | 9.875% 10/15/13 | | | 1,392,000 | | | | 1,531,200 | | |
| Trinity Industries, Inc. | |
| | | 6.500% 03/15/14 | | | 2,910,000 | | | | 2,782,688 | | |
| | | | | | | | | | 9,354,919 | | |
| Miscellaneous Manufacturing – 0.2% | |
| Nutro Products, Inc. | |
| | | 10.750% 04/15/14(a) | | | 2,050,000 | | | | 2,096,125 | | |
| Samsonite Corp. | |
| | | 8.875% 06/01/11 | | | 1,615,000 | | | | 1,693,731 | | |
| | | | | | | | | | 3,789,856 | | |
| | | Miscellaneous Manufacturing Total | | | | | | | 13,144,775 | | |
See Accompanying Notes to Financial Statements.
26
Columbia Strategic Income Fund May 31, 2006
Corporate Fixed-Income Bonds & Notes (continued)
| Industrials (continued) | | | | Par ($) | | Value ($) | |
| Packaging & Containers – 1.1% | |
| Containers-Metal/Glass – 0.6% | |
| Crown Americas LLC & Crown Americas Capital Corp. | |
| | | 7.750% 11/15/15(a) | | | 2,740,000 | | | | 2,760,550 | | |
| Owens-Brockway Glass Container, Inc. | |
| | | 8.250% 05/15/13 | | | 3,890,000 | | | | 3,953,213 | | |
| Owens-Illinois, Inc. | |
| | | 7.500% 05/15/10 | | | 2,060,000 | | | | 2,047,125 | | |
| | | | | | | | | | 8,760,888 | | |
| Containers-Paper/Plastic – 0.5% | |
| Consolidated Container Co., LLC | |
| | | (f) 06/15/09
(10.750% 06/15/07) | | | 1,530,000 | | | | 1,434,375 | | |
| Jefferson Smurfit Corp. | |
| | | 8.250% 10/01/12 | | | 2,290,000 | | | | 2,164,050 | | |
| JSG Funding PLC | |
| | | 7.750% 04/01/15 | | | 145,000 | | | | 131,950 | | |
| JSG Holding PLC | |
| | | PIK,
11.500% 10/01/15(a) | | | 1,538,443 | | | | 1,990,668 | | |
| MDP Acquisitions PLC | |
| | | 9.625% 10/01/12 | | | 2,020,000 | | | | 2,115,950 | | |
| | | | | | | | | | 7,836,993 | | |
| | | Packaging & Containers Total | | | | | | | 16,597,881 | | |
| Transportation – 1.0% | |
| Transportation-Marine – 0.4% | |
| Ship Finance International Ltd. | |
| | | 8.500% 12/15/13 | | | 3,335,000 | | | | 3,147,406 | | |
| Stena AB | |
| | | 7.000% 12/01/16 | | | 1,000,000 | | | | 935,000 | | |
| | | 7.500% 11/01/13 | | | 3,070,000 | | | | 3,031,625 | | |
| | | | | | | | | | 7,114,031 | | |
| Transportation-Railroad – 0.2% | |
| TFM SA de CV | |
| | | 9.375% 05/01/12 | | | 2,305,000 | | | | 2,469,231 | | |
| | | 12.500% 06/15/12 | | | 615,000 | | | | 677,269 | | |
| | | | | | | | | | 3,146,500 | | |
| Transportation-Services – 0.3% | |
| CHC Helicopter Corp. | |
| | | 7.375% 05/01/14 | | | 2,785,000 | | | | 2,753,669 | | |
| PHI, Inc. | |
| | | 7.125% 04/15/13(a) | | | 1,540,000 | | | | 1,501,500 | | |
| | | | | | | | | | 4,255,169 | | |
See Accompanying Notes to Financial Statements.
27
Columbia Strategic Income Fund May 31, 2006
Corporate Fixed-Income Bonds & Notes (continued)
| Industrials (continued) | | | | Par ($) | | Value ($) | |
| Transportation (continued) | |
| Transportation-Trucks – 0.1% | |
| QDI LLC | |
| | | 9.000% 11/15/10 | | | 1,305,000 | | | | 1,236,487 | | |
| | | | | | | | | | 1,236,487 | | |
| | | Transportation Total | | | | | | | 15,752,187 | | |
| Industrials Total | | | | | | | | | 83,999,090 | | |
| Technology – 0.3% | |
| Office/Business Equipment – 0.2% | |
| Office Automation & Equipment – 0.2% | |
| Xerox Corp. | |
| | | 6.400% 03/15/16 | | | 570,000 | | | | 549,338 | | |
| | | 7.125% 06/15/10 | | | 2,145,000 | | | | 2,201,306 | | |
| | | | | | | | | | 2,750,644 | | |
| | | Office/Business Equipment Total | | | | | | | 2,750,644 | | |
| Semiconductors – 0.1% | |
| Electronic Components-Semiconductors – 0.1% | |
| Amkor Technology, Inc. | |
| | | 9.250% 06/01/16 | | | 1,070,000 | | | | 1,031,212 | | |
| Freescale Semiconductor, Inc. | |
| | | 6.875% 07/15/11 | | | 1,300,000 | | | | 1,317,875 | | |
| | | | | | | | | | 2,349,087 | | |
| | | Semiconductors Total | | | | | | | 2,349,087 | | |
| Technology Total | | | | | | | | | 5,099,731 | | |
| Utilities – 1.8% | |
| Electric – 1.8% | |
| Electric-Generation – 0.5% | |
| AES Corp. | |
| | | 9.000% 05/15/15(a) | | | 635,000 | | | | 684,212 | | |
| | | 9.500% 06/01/09 | | | 2,866,000 | | | | 3,066,620 | | |
| Edison Mission Energy | |
| | | 7.730% 06/15/09 | | | 3,555,000 | | | | 3,648,319 | | |
| | | | | | | | | | 7,399,151 | | |
| Electric-Integrated – 0.6% | |
| CMS Energy Corp. | |
| | | 6.875% 12/15/15 | | | 1,050,000 | | | | 1,022,437 | | |
| | | 8.500% 04/15/11 | | | 655,000 | | | | 689,388 | | |
| Mirant Mid Atlantic LLC | |
| | | 8.625% 06/30/12 | | | 590,194 | | | | 623,392 | | |
| Nevada Power Co. | |
| | | 9.000% 08/15/13 | | | 738,000 | | | | 807,527 | | |
| | | 10.875% 10/15/09 | | | 1,398,000 | | | | 1,496,741 | | |
| Sierra Pacific Resources | |
| | | 6.750% 08/15/17 | | | 1,930,000 | | | | 1,891,400 | | |
See Accompanying Notes to Financial Statements.
28
Columbia Strategic Income Fund May 31, 2006
Corporate Fixed-Income Bonds & Notes (continued)
| Utilities (continued) | | | | Par ($) | | Value ($) | |
| Electric (continued) | |
| Electric-Integrated (continued) | |
| TECO Energy, Inc. | |
| | | 7.000% 05/01/12 | | | 1,935,000 | | | | 1,964,025 | | |
| | | | | | | | | | 8,494,910 | | |
| Independent Power Producer – 0.7% | |
| Dynegy Holdings, Inc. | |
| | | 6.875% 04/01/11 | | | 1,945,000 | | | | 1,864,769 | | |
| | | 7.125% 05/15/18 | | | 1,315,000 | | | | 1,170,350 | | |
| Mirant North America LLC | |
| | | 7.375% 12/31/13(a) | | | 2,955,000 | | | | 2,903,287 | | |
| MSW Energy Holdings LLC | |
| | | 7.375% 09/01/10 | | | 800,000 | | | | 805,000 | | |
| | | 8.500% 09/01/10 | | | 1,960,000 | | | | 2,040,850 | | |
| NRG Energy, Inc. | |
| | | 7.250% 02/01/14 | | | 1,460,000 | | | | 1,461,825 | | |
| | | 7.375% 02/01/16 | | | 1,155,000 | | | | 1,156,444 | | |
| | | | | | | | | | 11,402,525 | | |
| | | Electric Total | | | | | | | 27,296,586 | | |
| Utilities Total | | | | | | | | | 27,296,586 | | |
| | | Total Corporate Fixed-Income Bonds & Notes
(cost of $607,321,640) | | | | | | | 599,305,925 | | |
Mortgage-Backed Securities – 5.5%
| Federal Home Loan Mortgage Corp. | |
| | 7.500% 03/01/16 | | | 3,100 | | | | 3,098 | | |
| | | 8.000% 05/01/07 | | | 1,230 | | | | 1,239 | | |
| | | 8.000% 08/01/07 | | | 1,754 | | | | 1,767 | | |
| | | 8.000% 06/01/09 | | | 712 | | | | 712 | | |
| | | 8.000% 08/01/09 | | | 2,843 | | | | 2,905 | | |
| | | 8.000% 05/01/10 | | | 4,131 | | | | 4,246 | | |
| | | 8.000% 05/01/16 | | | 13,609 | | | | 13,838 | | |
| | | 8.500% 12/01/07 | | | 2,804 | | | | 2,831 | | |
| | | 8.500% 01/01/08 | | | 2,335 | | | | 2,356 | | |
| | | 8.500% 04/01/08 | | | 887 | | | | 904 | | |
| | | 8.500% 10/01/08 | | | 685 | | | | 695 | | |
| | | 8.500% 05/01/09 | | | 3,741 | | | | 3,809 | | |
| | | 8.500% 01/01/10 | | | 5,034 | | | | 5,213 | | |
| | | 8.500% 07/01/10 | | | 1,063 | | | | 1,077 | | |
| | | 9.000% 06/01/08 | | | 3,626 | | | | 3,694 | | |
| | | 9.000% 07/01/09 | | | 2,089 | | | | 2,095 | | |
| | | 9.000% 12/01/18 | | | 6,405 | | | | 6,424 | | |
| | | 9.000% 01/01/22 | | | 31,542 | | | | 34,001 | | |
| | | 9.250% 08/01/08 | | | 4,088 | | | | 4,178 | | |
| | | 9.250% 11/01/09 | | | 1,174 | | | | 1,203 | | |
| | | 9.250% 10/01/14 | | | 2,731 | | | | 2,828 | | |
| | | 9.250% 05/01/16 | | | 55,503 | | | | 59,802 | | |
| | | 9.500% 11/01/08 | | | 5,150 | | | | 5,291 | | |
| | | 9.500% 02/01/10 | | | 11,000 | | | | 11,301 | | |
See Accompanying Notes to Financial Statements.
29
Columbia Strategic Income Fund May 31, 2006
Mortgage-Backed Securities (continued)
| | | | | Par ($) | | Value ($) | |
| Federal Home Loan Mortgage Corp. (continued) | |
| | 9.500% 08/01/16 | | | 1,014 | | | | 1,095 | | |
| | | 9.750% 12/01/08 | | | 3,328 | | | | 3,431 | | |
| | | 9.750% 09/01/16 | | | 2,470 | | | | 2,635 | | |
| | | 10.000% 07/01/09 | | | 20,290 | | | | 21,235 | | |
| | | 10.000% 11/01/16 | | | 33,171 | | | | 33,763 | | |
| | | 10.000% 10/01/19 | | | 17,806 | | | | 18,840 | | |
| | | 10.000% 11/01/19 | | | 5,541 | | | | 6,042 | | |
| | | 10.500% 01/01/20 | | | 14,386 | | | | 15,767 | | |
| | | 10.500% 10/01/24 | | | 75,908 | | | | 83,840 | | |
| | | 10.750% 05/01/10 | | | 49,208 | | | | 52,513 | | |
| | | 10.750% 07/01/11 | | | 19,709 | | | | 21,017 | | |
| | | 10.750% 08/01/11 | | | 9,013 | | | | 9,521 | | |
| | | 10.750% 09/01/13 | | | 4,330 | | | | 4,574 | | |
| | | 11.250% 10/01/10 | | | 25,462 | | | | 27,020 | | |
| | | 11.250% 08/01/13 | | | 4,111 | | | | 4,370 | | |
| | | 11.250% 09/01/15 | | | 7,244 | | | | 7,877 | | |
| | | 11.250% 11/01/15 | | | 43,626 | | | | 47,441 | | |
| Federal National Mortgage Association | |
| | 6.500% 12/01/31 | | | 31,395 | | | | 31,777 | | |
| | | 6.500% 05/01/32 | | | 42,635 | | | | 43,130 | | |
| | | 6.500% 01/01/33 | | | 19,206 | | | | 19,429 | | |
| | | 6.500% 05/01/33 | | | 109,315 | | | | 110,645 | | |
| | | 7.500% 11/01/11 | | | 10,333 | | | | 10,491 | | |
| | | 8.000% 07/01/08 | | | 1,804 | | | | 1,824 | | |
| | | 8.000% 12/01/08 | | | 1,973 | | | | 1,990 | | |
| | | 8.000% 03/01/09 | | | 449 | | | | 453 | | |
| | | 8.000% 04/01/09 | | | 5,996 | | | | 6,046 | | |
| | | 8.000% 07/01/09 | | | 7,574 | | | | 7,659 | | |
| | | 8.250% 11/01/07 | | | 8,826 | | | | 8,891 | | |
| | | 8.500% 05/01/08 | | | 406 | | | | 408 | | |
| | | 8.500% 12/01/08 | | | 899 | | | | 902 | | |
| | | 8.500% 06/01/09 | | | 4,557 | | | | 4,637 | | |
| | | 8.500% 03/01/10 | | | 2,626 | | | | 2,634 | | |
| | | 8.500% 10/01/10 | | | 2,256 | | | | 2,281 | | |
| | | 8.500% 05/01/11 | | | 7,533 | | | | 7,619 | | |
| | | 8.500% 12/01/11 | | | 2,724 | | | | 2,755 | | |
| | | 8.500% 02/01/15 | | | 827 | | | | 846 | | |
| | | 8.500% 05/01/15 | | | 2,611 | | | | 2,698 | | |
| | | 8.500% 06/01/15 | | | 11,516 | | | | 11,552 | | |
| | | 8.500% 06/01/17 | | | 1,299 | | | | 1,316 | | |
| | | 8.500% 07/01/17 | | | 1,974 | | | | 1,996 | | |
| | | 8.500% 09/01/21 | | | 13,865 | | | | 14,288 | | |
| | | 9.000% 11/01/08 | | | 2,455 | | | | 2,517 | | |
| | | 9.000% 12/01/08 | | | 7,272 | | | | 7,370 | | |
| | | 9.000% 05/01/09 | | | 5,940 | | | | 6,084 | | |
| | | 9.000% 08/01/09 | | | 6,659 | | | | 6,802 | | |
| | | 9.000% 10/01/09 | | | 9,370 | | | | 9,607 | | |
| | | 9.000% 11/01/09 | | | 321 | | | | 325 | | |
| | | 9.000% 04/01/10 | | | 1,465 | | | | 1,484 | | |
| | | 9.000% 10/01/11 | | | 12,145 | | | | 12,309 | | |
| | | 9.000% 05/01/12 | | | 7,550 | | | | 7,885 | | |
| | | 9.000% 03/01/13 | | | 99 | | | | 103 | | |
See Accompanying Notes to Financial Statements.
30
Columbia Strategic Income Fund May 31, 2006
Mortgage-Backed Securities (continued)
| | | | | Par ($) | | Value ($) | |
| Federal National Mortgage Association (continued) | |
| | 9.000% 09/01/13 | | | 3,018 | | | | 3,059 | | |
| | | 9.000% 07/01/14 | | | 885 | | | | 897 | | |
| | | 9.000% 05/01/15 | | | 4,658 | | | | 4,899 | | |
| | | 9.000% 04/01/16 | | | 37,283 | | | | 38,775 | | |
| | | 9.000% 12/01/16 | | | 4,842 | | | | 4,960 | | |
| | | 9.000% 05/01/17 | | | 38,397 | | | | 40,673 | | |
| | | 9.000% 08/01/21 | | | 63,662 | | | | 65,923 | | |
| | | 9.250% 05/01/16 | | | 86,896 | | | | 94,016 | | |
| | | 10.000% 11/01/13 | | | 36,844 | | | | 39,631 | | |
| | | 10.000% 04/01/14 | | | 112,325 | | | | 122,392 | | |
| | | 10.000% 03/01/16 | | | 6,120 | | | | 6,474 | | |
| | | 10.500% 03/01/14 | | | 1,659 | | | | 1,754 | | |
| | | 10.500% 07/01/14 | | | 28,118 | | | | 29,609 | | |
| | | 10.500% 01/01/16 | | | 5,964 | | | | 6,280 | | |
| | | 10.500% 03/01/16 | | | 137,080 | | | | 150,169 | | |
| | | TBA:
5.000% 03/16/21(i) | | | 14,187,000 | | | | 13,699,322 | | |
| | | 5.500% 03/13/36(i) | | | 5,808,000 | | | | 5,592,012 | | |
| | | 6.500% 03/13/36(i) | | | 63,281,000 | | | | 63,834,709 | | |
| Government National Mortgage Association | |
| | 9.000% 08/15/08 | | | 6,881 | | | | 7,069 | | |
| | | 9.000% 09/15/08 | | | 6,575 | | | | 6,755 | | |
| | | 9.000% 10/15/08 | | | 11,260 | | | | 11,567 | | |
| | | 9.000% 12/15/08 | | | 7,433 | | | | 7,636 | | |
| | | 9.000% 01/15/09 | | | 1,757 | | | | 1,822 | | |
| | | 9.000% 03/15/09 | | | 14,732 | | | | 15,243 | | |
| | | 9.000% 05/15/09 | | | 46,457 | | | | 48,091 | | |
| | | 9.000% 06/15/09 | | | 42,675 | | | | 44,124 | | |
| | | 9.000% 05/15/16 | | | 31,277 | | | | 33,533 | | |
| | | 9.000% 06/15/16 | | | 46,287 | | | | 49,627 | | |
| | | 9.000% 07/15/16 | | | 156,701 | | | | 168,003 | | |
| | | 9.000% 08/15/16 | | | 59,349 | | | | 63,630 | | |
| | | 9.000% 09/15/16 | | | 134,416 | | | | 144,111 | | |
| | | 9.000% 10/15/16 | | | 40,726 | | | | 43,663 | | |
| | | 9.000% 11/15/16 | | | 75,083 | | | | 80,498 | | |
| | | 9.000% 12/15/16 | | | 38,115 | | | | 40,863 | | |
| | | 9.000% 01/15/17 | | | 3,203 | | | | 3,433 | | |
| | | 9.000% 02/15/17 | | | 8,086 | | | | 8,669 | | |
| | | 9.000% 04/15/17 | | | 30,416 | | | | 32,609 | | |
| | | 9.000% 07/15/17 | | | 31,380 | | | | 33,641 | | |
| | | 9.000% 10/15/17 | | | 12,599 | | | | 13,507 | | |
| | | 9.000% 12/15/17 | | | 16,730 | | | | 17,911 | | |
| | | 9.500% 06/15/09 | | | 10,152 | | | | 10,610 | | |
| | | 9.500% 07/15/09 | | | 85,902 | | | | 89,788 | | |
| | | 9.500% 08/15/09 | | | 40,161 | | | | 41,977 | | |
| | | 9.500% 09/15/09 | | | 60,640 | | | | 63,382 | | |
| | | 9.500% 10/15/09 | | | 78,542 | | | | 82,076 | | |
| | | 9.500% 11/15/09 | | | 43,121 | | | | 45,071 | | |
| | | 9.500% 07/15/16 | | | 6,816 | | | | 7,433 | | |
| | | 9.500% 10/15/16 | | | 7,789 | | | | 8,494 | | |
| | | 9.500% 08/15/17 | | | 8,980 | | | | 9,819 | | |
| | | 9.500% 09/15/17 | | | 2,188 | | | | 2,393 | | |
See Accompanying Notes to Financial Statements.
31
Columbia Strategic Income Fund May 31, 2006
Mortgage-Backed Securities (continued)
| | | | | Par ($) | | Value ($) | |
| Government National Mortgage Association (continued) | |
| | 10.000% 11/15/09 | | | 27,310 | | | | 28,682 | | |
| | | 10.000% 01/15/10 | | | 855 | | | | 906 | | |
| | | 10.000% 12/15/10 | | | 908 | | | | 961 | | |
| | | 10.000% 02/15/16 | | | 7,590 | | | | 8,302 | | |
| | | 10.000% 08/15/17 | | | 791 | | | | 865 | | |
| | | 10.000% 09/15/17 | | | 26,223 | | | | 28,673 | | |
| | | 10.000% 11/15/17 | | | 3,877 | | | | 4,239 | | |
| | | 10.000% 02/15/18 | | | 15,227 | | | | 16,641 | | |
| | | 10.000% 08/15/18 | | | 3,584 | | | | 3,916 | | |
| | | 10.000% 09/15/18 | | | 3,853 | | | | 4,212 | | |
| | | 10.000% 11/15/18 | | | 11,168 | | | | 12,205 | | |
| | | 10.000% 03/15/19 | | | 12,561 | | | | 13,728 | | |
| | | 10.000% 06/15/19 | | | 3,812 | | | | 4,166 | | |
| | | 10.000% 08/15/19 | | | 1,684 | | | | 1,840 | | |
| | | 10.000% 11/15/20 | | | 1,672 | | | | 1,829 | | |
| | | 10.000% 09/15/21 | | | 453 | | | | 496 | | |
| | | 10.500% 12/15/10 | | | 460 | | | | 491 | | |
| | | 10.500% 10/15/15 | | | 6,098 | | | | 6,677 | | |
| | | 10.500% 12/15/15 | | | 790 | | | | 865 | | |
| | | 10.500% 01/15/16 | | | 3,562 | | | | 3,908 | | |
| | | 10.500% 11/15/16 | | | 7,088 | | | | 7,635 | | |
| | | 10.500% 10/15/17 | | | 9,424 | | | | 10,356 | | |
| | | 10.500% 12/15/17 | | | 3,361 | | | | 3,693 | | |
| | | 10.500% 01/15/18 | | | 5,546 | | | | 6,105 | | |
| | | 10.500% 07/15/18 | | | 1,078 | | | | 1,186 | | |
| | | 10.500% 12/15/18 | | | 1,088 | | | | 1,197 | | |
| | | 10.500% 05/15/19 | | | 93 | | | | 102 | | |
| | | 10.500% 06/15/19 | | | 1,843 | | | | 2,031 | | |
| | | 10.500% 07/15/19 | | | 2,010 | | | | 2,215 | | |
| | | 10.500% 08/15/19 | | | 784 | | | | 864 | | |
| | | 10.500% 04/15/21 | | | 1,792 | | | | 1,978 | | |
| | | 11.000% 09/15/15 | | | 62,003 | | | | 67,987 | | |
| | | 11.000% 10/15/15 | | | 153,647 | | | | 168,475 | | |
| | | 11.750% 08/15/13 | | | 7,743 | | | | 8,553 | | |
| | | 12.000% 05/15/14 | | | 387 | | | | 434 | | |
| | | Total Mortgage-Backed Securities (cost of $86,599,882) | | | | | | | 86,286,256 | | |
| Asset-Backed Securities – 2.0% | |
| Advanta Business Card Master Trust 2005 | |
| | | Class A5,
5.141% 04/20/12(b) | | | 7,000,000 | | | | 7,021,572 | | |
| American Express Credit Account Master Trust | |
| | | 1.690% 01/15/09 | | | 225,779 | | | | 225,456 | | |
| AmeriCredit Automobile Receivables Trust | |
| | | 2.070% 08/06/08 | | | 392,818 | | | | 390,892 | | |
| Bank One Auto Securitization Trust | |
| | | 1.820% 09/20/07 | | | 21,161 | | | | 21,133 | | |
| BMW Vehicle Owner Trust | |
| | | 3.320% 02/25/09 | | | 1,126,000 | | | | 1,105,825 | | |
| Chase Credit Card Master Trust | |
| | | 5.191% 02/15/11(b) | | | 8,000,000 | | | | 8,021,136 | | |
See Accompanying Notes to Financial Statements.
32
Columbia Strategic Income Fund May 31, 2006
Asset-Backed Securities (continued)
| | | | | Par ($) | | Value ($) | |
| Discover Card Master Trust | |
| | | 5.750% 12/15/08 | | | 212,000 | | | | 212,034 | | |
| Equity One ABS, Inc. | |
| | | 4.205% 04/25/34 | | | 5,050,000 | | | | 4,720,548 | | |
| First Plus Home Loan Trust | |
| | | 7.720% 05/10/24 | | | 7,706 | | | | 7,708 | | |
| Ford Credit Auto Owner Trust | |
| | | 2.700% 06/15/07 | | | 145,253 | | | | 144,964 | | |
| | | 3.540% 11/15/08 | | | 2,503,000 | | | | 2,451,698 | | |
| GMAC Mortgage Corp. | |
| | | 4.865% 09/25/34 | | | 4,130,000 | | | | 3,986,962 | | |
| Honda Auto Receivables Owner Trust | |
| | | 3.060% 10/21/09 | | | 1,403,000 | | | | 1,370,473 | | |
| Household Automotive Trust | |
| | | 2.310% 04/17/08 | | | 165,909 | | | | 165,606 | | |
| Nissan Auto Receivables Owner Trust | |
| | | 2.700% 12/17/07 | | | 382,024 | | | | 379,815 | | |
| Volkswagen Auto Loan Enhanced Trust | |
| | | 2.270% 10/22/07 | | | 158,974 | | | | 158,335 | | |
| | | Total Asset-Backed Securities (cost of $30,921,253) | | | | | | | 30,384,157 | | |
| Convertible Bonds – 0.2% | |
| Communications – 0.2% | | | | | | | | | | | |
| Telecommunication Services – 0.2% | |
| Telecommunication Equipment – 0.2% | |
| Nortel Networks Corp. | |
| | | 4.250% 09/01/08 | | | 3,460,000 | | | | 3,274,025 | | |
| | | | | | | | | | 3,274,025 | | |
| | | Telecommunication Services Total | | | | | | | 3,274,025 | | |
| Communications Total | | | | | | | | | 3,274,025 | | |
| | | Total Convertible Bonds (cost of $3,212,003) | | | | | | | 3,274,025 | | |
| Municipal Bonds (Taxable) – 0.2% | |
| California – 0.2% | |
| CA Cabazon Band Mission Indians | |
| | | 13.000% 10/01/11(c) | | | 2,820,000 | | | | 2,785,004 | | |
| California Total | | | | | | | | | 2,785,004 | | |
| | | Total Municipal Bonds (Taxable) (cost of $2,820,000) | | | | | | | 2,785,004 | | |
See Accompanying Notes to Financial Statements.
33
Columbia Strategic Income Fund May 31, 2006
Collateralized Mortgage Obligations – 0.0%
| Agency – 0.0% | | | | Par ($) | | Value ($) | |
| Federal Home Loan Mortgage Corp. | |
| | | 5.500% 01/15/23(j) | | | 293,465 | | | | 11,588 | | |
| | | 5.500% 05/15/27(j) | | | 350,045 | | | | 28,942 | | |
| Agency Total | | | | | | | | | 40,530 | | |
| | | Total Collateralized Mortgage Obligations (cost of $34,420) | | | | | | | 40,530 | | |
| Common Stocks – 0.0% | |
| Consumer Discretionary – 0.0% | | | | Shares | | | |
| Hotels, Restaurants & Leisure – 0.0% | |
| | | Shreveport Gaming Holdings, Inc.(c)(k) | | | 26,719 | | | | 227,111 | | |
| | | Total Hotels, Restaurants & Leisure | | | | | | | 227,111 | | |
| Consumer Discretionary Total | | | | | | | | | 227,111 | | |
| | | Total Common Stocks (cost of $387,960) | | | | | | | 227,111 | | |
| Short-Term Obligation – 6.8% | | | | Par ($) | | | |
| | | Repurchase agreement with State Street Bank & Trust Co., dated
05/31/06, due 06/01/06 at 4.770%, collateralized by U.S.
Treasury Bonds with various maturities, market value of
$108,064,208 (repurchase proceeds $105,956,037) | | | 105,942,000 | | | | 105,942,000 | | |
| | | Total Short-Term Obligation (cost of $105,942,000) | | | | | | | 105,942,000 | | |
| | | Total Investments – 103.5% (cost of $1,605,674,168)(l) | | | | | | | 1,607,515,614 | | |
| | | Other Assets & Liabilities, Net – (3.5)% | | | | | | | (54,169,472 | ) | |
| | | Net Assets – 100.0% | | | | | | | 1,553,346,142 | | |
Notes to Investment Portfolio:
(a) Security exempt from registration pursuant to Rule 144A under the Securities Act of 1933. These securities may be resold in transactions exempt from registration, normally to qualified institutional buyers. At May 31, 2006, these securities, which did not include any illiquid securities except the following, amounted to $127,250,123, which represents 8.2% of net assets.
| Security | | Acquisition
Date | | Par/Unit | | Cost | | Value | |
Hollinger, Inc.
11.875% 03/01/11 | | 09/30/04 | | $ | 734,000 | | | $ | 734,000 | | | $ | 734,000 | | |
| 12.875% 03/01/11 | | 03/05/03~11/29/05 | | | 1,636,000 | | | | 1,678,276 | | | | 1,703,485 | | |
| | | $ | 2,437,485 | | |
(b) The interest rate shown on floating rate or variable rate securities reflects the rate at May 31, 2006.
(c) Illiquid security.
(d) Step bond. Shown parenthetically is the next interest rate to be paid and the date the Fund will begin accruing at this rate.
(e) Zero coupon bond.
(f) Step bond. This security is currently not paying coupon. Shown parenthetically is the next interest rate to be paid and the date the Fund will begin accruing at this rate.
(g) The issuer has filed for bankruptcy protection under Chapter 11, and is in default of certain debt covenants. Income is not being accrued. At May 31, 2006, the value of these securities amounted to $0, which represents 0.0% of net assets.
(h) Represents fair value as determined in good faith under procedures approved by the Board of Trustees.
(i) Securities purchased on a delayed delivery basis.
(j) Interest only security.
(k) Non-income producing security.
(l) Cost for federal income tax purposes is $1,630,691,569.
See Accompanying Notes to Financial Statements.
34
Columbia Strategic Income Fund May 31, 2006
At May 31, 2006, the Trust had entered into the following forward currency exchange contracts:
Forward Currency
Contracts to Buy | | Value | | Aggregate
Face Value | | Settlement
Date | | Unrealized
Appreciation | |
| CAD | $ | | | | 16,368,664 | | | $ | 16,292,948 | | | 06/21/06 | | $ | 75,716 | | |
Forward Currency
Contracts to Sell | | Value | | Aggregate
Face Value | | Settlement
Date | | Unrealized
Appreciation/
(Depreciation) | |
| AUD | $ | | | | 10,231,027 | | | $ | 10,338,720 | | | 06/05/06 | | | 107,693 | | |
| | | CAD | 16,368,664 | | | | 15,820,896 | | | 06/21/06 | | | (547,768 | ) | |
| | | EUR | 10,584,870 | | | | 10,042,642 | | | 06/19/06 | | | (542,228 | ) | |
| | | EUR | 15,660,044 | | | | 15,094,084 | | | 06/26/06 | | | (565,960 | ) | |
| | | EUR | 6,482,660 | | | | 6,291,391 | | | 06/27/06 | | | (191,269 | ) | |
| | | EUR | 1,746,173 | | | | 1,700,938 | | | 06/30/06 | | | (45,235 | ) | |
| | | GBP | 10,288,725 | | | | 9,614,578 | | | 06/19/06 | | | (674,147 | ) | |
| | | GBP | 13,133,515 | | | | 12,506,411 | | | 06/26/06 | | | (627,104 | ) | |
| | | $ | (3,086,018 | ) | |
At May 31, 2006, the asset allocation of the Fund is as follows:
| Asset Allocation (unaudited) | | % of
Net Assets | |
| Government Agencies & Obligations | | | 50.2 | % | |
| Corporate Fixed-Income Bonds & Notes | | | 38.6 | | |
| Mortgage-Backed Securities | | | 5.5 | | |
| Asset-Backed Securities | | | 2.0 | | |
| Convertible Bonds | | | 0.2 | | |
| Municipal Bond (Taxable) | | | 0.2 | | |
| Collateralized Mortgage Obligations | | | — | * | |
| Common Stocks | | | — | * | |
| Short-Term Obligation | | | 6.8 | | |
| Other Assets & Liabilities, Net | | | (3.5 | ) | |
| | | | 100.0 | % | |
* Rounds to less than 0.1%.
| Acronym | | Name | |
| AUD | | Australian Dollar | |
|
| CAD | | Canadian Dollar | |
|
| EUR | | Euro | |
|
| GBP | | British Pound | |
|
| NOK | | Norwegian Krone | |
|
| NZD | | New Zealand Dollar | |
|
| PIK | | Payment-In-Kind | |
|
| PLN | | Polish Zloty | |
|
| REIT | | Real Estate Investment Trust | |
|
| SEK | | Swedish Krona | |
|
| STRIPS | | Separate Trading of Registered Interest and Principal of Securities | |
|
| TBA | | To Be Announced | |
|
| USD | | United States Dollar | |
|
| ZAR | | South African Rand | |
|
See Accompanying Notes to Financial Statements.
35
Statement of Assets and Liabilities – Columbia Strategic Income Fund
May 31, 2006
| | | | | ($) | |
| Assets | | Investments, at cost | | | 1,605,674,168 | | |
| | | Investments, at value | | | 1,607,515,614 | | |
| | | Cash | | | 457 | | |
| | | Foreign currency (cost of $15,961) | | | 15,907 | | |
| | | Unrealized appreciation on foreign forward currency contracts | | | 183,409 | | |
| | | Receivable for: | | | | | |
| | | Investments sold | | | 4,895,955 | | |
| | | Fund shares sold | | | 2,660,572 | | |
| | | Interest | | | 28,442,609 | | |
| | | Foreign tax reclaims | | | 163,556 | | |
| | | Dollar roll fee income | | | 222,607 | | |
| | | Expense reimbursement due from Investment Advisor | | | 63,951 | | |
| | | Deferred Trustees' compensation plan | | | 77,688 | | |
| | | Total Assets | | | 1,644,242,325 | | |
| Liabilities | | Unrealized depreciation on foreign forward currency contracts | | | 3,193,711 | | |
| | | Payable for: | | | | | |
| | | Investments purchased on a delayed delivery basis | | | 83,635,621 | | |
| | | Fund shares repurchased | | | 2,066,068 | | |
| | | Distributions | | | 17 | | |
| | | Investment advisory fee | | | 730,658 | | |
| | | Transfer agent fee | | | 267,131 | | |
| | | Pricing and bookkeeping fees | | | 45,344 | | |
| | | Trustees' fees | | | 885 | | |
| | | Custody fee | | | 27,685 | | |
| | | Distribution and service fees | | | 532,845 | | |
| | | Chief compliance officer expenses | | | 2,149 | | |
| | | Deferred dollar roll fee income | | | 28,080 | | |
| | | Deferred Trustees' fees | | | 77,688 | | |
| | | Other liabilities | | | 288,301 | | |
| | | Total Liabilities | | | 90,896,183 | | |
| | | Net Assets | | | 1,553,346,142 | | |
| Composition of Net Assets | | Paid-in capital | | | 1,941,583,149 | | |
| | | Overdistributed net investment income | | | (21,722,212 | ) | |
| | | Accumulated net realized loss | | | (365,706,861 | ) | |
| | | Net unrealized appreciation (depreciation) on: | | | | | |
| | | Investments | | | 1,841,446 | | |
| | | Foreign currency translations | | | (2,649,380 | ) | |
| | | Net Assets | | | 1,553,346,142 | | |
| Class A | | Net assets | | | 703,746,331 | | |
| | | Shares outstanding | | | 119,591,282 | | |
| | | Net asset value per share | | | 5.88 | (a) | |
| | | Maximum offering price per share ($5.88/0.9525) | | | 6.17 | (b) | |
| Class B | | Net assets | | | 295,982,772 | | |
| | | Shares outstanding | | | 50,339,701 | | |
| | | Net asset value and offering price per share | | | 5.88 | (a) | |
| Class C | | Net assets | | | 72,221,028 | | |
| | | Shares outstanding | | | 12,271,097 | | |
| | | Net asset value and offering price per share | | | 5.89 | (a) | |
| Class J | | Net assets | | | 173,101,396 | | |
| | | Shares outstanding | | | 29,499,036 | | |
| | | Net asset value and redemption price per share | | | 5.87 | (a) | |
| | | Maximum offering price per share ($5.87/0.9700) | | | 6.05 | (b) | |
| Class Z | | Net assets | | | 308,294,615 | | |
| | | Shares outstanding | | | 52,855,404 | | |
| | | Net asset value, offering and redemption price per share | | | 5.83 | | |
(a) Redemption price per share is equal to net asset value less any applicable contingent deferred sales charge.
(b) On sales of $50,000 or more the offering price is reduced.
See Accompanying Notes to Financial Statements.
36
Statement of Operations – Columbia Strategic Income Fund
For the Year Ended May 31, 2006
| | | | | ($) | |
| Investment Income | | Interest (net of foreign taxes withheld of $5,726) | | | 94,444,674 | | |
| | | Dollar roll fee income | | | 884,207 | | |
| | | Total Investment Income | | | 95,328,881 | | |
| Expenses | | Investment advisory fee | | | 8,118,519 | | |
| | | Distribution fee: | | | | | |
| | | Class B | | | 2,492,199 | | |
| | | Class C | | | 470,690 | | |
| | | Class J | | | 680,138 | | |
| | | Printing fee — Class J | | | 58,000 | | |
| | | Service fee: | | | | | |
| | | Class A | | | 1,616,399 | | |
| | | Class B | | | 805,688 | | |
| | | Class C | | | 152,358 | | |
| | | Class J | | | 470,973 | | |
| | | Transfer agent fee | | | 1,706,981 | | |
| | | Pricing and bookkeeping fees | | | 281,324 | | |
| | | Trustees' fees | | | 65,171 | | |
| | | Custody fee | | | 197,253 | | |
| | | Merger costs | | | 18,750 | | |
| | | Chief compliance officer expenses (See Note 4) | | | 13,148 | | |
| | | Non-recurring costs (See Note 8) | | | 19,603 | | |
| | | Other expenses | | | 627,478 | | |
| | | Total Expenses | | | 17,794,672 | | |
| | | Fees waived by Distributor — Class C | | | (94,445 | ) | |
| | | Fees and expenses waived by Transfer Agent | | | (134,495 | ) | |
| | | Non-recurring costs assumed by Investment Advisor (See Note 8) | | | (19,603 | ) | |
| | | Custody earnings credit | | | (55,537 | ) | |
| | | Net Expenses | | | 17,490,592 | | |
| | | Net Investment Income | | | 77,838,289 | | |
| Net Realized and Unrealized Gain (Loss) on Investments and Foreign Currency | | Net realized gain (loss) on: | | | | | |
| | | Investments | | | 498,198 | | |
| | | Foreign currency transactions | | | 5,338,579 | | |
| | | Net realized gain | | | 5,836,777 | | |
| | | Net change in unrealized appreciation (depreciation) on: | | | | | |
| | | Investments | | | (35,526,640 | ) | |
| | | Foreign currency translations | | | (6,578,014 | ) | |
| | | Net change in unrealized appreciation (depreciation) | | | (42,104,654 | ) | |
| | | Net Loss | | | (36,267,877 | ) | |
| | | Net Increase in Net Assets from Operations | | | 41,570,412 | | |
See Accompanying Notes to Financial Statements.
37
Statement of Changes in Net Assets – Columbia Strategic Income Fund
| Increase (Decrease) in Net Assets | | | | Year Ended
May 31,
2006 ($) | | Year Ended
May 31,
2005 ($) | |
| Operations | | Net investment income | | | 77,838,289 | | | | 69,564,466 | | |
| | | Net realized gain on investments and foreign
currency transactions | | | 5,836,777 | | | | 17,837,174 | | |
| | | Net change in unrealized appreciation (depreciation)
on investments and foreign currency translations | | | (42,104,654 | ) | | | 32,282,261 | | |
| | | Net Increase from Operations | | | 41,570,412 | | | | 119,683,901 | | |
| Distributions Declared to Shareholders | | From net investment income: | | | | | | | | | |
| | | Class A | | | (51,256,404 | ) | | | (46,245,319 | ) | |
| | | Class B | | | (22,850,436 | ) | | | (26,670,567 | ) | |
| | | Class C | | | (4,470,619 | ) | | | (3,110,631 | ) | |
| | | Class J | | | (14,138,568 | ) | | | (16,716,434 | ) | |
| | | Class Z | | | (16,845,296 | ) | | | (1,333,633 | ) | |
| | | Total Distributions Declared to Shareholders | | | (109,561,323 | ) | | | (94,076,584 | ) | |
| Share Transactions | | Class A: | | | | | | | | | |
| | | Subscriptions | | | 180,682,015 | | | | 112,949,787 | | |
| | | Proceeds received in connection with merger | | | 33,718,528 | | | | — | | |
| | | Distributions reinvested | | | 32,004,239 | | | | 26,643,837 | | |
| | | Redemptions | | | (128,311,011 | ) | | | (101,234,635 | ) | |
| | | Net Increase | | | 118,093,771 | | | | 38,358,989 | | |
| | | Class B: | | | | | | | | | |
| | | Subscriptions | | | 33,569,739 | | | | 31,189,953 | | |
| | | Proceeds received in connection with merger | | | 19,899,198 | | | | — | | |
| | | Distributions reinvested | | | 13,525,076 | | | | 15,375,032 | | |
| | | Redemptions | | | (106,395,392 | ) | | | (114,341,740 | ) | |
| | | Net Decrease | | | (39,401,379 | ) | | | (67,776,755 | ) | |
| | | Class C: | | | | | | | | | |
| | | Subscriptions | | | 32,482,823 | | | | 18,283,803 | | |
| | | Proceeds received in connection with merger | | | 2,478,157 | | | | — | | |
| | | Distributions reinvested | | | 2,865,677 | | | | 1,832,963 | | |
| | | Redemptions | | | (14,165,883 | ) | | | (10,901,213 | ) | |
| | | Net Increase | | | 23,660,774 | | | | 9,215,553 | | |
| | | Class J: | | | | | | | | | |
| | | Subscriptions | | | 1,596,529 | | | | 4,292,898 | | |
| | | Redemptions | | | (32,106,939 | ) | | | (26,429,927 | ) | |
| | | Net Decrease | | | (30,510,410 | ) | | | (22,137,029 | ) | |
| | | Class Z: | | | | | | | | | |
| | | Subscriptions | | | 159,194,986 | | | | 49,407,426 | | |
| | | Proceeds received in connection with merger | | | 151,232,391 | | | | — | | |
| | | Distributions reinvested | | | 952,766 | | | | 153,680 | | |
| | | Redemptions | | | (37,949,196 | ) | | | (3,229,230 | ) | |
| | | Net Increase | | | 273,430,947 | | | | 46,331,876 | | |
| | | Net Increase from Share Transactions | | | 345,273,703 | | | | 3,992,634 | | |
| | | Total Increase in Net Assets | | | 277,282,792 | | | | 29,599,951 | | |
| Net Assets | | Beginning of period | | | 1,276,063,350 | | | | 1,246,463,399 | | |
| | | End of period | | | 1,553,346,142 | | | | 1,276,063,350 | | |
| | | Overdistributed net investment income at end of period | | | (21,722,212 | ) | | | (6,799,350 | ) | |
See Accompanying Notes to Financial Statements.
38
Columbia Strategic Income Fund
| Increase (Decrease) in Net Assets | | | | Year Ended
May 31,
2006 ($) | | Year Ended
May 31,
2005 ($) | |
| Changes in Shares | | Class A: | | | | | | | | | |
| | | Subscriptions | | | 29,919,637 | | | | 18,079,113 | | |
| | | Issued in connection with merger | | | 5,482,006 | | | | — | | |
| | | Issued for distributions reinvested | | | 5,326,801 | | | | 4,268,478 | | |
| | | Redemptions | | | (21,245,904 | ) | | | (16,268,593 | ) | |
| | | Net Increase | | | 19,482,540 | | | | 6,078,998 | | |
| | | Class B: | | | | | | | | | |
| | | Subscriptions | | | 5,539,861 | | | | 5,004,940 | | |
| | | Issued in connection with merger | | | 3,235,866 | | | | — | | |
| | | Issued for distributions reinvested | | | 2,250,542 | | | | 2,464,933 | | |
| | | Redemptions | | | (17,624,321 | ) | | | (18,379,866 | ) | |
| | | Net Decrease | | | (6,598,052 | ) | | | (10,909,993 | ) | |
| | | Class C: | | | | | | | | | |
| | | Subscriptions | | | 5,374,622 | | | | 2,940,461 | | |
| | | Issued in connection with merger | | | 402,834 | | | | — | | |
| | | Issued for distributions reinvested | | | 477,087 | | | | 293,565 | | |
| | | Redemptions | | | (2,353,172 | ) | | | (1,758,067 | ) | |
| | | Net Increase | | | 3,901,371 | | | | 1,475,959 | | |
| | | Class J: | | | | | | | | | |
| | | Subscriptions | | | 262,020 | | | | 685,030 | | |
| | | Redemptions | | | (5,327,010 | ) | | | (4,251,415 | ) | |
| | | Net Decrease | | | (5,064,990 | ) | | | (3,566,385 | ) | |
| | | Class Z: | | | | | | | | | |
| | | Subscriptions | | | 26,660,068 | | | | 7,959,417 | | |
| | | Issued in connection with merger | | | 24,785,764 | | | | — | | |
| | | Issued for distributions reinvested | | | 161,096 | | | | 24,800 | | |
| | | Redemptions | | | (6,403,300 | ) | | | (524,884 | ) | |
| | | Net Increase | | | 45,203,628 | | | | 7,459,333 | | |
See Accompanying Notes to Financial Statements.
39
Financial Highlights – Columbia Strategic Income Fund
Selected data for a share outstanding throughout each period is as follows:
| | | Year Ended May 31, | | Period
Ended
May 31, | | Year Ended
December 31, | |
| Class A Shares | | 2006 | | 2005 | | 2004 | | 2003 (a) | | 2002 | | 2001 | |
| Net Asset Value, Beginning of Period | | $ | 6.15 | | | $ | 6.02 | | | $ | 6.09 | | | $ | 5.63 | | | $ | 5.64 | | | $ | 6.00 | | |
| Income from Investment Operations: | |
| Net investment income (b) | | | 0.34 | | | | 0.36 | | | | 0.36 | | | | 0.16 | | | | 0.38 | | | | 0.48 | (c) | |
Net realized and unrealized gain (loss) on investments
and foreign currency | | | (0.15 | ) | | | 0.25 | | | | 0.01 | | | | 0.46 | | | | 0.05 | | | | (0.30 | )(c) | |
| Total from Investment Operations | | | 0.19 | | | | 0.61 | | | | 0.37 | | | | 0.62 | | | | 0.43 | | | | 0.18 | | |
| Less Distributions Declared to Shareholders: | |
| From net investment income | | | (0.46 | ) | | | (0.48 | ) | | | (0.44 | ) | | | (0.16 | ) | | | (0.42 | ) | | | (0.50 | ) | |
| Return of capital | | | — | | | | — | | | | — | | | | — | | | | (0.02 | ) | | | (0.04 | ) | |
| Total Distributions Declared to Shareholders | | | (0.46 | ) | | | (0.48 | ) | | | (0.44 | ) | | | (0.16 | ) | | | (0.44 | ) | | | (0.54 | ) | |
| Net Asset Value, End of Period | | $ | 5.88 | | | $ | 6.15 | | | $ | 6.02 | | | $ | 6.09 | | | $ | 5.63 | | | $ | 5.64 | | |
| Total return (d) | | | 3.24 | %(e) | | | 10.37 | % | | | 6.21 | % | | | 11.10 | %(f) | | | 7.97 | % | | | 3.07 | % | |
Ratios to Average Net Assets/
Supplemental Data: | |
| Expenses (g) | | | 0.99 | % | | | 1.09 | % | | | 1.17 | % | | | 1.27 | %(h) | | | 1.23 | % | | | 1.21 | % | |
| Net investment income (g) | | | 5.56 | % | | | 5.81 | % | | | 5.90 | % | | | 6.52 | %(h) | | | 6.75 | % | | | 8.22 | %(c) | |
| Waiver/reimbursement | | | 0.01 | % | | | — | | | | — | | | | — | | | | — | | | | — | | |
| Portfolio turnover rate | | | 56 | % | | | 57 | % | | | 68 | % | | | 59 | %(f) | | | 62 | % | | | 106 | % | |
| Net assets, end of period (000's) | | $ | 703,746 | | | $ | 615,772 | | | $ | 566,269 | | | $ | 595,223 | | | $ | 552,737 | | | $ | 575,791 | | |
(a) The Fund changed its fiscal year end from December 31 to May 31.
(b) Per share data was calculated using average shares outstanding during the period.
(c) Effective January 1, 2001, the Fund adopted the provisions of the AICPA Audit and Accounting Guide for Investment Companies and began amortizing premium and accreting discount on all debt securities. The effect of this change for the year ended December 31, 2001 was to decrease net investment income per share by $0.02, increase net realized and unrealized loss per share by $0.02 and decrease the ratio of net investment income to average net assets from 8.60% to 8.22%. Per share data and ratios for periods prior to December 31, 2001 have not been restated to reflect this change in presentation.
(d) Total return at net asset value assuming all distributions reinvested and no initial sales charge or contingent deferred sales charge.
(e) Had the Transfer Agent not waived a portion of expenses, total return would have been reduced.
(f) Not annualized.
(g) The benefits derived from custody credits had an impact of less than 0.01%.
(h) Annualized.
See Accompanying Notes to Financial Statements.
40
Financial Highlights – Columbia Strategic Income Fund
Selected data for a share outstanding throughout each period is as follows:
| | | Year Ended May 31, | | Period
Ended
May 31, | | Year Ended
December 31, | |
| Class B Shares | | 2006 | | 2005 | | 2004 | | 2003 (a) | | 2002 | | 2001 | |
| Net Asset Value, Beginning of Period | | $ | 6.15 | | | $ | 6.02 | | | $ | 6.09 | | | $ | 5.62 | | | $ | 5.63 | | | $ | 6.00 | | |
| Income from Investment Operations: | |
| Net investment income (b) | | | 0.29 | | | | 0.32 | | | | 0.32 | | | | 0.14 | | | | 0.34 | | | | 0.44 | (c) | |
Net realized and unrealized gain (loss) on investments
and foreign currency | | | (0.14 | ) | | | 0.25 | | | | 0.01 | | | | 0.47 | | | | 0.04 | | | | (0.32 | )(c) | |
| Total from Investment Operations | | | 0.15 | | | | 0.57 | | | | 0.33 | | | | 0.61 | | | | 0.38 | | | | 0.12 | | |
| Less Distributions Declared to Shareholders: | |
| From net investment income | | | (0.42 | ) | | | (0.44 | ) | | | (0.40 | ) | | | (0.14 | ) | | | (0.37 | ) | | | (0.45 | ) | |
| Return of capital | | | — | | | | — | | | | — | | | | — | | | | (0.02 | ) | | | (0.04 | ) | |
| Total Distributions Declared to Shareholders | | | (0.42 | ) | | | (0.44 | ) | | | (0.40 | ) | | | (0.14 | ) | | | (0.39 | ) | | | (0.49 | ) | |
| Net Asset Value, End of Period | | $ | 5.88 | | | $ | 6.15 | | | $ | 6.02 | | | $ | 6.09 | | | $ | 5.62 | | | $ | 5.63 | | |
| Total return (d) | | | 2.48 | %(e) | | | 9.55 | % | | | 5.42 | % | | | 10.95 | %(f) | | | 7.17 | % | | | 2.12 | % | |
Ratios to Average Net Assets/
Supplemental Data: | |
| Expenses (g) | | | 1.74 | % | | | 1.84 | % | | | 1.92 | % | | | 2.02 | %(h) | | | 1.98 | % | | | 1.96 | % | |
| Net investment income (g) | | | 4.82 | % | | | 5.06 | % | | | 5.15 | % | | | 5.77 | %(h) | | | 6.00 | % | | | 7.47 | %(c) | |
| Waiver/reimbursement | | | 0.01 | % | | | — | | | | — | | | | — | | | | — | | | | — | | |
| Portfolio turnover rate | | | 56 | % | | | 57 | % | | | 68 | % | | | 59 | %(f) | | | 62 | % | | | 106 | % | |
| Net assets, end of period (000's) | | $ | 295,983 | | | $ | 349,975 | | | $ | 408,345 | | | $ | 484,540 | | | $ | 456,563 | | | $ | 533,406 | | |
(a) The Fund changed its fiscal year end from December 31 to May 31.
(b) Per share data was calculated using average shares outstanding during the period.
(c) Effective January 1, 2001, the Fund adopted the provisions of the AICPA Audit and Accounting Guide for Investment Companies and began amortizing premium and accreting discount on all debt securities. The effect of this change for the year ended December 31, 2001 was to decrease net investment income per share by $0.02, increase net realized and unrealized loss per share by $0.02 and decrease the ratio of net investment income to average net assets from 7.85% to 7.47%. Per share data and ratios for periods prior to December 31, 2001 have not been restated to reflect this change in presentation.
(d) Total return at net asset value assuming all distributions reinvested and no contingent deferred sales charge.
(e) Had the Transfer Agent not waived a portion of expenses, total return would have been reduced.
(f) Not annualized.
(g) The benefits derived from custody credits had an impact of less than 0.01%.
(h) Annualized.
See Accompanying Notes to Financial Statements.
41
Financial Highlights – Columbia Strategic Income Fund
Selected data for a share outstanding throughout each period is as follows:
| | | Year Ended May 31, | | Period
Ended
May 31, | | Year Ended
December 31, | |
| Class C Shares | | 2006 | | 2005 | | 2004 | | 2003 (a) | | 2002 | | 2001 | |
| Net Asset Value, Beginning of Period | | $ | 6.15 | | | $ | 6.02 | | | $ | 6.09 | | | $ | 5.63 | | | $ | 5.64 | | | $ | 6.00 | | |
| Income from Investment Operations: | |
| Net investment income (b) | | | 0.30 | | | | 0.32 | | | | 0.33 | | | | 0.14 | | | | 0.35 | | | | 0.45 | (c) | |
Net realized and unrealized gain (loss) on investments
and foreign currency | | | (0.13 | ) | | | 0.26 | | | | 0.01 | | | | 0.46 | | | | 0.04 | | | | (0.31 | )(c) | |
| Total from Investment Operations | | | 0.17 | | | | 0.58 | | | | 0.34 | | | | 0.60 | | | | 0.39 | | | | 0.14 | | |
| Less Distributions Declared to Shareholders: | |
| From net investment income | | | (0.43 | ) | | | (0.45 | ) | | | (0.41 | ) | | | (0.14 | ) | | | (0.38 | ) | | | (0.46 | ) | |
| Return of capital | | | — | | | | — | | | | — | | | | — | | | | (0.02 | ) | | | (0.04 | ) | |
| Total Distributions Declared to Shareholders | | | (0.43 | ) | | | (0.45 | ) | | | (0.41 | ) | | | (0.14 | ) | | | (0.40 | ) | | | (0.50 | ) | |
| Net Asset Value, End of Period | | $ | 5.89 | | | $ | 6.15 | | | $ | 6.02 | | | $ | 6.09 | | | $ | 5.63 | | | $ | 5.64 | | |
| Total return (d) | | | 2.79 | %(e) | | | 9.71 | %(e) | | | 5.57 | %(e) | | | 10.82 | %(e)(f) | | | 7.32 | %(e) | | | 2.45 | % | |
Ratios to Average Net Assets/
Supplemental Data: | |
| Expenses (g) | | | 1.59 | % | | | 1.69 | % | | | 1.77 | % | | | 1.87 | %(h) | | | 1.83 | % | | | 1.81 | % | |
| Net investment income (g) | | | 4.95 | % | | | 5.21 | % | | | 5.31 | % | | | 5.92 | %(h) | | | 6.15 | % | | | 7.62 | %(c) | |
| Waiver/reimbursement | | | 0.16 | % | | | 0.15 | % | | | 0.15 | % | | | 0.15 | %(h) | | | 0.15 | % | | | — | | |
| Portfolio turnover rate | | | 56 | % | | | 57 | % | | | 68 | % | | | 59 | %(f) | | | 62 | % | | | 106 | % | |
| Net assets, end of period (000's) | | $ | 72,221 | | | $ | 51,488 | | | $ | 41,520 | | | $ | 45,572 | | | $ | 38,923 | | | $ | 42,906 | | |
(a) The Fund changed its fiscal year end from December 31 to May 31.
(b) Per share data was calculated using average shares outstanding during the period.
(c) Effective January 1, 2001, the Fund adopted the provisions of the AICPA Audit and Accounting Guide for Investment Companies and began amortizing premium and accreting discount on all debt securities. The effect of this change for the year ended December 31, 2001 was to decrease net investment income per share by $0.02, increase net realized and unrealized loss per share by $0.02 and decrease the ratio of net investment income to average net assets from 8.00% to 7.62%. Per share data and ratios for periods prior to December 31, 2001 have not been restated to reflect this change in presentation.
(d) Total return at net asset value assuming all distributions reinvested and no contingent deferred sales charge.
(e) Had the Distributor and/or Transfer Agent not waived a portion of expenses, total return would have been reduced.
(f) Not annualized.
(g) The benefits derived from custody credits had an impact of less than 0.01%.
(h) Annualized.
See Accompanying Notes to Financial Statements.
42
Financial Highlights – Columbia Strategic Income Fund
Selected data for a share outstanding throughout each period is as follows:
| | | Year Ended May 31, | | Period
Ended
May 31, | | Year Ended
December 31, | |
| Class J Shares | | 2006 | | 2005 | | 2004 | | 2003 (a) | | 2002 | | 2001 | |
| Net Asset Value, Beginning of Period | | $ | 6.14 | | | $ | 6.01 | | | $ | 6.08 | | | $ | 5.62 | | | $ | 5.63 | | | $ | 6.00 | | |
| Income from Investment Operations: | |
| Net investment income (b) | | | 0.31 | | | | 0.34 | | | | 0.34 | | | | 0.15 | | | | 0.36 | | | | 0.46 | (c) | |
Net realized and unrealized gain (loss) on investments
and foreign currency | | | (0.14 | ) | | | 0.25 | | | | 0.01 | | | | 0.46 | | | | 0.05 | | | | (0.31 | )(c) | |
| Total from Investment Operations | | | 0.17 | | | | 0.59 | | | | 0.35 | | | | 0.61 | | | | 0.41 | | | | 0.15 | | |
| Less Distributions Declared to Shareholders: | |
| From net investment income | | | (0.44 | ) | | | (0.46 | ) | | | (0.42 | ) | | | (0.15 | ) | | | (0.40 | ) | | | (0.48 | ) | |
| Return of capital | | | — | | | | — | | | | — | | | | — | | | | (0.02 | ) | | | (0.04 | ) | |
| Total Distributions Declared to Shareholders | | | (0.44 | ) | | | (0.46 | ) | | | (0.42 | ) | | | (0.15 | ) | | | (0.42 | ) | | | (0.52 | ) | |
| Net Asset Value, End of Period | | $ | 5.87 | | | $ | 6.14 | | | $ | 6.01 | | | $ | 6.08 | | | $ | 5.62 | | | $ | 5.63 | | |
| Total return (d) | | | 2.88 | %(e) | | | 10.01 | % | | | 5.88 | % | | | 10.97 | %(f) | | | 7.61 | % | | | 2.56 | % | |
Ratios to Average Net Assets/
Supplemental Data: | |
| Expenses (g) | | | 1.37 | % | | | 1.44 | % | | | 1.52 | % | | | 1.62 | %(h) | | | 1.58 | % | | | 1.56 | % | |
| Net investment income (g) | | | 5.19 | % | | | 5.46 | % | | | 5.55 | % | | | 6.17 | %(h) | | | 6.40 | % | | | 7.87 | %(c) | |
| Waiver/reimbursement | | | 0.01 | % | | | — | | | | — | | | | — | | | | — | | | | — | | |
| Portfolio turnover rate | | | 56 | % | | | 57 | % | | | 68 | % | | | 59 | %(f) | | | 62 | % | | | 106 | % | |
| Net assets, end of period (000's) | | $ | 173,101 | | | $ | 212,131 | | | $ | 229,179 | | | $ | 258,057 | | | $ | 271,733 | | | $ | 323,866 | | |
(a) The Fund changed its fiscal year end from December 31 to May 31.
(b) Per share data was calculated using average shares outstanding during the period.
(c) Effective January 1, 2001, the Fund adopted the provisions of the AICPA Audit and Accounting Guide for Investment Companies and began amortizing premium and accreting discount on all debt securities. The effect of this change for the year ended December 31, 2001 was to decrease net investment income per share by $0.02, increase net realized and unrealized loss per share by $0.02 and decrease the ratio of net investment income to average net assets from 8.25% to 7.87%. Per share data and ratios for periods prior to December 31, 2001 have not been restated to reflect this change in presentation.
(d) Total return at net asset value assuming all distributions reinvested and no initial sales charge.
(e) Had the Transfer Agent not waived a portion of expenses, total return would have been reduced.
(f) Not annualized.
(g) The benefits derived from custody credits had an impact of less than 0.01%.
(h) Annualized.
See Accompanying Notes to Financial Statements.
43
Financial Highlights – Columbia Strategic Income Fund
Selected data for a share outstanding throughout each period is as follows:
| | | Year Ended May 31, | | Period
Ended
May 31, | | Year Ended
December 31, | |
| Class Z Shares | | 2006 | | 2005 | | 2004 | | 2003 (a) | | 2002 | | 2001 | |
| Net Asset Value, Beginning of Period | | $ | 6.10 | | | $ | 5.98 | | | $ | 6.05 | | | $ | 5.59 | | | $ | 5.62 | | | $ | 5.99 | | |
| Income from Investment Operations: | |
| Net investment income (b) | | | 0.34 | | | | 0.37 | | | | 0.38 | | | | 0.17 | | | | 0.39 | | | | 0.49 | (c) | |
Net realized and unrealized gain (loss) on investments
and foreign currency | | | (0.13 | ) | | | 0.25 | | | | 0.01 | | | | 0.45 | | | | 0.03 | | | | (0.31 | )(c) | |
| Total from Investment Operations | | | 0.21 | | | | 0.62 | | | | 0.39 | | | | 0.62 | | | | 0.42 | | | | 0.18 | | |
| Less Distributions Declared to Shareholders: | |
| From net investment income | | | (0.48 | ) | | | (0.50 | ) | | | (0.46 | ) | | | (0.16 | ) | | | (0.43 | ) | | | (0.51 | ) | |
| Return of capital | | | — | | | | — | | | | — | | | | — | | | | (0.02 | ) | | | (0.04 | ) | |
| Total Distributions Declared to Shareholders | | | (0.48 | ) | | | (0.50 | ) | | | (0.46 | ) | | | (0.16 | ) | | | (0.45 | ) | | | (0.55 | ) | |
| Net Asset Value, End of Period | | $ | 5.83 | | | $ | 6.10 | | | $ | 5.98 | | | $ | 6.05 | | | $ | 5.59 | | | $ | 5.62 | | |
| Total return (d) | | | 3.51 | %(e) | | | 10.53 | % | | | 6.52 | % | | | 11.29 | %(f) | | | 7.87 | % | | | 3.14 | % | |
Ratios to Average Net Assets/
Supplemental Data: | |
| Expenses (g) | | | 0.75 | % | | | 0.85 | % | | | 0.93 | % | | | 1.03 | %(h) | | | 0.99 | % | | | 0.98 | % | |
| Net investment income (g) | | | 5.76 | % | | | 6.05 | % | | | 6.15 | % | | | 6.76 | %(h) | | | 6.99 | % | | | 8.45 | %(c) | |
| Waiver/reimbursement | | | 0.01 | % | | | — | | | | — | | | | — | | | | — | | | | — | | |
| Portfolio turnover rate | | | 56 | % | | | 57 | % | | | 68 | % | | | 59 | %(f) | | | 62 | % | | | 106 | % | |
| Net assets, end of period (000's) | | $ | 308,295 | | | $ | 46,698 | | | $ | 1,150 | | | $ | 1,188 | | | $ | 3 | | | $ | 1,860 | | |
(a) The Fund changed its fiscal year end from December 31 to May 31.
(b) Per share data was calculated using average shares outstanding during the period.
(c) Effective January 1, 2001, the Fund adopted the provisions of the AICPA Audit and Accounting Guide for Investment Companies and began amortizing premium and accreting discount on all debt securities. The effect of this change for the year ended December 31, 2001 was to decrease net investment income per share by $0.02, increase net realized and unrealized loss per share by $0.02 and decrease the ratio of net investment income to average net assets from 8.84% to 8.45%. Per share data and ratios for periods prior to December 31, 2001 have not been restated to reflect this change in presentation.
(d) Total return at net asset value assuming all distributions reinvested.
(e) Had the Transfer Agent not waived a portion of expenses, total return would have been reduced.
(f) Not annualized.
(g) The benefits derived from custody credits had an impact of less than 0.01%.
(h) Annualized.
See Accompanying Notes to Financial Statements.
44
Notes to Financial Statements – Columbia Strategic Income Fund May 31, 2006
Note 1. Organization
Columbia Strategic Income Fund (the "Fund"), a series of Columbia Fund Series Trust I (the "Trust"), is a diversified portfolio. The Trust is a Massachusetts business trust registered under the Investment Company Act of 1940, as amended, as an open-end management investment company. Effective September 23, 2005, Nations Strategic Income Fund merged into Columbia Strategic Income Fund. The newly combined Fund was then reorganized as a series of Columbia Funds Series Trust I. Prior to such date, the Fund was a series of Columbia Funds Trust I.
Investment Goal
The Fund seeks current income consistent with prudent risk. The Fund also seeks maximum total return.
Fund Shares
The Fund may issue an unlimited number of shares and offers five classes of shares: Class A, Class B, Class C, Class J and Class Z. Each share class has its own sales charge and expense structure.
Class A shares are subject to a maximum front-end sales charge of 4.75% based on the amount of initial investment. Class A shares purchased without an initial sales charge in accounts aggregating up to $50 million at the time of purchase are subject to a 1.00% contingent deferred sales charge ("CDSC") if the shares are sold within twelve months of the time of the purchase. Class B shares are subject to a maximum CDSC of 5.00% based upon the holding period after purchase. Class B shares will convert to Class A shares eight years after purchase. Class C shares are subject to a 1.00% CDSC on shares sold within one year after purchase. Class J shares are subject to a 3.00% front-end sales charge and are available for purchase only by residents or citizens of Japan. Class Z shares are offered continuously at net asset value. There are certain restrictions on the purchase of Class Z shares, as described in the Fund's prospectus.
Note 2. Significant Accounting Policies
Use of Estimates
The preparation of financial statements in conformity with accounting principles generally accepted in the United States of America ("GAAP") requires management to make estimates and assumptions that affect the reported amounts of assets and liabilities, the disclosure of contingent assets and liabilities at the date of the financial statements and the reported amounts of revenue and expenses during the reporting period. Actual results could differ from those estimates. The following is a summary of significant accounting policies consistently followed by the Fund in the preparation of its financial statements.
Security Valuation
Debt securities generally are valued by pricing services approved by the Fund's Board of Trustees, based upon market transactions for normal, institutional-size trading units of similar securities. The services may use various pricing techniques which take into account appropriate factors such as yield, quality, coupon rate, maturity, type of issue, trading characteristics and other data, as well as broker quotes. Debt securities for which quotations are readily available are valued at an over-the-counter or exchange bid quotation. Certain debt securities, which tend to be more thinly traded and of lesser quality, are priced based on fundamental analysis of the financial condition of the issuer and the estimated value of any collateral. Valuations developed through pricing techniques may vary from the actual amounts realized upon sale of the securities, and the potential variation may be greater for those securities valued using fundamental analysis.
Short-term debt obligations maturing within 60 days are valued at amortized cost, which approximates market value.
Forward currency exchange contracts are valued at the prevailing forward exchange rate of the underlying currencies.
Foreign securities are generally valued at the last sale price on the foreign exchange or market on which they trade. If any foreign share prices are not readily available as a result of limited share activity, the securities are valued at the last sale price of the local shares in the principal market in which such securities are normally traded.
Generally, trading in foreign securities is substantially completed each day at various times prior to the close of the New York Stock Exchange ("NYSE"). The values of such securities used in computing the net asset value of the Fund's (Funds') shares are determined as of such times. Foreign currency exchange rates are generally determined at 4:00 p.m.
45
Columbia Strategic Income Fund May 31, 2006
Eastern (U.S.) time. Events affecting the values of such foreign securities and such exchange rates may occur between the times at which they are determined and the close of the customary trading session of the NYSE, which would not be reflected in the computation of the Fund's net asset value. If events materially affecting the values of such foreign securities occur and it is determined that market quotations are not reliable, then these foreign securities will be valued at their fair value using procedures approved by the Board of Trustees. If a security is valued at "fair value", such value is likely to be different from the last quoted market price for the security.
Investments for which market quotations are not readily available, or that have quotations which management believes are not appropriate, are valued at fair value as determined in good faith under consistently applied procedures established by and under the general supervision of the Board of Trustees.
Security Transactions
Security transactions are accounted for on the trade date. Cost is determined and gains (losses) are based upon the specific identification method for both financial statement and federal income tax purposes.
Forward Foreign Currency Exchange Contracts
Forward foreign currency exchange contracts are agreements to exchange one currency for another at a future date at a specified price. These contracts are used to minimize the exposure to foreign exchange rate fluctuations during the period between trade and settlement date of the contracts. The Fund may utilize forward foreign currency exchange contracts in connection with the settlement of purchases and sales of securities. The Fund may also enter into these contracts to hedge certain other foreign currency denominated assets. Contracts to buy generally are used to acquire exposure to foreign currencies, while contracts to sell are used to hedge the Fund's investments against currency fluctuations. Forward currency contracts are valued daily at the current exchange rate of the underlying currency, resulting in unrealized gains (losses) which become realized at the time the foreign currency contracts are closed or mature. Reali zed and unrealized gains (losses) arising from such transactions are included in net realized and unrealized gains (losses) on foreign currency transactions. The use of forward currency contracts does not eliminate fluctuations in the prices of the Fund's portfolio securities. While the maximum potential loss from such contracts is the aggregate face value in U.S. dollars at the time the contract was opened, exposure is typically limited to the change in value of the contract (in U.S. dollars) over the period it remains open. The Fund could also be exposed to risk if the counterparties of the contracts are unable to fulfill the terms of the contracts.
Repurchase Agreements
The Fund may engage in repurchase agreement transactions with institutions that the Fund's investment advisor has determined are creditworthy. The Fund, through its custodian, receives delivery of underlying securities collateralizing a repurchase agreement. Collateral is at least equal, at all times, to the value of the repurchase obligation including interest. A repurchase agreement transaction involves certain risks in the event of default or insolvency of the counterparty. These risks include possible delays or restrictions upon the Fund's ability to dispose of the underlying securities and a possible decline in the value of the underlying securities during the period while the Fund seeks to assert its rights.
Mortgage Dollar Roll Transactions
The Fund may enter into mortgage "dollar rolls" in which the Fund sells securities for delivery in the current month and simultaneously contracts with the same counterparty to repurchase similar (same type, coupon and maturity) but not identical securities on a specified future date not exceeding 120 days. During the roll period, the Fund loses the right to receive principal and interest paid on the securities sold. However, the Fund would benefit to the extent of any difference between the price received for the securities sold and the lower forward price for the future purchase (often referred to as the "drop") or fee income plus the interest earned on the cash proceeds of the securities sold until the settlement date of the forward purchase. Unless such benefits exceed the income, capital appreciation and gain or loss due to mortgage prepayments that would have been realized on the securities sold as part of the mortgage doll ar roll, the use of this technique will diminish the investment performance of the Fund compared with what such performance would have been
46
Columbia Strategic Income Fund May 31, 2006
without the use of mortgage dollar rolls. All cash proceeds will be invested in instruments that are permissible investments for the Fund. The Fund will hold and maintain in a segregated account until the settlement date, cash or liquid securities in an amount equal to the forward purchase price.
The Fund's policy is to record the components of dollar rolls using "to be announced" mortgage-backed securities ("TBA Dollar Rolls"). For financial reporting and tax purposes, the Fund treats mortgage dollar rolls as two separate transactions, one involving the purchase of a security and a separate transaction involving a sale. The Fund does not currently enter into mortgage dollar rolls that are accounted for as a financing.
Mortgage dollar rolls involve certain risks. If the broker-dealer to whom the Fund sells the security becomes insolvent, the Fund's right to purchase or repurchase the mortgage-related securities may be restricted and the instrument which the Fund is required to repurchase may be worth less than an instrument which the Fund originally held. Successful use of mortgage dollar rolls may depend upon the Advisor's ability to predict correctly interest rates and mortgage prepayments. For these reasons, there is no assurance that mortgage dollar rolls can be successfully employed.
Delayed Delivery Securities
The Fund may trade securities on other than normal settlement terms, including securities purchased or sold on a "when-issued" basis. This may increase the risk if the other party to the transaction fails to deliver and causes the Fund to subsequently invest at less advantageous prices. The Fund identifies cash or liquid portfolio securities as segregated with the custodian in an amount equal to the delayed delivery commitment.
Stripped Securities
Stripped mortgage-backed securities are derivative multi-class mortgage securities structured so that one class receives most, if not all, of the principal from the underlying mortgage assets, while the other class receives most, if not all, of the interest and the remainder of the principal. If the underlying mortgage assets experience greater than anticipated prepayments of principal, a Fund may fail to fully recoup its initial investment in an interest-only security. The market value of these securities consisting entirely of principal or interest payments can be extremely volatile in response to changes in interest rates. Credit risk reflects the risk that a Fund may not receive all or part of its principal because the issuer or credit enhancer has defaulted on its obligation.
Income Recognition
Interest income is recorded on the accrual basis and includes accretion of discounts, amortization of premiums and paydown gains and losses. Fee income attributable to mortgage dollar roll transactions is recorded on the accrual basis over the term of the transaction. The value of additional securities received as an income payment is recorded as income and as the cost basis of such securities.
Foreign Currency Transactions
The values of all assets and liabilities quoted in foreign currencies are translated into U.S. dollars at that day's exchange rates. Net realized and unrealized gains (losses) on foreign currency transactions include gains (losses) arising from the fluctuation in exchange rates between trade and settlement dates on securities transactions, gains (losses) arising from the disposition of foreign currency and currency gains (losses) between the accrual and payment dates on dividends, interest income and foreign withholding taxes.
For financial statement purposes, the Fund does not distinguish that portion of gains (losses) on investments which is due to changes in foreign exchange rates from that which is due to changes in market prices of the investments. Such fluctuations are included with the net realized and unrealized gains (losses) on investments.
Determination of Class Net Asset Values
All income, expenses (other than class-specific expenses, as shown on the Statement of Operations) and realized and unrealized gains (losses) are allocated to each class of the Fund on a daily basis for purposes of determining the net asset value of each class. Income and expenses are allocated to each class based on the settled shares method, while realized and unrealized gains (losses) are allocated based on the relative net assets of each class.
47
Columbia Strategic Income Fund May 31, 2006
Federal Income Tax Status
The Fund intends to qualify each year as a "regulated investment company" under Subchapter M of the Internal Revenue Code, as amended, and will distribute substantially all of its taxable income, if any, for its tax year, and as such will not be subject to federal income taxes. In addition, the Fund intends to distribute in each calendar year substantially all of its net investment income, capital gains and certain other amounts, if any, such that the Fund should not be subject to federal excise tax. Therefore, no federal income or excise tax provision is recorded.
Distributions to Shareholders
Distributions to shareholders are recorded on the ex-date. Net realized capital gains, if any, are distributed at least annually.
Note 3. Federal Tax Information
The timing and character of income and capital gain distributions are determined in accordance with income tax regulations, which may differ from GAAP. Reclassifications are made to the Fund's capital accounts for permanent tax differences to reflect income and gains available for distribution (or available capital loss carryforwards) under income tax regulations.
For the year ended May 31, 2006, permanent book and tax basis differences resulting primarily from differing treatments for Section 988 bond bifurcation, discount accretion/premium amortization on debt securities, paydown reclassifications and market discount reclassifications were identified and reclassified among the components of the Fund's net assets as follows:
Overdistributed
Net Investment
Income | | Accumulated
Net Realized Loss | | Paid-In Capital | |
| $ | 16,953,228 | | | $ | (27,423,511 | ) | | $ | 10,470,283 | | |
Net investment income and net realized gains (losses), as disclosed on the Statement of Operations, and net assets were not affected by this reclassification.
The tax character of distributions paid during the years ended May 31, 2006 and May 31, 2005 was as follows:
| | | May 31,
2006 | | May 31,
2005 | |
| Distributions paid from: | |
| Ordinary Income* | | $ | 109,561,323 | | | $ | 94,076,584 | | |
| Long-Term Capital Gains | | | — | | | | — | | |
* For tax purposes short-term capital gains distributions, if any, are considered ordinary income distributions.
As of May 31, 2006, the components of distributable earnings on a tax basis were as follows:
Undistributed
Ordinary
Income | | Undistributed
Long-term
Capital Gains | | Net Unrealized
(Depreciation)* | |
| $ | 874,620 | | | $ | — | | | $ | (20,165,654 | ) | |
* The differences between book-basis and tax-basis net unrealized appreciation/depreciation are primarily due to deferral of losses from wash sales and discount accretion/premium amortization on debt securities.
Unrealized appreciation and depreciation at May 31, 2006, based on cost of investments for federal income tax purposes, was:
| Unrealized appreciation | | $ | 39,495,176 | | |
| Unrealized depreciation | | | (62,671,131 | ) | |
| Net unrealized depreciation | | $ | (23,175,955 | ) | |
The following capital loss carryforwards, determined as of May 31, 2006, may be available to reduce taxable income arising from future net realized gains on investments, if any, to the extent permitted by the Internal Revenue Code:
Year of
Expiration | | Capital Loss
Carryforward | |
| | 2007 | | | $ | 3,089,988 | | |
| | 2008 | | | | 67,063,032 | | |
| | 2009 | | | | 138,841,137 | | |
| | 2010 | | | | 138,626,928 | | |
| | 2011 | | | | 318,608 | | |
| | 2013 | | | | 234,018 | | |
| | 2014 | | | | 13,317,432 | | |
| | | | | $ | 361,491,143 | | |
48
Columbia Strategic Income Fund May 31, 2006
Under current tax rules, certain currency (and capital) losses realized after October 31 may be deferred and treated as occurring on the first day of the following fiscal year. As of May 31, 2006, post-October currency losses of $512,320 and capital losses of $4,209,103 attributed to security transactions were deferred to June 1, 2006.
Note 4. Fees and Compensation Paid to Affiliates
Investment Advisory Fee
Columbia Management Advisors, LLC ("Columbia"), an indirect, wholly-owned subsidiary of Bank of America Corporation ("BOA"), is the investment advisor to the Fund and provides administrative and other services. Prior to September 30, 2005, Columbia Management Advisors, Inc. was the investment advisor to the Fund under the same fee structure. On September 30, 2005, Columbia Management Advisors, Inc. merged into Banc of America Capital Management, LLC. At that time, the investment advisor was then renamed Columbia Management Advisors, LLC. Columbia receives a monthly investment advisory fee based on the Fund's average daily net assets at the following annual rates:
| Average Daily Net Assets | | Annual Fee Rate | |
| First $500 million | | | 0.60 | % | |
| $500 million to $1 billion | | | 0.55 | % | |
| $1 billion to $1.5 billion | | | 0.52 | % | |
| Over $1.5 billion | | | 0.49 | % | |
For the year ended May 31, 2006, the Fund's effective investment advisory fee rate was 0.56%.
Pricing and Bookkeeping Fees
Columbia is responsible for providing pricing and bookkeeping services to the Fund under a pricing and bookkeeping agreement. Under a separate agreement (the "Outsourcing Agreement"), Columbia has delegated those functions to State Street Corporation ("State Street"). As a result, Columbia pays State Street the total fees collected under the pricing and bookkeeping agreement.
Under its pricing and bookkeeping agreement with the Fund, Columbia receives an annual fee of $38,000 paid monthly plus an additional monthly fee based on the level of average daily net assets for the month; provided that during any 12-month period, the aggregate fee, exclusive of out-of-pocket expenses and changes, shall not exceed $140,000.
Prior to November 1, 2005, Columbia received from the Fund an annual fee of $10,000 paid monthly, and in any month that the Fund's average daily net assets exceeded $50 million, an additional monthly fee, calculated by taking into account the fees payable to State Street under the Outsourcing Agreement.
The Fund also reimburses Columbia and State Street for out-of-pocket expenses and charges, including fees payable to third parties for pricing the Fund's portfolio securities and direct internal costs incurred by Columbia in connection with providing fund accounting oversight and monitoring and certain other services. For the year ended May 31, 2006, the annualized effective pricing and bookkeeping fee rate for the Fund, inclusive of out-of-pocket expenses, was 0.019% of the Fund's average daily net assets.
Transfer Agent Fee
Columbia Management Services, Inc. (formerly Columbia Funds Services, Inc.) (the "Transfer Agent"), an affiliate of Columbia and an indirect, wholly-owned subsidiary of BOA, provides shareholder services to the Fund and has contracted with Boston Financial Data Services ("BFDS") to serve as sub-transfer agent. The Transfer Agent is entitled to receive a fee for its services, paid monthly, at the annual rate of $17.00 per open account plus sub-transfer agent fees (exclusive of BFDS fees) calculated based on assets held in omnibus accounts and intended to recover the cost of payments to third parties for services to those accounts. The annual rate was $15.23 from November 1, 2005 through March 31, 2006. The Transfer Agent may also retain, as additional compensation for its services, fees for wire, telephone and redemption orders, IRA trustee agent fees and account transcript fees due the Transfer Agent from shareholders of the Fun d and credits (net of bank charges) earned with respect to balances in accounts the Transfer Agent maintains in connection with its services to the Fund. The Transfer Agent also receives reimbursement for certain out-of-pocket expenses. Prior to November 1, 2005, the Transfer Agent received a fee, paid monthly at the annual rate of $34.00 per open account and was reimbursed for certain out-of-pocket expenses.
49
Columbia Strategic Income Fund May 31, 2006
The Transfer Agent voluntarily waived a portion of its fees for the Fund for the period from May 1, 2005 through October 31, 2005. For the year ended May 31, 2006, the Transfer Agent waived fees of $134,495 for the Fund.
For the year ended May 31, 2006, the effective transfer agent fee rate, inclusive of out-of-pocket expenses and net of fee waivers, for the Fund was 0.11% of the Fund's average daily net assets.
Underwriting Discounts, Service and Distribution Fees
Columbia Management Distributors, Inc. (the "Distributor"), a subsidiary of Columbia and an indirect, wholly-owned subsidiary of BOA, is the principal underwriter of the Fund. On August 22, 2005, Columbia Funds Distributor, Inc. was renamed Columbia Management Distributors, Inc. For the year ended May 31, 2006, the Distributor has retained net underwriting discounts of $220,781 on sales of the Fund's Class A shares and net CDSC fees of $4,857, $622,055 and $23,282 on Class A, Class B and Class C share redemptions, respectively.
The Fund has adopted a Rule 12b-1 plan (the "Plan") which allows the payment of a monthly service fee to the Distributor. The service fee is equal to 0.15% annually of the average daily net assets attributable to outstanding Class A and Class B shares issued prior to January 1, 1993 and 0.25% annually of the average daily net assets attributable to outstanding Class A, Class B, Class C and Class J shares issued thereafter. This arrangement results in a service fee between the 0.15% and 0.25% annual rates. For the year ended May 31, 2006, the effective service fee rate was 0.24% for Class A, Class B, Class C and Class J shares of the Fund.
The Plan also requires the payment of a monthly distribution fee to the Distributor equal to 0.75% annually of the average daily net assets attributable to Class B and Class C shares and 0.35% annually of the average daily net assets attributable to Class J shares. The Distributor has voluntarily agreed to waive a portion of the Class C share distribution fee so that it will not exceed 0.60% annually.
The CDSC and the distribution fees received from the Plan are used principally as repayment to the Distributor for amounts paid by the Distributor to dealers who sold such shares.
Custody Credits
The Fund has an agreement with its custodian bank under which custody fees may be reduced by balance credits. These credits are recorded as a reduction of total expenses on the Statement of Operations. The Fund could have invested a portion of the assets utilized in connection with the expense offset arrangement in an income-producing asset if it had not entered into such an agreement.
Fees Paid to Officers and Trustees
All officers of the Fund, with the exception of the Fund's Chief Compliance Officer, are employees of Columbia or its affiliates and receive no compensation from the Fund. The Board of Trustees has appointed a Chief Compliance Officer to the Fund in accordance with federal securities regulations. The Fund, along with other affiliated funds, pays its pro-rata share of the expenses associated with the Chief Compliance Officer. The Fund's expenses for the Chief Compliance Officer will not exceed $15,000 per year.
The Fund's Trustees may participate in a deferred compensation plan which may be terminated at any time. Obligations of the plan will be paid solely out of the Fund's assets.
Other
Columbia provides certain services to the Fund related to Sarbanes-Oxley compliance. For the year ended May 31, 2006, the Fund paid $3,412 to Columbia for such services. This amount is included in "Other expenses" on the Statement of Operations.
Note 5. Portfolio Information
For the year ended May 31, 2006, the cost of purchases and proceeds from sales of securities, excluding short-term obligations, were $813,864,474 and $705,686,641, respectively, of which $70,552,706 and $38,154,780, respectively, were U.S. Government securities.
Note 6. Line of Credit
The Fund and other affiliated funds participate in a $350,000,000 committed unsecured revolving line of credit
50
Columbia Strategic Income Fund May 31, 2006
provided by State Street Bank and Trust Company. Borrowings are used for temporary or emergency purposes to facilitate portfolio liquidity. Interest is charged to each participating fund based on its borrowings at a rate per annum equal to the Federal Funds rate plus 0.50%. In addition, a commitment fee of 0.10% per annum is accrued and apportioned among the participating funds based on their pro-rata portion of the unutilized line of credit. The commitment fee is included in "Other expenses" on the Statement of Operations.
For the year ended May 31, 2006, the Fund did not borrow under this arrangement.
Note 7. Shares of Beneficial Interest
As of May 31, 2006, the Fund had a shareholder that held 18.4% of the shares outstanding whose shares were beneficially owned by participant accounts over which Bank of America and/or its affiliates had either sole or joint investment discretion. Also, the Fund had an other unaffiliated shareholder that held 10.5% of the shares outstanding. Subscription and redemption activity of these accounts may have a significant effect on the operations of the Fund.
Note 8. Disclosure of Significant Risks and Contingencies
Foreign Securities
There are certain additional risks involved when investing in foreign securities that are not inherent with investments in domestic securities. These risks may involve foreign currency exchange rate fluctuations, adverse political and economic developments and the possible prevention of currency exchange or other foreign governmental laws or restrictions. In addition, the liquidity of foreign securities may be more limited than that of domestic securities.
Investments in emerging market countries are subject to additional risk. The risk of foreign investments is typically increased in less developed countries. These countries are also more likely to experience high levels of inflation, deflation or currency devaluation which could hurt their economies and securities markets.
High-Yield Securities
Investing in high-yield securities may involve greater credit risk and considerations not typically associated with investing in U.S. government bonds and other higher quality fixed income securities. These securities are non-investment grade securities, often referred to as "junk" bonds. Economic downturns may disrupt the high yield market and impair the ability of issuers to repay principal and interest. Also, an increase in interest rates would likely have an adverse impact on the value of such obligations. Moreover, high-yield securities may be less liquid to the extent that there is no established secondary market.
Industry Focus
The Fund may focus its investments in certain industries, subjecting it to greater risk than a fund that is more diversified.
Legal Proceedings
On February 9, 2005, Columbia Management Advisors, Inc. (which has since merged into Banc of America Capital Management, LLC (now named Columbia Management Advisors, LLC)) ("Columbia") and Columbia Funds Distributor, Inc. (which has been renamed Columbia Management Distributors, Inc.) (the "Distributor") (collectively, the "Columbia Group") entered into an Assurance of Discontinuance with the New York Attorney General ("NYAG") (the "NYAG Settlement") and consented to the entry of a cease-and-desist order by the Securities and Exchange Commission ("SEC") (the "SEC Order"). The SEC Order and the NYAG Settlement are referred to collectively as the "Settlements". The Settlements contain substantially the same terms and conditions as outlined in the agreements in principle which Columbia Group entered into with the SEC and NYAG in March 2004.
Under the terms of the SEC Order, the Columbia Group agreed, among other things, to: pay $70 million in disgorgement and $70 million in civil money penalties; cease and desist from violations of the antifraud provisions and certain other provisions of the federal securities laws; maintain certain compliance and ethics oversight
51
Columbia Strategic Income Fund May 31, 2006
structures; retain an independent consultant to review the Columbia Group's applicable supervisory, compliance, control and other policies and procedures; and retain an independent distribution consultant (see below). The Columbia Funds have also voluntarily undertaken to implement certain governance measures designed to maintain the independence of their boards of trustees. The NYAG Settlement also, among other things, requires Columbia and its affiliates to reduce management fees for certain Columbia Funds (including the former Nations Funds) and other mutual funds collectively by $32 million per year for five years, for a projected total of $160 million in management fee reductions.
Pursuant to the procedures set forth in the SEC order, the $140 million in settlement amounts described above will be distributed in accordance with a distribution plan developed by an independent distribution consultant and approved by the SEC. The independent distribution consultant has been in consultation with the staff of the SEC and has submitted a proposed plan of distribution. The SEC has not yet approved a final plan of distribution.
As a result of these matters or any adverse publicity or other developments resulting from them, there may be increased redemptions or reduced sales of fund shares, which could increase transaction costs or operating expenses, or have other adverse consequences for the funds.
A copy of the SEC Order is available on the SEC website at http://www.sec.gov. A copy of the NYAG Settlement is available as part of the Bank of America Corporation Form 8-K filing on February 10, 2005.
In connection with the events described in detail above, various parties have filed suit against certain funds, the Trustees of the Columbia Funds, FleetBoston Financial Corporation and its affiliated entities and/or Bank of America and its affiliated entities.
On February 20, 2004, the Judicial Panel on Multidistrict Litigation transferred these cases and cases against several other mutual fund companies based on similar allegations to the United States District Court in Maryland for consolidated or coordinated pretrial proceedings (the "MDL"). Subsequently, additional related cases were transferred to the MDL. On September 29, 2004, the plaintiffs in the MDL filed amended and consolidated complaints. One of these amended complaints is a putative class action that includes claims under the federal securities laws and state common law, and that names Columbia, the Distributor, the Trustees of the Columbia Funds, Bank of America Corporation and others as defendants. Another of the amended complaints is a derivative action purportedly on behalf of the Columbia Funds that asserts claims under federal securities laws a nd state common law.
On February 25, 2005, Columbia and other defendants filed motions to dismiss the claims in the pending cases. On March 1, 2006, for reasons stated in the court's memoranda dated November 3, 2005, the U.S. District Court for the District of Maryland granted in part and denied in part the defendants' motions to dismiss. The court dismissed all of the class action claims pending against the Columbia Funds Trusts and the Columbia Acorn Trusts. As to Columbia and the Distributor, the claims under the Securities Act of 1933, the claims under Sections 34(b) and 36(a) of the Investment Company Act of 1940 ("ICA") and the state law claims were dismissed. The claims under Sections 10(b) and 20(a) of the Securities Exchange Act of 1934 and claims under Section 36(b) of the ICA along with related claims under Section 48(a) of the ICA were not dismissed.
On March 21, 2005, a purported class action was filed in Massachusetts state court alleging that the conduct, including market timing, entitles Class B shareholders in certain Columbia funds to an exemption from contingent deferred sales charges upon early redemption ("the CDSC Lawsuit"). The CDSC Lawsuit has been removed to federal court in Massachusetts and the federal Judicial Panel has transferred the CDSC Lawsuit to the MDL.
The MDL is ongoing. Accordingly, an estimate of the financial impact of this litigation on any fund, if any, cannot currently be made.
In 2004, certain Columbia funds, the Trustees of the Columbia Funds, advisers and affiliated entities were named as defendants in certain purported shareholder class and derivative actions making claims, including claims under the Investment Company and the Investment Advisers Acts of 1940 and state law. The suits allege, inter alia, that the fees and expenses paid by the funds are excessive and that the
52
Columbia Strategic Income Fund May 31, 2006
advisers and their affiliates inappropriately used fund assets to distribute the funds and for other improper purpose. On March 2, 2005, the actions were consolidated in the Massachusetts federal court as In re Columbia Entities Litigation. The plaintiffs filed a consolidated amended complaint on June 9, 2005. On November 30, 2005, the judge dismissed all claims by plaintiffs and ordered that the case be closed. The plaintiffs filed a notice of appeal on December 30, 2005 and this appeal is pending.
For the year ended May 31, 2006, Columbia has assumed $19,603 of legal, consulting services and Trustees' fees incurred by the Fund in connection with these matters.
Note 9. Business Combinations and Mergers
On September 23, 2005, Nations Strategic Income Fund merged into Columbia Strategic Income Fund. Columbia Strategic Income Fund received a tax-free transfer of assets from Nations Strategic Income Fund as follows:
Shares
Issued | | Net Assets
Received | | Unrealized
Appreciation* | |
| | 33,906,470 | | | $ | 207,328,274 | | | $ | 742,564 | | |
Net Assets of
Columbia Strategic
Income Fund
Prior to
Combination | | Net Assets of
Nations Strategic
Income Fund
Immediately
Prior to
Combination | | Net Assets of
Columbia
Strategic
Income Fund
After
Combination | |
| $ | 1,317,810,855 | | | $ | 207,328,274 | | | $ | 1,525,139,129 | | |
* Unrealized appreciation is included in the Net Assets Received.
53
Report of Independent Registered Public Accounting Firm
Columbia Strategic Income Fund
To the Trustees of the Columbia Funds Series Trust I and the Shareholders of Columbia Strategic Income Fund
In our opinion, the accompanying statement of assets and liabilities, including the investment portfolio, and the related statements of operations and of changes in net assets and the financial highlights present fairly, in all material respects, the financial position of Columbia Strategic Income Fund (the "Fund") (a series of Columbia Funds Series Trust I) at May 31, 2006, the results of its operations, the changes in its net assets and its financial highlights for the periods indicated in conformity with accounting principles generally accepted in the United States of America. These financial statements and financial highlights (hereafter referred to as "financial statements") are the responsibility of the Fund's management. Our responsibility is to express an opinion on these financial statements based on our audits. We conducted our audits of these financial statements in accordance with the standards of the Public Company Accounting Oversight Board (United States). Those standards require that we plan and perform the audit to obtain reasonable assurance about whether the financial statements are free of material misstatement. An audit includes examining, on a test basis, evidence supporting the amounts and disclosures in the financial statements, assessing the accounting principles used and significant estimates made by management, and evaluating the overall financial statement presentation. We believe that our audits, which included confirmation of securities at May 31, 2006 by correspondence with the custodian and brokers, provide a reasonable basis for our opinion.
PricewaterhouseCoopers LLP
Boston, Massachusetts
July 25, 2006
54
Fund governance
Trustees Columbia Strategic Income Fund
The Trustees/Directors serve terms of indefinite duration. The names, addresses and ages of the Trustees/Directors and officers of the Funds in the Columbia Funds Complex, the year each was first elected or appointed to office, their principal business occupations during at least the last five years, the number of portfolios overseen by each Trustee/Director and other directorships they hold are shown below. Each officer listed below serves as an officer of each Fund in the Columbia Funds Complex.
Name, address and age, Position with funds,
Year first elected or appointed to office1 | | Principal occupation(s) during past five years, Number of portfolios in Columbia
Funds Complex overseen by trustee/director, Other directorships held | |
| Disinterested Trustees | |
|
Douglas A. Hacker (Born 1955)
c/o Columbia Management Advisors, LLC
One Financial Center
Boston, MA 02111
Trustee (since 1996) | | Executive Vice President-Strategy of United Airlines (airline) from December, 2002 to April 1, 2006; (formerly President of UAL Loyalty Services (airline) from September, 2001 to December, 2002; Executive Vice President and Chief Financial Officer of United Airlines from July, 1999 to September, 2001; Senior Vice President-Finance from March, 1993 to July, 1999). Oversees 83, Nash Finch Company (food distributor) | |
|
Janet Langford Kelly (Born 1957)
c/o Columbia Management Advisors, LLC One Financial Center
Boston, MA 02111
Trustee (since 1996) | | Partner, Zelle, Hofmann, Voelbel, Mason & Gette LLP (law firm) since March, 2005; Adjunct Professor of Law, Northwestern University, since September, 2004 (formerly Chief Administrative Officer and Senior Vice President, Kmart Holding Corporation (consumer goods), from September, 2003 to March, 2004; Executive Vice President-Corporate Development and Administration, General Counsel and Secretary, Kellogg Company (food manufacturer), from September, 1999 to August, 2003; Oversees 83, UAL Corporation (airline) | |
|
Richard W. Lowry (Born 1936)
c/o Columbia Management Advisors, LLC One Financial Center
Boston, MA 02111
Trustee (since 1995) | | Private Investor since August, 1987 (formerly Chairman and Chief Executive Officer, U.S. Plywood Corporation (building products manufacturer until 1987)). Oversees 852, None | |
|
1 In December 2000, the boards of each of the former Liberty Funds and former Stein Roe Funds were combined into one board of trustees responsible for the oversight of both fund groups (collectively, the "Liberty Board"). In October 2003, the trustees on the Liberty Board were elected to the boards of the Columbia Funds (the "Columbia Board") and of the CMG Fund Trust (the "CMG Funds Board"); simultaneous with that election, Patrick J. Simpson and Richard L. Woolworth, who had been directors on the Columbia Board and trustees on the CMG Funds Board, were appointed to serve as trustees of the Liberty Board. The date shown is the earliest date on which a trustee/director was elected or appointed to the board of a Fund in the Columbia Funds Complex.
2 Messrs. Lowry, Neuhauser and Mayer also serve as directors/trustees of the Liberty All-Star Funds, currently consisting of 3 funds, which are advised by an affiliate of the Advisor.
55
Fund governance (continued)
Trustees Columbia Strategic Income Fund
Name, address and age, Position with funds,
Year first elected or appointed to office1 | | Principal occupation(s) during past five years, Number of portfolios in Columbia
Funds Complex overseen by trustee/director, Other directorships held | |
| Disinterested Trustees | |
|
Charles R. Nelson (Born 1943)
c/o Columbia Management Advisors, LLC One Financial Center
Boston, MA 02111
Trustee (since 1981) | | Professor of Economics, University of Washington, since January, 1976; Ford and Louisa Van Voorhis Professor of Political Economy, University of Washington, since September, 1993 (formerly Director, Institute for Economic Research, University of Washington from September, 2001 to June, 2003); Adjunct Professor of Statistics, University of Washington, since September, 1980; Associate Editor, Journal of Money Credit and Banking, since September, 1993; consultant on econometric and statistical matters. Oversees 83, None | |
|
John J. Neuhauser (Born 1942)
c/o Columbia Management Advisors, LLC One Financial Center
Boston, MA 02111
Trustee (since 1985) | | University Professor Boston College since November, 2005; Academic Vice President and Dean of Faculties since August, 1999, Boston College (formerly Dean Boston College School of Management from September, 1977 to August, 1999). Oversees 852, Saucony, Inc. (athletic footwear) | |
|
Patrick J. Simpson (Born 1944)
c/o Columbia Management Advisors, LLC One Financial Center
Boston, MA 02111
Trustee (since 2000) | | Partner, Perkins Coie LLP (law firm). Oversees 83, None | |
|
Thomas E. Stitzel (Born 1936)
c/o Columbia Management Advisors, LLC One Financial Center
Boston, MA 02111
Trustee (since 1998) | | Business Consultant since 1999; Chartered Financial Analyst. Oversees 83, None | |
|
Thomas C. Theobald (Born 1937)
c/o Columbia Management Advisors, LLC One Financial Center
Boston, MA 02111
Trustee and Chairman of the Board
(since 1996) | | Partner and Senior Advisor, Chicago Growth Partners (private equity investing) since September, 2004 (formerly Managing Director, William Blair Capital Partners (private equity investing) from September, 1994 to September, 2004). Oversees 833, Anixter International (network support equipment distributor); Ventas, Inc. (real estate investment trust); Jones Lang LaSalle (real estate management services) and Ambac Financial Group (financial guaranty insurance) | |
|
3 Mr. Theobald was appointed as Chairman of the Board effective December 10, 2003.
56
Fund governance (continued)
Trustees Columbia Strategic Income Fund
Name, address and age, Position with funds,
Year first elected or appointed to office1 | | Principal occupation(s) during past five years, Number of portfolios in Columbia
Funds Complex overseen by trustee/director, Other directorships held | |
| Disinterested Trustees | |
|
Anne-Lee Verville (Born 1945)
c/o Columbia Management Advisors, LLC One Financial Center
Boston, MA 02111
Trustee (since 1998) | | Retired since 1997 (formerly General Manager, Global Education Industry, IBM Corporation (computer and technology) from 1994 to 1997). Oversees 83, Chairman of the Board of Directors, Enesco Group, Inc. (producer of giftware and home and garden decor products) | |
|
Richard L. Woolworth (Born 1941)
c/o Columbia Management Advisors, LLC One Financial Center
Boston, MA 02111
Trustee (since 1991) | | Retired since December, 2003 (formerly Chairman and Chief Executive Officer, The Regence Group (regional health insurer); Chairman and Chief Executive Officer, BlueCross BlueShield of Oregon; Certified Public Accountant, Arthur Young & Company). Oversees 83, Northwest Natural Gas Co. (natural gas service provider) | |
|
| Interested Trustee | |
|
William E. Mayer (Born 1940)
c/o Columbia Management Advisors, LLC One Financial Center
Boston, MA 02111
Trustee (since 1994) | | Partner, Park Avenue Equity Partners (private equity) since February, 1999 (formerly Partner, Development Capital LLC from November, 1996 to February, 1999). Oversees 834, Lee Enterprises (print media), WR Hambrecht + Co. (financial service provider); Reader's Digest (publishing); OPENFIELD Solutions (retail industry technology provider) | |
|
4 Mr. Mayer is an "interested person" (as defined in the Investment Company Act of 1940 (1940 Act)) by reason of his affiliation with WR Hambrecht + Co.
The Statement of Additional Information Includes additional information about the Trustees of the Funds and is available, without charge, upon request by calling 800-426-3750.
57
Fund governance
Officers Columbia Strategic Income Fund
Name, address and age, Position with
Columbia Funds, Year first elected or
appointed to office | | Principal occupation(s) during past five years | |
Christopher L. Wilson (Born 1957)
One Financial Center
Boston, MA 02111
President (since 2004) | | Head of Mutual Funds since August, 2004 and Managing Director of the Advisor since September, 2005; President and Chief Executive Officer, CDC IXIS Asset Management Services, Inc. (investment management) from September, 1998 to August, 2004. | |
|
James R. Bordewick, Jr. (Born 1959)
One Financial Center
Boston, MA 02111
Senior Vice President, Secretary and
Chief Legal Officer (since 2006) | | Associate General Counsel, Bank of America since April, 2005; Senior Vice President and Associate General Counsel, MFS Investment Management (investment management) prior to April, 2005. | |
|
J. Kevin Connaughton (Born 1964)
One Financial Center
Boston, MA 02111
Senior Vice President, Chief Financial Officer and Treasurer (since 2000) | | Managing Director of the Advisor since February, 1998. | |
|
Mary Joan Hoene (Born 1949)
100 Federal Street
Boston, MA 02110
Senior Vice President and
Chief Compliance Officer (since 2004) | | Senior Vice President and Chief Compliance Officer of various funds in the Fund Complex; Partner, Carter, Ledyard & Milburn LLP (law firm) from January, 2001 to August, 2004. | |
|
Michael G. Clarke (Born 1969)
One Financial Center
Boston, MA 02111
Chief Accounting Officer and
Assistant Treasurer (since 2004) | | Director of Fund Administration since January, 2006; Managing Director of Columbia Management Advisors, LLC September, 2004 to December, 2005; Vice President Fund Administration June, 2002 to September, 2004. Vice President Product Strategy and Development from February, 2001 to June, 2002. | |
|
Jeffrey R. Coleman (Born 1969)
One Financial Center
Boston, MA 02111
Deputy Treasurer (since 2004) | | Director of Fund Administration since January, 2006; Fund Controller from October 2004 to January 2006; Vice President of CDC IXIS Asset Management Services, Inc. (investment management) from August, 2000 to September, 2004. | |
|
Joseph F. DiMaria (Born 1968)
One Financial Center
Boston, MA 02111
Deputy Treasurer (since 2006) | | Director of Fund Administration since January, 2006; Head of Tax/Compliance and Assistant Treasurer from November, 2004 to December, 2005; Director of Trustee Administration (Sarbanes-Oxley) from May, 2003 to October, 2004; Senior Audit Manager, PricewaterhouseCoopers (independent registered public accounting firm) from July, 2000 to April, 2003. | |
|
Ty S. Edwards (Born 1966)
One Financial Center
Boston, MA 02111
Deputy Treasurer (since 2006) | | Director of Fund Administration since January, 2006; Vice President of the Advisor from July, 2002 to December, 2005; Assistant Vice president and Director, State Street Corporation (financial services) prior to 2002. | |
|
Barry S. Vallan (Born 1969)
One Financial Center
Boston, MA 02111
Controller (since 2006) | | Vice President-Fund Treasury of the Advisor since October, 2004; Vice President-Trustee Reporting from April, 2002 to October, 2004; Management Consultant, PricewaterhouseCoopers (independent registered public accounting firm) prior to October, 2002. | |
|
58
Columbia Funds – Columbia Strategic Income Fund
| Growth Funds | | Columbia Acorn Fund
Columbia Acorn Select
Columbia Acorn USA
Columbia Growth Stock Fund
Columbia Large Cap Growth Fund
Columbia Marsico 21st Century Fund
Columbia Marsico Focused Equities Fund
Columbia Marsico Growth Fund
Columbia Marsico Mid Cap Growth Fund
Columbia Mid Cap Growth Fund
Columbia Small Cap Growth Fund I
Columbia Small Cap Growth Fund II
Columbia Small Company Equity Fund | |
|
| Core Funds | | Columbia Common Stock Fund
Columbia Large Cap Core Fund
Columbia Small Cap Core Fund
Columbia Young Investor Fund | |
|
| Value Funds | | Columbia Disciplined Value Fund
Columbia Dividend Income Fund
Columbia Large Cap Value Fund
Columbia Mid Cap Value Fund
Columbia Small Cap Value Fund I
Columbia Small Cap Value Fund II
Columbia Strategic Investor Fund | |
|
| Asset Allocation/Hybrid Funds | | Columbia Asset Allocation Fund
Columbia Asset Allocation Fund II
Columbia Balanced Fund
Columbia Liberty Fund
Columbia LifeGoal(TM) Balanced Growth Portfolio
Columbia LifeGoal(TM) Growth Portfolio
Columbia LifeGoal(TM) Income Portfolio
Columbia LifeGoal(TM) Income and Growth Portfolio
Columbia Masters Global Equity Portfolio
Columbia Masters Heritage Portfolio
Columbia Masters International Equity Portfolio
Columbia Thermostat Fund | |
|
| Index Funds | | Columbia Large Cap Enhanced Core Fund
Columbia Large Cap Index Fund
Columbia Mid Cap Index Fund
Columbia Small Cap Index Fund | |
|
| Tax-Managed Fund | | Columbia Tax-Managed Growth Fund | |
|
| Specialty Funds | | Columbia Convertible Securities Fund
Columbia Real Estate Equity Fund
Columbia Technology Fund
Columbia Utilities Fund | |
|
| Global/International Funds | | Columbia Acorn International
Columbia Acorn International Select
Columbia Global Value Fund
Columbia Greater China Fund
Columbia International Stock Fund
Columbia International Value Fund
Columbia Marsico International Opportunities Fund
Columbia Multi-Advisor International Equity Fund
Columbia World Equity Fund | |
|
59
Columbia Funds – Columbia Strategic Income Fund
| Taxable Bond Funds | | Columbia Conservative High Yield Fund
Columbia Core Bond Fund
Columbia Federal Securities Fund
Columbia High Income Fund
Columbia High Yield Opportunity Fund
Columbia Income Fund
Columbia Intermediate Bond Fund
Columbia Intermediate Core Bond Fund
Columbia Short Term Bond Fund
Colum bia Strategic Income Fund
Columbia Total Return Bond Fund
Columbia U.S. Treasury Index Fund | |
|
| Tax-Exempt Bond Funds | | Columbia California Tax-Exempt Fund
Columbia California Intermediate Municipal Bond Fund
Columbia Connecticut Tax-Exempt Fund
Columbia Connecticut Intermediate Municipal Bond Fund
Columbia Florida Intermediate Municipal Bond Fund
Columbia Georgia Intermediate Municipal Bond Fund
Columbia High Yield Municipal Fund
Columbia Intermediate Municipal Bond Fund
C olumbia Massachusetts Intermediate Municipal Bond Fund
Columbia Massachusetts Tax-Exempt Fund
Columbia Maryland Intermediate Municipal Bond Fund
Columbia Municipal Income Fund
Columbia North Carolina Intermediate Municipal Bond Fund
Columbia New York Tax-Exempt Fund
Columbia New Jersey Intermediate Municipal Bond Fund
Columbia New York Intermediate Municipal Bond Fund
Columbia Oregon Intermediate Municipal Bond Fund
Columbia Rhode Island Intermediate Municipal Bond Fund
Columbia South Carolina Intermediate Municipal Bond Fund
Columbia Short Term Municipal Bond Fund
Columbia Tax-Exempt Fund
Columbia Tax-Exempt Insured Fund
Columbia Texas Intermediate Municipal Bond Fund
Columbia Virginia Intermediate Municipal Bond Fund | |
|
| Money Market Funds | | Columbia California Tax-Exempt Reserves
Columbia Cash Reserves
Columbia Connecticut Municipal Reserves
Columbia Government Plus Reserves
Columbia Government Reserves
Columbia Massachusetts Municipal Reserves
Columbia Money Market Reserves
Columbia Municipal Reserves
Columbia New York Tax-Exempt Reserves
Columbia Prime Reserves
Columbia Tax-Exempt Reserves
Columbia Treasury Reserves | |
|
For complete product information on any Columbia fund, visit our website at www.columbiafunds.com.
Columbia Management Group, LLC ("Columbia Management") is the primary investment management division of Bank of America Corporation. Columbia Management entities furnish investment management services and advise institutional and mutual fund portfolios. Columbia Funds are distributed by Columbia Management Distributors, Inc., member of NASD, SIPC, part of Columbia Management and an affiliate of Bank of America Corporation.
60
Important Information About This Report
Columbia Strategic Income Fund
The fund mails one shareholder report to each shareholder address. If you would like more than one report, please call shareholder services at 800-345-6611 and additional reports will be sent to you.
This report has been prepared for shareholders of Columbia Strategic Income Fund. This report may also be used as sales literature when preceded or accompanied by the current prospectus which provides details of sales charges, investment objectives and operating policies of the fund and with the most recent copy of the Columbia Funds Performance Update.
A description of the policies and procedures that the fund uses to determine how to vote proxies and a copy of the fund's voting records are available (i) at www.columbiamanagement.com; (ii) on the Securities and Exchange Commission's website at www.sec.gov, and (iii) without charge, upon request, by calling 800-368-0346. Information regarding how the fund voted proxies relating to portfolio securities during the 12-month period ended June 30 is available from the SEC's website. Information regarding how the fund voted proxies relating to portfolio securities is also available from the fund's website.
The fund files a complete schedule of portfolio holdings with the SEC for the first and third quarters of each fiscal year on Form N-Q. The fund's Form N-Q is available on the SEC's website at www.sec.gov and may be reviewed and copied at the SEC's Public Reference Room in Washington, DC. Information on the operation of the Public Reference Room may be obtained by calling 1-800-SEC-0330.
Columbia Management Group, LLC ("Columbia Management") is the primary investment management division of Bank of America Corporation. Columbia Management entities furnish investment management services and advise institutional and mutual fund portfolios. Columbia Funds are distributed by Columbia Management Distributors, Inc., member of NASD, SIPC, part of Columbia Management and an affiliate of Bank of America Corporation.
Transfer Agent
Columbia Management Services, Inc.
P.O. Box 8081
Boston MA 02266-8081
800.345.6611
Distributor
Columbia Management
Distributors, Inc.
One Financial Center
Boston MA 02111
Investment Advisor
Columbia Management Advisors, LLC
100 Federal Street
Boston MA 02110
61
Columbia Strategic Income Fund
Annual Report, May 31, 2006
Columbia Management®
PRSRT STD
U.S. Postage
PAID
Holliston, MA
Permit NO. 20
©2006 Columbia Management Distributors, Inc.
One Financial Center, Boston, MA 02111-2621
800-345-6611 www.columbiafunds.com
SHC-42/111298-0506 (07/06) 06/26748
Columbia Management®
Columbia High Yield Opportunity Fund
Annual Report – May 31, 2006
NOT FDIC-INSURED
May Lose Value
No Bank Guarantee
Table of contents
| Performance Information | | | 1 | | |
|
| Understanding Your Expenses | | | 2 | | |
|
| Economic Update | | | 3 | | |
|
| Portfolio Manager's Report | | | 4 | | |
|
| Fund Profile | | | 6 | | |
|
| Investment Portfolio | | | 7 | | |
|
Statement of Assets and
Liabilities | | | 32 | | |
|
| Statement of Operations | | | 33 | | |
|
Statement of Changes in
Net Assets | | | 34 | | |
|
| Financial Highlights | | | 35 | | |
|
| Notes to Financial Statements | | | 39 | | |
|
Report of Independent
Registered Public Accounting
Firm | | | 46 | | |
|
| Fund Governance | | | 47 | | |
|
| Columbia Funds | | | 51 | | |
|
Important Information About
This Report | | | 53 | | |
|
The views expressed in the President's Message and Portfolio Manager's Report reflect the current views of the respective parties. These views are not guarantees of future performance and involve certain risks, uncertainties and assumptions that are difficult to predict so actual outcomes and results may differ significantly from the views expressed. These views are subject to change at any time based upon economic, market or other conditions and the respective parties disclaim any responsibility to update such views. These views may not be relied on as investment advice and, because investment decisions for a Columbia Fund are based on numerous factors, may not be relied on as an indication of trading intent on behalf of any particular Columbia Fund. References to specific company securities should not be construed as a recommendation or investment advice.
President's Message

A message to our valued clients
In the mutual fund business, success can be measured a number of different ways. Performance is a key measure—the one that gains most attention. But fees and service are also important. In that regard, we are pleased to report that Columbia Management has experienced success on all three fronts over the past year. Even more important, our shareholders have benefited from this success.
Because performance ultimately determines investment success, we have devoted considerable energy to improving the performance of all Columbia funds. And we are happy to report that we have made considerable progress toward this important goal.1
Columbia has also taken great strides toward making fund operations more cost effective, which has translated into lower expense ratios on many Columbia funds. In this regard, we believe we still have more work to do, and we will continue to explore opportunities for reining in expenses to the benefit of all our shareholders.
On the service front, we have made it easy and convenient for shareholders to do business with us both on the web at www.columbiafunds.com or over the phone at 800.345.6611. In fact, we've recently upgraded our automated phone system with an advanced speech recognition system that allows callers to interact with the system using natural spoken commands.
After secure login, shareholders can buy, sell or exchange funds either online or over the phone. (Buying shares requires that a link has been established between the shareholder's bank account and Columbia.) Up-to-date performance and pricing information is available online and over the phone. At www.columbiafunds.com, shareholders can also update important personal information and get access to prospectuses and fund reports, which reduces paper clutter for shareholders and translates into a reduction of costs for the funds.
At Columbia Management, we think that you'll like what you see as you read the reports for the period ended May 31, 2006. We are committed to continued improvements in an effort to help our shareholders reach their long-term financial goals. And we look forward to continuing to work with you, our valued financial clients, in the years to come.
Sincerely,

Christopher L. Wilson
President, Columbia Funds
1Past performance is no guarantee of future results.
Performance Information – Columbia High Yield Opportunity Fund
Performance data quoted represents past performance and current performance may be lower or higher. Past performance is no guarantee of future results. The investment return and principal value will fluctuate so that shares, when redeemed, may be worth more or less than the original cost. Please visit www.columbiafunds.com for daily and most recent month-end performance updates.
Performance of a $10,000 investment
06/01/96 – 05/31/06 ($)
| sales charge | | without | | with | |
| Class A | | | 16,398 | | | | 15,619 | | |
| Class B | | | 15,211 | | | | 15,211 | | |
| Class C | | | 15,418 | | | | 15,418 | | |
| Class Z | | | 16,703 | | | | n/a | | |
Growth of a $10,000 Investment 06/01/96 – 05/31/06
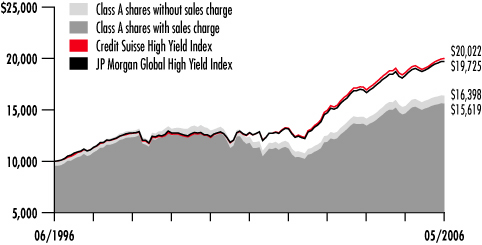
The chart above shows the growth in value of a hypothetical $10,000 investment in Class A shares of Columbia High Yield Opportunity Fund during the stated time period. The graph and table do not reflect the deduction of taxes that a shareholder would pay on fund distributions or the redemption of fund shares. The Credit Suisse High Yield Index is a broad-based, unmanaged index that tracks the performance of high-yield bonds. The JP Morgan Global High Yield Index is designed to mirror the investable universe of the US dollar global high-yield corporate debt market, including domestic and international issues. Unlike the fund, indices are not investments, do not incur fees or expenses and are not professionally managed. It is not possible to invest directly in an index. Securities in the fund may not match those in an index.
Average annual total return as of 05/31/06 (%)
| Share class | | A | | B | | C | | Z | |
| Inception | | 10/21/71 | | 06/08/92 | | 01/15/96 | | 01/08/99 | |
| Sales charge | | without | | with | | without | | with | | without | | with | | without | |
| 1-year | | | 6.70 | | | | 1.64 | | | | 5.91 | | | | 0.98 | | | | 6.07 | | | | 5.08 | | | | 6.97 | | |
| 5-year | | | 5.82 | | | | 4.79 | | | | 5.03 | | | | 4.75 | | | | 5.19 | | | | 5.19 | | | | 6.08 | | |
| 10-year | | | 5.07 | | | | 4.56 | | | | 4.28 | | | | 4.28 | | | | 4.42 | | | | 4.42 | | | | 5.26 | | |
Average annual total return as of 03/31/06 (%)
| Share class | | A | | B | | C | | Z | |
| Sales charge | | without | | with | | without | | with | | without | | with | | without | |
| 1-year | | | 5.23 | | | | 0.23 | | | | 4.44 | | | | -0.42 | | | | 4.60 | | | | 3.63 | | | | 5.49 | | |
| 5-year | | | 5.39 | | | | 4.37 | | | | 4.61 | | | | 4.33 | | | | 4.77 | | | | 4.77 | | | | 5.65 | | |
| 10-year | | | 5.15 | | | | 4.64 | | | | 4.36 | | | | 4.36 | | | | 4.50 | | | | 4.50 | | | | 5.34 | | |
The "with sales charge" returns include the maximum initial sales charge of 4.75% for class A shares, maximum contingent deferred sales charge of 5.00% for class B shares and 1.00% for class C shares for the first year only. The "without sales charge" returns do not include the effect of sales charges. If they had, returns would be lower.
Performance results reflect any voluntary waivers or reimbursement of fund expenses by the advisor or its affiliates. Absent these waivers or reimbursement arrangements, performance results would have been lower.
Class Z shares are sold at net asset value with no Rule 12b-1 fees. Class Z shares have limited eligibility and the investment minimum requirement may vary. All results shown assume reinvestment of distributions. Please see the funds prospectus for details.
Performance for different share classes will vary based on differences in sales charges and fees associated with each class.
Class Z is a newer class of shares. Its performance information includes returns of the fund's class A shares (the oldest existing fund class) for periods prior to its inception. The returns have not been restated to reflect any differences in expenses (such as Rule 12b-1 fees) between class A shares and the newer class of shares. If differences in expenses had been reflected, the returns shown for periods prior to the inception of the newer class of shares would have been higher. Class Z shares were initially offered on January 8, 1999. Class A shares were initially offered on October 21, 1971.
1
Understanding Your Expenses – Columbia High Yield Opportunity Fund
Shareholder expense example
As a fund shareholder, you incur two types of costs. There are transaction costs, which generally include sales charges on purchases and may include redemption or exchange fees. There are also ongoing costs, which generally include investment advisory, Rule 12b-1 fees and other fund expenses. The information on this page is intended to help you understand your ongoing costs of investing in the fund and to compare these costs with the ongoing costs of investing in other mutual funds.
Analyzing your fund's expenses by share class
To illustrate these ongoing costs, we have provided an example and calculated the expenses paid by investors in each share class during the period. The information in the following table is based on an initial investment of $1,000, which is invested at the beginning of the reporting period and held for the entire period. Expense information is calculated two ways and each method provides you with different information. The amount listed in the "actual" column is calculated using the fund's actual operating expenses and total return for the period. The amount listed in the "hypothetical" column for each share class assumes that the return each year is 5% before expenses and includes the fund's actual expense ratio. You should not use the hypothetical account values and expenses to estimate either your actual account balance at the end of the period or the expenses you paid during this reporting period.
Estimating your actual expenses
To estimate the expenses that you paid over the period, first you will need your account balance at the end of the period:
g For shareholders who receive their account statements from Columbia Management Services, Inc., your account balance is available online at www.columbiafunds.com or by calling Shareholder Services at 800.345.6611.
g For shareholders who receive their account statements from their brokerage firm, contact your brokerage firm to obtain your account balance.
1. Divide your ending account balance by $1,000. For example, if an account balance was $8,600 at the end of the period, the result would be 8.6.
2. In the section of the table below titled "Expenses paid during the period," locate the amount for your share class. You will find this number is in the column labeled "actual." Multiply this number by the result from step 1. Your answer is an estimate of the expenses you paid on your account during the period.
12/01/05 – 05/31/06
| | | Account value at the
beginning of the period ($) | | Account value at the
end of the period ($) | | Expenses paid
during the period ($) | | Fund's annualized
expense ratio (%) | |
| | | Actual | | Hypothetical | | Actual | | Hypothetical | | Actual | | Hypothetical | |
| Class A | | | 1,000.00 | | | | 1,000.00 | | | | 1,032.76 | | | | 1,019.55 | | | | 5.47 | | | | 5.44 | | | | 1.08 | | |
| Class B | | | 1,000.00 | | | | 1,000.00 | | | | 1,028.92 | | | | 1,015.81 | | | | 9.26 | | | | 9.20 | | | | 1.83 | | |
| Class C | | | 1,000.00 | | | | 1,000.00 | | | | 1,029.67 | | | | 1,016.55 | | | | 8.50 | | | | 8.45 | | | | 1.68 | | |
| Class Z | | | 1,000.00 | | | | 1,000.00 | | | | 1,034.01 | | | | 1,020.79 | | | | 4.21 | | | | 4.18 | | | | 0.83 | | |
Expenses paid during the period are equal to the fund's respective class annualized expense ratio, multiplied by the average account value over the period, then multiplied by the number of days in the fund's most recent fiscal half-year and divided by 365.
Had the distributor not waived a portion of Class C shares' expenses, total return would have been reduced.
It is important to note that the expense amounts shown in the table are meant to highlight only ongoing costs of investing in the fund and do not reflect any transaction costs, such as sales charges, redemption or exchange fees. Therefore, the hypothetical examples provided will not help you determine the relative total costs of owning shares of different funds. If these transaction costs were included, your costs would have been higher.
Compare with other funds
Since all mutual funds are required to include the same hypothetical calculations about expenses in shareholder reports, you can use this information to compare the ongoing cost of investing in the fund with other funds. To do so, compare the 5% hypothetical example with the 5% hypothetical examples that appear in the shareholder reports of other funds. As you compare hypothetical examples of other funds, it is important to note that hypothetical examples are meant to highlight the continuing cost of investing in a fund and do not reflect any transaction costs, such as sales charges or redemption or exchange fees.
2
Economic Update – Columbia High Yield Opportunity Fund
The US economy fired on all cylinders during the 12-month period that began June 1, 2005 and ended May 30, 2006. Gross domestic product (GDP) expanded at an estimated annualized rate of approximately 3.6% as job growth and a strong housing market provided strong support for consumer spending. Rising profits freed up cash for business spending, which picked up during the period. Personal income rose.
Yet, these overall measures masked a host of challenges, which led to considerable volatility during the 12-month period. Late last summer, hurricanes Katrina and Rita devastated the Gulf Coast, disrupting the flow of energy products and leaving millions of Americans without homes or jobs. Consumer confidence plummeted in the wake of the storms. The impact on the labor market was actually less than anticipated. However, economic growth fell to a mere 1.7% in the fourth quarter.
In the first half of 2006, the economy regained considerable momentum. GDP growth rebounded to 5.3%. Yet, the once strong housing market began to show signs of slowing. After months of steady rebound, consumer confidence took a dive in May as Americans grew apprehensive about the economy, in general, and the labor market in particular. And inflation edged higher as record-high energy prices took a bigger bite out of household budgets.
After a solid start, bond market sputters
The US bond market delivered positive, but modest returns for the first half of the period, then came to a standstill as interest rates moved higher across the maturity spectrum. The yield on the 10-year US Treasury note, a bellwether for the bond market, rose more than one full percentage point and ended the period at 5.13%. In this environment, the Lehman Brothers Aggregate Bond Index returned negative 0.48% for the 12-month period. High-yield bonds led the fixed-income markets. The Credit Suisse First Boston High Yield Index returned 7.38%.
Eight short-term rate hikes—and more to come?
The Federal Reserve Board (the Fed) raised the federal funds rate, a key short-term rate, from 3.00% to 5.00% in eight consecutive one-quarter point increases.1 In the wake of hurricanes Katrina and Rita, some market observers speculated that the Fed might curtail its rate hikes. However, outgoing Fed Chairman Greenspan indicated that inflation was a greater concern than the sustainability of economic growth, and the Fed, under new chairman Ben Bernanke, continued to raise short-term interest rates through the end of the period.
Stocks moved higher
Despite bouts of volatility, the S&P 500 Index—a broad measure of large-company stock market performance—returned a respectable 8.64% for this reporting period. Small- and mid-cap stocks did even better. The Russell 2000 Growth Index returned 18.22% while the Russell 2000 Value Index returned 18.22%. Energy stocks led the US stock market as commodity prices continued to climb. Foreign stock markets generally did better than the US market. The MSCI EAFE Index, which tracks stock market performance in industrialized countries outside the United States, returned 28.24%.
1On June 29, 2006 the federal funds rate was raised to 5.25%.
The Lehman Brothers Aggregate Bond Index is a market value-weighted index that tracks the daily price, coupon, pay-downs, and total return performance of fixed-rate, publicly placed, dollar denominated non-convertible investment grade debt issues with at least $250 million par amount outstanding and with at least one year to final maturity.
The Credit Suisse High Yield Index is a broad-based, unmanaged index that tracks the performance of high-yield bonds.
The S&P 500 Index is an index that tracks the performance of 500 widely held, large-capitalization US stocks.
The Russell 2000 Growth Index, an index that tracks the performance of those Russell 2000 companies with higher price-to-book ratios and higher forecasted growth values.
The Russell 2000 Value Index measures the performance of those Russell 2000 companies with lower price-to-book ratios and lower forecasted growth values.
The MSCI EAFE Index (Europe, Australasia, Far East) is a market capitalization index that is designed to measure developed market equity performance, excluding the U.S. and Canada.
Unlike the fund, indices are not investments, do not incur fees or expenses and are not professionally managed. It is not possible to invest directly in an index.
Summary
For the 12-month period ended May 30, 2006
g Investment-grade bonds delivered negative returns, as measured by the Lehman Brothers Aggregate Bond Index. High-yield bonds led the fixed-income markets, as measured by the Credit Suisse High Yield Index.
| 1 year return as of 05/31/06: | |
|
| | -0.48 | % | |
|
 Lehman Index Lehman Index | |
|
| | +7.38 | % | |
|
 Credit Suisse Index Credit Suisse Index | |
|
g Despite volatility, the broad stock market, as measured by the S&P 500 Index, returned 8.64%. Small-cap growth stocks were the period's best performers within the US stock market, as measured by the Russell 2000 Growth Index.
| | +8.64 | % | |
|
 S&P Index S&P Index | |
|
| | +18.22 | % | |
|
 Russell Index Russell Index | |
|
3
Portfolio Manager's Report – Columbia High Yield Opportunity Fund
For the 12-month period ended May 31, 2006, class A shares of Columbia High Yield Opportunity Fund returned 6.70% without sales charge. The average return of its peer group, the Lipper High Current Yield Funds Category, was 6.88% for the same period.1 The fund's benchmarks, the Credit Suisse High Yield Index and the JP Morgan Global High Yield Index, returned 7.38% and 7.40%, respectively.
High-yield sector delivered robust returns
High-yield bonds led other fixed-income sectors over the past 12 months, extending a period of robust returns that has roughly paralleled the current long-running economic expansion. Lower default rates, healthier corporate balance sheets and continued investor demand for higher yields continued to benefit the sector. In this environment, the fund benefited from good industry allocation. However, a decision to shift the portfolio's quality mix detracted somewhat from relative returns.
Quality shift detracted from return
Early in the period, the fund benefited from its emphasis on lower-rated issues. However, when valuations for lower quality bonds moved up past our comfort level, we upgraded the portfolio by selling CCC-rated bonds in favor of potentially more stable BB and B-rated issues. Our decision to restructure the fund's quality orientation proved somewhat premature as lower quality continued to perform well. Despite this near-term performance shortfall, we believe that our strategy has the potential to reap benefits if the yield difference between lower and higher quality issues widens in the future.
Utility and wireless aided sectors results; health care disappointed
Across sectors, the fund benefited from allocations to utilities and wireless telecommunications. Utilities moved higher on improved valuations and both sectors were aided by significant merger and acquisition activity.
Among individual credits, gainers included Continental Airlines, Inc., which benefited from increased passenger traffic and improving financials; LaBranche & Co., Inc., a finance company that reported better-than-expected results during the period. Stronger cash flows and a growing subscriber base for its DSL Internet service boosted bonds of Qwest Communications International, Inc. Town Sports International, Inc., an owner and operator of fitness clubs, also performed well during the period as they expanded their presence in the Northeast and mid-Atlantic U.S. Other strong performers included Dollar Financial Group, Inc., which provides consumer-based finance services and Nycomed A/S, an international pharmaceuticals company.
1Lipper Inc., a widely respected data provider in the industry, calculates an average total return (assuming reinvestment of distributions) for mutual funds with investment objectives similar to those of the fund. Lipper makes no adjustment for the effect of sales loads.
Performance data quoted represents past performance and current performance may be lower or higher. Past performance is no guarantee of future results. The investment return and principal value will fluctuate so that shares, when redeemed, may be worth more or less than the original cost. Please visit www.columbiafunds.com for daily and most recent month-end performance updates.
Summary
g For the 12-month period ended May 31, 2006, the fund's class A shares returned 6.70% without sales charge.
g A shift in emphasis from lower quality to higher quality bonds tempered results relative to the fund's benchmarks and peer group.
g Utility and wireless telecommunications bonds were strong performers for the fund.
Holdings discussed
in this report as of 5/31/06 (%)
| Continental Airlines, Inc. | | | 0.5 | | |
| LaBranche & Co., Inc. | | | 0.4 | | |
Qwest Communications
International, Inc. | | | 0.3 | | |
| Town Sports International, Inc. | | | 0.4 | | |
| Dollar Financial Group, Inc. | | | 0.2 | | |
| Nycomed A/S | | | 0.5 | | |
| MedQuest, Inc. | | | 0.1 | | |
| Abitibi-Consolidated, Inc. | | | 0.3 | | |
Your fund is actively managed and the composition of its portfolio will change over time. Information provided is calculated as a percentage of net assets.
4
Portfolio Manager's Report – Columbia High Yield Opportunity Fund
By contrast, results were disappointing in the health care and forestry sectors. Bonds of MedQuest, Inc. and InSight Health Services Corp. both suffered as they missed their earnings targets and dealt with unfavorable regulatory changes. The inability to raise prices limited Abitibi-Consolidated, Inc.'s ability to pass on higher costs. The strong Canadian dollar also curbed profits for this Montreal-based papermaker and recycler.
Looking ahead
We believe that the economy's prospects for continued growth are favorable. Although we expect corporate earnings to continue to expand, we also believe that many high-yield issues have been accorded excessive valuations. In addition, the yield advantage that lower quality bonds offer over higher quality bonds, no longer appears sufficient to compensate for added risk. The quality of new issues has also deteriorated over the last three years as more CCC and non-rated issues have come to market. We believe that this downshift in quality could lead to a higher default rate over time.
Against this backdrop, we believe that our decision to upgrade the portfolio's quality has the potential to be rewarded, even though it has hindered results somewhat thus far. We believe that several factors could lead to better future performance among high quality companies, specifically: the Federal Reserve increasing rates further than necessary; the cooling housing market; elevated oil prices; international unrest; excessive leverage in the financial system; and slower corporate profit growth.
Investing in fixed-income securities may involve certain risks, including the credit quality of individual issuers, possible prepayments, market or economic developments and yield and share price fluctuations due to changes in interest rates. When interest rates go up, bond prices typically drop, and vice versa.
Investing in high-yield or "junk" bonds offers the potential for higher income than investments in investment-grade bonds, but also has a higher degree of risk. Changes in economic conditions or other circumstances may adversely affect a high-yield bond issuer's ability to make timely principal and interest payments. Rising interest rates tend to lower the value of all bonds. International investing involves special risks, including foreign taxation, currency fluctuations, risks associated with possible differences in financial standards and other monetary and political risks.
5
Fund Profile – Columbia High Yield Opportunity Fund
Performance data quoted represents past performance and current performance may be lower or higher. Past performance is no guarantee of future results. The investment return and principal value will fluctuate so that shares, when redeemed, may be worth more or less than the original cost. Please visit www.columbiafunds.com for daily and most recent month-end performance updates.
Summary
| 1 year return as of 05/31/06 | |
|
| | +6.70 | % | |
|
 Class A shares Class A shares | |
|
| | +7.38 | % | |
|
 Credit Suisse High Yield Index Credit Suisse High Yield Index | |
|
Management Style

| Top 10 issuers as of 05/31/06 (%) | |
| General Motors Acceptance Corp. | | | 1.5 | | |
| Qwest Corp. | | | 1.1 | | |
Eldorado Casino Shreveport/
Shreveport Capital Corp. | | | 1.1 | | |
| Williams Companies, Inc. | | | 0.9 | | |
Spanish Broadcasting
System, Inc. | | | 0.9 | | |
| iStar Financial, Inc. | | | 0.9 | | |
Allied Waste
North America, Inc. | | | 0.9 | | |
| Dobson Cellular Systems, Inc. | | | 0.8 | | |
| El Paso Corp. | | | 0.8 | | |
| Rural Cellular Corp. | | | 0.8 | | |
| Quality breakdown as of 05/31/06 (%) | |
| AAA | | | 2.8 | | |
| BBB | | | 1.2 | | |
| BB | | | 22.4 | | |
| B | | | 50.2 | | |
| CCC | | | 13.9 | | |
| CC | | | 1.2 | | |
| Non-rated | | | 3.4 | | |
| Other | | | 4.9 | | |
| Maturity breakdown as of 05/31/06 (%) | |
| 0 – 3 years | | | 4.3 | | |
| 3 – 5 years | | | 11.8 | | |
| 5 – 7 years | | | 27.0 | | |
| 7 – 10 years | | | 42.3 | | |
| 10 – 15 years | | | 0.7 | | |
| 15 - 20 years | | | 1.0 | | |
| 20 – 30 years | | | 2.8 | | |
| Other | | | 10.1 | | |
| Portfolio structure as of 05/31/06 (%) | |
Corporate fixed-income
bonds & notes | | | 88.4 | | |
Cash and Equivalents, net
other assets & liabilities | | | 6.4 | | |
| Preferred Stocks | | | 2.3 | | |
| Common Stocks and warrants | | | 1.4 | | |
| Municipal bond (taxable) | | | 0.8 | | |
| Convertible bonds | | | 0.7 | | |
Net asset value per share
as of 05/31/06 ($) | |
| Class A | | | 4.50 | | |
| Class B | | | 4.50 | | |
| Class C | | | 4.50 | | |
| Class Z | | | 4.50 | | |
Distributions declared per share
06/01/05 – 05/31/06 ($) | |
| Class A | | | 0.36 | | |
| Class B | | | 0.32 | | |
| Class C | | | 0.33 | | |
| Class Z | | | 0.37 | | |
| SEC yields as of 05/31/06 (%) | |
| Class A | | | 6.23 | | |
| Class B | | | 5.77 | | |
| Class C | | | 5.93 | | |
| Class Z | | | 6.79 | | |
Management style is determined by Columbia Management and is based on the Investment strategy and process as outlined in the fund's prospectus.
Maturity and quality breakdowns are calculated as a percentage of net assets. Ratings shown in the quality breakdown represent the rating assigned to a particular bond by one of the following nationally-recognized rating agencies: Standard & Poor's, a division of the McGraw-Hill Companies, Inc., Moody's Investors Service, Inc. or Fitch Ratings Ltd. Ratings are relative and subjective and are not absolute standards of quality. The fund's credit quality does not remove market risk. Portfolio structure and top 10 issuers are calculated as a percentage of net assets.
The 30-day SEC yields reflect the portfolio's earning power net of expenses, expressed as an annualized percentage of the public offering price per share at the end of the period.
6
Investment Portfolio – Columbia High Yield Opportunity Fund May 31, 2006
Corporate Fixed-Income Bonds & Notes – 88.4%
Basic Materials – 7.3%
| Chemicals – 4.4% | | | | Par ($) | | Value ($) | |
| Agricultural Chemicals – 1.1% | |
| | | IMC Global, Inc.
10.875% 08/01/13 | | | 1,050,000 | | | | 1,183,875 | | |
| | | Terra Capital, Inc.
12.875% 10/15/08 | | | 1,420,000 | | | | 1,625,900 | | |
| | | UAP Holding Corp. (a)
07/15/12 (10.750% 01/15/08) | | | 1,190,000 | | | | 1,148,350 | | |
| | | United Agri Products
8.250% 12/15/11 | | | 555,000 | | | | 598,290 | | |
| | | | | | | | | | 4,556,415 | | |
| Chemicals-Diversified – 2.7% | |
| | | BCP Crystal US Holdings Corp.
9.625% 06/15/14 | | | 917,000 | | | | 1,008,700 | | |
| | | EquiStar Chemicals LP
10.625% 05/01/11 | | | 1,150,000 | | | | 1,247,750 | | |
| | | Huntsman International LLC
8.125% 01/01/15(b) | | | 1,415,000 | | | | 1,365,475 | | |
| | | Huntsman LLC
11.500% 07/15/12 | | | 535,000 | | | | 607,225 | | |
| | | Ineos Group Holdings PLC
7.875% 02/15/16(b) | | | 1,020,000 | | | | 1,244,945 | | |
| | | 8.500% 02/15/16(b) | | | 1,220,000 | | | | 1,148,325 | | |
| | | Innophos Investments Holdings, Inc.
PIK,
13.170% 02/15/15(c) | | | 955,507 | | | | 957,895 | | |
| | | Lyondell Chemical Co.
9.625% 05/01/07 | | | 1,750,000 | | | | 1,800,313 | | |
| | | NOVA Chemicals Corp.
6.500% 01/15/12 | | | 1,265,000 | | | | 1,170,125 | | |
| | | 8.405% 11/15/13(c) | | | 805,000 | | | | 817,075 | | |
| | | | | | | | | | 11,367,828 | | |
| Chemicals-Specialty – 0.6% | |
| | | Chemtura Corp.
6.875% 06/01/16 | | | 590,000 | | | | 575,250 | | |
| | | Rhodia SA
8.875% 06/01/11 | | | 1,739,000 | | | | 1,754,216 | | |
| | | | | | | | | | 2,329,466 | | |
| | | Chemicals Total | | | | | | | 18,253,709 | | |
See Accompanying Notes to Financial Statements.
7
Columbia High Yield Opportunity Fund May 31, 2006
Corporate Fixed-Income Bonds & Notes (continued)
Basic Materials (continued)
| Forest Products & Paper – 2.2% | | | | Par ($) | | Value ($) | |
| Paper & Related Products – 2.2% | |
| | | Abitibi-Consolidated, Inc.
8.375% 04/01/15 | | | 1,325,000 | | | | 1,265,375 | | |
| | | Boise Cascade LLC
7.125% 10/15/14 | | | 500,000 | | | | 455,000 | | |
| | | 7.943% 10/15/12(c) | | | 1,370,000 | | | | 1,380,275 | | |
| | | Buckeye Technologies, Inc.
8.500% 10/01/13 | | | 480,000 | | | | 471,600 | | |
| | | Georgia-Pacific Corp.
8.000% 01/15/24 | | | 2,035,000 | | | | 1,973,950 | | |
| | | Neenah Paper, Inc.
7.375% 11/15/14 | | | 790,000 | | | | 734,700 | | |
| | | NewPage Corp.
10.000% 05/01/12 | | | 1,090,000 | | | | 1,163,575 | | |
| | | 12.000% 05/01/13 | | | 470,000 | | | | 507,600 | | |
| | | Norske Skog
7.375% 03/01/14 | | | 995,000 | | | | 915,400 | | |
| | | 8.625% 06/15/11 | | | 450,000 | | | | 447,750 | | |
| | | | | | | | | | 9,315,225 | | |
| | | Forest Products & Paper Total | | | | | | | 9,315,225 | | |
| Iron/Steel – 0.5% | | | | | | | |
| Steel-Producers – 0.3% | |
| | | Steel Dynamics, Inc.
9.500% 03/15/09 | | | 1,080,000 | | | | 1,125,900 | | |
| | | | | | | | | | 1,125,900 | | |
| Steel-Specialty – 0.2% | |
| | | UCAR Finance, Inc.
10.250% 02/15/12 | | | 1,011,000 | | | | 1,076,715 | | |
| | | | | | | | | | 1,076,715 | | |
| | | Iron/Steel Total | | | | | | | 2,202,615 | | |
| Metals & Mining – 0.2% | | | | | | | | | | | |
| Mining Services – 0.2% | |
| | | Hudson Bay Mining & Smelting Co., Ltd.
9.625% 01/15/12 | | | 560,000 | | | | 616,000 | | |
| | | | | | | | | | 616,000 | | |
| | | Metals & Mining Total | | | | | | | 616,000 | | |
| BASIC MATERIALS TOTAL | | | | | | | | | 30,387,549 | | |
See Accompanying Notes to Financial Statements.
8
Columbia High Yield Opportunity Fund May 31, 2006
Corporate Fixed-Income Bonds & Notes (continued)
Communications – 19.0%
| Media – 7.6% | | | | Par ($) | | Value ($) | |
| Broadcast Services/Programs – 0.5% | |
| | | Fisher Communications, Inc.
8.625% 09/15/14 | | | 860,000 | | | | 896,550 | | |
| | | XM Satellite Radio, Inc.
9.750% 05/01/14(b) | | | 1,130,000 | | | | 1,050,900 | | |
| | | | | | | | | | 1,947,450 | | |
| Cable TV – 3.3% | |
| | | Atlantic Broadband Finance LLC
9.375% 01/15/14 | | | 1,225,000 | | | | 1,176,000 | | |
| | | Charter Communications Holdings II LLC
10.250% 09/15/10 | | | 2,410,000 | | | | 2,416,025 | | |
| | | Charter Communications Holdings LLC
9.920% 04/01/14 | | | 3,935,000 | | | | 2,420,025 | | |
| | | CSC Holdings, Inc.
7.250% 04/15/12(b) | | | 2,270,000 | | | | 2,241,625 | | |
| | | 7.625% 04/01/11 | | | 775,000 | | | | 782,750 | | |
| | | EchoStar DBS Corp.
6.625% 10/01/14 | | | 1,935,000 | | | | 1,833,412 | | |
| | | Insight Midwest LP
9.750% 10/01/09 | | | 1,255,000 | | | | 1,286,375 | | |
| | | Telenet Group Holding NV (a) 06/15/14
(11.500% 12/15/08)(b) | | | 1,662,000 | | | | 1,396,080 | | |
| | | | | | | | | | 13,552,292 | | |
| Multimedia – 1.0% | |
| | | Advanstar Communications, Inc.
15.000% 10/15/11 | | | 1,325,000 | | | | 1,392,906 | | |
| | | Lamar Media Corp.
6.625% 08/15/15 | | | 1,445,000 | | | | 1,383,588 | | |
| | | Quebecor Media, Inc.
7.750% 03/15/16(b) | | | 1,530,000 | | | | 1,545,300 | | |
| | | | | | | | | | 4,321,794 | | |
| Publishing-Newspapers – 0.4% | |
| | | Hollinger, Inc.
11.875% 03/01/11(b) | | | 1,009,000 | | | | 1,009,000 | | |
| | | 12.875% 03/01/11(b) | | | 774,000 | | | | 805,928 | | |
| | | | | | | | | | 1,814,928 | | |
| Publishing-Periodicals – 1.9% | |
| | | Dex Media West LLC
9.875% 08/15/13 | | | 1,877,000 | | | | 2,050,622 | | |
| | | Dex Media, Inc. (a) 11/15/13
(9.000% 11/15/08) | | | 1,230,000 | | | | 1,039,350 | | |
| | | PriMedia, Inc.
8.000% 05/15/13 | | | 2,200,000 | | | | 1,980,000 | | |
| | | RH Donnelley Corp.
8.875% 01/15/16(b) | | | 1,405,000 | | | | 1,408,513 | | |
| | | WDAC Subsidiary Corp.
8.375% 12/01/14(b) | | | 1,385,000 | | | | 1,359,031 | | |
| | | | | | | | | | 7,837,516 | | |
| Radio – 0.3% | |
| | | CMP Susquehanna Corp.
9.875% 05/15/14(b) | | | 1,405,000 | | | | 1,369,875 | | |
| | | | | | | | | | 1,369,875 | | |
See Accompanying Notes to Financial Statements.
9
Columbia High Yield Opportunity Fund May 31, 2006
Corporate Fixed-Income Bonds & Notes (continued)
Communications (continued)
| Media (continued) | | | | Par ($) | | Value ($) | |
| Television – 0.2% | |
| | | LIN Television Corp.
6.500% 05/15/13 | | | 450,000 | | | | 421,875 | | |
| | | Sinclair Broadcast Group, Inc.
8.750% 12/15/11 | | | 245,000 | | | | 256,331 | | |
| | | | | | | | | | 678,206 | | |
| | | Media Total | | | | | | | 31,522,061 | | |
| Telecommunication Services – 11.4% | | | | | | | | | | | |
| Cellular Telecommunications – 4.0% | |
| | | Digicel Ltd.
9.250% 09/01/12(b) | | | 1,655,000 | | | | 1,743,956 | | |
| | | Dobson Cellular Systems, Inc.
8.375% 11/01/11 | | | 1,805,000 | | | | 1,874,944 | | |
| | | 9.875% 11/01/12 | | | 1,280,000 | | | | 1,388,800 | | |
| | | Horizon PCS, Inc.
11.375% 07/15/12 | | | 325,000 | | | | 368,469 | | |
| | | iPCS Escrow Co.
11.500% 05/01/12 | | | 790,000 | | | | 890,725 | | |
| | | Nextel Communications, Inc.
7.375% 08/01/15 | | | 1,275,000 | | | | 1,315,735 | | |
| | �� | Nextel Partners, Inc.
8.125% 07/01/11 | | | 1,070,000 | | | | 1,130,187 | | |
| | | Rogers Cantel, Inc.
9.750% 06/01/16 | | | 1,880,000 | | | | 2,190,200 | | |
| | | Rogers Wireless, Inc.
8.000% 12/15/12 | | | 1,295,000 | | | | 1,340,325 | | |
| | | Rural Cellular Corp.
8.250% 03/15/12 | | | 1,355,000 | | | | 1,404,119 | | |
| | | 9.750% 01/15/10 | | | 375,000 | | | | 380,625 | | |
| | | 10.899% 11/01/12(b)(c) | | | 1,315,000 | | | | 1,375,819 | | |
| | | US Unwired, Inc.
10.000% 06/15/12 | | | 945,000 | | | | 1,054,768 | | |
| | | | | | | | | | 16,458,672 | | |
| Satellite Telecommunications – 1.5% | |
| | | Inmarsat Finance II PLC (a) 11/15/12
(10.375% 11/15/08) | | | 2,285,000 | | | | 1,965,100 | | |
| | | Intelsat Bermuda, Ltd.
8.250% 01/15/13 | | | 1,935,000 | | | | 1,925,325 | | |
| | | PanAmSat Corp.
9.000% 08/15/14 | | | 1,031,000 | | | | 1,072,240 | | |
| | | Zeus Special Subsidiary Ltd. (a) 02/01/15
(9.250% 02/01/10)(b) | | | 1,780,000 | | | | 1,281,600 | | |
| | | | | | | | | | 6,244,265 | | |
| Telecommunication Equipment – 0.4% | |
| | | Lucent Technologies, Inc.
6.450% 03/15/29 | | | 1,790,000 | | | | 1,561,775 | | |
| | | | | | | | | | 1,561,775 | | |
See Accompanying Notes to Financial Statements.
10
Columbia High Yield Opportunity Fund May 31, 2006
Corporate Fixed-Income Bonds & Notes (continued)
Communications (continued)
| Telecommunication Services (continued) | | | | Par ($) | | Value ($) | |
| Telecommunication Services – 1.5% | |
| | | Embarq Corp.
7.082% 06/01/16 | | | 665,000 | | | | 667,073 | | |
| | | 7.995% 06/01/36 | | | 665,000 | | | | 669,074 | | |
| | | Nordic Telephone Co. Holdings ApS
8.250% 05/01/16(b) | | | 1,030,000 | | | | 1,356,138 | | |
| | | 8.875% 05/01/16(b) | | | 475,000 | | | | 494,000 | | |
| | | Syniverse Technologies, Inc.
7.750% 08/15/13 | | | 1,210,000 | | | | 1,206,975 | | |
| | | Time Warner Telecom Holdings, Inc.
9.250% 02/15/14 | | | 1,735,000 | | | | 1,852,112 | | |
| | | | | | | | | | 6,245,372 | | |
| Telephone-Integrated – 3.6% | |
| | | Axtel SA de CV
11.000% 12/15/13 | | | 335,000 | | | | 376,456 | | |
| | | Cincinnati Bell, Inc.
7.000% 02/15/15 | | | 2,730,000 | | | | 2,648,100 | | |
| | | Citizens Communications Co.
9.000% 08/15/31 | | | 2,335,000 | | | | 2,442,994 | | |
| | | Qwest Capital Funding, Inc.
6.875% 07/15/28 | | | 3,205,000 | | | | 2,812,388 | | |
| | | Qwest Communications International, Inc.
7.500% 02/15/14 | | | 1,380,000 | | | | 1,364,475 | | |
| | | Qwest Corp.
7.500% 06/15/23 | | | 2,430,000 | | | | 2,332,800 | | |
| | | 8.875% 03/15/12 | | | 1,910,000 | | | | 2,048,475 | | |
| | | US LEC Corp.
13.620% 10/01/09(c) | | | 960,000 | | | | 1,030,800 | | |
| | | | | | | | | | 15,056,488 | | |
| Wireless Equipment – 0.4% | |
| | | American Towers, Inc.
7.250% 12/01/11 | | | 1,540,000 | | | | 1,578,500 | | |
| | | | | | | | | | 1,578,500 | | |
| | | Telecommunication Services Total | | | | | | | 47,145,072 | | |
| COMMUNICATIONS TOTAL | | | | | | | | | 78,667,133 | | |
Consumer Cyclical – 15.5%
| Airlines – 0.5% | | | | | | | | | |
| Airlines – 0.5% | |
| | | Continental Airlines, Inc.
7.568% 12/01/06 | | | 2,215,000 | | | | 2,215,000 | | |
| | | | | | | | 2,215,000 | | |
| | | Airlines Total | | | | | 2,215,000 | | |
See Accompanying Notes to Financial Statements.
11
Columbia High Yield Opportunity Fund May 31, 2006
Corporate Fixed-Income Bonds & Notes (continued)
Consumer Cyclical (continued)
| Apparel – 1.2% | | | | Par ($) | | Value ($) | |
| Apparel Manufacturers – 1.2% | |
| | | Broder Brothers Co.
11.250% 10/15/10 | | | 830,000 | | | | 786,425 | | |
| | | Levi Strauss & Co.
9.750% 01/15/15 | | | 1,875,000 | | | | 1,945,312 | | |
| | | Phillips-Van Heusen Corp.
7.250% 02/15/11 | | | 1,010,000 | | | | 1,015,050 | | |
| | | 8.125% 05/01/13 | | | 1,000,000 | | | | 1,035,000 | | |
| | | | | | | | | | 4,781,787 | | |
| | | Apparel Total | | | | | | | 4,781,787 | | |
| Auto Manufacturers – 0.2% | | | | | | | | | | | |
| Auto-Cars/Light Trucks – 0.2% | |
| | | General Motors Corp.
8.375% 07/15/33 | | | 1,210,000 | | | | 919,600 | | |
| | | | | | | | | | 919,600 | | |
| | | Auto Manufacturers Total | | | | | | | 919,600 | | |
| Auto Parts & Equipment – 1.6% | | | | | | | | | | | |
| Auto/Truck Parts & Equipment-Original – 0.4% | |
| | | TRW Automotive, Inc.
9.375% 02/15/13 | | | 1,385,000 | | | | 1,495,800 | | |
| | | | | | | | | | 1,495,800 | | |
| Auto/Truck Parts & Equipment-Replacement – 0.6% | |
| | | Commercial Vehicle Group
8.000% 07/01/13 | | | 1,475,000 | | | | 1,452,875 | | |
| | | Rexnord Corp.
10.125% 12/15/12 | | | 1,160,000 | | | | 1,276,000 | | |
| | | | | | | | | | 2,728,875 | | |
| Rubber-Tires – 0.6% | |
| | | Goodyear Tire & Rubber Co.
9.000% 07/01/15 | | | 2,390,000 | | | | 2,437,800 | | |
| | | | | | | | | | 2,437,800 | | |
| | | Auto Parts & Equipment Total | | | | | | | 6,662,475 | | |
| Distribution/Wholesale – 0.3% | | | | | | | | | | | |
| Distribution/Wholesale – 0.3% | |
| | | Buhrmann US, Inc.
7.875% 03/01/15 | | | 1,065,000 | | | | 1,067,663 | | |
| | | | | | | | | | 1,067,663 | | |
| | | Distribution/Wholesale Total | | | | | | | 1,067,663 | | |
See Accompanying Notes to Financial Statements.
12
Columbia High Yield Opportunity Fund May 31, 2006
Corporate Fixed-Income Bonds & Notes (continued)
Consumer Cyclical (continued)
| Entertainment – 1.3% | | | | Par ($) | | Value ($) | |
| Gambling (Non-Hotel) – 0.4% | |
| | | Global Cash Access LLC
8.750% 03/15/12 | | | 1,554,000 | | | | 1,647,240 | | |
| | | | | | | | | | 1,647,240 | | |
| Music – 0.7% | |
| | | Steinway Musical Instruments, Inc.
7.000% 03/01/14(b) | | | 1,265,000 | | | | 1,238,119 | | |
| | | Warner Music Group
7.375% 04/15/14 | | | 1,715,000 | | | | 1,697,850 | | |
| | | | | | | | | | 2,935,969 | | |
| Resorts/Theme Parks – 0.2% | |
| | | Six Flags, Inc.
9.625% 06/01/14 | | | 935,000 | | | | 927,987 | | |
| | | | | | | | | | 927,987 | | |
| | | Entertainment Total | | | | | | | 5,511,196 | | |
| Home Builders – 1.3% | | | | | | | | | | | |
Building-Residential/
Commercial – 1.3% | |
| | | D.R. Horton, Inc.
9.750% 09/15/10 | | | 2,045,000 | | | | 2,286,367 | | |
| | | K. Hovnanian Enterprises, Inc.
6.375% 12/15/14 | | | 1,435,000 | | | | 1,300,469 | | |
| | | 8.875% 04/01/12 | | | 1,435,000 | | | | 1,483,431 | | |
| | | Standard Pacific Corp.
9.250% 04/15/12 | | | 170,000 | | | | 173,400 | | |
| | | | | | | | | | 5,243,667 | | |
| | | Home Builders Total | | | | | | | 5,243,667 | | |
| Home Furnishings – 0.2% | | | | | | | | | | | |
| Home Furnishings – 0.2% | |
| Sealy Mattress Co. | | 8.250% 06/15/14 | | | 730,000 | | | | 762,850 | | |
| | | | | | | | | | 762,850 | | |
| | | Home Furnishings Total | | | | | | | 762,850 | | |
| Leisure Time – 0.6% | | | | | | | | | | | |
Leisure & Recreational
Products – 0.2% | |
| | | K2, Inc.
7.375% 07/01/14 | | | 1,100,000 | | | | 1,083,500 | | |
| | | | | | | | | | 1,083,500 | | |
| Recreational Centers – 0.4% | |
| | | Town Sports International, Inc.
(a) 02/01/14
(11.000% 02/01/09) | | | 1,950,000 | | | | 1,547,813 | | |
| | | | | | | | | | 1,547,813 | | |
| | | Leisure Time Total | | | | | | | 2,631,313 | | |
See Accompanying Notes to Financial Statements.
13
Columbia High Yield Opportunity Fund May 31, 2006
Corporate Fixed-Income Bonds & Notes (continued)
Consumer Cyclical (continued)
| Lodging – 5.5% | | | | Par ($) | | Value ($) | |
| Casino Hotels – 5.2% | |
| | | CCM Merger, Inc.
8.000% 08/01/13(b) | | | 1,360,000 | | | | 1,309,000 | | |
| | | Chukchansi Economic Development Authority
8.780% 11/15/12(b)(c) | | | 1,250,000 | | | | 1,275,000 | | |
| | | Eldorado Casino Shreveport/Shreveport Capital Corp.
10.000% 08/01/12(d) | | | 5,654,345 | | | | 4,523,476 | | |
| | | Galaxy Entertainment Finance Co., Ltd.
9.875% 12/15/12(b) | | | 1,340,000 | | | | 1,393,600 | | |
| | | Greektown Holdings LLC
10.750% 12/01/13(b) | | | 1,685,000 | | | | 1,786,100 | | |
| | | Hard Rock Hotel, Inc.
8.875% 06/01/13 | | | 2,205,000 | | | | 2,392,425 | | |
| | | Inn of the Mountain Gods Resort & Casino
12.000% 11/15/10 | | | 595,000 | | | | 641,113 | | |
| | | Kerzner International Ltd.
6.750% 10/01/15 | | | 2,080,000 | | | | 2,194,400 | | |
| | | MGM Mirage
6.000% 10/01/09 | | | 635,000 | | | | 622,300 | | |
| | | 6.750% 09/01/12 | | | 845,000 | | | | 831,269 | | |
| | | 8.500% 09/15/10 | | | 575,000 | | | | 608,781 | | |
| | | Mohegan Tribal Gaming Authority
6.125% 02/15/13 | | | 380,000 | | | | 361,475 | | |
| | | Pinnacle Entertainment, Inc.
8.250% 03/15/12 | | | 1,170,000 | | | | 1,199,250 | | |
| | | Station Casinos, Inc.
6.000% 04/01/12 | | | 785,000 | | | | 749,675 | | |
| | | Wynn Las Vegas LLC
6.625% 12/01/14 | | | 1,705,000 | | | | 1,624,012 | | |
| | | | | | | | | | 21,511,876 | | |
| Hotels & Motels – 0.3% | |
| | | Hilton Hotels Corp.
7.500% 12/15/17 | | | 1,171,000 | | | | 1,218,025 | | |
| | | | | | | | | | 1,218,025 | | |
| | | Lodging Total | | | | | | | 22,729,901 | | |
See Accompanying Notes to Financial Statements.
14
Columbia High Yield Opportunity Fund May 31, 2006
Corporate Fixed-Income Bonds & Notes (continued)
Consumer Cyclical (continued)
| Retail – 2.6% | | | | Par ($) | | Value ($) | |
| Retail-Automobiles – 0.6% | |
| | | Asbury Automotive Group, Inc.
8.000% 03/15/14 | | | 1,680,000 | | | | 1,673,700 | | |
| | | AutoNation, Inc.
7.000% 04/15/14(b) | | | 610,000 | | | | 603,900 | | |
| | | 7.045% 04/15/13(b)(c) | | | 365,000 | | | | 370,475 | | |
| | | | | | | | | | 2,648,075 | | |
| Retail-Drug Stores – 0.3% | |
| | | Rite Aid Corp.
7.500% 01/15/15 | | | 1,250,000 | | | | 1,228,125 | | |
| | | | | | | | | | 1,228,125 | | |
| Retail-Home Furnishings – 0.4% | |
| | | Tempur-Pedic, Inc.
10.250% 08/15/10 | | | 1,521,000 | | | | 1,631,273 | | |
| | | | | | | | | | 1,631,273 | | |
| Retail-Propane Distributors – 0.8% | |
| | | AmeriGas Partners LP
7.125% 05/20/16 | | | 1,100,000 | | | | 1,058,750 | | |
| | | Ferrellgas Partners LP
8.750% 06/15/12 | | | 1,145,000 | | | | 1,165,037 | | |
| | | Inergy LP/Inergy Finance Corp.
8.250% 03/01/16 | | | 1,110,000 | | | | 1,137,750 | | |
| | | | | | | | | | 3,361,537 | | |
| Retail-Restaurants – 0.5% | |
| | | Dave & Buster's, Inc.
11.250% 03/15/14(b) | | | 845,000 | | | | 853,450 | | |
| | | Landry's Restaurants, Inc.
7.500% 12/15/14 | | | 1,355,000 | | | | 1,277,087 | | |
| | | | | | | | | | 2,130,537 | | |
| | | Retail Total | | | | | | | 10,999,547 | | |
| Textiles – 0.2% | | | | | | | | | | | |
| Textile-Products – 0.2% | |
| | | INVISTA
9.250% 05/01/12(b) | | | 890,000 | | | | 943,400 | | |
| | | | | | | | | | 943,400 | | |
| | | Textiles Total | | | | | | | 943,400 | | |
| CONSUMER CYCLICAL TOTAL | | | | | | | | | 64,468,399 | | |
See Accompanying Notes to Financial Statements.
15
Columbia High Yield Opportunity Fund May 31, 2006
Corporate Fixed-Income Bonds & Notes (continued)
Consumer Non-Cyclical – 14.4%
| Agriculture – 0.5% | | | | Par ($) | | Value ($) | |
| Tobacco – 0.5% | |
| | | Alliance One International, Inc.
11.000% 05/15/12 | | | 1,220,000 | | | | 1,163,575 | | |
| | | Reynolds American, Inc.
7.625% 06/01/16(b) | | | 1,020,000 | | | | 1,017,450 | | |
| | | Agriculture Total | | | | | | | 2,181,025 | | |
| Beverages – 0.5% | | | | | | | | | | | |
| Beverages-Non-Alcoholic – 0.2% | |
| | | Cott Beverages, Inc.
8.000% 12/15/11 | | | 1,030,000 | | | | 1,032,575 | | |
| | | | | | | | | | 1,032,575 | | |
| Beverages-Wine/Spirits – 0.3% | |
| | | Constellation Brands, Inc.
8.000% 02/15/08 | | | 780,000 | | | | 799,500 | | |
| | | 8.125% 01/15/12 | | | 320,000 | | | | 331,200 | | |
| | | | | | | | | | 1,130,700 | | |
| | | Beverages Total | | | | | | | 2,163,275 | | |
| Biotechnology – 0.4% | | | | | | | | | | | |
| Medical-Biomedical/Gene – 0.4% | |
| | | Bio-Rad Laboratories, Inc.
7.500% 08/15/13 | | | 1,615,000 | | | | 1,635,187 | | |
| | | | | | | | | | 1,635,187 | | |
| | | Biotechnology Total | | | | | | | 1,635,187 | | |
See Accompanying Notes to Financial Statements.
16
Columbia High Yield Opportunity Fund May 31, 2006
Corporate Fixed-Income Bonds & Notes (continued)
Consumer Non-Cyclical (continued)
| Commercial Services – 4.5% | | | | Par ($) | | Value ($) | |
| Commercial Services – 0.3% | |
| | | Iron Mountain, Inc.
7.750% 01/15/15 | | | 1,115,000 | | | | 1,115,000 | | |
| | | | | | | | | | 1,115,000 | | |
Commercial
Services-Finance – 0.2% | |
| | | Dollar Financial Group, Inc.
9.750% 11/15/11 | | | 875,000 | | | | 940,625 | | |
| | | | | | | | | | 940,625 | | |
| Consulting Services – 0.2% | |
| | | FTI Consulting
7.625% 06/15/13 | | | 960,000 | | | | 979,200 | | |
| | | | | | | | | | 979,200 | | |
Funeral Services & Related
Items – 0.5% | |
| | | Service Corp. International
6.750% 04/01/16 | | | 710,000 | | | | 671,837 | | |
| | | 7.700% 04/15/09 | | | 1,300,000 | | | | 1,326,000 | | |
| | | | | | | | | | 1,997,837 | | |
| Printing-Commercial – 0.6% | |
| | | Quebecor World Capital Corp.
8.750% 03/15/16(b) | | | 1,485,000 | | | | 1,393,460 | | |
| | | Sheridan Group
10.250% 08/15/11 | | | 965,000 | | | | 984,300 | | |
| | | | | | | | | | 2,377,760 | | |
| Private Corrections – 0.7% | |
| | | Corrections Corp. of America
6.250% 03/15/13 | | | 1,455,000 | | | | 1,382,250 | | |
| | | GEO Group, Inc.
8.250% 07/15/13 | | | 1,400,000 | | | | 1,431,500 | | |
| | | | | | | | | | 2,813,750 | | |
| Rental Auto/Equipment – 2.0% | |
| | | Ashtead Holdings PLC
8.625% 08/01/15(b) | | | 1,615,000 | | | | 1,645,281 | | |
| | | Avis Budget Car Rental LLC
7.625% 05/15/14(b) | | | 920,000 | | | | 929,200 | | |
| | | 7.750% 05/15/16(b) | | | 610,000 | | | | 616,100 | | |
| | | Hertz Corp.
8.875% 01/01/14(b) | | | 1,560,000 | | | | 1,634,100 | | |
| | | NationsRent, Inc.
9.500% 10/15/10 | | | 1,455,000 | | | | 1,564,125 | | |
| | | United Rentals North America, Inc.
6.500% 02/15/12 | | | 1,360,000 | | | | 1,309,000 | | |
| | | 7.750% 11/15/13 | | | 685,000 | | | | 676,438 | | |
| | | | | | | | | | 8,374,244 | | |
| | | Commercial Services Total | | | | | | | 18,598,416 | | |
| Cosmetics/Personal Care – 0.6% | | | | | | | | | | | |
| Cosmetics & Toiletries – 0.6% | |
| | | DEL Laboratories, Inc.
8.000% 02/01/12 | | | 1,320,000 | | | | 1,105,500 | | |
| | | Elizabeth Arden, Inc.
7.750% 01/15/14 | | | 1,520,000 | | | | 1,527,600 | | |
| | | | | | | | | | 2,633,100 | | |
| | | Cosmetics/Personal Care Total | | | | | | | 2,633,100 | | |
See Accompanying Notes to Financial Statements.
17
Columbia High Yield Opportunity Fund May 31, 2006
Corporate Fixed-Income Bonds & Notes (continued)
Consumer Non-Cyclical (continued)
| Food – 1.5% | | | | Par ($) | | Value ($) | |
| Food-Confectionery – 0.2% | |
| | | Merisant Co.
9.500% 07/15/13 | | | 1,405,000 | | | | 962,425 | | |
| | | | | | | | | | 962,425 | | |
Food-Miscellaneous/
Diversified – 1.1% | |
| | | Dole Food Co., Inc.
8.625% 05/01/09 | | | 1,510,000 | | | | 1,487,350 | | |
| | | Pinnacle Foods Holding Corp.
8.250% 12/01/13 | | | 1,930,000 | | | | 1,910,700 | | |
| | | Reddy Ice Holdings, Inc. (a) 11/01/12
(10.500% 11/01/08) | | | 1,420,000 | | | | 1,185,700 | | |
| | | | | | | | | | 4,583,750 | | |
| Food-Retail – 0.2% | |
| | | Stater Brothers Holdings, Inc.
8.125% 06/15/12 | | | 635,000 | | | | 635,000 | | |
| | | | | | | | | | 635,000 | | |
| | | Food Total | | | | | | | 6,181,175 | | |
| Healthcare Services – 2.7% | | | | | | | | | | | |
| Dialysis Centers – 0.4% | |
| | | DaVita, Inc.
7.250% 03/15/15 | | | 1,520,000 | | | | 1,485,800 | | |
| | | | | | | | | | 1,485,800 | | |
| Medical-HMO – 0.2% | |
| | | Coventry Health Care, Inc.
8.125% 02/15/12 | | | 945,000 | | | | 987,481 | | |
| | | | | | | | | | 987,481 | | |
| Medical-Hospitals – 1.0% | |
| | | HCA, Inc.
7.875% 02/01/11 | | | 1,695,000 | | | | 1,758,438 | | |
| | | Tenet Healthcare Corp.
9.875% 07/01/14 | | | 2,325,000 | | | | 2,365,688 | | |
| | | | | | | | | | 4,124,126 | | |
Medical-Outpatient/Home
Medical – 0.2% | |
| | | Select Medical Corp.
7.625% 02/01/15 | | | 950,000 | | | | 847,875 | | |
| | | | | | | | | | 847,875 | | |
MRI/Medical Diagnostic
Imaging – 0.3% | |
| | | MedQuest, Inc.
11.875% 08/15/12 | | | 675,000 | | | | 610,875 | | |
| | | MQ Associates, Inc. (a) 08/15/12
(12.250% 08/15/08) | | | 1,015,000 | | | | 395,850 | | |
| | | | | | | | | | 1,006,725 | | |
Physician Practice
Management – 0.6% | |
| | | US Oncology Holdings, Inc.
10.320% 03/15/15(c) | | | 745,000 | | | | 757,106 | | |
| | | US Oncology, Inc.
9.000% 08/15/12 | | | 1,780,000 | | | | 1,877,900 | | |
| | | | | | | | | | 2,635,006 | | |
| | | Healthcare Services Total | | | | | | | 11,087,013 | | |
See Accompanying Notes to Financial Statements.
18
Columbia High Yield Opportunity Fund May 31, 2006
Corporate Fixed-Income Bonds & Notes (continued)
Consumer Non-Cyclical (continued)
| Household Products/Wares – 1.5% | | | | Par ($) | | Value ($) | |
Consumer Products-
Miscellaneous – 1.2% | |
| | | American Greetings Corp.
7.375% 06/01/16 | | | 735,000 | | | | 744,188 | | |
| | | Amscan Holdings, Inc.
8.750% 05/01/14 | | | 1,420,000 | | | | 1,288,650 | | |
| | | Jostens IH Corp.
7.625% 10/01/12 | | | 1,360,000 | | | | 1,339,600 | | |
| | | Scotts Co.
6.625% 11/15/13 | | | 1,550,000 | | | | 1,513,187 | | |
| | | | | | | | | | 4,885,625 | | |
| Office Supplies & Forms – 0.3% | |
| | | ACCO Brands Corp.
7.625% 08/15/15 | | | 1,130,000 | | | | 1,081,975 | | |
| | | | | | | | | | 1,081,975 | | |
| | | Household Products/Wares Total | | | | | | | 5,967,600 | | |
| Pharmaceuticals – 2.2% | | | | | | | | | | | |
| Medical-Drugs – 0.8% | |
| | | Elan Finance PLC
7.750% 11/15/11 | | | 1,920,000 | | | | 1,886,400 | | |
| | | Warner Chilcott Corp.
8.750% 02/01/15 | | | 1,320,000 | | | | 1,323,300 | | |
| | | | | | | | | | 3,209,700 | | |
| Medical-Generic Drugs – 0.2% | |
| | | Mylan Laboratories, Inc.
6.375% 08/15/15 | | | 1,000,000 | | | | 965,000 | | |
| | | | | | | | | | 965,000 | | |
| Medical-Wholesale Drug Distribution – 0.7% | |
| | | AmerisourceBergen Corp.
5.875% 09/15/15(b) | | | 1,125,000 | | | | 1,085,811 | | |
| | | Nycomed A/S
PIK,
11.750% 09/15/13(b) | | | 1,511,883 | | | | 2,020,908 | | |
| | | | | | | | | | 3,106,719 | | |
| Pharmacy Services – 0.2% | |
| | | Omnicare, Inc.
6.750% 12/15/13 | | | 760,000 | | | | 737,200 | | |
| | | | | | | | | | 737,200 | | |
Vitamins & Nutrition
Products – 0.3% | |
| | | NBTY, Inc.
7.125% 10/01/15 | | | 1,260,000 | | | | 1,209,600 | | |
| | | | | | | | | | 1,209,600 | | |
| | | Pharmaceuticals Total | | | | | | | 9,228,219 | | |
| CONSUMER NON-CYCLICAL TOTAL | | | | | | | | | 59,675,010 | | |
See Accompanying Notes to Financial Statements.
19
Columbia High Yield Opportunity Fund May 31, 2006
Corporate Fixed-Income Bonds & Notes (continued)
Energy – 9.2%
| Coal – 0.8% | | | | Par ($) | | Value ($) | |
| Coal – 0.8% | |
| | | Arch Western Finance LLC
6.750% 07/01/13 | | | 1,835,000 | | | | 1,789,125 | | |
| | | Massey Energy Co.
6.875% 12/15/13(b) | | | 1,650,000 | | | | 1,579,875 | | |
| | | | | | | | | | 3,369,000 | | |
| | | Coal Total | | | | | | | 3,369,000 | | |
| Oil & Gas – 3.6% | | | | | | | | | | | |
| Oil & Gas Drilling – 0.3% | |
| | | Pride International, Inc.
7.375% 07/15/14 | | | 960,000 | | | | 981,600 | | |
| | | | | | | | | | 981,600 | | |
| Oil Companies-Exploration & Production – 2.7% | |
| | | Chesapeake Energy Corp.
6.375% 06/15/15 | | | 1,145,000 | | | | 1,079,162 | | |
| | | 7.500% 06/15/14 | | | 1,145,000 | | | | 1,167,900 | | |
| | | Compton Petroleum Corp.
7.625% 12/01/13 | | | 1,415,000 | | | | 1,379,625 | | |
| | | Delta Petroleum Corp.
7.000% 04/01/15 | | | 565,000 | | | | 519,800 | | |
| | | Forest Oil Corp.
8.000% 12/15/11 | | | 1,080,000 | | | | 1,128,600 | | |
| | | Magnum Hunter Resources, Inc.
9.600% 03/15/12 | | | 1,133,000 | | | | 1,209,477 | | |
| | | Newfield Exploration Co.
6.625% 04/15/16 | | | 1,120,000 | | | | 1,072,400 | | |
| | | Pogo Producing Co.
6.625% 03/15/15 | | | 1,100,000 | | | | 1,045,000 | | |
| | | Quicksilver Resources, Inc.
7.125% 04/01/16 | | | 895,000 | | | | 856,963 | | |
| | | Whiting Petroleum Corp.
7.250% 05/01/12 | | | 1,815,000 | | | | 1,780,969 | | |
| | | | | | | | | | 11,239,896 | | |
| Oil Refining & Marketing – 0.6% | |
| | | Premcor Refining Group, Inc.
7.500% 06/15/15 | | | 1,015,000 | | | | 1,055,600 | | |
| | | Tesoro Petroleum Corp.
6.625% 11/01/15(b) | | | 1,465,000 | | | | 1,413,725 | | |
| | | | | | | | | | 2,469,325 | | |
| | | Oil & Gas Total | | | | | | | 14,690,821 | | |
| Oil & Gas Services – 0.7% | | | | | | | | | | | |
| Oil-Field Services – 0.7% | |
| | | Hornbeck Offshore Services, Inc.
6.125% 12/01/14 | | | 1,505,000 | | | | 1,395,888 | | |
| | | Newpark Resources, Inc.
8.625% 12/15/07 | | | 1,660,000 | | | | 1,660,000 | | |
| | | | | | | | | | 3,055,888 | | |
| | | Oil & Gas Services Total | | | | | | | 3,055,888 | | |
See Accompanying Notes to Financial Statements.
20
Columbia High Yield Opportunity Fund May 31, 2006
Corporate Fixed-Income Bonds & Notes (continued)
Energy (continued)
| Pipelines – 4.1% | | | | Par ($) | | Value ($) | |
| Pipelines – 4.1% | |
| | | Atlas Pipeline Partners LP
8.125% 12/15/15(b) | | | 1,070,000 | | | | 1,099,425 | | |
| | | Colorado Interstate Gas Co.
6.800% 11/15/15(b) | | | 2,145,000 | | | | 2,155,725 | | |
| | | El Paso Corp.
7.625% 09/01/08(b) | | | 500,000 | | | | 508,750 | | |
| | | 7.750% 06/15/10(b) | | | 2,685,000 | | | | 2,752,125 | | |
| | | Northwest Pipeline Corp.
8.125% 03/01/10 | | | 915,000 | | | | 961,894 | | |
| | | Pacific Energy Partners LP/Pacific Energy Finance Corp.
6.250% 09/15/15 | | | 1,960,000 | | | | 1,822,800 | | |
| | | Sonat, Inc.
7.625% 07/15/11 | | | 2,040,000 | | | | 2,068,050 | | |
| | | Southern Natural Gas Co.
8.875% 03/15/10 | | | 1,630,000 | | | | 1,733,913 | | |
| | | Williams Companies, Inc.
6.375% 10/01/10(b) | | | 2,790,000 | | | | 2,793,487 | | |
| | | 8.125% 03/15/12 | | | 1,015,000 | | | | 1,074,631 | | |
| | | | | | | | | | 16,970,800 | | |
| | | Pipelines Total | | | | | | | 16,970,800 | | |
| ENERGY TOTAL | | | | | | | | | 38,086,509 | | |
Financials – 3.9%
| Diversified Financial Services – 3.0% | | | | | | | | | | | |
| Finance-Auto Loans – 2.1% | |
| | | Ford Motor Credit Co.
7.375% 02/01/11 | | | 2,670,000 | | | | 2,406,516 | | |
| | | General Motors Acceptance Corp.
6.875% 09/15/11 | | | 3,085,000 | | | | 2,903,718 | | |
| | | 8.000% 11/01/31 | | | 3,490,000 | | | | 3,280,600 | | |
| | | | | | | | | | 8,590,834 | | |
| Finance-Investment Banker/Broker – 0.8% | |
| | *Trade Financial Corp.
8.000% 06/15/11 | | | 1,700,000 | | | | 1,763,750 | | |
| | | LaBranche & Co., Inc.
11.000% 05/15/12 | | | 1,375,000 | | | | 1,509,063 | | |
| | | | | | | | | | 3,272,813 | | |
| Special Purpose Entity – 0.1% | |
| | | Hughes Network Systems LLC/HNS Finance Corp.
9.500% 04/15/14(b) | | | 570,000 | | | | 575,700 | | |
| | | | | | | | | | 575,700 | | |
| | | Diversified Financial Services Total | | | | | | | 12,439,347 | | |
See Accompanying Notes to Financial Statements.
21
Columbia High Yield Opportunity Fund May 31, 2006
Corporate Fixed-Income Bonds & Notes (continued)
Financials (continued)
| Real Estate Investment Trusts – 0.9% | | | | Par ($) | | Value ($) | |
| REITS-Hotels – 0.5% | |
| | | Host Marriott LP
6.750% 06/01/16(b) | | | 2,240,000 | | | | 2,184,000 | | |
| | | | | | | | 2,184,000 | | |
| REITS-Regional Malls – 0.4% | |
| | | Rouse Co. LP/TRC Co-Issuer, Inc.
6.750% 05/01/13(b) | | | 1,405,000 | | | | 1,395,963 | | |
| | | | | | | | 1,395,963 | | |
| | | Real Estate Investment Trusts Total | | | | | 3,579,963 | | |
| FINANCIALS TOTAL | | | | | | | 16,019,310 | | |
Industrials – 13.8%
| Aerospace & Defense – 1.5% | | | | | | | | | | | |
Aerospace/Defense-
Equipment – 1.1% | |
| | | BE Aerospace, Inc.
8.500% 10/01/10 | | | 1,655,000 | | | | 1,758,438 | | |
| | | Sequa Corp.
8.875% 04/01/08 | | | 798,000 | | | | 833,910 | | |
| | | 9.000% 08/01/09 | | | 780,000 | | | | 826,800 | | |
| | | TransDigm, Inc.
8.375% 07/15/11 | | | 1,160,000 | | | | 1,232,500 | | |
| | | | | | | | | | 4,651,648 | | |
| Electronics-Military – 0.4% | |
| | | Condor Systems, Inc.
11.875% 05/01/09(d)(e)(f)(g) | | | 4,000,000 | | | | — | | |
| | | L-3 Communications Corp.
5.875% 01/15/15 | | | 385,000 | | | | 352,275 | | |
| | | 6.375% 10/15/15 | | | 1,380,000 | | | | 1,307,550 | | |
| | | | | | | | | | 1,659,825 | | |
| | | Aerospace & Defense Total | | | | | | | 6,311,473 | | |
| Building Materials – 1.1% | | | | | | | | | | | |
| Building & Construction Products-Miscellaneous – 0.5% | |
| | | Nortek, Inc.
8.500% 09/01/14 | | | 1,110,000 | | | | 1,115,550 | | |
| | | NTK Holdings, Inc.
(a) 03/01/14 (10.750% 09/01/09) | | | 1,040,000 | | | | 787,800 | | |
| | | | | | | | | | 1,903,350 | | |
Building Products-Air &
Heating – 0.3% | |
| | | Goodman Global Holding Co., Inc.
7.875% 12/15/12 | | | 1,310,000 | | | | 1,280,525 | | |
| | | | | | | | | | 1,280,525 | | |
| Building Products-Cement/Aggregation – 0.3% | |
| | | RMCC Acquisition Co.
9.500% 11/01/12(b) | | | 1,250,000 | | | | 1,300,000 | | |
| | | | | | | | | | 1,300,000 | | |
| | | Building Materials Total | | | | | | | 4,483,875 | | |
See Accompanying Notes to Financial Statements.
22
Columbia High Yield Opportunity Fund May 31, 2006
Corporate Fixed-Income Bonds & Notes (continued)
Industrials (continued)
| Electronics – 0.3% | | | | Par ($) | | Value ($) | |
| Electronic Components-Miscellaneous – 0.3% | |
| | | Flextronics International Ltd.
6.250% 11/15/14 | | | 1,470,000 | | | | 1,400,175 | | |
| | | | | | | | | | 1,400,175 | | |
| | | Electronics Total | | | | | | | 1,400,175 | | |
| Engineering & Construction – 0.4% | | | | | | | | | | | |
| Building & Construction-Miscellaneous – 0.4% | |
| | | J. Ray McDermott SA
11.500% 12/15/13(b) | | | 1,595,000 | | | | 1,893,584 | | |
| | | | | | | | | | 1,893,584 | | |
| | | Engineering & Construction Total | | | | | | | 1,893,584 | | |
| Environmental Control – 1.0% | | | | | | | | | | | |
Non-Hazardous Waste
Disposal – 0.9% | |
| | | Allied Waste North America, Inc.
7.125% 05/15/16(b) | | | 2,500,000 | | | | 2,437,500 | | |
| | | 7.875% 04/15/13 | | | 1,220,000 | | | | 1,247,450 | | |
| | | | | | | | | | 3,684,950 | | |
| Recycling – 0.1% | |
| | | Aleris International, Inc.
9.000% 11/15/14 | | | 670,000 | | | | 700,150 | | |
| | | | | | | | | | 700,150 | | |
| | | Environmental Control Total | | | | | | | 4,385,100 | | |
| Machinery-Construction & Mining – 0.4% | | | | | | | |
Machinery-Construction &
Mining – 0.4% | |
| | | Terex Corp.
7.375% 01/15/14 | | | 1,510,000 | | | | 1,525,100 | | |
| | | | | | | | | | 1,525,100 | | |
| | | Machinery-Construction & Mining Total | | | | | | | 1,525,100 | | |
| Machinery-Diversified – 0.7% | | | | | | | | | | | |
| Machinery-General Industry – 0.4% | |
| | | Douglas Dynamics LLC
7.750% 01/15/12(b) | | | 1,070,000 | | | | 1,027,200 | | |
| | | Manitowoc Co., Inc.
7.125% 11/01/13 | | | 760,000 | | | | 773,300 | | |
| | | | | | | | | | 1,800,500 | | |
| Machinery-Material Handling – 0.3% | |
| | | Columbus McKinnon Corp.
8.875% 11/01/13 | | | 1,190,000 | | | | 1,231,650 | | |
| | | | | | | | | | 1,231,650 | | |
| | | Machinery-Diversified Total | | | | | | | 3,032,150 | | |
See Accompanying Notes to Financial Statements.
23
Columbia High Yield Opportunity Fund May 31, 2006
Corporate Fixed-Income Bonds & Notes (continued)
Industrials (continued)
| Metal Fabricate/Hardware – 0.7% | | | | Par ($) | | Value ($) | |
Metal Processors &
Fabrication – 0.7% | |
| | | Mueller Group, Inc.
10.000% 05/01/12 | | | 1,065,000 | | | | 1,162,181 | | |
| | | Mueller Holdings, Inc.
(a) 04/15/14 (14.750% 04/15/09) | | | 1,190,000 | | | | 999,600 | | |
| | | TriMas Corp.
9.875% 06/15/12 | | | 770,000 | | | | 739,200 | | |
| | | | | | | | | | 2,900,981 | | |
| | | Metal Fabricate/Hardware Total | | | | | | | 2,900,981 | | |
| Miscellaneous Manufacturing – 2.2% | | | | | | | | | | | |
Diversified Manufacturing
Operators – 1.5% | |
| | | Bombardier, Inc.
6.300% 05/01/14(b) | | | 2,281,000 | | | | 2,061,453 | | |
| | | J.B. Poindexter & Co.
8.750% 03/15/14 | | | 1,255,000 | | | | 1,047,925 | | |
| | | Koppers Industries, Inc.
9.875% 10/15/13 | | | 1,004,000 | | | | 1,104,400 | | |
| | | Trinity Industries, Inc.
6.500% 03/15/14 | | | 2,136,000 | | | | 2,042,550 | | |
| | | | | | | | | | 6,256,328 | | |
Miscellaneous
Manufacturing – 0.7% | |
| | | Nutro Products, Inc.
10.750% 04/15/14(b) | | | 1,500,000 | | | | 1,533,750 | | |
| | | Samsonite Corp.
8.875% 06/01/11 | | | 1,125,000 | | | | 1,179,844 | | |
| | | | | | | | | | 2,713,594 | | |
| | | Miscellaneous Manufacturing Total | | | | | | | 8,969,922 | | |
| Packaging & Containers – 2.8% | | | | | | | | | | | |
| Containers-Metal/Glass – 1.4% | |
| | | Crown Americas LLC & Crown Americas Capital Corp.
7.750% 11/15/15(b) | | | 1,830,000 | | | | 1,843,725 | | |
| | | Owens-Brockway Glass Container, Inc.
8.250% 05/15/13 | | | 2,470,000 | | | | 2,510,137 | | |
| | | Owens-Illinois, Inc.
7.500% 05/15/10 | | | 1,530,000 | | | | 1,520,438 | | |
| | | | | | | | | | 5,874,300 | | |
| Containers-Paper/Plastic – 1.4% | |
| | | Consolidated Container Co., LLC
(a) 06/15/09 (10.750% 06/15/07) | | | 1,065,000 | | | | 998,438 | | |
| | | Jefferson Smurfit Corp.
8.250% 10/01/12 | | | 1,770,000 | | | | 1,672,650 | | |
| | | JSG Holding PLC PIK,
11.500% 10/01/15(b) | | | 1,233,623 | | | | 1,596,640 | | |
| | | MDP Acquisitions PLC
9.625% 10/01/12 | | | 1,290,000 | | | | 1,351,275 | | |
| | | | | | | | | | 5,619,003 | | |
| | | Packaging & Containers Total | | | | | | | 11,493,303 | | |
See Accompanying Notes to Financial Statements.
24
Columbia High Yield Opportunity Fund May 31, 2006
Corporate Fixed-Income Bonds & Notes (continued)
Industrials (continued)
| Transportation – 2.7% | | | | Par ($) | | Value ($) | |
| Transportation-Marine – 1.0% | |
| | | Ship Finance International Ltd.
8.500% 12/15/13 | | | 2,110,000 | | | | 1,991,313 | | |
| | | Stena AB
7.500% 11/01/13 | | | 2,345,000 | | | | 2,315,687 | | |
| | | | | | | | | | 4,307,000 | | |
| Transportation-Railroad – 0.7% | |
| | | TFM SA de CV
9.375% 05/01/12 | | | 1,755,000 | | | | 1,880,044 | | |
| | | 12.500% 06/15/12 | | | 780,000 | | | | 858,975 | | |
| | | | | | | | | | 2,739,019 | | |
| Transportation-Services – 0.7% | |
| | | CHC Helicopter Corp.
7.375% 05/01/14 | | | 2,015,000 | | | | 1,992,331 | | |
| | | PHI, Inc.
7.125% 04/15/13(b) | | | 1,050,000 | | | | 1,023,750 | | |
| | | | | | | | | | 3,016,081 | | |
| Transportation-Trucks – 0.3% | |
| | | QDI LLC
9.000% 11/15/10 | | | 1,060,000 | | | | 1,004,350 | | |
| | | | | | | | | | 1,004,350 | | |
| | | Transportation Total | | | | | | | 11,066,450 | | |
| INDUSTRIALS TOTAL | | | | | | | | | 57,462,113 | | |
Technology – 0.9%
| Office/Business Equipment – 0.5% | | | | | | | | | | | |
| Office Automation & Equipment – 0.5% | |
| | | Xerox Corp.
6.400% 03/15/16 | | | 470,000 | | | | 452,963 | | |
| | | 7.125% 06/15/10 | | | 1,470,000 | | | | 1,508,587 | | |
| | | | | | | | | | 1,961,550 | | |
| | | Office/Business Equipment Total | | | | | | | 1,961,550 | | |
| Semiconductors – 0.4% | | | | | | | | | | | |
Electronic Components-
Semiconductors – 0.4% | |
| | | Amkor Technology, Inc.
9.250% 06/01/16 | | | 850,000 | | | | 819,188 | | |
| | | Freescale Semiconductor, Inc.
6.875% 07/15/11 | | | 855,000 | | | | 866,756 | | |
| | | | | | | | | | 1,685,944 | | |
| | | Semiconductors Total | | | | | | | 1,685,944 | | |
| TECHNOLOGY TOTAL | | | | | | | | | 3,647,494 | | |
See Accompanying Notes to Financial Statements.
25
Columbia High Yield Opportunity Fund May 31, 2006
Corporate Fixed-Income Bonds & Notes (continued)
Utilities – 4.4%
| Electric – 4.4% | | | | Par ($) | | Value ($) | |
| Electric-Generation – 1.1% | |
| | | AES Corp.
9.000% 05/15/15(b) | | | 610,000 | | | | 657,275 | | |
| | | 9.500% 06/01/09 | | | 1,318,000 | | | | 1,410,260 | | |
| | | Edison Mission Energy
7.730% 06/15/09 | | | 2,640,000 | | | | 2,709,300 | | |
| | | | | | | | | | 4,776,835 | | |
| Electric-Integrated – 1.3% | |
| | | CMS Energy Corp.
6.875% 12/15/15 | | | 910,000 | | | | 886,113 | | |
| | | 8.500% 04/15/11 | | | 575,000 | | | | 605,188 | | |
| | | Nevada Power Co.
9.000% 08/15/13 | | | 640,000 | | | | 700,294 | | |
| | | 10.875% 10/15/09 | | | 1,088,000 | | | | 1,164,845 | | |
| | | Sierra Pacific Resources
6.750% 08/15/17 | | | 910,000 | | | | 891,800 | | |
| | | TECO Energy, Inc.
7.000% 05/01/12 | | | 1,205,000 | | | | 1,223,075 | | |
| | | | | | | | | | 5,471,315 | | |
| Independent Power Producer – 2.0% | |
| | | Dynegy Holdings, Inc.
6.875% 04/01/11 | | | 1,275,000 | | | | 1,222,406 | | |
| | | 7.125% 05/15/18 | | | 870,000 | | | | 774,300 | | |
| | | Mirant North America LLC
7.375% 12/31/13(b) | | | 2,195,000 | | | | 2,156,587 | | |
| | | MSW Energy Holdings LLC
7.375% 09/01/10 | | | 910,000 | | | | 915,688 | | |
| | | 8.500% 09/01/10 | | | 1,195,000 | | | | 1,244,294 | | |
| | | NRG Energy, Inc.
7.250% 02/01/14 | | | 960,000 | | | | 961,200 | | |
| | | 7.375% 02/01/16 | | | 900,000 | | | | 901,125 | | |
| | | | | | | | | | 8,175,600 | | |
| | | Electric Total | | | | | | | 18,423,750 | | |
| UTILITIES TOTAL | | | | | | | | | 18,423,750 | | |
| | | Total Corporate Fixed-Income Bonds & Notes
(cost of $371,932,621) | | | | | | | 366,837,267 | | |
See Accompanying Notes to Financial Statements.
26
Columbia High Yield Opportunity Fund May 31, 2006
Preferred Stocks – 2.3%
Communications – 0.9%
| Media – 0.9% | | | | Shares | | Value ($) | |
| | | PTV Inc.
10.000% | | | 18 | | | | 40 | | |
| | | Spanish Broadcasting System, Inc. PIK,
10.750% | | | 3,250 | | | | 3,610,750 | | |
| | | Media Total | | | | | | | 3,610,790 | | |
| COMMUNICATIONS TOTAL | | | | | | | | | 3,610,790 | | |
| Financials – 1.4% | |
| Real Estate Investment Trusts – 1.4% | | | | | | | | | | | |
| | | iStar Financial, Inc.
Series E, 7.875% | | | 86,769 | | | | 2,125,840 | | |
| | | Series F, 7.800% | | | 57,000 | | | | 1,407,188 | | |
| | | Sovereign Real Estate Investment Corp.
12.000%(b) | | | 1,800,000 | | | | 2,430,000 | | |
| | | Real Estate Investment Trusts Total | | | | | | | 5,963,028 | | |
| FINANCIALS TOTAL | | | | | | | | | 5,963,028 | | |
| | | Total Preferred Stocks
(cost of $9,638,202) | | | | | | | 9,573,818 | | |
| Common Stocks – 1.4% | |
| Consumer Discretionary – 0.5% | |
| Hotels, Restaurants & Leisure – 0.1% | | | | | | | | | | | |
| | | Shreveport Gaming Holdings, Inc. (d)(h) | | | 36,086 | | | | 306,731 | | |
| | | Hotels, Restaurants & Leisure Total | | | | | | | 306,731 | | |
| Media – 0.4% | | | | | | | | | | | |
| | | NTL, Inc. (h) | | | 35,385 | | | | 944,072 | | |
| | | Sinclair Broadcast Group, Inc., Class A | | | 100,000 | | | | 851,000 | | |
| | | Media Total | | | | | | | 1,795,072 | | |
| CONSUMER DISCRETIONARY TOTAL | | | | | | | | | 2,101,803 | | |
| Industrials – 0.0% | |
| Commercial Services & Supplies – 0.0% | | | | | | | | | | | |
| | | Fairlane Management Corp. (d)(e)(f)(h) | | | 50,004 | | | | — | | |
| | | Commercial Services & Supplies Total | | | | | | | — | | |
| INDUSTRIALS TOTAL | | | | | | | | | — | | |
| Materials – 0.2% | |
| Chemicals – 0.2% | | | | | | | | | | | |
| | | Lyondell Chemical Co. | | | 30,000 | | | | 726,000 | | |
| | | Chemicals Total | | | | | | | 726,000 | | |
| MATERIALS TOTAL | | | | | | | | | 726,000 | | |
See Accompanying Notes to Financial Statements.
27
Columbia High Yield Opportunity Fund May 31, 2006
Common Stocks (continued)
Telecommunication Services – 0.4%
| Diversified Telecommunication Services – 0.0% | | | | Shares | | Value ($) | |
| | | Embarq Corp. (h) | | | 3,846 | | | | 160,267 | | |
| | | Diversified Telecommunication Services Total | | | | | | | 160,267 | | |
| Wireless Telecommunication Services – 0.4% | | | | | | | | | | | |
| | | Sprint Nextel Corp. | | | 76,922 | | | | 1,631,515 | | |
| | | Wireless Telecommunication Services Total | | | | | | | 1,631,515 | | |
| TELECOMMUNICATION SERVICES TOTAL | | | | | | | | | 1,791,782 | | |
| Utilities – 0.3% | |
| Independent Power Producers & Energy Traders – 0.3% | | | | | | | | | | | |
| | | Dynegy, Inc., Class A (h) | | | 113,000 | | | | 596,640 | | |
| | | Mirant Corp. (h) | | | 23,717 | | | | 590,079 | | |
| | | Independent Power Producers & Energy Traders Total | | | | | | | 1,186,719 | | |
| UTILITIES TOTAL | | | | | | | | | 1,186,719 | | |
| | | Total Common Stocks
(cost of $6,032,981) | | | | | | | 5,806,304 | | |
| Municipal Bonds (Taxable) – 0.8% | |
| California – 0.8% | | | | Par ($) | | | |
| | | CA Cabazon Band Mission Indians
13.000% 10/01/11(d) | | | 3,250,000 | | | | 3,209,668 | | |
| | | California Total | | | | | | | 3,209,668 | | |
| | | Total Municipal Bonds
(cost of $3,250,000) | | | | | | | 3,209,668 | | |
| Convertible Bonds – 0.7% | |
| Communications – 0.7% | |
| Telecommunication Services – 0.7% | | | | | | | | | | | |
Telecommunication
Equipment – 0.5% | |
| | | Nortel Networks Corp.
4.250% 09/01/08 | | | 1,975,000 | | | | 1,868,844 | | |
| | | | | | | | | | 1,868,844 | | |
| Telephone-Integrated – 0.2% | |
| | | NTL Cable PLC
8.750% 04/15/14 | | | 690,000 | | | | 910,691 | | |
| | | | | | | | | | 910,691 | | |
| | | Telecommunication Services Total | | | | | | | 2,779,535 | | |
| COMMUNICATIONS TOTAL | | | | | | | | | 2,779,535 | | |
| | | Total Convertible Bonds
(cost of $2,821,523) | | | | | | | 2,779,535 | | |
See Accompanying Notes to Financial Statements.
28
Columbia High Yield Opportunity Fund May 31, 2006
Warrants (h) – 0.0%
Communications – 0.0%
| Media – 0.0% | | | | Units | | Value ($) | |
Broadcast Services/
Programs – 0.0% | |
| | | XM Satellite Radio Holdings, Inc.
Expires 03/15/10(b) | | | 2,435 | | | | 26,541 | | |
| | | | | | | | | | 26,541 | | |
| | | Media Total | | | | | | | 26,541 | | |
| Telecommunication Services – 0.0% | | | | | | | | | | | |
| Cellular Telecommunications – 0.0% | |
| | | UbiquiTel, Inc.
Expires 04/15/10(b) | | | 5,250 | | | | 53 | | |
| | | | | | | | | | 53 | | |
| Telecommunication Services – 0.0% | |
| | | Jazztel PLC
Expires 07/15/10(d)(e)(f) | | | 1,435 | | | | — | | |
| | | | | | | | | | — | | |
| | | Telecommunication Services Total | | | | | | | 53 | | |
| COMMUNICATIONS TOTAL | | | | | | | | | 26,594 | | |
| Consumer Non-Cyclical – 0.0% | |
| Food – 0.0% | | | | | | | | | | | |
| Food-Retail – 0.0% | |
| | | Pathmark Stores Inc.
Expires 09/19/10(d) | | | 58,758 | | | | 13,514 | | |
| | | | | | | | | | 13,514 | | |
| | | Food Total | | | | | | | 13,514 | | |
| CONSUMER NON-CYCLICAL TOTAL | | | | | | | | | 13,514 | | |
| Industrials – 0.0% | |
| Transportation – 0.0% | | | | | | | | | | | |
| Transportation-Trucks – 0.0% | |
| | | QDI LLC
Expires 01/15/07(b)(e) | | | 10,207 | | | | 109,317 | | |
| | | | | | | | | | 109,317 | | |
| | | Transportation Total | | | | | | | 109,317 | | |
| INDUSTRIALS TOTAL | | | | | | | | | 109,317 | | |
| | | Total Warrants
(cost of $7,829,466) | | | | | | | 149,425 | | |
See Accompanying Notes to Financial Statements.
29
Columbia High Yield Opportunity Fund May 31, 2006
Short-Term Obligations – 2.8%
| | | | | Par ($) | | Value ($) | |
| | Repurchase agreement with State Street Bank & Trust Co.,
dated 05/31/06, due 06/01/06 at 4.770%, collateralized by
a U.S. Treasury Note maturing 07/15/10, market value of
$11,928,438 (repurchase proceeds $11,695,549) | | | 11,694,000 | | | | 11,694,000 | | |
| | Total Short-Term Obligations
(cost of $11,694,000) | | | | | 11,694,000 | | |
| | Total Investments – 96.4%
(cost of $413,198,793)(i) | | | | | 400,050,017 | | |
| | Other Assets & Liabilities, Net – 3.6% | | | | | 15,058,627 | | |
| | Net Assets – 100.0% | | | | | 415,108,644 | | |
Notes to Investment Portfolio:
(a) Step bond. This security is currently not paying coupon. Shown parenthetically is the next interest rate to be paid and the date the Fund will begin accruing at this rate.
(b) Security exempt from registration pursuant to Rule 144A under the Securities Act of 1933. These securities may be resold in transactions exempt from registration, normally to qualified institutional buyers. At May 31, 2006, these securities, which are not illiquid, except for the following, amounted to $78,868,014, which represents 19.0% of net assets.
| Security | | Acquisition
Date | | Par/Units | | Cost | | Value | |
| Hollinger, Inc. | |
| 11.875% 03/01/11 | | 09/30/04 | | $ | 1,009,000 | | | $ | 1,009,000 | | | $ | 1,009,000 | | |
| 12.875% 03/01/11 | | 03/05/03 | | | 774,000 | | | | 782,980 | | | | 805,928 | | |
| QDI LLC | | 05/28/02 | | | 10,207 | | | | — | | | | 109,317 | | |
| UbiquiTel, Inc. | | 04/04/00 | | | 5,250 | | | | 247,969 | | | | 53 | | |
| | | $ | 1,924,298 | | |
(c) The interest rate shown on floating rate or variable rate securities reflects the rate at May 31, 2006.
(d) Illiquid Security.
(e) Represents fair value as determined in good faith under procedures approved by the Board of Trustees.
(f) Security has no value.
(g) The issuer has filed for bankruptcy protection under Chapter 11. Income is not being accrued. At May 31, 2006, the value of these securities amounted to $0, which represents 0.0% of net assets.
(h) Non-income producing.
(i) Cost for federal income tax purposes is $414,000,891.
At May 31, 2006, the Fund had entered into the following forward currency exchange contracts:
Forward Currency
Contracts to Sell | | Value | | Aggregate
Face Value | | Settlement
Date | | Unrealized
Depreciation | |
| EUR | | $ | 2,496,710 | | | $ | 2,590,325 | | | 06/26/06 | | $ | (93,615 | ) | |
| EUR | | | 2,197,462 | | | | 2,255,901 | | | 06/30/06 | | | (58,439 | ) | |
| EUR | | | 2,225,209 | | | | 2,272,594 | | | 06/30/06 | | | (47,385 | ) | |
| | | $ | (199,439 | ) | |
See Accompanying Notes to Financial Statements.
30
Columbia High Yield Opportunity Fund May 31, 2006
At May 31, 2006, the Fund held investments in the following sectors:
Holdings by Revenue
Source (Unaudited) | | % of
Net Assets | |
| Corporate Fixed-Income Bonds & Notes | | | 88.4 | % | |
| Preferred Stocks | | | 2.3 | | |
| Common Stocks | | | 1.4 | | |
| Municipal Bond (Taxable) | | | 0.8 | | |
| Convertible Bonds | | | 0.7 | | |
| Warrants | | | 0.0 | | |
| Short-Term Obligation | | | 2.8 | | |
| Other Assets & Liabilities, Net | | | 3.6 | | |
| | | | 100.0 | % | |
| Acronym | | Name | |
| EUR | | | Euro Currency | | |
| PIK | | | Payment-In-Kind | | |
| REIT | | | Real Estate Investment Trust | | |
See Accompanying Notes to Financial Statements.
31
Statement of Assets and Liabilities – Columbia High Yield Opportunity Fund
May 31, 2006
| | | | | ($) | |
| Assets | | Investments, at cost | | | 413,198,793 | | |
| | | Investments, at value | | | 400,050,017 | | |
| | | Foreign currency (cost of $12,580) | | | 12,674 | | |
| | | Receivable for: | | | | | |
| | | Investments sold | | | 11,351,069 | | |
| | | Fund shares sold | | | 169,250 | | |
| | | Interest | | | 7,894,440 | | |
| | | Dividends | | | 74,753 | | |
| | | Foreign tax reclaims | | | 6,568 | | |
| | | Deferred Trustees' compensation plan | | | 50,125 | | |
| | | Total Assets | | | 419,608,896 | | |
| Liabilities | | Payable to custodian bank | | | 1,242,167 | | |
| | | Net unrealized depreciation on foreign forward currency contracts | | | 199,439 | | |
| | | Payable for: | | | | | |
| | | Fund shares repurchased | | | 1,199,056 | | |
| | | Distributions | | | 874,969 | | |
| | | Investment advisory fee | | | 222,778 | | |
| | | Transfer agent fee | | | 119,761 | | |
| | | Pricing and bookkeeping fees | | | 13,089 | | |
| | | Trustees' fees | | | 421 | | |
| | | Custody fee | | | 993 | | |
| | | Distribution and service fees | | | 199,435 | | |
| | | Chief compliance officer expenses | | | 1,055 | | |
| | | Deferred Trustees' fees | | | 50,125 | | |
| | | Other liabilities | | | 376,964 | | |
| | | Total Liabilities | | | 4,500,252 | | |
| | | Net Assets | | | 415,108,644 | | |
| Composition of Net Assets | | Paid-in capital | | | 833,760,635 | | |
| | | Undistributed net investment income | | | 147,126 | | |
| | | Accumulated net realized loss | | | (405,454,718 | ) | |
| | | Net unrealized appreciation (depreciation) on: | | | | | |
| | | Investments | | | (13,148,776 | ) | |
| | | Foreign currency translations | | | (195,623 | ) | |
| | | Net Assets | | | 415,108,644 | | |
| Class A | | Net assets | | | 245,713,153 | | |
| | | Shares outstanding | | | 54,649,528 | | |
| | | Net asset value per share | | | 4.50 | (a) | |
| | | Maximum offering price per share ($4.50/0.9525) | | | 4.72 | (b) | |
| Class B | | Net assets | | | 135,121,657 | | |
| | | Shares outstanding | | | 30,054,858 | | |
| | | Net asset value and offering price per share | | | 4.50 | (a) | |
| Class C | | Net assets | | | 23,084,315 | | |
| | | Shares outstanding | | | 5,134,579 | | |
| | | Net asset value and offering price per share | | | 4.50 | (a) | |
| Class Z | | Net assets | | | 11,189,519 | | |
| | | Shares outstanding | | | 2,488,789 | | |
| | | Net asset value, offering and redemption price per share | | | 4.50 | | |
(a) Redemption price per share is equal to net asset value less any applicable contingent deferred sales charge.
(b) On sales of $50,000 or more the offering price is reduced.
See Accompanying Notes to Financial Statements.
32
Statement of Operations – Columbia High Yield Opportunity Fund
For the Year Ended May 31, 2006
| | | | | ($) | |
| Investment Income | | Dividends | | | 686,821 | | |
| | | Interest | | | 39,404,203 | | |
| | | Total Investment Income (net of foreign taxes withheld of $4,414) | | | 40,091,024 | | |
| Expenses | | Investment advisory fee | | | 2,863,146 | | |
| | | Distribution fee: | | | | | |
| | | Class B | | | 1,253,649 | | |
| | | Class C | | | 202,487 | | |
| | | Service fee: | | | | | |
| | | Class A | | | 676,799 | | |
| | | Class B | | | 417,883 | | |
| | | Class C | | | 67,578 | | |
| | | Transfer agent fee | | | 853,056 | | |
| | | Pricing and bookkeeping fees | | | 155,541 | | |
| | | Trustees' fees | | | 30,051 | | |
| | | Custody fee | | | 27,028 | | |
| | | Chief compliance officer expenses (See Note 4) | | | 7,678 | | |
| | | Non-recurring costs (See Note 7) | | | 6,519 | | |
| | | Other expenses | | | 294,081 | | |
| | | Total Expenses | | | 6,855,496 | | |
| | | Fees and expenses waived or reimbursed by Transfer Agent | | | (76,688 | ) | |
| | | Fees waived by Distributor—Class C | | | (40,297 | ) | |
| | | Non-recurring costs assumed by Investment Advisor (See Note 7) | | | (6,519 | ) | |
| | | Custody earnings credit | | | (20,566 | ) | |
| | | Net Expenses | | | 6,711,426 | | |
| | | Net Investment Income | | | 33,379,598 | | |
| Net Realized and Unrealized Gain (Loss) on Investments and Foreign Currency | | Net realized gain (loss) on: | | | | | |
| | | Investments | | | (15,888,892 | ) | |
| | | Foreign currency transactions | | | 207,721 | | |
| | | Net realized loss | | | (15,681,171 | ) | |
| | | Net change in unrealized appreciation (depreciation) on: | | | | | |
| | | Investments | | | 12,809,627 | | |
| | | Foreign currency translations | | | (830,770 | ) | |
| | | Net change in unrealized appreciation (depreciation) | | | 11,978,857 | | |
| | | Net Loss | | | (3,702,314 | ) | |
| | | Net Increase in Net Assets from Operations | | | 29,677,284 | | |
See Accompanying Notes to Financial Statements.
33
Statement of Changes in Net Assets – Columbia High Yield Opportunity Fund
Year Ended May 31,
| Increase (Decrease) in Net Assets: | | | | 2006 ($) | | 2005 ($) | |
| Operations | | Net investment income | | | 33,379,598 | | | | 42,938,667 | | |
| | | Net realized gain (loss) on investments and foreign
currency transactions | | | (15,681,171 | ) | | | 16,486,865 | | |
| | | Net change in unrealized appreciation (depreciation)
on investments and foreign currency translations | | | 11,978,857 | | | | (6,978,243 | ) | |
| | | Net Increase from Operations | | | 29,677,284 | | | | 52,447,289 | | |
| Distributions Declared to Shareholders | | From net investment income: | | | | | | | | | |
| | | Class A | | | (21,051,533 | ) | | | (24,843,221 | ) | |
| | | Class B | | | (11,823,125 | ) | | | (17,229,500 | ) | |
| | | Class C | | | (1,950,865 | ) | | | (3,195,340 | ) | |
| | | Class Z | | | (1,001,542 | ) | | | (1,286,008 | ) | |
| | | Total Distributions Declared to Shareholders | | | (35,827,065 | ) | | | (46,554,069 | ) | |
| Share Transactions | | Class A: | | | | | | | | | |
| | | Subscriptions | | | 52,657,938 | | | | 51,631,025 | | |
| | | Distributions reinvested | | | 10,782,697 | | | | 12,970,332 | | |
| | | Redemptions | | | (87,163,976 | ) | | | (119,788,196 | ) | |
| | | Net Decrease | | | (23,723,341 | ) | | | (55,186,839 | ) | |
| | | Class B: | | | | | | | | | |
| | | Subscriptions | | | 5,471,089 | | | | 15,033,791 | | |
| | | Distributions reinvested | | | 5,895,770 | | | | 8,549,272 | | |
| | | Redemptions | | | (68,754,799 | ) | | | (84,300,266 | ) | |
| | | Net Decrease | | | (57,387,940 | ) | | | (60,717,203 | ) | |
| | | Class C: | | | | | | | | | |
| | | Subscriptions | | | 2,059,957 | | | | 2,313,673 | | |
| | | Distributions reinvested | | | 1,094,117 | | | | 2,060,574 | | |
| | | Redemptions | | | (10,070,893 | ) | | | (20,777,439 | ) | |
| | | Net Decrease | | | (6,916,819 | ) | | | (16,403,192 | ) | |
| | | Class Z: | | | | | | | | | |
| | | Subscriptions | | | 2,671,255 | | | | 8,036,535 | | |
| | | Distributions reinvested | | | 729,510 | | | | 964,387 | | |
| | | Redemptions | | | (4,873,301 | ) | | | (10,416,599 | ) | |
| | | Net Decrease | | | (1,472,536 | ) | | | (1,415,677 | ) | |
| | | Net Decrease from Share Transactions | | | (89,500,636 | ) | | | (133,722,911 | ) | |
| | | Total Decrease in Net Assets | | | (95,650,417 | ) | | | (127,829,691 | ) | |
| Net Assets | | Beginning of year | | | 510,759,061 | | | | 638,588,752 | | |
| | | End of year | | | 415,108,644 | | | | 510,759,061 | | |
| | | Undistributed net investment income at end of year | | | 147,126 | | | | 994,259 | | |
| Changes in Shares | | Class A: | | | | | | | | | |
| | | Subscriptions | | | 11,587,648 | | | | 11,017,719 | | |
| | | Issued for distributions reinvested | | | 2,362,678 | | | | 2,760,651 | | |
| | | Redemptions | | | (19,172,288 | ) | | | (25,637,277 | ) | |
| | | Net Decrease | | | (5,221,962 | ) | | | (11,858,907 | ) | |
| | | Class B: | | | | | | | | | |
| | | Subscriptions | | | 1,200,104 | | | | 3,195,705 | | |
| | | Issued for distributions reinvested | | | 1,290,777 | | | | 1,819,533 | | |
| | | Redemptions | | | (15,066,524 | ) | | | (17,983,556 | ) | |
| | | Net Decrease | | | (12,575,643 | ) | | | (12,968,318 | ) | |
| | | Class C: | | | | | | | | | |
| | | Subscriptions | | | 449,541 | | | | 492,732 | | |
| | | Issued for distributions reinvested | | | 239,512 | | | | 438,421 | | |
| | | Redemptions | | | (2,211,292 | ) | | | (4,477,212 | ) | |
| | | Net Decrease | | | (1,522,239 | ) | | | (3,546,059 | ) | |
| | | Class Z: | | | | | | | | | |
| | | Subscriptions | | | 587,303 | | | | 1,698,113 | | |
| | | Issued for distributions reinvested | | | 159,845 | | | | 204,777 | | |
| | | Redemptions | | | (1,070,811 | ) | | | (2,216,660 | ) | |
| | | Net Decrease | | | (323,663 | ) | | | (313,770 | ) | |
See Accompanying Notes to Financial Statements.
34
Financial Highlights – Columbia High Yield Opportunity Fund
Selected data for a share outstanding throughout each period is as follows:
| | | Year Ended May 31, | | Period
Ended
May 31, | | Year Ended
December 31, | |
| Class A Shares | | 2006 | | 2005 | | 2004 | | 2003 (a) | | 2002 | | 2001 | |
Net Asset Value,
Beginning of Period | | $ | 4.56 | | | $ | 4.54 | | | $ | 4.30 | | | $ | 4.01 | | | $ | 4.62 | | | $ | 5.30 | | |
| Income from Investment Operations: | |
| Net investment income (b) | | | 0.33 | | | | 0.35 | | | | 0.35 | | | | 0.14 | | | | 0.34 | | | | 0.52 | (c) | |
Net realized and unrealized gain
(loss) on investments and
foreign currency | | | (0.03 | ) | | | 0.05 | | | | 0.21 | | | | 0.30 | | | | (0.53 | ) | | | (0.65 | )(c) | |
| Total from Investment Operations | | | 0.30 | | | | 0.40 | | | | 0.56 | | | | 0.44 | | | | (0.19 | ) | | | (0.13 | ) | |
Less Distributions Declared
to Shareholders: | |
| From net investment income | | | (0.36 | ) | | | (0.38 | ) | | | (0.32 | ) | | | (0.15 | ) | | | (0.39 | ) | | | (0.51 | ) | |
| Return of capital | | | — | | | | — | | | | — | | | | — | | | | (0.03 | ) | | | (0.04 | ) | |
Total Distributions Declared to
Shareholders | | | (0.36 | ) | | | (0.38 | ) | | | (0.32 | ) | | | (0.15 | ) | | | (0.42 | ) | | | (0.55 | ) | |
| Net Asset Value, End of Period | | $ | 4.50 | | | $ | 4.56 | | | $ | 4.54 | | | $ | 4.30 | | | $ | 4.01 | | | $ | 4.62 | | |
| Total return (d) | | | 6.70 | %(e) | | | 8.93 | %(f) | | | 13.30 | %(e) | | | 11.01 | %(e)(g) | | | (4.27 | )% | | | (2.78 | )% | |
Ratios to Average Net Assets/
Supplemental Data: | |
| Expenses (h) | | | 1.12 | % | | | 1.15 | % | | | 1.19 | % | | | 1.29 | %(i) | | | 1.31 | % | | | 1.22 | % | |
| Net investment income (h) | | | 7.28 | % | | | 7.55 | % | | | 7.65 | % | | | 8.24 | %(i) | | | 7.92 | % | | | 10.34 | %(c) | |
| Waiver/reimbursement | | | 0.02 | % | | | — | | | | 0.01 | % | | | — | %(i)(j) | | | — | | | | — | | |
| Portfolio turnover rate | | | 61 | % | | | 67 | % | | | 75 | % | | | 45 | %(g) | | | 63 | % | | | 62 | % | |
| Net assets, end of period (000's) | | $ | 245,713 | | | $ | 273,104 | | | $ | 325,658 | | | $ | 376,944 | | | $ | 361,780 | | | $ | 369,043 | | |
(a) The Fund changed its fiscal year end from December 31 to May 31.
(b) Per share data was calculated using average shares outstanding during the period.
(c) Effective January 1, 2001, the Fund adopted the provisions of the AICPA Audit and Accounting Guide for Investment Companies and began amortizing premium and accreting discount on all debt securities. The effect of this change for the year ended December 31, 2001 was to increase net investment income per share by $0.05, decrease net realized and unrealized loss per share by $0.05 and increase the ratio of net investment income to average net assets from 9.76% to 10.34%. Per share data and ratios for periods prior to December 31, 2001 have not been restated to reflect this change in presentation.
(d) Total return at net asset value assuming all distributions reinvested and no initial sales charge or contingent deferred sales charge.
(e) Had the Investment Advisor and/or any of its affiliates not waived or reimbursed a portion of expenses, total return would have been reduced.
(f) Total return includes a voluntary reimbursement by the Investment Advisor for a realized investment loss. This reimbursement had an impact of less than 0.01% on the Fund's total return.
(g) Not annualized.
(h) The benefits derived from custody credits had an impact of less than 0.01%.
(i) Annualized.
(j) Rounds to less than 0.01%.
See Accompanying Notes to Financial Statements.
35
Financial Highlights – Columbia High Yield Opportunity Fund
Selected data for a share outstanding throughout each period is as follows:
| | | Year Ended May 31, | | Period
Ended
May 31, | | Year Ended
December 31, | |
| Class B Shares | | 2006 | | 2005 | | 2004 | | 2003 (a) | | 2002 | | 2001 | |
Net Asset Value,
Beginning of Period | | $ | 4.56 | | | $ | 4.54 | | | $ | 4.30 | | | $ | 4.01 | | | $ | 4.62 | | | $ | 5.30 | | |
Income from Investment
Operations: | |
| Net investment income (b) | | | 0.30 | | | | 0.32 | | | | 0.31 | | | | 0.13 | | | | 0.31 | | | | 0.48 | (c) | |
Net realized and unrealized gain
(loss) on investments and
foreign currency | | | (0.04 | ) | | | 0.05 | | | | 0.22 | | | | 0.29 | | | | (0.54 | ) | | | (0.65 | )(c) | |
| Total from Investment Operations | | | 0.26 | | | | 0.37 | | | | 0.53 | | | | 0.42 | | | | (0.23 | ) | | | (0.17 | ) | |
Less Distributions Declared
to Shareholders: | |
| From net investment income | | | (0.32 | ) | | | (0.35 | ) | | | (0.29 | ) | | | (0.13 | ) | | | (0.35 | ) | | | (0.47 | ) | |
| Return of capital | | | — | | | | — | | | | — | | | | — | | | | (0.03 | ) | | | (0.04 | ) | |
Total Distributions Declared to
Shareholders | | | (0.32 | ) | | | (0.35 | ) | | | (0.29 | ) | | | (0.13 | ) | | | (0.38 | ) | | | (0.51 | ) | |
| Net Asset Value, End of Period | | $ | 4.50 | | | $ | 4.56 | | | $ | 4.54 | | | $ | 4.30 | | | $ | 4.01 | | | $ | 4.62 | | |
| Total return (d) | | | 5.91 | %(e) | | | 8.13 | %(f) | | | 12.46 | %(e) | | | 10.67 | %(e)(g) | | | (4.99 | )% | | | (3.51 | )% | |
Ratios to Average Net Assets/
Supplemental Data: | |
| Expenses (h) | | | 1.87 | % | | | 1.90 | % | | | 1.94 | % | | | 2.04 | %(i) | | | 2.06 | % | | | 1.97 | % | |
| Net investment income (h) | | | 6.55 | % | | | 6.80 | % | | | 6.90 | % | | | 7.49 | %(i) | | | 7.17 | % | | | 9.59 | %(c) | |
| Waiver/reimbursement | | | 0.02 | % | | | — | | | | 0.01 | % | | | — | %(i)(j) | | | — | | | | — | | |
| Portfolio turnover rate | | | 61 | % | | | 67 | % | | | 75 | % | | | 45 | %(g) | | | 63 | % | | | 62 | % | |
| Net assets, end of period (000's) | | $ | 135,122 | | | $ | 194,460 | | | $ | 252,415 | | | $ | 305,021 | | | $ | 280,220 | | | $ | 350,464 | | |
(a) The Fund changed its fiscal year end from December 31 to May 31.
(b) Per share data was calculated using average shares outstanding during the period.
(c) Effective January 1, 2001, the Fund adopted the provisions of the AICPA Audit and Accounting Guide for Investment Companies and began amortizing premium and accreting discount on all debt securities. The effect of this change for the year ended December 31, 2001 was to increase net investment income per share by $0.05, decrease net realized and unrealized loss per share by $0.05 and increase the ratio of net investment income to average net assets from 9.02% to 9.59%. Per share data and ratios for periods prior to December 31, 2001 have not been restated to reflect this change in presentation.
(d) Total return at net asset value assuming all distributions reinvested and no contingent deferred sales charge.
(e) Had the Investment Advisor and/or any of its affiliates not waived or reimbursed a portion of expenses, total return would have been reduced.
(f) Total return includes a voluntary reimbursement by the Investment Advisor for a realized investment loss. This reimbursement had an impact of less than 0.01% on the Fund's total return.
(g) Not annualized.
(h) The benefits derived from custody credits had an impact of less than 0.01%.
(i) Annualized.
(j) Rounds to less than 0.01%.
See Accompanying Notes to Financial Statements.
36
Financial Highlights – Columbia High Yield Opportunity Fund
Selected data for a share outstanding throughout each period is as follows:
| | | Year Ended May 31, | | Period
Ended
May 31, | | Year Ended
December 31, | |
| Class C Shares | | 2006 | | 2005 | | 2004 | | 2003 (a) | | 2002 | | 2001 | |
Net Asset Value,
Beginning of Period | | $ | 4.56 | | | $ | 4.54 | | | $ | 4.30 | | | $ | 4.01 | | | $ | 4.62 | | | $ | 5.30 | | |
Income from Investment
Operations: | |
| Net investment income (b) | | | 0.31 | | | | 0.33 | | | | 0.32 | | | | 0.13 | | | | 0.31 | | | | 0.49 | (c) | |
Net realized and unrealized gain
(loss) on investments and
foreign currency | | | (0.04 | ) | | | 0.04 | | | | 0.21 | | | | 0.29 | | | | (0.53 | ) | | | (0.65 | )(c) | |
| Total from Investment Operations | | | 0.27 | | | | 0.37 | | | | 0.53 | | | | 0.42 | | | | (0.22 | ) | | | (0.16 | ) | |
Less Distributions Declared
to Shareholders: | |
| From net investment income | | | (0.33 | ) | | | (0.35 | ) | | | (0.29 | ) | | | (0.13 | ) | | | (0.36 | ) | | | (0.48 | ) | |
| Return of capital | | | — | | | | — | | | | — | | | | — | | | | (0.03 | ) | | | (0.04 | ) | |
Total Distributions Declared to
Shareholders | | | (0.33 | ) | | | (0.35 | ) | | | (0.29 | ) | | | (0.13 | ) | | | (0.39 | ) | | | (0.52 | ) | |
| Net Asset Value, End of Period | | $ | 4.50 | | | $ | 4.56 | | | $ | 4.54 | | | $ | 4.30 | | | $ | 4.01 | | | $ | 4.62 | | |
| Total return (d)(e) | | | 6.07 | % | | | 8.29 | %(f) | | | 12.63 | % | | | 10.74 | %(g) | | | (4.85 | )% | | | (3.37 | )% | |
Ratios to Average Net Assets/
Supplemental Data: | |
| Expenses (h) | | | 1.72 | % | | | 1.75 | % | | | 1.79 | % | | | 1.89 | %(i) | | | 1.91 | % | | | 1.82 | % | |
| Net investment income (h) | | | 6.70 | % | | | 6.95 | % | | | 7.05 | % | | | 7.64 | %(i) | | | 7.32 | % | | | 9.74 | %(c) | |
| Waiver/reimbursement | | | 0.17 | % | | | 0.15 | % | | | 0.16 | % | | | 0.15 | %(i) | | | 0.15 | % | | | 0.15 | % | |
| Portfolio turnover rate | | | 61 | % | | | 67 | % | | | 75 | % | | | 45 | %(g) | | | 63 | % | | | 62 | % | |
| Net assets, end of period (000's) | | $ | 23,084 | | | $ | 30,366 | | | $ | 46,322 | | | $ | 51,471 | | | $ | 46,568 | | | $ | 52,122 | | |
(a) The Fund changed its fiscal year end from December 31 to May 31.
(b) Per share data was calculated using average shares outstanding during the period.
(c) Effective January 1, 2001, the Fund adopted the provisions of the AICPA Audit and Accounting Guide for Investment Companies and began amortizing premium and accreting discount on all debt securities. The effect of this change for the year ended December 31, 2001 was to increase net investment income per share by $0.05, decrease net realized and unrealized loss per share by $0.05 and increase the ratio of net investment income to average net assets from 9.16% to 9.74%. Per share data and ratios for periods prior to December 31, 2001 have not been restated to reflect this change in presentation.
(d) Total return at net asset value assuming all distributions reinvested and no contingent deferred sales charge.
(e) Had the Investment Advisor and Distributor not waived or reimbursed a portion of expenses, total return would have been reduced.
(f) Total return includes a voluntary reimbursement by the Investment Advisor for a realized investment loss. This reimbursement had an impact of less than 0.01% on the Fund's total return.
(g) Not annualized.
(h) The benefits derived from custody credits had an impact of less than 0.01%.
(i) Annualized.
See Accompanying Notes to Financial Statements.
37
Financial Highlights – Columbia High Yield Opportunity Fund
Selected data for a share outstanding throughout each period is as follows:
| | | Year Ended May 31, | | Period
Ended
May 31, | | Year Ended
December 31, | |
| Class Z Shares | | 2006 | | 2005 | | 2004 | | 2003 (a) | | 2002 | | 2001 | |
Net Asset Value,
Beginning of Period | | $ | 4.56 | | | $ | 4.54 | | | $ | 4.30 | | | $ | 4.01 | | | $ | 4.62 | | | $ | 5.30 | | |
Income from Investment
Operations: | |
| Net investment income (b) | | | 0.34 | | | | 0.37 | | | | 0.36 | | | | 0.15 | | | | 0.33 | | | | 0.53 | (c) | |
Net realized and unrealized gain
(loss) on investments and
foreign currency | | | (0.03 | ) | | | 0.04 | | | | 0.21 | | | | 0.29 | | | | (0.51 | ) | | | (0.65 | )(c) | |
| Total from Investment Operations | | | 0.31 | | | | 0.41 | | | | 0.57 | | | | 0.44 | | | | (0.18 | ) | | | (0.12 | ) | |
Less Distributions Declared
to Shareholders: | |
| From net investment income | | | (0.37 | ) | | | (0.39 | ) | | | (0.33 | ) | | | (0.15 | ) | | | (0.40 | ) | | | (0.52 | ) | |
| Return of capital | | | — | | | | — | | | | — | | | | — | | | | (0.03 | ) | | | (0.04 | ) | |
Total Distributions Declared to
Shareholders | | | (0.37 | ) | | | (0.39 | ) | | | (0.33 | ) | | | (0.15 | ) | | | (0.43 | ) | | | (0.56 | ) | |
| Net Asset Value, End of Period | | $ | 4.50 | | | $ | 4.56 | | | $ | 4.54 | | | $ | 4.30 | | | $ | 4.01 | | | $ | 4.62 | | |
| Total return (d) | | | 6.97 | %(e) | | | 9.21 | %(f) | | | 13.58 | %(e) | | | 11.12 | %(e)(g) | | | (4.03 | )% | | | (2.53 | )% | |
Ratios to Average Net Assets/
Supplemental Data: | |
| Expenses (h) | | | 0.87 | % | | | 0.90 | % | | | 0.94 | % | | | 1.04 | %(i) | | | 1.06 | % | | | 0.97 | % | |
| Net investment income (h) | | | 7.53 | % | | | 7.80 | % | | | 7.92 | % | | | 8.49 | %(i) | | | 8.17 | % | | | 10.59 | %(c) | |
| Waiver/reimbursement | | | 0.02 | % | | | — | | | | 0.01 | % | | | — | %(i)(j) | | | — | | | | — | | |
| Portfolio turnover rate | | | 61 | % | | | 67 | % | | | 75 | % | | | 45 | %(g) | | | 63 | % | | | 62 | % | |
| Net assets, end of period (000's) | | $ | 11,190 | | | $ | 12,829 | | | $ | 14,194 | | | $ | 45,803 | | | $ | 35,541 | | | $ | 1,978 | | |
(a) The Fund changed its fiscal year end from December 31 to May 31.
(b) Per share data was calculated using average shares outstanding during the period.
(c) Effective January 1, 2001, the Fund adopted the provisions of the AICPA Audit and Accounting Guide for Investment Companies and began amortizing premium and accreting discount on all debt securities. The effect of this change for the year ended December 31, 2001 was to increase net investment income per share by $0.05, decrease net realized and unrealized loss per share by $0.05 and increase the ratio of net investment income to average net assets from 10.01% to 10.59%. Per share data and ratios for periods prior to December 31, 2001 have not been restated to reflect this change in presentation.
(d) Total return at net asset value assuming all distributions reinvested.
(e) Had the Investment Advisor and/or any of its affiliates not waived or reimbursed a portion of expenses, total return would have been reduced.
(f) Total return includes a voluntary reimbursement by the Investment Advisor for a realized investment loss. This reimbursement had an impact of less than 0.01% on the Fund's total return.
(g) Not annualized.
(h) The benefits derived from custody credits had an impact of less than 0.01%.
(i) Annualized.
(j) Rounds to less than 0.01%.
See Accompanying Notes to Financial Statements.
38
Notes to Financial Statements – Columbia High Yield Opportunity Fund (May 31, 2006)
Note 1. Organization
Columbia High Yield Opportunity Fund (the "Fund"), a series of Columbia Funds Series Trust I (the "Trust"), is a non-diversified portfolio. The Trust is a Massachusetts business trust registered under the Investment Company Act of 1940, as amended, as an open-end management investment company. After the close of business on March 24, 2006, the Fund was re-domiciled into a new series of Columbia Funds Series Trust I. Prior to March 24, 2006, the Fund was a series of Columbia Funds Trust I.
Investment Goal
The Fund seeks high current income and total return.
Fund Shares
The Fund may issue an unlimited number of shares and offers four classes of shares: Class A, Class B, Class C and Class Z. Each share class has its own sales charge and expense structure.
Class A shares are subject to a maximum front-end sales charge of 4.75% based on the amount of initial investment. Class A shares purchased without an initial sales charge in accounts aggregating up to $50 million at the time of purchase are subject to a 1.00% contingent deferred sales charge ("CDSC") if the shares are sold within twelve months of the time of the purchase. Class B shares are subject to a maximum CDSC of 5.00% based upon the holding period after purchase. Class B shares will convert to Class A shares in a certain number of years after purchase, depending on the program under which shares were purchased. Class C shares are subject to a 1.00% CDSC on shares sold within one year after purchase. Class Z shares are offered continuously at net asset value. There are certain restrictions on the purchase of Class Z shares, as described in the Fund's prospectus.
Note 2. Significant Accounting Policies
Use of Estimates
The preparation of financial statements in conformity with accounting principles generally accepted in the United States of America ("GAAP") requires management to make estimates and assumptions that affect the reported amounts of assets and liabilities, the disclosure of contingent assets and liabilities at the date of the financial statements and the reported amounts of revenue and expenses during the reporting period. Actual results could differ from those estimates. The following is a summary of significant accounting policies consistently followed by the Fund in the preparation of its financial statements.
Security Valuation
Debt securities generally are valued by pricing services approved by the Fund's Board of Trustees, based upon market transactions for normal, institutional-size trading units of similar securities. The services may use various pricing techniques which take into account appropriate factors such as yield, quality, coupon rate, maturity, type of issue, trading characteristics and other data, as well as broker quotes. Debt securities for which quotations are readily available are valued at an over-the-counter or exchange bid quotation. Certain debt securities, which tend to be more thinly traded and of lesser quality, are priced based on fundamental analysis of the financial condition of the issuer and the estimated value of any collateral. Valuations developed through pricing techniques may vary from the actual amounts realized upon sale of the securities, and the potential variation may be greater for those securities valued using fundamental analysis.
Equity securities are valued at the last sale price on the principal exchange on which they trade, except for securities traded on the NASDAQ, which are valued at the NASDAQ official close price. Unlisted securities or listed securities for which there were no sales during the day are valued at the closing bid price on such exchanges or over-the-counter markets.
Short-term debt obligations maturing within 60 days are valued at amortized cost, which approximates market value.
Forward currency exchange contracts are valued at the prevailing forward exchange rate of the underlying currencies.
Foreign securities are generally valued at the last sale price on the foreign exchange or market on which they trade. If any foreign share prices are not readily available as a result of limited share activity, the securities are valued at the last sale price of the local shares in the principal market in which such securities are normally traded.
39
Columbia High Yield Opportunity Fund (May 31, 2006)
Generally, trading in foreign securities is substantially completed each day at various times prior to the close of the New York Stock Exchange ("NYSE"). The values of such securities used in computing the net asset value of the Fund's shares are determined as of such times. Foreign currency exchange rates are generally determined at 4:00 p.m. Eastern (U.S.) time. Occasionally, events affecting the values of such foreign securities and such exchange rates may occur between the times at which they are determined and the close of the customary trading session of the NYSE, which would not be reflected in the computation of the Fund's net asset value. If events materially affecting the values of such foreign securities occur and it is determined that market quotations are not reliable, then these foreign securities will be valued at their fair value using procedures approved by the Board of Trustees.
Investments for which market quotations are not readily available, or that have quotations which management believes are not appropriate, are valued at fair value as determined in good faith under consistently applied procedures established by and under the general supervision of the Board of Trustees.
Security Transactions
Security transactions are accounted for on the trade date. Cost is determined and gains (losses) are based upon the specific identification method for both financial statement and federal income tax purposes.
Forward Foreign Currency Exchange Contracts
Forward foreign currency exchange contracts are agreements to exchange one currency for another at a future date at a specified price. These contracts are used to minimize the exposure to foreign exchange rate fluctuations during the period between trade and settlement date of the contracts. The Fund may utilize forward foreign currency exchange contracts in connection with the settlement of purchases and sales of securities. The Fund may also enter into these contracts to hedge certain other foreign currency denominated assets. Contracts to buy generally are used to acquire exposure to foreign currencies, while contracts to sell are used to hedge the Fund's investments against currency fluctuations. Forward currency contracts are valued daily at the current exchange rate of the underlying currency, resulting in unrealized gains (losses) which become realize d at the time the foreign currency contracts are closed or mature. Realized and unrealized gains (losses) arising from such transactions are included in net realized and unrealized gains (losses) on foreign currency transactions. The use of forward currency contracts does not eliminate fluctuations in the prices of the Fund's portfolio securities. While the maximum potential loss from such contracts is the aggregate face value in U.S. dollars at the time the contract was opened, exposure is typically limited to the change in value of the contract (in U.S. dollars) over the period it remains open. The Fund could also be exposed to risk if the counterparties of the contracts are unable to fulfill the terms of the contracts.
Repurchase Agreements
The Fund may engage in repurchase agreement transactions with institutions that the Fund's investment advisor has determined are creditworthy. The Fund, through its custodian, receives delivery of underlying securities collateralizing a repurchase agreement. Collateral is at least equal, at all times, to the value of the repurchase obligation including interest. A repurchase agreement transaction involves certain risks in the event of default or insolvency of the counterparty. These risks include possible delays or restrictions upon the Fund's ability to dispose of the underlying securities and a possible decline in the value of the underlying securities during the period while the Fund seeks to assert its rights.
Income Recognition
Interest income is recorded on the accrual basis. Premium and discount are amortized and accreted, respectively, on all debt securities. Corporate actions and dividend income are recorded on the ex-date. The value of additional securities received as an income payment is recorded as income and as the cost basis of such securities.
Foreign Currency Transactions
The values of all assets and liabilities quoted in foreign currencies are translated into U.S. dollars at that day's exchange rates. Net realized and unrealized gains (losses) on foreign currency transactions include gains (losses) arising from the fluctuation in exchange rates between trade and settlement dates on securities transactions, gains (losses) arising from the disposition of foreign currency and currency
40
Columbia High Yield Opportunity Fund (May 31, 2006)
gains (losses) between the accrual and payment dates on dividends, interest income and foreign withholding taxes.
For financial statement purposes, the Fund does not distinguish that portion of gains (losses) on investments which is due to changes in foreign exchange rates from that which is due to changes in market prices of the investments. Such fluctuations are included with the net realized and unrealized gains (losses) on investments.
Determination of Class Net Asset Values
All income, expenses (other than class-specific expenses, as shown on the Statement of Operations) and realized and unrealized gains (losses) are allocated to each class of the Fund on a daily basis for purposes of determining the net asset value of each class. Income and expenses are allocated to each class based on the settled shares method, while realized and unrealized gains (losses) are allocated based on the relative net assets of each class.
Federal Income Tax Status
The Fund intends to qualify each year as a "regulated investment company" under Subchapter M of the Internal Revenue Code, as amended, and will distribute substantially all of its tax-exempt or taxable income, if any, for its tax year, and as such will not be subject to federal income taxes. In addition, the Fund intends to distribute in each calendar year substantially all of its net investment income, capital gains and certain other amounts, if any, such that the Fund should not be subject to federal excise tax. Therefore, no federal income or excise tax provision is recorded.
Distributions to Shareholders
Dividends from net investment income are declared daily and paid monthly. Net realized capital gains, if any, are distributed at least annually.
Note 3. Federal Tax Information
The timing and character of income and capital gain distributions are determined in accordance with income tax regulations, which may differ from GAAP. Reclassifications are made to the Fund's capital accounts for permanent tax differences to reflect income and gains available for distribution (or available capital loss carryforwards) under income tax regulations.
For the year ended May 31, 2006, permanent book and tax basis differences resulting primarily from differing treatments for discount accretion/premium amortization on debt securities, market discount reclassifications, paydown reclassifications and Section 988 reclassifications of foreign currency were identified and reclassified among the components of the Fund's net assets as follows:
Undistributed
Net Investment
Income | | Accumulated
Net Realized Loss | | Paid-In
Capital | |
| $ | 1,600,334 | | | $ | (1,600,334 | ) | | $ | – | | |
Net investment income and net realized gains (losses), as disclosed on the Statement of Operations, and net assets were not affected by this reclassification.
The tax character of distributions paid during the years ended May 31, 2006 and May 31, 2005 was as follows:
| | | May 31, 2006 | | May 31, 2005 | |
| Distributions paid from: | | | | | |
| Ordinary Income* | | $ | 35,827,065 | | | $ | 46,554,069 | | |
| Long-Term Capital Gains | | | | | – | | |
*For tax purposes short-term capital gains distributions, if any, are considered ordinary income distributions.
As of May 31, 2006, the components of distributable earnings on a tax basis were as follows:
Undistributed
Ordinary
Income | | Undistributed
Long-term
Capital Gains | | Net
Unrealized
Depreciation* | |
| $ | 1,650,870 | | | | $ | | | $ | (13,950,874 | ) | |
*The differences between book-basis and tax-basis net unrealized appreciation/depreciation are primarily due to deferral of losses from wash sales and discount accretion/ premium amortization on debt securities.
41
Columbia High Yield Opportunity Fund (May 31, 2006)
Unrealized appreciation and depreciation at May 31, 2006, based on cost of investments for federal income tax purposes, was:
| Unrealized appreciation | | $ | 8,166,182 | | |
| Unrealized depreciation | | | (22,117,056 | ) | |
| Net unrealized depreciation | | $ | (13,950,874 | ) | |
The following capital loss carryforwards, determined as of May 31, 2006, may be available to reduce taxable income arising from future net realized gains on investments, if any, to the extent permitted by the Internal Revenue Code:
| Year of Expiration | | Capital Loss
Carryforward | |
| | 2008 | | | $ | 37,575,496 | | |
| | 2009 | | | | 161,087,717 | | |
| | 2010 | | | | 171,019,187 | | |
| | 2011 | | | | 18,463,873 | | |
| | 2014 | | | | 7,033,993 | | |
| | | | | $ | 395,180,266 | | |
Of the capital loss carryforwards attributable to the Fund $3,086,545 ($2,216,468 will expire May 31, 2008 and $870,077 will expire May 31, 2009) was obtained in the merger with Stein Roe High Yield Fund. Utilization of these losses could be subject to limitations imposed by the Internal Revenue Code. Under current tax rules, certain capital losses realized after October 31 may be deferred and treated as occuring on the first day of the following fiscal year. As of May 31, 2006 post-October capital losses of $10,246,815 attributted to security transactions were deferred to June 1, 2006.
Note 4. Fees and Compensation Paid to Affiliates
Investment Advisory Fee
Columbia Management Advisors, LLC ("Columbia"), an indirect, wholly-owned subsidiary of Bank of America Corporation ("BOA"), is the investment advisor to the Fund and provides administrative and other services. Prior to September 30, 2005, Columbia Management Advisors, Inc. was the investment advisor to the Fund under the same fee structure. On September 30, 2005, Columbia Management Advisors, Inc. merged into Banc of America Capital Management, LLC. At that time, the investment advisor was then renamed Columbia Management Advisors, LLC. Columbia receives a monthly investment advisory fee based on the Fund's average daily net assets at the following annual rates:
| Average Daily Net Assets | | Annual Fee Rate | |
| First $500 million | | | 0.60 | % | |
| $500 million to $1 billion | | | 0.55 | % | |
| $1 billion to $1.5 billion | | | 0.52 | % | |
| Over $1.5 billion | | | 0.49 | % | |
For the year ended May 31, 2006, the Fund's effective investment advisory fee rate was 0.60%.
Pricing and Bookkeeping Fees
Columbia is responsible for providing pricing and bookkeeping services to the Fund under a pricing and bookkeeping agreement. Under a separate agreement (the "Outsourcing Agreement"), Columbia has delegated those functions to State Street Corporation ("State Street"). As a result, Columbia pays State Street the total fees collected under the pricing and bookkeeping agreement.
Under its pricing and bookkeeping agreement with the Fund, Columbia receives an annual fee of $38,000 paid monthly plus an additional monthly fee based on the level of average daily net assets for the month; provided that during any 12-month period, the aggregate fee, exclusive of out-of-pocket expenses and changes, shall not exceed $140,000.
Prior to November 1, 2005, Columbia received from the Fund an annual fee of $10,000 paid monthly, and in any month that the Fund's average daily net assets exceeded $50 million, an additional monthly fee, calculated by taking into account the fees payable to State Street under the Outsourcing Agreement.
The Fund also reimburses Columbia and State Street for out-of-pocket expenses and charges, including fees payable to third parties for pricing the Fund's portfolio securities and direct internal costs incurred by Columbia in connection with providing fund accounting oversight and monitoring and certain other services. For the year ended May 31, 2006, the annualized effective pricing and bookkeeping fee rate for the
42
Columbia High Yield Opportunity Fund (May 31, 2006)
Fund, inclusive of out-of-pocket expenses, was 0.033% of the Fund's average daily net assets.
Transfer Agent Fee
Columbia Management Services, Inc. (formerly Columbia Funds Services, Inc.) (the "Transfer Agent"), an affiliate of Columbia and an indirect, wholly-owned subsidiary of BOA, provides shareholder services to the Fund and has contracted with Boston Financial Data Services ("BFDS") to serve as subtransfer agent. The Transfer Agent is entitled to receive a fee for its services, paid monthly, at the annual rate of $17.00 per open account plus sub-transfer agent fees (exclusive of BFDS fees) calculated based on assets held in omnibus accounts and intended to recover the cost of payments to third parties for services to those accounts. The annual rate was $15.23 from November 1, 2005 through March 31, 2006. The Transfer Agent may also retain, as additional compensation for its services, fees for wire, telephone and redemption orders, IRA trustee agent fees and account transcript fees due the Transfer Agent from shareholders of the Fund and credits (net of bank charges) earned with respect to balances in accounts the Transfer Agent maintains in connection with its services to the Fund. The Transfer Agent also receives reimbursement for certain out-of-pocket expenses. Prior to November 1, 2005, the Transfer Agent received a fee, paid monthly at the annual rate of $34.00 per open account and was reimbursed for certain out-of-pocket expenses.
The Transfer Agent voluntarily waived a portion of its fees for the Fund for the period from May 1, 2005 through October 31, 2005. For the year ended May 31, 2006, the Transfer Agent waived fees of $76,688 for the Fund.
For the year ended May 31, 2006, the effective transfer agent fee rate, inclusive of out-of-pocket expenses and net of fee waivers, for the Fund was 0.16% of the Fund's average daily net assets.
Underwriting Discounts, Service and Distribution Fees
Columbia Management Distributors, Inc. (the "Distributor"), a subsidiary of Columbia and an indirect, wholly-owned subsidiary of BOA, is the principal underwriter of the Fund. On August 22, 2005, Columbia Funds Distributor, Inc. was renamed Columbia Management Distributors, Inc. For the year ended May 31, 2006, the Distributor has retained net underwriting discounts of $27,585 on sales of the Fund's Class A shares and net CDSC fees of $34, $388,225 and $1,886 on Class A, B and C share redemptions, respectively.
The Fund has adopted a Rule 12b-1 plan (the "Plan") which allows the payment of a monthly service fee to the Distributor equal to 0.25% annually of the average daily net assets attributable to Class A, B and C shares respectively. The Plan also requires the payment of a monthly distribution fee to the Distributor equal to 0.75% annually of the average daily net assets attributable to Class B and Class C shares only. The Distributor has voluntarily agreed to waive a portion of the Class C share distribution fee so that it will not exceed 0.60% annually.
The CDSC and the distribution fees received from the Plan are used principally as repayment to the Distributor for amounts paid by the Distributor to dealers who sold such shares.
Custody Credits
The Fund has an agreement with its custodian bank under which custody fees may be reduced by balance credits. These credits are recorded as a reduction of total expenses on the Statement of Operations. The Fund could have invested a portion of the assets utilized in connection with the expense offset arrangement in an income-producing asset if it had not entered into such an agreement.
Fees Paid to Officers and Trustees
With the exception of one officer, all officers of the Fund are employees of Columbia or its affiliates and receive no compensation from the Fund. The Board of Trustees has appointed a Chief Compliance Officer to the Fund in accordance with federal securities regulations. The Fund, along with other affiliated funds, will pay its pro-rata share of the expenses associated with the Chief Compliance Officer position. The Fund's fee for the Office of the Chief Compliance Officer will not exceed $15,000 per year.
The Fund's Trustees may participate in a deferred compensation plan which may be terminated at any time. Obligations of the plan will be paid solely out of the Fund's assets.
Other
Columbia provides certain services to the Fund related to Sarbanes-Oxley compliance. For the year ended May 31, 2006, the Fund paid $2,385 to Columbia for such services. This amount is included in "Other expenses" on the Statement of Operations.
43
Columbia High Yield Opportunity Fund (May 31, 2006)
Note 5. Portfolio Information
For the year ended May 31, 2006, the cost of purchases and proceeds from sales of securities, excluding short-term obligations, were $277,888,571 and $377,979,942, respectively.
Note 6. Line of Credit
The Fund and other affiliated funds participate in a $350,000,000 committed unsecured revolving line of credit provided by State Street Bank and Trust Company. Borrowings are used for temporary or emergency purposes to facilitate portfolio liquidity. Interest is charged to each participating fund based on its borrowings at a rate per annum equal to the Federal Funds rate plus 0.50%. In addition, a commitment fee of 0.10% per annum is accrued and apportioned among the participating funds based on their pro-rata portion of the unutilized line of credit. The commitment fee is included in "Other expenses" on the Statement of Operations.
For the year ended May 31, 2006, the Fund did not borrow under this arrangement.
Note 7. Disclosure of Significant Risks and Contingencies
Industry Focus
The Fund may focus its investments in certain industries, subjecting it to greater risk than a fund that is more diversified.
High-Yield Securities
Investing in high-yield securities may involve greater credit risk and considerations not typically associated with investing in U.S. government bonds and other higher quality fixed income securities. These securities are non-investment grade securities, often referred to as "junk" bonds. Economic downturns may disrupt the high yield market and impair the ability of issuers to repay principal and interest. Also, an increase in interest rates would likely have an adverse impact on the value of such obligations. Moreover, high-yield securities may be less liquid to the extent that there is no established secondary market.
Foreign Securities
There are certain additional risks involved when investing in foreign securities that are not inherent with investments in domestic securities. These risks may involve foreign currency exchange rate fluctuations, adverse political and economic developments and the possible prevention of currency exchange or other foreign governmental laws or restrictions. In addition, the liquidity of foreign securities may be more limited than that of domestic securities.
Investments in emerging market countries are subject to additional risk. The risk of foreign investments is typically increased in less developed countries. These countries are also more likely to experience high levels of inflation, deflation or currency devaluation which could hurt their economies and securities markets.
Legal Proceedings
On February 9, 2005, Columbia Management Advisors, Inc. (which has since merged into Banc of America Capital Management, LLC (now named Columbia Management Advisors, LLC)) ("Columbia") and Columbia Funds Distributor, Inc. (which has been renamed Columbia Management Distributors, Inc.) (the "Distributor") (collectively, the "Columbia Group") entered into an Assurance of Discontinuance with the New York Attorney General ("NYAG") (the "NYAG Settlement") and consented to the entry of a cease-and-desist order by the Securities and Exchange Commission ("SEC") (the "SEC Order"). The SEC Order and the NYAG Settlement are referred to collectively as the "Settlements". The Settlements contain substantially the same terms and conditions as outlined in the agreements in principle which Columbia Group entered into with the SEC and NYAG in March 2004.
Under the terms of the SEC Order, the Columbia Group agreed, among other things, to: pay $70 million in disgorgement and $70 million in civil money penalties; cease and desist from violations of the antifraud provisions and certain other provisions of the federal securities laws; maintain certain compliance and ethics oversight structures; retain an independent consultant to review the Columbia Group's applicable supervisory, compliance, control and other policies and procedures; and retain an independent distribution consultant (see below). The Columbia Funds have also voluntarily undertaken to implement certain governance measures designed to maintain the independence of their boards of trustees. The NYAG Settlement also, among other things, requires Columbia and its affiliates to reduce management fees for certain Columbia Funds (including the former Nations Funds) and other mutual funds collectively by
44
Columbia High Yield Opportunity Fund (May 31, 2006)
$32 million per year for five years, for a projected total of $160 million in management fee reductions.
Pursuant to the procedures set forth in the SEC order, the $140 million in settlement amounts described above will be distributed in accordance with a distribution plan developed by an independent distribution consultant and approved by the SEC. The independent distribution consultant has been in consultation with the staff of the SEC and has submitted a proposed plan of distribution. The SEC has not yet approved a final plan of distribution.
As a result of these matters or any adverse publicity or other developments resulting from them, there may be increased redemptions or reduced sales of fund shares, which could increase transaction costs or operating expenses, or have other adverse consequences for the funds.
A copy of the SEC Order is available on the SEC website at http://www.sec.gov. A copy of the NYAG Settlement is available as part of the Bank of America Corporation Form 8-K filing on February 10, 2005.
In connection with the events described in detail above, various parties have filed suit against certain funds, the Trustees of the Columbia Funds, FleetBoston Financial Corporation and its affiliated entities and/or Bank of America and its affiliated entities.
On February 20, 2004, the Judicial Panel on Multidistrict Litigation transferred these cases and cases against several other mutual fund companies based on similar allegations to the United States District Court in Maryland for consolidated or coordinated pretrial proceedings (the "MDL"). Subsequently, additional related cases were transferred to the MDL. On September 29, 2004, the plaintiffs in the MDL filed amended and consolidated complaints. One of these amended complaints is a putative class action that includes claims under the federal securities laws and state common law, and that names Columbia, the Distributor, the Trustees of the Columbia Funds, Bank of America Corporation and others as defendants. Another of the amended complaints is a derivative action purportedly on behalf of the Columbia Funds that asserts claims under federal securities laws and state common law.
On February 25, 2005, Columbia and other defendants filed motions to dismiss the claims in the pending cases. On March 1, 2006, for reasons stated in the court's memoranda dated November 3, 2005, the U.S. District Court for the District of Maryland granted in part and denied in part the defendants' motions to dismiss. The court dismissed all of the class action claims pending against the Columbia Funds Trusts and the Columbia Acorn Trusts. As to Columbia and the Distributor, the claims under the Securities Act of 1933, the claims under Sections 34(b) and 36(a) of the Investment Company Act of 1940 ("ICA") and the state law claims were dismissed. The claims under Sections 10(b) and 20(a) of the Securities Exchange Act of 1934 and claims under Section 36(b) of the ICA along with related claims under Section 48(a) of the ICA were not dismissed.
On March 21, 2005, a purported class action was filed in Massachusetts state court alleging that the conduct, including market timing, entitles Class B shareholders in certain Columbia funds to an exemption from contingent deferred sales charges upon early redemption ("the CDSC Lawsuit"). The CDSC Lawsuit has been removed to federal court in Massachusetts and the federal Judicial Panel has transferred the CDSC Lawsuit to the MDL.
The MDL is ongoing. Accordingly, an estimate of the financial impact of this litigation on any fund, if any, cannot currently be made.
In 2004, certain Columbia funds, the Trustees of the Columbia Funds, advisers and affiliated entities were named as defendants in certain purported shareholder class and derivative actions making claims, including claims under the Investment Company and the Investment Advisers Acts of 1940 and state law. The suits allege, inter alia, that the fees and expenses paid by the funds are excessive and that the advisers and their affiliates inappropriately used fund assets to distribute the funds and for other improper purpose. On March 2, 2005, the actions were consolidated in the Massachusetts federal court as In re Columbia Entities Litigation. The plaintiffs filed a consolidated amended complaint on June 9, 2005. On November 30, 2005, the judge dismissed all claims by plaintiffs and ordered that the case be closed. The plaintiffs filed a notice of appeal on December 30, 2005 and this appeal is pending.
For the year ended May 31, 2006, Columbia has assumed $6,519 of legal, consulting services and Trustees' fees incurred by the Fund in connection with these matters.
45
Report of Independent Registered Public Accounting Firm
Columbia High Yield Opportunity Fund
To the Trustees of the Columbia Funds Series Trust I and the Shareholders of Columbia Strategic Income Fund
In our opinion, the accompanying statement of assets and liabilities, including the investment portfolio, and the related statements of operations and of changes in net assets and the financial highlights present fairly, in all material respects, the financial position of Columbia High Yield Opportunity Fund (the "Fund") (a series of Columbia Funds Series Trust I) at May 31, 2006, the results of its operations, the changes in its net assets and its financial highlights for the periods indicated, in conformity with accounting principles generally accepted in the United States of America. These financial statements and financial highlights (hereafter referred to as "financial statements") are the responsibility of the Fund's management. Our responsibility is to express an opinion on these financial statements based on our audits. We conducted our audits of these financial statements in accordance with the standards of the Public C ompany Accounting Oversight Board (United States). Those standards require that we plan and perform the audit to obtain reasonable assurance about whether the financial statements are free of material misstatement. An audit includes examining, on a test basis, evidence supporting the amounts and disclosures in the financial statements, assessing the accounting principles used and significant estimates made by management, and evaluating the overall financial statement presentation.We believe that our audits, which included confirmation of securities at May 31, 2006 by correspondence with the custodian and brokers, provide a reasonable basis for our opinion.
PricewaterhouseCoopers LLP
Boston, Massachusetts
July 25, 2006
46
Fund Governance
Trustees Columbia High Yield Opportunity
The Trustees/Directors serve terms of indefinite duration. The names, addresses and ages of the Trustees/Directors and officers of the Funds in the Columbia Funds Complex, the year each was first elected or appointed to office, their principal business occupations during at least the last five years, the number of portfolios overseen by each Trustee/Director and other directorships they hold are shown below. Each officer listed below serves as an officer of each Fund in the Columbia Funds Complex.
Name, address and age, Position with funds,
Year first elected or appointed to office1 | | Principal occupation(s) during past five years, Number of portfolios in Columbia
Funds Complex overseen by trustee/director, Other directorships held | |
Disinterested Trustees
Douglas A. Hacker (Born 1955)
c/o Columbia Management Advisors, LLC
One Financial Center
Boston, MA 02111
Trustee (since 1996) | | Executive Vice President-Strategy of United Airlines (airline) from December, 2002 to April 1, 2006; (formerly President of UAL Loyalty Services (airline) from September, 2001 to December, 2002; Executive Vice President and Chief Financial Officer of United Airlines from July, 1999 to September, 2001; Senior Vice President-Finance from March, 1993 to July, 1999). Oversees 83, Nash Finch Company (food distributor) | |
|
Janet Langford Kelly (Born 1957)
c/o Columbia Management Advisors, LLC One Financial Center
Boston, MA 02111
Trustee (since 1996) | | Partner, Zelle, Hofmann, Voelbel, Mason & Gette LLP (law firm) since March, 2005; Adjunct Professor of Law, Northwestern University, since September, 2004 (formerly Chief Administrative Officer and Senior Vice President, Kmart Holding Corporation (consumer goods), from September, 2003 to March, 2004; Executive Vice President-Corporate Development and Administration, General Counsel and Secretary, Kellogg Company (food manufacturer), from September, 1999 to August, 2003; Oversees 83, UAL Corporation (airline) | |
|
Richard W. Lowry (Born 1936)
c/o Columbia Management Advisors, LLC One Financial Center
Boston, MA 02111
Trustee (since 1995) | | Private Investor since August, 1987 (formerly Chairman and Chief Executive Officer, U.S. Plywood Corporation (building products manufacturer until 1987)). Oversees 852, None | |
|
1 In December 2000, the boards of each of the former Liberty Funds and former Stein Roe Funds were combined into one board of trustees responsible for the oversight of both fund groups (collectively, the "Liberty Board"). In October 2003, the trustees on the Liberty Board were elected to the boards of the Columbia Funds (the "Columbia Board") and of the CMG Fund Trust (the "CMG Funds Board"); simultaneous with that election, Patrick J. Simpson and Richard L. Woolworth, who had been directors on the Columbia Board and trustees on the CMG Funds Board, were appointed to serve as trustees of the Liberty Board. The date shown is the earliest date on which a trustee/director was elected or appointed to the board of a Fund in the Columbia Funds Complex.
2 Messrs. Lowry, Neuhauser and Mayer also serve as directors/trustees of the Liberty All-Star Funds, currently consisting of 3 funds, which are advised by an affiliate of the Advisor.
47
Fund Governance (continued)
Trustees Columbia High Yield Opportunity Fund
Name, address and age, Position with funds,
Year first elected or appointed to office1 | | Principal occupation(s) during past five years, Number of portfolios in Columbia
Funds Complex overseen by trustee/director, Other directorships held | |
Disinterested Trustees
Charles R. Nelson (Born 1943)
c/o Columbia Management Advisors, LLC
One Financial Center
Boston, MA 02111
Trustee (since 1981) | | Professor of Economics, University of Washington, since January, 1976; Ford and Louisa Van Voorhis Professor of Political Economy, University of Washington, since September, 1993 (formerly Director, Institute for Economic Research, University of Washington from September, 2001 to June, 2003); Adjunct Professor of Statistics, University of Washington, since September, 1980; Associate Editor, Journal of Money Credit and Banking, since September, 1993; consultant on econometric and statistical matters. Oversees 83, None | |
|
John J. Neuhauser (Born 1942)
c/o Columbia Management Advisors, LLC
One Financial Center
Boston, MA 02111
Trustee (since 1985) | | University Professor Boston College since November, 2005; Academic Vice President and Dean of Faculties since August, 1999, Boston College (formerly Dean Boston College School of Management from September, 1977 to August, 1999). Oversees 852, Saucony, Inc. (athletic footwear) | |
|
Patrick J. Simpson (Born 1944)
c/o Columbia Management Advisors, LLC
One Financial Center
Boston, MA 02111
Trustee (since 2000) | | Partner, Perkins Coie LLP (law firm). Oversees 83, None | |
|
Thomas E. Stitzel (Born 1936)
c/o Columbia Management Advisors, LLC
One Financial Center
Boston, MA 02111
Trustee (since 1998) | | Business Consultant since 1999; Chartered Financial Analyst. Oversees 83, None | |
|
Thomas C. Theobald (Born 1937)
c/o Columbia Management Advisors, LLC
One Financial Center
Boston, MA 02111
Trustee and Chairman of the Board
(since 1996) | | Partner and Senior Advisor, Chicago Growth Partners (private equity investing) since September, 2004 (formerly Managing Director, William Blair Capital Partners (private equity investing) from September, 1994 to September, 2004). Oversees 833, Anixter International (network support equipment distributor); Ventas, Inc. (real estate investment trust); Jones Lang LaSalle (real estate management services) and Ambac Financial Group (financial guaranty insurance) | |
|
3 Mr. Theobald was appointed as Chairman of the Board effective December 10, 2003.
48
Fund Governance (continued)
Trustees Columbia High Yield Opportunity Fund
Name, address and age, Position with funds,
Year first elected or appointed to office1 | | Principal occupation(s) during past five years, Number of portfolios in Columbia
Funds Complex overseen by trustee/director, Other directorships held | |
Disinterested Trustees
Anne-Lee Verville (Born 1945)
c/o Columbia Management Advisors, LLC One Financial Center
Boston, MA 02111
Trustee (since 1998) | | Retired since 1997 (formerly General Manager, Global Education Industry, IBM Corporation (computer and technology) from 1994 to 1997). Oversees 83, Chairman of the Board of Directors, Enesco Group, Inc. (producer of giftware and home and garden decor products) | |
|
Richard L. Woolworth (Born 1941)
c/o Columbia Management Advisors, LLC One Financial Center
Boston, MA 02111
Trustee (since 1991) | | Retired since December, 2003 (formerly Chairman and Chief Executive Officer, The Regence Group (regional health insurer); Chairman and Chief Executive Officer, BlueCross BlueShield of Oregon; Certified Public Accountant, Arthur Young & Company). Oversees 83, Northwest Natural Gas Co. (natural gas service provider) | |
|
Interested Trustee
William E. Mayer (Born 1940)
c/o Columbia Management Advisors, LLC One Financial Center
Boston, MA 02111
Trustee (since 1994) | | Partner, Park Avenue Equity Partners (private equity) since February, 1999 (formerly Partner, Development Capital LLC from November, 1996 to February, 1999). Oversees 834, Lee Enterprises (print media), WR Hambrecht + Co. (financial service provider); Reader's Digest (publishing); OPENFIELD Solutions (retail industry technology provider) | |
|
4 Mr. Mayer is an "interested person" (as defined in the Investment Company Act of 1940 (1940 Act)) by reason of his affiliation with WR Hambrecht + Co.
The Statement of Additional Information Includes additional information about the Trustees of the Funds and is available, without charge, upon request by calling 800-426-3750.
49
Fund Governance (continued)
Officers Columbia High Yield Opportunity Fund
Name, address and age, Position with
Columbia Funds, Year first elected or
appointed to office | | Principal occupation(s) during past five years | |
Christopher L. Wilson (Born 1957)
One Financial Center
Boston, MA 02111
President (since 2004) | | Head of Mutual Funds since August, 2004 and Managing Director of the Advisor since September, 2005; President and Chief Executive Officer, CDC IXIS Asset Management Services, Inc. (investment management) from September, 1998 to August, 2004. | |
|
James R. Bordewick, Jr. (Born 1959)
One Financial Center
Boston, MA 02111
Senior Vice President, Secretary and
Chief Legal Officer (since 2006) | | Associate General Counsel, Bank of America since April, 2005; Senior Vice President and Associate General Counsel, MFS Investment Management (investment management) prior to April, 2005. | |
|
J. Kevin Connaughton (Born 1964)
One Financial Center
Boston, MA 02111
Senior Vice President, Chief Financial Officer and Treasurer (since 2000) | | Managing Director of the Advisor since February, 1998. | |
|
Mary Joan Hoene (Born 1949)
100 Federal Street
Boston, MA 02110
Senior Vice President and
Chief Compliance Officer (since 2004) | | Senior Vice President and Chief Compliance Officer of various funds in the Fund Complex; Partner, Carter, Ledyard & Milburn LLP (law firm) from January, 2001 to August, 2004. | |
|
Michael G. Clarke (Born 1969)
One Financial Center
Boston, MA 02111
Chief Accounting Officer and
Assistant Treasurer (since 2004) | | Director of Fund Administration since January, 2006; Managing Director of Columbia Management Advisors, LLC September, 2004 to December, 2005; Vice President Fund Administration June, 2002 to September, 2004. Vice President Product Strategy and Development from February, 2001 to June, 2002. | |
|
Jeffrey R. Coleman (Born 1969)
One Financial Center
Boston, MA 02111
Deputy Treasurer (since 2004) | | Director of Fund Administration since January, 2006; Fund Controller from October 2004 to January 2006; Vice President of CDC IXIS Asset Management Services, Inc. (investment management) from August, 2000 to September, 2004. | |
|
Joseph F. DiMaria (Born 1968)
One Financial Center
Boston, MA 02111
Deputy Treasurer (since 2006) | | Director of Fund Administration since January, 2006; Head of Tax/Compliance and Assistant Treasurer from November, 2004 to December, 2005; Director of Trustee Administration (Sarbanes-Oxley) from May, 2003 to October, 2004; Senior Audit Manager, PricewaterhouseCoopers (independent registered public accounting firm) from July, 2000 to April, 2003. | |
|
Ty S. Edwards (Born 1966)
One Financial Center
Boston, MA 02111
Deputy Treasurer (since 2006) | | Director of Fund Administration since January, 2006; Vice President of the Advisor from July, 2002 to December, 2005; Assistant Vice president and Director, State Street Corporation (financial services) prior to 2002. | |
|
Barry S. Vallan (Born 1969)
One Financial Center
Boston, MA 02111
Controller (since 2006) | | Vice President-Fund Treasury of the Advisor since October, 2004; Vice President-Trustee Reporting from April, 2002 to October, 2004; Management Consultant, PricewaterhouseCoopers (independent registered public accounting firm) prior to October, 2002. | |
|
50
Columbia Funds – Columbia High Yield Opportunity Fund
| Growth Funds | | Columbia Acorn Fund
Columbia Acorn Select
Columbia Acorn USA
Columbia Growth Stock Fund
Columbia Large Cap Growth Fund
Columbia Marsico 21st Century Fund
Columbia Marsico Focused Equities Fund
Columbia Marsico Growth Fund
Columbia Marsico Mid Cap Growth Fund
Columbia Mid Cap Growth Fund
Columbia Small Cap Growth Fund I
Columbia Small Cap Growth Fund II
Columbia Small Company Equity Fund | |
|
| Core Funds | | Columbia Common Stock Fund
Columbia Large Cap Core Fund
Columbia Small Cap Core Fund
Columbia Young Investor Fund | |
|
| Value Funds | | Columbia Disciplined Value Fund
Columbia Dividend Income Fund
Columbia Large Cap Value Fund
Columbia Mid Cap Value Fund
Columbia Small Cap Value Fund I
Columbia Small Cap Value Fund II
Columbia Strategic Investor Fund | |
|
| Asset Allocation/Hybrid Funds | | Columbia Asset Allocation Fund
Columbia Asset Allocation Fund II
Columbia Balanced Fund
Columbia Liberty Fund
Columbia LifeGoal(TM) Balanced Growth Portfolio
Columbia LifeGoal(TM) Growth Portfolio
Columbia LifeGoal(TM) Income Portfolio
Columbia LifeGoal(TM) Income and Growth Portfolio
Columbia Masters Global Equity Portfolio
Columbia Masters Heritage Portfolio
Columbia Masters International Equity Portfolio
Columbia Thermostat Fund | |
|
| Index Funds | | Columbia Large Cap Enhanced Core Fund
Columbia Large Cap Index Fund
Columbia Mid Cap Index Fund
Columbia Small Cap Index Fund | |
|
| Tax-Managed Fund | | Columbia Tax-Managed Growth Fund | |
|
| Specialty Funds | | Columbia Convertible Securities Fund
Columbia Real Estate Equity Fund
Columbia Technology Fund
Columbia Utilities Fund | |
|
| Global/International Funds | | Columbia Acorn International
Columbia Acorn International Select
Columbia Global Value Fund
Columbia Greater China Fund
Columbia International Stock Fund
Columbia International Value Fund
Columbia Marsico International Opportunities Fund
Columbia Multi-Advisor International Equity Fund
Columbia World Equity Fund | |
|
51
Columbia Funds – Columbia High Yield Opportunity Fund
| Taxable Bond Funds | | Columbia Conservative High Yield Fund
Columbia Core Bond Fund
Columbia Federal Securities Fund
Columbia High Income Fund
Columbia High Yield Opportunity Fund
Columbia Income Fund
Columbia Intermediate Bond Fund
Columbia Intermediate Core Bond Fund
Columbia Short Term Bond Fund
Colum bia Strategic Income Fund
Columbia Total Return Bond Fund
Columbia U.S. Treasury Index Fund | |
|
| Tax-Exempt Bond Funds | | Columbia California Tax-Exempt Fund
Columbia California Intermediate Municipal Bond Fund
Columbia Connecticut Tax-Exempt Fund
Columbia Connecticut Intermediate Municipal Bond Fund
Columbia Florida Intermediate Municipal Bond Fund
Columbia Georgia Intermediate Municipal Bond Fund
Columbia High Yield Municipal Fund
Columbia Intermediate Municipal Bond Fund
C olumbia Massachusetts Intermediate Municipal Bond Fund
Columbia Massachusetts Tax-Exempt Fund
Columbia Maryland Intermediate Municipal Bond Fund
Columbia Municipal Income Fund
Columbia North Carolina Intermediate Municipal Bond Fund
Columbia New York Tax-Exempt Fund
Columbia New Jersey Intermediate Municipal Bond Fund
Columbia New York Intermediate Municipal Bond Fund
Columbia Oregon Intermediate Municipal Bond Fund
Columbia Rhode Island Intermediate Municipal Bond Fund
Columbia South Carolina Intermediate Municipal Bond Fund
Columbia Short Term Municipal Bond Fund
Columbia Tax-Exempt Fund
Columbia Tax-Exempt Insured Fund
Columbia Texas Intermediate Municipal Bond Fund
Columbia Virginia Intermediate Municipal Bond Fund | |
|
| Money Market Funds | | Columbia California Tax-Exempt Reserves
Columbia Cash Reserves
Columbia Connecticut Municipal Reserves
Columbia Government Plus Reserves
Columbia Government Reserves
Columbia Massachusetts Municipal Reserves
Columbia Money Market Reserves
Columbia Municipal Reserves
Columbia New York Tax-Exempt Reserves
Columbia Prime Reserves
Columbia Tax-Exempt Reserves
Columbia Treasury Reserves | |
|
For complete product information on any Columbia fund, visit our website at www.columbiafunds.com.
Columbia Management Group, LLC ("Columbia Management") is the primary investment management division of Bank of America Corporation. Columbia Management entities furnish investment management services and advise institutional and mutual fund portfolios. Columbia Funds are distributed by Columbia Management Distributors, Inc., member of NASD, SIPC, part of Columbia Management and an affiliate of Bank of America Corporation.
52
Important Information About This Report
Columbia High Yield Opportunity Fund
The fund mails one shareholder report to each shareholder address. If you would like more than one report, please call shareholder services at 800-345-6611 and additional reports will be sent to you.
This report has been prepared for shareholders of Columbia High Yield Opportunity Fund. This report may also be used as sales literature when preceded or accompanied by the current prospectus which provides details of sales charges, investment objectives and operating policies of the fund and with the most recent copy of the Columbia Funds Performance Update.
A description of the policies and procedures that the fund uses to determine how to vote proxies and a copy of the fund's voting records are available (i) at www.columbiamanagement.com; (ii) on the Securities and Exchange Commission's website at www.sec.gov, and (iii) without charge, upon request, by calling 800-368-0346. Information regarding how the fund voted proxies relating to portfolio securities during the 12-month period ended June 30 is available from the SEC's website. Information regarding how the fund voted proxies relating to portfolio securities is also available from the fund's website.
The fund files a complete schedule of portfolio holdings with the SEC for the first and third quarters of each fiscal year on Form N-Q. The fund's Form N-Q is available on the SEC's website at www.sec.gov and may be reviewed and copied at the SEC's Public Reference Room in Washington, DC. Information on the operation of the Public Reference Room may be obtained by calling 1-800-SEC-0330.
Columbia Management Group, LLC ("Columbia Management") is the primary investment management division of Bank of America Corporation. Columbia Management entities furnish investment management services and advise institutional and mutual fund portfolios. Columbia Funds are distributed by Columbia Management Distributors, Inc., member of NASD, SIPC, part of Columbia Management and an affiliate of Bank of America Corporation.
Transfer Agent
Columbia Management Services, Inc.
P.O. Box 8081
Boston MA 02266-8081
800.345.6611
Distributor
Columbia Management
Distributors, Inc.
One Financial Center
Boston MA 02111
Investment Advisor
Columbia Management Advisors, LLC
100 Federal Street
Boston MA 02110
53
Columbia High Yield Opportunity Fund
Annual Report, May 31, 2006
Columbia Management®
PRSRT STD
U.S. Postage
PAID
Holliston, MA
Permit NO. 20
©2006 Columbia Management Distributors, Inc.
One Financial Center, Boston, MA 02111-2621
800-345-6611 www.columbiafunds.com
SHC-42/111299-0506 (07/06) 06/26832
Item 2. Code of Ethics.
(a) The registrant has, as of the end of the period covered by this report, adopted a code of ethics that applies to the registrant’s principal executive officer, principal financial officer, principal accounting officer or controller, or persons performing similar functions, regardless of whether these individuals are employed by the registrant or a third party.
(b) During the period covered by this report, there were not any amendments to a provision of the code of ethics adopted in 2(a) above.
(c) During the period covered by this report, there were no waivers, including any implicit waivers, from a provision of the code of ethics described in 2(a) above that relates to one or more of the items set forth in paragraph (b) of this item’s instructions.
Item 3. Audit Committee Financial Expert.
The registrant’s Board of Trustees has determined that Douglas A. Hacker, Thomas E. Stitzel, Anne-Lee Verville and Richard L. Woolworth, each of whom are members of the registrant’s Board of Trustees and Audit Committee, each qualify as an audit committee financial expert. Mr. Hacker, Mr. Stitzel, Ms. Verville and Mr. Woolworth are each independent trustees, as defined in paragraph (a)(2) of this item’s instructions and collectively constitute the entire Audit Committee.
Item 4. Principal Accountant Fees and Services.
Fee information below is disclosed for the two series of the registrant whose reports to stockholders are included in this annual filing. The comparative information for fiscal year ended May 31, 2006 also includes fees paid by one series that was merged into the registrant during the period. The comparative information for fiscal year ended May 31, 2005 includes fees paid by the two series that were re-domiciled into the registrant during the period.
(a) Audit Fees. Aggregate Audit Fees billed by the principal accountant for professional services rendered during the fiscal years ended May 31, 2006 and May 31, 2005 are approximately as follows:
2006 | | 2005 | |
$ | 90,000 | | $ | 84,900 | |
| | | | | |
Audit Fees include amounts related to the audit of the registrant’s annual financial statements or services that are normally provided by the accountant in connection with statutory and regulatory filings or engagements for those fiscal years.
(b) Audit-Related Fees. Aggregate Audit-Related Fees billed to the registrant by the principal accountant for professional services rendered during the fiscal years ended May 31, 2006 and May 31, 2005 are approximately as follows:
Audit-Related Fees include amounts for assurance and related services by the principal accountant that are reasonably related to the performance of the audit of the registrant’s financial statements and are not reported in Audit Fees above. In both fiscal years 2006 and 2005, Audit-Related Fees include agreed-upon procedures performed for semi-annual shareholder reports. Fiscal year 2006 also includes Audit-Related Fees of approximately $13,700 for agreed-upon procedures related to a fund merger and the review of the registrant’s anti-money laundering program.
During the fiscal years ended May 31, 2006 and May 31, 2005, there were no Audit-Related Fees billed by the registrant’s principal accountant to the registrant’s investment adviser (not including any sub-adviser whose role is primarily portfolio management and is subcontracted with or overseen by another investment adviser) and any entity controlling, controlled by, or under common control with the adviser that provides ongoing services to the registrant for an engagement that related directly to the operations and financial reporting of the registrant.
(c) Tax Fees. Aggregate Tax Fees billed by the principal accountant to the registrant for professional services rendered during the fiscal years ended May 31, 2006 and May 31, 2005 are approximately as follows:
Tax Fees consist of the review of annual tax returns and include amounts for professional services by the principal accountant for tax compliance, tax advice and tax planning. Fiscal year 2006 also includes tax fees of approximately $9,500 for agreed-upon procedures related to a fund merger and review of the final tax return.
During the fiscal years ended May 31, 2006 and May 31, 2005, there were no Tax Fees billed by the registrant’s principal accountant to the registrant’s investment adviser (not including any sub-adviser whose role is primarily portfolio management and is subcontracted with or overseen by another investment adviser) and any entity controlling,
controlled by, or under common control with the adviser that provides ongoing services to the registrant for an engagement that related directly to the operations and financial reporting of the registrant.
(d) All Other Fees. Aggregate All Other Fees billed by the principal accountant to the registrant for professional services rendered during the fiscal years ended May 31, 2006 and May 31, 2005 are approximately as follows:
All Other Fees include amounts for products and services provided by the principal accountant, other than the services reported in paragraphs (a) through (c) above.
Aggregate All Other Fees billed by the registrant’s principal accountant to the registrant’s investment adviser (not including any sub-adviser whose role is primarily portfolio management and is subcontracted with or overseen by another investment adviser) and any entity controlling, controlled by, or under common control with the adviser that provides ongoing services to the registrant for an engagement that related directly to the operations and financial reporting of the registrant during the fiscal years ended May 31, 2006 and May 31, 2005 are approximately as follows:
2006 | | 2005 | |
$ | 359,600 | | $ | 93,500 | |
| | | | | |
These fees consist of an internal control review of the registrant’s transfer agent. In addition, fiscal year 2006 also includes an internal control examination of the registrant’s investment advisor.
(e)(1) Audit Committee Pre-Approval Policies and Procedures
The registrant’s Audit Committee is required to pre-approve the engagement of the registrant’s independent accountants to provide audit and non-audit services to the registrant and non-audit services to its investment adviser (not including any sub-adviser whose role is primarily portfolio management and is subcontracted with or overseen by another investment adviser) or any entity controlling, controlled by or under common control with such investment adviser that provides ongoing services to the registrant (“Adviser Affiliates”), if the engagement relates directly to the operations and financial reporting of the registrant.
The Audit Committee has adop ted a Policy for Engagement of Independent Accountants for Audit and Non-Audit Services (“Policy”). The Policy sets forth the understanding of the Audit Committee regarding the engagement of the registrant’s independent accountants to provide (i) audit and permissible audit-related, tax and other services to the registrant (collectively “Fund Services”); (ii) non-audit services to the registrant’s investment adviser (not including any sub-adviser whose role is primarily
portfolio management and is subcontracted with or overseen by another investment adviser) and Adviser Affiliates, if the engagement relates directly to the operations or financial reporting of a Fund (collectively “Fund-related Adviser Services”); and (iii) certain other audit and non-audit services to the registrant’s investment adviser (not including any sub-adviser whose role is primarily portfolio management and is subcontracted with or overseen by another investment adviser) and Adviser Affiliates. Unless a type of service receives general pre-approval under the Policy, it requires specific pre-approval by the Audit Committee if it is to be provided by the independent accountants. Pre-approval of non-audit services to the registrant, the registrant’s investment adviser (not including any sub-adviser whose role is primarily portfolio management and is subcontracted with or overseen by an other investment adviser) and Adviser Affiliates may be waived provided that the “de minimis” requirements set forth under paragraph (c)(7)(i)(C) of Rule 2-01 of Regulation S-X are met.
Under the Policy, the Audit Committee may delegate pre-approval authority to any pre-designated member or members who are Independent Trustees/Directors. The member(s) to whom such authority is delegated must report, for informational purposes only, any pre-approval decisions to the Audit Committee at its next regular meeting. The Audit Committee’s responsibilities with respect to the pre-approval of services performed by the independent accountants may not be delegated to management.
The Policy requires the Fund Treasurer and/or Director of Board Administration to submit to the Audit Committee, on an annual basis, a schedule of the types of services that are subject to general pre-approval. The schedule(s) provide a description of each type of service that is subject to general pre-approval and, where possible, will provide estimated fee caps for each instance of providing each service. The Audit Committees will review and approve the types of services and review the projected fees for the next fiscal year and may add to, or subtract from, the list of general pre-approved services from time to time based on subsequent determinations. That approval acknowledges that the Audit Committee is in agreement with the specific types of services that the independent accountants will be permitted to perform.
The Fund Treasurer and/or Director of Board Administration shall report to the Audit Committee at each of its regular meetings regarding all Fund Services or Fund-related Adviser Services initiated since the last such report was rendered, including a general description of the services, actual billed and projected fees, and the means by which such Fund Services or Fund-related Adviser Services were pre-approved by the Audit Committee.
*****
(e)(2) The percentage of services described in paragraphs (b) through (d) of this Item approved pursuant to the “de minimis” exception under paragraph (c)(7)(i)(C) of Rule 2-01 of Regulation S-X during both fiscal years ended May 31, 2006 and May 31, 2005 was zero.
(f) Not applicable.
(g) The aggregate non-audit fees billed by the registrant’s accountant for services rendered to the registrant, and rendered to the registrant’s investment adviser (not including any sub-adviser whose role is primarily portfolio management and is subcontracted with or overseen by another investment adviser), and any entity controlling, controlled by, or under common control with the adviser that provides ongoing services to the registrant for the fiscal years ended May 31, 2006 and May 31, 2005 are approximately as follows:
2006 | | 2005 | |
$ | 403,500 | | $ | 106,200 | |
| | | | | |
(h) The registrant’s Audit Committee of the Board of Directors has considered whether the provision of non-audit services that were rendered to the registrant’s adviser (not including any sub-adviser whose role is primarily portfolio management and is subcontracted with or overseen by another investment adviser), and any entity controlling, controlled by, or under common control with the investment adviser that provides ongoing services to the registrant that were not pre-approved pursuant to paragraph (c)(7)(ii) of Rule 2-01 of Regulation S-X, is compatible with maintaining the principal accountant’s independence.
Item 5. Audit Committee of Listed Registrants.
Not applicable.
Item 6. Schedule of Investments
The registrant’s “Schedule I – Investments in securities of unaffiliated issuers” (as set forth in 17 CFR 210.12-12) is included in Item 1 of this Form N-CSR.
Item 7. Disclosure of Proxy Voting Policies and Procedures for Closed-End Management Investment Companies.
Not applicable.
Item 8. Portfolio Managers of Closed-End Management Investment Companies.
Not applicable.
Item 9. Purchases of Equity Securities by Closed-End Management Investment Company and Affiliated Purchasers.
Not applicable.
Item 10. Submission of Matters to a Vote of Security Holders.
There have not been any material changes to the procedures by which shareholders may recommend nominees to the registrant’s board of directors, since those procedures were last disclosed in response to requirements of Item 7(d)(2)(ii)(G) of Schedule 14A or this Item.
Item 11. Controls and Procedures.
(a) The registrant’s principal executive officer and principal financial officers, based on their evaluation of the registrant’s disclosure controls and procedures as of a date within 90 days of the filing of this report, has concluded that such controls and procedures are adequately designed to ensure that information required to be disclosed by the registrant in Form N-CSR is accumulated and communicated to the registrant’s management, including the principal executive officer and principal financial officer, or persons performing similar functions, as appropriate to allow timely decisions regarding required disclosure.
(b) There were no changes in the registrant’s internal control over financial reporting that occurred during the registrant’s second fiscal quarter of the period covered by this report that has materially affected, or is reasonably likely to materially affect, the registrant’s internal control over financial reporting.
Item 12. Exhibits.
(a)(1) Code of ethics required to be disclosed under Item 2 of Form N-CSR attached hereto as Exhibit 99.CODE ETH.
(a)(2) Certifications pursuant to Rule 30a-2(a) under the Investment Company Act of 1940 (17 CFR 270.30a-2(a)) attached hereto as Exhibit 99.CERT.
(a)(3) Not applicable.
(b) Certification pursuant to Rule 30a-2(b) under the Investment Company Act of 1940 (17 CFR 270.30a-2(b)) attached hereto as Exhibit 99.906CERT.
SIGNATURES
Pursuant to the requirements of the Securities Exchange Act of 1934 and the Investment Company Act of 1940, the registrant has duly caused this report to be signed on its behalf by the undersigned, thereunto duly authorized.
(registrant) | Columbia Funds Series Trust I | |
| | | | |
| | | | |
By (Signature and Title) | /S/ Christopher L. Wilson | |
| Christopher L. Wilson, President | |
| | | | |
| | | | |
Date | | July 27, 2006 | |
| | | | | | | |
Pursuant to the requirements of the Securities Exchange Act of 1934 and the Investment Company Act of 1940, this report has been signed below by the following persons on behalf of the registrant and in the capacities and on the dates indicated.
By (Signature and Title) | /S/ Christopher L. Wilson | |
| Christopher L. Wilson, President | |
| | | | |
| | | | |
Date | | July 27, 2006 | |
| | | | | |
By (Signature and Title) | /S/ J. Kevin Connaughton | |
| J. Kevin Connaughton, Treasurer | |
| | | | |
| | | | |
Date | | July 27, 2006 | |
| | | | | |