UNITED STATES
SECURITIES AND EXCHANGE COMMISSION
Washington, D.C. 20549
FORM N-CSR
CERTIFIED SHAREHOLDER REPORT OF REGISTERED MANAGEMENT INVESTMENT COMPANIES
Investment Company Act file number 811-04367
Columbia Funds Series Trust I
(Exact name of registrant as specified in charter)
290 Congress Street
Boston, MA 02210
(Address of principal executive offices) (Zip code)
Daniel J. Beckman
c/o Columbia Management Investment Advisers, LLC
290 Congress Street
Boston, MA 02210
Ryan C. Larrenaga, Esq.
c/o Columbia Management Investment Advisers, LLC
290 Congress Street
Boston, MA 02210
(Name and address of agent for service)
Registrant's telephone number, including area code: (800) 345-6611
Date of fiscal year end: March 31
Date of reporting period: March 31, 2023
Form N-CSR is to be used by management investment companies to file reports with the Commission not later than 10 days after the transmission to stockholders of any report that is required to be transmitted to stockholders under Rule 30e-1 under the Investment Company Act of 1940 (17 CFR 270.30e-1). The Commission may use the information provided on Form N-CSR in its regulatory, disclosure review, inspection, and policymaking roles.
A registrant is required to disclose the information specified by Form N-CSR, and the Commission will make this information public. A registrant is not required to respond to the collection of information contained in Form N-CSR unless the Form displays a currently valid Office of Management and Budget ("OMB") control number. Please direct comments concerning the accuracy of the information collection burden estimate and any suggestions for reducing the burden to Secretary, Securities and Exchange Commission, 100 F Street, NE, Washington, DC 20549. The OMB has reviewed this collection of information under the clearance requirements of 44 U.S.C. § 3507.
Item 1. Reports to Stockholders.

March 31, 2023

| 3 | |
| 5 | |
| 7 | |
| 8 | |
| 11 | |
| 13 | |
| 14 | |
| 16 | |
| 20 | |
| 29 | |
| 30 | |
| 30 | |
| 36 |
(Unaudited)
| Average annual total returns (%) (for the period ended March 31, 2023) | ||||||
| Inception | 1 Year | 5 Years | 10 Years | |||
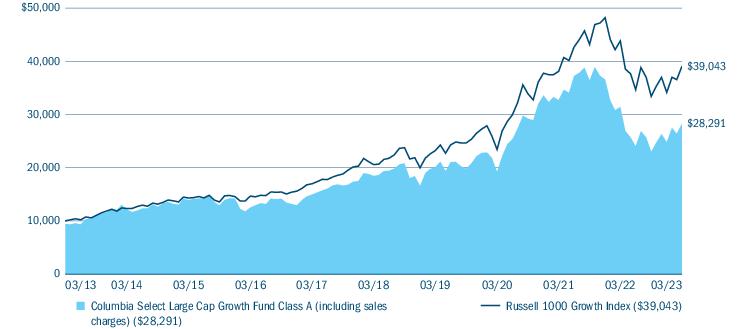
| Class A | Excluding sales charges | 09/28/07 | -10.01 | 8.91 | 11.62 | |
| Including sales charges | -15.18 | 7.63 | 10.96 | |||
| Advisor Class | 11/08/12 | -9.72 | 9.18 | 11.89 | ||
| Class C | Excluding sales charges | 09/28/07 | -10.67 | 8.09 | 10.79 | |
| Including sales charges | -11.35 | 8.09 | 10.79 | |||
| Institutional Class | 10/01/97 | -9.67 | 9.20 | 11.90 | ||
| Institutional 2 Class | 11/08/12 | -9.61 | 9.31 | 12.03 | ||
| Institutional 3 Class | 11/08/12 | -9.59 | 9.35 | 12.07 | ||
| Class R | 12/31/04 | -10.19 | 8.65 | 11.34 | ||
| Russell 1000 Growth Index | -10.90 | 13.66 | 14.59 | |||
| Columbia Select Large Cap Growth Fund | Annual Report 2023 | 3 |
(Unaudited)
| Portfolio breakdown (%) (at March 31, 2023) | |
| Common Stocks | 99.4 |
| Money Market Funds | 0.6 |
| Total | 100.0 |
| Equity sector breakdown (%) (at March 31, 2023) | |
| Communication Services | 1.8 |
| Consumer Discretionary | 18.0 |
| Consumer Staples | 7.4 |
| Financials | 8.0 |
| Health Care | 24.7 |
| Industrials | 10.0 |
| Information Technology | 30.1 |
| Total | 100.0 |
| 4 | Columbia Select Large Cap Growth Fund | Annual Report 2023 |
(Unaudited)
| • | The Fund benefited most, relative to the benchmark, from its security selection within the consumer discretionary sector. |
| • | Security selection, along with overweight positioning in, the industrials and health care sectors, also contributed to the Fund’s relative performance during the period. |
| • | An overweighted allocation to the financials sector also aided relative performance during the period. |
| • | Top individual holdings that contributed to performance during the period included biotechnology company BioMarin Pharmaceutical, Inc., heating and cooling manufacturer Trane Technologies PLC, online travel and restaurant reservation company Booking Holdings, Inc., investment data services provider MSCI, Inc. and manufacturer of insulin delivery systems Insulet Corp. |
| • | The information technology sector was the area of largest detraction for the Fund, relative to the benchmark, during the period, due to a combination of security selection and allocation. |
| • | Security selection within the communication services and consumer staples sectors also weighed on relative results. |
| • | Holdings that detracted most from performance, relative to the benchmark, included online dating app provider Match Group, Inc., orthodontic products manufacturer Align Technology, Inc., cloud-based cybersecurity provider Crowdstrike Holdings, Inc., medical devices company Edwards Lifesciences Corp. and cloud-based communications company RingCentral, Inc. The Fund’s holdings in Align Technology and RingCentral were sold during the period. |
| Columbia Select Large Cap Growth Fund | Annual Report 2023 | 5 |
(Unaudited)
| 6 | Columbia Select Large Cap Growth Fund | Annual Report 2023 |
(Unaudited)
| October 1, 2022 — March 31, 2023 | |||||||
| Account value at the beginning of the period ($) | Account value at the end of the period ($) | Expenses paid during the period ($) | Fund’s annualized expense ratio (%) | ||||
| Actual | Hypothetical | Actual | Hypothetical | Actual | Hypothetical | Actual | |
| Class A | 1,000.00 | 1,000.00 | 1,229.80 | 1,019.70 | 5.84 | 5.29 | 1.05 |
| Advisor Class | 1,000.00 | 1,000.00 | 1,231.00 | 1,020.94 | 4.45 | 4.03 | 0.80 |
| Class C | 1,000.00 | 1,000.00 | 1,224.90 | 1,015.96 | 9.98 | 9.05 | 1.80 |
| Institutional Class | 1,000.00 | 1,000.00 | 1,232.20 | 1,020.94 | 4.45 | 4.03 | 0.80 |
| Institutional 2 Class | 1,000.00 | 1,000.00 | 1,232.70 | 1,021.39 | 3.95 | 3.58 | 0.71 |
| Institutional 3 Class | 1,000.00 | 1,000.00 | 1,231.40 | 1,021.64 | 3.67 | 3.33 | 0.66 |
| Class R | 1,000.00 | 1,000.00 | 1,228.00 | 1,018.45 | 7.22 | 6.54 | 1.30 |
| Columbia Select Large Cap Growth Fund | Annual Report 2023 | 7 |
March 31, 2023
| Common Stocks 99.5% | ||
| Issuer | Shares | Value ($) |
| Communication Services 1.8% | ||
| Interactive Media & Services 1.8% | ||
| Match Group, Inc.(a) | 513,910 | 19,729,005 |
| Total Communication Services | 19,729,005 | |
| Consumer Discretionary 18.0% | ||
| Auto Components 1.4% | ||
| Aptiv PLC(a) | 143,490 | 16,098,143 |
| Broadline Retail 4.0% | ||
| Amazon.com, Inc.(a) | 431,078 | 44,526,047 |
| Hotels, Restaurants & Leisure 6.5% | ||
| Booking Holdings, Inc.(a) | 14,336 | 38,024,950 |
| Chipotle Mexican Grill, Inc.(a) | 19,981 | 34,133,342 |
| Total | 72,158,292 | |
| Textiles, Apparel & Luxury Goods 6.1% | ||
| lululemon athletica, Inc.(a) | 65,499 | 23,854,081 |
| NIKE, Inc., Class B | 362,713 | 44,483,122 |
| Total | 68,337,203 | |
| Total Consumer Discretionary | 201,119,685 | |
| Consumer Staples 7.3% | ||
| Consumer Staples Distribution & Retail 3.5% | ||
| Costco Wholesale Corp. | 80,154 | 39,826,118 |
| Personal Care Products 3.8% | ||
| Estee Lauder Companies, Inc. (The), Class A | 170,964 | 42,135,787 |
| Total Consumer Staples | 81,961,905 | |
| Financials 8.0% | ||
| Capital Markets 3.8% | ||
| MSCI, Inc. | 77,005 | 43,098,928 |
| Financial Services 4.2% | ||
| Visa, Inc., Class A | 206,312 | 46,515,104 |
| Total Financials | 89,614,032 | |
| Common Stocks (continued) | ||
| Issuer | Shares | Value ($) |
| Health Care 24.6% | ||
| Biotechnology 7.5% | ||
| BioMarin Pharmaceutical, Inc.(a) | 393,292 | 38,243,714 |
| Exact Sciences Corp.(a) | 452,363 | 30,674,735 |
| Sarepta Therapeutics, Inc.(a) | 112,025 | 15,440,406 |
| Total | 84,358,855 | |
| Health Care Equipment & Supplies 11.1% | ||
| Edwards Lifesciences Corp.(a) | 458,847 | 37,960,412 |
| Insulet Corp.(a) | 141,916 | 45,265,527 |
| Intuitive Surgical, Inc.(a) | 161,286 | 41,203,735 |
| Total | 124,429,674 | |
| Life Sciences Tools & Services 2.5% | ||
| Illumina, Inc.(a) | 119,183 | 27,716,007 |
| Pharmaceuticals 3.5% | ||
| Eli Lilly & Co. | 114,432 | 39,298,237 |
| Total Health Care | 275,802,773 | |
| Industrials 9.9% | ||
| Building Products 2.6% | ||
| Trane Technologies PLC | 157,259 | 28,932,511 |
| Construction & Engineering 2.6% | ||
| Quanta Services, Inc. | 176,282 | 29,375,632 |
| Electrical Equipment 1.2% | ||
| Bloom Energy Corp., Class A(a) | 707,984 | 14,110,121 |
| Professional Services 3.5% | ||
| CoStar Group, Inc.(a) | 566,406 | 38,997,053 |
| Total Industrials | 111,415,317 | |
| Information Technology 29.9% | ||
| Semiconductors & Semiconductor Equipment 6.9% | ||
| Advanced Micro Devices, Inc.(a) | 200,150 | 19,616,701 |
| Applied Materials, Inc. | 51,408 | 6,314,445 |
| NVIDIA Corp. | 185,065 | 51,405,505 |
| Total | 77,336,651 | |
| 8 | Columbia Select Large Cap Growth Fund | Annual Report 2023 |
March 31, 2023
| Common Stocks (continued) | ||
| Issuer | Shares | Value ($) |
| Software 23.0% | ||
| Adobe, Inc.(a) | 118,585 | 45,699,102 |
| Crowdstrike Holdings, Inc., Class A(a) | 197,777 | 27,146,871 |
| Intuit, Inc. | 107,587 | 47,965,512 |
| Microsoft Corp. | 170,371 | 49,117,960 |
| Palo Alto Networks, Inc.(a) | 194,126 | 38,774,727 |
| ServiceNow, Inc.(a) | 105,099 | 48,841,607 |
| Total | 257,545,779 | |
| Total Information Technology | 334,882,430 | |
| Total Common Stocks (Cost $642,924,108) | 1,114,525,147 | |
| Money Market Funds 0.6% | ||
| Shares | Value ($) | |
| Columbia Short-Term Cash Fund, 4.983%(b),(c) | 6,435,192 | 6,433,905 |
| Total Money Market Funds (Cost $6,432,841) | 6,433,905 | |
| Total Investments in Securities (Cost: $649,356,949) | 1,120,959,052 | |
| Other Assets & Liabilities, Net | (806,823) | |
| Net Assets | 1,120,152,229 | |
| (a) | Non-income producing investment. |
| (b) | The rate shown is the seven-day current annualized yield at March 31, 2023. |
| (c) | As defined in the Investment Company Act of 1940, as amended, an affiliated company is one in which the Fund owns 5% or more of the company’s outstanding voting securities, or a company which is under common ownership or control with the Fund. The value of the holdings and transactions in these affiliated companies during the year ended March 31, 2023 are as follows: |
| Affiliated issuers | Beginning of period($) | Purchases($) | Sales($) | Net change in unrealized appreciation (depreciation)($) | End of period($) | Realized gain (loss)($) | Dividends($) | End of period shares |
| Columbia Short-Term Cash Fund, 4.983% | ||||||||
| 6,975,429 | 375,685,873 | (376,228,455) | 1,058 | 6,433,905 | (726) | 288,708 | 6,435,192 | |
| ■ | Level 1 — Valuations based on quoted prices for investments in active markets that the Fund has the ability to access at the measurement date. Valuation adjustments are not applied to Level 1 investments. |
| ■ | Level 2 — Valuations based on other significant observable inputs (including quoted prices for similar securities, interest rates, prepayment speeds, credit risks, etc.). |
| ■ | Level 3 — Valuations based on significant unobservable inputs (including the Fund’s own assumptions and judgment in determining the fair value of investments). |
| Columbia Select Large Cap Growth Fund | Annual Report 2023 | 9 |
March 31, 2023
The Fund’s Board of Trustees (the Board) has designated the Investment Manager, through its Valuation Committee (the Committee), as valuation designee, responsible for determining the fair value of the assets of the Fund for which market quotations are not readily available using valuation procedures approved by the Board. The Committee consists of voting and non-voting members from various groups within the Investment Manager’s organization, including operations and accounting, trading and investments, compliance, risk management and legal.
| Level 1 ($) | Level 2 ($) | Level 3 ($) | Total ($) | |
| Investments in Securities | ||||
| Common Stocks | ||||
| Communication Services | 19,729,005 | — | — | 19,729,005 |
| Consumer Discretionary | 201,119,685 | — | — | 201,119,685 |
| Consumer Staples | 81,961,905 | — | — | 81,961,905 |
| Financials | 89,614,032 | — | — | 89,614,032 |
| Health Care | 275,802,773 | — | — | 275,802,773 |
| Industrials | 111,415,317 | — | — | 111,415,317 |
| Information Technology | 334,882,430 | — | — | 334,882,430 |
| Total Common Stocks | 1,114,525,147 | — | — | 1,114,525,147 |
| Money Market Funds | 6,433,905 | — | — | 6,433,905 |
| Total Investments in Securities | 1,120,959,052 | — | — | 1,120,959,052 |
| 10 | Columbia Select Large Cap Growth Fund | Annual Report 2023 |
March 31, 2023
| Assets | |
| Investments in securities, at value | |
| Unaffiliated issuers (cost $642,924,108) | $1,114,525,147 |
| Affiliated issuers (cost $6,432,841) | 6,433,905 |
| Cash | 6,842 |
| Receivable for: | |
| Capital shares sold | 647,482 |
| Dividends | 164,615 |
| Expense reimbursement due from Investment Manager | 3,916 |
| Prepaid expenses | 15,364 |
| Trustees’ deferred compensation plan | 411,223 |
| Total assets | 1,122,208,494 |
| Liabilities | |
| Payable for: | |
| Capital shares purchased | 1,388,187 |
| Management services fees | 22,297 |
| Distribution and/or service fees | 1,732 |
| Transfer agent fees | 145,187 |
| Compensation of board members | 31,000 |
| Other expenses | 56,639 |
| Trustees’ deferred compensation plan | 411,223 |
| Total liabilities | 2,056,265 |
| Net assets applicable to outstanding capital stock | $1,120,152,229 |
| Represented by | |
| Paid in capital | 599,872,255 |
| Total distributable earnings (loss) | 520,279,974 |
| Total - representing net assets applicable to outstanding capital stock | $1,120,152,229 |
| Columbia Select Large Cap Growth Fund | Annual Report 2023 | 11 |
March 31, 2023
| Class A | |
| Net assets | $158,840,588 |
| Shares outstanding | 22,143,416 |
| Net asset value per share | $7.17 |
| Maximum sales charge | 5.75% |
| Maximum offering price per share (calculated by dividing the net asset value per share by 1.0 minus the maximum sales charge for Class A shares) | $7.61 |
| Advisor Class | |
| Net assets | $9,550,326 |
| Shares outstanding | 1,073,200 |
| Net asset value per share | $8.90 |
| Class C | |
| Net assets | $20,478,444 |
| Shares outstanding | 4,945,320 |
| Net asset value per share | $4.14 |
| Institutional Class | |
| Net assets | $680,663,194 |
| Shares outstanding | 83,829,003 |
| Net asset value per share | $8.12 |
| Institutional 2 Class | |
| Net assets | $88,679,957 |
| Shares outstanding | 9,737,980 |
| Net asset value per share | $9.11 |
| Institutional 3 Class | |
| Net assets | $154,171,055 |
| Shares outstanding | 16,360,161 |
| Net asset value per share | $9.42 |
| Class R | |
| Net assets | $7,768,665 |
| Shares outstanding | 1,428,015 |
| Net asset value per share | $5.44 |
| 12 | Columbia Select Large Cap Growth Fund | Annual Report 2023 |
Year Ended March 31, 2023
| Net investment income | |
| Income: | |
| Dividends — unaffiliated issuers | $4,074,286 |
| Dividends — affiliated issuers | 288,708 |
| Interfund lending | 145 |
| Total income | 4,363,139 |
| Expenses: | |
| Management services fees | 8,865,863 |
| Distribution and/or service fees | |
| Class A | 388,172 |
| Class C | 237,792 |
| Class R | 36,214 |
| Transfer agent fees | |
| Class A | 252,840 |
| Advisor Class | 20,797 |
| Class C | 38,639 |
| Institutional Class | 1,104,080 |
| Institutional 2 Class | 76,263 |
| Institutional 3 Class | 15,073 |
| Class R | 11,809 |
| Compensation of board members | 33,257 |
| Custodian fees | 8,120 |
| Printing and postage fees | 99,842 |
| Registration fees | 130,484 |
| Accounting services fees | 30,090 |
| Legal fees | 29,947 |
| Interest on interfund lending | 234 |
| Compensation of chief compliance officer | 206 |
| Other | 31,700 |
| Total expenses | 11,411,422 |
| Fees waived or expenses reimbursed by Investment Manager and its affiliates | (1,359,968) |
| Fees waived by transfer agent | |
| Institutional 2 Class | (3,580) |
| Institutional 3 Class | (5,838) |
| Expense reduction | (660) |
| Total net expenses | 10,041,376 |
| Net investment loss | (5,678,237) |
| Realized and unrealized gain (loss) — net | |
| Net realized gain (loss) on: | |
| Investments — unaffiliated issuers | 53,109,562 |
| Investments — affiliated issuers | (726) |
| Net realized gain | 53,108,836 |
| Net change in unrealized appreciation (depreciation) on: | |
| Investments — unaffiliated issuers | (246,446,103) |
| Investments — affiliated issuers | 1,058 |
| Net change in unrealized appreciation (depreciation) | (246,445,045) |
| Net realized and unrealized loss | (193,336,209) |
| Net decrease in net assets resulting from operations | $(199,014,446) |
| Columbia Select Large Cap Growth Fund | Annual Report 2023 | 13 |
| Year Ended March 31, 2023 | Year Ended March 31, 2022 | |
| Operations | ||
| Net investment loss | $(5,678,237) | $(11,986,440) |
| Net realized gain | 53,108,836 | 391,699,775 |
| Net change in unrealized appreciation (depreciation) | (246,445,045) | (406,069,309) |
| Net decrease in net assets resulting from operations | (199,014,446) | (26,355,974) |
| Distributions to shareholders | ||
| Net investment income and net realized gains | ||
| Class A | (20,833,919) | (78,918,906) |
| Advisor Class | (1,533,659) | (5,028,694) |
| Class C | (5,334,510) | (22,203,505) |
| Institutional Class | (81,719,629) | (296,318,314) |
| Institutional 2 Class | (18,375,074) | (60,103,958) |
| Institutional 3 Class | (25,431,479) | (142,927,250) |
| Class R | (1,188,225) | (4,419,902) |
| Total distributions to shareholders | (154,416,495) | (609,920,529) |
| Increase (decrease) in net assets from capital stock activity | (208,345,130) | 196,206,640 |
| Total decrease in net assets | (561,776,071) | (440,069,863) |
| Net assets at beginning of year | 1,681,928,300 | 2,121,998,163 |
| Net assets at end of year | $1,120,152,229 | $1,681,928,300 |
| 14 | Columbia Select Large Cap Growth Fund | Annual Report 2023 |
| Year Ended | Year Ended | |||
| March 31, 2023 | March 31, 2022 | |||
| Shares | Dollars ($) | Shares | Dollars ($) | |
| Capital stock activity | ||||
| Class A | ||||
| Subscriptions | 3,357,425 | 22,303,218 | 4,408,568 | 53,070,071 |
| Distributions reinvested | 3,117,950 | 18,052,933 | 5,903,906 | 68,734,746 |
| Redemptions | (5,674,645) | (38,655,560) | (6,974,948) | (81,960,563) |
| Net increase | 800,730 | 1,700,591 | 3,337,526 | 39,844,254 |
| Advisor Class | ||||
| Subscriptions | 299,458 | 2,437,018 | 810,379 | 10,528,998 |
| Distributions reinvested | 195,174 | 1,399,397 | 332,848 | 4,605,905 |
| Redemptions | (945,901) | (7,883,136) | (819,183) | (11,819,817) |
| Net increase (decrease) | (451,269) | (4,046,721) | 324,044 | 3,315,086 |
| Class C | ||||
| Subscriptions | 772,782 | 3,029,175 | 631,043 | 5,136,991 |
| Distributions reinvested | 1,551,314 | 5,212,415 | 2,772,252 | 21,681,443 |
| Redemptions | (3,146,181) | (12,763,486) | (3,566,921) | (29,913,884) |
| Net decrease | (822,085) | (4,521,896) | (163,626) | (3,095,450) |
| Institutional Class | ||||
| Subscriptions | 24,459,307 | 183,304,188 | 19,023,932 | 235,113,589 |
| Distributions reinvested | 11,390,689 | 74,495,107 | 20,576,626 | 263,755,395 |
| Redemptions | (36,797,775) | (280,958,674) | (23,407,683) | (306,619,566) |
| Net increase (decrease) | (947,779) | (23,159,379) | 16,192,875 | 192,249,418 |
| Institutional 2 Class | ||||
| Subscriptions | 3,026,069 | 26,540,782 | 2,997,315 | 39,457,069 |
| Distributions reinvested | 2,505,349 | 18,364,209 | 4,271,244 | 60,086,113 |
| Redemptions | (13,095,935) | (111,098,657) | (3,273,010) | (46,922,281) |
| Net increase (decrease) | (7,564,517) | (66,193,666) | 3,995,549 | 52,620,901 |
| Institutional 3 Class | ||||
| Subscriptions | 2,367,315 | 20,786,761 | 2,758,862 | 39,965,558 |
| Distributions reinvested | 895,294 | 6,786,325 | 1,870,089 | 27,028,771 |
| Redemptions | (15,932,180) | (140,729,914) | (11,226,988) | (157,002,278) |
| Net decrease | (12,669,571) | (113,156,828) | (6,598,037) | (90,007,949) |
| Class R | ||||
| Subscriptions | 188,326 | 975,719 | 113,760 | 1,059,632 |
| Distributions reinvested | 270,051 | 1,188,224 | 467,350 | 4,419,902 |
| Redemptions | (213,969) | (1,131,174) | (443,850) | (4,199,154) |
| Net increase | 244,408 | 1,032,769 | 137,260 | 1,280,380 |
| Total net increase (decrease) | (21,410,083) | (208,345,130) | 17,225,591 | 196,206,640 |
| Columbia Select Large Cap Growth Fund | Annual Report 2023 | 15 |
| Net asset value, beginning of period | Net investment income (loss) | Net realized and unrealized gain (loss) | Total from investment operations | Distributions from net realized gains | Total distributions to shareholders | |
| Class A | ||||||
| Year Ended 3/31/2023 | $9.36 | (0.05) | (1.13) | (1.18) | (1.01) | (1.01) |
| Year Ended 3/31/2022 | $13.58 | (0.10) | 0.11(e) | 0.01 | (4.23) | (4.23) |
| Year Ended 3/31/2021 | $10.37 | (0.09) | 6.94 | 6.85 | (3.64) | (3.64) |
| Year Ended 3/31/2020 | $15.01 | (0.09) | (0.20) | (0.29) | (4.35) | (4.35) |
| Year Ended 3/31/2019 | $16.93 | (0.11) | 1.34 | 1.23 | (3.15) | (3.15) |
| Advisor Class | ||||||
| Year Ended 3/31/2023 | $11.25 | (0.04) | (1.30) | (1.34) | (1.01) | (1.01) |
| Year Ended 3/31/2022 | $15.53 | (0.08) | 0.04(e) | (0.04) | (4.24) | (4.24) |
| Year Ended 3/31/2021 | $11.50 | (0.06) | 7.76 | 7.70 | (3.67) | (3.67) |
| Year Ended 3/31/2020 | $16.16 | (0.07) | (0.24) | (0.31) | (4.35) | (4.35) |
| Year Ended 3/31/2019 | $17.96 | (0.07) | 1.43 | 1.36 | (3.16) | (3.16) |
| Class C | ||||||
| Year Ended 3/31/2023 | $6.03 | (0.06) | (0.82) | (0.88) | (1.01) | (1.01) |
| Year Ended 3/31/2022 | $10.15 | (0.13) | 0.21(e) | 0.08 | (4.20) | (4.20) |
| Year Ended 3/31/2021 | $8.37 | (0.15) | 5.52 | 5.37 | (3.59) | (3.59) |
| Year Ended 3/31/2020 | $13.00 | (0.16) | (0.12) | (0.28) | (4.35) | (4.35) |
| Year Ended 3/31/2019 | $15.16 | (0.20) | 1.16 | 0.96 | (3.12) | (3.12) |
| Institutional Class | ||||||
| Year Ended 3/31/2023 | $10.38 | (0.03) | (1.22) | (1.25) | (1.01) | (1.01) |
| Year Ended 3/31/2022 | $14.63 | (0.07) | 0.06(e) | (0.01) | (4.24) | (4.24) |
| Year Ended 3/31/2021 | $10.97 | (0.06) | 7.39 | 7.33 | (3.67) | (3.67) |
| Year Ended 3/31/2020 | $15.61 | (0.06) | (0.23) | (0.29) | (4.35) | (4.35) |
| Year Ended 3/31/2019 | $17.45 | (0.07) | 1.39 | 1.32 | (3.16) | (3.16) |
| Institutional 2 Class | ||||||
| Year Ended 3/31/2023 | $11.47 | (0.03) | (1.32) | (1.35) | (1.01) | (1.01) |
| Year Ended 3/31/2022 | $15.75 | (0.07) | 0.04(e) | (0.03) | (4.25) | (4.25) |
| Year Ended 3/31/2021 | $11.62 | (0.04) | 7.85 | 7.81 | (3.68) | (3.68) |
| Year Ended 3/31/2020 | $16.27 | (0.05) | (0.25) | (0.30) | (4.35) | (4.35) |
| Year Ended 3/31/2019 | $18.05 | (0.06) | 1.45 | 1.39 | (3.17) | (3.17) |
| 16 | Columbia Select Large Cap Growth Fund | Annual Report 2023 |
| Net asset value, end of period | Total return | Total gross expense ratio to average net assets(a) | Total net expense ratio to average net assets(a),(b) | Net investment income (loss) ratio to average net assets | Portfolio turnover | Net assets, end of period (000’s) | |
| Class A | |||||||
| Year Ended 3/31/2023 | $7.17 | (10.01%) | 1.18%(c) | 1.06%(c),(d) | (0.69%) | 26% | $158,841 |
| Year Ended 3/31/2022 | $9.36 | (3.91%) | 1.10% | 1.06%(d) | (0.82%) | 32% | $199,667 |
| Year Ended 3/31/2021 | $13.58 | 70.22% | 1.11%(c) | 1.07%(c),(d) | (0.63%) | 31% | $244,546 |
| Year Ended 3/31/2020 | $10.37 | (4.31%) | 1.12%(c) | 1.12%(c),(d) | (0.71%) | 22% | $151,807 |
| Year Ended 3/31/2019 | $15.01 | 8.79% | 1.07%(c) | 1.07%(c),(d) | (0.67%) | 27% | $220,858 |
| Advisor Class | |||||||
| Year Ended 3/31/2023 | $8.90 | (9.72%) | 0.92%(c) | 0.81%(c),(d) | (0.45%) | 26% | $9,550 |
| Year Ended 3/31/2022 | $11.25 | (3.73%) | 0.85% | 0.81%(d) | (0.56%) | 32% | $17,145 |
| Year Ended 3/31/2021 | $15.53 | 70.74% | 0.86%(c) | 0.83%(c),(d) | (0.39%) | 31% | $18,638 |
| Year Ended 3/31/2020 | $11.50 | (4.10%) | 0.87%(c) | 0.87%(c),(d) | (0.46%) | 22% | $19,707 |
| Year Ended 3/31/2019 | $16.16 | 9.04% | 0.82%(c) | 0.82%(c),(d) | (0.42%) | 27% | $33,403 |
| Class C | |||||||
| Year Ended 3/31/2023 | $4.14 | (10.67%) | 1.92%(c) | 1.81%(c),(d) | (1.45%) | 26% | $20,478 |
| Year Ended 3/31/2022 | $6.03 | (4.66%) | 1.85% | 1.81%(d) | (1.56%) | 32% | $34,758 |
| Year Ended 3/31/2021 | $10.15 | 69.06% | 1.86%(c) | 1.83%(c),(d) | (1.39%) | 31% | $60,193 |
| Year Ended 3/31/2020 | $8.37 | (5.04%) | 1.88%(c) | 1.88%(c),(d) | (1.46%) | 22% | $55,584 |
| Year Ended 3/31/2019 | $13.00 | 7.93% | 1.83%(c) | 1.83%(c),(d) | (1.42%) | 27% | $90,268 |
| Institutional Class | |||||||
| Year Ended 3/31/2023 | $8.12 | (9.67%) | 0.93%(c) | 0.81%(c),(d) | (0.45%) | 26% | $680,663 |
| Year Ended 3/31/2022 | $10.38 | (3.77%) | 0.85% | 0.81%(d) | (0.56%) | 32% | $880,232 |
| Year Ended 3/31/2021 | $14.63 | 70.79% | 0.86%(c) | 0.83%(c),(d) | (0.39%) | 31% | $1,003,322 |
| Year Ended 3/31/2020 | $10.97 | (4.12%) | 0.87%(c) | 0.87%(c),(d) | (0.46%) | 22% | $744,099 |
| Year Ended 3/31/2019 | $15.61 | 9.08% | 0.83%(c) | 0.83%(c),(d) | (0.42%) | 27% | $1,311,174 |
| Institutional 2 Class | |||||||
| Year Ended 3/31/2023 | $9.11 | (9.61%) | 0.81%(c) | 0.72%(c) | (0.36%) | 26% | $88,680 |
| Year Ended 3/31/2022 | $11.47 | (3.65%) | 0.77% | 0.72% | (0.48%) | 32% | $198,407 |
| Year Ended 3/31/2021 | $15.75 | 71.00% | 0.77%(c) | 0.73%(c) | (0.29%) | 31% | $209,540 |
| Year Ended 3/31/2020 | $11.62 | (4.00%) | 0.77%(c) | 0.75%(c) | (0.34%) | 22% | $144,651 |
| Year Ended 3/31/2019 | $16.27 | 9.14% | 0.73%(c) | 0.72%(c) | (0.32%) | 27% | $166,669 |
| Columbia Select Large Cap Growth Fund | Annual Report 2023 | 17 |
| Net asset value, beginning of period | Net investment income (loss) | Net realized and unrealized gain (loss) | Total from investment operations | Distributions from net realized gains | Total distributions to shareholders | |
| Institutional 3 Class | ||||||
| Year Ended 3/31/2023 | $11.81 | (0.03) | (1.35) | (1.38) | (1.01) | (1.01) |
| Year Ended 3/31/2022 | $16.10 | (0.06) | 0.02(e) | (0.04) | (4.25) | (4.25) |
| Year Ended 3/31/2021 | $11.83 | (0.04) | 8.00 | 7.96 | (3.69) | (3.69) |
| Year Ended 3/31/2020 | $16.48 | (0.04) | (0.26) | (0.30) | (4.35) | (4.35) |
| Year Ended 3/31/2019 | $18.23 | (0.05) | 1.47 | 1.42 | (3.17) | (3.17) |
| Class R | ||||||
| Year Ended 3/31/2023 | $7.45 | (0.05) | (0.95) | (1.00) | (1.01) | (1.01) |
| Year Ended 3/31/2022 | $11.61 | (0.11) | 0.17(e) | 0.06 | (4.22) | (4.22) |
| Year Ended 3/31/2021 | $9.21 | (0.10) | 6.12 | 6.02 | (3.62) | (3.62) |
| Year Ended 3/31/2020 | $13.83 | (0.11) | (0.16) | (0.27) | (4.35) | (4.35) |
| Year Ended 3/31/2019 | $15.87 | (0.14) | 1.24 | 1.10 | (3.14) | (3.14) |
| Notes to Financial Highlights | |
| (a) | In addition to the fees and expenses that the Fund bears directly, the Fund indirectly bears a pro rata share of the fees and expenses of any other funds in which it invests. Such indirect expenses are not included in the Fund’s reported expense ratios. |
| (b) | Total net expenses include the impact of certain fee waivers/expense reimbursements made by the Investment Manager and certain of its affiliates, if applicable. |
| (c) | Ratios include interfund lending expense which is less than 0.01%. |
| (d) | The benefits derived from expense reductions had an impact of less than 0.01%. |
| (e) | Calculation of the net gain (loss) per share (both realized and unrealized) does not correlate to the aggregate realized and unrealized gain (loss) presented in the Statement of Operations due to the timing of subscriptions and redemptions of Fund shares in relation to fluctuations in the market value of the portfolio. |
| 18 | Columbia Select Large Cap Growth Fund | Annual Report 2023 |
| Net asset value, end of period | Total return | Total gross expense ratio to average net assets(a) | Total net expense ratio to average net assets(a),(b) | Net investment income (loss) ratio to average net assets | Portfolio turnover | Net assets, end of period (000’s) | |
| Institutional 3 Class | |||||||
| Year Ended 3/31/2023 | $9.42 | (9.59%) | 0.77%(c) | 0.67%(c) | (0.31%) | 26% | $154,171 |
| Year Ended 3/31/2022 | $11.81 | (3.63%) | 0.72% | 0.67% | (0.43%) | 32% | $342,904 |
| Year Ended 3/31/2021 | $16.10 | 70.96% | 0.72%(c) | 0.69%(c) | (0.24%) | 31% | $573,613 |
| Year Ended 3/31/2020 | $11.83 | (3.93%) | 0.72%(c) | 0.71%(c) | (0.30%) | 22% | $550,287 |
| Year Ended 3/31/2019 | $16.48 | 9.24% | 0.69%(c) | 0.68%(c) | (0.27%) | 27% | $835,068 |
| Class R | |||||||
| Year Ended 3/31/2023 | $5.44 | (10.19%) | 1.43%(c) | 1.31%(c),(d) | (0.94%) | 26% | $7,769 |
| Year Ended 3/31/2022 | $7.45 | (4.20%) | 1.35% | 1.31%(d) | (1.06%) | 32% | $8,814 |
| Year Ended 3/31/2021 | $11.61 | 69.94% | 1.36%(c) | 1.32%(c),(d) | (0.88%) | 31% | $12,146 |
| Year Ended 3/31/2020 | $9.21 | (4.59%) | 1.38%(c) | 1.38%(c),(d) | (0.97%) | 22% | $8,892 |
| Year Ended 3/31/2019 | $13.83 | 8.53% | 1.33%(c) | 1.33%(c),(d) | (0.92%) | 27% | $9,830 |
| Columbia Select Large Cap Growth Fund | Annual Report 2023 | 19 |
March 31, 2023
| 20 | Columbia Select Large Cap Growth Fund | Annual Report 2023 |
March 31, 2023
| Columbia Select Large Cap Growth Fund | Annual Report 2023 | 21 |
March 31, 2023
| 22 | Columbia Select Large Cap Growth Fund | Annual Report 2023 |
March 31, 2023
| Effective rate (%) | |
| Class A | 0.16 |
| Advisor Class | 0.16 |
| Class C | 0.16 |
| Institutional Class | 0.16 |
| Institutional 2 Class | 0.05 |
| Institutional 3 Class | 0.00 |
| Class R | 0.16 |
| Columbia Select Large Cap Growth Fund | Annual Report 2023 | 23 |
March 31, 2023
| Front End (%) | CDSC (%) | Amount ($) | |
| Class A | 5.75 | 0.50 - 1.00(a) | 95,668 |
| Class C | — | 1.00(b) | 2,084 |
| (a) | This charge is imposed on certain investments of between $1 million and $50 million redeemed within 18 months after purchase, as follows: 1.00% if redeemed within 12 months after purchase, and 0.50% if redeemed more than 12, but less than 18, months after purchase, with certain limited exceptions. |
| (b) | This charge applies to redemptions within 12 months after purchase, with certain limited exceptions. |
| August 1, 2022 through July 31, 2023 | Prior to August 1, 2022 | |
| Class A | 1.05% | 1.07% |
| Advisor Class | 0.80 | 0.82 |
| Class C | 1.80 | 1.82 |
| Institutional Class | 0.80 | 0.82 |
| Institutional 2 Class | 0.71 | 0.73 |
| Institutional 3 Class | 0.66 | 0.68 |
| Class R | 1.30 | 1.32 |
| 24 | Columbia Select Large Cap Growth Fund | Annual Report 2023 |
March 31, 2023
| Excess of distributions over net investment income ($) | Accumulated net realized gain ($) | Paid in capital ($) |
| 6,976,712 | — | (6,976,712) |
| Year Ended March 31, 2023 | Year Ended March 31, 2022 | ||||
| Ordinary income ($) | Long-term capital gains ($) | Total ($) | Ordinary income ($) | Long-term capital gains ($) | Total ($) |
| — | 154,416,495 | 154,416,495 | 48,181,003 | 561,739,526 | 609,920,529 |
| Undistributed ordinary income ($) | Undistributed long-term capital gains ($) | Capital loss carryforwards ($) | Net unrealized appreciation ($) |
| — | 51,425,762 | — | 470,417,955 |
| Federal tax cost ($) | Gross unrealized appreciation ($) | Gross unrealized (depreciation) ($) | Net unrealized appreciation ($) |
| 650,541,097 | 475,476,110 | (5,058,155) | 470,417,955 |
| Late year ordinary losses ($) | Post-October capital losses ($) |
| 1,140,844 | — |
| Columbia Select Large Cap Growth Fund | Annual Report 2023 | 25 |
March 31, 2023
| Borrower or lender | Average loan balance ($) | Weighted average interest rate (%) | Number of days with outstanding loans |
| Borrower | 4,100,000 | 2.06 | 1 |
| Lender | 2,500,000 | 2.08 | 1 |
| 26 | Columbia Select Large Cap Growth Fund | Annual Report 2023 |
March 31, 2023
| Columbia Select Large Cap Growth Fund | Annual Report 2023 | 27 |
March 31, 2023
| 28 | Columbia Select Large Cap Growth Fund | Annual Report 2023 |
| Columbia Select Large Cap Growth Fund | Annual Report 2023 | 29 |
| Capital gain dividend | |
| $54,364,057 |
| Name, address, year of birth | Position held with the Columbia Funds and length of service | Principal occupation(s) during past five years and other relevant professional experience | Number of Funds in the Columbia Funds Complex* overseen | Other directorships held by Trustee during the past five years and other relevant Board experience |
| George S. Batejan c/o Columbia Management Investment Advisers, LLC 290 Congress Street Boston, MA 02210 1954 | Trustee since 2017 | Executive Vice President, Global Head of Technology and Operations, Janus Capital Group, Inc., 2010-2016 | 177 | Former Chairman of the Board, NICSA (National Investment Company Services Association) (Executive Committee, Nominating Committee and Governance Committee), 2014-2016; former Director, Intech Investment Management, 2011-2016; former Board Member, Metro Denver Chamber of Commerce, 2015-2016; former Advisory Board Member, University of Colorado Business School, 2015-2018; former Board Member, Chase Bank International, 1993-1994 |
| 30 | Columbia Select Large Cap Growth Fund | Annual Report 2023 |
(Unaudited)
Independent trustees (continued)
| Name, address, year of birth | Position held with the Columbia Funds and length of service | Principal occupation(s) during past five years and other relevant professional experience | Number of Funds in the Columbia Funds Complex* overseen | Other directorships held by Trustee during the past five years and other relevant Board experience |
| Kathleen Blatz c/o Columbia Management Investment Advisers, LLC 290 Congress Street Boston, MA 02210 1954 | Trustee since 2006 | Attorney, specializing in arbitration and mediation; Chief Justice, Minnesota Supreme Court, 1998-2006; Associate Justice, Minnesota Supreme Court, 1996-1998; Fourth Judicial District Court Judge, Hennepin County, 1994-1996; Attorney in private practice and public service, 1984-1993; State Representative, Minnesota House of Representatives, 1979-1993, which included service on the Tax and Financial Institutions and Insurance Committees; Member and Interim Chair, Minnesota Sports Facilities Authority, January-July 2017; Interim President and Chief Executive Officer, Blue Cross and Blue Shield of Minnesota (health care insurance), February-July 2018, April-October 2021 | 177 | Former Trustee, Blue Cross and Blue Shield of Minnesota, 2009-2021 (Chair of the Business Development Committee, 2014-2017; Chair of the Governance Committee, 2017-2019); former Member and Chair of the Board, Minnesota Sports Facilities Authority, January 2017-July 2017; former Director, Robina Foundation, 2009-2020 (Chair, 2014-2020); Director, Richard M. Schulze Family Foundation, since 2021 |
| Pamela G. Carlton c/o Columbia Management Investment Advisers, LLC 290 Congress Street Boston, MA 02210 1954 | Chair since 2023; Trustee since 2007 | President, Springboard — Partners in Cross Cultural Leadership (consulting company), since 2003; Managing Director of US Equity Research, JP Morgan Chase, 1999-2003; Director of US Equity Research, Chase Asset Management, 1996-1999; Co-Director Latin America Research, 1993-1996, COO Global Research, 1992-1996, Co-Director of US Research, 1991-1992, Investment Banker, 1982-1991, Morgan Stanley; Attorney, Cleary Gottlieb Steen & Hamilton LLP, 1980-1982 | 177 | Trustee, New York Presbyterian Hospital Board, since 1996; Director, DR Bank (Audit Committee) since 2017; Director, Evercore Inc. (Audit Committee, Nominating and Governance Committee), since 2019; Director, Apollo Commercial Real Estate Finance, Inc. (Chair, Nominating and Governance Committee) (financial services), since 2021; the Governing Council of the Independent Directors Council (IDC), since 2021 |
| Janet Langford Carrig c/o Columbia Management Investment Advisers, LLC 290 Congress Street Boston, MA 02210 1957 | Trustee since 1996 | Senior Vice President, General Counsel and Corporate Secretary, ConocoPhillips (independent energy company), September 2007-October 2018 | 175 | Director, EQT Corporation (natural gas producer), since 2019; former Director, Whiting Petroleum Corporation (independent oil and gas company), 2020-2022 |
| J. Kevin Connaughton c/o Columbia Management Investment Advisers, LLC 290 Congress Street Boston, MA 02210 1964 | Trustee since 2020 | CEO and President, RhodeWay Financial (non-profit financial planning firm), since December 2022; Member, FINRA National Adjudicatory Council, since January 2020; Adjunct Professor of Finance, Bentley University since January 2018; Consultant to Independent Trustees of CFVIT and CFST I from March 2016 to June 2020 with respect to CFVIT and to December 2020 with respect to CFST I; Managing Director and General Manager of Mutual Fund Products, Columbia Management Investment Advisers, LLC, May 2010-February 2015; President, Columbia Funds, 2008-2015; and senior officer of Columbia Funds and affiliated funds, 2003-2015 | 175 | Former Director, The Autism Project, March 2015-December 2021; former Member of the Investment Committee, St. Michael’s College, November 2015-February 2020; former Trustee, St. Michael’s College, June 2017-September 2019; former Trustee, New Century Portfolios (former mutual fund complex), January 2015-December 2017 |
| Columbia Select Large Cap Growth Fund | Annual Report 2023 | 31 |
(Unaudited)
Independent trustees (continued)
| Name, address, year of birth | Position held with the Columbia Funds and length of service | Principal occupation(s) during past five years and other relevant professional experience | Number of Funds in the Columbia Funds Complex* overseen | Other directorships held by Trustee during the past five years and other relevant Board experience |
| Olive M. Darragh c/o Columbia Management Investment Advisers, LLC 290 Congress Street Boston, MA 02210 1962 | Trustee since 2020 | Managing Director of Darragh Inc. (strategy and talent management consulting firm), since 2010; Founder and CEO, Zolio, Inc. (investment management talent identification platform), since 2004; Consultant to Independent Trustees of CFVIT and CFST I from June 2019 to June 2020 with respect to CFVIT and to December 2020 with respect to CFST I; Partner, Tudor Investments, 2004-2010; Senior Partner, McKinsey & Company (consulting), 1990-2004; Touche Ross CPA, 1985-1988 | 175 | Treasurer, Edinburgh University US Trust Board, since January 2023; Member, HBS Community Action Partners Board, since September 2022; former Director, University of Edinburgh Business School (Member of US Board), 2004-2019; former Director, Boston Public Library Foundation, 2008-2017 |
| Patricia M. Flynn c/o Columbia Management Investment Advisers, LLC 290 Congress Street Boston, MA 02210 1950 | Trustee since 2004 | Professor of Economics and Management, Bentley University, since 2002; Dean, McCallum Graduate School of Business, Bentley University, 1992-2002 | 177 | Former Trustee, MA Taxpayers Foundation, 1997-2022; former Director, The MA Business Roundtable, 2003-2019; former Chairperson, Innovation Index Advisory Committee, MA Technology Collaborative, 1997-2020 |
| Brian J. Gallagher c/o Columbia Management Investment Advisers, LLC 290 Congress Street Boston, MA 02210 1954 | Trustee since 2017 | Retired; Partner with Deloitte & Touche LLP and its predecessors, 1977-2016 | 177 | Trustee, Catholic Schools Foundation, since 2004 |
| Douglas A. Hacker c/o Columbia Management Investment Advisers, LLC 290 Congress Street Boston, MA 02210 1955 | Trustee since 1996 | Independent business executive, since May 2006; Executive Vice President – Strategy of United Airlines, December 2002 - May 2006; President of UAL Loyalty Services (airline marketing company), September 2001-December 2002; Executive Vice President and Chief Financial Officer of United Airlines, July 1999-September 2001 | 177 | Director, SpartanNash Company (Chair of the Board) (food distributor), since May 2021; Director, Aircastle Limited (Chair of Audit Committee) (aircraft leasing), since August 2006; former Director, Nash Finch Company (food distributor), 2005-2013; former Director, SeaCube Container Leasing Ltd. (container leasing), 2010-2013; and former Director, Travelport Worldwide Limited (travel information technology), 2014-2019 |
| Nancy T. Lukitsh c/o Columbia Management Investment Advisers, LLC 290 Congress Street Boston, MA 02210 1956 | Trustee since 2011 | Senior Vice President, Partner and Director of Marketing, Wellington Management Company, LLP (investment adviser), 1997-2010; Chair, Wellington Management Portfolios (commingled non-U.S. investment pools), 2007-2010; Director, Wellington Trust Company, NA and other Wellington affiliates, 1997-2010 | 175 | None |
| 32 | Columbia Select Large Cap Growth Fund | Annual Report 2023 |
(Unaudited)
Independent trustees (continued)
| Name, address, year of birth | Position held with the Columbia Funds and length of service | Principal occupation(s) during past five years and other relevant professional experience | Number of Funds in the Columbia Funds Complex* overseen | Other directorships held by Trustee during the past five years and other relevant Board experience |
| David M. Moffett c/o Columbia Management Investment Advisers, LLC 290 Congress Street Boston, MA 02210 1952 | Trustee since 2011 | Retired; former Chief Executive Officer of Freddie Mac and Chief Financial Officer of U.S. Bank | 175 | Director, CSX Corporation (transportation suppliers); Director, PayPal Holdings Inc. (payment and data processing services); Trustee, University of Oklahoma Foundation; former Director, eBay Inc. (online trading community), 2007-2015; and former Director, CIT Bank, CIT Group Inc. (commercial and consumer finance), 2010-2016; former Senior Adviser to The Carlyle Group (financial services), March 2008-September 2008; former Governance Consultant to Bridgewater Associates, January 2013-December 2015 |
| Catherine James Paglia c/o Columbia Management Investment Advisers, LLC 290 Congress Street Boston, MA 02210 1952 | Trustee since 2004 | Director, Enterprise Asset Management, Inc. (private real estate and asset management company), since September 1998; Managing Director and Partner, Interlaken Capital, Inc., 1989-1997; Vice President, 1982-1985, Principal, 1985-1987, Managing Director, 1987-1989, Morgan Stanley; Vice President, Investment Banking, 1980-1982, Associate, Investment Banking, 1976-1980, Dean Witter Reynolds, Inc. | 177 | Director, Valmont Industries, Inc. (irrigation systems manufacturer), since 2012; Trustee, Carleton College (on the Investment Committee), since 1987; Trustee, Carnegie Endowment for International Peace (on the Investment Committee), since 2009 |
| Natalie A. Trunow c/o Columbia Management Investment Advisers, LLC 290 Congress Street Boston, MA 02210 1967 | Trustee since 2020 | Chief Executive Officer, Millennial Portfolio Solutions LLC (asset management and consulting services), January 2016-January 2021; Non-executive Member of the Investment Committee and Valuation Committee, Sarona Asset Management Inc. (private equity firm) since September 2019; Advisor, Horizon Investments (asset management and consulting services), August 2018-January 2022; Advisor, Paradigm Asset Management, November 2016-January 2022; Consultant to Independent Trustees of CFVIT and CFST I from September 2016 to June 2020 with respect to CFVIT and to December 2020 with respect to CFST I; Director of Investments/Consultant, Casey Family Programs, April 2016-November 2016; Senior Vice President and Chief Investment Officer, Calvert Investments, August 2008-January 2016; Section Head and Portfolio Manager, General Motors Asset Management, June 1997-August 2008 | 175 | Independent Director, Investment Committee, Health Services for Children with Special Needs, Inc., 2010-2021; Independent Director, (Executive Committee and Chair, Audit Committee), Consumer Credit Counseling Services (formerly Guidewell Financial Solutions), since 2016; Independent Director, (Investment Committee), Sarona Asset Management, since 2019 |
| Columbia Select Large Cap Growth Fund | Annual Report 2023 | 33 |
(Unaudited)
Independent trustees (continued)
| Name, address, year of birth | Position held with the Columbia Funds and length of service | Principal occupation(s) during past five years and other relevant professional experience | Number of Funds in the Columbia Funds Complex* overseen | Other directorships held by Trustee during the past five years and other relevant Board experience |
| Sandra L. Yeager c/o Columbia Management Investment Advisers, LLC 290 Congress Street Boston, MA 02210 1964 | Trustee since 2017 | Retired; President and founder, Hanoverian Capital, LLC (SEC registered investment advisor firm), 2008-2016; Managing Director, DuPont Capital, 2006-2008; Managing Director, Morgan Stanley Investment Management, 2004-2006; Senior Vice President, Alliance Bernstein, 1990-2004 | 177 | Former Director, NAPE (National Alliance for Partnerships in Equity) Education Foundation, October 2016-October 2020; Advisory Board, Jennersville YMCA, since 2022 |
| Name, address, year of birth | Position held with the Columbia Funds and length of service | Principal occupation(s) during the past five years and other relevant professional experience | Number of Funds in the Columbia Funds Complex overseen | Other directorships held by Trustee during the past five years and other relevant Board experience |
| Daniel J. Beckman c/o Columbia Management Investment Advisers, LLC 290 Congress Street Boston, MA 02210 1962 | Trustee since November 2021 and President since June 2021 | Vice President – Head of North America Product, Columbia Management Investment Advisers, LLC, since April 2015; President and Principal Executive Officer of the Columbia Funds, since June 2021; officer of Columbia Funds and affiliated funds, 2020-2021 | 177 | Director, Ameriprise Trust Company, since October 2016; Director, Columbia Management Investment Distributors, Inc. since November 2018; Board of Governors, Columbia Wanger Asset Management, LLC since, January 2022; Director, Columbia Threadneedle Canada, Inc., since December 2022 |
| * | The term “Columbia Funds Complex” as used herein includes Columbia Seligman Premium Technology Growth Fund, Tri-Continental Corporation and each series of Columbia Funds Series Trust (CFST), Columbia Funds Series Trust I (CFST I), Columbia Funds Series Trust II (CFST II), Columbia ETF Trust I (CET I), Columbia ETF Trust II (CET II), Columbia Funds Variable Insurance Trust (CFVIT) and Columbia Funds Variable Series Trust II (CFVST II).Messrs. Batejan, Beckman, Gallagher and Hacker and Mses. Blatz, Carlton, Carrig, Flynn, Paglia and Yeager serve as Directors of Columbia Seligman Premium Technology Growth Fund and Tri-Continental Corporation. |
| ** | Interested person (as defined under the 1940 Act) by reason of being an officer, director, security holder and/or employee of the Investment Manager or Ameriprise Financial. |
| 34 | Columbia Select Large Cap Growth Fund | Annual Report 2023 |
(Unaudited)
The Board has appointed officers who are responsible for day-to-day business decisions based on policies it has established. The officers serve at the pleasure of the Board. The following table provides basic information about the Officers of the Fund as of the printing of this report, including principal occupations during the past five years, although their specific titles may have varied over the period. In addition to Mr. Beckman, who is President and Principal Executive Officer, the Fund’s other officers are:
| Name, address and year of birth | Position and year first appointed to position for any Fund in the Columbia Funds Complex or a predecessor thereof | Principal occupation(s) during past five years |
| Michael G. Clarke 290 Congress Street Boston, MA 02210 1969 | Chief Financial Officer and Principal Financial Officer (2009) and Senior Vice President (2019) | Senior Vice President and Head of Global Operations & Investor Services, Columbia Management Investment Advisers, LLC, since March 2022 (previously Vice President, Head of North American Operations, and Co-Head of Global Operations, June 2019 to February 2022 and Vice President – Accounting and Tax, May 2010 - May 2019); senior officer of Columbia Funds and affiliated funds, since 2002. |
| Joseph Beranek 5890 Ameriprise Financial Center Minneapolis, MN 55474 1965 | Treasurer and Chief Accounting Officer (Principal Accounting Officer) (2019) and Principal Financial Officer (2020), CFST, CFST I, CFST II, CFVIT and CFVST II; Assistant Treasurer, CET I and CET II | Vice President – Mutual Fund Accounting and Financial Reporting, Columbia Management Investment Advisers, LLC, since December 2018 and March 2017, respectively. |
| Marybeth Pilat 290 Congress Street Boston, MA 02210 1968 | Treasurer and Chief Accounting Officer (Principal Accounting Officer) and Principal Financial Officer (2020) for CET I and CET II; Assistant Treasurer, CFST, CFST I, CFST II, CFVIT and CFVST II | Vice President – Product Pricing and Administration, Columbia Management Investment Advisers, LLC, since May 2017. |
| William F. Truscott 290 Congress Street Boston, MA 02210 1960 | Senior Vice President (2001) | Formerly, Trustee/Director of Columbia Funds Complex or legacy funds, November 2001-January 1, 2021; Chief Executive Officer, Global Asset Management, Ameriprise Financial, Inc., since September 2012; Chairman of the Board and President, Columbia Management Investment Advisers, LLC, since July 2004 and February 2012, respectively; Chairman of the Board and Chief Executive Officer, Columbia Management Investment Distributors, Inc., since November 2008 and February 2012, respectively; Chairman of the Board and Director, Threadneedle Asset Management Holdings, Sàrl, since March 2013 and December 2008, respectively; senior executive of various entities affiliated with Columbia Threadneedle. |
| Christopher O. Petersen 5228 Ameriprise Financial Center Minneapolis, MN 55474 1970 | Senior Vice President and Assistant Secretary (2021) | Formerly, Trustee/Director of funds within the Columbia Funds Complex, July 1, 2020 - November 22, 2021; Senior Vice President and Assistant General Counsel, Ameriprise Financial, Inc., since September 2021 (previously Vice President and Lead Chief Counsel, January 2015 - September 2021); formerly, President and Principal Executive Officer of the Columbia Funds, 2015 - 2021; officer of Columbia Funds and affiliated funds, since 2007. |
| Thomas P. McGuire 290 Congress Street Boston, MA 02210 1972 | Senior Vice President and Chief Compliance Officer (2012) | Vice President – Asset Management Compliance, Ameriprise Financial, Inc., since May 2010; Chief Compliance Officer, Columbia Acorn/Wanger Funds, since December 2015; formerly, Chief Compliance Officer, Ameriprise Certificate Company, September 2010 – September 2020. |
| Ryan C. Larrenaga 290 Congress Street Boston, MA 02210 1970 | Senior Vice President (2017), Chief Legal Officer (2017), and Secretary (2015) | Vice President and Chief Counsel, Ameriprise Financial, Inc., since August 2018 (previously Vice President and Group Counsel, August 2011 - August 2018); Chief Legal Officer, Columbia Acorn/Wanger Funds, since September 2020; officer of Columbia Funds and affiliated funds, since 2005. |
| Columbia Select Large Cap Growth Fund | Annual Report 2023 | 35 |
(Unaudited)
Fund officers (continued)
| Name, address and year of birth | Position and year first appointed to position for any Fund in the Columbia Funds Complex or a predecessor thereof | Principal occupation(s) during past five years |
| Michael E. DeFao 290 Congress Street Boston, MA 02210 1968 | Vice President (2011) and Assistant Secretary (2010) | Vice President and Chief Counsel, Ameriprise Financial, Inc., since May 2010; Vice President, Chief Legal Officer and Assistant Secretary, Columbia Management Investment Advisers, LLC, since October 2021 (previously Vice President and Assistant Secretary, May 2010 – September 2021). |
| Lyn Kephart-Strong 5228 Ameriprise Financial Center Minneapolis, MN 55474 1960 | Vice President (2015) | Vice President, Global Investment Operations Services, Columbia Management Investment Advisers, LLC, since 2010; President, Columbia Management Investment Services Corp., since October 2014; President, Ameriprise Trust Company, since January 2017. |
| • | the Fund had sufficient liquidity to both meet redemptions and operate effectively on behalf of shareholders; |
| • | there were no material changes to the Program during the period; |
| • | the implementation of the Program was effective to manage the Fund’s liquidity risk; and |
| • | the Program operated adequately during the period. |
| 36 | Columbia Select Large Cap Growth Fund | Annual Report 2023 |
columbiathreadneedleus.com/investor/. The Fund is distributed by Columbia Management Investment Distributors, Inc., member FINRA, and managed by Columbia Management Investment Advisers, LLC.

March 31, 2023

| 3 | |
| 5 | |
| 9 | |
| 10 | |
| 16 | |
| 17 | |
| 18 | |
| 20 | |
| 22 | |
| 30 | |
| 31 | |
| 31 | |
| 37 |
(Unaudited)

| Average annual total returns (%) (for the period ended March 31, 2023) | ||||||
| Inception | 1 Year | 5 Years | 10 Years | |||
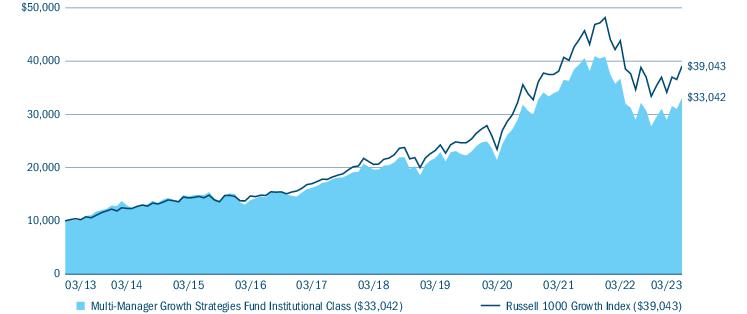
| Institutional Class* | 01/03/17 | -9.89 | 11.02 | 12.70 | ||
| Institutional 3 Class* | 12/18/19 | -9.78 | 11.09 | 12.73 | ||
| Russell 1000 Growth Index | -10.90 | 13.66 | 14.59 | |||
| * | The returns shown for periods prior to the share class inception date (including returns for the Life of the Fund, if shown, which are since Fund inception) include the returns of the Fund’s oldest share class. Returns shown for periods prior to the inception date of the Fund’s Institutional Class shares include the returns of the Fund’s Class A shares for the period from April 20, 2012 (the inception date of the Fund) through January 2, 2017. Returns shown for periods prior to the inception date of the Fund’s Institutional 3 Class shares include the returns of the Fund’s Class A shares for the period from April 20, 2012 through January 2, 2017 and the returns of the Institutional Class shares from January 3, 2017 through December 17, 2019. Class A shares were offered prior to the Fund’s Institutional Class shares but have since been merged into the Fund’s Institutional Class shares. These returns are adjusted to reflect any higher class-related operating expenses of the newer share classes, as applicable. Please visit columbiathreadneedleus.com/investor/investment-products/mutual-funds/appended-performance for more information. |
| Multi-Manager Growth Strategies Fund | Annual Report 2023 | 3 |
(Unaudited)
| Portfolio breakdown (%) (at March 31, 2023) | |
| Common Stocks | 98.8 |
| Money Market Funds | 1.2 |
| Total | 100.0 |
| Equity sector breakdown (%) (at March 31, 2023) | |
| Communication Services | 11.7 |
| Consumer Discretionary | 16.2 |
| Consumer Staples | 4.1 |
| Energy | 0.7 |
| Financials | 9.1 |
| Health Care | 12.1 |
| Industrials | 8.7 |
| Information Technology | 36.3 |
| Materials | 0.9 |
| Real Estate | 0.2 |
| Total | 100.0 |
| 4 | Multi-Manager Growth Strategies Fund | Annual Report 2023 |
(Unaudited)
| Multi-Manager Growth Strategies Fund | Annual Report 2023 | 5 |
(Unaudited)
| • | Stock selection contributed most to performance in our portion of the Fund, particularly within the communication services, industrials, health care, consumer staples, consumer discretionary, information technology and financials sectors. |
| • | Allocations to the health care, consumer discretionary and industrials sectors contributed positively to relative performance. |
| • | Individual holdings that contributed most to performance during the period included commercial and defense aerospace company Boeing Co., energy drink company Monster Beverage Corp. and online entertainment streaming platform Netflix, Inc. |
| • | Allocations to the communication services, information technology and financials sectors detracted from relative performance. |
| • | Individual securities that detracted most from performance in our portion of the Fund during the period included online retailing giant Amazon.com, Inc., Google-parent Alphabet, Inc. and electric vehicle company Tesla, Inc. |
| • | The financials, communication services and retail sectors were among the three strongest contributing sectors to the portfolio’s performance on a relative basis. The financials sector returned a positive absolute return, while communication services and retail returned negative absolute returns for the portfolio. |
| ○ | Positive contribution within the financials sector was driven by strong selection within the sector. |
| ○ | Positive contributions within the communication services and retail sectors were driven by both sector allocation and stock selection. |
| ○ | As economic conditions softened during the period, investors penalized economically-sensitive segments, such as retail and communication services, and the portfolio’s average underweight to both sectors contributed positively to excess return. |
| • | An average overweight to insurance company Arch Capital Group Ltd. and average underweights to online retailer Amazon.com and electric vehicle company Tesla provided the strongest positive contributions to the portfolio’s relative performance over the period. |
| • | Capital goods, technology and business services were among the three sectors that detracted most from the portfolio’s performance on a relative basis. |
| ○ | All three sectors generated negative absolute returns for the portfolio. |
| ○ | Stock selection across the three sector groupings held performance back during the period. |
| • | An average underweight in semiconductor company NVIDIA Corp. and overweights in semiconductor company QUALCOMM, Inc. and cybersecurity software firm Crowdstrike Holdings, Inc. held performance back in our portion of the fund during the period. |
| 6 | Multi-Manager Growth Strategies Fund | Annual Report 2023 |
(Unaudited)
| • | Stock selection in the financials sector was the largest detractor to performance during our reporting period. We were overweight in the sector, which also detracted from relative returns. |
| • | Stock selection in the industrials sector also weighed on results, along with an underweighting to the sector, relative to the benchmark. |
| • | An overweight position in energy also detracted, as did stock selection within the sector. |
| • | Individual positions that detracted most from performance in our portion of the Fund during our reporting period included financial services companies SVB Financial Group and Charles Schwab Corp. and oil and gas exploration and production company ConocoPhillips Co. |
| • | Stock selection in the health care sector contributed during our reporting period. (Our overweight allocation to the sector detracted somewhat, however.) |
| • | Stock selection within the consumer discretionary sector, as well as an overweight position to the sector, added to performance in our portion of the Fund during our reporting period. |
| • | Stock selection within the basic materials sector was a contributor. (Our overweight position was a marginal detractor, however.) |
| • | Individual holdings that contributed most to performance in our portion of the Fund during our reporting period included electric vehicle company Tesla, online retail giant Amazon.com and software company Oracle Corp. |
| • | Our underweight positions, relative to the benchmark, in Tesla and Amazon drove their respective contributions as both companies returned disappointing results during our reporting period. |
| • | Stock selection drove our underperformance of the benchmark during our reporting period, particularly within the information technology, health care, consumer discretionary and communication services sectors. |
| • | Top individual detractors during the period included online dating app provider Match Group, Inc., health care screening and diagnostics company Exact Sciences Corp., orthodontic products manufacturer Align Technology, Inc., cloud-based communications company RingCentral, Inc. and biotechnology company Illumina, Inc. |
| • | Sector allocations overall contributed to relative performance during our reporting period, most notably overweighted positions within the health care and industrials sectors and an underweight in the communication services sector. |
| • | Top individual contributors to performance during the period included an out-of-benchmark position in biotechnology companies BioMarin Pharmaceutical, Inc. and Sarepta Therapeutics, Inc., real estate services company CoStar Group, Inc., heating and cooling manufacturer Trane Technologies PLC and pharmaceutical giant Eli Lilly and Company. |
| Multi-Manager Growth Strategies Fund | Annual Report 2023 | 7 |
(Unaudited)
| 8 | Multi-Manager Growth Strategies Fund | Annual Report 2023 |
(Unaudited)
| October 1, 2022 — March 31, 2023 | |||||||
| Account value at the beginning of the period ($) | Account value at the end of the period ($) | Expenses paid during the period ($) | Fund’s annualized expense ratio (%) | ||||
| Actual | Hypothetical | Actual | Hypothetical | Actual | Hypothetical | Actual | |
| Institutional Class | 1,000.00 | 1,000.00 | 1,192.40 | 1,021.24 | 4.04 | 3.73 | 0.74 |
| Institutional 3 Class | 1,000.00 | 1,000.00 | 1,192.40 | 1,021.64 | 3.61 | 3.33 | 0.66 |
| Multi-Manager Growth Strategies Fund | Annual Report 2023 | 9 |
March 31, 2023
| Common Stocks 98.9% | ||
| Issuer | Shares | Value ($) |
| Communication Services 11.6% | ||
| Entertainment 3.1% | ||
| Netflix, Inc.(a) | 229,533 | 79,299,061 |
| Walt Disney Co. (The)(a) | 370,772 | 37,125,400 |
| Total | 116,424,461 | |
| Interactive Media & Services 8.2% | ||
| Alphabet, Inc., Class A(a) | 893,442 | 92,676,739 |
| Alphabet, Inc., Class C(a) | 832,381 | 86,567,624 |
| Match Group, Inc.(a) | 37,300 | 1,431,947 |
| Meta Platforms, Inc., Class A(a) | 608,426 | 128,949,807 |
| Snap, Inc., Class A(a) | 279,906 | 3,137,746 |
| Total | 312,763,863 | |
| Media 0.3% | ||
| Trade Desk, Inc. (The), Class A(a) | 181,265 | 11,040,851 |
| Total Communication Services | 440,229,175 | |
| Consumer Discretionary 16.0% | ||
| Automobiles 3.2% | ||
| Tesla, Inc.(a) | 586,585 | 121,692,924 |
| Broadline Retail 5.8% | ||
| Alibaba Group Holding Ltd., ADR(a) | 178,240 | 18,212,563 |
| Amazon.com, Inc.(a) | 1,708,309 | 176,451,237 |
| Etsy, Inc.(a) | 61,972 | 6,899,343 |
| MercadoLibre, Inc.(a) | 13,639 | 17,977,020 |
| Total | 219,540,163 | |
| Diversified Consumer Services 0.2% | ||
| H&R Block, Inc. | 252,597 | 8,904,044 |
| Hotels, Restaurants & Leisure 3.9% | ||
| Airbnb, Inc., Class A(a) | 125,106 | 15,563,186 |
| Booking Holdings, Inc.(a) | 5,624 | 14,917,154 |
| Boyd Gaming Corp. | 13,475 | 864,017 |
| Chipotle Mexican Grill, Inc.(a) | 8,918 | 15,234,530 |
| Hilton Worldwide Holdings, Inc. | 5,121 | 721,395 |
| Marriott International, Inc., Class A | 81,672 | 13,560,819 |
| McDonald’s Corp. | 25,104 | 7,019,330 |
| Six Flags Entertainment Corp.(a) | 77,227 | 2,062,733 |
| Starbucks Corp. | 365,195 | 38,027,755 |
| Common Stocks (continued) | ||
| Issuer | Shares | Value ($) |
| Travel + Leisure Co. | 156,058 | 6,117,474 |
| Wendy’s Co. (The) | 133,402 | 2,905,496 |
| Yum China Holdings, Inc. | 174,258 | 11,046,215 |
| Yum! Brands, Inc. | 148,927 | 19,670,278 |
| Total | 147,710,382 | |
| Household Durables 0.5% | ||
| PulteGroup, Inc. | 40,592 | 2,365,702 |
| Toll Brothers, Inc. | 212,489 | 12,755,715 |
| TopBuild Corp.(a) | 17,345 | 3,610,188 |
| Total | 18,731,605 | |
| Specialty Retail 2.0% | ||
| AutoZone, Inc.(a) | 10,001 | 24,583,958 |
| Home Depot, Inc. (The) | 3,835 | 1,131,785 |
| Lowe’s Companies, Inc. | 164,047 | 32,804,479 |
| O’Reilly Automotive, Inc.(a) | 4,949 | 4,201,602 |
| TJX Companies, Inc. (The) | 50,476 | 3,955,299 |
| Ulta Beauty, Inc.(a) | 16,815 | 9,175,441 |
| Total | 75,852,564 | |
| Textiles, Apparel & Luxury Goods 0.4% | ||
| Columbia Sportswear Co. | 25,575 | 2,307,888 |
| lululemon athletica, Inc.(a) | 152 | 55,357 |
| NIKE, Inc., Class B | 70,338 | 8,626,252 |
| Tapestry, Inc. | 157,098 | 6,772,495 |
| Total | 17,761,992 | |
| Total Consumer Discretionary | 610,193,674 | |
| Consumer Staples 4.1% | ||
| Beverages 2.7% | ||
| Brown-Forman Corp., Class B | 94,586 | 6,079,042 |
| Coca-Cola Co. (The) | 336,307 | 20,861,123 |
| Monster Beverage Corp.(a) | 1,156,208 | 62,446,794 |
| PepsiCo, Inc. | 77,395 | 14,109,109 |
| Total | 103,496,068 | |
| Consumer Staples Distribution & Retail 0.5% | ||
| Costco Wholesale Corp. | 21,198 | 10,532,650 |
| Target Corp. | 55,931 | 9,263,852 |
| Total | 19,796,502 | |
| 10 | Multi-Manager Growth Strategies Fund | Annual Report 2023 |
March 31, 2023
| Common Stocks (continued) | ||
| Issuer | Shares | Value ($) |
| Food Products 0.4% | ||
| Hershey Co. (The) | 39,033 | 9,930,386 |
| Lamb Weston Holdings, Inc. | 56,956 | 5,953,041 |
| Total | 15,883,427 | |
| Household Products 0.2% | ||
| Procter & Gamble Co. (The) | 53,670 | 7,980,192 |
| Personal Care Products 0.1% | ||
| Estee Lauder Companies, Inc. (The), Class A | 9,483 | 2,337,180 |
| Tobacco 0.2% | ||
| Altria Group, Inc. | 123,770 | 5,522,617 |
| Total Consumer Staples | 155,015,986 | |
| Energy 0.7% | ||
| Oil, Gas & Consumable Fuels 0.7% | ||
| Cheniere Energy, Inc. | 43,397 | 6,839,367 |
| ConocoPhillips Co. | 184,260 | 18,280,435 |
| PDC Energy, Inc. | 2,955 | 189,652 |
| Total | 25,309,454 | |
| Total Energy | 25,309,454 | |
| Financials 9.0% | ||
| Capital Markets 2.5% | ||
| Blackstone, Inc. | 97,831 | 8,593,475 |
| Charles Schwab Corp. (The) | 132,265 | 6,928,041 |
| FactSet Research Systems, Inc. | 56,701 | 23,536,018 |
| MarketAxess Holdings, Inc. | 10,150 | 3,971,594 |
| Morgan Stanley | 148,863 | 13,070,171 |
| MSCI, Inc. | 31,459 | 17,607,288 |
| SEI Investments Co. | 322,993 | 18,588,247 |
| Tradeweb Markets, Inc., Class A | 60,795 | 4,804,021 |
| Total | 97,098,855 | |
| Consumer Finance 0.2% | ||
| American Express Co. | 18,277 | 3,014,791 |
| Capital One Financial Corp. | 47,414 | 4,559,330 |
| Total | 7,574,121 | |
| Common Stocks (continued) | ||
| Issuer | Shares | Value ($) |
| Financial Services 5.5% | ||
| Block, Inc., Class A(a) | 349,701 | 24,006,974 |
| FleetCor Technologies, Inc.(a) | 82 | 17,290 |
| MasterCard, Inc., Class A | 111,609 | 40,559,827 |
| PayPal Holdings, Inc.(a) | 399,977 | 30,374,253 |
| Visa, Inc., Class A | 498,147 | 112,312,222 |
| Western Union Co. (The) | 287,829 | 3,209,293 |
| Total | 210,479,859 | |
| Insurance 0.8% | ||
| Aon PLC, Class A | 12,607 | 3,974,861 |
| Arch Capital Group Ltd.(a) | 80,787 | 5,483,014 |
| Everest Re Group Ltd. | 14,009 | 5,015,502 |
| Marsh & McLennan Companies, Inc. | 13,132 | 2,187,135 |
| Progressive Corp. (The) | 60,288 | 8,624,801 |
| RenaissanceRe Holdings Ltd. | 18,905 | 3,787,428 |
| Total | 29,072,741 | |
| Total Financials | 344,225,576 | |
| Health Care 11.9% | ||
| Biotechnology 4.8% | ||
| AbbVie, Inc. | 201,817 | 32,163,575 |
| Alnylam Pharmaceuticals, Inc.(a) | 16,157 | 3,236,570 |
| Amgen, Inc. | 30,771 | 7,438,889 |
| Exact Sciences Corp.(a) | 132,217 | 8,965,635 |
| Exelixis, Inc.(a) | 234,130 | 4,544,463 |
| Horizon Therapeutics PLC(a) | 6,162 | 672,521 |
| Incyte Corp.(a) | 40,501 | 2,927,007 |
| Moderna, Inc.(a) | 14,627 | 2,246,415 |
| Neurocrine Biosciences, Inc.(a) | 24,107 | 2,440,111 |
| Regeneron Pharmaceuticals, Inc.(a) | 73,347 | 60,267,029 |
| Sarepta Therapeutics, Inc.(a) | 32,502 | 4,479,751 |
| Seagen, Inc.(a) | 32,295 | 6,538,769 |
| Vertex Pharmaceuticals, Inc.(a) | 146,642 | 46,202,495 |
| Total | 182,123,230 | |
| Multi-Manager Growth Strategies Fund | Annual Report 2023 | 11 |
March 31, 2023
| Common Stocks (continued) | ||
| Issuer | Shares | Value ($) |
| Health Care Equipment & Supplies 1.4% | ||
| Align Technology, Inc.(a) | 40,700 | 13,599,498 |
| DexCom, Inc.(a) | 68,482 | 7,956,239 |
| Globus Medical, Inc., Class A(a) | 6,676 | 378,128 |
| Intuitive Surgical, Inc.(a) | 109,937 | 28,085,605 |
| Stryker Corp. | 19,119 | 5,457,901 |
| Total | 55,477,371 | |
| Health Care Providers & Services 1.8% | ||
| CVS Health Corp. | 68,591 | 5,096,997 |
| Encompass Health Corp. | 27,920 | 1,510,472 |
| Enhabit, Inc.(a) | 20,001 | 278,214 |
| HCA Healthcare, Inc. | 54,313 | 14,321,252 |
| Humana, Inc. | 277 | 134,472 |
| McKesson Corp. | 39,557 | 14,084,270 |
| Molina Healthcare, Inc.(a) | 19,810 | 5,298,977 |
| UnitedHealth Group, Inc. | 57,752 | 27,293,018 |
| Total | 68,017,672 | |
| Health Care Technology 0.1% | ||
| Veeva Systems Inc., Class A(a) | 24,780 | 4,554,316 |
| Life Sciences Tools & Services 1.3% | ||
| Agilent Technologies, Inc. | 83,495 | 11,550,698 |
| Illumina, Inc.(a) | 112,040 | 26,054,902 |
| IQVIA Holdings, Inc.(a) | 11,098 | 2,207,281 |
| Mettler-Toledo International, Inc.(a) | 1,511 | 2,312,147 |
| Thermo Fisher Scientific, Inc. | 4,753 | 2,739,487 |
| Waters Corp.(a) | 6,530 | 2,021,884 |
| West Pharmaceutical Services, Inc. | 9,480 | 3,284,536 |
| Total | 50,170,935 | |
| Pharmaceuticals 2.5% | ||
| Eli Lilly & Co. | 66,127 | 22,709,334 |
| Novartis AG, ADR | 215,235 | 19,801,620 |
| Novo Nordisk A/S, ADR | 161,756 | 25,741,850 |
| Roche Holding AG, ADR | 489,562 | 17,558,141 |
| Zoetis, Inc. | 46,534 | 7,745,119 |
| Total | 93,556,064 | |
| Total Health Care | 453,899,588 | |
| Common Stocks (continued) | ||
| Issuer | Shares | Value ($) |
| Industrials 8.6% | ||
| Aerospace & Defense 2.1% | ||
| Boeing Co. (The)(a) | 372,886 | 79,212,173 |
| Lockheed Martin Corp. | 2,450 | 1,158,188 |
| Total | 80,370,361 | |
| Air Freight & Logistics 1.2% | ||
| Expeditors International of Washington, Inc. | 215,196 | 23,697,383 |
| United Parcel Service, Inc., Class B | 111,626 | 21,654,328 |
| Total | 45,351,711 | |
| Building Products 0.3% | ||
| Allegion PLC | 32,015 | 3,416,961 |
| Carlisle Companies, Inc. | 2,195 | 496,224 |
| Trane Technologies PLC | 52,421 | 9,644,415 |
| Total | 13,557,600 | |
| Commercial Services & Supplies 0.3% | ||
| Cintas Corp. | 17,122 | 7,922,007 |
| Tetra Tech, Inc. | 15,471 | 2,272,845 |
| Total | 10,194,852 | |
| Construction & Engineering 0.1% | ||
| AECOM | 43,943 | 3,705,274 |
| Electrical Equipment 0.2% | ||
| Rockwell Automation, Inc. | 24,762 | 7,266,409 |
| Ground Transportation 0.6% | ||
| Landstar System, Inc. | 18,534 | 3,322,405 |
| Uber Technologies, Inc.(a) | 600,531 | 19,036,832 |
| Total | 22,359,237 | |
| Industrial Conglomerates 0.2% | ||
| Honeywell International, Inc. | 40,173 | 7,677,864 |
| Machinery 1.8% | ||
| Allison Transmission Holdings, Inc. | 70,165 | 3,174,265 |
| Caterpillar, Inc. | 44,627 | 10,212,443 |
| Deere & Co. | 121,132 | 50,012,980 |
| Donaldson Co., Inc. | 32,195 | 2,103,621 |
| Illinois Tool Works, Inc. | 11,122 | 2,707,651 |
| Otis Worldwide Corp. | 15,418 | 1,301,279 |
| Xylem, Inc. | 6,214 | 650,606 |
| Total | 70,162,845 | |
| 12 | Multi-Manager Growth Strategies Fund | Annual Report 2023 |
March 31, 2023
| Common Stocks (continued) | ||
| Issuer | Shares | Value ($) |
| Professional Services 1.1% | ||
| Automatic Data Processing, Inc. | 38,945 | 8,670,325 |
| Equifax, Inc. | 16,181 | 3,282,154 |
| Paychex, Inc. | 156,904 | 17,979,630 |
| Paycom Software, Inc.(a) | 37,288 | 11,335,925 |
| Total | 41,268,034 | |
| Trading Companies & Distributors 0.7% | ||
| Core & Main, Inc., Class A(a) | 200,124 | 4,622,864 |
| Fastenal Co. | 77,711 | 4,191,731 |
| United Rentals, Inc. | 6,479 | 2,564,129 |
| W.W. Grainger, Inc. | 17,913 | 12,338,654 |
| WESCO International, Inc. | 12,142 | 1,876,425 |
| Total | 25,593,803 | |
| Total Industrials | 327,507,990 | |
| Information Technology 35.9% | ||
| Communications Equipment 0.3% | ||
| Arista Networks, Inc.(a) | 66,392 | 11,144,561 |
| Electronic Equipment, Instruments & Components 0.4% | ||
| Amphenol Corp., Class A | 163,427 | 13,355,254 |
| Vontier Corp. | 46,511 | 1,271,611 |
| Total | 14,626,865 | |
| IT Services 2.1% | ||
| Accenture PLC, Class A | 114,226 | 32,646,933 |
| Cognizant Technology Solutions Corp., Class A | 107,365 | 6,541,749 |
| Gartner, Inc.(a) | 2,497 | 813,448 |
| MongoDB, Inc.(a) | 22,348 | 5,209,766 |
| Shopify, Inc., Class A(a) | 642,522 | 30,802,505 |
| VeriSign, Inc.(a) | 10,108 | 2,136,124 |
| Wix.com Ltd.(a) | 9,942 | 992,211 |
| Total | 79,142,736 | |
| Semiconductors & Semiconductor Equipment 9.8% | ||
| Advanced Micro Devices, Inc.(a) | 194,200 | 19,033,542 |
| Allegro MicroSystems, Inc.(a) | 42,048 | 2,017,883 |
| Applied Materials, Inc. | 91,414 | 11,228,382 |
| ASML Holding NV | 14,359 | 9,774,315 |
| Broadcom, Inc. | 80,279 | 51,502,190 |
| Enphase Energy, Inc.(a) | 11,707 | 2,461,748 |
| KLA Corp. | 1,178 | 470,222 |
| Common Stocks (continued) | ||
| Issuer | Shares | Value ($) |
| Lam Research Corp. | 22,686 | 12,026,302 |
| Lattice Semiconductor Corp.(a) | 20,196 | 1,928,718 |
| Micron Technology, Inc. | 1,665 | 100,466 |
| Monolithic Power Systems, Inc. | 33,843 | 16,939,775 |
| NVIDIA Corp. | 660,350 | 183,425,419 |
| QUALCOMM, Inc. | 364,365 | 46,485,687 |
| Texas Instruments, Inc. | 41,281 | 7,678,679 |
| Universal Display Corp. | 43,814 | 6,796,866 |
| Total | 371,870,194 | |
| Software 17.2% | ||
| Adobe, Inc.(a) | 72,739 | 28,031,428 |
| Alteryx, Inc., Class A(a) | 61,068 | 3,593,241 |
| ANSYS, Inc.(a) | 10,662 | 3,548,314 |
| Atlassian Corp., Class A(a) | 3,231 | 553,050 |
| Autodesk, Inc.(a) | 217,025 | 45,175,924 |
| Cadence Design Systems, Inc.(a) | 30,268 | 6,359,004 |
| Datadog, Inc., Class A(a) | 15,081 | 1,095,786 |
| DoubleVerify Holdings, Inc.(a) | 75,573 | 2,278,526 |
| Dynatrace, Inc.(a) | 168,013 | 7,106,950 |
| Fair Isaac Corp.(a) | 5,634 | 3,958,956 |
| Fortinet, Inc.(a) | 13,345 | 886,909 |
| HubSpot, Inc.(a) | 28,346 | 12,153,348 |
| Intuit, Inc. | 32,998 | 14,711,498 |
| Manhattan Associates, Inc.(a) | 46,293 | 7,168,471 |
| Microsoft Corp. | 994,706 | 286,773,740 |
| New Relic, Inc.(a) | 86,106 | 6,482,921 |
| Oracle Corp. | 904,671 | 84,062,029 |
| Palo Alto Networks, Inc.(a) | 55,637 | 11,112,934 |
| Paylocity Holding Corp.(a) | 1,844 | 366,550 |
| Pegasystems, Inc. | 78,962 | 3,828,078 |
| Salesforce, Inc.(a) | 308,796 | 61,691,265 |
| ServiceNow, Inc.(a) | 30,163 | 14,017,349 |
| Smartsheet, Inc., Class A(a) | 24,128 | 1,153,318 |
| Synopsys, Inc.(a) | 31,856 | 12,304,380 |
| Teradata Corp.(a) | 161,374 | 6,500,145 |
| Workday, Inc., Class A(a) | 136,743 | 28,242,899 |
| Total | 653,157,013 | |
| Multi-Manager Growth Strategies Fund | Annual Report 2023 | 13 |
March 31, 2023
| Common Stocks (continued) | ||
| Issuer | Shares | Value ($) |
| Technology Hardware, Storage & Peripherals 6.1% | ||
| Apple, Inc. | 1,421,668 | 234,433,053 |
| Total Information Technology | 1,364,374,422 | |
| Materials 0.9% | ||
| Chemicals 0.1% | ||
| Sherwin-Williams Co. (The) | 22,257 | 5,002,706 |
| Construction Materials 0.1% | ||
| Eagle Materials, Inc. | 25,220 | 3,701,035 |
| Containers & Packaging 0.1% | ||
| Graphic Packaging Holding Co. | 68,432 | 1,744,332 |
| Metals & Mining 0.6% | ||
| Freeport-McMoRan, Inc. | 431,071 | 17,635,114 |
| Southern Copper Corp. | 68,043 | 5,188,279 |
| Total | 22,823,393 | |
| Total Materials | 33,271,466 | |
| Common Stocks (continued) | ||
| Issuer | Shares | Value ($) |
| Real Estate 0.2% | ||
| Specialized REITs 0.2% | ||
| SBA Communications Corp. | 25,633 | 6,692,007 |
| Total Real Estate | 6,692,007 | |
| Total Common Stocks (Cost $3,249,960,644) | 3,760,719,338 | |
| Money Market Funds 1.2% | ||
| Shares | Value ($) | |
| Columbia Short-Term Cash Fund, 4.983%(b),(c) | 44,936,611 | 44,927,624 |
| Total Money Market Funds (Cost $44,923,394) | 44,927,624 | |
| Total Investments in Securities (Cost: $3,294,884,038) | 3,805,646,962 | |
| Other Assets & Liabilities, Net | (1,911,491) | |
| Net Assets | 3,803,735,471 | |
| (a) | Non-income producing investment. |
| (b) | The rate shown is the seven-day current annualized yield at March 31, 2023. |
| (c) | As defined in the Investment Company Act of 1940, as amended, an affiliated company is one in which the Fund owns 5% or more of the company’s outstanding voting securities, or a company which is under common ownership or control with the Fund. The value of the holdings and transactions in these affiliated companies during the year ended March 31, 2023 are as follows: |
| Affiliated issuers | Beginning of period($) | Purchases($) | Sales($) | Net change in unrealized appreciation (depreciation)($) | End of period($) | Realized gain (loss)($) | Dividends($) | End of period shares |
| Columbia Short-Term Cash Fund, 4.983% | ||||||||
| 49,935,449 | 1,144,464,143 | (1,149,476,421) | 4,453 | 44,927,624 | (12,607) | 1,584,361 | 44,936,611 | |
| ADR | American Depositary Receipt |
| ■ | Level 1 — Valuations based on quoted prices for investments in active markets that the Fund has the ability to access at the measurement date. Valuation adjustments are not applied to Level 1 investments. |
| ■ | Level 2 — Valuations based on other significant observable inputs (including quoted prices for similar securities, interest rates, prepayment speeds, credit risks, etc.). |
| ■ | Level 3 — Valuations based on significant unobservable inputs (including the Fund’s own assumptions and judgment in determining the fair value of investments). |
| 14 | Multi-Manager Growth Strategies Fund | Annual Report 2023 |
March 31, 2023
Inputs that are used in determining fair value of an investment may include price information, credit data, volatility statistics, and other factors. These inputs can be either observable or unobservable. The availability of observable inputs can vary between investments, and is affected by various factors such as the type of investment, and the volume and level of activity for that investment or similar investments in the marketplace. The inputs will be considered by the Investment Manager, along with any other relevant factors in the calculation of an investment’s fair value. The Fund uses prices and inputs that are current as of the measurement date, which may include periods of market dislocations. During these periods, the availability of prices and inputs may be reduced for many investments. This condition could cause an investment to be reclassified between the various levels within the hierarchy.
| Level 1 ($) | Level 2 ($) | Level 3 ($) | Total ($) | |
| Investments in Securities | ||||
| Common Stocks | ||||
| Communication Services | 440,229,175 | — | — | 440,229,175 |
| Consumer Discretionary | 610,193,674 | — | — | 610,193,674 |
| Consumer Staples | 155,015,986 | — | — | 155,015,986 |
| Energy | 25,309,454 | — | — | 25,309,454 |
| Financials | 344,225,576 | — | — | 344,225,576 |
| Health Care | 436,341,447 | 17,558,141 | — | 453,899,588 |
| Industrials | 327,507,990 | — | — | 327,507,990 |
| Information Technology | 1,364,374,422 | — | — | 1,364,374,422 |
| Materials | 33,271,466 | — | — | 33,271,466 |
| Real Estate | 6,692,007 | — | — | 6,692,007 |
| Total Common Stocks | 3,743,161,197 | 17,558,141 | — | 3,760,719,338 |
| Money Market Funds | 44,927,624 | — | — | 44,927,624 |
| Total Investments in Securities | 3,788,088,821 | 17,558,141 | — | 3,805,646,962 |
| Multi-Manager Growth Strategies Fund | Annual Report 2023 | 15 |
March 31, 2023
| Assets | |
| Investments in securities, at value | |
| Unaffiliated issuers (cost $3,249,960,644) | $3,760,719,338 |
| Affiliated issuers (cost $44,923,394) | 44,927,624 |
| Cash | 191 |
| Receivable for: | |
| Investments sold | 3,951,590 |
| Capital shares sold | 2,997,148 |
| Dividends | 1,077,686 |
| Foreign tax reclaims | 299,561 |
| Expense reimbursement due from Investment Manager | 4,473 |
| Prepaid expenses | 26,998 |
| Trustees’ deferred compensation plan | 178,479 |
| Total assets | 3,814,183,088 |
| Liabilities | |
| Payable for: | |
| Investments purchased | 5,617,215 |
| Capital shares purchased | 4,096,627 |
| Management services fees | 67,185 |
| Transfer agent fees | 273,863 |
| Compensation of board members | 54,654 |
| Other expenses | 159,594 |
| Trustees’ deferred compensation plan | 178,479 |
| Total liabilities | 10,447,617 |
| Net assets applicable to outstanding capital stock | $3,803,735,471 |
| Represented by | |
| Paid in capital | 3,275,221,318 |
| Total distributable earnings (loss) | 528,514,153 |
| Total - representing net assets applicable to outstanding capital stock | $3,803,735,471 |
| Institutional Class | |
| Net assets | $3,803,733,047 |
| Shares outstanding | 262,355,342 |
| Net asset value per share | $14.50 |
| Institutional 3 Class | |
| Net assets | $2,424 |
| Shares outstanding | 167 |
| Net asset value per share(a) | $14.49 |
| (a) | Net asset value per share rounds to this amount due to fractional shares outstanding. |
| 16 | Multi-Manager Growth Strategies Fund | Annual Report 2023 |
Year Ended March 31, 2023
| Net investment income | |
| Income: | |
| Dividends — unaffiliated issuers | $32,416,602 |
| Dividends — affiliated issuers | 1,584,361 |
| Interfund lending | 764 |
| Foreign taxes withheld | (506,374) |
| Total income | 33,495,353 |
| Expenses: | |
| Management services fees | 24,510,241 |
| Transfer agent fees | |
| Institutional Class | 3,671,487 |
| Compensation of board members | 70,746 |
| Custodian fees | 40,492 |
| Printing and postage fees | 356,794 |
| Registration fees | 89,871 |
| Accounting services fees | 57,840 |
| Legal fees | 66,063 |
| Compensation of chief compliance officer | 717 |
| Other | 105,798 |
| Total expenses | 28,970,049 |
| Fees waived or expenses reimbursed by Investment Manager and its affiliates | (1,366,707) |
| Total net expenses | 27,603,342 |
| Net investment income | 5,892,011 |
| Realized and unrealized gain (loss) — net | |
| Net realized gain (loss) on: | |
| Investments — unaffiliated issuers | 86,830,031 |
| Investments — affiliated issuers | (12,607) |
| Net realized gain | 86,817,424 |
| Net change in unrealized appreciation (depreciation) on: | |
| Investments — unaffiliated issuers | (424,943,121) |
| Investments — affiliated issuers | 4,453 |
| Net change in unrealized appreciation (depreciation) | (424,938,668) |
| Net realized and unrealized loss | (338,121,244) |
| Net decrease in net assets resulting from operations | $(332,229,233) |
| Multi-Manager Growth Strategies Fund | Annual Report 2023 | 17 |
| Year Ended March 31, 2023 | Year Ended March 31, 2022 | |
| Operations | ||
| Net investment income (loss) | $5,892,011 | $(7,896,979) |
| Net realized gain | 86,817,424 | 714,284,136 |
| Net change in unrealized appreciation (depreciation) | (424,938,668) | (355,864,640) |
| Net increase (decrease) in net assets resulting from operations | (332,229,233) | 350,522,517 |
| Distributions to shareholders | ||
| Net investment income and net realized gains | ||
| Institutional Class | (355,197,806) | (584,937,031) |
| Institutional 3 Class | (222) | (509) |
| Total distributions to shareholders | (355,198,028) | (584,937,540) |
| Increase in net assets from capital stock activity | 431,364,681 | 429,863,077 |
| Total increase (decrease) in net assets | (256,062,580) | 195,448,054 |
| Net assets at beginning of year | 4,059,798,051 | 3,864,349,997 |
| Net assets at end of year | $3,803,735,471 | $4,059,798,051 |
| Year Ended | Year Ended | |||
| March 31, 2023 | March 31, 2022 | |||
| Shares | Dollars ($) | Shares | Dollars ($) | |
| Capital stock activity | ||||
| Institutional Class | ||||
| Subscriptions | 92,317,235 | 1,302,089,222 | 67,391,020 | 1,289,814,755 |
| Distributions reinvested | 28,368,497 | 355,197,806 | 29,487,010 | 584,937,031 |
| Redemptions | (86,223,408) | (1,225,922,347) | (68,815,072) | (1,444,888,709) |
| Net increase | 34,462,324 | 431,364,681 | 28,062,958 | 429,863,077 |
| Total net increase | 34,462,324 | 431,364,681 | 28,062,958 | 429,863,077 |
| 18 | Multi-Manager Growth Strategies Fund | Annual Report 2023 |
| Net asset value, beginning of period | Net investment income (loss) | Net realized and unrealized gain (loss) | Total from investment operations | Distributions from net investment income | Distributions from net realized gains | Total distributions to shareholders | |
| Institutional Class | |||||||
| Year Ended 3/31/2023 | $17.81 | 0.02 | (2.01) | (1.99) | (0.02) | (1.30) | (1.32) |
| Year Ended 3/31/2022 | $19.34 | (0.04) | 1.52 | 1.48 | — | (3.01) | (3.01) |
| Year Ended 3/31/2021 | $13.05 | (0.00)(d) | 7.78 | 7.78 | (0.00)(d) | (1.49) | (1.49) |
| Year Ended 3/31/2020 | $14.09 | 0.03 | (0.23) | (0.20) | (0.02) | (0.82) | (0.84) |
| Year Ended 3/31/2019 | $14.86 | 0.00(d) | 1.50 | 1.50 | — | (2.27) | (2.27) |
| Institutional 3 Class | |||||||
| Year Ended 3/31/2023 | $17.79 | 0.03 | (2.00) | (1.97) | (0.03) | (1.30) | (1.33) |
| Year Ended 3/31/2022 | $19.32 | (0.02) | 1.54 | 1.52 | — | (3.05) | (3.05) |
| Year Ended 3/31/2021 | $13.03 | 0.01 | 7.77 | 7.78 | (0.00)(d) | (1.49) | (1.49) |
| Year Ended 3/31/2020(e) | $14.94 | 0.02 | (1.92) | (1.90) | (0.01) | — | (0.01) |
| Notes to Financial Highlights | |
| (a) | In addition to the fees and expenses that the Fund bears directly, the Fund indirectly bears a pro rata share of the fees and expenses of any other funds in which it invests. Such indirect expenses are not included in the Fund’s reported expense ratios. |
| (b) | Total net expenses include the impact of certain fee waivers/expense reimbursements made by the Investment Manager and certain of its affiliates, if applicable. |
| (c) | Ratios include interfund lending expense which is less than 0.01%. |
| (d) | Rounds to zero. |
| (e) | Institutional 3 Class shares commenced operations on December 18, 2019. Per share data and total return reflect activity from that date. |
| 20 | Multi-Manager Growth Strategies Fund | Annual Report 2023 |
| Net asset value, end of period | Total return | Total gross expense ratio to average net assets(a) | Total net expense ratio to average net assets(a),(b) | Net investment income (loss) ratio to average net assets | Portfolio turnover | Net assets, end of period (000’s) | |
| Institutional Class | |||||||
| Year Ended 3/31/2023 | $14.50 | (9.89%) | 0.78% | 0.74% | 0.16% | 83% | $3,803,733 |
| Year Ended 3/31/2022 | $17.81 | 6.57% | 0.75%(c) | 0.74%(c) | (0.19%) | 53% | $4,059,795 |
| Year Ended 3/31/2021 | $19.34 | 61.13% | 0.78% | 0.69% | (0.02%) | 45% | $3,864,347 |
| Year Ended 3/31/2020 | $13.05 | (1.88%) | 0.86%(c) | 0.76%(c) | 0.19% | 42% | $2,164,853 |
| Year Ended 3/31/2019 | $14.09 | 11.09% | 0.88%(c) | 0.88%(c) | 0.02% | 41% | $1,957,462 |
| Institutional 3 Class | |||||||
| Year Ended 3/31/2023 | $14.49 | (9.78%) | 0.67% | 0.66% | 0.23% | 83% | $2 |
| Year Ended 3/31/2022 | $17.79 | 6.76% | 0.66%(c) | 0.63%(c) | (0.09%) | 53% | $3 |
| Year Ended 3/31/2021 | $19.32 | 61.23% | 0.69% | 0.60% | 0.07% | 45% | $3 |
| Year Ended 3/31/2020(e) | $13.03 | (12.69%) | 0.74%(c) | 0.60%(c) | 0.44% | 42% | $2 |
| Multi-Manager Growth Strategies Fund | Annual Report 2023 | 21 |
March 31, 2023
| 22 | Multi-Manager Growth Strategies Fund | Annual Report 2023 |
March 31, 2023
| Multi-Manager Growth Strategies Fund | Annual Report 2023 | 23 |
March 31, 2023
| 24 | Multi-Manager Growth Strategies Fund | Annual Report 2023 |
March 31, 2023
| Effective rate (%) | |
| Institutional Class | 0.10 |
| Institutional 3 Class | 0.01 |
| Multi-Manager Growth Strategies Fund | Annual Report 2023 | 25 |
March 31, 2023
| August 1, 2022 through July 31, 2023 | Prior to August 1, 2022 | |
| Institutional Class | 0.74% | 0.74% |
| Institutional 3 Class | 0.66 | 0.65 |
| Undistributed net investment income ($) | Accumulated net realized gain ($) | Paid in capital ($) |
| 128,622 | (3,294,617) | 3,165,995 |
| Year Ended March 31, 2023 | Year Ended March 31, 2022 | ||||
| Ordinary income ($) | Long-term capital gains ($) | Total ($) | Ordinary income ($) | Long-term capital gains ($) | Total ($) |
| 4,427,764 | 350,770,264 | 355,198,028 | 103,122,560 | 481,814,980 | 584,937,540 |
| 26 | Multi-Manager Growth Strategies Fund | Annual Report 2023 |
March 31, 2023
| Undistributed ordinary income ($) | Undistributed long-term capital gains ($) | Capital loss carryforwards ($) | Net unrealized appreciation ($) |
| 1,568,130 | 58,552,298 | — | 468,611,369 |
| Federal tax cost ($) | Gross unrealized appreciation ($) | Gross unrealized (depreciation) ($) | Net unrealized appreciation ($) |
| 3,337,035,593 | 558,810,897 | (90,199,528) | 468,611,369 |
| Borrower or lender | Average loan balance ($) | Weighted average interest rate (%) | Number of days with outstanding loans |
| Lender | 3,540,000 | 1.95 | 5 |
| Multi-Manager Growth Strategies Fund | Annual Report 2023 | 27 |
March 31, 2023
| 28 | Multi-Manager Growth Strategies Fund | Annual Report 2023 |
March 31, 2023
| Multi-Manager Growth Strategies Fund | Annual Report 2023 | 29 |
| 30 | Multi-Manager Growth Strategies Fund | Annual Report 2023 |
| Qualified dividend income | Dividends received deduction | Capital gain dividend |
| 100.00% | 100.00% | $121,358,281 |
| Name, address, year of birth | Position held with the Columbia Funds and length of service | Principal occupation(s) during past five years and other relevant professional experience | Number of Funds in the Columbia Funds Complex* overseen | Other directorships held by Trustee during the past five years and other relevant Board experience |
| George S. Batejan c/o Columbia Management Investment Advisers, LLC 290 Congress Street Boston, MA 02210 1954 | Trustee since 2017 | Executive Vice President, Global Head of Technology and Operations, Janus Capital Group, Inc., 2010-2016 | 177 | Former Chairman of the Board, NICSA (National Investment Company Services Association) (Executive Committee, Nominating Committee and Governance Committee), 2014-2016; former Director, Intech Investment Management, 2011-2016; former Board Member, Metro Denver Chamber of Commerce, 2015-2016; former Advisory Board Member, University of Colorado Business School, 2015-2018; former Board Member, Chase Bank International, 1993-1994 |
| Multi-Manager Growth Strategies Fund | Annual Report 2023 | 31 |
(Unaudited)
Independent trustees (continued)
| Name, address, year of birth | Position held with the Columbia Funds and length of service | Principal occupation(s) during past five years and other relevant professional experience | Number of Funds in the Columbia Funds Complex* overseen | Other directorships held by Trustee during the past five years and other relevant Board experience |
| Kathleen Blatz c/o Columbia Management Investment Advisers, LLC 290 Congress Street Boston, MA 02210 1954 | Trustee since 2006 | Attorney, specializing in arbitration and mediation; Chief Justice, Minnesota Supreme Court, 1998-2006; Associate Justice, Minnesota Supreme Court, 1996-1998; Fourth Judicial District Court Judge, Hennepin County, 1994-1996; Attorney in private practice and public service, 1984-1993; State Representative, Minnesota House of Representatives, 1979-1993, which included service on the Tax and Financial Institutions and Insurance Committees; Member and Interim Chair, Minnesota Sports Facilities Authority, January-July 2017; Interim President and Chief Executive Officer, Blue Cross and Blue Shield of Minnesota (health care insurance), February-July 2018, April-October 2021 | 177 | Former Trustee, Blue Cross and Blue Shield of Minnesota, 2009-2021 (Chair of the Business Development Committee, 2014-2017; Chair of the Governance Committee, 2017-2019); former Member and Chair of the Board, Minnesota Sports Facilities Authority, January 2017-July 2017; former Director, Robina Foundation, 2009-2020 (Chair, 2014-2020); Director, Richard M. Schulze Family Foundation, since 2021 |
| Pamela G. Carlton c/o Columbia Management Investment Advisers, LLC 290 Congress Street Boston, MA 02210 1954 | Chair since 2023; Trustee since 2007 | President, Springboard — Partners in Cross Cultural Leadership (consulting company), since 2003; Managing Director of US Equity Research, JP Morgan Chase, 1999-2003; Director of US Equity Research, Chase Asset Management, 1996-1999; Co-Director Latin America Research, 1993-1996, COO Global Research, 1992-1996, Co-Director of US Research, 1991-1992, Investment Banker, 1982-1991, Morgan Stanley; Attorney, Cleary Gottlieb Steen & Hamilton LLP, 1980-1982 | 177 | Trustee, New York Presbyterian Hospital Board, since 1996; Director, DR Bank (Audit Committee) since 2017; Director, Evercore Inc. (Audit Committee, Nominating and Governance Committee), since 2019; Director, Apollo Commercial Real Estate Finance, Inc. (Chair, Nominating and Governance Committee) (financial services), since 2021; the Governing Council of the Independent Directors Council (IDC), since 2021 |
| Janet Langford Carrig c/o Columbia Management Investment Advisers, LLC 290 Congress Street Boston, MA 02210 1957 | Trustee since 1996 | Senior Vice President, General Counsel and Corporate Secretary, ConocoPhillips (independent energy company), September 2007-October 2018 | 175 | Director, EQT Corporation (natural gas producer), since 2019; former Director, Whiting Petroleum Corporation (independent oil and gas company), 2020-2022 |
| J. Kevin Connaughton c/o Columbia Management Investment Advisers, LLC 290 Congress Street Boston, MA 02210 1964 | Trustee since 2020 | CEO and President, RhodeWay Financial (non-profit financial planning firm), since December 2022; Member, FINRA National Adjudicatory Council, since January 2020; Adjunct Professor of Finance, Bentley University since January 2018; Consultant to Independent Trustees of CFVIT and CFST I from March 2016 to June 2020 with respect to CFVIT and to December 2020 with respect to CFST I; Managing Director and General Manager of Mutual Fund Products, Columbia Management Investment Advisers, LLC, May 2010-February 2015; President, Columbia Funds, 2008-2015; and senior officer of Columbia Funds and affiliated funds, 2003-2015 | 175 | Former Director, The Autism Project, March 2015-December 2021; former Member of the Investment Committee, St. Michael’s College, November 2015-February 2020; former Trustee, St. Michael’s College, June 2017-September 2019; former Trustee, New Century Portfolios (former mutual fund complex), January 2015-December 2017 |
| 32 | Multi-Manager Growth Strategies Fund | Annual Report 2023 |
(Unaudited)
Independent trustees (continued)
| Name, address, year of birth | Position held with the Columbia Funds and length of service | Principal occupation(s) during past five years and other relevant professional experience | Number of Funds in the Columbia Funds Complex* overseen | Other directorships held by Trustee during the past five years and other relevant Board experience |
| Olive M. Darragh c/o Columbia Management Investment Advisers, LLC 290 Congress Street Boston, MA 02210 1962 | Trustee since 2020 | Managing Director of Darragh Inc. (strategy and talent management consulting firm), since 2010; Founder and CEO, Zolio, Inc. (investment management talent identification platform), since 2004; Consultant to Independent Trustees of CFVIT and CFST I from June 2019 to June 2020 with respect to CFVIT and to December 2020 with respect to CFST I; Partner, Tudor Investments, 2004-2010; Senior Partner, McKinsey & Company (consulting), 1990-2004; Touche Ross CPA, 1985-1988 | 175 | Treasurer, Edinburgh University US Trust Board, since January 2023; Member, HBS Community Action Partners Board, since September 2022; former Director, University of Edinburgh Business School (Member of US Board), 2004-2019; former Director, Boston Public Library Foundation, 2008-2017 |
| Patricia M. Flynn c/o Columbia Management Investment Advisers, LLC 290 Congress Street Boston, MA 02210 1950 | Trustee since 2004 | Professor of Economics and Management, Bentley University, since 2002; Dean, McCallum Graduate School of Business, Bentley University, 1992-2002 | 177 | Former Trustee, MA Taxpayers Foundation, 1997-2022; former Director, The MA Business Roundtable, 2003-2019; former Chairperson, Innovation Index Advisory Committee, MA Technology Collaborative, 1997-2020 |
| Brian J. Gallagher c/o Columbia Management Investment Advisers, LLC 290 Congress Street Boston, MA 02210 1954 | Trustee since 2017 | Retired; Partner with Deloitte & Touche LLP and its predecessors, 1977-2016 | 177 | Trustee, Catholic Schools Foundation, since 2004 |
| Douglas A. Hacker c/o Columbia Management Investment Advisers, LLC 290 Congress Street Boston, MA 02210 1955 | Trustee since 1996 | Independent business executive, since May 2006; Executive Vice President – Strategy of United Airlines, December 2002 - May 2006; President of UAL Loyalty Services (airline marketing company), September 2001-December 2002; Executive Vice President and Chief Financial Officer of United Airlines, July 1999-September 2001 | 177 | Director, SpartanNash Company (Chair of the Board) (food distributor), since May 2021; Director, Aircastle Limited (Chair of Audit Committee) (aircraft leasing), since August 2006; former Director, Nash Finch Company (food distributor), 2005-2013; former Director, SeaCube Container Leasing Ltd. (container leasing), 2010-2013; and former Director, Travelport Worldwide Limited (travel information technology), 2014-2019 |
| Nancy T. Lukitsh c/o Columbia Management Investment Advisers, LLC 290 Congress Street Boston, MA 02210 1956 | Trustee since 2011 | Senior Vice President, Partner and Director of Marketing, Wellington Management Company, LLP (investment adviser), 1997-2010; Chair, Wellington Management Portfolios (commingled non-U.S. investment pools), 2007-2010; Director, Wellington Trust Company, NA and other Wellington affiliates, 1997-2010 | 175 | None |
| Multi-Manager Growth Strategies Fund | Annual Report 2023 | 33 |
(Unaudited)
Independent trustees (continued)
| Name, address, year of birth | Position held with the Columbia Funds and length of service | Principal occupation(s) during past five years and other relevant professional experience | Number of Funds in the Columbia Funds Complex* overseen | Other directorships held by Trustee during the past five years and other relevant Board experience |
| David M. Moffett c/o Columbia Management Investment Advisers, LLC 290 Congress Street Boston, MA 02210 1952 | Trustee since 2011 | Retired; former Chief Executive Officer of Freddie Mac and Chief Financial Officer of U.S. Bank | 175 | Director, CSX Corporation (transportation suppliers); Director, PayPal Holdings Inc. (payment and data processing services); Trustee, University of Oklahoma Foundation; former Director, eBay Inc. (online trading community), 2007-2015; and former Director, CIT Bank, CIT Group Inc. (commercial and consumer finance), 2010-2016; former Senior Adviser to The Carlyle Group (financial services), March 2008-September 2008; former Governance Consultant to Bridgewater Associates, January 2013-December 2015 |
| Catherine James Paglia c/o Columbia Management Investment Advisers, LLC 290 Congress Street Boston, MA 02210 1952 | Trustee since 2004 | Director, Enterprise Asset Management, Inc. (private real estate and asset management company), since September 1998; Managing Director and Partner, Interlaken Capital, Inc., 1989-1997; Vice President, 1982-1985, Principal, 1985-1987, Managing Director, 1987-1989, Morgan Stanley; Vice President, Investment Banking, 1980-1982, Associate, Investment Banking, 1976-1980, Dean Witter Reynolds, Inc. | 177 | Director, Valmont Industries, Inc. (irrigation systems manufacturer), since 2012; Trustee, Carleton College (on the Investment Committee), since 1987; Trustee, Carnegie Endowment for International Peace (on the Investment Committee), since 2009 |
| Natalie A. Trunow c/o Columbia Management Investment Advisers, LLC 290 Congress Street Boston, MA 02210 1967 | Trustee since 2020 | Chief Executive Officer, Millennial Portfolio Solutions LLC (asset management and consulting services), January 2016-January 2021; Non-executive Member of the Investment Committee and Valuation Committee, Sarona Asset Management Inc. (private equity firm) since September 2019; Advisor, Horizon Investments (asset management and consulting services), August 2018-January 2022; Advisor, Paradigm Asset Management, November 2016-January 2022; Consultant to Independent Trustees of CFVIT and CFST I from September 2016 to June 2020 with respect to CFVIT and to December 2020 with respect to CFST I; Director of Investments/Consultant, Casey Family Programs, April 2016-November 2016; Senior Vice President and Chief Investment Officer, Calvert Investments, August 2008-January 2016; Section Head and Portfolio Manager, General Motors Asset Management, June 1997-August 2008 | 175 | Independent Director, Investment Committee, Health Services for Children with Special Needs, Inc., 2010-2021; Independent Director, (Executive Committee and Chair, Audit Committee), Consumer Credit Counseling Services (formerly Guidewell Financial Solutions), since 2016; Independent Director, (Investment Committee), Sarona Asset Management, since 2019 |
| 34 | Multi-Manager Growth Strategies Fund | Annual Report 2023 |
(Unaudited)
Independent trustees (continued)
| Name, address, year of birth | Position held with the Columbia Funds and length of service | Principal occupation(s) during past five years and other relevant professional experience | Number of Funds in the Columbia Funds Complex* overseen | Other directorships held by Trustee during the past five years and other relevant Board experience |
| Sandra L. Yeager c/o Columbia Management Investment Advisers, LLC 290 Congress Street Boston, MA 02210 1964 | Trustee since 2017 | Retired; President and founder, Hanoverian Capital, LLC (SEC registered investment advisor firm), 2008-2016; Managing Director, DuPont Capital, 2006-2008; Managing Director, Morgan Stanley Investment Management, 2004-2006; Senior Vice President, Alliance Bernstein, 1990-2004 | 177 | Former Director, NAPE (National Alliance for Partnerships in Equity) Education Foundation, October 2016-October 2020; Advisory Board, Jennersville YMCA, since 2022 |
| Name, address, year of birth | Position held with the Columbia Funds and length of service | Principal occupation(s) during the past five years and other relevant professional experience | Number of Funds in the Columbia Funds Complex overseen | Other directorships held by Trustee during the past five years and other relevant Board experience |
| Daniel J. Beckman c/o Columbia Management Investment Advisers, LLC 290 Congress Street Boston, MA 02210 1962 | Trustee since November 2021 and President since June 2021 | Vice President – Head of North America Product, Columbia Management Investment Advisers, LLC, since April 2015; President and Principal Executive Officer of the Columbia Funds, since June 2021; officer of Columbia Funds and affiliated funds, 2020-2021 | 177 | Director, Ameriprise Trust Company, since October 2016; Director, Columbia Management Investment Distributors, Inc. since November 2018; Board of Governors, Columbia Wanger Asset Management, LLC since, January 2022; Director, Columbia Threadneedle Canada, Inc., since December 2022 |
| * | The term “Columbia Funds Complex” as used herein includes Columbia Seligman Premium Technology Growth Fund, Tri-Continental Corporation and each series of Columbia Funds Series Trust (CFST), Columbia Funds Series Trust I (CFST I), Columbia Funds Series Trust II (CFST II), Columbia ETF Trust I (CET I), Columbia ETF Trust II (CET II), Columbia Funds Variable Insurance Trust (CFVIT) and Columbia Funds Variable Series Trust II (CFVST II).Messrs. Batejan, Beckman, Gallagher and Hacker and Mses. Blatz, Carlton, Carrig, Flynn, Paglia and Yeager serve as Directors of Columbia Seligman Premium Technology Growth Fund and Tri-Continental Corporation. |
| ** | Interested person (as defined under the 1940 Act) by reason of being an officer, director, security holder and/or employee of the Investment Manager or Ameriprise Financial. |
| Multi-Manager Growth Strategies Fund | Annual Report 2023 | 35 |
(Unaudited)
The Board has appointed officers who are responsible for day-to-day business decisions based on policies it has established. The officers serve at the pleasure of the Board. The following table provides basic information about the Officers of the Fund as of the printing of this report, including principal occupations during the past five years, although their specific titles may have varied over the period. In addition to Mr. Beckman, who is President and Principal Executive Officer, the Fund’s other officers are:
| Name, address and year of birth | Position and year first appointed to position for any Fund in the Columbia Funds Complex or a predecessor thereof | Principal occupation(s) during past five years |
| Michael G. Clarke 290 Congress Street Boston, MA 02210 1969 | Chief Financial Officer and Principal Financial Officer (2009) and Senior Vice President (2019) | Senior Vice President and Head of Global Operations & Investor Services, Columbia Management Investment Advisers, LLC, since March 2022 (previously Vice President, Head of North American Operations, and Co-Head of Global Operations, June 2019 to February 2022 and Vice President – Accounting and Tax, May 2010 - May 2019); senior officer of Columbia Funds and affiliated funds, since 2002. |
| Joseph Beranek 5890 Ameriprise Financial Center Minneapolis, MN 55474 1965 | Treasurer and Chief Accounting Officer (Principal Accounting Officer) (2019) and Principal Financial Officer (2020), CFST, CFST I, CFST II, CFVIT and CFVST II; Assistant Treasurer, CET I and CET II | Vice President – Mutual Fund Accounting and Financial Reporting, Columbia Management Investment Advisers, LLC, since December 2018 and March 2017, respectively. |
| Marybeth Pilat 290 Congress Street Boston, MA 02210 1968 | Treasurer and Chief Accounting Officer (Principal Accounting Officer) and Principal Financial Officer (2020) for CET I and CET II; Assistant Treasurer, CFST, CFST I, CFST II, CFVIT and CFVST II | Vice President – Product Pricing and Administration, Columbia Management Investment Advisers, LLC, since May 2017. |
| William F. Truscott 290 Congress Street Boston, MA 02210 1960 | Senior Vice President (2001) | Formerly, Trustee/Director of Columbia Funds Complex or legacy funds, November 2001-January 1, 2021; Chief Executive Officer, Global Asset Management, Ameriprise Financial, Inc., since September 2012; Chairman of the Board and President, Columbia Management Investment Advisers, LLC, since July 2004 and February 2012, respectively; Chairman of the Board and Chief Executive Officer, Columbia Management Investment Distributors, Inc., since November 2008 and February 2012, respectively; Chairman of the Board and Director, Threadneedle Asset Management Holdings, Sàrl, since March 2013 and December 2008, respectively; senior executive of various entities affiliated with Columbia Threadneedle. |
| Christopher O. Petersen 5228 Ameriprise Financial Center Minneapolis, MN 55474 1970 | Senior Vice President and Assistant Secretary (2021) | Formerly, Trustee/Director of funds within the Columbia Funds Complex, July 1, 2020 - November 22, 2021; Senior Vice President and Assistant General Counsel, Ameriprise Financial, Inc., since September 2021 (previously Vice President and Lead Chief Counsel, January 2015 - September 2021); formerly, President and Principal Executive Officer of the Columbia Funds, 2015 - 2021; officer of Columbia Funds and affiliated funds, since 2007. |
| Thomas P. McGuire 290 Congress Street Boston, MA 02210 1972 | Senior Vice President and Chief Compliance Officer (2012) | Vice President – Asset Management Compliance, Ameriprise Financial, Inc., since May 2010; Chief Compliance Officer, Columbia Acorn/Wanger Funds, since December 2015; formerly, Chief Compliance Officer, Ameriprise Certificate Company, September 2010 – September 2020. |
| Ryan C. Larrenaga 290 Congress Street Boston, MA 02210 1970 | Senior Vice President (2017), Chief Legal Officer (2017), and Secretary (2015) | Vice President and Chief Counsel, Ameriprise Financial, Inc., since August 2018 (previously Vice President and Group Counsel, August 2011 - August 2018); Chief Legal Officer, Columbia Acorn/Wanger Funds, since September 2020; officer of Columbia Funds and affiliated funds, since 2005. |
| 36 | Multi-Manager Growth Strategies Fund | Annual Report 2023 |
(Unaudited)
Fund officers (continued)
| Name, address and year of birth | Position and year first appointed to position for any Fund in the Columbia Funds Complex or a predecessor thereof | Principal occupation(s) during past five years |
| Michael E. DeFao 290 Congress Street Boston, MA 02210 1968 | Vice President (2011) and Assistant Secretary (2010) | Vice President and Chief Counsel, Ameriprise Financial, Inc., since May 2010; Vice President, Chief Legal Officer and Assistant Secretary, Columbia Management Investment Advisers, LLC, since October 2021 (previously Vice President and Assistant Secretary, May 2010 – September 2021). |
| Lyn Kephart-Strong 5228 Ameriprise Financial Center Minneapolis, MN 55474 1960 | Vice President (2015) | Vice President, Global Investment Operations Services, Columbia Management Investment Advisers, LLC, since 2010; President, Columbia Management Investment Services Corp., since October 2014; President, Ameriprise Trust Company, since January 2017. |
| • | the Fund had sufficient liquidity to both meet redemptions and operate effectively on behalf of shareholders; |
| • | there were no material changes to the Program during the period; |
| • | the implementation of the Program was effective to manage the Fund’s liquidity risk; and |
| • | the Program operated adequately during the period. |
| Multi-Manager Growth Strategies Fund | Annual Report 2023 | 37 |
columbiathreadneedleus.com/investor/. The Fund is distributed by Columbia Management Investment Distributors, Inc., member FINRA, and managed by Columbia Management Investment Advisers, LLC.

March 31, 2023

| 3 | |
| 5 | |
| 7 | |
| 9 | |
| 11 | |
| 13 | |
| 15 | |
| 17 | |
| 19 | |
| 21 | |
| 23 | |
| 25 | |
| 43 | |
| 46 | |
| 49 | |
| 54 | |
| 72 | |
| 83 | |
| 84 | |
| 90 | |
| 91 | |
| 97 |
Columbia Adaptive Retirement 2020 Fund (Unaudited)
| Average annual total returns (%) (for the period ended March 31, 2023) | |||||
| Inception | 1 Year | 5 Years | Life | ||
| Advisor Class | 10/24/17 | -4.30 | 3.29 | 3.16 | |
| Institutional 3 Class | 10/24/17 | -4.23 | 3.31 | 3.18 | |
| Dow Jones Target 2020 Index | -6.25 | 1.36 | 1.62 | ||
| Columbia Adaptive Retirement Funds | Annual Report 2023 | 3 |
Columbia Adaptive Retirement 2020 Fund (Unaudited)
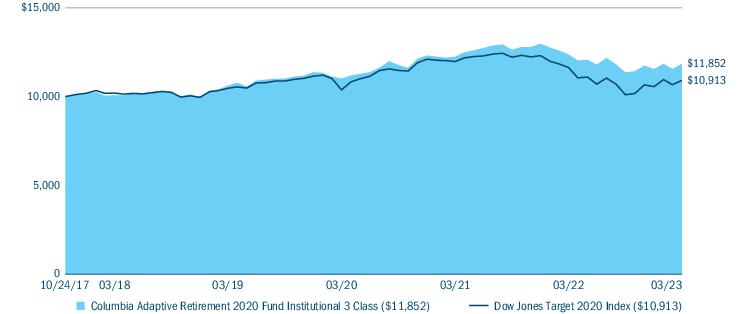
| Portfolio breakdown (%) (at March 31, 2023) | |
| Alternative Strategies Funds | 4.0 |
| Exchange-Traded Equity Funds | 4.0 |
| Exchange-Traded Fixed Income Funds | 7.8 |
| Money Market Funds | 5.4 |
| Multi-Asset/Tactical Strategies Funds | 78.8 |
| Total | 100.0 |
| 4 | Columbia Adaptive Retirement Funds | Annual Report 2023 |
Columbia Adaptive Retirement 2025 Fund (Unaudited)
| Average annual total returns (%) (for the period ended March 31, 2023) | ||||
| Inception | 1 Year | Life | ||
| Advisor Class | 04/04/18 | -4.79 | 3.85 | |
| Institutional 3 Class | 04/04/18 | -4.73 | 3.90 | |
| Dow Jones Target 2025 Index | -6.18 | 2.29 | ||
| Columbia Adaptive Retirement Funds | Annual Report 2023 | 5 |
Columbia Adaptive Retirement 2025 Fund (Unaudited)
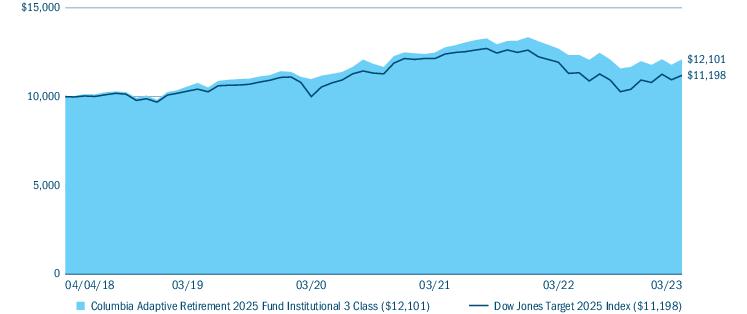
| Portfolio breakdown (%) (at March 31, 2023) | |
| Alternative Strategies Funds | 3.9 |
| Exchange-Traded Equity Funds | 4.0 |
| Exchange-Traded Fixed Income Funds | 7.9 |
| Money Market Funds | 5.7 |
| Multi-Asset/Tactical Strategies Funds | 78.5 |
| Total | 100.0 |
| 6 | Columbia Adaptive Retirement Funds | Annual Report 2023 |
Columbia Adaptive Retirement 2030 Fund (Unaudited)
| Average annual total returns (%) (for the period ended March 31, 2023) | |||||
| Inception | 1 Year | 5 Years | Life | ||
| Advisor Class | 10/24/17 | -5.40 | 4.36 | 4.17 | |
| Institutional 3 Class | 10/24/17 | -5.34 | 4.46 | 4.26 | |
| Dow Jones Target 2030 Index | -6.35 | 3.22 | 3.49 | ||
| Columbia Adaptive Retirement Funds | Annual Report 2023 | 7 |
Columbia Adaptive Retirement 2030 Fund (Unaudited)

| Portfolio breakdown (%) (at March 31, 2023) | |
| Alternative Strategies Funds | 4.0 |
| Exchange-Traded Equity Funds | 3.8 |
| Exchange-Traded Fixed Income Funds | 7.9 |
| Money Market Funds | 4.7 |
| Multi-Asset/Tactical Strategies Funds | 79.6 |
| Total | 100.0 |
| 8 | Columbia Adaptive Retirement Funds | Annual Report 2023 |
Columbia Adaptive Retirement 2035 Fund (Unaudited)
| Average annual total returns (%) (for the period ended March 31, 2023) | ||||
| Inception | 1 Year | Life | ||
| Advisor Class | 04/04/18 | -5.97 | 5.20 | |
| Institutional 3 Class | 04/04/18 | -5.96 | 5.26 | |
| Dow Jones Target 2035 Index | -6.52 | 4.22 | ||
| Columbia Adaptive Retirement Funds | Annual Report 2023 | 9 |
Columbia Adaptive Retirement 2035 Fund (Unaudited)
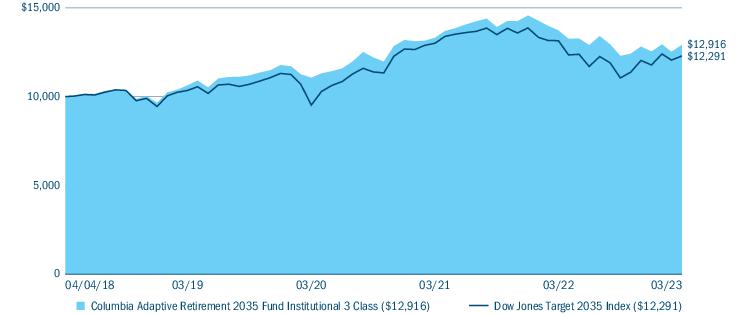
| Portfolio breakdown (%) (at March 31, 2023) | |
| Alternative Strategies Funds | 4.0 |
| Exchange-Traded Equity Funds | 4.0 |
| Exchange-Traded Fixed Income Funds | 7.9 |
| Money Market Funds | 4.8 |
| Multi-Asset/Tactical Strategies Funds | 79.3 |
| Total | 100.0 |
| 10 | Columbia Adaptive Retirement Funds | Annual Report 2023 |
Columbia Adaptive Retirement 2040 Fund (Unaudited)
| Average annual total returns (%) (for the period ended March 31, 2023) | |||||
| Inception | 1 Year | 5 Years | Life | ||
| Advisor Class | 10/24/17 | -6.82 | 5.87 | 5.57 | |
| Institutional 3 Class | 10/24/17 | -6.73 | 5.93 | 5.63 | |
| Dow Jones Target 2040 Index | -6.78 | 5.00 | 5.25 | ||
| Columbia Adaptive Retirement Funds | Annual Report 2023 | 11 |
Columbia Adaptive Retirement 2040 Fund (Unaudited)
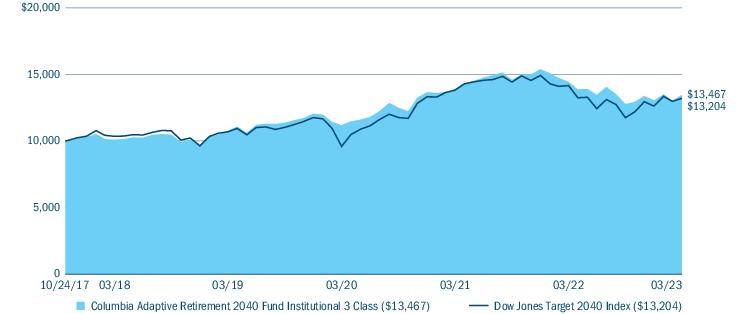
| Portfolio breakdown (%) (at March 31, 2023) | |
| Alternative Strategies Funds | 3.9 |
| Exchange-Traded Equity Funds | 4.0 |
| Exchange-Traded Fixed Income Funds | 7.9 |
| Money Market Funds | 5.0 |
| Multi-Asset/Tactical Strategies Funds | 79.2 |
| Total | 100.0 |
| 12 | Columbia Adaptive Retirement Funds | Annual Report 2023 |
Columbia Adaptive Retirement 2045 Fund (Unaudited)
| Average annual total returns (%) (for the period ended March 31, 2023) | ||||
| Inception | 1 Year | Life | ||
| Advisor Class | 04/04/18 | -7.51 | 6.60 | |
| Institutional 3 Class | 04/04/18 | -7.45 | 6.63 | |
| Dow Jones Target 2045 Index | -6.89 | 5.75 | ||
| Columbia Adaptive Retirement Funds | Annual Report 2023 | 13 |
Columbia Adaptive Retirement 2045 Fund (Unaudited)
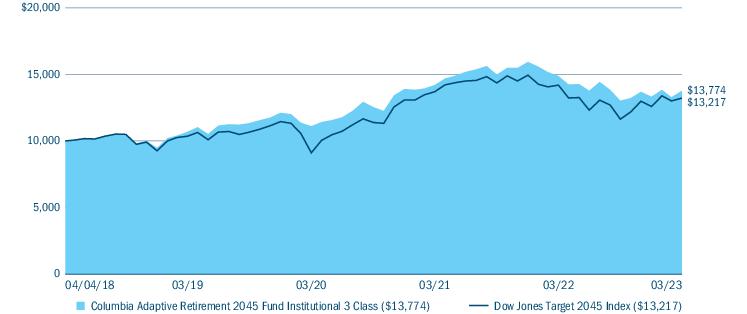
| Portfolio breakdown (%) (at March 31, 2023) | |
| Alternative Strategies Funds | 3.9 |
| Exchange-Traded Equity Funds | 4.0 |
| Exchange-Traded Fixed Income Funds | 7.8 |
| Money Market Funds | 5.2 |
| Multi-Asset/Tactical Strategies Funds | 79.1 |
| Total | 100.0 |
| 14 | Columbia Adaptive Retirement Funds | Annual Report 2023 |
Columbia Adaptive Retirement 2050 Fund (Unaudited)
| Average annual total returns (%) (for the period ended March 31, 2023) | |||||
| Inception | 1 Year | 5 Years | Life | ||
| Advisor Class | 10/24/17 | -8.17 | 6.96 | 6.59 | |
| Institutional 3 Class | 10/24/17 | -8.04 | 6.98 | 6.62 | |
| Dow Jones Target 2050 Index | -6.95 | 6.12 | 6.34 | ||
| Columbia Adaptive Retirement Funds | Annual Report 2023 | 15 |
Columbia Adaptive Retirement 2050 Fund (Unaudited)
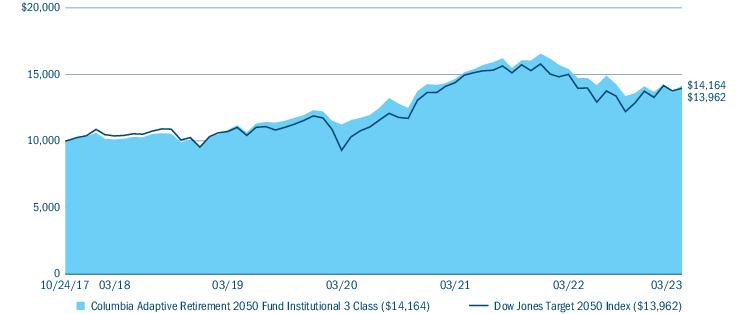
| Portfolio breakdown (%) (at March 31, 2023) | |
| Alternative Strategies Funds | 3.9 |
| Exchange-Traded Equity Funds | 4.0 |
| Exchange-Traded Fixed Income Funds | 7.8 |
| Money Market Funds | 5.0 |
| Multi-Asset/Tactical Strategies Funds | 79.3 |
| Total | 100.0 |
| 16 | Columbia Adaptive Retirement Funds | Annual Report 2023 |
Columbia Adaptive Retirement 2055 Fund (Unaudited)
| Average annual total returns (%) (for the period ended March 31, 2023) | ||||
| Inception | 1 Year | Life | ||
| Advisor Class | 04/04/18 | -8.30 | 7.03 | |
| Institutional 3 Class | 04/04/18 | -8.23 | 7.05 | |
| Dow Jones Target 2055 Index | -6.98 | 6.37 | ||
| Columbia Adaptive Retirement Funds | Annual Report 2023 | 17 |
Columbia Adaptive Retirement 2055 Fund (Unaudited)
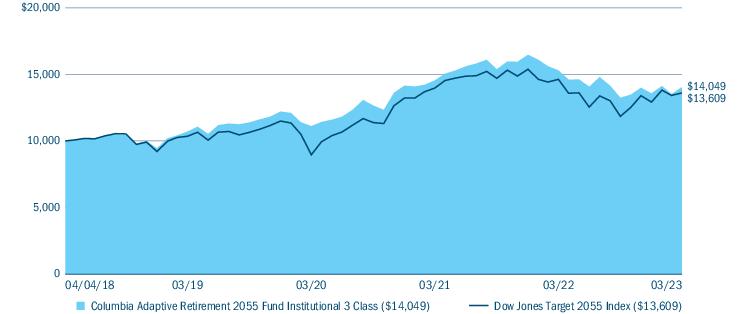
| Portfolio breakdown (%) (at March 31, 2023) | |
| Alternative Strategies Funds | 3.9 |
| Exchange-Traded Equity Funds | 4.0 |
| Exchange-Traded Fixed Income Funds | 7.9 |
| Money Market Funds | 4.9 |
| Multi-Asset/Tactical Strategies Funds | 79.3 |
| Total | 100.0 |
| 18 | Columbia Adaptive Retirement Funds | Annual Report 2023 |
Columbia Adaptive Retirement 2060 Fund (Unaudited)
| Average annual total returns (%) (for the period ended March 31, 2023) | |||||
| Inception | 1 Year | 5 Years | Life | ||
| Advisor Class | 10/24/17 | -8.31 | 7.03 | 6.67 | |
| Institutional 3 Class | 10/24/17 | -8.28 | 7.07 | 6.71 | |
| Dow Jones Target 2060 Index | -6.97 | 6.29 | 6.50 | ||
| Columbia Adaptive Retirement Funds | Annual Report 2023 | 19 |
Columbia Adaptive Retirement 2060 Fund (Unaudited)
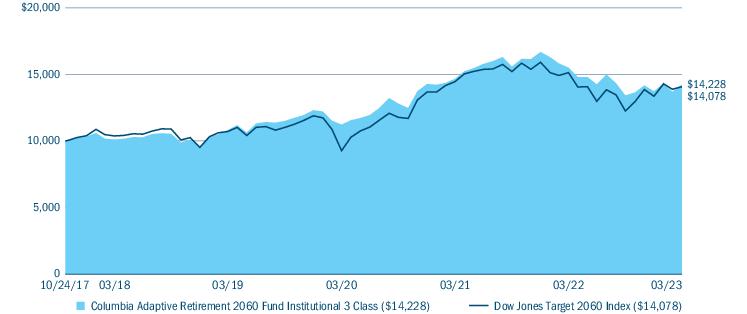
| Portfolio breakdown (%) (at March 31, 2023) | |
| Alternative Strategies Funds | 3.9 |
| Exchange-Traded Equity Funds | 4.0 |
| Exchange-Traded Fixed Income Funds | 7.8 |
| Money Market Funds | 4.9 |
| Multi-Asset/Tactical Strategies Funds | 79.4 |
| Total | 100.0 |
| 20 | Columbia Adaptive Retirement Funds | Annual Report 2023 |
(Unaudited)
| • | Columbia Adaptive Retirement 2020 Fund returned -4.23% for the 12-month period ended March 31, 2023. The Fund outperformed the Dow Jones Target 2020 Index, which returned -6.25% for the same period. |
| • | Columbia Adaptive Retirement 2025 Fund returned -4.73% for the 12-month period ended March 31, 2023. The Fund outperformed the Dow Jones Target 2025 Index, which returned -6.18% for the same period. |
| • | Columbia Adaptive Retirement 2030 Fund returned -5.34% for the 12-month period ended March 31, 2023. The Fund outperformed the Dow Jones Target 2030 Index, which returned -6.35% for the same period. |
| • | Columbia Adaptive Retirement 2035 Fund returned -5.96% for the 12-month period ended March 31, 2023. The Fund outperformed the Dow Jones Target 2035 Index, which returned -6.52% for the same period. |
| • | Columbia Adaptive Retirement 2040 Fund returned -6.73% for the 12-month period ended March 31, 2023. The Fund outperformed the Dow Jones Target 2040 Index, which returned -6.78% for the same period. |
| • | Columbia Adaptive Retirement 2045 Fund returned -7.45% for the 12-month period ended March 31, 2023. The Fund underperformed the Dow Jones Target 2045 Index, which returned -6.89% for the same period. |
| • | Columbia Adaptive Retirement 2050 Fund returned -8.04% for the 12-month period ended March 31, 2023. The Fund underperformed the Dow Jones Target 2050 Index, which returned -6.95% for the same period. |
| • | Columbia Adaptive Retirement 2055 Fund returned -8.23% for the 12-month period ended March 31, 2023. The Fund underperformed the Dow Jones Target 2055 Index, which returned -6.98% for the same period. |
| • | Columbia Adaptive Retirement 2060 Fund returned -8.28% for the 12-month period ended March 31, 2023. The Fund underperformed the Dow Jones Target 2060 Index, which returned -6.97% for the same period. |
| Columbia Adaptive Retirement Funds | Annual Report 2023 | 21 |
(Unaudited)
| • | The Funds were underweight in equities compared to their corresponding benchmarks for the second and third quarter of 2022, which contributed positively to performance during periods of heightened equity volatility during the aforementioned quarters in 2022. |
| • | Exposure to Treasury Inflation-Protected Securities (TIPS) contributed positively to performance relative to the Funds’ corresponding benchmarks in the second half of the reporting period, as the Funds were overweight TIPS compared to their Dow Jones Target-Date benchmarks. |
| • | Each Fund in the target-date lineup remained underweight in equities compared to their corresponding benchmark during the second half of the reporting period. Equities rebounded from increased volatility experienced during the beginning of 2022, and the Funds’ respective underweights in the asset class compared to their respective benchmarks detracted from overall performance. |
| • | The Funds were overweight in interest-rate sensitive securities compared to their benchmarks in the second and third quarter of 2022. Fixed income experienced periods of heavy volatility in the beginning of 2022, and the Funds’ overweight exposures to the asset class detracted from performance during the first half of the reporting period. |
| 22 | Columbia Adaptive Retirement Funds | Annual Report 2023 |
(Unaudited)
| October 1, 2022 — March 31, 2023 | ||||||||||
| Account value at the beginning of the period ($) | Account value at the end of the period ($) | Expenses paid during the period ($) | Fund’s annualized expense ratio (%) | Effective expenses paid during the period ($) | Fund’s effective annualized expense ratio (%) | |||||
| Actual | Hypothetical | Actual | Hypothetical | Actual | Hypothetical | Actual | Actual | Hypothetical | Actual | |
| Columbia Adaptive Retirement 2020 Fund | ||||||||||
| Advisor Class | 1,000.00 | 1,000.00 | 1,043.50 | 1,022.59 | 2.39 | 2.37 | 0.47 | 2.60 | 2.57 | 0.51 |
| Institutional 3 Class | 1,000.00 | 1,000.00 | 1,042.70 | 1,022.99 | 1.99 | 1.97 | 0.39 | 2.19 | 2.17 | 0.43 |
| Columbia Adaptive Retirement 2025 Fund | ||||||||||
| Advisor Class | 1,000.00 | 1,000.00 | 1,044.10 | 1,022.74 | 2.24 | 2.22 | 0.44 | 2.45 | 2.42 | 0.48 |
| Institutional 3 Class | 1,000.00 | 1,000.00 | 1,044.60 | 1,022.99 | 1.99 | 1.97 | 0.39 | 2.19 | 2.17 | 0.43 |
| Columbia Adaptive Retirement 2030 Fund | ||||||||||
| Advisor Class | 1,000.00 | 1,000.00 | 1,046.60 | 1,022.24 | 2.76 | 2.72 | 0.54 | 2.96 | 2.92 | 0.58 |
| Institutional 3 Class | 1,000.00 | 1,000.00 | 1,045.90 | 1,022.99 | 1.99 | 1.97 | 0.39 | 2.19 | 2.17 | 0.43 |
| Columbia Adaptive Retirement 2035 Fund | ||||||||||
| Advisor Class | 1,000.00 | 1,000.00 | 1,050.60 | 1,022.44 | 2.56 | 2.52 | 0.50 | 2.76 | 2.72 | 0.54 |
| Institutional 3 Class | 1,000.00 | 1,000.00 | 1,050.70 | 1,022.99 | 1.99 | 1.97 | 0.39 | 2.20 | 2.17 | 0.43 |
| Columbia Adaptive Retirement Funds | Annual Report 2023 | 23 |
(Unaudited)
| October 1, 2022 — March 31, 2023 | ||||||||||
| Account value at the beginning of the period ($) | Account value at the end of the period ($) | Expenses paid during the period ($) | Fund’s annualized expense ratio (%) | Effective expenses paid during the period ($) | Fund’s effective annualized expense ratio (%) | |||||
| Actual | Hypothetical | Actual | Hypothetical | Actual | Hypothetical | Actual | Actual | Hypothetical | Actual | |
| Columbia Adaptive Retirement 2040 Fund | ||||||||||
| Advisor Class | 1,000.00 | 1,000.00 | 1,053.20 | 1,022.49 | 2.51 | 2.47 | 0.49 | 2.71 | 2.67 | 0.53 |
| Institutional 3 Class | 1,000.00 | 1,000.00 | 1,054.10 | 1,022.99 | 2.00 | 1.97 | 0.39 | 2.20 | 2.17 | 0.43 |
| Columbia Adaptive Retirement 2045 Fund | ||||||||||
| Advisor Class | 1,000.00 | 1,000.00 | 1,056.60 | 1,022.59 | 2.41 | 2.37 | 0.47 | 2.61 | 2.57 | 0.51 |
| Institutional 3 Class | 1,000.00 | 1,000.00 | 1,057.30 | 1,022.99 | 2.00 | 1.97 | 0.39 | 2.21 | 2.17 | 0.43 |
| Columbia Adaptive Retirement 2050 Fund | ||||||||||
| Advisor Class | 1,000.00 | 1,000.00 | 1,058.90 | 1,022.84 | 2.16 | 2.12 | 0.42 | 2.36 | 2.32 | 0.46 |
| Institutional 3 Class | 1,000.00 | 1,000.00 | 1,059.50 | 1,022.99 | 2.00 | 1.97 | 0.39 | 2.21 | 2.17 | 0.43 |
| Columbia Adaptive Retirement 2055 Fund | ||||||||||
| Advisor Class | 1,000.00 | 1,000.00 | 1,060.40 | 1,022.59 | 2.41 | 2.37 | 0.47 | 2.62 | 2.57 | 0.51 |
| Institutional 3 Class | 1,000.00 | 1,000.00 | 1,060.10 | 1,022.99 | 2.00 | 1.97 | 0.39 | 2.21 | 2.17 | 0.43 |
| Columbia Adaptive Retirement 2060 Fund | ||||||||||
| Advisor Class | 1,000.00 | 1,000.00 | 1,060.10 | 1,022.44 | 2.57 | 2.52 | 0.50 | 2.77 | 2.72 | 0.54 |
| Institutional 3 Class | 1,000.00 | 1,000.00 | 1,060.20 | 1,022.99 | 2.00 | 1.97 | 0.39 | 2.21 | 2.17 | 0.43 |
| 24 | Columbia Adaptive Retirement Funds | Annual Report 2023 |
Columbia Adaptive Retirement 2020 Fund, March 31, 2023
| Alternative Strategies Funds 4.0% | ||
| Shares | Value ($) | |
| Columbia Commodity Strategy Fund, Institutional 3 Class(a) | 5,273 | 53,468 |
| Total Alternative Strategies Funds (Cost $56,034) | 53,468 | |
| Exchange-Traded Equity Funds 4.0% | ||
| Real Estate 4.0% | ||
| iShares U.S. Real Estate ETF | 637 | 54,081 |
| Total Exchange-Traded Equity Funds (Cost $58,583) | 54,081 | |
| Exchange-Traded Fixed Income Funds 8.0% | ||
| Emerging Markets 1.0% | ||
| iShares JPMorgan USD Emerging Markets Bond ETF | 150 | 12,942 |
| Inflation Protected Securities 4.0% | ||
| iShares TIPS Bond ETF | 484 | 53,361 |
| Investment Grade 3.0% | ||
| Vanguard Mortgage-Backed Securities ETF | 856 | 39,847 |
| Total Exchange-Traded Fixed Income Funds (Cost $109,624) | 106,150 | |
| Multi-Asset/Tactical Strategies Funds 80.0% | ||
| Shares | Value ($) | |
| Columbia Solutions Aggressive Portfolio(a) | 11,152 | 88,097 |
| Columbia Solutions Conservative Portfolio(a) | 110,241 | 978,938 |
| Total Multi-Asset/Tactical Strategies Funds (Cost $1,175,803) | 1,067,035 | |
| Money Market Funds 5.5% | ||
| Columbia Short-Term Cash Fund, 4.983%(a),(b) | 72,842 | 72,828 |
| Total Money Market Funds (Cost $72,807) | 72,828 | |
| Total Investments in Securities (Cost: $1,472,851) | 1,353,562 | |
| Other Assets & Liabilities, Net | (19,731) | |
| Net Assets | 1,333,831 | |
| (a) | As defined in the Investment Company Act of 1940, as amended, an affiliated company is one in which the Fund owns 5% or more of the company’s outstanding voting securities, or a company which is under common ownership or control with the Fund. The value of the holdings and transactions in these affiliated companies during the year ended March 31, 2023 are as follows: |
| Affiliated issuers | Beginning of period($) | Purchases($) | Sales($) | Net change in unrealized appreciation (depreciation)($) | End of period($) | Capital gain distributions($) | Realized gain (loss)($) | Dividends — affiliated issuers ($) | End of period shares |
| Columbia Commodity Strategy Fund, Institutional 3 Class | |||||||||
| 28,992 | 62,169 | (25,650) | (12,043) | 53,468 | — | 7,567 | — | 5,273 | |
| Columbia Short-Term Cash Fund, 4.983% | |||||||||
| 164,665 | 717,441 | (809,314) | 36 | 72,828 | — | (15) | 3,675 | 72,842 | |
| Columbia Solutions Aggressive Portfolio | |||||||||
| 112,863 | 25,579 | (38,177) | (12,168) | 88,097 | — | (5,082) | 7,274 | 11,152 | |
| Columbia Solutions Conservative Portfolio | |||||||||
| 1,052,093 | 123,739 | (124,378) | (72,516) | 978,938 | — | (11,512) | 45,816 | 110,241 | |
| Total | 1,358,613 | (96,691) | 1,193,331 | — | (9,042) | 56,765 | |||
| (b) | The rate shown is the seven-day current annualized yield at March 31, 2023. |
| Columbia Adaptive Retirement Funds | Annual Report 2023 | 25 |
Columbia Adaptive Retirement 2020 Fund, March 31, 2023
| ■ | Level 1 — Valuations based on quoted prices for investments in active markets that the Fund has the ability to access at the measurement date. Valuation adjustments are not applied to Level 1 investments. |
| ■ | Level 2 — Valuations based on other significant observable inputs (including quoted prices for similar securities, interest rates, prepayment speeds, credit risks, etc.). |
| ■ | Level 3 — Valuations based on significant unobservable inputs (including the Fund’s own assumptions and judgment in determining the fair value of investments). |
| Level 1 ($) | Level 2 ($) | Level 3 ($) | Assets at NAV ($) | Total ($) | |
| Investments in Securities | |||||
| Alternative Strategies Funds | 53,468 | — | — | — | 53,468 |
| Exchange-Traded Equity Funds | 54,081 | — | — | — | 54,081 |
| Exchange-Traded Fixed Income Funds | 106,150 | — | — | — | 106,150 |
| Multi-Asset/Tactical Strategies Funds | — | — | — | 1,067,035 | 1,067,035 |
| Money Market Funds | 72,828 | — | — | — | 72,828 |
| Total Investments in Securities | 286,527 | — | — | 1,067,035 | 1,353,562 |
| 26 | Columbia Adaptive Retirement Funds | Annual Report 2023 |
Columbia Adaptive Retirement 2025 Fund, March 31, 2023
| Alternative Strategies Funds 4.0% | ||
| Shares | Value ($) | |
| Columbia Commodity Strategy Fund, Institutional 3 Class(a) | 4,041 | 40,973 |
| Total Alternative Strategies Funds (Cost $42,959) | 40,973 | |
| Exchange-Traded Equity Funds 4.1% | ||
| Real Estate 4.1% | ||
| iShares U.S. Real Estate ETF | 488 | 41,431 |
| Total Exchange-Traded Equity Funds (Cost $44,909) | 41,431 | |
| Exchange-Traded Fixed Income Funds 8.0% | ||
| Emerging Markets 1.0% | ||
| iShares JPMorgan USD Emerging Markets Bond ETF | 115 | 9,922 |
| Inflation Protected Securities 4.0% | ||
| iShares TIPS Bond ETF | 374 | 41,233 |
| Investment Grade 3.0% | ||
| Vanguard Mortgage-Backed Securities ETF | 658 | 30,630 |
| Total Exchange-Traded Fixed Income Funds (Cost $84,833) | 81,785 | |
| Multi-Asset/Tactical Strategies Funds 80.0% | ||
| Shares | Value ($) | |
| Columbia Solutions Aggressive Portfolio(a) | 18,262 | 144,275 |
| Columbia Solutions Conservative Portfolio(a) | 75,894 | 673,937 |
| Total Multi-Asset/Tactical Strategies Funds (Cost $915,000) | 818,212 | |
| Money Market Funds 5.8% | ||
| Columbia Short-Term Cash Fund, 4.983%(a),(b) | 59,665 | 59,653 |
| Total Money Market Funds (Cost $59,632) | 59,653 | |
| Total Investments in Securities (Cost: $1,147,333) | 1,042,054 | |
| Other Assets & Liabilities, Net | (19,395) | |
| Net Assets | 1,022,659 | |
| (a) | As defined in the Investment Company Act of 1940, as amended, an affiliated company is one in which the Fund owns 5% or more of the company’s outstanding voting securities, or a company which is under common ownership or control with the Fund. The value of the holdings and transactions in these affiliated companies during the year ended March 31, 2023 are as follows: |
| Affiliated issuers | Beginning of period($) | Purchases($) | Sales($) | Net change in unrealized appreciation (depreciation)($) | End of period($) | Capital gain distributions($) | Realized gain (loss)($) | Dividends — affiliated issuers ($) | End of period shares |
| Columbia Commodity Strategy Fund, Institutional 3 Class | |||||||||
| 21,694 | 46,786 | (18,431) | (9,076) | 40,973 | — | 5,711 | — | 4,041 | |
| Columbia Short-Term Cash Fund, 4.983% | |||||||||
| 126,364 | 167,020 | (233,764) | 33 | 59,653 | — | (16) | 3,110 | 59,665 | |
| Columbia Solutions Aggressive Portfolio | |||||||||
| 171,085 | 35,499 | (41,341) | (20,968) | 144,275 | — | (5,900) | 12,060 | 18,262 | |
| Columbia Solutions Conservative Portfolio | |||||||||
| 699,230 | 63,245 | (35,556) | (52,982) | 673,937 | — | (3,268) | 31,929 | 75,894 | |
| Total | 1,018,373 | (82,993) | 918,838 | — | (3,473) | 47,099 | |||
| (b) | The rate shown is the seven-day current annualized yield at March 31, 2023. |
| Columbia Adaptive Retirement Funds | Annual Report 2023 | 27 |
Columbia Adaptive Retirement 2025 Fund, March 31, 2023
| ■ | Level 1 — Valuations based on quoted prices for investments in active markets that the Fund has the ability to access at the measurement date. Valuation adjustments are not applied to Level 1 investments. |
| ■ | Level 2 — Valuations based on other significant observable inputs (including quoted prices for similar securities, interest rates, prepayment speeds, credit risks, etc.). |
| ■ | Level 3 — Valuations based on significant unobservable inputs (including the Fund’s own assumptions and judgment in determining the fair value of investments). |
| Level 1 ($) | Level 2 ($) | Level 3 ($) | Assets at NAV ($) | Total ($) | |
| Investments in Securities | |||||
| Alternative Strategies Funds | 40,973 | — | — | — | 40,973 |
| Exchange-Traded Equity Funds | 41,431 | — | — | — | 41,431 |
| Exchange-Traded Fixed Income Funds | 81,785 | — | — | — | 81,785 |
| Multi-Asset/Tactical Strategies Funds | — | — | — | 818,212 | 818,212 |
| Money Market Funds | 59,653 | — | — | — | 59,653 |
| Total Investments in Securities | 223,842 | — | — | 818,212 | 1,042,054 |
| 28 | Columbia Adaptive Retirement Funds | Annual Report 2023 |
Columbia Adaptive Retirement 2030 Fund, March 31, 2023
| Alternative Strategies Funds 4.0% | ||
| Shares | Value ($) | |
| Columbia Commodity Strategy Fund, Institutional 3 Class(a) | 9,302 | 94,323 |
| Total Alternative Strategies Funds (Cost $98,879) | 94,323 | |
| Exchange-Traded Equity Funds 3.8% | ||
| Real Estate 3.8% | ||
| iShares U.S. Real Estate ETF | 1,063 | 90,249 |
| Total Exchange-Traded Equity Funds (Cost $98,227) | 90,249 | |
| Exchange-Traded Fixed Income Funds 8.0% | ||
| Emerging Markets 1.0% | ||
| iShares JPMorgan USD Emerging Markets Bond ETF | 265 | 22,864 |
| Inflation Protected Securities 4.0% | ||
| iShares TIPS Bond ETF | 859 | 94,705 |
| Investment Grade 3.0% | ||
| Vanguard Mortgage-Backed Securities ETF | 1,515 | 70,523 |
| Total Exchange-Traded Fixed Income Funds (Cost $198,726) | 188,092 | |
| Multi-Asset/Tactical Strategies Funds 80.0% | ||
| Shares | Value ($) | |
| Columbia Solutions Aggressive Portfolio(a) | 71,611 | 565,727 |
| Columbia Solutions Conservative Portfolio(a) | 148,608 | 1,319,645 |
| Total Multi-Asset/Tactical Strategies Funds (Cost $2,170,136) | 1,885,372 | |
| Money Market Funds 4.7% | ||
| Columbia Short-Term Cash Fund, 4.983%(a),(b) | 110,102 | 110,080 |
| Total Money Market Funds (Cost $110,045) | 110,080 | |
| Total Investments in Securities (Cost: $2,676,013) | 2,368,116 | |
| Other Assets & Liabilities, Net | (12,088) | |
| Net Assets | 2,356,028 | |
| (a) | As defined in the Investment Company Act of 1940, as amended, an affiliated company is one in which the Fund owns 5% or more of the company’s outstanding voting securities, or a company which is under common ownership or control with the Fund. The value of the holdings and transactions in these affiliated companies during the year ended March 31, 2023 are as follows: |
| Affiliated issuers | Beginning of period($) | Purchases($) | Sales($) | Net change in unrealized appreciation (depreciation)($) | End of period($) | Capital gain distributions($) | Realized gain (loss)($) | Dividends — affiliated issuers ($) | End of period shares |
| Columbia Commodity Strategy Fund, Institutional 3 Class | |||||||||
| 49,120 | 108,620 | (42,808) | (20,609) | 94,323 | — | 13,101 | — | 9,302 | |
| Columbia Short-Term Cash Fund, 4.983% | |||||||||
| 267,519 | 385,967 | (543,469) | 63 | 110,080 | — | (28) | 6,127 | 110,102 | |
| Columbia Solutions Aggressive Portfolio | |||||||||
| 644,705 | 148,133 | (148,315) | (78,796) | 565,727 | — | (23,332) | 46,996 | 71,611 | |
| Columbia Solutions Conservative Portfolio | |||||||||
| 1,328,014 | 202,527 | (119,745) | (91,151) | 1,319,645 | — | (15,501) | 62,138 | 148,608 | |
| Total | 2,289,358 | (190,493) | 2,089,775 | — | (25,760) | 115,261 | |||
| (b) | The rate shown is the seven-day current annualized yield at March 31, 2023. |
| Columbia Adaptive Retirement Funds | Annual Report 2023 | 29 |
Columbia Adaptive Retirement 2030 Fund, March 31, 2023
| ■ | Level 1 — Valuations based on quoted prices for investments in active markets that the Fund has the ability to access at the measurement date. Valuation adjustments are not applied to Level 1 investments. |
| ■ | Level 2 — Valuations based on other significant observable inputs (including quoted prices for similar securities, interest rates, prepayment speeds, credit risks, etc.). |
| ■ | Level 3 — Valuations based on significant unobservable inputs (including the Fund’s own assumptions and judgment in determining the fair value of investments). |
| Level 1 ($) | Level 2 ($) | Level 3 ($) | Assets at NAV ($) | Total ($) | |
| Investments in Securities | |||||
| Alternative Strategies Funds | 94,323 | — | — | — | 94,323 |
| Exchange-Traded Equity Funds | 90,249 | — | — | — | 90,249 |
| Exchange-Traded Fixed Income Funds | 188,092 | — | — | — | 188,092 |
| Multi-Asset/Tactical Strategies Funds | — | — | — | 1,885,372 | 1,885,372 |
| Money Market Funds | 110,080 | — | — | — | 110,080 |
| Total Investments in Securities | 482,744 | — | — | 1,885,372 | 2,368,116 |
| 30 | Columbia Adaptive Retirement Funds | Annual Report 2023 |
Columbia Adaptive Retirement 2035 Fund, March 31, 2023
| Alternative Strategies Funds 4.0% | ||
| Shares | Value ($) | |
| Columbia Commodity Strategy Fund, Institutional 3 Class(a) | 7,970 | 80,813 |
| Total Alternative Strategies Funds (Cost $84,724) | 80,813 | |
| Exchange-Traded Equity Funds 4.1% | ||
| Real Estate 4.1% | ||
| iShares U.S. Real Estate ETF | 963 | 81,759 |
| Total Exchange-Traded Equity Funds (Cost $88,609) | 81,759 | |
| Exchange-Traded Fixed Income Funds 8.0% | ||
| Emerging Markets 1.0% | ||
| iShares JPMorgan USD Emerging Markets Bond ETF | 227 | 19,586 |
| Inflation Protected Securities 4.0% | ||
| iShares TIPS Bond ETF | 737 | 81,254 |
| Investment Grade 3.0% | ||
| Vanguard Mortgage-Backed Securities ETF | 1,297 | 60,375 |
| Total Exchange-Traded Fixed Income Funds (Cost $164,770) | 161,215 | |
| Multi-Asset/Tactical Strategies Funds 80.0% | ||
| Shares | Value ($) | |
| Columbia Solutions Aggressive Portfolio(a) | 93,288 | 736,979 |
| Columbia Solutions Conservative Portfolio(a) | 99,121 | 880,193 |
| Total Multi-Asset/Tactical Strategies Funds (Cost $1,781,357) | 1,617,172 | |
| Money Market Funds 4.8% | ||
| Columbia Short-Term Cash Fund, 4.983%(a),(b) | 97,334 | 97,315 |
| Total Money Market Funds (Cost $97,285) | 97,315 | |
| Total Investments in Securities (Cost: $2,216,745) | 2,038,274 | |
| Other Assets & Liabilities, Net | (17,854) | |
| Net Assets | 2,020,420 | |
| (a) | As defined in the Investment Company Act of 1940, as amended, an affiliated company is one in which the Fund owns 5% or more of the company’s outstanding voting securities, or a company which is under common ownership or control with the Fund. The value of the holdings and transactions in these affiliated companies during the year ended March 31, 2023 are as follows: |
| Affiliated issuers | Beginning of period($) | Purchases($) | Sales($) | Net change in unrealized appreciation (depreciation)($) | End of period($) | Capital gain distributions($) | Realized gain (loss)($) | Dividends — affiliated issuers ($) | End of period shares |
| Columbia Commodity Strategy Fund, Institutional 3 Class | |||||||||
| 29,342 | 90,827 | (25,851) | (13,505) | 80,813 | — | 7,760 | — | 7,970 | |
| Columbia Short-Term Cash Fund, 4.983% | |||||||||
| 166,778 | 849,805 | (919,313) | 45 | 97,315 | — | (21) | 4,744 | 97,334 | |
| Columbia Solutions Aggressive Portfolio | |||||||||
| 574,331 | 344,710 | (114,211) | (67,851) | 736,979 | — | (18,511) | 43,568 | 93,288 | |
| Columbia Solutions Conservative Portfolio | |||||||||
| 604,737 | 371,916 | (61,627) | (34,833) | 880,193 | — | (8,888) | 29,493 | 99,121 | |
| Total | 1,375,188 | (116,144) | 1,795,300 | — | (19,660) | 77,805 | |||
| (b) | The rate shown is the seven-day current annualized yield at March 31, 2023. |
| Columbia Adaptive Retirement Funds | Annual Report 2023 | 31 |
Columbia Adaptive Retirement 2035 Fund, March 31, 2023
| ■ | Level 1 — Valuations based on quoted prices for investments in active markets that the Fund has the ability to access at the measurement date. Valuation adjustments are not applied to Level 1 investments. |
| ■ | Level 2 — Valuations based on other significant observable inputs (including quoted prices for similar securities, interest rates, prepayment speeds, credit risks, etc.). |
| ■ | Level 3 — Valuations based on significant unobservable inputs (including the Fund’s own assumptions and judgment in determining the fair value of investments). |
| Level 1 ($) | Level 2 ($) | Level 3 ($) | Assets at NAV ($) | Total ($) | |
| Investments in Securities | |||||
| Alternative Strategies Funds | 80,813 | — | — | — | 80,813 |
| Exchange-Traded Equity Funds | 81,759 | — | — | — | 81,759 |
| Exchange-Traded Fixed Income Funds | 161,215 | — | — | — | 161,215 |
| Multi-Asset/Tactical Strategies Funds | — | — | — | 1,617,172 | 1,617,172 |
| Money Market Funds | 97,315 | — | — | — | 97,315 |
| Total Investments in Securities | 421,102 | — | — | 1,617,172 | 2,038,274 |
| 32 | Columbia Adaptive Retirement Funds | Annual Report 2023 |
Columbia Adaptive Retirement 2040 Fund, March 31, 2023
| Alternative Strategies Funds 4.0% | ||
| Shares | Value ($) | |
| Columbia Commodity Strategy Fund, Institutional 3 Class(a) | 5,954 | 60,375 |
| Total Alternative Strategies Funds (Cost $63,286) | 60,375 | |
| Exchange-Traded Equity Funds 4.0% | ||
| Real Estate 4.0% | ||
| iShares U.S. Real Estate ETF | 719 | 61,043 |
| Total Exchange-Traded Equity Funds (Cost $66,148) | 61,043 | |
| Exchange-Traded Fixed Income Funds 8.0% | ||
| Emerging Markets 1.0% | ||
| iShares JPMorgan USD Emerging Markets Bond ETF | 169 | 14,582 |
| Inflation Protected Securities 4.0% | ||
| iShares TIPS Bond ETF | 549 | 60,527 |
| Investment Grade 3.0% | ||
| Vanguard Mortgage-Backed Securities ETF | 969 | 45,106 |
| Total Exchange-Traded Fixed Income Funds (Cost $126,727) | 120,215 | |
| Multi-Asset/Tactical Strategies Funds 80.1% | ||
| Shares | Value ($) | |
| Columbia Solutions Aggressive Portfolio(a) | 96,339 | 761,075 |
| Columbia Solutions Conservative Portfolio(a) | 50,528 | 448,695 |
| Total Multi-Asset/Tactical Strategies Funds (Cost $1,414,786) | 1,209,770 | |
| Money Market Funds 5.1% | ||
| Columbia Short-Term Cash Fund, 4.983%(a),(b) | 77,039 | 77,023 |
| Total Money Market Funds (Cost $77,000) | 77,023 | |
| Total Investments in Securities (Cost: $1,747,947) | 1,528,426 | |
| Other Assets & Liabilities, Net | (17,383) | |
| Net Assets | 1,511,043 | |
| (a) | As defined in the Investment Company Act of 1940, as amended, an affiliated company is one in which the Fund owns 5% or more of the company’s outstanding voting securities, or a company which is under common ownership or control with the Fund. The value of the holdings and transactions in these affiliated companies during the year ended March 31, 2023 are as follows: |
| Affiliated issuers | Beginning of period($) | Purchases($) | Sales($) | Net change in unrealized appreciation (depreciation)($) | End of period($) | Capital gain distributions($) | Realized gain (loss)($) | Dividends — affiliated issuers ($) | End of period shares |
| Columbia Commodity Strategy Fund, Institutional 3 Class | |||||||||
| 30,060 | 69,323 | (26,266) | (12,742) | 60,375 | — | 7,878 | — | 5,954 | |
| Columbia Short-Term Cash Fund, 4.983% | |||||||||
| 169,453 | 247,110 | (339,577) | 37 | 77,023 | — | (13) | 3,978 | 77,039 | |
| Columbia Solutions Aggressive Portfolio | |||||||||
| 799,949 | 180,519 | (104,324) | (115,069) | 761,075 | — | (17,303) | 62,893 | 96,339 | |
| Columbia Solutions Conservative Portfolio | |||||||||
| 407,323 | 99,778 | (28,114) | (30,292) | 448,695 | — | (4,290) | 21,016 | 50,528 | |
| Total | 1,406,785 | (158,066) | 1,347,168 | — | (13,728) | 87,887 | |||
| (b) | The rate shown is the seven-day current annualized yield at March 31, 2023. |
| Columbia Adaptive Retirement Funds | Annual Report 2023 | 33 |
Columbia Adaptive Retirement 2040 Fund, March 31, 2023
| ■ | Level 1 — Valuations based on quoted prices for investments in active markets that the Fund has the ability to access at the measurement date. Valuation adjustments are not applied to Level 1 investments. |
| ■ | Level 2 — Valuations based on other significant observable inputs (including quoted prices for similar securities, interest rates, prepayment speeds, credit risks, etc.). |
| ■ | Level 3 — Valuations based on significant unobservable inputs (including the Fund’s own assumptions and judgment in determining the fair value of investments). |
| Level 1 ($) | Level 2 ($) | Level 3 ($) | Assets at NAV ($) | Total ($) | |
| Investments in Securities | |||||
| Alternative Strategies Funds | 60,375 | — | — | — | 60,375 |
| Exchange-Traded Equity Funds | 61,043 | — | — | — | 61,043 |
| Exchange-Traded Fixed Income Funds | 120,215 | — | — | — | 120,215 |
| Multi-Asset/Tactical Strategies Funds | — | — | — | 1,209,770 | 1,209,770 |
| Money Market Funds | 77,023 | — | — | — | 77,023 |
| Total Investments in Securities | 318,656 | — | — | 1,209,770 | 1,528,426 |
| 34 | Columbia Adaptive Retirement Funds | Annual Report 2023 |
Columbia Adaptive Retirement 2045 Fund, March 31, 2023
| Alternative Strategies Funds 4.0% | ||
| Shares | Value ($) | |
| Columbia Commodity Strategy Fund, Institutional 3 Class(a) | 5,273 | 53,467 |
| Total Alternative Strategies Funds (Cost $56,027) | 53,467 | |
| Exchange-Traded Equity Funds 4.0% | ||
| Real Estate 4.0% | ||
| iShares U.S. Real Estate ETF | 637 | 54,081 |
| Total Exchange-Traded Equity Funds (Cost $58,571) | 54,081 | |
| Exchange-Traded Fixed Income Funds 7.9% | ||
| Emerging Markets 0.9% | ||
| iShares JPMorgan USD Emerging Markets Bond ETF | 149 | 12,855 |
| Inflation Protected Securities 4.0% | ||
| iShares TIPS Bond ETF | 483 | 53,251 |
| Investment Grade 3.0% | ||
| Vanguard Mortgage-Backed Securities ETF | 856 | 39,847 |
| Total Exchange-Traded Fixed Income Funds (Cost $111,128) | 105,953 | |
| Multi-Asset/Tactical Strategies Funds 80.1% | ||
| Shares | Value ($) | |
| Columbia Solutions Aggressive Portfolio(a) | 108,522 | 857,323 |
| Columbia Solutions Conservative Portfolio(a) | 24,258 | 215,417 |
| Total Multi-Asset/Tactical Strategies Funds (Cost $1,267,577) | 1,072,740 | |
| Money Market Funds 5.3% | ||
| Columbia Short-Term Cash Fund, 4.983%(a),(b) | 70,737 | 70,723 |
| Total Money Market Funds (Cost $70,700) | 70,723 | |
| Total Investments in Securities (Cost: $1,564,003) | 1,356,964 | |
| Other Assets & Liabilities, Net | (17,414) | |
| Net Assets | 1,339,550 | |
| (a) | As defined in the Investment Company Act of 1940, as amended, an affiliated company is one in which the Fund owns 5% or more of the company’s outstanding voting securities, or a company which is under common ownership or control with the Fund. The value of the holdings and transactions in these affiliated companies during the year ended March 31, 2023 are as follows: |
| Affiliated issuers | Beginning of period($) | Purchases($) | Sales($) | Net change in unrealized appreciation (depreciation)($) | End of period($) | Capital gain distributions($) | Realized gain (loss)($) | Dividends — affiliated issuers ($) | End of period shares |
| Columbia Commodity Strategy Fund, Institutional 3 Class | |||||||||
| 25,667 | 61,320 | (22,569) | (10,951) | 53,467 | — | 6,714 | — | 5,273 | |
| Columbia Short-Term Cash Fund, 4.983% | |||||||||
| 147,680 | 296,808 | (373,802) | 37 | 70,723 | — | (13) | 3,775 | 70,737 | |
| Columbia Solutions Aggressive Portfolio | |||||||||
| 853,174 | 226,088 | (93,294) | (128,645) | 857,323 | — | (15,269) | 69,786 | 108,522 | |
| Columbia Solutions Conservative Portfolio | |||||||||
| 175,753 | 67,467 | (14,595) | (13,208) | 215,417 | — | (2,281) | 9,939 | 24,258 | |
| Total | 1,202,274 | (152,767) | 1,196,930 | — | (10,849) | 83,500 | |||
| (b) | The rate shown is the seven-day current annualized yield at March 31, 2023. |
| Columbia Adaptive Retirement Funds | Annual Report 2023 | 35 |
Columbia Adaptive Retirement 2045 Fund, March 31, 2023
| ■ | Level 1 — Valuations based on quoted prices for investments in active markets that the Fund has the ability to access at the measurement date. Valuation adjustments are not applied to Level 1 investments. |
| ■ | Level 2 — Valuations based on other significant observable inputs (including quoted prices for similar securities, interest rates, prepayment speeds, credit risks, etc.). |
| ■ | Level 3 — Valuations based on significant unobservable inputs (including the Fund’s own assumptions and judgment in determining the fair value of investments). |
| Level 1 ($) | Level 2 ($) | Level 3 ($) | Assets at NAV ($) | Total ($) | |
| Investments in Securities | |||||
| Alternative Strategies Funds | 53,467 | — | — | — | 53,467 |
| Exchange-Traded Equity Funds | 54,081 | — | — | — | 54,081 |
| Exchange-Traded Fixed Income Funds | 105,953 | — | — | — | 105,953 |
| Multi-Asset/Tactical Strategies Funds | — | — | — | 1,072,740 | 1,072,740 |
| Money Market Funds | 70,723 | — | — | — | 70,723 |
| Total Investments in Securities | 284,224 | — | — | 1,072,740 | 1,356,964 |
| 36 | Columbia Adaptive Retirement Funds | Annual Report 2023 |
Columbia Adaptive Retirement 2050 Fund, March 31, 2023
| Alternative Strategies Funds 4.0% | ||
| Shares | Value ($) | |
| Columbia Commodity Strategy Fund, Institutional 3 Class(a) | 6,149 | 62,356 |
| Total Alternative Strategies Funds (Cost $65,353) | 62,356 | |
| Exchange-Traded Equity Funds 4.1% | ||
| Real Estate 4.1% | ||
| iShares U.S. Real Estate ETF | 743 | 63,081 |
| Total Exchange-Traded Equity Funds (Cost $68,335) | 63,081 | |
| Exchange-Traded Fixed Income Funds 7.9% | ||
| Emerging Markets 0.9% | ||
| iShares JPMorgan USD Emerging Markets Bond ETF | 174 | 15,013 |
| Inflation Protected Securities 4.0% | ||
| iShares TIPS Bond ETF | 565 | 62,291 |
| Investment Grade 3.0% | ||
| Vanguard Mortgage-Backed Securities ETF | 999 | 46,503 |
| Total Exchange-Traded Fixed Income Funds (Cost $130,855) | 123,807 | |
| Multi-Asset/Tactical Strategies Funds 80.1% | ||
| Shares | Value ($) | |
| Columbia Solutions Aggressive Portfolio(a) | 148,545 | 1,173,502 |
| Columbia Solutions Conservative Portfolio(a) | 8,851 | 78,601 |
| Total Multi-Asset/Tactical Strategies Funds (Cost $1,496,255) | 1,252,103 | |
| Money Market Funds 5.0% | ||
| Columbia Short-Term Cash Fund, 4.983%(a),(b) | 78,661 | 78,645 |
| Total Money Market Funds (Cost $78,617) | 78,645 | |
| Total Investments in Securities (Cost: $1,839,415) | 1,579,992 | |
| Other Assets & Liabilities, Net | (16,504) | |
| Net Assets | 1,563,488 | |
| (a) | As defined in the Investment Company Act of 1940, as amended, an affiliated company is one in which the Fund owns 5% or more of the company’s outstanding voting securities, or a company which is under common ownership or control with the Fund. The value of the holdings and transactions in these affiliated companies during the year ended March 31, 2023 are as follows: |
| Affiliated issuers | Beginning of period($) | Purchases($) | Sales($) | Net change in unrealized appreciation (depreciation)($) | End of period($) | Capital gain distributions($) | Realized gain (loss)($) | Dividends — affiliated issuers ($) | End of period shares |
| Columbia Commodity Strategy Fund, Institutional 3 Class | |||||||||
| 30,247 | 70,865 | (25,865) | (12,891) | 62,356 | — | 7,814 | — | 6,149 | |
| Columbia Short-Term Cash Fund, 4.983% | |||||||||
| 169,766 | 392,113 | (483,277) | 43 | 78,645 | — | (20) | 4,037 | 78,661 | |
| Columbia Solutions Aggressive Portfolio | |||||||||
| 1,158,872 | 322,839 | (130,521) | (177,688) | 1,173,502 | — | (20,817) | 95,989 | 148,545 | |
| Columbia Solutions Conservative Portfolio | |||||||||
| 51,514 | 35,463 | (3,924) | (4,452) | 78,601 | — | (638) | 3,654 | 8,851 | |
| Total | 1,410,399 | (194,988) | 1,393,104 | — | (13,661) | 103,680 | |||
| (b) | The rate shown is the seven-day current annualized yield at March 31, 2023. |
| Columbia Adaptive Retirement Funds | Annual Report 2023 | 37 |
Columbia Adaptive Retirement 2050 Fund, March 31, 2023
| ■ | Level 1 — Valuations based on quoted prices for investments in active markets that the Fund has the ability to access at the measurement date. Valuation adjustments are not applied to Level 1 investments. |
| ■ | Level 2 — Valuations based on other significant observable inputs (including quoted prices for similar securities, interest rates, prepayment speeds, credit risks, etc.). |
| ■ | Level 3 — Valuations based on significant unobservable inputs (including the Fund’s own assumptions and judgment in determining the fair value of investments). |
| Level 1 ($) | Level 2 ($) | Level 3 ($) | Assets at NAV ($) | Total ($) | |
| Investments in Securities | |||||
| Alternative Strategies Funds | 62,356 | — | — | — | 62,356 |
| Exchange-Traded Equity Funds | 63,081 | — | — | — | 63,081 |
| Exchange-Traded Fixed Income Funds | 123,807 | — | — | — | 123,807 |
| Multi-Asset/Tactical Strategies Funds | — | — | — | 1,252,103 | 1,252,103 |
| Money Market Funds | 78,645 | — | — | — | 78,645 |
| Total Investments in Securities | 327,889 | — | — | 1,252,103 | 1,579,992 |
| 38 | Columbia Adaptive Retirement Funds | Annual Report 2023 |
Columbia Adaptive Retirement 2055 Fund, March 31, 2023
| Alternative Strategies Funds 4.0% | ||
| Shares | Value ($) | |
| Columbia Commodity Strategy Fund, Institutional 3 Class(a) | 6,130 | 62,156 |
| Total Alternative Strategies Funds (Cost $65,161) | 62,156 | |
| Exchange-Traded Equity Funds 4.0% | ||
| Real Estate 4.0% | ||
| iShares U.S. Real Estate ETF | 740 | 62,826 |
| Total Exchange-Traded Equity Funds (Cost $68,092) | 62,826 | |
| Exchange-Traded Fixed Income Funds 8.0% | ||
| Emerging Markets 1.0% | ||
| iShares JPMorgan USD Emerging Markets Bond ETF | 174 | 15,013 |
| Inflation Protected Securities 4.0% | ||
| iShares TIPS Bond ETF | 567 | 62,512 |
| Investment Grade 3.0% | ||
| Vanguard Mortgage-Backed Securities ETF | 997 | 46,410 |
| Total Exchange-Traded Fixed Income Funds (Cost $131,403) | 123,935 | |
| Multi-Asset/Tactical Strategies Funds 80.1% | ||
| Shares | Value ($) | |
| Columbia Solutions Aggressive Portfolio(a) | 158,083 | 1,248,855 |
| Total Multi-Asset/Tactical Strategies Funds (Cost $1,516,381) | 1,248,855 | |
| Money Market Funds 5.0% | ||
| Columbia Short-Term Cash Fund, 4.983%(a),(b) | 77,694 | 77,679 |
| Total Money Market Funds (Cost $77,654) | 77,679 | |
| Total Investments in Securities (Cost: $1,858,691) | 1,575,451 | |
| Other Assets & Liabilities, Net | (16,427) | |
| Net Assets | 1,559,024 | |
| (a) | As defined in the Investment Company Act of 1940, as amended, an affiliated company is one in which the Fund owns 5% or more of the company’s outstanding voting securities, or a company which is under common ownership or control with the Fund. The value of the holdings and transactions in these affiliated companies during the year ended March 31, 2023 are as follows: |
| Affiliated issuers | Beginning of period($) | Purchases($) | Sales($) | Net change in unrealized appreciation (depreciation)($) | End of period($) | Capital gain distributions($) | Realized gain (loss)($) | Dividends — affiliated issuers ($) | End of period shares |
| Columbia Commodity Strategy Fund, Institutional 3 Class | |||||||||
| 32,772 | 71,573 | (28,617) | (13,572) | 62,156 | — | 8,623 | — | 6,130 | |
| Columbia Short-Term Cash Fund, 4.983% | |||||||||
| 180,485 | 392,200 | (495,044) | 38 | 77,679 | — | (13) | 4,375 | 77,694 | |
| Columbia Solutions Aggressive Portfolio | |||||||||
| 1,302,586 | 282,644 | (152,627) | (183,748) | 1,248,855 | — | (31,987) | 104,325 | 158,083 | |
| Total | 1,515,843 | (197,282) | 1,388,690 | — | (23,377) | 108,700 | |||
| (b) | The rate shown is the seven-day current annualized yield at March 31, 2023. |
| Columbia Adaptive Retirement Funds | Annual Report 2023 | 39 |
Columbia Adaptive Retirement 2055 Fund, March 31, 2023
pricing an investment. An investment’s level within the fair value hierarchy is based on the lowest level of any input that is deemed significant to the asset’s or liability’s fair value measurement. The input levels are not necessarily an indication of the risk or liquidity associated with investments at that level. For example, certain U.S. government securities are generally high quality and liquid, however, they are reflected as Level 2 because the inputs used to determine fair value may not always be quoted prices in an active market.
| ■ | Level 1 — Valuations based on quoted prices for investments in active markets that the Fund has the ability to access at the measurement date. Valuation adjustments are not applied to Level 1 investments. |
| ■ | Level 2 — Valuations based on other significant observable inputs (including quoted prices for similar securities, interest rates, prepayment speeds, credit risks, etc.). |
| ■ | Level 3 — Valuations based on significant unobservable inputs (including the Fund’s own assumptions and judgment in determining the fair value of investments). |
| Level 1 ($) | Level 2 ($) | Level 3 ($) | Assets at NAV ($) | Total ($) | |
| Investments in Securities | |||||
| Alternative Strategies Funds | 62,156 | — | — | — | 62,156 |
| Exchange-Traded Equity Funds | 62,826 | — | — | — | 62,826 |
| Exchange-Traded Fixed Income Funds | 123,935 | — | — | — | 123,935 |
| Multi-Asset/Tactical Strategies Funds | — | — | — | 1,248,855 | 1,248,855 |
| Money Market Funds | 77,679 | — | — | — | 77,679 |
| Total Investments in Securities | 326,596 | — | — | 1,248,855 | 1,575,451 |
| 40 | Columbia Adaptive Retirement Funds | Annual Report 2023 |
Columbia Adaptive Retirement 2060 Fund, March 31, 2023
| Alternative Strategies Funds 4.0% | ||
| Shares | Value ($) | |
| Columbia Commodity Strategy Fund, Institutional 3 Class(a) | 7,742 | 78,500 |
| Total Alternative Strategies Funds (Cost $82,253) | 78,500 | |
| Exchange-Traded Equity Funds 4.0% | ||
| Real Estate 4.0% | ||
| iShares U.S. Real Estate ETF | 935 | 79,381 |
| Total Exchange-Traded Equity Funds (Cost $85,958) | 79,381 | |
| Exchange-Traded Fixed Income Funds 7.9% | ||
| Emerging Markets 1.0% | ||
| iShares JPMorgan USD Emerging Markets Bond ETF | 216 | 18,637 |
| Inflation Protected Securities 4.0% | ||
| iShares TIPS Bond ETF | 708 | 78,057 |
| Investment Grade 2.9% | ||
| Vanguard Mortgage-Backed Securities ETF | 1,246 | 58,001 |
| Total Exchange-Traded Fixed Income Funds (Cost $164,113) | 154,695 | |
| Multi-Asset/Tactical Strategies Funds 80.1% | ||
| Shares | Value ($) | |
| Columbia Solutions Aggressive Portfolio(a) | 199,675 | 1,577,433 |
| Total Multi-Asset/Tactical Strategies Funds (Cost $1,890,566) | 1,577,433 | |
| Money Market Funds 4.9% | ||
| Columbia Short-Term Cash Fund, 4.983%(a),(b) | 96,776 | 96,757 |
| Total Money Market Funds (Cost $96,725) | 96,757 | |
| Total Investments in Securities (Cost: $2,319,615) | 1,986,766 | |
| Other Assets & Liabilities, Net | (17,595) | |
| Net Assets | 1,969,171 | |
| (a) | As defined in the Investment Company Act of 1940, as amended, an affiliated company is one in which the Fund owns 5% or more of the company’s outstanding voting securities, or a company which is under common ownership or control with the Fund. The value of the holdings and transactions in these affiliated companies during the year ended March 31, 2023 are as follows: |
| Affiliated issuers | Beginning of period($) | Purchases($) | Sales($) | Net change in unrealized appreciation (depreciation)($) | End of period($) | Capital gain distributions($) | Realized gain (loss)($) | Dividends — affiliated issuers ($) | End of period shares |
| Columbia Commodity Strategy Fund, Institutional 3 Class | |||||||||
| 37,097 | 89,968 | (32,984) | (15,581) | 78,500 | — | 9,376 | — | 7,742 | |
| Columbia Short-Term Cash Fund, 4.983% | |||||||||
| 206,841 | 461,907 | (572,038) | 47 | 96,757 | — | (18) | 4,994 | 96,776 | |
| Columbia Solutions Aggressive Portfolio | |||||||||
| 1,508,051 | 429,460 | (119,977) | (240,101) | 1,577,433 | — | (19,667) | 128,602 | 199,675 | |
| Total | 1,751,989 | (255,635) | 1,752,690 | — | (10,309) | 133,596 | |||
| (b) | The rate shown is the seven-day current annualized yield at March 31, 2023. |
| Columbia Adaptive Retirement Funds | Annual Report 2023 | 41 |
Columbia Adaptive Retirement 2060 Fund, March 31, 2023
pricing an investment. An investment’s level within the fair value hierarchy is based on the lowest level of any input that is deemed significant to the asset’s or liability’s fair value measurement. The input levels are not necessarily an indication of the risk or liquidity associated with investments at that level. For example, certain U.S. government securities are generally high quality and liquid, however, they are reflected as Level 2 because the inputs used to determine fair value may not always be quoted prices in an active market.
| ■ | Level 1 — Valuations based on quoted prices for investments in active markets that the Fund has the ability to access at the measurement date. Valuation adjustments are not applied to Level 1 investments. |
| ■ | Level 2 — Valuations based on other significant observable inputs (including quoted prices for similar securities, interest rates, prepayment speeds, credit risks, etc.). |
| ■ | Level 3 — Valuations based on significant unobservable inputs (including the Fund’s own assumptions and judgment in determining the fair value of investments). |
| Level 1 ($) | Level 2 ($) | Level 3 ($) | Assets at NAV ($) | Total ($) | |
| Investments in Securities | |||||
| Alternative Strategies Funds | 78,500 | — | — | — | 78,500 |
| Exchange-Traded Equity Funds | 79,381 | — | — | — | 79,381 |
| Exchange-Traded Fixed Income Funds | 154,695 | — | — | — | 154,695 |
| Multi-Asset/Tactical Strategies Funds | — | — | — | 1,577,433 | 1,577,433 |
| Money Market Funds | 96,757 | — | — | — | 96,757 |
| Total Investments in Securities | 409,333 | — | — | 1,577,433 | 1,986,766 |
| 42 | Columbia Adaptive Retirement Funds | Annual Report 2023 |
March 31, 2023
| Columbia Adaptive Retirement 2020 Fund | Columbia Adaptive Retirement 2025 Fund | Columbia Adaptive Retirement 2030 Fund | |
| Assets | |||
| Investments in securities, at value | |||
| Unaffiliated issuers (cost $168,207, $129,742, $296,953, respectively) | $160,231 | $123,216 | $278,341 |
| Affiliated issuers (cost $1,304,644, $1,017,591, $2,379,060, respectively) | 1,193,331 | 918,838 | 2,089,775 |
| Receivable for: | |||
| Investments sold | 4,525 | 3,465 | 10,392 |
| Dividends | 279 | 222 | 434 |
| Expense reimbursement due from Investment Manager | 260 | 280 | 259 |
| Prepaid expenses | 925 | 923 | 937 |
| Trustees’ deferred compensation plan | 18,174 | 15,090 | 18,077 |
| Total assets | 1,377,725 | 1,062,034 | 2,398,215 |
| Liabilities | |||
| Payable for: | |||
| Investments purchased | 4,821 | 3,405 | 2,997 |
| Management services fees | 16 | 12 | 29 |
| Transfer agent fees | 37 | 21 | 178 |
| Compensation of board members | 12,349 | 12,343 | 12,356 |
| Accounting services fees | 5,610 | 5,610 | 5,610 |
| Legal fees | 2,874 | 2,872 | 2,877 |
| Other expenses | 13 | 22 | 63 |
| Trustees’ deferred compensation plan | 18,174 | 15,090 | 18,077 |
| Total liabilities | 43,894 | 39,375 | 42,187 |
| Net assets applicable to outstanding capital stock | $1,333,831 | $1,022,659 | $2,356,028 |
| Represented by | |||
| Paid in capital | 1,492,077 | 1,144,007 | 2,723,463 |
| Total distributable earnings (loss) | (158,246) | (121,348) | (367,435) |
| Total - representing net assets applicable to outstanding capital stock | $1,333,831 | $1,022,659 | $2,356,028 |
| Advisor Class | |||
| Net assets | $415,354 | $527,818 | $1,500,837 |
| Shares outstanding | 65,415 | 72,665 | 176,180 |
| Net asset value per share | $6.35 | $7.26 | $8.52 |
| Institutional 3 Class | |||
| Net assets | $918,477 | $494,841 | $855,191 |
| Shares outstanding | 144,620 | 68,094 | 100,204 |
| Net asset value per share | $6.35 | $7.27 | $8.53 |
| Columbia Adaptive Retirement Funds | Annual Report 2023 | 43 |
March 31, 2023
| Columbia Adaptive Retirement 2035 Fund | Columbia Adaptive Retirement 2040 Fund | Columbia Adaptive Retirement 2045 Fund | |
| Assets | |||
| Investments in securities, at value | |||
| Unaffiliated issuers (cost $253,379, $192,875, $169,699, respectively) | $242,974 | $181,258 | $160,034 |
| Affiliated issuers (cost $1,963,366, $1,555,072, $1,394,304, respectively) | 1,795,300 | 1,347,168 | 1,196,930 |
| Receivable for: | |||
| Investments sold | 10,069 | 8,755 | 8,115 |
| Dividends | 374 | 300 | 270 |
| Expense reimbursement due from Investment Manager | 289 | 262 | 288 |
| Prepaid expenses | 927 | 927 | 924 |
| Trustees’ deferred compensation plan | 15,045 | 18,032 | 15,041 |
| Total assets | 2,064,978 | 1,556,702 | 1,381,602 |
| Liabilities | |||
| Payable for: | |||
| Investments purchased | 8,316 | 6,474 | 5,925 |
| Management services fees | 25 | 19 | 16 |
| Transfer agent fees | 68 | 44 | 28 |
| Compensation of board members | 12,347 | 12,346 | 12,345 |
| Accounting services fees | 5,610 | 5,610 | 5,610 |
| Legal fees | 2,876 | 2,874 | 2,873 |
| Other expenses | 271 | 260 | 214 |
| Trustees’ deferred compensation plan | 15,045 | 18,032 | 15,041 |
| Total liabilities | 44,558 | 45,659 | 42,052 |
| Net assets applicable to outstanding capital stock | $2,020,420 | $1,511,043 | $1,339,550 |
| Represented by | |||
| Paid in capital | 2,246,563 | 1,792,421 | 1,620,286 |
| Total distributable earnings (loss) | (226,143) | (281,378) | (280,736) |
| Total - representing net assets applicable to outstanding capital stock | $2,020,420 | $1,511,043 | $1,339,550 |
| Advisor Class | |||
| Net assets | $752,976 | $554,137 | $424,879 |
| Shares outstanding | 84,055 | 66,504 | 52,839 |
| Net asset value per share | $8.96 | $8.33 | $8.04 |
| Institutional 3 Class | |||
| Net assets | $1,267,444 | $956,906 | $914,671 |
| Shares outstanding | 141,432 | 114,712 | 113,735 |
| Net asset value per share | $8.96 | $8.34 | $8.04 |
| 44 | Columbia Adaptive Retirement Funds | Annual Report 2023 |
March 31, 2023
| Columbia Adaptive Retirement 2050 Fund | Columbia Adaptive Retirement 2055 Fund | Columbia Adaptive Retirement 2060 Fund | |
| Assets | |||
| Investments in securities, at value | |||
| Unaffiliated issuers (cost $199,190, $199,495, $250,071, respectively) | $186,888 | $186,761 | $234,076 |
| Affiliated issuers (cost $1,640,225, $1,659,196, $2,069,544, respectively) | 1,393,104 | 1,388,690 | 1,752,690 |
| Receivable for: | |||
| Investments sold | 9,073 | 8,830 | 11,243 |
| Dividends | 303 | 297 | 367 |
| Expense reimbursement due from Investment Manager | 263 | 286 | 263 |
| Prepaid expenses | 926 | 925 | 925 |
| Trustees’ deferred compensation plan | 18,030 | 15,041 | 18,030 |
| Total assets | 1,608,587 | 1,600,830 | 2,017,594 |
| Liabilities | |||
| Payable for: | |||
| Investments purchased | 6,122 | 5,829 | 9,187 |
| Management services fees | 19 | 19 | 24 |
| Transfer agent fees | 7 | 21 | 85 |
| Compensation of board members | 12,346 | 12,347 | 12,348 |
| Accounting services fees | 5,610 | 5,610 | 5,610 |
| Legal fees | 2,874 | 2,874 | 2,876 |
| Other expenses | 91 | 65 | 263 |
| Trustees’ deferred compensation plan | 18,030 | 15,041 | 18,030 |
| Total liabilities | 45,099 | 41,806 | 48,423 |
| Net assets applicable to outstanding capital stock | $1,563,488 | $1,559,024 | $1,969,171 |
| Represented by | |||
| Paid in capital | 1,928,114 | 1,952,121 | 2,442,558 |
| Total distributable earnings (loss) | (364,626) | (393,097) | (473,387) |
| Total - representing net assets applicable to outstanding capital stock | $1,563,488 | $1,559,024 | $1,969,171 |
| Advisor Class | |||
| Net assets | $232,306 | $339,250 | $987,377 |
| Shares outstanding | 29,173 | 42,133 | 118,009 |
| Net asset value per share | $7.96 | $8.05 | $8.37 |
| Institutional 3 Class | |||
| Net assets | $1,331,182 | $1,219,774 | $981,794 |
| Shares outstanding | 167,242 | 151,450 | 117,288 |
| Net asset value per share | $7.96 | $8.05 | $8.37 |
| Columbia Adaptive Retirement Funds | Annual Report 2023 | 45 |
Year Ended March 31, 2023
| Columbia Adaptive Retirement 2020 Fund | Columbia Adaptive Retirement 2025 Fund | Columbia Adaptive Retirement 2030 Fund | |
| Net investment income | |||
| Income: | |||
| Dividends — unaffiliated issuers | $5,530 | $4,081 | $9,205 |
| Dividends — affiliated issuers | 56,765 | 47,099 | 115,261 |
| Total income | 62,295 | 51,180 | 124,466 |
| Expenses: | |||
| Management services fees | 6,327 | 4,699 | 10,663 |
| Transfer agent fees | |||
| Advisor Class | 328 | 253 | 2,250 |
| Institutional 3 Class | 95 | 57 | 99 |
| Compensation of board members | 14,431 | 14,426 | 14,445 |
| Custodian fees | 1,459 | 1,405 | 1,525 |
| Printing and postage fees | 7,585 | 7,585 | 7,721 |
| Registration fees | 39,333 | 39,393 | 39,393 |
| Accounting services fees | 12,420 | 11,220 | 11,220 |
| Legal fees | 13,171 | 13,166 | 13,184 |
| Other | 6,677 | 6,673 | 6,690 |
| Total expenses | 101,826 | 98,877 | 107,190 |
| Fees waived or expenses reimbursed by Investment Manager and its affiliates | (96,145) | (94,649) | (95,910) |
| Total net expenses | 5,681 | 4,228 | 11,280 |
| Net investment income | 56,614 | 46,952 | 113,186 |
| Realized and unrealized gain (loss) — net | |||
| Net realized gain (loss) on: | |||
| Investments — unaffiliated issuers | (3,708) | (2,888) | (8,676) |
| Investments — affiliated issuers | (9,042) | (3,473) | (25,760) |
| Net realized loss | (12,750) | (6,361) | (34,436) |
| Net change in unrealized appreciation (depreciation) on: | |||
| Investments — unaffiliated issuers | (13,149) | (9,493) | (19,135) |
| Investments — affiliated issuers | (96,691) | (82,993) | (190,493) |
| Net change in unrealized appreciation (depreciation) | (109,840) | (92,486) | (209,628) |
| Net realized and unrealized loss | (122,590) | (98,847) | (244,064) |
| Net decrease in net assets resulting from operations | $(65,976) | $(51,895) | $(130,878) |
| 46 | Columbia Adaptive Retirement Funds | Annual Report 2023 |
Year Ended March 31, 2023
| Columbia Adaptive Retirement 2035 Fund | Columbia Adaptive Retirement 2040 Fund | Columbia Adaptive Retirement 2045 Fund | |
| Net investment income | |||
| Income: | |||
| Dividends — unaffiliated issuers | $5,877 | $5,787 | $4,979 |
| Dividends — affiliated issuers | 77,805 | 87,887 | 83,500 |
| Total income | 83,682 | 93,674 | 88,479 |
| Expenses: | |||
| Management services fees | 7,205 | 6,717 | 5,809 |
| Transfer agent fees | |||
| Advisor Class | 832 | 538 | 328 |
| Institutional 3 Class | 114 | 104 | 98 |
| Compensation of board members | 14,433 | 14,433 | 14,430 |
| Custodian fees | 1,591 | 1,538 | 1,575 |
| Printing and postage fees | 7,867 | 7,867 | 7,796 |
| Registration fees | 39,393 | 39,333 | 39,393 |
| Accounting services fees | 12,420 | 11,220 | 12,420 |
| Legal fees | 13,174 | 13,172 | 13,169 |
| Other | 6,679 | 6,680 | 6,677 |
| Total expenses | 103,708 | 101,602 | 101,695 |
| Fees waived or expenses reimbursed by Investment Manager and its affiliates | (96,788) | (95,380) | (96,452) |
| Total net expenses | 6,920 | 6,222 | 5,243 |
| Net investment income | 76,762 | 87,452 | 83,236 |
| Realized and unrealized gain (loss) — net | |||
| Net realized gain (loss) on: | |||
| Investments — unaffiliated issuers | (6,173) | (5,515) | (4,673) |
| Investments — affiliated issuers | (19,660) | (13,728) | (10,849) |
| Net realized loss | (25,833) | (19,243) | (15,522) |
| Net change in unrealized appreciation (depreciation) on: | |||
| Investments — unaffiliated issuers | (11,904) | (12,009) | (10,455) |
| Investments — affiliated issuers | (116,144) | (158,066) | (152,767) |
| Net change in unrealized appreciation (depreciation) | (128,048) | (170,075) | (163,222) |
| Net realized and unrealized loss | (153,881) | (189,318) | (178,744) |
| Net decrease in net assets resulting from operations | $(77,119) | $(101,866) | $(95,508) |
| Columbia Adaptive Retirement Funds | Annual Report 2023 | 47 |
Year Ended March 31, 2023
| Columbia Adaptive Retirement 2050 Fund | Columbia Adaptive Retirement 2055 Fund | Columbia Adaptive Retirement 2060 Fund | |
| Net investment income | |||
| Income: | |||
| Dividends — unaffiliated issuers | $5,893 | $6,119 | $7,282 |
| Dividends — affiliated issuers | 103,680 | 108,700 | 133,596 |
| Total income | 109,573 | 114,819 | 140,878 |
| Expenses: | |||
| Management services fees | 6,835 | 7,023 | 8,482 |
| Transfer agent fees | |||
| Advisor Class | 71 | 257 | 1,081 |
| Institutional 3 Class | 116 | 112 | 88 |
| Compensation of board members | 14,433 | 14,434 | 14,438 |
| Custodian fees | 1,542 | 1,511 | 1,498 |
| Printing and postage fees | 7,586 | 7,585 | 7,867 |
| Registration fees | 39,393 | 39,333 | 39,335 |
| Accounting services fees | 12,420 | 12,420 | 11,220 |
| Legal fees | 13,172 | 13,173 | 13,178 |
| Other | 6,680 | 6,680 | 6,682 |
| Total expenses | 102,248 | 102,528 | 103,869 |
| Fees waived or expenses reimbursed by Investment Manager and its affiliates | (96,389) | (96,323) | (95,599) |
| Total net expenses | 5,859 | 6,205 | 8,270 |
| Net investment income | 103,714 | 108,614 | 132,608 |
| Realized and unrealized gain (loss) — net | |||
| Net realized gain (loss) on: | |||
| Investments — unaffiliated issuers | (5,886) | (6,685) | (7,246) |
| Investments — affiliated issuers | (13,661) | (23,377) | (10,309) |
| Net realized loss | (19,547) | (30,062) | (17,555) |
| Net change in unrealized appreciation (depreciation) on: | |||
| Investments — unaffiliated issuers | (12,104) | (11,815) | (14,857) |
| Investments — affiliated issuers | (194,988) | (197,282) | (255,635) |
| Net change in unrealized appreciation (depreciation) | (207,092) | (209,097) | (270,492) |
| Net realized and unrealized loss | (226,639) | (239,159) | (288,047) |
| Net decrease in net assets resulting from operations | $(122,925) | $(130,545) | $(155,439) |
| 48 | Columbia Adaptive Retirement Funds | Annual Report 2023 |
| Columbia Adaptive Retirement 2020 Fund | Columbia Adaptive Retirement 2025 Fund | |||
| Year Ended March 31, 2023 | Year Ended March 31, 2022 | Year Ended March 31, 2023 | Year Ended March 31, 2022 | |
| Operations | ||||
| Net investment income | $56,614 | $38,700 | $46,952 | $27,415 |
| Net realized gain (loss) | (12,750) | 132,151 | (6,361) | 136,032 |
| Net change in unrealized appreciation (depreciation) | (109,840) | (139,117) | (92,486) | (129,173) |
| Net increase (decrease) in net assets resulting from operations | (65,976) | 31,734 | (51,895) | 34,274 |
| Distributions to shareholders | ||||
| Net investment income and net realized gains | ||||
| Advisor Class | (40,213) | (246,760) | (60,341) | (179,043) |
| Institutional 3 Class | (87,364) | (457,996) | (56,400) | (176,417) |
| Total distributions to shareholders | (127,577) | (704,756) | (116,741) | (355,460) |
| Increase in net assets from capital stock activity | 70,430 | 555,351 | 103,917 | 88,348 |
| Total decrease in net assets | (123,123) | (117,671) | (64,719) | (232,838) |
| Net assets at beginning of year | 1,456,954 | 1,574,625 | 1,087,378 | 1,320,216 |
| Net assets at end of year | $1,333,831 | $1,456,954 | $1,022,659 | $1,087,378 |
| Columbia Adaptive Retirement 2020 Fund | Columbia Adaptive Retirement 2025 Fund | |||||||
| Year Ended | Year Ended | Year Ended | Year Ended | |||||
| March 31, 2023 | March 31, 2022 | March 31, 2023 | March 31, 2022 | |||||
| Shares | Dollars ($) | Shares | Dollars ($) | Shares | Dollars ($) | Shares | Dollars ($) | |
| Capital stock activity | ||||||||
| Advisor Class | ||||||||
| Subscriptions | 308 | 2,087 | 2,467 | 27,634 | 657 | 5,166 | 315 | 3,272 |
| Distributions reinvested | 6,434 | 40,213 | 32,089 | 246,760 | 8,439 | 60,341 | 19,806 | 179,043 |
| Redemptions | (31) | (210) | (53,492) | (461,631) | (19) | (148) | (21,838) | (194,585) |
| Net increase (decrease) | 6,711 | 42,090 | (18,936) | (187,237) | 9,077 | 65,359 | (1,717) | (12,270) |
| Institutional 3 Class | ||||||||
| Subscriptions | 10,405 | 70,798 | 72,067 | 789,264 | 1,145 | 8,795 | 10,845 | 121,478 |
| Distributions reinvested | 13,978 | 87,363 | 59,557 | 457,996 | 7,888 | 56,400 | 19,515 | 176,417 |
| Redemptions | (19,056) | (129,821) | (58,858) | (504,672) | (3,290) | (26,637) | (22,069) | (197,277) |
| Net increase | 5,327 | 28,340 | 72,766 | 742,588 | 5,743 | 38,558 | 8,291 | 100,618 |
| Total net increase | 12,038 | 70,430 | 53,830 | 555,351 | 14,820 | 103,917 | 6,574 | 88,348 |
| Columbia Adaptive Retirement Funds | Annual Report 2023 | 49 |
| Columbia Adaptive Retirement 2030 Fund | Columbia Adaptive Retirement 2035 Fund | |||
| Year Ended March 31, 2023 | Year Ended March 31, 2022 | Year Ended March 31, 2023 | Year Ended March 31, 2022 | |
| Operations | ||||
| Net investment income | $113,186 | $55,400 | $76,762 | $36,024 |
| Net realized gain (loss) | (34,436) | 315,788 | (25,833) | 254,868 |
| Net change in unrealized appreciation (depreciation) | (209,628) | (287,482) | (128,048) | (214,696) |
| Net increase (decrease) in net assets resulting from operations | (130,878) | 83,706 | (77,119) | 76,196 |
| Distributions to shareholders | ||||
| Net investment income and net realized gains | ||||
| Advisor Class | (172,798) | (181,978) | (78,288) | (115,438) |
| Institutional 3 Class | (95,731) | (113,059) | (131,953) | (103,539) |
| Total distributions to shareholders | (268,529) | (295,037) | (210,241) | (218,977) |
| Increase (decrease) in net assets from capital stock activity | 290,533 | 67,566 | 833,130 | (103,813) |
| Total increase (decrease) in net assets | (108,874) | (143,765) | 545,770 | (246,594) |
| Net assets at beginning of year | 2,464,902 | 2,608,667 | 1,474,650 | 1,721,244 |
| Net assets at end of year | $2,356,028 | $2,464,902 | $2,020,420 | $1,474,650 |
| Columbia Adaptive Retirement 2030 Fund | Columbia Adaptive Retirement 2035 Fund | |||||||
| Year Ended | Year Ended | Year Ended | Year Ended | |||||
| March 31, 2023 | March 31, 2022 | March 31, 2023 | March 31, 2022 | |||||
| Shares | Dollars ($) | Shares | Dollars ($) | Shares | Dollars ($) | Shares | Dollars ($) | |
| Capital stock activity | ||||||||
| Advisor Class | ||||||||
| Subscriptions | — | — | — | — | 606 | 5,841 | 311 | 3,643 |
| Distributions reinvested | 20,620 | 172,797 | 16,976 | 181,978 | 8,896 | 78,287 | 10,261 | 115,438 |
| Redemptions | — | — | (46,372) | (501,000) | (22) | (211) | (32,196) | (363,625) |
| Net increase (decrease) | 20,620 | 172,797 | (29,396) | (319,022) | 9,480 | 83,917 | (21,624) | (244,544) |
| Institutional 3 Class | ||||||||
| Subscriptions | 13,444 | 125,592 | 74,057 | 830,072 | 68,514 | 674,334 | 40,484 | 477,841 |
| Distributions reinvested | 11,410 | 95,731 | 10,526 | 113,058 | 14,995 | 131,953 | 9,204 | 103,539 |
| Redemptions | (10,537) | (103,587) | (51,106) | (556,542) | (5,744) | (57,074) | (38,754) | (440,649) |
| Net increase | 14,317 | 117,736 | 33,477 | 386,588 | 77,765 | 749,213 | 10,934 | 140,731 |
| Total net increase (decrease) | 34,937 | 290,533 | 4,081 | 67,566 | 87,245 | 833,130 | (10,690) | (103,813) |
| 50 | Columbia Adaptive Retirement Funds | Annual Report 2023 |
| Columbia Adaptive Retirement 2040 Fund | Columbia Adaptive Retirement 2045 Fund | |||
| Year Ended March 31, 2023 | Year Ended March 31, 2022 | Year Ended March 31, 2023 | Year Ended March 31, 2022 | |
| Operations | ||||
| Net investment income | $87,452 | $36,640 | $83,236 | $34,183 |
| Net realized gain (loss) | (19,243) | 289,863 | (15,522) | 306,758 |
| Net change in unrealized appreciation (depreciation) | (170,075) | (237,079) | (163,222) | (236,366) |
| Net increase (decrease) in net assets resulting from operations | (101,866) | 89,424 | (95,508) | 104,575 |
| Distributions to shareholders | ||||
| Net investment income and net realized gains | ||||
| Advisor Class | (95,131) | (100,364) | (89,349) | (91,037) |
| Institutional 3 Class | (159,837) | (141,814) | (182,434) | (155,103) |
| Total distributions to shareholders | (254,968) | (242,178) | (271,783) | (246,140) |
| Increase (decrease) in net assets from capital stock activity | 358,146 | 78,972 | 419,661 | (1,351) |
| Total increase (decrease) in net assets | 1,312 | (73,782) | 52,370 | (142,916) |
| Net assets at beginning of year | 1,509,731 | 1,583,513 | 1,287,180 | 1,430,096 |
| Net assets at end of year | $1,511,043 | $1,509,731 | $1,339,550 | $1,287,180 |
| Columbia Adaptive Retirement 2040 Fund | Columbia Adaptive Retirement 2045 Fund | |||||||
| Year Ended | Year Ended | Year Ended | Year Ended | |||||
| March 31, 2023 | March 31, 2022 | March 31, 2023 | March 31, 2022 | |||||
| Shares | Dollars ($) | Shares | Dollars ($) | Shares | Dollars ($) | Shares | Dollars ($) | |
| Capital stock activity | ||||||||
| Advisor Class | ||||||||
| Subscriptions | 488 | 4,629 | 384 | 4,695 | 848 | 8,260 | 368 | 4,490 |
| Distributions reinvested | 11,630 | 95,131 | 8,743 | 100,364 | 11,325 | 89,348 | 7,735 | 91,037 |
| Redemptions | (16) | (150) | (33,521) | (387,698) | (7) | (73) | (33,718) | (399,298) |
| Net increase (decrease) | 12,102 | 99,610 | (24,394) | (282,639) | 12,166 | 97,535 | (25,615) | (303,771) |
| Institutional 3 Class | ||||||||
| Subscriptions | 10,967 | 103,966 | 53,292 | 643,089 | 16,582 | 155,383 | 57,569 | 711,804 |
| Distributions reinvested | 19,516 | 159,837 | 12,342 | 141,814 | 23,122 | 182,434 | 13,178 | 155,103 |
| Redemptions | (526) | (5,267) | (36,672) | (423,292) | (1,553) | (15,691) | (47,766) | (564,487) |
| Net increase | 29,957 | 258,536 | 28,962 | 361,611 | 38,151 | 322,126 | 22,981 | 302,420 |
| Total net increase (decrease) | 42,059 | 358,146 | 4,568 | 78,972 | 50,317 | 419,661 | (2,634) | (1,351) |
| Columbia Adaptive Retirement Funds | Annual Report 2023 | 51 |
| Columbia Adaptive Retirement 2050 Fund | Columbia Adaptive Retirement 2055 Fund | |||
| Year Ended March 31, 2023 | Year Ended March 31, 2022 | Year Ended March 31, 2023 | Year Ended March 31, 2022 | |
| Operations | ||||
| Net investment income | $103,714 | $33,851 | $108,614 | $36,086 |
| Net realized gain (loss) | (19,547) | 327,544 | (30,062) | 351,612 |
| Net change in unrealized appreciation (depreciation) | (207,092) | (258,926) | (209,097) | (277,797) |
| Net increase (decrease) in net assets resulting from operations | (122,925) | 102,469 | (130,545) | 109,901 |
| Distributions to shareholders | ||||
| Net investment income and net realized gains | ||||
| Advisor Class | (49,003) | (70,134) | (72,494) | (79,302) |
| Institutional 3 Class | (272,262) | (220,725) | (257,404) | (201,513) |
| Total distributions to shareholders | (321,265) | (290,859) | (329,898) | (280,815) |
| Increase in net assets from capital stock activity | 494,110 | 404,338 | 390,961 | 392,350 |
| Total increase (decrease) in net assets | 49,920 | 215,948 | (69,482) | 221,436 |
| Net assets at beginning of year | 1,513,568 | 1,297,620 | 1,628,506 | 1,407,070 |
| Net assets at end of year | $1,563,488 | $1,513,568 | $1,559,024 | $1,628,506 |
| Columbia Adaptive Retirement 2050 Fund | Columbia Adaptive Retirement 2055 Fund | |||||||
| Year Ended | Year Ended | Year Ended | Year Ended | |||||
| March 31, 2023 | March 31, 2022 | March 31, 2023 | March 31, 2022 | |||||
| Shares | Dollars ($) | Shares | Dollars ($) | Shares | Dollars ($) | Shares | Dollars ($) | |
| Capital stock activity | ||||||||
| Advisor Class | ||||||||
| Subscriptions | 830 | 7,828 | 515 | 6,513 | 558 | 5,324 | 279 | 3,528 |
| Distributions reinvested | 6,274 | 49,003 | 5,949 | 70,134 | 9,188 | 72,494 | 6,614 | 79,302 |
| Redemptions | (32) | (306) | (37,293) | (452,800) | (15) | (149) | (36,841) | (451,085) |
| Net increase (decrease) | 7,072 | 56,525 | (30,829) | (376,153) | 9,731 | 77,669 | (29,948) | (368,255) |
| Institutional 3 Class | ||||||||
| Subscriptions | 22,367 | 213,278 | 90,077 | 1,137,735 | 17,057 | 165,702 | 86,892 | 1,096,724 |
| Distributions reinvested | 34,906 | 272,262 | 18,721 | 220,725 | 32,624 | 257,404 | 16,807 | 201,512 |
| Redemptions | (4,722) | (47,955) | (46,808) | (577,969) | (10,683) | (109,814) | (43,722) | (537,631) |
| Net increase | 52,551 | 437,585 | 61,990 | 780,491 | 38,998 | 313,292 | 59,977 | 760,605 |
| Total net increase | 59,623 | 494,110 | 31,161 | 404,338 | 48,729 | 390,961 | 30,029 | 392,350 |
| 52 | Columbia Adaptive Retirement Funds | Annual Report 2023 |
| Columbia Adaptive Retirement 2060 Fund | ||
| Year Ended March 31, 2023 | Year Ended March 31, 2022 | |
| Operations | ||
| Net investment income | $132,608 | $37,449 |
| Net realized gain (loss) | (17,555) | 342,067 |
| Net change in unrealized appreciation (depreciation) | (270,492) | (267,411) |
| Net increase (decrease) in net assets resulting from operations | (155,439) | 112,105 |
| Distributions to shareholders | ||
| Net investment income and net realized gains | ||
| Advisor Class | (194,159) | (146,687) |
| Institutional 3 Class | (186,356) | (138,628) |
| Total distributions to shareholders | (380,515) | (285,315) |
| Increase in net assets from capital stock activity | 619,770 | 486,252 |
| Total increase in net assets | 83,816 | 313,042 |
| Net assets at beginning of year | 1,885,355 | 1,572,313 |
| Net assets at end of year | $1,969,171 | $1,885,355 |
| Columbia Adaptive Retirement 2060 Fund | ||||
| Year Ended | Year Ended | |||
| March 31, 2023 | March 31, 2022 | |||
| Shares | Dollars ($) | Shares | Dollars ($) | |
| Capital stock activity | ||||
| Advisor Class | ||||
| Subscriptions | 3,036 | 26,058 | 32,763 | 414,013 |
| Distributions reinvested | 23,678 | 194,159 | 11,975 | 146,687 |
| Redemptions | (29) | (279) | (28,630) | (344,127) |
| Net increase | 26,685 | 219,938 | 16,108 | 216,573 |
| Institutional 3 Class | ||||
| Subscriptions | 27,117 | 266,485 | 44,852 | 571,184 |
| Distributions reinvested | 22,726 | 186,356 | 11,316 | 138,627 |
| Redemptions | (5,424) | (53,009) | (36,098) | (440,132) |
| Net increase | 44,419 | 399,832 | 20,070 | 269,679 |
| Total net increase | 71,104 | 619,770 | 36,178 | 486,252 |
| Columbia Adaptive Retirement Funds | Annual Report 2023 | 53 |
Columbia Adaptive Retirement 2020 Fund
| Net asset value, beginning of period | Net investment income | Net realized and unrealized gain (loss) | Total from investment operations | Distributions from net investment income | Distributions from net realized gains | Total distributions to shareholders | |
| Advisor Class | |||||||
| Year Ended 3/31/2023 | $7.36 | 0.29 | (0.62) | (0.33) | (0.27) | (0.41) | (0.68) |
| Year Ended 3/31/2022 | $10.92 | 0.20 | 0.07(c) | 0.27 | (0.48) | (3.35) | (3.83) |
| Year Ended 3/31/2021 | $10.12 | 0.11 | 1.02 | 1.13 | (0.26) | (0.07) | (0.33) |
| Year Ended 3/31/2020 | $10.17 | 0.21 | 0.19 | 0.40 | (0.41) | (0.04) | (0.45) |
| Year Ended 3/31/2019 | $10.04 | 0.33 | 0.18 | 0.51 | (0.35) | (0.03) | (0.38) |
| Institutional 3 Class | |||||||
| Year Ended 3/31/2023 | $7.36 | 0.28 | (0.60) | (0.32) | (0.28) | (0.41) | (0.69) |
| Year Ended 3/31/2022 | $10.92 | 0.20 | 0.08(c) | 0.28 | (0.49) | (3.35) | (3.84) |
| Year Ended 3/31/2021 | $10.12 | 0.11 | 1.02 | 1.13 | (0.26) | (0.07) | (0.33) |
| Year Ended 3/31/2020 | $10.17 | 0.21 | 0.19 | 0.40 | (0.41) | (0.04) | (0.45) |
| Year Ended 3/31/2019 | $10.04 | 0.33 | 0.18 | 0.51 | (0.35) | (0.03) | (0.38) |
| Notes to Financial Highlights | |
| (a) | In addition to the fees and expenses that the Fund bears directly, the Fund indirectly bears a pro rata share of the fees and expenses of any other funds in which it invests. Such indirect expenses are not included in the Fund’s reported expense ratios. |
| (b) | Total net expenses include the impact of certain fee waivers/expense reimbursements made by the Investment Manager and certain of its affiliates, if applicable. |
| (c) | Calculation of the net gain (loss) per share (both realized and unrealized) does not correlate to the aggregate realized and unrealized gain (loss) presented in the Statement of Operations due to the timing of subscriptions and redemptions of Fund shares in relation to fluctuations in the market value of the portfolio. |
| 54 | Columbia Adaptive Retirement Funds | Annual Report 2023 |
Columbia Adaptive Retirement 2020 Fund
| Net asset value, end of period | Total return | Total gross expense ratio to average net assets(a) | Total net expense ratio to average net assets(a),(b) | Net investment income ratio to average net assets | Portfolio turnover | Net assets, end of period (000’s) | |
| Advisor Class | |||||||
| Year Ended 3/31/2023 | $6.35 | (4.30%) | 7.51% | 0.47% | 4.28% | 17% | $415 |
| Year Ended 3/31/2022 | $7.36 | 1.01% | 5.30% | 0.43% | 1.98% | 79% | $432 |
| Year Ended 3/31/2021 | $10.92 | 11.14% | 1.78% | 0.45% | 1.03% | 36% | $848 |
| Year Ended 3/31/2020 | $10.12 | 3.80% | 1.52% | 0.43% | 2.05% | 25% | $3,791 |
| Year Ended 3/31/2019 | $10.17 | 5.41% | 1.87% | 0.42% | 3.27% | 26% | $3,809 |
| Institutional 3 Class | |||||||
| Year Ended 3/31/2023 | $6.35 | (4.23%) | 7.41% | 0.39% | 4.08% | 17% | $918 |
| Year Ended 3/31/2022 | $7.36 | 1.04% | 5.32% | 0.39% | 2.00% | 79% | $1,025 |
| Year Ended 3/31/2021 | $10.92 | 11.14% | 1.73% | 0.44% | 1.02% | 36% | $727 |
| Year Ended 3/31/2020 | $10.12 | 3.80% | 1.52% | 0.42% | 2.05% | 25% | $3,791 |
| Year Ended 3/31/2019 | $10.17 | 5.41% | 1.87% | 0.42% | 3.27% | 26% | $3,809 |
| Columbia Adaptive Retirement Funds | Annual Report 2023 | 55 |
Columbia Adaptive Retirement 2025 Fund
| Net asset value, beginning of period | Net investment income | Net realized and unrealized gain (loss) | Total from investment operations | Distributions from net investment income | Distributions from net realized gains | Total distributions to shareholders | |
| Advisor Class | |||||||
| Year Ended 3/31/2023 | $8.63 | 0.37 | (0.80) | (0.43) | (0.34) | (0.60) | (0.94) |
| Year Ended 3/31/2022 | $11.06 | 0.21 | 0.09 | 0.30 | (0.56) | (2.17) | (2.73) |
| Year Ended 3/31/2021 | $10.06 | 0.12 | 1.25 | 1.37 | (0.28) | (0.09) | (0.37) |
| Year Ended 3/31/2020 | $10.14 | 0.22 | 0.19 | 0.41 | (0.43) | (0.06) | (0.49) |
| Year Ended 3/31/2019(c) | $10.00 | 0.34 | 0.20 | 0.54 | (0.38) | (0.02) | (0.40) |
| Institutional 3 Class | |||||||
| Year Ended 3/31/2023 | $8.64 | 0.37 | (0.79) | (0.42) | (0.35) | (0.60) | (0.95) |
| Year Ended 3/31/2022 | $11.06 | 0.21 | 0.11 | 0.32 | (0.57) | (2.17) | (2.74) |
| Year Ended 3/31/2021 | $10.06 | 0.11 | 1.26 | 1.37 | (0.28) | (0.09) | (0.37) |
| Year Ended 3/31/2020 | $10.14 | 0.22 | 0.19 | 0.41 | (0.43) | (0.06) | (0.49) |
| Year Ended 3/31/2019(c) | $10.00 | 0.34 | 0.20 | 0.54 | (0.38) | (0.02) | (0.40) |
| Notes to Financial Highlights | |
| (a) | In addition to the fees and expenses that the Fund bears directly, the Fund indirectly bears a pro rata share of the fees and expenses of any other funds in which it invests. Such indirect expenses are not included in the Fund’s reported expense ratios. |
| (b) | Total net expenses include the impact of certain fee waivers/expense reimbursements made by the Investment Manager and certain of its affiliates, if applicable. |
| (c) | The Fund commenced operations on April 4, 2018. Per share data and total return reflect activity from that date. |
| 56 | Columbia Adaptive Retirement Funds | Annual Report 2023 |
Columbia Adaptive Retirement 2025 Fund
| Net asset value, end of period | Total return | Total gross expense ratio to average net assets(a) | Total net expense ratio to average net assets(a),(b) | Net investment income ratio to average net assets | Portfolio turnover | Net assets, end of period (000’s) | |
| Advisor Class | |||||||
| Year Ended 3/31/2023 | $7.26 | (4.79%) | 9.76% | 0.44% | 4.62% | 12% | $528 |
| Year Ended 3/31/2022 | $8.63 | 1.63% | 7.09% | 0.43% | 1.90% | 48% | $549 |
| Year Ended 3/31/2021 | $11.06 | 13.63% | 3.10% | 0.45% | 1.09% | 40% | $722 |
| Year Ended 3/31/2020 | $10.06 | 3.89% | 2.78% | 0.42% | 2.13% | 29% | $1,761 |
| Year Ended 3/31/2019(c) | $10.14 | 5.71% | 3.75% | 0.42% | 3.50% | 28% | $1,775 |
| Institutional 3 Class | |||||||
| Year Ended 3/31/2023 | $7.27 | (4.73%) | 9.71% | 0.39% | 4.62% | 12% | $495 |
| Year Ended 3/31/2022 | $8.64 | 1.78% | 7.07% | 0.39% | 1.95% | 48% | $538 |
| Year Ended 3/31/2021 | $11.06 | 13.63% | 3.09% | 0.44% | 1.07% | 40% | $598 |
| Year Ended 3/31/2020 | $10.06 | 3.89% | 2.78% | 0.42% | 2.13% | 29% | $1,761 |
| Year Ended 3/31/2019(c) | $10.14 | 5.71% | 3.75% | 0.42% | 3.50% | 28% | $1,775 |
| Columbia Adaptive Retirement Funds | Annual Report 2023 | 57 |
Columbia Adaptive Retirement 2030 Fund
| Net asset value, beginning of period | Net investment income | Net realized and unrealized gain (loss) | Total from investment operations | Distributions from net investment income | Distributions from net realized gains | Total distributions to shareholders | |
| Advisor Class | |||||||
| Year Ended 3/31/2023 | $10.20 | 0.45 | (1.02) | (0.57) | (0.43) | (0.68) | (1.11) |
| Year Ended 3/31/2022 | $10.99 | 0.20 | 0.08 | 0.28 | (0.65) | (0.42) | (1.07) |
| Year Ended 3/31/2021 | $9.82 | 0.08 | 1.53 | 1.61 | (0.29) | (0.15) | (0.44) |
| Year Ended 3/31/2020 | $9.91 | 0.31 | 0.07 | 0.38 | (0.45) | (0.02) | (0.47) |
| Year Ended 3/31/2019 | $10.05 | 0.35 | 0.20 | 0.55 | (0.41) | (0.28) | (0.69) |
| Institutional 3 Class | |||||||
| Year Ended 3/31/2023 | $10.22 | 0.47 | (1.03) | (0.56) | (0.45) | (0.68) | (1.13) |
| Year Ended 3/31/2022 | $11.00 | 0.22 | 0.09 | 0.31 | (0.67) | (0.42) | (1.09) |
| Year Ended 3/31/2021 | $9.83 | 0.10 | 1.52 | 1.62 | (0.30) | (0.15) | (0.45) |
| Year Ended 3/31/2020 | $9.92 | 0.23 | 0.16 | 0.39 | (0.46) | (0.02) | (0.48) |
| Year Ended 3/31/2019 | $10.05 | 0.34 | 0.22 | 0.56 | (0.41) | (0.28) | (0.69) |
| Notes to Financial Highlights | |
| (a) | In addition to the fees and expenses that the Fund bears directly, the Fund indirectly bears a pro rata share of the fees and expenses of any other funds in which it invests. Such indirect expenses are not included in the Fund’s reported expense ratios. |
| (b) | Total net expenses include the impact of certain fee waivers/expense reimbursements made by the Investment Manager and certain of its affiliates, if applicable. |
| 58 | Columbia Adaptive Retirement Funds | Annual Report 2023 |
Columbia Adaptive Retirement 2030 Fund
| Net asset value, end of period | Total return | Total gross expense ratio to average net assets(a) | Total net expense ratio to average net assets(a),(b) | Net investment income ratio to average net assets | Portfolio turnover | Net assets, end of period (000’s) | |
| Advisor Class | |||||||
| Year Ended 3/31/2023 | $8.52 | (5.40%) | 4.70% | 0.54% | 4.83% | 16% | $1,501 |
| Year Ended 3/31/2022 | $10.20 | 2.11% | 3.68% | 0.52% | 1.75% | 70% | $1,587 |
| Year Ended 3/31/2021 | $10.99 | 16.43% | 3.87% | 0.55% | 0.77% | 25% | $2,032 |
| Year Ended 3/31/2020 | $9.82 | 3.65% | 5.30% | 0.52% | 3.00% | 41% | $1,738 |
| Year Ended 3/31/2019 | $9.91 | 6.19% | 8.55% | 0.45% | 3.40% | 23% | $645 |
| Institutional 3 Class | |||||||
| Year Ended 3/31/2023 | $8.53 | (5.34%) | 4.56% | 0.39% | 5.05% | 16% | $855 |
| Year Ended 3/31/2022 | $10.22 | 2.32% | 3.56% | 0.40% | 1.94% | 70% | $878 |
| Year Ended 3/31/2021 | $11.00 | 16.51% | 3.77% | 0.44% | 0.91% | 25% | $577 |
| Year Ended 3/31/2020 | $9.83 | 3.68% | 5.21% | 0.42% | 2.20% | 41% | $495 |
| Year Ended 3/31/2019 | $9.92 | 6.31% | 8.52% | 0.43% | 3.34% | 23% | $500 |
| Columbia Adaptive Retirement Funds | Annual Report 2023 | 59 |
Columbia Adaptive Retirement 2035 Fund
| Net asset value, beginning of period | Net investment income | Net realized and unrealized gain (loss) | Total from investment operations | Distributions from net investment income | Distributions from net realized gains | Total distributions to shareholders | |
| Advisor Class | |||||||
| Year Ended 3/31/2023 | $10.66 | 0.52 | (1.18) | (0.66) | (0.36) | (0.68) | (1.04) |
| Year Ended 3/31/2022 | $11.56 | 0.21 | 0.20 | 0.41 | (0.82) | (0.49) | (1.31) |
| Year Ended 3/31/2021 | $9.99 | 0.10 | 1.92 | 2.02 | (0.32) | (0.13) | (0.45) |
| Year Ended 3/31/2020 | $10.13 | 0.31 | 0.13 | 0.44 | (0.52) | (0.06) | (0.58) |
| Year Ended 3/31/2019(c) | $10.00 | 0.40 | 0.18 | 0.58 | (0.43) | (0.02) | (0.45) |
| Institutional 3 Class | |||||||
| Year Ended 3/31/2023 | $10.67 | 0.43 | (1.08) | (0.65) | (0.38) | (0.68) | (1.06) |
| Year Ended 3/31/2022 | $11.56 | 0.23 | 0.20 | 0.43 | (0.83) | (0.49) | (1.32) |
| Year Ended 3/31/2021 | $10.00 | 0.11 | 1.91 | 2.02 | (0.33) | (0.13) | (0.46) |
| Year Ended 3/31/2020 | $10.13 | 0.25 | 0.20 | 0.45 | (0.52) | (0.06) | (0.58) |
| Year Ended 3/31/2019(c) | $10.00 | 0.40 | 0.18 | 0.58 | (0.43) | (0.02) | (0.45) |
| Notes to Financial Highlights | |
| (a) | In addition to the fees and expenses that the Fund bears directly, the Fund indirectly bears a pro rata share of the fees and expenses of any other funds in which it invests. Such indirect expenses are not included in the Fund’s reported expense ratios. |
| (b) | Total net expenses include the impact of certain fee waivers/expense reimbursements made by the Investment Manager and certain of its affiliates, if applicable. |
| (c) | The Fund commenced operations on April 4, 2018. Per share data and total return reflect activity from that date. |
| 60 | Columbia Adaptive Retirement Funds | Annual Report 2023 |
Columbia Adaptive Retirement 2035 Fund
| Net asset value, end of period | Total return | Total gross expense ratio to average net assets(a) | Total net expense ratio to average net assets(a),(b) | Net investment income ratio to average net assets | Portfolio turnover | Net assets, end of period (000’s) | |
| Advisor Class | |||||||
| Year Ended 3/31/2023 | $8.96 | (5.97%) | 6.70% | 0.50% | 5.37% | 15% | $753 |
| Year Ended 3/31/2022 | $10.66 | 2.97% | 5.43% | 0.48% | 1.80% | 72% | $795 |
| Year Ended 3/31/2021 | $11.56 | 20.36% | 5.61% | 0.52% | 0.90% | 29% | $1,112 |
| Year Ended 3/31/2020 | $9.99 | 3.97% | 6.94% | 0.48% | 2.90% | 42% | $924 |
| Year Ended 3/31/2019(c) | $10.13 | 6.31% | 11.96% | 0.43% | 4.04% | 32% | $507 |
| Institutional 3 Class | |||||||
| Year Ended 3/31/2023 | $8.96 | (5.96%) | 6.61% | 0.39% | 4.52% | 15% | $1,267 |
| Year Ended 3/31/2022 | $10.67 | 3.14% | 5.36% | 0.40% | 1.94% | 72% | $679 |
| Year Ended 3/31/2021 | $11.56 | 20.32% | 5.56% | 0.44% | 1.03% | 29% | $610 |
| Year Ended 3/31/2020 | $10.00 | 4.09% | 6.89% | 0.42% | 2.37% | 42% | $500 |
| Year Ended 3/31/2019(c) | $10.13 | 6.31% | 11.96% | 0.43% | 4.04% | 32% | $507 |
| Columbia Adaptive Retirement Funds | Annual Report 2023 | 61 |
Columbia Adaptive Retirement 2040 Fund
| Net asset value, beginning of period | Net investment income | Net realized and unrealized gain (loss) | Total from investment operations | Distributions from net investment income | Distributions from net realized gains | Total distributions to shareholders | |
| Advisor Class | |||||||
| Year Ended 3/31/2023 | $10.84 | 0.56 | (1.33) | (0.77) | (0.58) | (1.16) | (1.74) |
| Year Ended 3/31/2022 | $11.76 | 0.22 | 0.32 | 0.54 | (0.99) | (0.47) | (1.46) |
| Year Ended 3/31/2021 | $10.01 | 0.12 | 2.26 | 2.38 | (0.36) | (0.27) | (0.63) |
| Year Ended 3/31/2020 | $10.15 | 0.27 | 0.18 | 0.45 | (0.55) | (0.04) | (0.59) |
| Year Ended 3/31/2019 | $10.05 | 0.43 | 0.16 | 0.59 | (0.45) | (0.04) | (0.49) |
| Institutional 3 Class | |||||||
| Year Ended 3/31/2023 | $10.85 | 0.58 | (1.34) | (0.76) | (0.59) | (1.16) | (1.75) |
| Year Ended 3/31/2022 | $11.77 | 0.23 | 0.32 | 0.55 | (1.00) | (0.47) | (1.47) |
| Year Ended 3/31/2021 | $10.01 | 0.13 | 2.26 | 2.39 | (0.36) | (0.27) | (0.63) |
| Year Ended 3/31/2020 | $10.15 | 0.26 | 0.19 | 0.45 | (0.55) | (0.04) | (0.59) |
| Year Ended 3/31/2019 | $10.05 | 0.44 | 0.15 | 0.59 | (0.45) | (0.04) | (0.49) |
| Notes to Financial Highlights | |
| (a) | In addition to the fees and expenses that the Fund bears directly, the Fund indirectly bears a pro rata share of the fees and expenses of any other funds in which it invests. Such indirect expenses are not included in the Fund’s reported expense ratios. |
| (b) | Total net expenses include the impact of certain fee waivers/expense reimbursements made by the Investment Manager and certain of its affiliates, if applicable. |
| 62 | Columbia Adaptive Retirement Funds | Annual Report 2023 |
Columbia Adaptive Retirement 2040 Fund
| Net asset value, end of period | Total return | Total gross expense ratio to average net assets(a) | Total net expense ratio to average net assets(a),(b) | Net investment income ratio to average net assets | Portfolio turnover | Net assets, end of period (000’s) | |
| Advisor Class | |||||||
| Year Ended 3/31/2023 | $8.33 | (6.82%) | 7.04% | 0.49% | 5.88% | 13% | $554 |
| Year Ended 3/31/2022 | $10.84 | 3.89% | 5.33% | 0.47% | 1.81% | 79% | $590 |
| Year Ended 3/31/2021 | $11.76 | 23.95% | 6.19% | 0.50% | 1.04% | 28% | $927 |
| Year Ended 3/31/2020 | $10.01 | 4.03% | 7.83% | 0.45% | 2.51% | 41% | $598 |
| Year Ended 3/31/2019 | $10.15 | 6.54% | 10.76% | 0.43% | 4.26% | 30% | $527 |
| Institutional 3 Class | |||||||
| Year Ended 3/31/2023 | $8.34 | (6.73%) | 6.97% | 0.39% | 6.11% | 13% | $957 |
| Year Ended 3/31/2022 | $10.85 | 3.94% | 5.31% | 0.40% | 1.92% | 79% | $920 |
| Year Ended 3/31/2021 | $11.77 | 24.10% | 6.15% | 0.44% | 1.15% | 28% | $657 |
| Year Ended 3/31/2020 | $10.01 | 4.05% | 7.84% | 0.42% | 2.45% | 41% | $513 |
| Year Ended 3/31/2019 | $10.15 | 6.55% | 10.75% | 0.43% | 4.34% | 30% | $508 |
| Columbia Adaptive Retirement Funds | Annual Report 2023 | 63 |
Columbia Adaptive Retirement 2045 Fund
| Net asset value, beginning of period | Net investment income | Net realized and unrealized gain (loss) | Total from investment operations | Distributions from net investment income | Distributions from net realized gains | Total distributions to shareholders | |
| Advisor Class | |||||||
| Year Ended 3/31/2023 | $11.07 | 0.62 | (1.49) | (0.87) | (0.65) | (1.51) | (2.16) |
| Year Ended 3/31/2022 | $12.03 | 0.23 | 0.43 | 0.66 | (1.16) | (0.46) | (1.62) |
| Year Ended 3/31/2021 | $9.87 | 0.15 | 2.59 | 2.74 | (0.41) | (0.17) | (0.58) |
| Year Ended 3/31/2020 | $10.12 | 0.28 | 0.17 | 0.45 | (0.60) | (0.10) | (0.70) |
| Year Ended 3/31/2019(c) | $10.00 | 0.45 | 0.16 | 0.61 | (0.46) | (0.03) | (0.49) |
| Institutional 3 Class | |||||||
| Year Ended 3/31/2023 | $11.07 | 0.63 | (1.50) | (0.87) | (0.65) | (1.51) | (2.16) |
| Year Ended 3/31/2022 | $12.03 | 0.24 | 0.42 | 0.66 | (1.16) | (0.46) | (1.62) |
| Year Ended 3/31/2021 | $9.87 | 0.14 | 2.60 | 2.74 | (0.41) | (0.17) | (0.58) |
| Year Ended 3/31/2020 | $10.12 | 0.28 | 0.17 | 0.45 | (0.60) | (0.10) | (0.70) |
| Year Ended 3/31/2019(c) | $10.00 | 0.45 | 0.16 | 0.61 | (0.46) | (0.03) | (0.49) |
| Notes to Financial Highlights | |
| (a) | In addition to the fees and expenses that the Fund bears directly, the Fund indirectly bears a pro rata share of the fees and expenses of any other funds in which it invests. Such indirect expenses are not included in the Fund’s reported expense ratios. |
| (b) | Total net expenses include the impact of certain fee waivers/expense reimbursements made by the Investment Manager and certain of its affiliates, if applicable. |
| (c) | The Fund commenced operations on April 4, 2018. Per share data and total return reflect activity from that date. |
| 64 | Columbia Adaptive Retirement Funds | Annual Report 2023 |
Columbia Adaptive Retirement 2045 Fund
| Net asset value, end of period | Total return | Total gross expense ratio to average net assets(a) | Total net expense ratio to average net assets(a),(b) | Net investment income ratio to average net assets | Portfolio turnover | Net assets, end of period (000’s) | |
| Advisor Class | |||||||
| Year Ended 3/31/2023 | $8.04 | (7.51%) | 8.12% | 0.47% | 6.48% | 13% | $425 |
| Year Ended 3/31/2022 | $11.07 | 4.67% | 5.72% | 0.45% | 1.81% | 89% | $450 |
| Year Ended 3/31/2021 | $12.03 | 27.94% | 7.06% | 0.48% | 1.29% | 18% | $797 |
| Year Ended 3/31/2020 | $9.87 | 3.92% | 8.27% | 0.43% | 2.60% | 35% | $494 |
| Year Ended 3/31/2019(c) | $10.12 | 6.89% | 11.97% | 0.43% | 4.59% | 30% | $506 |
| Institutional 3 Class | |||||||
| Year Ended 3/31/2023 | $8.04 | (7.45%) | 8.08% | 0.39% | 6.70% | 13% | $915 |
| Year Ended 3/31/2022 | $11.07 | 4.71% | 5.72% | 0.40% | 1.95% | 89% | $837 |
| Year Ended 3/31/2021 | $12.03 | 27.96% | 7.05% | 0.44% | 1.27% | 18% | $633 |
| Year Ended 3/31/2020 | $9.87 | 3.92% | 8.27% | 0.42% | 2.61% | 35% | $494 |
| Year Ended 3/31/2019(c) | $10.12 | 6.89% | 11.98% | 0.43% | 4.59% | 30% | $506 |
| Columbia Adaptive Retirement Funds | Annual Report 2023 | 65 |
Columbia Adaptive Retirement 2050 Fund
| Net asset value, beginning of period | Net investment income | Net realized and unrealized gain (loss) | Total from investment operations | Distributions from net investment income | Distributions from net realized gains | Total distributions to shareholders | |
| Advisor Class | |||||||
| Year Ended 3/31/2023 | $11.07 | 0.65 | (1.60) | (0.95) | (0.68) | (1.48) | (2.16) |
| Year Ended 3/31/2022 | $12.28 | 0.23 | 0.53 | 0.76 | (1.30) | (0.67) | (1.97) |
| Year Ended 3/31/2021 | $9.93 | 0.15 | 2.83 | 2.98 | (0.41) | (0.22) | (0.63) |
| Year Ended 3/31/2020 | $10.15 | 0.28 | 0.17 | 0.45 | (0.61) | (0.06) | (0.67) |
| Year Ended 3/31/2019 | $10.06 | 0.47 | 0.15 | 0.62 | (0.49) | (0.04) | (0.53) |
| Institutional 3 Class | |||||||
| Year Ended 3/31/2023 | $11.06 | 0.66 | (1.59) | (0.93) | (0.69) | (1.48) | (2.17) |
| Year Ended 3/31/2022 | $12.29 | 0.23 | 0.51 | 0.74 | (1.30) | (0.67) | (1.97) |
| Year Ended 3/31/2021 | $9.93 | 0.16 | 2.84 | 3.00 | (0.42) | (0.22) | (0.64) |
| Year Ended 3/31/2020 | $10.15 | 0.28 | 0.17 | 0.45 | (0.61) | (0.06) | (0.67) |
| Year Ended 3/31/2019 | $10.06 | 0.47 | 0.15 | 0.62 | (0.49) | (0.04) | (0.53) |
| Notes to Financial Highlights | |
| (a) | In addition to the fees and expenses that the Fund bears directly, the Fund indirectly bears a pro rata share of the fees and expenses of any other funds in which it invests. Such indirect expenses are not included in the Fund’s reported expense ratios. |
| (b) | Total net expenses include the impact of certain fee waivers/expense reimbursements made by the Investment Manager and certain of its affiliates, if applicable. |
| 66 | Columbia Adaptive Retirement Funds | Annual Report 2023 |
Columbia Adaptive Retirement 2050 Fund
| Net asset value, end of period | Total return | Total gross expense ratio to average net assets(a) | Total net expense ratio to average net assets(a),(b) | Net investment income ratio to average net assets | Portfolio turnover | Net assets, end of period (000’s) | |
| Advisor Class | |||||||
| Year Ended 3/31/2023 | $7.96 | (8.17%) | 6.93% | 0.42% | 6.91% | 13% | $232 |
| Year Ended 3/31/2022 | $11.07 | 5.20% | 5.51% | 0.41% | 1.82% | 89% | $245 |
| Year Ended 3/31/2021 | $12.28 | 30.31% | 6.59% | 0.49% | 1.29% | 37% | $650 |
| Year Ended 3/31/2020 | $9.93 | 3.91% | 8.16% | 0.43% | 2.60% | 31% | $501 |
| Year Ended 3/31/2019 | $10.15 | 7.01% | 11.02% | 0.43% | 4.73% | 27% | $508 |
| Institutional 3 Class | |||||||
| Year Ended 3/31/2023 | $7.96 | (8.04%) | 6.92% | 0.39% | 7.04% | 13% | $1,331 |
| Year Ended 3/31/2022 | $11.06 | 5.04% | 5.52% | 0.40% | 1.81% | 89% | $1,269 |
| Year Ended 3/31/2021 | $12.29 | 30.45% | 6.59% | 0.44% | 1.39% | 37% | $647 |
| Year Ended 3/31/2020 | $9.93 | 3.91% | 8.16% | 0.42% | 2.60% | 31% | $496 |
| Year Ended 3/31/2019 | $10.15 | 7.01% | 11.02% | 0.43% | 4.73% | 27% | $508 |
| Columbia Adaptive Retirement Funds | Annual Report 2023 | 67 |
Columbia Adaptive Retirement 2055 Fund
| Net asset value, beginning of period | Net investment income | Net realized and unrealized gain (loss) | Total from investment operations | Distributions from net investment income | Distributions from net realized gains | Total distributions to shareholders | |
| Advisor Class | |||||||
| Year Ended 3/31/2023 | $11.24 | 0.67 | (1.65) | (0.98) | (0.58) | (1.63) | (2.21) |
| Year Ended 3/31/2022 | $12.25 | 0.23 | 0.53 | 0.76 | (1.35) | (0.42) | (1.77) |
| Year Ended 3/31/2021 | $9.83 | 0.17 | 2.83 | 3.00 | (0.41) | (0.17) | (0.58) |
| Year Ended 3/31/2020 | $10.12 | 0.29 | 0.16 | 0.45 | (0.63) | (0.11) | (0.74) |
| Year Ended 3/31/2019(c) | $10.00 | 0.47 | 0.15 | 0.62 | (0.47) | (0.03) | (0.50) |
| Institutional 3 Class | |||||||
| Year Ended 3/31/2023 | $11.24 | 0.69 | (1.66) | (0.97) | (0.59) | (1.63) | (2.22) |
| Year Ended 3/31/2022 | $12.26 | 0.23 | 0.52 | 0.75 | (1.35) | (0.42) | (1.77) |
| Year Ended 3/31/2021 | $9.83 | 0.16 | 2.85 | 3.01 | (0.41) | (0.17) | (0.58) |
| Year Ended 3/31/2020 | $10.12 | 0.29 | 0.16 | 0.45 | (0.63) | (0.11) | (0.74) |
| Year Ended 3/31/2019(c) | $10.00 | 0.47 | 0.15 | 0.62 | (0.47) | (0.03) | (0.50) |
| Notes to Financial Highlights | |
| (a) | In addition to the fees and expenses that the Fund bears directly, the Fund indirectly bears a pro rata share of the fees and expenses of any other funds in which it invests. Such indirect expenses are not included in the Fund’s reported expense ratios. |
| (b) | Total net expenses include the impact of certain fee waivers/expense reimbursements made by the Investment Manager and certain of its affiliates, if applicable. |
| (c) | The Fund commenced operations on April 4, 2018. Per share data and total return reflect activity from that date. |
| 68 | Columbia Adaptive Retirement Funds | Annual Report 2023 |
Columbia Adaptive Retirement 2055 Fund
| Net asset value, end of period | Total return | Total gross expense ratio to average net assets(a) | Total net expense ratio to average net assets(a),(b) | Net investment income ratio to average net assets | Portfolio turnover | Net assets, end of period (000’s) | |
| Advisor Class | |||||||
| Year Ended 3/31/2023 | $8.05 | (8.30%) | 6.80% | 0.47% | 7.05% | 14% | $339 |
| Year Ended 3/31/2022 | $11.24 | 5.28% | 5.19% | 0.45% | 1.76% | 81% | $364 |
| Year Ended 3/31/2021 | $12.25 | 30.78% | 7.38% | 0.46% | 1.51% | 16% | $764 |
| Year Ended 3/31/2020 | $9.83 | 3.82% | 8.25% | 0.43% | 2.67% | 33% | $491 |
| Year Ended 3/31/2019(c) | $10.12 | 7.05% | 12.00% | 0.43% | 4.73% | 29% | $506 |
| Institutional 3 Class | |||||||
| Year Ended 3/31/2023 | $8.05 | (8.23%) | 6.74% | 0.39% | 7.18% | 14% | $1,220 |
| Year Ended 3/31/2022 | $11.24 | 5.22% | 5.19% | 0.40% | 1.82% | 81% | $1,264 |
| Year Ended 3/31/2021 | $12.26 | 30.89% | 7.38% | 0.44% | 1.37% | 16% | $643 |
| Year Ended 3/31/2020 | $9.83 | 3.83% | 8.25% | 0.42% | 2.68% | 33% | $491 |
| Year Ended 3/31/2019(c) | $10.12 | 7.05% | 12.00% | 0.43% | 4.73% | 29% | $506 |
| Columbia Adaptive Retirement Funds | Annual Report 2023 | 69 |
Columbia Adaptive Retirement 2060 Fund
| Net asset value, beginning of period | Net investment income | Net realized and unrealized gain (loss) | Total from investment operations | Distributions from net investment income | Distributions from net realized gains | Total distributions to shareholders | |
| Advisor Class | |||||||
| Year Ended 3/31/2023 | $11.48 | 0.69 | (1.69) | (1.00) | (0.72) | (1.39) | (2.11) |
| Year Ended 3/31/2022 | $12.28 | 0.22 | 0.56 | 0.78 | (1.23) | (0.35) | (1.58) |
| Year Ended 3/31/2021 | $9.92 | 0.14 | 2.88 | 3.02 | (0.42) | (0.24) | (0.66) |
| Year Ended 3/31/2020 | $10.15 | 0.28 | 0.17 | 0.45 | (0.62) | (0.06) | (0.68) |
| Year Ended 3/31/2019 | $10.06 | 0.47 | 0.14 | 0.61 | (0.49) | (0.03) | (0.52) |
| Institutional 3 Class | |||||||
| Year Ended 3/31/2023 | $11.49 | 0.73 | (1.73) | (1.00) | (0.73) | (1.39) | (2.12) |
| Year Ended 3/31/2022 | $12.28 | 0.25 | 0.55 | 0.80 | (1.24) | (0.35) | (1.59) |
| Year Ended 3/31/2021 | $9.92 | 0.15 | 2.87 | 3.02 | (0.42) | (0.24) | (0.66) |
| Year Ended 3/31/2020 | $10.15 | 0.28 | 0.17 | 0.45 | (0.62) | (0.06) | (0.68) |
| Year Ended 3/31/2019 | $10.06 | 0.47 | 0.14 | 0.61 | (0.49) | (0.03) | (0.52) |
| Notes to Financial Highlights | |
| (a) | In addition to the fees and expenses that the Fund bears directly, the Fund indirectly bears a pro rata share of the fees and expenses of any other funds in which it invests. Such indirect expenses are not included in the Fund’s reported expense ratios. |
| (b) | Total net expenses include the impact of certain fee waivers/expense reimbursements made by the Investment Manager and certain of its affiliates, if applicable. |
| 70 | Columbia Adaptive Retirement Funds | Annual Report 2023 |
Columbia Adaptive Retirement 2060 Fund
| Net asset value, end of period | Total return | Total gross expense ratio to average net assets(a) | Total net expense ratio to average net assets(a),(b) | Net investment income ratio to average net assets | Portfolio turnover | Net assets, end of period (000’s) | |
| Advisor Class | |||||||
| Year Ended 3/31/2023 | $8.37 | (8.31%) | 5.70% | 0.50% | 6.97% | 11% | $987 |
| Year Ended 3/31/2022 | $11.48 | 5.55% | 5.10% | 0.46% | 1.69% | 68% | $1,048 |
| Year Ended 3/31/2021 | $12.28 | 30.70% | 7.22% | 0.46% | 1.27% | 16% | $924 |
| Year Ended 3/31/2020 | $9.92 | 3.85% | 8.09% | 0.43% | 2.60% | 31% | $513 |
| Year Ended 3/31/2019 | $10.15 | 6.93% | 10.98% | 0.43% | 4.73% | 26% | $514 |
| Institutional 3 Class | |||||||
| Year Ended 3/31/2023 | $8.37 | (8.28%) | 5.62% | 0.39% | 7.52% | 11% | $982 |
| Year Ended 3/31/2022 | $11.49 | 5.68% | 5.03% | 0.40% | 1.93% | 68% | $837 |
| Year Ended 3/31/2021 | $12.28 | 30.72% | 7.19% | 0.44% | 1.35% | 16% | $649 |
| Year Ended 3/31/2020 | $9.92 | 3.86% | 8.09% | 0.42% | 2.61% | 31% | $496 |
| Year Ended 3/31/2019 | $10.15 | 6.93% | 10.97% | 0.43% | 4.73% | 26% | $508 |
| Columbia Adaptive Retirement Funds | Annual Report 2023 | 71 |
March 31, 2023
| 72 | Columbia Adaptive Retirement Funds | Annual Report 2023 |
March 31, 2023
| Columbia Adaptive Retirement Funds | Annual Report 2023 | 73 |
March 31, 2023
| Effective management services fee rate (%) | |
| Columbia Adaptive Retirement 2020 Fund | 0.46 |
| Columbia Adaptive Retirement 2025 Fund | 0.46 |
| Columbia Adaptive Retirement 2030 Fund | 0.46 |
| Columbia Adaptive Retirement 2035 Fund | 0.46 |
| Columbia Adaptive Retirement 2040 Fund | 0.46 |
| Columbia Adaptive Retirement 2045 Fund | 0.46 |
| Columbia Adaptive Retirement 2050 Fund | 0.46 |
| Columbia Adaptive Retirement 2055 Fund | 0.46 |
| Columbia Adaptive Retirement 2060 Fund | 0.46 |
| 74 | Columbia Adaptive Retirement Funds | Annual Report 2023 |
March 31, 2023
| Columbia Adaptive Retirement Funds | Annual Report 2023 | 75 |
March 31, 2023
| Fund | Advisor Class (%) | Institutional 3 Class (%) |
| Columbia Adaptive Retirement 2020 Fund | 0.08 | 0.01 |
| Columbia Adaptive Retirement 2025 Fund | 0.05 | 0.01 |
| Columbia Adaptive Retirement 2030 Fund | 0.15 | 0.01 |
| Columbia Adaptive Retirement 2035 Fund | 0.11 | 0.01 |
| Columbia Adaptive Retirement 2040 Fund | 0.10 | 0.01 |
| Columbia Adaptive Retirement 2045 Fund | 0.08 | 0.01 |
| Columbia Adaptive Retirement 2050 Fund | 0.03 | 0.01 |
| Columbia Adaptive Retirement 2055 Fund | 0.08 | 0.01 |
| Columbia Adaptive Retirement 2060 Fund | 0.11 | 0.01 |
| August 1, 2022 through May 31, 2023 | Prior to August 1, 2022 | |||
| Advisor Class (%) | Institutional 3 Class (%) | Advisor Class (%) | Institutional 3 Class (%) | |
| Columbia Adaptive Retirement 2020 Fund | 0.62 | 0.43 | 0.64 | 0.45 |
| Columbia Adaptive Retirement 2025 Fund | 0.62 | 0.43 | 0.64 | 0.45 |
| Columbia Adaptive Retirement 2030 Fund | 0.62 | 0.43 | 0.64 | 0.45 |
| Columbia Adaptive Retirement 2035 Fund | 0.62 | 0.43 | 0.64 | 0.45 |
| Columbia Adaptive Retirement 2040 Fund | 0.62 | 0.43 | 0.64 | 0.45 |
| Columbia Adaptive Retirement 2045 Fund | 0.62 | 0.43 | 0.64 | 0.45 |
| Columbia Adaptive Retirement 2050 Fund | 0.62 | 0.43 | 0.64 | 0.45 |
| Columbia Adaptive Retirement 2055 Fund | 0.62 | 0.43 | 0.64 | 0.45 |
| Columbia Adaptive Retirement 2060 Fund | 0.62 | 0.43 | 0.64 | 0.45 |
| 76 | Columbia Adaptive Retirement Funds | Annual Report 2023 |
March 31, 2023
| Fund | Excess of distributions over net investment income ($) | Accumulated net realized gain (loss) ($) | Paid in capital decrease ($) |
| Columbia Adaptive Retirement 2020 Fund | (352) | 352 | — |
| Columbia Adaptive Retirement 2025 Fund | (302) | 302 | — |
| Columbia Adaptive Retirement 2030 Fund | (504) | 504 | — |
| Columbia Adaptive Retirement 2035 Fund | (703) | 703 | — |
| Columbia Adaptive Retirement 2040 Fund | (459) | 502 | (43) |
| Columbia Adaptive Retirement 2045 Fund | (302) | 302 | — |
| Columbia Adaptive Retirement 2050 Fund | (501) | 501 | — |
| Columbia Adaptive Retirement 2055 Fund | (303) | 303 | — |
| Columbia Adaptive Retirement 2060 Fund | (203) | 203 | — |
| Columbia Adaptive Retirement Funds | Annual Report 2023 | 77 |
March 31, 2023
| Year Ended March 31, 2023 | Year Ended March 31, 2022 | |||||
| Fund | Ordinary income ($) | Long-term capital gains ($) | Total ($) | Ordinary income ($) | Long-term capital gains ($) | Total ($) |
| Columbia Adaptive Retirement 2020 Fund | 50,979 | 76,598 | 127,577 | 163,011 | 541,745 | 704,756 |
| Columbia Adaptive Retirement 2025 Fund | 43,239 | 73,502 | 116,741 | 102,739 | 252,721 | 355,460 |
| Columbia Adaptive Retirement 2030 Fund | 106,357 | 162,172 | 268,529 | 196,340 | 98,697 | 295,037 |
| Columbia Adaptive Retirement 2035 Fund | 75,614 | 134,627 | 210,241 | 159,412 | 59,565 | 218,977 |
| Columbia Adaptive Retirement 2040 Fund | 86,420 | 168,548 | 254,968 | 178,142 | 64,036 | 242,178 |
| Columbia Adaptive Retirement 2045 Fund | 82,269 | 189,514 | 271,783 | 189,586 | 56,554 | 246,140 |
| Columbia Adaptive Retirement 2050 Fund | 102,193 | 219,072 | 321,265 | 217,072 | 73,787 | 290,859 |
| Columbia Adaptive Retirement 2055 Fund | 88,053 | 241,845 | 329,898 | 229,541 | 51,274 | 280,815 |
| Columbia Adaptive Retirement 2060 Fund | 131,262 | 249,253 | 380,515 | 236,824 | 48,491 | 285,315 |
| Fund | Undistributed ordinary income ($) | Undistributed long-term capital gains ($) | Capital loss carryforwards ($) | Net unrealized (depreciation) ($) |
| Columbia Adaptive Retirement 2020 Fund | 5,161 | — | (33,947) | (129,460) |
| Columbia Adaptive Retirement 2025 Fund | 3,711 | — | (12,282) | (112,778) |
| Columbia Adaptive Retirement 2030 Fund | 4,835 | — | (20,743) | (351,528) |
| Columbia Adaptive Retirement 2035 Fund | 61 | — | (14,623) | (211,581) |
| Columbia Adaptive Retirement 2040 Fund | — | — | (31,878) | (249,500) |
| Columbia Adaptive Retirement 2045 Fund | 147 | — | (45,503) | (235,381) |
| Columbia Adaptive Retirement 2050 Fund | 630 | — | (72,243) | (293,013) |
| Columbia Adaptive Retirement 2055 Fund | 19,646 | — | (87,193) | (325,550) |
| Columbia Adaptive Retirement 2060 Fund | 242 | — | (87,598) | (386,031) |
| Fund | Tax cost ($) | Gross unrealized appreciation ($) | Gross unrealized (depreciation) ($) | Net unrealized (depreciation) ($) |
| Columbia Adaptive Retirement 2020 Fund | 1,483,022 | 21 | (129,481) | (129,460) |
| Columbia Adaptive Retirement 2025 Fund | 1,154,831 | 20 | (112,798) | (112,778) |
| Columbia Adaptive Retirement 2030 Fund | 2,719,644 | 35 | (351,563) | (351,528) |
| Columbia Adaptive Retirement 2035 Fund | 2,249,855 | 30 | (211,611) | (211,581) |
| Columbia Adaptive Retirement 2040 Fund | 1,777,926 | 23 | (249,523) | (249,500) |
| Columbia Adaptive Retirement 2045 Fund | 1,592,345 | 22 | (235,403) | (235,381) |
| Columbia Adaptive Retirement 2050 Fund | 1,873,005 | 28 | (293,041) | (293,013) |
| Columbia Adaptive Retirement 2055 Fund | 1,901,001 | 25 | (325,575) | (325,550) |
| Columbia Adaptive Retirement 2060 Fund | 2,372,797 | 31 | (386,062) | (386,031) |
| 78 | Columbia Adaptive Retirement Funds | Annual Report 2023 |
March 31, 2023
| Fund | No expiration short-term ($) | No expiration long-term ($) | Total ($) | Utilized ($) |
| Columbia Adaptive Retirement 2020 Fund | (28,500) | (5,447) | (33,947) | — |
| Columbia Adaptive Retirement 2025 Fund | (12,071) | (211) | (12,282) | — |
| Columbia Adaptive Retirement 2030 Fund | (19,800) | (943) | (20,743) | — |
| Columbia Adaptive Retirement 2035 Fund | (13,763) | (860) | (14,623) | — |
| Columbia Adaptive Retirement 2040 Fund | (31,878) | — | (31,878) | — |
| Columbia Adaptive Retirement 2045 Fund | (45,503) | — | (45,503) | — |
| Columbia Adaptive Retirement 2050 Fund | (72,243) | — | (72,243) | — |
| Columbia Adaptive Retirement 2055 Fund | (84,880) | (2,313) | (87,193) | — |
| Columbia Adaptive Retirement 2060 Fund | (87,598) | — | (87,598) | — |
| Purchases ($) | Proceeds from sales ($) | |
| Columbia Adaptive Retirement 2020 Fund | 303,014 | 209,560 |
| Columbia Adaptive Retirement 2025 Fund | 213,331 | 110,422 |
| Columbia Adaptive Retirement 2030 Fund | 616,280 | 331,690 |
| Columbia Adaptive Retirement 2035 Fund | 979,937 | 210,841 |
| Columbia Adaptive Retirement 2040 Fund | 454,212 | 171,486 |
| Columbia Adaptive Retirement 2045 Fund | 450,274 | 142,395 |
| Columbia Adaptive Retirement 2050 Fund | 541,357 | 174,538 |
| Columbia Adaptive Retirement 2055 Fund | 461,657 | 190,579 |
| Columbia Adaptive Retirement 2060 Fund | 660,159 | 177,174 |
| Columbia Adaptive Retirement Funds | Annual Report 2023 | 79 |
March 31, 2023
| 80 | Columbia Adaptive Retirement Funds | Annual Report 2023 |
March 31, 2023
| Fund | Number of unaffiliated accounts | Percentage of shares outstanding held — unaffiliated (%) | Percentage of shares outstanding held — affiliated (%) |
| Columbia Adaptive Retirement 2020 Fund | 1 | 48.5 | 40.6 |
| Columbia Adaptive Retirement 2025 Fund | 1 | 11.8 | 78.2 |
| Columbia Adaptive Retirement 2030 Fund | 2 | 92.0 | — |
| Columbia Adaptive Retirement 2035 Fund | 3 | 74.3 | 24.8 |
| Columbia Adaptive Retirement 2040 Fund | 2 | 61.8 | 33.0 |
| Columbia Adaptive Retirement 2045 Fund | 2 | 61.2 | 38.2 |
| Columbia Adaptive Retirement 2050 Fund | 1 | 71.3 | 27.7 |
| Columbia Adaptive Retirement 2055 Fund | 1 | 64.5 | 27.5 |
| Columbia Adaptive Retirement 2060 Fund | 2 | 66.3 | 33.2 |
| Columbia Adaptive Retirement Funds | Annual Report 2023 | 81 |
March 31, 2023
| 82 | Columbia Adaptive Retirement Funds | Annual Report 2023 |
| Columbia Adaptive Retirement Funds | Annual Report 2023 | 83 |
(Unaudited)
| Name, address, year of birth | Position held with the Columbia Funds and length of service | Principal occupation(s) during past five years and other relevant professional experience | Number of Funds in the Columbia Funds Complex* overseen | Other directorships held by Trustee during the past five years and other relevant Board experience |
| George S. Batejan c/o Columbia Management Investment Advisers, LLC 290 Congress Street Boston, MA 02210 1954 | Trustee since 2017 | Executive Vice President, Global Head of Technology and Operations, Janus Capital Group, Inc., 2010-2016 | 177 | Former Chairman of the Board, NICSA (National Investment Company Services Association) (Executive Committee, Nominating Committee and Governance Committee), 2014-2016; former Director, Intech Investment Management, 2011-2016; former Board Member, Metro Denver Chamber of Commerce, 2015-2016; former Advisory Board Member, University of Colorado Business School, 2015-2018; former Board Member, Chase Bank International, 1993-1994 |
| Kathleen Blatz c/o Columbia Management Investment Advisers, LLC 290 Congress Street Boston, MA 02210 1954 | Trustee since 2006 | Attorney, specializing in arbitration and mediation; Chief Justice, Minnesota Supreme Court, 1998-2006; Associate Justice, Minnesota Supreme Court, 1996-1998; Fourth Judicial District Court Judge, Hennepin County, 1994-1996; Attorney in private practice and public service, 1984-1993; State Representative, Minnesota House of Representatives, 1979-1993, which included service on the Tax and Financial Institutions and Insurance Committees; Member and Interim Chair, Minnesota Sports Facilities Authority, January-July 2017; Interim President and Chief Executive Officer, Blue Cross and Blue Shield of Minnesota (health care insurance), February-July 2018, April-October 2021 | 177 | Former Trustee, Blue Cross and Blue Shield of Minnesota, 2009-2021 (Chair of the Business Development Committee, 2014-2017; Chair of the Governance Committee, 2017-2019); former Member and Chair of the Board, Minnesota Sports Facilities Authority, January 2017-July 2017; former Director, Robina Foundation, 2009-2020 (Chair, 2014-2020); Director, Richard M. Schulze Family Foundation, since 2021 |
| 84 | Columbia Adaptive Retirement Funds | Annual Report 2023 |
(Unaudited)
| Name, address, year of birth | Position held with the Columbia Funds and length of service | Principal occupation(s) during past five years and other relevant professional experience | Number of Funds in the Columbia Funds Complex* overseen | Other directorships held by Trustee during the past five years and other relevant Board experience |
| Pamela G. Carlton c/o Columbia Management Investment Advisers, LLC 290 Congress Street Boston, MA 02210 1954 | Chair since 2023; Trustee since 2007 | President, Springboard — Partners in Cross Cultural Leadership (consulting company), since 2003; Managing Director of US Equity Research, JP Morgan Chase, 1999-2003; Director of US Equity Research, Chase Asset Management, 1996-1999; Co-Director Latin America Research, 1993-1996, COO Global Research, 1992-1996, Co-Director of US Research, 1991-1992, Investment Banker, 1982-1991, Morgan Stanley; Attorney, Cleary Gottlieb Steen & Hamilton LLP, 1980-1982 | 177 | Trustee, New York Presbyterian Hospital Board, since 1996; Director, DR Bank (Audit Committee) since 2017; Director, Evercore Inc. (Audit Committee, Nominating and Governance Committee), since 2019; Director, Apollo Commercial Real Estate Finance, Inc. (Chair, Nominating and Governance Committee) (financial services), since 2021; the Governing Council of the Independent Directors Council (IDC), since 2021 |
| Janet Langford Carrig c/o Columbia Management Investment Advisers, LLC 290 Congress Street Boston, MA 02210 1957 | Trustee since 1996 | Senior Vice President, General Counsel and Corporate Secretary, ConocoPhillips (independent energy company), September 2007-October 2018 | 175 | Director, EQT Corporation (natural gas producer), since 2019; former Director, Whiting Petroleum Corporation (independent oil and gas company), 2020-2022 |
| J. Kevin Connaughton c/o Columbia Management Investment Advisers, LLC 290 Congress Street Boston, MA 02210 1964 | Trustee since 2020 | CEO and President, RhodeWay Financial (non-profit financial planning firm), since December 2022; Member, FINRA National Adjudicatory Council, since January 2020; Adjunct Professor of Finance, Bentley University since January 2018; Consultant to Independent Trustees of CFVIT and CFST I from March 2016 to June 2020 with respect to CFVIT and to December 2020 with respect to CFST I; Managing Director and General Manager of Mutual Fund Products, Columbia Management Investment Advisers, LLC, May 2010-February 2015; President, Columbia Funds, 2008-2015; and senior officer of Columbia Funds and affiliated funds, 2003-2015 | 175 | Former Director, The Autism Project, March 2015-December 2021; former Member of the Investment Committee, St. Michael’s College, November 2015-February 2020; former Trustee, St. Michael’s College, June 2017-September 2019; former Trustee, New Century Portfolios (former mutual fund complex), January 2015-December 2017 |
| Olive M. Darragh c/o Columbia Management Investment Advisers, LLC 290 Congress Street Boston, MA 02210 1962 | Trustee since 2020 | Managing Director of Darragh Inc. (strategy and talent management consulting firm), since 2010; Founder and CEO, Zolio, Inc. (investment management talent identification platform), since 2004; Consultant to Independent Trustees of CFVIT and CFST I from June 2019 to June 2020 with respect to CFVIT and to December 2020 with respect to CFST I; Partner, Tudor Investments, 2004-2010; Senior Partner, McKinsey & Company (consulting), 1990-2004; Touche Ross CPA, 1985-1988 | 175 | Treasurer, Edinburgh University US Trust Board, since January 2023; Member, HBS Community Action Partners Board, since September 2022; former Director, University of Edinburgh Business School (Member of US Board), 2004-2019; former Director, Boston Public Library Foundation, 2008-2017 |
| Columbia Adaptive Retirement Funds | Annual Report 2023 | 85 |
(Unaudited)
| Name, address, year of birth | Position held with the Columbia Funds and length of service | Principal occupation(s) during past five years and other relevant professional experience | Number of Funds in the Columbia Funds Complex* overseen | Other directorships held by Trustee during the past five years and other relevant Board experience |
| Patricia M. Flynn c/o Columbia Management Investment Advisers, LLC 290 Congress Street Boston, MA 02210 1950 | Trustee since 2004 | Professor of Economics and Management, Bentley University, since 2002; Dean, McCallum Graduate School of Business, Bentley University, 1992-2002 | 177 | Former Trustee, MA Taxpayers Foundation, 1997-2022; former Director, The MA Business Roundtable, 2003-2019; former Chairperson, Innovation Index Advisory Committee, MA Technology Collaborative, 1997-2020 |
| Brian J. Gallagher c/o Columbia Management Investment Advisers, LLC 290 Congress Street Boston, MA 02210 1954 | Trustee since 2017 | Retired; Partner with Deloitte & Touche LLP and its predecessors, 1977-2016 | 177 | Trustee, Catholic Schools Foundation, since 2004 |
| Douglas A. Hacker c/o Columbia Management Investment Advisers, LLC 290 Congress Street Boston, MA 02210 1955 | Trustee since 1996 | Independent business executive, since May 2006; Executive Vice President – Strategy of United Airlines, December 2002 - May 2006; President of UAL Loyalty Services (airline marketing company), September 2001-December 2002; Executive Vice President and Chief Financial Officer of United Airlines, July 1999-September 2001 | 177 | Director, SpartanNash Company (Chair of the Board) (food distributor), since May 2021; Director, Aircastle Limited (Chair of Audit Committee) (aircraft leasing), since August 2006; former Director, Nash Finch Company (food distributor), 2005-2013; former Director, SeaCube Container Leasing Ltd. (container leasing), 2010-2013; and former Director, Travelport Worldwide Limited (travel information technology), 2014-2019 |
| Nancy T. Lukitsh c/o Columbia Management Investment Advisers, LLC 290 Congress Street Boston, MA 02210 1956 | Trustee since 2011 | Senior Vice President, Partner and Director of Marketing, Wellington Management Company, LLP (investment adviser), 1997-2010; Chair, Wellington Management Portfolios (commingled non-U.S. investment pools), 2007-2010; Director, Wellington Trust Company, NA and other Wellington affiliates, 1997-2010 | 175 | None |
| 86 | Columbia Adaptive Retirement Funds | Annual Report 2023 |
(Unaudited)
| Name, address, year of birth | Position held with the Columbia Funds and length of service | Principal occupation(s) during past five years and other relevant professional experience | Number of Funds in the Columbia Funds Complex* overseen | Other directorships held by Trustee during the past five years and other relevant Board experience |
| David M. Moffett c/o Columbia Management Investment Advisers, LLC 290 Congress Street Boston, MA 02210 1952 | Trustee since 2011 | Retired; former Chief Executive Officer of Freddie Mac and Chief Financial Officer of U.S. Bank | 175 | Director, CSX Corporation (transportation suppliers); Director, PayPal Holdings Inc. (payment and data processing services); Trustee, University of Oklahoma Foundation; former Director, eBay Inc. (online trading community), 2007-2015; and former Director, CIT Bank, CIT Group Inc. (commercial and consumer finance), 2010-2016; former Senior Adviser to The Carlyle Group (financial services), March 2008-September 2008; former Governance Consultant to Bridgewater Associates, January 2013-December 2015 |
| Catherine James Paglia c/o Columbia Management Investment Advisers, LLC 290 Congress Street Boston, MA 02210 1952 | Trustee since 2004 | Director, Enterprise Asset Management, Inc. (private real estate and asset management company), since September 1998; Managing Director and Partner, Interlaken Capital, Inc., 1989-1997; Vice President, 1982-1985, Principal, 1985-1987, Managing Director, 1987-1989, Morgan Stanley; Vice President, Investment Banking, 1980-1982, Associate, Investment Banking, 1976-1980, Dean Witter Reynolds, Inc. | 177 | Director, Valmont Industries, Inc. (irrigation systems manufacturer), since 2012; Trustee, Carleton College (on the Investment Committee), since 1987; Trustee, Carnegie Endowment for International Peace (on the Investment Committee), since 2009 |
| Natalie A. Trunow c/o Columbia Management Investment Advisers, LLC 290 Congress Street Boston, MA 02210 1967 | Trustee since 2020 | Chief Executive Officer, Millennial Portfolio Solutions LLC (asset management and consulting services), January 2016-January 2021; Non-executive Member of the Investment Committee and Valuation Committee, Sarona Asset Management Inc. (private equity firm) since September 2019; Advisor, Horizon Investments (asset management and consulting services), August 2018-January 2022; Advisor, Paradigm Asset Management, November 2016-January 2022; Consultant to Independent Trustees of CFVIT and CFST I from September 2016 to June 2020 with respect to CFVIT and to December 2020 with respect to CFST I; Director of Investments/Consultant, Casey Family Programs, April 2016-November 2016; Senior Vice President and Chief Investment Officer, Calvert Investments, August 2008-January 2016; Section Head and Portfolio Manager, General Motors Asset Management, June 1997-August 2008 | 175 | Independent Director, Investment Committee, Health Services for Children with Special Needs, Inc., 2010-2021; Independent Director, (Executive Committee and Chair, Audit Committee), Consumer Credit Counseling Services (formerly Guidewell Financial Solutions), since 2016; Independent Director, (Investment Committee), Sarona Asset Management, since 2019 |
| Sandra L. Yeager c/o Columbia Management Investment Advisers, LLC 290 Congress Street Boston, MA 02210 1964 | Trustee since 2017 | Retired; President and founder, Hanoverian Capital, LLC (SEC registered investment advisor firm), 2008-2016; Managing Director, DuPont Capital, 2006-2008; Managing Director, Morgan Stanley Investment Management, 2004-2006; Senior Vice President, Alliance Bernstein, 1990-2004 | 177 | Former Director, NAPE (National Alliance for Partnerships in Equity) Education Foundation, October 2016-October 2020; Advisory Board, Jennersville YMCA, since 2022 |
| Columbia Adaptive Retirement Funds | Annual Report 2023 | 87 |
(Unaudited)
| Name, address, year of birth | Position held with the Columbia Funds and length of service | Principal occupation(s) during the past five years and other relevant professional experience | Number of Funds in the Columbia Funds Complex overseen | Other directorships held by Trustee during the past five years and other relevant Board experience |
| Daniel J. Beckman c/o Columbia Management Investment Advisers, LLC 290 Congress Street Boston, MA 02210 1962 | Trustee since November 2021 and President since June 2021 | Vice President – Head of North America Product, Columbia Management Investment Advisers, LLC, since April 2015; President and Principal Executive Officer of the Columbia Funds, since June 2021; officer of Columbia Funds and affiliated funds, 2020-2021 | 177 | Director, Ameriprise Trust Company, since October 2016; Director, Columbia Management Investment Distributors, Inc. since November 2018; Board of Governors, Columbia Wanger Asset Management, LLC since, January 2022; Director, Columbia Threadneedle Canada, Inc., since December 2022 |
| * | The term “Columbia Funds Complex” as used herein includes Columbia Seligman Premium Technology Growth Fund, Tri-Continental Corporation and each series of Columbia Funds Series Trust (CFST), Columbia Funds Series Trust I (CFST I), Columbia Funds Series Trust II (CFST II), Columbia ETF Trust I (CET I), Columbia ETF Trust II (CET II), Columbia Funds Variable Insurance Trust (CFVIT) and Columbia Funds Variable Series Trust II (CFVST II).Messrs. Batejan, Beckman, Gallagher and Hacker and Mses. Blatz, Carlton, Carrig, Flynn, Paglia and Yeager serve as Directors of Columbia Seligman Premium Technology Growth Fund and Tri-Continental Corporation. |
| ** | Interested person (as defined under the 1940 Act) by reason of being an officer, director, security holder and/or employee of the Investment Manager or Ameriprise Financial. |
| Name, address and year of birth | Position and year first appointed to position for any Fund in the Columbia Funds Complex or a predecessor thereof | Principal occupation(s) during past five years |
| Michael G. Clarke 290 Congress Street Boston, MA 02210 1969 | Chief Financial Officer and Principal Financial Officer (2009) and Senior Vice President (2019) | Senior Vice President and Head of Global Operations & Investor Services, Columbia Management Investment Advisers, LLC, since March 2022 (previously Vice President, Head of North American Operations, and Co-Head of Global Operations, June 2019 to February 2022 and Vice President – Accounting and Tax, May 2010 - May 2019); senior officer of Columbia Funds and affiliated funds, since 2002. |
| Joseph Beranek 5890 Ameriprise Financial Center Minneapolis, MN 55474 1965 | Treasurer and Chief Accounting Officer (Principal Accounting Officer) (2019) and Principal Financial Officer (2020), CFST, CFST I, CFST II, CFVIT and CFVST II; Assistant Treasurer, CET I and CET II | Vice President – Mutual Fund Accounting and Financial Reporting, Columbia Management Investment Advisers, LLC, since December 2018 and March 2017, respectively. |
| 88 | Columbia Adaptive Retirement Funds | Annual Report 2023 |
(Unaudited)
| Name, address and year of birth | Position and year first appointed to position for any Fund in the Columbia Funds Complex or a predecessor thereof | Principal occupation(s) during past five years |
| Marybeth Pilat 290 Congress Street Boston, MA 02210 1968 | Treasurer and Chief Accounting Officer (Principal Accounting Officer) and Principal Financial Officer (2020) for CET I and CET II; Assistant Treasurer, CFST, CFST I, CFST II, CFVIT and CFVST II | Vice President – Product Pricing and Administration, Columbia Management Investment Advisers, LLC, since May 2017. |
| William F. Truscott 290 Congress Street Boston, MA 02210 1960 | Senior Vice President (2001) | Formerly, Trustee/Director of Columbia Funds Complex or legacy funds, November 2001-January 1, 2021; Chief Executive Officer, Global Asset Management, Ameriprise Financial, Inc., since September 2012; Chairman of the Board and President, Columbia Management Investment Advisers, LLC, since July 2004 and February 2012, respectively; Chairman of the Board and Chief Executive Officer, Columbia Management Investment Distributors, Inc., since November 2008 and February 2012, respectively; Chairman of the Board and Director, Threadneedle Asset Management Holdings, Sàrl, since March 2013 and December 2008, respectively; senior executive of various entities affiliated with Columbia Threadneedle. |
| Christopher O. Petersen 5228 Ameriprise Financial Center Minneapolis, MN 55474 1970 | Senior Vice President and Assistant Secretary (2021) | Formerly, Trustee/Director of funds within the Columbia Funds Complex, July 1, 2020 - November 22, 2021; Senior Vice President and Assistant General Counsel, Ameriprise Financial, Inc., since September 2021 (previously Vice President and Lead Chief Counsel, January 2015 - September 2021); formerly, President and Principal Executive Officer of the Columbia Funds, 2015 - 2021; officer of Columbia Funds and affiliated funds, since 2007. |
| Thomas P. McGuire 290 Congress Street Boston, MA 02210 1972 | Senior Vice President and Chief Compliance Officer (2012) | Vice President – Asset Management Compliance, Ameriprise Financial, Inc., since May 2010; Chief Compliance Officer, Columbia Acorn/Wanger Funds, since December 2015; formerly, Chief Compliance Officer, Ameriprise Certificate Company, September 2010 – September 2020. |
| Ryan C. Larrenaga 290 Congress Street Boston, MA 02210 1970 | Senior Vice President (2017), Chief Legal Officer (2017), and Secretary (2015) | Vice President and Chief Counsel, Ameriprise Financial, Inc., since August 2018 (previously Vice President and Group Counsel, August 2011 - August 2018); Chief Legal Officer, Columbia Acorn/Wanger Funds, since September 2020; officer of Columbia Funds and affiliated funds, since 2005. |
| Michael E. DeFao 290 Congress Street Boston, MA 02210 1968 | Vice President (2011) and Assistant Secretary (2010) | Vice President and Chief Counsel, Ameriprise Financial, Inc., since May 2010; Vice President, Chief Legal Officer and Assistant Secretary, Columbia Management Investment Advisers, LLC, since October 2021 (previously Vice President and Assistant Secretary, May 2010 – September 2021). |
| Lyn Kephart-Strong 5228 Ameriprise Financial Center Minneapolis, MN 55474 1960 | Vice President (2015) | Vice President, Global Investment Operations Services, Columbia Management Investment Advisers, LLC, since 2010; President, Columbia Management Investment Services Corp., since October 2014; President, Ameriprise Trust Company, since January 2017. |
| Columbia Adaptive Retirement Funds | Annual Report 2023 | 89 |
(Unaudited)
| • | each Fund had sufficient liquidity to both meet redemptions and operate effectively on behalf of shareholders; |
| • | there were no material changes to the Program during the period; |
| • | the implementation of the Program was effective to manage each Fund’s liquidity risk; and |
| • | the Program operated adequately during the period. |
| 90 | Columbia Adaptive Retirement Funds | Annual Report 2023 |
(Unaudited)
| • | Information on the investment performance of each Fund relative to the performance of a group of mutual funds determined to be comparable to the Funds by an independent third-party data provider, Broadridge Financial Solutions, Inc. (Broadridge), as well as performance relative to benchmarks; |
| • | Information on the Funds’ management fees and total expenses, including information comparing each Fund’s expenses to those of a group of comparable mutual funds, as determined by Broadridge; |
| Columbia Adaptive Retirement Funds | Annual Report 2023 | 91 |
(Unaudited)
| • | The impact of the proposed changes in fee structures on the gross and net expense ratios of the Funds, and the willingness of the Investment Manager to contractually agree to limit total operating expenses for each Fund; |
| • | The terms of the Management Agreement, as proposed to be amended; |
| • | Descriptions of other agreements and arrangements with affiliates of the Investment Manager relating to the operations of the Funds, including agreements with respect to the provision of transfer agency services to the Funds; |
| • | Descriptions of various services performed by the Investment Manager under the Management Agreement, including portfolio management and portfolio trading practices; |
| • | Information regarding the resources of the Investment Manager, including information regarding senior management, portfolio managers and other personnel; |
| • | Information regarding the capabilities of the Investment Manager with respect to compliance monitoring services; and |
| • | The profitability to the Investment Manager and its affiliates from their relationships with the Funds, including current and projected profits to the Investment Manager, both under the current fee structure and the proposed fee structures of the Funds. |
| 92 | Columbia Adaptive Retirement Funds | Annual Report 2023 |
(Unaudited)
| Columbia Adaptive Retirement Funds | Annual Report 2023 | 93 |
(Unaudited)
| • | Information on the investment performance of the Funds relative to the performance of a group of mutual funds determined to be comparable to the Funds by Broadridge, as well as performance relative to benchmarks; |
| • | Information on the Funds’ management fees and total expenses, including information comparing the Funds’ expenses to those of a group of comparable mutual funds, as determined by Broadridge; |
| • | The Investment Manager’s agreement to contractually limit or cap total operating expenses for the Funds so that total operating expenses (excluding certain fees and expenses, such as transaction costs and certain other investment related expenses, interest, taxes and infrequent and/or unusual expenses) would not exceed a specified annual rate, as a percentage of the Funds’ net assets; |
| • | Terms of the Management Agreement; |
| • | Descriptions of other agreements and arrangements with affiliates of the Investment Manager relating to the operations of the Funds, including agreements with respect to the provision of transfer agency and shareholder services to the Funds; |
| • | Descriptions of various services performed by the Investment Manager under the Management Agreement, including portfolio management and portfolio trading practices; |
| • | Information regarding any recently negotiated management fees of similarly-managed portfolios of other institutional clients of the Investment Manager; |
| • | Information regarding the resources of the Investment Manager, including information regarding senior management, portfolio managers and other personnel; |
| • | Information regarding the capabilities of the Investment Manager with respect to compliance monitoring services; |
| • | The profitability to the Investment Manager and its affiliates from their relationships with the Funds; and |
| • | Report provided by the Board’s independent fee consultant, JDL Consultants, LLC (JDL). |
| 94 | Columbia Adaptive Retirement Funds | Annual Report 2023 |
(Unaudited)
| Columbia Adaptive Retirement Funds | Annual Report 2023 | 95 |
(Unaudited)
| 96 | Columbia Adaptive Retirement Funds | Annual Report 2023 |
| Columbia Adaptive Retirement Funds | Annual Report 2023 | 97 |
columbiathreadneedleus.com/investor/. The Funds are distributed by Columbia Management Investment Distributors, Inc., member FINRA, and managed by Columbia Management Investment Advisers, LLC.

March 31, 2023

| 3 | |
| 5 | |
| 7 | |
| 8 | |
| 13 | |
| 14 | |
| 15 | |
| 16 | |
| 17 | |
| 32 | |
| 33 | |
| 39 |
(Unaudited)
| Average annual total returns (%) (for the period ended March 31, 2023) | |||||
| Inception | 1 Year | 5 Years | Life | ||
| Columbia Solutions Aggressive Portfolio | 10/24/17 | -8.89 | 8.15 | 7.77 | |
| MSCI ACWI with Developed Markets 100% Hedged to USD Index (Net) | -5.25 | 8.38 | 8.03 | ||
| Columbia Solutions Aggressive Portfolio | Annual Report 2023 | 3 |
(Unaudited)
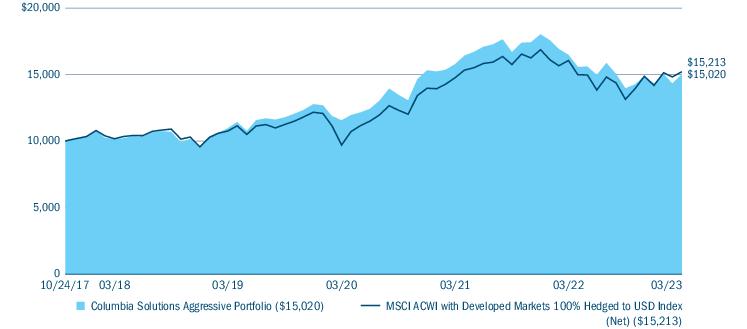
| Portfolio breakdown (%) (at March 31, 2023) | |
| Foreign Government Obligations | 25.1 |
| Money Market Funds(a) | 32.6 |
| U.S. Treasury Obligations | 42.3 |
| Total | 100.0 |
| (a) | Includes investments in Money Market Funds, including investing for the purpose of covering obligations relating to the Fund’s investment in derivatives. For a description of the Fund’s investments in derivatives, see Investments in derivatives following the Portfolio of Investments and the derivative instruments discussion in Note 2 to the Notes to Financial Statements. |
| Market exposure through derivatives investments (% of notional exposure) (at March 31, 2023)(a) | |||
| Long | Short | Net | |
| Fixed Income Derivative Contracts | 50.4 | (2.5) | 47.9 |
| Equity Derivative Contracts | 101.6 | — | 101.6 |
| Foreign Currency Derivative Contracts | 0.3 | (49.8) | (49.5) |
| Total Notional Market Value of Derivative Contracts | 152.3 | (52.3) | 100.0 |
| 4 | Columbia Solutions Aggressive Portfolio | Annual Report 2023 |
(Unaudited)
| • | Overall, the Fund’s exposure to interest-rate-sensitive securities was the single largest detractor relative to the benchmark. Fixed-income investments faced increased volatility during the period and negative overall returns from the fixed-income market hurt Fund performance versus its benchmark. |
| • | Within equities, the Fund’s allocation to international developed securities detracted from overall performance against the benchmark. |
| • | The Fund’s overall allocation to equity securities was the largest performance contributor relative to its benchmark. Within equities, the Fund benefited from an underweight to U.S. large-cap equities and strong security selection in both U.S. large-cap and emerging market equities. |
| • | The Fund’s cash position contributed positively to performance against the benchmark during a period of heightened volatility across both equity and fixed-income markets. |
| Columbia Solutions Aggressive Portfolio | Annual Report 2023 | 5 |
(Unaudited)
| 6 | Columbia Solutions Aggressive Portfolio | Annual Report 2023 |
(Unaudited)
| October 1, 2022 — March 31, 2023 | |||||||
| Account value at the beginning of the period ($) | Account value at the end of the period ($) | Expenses paid during the period ($) | Fund’s annualized expense ratio (%) | ||||
| Actual | Hypothetical | Actual | Hypothetical | Actual | Hypothetical | Actual | |
| Columbia Solutions Aggressive Portfolio | 1,000.00 | 1,000.00 | 1,075.50 | 1,024.88 | 0.05 | 0.05 | 0.01 |
| Columbia Solutions Aggressive Portfolio | Annual Report 2023 | 7 |
March 31, 2023
| Foreign Government Obligations(a),(b) 23.5% | ||||
| Issuer | Coupon Rate | Principal Amount ($) | Value ($) | |
| Austria 2.9% | ||||
| Republic of Austria Government Bond(c) | ||||
| 10/20/2026 | 0.750% | EUR | 186,000 | 189,115 |
| 05/23/2034 | 2.400% | EUR | 47,000 | 48,281 |
| Total | 237,396 | |||
| Belgium 2.0% | ||||
| Kingdom of Belgium Government Bond(c) | ||||
| 06/22/2031 | 1.000% | EUR | 113,000 | 106,463 |
| 04/22/2033 | 1.250% | EUR | 63,000 | 58,751 |
| Total | 165,214 | |||
| China 1.8% | ||||
| China Development Bank | ||||
| 07/18/2032 | 2.960% | CNY | 300,000 | 43,417 |
| China Government Bond | ||||
| 11/21/2029 | 3.130% | CNY | 250,000 | 37,164 |
| 05/21/2030 | 2.680% | CNY | 200,000 | 28,785 |
| 05/15/2032 | 2.760% | CNY | 300,000 | 43,262 |
| Total | 152,628 | |||
| France 3.4% | ||||
| French Republic Government Bond OAT(c) | ||||
| 10/25/2027 | 2.750% | EUR | 159,000 | 173,386 |
| French Republic Government Bond OAT(c),(d) | ||||
| 11/25/2030 | 0.000% | EUR | 122,000 | 108,175 |
| Total | 281,561 | |||
| Italy 0.3% | ||||
| Italy Buoni Poliennali Del Tesoro(c) | ||||
| 09/01/2046 | 3.250% | EUR | 26,000 | 23,880 |
| Japan 6.9% | ||||
| Japan Government 10-Year Bond | ||||
| 06/20/2031 | 0.100% | JPY | 15,000,000 | 110,940 |
| Japan Government 20-Year Bond | ||||
| 06/20/2041 | 0.400% | JPY | 8,000,000 | 54,369 |
| 09/20/2041 | 0.500% | JPY | 10,500,000 | 72,550 |
| 03/20/2042 | 0.800% | JPY | 5,550,000 | 40,072 |
| Japan Government 30-Year Bond | ||||
| 06/20/2050 | 0.600% | JPY | 6,300,000 | 40,166 |
| 06/20/2051 | 0.700% | JPY | 6,600,000 | 42,918 |
| 09/20/2051 | 0.700% | JPY | 5,600,000 | 36,369 |
| 12/20/2051 | 0.700% | JPY | 7,000,000 | 45,429 |
| 03/20/2052 | 1.000% | JPY | 4,000,000 | 28,059 |
| Japan Government Twenty-Year Bond | ||||
| 06/20/2042 | 0.900% | JPY | 13,000,000 | 95,987 |
| Total | 566,859 | |||
| Foreign Government Obligations(a),(b) (continued) | ||||
| Issuer | Coupon Rate | Principal Amount ($) | Value ($) | |
| Netherlands 2.9% | ||||
| Netherlands Government Bond(c) | ||||
| 07/15/2026 | 0.500% | EUR | 183,000 | 185,811 |
| Netherlands Government Bond(c),(d) | ||||
| 07/15/2031 | 0.000% | EUR | 64,000 | 56,356 |
| Total | 242,167 | |||
| Spain 2.4% | ||||
| Spain Government Bond(d) | ||||
| 01/31/2028 | 0.000% | EUR | 65,000 | 61,316 |
| Spain Government Bond(c) | ||||
| 04/30/2030 | 0.500% | EUR | 66,000 | 60,224 |
| 07/30/2035 | 1.850% | EUR | 66,000 | 60,294 |
| 07/30/2041 | 4.700% | EUR | 15,000 | 18,474 |
| Total | 200,308 | |||
| United Kingdom 0.9% | ||||
| United Kingdom Gilt(c) | ||||
| 10/22/2028 | 1.625% | GBP | 34,000 | 38,306 |
| 12/07/2042 | 4.500% | GBP | 26,000 | 35,089 |
| Total | 73,395 | |||
| Total Foreign Government Obligations (Cost $2,321,767) | 1,943,408 | |||
| U.S. Treasury Obligations 39.4% | ||||
| U.S. Treasury | ||||
| 10/31/2026 | 1.125% | 235,000 | 214,382 | |
| 03/31/2028 | 1.250% | 251,000 | 223,900 | |
| 06/30/2028 | 1.250% | 243,000 | 215,701 | |
| 09/30/2028 | 1.250% | 675,000 | 595,582 | |
| 10/31/2028 | 1.375% | 540,000 | 479,166 | |
| 11/30/2028 | 1.500% | 175,000 | 156,119 | |
| 04/30/2029 | 2.875% | 320,000 | 307,250 | |
| 05/15/2029 | 2.375% | 128,000 | 119,430 | |
| 08/15/2029 | 1.625% | 129,000 | 115,092 | |
| 02/15/2030 | 1.500% | 123,000 | 107,836 | |
| 08/15/2030 | 0.625% | 196,000 | 159,740 | |
| 02/15/2031 | 1.125% | 132,000 | 111,148 | |
| 08/15/2031 | 1.250% | 550,000 | 461,313 | |
| Total U.S. Treasury Obligations (Cost $3,680,092) | 3,266,659 | |||
| 8 | Columbia Solutions Aggressive Portfolio | Annual Report 2023 |
March 31, 2023
| Money Market Funds 30.4% | ||
| Shares | Value ($) | |
| Columbia Short-Term Cash Fund, 4.983%(e),(f) | 2,516,255 | 2,515,751 |
| Total Money Market Funds (Cost $2,515,150) | 2,515,751 | |
| Total Investments in Securities (Cost: $8,517,009) | 7,725,818 | |
| Other Assets & Liabilities, Net | 555,968 | |
| Net Assets | 8,281,786 | |
| Forward foreign currency exchange contracts | |||||
| Currency to be sold | Currency to be purchased | Counterparty | Settlement date | Unrealized appreciation ($) | Unrealized depreciation ($) |
| 193,000 CHF | 212,111 USD | Citi | 04/19/2023 | 829 | — |
| 821,000 CNY | 120,020 USD | Citi | 04/19/2023 | 380 | — |
| 1,709,043 EUR | 1,837,189 USD | Citi | 04/19/2023 | — | (17,824) |
| 468,000 HKD | 59,749 USD | Citi | 04/19/2023 | 83 | — |
| 737,000 SEK | 70,508 USD | Citi | 04/19/2023 | — | (561) |
| 13,967 USD | 13,000 EUR | Citi | 04/19/2023 | 144 | — |
| 148,000 NOK | 14,068 USD | Goldman Sachs International | 04/19/2023 | — | (77) |
| 132,686,000 JPY | 992,119 USD | HSBC | 04/19/2023 | — | (9,668) |
| 37,000 SGD | 27,541 USD | HSBC | 04/19/2023 | — | (275) |
| 61,000 ZAR | 3,345 USD | HSBC | 04/19/2023 | — | (76) |
| 256,000 CNY | 37,498 USD | Standard Chartered | 04/19/2023 | 192 | — |
| 246,000 AUD | 164,247 USD | UBS | 04/19/2023 | — | (280) |
| 406,000 DKK | 58,625 USD | UBS | 04/19/2023 | — | (537) |
| 8,000 EUR | 8,600 USD | UBS | 04/19/2023 | — | (84) |
| 330,000 GBP | 401,095 USD | UBS | 04/19/2023 | — | (6,120) |
| 4,391 USD | 6,000 CAD | UBS | 04/19/2023 | 50 | — |
| 8,585 USD | 7,000 GBP | UBS | 04/19/2023 | 53 | — |
| Total | 1,731 | (35,502) | |||
| Long futures contracts | ||||||
| Description | Number of contracts | Expiration date | Trading currency | Notional amount | Value/Unrealized appreciation ($) | Value/Unrealized depreciation ($) |
| Australian 10-Year Bond | 1 | 06/2023 | AUD | 122,886 | 2,495 | — |
| Euro-Bobl | 4 | 06/2023 | EUR | 471,520 | 11,244 | — |
| Euro-BTP | 2 | 06/2023 | EUR | 230,700 | 8,448 | — |
| Euro-OAT | 1 | 06/2023 | EUR | 130,230 | 4,501 | — |
| Long Gilt | 2 | 06/2023 | GBP | 206,700 | 5,959 | — |
| MSCI EAFE Index | 20 | 06/2023 | USD | 2,096,500 | 58,843 | — |
| MSCI Emerging Markets Index | 18 | 06/2023 | USD | 895,950 | 26,175 | — |
| Russell 2000 Index E-mini | 5 | 06/2023 | USD | 453,375 | — | (162) |
| S&P 500 Index E-mini | 22 | 06/2023 | USD | 4,551,525 | 200,102 | — |
| S&P/TSX 60 Index | 1 | 06/2023 | CAD | 241,840 | — | (63) |
| Short Term Euro-BTP | 1 | 06/2023 | EUR | 105,370 | 1,301 | — |
| U.S. Treasury 10-Year Note | 3 | 06/2023 | USD | 344,766 | 10,073 | — |
| U.S. Treasury 5-Year Note | 3 | 06/2023 | USD | 328,523 | 5,611 | — |
| U.S. Treasury Ultra 10-Year Note | 5 | 06/2023 | USD | 605,703 | 19,098 | — |
| Total | 353,850 | (225) | ||||
| Columbia Solutions Aggressive Portfolio | Annual Report 2023 | 9 |
March 31, 2023
| Short futures contracts | ||||||
| Description | Number of contracts | Expiration date | Trading currency | Notional amount | Value/Unrealized appreciation ($) | Value/Unrealized depreciation ($) |
| 10-Year Mini Japanese Government Bond | (1) | 06/2023 | JPY | (14,782,000) | — | (1,813) |
| Canadian Government 10-Year Bond | (1) | 06/2023 | CAD | (126,160) | — | (3,705) |
| Total | — | (5,518) | ||||
| Cleared credit default swap contracts - sell protection | ||||||||||||
| Reference entity | Counterparty | Maturity date | Receive fixed rate (%) | Payment frequency | Implied credit spread (%)* | Notional currency | Notional amount | Value ($) | Upfront payments ($) | Upfront receipts ($) | Unrealized appreciation ($) | Unrealized depreciation ($) |
| Markit CDX North America High Yield Index, Series 40 | Morgan Stanley | 06/20/2028 | 5.000 | Quarterly | 4.635 | USD | 913,000 | 14,356 | — | — | 14,356 | — |
| Markit CDX North America Investment Grade Index, Series 40 | Morgan Stanley | 06/20/2028 | 1.000 | Quarterly | 0.756 | USD | 505,000 | 3,233 | — | — | 3,233 | — |
| Total | 17,589 | — | — | 17,589 | — | |||||||
| * | Implied credit spreads, represented in absolute terms, utilized in determining the market value of credit default swap agreements on corporate or sovereign issues as of period end serve as an indicator of the current status of the payment/performance risk and represent the likelihood or risk of default for the credit derivative. The implied credit spread of a particular referenced entity reflects the cost of buying/selling protection and may include upfront payments required to be made to enter into the agreement. Wider credit spreads represent a deterioration of the referenced entity’s credit soundness and a greater likelihood or risk of default or other credit event occurring as defined under the terms of the agreement. |
| (a) | Principal amounts are denominated in United States Dollars unless otherwise noted. |
| (b) | Principal and interest may not be guaranteed by a governmental entity. |
| (c) | Represents privately placed and other securities and instruments exempt from Securities and Exchange Commission registration (collectively, private placements), such as Section 4(a)(2) and Rule 144A eligible securities, which are often sold only to qualified institutional buyers. At March 31, 2023, the total value of these securities amounted to $1,162,605, which represents 14.04% of total net assets. |
| (d) | Zero coupon bond. |
| (e) | The rate shown is the seven-day current annualized yield at March 31, 2023. |
| (f) | As defined in the Investment Company Act of 1940, as amended, an affiliated company is one in which the Fund owns 5% or more of the company’s outstanding voting securities, or a company which is under common ownership or control with the Fund. The value of the holdings and transactions in these affiliated companies during the year ended March 31, 2023 are as follows: |
| Affiliated issuers | Beginning of period($) | Purchases($) | Sales($) | Net change in unrealized appreciation (depreciation)($) | End of period($) | Realized gain (loss)($) | Dividends($) | End of period shares |
| Columbia Short-Term Cash Fund, 4.983% | ||||||||
| 1,836,867 | 9,063,073 | (8,384,976) | 787 | 2,515,751 | (268) | 55,388 | 2,516,255 | |
| AUD | Australian Dollar |
| CAD | Canada Dollar |
| CHF | Swiss Franc |
| CNY | China Yuan Renminbi |
| DKK | Danish Krone |
| EUR | Euro |
| GBP | British Pound |
| HKD | Hong Kong Dollar |
| JPY | Japanese Yen |
| NOK | Norwegian Krone |
| SEK | Swedish Krona |
| 10 | Columbia Solutions Aggressive Portfolio | Annual Report 2023 |
March 31, 2023
| SGD | Singapore Dollar |
| USD | US Dollar |
| ZAR | South African Rand |
| ■ | Level 1 — Valuations based on quoted prices for investments in active markets that the Fund has the ability to access at the measurement date. Valuation adjustments are not applied to Level 1 investments. |
| ■ | Level 2 — Valuations based on other significant observable inputs (including quoted prices for similar securities, interest rates, prepayment speeds, credit risks, etc.). |
| ■ | Level 3 — Valuations based on significant unobservable inputs (including the Fund’s own assumptions and judgment in determining the fair value of investments). |
| Level 1 ($) | Level 2 ($) | Level 3 ($) | Total ($) | |
| Investments in Securities | ||||
| Foreign Government Obligations | — | 1,943,408 | — | 1,943,408 |
| U.S. Treasury Obligations | — | 3,266,659 | — | 3,266,659 |
| Money Market Funds | 2,515,751 | — | — | 2,515,751 |
| Total Investments in Securities | 2,515,751 | 5,210,067 | — | 7,725,818 |
| Investments in Derivatives | ||||
| Asset | ||||
| Forward Foreign Currency Exchange Contracts | — | 1,731 | — | 1,731 |
| Futures Contracts | 353,850 | — | — | 353,850 |
| Swap Contracts | — | 17,589 | — | 17,589 |
| Liability | ||||
| Forward Foreign Currency Exchange Contracts | — | (35,502) | — | (35,502) |
| Futures Contracts | (5,743) | — | — | (5,743) |
| Total | 2,863,858 | 5,193,885 | — | 8,057,743 |
| Columbia Solutions Aggressive Portfolio | Annual Report 2023 | 11 |
March 31, 2023
The Fund’s assets assigned to the Level 2 input category are generally valued using the market approach, in which a security’s value is determined through reference to prices and information from market transactions for similar or identical assets.
| 12 | Columbia Solutions Aggressive Portfolio | Annual Report 2023 |
March 31, 2023
| Assets | |
| Investments in securities, at value | |
| Unaffiliated issuers (cost $6,001,859) | $5,210,067 |
| Affiliated issuers (cost $2,515,150) | 2,515,751 |
| Foreign currency (cost $12,617) | 12,729 |
| Margin deposits on: | |
| Futures contracts | 457,913 |
| Swap contracts | 101,040 |
| Unrealized appreciation on forward foreign currency exchange contracts | 1,731 |
| Receivable for: | |
| Dividends | 8,947 |
| Interest | 23,764 |
| Foreign tax reclaims | 830 |
| Variation margin for futures contracts | 91,045 |
| Variation margin for swap contracts | 5,483 |
| Expense reimbursement due from Investment Manager | 387 |
| Prepaid expenses | 973 |
| Trustees’ deferred compensation plan | 18,165 |
| Total assets | 8,448,825 |
| Liabilities | |
| Due to custodian | 73 |
| Unrealized depreciation on forward foreign currency exchange contracts | 35,502 |
| Payable for: | |
| Investments purchased | 643 |
| Capital shares purchased | 68,272 |
| Variation margin for futures contracts | 2,584 |
| Compensation of board members | 12,447 |
| Accounting services fees | 20,145 |
| Other expenses | 9,208 |
| Trustees’ deferred compensation plan | 18,165 |
| Total liabilities | 167,039 |
| Net assets applicable to outstanding capital stock | $8,281,786 |
| Represented by | |
| Paid in capital | 10,286,515 |
| Total distributable earnings (loss) | (2,004,729) |
| Total - representing net assets applicable to outstanding capital stock | $8,281,786 |
| Shares outstanding | 1,048,149 |
| Net asset value per share | 7.90 |
| Columbia Solutions Aggressive Portfolio | Annual Report 2023 | 13 |
Year Ended March 31, 2023
| Net investment income | |
| Income: | |
| Dividends — affiliated issuers | $55,388 |
| Interest | 74,948 |
| Foreign taxes withheld | (83) |
| Total income | 130,253 |
| Expenses: | |
| Compensation of board members | 14,551 |
| Custodian fees | 27,041 |
| Printing and postage fees | 5,767 |
| Accounting services fees | 42,790 |
| Legal fees | 13,261 |
| Interest on collateral | 210 |
| Compensation of chief compliance officer | 2 |
| Other | 4,471 |
| Total expenses | 108,093 |
| Fees waived or expenses reimbursed by Investment Manager and its affiliates | (107,091) |
| Total net expenses | 1,002 |
| Net investment income | 129,251 |
| Realized and unrealized gain (loss) — net | |
| Net realized gain (loss) on: | |
| Investments — unaffiliated issuers | (242,969) |
| Investments — affiliated issuers | (268) |
| Foreign currency translations | (2,869) |
| Forward foreign currency exchange contracts | 266,423 |
| Futures contracts | (821,134) |
| Swap contracts | 7,663 |
| Net realized loss | (793,154) |
| Net change in unrealized appreciation (depreciation) on: | |
| Investments — unaffiliated issuers | (318,457) |
| Investments — affiliated issuers | 787 |
| Foreign currency translations | 633 |
| Forward foreign currency exchange contracts | (30,644) |
| Futures contracts | 287,481 |
| Swap contracts | 4,752 |
| Net change in unrealized appreciation (depreciation) | (55,448) |
| Net realized and unrealized loss | (848,602) |
| Net decrease in net assets resulting from operations | $(719,351) |
| 14 | Columbia Solutions Aggressive Portfolio | Annual Report 2023 |
| Year Ended March 31, 2023 | Year Ended March 31, 2022 | |
| Operations | ||
| Net investment income | $129,251 | $81,807 |
| Net realized gain (loss) | (793,154) | 803,778 |
| Net change in unrealized appreciation (depreciation) | (55,448) | (363,079) |
| Net increase (decrease) in net assets resulting from operations | (719,351) | 522,506 |
| Distributions to shareholders | ||
| Net investment income and net realized gains | (666,913) | (2,705,913) |
| Total distributions to shareholders | (666,913) | (2,705,913) |
| Increase in net assets from capital stock activity | 1,305,285 | 2,252,302 |
| Total increase (decrease) in net assets | (80,979) | 68,895 |
| Net assets at beginning of year | 8,362,765 | 8,293,870 |
| Net assets at end of year | $8,281,786 | $8,362,765 |
| Year Ended | Year Ended | |||
| March 31, 2023 | March 31, 2022 | |||
| Shares | Dollars ($) | Shares | Dollars ($) | |
| Capital stock activity | ||||
| Subscriptions | 172,619 | 1,424,019 | 342,226 | 4,154,573 |
| Distributions reinvested | 86,070 | 666,182 | 265,739 | 2,702,570 |
| Redemptions | (91,834) | (784,916) | (414,072) | (4,604,841) |
| Total net increase | 166,855 | 1,305,285 | 193,893 | 2,252,302 |
| Columbia Solutions Aggressive Portfolio | Annual Report 2023 | 15 |
| Year Ended March 31, | |||||
| 2023 | 2022 | 2021 | 2020 | 2019 | |
| Per share data | |||||
| Net asset value, beginning of period | $9.49 | $12.07 | $9.57 | $10.12 | $10.07 |
| Income from investment operations: | |||||
| Net investment income | 0.14 | 0.10 | 0.11 | 0.21 | 0.21 |
| Net realized and unrealized gain (loss) | (1.00) | 0.66 | 3.33 | 0.45 | 0.50 |
| Total from investment operations | (0.86) | 0.76 | 3.44 | 0.66 | 0.71 |
| Less distributions to shareholders from: | |||||
| Net investment income | (0.73) | (0.11) | (0.21) | (0.35) | (0.51) |
| Net realized gains | — | (3.23) | (0.73) | (0.86) | (0.15) |
| Total distributions to shareholders | (0.73) | (3.34) | (0.94) | (1.21) | (0.66) |
| Net asset value, end of period | $7.90 | $9.49 | $12.07 | $9.57 | $10.12 |
| Total return | (8.89%) | 4.47% | 36.42% | 5.44% | 8.05% |
| Ratios to average net assets | |||||
| Total gross expenses(a) | 1.36%(b) | 1.02%(b),(c) | 1.19% | 1.33% | 1.78% |
| Total net expenses(a),(d) | 0.01%(b) | 0.01%(b),(c) | 0.01% | 0.01% | 0.01% |
| Net investment income | 1.63% | 0.79% | 1.04% | 2.01% | 2.08% |
| Supplemental data | |||||
| Portfolio turnover | 16% | 204% | 54% | 184% | 149% |
| Net assets, end of period (in thousands) | $8,282 | $8,363 | $8,294 | $6,668 | $6,434 |
| Notes to Financial Highlights | |
| (a) | In addition to the fees and expenses that the Fund bears directly, the Fund indirectly bears a pro rata share of the fees and expenses of any other funds in which it invests. Such indirect expenses are not included in the Fund’s reported expense ratios. |
| (b) | Ratios include interest on collateral expense which is less than 0.01%. |
| (c) | Ratios include interfund lending expense which is less than 0.01%. |
| (d) | Total net expenses include the impact of certain fee waivers/expense reimbursements made by the Investment Manager and certain of its affiliates, if applicable. |
| 16 | Columbia Solutions Aggressive Portfolio | Annual Report 2023 |
March 31, 2023
| Columbia Solutions Aggressive Portfolio | Annual Report 2023 | 17 |
March 31, 2023
| 18 | Columbia Solutions Aggressive Portfolio | Annual Report 2023 |
March 31, 2023
| Columbia Solutions Aggressive Portfolio | Annual Report 2023 | 19 |
March 31, 2023
| 20 | Columbia Solutions Aggressive Portfolio | Annual Report 2023 |
March 31, 2023
| Columbia Solutions Aggressive Portfolio | Annual Report 2023 | 21 |
March 31, 2023
| Asset derivatives | ||
| Risk exposure category | Statement of assets and liabilities location | Fair value ($) |
| Credit risk | Component of total distributable earnings (loss) — unrealized appreciation on swap contracts | 17,589* |
| Equity risk | Component of total distributable earnings (loss) — unrealized appreciation on futures contracts | 285,120* |
| Foreign exchange risk | Unrealized appreciation on forward foreign currency exchange contracts | 1,731 |
| Interest rate risk | Component of total distributable earnings (loss) — unrealized appreciation on futures contracts | 68,730* |
| Total | 373,170 |
| Liability derivatives | ||
| Risk exposure category | Statement of assets and liabilities location | Fair value ($) |
| Equity risk | Component of total distributable earnings (loss) — unrealized depreciation on futures contracts | 225* |
| Foreign exchange risk | Unrealized depreciation on forward foreign currency exchange contracts | 35,502 |
| Interest rate risk | Component of total distributable earnings (loss) — unrealized depreciation on futures contracts | 5,518* |
| Total | 41,245 |
| * | Includes cumulative appreciation (depreciation) as reported in the tables following the Portfolio of Investments. Only the current day’s variation margin is reported in receivables or payables in the Statement of Assets and Liabilities. |
| Amount of realized gain (loss) on derivatives recognized in income | ||||
| Risk exposure category | Forward foreign currency exchange contracts ($) | Futures contracts ($) | Swap contracts ($) | Total ($) |
| Credit risk | — | — | (2,832) | (2,832) |
| Equity risk | — | (451,983) | — | (451,983) |
| Foreign exchange risk | 266,423 | — | — | 266,423 |
| Interest rate risk | — | (369,151) | 10,495 | (358,656) |
| Total | 266,423 | (821,134) | 7,663 | (547,048) |
| Change in unrealized appreciation (depreciation) on derivatives recognized in income | ||||
| Risk exposure category | Forward foreign currency exchange contracts ($) | Futures contracts ($) | Swap contracts ($) | Total ($) |
| Credit risk | — | — | 12,045 | 12,045 |
| Equity risk | — | 140,583 | — | 140,583 |
| Foreign exchange risk | (30,644) | — | — | (30,644) |
| Interest rate risk | — | 146,898 | (7,293) | 139,605 |
| Total | (30,644) | 287,481 | 4,752 | 261,589 |
| 22 | Columbia Solutions Aggressive Portfolio | Annual Report 2023 |
March 31, 2023
| Derivative instrument | Average notional amounts ($)* |
| Futures contracts — long | 6,496,421 |
| Futures contracts — short | 96,165 |
| Credit default swap contracts — sell protection | 870,505 |
| Derivative instrument | Average unrealized appreciation ($) | Average unrealized depreciation ($) |
| Forward foreign currency exchange contracts | 43,796* | (20,021)* |
| Interest rate swap contracts | 836** | — |
| * | Based on the ending quarterly outstanding amounts for the year ended March 31, 2023. |
| ** | Based on the ending daily outstanding amounts for the year ended March 31, 2023. |
| Citi ($) | Goldman Sachs International ($) | HSBC ($) | Morgan Stanley ($) | Standard Chartered ($) | UBS ($) | Total ($) | |||
| Assets | |||||||||
| Centrally cleared credit default swap contracts (a) | - | - | - | 5,483 | - | - | 5,483 | ||
| Forward foreign currency exchange contracts | 1,436 | - | - | - | 192 | 103 | 1,731 | ||
| Total assets | 1,436 | - | - | 5,483 | 192 | 103 | 7,214 | ||
| Liabilities | |||||||||
| Forward foreign currency exchange contracts | 18,385 | 77 | 10,019 | - | - | 7,021 | 35,502 | ||
| Total financial and derivative net assets | (16,949) | (77) | (10,019) | 5,483 | 192 | (6,918) | (28,288) | ||
| Total collateral received (pledged) (b) | - | - | - | - | - | - | - | ||
| Net amount (c) | (16,949) | (77) | (10,019) | 5,483 | 192 | (6,918) | (28,288) |
| (a) | Centrally cleared swaps are included within payable/receivable for variation margin in the Statement of Assets and Liabilities. |
| (b) | In some instances, the actual collateral received and/or pledged may be more than the amount shown due to overcollateralization. |
| (c) | Represents the net amount due from/(to) counterparties in the event of default. |
| Columbia Solutions Aggressive Portfolio | Annual Report 2023 | 23 |
March 31, 2023
| 24 | Columbia Solutions Aggressive Portfolio | Annual Report 2023 |
March 31, 2023
| Columbia Solutions Aggressive Portfolio | Annual Report 2023 | 25 |
March 31, 2023
| Excess of distributions over net investment income ($) | Accumulated net realized (loss) ($) | Paid in capital ($) |
| 219,656 | (219,656) | — |
| Year Ended March 31, 2023 | Year Ended March 31, 2022 | ||||
| Ordinary income ($) | Long-term capital gains ($) | Total ($) | Ordinary income ($) | Long-term capital gains ($) | Total ($) |
| 666,913 | — | 666,913 | 1,209,885 | 1,496,028 | 2,705,913 |
| Undistributed ordinary income ($) | Undistributed long-term capital gains ($) | Capital loss carryforwards ($) | Net unrealized (depreciation) ($) |
| — | — | (962,195) | (819,511) |
| Federal tax cost ($) | Gross unrealized appreciation ($) | Gross unrealized (depreciation) ($) | Net unrealized (depreciation) ($) |
| 8,877,254 | 10,090 | (829,601) | (819,511) |
| No expiration short-term ($) | No expiration long-term ($) | Total ($) | Utilized ($) |
| (597,291) | (364,904) | (962,195) | — |
| 26 | Columbia Solutions Aggressive Portfolio | Annual Report 2023 |
March 31, 2023
| Late year ordinary losses ($) | Post-October capital losses ($) |
| 223,424 | — |
| Columbia Solutions Aggressive Portfolio | Annual Report 2023 | 27 |
March 31, 2023
| 28 | Columbia Solutions Aggressive Portfolio | Annual Report 2023 |
March 31, 2023
| Columbia Solutions Aggressive Portfolio | Annual Report 2023 | 29 |
March 31, 2023
| 30 | Columbia Solutions Aggressive Portfolio | Annual Report 2023 |
March 31, 2023
| Columbia Solutions Aggressive Portfolio | Annual Report 2023 | 31 |
| 32 | Columbia Solutions Aggressive Portfolio | Annual Report 2023 |
| Name, address, year of birth | Position held with the Columbia Funds and length of service | Principal occupation(s) during past five years and other relevant professional experience | Number of Funds in the Columbia Funds Complex* overseen | Other directorships held by Trustee during the past five years and other relevant Board experience |
| George S. Batejan c/o Columbia Management Investment Advisers, LLC 290 Congress Street Boston, MA 02210 1954 | Trustee since 2017 | Executive Vice President, Global Head of Technology and Operations, Janus Capital Group, Inc., 2010-2016 | 177 | Former Chairman of the Board, NICSA (National Investment Company Services Association) (Executive Committee, Nominating Committee and Governance Committee), 2014-2016; former Director, Intech Investment Management, 2011-2016; former Board Member, Metro Denver Chamber of Commerce, 2015-2016; former Advisory Board Member, University of Colorado Business School, 2015-2018; former Board Member, Chase Bank International, 1993-1994 |
| Kathleen Blatz c/o Columbia Management Investment Advisers, LLC 290 Congress Street Boston, MA 02210 1954 | Trustee since 2006 | Attorney, specializing in arbitration and mediation; Chief Justice, Minnesota Supreme Court, 1998-2006; Associate Justice, Minnesota Supreme Court, 1996-1998; Fourth Judicial District Court Judge, Hennepin County, 1994-1996; Attorney in private practice and public service, 1984-1993; State Representative, Minnesota House of Representatives, 1979-1993, which included service on the Tax and Financial Institutions and Insurance Committees; Member and Interim Chair, Minnesota Sports Facilities Authority, January-July 2017; Interim President and Chief Executive Officer, Blue Cross and Blue Shield of Minnesota (health care insurance), February-July 2018, April-October 2021 | 177 | Former Trustee, Blue Cross and Blue Shield of Minnesota, 2009-2021 (Chair of the Business Development Committee, 2014-2017; Chair of the Governance Committee, 2017-2019); former Member and Chair of the Board, Minnesota Sports Facilities Authority, January 2017-July 2017; former Director, Robina Foundation, 2009-2020 (Chair, 2014-2020); Director, Richard M. Schulze Family Foundation, since 2021 |
| Columbia Solutions Aggressive Portfolio | Annual Report 2023 | 33 |
(Unaudited)
Independent trustees (continued)
| Name, address, year of birth | Position held with the Columbia Funds and length of service | Principal occupation(s) during past five years and other relevant professional experience | Number of Funds in the Columbia Funds Complex* overseen | Other directorships held by Trustee during the past five years and other relevant Board experience |
| Pamela G. Carlton c/o Columbia Management Investment Advisers, LLC 290 Congress Street Boston, MA 02210 1954 | Chair since 2023; Trustee since 2007 | President, Springboard — Partners in Cross Cultural Leadership (consulting company), since 2003; Managing Director of US Equity Research, JP Morgan Chase, 1999-2003; Director of US Equity Research, Chase Asset Management, 1996-1999; Co-Director Latin America Research, 1993-1996, COO Global Research, 1992-1996, Co-Director of US Research, 1991-1992, Investment Banker, 1982-1991, Morgan Stanley; Attorney, Cleary Gottlieb Steen & Hamilton LLP, 1980-1982 | 177 | Trustee, New York Presbyterian Hospital Board, since 1996; Director, DR Bank (Audit Committee) since 2017; Director, Evercore Inc. (Audit Committee, Nominating and Governance Committee), since 2019; Director, Apollo Commercial Real Estate Finance, Inc. (Chair, Nominating and Governance Committee) (financial services), since 2021; the Governing Council of the Independent Directors Council (IDC), since 2021 |
| Janet Langford Carrig c/o Columbia Management Investment Advisers, LLC 290 Congress Street Boston, MA 02210 1957 | Trustee since 1996 | Senior Vice President, General Counsel and Corporate Secretary, ConocoPhillips (independent energy company), September 2007-October 2018 | 175 | Director, EQT Corporation (natural gas producer), since 2019; former Director, Whiting Petroleum Corporation (independent oil and gas company), 2020-2022 |
| J. Kevin Connaughton c/o Columbia Management Investment Advisers, LLC 290 Congress Street Boston, MA 02210 1964 | Trustee since 2020 | CEO and President, RhodeWay Financial (non-profit financial planning firm), since December 2022; Member, FINRA National Adjudicatory Council, since January 2020; Adjunct Professor of Finance, Bentley University since January 2018; Consultant to Independent Trustees of CFVIT and CFST I from March 2016 to June 2020 with respect to CFVIT and to December 2020 with respect to CFST I; Managing Director and General Manager of Mutual Fund Products, Columbia Management Investment Advisers, LLC, May 2010-February 2015; President, Columbia Funds, 2008-2015; and senior officer of Columbia Funds and affiliated funds, 2003-2015 | 175 | Former Director, The Autism Project, March 2015-December 2021; former Member of the Investment Committee, St. Michael’s College, November 2015-February 2020; former Trustee, St. Michael’s College, June 2017-September 2019; former Trustee, New Century Portfolios (former mutual fund complex), January 2015-December 2017 |
| Olive M. Darragh c/o Columbia Management Investment Advisers, LLC 290 Congress Street Boston, MA 02210 1962 | Trustee since 2020 | Managing Director of Darragh Inc. (strategy and talent management consulting firm), since 2010; Founder and CEO, Zolio, Inc. (investment management talent identification platform), since 2004; Consultant to Independent Trustees of CFVIT and CFST I from June 2019 to June 2020 with respect to CFVIT and to December 2020 with respect to CFST I; Partner, Tudor Investments, 2004-2010; Senior Partner, McKinsey & Company (consulting), 1990-2004; Touche Ross CPA, 1985-1988 | 175 | Treasurer, Edinburgh University US Trust Board, since January 2023; Member, HBS Community Action Partners Board, since September 2022; former Director, University of Edinburgh Business School (Member of US Board), 2004-2019; former Director, Boston Public Library Foundation, 2008-2017 |
| 34 | Columbia Solutions Aggressive Portfolio | Annual Report 2023 |
(Unaudited)
Independent trustees (continued)
| Name, address, year of birth | Position held with the Columbia Funds and length of service | Principal occupation(s) during past five years and other relevant professional experience | Number of Funds in the Columbia Funds Complex* overseen | Other directorships held by Trustee during the past five years and other relevant Board experience |
| Patricia M. Flynn c/o Columbia Management Investment Advisers, LLC 290 Congress Street Boston, MA 02210 1950 | Trustee since 2004 | Professor of Economics and Management, Bentley University, since 2002; Dean, McCallum Graduate School of Business, Bentley University, 1992-2002 | 177 | Former Trustee, MA Taxpayers Foundation, 1997-2022; former Director, The MA Business Roundtable, 2003-2019; former Chairperson, Innovation Index Advisory Committee, MA Technology Collaborative, 1997-2020 |
| Brian J. Gallagher c/o Columbia Management Investment Advisers, LLC 290 Congress Street Boston, MA 02210 1954 | Trustee since 2017 | Retired; Partner with Deloitte & Touche LLP and its predecessors, 1977-2016 | 177 | Trustee, Catholic Schools Foundation, since 2004 |
| Douglas A. Hacker c/o Columbia Management Investment Advisers, LLC 290 Congress Street Boston, MA 02210 1955 | Trustee since 1996 | Independent business executive, since May 2006; Executive Vice President – Strategy of United Airlines, December 2002 - May 2006; President of UAL Loyalty Services (airline marketing company), September 2001-December 2002; Executive Vice President and Chief Financial Officer of United Airlines, July 1999-September 2001 | 177 | Director, SpartanNash Company (Chair of the Board) (food distributor), since May 2021; Director, Aircastle Limited (Chair of Audit Committee) (aircraft leasing), since August 2006; former Director, Nash Finch Company (food distributor), 2005-2013; former Director, SeaCube Container Leasing Ltd. (container leasing), 2010-2013; and former Director, Travelport Worldwide Limited (travel information technology), 2014-2019 |
| Nancy T. Lukitsh c/o Columbia Management Investment Advisers, LLC 290 Congress Street Boston, MA 02210 1956 | Trustee since 2011 | Senior Vice President, Partner and Director of Marketing, Wellington Management Company, LLP (investment adviser), 1997-2010; Chair, Wellington Management Portfolios (commingled non-U.S. investment pools), 2007-2010; Director, Wellington Trust Company, NA and other Wellington affiliates, 1997-2010 | 175 | None |
| Columbia Solutions Aggressive Portfolio | Annual Report 2023 | 35 |
(Unaudited)
Independent trustees (continued)
| Name, address, year of birth | Position held with the Columbia Funds and length of service | Principal occupation(s) during past five years and other relevant professional experience | Number of Funds in the Columbia Funds Complex* overseen | Other directorships held by Trustee during the past five years and other relevant Board experience |
| David M. Moffett c/o Columbia Management Investment Advisers, LLC 290 Congress Street Boston, MA 02210 1952 | Trustee since 2011 | Retired; former Chief Executive Officer of Freddie Mac and Chief Financial Officer of U.S. Bank | 175 | Director, CSX Corporation (transportation suppliers); Director, PayPal Holdings Inc. (payment and data processing services); Trustee, University of Oklahoma Foundation; former Director, eBay Inc. (online trading community), 2007-2015; and former Director, CIT Bank, CIT Group Inc. (commercial and consumer finance), 2010-2016; former Senior Adviser to The Carlyle Group (financial services), March 2008-September 2008; former Governance Consultant to Bridgewater Associates, January 2013-December 2015 |
| Catherine James Paglia c/o Columbia Management Investment Advisers, LLC 290 Congress Street Boston, MA 02210 1952 | Trustee since 2004 | Director, Enterprise Asset Management, Inc. (private real estate and asset management company), since September 1998; Managing Director and Partner, Interlaken Capital, Inc., 1989-1997; Vice President, 1982-1985, Principal, 1985-1987, Managing Director, 1987-1989, Morgan Stanley; Vice President, Investment Banking, 1980-1982, Associate, Investment Banking, 1976-1980, Dean Witter Reynolds, Inc. | 177 | Director, Valmont Industries, Inc. (irrigation systems manufacturer), since 2012; Trustee, Carleton College (on the Investment Committee), since 1987; Trustee, Carnegie Endowment for International Peace (on the Investment Committee), since 2009 |
| Natalie A. Trunow c/o Columbia Management Investment Advisers, LLC 290 Congress Street Boston, MA 02210 1967 | Trustee since 2020 | Chief Executive Officer, Millennial Portfolio Solutions LLC (asset management and consulting services), January 2016-January 2021; Non-executive Member of the Investment Committee and Valuation Committee, Sarona Asset Management Inc. (private equity firm) since September 2019; Advisor, Horizon Investments (asset management and consulting services), August 2018-January 2022; Advisor, Paradigm Asset Management, November 2016-January 2022; Consultant to Independent Trustees of CFVIT and CFST I from September 2016 to June 2020 with respect to CFVIT and to December 2020 with respect to CFST I; Director of Investments/Consultant, Casey Family Programs, April 2016-November 2016; Senior Vice President and Chief Investment Officer, Calvert Investments, August 2008-January 2016; Section Head and Portfolio Manager, General Motors Asset Management, June 1997-August 2008 | 175 | Independent Director, Investment Committee, Health Services for Children with Special Needs, Inc., 2010-2021; Independent Director, (Executive Committee and Chair, Audit Committee), Consumer Credit Counseling Services (formerly Guidewell Financial Solutions), since 2016; Independent Director, (Investment Committee), Sarona Asset Management, since 2019 |
| 36 | Columbia Solutions Aggressive Portfolio | Annual Report 2023 |
(Unaudited)
Independent trustees (continued)
| Name, address, year of birth | Position held with the Columbia Funds and length of service | Principal occupation(s) during past five years and other relevant professional experience | Number of Funds in the Columbia Funds Complex* overseen | Other directorships held by Trustee during the past five years and other relevant Board experience |
| Sandra L. Yeager c/o Columbia Management Investment Advisers, LLC 290 Congress Street Boston, MA 02210 1964 | Trustee since 2017 | Retired; President and founder, Hanoverian Capital, LLC (SEC registered investment advisor firm), 2008-2016; Managing Director, DuPont Capital, 2006-2008; Managing Director, Morgan Stanley Investment Management, 2004-2006; Senior Vice President, Alliance Bernstein, 1990-2004 | 177 | Former Director, NAPE (National Alliance for Partnerships in Equity) Education Foundation, October 2016-October 2020; Advisory Board, Jennersville YMCA, since 2022 |
| Name, address, year of birth | Position held with the Columbia Funds and length of service | Principal occupation(s) during the past five years and other relevant professional experience | Number of Funds in the Columbia Funds Complex overseen | Other directorships held by Trustee during the past five years and other relevant Board experience |
| Daniel J. Beckman c/o Columbia Management Investment Advisers, LLC 290 Congress Street Boston, MA 02210 1962 | Trustee since November 2021 and President since June 2021 | Vice President – Head of North America Product, Columbia Management Investment Advisers, LLC, since April 2015; President and Principal Executive Officer of the Columbia Funds, since June 2021; officer of Columbia Funds and affiliated funds, 2020-2021 | 177 | Director, Ameriprise Trust Company, since October 2016; Director, Columbia Management Investment Distributors, Inc. since November 2018; Board of Governors, Columbia Wanger Asset Management, LLC since, January 2022; Director, Columbia Threadneedle Canada, Inc., since December 2022 |
| * | The term “Columbia Funds Complex” as used herein includes Columbia Seligman Premium Technology Growth Fund, Tri-Continental Corporation and each series of Columbia Funds Series Trust (CFST), Columbia Funds Series Trust I (CFST I), Columbia Funds Series Trust II (CFST II), Columbia ETF Trust I (CET I), Columbia ETF Trust II (CET II), Columbia Funds Variable Insurance Trust (CFVIT) and Columbia Funds Variable Series Trust II (CFVST II).Messrs. Batejan, Beckman, Gallagher and Hacker and Mses. Blatz, Carlton, Carrig, Flynn, Paglia and Yeager serve as Directors of Columbia Seligman Premium Technology Growth Fund and Tri-Continental Corporation. |
| ** | Interested person (as defined under the 1940 Act) by reason of being an officer, director, security holder and/or employee of the Investment Manager or Ameriprise Financial. |
| Columbia Solutions Aggressive Portfolio | Annual Report 2023 | 37 |
(Unaudited)
The Board has appointed officers who are responsible for day-to-day business decisions based on policies it has established. The officers serve at the pleasure of the Board. The following table provides basic information about the Officers of the Fund as of the printing of this report, including principal occupations during the past five years, although their specific titles may have varied over the period. In addition to Mr. Beckman, who is President and Principal Executive Officer, the Fund’s other officers are:
| Name, address and year of birth | Position and year first appointed to position for any Fund in the Columbia Funds Complex or a predecessor thereof | Principal occupation(s) during past five years |
| Michael G. Clarke 290 Congress Street Boston, MA 02210 1969 | Chief Financial Officer and Principal Financial Officer (2009) and Senior Vice President (2019) | Senior Vice President and Head of Global Operations & Investor Services, Columbia Management Investment Advisers, LLC, since March 2022 (previously Vice President, Head of North American Operations, and Co-Head of Global Operations, June 2019 to February 2022 and Vice President – Accounting and Tax, May 2010 - May 2019); senior officer of Columbia Funds and affiliated funds, since 2002. |
| Joseph Beranek 5890 Ameriprise Financial Center Minneapolis, MN 55474 1965 | Treasurer and Chief Accounting Officer (Principal Accounting Officer) (2019) and Principal Financial Officer (2020), CFST, CFST I, CFST II, CFVIT and CFVST II; Assistant Treasurer, CET I and CET II | Vice President – Mutual Fund Accounting and Financial Reporting, Columbia Management Investment Advisers, LLC, since December 2018 and March 2017, respectively. |
| Marybeth Pilat 290 Congress Street Boston, MA 02210 1968 | Treasurer and Chief Accounting Officer (Principal Accounting Officer) and Principal Financial Officer (2020) for CET I and CET II; Assistant Treasurer, CFST, CFST I, CFST II, CFVIT and CFVST II | Vice President – Product Pricing and Administration, Columbia Management Investment Advisers, LLC, since May 2017. |
| William F. Truscott 290 Congress Street Boston, MA 02210 1960 | Senior Vice President (2001) | Formerly, Trustee/Director of Columbia Funds Complex or legacy funds, November 2001-January 1, 2021; Chief Executive Officer, Global Asset Management, Ameriprise Financial, Inc., since September 2012; Chairman of the Board and President, Columbia Management Investment Advisers, LLC, since July 2004 and February 2012, respectively; Chairman of the Board and Chief Executive Officer, Columbia Management Investment Distributors, Inc., since November 2008 and February 2012, respectively; Chairman of the Board and Director, Threadneedle Asset Management Holdings, Sàrl, since March 2013 and December 2008, respectively; senior executive of various entities affiliated with Columbia Threadneedle. |
| Christopher O. Petersen 5228 Ameriprise Financial Center Minneapolis, MN 55474 1970 | Senior Vice President and Assistant Secretary (2021) | Formerly, Trustee/Director of funds within the Columbia Funds Complex, July 1, 2020 - November 22, 2021; Senior Vice President and Assistant General Counsel, Ameriprise Financial, Inc., since September 2021 (previously Vice President and Lead Chief Counsel, January 2015 - September 2021); formerly, President and Principal Executive Officer of the Columbia Funds, 2015 - 2021; officer of Columbia Funds and affiliated funds, since 2007. |
| Thomas P. McGuire 290 Congress Street Boston, MA 02210 1972 | Senior Vice President and Chief Compliance Officer (2012) | Vice President – Asset Management Compliance, Ameriprise Financial, Inc., since May 2010; Chief Compliance Officer, Columbia Acorn/Wanger Funds, since December 2015; formerly, Chief Compliance Officer, Ameriprise Certificate Company, September 2010 – September 2020. |
| Ryan C. Larrenaga 290 Congress Street Boston, MA 02210 1970 | Senior Vice President (2017), Chief Legal Officer (2017), and Secretary (2015) | Vice President and Chief Counsel, Ameriprise Financial, Inc., since August 2018 (previously Vice President and Group Counsel, August 2011 - August 2018); Chief Legal Officer, Columbia Acorn/Wanger Funds, since September 2020; officer of Columbia Funds and affiliated funds, since 2005. |
| 38 | Columbia Solutions Aggressive Portfolio | Annual Report 2023 |
(Unaudited)
Fund officers (continued)
| Name, address and year of birth | Position and year first appointed to position for any Fund in the Columbia Funds Complex or a predecessor thereof | Principal occupation(s) during past five years |
| Michael E. DeFao 290 Congress Street Boston, MA 02210 1968 | Vice President (2011) and Assistant Secretary (2010) | Vice President and Chief Counsel, Ameriprise Financial, Inc., since May 2010; Vice President, Chief Legal Officer and Assistant Secretary, Columbia Management Investment Advisers, LLC, since October 2021 (previously Vice President and Assistant Secretary, May 2010 – September 2021). |
| Lyn Kephart-Strong 5228 Ameriprise Financial Center Minneapolis, MN 55474 1960 | Vice President (2015) | Vice President, Global Investment Operations Services, Columbia Management Investment Advisers, LLC, since 2010; President, Columbia Management Investment Services Corp., since October 2014; President, Ameriprise Trust Company, since January 2017. |
| • | the Fund had sufficient liquidity to both meet redemptions and operate effectively on behalf of shareholders; |
| • | there were no material changes to the Program during the period; |
| • | the implementation of the Program was effective to manage the Fund’s liquidity risk; and |
| • | the Program operated adequately during the period. |
| Columbia Solutions Aggressive Portfolio | Annual Report 2023 | 39 |

March 31, 2023

| 3 | |
| 5 | |
| 7 | |
| 8 | |
| 13 | |
| 14 | |
| 15 | |
| 16 | |
| 17 | |
| 31 | |
| 32 | |
| 38 |
(Unaudited)
| Average annual total returns (%) (for the period ended March 31, 2023) | |||||
| Inception | 1 Year | 5 Years | Life | ||
| Columbia Solutions Conservative Portfolio | 10/24/17 | -3.44 | 2.71 | 2.66 | |
| Bloomberg Global Aggregate Hedged USD Index | -3.86 | 0.95 | 0.99 | ||
| Blended Benchmark | -4.03 | 2.99 | 2.93 | ||
| Columbia Solutions Conservative Portfolio | Annual Report 2023 | 3 |
(Unaudited)
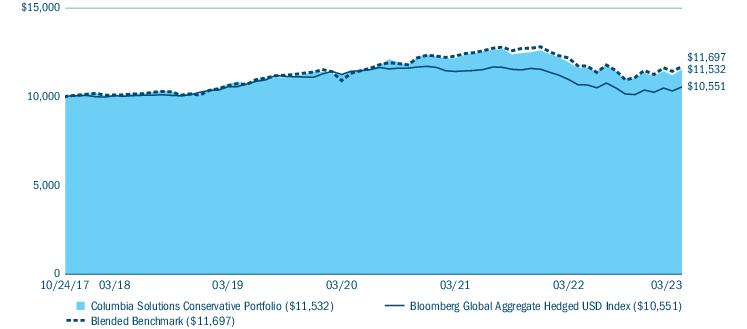
| Portfolio breakdown (%) (at March 31, 2023) | |
| Foreign Government Obligations | 15.0 |
| Money Market Funds(a) | 58.1 |
| U.S. Treasury Obligations | 26.9 |
| Total | 100.0 |
| (a) | Includes investments in Money Market Funds, including investing for the purpose of covering obligations relating to the Fund’s investment in derivatives. For a description of the Fund’s investments in derivatives, see Investments in derivatives following the Portfolio of Investments and the derivative instruments discussion in Note 2 to the Notes to Financial Statements. |
| Market exposure through derivatives investments (% of notional exposure) (at March 31, 2023)(a) | |||
| Long | Short | Net | |
| Fixed Income Derivative Contracts | 94.6 | (3.8) | 90.8 |
| Equity Derivative Contracts | 51.4 | — | 51.4 |
| Foreign Currency Derivative Contracts | 0.6 | (42.8) | (42.2) |
| Total Notional Market Value of Derivative Contracts | 146.6 | (46.6) | 100.0 |
| 4 | Columbia Solutions Conservative Portfolio | Annual Report 2023 |
(Unaudited)
| • | The Fund’s largest contribution relative to the Blended Benchmark came from its allocation to credit-sensitive securities. The Fund was underweight credit securities overall, compared to the Blended Benchmark, and outperformed due to strong security selection within the asset class. |
| • | The Fund’s overweight in interest-rate-sensitive securities during the period contributed positively to performance, due in part to specific security selection within the sector. |
| • | The Fund’s overweighted cash exposure during a period of heightened equity and fixed-income volatility contributed positively to performance against the Blended Benchmark. |
| • | Overall, the Fund’s exposure to equity securities, compared to its Blended Benchmark, was one of the largest detractors during the period. |
| • | The Fund’s exposure to U.S. small- and large-cap stocks, as well as international developed and emerging market equities, detracted from overall performance. |
| Columbia Solutions Conservative Portfolio | Annual Report 2023 | 5 |
(Unaudited)
| • | Unlike the benchmark, the Fund did not have any exposure to foreign currency exchanges, which detracted from overall performance. |
| 6 | Columbia Solutions Conservative Portfolio | Annual Report 2023 |
(Unaudited)
| October 1, 2022 — March 31, 2023 | |||||||
| Account value at the beginning of the period ($) | Account value at the end of the period ($) | Expenses paid during the period ($) | Fund’s annualized expense ratio (%) | ||||
| Actual | Hypothetical | Actual | Hypothetical | Actual | Hypothetical | Actual | |
| Columbia Solutions Conservative Portfolio | 1,000.00 | 1,000.00 | 1,049.20 | 1,024.88 | 0.05 | 0.05 | 0.01 |
| Columbia Solutions Conservative Portfolio | Annual Report 2023 | 7 |
March 31, 2023
| Foreign Government Obligations(a),(b) 14.5% | ||||
| Issuer | Coupon Rate | Principal Amount ($) | Value ($) | |
| Austria 1.6% | ||||
| Republic of Austria Government Bond(c) | ||||
| 10/20/2026 | 0.750% | EUR | 73,000 | 74,223 |
| 05/23/2034 | 2.400% | EUR | 44,000 | 45,199 |
| Republic of Austria Government Bond(c),(d) | ||||
| 02/20/2030 | 0.000% | EUR | 57,000 | 50,999 |
| Total | 170,421 | |||
| Belgium 1.2% | ||||
| Kingdom of Belgium Government Bond(c) | ||||
| 06/22/2031 | 1.000% | EUR | 57,000 | 53,702 |
| 04/22/2033 | 1.250% | EUR | 54,000 | 50,359 |
| 03/28/2035 | 5.000% | EUR | 17,000 | 21,936 |
| Total | 125,997 | |||
| China 1.1% | ||||
| China Development Bank | ||||
| 07/18/2032 | 2.960% | CNY | 250,000 | 36,181 |
| China Government Bond | ||||
| 11/21/2029 | 3.130% | CNY | 100,000 | 14,865 |
| 05/21/2030 | 2.680% | CNY | 200,000 | 28,785 |
| 05/15/2032 | 2.760% | CNY | 250,000 | 36,052 |
| Total | 115,883 | |||
| France 1.1% | ||||
| French Republic Government Bond OAT(c),(d) | ||||
| 11/25/2031 | 0.000% | EUR | 39,000 | 33,548 |
| French Republic Government Bond OAT(c) | ||||
| 05/25/2036 | 1.250% | EUR | 80,000 | 70,092 |
| 05/25/2045 | 3.250% | EUR | 20,000 | 21,926 |
| Total | 125,566 | |||
| Italy 1.6% | ||||
| Italy Buoni Poliennali Del Tesoro(c) | ||||
| 05/01/2031 | 6.000% | EUR | 73,000 | 91,182 |
| 02/01/2037 | 4.000% | EUR | 75,000 | 79,691 |
| Total | 170,873 | |||
| Japan 4.1% | ||||
| Japan Government 10-Year Bond | ||||
| 06/20/2031 | 0.100% | JPY | 22,000,000 | 162,711 |
| Japan Government 20-Year Bond | ||||
| 06/20/2041 | 0.400% | JPY | 14,000,000 | 95,146 |
| 09/20/2041 | 0.500% | JPY | 3,000,000 | 20,729 |
| 03/20/2042 | 0.800% | JPY | 5,050,000 | 36,462 |
| Foreign Government Obligations(a),(b) (continued) | ||||
| Issuer | Coupon Rate | Principal Amount ($) | Value ($) | |
| Japan Government 30-Year Bond | ||||
| 06/20/2050 | 0.600% | JPY | 2,000,000 | 12,751 |
| 06/20/2051 | 0.700% | JPY | 8,000,000 | 52,021 |
| 03/20/2052 | 1.000% | JPY | 3,650,000 | 25,604 |
| Japan Government Twenty-Year Bond | ||||
| 06/20/2042 | 0.900% | JPY | 6,000,000 | 44,302 |
| Total | 449,726 | |||
| Netherlands 1.8% | ||||
| Netherlands Government Bond(c) | ||||
| 07/15/2026 | 0.500% | EUR | 110,000 | 111,689 |
| Netherlands Government Bond(c),(d) | ||||
| 07/15/2031 | 0.000% | EUR | 95,000 | 83,654 |
| Total | 195,343 | |||
| Spain 1.4% | ||||
| Spain Government Bond(c) | ||||
| 04/30/2030 | 0.500% | EUR | 90,000 | 82,123 |
| 07/30/2035 | 1.850% | EUR | 40,000 | 36,542 |
| 07/30/2041 | 4.700% | EUR | 25,000 | 30,790 |
| Total | 149,455 | |||
| United Kingdom 0.6% | ||||
| United Kingdom Gilt(c) | ||||
| 12/07/2042 | 4.500% | GBP | 52,000 | 70,178 |
| Total Foreign Government Obligations (Cost $1,919,329) | 1,573,442 | |||
| U.S. Treasury Obligations 25.9% | ||||
| U.S. Treasury | ||||
| 03/31/2028 | 1.250% | 142,000 | 126,669 | |
| 06/30/2028 | 1.250% | 142,000 | 126,047 | |
| 09/30/2028 | 1.250% | 700,000 | 617,641 | |
| 10/31/2028 | 1.375% | 250,000 | 221,836 | |
| 11/30/2028 | 1.500% | 515,000 | 459,436 | |
| 04/30/2029 | 2.875% | 450,000 | 432,070 | |
| 05/15/2029 | 2.375% | 122,000 | 113,832 | |
| 08/15/2029 | 1.625% | 122,000 | 108,847 | |
| 08/15/2030 | 0.625% | 111,000 | 90,465 | |
| 02/15/2031 | 1.125% | 103,000 | 86,729 | |
| 08/15/2031 | 1.250% | 515,000 | 431,956 | |
| Total U.S. Treasury Obligations (Cost $3,165,979) | 2,815,528 | |||
| 8 | Columbia Solutions Conservative Portfolio | Annual Report 2023 |
March 31, 2023
| Money Market Funds 56.0% | ||
| Shares | Value ($) | |
| Columbia Short-Term Cash Fund, 4.983%(e),(f) | 6,085,601 | 6,084,384 |
| Total Money Market Funds (Cost $6,083,239) | 6,084,384 | |
| Total Investments in Securities (Cost: $11,168,547) | 10,473,354 | |
| Other Assets & Liabilities, Net | 389,232 | |
| Net Assets | 10,862,586 | |
| Forward foreign currency exchange contracts | |||||
| Currency to be sold | Currency to be purchased | Counterparty | Settlement date | Unrealized appreciation ($) | Unrealized depreciation ($) |
| 67,000 CHF | 73,634 USD | Citi | 04/19/2023 | 287 | — |
| 557,000 CNY | 81,427 USD | Citi | 04/19/2023 | 258 | — |
| 1,089,000 EUR | 1,170,654 USD | Citi | 04/19/2023 | — | (11,357) |
| 164,000 HKD | 20,938 USD | Citi | 04/19/2023 | 29 | — |
| 258,000 SEK | 24,683 USD | Citi | 04/19/2023 | — | (196) |
| 9,669 USD | 9,000 EUR | Citi | 04/19/2023 | 100 | — |
| 287 USD | 3,000 SEK | Citi | 04/19/2023 | 2 | — |
| 67,000 NOK | 6,369 USD | Goldman Sachs International | 04/19/2023 | — | (35) |
| 79,953,034 JPY | 597,824 USD | HSBC | 04/19/2023 | — | (5,825) |
| 7,000 SGD | 5,210 USD | HSBC | 04/19/2023 | — | (52) |
| 4,576 USD | 600,000 JPY | HSBC | 04/19/2023 | — | (46) |
| 40,000 ZAR | 2,194 USD | HSBC | 04/19/2023 | — | (50) |
| 266,000 CNY | 38,963 USD | Standard Chartered | 04/19/2023 | 200 | — |
| 92,000 AUD | 61,426 USD | UBS | 04/19/2023 | — | (105) |
| 6,000 CAD | 4,391 USD | UBS | 04/19/2023 | — | (50) |
| 142,000 DKK | 20,504 USD | UBS | 04/19/2023 | — | (188) |
| 6,000 EUR | 6,450 USD | UBS | 04/19/2023 | — | (63) |
| 162,000 GBP | 196,901 USD | UBS | 04/19/2023 | — | (3,004) |
| 5,861 USD | 8,000 CAD | UBS | 04/19/2023 | 59 | — |
| 9,812 USD | 8,000 GBP | UBS | 04/19/2023 | 60 | — |
| Total | 995 | (20,971) | |||
| Long futures contracts | ||||||
| Description | Number of contracts | Expiration date | Trading currency | Notional amount | Value/Unrealized appreciation ($) | Value/Unrealized depreciation ($) |
| 10-Year Mini Japanese Government Bond | 2 | 06/2023 | JPY | 29,564,000 | 3,630 | — |
| Australian 10-Year Bond | 1 | 06/2023 | AUD | 122,886 | 2,495 | — |
| Euro-Bobl | 3 | 06/2023 | EUR | 353,640 | 8,433 | — |
| Euro-BTP | 1 | 06/2023 | EUR | 115,350 | 4,224 | — |
| Euro-OAT | 1 | 06/2023 | EUR | 130,230 | 4,501 | — |
| Long Gilt | 2 | 06/2023 | GBP | 206,700 | 5,959 | — |
| MSCI EAFE Index | 7 | 06/2023 | USD | 733,775 | 20,600 | — |
| MSCI Emerging Markets Index | 6 | 06/2023 | USD | 298,650 | 8,725 | — |
| Russell 2000 Index E-mini | 1 | 06/2023 | USD | 90,675 | — | (32) |
| S&P 500 Index E-mini | 8 | 06/2023 | USD | 1,655,100 | 72,764 | — |
| U.S. Treasury 10-Year Note | 4 | 06/2023 | USD | 459,688 | 13,727 | — |
| Columbia Solutions Conservative Portfolio | Annual Report 2023 | 9 |
March 31, 2023
| Long futures contracts (continued) | ||||||
| Description | Number of contracts | Expiration date | Trading currency | Notional amount | Value/Unrealized appreciation ($) | Value/Unrealized depreciation ($) |
| U.S. Treasury 5-Year Note | 2 | 06/2023 | USD | 219,016 | 4,653 | — |
| U.S. Treasury Ultra 10-Year Note | 11 | 06/2023 | USD | 1,332,547 | 42,016 | — |
| Total | 191,727 | (32) | ||||
| Short futures contracts | ||||||
| Description | Number of contracts | Expiration date | Trading currency | Notional amount | Value/Unrealized appreciation ($) | Value/Unrealized depreciation ($) |
| Canadian Government 10-Year Bond | (1) | 06/2023 | CAD | (126,160) | — | (3,705) |
| Short Term Euro-BTP | (1) | 06/2023 | EUR | (105,370) | — | (1,293) |
| Total | — | (4,998) | ||||
| Cleared credit default swap contracts - sell protection | ||||||||||||
| Reference entity | Counterparty | Maturity date | Receive fixed rate (%) | Payment frequency | Implied credit spread (%)* | Notional currency | Notional amount | Value ($) | Upfront payments ($) | Upfront receipts ($) | Unrealized appreciation ($) | Unrealized depreciation ($) |
| Markit CDX North America High Yield Index, Series 40 | Morgan Stanley | 06/20/2028 | 5.000 | Quarterly | 4.635 | USD | 1,218,000 | 19,367 | — | — | 19,367 | — |
| Markit CDX North America Investment Grade Index, Series 40 | Morgan Stanley | 06/20/2028 | 1.000 | Quarterly | 0.756 | USD | 676,000 | 4,328 | — | — | 4,328 | — |
| Total | 23,695 | — | — | 23,695 | — | |||||||
| * | Implied credit spreads, represented in absolute terms, utilized in determining the market value of credit default swap agreements on corporate or sovereign issues as of period end serve as an indicator of the current status of the payment/performance risk and represent the likelihood or risk of default for the credit derivative. The implied credit spread of a particular referenced entity reflects the cost of buying/selling protection and may include upfront payments required to be made to enter into the agreement. Wider credit spreads represent a deterioration of the referenced entity’s credit soundness and a greater likelihood or risk of default or other credit event occurring as defined under the terms of the agreement. |
| (a) | Principal amounts are denominated in United States Dollars unless otherwise noted. |
| (b) | Principal and interest may not be guaranteed by a governmental entity. |
| (c) | Represents privately placed and other securities and instruments exempt from Securities and Exchange Commission registration (collectively, private placements), such as Section 4(a)(2) and Rule 144A eligible securities, which are often sold only to qualified institutional buyers. At March 31, 2023, the total value of these securities amounted to $1,007,833, which represents 9.28% of total net assets. |
| (d) | Zero coupon bond. |
| (e) | The rate shown is the seven-day current annualized yield at March 31, 2023. |
| (f) | As defined in the Investment Company Act of 1940, as amended, an affiliated company is one in which the Fund owns 5% or more of the company’s outstanding voting securities, or a company which is under common ownership or control with the Fund. The value of the holdings and transactions in these affiliated companies during the year ended March 31, 2023 are as follows: |
| Affiliated issuers | Beginning of period($) | Purchases($) | Sales($) | Net change in unrealized appreciation (depreciation)($) | End of period($) | Realized gain (loss)($) | Dividends($) | End of period shares |
| Columbia Short-Term Cash Fund, 4.983% | ||||||||
| 5,767,626 | 5,726,262 | (5,411,876) | 2,372 | 6,084,384 | (1,137) | 157,478 | 6,085,601 | |
| AUD | Australian Dollar |
| CAD | Canada Dollar |
| CHF | Swiss Franc |
| CNY | China Yuan Renminbi |
| 10 | Columbia Solutions Conservative Portfolio | Annual Report 2023 |
March 31, 2023
| DKK | Danish Krone |
| EUR | Euro |
| GBP | British Pound |
| HKD | Hong Kong Dollar |
| JPY | Japanese Yen |
| NOK | Norwegian Krone |
| SEK | Swedish Krona |
| SGD | Singapore Dollar |
| USD | US Dollar |
| ZAR | South African Rand |
| ■ | Level 1 — Valuations based on quoted prices for investments in active markets that the Fund has the ability to access at the measurement date. Valuation adjustments are not applied to Level 1 investments. |
| ■ | Level 2 — Valuations based on other significant observable inputs (including quoted prices for similar securities, interest rates, prepayment speeds, credit risks, etc.). |
| ■ | Level 3 — Valuations based on significant unobservable inputs (including the Fund’s own assumptions and judgment in determining the fair value of investments). |
| Level 1 ($) | Level 2 ($) | Level 3 ($) | Total ($) | |
| Investments in Securities | ||||
| Foreign Government Obligations | — | 1,573,442 | — | 1,573,442 |
| U.S. Treasury Obligations | — | 2,815,528 | — | 2,815,528 |
| Money Market Funds | 6,084,384 | — | — | 6,084,384 |
| Total Investments in Securities | 6,084,384 | 4,388,970 | — | 10,473,354 |
| Investments in Derivatives |
| Columbia Solutions Conservative Portfolio | Annual Report 2023 | 11 |
March 31, 2023
| Level 1 ($) | Level 2 ($) | Level 3 ($) | Total ($) | |
| Asset | ||||
| Forward Foreign Currency Exchange Contracts | — | 995 | — | 995 |
| Futures Contracts | 191,727 | — | — | 191,727 |
| Swap Contracts | — | 23,695 | — | 23,695 |
| Liability | ||||
| Forward Foreign Currency Exchange Contracts | — | (20,971) | — | (20,971) |
| Futures Contracts | (5,030) | — | — | (5,030) |
| Total | 6,271,081 | 4,392,689 | — | 10,663,770 |
| 12 | Columbia Solutions Conservative Portfolio | Annual Report 2023 |
March 31, 2023
| Assets | |
| Investments in securities, at value | |
| Unaffiliated issuers (cost $5,085,308) | $4,388,970 |
| Affiliated issuers (cost $6,083,239) | 6,084,384 |
| Foreign currency (cost $11,712) | 11,766 |
| Margin deposits on: | |
| Futures contracts | 213,246 |
| Swap contracts | 136,217 |
| Unrealized appreciation on forward foreign currency exchange contracts | 995 |
| Receivable for: | |
| Capital shares sold | 2,904 |
| Dividends | 23,967 |
| Interest | 23,310 |
| Foreign tax reclaims | 1,131 |
| Variation margin for futures contracts | 38,626 |
| Variation margin for swap contracts | 7,187 |
| Expense reimbursement due from Investment Manager | 384 |
| Prepaid expenses | 994 |
| Trustees’ deferred compensation plan | 18,205 |
| Total assets | 10,952,286 |
| Liabilities | |
| Unrealized depreciation on forward foreign currency exchange contracts | 20,971 |
| Payable for: | |
| Investments purchased | 643 |
| Capital shares purchased | 6,193 |
| Variation margin for futures contracts | 1,940 |
| Compensation of board members | 12,471 |
| Accounting services fees | 20,145 |
| Custodian fees | 7,407 |
| Other expenses | 1,725 |
| Trustees’ deferred compensation plan | 18,205 |
| Total liabilities | 89,700 |
| Net assets applicable to outstanding capital stock | $10,862,586 |
| Represented by | |
| Paid in capital | 12,397,238 |
| Total distributable earnings (loss) | (1,534,652) |
| Total - representing net assets applicable to outstanding capital stock | $10,862,586 |
| Shares outstanding | 1,223,279 |
| Net asset value per share | 8.88 |
| Columbia Solutions Conservative Portfolio | Annual Report 2023 | 13 |
Year Ended March 31, 2023
| Net investment income | |
| Income: | |
| Dividends — affiliated issuers | $157,478 |
| Interest | 64,428 |
| Foreign taxes withheld | (113) |
| Total income | 221,793 |
| Expenses: | |
| Compensation of board members | 14,588 |
| Custodian fees | 26,412 |
| Printing and postage fees | 5,766 |
| Accounting services fees | 40,290 |
| Legal fees | 13,297 |
| Interest on collateral | 49 |
| Compensation of chief compliance officer | 2 |
| Other | 4,505 |
| Total expenses | 104,909 |
| Fees waived or expenses reimbursed by Investment Manager and its affiliates | (104,340) |
| Total net expenses | 569 |
| Net investment income | 221,224 |
| Realized and unrealized gain (loss) — net | |
| Net realized gain (loss) on: | |
| Investments — unaffiliated issuers | (145,098) |
| Investments — affiliated issuers | (1,137) |
| Foreign currency translations | (1,650) |
| Forward foreign currency exchange contracts | 169,425 |
| Futures contracts | (553,754) |
| Swap contracts | 3,739 |
| Net realized loss | (528,475) |
| Net change in unrealized appreciation (depreciation) on: | |
| Investments — unaffiliated issuers | (292,097) |
| Investments — affiliated issuers | 2,372 |
| Foreign currency translations | 601 |
| Forward foreign currency exchange contracts | (18,100) |
| Futures contracts | 234,563 |
| Swap contracts | 10,811 |
| Net change in unrealized appreciation (depreciation) | (61,850) |
| Net realized and unrealized loss | (590,325) |
| Net decrease in net assets resulting from operations | $(369,101) |
| 14 | Columbia Solutions Conservative Portfolio | Annual Report 2023 |
| Year Ended March 31, 2023 | Year Ended March 31, 2022 | |
| Operations | ||
| Net investment income | $221,224 | $61,926 |
| Net realized gain (loss) | (528,475) | 58,760 |
| Net change in unrealized appreciation (depreciation) | (61,850) | (325,045) |
| Net decrease in net assets resulting from operations | (369,101) | (204,359) |
| Distributions to shareholders | ||
| Net investment income and net realized gains | (500,033) | (790,929) |
| Total distributions to shareholders | (500,033) | (790,929) |
| Increase in net assets from capital stock activity | 918,177 | 692,404 |
| Total increase (decrease) in net assets | 49,043 | (302,884) |
| Net assets at beginning of year | 10,813,543 | 11,116,427 |
| Net assets at end of year | $10,862,586 | $10,813,543 |
| Year Ended | Year Ended | |||
| March 31, 2023 | March 31, 2022 | |||
| Shares | Dollars ($) | Shares | Dollars ($) | |
| Capital stock activity | ||||
| Subscriptions | 84,443 | 760,150 | 198,052 | 2,113,253 |
| Distributions reinvested | 57,162 | 499,593 | 77,705 | 790,260 |
| Redemptions | (37,347) | (341,566) | (216,468) | (2,211,109) |
| Total net increase | 104,258 | 918,177 | 59,289 | 692,404 |
| Columbia Solutions Conservative Portfolio | Annual Report 2023 | 15 |
| Year Ended March 31, | |||||
| 2023 | 2022 | 2021 | 2020 | 2019 | |
| Per share data | |||||
| Net asset value, beginning of period | $9.66 | $10.49 | $10.15 | $10.24 | $10.05 |
| Income from investment operations: | |||||
| Net investment income | 0.19 | 0.05 | 0.08 | 0.21 | 0.21 |
| Net realized and unrealized gain (loss) | (0.53) | (0.21) | 0.76 | 0.34 | 0.36 |
| Total from investment operations | (0.34) | (0.16) | 0.84 | 0.55 | 0.57 |
| Less distributions to shareholders from: | |||||
| Net investment income | (0.44) | (0.11) | (0.11) | (0.26) | (0.30) |
| Net realized gains | — | (0.56) | (0.39) | (0.38) | (0.08) |
| Total distributions to shareholders | (0.44) | (0.67) | (0.50) | (0.64) | (0.38) |
| Net asset value, end of period | $8.88 | $9.66 | $10.49 | $10.15 | $10.24 |
| Total return | (3.44%) | (1.85%) | 8.23% | 5.26% | 5.85% |
| Ratios to average net assets | |||||
| Total gross expenses(a) | 1.01%(b) | 0.87%(b) | 0.90% | 1.01% | 1.44% |
| Total net expenses(a),(c) | 0.01%(b) | 0.01%(b) | 0.01% | 0.01% | 0.01% |
| Net investment income | 2.13% | 0.51% | 0.73% | 1.98% | 2.11% |
| Supplemental data | |||||
| Portfolio turnover | 22% | 233% | 66% | 218% | 141% |
| Net assets, end of period (in thousands) | $10,863 | $10,814 | $11,116 | $9,356 | $8,363 |
| Notes to Financial Highlights | |
| (a) | In addition to the fees and expenses that the Fund bears directly, the Fund indirectly bears a pro rata share of the fees and expenses of any other funds in which it invests. Such indirect expenses are not included in the Fund’s reported expense ratios. |
| (b) | Ratios include interest on collateral expense which is less than 0.01%. |
| (c) | Total net expenses include the impact of certain fee waivers/expense reimbursements made by the Investment Manager and certain of its affiliates, if applicable. |
| 16 | Columbia Solutions Conservative Portfolio | Annual Report 2023 |
March 31, 2023
| Columbia Solutions Conservative Portfolio | Annual Report 2023 | 17 |
March 31, 2023
| 18 | Columbia Solutions Conservative Portfolio | Annual Report 2023 |
March 31, 2023
| Columbia Solutions Conservative Portfolio | Annual Report 2023 | 19 |
March 31, 2023
| 20 | Columbia Solutions Conservative Portfolio | Annual Report 2023 |
March 31, 2023
| Columbia Solutions Conservative Portfolio | Annual Report 2023 | 21 |
March 31, 2023
| Asset derivatives | ||
| Risk exposure category | Statement of assets and liabilities location | Fair value ($) |
| Credit risk | Component of total distributable earnings (loss) — unrealized appreciation on swap contracts | 23,695* |
| Equity risk | Component of total distributable earnings (loss) — unrealized appreciation on futures contracts | 102,089* |
| Foreign exchange risk | Unrealized appreciation on forward foreign currency exchange contracts | 995 |
| Interest rate risk | Component of total distributable earnings (loss) — unrealized appreciation on futures contracts | 89,638* |
| Total | 216,417 |
| Liability derivatives | ||
| Risk exposure category | Statement of assets and liabilities location | Fair value ($) |
| Equity risk | Component of total distributable earnings (loss) — unrealized depreciation on futures contracts | 32* |
| Foreign exchange risk | Unrealized depreciation on forward foreign currency exchange contracts | 20,971 |
| Interest rate risk | Component of total distributable earnings (loss) — unrealized depreciation on futures contracts | 4,998* |
| Total | 26,001 |
| * | Includes cumulative appreciation (depreciation) as reported in the tables following the Portfolio of Investments. Only the current day’s variation margin is reported in receivables or payables in the Statement of Assets and Liabilities. |
| Amount of realized gain (loss) on derivatives recognized in income | ||||
| Risk exposure category | Forward foreign currency exchange contracts ($) | Futures contracts ($) | Swap contracts ($) | Total ($) |
| Credit risk | — | — | (4,424) | (4,424) |
| Equity risk | — | (150,470) | — | (150,470) |
| Foreign exchange risk | 169,425 | — | — | 169,425 |
| Interest rate risk | — | (403,284) | 8,163 | (395,121) |
| Total | 169,425 | (553,754) | 3,739 | (380,590) |
| Change in unrealized appreciation (depreciation) on derivatives recognized in income | ||||
| Risk exposure category | Forward foreign currency exchange contracts ($) | Futures contracts ($) | Swap contracts ($) | Total ($) |
| Credit risk | — | — | 16,484 | 16,484 |
| Equity risk | — | 50,870 | — | 50,870 |
| Foreign exchange risk | (18,100) | — | — | (18,100) |
| Interest rate risk | — | 183,693 | (5,673) | 178,020 |
| Total | (18,100) | 234,563 | 10,811 | 227,274 |
| 22 | Columbia Solutions Conservative Portfolio | Annual Report 2023 |
March 31, 2023
| Derivative instrument | Average notional amounts ($)* |
| Futures contracts — long | 4,317,721 |
| Futures contracts — short | 179,362 |
| Credit default swap contracts — sell protection | 1,147,380 |
| Derivative instrument | Average unrealized appreciation ($) | Average unrealized depreciation ($) |
| Forward foreign currency exchange contracts | 28,351* | (12,695)* |
| Interest rate swap contracts | 650** | — |
| * | Based on the ending quarterly outstanding amounts for the year ended March 31, 2023. |
| ** | Based on the ending daily outstanding amounts for the year ended March 31, 2023. |
| Citi ($) | Goldman Sachs International ($) | HSBC ($) | Morgan Stanley ($) | Standard Chartered ($) | UBS ($) | Total ($) | |||
| Assets | |||||||||
| Centrally cleared credit default swap contracts (a) | - | - | - | 7,187 | - | - | 7,187 | ||
| Forward foreign currency exchange contracts | 676 | - | - | - | 200 | 119 | 995 | ||
| Total assets | 676 | - | - | 7,187 | 200 | 119 | 8,182 | ||
| Liabilities | |||||||||
| Forward foreign currency exchange contracts | 11,553 | 35 | 5,973 | - | - | 3,410 | 20,971 | ||
| Total financial and derivative net assets | (10,877) | (35) | (5,973) | 7,187 | 200 | (3,291) | (12,789) | ||
| Total collateral received (pledged) (b) | - | - | - | - | - | - | - | ||
| Net amount (c) | (10,877) | (35) | (5,973) | 7,187 | 200 | (3,291) | (12,789) |
| (a) | Centrally cleared swaps are included within payable/receivable for variation margin in the Statement of Assets and Liabilities. |
| (b) | In some instances, the actual collateral received and/or pledged may be more than the amount shown due to overcollateralization. |
| (c) | Represents the net amount due from/(to) counterparties in the event of default. |
| Columbia Solutions Conservative Portfolio | Annual Report 2023 | 23 |
March 31, 2023
| 24 | Columbia Solutions Conservative Portfolio | Annual Report 2023 |
March 31, 2023
| Columbia Solutions Conservative Portfolio | Annual Report 2023 | 25 |
March 31, 2023
| Excess of distributions over net investment income ($) | Accumulated net realized (loss) ($) | Paid in capital ($) |
| 139,943 | (139,943) | — |
| Year Ended March 31, 2023 | Year Ended March 31, 2022 | ||||
| Ordinary income ($) | Long-term capital gains ($) | Total ($) | Ordinary income ($) | Long-term capital gains ($) | Total ($) |
| 500,033 | — | 500,033 | 414,368 | 376,561 | 790,929 |
| Undistributed ordinary income ($) | Undistributed long-term capital gains ($) | Capital loss carryforwards ($) | Net unrealized (depreciation) ($) |
| — | — | (746,794) | (694,677) |
| Federal tax cost ($) | Gross unrealized appreciation ($) | Gross unrealized (depreciation) ($) | Net unrealized (depreciation) ($) |
| 11,358,447 | 27,217 | (721,894) | (694,677) |
| 26 | Columbia Solutions Conservative Portfolio | Annual Report 2023 |
March 31, 2023
| No expiration short-term ($) | No expiration long-term ($) | Total ($) | Utilized ($) |
| (446,929) | (299,865) | (746,794) | — |
| Late year ordinary losses ($) | Post-October capital losses ($) |
| 93,554 | — |
| Columbia Solutions Conservative Portfolio | Annual Report 2023 | 27 |
March 31, 2023
| 28 | Columbia Solutions Conservative Portfolio | Annual Report 2023 |
March 31, 2023
| Columbia Solutions Conservative Portfolio | Annual Report 2023 | 29 |
March 31, 2023
| 30 | Columbia Solutions Conservative Portfolio | Annual Report 2023 |
| Columbia Solutions Conservative Portfolio | Annual Report 2023 | 31 |
| Name, address, year of birth | Position held with the Columbia Funds and length of service | Principal occupation(s) during past five years and other relevant professional experience | Number of Funds in the Columbia Funds Complex* overseen | Other directorships held by Trustee during the past five years and other relevant Board experience |
| George S. Batejan c/o Columbia Management Investment Advisers, LLC 290 Congress Street Boston, MA 02210 1954 | Trustee since 2017 | Executive Vice President, Global Head of Technology and Operations, Janus Capital Group, Inc., 2010-2016 | 177 | Former Chairman of the Board, NICSA (National Investment Company Services Association) (Executive Committee, Nominating Committee and Governance Committee), 2014-2016; former Director, Intech Investment Management, 2011-2016; former Board Member, Metro Denver Chamber of Commerce, 2015-2016; former Advisory Board Member, University of Colorado Business School, 2015-2018; former Board Member, Chase Bank International, 1993-1994 |
| Kathleen Blatz c/o Columbia Management Investment Advisers, LLC 290 Congress Street Boston, MA 02210 1954 | Trustee since 2006 | Attorney, specializing in arbitration and mediation; Chief Justice, Minnesota Supreme Court, 1998-2006; Associate Justice, Minnesota Supreme Court, 1996-1998; Fourth Judicial District Court Judge, Hennepin County, 1994-1996; Attorney in private practice and public service, 1984-1993; State Representative, Minnesota House of Representatives, 1979-1993, which included service on the Tax and Financial Institutions and Insurance Committees; Member and Interim Chair, Minnesota Sports Facilities Authority, January-July 2017; Interim President and Chief Executive Officer, Blue Cross and Blue Shield of Minnesota (health care insurance), February-July 2018, April-October 2021 | 177 | Former Trustee, Blue Cross and Blue Shield of Minnesota, 2009-2021 (Chair of the Business Development Committee, 2014-2017; Chair of the Governance Committee, 2017-2019); former Member and Chair of the Board, Minnesota Sports Facilities Authority, January 2017-July 2017; former Director, Robina Foundation, 2009-2020 (Chair, 2014-2020); Director, Richard M. Schulze Family Foundation, since 2021 |
| 32 | Columbia Solutions Conservative Portfolio | Annual Report 2023 |
(Unaudited)
Independent trustees (continued)
| Name, address, year of birth | Position held with the Columbia Funds and length of service | Principal occupation(s) during past five years and other relevant professional experience | Number of Funds in the Columbia Funds Complex* overseen | Other directorships held by Trustee during the past five years and other relevant Board experience |
| Pamela G. Carlton c/o Columbia Management Investment Advisers, LLC 290 Congress Street Boston, MA 02210 1954 | Chair since 2023; Trustee since 2007 | President, Springboard — Partners in Cross Cultural Leadership (consulting company), since 2003; Managing Director of US Equity Research, JP Morgan Chase, 1999-2003; Director of US Equity Research, Chase Asset Management, 1996-1999; Co-Director Latin America Research, 1993-1996, COO Global Research, 1992-1996, Co-Director of US Research, 1991-1992, Investment Banker, 1982-1991, Morgan Stanley; Attorney, Cleary Gottlieb Steen & Hamilton LLP, 1980-1982 | 177 | Trustee, New York Presbyterian Hospital Board, since 1996; Director, DR Bank (Audit Committee) since 2017; Director, Evercore Inc. (Audit Committee, Nominating and Governance Committee), since 2019; Director, Apollo Commercial Real Estate Finance, Inc. (Chair, Nominating and Governance Committee) (financial services), since 2021; the Governing Council of the Independent Directors Council (IDC), since 2021 |
| Janet Langford Carrig c/o Columbia Management Investment Advisers, LLC 290 Congress Street Boston, MA 02210 1957 | Trustee since 1996 | Senior Vice President, General Counsel and Corporate Secretary, ConocoPhillips (independent energy company), September 2007-October 2018 | 175 | Director, EQT Corporation (natural gas producer), since 2019; former Director, Whiting Petroleum Corporation (independent oil and gas company), 2020-2022 |
| J. Kevin Connaughton c/o Columbia Management Investment Advisers, LLC 290 Congress Street Boston, MA 02210 1964 | Trustee since 2020 | CEO and President, RhodeWay Financial (non-profit financial planning firm), since December 2022; Member, FINRA National Adjudicatory Council, since January 2020; Adjunct Professor of Finance, Bentley University since January 2018; Consultant to Independent Trustees of CFVIT and CFST I from March 2016 to June 2020 with respect to CFVIT and to December 2020 with respect to CFST I; Managing Director and General Manager of Mutual Fund Products, Columbia Management Investment Advisers, LLC, May 2010-February 2015; President, Columbia Funds, 2008-2015; and senior officer of Columbia Funds and affiliated funds, 2003-2015 | 175 | Former Director, The Autism Project, March 2015-December 2021; former Member of the Investment Committee, St. Michael’s College, November 2015-February 2020; former Trustee, St. Michael’s College, June 2017-September 2019; former Trustee, New Century Portfolios (former mutual fund complex), January 2015-December 2017 |
| Olive M. Darragh c/o Columbia Management Investment Advisers, LLC 290 Congress Street Boston, MA 02210 1962 | Trustee since 2020 | Managing Director of Darragh Inc. (strategy and talent management consulting firm), since 2010; Founder and CEO, Zolio, Inc. (investment management talent identification platform), since 2004; Consultant to Independent Trustees of CFVIT and CFST I from June 2019 to June 2020 with respect to CFVIT and to December 2020 with respect to CFST I; Partner, Tudor Investments, 2004-2010; Senior Partner, McKinsey & Company (consulting), 1990-2004; Touche Ross CPA, 1985-1988 | 175 | Treasurer, Edinburgh University US Trust Board, since January 2023; Member, HBS Community Action Partners Board, since September 2022; former Director, University of Edinburgh Business School (Member of US Board), 2004-2019; former Director, Boston Public Library Foundation, 2008-2017 |
| Columbia Solutions Conservative Portfolio | Annual Report 2023 | 33 |
(Unaudited)
Independent trustees (continued)
| Name, address, year of birth | Position held with the Columbia Funds and length of service | Principal occupation(s) during past five years and other relevant professional experience | Number of Funds in the Columbia Funds Complex* overseen | Other directorships held by Trustee during the past five years and other relevant Board experience |
| Patricia M. Flynn c/o Columbia Management Investment Advisers, LLC 290 Congress Street Boston, MA 02210 1950 | Trustee since 2004 | Professor of Economics and Management, Bentley University, since 2002; Dean, McCallum Graduate School of Business, Bentley University, 1992-2002 | 177 | Former Trustee, MA Taxpayers Foundation, 1997-2022; former Director, The MA Business Roundtable, 2003-2019; former Chairperson, Innovation Index Advisory Committee, MA Technology Collaborative, 1997-2020 |
| Brian J. Gallagher c/o Columbia Management Investment Advisers, LLC 290 Congress Street Boston, MA 02210 1954 | Trustee since 2017 | Retired; Partner with Deloitte & Touche LLP and its predecessors, 1977-2016 | 177 | Trustee, Catholic Schools Foundation, since 2004 |
| Douglas A. Hacker c/o Columbia Management Investment Advisers, LLC 290 Congress Street Boston, MA 02210 1955 | Trustee since 1996 | Independent business executive, since May 2006; Executive Vice President – Strategy of United Airlines, December 2002 - May 2006; President of UAL Loyalty Services (airline marketing company), September 2001-December 2002; Executive Vice President and Chief Financial Officer of United Airlines, July 1999-September 2001 | 177 | Director, SpartanNash Company (Chair of the Board) (food distributor), since May 2021; Director, Aircastle Limited (Chair of Audit Committee) (aircraft leasing), since August 2006; former Director, Nash Finch Company (food distributor), 2005-2013; former Director, SeaCube Container Leasing Ltd. (container leasing), 2010-2013; and former Director, Travelport Worldwide Limited (travel information technology), 2014-2019 |
| Nancy T. Lukitsh c/o Columbia Management Investment Advisers, LLC 290 Congress Street Boston, MA 02210 1956 | Trustee since 2011 | Senior Vice President, Partner and Director of Marketing, Wellington Management Company, LLP (investment adviser), 1997-2010; Chair, Wellington Management Portfolios (commingled non-U.S. investment pools), 2007-2010; Director, Wellington Trust Company, NA and other Wellington affiliates, 1997-2010 | 175 | None |
| 34 | Columbia Solutions Conservative Portfolio | Annual Report 2023 |
(Unaudited)
Independent trustees (continued)
| Name, address, year of birth | Position held with the Columbia Funds and length of service | Principal occupation(s) during past five years and other relevant professional experience | Number of Funds in the Columbia Funds Complex* overseen | Other directorships held by Trustee during the past five years and other relevant Board experience |
| David M. Moffett c/o Columbia Management Investment Advisers, LLC 290 Congress Street Boston, MA 02210 1952 | Trustee since 2011 | Retired; former Chief Executive Officer of Freddie Mac and Chief Financial Officer of U.S. Bank | 175 | Director, CSX Corporation (transportation suppliers); Director, PayPal Holdings Inc. (payment and data processing services); Trustee, University of Oklahoma Foundation; former Director, eBay Inc. (online trading community), 2007-2015; and former Director, CIT Bank, CIT Group Inc. (commercial and consumer finance), 2010-2016; former Senior Adviser to The Carlyle Group (financial services), March 2008-September 2008; former Governance Consultant to Bridgewater Associates, January 2013-December 2015 |
| Catherine James Paglia c/o Columbia Management Investment Advisers, LLC 290 Congress Street Boston, MA 02210 1952 | Trustee since 2004 | Director, Enterprise Asset Management, Inc. (private real estate and asset management company), since September 1998; Managing Director and Partner, Interlaken Capital, Inc., 1989-1997; Vice President, 1982-1985, Principal, 1985-1987, Managing Director, 1987-1989, Morgan Stanley; Vice President, Investment Banking, 1980-1982, Associate, Investment Banking, 1976-1980, Dean Witter Reynolds, Inc. | 177 | Director, Valmont Industries, Inc. (irrigation systems manufacturer), since 2012; Trustee, Carleton College (on the Investment Committee), since 1987; Trustee, Carnegie Endowment for International Peace (on the Investment Committee), since 2009 |
| Natalie A. Trunow c/o Columbia Management Investment Advisers, LLC 290 Congress Street Boston, MA 02210 1967 | Trustee since 2020 | Chief Executive Officer, Millennial Portfolio Solutions LLC (asset management and consulting services), January 2016-January 2021; Non-executive Member of the Investment Committee and Valuation Committee, Sarona Asset Management Inc. (private equity firm) since September 2019; Advisor, Horizon Investments (asset management and consulting services), August 2018-January 2022; Advisor, Paradigm Asset Management, November 2016-January 2022; Consultant to Independent Trustees of CFVIT and CFST I from September 2016 to June 2020 with respect to CFVIT and to December 2020 with respect to CFST I; Director of Investments/Consultant, Casey Family Programs, April 2016-November 2016; Senior Vice President and Chief Investment Officer, Calvert Investments, August 2008-January 2016; Section Head and Portfolio Manager, General Motors Asset Management, June 1997-August 2008 | 175 | Independent Director, Investment Committee, Health Services for Children with Special Needs, Inc., 2010-2021; Independent Director, (Executive Committee and Chair, Audit Committee), Consumer Credit Counseling Services (formerly Guidewell Financial Solutions), since 2016; Independent Director, (Investment Committee), Sarona Asset Management, since 2019 |
| Columbia Solutions Conservative Portfolio | Annual Report 2023 | 35 |
(Unaudited)
Independent trustees (continued)
| Name, address, year of birth | Position held with the Columbia Funds and length of service | Principal occupation(s) during past five years and other relevant professional experience | Number of Funds in the Columbia Funds Complex* overseen | Other directorships held by Trustee during the past five years and other relevant Board experience |
| Sandra L. Yeager c/o Columbia Management Investment Advisers, LLC 290 Congress Street Boston, MA 02210 1964 | Trustee since 2017 | Retired; President and founder, Hanoverian Capital, LLC (SEC registered investment advisor firm), 2008-2016; Managing Director, DuPont Capital, 2006-2008; Managing Director, Morgan Stanley Investment Management, 2004-2006; Senior Vice President, Alliance Bernstein, 1990-2004 | 177 | Former Director, NAPE (National Alliance for Partnerships in Equity) Education Foundation, October 2016-October 2020; Advisory Board, Jennersville YMCA, since 2022 |
| Name, address, year of birth | Position held with the Columbia Funds and length of service | Principal occupation(s) during the past five years and other relevant professional experience | Number of Funds in the Columbia Funds Complex overseen | Other directorships held by Trustee during the past five years and other relevant Board experience |
| Daniel J. Beckman c/o Columbia Management Investment Advisers, LLC 290 Congress Street Boston, MA 02210 1962 | Trustee since November 2021 and President since June 2021 | Vice President – Head of North America Product, Columbia Management Investment Advisers, LLC, since April 2015; President and Principal Executive Officer of the Columbia Funds, since June 2021; officer of Columbia Funds and affiliated funds, 2020-2021 | 177 | Director, Ameriprise Trust Company, since October 2016; Director, Columbia Management Investment Distributors, Inc. since November 2018; Board of Governors, Columbia Wanger Asset Management, LLC since, January 2022; Director, Columbia Threadneedle Canada, Inc., since December 2022 |
| * | The term “Columbia Funds Complex” as used herein includes Columbia Seligman Premium Technology Growth Fund, Tri-Continental Corporation and each series of Columbia Funds Series Trust (CFST), Columbia Funds Series Trust I (CFST I), Columbia Funds Series Trust II (CFST II), Columbia ETF Trust I (CET I), Columbia ETF Trust II (CET II), Columbia Funds Variable Insurance Trust (CFVIT) and Columbia Funds Variable Series Trust II (CFVST II).Messrs. Batejan, Beckman, Gallagher and Hacker and Mses. Blatz, Carlton, Carrig, Flynn, Paglia and Yeager serve as Directors of Columbia Seligman Premium Technology Growth Fund and Tri-Continental Corporation. |
| ** | Interested person (as defined under the 1940 Act) by reason of being an officer, director, security holder and/or employee of the Investment Manager or Ameriprise Financial. |
| 36 | Columbia Solutions Conservative Portfolio | Annual Report 2023 |
(Unaudited)
The Board has appointed officers who are responsible for day-to-day business decisions based on policies it has established. The officers serve at the pleasure of the Board. The following table provides basic information about the Officers of the Fund as of the printing of this report, including principal occupations during the past five years, although their specific titles may have varied over the period. In addition to Mr. Beckman, who is President and Principal Executive Officer, the Fund’s other officers are:
| Name, address and year of birth | Position and year first appointed to position for any Fund in the Columbia Funds Complex or a predecessor thereof | Principal occupation(s) during past five years |
| Michael G. Clarke 290 Congress Street Boston, MA 02210 1969 | Chief Financial Officer and Principal Financial Officer (2009) and Senior Vice President (2019) | Senior Vice President and Head of Global Operations & Investor Services, Columbia Management Investment Advisers, LLC, since March 2022 (previously Vice President, Head of North American Operations, and Co-Head of Global Operations, June 2019 to February 2022 and Vice President – Accounting and Tax, May 2010 - May 2019); senior officer of Columbia Funds and affiliated funds, since 2002. |
| Joseph Beranek 5890 Ameriprise Financial Center Minneapolis, MN 55474 1965 | Treasurer and Chief Accounting Officer (Principal Accounting Officer) (2019) and Principal Financial Officer (2020), CFST, CFST I, CFST II, CFVIT and CFVST II; Assistant Treasurer, CET I and CET II | Vice President – Mutual Fund Accounting and Financial Reporting, Columbia Management Investment Advisers, LLC, since December 2018 and March 2017, respectively. |
| Marybeth Pilat 290 Congress Street Boston, MA 02210 1968 | Treasurer and Chief Accounting Officer (Principal Accounting Officer) and Principal Financial Officer (2020) for CET I and CET II; Assistant Treasurer, CFST, CFST I, CFST II, CFVIT and CFVST II | Vice President – Product Pricing and Administration, Columbia Management Investment Advisers, LLC, since May 2017. |
| William F. Truscott 290 Congress Street Boston, MA 02210 1960 | Senior Vice President (2001) | Formerly, Trustee/Director of Columbia Funds Complex or legacy funds, November 2001-January 1, 2021; Chief Executive Officer, Global Asset Management, Ameriprise Financial, Inc., since September 2012; Chairman of the Board and President, Columbia Management Investment Advisers, LLC, since July 2004 and February 2012, respectively; Chairman of the Board and Chief Executive Officer, Columbia Management Investment Distributors, Inc., since November 2008 and February 2012, respectively; Chairman of the Board and Director, Threadneedle Asset Management Holdings, Sàrl, since March 2013 and December 2008, respectively; senior executive of various entities affiliated with Columbia Threadneedle. |
| Christopher O. Petersen 5228 Ameriprise Financial Center Minneapolis, MN 55474 1970 | Senior Vice President and Assistant Secretary (2021) | Formerly, Trustee/Director of funds within the Columbia Funds Complex, July 1, 2020 - November 22, 2021; Senior Vice President and Assistant General Counsel, Ameriprise Financial, Inc., since September 2021 (previously Vice President and Lead Chief Counsel, January 2015 - September 2021); formerly, President and Principal Executive Officer of the Columbia Funds, 2015 - 2021; officer of Columbia Funds and affiliated funds, since 2007. |
| Thomas P. McGuire 290 Congress Street Boston, MA 02210 1972 | Senior Vice President and Chief Compliance Officer (2012) | Vice President – Asset Management Compliance, Ameriprise Financial, Inc., since May 2010; Chief Compliance Officer, Columbia Acorn/Wanger Funds, since December 2015; formerly, Chief Compliance Officer, Ameriprise Certificate Company, September 2010 – September 2020. |
| Ryan C. Larrenaga 290 Congress Street Boston, MA 02210 1970 | Senior Vice President (2017), Chief Legal Officer (2017), and Secretary (2015) | Vice President and Chief Counsel, Ameriprise Financial, Inc., since August 2018 (previously Vice President and Group Counsel, August 2011 - August 2018); Chief Legal Officer, Columbia Acorn/Wanger Funds, since September 2020; officer of Columbia Funds and affiliated funds, since 2005. |
| Columbia Solutions Conservative Portfolio | Annual Report 2023 | 37 |
(Unaudited)
Fund officers (continued)
| Name, address and year of birth | Position and year first appointed to position for any Fund in the Columbia Funds Complex or a predecessor thereof | Principal occupation(s) during past five years |
| Michael E. DeFao 290 Congress Street Boston, MA 02210 1968 | Vice President (2011) and Assistant Secretary (2010) | Vice President and Chief Counsel, Ameriprise Financial, Inc., since May 2010; Vice President, Chief Legal Officer and Assistant Secretary, Columbia Management Investment Advisers, LLC, since October 2021 (previously Vice President and Assistant Secretary, May 2010 – September 2021). |
| Lyn Kephart-Strong 5228 Ameriprise Financial Center Minneapolis, MN 55474 1960 | Vice President (2015) | Vice President, Global Investment Operations Services, Columbia Management Investment Advisers, LLC, since 2010; President, Columbia Management Investment Services Corp., since October 2014; President, Ameriprise Trust Company, since January 2017. |
| • | the Fund had sufficient liquidity to both meet redemptions and operate effectively on behalf of shareholders; |
| • | there were no material changes to the Program during the period; |
| • | the implementation of the Program was effective to manage the Fund’s liquidity risk; and |
| • | the Program operated adequately during the period. |
| 38 | Columbia Solutions Conservative Portfolio | Annual Report 2023 |
Item 2. Code of Ethics.
(a) | The registrant has adopted a code of ethics that applies to the registrant’s principal executive officer, principal financial officer, principal accounting officer or controller, or persons performing similar functions, regardless of whether these individuals are employed by the registrant or a third party. |
(b) | During the period covered by this report, there were not any amendments to a provision of the code of ethics that applies to the registrant’s principal executive officer, principal financial officer, principal accounting officer or controller, or persons performing similar functions, regardless of whether these individuals are employed by the registrant or a third party, and that relates to any element of the code of ethics definition enumerated in paragraph (b) of this Item. |
(c) | During the period covered by this report, there were no waivers, including any implicit waivers, from a provision of the code of ethics to the registrant’s principal executive officer, principal financial officer, principal accounting officer or controller, or persons performing similar functions, regardless of whether these individuals are employed by the registrant or a third party that relates to one or more of the items set forth in paragraph (b) of this Item. |
Item 3. Audit Committee Financial Expert.
The registrant’s Board of Trustees has determined that David M. Moffett, Brian J. Gallagher, J. Kevin Connaughton, Sandra L. Yeager, and Douglas A. Hacker, each of whom are members of the registrant’s Board of Trustees and Audit Committee, each qualify as an audit committee financial expert. Mr. Moffett, Mr. Gallagher, Mr. Connaughton, Ms. Yeager, and Mr. Hacker are each independent trustees, as defined in paragraph (a)(2) of this item’s instructions.
Item 4. Principal Accountant Fees and Services.
Fee information below is disclosed for the thirteen series of the registrant whose reports to stockholders are included in this annual filing.
(a) Audit Fees. Aggregate Audit Fees billed by the principal accountant for professional services rendered during the fiscal years ended March 31, 2023 and March 31, 2022 are approximately as follows:
2023 | 2022 |
$241,700 | $245,800 |
Audit Fees include amounts related to the audit of the registrant’s annual financial statements or services that are normally provided by the accountant in connection with statutory and regulatory filings or engagements for those fiscal years.
(b) Audit-Related Fees. Aggregate Audit-Related Fees billed to the registrant by the principal accountant for professional services rendered during the fiscal years ended March 31, 2023 and March 31, 2022 are approximately as follows:
2023 | 2022 |
$0 | $4,000 |
Audit-Related Fees include amounts for assurance and related services by the principal accountant that are reasonably related to the performance of the audit of the registrant’s financial statements and are not reported in Audit Fees above.
During the fiscal years ended March 31, 2023 and March 31, 2022, there were no Audit-Related Fees billed by the registrant’s principal accountant to the registrant’s investment adviser (not including any sub-adviser whose role is primarily portfolio management and is subcontracted with or overseen by another investment adviser) and any entity controlling, controlled by, or under common control with the adviser that provides ongoing services to the registrant for an engagement that related directly to the operations and financial reporting of the registrant.
(c) Tax Fees. Aggregate Tax Fees billed by the principal accountant to the registrant for professional services rendered during the fiscal years ended March 31, 2023 and March 31, 2022 are approximately as follows:
2023 | 2022 |
$162,500 | $55,000 |
Tax Fees include amounts for the review of annual tax returns, the review of required shareholder distribution calculations and typically include amounts for professional services by the principal accountant for tax compliance, tax advice and tax planning.
During the fiscal years ended March 31, 2023 and March 31, 2022, there were no Tax Fees billed by the registrant’s principal accountant to the registrant’s investment adviser (not including any sub-adviser whose role is primarily portfolio management and is subcontracted with or overseen by another investment adviser) and any entity controlling, controlled by, or under common control with the adviser that provides ongoing services to the registrant for an engagement that related directly to the operations and financial reporting of the registrant.
(d) All Other Fees. Aggregate All Other Fees billed by the principal accountant to the registrant for professional services rendered during the fiscal years ended March 31, 2023 and March 31, 2022 are approximately as follows:
2023 | 2022 |
$0 | $0 |
All Other Fees, if any, include amounts for products and services provided by the principal accountant, other than the services reported in paragraphs (a) through (c) above.
Aggregate All Other Fees billed by the registrant’s principal accountant to the registrant’s investment adviser (not including any sub-adviser whose role is primarily portfolio management and is subcontracted with or overseen by another investment adviser) and any entity controlling, controlled by, or under common control with the adviser that provides ongoing services to the registrant for an engagement that related directly to the operations and financial reporting of the registrant during the fiscal years ended March 31, 2023 and March 31, 2022 are approximately as follows:
2023 | 2022 |
$541,000 | $535,000 |
In fiscal years 2023 and 2022, All Other Fees primarily consists of fees billed for internal control examinations of the registrant’s transfer agent and investment adviser.
(e)(1) Audit Committee Pre-Approval Policies and Procedures
The registrant’s Audit Committee is required to pre-approve the engagement of the registrant’s independent auditors to provide audit and non-audit services to the registrant and non-audit services to its investment adviser (excluding any sub-adviser whose role is primarily portfolio management and is sub-contracted or overseen by another investment adviser (the “Adviser”) or any entity controlling, controlled by or under common control with the Adviser that provides ongoing services to the Fund (a “Control Affiliate”) if the engagement relates directly to the operations and financial reporting of the registrant.
The Audit Committee has adopted a Policy for Engagement of Independent Auditors for Audit and Non-Audit Services (the “Policy”). The Policy sets forth the understanding of the Audit Committee regarding the engagement of the registrant’s independent accountants to provide (i) audit and permissible audit-related, tax and other services to the registrant (“Fund Services”); (ii) non-audit services to the registrant’s Adviser and any Control Affiliates, that relates directly to the operations and financial reporting of a Fund (“Fund-related Adviser Services”); and (iii) certain other audit and non-audit services to the registrant’s Adviser and its Control Affiliates. A service will require specific pre-approval by the Audit Committee if it is to be provided by the Fund’s independent auditor; provided, however, that pre-approval of non-audit services to the Fund, the Adviser or Control Affiliates may be waived if certain de minimis requirements set forth in the SEC’s rules are met.
Under the Policy, the Audit Committee may delegate pre-approval authority to any pre-designated member or members who are independent board members. The member(s) to whom such authority is delegated must report, for informational purposes only, any pre-approval decisions to the Audit Committee at its next regular meeting. The Audit Committee's responsibilities with respect to the pre-approval of services performed by the independent auditor may not be delegated to management.
On an annual basis, at a regularly scheduled Audit Committee meeting, the Fund’s Treasurer or other Fund officer shall submit to the Audit Committee a schedule of the types of Fund Services and Fund-related Adviser Services that are subject to specific pre-approval. This schedule will provide a description of each type of service that is subject to specific pre-approval, along with total projected fees for each service. The pre-approval will generally cover a one-year period. The Audit Committee will review and approve the types of services and the projected fees for the next one-year period and may add to, or subtract from, the list of pre-approved services from time to time, based on subsequent determinations. This specific approval acknowledges that the Audit Committee is in agreement with the specific types of services that the independent auditor will be permitted to perform and the projected fees for each service.
The Fund’s Treasurer or other Fund officer shall report to the Audit Committee at each of its regular meetings regarding all Fund Services or Fund-related Adviser Services provided since the last such report was rendered, including a description of the services, by category, with forecasted fees for the annual reporting period, proposed changes requiring specific pre-approval and a description of services provided by the independent auditor, by category, with actual fees during the current reporting period.
*****
(e)(2) None, or 0%, of the Audit-Related Fees, Tax Fees and All Other Fees paid by the Fund or affiliated entities relating directly to the operations and financial reporting of the Registrant disclosed above were approved by the audit committee pursuant to paragraphs (c)(7)(i)(C) of Rule 2-01 of Regulation S-X (which permits audit committee approval after the start of the engagement with respect to services other than audit, review or attest services, if certain conditions are satisfied).
(f) Not applicable.
(g) The aggregate non-audit fees billed by the registrant’s accountant for services rendered to the registrant, and rendered to the registrant’s investment adviser (not including any sub-adviser whose role is primarily portfolio management and is subcontracted with or overseen by another investment adviser), and any entity controlling, controlled by, or under common control with the adviser that provides ongoing services to the registrant for the fiscal years ended March 31, 2023 and March 31, 2022 are approximately as follows:
2023 | 2022 |
$703,500 | $594,000 |
(h) The registrant’s Audit Committee of the Board of Directors has considered whether the provision of non-audit services that were rendered to the registrant’s adviser (not including any sub-adviser whose role is primarily portfolio management and is subcontracted with or overseen by another investment adviser), and any entity controlling, controlled by, or under common control with the investment adviser that provides ongoing services to the registrant that were not pre-approved pursuant to paragraph (c)(7)(ii) of Rule 2-01 of Regulation S-X, is compatible with maintaining the principal accountant’s independence.
Item 5. Audit Committee of Listed Registrants.
Not applicable.
Item 6. Investments
(a) | The registrant’s “Schedule I – Investments in securities of unaffiliated issuers” (as set forth in 17 CFR 210.12-12) is included in Item 1 of this Form N-CSR. |
(b) | Not applicable. |
Item 7. Disclosure of Proxy Voting Policies and Procedures for Closed-End Management Investment Companies.
Not applicable.
Item 8. Portfolio Managers of Closed-End Management Investment Companies.
Not applicable.
Item 9. Purchases of Equity Securities by Closed-End Management Investment Company and Affiliated Purchasers.
Not applicable.
Item 10. Submission of Matters to a Vote of Security Holders.
There were no material changes to the procedures by which shareholders may recommend nominees to the registrant's board of directors.
Item 11. Controls and Procedures.
(a) | The registrant’s principal executive officer and principal financial officer, based on their evaluation of the registrant’s disclosure controls and procedures as of a date within 90 days of the filing of this report, have concluded that such controls and procedures are adequately designed to ensure that information required to be disclosed by the registrant in Form N-CSR is accumulated and communicated to the registrant’s management, including the principal executive officer and principal financial officer, or persons performing similar functions, as appropriate to allow timely decisions regarding required disclosure. |
(b) | There was no change in the registrant's internal control over financial reporting that occurred during the period covered by this report that has materially affected, or is reasonably likely to materially affect, the registrant's internal control over financial reporting. |
Item 12. Disclosure of Securities Lending Activities for Closed-End Management Investment Companies
Not applicable.
Item 13. Exhibits.
SIGNATURES
Pursuant to the requirements of the Securities Exchange Act of 1934 and the Investment Company Act of 1940, the registrant has duly caused this report to be signed on its behalf by the undersigned, thereunto duly authorized.
(registrant) | Columbia Funds Series Trust I |
|
|
By (Signature and Title) | /s/ Daniel J. Beckman |
| Daniel J. Beckman, President and Principal Executive Officer |
|
|
Date | May 23, 2023 |
|
|
|
|
Pursuant to the requirements of the Securities Exchange Act of 1934 and the Investment Company Act of 1940, this report has been signed below by the following persons on behalf of the registrant and in the capacities and on the dates indicated.
By (Signature and Title) | /s/ Daniel J. Beckman |
| Daniel J. Beckman, President and Principal Executive Officer |
|
|
Date | May 23, 2023 |
By (Signature and Title) | /s/ Michael G. Clarke |
| Michael G. Clarke, Chief Financial Officer, |
| Principal Financial Officer and Senior Vice President |
|
|
Date | May 23, 2023 |
By (Signature and Title) | /s/ Joseph Beranek |
| Joseph Beranek, Treasurer, Chief Accounting |
| Officer and Principal Financial Officer |
|
|
Date | May 23, 2023 |