UNITED STATES SECURITIES AND EXCHANGE COMMISSION
WASHINGTON, D.C. 20549
SCHEDULE 14A
(RULE 14a-101)
SCHEDULE 14A INFORMATION
Proxy Statement Pursuant to Section 14(a) of the Securities
Exchange Act of 1934
Filed by the Registrant þ
Filed by a Party other than the Registrant o
Check the appropriate box:
| o | Preliminary Proxy Statement |
| o | Confidential, for use of the Commission Only (as permitted by Rule 14a-6(e)(2)) |
| þ | Definitive Proxy Statement |
| o | Definitive Additional Materials |
| o | Soliciting Material Pursuant to § 240.14a-11(c) or § 240.14a-12 |
UNITED BANCORP, INC.
(Name of Registrant as Specified in its Charter)
Payment of Filing Fee (Check the appropriate box):
| þ | No Fee Required | ||
| o | Fee computed on table below per Exchange Act Rules 14a-6(i)(1) and 0-11 | ||
| • | Title of each class of securities to which transaction applies: | ||
| • | Aggregate number of securities to which transaction applies: | ||
| • | Per unit price or other underlying value of transaction computed pursuant to Exchange Act Rule 0-11 (Set forth the amount on which the filing fee is calculated and state how it was determined): | ||
| • | Proposed maximum aggregate value of transaction: | ||
| • | Total fee paid: | ||
| o | Fee paid previously with preliminary materials. | ||
| o | Check box if any part of the fee is offset as provided by Exchange Act Rule 0-11(a)(2) and identify the filing for which the offsetting fee was paid previously. Identify the previous filing by registration statement number, or the Form or Schedule and the date of its filing. | |
| (1) | Amount Previously Paid: | |
| (2) | Form, Schedule or Registration Statement No.: | |
| (3) | Filing Party: | |
| (4) | Date Filed: | |
Notice of
Annual Meeting of Shareholders
and
Proxy Statement
| 2011 |

P. O. Box 1127, Ann Arbor, MI 48104
Notice of Annual Meeting
of Shareholders
April 26, 2011
NOTICE IS HEREBY GIVEN that the Annual Meeting of Shareholders of United Bancorp, Inc. will be held at the Downing Center, United Bank & Trust, 209 E. Russell Road, Tecumseh, Michigan, on Tuesday, April 26, 2011 at 4:30 p.m., local time. At the meeting, we will consider and vote on the following matters:
| 1. | To elect two directors constituting Class II of the Board of Directors, to serve until the 2014 Annual Meeting of Shareholders and upon the election of their successors. |
| 2. | To consider and approve an advisory proposal to approve the Company’s executive compensation practices as disclosed in the Proxy Statement. |
| 3. | To consider and vote upon a proposal to authorize additional shares for issuance under the United Bancorp, Inc. Director Retainer Stock Plan. |
| 4. | To ratify the appointment of BKD, LLP as independent auditors. |
We will also conduct such other business as may properly come before the meeting or any adjournment of the meeting.
The Board of Directors has fixed the close of business on February 25, 2011 as the record date for the determination of shareholders entitled to notice of and to vote at the meeting.
You are invited to attend the meeting in person. However, whether or not you expect to attend in person, please promptly sign and date the enclosed Proxy and mail it in the return envelope, which is enclosed for that purpose. It will assist us in preparing for the meeting, and it is important that your shares be represented at the meeting.
Important Notice Regarding the Availability of Proxy Materials for the Shareholder Meeting to Be Held on April 26, 2011. Our Proxy Statement and 2010 Annual Report to Shareholders are available on our website, www.ubat.com.
| March 16, 2011 | By Order of the Board of Directors | |
 | ||
| Randal J. Rabe |
United Bancorp, Inc. · P. O. Box 1127 · Ann Arbor, Michigan 48104 · Phone 734-214-3700
2011 Proxy Statement
Annual Meeting of Shareholders
APRIL 26, 2011
This Proxy Statement is furnished in connection with the solicitation by the Board of Directors of United Bancorp, Inc. (the "Company" or “UBI”) of the accompanying Proxy to be used at the 2011 Annual Meeting of Shareholders of the Company and any adjournment thereof. The meeting will be held on April 26, 2011 at the time and place and for the purposes stated in the accompanying Notice of Annual Meeting of Shareholders.
This Proxy Statement, Proxy and Notice of Annual Meeting are being mailed to shareholders on or after March 16, 2011. If you have elected to receive your Proxy Statement and Annual Report electronically, we will mail your Proxy by that same date, along with the address of the website where you may download and view your other materials. The mailing address of the principal executive offices of the Company is P. O. Box 1127, Ann Arbor, Michigan 48104.
Only shareholders of record at the close of business on February 25, 2011 will be entitled to notice of and to vote at the meeting. On February 25, 2011, there were 12,667,111 shares of the Company’s Common Stock outstanding and entitled to vote at the meeting. Each share of Common Stock is entitled to one vote. The Common Stock constitutes the only voting security of the Company entitled to vote upon the proposals to be presented at the meeting.
Shares represented by properly executed Proxies received by the Company will be voted at the meeting in the manner specified in the Proxies. If no instructions are specified in any Proxy, the shares represented by the Proxy will be voted in favor of the proposals presented at the meeting by the Board of Directors. Any Proxy may be revoked by the person giving it at any time before being voted, either by giving another Proxy bearing a later date or by notifying the Secretary of the Company, Randal J. Rabe, at the Company’s principal executive offices, in writing of revocation or by attending the meeting and voting in person.
The cost of soliciting Proxies will be borne by the Company. The solicitation of Proxies will be made primarily by mail. Officers and regular employees of the Company and its subsidiaries may also solicit proxies, personally and by telephone or other means, for which they will receive no additional compensation and at a minimal cost to the Company. Arrangements may also be made directly by the Company with banks, brokerage houses, custodians, nominees, and fiduciaries to forward soliciting matter to the beneficial owners of stock held of record by them and to obtain authorization for the execution of Proxies. The Company may reimburse institutional holders for reasonable expenses incurred by them in connection with this process. The Company has retained Georgeson to assist with the solicitation of proxies for a fee not to exceed $6,500, plus reimbursement for out-of-pocket expenses.
| Planning to attend the meeting? | |
| If your Company stock is held in a brokerage account or by a bank or other nominee, you are considered the beneficial owner of shares “held in street name,” and this Proxy Statement is being forwarded to you by your broker or nominee. Your name does not appear on the register of shareholders and, in order to be admitted to the meeting, you must bring a letter or account statement showing that you are the beneficial owner of the shares. You will not be able to vote at the meeting, and should instruct your broker or nominee how to vote on your behalf, unless you have a legal proxy from the shareholder of record appointing you as its proxy. If you have any questions about the meeting or require special assistance, please call Diane Skeels at (517) 423-1760. |
Generally, broker non-votes occur when shares held by a broker in street name for a beneficial owner are not voted with respect to a particular proposal because the broker has not received voting instructions from the beneficial owner and the broker lacks discretionary voting power to vote those shares. If you do not provide your broker with voting instructions, then your broker has discretionary authority to vote your shares on certain "routine" matters. We expect that Proposal 4 will be considered a routine matter and your broker will have discretionary authority to vote your shares on that proposal. Election of directors and Proposals 2 and 3 are not considered a routine matters and your broker will not have discretionary authority to vote your shares on election of directors and Proposals 2 and 3. It is important that you promptly provide your broker with voting instructions if you want your shares voted in the election of directors and on Proposals 2 and 3.
Vote Necessary to Approve Proposals
Election of Directors. A plurality of the shares voting is required to elect Directors. This means that if there are more nominees than positions to be filled, the nominees who receive the most votes will be elected to the open director positions. Abstentions, broker non-votes and other shares that are not voted in person or by proxy will not be included in the vote count.
Proposals 2, 3 and 4. Proposals 2, 3 and 4 will be approved if a majority of the shares that are voted on each proposal at the meeting are voted in favor of each proposal. Abstentions, broker non-votes and other shares that are not voted on Proposals 2, 3 and 4 in person or by proxy will not be included in the vote count.
Required Vote for Other Matters. We do not know of any other matters to be presented at the meeting. Generally, any other proposal to be voted on at the meeting would be approved if a majority of the shares that are voted on the proposal at the meeting are voted in favor of the proposal. Abstentions, broker non-votes and other shares that are not voted on the proposal in person or by proxy would not be included in the vote count.
If any other matter should be presented upon which a vote properly may be taken, the shares represented by Proxies will be voted on the matter in accordance with the judgment of the person or persons named in the Proxies.
Proposal 1 – Election of Directors
In accordance with the Company's Articles of Incorporation and Bylaws, the Board of Directors is divided into three classes. Each year, on a rotating basis, the term of office of the Directors in one of the three classes will expire. Successors to the class of Directors whose terms have expired will be elected for a three-year term. The Directors whose terms expire at the 2011 Annual Meeting of Shareholders ("Class II Directors") are Stephanie H. Boyse, John H. Foss and David S. Hickman.
The Compensation & Governance Committee and the Board of Directors have nominated two individuals for election as Class II Directors at the 2011 Annual Meeting of Shareholders, both of whom currently serve as Class II Directors. Directors Boyse and Foss have been nominated for re-election. Director and Chairman of the Board David S. Hickman currently serves as a Class II Director, but has reached mandatory retirement age and will retire from the Board effective with the 2011 Annual Meeting of Shareholders.
Director James C. Lawson has been identified by our Board of Directors as the intended successor to David S. Hickman as Chairman of the Board of Directors of the Company. To facilitate an orderly transition, Mr. Lawson has worked closely with Mr. Hickman, with the intent that he will succeed Mr. Hickman as Chairman of the Board following the 2011 Annual Meeting of Shareholders.
Those persons who are elected as Class II Directors at the 2011 Annual Meeting of Shareholders will hold office until their terms expire at the 2014 Annual Meeting of Shareholders and upon the election of their successors.
It is intended that the shares represented by Proxies in the accompanying form will be voted for the election of the two nominees unless a contrary direction is indicated. If any of the nominees is unable to serve, the number of Directors to be elected at the meeting may be reduced by the number unable to serve or the individuals named in your Proxy may vote the shares to elect any substitute nominee recommended by the Board of Directors.
Your Board of Directors recommends that you vote
“FOR” the election of both nominees as Directors
Proposal 2 – Non-Binding Vote on Executive Compensation
The Company believes that our executive compensation programs appropriately align executives’ incentives with shareholder interests and are designed to attract and retain high quality executive talent. We also believe that both the Company and shareholders benefit from responsive corporate governance policies and dialogue. In accordance with these beliefs and as required by the Emergency Economic Stabilization Act of 2009 because of the Company’s participation in the U.S. Treasury’s Capital Purchase Program, the Board of Directors has requested an advisory shareholder vote on the Company’s executive compensation.
This proposal (sometimes referred to as a “Say-on-Pay” proposal) gives you as a shareholder the opportunity to endorse or not endorse the compensation of our executives through the following resolution:
“Resolved, that the shareholders approve the Company’s compensation of executives as disclosed in the Proxy Statement, including the Compensation Discussion and Analysis, the tabular disclosure regarding named executive officer compensation and the accompanying narrative disclosure.”
The vote is not binding upon the Board, and may not be construed as overruling a decision by the board or creating an additional fiduciary duty of the Board. However, the Compensation & Governance Committee will take into account the outcome of the vote when considering future executive compensation decisions.
Your Board of Directors and Compensation & Governance
Committee, which consists entirely of independent directors,
recommend that you vote “FOR” Proposal 2.
Proposal 3 – Authorize Additional Shares for Issuance under the Director Retainer Stock Plan
At the 1996 Annual Meeting of Shareholders, shareholders approved the Director Retainer Stock Plan (the "Director Plan"). The purpose of the Director Plan is to provide eligible directors of the Company and United Bank & Trust (the “Bank” or “UBT”) and members of the Bank’s community boards (for convenience, we sometimes refer to such members in this discussion as “directors”) with a means of deferring payment of retainers and board meeting fees payable to them as a result of serving as a director of the Company, the Bank, or a community board of the Bank, while at the same time expressing their commitment to the Company by subjecting such deferred retainers and fees to the market performance of the Company's Common Stock. At the 2007 Annual Meeting of Shareholders, shareholders approved the restated Director Plan, and increased the shares of common stock subject to the Plan.
There are currently a total of 150,000 shares of Company Common Stock authorized for issuance under the Director Plan. At January 13, 2011, there were 37,318 shares available for future issuance under the Director Plan. In order to continue to make shares available for future issuance under the Plan, the Board of Directors has adopted resolutions to increase the total amount of shares authorized for issuance under the Director Plan from 150,000 shares to 400,000 shares, subject to shareholder approval.
The Board of Directors believes increasing the total number of shares authorized for issuance under the Director Plan is in the best interests of the Company, its shareholders and the Bank. The deferral by eligible directors of cash fees for shares of Company Common Stock issuable at a later date aligns the participating directors' interests with those of the Company's shareholders by incentivizing the participating directors to promote the long-term performance and growth of the Company and the price of its Common Stock. In addition, the deferral of cash fees reduces the Company's expenses in any given period, which helps to improve its operating results.
The following is a summary of the material features of the Director Plan. This summary is not complete and, therefore, you should not rely solely on it for a detailed description of every aspect of the Director Plan. The summary is qualified in its entirety by reference to the terms of the Director Plan, a copy of which is attached as Appendix B to this Proxy Statement.
Summary of Material Features of Plan |
Eligibility and Permissible Deferrals. The only persons eligible to participate in the Director Plan are directors of the Company or the Bank and members of the Bank’s community boards who are not employees of the Company or the Bank. As of the date of this Proxy Statement, twenty-three persons were eligible to participate in the Director Plan. Future directors of the Company or the Bank and members of the Bank’s community boards may participate in the Director Plan. Directors of the Company or the Bank and members of the Bank’s community boards may be considered to have an interest in the Director Plan because they may in the future receive benefit under it.
Under the terms of the Director Plan, all or a portion of a participating eligible director's Retainer (as defined in the Director Plan) may be deferred.
Administration. The Director Plan is administered by a committee of the Company's Board of Directors (the "Director Plan Committee"). Whenever (as currently is the case) the Company's Chief Executive Officer also is a Company director, the Director Plan Committee will be comprised solely of the CEO; at any other time, the Director Plan Committee will be comprised of all Company directors other than directors who are eligible to participate in the Director Plan. To the extent consistent with the terms of the Director Plan, the Director Plan Committee has the power to interpret any Director Plan provision, to prescribe, amend, and rescind rules and regulations relating to the Director Plan, and to make all other determinations that it deems necessary or advisable to administer the Director Plan.
General Plan Operation. Each eligible director is permitted to elect, in accordance with specified election procedures, to participate in the Director Plan and defer payment of some or all of his or her future Retainers, and to change his or her participation election from time to time. Once a valid participation election is made and effective, the Company establishes a bookkeeping account (a "Reserve Account") for the participating director. Thereafter, and for as long as the election is in effect, whenever a portion of his or her Retainer is earned by the participating director, the cash amount payable is reduced by the percentage specified in the participation election, and his or her Reserve Account is credited with units equal to the amount by which the participating director's cash payment was reduced, divided by the Market Price (as defined in the Director Plan) as of the payment date.
In general, under Section 7.1 of the Director Plan, on a participating director's Determination Date (as defined in the Director Plan) or within 30 days thereafter, the Company is required to issue and deliver to the participant that number of shares of Company Common Stock which equals the number of whole units credited to his or her Reserve Account as of the Determination Date and to pay the participant in cash an amount equal to the difference (if any) between the total number of whole and fractional units credited to the Reserve Account as of that date and the number of shares of Company Common Stock being issued, multiplied by the Market Price on that date. If, on the date shares of Company Common Stock are issued to the participant, any cash dividend or other cash distribution on shares of Company Common Stock has been declared which has a record date earlier than the issuance date but after the Determination Date, the amount of that cash dividend or distribution, multiplied by the total number of units in the participant's Reserve Account as of the Determination Date, also is payable in cash to the participant.
However, if the Director Plan's limits on available shares of Company Common Stock are violated by settlement of the Reserve Account as described above, the number of shares to be issued would be reduced and the amount of cash to be paid would be increased under Section 7.2 of the Director Plan. In the case of death or mental incapacity of a participant, shares may be issued or payment made to the participant's beneficiary or another person under Section 7.3 of the Director Plan. In any case, the Company's obligation to settle a Reserve Account would be subject to satisfaction of any applicable tax withholding requirements.
Adjustments. Section 9 of the Director Plan provides that, upon the occurrence of specified events (such as a stock dividend, stock split, merger, consolidation, share exchange or other similar event), an adjustment will be made to the number and type of shares issuable under the Director Plan and in the numbers of units credited to participating directors' Reserve Accounts as the Company's Board of Directors deems appropriate in light of such event in order to continue to make available the benefits intended by the plan. The intention of Section 9 is to authorize adjustments to prevent dilution of benefits under the Director Plan, not to increase such benefits. As a result of the 100% stock dividend in 2007, the total number of shares authorized for issuance under the Director Plan increased from 75,000 shares to 150,000 shares.
Plan Benefits. Because benefits under the Director Plan will depend on the fair market value of Company Common Stock at various future dates, the benefits payable under the Director Plan and the benefits that would have been payable had the Director Plan been in effect during the most recent fiscal year are not determinable.
Duration of the Plan; Amendments. The Director Plan became effective when approved by the shareholders at the April 16, 1996 Annual Meeting of Shareholders, and will continue in effect until terminated by the Company's Board of Directors. The Board may at any time and from time to time amend, modify, suspend, or terminate the Director Plan, with or without shareholder approval, except that; (i) no amendment or modification of the plan would be effective without shareholder approval at any time at which such approval is required, either by applicable rules of any national securities exchange on which Company stock is then principally traded, or by Securities and Exchange Commission Rule 16b-3 as then in effect and applicable to the Company; (ii) none of the foregoing actions by the Board may adversely affect the rights of a participating director with respect to an effective participation election without such participating director's consent; and (iii) for so long as may be necessary for the plan to satisfy Rule 16b-3 requirements for "formula plans," the eligibility provisions of the plan and those provisions affecting the type, extent and timing of awards thereunder may not be amended more often than every six months, other than to comport with changes in the Internal Revenue Code, the Employee Retirement Income Security Act, or the rules thereunder.
Your Board of Directors recommends that you vote “FOR” Proposal 3.
Proposal 4 – Ratification of Independent Auditors
The Audit Committee of the Board of Directors and the Board of Directors recommend the ratification of the appointment of BKD, LLP as independent auditors for the Company for the year ending December 31, 2011 to audit the consolidated financial statements of the Company, and to perform such other appropriate accounting services as may be approved by the Audit
Committee. BKD, LLP has been appointed as the Company’s independent public accountants to audit the Company's financial statements since the year ended December 31, 2002. One or more representatives of the firm of BKD, LLP are expected to be present at the meeting, will have the opportunity to make a statement if they desire to do so, and are expected to be available to respond to appropriate questions.
Your Board of Directors and Audit Committee, which consists entirely
of independent directors, recommend that you vote “FOR” Proposal 4.
Directors and Executive Officers
Information Concerning Nominees and Incumbent Directors |
The following table discloses the name and age of each incumbent Director and Director Nominee, his or her five year business experience, the specific experience qualifications, attributes and skills that led to the conclusion of the Compensation & Governance Committee and the Board of Directors that the person should serve as a Director, and the year each became a Director of the Company.
Name, Age, and Five Year Business Experience | Director Since |
| Director Nominees – Terms to Expire in 2014 (Class II) | |
Stephanie H. Boyse, age 42; President (since 2001) and Chief Executive Officer (since 2006), Brazeway, Inc., manufacturer of extruded aluminum tubing and related products, Adrian, MI; Director of UBT. Ms. Boyse brings a diverse range of experience to the Board, including sales, marketing, operations, human resources, licensing and acquisitions as well as international experience. Her leadership is exhibited not only through her role as President of the world’s largest manufacturer of frost-free evaporators for household refrigeration, but also through board positions with many other local organizations. | 2008 |
John H. Foss, age 68; Director, La-Z-Boy Incorporated; Retired Director, Vice President, Treasurer and Chief Financial Officer, Tecumseh Products Company, manufacturer of compressors and refrigeration components, engines, and power train components, Tecumseh, MI; Director of UBT. Mr. Foss is a CPA, and his work experience includes financial management and auditing. He has served as CFO of two publicly traded companies and as Chairman of the Audit Committee of La-Z-Boy. He provides practical experience and understanding in the areas of strategic planning, compensation management, internal controls, mergers and acquisitions and corporate governance. | 1992 |
| Incumbent Directors – Terms Expiring in 2012 (Class III) | |
Robert K. Chapman, age 67; President (since 2003) and Chief Executive Officer (since 2006) of the Company; President (2001–2005) and Chief Executive Officer (to December, 2007) of the Company’s former subsidiary, United Bank & Trust – Washtenaw (“UBTW”). President and Chief Executive Officer of UBT (since 2010). Mr. Chapman is a CPA, and brings over thirty years of experience in the financial industry to the Board. More than twenty of those years were in a financial role, and five years were spent in mergers and acquisitions. Mr. Chapman has a strong background in risk management. | 2001 |
Norman G. Herbert, age 68; Independent financial consultant. Director of UBT since 2010; Director of UBTW (2006 – 2010). Mr. Herbert has an extensive financial background. For thirty-five years, he was a part of the financial management team for the University of Michigan, with responsibilities including management of endowment and working capital, real estate acquisitions and dispositions, external financing activities and risk management. He has long been active with a number of professional, civic and non-profit organizations. He brings an analytical background and a meticulous attention to detail to the Board. | 2009 |
Incumbent Directors – Terms Expiring in 2012 (Class III) (continued) | |
Len M. Middleton, age 47: Professor of Strategy and Entrepreneurship, Ross School of Business at the University of Michigan (since 1999). Director of UBT since 2010; Director of UBTW (2009 – 2010). Trustee at the Ann Arbor Hands-On Museum. In his role as a faculty member in the business school of the University of Michigan, Mr. Middleton works with entrepreneurial companies, non-profit organizations and major corporations. He holds an MBA, and is founder of a private equity firm that specializes in buyouts and other investment opportunities. He has worked in a family business and has a broad range of entrepreneurial experience. | 2010 |
Incumbent Directors – Terms Expiring in 2013 (Class I) | |
James D. Buhr, age 63; Owner, J.D. Buhr & Company, LLC, corporate finance advisors, Ann Arbor, MI; Director of UBT since 2010; Director of UBTW (2001 – 2010). Mr. Buhr has an extensive financial background, including experience as a bank credit analyst, commercial lender and investment banker. He is a native of Washtenaw County, is a registered stock broker, and holds an MBA from the University of Michigan. Mr. Buhr currently owns his own corporate finance advisory practice, which provides corporate finance advisory services to Michigan and Midwestern based companies. | 2004 |
James C. Lawson, age 63; General Manager, Avery Oil & Propane, Tecumseh, MI; Vice-Chairman of the Board of United Bancorp, Inc. (since 2010). Director of UBT. Mr. Lawson is an entrepreneur in Lenawee County, serving as owner or partner in a number of local businesses. These experiences have provided a diverse background into the formation and operation of a successful business. He is a lifelong resident of Lenawee County, and brings leadership, strategic planning, human resources and administrative skills and background to the Board. | 1986 |
None of the Director nominees or incumbents, with the exception of John H. Foss and Len M. Middleton, serves as a director, or at any time during the past five years served as a director, of any other Company with a class of securities registered pursuant to Section 12 of the Securities Exchange Act of 1934, as amended, or subject to the requirements of Section 15(d) of such act, or any Company registered as an investment company under the Investment Company Act of 1940, as amended. Mr. Foss is a director of La-Z-Boy Incorporated. Mr. Middleton is a Director of Arcadia Funds, Castle Oaks and One Tree. With the exception of Directors Hickman and Chapman, each Director and Director Nominee, and each person who served as a Director at any time during the last fiscal year, is or was independent as that term is defined under NASDAQ Listing Rules for service on the Board of Directors and each committee on which the Director serves.
The Board of Directors reviewed transactions in 2010 and 2009 with companies owned or managed by Directors, for the purpose of determining whether those transactions impacted the independence of the Directors. The Company conducted transactions in the normal course of business with companies affiliated with Mr. Lawson during 2010 and 2009 and Mr. Buhr in 2009, none of which exceeded $30,000. The Board determined that these transactions did not impact the independence of these Directors.
Communicating with the Board of Directors |
Shareholders may communicate with the Board of Directors, its committees or any member of the Board of Directors by sending a letter to Chairman of the Board, United Bancorp, Inc., P. O. Box 1127, Ann Arbor, Michigan, 48104. All shareholder communications will be forwarded to the Board, the committee or the Director as indicated in the letter. The Board of Directors reserves the right to revise this policy in the event that this process is abused, becomes unworkable or otherwise does not efficiently serve the purpose of the policy.
Meetings of the Board of Directors |
During the year ended December 31, 2010, the Board of Directors of the Company met a total of six times. Each of the Directors attended at least 75% of the aggregate of the total number of meetings of the Board and of the Board committees of which he or she is a member.
The Company encourages members of its Board of Directors to attend the Annual Meeting of Shareholders. All directors serving at April 27, 2010 attended the Company’s 2010 Annual Meeting of Shareholders held on that date.
Committees of the Board of Directors |
The Board of Directors has established a standing Audit Committee and Compensation & Governance Committee. The Compensation & Governance Committee also performs the functions of a nominating committee.
Audit Committee Report, Charter, and Independence |
The Audit Committee consists of John H. Foss, Norman G. Herbert and Len Middleton. The Audit Committee met six times during the year ended December 31, 2010. Each of the current members meets the requirements for independence as defined under NASDAQ listing rules. While the Company is not subject to these standards, it has chosen to comply with them voluntarily. In addition, the Board of Directors determined that Mr. Foss has met the qualifications to be considered an “audit committee financial expert” as set forth under rules adopted by the Securities and Exchange Commission.
The Audit Committee has selected BKD LLP (“BKD”) as its independent registered public accounting firm for 2011. BKD has served in that capacity since 2002. The services provided by BKD are limited by the Audit Committee to audit services and certain permitted audit related and tax services.
The Board of Directors has adopted a written charter for the Audit Committee, a copy of which is available on the Company's website at www.ubat.com. The Board of Directors reviews and approves changes to the Audit Committee charter annually.
The Audit Committee assists the Board in its oversight responsibilities of the integrity of the Company’s financial statements, the system of internal control over financial reporting, the Company’s internal audit function and independence, the independent registered public accounting firm’s qualifications, independence and performance, and the Company’s process for monitoring compliance with ethics policies and legal and regulatory requirements. Management is responsible for the Company’s financial statements and the financial reporting process, and for establishing and maintaining the Company’s system of internal controls. The independent registered public accounting firm is responsible for expressing an opinion on the conformity of the Company’s financial statements with U.S. generally accepted accounting principles.
The Audit Committee reports that with respect to the audit of the Company's consolidated financial statements for the year ended December 31, 2010:
| • | The Audit Committee has reviewed and discussed the Company's 2010 audited consolidated financial statements with the Company's management. |
| • | The Audit Committee has discussed with its independent registered public accounting firm, BKD, LLP, the matters required to be discussed by the Statement on Auditing Standards No. 61, as amended (AICPA, Professional Standards, Vol. 1. AU Section 380) as adopted by the Public Company Accounting Oversight Board in Rule 3200T. |
| • | The Audit Committee has received the written disclosures and the letter from its independent registered public accounting firm required by applicable requirements of the Public Company Accounting Oversight Board regarding BKD’s communications with the Audit Committee concerning independence, and has discussed with BKD its independence. |
Based on the review and the discussions referenced above, the Audit Committee recommended to the Board of Directors that the Company's 2010 audited consolidated financial statements be included in the Company’s Annual Report on Form 10-K for the year ended December 31, 2010.
| Audit Committee | |
| Norman G. Herbert, Chairman | |
| John H. Foss | |
| Len M. Middleton |
Compensation & Governance Committee |
The Board of Directors of the Company has established a Compensation & Governance Committee, which addresses matters relating to employment, compensation, and management performance. The Compensation & Governance Committee also performs the functions of a nominating committee for the Board of Directors. The Board of Directors has adopted a written charter for the Compensation & Governance Committee, a copy of which is available on the Company’s website at www.ubat.com.
Our Compensation & Governance Committee annually reviews and approves our compensation program, evaluates the performance of our Chief Executive Officer and, with input from the Chief Executive Officer, reviews the performance of the executive officers in achieving our business objectives, and recommends their compensation to our Board of Directors for its approval. The Chief Executive Officer of the Company provides input into the recommended compensation of the other executive officers to the Compensation & Governance Committee, but does not participate or deliberate in compensation decisions regarding his own compensation. Although input from the Chief Executive Officer is considered by the Compensation & Governance Committee and the Board, it is not given any disproportionate weight. The committee also recommends targets for bonuses and profit sharing and has sole authority to grant stock options and other equity awards to eligible individuals. The Compensation & Governance Committee and the Board have the final authority on compensation matters.
The Compensation & Governance Committee considers various potential candidates for Director that may come to its attention through current board members, shareholders or other persons. The Compensation & Governance Committee will review and evaluate candidates for Director nominated by shareholders in the same manner as it evaluates all other candidates. When
considering and evaluating candidates for nomination to the Board, the committee considers a number of factors. The Compensation & Governance Committee considers board diversity as a factor in identifying nominees for Director, but diversity is not a dispositive factor and the committee has no formal diversity policy. In addition, the Compensation & Governance Committee believes that a Board candidate should:
| • | Be a shareholder of United Bancorp, Inc. |
| • | Be willing and able to devote full interest and attendance to the Board and its committees |
| • | Bring their financial business to the Company, including personal and business accounts |
| • | Lend credibility to the Company and enhance its image |
| • | Help develop business and promote the Company and its subsidiaries |
| • | Provide advice and counsel to the CEO |
| • | Maintain integrity and confidentiality at all times. |
The Compensation & Governance Committee will consider shareholder nominations for candidates for membership on the Board when properly submitted in accordance with the Company’s bylaws. The bylaws provide that no less than 120 days prior to the date of the meeting, in the case of an annual meeting, and not more than seven days following the date of notice of the meeting, in the case of a special meeting, any shareholder who intends to make a nomination at the meeting shall deliver a notice to the secretary of the Company setting forth (i) the name, age, business address and residence of each nominee proposed in such notice, (ii) the principal occupation or employment of each such nominee, (iii) the number of shares of each class and series of capital stock of the Company which are beneficially owned by each such nominee and (iv) such other information concerning each such nominee as would be required, under the rules of the Securities and Exchange Commission, in a proxy statement soliciting proxies for the election of such nominee.
The Compensation & Governance Committee met six times during 2010, and is composed of the following Directors of the Company: Stephanie H. Boyse, James D. Buhr, John H. Foss and James C. Lawson. All members of the Company’s Compensation & Governance Committee meet the requirements for independence under NASDAQ Listing Rules. While the Company is not subject to these standards, it has chosen to comply with them voluntarily.
Board Leadership Structure |
The Board of Directors of United is led by its Chairman of the Board, who is not the Chief Executive Officer of the Company. The Compensation & Governance Committee believes that separation of the positions of Chairman of the Board and Chief Executive Officer recognizes the difference between the two roles and reflects good corporate governance practice. The Chairman of the Board leads the Board of Directors in adopting an overall strategic plan for the Company, sets the agenda for the meetings of the Board of Directors, presides over all meetings of the Board of Directors, and provides guidance to the Chief Executive Officer. The Chief Executive Officer implements the strategic plan for the Company, as adopted by the Board of Directors, and leads the Company, its management and its employees on a day-to-day basis. Because of
these differences, the Company currently believes keeping the Chairman of the Board and Chief Executive Officer as separate positions is the appropriate leadership structure for the Company.
Retiring Chairman of the Board David S. Hickman is the Company’s retired Chief Executive Officer, and has provided strength and experience as Chairman of the Board. James C. Lawson currently serves as Vice-Chairman of the Board, and is expected to succeed Mr. Hickman as Chairman of the Board following the 2011 Annual Meeting of Shareholders upon Mr. Hickman’s retirement. Mr. Lawson has a diverse background in the formation and operation of a successful business, and has served as a Director of the Company since 1986. Robert K. Chapman serves as the Company’s President and Chief Executive Officer, and brings years of banking experience in various roles, as well as leadership in the Washtenaw County market to his role.
Board Role in Risk Oversight |
The Company continues to develop and implement its enterprise risk management (ERM) process. The Board is responsible for overseeing the ERM process. The Enterprise Risk Management Committee implements the ERM process by overseeing policies, procedures and practices relating to enterprise-wide risk and compliance with bank and regulatory obligations. The committee consists of members of the executive management team and other appointed individuals from the various, identified risk areas. The Chief Financial Officer serves as chair of the committee. Among other things, the committee is responsible for designing and implementing effective ERM processes and practices, ensuring that management understands and accepts responsibility for identifying, assessing and managing risk, ensuring that risk assessments are completed for each identified risk area, and reviewing and updating risk assessments on at least a quarterly basis. The committee has identified and monitors 12 risk areas. In 2010, the ERM process involved a heightened focus on risks related to credit quality of the loan portfolio and earnings and capital, as both of these areas presented elevated levels of risk to the Company. The committee must meet at least four times per year. The Chief Financial Officer must report on the ERM process to the Board of Directors on at least a quarterly basis.
Information Concerning Executive Officers |
Following is a current listing of executive officers of the Company, setting forth the name, age, five year business experience, and year each became an executive officer of the Company. Officer appointments for the Company are made or reaffirmed annually at the Organizational Meeting of the Board of Directors. The Board may also designate executive officers at regular or special meetings of the Board.
Name, Age, and Five Year Business Experience | Executive Officer Since |
Robert K. Chapman, age 67; Director of UBI; President (since 2003) and Chief Executive Officer (since 2006) of the Company; President and Chief Executive Officer of UBT (2010); President (2001–2005) and Chief Executive Officer (to December, 2007) of UBTW; Director of UBTW (2001–2010). | 2001 |
Randal J. Rabe, age 52; Executive Vice President (since 2003) and Chief Financial Officer (since December, 2007) of the Company; President (2003–2007) & Chief Executive Officer (2005–2007) and Director (2003–2007) of UBT | 2003 |
Name, Age, and Five Year Business Experience | Executive Officer Since |
Todd C. Clark, age 41; Executive Vice President of the Company (since 2006); Chief Operating Officer and Washtenaw Community President (2010); President (2006–2010) and Chief Executive Officer (2007–2010) of UBTW; Director (2006–2010) of UBTW | 2005 |
Gary D. Haapala, age 47; Executive Vice President of the Company (since 2006); Executive Vice President – Wealth Management Group of UBT (since 2006). | 2006 |
Joseph R. Williams, age 46; Executive Vice President of the Company (since December, 2007); Lenawee Community President (2010); President and Chief Executive Officer and Director of UBT (2007–2010); Executive Vice President – Community Banking of UBT (2003–2007) | 2007 |
Compensation of Directors and Executive Officers
Compensation Discussion and Analysis |
This discussion describes our compensation program for our executive officers named in the Summary Compensation Table below ("named executive officers").
Compensation Philosophy and Objectives
Our executive compensation program is overseen by our Compensation & Governance Committee, which annually reviews and approves our compensation program, evaluates the performance of our chief executive officer and, with input from the Chief Executive Officer, reviews the performance of executive officers in achieving our business objectives, and recommends their compensation to our Board of Directors for its approval. Although input from the Chief Executive Officer is considered by the Compensation & Governance Committee and the Board, it is not given any disproportionate weight. The Compensation & Governance Committee and the Board have the final authority on compensation matters.
The Compensation & Governance Committee believes that our compensation programs should be designed to tie annual and long-term cash and stock incentives to achievement of measurable business and individual performance objectives. The Compensation & Governance Committee believes that this approach aligns executives’ incentives with shareholder value creation and allows the Company to attract and retain high quality executive talent. Accordingly, a portion of our executives’ overall compensation is tied to our financial performance (including our return on assets and net income). Our compensation philosophy is intended to compensate our executives with base salary targeted at the midrange of market competitive levels, while rewarding for outstanding corporate performance with our performance based plans. If performance goals are achieved, they will result in above-average total compensation based on a market comparison.
Compensation Process
In its process for deciding how to compensate our named executive officers, the Compensation & Governance Committee considers competitive market data. The Compensation & Governance Committee periodically engages the services of compensation consultants to help evaluate our executive compensation and to help select appropriate market data for comparison. Some of the resources considered were the ABA Executive Compensation Standard Report, American Bankers Association Compensation Benefits Survey, BAI Bank Cash Compensation Survey,
Crowe Chizek Financial Institutions Compensation Survey, Mercer Benchmark Database Human Resource Management, Michigan Bankers Association Compensation Survey and Watson Wyatt Benchmark Compensation Report for Financial Institutions. None of the resources was specifically prepared or customized for the Company and each resource contained only aggregate data with regard to the institutions surveyed. While the Compensation & Governance Committee considered these resources, it determined compensation levels in its judgment based on what it considered to be reasonable and appropriate for the Company.
For 2009 and 2010, the Committee engaged the services of Findley Davies as compensation consultants. These consultants have assisted the Compensation & Governance Committee in evaluating the mix of cash and equity compensation for our executives. Based on their recommendations and comparison to the market data they have provided, we believe that our mix of cash and equity compensation is appropriate and is consistent with that of similar financial institutions. Findley Davies did not provide any other services to the Company.
In 2009, the Compensation & Governance Committee engaged the services of Findley Davies to:
| • | Review current executive compensation structure, |
| • | Review prevalent market practices and trends, |
| • | Review competitiveness of the Company’s long term incentive compensation, |
| • | Review long-term incentive compensation delivery strategy, and |
| • | Prepare a new equity plan for shareholder approval. |
In 2010, Findley Davies was engaged to:
| • | Assist with development of a Long-term Incentive Program |
| • | Assist with review of executive base compensation |
The Compensation & Governance Committee also uses tally sheets prepared by our payroll department with respect to each of our named executive officers. Tally sheets include the dollar value of each component of the named executive officers’ compensation, including current cash compensation, accumulated deferred compensation balances, outstanding equity awards, retirement benefits, perquisites and any other compensation. The primary purpose of the tally sheets is to bring together in one place all of the elements of compensation of our named executive officers so that the Compensation & Governance Committee may analyze both the individual elements of compensation (including the compensation mix) as well as the aggregate total amount of compensation. The Compensation & Governance Committee generally compares the information on the tally sheets, on an individual and aggregate basis, to the extent comparisons are available, to market data. In addition, such tallies are also used to determine internal equity conformance.
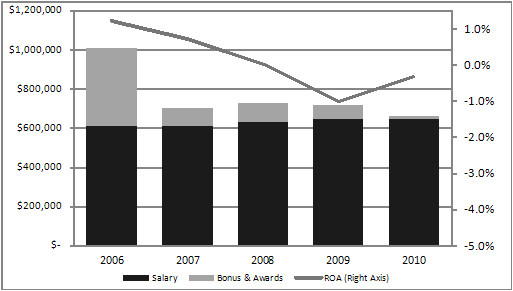
We believe that it is important that our executive compensation reflect the relative financial performance of the Company. The table below shows the base pay, bonus and awards of the named executive officers, compared to the return on average assets (“ROA”) of the Company for the past five years.
Page 14
Targets and Peer Data
The Compensation & Governance Committee has the authority to set targets at other than those contained in the current year Board-approved financial plan. For 2010, the targets for payouts under the Management Committee Bonus Plan and the Stakeholder Bonus Plan were set at a level that was considerably higher than the 2010 financial plan. The Compensation & Governance Committee has utilized comparison to a number of peer groups for the purpose of ranking our financial performance with peers in order to validate our performance targets. However, these peer groups were not used specifically to compare our compensation practices and levels to peer companies.
Compensation Components
The key components of our executive compensation program consist of a base salary and participation in various performance-based compensation plans, including our Management Committee Bonus Plan, Senior Management Bonus Deferral Stock Plan, Stakeholder Bonus Plan, 401(k) Plan, and our Stock Incentive Plan of 2010.
Base Salary
We use base salary to attract and retain executive officers near the midpoint of market rates, and rely on our performance-based plans to reward for performance. The Company generally hires executive officers at market rates necessary to attract talent. Raises and salary adjustments for named executive officers are provided primarily to allow us to retain our existing talent.
Management Committee Bonus Plan
The named executive officers participate in the Management Committee Bonus Plan. Under the plan, a participant is paid a percentage of his or her base salary based on the achievement of business and individual performance objectives. Bonuses under the plan are based all or in part on our achieving a target return on assets as established annually by the Board of Directors. For 2010, our target ROA was 1.0%.
The Management Committee Bonus Plan is divided into groups, each with differing payout levels based on a percentage of base salary. Participants in the plan may earn more or less than the prescribed bonus percentages at target levels, with threshold and maximum bonus levels established. The table below details the range of minimum, target and maximum thresholds and payouts for each group of the plan, relating to the named executive officers.
| NO BONUS IS EARNED IF PERFORMANCE IS BELOW: | BONUS EARNED AT MINIMUM THRESHOLD | BONUS EARNED AT 100% OF TARGET | MAXIMUM BONUS THAT CAN BE EARNED | MAXIMUM BONUS IS EARNED AT OR ABOVE: | |||
| Group 1 | 0.50% | ROA | 11.25% | 45% | 90% | 1.625% | ROA |
| Group 2 | 0.50% | ROA | 8.75% | 35% | 70% | 1.625% | ROA |
Targets for 2010 for all participants were based 100% on ROA, as they each have responsibilities with regard to the overall performance of the Company. Targets were not achieved in 2010, and as a result, no Management Committee Bonus incentive compensation was paid to any of the named executive officers.
The table below details the respective named executive officers in each group, the group within the plan that each participates in, the basis upon which the bonus is determined, and the payout percentages for calendar year 2010.
| EXECUTIVE OFFICER | GROUP | BASED ON: | 2010 PAYOUT |
| Chapman | 1 | Target ROA (100%) | 0% |
| Rabe | 2 | Target ROA (100%) | 0% |
| Clark | 2 | Target ROA (100%) | 0% |
Under the Senior Management Bonus Deferral Stock Plan adopted in 1996, participating officers are eligible to elect cash bonus deferrals and, after employment termination, to receive payment in the form of shares of Company stock. During 2010, none of the named executive officers received bonuses eligible to be deferred under the plan and, as of December 31, 2010, none of the named executive officers had any balance in the plan.
Stakeholder Bonus Plan
Prior to 2010, executive officers and all other full-time non-commissioned employees of our Company were eligible to participate in our Stakeholder Bonus Plan. Payouts from the plan are based on target net income for the Company as established annually by our Board of Directors, and payouts are based on a sliding scale that is set by the Board. All participants were paid at the same percentage level, and eligible co-workers receive a percentage of their base salary in the form of cash bonuses. No payouts are made if the Company falls below a minimum established by the Board, and maximum bonuses of 20% are paid at the highest level. The share of profits distributed to Stakeholder Bonus Plan participants is structured to provide awards consistent with the increase in profits as measured by net income, and is subject to change annually upon the recommendation of the Compensation & Governance Committee and the approval of the Board of Directors. Beginning in 2010, executive officers are not eligible to participate in the Stakeholder Bonus Plan.
Stock Incentive Plan of 2010
At the 2010 Annual Meeting of Shareholders, shareholders approved the United Bancorp, Inc. Stock Incentive Plan of 2010 (the “Incentive Plan”). The Incentive Plan is intended to supplement and continue the compensation policies and practices of our other equity compensation plans, which we have used for many years. The Board of Directors believes that the Incentive Plan is important to attract, retain and motivate corporate and subsidiary directors, officers and key employees of exceptional abilities, and to recognize the significant contributions these individuals have made to the long-term performance and growth of the Company and its subsidiaries. No awards were made in 2010 under the Incentive Plan. The Compensation & Governance Committee has awarded grants in 2011 under the Incentive Plan based on the Company’s 2010 performance.
The plan includes a number of components, as follows:
Stock Options |
The Incentive Plan permits the Company to grant to participants options to purchase shares of common stock at stated prices for specific periods of time. Stock options that could be granted under the Incentive Plan could be either nonqualified stock options or incentive stock options as defined in Section 422 of the Internal Revenue Code. The Compensation & Governance Committee could award options for any amount of consideration or no consideration, as the committee determines.
Stock Appreciation Rights |
The Incentive Plan permits the Compensation & Governance Committee to grant stock appreciation rights. A stock appreciation right permits the holder to receive the difference between the market value of a share of common stock subject to the stock appreciation right on the exercise date of the stock appreciation right and a “base” price set by the Compensation & Governance Committee. Stock appreciation rights would be exercisable on dates determined by the Compensation & Governance Committee at the time of grant. The committee could award stock appreciation rights for any amount of consideration or no consideration, as the committee determines.
Stock appreciation rights would be subject to terms and conditions determined by the Compensation & Governance Committee. A stock appreciation right could relate to a particular stock option and could be granted simultaneously with or subsequent to the stock option to which it relates.
| Restricted Stock and Restricted Stock Units |
The Incentive Plan permits the Compensation & Governance Committee to award restricted stock and restricted stock units, subject to the terms and conditions set by the committee that are consistent with the Incentive Plan. Shares of restricted stock are shares of common stock, the retention, vesting and transferability of which are subject, for specified periods of time, to such terms and conditions as the Compensation & Governance Committee deems appropriate (including continued service or employment and/or achievement of performance goals established by the committee). The Compensation & Governance Committee could award restricted stock or restricted stock units for any amount of consideration or no consideration, as the committee determines.
As with stock option grants, the Compensation & Governance Committee would establish the terms of individual awards of restricted stock and restricted stock units in award agreements or certificates of award. Restricted stock and restricted stock units granted to a participant would “vest” (i.e., the restrictions on them would lapse) in the manner and at the times that the Compensation & Governance Committee determines.
Stock Awards |
The Incentive Plan permits the Compensation & Governance Committee to make stock awards. The committee could make stock awards for any amount of consideration, or no consideration, as the committee determines. A stock award of common stock would be subject to terms and conditions set by the Compensation & Governance Committee at the time of the award. Stock award recipients would generally have all voting, dividend, liquidation and other rights with respect to awarded shares of common stock. However, the committee could impose restrictions on the assignment or transfer of common stock awarded under the Incentive Plan.
Other Stock-Based Awards |
Finally, the Incentive Plan permits the Compensation & Governance Committee to grant a participant one or more types of awards based on or related to shares of common stock, other than the types described above. Any such awards would be subject to such terms and conditions as the Compensation & Governance Committee deems appropriate, as set forth in the respective award agreements and as permitted under the Incentive Plan.
Stock Option Plans
Before December 31, 2009, we granted stock options under one of two stock option plans: the 1999 and 2005 stock option plans. The 1999 and 2005 stock option plans have expired and been replaced by the Stock Incentive Plan of 2010. Options granted under the plans and not exercised are still outstanding, and no new options may be granted under either plan.
Under the plans, options were granted at the then-current market price at the time the option was granted. The options have a three-year vesting period and, with certain exceptions, expire at the end of ten years from the date of grant, or three years after retirement. Options granted under our plans are non-qualified stock options as defined under the Internal Revenue Code.
Our Compensation & Governance Committee administered our stock option plans. Option grants for any certain year were generally determined by evaluating the number of option grants available under the plan, divided by the number of years remaining in the plan. The Committee allocated some or all of the options available for a particular year to eligible participants based on a number of factors, including the relative rank of the executive officer within our Company and his or her specific contributions to the success of the Company for the prior year. The committee did not time the grant of stock options to take advantage of material non-public information, or time the release of material non-public information to increase the value of option grants.
We believe the options served to enhance shareholder value by aligning the interests of our executive officers with those of the shareholders and also by acting to retain our executive officers through the vesting of the options. The exercise price of all options granted under the plans was higher than the Company’s stock price as of December 31, 2010, and accordingly,
unless the stock price significantly improves, the ability of those options to assist in retention of our executive officers may not be realized.
401(k) Plan
Under our 401(k) plan, executive officers and other participants may defer a portion of their compensation, and the Company’s 401(k) plan provides for a match of up to 4% of their salaries, subject to IRS regulations. In addition to the match contributions, the plan includes a profit-sharing feature based on achievement of a net income target as established annually by the Board of Directors. Effective July 1, 2009, the Company discontinued its match and profit sharing contributions to the 401(k) plan as a cost-cutting measure, and no match or profit sharing payments were paid in 2010. The Company has reinstated match contributions beginning in 2011, but does not anticipate making profit sharing contributions in 2011.
Severance Arrangements
Each named executive officer has an employment agreement with the Company. As part of our goal to attract and retain our executive officers, such employment agreements provide that if the Company terminates the employee’s employment before a Change in Control (as defined in the agreement) other than for Cause (as defined in the agreement), the employee will receive severance pay consisting of six months’ salary continuation and six months of COBRA payments, provided that the severance pay will end if the employee secures other employment. If the Company terminates the employee’s employment other than for Cause within 12 months after a Change in Control, or if the employee resigns for Good Reason (as defined in the agreement) within 12 months after a Change in Control, the employee will receive severance pay consisting of a lump sum payment equal to one year’s salary, and will also receive 12 months of COBRA payments. However, no severance payments will be made either before or after a Change in Control during the period in which any obligation arising from financial assistance under the Troubled Assets Relief Program remains outstanding, if such payments would be prohibited as to any employee of the Company under Section 111 of the Emergency Economic Stabilization Act of 2008 as amended by Section 7001 of the American Recovery and Reinvestment Act of 2009.
The contracts provide for a general release from the employee as a condition to eligibility for severance pay. The contracts also provide that to be eligible for severance pay the employee must comply with confidentiality requirements and 12-month non-solicitation and non-competition commitments included in the contracts. The purpose of the severance arrangements is to minimize the uncertainty and distraction caused by the current climate of bank acquisitions, and to allow our executive officers to focus on performance by providing transition assistance if we are acquired or if there is a change in control.
Inter-Relationship of Elements of Compensation Packages
The various elements of the compensation package are not inter-related. There is no significant interplay of the various elements of total compensation between each other. While the Compensation & Governance Committee may recommend, and the Board has discretion to make exceptions to any compensation or bonus payouts under existing plans, the Compensation &
Governance Committee has not recommended, and the Board has not approved, any exceptions to the plans with regard to any named executive officer.
Limitations on Executive Compensation
The Company participated in the United States Department of the Treasury’s (“Treasury”) Capital Purchase Program (“CPP”) effective January, 2009. The Company made immaterial, technical amendments to certain employment agreements and plans with the Corporation’s executive officers to comply with the limits on executive compensation as required by the CPP and the Emergency Economic Stabilization Act of 2008 as that Act existed at the time of the Company’s participation in the CPP.
The Company’s compensation plans are in compliance with the requirements of the American Recovery and Reinvestment Act of 2009 (the “Recovery Act”), which significantly amended the executive compensation requirements for all CPP participants. The Recovery Act prohibits the following practices:
| • | making any payments (other than accrued wages and benefits) to senior executive officers and the five most highly-compensated employees upon departure from United for any reason; |
| • | paying or accruing any bonus, retention award or incentive compensation to our highest-compensated employee (subject to certain exceptions); and |
| • | using any compensation plan that would encourage earnings manipulation to enhance the compensation of any employee. |
On September 15, 2009, the Company approved certain amendments to its compensation plans to comply with applicable requirements under the Economic Stabilization Act of 2008 as amended by the Recovery Act and related regulations.
Section 162(m) of the Internal Revenue Code generally disallows a tax deduction to public companies participating in the CPP for taxable compensation in excess of $500,000 paid to their chief executive officer or certain other highly compensated officers. Qualifying performance-based compensation is not subject to the deduction limitation if certain requirements are met. We consider the impact of Section 162(m) when structuring the performance based portion of our Executive Compensation, but Section 162(m) is not a dispositive consideration. No compensation was non-deductible because of Section 162(m) in 2010, and we do not expect any compensation to be non-deductible because of Section 162(m) in 2011.
As a condition to participation in the CPP, we are required to recover from any named executive officer and any of the next twenty highest-compensated employees any bonus or incentive compensation paid to such named executive officer if the financial statement or payment method on which the payment was based later proves to be materially inaccurate. Each named executive officer has consented to provisions which require him to repay any such amount. This obligation will continue for as long as the U.S. Treasury holds a debt or equity position in the Company. It is anticipated that actions to be taken under such circumstances would be determined by the Compensation & Governance Committee. We offer minor perquisites to some executive officers,
none of which have an annual aggregate incremental cost to us of more than $10,000 per executive.
Stock Ownership Guidelines
We believe that stock ownership by our executive officers is the clearest, most direct way to align their interests with those of our stockholders and that, by holding an equity position in the Company, executive officers demonstrate their commitment to and belief in the long-term profitability of the Company. Accordingly, guidelines for stock ownership by executive officers were adopted in 2008. As of December 31, 2010, all of the named executive officers had stock ownership in compliance with the stock ownership guidelines. We currently have no policies regarding hedging the economic risk of any ownership of our common stock.
Compensation of Executive Officers |
The following table sets forth information concerning the compensation earned by each person who served as Chief Executive Officer during 2010 and the two most highly compensated executive officers other than the Chief Executive Officer during 2010.
Summary Compensation Table
| NAME AND PRINCIPAL POSITION | YEAR | SALARY (1) | OPTION AWARDS (2) | NON-EQUITY INCENTIVE COMP (3) | ALL OTHER COMPEN- SATION (4) | TOTAL COMPEN- SATION | ||||||||||||||||||
Robert K. Chapman, President and Chief Executive Officer | 2010 | $ | 260,000 | $ | 0 | $ | 0 | $ | 10,500 | $ | 270,500 | |||||||||||||
| 2009 | 260,000 | 20,813 | 0 | 15,507 | 296,320 | |||||||||||||||||||
| Randal J. Rabe, Executive Vice President & Chief Financial Officer | 2010 | $ | 190,000 | $ | 0 | $ | 0 | $ | 3,725 | $ | 193,725 | |||||||||||||
| 2009 | 190,000 | 11,655 | 0 | 7,384 | 209,039 | |||||||||||||||||||
Todd C. Clark, Executive Vice President | 2010 | $ | 195,000 | $ | 0 | $ | 0 | $ | 2,400 | $ | 197,400 | |||||||||||||
| 2009 | 195,000 | 11,655 | 0 | 6,156 | 212,811 | |||||||||||||||||||
| (1) | Generally, we believe that our executives’ base salary should be set at mid-level market competitive levels. Base salaries are reviewed annually and are compared to several databases and public information, and adjusted from time to time. Salary amounts include amounts deferred under the Company’s 401(k) plan. | |
| (2) | Amounts in this column reflect the grant date fair value computed in accordance with FASB ASC Topic 718 (formerly FAS 123R). Further information regarding option valuation is contained in Note 16 of the Notes to Consolidated Financial Statements. | |
| (3) | “Non-Equity Incentive Compensation” includes amounts paid under the Management Committee Bonus Plan, the Stakeholder Bonus Plan and as a profit-sharing contribution under the Company’s 401(k) plan as further described in the “Compensation Discussion and Analysis” section of this Proxy Statement. | |
| (4) | "All other Compensation" includes matching contributions made by us under our 401(k) plan and life insurance premiums paid by the Company for the benefit of the named executive officers. Detail is shown in the table below. |
| NAME | YEAR | MANAGE-MENT COMMITTEE BONUS | STAKE- HOLDER BONUS | 401(k) PROFIT SHARING | TOTAL NON-EQUITY INCENTIVE PAY | 401(k) MATCH CONTRIBU-TIONS (a) | LIFE INSUR- ANCE PREMIUMS | TOTAL OTHER COMPEN-SATION | |||||||||||||||||||||||
Chapman | 2010 | $ | 0 | $ | 0 | $ | 0 | $ | 0 | $ | 0 | $ | 10,500 | $ | 10,500 | ||||||||||||||||
| 2009 | 0 | 0 | 0 | 0 | 5,007 | 10,500 | 15,507 | ||||||||||||||||||||||||
Rabe | 2010 | $ | 0 | $ | 0 | $ | 0 | $ | 0 | $ | 0 | $ | 3,725 | $ | 3,725 | ||||||||||||||||
| 2009 | 0 | 0 | 0 | 0 | 3,659 | 3,725 | 7,384 | ||||||||||||||||||||||||
Clark | 2010 | $ | 0 | $ | 0 | $ | 0 | $ | 0 | $ | 0 | $ | 2,400 | $ | 2,400 | ||||||||||||||||
| 2009 | 0 | 0 | 0 | 0 | 3,756 | 2,400 | 6,156 | ||||||||||||||||||||||||
(a) | We matched a maximum of 3% of our executives’ salaries in 2008.The maximum match was increased to 4% in 2009, and was discontinued July 1, 2009. The match has been reinstated for 2010 at a maximum of 4%. |
Narrative disclosure of the material terms of the compensation components shown in the Summary Compensation Table may be found above under the heading "Compensation Components" and is here incorporated by reference.
Outstanding Equity Awards at Fiscal Year End 2010 |
The following table provides information as of December 31, 2010 regarding the Company’s outstanding equity awards under the Company’s equity compensation plans. As of December 31, 2010, the exercise price of all of the stock options shown below was higher than the Company’s stock price, and accordingly, the options cannot be exercised profitably at this time. All shares issuable under the Senior Management Bonus Deferral Stock Plan are fully vested, and are not included in the table below. There were no other outstanding equity awards as of December 31, 2010.
| NAME | GRANT DATE (1) | # OF SHARES UNDERLYING UNEXERCISED OPTIONS AT YEAR END (2) | OPTION EXERCISE PRICE (2) | OPTION EXPIRATION DATE | |||||||||||
| EXERCISABLE | UNEXERCISABLE | ||||||||||||||
Robert K. Chapman | 01/09/02 | 4,135 | - - | $ | 19.98 | 01/09/12 | |||||||||
| 01/10/03 | 5,348 | - - | 22.21 | 01/10/13 | |||||||||||
| 01/09/04 | 5,788 | - - | 27.21 | 01/09/14 | |||||||||||
| 01/03/05 | 5,512 | - - | 30.39 | 01/03/15 | |||||||||||
| 01/03/06 | 5,880 | - - | 29.52 | 01/03/16 | |||||||||||
| 01/02/07 | 6,000 | - - | 22.50 | 01/02/17 | |||||||||||
| 02/15/08 | 4,752 | 2,448 | 19.75 | 02/15/18 | |||||||||||
| 03/04/09 | 4,125 | 8,375 | 7.24 | 03/04/19 | |||||||||||
Randal J. Rabe | 02/17/03 | 2 | - - | $ | 23.04 | 02/17/13 | |||||||||
| 01/09/04 | 4,630 | - - | 27.21 | 01/09/14 | |||||||||||
| 4,410 | - - | 30.39 | 01/03/15 | ||||||||||||
| 3,990 | - - | 29.52 | 01/03/16 | ||||||||||||
| 01/02/07 | 3,800 | - - | 22.50 | 01/02/17 | |||||||||||
| 02/15/08 | 2,640 | 1,360 | 19.75 | 02/15/18 | |||||||||||
| 03/04/09 | 2,310 | 4,690 | 7.24 | 03/04/19 | |||||||||||
Todd C. Clark | 01/10/01 | 2 | - - | $ | 18.66 | 01/10/11 | |||||||||
| 01/10/03 | 992 | - - | 22.21 | 01/10/13 | |||||||||||
| 01/09/04 | 2,018 | - - | 27.21 | 01/09/14 | |||||||||||
| 01/03/05 | 3,528 | - - | 30.39 | 01/03/15 | |||||||||||
| 01/03/06 | 4,200 | - - | 29.52 | 01/03/16 | |||||||||||
| 01/02/07 | 4,600 | - - | 22.50 | 01/02/17 | |||||||||||
| 02/15/08 | 3,300 | 1,700 | 19.75 | 02/15/18 | |||||||||||
| 03/04/09 | 2,310 | 4,690 | 7.24 | 03/04/19 | |||||||||||
(1) | Option grants are fully vested at the end of the first three years following the grant date; 33% per year at the end of each of the first two years and 34% at the end of the third year. | ||||||||||||||
(2) | The number of shares granted and the exercise price for each option is adjusted in accordance with the Company’s stock option plans to reflect stock dividends paid. | ||||||||||||||
The Company has not adjusted or amended the exercise price of options previously awarded to any executive officer.
Retirement, Termination or Change of Control Payments. |
As discussed in the Compensation Discussion & Analysis section of this Proxy Statement, the Recovery Act directs the Secretary of the Treasury to establish standards that would prohibit the
Company from making payments (other than accrued wages and benefits) to any named executive officer who departs the Company for any reason for as long as Treasury owns an equity position in United. The Company modified its employment agreements in 2009 to comply with Treasury requirements.
The Company has entered into employment agreements with each of the named executive officers. Additional information about retirement, termination or change in control payments under the employment agreements may be found above under the heading "Severance Arrangements" and is here incorporated by reference.
Under the terms of the Company’s 2005 stock option plan, upon the earlier of the occurrence of an Applicable Event, the death of Participant or total disability, all Options granted to the Participant shall be fully exercisable in accordance with terms of the plan. “Applicable Event” is defined by the plan as the expiration of a tender offer or exchange offer (other than an offer by the Company) pursuant to which more than 25% of the Company’s issued and outstanding stock has been purchased, or the entry into an agreement by the Board of Directors of the Company to merge or consolidate the Company with or into another entity where the Company is not the surviving entity, an agreement to sell or otherwise dispose of all or substantially all of the Company’s or the Bank’s assets (including a plan of liquidation), or the approval by the shareholders of the Company of an agreement to merge or consolidate the Company with or into another entity where the Company is the surviving entity, pursuant to which more than 25% of the stock of the surviving company will be owned by persons who were not holders of the Company’s issued and outstanding stock at the time of the agreement. At December 31, 2010, the exercise price of all of the options granted to our named executive officers was higher than the Company’s stock price, and therefore, the options could not have been exercised profitably.
Named executive officers may participate in the Company’s 401(k) plan, which will provide payment following retirement dependent on contributions by the officer and the Company during their term as an employee. Terms of the plan are disclosed above in the “Compensation Components” section. Named executive officers are not eligible for other Company benefits following retirement.
Equity Compensation Plan Information |
The following table provides information regarding equity compensation plans approved by shareholders as of December 31, 2010.
| Number of securities to be issued upon exercise of outstanding options, warrants and rights | Weighted-average exercise price of outstanding options, warrants and rights | Number of securities remaining available for future issuance under equity compensation plans (excluding securities reflected in column (a)) | ||||||||||
| Equity compensation plans approved by security holders | (a) | (b) | (c) | |||||||||
Stock Option Plans (1) | 407,730 | $ | 21.02 | - | ||||||||
| Stock Incentive Plan of 2010 | - | - | 500,000 | |||||||||
Director Retainer Plan (2) | 63,136 | NA | 39,517 | |||||||||
Deferred Bonus Plan (2) | 4,568 | NA | 21,373 | |||||||||
| Total | 475,434 | $ | 21.02 | 560,890 | ||||||||
| (1) | The Company's 2005 Stock Option Plan expired on January 1, 2010, and no additional options can be issued under the plan. |
| (2) | The number of shares credited to participants under the Director Retainer and Deferred Bonus plans is determined by dividing the amount of each deferral by the market price of stock at the date of that deferral. |
The Company has no equity compensation plans not approved by shareholders.
Compensation of Directors |
For 2010, the non-officer Directors of our Company were paid $450 per meeting of the Board and $250 per meeting of each committee. Prior to 2010, non-officer Directors of our Company were paid an annual retainer of $1,000 and Directors of the Company’s subsidiary banks were paid an annual retainer of $4,000. As of January 1, 2010, payment of the annual retainer for non-officer Directors of the Company and its subsidiary banks was suspended. Non-officer chairpersons of committees were paid an annual retainer of $2,000 in addition to the board meeting fees. All of the Company’s Directors are Directors of United Bank & Trust. The non-officer Directors of the Bank received $450 per meeting of the board of the Bank and $250 per meeting of each committee of the Bank.
On April 1, 2010, we merged our two subsidiary banks into United Bank & Trust, and we established market boards of directors within the Lenawee and Washtenaw markets. For 2010, the non-employee members of our community boards received $450 per meeting of the community boards and $250 per meeting of each committee of the community boards.
Effective January 1, 2011, the Company reinstated its annual Board retainer, and increased some of its fees paid to Directors. The table below details the fees to be paid by the Company and the Bank to its directors for 2011:
| Director Fees for 2011 | UBI | UBT | Community Boards | |||||||||
| Annual retainer | ||||||||||||
| Non-officer directors | $ | 1,000 | $ | 4,000 | $ | 1,000 | ||||||
| Committee Chairs | 2,500 | 2,500 | - | |||||||||
| Meeting attendance fee | ||||||||||||
| Board meeting | 500 | 500 | 500 | |||||||||
| Board Committee | 250 | 250 | 250 | |||||||||
Directors of our Company and the Bank that are not otherwise employees do not participate in our employee benefit programs, and receive no direct or indirect compensation, except for certain life insurance benefits. For 2010, three directors were included in the Company’s group life insurance program on a grandfathered basis. The amounts paid by the Company are less than $100 for each Director, and that amount is included in the table below under “All Other Compensation.”
Under the Director Retainer Stock Plan originally adopted in 1996, a Director may elect to defer all or a portion of the payments received for serving as a Director except for fees for serving on or as chairman of a committee. A Director who elects to defer payment will instead be awarded
units equal to the cash payment that was earned divided by the market price of the common stock on such date. The common stock earned will be issued to the director on the date on which such Director no longer is serving on our Board or on the board of the Bank. An election to defer made no later than 30 days after a Director is eligible is generally given effect commencing as of the next calendar quarter after the election. An election to defer made after 30 days from the date that a Director was eligible is generally given effect commencing as of the next calendar year. The plan is administered by the Company’s Chief Executive Officer. Up to 150,000 shares may be issued pursuant to the plan.
In the past, Directors of our Company and of the Bank have been granted 1,000 stock options at the time they join the Board. In addition, Directors of the Company and the Bank have been awarded grants at the inception of any new stock option plans. Since the Company’s 2005 stock option plan expired at the end of 2009, no stock options were granted to any Directors in 2010.
No Director who is also an employee of either the Company or the Bank receives any compensation for his or her services as a Director or as a committee member of the Company or the Bank. Accordingly, the compensation of Mr. Chapman, the Chief Executive Officer and President of the Company and who is also a Director of the Company and the Bank, is not set forth below, but is disclosed above in the Summary Compensation Table.
Chairman of the Board David S. Hickman entered into a management consulting agreement with United following his retirement as Chief Executive Officer of the Company, and that agreement remained in effect during 2010. The agreement currently in effect provides the following material points:
| • | Effective date is February 1, 2010 until April 30, 2011. |
| • | No Director fees for services as a Director of the Company or of the Bank. |
| • | Subject to cancellation by the Company at will. |
| • | Payment of $50,000 per year. |
| • | No participation in our employee benefit plans. |
| • | Under our Supplemental Employee Retirement Plan, in which only Mr. Hickman participates, he receives payment of $5,088 per month for 180 months, beginning January, 2006. |
| • | Mr. Hickman has agreed to confidentiality, non-compete and non-solicitation of employees and customers provisions. |
Vice-Chairman of the Board James C. Lawson is expected to be elected as Chairman of the Board upon the retirement of Mr. Hickman as of April 30, 2011. As a result, beginning May 1, 2011, it is anticipated that the Company will pay Mr. Lawson an annual fee of $40,000, and he will receive no other director fees for services as a director of the Company or the Bank.
Below is a summary of compensation paid to Directors of UBI for 2010:
| (1) | Amounts include fees earned as a Director of the Company, the Bank and the Bank’s Community Boards. As disclosed above, Directors are eligible to defer all or a portion of his or her retainer fees, and upon his or her termination as a director, to receive payment in the form of shares of common stock. Amounts deferred are included in this column, and were as follows for 2010: Boyse, $11,250; Foss, $12,600, Lawson, $12,600 and Martin, $4,050. | |
| (2) | For Mr. Hickman, the amount shown reflects the amount paid under the Company’s SERP. Amounts for Mr. Lawson, Mr. Martin and Mr. Maxwell represent the amount of life insurance premiums paid by the Company as part of the Company’s group life insurance program, in which they participate on a grandfathered basis. | |
| (3) | Aggregate number of shares of stock awards outstanding at the end of 2010, representing director fees deferred under the Director Retainer Stock Plan, along with accumulated cash dividends earned on deferred amounts. | |
| (4) | Director Casey resigned as a Director of the Company in January, 2010. Directors Martin and Maxwell retired as Directors effective with the 2010 Annual Meeting of Shareholders. |
Compensation Committee Report |
The Compensation & Governance Committee has reviewed and discussed the foregoing “Compensation Discussion and Analysis” section with Company management. Based on our review and discussion with management, the Compensation & Governance Committee recommended to the Board of Directors that the “Compensation Discussion and Analysis” section be included in this proxy statement and incorporated by reference into our annual report on Form 10-K for the year ended December 31, 2010.
The Compensation & Governance Committee has reviewed the Company’s compensation plans for its senior executive officers (“SEOs”), and has determined that the plans do not encourage the SEOs to take unnecessary and excessive risks that threaten the value of the Company. The Committee does not believe that the structure of the SEO incentive compensation plans, when considered within the overall compensation of the SEOs, is likely to encourage the SEOs to take risks, for the following reasons:
| • | Compensation Mix – Because SEO salary makes up the majority of the overall compensation, there is inherently less risk to the Company’s shareholders that the SEOs would undertake unnecessary and excessive risks than if short-term incentives comprised the majority of the SEO’s compensation. |
| • | Stock Incentive Plan – The committee has determined that this plan does not encourage unnecessary and excessive risk taking because: 1) the awards are determined subjectively based upon overall performance, including maintaining adequate capital and liquidity, and 2) the exercise of the option aligns the SEO with shareholders in the desire to build long-term value. |
| • | Management Committee Incentive Compensation Plan – For the SEOs, the primary component of this plan is the Company’s return on assets. Increasing net income is the best method for SEOs to maximize this short-term incentive. While there is some chance that SEOs could take on unnecessary risk to maximize net income, this risk is mitigated by Company policies and procedures and Board oversight. Significant windfalls provided by new or changed accounting standards or large one-time events that were not included in the plan can be excluded at the discretion of the Compensation & Governance Committee, so SEOs do not have an incentive to undertake these potentially risky events. |
The Compensation & Governance Committee certifies that
| 1. | It has reviewed with senior risk officers the senior executive officer compensation plans and has made all reasonable efforts to ensure that these plans do not encourage the senior executive officers to take unnecessary and excessive risks that threaten the value of the Company; |
| 2. | It has reviewed with senior risk officers the employee compensation plans and has made all reasonable efforts to limit any unnecessary risks these plans pose to the Company; and |
| 3. | It has reviewed the employee compensation plans to eliminate any features of these plans that would encourage the manipulation of reported earnings of the Company to enhance the compensation of any employee. |
| Submitted by the Compensation & Governance Committee | |
| James D. Buhr, Chairman | |
| Stephanie H. Boyse | |
| John H. Foss | |
| James C. Lawson |
Notwithstanding anything to the contrary set forth in any of the Company’s previous filings under the Securities Act of 1933, as amended, or the Securities Exchange Act of 1934, as amended, that incorporate future filings, including this proxy statement in whole or in part, the foregoing Compensation & Governance Committee Report shall not be incorporated by reference into any such filings.
Compensation Committee Interlocks and Insider Participation
No officer, or employee or former officer or employee of the Company or any of its subsidiaries served as a member of the Compensation & Governance Committee during 2010. During 2010, other than for relationships involving subsidiaries of the Company:
| 1. | No executive officer of the Company served on the Compensation & Governance Committee of another entity, one of whose executive officers served on the Compensation & Governance Committee of the Company; |
| 2. | No executive officer of the Company served as a director of another entity, one of whose executive officers served on the Compensation & Governance Committee of the Company; |
| 3. | No executive officer of the Company served as a member of the Compensation & Governance Committee of another entity, one of whose executive officers served as a Director of the Company. |
Members of the Compensation & Governance Committee were clients of and had transactions (loans and commitments to lend) with the Bank in the ordinary course of business during 2010. All such loans and commitments were made by the Bank on substantially the same terms, including interest rates and collateral, as those prevailing at the time for comparable transactions with other persons, and did not involve more than the normal risk of collectability or present other unfavorable features. See “Directors, Executive Officers, Principal Shareholders and Their Related Interests – Transactions with the Bank.”
Security Ownership of Certain Beneficial Owners
To the extent known by the Company, as of February 25, 2011, no persons except those listed in the following table owned beneficially more than five percent (5%) of the voting securities of the Company. The following table discloses the name and address of such beneficial owner, the total number of shares beneficially owned, and the percentage of ownership in relation to the total Common Stock of the Company outstanding and entitled to vote as of February 25, 2011. The Company is not responsible for the accuracy of this information.
| NAME OF BENEFICIAL OWNER | SOLE VOTING POWER | SOLE DISPOSITIVE POWER | SHARED VOTING AND DISPOSITIVE POWER | TOTAL BENEFICIAL OWNERSHIP | PERCENT OF CLASS | |||||||||||||||
Wellington Management Company LLP (1) 280 Congress Street Boston, MA 02210 | - | - | 1,172,091 | 1,172,091 | 9.25 | % | ||||||||||||||
Jacobs Asset Management, LLC (2) 11 East 26 Street, Suite 1900 New York, NY 10010 | - | - | 1,170,000 | 1,170,000 | 9.24 | % | ||||||||||||||
Manulife Asset Management (US) LLC (3) 101 Huntington Avenue Boston, MA 02199 | 885,000 | - | - | 885,000 | 6.99 | % | ||||||||||||||
Raffles Associates, LLP (4) 2 Penn Plaza, Suite 1920A New York, NY 10121 | - | - | 790,000 | 790,000 | 6.24 | % | ||||||||||||||
| (1) | Wellington Management, in its capacity as investment adviser, may be deemed to beneficially own 1,172,091 shares of common stock, which are held of record by clients of Wellington Management. Those clients have the right to receive, or the power to direct the receipt of, dividends from, or the proceeds from the sale of, such securities. No such client is known to have such right or power with respect to more than five percent of such class of securities. |
| (2) | Based on a Schedule 13G filed January 4, 2011 by Jacobs Asset Management, LLC |
| (3) | Manulife Asset Management (US) LLC (“MAM (US)”) has beneficial ownership of 885,000 shares of common stock. Through its parent-subsidiary relationship to MAM (US), Manulife Financial Corporation may be deemed to have beneficial ownership of these same shares. |
(4) | Based on a Schedule 13G filed February 10, 2011 by Raffles Associates, L.P. |
Security Ownership of Management
The table below discloses number and percentage of shares of Company Common Stock beneficially owned by each of our Directors and Director Nominees, each named executive officer in the Summary Compensation table above, and all Directors, Director nominees and named executive officers of the Company as a group. The information is based on the total number of shares of Company Common Stock outstanding and entitled to vote as of February 25, 2011 plus shares of Common Stock subject to stock options that are currently exercisable or that will be exercisable within 60 days after February 25, 2011 according to information furnished to the Company by the listed persons. The Company is not responsible for the accuracy of this information.
The numbers of shares shown below includes shares owned directly or indirectly, through any contract, arrangement, understanding, relationship, or which the listed persons otherwise have voting power, shared voting power, sole investment power or shared investment power. Amounts deferred under the Director Retainer Stock Plan or the Senior Management Bonus Deferral Stock Plan do not result in shares issued until the date upon which a person ceases being a member of the plan and are included in the table below.
Directors, Executive Officers, Principal Shareholders And
Their Related Interests – Transactions With The Bank
Directors and executive officers of the Company, and their related interests, were clients of and had transactions (including loans and commitments to lend) with the Bank in the ordinary course of business during 2010. All such loans and commitments were made by the Bank in the
ordinary course of business, were made on substantially the same terms, including interest rates and collateral, as those prevailing at the time for comparable loans with persons not related to the Bank, and did not involve more than the normal risk of collectability or present other unfavorable features. None of these loan relationships presently in effect are in default as of the date of this Proxy Statement.
Under the charter of the Audit Committee, the Audit Committee is to review and approve all related party transactions for potential conflicts of interest to the extent such transactions are ongoing business relationships with United Bancorp, Inc. and its subsidiaries. Related party transactions are those involving United Bancorp, Inc. and its subsidiaries, which are required to be disclosed pursuant to SEC Regulation S-K, Item 404.
Section 16(a) Beneficial Ownership Reporting Compliance
Pursuant to Section 16(a) of the Securities Exchange Act of 1934, the Company’s Directors and officers, and persons who own more than 10% of the Company’s Common Stock, are required to file with the SEC initial reports of ownership and reports of changes in ownership of common stock and other equity securities of the Company. Officers, Directors and greater than 10% shareholders are required by regulation to furnish the Company with copies of all Section 16(a) reports they file. To the Company’s knowledge, based solely on a review of the copies of such reports furnished to the Company, all officers, Directors and greater than 10% beneficial owners timely filed required reports under Section 16(a) during 2010.
Relationship With Independent Public Accountants
The Company has appointed BKD, LLP as its independent public accountants to audit the Company’s consolidated financial statements for the year ending December 31, 2011. BKD, LLP has been appointed as the Company’s independent public accountants to audit the Company's consolidated financial statements since the year ended December 31, 2002. The following table details the fees billed by BKD, LLP for work performed for the fiscal years ended December 31, 2010 and 2009, by category of fee:
| 2010 | 2009 | |||||||
| Audit Fees | $ | 224,700 | $ | 140,000 | ||||
| Audit Related Fees | - - | 2,500 | ||||||
| Tax Fees | 19,770 | 15,380 | ||||||
| All Other Fees | - - | - - | ||||||
| Total | $ | 244,470 | $ | 157,880 | ||||
Audit fees consist of fees for the audit of the Company’s financial statements, or for services that are usually provided by an auditor in connection with statutory and regulatory filings and engagements. Audit related fees consist of fees for assurance and related services that are reasonably related to the performance of the audit or review of financial statements. Tax fees consist of fees billed for tax preparation, tax compliance, tax advice and tax planning.
The Company’s Audit Committee has concluded that the provision of services covered under the captions “Audit Related Fees” and “Tax Fees” with respect to BKD, LLP is compatible with
BKD, LLP maintaining its independence. In compliance with its Audit Committee charter, which requires all audit and permitted non-audit services to be pre-approved by the Audit Committee, all audit and non-audit services as disclosed above were pre-approved by the Audit Committee. None of the hours expended on BKD, LLP’s appointment to audit the consolidated financial statements for the year ended December 31, 2010 were attributed to work performed by persons other than BKD, LLP’s full-time, permanent employees.
Shareholder Proposals
To be considered timely, any proposal by a shareholder (other than director nominations) of the Company for the 2012 Annual Meeting of Shareholders, whether or not intended to be included in the proxy statement and form of proxy for that meeting, must be received by Randal J. Rabe, Executive Vice President and Chief Financial Officer, at the principal executive offices of the Company by November 17, 2011. Director nominations must be submitted no less than 120 days prior to the date of the meeting, in the case of an annual meeting, and not more than seven days following the date of notice of the meeting, in the case of a special meeting. All shareholder proposals and director nominations must fully comply with the notice and procedural requirements in the Company's Bylaws.
Other Matters
The FDIC requires state-chartered banks that are not members of the Federal Reserve System to prepare an annual disclosure statement that must be available to the public by March 31, 2011. A copy of the disclosure statement for United Bank & Trust may be obtained by contacting Randal J. Rabe at United Bancorp, Inc., P.O. Box 248, Tecumseh, MI 49286.
As permitted by Securities and Exchange Commission rules, only one copy of this 2011 Proxy Statement and the 2010 Annual Report to Shareholders is being delivered to multiple shareholders sharing the same address who have notified us of their election to receive only one copy of such documents. We will deliver on a one-time basis, promptly upon written or oral request from a shareholder at a shared address, a separate copy of our 2011 Proxy Statement and the 2010 Annual Report to Shareholders. Shareholders sharing an address who are currently receiving multiple copies of the proxy statement and annual report to shareholders may instruct us to deliver a single copy of such documents on an ongoing basis. Such instructions must be in writing, must be signed by each shareholder who is currently receiving a separate copy of the documents, and will continue in effect unless and until we receive contrary instructions as provided below. Any shareholder sharing an address may request to receive and instruct us to send separate copies of the proxy statement and annual report to shareholders on an ongoing basis by written or verbal request. We will begin sending separate copies of such documents within thirty days of receipt of such instructions. All requests should be addressed to United Bancorp, Inc., Attn: Diane Skeels, P.O. Box 248, Tecumseh, MI, 49286, phone 517/423-1760.
| March 16, 2011 | By Order of the Board of Directors |
| | |
| Randal J. Rabe |
A Message to Our Shareholders
This 2010 Annual Report contains audited financial statements and a detailed financial review. This is the Company's 2010 annual report to shareholders as required by Rule 14a-3 of the Securities and Exchange Commission (the "SEC"). Although attached to our proxy statement, this report is not part of our proxy statement, is not deemed to be soliciting material, and is not deemed to be filed with the SEC, except to the extent that it is expressly incorporated by reference in a document filed with the SEC.
Shareholders who would like to receive even more detailed information than that contained in this 2010 Annual Report are invited to request our Annual Report on Form 10-K or obtain a copy of it from the SEC's website at www.sec.gov. The Annual Report on Form 10-K, as filed with the SEC, will be provided to any shareholder, without charge, upon written request to: Randal J. Rabe, Executive Vice President and Chief Financial Officer, United Bancorp, Inc., P.O. Box 248, Tecumseh, Michigan 49286.
Forward-Looking Statements
This report contains forward-looking statements that are based on management's beliefs, assumptions, current expectations, estimates and projections about the financial services industry, the economy, and United Bancorp, Inc. Forward-looking statements are identifiable by words or phrases such as "outlook" or "strategy"; that an event or trend "may", "should", "will", "is likely", or is "probable" to occur or "continue" or "is scheduled" or "on track" or that the Company or its management "anticipates", "believes", "estimates", "plans", "forecasts", "intends", "predicts", "projects", or "expects" a particular result, or is "confident," "optimistic" or has an "opinion" that an event will occur, or other words or phrases such as "ongoing", "future", or "tend" and variations of such words and similar expressions. Such statements are based upon current beliefs and expectations and involve substantial risks and uncertainties which could cause actual results to differ materially from those expressed or implied by such forward-looking statements. These statements include, among others, statements related to real estate valuation, future levels of non-performing loans, the rate of asset dispositions, future capital levels, future dividends, future growth and funding sources, future liquidity levels, future profitability levels, our ability to comply with our memorandum of understanding, the effects on earnings of changes in interest rates and the future level of other revenue sources. All of the information concerning interest rate sensitivity is forward-looking.
Management's determination of the provision and allowance for loan losses, the appropriate carrying value of intangible assets (including goodwill, mortgage servicing rights and deferred tax assets) and the fair value of investment securities (including whether any impairment on any investment security is temporary or other-than-temporary and the amount of any impairment) involves judgments that are inherently forward-looking. There can be no assurance that future loan losses will be limited to the amounts estimated. Our ability to fully comply with all of the provisions of our memorandum of understanding, improve regulatory capital ratios, successfully implement new programs and initiatives, increase efficiencies, utilize our deferred tax asset, address regulatory issues, respond to declines in collateral values and credit quality, and improve profitability is not entirely within our control and is not assured. The future effect of changes in the financial and credit markets and the national and regional economy on the banking industry, generally, and on United Bancorp, Inc., specifically, are also inherently uncertain. These statements are not guarantees of future performance and involve certain risks, uncertainties and assumptions ("risk factors") that are difficult to predict with regard to timing, extent, likelihood and degree of occurrence. Therefore, actual results and outcomes may materially differ from what may be expressed or forecasted in such forward-looking statements. United Bancorp, Inc. undertakes no obligation to update, clarify or revise forward-
looking statements to reflect developments that occur or information obtained after the date of this report.
Risk factors include, but are not limited to, the risk factors described in "Item 1A - Risk Factors" of our Annual Report on Form 10-K for the year ended December 31, 2010. These and other factors are representative of the risk factors that may emerge and could cause a difference between an ultimate actual outcome and a preceding forward-looking statement.
Selected Financial Data
The following table shows summarized historical consolidated financial data for the Company. The table is unaudited, and the information in the table is derived from the Company's audited financial statements for 2006 through 2010. This information is only a summary. You should read it in conjunction with the consolidated financial statements, related notes, Management's Discussion and Analysis of Financial Condition and Results of Operations, and other information included in this report. Information is in thousands, except per share data.
| FINANCIAL CONDITION | 2010 | 2009 | 2008 | 2007 | 2006 | ||||||||||||||||
| Assets: | |||||||||||||||||||||
| Cash and demand balances in other banks | $ | 10,623 | $ | 10,047 | $ | 12,147 | $ | 17,996 | $ | 17,606 | |||||||||||
| Federal funds sold and interest bearing balances with banks | 95,599 | 115,542 | 6,325 | 11,130 | 3,770 | ||||||||||||||||
| Securities available for sale | 124,544 | 92,146 | 82,101 | 83,128 | 93,141 | ||||||||||||||||
| Net loans | 577,111 | 638,012 | 683,695 | 637,994 | 593,914 | ||||||||||||||||
| Other assets | 53,833 | 53,581 | 48,125 | 45,439 | 42,558 | ||||||||||||||||
| Total Assets | $ | 861,710 | $ | 909,328 | $ | 832,393 | $ | 795,687 | $ | 750,989 | |||||||||||
| Liabilities and shareholders' equity: | |||||||||||||||||||||
| Noninterest bearing deposits | $ | 113,206 | $ | 99,893 | $ | 89,487 | $ | 77,878 | $ | 81,373 | |||||||||||
| Other interest bearing deposits | 620,792 | 682,908 | 620,062 | 593,659 | 546,629 | ||||||||||||||||
| Total deposits | 733,998 | 782,801 | 709,549 | 671,537 | 628,002 | ||||||||||||||||
| Short term borrowings | 1,234 | - | - | - | 77 | ||||||||||||||||
| Other borrowings | 30,321 | 42,098 | 50,036 | 44,611 | 40,945 | ||||||||||||||||
| Other liabilities | 3,453 | 3,562 | 3,357 | 6,572 | 7,429 | ||||||||||||||||
| Total liabilities | 769,006 | 828,461 | 762,942 | 722,720 | 676,453 | ||||||||||||||||
| Total shareholders' equity | 92,704 | 80,867 | 69,451 | 72,967 | 74,536 | ||||||||||||||||
| Total Liabilities and Shareholders' Equity | $ | 861,710 | $ | 909,328 | $ | 832,393 | $ | 795,687 | $ | 750,989 | |||||||||||
| RESULTS OF OPERATIONS | |||||||||||||||||||||
| Interest income | $ | 39,770 | $ | 43,766 | $ | 47,041 | $ | 51,634 | $ | 47,056 | |||||||||||
| Interest expense | 8,687 | 12,251 | 17,297 | 21,873 | 17,802 | ||||||||||||||||
| Net interest income | 31,083 | 31,515 | 29,744 | 29,761 | 29,254 | ||||||||||||||||
| Noninterest income | 16,298 | 16,899 | 13,510 | 13,652 | 12,175 | ||||||||||||||||
Noninterest expense (1) | 32,497 | 33,647 | 29,963 | 27,559 | 26,914 | ||||||||||||||||
| Pre-tax, pre-provision income | 14,884 | 14,767 | 13,291 | 15,854 | 14,515 | ||||||||||||||||
| Provision for loan losses | 21,530 | 25,770 | 14,607 | 8,637 | 2,123 | ||||||||||||||||
| Goodwill impairment | - | 3,469 | - | - | - | ||||||||||||||||
| Federal income tax (benefit) | (2,938 | ) | (5,639 | ) | (1,280 | ) | 1,635 | 3,420 | |||||||||||||
| Net income (loss) | $ | (3,708 | ) | $ | (8,833 | ) | $ | (36 | ) | $ | 5,582 | $ | 8,972 | ||||||||
Basic and diluted earnings (loss) per share (2) (3) | $ | (0.89 | ) | $ | (1.93 | ) | $ | (0.01 | ) | $ | 1.06 | $ | 1.69 | ||||||||
Cash dividends paid per common share (3) | - | 0.02 | 0.70 | 0.79 | 0.73 | ||||||||||||||||
(1) | Excludes 2009 goodwill impairment. | ||||||||||||||||||||
(2) | Earnings per share data is based on average shares outstanding plus average contingently issuable shares. | ||||||||||||||||||||
(3) | Adjusted to reflect stock dividends paid in 2007 and 2006. | ||||||||||||||||||||
Management's Discussion and Analysis of
Financial Condition and Results of Operations
and
Consolidated Financial Statements
Table of Contents
| Management's Discussion and Analysis of Financial Condition and Results of Operations | ||
| Consolidated Financial Statements | ||
United Bancorp, Inc. (the "Company" or “United”) is a Michigan bank holding company headquartered in Ann Arbor, Michigan. The Company, through its subsidiary bank, United Bank & Trust ("UBT" or the “Bank”), offers a full range of financial services through a system of sixteen banking offices located in Lenawee, Monroe and Washtenaw Counties. The Bank is 100% owner of United Mortgage Company. United Structured Finance Company is a DBA of the Bank’s structured finance group. While the Company's chief decision makers monitor the revenue streams of the Company’s various products and services, operations are managed and financial performance is evaluated on a company-wide basis. Accordingly, all of the Company's financial services operations are considered by management to be aggregated in one reportable operating segment – commercial banking.
This discussion provides information about the consolidated financial condition and results of operations of the Company and the Bank.
We are a Michigan corporation headquartered in Ann Arbor, Michigan and serve as the holding company for UBT, a Michigan-chartered bank organized over 115 years ago. We are registered as a bank holding company under the Bank Holding Company Act of 1956. At December 31, 2010, we had total assets of approximately $861.7 million, deposits of approximately $734.0 million, and total shareholders' equity of approximately $92.7 million. Our common stock is quoted on the OTC Bulletin Board under the symbol "UBMI."
We have four primary lines of business: banking services, residential mortgage, wealth management and structured finance. Subject to our overall business strategy, each line of business is encouraged to be entrepreneurial in how it develops and implements its business. We believe that these four lines of business provide us with a diverse and strong core revenue stream that is unmatched by our community bank competitors and positions us well for future revenue growth and profitability. During the twelve month period ended December 31, 2010, our non-interest income equaled 34.4% of our operating revenues and for each of the last five years ended December 31, 2010 approximated 32.3% of our operating revenues. This diverse revenue stream has enabled us to recognize a pre-tax, pre-provision return on average assets of 1.70% for the 12 month period ended December 31, 2010. Our average pre-tax, pre-provision return on average assets over the last five years ended December 31, 2010 was approximately 1.81%. For additional information about our pre-tax, pre-provision income, please see "Earnings Summary and Key Ratios” under “Results of Operations” on Page A-17 and A-18.
Our Bank offers a full range of services to individuals, corporations, fiduciaries and other institutions. Banking services include checking accounts, NOW accounts, savings accounts, time deposit accounts, money market deposit accounts, safe deposit facilities and money transfers. Lending operations provide real estate loans, secured and unsecured business and personal loans, consumer installment loans, credit card and check-credit loans, home equity loans, accounts receivable and inventory financing, and construction financing.
Our mortgage company, United Mortgage Company, offers our customers a full array of conventional residential mortgage products, including purchase, refinance and construction loans. Due to our local decision making and fully-functional back office, we have consistently been the most active originator of mortgage loans in our market area. United Mortgage Company was the leading residential mortgage lender in Lenawee County and in the City of Ann Arbor for 2009.
Our Wealth Management Group is a key focus of our growth and diversification strategy and offers a variety of investment services to individuals, corporations and governmental entities. Our Wealth Management Group generated 27.7% of our noninterest income for the twelve months ended December 31, 2010.
Our structured finance group, United Structured Finance Company, offers simple, effective financing solutions to small businesses and commercial property owners, primarily by utilizing various government guaranteed loan programs and other off-balance sheet finance solutions through secondary market sources. For the twelve months ended September 30, 2009, United Structured Finance Company was the leading SBA lender in each of Lenawee, Washtenaw and Livingston Counties. For the twelve months ended September 30, 2010, United Structured Finance Company was the leading SBA lender in Lenawee, Washtenaw and Livingston Counties combined.
Our primary market area is in Washtenaw, Lenawee, and Monroe Counties and generally encompasses the Ann Arbor metropolitan area, which we believe is our primary area for future organic growth.
While Michigan has the fourth highest seasonally-adjusted unemployment rate in the United States (as of December 2010),1 the unemployment rate has shown an improving trend for the past several quarters.2 The Michigan December 2010 seasonally-adjusted unemployment rate of 11.7%3 was the lowest monthly rate since January, 20094 and the December 2010 unadjusted rate of 10.6%5 was the lowest monthly rate since December 2008.6 Michigan lost just 12,900 jobs in all of 2010, representing a significant decrease from the monthly average loss of 16,500 in 2008 and 17,000 in 2009, to an average monthly decline of 1,100 jobs in 2010. University of Michigan economists expect positive job growth in 2011, which would be the first yearly gain in over a decade.7
Washtenaw County had the lowest unadjusted unemployment rate in the state at 6.6% for December 2010.8 It appears that the Michigan housing market is beginning to show signs of stabilization. The Michigan Economic Activity Index equally weighs nine, seasonally adjusted coincident indicators of real economic activity that reflect activity in the construction, manufacturing and service sectors as well as job growth and consumer outlays. The index is measured on a scale of 110. The index rose three points in July 2010 reaching a level of 87, the index's highest value in over two years,9 and held flat in November 2010 at that level, for the fourth time in five months.10 The index has experienced a 16 point growth above the cycle low of 71 reached in July 2009.11
1U.S. Bureau of Labor Statistics, Local Area Unemployment Statistics, Unemployment Rates for November 2010.
2 Michigan Labor Market Information, Data Explorer – Unemployment Statistics, Statewide (Monthly Historical).
3 Michigan Labor Market Information, Data Explorer – Unemployment Statistics, Statewide, Adjusted (Monthly Historical).
5 Michigan Labor Market Information, Data Explorer – Unemployment Statistics, Statewide, Unadjusted (Monthly Historical)
8 Michigan Labor Market Information, Data Explorer – Unemployment Statistics, by County (December 2010).
9 Michigan Economy Flat in November, Reports Comerica Bank's Michigan Economic Activity Index (January 20, 2011).
Washtenaw County had a population of approximately 347,563 for 200912 and is projected to grow by approximately 2.58% from 2009-2020 and approximately 9.38% from 2009-2035.13 Washtenaw County had a median household income of approximately $59,000 for 2008, which was the third highest in the state.14
The economic base of Washtenaw County has a substantial reliance on health care, education and automotive high technology. Economic stability is provided to a great extent by the University of Michigan, which is a major employer and is not as economically sensitive to the fluctuations of the automotive industry. The services and public sectors account for a substantial percentage of total employment, in large part due to the University of Michigan and the University of Michigan Medical Center.
The economic base of Lenawee and Monroe Counties is primarily agricultural and light manufacturing, with their manufacturing sectors exhibiting moderate dependence on the automotive industry. Lenawee County had a population of approximately 100,000 for 200915 and a median household income of approximately $51,000 for 2008.16 Monroe County had a population of approximately 153,000 for 200917 and a median household income of approximately $58,000 for 2008.18 Lenawee County had an unadjusted unemployment rate of 12.4% for December 201019 and Monroe County had an unadjusted unemployment rate of 10.6% for that same month.20
Dodd-Frank Act
The Dodd-Frank Wall Street Reform and Consumer Protection Act of 2010 ("Dodd-Frank Act"), was signed into law by President Obama on July 21, 2010. The Dodd-Frank Act represents a comprehensive overhaul of the financial services industry within the United States, establishes the new federal Bureau of Consumer Financial Protection ("BCFP"), and will require the BCFP and other federal agencies to implement many new and significant rules and regulations. At this time, it is difficult to predict the extent to which the Dodd-Frank Act or the resulting rules and regulations will impact the Company's business. Compliance with these new laws and regulations will likely result in additional costs, which could be significant and could adversely impact the Company's results of operations, financial condition or liquidity.
16 Michigan Labor Market Information, Data Explorer – Income (2008 Annual). See Exhibit Q, supra note 21.
18 Michigan Labor Market Information, Data Explorer – Income (2008 Annual). See Exhibit Q, supra note 21.
Deposit Insurance
On November 9, 2010, the FDIC issued a proposed rule that would change the assessment base, beginning with the second quarter of 2011 and payable at the end of September, 2011, from adjusted domestic deposits to a bank’s average consolidated total assets minus average tangible equity, as required by the Dodd-Frank Act.21 The proposal defines tangible equity as Tier 1 capital. Since the new base is larger than the current base, the FDIC proposal also would lower assessment rates to between 2.5 and 9 basis points on the broader base for banks in the lowest risk category, and 30 to 45 basis points for banks in the highest risk category. Initial assessment rates would be determined by combining supervisory ratings with financial ratios. Under the proposed rule, the Bank would pay 20% to 35% less in FDIC assessments than under the current methodology, at similar risk ratings and balance sheet size.
As a result of provisions of the Dodd-Frank Act, all funds in a "noninterest-bearing transaction account" are insured in full by the FDIC from December 31, 2010, through December 31, 2012. This temporary unlimited coverage is in addition to, and separate from, the general FDIC deposit insurance coverage of up to $250,000 available to depositors. The increase in maximum deposit insurance coverage to $250,000 was made permanent under the Dodd-Frank Act.
Debit Card Interchange Fees and Routing
The Federal Reserve Board on December 16 issued a proposal to implement a provision in the Dodd-Frank Act -- the Durbin amendment -- that requires the Fed to set debit-card interchange fees so they are "reasonable and proportional" to the cost of the transaction.22 Though the rule technically does not apply to institutions with less than $10 billion, there is concern that the price controls will harm community banks such as UBT, which will be pressured by the marketplace to lower their own interchange rates.
Overdraft Protection Rules
On November 24, 2010, the FDIC issued final guidance to address the risks associated with overdraft payment programs. The guidance is intended to ensure robust oversight of automated overdraft programs offered by certain FDIC-insured institutions.
In response to concerns about automated overdraft programs, the FDIC on August 11, 2010, proposed guidance for public comment on how the banking institutions it supervises should monitor and oversee overdraft programs. The final guidance provides information to assist FDIC-supervised institutions in identifying, managing and mitigating risks associated with overdraft payment programs, including risks that could result in serious financial harm to certain consumers.
The guidance focuses on automated overdraft programs and encourages banks to offer less costly alternatives if, for example, a borrower overdraws his or her account on more than six occasions where a fee is charged in a rolling twelve-month period. Additionally, to avoid reputational and
22 American Bankers Association at aba.com; “Issues and Advocacy”, Debit Card Interchange Fees and Routing
other risks, the FDIC expects institutions to institute appropriate daily limits on customer costs and ensure that transactions are not processed in a manner designed to maximize the cost to consumers, such as by processing checks from the largest to the smallest.
In order to give institutions sufficient time to review, consider and respond to the expectations set out in the final guidance, the FDIC expects any additional efforts to mitigate risks to be in place by July 1, 2011. 23 The Bank is currently evaluating its alternatives with regard to this guidance, and has not determined the potential impact on its financial statements.
Small Business Lending Fund
The Small Business Jobs Act of 2010 was enacted on September 27, 2010, and created the Small Business Lending Fund (“SBLF”). The SBLF authorizes the U.S. Treasury Department (“Treasury”) to invest up to a total of $30 billion in institutions with assets below $10 billion that meet certain supervisory conditions and that present an acceptable small business lending plan.
Treasury has authority to make investments from the SBLF until September 27, 2011. The deadline for banks to apply for the SBLF is generally March 31, 2011. Treasury stresses that Boards of directors of institutions that participate in the SBLF Program should ensure that small business lending policies are consistent with the safe and sound lending practices outlined in the banking agencies' interagency guidance.24
The Company is evaluating the program for utilization as a potential vehicle for refinancing its TARP preferred shares.
Memorandum of Understanding
On January 15, 2010, UBT entered into a Memorandum of Understanding with the Federal Deposit Insurance Corporation (“FDIC”) and the Michigan Office of Financial and Insurance Regulation (“OFIR”). On January 11, 2011, we entered into a revised Memorandum of Understanding (“MOU”) with substantially the same requirements as the MOU dated January 15, 2010. The MOU is not a “written agreement” for purposes of Section 8 of the Federal Deposit Insurance Act. The MOU documents an understanding among UBT, the FDIC and OFIR, that, among other things, (i) UBT will not declare or pay any dividend to the Company without the prior consent of the FDIC and OFIR; and (ii) UBT will have and maintain its Tier 1 capital ratio at a minimum of 9% for the duration of the MOU, and will maintain its ratio of total capital to risk-weighted assets at a minimum of 12% for the duration of the MOU.
Board Leadership
On October 21, 2010, our Board of Directors appointed James C. Lawson as Vice Chairman of the Board of the Company. Mr. Lawson has been identified by our Board of Directors as the intended successor to David S. Hickman as Chairman of the Board of Directors of the Company. Mr. Lawson's appointment is a component of the Board's succession plan to fill the position that will be vacated by Mr. Hickman upon his retirement. To facilitate an orderly transition, Mr. Lawson will work closely with Mr. Hickman, with the intent that he will succeed Mr. Hickman as Chairman of the Board following the 2011 annual meeting of shareholders.
Capital Management
In December, 2010, the Company closed its public offering of 7,583,800 shares of common stock. The net proceeds to the Company, after deducting underwriting discounts and commissions and offering expenses, were approximately $17.1 million. The Company contributed $10 million of the net proceeds of the offering to the capital of the Bank to increase the Bank's capital and regulatory capital ratios. As a result of the additional capital, the Bank was in compliance with the capital requirements of its MOU with the FDIC and OFIR at December 31, 2010. At December 31, 2010, the Bank’s Tier 1 capital ratio was 9.21%, and its ratio of total capital to risk-weighted assets was 14.71%.
The Company achieved consolidated net income of $600,000 in the second six months of 2010, following losses of $4.3 million in the first half of the year, as a result of strong pre-tax, pre-provision income and improving credit quality. United’s pre-tax, pre-provision return on average assets (“PTPP ROA”) for the twelve month period ended December 31, 2010 of 1.70% was improved from 1.67% for the twelve month period ended December 31, 2009. The Company’s net loss for 2010 of $3.708 million was an improvement from the net loss of $8.833 million incurred during 2009.
Net interest income for 2010 was 1.4% lower than achieved in 2009, as earning assets have declined. At the same time, the Company’s net interest margin continued to be very stable in spite of a decline in loan balances and continued elevated levels of short-term liquid assets. United’s full year 2010 net interest margin of 3.79% was substantially unchanged from 3.80% for all of 2009.
Noninterest income was down $600,000, or 3.6%, in 2010 compared to 2009. Wealth management revenues improved by $448,000, or 11.0%, in 2010 compared to 2009, but that increase was offset by decreases in deposit service charges, fee income and income from loan sales and servicing.
Total noninterest expenses declined 3.4% for all of 2010 compared to 2009, when excluding the first quarter 2009 goodwill impairment charge. Most categories of expenses were lower in 2010 than in 2009, reflecting cost containment and reduction measures. Professional fees and expenses related to nonperforming loans were higher in 2010 than in 2009, reflecting the continuing costs
associated with working through problem loans. The Company’s provision for loan losses of $21.5 million for the twelve months of 2010 was 16.5% lower than the provision expense of $25.8 million for the same period of 2009.
Total consolidated assets of the Company were $861.7 million at December 31, 2010, down 5.2% from $909.3 million at December 31, 2009. Gross portfolio loans have declined in 2010 as a result of slowing loan demand, charge-offs and the Company’s effective use of loan sales and servicing to mitigate credit and interest rate risk. The Company generally sells its fixed rate long-term residential mortgages on the secondary market, and retains adjustable rate mortgages in its loan portfolio. While the Company’s portfolio loans have declined by $58.1 million, or 8.9%, since December 31, 2009, the balance of loans serviced for others has increased by $132.6 million, or 25.4%, during the same time period.
The Company continued to hold elevated levels of investments, federal funds sold and cash equivalents in order to protect the balance sheet during this prolonged period of economic uncertainty. United’s balances in federal funds sold and other short-term investments were $95.6 million at December 31, 2010, compared to $115.5 million at December 31, 2009.
United generally did not replace maturing wholesale deposits in 2010, resulting in a decline in deposit balances. Total deposits of $734.0 million at December 31, 2010 were down $48.8 million, or 6.2% over the twelve months of 2010. The majority of the Bank’s deposits are derived from core client sources, relating to long-term relationships with local individual, business and public clients. Public clients include local government and municipal bodies, hospitals, universities and other educational institutions. As a result of its strong core funding, the Company’s cost of deposits was 1.13% for all of 2010, down from 1.60% for 2009.
The Company’s ongoing proactive efforts to resolve nonperforming loans have contributed to the Company’s improving credit quality trends of the past few quarters. Within the Company’s loan portfolio, $29.2 million of loans were considered nonperforming at December 31, 2010, compared to $31.7 million as of December 31, 2009. Total nonperforming loans as a percent of total portfolio loans moved from 4.87% at the end of 2009 to 4.94% at December 31, 2010. For purposes of this presentation, nonperforming loans consist of nonaccrual loans and accruing loans that are past due 90 days or more and exclude accruing restructured loans. Balances of accruing restructured loans at December 31, 2010 and 2009 were $17.3 million and $15.6 million, respectively.
The Company’s ratio of allowance for loan losses to total loans at December 31, 2010 was 4.25%, and covered 86.0% of nonperforming loans, compared to 3.08% and 63.2%, respectively, at December 31, 2009. The Company’s allowance for loan losses increased by $5.1 million, or 25.7%, from December 31, 2009 to December 31, 2010. Net charge-offs of $16.4 million for 2010 were 31.9% below the $24.1 million charged off in 2009.
Securities
Balances in the securities portfolio increased in recent periods, generally reflecting deposit growth in excess of loan growth. The makeup of the Company’s investment portfolio evolves with the changing price and risk structure, and liquidity needs of the Company. The table below reflects the carrying value of various categories of investment securities of the Company, along with the percentage composition of the portfolio by type as of the end of 2010 and 2009.
| At December 31, | 2010 | 2009 | |||||||||||||||
| In thousands of dollars | Balance | % of total | Balance | % of total | |||||||||||||
| U.S. Treasury and agency securities | $ | 33,687 | 27.0 | % | $ | 32,239 | 35.0 | % | |||||||||
| Mortgage backed agency securities | 66,098 | 53.1 | % | 23,142 | 25.1 | % | |||||||||||
| Obligations of states and political subdivisions | 24,605 | 19.8 | % | 34,111 | 37.0 | % | |||||||||||
| Corporate, asset backed and other securities | 126 | 0.1 | % | 2,623 | 2.8 | % | |||||||||||
| Equity securities | 28 | 0.0 | % | 31 | 0.0 | % | |||||||||||
| Total Investment Securities | $ | 124,544 | 100.0 | % | $ | 92,146 | 100.0 | % | |||||||||
Investments in U.S. Treasury and agency securities are considered to possess low credit risk. Obligations of U.S. government agency mortgage-backed securities possess a somewhat higher interest rate risk due to certain prepayment risks. The municipal portfolio contains a small level of geographic risk, as approximately 2.9% of the investment portfolio is issued by political subdivisions located within Lenawee County, Michigan and 4.1% in Washtenaw County, Michigan. The Company's portfolio contains no mortgage-backed securities or structured notes that the Company believes to be “high risk.” The Bank’s investment in local municipal issues also reflects our commitment to the development of the local area through support of its local political subdivisions.
Management believes that the unrealized gains and losses within the investment portfolio are temporary, since they are a result of market changes, rather than a reflection of credit quality. Management has no specific intent to sell any securities, although the entire investment portfolio is classified as available for sale. The following chart summarizes net unrealized gains (losses) in each category of the portfolio at the end of 2010 and 2009.
| In thousands of dollars | 2010 | 2009 | Change | ||||||||||
| U.S. Treasury and agency securities | $ | (210 | ) | $ | 393 | $ | (603 | ) | |||||
| Mortgage backed agency securities | 384 | 685 | (301 | ) | |||||||||
| Obligations of states and political subdivisions | 764 | 856 | (92 | ) | |||||||||
| Corporate, asset backed and other securities | - | (5 | ) | 5 | |||||||||
| Equity securities | 2 | 5 | (3 | ) | |||||||||
| Total Investment Securities | $ | 940 | $ | 1,934 | $ | (994 | ) | ||||||
FHLB Stock
The Bank is a member of the Federal Home Loan Bank of Indianapolis (“FHLBI”) and holds a $2.8 million investment in stock of the FHLBI. The investment is carried at par value, as there is not an active market for FHLBI stock. If total Federal Home Loan Bank gross unrealized losses were deemed “other than temporary” for accounting purposes, this would significantly impair the Federal Home Loan Bank capital levels and the resulting value of FHLBI stock. The FHLBI reported a profit of $70.2 million for the first nine months of 201025, and continues to pay dividends on its stock. The Company regularly reviews the credit quality of FHLBI stock for impairment, and determined that no impairment of FHLBI stock was necessary as of December 31, 2010.
Loans
As a full service lender, the Bank offers a variety of loan products in its markets. Portfolio loan balances declined by 8.9% in 2010, with the declines across all major categories of the portfolio.
Personal loans on the Company's balance sheet included home equity lines of credit, direct and indirect loans for automobiles, boats and recreational vehicles, and other items for personal use. Personal loan balances declined by 3.0% for the year.
Business loan balances were down 9.7% during 2010, following a decline of 4.5% in 2009. The decline in loans to commercial enterprises reflects a reduction in demand, primarily relating to the current economic conditions, as well as write-downs, charge-offs and payoffs.
The Bank generally sells its production of fixed-rate mortgages on the secondary market, and retains high credit quality mortgage loans that are not otherwise eligible to be sold on the secondary market and shorter-term adjustable rate mortgages in their portfolios. As a result, the mix of mortgage production for any given year will have an impact on the amount of mortgages held in the portfolios of the Bank. Refinancing activity has resulted in a decline in residential mortgage balances on the Bank's portfolios of 0.5% in 2010 and 4.3% in 2009.
The Bank’s loan portfolio includes $7.5 million of purchased participations in business loans originated by other institutions. These participations represent 1.3% of total portfolio loans. Of those participation loans, 70.1% of the outstanding balances are the result of participations purchased from other Michigan banks.
Outstanding balances of loans for construction and development declined by approximately $15.2 million, or 26.7%, during 2010. The change in balances reflects a decrease in the amount of individual construction loan volume, the shift of some construction loans to permanent financing, and the payoff or charge-off of a number of construction and development loans. Residential construction loans generally convert to residential mortgages to be retained in the Bank's portfolios or to be sold in the secondary market, while commercial construction loans generally will be converted to commercial mortgages.
The following table shows the balances of the various categories of loans of the Company, along with the percentage change of the portfolio by type as of the end of 2010 and 2009.
| December 31, 2010 | December 31, 2009 | ||||||||||||||||
| In thousands of dollars | Balance | % of total | Balance | % of total | |||||||||||||
| Personal | $ | 107,399 | 18.1 | % | $ | 110,702 | 17.0 | % | |||||||||
| Business, including commercial mortgages | 354,340 | 59.9 | % | 392,495 | 60.4 | % | |||||||||||
| Tax exempt | 2,169 | 0.4 | % | 3,005 | 0.5 | % | |||||||||||
| Residential mortgage | 86,006 | 14.5 | % | 86,417 | 13.3 | % | |||||||||||
| Construction and development | 41,554 | 7.0 | % | 56,706 | 8.7 | % | |||||||||||
| Deferred loan fees and costs | 517 | 0.1 | % | 728 | 0.1 | % | |||||||||||
| Total portfolio loans | $ | 591,985 | 100.0 | % | $ | 650,053 | 100.0 | % | |||||||||
Credit Quality
The Company actively monitors delinquencies, nonperforming assets and potential problem loans. The accrual of interest income is discontinued when a loan becomes ninety days past due unless the loan is both well secured and in the process of collection, or the borrower's capacity to repay the loan and the collateral value appears sufficient. The chart below shows the amount of nonperforming assets by category at December 31 for each of the past two years.
| December 31, | Change | ||||||||||||||||
| Nonperforming Assets, in thousands of dollars | 2010 | 2009 | Amount | Percent | |||||||||||||
| Nonaccrual loans | $ | 28,661 | $ | 26,188 | $ | 2,473 | 9.4 | % | |||||||||
| Accruing loans past due 90 days or more | 583 | 5,474 | (4,891 | ) | -89.3 | % | |||||||||||
| Total nonperforming loans | 29,244 | 31,662 | (2,418 | ) | -7.6 | % | |||||||||||
| Other assets owned | 4,304 | 2,803 | 1,501 | 53.5 | % | ||||||||||||
| Total nonperforming assets | $ | 33,548 | $ | 34,465 | $ | (917 | ) | -2.7 | % | ||||||||
| Percent of nonperforming loans to total loans | 4.94 | % | 4.87 | % | 0.07 | % | |||||||||||
| Percent of nonperforming assets to total assets | 3.89 | % | 3.79 | % | 0.10 | % | |||||||||||
| Allowance coverage of nonperforming loans | 86.0 | % | 63.2 | % | 22.81 | % | |||||||||||
| Loans delinquent 30-89 days | $ | 7,838 | $ | 7,814 | $ | 24 | 0.3 | % | |||||||||
Accruing restructured loans (1) | ||||||||||||||||||
| Business, including commercial mortgages | $ | 10,382 | $ | 11,268 | $ | (886 | ) | -7.9 | % | |||||||||
| Construction and development | 4,045 | 3,281 | 764 | 23.3 | % | |||||||||||||
| Residential mortgage | 2,844 | 1,035 | 1,809 | 174.8 | % | |||||||||||||
| Total accruing restructured loans | $ | 17,271 | $ | 15,584 | $ | 1,687 | 10.8 | % | ||||||||||
| (1) | Prior period amounts have been revised to reflect the retrospective application of more definitive regulatory guidance. | |||||||||||||||||
Total nonaccrual loans have increased by $2.5 million, or 9.4%, since the end of 2009, while accruing loans past due 90 days or more have declined by $4.9 million. The increase in nonaccrual loans reflects the move of some loans to nonaccrual status, net of payoff or charge-off of some nonperforming loans. The decrease in accruing loans past due 90 days or more reflects the move of some delinquent borrowers to nonaccrual status and the move of some clients to current status. Loan workout and collection efforts continue with all delinquent clients, in an effort to bring them back to performing status.
Total nonperforming loans declined by $2.4 million, or 7.6%, since December 31, 2009. Total nonperforming loans as a percent of total portfolio loans moved from 4.87% at the end of 2009 to 4.94% at December 31, 2010, and the allowance coverage of nonperforming loans improved from 63.2% at December 31, 2009 to 86.0% at December 31, 2010. The decline in nonperforming loans is a result of the Company’s ongoing proactive efforts to resolve nonperforming loans by bringing borrowers current.
Other assets owned include other real estate owned and other repossessed assets. Holdings of other assets owned increased by $1.5 million since the end of 2009 as the Bank has assumed ownership of an increased number of properties. At December 31, 2010, other real estate owned included forty-two properties that were acquired through foreclosure or in lieu of foreclosure. The properties included twenty-five commercial properties, seven of which were the result of out-of-state loan participations, and seventeen residential properties. Three commercial properties are leased, and all are for sale. This compares to fourteen commercial properties and one residential home at December 31, 2009. Also included in these totals at December 31, 2010 are other assets owned of $26,000, consisting of two boats, which are also for sale.
The table below reflects the changes in other assets owned during 2010:
| In thousands of dollars | Other Real Estate | Other Assets | Total | |||||||||
| Balance at January 1 | $ | 2,774 | $ | 29 | $ | 2,803 | ||||||
| Additions | 3,379 | 118 | 3,497 | |||||||||
| Sold | (1,002 | ) | (163 | ) | (1,165 | ) | ||||||
| Gains (losses) on sale | (873 | ) | 42 | (831 | ) | |||||||
| Balance at December 31 | $ | 4,278 | $ | 26 | $ | 4,304 | ||||||
Accruing restructured loans of $17.3 million at December 31, 2010 are comprised of two categories of loans on which interest is being accrued under their restructured terms, and the loans are current or less than ninety days past due. The first category consists of $14.4 million of commercial loans, primarily comprised of business loans that have been temporarily modified as interest-only loans, generally for a period of up to one year, without a sufficient corresponding increase in the interest rate. This category also includes $4.0 million of construction and development loans that have been renewed as interest only, generally for a period of up to one year, to assist the borrower. United does not typically lower the interest rate and does not forgive principal or interest as part of the modification. United frequently obtains additional collateral, guarantor support or an increase in the rate when granting a principal deferral. The average yield
on these modified commercial loans was 5.90%, compared to 5.54% earned on the entire commercial loan portfolio in the fourth quarter of 2010.
The second category included in accruing restructured loans is mortgage loans whose terms have been restructured at less than market terms and include rate modifications and forbearance. These totals consist of fourteen loans for a total of $2.8 million at December 31, 2010, all of which are the result of residential mortgage loans modified as part of United’s mortgage modification program implemented in 2009.
Management believes that the Company's allowance for loan losses provides for currently estimated losses inherent in the portfolio. An analysis of the allowance for loan losses for the twelve months ended December 31, 2010, 2009 and 2008 follows:
| In thousands of dollars | 2010 | 2009 | 2008 | |||||||||
| Balance, January 1 | $ | 20,020 | $ | 18,312 | $ | 12,306 | ||||||
| Loans charged off | (17,329 | ) | (24,368 | ) | (8,772 | ) | ||||||
| Recoveries credited to allowance | 942 | 306 | 171 | |||||||||
| Provision charged to operations | 21,530 | 25,770 | 14,607 | |||||||||
| Balance, December 31 | $ | 25,163 | $ | 20,020 | $ | 18,312 | ||||||
| Allowance as % of total loans | 4.25 | % | 3.08 | % | 2.63 | % | ||||||
The Company’s provision for loan losses of $21.5 million for the twelve months of 2010 was 16.5% lower than the provision expense of $25.8 million for the same period of 2009. For 2010, the Company’s provision for loan losses exceeded its net charge offs by $5.1 million. The allowance as a percent of total loans has increased from 3.08% at December 31, 2009 to 4.25% at December 31, 2010.
A loan is classified as impaired when it is probable that the Bank will be unable to collect all amounts due (including both interest and principal) according to the contractual terms of the loan agreement. Within the Bank’s loan portfolio, $48.8 million of impaired loans have been identified as of December 31, 2010, compared with $36.2 million as of December 31, 2009, and the specific allowance for impaired loans was $9.2 million at December 31, 2010, compared to $5.8 million at December 31, 2009. The ultimate amount of the impairment and the potential losses to the Company may be higher or lower than estimated, depending on the realizable value of the collateral. The level of the provision made in connection with impaired loans reflects the amount management believes to be necessary to maintain the allowance for loan losses at an adequate level, based upon the Bank’s current analysis of losses inherent in its loan portfolios.
The following table presents the allocation of the allowance for loan losses applicable to each loan category in thousands of dollars, as of December 31, 2010 and 2009. The allocation method used takes into account specific allocations for identified credits and a historical loss average, adjusted for certain qualitative factors, in determining the allocation for the balance of the portfolio.
| December 31, 2010 | December 31, 2009 | ||||||||||||||||
| Dollars in thousands | Allocation | % of Loans | Allocation | % of Loans | |||||||||||||
| Business and commercial mortgage | $ | 16,672 | 4.71 | % | $ | 12,221 | 3.10 | % | |||||||||
| Construction and development loans | 3,248 | 9.87 | % | 5,164 | 10.10 | % | |||||||||||
| Residential mortgage | 2,661 | 2.93 | % | 760 | 0.82 | % | |||||||||||
| Personal | 2,582 | 2.26 | % | 1,875 | 1.67 | % | |||||||||||
| Total | $ | 25,163 | 4.25 | % | $ | 20,020 | 3.08 | % | |||||||||
Business loans carry the largest balances per loan, and therefore, any single loss would be proportionally larger than losses in other portfolios. In addition to internal loan rating systems and active monitoring of loan trends, the Bank uses an independent loan review firm to assess the quality of its business loan portfolio.
Construction and development loans (“CLD loans”) include residential and non-residential construction and development loans. The residential construction and development portfolio consists mainly of loans for the construction, development, and improvement of residential lots, homes, and subdivisions. The non-residential construction and development portfolio consists mainly of loans for the construction and development of office buildings and other non-residential commercial properties. This type of lending is generally considered to have more complex credit risks than traditional single-family residential lending because the principal is concentrated in a limited number of loans with repayment dependent on the successful completion and sales of the related real estate project. Consequently, these loans are often more sensitive to adverse conditions in the real estate market or the general economy than other real estate loans. These loans are generally less predictable and more difficult to evaluate and monitor and collateral may be difficult to dispose of in a market decline. Additionally, we may experience significant construction loan losses because independent appraisers or project engineers inaccurately estimate the cost and value of construction loan projects.
During the past two years, the Company has reduced its CLD balances by $38.9 million, or 48.3%, with approximately one-half of the decrease attributable to charge-offs. However, the net charge-offs of CLD loans declined from $14.4 million in 2009 to $5.6 million in 2010.
The Bank’s portfolio of residential mortgages consists of loans to finance 1-4 family residences, second homes, vacation homes, and residential investment properties. In the second quarter of 2010, the Company began recognizing losses on specific residential mortgage loans in the process of foreclosure at an earlier point in the foreclosure process, in accordance with recently provided regulatory guidance. This resulted in an increase in the portion of the Company’s allowance for loan losses determined by measurement of the impairment in groups of loans with similar characteristics, and resulted in a corresponding increase in the Company’s provision for loan losses during 2010 of approximately $667,000.
The personal loan portfolio consists of direct and indirect installment, home equity and unsecured revolving line of credit loans. Installment loans consist primarily of home equity loans and loans for consumer durable goods, principally automobiles. Indirect personal loans consist of
loans for automobiles, boats and manufactured housing, and make up a small percent of the personal loans.
Further information concerning credit quality is contained in Note 5 of the Notes to Consolidated Financial Statements, which information is incorporated here by reference.
Deposits
United internally funds its operations through a large, stable base of core deposits that provides cost-effective funding for its lending operations. The majority of deposits are derived from core client sources, relating to long term relationships with local individual, business and public clients. Public clients include local governments and municipal bodies, hospitals, universities and other educational institutions. At December 31, 2010, core deposits accounted for 97.3% of total deposits, as compared to 95.2% at December 31, 2009. For this presentation, core deposits consist of total deposits less national certificates of deposit and brokered deposits. Core deposits include CDARS deposits as they represent deposits originated in the Bank’s market area.
The table below shows the change in the various categories of the deposit portfolio for the reported periods.
| 2010 Change | 2009 Change | |||||||||||||||
| In thousands of dollars | Amount | Percent | Amount | Percent | ||||||||||||
| Noninterest bearing deposits | $ | 13,313 | 13.3 | % | $ | 10,406 | 11.6 | % | ||||||||
| Interest bearing deposits | (62,116 | ) | -9.1 | % | 62,846 | 10.1 | % | |||||||||
| Total deposits | $ | (48,803 | ) | -6.2 | % | $ | 73,252 | 10.3 | % | |||||||
Total deposits declined by $48.8 million in the twelve months ended December 31, 2010. The Bank’s noninterest bearing deposits increased by 13.3% during 2010, while interest bearing deposits declined by 9.1%. As part of its capital ratio improvement initiatives, United generally did not replace maturing wholesale deposits in 2010. The Bank utilizes purchased or brokered deposits for interest rate risk management purposes, but does not support its growth through the use of those products. In addition, the Bank participates in the CDARS program, which allows it to provide competitive CD products while maintaining FDIC insurance for clients with larger balances. The Bank's deposit rates are consistently competitive with other banks in its market areas.
Noninterest bearing deposits made up 15.4% of total deposits at December 31, 2010, compared to 12.8% at December 31, 2009. The table below shows the makeup of the Company’s deposits at December 31, 2010 and 2009.
| December 31, 2010 | December 31, 2009 | |||||||||||||||
| In thousands of dollars | Balance | % of total | Balance | % of total | ||||||||||||
| Noninterest bearing deposits | $ | 113,206 | 15.4 | % | $ | 99,893 | 12.8 | % | ||||||||
| Interest bearing deposits | 620,792 | 84.6 | % | 682,908 | 87.2 | % | ||||||||||
| Total deposits | $ | 733,998 | 100.0 | % | $ | 782,801 | 100.0 | % | ||||||||
Cash Equivalents and Borrowed Funds
The Company maintains correspondent accounts with a number of other banks for various purposes. In addition, cash sufficient to meet the operating needs of its banking offices is maintained at its lowest practical levels. The Bank is also a participant in the federal funds market, either as a borrower or seller. Federal funds are generally borrowed or sold for one-day periods. The Bank maintains interest-bearing deposit accounts with the Federal Reserve Bank and the FHLBI, as alternatives to federal funds.
The Bank also has the ability to utilize short term advances from the FHLBI and borrowings at the discount window of the Federal Reserve Bank as additional short-term funding sources. Federal funds and equivalents were used during 2010 and 2009, while short term advances and discount window borrowings were not utilized during either year.
The Company’s balance sheet includes short-term borrowings representing the secured borrowing portion of SBA 7a loans held for sale, as a result of adoption of ASU 2009-16 in 2010. Qualifying loans are carried as loans held for sale, while the sold portion of the loans is carried as secured borrowing for a 90-day period.
The Company periodically finds it advantageous to utilize longer-term borrowings from the FHLBI. These long-term borrowings, as detailed in Note 11 of the Notes to Consolidated Financial Statements, serve to provide a balance to some of the interest rate risk inherent in the Company's balance sheet. Additional information regarding borrowed funds is found in the Liquidity section below.
Earnings Summary and Key Ratios
The Company experienced a consolidated net loss of $3.708 million for 2010, improving from a loss of $8.833 million in 2009. Net interest income for 2010 was 1.4% lower than in 2009, as balances of average earning assets have declined. At the same time, the Company’s net interest margin continued to be very stable in spite of a decline in loan balances and continued elevated levels of short-term liquid assets. The Company’s return on average assets for 2010 was -0.42%, compared to -1.00% for 2009 and 0.00% for 2008. Return on average shareholders’ equity for 2010 was -4.66%, compared to -10.47% for 2009 and -0.05% for 2008.
United’s noninterest income declined by 3.6% in 2010 compared to 2009, in part from lower deposit service charges, fee income and income from loan sales and servicing, following an increase of 25.1% from 2008 to 2009. In addition, the Company’s volume of loans sold on the secondary market was particularly high in 2009, contributing to the decline in 2010 compared to 2009. Those items are discussed in more detail later in this discussion. Noninterest income represented 34.4% of the Company’s total revenues for 2010, compared to 34.9% for 2009.
Noninterest expenses, excluding a one-time goodwill impairment charge taken in 2009, were down 3.4% from 2009. Several categories of expenses were lower in 2010 than in 2009, reflecting cost containment and reduction measures. While professional fees and expenses related to nonperforming loans have increased, reductions in other categories of expense have more than offset those increases. In particular, salaries and employee benefit costs for 2010 reflect cost containment and reduction measures previously mentioned, including a number of staff reductions undertaken in December, 2009. The Company’s provision for loan losses was $21.5 million in 2010, down from $25.8 million in 2009, or 16.5%, following an increase of 76.4% in 2009 over 2008.
The following table shows the trends of the major components of earnings for the five most recent quarters.
| 2010 | 2009 | |||||||||||||||||||
| Dollars in thousands | 4th Qtr | 3rd Qtr | 2nd Qtr | 1st Qtr | 4th Qtr | |||||||||||||||
| Net interest income before provision | $ | 7,735 | $ | 7,964 | $ | 7,677 | $ | 7,707 | $ | 8,180 | ||||||||||
| Provision for loan losses | 4,930 | 3,150 | 8,650 | 4,800 | 5,300 | |||||||||||||||
| Noninterest income | 4,553 | 4,812 | 3,709 | 3,224 | 4,022 | |||||||||||||||
| Noninterest expense | 8,225 | 8,315 | 8,298 | 7,659 | 7,953 | |||||||||||||||
| Federal income taxes | (440 | ) | 284 | (2,063 | ) | (719 | ) | (569 | ) | |||||||||||
| Net income (loss) | $ | (427 | ) | $ | 1,027 | $ | (3,499 | ) | $ | (809 | ) | $ | (482 | ) | ||||||
| Basic and diluted earnings (loss) per share | $ | (0.11 | ) | $ | 0.14 | $ | (0.74 | ) | $ | (0.21 | ) | $ | (0.15 | ) | ||||||
| Return on average assets | -0.20 | % | 0.47 | % | -1.60 | % | -0.36 | % | -0.21 | % | ||||||||||
| Return on average shareholders' equity | -2.12 | % | 5.25 | % | -17.56 | % | -4.05 | % | -2.34 | % | ||||||||||
| Net interest margin | 3.81 | % | 3.97 | % | 3.76 | % | 3.69 | % | 3.81 | % | ||||||||||
| Efficiency Ratio (tax equivalent basis) | 66.3 | % | 64.5 | % | 72.1 | % | 69.0 | % | 64.9 | % | ||||||||||
| Dividend payout ratio | 0.0 | % | 0.0 | % | 0.0 | % | 0.0 | % | 0.0 | % | ||||||||||
| Tier 1 Leverage Ratio | 10.2 | % | 8.5 | % | 8.1 | % | 8.4 | % | 8.6 | % | ||||||||||
In an attempt to evaluate the trends of net interest income, noninterest income and noninterest expense, the Company calculates pre-tax, pre-provision income and return on average assets. This calculation adjusts net income before tax by the amount of the Company’s provision for loan losses and one-time goodwill impairment charge. While this information is not consistent with, or intended to replace, presentation under generally accepted accounting principles, it is presented here for comparison. The table below shows the calculation and trend of pre-tax, pre-provision income and return on average assets for the twelve month periods ended December 31, 2010, 2009 and 2008.
| Twelve Months Ended December 31, | |||||||||||||||||||||
| Dollars in thousands | 2010 | 2009 | Change | 2008 | Change | ||||||||||||||||
| Interest income | $ | 39,770 | $ | 43,766 | -9.1 | % | $ | 47,041 | -7.0 | % | |||||||||||
| Interest expense | 8,687 | 12,251 | -29.1 | % | 17,297 | -29.2 | % | ||||||||||||||
| Net interest income | 31,083 | 31,515 | -1.4 | % | 29,744 | 6.0 | % | ||||||||||||||
| Noninterest income | 16,298 | 16,899 | -3.6 | % | 13,510 | 25.1 | % | ||||||||||||||
Noninterest expense (1) | 32,497 | 33,647 | -3.4 | % | 29,963 | 12.3 | % | ||||||||||||||
| Pre-tax, pre-provision income | $ | 14,884 | $ | 14,767 | 0.8 | % | $ | 13,291 | 11.1 | % | |||||||||||
| Pre-tax, pre-provision ROA | 1.70 | % | 1.67 | % | 0.03 | % | 1.64 | % | 0.03 | % | |||||||||||
| Reconcilement to GAAP income: | |||||||||||||||||||||
| Provision for loan losses | $ | 21,530 | $ | 25,770 | -16.5 | % | $ | 14,607 | 76.4 | % | |||||||||||
| Goodwill impairment | - | 3,469 | -100.0 | % | - | 100.0 | % | ||||||||||||||
| Income tax benefit | (2,938 | ) | (5,639 | ) | NA | (1,280 | ) | NA | |||||||||||||
| Net loss | $ | (3,708 | ) | $ | (8,833 | ) | NA | $ | (36 | ) | NA | ||||||||||
| (1) | Excludes goodwill impairment charge in 1st quarter of 2009 | ||||||||||||||||||||
Net Interest Income
Declining interest rates over the past few years have significantly reduced the Company’s yield on earning assets, but have also resulted in a reduction in its cost of funds. Interest income decreased 9.1% in 2010 compared to 2009, while interest expense decreased 29.1% for 2010 compared to 2009, resulting in a reduction in net interest income of 1.4% for 2010 compared to 2009. Net interest margin for all of 2010 was 3.79%, compared to 3.80% for 2009. The Company’s net interest margin has remained relatively stable, due primarily to continued reduction in FHLB advances and higher-cost deposits combined with a corresponding reduction in short-term interest bearing assets.
Tax-equivalent yields on earning assets declined from 5.25% for 2009 to 4.83% for 2010, for a reduction of 42 basis points. The Company's average cost of funds decreased by 49 basis points, and tax equivalent spread improved from 3.49% for 2009 to 3.56% for all of 2010.
The following table provides a summary of the various components of net interest income, as well as the results of changes in balance sheet makeup that have resulted in the changes in spread and net interest margin for 2010, 2009 and 2008.
| 2010 | 2009 | 2008 | |||||||||||||||||||||||||||||||||||
| Average | Interest | Yield/ | Average | Interest | Yield/ | Average | Interest | Yield/ | |||||||||||||||||||||||||||||
| Dollars in thousands | Balance | (b) | Rate | Balance | (b) | Rate | Balance | (b) | Rate | ||||||||||||||||||||||||||||
| Assets | |||||||||||||||||||||||||||||||||||||
| Interest earning assets (a) | |||||||||||||||||||||||||||||||||||||
| Federal funds sold and equivalents | $ | 93,072 | $ | 235 | 0.25 | % | $ | 61,027 | $ | 153 | 0.25 | % | $ | 5,170 | $ | 128 | 2.47 | % | |||||||||||||||||||
| Taxable securities | 79,088 | 2,136 | 2.69 | % | 60,363 | 1,896 | 3.14 | % | 46,366 | 2,164 | 4.67 | % | |||||||||||||||||||||||||
| Tax exempt securities (b) | 27,805 | 1,455 | 5.69 | % | 33,594 | 1,989 | 5.92 | % | 36,939 | 2,148 | 5.82 | % | |||||||||||||||||||||||||
| Taxable loans | 632,319 | 36,279 | 5.74 | % | 690,299 | 40,238 | 5.83 | % | 670,279 | 43,171 | 6.44 | % | |||||||||||||||||||||||||
| Tax exempt loans (b) | 2,359 | 194 | 8.23 | % | 2,767 | 210 | 7.57 | % | 2,606 | 172 | 6.58 | % | |||||||||||||||||||||||||
| Total interest earning assets (b) | 834,643 | $ | 40,299 | 4.83 | % | 848,049 | $ | 44,486 | 5.25 | % | 761,360 | $ | 47,783 | 6.28 | % | ||||||||||||||||||||||
| Cash and due from banks | 13,683 | 12,301 | 17,260 | ||||||||||||||||||||||||||||||||||
| Premises and equipment, net | 11,758 | 12,703 | 13,006 | ||||||||||||||||||||||||||||||||||
| Intangible assets | - | 855 | 3,469 | ||||||||||||||||||||||||||||||||||
| Other assets | 34,702 | 30,630 | 26,870 | ||||||||||||||||||||||||||||||||||
| Unrealized (gain) on securities available for sale | 2,308 | 1,839 | 370 | ||||||||||||||||||||||||||||||||||
| Allowance for loan losses | (22,326 | ) | (22,666 | ) | (13,035 | ) | |||||||||||||||||||||||||||||||
| Total Assets | $ | 874,768 | $ | 883,711 | $ | 809,300 | |||||||||||||||||||||||||||||||
| Liabilities and Shareholders' Equity | |||||||||||||||||||||||||||||||||||||
| Interest bearing liabilities | |||||||||||||||||||||||||||||||||||||
| NOW and savings deposits | $ | 356,153 | $ | 1,378 | 0.39 | % | $ | 340,509 | $ | 1,752 | 0.51 | % | $ | 310,569 | $ | 4,069 | 1.31 | % | |||||||||||||||||||
| Other interest bearing deposits | 292,693 | 5,975 | 2.04 | % | 308,962 | 8,650 | 2.80 | % | 280,027 | 10,895 | 3.89 | % | |||||||||||||||||||||||||
| Total interest bearing deposits | 648,846 | 7,353 | 1.13 | % | 649,471 | 10,402 | 1.60 | % | 590,596 | 14,964 | 2.53 | % | |||||||||||||||||||||||||
| Short term borrowings | 2,022 | 144 | 7.10 | % | - | - | 0.00 | % | 4,399 | 96 | 2.18 | % | |||||||||||||||||||||||||
| Long term borrowings | 32,524 | 1,190 | 3.66 | % | 44,896 | 1,849 | 4.12 | % | 48,833 | 2,238 | 4.58 | % | |||||||||||||||||||||||||
| Total interest bearing liabilities | 683,392 | 8,687 | 1.27 | % | 694,367 | 12,251 | 1.76 | % | 643,828 | 17,298 | 2.69 | % | |||||||||||||||||||||||||
| Noninterest bearing deposits | 108,390 | 102,549 | 86,248 | ||||||||||||||||||||||||||||||||||
| Other liabilities | 3,442 | 2,462 | 5,639 | ||||||||||||||||||||||||||||||||||
| Shareholders' equity | 79,544 | 84,333 | 73,585 | ||||||||||||||||||||||||||||||||||
| Total Liabilities and Shareholders' Equity | $ | 874,768 | $ | 883,711 | $ | 809,300 | |||||||||||||||||||||||||||||||
| Net interest income (b) | $ | 31,612 | $ | 32,236 | $ | 30,485 | |||||||||||||||||||||||||||||||
| Net spread (b) | 3.56 | % | 3.49 | % | 3.59 | % | |||||||||||||||||||||||||||||||
| Net yield on interest earning assets (b) | 3.79 | % | 3.80 | % | 4.04 | % | |||||||||||||||||||||||||||||||
| Tax equivalent adjustment on interest income | 529 | 721 | 741 | ||||||||||||||||||||||||||||||||||
| Net interest income per income statement | $ | 31,083 | $ | 31,515 | $ | 29,744 | |||||||||||||||||||||||||||||||
| Ratio of interest earning assets to interest bearing liabilities | 1.22 | 1.22 | 1.18 | ||||||||||||||||||||||||||||||||||
| (a) | Non-accrual loans and overdrafts are included in the average balances of loans. | ||||||||||||||||||||||||||||||||||||
| (b) | Fully tax-equivalent basis; 34% tax rate. | ||||||||||||||||||||||||||||||||||||
Provision for Loan Losses
The Company’s provision for loan losses for 2010 was $21.5 million, down 16.5% from $25.8 million for 2009. For 2010, the Company’s provision for loan losses exceeded its net charge offs by $5.1 million. The provision provides for probable incurred losses inherent in the current portfolio.
While the local real estate markets and the economy in general have experienced some signs of stabilization, the loan portfolio of the Bank is affected by loans to a number of residential real
estate developers that continue to struggle to meet their financial obligations. Loans in the Bank's residential land development and construction portfolios are secured by unimproved and improved land, residential lots, and single-family homes and condominium units. In addition, loans secured by commercial real estate are continuing to experience stresses resulting from the current economic conditions.
Generally, lot sales by the developers/borrowers continue to take place at a greatly reduced pace and at reduced prices. As home sales volumes have declined, income of residential developers, contractors and other real estate-dependent borrowers has also been reduced. The Bank has continued to closely monitor the impact of economic circumstances on its lending clients, and is working with these clients to minimize losses. Additional information regarding the provision for loan losses is included in the “Credit Quality” discussion above.
Noninterest Income
Total noninterest income declined by 3.6% in 2010, following an increase of 25.1% in 2009 over 2008. The following table summarizes changes in noninterest income by category for 2010, 2009 and 2008.
| Dollars in thousands | 2010 | 2009 | Change | 2008 | Change | ||||||||||||||||
| Service charges on deposit accounts | $ | 2,191 | $ | 2,731 | -19.8 | % | $ | 3,381 | -19.2 | % | |||||||||||
| Wealth Management fee income | 4,518 | 4,070 | 11.0 | % | 4,343 | -6.3 | % | ||||||||||||||
| Gains (losses) on securities transactions | 31 | (24 | ) | -229.2 | % | (18 | ) | 33.3 | % | ||||||||||||
| Income from loan sales and servicing | 6,351 | 6,689 | -5.1 | % | 2,187 | 205.9 | % | ||||||||||||||
| ATM, debit and credit card fee income | 1,940 | 2,174 | -10.8 | % | 2,257 | -3.7 | % | ||||||||||||||
| Other income | 1,267 | 1,259 | 0.6 | % | 1,360 | -7.4 | % | ||||||||||||||
| Total noninterest income | $ | 16,298 | $ | 16,899 | -3.6 | % | $ | 13,510 | 25.1 | % | |||||||||||
Service charges on deposit accounts were down 19.8% in 2010 following a decrease of 19.2% in 2009 over 2008. This continuing decline is in spite of the Company's 13.3% growth of noninterest bearing deposit account balances over the twelve months ended December 31, 2010. No significant changes to service charge structure were implemented in 2010. Substantially all of the decline in service charges in 2009 and 2010 was due to a reduction in NSF and overdraft fees collected.
The Wealth Management Group of UBT provides a relatively large component of the Company's noninterest income. Wealth Management income includes trust fee income and income from the sale of nondeposit investment products within the Bank’s offices. Wealth Management income improved by 11.0% in 2010 compared to 2009, following a decline of 6.3% in 2009 compared to 2008. Market values of assets managed by the Wealth Management Group have continued to recover in the past year as financial markets have rebounded, resulting in improvement in fee income.
Income from loan sales and servicing declined 5.1% in 2010 compared to 2009, following an unprecedented increase of 205.9% in 2009 compared to 2008. While the Company’s volume of rate-driven refinancing of residential mortgages had slowed in the fourth quarter of 2009 and the
first half of 2010, mortgage origination and sale activity increased again in the third and fourth quarters of 2010, resulting in strong levels of income from the sales and servicing of residential mortgage loans for 2010. The Bank generally sells the fixed rate long-term residential mortgages it originates on the secondary market, and retains adjustable rate mortgages for its portfolios.
Also contributing to the higher fee income levels in 2009, the Company had a positive valuation adjustment to loan servicing rights of $520,000 in 2009, and had no servicing rights valuation adjustment in 2010. The loan servicing rights valuation adjustment in 2009 was a reflection of a slowing of prepay speeds in the industry. The Bank generally markets its production of fixed rate long-term residential mortgages in the secondary market, and retains adjustable rate mortgages for its portfolio.
The Company maintains a portfolio of sold residential real estate mortgages that it services, and this servicing provides ongoing income for the life of the loans. Loans serviced consist primarily of residential mortgages sold on the secondary market. The Bank also originates, sells and services SBA loans through its structured finance group, United Structured Finance Company (“USFC”). SBA loan origination volume increased in 2010, resulting in an increase in the Company’s income from the origination, sales and servicing of SBA loans.
The guaranteed portion of SBA loans originated by USFC is typically sold on the secondary market, and gains on the sale of those loans contribute to income from loan sales and servicing. The following table shows the breakdown of income from loan sales and servicing between residential mortgages and USFC.
| In thousands of dollars | 2010 | 2009 | Change | |||||||||
| Residential mortgage sales and servicing | $ | 5,272 | $ | 6,009 | -12.3 | % | ||||||
| USFC loan sales and servicing | 1,079 | 680 | 58.7 | % | ||||||||
| Total income from loan sales and servicing | $ | 6,351 | $ | 6,689 | -5.1 | % | ||||||
ATM, debit and credit card fee income provides a steady source of noninterest income for the Company. The Bank operates twenty ATMs throughout its market areas, and Bank clients are active users of debit cards. The Bank receives ongoing fee income from credit card referrals and operation of its credit card merchant business. Fee income in these areas was reduced in 2010 compared to 2009, reflecting changes made in its provider of credit card services for the Bank late in 2009. Expenses relating to production of that fee income were also reduced, with a net benefit to the Bank.
Other income includes income from various fee-based banking services, such as sale of official checks, wire transfer fees, safe deposit box income, sweep account and other fees, as well as income from bank-owned life insurance. Total other income was up 0.6% in 2010 compared to 2009, following a decline from 2008 to 2009.
Noninterest Expense
The following table summarizes changes in the Company's noninterest expense by category for 2010, 2009 and 2008.
| In thousands of dollars | 2010 | 2009 | Change | 2008 | Change | ||||||||||||||||
| Salaries and employee benefits | $ | 17,217 | $ | 17,904 | -3.8 | % | $ | 16,333 | 9.6 | % | |||||||||||
| Occupancy and equipment expense, net | 5,207 | 5,255 | -0.9 | % | 4,874 | 7.8 | % | ||||||||||||||
| External data processing | 1,206 | 1,590 | -24.2 | % | 1,755 | -9.4 | % | ||||||||||||||
| Advertising and marketing | 610 | 605 | 0.8 | % | 1,191 | -49.2 | % | ||||||||||||||
| Attorney, accounting and other professional fees | 1,561 | 1,183 | 32.0 | % | 1,020 | 16.0 | % | ||||||||||||||
| Expenses relating to ORE property | 1,698 | 1,797 | -5.5 | % | 639 | 181.2 | % | ||||||||||||||
| FDIC Insurance premiums | 1,806 | 1,954 | -7.6 | % | 408 | 378.9 | % | ||||||||||||||
| Goodwill impairment | - | 3,469 | -100.0 | % | - | 100.0 | % | ||||||||||||||
| Other expenses | 3,192 | 3,359 | -5.0 | % | 3,743 | -10.3 | % | ||||||||||||||
| Total Noninterest Expense | $ | 32,497 | $ | 37,116 | -12.4 | % | $ | 29,963 | 23.9 | % | |||||||||||
Salaries and employee benefits, which are the Company’s largest single area of expense, were $687,000 lower, or 3.8% less, in 2010 than the same period one year earlier, primarily as a result of the Company’s cost containment initiatives implemented late in 2009 and in 2010.
Occupancy and equipment expenses were down slightly in 2010 compared to 2009, following an increase of 7.8% in 2009 over 2008, which included an increase in building and premises lease expense. External data processing costs were down year to date compared to 2009, reflecting changes made in providers of some specific services for the Bank late in 2009. Advertising and marketing expenses for 2010 were flat compared to 2009, following a decrease of 49.2% in 2009 compared to 2008 resulting from the Company’s cost-containment efforts.
Attorney, accounting and other professional fees were up 32.0% for 2010 compared to 2009, following an increase of 16.0% in 2009 compared to 2008. While much of the increase represents attorney and appraisal fees related to the Bank’s credit issues, the Company also incurred data processing conversion costs during the second and third quarters of 2010 relating to the consolidation of the Company’s subsidiary banks.
While expenses related to ORE property continued to make up a larger portion of the Company’s expenses, this category of expense decreased by 5.5% in 2010 compared to 2009. Those expenses included write-downs of the value and losses on the sale of property held as ORE, along with costs to maintain and carry those properties. Deterioration in the value of certain of these properties resulted in losses of $873,000 for 2010, compared to $1.2 million for 2009 and $0.4 million in 2008. Assets were written down to their estimated fair value less costs to sell, as a result of a decline in prevailing real estate prices and the Bank’s experience with increased foreclosures resulting from the weakened economy.
FDIC insurance costs continue to be a significant expense for the Bank. However, FDIC costs decreased by 7.6% in 2010 compared to 2009, as the Bank incurred expenses of $405,400 in the second quarter of 2009 as a result of the industry-wide FDIC special assessment for that quarter.
As a result of an evaluation of the value of its goodwill, United took an impairment charge of $3.47 million during the first quarter of 2009. Additional information regarding the 2009 goodwill impairment charge is included in Note 8 to the consolidated financial statements, which information is incorporated here by reference.
Other expenses were down 5.0% in 2010 compared to 2009, with those expenses including shareholder and compliance expense, among others. That decrease follows a decline of 10.3% in 2009 compared to 2008.
Federal Income Tax
The following chart shows the effective federal tax rates of the Company for the past three years, in thousands of dollars where applicable.
| Dollars in thousands | 2010 | 2009 | 2008 | |||||||||
| Loss before tax | $ | (6,646 | ) | $ | (14,472 | ) | $ | (1,316 | ) | |||
| Federal income tax benefit | (2,938 | ) | (5,639 | ) | (1,280 | ) | ||||||
| Effective federal tax rate | 44.2 | % | 39.0 | % | 97.3 | % | ||||||
The Company's effective tax rate for 2010 was 44.2% compared with 39.0% for 2009 and 97.3% for 2008. The effective tax rates for 2010, 2009 and 2008 were a calculated benefit based upon a pre-tax loss. The differences between the effective rates and the Company’s expected tax rate were primarily due to the benefit from tax-exempt income.
While the Company had a loss for both book and tax purposes for 2010 and 2009, the Company had taxable income of $11.7 million from 2007 and 2008 that was utilized for a majority of the Company’s tax loss. The Company’s net deferred tax asset was $9.8 million at December 31, 2010. A valuation allowance related to deferred tax assets is required when it is considered more likely than not that all or part of the benefit related to such assets will not be realized. Based on the levels of taxable income in prior years, the significant improvement in operating results in 2010 compared to 2009, and the Company’s expectation of a return to profitability in future years as a result of strong core earnings, Management has determined that no valuation allowance was required at December 31, 2010 or 2009.
Liquidity
The Company maintains correspondent accounts with a number of other banks for various purposes. In addition, cash sufficient to meet the operating needs of its banking offices is maintained at its lowest practical levels. At times, the Bank is a participant in the federal funds market, either as a borrower or seller. Federal funds are generally borrowed or sold for one-day periods. In 2010, the Bank generally utilized short-term interest-bearing balances with banks as an alternative to federal funds sold.
The Company’s balances in federal funds sold and short-term interest-bearing balances with banks were $95.6 million at December 31, 2010, down from $115.5 million at December 31, 2009. The 17.0% decrease has resulted from increases in investments, along with planned decreases in wholesale funding that exceeded reductions in loan balances, as United did not replaced maturing FHLB advances or wholesale deposits in 2010. The Company continued to maintain high levels of liquidity, with investments, federal funds and cash equivalents held to
improve the liquidity of the balance sheet during this period of economic uncertainty, and the Company expects to maintain higher than normal levels of liquidity until economic conditions improve and more attractive investment opportunities emerge.
The Bank also has the ability to utilize short-term advances from the FHLBI and borrowings at the discount window of the Federal Reserve Bank as additional short-term funding sources. Short-term advances and discount window borrowings were not utilized during 2010 or 2009.
The Company’s balance sheet includes short-term borrowings representing the secured borrowing portion of SBA 7a loans held for sale, as a result of adoption of ASU 2009-16 in 2010. Qualifying loans are carried as loans held for sale, while the sold portion of the loans is carried as secured borrowing for a 90-day period.
The Company periodically finds it advantageous to utilize longer term borrowings from the FHLBI. Theselong-term borrowings serve primarily to provide a balance to some of the interest rate risk inherent in the Company's balance sheet. During 2010, the Bank procured no new advances and repaid $11.8 million in matured borrowings and scheduled principal payments, resulting in a decrease in total FHLBI borrowings outstanding for the year. Information concerning available lines is contained in Note 10 of the Notes to Consolidated Financial Statements.
Funds Management and Market Risk
The composition of the Company’s balance sheet consists of investments in interest earning assets (loans and investment securities) that are funded by interest bearing liabilities (deposits and borrowings). These financial instruments have varying levels of sensitivity to changes in market interest rates resulting in market risk.
Policies of the Company place strong emphasis on stabilizing net interest margin while managing interest rate, liquidity and market risks, with the goal of providing a sustained level of satisfactory earnings. The Funds Management, Investment and Loan policies provide direction for the flow of funds necessary to supply the needs of depositors and borrowers. Management of interest sensitive assets and liabilities is also necessary to reduce interest rate risk during times of fluctuating interest rates.
Interest rate risk is the exposure of the Company’s financial condition to adverse movements in interest rates. It results from differences in the maturities or timing of interest adjustments of the Company’s assets, liabilities and off-balance-sheet instruments; from changes in the slope of the yield curve; from imperfect correlations in the adjustment of interest rates earned and paid on different financial instruments with otherwise similar repricing characteristics; and from interest rate related options embedded in the Company’s products such as prepayment and early withdrawal options.
A number of measures are used to monitor and manage interest rate risk, including interest sensitivity and income simulation analyses. An interest sensitivity model is the primary tool used to assess this risk, with supplemental information supplied by an income simulation model. The
simulation model is used to estimate the effect that specific interest rate changes would have on twelve months of pretax net interest income assuming an immediate and sustained up or down parallel change in interest rates of 300 basis points. Key assumptions in the models include prepayment speeds on mortgage related assets; cash flows and maturities of financial instruments; changes in market conditions, loan volumes and pricing; and management’s determination of core deposit sensitivity. These assumptions are inherently uncertain and, as a result, the models cannot precisely estimate net interest income or precisely predict the impact of higher or lower interest rates on net interest income. Actual results may differ from simulated results due to timing, magnitude, and frequency of interest rate changes and changes in market conditions.
The Funds Management Committee is also responsible for evaluating and anticipating various risks other than interest rate risk. Those risks include prepayment risk, pricing for credit risk and liquidity risk. The Committee is made up of senior members of management, and continually monitors the makeup of interest sensitive assets and liabilities to assure appropriate liquidity, maintain interest margins and to protect earnings in the face of changing interest rates and other economic factors.
The Funds Management policy provides for a level of interest sensitivity that, Management believes, allows the Company to take advantage of opportunities within the market relating to liquidity and interest rate risk, allowing flexibility without subjecting the Company to undue exposure to risk. In addition, other measures are used to evaluate and project the anticipated results of Management's decisions.
We conducted multiple simulations as of December 31, 2010, in which it was assumed that changes in market interest rates occurred ranging from up 300 basis points to down 200 basis points in equal quarterly installments over the next twelve months. The following table reflects the suggested impact on net interest income over the next twelve months in comparison to estimated net interest income based on our balance sheet structure, including the balances and interest rates associated with our specific loans, securities, deposits and borrowed funds as of December 31, 2010. The resulting estimates are within our policy parameters established to manage and monitor interest rate risk.
| Dollars in thousands | Change in Net Interest Income | |||||||
| Interest Rate Scenario | Amount | Percent | ||||||
| Interest rates down 200 basis points | $ | (590 | ) | -1.8 | % | |||
| Interest rates down 100 basis points | 752 | 2.3 | % | |||||
| No change in interest rates | - | 0.0 | % | |||||
| Interest rates up 100 basis points | 501 | 1.5 | % | |||||
| Interest rates up 200 basis points | 1,459 | 4.5 | % | |||||
| Interest rates up 300 basis points | 2,496 | 7.7 | % | |||||
In addition to changes in interest rates, the level of future net interest income is also dependent on a number of other variables, including the growth, composition and levels of loans, deposits and other earnings assets and interest-bearing liabilities, level of nonperforming assets, economic and competitive conditions, potential changes in lending, investing and deposit gathering strategies, client preferences and other factors.
The common stock of the Company is quoted on the OTC Bulletin Board under the symbol “UBMI.” As was the case with much of the financial services industry, the stock of the Company continued to experience significant price declines during 2010 and 2009. In its ongoing efforts to preserve capital, the Board of Directors of the Company suspended payment of a quarterly dividend on its common shares in the second quarter of 2009.
In December, 2010, the Company closed its public offering of 7,583,800 shares of common stock. The net proceeds to the Company, after deducting underwriting discounts and commissions and offering expenses, were approximately $17.1 million. The Company contributed $10 million of the net proceeds of the offering to the capital of the Bank to increase the Bank's capital and regulatory capital ratios.
UBT is party to a MOU as described under “Other Developments – Memorandum of Understanding” on Page A-6 hereof. The Bank has continued to maintain its ratio of total capital to risk-weighted assets above the prescribed minimum level of 12%. The Bank did not reach the Tier 1 capital ratio level required to comply with the January 15, 2010 memorandum of understanding within the timeframe provided, but has met the minimum Tier 1 capital ratio at December 31, 2010. At December 31, 2010, the Bank’s Tier 1 capital ratio was 9.21%, and its ratio of total capital to risk-weighted assets was 14.71%.
Current capital ratios for the Company and the Bank are shown in Note 18 of the Notes to Consolidated Financial Statements. At December 31, 2010, the Company’s Tier 1 capital ratio was 10.24%, its ratio of total capital to risk-weighted assets was 16.26% and its tangible common equity ratio was 8.41%. As a result of ongoing losses in 2010 and the increased number of common shares outstanding, book value per share of the Company’s common stock declined from $11.98 at December 31, 2009 to $5.72 at the end of 2010.
The following table details the Company's known contractual obligations at December 31, 2010, in thousands of dollars:
| Contractual Obligations | Less than | More than | ||||||||||||||||||
| Thousands of dollars | 1 year | 1-3 years | 3-5 years | 5 years | Total | |||||||||||||||
| Long term debt (FHLB advances) | $ | 6,286 | $ | 12,602 | $ | 9,557 | $ | 1,876 | $ | 30,321 | ||||||||||
| Operating lease arrangements | 1,173 | 2,384 | 2,098 | 3,504 | 9,159 | |||||||||||||||
| Total | $ | 7,459 | $ | 14,986 | $ | 11,655 | $ | 5,380 | $ | 39,480 | ||||||||||
Generally accepted accounting principles are complex and require Management to apply significant judgments to various accounting, reporting and disclosure matters. The Company's Management must use assumptions and estimates to apply these principles where actual measurement is not possible or practical. For a complete discussion of the Company's significant accounting policies, see "Notes to the Consolidated Financial Statements" on pages A-30 to A-62 of the Company's Annual Report on Form 10-K for the year ended December 31, 2010. Certain policies are considered critical because they are highly dependent upon subjective or complex judgments, assumptions and estimates. Changes in such estimates may have a significant impact on the financial statements.
Allowance for Credit Losses
The allowance for credit losses provides coverage for probable losses inherent in the Company’s loan portfolio. Management evaluates the adequacy of the allowance for credit losses each quarter based on changes, if any, in underwriting activities, the loan portfolio composition (including product mix and geographic, industry or customer-specific concentrations), trends in loan performance, regulatory guidance and economic factors. This evaluation is inherently subjective, as it requires the use of significant management estimates. Many factors can affect management’s estimates of incurred losses, including volatility of default probabilities, credit rating migrations, loss severity and economic and political conditions. The allowance is increased through provisions charged to operating earnings and reduced by net charge-offs.
The Company determines the amount of the allowance based on relative risk characteristics of the loan portfolio. The allowance recorded for commercial loans is based on reviews of individual credit relationships and an analysis of the migration of commercial loans and actual loss experience. The allowance recorded for homogeneous consumer loans is based on an analysis of loan mix, risk characteristics of the portfolio, fraud loss and bankruptcy experiences, and historical losses, adjusted for current trends, for each homogeneous category or group of loans. The allowance for credit losses relating to impaired loans is based on the loan’s observable market price, the collateral value for collateral-dependent loans, or the discounted cash flows using the loan’s effective interest rate.
Regardless of the extent of the Company’s analysis of client performance, portfolio trends or risk management processes, certain inherent but undetected losses are probable within the loan portfolio. This is due to several factors including inherent delays in obtaining information regarding a client’s financial condition or changes in their unique business conditions, the judgmental nature of individual loan evaluations, collateral assessments and the interpretation of economic trends. Volatility of economic or client-specific conditions affecting the identification and estimation of losses for larger non-homogeneous credits and the sensitivity of assumptions utilized to establish allowances for homogenous groups of loans are among other factors. The Company estimates a range of inherent losses related to the existence of these exposures. The estimates are based upon the Company’s evaluation of imprecision risk associated with the commercial and consumer allowance levels and the estimated impact of the current economic environment.
Loan Servicing Rights
Loan servicing rights (“LSRs”) associated with loans originated and sold, where servicing is retained, are capitalized and included in other intangible assets in the consolidated balance sheet. The value of the capitalized servicing rights represents the present value of the future servicing fees arising from the right to service loans in the portfolio. Critical accounting policies for LSRs relate to the initial valuation and subsequent impairment tests. The methodology used to determine the valuation of LSRs requires the development and use of a number of estimates, including anticipated principal amortization and prepayments of that principal balance. Events that may significantly affect the estimates used are changes in interest rates, mortgage loan prepayment speeds and the payment performance of the underlying loans. The carrying value of the LSRs is periodically reviewed for impairment based on a determination of fair value. For purposes of measuring impairment, the servicing rights are compared to a valuation prepared based on a discounted cash flow methodology, utilizing current prepayment speeds and discount rates. Impairment, if any, is recognized through a valuation allowance and is recorded as amortization of intangible assets.
Deferred Tax Assets
Deferred tax assets are only recognized to the extent it is more likely than not they will be realized. Should our management determine it is not more likely than not that the deferred tax assets will be realized, a valuation allowance with a charge to earnings would be reflected in the period. If the Company is required in the future to take a valuation allowance with respect to its deferred tax asset, its financial condition, results of operations and regulatory capital levels would be negatively affected.
Report of Independent Registered Public Accounting Firm

Audit Committee, Board of Directors and Stockholders
United Bancorp, Inc.
Ann Arbor, Michigan
We have audited the accompanying consolidated balance sheets of United Bancorp, Inc. as of December 31, 2010 and 2009, and the related consolidated statements of operations, changes in shareholders’ equity and cash flows for each of the years in the three-year period ended December 31, 2010. The Company's management is responsible for these financial statements. Our responsibility is to express an opinion on these financial statements based on our audits.
We conducted our audits in accordance with the standards of the Public Company Accounting Oversight Board (United States). Those standards require that we plan and perform the audits to obtain reasonable assurance about whether the financial statements are free of material misstatement. The Company is not required to have, nor were we engaged to perform, an audit of its internal control over financial reporting. Our audits included consideration of internal control over financial reporting as a basis for designing auditing procedures that are appropriate in the circumstances, but not for the purpose of expressing an opinion on the effectiveness of the Company's internal control over financial reporting. Accordingly, we express no such opinion. Our audits also included examining, on a test basis, evidence supporting the amounts and disclosures in the financial statements, assessing the accounting principles used and significant estimates made by management and evaluating the overall financial statement presentation. We believe that our audits provide a reasonable basis for our opinion.
In our opinion, the consolidated financial statements referred to above present fairly, in all material respects, the financial position of United Bancorp, Inc. as of December 31, 2010, and 2009, and the results of its operations and its cash flows for each of the years in the three-year period ended December 31, 2010, in conformity with accounting principles generally accepted in the United States of America.

Indianapolis, Indiana
February 25, 2011
| United Bancorp, Inc. and Subsidiary | ||||||||||
| In thousands of dollars | December 31, | |||||||||
| Assets | 2010 | 2009 | ||||||||
| Cash and demand balances in other banks | $ | 10,623 | $ | 10,047 | ||||||
| Interest bearing balances with banks | 95,599 | 115,247 | ||||||||
| Federal funds sold | - | 295 | ||||||||
| Total cash and cash equivalents | 106,222 | 125,589 | ||||||||
| Securities available for sale | 124,544 | 92,146 | ||||||||
| FHLB Stock | 2,788 | 2,992 | ||||||||
| Loans held for sale | 10,289 | 7,979 | ||||||||
| Portfolio loans | 591,985 | 650,053 | ||||||||
| Less allowance for loan losses | 25,163 | 20,020 | ||||||||
| Net portfolio loans | 566,822 | 630,033 | ||||||||
| Premises and equipment, net | 11,241 | 12,332 | ||||||||
| Bank-owned life insurance | 13,391 | 12,939 | ||||||||
| Accrued interest receivable and other assets | 26,413 | 25,318 | ||||||||
| Total Assets | $ | 861,710 | $ | 909,328 | ||||||
| Liabilities | ||||||||||
| Deposits | ||||||||||
| Noninterest bearing deposits | $ | 113,206 | $ | 99,893 | ||||||
| Interest bearing deposits | 620,792 | 682,908 | ||||||||
| Total deposits | 733,998 | 782,801 | ||||||||
| Short term borrowings | 1,234 | - | ||||||||
| Other borrowings | 30,321 | 42,098 | ||||||||
| Accrued interest payable and other liabilities | 3,453 | 3,562 | ||||||||
| Total Liabilities | 769,006 | 828,461 | ||||||||
| Commitments and Contingent Liabilities | ||||||||||
| Shareholders' Equity | ||||||||||
| Preferred stock, no par value; 2,000,000 shares authorized, 20,600 shares outstanding in 2010 and 2009 | 20,258 | 20,158 | ||||||||
| Common stock and paid in capital, no par value; 30,000,000 shares authorized and 12,667,111 shares issued and outstanding at December 31, 2010; 10,000,000 shares authorized and 5,066,384 issued and outstanding at December 31, 2009 | 85,351 | 68,122 | ||||||||
| Accumulated deficit | (13,526 | ) | (8,689 | ) | ||||||
| Accumulated other comprehensive income, net of tax | 621 | 1,276 | ||||||||
| Total Shareholders' Equity | 92,704 | 80,867 | ||||||||
| Total Liabilities and Shareholders' Equity | $ | 861,710 | $ | 909,328 | ||||||
| The accompanying notes are an integral part of these consolidated financial statements. | ||||||||||
Consolidated Statements of Operations | |||||||||||||
| United Bancorp, Inc. and Subsidiary | |||||||||||||
For the years ended December 31, | |||||||||||||
| In thousands of dollars, except per share data | 2010 | 2009 | 2008 | ||||||||||
| Interest Income | |||||||||||||
| Interest and fees on loans | $ | 36,411 | $ | 40,379 | $ | 43,288 | |||||||
| Interest on securities | |||||||||||||
| Taxable | 2,136 | 1,896 | 2,164 | ||||||||||
| Tax exempt | 988 | 1,338 | 1,461 | ||||||||||
| Interest on federal funds sold and balances with banks | 235 | 153 | 128 | ||||||||||
| Total interest income | 39,770 | 43,766 | 47,041 | ||||||||||
| Interest Expense | |||||||||||||
| Interest on deposits | 7,353 | 10,402 | 14,964 | ||||||||||
| Interest on fed funds and other short term borrowings | 144 | - | 96 | ||||||||||
| Interest on FHLB advances | 1,190 | 1,849 | 2,237 | ||||||||||
| Total interest expense | 8,687 | 12,251 | 17,297 | ||||||||||
| Net Interest Income | 31,083 | 31,515 | 29,744 | ||||||||||
| Provision for loan losses | 21,530 | 25,770 | 14,607 | ||||||||||
| Net Interest Income After Provision for Loan Losses | 9,553 | 5,745 | 15,137 | ||||||||||
| Noninterest Income | |||||||||||||
| Service charges on deposit accounts | 2,191 | 2,731 | 3,381 | ||||||||||
| Wealth Management fee income | 4,518 | 4,070 | 4,343 | ||||||||||
| Gains (losses) on securities transactions | 31 | (24 | ) | (18 | ) | ||||||||
| Income from loan sales and servicing | 6,351 | 6,689 | 2,187 | ||||||||||
| ATM, debit and credit card fee income | 1,940 | 2,174 | 2,257 | ||||||||||
| Other income | 1,267 | 1,259 | 1,360 | ||||||||||
| Total noninterest income | 16,298 | 16,899 | 13,510 | ||||||||||
| Noninterest Expense | |||||||||||||
| Salaries and employee benefits | 17,217 | 17,904 | 16,333 | ||||||||||
| Occupancy and equipment expense, net | 5,207 | 5,255 | 4,874 | ||||||||||
| External data processing | 1,206 | 1,590 | 1,755 | ||||||||||
| Advertising and marketing | 610 | 605 | 1,191 | ||||||||||
| Attorney, accounting and other professional fees | 1,561 | 1,183 | 1,020 | ||||||||||
| Expenses relating to ORE property | 1,698 | 1,797 | 639 | ||||||||||
| FDIC Insurance premiums | 1,806 | 1,954 | 408 | ||||||||||
| Goodwill impairment | - | 3,469 | - | ||||||||||
| Other expenses | 3,192 | 3,359 | 3,743 | ||||||||||
| Total noninterest expense | 32,497 | 37,116 | 29,963 | ||||||||||
| Loss Before Federal Income Tax | (6,646 | ) | (14,472 | ) | (1,316 | ) | |||||||
| Federal income tax | (2,938 | ) | (5,639 | ) | (1,280 | ) | |||||||
| Net Loss | $ | (3,708 | ) | $ | (8,833 | ) | $ | (36 | ) | ||||
| Preferred stock dividends and accretion | (1,130 | ) | (1,078 | ) | - | ||||||||
| Loss Available to Common Shareholders | $ | (4,838 | ) | $ | (9,911 | ) | $ | (36 | ) | ||||
| Basic and diluted loss per share | $ | (0.89 | ) | $ | (1.93 | ) | $ | (0.01 | ) | ||||
| Cash dividend declared per share of common stock | $ | - | $ | 0.02 | $ | 0.70 | |||||||
| The accompanying notes are an integral part of these consolidated financial statements. | |||||||||||||
Consolidated Statements of Cash Flows | |||||||||||||
| United Bancorp, Inc. and Subsidiary | |||||||||||||
| Years Ended December 31, | |||||||||||||
| In thousands of dollars | 2010 | 2009 | 2008 | ||||||||||
| Cash Flows from Operating Activities | |||||||||||||
| Net income (loss) | $ | (3,708 | ) | $ | (8,833 | ) | $ | (36 | ) | ||||
| Adjustments to Reconcile Net Income to Net Cash from Operating Activities | |||||||||||||
| Depreciation and amortization | 2,743 | 2,121 | 1,679 | ||||||||||
| Provision for loan losses | 21,530 | 25,770 | 14,607 | ||||||||||
| Gain on sale of loans | (5,698 | ) | (5,891 | ) | (2,229 | ) | |||||||
| Proceeds from sales of loans originated for sale | 268,874 | 309,558 | 120,027 | ||||||||||
| Loans originated for sale | (265,486 | ) | (306,658 | ) | (117,016 | ) | |||||||
| Losses (gains) on securities transactions | (31 | ) | 24 | 18 | |||||||||
| Change in deferred income taxes | (2,748 | ) | (2,672 | ) | (2,036 | ) | |||||||
| Stock option expense | 92 | 150 | 137 | ||||||||||
| Increase in cash surrender value on bank owned life insurance | (451 | ) | (493 | ) | (486 | ) | |||||||
| Change in investment in limited partnership | (106 | ) | (135 | ) | (116 | ) | |||||||
| Goodwill impairment | - | 3,469 | - | ||||||||||
| Change in accrued interest receivable and other assets | 4,933 | (5,410 | ) | 1,607 | |||||||||
| Change in accrued interest payable and other liabilities | 117 | 441 | (2,969 | ) | |||||||||
| Total adjustments | 23,769 | 20,274 | 13,223 | ||||||||||
| Net cash from operating activities | 20,061 | 11,441 | 13,187 | ||||||||||
| Cash Flows from Investing Activities | |||||||||||||
| Securities available for sale | |||||||||||||
| Purchases | (82,785 | ) | (43,373 | ) | (46,896 | ) | |||||||
| Sales | 4,376 | - | 214 | ||||||||||
| Maturities and calls | 32,517 | 26,789 | 44,526 | ||||||||||
| Principal payments | 11,397 | 6,629 | 3,840 | ||||||||||
| Sale of FHLB stock | 204 | - | - | ||||||||||
| Net change in portfolio loans | 38,302 | 21,090 | (63,334 | ) | |||||||||
| Premises and equipment expenditures | (201 | ) | (514 | ) | (1,386 | ) | |||||||
| Net cash from investing activities | 3,810 | 10,621 | (63,036 | ) | |||||||||
| Cash Flows from Financing Activities | |||||||||||||
| Net change in deposits | (48,803 | ) | 73,252 | 38,012 | |||||||||
| Net change in short term borrowings | 1,234 | - | - | ||||||||||
| Principal payments on other borrowings | (11,777 | ) | (18,438 | ) | (8,575 | ) | |||||||
| Proceeds from other borrowings | - | 10,500 | 14,000 | ||||||||||
| Proceeds from issuance of preferred stock and warrants | - | 20,600 | - | ||||||||||
| Purchase of common stock | - | - | (831 | ) | |||||||||
| Proceeds from public stock offering and other common stock transactions | 17,138 | 98 | 133 | ||||||||||
| Cash dividends paid on common and preferred | (1,030 | ) | (957 | ) | (3,544 | ) | |||||||
| Net cash from financing activities | (43,238 | ) | 85,055 | 39,195 | |||||||||
| Net Change in Cash and Cash Equivalents | (19,367 | ) | 107,117 | (10,654 | ) | ||||||||
| Cash and cash equivalents at beginning of year | 125,589 | 18,472 | 29,126 | ||||||||||
| Cash and Cash Equivalents at End of Year | $ | 106,222 | $ | 125,589 | $ | 18,472 | |||||||
| Supplemental Disclosures: | |||||||||||||
| Interest paid | $ | 9,004 | $ | 12,707 | $ | 19,060 | |||||||
| Income tax paid | - | - | 2,163 | ||||||||||
| Loans transferred to other real estate | 3,379 | 1,814 | 2,244 | ||||||||||
| The accompanying notes are an integral part of these consolidated financial statements. | |||||||||||||
Consolidated Statements of Changes in Shareholders' Equity | |||||||||||||||||||||
| United Bancorp, Inc. and Subsidiary | |||||||||||||||||||||
| For the years ended December 31, 2010, 2009, 2008 | |||||||||||||||||||||
| In thousands of dollars, except per share data | Preferred Stock | Common Stock and Paid In Capital | Retained Earnings (Accumulated Deficit) | AOCI (1) | Total | ||||||||||||||||
| Balance, December 31, 2007 | $ | - | $ | 67,860 | $ | 4,814 | $ | 293 | $ | 72,967 | |||||||||||
| Net loss, 2008 | (36 | ) | (36 | ) | |||||||||||||||||
| Other comprehensive income: | |||||||||||||||||||||
| Net change in unrealized gains on securities available for sale, net of reclass adjustments for realized gains and related taxes | 625 | 625 | |||||||||||||||||||
| Total comprehensive income | 589 | ||||||||||||||||||||
| Cash dividends declared, $0.70 per common share | (3,544 | ) | (3,544 | ) | |||||||||||||||||
| Common stock transactions | 137 | 137 | |||||||||||||||||||
| Purchase of common stock | (831 | ) | (831 | ) | |||||||||||||||||
| Director and management deferred stock plans | - | 174 | (41 | ) | - | 133 | |||||||||||||||
| Balance, December 31, 2008 | $ | - | $ | 67,340 | $ | 1,193 | $ | 918 | $ | 69,451 | |||||||||||
| Net loss, 2009 | (8,833 | ) | (8,833 | ) | |||||||||||||||||
| Other comprehensive income (loss): | |||||||||||||||||||||
| Net change in unrealized gains on securities available for sale, net of reclass adjustments for realized losses and related taxes | 358 | 358 | |||||||||||||||||||
| Total comprehensive loss | (8,475 | ) | |||||||||||||||||||
| Preferred stock issued | 20,067 | 20,067 | |||||||||||||||||||
| Warrants issued | 533 | 533 | |||||||||||||||||||
| Accretion of discount on preferred stock | 91 | (91 | ) | - | |||||||||||||||||
| Cash dividends paid on preferred shares | (855 | ) | (855 | ) | |||||||||||||||||
| Cash dividends declared, $0.02 per share | (102 | ) | (102 | ) | |||||||||||||||||
| Common stock transactions | 150 | 150 | |||||||||||||||||||
| Director and management deferred stock plans | - | 99 | (1 | ) | - | 98 | |||||||||||||||
| Balance, December 31, 2009 | $ | 20,158 | $ | 68,122 | $ | (8,689 | ) | $ | 1,276 | $ | 80,867 | ||||||||||
| Net loss, 2010 | (3,708 | ) | (3,708 | ) | |||||||||||||||||
| Other comprehensive income (loss): | |||||||||||||||||||||
| Net change in unrealized gains on securities available for sale, net of reclass adjustments for realized losses and related taxes | (655 | ) | (655 | ) | |||||||||||||||||
| Total comprehensive loss | (4,363 | ) | |||||||||||||||||||
| Common stock issued | 17,068 | 17,068 | |||||||||||||||||||
| Accretion of discount on preferred stock | 100 | (100 | ) | - | |||||||||||||||||
| Cash dividends paid on preferred shares | (1,030 | ) | (1,030 | ) | |||||||||||||||||
| Other common stock transactions | 89 | 1 | 90 | ||||||||||||||||||
| Director and management deferred stock plans | - | 72 | - | - | 72 | ||||||||||||||||
| Balance, December 31, 2010 | $ | 20,258 | $ | 85,351 | $ | (13,526 | ) | $ | 621 | $ | 92,704 | ||||||||||
| (1) | Accumulated Other Comprehensive Income, Net of Tax | ||||||||||||||||||||
| The accompanying notes are an integral part of these consolidated financial statements. | |||||||||||||||||||||
Notes to Consolidated Financial Statements
United Bancorp, Inc. and Subsidiaries
NOTE 1 - SIGNIFICANT ACCOUNTING POLICIES
Nature of Operations and Basis of Presentation
The consolidated financial statements include the accounts of United Bancorp, Inc. and its wholly owned subsidiary, United Bank & Trust (“UBT” or “the Bank”) after elimination of significant intercompany transactions and accounts. The Company is engaged 100% in the business of commercial and retail banking, including trust and investment services, with operations conducted through its offices located in Lenawee, Washtenaw, and Monroe Counties in southeastern Michigan. These counties are the source of substantially all of the Company's deposit, loan, trust and investment activities.
Effective April 1, 2010, the Company completed the consolidation of its subsidiary banks, United Bank & Trust and United Bank & Trust – Washtenaw. Under the consolidation, United Bank & Trust – Washtenaw was consolidated and merged with and into United Bank & Trust, and the consolidated bank operates under the charter and name of United Bank & Trust.
Use of Estimates
The preparation of the consolidated financial statements in conformity with accounting principles generally accepted in the United States of America requires Management to make estimates and assumptions that affect the reported amounts of assets and liabilities at the date of the financial statements and the reported amounts of revenues and expenses during the reporting period as well as affecting the disclosures provided. Actual results could differ from those estimates. The allowance for loan losses, goodwill, loan servicing rights and the fair values of financial instruments are particularly subject to change.
Securities
Securities available for sale consist of bonds and notes that might be sold prior to maturity. Securities classified as available for sale are reported at their fair values and the related net unrealized holding gain or loss is reported in other comprehensive income. Premiums and discounts on securities are recognized in interest income using the interest method over the period to maturity. Realized gains or losses are based upon the amortized cost of the specific securities sold.
Loans Held for Sale
Mortgage loans originated and intended for sale in the secondary market are carried at the lower of cost or market value in the aggregate. Net unrealized losses, if any, are recognized in a valuation allowance by charges to income.
Loans
Loans that Management has the intent and ability to hold for the foreseeable future or until maturity or payoff are reported at the principal balance outstanding, net of deferred loan fees and costs and the allowance for loan losses. Interest income is reported on the interest method and includes amortization of net deferred loan fees and costs over the loan term. Loans are placed on non-accrual status at ninety days or more past due and interest is considered a loss, unless the loan is well-secured and in the process of collection.
Allowance for Loan Losses
The allowance for loan losses is maintained at a level believed adequate by management to absorb probable incurred credit losses in the loan portfolio. Management's determination of the adequacy of the allowance is based on an evaluation of the portfolio, past loan loss experience, current economic conditions, volume, amount and composition of the loan portfolio, and other factors management believes to be relevant. The Company’s past loan loss experience is determined by evaluating the average charge-offs over the most recent eight quarters. Prior to the fourth quarter of 2009, the Company determined its past loan loss experience by using a rolling twelve quarter historical approach. The allowance is increased by provisions for loan losses charged to income. Loan losses are charged against the allowance when management believes the uncollectability of a loan is confirmed. Subsequent recoveries, if any, are credited to the allowance.
Loan impairment is reported when full payment under the loan terms is not expected. Impaired loans are carried at the present value of estimated future cash flows using the loan's existing rate, or the fair value of collateral if the loan is collateral dependent. A portion of the allowance for loan losses is allocated to impaired loans if the value of such loans is deemed to be less than the unpaid balance. If these allocations require an increase in the allowance for loan losses, that increase is recorded as a component of the provision for loan losses. Loans are evaluated for impairment when payments are delayed or when the internal grading system indicates a substandard or doubtful classification.
Impairment is evaluated in total for smaller-balance loans of similar nature such as residential mortgage, consumer, home equity and second mortgage loans. Commercial loans and mortgage loans secured by other properties are evaluated individually for impairment. When credit analysis of borrower operating results and financial condition indicates that underlying cash flows of the borrower's business are not adequate to meet its debt service requirements, including the Company’s subsidiary bank's loans to the borrower, the loan is evaluated for impairment. Often this is associated with a delay or shortfall of payments of thirty days or more. Loans are generally moved to nonaccrual status when ninety days or more past due or in bankruptcy. These loans are often also considered impaired. Impaired loans, or portions thereof, are charged off when deemed uncollectible. This typically occurs when the loan is 120 or more days past due unless the loan is both well-secured and in the process of collection.
Premises and Equipment
Premises and equipment are stated at cost, less accumulated depreciation. The provisions for depreciation are computed principally by the straight-line method, based on useful lives of ten to forty years for premises and three to eight years for equipment.
Other Real Estate Owned
Other real estate consists of properties acquired through foreclosure or acceptance of a deed in lieu of foreclosure and property acquired for possible future expansion. Real estate properties acquired through, or in lieu of, loan foreclosure are to be sold and are initially recorded at fair value, less estimated selling costs, at the date of foreclosure establishing a new cost basis. After foreclosure, valuations are periodically performed and the real estate is carried at the lower of cost basis or fair value, less estimated selling costs. The historical average holding period for such properties is less than eighteen months. As of December 31, 2010 and 2009, other real
estate owned totaled $4,278,000 and $2,774,000, and is included in other assets on the consolidated balance sheets.
Goodwill
The Company has no goodwill on its balance sheet at December 31, 2010 or 2009.
Servicing Rights
Servicing rights are recognized as assets for the allocated value of retained servicing on loans sold. Servicing rights are expensed in proportion to, and over the period of, estimated net servicing revenues. Impairment is evaluated based on the fair value of the rights, using groupings of the underlying loans as to interest rates, remaining loan terms and prepayment characteristics. Any impairment of a grouping is reported as a valuation allowance.
Long-term Assets
Long-term assets are reviewed for impairment when events indicate their carrying amount may not be recoverable from future undiscounted cash flows. If impaired, the assets are written down to discounted amounts.
Income Tax
The Company records income tax expense based on the amount of taxes due on its tax return plus deferred taxes computed based on the expected future tax consequences of temporary differences between the carrying amounts and tax bases of assets and liabilities, using enacted tax rates, adjusted for allowances made for uncertainty regarding the realization of deferred tax assets. The Company has no uncertain tax positions as defined by The Tax Position Topic of the FASB Accounting Standards Codification (“FASB ASC”) Topic 740-10-05
The Company recognizes interest and penalties on income taxes as a component of income tax expense. The Company files consolidated income tax returns with its subsidiaries. With a few exceptions, the Company is no longer subject to U.S. federal, state and local or non-U.S. income tax examinations by tax authorities for years before 2007.
Earnings (Loss) Per Share
Amounts reported as earnings or loss per share are based on income or loss available to common shareholders divided by weighted average shares outstanding. Income or loss available to common shareholders is calculated by subtracting dividends on preferred stock and the accretion of discount on preferred stock from net income or loss. Weighted average shares outstanding include the weighted average number of common shares outstanding plus the weighted average number of contingently issuable shares associated with the Directors' and Senior Management Group's deferred stock plans.
Stock Based Compensation
At December 31, 2010, the Company has a stock-based employee compensation plan, which is described more fully in Note 16. The Company’s disclosure regarding this plan is in accordance with the fair value recognition provisions of FASB ASC Topic 718-10.
Statements of Cash Flows
For purposes of this Statement, cash and cash equivalents include cash on hand, demand balances with banks, and federal funds sold. Federal funds are generally sold for one-day
periods. The Company reports net cash flows for client loan and deposit transactions, deposits made with other financial institutions, and short-term borrowings with an original maturity of ninety days or less.
Comprehensive Income (Loss)
Comprehensive income (loss) consists of net income or loss and other comprehensive income (loss). Other comprehensive income (loss) includes net unrealized gains and losses on securities available for sale, net of tax, which are also recognized as separate components of shareholders' equity.
Industry Segment
The Company and its subsidiary are primarily organized to operate in the banking industry. Substantially all revenues and services are derived from banking products and services in southeastern Michigan. While the Company's chief decision makers monitor various products and services, operations are managed and financial performance is evaluated on a company-wide basis. Accordingly, all of the Company's banking operations are considered by Management to be aggregated in one business segment.
Recently Issued Accounting Standards
FASB ASU 2009-16, Transfers and Servicing (Topic 860); Accounting for Transfers of Financial Assets – In June 2009, the Financial Accounting Standards Board (“FASB”) issued FASB ASC Topic 860, Accounting for Transfers of Financial Assets, which pertains to securitizations. ASU 2009-16 requires more information about transfers of financial assets, including securitization transactions, and where entities have continued exposure to the risks related to transferred assets. The Company adopted ASU 2009-16 effective January 1, 2010 and adoption did not have a material effect on its financial position or results of operations.
ASU No. 2010-06, Fair Value Measurements and Disclosures (Topic 820): Improving Disclosures about Fair Value Measurements. In January 2010, FASB issued ASU No. 2010-06, Fair Value Measurements and Disclosures (Topic 820): Improving Disclosures about Fair Value Measurements. ASU 2010-06 revises two disclosure requirements concerning fair value measurements and clarifies two others. It requires separate presentation of significant transfers into and out of Levels 1 and 2 of the fair value hierarchy and disclosure of the reasons for such transfers. It will also require the presentation of purchases, sales, issuances, and settlements within Level 3 on a gross basis rather than a net basis. The amendments also clarify that disclosures should be disaggregated by class of asset or liability and that disclosures about inputs and valuation techniques should be provided for both recurring and non-recurring fair value measurements. The Company’s disclosures about fair value measurements are presented in Note 9 - Disclosures About Fair Value of Assets and Liabilities. These new disclosure requirements were effective for the period ended March 31, 2010, except for the requirement concerning gross presentation of Level 3 activity, which is effective for fiscal years beginning after December 15, 2010. There was no significant effect to the Company’s financial statement disclosure upon adoption of this ASU.
FASB ASU 2010-18 - Effect of a Loan Modification When the Loan Is Part of a Pool That Is Accounted for as a Single Asset. In April, 2010, FASB issued ASU 2010-18 - Effect of a Loan Modification When the Loan Is Part of a Pool That Is Accounted for as a Single Asset. This Update clarifies that modifications of loans that are accounted for within a pool under Subtopic
310-30, which provides guidance on accounting for acquired loans that have evidence of credit deterioration upon acquisition, do not result in the removal of those loans from the pool even if the modification would otherwise be considered a troubled debt restructuring. An entity will continue to be required to consider whether the pool of assets in which the loan is included is impaired if expected cash flows for the pool change. The amendments do not affect the accounting for loans under the scope of Subtopic 310-30 that are not accounted for within pools. Loans accounted for individually under Subtopic 310-30 continue to be subject to the troubled debt restructuring accounting provisions within Subtopic 310-40. The Company has adopted ASU 2010-18, and adoption did not have an impact on its financial statements.
ASU No. 2010-20, Receivables (Topic 310): Disclosures about the Credit Quality of Financing Receivables and the Allowance for Credit Losses. In July 2010, FASB issued ASU No. 2010-20, Receivables (Topic 310): Disclosures about the Credit Quality of Financing Receivables and the Allowance for Credit Losses. ASU 2010-20 requires that more information be disclosed about the credit quality of a company’s loans and the allowance for loan losses held against those loans. A company is required to disaggregate new and existing disclosure based on how it develops its allowance for loan losses and how it manages credit exposures. Existing disclosures to be presented on a disaggregated basis include a roll-forward of the allowance for loan losses, the related recorded investment in such loans, the nonaccrual status of loans, and impaired loans. Additional disclosure is also required about the credit quality indicators of loans by class at the end of the reporting period, the aging of past due loans, information about troubled debt restructurings, and significant purchases and sales of loans during the reporting period by class. For public companies, ASU 2010-20 requires certain disclosures as of the end of a reporting period effective for periods ending on or after December 15, 2010. Other required disclosures about activity that occurs during a reporting period are effective for periods beginning on or after December 15, 2010. The Company adopted the applicable required additional disclosures effective December 31, 2010, and adoption of these additional disclosures did not have a material effect on its financial position or results of operations.
ASU No. 2011-01; The amendments in ASU No. 2011-01 temporarily delay the effective date of the disclosures about troubled debt restructurings in Accounting Standards Update No. 2010-20, Receivables (Topic 310): Disclosures about the Credit Quality of Financing Receivables and the Allowance for Credit Losses for public entities. The delay is intended to allow the Board time to complete its deliberations on what constitutes a troubled debt restructuring. The effective date of the new disclosures about troubled debt restructurings for public entities and the guidance for determining what constitutes a troubled debt restructuring will then be coordinated.
Current Economic Conditions
The current protracted economic decline continues to present financial institutions with circumstances and challenges that in many cases have resulted in large and unanticipated declines in the fair values of investments and other assets, constraints on liquidity and capital and significant credit quality problems, including severe volatility in the valuation of real estate and other collateral supporting loans. The financial statements have been prepared using values and information currently available to the Company.
At December 31, 2010, the Company held $3.1 million in commercial real estate and $256.0 million in loans collateralized by commercial and development real estate. Due to national, state
and local economic conditions, values for commercial and development real estate have declined significantly, and the market for these properties is depressed.
Given the volatility of current economic conditions, the values of assets and liabilities recorded in the financial statements could change rapidly, resulting in material future adjustments in asset values, the allowance for loan losses, capital that could negatively impact the Company’s ability to meet regulatory capital requirements and maintain sufficient liquidity.
NOTE 2 - RESTRICTIONS ON CASH AND DEMAND BALANCES IN OTHER BANKS
The Bank is subject to average reserve and clearing balance requirements in the form of cash on hand or balances due from the Federal Reserve Bank. The amount of reserve and clearing balances required at December 31, 2010 were $282,000. These reserve balances vary depending on the level of client deposits in the Bank.
The Company considers all liquid investments with original maturities of three months or less to be cash equivalents. At December 31, 2010 and 2009, cash equivalents consisted primarily of interest-bearing balances with banks.
As a result of provisions of the Dodd-Frank Wall Street Reform and Consumer Protection Act, all funds in a “noninterest-bearing transaction account” are insured in full by the Federal Deposit Insurance Corporation from December 31, 2010, through December 31, 2012. This temporary unlimited coverage is in addition to, and separate from, the general FDIC deposit insurance coverage of up to $250,000 available to depositors. The financial institution holding the Company’s cash accounts is insured by the FDIC. At December 31, 2010, the Company’s cash accounts did not exceed federally insured limits. At December 31, 2010, the Company had cash balances of $95,847,000 at the FRB and FHLB that did not have FDIC insurance coverage.
NOTE 3 - SECURITIES
Balances of investment securities by category are shown below, as of December 31, 2010 and 2009:
| Thousands of dollars | Securities Available for Sale | ||||||||||||||||
| 2010 | Amortized Cost | Unrealized Gains | Unrealized Losses | Fair Value | |||||||||||||
| U.S. Treasury and agency securities | $ | 33,897 | $ | 157 | $ | (367 | ) | $ | 33,687 | ||||||||
| Mortgage backed agency securities | 65,714 | 821 | (437 | ) | 66,098 | ||||||||||||
| Obligations of states and political subdivisions | 23,841 | 817 | (53 | ) | 24,605 | ||||||||||||
| Corporate, asset backed and other debt securities | 126 | - | - | 126 | |||||||||||||
| Equity securities | 26 | 2 | - | 28 | |||||||||||||
| Total | $ | 123,604 | $ | 1,797 | $ | (857 | ) | $ | 124,544 | ||||||||
| Securities Available for Sale | |||||||||||||||||
| 2009 | Amortized Cost | Unrealized Gains | Unrealized Losses | Fair Value | |||||||||||||
| U.S. Treasury and agency securities | $ | 31,846 | $ | 412 | $ | (19 | ) | $ | 32,239 | ||||||||
| Mortgage backed agency securities | 22,457 | 713 | (28 | ) | 23,142 | ||||||||||||
| Obligations of states and political subdivisions | 33,255 | 997 | (141 | ) | 34,111 | ||||||||||||
| Corporate, asset backed and other debt securities | 2,628 | - | (5 | ) | 2,623 | ||||||||||||
| Equity securities | 26 | 5 | - | 31 | |||||||||||||
| Total | $ | 90,212 | $ | 2,127 | $ | (193 | ) | $ | 92,146 | ||||||||
The following table shows the gross unrealized loss and fair value of the Company's investment securities, aggregated by investment category and length of time that individual securities have been in a continuous unrealized loss position at December 31, 2010 and 2009.
| Less than 12 Months | 12 Months or Longer | Total | |||||||||||||||||||||||
| Thousands of dollars | Fair Value | Losses | Fair Value | Losses | Fair Value | Losses | |||||||||||||||||||
| 2010 | |||||||||||||||||||||||||
| U.S. Treasury and agency securities | $ | 22,677 | $ | (367 | ) | $ | - | $ | - | $ | 22,677 | $ | (367 | ) | |||||||||||
| Mortgage backed agency securities | 35,933 | (437 | ) | - | - | 35,933 | (437 | ) | |||||||||||||||||
| Obligations of states and political subdivisions | 2,214 | (53 | ) | - | - | 2,214 | (53 | ) | |||||||||||||||||
| Total | $ | 60,824 | $ | (857 | ) | $ | - | $ | - | $ | 60,824 | $ | (857 | ) | |||||||||||
| 2009 | |||||||||||||||||||||||||
| U.S. Treasury and agency securities | $ | 10,105 | $ | (19 | ) | $ | - | $ | - | $ | 10,105 | $ | (19 | ) | |||||||||||
| Mortgage backed agency securities | 5,123 | (28 | ) | - | - | 5,123 | (28 | ) | |||||||||||||||||
| Obligations of states and political subdivisions | 1,156 | (41 | ) | 2,089 | (100 | ) | 3,245 | (141 | ) | ||||||||||||||||
| Corporate, asset backed and other debt securities | - | - | 2,496 | (5 | ) | 2,496 | (5 | ) | |||||||||||||||||
| Total | $ | 16,384 | $ | (88 | ) | $ | 4,585 | $ | (105 | ) | $ | 20,969 | $ | (193 | ) | ||||||||||
Unrealized gains and losses within the investment portfolio are determined to be temporary. The Company has performed an evaluation of its investments for other than temporary impairment, and no losses were recognized during 2010. Loss from other than temporary impairment for 2009 and 2008 consisted of write-down of one equity security that was deemed to be impaired.
The unrealized losses on the Company’s investments in direct obligations of U.S. government agencies were caused by interest rate changes. The contractual terms of those investments do not permit the issuer to settle the securities at a price less than the amortized cost bases of the investments. Because the Company does not intend to sell the investments and it is not more likely than not the Company will be required to sell the investments before recovery of their amortized cost bases, which may be maturity, the Company does not consider those investments to be other-than-temporarily impaired at December 31, 2010.
The unrealized losses on the Company’s investment in residential mortgage-backed securities were caused by interest rate changes. The Company expects to recover the amortized cost basis over the term of the securities. Because the decline in market value is attributable to changes in interest rates and not credit quality, and because the Company does not intend to sell the investments and it is not more likely than not the Company will be required to sell the investments before recovery of their amortized cost bases, which may be maturity, the Company does not consider those investments to be other-than-temporarily impaired at December 31, 2010.
The entire investment portfolio is classified as available for sale. However, management has no specific intent to sell any securities, and management believes that it is more likely than not that the Company will not have to sell any security before recovery of its cost basis. Sales activities for securities for the years indicated are shown in the following table. All sales were of securities identified as available for sale.
| Thousands of dollars | 2010 | 2009 | 2008 | |||||||||
| Sales proceeds | $ | 4,376 | $ | - | $ | 214 | ||||||
| Gross gains on sales | 38 | - | 15 | |||||||||
| Gross loss on sales | (7 | ) | - | - | ||||||||
| Gross gains on calls | - | - | 90 | |||||||||
| Loss from other than temporary impairment | - | (24 | ) | (123 | ) | |||||||
The fair value of securities available for sale by contractual maturity as of December 31, 2010 is shown below. Expected maturities may differ from contractual maturities because borrowers may have the right to call or prepay obligations with or without call or prepayment penalties. Asset-backed securities are included in the “Due in one year or less” category.
| Thousands of dollars | Amortized Cost | Fair Value | |||||||
| Due in one year or less | $ | 15,201 | $ | 15,458 | |||||
| Due after one year through five years | 103,360 | 103,818 | |||||||
| Due after five years through ten years | 4,447 | 4,627 | |||||||
| Due after ten years | 570 | 613 | |||||||
| Equity securities | 26 | 28 | |||||||
| Total securities | $ | 123,604 | $ | 124,544 | |||||
Securities carried at $4,857,000 and $8,122,000 as of December 31, 2010 and 2009, respectively, were pledged to secure deposits of public funds, funds borrowed, repurchase agreements, and for other purposes as required by law.
NOTE 4 - LOANS
The following table shows total loans outstanding at December 31, and the percentage change in balances from the prior year. All loans are domestic and contain no significant concentrations by industry or client.
| Thousands of dollars | 2010 | % Change | 2009 | % Change | |||||||||||||
| Personal | $ | 107,399 | -3.0 | % | $ | 110,702 | -1.2 | % | |||||||||
| Business, including commercial mortgages | 354,340 | -9.7 | % | 392,495 | -4.5 | % | |||||||||||
| Tax exempt | 2,169 | -27.8 | % | 3,005 | 18.6 | % | |||||||||||
| Residential mortgage | 86,006 | -0.5 | % | 86,417 | -4.3 | % | |||||||||||
| Construction and development | 41,554 | -26.7 | % | 56,706 | -29.5 | % | |||||||||||
| Deferred loan fees and costs | 517 | -29.0 | % | 728 | 0.4 | % | |||||||||||
| Total portfolio loans | $ | 591,985 | -8.9 | % | $ | 650,053 | -6.7 | % | |||||||||
Accruing loans delinquent ninety days or more totaled $583,000 and $5,474,000 at December 31, 2010 and 2009, respectively. Non-accruing loans at December 31, 2010 and 2009 were $28,661,000 and $26,188,000, respectively.
NOTE 5 - ALLOWANCE FOR LOAN LOSSES
An analysis of the allowance for loan losses for the years ended December 31 follows:
| 2010 | |||||||||||||||||||||||||||||
| Thousands of dollars | Business & Commercial | CLD (1) | Residential Mortgage | Personal | Total | 2009 | 2008 | ||||||||||||||||||||||
| Balance, January 1 | $ | 12,221 | $ | 5,164 | $ | 760 | $ | 1,875 | $ | 20,020 | $ | 18,312 | $ | 12,306 | |||||||||||||||
| Provision charged to expense | 11,710 | 3,716 | 3,655 | 2,449 | 21,530 | 25,770 | 14,607 | ||||||||||||||||||||||
| Losses charged off | (7,683 | ) | (5,919 | ) | (1,820 | ) | (1,907 | ) | (17,329 | ) | (24,368 | ) | (8,772 | ) | |||||||||||||||
| Recoveries | 424 | 287 | 66 | 165 | 942 | 306 | 171 | ||||||||||||||||||||||
| Balance, December 31 | $ | 16,672 | $ | 3,248 | $ | 2,661 | $ | 2,582 | $ | 25,163 | $ | 20,020 | $ | 18,312 | |||||||||||||||
| Ending balance: individually evaluated for impairment | $ | 6,402 | $ | 1,765 | $ | 708 | $ | 283 | $ | 9,158 | |||||||||||||||||||
| Ending balance: collectively evaluated for impairment | $ | 10,270 | $ | 1,483 | $ | 1,953 | $ | 2,299 | $ | 16,005 | |||||||||||||||||||
| Total Loans: | |||||||||||||||||||||||||||||
| Ending balance | $ | 354,020 | $ | 32,924 | $ | 90,867 | $ | 114,174 | $ | 591,985 | |||||||||||||||||||
| Ending balance: individually evaluated for impairment | $ | 26,628 | $ | 14,699 | $ | 3,290 | $ | 566 | $ | 45,183 | |||||||||||||||||||
| Ending balance: collectively evaluated for impairment | $ | 327,392 | $ | 18,225 | $ | 87,577 | $ | 113,608 | $ | 546,802 | |||||||||||||||||||
(1) | Construction and land development loans | ||||||||||||||||||||||||||||
The Company categorizes commercial and tax-exempt loans into risk categories based on relevant information about the ability of borrowers to service their debt, such as current financial information, management capacity, historical payment experience, credit documentation, public information and current economic trends, among other factors. The Company analyzes loans individually by classifying the loans as to credit risk. This analysis is performed during the loan approval process and is updated as circumstances warrant. The Company uses the following risk category definitions for commercial and tax-exempt loans:
| Special Mention. Loans classified as special mention have a potential weakness that deserves management’s close attention. If left uncorrected, these potential weaknesses may result in deterioration of the repayment prospects for the loan or of the Bank’s credit position at some future date. | |
| Substandard. Loans classified as substandard are inadequately protected by the current net worth and paying capacity of the obligor or of the collateral pledged, if any. Loans so classified have a well-defined weakness or weaknesses that jeopardize the liquidation of the debt. They are characterized by the distinct possibility that the institution will sustain some loss if the deficiencies are not corrected. | |
| Doubtful. Loans classified as doubtful have all the weaknesses inherent in those classified as substandard, with the additional characteristic that the weaknesses make collection or liquidation in full, on the basis of currently existing facts, conditions and values, highly questionable and improbable. |
Commercial and tax-exempt loans not meeting the criteria above that are analyzed individually as part of the above-described process are considered to be pass rated loans.
Consumer loans are not rated on the above-listed risk categories, but are classified by their payment activity, either as performing, accruing restructured, delinquent less than 90 days, or nonperforming.
Quality indicators for portfolio loans as of December 31, 2010 are detailed in the following table.
| In thousands of dollars | ||||||||||||||||||||||||
| Commercial & Tax-exempt Loans | ||||||||||||||||||||||||
| Credit Risk Profile by Internally Assigned Rating | CLD | Owner-Occupied CRE | Other CRE | Commercial & Industrial | Total Commercial | |||||||||||||||||||
| 1-4 | Pass | $ | 16,246 | $ | 79,929 | $ | 106,379 | $ | 51,751 | $ | 254,305 | |||||||||||||
| 5 | Special Mention | 5,942 | 12,556 | 20,467 | 22,697 | 61,662 | ||||||||||||||||||
| 6 | Substandard | 13,381 | 12,641 | 10,773 | 9,350 | 46,145 | ||||||||||||||||||
| 7 | Doubtful | 427 | 416 | 74 | 120 | 1,037 | ||||||||||||||||||
| Total | $ | 35,996 | $ | 105,542 | $ | 137,693 | $ | 83,918 | $ | 363,149 | ||||||||||||||
| Consumer Loans | ||||||||||||||||||||||||
| Credit risk profile based on payment activity | Residential Mortgage | Consumer Construction | Home Equity | Other Consumer | Total Consumer | |||||||||||||||||||
| Performing | $ | 105,932 | $ | 5,558 | $ | 77,389 | $ | 24,632 | $ | 213,511 | ||||||||||||||
| Accruing restructured | 2,844 | - | - | - | 2,844 | |||||||||||||||||||
| Delinquent less than 90 days | 1,854 | - | 411 | 125 | 2,390 | |||||||||||||||||||
| Nonperforming | 4,765 | - | 762 | 56 | 5,583 | |||||||||||||||||||
| Total | $ | 113,541 | $ | 5,558 | $ | 78,151 | $ | 24,688 | $ | 221,938 | ||||||||||||||
| Subtotal | - | $ | 585,087 | |||||||||||||||||||||
| Deferred loan fees and costs, overdrafts, in-process accounts | 6,898 | |||||||||||||||||||||||
| Total Portfolio Loans | $ | 591,985 | ||||||||||||||||||||||
Loan totals in the classifications above are based on categories of loans as classified within the Bank’s regulatory reporting. As a result, they may differ from totals of similar classifications in Note 4 and the tables above.
A schedule detailing the loan portfolio aging analysis as of December 31, 2010 follows.
| Delinquent Loans | Total | ||||||||||||||||||||||||||||
| Thousands of dollars | 30-89 Days Past Due | 90 Days and Over (a) (1) | Total Past Due (b) | Current (c-b-d) | Total Portfolio Loans (c) | Nonaccrual Loans (d) | Nonperforming (a+d) | ||||||||||||||||||||||
| Commercial | |||||||||||||||||||||||||||||
| Commercial CLD | $ | 1,044 | $ | - | $ | 1,044 | $ | 26,393 | $ | 35,996 | $ | 8,559 | $ | 8,559 | |||||||||||||||
| Owner-Occupied CRE | 688 | - | 688 | 101,317 | 105,542 | 3,537 | 3,537 | ||||||||||||||||||||||
| Other CRE | 2,982 | - | 2,982 | 128,126 | 137,693 | 6,585 | 6,585 | ||||||||||||||||||||||
| Commercial & Industrial | 734 | 142 | 876 | 78,204 | 83,918 | 4,838 | 4,980 | ||||||||||||||||||||||
| Consumer | |||||||||||||||||||||||||||||
| Residential Mortgage | 1,854 | 441 | 2,295 | 106,922 | 113,541 | 4,324 | 4,765 | ||||||||||||||||||||||
| Consumer Construction | - | - | - | 5,558 | 5,558 | - | - | ||||||||||||||||||||||
| Home Equity | 411 | - | 411 | 76,978 | 78,151 | 762 | 762 | ||||||||||||||||||||||
| Other Consumer | 125 | - | 125 | 24,507 | 24,688 | 56 | 56 | ||||||||||||||||||||||
| Subtotal | $ | 7,838 | $ | 583 | $ | 8,421 | $ | 548,005 | $ | 585,087 | $ | 28,661 | $ | 29,244 | |||||||||||||||
| Deferred loan fees and costs, overdrafts, in-process accounts | 6,898 | ||||||||||||||||||||||||||||
| Total Portfolio Loans | $ | 591,985 | |||||||||||||||||||||||||||
| (1) | All are accruing | ||||||||||||||||||||||||||||
Information regarding impaired loans as of December 31, 2010 follows:
| Thousands of dollars | Recorded Balance | Unpaid Principal Balance | Specific Allowance | Average Investment in Impaired Loans | Interest Income Recognized | |||||||||||||||||
| Loans without a specific valuation allowance | ||||||||||||||||||||||
| Business & Commercial Mortgage | $ | 5,059 | $ | 5,865 | $ | - | $ | 4,330 | $ | 78 | ||||||||||||
| Construction & Land Development | 3,434 | 8,195 | - | 3,955 | 46 | |||||||||||||||||
| Residential Mortgage | 3,129 | 3,693 | - | 4,418 | - | |||||||||||||||||
| Personal | 509 | 509 | - | 1,020 | - | |||||||||||||||||
| Subtotal | $ | 12,131 | $ | 18,262 | $ | - | $ | 13,723 | $ | 124 | ||||||||||||
Recorded Balance | Unpaid Principal Balance | Specific Allowance | Average Investment in Impaired Loans | Interest Income Recognized | ||||||||||||||||||
| Loans with a specific valuation allowance | ||||||||||||||||||||||
| Business & Commercial Mortgage | $ | 21,570 | $ | 26,591 | $ | 6,402 | $ | 18,949 | $ | 619 | ||||||||||||
| Construction & Land Development | 11,265 | 19,083 | 1,765 | 10,579 | 168 | |||||||||||||||||
| Residential Mortgage | 3,290 | 3,327 | 708 | 2,360 | 106 | |||||||||||||||||
| Personal | 566 | 570 | 283 | 476 | 18 | |||||||||||||||||
| Subtotal | $ | 36,691 | $ | 49,571 | $ | 9,158 | $ | 32,364 | $ | 911 | ||||||||||||
| Total Impaired Loans | ||||||||||||||||||||||
| Business & Commercial Mortgage | $ | 26,629 | $ | 32,456 | $ | 6,402 | $ | 23,279 | $ | 697 | ||||||||||||
| Construction & Land Development | 14,699 | 27,278 | 1,765 | 14,534 | 214 | |||||||||||||||||
| Residential Mortgage | 6,419 | 7,020 | 708 | 6,778 | 106 | |||||||||||||||||
| Personal | 1,075 | 1,079 | 283 | 1,496 | 18 | |||||||||||||||||
| Total Impaired Loans | $ | 48,822 | $ | 67,833 | $ | 9,158 | $ | 46,087 | $ | 1,035 | ||||||||||||
Information regarding impaired loans as of December 31, 2010, 2009 and 2008 is shown below.
| In thousands of dollars | 2010 | 2009 | 2008 | ||||||||||
| Average investment in impaired loans | $ | 46,087 | $ | 40,295 | $ | 27,342 | |||||||
| Interest income recognized on impaired loans | 1,035 | 936 | 794 | ||||||||||
| Interest income recognized on a cash basis | 1,035 | 936 | 794 | ||||||||||
| Balance of impaired loans at December 31 | $ | 48,822 | $ | 36,160 | $ | 37,206 | |||||||
| Portion for which no allowance for loan losses is allocated | 12,131 | 7,029 | 4,160 | ||||||||||
| Portion for which an allowance for loan losses is allocated | 36,691 | 29,131 | 33,046 | ||||||||||
| Portion of allowance for loan losses allocated to impaired loans | 9,158 | 5,775 | 8,126 | ||||||||||
At December 31, 2010, the Company had $17.3 million of loan modifications meeting the definition of a troubled debt restructuring that were performing in accordance with their agreements and accruing interest that are included above in our impaired loans.
NOTE 6 - LOAN SERVICING
Loans serviced for others are not included in the accompanying consolidated financial statements. The unpaid principal balance of loans serviced for others was $655,054,000 and $522,462,000 at December 31, 2010 and 2009, respectively. The balance of loans serviced for others related to servicing rights that have been capitalized was $651,629,000 and $521,076,000 at December 31, 2010 and 2009, respectively.
Unamortized cost of loan servicing rights included in accrued interest receivable and other assets on the consolidated balance sheet, for the years ended December 31 was as follows:
| In thousands of dollars | 2010 | 2009 | ||||||
| Balance, January 1 | $ | 3,775 | $ | 1,772 | ||||
| Amount capitalized | 1,922 | 2,318 | ||||||
| Amount amortized | (935 | ) | (835 | ) | ||||
| Change in valuation allowance | 1 | 520 | ||||||
| Balance, December 31 | $ | 4,763 | $ | 3,775 | ||||
The fair value of servicing rights was as follows at December 31:
| In thousands of dollars | 2010 | 2009 | ||||||
| Fair value, January 1 | 4,535 | $ | 1,772 | |||||
| Fair value, December 31 | $ | 5,806 | $ | 4,535 | ||||
NOTE 7 - PREMISES AND EQUIPMENT
Depreciation expense was approximately $1,251,000 in 2010, $1,387,000 in 2009 and $1,371,000 in 2008. Premises and equipment as of December 31 consisted of the following:
| In thousands of dollars | 2010 | 2009 | |||||||
| Land | $ | 1,863 | $ | 1,863 | |||||
| Buildings and improvements | 14,726 | 14,783 | |||||||
| Furniture and equipment | 14,470 | 14,687 | |||||||
| Total cost | 31,059 | 31,333 | |||||||
| Less accumulated depreciation | (19,818 | ) | (19,001 | ) | |||||
| Premises and equipment, net | $ | 11,241 | $ | 12,332 | |||||
The Company has a small number of non-cancellable operating leases, primarily for banking facilities that expire over the next fifteen years. The leases generally contain renewal options for periods ranging from one to five years. Rental expense for these leases was $1.1 million for the years ended December 31, 2010 and 2009, and $988,000 for 2008, respectively.
Future minimum lease payments under operating leases are shown in the table below:
| In thousands of dollars | ||||
| 2011 | $ | 1,173 | ||
| 2012 | 1,178 | |||
| 2013 | 1,206 | |||
| 2014 | 1,126 | |||
| 2015 | 972 | |||
| Thereafter | 3,504 | |||
| Total Minimum Lease Payments | $ | 9,159 | ||
NOTE 8 - GOODWILL
In 2009, management performed an impairment evaluation to identify potential impairment of goodwill carried by the Company’s subsidiary banks. As a result of the impairment evaluation, a goodwill impairment charge was taken in the first quarter of 2009 for the Company’s entire book value of goodwill of $3.469 million. This non-cash charge was recorded as a component of noninterest expense. The goodwill on the books of the banks originally resulted from the acquisition of various banking offices between 1992 and 1999.
NOTE 9 - DEPOSITS
Information relating to maturities of time deposits as of December 31 is summarized below:
| In thousands of dollars | 2010 | 2009 | |||||||
| Within one year | $ | 152,392 | $ | 211,353 | |||||
| Between one and two years | 49,765 | 36,947 | |||||||
| Between two and three years | 24,690 | 19,923 | |||||||
| Between three and four years | 7,742 | 15,828 | |||||||
| Between four and five years | 4,625 | 6,420 | |||||||
| Total time deposits | $ | 239,214 | $ | 290,471 | |||||
| Interest bearing time deposits in denominations of $100,000 or more | $ | 87,482 | $ | 107,942 | |||||
NOTE 10 - SHORT TERM BORROWINGS
The Company has several credit facilities in place for short term borrowing which are used on occasion as a source of liquidity. These facilities consist of borrowing authority totaling $7.0 million from correspondent banks to purchase federal funds on a daily basis. There were no fed funds purchased outstanding at December 31, 2010 and 2009.
The Company’s balance sheet includes short-term borrowings of $1.234 million at December 31, 2010, representing the secured borrowing portion of SBA 7a loans held for sale, as a result of adoption of ASU 2009-16 in 2010. Qualifying loans are carried as loans held for sale, while the sold portion of the loans is carried as secured borrowing for a 90-day period.
The Bank may also enter into sales of securities under agreements to repurchase ("repurchase agreements"). These agreements generally mature within one to 120 days from the transaction date. U.S. Treasury, agency and other securities involved with the agreements are recorded as assets and are generally held in safekeeping by correspondent banks. Repurchase agreements are offered principally to certain clients as an investment alternative to deposit products. There were no balances outstanding at any time during 2010 or 2009.
NOTE 11 - OTHER BORROWINGS
The Bank carried fixed rate, non-callable advances from the Federal Home Loan Bank of Indianapolis totaling $30.3 million and $42.1 million at December 31, 2010 and 2009, respectively. As of December 31, 2010, the rates on the advances ranged from 2.74% to 5.36% with a weighted average rate of 3.52%.
Advances are primarily collateralized by residential mortgage loans under a blanket security agreement. Additional coverage is provided by Other Real Estate Related (“ORER”) and Community Financial Institution (“CFI”) collateral. The unpaid principal balance of the loans pledged as collateral required is between 155% and 250%, depending on the type of collateral and was $152.5 million at year-end 2010. Interest payments are made monthly, with principal due annually and at maturity. If principal payments are paid prior to maturity, advances are subject to a prepayment penalty.
Maturities and scheduled principal payments for other borrowings over the next five years as of December 31 are shown below.
| In thousands of dollars | 2010 | ||||
| Within one year | $ | 6,286 | |||
| Between one and two years | 2,296 | ||||
| Between two and three years | 10,306 | ||||
| Between three and four years | 9,513 | ||||
| Between four and five years | 44 | ||||
| More than five years | 1,876 | ||||
| Total | $ | 30,321 | |||
NOTE 12 - FINANCIAL INSTRUMENTS WITH OFF-BALANCE-SHEET RISK
The Bank is a party to financial instruments with off-balance-sheet risk in the normal course of business to meet financing needs of its clients. These financial instruments include commitments to make loans, unused lines of credit, and letters of credit. The Bank's exposure to credit loss in the event of nonperformance by the other party to the financial instrument for commitments to extend credit is represented by the contractual amount of those instruments. The Bank follows the same credit policy to make such commitments as is followed for loans and investments recorded in the consolidated financial statements. The Bank's commitments to extend credit are agreements at predetermined terms, as long as the client continues to meet specified criteria, with fixed expiration dates or termination clauses.
The following table shows the commitments to make loans and the unused lines of credit available to clients at December 31:
| 2010 | 2009 | |||||||||||||||
| In thousands of dollars | Variable Rate | Fixed Rate | Variable Rate | Fixed Rate | ||||||||||||
| Commitments to make loans | $ | 1,729 | $ | 2,566 | $ | 1,486 | $ | 10,285 | ||||||||
| Unused lines of credit | 88,973 | 3,236 | 95,891 | 5,361 | ||||||||||||
| Standby letters of credit | 10,718 | - | 7,380 | - | ||||||||||||
Commitments to make loans generally expire within thirty to ninety days, while unused lines of credit expire at the maturity date of the individual loans. At December 31, 2010, the rates for amounts in the fixed rate category ranged from 3.50% to 8.50%.
In 2001, United Bank & Trust entered into a limited partnership agreement to purchase tax credits awarded from the construction, ownership and management of an affordable housing project and a residual interest in the real estate. As of December 31, 2010 and 2009, the total recorded investment including the obligation to make additional future investments were $1,014,000 and $1,134,000 respectively, and was included in other assets. As of December 31, 2010 and 2009, the obligation of UBT to the limited partnership was $664,000 and $890,000, respectively, which was reported in other liabilities. While UBT is a 99% partner, the investment
is accounted for on the equity method as UBT is a limited partner and has no control over the operation and management of the partnership or the affordable housing project.
NOTE 13 - FEDERAL INCOME TAX
Income tax benefit consists of the following for the years ended December 31:
| In thousands of dollars | 2010 | 2009 | 2008 | ||||||||||
| Current | $ | (190 | ) | $ | (2,967 | ) | $ | 756 | |||||
| Deferred | (2,748 | ) | (2,672 | ) | (2,036 | ) | |||||||
| Total income tax benefit | $ | (2,938 | ) | $ | (5,639 | ) | $ | (1,280 | ) | ||||
The components of deferred tax assets and liabilities at December 31 are as follows:
| In thousands of dollars | 2010 | 2009 | |||||||
| Deferred tax assets: | |||||||||
| Allowance for loan losses | $ | 8,555 | $ | 6,807 | |||||
| Other real estate owned | 878 | 545 | |||||||
| Deferred compensation | 726 | 750 | |||||||
| Low income housing and Alternative Minimum Tax credit | 1,284 | 1,231 | |||||||
| Net Operating Loss | 510 | - | |||||||
| Other | 1,038 | 711 | |||||||
| Total deferred tax assets | $ | 12,991 | $ | 10,044 | |||||
| Deferred tax liabilities: | ||||||||||
| Property and equipment | $ | (328 | ) | $ | (484 | ) | ||||
| Mortgage servicing rights | (1,620 | ) | (1,284 | ) | ||||||
| Unrealized appreciation on securities available for sale | (320 | ) | (657 | ) | ||||||
| Other | (967 | ) | (1,051 | ) | ||||||
| Total deferred tax liabilities | $ | (3,235 | ) | $ | (3,476 | ) | ||||
| Net deferred tax asset | $ | 9,756 | $ | 6,568 | ||||||
At December 31, 2010, the Company had net operating losses of $1.5 million that are being carried forward to reduce future taxable income. The carryforwards expire in 2030. As of December 31, 2010, the Company had approximately $1.3 million of low income housing and alternative minimum tax credits available to offset future federal income taxes. The low income housing credits expire in 2030, and the alternative minimum tax credits have no expiration date.
The Company’s net deferred tax asset is included in the category “Accrued interest receivable and other assets” on the balance sheet. While the Company had a loss for both book and tax purposes for 2010 and 2009, the Company had taxable income of $11.7 million from 2007 and 2008 that was utilized for a majority of the Company’s tax loss. The Company’s net deferred tax asset was $9.8 million at December 31, 2010. A valuation allowance related to deferred tax
assets is required when it is considered more likely than not that all or part of the benefit related to such assets will not be realized. Based on the levels of taxable income in prior years, the significant improvement in operating results in 2010 compared to 2009, and the Company’s expectation of a return to sustained profitability in future years as a result of strong core earnings, Management has determined that no valuation allowance was required at December 31, 2010 or 2009.
Reconciliation between total federal income tax and the amount computed through the use of the federal statutory tax rate for the years ended is as follows:
| In thousands of dollars | 2010 | 2009 | 2008 | |||||||||
| Income taxes at statutory rate of 34% | $ | (2,259 | ) | $ | (4,920 | ) | $ | (447 | ) | |||
| Non-taxable income, net of nondeductible interest expense | (363 | ) | (476 | ) | (490 | ) | ||||||
| Income on non-taxable bank owned life insurance | (153 | ) | (168 | ) | (165 | ) | ||||||
| Affordable housing credit | (188 | ) | (188 | ) | (188 | ) | ||||||
| Goodwill write-off | - | 150 | - | |||||||||
| Other | 25 | (37 | ) | 10 | ||||||||
| Total federal income tax | $ | (2,938 | ) | $ | (5,639 | ) | $ | (1,280 | ) | |||
NOTE 14 - RELATED PARTY TRANSACTIONS
Certain directors and executive officers of the Company and the Bank, including their immediate families and companies in which they are principal owners, are clients of the Bank. Loans to these parties did not, in the judgment of Management, involve more than normal credit risk or present other unfavorable features. The aggregate amount of these loans at December 31, 2009 was $2,597,000. That balance was adjusted to exclude directors and officers that were not with the Company at the end of 2010. During 2010, new and newly reportable loans to such related parties amounted to $305,000 and repayments amounted to $974,000, resulting in a balance at December 31, 2010 of $1,929,000. Related party deposits totaled $1,046,000 and $987,000 at December 31, 2010 and 2009, respectively. The balance of deposits at December 31, 2009 was adjusted to exclude directors and officers that were not with the Company at the end of 2010
NOTE 15 - RESTRICTIONS ON SUBSIDIARY DIVIDENDS, LOANS OR ADVANCES
Banking laws and regulations restrict the amount the Bank can transfer to the Company in the form of cash dividends and loans. Under the Memorandum of Understanding described in Note 18, United Bank & Trust may not declare or pay any dividends without prior approval of its regulators. It is not the intent of Management to pay dividends in amounts that would reduce the capital of the Bank to a level below that which is considered prudent by Management and in accordance with the guidelines of regulatory authorities.
NOTE 16 - EMPLOYEE BENEFIT PLANS
Employee Savings Plan
The Company maintains a 401(k) employee savings plan ("plan") which is available to substantially all employees. Individual employees may make contributions to the plan up to 100% of their compensation up to a maximum of $16,500 for 2010 and 2009 and $15,500 for
2008. Prior to July, 2009, the Company offered discretionary matching of funds for a percentage of the employee contribution, plus an amount based on Company earnings. In July 1, 2009, the Company discontinued its profit sharing and employer matching contributions to the plan, and had no expense for the plan for 2010. The expense for the plan for 2009 and 2008 was $238,000 and $556,000, respectively. The plan offers employees the option of purchasing Company stock with the match portion of their 401(k) contribution, and shares available to employees within the plan are purchased on the open market.
Director Retainer Stock Plan
The Company maintains a deferred compensation plan designated as the Director Retainer Stock Plan ("Director Plan"). The plan provides eligible directors of the Company and the Bank with a means of deferring payment of retainers and certain fees payable to them for Board service. Under the Director Plan, any retainers or fees elected to be deferred under the plan by an eligible director ultimately will be payable in common stock at the time of payment.
Senior Management Bonus Deferral Stock Plan
The Company maintains a deferred compensation plan designated as the Senior Management Bonus Deferral Stock Plan ("Management Plan"). The Management Plan has essentially the same purposes as the Director Plan discussed above and permits eligible employees of the Company and its affiliates to elect cash bonus deferrals and, after employment termination, to receive payouts in whole or in part in the form of common stock on terms substantially similar to those of the Director Plan.
Stock Options and Other Equity Awards
Through December 31, 2009, the Company granted stock options under its 2005 Stock Option Plan (the "2005 Plan"), which is a non-qualified stock option plan as defined under Internal Revenue Service regulations. The shares of stock that are subject to options are the authorized and unissued shares of common stock of the Company. Under the 2005 Plan, directors and management of the Company and subsidiaries were given the right to purchase stock of the Company at the then-current market price at the time the option was granted. The options have a three-year vesting period, and with certain exceptions, expire at the end of ten years, three years after retirement or ninety days after other separation from the Company. The 2005 Stock Option Plan expired effective January 1, 2010, and no additional options may be granted under the plan.
On April 27, 2010, shareholders of the Company approved the United Bancorp, Inc. Stock Incentive Plan of 2010 (the "Incentive Plan"). The Incentive Plan permits the grant and award of stock options, stock appreciation rights, restricted stock, restricted stock units, stock awards and other stock-based and stock-related awards (collectively referred to as "incentive awards") to directors, consultative board members, officers and other key employees of the Company and its subsidiaries. The purpose of the plan is to provide participants with an increased incentive to contribute to the long-term performance and growth of the Company and its subsidiaries, to join the interests of participants with the interests of the Company's shareholders through the opportunity for increased stock ownership and to attract and retain participants. The plan is further intended to provide flexibility to the Company in structuring long-term incentive compensation to best promote these objectives.
No incentive awards may be granted under the Incentive Plan after February 25, 2020. Incentive awards may be granted under the Incentive Plan to participants for no cash consideration or for such minimum consideration as determined by the Company’s Compensation & Governance Committee. The Incentive Plan is not qualified under Section 401(a) of the Internal Revenue Code and is not subject to the Employee Retirement Income Security Act of 1974 (ERISA).
The following table summarizes option activity for 2010:
Options Outstanding | Weighted Avg. Exercise Price | |||||||
| Balance, January 1, 2010 | 435,561 | $ | 20.98 | |||||
| Options forfeited | (27,831 | ) | 20.34 | |||||
| Balance, December 31 | 407,730 | $ | 21.02 | |||||
| Options exercisable at year-end | 327,444 | $ | 23.68 | |||||
No incentive awards were granted and no outstanding stock options were exercised during 2010. The following table provides information regarding stock options under the 2005 Plan at December 31, 2010:
| Options Outstanding | Options Exercisable | ||||||||||||||||||||
Range of Exercise Prices | Number Outstanding | Weighted Avg. Remaining Contractual Life | Weighted Avg. Exercise Price | Number Outstanding | Weighted Avg. Exercise Price | ||||||||||||||||
| $6.00 to $32.14 | 407,730 | 5.25 | Years | $ | 21.02 | 327,444 | $ | 23.68 | |||||||||||||
The fair value of each option grant is estimated on the date of the grant using the Black-Scholes option pricing model with the weighted-average assumptions shown below. No figures are shown for 2010, as there were no options granted during the year:
| 2009 | 2008 | |||||||
| Dividend yield | 1.00 | % | 4.02 | % | ||||
| Expected life | 5 years | 5 years | ||||||
| Expected volatility | 25.67 | % | 17.55 | % | ||||
| Risk-free interest rate | 1.98 | % | 2.76 | % | ||||
The Company has recorded approximately $92,000, $150,000 and $137,000 in compensation expense related to vested stock options less estimated forfeitures for the periods ended December 31, 2010, 2009 and 2008, respectively. As of December 31, 2010, unrecognized compensation expense related to the stock options totaled $63,000, and is expected to be recognized over two years.
At December 31, 2010, the total options outstanding had no aggregate intrinsic value. Intrinsic value was determined by calculating the difference between the Company's closing stock price on December 31, 2010 and the exercise price of each option, multiplied by the number of in-the-money options held by each holder, assuming all option holders had exercised their stock options on December 31, 2010.
NOTE 17 - FAIR VALUE OF FINANCIAL INSTRUMENTS
Fair Value Measurements. The Fair Value Measurements Topic of the FASB Accounting Standards Codification (“FASB ASC”) defines fair value, establishes a framework for measuring fair value and expands disclosures about fair value measurements. FASB ASC Topic 820-10-20 defines fair value as the price that would be received to sell an asset or paid to transfer a liability in an orderly transaction between market participants at the measurement date. Topic 820-10-55 establishes a fair value hierarchy that emphasizes use of observable inputs and minimizes use of unobservable inputs when measuring fair value. The standard describes three levels of inputs that may be used to measure fair value:
| Level 1 | Quoted prices in active markets for identical assets or liabilities |
| Level 2 | Observable inputs other than Level 1 prices, such as quoted prices for similar assets or liabilities; quoted prices in markets that are not active; or other inputs that are observable or can be corroborated by observable market data for substantially the full term of the assets or liabilities |
| Level 3 | Unobservable inputs that are supported by little or no market activity and that are significant to the fair value of the assets or liabilities |
Following is a description of the inputs and valuation methodologies used for instruments measured at fair value on a recurring basis and recognized in the accompanying consolidated balance sheets, as well as the general classification of those instruments under the valuation hierarchy.
Available-for-sale Securities Where quoted market prices are available in an active market, securities are classified within Level 1 of the valuation hierarchy. If quoted market prices are not available, then fair values are estimated by using pricing models, quoted prices of securities with similar characteristics, or discounted cash flows. Level 2 securities include U.S. Government agency securities, mortgage backed securities, obligations of states and municipalities, and certain corporate securities. Matrix pricing is a mathematical technique widely used in the banking industry to value investment securities without relying exclusively on quoted prices for specific investment securities, but rather, relying on the investment securities’ relationship to other benchmark quoted investment securities. In certain cases where Level 1 or Level 2 inputs are not available, securities are classified within Level 3 of the hierarchy. The Company has no Level 3 securities. |
The following table presents the fair value measurements of assets recognized in the accompanying condensed consolidated balance sheets measured at fair value on a recurring basis and the level within the FASB ASC fair value hierarchy in which the fair value measurements fall at December 31, 2010 and 2009:
| In thousands of dollars | Fair Value Measurements Using | ||||||||||||||||
| December 31, 2010 | Fair Value | Level 1 | Level 2 | Level 3 | |||||||||||||
| Available for sale securities: | |||||||||||||||||
| U.S. Treasury and agency securities | $ | 33,687 | $ | - | $ | 33,687 | $ | - | |||||||||
| Mortgage backed agency securities | 66,098 | - | 66,098 | - | |||||||||||||
| Obligations of states and political subdivisions | 24,605 | - | 24,605 | - | |||||||||||||
| Corporate, asset backed and other debt securities | 126 | - | 126 | - | |||||||||||||
| Equity securities | 28 | 28 | - | - | |||||||||||||
| Total available for sale securities | $ | 124,544 | $ | 28 | $ | 124,516 | $ | - | |||||||||
| December 31, 2009 | |||||||||||||||||
| Available for sale securities: | |||||||||||||||||
| U.S. Treasury and agency securities | $ | 32,239 | $ | - | $ | 32,239 | $ | - | |||||||||
| Mortgage backed agency securities | 23,142 | - | 23,142 | - | |||||||||||||
| Obligations of states and political subdivisions | 34,111 | - | 34,111 | - | |||||||||||||
| Corporate, asset backed and other debt securities | 2,623 | - | 2,623 | - | |||||||||||||
| Equity securities | 31 | 31 | - | - | |||||||||||||
| Total available for sale securities | $ | 92,146 | $ | 31 | $ | 92,115 | $ | - | |||||||||
Following is a description of the valuation methodologies used for instruments measured at fair value on a non-recurring basis and recognized in the accompanying balance sheets, as well as the general classification of those instruments under the valuation hierarchy.
Impaired Loans (Collateral Dependent) Loans for which it is probable that the Company will not collect all principal and interest due according to contractual terms are measured for impairment. Allowable methods for determining the amount of impairment include estimating fair value using the fair value of the collateral for collateral-dependent loans. If the impaired loan is identified as collateral dependent, the fair value method of measuring the amount of impairment is utilized. This method requires obtaining a current independent appraisal of the collateral and applying a discount factor to the value. Impaired loans that are collateral dependent are classified within Level 3 of the fair value hierarchy when impairment is determined using the fair value method. |
The following table presents the fair value measurements of assets recognized in the accompanying condensed consolidated balance sheets measured at fair value on a non-recurring basis and the level within the FASB ASC fair value hierarchy in which the fair value measurements fall at December 31, 2010 and 2009:
| Fair Value Measurements Using | |||||||||||||||||
| In thousands of dollars | Fair Value | Level 1 | Level 2 | Level 3 | |||||||||||||
| Impaired Loans (Collateral Dependent) | |||||||||||||||||
| December 31, 2010 | $ | 33,961 | $ | - | $ | - | $ | 33,961 | |||||||||
| December 31, 2009 | 26,881 | - | - | 26,881 | |||||||||||||
The carrying amounts and estimated fair value of principal financial assets and liabilities were as follows:
| December 31, 2010 | December 31, 2009 | |||||||||||||||
| In thousands of dollars | Carrying Value | Fair Value | Carrying Value | Fair Value | ||||||||||||
| Financial Assets | ||||||||||||||||
| Cash and cash equivalents | $ | 106,222 | $ | 106,222 | $ | 125,589 | $ | 125,589 | ||||||||
| Securities available for sale | 124,544 | 124,544 | 92,146 | 92,146 | ||||||||||||
| FHLB Stock | 2,788 | 2,788 | 2,992 | 2,992 | ||||||||||||
| Loans held for sale | 10,289 | 10,289 | 7,979 | 7,979 | ||||||||||||
| Net portfolio loans | 566,822 | 571,830 | 630,033 | 632,831 | ||||||||||||
| Accrued interest receivable | 2,777 | 2,777 | 3,349 | 3,349 | ||||||||||||
| Financial Liabilities | ||||||||||||||||
| Total deposits | $ | (733,998 | ) | $ | (738,117 | ) | $ | (782,801 | ) | $ | (787,443 | ) | ||||
| Short term borrowings | (1,234 | ) | (1,234 | ) | - | - | ||||||||||
| FHLB advances | (30,321 | ) | (31,700 | ) | (42,098 | ) | (43,167 | ) | ||||||||
| Accrued interest payable | (612 | ) | (612 | ) | (930 | ) | (930 | ) | ||||||||
Estimated fair values require subjective judgments and are approximate. The above estimates of fair value are not necessarily representative of amounts that could be realized in actual market transactions, or of the underlying value of the Company. Changes in the following methodologies and assumptions could significantly affect the estimated fair value:
Cash and cash equivalents, FHLB stock, loans held for sale, accrued interest receivable and accrued interest payable – The carrying amounts are reasonable estimates of the fair values of these instruments at the respective balance sheet dates. | |
Net portfolio loans – The carrying amount is a reasonable estimate of fair value for personal loans for which rates adjust quarterly or more frequently, and for business and tax-exempt loans that are prime related and for which rates adjust immediately or quarterly. The fair value of all other loans is estimated by discounting future cash flows using current rates for loans with similar characteristics and maturities. The allowance for loan losses is considered to be a reasonable estimate of discount for credit quality concerns. | |
Total deposits – With the exception of certificates of deposit, the carrying value is deemed to be the fair value due to the demand nature of the deposits. The fair value of fixed maturity certificates of deposit is estimated by discounting future cash flows using the current rates paid on certificates of deposit with similar maturities. | |
Short Term Borrowings – The carrying amounts are reasonable estimates of the fair values of these instruments at the respective balance sheet dates. | |
FHLB Advances – The fair value is estimated by discounting future cash flows using current rates on advances with similar maturities. | |
Off-balance-sheet financial instruments – Commitments to extend credit, standby letters of credit and undisbursed loans are deemed to have no material fair value as such commitments are generally fulfilled at current market rates. |
NOTE 18 - REGULATORY CAPITAL REQUIREMENTS
The Company and the Bank are subject to various regulatory capital requirements administered by the federal banking agencies. Failure to meet minimum capital requirements can initiate certain mandatory and discretionary actions by regulators that, if undertaken, could have a direct material effect on the financial statements. Under capital adequacy guidelines and the regulatory framework for prompt corrective action, the Company and the Bank must meet specific capital guidelines that involve quantitative measures of assets, liabilities, and certain off-balance-sheet items as calculated under regulatory accounting practices. Capital amounts and classification are also subject to qualitative judgments by the regulators about components, risk weightings and other factors. Quantitative measures established by regulation to ensure capital adequacy require the Company and the Bank to maintain minimum ratios of Total and Tier I capital to risk-weighted assets, and of Tier I capital to average assets.
On January 15, 2010, UBT entered into a Memorandum of Understanding with the Federal Deposit Insurance Corporation (“FDIC”) and the Michigan Office of Financial and Insurance Regulation (“OFIR”). On January 11, 2011, we entered into a revised Memorandum of Understanding (“MOU”) with substantially the same requirements as the MOU dated January 15, 2010. The MOU is not a “written agreement” for purposes of Section 8 of the Federal Deposit Insurance Act. The MOU documents an understanding among UBT, the FDIC and OFIR, that, among other things, (i) UBT will not declare or pay any dividend to the Company without the prior consent of the FDIC and OFIR; and (ii) UBT will have and maintain its Tier 1 capital ratio at a minimum of 9% for the duration of the MOU, and will maintain its ratio of total capital to risk-weighted assets at a minimum of 12% for the duration of the MOU.
The Bank has continued to maintain its ratio of total capital to risk-weighted assets above the prescribed minimum level of 12%. The Bank did not reach the Tier 1 capital ratio level required to comply with the MOU dated January 15, 2010 within the timeframe provided, but has met the minimum Tier 1 capital ratio at December 31, 2010.
In December, 2010, the Company closed its previously announced public offering of 7,583,800 shares of common stock at a price of $2.50 per share. The net proceeds to the Company, after deducting underwriting discounts and commissions and offering expenses, were approximately $17.1 million. At December 31, 2010, the Company’s Tier 1 capital ratio was 10.24%, and its ratio of total capital to risk-weighted assets was 16.26%. Capital of $10.0 million was contributed to UBT as of December 29, 2010.
The following table shows information about the Company's and the Banks' capital levels compared to regulatory requirements at year-end 2010 and 2009.
| Actual | Regulatory Minimum for Capital Adequacy (1) | Regulatory Minimum to be Well Capitalized (2) | Required by MOU (3) | ||||||||||||||||||||||||||||||
| As of December 31, 2010 | $000 | % | $000 | % | $000 | % | $000 | % | |||||||||||||||||||||||||
| Tier 1 Capital to Average Assets | |||||||||||||||||||||||||||||||||
| Consolidated | $ | 88,022 | 10.2 | % | $ | 34,380 | 4.0 | % | N/A | N/A | N/A | N/A | |||||||||||||||||||||
| Bank | 78,806 | 9.2 | % | 34,232 | 4.0 | % | 42,791 | 5.0 | % | 77,023 | 9.0 | % | |||||||||||||||||||||
| Tier 1 Capital to Risk Weighted Assets | |||||||||||||||||||||||||||||||||
| Consolidated | 88,022 | 15.0 | % | 23,510 | 4.0 | % | N/A | N/A | N/A | N/A | |||||||||||||||||||||||
| Bank | 78,806 | 13.4 | % | 23,491 | 4.0 | % | 35,237 | 6.0 | % | N/A | N/A | ||||||||||||||||||||||
| Total Capital to Risk Weighted Assets | |||||||||||||||||||||||||||||||||
| Consolidated | 95,589 | 16.3 | % | 47,020 | 8.0 | % | N/A | N/A | N/A | N/A | |||||||||||||||||||||||
| Bank | 86,367 | 14.7 | % | 46,982 | 8.0 | % | 58,728 | 10.0 | % | 70,474 | 12.0 | % | |||||||||||||||||||||
| As of December 31, 2009 | |||||||||||||||||||||||||||||||||
| Tier 1 Capital to Average Assets | |||||||||||||||||||||||||||||||||
| Consolidated | $ | 78,076 | 8.6 | % | $ | 36,108 | 4.0 | % | N/A | N/A | N/A | N/A | |||||||||||||||||||||
| United Bank & Trust | 37,590 | 7.3 | % | 20,495 | 4.0 | % | 25,618 | 5.0 | % | N/A | N/A | ||||||||||||||||||||||
| United Bank & Trust – Washtenaw | 33,506 | 8.7 | % | 15,487 | 4.0 | % | 19,358 | 5.0 | % | N/A | N/A | ||||||||||||||||||||||
| Tier 1 Capital to Risk Weighted Assets | |||||||||||||||||||||||||||||||||
| Consolidated | 78,076 | 11.9 | % | 26,219 | 4.0 | % | N/A | N/A | N/A | N/A | |||||||||||||||||||||||
| United Bank & Trust | 37,590 | 11.2 | % | 13,376 | 4.0 | % | 20,064 | 6.0 | % | N/A | N/A | ||||||||||||||||||||||
| United Bank & Trust – Washtenaw | 33,506 | 10.6 | % | 12,694 | 4.0 | % | 19,041 | 6.0 | % | N/A | N/A | ||||||||||||||||||||||
| Total Capital to Risk Weighted Assets | |||||||||||||||||||||||||||||||||
| Consolidated | 86,416 | 13.2 | % | 52,438 | 8.0 | % | N/A | N/A | N/A | N/A | |||||||||||||||||||||||
| United Bank & Trust | 41,872 | 12.5 | % | 26,752 | 8.0 | % | 33,440 | 10.0 | % | N/A | N/A | ||||||||||||||||||||||
| United Bank & Trust – Washtenaw | 37,517 | 11.8 | % | 25,388 | 8.0 | % | 31,735 | 10.0 | % | N/A | N/A | ||||||||||||||||||||||
| (1) | Represents minimum required to be categorized as adequately capitalized under Federal regulatory requirements. | ||||||||||||||||||||||||||||||||
(2) | Represents minimum generally required to be categorized as well-capitalized under Federal regulatory prompt corrective action provisions. The Memorandum of Understanding described above in Note 18 subjects the Bank to higher requirements. | ||||||||||||||||||||||||||||||||
| (3) | Represents requirements by the Bank's regulators under terms of the MOU. | ||||||||||||||||||||||||||||||||
NOTE 19 - LOSS PER SHARE
A reconciliation of basic and diluted loss per share follows:
| In thousands of dollars, except share data | 2010 | 2009 | 2008 | ||||||||||
| Net loss | $ | (3,708 | ) | $ | (8,833 | ) | $ | (36 | ) | ||||
| Less: | Accretion of discount on preferred stock | (100 | ) | (91 | ) | - | |||||||
| Dividends on preferred stock | (1,030 | ) | (987 | ) | - | ||||||||
| Income available to common shareholders | $ | (4,838 | ) | $ | (9,911 | ) | $ | (36 | ) | ||||
| Basic loss per share: | |||||||||||||
| Weighted average common shares outstanding | 5,389,947 | 5,059,669 | 5,061,544 | ||||||||||
| Weighted average contingently issuable shares | 60,868 | 67,244 | 59,830 | ||||||||||
| Total weighted average shares outstanding | 5,450,815 | 5,126,913 | 5,121,374 | ||||||||||
| Basic and diluted loss per share | $ | (0.89 | ) | $ | (1.93 | ) | $ | (0.01 | ) | ||||
There was no dilutive effect of stock warrants in 2010, 2009 or 2008. Stock options for 407,730, 416,594 and 340,886 shares of common stock were not considered in computing diluted earnings per share for 2010, 2009 and 2008 because they were not dilutive.
NOTE 20 - OTHER COMPREHENSIVE INCOME
Other comprehensive income components and related taxes were as follows:
| In thousands of dollars | 2010 | 2009 | 2008 | |||||||||
| Unrealized gains on securities available for sale | $ | (962 | ) | $ | 519 | $ | 936 | |||||
| Reclassification for realized amount included in income | (31 | ) | 24 | 18 | ||||||||
| Other comprehensive income (loss) before tax effect | (993 | ) | 543 | 954 | ||||||||
| Tax expense | (338 | ) | 185 | 329 | ||||||||
| Other comprehensive income (loss) | $ | (655 | ) | $ | 358 | $ | 625 | |||||
The components of accumulated other comprehensive income included in shareholders’ equity at December 31, 2010 and, 2009 were as follows:
| In thousands of dollars | 12/31/10 | 12/31/09 | ||||||
| Net unrealized gains on securities available for sale | $ | 940 | $ | 1,934 | ||||
| Tax expense | 319 | 658 | ||||||
| Accumulated other comprehensive income | $ | 621 | $ | 1,276 | ||||
NOTE 21 - PARENT COMPANY ONLY FINANCIAL INFORMATION
The condensed financial information for United Bancorp, Inc. is summarized below.
| CONDENSED BALANCE SHEETS | December 31, | |||||||
| In thousands of dollars | 2010 | 2009 | ||||||
| Assets | ||||||||
| Cash and cash equivalents | $ | 8,800 | $ | 844 | ||||
| Securities available for sale | 28 | 31 | ||||||
| Investment in subsidiaries | 83,486 | 73,885 | ||||||
| Furniture and equipment | - | 2,262 | ||||||
| Loan to subsidiaries | - | 2,400 | ||||||
| Other assets | 438 | 2,119 | ||||||
| Total Assets | $ | 92,752 | $ | 81,541 | ||||
| Liabilities and Shareholders' Equity | ||||||||
| Liabilities | $ | 48 | $ | 674 | ||||
| Shareholders' equity | 92,704 | 80,867 | ||||||
| Total Liabilities and Shareholders' Equity | $ | 92,752 | $ | 81,541 | ||||
| CONDENSED STATEMENTS OF OPERATIONS | For the years ended December 31, | |||||||||||
| In thousands of dollars | 2010 | 2009 | 2008 | |||||||||
| Income | ||||||||||||
| Dividends from subsidiaries | $ | - | $ | - | $ | 5,480 | ||||||
| Other income | 2,398 | 11,144 | 10,273 | |||||||||
| Total Income | 2,398 | 11,144 | 15,753 | |||||||||
| Total Noninterest Expense | 3,083 | 11,757 | 10,525 | |||||||||
| Income (loss) before undistributed net income of subsidiaries and income taxes | (685 | ) | (613 | ) | 5,228 | |||||||
| Income tax benefit | (222 | ) | (258 | ) | (87 | ) | ||||||
| Net income (loss) before undistributed net income of subsidiaries | (463 | ) | (355 | ) | 5,315 | |||||||
| Excess distributed net income of subsidiaries | (3,245 | ) | (8,478 | ) | (5,351 | ) | ||||||
| Net Loss | (3,708 | ) | (8,833 | ) | (36 | ) | ||||||
Other comprehensive income (loss), including net change in unrealized gains on securities available for sale | (655 | ) | 358 | 625 | ||||||||
| Comprehensive Income (Loss) | $ | (4,363 | ) | $ | (8,475 | ) | $ | 589 | ||||
| CONDENSED STATEMENTS OF CASH FLOWS | For the years ended December 31, | |||||||||||
| In thousands of dollars | 2010 | 2009 | 2008 | |||||||||
| Cash Flows from Operating Activities | ||||||||||||
| Net Loss | $ | (3,708 | ) | $ | (8,833 | ) | $ | (36 | ) | |||
| Adjustments to Reconcile Net Income to Net Cash from Operating Activities | ||||||||||||
| Excess distributed net income of subsidiaries | 3,245 | 8,478 | 5,351 | |||||||||
| Stock option expense | 92 | 150 | 137 | |||||||||
| Change in other assets | 1,684 | (727 | ) | (16 | ) | |||||||
| Change in other liabilities | (626 | ) | (292 | ) | 48 | |||||||
| Total adjustments | 4,395 | 7,609 | 5,520 | |||||||||
| Net cash from operating activities | 687 | (1,224 | ) | 5,484 | ||||||||
| Cash Flows from Investing Activities | ||||||||||||
| Proceeds from sale of securities available for sale | - | - | 214 | |||||||||
| Investments in subsidiaries | (13,500 | ) | (15,600 | ) | (1,500 | ) | ||||||
| Change in loan to subsidiaries | 2,400 | (2,400 | ) | - | ||||||||
| Net change in premises and equipment | 2,261 | 309 | (540 | ) | ||||||||
| Net cash from investing activities | (8,839 | ) | (17,691 | ) | (1,826 | ) | ||||||
| Cash Flows from Financing Activities | ||||||||||||
| Proceeds from issuance of preferred stock and warrants | - | 20,600 | - | |||||||||
| Proceeds from common stock transactions | 17,138 | 98 | 133 | |||||||||
| Purchase of common stock | - | - | (831 | ) | ||||||||
| Cash dividends paid on common and preferred stock | (1,030 | ) | (957 | ) | (3,544 | ) | ||||||
| Net cash from financing activities | 16,108 | 19,741 | (4,242 | ) | ||||||||
| Net Change in Cash and Cash Equivalents | 7,956 | 826 | (584 | ) | ||||||||
| Cash and cash equivalents at beginning of year | 844 | 18 | 602 | |||||||||
| Cash and Cash Equivalents at End of Year | $ | 8,800 | $ | 844 | $ | 18 | ||||||
NOTE 22 – QUARTERLY FINANCIAL DATA (UNAUDITED)
Quarterly financial information is summarized below:
| In thousands of dollars, except per share data | Full Year | 4th Qtr | 3rd Qtr | 2nd Qtr | 1st Qtr | ||||||||||||||||
| 2010 | |||||||||||||||||||||
| Interest Income | $ | 39,770 | $ | 9,567 | $ | 9,993 | $ | 9,962 | $ | 10,248 | |||||||||||
| Interest Expense | 8,687 | 1,832 | 2,029 | 2,285 | 2,541 | ||||||||||||||||
| Net Interest Income | 31,083 | 7,735 | 7,964 | 7,677 | 7,707 | ||||||||||||||||
| Provision for Loan Losses | 21,530 | 4,930 | 3,150 | 8,650 | 4,800 | ||||||||||||||||
| Net Income (Loss) | $ | (3,708 | ) | $ | (427 | ) | $ | 1,027 | $ | (3,499 | ) | $ | (809 | ) | |||||||
Basic and Diluted Earnings (Loss) per Share (1) | $ | (0.89 | ) | $ | (0.11 | ) | $ | 0.14 | $ | (0.74 | ) | $ | (0.21 | ) | |||||||
(1) | As a result of a large number of shares issued in the fourth quarter of 2010, the sum of the EPS figures for the four quarters do not equal the calculation of EPS for the full year 2010. | ||||||||||||||||||||
| 2009 | ||||||||||||||||||||
| Interest Income | $ | 43,766 | $ | 10,955 | $ | 10,775 | $ | 11,007 | $ | 11,029 | ||||||||||
| Interest Expense | 12,251 | 2,775 | 2,915 | 3,094 | 3,467 | |||||||||||||||
| Net Interest Income | 31,515 | 8,180 | 7,860 | 7,913 | 7,562 | |||||||||||||||
| Provision for Loan Losses | 25,770 | 5,300 | 8,200 | 5,400 | 6,870 | |||||||||||||||
| Net Loss | $ | (8,833 | ) | $ | (482 | ) | $ | (2,890 | ) | $ | (762 | ) | $ | (4,699 | ) | |||||
| Basic and Diluted Loss per Share | $ | (1.93 | ) | $ | (0.15 | ) | $ | (0.62 | ) | $ | (0.20 | ) | $ | (0.96 | ) | |||||
NOTE 23 — CAPITAL PURCHASE PROGRAM
On January 16, 2009, the Company entered into a Letter Agreement (“Purchase Agreement”) with the U.S. Department of the Treasury (“Treasury”), pursuant to which United issued and sold (a) 20,600 shares of our Fixed Rate Cumulative Perpetual Preferred Stock, Series A (“Preferred Stock”) for an aggregate purchase price of $20,600,000 and (b) a 10-year warrant (“Warrant”) to purchase 311,492 shares of our common stock at an aggregate exercise price of $3,090,000.
The Preferred Stock qualifies as Tier I capital and will pay cumulative dividends at a rate of 5% per annum for the first five years and 9% per annum thereafter. The Preferred Stock is non-voting except with respect to certain matters affecting the rights of the holders, and may be redeemed by United after three years. The Warrant has a ten year term and is immediately exercisable with an exercise price of $9.92 per share of the Company’s common stock. Pursuant to the Purchase Agreement, Treasury has agreed not to exercise voting power with respect to any shares of United common stock issued upon exercise of the Warrant.
In the Purchase Agreement, the Company agreed that, until such time as Treasury ceases to own any debt or equity securities of the Company, acquired pursuant to the Purchase Agreement,
United will take all necessary action to ensure that its benefit plans with respect to its senior executive officers comply with Section 111(b) of the Emergency Economic Stabilization Act of 2008 (“EESA”) as implemented by any guidance or regulation under EESA that has been issued and is in effect as of the date of issuance of the Preferred Stock and the Warrant, and has agreed to not adopt any benefit plans with respect to, or which cover, its senior executive officers that do not comply with the EESA, and the applicable executives have consented to the foregoing.
As a result of issuance of the Preferred Stock on January 16, 2009, the ability of United to declare or pay dividends on, or purchase, redeem or otherwise acquire for consideration, shares of its common stock will be subject to restrictions, including an agreement that United will not declare or pay any dividend on its common stock in excess of $.10 per share per quarter, which was the last dividend declared and paid before October 14, 2008. The redemption, purchase or other acquisition of common stock or other securities of United or its affiliates also is restricted. These restrictions will terminate the earlier of (a) the third anniversary of the date of issuance of the Preferred Stock or (b) the date on which the Preferred Stock has been redeemed in whole or Treasury has transferred all of the Preferred Stock to third parties. In addition, United may not declare or pay dividends on, or repurchase, redeem or otherwise acquire for consideration, shares of its Common Stock unless all accrued and unpaid dividends on the Preferred Stock have been declared and paid in full.
Market for Common Stock
The following table shows the high and low bid prices of common stock of the Company for each quarter of 2010 and 2009 as quoted on the OTC Bulletin Board, under the symbol of "UBMI.” The prices listed below are OTC Bulletin Board quotations. They reflect inter-dealer prices without retail markup, markdown or commission and may not necessarily represent actual transactions. They also do not include private transactions not involving brokers or dealers. The Company had 1,221 shareholders of record as of December 31, 2010.
| 2010 | 2009 | |||||||||||||||||||||||
| Market Price | Cash Dividends Declared | Market Price | Cash Dividends Declared | |||||||||||||||||||||
| Quarter | High | Low | High | Low | ||||||||||||||||||||
| 1st | $ | 8.50 | $ | 5.50 | - | $ | 10.50 | $ | 5.50 | $ | 0.02 | |||||||||||||
| 2nd | 7.00 | 4.00 | - | 7.00 | 5.60 | - | ||||||||||||||||||
| 3rd | 6.25 | 3.65 | - | 6.90 | 4.74 | - | ||||||||||||||||||
| 4th | 4.00 | 2.65 | - | 6.50 | 5.00 | - | ||||||||||||||||||
Banking laws and regulations restrict the amount the Bank can transfer to the Company in the form of cash dividends and loans. Those restrictions are discussed in Note 15 of the consolidated financial statements, which appear in this report. In addition, the Company is subject to restrictions on the declaration and payment of dividends to common shareholders as a result of its participation in the TARP Capital Purchase Program.
| Board of Directors of United Bancorp, Inc. | |
| Stephanie H. Boyse | President and Chief Executive Officer, Brazeway, Inc. |
| James D. Buhr | President, J.D. Buhr & Company, LLC |
| Robert K. Chapman | President and Chief Executive Officer, United Bancorp, Inc. |
| John H. Foss | Retired Vice President, Treasurer, and Chief Financial Officer, Tecumseh Products Co. |
| Norman G. Herbert | Independent financial consultant |
| David S. Hickman | Chairman of the Board, United Bancorp, Inc. |
| James C. Lawson | General Manager, Avery Oil & Propane |
| Len M. Middleton | Professor of Strategy and Entrepreneurship, Ross School of Business, University of Michigan |
| Executive Officers of United Bancorp, Inc. | |
| Robert K. Chapman | President and Chief Executive Officer |
| Randal J. Rabe | Executive Vice President, Chief Financial Officer, Secretary to the Board |
| Todd C. Clark | Executive Vice President |
| Gary D. Haapala | Executive Vice President |
| Joseph R. Williams | Executive Vice President |
United Bancorp, Inc.
Amended and Restated
Director Retainer Stock Plan
January 22, 2007
(As amended through February 26, 2009)
1 – PURPOSE
The purpose of this Director Retainer Stock Plan is to provide Eligible Directors with a means of deferring payment of retainers and board meeting fees payable to them in the future as a result of serving as a director of the Company and/or its subsidiary Banks, while at the same time expressing their commitment to the Company by subjecting such deferred retainers and fees to the stock market performance of the common stock of the Company.
2 -- DEFINITIONS
As used in the Plan, the following terms have the following respective meanings:
"Bank" means a subsidiary bank of the Company.
"Board" means the Board of Directors of the Company.
"Committee" has the meaning given in Section 3 hereof.
"Company" means United Bancorp, Inc., a Michigan corporation, and any successor thereof.
“Determination Date” means, for each Participating Director, the earliest date on which, due to death, Disability or Separation of Service, such Participating Director is neither an employee of the Company nor an employee of any Affiliated Entity.
“Disability” means, the employee is unable to perform any substantially gainful activity by reason of any medically determinable mental impairment that is expected to last for more than twelve (12) months or result in death.
"Eligible Director" means, for any relevant time, each individual who at that time is a Director of the Company and/or the Bank and is not also an employee of the Company or any subsidiary of the Company.
“Exchange” means national securities exchanges, including for this purpose the NASDAQ National Market" or the OTC Bulletin Board, if applicable.
“Key Employee” means, an employee has met the requirements of Code §§ 414(i)(1)(A)(i), 414(i)(1)(A)(ii) or 414(i)(1)(A)(iii), but disregarding Code § 416(i)(5) at any time during the twelve (12) month period ending on December 31st of each calendar year.
"Market Price" means, for any given date: (i) if the Shares are then listed for trading on one or more Exchanges, the closing price for a Share on the principal such Exchange on the date in question (or, if no Shares traded on such Exchange on such date, the next preceding date on which such trading occurred); (ii) if (i) is inapplicable but bid and asked prices for Shares are quoted through such Exchange, the average of the highest bid and lowest asked prices so quoted for a Share on the date in question (or, if no prices for Shares were quoted on that date, the next preceding date on which they were quoted); (iii) if (i) and (ii) are inapplicable but bid and asked prices for Shares are otherwise quoted by one or more broker-dealers known to the Company to be making a market in the Shares, the average of the highest bid and lowest asked prices so quoted on the date in question (or, if no prices were quoted on that date, the next preceding date on which they were quoted); and (iv) if all of the foregoing are inapplicable, the fair market value of a Share on the date in question as determined in good faith by the Committee.
"NASDAQ" means the National Association of Securities Dealers, Inc. Automated Quotation System.
"Participating Director" means an individual who, while an Eligible Director, has elected to participate in the Plan as contemplated by Section 5.1 hereof.
"Participation Election" has the meaning given in Section 5.1 hereof.
"Plan" means this Director Retainer Stock Plan.
“Related Employer” means, an employer and any corporation which is a member of a controlled group of corporations (as defined in Code § 414(b)), any trade or business (whether or not incorporated) which is under common control (as defined in Code § 414(c)) or an affiliated service group (as defined in Code §§ 414(m) and 414(o)) hereinafter referred to as the “Related Group.” Only a member of the Related Group who has adopted this Agreement may contribute to it and only employees of an adopting member of the Related Group may become eligible to participate and receive benefits under the Agreement.
"Reserve Account" has the meaning given in Section 6.1 hereof.
"Retainer" means the entire amount payable to a Participating Director for serving as a director of the Company and/or the Bank during a given period, including amounts payable for attendance during such period at meetings of the Board or of the board of directors of the Bank, but excluding any amounts payable for serving on or as chair of any committee of either board and excluding any amounts payable for reimbursement of expenses.
"Rule 16b-3" means Securities and Exchange Commission Rule 16b-3 (or any successor rule or regulation), as in effect and applicable to the Company at a given time.
“Separation from Service” shall have the same meaning given to that term under Treas. Reg. § 1.409A-1(h) and shall be determined in the same manner.
“Specified Employee” means, an employee, as of the date of Separation from Service, is treated as a Key Employee and is employed by a Related Employer whose stock is publicly traded on an established securities market.
"Shares" means shares of the no par value common stock of the Company, or such other securities or other property as hereafter may become issuable to a Participating Director in lieu of shares of such stock pursuant to an adjustment made under Section 9 hereof.
3 -- ADMINISTRATION
The Plan shall be administered by a committee of the Board (the "Committee") consisting of the Chief Executive Officer of the Company (or, if the Chief Executive Officer is a not a member of the Board at a given time, consisting of all members of the Board who are not Eligible Directors). To the extent consistent with the terms of the Plan, the Committee shall have the power to interpret any Plan provision, to prescribe, amend, and rescind rules and regulations relating to the Plan, and to make all other determinations that it deems necessary or advisable to administer the Plan. The Committee may appoint such agents to assist in administration of the Plan, other than Eligible Directors, as the Committee deems appropriate.
4 -- SHARES SUBJECT TO THE PLAN
Subject to adjustment as provided in Section 9 hereof, no more than 150,000 Shares in the aggregate may be issued pursuant to the Plan. There shall at all times be reserved for issuance under the Plan from the authorized and unissued Shares a number of Shares equal to the maximum number that in future may be issued under the Plan.
5 -- ELECTION PROCEDURES
5.1 Initial Elections. After the Plan becomes effective, an Eligible Director may elect to defer payment of all or a portion of his or her future Retainer by executing and delivering to the Secretary of the Company (or such other officer of the Company as the Committee hereafter may designate) a written election to participate in the Plan (a "Participation Election"), identifying (as a multiple of 10%) the percentage of the director's Retainer elected to be deferred and otherwise in such form as the Committee shall have approved. If a Participation Election is executed and delivered by an Eligible Director no later than 30 days after the Plan becomes effective (or, for an individual who later becomes an Eligible Director, no later than 30 days after he or she became eligible), the director's election shall be given effect commencing as of the next calendar quarter after delivery of the Participation Election or, if later, the date specified in the Participation Election. If a Participation Election is executed and delivered by an Eligible Director after the 30 day period applicable to such director, the director's election shall be given effect commencing as of the next calendar year after delivery of the Participation Election or, if later, the date specified therein.
5.2 Changes in Elections. An Eligible Director who has become a Participating Director by complying with the procedures set forth above thereafter may increase or decrease the percentage of his or her Retainer to be deferred or may terminate future deferrals by executing
and delivering to the Secretary or other designated officer another Participation Election reflecting such increase, decrease, or termination. However, the change reflected in such other Participation Election shall not be given effect until the next calendar year after it is delivered or, if later, the date specified therein.
6 -- RESERVE ACCOUNTS
6.1 Establishment of Accounts. For each Participating Director, the Company shall establish and maintain a bookkeeping account (a "Reserve Account") in which all units allocable to the Participating Director due to his or her participation in the Plan shall be credited.
6.2 Credits to Accounts for Deferred Retainers. Whenever a portion of his or her Retainer is earned by a Participating Director, the cash amount payable shall be reduced by the percentage of such amount which the Participating Director has elected to defer pursuant to his or her Participation Election then in effect, and there shall be credited to the Participating Director's Reserve Account a number (to four decimal places) of units that is equal to the amount by which the Participating Director's cash payment has been reduced, divided by the Market Price as of the cash payment date. For this purpose, portions of a Retainer attributable to meeting attendance shall be deemed earned as meetings are attended, and one quarter of the remainder of a Retainer for any calendar year shall be deemed earned as of the first business day of each calendar quarter.
6.3 Credits for Cash Dividends or Distributions. On the payment date for any cash dividend or other cash distribution declared upon the Shares, there shall be credited to each Participating Director's Reserve Account that number (to four decimal places) of units that is equal to the total of units which on the related record date were in the Participating Director's Reserve Account, multiplied by the per Share cash dividend or other distribution, and divided by the Market Price on such payment date.
6.4 Reports Concerning Accounts. In January of each year, the Company shall provide each Participating Director with a report of his or her Reserve Account balance as of the end of the preceding year.
7 -- PAYMENT OF ACCOUNT VALUES
7.1 General. Subject to the provisions of Sections 7.2 and 7.3, on or within 30 days after a Participating Director's Determination Date, the Company shall issue and deliver to the Participating Director that number of Shares which equals the number of whole units credited to his or her Reserve Account as of the Determination Date and shall pay to the Participating Director in cash an amount equal to the difference (if any) between the total number of whole and fractional units credited to the Reserve Account as of the Determination Date and the number of Shares being distributed, multiplied by the Market Price as of the Determination Date. If, on the date such Shares are issued and/or such payment is made, any cash dividend or other cash distribution has been declared upon the Shares with a record date earlier than the issuance date but after the Determination Date, then the Company also shall pay to the Participating
Director in cash an amount equal to the total number of units in his or her Reserve Account on the Determination Date multiplied by the per Share cash dividend or distribution.
7.2 Effect of Plan Limits on Shares. In any case in which the distribution of Shares to a Participating Director in accordance with Section 7.1 would be impermissible due to the Plan's limits on available Shares (after taking into account any then pending distribution to be made to any other Participating Director having an earlier Determination Date), the number of Shares to be issued to the affected Participating Director shall be reduced to the maximum number of Shares then permissible under such limits (or, if more than one Participating Director having the same Determination Date is affected, the highest whole number determined by multiplying the maximum number of Shares then available by a fraction the numerator of which is the Determination Date number of units in his or her Reserve Account and the denominator of which is the aggregate Determination Date number of units in the affected Participating Directors' Reserve Accounts), and the remaining value of his or her Reserve Account (or, if necessary, the entire value of such account) shall be determined in accordance with Section 7.1 and shall be payable in cash.
7.3 Distribution in Case of Death or Disability. If a Participating Director’s Determination Date occurs due to death, or if he or she dies prior to delivery of Shares and any cash required to be delivered pursuant to the Plan, the Shares deliverable shall be issued in the name of, and such Shares and any cash required to be delivered under the Plan shall be delivered to, the beneficiary or beneficiaries designated in the Participating Director’s then most recent Participation Election, or, if no beneficiary has been designated, the legally appointed personal representative of the Participating Director’s estate. If no such representative is appointed by the time delivery is due, then the Company shall hold the items to be delivered until appointment occurs or proper claim for such items otherwise is made of the Company by the person or persons entitled thereto. If the Company is notified that a Participating Director has been adjudicated mentally incompetent, using criteria that satisfied the requirements of Treasury Regulation § 1.409A-3(i)(4), as of the time Shares and any cash deliverable under the Plan are to be delivered to the Participating Director, or if it otherwise is demonstrated to the satisfaction of the Company, by a method permissible under Treasury Regulation § 1.409A-3(i)(4), that such mental incapacity then exists by a person authorized by a durable power of attorney or similar document to attend to the Participating Director’s financial affairs, the Shares shall be issued in the name of, and such Shares and any required cash shall be delivered to, the Participating Director’s legally appointed guardian or conservator or, if none has been appointed, the holder of such power of attorney or similar document.
8 -- MISCELLANEOUS MATTERS
8.1 Director Rights Concerning Reserve Accounts. Reserve Accounts are not intended to be and shall not be trust accounts or escrow accounts for the benefit of any Participating Director or other person, nor shall the establishment and maintenance of a Reserve Account in itself afford any Participating Director or other person any right or interest in any asset the Company may determine to earmark or in any Shares reserved for future payment of benefits under the Plan. Rather, future benefits payable under the Plan are intended to be unfunded for tax purposes, and the sole right of a Participating Director or beneficiary or other successor in interest thereof
with respect to his or Reserve Account shall be the right as an unsecured general creditor of the Company to claim any Shares or cash to which the Participating Director becomes entitled after his or her Determination Date, pursuant to the terms and conditions of the Plan.
8.2 Inalienability of Reserve Accounts. A Participating Director's right and interest in his or her Reserve Account shall not be subject in any manner to anticipation, alienation, sale, assignment, pledge, encumbrance, attachment, garnishment for the benefit of creditors of the Participating Director, or other transfer whatsoever, other than by will or the laws of descent and distribution.
8.3 Rights as Holder of Shares. A Participating Director shall have no rights as a holder of Shares to be delivered pursuant to the Plan unless and until a certificate evidencing such Shares is issued by the Company.
8.4 Future Terms as a Director. Nothing in the Plan or any Participation Election shall obligate any Eligible Director or Participating Director to continue as a director of the Company or the Bank, or to accept any nomination for a future term as such a director, or require the Company to nominate or cause the nomination of any Eligible Director or Participating Director for a future term as a director of the Company or the Bank.
8.5 Withholding. The Company shall be entitled to withhold and deduct from any amounts due from the Company to a Participating Director, all legally required amounts necessary to satisfy any Federal, state or local withholding taxes arising directly or indirectly in connection with the Plan or any Participation Election, and the Company may require the Participating Director to remit promptly to the Company the amount of such taxes before taking any future actions with respect to the Participating Director's Reserve Account or Participation Election.
8.6 Applicable Law. The Plan and all actions taken under it shall be governed by the internal laws of the State of Michigan.
8.7 Specified Employee Limitation. Except as otherwise provided in this subsection a distribution made because of a Separation of Service by a Specified Employee shall not occur before the date which is six (6) months after the Separation of Service. For this purpose, if an employee is treated as a Specified Employee he shall be treated as a Specified Employee for the entire twelve (12) month period beginning on April 1st of each calendar year. This subsection shall not apply to payments that occur after the death of an employee.
9 -- ADJUSTMENTS
In the event of any non-cash dividend or other distribution, or any stock split, reverse stock split, recapitalization, reorganization, split-up, spin-off, merger, consolidation, share exchange, or other like change in the capital or corporate structure of the Company affecting the Shares, there shall be made such adjustment or adjustments (if any) in the number and type of Shares issuable under the Plan and in the numbers of units credited to the Reserve Accounts of Participating Directors as the Board determines to be appropriate in light of such event in order to continue to make available the benefits intended by the Plan, but no adjustment shall be required by reason of any sales of Shares or other Company securities by the Company at any
price, whether below, or at or about, Market Price, and whether by or pursuant to warrant, option, right, conversion right or privilege, or otherwise.
10 -- DURATION OF THE PLAN
10.1 Effective Date. The Plan has been adopted by the Board subject to shareholder approval at the Company's 1996 annual meeting of shareholders and shall become effective when, and only when, such approval is obtained.
10.2 Termination and Amendment. The Board may at any time and from time to time amend, modify, suspend, or terminate the Plan, with or without the approval of shareholders of the Company, except that: (i) no amendment or modification of the Plan shall be effective without shareholder approval at any time at which such approval is required, either by applicable rules of any securities exchange (including the NASDAQ National Market) on which Company stock is then principally traded, or by Rule 16b-3; (ii) none of the foregoing actions by the Board shall adversely affect the rights of a Participating Director with respect to an effective Participation Election without such Participating Director's consent; and (iii) for so long as may be necessary in order for the Plan to satisfy Rule 16b-3 requirements for "formula plans," the eligibility provisions of the Plan and those provisions affecting the type, extent, and timing of awards under the Plan may not be amended on a frequent basis, other than to comport with changes in the Internal Revenue Code, the Employee Retirement Income Security Act, or the rules thereunder.