UNITED STATES
SECURITIES AND EXCHANGE COMMISSION
Washington, D.C. 20549
FORM N-CSR
CERTIFIED SHAREHOLDER REPORT OF REGISTERED
MANAGEMENT INVESTMENT COMPANIES
Investment Company Act file number 811-4395
Smith Barney Muni Funds
(Exact name of registrant as specified in charter)
125 Broad Street, New York, NY 10004
(Address of principal executive offices) (Zip code)
Robert I. Frenkel, Esq.
Smith Barney Fund Management LLC
300 First Stamford Place
Stamford, CT 06902
(Name and address of agent for service)
Registrant’s telephone number, including area code: (800) 451-2010
Date of fiscal year end: March 31,
Date of reporting period: September 30, 2004
| | |
| ITEM 1. | | REPORT TO STOCKHOLDERS. |
The Semi-Annual Report to Stockholders is filed herewith.
SMITH BARNEY
MUNI FUNDS
LIMITED TERM PORTFOLIO
STYLE PURE SERIES | SEMI-ANNUAL REPORT | SEPTEMBER 30, 2004

NOT FDIC INSURED • NOT BANK GUARANTEED • MAY LOSE VALUE
WHAT’S INSIDE
LETTER FROM THE CHAIRMAN

R. JAY GERKEN, CFA
Chairman, President and
Chief Executive Officer
Dear Shareholder,
For the first time in four years, the Federal Reserve Board (“Fed”)i pushed short-term interest rates higher during the six months ended September 30, 2004. The Fed raised its target for the closely watched federal funds rateii by 0.25% on three occasions, increasing it from a four-decade low of 1.00% at the end of June to 1.75% in September. Following the end of the fund’s reporting period, at its November meeting, the Fed once again raised its target for the federal funds rate by 0.25% to 2.00%. Higher rates can help slow a potential acceleration of economic growth and thereby help maintain a balance between that growth and the inflation that can generally accompany it.
Although inflation picked up earlier this year, recently reported figures were benign. The U.S.
PERFORMANCE SNAPSHOT
AS OF SEPTEMBER 30, 2004
(excluding sales charges)
| | | |
| | | 6 Months | |
| | | | |
Class A Shares — Limited Term Portfolio | | 1.40 | % |
| | | | |
Lehman Brothers Municipal Bond Index | | 1.43 | % |
| | | | |
Lipper Intermediate Municipal Debt Funds Category Average | | 0.80 | % |
The performance shown represents past performance. Past performance is no guarantee of future results and current performance may be higher or lower than the performance shown above. Principal value and investment returns will fluctuate and investors’ shares, when redeemed, may be worth more or less than their original cost. To obtain performance data current to the most recent month-end, please visit our website at www.smithbarneymutualfunds.com.
Performance figures may reflect reimbursements or fee waivers, without which the performance would have been lower.
Class A share returns assume the reinvestment of income dividends and capital gains distributions at net asset value and the deduction of all fund expenses. Returns have not been adjusted to include sales charges that may apply when shares are purchased or the deduction of taxes that a shareholder would pay on fund distributions. Excluding sales charges, Class B shares returned 1.16%, Class C shares returned 1.08%, Class O shares returned 1.28% and Class Y shares returned 1.64% over the six months ended September 30, 2004.
1 Smith Barney Muni Funds | 2004 Semi-Annual Report
economy grew at a more moderate rate during the second quarter versus the first, according to data released in Septemberiii, albeit at a significantly stronger pace than the second quarter of last year. Following robust results in the early spring, labor market growth tapered off, picked up in the late summer and held steady through the end of the period.iv
While rising interest rates are generally troublesome for longer-term fixed income securities, because bond prices decline as rates are expected to rise, rising rates result in higher levels of income on new bonds issued in the future. Municipal bonds returned -2.37%v in the second quarter amid expectations that the Fed was positioning to push rates higher. Given that bond prices had already factored in rate hikes to a significant extent during the second quarter, and coupling this with investors’ reaction to tepid economic growth and lack of inflationary pressures, bond prices bounced back in the third quarter. Yieldsvi correspondingly dropped to levels virtually in line with those when the period began, and municipal bonds finished the period in modestly positive territory on a total return basis, which includes reinvested dividend income.v
While the broader-based Lehman Brothers Municipal Bond Index returned 1.43%v intermediate-term issues finished slightly lower, with seven-year issues on average returning 0.98% and 10-year issues returning 1.66% overall.vii
Given the portfolio manager’s view prior to the period that interest rates were poised to rise, and that recent figures could potentially understate actual inflation, the fund assumed a defensive posture in terms of its overall duration, or price sensitivity to interest rate movements. This low-duration approach to managing interest rate risk limited the fund’s ability to completely participate in upside market movements during intervals when bond prices rose, such as during the third quarter, when municipal bonds collectively returned 3.89%.v However, the fund benefited from this approach in absolute terms when bond prices dropped, particularly in the spring. In the recent market environment, the portfolio manager believes his defensive approach to reducing potential volatility was more prudent than a longer-duration strategy.
Performance Review
Within this environment, the fund performed as follows: For the six months ended September 30, 2004, Class A shares of the Smith Barney Muni Funds — Limited Term Portfolio, excluding sales charges, returned 1.40%. In comparison, the broad-based Lehman Brothers Municipal Bond Index returned
| 1 | Lipper, Inc. is a major independent mutual-fund tracking organization. Returns are based on the six-month period ended September 30, 2004, calculated among the 160 funds in the fund’s Lipper category, including the reinvestment of dividends and capital gains, if any, and excluding sales charges. |
2 Smith Barney Muni Funds | 2004 Semi-Annual Report
1.43% for the same period. They outperformed the fund’s Lipper intermediate municipal debt funds category average1, which was 0.80%.
Certain investors may be subject to the federal Alternative Minimum Tax, and state and local taxes may apply. Capital gains, if any, are fully taxable. Please consult your personal tax or legal adviser.
Special Shareholder Notice
Effective April 29, 2004, Smith Barney Class L shares were renamed Class C shares. The current expenses, management fees, and sales charges have not changed.
Information About Your Fund
In recent months several issues in the mutual fund industry have come under the scrutiny of federal and state regulators. The fund’s Adviser and some of its affiliates have received requests for information from various government regulators regarding market timing, late trading, fees, and other mutual fund issues in connection with various investigations. The regulators appear to be examining, among other things, the fund’s response to market timing and shareholder exchange activity, including compliance with prospectus disclosure related to these subjects. The fund has been informed that the Adviser and its affiliates are responding to those information requests, but are not in a position to predict the outcome of these requests and investigations.
In November 2003, Citigroup Asset Management (“CAM”) disclosed an investigation by the Securities and Exchange Commission (“SEC”) and the U.S. Attorney relating to CAM’s entry into the transfer agency business during 1997-1999. Citigroup has disclosed that the Staff of the SEC is considering recommending a civil injunctive action and/or an administrative proceeding against certain advisory and transfer agent entities affiliated with Citigroup, the former CEO of CAM, a former employee and a current employee of CAM, relating to the creation, operation and fees of its internal transfer agent unit that serves various CAM-managed funds. Citigroup is cooperating with the SEC and will seek to resolve this matter in discussion with the SEC Staff. Although there can be no assurance, Citigroup does not believe that this matter will have a material adverse effect on the fund.
3 Smith Barney Muni Funds | 2004 Semi-Annual Report
As always, thank you for your confidence in our stewardship of your assets. We look forward to helping you continue to meet your financial goals.
Sincerely,

R. Jay Gerken, CFA
Chairman, President and Chief Executive Officer
November 10, 2004
The information provided is not intended to be a forecast of future events, a guarantee of future results or investment advice. Views expressed may differ from those of the firm as a whole.
RISKS: Keep in mind, the fund’s investments are subject to interest rate and credit risk. As interest rates rise, bond prices fall, reducing the value of the Fund's share price. Portfolio holdings may include lower-quality securities which present greater risk of loss of principal and interest than higher rated securities. The fund may use derivatives, such as options and futures, which can be illiquid, may disproportionately increase losses, and have a potentially large impact on fund performance.
All index performance reflects no deduction for fees, expenses or taxes. Please note an investor cannot invest directly in an index.
| i | Source: U.S. Federal Reserve Board. The Fed is responsible for the formulation of a policy designed to promote economic growth, full employment, stable prices, and a sustainable pattern of international trade and payments. |
| ii | The federal funds rate is the interest rate that banks with excess reserves at a Federal Reserve district bank charge other banks that need overnight loans. |
| iii | Source: Commerce Department (Bureau of Economic Analysis). Refers to quarterly growth of Gross Domestic Product (“GDP”). Gross domestic product is a market value of goods and services produced by labor and property in a given country. |
| iv | Source: Bureau of Labor Statistics. |
| v | Source: Based upon the performance of the Lehman Brothers Municipal Bond Index over the referenced period, which is a broad measure of the municipal bond market with maturities of at least one year. |
| vi | Yields are based upon data reflecting average yields of a universe of municipal bonds over the stated period derived via data on Bloomberg L.P. |
| vii | Source: Based upon the performance of the Lehman Brothers 6-8 Year Municipal Bond Index and Lehman Brothers 8-12 Municipal Bond Index over the referenced period, which are each a broad measure of the municipal bond market with average maturities of seven and 10 years, respectively, with maturities of at least one year. |
4 Smith Barney Muni Funds | 2004 Semi-Annual Report
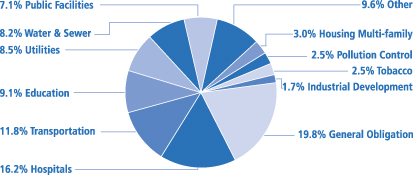
Fund at a Glance (unaudited)
Investment Breakdown†
March 31, 2004
September 30, 2004
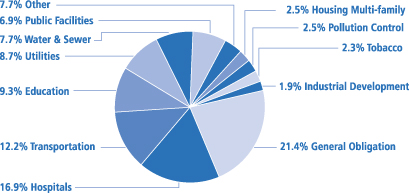
| † | | As a percentage of total investments. Please note that portfolio holdings are subject to change. |
5 Smith Barney Muni Funds | 2004 Semi-Annual Report
Fund Expenses (unaudited)
Example
As a shareholder of the Fund, you may incur two types of costs: (1) transaction costs, including front-end and back-end sales charges (loads) on purchase payments, reinvested dividends, or other distributions; and (2) ongoing costs, including management fees; distribution and/or service (12b-1) fees; and other Fund expenses. This example is intended to help you understand your ongoing costs (in dollars) of investing in the Fund and to compare these costs with the ongoing costs of investing in other mutual funds.
This example is based on an investment of $1,000 invested on April 1, 2004 and held for the six months ended September 30, 2004.
Actual Expenses
The table below titled “Based on Actual Total Return” provides information about actual account values and actual expenses. You may use the information provided in this table, together with the amount you invested, to estimate the expenses that you paid over the period. To estimate the expenses you paid on your account, divide your ending account value by $1,000 (for example, an $8,600 ending account value divided by $1,000 = 8.6), then multiply the result by the number under the heading entitled “Expenses Paid During the Period”.
Based on Actual Total Return(1)
| | | | | | | | | | | | | | | |
| | | Actual Total Return Without Sales Charges(2) | | | Beginning
Account
Value | | Ending Account
Value | | Annualized
Expense
Ratio | | | Expenses Paid During the Period(3) |
Class A | | 1.40 | % | | $ | 1,000.00 | | $ | 1,014.00 | | 0.70 | % | | $ | 3.53 |
|
Class B | | 1.16 | | | | 1,000.00 | | | 1,011.60 | | 1.19 | | | | 6.00 |
|
Class C(4) | | 1.08 | | | | 1,000.00 | | | 1,010.80 | | 1.30 | | | | 6.55 |
|
Class O | | 1.28 | | | | 1,000.00 | | | 1,012.80 | | 0.94 | | | | 4.74 |
|
Class Y | | 1.64 | | | | 1,000.00 | | | 1,016.40 | | 0.54 | | | | 2.73 |
|
| (1) | | For the six months ended September 30, 2004. |
| (2) | | Assumes reinvestment of all dividends and capital gain distributions, if any, at net asset value and does not reflect the deduction of the applicable sales charges with respect to Class A shares or the applicable contingent deferred sales charges (“CDSC”) with respect to Class A, B and O shares. |
| (3) | | Expenses (net of voluntary waiver) are equal to each class’ respective annualized expense ratio multiplied by the average account value over the period, multiplied by the number of days in the most recent fiscal half-year, then divided by 365. |
| (4) | | On April 29, 2004, Class L shares were renamed as Class C shares. |
6 Smith Barney Muni Funds | 2004 Semi-Annual Report
Fund Expenses (unaudited) (continued)
Hypothetical Example for Comparison Purposes
The table below titled “Based on Hypothetical Total Return” provides information about hypothetical account values and hypothetical expenses based on the actual expense ratio and an assumed rate of return of 5.00% per year before expenses, which is not the Fund’s actual return. The hypothetical account values and expenses may not be used to estimate the actual ending account balance or expenses you paid for the period. You may use the information provided in this table to compare the ongoing costs of investing in the Fund and other funds. To do so, compare the 5.00% hypothetical example relating to the Fund with the 5.00% hypothetical examples that appear in the shareholder reports of the other funds.
Please note that the expenses shown in the table below are meant to highlight your ongoing costs only and do not reflect any transactional costs, such as front-end or back-end sales charges (loads). Therefore, the table is useful in comparing ongoing costs only, and will not help you determine the relative total costs of owning different funds. In addition, if these transaction costs were included, your costs would have been higher.
Based on Hypothetical Total Return(1)
| | | | | | | | | | | | | | | |
| | | Hypothetical
Annualized
Total Return | | | Beginning
Account
Value | | Ending
Account
Value | | Annualized
Expense
Ratio | | | Expenses Paid During the Period(2) |
Class A | | 5.00 | % | | $ | 1,000.00 | | $ | 1,021.56 | | 0.70 | % | | $ | 3.55 |
|
Class B | | 5.00 | | | | 1,000.00 | | | 1,019.10 | | 1.19 | | | | 6.02 |
|
Class C(3) | | 5.00 | | | | 1,000.00 | | | 1,018.55 | | 1.30 | | | | 6.58 |
|
Class O | | 5.00 | | | | 1,000.00 | | | 1,020.36 | | 0.94 | | | | 4.76 |
|
Class Y | | 5.00 | | | | 1,000.00 | | | 1,022.36 | | 0.54 | | | | 2.74 |
|
| (1) | | For the six months ended September 30, 2004. |
| (2) | | Expenses (net of voluntary waiver) are equal to each class’ respective annualized expense ratio multiplied by the average account value over the period, multiplied by the number of days in the most recent fiscal half-year, then divided by 365. |
| (3) | | On April 29, 2004, Class L shares were renamed as Class C shares. |
7 Smith Barney Muni Funds | 2004 Semi-Annual Report
| | |
| Schedule of Investments (unaudited) | | September 30, 2004 |
| | | | | | | |
FACE
AMOUNT | | RATING(a) | | SECURITY | | VALUE |
| | | | | | | | |
| Alabama — 3.5% | | | | | |
| $ 2,415,000 | | A- | | Alabama 21st Century Authority, Tobacco Settlement Revenue, 5.750% due 12/1/17 | | $ | 2,508,581 |
| 5,000,000 | | AAA | | Alabama State Public School and College Authority,
5.125% due 11/1/15 (b) | | | 5,388,700 |
| 3,040,000 | | AAA | | Birmingham, AL Airport Authority, Airport Revenue,
MBIA-Insured, 5.500% due 7/1/16 | | | 3,212,581 |
| 7,000,000 | | AAA | | Jefferson County, AL Sewer Revenue, Refunding, Series B 8, 5.250% due 2/1/16 (b) | | | 7,635,950 |
| 1,000,000 | | A- | | Marshall County, AL Health Care Authority Revenue, Series A, 6.250% due 1/1/22 | | | 1,065,400 |
| 3,215,000 | | AAA | | Mobile, AL GO, 10.875% due 11/1/07 (b)(c) | | | 3,664,553 |
| 1,750,000 | | NR | | Rainbow City, AL Special Health Care Facilities Financing Authority, Regency Pointe Inc., Series B, 7.250% due 1/1/06 | | | 1,585,395 |
| 1,000,000 | | AAA | | Saraland, AL GO, MBIA-Insured, 5.250% due 1/1/14 | | | 1,098,830 |
|
| | | | | | | | 26,159,990 |
|
| Alaska — 0.1% | | | | | |
| 1,000,000 | | NR | | Alaska Industrial Development & Export Authority Revenue, Williams Lynxs Alaska Cargo Port LLC,
8.000% due 5/1/23 (d) | | | 1,045,430 |
|
| American Samoa — 0.1% | | | |
| 1,000,000 | | A | | Territory of American Samoa, ACA-Insured, 6.000% due 9/1/08 | | | 1,100,840 |
|
| Arizona — 1.1% | | | | | |
| 1,000,000 | | Aaa* | | Arizona Educational Loan Marketing Corp., Education Loan Revenue, 6.375% due 9/1/05 (d) | | | 1,003,510 |
| 1,740,000 | | BBB+ | | Arizona Health Facilities Authority Revenue, Catholic Healthcare West, Series A, 6.125% due 7/1/09 | | | 1,869,299 |
| 1,000,000 | | AAA | | Arizona State University, Revenue Bonds,
FGIC-Insured, 5.500% due 7/1/21 | | | 1,113,700 |
| | | | | Maricopa County, AZ Hospital Revenue: | | | |
| 135,000 | | AAA | | Intercommunity Healthcare, (Sun City Project),
8.625% due 1/1/10 (c) | | | 157,043 |
| | | | | St. Luke’s Medical Center: | | | |
| 1,525,000 | | AAA | | 8.750% due 2/1/10 (c) | | | 1,786,660 |
| 260,000 | | AAA | | 10.250% due 2/1/11 (c) | | | 325,562 |
| 610,000 | | NR | | Maricopa County, AZ IDA, MFH Revenue, Stanford Court Apartments, Series B, 5.750% due 7/1/08 | | | 570,027 |
| 961,000 | | AAA | | Pima County, AZ Hospital Revenue, Tucson Medical Center, 10.375% due 4/1/07 (c) | | | 1,078,204 |
|
| | | | | | | | 7,904,005 |
|
| Arkansas — 1.0% | | | | | |
| 580,000 | | AAA | | Arkansas Housing Development Agency, Single-Family Mortgage, FHA/VA-Insured, 8.375% due 7/1/10 (c) | | | 685,137 |
See Notes to Financial Statements.
8 Smith Barney Muni Funds | 2004 Semi-Annual Report
| | |
| Schedule of Investments (unaudited) (continued) | | September 30, 2004 |
| | | | | | | |
FACE
AMOUNT | | RATING(a) | | SECURITY | | VALUE |
| | | | | | | | |
| Arkansas — 1.0% (continued) | | | |
| | | | | Arkansas State Development Finance Authority: | | | |
| | | | | Hospital Revenue, Washington Regional Medical Center: | | | |
| $ 1,500,000 | | BBB- | | 7.000% due 2/1/15 | | $ | 1,655,460 |
| 2,500,000 | | BBB- | | 7.250% due 2/1/20 | | | 2,764,675 |
| 260,000 | | AAA | | Single-Family Mortgage Revenue, Series A,
GNMA/FNMA-Collateralized, 6.200% due 7/1/15 | | | 267,589 |
| 650,000 | | AAA | | Pulaski County, AR Hospital Revenue, Arkansas Children’s Hospital, 9.250% due 3/1/10 (c) | | | 775,944 |
| 1,000,000 | | BB+ | | Warren County, AR Solid Waste Disposal Revenue, (Potlatch Corp. Project), 7.000% due 4/1/12 (d) | | | 1,047,340 |
|
| | | | | | | | 7,196,145 |
|
| California — 3.1% | | | | | |
| 3,000,000 | | NR | | Barona Band of Mission Indians, CA GO, 8.250% due 1/1/20 | | | 3,222,630 |
| 2,500,000 | | NR | | California State Department Water Resources Power Supply Revenue, RITES, Series A, AMBAC-Insured,
5.375% due 5/1/18 (e) | | | 3,041,000 |
| 5,000,000 | | AA- | | California State Economic Recovery GO, Series A,
5.000% due 7/1/16 (b) | | | 5,362,700 |
| 4,245,000 | | A- | | California State Public Works Board Lease Revenue, Department of Corrections, Series A,
5.250% due 9/1/16 (b) | | | 4,534,849 |
| 225,000 | | Aaa* | | Camarillo, CA Hospital Revenue, Pleasant Valley Hospital Building Corp., 9.700% due 12/15/07 (c) | | | 253,453 |
| 390,000 | | NR | | Los Angeles, CA COP, Hollywood Presbyterian | | | |
| | | | | Medical Center, 9.625% due 7/1/13 (c) | | | 507,257 |
| 4,000,000 | | NR | | Los Angeles, CA Unified School District, RITES PA-1118,
MBIA-Insured, 9.185% due 1/1/11 (b)(e) | | | 5,011,360 |
| 240,000 | | AAA | | San Leandro, CA Hospital Revenue, Vesper Memorial Hospital, 11.500% due 5/1/11 (c) | | | 315,931 |
| 965,000 | | AAA | | Santa Rosa, CA Hospital Revenue, (Santa Rosa Hospital Memorial Project), 10.300% due 3/1/11 (c) | | | 1,223,958 |
|
| | | | | | | | 23,473,138 |
|
| Colorado — 1.4% | | | | | |
| 1,025,000 | | Baa3* | | Colorado Educational & Cultural Facilities Authority Revenue, Charter School, (Bromley East Project), Series A,
7.000% due 9/15/20 | | | 1,063,058 |
| 1,035,000 | | NR | | Colorado Health Facilities Authority, Hospital Revenue, (Weld County General Hospital Project), 9.375% due 7/1/09 (c) | | | 1,227,479 |
| 410,000 | | AA | | Colorado HFA, Single-Family Mortgage Program, Sr. Bonds, Series D-2, 6.900% due 4/1/29 (d) | | | 425,797 |
| | | | | Denver, CO City & County: | | | |
| 3,000,000 | | AAA | | Excise Tax Revenue, Refunding, Series A, FSA-Insured,
5.500% due 9/1/14 | | | 3,336,780 |
| 1,480,000 | | AAA | | Wastewater Revenue, FGIC-Insured, 5.250% due 11/1/14 | | | 1,651,902 |
See Notes to Financial Statements.
9 Smith Barney Muni Funds | 2004 Semi-Annual Report
| | |
| Schedule of Investments (unaudited) (continued) | | September 30, 2004 |
| | | | | | | |
FACE
AMOUNT | | RATING(a) | | SECURITY | | VALUE |
| | | | | | | | |
| Colorado — 1.4% (continued) | | | |
| $ 2,200,000 | | AAA | | Longmont, CO Sales & Use Tax Revenue,
5.750% due 11/15/19 | | $ | 2,484,328 |
| 70,000 | | Aaa* | | Loveland, CO GO, 8.875% due 11/1/05 (c) | | | 72,712 |
|
| | | | | | | | 10,262,056 |
|
| Connecticut — 2.7% | | | |
| | | | | Connecticut State GO: | | | |
| 5,000,000 | | AA | | Series C, 5.000% due 12/15/11 (b) | | | 5,570,650 |
| 5,000,000 | | AA | | Series D, 5.375% due 11/15/19 (b) | | | 5,541,400 |
| 2,000,000 | | A | | Connecticut State Special Obligation Parking Revenue, Bradley International Airport, Series A, ACA-Insured,
6.375% due 7/1/12 (d) | | | 2,223,500 |
| | | | | Connecticut State Special Tax Obligation Revenue: | | | |
| | | | | RITES, FSA-Insured: | | | |
| 2,000,000 | | AAA | | Series A, 9.208% due 10/1/09 (e) | | | 2,482,480 |
| 2,000,000 | | AAA | | Series B, 9.208% due 10/1/09 (e) | | | 2,440,480 |
| 2,000,000 | | AAA | | Transportation Infrastructure, Series A, FSA-Insured,
5.375% due 7/1/16 | | | 2,233,520 |
|
| | | | | | | | 20,492,030 |
|
| Delaware — 0.9% | | | | | |
| 3,440,000 | | AAA | | Delaware River Port Authority,
Series A, 9.088% due 1/1/10 (b)(e) | | | 4,388,202 |
| | | | | Delaware State GO, Series A: | | | |
| 1,596,000 | | AAA | | 5.000% due 7/1/13 | | | 1,737,581 |
| 404,000 | | AAA | | Call 7/1/10 @ 100, 5.000% due 7/1/13 (f) | | | 448,315 |
|
| | | | | | | | 6,574,098 |
|
| Florida — 8.4% | | | | | |
| 935,000 | | NR | | Bonita Springs, FL Vasari Community Development District Revenue, Capital Improvement, Series B, 6.200% due 5/1/09 | | | 977,982 |
| 3,000,000 | | NR | | Capital Projects Finance Authority, FL Student Housing Revenue, Cafra Capital Corp., Series A, 7.750% due 8/15/20 | | | 3,009,060 |
| 540,000 | | NR | | Capital Region Community Development, FL Development District Revenue, Capital Improvement,
Series B, 5.950% due 5/1/06 | | | 547,150 |
| 1,660,000 | | NR | | Fishhawk Community Development District II Special Assessment Revenue, Series B, 5.000% due 11/1/07 | | | 1,673,380 |
| | | | | Florida Municipal Loan Council Revenue,
Series A, MBIA-Insured: | | | |
| 1,790,000 | | AAA | | 5.250% due 11/1/13 | | | 2,002,294 |
| 3,175,000 | | AAA | | 5.250% due 11/1/16 (b) | | | 3,540,951 |
| 1,500,000 | | AA+ | | Florida State Board of Education GO,
Series A, 5.500% due 6/1/16 | | | 1,673,970 |
See Notes to Financial Statements.
10 Smith Barney Muni Funds | 2004 Semi-Annual Report
| | |
| Schedule of Investments (unaudited) (continued) | | September 30, 2004 |
| | | | | | | |
FACE
AMOUNT | | RATING(a) | | SECURITY | | VALUE |
| | | | | | | | |
| Florida — 8.4% (continued) | | | |
| $ 1,845,000 | | NR | | Gateway Services Community Development District, FL Special Assessment Revenue, Sun City Center, (Fort Meyers Project), Series B, 5.500% due 5/1/10 | | $ | 1,886,697 |
| 2,185,000 | | NR | | Greyhawk Landing Community Development District, FL Special Assessment Revenue, Series B, 6.250% due 5/1/09 | | | 2,250,353 |
| | | | | Hillsborough County, FL: | | | |
| 2,295,000 | | AA | | Educational Facilities Authority Revenue, Refunding, (University of Tampa Project), Radian-Insured,
5.750% due 4/1/18 | | | 2,484,108 |
| 3,500,000 | | AAA | | School District Sales Tax Revenue, AMBAC-Insured,
5.375% due 10/1/15 (b) | | | 3,864,910 |
| | | | | Jacksonville Beach, FL Utility Revenue: | | | |
| 2,470,000 | | AAA | | 7.900% due 10/1/14 (c) | | | 3,054,945 |
| 2,145,000 | | Aaa* | | 5.000% due 4/1/18 | | | 2,281,701 |
| 1,500,000 | | NR | | Killarney Community Development District Special Assessment Revenue, Series B, 5.125% due 5/1/09 | | | 1,514,835 |
| 2,580,000 | | NR | | Lee Memorial Health System Board of Directors, FL Hospital Revenue, RITES, Series PA 1026R-B, FSA-Insured,
9.527% due 4/1/10 (e) | | | 3,346,363 |
| 790,000 | | NR | | Lexington Oaks Community Development District, FL Special Assessment Revenue, Series B, 5.625% due 5/1/06 | | | 799,725 |
| 545,000 | | NR | | Mediterra North Community Development District, FL Capital Improvement Revenue, Series B, 6.000% due 5/1/08 | | | 559,737 |
| 1,000,000 | | BB | | Miami Beach, FL Health Facilities Authority, Hospital Revenue, Mt. Sinai Medical Center, Series A, 6.700% due 11/15/19 | | | 1,035,920 |
| 1,000,000 | | NR | | Oglala Sioux Tribe, SD Revenue, 5.500% due 7/1/13 | | | 1,029,260 |
| | | | | Orange County, FL Health Facilities Authority Revenue: | | | |
| 1,835,000 | | NR | | First Mortgage, 8.875% due 7/1/21 | | | 1,859,534 |
| 2,000,000 | | A | | Hospital Adventist Health System, 6.250% due 11/15/24 | | | 2,197,060 |
| 1,470,000 | | AA | | Orlando, FL Utilities Commission Water & Electric Revenue, | | | |
| | | | | Series A, 5.250% due 10/1/13 | | | 1,637,903 |
| 250,000 | | NR | | Panther Trace Community Development District, FL Special Assessment Revenue, Series B, 6.500% due 5/1/09 | | | 256,825 |
| 825,000 | | NR | | Parklands West Community Development District, FL Special Assessment Revenue, Series B, 6.000% due 5/1/06 | | | 834,677 |
| 3,000,000 | | AAA | | Pasco County, FL Optional Gas Tax Revenue, Refunding,
FGIC-Insured, 5.250% due 8/1/11 | | | 3,385,860 |
| 890,000 | | NR | | Port St. Lucie, FL Special Assessment Revenue, Series A,
6.375% due 9/1/11 | | | 926,926 |
| 1,895,000 | | NR | | Renaissance Community Development District, FL Capital Improvement Revenue, Series B, 6.250% due 5/1/08 | | | 1,964,016 |
| 1,795,000 | | NR | | Reunion East Community Development District, FL Special Assessment Revenue, Series B, 5.900% due 11/1/07 | | | 1,835,585 |
| 4,000,000 | | NR | | Sterling Hill, FL Community Development District, Series B, 5.500% due 11/1/10 (b) | | | 4,059,560 |
See Notes to Financial Statements.
11 Smith Barney Muni Funds | 2004 Semi-Annual Report
| | |
| Schedule of Investments (unaudited) (continued) | | September 30, 2004 |
| | | | | | | |
FACE
AMOUNT | | RATING(a) | | SECURITY | | VALUE |
| | | | | | | | |
| Florida — 8.4% (continued) | | | |
| $ 915,000 | | NR | | Sumter Landing Community Development District Special Assessment Revenue, 6.250% due 5/1/13 | | $ | 950,593 |
| 195,000 | | AAA | | Tamarac, FL Water & Sewer Utilities Revenue, AMBAC-Insured, 9.250% due 10/1/10 (c) | | | 229,640 |
| | | | | Village Community Development District No. 5, FL Special Assessment Revenue: | | | |
| 640,000 | | NR | | Series B, 5.400% due 5/1/07 | | | 650,714 |
| 2,935,000 | | NR | | Series B, 5.000% due 5/1/08 | | | 2,977,235 |
| 285,000 | | NR | | Waterlefe Community Development District, FL Capital Improvement Revenue, Series B, 6.250% due 5/1/10 | | | 290,338 |
| 840,000 | | AAA | | West Coast Regional Water Supply Authority, FL Capital Improvement Revenue, (Hillsborough County Project), AMBAC-Insured, 10.300% due 10/1/04 (c) | | | 840,000 |
|
| | | | | | | | 62,429,807 |
|
| Georgia — 1.5% | | | | | |
| 1,980,000 | | AAA | | East Point, GA Building Authority Revenue, FSA-Insured,
zero coupon due 2/1/20 | | | 870,586 |
| 1,630,000 | | AAA | | Fulton County, GA Water and Sewer Revenue,
5.000% due 1/1/16 | | | 1,759,422 |
| 2,500,000 | | AAA | | Georgia Municipal Electric Authority Revenue, (Combustion Turbine Project), Series A, MBIA-Insured,
5.250% due 11/1/19 | | | 2,698,200 |
| 3,500,000 | | NR | | Georgia State GO, Rites-PA-1197-A, 5.575% due 4/1/09 (b)(e) | | | 4,606,210 |
| 1,320,000 | | NR | | Savannah, GA EDA, (College of Art & Design Inc. Project), 6.200% due 10/1/09 (c) | | | 1,469,662 |
|
| | | | | | | | 11,404,080 |
|
| Hawaii — 0.6% | | | | | |
| 4,000,000 | | AAA | | Hawaii State GO, Series CW, 5.375% due 8/1/15 (b) | | | 4,441,200 |
|
| Idaho — 0.2% | | | | | |
| 15,000 | | Aaa* | | Idaho Falls, ID Electric Revenue, 10.250% due 4/1/06 (c) | | | 16,218 |
| 1,500,000 | | BB+ | | Nez Perce County, ID PCR, Refunding, (Potlatch Corp. Project), 6.125% due 12/1/07 | | | 1,530,600 |
|
| | | | | | | | 1,546,818 |
|
| Illinois — 5.7% | | | | | |
| 160,000 | | AA | | Chicago Heights, IL Single-Family Mortgage Revenue,
7.600% due 5/1/10 (c) | | | 185,286 |
| | | | | Chicago, IL GO: | | | |
| 4,000,000 | | AAA | | Project & Refunding, Series A, AMBAC-Insured,
5.375% due 1/1/16 (b) | | | 4,469,880 |
| 1,500,000 | | AAA | | Series A, FGIC-Insured, (Call 7/1/10 @ 101),
6.000% due 1/1/14 (f) | | | 1,755,975 |
| 2,000,000 | | AA+ | | Chicago, IL Metropolitan Water Reclamation District Greater Chicago, Capital Improvement, Series A, (Call 12/1/12 @ 101), 5.500% due 12/1/14 (f) | | | 2,322,920 |
See Notes to Financial Statements.
12 Smith Barney Muni Funds | 2004 Semi-Annual Report
| | |
| Schedule of Investments (unaudited) (continued) | | September 30, 2004 |
| | | | | | | |
FACE
AMOUNT | | RATING(a) | | SECURITY | | VALUE |
| | | | | | | | |
| Illinois — 5.7% (continued) | | | |
| | | | | Chicago, IL O’Hare International Airport: | | | |
| $ 1,500,000 | | AAA | | Second Lien Passenger Facility, Series B, AMBAC-Insured, 5.500% due 1/1/16 | | $ | 1,647,840 |
| 2,500,000 | | NR | | Special Facilities Revenue, (United Airlines Project), Series C, 6.300% due 5/1/16 (g) | | | 680,425 |
| 2,415,000 | | AAA | | Cicero, IL GO, MBIA-Insured, 5.625% due 12/1/16 | | | 2,790,726 |
| 3,000,000 | | Aaa* | | Cook Kane Lake & McHenry Counties, IL Community College, District No. 512, William Rainey Harper College, Series A, 5.500% due 12/1/15 | | | 3,352,410 |
| 5,000,000 | | AAA | | Glendale Heights, IL Hospital Revenue,
(Glendale Heights Project), Series B,
7.100% due 12/1/15 (b)(c) | | | 6,096,900 |
| | | | | Illinois DFA Revenue: | | | |
| 1,005,000 | | A | | Debt Restructure — East St. Louis, 6.875% due 11/15/05 | | | 1,030,055 |
| 2,000,000 | | Aaa* | | Revolving Fund — Master Trust, 5.500% due 9/1/17 | | | 2,249,100 |
| 245,000 | | AAA | | Illinois Educational Facilities Authority Revenue, Chicago College of Osteopathic, 8.750% due 7/1/05 (c) | | | 257,862 |
| | | | | Illinois Health Facilities Authority Revenue: | | | |
| 615,000 | | AAA | | Methodist Medical Center of Illinois Project,
9.000% due 10/1/10 (c) | | | 724,568 |
| 5,000,000 | | A | | OSF Healthcare System, 6.250% due 11/15/19 (b) | | | 5,413,700 |
| 1,140,000 | | A | | Passavant Memorial Area Hospital, 6.250% due 10/1/17 | | | 1,225,261 |
| 35,000 | | A | | Victory Memorial Hospital Association Project,
7.500% due 10/1/06 (c) | | | 36,812 |
| 5,000,000 | | AAA | | Illinois State GO, First Series, 5.375% due 7/1/19 (b) | | | 5,523,400 |
| 2,440,000 | | AAA | | Kane County, IL GO, FGIC-Insured, 5.500% due 1/1/15 | | | 2,797,362 |
|
| | | | | | | | 42,560,482 |
|
| Indiana — 2.3% | | | | | |
| 1,720,000 | | AAA | | Evansville Vanderburgh Public Library Leasing Corp., First Mortgage, MBIA-Insured, 5.750% due 7/15/18 | | | 1,939,558 |
| 2,500,000 | | AAA | | Hamilton County, IN County Optional Income Tax Revenue, | | | |
| | | | | FSA-Insured, 5.250% due 1/10/20 | | | 2,660,000 |
| 785,000 | | AAA | | Indiana Bond Bank, Special Program, Series A, AMBAC-Insured, 9.750% due 8/1/09 (c) | | | 935,265 |
| 3,000,000 | | AAA | | Indianapolis Local Public Improvement Bond Bank,
(Waterworks Project), Series A, 5.500% due 7/1/19 | | | 3,343,230 |
| 1,000,000 | | AAA | | Lawrence Township, IN Metropolitan School District, First Mortgage, IBC/MBIA-Insured, 6.750% due 7/5/13 | | | 1,238,810 |
| | | | | Madison County, IN Hospital Facilities Authority Revenue: | | | |
| 775,000 | | AAA | | Community Hospital Anderson Project,
9.250% due 1/1/10 (c) | | | 914,802 |
| 395,000 | | AAA | | St Johns Hickey Memorial Hospital Project,
9.000% due 12/1/09 (c) | | | 462,430 |
| 1,075,000 | | AAA | | Mishawaka, IN School Building Corp., First Mortgage,
AMBAC-Insured, 5.500% due 7/15/18 | | | 1,193,400 |
See Notes to Financial Statements.
13 Smith Barney Muni Funds | 2004 Semi-Annual Report
| | |
| Schedule of Investments (unaudited) (continued) | | September 30, 2004 |
| | | | | | | |
FACE
AMOUNT | | RATING(a) | | SECURITY | | VALUE |
| | | | | | | | |
| Indiana — 2.3% (continued) | | | |
| $ 2,000,000 | | NR | | North Manchester IN Revenue, (Peabody Retirement Community Project), Series A, 7.125% due 7/1/22 | | $ | 2,039,160 |
| 1,915,000 | | AAA | | St. Joseph County, IN Hospital Authority Facilities Revenue, Memorial Hospital South Bend, 9.400% due 6/1/10 (c) | | | 2,317,839 |
|
| | | | | | | | 17,044,494 |
|
| Iowa — 1.4% | | | | | |
| 3,000,000 | | A1* | | Iowa Finance Authority, Health Care Facilities Revenue, Genesis Medical Center, 6.250% due 7/1/20 | | | 3,243,780 |
| 4,535,000 | | AAA | | Muscatine, IA Electric Revenue, 9.700% due 1/1/13 (b)(c) | | | 5,850,513 |
| 1,085,000 | | AAA | | University of Iowa Facilities Corp., (Medical Education & Biomed Research Facilities Project), AMBAC-Insured,
5.375% due 6/1/18 | | | 1,170,606 |
|
| | | | | | | | 10,264,899 |
|
| Kansas — 0.6% | | | | | |
| 4,000,000 | | BBB | | Burlington, KS Environmental Improvement Revenue, Kansas City Power & Light, Refunding, 4.750% due 9/1/15 (b)(e) | | | 4,183,520 |
|
| Kentucky — 1.3% | | | | | |
| 3,000,000 | | NR | | Kenton County, KY Airport Board, Special Facilities Revenue, (Mesaba Aviation Inc. Project), Series A,
6.625% due 7/1/19 (d) | | | 2,355,300 |
| 5,000,000 | | AAA | | Kentucky Property & Buildings, (Call 10/1/11 @ 100),
5.375% due 10/1/19 (b)(f) | | | 5,726,700 |
| 1,895,000 | | A | | Pendleton County, KY Multi-County Lease Revenue, Associated Counties Leasing Trust, Program A, 6.500% due 3/1/19 | | | 1,920,715 |
|
| | | | | | | | 10,002,715 |
|
| Louisiana — 0.6% | | | | | |
| 1,000,000 | | AAA | | Calcasieu Parish, LA Memorial Hospital Services District Revenue, (Lake Charles Memorial Hospital Project), Series A, CONNIE LEE-Insured, 7.500% due 12/1/05 | | | 1,060,460 |
| 710,000 | | Aaa* | | Jefferson Parish, LA Home Mortgage Authority, Single-Family Mortgage Revenue, Series G, GNMA/FNMA-Collateralized, 6.300% due 6/1/32 (d) | | | 755,135 |
| 730,000 | | NR | | Lafayette, LA Public Trust Financing Authority, Single-Family Mortgage Revenue, FHA-Insured, 7.200% due 4/1/10 (c) | | | 821,754 |
| 1,480,000 | | AAA | | Louisiana Local Government Environment Facilities and Community Development Authority Revenue, Series A, AMBAC-Insured, (Parking Facilities Corp. Garage Project), 5.625% due 10/1/17 | | | 1,670,550 |
| 425,000 | | AAA | | Louisiana Public Facilities Hospital Authority Revenue, (Southern Baptist Hospital Inc. Project), Aetna-Insured,
8.000% due 5/15/12 (c) | | | 507,692 |
|
| | | | | | | | 4,815,591 |
|
See Notes to Financial Statements.
14 Smith Barney Muni Funds | 2004 Semi-Annual Report
| | |
| Schedule of Investments (unaudited) (continued) | | September 30, 2004 |
| | | | | | | |
FACE
AMOUNT | | RATING(a) | | SECURITY | | VALUE |
| | | | | | | | |
| Maryland — 0.6% | | | | | |
| $ 3,000,000 | | AA+ | | Anne Arundel County, MD GO, 5.375% due 3/1/14 (b) | | $ | 3,401,730 |
| 1,000,000 | | A | | Maryland State Health & Higher Educational Facilities Authority Revenue, University of Maryland Medical System,
6.000% due 7/1/22 | | | 1,066,740 |
|
| | | | | | | | 4,468,470 |
|
| Massachusetts — 4.0% | | | |
| 2,025,000 | | AAA | | Boston, MA Water & Sewer Community Revenue,
10.875% due 1/1/09 (b)(c) | | | 2,415,683 |
| 2,000,000 | | AAA | | Pittsfield, MA GO, MBIA-Insured, 5.500% due 4/15/17 | | | 2,259,660 |
| 1,140,000 | | Aaa* | | Massachusetts Rail Connections Inc., Route 128, Parking Garage Revenue, Series A, (Call 7/1/09 @ 102)
6.000% due 7/1/13 (f) | | | 1,328,545 |
| | | | | Massachusetts State DFA Revenue, First Mortgage,
(Edgecombe Project): | | | |
| 585,000 | | BBB- | | Series A, 6.000% due 7/1/11 | | | 619,439 |
| 1,000,000 | | BBB- | | Series B, 5.750% due 7/1/29 | | | 1,003,160 |
| | | | | Massachusetts State GO, RITES, MBIA-Insured: | | | |
| 3,500,000 | | AAA | | Series PA 964-R, 9.113% due 11/1/09 (b)(e) | | | 4,521,160 |
| 1,500,000 | | AAA | | Series PA 993-R, 9.090% due 5/1/09 (e) | | | 1,937,640 |
| 2,000,000 | | Aa3* | | Massachusetts State, Grant Anticipation Notes, Series A,
5.750% due 6/15/15 | | | 2,269,980 |
| | | | | Massachusetts State Health & Educational Facilities Authority Revenue: | | | |
| | | | | Caritas Christi Obligated Group, Series B: | | | |
| 2,000,000 | | BBB | | 6.500% due 7/1/12 | | | 2,231,120 |
| 3,000,000 | | BBB | | 6.750% due 7/1/16 | | | 3,331,230 |
| 1,000,000 | | AAA | | Harvard University, Series Z, 5.000% due 1/15/16 | | | 1,084,200 |
| 1,300,000 | | AAA | | University of Massachusetts, Series C,
5.500% due 10/1/18 | | | 1,470,157 |
| | | | | Massachusetts State HFA, Single-Family Housing Revenue: | | | |
| 565,000 | | AA | | Series 38, 7.200% due 12/1/26 (d) | | | 577,441 |
| 715,000 | | AA | | Series 41, 6.300% due 12/1/14 | | | 736,307 |
| 1,340,000 | | AAA | | Massachusetts State Industrial Finance Agency Revenue, University Commons Nursing, Series A, FHA-Insured,
6.550% due 8/1/18 | | | 1,478,033 |
| 1,620,000 | | AAA | | Massachusetts State Port Authority Revenue,
13.000% due 7/1/13 (c) | | | 2,408,827 |
|
| | | | | | | | 29,672,582 |
|
| Michigan — 1.8% | | | | | |
| 1,165,000 | | NR | | Allen Academy COP, 7.000% due 6/1/15 | | | 1,127,580 |
| 1,000,000 | | AAA | | Carman-Ainsworth, MI Community School District GO,
FGIC-Insured, 5.500% due 5/1/19 | | | 1,113,010 |
| 1,775,000 | | AA+ | | Chippewa Valley, MI Schools Administration Building,
Q-SBLF, 5.500% due 5/1/18 | | | 1,999,236 |
See Notes to Financial Statements.
15 Smith Barney Muni Funds | 2004 Semi-Annual Report
| | |
| Schedule of Investments (unaudited) (continued) | | September 30, 2004 |
| | | | | | | |
FACE
AMOUNT | | RATING(a) | | SECURITY | | VALUE |
| | | | | | | | |
| Michigan — 1.8% (continued) | | | |
| $ 1,000,000 | | AAA | | Holland, MI Area Community Swimming Pool Authority GO, FGIC-Insured, 5.125% due 5/1/19 | | $ | 1,025,080 |
| 2,000,000 | | A- | | Michigan State Strategic Fund Limited Obligation Revenue, Refunding, (Dow Chemical Project),
4.600% due 6/1/14 (e) | | | 2,116,120 |
| 1,000,000 | | AAA | | Mount Clemens, MI GO, Community School District, Q-SBLF Insured, 5.500% due 5/1/16 | | | 1,115,690 |
| 2,000,000 | | AAA | | Southfield, MI Library Building Authority GO, MBIA-Insured, 5.500% due 5/1/24 | | | 2,124,860 |
| 2,985,000 | | NR | | Wenonah Park Properties Inc. Revenue, MI Bay City Hotel, 7.875% due 4/1/22 | | | 3,011,686 |
|
| | | | | | | | 13,633,262 |
|
| Minnesota — 1.3% | | | | | |
| 1,900,000 | | BB | | Maplewood, MN Healthcare Facilities Revenue, (Health East Project), 5.950% due 11/15/06 | | | 1,922,724 |
| 1,000,000 | | A3* | | Minneapolis, MN Health Care System Revenue, Allina Health System, Series A, 6.000% due 11/15/18 | | | 1,100,230 |
| 5,255,000 | | AAA | | Minnesota Public Facilities Authority, Water PCR, Series A, 5.250% due 3/1/17 (b) | | | 5,703,251 |
| 1,000,000 | | A | | St. Paul, MN Housing & Redevelopment Authority, Hospital Revenue, (Health East Project), Series B, ACA/CBI-Insured, 5.850% due 11/1/17 | | | 1,053,670 |
|
| | | | | | | | 9,779,875 |
|
| Missouri — 0.7% | | | | | |
| 40,000 | | AAA | | Chillicothe, MO Electric Revenue, AMBAC-Insured,
10.250% due 9/1/06 (c) | | | 43,810 |
| 1,000,000 | | A-** | | Lee’s Summit, MO IDA, Health Facilities Revenue, John Knox Village, 5.750% due 8/15/11 | | | 1,094,000 |
| 1,500,000 | | Aaa* | | Missouri State Environmental Improvement & Energy Resources Authority, Water Pollution State Revolving Funds Programs, Series A, 5.250% due 1/1/16 | | | 1,649,820 |
| 910,000 | | AA | | Missouri State Housing Development Community, MFH Revenue, Series I, 5.500% due 12/1/15 | | | 973,108 |
| 35,000 | | BBB- | | Nevada, MO Waterworks System Revenue,
10.000% due 10/1/07 (c) | | | 39,145 |
| 1,000,000 | | AAA | | St. Louis, MO Airport Revenue, Airport Development Program, Series A, MBIA-Insured, 5.625% due 7/1/16 | | | 1,132,300 |
|
| | | | | | | | 4,932,183 |
|
| Montana — 0.0% | | | | | |
| 110,000 | | AAA | | Montana State University Revenue, MBIA-Insured,
10.000% due 11/15/08 (c) | | | 127,776 |
|
See Notes to Financial Statements.
16 Smith Barney Muni Funds | 2004 Semi-Annual Report
| | |
| Schedule of Investments (unaudited) (continued) | | September 30, 2004 |
| | | | | | | |
FACE
AMOUNT | | RATING(a) | | SECURITY | | VALUE |
| | | | | | | | |
| Nebraska — 0.0% | | | | | |
| $ 15,000 | | NR | | Douglas County, NE Hospital Authority Revenue (Project Number 2), Archbishop Bergan Mercy Hospital,
9.500% due 7/1/10 (c) | | $ | 18,345 |
|
| Nevada — 1.4% | | | | | |
| 1,185,000 | | BBB+ | | Carson City, NV Hospital Revenue, (Carson-Tahoe Hospital Project), 6.000% due 9/1/14 | | | 1,318,787 |
| 2,240,000 | | AA | | Clark County, NV GO, (Call 12/1/06 @ 101),
5.375% due 6/1/15 (f) | | | 2,425,091 |
| 3,000,000 | | AAA | | Clark County, NV School District GO, Building and Renovation, (Call 6/15/07 @ 101), Series B, FGIC-Insured,
5.250% due 6/15/17 (f) | | | 3,286,200 |
| 2,500,000 | | AAA | | Las Vegas New Convention & Visitors Authority Revenue, AMBAC-Insured, 6.000% due 7/1/14 | | | 2,856,550 |
| 865,000 | | AAA | | Nevada Housing Division, Multi-Unit Housing, Saratoga Palms, FNMA-Collateralized, 6.250% due 10/1/16 (d) | | | 900,205 |
|
| | | | | | | | 10,786,833 |
|
| New Hampshire — 0.8% | | | |
| | | | | New Hampshire Health & Education Facilities Authority Revenue: | | | |
| 3,660,000 | | A- | | Covenant Health System, 6.500% due 7/1/17 (b) | | | 4,090,892 |
| 900,000 | | AAA | | University System of New Hampshire, AMBAC-Insured, 5.375% due 7/1/16 | | | 1,004,148 |
| 1,000,000 | | AA | | New Hampshire State GO, Capital Improvement, Series A, 5.125% due 10/1/17 | | | 1,069,480 |
|
| | | | | | | | 6,164,520 |
|
| New Jersey — 3.9% | | | |
| | | | | New Jersey Healthcare Facilities Financing Authority Revenue: | | | |
| 375,000 | | AAA | | Hackensack Hospital, 8.750% due 7/1/09 (c) | | | 434,962 |
| 3,000,000 | | BBB- | | Trinitas Hospital Obligation Group, 7.375% due 7/1/15 (b) | | | 3,430,380 |
| 4,000,000 | | AAA | | New Jersey State Highway Authority, Garden State Parkway General Revenue, Refunding, FGIC-Insured,
5.500% due 1/1/11 (b)(c) | | | 4,552,720 |
| | | | | New Jersey State Turnpike Authority Revenue: | | | |
| 725,000 | | AAA | | 6.750% due 1/1/09 (c) | | | 774,887 |
| 320,000 | | AAA | | 6.000% due 1/1/14 (c) | | | 356,355 |
| | | | | New Jersey Transportation Trust Fund Authority: | | | |
| | | | | RITES, MBIA-Insured: | | | |
| 2,500,000 | | AAA | | 5.500% due 6/15/16 | | | 2,803,650 |
| 2,500,000 | | AAA | | Series A,
10.136% due 12/15/09 (b)(e) | | | 3,417,750 |
| | | | | Series B: | | | |
| 1,000,000 | | AAA | | 10.136% due 12/15/09 (e) | | | 1,367,100 |
| 3,000,000 | | AAA | | 5.250% due 12/15/14 (b) | | | 3,394,470 |
| 1,890,000 | | AAA | | Call 12/15/11 @ 100, 6.000% due 12/15/19 (f) | | | 2,236,909 |
See Notes to Financial Statements.
17 Smith Barney Muni Funds | 2004 Semi-Annual Report
| | |
| Schedule of Investments (unaudited) (continued) | | September 30, 2004 |
| | | | | | | |
FACE
AMOUNT | | RATING(a) | | SECURITY | | VALUE |
| | | | | | | | |
| New Jersey — 3.9% (continued) | | | |
| $ 3,095,000 | | Aaa* | | Passaic Valley, NJ Sewage Commissioners Sewer System, Series E, AMBAC-Insured, 5.625% due 12/1/17 (b) | | $ | 3,479,956 |
| 225,000 | | AAA | | Ringwood Boro, NJ Sewage Authority, 9.875% due 1/1/14 (c) | | | 291,971 |
| 2,290,000 | | BBB | | Tobacco Settlement Financing Corp., NJ, Asset-Backed,
5.500% due 6/1/11 | | | 2,301,221 |
|
| | | | | | | | 28,842,331 |
|
| New Mexico — 0.0% | | | |
| 200,000 | | AAA | | Farmington, NM Utilities Systems Revenue, AMBAC-Insured, 9.875% due 1/1/08 (c) | | | 223,258 |
|
| New York — 4.8% | | | | | |
| 1,000,000 | | Baa3* | | Albany, NY IDA, Civic Facility Revenue, (Charitable Leadership Project), Series A, 6.000% due 7/1/19 | | | 1,072,200 |
| | | | | New York City, NY : | | | |
| 1,000,000 | | AAA | | Health & Hospital Corp. Revenue, Health System, Series A, FSA-Insured, 5.500% due 2/15/19 | | | 1,112,290 |
| | | | | IDA Civic Facilities Revenue: | | | |
| 1,550,000 | | NR | | Community Hospital, Brooklyn, 6.875% due 11/1/10 | | | 1,584,053 |
| 1,090,000 | | NR | | Special Needs Facilities Pooled Project, Series A-1, 6.100% due 7/1/12 | | | 1,129,959 |
| | | | | New York City, NY GO: | | | |
| 2,500,000 | | A | | Series A, 6.250% due 8/1/08 | | | 2,711,575 |
| 5,000,000 | | AA- | | Subseries-H4, 1.730% due 3/1/34 (e) | | | 5,000,000 |
| | | | | New York State Dormitory Authority Revenues: | | | |
| 1,000,000 | | AAA | | Columbia University, Series B, 5.250% due 7/1/17 | | | 1,111,240 |
| 1,000,000 | | A3* | | Lenox Hill Hospital Obligated Group, 5.750% due 7/1/17 | | | 1,089,040 |
| 1,780,000 | | AA | | Marymount Manhattan College, Radian-Insured,
6.375% due 7/1/14 | | | 2,049,510 |
| 2,500,000 | | AAA | | School Districts Financing Programs, Series D,
MBIA-Insured, 5.500% due 10/1/17 | | | 2,834,650 |
| 1,715,000 | | AAA | | State University Educational Facilities, MBIA-Insured, 6.000% due 5/15/15 | | | 1,977,001 |
| 1,970,000 | | NR | | Suffolk County, NY IDA, Civic Facility Revenue, Eastern Long Island Hospital Association, Series A, 7.750% due 1/1/22 | | | 2,020,156 |
| | | | | Tobacco Settlement Financing Corp., NY, Asset-Backed: | | | |
| 5,000,000 | | AA- | | Series A-1, Callable, 5.500% due 6/1/16 (b) | | | 5,449,900 |
| 6,000,000 | | AA- | | Series C-1, Callable, 5.500% due 6/1/14 (b) | | | 6,548,820 |
|
| | | | | | | | 35,690,394 |
|
| North Carolina — 3.0% | | | |
| 830,000 | | NR | | Asheville, NC HDC, First Lien Revenue, Ashville Gardens,
HUD Section 8-Insured, (Call 11/1/09 @ 100)
10.500% due 5/1/11 (f) | | | 1,022,195 |
| 3,000,000 | | AAA | | Guilford County, NC GO, Public Improvement, Series B, 5.250% due 10/1/15 | | | 3,334,830 |
See Notes to Financial Statements.
18 Smith Barney Muni Funds | 2004 Semi-Annual Report
| | |
| Schedule of Investments (unaudited) (continued) | | September 30, 2004 |
| | | | | | | |
FACE
AMOUNT | | RATING(a) | | SECURITY | | VALUE |
| | | | | | | | |
| North Carolina — 3.0% (continued) | | | |
| | | | | North Carolina Eastern Municipal Power Agency, Power System Revenue: | | | |
| $ 550,000 | | A | | Series B, ACA/CBI-Insured, 5.650% due 1/1/16 | | $ | 592,757 |
| 2,000,000 | | BBB | | Series D, 5.500% due 1/1/14 | | | 2,203,700 |
| | | | | North Carolina Municipal Power Agency No. 1, Catawba Electric Revenue: | | | |
| 4,285,000 | | AAA | | 10.500% due 1/1/10 (b)(c) | | | 5,234,170 |
| 3,000,000 | | A | | Series B, ACA/CBI-Insured, 6.375% due 1/1/13 (b) | | | 3,395,910 |
| | | | | North Carolina State GO: | | | |
| 3,000,000 | | AAA | | Public Improvement, Series A, (Call 3/1/09 @ 102),
5.250% due 3/1/18 (b)(f) | | | 3,391,800 |
| 3,000,000 | | AAA | | Series A, 5.100% due 9/1/16 | | | 3,326,700 |
|
| | | | | | | | 22,502,062 |
|
| Ohio — 6.1% | | | | | |
| 5,450,000 | | AAA | | Butler County, OH Transportation Improvement District,
Series A, 5.125% due 4/1/17 (b) | | | 5,827,576 |
| 1,750,000 | | AAA | | Cleveland, OH Public Power System Revenue, AMBAC-Insured, 5.500% due 11/15/15 | | | 1,972,093 |
| 2,650,000 | | BBB | | Cuyahoga County, OH Hospital Facilities Revenue, (Canton Inc. Project), 6.750% due 1/1/10 | | | 2,931,801 |
| 360,000 | | AAA | | Erie County, OH Hospital Improvement Revenue, Sandusky Memorial Hospital, 8.750% due 1/1/06 (c) | | | 377,194 |
| 1,785,000 | | NR | | Franklin County, OH Hospital Revenue, (Children’s Hospital Project), 10.375% due 6/1/13 (c) | | | 2,359,824 |
| 1,500,000 | | Aaa* | | Hamilton County, OH Sales Tax Revenue, Series B,
AMBAC-Insured, 5.250% due 12/1/18 | | | 1,625,145 |
| 1,270,000 | | AAA | | Lake County, OH Hospital Improvement Revenue, (Lake County Memorial Hospitals Project), 8.625% due 11/1/09 (c) | | | 1,466,482 |
| 265,000 | | AAA | | Lima, OH Hospital Revenue, St. Rita’s Medical Center,
7.500% due 11/1/06 (c) | | | 279,734 |
| 1,410,000 | | Aaa* | | Logan Hocking, OH Local School District GO, Construction & Improvement, MBIA-Insured, 5.500% due 12/1/16 | | | 1,584,220 |
| 2,775,000 | | AA | | Montgomery County, OH Revenue, Catholic Health Initiatives, 5.500% due 9/1/14 | | | 2,992,643 |
| | | | | Ohio State Building Authority, Series A: | | | |
| 3,000,000 | | AA | | Call 10/1/09 @ 101, 5.375% due 10/1/14 (f) | | | 3,341,880 |
| 3,600,000 | | AAA | | State Facilities-Administration Building Fund, FSA-Insured, 5.500% due 10/1/14 (b) | | | 4,066,740 |
| 5,000,000 | | BB+ | | Ohio State, OH Air Quality Development Authority Revenue Refunding, Cleveland Pollution Control,
Series A, 6.000% due 12/1/13 (b) | | | 5,313,050 |
| | | | | Ohio State Water Development Authority Revenue: | | | |
| 6,890,000 | | AAA | | 9.375% due 12/1/10 (b)(c) | | | 8,097,886 |
| 1,425,000 | | AAA | | Safe Water, Series 3, 9.000% due 12/1/10 (c) | | | 1,609,367 |
See Notes to Financial Statements.
19 Smith Barney Muni Funds | 2004 Semi-Annual Report
| | |
| Schedule of Investments (unaudited) (continued) | | September 30, 2004 |
| | | | | | | |
FACE
AMOUNT | | RATING(a) | | SECURITY | | VALUE |
| | | | | | | | |
| Ohio — 6.1% (continued) | | | |
| $ 1,960,000 | | AAA | | University of Akron, OH General Receipts Bonds,
AMBAC-Insured, 5.250% due 1/1/17 | | $ | 2,119,485 |
|
| | | | | | | | 45,965,120 |
|
| Oklahoma — 0.7% | | | | | |
| 2,750,000 | | AA | | Oklahoma DFA Revenue, Refunding, St. John’s Health System, 5.750% due 2/15/18 | | | 2,953,555 |
| 1,725,000 | | AAA | | Tulsa, OK Airports Improvement Trust General Revenue,
Series A, 6.000% due 6/1/14 (d) | | | 1,931,293 |
|
| | | | | | | | 4,884,848 |
|
| Oregon — 1.9% | | | | | |
| 1,000,000 | | AA | | Clackamas County, OR Hospital Facilities Authority Revenue, Legacy Health System, 5.750% due 5/1/16 | | | 1,100,020 |
| 1,500,000 | | BBB | | Klamath Falls, OR, Intercommunity Hospital Authority Revenue, (Merle West Medical Center Project), 6.125% due 9/1/22 | | | 1,569,525 |
| 3,320,000 | | Aa2* | | Multnomah County, OR GO, Series A, (Call 4/1/10 @ 100), 5.250% due 4/1/14 (b)(f) | | | 3,724,011 |
| | | | | Oregon State Department Administrative Services Lottery Revenue: | | | |
| 1,375,000 | | AAA | | Series A, FSA-Insured, (Call 4/1/12 @ 100),
5.500% due 4/1/14 (f) | | | 1,584,110 |
| 3,500,000 | | AAA | | Series B, 5.250% due 4/1/15 (b) | | | 3,818,920 |
| 2,585,000 | | NR | | Wasco County, OR Solid Waste Disposal Revenue, (Waste Connections Inc. Project), 7.000% due 3/1/12 (d) | | | 2,755,015 |
|
| | | | | | | | 14,551,601 |
|
| Puerto Rico — 0.3% | | | |
| 2,000,000 | | AAA | | Puerto Rico Highway and Transportation Authority Highway Revenue, Refunding, Series AA, 5.000% due 7/1/26 (e) | | | 2,203,800 |
|
| Pennsylvania — 8.1% | | | |
| 3,000,000 | | AAA | | Allegheny County, PA Port Authority Special Revenue,
FGIC-Insured, 5.500% due 3/1/16 | | | 3,339,960 |
| 1,305,000 | | NR | | Berks County Municipal Authority, (Phoebe Berks Village Inc. Project), (Call 5/15/06 @ 102) 7.500% due 5/15/13 (f) | | | 1,422,594 |
| 2,405,000 | | BBB- | | Carbon County, PA IDA, (Panther Creek Partners Project), 6.650% due 5/1/10 (d) | | | 2,604,495 |
| 2,500,000 | | Aaa* | | Central Bucks, PA School District GO, FGIC-Insured,
5.500% due 5/15/19 | | | 2,778,500 |
| 1,070,000 | | A | | Chester County, PA School Authority, School Lease Revenue, 5.375% due 6/1/17 | | | 1,188,824 |
| 2,480,000 | | NR | | Dauphin County, PA General Authority Revenue, Office and Packaging, 5.500% due 1/1/08 | | | 2,470,328 |
| 1,750,000 | | AAA | | Greater Johnstown, PA GO, School District, Series B,
MBIA-Insured, 5.375% due 8/1/14 | | | 1,961,435 |
See Notes to Financial Statements.
20 Smith Barney Muni Funds | 2004 Semi-Annual Report
| | |
| Schedule of Investments (unaudited) (continued) | | September 30, 2004 |
| | | | | | | |
FACE
AMOUNT | | RATING(a) | | SECURITY | | VALUE |
| | | | | | | | |
| Pennsylvania — 8.1% (continued) | | | |
| $ 2,000,000 | | AAA | | Pennsylvania State Department of General Services, COP,
FSA-Insured, 5.250% due 5/1/16 | | $ | 2,197,820 |
| | | | | Pennsylvania State GO, Second Series: | | | |
| 4,000,000 | | AAA | | Call 5/1/12 @ 100, 5.500% due 5/1/15 (b)(f) | | | 4,614,240 |
| 5,000,000 | | AAA | | Call 10/1/09 @ 101, 5.750% due 10/1/17 (b)(f) | | | 5,761,200 |
| | | | | Pennsylvania State Higher Educational Facilities Authority, Health Services Revenue, Series A: | | | |
| 3,330,000 | | AAA | | Allegheny Delaware Valley Obligation Group,
MBIA-Insured, 5.600% due 11/15/09 (b) | | | 3,661,102 |
| 1,000,000 | | A | | University of Pittsburgh, UPMC Health System,
6.250% due 1/15/18 | | | 1,105,150 |
| | | | | Philadelphia, PA Authority for Industrial Development, Series B, FSA-Insured: | | | |
| 2,000,000 | | AAA | | 5.500% due 10/1/15 | | | 2,245,900 |
| 1,000,000 | | AAA | | 5.500% due 10/1/19 | | | 1,113,120 |
| | | | | Philadelphia, PA Gas Works Revenue, Third Series: | | | |
| 3,240,000 | | AAA | | 5.500% due 8/1/19 (b) | | | 3,572,197 |
| 1,675,000 | | AAA | | FSA-Insured, 5.500% due 8/1/17 | | | 1,853,103 |
| | | | | Philadelphia, PA GO, School District: | | | |
| 2,000,000 | | AAA | | 5.250% due 9/15/18 | | | 2,156,040 |
| | | | | Series A, FSA-Insured: | | | |
| 2,000,000 | | AAA | | Call 2/1/12 @ 100, 5.500% due 2/1/20 (f) | | | 2,291,040 |
| 1,865,000 | | AAA | | Call 2/1/12 @ 100, 5.500% due 2/1/21 (f) | | | 2,136,395 |
| 2,000,000 | | AAA | | Series B, 5.625% due 8/1/18 | | | 2,242,000 |
| 420,000 | | Aaa* | | Philadelphia, PA Hospitals Authority Revenue, (United Hospitals Inc. Project), (Call 7/1/05 @ 100), 10.875% due 7/1/08 (f) | | | 448,413 |
| | | | | Philadelphia, PA Parking Authority, Parking Revenue,
FSA-Insured: | | | |
| 2,000,000 | | AAA | | 5.625% due 9/1/15 | | | 2,225,980 |
| 1,500,000 | | AAA | | 5.625% due 9/1/19 | | | 1,656,555 |
| 1,265,000 | | NR | | Pittsburgh, PA Public Parking Authority, Parking Revenue,
St. Francis General Hospital,
6.625% due 10/1/12 (c) | | | 1,452,245 |
| 1,445,000 | | AA | | Southcentral, PA General Authority Revenue, Hanover Hospital Inc., Radian-Insured, 5.500% due 12/1/18 | | | 1,589,644 |
| 795,000 | | AAA | | Westmoreland County, PA Municipal Authority,
9.125% due 7/1/10 (c) | | | 909,917 |
| 1,000,000 | | AAA | | West View, PA Municipal Authority,
9.500% due 11/15/14 (c) | | | 1,373,590 |
|
| | | | | | | | 60,371,787 |
|
| Rhode Island — 0.6% | | | |
| 1,000,000 | | AAA | | Cranston, RI GO, FGIC-Insured, 6.375% due 11/15/14 | | | 1,177,790 |
| 1,000,000 | | AAA | | Providence, RI Public Building Authority, General Revenue, Series A, MBIA-Insured, 5.375% due 12/15/21 | | | 1,089,730 |
See Notes to Financial Statements.
21 Smith Barney Muni Funds | 2004 Semi-Annual Report
| | |
| Schedule of Investments (unaudited) (continued) | | September 30, 2004 |
| | | | | | | |
FACE
AMOUNT | | RATING(a) | | SECURITY | | VALUE |
| | | | | | | | |
| Rhode Island — 0.6% (continued) | | | |
| $ 2,000,000 | | Aaa* | | Woonsocket, RI GO, FGIC-Insured, 5.375% due 10/1/20 | | $ | 2,176,540 |
|
| | | | | | | | 4,444,060 |
|
| South Carolina — 1.7% | | | |
| 1,230,000 | | AAA | | Charleston, SC Waterworks & Sewer Revenue,
10.375% due 1/1/10 (c) | | | 1,495,446 |
| 6,400,000 | | B- | | Connector 2000 Association Inc., SC Toll Road, Sr. Revenue Bond, Capital Appreciation, Series B,
zero coupon due 1/1/16 | | | 2,015,360 |
| | | | | Greenville County, SC School District Installment Purchase Revenue, Building Equity Sooner for Tomorrow: | | | |
| 1,000,000 | | AA- | | 5.875% due 12/1/19 | | | 1,127,630 |
| 3,000,000 | | AA- | | 6.000% due 12/1/21 (b) | | | 3,415,350 |
| 4,530,000 | | AAA | | South Carolina Transportation Infrastructure Bank Revenue, Series A, 5.000% due 10/1/15 (b) | | | 4,890,679 |
|
| | | | | | | | 12,944,465 |
|
| South Dakota — 0.4% | | | |
| 2,635,000 | | Aa2* | | Minnehaha County, SD GO, Limited Tax Certificates,
5.625% due 12/1/19 | | | 2,937,893 |
|
| Tennessee — 1.6% | | | | | |
| 5,000,000 | | AAA | | Elizabethton, TN Health & Educational Facilities Board Revenue, Series B, 5.750% due 7/1/23 (b) | | | 5,530,300 |
| 300,000 | | Aaa* | | Greenville, TN Health & Educational Facilities Board, Hospital Revenue, Southern Adventist Health System,
8.700% due 10/1/09 (c) | | | 347,106 |
| 1,000,000 | | AAA | | Memphis-Shelby County, TN Airport Authority, Airport Revenue, Series D, AMBAC-Insured, 6.250% due 3/1/14 (d) | | | 1,142,090 |
| 2,000,000 | | AAA | | Memphis-Shelby County, TN Sports Authority Inc. Revenue, (Memphis Arena Project), Series A, 5.500% due 11/1/18 | | | 2,250,660 |
| 2,000,000 | | AA | | Memphis, TN GO, General Improvement, 5.250% due 4/1/16 | | | 2,157,740 |
| 625,000 | | AAA | | SCA Tax Exempt Trust, Knox Health Educational & Housing, FSA-Insured, 7.125% due 1/1/30 | | | 640,675 |
|
| | | | | | | | 12,068,571 |
|
| Texas — 10.5% | | | | | |
| 1,000,000 | | BBB- | | Austin, TX Convention Enterprises Inc., Convention Center, First Tier, Series A, 6.600% due 1/1/21 | | | 1,078,640 |
| 2,620,000 | | AA+ | | Austin, TX GO, Public Improvement, 5.500% due 9/1/19 | | | 2,869,057 |
| | | | | Bexar County, TX Housing Finance Corp., Multi-Family Housing Revenue, Series A: | | | |
| 440,000 | | Baa1* | | American Opportunity For Housing-Nob Hill Apartments LLC, 6.000% due 6/1/21 | | | 451,299 |
| 700,000 | | Aaa* | | The Waters At Northern Hills Apartments, MBIA-Insured, 5.800% due 8/1/21 | | | 758,590 |
See Notes to Financial Statements.
22 Smith Barney Muni Funds | 2004 Semi-Annual Report
| | |
| Schedule of Investments (unaudited) (continued) | | September 30, 2004 |
| | | | | | | |
FACE
AMOUNT | | RATING(a) | | SECURITY | | VALUE |
| | | | | | | | |
| Texas — 10.5% (continued) | | | |
| $ 45,000 | | AAA | | Brownsville, TX Utility System Revenue, 9.400% due 1/1/13 (c) | | $ | 57,353 |
| 3,000,000 | | CCC | | Dallas-Fort Worth, TX International Airport Facility Improvement Corp. Revenue, American Airlines Inc., Series C,
6.150% due 5/1/29, mandatory tender 11/1/07 (d)(e) | | | 2,714,280 |
| 3,290,000 | | AAA | | Duncanville, TX Hospital Authority, (Methodist Hospitals of Dallas Project), 9.000% due 1/1/10 (b)(c) | | | 3,856,505 |
| | | | | El Paso County, TX Housing Finance Corp., Multi-Family Housing Revenue, Series A: | | | |
| | | | | American Village Communities: | | | |
| 1,250,000 | | A3* | | 6.250% due 12/1/20 | | | 1,302,500 |
| 1,000,000 | | A3* | | 6.250% due 12/1/24 | | | 1,032,090 |
| 415,000 | | A3* | | La Plaza Apartments, 6.700% due 7/1/20 | | | 460,447 |
| 1,000,000 | | AAA | | Fort Bend, TX GO, ISD, PSFG, 5.500% due 2/15/16 | | | 1,092,460 |
| 2,000,000 | | AA | | Fort Worth, TX Water & Sewer Revenue, 5.625% due 2/15/18 | | | 2,261,140 |
| 1,000,000 | | AAA | | Grand Prairie, TX Housing Finance Corp., Multi-Family Housing Revenue, (Landings of Carrier Project), Series A, GNMA-Collateralized, 6.750% due 9/20/32 | | | 1,107,100 |
| 5,000,000 | | Ba2* | | Gulf Coast IDA, Texas Solid Waste Disposal Revenue, (Citgo Petroleum Corp. Project), 7.500% due 5/1/25 (b)(d)(e) | | | 5,304,450 |
| 1,000,000 | | AAA | | Harlandale, TX GO, ISD, Refunding, PSFG,
6.000% due 8/15/16 (d) | | | 1,146,790 |
| | | | | Harris County, TX Houston Sports Authority Revenue, Series G: | | | |
| 3,000,000 | | AAA | | 5.750% due 11/15/19 | | | 3,349,530 |
| 1,125,000 | | AAA | | MBIA-Insured, 5.250% due 11/15/16 | | | 1,233,113 |
| 2,200,000 | | AA+ | | Harris County, TX GO, Series B, 5.250% due 10/1/18 | | | 2,433,926 |
| 3,635,000 | | AAA | | Houston, TX Airport System Revenue, 9.500% due 7/1/10 (b)(c) | | | 4,489,588 |
| | | | | Houston, TX GO: | | | |
| | | | | FSA-Insured: | | | |
| 910,000 | | AAA | | (Call 9/1/10 @ 100), 5.750% due 3/1/18 (f) | | | 1,041,304 |
| 90,000 | | AAA | | Unrefunded Balance, 5.750% due 3/1/18 | | | 101,587 |
| 4,000,000 | | AAA | | PSFG, 5.250% due 2/15/18 (b) | | | 4,307,520 |
| | | | | Houston, TX Water & Sewer System Revenue,
Refunding, Jr. Lien: | | | |
| 1,000,000 | | AAA | | Series A, FSA-Insured, 5.500% due 12/1/17 | | | 1,118,200 |
| 4,545,000 | | AAA | | Series B, (Call 12/1/10 @ 100), 5.750% due 12/1/16 (b)(f) | | | 5,253,611 |
| 2,930,000 | | NR | | Midlothian, TX Development Authority Tax, Increment Contract Revenue, 7.875% due 11/15/21 | | | 3,183,474 |
| 3,515,000 | | Aaa* | | Midlothian, TX ISD, Capital Appreciation Bonds, PSFG, zero coupon due 2/15/17 | | | 1,768,853 |
| 1,800,000 | | AAA | | Montgomery, TX GO, ISD, PSFG, 5.500% due 2/15/17 | | | 1,996,038 |
| 1,230,000 | | A | | North Forest ISD, ACA-Insured, 6.500% due 8/15/17 | | | 1,458,854 |
| 755,000 | | Aaa* | | Panhandle, TX Regional Housing Finance, Series A,
GNMA-Collateralized, 6.500% due 7/20/21 | | | 848,741 |
See Notes to Financial Statements.
23 Smith Barney Muni Funds | 2004 Semi-Annual Report
| | |
| Schedule of Investments (unaudited) (continued) | | September 30, 2004 |
| | | | | | | |
FACE
AMOUNT | | RATING(a) | | SECURITY | | VALUE |
| | | | | | | | |
| Texas — 10.5% (continued) | | | |
| $ 810,000 | | AAA | | Southeast Texas Hospital Financing Agency, (Memorial Hospital System Project), 8.500% due 12/1/08 (c) | | $ | 913,591 |
| | | | | Tarrant County, TX Health Facilities Development Corp., Hospital Revenue: | | | |
| 2,000,000 | | A | | 6.625% due 11/15/20 | | | 2,218,500 |
| 4,000,000 | | AA- | | Baylor Health Care System Project,
5.750% due 11/15/19 (b) | | | 4,353,440 |
| 155,000 | | AAA | | Tarrant County, TX Hospital Authority Revenue, St. Joseph Hospital Project, 8.750% due 2/1/10 (c) | | | 181,617 |
| 1,000,000 | | Baa3* | | Texas State Student Housing Corp., Student Housing Revenue, (Midwestern State University Project), 6.500% due 9/1/22 | | | 1,055,200 |
| 2,000,000 | | AAA | | Texas Technical University Revenues Financing System, Seventh Series, MBIA-Insured, 5.500% due 8/15/18 | | | 2,219,160 |
| 3,500,000 | | AAA | | Texas Water Development Board Revenue, Revolving Fund, Sr. Lien, Series B, 5.250% due 7/15/17 (b) | | | 3,775,135 |
| 2,000,000 | | Baa3* | | Tomball, TX Hospital Authority Revenue,
Tomball Regional Hospital, 5.500% due 7/1/09 | | | 2,080,020 |
| 2,000,000 | | AAA | | University of Texas Revenues Financing System, Series B, (Call 8/15/11 @ 100), 5.375% due 8/15/18 (f) | | | 2,285,840 |
| 1,000,000 | | AAA | | Wichita Falls, TX Water & Sewer Revenue, Priority Lien, AMBAC-Insured, 5.375% due 8/1/19 | | | 1,090,050 |
|
| | | | | | | | 78,249,593 |
|
| Utah — 1.3% | | | | | |
| 2,500,000 | | AAA | | Intermountain Power Agency, UT Power Supply Revenue, Refunding, Series B MBIA-Insured, 5.750% due 7/1/19 | | | 2,762,525 |
| | | | | Provo, UT Electric Revenue: | | | |
| 1,010,000 | | AAA | | 10.125% due 4/1/15 (c) | | | 1,372,539 |
| 1,120,000 | | AAA | | MBIA-Insured, 10.125% due 4/1/15 (c) | | | 1,522,024 |
| 10,000 | | AAA | | Series A, AMBAC-Insured, 10.375% due 9/15/15 (c) | | | 14,156 |
| 1,500,000 | | AAA | | Salt Lake County, UT Hospital Revenue,
IHC Health Services Inc., AMBAC-Insured,
5.500% due 5/15/13 | | | 1,680,015 |
| | | | | Spanish Fork City, UT Water Revenue, FSA-Insured: | | | |
| 760,000 | | Aaa* | | 5.500% due 6/1/17 | | | 850,980 |
| 240,000 | | Aaa* | | Call 6/1/12 @ 100, 5.500% due 6/1/17 (f) | | | 277,207 |
| 1,000,000 | | AAA | | Utah State Board of Regents, Utah State University Hospital, MBIA-Insured, 5.500% due 8/1/18 | | | 1,113,970 |
|
| | | | | | | | 9,593,416 |
|
| Vermont — 0.2% | | | |
| 1,415,000 | | BBB+ | | Vermont Educational & Health Buildings Financing Agency Revenue, Developmental & Mental Health, Series A, 5.500% due 6/15/12 | | | 1,473,369 |
|
See Notes to Financial Statements.
24 Smith Barney Muni Funds | 2004 Semi-Annual Report
| | |
| Schedule of Investments (unaudited) (continued) | | September 30, 2004 |
| | | | | | | |
FACE
AMOUNT | | RATING(a) | | SECURITY | | VALUE |
| | | | | | | | |
| Virginia — 2.8% | | | | | |
| $ 1,445,000 | | AA | | Chesapeake, VA GO, Public Improvement,
5.500% due 12/1/17 | | $ | 1,620,640 |
| 1,305,000 | | AA | | Fauquier County, VA IDA Hospital Revenue, Fauquier Hospital Foundation Inc., Radian-Insured, 5.500% due 10/1/15 | | | 1,488,587 |
| 1,000,000 | | AAA | | Harrisonburg, VA Redevelopment & Housing Authority, Multi-Family Housing Revenue, (Greens of Salem Run Project),
FSA-Insured, 6.000% due 4/1/12 (d) | | | 1,065,790 |
| 750,000 | | A | | Norton, VA IDA Hospital Revenue, Norton Community Hospital, ACA-Insured, 6.000% due 12/1/22 | | | 804,540 |
| 10,000,000 | | BB | | Pocahontas Parkway Association, VA Toll Road,
Sr. Revenue Bond, Capital Appreciation, Series B,
zero coupon due 8/15/19 (b) | | | 3,391,500 |
| 2,000,000 | | B2* | | Rockbridge County, VA IDA Revenue, Virginia Horse Center Foundation, Series C, 6.850% due 7/15/21 | | | 1,891,300 |
| 1,750,000 | | AA+ | | Virginia State Public Building Authority, Public Facilities Revenue, Series A, 5.750% due 8/1/20 | | | 1,975,330 |
| 5,035,000 | | AAA | | Virginia State Resources Authority, Clean Water Revenue, Revolving Fund, 5.400% due 10/1/18 (b) | | | 5,596,654 |
| 3,000,000 | | BBB+ | | York County, VA IDA, PCR, Electric & Power Co., Refunding Market, 5.500% due 7/1/09 | | | 3,180,930 |
|
| | | | | | | | 21,015,271 |
|
| Washington — 1.3% | | | |
| 4,000,000 | | AAA | | Energy Northwest Washington Electric Revenue, Refunding, (Project Number 1), Series A, 5.500% due 7/1/14 (b) | | | 4,497,640 |
| 2,000,000 | | AAA | | Pierce County, WA GO, School District No. 10 Tacoma,
FGIC-Insured, 5.375% due 12/1/14 | | | 2,236,800 |
| | | | | Radford Court Properties, WA Student Housing Revenue,
MBIA-Insured: | | | |
| 1,695,000 | | AAA | | 6.000% due 6/1/17 | | | 1,945,250 |
| 1,000,000 | | AAA | | 5.375% due 6/1/19 | | | 1,084,320 |
|
| | | | | | | | 9,764,010 |
|
| West Virginia — 0.3% | | | |
| 2,200,000 | | BBB- | | South Charleston, WV PCR, Revenue Refunding, Union Carbide, Remarketed 5/1/91, 7.625% due 8/1/05 | | | 2,210,736 |
|
| Wisconsin — 0.7% | | | | | |
| 185,000 | | AAA | | Oshkosh, WI Hospital Facility Revenue, Mercy Medical Center, (Call 7/1/07 @ 100), 7.375% due 7/1/09 (f) | | | 204,353 |
| 2,000,000 | | AA- | | Wisconsin State GO, (Call 5/1/11 @ 100),
Series B, 5.500% due 5/1/14 (f) | | | 2,289,780 |
| | | | | Wisconsin State HEFA Revenue: | | | |
| 1,000,000 | | A- | | Agnesian Health Care Inc., 6.000% due 7/1/17 | | | 1,076,050 |
See Notes to Financial Statements.
25 Smith Barney Muni Funds | 2004 Semi-Annual Report
| | |
| Schedule of Investments (unaudited) (continued) | | September 30, 2004 |
| | | | | | | |
FACE
AMOUNT | | RATING(a) | | SECURITY | | VALUE |
| | | | | | | | |
| Wisconsin — 0.7% (continued) | | | |
| $ 1,500,000 | | A | | Wheaton Franciscan Services Inc., 6.000% due 8/15/15 | | $ | 1,669,320 |
|
| | | | | | | | 5,239,503 |
|
| | | | | TOTAL INVESTMENTS — 97.3%
(Cost — $695,144 848***) | | | 727,661,272 |
| | | | | Other Assets in Excess of Liabilities — 2.7% | | | 20,386,198 |
|
| | | | | TOTAL NET ASSETS — 100.0% | | $ | 748,047,470 |
|
| (a) | | All ratings are by Standard & Poor’s Ratings Service, except for those that are identified by an asterisk (*), which are rated by Moody’s Investors Service, Inc and those identified by a (**), which are rated by Fitch Ratings. |
| (b) | | All or a portion of this security is segregated and/or held as collateral for open futures contracts. |
| (c) | | Bonds are escrowed to maturity with U.S. government securities and are considered by the Manager to be triple-A rated even if the issuer has not applied for new ratings. |
| (d) | | Income from this issue is considered a preference item for purposes of calculating the alternative minimum tax. |
| (e) | | Inverse floating rate security-coupon varies inversely with level of short term tax exempt interest rates. |
| (f) | | Pre-Refunded bonds are escrowed with U.S. government securities and are considered by the Manager to be triple-A rated even if issuer has not applied for new ratings. |
| (g) | | Security is in default. |
| *** | | Aggregate cost for Federal income tax purposes is substantially the same. |
See pages 27 through 29 for definitions of ratings and certain abbreviations.
| | | |
| Summary of Investments by Industry† | | | |
General Obligation | | 21.4 | % |
Hospitals | | 16.9 | |
Transportation | | 12.2 | |
Education | | 9.3 | |
Utilities | | 8.7 | |
Water & Sewer | | 7.7 | |
Public Facilities | | 6.9 | |
Housing — Multi-family | | 2.5 | |
Pollution Control | | 2.5 | |
Tobacco | | 2.3 | |
Industrial Development | | 1.9 | |
Other | | 7.7 | |
| | |
|
|
| | | 100.0 | % |
| | |
|
|
| † | | As a percentage of total investments. Please note that Fund holdings are as of September 30, 2004 and are subject to change. |
See Notes to Financial Statements.
26 Smith Barney Muni Funds | 2004 Semi-Annual Report
Bond Ratings (unaudited)
The definitions of the applicable rating symbols are set forth below:
Standard & Poor’s Ratings Service (“Standard & Poor’s”) — Ratings from “AA” to “CCC” may be modified by the addition of a plus (+) or minus (-) sign to show relative standings within the major rating categories.
| | |
AAA | | — Bonds rated “AAA” have the highest rating assigned by Standard & Poor’s to a debt obligation. Capacity to pay interest and repay principal is extremely strong. |
AA | | — Bonds rated “AA” have a very strong capacity to pay interest and repay principal and differ from the highest rated issue only in a small degree. |
A | | — Bonds rated “A” have a strong capacity to pay interest and repay principal although they are somewhat more susceptible to the adverse effects of changes in circumstances and economic conditions than debt in higher rated categories. |
BBB | | — Bonds rated “BBB” are regarded as having an adequate capacity to pay interest and repay principal. Whereas they normally exhibit adequate protection parameters, adverse economic conditions or changing circumstances are more likely to lead to a weakened capacity to pay interest and repay principal for bonds in this category than in higher rated categories. |
BB, B, and CCC | | — Bonds rated “BB”, “B” and “CCC” are regarded, on balance, as predominantly speculative with respect to the issuer’s capacity to pay interest and repay principal in accordance with the terms of the obligation. “BB” indicates the lowest degree of speculation than “B” and “CCC” the highest degree of speculation. While such bonds will likely have some quality and protective characteristics, these are outweighed by large uncertainties or major risk exposures to adverse conditions. |
Moody’s Investors Service (“Moody’s”) — Numerical modifiers 1, 2 and 3 may be applied to each generic rating from “Aa” to “Caa”, where 1 is the highest and 3 the lowest ranking within its generic category.
| | |
Aaa | | — Bonds rated “Aaa” are judged to be of the best quality. They carry the smallest degree of investment risk and are generally referred to as “gilt edge”. Interest payments are protected by a large or by an exceptionally stable margin, and principal is secure. While the various protective elements are likely to change, such changes as can be visualized are most unlikely to impair the fundamentally strong position of these bonds. |
Aa | | — Bonds rated “Aa” are judged to be of high quality by all standards. Together with the “Aaa” group they comprise what are generally known as high grade bonds. They are rated lower than the best bonds because margins of protection may not be as large as in “Aaa” securities, or fluctuation of protective elements may be of greater amplitude, or there may be other elements present which make the long-term risks appear somewhat larger than in “Aaa” securities. |
A | | — Bonds rated “A” possess many favorable investment attributes and are to be considered as upper medium grade obligations. Factors giving security to principal and interest are considered adequate, but elements may be present which suggest a susceptibility to impairment some time in the future. |
Baa | | — Bonds rated “Baa” are considered as medium grade obligations, i.e., they are neither highly protected nor poorly secured. Interest payment and principal security appear adequate for the present but certain protective elements may be lacking or may be characteristically unreliable over any great length of time. Such bonds lack outstanding investment characteristics and in fact have speculative characteristics as well. |
Ba | | — Bonds rated “Ba” are judged to have speculative elements; their future cannot be considered as well assured. Often the protection of interest and principal payments may be very moderate, and thereby not well safeguarded during both good and bad times over the future. Uncertainty of position characterizes bonds in this class. |
B | | — Bonds rated “B” generally lack characteristics of the desirable investments. Assurance of interest and principal payments or maintenance of other terms of the contract over any long period of time may be small. |
Caa | | — Bonds that are rated “Caa” are of poor standing. Such issues may be in default or present elements of danger with respect to principal or interest. |
27 Smith Barney Muni Funds | 2004 Semi-Annual Report
Bond Ratings (unaudited) (continued)
Fitch Ratings (“Fitch”) — Ratings from “AA” to “BBB” may be modified by the addition of a plus (+) sign or minus (-) sign to show relative standings within the major ratings categories.
| | |
AA | | — Bonds rated “AA” are considered to be investment-grade and of very high credit quality. The obligator’s ability to pay interest and/or dividends and repay principal is very strong. |
A | | — Bonds rated “A” are considered to be investment-grade and of high credit quality. The obligor’s ability to pay interest and/or dividends and repay principal is considered to be strong, but may be more vulnerable to adverse changes in economic conditions and circumstances than debt or preferred securities with higher ratings. |
BBB | | — Bonds rated “BBB” are considered to be investment-grade and of satisfactory credit quality. The obligator’s ability to pay interest or dividends and repay principal is considered to be adequate. Adverse changes in economic conditions and circumstances, however, are more likely to have adverse impact on these securities and, therefore, impair timely payment. The likelihood that the ratings of these bonds will fall below investment-grade is higher than for securities with higher ratings. |
| |
NR | | — Indicates that the bond is not rated by Standard & Poor’s, Moody’s or Fitch. |
Short-Term Security Ratings (unaudited)
| | |
SP-1 | | — Standard & Poor’s highest rating indicating very strong or strong capacity to pay principal and interest; those issues determined to possess overwhelming safety characteristics are denoted with a plus (+) sign. |
A-1 | | — Standard & Poor’s highest commercial paper and variable rate demand obligation (VRDO) rating indicating that the degree of safety regarding timely payment is either overwhelming or very strong; those issues determined to possess overwhelming safety characteristics are denoted with a plus (+) sign. |
P-1 | | — Moody’s highest rating for commercial paper and for VRDO prior to the advent of the VMIG 1 rating. |
VMIG 1 | | — Moody’s highest rating for issues having a demand feature — VRDO. |
MIG 1 | | — Moody’s highest rating for short-term municipal obligations. |
MIG 2 | | — Moody’s second highest rating for short-term municipal obligations. |
Abbreviations* (unaudited)
| | |
ABAG | | — Association of Bay Area
Governments |
AIG | | — American International Guaranty |
AMBAC | | — Ambac Assurance Corporation |
AMT | | — Alternative Minimum Tax |
BAN | | — Bond Anticipation Notes |
BIG | | — Bond Investors Guaranty |
CDA | | — Community Development Authority |
CGIC | | — Capital Guaranty Insurance Company |
CHFCLI | | — California Health Facility Construction Loan Insurance |
CONNIE LEE | | — College Construction Loan Insurance Association |
COP | | — Certificate of Participation |
CSD | | — Central School District |
CTFS | | — Certificates |
DFA | | — Development Finance Agency |
| | |
EDA | | — Economic Development Authority |
EFA | | — Educational Facilities Authority |
ETM | | — Escrowed to Maturity |
FGIC | | — Financial Guaranty Insurance Company |
FHA | | — Federal Housing Administration |
FHLMC | | — Federal Home Loan Mortgage Corporation |
FLAIRS | | — Floating Adjustable Interest Rate Securities |
FNMA | | — Federal National Mortgage Association |
FRTC | | — Floating Rate Trust Certificates |
FSA | | — Federal Savings Association |
GDB | | — Government Development Bank |
GIC | | — Guaranteed Investment Contract |
GNMA | | — Government National Mortgage Association |
28 Smith Barney Muni Funds | 2004 Semi-Annual Report
Abbreviations* (unaudited) (continued)
| | |
GO | | — General Obligation |
HDC | | — Housing Development Corporation |
HEFA | | — Health & Educational Facilities Authority |
HFA | | — Housing Finance Authority |
IBC | | — Insured Bond Certificates |
IDA | | — Industrial Development Authority |
IDB | | — Industrial Development Board |
IDR | | — Industrial Development Revenue |
IFA | | — Industrial Finance Agency |
INFLOS | | — Inverse Floaters |
ISD | | — Independent School District |
ISO | | — Independent System Operator |
LGAC | | — Local Government Assistance Corporation |
LOC | | — Letter of Credit |
MBIA | | — Municipal Bond Investors Assurance Corporation |
MERLOT | | — Municipal Exempt Receipts Liquidity Optional Tender |
MFH | | ��� Multi-Family Housing |
MSTC | | — Municipal Securities Trust Certificates |
MUD | | — Municipal Utilities District |
MVRICS | | — Municipal Variable Rate Inverse Coupon Security |
PART | | — Partnership Structure |
PCFA | | — Pollution Control Finance Authority |
PCR | | — Pollution Control Revenue |
PFA | | — Public Finance Authority |
| | |
PFC | | — Public Finance Corporation |
PSFG | | — Permanent School Fund Guaranty |
Q-SBLF | | — Qualified School Bond Loan Fund |
Radian | | — Radian Asset Assurance |
RAN | | — Revenue Anticipation Notes |
RAW | | — Revenue Anticipation Warrants |
RDA | | — Redevelopment Agency |
RIBS | | — Residual Interest Bonds |
RITES | | — Residual Interest Tax-Exempt Securities |
SPA | | — Standby Bond Purchase Agreement |
SWAP | | — Swap Structure |
SYCC | | — Structured Yield Curve Certificate |
TAN | | — Tax Anticipation Notes |
TCRS | | — Transferable Custodial Receipts |
TECP | | — Tax Exempt Commercial Paper |
TFA | | — Transitional Finance Authority |
TOB | | — Tender Option Bond Structure |
TRAN | | — Tax and Revenue Anticipation Notes |
UFSD | | — Unified Free School District |
UHSD | | — Unified High School District |
USD | | — Unified School District |
VA | | — Veterans Administration |
VRDD | | — Variable Rate Daily Demand |
VRDO | | — Variable Rate Demand Obligation |
VRWE | | — Variable Rate Wednesday Demand |
XLCA | | — XL Capital Assurance |
| * | | Abbreviations may or may not appear in the schedule of investments. |
29 Smith Barney Muni Funds | 2004 Semi-Annual Report
| | |
| Statement of Assets and Liabilities (unaudited) | | September 30, 2004 |
| | | | |
| ASSETS: | | | | |
Investments, at value (Cost — $695,144,848) | | $ | 727,661,272 | |
Cash | | | 58,793 | |
Interest receivable | | | 12,572,995 | |
Receivable for Fund shares sold | | | 9,968,042 | |
Receivable for securities sold | | | 1,774,200 | |
Receivable from broker — variation margin | | | 914,063 | |
Other assets | | | 27,257 | |
|
|
Total Assets | | | 752,976,622 | |
|
|
| LIABILITIES: | | | | |
Payable for securities purchased | | | 3,406,020 | |
Payable for Fund shares reacquired | | | 990,104 | |
Management fee payable | | | 303,722 | |
Distribution plan fees payable | | | 115,453 | |
Accrued expenses | | | 113,853 | |
|
|
Total Liabilities | | | 4,929,152 | |
|
|
Total Net Assets | | $ | 748,047,470 | |
|
|
| NET ASSETS: | | | | |
Par value of shares of beneficial interest ($0.001 par value, unlimited shares authorized) | | $ | 114,312 | |
Capital paid in excess of par value | | | 757,062,274 | |
Undistributed net investment income | | | 1,685,361 | |
Accumulated net realized loss from investment transactions and futures contracts | | | (37,319,182 | ) |
Net unrealized appreciation of investments and futures contracts | | | 26,504,705 | |
|
|
Total Net Assets | | $ | 748,047,470 | |
|
|
Shares Outstanding: | | | | |
Class A | | | 58,863,134 | |
| |
Class B | | | 1,059,267 | |
| |
Class C | | | 48,857,163 | |
| |
Class O | | | 4,470,198 | |
| |
Class Y | | | 1,061,804 | |
| |
Net Asset Value: | | | | |
Class A (and redemption price) | | | $6.54 | |
| |
Class B * | | | $6.54 | |
| |
Class C (and redemption price) | | | $6.55 | |
| |
Class O * | | | $6.55 | |
| |
Class Y (and redemption price) | | | $6.54 | |
| |
Maximum Public Offering Price Per Share: | | | | |
Class A (based on maximum sales charge of 2.00%) | | | $6.67 | |
|
|
| * | | Redemption price is NAV of Class B and C shares reduced by 5.00% and 1.00% CDSC, respectively, if shares are redeemed within one year from purchase payment (See Note 2). |
See Notes to Financial Statements.
30 Smith Barney Muni Funds | 2004 Semi-Annual Report
Statement of Operations (unaudited)
For the Six Months Ended September 30, 2004
| | | | |
| INVESTMENT INCOME: | | | | |
Interest | | $ | 19,018,100 | |
|
|
| EXPENSES: | | | | |
Management fee (Note 2) | | | 1,858,080 | |
Distribution plan fees (Notes 2 and 4) | | | 1,567,415 | |
Transfer agency services (Notes 2 and 4) | | | 69,180 | |
Registration fees | | | 45,940 | |
Shareholder communications (Note 4) | | | 43,912 | |
Custody | | | 43,444 | |
Audit and legal | | | 19,361 | |
Trustees’ fees | | | 4,575 | |
Other | | | 4,466 | |
|
|
Total Expenses | | | 3,656,373 | |
Less: Management fee waiver (Notes 2 and 7) | | | (29,006 | ) |
|
|
Net Expenses | | | 3,627,367 | |
|
|
Net Investment Income | | | 15,390,733 | |
|
|
REALIZED AND UNREALIZED LOSS ON INVESTMENTS AND FUTURES CONTRACTS (NOTES 1 AND 3): | | | | |
Net Realized Loss From Investments Transactions and Futures Contracts | | | (2,535,909 | ) |
|
|
Net Decrease in Unrealized Appreciation of Investments and
Futures Contracts | | | (3,663,784 | ) |
|
|
Net Loss on Investments and Futures Contracts | | | (6,199,693 | ) |
|
|
Increase in Net Assets From Operations | | $ | 9,191,040 | |
|
|
See Notes to Financial Statements.
31 Smith Barney Muni Funds | 2004 Semi-Annual Report
Statements of Changes in Net Assets
For the Six Months Ended September 30, 2004 (unaudited)
and the Year Ended March 31, 2004
| | | | | | | | |
| | | September 30 | | | March 31 | |
| OPERATIONS: | | | | | | | | |
Net investment income | | $ | 15,390,733 | | | $ | 30,783,114 | |
Net realized loss | | | (2,535,909 | ) | | | (6,788,079 | ) |
Net increase (decrease) in unrealized appreciation | | | (3,663,784 | ) | | | 7,217,996 | |
|
|
Increase in Net Assets From Operations | | | 9,191,040 | �� | | | 31,213,031 | |
|
|
DISTRIBUTIONS TO SHAREHOLDERS
FROM (NOTES 1 AND 6): | | | | | | | | |
Net investment income | | | (14,854,219 | ) | | | (29,987,923 | ) |
|
|
Decrease in Net Assets From
Distributions to Shareholders | | | (14,854,219 | ) | | | (29,987,923 | ) |
|
|
| FUND SHARE TRANSACTIONS (NOTE 6): | | | | | | | | |
Net proceeds from sale of shares | | | 131,044,561 | | | | 347,860,600 | |
Net asset value of shares issued for reinvestment of distributions | | | 9,188,000 | | | | 18,303,894 | |
Cost of shares reacquired | | | (159,750,202 | ) | | | (329,061,181 | ) |
|
|
Increase (Decrease) in Net Assets From Fund
Share Transactions | | | (19,517,641 | ) | | | 37,103,313 | |
|
|
Increase (Decrease) in Net Assets | | | (25,180,820 | ) | | | 38,328,421 | |
| NET ASSETS: | | | | | | | | |
Beginning of period | | | 773,228,290 | | | | 734,899,869 | |
|
|
End of period* | | $ | 748,047,470 | | | $ | 773,228,290 | |
|
|
* Includes undistributed net investment income of: | | | $1,685,361 | | | | $1,148,847 | |
|
|
See Notes to Financial Statements.
32 Smith Barney Muni Funds | 2004 Semi-Annual Report
Financial Highlights
For a share of each class of beneficial interest outstanding throughout each year ended March 31, unless otherwise noted:
| | | | | | | | | | | | | | | | | | | | | | | | |
| Class A Shares(1) | | 2004(2) | | | 2004 | | | 2003 | | | 2002 | | | 2001 | | | 2000 | |
Net Asset Value,
Beginning of Period | | $ | 6.59 | | | $ | 6.57 | | | $ | 6.40 | | | $ | 6.51 | | | $ | 6.36 | | | $ | 6.78 | |
|
|
Income (Loss) From Operations: | | | | | | | | | | | | | | | | | | | | | | | | |
Net investment income(3) | | | 0.14 | | | | 0.29 | | | | 0.31 | | | | 0.34 | | | | 0.34 | | | | 0.32 | |
Net realized and unrealized gain (loss)(3) | | | (0.05 | ) | | | 0.01 | | | | 0.17 | | | | (0.10 | ) | | | 0.16 | | | | (0.42 | ) |
|
|
Total Income (Loss) From Operations | | | 0.09 | | | | 0.30 | | | | 0.48 | | | | 0.24 | | | | 0.50 | | | | (0.10 | ) |
|
|
Less Distributions From: | | | | | | | | | | | | | | | | | | | | | | | | |
Net investment income | | | (0.14 | ) | | | (0.28 | ) | | | (0.30 | ) | | | (0.35 | ) | | | (0.35 | ) | | | (0.32 | ) |
In excess of net investment income | | | — | | | | — | | | | (0.01 | ) | | | (0.00 | )* | | | — | | | | — | |
|
|
Total Distributions | | | (0.14 | ) | | | (0.28 | ) | | | (0.31 | ) | | | (0.35 | ) | | | (0.35 | ) | | | (0.32 | ) |
|
|
Net Asset Value, End of Period | | | $ 6.54 | | | | $ 6.59 | | | | $ 6.57 | | | | $ 6.40 | | | | $ 6.51 | | | | $ 6.36 | |
|
|
Total Return(4) | | | 1.40 | %‡ | | | 4.67 | % | | | 7.64 | % | | | 3.70 | % | | | 8.06 | % | | | (1.46 | )% |
|
|
Net Assets, End of Period (millions) | | | $385 | | | | $376 | | | | $364 | | | | $284 | | | | $222 | | | | $236 | |
|
|
Ratios to Average Net Assets: | | | | | | | | | | | | | | | | | | | | | | | | |
Expenses(5) | | | 0.70 | %†(6) | | | 0.70 | % | | | 0.75 | % | | | 0.72 | % | | | 0.72 | % | | | 0.75 | % |
Net investment income(3) | | | 4.40 | † | | | 4.36 | | | | 4.64 | | | | 5.26 | | | | 5.41 | | | | 4.97 | |
|
|
Portfolio Turnover Rate | | | 7 | % | | | 27 | % | | | 57 | % | | | 53 | % | | | 49 | % | | | 108 | % |
|
|
| (1) | | Per share amounts have been calculated using the monthly average shares method. |
| (2) | | For the six months ended September 30, 2004 (unaudited). |
| (3) | | Effective April 1, 2001, the Fund adopted a change in the accounting method which requires the Fund to amortize premiums and accrete all discounts. Without the adoption of this change, for the year ended March 31, 2002, the ratio of net investment income to average net assets would have been 5.24%. Per share information, ratios and supplemental data for the periods prior to April 1, 2001 have not been restated to reflect this change in presentation. In addition, the impact of this change to net investment income and net realized and unrealized loss was less than $0.01 per share. |
| (4) | | Performance figures may reflect fee waivers and/or expense reimbursements. Past performance is no guarantee of future results. In the absence of fee waivers and/or expense reimbursements, the total return would be reduced. |
| (5) | | As a result of a voluntary expense limitation, the ratio of expenses to average net assets will not exceed 0.85%. |
| (6) | | The investment advisor waived a portion of its advisory fee for the period ended September 30, 2004. If such fees were not waived, the actual expense ratio for Class A shares would have been 0.70%. |
| * | | Amount represents less than $0.01 per share. |
| ‡ | | Total return is not annualized, as it may not be representative of the total return for the year. |
See Notes to Financial Statements.
33 Smith Barney Muni Funds | 2004 Semi-Annual Report
Financial Highlights (continued)
For a share of each class of beneficial interest outstanding throughout each year ended March 31, unless otherwise noted:
| | | | | | | | | |
| Class B Shares(1) | | 2004(2) | | | 2004 | | | 2003(3) | |
Net Asset Value,
Beginning of Period | | $ 6.59 | | | $ 6.57 | | | $ 6.57 | |
|
|
Income From Operations: | | | | | | | | | |
Net investment income | | 0.13 | | | 0.26 | | | 0.05 | |
Net realized and unrealized gain (loss) | | (0.05 | ) | | 0.01 | | | 0.02 | |
|
|
Total Income From Operations | | 0.08 | | | 0.27 | | | 0.07 | |
|
|
Less Distributions From: | | | | | | | | | |
Net investment income | | (0.13 | ) | | (0.25 | ) | | (0.07 | ) |
In excess of net investment income | | — | | | — | | | (0.00 | )* |
|
|
Total Distributions | | (0.13 | ) | | (0.25 | ) | | (0.07 | ) |
|
|
Net Asset Value, End of Period | | $ 6.54 | | | $ 6.59 | | | $ 6.57 | |
|
|
Total Return(4) | | 1.16 | %‡ | | 4.18 | % | | 1.07 | %‡ |
|
|
Net Assets, End of Period (000s) | | $6,926 | | | $6,401 | | | $4,084 | |
|
|
Ratios to Average Net Assets: | | | | | | | | | |
Expenses(5) | | 1.19 | %†(6) | | 1.18 | % | | 1.31 | %† |
Net investment income | | 3.93 | † | | 3.87 | | | 4.14 | † |
|
|
Portfolio Turnover Rate | | 7 | % | | 27 | % | | 57 | % |
|
|
| (1) | | Per share amounts have been calculated using the monthly average shares method. |
| (2) | | For the six months ended September 30, 2004 (unaudited). |
| (3) | | For the period January 13, 2003 (inception date) to March 31, 2003. |
| (4) | | Performance figures may reflect fee waivers and/or expense reimbursements. Past performance is no guarantee of future results. In the absence of fee waivers and/or expense reimbursements, the total return would be reduced. |
| (5) | | As a result of a voluntary expense limitation, the ratio of expenses to average net assets will not exceed 1.35%. |
| (6) | | The investment advisor waived a portion of its advisory fee for the period ended September 30, 2004. If such fees were not waived, the actual expense ratio for Class B shares would have been 1.20%. |
| * | | Amount represents less than $0.01 per share. |
| ‡ | | Total return is not annualized, as it may not be representative of the total return for the year. |
See Notes to Financial Statements.
34 Smith Barney Muni Funds | 2004 Semi-Annual Report
Financial Highlights (continued)
For a share of each class of beneficial interest outstanding throughout each year ended March 31, unless otherwise noted:
| | | | | | | | | | | | |
| Class C Shares(1)(2) | | 2004(3) | | | 2004 | | | 2003 | | | 2002(4) | |
Net Asset Value,
Beginning of Period | | $ 6.60 | | | $ 6.58 | | | $ 6.41 | | | $ 6.46 | |
|
|
Income (Loss) From Operations: | | | | | | | | | | | | |
Net investment income(5) | | 0.12 | | | 0.25 | | | 0.27 | | | 0.08 | |
Net realized and unrealized gain (loss)(5) | | (0.05 | ) | | 0.01 | | | 0.17 | | | (0.04 | ) |
|
|
Total Income From Operations | | 0.07 | | | 0.26 | | | 0.44 | | | 0.04 | |
|
|
Less Distributions From: | | | | | | | | | | | | |
Net investment income | | (0.12 | ) | | (0.24 | ) | | (0.26 | ) | | (0.09 | ) |
In excess of net investment income | | — | | | — | | | (0.01 | ) | | — | |
|
|
Total Distributions | | (0.12 | ) | | (0.24 | ) | | (0.27 | ) | | (0.09 | ) |
|
|
Net Asset Value, End of Period | | $ 6.55 | | | $ 6.60 | | | $ 6.58 | | | $ 6.41 | |
|
|
Total Return(6) | | 1.08 | %‡ | | 4.02 | % | | 6.99 | % | | 0.58 | %‡ |
|
|
Net Assets, End of Period (millions) | | $320 | | | $351 | | | $322 | | | $184 | |
|
|
Ratios to Average Net Assets: | | | | | | | | | | | | |
Expenses | | 1.30 | %†(8) | | 1.30 | % | | 1.35 | % | | 1.32 | %† |
Net investment income(5) | | 3.78 | † | | 3.75 | | | 4.02 | | | 4.68 | † |
|
|
Portfolio Turnover Rate | | 7 | % | | 27 | % | | 57 | % | | 53 | % |
|
|
| (1) | | Effective April 29, 2004, Class L shares were renamed as Class C shares. |
| (2) | | Per share amounts have been calculated using the monthly average shares method. |
| (3) | | For the six months ended September 30, 2004 (unaudited). |
| (4) | | For the period December 19, 2001 (inception date) to March 31, 2002. |
| (5) | | Effective April 1, 2001, the Fund adopted a change in the accounting method which requires the Fund to amortize premiums and accrete all discounts. Without the adoption of this change, for the period ended March 31, 2002, the ratio of net investment income to average net assets would have been 4.65%. Per share information, ratios and supplemental data for the periods prior to April 1, 2001 have not been restated to reflect this change in presentation. In addition, the impact of this change to net investment income and net realized and unrealized loss was less than $0.01 per share. |
| (6) | | Performance figures may reflect fee waivers and/or expense reimbursements. Past performance is no guarantee of future results. In the absence of fee waivers and/or expense reimbursements, the total return would be reduced. |
| (7) | | As a result of a voluntary expense limitation, the ratio of expenses to average net assets will not exceed 1.45%. |
| (8) | | The investment advisor waived a portion of its advisory fee for the period ended September 30, 2004. If such fees were not waived, the actual expense ratio for Class C shares would have been 1.31%. |
| ‡ | | Total return is not annualized, as it may not be representative of the total return for the year. |
See Notes to Financial Statements.
35 Smith Barney Muni Funds | 2004 Semi-Annual Report
Financial Highlights (continued)
For a share of each class of beneficial interest outstanding throughout each year ended March 31, unless otherwise noted:
| | | | | | | | | | | | | | | | | | |
| Class O Shares(1)(2) | | 2004(3) | | | 2004 | | | 2003 | | | 2002 | | | 2001 | | | 2000 | |
Net Asset Value,
Beginning of Period | | $ 6.60 | | | $ 6.58 | | | $ 6.41 | | | $ 6.52 | | | $ 6.37 | | | $ 6.79 | |
|
|
Income (Loss) From Operations: | | | | | | | | | | | | | | | | | | |
Net investment income(4) | | 0.13 | | | 0.27 | | | 0.29 | | | 0.33 | | | 0.33 | | | 0.31 | |
Net realized and unrealized gain (loss)(4) | | (0.05 | ) | | 0.02 | | | 0.18 | | | (0.11 | ) | | 0.15 | | | (0.43 | ) |
|
|
Total Income (Loss) From Operations | | 0.08 | | | 0.29 | | | 0.47 | | | 0.22 | | | 0.48 | | | (0.12 | ) |
|
|
Less Distributions From: | | | | | | | | | | | | | | | | | | |
Net investment income | | (0.13 | ) | | (0.27 | ) | | (0.29 | ) | | (0.33 | ) | | (0.33 | ) | | (0.30 | ) |
In excess of net investment income | | — | | | — | | | (0.01 | ) | | (0.00 | )* | | — | | | — | |
|
|
Total Distributions | | (0.13 | ) | | (0.27 | ) | | (0.30 | ) | | (0.33 | ) | | (0.33 | ) | | (0.30 | ) |
|
|
Net Asset Value, End of Period | | $ 6.55 | | | $ 6.60 | | | $ 6.58 | | | $ 6.41 | | | $ 6.52 | | | $ 6.37 | |
|
|
Total Return(5) | | 1.28 | %‡ | | 4.42 | % | | 7.38 | % | | 3.48 | % | | 7.82 | % | | (1.69 | )% |
|
|
Net Assets, End of Period (000s) | | $29,267 | | | $31,414 | | | $35,079 | | | $39,009 | | | $32,157 | | | $33,113 | |
|
|
Ratios to Average Net Assets: | | | | | | | | | | | | | | | | | | |
Expenses(6) | | 0.94 | %†(7) | | 0.93 | % | | 0.98 | % | | 0.95 | % | | 0.95 | % | | 0.98 | % |
Net investment income(4) | | 4.18 | † | | 4.13 | | | 4.42 | | | 5.04 | | | 5.18 | | | 4.74 | |
|
|
Portfolio Turnover Rate | | 7 | % | | 27 | % | | 57 | % | | 53 | % | | 49 | % | | 108 | % |
|
|
| (1) | | On December 19, 2001, Class L shares were renamed as Class O shares. |
| (2) | | Per share amounts have been calculated using the monthly average shares method. |
| (3) | | For the six months ended September 30, 2004 (unaudited). |
| (4) | | Effective April 1, 2001, the Fund adopted a change in the accounting method which requires the Fund to amortize premiums and accrete all discounts. Without the adoption of this change, for the year ended March 31, 2002, those amounts would have been $0.32, $0.10 and 5.01% for net investment income, net realized and unrealized loss and the ratio of net investment income to average net assets, respectively. Per share information, ratios and supplemental data for the periods prior to April 1, 2001 have not been restated to reflect this change in presentation. |
| (5) | | Performance figures may reflect fee waivers and/or expense reimbursements. Past performance is no guarantee of future results. In the absence of fee waivers and/or expense reimbursements, the total return would be reduced. |
| (6) | | As a result of a voluntary expense limitation, the ratio of expenses to average net assets will not exceed 1.05%. |
| (7) | | The investment advisor waived a portion of its advisory fee for the period ended September 30, 2004. If such fees were not waived, the actual expense ratio for Class O shares would have been 0.95%. |
| * | | Amount represents less than $0.01 per share. |
| ‡ | | Total return is not annualized, as it may not be representative of the total return for the year. |
See Notes to Financial Statements.
36 Smith Barney Muni Funds | 2004 Semi-Annual Report
Financial Highlights (continued)
For a share of each class of beneficial interest outstanding throughout each year ended March 31, unless otherwise noted:
| | | | | | | | | | | | | | | | | | |
| Class Y Shares(1) | | 2004(2) | | | 2004 | | | 2003 | | | 2002 | | | 2001 | | | 2000 | |
Net Asset Value,
Beginning of Period | | $ 6.58 | | | $ 6.57 | | | $ 6.40 | | | $ 6.51 | | | $ 6.36 | | | $ 6.78 | |
|
|
Income (Loss) From Operations: | | | | | | | | | | | | | | | | | | |
Net investment income(3) | | 0.15 | | | 0.32 | | | 0.32 | | | 0.36 | | | 0.36 | | | 0.33 | |
Net realized and unrealized gain (loss)(3) | | (0.04 | ) | | (0.02 | ) | | 0.17 | | | (0.11 | ) | | 0.15 | | | (0.42 | ) |
|
|
Total Income (Loss) From Operations | | 0.11 | | | 0.30 | | | 0.49 | | | 0.25 | | | 0.51 | | | (0.09 | ) |
|
|
Less Distributions From: | | | | | | | | | | | | | | | | | | |
Net investment income | | (0.15 | ) | | (0.29 | ) | | (0.31 | ) | | (0.36 | ) | | (0.36 | ) | | (0.33 | ) |
In excess of net investment income | | — | | | — | | | (0.01 | ) | | (0.00 | )* | | — | | | — | |
|
|
Total Distributions | | (0.15 | ) | | (0.29 | ) | | (0.32 | ) | | (0.36 | ) | | (0.36 | ) | | (0.33 | ) |
|
|
Net Asset Value, End of Period | | $ 6.54 | | | $ 6.58 | | | $ 6.57 | | | $ 6.40 | | | $ 6.51 | | | $ 6.36 | |
|
|
Total Return(4) | | 1.64 | %‡ | | 4.68 | % | | 7.83 | % | | 3.89 | % | | 8.26 | % | | (1.31 | )% |
|
|
Net Assets, End of Period (000s) | | $6,940 | | | $8,495 | | | $9,604 | | | $6,797 | | | $12,030 | | | $12,843 | |
|
|
Ratios to Average Net Assets: | | | | | | | | | | | | | | | | | | |
Expenses(5) | | 0.54 | %†(6) | | 0.53 | % | | 0.56 | % | | 0.55 | % | | 0.54 | % | | 0.55 | % |
Net investment income(3) | | 4.59 | † | | 4.62 | | | 4.80 | | | 5.47 | | | 5.59 | | | 5.09 | |
|
|
Portfolio Turnover Rate | | 7 | % | | 27 | % | | 57 | % | | 53 | % | | 49 | % | | 108 | % |
|
|
| (1) | | Per share amounts have been calculated using the monthly average shares method. |
| (2) | | For the six months ended September 30, 2004 (unaudited). |
| (3) | | Effective April 1, 2001, the Fund adopted a change in the accounting method which requires the Fund to amortize premiums and accrete all discounts. Without the adoption of this change, for the year ended March 31, 2002, the ratio of net investment income to average net assets would have been 5.44%. Per share information, ratios and supplemental data for the periods prior to April 1, 2001 have not been restated to reflect this change in presentation. In addition, the impact of this change to net investment income and net realized and unrealized loss was less than $0.01 per share. |
| (4) | | Performance figures may reflect fee waivers and/or expense reimbursements. Past performance is no guarantee of future results. In the absence of fee waivers and/or expense reimbursements, the total return would be reduced. |
| (5) | | As a result of a voluntary expense limitation, the ratio of expenses to average net assets will not exceed 0.70%. |
| (6) | | The investment advisor waived a portion of its advisory fee for the period ended September 30, 2004. If such fees were not waived, the actual expense ratio for Class Y shares would have been 0.54%. |
| * | | Amount represents less than $0.01 per share. |
| ‡ | | Total return is not annualized, as it may not be representative of the total return for the year. |
See Notes to Financial Statements.
37 Smith Barney Muni Funds | 2004 Semi-Annual Report
Notes to Financial Statements (unaudited)
| 1. | Significant Accounting Policies |
The Limited Term Portfolio (“Fund”), a separate diversified investment fund of the Smith Barney Muni Funds (“Trust”), a Massachusetts business trust, is registered under the Investment Company Act of 1940, as amended, as an open-end management investment company.
The following is a summary of the significant accounting policies consistently followed by the Fund and is in conformity with U.S. generally accepted accounting principles (“GAAP”). The preparation of financial statements in accordance with GAAP requires management to make estimates and assumptions regarding assets, liabilities and changes in net assets resulting from operations when financial statements are prepared. Changes in the economic environment, financial markets and any other parameters used in determining these estimates could cause actual results to differ.
(a) Investment Valuation. Securities are valued at the mean between the bid and asked prices provided by an independent pricing service that are based on transactions in municipal obligations, quotations from municipal bond dealers, market transactions in comparable securities and various relationships between securities. Short-term obligations with maturities of 60 days or less are valued at cost plus accreted discount, or minus amortized premium, which approximates value. Securities for which market quotations are not available will be valued in good faith at fair value by or under the direction of the Board of Trustees. When market quotations or official closing prices are not readily available, or are determined not to reflect accurately fair value, such as when the value of a security has been significantly affected by events after the close of the exchange or market on which the security is principally traded (for example, a foreign exchange or market), but before the Fund calculates its net asset value, the Fund may value these investments at fair value as determined in accordance with the procedures approved by the Fund’s Board of Trustees.
(b) Futures Contracts. The Fund may enter into futures contracts to the extent permitted by its investment policies and objectives. Upon entering into a futures contract, the Fund is required to deposit cash or pledge securities as initial margin. Additional securities are also segregated up to the current market value of the futures contracts. Subsequent payments, which are dependent on the daily fluctuations in the value of the underlying instrument, are made or
38 Smith Barney Muni Funds | 2004 Semi-Annual Report
Notes to Financial Statements (unaudited) (continued)
received by the Fund each day (daily variation margin) and are recorded as unrealized gains or losses until the contracts are closed. When the contracts are closed, the Fund records a realized gain or loss equal to the difference between the proceeds from (or cost of) the closing transactions and the Fund’s basis in the contracts. The Fund enters into such contracts typically to hedge a portion of the portfolio. Risks of entering into futures contracts for hedging purposes include the possibility that a change in the value of the contract may not correlate with the changes in the value of the investments hedged. In addition, the purchase of a futures contract involves the risk that the Fund could lose more than the original margin deposit and subsequent payments required for a futures transaction.
(c) Investment Transactions and Investment Income. Security transactions are accounted for on trade date. Interest income, adjusted for amortization of premium and accretion of discount, is recorded on an accrual basis. Gains or losses on the sale of securities are calculated by using the specific identification method.
(d) Exempt-Interest Dividends and Other Distributions. The Fund intends to satisfy conditions that will enable interest from municipal securities, which is exempt from regular Federal income tax and from designated state income taxes, to retain such tax-exempt status when distributed to the shareholders of the Fund. It is the Fund’s policy to distribute dividends monthly. Capital gain distributions, if any, are taxable to shareholders, and are declared and paid at least annually. Dividends and distributions to shareholders are recorded on the ex-dividend date; the Fund distributes dividends and capital gains, if any, at least annually. The character of income and gains to be distributed is determined in accordance with income tax regulations, which may differ from GAAP.
(e) Class Accounting. Class specific expenses are charged to each class; management fees and general fund expenses are allocated on the basis of relative net assets of each class or on another reasonable basis.
(f) Federal Income Taxes. It is the Fund’s policy to comply with the federal income and excise tax requirements of the Internal Revenue Code of 1986, as amended, applicable to regulated investment companies. Accordingly, the Fund intends to distribute substantially all of its taxable income and net realized gains on investments, if any, to shareholders each year. Therefore, no federal income tax provision is required. Under the applicable foreign tax law, a withholding tax may be imposed on interest, dividends, and capital gains at various rates.
39 Smith Barney Muni Funds | 2004 Semi-Annual Report
Notes to Financial Statements (unaudited) (continued)
| 2. | Management Agreement and Transactions with Affiliated Persons |
Smith Barney Fund Management LLC (“SBFM”), an indirect wholly-owned subsidiary of Citigroup Inc. (“Citigroup”), acts as investment manager to the Fund. The Fund pays SBFM a management fee calculated at an annual rate of 0.50% of the Fund’s average daily net assets. This fee is calculated daily and paid monthly.
During the six months ended September 30, 2004, the investment manager waived a portion of its management fee amounting to $29,006.
Citicorp Trust Bank, fsb. (“CTB”), another subsidiary of Citigroup, acts as the Fund’s transfer agent. PFPC Inc. (“PFPC”) acts as the Fund’s sub-transfer agent. CTB receives account fees and asset-based fees that vary according to the size and type of account. PFPC is responsible for shareholder recordkeeping and financial processing for all shareholder accounts and is paid by CTB. For the six months ended September 30, 2004, the Fund paid transfer agent fees of $26,440 to CTB.
Citigroup Global Markets Inc. (“CGM”), another indirect wholly-owned subsidiary of Citigroup, acts as the Fund’s distributor.
On February 2, 2004, the initial sales charges on Class L shares were eliminated. Effective April 29, 2004, Class L shares were renamed Class C shares and the initial sales charges for Class O shares were eliminated.
There are maximum initial sales charges of 2.00% for Class A shares. There is a contingent deferred sales charge (“CDSC”) of 5.00% on Class B shares, which applies if redemption occurs within one year from purchase payment and declines thereafter by 1.00% per year until no CDSC is incurred. There is a CDSC of 1.00% on Class A shares, which applies if redemption occurs within one year from purchase payment. This CDSC only applies to those purchases of Class A shares, which, when combined with current holdings of Class A shares, equal or exceed $500,000 in the aggregate. These purchases do not incur an initial sales charge. Class O shares also have a 1.00% CDSC, which applies if redemption occurs within one year from purchase payment.
For the six months ended September 30, 2004, CGM received sales charges of approximately $567,000 and $1,000 on sales of the Fund’s Class A and O shares,
40 Smith Barney Muni Funds | 2004 Semi-Annual Report
Notes to Financial Statements (unaudited) (continued)
respectively. In addition, for the six months ended September 30, 2004, CDSCs paid to CGM were approximately:
| | | | | | |
| | | Class A | | Class B |
CDSCs | | $ | 46,000 | | $ | 1,000 |
|
All officers and one Trustee of the Trust are employees of Citigroup or its affiliates and do not receive compensation from the Fund.
During the six months ended September 30, 2004, the aggregate cost of purchases and proceeds from sales of investments (including maturities of long-term investments, but excluding short-term investments) were as follows:
| | | |
|
Purchases | | $ | 51,721,929 |
|
Sales | | | 80,778,075 |
|
At September 30, 2004, the aggregate gross unrealized appreciation and depreciation of investments for Federal income tax purposes were as follows:
| | | | |
|
|
Gross unrealized appreciation | | $ | 36,660,865 | |
Gross unrealized depreciation | | | (4,144,441 | ) |
|
|
Net unrealized appreciation | | $ | 32,516,424 | |
|
|
For the six months ended September 30, 2004, the Fund had the following open futures contracts:
| | | | | | | | | | | | | | |
| | | # of
Contracts | | Expiration | | Basis
Value | | Market
Value | | Unrealized
Loss | |
Contracts to Sell: | | | | | | | | | | | | | | |
20 Year U.S. Treasury Bond, 6.000% | | 2,250 | | 12/04 | | $ | 246,480,469 | | $ | 252,492,188 | | $ | (6,011,719 | ) |
|
|
| 4. | Class Specific Expenses |
Pursuant to a Rule 12b-1 Distribution Plan, the Fund pays a service fee with respect to its Class A, B, C and O shares calculated at the annual rate of 0.15% of the average daily net assets of each respective class. The Fund also pays a distribution fee with respect to Class B, C and O shares calculated at the annual rate of 0.50%, 0.60% and 0.20%, of the average daily net assets of each class, respectively. For the six months ended September 30, 2004, total Rule 12b-1
41 Smith Barney Muni Funds | 2004 Semi-Annual Report
Notes to Financial Statements (unaudited) (continued)
Distribution Plan fees, which are accrued daily and paid monthly, were as follows:
| | | | | | | | | | | | |
| | | Class A | | Class B | | Class C | | Class O |
Rule 12b-1 Distribution Plan Fees | | $ | 281,356 | | $ | 21,610 | | $ | 1,211,343 | | $ | 53,106 |
|
For the six months ended September 30, 2004, total Transfer Agency Service expenses were as follows:
| | | | | | | | | | | | | | | |
| | | Class A | | Class B | | Class C | | Class O | | Class Y |
Transfer Agency Service Expenses | | $ | 23,203 | | $ | 375 | | $ | 39,963 | | $ | 5,601 | | $ | 38 |
|
For the six months ended September 30, 2004, total Shareholder Communication expenses were as follows:
| | | | | | | | | | | | | | | |
| | | Class A | | Class B | | Class C | | Class O | | Class Y |
Shareholder Communication Expenses | | $ | 23,233 | | $ | 183 | | $ | 16,104 | | $ | 4,026 | | $ | 366 |
|
| 5. | Distributions Paid to Shareholders by Class |
| | | | | | |
| Net Investment Income | | Six Months Ended
September 30, 2004 | | Year Ended
March 31, 2004 |
Class A | | $ | 8,047,420 | | $ | 15,629,546 |
Class B | | | 127,884 | | | 209,312 |
Class C | | | 5,890,093 | | | 11,902,719 |
Class O | | | 610,956 | | | 1,331,391 |
Class Y | | | 177,866 | | | 914,955 |
|
Total | | $ | 14,854,219 | | $ | 29,987,923 |
|
42 Smith Barney Muni Funds | 2004 Semi-Annual Report
Notes to Financial Statements (unaudited) (continued)
| 6. | Shares of Beneficial Interest |
At September 30, 2004, the Trust had an unlimited amount of shares of beneficial interest authorized with a par value of $0.001 per share. The Fund has the ability to issue multiple classes of shares. Each share of a class represents an identical interest in the Fund and has the same rights, except that each class bears certain expenses specifically related to the distribution of its shares. In addition, Class O shares are available for purchase only by former Class C shareholders.
Transactions in shares of each class were as follows:
| | | | | | | | | | | | | | |
| | | Six Months Ended
September 30, 2004
| | | Year Ended
March 31, 2004
| |
| | | Shares | | | Amount | | | Shares | | | Amount | |
Class A | | | | | | | | | | | | | | |
Shares sold | | 9,077,343 | | | $ | 59,532,341 | | | 16,203,203 | | | $ | 107,309,065 | |
Shares issued on reinvestment | | 695,033 | | | | 4,544,321 | | | 1,341,962 | | | | 8,864,846 | |
Shares reacquired | | (7,998,991 | ) | | | (52,443,497 | ) | | (15,901,637 | ) | | | (105,224,263 | ) |
|
|
Net Increase | | 1,773,385 | | | $ | 11,633,165 | | | 1,643,528 | | | $ | 10,949,648 | |
|
|
Class B | | | | | | | | | | | | | | |
Shares sold | | 223,559 | | | $ | 1,466,644 | | | 582,428 | | | $ | 3,840,565 | |
Shares issued on reinvestment | | 10,940 | | | | 71,531 | | | 21,197 | | | | 140,075 | |
Shares reacquired | | (147,053 | ) | | | (963,575 | ) | | (253,344 | ) | | | (1,675,541 | ) |
|
|
Net Increase | | 87,446 | | | $ | 574,600 | | | 350,281 | | | $ | 2,305,099 | |
|
|
Class C† | | | | | | | | | | | | | | |
Shares sold | | 10,640,269 | | | $ | 69,915,011 | | | 32,434,087 | | | $ | 215,388,844 | |
Shares issued on reinvestment | | 639,211 | | | | 4,187,027 | | | 1,255,744 | | | | 8,307,432 | |
Shares reacquired | | (15,599,875 | ) | | | (102,404,029 | ) | | (29,424,231 | ) | | | (194,787,267 | ) |
|
|
Net Increase (Decrease) | | (4,320,395 | ) | | $ | (28,301,991) | | | 4,265,600 | | | $ | 28,909,009 | |
|
|
Class O | | | | | | | | | | | | | | |
Shares sold | | 19,892 | | | $ | 130,565 | | | 124,362 | | | $ | 822,126 | |
Shares issued on reinvestment | | 55,402 | | | | 362,703 | | | 125,362 | | | | 829,103 | |
Shares reacquired | | (368,297 | ) | | | (2,415,910 | ) | | (819,690 | ) | | | (5,420,675 | ) |
|
|
Net Decrease | | (293,003 | ) | | $ | (1,922,642 | ) | | (569,966 | ) | | $ | (3,769,446 | ) |
|
|
Class Y | | | | | | | | | | | | | | |
Shares sold | | — | | | $ | — | | | 3,092,579 | | | $ | 20,500,000 | |
Shares issued on reinvestment | | 3,432 | | | | 22,418 | | | 24,655 | | | | 162,438 | |
Shares reacquired | | (231,841 | ) | | | (1,523,191 | ) | | (3,288,830 | ) | | | (21,953,435 | ) |
|
|
Net Decrease | | (228,409 | ) | | $ | (1,500,773 | ) | | (171,596 | ) | | $ | (1,290,997 | ) |
|
|
| † | | On April 29, 2004, Class L shares were renamed as Class C shares. |
| 7. | Capital Loss Carryforward |
On March 31, 2004, the Fund had a net capital loss carryforward of $23,926,000, of which $9,495,000 expires in 2008, $5,515,000 expires in 2009, $214,000 expires in 2010, $5,538,000 expires in 2011 and $3,164,000 expires in 2012. This amount will be available to offset like amounts of any future taxable gains.
43 Smith Barney Muni Funds | 2004 Semi-Annual Report
Notes to Financial Statements (unaudited) (continued)
In connection with an investigation previously disclosed by Citigroup, the Staff of the Securities and Exchange Commission (“SEC”) has notified Citigroup Asset Management (“CAM”), the Citigroup business unit that includes the funds’ investment manager and other investment advisory companies; Citicorp Trust Bank (“CTB”), an affiliate of CAM; Thomas W. Jones, the former CEO of CAM; and two other individuals, one of whom is an employee and the other of whom is a former employee of CAM, that the SEC Staff is considering recommending a civil injunctive action and/or an administrative proceeding against each of them relating to the creation and operation of an internal transfer agent unit to serve various CAM-managed funds.
In 1999, CTB entered the transfer agent business. CTB hired an unaffiliated subcontractor to perform some of the transfer agent services. The subcontractor, in exchange, had signed a separate agreement with CAM in 1998 that guaranteed investment management revenue to CAM and investment banking revenue to a CAM affiliate. The subcontractor’s business was later taken over by PFPC Inc., and at that time the revenue guarantee was eliminated and a one-time payment was made by the subcontractor to a CAM affiliate.
CAM did not disclose the revenue guarantee when the boards of various CAM-managed funds hired CTB as transfer agent. Nor did CAM disclose to the boards of the various CAM-managed funds the one-time payment received by the CAM affiliate when it was made.
In addition, the SEC Staff has indicated that it is considering recommending action based on the adequacy of the disclosures made to the fund boards that approved the transfer agency arrangement, CAM’s initiation and operation of, and compensation for, the transfer agent business and CAM’s retention of, and agreements with, the subcontractor.
Citigroup is cooperating fully in the investigation and will seek to resolve the matter in discussions with the SEC Staff. Although there can be no assurance, Citigroup does not believe that this matter will have a material adverse effect on the funds. As previously disclosed, CAM has already agreed to pay the applicable funds, primarily through fee waivers, a total of approximately $17 million (plus interest) that is the amount of the revenue received by Citigroup relating to the revenue guarantee.
44 Smith Barney Muni Funds | 2004 Semi-Annual Report
Notes to Financial Statements (unaudited) (continued)
Class action lawsuits have been filed against Citigroup Global Markets Inc. (the “Distributor”) and a number of its affiliates, including Smith Barney Fund Management LLC and Salomon Brothers Asset Management Inc (the “Advisers”), substantially all of the mutual funds managed by the Advisers (the “Funds”), and directors or trustees of the Funds. The complaints allege, among other things, that the Distributor created various undisclosed incentives for its brokers to sell Smith Barney and Salomon Brothers funds. In addition, according to the complaints, the Advisers caused the Funds to pay excessive brokerage commissions to the Distributor for steering clients towards proprietary funds. The complaints also allege that the defendants breached their fiduciary duty to the Funds by improperly charging Rule 12b-1 fees and by drawing on Fund assets to make undisclosed payments of soft dollars and excessive brokerage commissions. The complaints seek injunctive relief and compensatory and punitive damages, rescission of the Funds’ contracts with the Advisers, recovery of all fees paid to the Advisers pursuant to such contracts and an award of attorneys’ fees and litigation expenses. Citigroup Asset Management believes that the suits are without merit and intends to defend the cases vigorously.
Additional lawsuits arising out of these circumstances and presenting similar allegations and requests for relief may be filed against the defendants in the future. Neither Citigroup Asset Management nor the Funds believe that any of the pending actions will have a material adverse effect on the Funds or the ability of the Distributor or the Advisers to perform under their respective contracts with the Funds.
45 Smith Barney Muni Funds | 2004 Semi-Annual Report
SMITH BARNEY
MUNI FUNDS
| | |
TRUSTEES Lee Abraham Allan J. Bloostein Jane F. Dasher Donald R. Foley R. Jay Gerken, CFA
Chairman Richard E. Hanson, Jr. Paul Hardin Roderick C. Rasmussen John P. Toolan OFFICERS R. Jay Gerken, CFA President and Chief Executive Officer Andrew B. Shoup Senior Vice President
and Chief Administrative Officer Robert J. Brault Chief Financial Officer and Treasurer Peter M. Coffey Vice President and Investment Officer Andrew Beagley
Chief Anti-Money
Laundering Compliance
Officer and Chief Compliance Officer Kaprel Ozsolak Controller | | OFFICERS (continued) Robert I. Frenkel Secretary and
Chief Legal Officer INVESTMENT MANAGER Smith Barney Fund Management LLC DISTRIBUTOR Citigroup Global Markets Inc. CUSTODIAN State Street Bank and Trust Company TRANSFER AGENT Citicorp Trust Bank, fsb. 125 Broad Street, 11th Floor New York, New York 10004 SUB-TRANSFER AGENT PFPC Inc. P.O. Box 9699 Providence, Rhode Island 02940-9699 |
Smith Barney Muni Funds
Limited Term Portfolio
The Fund is a separate investment fund of the Smith Barney Muni Funds, a Massachusetts business trust.
The Fund files its complete schedule of portfolio holdings with Securities Exchange Commission for the first and third quarters of each fiscal year on Form N-Q. The Fund’s Forms N-Q are available on the Commission’s website at http://www.sec.gov. The Fund’s Forms N-Q may be reviewed and copied at the Commission’s Public Reference Room in Washington D.C., and how information on the operation of the Public Reference Room may be obtained by calling 800-SEC-0330. To obtain information on Form N-Q from the Fund, shareholders can call 800-451-2010.
Information on how the Fund voted-proxies relating to portfolio securities during the 12 month period ended June 30, 2004 and a description of the policies and procedures that the Fund uses to determine how to vote proxies relating to portfolio securities is available (1) without charge, upon request, by calling 1-800-451-2010, (2) on the Fund’s website at www.CitigroupAM.com and (3) on the SEC’s website at www.sec.gov.
This report is submitted for the general information of the shareholders of Smith Barney Muni Funds — Limited Term Portfolio, but it may also be used as sales literature when preceded or accompanied by a current Prospectus.
SMITH BARNEY MUNI FUNDS
Smith Barney Mutual Funds
125 Broad Street
10th Floor, MF-2
New York, New York 10004
This document must be preceded or accompanied by a free prospectus. Investors should consider the fund’s investment objectives, risks, charges and expenses carefully before investing. The prospectus contains this and other important information about the fund. Please read the prospectus carefully before you invest or send money.
www.smithbarneymutualfunds.com
©2004 Citigroup Global Markets Inc.
Member NASD, SIPC
| | | | |
| ITEM 2. | | CODE OF ETHICS. |
| |
| | | Not Applicable. |
| |
| ITEM 3. | | AUDIT COMMITTEE FINANCIAL EXPERT. |
| |
| | | Not Applicable. |
| |
| ITEM 4. | | PRINCIPAL ACCOUNTANT FEES AND SERVICES. |
| |
| | | Not applicable. |
| |
| ITEM 5. | | AUDIT COMMITTEE OF LISTED REGISTRANTS. |
| |
| | | Not applicable. |
| |
| ITEM 6. | | [RESERVED] |
| |
| ITEM 7. | | DISCLOSURE OF PROXY VOTING POLICIES AND PROCEDURES FOR CLOSED-END MANAGEMENT INVESTMENT COMPANIES. |
| |
| | | Not applicable. |
| |
| ITEM 8. | | [RESERVED] |
| |
| ITEM 9. | | SUBMISSION OF MATTERS TO A VOTE OF SECURITY HOLDERS. |
| |
| | | Not applicable. |
| |
| ITEM 10. | | CONTROLS AND PROCEDURES. |
| | |
| | | (a) | | The registrant’s principal executive officer and principal financial officer have concluded that the registrant’s disclosure controls and procedures (as defined in Rule 30a - 3(c) under the Investment Company Act of 1940, as amended (the “1940 Act”)) are effective as of a date within 90 days of the filing date of this report that includes the disclosure required by this paragraph, based on their evaluation of the disclosure controls and procedures required by Rule 30a-3(b) under the 1940 Act and 15d-15(b) under the Securities Exchange Act of 1934. |
| | |
| | | (b) | | There were no changes in the registrant’s internal control over financial reporting (as defined in Rule 30a-3(d) under the 1940 Act) that occurred during the registrant’s last fiscal half-year (the registrant’s second fiscal half-year in the case of an annual report) that have materially affected, or are likely to materially affect the registrant’s internal control over financial reporting. |
| | | | | | |
| ITEM 11. | | EXHIBITS. |
| | |
| | | (a) | | Not applicable. |
| | |
| | | (b) | | Attached hereto. |
| | | | |
| | | Exhibit 99.CERT | | Certifications pursuant to section 302 of the Sarbanes-Oxley Act of 2002 |
| | |
| | | Exhibit 99.906CERT | | Certifications pursuant to Section 906 of the Sarbanes-Oxley Act of 2002 |
SIGNATURES
Pursuant to the requirements of the Securities Exchange Act of 1934 and the Investment Company Act of 1940, the registrant has duly caused this Report to be signed on its behalf by the undersigned, there unto duly authorized.
| | |
| Smith Barney Muni Funds |
| |
| By: | | /s/ R. Jay Gerken
|
| | | R. Jay Gerken |
| | | Chief Executive Officer of |
| | | Smith Barney Muni Funds |
| |
| Date: | | November 30, 2004 |
Pursuant to the requirements of the Securities Exchange Act of 1934 and the Investment Company Act of 1940, this report has been signed below by the following persons on behalf of the registrant and in the capacities and on the dates indicated.
| | |
| By: | | /s/ R. Jay Gerken
|
| | | R. Jay Gerken |
| | | Chief Executive Officer of |
| | | Smith Barney Muni Funds |
| |
| Date: | | November 30, 2004 |
| |
| By: | | /s/ Robert J. Brault
|
| | | Robert J. Brault |
| | | Chief Financial Officer of |
| | | Smith Barney Muni Funds |
| |
| Date: | | November 30, 2004 |