UNITED STATES
SECURITIES AND EXCHANGE COMMISSION
Washington, D.C. 20549
FORM N-CSR
CERTIFIED SHAREHOLDER REPORT OF REGISTERED MANAGEMENT INVESTMENT COMPANIES
Investment Company Act file number 811-4395
Smith Barney Muni Funds
(Exact name of registrant as specified in charter)
125 Broad Street, New York, NY 10004
(Address of principal executive offices) (Zip code)
Robert I. Frenkel, Esq.
Smith Barney Fund Management LLC
300 First Stamford Place
Stamford, CT 06902
(Name and address of agent for service)
Registrant’s telephone number, including area code: (800) 451-2010
Date of fiscal year end: March 31,
Date of reporting period: September 30, 2004
| ITEM 1. | REPORT TO STOCKHOLDERS. |
The Semi-Annual Report to Stockholders is filed herewith.
SMITH BARNEY
MUNI FUNDS
MASSACHUSETTS MONEY
MARKET PORTFOLIO SEMI-ANNUAL REPORT | SEPTEMBER 30, 2004 
NOT FDIC INSURED • NOT BANK GUARANTEED • MAY LOSE VALUE |
LETTER FROM THE CHAIRMAN 
R. JAY GERKEN, CFA
Chairman, President and
Chief Executive Officer Dear Shareholder, For the first time in four years, the Federal Reserve Board (“Fed”)i pushed short-term interest rates higher during the six months ended September 30, 2004. The Fed raised its target for the closely watched federal funds rateii by 0.25% on three occasions, increasing it from a four-decade low of 1.00% at the end of June to 1.75% in September. Following the end of the fund’s reporting period, at its November meeting, the Fed once again raised its target for the federal funds rate by 0.25% to 2.00%. Higher rates can help slow a potential acceleration of economic growth and thereby help maintain a balance between that growth and the inflation that can generally accompany it. While rising interest rates are generally troublesome for longer-term fixed income securities, because bond prices decline as rates are expected to rise, they can be good for short-term instruments such as money market securities. Prices for these instruments, and the funds that invest in them, are generally held stable and their rates closely track movements in the federal funds rate target. Although inflation picked up earlier this year, recently reported figures were benign. The U.S. economyiii grew at a more moderate rate during the second quarter versus the first, according to data released in September, albeit at a significantly stronger pace than the second quarter of last year. Following robust results in the early spring, labor market growth tapered off, picked up in the late summer and held steady through the end of the period.iv During the spring, after-tax yields on municipal money market instruments exceeded those on taxable instruments with comparable maturities and credit ratings.v Prices of short-term tax-exempt money market instruments rallied in June as proceeds from maturing bonds were reinvested into these securities. However, many investors gravitated from shorter-term instruments into longer-term bonds in August as the bond environment stabilized, causing yields on floating-rate money market instruments to rise. Given the recent rate environment and expectations that interest rates were poised to rise, the manager maintained a cautious maturity stance in the municipal money market portfolio. |
| 1 Smith Barney Muni Funds | 2004 Semi-Annual Report |
| |
|
| |
| Performance Review As of September 30, 2004, the seven-day current yield for Class A shares of the Smith Barney Muni Funds-Massachusetts Money Market Portfolio was 0.86% and its seven-day effective yield, which reflects compounding, was 0.86%1. Past performance is no guarantee of future results. The fund’s yields will vary and performance of other share classes may differ. In addition, your investment is neither insured nor guaranteed by the Federal Deposit Insurance Corporation (“FDIC”) or any other government agency. Although the fund seeks to preserve the net asset value of your investment at $1.00 per share, it is possible to lose money by investing in the fund. Certain investors may be subject to the federal Alternative Minimum Tax, and state and local taxes may apply. Capital gains, if any, are fully taxable. Please consult your personal tax or legal adviser. Within this environment, the fund performed as follows: SMITH BARNEY MUNI FUNDS-MASSACHUSETTS
MONEY MARKET PORTFOLIO YIELDS AS OF SEPTEMBER 30, 2004 |
| Seven-day current yield | 0.86 | % |
| Seven-day effective yield | 0.86 | % |
The performance shown represents past performance. Past performance is no guarantee of future results and current performance may be higher or lower than the performance shown above. Principal value and investment returns will fluctuate and investors’ shares, when redeemed may be worth more or less than their original cost. As of September 30, 2004, there were no outstanding Class Y shares. Information About Your Fund In recent months several issues in the mutual fund industry have come under the scrutiny of federal and state regulators. The fund’s Adviser and some of its affiliates have received requests for information from various government regulators regarding market timing, late trading, fees, and other mutual fund issues in connection with various investigations. The regulators appear to be examining, among other things, the fund’s response to market timing and shareholder exchange activity, including compliance with prospectus disclosure related to these subjects. The fund has been informed that the Adviser and its affiliates are responding to those information requests, but are not in a position to predict the outcome of these requests and investigations. |
| 1 | The seven-day current and effective yields are the same due to rounding. The seven-day effective yield is calculated similarly to the seven-day current yield but, when annualized, the income earned by an investment in the fund is assumed to be reinvested. The effective yield typically will be slightly higher than the current yield because of the compounding effect of the assumed reinvestment. |
| 2 Smith Barney Muni Funds | 2004 Semi-Annual Report |
| |
|
In November 2003, Citigroup Asset Management (“CAM”) disclosed an investigation by the Securities and Exchange Commission (“SEC”) and the U.S. Attorney relating to CAM’s entry into the transfer agency business during 1997-1999. On July 20, 2004, Citigroup has disclosed that the Staff of the SEC is considering recommending a civil injunctive action and/or an administrative proceeding against certain advisory and transfer agent entities affiliated with Citigroup, the former CEO of CAM, a former employee and a current employee of CAM, relating to the creation and operation of its internal transfer agent unit that serves various CAM-managed funds. Citigroup is cooperating with the SEC and will seek to resolve this matter in discussion with the SEC Staff. Although there can be no assurance, Citigroup does not believe that this matter will have a material adverse effect on the fund. As always thank you for your confidence in our stewardship of your assets. We look forward to helping you continue to meet your financial goals. Sincerely, 
R. Jay Gerken, CFA
Chairman, President and Chief Executive Officer November 10, 2004 |
| |
| 3 Smith Barney Muni Funds | 2004 Semi-Annual Report |
| |
|
The information provided is not intended to be a forecast of future events, a guarantee of future results or investment advice. Views expressed may differ from those of the firm as a whole. RISKS: Certain Investors may be subject to the Federal Alternative Minimum Tax (AMT), and state and local taxes will apply. Certain gains, if any, are fully taxable. An investment in a money market fund is neither insured nor guaranteed by the Federal Deposit Insurance Corporation (“FDIC”) or any other government agency. Although the fund seeks to preserve the value of your investment at $1.00 per share, it is possible to lose money by investing in the fund. |
| |
| i | Source: U.S. Federal Reserve Board. The Fed is responsible for the formulation of a policy designed to promote economic growth, full employment, stable prices, and a sustainable pattern of international trade and payments. |
| ii | The federal funds rate is the interest rate that banks with excess reserves at a Federal Reserve district bank charge other banks that need overnight loans. |
| iii | Source: Commerce Department (Bureau of Economic Analysis). Refers to quarterly growth of Gross Domestic Product (“GDP”). GDP is a market value of goods and services produced by labor and property in a given country. |
| iv | Source: Bureau of Labor Statistics. |
| v | Money market yields are based upon data reflecting average yields of a universe of municipal and taxable money market instruments over the stated period derived via data on Bloomberg L.P. |
| | |
| 4 Smith Barney Muni Funds | 2004 Semi-Annual Report |
| |
|
| Fund at a Glance (unaudited) |
| |
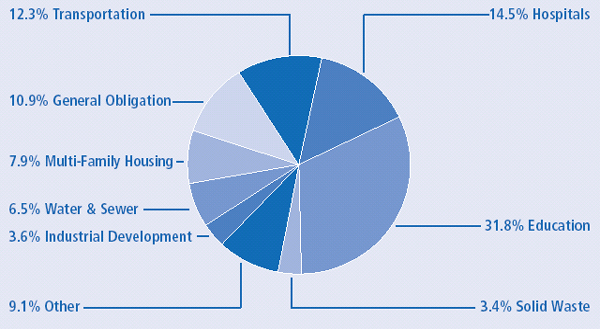
Investment Breakdown†
March 31, 2004 |
| |
|
| |
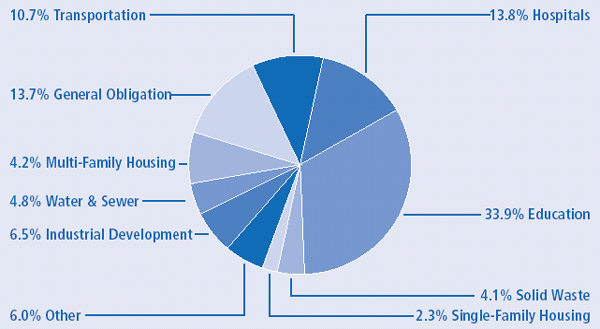
| September 30, 2004 |
| |
|
| |
| † As a percentage of total investments. Please note that Fund holdings are subject to change. |
| 5 Smith Barney Muni Funds | 2004 Semi-Annual Report |
| |
|
Fund Expenses (unaudited) Example As a shareholder of the Fund, you may incur two types of costs: (1) transaction costs, including front-end and back-end sales charges (loads) on purchase payments, reinvested dividends, or other distributions; and (2) ongoing costs, including management fees; distribution and/or service (12b-1) fees; and other Fund expenses. This example is intended to help you understand your ongoing costs (in dollars) of investing in the Fund and to compare these costs with the ongoing costs of investing in other mutual funds. This example is based on an investment of $1,000 invested on April 1, 2004 and held for the six months ended September 30, 2004. Actual Expenses The table below titled “Based on Actual Total Return” provides information about actual account values and actual expenses. You may use the information provided in this table, together with the amount you invested, to estimate the expenses that you paid over the period. To estimate the expenses you paid on your account, divide your ending account value by $1,000 (for example, an $8,600 ending account value divided by $1,000 = 8.6), then multiply the result by the number under the heading entitled “Expenses Paid During the Period”. |
| |
| Based on Actual Total Return(1) |
| | | | | | | | | | | | | | | |
| | | Actual
Total Return(2) | | | Beginning
Account
Value | | | Ending
Account
Value | | Annualized
Expense
Ratio | | | Expenses
Paid During
the Period(3) | |
|
| Class A | | 0.25 | % | $ | 1,000.00 | | $ | 1,002.50 | | 0.64 | % | $ | 3.21 | |
|
| (1) | For the six months ended September 30, 2004. |
| (2) | Assumes reinvestment of all dividends and capital gain distributions, if any, at net asset value. Total return is not annualized, as it may not be representative of the total return for the year. |
| (3) | Expenses (net of voluntary waiver) are equal to the Fund’s annualized expense ratio multiplied by the average account value over the period, multiplied by the number of days in the most recent fiscal half-year, then divided by 365. |
| 6 Smith Barney Muni Funds | 2004 Semi-Annual Report |
| |
|
| Fund Expenses (unaudited) Hypothetical Example for Comparison Purposes The table below titled “Based on Hypothetical Total Return” provides information about hypothetical account values and hypothetical expenses based on the actual expense ratio and an assumed rate of return of 5.00% per year before expenses, which is not the Fund’s actual return. The hypothetical account values and expenses may not be used to estimate the actual ending account balance or expenses you paid for the period. You may use the information provided in this table to compare the ongoing costs of investing in the Fund and other funds. To do so, compare the 5.00% hypothetical example relating to the Fund with the 5.00% hypothetical examples that appear in the shareholder reports of the other funds. Please note that the expenses shown in the table below are meant to highlight your ongoing costs only and do not reflect any transactional costs such as front-end or back-end sales charges (loads). Therefore, the table is useful in comparing ongoing costs only, and will not help you determine the relative total costs of owning different funds. In addition, if these transaction costs were included, your costs would have been higher. |
| |
| Based on Hypothetical Total Return(1) |
| | | | | | | | | | | | | | | |
| | | Hypothetical
Annualized
Total Return | | | Beginning
Account
Value | | | Ending
Account
Value | | Annualized
Expense
Ratio | | | Expenses
Paid During
the Period(2) | |
|
| Class A | | 5.00 | % | $ | 1,000.00 | | $ | 1,021.86 | | 0.64 | % | $ | 3.24 | |
|
| (1) | For the six months ended September 30, 2004. |
| (2) | Expenses (net of voluntary waiver) are equal to the Fund’s annualized expense ratio multiplied by the average account value over the period, multiplied by the number of days in the most recent fiscal half-year, then divided by 365. |
| 7 Smith Barney Muni Funds | 2004 Semi-Annual Report |
| |
|
| Schedule of Investments (unaudited) | September 30, 2004 |
|
FACE
AMOUNT | | RATING(a) | SECURITY | | VALUE |
|
| $ | 2,496,000 | | Aaa* | Beverly GO MBIA-Insured 3.00% due 11/1/04 | $ | 2,499,981 |
| | 400,000 | | A-1+ | Boston Water and Sewer Commission Series A 1.59% VRDO | | 400,000 |
| | 4,000,000 | | MIG 1* | Bridgewater & Raynham Regional School District | | |
| | | | | 3.00% due 7/1/05 | | 4,039,120 |
| | | | | Clipper Tax Exempt Trust PART: | | |
| | 4,259,000 | | Aa3* | CTFS 2000-2 MBIA-Insured 1.35% due 2/10/05 | | 4,259,000 |
| | 4,452,000 | | VMIG 1* | Series 1998-8 AMBAC-Insured 1.72% VRDO | | 4,452,000 |
| | 260,000 | | AAA | Harwich GO MBIA-Insured 5.00% due 12/1/04 | | 261,654 |
| | 5,000,000 | | MIG 1* | Lawrence GO BAN 2.00% due 12/23/04 | | 5,005,753 |
| | 250,000 | | MIG 1* | Leominster GO BAN Series B 4.00% due 11/15/04 | | 250,869 |
| | 9,560,000 | | A-1+ | Massachusetts Bay Transportation Authority 1.70% VRDO | | 9,560,000 |
| | | | | Massachusetts Port Authority TECP: | | |
| | | | | Series 2003 A: | | |
| | 2,000,000 | | A-1+ | 1.28% due 10/6/04 | | 2,000,000 |
| | 4,000,000 | | A-1+ | 1.20% due 11/4/04 | | 4,000,000 |
| | 2,000,000 | | A-1+ | Series 2003 B 1.18% due 11/1/04 AMT | | 2,000,000 |
| | 5,140,000 | | VMIG 1* | Massachusetts State College Building Authority MERLOT | | |
| | | | | Series B-11 AMBAC-Insured PART 1.72% VRDO | | 5,140,000 |
| | | | | Massachusetts State DFA: | | |
| | 2,750,000 | | NR† | Assisted Living Facilities Whalers Cove Project Series A | | |
| | | | | 1.74% VRDO AMT | | 2,750,000 |
| | | | | Boston University XLCA-Insured: | | |
| | 3,000,000 | | A-1+ | Series R-1 1.70% VRDO | | 3,000,000 |
| | 6,600,000 | | A-1+ | Series R-3 1.70% VRDO | | 6,600,000 |
| | 1,000,000 | | A-1+ | Carleton Williard Village 1.67% VRDO | | 1,000,000 |
| | 800,000 | | A-1+ | Cider Mill Farms 1.75% VRDO AMT | | 800,000 |
| | 1,500,000 | | A-1+ | Clark University Series A AMBAC-Insured 1.68% VRDO | | 1,500,000 |
| | 2,090,000 | | A-1+ | Decas Cranberry 1.75% VRDO AMT | | 2,090,000 |
| | 3,700,000 | | A-1+ | Draper Laboratory Issue MBIA-Insured 1.70% VRDO | | 3,700,000 |
| | 3,055,000 | | NR† | Epichem Inc. Project 1.84% VRDO AMT | | 3,055,000 |
| | 9,926,000 | | A-1+ | Higher Education Smith College 1.69% VRDO | | 9,926,000 |
| | 2,880,000 | | A-1+ | Horner Millwork Corp. 1.75% VRDO AMT | | 2,880,000 |
| | 2,945,000 | | A-1+ | Kayem Foods Inc. 1.75% VRDO AMT | | 2,945,000 |
| | 1,445,000 | | A-1+ | Metalcrafters Inc. Series 1999 1.80% VRDO AMT | | 1,445,000 |
| | 10,000,000 | | VMIG 1* | Notre Dame Health Care Center 1.78% VRDO | | 10,000,000 |
| | 2,000,000 | | A-1+ | Phillips Academy 1.72% VRDO | | 2,000,000 |
| | 3,000,000 | | A-1 | Revenue Notes 1.25% due 11/10/04 TECP | | 3,000,000 |
| | | | | Solid Waste Disposal Newark Group Project: | | |
| | 1,500,000 | | A-1+ | Series A 1.75% VRDO AMT | | 1,500,000 |
| | 7,300,000 | | A-1+ | Series C 1.75% VRDO AMT | | 7,300,000 |
| See Notes to Financial Statements. |
| |
| 8 Smith Barney Muni Funds | 2004 Semi-Annual Report |
| |
|
| Schedule of Investments (unaudited) (continued) | September 30, 2004 |
FACE
AMOUNT | | RATING(a) | SECURITY | | VALUE |
|
| | | | | Massachusetts State GO: | | |
| $ | 1,200,000 | | A-1+ | Central Artery Series A 1.74% VRDO | $ | 1,200,000 |
| | 500,000 | | A-1 | Central Artery Series B 1.74% VRDO | | 500,000 |
| | 5,000,000 | | A-1 | MSTC Series 02-209 FSA-Insured PART 1.75% VRDO | | 5,000,000 |
| | 1,000,000 | | A-1+ | Series 1997 B 1.73% VRDO | | 1,000,000 |
| | 1,000,000 | | AA- | Series B 4.00% due 12/1/04 | | 1,004,950 |
| | 1,500,000 | | A-1+ | Series C 1.73% VRDO | | 1,500,000 |
| | | | | Massachusetts State HEFA: | | |
| | 2,500,000 | | A-1 | Baystate Medical Center Series 834 FGIC-Insured | | |
| | | | | PART 1.72% VRDO | | 2,500,000 |
| | 4,905,000 | | A-1 | Berklee College of Music Series 385 MBIA-Insured | | |
| | | | | PART 1.69% due VRDO | | 4,905,000 |
| | | | | Capital Asset Program MBIA-Insured: | | |
| | 300,000 | | A-1+ | Series B 1.74% VRDO | | 300,000 |
| | 1,470,000 | | A-1+ | Series C 1.74% VRDO | | 1,470,000 |
| | 2,400,000 | | VMIG 1* | Series E 1.72% VRDO | | 2,400,003 |
| | 4,000,000 | | VMIG 1* | CIL Realty of Massachusetts Inc. Series 1999 | | |
| | | | | 1.68% VRDO | | 4,000,000 |
| | | | | Harvard University : | | |
| | 3,000,000 | | A-1+ | Series BB 1.67% VRDO | | 3,000,000 |
| | | | | Series EE TECP: | | |
| | 5,500,000 | | A-1+ | 1.17% due 10/14/04 | | 5,500,000 |
| | 1,500,000 | | A-1+ | 1.17% due 10/28/04 | | 1,500,000 |
| | | | | Partners Healthcare: | | |
| | 2,990,000 | | A-1+ | Series D-4 1.69% VRDO | | 2,990,000 |
| | 900,000 | | A-1+ | Series D-6 1.77% VRDO | | 900,000 |
| | 6,300,000 | | A-1+ | Series P-1 FSA-Insured 1.69% VRDO | | 6,300,000 |
| | | | | Simmons College AMBAC-Insured: | | |
| | 4,390,000 | | VMIG 1* | MERLOT Series D PART 1.72% VRDO | | 4,390,000 |
| | 2,045,000 | | A-1+ | Series E 1.70% VRDO | | 2,045,000 |
| | 9,000,000 | | A-1+ | University of Massachusetts Series A 1.66% VRDO | | 9,000,000 |
| | 1,000,000 | | A-1+ | Wellesley College Issue Series E 1.62% VRDO | | 1,000,000 |
| | | | | Williams College Issue: | | |
| | 4,900,000 | | A-1+ | Series E 1.68% VRDO | | 4,900,000 |
| | 4,000,000 | | AA+ | Series I 1.05% due 4/1/05 | | 4,000,000 |
| | | | | Massachusetts State HFA: | | |
| | 4,000,000 | | VMIG 1* | MFH Princeton Crossings 1.71% VRDO AMT | | 4,000,000 |
| | 400,000 | | VMIG 1* | Single Family 1.73% VRDO AMT | | 400,000 |
| | 5,000,000 | | A-1+ | Series F FSA-Insured 1.70% VRDO | | 5,000,000 |
| | | | | Massachusetts State IFA: | | |
| | 750,000 | | A-1+ | 420 Newburyport Turnpike Series 1998 1.75% VRDO | | 750,000 |
| | 4,100,000 | | VMIG 1* | Buckingham Browne Nichols 1.72% VRDO | | 4,100,000 |
| | 285,000 | | A-1+ | First Mortgage Orchard Grove B 1.64% VRDO | | 285,000 |
| | 500,000 | | NR† | Peterson American Corp. Project 1.90% VRDO AMT | | 500,000 |
| | 1,000,000 | | VMIG 1* | Massachusetts State Turnpike Authority Series 334 | | |
| | | | | MBIA-Insured PART 1.69% VRDO | | 1,000,000 |
| See Notes to Financial Statements. |
| |
| 9 Smith Barney Muni Funds | 2004 Semi-Annual Report |
| |
|
| Schedule of Investments (unaudited) (continued) | September 30, 2004 |
FACE
AMOUNT | | RATING(a) | SECURITY | | VALUE | |
| |
| | | | | Massachusetts State Water Authority: | | | |
| | | | | Series C: | | | |
| $ | 250,000 | | AA | 5.25% due 12/1/04 (ETM in U.S. | | | |
| | | | | Government Securities) | $ | 256,724 | |
| | 1,000,000 | | AAA | AMBAC-Insured 5.10% due 12/1/04 | | 1,006,444 | |
| | 5,800,000 | | A-1+ | FGIC-Insured 1.69% VRDO | | 5,800,000 | |
| | 2,750,000 | | A-1+ | Series D FGIC-Insured 1.69% VRDO | | 2,750,000 | |
| | | | | Puerto Rico GDB TECP: | | | |
| | 4,000,000 | | A-1 | 1.17% due 10/8/04 | | 4,000,000 | |
| | 2,400,000 | | A-1 | 1.21% due 10/21/04 | | 2,400,000 | |
| | | | | Spencer East Brookfield Regional School District GO | | | |
| | | | | MBIA-Insured: | | | |
| | 280,000 | | Aaa* | 4.00% due 4/15/2005 | | 284,248 | |
| | 160,000 | | Aaa* | 4.20% due 4/15/2005 | | 162,641 | |
| | 259,000 | | Aaa* | Tewksbury GO AMBAC-Insured 3.50% due 2/15/05 | | 261,307 | |
| |
| | | | | TOTAL INVESTMENTS — 101.6% | | | |
| | | | | (Cost — $213,620,694** ) | | 213,620,694 | |
| | | | | Liabilities in Excess of Other Assets — (1.6)% | | (3,370,257 | ) |
| |
| | | | | TOTAL NET ASSETS — 100.0% | $ | 210,250,437 | |
| |
| (a) | All ratings are by Standard & Poor’s Ratings Service (“Standard & Poor’s”), except for those which are identified by an asterisk (*), are rated by Moody’s Investors Service (“Moody’s”). |
| † | Security has not been rated by either Standard & Poor’s or Moody’s. However, the Board of Trustees had determined this security to be considered a first tier quality issue due to enhancement features, such as insurance and/or irrevocable letters of credit. |
| ** | Aggregate cost for Federal income tax purposes is substantially the same. |
| | |
| | See pages 12 and 13 for definitions of ratings and certain abbreviations. |
| See Notes to Financial Statements. |
| |
| 10 Smith Barney Muni Funds | 2004 Semi-Annual Report |
| |
|
| Summary of Investments by Industry* (unaudited) |
|---|
| | | | |
| Education | | 33.9 | % |
| Hospitals | | 13.8 | |
| General Obligation | | 13.7 | |
| Transportation | | 10.7 | |
| Industrial Development | | 6.5 | |
| Water & Sewer | | 4.8 | |
| Multi-Family Housing | | 4.2 | |
| Solid Waste | | 4.1 | |
| Single-Family Housing | | 2.3 | |
| Other | | 6.0 | |
| |
| | | 100.0 | % |
| |
| * | As a percentage of total investments. Please note that Fund holdings are as of September 30, 2004 and are subject to change. |
| 11 Smith Barney Muni Funds | 2004 Semi-Annual Report |
| |
|
Bond Ratings (unaudited) The definitions of the applicable rating symbols are set forth below: Standard & Poor’s Ratings Service (“Standard & Poor’s”) — Rating “AA” may be modified by the addition of a plus (+) or minus (-) sign to show relative standings within the major rating categories. |
| |
| AAA | — | Bonds rated “AAA” have the highest rating assigned by Standard & Poor’s. Capacity to pay interest and repay principal is extremely strong. |
| | |
| AA | — | Bonds rated “AA” have a very strong capacity to pay interest and repay principal and differ from the highest rated issue only in a small degree. |
| |
Moody’s Investors Service (“Moody’s”) — Numerical modifiers 1, 2 and 3 may be applied to generic rating “Aa”, where 1 is the highest and 3 the lowest ranking within its generic category. |
| |
| Aaa | — | Bonds rated “Aaa” are judged to be of the best quality. They carry the smallest degree of investment risk and are generally referred to as “gilt edge.” Interest payments are protected by a large or by an exceptionally stable margin and principal is secure. While the various protective elements are likely to change, such changes as can be visualized are most unlikely to impair the fundamentally strong position of such issues. |
| | |
| Aa | — | Bonds rated “Aa” are judged to be of high quality by all standards. Together with the “Aaa” group they comprise what are generally known as high grade bonds. They are rated lower than the best bonds because margins of protection may not be as large as in “Aaa” securities or fluctuation of protective elements may be of greater amplitude or there may be other elements present which make the long-term risks appear somewhat larger than in “Aaa” securities. |
| |
Short-Term Security Ratings (unaudited) |
| |
| SP-1 | — | Standard & Poor’s highest rating indicating very strong or strong capacity to pay principal and interest; those issues determined to possess overwhelming safety characteristics are denoted with a plus (+) sign. |
| | |
| A-1 | — | Standard & Poor’s highest commercial paper and variable-rate demand obligation (VRDO) rating indicating that the degree of safety regarding timely payment is either overwhelming or very strong; those issues determined to possess overwhelming safety characteristics are denoted with a plus (+) sign. |
| | | |
| VMIG 1 | — | Moody’s highest rating for issues having a demand feature — VRDO. |
| | | |
| MIG 1 | — | Moody’s highest rate for short-term municipal obligations. |
| | | |
| NR | — | Indicates that the bond is not rated by Standard & Poor’s or Moody’s. |
| 12 Smith Barney Muni Funds | 2004 Semi-Annual Report |
| |
|
| Abbreviations* (unaudited) |
| | | | | | | |
| ABAG | — | Association of Bay Area | | ISO | — | Independent System Operator |
| | | Governments | | LOC | — | Letter of Credit |
| AIG | — | American International Guaranty | | MBIA | — | Municipal Bond Investors |
| AMBAC | — | Ambac Assurance Corporation | | | | Assurance Corporation |
| AMT | — | Alternative Minimum Tax | | MERLOT | — | Municipal Exempt Receipts |
| BAN | — | Bond Anticipation Notes | | | | Liquidity Optional Tender |
| BIG | — | Bond Investors Guaranty | | MFH | — | Multi-Family Housing |
| CDA | — | Community Development | | MSTC | — | Municipal Securities Trust |
| | | Authority | | | | Certificates |
| CGIC | — | Capital Guaranty Insurance | | MUD | — | Municipal Utilities District |
| | | Company | | MVRICS | — | Municipal Variable Rate Inverse |
| CHFCLI | — | California Health Facility | | | | Coupon Security |
| | | Construction Loan Insurance | | PART | — | Partnership Structure |
| CONNIE | — | College Construction Loan | | PCFA | — | Pollution Control Finance |
| LEE | | Insurance Association | | | | Authority |
| COP | — | Certificate of Participation | | PCR | — | Pollution Control Revenue |
| CSD | — | Central School District | | PFA | — | Public Finance Authority |
| CTFS | — | Certificates | | PFC | — | Public Finance Corporation |
| DFA | — | Development Finance Agency | | PSFG | — | Permanent School Fund |
| EDA | — | Economic Development | | | | Guaranty |
| | | Authority | | Q-SBLF | — | Qualified School Bond Loan |
| EFA | — | Educational Facilities Authority | | | | Fund |
| ETM | — | Escrowed To Maturity | | Radian | — | Radian Asset Assurrance |
| FGIC | — | Financial Guaranty Insurance | | RAN | — | Revenue Anticipation Notes |
| | | Company | | RAW | — | Revenue Anticipation Warrants |
| FHA | — | Federal Housing Administration | | RDA | — | Redevelopment Agency |
| FHLMC | — | Federal Home Loan Mortgage | | RIBS | — | Residual Interest Bonds |
| | | Corporation | | RITES | — | Residual Interest Tax-Exempt |
| FLAIRS | — | Floating Adjustable Interest Rate | | | | Securities |
| | | Securities | | SPA | — | Standby Bond Purchase |
| FNMA | — | Federal National Mortgage | | | | Agreement |
| | | Association | | SWAP | — | Swap Structure |
| FRTC | — | Floating Rate Trust Certificates | | SYCC | — | Structured Yield Curve |
| FSA | — | Federal Savings Association | | | | Certificate |
| GDB | — | Government Development Bond | | TAN | — | Tax Anticipation Notes |
| GIC | — | Guaranteed Investment Contract | | TCRS | — | Transferable Custodial Receipts |
| GNMA | — | Government National Mortgage | | TECP | — | Tax Exempt Commercial Paper |
| | | Association | | TFA | — | Transitional Finance Authority |
| GO | — | General Obligation | | TOB | — | Tender Option Bond Structure |
| HDC | — | Housing Development | | TRAN | — | Tax and Revenue Anticipation |
| | | Corporation | | | | Notes |
| HEFA | — | Health & Educational Facilities | | UFSD | — | Unified Free School District |
| | | Authority | | UHSD | — | Unified High School District |
| HFA | — | Housing Finance Authority | | USD | — | Unified School District |
| IBC | — | Insured Bond Certificates | | VA | — | Veterans Administration |
| IDA | — | Industrial Development | | VRDD | — | Variable Rate Daily Demand |
| | | Authority | | VRDO | — | Variable Rate Demand |
| IDB | — | Industrial Development Board | | | | Obligation |
| IDR | — | Industrial Development Revenue | | VRWE | — | Variable Rate Wednesday |
| IFA | — | Industrial Finance Agency | | | | Demand |
| INFLOS | — | Inverse Floaters | | XLCA | — | XL Capital Assurance |
| ISD | — | Independent School District | | | | |
| _____________ |
| * | Abbreviations may or may not appear on the schedule of investments. |
| 13 Smith Barney Muni Funds | 2004 Semi-Annual Report |
| |
|
| Statement of Assets and Liabilities (unaudited) | | September 30, 2004 | |
| | | | | | |
| ASSETS: | | | | | |
| Investments, at amortized cost | | | $ | 213,620,694 | |
| Cash | | | | 172,256 | |
| Receivable for Fund shares sold | | | | 910,434 | |
| Interest receivable | | | | 557,017 | |
| Prepaid expenses | | | | 4,458 | |
| Other assets | | | | 1,165 | |
| |
| Total Assets | | | | 215,266,024 | |
| |
| LIABILITIES: | | |
| Payable for Fund shares reacquired | | | | 4,787,072 | |
| Management fee payable | | | | 83,062 | |
| Dividends payable | | | | 81,230 | |
| Distribution plan fees payable | | | | 5,921 | |
| Deferred compensation payable | | | | 1,165 | |
| Accrued expenses | | | | 57,137 | |
| |
| Total Liabilities | | | | 5,015,587 | |
| |
| Total Net Assets | | | $ | 210,250,437 | |
| |
| NET ASSETS: | | |
| Par value of shares of beneficial interest | | |
| ($0.001 par value, unlimited shares authorized) | | | $ | 210,128 | |
| Capital paid in excess of par value | | | | 210,040,309 | |
| |
| Total Net Assets | | | $ | 210,250,437 | |
| |
| Shares Outstanding | | | | 210,127,828 | |
| |
| Net Asset Value, Per Share (and redemption price) | | | $ | 1.00 | |
| |
| |
| See Notes to Financial Statements. |
| |
| 14 Smith Barney Muni Funds | 2004 Semi-Annual Report |
| |
|
Statement of Operations (unaudited) For the Six Months Ended September 30, 2004 |
| INVESTMENT INCOME: | | | | | |
| Interest | | | $ | 1,227,236 | |
| |
| EXPENSES: | | |
| Management fee (Note 2) | | | | 514,849 | |
| Distribution plan fees (Note 2) | | | | 108,395 | |
| Transfer agency services (2) | | | | 24,419 | |
| Custody | | | | 14,821 | |
| Audit and legal | | | | 14,627 | |
| Shareholder communications | | | | 10,149 | |
| Registration fees | | | | 1,932 | |
| Trustees’ fees | | | | 1,600 | |
| Other | | | | 7,172 | |
| |
| Total Expenses | | | | 697,964 | |
| Less: Management fee waiver (Notes 2 and 4) | | | | (12,330 | ) |
| |
| Net Expenses | | | | 685,634 | |
| |
| Net Investment Income | | | $ | 541,602 | |
| |
| |
| See Notes to Financial Statements. |
| |
| 15 Smith Barney Muni Funds | 2004 Semi-Annual Report |
| |
|
Statements of Changes in Net Assets For the Six Months Ended September 30, 2004 (unaudited)
and the Year Ended March 31, 2004 |
| | | | September 30 | | March 31 | |
| |
| OPERATIONS: | | |
| Net investment income | | | $ | 541,602 | | $ | 1,164,804 | |
| |
| DISTRIBUTIONS TO SHAREHOLDERS | | |
| FROM (NOTE 1): | | |
| Net investment income | | | | (541,602 | ) | | (1,164,804 | ) |
| |
| Decrease in Net Assets From | | |
| Distribution to Shareholders | | | | (541,602 | ) | | (1,164,804 | ) |
| |
| FUND SHARE TRANSACTIONS (NOTE 3): | | |
| Net proceeds from sale of shares | | | | 387,792,315 | | | 1,122,099,513 | |
| Net asset value of shares issued for | | |
| reinvestment of dividends | | | | 494,302 | | | 1,160,548 | |
| Cost of shares reacquired | | | | (400,645,953 | ) | | (1,154,786,703 | ) |
| |
| Decrease in Net Assets From | | |
| Fund Share Transactions | | | | (12,359,336 | ) | | (31,526,642 | ) |
| |
| Decrease in Net Assets | | | | (12,359,336 | ) | | (31,526,642 | ) |
| NET ASSETS: | | |
| Beginning of period | | | | 222,609,773 | | | 254,136,415 | |
| |
| End of period | | | $ | 210,250,437 | | $ | 222,609,773 | |
| |
| |
| See Notes to Financial Statements. |
| |
| 16 Smith Barney Muni Funds | 2004 Semi-Annual Report |
| |
|
Financial Highlights For a share of beneficial interest outstanding throughout each year ended March 31, unless otherwise noted: |
| Class A Shares | | | | 2004(1) | | | 2004 | | | 2003 | | | 2002 | | | 2001 | | | 2000(2) | |
| |
| Net Asset Value, | | |
| Beginning of Period | | | $ | 1.00 | | $ | 1.00 | | $ | 1.00 | | $ | 1.00 | | $ | 1.00 | | $ | 1.00 | |
| |
| Net investment income | | | | 0.003 | | | 0.004 | | | 0.008 | | | 0.018 | | | 0.034 | | | 0.016 | |
| Dividends from net | | |
| investment income | | | | (0.003 | ) | | (0.004 | ) | | (0.008 | ) | | (0.018 | ) | | (0.034 | ) | | (0.016 | ) |
| |
| Net Asset Value, | | |
| End of Period | | | $ | 1.00 | | $ | 1.00 | | $ | 1.00 | | $ | 1.00 | | $ | 1.00 | | $ | 1.00 | |
| |
| Total Return(3) | | | | 0.25 | %‡ | | 0.44 | % | | 0.78 | % | | 1.81 | % | | 3.46 | % | | 1.66 | %‡ |
| |
| Net Assets, | | |
| End of Period (millions) | | | $ | 210 | | $ | 223 | | $ | 254 | | $ | 300 | | $ | 336 | | $ | 260 | |
| |
| Ratios to Average | | |
| Net Assets: | | |
| Expenses(4)(5) | | | | 0.64 | %† | | 0.61 | % | | 0.65 | % | | 0.65 | % | | 0.65 | % | | 0.65 | %† |
| Net investment income | | | | 0.51 | † | | 0.43 | | | 0.78 | | | 1.80 | | | 3.36 | | | 3.05 | † |
| |
| (1) | For the six months ended September 30, 2004 (unaudited). |
| (2) | For the period September 14, 1999 (commencement of operations) to March 31, 2000. |
| (3) | Performance figures may reflect fee waivers and/or expense reimbursements. Past performance is no guarantee of future results. In the absence of fee waivers and/or expense reimbursements, the total return would be reduced. |
| (4) | As a result of voluntary expense limitations, the ratio of expenses to average net assets will not exceed 0.80%. |
| (5) | The manager waived a portion of its fees for the six months ended September 30, 2004, the years ended March 31, 2002, March 31, 2001, and the period ended March 31, 2000. If such fees were not waived, the actual annualized expense ratios would have been 0.66%, 0.66%, 0.66% and 0.76%, respectively. |
| ‡ | Total return is not annualized, as it may not be representative of the total return for the year. |
| † | Annualized. |
| |
| 17 Smith Barney Muni Funds | 2004 Semi-Annual Report |
| |
|
Notes to Financial Statements (unaudited) 1. Organization and Significant Accounting Policies The Massachusetts Money Market Portfolio (“Fund”), a separate investment fund of the Smith Barney Muni Funds (“Trust”), a Massachusetts business trust, is registered under the Investment Company Act of 1940, as amended, as an open-end management investment company. The following is a summary of the significant accounting policies consistently followed by the Fund and is in conformity with U.S. generally accepted accounting principles (“GAAP”). The preparation of financial statements in accordance with GAAP requires management to make estimates and assumptions regarding assets, liabilities and changes in net assets resulting from operations when financial statements are prepared. Changes in the economic environment, financial markets and any other parameters used in determining these estimates could cause actual results to differ. (a) Investment Valuation. The Fund uses the amortized cost method for valuing investments; accordingly, the cost of securities plus accreted discount, or minus amortized premium, approximates value. (b) Investment Transactions and Investment Income. Security transactions are accounted for on trade date. Dividends and distributions to shareholders are recorded on the ex-dividend date. Interest income, adjusted for amortization of premium and accretion of discount, is recorded on an accrual basis. Gains or losses on the sale of securities are calculated by using the specific identification method. (c) Fund Concentration. Since the Fund invests primarily in obligations of issuers within Massachusetts, it is subject to possible concentration risks associated with economic, political, or legal developments or industrial or regional matters specifically affecting Massachusetts. (d) Exempt-Interest Dividends and Other Distributions. The Fund declares and records a dividend of substantially all of its net investment income on each business day. Such dividends are paid or reinvested monthly in Fund shares on the payable date. Furthermore, the Fund intends to satisfy conditions that will enable interest from municipal securities, which is exempt from regular Federal income tax and from designated state income taxes, to retain such status when distributed to the shareholders of the Fund. The character of income and gains to be distributed is determined in accordance with income tax regulations, which may differ from GAAP. |
| 18 Smith Barney Muni Funds | 2004 Semi-Annual Report |
| |
|
Notes to Financial Statements (unaudited) (continued) (e) Federal Income Taxes. The Fund intends to comply with the applicable provisions of the Internal Revenue Code of 1986, as amended, pertaining to regulated investment companies and to make distributions of taxable income sufficient to relieve it from substantially all Federal income and excise taxes. 2. Management Agreement and Other Transactions Smith Barney Fund Management LLC (“SBFM”), an indirect wholly-owned subsidiary of Citigroup Inc. (“Citigroup”), acts as investment manager to the Fund. The Fund pays SBFM a management fee calculated at an annual rate of 0.475% on the first $1 billion of the Fund’s average daily net assets; 0.450% on the next $1 billion; 0.425% on the next $3 billion; 0.400% on the next $5 billion and 0.375% on the Fund’s average daily net assets in excess of $10 billion. This fee is calculated daily and paid monthly. During the six months ended September 30, 2004, SBFM waived a portion of its management fee in the amount of $12,330. Citicorp Trust Bank, fsb. (“CTB”), another subsidiary of Citigroup, acts as the Fund’s transfer agent. PFPC Inc. (“PFPC”) acts as the Fund’s sub-transfer agent. CTB receives account fees and asset-based fees that vary according to the size and type of account. PFPC is responsible for shareholder recordkeeping and financial processing for all shareholder accounts and is paid by CTB. For the six months ended September 30, 2004, the Fund paid transfer agent fees of $18,461 to CTB. Citigroup Global Markets Inc. (“CGM”), another indirect wholly-owned subsidiary of Citigroup, acts as the Fund’s distributor. Pursuant to a Rule 12b-1 Distribution Plan, the Fund pays a distribution fee with respect to its Class A shares calculated at the annual rate of 0.10% of the average daily net assets of that class. For the six months ended September 30, 2004, total Rule 12b-1 Distribution Plan fees, which are accrued daily and paid monthly, were $108,395. All officers and one Trustee of the Trust are employees of Citigroup or its affiliates. |
| 19 Smith Barney Muni Funds | 2004 Semi-Annual Report |
| |
|
Notes to Financial Statements (unaudited) (continued) 3. Shares of Beneficial Interest At September 30, 2004, the Trust had an unlimited amount of shares of beneficial interest authorized with a par value of $0.001 per share. Transactions in shares of the Fund were as follows: |
| | | | | Six Months Ended
September 30, 2004 | | | Year Ended
March 31, 2004 | |
| |
| Class A | | |
| Shares sold | | | | 387,792,315 | | | 1,122,099,513 | |
| Shares issued on reinvestment | | | | 494,302 | | | 1,160,548 | |
| Shares reacquired | | | | (400,645,953 | ) | | (1,154,786,703 | ) |
| |
| Net Decrease | | | | (12,359,336 | ) | | (31,526,642 | ) |
| |
4. Additional Information In connection with an investigation previously disclosed by Citigroup, the Staff of the Securities and Exchange Commission (“SEC”) has notified Citigroup Asset Management (“CAM”), the Citigroup business unit that includes the funds’ investment manager and other investment advisory companies; Citigroup Trust Bank (“CTB”), an affiliate of CAM; Thomas W. Jones, the former CEO of CAM; and two other individuals, one of whom is an employee and the other of whom is a former employee of CAM, that the SEC Staff is considering recommending a civil injunctive action and/or an administrative proceeding against each of them relating to the creation and operation of an internal transfer agent unit to serve various CAM-managed funds. In 1999, CTB entered the transfer agent business. CTB hired an unaffiliated subcontractor to perform some of the transfer agent services. The subcontractor, in exchange, had signed a separate agreement with CAM in 1998 that guaranteed investment management revenue to CAM and investment banking revenue to a CAM affiliate. The subcontractor’s business was later taken over by PFPC Inc., and at that time the revenue guarantee was eliminated and a one-time payment was made by the subcontractor to a CAM affiliate. CAM did not disclose the revenue guarantee when the boards of various CAM-managed funds hired CTB as transfer agent. Nor did CAM disclose to the boards of the various CAM-managed funds the one-time payment received by the CAM affiliate when it was made. |
| 20 Smith Barney Muni Funds | 2004 Semi-Annual Report |
| |
|
Notes to Financial Statements (unaudited) (continued) In addition, the SEC Staff has indicated that it is considering recommending action based on the adequacy of the disclosures made to the fund boards that approved the transfer agency arrangement, CAM’s initiation and operation of, and compensation for, the transfer agent business and CAM’s retention of, and agreements with, the subcontractor. Citigroup is cooperating fully in the investigation and will seek to resolve the matter in discussion with the SEC Staff. Although there can be no assurance, Citigroup does not believe that this matter will have a material adverse effect on the funds. As previously disclosed, CAM has already agreed to pay the applicable funds, primarily through fee waivers, a total of approximately $17 million (plus interest) that is the amount of the revenue received by Citigroup relating to the revenue guarantee. |
| 21 Smith Barney Muni Funds | 2004 Semi-Annual Report |
| |
|
(This page intentionally left blank.) |
(This page intentionally left blank.) |
(This page intentionally left blank.) |
SMITH BARNEY
MUNI FUNDS |
| TRUSTEES | Robert I. Frenkel |
| Lee Abraham | Secretary and |
| Allan J. Bloostein | Chief Legal Officer |
| Jane F. Dasher | |
| R. Jay Gerken, CFA | INVESTMENT MANAGER |
| Chairman | Smith Barney Fund |
| Richard E. Hanson, Jr. | Management LLC |
| Paul Hardin | |
| Roderick C. Rasmussen | DISTRIBUTOR |
| John P. Toolan | Citigroup Global Markets Inc. |
| | |
| OFFICERS | CUSTODIAN |
| R. Jay Gerken, CFA | State Street Bank and |
| President and Chief | Trust Company |
| Executive Officer | |
| | TRANSFER AGENT |
| Andrew B. Shoup | Citicorp Trust Bank, fsb. |
| Senior Vice President and | 125 Broad Street , 11th Floor |
| Chief Administrative Officer | New York, New York 10004 |
| | |
| Robert J. Brault | SUB-TRANSFER AGENT |
| Chief Financial Officer | PFPC Inc. |
| and Treasurer | P.O. Box 9699 |
| | Providence, Rhode Island |
| Julie P. Callahan, CFA | 02940-9699 |
| Vice President and | |
| Investment Officer | |
| | |
| Joseph P. Deane | |
| Vice President and | |
| Investment Officer | |
| | |
| Andrew Beagley | |
| Chief Anti-Money Laundering | |
| Compliance Officer and | |
| Chief Compliance Officer | |
| | |
| Kaprel Ozsolak | |
| Controller | |
| | Smith Barney Muni Funds Massachusetts Money
Market Portfolio The Fund is a separate investment fund of the Smith Barney Muni Funds, a Massachusetts business trust. The Fund files its complete schedule of portfolio holdings with Securities Exchange Commission for the first and third quarters of each fiscal year on Form N-Q. The Fund’s Forms N-Q are available on the Commission’s website at www.sec.gov. The Fund’s Forms N-Q may be reviewed and copied at the Commission’s Public Reference Room in Washington D.C., and information on the operation of the Public Reference Room may be obtained by calling 1-800-SEC-0330. To obtain information on Form N-Q from the Fund, shareholders can call 1-800-451-2010. Information on how the fund voted proxies relating to portfolio securities during the 12-month period ended June 30, 2004 and a description of the policies and procedures that the fund uses to determine how to vote proxies relating to portfolio securities is aviailabe (1) without charge, upon request, by calling 1-800-451-2010, (2) on the fund’s website at www.citigroupAM.com and (3) on the SEC’s website at www.sec.gov. This report is submitted for general information of the shareholders of Smith Barney Muni Funds — Massachusetts Money Market Portfolio. SMITH BARNEY MUNI FUNDS
Smith Barney Mutual Funds
125 Broad Street
10th Floor, MF-2
New York, New York 10004 |
| | |
| | |
| | |
| | ©2004 Citigroup Global Markets Inc. |
| | Member NASD, SIPC |
Not Applicable.
| ITEM 3. | AUDIT COMMITTEE FINANCIAL EXPERT. |
Not Applicable.
| ITEM 4. | PRINCIPAL ACCOUNTANT FEES AND SERVICES. |
Not applicable.
| ITEM 5. | AUDIT COMMITTEE OF LISTED REGISTRANTS. |
Not applicable.
| ITEM 7. | DISCLOSURE OF PROXY VOTING POLICIES AND PROCEDURES FOR CLOSED-END MANAGEMENT INVESTMENT COMPANIES. |
Not applicable.
| ITEM 9. | SUBMISSION OF MATTERS TO A VOTE OF SECURITY HOLDERS. |
Not applicable.
| ITEM 10. | CONTROLS AND PROCEDURES. |
| | (a) | The registrant’s principal executive officer and principal financial officer have concluded that the registrant’s disclosure controls and procedures (as defined in Rule 30a- 3(c) under the Investment Company Act of 1940, as amended (the “1940 Act”)) are effective as of a date within 90 days of the filing date of this report that includes the disclosure required by this paragraph, based on their evaluation of the disclosure controls and procedures required by Rule 30a-3(b) under the 1940 Act and 15d-15(b) under the Securities Exchange Act of 1934. |
| | (b) | There were no changes in the registrant’s internal control over financial reporting (as defined in Rule 30a-3(d) under the 1940 Act) that occurred during the registrant’s last fiscal half-year (the registrant’s second fiscal half-year in the case of an annual report) that have materially affected, or are likely to materially affect the registrant’s internal control over financial reporting. |
| | Exhibit 99.CERT | Certifications pursuant to section 302 of the Sarbanes-Oxley Act of 2002 |
| | Exhibit 99.906CERT | Certifications pursuant to Section 906 of the Sarbanes-Oxley Act of 2002 |
SIGNATURES
Pursuant to the requirements of the Securities Exchange Act of 1934 and the Investment Company Act of 1940, the registrant has duly caused this Report to be signed on its behalf by the undersigned, there unto duly authorized.
Smith Barney Muni Funds
| By: | /s/ R. Jay Gerken
R. Jay Gerken
Chief Executive Officer of
Smith Barney Muni Funds |
Date: December 6, 2004
Pursuant to the requirements of the Securities Exchange Act of 1934 and the Investment Company Act of 1940, this report has been signed below by the following persons on behalf of the registrant and in the capacities and on the dates indicated.
| By: | /s/ R. Jay Gerken
R. Jay Gerken
Chief Executive Officer of
Smith Barney Muni Funds |
Date: December 6, 2004
| By: | /s/ Robert J. Brault
Robert J. Brault
Chief Financial Officer of
Smith Barney Muni Funds |
Date: December 6, 2004