UNITED STATES
SECURITIES AND EXCHANGE COMMISSION
Washington, DC 20549
FORM N-CSR
CERTIFIED SHAREHOLDER REPORT OF REGISTERED MANAGEMENT
INVESTMENT COMPANIES
Investment Company Act file number File No. 811-04415
COLLEGE RETIREMENT EQUITIES FUND
(Exact Name of Registrant as specified in charter)
730 Third Avenue, New York, New York 10017-3206
(Address of Principal Executive Offices) (Zip code)
Terry H. Lin, Esq.
College Retirement Equities Fund
730 Third Avenue
New York, New York 10017-3206
(Name and address of agent for service)
Registrant’s telephone number, including area code:212-490-9000
Date of fiscal year end:December 31
Date of reporting period:December 31, 2018
Item 1. Reports to Stockholders.

Annual Report ■ December 31, 2018
College Retirement
Equities Fund
The annual report contains the audited financial statements.
| Account name | Class R1 | Class R2 | Class R3 |
| Stock Account | QCSTRX | QCSTPX | QCSTIX |
| Global Equities Account | QCGLRX | QCGLPX | QCGLIX |
| Growth Account | QCGRRX | QCGRPX | QCGRIX |
| Equity Index Account | QCEQRX | QCEQPX | QCEQIX |
| Bond Market Account | QCBMRX | QCBMPX | QCBMIX |
| Inflation-Linked Bond Account | QCILRX | QCILPX | QCILIX |
| Social Choice Account | QCSCRX | QCSCPX | QCSCIX |
| Money Market Account | QCMMRX | QCMMPX | QCMMIX |

Beginning on January 1, 2021, as permitted by regulations adopted by the Securities and Exchange Commission, paper copies of the CREF Accounts’ (the “Accounts”) annual and semiannual reports will no longer be sent by mail, unless you specifically request paper copies of the reports. Instead, they will be made available on TIAA’s website, TIAA.org, and you will be notified by mail each time a report is posted and provided with a website link to access the report.
If you already elected to receive these reports electronically, you will not be affected by this change and you need not take any action. You may elect to receive reports and other communications from the Accounts electronically anytime by either updating your account settings at TIAA.org/eDelivery, if you hold your Account units through a TIAA-affiliated financial intermediary, account or retirement plan (each, a “TIAA Account”), or by contacting your financial intermediary (such as a broker/dealer or bank) through which you hold Account units.
If you invest in the Accounts through a TIAA Account, you may elect to continue to receive all future reports in paper free of charge by updating your account settings at TIAA.org/eDelivery or by calling 877-518-9161 during regular business hours. If you invest through another financial intermediary, you can contact your financial intermediary to request that you continue receiving paper copies of your reports. Your election to receive reports in paper will apply to all funds held through your financial intermediary or, if you invest through a TIAA Account, to all funds held with the Accounts and any other investment companies within the same group of related investment companies.
Contents
Understanding this report
This annual report contains information about the CREF variable annuity accounts and describes their results for the twelve months ended December 31, 2018. The report contains four main sections:
| • | A letter to participants from Carol Deckbar, Principal Executive Officer, CREF; Executive Vice President, TIAA Institutional Investments and Endowment Services. |
| • | The account performance section compares each account’s investment returns with those of its benchmark index. |
| • | The summary portfolios of investments list the industries and types of securities in which each account had investments as of December 31, 2018. |
| • | The financial statements provide detailed information about the operations and financial condition of each account. |
The views and opinions expressed in this report are through the end of the period, as stated on the cover of this report. They are subject to change at any time based on a variety of factors. As such, they are not guarantees of future performance or investment results and should not be taken as investment advice. To see the risks of investing in any account, please read the latest prospectus.
As always, you should carefully consider the investment objectives, risks, charges and expenses of any account before investing. For a prospectus that contains this and other important information, please visit our website at TIAA.org, or call 877-518-9161. We urge you to read the prospectus carefully before investing.
| College Retirement Equities Fund ■ 2018 Annual Report | 3 |
Letter to CREF participants
Global equity markets became more volatile in 2018, serving as a reminder to investors that downturns can and do occur. After nearly a decade-long stretch of strong performance, the sharp decline near the year’s end caught some investors off guard. Nevertheless, the U.S. economy remained strong with moderate inflation. The U.S. unemployment rate fell to its lowest level in nearly 50 years, and wage growth continued. In response to the economy’s strength, the Federal Reserve increased the federal funds target rate four times to 2.25%–2.50%. Overseas, growth in Europe slowed, while returns in emerging markets were hurt by rising interest rates and a stronger U.S. dollar. In the fixed-income markets, U.S. Treasury yields increased, which dampened returns as bond prices move in the opposite direction of yields.
| • | Returns for the five CREF Accounts with significant exposure to U.S. equities ranged from –12.6% for the Global Equities Account to –2.7% for the Growth Account. |
| • | The Bond Market Account returned –0.4% for the year, and the Inflation-Linked Bond Account returned –0.7%. |
| • | Seven out of the eight CREF Accounts lagged their respective benchmarks. |
| | • | All account returns are for Class R1. |
Most CREF Accounts produced negative returns in 2018
For the twelve-month period, seven out of eight CREF Accounts had negative performance. Among domestic equities, growth stocks performed better than value shares, and large-cap stocks generally outperformed mid- and small-cap equities. International stocks trailed U.S. stocks, while fixed-income securities generally outperformed equities.
Looking at individual account performance, the Stock Account, which is the largest CREF Account in terms of net assets, returned –9.9%, lagging its composite benchmark. The Growth Account returned –2.7%, also trailing its benchmark’s return of –1.5% due to certain stock selections.
The Equity Index Account, which returned –5.6%, and the Inflation-Linked Bond Account, which declined 0.7%, lagged their respective benchmarks by modest margins, mostly due to the effect of expenses. The Money Market Account also trailed its benchmark.
The Social Choice Account returned –4.5%, slightly outpacing the 4.6% decline of its benchmark due to advantageous portfolio allocations.
The Global Equities Account returned –12.6%, which trailed its benchmark’s return of –9.4% in a difficult environment for foreign equities.
The Bond Market Account returned –0.4%, trailing its benchmark, the Bloomberg Barclays US. Aggregate Bond Index, primarily due to an underweight allocation in U.S. Treasuries.
| 4 | 2018 Annual Report ■ College Retirement Equities Fund |
For full details on all CREF Accounts, please see the commentaries on the following pages.
Global equity markets posted losses
The broad U.S. stock market, as measured by the Russell 3000 Index, returned –5.2% for the twelve months. Concerns about rising interest rates, trade tensions with China and a decelerating global economy weighed on markets in the latter months of the period.
Foreign equities, as represented in U.S.-dollar terms by the MSCI EAFE Index, declined more sharply, posting a return of –13.8%.
U.S. investment-grade fixed-rate bonds, as measured by the Bloomberg Barclays U.S.
Aggregate Bond Index, were essentially flat for the year, reflecting the impact of four interest-rate increases by the Federal Reserve. Yields on U.S. Treasury securities were also affected by the Fed’s actions, rising during the period, with greater increases occurring among shorter-term bonds.

Carol Deckbar
Maintain perspective during periods of increased volatility
Periodic corrections are a normal part of investing in the stock market and have occurred frequently throughout the course of history. Perhaps the most important thing to remember during periods of volatility is to avoid overreacting. We believe that investment decisions should be based on a current assessment of long-term goals and personal risk tolerance, rather than emotions. Attempts to time stock market declines and rallies are rarely successful. We believe that investors who can ride out the market’s inevitable ups and downs have a greater chance of achieving more consistent investment results over the long term. The market’s strong start in 2019 illustrates this point.
As always, we recommend that you consult your financial advisor or call a TIAA financial consultant with any questions about your investments. To learn more, visit us at TIAA.org or call 800-842-2252. We would be happy to assist you.
/s/ Carol W. Deckbar
Carol W. Deckbar
Principal Executive Officer, CREF
Executive Vice President, TIAA Institutional Investments and Endowment Services
| College Retirement Equities Fund ■ 2018 Annual Report | 5 |
Information for CREF participants
Portfolio holdings
Securities and Exchange Commission (SEC) rules allow investment companies to list the top holdings of each account in their annual and semiannual reports, instead of providing complete portfolio listings. CREF also files complete portfolio listings with the SEC, and they are available to the public.
You can obtain a complete list of CREF’s holdings (Schedules of Investments) as of the most recently completed fiscal quarter in the following ways:
| • | By visiting our website at TIAA.org; or |
| • | By calling us at 800-842-2252 to request a copy, which will be provided free of charge. |
You can also obtain a complete list of CREF’s portfolio holdings as of the most recently completed fiscal quarter, and for prior quarter-ends, from our SEC Form N-CSR and Form N-Q filings. Form N-CSR filings are as of December 31 or June 30; Form N-Q filings are as of March 31 or September 30. Copies of these forms are available:
| • | Through the Electronic Data Gathering and Retrieval System (EDGAR) on the SEC’s website at sec.gov; or |
| • | From the SEC’s Office of Investor Education and Advocacy. Call 202-551-8090 for more information. |
Proxy voting
CREF’s ownership of stock gives it the right to vote on proxy issues of companies in which it invests. A description of our proxy voting policies and procedures can be found on our website at TIAA.org or on the SEC’s website at sec.gov. You can also call us at 800-842-2252 to request a free copy. A report of how the accounts voted during the most recently completed twelve-month period ended June 30 can be found on our website or on Form N-PX at sec.gov.
Contacting TIAA
There are three easy ways to contact us: by email, using the Contact Us link at the top of our home page; by mail at TIAA, 730 Third Avenue, New York, NY 10017-3206; or by phone at 800-842-2252.
Account management
The CREF Accounts are managed by the portfolio management teams of TIAA-CREF Investment Management, LLC. The members of these teams are responsible for the day-to-day investment management of the accounts.
| 6 | 2018 Annual Report ■ College Retirement Equities Fund |
About the accounts’ benchmarks
CREF Stock Account
The Account’s composite benchmark is a weighted average of two unmanaged indexes: the Russell 3000® Index, which measures the performance of the broad U.S. stock market, and the MSCI All Country World ex USA Investable Market Index, which measures the performance of small-, mid- and large-cap stocks in 46 developed- and emerging-markets nations throughout the world, excluding the United States.
The Morningstar Aggressive Target Risk Index is a broad-based securities market index for the Stock Account and has a 95% global equity market exposure and a multi-asset class exposure that is similar to the Stock Account.
CREF Global Equities Account
On May 1, 2018, the benchmark for the Global Equities Account changed from the MSCI World Index to the MSCI All Country World Index (ACWI). The MSCI ACWI measures the performance of large- and mid-capitalization stocks in 23 developed-markets countries and 24 emerging-markets countries.
CREF Growth Account
The Account’s benchmark is the Russell 1000® Growth Index, a subset of the Russell 1000 Index, which measures the performance of the stocks of the 1,000 largest companies in the Russell 3000 Index, based on market capitalization. The Russell 1000 Growth Index measures the performance of those stocks of the Russell 1000 Index with higher relative forecasted growth rates and price/book ratios.
CREF Equity Index Account
The Account’s benchmark is the Russell 3000 Index, which measures the performance of the stocks of the 3,000 largest publicly traded U.S. companies, based on market capitalization. The index measures the performance of about 98% of the total market capitalization of the publicly traded U.S. equity market.
CREF Bond Market Account
The Account’s benchmark is the Bloomberg Barclays U.S. Aggregate Bond Index, which measures the performance of the domestic investment-grade fixed-rate bond market, including government and corporate securities, agency mortgage pass-through securities, asset-backed securities and commercial mortgage-backed securities.
| College Retirement Equities Fund ■ 2018 Annual Report | 7 |
About the accounts’ benchmarks
CREF Inflation-Linked Bond Account
The Account’s benchmark is the Bloomberg Barclays U.S. Treasury Inflation Protected Securities (TIPS) 1–10 Year Index, which measures the performance of fixed-income securities with maturities between 1 and 10 years that are adjusted for inflation, as measured by the Consumer Price Index for All Urban Consumers (CPI-U).
CREF Social Choice Account
The Account’s composite benchmark is a weighted average of three unmanaged indexes: the Russell 3000® Index, which measures the performance of the broad U.S. stock market; the Bloomberg Barclays U.S. Aggregate Bond Index, which measures the performance of the domestic investment-grade, fixed-rate bond market; and the MSCI EAFE+Canada Index, which measures stock performance in 22 developed-markets nations, excluding the United States.
On May 1, 2018, the Morningstar Moderate Target Risk Index was added as a broad-based securities market index for the Social Choice Account. This index is part of a family of five indexes covering equity risk preferences ranging from aggressive to conservative. The index has a multi-asset class exposure (60% global equity, 40% global fixed income) that is similar to the Social Choice Account.
You cannot invest directly in any index. Index returns do not include a deduction for fees or expenses.
Russell 1000® and Russell 3000 are trademarks and service marks of Frank Russell Company. TIAA products are not promoted or sponsored by, or affiliated with, Frank Russell Company. MSCI makes no express or implied warranties or representations and shall have no liability whatsoever with respect to any MSCI data contained herein. This report is not approved, reviewed or produced by MSCI. EAFE stands for Europe, Australasia, Far East.
| 8 | 2018 Annual Report ■ College Retirement Equities Fund |
Important information about expenses
All participants in the CREF Accounts incur ongoing costs, including management fees and other account expenses.
The expense examples for each Class that appear in this report are intended to help you understand your ongoing costs (in U.S. dollars) and do not reflect transactional costs. The examples are designed to help you compare these ongoing costs with the ongoing costs of investing in other variable annuity accounts and mutual funds. Participants in the CREF Accounts do not incur a sales charge for purchases or other distributions.
The examples are based on an investment of $1,000 invested at the beginning of the six-month period and held for the entire period (July 1, 2018–December 31, 2018).
Actual expenses
The first section in each table uses the Account’s actual expenses and its actual rate of return. You may use the information in this section, together with the amount you invested, to estimate the expenses that you paid over the six-month period.
Simply divide your account value by $1,000 (for example, an $8,600 account value divided by $1,000 = 8.6), then multiply the result by the number in the first line under the heading “Expenses paid during period” to estimate the expenses you paid during the six-month period.
Hypothetical example for comparison purposes
The second section in the table shows hypothetical account values and expenses based on the Account’s actual expense ratio for each Class for the six-month period and an assumed 5%-per-year rate of return before expenses. This was not the Account’s actual return.
This hypothetical example cannot be used to estimate the actual expenses you paid for the period, but rather allows you to compare the ongoing costs of investing in the Account with the costs of other accounts. To do so, compare this 5% hypothetical example with the 5% hypothetical examples that appear in the shareholder reports of other variable annuity accounts and mutual funds.
| College Retirement Equities Fund ■ 2018 Annual Report | 9 |
CREF Stock Account
Performance for the twelve months ended December 31, 2018
The CREF Stock Account returned –9.86% for the year, compared with the –8.12% return of its composite benchmark, a weighted average of the Russell 3000® Index and the MSCI All Country World (ACWI) ex USA Investable Market Index (IMI). (All returns for the Account are for Class R1.)
The U.S. economy grew at a solid pace in 2018, while inflation remained moderate. The unemployment rate fell to 3.7%—its lowest level in nearly 50 years—before ending the period at 3.9% on December 31, 2018. Wage growth increased and consumer confidence was strong. The Federal Reserve raised the federal funds target rate four times during the year, increasing the key short-term interest-rate measure to 2.25%–2.50%. Oil prices declined, while concerns over rising rates and slower global economic growth caused volatility late in the period. The broad U.S. stock market, as measured by the Russell 3000 Index, declined 5.24%. Growth stocks outperformed value shares, and large-cap stocks surpassed mid- and small-cap equities. (Returns by investment style and capitalization size are based on the Russell indexes.)
The MSCI ACWI ex USA IMI, which measures the performance of mid- and large-cap stocks in 46 developed- and emerging-markets countries outside the United States, declined 14.76% in U.S.-dollar terms for the twelve months, underperforming U.S. stocks. Equity prices fell in both developed- and emerging-markets countries.
Account trailed its composite benchmark
The Account lagged its benchmark for the twelve-month period as certain holdings did not perform as anticipated. An out-of-benchmark investment in Australia-based titanium dioxide producer Tronox was the leading detractor, followed by overweight positions in U.S. shale producer Parsley Energy and information technology services firm DXC Technology. On the positive side, the Account benefited from an overweight in salesforce.com, a developer of customer relationship management software. An underweight position in industrial conglomerate General Electric and an overweight in electricity generator FirstEnergy were also beneficial.
The Account’s returns may sometimes diverge from the returns of its benchmark more than would be expected. This divergence may be the result of the Account’s fair value pricing adjustments or of the timing of foreign currency valuations. Many foreign exchanges close for trading before the Account’s accumulation unit value (AUV) is calculated (see the current CREF prospectus for more details on AUV calculations). In the intervening hours, the values of foreign securities can change, and these changes are not reflected immediately in the returns of the Account’s benchmark. These changes are, however, taken into account to value the Account’s portfolio holdings at the time the Account’s AUV is calculated; these are known as fair value pricing adjustments.
| 10 | 2018 Annual Report ■ College Retirement Equities Fund |
CREF Stock Account
Performance as of December 31, 2018
| CREF Stock Account | | | | Total | | Average annual | | | Estimated
annual | |
| | | | | return | | total return | | | operating | |
| | | Inception date | | 1 year | | 5 years | | 10 years | | expenses | * |
| Class R1 | | 7/31/1952 | | | –9.86 | % | | | 4.88 | % | | | 10.70 | % | | | 0.580 | % |
| Class R2 | | 4/24/2015 | | | –9.69 | | | | 5.08 | † | | | 10.80 | † | | | 0.370 | |
| Class R3 | | 4/24/2015 | | | –9.65 | | | | 5.14 | † | | | 10.83 | † | | | 0.305 | |
| CREF Stock Composite Benchmark‡ | | | | | –8.12 | | | | 5.81 | | | | 11.21 | | | | — | |
| Broad market index | | | | | | | | | | | | | | | | | | |
| Morningstar Aggressive Target Risk Index | | | | | –8.17 | | | | 5.01 | | | | 10.61 | | | | — | |
The returns in this report show past performance, which is no guarantee of future results. Returns and the principal value of your investment will fluctuate. Current performance may be higher or lower than that shown, and you may have a gain or a loss when you redeem your accumulation units. For current performance information, including performance to the most recent month-end, please visit TIAA.org.
You cannot invest directly in any index. Index returns do not include a deduction for fees or expenses.
| * | The estimated annual operating expenses are taken from the Account’s current prospectus. Expenses are estimated each year based on projected expense and asset levels. Differences between actual expenses and the estimate are adjusted quarterly and are reflected in current investment results. |
| † | The performance shown for Classes R2 and R3 that is prior to their inception date is based on performance of the Account’s Class R1. The performance for these periods has not been restated to reflect the lower expenses of Classes R2 and R3. If those expenses had been reflected, the performance would have been higher. |
| ‡ | As of the close of business on December 31, 2018, the CREF Stock Composite Benchmark consisted of: 70.0% Russell 3000 Index and 30.0% MSCI All Country World ex USA Investable Market Index. The Account’s benchmark, the components that make up the composite benchmark and the method of calculating the composite benchmark’s performance may vary over time. |
| College Retirement Equities Fund ■ 2018 Annual Report | 11 |
CREF Stock Account
$10,000 over 10 years (Class R1)
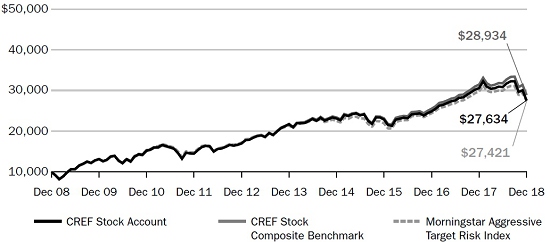
For the purpose of comparison, the graph also shows the change in the values of the Account’s composite benchmark and a broad market index during the same period. The performance of other Classes varies due to differences in expense charges.
Expense example
Six months ended December 31, 2018
| | | Beginning
account value | | | Ending
account value | | | Expenses paid
during period | * |
| CREF Stock Account | | (7/1/18 | ) | | (12/31/18 | ) | | (7/1/18–12/31/18 | ) |
| Actual return | | | | | | | | | | | | |
| Class R1 | | | $1,000.00 | | | | $ 894.06 | | | | $2.43 | |
| Class R2 | | | 1,000.00 | | | | 894.86 | | | | 1.58 | |
| Class R3 | | | 1,000.00 | | | | 895.07 | | | | 1.39 | |
| 5% annual hypothetical return | | | | | | | | | | | | |
| Class R1 | | | 1,000.00 | | | | 1,022.63 | | | | 2.60 | |
| Class R2 | | | 1,000.00 | | | | 1,023.54 | | | | 1.68 | |
| Class R3 | | | 1,000.00 | | | | 1,023.74 | | | | 1.48 | |
| * | Expenses paid during period” is based on the Account’s actual expense ratio for the most recent fiscal half-year, multiplied by the average account value over the six-month period, multiplied by 184/365. There were 184 days in the six months ended December 31, 2018. The Account’s annualized six-month expense ratios for that period were 0.51% for Class R1, 0.33% for Class R2 and 0.29% for Class R3. |
For more information about this expense example, please see page 9.
| Actual expenses | |
| | Net expense ratio for the one-year period ended 12/31/2018 |
| Class R1 | 0.53% |
| Class R2 | 0.34% |
| Class R3 | 0.30% |
| 12 | 2018 Annual Report ■ College Retirement Equities Fund |
CREF Stock Account
| Account profile | | |
| as of 12/31/2018 |
| Net assets | | $103.84 billion |
| Portfolio turnover rate | | 55% |
| Number of holdings | | 9,605 |
| Weighted median market capitalization | | $43.80 billion |
| Price/earnings ratio (weighted 12-month trailing average)* | | 17.74 |
| * | Price/earnings ratio is the price of a stock divided by its earnings per share for the past twelve-month period. |
| Portfolio composition | | |
| Sector | | % of net assets
as of 12/31/2018 |
| Information technology | | 16.9 |
| Financials | | 15.3 |
| Health care | | 13.0 |
| Industrials | | 10.6 |
| Consumer discretionary | | 10.6 |
| Communication services | | 8.5 |
| Consumer staples | | 7.2 |
| Energy | | 5.6 |
| Materials | | 4.8 |
| Real estate | | 3.8 |
| Utilities | | 2.9 |
| Short-term investments, other assets & liabilities, net | | 0.8 |
| Total | | 100.0 |
| Holdings by company size | | |
| Market capitalization | | % of equity investments
as of 12/31/2018 |
| More than $50 billion | | 45.4 |
| More than $15 billion-$50 billion | | 23.6 |
| More than $2 billion-$15 billion | | 24.1 |
| $2 billion or less | | 6.9 |
| Total | | 100.0 |
| Holdings by country | | |
| | | % of portfolio investments
as of 12/31/2018 |
| United States | | 66.6 |
| Japan | | 5.3 |
| United Kingdom | | 3.7 |
| China | | 2.4 |
| France | | 2.3 |
| Canada | | 2.0 |
| Germany | | 1.6 |
| Switzerland | | 1.6 |
| 65 other nations | | 12.5 |
| Short-term investments | | 2.0 |
| Total | | 100.0 |
| College Retirement Equities Fund ■ 2018 Annual Report | 13 |
CREF Global Equities Account
Performance for the twelve months ended December 31, 2018
The CREF Global Equities Account returned –12.56% for the year, compared with the –9.42% return of its benchmark, the MSCI All Country World Index (ACWI). (All returns for the Account are for Class R1.)
During the twelve-month period, declines in foreign equities exceeded those of U.S. equities amid slowing economic growth in many parts of the world and rising global trade tensions. Stock prices fell in both developed- and emerging-markets countries. GDP in the 19-nation euro area grew at its slowest pace in four years during the third quarter of 2018, with notable contractions in the economies of Germany and Italy. China’s economic growth slowed to 6.5% in the third quarter, its worst year-over-year performance since 2009, while Japan struggled with natural disasters and declining exports. Emerging-markets countries wrestled with the effects of rising interest rates and a stronger U.S. dollar.
The U.S. Federal Reserve raised the federal funds target rate four times during the period, increasing the key short-term interest-rate measure to 2.25%–2.50%. In September, the European Central Bank indicated it would leave benchmark interest rates at their low levels until at least the summer of 2019. The Bank of England raised its benchmark interest rate to 0.75% in August; toward the end of the year, however, the bank noted that uncertainty over the United Kingdom’s plan to exit the European Union was evident in financial markets.
In this challenging period, all 23 of the developed markets and most of the 24 emerging markets in the MSCI ACWI declined in U.S.-dollar terms.
Account trailed its benchmark
Many of the Account’s holdings had negative performance during the period. The largest detractors were overweight positions in Netherlands-based bank ING Groep, Las Vegas-based casino resort operator Wynn Resorts and U.S. information technology services provider DXC Technology.
On the positive side, the top contributors were overweight positions in networking giant Cisco Systems, software developer salesforce.com and digital transactions pioneer PayPal.
The Account’s returns may sometimes diverge from the returns of its benchmark more than would be expected. This divergence may be the result of the Account’s fair value pricing adjustments or of the timing of foreign currency valuations. Many foreign exchanges close for trading before the Account’s accumulation unit value (AUV) is calculated (see the current CREF prospectus for more details on AUV calculations). In the intervening hours, the values of foreign securities can change, and these changes are not reflected immediately in the returns of the Account’s benchmark. These changes are, however, taken into account to value the Account’s portfolio holdings at the time the Account’s AUV is calculated; these are known as fair value pricing adjustments.
| 14 | 2018 Annual Report ■ College Retirement Equities Fund |
CREF Global Equities Account
Performance as of December 31, 2018
| CREF Global Equities Account | | | | Total
return | | Average annual
total return | | Estimated
annual
operating | |
| | | Inception date | | 1 year | | 5 years | | 10 years | | expenses | * |
| Class R1 | | 5/1/1992 | | | –12.56 | % | | | 3.35 | % | | | 9.36 | % | | | 0.610 | % |
| Class R2 | | 4/24/2015 | | | –12.40 | | | | 3.54 | † | | | 9.46 | † | | | 0.400 | |
| Class R3 | | 4/24/2015 | | | –12.36 | | | | 3.60 | † | | | 9.49 | † | | | 0.335 | |
| MSCI ACWI Index‡ | | — | | | –9.42 | | | | 4.26 | | | | 9.46 | | | | — | |
| MSCI World Index | | — | | | –8.71 | | | | 4.56 | | | | 9.67 | | | | — | |
The returns in this report show past performance, which is no guarantee of future results. Returns and the principal value of your investment will fluctuate. Current performance may be higher or lower than that shown, and you may have a gain or a loss when you redeem your accumulation units. For current performance information, including performance to the most recent month-end, please visit TIAA.org.
You cannot invest directly in any index. Index returns do not include a deduction for fees or expenses.
| * | The estimated annual operating expenses are taken from the Account’s current prospectus. Expenses are estimated each year based on projected expense and asset levels. Differences between actual expenses and the estimate are adjusted quarterly and are reflected in current investment results. |
| † | The performance shown for Classes R2 and R3 that is prior to their inception date is based on performance of the Account’s Class R1. The performance for these periods has not been restated to reflect the lower expenses of the Classes R2 and R3. If those expenses had been reflected, the performance would have been higher. |
| ‡ | On May 1, 2018, the benchmark for the Global Equities Account changed from the MSCI World Index to the MSCI All Country World Index (ACWI). For more information, please see the Account’s current prospectus. |
$10,000 over 10 years (Class R1)
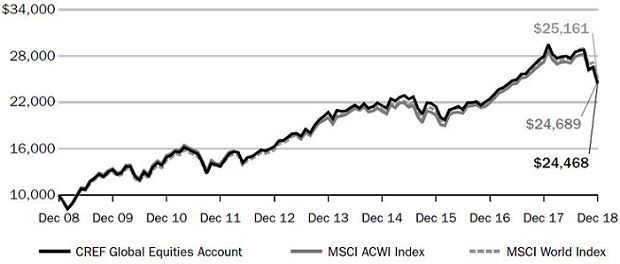
For the purpose of comparison, the graph also shows the change in the values of the Account’s new and old benchmarks during the same period. The performance of other Classes varies due to differences in expense charges.
| College Retirement Equities Fund ■ 2018 Annual Report | 15 |
CREF Global Equities Account
Expense example
Six months ended December 31, 2018
| CREF Global Equities Account | | Beginning
account value
(7/1/18 | ) | | Ending
account value
(12/31/18 | ) | | Expenses paid
during period
(7/1/18–12/31/18 |
*
) |
| Actual return | | | | | | | | | |
| Class R1 | | | $1,000.00 | | | | $ 881.61 | | | | $2.37 | |
| Class R2 | | | 1,000.00 | | | | 882.40 | | | | 1.52 | |
| Class R3 | | | 1,000.00 | | | | 882.61 | | | | 1.28 | |
| 5% annual hypothetical return | | | | | | | | | | | | |
| Class R1 | | | 1,000.00 | | | | 1,022.68 | | | | 2.55 | |
| Class R2 | | | 1,000.00 | | | | 1,023.59 | | | | 1.63 | |
| Class R3 | | | 1,000.00 | | | | 1,023.84 | | | | 1.38 | |
| * | “Expenses paid during period” is based on the Account’s actual expense ratio for the most recent fiscal half-year, multiplied by the average account value over the six-month period, multiplied by 184/365. There were 184 days in the six months ended December 31, 2018. The Account’s annualized six-month expense ratios for that period were 0.50% for Class R1, 0.32% for Class R2 and 0.27% for Class R3. |
For more information about this expense example, please see page 9.
Actual expenses
| Net expense ratio for the one-year period ended 12/31/2018 |
| Class R1 | | | 0.53 | % |
| Class R2 | | | 0.35 | % |
| Class R3 | | | 0.30 | % |
| 16 | 2018 Annual Report ■ College Retirement Equities Fund |
CREF Global Equities Account
Account profile
| | as of 12/31/2018 |
| Net assets | | | $18.21 billion |
| Portfolio turnover rate | | | 77% |
| Number of holdings | | | 2,925 |
| Weighted median market capitalization | | | $56.33 billion |
| Price/earnings ratio (weighted 12-month trailing average)* | | | 16.59 |
| * | Price/earnings ratio is the price of a stock divided by its earnings per share for the past twelve-month period. |
Portfolio composition
| Sector | % of net assets
as of 12/31/2018 |
| Information technology | | | 16.6 |
| Financials | | | 14.6 |
| Consumer discretionary | | | 13.2 |
| Health care | | | 13.1 |
| Industrials | | | 11.0 |
| Communication services | | | 7.8 |
| Consumer staples | | | 7.7 |
| Energy | | | 6.1 |
| Materials | | | 5.3 |
| Real estate | | | 1.7 |
| Utilities | | | 1.5 |
| Short-term investments, other assets & liabilities, net | | | 1.4 |
| Total | | | 100.0 |
Holdings by company size
| Market capitalization | % of equity investments
as of 12/31/2018 |
| More than $50 billion | | | 52.0 |
| More than $15 billion–$50 billion | | | 23.1 |
| More than $2 billion–$15 billion | | | 22.6 |
| $2 billion or less | | | 2.3 |
| Total | | | 100.0 |
Holdings by country
| | % of portfolio investments
as of 12/31/2018 |
| United States | | | 57.0 |
| Japan | | | 6.7 |
| United Kingdom | | | 5.5 |
| China | | | 3.5 |
| France | | | 3.2 |
| Switzerland | | | 2.5 |
| Canada | | | 2.3 |
| Netherlands | | | 2.1 |
| 49 other nations | | | 14.4 |
| Short-term investments | | | 2.8 |
| Total | | | 100.0 |
| College Retirement Equities Fund ■ 2018 Annual Report | 17 |
CREF Growth Account
Performance for the twelve months ended December 31, 2018
The CREF Growth Account returned –2.69% for the year, compared with the –1.51% return of its benchmark, the Russell 1000®Growth Index. (All returns for the Account are for Class R1.)
The U.S. economy grew at a solid pace in 2018, while inflation remained moderate. The unemployment rate fell to 3.7%—its lowest level in nearly 50 years—before ending the period at 3.9% on December 31, 2018. Wage growth increased and consumer confidence was strong. The Federal Reserve responded to the growing economy by raising the federal funds target rate four times during the period, increasing the key short-term interest-rate measure to 2.25%–2.50%. Oil prices declined for the year, falling sharply over the final three months of the period. Concerns over rising interest rates, trade tensions with China and a decelerating global economy weighed on markets in the latter months of the period.
The broad U.S. stock market, as measured by the Russell 3000® Index, declined 5.24% for the twelve-month period as performance was negative across investment styles and capitalization sizes. Growth stocks performed better than value shares, and large-cap stocks surpassed mid- and small-cap equities. (Returns by investment style and capitalization size are based on the Russell indexes.)
For the ten years ended December 31, 2018, the Russell 1000 Growth Index recorded an annual average return of 15.29%, compared with the 11.18% average annual return of the Russell 1000 Value Index.
Account trailed its benchmark
Seven of the eleven industry sectors in the Russell 1000 Growth Index posted losses for the year. Energy (down 29.9%) was the worst-performing sector, reflecting the decline in oil prices. Next came materials (down 14.6%), communication services (down 11.1%) and industrials (down 10.1%), the latter detracting most from the benchmark’s return. Together, these four sectors represented more than one-quarter of the benchmark’s total market capitalization on December 31, 2018. The sectors with positive performance were utilities (up 9.2%)—the benchmark’s smallest sector—consumer discretionary (up 5.2%), information technology (up 4.5%) and health care (up 4.1%).
The Account underperformed its benchmark mostly due to security selections that did not perform as anticipated. An underweight position in Starbucks had the greatest negative impact on relative performance. Holdings in semiconductor maker Broadcom and an out-of-index position in Chinese Internet provider Tencent Holdings also detracted from relative performance.
By contrast, the Account’s relative performance benefited from overweight positions in software firm salesforce.com and financial software developer Intuit. An overweight in media holding company IAC/Interactive also contributed.
| 18 | 2018 Annual Report ■ College Retirement Equities Fund |
CREF Growth Account
Performance as of December 31, 2018
| CREF Growth Account | | | | Total
return | | Average annual
total return | | Estimated
annual
operating | |
| | | Inception date | | 1 year | | 5 years | | 10 years | | expenses | * |
| Class R1 | | 4/29/1994 | | | –2.69 | % | | | 9.61 | % | | | 14.67 | % | | | 0.530 | % |
| Class R2 | | 4/24/2015 | | | –2.51 | | | | 9.81 | † | | | 14.78 | † | | | 0.320 | |
| Class R3 | | 4/24/2015 | | | –2.46 | | | | 9.87 | † | | | 14.81 | † | | | 0.255 | |
| Russell 1000® Growth Index | | — | | | –1.51 | | | | 10.40 | | | | 15.29 | | | | — | |
The returns in this report show past performance, which is no guarantee of future results. Returns and the principal value of your investment will fluctuate. Current performance may be higher or lower than that shown, and you may have a gain or a loss when you redeem your accumulation units. For current performance information, including performance to the most recent month-end, please visit TIAA.org.
You cannot invest directly in any index. Index returns do not include a deduction for fees or expenses.
| * | The estimated annual operating expenses are taken from the Account’s current prospectus. Expenses are estimated each year based on projected expense and asset levels. Differences between actual expenses and the estimate are adjusted quarterly and are reflected in current investment results. |
| † | The performance shown for Classes R2 and R3 that is prior to their inception date is based on performance of the Account’s Class R1. The performance for these periods has not been restated to reflect the lower expenses of the Classes R2 and R3. If those expenses had been reflected, the performance would have been higher. |
$10,000 over 10 years (Class R1)
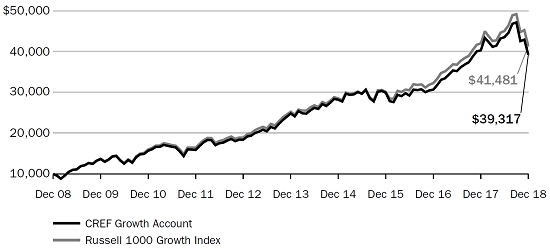
For the purpose of comparison, the graph also shows the change in the value of the Account’s benchmark during the same period. The performance of other Classes varies due to differences in expense charges.
| College Retirement Equities Fund ■ 2018 Annual Report | 19 |
CREF Growth Account
Expense example
Six months ended December 31, 2018
| CREF Growth Account | | Beginning
account value
(7/1/18 | ) | | Ending
account value
(12/31/18 | ) | | Expenses paid
during period
(7/1/18–12/31/18 | *
) |
| Actual return | | | | | | | | | | | | |
| Class R1 | | | $1,000.00 | | | | $ 901.00 | | | | $2.11 | |
| Class R2 | | | 1,000.00 | | | | 901.81 | | | | 1.25 | |
| Class R3 | | | 1,000.00 | | | | 902.03 | | | | 1.05 | |
| 5% annual hypothetical return | | | | | | | | | | | | |
| Class R1 | | | 1,000.00 | | | | 1,022.99 | | | | 2.24 | |
| Class R2 | | | 1,000.00 | | | | 1,023.89 | | | | 1.33 | |
| Class R3 | | | 1,000.00 | | | | 1,024.10 | | | | 1.12 | |
| * | “Expenses paid during period” is based on the Account’s actual expense ratio for the most recent fiscal half-year, multiplied by the average account value over the six-month period, multiplied by 184/365. There were 184 days in the six months ended December 31, 2018. The Account’s annualized six-month expense ratios for that period were 0.44% for Class R1, 0.26% for Class R2 and 0.22% for Class R3. |
For more information about this expense example, please see page 9.
Actual expenses
| | | Net expense ratio for the one-year period ended 12/31/2018 |
| Class R1 | | 0.46% |
| Class R2 | | 0.28% |
| Class R3 | | 0.24% |
| 20 | 2018 Annual Report ■ College Retirement Equities Fund |
CREF Growth Account
Account profile
| | | as of 12/31/2018 |
| Net assets | | $23.23 billion |
| Portfolio turnover rate | | 62% |
| Number of holdings | | 598 |
| Weighted median market capitalization | | $90.11 billion |
| Price/earnings ratio (weighted 12-month trailing average)* | | 26.45 |
| * | Price/earnings ratio is the price of a stock divided by its earnings per share for the past twelve-month period. |
Portfolio composition
| Sector | | % of net assets
as of 12/31/2018 |
| Information technology | | 34.4 |
| Consumer discretionary | | 16.3 |
| Health care | | 13.9 |
| Communication services | | 13.6 |
| Industrials | | 10.7 |
| Financials | | 3.9 |
| Consumer staples | | 3.9 |
| Materials | | 1.9 |
| Energy | | 0.6 |
| Real estate | | 0.5 |
| Short-term investments, other assets & liabilities, net | | 0.3 |
| Total | | 100.0 |
Holdings by company size
| Market capitalization | | % of equity investments
as of 12/31/2018 |
| More than $50 billion | | 62.5 |
| More than $15 billion–$50 billion | | 22.2 |
| More than $2 billion–$15 billion | | 15.1 |
| $2 billion or less | | 0.2 |
| Total | | 100.0 |
| College Retirement Equities Fund ■ 2018 Annual Report | 21 |
CREF Equity Index Account
Performance for the twelve months ended December 31, 2018
The CREF Equity Index Account returned –5.59% for the year, compared with the –5.24% return of its benchmark, the Russell 3000® Index. (All returns for the Account are for Class R1.)
For the twelve-month period, the Account’s return underperformed that of its benchmark index due to the effect of expenses. The Account’s return includes a deduction for expenses, while the benchmark’s does not. The Account had a risk profile similar to that of its benchmark.
The U.S. economy grew at a solid pace in 2018, while inflation remained moderate. The unemployment rate fell to 3.7%—its lowest level in nearly 50 years—before ending the period at 3.9% on December 31, 2018. Wage growth increased and consumer confidence was strong. The Federal Reserve responded to the growing economy by raising the federal funds target rate four times during the period, increasing the key short-term interest-rate measure to 2.25%–2.50%. Oil prices declined for the year, falling sharply over the final three months of the period. Concerns over rising interest rates, trade tensions with China and a decelerating global economy weighed on markets in the latter months of the period.
The performance of the broad U.S. stock market, as measured by the Russell 3000 Index, was negative across investment styles and capitalization sizes. Growth stocks performed better than value shares, and large-cap stocks surpassed mid- and small-cap equities. (Returns by investment style and capitalization size are based on the Russell indexes.)
Financials and industrials led the benchmark’s decline
Eight of the eleven industry sectors in the Russell 3000 Index posted losses for the year. The worst-performing sectors were energy (down 19.8%), materials (down 17.4%) and industrials (down 14.0%). Financials (down 12.7%)—the benchmark’s second-largest sector—detracted most from the index’s return amid concerns that rising short-term interest rates would reduce banks’ profits. Together, these four sectors represented more than one-third of the benchmark’s total market capitalization on December 31, 2018. The sectors with positive performance were health care (up 5.2%), utilities (up 4.5%) and information technology (up 3.1%), which was the index’s largest sector.
For the twelve-month period, four of the benchmark’s five largest stocks outperformed the benchmark’s overall return. Amazon.com performed best with strong double-digit gains, followed by Microsoft. Berkshire Hathaway posted a single-digit rise. Johnson & Johnson declined amid uncertainty about drug prices but outpaced the benchmark’s return. Apple slightly underperformed the index as concerns about U.S.-Chinese trade issues and slowing global growth weighed on the stock.
| 22 | 2018 Annual Report ■ College Retirement Equities Fund |
CREF Equity Index Account
Performance as of December 31, 2018
| CREF Equity Index Account | | | | Total | | Average annual | | Estimated
annual | |
| | | | | return | | total return | | operating | |
| | | Inception date | | 1 year | | 5 years | | 10 years | | expenses | * |
| Class R1 | | 4/29/1994 | | | –5.59 | % | | | 7.40 | % | | | 12.69 | % | | | 0.505 | % |
| Class R2 | | 4/24/2015 | | | –5.41 | | | | 7.60 | † | | | 12.80 | † | | | 0.295 | |
| Class R3 | | 4/24/2015 | | | –5.37 | | | | 7.66 | † | | | 12.83 | † | | | 0.230 | |
| Russell 3000® Index | | — | | | –5.24 | | | | 7.91 | | | | 13.18 | | | | — | |
The returns in this report show past performance, which is no guarantee of future results. Returns and the principal value of your investment will fluctuate. Current performance may be higher or lower than that shown, and you may have a gain or a loss when you redeem your accumulation units. For current performance information, including performance to the most recent month-end, please visit TIAA.org.
You cannot invest directly in any index. Index returns do not include a deduction for fees or expenses.
| * | The estimated annual operating expenses are taken from the Account’s current prospectus. Expenses are estimated each year based on projected expense and asset levels. Differences between actual expenses and the estimate are adjusted quarterly and are reflected in current investment results. |
| † | The performance shown for Classes R2 and R3 that is prior to their inception date is based on performance of the Account’s Class R1. The performance for these periods has not been restated to reflect the lower expenses of the Classes R2 and R3. If those expenses had been reflected, the performance would have been higher. |
$10,000 over 10 years (Class R1)
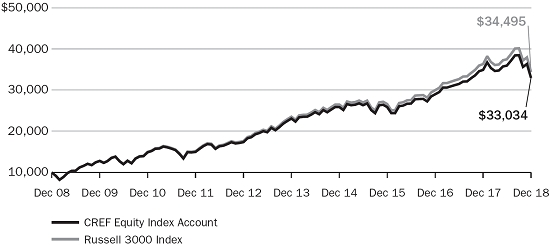
For the purpose of comparison, the graph also shows the change in the value of the Account’s benchmark during the same period. The performance of other Classes varies due to differences in expense charges.
| College Retirement Equities Fund ■ 2018 Annual Report | 23 |
CREF Equity Index Account
Expense example
Six months ended December 31, 2018
| | | Beginning | | | Ending | | | Expenses paid | |
| | | account value | | | account value | | | during period | * |
| CREF Equity Index Account | | (7/1/18 | ) | | (12/31/18 | ) | | (7/1/18–12/31/18 | ) |
| Actual return | | | | | | | | | | | | |
| Class R1 | | | $1,000.00 | | | | $ 916.69 | | | | $2.03 | |
| Class R2 | | | 1,000.00 | | | | 917.51 | | | | 1.16 | |
| Class R3 | | | 1,000.00 | | | | 917.73 | | | | 0.92 | |
| 5% annual hypothetical return | | | | | | | | | | | | |
| Class R1 | | | 1,000.00 | | | | 1,023.09 | | | | 2.14 | |
| Class R2 | | | 1,000.00 | | | | 1,024.00 | | | | 1.22 | |
| Class R3 | | | 1,000.00 | | | | 1,024.25 | | | | 0.97 | |
| * | “Expenses paid during period” is based on the Account’s actual expense ratio for the most recent fiscal half-year, multiplied by the average account value over the six-month period, multiplied by 184/365. There were 184 days in the six months ended December 31, 2018. The Account’s annualized six-month expense ratios for that period were 0.42% for Class R1, 0.24% for Class R2 and 0.19% for Class R3. |
For more information about this expense example, please see page 9.
Actual expenses
| | | Net expense ratio for the one-year period ended 12/31/2018 |
| Class R1 | | 0.44% |
| Class R2 | | 0.26% |
| Class R3 | | 0.21% |
| 24 | 2018 Annual Report ■ College Retirement Equities Fund |
CREF Equity Index Account
Account profile
| as of 12/31/2018 |
| Net assets | | $16.83 billion |
| Portfolio turnover rate | | 3% |
| Number of holdings | | 2,839 |
| Weighted median market capitalization | | $67.26 billion |
| Price/earnings ratio (weighted 12-month trailing average)* | | 19.89 |
| | |
| * | Price/earnings ratio is the price of a stock divided by its earnings per share for the past twelve-month period. |
| Portfolio composition | | |
| | | % of net assets |
| Sector | | as of 12/31/2018 |
| Information technology | | 19.8 |
| Health care | | 14.9 |
| Financials | | 13.8 |
| Consumer discretionary | | 10.2 |
| Industrials | | 9.9 |
| Communication services | | 9.1 |
| Consumer staples | | 6.6 |
| Energy | | 4.9 |
| Real estate | | 3.9 |
| Utilities | | 3.3 |
| Materials | | 3.0 |
| Short-term investments, other assets & liabilities, net | | 0.6 |
| Total | | 100.0 |
Holdings by company size
| | | % of equity investments |
| Market capitalization | | as of 12/31/2018 |
| More than $50 billion | | 54.4 |
| More than $15 billion-$50 billion | | 22.6 |
| More than $2 billion-$15 billion | | 19.0 |
| $2 billion or less | | 4.0 |
| Total | | 100.0 |
| College Retirement Equities Fund ■ 2018 Annual Report | 25 |
CREF Bond Market Account
Performance for the twelve months ended December 31, 2018
The CREF Bond Market Account returned –0.41% for the year, compared with the 0.01% return of its benchmark, the Bloomberg Barclays U.S. Aggregate Bond Index. (All returns for the Account are for Class R1.)
During the twelve-month period, the U.S. economy continued to grow at a solid pace. The unemployment rate fell to 3.7%, its lowest level in nearly 50 years, before ending the period at 3.9% on December 31, 2018. Wages grew at the fastest rate in nearly a decade, and, in October, consumer confidence reached its highest level since 2000 before declining in November. Annual core inflation, which includes all items except food and energy, was moderate at 2.2% in December. The price of oil declined for the year, falling sharply over the final three months of the period, while the U.S. dollar strengthened.
The Federal Reserve raised the federal funds target rate four times during the period, increasing the key short-term interest-rate measure to 2.25%–2.50%. Fed policymakers were criticized for rate increases amid declining stock markets and evidence of a slowing global economy late in the year. Chairman Jerome Powell said the Fed would be “patient” with monetary policy in 2019. Yields on U.S. Treasury securities of all maturities rose during the period, but the increases were greatest among shorter-term investments. In August, the Bank of England raised its benchmark rate to 0.75%, while in September, the European Central Bank indicated it would leave benchmark interest rates unchanged until at least the summer of 2019.
Account underperformed its benchmark during the period
For the twelve-month period, the Account’s benchmark returns were driven primarily by mortgaged-backed securities, which gained 1.0% and accounted for 27.7% of the index’s total market capitalization at period-end. U.S. Treasuries, the largest index sector with a weighting of 37.6%, and asset-backed securities (ABS), one of the smallest sectors at 0.5%, rose 0.9% and 1.8%, respectively. By contrast, corporate bonds, which represented 25.2% of the index, declined 2.5%, while the smallest sector in the benchmark, municipal bonds, fell 1.6%.
The Account underperformed its benchmark during the period, primarily as a result of an underweight position in U.S. Treasuries, which outperformed the index. Overweighted positions in government credit securities, commercial mortgage-backed securities and corporate bonds also detracted.
These negative effects were tempered by positive factors, including overweight positions in the stronger-performing ABS, municipals and government agency sectors. In general, the Account’s yield curve positioning across the portfolio also contributed to its relative returns, as did a small exposure to derivatives instruments.
| 26 | 2018 Annual Report ■ College Retirement Equities Fund |
CREF Bond Market Account
Performance as of December 31, 2018
| CREF Bond Market Account | | | | Total | | Average annual | | Estimated
annual | |
| | | | | return | | total return | | operating | |
| | | Inception date | | 1 year | | 5 years | | 10 years | | expenses | * |
| Class R1 | | 3/1/1990 | | | –0.41 | % | | | 2.42 | % | | | 3.57 | % | | | 0.580 | % |
| Class R2 | | 4/24/2015 | | | –0.23 | | | | 2.60 | † | | | 3.66 | † | | | 0.370 | |
| Class R3 | | 4/24/2015 | | | –0.19 | | | | 2.66 | † | | | 3.69 | † | | | 0.305 | |
| Bloomberg Barclays U.S. Aggregate Bond Index | | — | | | 0.01 | | | | 2.52 | | | | 3.48 | | | | — | |
The returns in this report show past performance, which is no guarantee of future results. Returns and the principal value of your investment will fluctuate. Current performance may be higher or lower than that shown, and you may have a gain or a loss when you redeem your accumulation units. For current performance information, including performance to the most recent month-end, please visit TIAA.org.
You cannot invest directly in any index. Index returns do not include a deduction for fees or expenses.
| * | The estimated annual operating expenses are taken from the Account’s current prospectus. Expenses are estimated each year based on projected expense and asset levels. Differences between actual expenses and the estimate are adjusted quarterly and are reflected in current investment results. |
| † | The performance shown for Classes R2 and R3 that is prior to their inception date is based on performance of the Account’s Class R1. The performance for these periods has not been restated to reflect the lower expenses of the Classes R2 and R3. If those expenses had been reflected, the performance would have been higher. |
$10,000 over 10 years (Class R1)
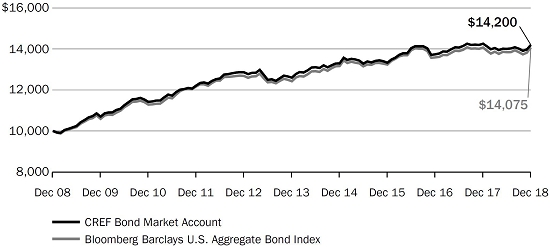
For the purpose of comparison, the graph also shows the change in the value of the Account’s benchmark during the same period. The performance of other Classes varies due to differences in expense charges.
| College Retirement Equities Fund ■ 2018 Annual Report | 27 |
CREF Bond Market Account
Expense example
Six months ended December 31, 2018
| | | Beginning | | | Ending | | | Expenses paid | |
| | | account value | | | account value | | | during period | * |
| CREF Bond Market Account | | (7/1/18 | ) | | (12/31/18 | ) | | (7/1/18–12/31/18 | ) |
| Actual return | | | | | | | | | | | | |
| Class R1 | | | $1,000.00 | | | | $1,013.81 | | | | $2.49 | |
| Class R2 | | | 1,000.00 | | | | 1,014.73 | | | | 1.57 | |
| Class R3 | | | 1,000.00 | | | | 1,014.96 | | | | 1.37 | |
| 5% annual hypothetical return | | | | | | | | | | | | |
| Class R1 | | | 1,000.00 | | | | 1,022.74 | | | | 2.50 | |
| Class R2 | | | 1,000.00 | | | | 1,023.64 | | | | 1.58 | |
| Class R3 | | | 1,000.00 | | | | 1,023.84 | | | | 1.38 | |
| | |
| * | “Expenses paid during period” is based on the Account’s actual expense ratio for the most recent fiscal half-year, multiplied by the average account value over the six-month period, multiplied by 184/365. There were 184 days in the six months ended December 31, 2018. The Account’s annualized six-month expense ratios for that period were 0.49% for Class R1, 0.31% for Class R2 and 0.27% for Class R3. |
For more information about this expense example, please see page 9.
Actual expenses
| | Net expense ratio for the one-year period ended 12/31/2018 |
| Class R1 | 0.52% |
| Class R2 | 0.33% |
| Class R3 | 0.29% |
| 28 | 2018 Annual Report ■ College Retirement Equities Fund |
CREF Bond Market Account
| Account profile | |
| | as of 12/31/2018 |
| Net assets | $13.22 billion |
| Portfolio turnover rate | 106% |
| Portfolio turnover rate, excluding mortgage dollar roll transactions | 91% |
| Number of issues | 1,800 |
| Option-adjusted duration* | 5.75 years |
| Average maturity† | 8.05 years |
| | |
| * | Option-adjusted duration estimates how much the value of a bond portfolio would be affected by a change in prevailing interest rates, taking into account the options embedded in the individual securities. The longer a portfolio’s duration, the more sensitive it is to changes in interest rates. |
| † | Average maturity is a simple average of the maturities of all the bonds in an account’s portfolio. The maturity of a bond is the amount of time until the bond’s principal becomes due or payable. |
| Portfolio composition | |
| | % of net assets |
| Sector | as of 12/31/2018 |
| Corporate bonds | 23.5 |
| Mortgage-backed securities | 21.1 |
| U.S. Treasury securities | 16.2 |
| Foreign government & corporate bonds denominated in U.S. dollars | 14.4 |
| Asset-backed securities | 9.5 |
| Commercial mortgage-backed securities | 6.6 |
| Municipal bonds | 4.0 |
| U.S. agency securities | 2.3 |
| Bank loan obligations | 0.4 |
| Preferred stock | 0.1 |
| Short-term investments, other assets & liabilities, net | 1.9 |
| Total | 100.0 |
Holdings by maturity
| % of fixed-income investments |
| (excluding short-term investments) |
| as of 12/31/2018 |
| Less than 1 year | 5.8 |
| 1-3 years | 17.8 |
| 3-5 years | 18.4 |
| 5-10 years | 41.7 |
| Over 10 years | 16.3 |
| Total | 100.0 |
Holdings by credit quality
| % of fixed-income investments |
| (excluding short-term investments) |
| as of 12/31/2018 |
| U.S. Treasury & U.S. agency securities* | 36.8 |
| Aaa/AAA | 15.9 |
| Aa/AA | 7.6 |
| A/A | 13.1 |
| Baa/BBB | 21.9 |
| Ba/BB | 1.9 |
| B/B | 1.2 |
| Below B/B | 0.4 |
| Non-rated | 1.2 |
| Total | 100.0 |
| | |
| * | These securities are guaranteed by the full faith and credit of the U.S. government. |
Credit quality ratings are based on the Bloomberg Barclays methodology, which uses the median rating of those compiled by the Moody’s, Standard & Poor’s and Fitch ratings agencies. If ratings are available from only two of these agencies, the lower rating is used. When only one rating is available, that one is used. These ratings are subject to change without notice.
| College Retirement Equities Fund ■ 2018 Annual Report | 29 |
CREF Inflation-Linked Bond Account
Performance for the twelve months ended December 31, 2018
The CREF Inflation-Linked Bond Account returned –0.72% for the period, compared with the –0.25% return of its benchmark, the Bloomberg Barclays U.S. Treasury Inflation Protected Securities (TIPS) 1–10 Year Index. (All returns for the Account are for Class R1.)
During the twelve-month period, the U.S. economy continued to grow at a solid pace. The unemployment rate fell to 3.7%, its lowest rate in nearly 50 years, before ending the period at 3.9% on December 31, 2018. Wages grew at the fastest rate in nearly a decade, and, in October, consumer confidence reached its highest level since 2000 before declining in November. Annual core inflation, which includes all items except food and energy, was moderate at 2.2% in December. The price of oil declined for the year, falling sharply over the final three months of the period, while the U.S. dollar strengthened.
The Federal Reserve raised the federal funds target rate four times during the period, increasing the key short-term interest-rate measure to 2.25%–2.50%. Fed policymakers were criticized by the White House for rate increases amid declining stock markets and evidence of a slowing global economy late in the year. Chairman Jerome Powell said the Fed would be “patient” with monetary policy in 2019. Yields on U.S. Treasury securities of all maturities rose during the period, but the increases were greatest among shorter-term investments. In August, the Bank of England raised its benchmark rate to 0.75%, while in September, the European Central Bank indicated it would leave benchmark interest rates unchanged until at least the summer of 2019.
TIPS underperformed the broader bond market
In 2018, the performance of the TIPS 1–10 Year Index fell short of the 0.01% return of the broad U.S. investment-grade fixed-rate bond market, as measured by the Bloomberg Barclays U.S. Aggregate Bond Index. Most fixed-income securities struggled to record gains amid rising interest rates and a strong U.S. economy. Inflation-protected securities were restrained by continued moderate inflation.
The Account underperformed its benchmark primarily due to its expense charge. The Account’s return includes a deduction for expenses, while the benchmark’s does not. Since the Account’s portfolio resembled the composition of its benchmark, the above discussion of the benchmark’s performance also applies to the Account’s performance. Security selection and yield curve positioning among the Account’s U.S. Treasury holdings also detracted slightly from relative performance.
During the period, the Account’s portfolio managers kept the Account’s duration—a measure of its sensitivity to interest-rate changes—close to that of the TIPS 1–10 Year Index. This strategy helped the Account’s risk and reward characteristics to more closely resemble those of its benchmark.
| 30 | 2018 Annual Report ■ College Retirement Equities Fund |
CREF Inflation-Linked Bond Account
Performance as of December 31, 2018
| CREF Inflation-Linked Bond Account | | |
| Total
return |
| Average annual
total return | | Estimated
annual
operating | |
| | | Inception date | | 1 year | | 5 years | | 10 years | | expenses | * |
| Class R1 | | 5/1/1997 | | | –0.72 | % | | | 1.18 | % | | | 3.03 | % | | | 0.515 | % |
| Class R2 | | 4/24/2015 | | | –0.53 | | | | 1.36 | † | | | 3.12 | † | | | 0.305 | |
| Class R3 | | 4/24/2015 | | | –0.49 | | | | 1.42 | † | | | 3.15 | † | | | 0.240 | |
| Bloomberg Barclays U.S. Treasury Inflation Protected Securities (TIPS) 1–10 Year Index | | — | | | –0.25 | | | | 1.20 | | | | 3.06 | | | | — | |
The returns in this report show past performance, which is no guarantee of future results. Returns and the principal value of your investment will fluctuate. Current performance may be higher or lower than that shown, and you may have a gain or a loss when you redeem your accumulation units. For current performance information, including performance to the most recent month-end, please visit TIAA.org.
You cannot invest directly in any index. Index returns do not include a deduction for fees or expenses.
| * | The estimated annual operating expenses are taken from the Account’s current prospectus. Expenses are estimated each year based on projected expense and asset levels. Differences between actual expenses and the estimate are adjusted quarterly and are reflected in current investment results. |
| † | The performance shown for Classes R2 and R3 that is prior to their inception date is based on performance of the Account’s Class R1. The performance for these periods has not been restated to reflect the lower expenses of the Classes R2 and R3. If those expenses had been reflected, the performance would have been higher. |
$10,000 over 10 years (Class R1)

For the purpose of comparison, the graph also shows the change in the value of the Account’s benchmark during the same period. The performance of other Classes varies due to differences in expense charges.
| College Retirement Equities Fund ■ 2018 Annual Report | 31 |
CREF Inflation-Linked Bond Account
Expense example
Six months ended December 31, 2018
CREF Inflation-Linked
Bond Account | | Beginning
account value
(7/1/18 | ) | | Ending
account value
(12/31/18 | ) | | Expenses paid
during period
(7/1/18–12/31/18 | *
) |
| Actual return | | | | | | | | | |
| Class R1 | | | $1,000.00 | | | | $ 993.31 | | | | $2.16 | |
| Class R2 | | | 1,000.00 | | | | 994.21 | | | | 1.26 | |
| Class R3 | | | 1,000.00 | | | | 994.44 | | | | 1.01 | |
| 5% annual hypothetical return | | | | | | | | | | | | |
| Class R1 | | | 1,000.00 | | | | 1,023.04 | | | | 2.19 | |
| Class R2 | | | 1,000.00 | | | | 1,023.95 | | | | 1.28 | |
| Class R3 | | | 1,000.00 | | | | 1,024.20 | | | | 1.02 | |
| | |
| * | “Expenses paid during period” is based on the Account’s actual expense ratio for the most recent fiscal half-year, multiplied by the average account value over the six-month period, multiplied by 184/365. There were 184 days in the six months ended December 31, 2018. The Account’s annualized six-month expense ratios for that period were 0.43% for Class R1, 0.25% for Class R2 and 0.20% for Class R3. |
For more information about this expense example, please see page 9.
| Actual expenses | | | | |
| | | | | Net expense ratio for the one-year period ended 12/31/2018 |
| Class R1 | | | | 0.45% |
| Class R2 | | | | 0.26% |
| Class R3 | | | | 0.22% |
| 32 | 2018 Annual Report ■ College Retirement Equities Fund |
CREF Inflation-Linked Bond Account
| Account profile | | |
| | | as of 12/31/2018 |
| Net assets | | | $6.34 billion |
| Portfolio turnover rate | | | 21% |
| Number of issues | | | 43 |
| Option-adjusted duration* | | | 4.85 years |
| Average maturity† | | | 5.16 years |
| | |
| * | Option-adjusted duration estimates how much the value of a bond portfolio would be affected by a change in prevailing interest rates, taking into account the options embedded in the individual securities. The longer a portfolio’s duration, the more sensitive it is to changes in interest rates. |
| † | Average maturity is a simple average of the maturities of all the bonds in an account’s portfolio. The maturity of a bond is the amount of time until the bond’s principal becomes due or payable. |
| | |
| Portfolio composition | | |
| | | % of net assets |
| Sector | | as of 12/31/2018 |
| U.S. Treasury securities | | | 98.0 |
| U.S. agency securities | | | 0.7 |
| Mortgage-backed securities | | | 0.7 |
| Foreign government & corporate bonds denominated in U.S. dollars | | | 0.1 |
| Short-term investments, other assets & liabilities, net | | | 0.5 |
| Total | | | 100.0 |
Holdings by maturity
| % of fixed-income investments |
| (excluding short-term investments) |
| as of 12/31/2018 |
| 1–3 years | | | 26.1 |
| 3–5 years | | | 27.5 |
| 5–10 years | | | 39.6 |
| Over 10 years | | | 6.8 |
| Total | | | 100.0 |
Holdings by credit quality
| % of fixed-income investments |
| (excluding short-term investments) |
| as of 12/31/2018 |
| U.S. Treasury & U.S. agency securities* | | | 99.7 |
| Non-rated | | | 0.3 |
| Total | | | 100.0 |
| | |
| * | These securities are guaranteed by the full faith and credit of the U.S. government. |
Credit quality ratings are based on the Bloomberg Barclays methodology, which uses the median rating of those compiled by the Moody’s, Standard & Poor’s and Fitch ratings agencies. If ratings are available from only two of these agencies, the lower rating is used. When only one rating is available, that one is used. These ratings are subject to change without notice.
| College Retirement Equities Fund ■ 2018 Annual Report | 33 |
CREF Social Choice Account
Performance for the twelve months ended December 31, 2018
The CREF Social Choice Account returned –4.51% for the year, compared with the –4.56% return of its composite benchmark, a weighted average of the Russell 3000® Index, the MSCI EAFE+Canada Index and the Bloomberg Barclays U.S. Aggregate Bond Index. The Account utilizes environmental, social and governance (ESG) criteria, while the benchmark does not. (All returns for the Account are for Class R1.)
Because of its ESG criteria, the Account did not invest in a number of stocks and bonds that were included in the indexes that comprise its composite benchmark. Avoiding these investments produced mixed results, but the net effect was that the Account slightly outperformed its benchmark.
The Account’s domestic equity component slightly underperformed the Russell 3000 Index. Among stocks the Account avoided, Amazon.com, Pfizer and Visa were the largest detractors, while exclusions of Facebook, General Electric and Philip Morris International made the biggest contributions. The Account’s international component outperformed the MSCI EAFE+Canada Index. Among stocks the Account excluded, British American Tobacco, German drug maker Bayer and Belgium-based Anheuser-Busch contributed the most to relative performance, while avoiding energy giant Royal Dutch Shell, Australian mining company BHP Group and pan-Asian life insurance firm AIA Group detracted most.
Account’s international and fixed-income components aided relative performance
To compensate for the Account’s exclusion of some stocks, its managers use quantitative (mathematical) modeling and other techniques in an attempt to match the overall investment characteristics of the portfolio with those of its composite benchmark.
Among the Account’s domestic holdings, underweight investments in Apple, Johnson & Johnson and Verizon detracted most from performance relative to the Russell 3000 Index. Conversely, the top-contributing domestic holdings were overweight positions in Netflix and drug makers Eli Lilly and Merck.
In the international component of the Account, the main contributors to performance relative to the MSCI EAFE+Canada Index were an underweight position in Nestlé, an overweight investment in British telecommunications firm Sky and an underweight position in French drug maker Sanofi. Somewhat offsetting these contributors, an underweight position in Swiss pharmaceutical company Novartis and overweight positions in Canadian energy producer Encana and Japanese mining company Sumitomo were the main detractors.
The Account’s fixed-income component outperformed the Bloomberg Barclays U.S. Aggregate Bond Index. Account holdings in the corporate, municipals and government agency sectors contributed most to performance relative to this index, while holdings in the U.S. Treasury and mortgage-backed securities sectors detracted.
| 34 | 2018 Annual Report ■ College Retirement Equities Fund |
CREF Social Choice Account
Performance as of December 31, 2018
| CREF Social Choice Account | | | | Total
return | | Average annual
total return | | | Estimated
annual
operating | |
| | Inception date | | 1 year | | 5 years | | 10 years | | | expenses | * |
| Class R1 | | 3/1/1990 | | | –4.51 | % | | | 4.21 | % | | | 8.30 | % | | | 0.540 | % |
| Class R2 | | 4/24/2015 | | | –4.33 | | | | 4.40 | † | | | 8.40 | † | | | 0.330 | |
| Class R3 | | 4/24/2015 | | | –4.29 | | | | 4.46 | † | | | 8.43 | † | | | 0.265 | |
| CREF Social Choice Composite Benchmark‡ | | — | | | –4.56 | | | | 4.69 | | | | 8.49 | | | | — | |
| Broad market indexes | | | | | | | | | | | | | | | | | | |
| Morningstar Moderate Target Risk Index§ | | — | | | –4.76 | | | | 4.08 | | | | 7.97 | | | | — | |
| Russell 3000® Index | | — | | | –5.24 | | | | 7.91 | | | | 13.18 | | | | — | |
The returns in this report show past performance, which is no guarantee of future results. Returns and the principal value of your investment will fluctuate. Current performance may be higher or lower than that shown, and you may have a gain or a loss when you redeem your accumulation units. For current performance information, including performance to the most recent month-end, please visit TIAA.org.
You cannot invest directly in any index. Index returns do not include a deduction for fees or expenses.
| * | The estimated annual operating expenses are taken from the Account’s current prospectus. Expenses are estimated each year based on projected expense and asset levels. Differences between actual expenses and the estimate are adjusted quarterly and are reflected in current investment results. |
| † | The performance shown for Classes R2 and R3 that is prior to their inception date is based on performance of the Account’s Class R1. The performance for these periods has not been restated to reflect the lower expenses of the Classes R2 and R3. If those expenses had been reflected, the performance would have been higher. |
| ‡ | As of the close of business on December 31, 2018, the CREF Social Choice Composite Benchmark consisted of: 42.0% Russell 3000 Index; 40.0% Bloomberg Barclays U.S. Aggregate Bond Index; and 18.0% MSCI EAFE+Canada Index. The Account’s benchmark, the components that make up the composite benchmark and the method of calculating the composite benchmark’s performance may vary over time. |
| § | On May 1, 2018, the Morningstar Moderate Target Risk Index was added as an additional broad-based securities market index for the Social Choice Account. For more information, please see the Account’s current prospectus. |
| College Retirement Equities Fund ■ 2018 Annual Report | 35 |
CREF Social Choice Account
$10,000 over 10 years (Class R1)
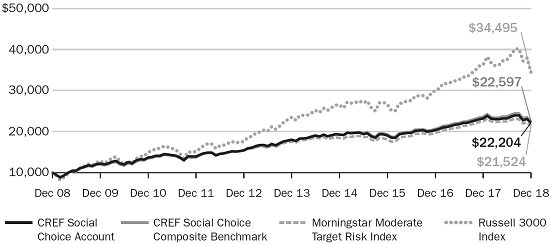
For the purpose of comparison, the graph also shows the change in the values of the Account’s composite benchmark and broad market indexes during the same period. The performance of other Classes varies due to differences in expense charges.
Expense example
Six months ended December 31, 2018
| CREF Social Choice Account | | Beginning
account value
(7/1/18 | ) | | Ending
account value
(12/31/18 | ) | | Expenses paid
during period
(7/1/18–12/31/18 | *
) |
| Actual return | | | | | | | | | | | | |
| Class R1 | | | $1,000.00 | | | | $ ��955.23 | | | | $2.22 | |
| Class R2 | | | 1,000.00 | | | | 956.09 | | | | 1.33 | |
| Class R3 | | | 1,000.00 | | | | 956.32 | | | | 1.08 | |
| 5% annual hypothetical return | | | | | | | | | | | | |
| Class R1 | | | 1,000.00 | | | | 1,022.94 | | | | 2.29 | |
| Class R2 | | | 1,000.00 | | | | 1,023.84 | | | | 1.38 | |
| Class R3 | | | 1,000.00 | | | | 1,024.10 | | | | 1.12 | |
| * | “Expenses paid during period” is based on the Account’s actual expense ratio for the most recent fiscal half-year, multiplied by the average account value over the six-month period, multiplied by 184/365. There were 184 days in the six months ended December 31, 2018. The Account’s annualized six-month expense ratios for that period were 0.45% for Class R1, 0.27% for Class R2 and 0.22% for Class R3. |
For more information about this expense example, please see page 9.
Actual expenses
| | | Net expense ratio for the one-year period ended 12/31/2018 |
| Class R1 | | 0.47% |
| Class R2 | | 0.28% |
| Class R3 | | 0.24% |
| 36 | 2018 Annual Report ■ College Retirement Equities Fund |
CREF Social Choice Account
Account profile
| as of 12/31/2018 |
| Net assets | | $12.86 billion |
| Portfolio turnover rate | | 52% |
| Portfolio turnover rate, excluding mortgage dollar roll transactions | | 47% |
| Equity segment | | |
| Number of holdings | | 1,113 |
| Weighted median market capitalization | | $42.33 billion |
| Price/earnings ratio (weighted 12-month trailing average)* | | 18.07 |
| Fixed-income segment | | |
| Number of issues | | 775 |
| Option-adjusted duration† | | 5.82 years |
| Average maturity‡ | | 9.34 years |
| * | Price/earnings ratio is the price of a stock divided by its earnings per share for the past twelve-month period. |
| † | Option-adjusted duration estimates how much the value of a bond portfolio would be affected by a change in prevailing interest rates, taking into account the options embedded in the individual securities. The longer a portfolio’s duration, the more sensitive it is to changes in interest rates. |
| ‡ | Average maturity is a simple average of the maturities of all the bonds in an account’s portfolio. The maturity of a bond is the amount of time until the bond’s principal becomes due or payable. |
Portfolio composition
| Sector | | % of net assets
as of 12/31/2018 |
| Equities | | 57.1 |
| Fixed-income securities | | 41.9 |
| Short-term investments, other assets & liabilities, net | | 1.0 |
| Total | | 100.0 |
Holdings by company size
| Market capitalization | | % of equity investments
as of 12/31/2018 |
| More than $50 billion | | 42.6 |
| More than $15 billion-$50 billion | | 36.5 |
| More than $2 billion-$15 billion | | 18.8 |
| $2 billion or less | | 2.1 |
| Total | | 100.0 |
Holdings by maturity
% of fixed-income investments
(excluding short-term investments)
as of 12/31/2018 |
| Less than 1 year | | 2.9 |
| 1–3 years | | 15.1 |
| 3–5 years | | 18.3 |
| 5–10 years | | 39.1 |
| Over 10 years | | 24.6 |
| Total | | 100.0 |
| College Retirement Equities Fund ■ 2018 Annual Report | 37 |
CREF Money Market Account
Performance for the twelve months ended December 31, 2018
The CREF Money Market Account returned 1.05% for the year, compared with the 1.42% return of the iMoneyNet Money Fund Averages™—All Government, a simple average of over 500 money market funds that invest in short-term U.S. government securities. The iMoneyNet average is not an index, and its return reflects the deduction of expenses charged by the funds included in the average. (All returns for the Account are for Class R1.)
During the twelve-month period, the U.S. economy continued to grow at a solid pace. Unemployment fell to 3.7%, its lowest rate in nearly 50 years, before ending the period at 3.9%. Wage growth increased and consumer confidence was strong. Annual core inflation, which includes all items except food and energy, was moderate at 2.2% in December. The Federal Reserve raised the federal funds target rate four times during the period, increasing the key short-term interest-rate measure to 2.25%–2.50%. Chairman Jerome Powell indicated that the Fed would be “patient” with monetary policy in 2019. Yields on U.S. Treasury securities of all maturities rose during the period, but the increases were greatest among shorter-term investments (bond yields move in the opposite direction of prices).
Money market funds benefited from a high issuance of short-term Treasury Bills late in the period, which lowered prices and increased yields, as well as from the introduction of a new two-month maturity Treasury Bill, which provided investors with increased supply and greater flexibility of maturities.
As a result of the Fed’s actions and signals, yields on LIBOR—a key interest-rate benchmark for money market funds—continued to rise. For the twelve-month period, one-month LIBOR yields rose from 1.56% on January 2, 2018, to 2.50% on December 31, 2018. Over the same period, three-month LIBOR rose from 1.70% to 2.81%; six-month LIBOR rose from 1.84% to 2.88%; and twelve-month LIBOR rose from 2.11% to 3.01%. (LIBOR is an indication of the interest rates that banks expect to pay to other banks for loans on the London market and is the most widely used benchmark for short-term rates.)
Account gained but trailed the iMoneyNet average
In this environment of rising interest rates, the Account’s return increased, but it lagged that of the iMoneyNet government fund average, primarily due to the effect of expenses. The Account increased its exposure to longer-dated floating-rate government agency securities, which benefited performance as short-term rates increased. As of December 25, 2018, the Account’s weighted average maturity (WAM) was 43 days, versus 32 days for the iMoneyNet government fund average, and this longer WAM also benefited the Account’s relative performance. (iMoneyNet releases their data on a weekly basis, and December 25, 2018, was the last date of release for the month.)
| 38 | 2018 Annual Report ■ College Retirement Equities Fund | |
CREF Money Market Account
Net annualized yield for the 7 days ended December 25, 2018§
| | | Current yield | | | Effective yield | |
| CREF Money Market Account# | | | | | | |
| Class R1 | | | 1.48 | % | | | 1.50 | % |
| Class R2 | | | 2.14 | | | | 2.16 | |
| Class R3 | | | 2.19 | | | | 2.21 | |
| iMoneyNet Money Fund Averages™—All Government‡ | | | 1.91 | | | | 1.93 | |
The current yield more closely reflects current earnings than does the total return.
| § | Typically, iMoneyNet reports its 7-day yields as of Tuesday of each week. |
Performance as of December 31, 2018
| CREF Money Market Account# | | | | Total
return | | Average annual
total return | | Estimated
annual
operating | |
| | | Inception date | | 1 year | | 5 years | | 10 years | | expenses | * |
| Class R1 | | 4/1/1988 | | | 1.05 | % | | | 0.26 | % | | | 0.14 | % | | | 0.510 | % |
| Class R2 | | 4/24/2015 | | | 1.32 | | | | 0.36 | † | | | 0.19 | † | | | 0.300 | |
| Class R3 | | 4/24/2015 | | | 1.46 | | | | 0.42 | † | | | 0.22 | † | | | 0.235 | |
| iMoneyNet Money Fund Averages—All Government‡ | | — | | | 1.42 | | | | 0.40 | | | | 0.21 | | | | — | |
The returns in this report show past performance, which is no guarantee of future results. Returns and the principal value of your investment will fluctuate. Current performance may be higher or lower than that shown, and you may have a gain or a loss when you redeem your accumulation units. For current performance information, including performance to the most recent month-end, please visit TIAA.org.
You could lose money by investing in the Money Market Account. Because the accumulation unit value of the Account will fluctuate, the value of your investment may increase or decrease. An investment in the Account is not insured or guaranteed by the Federal Deposit Insurance Corporation or any other government agency. The Account’s sponsor has no legal obligation to provide support to the Account, and you should not expect that the sponsor will provide financial support to the Account at any time. The current yield more closely reflects current earnings than does the total return.
Note: Unlike most money market funds, the CREF Money Market Account does not distribute income on a daily basis. Therefore, the Account does not maintain a constant value of $1.00 per accumulation unit.
| # | Between July 16, 2009, and March 7, 2017, TIAA agreed to voluntarily withhold (“waive”) a portion of the 12b-1 distribution and/or administrative expenses for each class of the CREF Money Market Account when a class’ yield was less than zero. Without this waiver, the effective yields and total returns of the Money Market Account would have been lower. TIAA may, for a period of three years after the date an amount was waived, recover from the Money Market Account a portion of the amounts waived at such time as the class’ daily yield would be positive absent the effect of the waiver, and in such event the amount of recovery on any day will be approximately 25% of the class’ yield (net of all other expenses) on that day. As a result of the share class conversion on April 24, 2015, previously recoverable amounts have been allocated to the various classes. |
| * | The estimated annual operating expenses are taken from the Account’s current prospectus. Expenses are estimated each year based on projected expense and asset levels. Differences between actual expenses and the estimate are adjusted quarterly and are reflected in current investment results. |
| † | The performance shown for Classes R2 and R3 that is prior to their inception date is based on performance of the Account’s Class R1. The performance for these periods has not been restated to reflect the lower expenses of the Classes R2 and R3. If those expenses had been reflected, the performance would have been higher. |
| ‡ | The iMoneyNet Money Fund Averages—All Government is a simple average of over 500 money market funds that invest in U.S. Treasuries, U.S. agencies, repurchase agreements and government-backed floating rate notes. You cannot invest directly in it. |
| | College Retirement Equities Fund ■ 2018 Annual Report | 39 |
CREF Money Market Account
Expense example
Six months ended December 31, 2018
| CREF Money Market Account | | Beginning
account value
(7/1/18 | ) | | Ending
account value
(12/31/18 | ) | | Expenses paid
during period
(7/1/18–12/31/18 | *
) |
| Actual return | | | | | | | | | | | | |
| Class R1 | | | $1,000.00 | | | | $1,006.31 | | | | $4.30 | |
| Class R2 | | | 1,000.00 | | | | 1,008.30 | | | | 2.33 | |
| Class R3 | | | 1,000.00 | | | | 1,009.52 | | | | 1.11 | |
| 5% annual hypothetical return | | | | | | | | | | | | |
| Class R1 | | | 1,000.00 | | | | 1,020.92 | | | | 4.33 | |
| Class R2 | | | 1,000.00 | | | | 1,022.89 | | | | 2.35 | |
| Class R3 | | | 1,000.00 | | | | 1,024.10 | | | | 1.12 | |
| * | “Expenses paid during period” is based on the Account’s actual expense ratio for the most recent fiscal half-year, multiplied by the average account value over the six-month period, multiplied by 184/365. There were 184 days in the six months ended December 31, 2018. The Account’s annualized six-month expense ratios for that period were 0.85% for Class R1, 0.46% for Class R2 and 0.22% for Class R3. |
For more information about this expense example, please see page 9.
| Actual expenses | | | |
| | | | Net expense ratio for the one-year period ended 12/31/2018 |
| Class R1 | | | 0.80% |
| Class R2 | | | 0.53% |
| Class R3 | | | 0.40% |
| Account profile | | |
| | as of 12/31/2018 |
| Net assets | | | $9.90 billion |
| Number of issues | | | 216 |
| Portfolio composition | | |
| Sector | % of net assets
as of 12/31/2018 |
| U.S. government agency securities | | | 59.6 |
| U.S. Treasury securities | | | 20.5 |
| Floating-rate securities, government | | | 20.1 |
| Other assets & liabilities, net | | | –0.2 |
| Total | | | 100.0 |
| 40 | 2018 Annual Report ■ College Retirement Equities Fund | |
Summary portfolio of investments
CREF Stock Account ■ December 31, 2018
| Principal | | | | | Issuer | | | | Value
(000) | | | % of net
assets | |
| GOVERNMENT BONDS | | | | | | | | | | | |
| U.S. TREASURY SECURITIES | | | | $ | 293 | | | | 0.0 | % | |
| | | | | | | TOTAL GOVERNMENT BONDS | | (Cost $301) | | | 293 | | | | 0.0 | | |
| | | | | | | | | | | | | | | | | | |
| EQUITY-LINKED NOTES | | | | | | | | | | | |
| DIVERSIFIED FINANCIALS | | | | | 1,639 | | | | 0.0 | | |
| | | | | | | TOTAL EQUITY-LINKED NOTES | | (Cost $1,634) | | | 1,639 | | | | 0.0 | | |
| | | | | | | | | | | | | | | | | | |
| | Shares | | | | | Company | | | | | | | | | | | | | |
| COMMON STOCKS | | | | | | | | | | | |
| AUTOMOBILES & COMPONENTS | | | | | | | | | | | |
| | 4,818,489 | | | | | Toyota Motor Corp | | | | | 278,926 | | | | 0.3 | | |
| | | | | | | Other | | | | | 1,310,513 | | | | 1.2 | | |
| | | | | | | | | | | | 1,589,439 | | | | 1.5 | | |
| BANKS | | | | | | | | | | | |
| | 25,469,879 | | | | | Bank of America Corp | | | | | 627,578 | | | | 0.6 | | |
| | 6,882,913 | | | | | Citigroup, Inc | | | | | 358,324 | | | | 0.3 | | |
| | 11,307,135 | | | | | JPMorgan Chase & Co | | | | | 1,103,802 | | | | 1.1 | | |
| | 13,886,861 | | | | | Wells Fargo & Co | | | | | 639,907 | | | | 0.6 | | |
| | | | | | | Other | | | | | 5,268,860 | | | | 5.1 | | |
| | | | | | | | | | | | 7,998,471 | | | | 7.7 | | |
| CAPITAL GOODS | | | | | | | | | | | |
| | 1,499,482 | | | | | Boeing Co | | | | | 483,583 | | | | 0.4 | | |
| | 3,854,109 | | | | | Honeywell International, Inc | | | | | 509,205 | | | | 0.5 | | |
| | | | | | | Other | | | | | 6,622,289 | | | | 6.4 | | |
| | | | | | | | | | | | 7,615,077 | | | | 7.3 | | |
| COMMERCIAL & PROFESSIONAL SERVICES | | | | | 1,252,441 | | | | 1.2 | | |
| CONSUMER DURABLES & APPAREL | | | | | 1,997,045 | | | | 1.9 | | |
| CONSUMER SERVICES | | | | | | | | | | | |
| | 2,064,553 | | | | | McDonald’s Corp | | | | | 366,603 | | | | 0.4 | | |
| | | | | | | Other | | | | | 1,819,803 | | | | 1.7 | | |
| | | | | | | | | | | | 2,186,406 | | | | 2.1 | | |
| DIVERSIFIED FINANCIALS | | | | | | | | | | | |
| | 3,049,463 | | | | | American Express Co | | | | | 290,675 | | | | 0.3 | | |
| | | | | | | Other | | | | | 3,383,349 | | | | 3.2 | | |
| | | | | | | | | | | | 3,674,024 | | | | 3.5 | | |
| ENERGY | | | | | | | | | | | |
| | 6,366,850 | | | | | Chevron Corp | | | | | 692,650 | | | | 0.7 | | |
| | 3,816,184 | | | | | EOG Resources, Inc | | | | | 332,809 | | | | 0.3 | | |
| | 7,282,557 | | | | | Exxon Mobil Corp | | | | | 496,598 | | | | 0.5 | | |
| | | | | | | Other | | | | | 4,309,249 | | | | 4.1 | | |
| | | | | | | | | | | | 5,831,306 | | | | 5.6 | | |
| See notes to financial statements | College Retirement Equities Fund ■ 2018 Annual Report | 41 |
| Summary portfolio of investments | continued |
| | |
| CREF Stock Account ■ December 31, 2018 | |
| Shares | | | | | Company | | | Value
(000) | | | % of net
assets | |
| FOOD & STAPLES RETAILING |
| | 1,621,534 | | | | | Costco Wholesale Corp | | | $ | 330,323 | | | | 0.3 | % | |
| | 4,027,525 | | | n | | Walmart, Inc | | | | 375,164 | | | | 0.4 | | |
| | | | | | | Other | | | | 793,912 | | | | 0.8 | | |
| | | | | | | | | | | 1,499,399 | | | | 1.5 | | |
| FOOD, BEVERAGE & TOBACCO |
| | 11,345,293 | | | | | Coca-Cola Co | | | | 537,200 | | | | 0.5 | | |
| | 4,326,984 | | | | | Philip Morris International, Inc | | | | 288,869 | | | | 0.3 | | |
| | | | | | | Other | | | | 3,423,083 | | | | 3.3 | | |
| | | | | | | | | | | 4,249,152 | | | | 4.1 | | |
| HEALTH CARE EQUIPMENT & SERVICES |
| | 6,671,660 | | | | | Abbott Laboratories | | | | 482,561 | | | | 0.5 | | |
| | 5,719,769 | | | | | CVS Health Corp | | | | 374,759 | | | | 0.4 | | |
| | 3,637,077 | | | | | Medtronic plc | | | | 330,829 | | | | 0.3 | | |
| | 2,974,278 | | | e | | UnitedHealth Group, Inc | | | | 740,952 | | | | 0.7 | | |
| | | | | | | Other | | | | 3,540,682 | | | | 3.4 | | |
| | | | | | | | | | | 5,469,783 | | | | 5.3 | | |
| HOUSEHOLD & PERSONAL PRODUCTS |
| | 7,892,706 | | | | | Procter & Gamble Co | | | | 725,498 | | | | 0.7 | | |
| | | | | | | Other | | | | 1,011,138 | | | | 1.0 | | |
| | | | | | | | | | | 1,736,636 | | | | 1.7 | | |
| INSURANCE |
| | 4,407,029 | | | * | | Berkshire Hathaway, Inc (Class B) | | | | 899,827 | | | | 0.9 | | |
| | | | | | | Other | | | | 3,346,847 | | | | 3.2 | | |
| | | | | | | | | | | 4,246,674 | | | | 4.1 | | |
| MATERIALS |
| | 6,344,877 | | | | | DowDuPont, Inc | | | | 339,324 | | | | 0.3 | | |
| | | | | | | Other | | | | 4,661,397 | | | | 4.5 | | |
| | | | | | | | | | | 5,000,721 | | | | 4.8 | | |
| MEDIA & ENTERTAINMENT |
| | 737,667 | | | * | | Alphabet, Inc (Class A) | | | | 770,833 | | | | 0.7 | | |
| | 967,722 | | | * | | Alphabet, Inc (Class C) | | | | 1,002,183 | | | | 1.0 | | |
| | 19,732,963 | | | | | Comcast Corp (Class A) | | | | 671,907 | | | | 0.7 | | |
| | 6,688,506 | | | *,n | | Facebook, Inc | | | | 876,796 | | | | 0.8 | | |
| | 9,433,459 | | | | | Tencent Holdings Ltd | | | | 378,096 | | | | 0.4 | | |
| | 4,008,707 | | | | | Walt Disney Co | | | | 439,555 | | | | 0.4 | | |
| | | | | | | Other | | | | 2,405,581 | | | | 2.3 | | |
| | | | | | | | | | | 6,544,951 | | | | 6.3 | | |
| PHARMACEUTICALS, BIOTECHNOLOGY & LIFE SCIENCES |
| | 5,127,139 | | | | | Gilead Sciences, Inc | | | | 320,703 | | | | 0.3 | | |
| | 6,697,307 | | | | | Johnson & Johnson | | | | 864,287 | | | | 0.8 | | |
| | 3,476,101 | | | | | Novartis AG. | | | | 297,708 | | | | 0.3 | | |
| | 16,267,540 | | | | | Pfizer, Inc | | | | 710,078 | | | | 0.7 | | |
| | 9,023,291 | | | | | Schering-Plough Corp | | | | 689,470 | | | | 0.7 | | |
| | | | | | | Other | | | | 5,149,728 | | | | 5.0 | | |
| | | | | | | | | | | 8,031,974 | | | | 7.8 | | |
| 42 | 2018 Annual Report ■ College Retirement Equities Fund | See notes to financial statements |
| Summary portfolio of investments | continued |
| | |
| CREF Stock Account ■ December 31, 2018 | |
| Shares | | | | | Company | | | | | | | Value
(000) | | | % of net
assets | |
| REAL ESTATE | | | | | | | $ | 3,937,025 | | | 3.8 | % | |
| RETAILING | | | | | | | | | | | | | |
| | 2,381,791 | | | * | | Alibaba Group Holding Ltd (ADR) | | | | 326,472 | | | 0.3 | | |
| | 1,132,969 | | | *,n | | Amazon.com, Inc | | | | | | | | 1,701,685 | | | 1.7 | | |
| | 3,551,133 | | | | | Home Depot, Inc | | | | | | | | 610,156 | | | 0.6 | | |
| | | | | | | Other | | | | | | | | 2,600,081 | | | 2.5 | | |
| | | | | | | | | | | | | | | 5,238,394 | | | 5.1 | | |
| SEMICONDUCTORS & SEMICONDUCTOR EQUIPMENT |
| | 1,250,690 | | | | | Broadcom, Inc | | | | | | | | 318,025 | | | 0.3 | | |
| | 11,409,643 | | | n | | Intel Corp | | | | | | | | 535,455 | | | 0.5 | | |
| | | | | | | Other | | | | | | | | 2,587,439 | | | 2.5 | | |
| | | | | | | | | | | | | | | 3,440,919 | | | 3.3 | | |
| SOFTWARE & SERVICES |
| | 2,999,654 | | | | | MasterCard, Inc (Class A) | | | | 565,885 | | | 0.5 | | |
| | 20,091,123 | | | | | Microsoft Corp | | | | | | | | 2,040,656 | | | 2.0 | | |
| | 5,481,768 | | | * | | PayPal Holdings, Inc | | | | | | | | 460,962 | | | 0.4 | | |
| | 4,795,425 | | | * | | salesforce.com, Inc | | | | | | | | 656,829 | | | 0.6 | | |
| | 1,891,374 | | | * | | ServiceNow, Inc | | | | | | | | 336,759 | | | 0.3 | | |
| | 5,893,416 | | | | | Visa, Inc (Class A) | | | | | | | | 777,577 | | | 0.8 | | |
| | | | | | | Other | | | | | | | | 4,344,812 | | | 4.2 | | |
| | | | | | | | | | | | | | | 9,183,480 | | | 8.8 | | |
| TECHNOLOGY HARDWARE & EQUIPMENT |
| | 12,205,477 | | | d,n | | Apple, Inc | | | | | | | | 1,925,292 | | | 1.9 | | |
| | 17,340,684 | | | | | Cisco Systems, Inc | | | | | | | | 751,372 | | | 0.7 | | |
| | | | | | | Other | | | | | | | | 2,121,608 | | | 2.0 | | |
| | | | | | | | | | | | | | | 4,798,272 | | | 4.6 | | |
| TELECOMMUNICATION SERVICES |
| | 15,031,723 | | | | | AT&T, Inc | | | | | | | | 429,005 | | | 0.4 | | |
| | 10,237,858 | | | | | Verizon Communications, Inc | | | | 575,572 | | | 0.5 | | |
| | | | | | | Other | | | | | | | | 1,305,416 | | | 1.3 | | |
| | | | | | | | | | | | | | | 2,309,993 | | | 2.2 | | |
| TRANSPORTATION |
| | 2,936,975 | | | | | Union Pacific Corp | | | | | | | | 405,978 | | | 0.4 | | |
| | | | | | | Other | | | | | | | | 1,754,776 | | | 1.7 | | |
| | | | | | | | | | | | | | | 2,160,754 | | | 2.1 | | |
| UTILITIES | | | | | | | | 3,048,709 | | | 2.9 | | |
| | | | | | | TOTAL COMMON STOCKS | | (Cost $105,711,672) | | | | 103,041,045 | | | 99.2 | | |
| | | | | | | | | | | | | | | | | | | | |
| PURCHASED OPTIONS | | | | | | | | | | | | | |
| AUTOMOBILES & COMPONENTS | | | | | | | | 11 | | | 0.0 | | |
| FOOD & STAPLES RETAILING | | | | | | | | 696 | | | 0.0 | | |
| HEALTH CARE EQUIPMENT & SERVICES | | | | 7 | | | 0.0 | | |
| SEMICONDUCTORS & SEMICONDUCTOR EQUIPMENT | | | | 1,737 | | | 0.0 | | |
| | | | | | | TOTAL PURCHASED OPTIONS | | (Cost $5,125) | | | | 2,451 | | | 0.0 | | |
| See notes to financial statements | College Retirement Equities Fund ■ 2018 Annual Report | 43 |
| Summary portfolio of investments | continued |
| | |
| CREF Stock Account ■ December 31, 2018 | |
| Shares | | | | | Company | | | | Value
(000) | | | % of net
assets | |
| PREFERRED STOCKS |
| DIVERSIFIED FINANCIALS | | | | $ | 2,211 | | | | 0.0 | % | |
| REAL ESTATE | | | | | 16 | | | | 0.0 | | |
| | | | | | | TOTAL PREFERRED STOCKS | | (Cost $3,815) | | | 2,227 | | | | 0.0 | | |
| RIGHTS / WARRANTS | | | | | | | | | | | |
| CAPITAL GOODS | | | | | 2 | | | | 0.0 | | |
| ENERGY | | | | | 582 | | | | 0.0 | | |
| PHARMACEUTICALS, BIOTECHNOLOGY & LIFE SCIENCES | | | | | 149 | | | | 0.0 | | |
| REAL ESTATE | | | | | 38 | | | | 0.0 | | |
| TRANSPORTATION | | | | | 2 | | | | 0.0 | | |
| | | | | | | TOTAL RIGHTS / WARRANTS | | (Cost $689) | | | 773 | | | | 0.0 | | |
| | | | | | | | | | | | | | | | | | |
| Principal | | | | | Issuer | | | | | | | | | | | | | |
| | | | | | | | | | | | | | | | | | | | |
| SHORT-TERM INVESTMENTS |
| GOVERNMENT AGENCY DEBT | | | | 19,388 | | | | 0.0 | | |
| TREASURY DEBT | | | | 606,187 | | | | 0.6 | | |
| | | | | | | | | | |
| INVESTMENT OF CASH COLLATERAL FOR SECURITIES LOANED | | | | | | | | | |
| CERTIFICATE OF DEPOSIT | | | 147,000 | | | | 0.1 | | |
| COMMERCIAL PAPER | | | 708,681 | | | | 0.7 | | |
| REPURCHASE AGREEMENT | | | 737,000 | | | | 0.7 | | |
| VARIABLE RATE SECURITIES | | | 31,860 | | | | 0.0 | | |
| TOTAL INVESTMENT OF CASH COLLATERAL FOR SECURITIES LOANED | | | | | 1,624,541 | | | | 1.5 | | |
| | | | | | | TOTAL SHORT-TERM INVESTMENTS | | (Cost $2,250,081) | | | 2,250,116 | | | | 2.1 | | |
| | | | | | | | | | | | | | | | | | |
| | | | | | | TOTAL PORTFOLIO | | (Cost $107,973,317) | | | 105,298,544 | | | | 101.3 | | |
| | | | | | | OTHER ASSETS & LIABILITIES, NET | | | | | (1,462,795 | ) | | | (1.3 | ) | |
| | | | | | | NET ASSETS | | | | $ | 103,835,749 | | | | 100.0 | % | |
| 44 | 2018 Annual Report ■ College Retirement Equities Fund | See notes to financial statements |
| Summary portfolio of investments | continued |
| | |
| CREF Stock Account ■ December 31, 2018 | |
Abbreviation(s):
ADR American Depositary Receipt
| * | Non-income producing |
| d | All or a portion of these securities have been segregated to cover requirements on open futures contracts. |
| e | All or a portion of these securities are out on loan. The aggregate value of securities on loan is $1,647,489,505. |
| n | All or a portion of these securities have been segregated by the custodian to cover requirements on open written options contracts. |
“Other” securities represent the aggregate value, by category, of securities that are not among the 50 largest holdings and, in total for any issuer, represent 1% or less of net assets.
At 12/31/18, the aggregate value of securities exempt from registration under Rule 144(A) of the Securities Act of 1933 amounted to $635,131,577 or 0.6% of net assets. Such securities are deemed liquid and may be resold in transactions exempt from registration to qualified institutional buyers.
Cost amounts are in thousands.
For ease of presentation, a number of classification categories have been grouped together in the Summary portfolio of investments. Note that the Account uses more specific categories in following its investment limitations on investment concentrations.
Futures contracts outstanding as of December 31, 2018 were as follows (notional amounts and values are in thousands) (See Note 3):
| Description | | Number of
long (short
contracts | )
| | Expiration
date | | Notional
amount | | | Value | | | Unrealized
appreciation
(depreciation | ) |
| Russell 2000 E Mini Index | | | 316 | | | 03/15/19 | | $ | 23,062 | | | $ | 21,314 | | | $ | (1,748 | ) |
| S&P 500 E Mini Index | | | 2,018 | | | 03/15/19 | | | 268,040 | | | | 252,775 | | | | (15,265 | ) |
| S&P Mid-Cap 400 E Mini Index | | | 187 | | | 03/15/19 | | | 33,290 | | | | 31,083 | | | | (2,207 | ) |
| Total | | | 2,521 | | | | | $ | 324,392 | | | $ | 305,172 | | | $ | (19,220 | ) |
Purchased options outstanding as of December 31, 2018 were as follows (notional amounts and values are in thousands) (See Note 3):
| Description/underlying investment | | Number of
contracts | | | Notional
amount | | | Exercise
price | | | Expiration
date | | Value | |
| Cigna Corp, Call | | | 30 | | | $ | 28 | | | $ | 230.00 | | | 04/18/19 | | $ | 7 | |
| Intel Corp, Call | | | 17,200 | | | | 4,597 | | | | 50.00 | | | 02/15/19 | | | 1,737 | |
| Tesla, Inc, Call | | | 122 | | | | 155 | | | | 400.00 | | | 01/18/19 | | | 11 | |
| Walmart, Inc, Call | | | 1,600 | | | | 344 | | | | 92.50 | | | 03/15/19 | | | 696 | |
| Total | | | 18,952 | | | $ | 5,124 | | | | | | | | | $ | 2,451 | |
| See notes to financial statements | College Retirement Equities Fund ■ 2018 Annual Report | 45 |
| Summary portfolio of investments | concluded |
| | |
| CREF Stock Account ■ December 31, 2018 | |
Written options outstanding as of December 31, 2018 were as follows (notional amounts and values are in thousands) (See Note 3):
| Description/underlying investment | | Number of
contracts | | | Notional
amount | | | Exercise
price | | | Expiration
date | | Value | |
| Amazon.com, Inc, Call | | | 10 | | | $ | (18 | ) | | $ | 1,880.00 | | | 01/18/19 | | $ | (1 | ) |
| Amazon.com, Inc, Put | | | 10 | | | | (44 | ) | | | 1,300.00 | | | 02/15/19 | | | (30 | ) |
| Apple, Inc, Put | | | 25 | | | | (16 | ) | | | 150.00 | | | 03/15/19 | | | (17 | ) |
| Cigna Corp, Call | | | 30 | | | | (17 | ) | | | 240.00 | | | 04/18/19 | | | (4 | ) |
| Cigna Corp, Call | | | 30 | | | | (11 | ) | | | 250.00 | | | 04/18/19 | | | (3 | ) |
| Facebook, Inc, Put | | | 30 | | | | (2 | ) | | | 110.00 | | | 01/18/19 | | | (1 | ) |
| General Electric Co, Put | | | 50 | | | | (1 | ) | | | 6.50 | | | 01/11/19 | | | (0 | )^ |
| General Electric Co, Put | | | 100 | | | | (10 | ) | | | 7.00 | | | 03/15/19 | | | (6 | ) |
| Intel Corp, Call | | | 17,200 | | | | (1,320 | ) | | | 55.00 | | | 02/15/19 | | | (344 | ) |
| Intel Corp, Put | | | 17,200 | | | | (554 | ) | | | 45.00 | | | 01/18/19 | | | (1,273 | ) |
| Kraft Heinz Co, Put | | | 30 | | | | (9 | ) | | | 47.50 | | | 04/18/19 | | | (18 | ) |
| PVH Corp, Put | | | 20 | | | | (7 | ) | | | 85.00 | | | 03/15/19 | | | (7 | ) |
| PVH Corp, Put | | | 10 | | | | (8 | ) | | | 90.00 | | | 06/21/19 | | | (8 | ) |
| S&P 500 Index, Put | | | 30 | | | | (18 | ) | | | 2,300.00 | | | 01/11/19 | | | (14 | ) |
| Tesla, Inc, Call | | | 122 | | | | (92 | ) | | | 420.00 | | | 01/18/19 | | | (4 | ) |
| Tesla, Inc, Call | | | 122 | | | | (70 | ) | | | 430.00 | | | 01/18/19 | | | (2 | ) |
| Tiffany & Co, Put | | | 30 | | | | (2 | ) | | | 70.00 | | | 01/18/19 | | | (2 | ) |
| Twitter, Inc, Put | | | 30 | | | | (1 | ) | | | 22.00 | | | 01/18/19 | | | (0 | )^ |
| Twitter, Inc, Put | | | 320 | | | | (24 | ) | | | 26.00 | | | 01/18/19 | | | (19 | ) |
| Walmart, Inc, Call | | | 1,600 | | | | (152 | ) | | | 97.50 | | | 03/15/19 | | | (360 | ) |
| Walmart, Inc, Put | | | 1,600 | | | | (320 | ) | | | 80.00 | | | 03/15/19 | | | (122 | ) |
| Total | | | 38,599 | | | $ | (2,696 | ) | | | | | | | | $ | (2,235 | ) |
| ^ | Amount represents less than $1,000. |
Forward foreign currency contracts outstanding as of December 31, 2018 were as follows (dollar amounts are in thousands) (See Note 3):
Currency
to be
purchased | | Receive | | | Currency
to be
sold | | Deliver | | | Counterparty | | Settlement date | | Unrealized
appreciation
(depreciation | ) |
| $ | | | 1,002 | | | SEK | | | 8,850 | | | Bank of America | | 01/10/19 | | | $ | 3 | |
| Total | | | | | | | | | | | | | | | | | $ | 3 | |
| $ | | | 4,612 | | | CAD | | | 5,900 | | | Morgan Stanley | | 01/10/19 | | | $ | 289 | |
| $ | | | 7,010 | | | GBP | | | 5,350 | | | Morgan Stanley | | 01/10/19 | | | | 187 | |
| $ | | | 1,004 | | | JPY | | | 113,000 | | | Morgan Stanley | | 01/10/19 | | | | (28 | ) |
| EUR | | | 2,600 | | | $ | | | 3,036 | | | Morgan Stanley | | 01/10/19 | | | | (54 | ) |
| Total | | | | | | | | | | | | | | | | | $ | 394 | |
| Total | | | | | | | | | | | | | | | | | $ | 397 | |
| Abbreviation(s): |
| |
| CAD | Canadian Dollar |
| EUR | Euro |
| GBP | Pound Sterling |
| JPY | Japanese Yen |
| SEK | Swedish Krona |
| 46 | 2018 Annual Report ■ College Retirement Equities Fund | See notes to financial statements |
Summary of market values by country
CREF Stock Account ■ December 31, 2018
| Country | | Value
(000) | | | % of
total
portfolio | |
| DOMESTIC | | | | | | |
| UNITED STATES | | $ | 72,060,590 | | | | 68.4 | % |
| TOTAL DOMESTIC | | | 72,060,590 | | | | 68.4 | |
| | | | | | | | | |
| FOREIGN | | | | | | | | |
| ARGENTINA | | | 12,864 | | | | 0.0 | |
| AUSTRALIA | | | 1,405,913 | | | | 1.4 | |
| AUSTRIA | | | 161,172 | | | | 0.2 | |
| BELGIUM | | | 150,145 | | | | 0.2 | |
| BERMUDA | | | 47,865 | | | | 0.0 | |
| BRAZIL | | | 680,471 | | | | 0.6 | |
| CANADA | | | 2,053,014 | | | | 2.0 | |
| CAYMAN ISLANDS | | | 646 | | | | 0.0 | |
| CHILE | | | 104,987 | | | | 0.1 | |
| CHINA | | | 2,480,751 | | | | 2.4 | |
| COLOMBIA | | | 29,379 | | | | 0.0 | |
| COTE D’IVOIRE | | | 794 | | | | 0.0 | |
| CYPRUS | | | 65 | | | | 0.0 | |
| CZECH REPUBLIC | | | 27,331 | | | | 0.0 | |
| DENMARK | | | 303,338 | | | | 0.3 | |
| EGYPT | | | 14,320 | | | | 0.0 | |
| FAROE ISLANDS | | | 5,872 | | | | 0.0 | |
| FINLAND | | | 340,894 | | | | 0.3 | |
| FRANCE | | | 2,381,084 | | | | 2.3 | |
| GEORGIA | | | 1,605 | | | | 0.0 | |
| GERMANY | | | 1,690,250 | | | | 1.6 | |
| GHANA | | | 4,252 | | | | 0.0 | |
| GREECE | | | 22,377 | | | | 0.0 | |
| HONG KONG | | | 812,024 | | | | 0.8 | |
| HUNGARY | | | 31,583 | | | | 0.0 | |
| INDIA | | | 853,423 | | | | 0.8 | |
| INDONESIA | | | 207,474 | | | | 0.2 | |
| IRELAND | | | 290,414 | | | | 0.3 | |
| ISRAEL | | | 196,258 | | | | 0.2 | |
| ITALY | | | 612,832 | | | | 0.6 | |
| JAPAN | | | 5,527,443 | | | | 5.3 | |
| JERSEY, C.I. | | | 2,338 | | | | 0.0 | |
| JORDAN | | | 18,654 | | | | 0.0 | |
| KAZAKHSTAN | | | 15,298 | | | | 0.0 | |
| KOREA, REPUBLIC OF | | | 1,162,737 | | | | 1.1 | |
| LIECHTENSTEIN | | | 1,011 | | | | 0.0 | |
| Country | | Value
(000) | | | % of
total
portfolio | |
| LUXEMBOURG | | $ | 50,467 | | | | 0.0 | % |
| MACAU | | | 35,362 | | | | 0.0 | |
| MALAYSIA | | | 204,052 | | | | 0.2 | |
| MALTA | | | 6,560 | | | | 0.0 | |
| MEXICO | | | 211,603 | | | | 0.2 | |
| MONACO | | | 3,558 | | | | 0.0 | |
| MONGOLIA | | | 3,153 | | | | 0.0 | |
| MYANMAR | | | 205 | | | | 0.0 | |
| NETHERLANDS | | | 1,264,273 | | | | 1.2 | |
| NEW ZEALAND | | | 69,371 | | | | 0.1 | |
| NORWAY | | | 209,539 | | | | 0.2 | |
| PAKISTAN | | | 10,206 | | | | 0.0 | |
| PANAMA | | | 9,810 | | | | 0.0 | |
| PERU | | | 35,872 | | | | 0.0 | |
| PHILIPPINES | | | 122,250 | | | | 0.1 | |
| POLAND | | | 88,288 | | | | 0.1 | |
| PORTUGAL | | | 48,317 | | | | 0.0 | |
| PUERTO RICO | | | 42,748 | | | | 0.0 | |
| QATAR | | | 75,355 | | | | 0.1 | |
| ROMANIA | | | 2,720 | | | | 0.0 | |
| RUSSIA | | | 266,119 | | | | 0.3 | |
| SINGAPORE | | | 248,047 | | | | 0.2 | |
| SLOVENIA | | | 6,393 | | | | 0.0 | |
| SOUTH AFRICA | | | 520,928 | | | | 0.5 | |
| SPAIN | | | 556,391 | | | | 0.5 | |
| SWEDEN | | | 508,019 | | | | 0.5 | |
| SWITZERLAND | | | 1,665,226 | | | | 1.6 | |
| TAIWAN | | | 1,040,025 | | | | 1.0 | |
| TANZANIA, UNITED REPUBLIC OF | | | 245 | | | | 0.0 | |
| THAILAND | | | 204,739 | | | | 0.2 | |
| TURKEY | | | 65,847 | | | | 0.1 | |
| UKRAINE | | | 4,756 | | | | 0.0 | |
| UNITED ARAB EMIRATES | | | 69,250 | | | | 0.1 | |
| UNITED KINGDOM | | | 3,861,690 | | | | 3.7 | |
| URUGUAY | | | 49,160 | | | | 0.0 | |
| ZAMBIA | | | 26,532 | | | | 0.0 | |
| TOTAL FOREIGN | | | 33,237,954 | | | | 31.6 | |
| | | | | | | | | |
| TOTAL PORTFOLIO | | $ | 105,298,544 | | | | 100.0 | % |
| See notes to financial statements | College Retirement Equities Fund ■ 2018 Annual Report | 47 |
Summary portfolio of investments
CREF Global Equities Account ■ December 31, 2018
| Shares | | | | | Company | | | Value
(000) | | | % of net
assets | |
| COMMON STOCKS | | | | | | | | | | |
| ARGENTINA | | | $ | 22,113 | | | | 0.1 | % | |
| AUSTRALIA | | | | 249,189 | | | | 1.4 | | |
| AUSTRIA | | | | 7,791 | | | | 0.0 | | |
| BELGIUM | | | | 9,499 | | | | 0.1 | | |
| BERMUDA | | | | 1,671 | | | | 0.0 | | |
| BRAZIL | | | | 257,880 | | | | 1.4 | | |
| CANADA | | | | 426,029 | | | | 2.3 | | |
| CHILE | | | | 10,686 | | | | 0.1 | | |
| CHINA | | | | | | | | | | |
| | 931,489 | | | * | | Alibaba Group Holding Ltd (ADR) | | | | 127,679 | | | | 0.7 | | |
| | 4,183,800 | | | | | Tencent Holdings Ltd | | | | 167,688 | | | | 0.9 | | |
| | | | | | | Other | | | | 348,030 | | | | 1.9 | | |
| | | | | | | | | | | 643,397 | | | | 3.5 | | |
| COLOMBIA | | | | 1,506 | | | | 0.0 | | |
| CZECH REPUBLIC | | | | 4,871 | | | | 0.0 | | |
| DENMARK | | | | 145,642 | | | | 0.8 | | |
| EGYPT | | | | 414 | | | | 0.0 | | |
| FINLAND | | | | 99,649 | | | | 0.6 | | |
| FRANCE | | | | | | | | | | |
| | 1,069,638 | | | | | Sanofi-Aventis | | | | 92,791 | | | | 0.5 | | |
| | | | | | | Other | | | | 500,811 | | | | 2.8 | | |
| | | | | | | | | | | 593,602 | | | | 3.3 | | |
| GERMANY | | | | 243,554 | | | | 1.3 | | |
| GREECE | | | | 794 | | | | 0.0 | | |
| HONG KONG | | | | | | | | | | |
| | 5,489,044 | | | | | Melco Crown Entertainment Ltd (ADR) | | | | 96,717 | | | | 0.5 | | |
| | | | | | | Other | | | | 79,663 | | | | 0.5 | | |
| | | | | | | | | | | 176,380 | | | | 1.0 | | |
| HUNGARY | | | | 12,826 | | | | 0.1 | | |
| INDIA | | | | 191,843 | | | | 1.1 | | |
| INDONESIA | | | | 22,928 | | | | 0.1 | | |
| IRELAND | | | | 73,395 | | | | 0.4 | | |
| ISRAEL | | | | 18,455 | | | | 0.1 | | |
| ITALY | | | | 136,810 | | | | 0.8 | | |
| 48 | 2018 Annual Report ■ College Retirement Equities Fund | See notes to financial statements |
| Summary portfolio of investments | continued |
| | |
| CREF Global Equities Account ■ December 31, 2018 | |
| | |
| Shares | | | | | Company | | | Value
(000) | | | % of net
assets | |
| JAPAN | | | | | | | | | | |
| | 2,917,904 | | | | | Sony Corp | | | $ | 140,671 | | | | 0.8 | % | |
| | 1,823,953 | | | | | Toyota Motor Corp | | | | 105,582 | | | | 0.6 | | |
| | | | | | | Other | | | | 992,833 | | | | 5.4 | | |
| | | | | | | | | | | 1,239,086 | | | | 6.8 | | |
| JERSEY, C.I. | | | | 749 | | | | 0.0 | | |
| KAZAKHSTAN | | | | 7,328 | | | | 0.0 | | |
| KOREA, REPUBLIC OF | | | | 162,072 | | | | 0.9 | | |
| LUXEMBOURG | | | | 2,069 | | | | 0.0 | | |
| MACAU | | | | 11,889 | | | | 0.1 | | |
| MALAYSIA | | | | 14,565 | | | | 0.1 | | |
| MEXICO | | | | 22,902 | | | | 0.1 | | |
| MONGOLIA | | | | 82 | | | | 0.0 | | |
| NETHERLANDS | | | | | | | | | | |
| | 8,782,156 | | | | | ING Groep NV | | | | 94,466 | | | | 0.5 | | |
| | 2,613,967 | | | | | Royal Dutch Shell plc (A Shares) | | | | 76,937 | | | | 0.4 | | |
| | | | | | | Other | | | | 210,214 | | | | 1.2 | | |
| | | | | | | | | | | 381,617 | | | | 2.1 | | |
| NEW ZEALAND | | | | 14,561 | | | | 0.1 | | |
| NORWAY | | | | 95,756 | | | | 0.5 | | |
| PAKISTAN | | | | 139 | | | | 0.0 | | |
| PERU | | | | 3,083 | | | | 0.0 | | |
| PHILIPPINES | | | | 22,601 | | | | 0.1 | | |
| POLAND | | | | 7,966 | | | | 0.0 | | |
| PORTUGAL | | | | 10,424 | | | | 0.1 | | |
| QATAR | | | | 4,037 | | | | 0.0 | | |
| ROMANIA | | | | 207 | | | | 0.0 | | |
| RUSSIA | | | | 37,861 | | | | 0.2 | | |
| SINGAPORE | | | | 23,150 | | | | 0.1 | | |
| SOUTH AFRICA | | | | 71,312 | | | | 0.4 | | |
| SPAIN | | | | 82,012 | | | | 0.5 | | |
| SWEDEN | | | | 91,058 | | | | 0.5 | | |
| SWITZERLAND | | | | | | | | | | |
| | 440,530 | | | | | Lonza Group AG. | | | | 114,518 | | | | 0.6 | | |
| | 1,345,026 | | | | | Novartis AG. | | | | 115,193 | | | | 0.7 | | |
| | | | | | | Other | | | | 224,270 | | | | 1.2 | | |
| | | | | | | | | | | 453,981 | | | | 2.5 | | |
| See notes to financial statements | College Retirement Equities Fund ■ 2018 Annual Report | 49 |
| Summary portfolio of investments | continued |
| | |
| CREF Global Equities Account ■ December 31, 2018 | |
| | |
| Shares | | | | | Company | | | Value
(000) | | | % of net
assets | |
| TAIWAN | | | | | | | | | | |
| | 12,074,200 | | | | | Taiwan Semiconductor Manufacturing Co Ltd | | | $ | 87,674 | | | | 0.5 | % | |
| | | | | | | Other | | | | 118,580 | | | | 0.6 | | |
| | | | | | | | | | | 206,254 | | | | 1.1 | | |
| THAILAND | | | | 27,993 | | | | 0.2 | | |
| TURKEY | | | | 22,618 | | | | 0.1 | | |
| UNITED ARAB EMIRATES | | | | 15,498 | | | | 0.1 | | |
| UNITED KINGDOM | | | | | | | | | | |
| | 1,282,922 | | | | | AstraZeneca plc | | | | 95,765 | | | | 0.5 | | |
| | 784,042 | | | | | Linde plc | | | | 124,462 | | | | 0.7 | | |
| | | | | | | Other | | | | 787,165 | | | | 4.3 | | |
| | | | | | | | | | | 1,007,392 | | | | 5.5 | | |
| UNITED STATES | | | | | | | | | | |
| | 1,499,158 | | | | | Abbott Laboratories | | | | 108,434 | | | | 0.6 | | |
| | 194,037 | | | * | | Alphabet, Inc (Class A) | | | | 202,761 | | | | 1.1 | | |
| | 153,029 | | | * | | Alphabet, Inc (Class C) | | | | 158,478 | | | | 0.9 | | |
| | 238,108 | | | * | | Amazon.com, Inc | | | | 357,631 | | | | 2.0 | | |
| | 2,537,521 | | | | | Apple, Inc | | | | 400,269 | | | | 2.2 | | |
| | 4,275,206 | | | | | Bank of America Corp | | | | 105,341 | | | | 0.6 | | |
| | 507,837 | | | * | | Berkshire Hathaway, Inc (Class B) | | | | 103,690 | | | | 0.6 | | |
| | 509,782 | | | | | Boeing Co | | | | 164,405 | | | | 0.9 | | |
| | 744,421 | | | | | Caterpillar, Inc | | | | 94,594 | | | | 0.5 | | |
| | 1,787,012 | | | | | Chevron Corp | | | | 194,409 | | | | 1.1 | | |
| | 4,452,574 | | | | | Cisco Systems, Inc | | | | 192,930 | | | | 1.1 | | |
| | 3,164,943 | | | | | Coca-Cola Co | | | | 149,860 | | | | 0.8 | | |
| | 2,486,598 | | | | | Comcast Corp (Class A) | | | | 84,669 | | | | 0.5 | | |
| | 743,718 | | | * | | Concho Resources, Inc | | | | 76,447 | | | | 0.4 | | |
| | 532,406 | | | | | Costco Wholesale Corp | | | | 108,456 | | | | 0.6 | | |
| | 788,940 | | | | | Eli Lilly & Co | | | | 91,296 | | | | 0.5 | | |
| | 1,305,356 | | | | | EOG Resources, Inc | | | | 113,840 | | | | 0.6 | | |
| | 1,716,518 | | | d | | Exxon Mobil Corp | | | | 117,049 | | | | 0.6 | | |
| | 1,329,056 | | | * | | Facebook, Inc | | | | 174,226 | | | | 0.9 | | |
| | 874,046 | | | | | Home Depot, Inc | | | | 150,179 | | | | 0.8 | | |
| | 767,330 | | | | | Honeywell International, Inc | | | | 101,380 | | | | 0.5 | | |
| | 3,383,371 | | | | | Intel Corp | | | | 158,782 | | | | 0.9 | | |
| | 827,994 | | | | | Johnson & Johnson | | | | 106,853 | | | | 0.6 | | |
| | 2,564,209 | | | | | JPMorgan Chase & Co | | | | 250,318 | | | | 1.4 | | |
| | 549,586 | | | | | McDonald’s Corp | | | | 97,590 | | | | 0.5 | | |
| | 3,946,873 | | | | | Microsoft Corp | | | | 400,884 | | | | 2.2 | | |
| | 1,323,542 | | | | | Nike, Inc (Class B) | | | | 98,127 | | | | 0.5 | | |
| | 1,882,141 | | | * | | PayPal Holdings, Inc | | | | 158,269 | | | | 0.9 | | |
| | 1,989,025 | | | | | Pfizer, Inc | | | | 86,821 | | | | 0.5 | | |
| | 1,571,977 | | | | | Procter & Gamble Co | | | | 144,496 | | | | 0.8 | | |
| | 908,761 | | | * | | salesforce.com, Inc | | | | 124,473 | | | | 0.7 | | |
| | 2,161,158 | | | | | Schering-Plough Corp | | | | 165,134 | | | | 0.9 | | |
| | 1,044,291 | | | | | Union Pacific Corp | | | | 144,352 | | | | 0.8 | | |
| | 826,397 | | | | | UnitedHealth Group, Inc | | | | 205,872 | | | | 1.1 | | |
| 50 | 2018 Annual Report ■ College Retirement Equities Fund | See notes to financial statements |
| Summary portfolio of investments | continued |
| | |
| CREF Global Equities Account ■ December 31, 2018 | |
| | |
| Principal | | | | | Issuer | | | | | | Value
(000) | | | % of net
assets | |
| UNITED STATES—continued | | | | | | | | | | | | | |
| | 1,257,646 | | | | | Visa, Inc (Class A) | | | | | | $ | 165,934 | | | | 0.9 | % | |
| | 1,683,537 | | | | | Wells Fargo & Co | | | | | | | 77,577 | | | | 0.4 | | |
| | | | | | | Other | | | | | | | 4,879,108 | | | | 26.8 | | |
| | | | | | | | | | | | | | 10,514,934 | | | | 57.7 | | |
| URUGUAY | | | | | | | 40,401 | | | | 0.2 | | |
| ZAMBIA | | | | | | | 12,541 | | | | 0.1 | | |
| | | | | | | TOTAL COMMON STOCKS | | (Cost $18,562,046) | | | 17,959,062 | | | | 98.6 | | |
| RIGHTS / WARRANTS | | | | | | | | | | | | | |
| SPAIN | | | | | | | 33 | | | | 0.0 | | |
| THAILAND | | | | | | | 1 | | | | 0.0 | | |
| | | | | | | TOTAL RIGHTS / WARRANTS | | (Cost $33) | | | 34 | | | | 0.0 | | |
| | | | | | | | | | | | | | | | | | |
| | Principal | | | | | Issuer | | | | | | | | | | | | | | |
| | | | | | | | | | | | | | |
| SHORT-TERM INVESTMENTS | | | | | | | | | | | | | |
| GOVERNMENT AGENCY DEBT | | | | | | | 25,000 | | | | 0.1 | | |
| TREASURY DEBT | | | | | | | | | | | | | |
| $ | 139,620,000 | | | | | United States Treasury Bill | | 2.253%–2.286%, 01/08/19 | | | 139,567 | | | | 0.7 | | |
| | | | | | | Other | | | | | | | 103,466 | | | | 0.6 | | |
| | | | | | | | | | | | | | 243,033 | | | | 1.3 | | |
| INVESTMENT OF CASH COLLATERAL FOR SECURITIES LOANED | | | | | | | | | | | |
| CERTIFICATE OF DEPOSIT | | | | | | | 13,000 | | | | 0.1 | | |
| COMMERCIAL PAPER | | | | | | | 66,033 | | | | 0.4 | | |
| REPURCHASE AGREEMENTS | | | | | | | 175,000 | | | | 1.0 | | |
| VARIABLE RATE SECURITIES | | | | | | | 3,740 | | | | 0.0 | | |
| | | | | TOTAL INVESTMENT OF CASH COLLATERAL FOR SECURITIES LOANED | | | | | 257,773 | | | | 1.5 | | |
| | | | | | | TOTAL SHORT-TERM INVESTMENTS | | (Cost $525,793) | | | 525,806 | | | | 2.9 | | |
| | | | | | | | | | | | | | | | | | |
| | | | | | | TOTAL PORTFOLIO | | (Cost $19,087,872) | | | 18,484,902 | | | | 101.5 | | |
| | | | | | | OTHER ASSETS & LIABILITIES, NET | | | | | (271,039 | ) | | | (1.5 | ) | |
| | | | | | | NET ASSETS | | | | $ | 18,213,863 | | | | 100.0 | % | |
| See notes to financial statements | College Retirement Equities Fund ■ 2018 Annual Report | 51 |
| Summary portfolio of investments | concluded |
CREF Global Equities Account ■ December 31, 2018
Abbreviation(s):
ADR American Depositary Receipt
| * | Non-income producing |
| d | All or a portion of these securities have been segregated to cover margin requirements on open futures contracts. |
“Other” securities represent the aggregate value, by category, of securities that are not among the 50 largest holdings and, in total for any issuer, represent 1% or less of net assets.
At 12/31/18, the aggregate value of securities on loan is $257,172,550.
At 12/31/18, the aggregate value of securities exempt from registration under Rule 144(A) of the Securities Act of 1933 amounted to $170,655,994 or 0.9% of net assets. Such securities are deemed liquid and may be resold in transactions exempt from registration to qualified institutional buyers.
Cost amounts are in thousands.
For ease of presentation, a number of classification categories have been grouped together in the Summary portfolio of investments. Note that the Account uses more specific categories in following its investment limitations on investment concentrations.
Futures contracts outstanding as of December 31, 2018 were as follows (notional amounts and values are in thousands) (See Note 3):
| Description | | | Number of
long (short
contracts | )
| | Expiration
date | | Notional
amount | | | Value | | | Unrealized
appreciation
(depreciation | ) |
| MSCI EAFE Index | | | 740 | | | 03/15/19 | | $ | 65,565 | | | $ | 63,492 | | | $ | (2,073 | ) |
| S&P 500 E Mini Index | | | 910 | | | 03/15/19 | | | 120,275 | | | | 113,987 | | | | (6,288 | ) |
| Total | | | 1,650 | | | | | $ | 185,840 | | | $ | 177,479 | | | $ | (8,361 | ) |
| 52 | 2018 Annual Report ■ College Retirement Equities Fund | See notes to financial statements |
Summary of market values by sector
CREF Global Equities Account ■ December 31, 2018
| Sector | | | Value
(000) | | | | % of net
assets | |
| INFORMATION TECHNOLOGY | | $ | 3,021,177 | | | | 16.6 | % | |
| FINANCIALS | | | 2,663,016 | | | | 14.6 | | |
| CONSUMER DISCRETIONARY | | | 2,401,973 | | | | 13.2 | | |
| HEALTH CARE | | | 2,387,862 | | | | 13.1 | | |
| INDUSTRIALS | | | 1,994,720 | | | | 11.0 | | |
| COMMUNICATION SERVICES | | | 1,417,621 | | | | 7.8 | | |
| CONSUMER STAPLES | | | 1,406,655 | | | | 7.7 | | |
| ENERGY | | | 1,111,805 | | | | 6.1 | | |
| MATERIALS | | | 962,303 | | | | 5.3 | | |
| REAL ESTATE | | | 312,881 | | | | 1.7 | | |
| UTILITIES | | | 279,083 | | | | 1.5 | | |
| SHORT-TERM INVESTMENTS | | | 525,806 | | | | 2.9 | | |
| OTHER ASSETS & LIABILITES, NET | | | (271,039 | ) | | | (1.5 | ) | |
| NET ASSETS | | $ | 18,213,863 | | | | 100.0 | % | |
| See notes to financial statements | College Retirement Equities Fund ■ 2018 Annual Report | 53 |
Summary portfolio of investments
CREF Growth Account ■ December 31, 2018
| Shares | | | | | Company | | | Value
(000) | | | % of net
assets | |
| COMMON STOCKS | | | | | | | | |
| AUTOMOBILES & COMPONENTS | | | $ | 61,004 | | | | 0.3 | % | |
| BANKS | | | | 101,322 | | | | 0.4 | | |
| CAPITAL GOODS | | | | | | | | | | |
| | 1,085,984 | | | | | Airbus SE | | | | 103,537 | | | | 0.5 | | |
| | 1,081,773 | | | | | Boeing Co | | | | 348,872 | | | | 1.5 | | |
| | 1,260,203 | | | | | Honeywell International, Inc | | | | 166,498 | | | | 0.7 | | |
| | 689,411 | | | | | Northrop Grumman Corp | | | | 168,837 | | | | 0.7 | | |
| | 469,565 | | | | | Roper Industries, Inc | | | | 125,148 | | | | 0.6 | | |
| | 519,367 | | | | | W.W. Grainger, Inc | | | | 146,649 | | | | 0.6 | | |
| | | | | | | Other | | | | 751,720 | | | | 3.2 | | |
| | | | | | | | | | | 1,811,261 | | | | 7.8 | | |
| COMMERCIAL & PROFESSIONAL SERVICES | | | | 351,337 | | | | 1.5 | | |
| CONSUMER DURABLES & APPAREL | | | | | | | | | | |
| | 2,102,518 | | | | | Nike, Inc (Class B) | | | | 155,881 | | | | 0.7 | | |
| | | | | | | Other | | | | 358,221 | | | | 1.5 | | |
| | | | | | | | | | | 514,102 | | | | 2.2 | | |
| CONSUMER SERVICES | | | | | | | | | | |
| | 1,164,848 | | | | | Marriott International, Inc (Class A) | | | | 126,456 | | | | 0.5 | | |
| | | | | | | Other | | | | 206,225 | | | | 0.9 | | |
| | | | | | | | | | | 332,681 | | | | 1.4 | | |
| DIVERSIFIED FINANCIALS | | | | | | | | | | |
| | 1,968,794 | | | | | IntercontinentalExchange Group, Inc | | | | 148,309 | | | | 0.6 | | |
| | 1,209,500 | | | e | | iShares Russell 1000 Growth Index Fund | | | | 158,336 | | | | 0.7 | | |
| | | | | | | Other | | | | 370,920 | | | | 1.6 | | |
| | | | | | | | | | | 677,565 | | | | 2.9 | | |
| ENERGY | | | | 139,783 | | | | 0.6 | | |
| FOOD & STAPLES RETAILING | | | | | | | | | | |
| | 820,035 | | | | | Costco Wholesale Corp | | | | 167,050 | | | | 0.7 | | |
| | 1,131,941 | | | | | Walmart, Inc | | | | 105,440 | | | | 0.5 | | |
| | | | | | | Other | | | | 17,605 | | | | 0.1 | | |
| | | | | | | | | | | 290,095 | | | | 1.3 | | |
| FOOD, BEVERAGE & TOBACCO | | | | | | | | | | |
| | 654,100 | | | | | Constellation Brands, Inc (Class A) | | | | 105,193 | | | | 0.4 | | |
| | 2,235,470 | | | * | | Monster Beverage Corp | | | | 110,030 | | | | 0.5 | | |
| | | | | | | Other | | | | 208,441 | | | | 0.9 | | |
| | | | | | | | | | | 423,664 | | | | 1.8 | | |
| 54 | 2018 Annual Report ■ College Retirement Equities Fund | See notes to financial statements |
| Summary portfolio of investments | continued |
| | |
| CREF Growth Account ■ December 31, 2018 | |
| Shares | | | | | Company | | | | Value
(000) | | | | % of net
assets | |
| HEALTH CARE EQUIPMENT & SERVICES | | | | | | | | | | |
| | 1,435,542 | | | | | Abbott Laboratories | | | $ | 103,833 | | | | 0.4 | % | |
| | 1,102,345 | | | * | | Edwards Lifesciences Corp | | | | 168,846 | | | | 0.7 | | |
| | 584,483 | | | * | | Intuitive Surgical, Inc | | | | 279,920 | | | | 1.2 | | |
| | 839,358 | | | | | Stryker Corp | | | | 131,569 | | | | 0.6 | | |
| | 950,204 | | | | | UnitedHealth Group, Inc | | | | 236,715 | | | | 1.0 | | |
| | | | | | | Other | | | | 711,300 | | | | 3.1 | | |
| | | | | | | | | | | 1,632,183 | | | | 7.0 | | |
| HOUSEHOLD & PERSONAL PRODUCTS | | | | 180,327 | | | | 0.8 | | |
| INSURANCE | | | | 127,950 | | | | 0.6 | | |
| MATERIALS | | | | | | | | | | |
| | 988,334 | | | | | Linde plc | | | | 154,220 | | | | 0.7 | | |
| | 305,435 | | | | | Sherwin-Williams Co | | | | 120,176 | | | | 0.5 | | |
| | | | | | | Other | | | | 166,571 | | | | 0.7 | | |
| | | | | | | | | | | 440,967 | | | | 1.9 | | |
| MEDIA & ENTERTAINMENT | | | | | | | | | | |
| | 498,740 | | | * | | Alphabet, Inc (Class A) | | | | 521,163 | | | | 2.2 | | |
| | 888,339 | | | * | | Alphabet, Inc (Class C) | | | | 919,973 | | | | 4.0 | | |
| | 4,926,519 | | | * | | Facebook, Inc | | | | 645,817 | | | | 2.8 | | |
| | 1,412,893 | | | * | | IAC/InterActiveCorp | | | | 258,616 | | | | 1.1 | | |
| | 499,450 | | | * | | NetFlix, Inc | | | | 133,683 | | | | 0.6 | | |
| | 1,304,914 | | | | | Walt Disney Co | | | | 143,084 | | | | 0.6 | | |
| | | | | | | Other | | | | 423,859 | | | | 1.8 | | |
| | | | | | | | | | | 3,046,195 | | | | 13.1 | | |
| PHARMACEUTICALS, BIOTECHNOLOGY & LIFE SCIENCES | | | | | | | | | | |
| | 1,297,167 | | | | | AbbVie, Inc | | | | 119,586 | | | | 0.5 | | |
| | 981,675 | | | | | Eli Lilly & Co | | | | 113,599 | | | | 0.5 | | |
| | 2,753,893 | | | | | Gilead Sciences, Inc | | | | 172,256 | | | | 0.8 | | |
| | 677,923 | | | * | | Illumina, Inc | | | | 203,329 | | | | 0.9 | | |
| | 2,933,175 | | | | | Zoetis, Inc | | | | 250,904 | | | | 1.1 | | |
| | | | | | | Other | | | | 728,637 | | | | 3.1 | | |
| | | | | | | | | | | 1,588,311 | | | | 6.9 | | |
| REAL ESTATE | | | | 120,166 | | | | 0.5 | | |
| RETAILING | | | | | | | | | | |
| | 848,631 | | | * | | Amazon.com, Inc | | | | 1,274,618 | | | | 5.5 | | |
| | 1,919,807 | | | | | Expedia, Inc | | | | 216,266 | | | | 0.9 | | |
| | 1,719,048 | | | | | Home Depot, Inc | | | | 295,367 | | | | 1.3 | | |
| | | | | | | Other | | | | 1,091,540 | | | | 4.7 | | |
| | | | | | | | | | | 2,877,791 | | | | 12.4 | | |
| SEMICONDUCTORS & SEMICONDUCTOR EQUIPMENT | | | | | | | | | | |
| | 561,283 | | | | | Broadcom, Inc | | | | 142,723 | | | | 0.6 | | |
| | 1,227,642 | | | | | NVIDIA Corp | | | | 163,890 | | | | 0.7 | | |
| | | | | | | Other | | | | 370,637 | | | | 1.6 | | |
| | | | | | | | | | | 677,250 | | | | 2.9 | | |
| See notes to financial statements | College Retirement Equities Fund ■ 2018 Annual Report | 55 |
| Summary portfolio of investments | continued |
| | |
| CREF Growth Account ■ December 31, 2018 | |
| Shares | | | | | Company | | | Value
(000) | | | % of net
assets | |
| SOFTWARE & SERVICES | | | | | | | | | | |
| | 1,617,072 | | | * | | Adobe, Inc | | | $ | 365,846 | | | | 1.6 | % | |
| | 1,511,780 | | | | | Automatic Data Processing, Inc | | | | 198,225 | | | | 0.8 | | |
| | 2,647,422 | | | | | Intuit, Inc | | | | 521,145 | | | | 2.2 | | |
| | 2,601,829 | | | | | MasterCard, Inc (Class A) | | | | 490,835 | | | | 2.1 | | |
| | 15,319,789 | | | | | Microsoft Corp | | | | 1,556,031 | | | | 6.7 | | |
| | 5,302,461 | | | * | | PayPal Holdings, Inc | | | | 445,884 | | | | 1.9 | | |
| | 4,225,714 | | | * | | salesforce.com, Inc | | | | 578,796 | | | | 2.5 | | |
| | 922,069 | | | * | | ServiceNow, Inc | | | | 164,174 | | | | 0.7 | | |
| | 5,030,310 | | | | | Visa, Inc (Class A) | | | | 663,699 | | | | 2.9 | | |
| | | | | | | Other | | | | 919,287 | | | | 4.0 | | |
| | | | | | | | | | | 5,903,922 | | | | 25.4 | | |
| TECHNOLOGY HARDWARE & EQUIPMENT | | | | | | | | | | |
| | 5,479,287 | | | | | Apple, Inc | | | | 864,303 | | | | 3.7 | | |
| | 2,962,686 | | | | | Cisco Systems, Inc | | | | 128,373 | | | | 0.6 | | |
| | 1,241,195 | | | | | Motorola, Inc | | | | 142,787 | | | | 0.6 | | |
| | | | | | | Other | | | | 281,293 | | | | 1.2 | | |
| | | | | | | | | | | 1,416,756 | | | | 6.1 | | |
| TELECOMMUNICATION SERVICES | | | | 105,407 | | | | 0.5 | | |
| TRANSPORTATION | | | | | | | | | | |
| | 1,058,398 | | | | | Union Pacific Corp | | | | 146,302 | | | | 0.6 | | |
| | | | | | | Other | | | | 181,736 | | | | 0.8 | | |
| | | | | | | | | | | 328,038 | | | | 1.4 | | |
| | | | | | | TOTAL COMMON STOCKS | | (Cost $20,105,154) | | 23,148,077 | | | | 99.7 | | |
| | | | | | | | | | | | | | | | | |
| Principal | | | | | Issuer | | | | | | | | | | | |
| | | | | | | | | | | | | | | | | |
| SHORT-TERM INVESTMENTS | | | | | | | | | | |
| TREASURY DEBT | | | | 65,216 | | | | 0.2 | | |
| | | | | | | | | | | | | | | | | | |
| Shares | | | | | Company | | | | | | | | | | | |
| INVESTMENTS IN REGISTERED INVESTMENT COMPANIES | | | | 85,482 | | | | 0.4 | | |
| | 85,482,277 | | | c | | State Street Navigator Securities Lending Government Money Market Portfolio | | 85,482 | | | | 0.4 | | |
| | | | | | | TOTAL SHORT-TERM INVESTMENTS | | (Cost $150,693) | | 150,698 | | | | 0.6 | | |
| | | | | | | | | | | | | | | | | |
| | | | | | | TOTAL PORTFOLIO | | (Cost $20,255,847) | | 23,298,775 | | | | 100.3 | | |
| | | | | | | OTHER ASSETS & LIABILITIES, NET | | | | (71,561 | ) | | | (0.3 | ) | |
| | | | | | | NET ASSETS | | | $ | 23,227,214 | | | | 100.0 | % | |
| 56 | 2018 Annual Report ■ College Retirement Equities Fund | See notes to financial statements |
| Summary portfolio of investments | concluded |
| | |
| CREF Growth Account ■ December 31, 2018 | |
| * | Non-income producing |
| c | Investments made with cash collateral from securities on loan. |
| e | All or a portion of these securities are out on loan. The aggregate value of securities on loan is $84,093,806. |
“Other” securities represent the aggregate value, by category, of securities that are not among the 50 largest holdings and, in total for any issuer, represent 1% or less of net assets.
Cost amounts are in thousands.
For ease of presentation, a number of classification categories have been grouped together in the Summary portfolio of investments. Note that the Account uses more specific categories in following its investment limitations on investment concentrations.
| See notes to financial statements | College Retirement Equities Fund ■ 2018 Annual Report | 57 |
Summary portfolio of investments
CREF Equity Index Account ■ December 31, 2018
| Shares | | | | | Company | | Value
(000) | | | % of net
assets | |
| COMMON STOCKS | | | | | | | |
| AUTOMOBILES & COMPONENTS | | $ | 128,130 | | | | 0.8 | % | |
| BANKS | | | | | | | | | |
| | 6,084,631 | | | | | Bank of America Corp | | | 149,925 | | | | 0.9 | | |
| | 1,624,924 | | | | | Citigroup, Inc | | | 84,594 | | | | 0.5 | | |
| | 2,201,073 | | | | | JPMorgan Chase & Co | | | 214,869 | | | | 1.3 | | |
| | 2,822,111 | | | | | Wells Fargo & Co | | | 130,043 | | | | 0.8 | | |
| | | | | | | Other | | | 424,797 | | | | 2.5 | | |
| | | | | | | | | | 1,004,228 | | | | 6.0 | | |
| CAPITAL GOODS | | | | | | | | | |
| | 378,129 | | | | | 3M Co | | | 72,049 | | | | 0.4 | | |
| | 356,151 | | | | | Boeing Co | | | 114,859 | | | | 0.7 | | |
| | 493,825 | | | | | Honeywell International, Inc | | | 65,244 | | | | 0.4 | | |
| | | | | | | Other | | | 898,663 | | | | 5.3 | | |
| | | | | | | | | | 1,150,815 | | | | 6.8 | | |
| COMMERCIAL & PROFESSIONAL SERVICES | | | 176,546 | | | | 1.0 | | |
| CONSUMER DURABLES & APPAREL | | | 215,665 | | | | 1.3 | | |
| CONSUMER SERVICES | | | | | | | | | |
| | 516,408 | | | | | McDonald’s Corp | | | 91,698 | | | | 0.5 | | |
| | | | | | | Other | | | 297,073 | | | | 1.8 | | |
| | | | | | | | | | 388,771 | | | | 2.3 | | |
| DIVERSIFIED FINANCIALS | | | 605,694 | | | | 3.6 | | |
| ENERGY | | | | | | | | | |
| | 1,266,759 | | | | | Chevron Corp | | | 137,811 | | | | 0.8 | | |
| | 2,817,203 | | | d | | Exxon Mobil Corp | | | 192,105 | | | | 1.1 | | |
| | | | | | | Other | | | 498,025 | | | | 3.0 | | |
| | | | | | | | | | 827,941 | | | | 4.9 | | |
| FOOD & STAPLES RETAILING | | | | | | | | | |
| | 946,620 | | | | | Walmart, Inc | | | 88,178 | | | | 0.5 | | |
| | | | | | | Other | | | 146,298 | | | | 0.9 | | |
| | | | | | | | | | 234,476 | | | | 1.4 | | |
| FOOD, BEVERAGE & TOBACCO | | | | | | | | | |
| | 2,541,268 | | | | | Coca-Cola Co | | | 120,329 | | | | 0.7 | | |
| | 940,801 | | | | | PepsiCo, Inc | | | 103,940 | | | | 0.6 | | |
| | 1,034,498 | | | | | Philip Morris International, Inc | | | 69,063 | | | | 0.4 | | |
| | | | | | | Other | | | 309,329 | | | | 1.9 | | |
| | | | | | | | | | 602,661 | | | | 3.6 | | |
| HEALTH CARE EQUIPMENT & SERVICES | | | | | | | | | |
| | 1,136,754 | | | | | Abbott Laboratories | | | 82,222 | | | | 0.5 | | |
| | 899,311 | | | | | Medtronic plc | | | 81,801 | | | | 0.5 | | |
| | 635,283 | | | | | UnitedHealth Group, Inc | | | 158,262 | | | | 0.9 | | |
| | | | | | | Other | | | 765,285 | | | | 4.6 | | |
| | | | | | | | | | 1,087,570 | | | | 6.5 | | |
| 58 | 2018 Annual Report ■ College Retirement Equities Fund | See notes to financial statements |
| Summary portfolio of investments | continued |
| | |
| CREF Equity Index Account ■ December 31, 2018 | |
| | |
| Shares | | | | | Company | | Value
(000) | | | % of net
assets | |
| HOUSEHOLD & PERSONAL PRODUCTS | | | | | | | | | |
| | 1,658,605 | | | | | Procter & Gamble Co | | $ | 152,459 | | | | 0.9 | % | |
| | | | | | | Other | | | 122,145 | | | | 0.7 | | |
| | | | | | | | | | 274,604 | | | | 1.6 | | |
| INSURANCE | | | | | | | | | |
| | 1,287,349 | | | * | | Berkshire Hathaway, Inc (Class B) | | | 262,851 | | | | 1.6 | | |
| | | | | | | Other | | | 444,563 | | | | 2.6 | | |
| | | | | | | | | | 707,414 | | | | 4.2 | | |
| MATERIALS | | | | | | | | | |
| | 1,526,619 | | | | | DowDuPont, Inc | | | 81,644 | | | | 0.5 | | |
| | | | | | | Other | | | 426,072 | | | | 2.5 | | |
| | | | | | | | | | 507,716 | | | | 3.0 | | |
| MEDIA & ENTERTAINMENT | | | | | | | | | |
| | 198,681 | | | * | | Alphabet, Inc (Class A) | | | 207,614 | | | | 1.2 | | |
| | 202,492 | | | * | | Alphabet, Inc (Class C) | | | 209,703 | | | | 1.3 | | |
| | 3,039,553 | | | | | Comcast Corp (Class A) | | | 103,497 | | | | 0.6 | | |
| | 1,582,192 | | | * | | Facebook, Inc | | | 207,409 | | | | 1.2 | | |
| | 277,571 | | | * | | NetFlix, Inc | | | 74,295 | | | | 0.4 | | |
| | 991,300 | | | | | Walt Disney Co | | | 108,696 | | | | 0.7 | | |
| | | | | | | Other | | | 283,536 | | | | 1.7 | | |
| | | | | | | | | | 1,194,750 | | | | 7.1 | | |
| PHARMACEUTICALS, BIOTECHNOLOGY & LIFE SCIENCES | | | | | | | | | |
| | 1,007,898 | | | | | AbbVie, Inc | | | 92,918 | | | | 0.6 | | |
| | 423,981 | | | | | Amgen, Inc | | | 82,536 | | | | 0.5 | | |
| | 625,362 | | | | | Eli Lilly & Co | | | 72,367 | | | | 0.4 | | |
| | 1,785,129 | | | | | Johnson & Johnson | | | 230,371 | | | | 1.4 | | |
| | 3,856,957 | | | | | Pfizer, Inc | | | 168,356 | | | | 1.0 | | |
| | 1,731,153 | | | | | Schering-Plough Corp | | | 132,278 | | | | 0.8 | | |
| | | | | | | Other | | | 646,806 | | | | 3.8 | | |
| | | | | | | | | | 1,425,632 | | | | 8.5 | | |
| REAL ESTATE | | | 656,354 | | | | 3.9 | | |
| RETAILING | | | | | | | | | |
| | 270,555 | | | * | | Amazon.com, Inc | | | 406,366 | | | | 2.4 | | |
| | 766,292 | | | | | Home Depot, Inc | | | 131,664 | | | | 0.8 | | |
| | | | | | | Other | | | 450,401 | | | | 2.7 | | |
| | | | | | | | | | 988,431 | | | | 5.9 | | |
| SEMICONDUCTORS & SEMICONDUCTOR EQUIPMENT | | | | | | | | | |
| | 273,898 | | | | | Broadcom, Inc | | | 69,647 | | | | 0.4 | | |
| | 3,039,128 | | | | | Intel Corp | | | 142,626 | | | | 0.8 | | |
| | | | | | | Other | | | 386,213 | | | | 2.3 | | |
| | | | | | | | | | 598,486 | | | | 3.5 | | |
| | | |
| See notes to financial statements | College Retirement Equities Fund ■ 2018 Annual Report | 59 |
| Summary portfolio of investments | continued |
| | |
| CREF Equity Index Account ■ December 31, 2018 | |
| | |
| Shares | | | | | Company | | Value
(000) | | | % of net
assets | |
| SOFTWARE & SERVICES | | | | | | | | | |
| | 327,971 | | | * | | Adobe, Inc | | $ | 74,200 | | | | 0.4 | % | |
| | 610,395 | | | | | International Business Machines Corp | | | 69,384 | | | | 0.4 | | |
| | 611,625 | | | | | MasterCard, Inc (Class A) | | | 115,383 | | | | 0.7 | | |
| | 5,041,476 | | | | | Microsoft Corp | | | 512,063 | | | | 3.0 | | |
| | 1,694,317 | | | | | Oracle Corp | | | 76,498 | | | | 0.5 | | |
| | 790,825 | | | * | | PayPal Holdings, Inc | | | 66,501 | | | | 0.4 | | |
| | 478,245 | | | * | | salesforce.com, Inc | | | 65,505 | | | | 0.4 | | |
| | 1,171,575 | | | | | Visa, Inc (Class A) | | | 154,578 | | | | 0.9 | | |
| | | | | | | Other | | | 704,372 | | | | 4.2 | | |
| | | | | | | | | | 1,838,484 | | | | 10.9 | | |
| TECHNOLOGY HARDWARE & EQUIPMENT | | | | | | | | | |
| | 3,159,014 | | | e | | Apple, Inc | | | 498,303 | | | | 3.0 | | |
| | 3,016,360 | | | | | Cisco Systems, Inc | | | 130,699 | | | | 0.8 | | |
| | | | | | | Other | | | 259,060 | | | | 1.5 | | |
| | | | | | | | | | 888,062 | | | | 5.3 | | |
| TELECOMMUNICATION SERVICES | | | | | | | | | |
| | 4,838,859 | | | | | AT&T, Inc | | | 138,101 | | | | 0.8 | | |
| | 2,754,368 | | | | | Verizon Communications, Inc | | | 154,850 | | | | 0.9 | | |
| | | | | | | Other | | | 39,922 | | | | 0.3 | | |
| | | | | | | | | | 332,873 | | | | 2.0 | | |
| TRANSPORTATION | | | | | | | | | |
| | 490,744 | | | | | Union Pacific Corp | | | 67,836 | | | | 0.4 | | |
| | | | | | | Other | | | 271,755 | | | | 1.6 | | |
| | | | | | | | | | 339,591 | | | | 2.0 | | |
| UTILITIES | | | 552,840 | | | | 3.3 | | |
| | | | | | | TOTAL COMMON STOCKS | | (Cost $8,432,863) | | | 16,727,734 | | | | 99.4 | | |
| | | | | | | | | | | | | | | | |
| RIGHTS / WARRANTS | | | | | | | | | |
| PHARMACEUTICALS, BIOTECHNOLOGY & LIFE SCIENCES | | | 13 | | | | 0.0 | | |
| | | | | | | TOTAL RIGHTS / WARRANTS | | (Cost $0) | | | 13 | | | | 0.0 | | |
| | | | | | | | | | | | | | | | |
| | Principal | | | | | Issuer | | | | | | | | | | | | |
| | | | | | | | | | | | | | | | | | | |
| SHORT-TERM INVESTMENTS | | | | | | | | | |
| GOVERNMENT AGENCY DEBT | | | 25,000 | | | | 0.1 | | |
| TREASURY DEBT | | | 53,717 | | | | 0.3 | | |
| | | | | | | | | | |
| Shares | | | | | Company | | | | | | | | | | |
| INVESTMENTS IN REGISTERED INVESTMENT COMPANIES | | | | | | | | | |
| | 133,008,986 | | | c | | State Street Navigator Securities Lending Government Money Market Portfolio | | | 133,009 | | | | 0.8 | | |
| | | | | | | | | | 133,009 | | | | 0.8 | | |
| | | | | | | TOTAL SHORT-TERM INVESTMENTS | | (Cost $211,724) | | | 211,726 | | | | 1.2 | | |
| | | | | | | | | | | | | | | | | | |
| | | | | | | TOTAL PORTFOLIO | | (Cost $8,644,587) | | | 16,939,473 | | | | 100.6 | | |
| | | | | | | OTHER ASSETS & LIABILITIES, NET | | | | | (107,918 | ) | | | (0.6 | ) | |
| | | | | | | NET ASSETS | | | | $ | 16,831,555 | | | | 100.0 | % | |
| | | |
| 60 | 2018 Annual Report ■ College Retirement Equities Fund | See notes to financial statements |
| Summary portfolio of investments | concluded |
| | |
| CREF Equity Index Account ■ December 31, 2018 | |
| * | Non-income producing |
| c | Investments made with cash collateral received from securities on loan. |
| d | All or a portion of these securities have been segregated to cover margin requirements on open futures contracts. |
| e | All or a portion of these securities are out on loan. The aggregate value of securities on loan is $129,293,945. |
“Other” securities represent the aggregate value, by category, of securities that are not among the 50 largest holdings and, in total for any issuer, represent 1% or less of net assets.
Cost amounts are in thousands.
For ease of presentation, a number of classification categories have been grouped together in the Summary portfolio of investments. Note that the Account uses more specific categories in following its investment limitations on investment concentrations.
Futures contracts outstanding as of December 31, 2018 were as follows (notional amounts and values are in thousands) (See Note 3):
| Description | | Number of
long (short
contracts |
) | | Expiration
date | | Notional
amount | | | Value | | | Unrealized
appreciation
(depreciation | ) |
| Russell 2000 E Mini Index | | | 83 | | | 03/15/19 | | $ | 5,372 | | | $ | 5,598 | | | $ | 226 | |
| S&P 500 E Mini Index | | | 480 | | | 03/15/19 | | | 57,953 | | | | 60,125 | | | | 2,172 | |
| S&P Mid-Cap 400 E Mini Index | | | 24 | | | 03/15/19 | | | 3,860 | | | | 3,989 | | | | 129 | |
| Total | | | 587 | | | | | $ | 67,185 | | | $ | 69,712 | | | $ | 2,527 | |
| See notes to financial statements | College Retirement Equities Fund ■ 2018 Annual Report | 61 |
Summary portfolio of investments
CREF Bond Market Account ■ December 31, 2018
| Principal | | | | | Issuer | | | | | | Value
(000) | | | % of net
assets | |
| BANK LOAN OBLIGATIONS | | | | | | | | | | | | | |
| CAPITAL GOODS | | | | | | $ | 438 | | | | 0.0 | % | |
| COMMERCIAL & PROFESSIONAL SERVICES | | 1,023 | | | | 0.0 | | |
| CONSUMER DURABLES & APPAREL | | | | | | | 2,303 | | | | 0.0 | | |
| CONSUMER SERVICES | | | | | | | 2,356 | | | | 0.0 | | |
| DIVERSIFIED FINANCIALS | | | | | | | 155 | | | | 0.0 | | |
| ENERGY | | | | | | | 1,681 | | | | 0.0 | | |
| FOOD & STAPLES RETAILING | | | | | | | 886 | | | | 0.0 | | |
| FOOD, BEVERAGE & TOBACCO | | | | | | | 572 | | | | 0.0 | | |
| HEALTH CARE EQUIPMENT & SERVICES | | | | | | | 5,659 | | | | 0.1 | | |
| MATERIALS | | | | | | | 7,197 | | | | 0.1 | | |
| MEDIA & ENTERTAINMENT | | | | | | | 5,750 | | | | 0.1 | | |
| PHARMACEUTICALS, BIOTECHNOLOGY & LIFE SCIENCES | | | | | | 1,509 | | | | 0.0 | | |
| REAL ESTATE | | | | | | | 4,097 | | | | 0.0 | | |
| RETAILING | | | | | | | 626 | | | | 0.0 | | |
| SOFTWARE & SERVICES | | | | | | | 5,282 | | | | 0.1 | | |
| TECHNOLOGY HARDWARE & EQUIPMENT | | | | | | 3,226 | | | | 0.0 | | |
| TRANSPORTATION | | | | | | | 4,583 | | | | 0.0 | | |
| | | | | | | TOTAL BANK LOAN OBLIGATIONS | | (Cost $49,877) | | | 47,343 | | | | 0.4 | | |
| BONDS | | | | | | | | | | | | | |
| | | | | | | �� | | | | | | | | | | | | | |
| CORPORATE BONDS | | | | | | | | | | | | | |
| AUTOMOBILES & COMPONENTS | | | | | | | 54,853 | | | | 0.4 | | |
| BANKS | | | | | | | | | | | | | |
| $ | 50,575,000 | | | | | Citigroup, Inc | | | | 3.200%, 10/21/26 | | | 46,706 | | | | 0.4 | | |
| | 40,000,000 | | | | | Royal Bank of Canada | | | | 1.875%, 02/05/20 | | | 39,578 | | | | 0.3 | | |
| | | | | | | Other | | | | | | | 771,479 | | | | 5.8 | | |
| | | | | | | | | | | | | | 857,763 | | | | 6.5 | | |
| CAPITAL GOODS | | | | | | | 87,006 | | | | 0.7 | | |
| COMMERCIAL & PROFESSIONAL SERVICES | | | | | | 50,702 | | | | 0.4 | | |
| CONSUMER DURABLES & APPAREL | | | | | | | 7,896 | | | | 0.1 | | |
| CONSUMER SERVICES | | | | | | | 159,687 | | | | 1.2 | | |
| DIVERSIFIED FINANCIALS | | | | | | | | | | | | | |
| | 45,550,000 | | | | | Wells Fargo & Co | | | | 2.625%, 07/22/22 | | | 43,920 | | | | 0.3 | | |
| | | | | | | Other | | | | | | | 410,689 | | | | 3.1 | | |
| | | | | | | | | | | | | | 454,609 | | | | 3.4 | | |
| ENERGY | | | | | | | 428,284 | | | | 3.2 | | |
| 62 | 2018 Annual Report ■ College Retirement Equities Fund | See notes to financial statements |
| Summary portfolio of investments | continued |
CREF Bond Market Account ■ December 31, 2018
| Principal | | | | | Issuer | | | | | | Value
(000) | | | % of net
assets | |
| FOOD & STAPLES RETAILING | | | | | | $ | 120,462 | | | | 0.9 | % | |
| FOOD, BEVERAGE & TOBACCO | | | | | | | 122,895 | | | | 0.9 | | |
| HEALTH CARE EQUIPMENT & SERVICES | | | | | | | 81,267 | | | | 0.7 | | |
| HOUSEHOLD & PERSONAL PRODUCTS | | | | | | | 1,160 | | | | 0.0 | | |
| INSURANCE | | | | | | | 170,718 | | | | 1.3 | | |
| MATERIALS | | | | | | | 120,607 | | | | 0.9 | | |
| MEDIA & ENTERTAINMENT | | | | | | | 202,707 | | | | 1.5 | | |
| PHARMACEUTICALS, BIOTECHNOLOGY & LIFE SCIENCES | | | | | | 185,585 | | | | 1.4 | | |
| REAL ESTATE | | | | | | | 174,972 | | | | 1.4 | | |
| RETAILING | | | | | | | 57,576 | | | | 0.4 | | |
| SEMICONDUCTORS & SEMICONDUCTOR EQUIPMENT | | | | | | 28,523 | | | | 0.2 | | |
| SOFTWARE & SERVICES | | | | | | | 114,078 | | | | 0.9 | | |
| TECHNOLOGY HARDWARE & EQUIPMENT | | | | | | 123,565 | | | | 0.9 | | |
| TELECOMMUNICATION SERVICES | | | | | | | 171,737 | | | | 1.3 | | |
| TRANSPORTATION | | | | | | | 96,926 | | | | 0.7 | | |
| UTILITIES | | | | | | | 350,691 | | | | 2.6 | | |
| | | | | | | | TOTAL CORPORATE BONDS | | (Cost $4,356,461) | | | 4,224,269 | | | | 31.9 | | |
| GOVERNMENT BONDS | | | | | | | | | | | | | |
| AGENCY SECURITIES | | | | | | | | | | | | | |
| $ | 41,206,846 | | | | | CES MU2 LLC | | | | 1.994%, 05/13/27 | | | 39,722 | | | | 0.4 | | |
| | | | | | | Other | | | | | | | 278,004 | | | | 2.1 | | |
| | | | | | | | | | | | | | 317,726 | | | | 2.5 | | |
| FOREIGN GOVERNMENT BONDS | | | | | | | | | | | | | |
| | 45,000,000 | | | | | KFW | | | | 2.750%, 10/01/20 | | | 45,089 | | | | 0.4 | | |
| | | | | | | Other | | | | | | | 678,888 | | | | 5.1 | | |
| | | | | | | | | | | | | | 723,977 | | | | 5.5 | | |
| MORTGAGE BACKED | | | | | | | | | | | | | |
| | 60,495,863 | | | | | Federal Home Loan Mortgage Corp Gold (FGLMC) | | 3.500%, 10/01/45 | | | 60,773 | | | | 0.5 | | |
| | 36,258,459 | | | | | FGLMC | | | | 4.000%, 12/01/45 | | | 37,230 | | | | 0.3 | | |
| | 91,387,937 | | | | | FGLMC | | | | 3.500%, 08/01/46 | | | 91,920 | | | | 0.7 | | |
| | 49,184,466 | | | | | FGLMC | | | | 3.000%, 01/01/47 | | | 47,963 | | | | 0.4 | | |
| | 99,063,952 | | | | | FGLMC | | | | 3.000%, 02/01/47 | | | 96,641 | | | | 0.7 | | |
| | 39,950,807 | | | | | FGLMC | | | | 4.000%, 03/01/48 | | | 40,989 | | | | 0.3 | | |
| | 133,397,890 | | | | | FGLMC | | 3.500%–8.000%, 10/01/20–08/01/48 | | | 137,563 | | | | 1.0 | | |
| | 39,096,525 | | | | | Federal National Mortgage Association (FNMA) | | 3.000%, 02/25/45 | | | 39,064 | | | | 0.3 | | |
| | 69,845,388 | | | | | FNMA | | | | 3.000%, 12/25/45 | | | 69,240 | | | | 0.5 | | |
| | 38,176,847 | | | | | FNMA | | | | 4.000%, 01/01/46 | | | 39,246 | | | | 0.3 | | |
| | 46,053,794 | | | | | FNMA | | | | 3.500%, 12/01/46 | | | 46,166 | | | | 0.3 | | |
| | 117,027,567 | | | | | FNMA | | | | 3.500%, 01/01/47 | | | 117,151 | | | | 0.9 | | |
| | 131,564,042 | | | | | FNMA | | | | 3.000%, 02/25/48 | | | 130,278 | | | | 1.0 | | |
| | 65,039,275 | | | | | FNMA | | | | 4.500%, 03/01/48 | | | 68,164 | | | | 0.5 | | |
| See notes to financial statements | College Retirement Equities Fund ■ 2018 Annual Report | 63 |
| Summary portfolio of investments | continued |
CREF Bond Market Account ■ December 31, 2018
| Principal | | | | | Issuer | | | | | | Value
(000) | | | % of net
assets | |
| MORTGAGE BACKED—continued | | | | | | | | | | | | | |
| $ | 183,224,677 | | | | | FNMA | | | | 4.000%, 04/01/48 | | $ | 187,507 | | | | 1.4 | % | |
| | 549,482,224 | | | | | FNMA | | 3.000%–9.000%, 07/01/24–01/25/49 | | | 562,853 | | | | 4.2 | | |
| | 49,984,010 | | | | | Government National Mortgage Association (GNMA) | | 3.000%, 12/20/47 | | | 49,192 | | | | 0.4 | | |
| | 114,824,763 | | | | | GNMA | | | | 3.500%, 12/20/47 | | | 115,661 | | | | 0.9 | | |
| | 64,318,889 | | | | | GNMA | | | | 3.000%, 01/20/48 | | | 63,300 | | | | 0.5 | | |
| | 95,569,308 | | | | | GNMA | | | | 3.500%, 01/20/48 | | | 96,266 | | | | 0.7 | | |
| | | | | | | Other | | | | | | | 234,343 | | | | 1.8 | | |
| | | | | | | | | | | | | | 2,331,510 | | | | 17.6 | | |
| MUNICIPAL BONDS | | | | | | | 533,860 | | | | 4.0 | | |
| U.S. TREASURY SECURITIES | | | | | | | | | | | | | |
| | 65,602,000 | | | | | United States Treasury Bond | | | 4.500%, 02/15/36 | | | 80,929 | | | | 0.6 | | |
| | 47,000,000 | | | | | United States Treasury Bond | | | 3.500%, 02/15/39 | | | 51,478 | | | | 0.4 | | |
| | 56,375,000 | | | | | United States Treasury Bond | | | 3.625%, 08/15/43 | | | 62,510 | | | | 0.5 | | |
| | 81,710,000 | | | | | United States Treasury Bond | | | 2.875%, 08/15/45 | | | 79,730 | | | | 0.6 | | |
| | 102,850,000 | | | | | United States Treasury Bond | | | 2.500%, 05/15/46 | | | 92,927 | | | | 0.7 | | |
| | 58,160,000 | | | | | United States Treasury Bond | | | 2.750%, 11/15/47 | | | 55,130 | | | | 0.4 | | |
| | 83,095,000 | | | | | United States Treasury Bond | | | 3.125%, 05/15/48 | | | 84,818 | | | | 0.6 | | |
| | 179,420,000 | | | | | United States Treasury Bond | | | 3.000%, 08/15/48 | | | 178,881 | | | | 1.4 | | |
| | 50,000,000 | | | | | United States Treasury Note | | | 1.375%, 02/28/19 | | | 49,919 | | | | 0.4 | | |
| | 50,000,000 | | | | | United States Treasury Note | | | 0.750%, 07/15/19 | | | 49,521 | | | | 0.4 | | |
| | 61,725,000 | | | | | United States Treasury Note | | | 1.375%, 07/31/19 | | | 61,303 | | | | 0.5 | | |
| | 51,445,000 | | | | | United States Treasury Note | | | 2.375%, 04/30/20 | | | 51,306 | | | | 0.4 | | |
| | 76,920,000 | | | | | United States Treasury Note | | | 2.500%, 05/31/20 | | | 76,846 | | | | 0.6 | | |
| | 40,110,000 | | | | | United States Treasury Note | | | 1.375%, 09/15/20 | | | 39,347 | | | | 0.3 | | |
| | 56,565,000 | | | | | United States Treasury Note | | | 2.625%, 05/15/21 | | | 56,737 | | | | 0.4 | | |
| | 37,305,000 | | | | | United States Treasury Note | | | 2.625%, 06/15/21 | | | 37,423 | | | | 0.3 | | |
| | 109,500,000 | | | | | United States Treasury Note | | | 2.625%, 12/15/21 | | | 109,987 | | | | 0.8 | | |
| | 157,834,000 | | | | | United States Treasury Note | | | 2.750%, 04/30/23 | | | 159,458 | | | | 1.2 | | |
| | 144,842,000 | | | | | United States Treasury Note | | | 2.750%, 05/31/23 | | | 146,421 | | | | 1.1 | | |
| | 37,173,000 | | | | | United States Treasury Note | | | 2.875%, 11/30/23 | | | 37,818 | | | | 0.3 | | |
| | 44,450,000 | | | | | United States Treasury Note | | | 2.750%, 02/15/28 | | | 44,712 | | | | 0.3 | | |
| | | | | | | Other | | | | | | | 538,613 | | | | 4.0 | | |
| | | | | | | | | | | | | | 2,145,814 | | | | 16.2 | | |
| | | | | | | | TOTAL GOVERNMENT BONDS | | (Cost $6,094,602) | | | 6,052,887 | | | | 45.8 | | |
| STRUCTURED ASSETS | | | | | | | | | | | | | |
| ASSET BACKED | | | | | | | | | | | | | |
| | 39,990,000 | | | | | CNH Equipment Trust
Series - 2017 C (Class A4) | | 2.360%, 11/15/24 | | | 39,455 | | | | 0.3 | | |
| | 64,187,500 | | | g | | Domino’s Pizza Master Issuer LLC
Series - 2017 1A (Class A2II) | | 3.082%, 07/25/47 | | | 62,538 | | | | 0.5 | | |
| | 49,400,000 | | | | | Verizon Owner Trust
Series - 2018 A (Class A1A) | | 3.230%, 04/20/23 | | | 49,698 | | | | 0.4 | | |
| | 38,610,000 | | | g | | Wendys Funding LLC
Series - 2018 1A (Class A2I) | | 3.573%, 03/15/48 | | | 37,002 | | | | 0.3 | | |
| | | | | | | Other | | | | | | | 1,104,788 | | | | 8.3 | | |
| | | | | | | | | | | | | | 1,293,481 | | | | 9.8 | | |
| 64 | 2018 Annual Report ■ College Retirement Equities Fund | See notes to financial statements |
| Summary portfolio of investments | continued |
CREF Bond Market Account ■ December 31, 2018
| Principal | | | | | Issuer | | | | | | Value
(000) | | | % of net
assets | |
| OTHER MORTGAGE BACKED | | | | | | | | | | | | | |
| $ | 41,006,803 | | | i | | Connecticut Avenue Securities
Series - 2018 C01 (Class 1M1),
LIBOR 1 M + 0.600% | | 3.106%, 07/25/30 | | $ | 40,861 | | | | 0.3 | % | |
| | 40,467,008 | | | i | | Structured Agency Credit Risk Debt Note (STACR)
Series - 2017 DNA3 (Class M1),
LIBOR 1 M + 0.750% | | 3.256%, 03/25/30 | | | 40,344 | | | | 0.3 | | |
| | | | | | | Other | | | | | | | 1,253,251 | | | | 9.5 | | |
| | | | | | | | | | | | | | 1,334,456 | | | | 10.1 | | |
| | | | | | | | TOTAL STRUCTURED ASSETS | | (Cost $2,664,372) | | | 2,627,937 | | | | 19.9 | | |
| | | | | | | | | TOTAL BONDS | | (Cost $13,115,435) | | | 12,905,093 | | | | 97.6 | | |
| | | | | | | | | | | | | | | | | | | | |
| Shares | | | | | Company | | | | | | | | | | | | | |
| | | | | | | | | | | | | | | | | | | | |
| COMMON STOCKS | | | | | | | | | | | | | |
| TELECOMMUNICATION SERVICES | | | | | | | 236 | | | | 0.0 | | |
| | | | | | | | TOTAL COMMON STOCKS | | (Cost $1,332) | | | 236 | | | | 0.0 | | |
| | | | | | | | | | | | | | | | | | | | |
| PREFERRED STOCKS | | | | | | | | | | | | | |
| BANKS | | | | | | | | | | | | 13,907 | | | | 0.1 | | |
| | | | | | | | TOTAL PREFERRED STOCKS | | (Cost $49,941) | | | 13,907 | | | | 0.1 | | |
| | | | | | | | | | | | | | | | | | | |
| Principal | | | | | Issuer | | | | | | | | | | | | | |
| | | | | | | | | | | | | | | | | | | | |
| SHORT-TERM INVESTMENTS | | | | | | | | | | | | | |
| GOVERNMENT AGENCY DEBT | | | | | | | 5,612 | | | | 0.0 | | |
| TREASURY DEBT | | | | | | | 40,527 | | | | 0.3 | | |
| | | | | | | TOTAL SHORT-TERM INVESTMENTS | | (Cost $46,143) | | | 46,139 | | | | 0.3 | | |
| | | | | | | | | | | | | | | | | | | | |
| | | | | | | | | TOTAL PORTFOLIO | | (Cost $13,262,728) | | | 13,012,718 | | | | 98.4 | | |
| | | | | | | OTHER ASSETS & LIABILITIES, NET | | | | | 208,537 | | | | 1.6 | | |
| | | | | | | | | NET ASSETS | | | | $ | 13,221,255 | | | | 100.0 | % | |
Abbreviation(s):
| LIBOR | London Interbank Offered Rate |
| M | Month |
| g | Security is exempt from registration under Rule 144(A) of the Securities Act of 1933. Such securities are deemed liquid and may be resold in transactions exempt from registration to qualified institutional buyers. At 12/31/18, the aggregate value of these securities, including those in “Other,” was $2,462,298,460 or 18.6% of net assets. |
| i | Floating or variable rate security includes the reference rate and spread, unless the variable rate is based on the underlying asset of the security. Coupon rate reflects the rate at period end. |
“Other” securities represent the aggregate value, by category, of securities that are not among the 50 largest holdings and, in total for any issuer, represent 1% or less of net assets.
Cost amounts are in thousands.
For ease of presentation, a number of classification categories have been grouped together in the Summary portfolio of investments. Note that the Account uses more specific categories in following its investment limitations on investment concentrations.
| See notes to financial statements | College Retirement Equities Fund ■ 2018 Annual Report | 65 |
| Summary portfolio of investments | concluded |
CREF Bond Market Account ■ December 31, 2018
Forward foreign currency contracts outstanding as of December 31, 2018 were as follows (dollar amounts are in thousands) (See Note 3):
Currency
to be
purchased | Receive | | Currency
to be
sold | | Deliver | | Counterparty | | Settlement date | | Unrealized
appreciation
(depreciation | ) |
| $ | 9,476 | | CAD | | 12,409 | | Bank of America | | 01/31/19 | | $ | 379 | |
| $ | 928 | | EUR | | 816 | | Bank of America | | 01/31/19 | | | (10 | ) |
| $ | 2,170 | | ILS | | 7,978 | | Bank of America | | 01/31/19 | | | 31 | |
| EUR | 1,003 | | $ | | 1,144 | | Bank of America | | 01/31/19 | | | 8 | |
| EUR | 136 | | $ | | 155 | | Bank of America | | 01/31/19 | | | 1 | |
| Total | | | | | | | | | | | $ | 409 | |
| $ | 8,037 | | AUD | | 11,341 | | Citibank N.A. | | 01/31/19 | | $ | 44 | |
| $ | 945 | | CZK | | 21,320 | | Citibank N.A. | | 01/31/19 | | | (5 | ) |
| $ | 655 | | EUR | | 570 | | Citibank N.A. | | 01/31/19 | | | 1 | |
| $ | 1,219 | | EUR | | 1,067 | | Citibank N.A. | | 01/31/19 | | | (8 | ) |
| $ | 1,294 | | GBP | | 1,027 | | Citibank N.A. | | 01/31/19 | | | (17 | ) |
| $ | 8,962 | | KRW | | 10,135,381 | | Citibank N.A. | | 01/31/19 | | | (146 | ) |
| $ | 1,582 | | NOK | | 13,192 | | Citibank N.A. | | 01/31/19 | | | 54 | |
| $ | 795 | | NZD | | 1,170 | | Citibank N.A. | | 01/31/19 | | | 10 | |
| $ | 2,217 | | PLN | | 8,397 | | Citibank N.A. | | 01/31/19 | | | (28 | ) |
| $ | 4,512 | | SGD | | 6,227 | | Citibank N.A. | | 01/31/19 | | | (59 | ) |
| EUR | 1,923 | | $ | | 2,195 | | Citibank N.A. | | 01/31/19 | | | 14 | |
| EUR | 1,036 | | $ | | 1,189 | | Citibank N.A. | | 01/31/19 | | | 2 | |
| GBP | 465 | | $ | | 599 | | Citibank N.A. | | 01/31/19 | | | (6 | ) |
| GBP | 669 | | $ | | 854 | | Citibank N.A. | | 01/31/19 | | | (0 | )^ |
| GBP | 1,085 | | $ | | 1,385 | | Citibank N.A. | | 01/31/19 | | | (1 | ) |
| JPY | 144,543 | | $ | | 1,293 | | Citibank N.A. | | 01/31/19 | | | 29 | |
| Total | | | | | | | | | | | $ | (116 | ) |
| $ | 530 | | NZD | | 810 | | Morgan Stanley | | 01/31/19 | | $ | (14 | ) |
| $ | 1,634 | | THB | | 54,202 | | Morgan Stanley | | 01/31/19 | | | (32 | ) |
| $ | 822 | | THB | | 27,074 | | Morgan Stanley | | 01/31/19 | | | (10 | ) |
| JPY | 252,215 | | $ | | 2,285 | | Morgan Stanley | | 01/31/19 | | | 22 | |
| Total | | | | | | | | | | | $ | (34 | ) |
| $ | 4,232 | | EUR | | 3,707 | | Toronto Dominion Bank | | 01/31/19 | | $ | (27 | ) |
| $ | 609 | | EUR | | 534 | | Toronto Dominion Bank | | 01/31/19 | | | (4 | ) |
| $ | 2,160 | | EUR | | 1,893 | | Toronto Dominion Bank | | 01/31/19 | | | (14 | ) |
| $ | 75,747 | | EUR | | 65,973 | | Toronto Dominion Bank | | 01/31/19 | | | (44 | ) |
| $ | 19,792 | | GBP | | 15,371 | | Toronto Dominion Bank | | 01/31/19 | | | 169 | |
| $ | 35,749 | | JPY | | 3,987,834 | | Toronto Dominion Bank | | 01/31/19 | | | (725 | ) |
| $ | 563 | | SEK | | 5,098 | | Toronto Dominion Bank | | 01/31/19 | | | (14 | ) |
| $ | 920 | | ZAR | | 13,525 | | Toronto Dominion Bank | | 01/31/19 | | | (17 | ) |
| Total | | | | | | | | | | | $ | (676 | ) |
| Total | | | | | | | | | | | $ | (417 | ) |
| ^ | Amount represents less than $1,000. |
| Abbreviation(s): | | | | |
| | | | | |
| AUD | Australian Dollar | ILS | Israeli Shekel | PLN | Polish Zloty |
| CAD | Canadian Dollar | JPY | Japanese Yen | SEK | Swedish Krona |
| CZK | Czechoslovak Koruna | KRW | South Korean Won | SGD | Singapore Dollar |
| EUR | Euro | NOK | Norwegian Krone | THB | Thailand Baht |
| GBP | Pound Sterling | NZD | New Zealand Dollar | ZAR | South African Rand |
| 66 | 2018 Annual Report ■ College Retirement Equities Fund | See notes to financial statements |
Portfolio of investments
CREF Inflation-Linked Bond Account ■ December 31, 2018
| | | | | | | | | | | Value | | | % of net | |
| Principal | | | | | Issuer | | | | | | | (000) | | | | assets | |
| GOVERNMENT BONDS | | | | | | | | | | | | | |
| AGENCY SECURITIES | | | | | | | | | | | | | |
| $ | 4,375,000 | | | | | Crowley Conro LLC | | | | 4.181%, 08/15/43 | | $ | 4,553 | | | | 0.1 | % | |
| | 15,815,000 | | | | | Montefiore Medical Center | | | | 2.895%, 04/20/32 | | | 15,523 | | | | 0.2 | | |
| | 3,500,000 | | | | | Private Export Funding Corp (PEFCO) | | | | 2.300%, 09/15/20 | | | 3,473 | | | | 0.1 | | |
| | 3,000,000 | | | | | PEFCO | | | | 3.250%, 06/15/25 | | | 3,061 | | | | 0.0 | | |
| | 4,934,211 | | | | | Reliance Industries Ltd | | | | 2.444%, 01/15/26 | | | 4,881 | | | | 0.1 | | |
| | 3,500,000 | | | | | Ukraine Government AID Bonds | | | | 1.847%, 05/29/20 | | | 3,463 | | | | 0.1 | | |
| | 15,000,000 | | | | | Ukraine Government AID Bonds | | | | 1.471%, 09/29/21 | | | 14,513 | | | | 0.2 | | |
| | | | | | | | | | | | | | 49,467 | | | | 0.8 | | |
| MORTGAGE BACKED | | | | | | | | | | | | | |
| | 24,859,389 | | | | | Government National Mortgage Association (GNMA) | | | | 3.600%, 09/15/31 | | | 25,034 | | | | 0.4 | | |
| | 12,247,052 | | | | | GNMA | | | | 3.650%, 02/15/32 | | | 12,365 | | | | 0.2 | | |
| | 2,606,393 | | | | | GNMA | | | | 3.380%, 07/15/35 | | | 2,579 | | | | 0.0 | | |
| | 3,324,852 | | | | | GNMA | | | | 3.870%, 10/15/36 | | | 3,394 | | | | 0.1 | | |
| | | | | | | | | | | | | | 43,372 | | | | 0.7 | | |
| U.S. TREASURY SECURITIES | | | | | | | | | | | | | |
| | 116,117,448 | | | k | | United States Treasury Inflation Indexed Bonds | | | | 1.375%, 01/15/20 | | | 115,373 | | | | 1.8 | | |
| | 360,656,690 | | | k | | United States Treasury Inflation Indexed Bonds | | | | 0.125%, 04/15/20 | | | 352,552 | | | | 5.5 | | |
| | 215,237,985 | | | k | | United States Treasury Inflation Indexed Bonds | | | | 1.250%, 07/15/20 | | | 214,800 | | | | 3.4 | | |
| | 284,299,262 | | | k | | United States Treasury Inflation Indexed Bonds | | | | 1.125%, 01/15/21 | | | 283,010 | | | | 4.5 | | |
| | 339,283,740 | | | k | | United States Treasury Inflation Indexed Bonds | | | | 0.125%, 04/15/21 | | | 329,923 | | | | 5.2 | | |
| | 331,875,768 | | | k | | United States Treasury Inflation Indexed Bonds | | | | 0.625%, 07/15/21 | | | 328,260 | | | | 5.2 | | |
| | 353,025,495 | | | k | | United States Treasury Inflation Indexed Bonds | | | | 0.125%, 01/15/22 | | | 342,683 | | | | 5.4 | | |
| | 290,618,510 | | | k | | United States Treasury Inflation Indexed Bonds | | | | 0.125%, 04/15/22 | | | 281,147 | | | | 4.4 | | |
| | 359,572,470 | | | k | | United States Treasury Inflation Indexed Bonds | | | | 0.125%, 07/15/22 | | | 349,263 | | | | 5.5 | | |
| | 327,560,480 | | | k | | United States Treasury Inflation Indexed Bonds | | | | 0.125%, 01/15/23 | | | 316,391 | | | | 5.0 | | |
| | 223,457,585 | | | k | | United States Treasury Inflation Indexed Bonds | | | | 0.625%, 04/15/23 | | | 219,757 | | | | 3.5 | | |
| | 233,075,700 | | | k | | United States Treasury Inflation Indexed Bonds | | | | 0.375%, 07/15/23 | | | 227,904 | | | | 3.6 | | |
| | 150,910,795 | | | k | | United States Treasury Inflation Indexed Bonds | | | | 0.625%, 01/15/24 | | | 148,562 | | | | 2.3 | | |
| | 136,847,360 | | | k | | United States Treasury Inflation Indexed Bonds | | | | 0.125%, 07/15/24 | | | 131,236 | | | | 2.1 | | |
| | 174,022,060 | | | k | | United States Treasury Inflation Indexed Bonds | | | | 0.250%, 01/15/25 | | | 166,654 | | | | 2.6 | | |
| | 264,626,263 | | | k | | United States Treasury Inflation Indexed Bonds | | | | 2.375%, 01/15/25 | | | 286,142 | | | | 4.5 | | |
| | 115,162,560 | | | k | | United States Treasury Inflation Indexed Bonds | | | | 0.375%, 07/15/25 | | | 111,031 | | | | 1.7 | | |
| | 156,440,340 | | | k | | United States Treasury Inflation Indexed Bonds | | | | 0.625%, 01/15/26 | | | 152,289 | | | | 2.4 | | |
| | 211,269,341 | | | k | | United States Treasury Inflation Indexed Bonds | | | | 2.000%, 01/15/26 | | | 225,500 | | | | 3.5 | | |
| | 135,032,320 | | | k | | United States Treasury Inflation Indexed Bonds | | | | 0.125%, 07/15/26 | | | 126,785 | | | | 2.0 | | |
| | 209,889,415 | | | k | | United States Treasury Inflation Indexed Bonds | | | | 0.375%, 01/15/27 | | | 199,381 | | | | 3.1 | | |
| | 120,627,104 | | | k | | United States Treasury Inflation Indexed Bonds | | | | 2.375%, 01/15/27 | | | 133,177 | | | | 2.1 | | |
| | 119,396,970 | | | k | | United States Treasury Inflation Indexed Bonds | | | | 0.375%, 07/15/27 | | | 113,280 | | | | 1.8 | | |
| | 210,670,380 | | | k | | United States Treasury Inflation Indexed Bonds | | | | 0.500%, 01/15/28 | | | 201,071 | | | | 3.2 | | |
| | 208,093,696 | | | k | | United States Treasury Inflation Indexed Bonds | | | | 1.750%, 01/15/28 | | | 220,997 | | | | 3.5 | | |
| | 111,043,326 | | | k | | United States Treasury Inflation Indexed Bonds | | | | 3.625%, 04/15/28 | | | 136,278 | | | | 2.1 | | |
| | 90,665,100 | | | k | | United States Treasury Inflation Indexed Bonds | | | | 0.750%, 07/15/28 | | | 88,753 | | | | 1.4 | | |
| | 138,861,441 | | | k | | United States Treasury Inflation Indexed Bonds | | | | 2.500%, 01/15/29 | | | 158,057 | | | | 2.5 | | |
| | 192,413,438 | | | k | | United States Treasury Inflation Indexed Bonds | | | | 3.875%, 04/15/29 | | | 244,792 | | | | 3.9 | | |
| | 3,561,550 | | | k | | United States Treasury Inflation Indexed Bonds | | | | 3.375%, 04/15/32 | | | 4,567 | | | | 0.1 | | |
| See notes to financial statements | College Retirement Equities Fund ■ 2018 Annual Report | 67 |
| Portfolio of investments | concluded |
CREF Inflation-Linked Bond Account ■ December 31, 2018
| Principal | | | | | Issuer | | | | | | | Value
(000) | | | | % of net
assets | |
| U.S. TREASURY SECURITIES—continued | | | | | | | | | | | | | |
| $ | 10,000,000 | | | | | United States Treasury Note | | | | 3.125%, 11/15/28 | | $ | 10,379 | | | | 0.2 | % | |
| | | | | | | | | | | | | | 6,219,994 | | | | 98.0 | | |
| | | | | | | TOTAL GOVERNMENT BONDS | | (Cost $6,321,560) | | | 6,312,833 | | | | 99.5 | | |
| | | | | | | | | | | | | | | | | | | | |
| SHORT-TERM INVESTMENTS | | | | | | | | | | | | | |
| GOVERNMENT AGENCY DEBT | | | | | | | | | | | | | |
| | 8,770,000 | | | | | Federal Home Loan Bank (FHLB) | | | | 2.150%, 01/02/19 | | | 8,770 | | | | 0.2 | | |
| | | | | | | | | | | | | | 8,770 | | | | 0.2 | | |
| | | | | | | TOTAL SHORT-TERM INVESTMENTS | | (Cost $8,769) | | | 8,770 | | | | 0.2 | | |
| | | | | | | | | | | | | | | | | | | | |
| | | | | | | TOTAL PORTFOLIO | | (Cost $6,330,329) | | | 6,321,603 | | | | 99.7 | | |
| | | | | | | OTHER ASSETS & LIABILITIES, NET | | | | | 21,612 | | | | 0.3 | | |
| | | | | | | NET ASSETS | | | | $ | 6,343,215 | | | | 100.0 | % | |
| k | Principal amount for interest accrual purposes is periodically adjusted based on changes in the Consumer Price Index. |
Cost amounts are in thousands.
Futures contracts outstanding as of December 31, 2018 were as follows (notional amounts and values are in thousands) (See Note 3):
| Description | | Number of
long (short
contracts |
) | Expiration
date | | Notional
amount | | Value | | Unrealized
appreciation
(depreciation | ) |
| US 10 Year Note (CBT) | | (100) | | 03/20/19 | | $ (11,917) | | $ (12,202) | | $ (285) | |
| 68 | 2018 Annual Report ■ College Retirement Equities Fund | See notes to financial statements |
Summary portfolio of investments
CREF Social Choice Account ■ December 31, 2018
| Principal | | | | | Issuer | | | | Value
(000) | | | % of net
assets | |
| BANK LOAN OBLIGATIONS | | | | | | | | | |
| COMMERCIAL & PROFESSIONAL SERVICES | | $ | 5,092 | | | | 0.1 | % | |
| ENERGY | | | 3,750 | | | | 0.0 | | |
| MATERIALS | | | 2,851 | | | | 0.0 | | |
| MEDIA & ENTERTAINMENT | | | 10,682 | | | | 0.1 | | |
| TECHNOLOGY HARDWARE & EQUIPMENT | | | 8,166 | | | | 0.0 | | |
| UTILITIES | | | 15,963 | | | | 0.1 | | |
| | | | | | TOTAL BANK LOAN OBLIGATIONS | | (Cost $50,712) | | | 46,504 | | | | 0.3 | | |
| BONDS | | | | | | | | | |
| | | | | | | | | | |
| CORPORATE BONDS | | | | | | | | | |
| AUTOMOBILES & COMPONENTS | | | 22,597 | | | | 0.2 | | |
| BANKS | | | 406,480 | | | | 3.2 | | |
| CAPITAL GOODS | | | 56,085 | | | | 0.4 | | |
| COMMERCIAL & PROFESSIONAL SERVICES | | | 16,259 | | | | 0.1 | | |
| CONSUMER SERVICES | | | 81,130 | | | | 0.6 | | |
| DIVERSIFIED FINANCIALS | | | 103,337 | | | | 0.8 | | |
| ENERGY | | | 171,975 | | | | 1.4 | | |
| HEALTH CARE EQUIPMENT & SERVICES | | | 43,367 | | | | 0.4 | | |
| HOUSEHOLD & PERSONAL PRODUCTS | | | 2,795 | | | | 0.0 | | |
| INSURANCE | | | 55,508 | | | | 0.4 | | |
| MATERIALS | | | 103,098 | | | | 0.8 | | |
| MEDIA & ENTERTAINMENT | | | 28,493 | | | | 0.2 | | |
| PHARMACEUTICALS, BIOTECHNOLOGY & LIFE SCIENCES | | | 41,576 | | | | 0.3 | | |
| REAL ESTATE | | | 89,984 | | | | 0.7 | | |
| TECHNOLOGY HARDWARE & EQUIPMENT | | | 22,123 | | | | 0.2 | | |
| TELECOMMUNICATION SERVICES | | | 40,352 | | | | 0.3 | | |
| TRANSPORTATION | | | 125,204 | | | | 1.0 | | |
| UTILITIES | | | | | | | | | |
| $ | 38,828,500 | | | e,g | | Star Energy Geothermal Wayang Windu Ltd | | 6.750%, 04/24/33 | | | 35,624 | | | | 0.3 | | |
| | | | Other | | | | | 420,013 | | | | 3.3 | | |
| | | | 455,637 | | | | 3.6 | | |
| | | | | | TOTAL CORPORATE BONDS | | (Cost $1,918,130) | | | 1,866,000 | | | | 14.6 | | |
| See notes to financial statements | College Retirement Equities Fund ■ 2018 Annual Report | 69 |
| Summary portfolio of investments | continued |
CREF Social Choice Account ■ December 31, 2018
| Principal | | | | Issuer | | | | Value
(000) | | | % of net
assets | |
| GOVERNMENT BONDS | | | | | | | | | | | |
| AGENCY SECURITIES | | | | | | | | | | | |
| $ | 45,500,000 | | | | Iraq Government AID Bond | | 2.149%, 01/18/22 | | $ | 44,701 | | | | 0.3 | % | |
| | 171,523,990 | | j | | Overseas Private Investment Corp (OPIC) | | | | | | | | | | | |
| | | | | | 0.000%–3.938%, 09/30/19–07/31/33 | | | 174,003 | | | | 1.4 | | |
| | | | | | Other | | | | | 283,124 | | | | 2.2 | | |
| | | | | | | | | | | 501,828 | | | | 3.9 | | |
| FOREIGN GOVERNMENT BONDS | | | | | | | | | | | |
| | 46,500,000 | | | | International Finance Corp | | 1.546%, 11/04/21 | | | 44,889 | | | | 0.4 | | |
| | 41,500,000 | | | | International Finance Corp | | 2.125%, 04/07/26 | | | 39,812 | | | | 0.3 | | |
| | | | | | Other | | | | | 448,873 | | | | 3.5 | | |
| | | | | | | | | | | | | 533,574 | | | | 4.2 | | |
| MORTGAGE BACKED | | | | | | | | | | | |
| | 165,710,921 | | | | Federal Home Loan Mortgage | | | | | | | | | | | |
| | | | | | Corp Gold (FGLMC) | | 3.000%–8.000%, 10/01/20–08/01/48 | | | 167,121 | | | | 1.3 | | |
| | 56,845,610 | | | | Federal National Mortgage Association (FNMA) | | 3.000%, 02/25/48 | | | 56,290 | | | | 0.4 | | |
| | 58,924,018 | | | | FNMA | | 4.000%, 04/01/48 | | | 60,301 | | | | 0.5 | | |
| | 337,148,236 | | | | FNMA | | 1.625%–8.000%, 01/21/20–01/25/49 | | | 344,153 | | | | 2.7 | | |
| | 42,984,530 | | | | Government National Mortgage Association (GNMA) | | 3.500%, 12/20/47 | | | 43,298 | | | | 0.3 | | |
| | 39,959,935 | | | | GNMA | | 3.500%, 01/20/48 | | | 40,251 | | | | 0.3 | | |
| | | | | | Other | | | | | | | 143,396 | | | | 1.1 | | |
| | | | | | | | | | | 854,810 | | | | 6.6 | | |
| MUNICIPAL BONDS | | | | | | | | | | | |
| | 38,830,000 | | | | State of California | | 3.750%, 10/01/37 | | | 39,594 | | | | 0.3 | | |
| | | | | | Other | | | | | 630,704 | | | | 4.9 | | |
| | | | | | | | | | | 670,298 | | | | 5.2 | | |
| U.S. TREASURY SECURITIES | | | | | | | | | | | |
| | 66,090,000 | | | | United States Treasury Bond | | 2.875%, 11/15/46 | | | 64,376 | | | | 0.5 | | |
| | 88,925,000 | | | | United States Treasury Bond | | 3.000%, 05/15/47 | | | 88,700 | | | | 0.7 | | |
| | 42,880,000 | | | | United States Treasury Note | | 2.875%, 09/30/23 | | | 43,575 | | | | 0.3 | | |
| | | | | | Other | | | | | 138,809 | | | | 1.1 | | |
| | | | | | | | | | | 335,460 | | | | 2.6 | | |
| | | | | | TOTAL GOVERNMENT BONDS | | (Cost $2,903,462) | | | 2,895,970 | | | | 22.5 | | |
| | | | | | | | | | | | | | | | | |
| STRUCTURED ASSETS | | | | | | | | | | | |
| ASSET BACKED | | | | | 237,004 | | | | 1.8 | | |
| OTHER MORTGAGE BACKED | | | | | 340,483 | | | | 2.7 | | |
| | | | | | TOTAL STRUCTURED ASSETS | | (Cost $582,827) | | | 577,487 | | | | 4.5 | | |
| | | | | | TOTAL BONDS | | (Cost $5,404,419) | | | 5,339,457 | | | | 41.6 | | |
| 70 | 2018 Annual Report ■ College Retirement Equities Fund | See notes to financial statements |
| Summary portfolio of investments | continued |
CREF Social Choice Account ■ December 31, 2018
| Shares | | | | Company | | Value
(000) | | | % of net
assets | |
| COMMON STOCKS | | | | | | | | | |
| AUTOMOBILES & COMPONENTS | | $ | 127,964 | | | | 1.0 | % | |
| BANKS | | | | | | | | | |
| | 2,868,991 | | | | Bank of America Corp | | | 70,692 | | | | 0.5 | | |
| | | | | | Other | | | 449,780 | | | | 3.5 | | |
| | | | | | | | | 520,472 | | | | 4.0 | | |
| CAPITAL GOODS | | | | | | | | | |
| | 249,070 | | | | 3M Co | | | 47,458 | | | | 0.4 | | |
| | | | | | Other | | | 454,462 | | | | 3.5 | | |
| | | | | | | | | 501,920 | | | | 3.9 | | |
| COMMERCIAL & PROFESSIONAL SERVICES | | | 99,070 | | | | 0.8 | | |
| CONSUMER DURABLES & APPAREL | | | | | | | | | |
| | 601,225 | | | | Nike, Inc (Class B) | | | 44,575 | | | | 0.3 | | |
| | | | | | Other | | | 100,283 | | | | 0.8 | | |
| | | | | | | | | 144,858 | | | | 1.1 | | |
| CONSUMER SERVICES | | | | | | | | | |
| | 662,396 | | | | Starbucks Corp | | | 42,658 | | | | 0.4 | | |
| | | | | | Other | | | 131,395 | | | | 1.0 | | |
| | | | | | | | | 174,053 | | | | 1.4 | | |
| DIVERSIFIED FINANCIALS | | | | | | | | | |
| | 388,609 | | | | American Express Co | | | 37,042 | | | | 0.3 | | |
| | 203,549 | | | | CME Group, Inc | | | 38,292 | | | | 0.3 | | |
| | | | | | Other | | | 345,308 | | | | 2.7 | | |
| | | | | | | | | 420,642 | | | | 3.3 | | |
| ENERGY | | | | | | | | | |
| | 629,558 | | | | ConocoPhillips | | | 39,253 | | | | 0.3 | | |
| | | | | | Other | | | 341,052 | | | | 2.7 | | |
| | | | | | | | | 380,305 | | | | 3.0 | | |
| FOOD & STAPLES RETAILING | | | 57,613 | | | | 0.4 | | |
| FOOD, BEVERAGE & TOBACCO | | | | | | | | | |
| | 1,300,747 | | | | Coca-Cola Co | | | 61,590 | | | | 0.5 | | |
| | 891,007 | | | | Mondelez International, Inc | | | 35,667 | | | | 0.3 | | |
| | 590,550 | | | | Nestle S.A. | | | 47,931 | | | | 0.3 | | |
| | 511,551 | | | | PepsiCo, Inc | | | 56,516 | | | | 0.4 | | |
| | | | | | Other | | | 113,035 | | | | 0.9 | | |
| | | | | | | | | 314,739 | | | | 2.4 | | |
| HEALTH CARE EQUIPMENT & SERVICES | | | | | | | | | |
| | 164,724 | | | | Becton Dickinson & Co | | | 37,116 | | | | 0.3 | | |
| | 287,788 | | | | UnitedHealth Group, Inc | | | 71,694 | | | | 0.5 | | |
| | | | | | Other | | | 268,858 | | | | 2.1 | | |
| | | | | | | | | 377,668 | | | | 2.9 | | |
| See notes to financial statements | College Retirement Equities Fund ■ 2018 Annual Report | 71 |
| Summary portfolio of investments | continued |
CREF Social Choice Account ■ December 31, 2018
| Shares | | | | Company | | Value
(000) | | | % of net
assets | |
| HOUSEHOLD & PERSONAL PRODUCTS | | | | | | | | | |
| | 768,452 | | | | Procter & Gamble Co | | $ | 70,636 | | | | 0.5 | % | |
| | | | | | Other | | | 103,067 | | | | 0.8 | | |
| | | | | | | | | 173,703 | | | | 1.3 | | |
| INSURANCE | | | | | | | | | |
| | 288,074 | | | | Chubb Ltd | | | 37,213 | | | | 0.3 | | |
| | | | | | Other | | | 296,596 | | | | 2.3 | | |
| | | | | | | | | 333,809 | | | | 2.6 | | |
| MATERIALS | | | 343,658 | | | | 2.7 | | |
| MEDIA & ENTERTAINMENT | | | | | | | | | |
| | 49,500 | | * | | Alphabet, Inc (Class A) | | | 51,725 | | | | 0.4 | | |
| | 51,184 | | * | | Alphabet, Inc (Class C) | | | 53,007 | | | | 0.4 | | |
| | 176,049 | | * | | NetFlix, Inc | | | 47,121 | | | | 0.4 | | |
| | | | | | Other | | | 112,687 | | | | 0.9 | | |
| | | | | | | | | 264,540 | | | | 2.1 | | |
| PHARMACEUTICALS, BIOTECHNOLOGY & LIFE SCIENCES | | | | | | | | | |
| | 402,535 | | | | AbbVie, Inc | | | 37,110 | | | | 0.3 | | |
| | 254,585 | | | | Amgen, Inc | | | 49,560 | | | | 0.4 | | |
| | 431,197 | | | | Eli Lilly & Co | | | 49,898 | | | | 0.4 | | |
| | 874,008 | | | | Schering-Plough Corp | | | 66,783 | | | | 0.5 | | |
| | | | | | Other | | | 428,692 | | | | 3.3 | | |
| | | | | | | | | 632,043 | | | | 4.9 | | |
| REAL ESTATE | | | | | | | | | |
| | 244,770 | | | | American Tower Corp | | | 38,720 | | | | 0.3 | | |
| | | | | | Other | | | 224,216 | | | | 1.7 | | |
| | | | | | | | | 262,936 | | | | 2.0 | | |
| RETAILING | | | | | | | | | |
| | 23,621 | | * | | Booking Holdings, Inc | | | 40,685 | | | | 0.3 | | |
| | 370,326 | | | | Home Depot, Inc | | | 63,629 | | | | 0.5 | | |
| | 401,684 | | | | Lowe’s Companies, Inc | | | 37,100 | | | | 0.3 | | |
| | | | | | Other | | | 177,546 | | | | 1.4 | | |
| | | | | | | | | 318,960 | | | | 2.5 | | |
| SEMICONDUCTORS & SEMICONDUCTOR EQUIPMENT | | | | | | | | | |
| | 1,322,542 | | | | Intel Corp | | | 62,067 | | | | 0.5 | | |
| | 435,099 | | | | Texas Instruments, Inc | | | 41,117 | | | | 0.3 | | |
| | | | | | Other | | | 77,378 | | | | 0.6 | | |
| | | | | | | | | 180,562 | | | | 1.4 | | |
| SOFTWARE & SERVICES | | | | | | | | | |
| | 299,265 | | | | Accenture plc | | | 42,199 | | | | 0.3 | | |
| | 396,413 | | | | International Business Machines Corp | | | 45,060 | | | | 0.3 | | |
| | 1,758,895 | | | | Microsoft Corp | | | 178,651 | | | | 1.4 | | |
| | 1,118,967 | | | | Oracle Corp | | | 50,521 | | | | 0.4 | | |
| | 336,752 | | * | | salesforce.com, Inc | | | 46,125 | | | | 0.4 | | |
| | | | | | Other | | | 278,417 | | | | 2.2 | | |
| | | | | | | | | 640,973 | | | | 5.0 | | |
| 72 | 2018 Annual Report ■ College Retirement Equities Fund | See notes to financial statements |
| Summary portfolio of investments | continued |
CREF Social Choice Account ■ December 31, 2018
| Shares | | | | Company | | | | Value
(000) | | | % of net
assets | |
| TECHNOLOGY HARDWARE & EQUIPMENT | | | | | | | | | | | |
| | 1,036,835 | | | | Apple, Inc | | | | $ | 163,550 | | | | 1.3 | % | |
| | 1,503,382 | | | | Cisco Systems, Inc | | | | | 65,142 | | | | 0.5 | | |
| | | | | | Other | | | | | 154,434 | | | | 1.2 | | |
| | | | | | | | | | | 383,126 | | | | 3.0 | | |
| TELECOMMUNICATION SERVICES | | | | | | | | | | | |
| | 723,589 | | | | Verizon Communications, Inc | | | | | 40,680 | | | | 0.3 | | |
| | | | | | Other | | | | | 137,725 | | | | 1.1 | | |
| | | | | | | | | | | 178,405 | | | | 1.4 | | |
| TRANSPORTATION | | | | | | | | | | | |
| | 286,217 | | | | Union Pacific Corp | | | | | 39,564 | | | | 0.3 | | |
| | | | | | Other | | | | | 174,407 | | | | 1.4 | | |
| | | | | | | | | | | 213,971 | | | | 1.7 | | |
| UTILITIES | | | | | 275,788 | | | | 2.1 | | |
| | | | | | TOTAL COMMON STOCKS | | (Cost $6,553,152) | | | 7,321,778 | | | | 56.9 | | |
| | | | | | | | | | | | | | | | | |
| PREFERRED STOCKS | | | | | | | | | | | |
| BANKS | | | | | 21,463 | | | | 0.2 | | |
| | | | | | TOTAL PREFERRED STOCKS | | (Cost $38,865) | | | 21,463 | | | | 0.2 | | |
| | | | | | | | | | | | | | | | | |
| RIGHTS / WARRANTS | | | | | | | | | | | |
| ENERGY | | | | | 267 | | | | 0.0 | | |
| | | | | | TOTAL RIGHTS / WARRANTS | | (Cost $272) | | | 267 | | | | 0.0 | | |
| | | | | | | | | | | | | | | | | |
| Principal | | | | Issuer | | | | | | | | | | | | |
| | | | | | | | | | | | | | | | | |
| SHORT-TERM INVESTMENTS | | | | | | | | | | | |
| GOVERNMENT AGENCY DEBT | | | | | 28,910 | | | | 0.2 | | |
| TREASURY DEBT | | | | | 19,896 | | | | 0.2 | | |
| | | | | | | | | | | | | | | | | |
| | Shares | | | | Company | | | | | | | | | | | | |
| INVESTMENTS IN REGISTERED INVESTMENT COMPANIES | | | | | | | | | | | |
| | 156,436,465 | | c | | State Street Navigator Securities Lending | | | | | | | | | | | |
| | | | | | Government Money Market Portfolio | | | | | 156,436 | | | | 1.2 | | |
| | | | | | | | | | | 156,436 | | | | 1.2 | | |
| | | | | | TOTAL SHORT-TERM INVESTMENTS | | (Cost $205,242) | | | 205,242 | | | | 1.6 | | |
| | | | | | | | | | | | | | | | | |
| | | | | | TOTAL PORTFOLIO | | (Cost $12,252,662) | | | 12,934,711 | | | | 100.6 | | |
| | | | | | OTHER ASSETS & LIABILITIES, NET | | | | | (76,344 | ) | | | (0.6 | ) | |
| | | | | | NET ASSETS | | | | $ | 12,858,367 | | | | 100.0 | % | |
| See notes to financial statements | College Retirement Equities Fund ■ 2018 Annual Report | 73 |
| Summary portfolio of investments | concluded |
CREF Social Choice Account ■ December 31, 2018
| * | Non-income producing |
| c | Investments made with cash collateral received from securities on loan. |
| e | All or a portion of these securities are out on loan. The aggregate value of securities on loan is $150,948,463. |
| g | Security is exempt from registration under Rule 144(A) of the Securities Act of 1933. Such securities are deemed liquid and may be resold in transactions exempt from registration to qualified institutional buyers. At 12/31/18, the aggregate value of these securities, including those in “Other,” was $1,241,326,160 or 9.7% of net assets. |
| j | Zero coupon |
“Other” securities represent the aggregate value, by category, of securities that are not among the 50 largest holdings and, in total for any issuer, represent 1% or less of net assets.
Cost amounts are in thousands.
For ease of presentation, a number of classification categories have been grouped together in the Summary portfolio of investments. Note that the Account uses more specific categories in following its investment limitations on investment concentrations.
| 74 | 2018 Annual Report ■ College Retirement Equities Fund | See notes to financial statements |
Summary portfolio of investments
CREF Money Market Account ■ December 31, 2018
| | Principal | | | | | Issuer | | | | | | | Value
(000) | | | % of net
assets | |
| SHORT-TERM INVESTMENTS | | | | | | | | | |
| | | | | | | | | | | | | | | | | | | | |
| GOVERNMENT AGENCY DEBT | | | | | | | | | | | | | |
| $623,350,000 | | | | | Federal Farm Credit Bank (FFCB) | | 0.010%, 01/07/19–05/23/19 | | $ | 620,354 | | | | 6.3 | % | |
| | 80,000,000 | | | | | Federal Home Loan Bank (FHLB) | | | | 0.010%, 01/04/19 | | | 79,985 | | | | 0.8 | | |
| | 80,000,000 | | | | | FHLB | | | | 0.010%, 01/08/19 | | | 79,966 | | | | 0.8 | | |
| | 110,258,000 | | | | | FHLB | | | | 0.010%, 01/09/19 | | | 110,203 | | | | 1.1 | | |
| | 110,725,000 | | | | | FHLB | | | | 0.010%, 01/11/19 | | | 110,656 | | | | 1.1 | | |
| | 100,590,000 | | | | | FHLB | | | | 0.010%, 01/14/19 | | | 100,508 | | | | 1.0 | | |
| | 95,090,000 | | | | | FHLB | | | | 0.010%, 01/23/19 | | | 94,958 | | | | 1.0 | | |
| | 183,000,000 | | | | | FHLB | | | | 0.010%, 01/28/19 | | | 182,684 | | | | 1.9 | | |
| | 90,000,000 | | | | | FHLB | | | | 0.010%, 01/29/19 | | | 89,840 | | | | 0.9 | | |
| | 138,350,000 | | | | | FHLB | | | | 0.010%, 01/30/19 | | | 138,094 | | | | 1.4 | | |
| | 130,497,000 | | | | | FHLB | | | | 0.010%, 02/01/19 | | | 130,235 | | | | 1.3 | | |
| | 90,200,000 | | | | | FHLB | | | | 0.010%, 02/05/19 | | | 89,992 | | | | 0.9 | | |
| | 111,775,000 | | | | | FHLB | | | | 0.010%, 02/06/19 | | | 111,515 | | | | 1.1 | | |
| | 168,500,000 | | | | | FHLB | | | | 0.010%, 02/11/19 | | | 168,048 | | | | 1.7 | | |
| | 70,000,000 | | | | | FHLB | | | | 0.010%, 02/15/19 | | | 69,793 | | | | 0.7 | | |
| | 94,398,000 | | | | | FHLB | | | | 0.010%, 02/20/19 | | | 94,088 | | | | 1.0 | | |
| | 100,000,000 | | | | | FHLB | | | | 0.010%, 02/25/19 | | | 99,641 | | | | 1.0 | | |
| | 70,000,000 | | | | | FHLB | | | | 0.010%, 02/26/19 | | | 69,743 | | | | 0.7 | | |
| | 82,800,000 | | | | | FHLB | | | | 0.010%, 03/05/19 | | | 82,456 | | | | 0.8 | | |
| | 108,000,000 | | | | | FHLB | | | | 0.010%, 03/08/19 | | | 107,526 | | | | 1.1 | | |
| | 101,500,000 | | | | | FHLB | | | | 0.010%, 03/11/19 | | | 101,034 | | | | 1.0 | | |
| | 100,000,000 | | | | | FHLB | | | | 0.010%, 03/12/19 | | | 99,538 | | | | 1.0 | | |
| | 97,230,000 | | | | | FHLB | | | | 0.010%, 03/13/19 | | | 96,772 | | | | 1.0 | | |
| | 83,855,000 | | | | | FHLB | | | | 0.010%, 03/18/19 | | | 83,431 | | | | 0.8 | | |
| | 859,309,000 | | | | | FHLB | | 0.010%, 01/02/19–05/03/19 | | | 856,537 | | | | 8.7 | | |
| | 70,000,000 | | | | | Federal Home Loan Mortgage Corp (FHLMC) | | 0.010%, 01/07/19 | | | 69,975 | | | | 0.7 | | |
| | 110,635,000 | | | | | FHLMC | | | | 0.010%, 01/22/19 | | | 110,490 | | | | 1.1 | | |
| | 78,985,000 | | | | | FHLMC | | | | 0.010%, 02/13/19 | | | 78,764 | | | | 0.8 | | |
| | 100,000,000 | | | | | FHLMC | | | | 0.010%, 03/04/19 | | | 99,592 | | | | 1.0 | | |
| | 94,274,000 | | | | | FHLMC | | | | 0.010%, 03/11/19 | | | 93,841 | | | | 1.0 | | |
| | 565,120,000 | | | | | FHLMC | | 0.010%, 01/02/19–03/26/19 | | | 563,372 | | | | 5.7 | | |
| | 80,000,000 | | | | | Federal National Mortgage Association (FNMA) | | 0.010%, 02/04/19 | | | 79,827 | | | | 0.8 | | |
| | 70,000,000 | | | | | FNMA | | | | 0.010%, 02/12/19 | | | 69,812 | | | | 0.7 | | |
| | 801,918,000 | | | | | FNMA | | 0.010%–1.875%, 01/02/19–03/20/19 | | | 799,819 | | | | 8.1 | | |
| | | | | | | Other | | | | | | | 61,673 | | | | 0.6 | | |
| | | | | | | | | | | | | | 5,894,762 | | | | 59.6 | | |
| TREASURY DEBT | | | | | | | | | | | | | |
| | 120,000,000 | | | | | United States Treasury Bill | | | | 0.010%, 01/03/19 | | | 119,986 | | | | 1.2 | | |
| | 133,625,000 | | | | | United States Treasury Bill | | | | 0.010%, 01/10/19 | | | 133,553 | | | | 1.3 | | |
| | 111,465,000 | | | | | United States Treasury Bill | | | | 0.010%, 01/17/19 | | | 111,357 | | | | 1.1 | | |
| | 129,485,000 | | | | | United States Treasury Bill | | | | 0.010%, 01/24/19 | | | 129,301 | | | | 1.3 | | |
| | 80,000,000 | | | | | United States Treasury Bill | | | | 0.010%, 01/31/19 | | | 79,846 | | | | 0.8 | | |
| | 140,000,000 | | | | | United States Treasury Bill | | | | 0.010%, 02/07/19 | | | 139,678 | | | | 1.4 | | |
| | 109,055,000 | | | | | United States Treasury Bill | | | | 0.010%, 02/14/19 | | | 108,753 | | | | 1.1 | | |
| | 164,455,000 | | | | | United States Treasury Bill | | | | 0.010%, 02/21/19 | | | 163,922 | | | | 1.7 | | |
| | 81,660,000 | | | | | United States Treasury Bill | | | | 0.010%, 02/28/19 | | | 81,356 | | | | 0.8 | | |
| | 116,110,000 | | | | | United States Treasury Bill | | | | 0.010%, 03/07/19 | | | 115,620 | | | | 1.2 | | |
| | 101,020,000 | | | | | United States Treasury Bill | | | | 0.010%, 03/14/19 | | | 100,548 | | | | 1.0 | | |
| | | |
| See notes to financial statements | College Retirement Equities Fund ■ 2018 Annual Report | 75 |
| Summary portfolio of investments | concluded |
CREF Money Market Account ■ December 31, 2018
| | | | | | | | | | | | Value | | | % of net | |
| Principal | | | | | Issuer | | | | | | (000) | | | assets | |
| TREASURY DEBT—continued | | | | | | | | | | | | | |
| $ 92,435,000 | | | | | United States Treasury Bill | | | | 0.010%, 04/04/19 | | $ | 91,868 | | | | 0.9 | % | |
| | 75,000,000 | | | | | United States Treasury Bill | | | | 0.010%, 04/11/19 | | | 74,499 | | | | 0.8 | | |
| | 267,535,000 | | | | | United States Treasury Bill | | 0.010%, 01/08/19–05/16/19 | | | 266,309 | | | | 2.7 | | |
| | 91,250,000 | | | | | United States Treasury Note | | | | 1.125%, 01/15/19 | | | 91,211 | | | | 0.9 | | |
| | 78,590,000 | | | | | United States Treasury Note | | | | 1.000%, 03/15/19 | | | 78,370 | | | | 0.8 | | |
| | 148,140,000 | | | | | United States Treasury Note | | 0.750%–1.500%, 01/31/19–02/28/19 | | | 147,948 | | | | 1.5 | | |
| | | | | | | | | | | | | | 2,034,125 | | | | 20.5 | | |
| VARIABLE RATE SECURITIES | | | | | | | | | | | | | |
| | 385,500,000 | | | i | | Federal Agricultural Mortgage Corp (FAMC), LIBOR 1 M – 0.105%–LIBOR 3 M – 0.200% | | 2.244%–2.567%, 01/25/19–02/26/20 | | | 385,500 | | | | 3.9 | | |
| | 80,000,000 | | | i | | Federal Farm Credit Bank (FFCB), FRED – 2.980% | | | | 2.520%, 02/20/20 | | | 79,996 | | | | 0.8 | | |
| | 767,400,000 | | | i | | FFCB, LIBOR 1 M – 0.125%–FRED – 2.870% | 2.258%–2.630%, 01/14/19–08/17/20 | | | 767,312 | | | | 7.8 | | |
| | 72,500,000 | | | i | | Federal Home Loan Bank (FHLB), LIBOR 3 M – 0.200% | | | | 2.245%, 01/18/19 | | | 72,500 | | | | 0.7 | | |
| | 69,000,000 | | | i | | FHLB, SOFR + 4.000% | | | | 2.500%, 05/15/19 | | | 69,000 | | | | 0.7 | | |
| | 180,300,000 | | | i | | FHLB, LIBOR 1 M – 0.070%–US Treasury Bill 3 M + 0.070%, | | 2.351%–2.534%, 02/13/19–01/30/20 | | | 180,304 | | | | 1.8 | | |
| | 80,900,000 | | | i | | Federal Home Loan Mortgage Corp (FHLMC), LIBOR 1 M – 0.100% | | | | 2.287%, 08/08/19 | | | 80,901 | | | | 0.8 | | |
| | 149,500,000 | | | i | | FHLMC, LIBOR 3 M – 0.165%–SOFR + 3.000% | | 2.243%–2.490%, 05/08/19–08/27/19 | | | 149,503 | | | | 1.5 | | |
| | 120,000,000 | | | i | | United States Treasury Floating Rate Note, US Treasury Bill 3 M + 0.033% | | | | 2.463%, 04/30/20 | | | 120,025 | | | | 1.2 | | |
| | | | | | | Other | | | | | | | 85,008 | | | | 0.9 | | |
| | | | | | | | | | | | | | 1,990,049 | | | | 20.1 | | |
| | | | | | | TOTAL SHORT-TERM INVESTMENTS | | (Cost $9,918,936) | | | 9,918,936 | | | | 100.2 | | |
| | | | | | | | | | | | | | | | | | |
| | | | | | | TOTAL PORTFOLIO | | (Cost $9,918,936) | | | 9,918,936 | | | | 100.2 | | |
| | | | | | | OTHER ASSETS & LIABILITIES, NET | | | | | (20,562 | ) | | | (0.2 | ) | |
| | | | | | | NET ASSETS | | | | $ | 9,898,374 | | | | 100.0 | % | |
Abbreviation(s):
| FRED | Federal Bank Prime Loan Rate |
| LIBOR | London Interbank Offered Rate |
| M | Month |
| SOFR | Secure Overnight Financing Rate |
| i | Floating or variable rate security includes the reference rate and spread, unless the variable rate is based on the underlying asset of the security. Coupon rate reflects the rate at period end. |
“Other” securities represent the aggregate value, by category, of securities that are not among the 50 largest holdings and, in total for any issuer, represent 1% or less of net assets.
Cost amounts are in thousands.
For ease of presentation, a number of classification categories have been grouped together in the Summary portfolio of investments. Note that the Account uses more specific categories in following its investment limitations on investment concentrations.
| 76 | 2018 Annual Report ■ College Retirement Equities Fund | See notes to financial statements |
[This page intentionally left blank.]
| College Retirement Equities Fund ■ 2018 Annual Report | 77 |
Statements of assets and liabilities
College Retirement Equities Fund ■ December 31, 2018
| | | | | Stock | | | Global Equities | | | Growth | | | Equity Index | | | Bond Market | | | Inflation-Linked | | | Social Choice | | | Money Market | |
| (amounts in thousands, except accumulation unit value) | | Account | | | Account | | | Account | | | Account | | | Account | | | Bond Account | | | Account | | | Account | |
| ASSETS | | | | | | | | | | | | | | | | | | | | | | | | | | | | | | | | | | |
| Portfolio investments, at value*† | | $ | 105,075,261 | | | $ | 18,484,902 | | | $ | 23,298,775 | | | $ | 16,939,473 | | | $ | 13,012,718 | | | $ | 6,321,603 | | | $ | 12,934,711 | | | $ | 9,918,936 | |
| Affiliated investments, at value‡ | | | 223,283 | | | | — | | | | — | | | | — | | | | — | | | | — | | | | — | | | | — | |
| Total portfolio investments, at value | | $ | 105,298,544 | | | $ | 18,484,902 | | | $ | 23,298,775 | | | $ | 16,939,473 | | | $ | 13,012,718 | | | $ | 6,321,603 | | | $ | 12,934,711 | | | $ | 9,918,936 | |
| Cash**#§ | | | | | 155,044 | | | | 27,485 | | | | 12,572 | | | | 8,773 | | | | 95,749 | | | | 360 | | | | 27,493 | | | | 236 | |
| Cash – foreign^ | | | | | 6,520 | | | | 1,538 | | | | — | | | | — | | | | 9 | | | | — | | | | 156 | | | | — | |
| Dividends and interest receivable | | | 150,609 | | | | 22,710 | | | | 11,162 | | | | 21,066 | | | | 78,997 | | | | 21,189 | | | | 50,027 | | | | 6,619 | |
| Receivable from securities transactions | | | 249,547 | | | | 21,668 | | | | 46,409 | | | | 544 | | | | 30,598 | | | | 2,639 | | | | 5,711 | | | | — | |
| Receivable for delayed delivery securities | | | 6,972 | | | | 530 | | | | 37,875 | | | | — | | | | 78,404 | | | | — | | | | 16,001 | | | | — | |
| Unrealized appreciation on forward foreign currency contracts | | | 479 | | | | — | | | | — | | | | — | | | | 764 | | | | — | | | | — | | | | — | |
| Due from affiliates | | | — | | | | — | | | | — | | | | — | | | | 54 | | | | — | | | | — | | | | — | |
| Receivable for variation margin on open futures contracts | | | — | | | | — | | | | — | | | | 2,528 | | | | — | | | | — | | | | — | | | | — | |
| Other | | | | | 10,415 | | | | 2,053 | | | | 2,151 | | | | 1,883 | | | | 1,682 | | | | 1,307 | | | | 2,046 | | | | 1,649 | |
| Total assets | | | | | 105,878,130 | | | | 18,560,886 | | | | 23,408,944 | | | | 16,974,267 | | | | 13,298,975 | | | | 6,347,098 | | | | 13,036,145 | | | | 9,927,440 | |
| LIABILITIES | | | | | | | | | | | | | | | | | | | | | | | | | | | | | | | | | | |
| Investment management fees payable | | | 1,830 | | | | 47 | | | | 34 | | | | 38 | | | | 91 | | | | 57 | | | | 338 | | | | 92 | |
| Service agreement fees payable | | | 1,807 | | | | 223 | | | | 368 | | | | 242 | | | | 18 | | | | 148 | | | | — | | | | 315 | |
| Payable for collateral for securities loaned | | | 1,723,589 | | | | 272,113 | | | | 85,482 | | | | 133,009 | | | | — | | | | — | | | | 156,436 | | | | — | |
| Payable for securities transactions | | | 146,607 | | | | 54,385 | | | | 87,154 | | | | 398 | | | | — | | | | — | | | | 156 | | | | 25,705 | |
| Payable for delayed delivery securities | | | 4,689 | | | | 3,983 | | | | — | | | | — | | | | 74,685 | | | | — | | | | 16,110 | | | | — | |
| Due to affiliates | | | | | 130,924 | | | | 5,841 | | | | 6,543 | | | | 7,202 | | | | — | | | | 2,086 | | | | 3,092 | | | | 1,228 | |
| Payable for variation margin on futures contracts | | | 19,215 | | | | 8,358 | | | | — | | | | — | | | | — | | | | 285 | | | | — | | | | — | |
| Written options◊ | | | 2,235 | | | | — | | | | — | | | | — | | | | — | | | | — | | | | — | | | | — | |
| Payable for trustee compensation | | | 10,236 | | | | 2,051 | | | | 2,149 | | | | 1,823 | | | | 1,740 | | | | 1,307 | | | | 1,646 | | | | 1,649 | |
| Unrealized depreciation on forward foreign currency contracts | | | 82 | | | | — | | | | — | | | | — | | | | 1,181 | | | | — | | | | — | | | | — | |
| Other | | | | | 1,167 | | | | 22 | | | | — | | | | — | | | | 5 | | | | — | | | | — | | | | 77 | |
| Total liabilities | | | | | 2,042,381 | | | | 347,023 | | | | 181,730 | | | | 142,712 | | | | 77,720 | | | | 3,883 | | | | 177,778 | | | | 29,066 | |
| NET ASSETS | | | | $ | 103,835,749 | | | $ | 18,213,863 | | | $ | 23,227,214 | | | $ | 16,831,555 | | | $ | 13,221,255 | | | $ | 6,343,215 | | | $ | 12,858,367 | | | $ | 9,898,374 | |
| CLASS R1 (Accumulation): | | Net assets | | $ | 12,654,918 | | | $ | 3,154,187 | | | $ | 4,311,075 | | | $ | 3,307,983 | | | $ | 2,047,580 | | | $ | 963,761 | | | $ | 2,104,433 | | | $ | 1,866,007 | |
| | | Units outstanding | | | 29,035 | | | | 20,074 | | | | 24,070 | | | | 16,072 | | | | 16,899 | | | | 14,117 | | | | 9,410 | | | | 72,141 | |
| | | Unit value | | $ | 435.85 | | | $ | 157.13 | | | $ | 179.10 | | | $ | 205.82 | | | $ | 121.17 | | | $ | 68.27 | | | $ | 223.63 | | | $ | 25.87 | |
| CLASS R2 (Accumulation): | | Net assets | | | 30,865,756 | | | | 6,104,210 | | | | 7,850,327 | | | | 5,728,005 | | | | 4,567,262 | | | | 2,027,775 | | | | 4,475,554 | | | | 2,970,199 | |
| | | Units outstanding | | | 70,170 | | | | 38,495 | | | | 43,432 | | | | 27,576 | | | | 37,350 | | | | 29,433 | | | | 19,830 | | | | 114,237 | |
| | | Unit value | | $ | 439.87 | | | $ | 158.57 | | | $ | 180.75 | | | $ | 207.72 | | | $ | 122.28 | | | $ | 68.90 | | | $ | 225.69 | | | $ | 26.00 | |
| CLASS R3 (Accumulation): | | Net assets | | | 50,308,827 | | | | 8,621,101 | | | | 10,665,099 | | | | 7,418,245 | | | | 6,329,207 | | | | 3,171,055 | | | | 5,930,851 | | | | 4,927,134 | |
| | | Units outstanding | | | 114,039 | | | | 54,209 | | | | 58,832 | | | | 35,609 | | | | 51,609 | | | | 45,894 | | | | 26,202 | | | | 189,001 | |
| | | Unit value | | $ | 441.15 | | | $ | 159.04 | | | $ | 181.28 | | | $ | 208.32 | | | $ | 122.64 | | | $ | 69.10 | | | $ | 226.35 | | | $ | 26.07 | |
| ANNUITY: | | Net assets | | $ | 10,006,248 | | | $ | 334,365 | | | $ | 400,713 | | | $ | 377,322 | | | $ | 277,206 | | | $ | 180,624 | | | $ | 347,529 | | | $ | 135,034 | |
| * Includes securities loaned of | | $ | 1,647,490 | | | $ | 257,173 | | | $ | 84,094 | | | $ | 129,294 | | | $ | — | | | $ | — | | | $ | 150,948 | | | $ | — | |
| ** Includes cash collateral for securities loaned of | | $ | 100,221 | | | $ | 14,644 | | | $ | — | | | $ | — | | | $ | — | | | $ | — | | | $ | — | | | $ | — | |
| # Includes cash collateral for mortgage dollar rolls of | | $ | — | | | $ | — | | | $ | — | | | $ | — | | | $ | 95,000 | | | $ | — | | | $ | 27,501 | | | $ | — | |
| § Includes cash collateral for open futures contracts of | | $ | — | | | $ | — | | | $ | — | | | $ | — | | | $ | — | | | $ | 105 | | | $ | — | | | $ | — | |
| † Portfolio investments; unaffiliated issuers cost | | $ | 107,555,804 | | | $ | 19,087,872 | | | $ | 20,255,847 | | | $ | 8,644,587 | | | $ | 13,262,728 | | | $ | 6,330,329 | | | $ | 12,252,662 | | | $ | 9,918,936 | |
| ‡ Portfolio investments; affiliated issuers cost | | $ | 417,513 | | | $ | — | | | $ | — | | | $ | — | | | $ | — | | | $ | — | | | $ | — | | | $ | — | |
| ^ Foreign cash, cost | | $ | 6,511 | | | $ | 1,538 | | | $ | — | | | $ | — | | | $ | 9 | | | $ | — | | | $ | 156 | | | $ | — | |
| ◊ Written options premiums | | $ | 2,696 | | | $ | — | | | $ | — | | | $ | — | | | $ | — | | | $ | — | | | $ | — | | | $ | — | |
| | | | | | |
| 78 | 2018 Annual Report ■ College Retirement Equities Fund | See notes to financial statements | See notes to financial statements | College Retirement Equities Fund ■ 2018 Annual Report | 79 |
Statements of operations
College Retirement Equities Fund ■ For the year ended December 31, 2018
| | | Stock | | | Global Equities | | | Growth | | | Equity Index | | | Bond Market | | | Inflation-Linked | | | Social Choice | | | Money Market | |
| (amounts in thousands) | | Account | | | Account | | | Account | | | Account | | | Account | | | Bond Account | | | Account | | | Account | |
| INVESTMENT INCOME | | | | | | | | | | | | | | | | | | | | | | | | | | | | | | | | |
| Dividends: | | | | | | | | | | | | | | | | | | | | | | | | | | | | | | | | |
| Unaffiliated issuers* | | $ | 2,513,785 | | | $ | 416,844 | | | $ | 288,936 | | | $ | 373,646 | | | $ | — | | | $ | — | | | $ | 184,637 | | | $ | — | |
| Affiliated issuers | | | 2,595 | | | | — | | | | — | | | | — | | | | — | | | | — | | | | — | | | | — | |
| Income from securities lending | | | 38,183 | | | | 7,420 | | | | 1,626 | | | | 3,472 | | | | — | | | | — | | | | 2,508 | | | | — | |
| Interest | | | 12,039 | | | | 6,116 | | | | 1,523 | | | | 1,433 | | | | 425,964 | | | | 197,910 | | | | 185,046 | | | | 175,312 | |
| Other | | | — | | | | — | | | | — | | | | — | | | | 1,508 | | | | — | | | | 2,654 | | | | — | |
| Total income | | | 2,566,602 | | | | 430,380 | | | | 292,085 | | | | 378,551 | | | | 427,472 | | | | 197,910 | | | | 374,845 | | | | 175,312 | |
| EXPENSES | | | | | | | | | | | | | | | | | | | | | | | | | | | | | | | | |
| Investment management fees | | | 125,226 | | | | 21,801 | | | | 10,172 | | | | 2,968 | | | | 12,343 | | | | 1,536 | | | | 6,160 | | | | 2,625 | |
| Administrative – Class R1 | | | 41,458 | | | | 9,981 | | | | 13,705 | | | | 10,536 | | | | 5,795 | | | | 2,749 | | | | 6,393 | | | | 5,074 | |
| Administrative – Class R2 | | | 58,744 | | | | 11,321 | | | | 14,564 | | | | 10,600 | | | | 7,458 | | | | 3,306 | | | | 7,869 | | | | 4,594 | |
| Administrative – Class R3 | | | 99,195 | | | | 14,091 | | | | 17,505 | | | | 12,363 | | | | 9,289 | | | | 4,732 | | | | 9,506 | | | | 6,741 | |
| Distribution fees – Class R1 | | | 21,620 | | | | 5,195 | | | | 7,131 | | | | 5,488 | | | | 3,015 | | | | 1,430 | | | | 3,330 | | | | 2,635 | |
| Distribution fees – Class R2 | | | 27,233 | | | | 5,241 | | | | 6,742 | | | | 4,913 | | | | 3,455 | | | | 1,532 | | | | 3,647 | | | | 2,125 | |
| Distribution fees – Class R3 | | | 37,821 | | | | 5,387 | | | | 6,712 | | | | 4,724 | | | | 3,536 | | | | 1,803 | | | | 3,624 | | | | 2,570 | |
| Mortality and expense risk charges | | | 6,127 | | | | 1,038 | | | | 1,330 | | | | 963 | | | | 668 | | | | 321 | | | | 700 | | | | 475 | |
| Total expenses | | | 417,424 | | | | 74,055 | | | | 77,861 | | | | 52,555 | | | | 45,559 | | | | 17,409 | | | | 41,229 | | | | 26,839 | |
| Plus: Recovery of expenses previously withheld by TIAA | | | — | | | | — | | | | — | | | | — | | | | — | | | | — | | | | — | | | | 22,072 | |
| Net expenses | | | 417,424 | | | | 74,055 | | | | 77,861 | | | | 52,555 | | | | 45,559 | | | | 17,409 | | | | 41,229 | | | | 48,911 | |
| Net investment income (loss) | | | 2,149,178 | | | | 356,325 | | | | 214,224 | | | | 325,996 | | | | 381,913 | | | | 180,501 | | | | 333,616 | | | | 126,401 | |
| NET REALIZED AND UNREALIZED GAIN (LOSS) ON TOTAL INVESTMENTS |
| Realized gain (loss): | | | | | | | | | | | | | | | | | | | | | | | | | | | | | | | | |
| Portfolio investments: | | | | | | | | | | | | | | | | | | | | | | | | | | | | | | | | |
| Unaffiliated issuers† | | | 12,218,069 | | | | 1,775,995 | | | | 3,390,111 | | | | 1,117,785 | | | | (113,342 | ) | | | 6,175 | | | | 1,081,646 | | | | (5 | ) |
| Affiliated issuers | | | (28,645 | ) | | | — | | | | — | | | | — | | | | — | | | | — | | | | — | | | | — | |
| Forward foreign currency contracts | | | 325 | | | | — | | | | — | | | | — | | | | 8,991 | | | | — | | | | — | | | | — | |
| Futures contracts | | | (21,641 | ) | | | (14,462 | ) | | | — | | | | (6,342 | ) | | | — | | | | 405 | | | | — | | | | — | |
| Purchased options | | | (11,366 | ) | | | (985 | ) | | | — | | | | — | | | | — | | | | — | | | | — | | | | — | |
| Written options | | | 18,514 | | | | 53 | | | | — | | | | — | | | | — | | | | — | | | | — | | | | — | |
| Swap contracts | | | (3,015 | ) | | | — | | | | — | | | | — | | | | (1,532 | ) | | | — | | | | — | | | | — | |
| Foreign currency transactions | | | (15,159 | ) | | | (4,580 | ) | | | (178 | ) | | | — | | | | (73 | ) | | | — | | | | (771 | ) | | | — | |
| Net realized gain (loss) on total investments | | | 12,157,082 | | | | 1,756,021 | | | | 3,389,933 | | | | 1,111,443 | | | | (105,956 | ) | | | 6,580 | | | | 1,080,875 | | | | (5 | ) |
| Change in unrealized appreciation (depreciation) on: | | | | | | | | | | | | | | | | | | | | | | | | | | | | | | | | |
| Portfolio investments: | | | | | | | | | | | | | | | | | | | | | | | | | | | | | | | | |
| Unaffiliated issuers‡ | | | (25,104,620 | ) | | | (4,693,852 | ) | | | (4,097,874 | ) | | | (2,351,154 | ) | | | (318,094 | ) | | | (222,282 | ) | | | (1,994,357 | ) | | | — | |
| Affiliated issuers | | | (216,833 | ) | | | — | | | | — | | | | — | | | | — | | | | — | | | | — | | | | — | |
| Forward foreign currency contracts | | | 397 | | | | — | | | | — | | | | — | | | | 733 | | | | — | | | | — | | | | — | |
| Futures contracts | | | (21,524 | ) | | | (12,539 | ) | | | — | | | | 1,798 | | | | — | | | | (322 | ) | | | — | | | | — | |
| Purchased options | | | (2,126 | ) | | | — | | | | — | | | | — | | | | — | | | | — | | | | — | | | | — | |
| Written options | | | 148 | | | | — | | | | — | | | | — | | | | — | | | | — | | | | — | | | | — | |
| Swap contracts | | | 190 | | | | — | | | | — | | | | — | | | | — | | | | — | | | | — | | | | — | |
| Translation of assets (other than portfolio investments) and liabilities denominated in foreign currencies | | | (1,347 | ) | | | (338 | ) | | | 7 | | | | — | | | | (49 | ) | | | — | | | | (172 | ) | | | — | |
| Net change in unrealized appreciation (depreciation) on total investments | | | (25,345,715 | ) | | | (4,706,729 | ) | | | (4,097,867 | ) | | | (2,349,356 | ) | | | (317,410 | ) | | | (222,604 | ) | | | (1,994,529 | ) | | | — | |
| Net realized and unrealized gain (loss) on total investments | | | (13,188,633 | ) | | | (2,950,708 | ) | | | (707,934 | ) | | | (1,237,913 | ) | | | (423,366 | ) | | | (216,024 | ) | | | (913,654 | ) | | | (5 | ) |
| Net increase (decrease) in net assets from operations | | $ | (11,039,455 | ) | | $ | (2,594,383 | ) | | $ | (493,710 | ) | | $ | (911,917 | ) | | $ | (41,453 | ) | | $ | (35,523 | ) | | $ | (580,038 | ) | | $ | 126,396 | |
| * Net of foreign withholding taxes of unaffiliated issuers | | $ | 110,159 | | | $ | 23,205 | | | $ | 2,103 | | | $ | 36 | | | $ | 153 | | | $ | — | | | $ | 7,510 | | | $ | — | |
| † Includes net realized gain (loss) from securities sold to affiliates of | | $ | 691,502 | | | $ | 332,182 | | | $ | 139,993 | | | $ | 54,804 | | | $ | — | | | $ | — | | | $ | 8,480 | | | $ | — | |
| ‡ Includes net change in unrealized foreign capital gains taxes of | | $ | 12,613 | | | $ | 1,651 | | | $ | — | | | $ | — | | | $ | 3 | | | $ | — | | | $ | — | | | $ | — | |
| | | | | | |
| 80 | 2018 Annual Report ■ College Retirement Equities Fund | See notes to financial statements | See notes to financial statements | College Retirement Equities Fund ■ 2018 Annual Report | 81 |
Statements of changes in net assets
College Retirement Equities Fund ■ For the year ended
| | | | | Stock Account | | Global Equities Account | | Growth Account |
| (amounts in thousands except accumulation units) | | December 31, 2018 | | | December 31, 2017 | | | December 31, 2018 | | | December 31, 2017 | | | December 31, 2018 | | | December 31, 2017 | |
| | | | | | | | | | | | | | | | | | | | | | | | | | | |
| OPERATIONS | | | | | | | | | | | | | | | | | | | | | | | | | | |
| Net investment income (loss) | | $ | 2,149,178 | | | $ | 1,996,008 | | | $ | 356,325 | | | $ | 315,950 | | | $ | 214,224 | | | $ | 178,818 | |
| Net realized gain (loss) on total investments | | | 12,157,082 | | | | 10,273,736 | | | | 1,756,021 | | | | 1,165,787 | | | | 3,389,933 | | | | 1,981,280 | |
| Net change in unrealized appreciation (depreciation) on total investments | | | (25,345,715 | ) | | | 12,938,878 | | | | (4,706,729 | ) | | | 2,794,100 | | | | (4,097,867 | ) | | | 4,221,425 | |
| Net increase (decrease) in net assets from operations | | | (11,039,455 | ) | | | 25,208,622 | | | | (2,594,383 | ) | | | 4,275,837 | | | | (493,710 | ) | | | 6,381,523 | |
| | | | | | | | | | | | | | | | | | | | | | | | | |
| FROM PARTICIPANT TRANSACTIONS | | | | | | | | | | | | | | | | | | | | | | | | |
| Premiums and contributions: | | Class R1 | | | 503,440 | | | | 562,937 | | | | 332,518 | | | | 167,345 | | | | 328,870 | | | | 269,213 | |
| | | Class R2 | | | 1,080,613 | | | | 1,096,517 | | | | 441,149 | | | | 251,551 | | | | 378,005 | | | | 383,624 | |
| | | Class R3 | | | 1,780,589 | | | | 1,796,500 | | | | 869,721 | | | | 399,103 | | | | 644,534 | | | | 477,167 | |
| Net transfers between CREF Accounts | | Class R1 | | | (519,523 | ) | | | (157,164 | ) | | | 7,063 | | | | (11,609 | ) | | | (150,821 | ) | | | (23,121 | ) |
| | | Class R2 | | | (928,765 | ) | | | (369,898 | ) | | | 131,993 | | | | (26,675 | ) | | | (187,671 | ) | | | (65,068 | ) |
| | | Class R3 | | | 167,910 | | | | (242,297 | ) | | | 459,837 | | | | 29,658 | | | | 116,893 | | | | 13,161 | |
| Withdrawals and death benefits | | Class R1 | | | (1,811,834 | ) | | | (1,838,633 | ) | | | (411,738 | ) | | | (456,836 | ) | | | (609,583 | ) | | | (542,934 | ) |
| | | Class R2 | | | (4,170,883 | ) | | | (4,132,496 | ) | | | (731,937 | ) | | | (786,449 | ) | | | (974,735 | ) | | | (897,313 | ) |
| | | Class R3 | | | (6,681,747 | ) | | | (6,731,436 | ) | | | (1,024,120 | ) | | | (1,145,370 | ) | | | (1,361,909 | ) | | | (1,250,681 | ) |
| Annuity payments: | | | | | (1,438,858 | ) | | | (1,363,308 | ) | | | (40,478 | ) | | | (36,450 | ) | | | (43,694 | ) | | | (36,769 | ) |
| Net increase (decrease) from participant transactions | | | (12,019,058 | ) | | | (11,379,278 | ) | | | 34,008 | | | | (1,615,732 | ) | | | (1,860,111 | ) | | | (1,672,721 | ) |
| Net increase (decrease) in net assets | | | (23,058,513 | ) | | | 13,829,344 | | | | (2,560,375 | ) | | | 2,660,105 | | | | (2,353,821 | ) | | | 4,708,802 | |
| | | | | | | | | | | | | | | | | | | | | | | | | | | |
| NET ASSETS | | | | | | | | | | | | | | | | | | | | | | | | | | |
| Beginning of period | | | | | 126,894,262 | | | | 113,064,918 | | | | 20,774,238 | | | | 18,114,133 | | | | 25,581,035 | | | | 20,872,233 | |
| End of period | | | | $ | 103,835,749 | | | $ | 126,894,262 | | | $ | 18,213,863 | | | $ | 20,774,238 | | | $ | 23,227,214 | | | $ | 25,581,035 | |
| | | | | | | | | | | | | | | | | | | | | | | | | | | |
| ACCUMULATION UNITS: | | | | | | | | | | | | | | | | | | | | | | | | | | |
| Units purchased: | | Class R1 | | | 1,034,071 | | | | 1,287,244 | | | | 1,861,332 | | | | 1,036,261 | | | | 1,666,487 | | | | 1,653,539 | |
| | | Class R2 | | | 2,196,235 | | | | 2,487,252 | | | | 2,434,695 | | | | 1,542,146 | | | | 1,899,333 | | | | 2,356,504 | |
| | | Class R3 | | | 3,253,935 | | | | 3,662,867 | | | | 4,692,659 | | | | 2,298,296 | | | | 3,113,703 | | | | 2,752,948 | |
| Units sold / transferred: | | Class R1 | | | (4,786,952 | ) | | | (4,559,634 | ) | | | (2,271,931 | ) | | | (2,911,570 | ) | | | (3,897,846 | ) | | | (3,488,438 | ) |
| | | Class R2 | | | (10,368,888 | ) | | | (10,225,025 | ) | | | (3,337,694 | ) | | | (5,022,346 | ) | | | (5,870,818 | ) | | | (5,914,089 | ) |
| | | Class R3 | | | (13,178,771 | ) | | | (15,744,720 | ) | | | (3,153,669 | ) | | | (6,880,321 | ) | | | (6,287,298 | ) | | | (7,591,087 | ) |
| Outstanding: | | | | | | | | | | | | | | | | | | | | | | | | | | |
| Beginning of period | | | | | 235,095,367 | | | | 258,187,383 | | | | 112,552,603 | | | | 122,490,137 | | | | 135,710,739 | | | | 145,941,362 | |
| End of period | | | | | 213,244,997 | | | | 235,095,367 | | | | 112,777,995 | | | | 112,552,603 | | | | 126,334,300 | | | | 135,710,739 | |
| | | | | | |
| 82 | 2018 Annual Report ■ College Retirement Equities Fund | See notes to financial statements | See notes to financial statements | College Retirement Equities Fund ■ 2018 Annual Report | 83 |
| Statements of changes in net assets | continued |
| | |
| College Retirement Equities Fund ■ For the year ended | |
| | |
| | | | | Equity Index Account | | Bond Market Account | | Inflation-Linked Bond Account |
| (amounts in thousands except accumulation units) | | December 31, 2018 | | | December 31, 2017 | | | December 31, 2018 | | | December 31, 2017 | | | December 31, 2018 | | | December 31, 2017 | |
| | | | | | | | | | | | | | | | | | | |
| OPERATIONS | | | | | | | | | | | | | | | | | | | | | | | | |
| Net investment income (loss) | | $ | 325,996 | | | $ | 297,825 | | | $ | 381,913 | | | $ | 349,341 | | | $ | 180,501 | | | $ | 147,769 | |
| Net realized gain (loss) on total investments | | | 1,111,443 | | | | 801,964 | | | | (105,956 | ) | | | 39,709 | | | | 6,580 | | | | 18,997 | |
| Net change in unrealized appreciation (depreciation) on total investments | | | (2,349,356 | ) | | | 2,384,274 | | | | (317,410 | ) | | | 150,734 | | | | (222,604 | ) | | | (49,795 | ) |
| Net increase (decrease) in net assets from operations | | | (911,917 | ) | | | 3,484,063 | | | | (41,453 | ) | | | 539,784 | | | | (35,523 | ) | | | 116,971 | |
| | | | | | | | | | | | | | | | | | | | | | | | | |
| FROM PARTICIPANT TRANSACTIONS | | | | | | | | | | | | | | | | | | | | | | | | |
| Premiums and contributions: | | Class R1 | | | 200,197 | | | | 236,397 | | | | 136,171 | | | | 155,840 | | | | 67,815 | | | | 69,648 | |
| | | Class R2 | | | 271,121 | | | | 308,385 | | | | 291,918 | | | | 327,534 | | | | 154,399 | | | | 154,467 | |
| | | Class R3 | | | 349,033 | | | | 372,915 | | | | 449,478 | | | | 487,490 | | | | 260,514 | | | | 256,823 | |
| Net transfers between CREF Accounts | | Class R1 | | | (133,292 | ) | | | (12,562 | ) | | | 13,932 | | | | 109,837 | | | | 3,421 | | | | 11,522 | |
| | | Class R2 | | | (138,318 | ) | | | (66,983 | ) | | | 94,759 | | | | 239,495 | | | | 64,477 | | | | 67,789 | |
| | | Class R3 | | | (20,287 | ) | | | 62,438 | | | | 255,450 | | | | 341,833 | | | | 149,050 | | | | 112,192 | |
| Withdrawals and death benefits | | Class R1 | | | (485,194 | ) | | | (501,867 | ) | | | (299,729 | ) | | | (312,433 | ) | | | (141,219 | ) | | | (162,852 | ) |
| | | Class R2 | | | (807,336 | ) | | | (768,991 | ) | | | (622,902 | ) | | | (608,059 | ) | | | (275,659 | ) | | | (286,394 | ) |
| | | Class R3 | | | (983,535 | ) | | | (1,007,528 | ) | | | (869,297 | ) | | | (911,805 | ) | | | (431,600 | ) | | | (478,592 | ) |
| Annuity payments: | | | | | (43,024 | ) | | | (39,262 | ) | | | (27,803 | ) | | | (27,849 | ) | | | (19,015 | ) | | | (19,915 | ) |
| Net increase (decrease) from participant transactions | | | (1,790,635 | ) | | | (1,417,058 | ) | | | (578,023 | ) | | | (198,117 | ) | | | (167,817 | ) | | | (275,312 | ) |
| Net increase (decrease) in net assets | | | (2,702,552 | ) | | | 2,067,005 | | | | (619,476 | ) | | | 341,667 | | | | (203,340 | ) | | | (158,341 | ) |
| | | | | | | | | | | | | | | | | | | | | | | | | |
| NET ASSETS | | | | | | | | | | | | | | | | | | | | | | | | | | |
| Beginning of period | | | | | 19,534,107 | | | | 17,467,102 | | | | 13,840,731 | | | | 13,499,064 | | | | 6,546,555 | | | | 6,704,896 | |
| End of period | | | | $ | 16,831,555 | | | $ | 19,534,107 | | | $ | 13,221,255 | | | $ | 13,840,731 | | | $ | 6,343,215 | | | $ | 6,546,555 | |
| | | | | | | | | | | | | | | | | | | | | | | | | | | |
| ACCUMULATION UNITS: | | | | | | | | | | | | | | | | | | | | | | | | | | |
| Units purchased: | | Class R1 | | | 891,750 | | | | 1,197,768 | | | | 1,137,926 | | | | 1,300,109 | | | | 993,482 | | | | 1,018,589 | |
| | | Class R2 | | | 1,198,508 | | | | 1,551,881 | | | | 2,420,078 | | | | 2,713,650 | | | | 2,243,650 | | | | 2,245,476 | |
| | | Class R3 | | | 1,463,674 | | | | 1,735,236 | | | | 3,559,308 | | | | 3,841,293 | | | | 3,673,498 | | | | 3,586,822 | |
| Units sold / transferred: | | Class R1 | | | (2,763,741 | ) | | | (2,592,555 | ) | | | (2,391,872 | ) | | | (1,694,376 | ) | | | (2,019,198 | ) | | | (2,212,715 | ) |
| | | Class R2 | | | (4,166,875 | ) | | | (4,186,789 | ) | | | (4,379,958 | ) | | | (3,062,047 | ) | | | (3,067,963 | ) | | | (3,176,740 | ) |
| | | Class R3 | | | (4,398,867 | ) | | | (4,742,130 | ) | | | (5,070,279 | ) | | | (4,702,871 | ) | | | (4,069,349 | ) | | | (5,279,162 | ) |
| Outstanding: | | | | | | | | | | | | | | | | | | | | | | | | | | |
| Beginning of period | | | | | 87,032,718 | | | | 94,069,307 | | | | 110,582,657 | | | | 112,186,899 | | | | 91,690,444 | | | | 95,508,174 | |
| End of period | | | | | 79,257,167 | | | | 87,032,718 | | | | 105,857,860 | | | | 110,582,657 | | | | 89,444,564 | | | | 91,690,444 | |
| | | | | | |
| 84 | 2018 Annual Report ■ College Retirement Equities Fund | See notes to financial statements | See notes to financial statements | College Retirement Equities Fund ■ 2018 Annual Report | 85 |
| Statements of changes in net assets | concluded |
| | |
| College Retirement Equities Fund ■ For the year ended | |
| | |
| | | | | Social Choice Account | | Money Market Account |
| (amounts in thousands except accumulation units) | | December 31, 2018 | | | December 31, 2017 | | | December 31, 2018 | | | December 31, 2017 | |
| | | | | | | | | | | | | | | | | |
| OPERATIONS | | | | | | | | | | | | | | | | |
| Net investment income (loss) | | $ | 333,616 | | | $ | 308,805 | | | $ | 126,401 | | | $ | 41,788 | |
| Net realized gain (loss) on total investments | | | 1,080,875 | | | | 553,058 | | | | (5 | ) | | | (3 | ) |
| Net change in unrealized appreciation (depreciation) | | | | | | | | | | | | | | | | |
| on total investments | | | (1,994,529 | ) | | | 989,572 | | | | — | | | | — | |
| Net increase (decrease) in net assets from operations | | | (580,038 | ) | | | 1,851,435 | | | | 126,396 | | | | 41,785 | |
| | | | | | | | | | | | | | | | | |
| FROM PARTICIPANT TRANSACTIONS | | | | | | | | | | | | | | | | |
| Premiums and contributions: | | Class R1 | | | 117,086 | | | | 119,019 | | | | 749,850 | | | | 840,606 | |
| | | Class R2 | | | 214,761 | | | | 225,417 | | | | 843,285 | | | | 753,090 | |
| | | Class R3 | | | 303,754 | | | | 293,384 | | | | 1,560,336 | | | | 1,286,365 | |
| Net transfers between CREF Accounts | | Class R1 | | | (71,016 | ) | | | (14,789 | ) | | | 21,896 | | | | (81,617 | ) |
| | | Class R2 | | | (98,505 | ) | | | (51,616 | ) | | | 219,439 | | | | 11,156 | |
| | | Class R3 | | | 59,266 | | | | 71,683 | | | | 482,808 | | | | 52,635 | |
| Withdrawals and death benefits | | Class R1 | | | (268,792 | ) | | | (271,321 | ) | | | (767,215 | ) | | | (1,066,634 | ) |
| | | Class R2 | | | (521,801 | ) | | | (530,080 | ) | | | (967,447 | ) | | | (1,245,857 | ) |
| | | Class R3 | | | (692,272 | ) | | | (716,951 | ) | | | (1,716,480 | ) | | | (2,065,474 | ) |
| Annuity payments: | | | | | (36,758 | ) | | | (34,518 | ) | | | (14,918 | ) | | | (16,521 | ) |
| Net increase (decrease) from participant transactions | | | (994,277 | ) | | | (909,772 | ) | | | 411,554 | | | | (1,532,251 | ) |
| Net increase (decrease) in net assets | | | (1,574,315 | ) | | | 941,663 | | | | 537,950 | | | | (1,490,466 | ) |
| | | | | | | | | | | | | | | | | | | |
| NET ASSETS | | | | | | | | | | | | | | | | | | |
| Beginning of period | | | | | 14,432,682 | | | | 13,491,019 | | | | 9,360,424 | | | | 10,850,890 | |
| End of period | | | | $ | 12,858,367 | | | $ | 14,432,682 | | | $ | 9,898,374 | | | $ | 9,360,424 | |
| | | | | | | | | | | | | | | | | |
| ACCUMULATION UNITS: | | | | | | | | | | | | | | | | |
| Units purchased: | | Class R1 | | | 499,348 | | | | 541,328 | | | | 29,165,709 | | | | 32,902,182 | |
| | | Class R2 | | | 906,825 | | | | 1,019,875 | | | | 32,681,140 | | | | 29,428,852 | |
| | | Class R3 | | | 1,186,592 | | | | 1,229,882 | | | | 60,106,404 | | | | 49,905,789 | |
| Units sold / transferred: | | Class R1 | | | (1,449,236 | ) | | | (1,302,201 | ) | | | (29,000,184 | ) | | | (44,947,545 | ) |
| | | Class R2 | | | (2,618,815 | ) | | | (2,631,542 | ) | | | (29,017,834 | ) | | | (48,263,532 | ) |
| | | Class R3 | | | (2,666,460 | ) | | | (2,916,334 | ) | | | (47,738,385 | ) | | | (77,878,520 | ) |
| Outstanding: | | | | | | | | | | | | | | | | | | |
| Beginning of period | | | | | 59,584,805 | | | | 63,643,797 | | | | 359,182,406 | | | | 418,035,180 | |
| End of period | | | | | 55,443,059 | | | | 59,584,805 | | | | 375,379,256 | | | | 359,182,406 | |
| | | | | | |
| 86 | 2018 Annual Report ■ College Retirement Equities Fund | See notes to financial statements | See notes to financial statements | College Retirement Equities Fund ■ 2018 Annual Report | 87 |
Financial highlights
College Retirement Equities Fund
| | | | | | Selected per accumulation unit data | | | | | | Ratios and supplemental data | |
| | | | | | Gain (loss) from investment operations | | | | | | | | | | | | | | | | | | | | | | | | | |
| | | | | | | | | | | | | | | | | | Net realized | | | | | | | | | | | | | | | Ratios to average net assets | | | | | Accumulation | | | | |
| | For the
year
ended | | | Investment
income | a | | Expenses | a | | Net
investment
income
(loss | )a | | & unrealized
gain (loss
on total
investments | )
| | Net
change in
accumulation
unit value | | | Accumulation
unit value
beginning
of period | | | Accumulation
unit value
end of
period | | | Total
return | b | | Gross
expenses | | | Net
investment
income
(loss | ) | | Portfolio
turnover
rate | | | units
outstanding
end of period
(in millions | ) | | Accumulation
fund net
assets
(in millions | )i |
| | | | | | | | | | | | | | | | | | | | | | | | | | | | | | | | | | | | |
| STOCK ACCOUNT | | | | | | | | | | | | | | | | | | | | | | | | | | | | | | | | | | | |
| Class R1: | | 12/31/18 | | | | $10.238 | | | | $2.573 | | | | $7.665 | | | | $(55.323 | ) | | | $(47.658 | ) | | | $483.507 | | | | $435.849 | | | | (9.86 | )% | | | 0.53 | % | | | 1.57 | % | | | 55 | % | | | 29 | | | | $12,655 | |
| | | 12/31/17 | | | | 8.937 | | | | 2.869 | | | | 6.068 | | | | 84.379 | | | | 90.447 | | | | 393.060 | | | | 483.507 | | | | 23.01 | | | | 0.65 | | | | 1.38 | | | | 48 | | | | 33 | | | | 15,853 | |
| | | 12/31/16 | | | | 8.586 | | | | 2.727 | | | | 5.859 | | | | 25.797 | | | | 31.656 | | | | 361.404 | | | | 393.060 | | | | 8.76 | | | | 0.74 | | | | 1.59 | | | | 56 | | | | 36 | | | | 14,174 | |
| | | 12/31/15 | h | | | 8.076 | | | | 2.108 | | | | 5.968 | | | | (9.995 | ) | | | (4.027 | ) | | | 365.431 | | | | 361.404 | | | | (1.10 | ) | | | 0.57 | | | | 1.60 | | | | 52 | | | | 39 | | | | 14,153 | |
| | | 12/31/14 | | | | 7.897 | | | | 1.620 | | | | 6.277 | | | | 15.744 | | | | 22.021 | | | | 343.410 | | | | 365.431 | | | | 6.41 | | | | 0.46 | | | | 1.77 | | | | 58 | | | | 306 | | | | 111,823 | |
| Class R2: | | 12/31/18 | | | | 10.327 | | | | 1.687 | | | | 8.640 | | | | (55.847 | ) | | | (47.207 | ) | | | 487.075 | | | | 439.868 | | | | (9.69 | ) | | | 0.34 | | | | 1.75 | | | | 55 | | | | 70 | | | | 30,866 | |
| | | 12/31/17 | | | | 8.990 | | | | 1.736 | | | | 7.254 | | | | 84.893 | | | | 92.147 | | | | 394.928 | | | | 487.075 | | | | 23.33 | | | | 0.39 | | | | 1.64 | | | | 48 | | | | 78 | | | | 38,159 | |
| | | 12/31/16 | | | | 8.610 | | | | 1.724 | | | | 6.886 | | | | 25.913 | | | | 32.799 | | | | 362.129 | | | | 394.928 | | | | 9.06 | | | | 0.47 | | | | 1.87 | | | | 56 | | | | 86 | | | | 33,996 | |
| | | 12/31/15 | g | | | 5.699 | | | | 1.215 | | | | 4.484 | | | | (30.621 | ) | | | (26.137 | ) | | | 388.266 | | | | 362.129 | | | | (6.73 | )c | | | 0.48 | d | | | 1.75 | d | | | 52 | | | | 94 | | | | 33,974 | |
| Class R3: | | 12/31/18 | | | | 10.352 | | | | 1.485 | | | | 8.867 | | | | (56.010 | ) | | | (47.143 | ) | | | 488.295 | | | | 441.152 | | | | (9.65 | ) | | | 0.30 | | | | 1.79 | | | | 55 | | | | 114 | | | | 50,309 | |
| | | 12/31/17 | | | | 9.010 | | | | 1.395 | | | | 7.615 | | | | 85.073 | | | | 92.688 | | | | 395.607 | | | | 488.295 | | | | 23.43 | | | | 0.32 | | | | 1.72 | | | | 48 | | | | 124 | | | | 60,531 | |
| | | 12/31/16 | | | | 8.619 | | | | 1.346 | | | | 7.273 | | | | 25.956 | | | | 33.229 | | | | 362.378 | | | | 395.607 | | | | 9.17 | | | | 0.36 | | | | 1.97 | | | | 56 | | | | 136 | | | | 53,821 | |
| | | 12/31/15 | g | | | 5.698 | | | | 0.960 | | | | 4.738 | | | | (30.626 | ) | | | (25.888 | ) | | | 388.266 | | | | 362.378 | | | | (6.67 | )c | | | 0.38 | d | | | 1.85 | d | | | 52 | | | | 148 | | | | 53,614 | |
| | | | | | | | | | | | | | | | | | | | | | | | | | | | | | | | | | | | | | | | | | | | | | | |
| GLOBAL EQUITIES ACCOUNT | | | | | | | | | | | | | | | | | | | | | | | | | | | | | | | | | | | | | | | | | | | | | | |
| Class R1: | | 12/31/18 | | | | 3.712 | | | | 0.948 | | | | 2.764 | | | | (25.325 | ) | | | (22.561 | ) | | | 179.688 | | | | 157.127 | | | | (12.56 | ) | | | 0.53 | | | | 1.54 | | | | 77 | | | | 20 | | | | 3,154 | |
| | | 12/31/17 | | | | 3.346 | | | | 1.117 | | | | 2.229 | | | | 32.997 | | | | 35.226 | | | | 144.462 | | | | 179.688 | | | | 24.38 | | | | 0.69 | | | | 1.38 | | | | 36 | | | | 20 | | | | 3,681 | |
| | | 12/31/16 | | | | 3.218 | | | | 1.027 | | | | 2.191 | | | | 4.314 | | | | 6.505 | | | | 137.957 | | | | 144.462 | | | | 4.72 | | | | 0.75 | | | | 1.60 | | | | 78 | | | | 22 | | | | 3,230 | |
| | | 12/31/15 | h | | | 3.077 | | | | 0.823 | | | | 2.254 | | | | (3.090 | ) | | | (0.836 | ) | | | 138.793 | | | | 137.957 | | | | (0.60 | ) | | | 0.58 | | | | 1.59 | | | | 49 | | | | 24 | | | | 3,312 | |
| | | 12/31/14 | | | | 3.394 | | | | 0.623 | | | | 2.771 | | | | 2.779 | | | | 5.550 | | | | 133.243 | | | | 138.793 | | | | 4.17 | | | | 0.46 | | | | 2.04 | | | | 59 | | | | 136 | | | | 18,808 | |
| Class R2: | | 12/31/18 | | | | 3.746 | | | | 0.624 | | | | 3.122 | | | | (25.558 | ) | | | (22.436 | ) | | | 181.007 | | | | 158.571 | | | | (12.40 | ) | | | 0.35 | | | | 1.73 | | | | 77 | | | | 38 | | | | 6,104 | |
| | | 12/31/17 | | | | 3.365 | | | | 0.700 | | | | 2.665 | | | | 33.198 | | | | 35.863 | | | | 145.144 | | | | 181.007 | | | | 24.71 | | | | 0.43 | | | | 1.64 | | | | 36 | | | | 39 | | | | 7,131 | |
| | | 12/31/16 | | | | 3.228 | | | | 0.655 | | | | 2.573 | | | | 4.341 | | | | 6.914 | | | | 138.230 | | | | 145.144 | | | | 5.00 | | | | 0.48 | | | | 1.87 | | | | 78 | | | | 43 | | | | 6,224 | |
| | | 12/31/15 | g | | | 2.030 | | | | 0.468 | | | | 1.562 | | | | (11.301 | ) | | | (9.739 | ) | | | 147.969 | | | | 138.230 | | | | (6.58 | )c | | | 0.48 | d | | | 1.60 | d | | | 49 | | | | 47 | | | | 6,435 | |
| Class R3: | | 12/31/18 | | | | 3.747 | | | | 0.547 | | | | 3.200 | | | | (25.626 | ) | | | (22.426 | ) | | | 181.461 | | | | 159.035 | | | | (12.36 | ) | | | 0.30 | | | | 1.77 | | | | 77 | | | | 54 | | | | 8,621 | |
| | | 12/31/17 | | | | 3.372 | | | | 0.574 | | | | 2.798 | | | | 33.270 | | | | 36.068 | | | | 145.393 | | | | 181.461 | | | | 24.81 | | | | 0.35 | | | | 1.71 | | | | 36 | | | | 53 | | | | 9,558 | |
| | | 12/31/16 | | | | 3.232 | | | | 0.514 | | | | 2.718 | | | | 4.350 | | | | 7.068 | | | | 138.325 | | | | 145.393 | | | | 5.11 | | | | 0.37 | | | | 1.98 | | | | 78 | | | | 57 | | | | 8,324 | |
| | | 12/31/15 | g | | | 2.030 | | | | 0.370 | | | | 1.660 | | | | (11.304 | ) | | | (9.644 | ) | | | 147.969 | | | | 138.325 | | | | (6.52 | )c | | | 0.38 | d | | | 1.70 | d | | | 49 | | | | 62 | | | | 8,527 | |
| | | | | | |
| 88 | 2018 Annual Report ■ College Retirement Equities Fund | See notes to financial statements | See notes to financial statements | College Retirement Equities Fund ■ 2018 Annual Report | 89 |
| Financial highlights | continued |
| | |
| College Retirement Equities Fund | |
| | | | | | Selected per accumulation unit data | | | | | | Ratios and supplemental data |
| | | | | | Gain (loss) from investment operations | | | | | | | | | | | | | | | | | | | | | | | | | |
| | | | | | | | | | | | | | | | | | Net realized | | | | | | | | | | | | | | | Ratios to average net assets | | | | | Accumulation | | | | |
| | For the
year
ended | | | Investment
income | a | | Expenses | a | | Net
investment
income
(loss | )a | | & unrealized
gain (loss
on total
investments | )
| | Net
change in
accumulation
unit value | | | Accumulation
unit value
beginning
of period | | | Accumulation
unit value
end of
period | | | Total
return | b | | Gross
expenses | | | Net
investment
income
(loss | ) | | Portfolio
turnover
rate | | | units
outstanding
end of period
(in millions | ) | | Accumulation
fund net
assets
(in millions | )i |
| | | | | | | | | | | | | | | | | | | | | | | | | | | | | | | | | | | | | | | | | | | |
| GROWTH ACCOUNT | | | | | | | | | | | | | | | | | | | | | | | | | | | | | | | | | | |
| Class R1: | | 12/31/18 | | | | $2.166 | | | | $0.914 | | | | $1.252 | | | | $(6.193 | ) | | | $(4.941 | ) | | | $184.043 | | | | $179.102 | | | | (2.69 | )% | | | 0.46 | % | | | 0.63 | % | | | 62 | % | | | 24 | | | | $4,311 | |
| | | 12/31/17 | | | | 1.818 | | | | 0.977 | | | | 0.841 | | | | 43.121 | | | | 43.962 | | | | 140.081 | | | | 184.043 | | | | 31.38 | | | | 0.60 | | | | 0.52 | | | | 48 | | | | 26 | | | | 4,841 | |
| | | 12/31/16 | | | | 1.782 | | | | 0.902 | | | | 0.880 | | | | 2.577 | | | | 3.457 | | | | 136.624 | | | | 140.081 | | | | 2.53 | | | | 0.67 | | | | 0.65 | | | | 64 | | | | 28 | | | | 3,941 | |
| | | 12/31/15 | h | | | 1.663 | | | | 0.683 | | | | 0.980 | | | | 6.976 | | | | 7.956 | | | | 128.668 | | | | 136.624 | | | | 6.19 | | | | 0.51 | | | | 0.73 | | | | 47 | | | | 31 | | | | 4,174 | |
| | | 12/31/14 | | | | 1.501 | | | | 0.482 | | | | 1.019 | | | | 14.445 | | | | 15.464 | | | | 113.204 | | | | 128.668 | | | | 13.66 | | | | 0.41 | | | | 0.86 | | | | 57 | | | | 164 | | | | 21,048 | |
| Class R2: | | 12/31/18 | | | | 2.186 | | | | 0.555 | | | | 1.631 | | | | (6.277 | ) | | | (4.646 | ) | | | 185.396 | | | | 180.750 | | | | (2.51 | ) | | | 0.28 | | | | 0.82 | | | | 62 | | | | 43 | | | | 7,850 | |
| | | 12/31/17 | | | | 1.830 | | | | 0.556 | | | | 1.274 | | | | 43.379 | | | | 44.653 | | | | 140.743 | | | | 185.396 | | | | 31.73 | | | | 0.34 | | | | 0.78 | | | | 48 | | | | 47 | | | | 8,788 | |
| | | 12/31/16 | | | | 1.788 | | | | 0.534 | | | | 1.254 | | | | 2.593 | | | | 3.847 | | | | 136.896 | | | | 140.743 | | | | 2.81 | | | | 0.39 | | | | 0.93 | | | | 64 | | | | 51 | | | | 7,172 | |
| | | 12/31/15 | g | | | 1.117 | | | | 0.380 | | | | 0.737 | | | | (1.993 | ) | | | (1.256 | ) | | | 138.152 | | | | 136.896 | | | | (0.91 | )c | | | 0.41 | d | | | 0.79 | d | | | 47 | | | | 55 | | | | 7,594 | |
| Class R3: | | 12/31/18 | | | | 2.193 | | | | 0.471 | | | | 1.722 | | | | (6.301 | ) | | | (4.579 | ) | | | 185.860 | | | | 181.281 | | | | (2.46 | ) | | | 0.24 | | | | 0.86 | | | | 62 | | | | 59 | | | | 10,665 | |
| | | 12/31/17 | | | | 1.834 | | | | 0.429 | | | | 1.405 | | | | 43.471 | | | | 44.876 | | | | 140.984 | | | | 185.860 | | | | 31.83 | | | | 0.26 | | | | 0.86 | | | | 48 | | | | 62 | | | | 11,524 | |
| | | 12/31/16 | | | | 1.790 | | | | 0.395 | | | | 1.395 | | | | 2.599 | | | | 3.994 | | | | 136.990 | | | | 140.984 | | | | 2.92 | | | | 0.29 | | | | 1.03 | | | | 64 | | | | 67 | | | | 9,424 | |
| | | 12/31/15 | g | | | 1.117 | | | | 0.287 | | | | 0.830 | | | | (1.992 | ) | | | (1.162 | ) | | | 138.152 | | | | 136.990 | | | | (0.84 | )c | | | 0.31 | d | | | 0.89 | d | | | 47 | | | | 73 | | | | 10,027 | |
| | | | | | | | | | | | | | | | | | | | | | | | | | | | | | | | | | | | | | | | | | | | | | | | | | | | | | | | |
| EQUITY INDEX ACCOUNT | | | | | | | | | | | | | | | | | | | | | | | | | | | | | | | | | | | | | | | | | | | | | | |
| Class R1: | | 12/31/18 | | | | 4.426 | | | | 0.992 | | | | 3.434 | | | | (15.616 | ) | | | (12.182 | ) | | | 218.005 | | | | 205.823 | | | | (5.59 | ) | | | 0.44 | | | | 1.52 | | | | 3 | | | | 16 | | | | 3,308 | |
| | | 12/31/17 | | | | 3.836 | | | | 1.126 | | | | 2.710 | | | | 34.271 | | | | 36.981 | | | | 181.024 | | | | 218.005 | | | | 20.43 | | | | 0.57 | | | | 1.37 | | | | 4 | | | | 18 | | | | 3,912 | |
| | | 12/31/16 | | | | 3.648 | | | | 1.044 | | | | 2.604 | | | | 16.892 | | | | 19.496 | | | | 161.528 | | | | 181.024 | | | | 12.07 | | | | 0.63 | | | | 1.56 | | | | 4 | | | | 19 | | | | 3,501 | |
| | | 12/31/15 | h | | | 3.254 | | | | 0.765 | | | | 2.489 | | | | (2.523 | ) | | | (0.034 | ) | | | 161.562 | | | | 161.528 | | | | (0.02 | ) | | | 0.47 | | | | 1.52 | | | | 5 | | | | 20 | | | | 3,260 | |
| | | 12/31/14 | | | | 2.937 | | | | 0.558 | | | | 2.379 | | | | 15.145 | | | | 17.524 | | | | 144.038 | | | | 161.562 | | | | 12.17 | | | | 0.37 | | | | 1.58 | | | | 4 | | | | 104 | | | | 16,841 | |
| Class R2: | | 12/31/18 | | | | 4.465 | | | | 0.581 | | | | 3.884 | | | | (15.774 | ) | | | (11.890 | ) | | | 219.607 | | | | 207.717 | | | | (5.41 | ) | | | 0.26 | | | | 1.71 | | | | 3 | | | | 28 | | | | 5,728 | |
| | | 12/31/17 | | | | 3.859 | | | | 0.612 | | | | 3.247 | | | | 34.480 | | | | 37.727 | | | | 181.880 | | | | 219.607 | | | | 20.74 | | | | 0.31 | | | | 1.63 | | | | 4 | | | | 31 | | | | 6,708 | |
| | | 12/31/16 | | | | 3.662 | | | | 0.591 | | | | 3.071 | | | | 16.959 | | | | 20.030 | | | | 161.850 | | | | 181.880 | | | | 12.38 | | | | 0.35 | | | | 1.84 | | | | 4 | | | | 33 | | | | 6,035 | |
| | | 12/31/15 | g | | | 2.443 | | | | 0.414 | | | | 2.029 | | | | (8.184 | ) | | | (6.155 | ) | | | 168.005 | | | | 161.850 | | | | (3.66 | )c | | | 0.37 | d | | | 1.81 | d | | | 5 | | | | 35 | | | | 5,667 | |
| Class R3: | | 12/31/18 | | | | 4.479 | | | | 0.486 | | | | 3.993 | | | | (15.823 | ) | | | (11.830 | ) | | | 220.154 | | | | 208.324 | | | | (5.37 | ) | | | 0.21 | | | | 1.75 | | | | 3 | | | | 36 | | | | 7,418 | |
| | | 12/31/17 | | | | 3.869 | | | | 0.458 | | | | 3.411 | | | | 34.551 | | | | 37.962 | | | | 182.192 | | | | 220.154 | | | | 20.84 | | | | 0.23 | | | | 1.71 | | | | 4 | | | | 39 | | | | 8,486 | |
| | | 12/31/16 | | | | 3.667 | | | | 0.419 | | | | 3.248 | | | | 16.983 | | | | 20.231 | | | | 161.961 | | | | 182.192 | | | | 12.49 | | | | 0.25 | | | | 1.94 | | | | 4 | | | | 42 | | | | 7,570 | |
| | | 12/31/15 | g | | | 2.443 | | | | 0.302 | | | | 2.141 | | | | (8.185 | ) | | | (6.044 | ) | | | 168.005 | | | | 161.961 | | | | (3.60 | )c | | | 0.27 | d | | | 1.90 | d | | | 5 | | | | 44 | | | | 7,061 | |
| | | | | | |
| 90 | 2018 Annual Report ■ College Retirement Equities Fund | See notes to financial statements | See notes to financial statements | College Retirement Equities Fund ■ 2018 Annual Report | 91 |
| Financial highlights | continued |
College Retirement Equities Fund
| | | | | Selected per accumulation unit data | | | | | | Ratios and supplemental data |
| | | | | Gain (loss) from investment operations | | | | | | | | | | | | | | | | | | | | | | | | | | | | |
| | | | | | | | | | | | | | Net realized | | | | | | | | | | | | | | | Ratios to average net assets | | | | | Portfolio | | | Accumulation | | | | |
| | | For the
year
ended | | Investment
income | a | | Expenses | a | | Net
investment
income
(loss | )a | | & unrealized
gain (loss
on total
investments | )
| | Net
change in
accumulation
unit value | | | Accumulation
unit value
beginning
of period | | | Accumulation
unit value
end of
period | | | Total
return | b | | Gross
expenses | | | Net
investment
income
(loss | ) | | Portfolio
turnover
rate | | | turnover rate
excluding
mortgage
dollar rolls | | | units
outstanding
end of period
(in millions | ) | | Accumulation
fund net
assets
(in millions | )i |
| | | | | | | | | | | | | | | | | | | | | | | | | | | | | | | | | | | | | | | | | | | | | |
| BOND MARKET ACCOUNT | | | | | | | | | | | | | | | | | | | | | | | | | | | | | | | | | | | | | | | | | | | | | | | | |
| Class R1: | | 12/31/18 | | | $3.829 | | | | $0.620 | | | | $3.209 | | | | $(3.713 | ) | | | $(0.504 | ) | | | $121.672 | | | | $121.168 | | | | (0.41 | )% | | | 0.52 | % | | | 2.68 | % | | | 106 | % | | | 91 | % | | | 17 | | | | $2,048 | |
| | | 12/31/17 | | | 3.517 | | | | 0.764 | | | | 2.753 | | | | 1.670 | | | | 4.423 | | | | 117.249 | | | | 121.672 | | | | 3.77 | | | | 0.64 | | | | 2.30 | | | | 140 | | | | 96 | | | | 18 | | | | 2,209 | |
| | | 12/31/16 | | | 3.430 | | | | 0.827 | | | | 2.603 | | | | 0.897 | | | | 3.500 | | | | 113.749 | | | | 117.249 | | | | 3.08 | | | | 0.70 | | | | 2.21 | | | | 240 | | | | 131 | | | | 19 | | | | 2,175 | |
| | | 12/31/15 | h | | 3.015 | | | | 0.637 | | | | 2.378 | | | | (2.100 | ) | | | 0.278 | | | | 113.471 | | | | 113.749 | | | | 0.25 | | | | 0.56 | | | | 2.07 | | | | 293 | | | | 123 | | | | 19 | | | | 2,149 | |
| | | 12/31/14 | | | 2.665 | | | | 0.494 | | | | 2.171 | | | | 3.764 | | | | 5.935 | | | | 107.536 | | | | 113.471 | | | | 5.52 | | | | 0.44 | | | | 1.95 | | | | 290 | | | | 89 | | | | 117 | | | | 13,254 | |
| Class R2: | | 12/31/18 | | | 3.861 | | | | 0.402 | | | | 3.459 | | | | (3.741 | ) | | | (0.282 | ) | | | 122.564 | | | | 122.282 | | | | (0.23 | ) | | | 0.33 | | | | 2.87 | | | | 106 | | | | 91 | | | | 37 | | | | 4,567 | |
| | | 12/31/17 | | | 3.539 | | | | 0.453 | | | | 3.086 | | | | 1.676 | | | | 4.762 | | | | 117.802 | | | | 122.564 | | | | 4.04 | | | | 0.38 | | | | 2.56 | | | | 140 | | | | 96 | | | | 39 | | | | 4,818 | |
| | | 12/31/16 | | | 3.442 | | | | 0.506 | | | | 2.936 | | | | 0.892 | | | | 3.828 | | | | 113.974 | | | | 117.802 | | | | 3.36 | | | | 0.43 | | | | 2.48 | | | | 240 | | | | 131 | | | | 40 | | | | 4,672 | |
| | | 12/31/15 | g | | 2.181 | | | | 0.369 | | | | 1.812 | | | | (3.573 | ) | | | (1.761 | ) | | | 115.735 | | | | 113.974 | | | | (1.52 | )c | | | 0.47 | d | | | 2.31 | d | | | 293 | | | | 123 | | | | 40 | | | | 4,599 | |
| Class R3: | | 12/31/18 | | | 3.872 | | | | 0.352 | | | | 3.520 | | | | (3.753 | ) | | | (0.233 | ) | | | 122.871 | | | | 122.638 | | | | (0.19 | ) | | | 0.29 | | | | 2.91 | | | | 106 | | | | 91 | | | | 52 | | | | 6,329 | |
| | | 12/31/17 | | | 3.546 | | | | 0.360 | | | | 3.186 | | | | 1.681 | | | | 4.867 | | | | 118.004 | | | | 122.871 | | | | 4.12 | | | | 0.30 | | | | 2.63 | | | | 140 | | | | 96 | | | | 53 | | | | 6,527 | |
| | | 12/31/16 | | | 3.446 | | | | 0.385 | | | | 3.061 | | | | 0.891 | | | | 3.952 | | | | 114.052 | | | | 118.004 | | | | 3.47 | | | | 0.32 | | | | 2.58 | | | | 240 | | | | 131 | | | | 54 | | | | 6,370 | |
| | | 12/31/15 | g | | 2.182 | | | | 0.292 | | | | 1.890 | | | | (3.573 | ) | | | (1.683 | ) | | | 115.735 | | | | 114.052 | | | | (1.45 | )c | | | 0.37 | d | | | 2.41 | d | | | 293 | | | | 123 | | | | 55 | | | | 6,237 | |
| | | | | | | | | | | | | | | | | | | | | | | | | | | | | | | | | | | | | | | | | | | | | | | | | | | | | | | | | | | |
| INFLATION-LINKED BOND ACCOUNT | | | | | | | | | | | | | | | | | | | | | | | | | | | | | | | | | | | | | | | | | | | | | | | | |
| Class R1: | | 12/31/18 | | | 2.105 | | | | 0.307 | | | | 1.798 | | | | (2.292 | ) | | | (0.494 | ) | | | 68.761 | | | | 68.267 | | | | (0.72 | ) | | | 0.45 | | | | 2.63 | | | | 21 | | | | 21 | | | | 14 | | | | 964 | |
| | | 12/31/17 | | | 1.731 | | | | 0.395 | | | | 1.336 | | | | (0.315 | ) | | | 1.021 | | | | 67.740 | | | | 68.761 | | | | 1.51 | | | | 0.58 | | | | 1.95 | | | | 18 | | | | 18 | | | | 15 | | | | 1,041 | |
| | | 12/31/16 | | | 1.465 | | | | 0.433 | | | | 1.032 | | | | 1.474 | | | | 2.506 | | | | 65.234 | | | | 67.740 | | | | 3.84 | | | | 0.64 | | | | 1.52 | | | | 23 | | | | 23 | | | | 16 | | | | 1,107 | |
| | | 12/31/15 | h | | (0.930 | ) | | | 0.324 | | | | (1.254 | ) | | | (0.034 | ) | | | (1.288 | ) | | | 66.522 | | | | 65.234 | | | | (1.94 | ) | | | 0.48 | | | | (1.87 | ) | | | 6 | | | | 6 | | | | 17 | | | | 1,127 | |
| | | 12/31/14 | | | 1.573 | | | | 0.257 | | | | 1.316 | | | | 0.824 | | | | 2.140 | | | | 64.382 | | | | 66.522 | | | | 3.32 | | | | 0.39 | | | | 1.97 | | | | 9 | | | | 9 | | | | 107 | | | | 7,143 | |
| Class R2: | | 12/31/18 | | | 2.122 | | | | 0.182 | | | | 1.940 | | | | (2.310 | ) | | | (0.370 | ) | | | 69.265 | | | | 68.895 | | | | (0.53 | ) | | | 0.26 | | | | 2.82 | | | | 21 | | | | 21 | | | | 29 | | | | 2,028 | |
| | | 12/31/17 | | | 1.743 | | | | 0.218 | | | | 1.525 | | | | (0.319 | ) | | | 1.206 | | | | 68.059 | | | | 69.265 | | | | 1.77 | | | | 0.32 | | | | 2.22 | | | | 18 | | | | 18 | | | | 30 | | | | 2,096 | |
| | | 12/31/16 | | | 1.471 | | | | 0.249 | | | | 1.222 | | | | 1.475 | | | | 2.697 | | | | 65.362 | | | | 68.059 | | | | 4.13 | | | | 0.37 | | | | 1.80 | | | | 23 | | | | 23 | | | | 31 | | | | 2,123 | |
| | | 12/31/15 | g | | 1.272 | | | | 0.185 | | | | 1.087 | | | | (3.973 | ) | | | (2.886 | ) | | | 68.248 | | | | 65.362 | | | | (4.23 | )c | | | 0.41 | d | | | 2.38 | d | | | 6 | | | | 6 | | | | 32 | | | | 2,118 | |
| Class R3: | | 12/31/18 | | | 2.125 | | | | 0.154 | | | | 1.971 | | | | (2.313 | ) | | | (0.342 | ) | | | 69.437 | | | | 69.095 | | | | (0.49 | ) | | | 0.22 | | | | 2.86 | | | | 21 | | | | 21 | | | | 46 | | | | 3,171 | |
| | | 12/31/17 | | | 1.746 | | | | 0.165 | | | | 1.581 | | | | (0.320 | ) | | | 1.261 | | | | 68.176 | | | | 69.437 | | | | 1.85 | | | | 0.24 | | | | 2.29 | | | | 18 | | | | 18 | | | | 46 | | | | 3,214 | |
| | | 12/31/16 | | | 1.480 | | | | 0.179 | | | | 1.301 | | | | 1.468 | | | | 2.769 | | | | 65.407 | | | | 68.176 | | | | 4.23 | | | | 0.26 | | | | 1.91 | | | | 23 | | | | 23 | | | | 48 | | | | 3,271 | |
| | | 12/31/15 | g | | 1.274 | | | | 0.140 | | | | 1.134 | | | | (3.975 | ) | | | (2.841 | ) | | | 68.248 | | | | 65.407 | | | | (4.16 | )c | | | 0.31 | d | | | 2.48 | d | | | 6 | | | | 6 | | | | 49 | | | | 3,222 | |
| 92 | 2018 Annual Report ■ College Retirement Equities Fund | See notes to financial statements | See notes to financial statements | College Retirement Equities Fund ■ 2018 Annual Report | 93 |
| Financial highlights | concluded |
College Retirement Equities Fund
| | | | | Selected per accumulation unit data | | | | | | Ratios and supplemental data | |
| | | | | Gain (loss) from investment operations | | | | | | | | | | | | | | | | | | | | | | | | | | | | |
| | | | | | | | | | | | | | Net realized | | | | | | | | | | | | | | | Ratios to average net assets | | | | | Portfolio | | | Accumulation | | | | |
| | | For the
year
ended | | Investment
income | a | | Expenses | a | | Net
investment
income
(loss | )a | | & unrealized
gain (loss
on total
investments | )
| | Net
change in
accumulation
unit value | | | Accumulation
unit value
beginning
of period | | | Accumulation
unit value
end of
period | | | Total
return | b | | Gross
expenses | | | Net
investment
income
(loss) | | | Portfolio
turnover
rate | | | turnover rate
excluding
mortgage
dollar rolls | | | units
outstanding
end of period
(in millions | ) | | Accumulation
fund net
assets
(in millions | )i |
| | | | | | | | | | | | | | | | | | | | | | | | | | | | | | | | | | | | | | | | | | | | | |
| SOCIAL CHOICE ACCOUNT | | | | | | | | | | | | | | | | | | | | | | | | | | | | | | | | | | | | | | | | | | | | | | | | |
| Class R1: | | 12/31/18 | | | $6.291 | | | | $1.102 | | | | $5.189 | | | | $(15.749 | ) | | | $(10.560 | ) | | | $234.195 | | | | $223.635 | | | | (4.51 | )% | | | 0.47 | % | | | 2.21 | % | | | 52 | % | | | 47 | % | | | 9 | | | | $ 2,104 | |
| | | 12/31/17 | | | 5.627 | | | | 1.327 | | | | 4.300 | | | | 24.249 | | | | 28.549 | | | | 205.646 | | | | 234.195 | | | | 13.88 | | | | 0.60 | | | | 1.95 | | | | 53 | | | | 37 | | | | 10 | | | | 2,426 | |
| | | 12/31/16 | | | 5.437 | | | | 1.336 | | | | 4.101 | | | | 9.343 | | | | 13.444 | | | | 192.202 | | | | 205.646 | | | | 7.00 | | | | 0.68 | | | | 2.07 | | | | 93 | | | | 50 | | | | 11 | | | | 2,287 | |
| | | 12/31/15 | h | | 4.618 | | | | 1.017 | | | | 3.601 | | | | (5.795 | ) | | | (2.194 | ) | | | 194.396 | | | | 192.202 | | | | (1.13 | ) | | | 0.52 | | | | 1.83 | | | | 115 | | | | 57 | | | | 12 | | | | 2,290 | |
| | | 12/31/14 | | | 4.446 | | | | 0.773 | | | | 3.673 | | | | 8.760 | | | | 12.433 | | | | 181.963 | | | | 194.396 | | | | 6.83 | | | | 0.41 | | | | 1.95 | | | | 120 | | | | 52 | | | | 72 | | | | 14,017 | |
| Class R2: | | 12/31/18 | | | 6.344 | | | | 0.673 | | | | 5.671 | | | | (15.895 | ) | | | (10.224 | ) | | | 235.915 | | | | 225.691 | | | | (4.33 | ) | | | 0.28 | | | | 2.39 | | | | 52 | | | | 47 | | | | 20 | | | | 4,476 | |
| | | 12/31/17 | | | 5.661 | | | | 0.757 | | | | 4.904 | | | | 24.394 | | | | 29.298 | | | | 206.617 | | | | 235.915 | | | | 14.18 | | | | 0.34 | | | | 2.21 | | | | 53 | | | | 37 | | | | 22 | | | | 5,082 | |
| | | 12/31/16 | | | 5.456 | | | | 0.799 | | | | 4.657 | | | | 9.377 | | | | 14.034 | | | | 192.583 | | | | 206.617 | | | | 7.29 | | | | 0.40 | | | | 2.35 | | | | 93 | | | | 50 | | | | 23 | | | | 4,784 | |
| | | 12/31/15 | g | | 3.229 | | | | 0.560 | | | | 2.669 | | | | (11.025 | ) | | | (8.356 | ) | | | 200.939 | | | | 192.583 | | | | (4.16 | )c | | | 0.42 | d | | | 1.99 | d | | | 115 | | | | 57 | | | | 25 | | | | 4,750 | |
| Class R3: | | 12/31/18 | | | 6.361 | | | | 0.576 | | | | 5.785 | | | | (15.940 | ) | | | (10.155 | ) | | | 236.504 | | | | 226.349 | | | | (4.29 | ) | | | 0.24 | | | | 2.43 | | | | 52 | | | | 47 | | | | 26 | | | | 5,931 | |
| | | 12/31/17 | | | 5.673 | | | | 0.586 | | | | 5.087 | | | | 24.445 | | | | 29.532 | | | | 206.972 | | | | 236.504 | | | | 14.27 | | | | 0.26 | | | | 2.29 | | | | 53 | | | | 37 | | | | 28 | | | | 6,547 | |
| | | 12/31/16 | | | 5.461 | | | | 0.594 | | | | 4.867 | | | | 9.391 | | | | 14.258 | | | | 192.714 | | | | 206.972 | | | | 7.40 | | | | 0.30 | | | | 2.45 | | | | 93 | | | | 50 | | | | 29 | | | | 6,078 | |
| | | 12/31/15 | g | | 3.230 | | | | 0.427 | | | | 2.803 | | | | (11.028 | ) | | | (8.225 | ) | | | 200.939 | | | | 192.714 | | | | (4.09 | )c | | | 0.32 | d | | | 2.09 | d | | | 115 | | | | 57 | | | | 31 | | | | 5,984 | |
| | | | | Selected per accumulation unit data | | | | | | Ratios and supplemental data | |
| | | | | Gain (loss) from investment operations | | | | | | | | | | | | | | | | | | | | | |
| | | | | | | | | | | | | | Net realized | | | | | | | | | | | | | | | Ratios to average net assets | | Accumulation | | | | |
| | | For the
year
ended | | Investment
income | a | | Expenses | a | | Net
investment
income
(loss | )a | | & unrealized
gain (loss
on total
investments | )
| | Net
change in
accumulation
unit value | | | Accumulation
unit value
beginning
of period | | | Accumulation
unit value
end of
period | | | Total
return | b | | Gross
expenses | | | Expenses
net of TIAA
withholding/
recovery | | | Net
investment
income
(loss | ) | | units
outstanding
end of period
(in millions | ) | | Accumulation
fund net
assets
(in millions | )i |
| |
| MONEY MARKET ACCOUNT | | | | | | | | | | | | | | | | | | | | | | | | | | | | | | | | | | | | | | | | | | | | |
| Class R1: | | 12/31/18 | | | $0.474 | | | | $0.206 | | | | $0.268 | | | | $0.002 | | | | $0.270 | | | | $25.596 | | | | $25.866 | | | | 1.05 | % | | | 0.45 | % | | | 0.80 | % | | | 1.04 | % | | | 72 | | | | $ 1,866 | |
| | | 12/31/17 | | | 0.227 | | | | 0.165 | | | | 0.062 | | | | 0.000 | | | | 0.062 | | | | 25.534 | | | | 25.596 | | | | 0.25 | | | | 0.57 | | | | 0.64 | | | | 0.32 | | | | 72 | | | | 1,842 | |
| | | 12/31/16 | | | 0.111 | | | | 0.111 | | | | 0.000 | | | | 0.000 | | | | 0.000 | | | | 25.534 | | | | 25.534 | | | | 0.00 | | | | 0.64 | | | | 0.43 | | | | 0.00 | | | | 84 | | | | 2,145 | |
| | | 12/31/15 | h | | 0.036 | | | | 0.036 | | | | 0.000 | | | | 0.000 | | | | 0.000 | | | | 25.534 | | | | 25.534 | | | | 0.00 | | | | 0.50 | | | | 0.14 | | | | 0.00 | | | | 87 | | | | 2,225 | |
| | | 12/31/14 | | | 0.029 | | | | 0.029 | | | | 0.000 | | | | 0.000 | | | | 0.000 | | | | 25.534 | | | | 25.534 | | | | 0.00 | | | | 0.39 | | | | 0.11 | | | | 0.00 | | | | 441 | | | | 11,261 | |
| Class R2: | | 12/31/18 | | | 0.476 | | | | 0.138 | | | | 0.338 | | | | 0.000 | | | | 0.338 | | | | 25.662 | | | | 26.000 | | | | 1.32 | | | | 0.27 | | | | 0.53 | | | | 1.31 | | | | 114 | | | | 2,970 | |
| | | 12/31/17 | | | 0.227 | | | | 0.116 | | | | 0.111 | | | | 0.002 | | | | 0.113 | | | | 25.549 | | | | 25.662 | | | | 0.44 | | | | 0.31 | | | | 0.45 | | | | 0.58 | | | | 111 | | | | 2,838 | |
| | | 12/31/16 | | | 0.111 | | | | 0.096 | | | | 0.015 | | | | 0.000 | | | | 0.015 | | | | 25.534 | | | | 25.549 | | | | 0.06 | | | | 0.36 | | | | 0.37 | | | | 0.08 | | | | 129 | | | | 3,306 | |
| | | 12/31/15 | g | | 0.030 | | | | 0.030 | | | | 0.000 | | | | 0.000 | | | | 0.000 | | | | 25.534 | | | | 25.534 | | | | 0.00 | c | | | 0.40 | d | | | 0.17 | d | | | 0.00 | d | | | 137 | | | | 3,507 | |
| Class R3: | | 12/31/18 | | | 0.477 | | | | 0.103 | | | | 0.374 | | | | 0.000 | | | | 0.374 | | | | 25.695 | | | | 26.069 | | | | 1.46 | | | | 0.23 | | | | 0.40 | | | | 1.45 | | | | 189 | | | | 4,927 | |
| | | 12/31/17 | | | 0.228 | | | | 0.102 | | | | 0.126 | | | | 0.002 | | | | 0.128 | | | | 25.567 | | | | 25.695 | | | | 0.50 | | | | 0.23 | | | | 0.40 | | | | 0.66 | | | | 177 | | | | 4,539 | |
| | | 12/31/16 | | | 0.111 | | | | 0.078 | | | | 0.033 | | | | 0.000 | | | | 0.033 | | | | 25.534 | | | | 25.567 | | | | 0.13 | | | | 0.26 | | | | 0.30 | | | | 0.17 | | | | 205 | | | | 5,231 | |
| | | 12/31/15 | g | | 0.030 | | | | 0.030 | | | | 0.000 | | | | 0.000 | | | | 0.000 | | | | 25.534 | | | | 25.534 | | | | 0.00 | c | | | 0.30 | d | | | 0.17 | d | | | 0.00 | d | | | 215 | | | | 5,499 | |
| a | Based on average units outstanding. |
| b | Based on per accumulation unit data. |
| c | The percentages shown for this period are not annualized. |
| d | The percentages shown for this period are annualized. |
| g | Classes R2 and R3 commenced operations on April 24, 2015. |
| h | Prior to April 24, 2015, CREF offered only one class of units, which became Class R1 on that date. |
| i | Does not include annuity net assets. |
| 94 | 2018 Annual Report ■ College Retirement Equities Fund | See notes to financial statements | See notes to financial statements | College Retirement Equities Fund ■ 2018 Annual Report | 95 |
Notes to financial statements
College Retirement Equities Fund
Note 1—organization and significant accounting policies
The purpose of the College Retirement Equities Fund (“CREF”), as stated in its charter, is to aid and strengthen non-profit educational and research organizations, governmental entities, and other non-profit institutions by providing their employees with variable retirement benefits. CREF is registered with the U.S. Securities and Exchange Commission (“Commission”) under the Investment Company Act of 1940, as amended (“1940 Act”), as an open-end management investment company. It consists of eight investment portfolios: the Stock, Global Equities, Growth, Equity Index, Bond Market, Inflation-Linked Bond, Social Choice and Money Market Accounts (individually referred to as the “Account” or collectively referred to as the “Accounts”).
The accompanying financial statements were prepared in accordance with accounting principles generally accepted in the United States of America (“U.S. GAAP”), which may require the use of estimates made by management and the evaluation of subsequent events. Actual results may differ from those estimates. The Accounts are investment companies and follow the accounting guidance in the Financial Accounting Standards Board (“FASB”) Accounting Standards Codification 946,Financial Services—Investment Companies. The Accumulation Unit Value (“AUV”) for financial reporting purposes may differ from the AUV for processing transactions. The AUV for financial reporting purposes includes security and participant transactions through the date of the report. Total return is computed based on the AUV used for processing transactions. The following is a summary of the significant accounting policies consistently followed by the Accounts.
Security valuation: For all Accounts (other than the Money Market Account), investments in securities are recorded at their estimated fair value as described in the valuation of investments note to the financial statements. Investments held by the Money Market Account are recorded at amortized cost, which approximates fair value. The amortized cost of an instrument is determined by valuing it at its original cost and thereafter accreting or amortizing any discount or premium to its face value at a constant rate until maturity.
Accumulation and Annuity Funds: The Accumulation Fund represents the net assets attributable to participants in the accumulation phase of their investment. The Annuity Fund represents the net assets attributable to the participants currently receiving annuity payments. The net increase or decrease in net assets from investment operations is apportioned between the funds based upon their relative daily net asset values. Annuitants bear the mortality risk under their contracts. Initial annuity payments are calculated based on the value of a participant’s accumulation on the last valuation day before the annuity start date, the income option chosen, an assumed annual investment return, and expense and mortality assumptions. Annuity payments vary after the initial payment based on investment performance, Account expenses, and mortality experience. Death benefits are paid to beneficiaries if the annuitant dies during the accumulation period, or during the annuity period while payments are still due for the remainder of a guaranteed period.
| 96 | 2018 Annual Report ■ College Retirement Equities Fund |
Investments and investment income: Securities transactions are accounted for as of the trade date for financial reporting purposes. Interest income is recorded as earned and includes accretion of discounts and amortization of premiums using the effective yield method. Dividend income is recorded on the ex-dividend date. Foreign dividend income is recorded on the ex-dividend date or as soon as possible after the Accounts determine the existence of a dividend declaration after exercising reasonable due diligence. Realized gains and losses on securities transactions are based upon the specific identification method. Distributions received on securities that represent a return of capital or capital gains are recorded as a reduction of cost of investments and/or as a realized gain. The Accounts estimate the components of distributions received that may be considered return of capital distributions or capital gain distributions.
Income, expenses, realized gains and losses and unrealized appreciation and depreciation of an Account are allocated on a pro rata basis to each class, except for administrative service fees and distribution fees, which are unique to each class of each Account. Most expenses of CREF can be directly attributed to an Account or class. Expenses that cannot be directly attributed are allocated based upon the average net assets of each Account or class.
Foreign currency transactions and translation: Assets, including investments, and liabilities denominated in foreign currencies are translated into U.S. dollar values each day using exchange rates obtained from an independent third party. Purchases and sales of securities, income, and expenses are translated into U.S. dollars at the prevailing exchange rate on the date of the transaction. The effect of changes in foreign currency exchange rates on realized and unrealized security gains and losses is reflected as a component of security gains and losses.
Income taxes: CREF is taxed as a life insurance company under Subchapter L of the Internal Revenue Code. CREF should incur no federal income tax liability. Under the rules of taxation applicable to life insurance companies, CREF’s Accumulation and Annuity Funds for participants will generally be treated as life insurance reserves; therefore, any increase in such reserves will be deductible. CREF files income tax returns in U.S. federal and applicable state jurisdictions. CREF’s federal income tax return is generally subject to examination for a period of three fiscal years after being filed. State and local tax returns may be subject to examination for an additional period of time depending on the jurisdiction. Management has analyzed the Accounts’ tax positions taken for all open income tax years and has concluded that no provision for income tax is required in the Accounts’ financial statements.
Foreign taxes: The Accounts may be subject to foreign taxes on income, gains on investments or currency repatriation, a portion of which may be recoverable. The Accounts will accrue such taxes and recoveries as applicable, based upon the current interpretation of tax rules and regulations that exist in the markets in which the Accounts invest.
| College Retirement Equities Fund ■ 2018 Annual Report | 97 |
Notes to financial statements
Trustee compensation: The Accounts pay the members of the Board of Trustees (“Board”), all of whom are independent, certain remuneration for their services, plus travel and other expenses. Trustees may elect to participate in a deferred compensation plan and defer all or a portion of their compensation. In addition, trustees participate in a long-term compensation plan. Amounts deferred are retained by the Accounts until paid. Amounts payable to the trustees for compensation are included separately in the accompanying Statements of Assets and Liabilities. Trustees’ fees, including any deferred and long-term compensation incurred, are reflected in the Statements of Operations.
New accounting pronouncement: In August 2018, FASB issued ASU 2018-13,Fair Value Measurement: Disclosure Framework—Changes to the Disclosure Requirements for Fair Value Measurements. ASU 2018-13 removes or modifies certain disclosures required for fair value measurements. This guidance is effective for fiscal years beginning after December 15, 2019. Management has early implemented this accounting pronouncement for this annual report. This implementation did not have a material impact on the Accounts’ financial statements and various filings. Refer to Note 2 for further details.
New rule issuances: In October 2016, the Commission issued Final Rule Release No. 33-10231,Investment Company Reporting Modernization. This final rule modernizes Investment Company reporting by requiring the filing of new Forms N-CEN and N-PORT, and amends Regulation S-X disclosures related to derivatives and other disclosures in the financial statements and various filings. The requirements of this final rule in relation to Form N-CEN must be complied with by June 1, 2018. In December 2017, the Commission issued Temporary Final Rule Release No. 33-10442, which delayed the filing requirements related to Form N-PORT from June 1, 2018 to April 2019, but still requires the Accounts to maintain the data that would have been filed on Form N-PORT during the deferral period. Form N-CEN and the data requirements of Form N-PORT were implemented on June 1, 2018 and did not have an impact on net assets or results of operations.
In October 2016, the Commission issued Final Rule Release No. 33-10233,Investment Company Liquidity Risk Management Programs. This final rule requires accounts to establish a liquidity risk management program and enhances disclosures regarding accounts’ liquidity. The requirements of this final rule, in relation to the establishment of the liquidity risk management program and the 15% illiquid investment limit, were implemented by the December 1, 2018 compliance date. This portion of the implementation did not have a material impact on the accounts’ financial statements and various filings. In February 2018, the Commission issued Release No. IC-33142, which delayed certain compliance requirements related to liquidity classification, highly liquid investment minimums, and board approval of the liquidity risk management programs from December 1, 2018 to June 1, 2019. Management is currently assessing the impact of these provisions on the Accounts’ financial statements and various filings.
| 98 | 2018 Annual Report ■ College Retirement Equities Fund |
continued
Note 2—valuation of investments
Portfolio investments are valued at fair value utilizing various valuation methods approved by the Board. U.S. GAAP establishes a hierarchy that prioritizes market inputs to valuation methods. The three levels of inputs are:
| • | Level 1 – quoted prices in active markets for identical securities |
| • | Level 2 – other significant observable inputs (including quoted prices for similar securities, interest rates, credit spreads, etc.) |
| • | Level 3 – significant unobservable inputs (including the Accounts’ own assumptions in determining the fair value of investments) |
The availability of observable inputs can vary from security to security and is affected by a wide variety of factors, including, for example, the type of security, whether the security is new and not yet established in the marketplace, the liquidity of markets, and other characteristics particular to the security. To the extent that valuation is based on models or inputs that are less observable or unobservable in the market, the determination of fair value requires more judgment. Accordingly, the degree of judgment exercised in determining fair value is greatest for instruments categorized as Level 3. The inputs or methodology used for valuing securities are not necessarily an indication of the risk associated with investing in those securities.
A description of the valuation techniques applied to the Accounts’ major categories of assets and liabilities measured at fair value follows:
Exchange-traded equity securities, common and preferred stock:Equity securities listed or traded on a national market or exchange are valued based on their sale price at the official close of business of such market or exchange on the valuation date, or if there is no official close of business, the latest sale price, or at the mean of the latest available bid and asked prices if no sale is reported. To the extent these securities are actively traded and valuation adjustments are not applied, they are categorized in Level 1 of the fair value hierarchy. Foreign equity securities are valued at the last sale price or official closing price reported on the exchange where traded and converted to U.S. dollars at the prevailing rates of exchange on the date of valuation. For events affecting the value of foreign securities between the time when the exchange on which they are traded closes and the time when the Accounts’ net assets are calculated, such securities will be valued at fair value in accordance with procedures adopted by the Board. Foreign securities are generally categorized as Level 2 of the fair value hierarchy.
Debt securities: Debt securities, including equity-linked notes, will generally be valued using prices provided by a pricing service that may employ various indications of value including but not limited to broker-dealer quotations. Certain debt securities, other than money market instruments, are valued based on the most recent bid price or the equivalent quoted yield for such securities (or those of comparable maturity, quality and type). Debt securities are generally categorized as Level 2 of the fair value hierarchy; in instances where prices, yields or any other key inputs are unobservable, they are categorized as Level 3 of the hierarchy.
| College Retirement Equities Fund ■ 2018 Annual Report | 99 |
Notes to financial statements
The Money Market Account: The Money Market Account’s portfolio securities are valued on an amortized cost basis. Money Market investments are generally categorized as Level 2 of the fair value hierarchy.
Investments in registered investment companies: These investments are valued at their net asset value on the valuation date. These investments are categorized as Level 1 of the fair value hierarchy.
Futures contracts: Stock and bond index futures contracts, which are traded on commodity exchanges, are valued at the last sale price as of the close of such commodity exchanges and are categorized as Level 1 of the fair value hierarchy.
Options: Purchased and written options traded over the counter and listed on a national market or exchange are valued at the last sale price as of the close of such exchange or at the mean of the closing bid and asked prices if no sale is reported. To the extent these securities are actively traded and valuation adjustments are not applied, they are categorized as Level 1 of the fair value hierarchy.
Credit default swap contracts: Credit default swap contracts are marked-to-market daily based upon a price supplied by a pricing service. Credit default swaps are generally categorized as Level 2 of the fair value hierarchy.
Total return swap contracts: Total return swap contracts are marked-to-market daily based upon a price supplied by a pricing service. Total return swaps are generally categorized as Level 2 in the fair value hierarchy.
Forward foreign currency contracts: Forward foreign currency contracts are valued using the prevailing forward exchange rate and are categorized as Level 2 of the fair value hierarchy.
Any portfolio security for which market quotations are not readily available or for which the above valuation procedures are deemed not to reflect fair value are valued at fair value, as determined in good faith using procedures approved by the Board. To the extent the inputs are observable and timely, the values would be categorized as Level 2 of the fair value hierarchy; otherwise they would be categorized as Level 3.
As of December 31, 2018, 100% of the value of investments in the Money Market Account was valued based on Level 2 inputs.
| 100 | 2018 Annual Report ■ College Retirement Equities Fund |
continued
The following table summarizes the market value of the Accounts’ investments as of December 31, 2018, based on the inputs used to value them (dollar amounts are in thousands):
| Account | | Level 1 | | | Level 2 | | | Level 3 | | | Total | |
| Stock | | | | | | | | | | | | | | | | |
| Equity investments: | | | | | | | | | | | | | | | | |
| Communication services | | $ | 6,650,956 | | | $ | 2,203,618 | | | $ | 370 | | | $ | 8,854,944 | |
| Consumer discretionary | | | 7,673,307 | | | | 3,337,732 | | | | 245 | | | | 11,011,284 | |
| Consumer staples | | | 4,569,483 | | | | 2,915,696 | | | | 8 | | | | 7,485,187 | |
| Energy | | | 3,959,752 | | | | 1,871,205 | | | | 931 | | | | 5,831,888 | |
| Financials | | | 9,597,680 | | | | 6,323,405 | | | | 295 | | | | 15,921,380 | |
| Health care | | | 10,871,190 | | | | 2,630,572 | | | | 144 | | | | 13,501,906 | |
| Industrials | | | 7,190,806 | | | | 3,836,998 | | | | 472 | | | | 11,028,276 | |
| Information technology | | | 14,688,331 | | | | 2,734,039 | | | | 301 | | | | 17,422,671 | |
| Materials | | | 2,322,260 | | | | 2,678,454 | | | | 7 | | | | 5,000,721 | |
| Real estate | | | 2,352,941 | | | | 1,578,188 | | | | 5,950 | | | | 3,937,079 | |
| Utilities | | | 2,016,818 | | | | 1,031,891 | | | | — | | | | 3,048,709 | |
| Government bonds | | | — | | | | 293 | | | | — | | | | 293 | |
| Equity-linked notes | | | — | | | | 1,639 | | | | — | | | | 1,639 | |
| Short-term investments | | | — | | | | 2,250,116 | | | | — | | | | 2,250,116 | |
| Purchased options** | | | 2,451 | | | | — | | | | — | | | | 2,451 | |
| Written options** | | | (2,235 | ) | | | — | | | | — | | | | (2,235 | ) |
| Futures contracts** | | | (19,220 | ) | | | — | | | | — | | | | (19,220 | ) |
| Forward foreign currency contracts** | | | — | | | | 397 | | | | — | | | | 397 | |
| Total | | $ | 71,874,520 | | | $ | 33,394,243 | | | $ | 8,723 | | | $ | 105,277,486 | |
| Global Equities | | | | | | | | | | | | | | | | |
| Equity investments: | | | | | | | | | | | | | | | | |
| Asia | | $ | 184,937 | | | $ | 1,697,534 | | | $ | 12 | | | $ | 1,882,483 | |
| Australasia | | | — | | | | 249,189 | | | | — | | | | 249,189 | |
| Europe | | | 46,333 | | | | 2,390,259 | | | | — | | | | 2,436,592 | |
| Latin America | | | 28,962 | | | | 228,918 | | | | — | | | | 257,880 | |
| North America | | | 10,487,133 | | | | 453,830 | | | | — | | | | 10,940,963 | |
| All other equity investments* | | | 230,561 | | | | 1,961,422 | | | | 6 | | | | 2,191,989 | |
| Short-term investments | | | — | | | | 525,806 | | | | — | | | | 525,806 | |
| Futures contracts** | | | (8,361 | ) | | | — | | | | — | | | | (8,361 | ) |
| Total | | $ | 10,969,565 | | | $ | 7,506,958 | | | $ | 18 | | | $ | 18,476,541 | |
| Growth | | | | | | | | | | | | | | | | |
| Equity investments: | | | | | | | | | | | | | | | | |
| Communication services | | $ | 3,018,402 | | | $ | 133,200 | | | $ | — | | | $ | 3,151,602 | |
| Consumer discretionary | | | 3,638,787 | | | | 146,791 | | | | — | | | | 3,785,578 | |
| Consumer staples | | | 843,388 | | | | 50,698 | | | | — | | | | 894,086 | |
| Health care | | | 3,123,538 | | | | 96,956 | | | | — | | | | 3,220,494 | |
| Industrials | | | 2,334,978 | | | | 155,658 | | | | — | | | | 2,490,636 | |
| All other equity investments* | | | 9,605,681 | | | | — | | | | — | | | | 9,605,681 | |
| Short-term investments | | | 85,482 | | | | 65,216 | | | | — | | | | 150,698 | |
| Total | | $ | 22,650,256 | | | $ | 648,519 | | | $ | — | | | $ | 23,298,775 | |
| College Retirement Equities Fund ■ 2018 Annual Report | 101 |
Notes to financial statements
| Account | | Level 1 | | | Level 2 | | | Level 3 | | | Total | |
| Equity Index | | | | | | | | | | | | | | | | |
| Equity investments: | | | | | | | | | | | | | | | | |
| Consumer discretionary | | $ | 1,720,997 | | | $ | — | | | $ | — | | | $ | 1,720,997 | |
| Consumer staples | | | 1,111,741 | | | | — | | | | — | | | | 1,111,741 | |
| Financials | | | 2,317,330 | | | | 6 | | | | — | | | | 2,317,336 | |
| Health care | | | 2,513,199 | | | | 3 | | | | 13 | | | | 2,513,215 | |
| Materials | | | 507,676 | | | | 40 | | | | — | | | | 507,716 | |
| All other equity investments * | | | 8,556,742 | | | | — | | | | — | | | | 8,556,742 | |
| Short-term investments | | | 133,009 | | | | 78,717 | | | | — | | | | 211,726 | |
| Futures contracts** | | | 2,527 | | | | — | | | | — | | | | 2,527 | |
| Total | | $ | 16,863,221 | | | $ | 78,766 | | | $ | 13 | | | $ | 16,942,000 | |
| Bond Market | | | | | | | | | | | | | | | | |
| Bank loan obligations | | $ | — | | | $ | 47,343 | | | $ | — | | | $ | 47,343 | |
| Corporate bonds | | | — | | | | 4,223,503 | | | | 766 | | | | 4,224,269 | |
| Government bonds | | | — | | | | 6,052,887 | | | | — | | | | 6,052,887 | |
| Structured assets | | | — | | | | 2,627,188 | | | | 749 | | | | 2,627,937 | |
| Common stocks | | | 236 | | | | — | | | | — | | | | 236 | |
| Preferred stocks | | | 13,907 | | | | — | | | | — | | | | 13,907 | |
| Short-term investments | | | — | | | | 46,139 | | | | — | | | | 46,139 | |
| Forward foreign currency contracts** | | | — | | | | (417 | ) | | | — | | | | (417 | ) |
| Total | | $ | 14,143 | | | $ | 12,996,643 | | | $ | 1,515 | | | $ | 13,012,301 | |
| Inflation-Linked Bond | | | | | | | | | | | | | | | | |
| Government bonds | | $ | — | | | $ | 6,312,833 | | | $ | — | | | $ | 6,312,833 | |
| Short-term investments | | | — | | | | 8,770 | | | | — | | | | 8,770 | |
| Futures contracts** | | | (285 | ) | | | — | | | | — | | | | (285 | ) |
| Total | | $ | (285 | ) | | $ | 6,321,603 | | | $ | — | | | $ | 6,321,318 | |
| Social Choice | | | | | | | | | | | | | | | | |
| Equity investments: | | | | | | | | | | | | | | | | |
| Communication services | | $ | 317,280 | | | $ | 125,665 | | | $ | — | | | $ | 442,945 | |
| Consumer discretionary | | | 494,367 | | | | 271,468 | | | | — | | | | 765,835 | |
| Consumer staples | | | 343,982 | | | | 202,073 | | | | — | | | | 546,055 | |
| Energy | | | 238,336 | | | | 142,236 | | | | — | | | | 380,572 | |
| Financials | | | 789,861 | | | | 506,525 | | | | — | | | | 1,296,386 | |
| Health care | | | 792,737 | | | | 216,974 | | | | — | | | | 1,009,711 | |
| Industrials | | | 499,917 | | | | 315,044 | | | | — | | | | 814,961 | |
| Information technology | | | 1,080,372 | | | | 124,289 | | | | — | | | | 1,204,661 | |
| Materials | | | 156,398 | | | | 187,260 | | | | — | | | | 343,658 | |
| Real estate | | | 185,974 | | | | 76,962 | | | | — | | | | 262,936 | |
| Utilities | | | 192,218 | | | | 83,570 | | | | — | | | | 275,788 | |
| Bank loan obligations | | | — | | | | 35,267 | | | | 11,237 | | | | 46,504 | |
| Corporate bonds | | | — | | | | 1,866,000 | | | | — | | | | 1,866,000 | |
| Government bonds | | | — | | | | 2,888,841 | | | | 7,129 | | | | 2,895,970 | |
| Structured assets | | | — | | | | 565,624 | | | | 11,863 | | | | 577,487 | |
| Short-term investments | | | 156,436 | | | | 48,806 | | | | — | | | | 205,242 | |
| Total | | $ | 5,247,878 | | | $ | 7,656,604 | | | $ | 30,229 | | | $ | 12,934,711 | |
| * | For detailed categories, see the accompanying Summary portfolio of investments. |
| ** | Derivative instruments, excluding purchased options, are not reflected in the market value of portfolio investments. |
| 102 | 2018 Annual Report ■ College Retirement Equities Fund |
continued
Note 3—derivative instruments
As defined by U.S. GAAP, a derivative is a financial instrument whose value is derived from an underlying security price, foreign exchange rate, interest rate, index of prices or rates, or other variables. Derivatives require little or no initial investment and permit or require net settlement. The Accounts value derivatives at fair value.
At December 31, 2018, the following Accounts have invested in derivative contracts which are reflected in the Statements of Assets and Liabilities as follows (dollar amounts are in thousands):
| | | Asset derivatives | | Liabilities derivatives |
| | | | | Fair value | | | | | Fair value | |
| Derivative contract | | Location | | amount | | | Location | | amount | |
| Stock Account | | | | | | | | | | | | |
| Equity contracts | | Futures contracts* | | | $(19,220 | ) | | | | | | |
| Equity contracts | | Portfolio investments | | | 2,451 | | | Written options | | | $(2,235 | ) |
| Foreign exchange contracts | | Forward foreign currency contracts | | | 479 | | | Forward foreign currency contracts | | | (82 | ) |
| Global Equities Account | | | | | | | | | | | | |
| Equity contracts | | Futures contracts* | | | (8,361 | ) | | | | | | |
| Equity Index Account | | | | | | | | | | | | |
| Equity contracts | | Futures contracts* | | | 2,527 | | | | | | | |
| Bond Market Account | | | | | | | | | | | | |
| Foreign exchange contracts | | Forward foreigncurrency contracts | | | 764 | | | Forward foreigncurrency contracts | | | (1,181 | ) |
| Inflation-Linked Bond Account | | | | | | | | | | | | |
| Interest-rate contracts | | | | | | | | Futures contracts* | | | (285 | ) |
| * | The fair value presented includes cumulative gain (loss) on open futures contracts; however, the value reflected on the accompanying Statements of Assets and Liabilities is only the receivable or payable for variation margin on open futures contracts. |
| College Retirement Equities Fund ■ 2018 Annual Report | 103 |
Notes to financial statements
For the year ended December 31, 2018, the effect of derivative contracts on the Accounts’ Statements of Operations was as follows (dollar amounts are in thousands):
| | | | | | | | Change in | |
| | | | | | | | unrealized | |
| | | | | Realized | | | appreciation | |
| Derivative contract | | Location | | gain (loss | ) | | (depreciation | ) |
| Stock Account | | | | | | | | | | |
| Equity contracts | | Futures contracts | | | $(21,641 | ) | | | $(21,524 | ) |
| Equity contracts | | Purchased options | | | (11,366 | ) | | | (2,126 | ) |
| Equity contracts | | Written options | | | 18,514 | | | | 148 | |
| Credit contracts | | Swap contracts | | | (3,015 | ) | | | 190 | |
| Foreign-exchange contracts | | Forward foreign currency contracts | | | 325 | | | | 397 | |
| Global Equities Account | | | | | | | | | | |
| Equity contracts | | Futures contracts | | | (14,462 | ) | | | (12,539 | ) |
| Equity contracts | | Purchased options | | | (985 | ) | | | — | |
| Equity contracts | | Written options | | | 53 | | | | — | |
| Equity Index Account | | | | | | | | | | |
| Equity contracts | | Futures contracts | | | (6,342 | ) | | | 1,798 | |
| Bond Market Account | | | | | | | | | | |
| Credit contracts | | Swap contracts | | | (1,532 | ) | | | — | |
| Foreign-exchange contracts | | Forward foreign currency contracts | | | 8,991 | | | | 733 | |
| Inflation-Linked Bond Account | | | | | | | | | | |
| Interest rate contracts | | Futures contracts | | | 405 | | | | (322 | ) |
Futures contracts: Certain Accounts are subject to equity price risk in the normal course of pursuing their investment objectives. The Accounts use futures contracts to manage exposure to the equity markets and for cash management purposes to remain highly invested in these markets while minimizing transaction costs. Buying futures contracts tends to increase exposure to the underlying instrument/index, while selling futures contracts tends to decrease exposure to the underlying instrument/index or hedge other investments. Initial margin deposits are made upon entering into a futures contract, and variation margin receipts or payments are settled daily reflecting changes in the value of the futures contracts. Daily changes in the value of such contracts are reflected in net unrealized gains and losses. Gains or losses are realized upon the expiration or closing of the futures contracts or if the counterparties do not perform in accordance with contractual provisions. With futures contracts, there is minimal counterparty credit risk to the Accounts since futures contracts are exchange-traded and the exchange’s clearinghouse, as counterparty to all exchange-traded funds, guarantees the futures contracts against default. During the year ended December 31, 2018, the Stock Account, Global Equities Account, Equity Index Account, and Inflation-Linked Bond Account had exposure to futures contracts, based on underlying notional values, generally between 0% and 2% of net assets. The futures contracts outstanding as of December 31, 2018 are disclosed in the summary portfolio of investments and the full Schedules of Investments.
| 104 | 2018 Annual Report ■ College Retirement Equities Fund |
continued
Options: Certain Accounts are subject to equity price risk in the normal course of pursuing their investment objectives. Options can be settled either directly with the counterparty (over the counter) or through a central clearing house (exchange traded). To manage the risk, the Accounts may invest in both equity and index options. The Accounts use options contracts for hedging and cash management purposes and to seek to increase total return. Call and put equity options give the holder the right, in return for a premium paid, to purchase or sell, respectively, a security at a specified exercise price at any time during the period of the option. Index options are written or purchased options in which the underlying investment is a specified index. The exercise of an index option will not result in the physical delivery of the underlier, but a cash transfer of the difference between the settlement price of the underlier and the strike price of the option. Purchased options are included in the summary portfolio of investments, and written options are separately reflected as a liability in the Statements of Assets and Liabilities. Premiums on unexercised, expired options are recorded as realized gains or losses; premiums on exercised options are recorded as an adjustment to the proceeds from the sale or cost of the purchase. The difference between the premium and the amount received or paid in a closing transaction is also treated as a realized gain or loss. Risks may arise upon entering into over the counter options from the potential of default by counterparty. Also, risks related to the use of options include possible illiquidity of the options markets, price movements in underlying security values, and losses that may exceed amounts recognized on the Statements of Assets and Liabilities. During the year ended December 31, 2018, the Stock Account and Global Equities Account had exposure to options, based on underlying notional values, generally between 0% and 1% of net assets. The purchased and written options outstanding as of December 31, 2018 are disclosed in the summary portfolio of investments and the full Schedules of Investments.
Credit default swap contracts: Certain Accounts are subject to credit risk in the normal course of pursuing their investment objectives. Credit default swaps can be settled either directly with the counterparty (bilateral) or through a central clearinghouse (centrally cleared). A credit default swap is a contract between a buyer and a seller of protection against pre-defined credit events for the reference entity. As a seller in a credit default swap contract, the Accounts are required to pay an agreed upon amount to the counterparty with the occurrence of a specified credit event, such as certain bankruptcies related to an underlying credit instrument, index, or issuer which would likely result in a loss to the Accounts. The agreed upon amount approximates the notional value of the swap and is estimated to be the maximum potential future payment that the Accounts could be required to make under the contract. In return, the Accounts receive from the counterparty a periodic stream of payments over the term of the contract provided that no credit event has occurred. If no credit event occurs, the Accounts keep the stream of payments with no payment obligations. When the Accounts sell a credit default swap contract it will cover its commitment. This may be achieved by, among other methods, maintaining cash or liquid assets in a segregated account equal to the aggregate notional value of the reference entities for all outstanding credit default swap contracts sold by the Accounts.
| College Retirement Equities Fund ■ 2018 Annual Report | 105 |
Notes to financial statements
Certain Accounts may also buy credit default swap contracts, in which case the Accounts function as the counterparty referenced above. This involves the risk that the contract may expire worthless. Bilateral swaps involve counterparty risk that the seller may fail to satisfy its payment obligations to the Accounts with the occurrence of a credit event. Centrally cleared swaps have minimal counterparty credit risk to the Accounts as they are entered into with a central clearinghouse which guarantees the swap against default.
The value of a bilateral swap included in net assets is the unrealized gain or loss of the contract plus or minus any unamortized premiums paid or received, respectively. Appreciated swaps and premiums paid are reflected as assets, while depreciated swaps and premiums received are reflected as liabilities on the Statements of Assets and Liabilities. Centrally cleared swaps initial margin deposits are made, and variation margin payments are made or received reflecting daily changes in the value of the swap contract. The daily fluctuation in fair value is accounted for as a variation margin receivable or payable on the Statements of Assets and Liabilities.
Under the terms of the credit default swap contracts, the Accounts receive or make quarterly payments based on a payment rate on a fixed notional amount. These payments are recorded as a realized gain or loss in the Statements of Operations. Payments received or made as a result of a credit event or termination of the contract are recognized as realized gains or losses. Daily changes in the value of such contracts are reflected in net unrealized gains and losses.
The Accounts (other than the Money Market Account) invest in credit default swaps to hedge or manage the risks associated with assets held in the Accounts and/or to facilitate the implementation of portfolio strategies to seek to increase the total return. During the year ended December 31, 2018, the Bond Market Account had exposure to credit default swap contracts, based on underlying notional values, generally between 0% and 1% of net assets. There are no credit default swap contracts outstanding as of December 31, 2018.
Total return swap contracts: Total return swaps are agreements that provide an Account with a return based on the performance of an underlying asset, in exchange for fee payments to a counterparty based on a specific rate. To the extent the total return of the reference security or index underlying the total return swap exceeds or falls short of the offsetting interest rate obligation, the Account will receive a payment or make a payment to the counterparty, respectively. Payments received or made at the end of each measurement period are recorded as a realized gain or loss in the Statements of Operations. The swap is valued daily and any change in the value of the swap is reflected separately as a change in unrealized appreciation (depreciation) in the Statements of Operations. The value of the swap contract is reflected in unrealized appreciation (depreciation) on swap agreements in the Statements of Assets and Liabilities. Total return swaps are exposed to the market risk factor of the specific underlying financial instrument or index. Additional risks to the Account include the possibility that there is no liquid market for these agreements or that the counterparty may default on its obligation to perform. The
| 106 | 2018 Annual Report ■ College Retirement Equities Fund |
continued
Account’s maximum loss from counterparty risk is the fair value of the contract. Certain Accounts may invest in total return swaps to gain or hedge exposure to the underlying reference assets. During the year ended December 31, 2018, the Stock Account had exposure to total return swaps, based on underlying notional amounts, generally between 0% and 1% of net assets. There are no total return swap contracts outstanding as of December 31, 2018.
Forward foreign currency contracts: Certain Accounts are subject to foreign exchange risk in the normal course of pursuing their investment objectives. The Accounts use forward foreign currency contracts (“forwards”), including non-deliverable forwards (“NDFs”), to, among other things, hedge portfolio currency risk and to facilitate transactions in securities denominated in foreign currencies. Forwards are over-the-counter (“OTC”) commitments that involve an obligation to purchase or sell a fixed amount of a specific currency on a future date at a locked exchange rate. NDFs allow hedging of currencies where government regulations restrict foreign access to local currency or the parties want to compensate for risk without a physical exchange of funds. Forwards are marked-to-market daily at the applicable foreign exchange rate, and any resulting unrealized gains or losses are recorded as appreciation or depreciation in the Statements of Assets and Liabilities. The Accounts realize gains and losses at the time the forward is closed. Realized and unrealized gains and losses are included in the Statements of Operations. Risks may arise upon entering into these contracts from the potential inability of counterparties to meet the terms of their contracts; from unanticipated movements in the value of a foreign currency relative to the U.S. dollar; and that losses may exceed amounts recognized on the Statements of Assets and Liabilities. During the year ended December 31, 2018, the Stock Account and Bond Market Account had exposure to forwards, based on underlying notional values, generally between 0% and 1%. The forward contracts outstanding as of December 31, 2018 are disclosed in the summary portfolio of investments and the full Schedules of Investments.
Note 4—investment adviser and affiliates
Investment advisory services for the Accounts are provided by TIAA-CREF Investment Management, LLC (“TCIM”) in accordance with an Investment Management Services Agreement. TCIM is a registered investment adviser and a wholly owned subsidiary of Teachers Insurance and Annuity Association of America (“TIAA”), a companion organization of CREF. Investment management expenses generally include investment management, portfolio accounting and custodial services and are the same across all classes of an Account.
Administrative services are provided to the Accounts by TIAA, pursuant to an Administrative Services Agreement with CREF. Distribution functions are provided to the Accounts by TIAA-CREF Individual & Institutional Services, LLC (“Services”), a wholly owned subsidiary of TIAA, pursuant to a Principal Underwriting and Distribution Services Agreement with CREF and the Rule 12b-1 plan. Teachers Personal Investors Services, Inc. (“TPIS”), a wholly owned subsidiary of TIAA, may also provide
| College Retirement Equities Fund ■ 2018 Annual Report | 107 |
Notes to financial statements
distribution functions for the Accounts on a limited basis. Participants invested in a particular CREF Account will be subject to different administrative and distribution expenses depending upon the class of the Account they own.
TIAA charges a mortality and expense charge of 0.005% to guarantee that CREF participants transferring Accounts to TIAA for the immediate purchase of lifetime payout annuities will not be charged more than the rate stipulated in the CREF contract. This charge is the same across all Accounts and classes.
The services provided by TCIM, Services, TPIS, and TIAA are provided to CREF at cost, and CREF also reimburses TCIM, Services, TPIS, and TIAA for certain third party expenses and trustee fees paid on its behalf. Payments from the CREF Accounts are made on a daily basis according to formulas established each year with the objective of keeping the estimated expenses as close as possible to each Account’s actual expenses. Any differences between actual expenses and the estimated expenses remitted are adjusted.
As of December 31, 2018, the following table represents the effective expense deductions as an annual percentage of average daily net assets to approximate the costs that CREF incurred:
| | | Investment
management
fee | | | Administrative fee | | Distribution fee | |
| Account | | All classes | | | Class R1 | | | Class R2 | | | Class R3 | | | Class R1 | | | Class R2 | | | Class R3 | |
| Stock | | 0.102 | % | | | 0.275 | % | | | 0.161 | % | | | 0.140 | % | | 0.144 | % | | | 0.074 | % | | | 0.053 | % |
| Global Equities | | 0.105 | | | | 0.276 | | | | 0.161 | | | | 0.140 | | | 0.144 | | | | 0.074 | | | | 0.053 | |
| Growth | | 0.038 | | | | 0.276 | | | | 0.161 | | | | 0.139 | | | 0.144 | | | | 0.074 | | | | 0.053 | |
| Equity Index | | 0.015 | | | | 0.276 | | | | 0.161 | | | | 0.140 | | | 0.144 | | | | 0.074 | | | | 0.053 | |
| Bond Market | | 0.092 | | | | 0.277 | | | | 0.161 | | | | 0.140 | | | 0.144 | | | | 0.075 | | | | 0.053 | |
| Inflation-Linked Bond | | 0.024 | | | | 0.277 | | | | 0.161 | | | | 0.140 | | | 0.144 | | | | 0.075 | | | | 0.053 | |
| Social Choice | | 0.044 | | | | 0.276 | | | | 0.161 | | | | 0.140 | | | 0.144 | | | | 0.074 | | | | 0.053 | |
| Money Market | | 0.028 | | | | 0.277 | | | | 0.161 | | | | 0.140 | | | 0.144 | | | | 0.075 | | | | 0.053 | |
Between July 16, 2009 and March 7, 2017, TIAA withheld (“waived”) a portion of the distribution Rule 12b-1 and as necessary, administrative expenses for the Money Market Account. TIAA terminated the waiver on April 14, 2017. TIAA may, for a period of three years after the date an amount was waived, recover from the Account a portion of the amounts waived at such time as the class’s daily yield would be positive absent the effect of the waiver, and in such event the amount of recovery on any day will be approximately 25% of the class’s yield (net of all expenses) on that day. As a result of the share class conversion on April 25, 2015, previously recoverable amounts have been allocated to the newly formed classes, using conversion date April 24, 2015 end of day net assets. For the year ended December 31, 2018, TIAA recovered previously waived expenses from the Account of $6,357,169 for Class R1, $7,541,739 for Class R2 and $8,173,403 for Class R3. In September 2018, Class R2 recouped all eligible waived expenses totaling $12,513,185, and in July
| 108 | 2018 Annual Report ■ College Retirement Equities Fund |
continued
2018, Class R3 recouped all eligible waived expenses totaling $18,705,483. As of December 31, 2018, the cumulative amount of expenses waived subject to recovery is $3,816,986 for Class R1. The amounts waived and recovered during the current period are disclosed on the Statements of Operations.
Amounts owed to Account affiliates for payment of Account expenses, payments for units purchased, and receipt for units sold are disclosed as due to/from affiliates on the Statements of Assets and Liabilities. Account expenses owed to affiliates are reflected in the Statements of Operations.
The Accounts may purchase or sell investment securities in transactions with affiliated entities under procedures adopted by the Board, pursuant to the 1940 Act. These transactions are effected at market rates without incurring broker commissions. For the year ended December 31, 2018, the Accounts engaged in the following security transactions with affiliated entities (dollar amounts are in thousands):
| Account | | Purchases | | | Sales | | | Realized
gain (loss | ) |
| Stock | | | $1,786,989 | | | | $2,665,506 | | | | $691,502 | |
| Global Equities | | | 1,492,562 | | | | 1,822,787 | | | | 332,182 | |
| Growth | | | 162,564 | | | | 397,748 | | | | 139,993 | |
| Equity Index | | | 10,459 | | | | 86,462 | | | | 54,804 | |
| Social Choice | | | 231,656 | | | | 61,881 | | | | 8,480 | |
Companies in which an Account holds 5% or more of the outstanding voting shares are considered “affiliated companies” of the Account, pursuant to the 1940 Act. Information regarding transactions with affiliated companies is as follows (dollar amounts are in thousands):
| Issue | | Value at
12/31/17 | | | Purchase
cost | | | Sales
proceeds | | | Realized
gain (loss | ) | | Change in
unrealized
appreciation
(depreciation | ) | | Dividend
income | | | Shares at
12/31/18 | | | Value at
12/31/18 | |
| Stock Account | | | | | | | | | | | | | | | | | | | | | | | | | | | | | | | | |
| Common Stock | | | | | | | | | | | | | | | | | | | | | | | | | | | | | | | | |
| Capital Goods | | | | | | | | | | | | | | | | | | | | | | | | | | | | | | | | |
| Manitowoc Co, Inc* | | | $ 2,088 | ‡ | | | $ 41,483 | | | | $ 384 | | | | $ 13 | | | | $ (16,824 | ) | | | $ — | | | | 1,785,766 | | | | $ 26,376 | |
| Terex Corp | | | 79,743 | ‡ | | | 254,358 | | | | 130,838 | | | | 4,986 | | | | (83,198 | ) | | | 906 | | | | 4,535,772 | | | | 125,051 | |
| Materials | | | | | | | | | | | | | | | | | | | | | | | | | | | | | | | | |
| Tronox Ltd | | | 166,864 | | | | 38,149 | | | | 15,650 | | | | (3,493 | ) | | | (115,335 | ) | | | 1,689 | | | | 9,066,187 | | | | 70,535 | |
| Software & Services | | | | | | | | | | | | | | | | | | | | | | | | | | | | | | | | |
| GreenSky, Inc*e | | | — | § | | | 80,831 | | | | 47,833 | | | | (30,151 | ) | | | (1,526 | ) | | | — | | | | 138,063 | § | | | 1,321 | § |
| Total | | | $248,695 | | | | $414,821 | | | | $194,705 | | | | $(28,645 | ) | | | $(216,883 | ) | | | $2,595 | | | | 15,525,788 | | | | $223,283 | |
| ‡ | At December 31, 2017 the issuer was not an affiliated company of the Account. |
| § | At December 31, 2017 and December 31, 2018, the issuer was not an affiliated company of the Account, but it was affiliated during the year. |
| * | Non-income producing |
| e | All or a portion of this security is out on loan. |
| College Retirement Equities Fund ■ 2018 Annual Report | 109 |
Notes to financial statements
Note 5—investments
Securities lending: Certain Accounts may lend their securities to qualified institutional borrowers to earn additional income. An Account receives collateral (in the form of cash, Treasury securities or other collateral permitted by applicable law) against the loaned securities and maintains collateral in an amount not less than 100% of the market value of loaned securities during the period of the loan; any additional collateral required due to changes in security values is delivered to the Account the next business day. Cash collateral received by the Account will generally be invested in high-quality short-term instruments or in one or more funds maintained by the securities lending agent (“Agent”) for the purpose of investing cash collateral. The value of the loaned securities and the liability to return the cash collateral received are reflected in the Statements of Assets and Liabilities. As of December 31, 2018, securities lending transactions (with the exception of the Social Choice Account) are for equity securities, and the resulting loans are continuous, can be recalled at any time, and have no set maturity. For the Social Choice Account, all loans from securities lending transactions are continuous, can be recalled at any time, and have no set maturity, with $77,959,448 related to equity securities and $72,989,015 related to fixed income securities. Securities lending income recognized by the Accounts consists of earnings on invested collateral and lending fees, net of any rebates to the borrower and compensation to the Agent. Such income is reflected separately in the Statements of Operations. In lending its securities, an Account bears the market risk with respect to the investment of collateral and the risk that the Agent may default on its contractual obligations to the Account. The Agent bears the risk that the borrower may default on its obligation to return the loaned securities as the Agent is contractually obligated to indemnify the Account if at the time of a default by a borrower some or all of the loan securities have not been returned.
Repurchase agreements: Each Account may enter into repurchase agreements with banks or broker-dealers. Repurchase agreements involve the purchase of securities from an institution, subject to the seller’s agreement to repurchase and the Account’s agreement to resell such securities at a mutually agreed-upon price. Pursuant to the terms of the repurchase agreement, securities purchased subject to repurchase agreements must have an aggregate market value greater than or equal to the agreed-upon repurchase price plus accrued interest at all times. If the value of the underlying securities falls below the value of the repurchase price plus accrued interest, the Account will require the seller to deposit additional collateral by the next business day. If a request for additional collateral is not met, or if the seller defaults on its repurchase obligation, the Account maintains the right to sell the underlying securities at market value and pursue a claim for any remaining loss against the seller.
Securities purchased on a when-issued or delayed-delivery basis: The Accounts may purchase securities on a when-issued or delayed-delivery basis. Securities purchased or sold on a when-issued or delayed-delivery basis may be settled a month or more after trade date; interest income is not accrued until settlement date. At the time an Account enters into such transactions, it is required to have segregated assets with
| 110 | 2018 Annual Report ■ College Retirement Equities Fund |
continued
a current value at least equal to the amount of its when-issued or delayed-delivery purchase commitments. Amounts receivable and/or payable for these transactions are reflected separately in the Statements of Assets and Liabilities.
Treasury Inflation-Protected Securities: The Accounts (other than the Money Market Account) may invest in Treasury Inflation-Protected Securities, specially structured bonds in which the principal amount is adjusted periodically to keep pace with inflation, as measured by the U.S. Consumer Price Index. The adjustments for interest income due to inflation or deflation are reflected in interest income in the Statements of Operations.
Mortgage dollar roll transactions: Some of the Accounts may enter into mortgage dollar rolls in which an Account sells mortgage securities for delivery in the current month, realizing a gain (loss), and simultaneously contracts to repurchase similar securities on a specified future date. During the roll period, an Account forgoes principal and interest paid on the securities. The Account is compensated by the interest earned on the cash proceeds of the initial sale and by the lower repurchase price at the future date. The difference between the sales proceeds and the lower repurchase price is recorded as a realized gain. The Account maintains a segregated account, the dollar value of which is at least equal to its obligations with respect to dollar rolls.
Restricted securities: Restricted securities held by the Accounts, if any, may not be sold except in exempt transactions or in a public offering registered under the Securities Act of 1933. The risk of investing in such securities is generally greater than the risk of investing in securities that are widely held and publicly traded.
Equity-linked notes: Equity-linked notes are debt securities issued by banks or broker-dealers and are designed to offer a return linked to an underlying security or market index. Equity-linked notes are structured with a defined maturity date. When the note matures, the issuer will pay to, or receive from the Account, the difference between the nominal value of the underlying instrument at the time of purchase and that instrument’s value at maturity. The Account will record a realized gain or loss on the transaction. The note is valued daily and any change in the value of the note is reflected in net unrealized gains and losses. Investments in equity-linked notes involve the same risks associated with a direct investment in the underlying security or index that the notes seek to replicate. In addition, there is also counterparty risk associated with these investments because the Account is relying on the creditworthiness of such counterparty and has no rights under an equity-linked note against the issuer of the underlying security.
Net unrealized appreciation (depreciation): At December 31, 2018, net unrealized appreciation (depreciation) based on the aggregate cost of all investments for federal income tax purposes, consisting of gross unrealized appreciation and gross unrealized depreciation, was as follows (dollar amounts are in thousands):
| College Retirement Equities Fund ■ 2018 Annual Report | 111 |
Notes to financial statements
| Account | | Tax cost | | | Gross
unrealized
appreciation | | | Gross
unrealized
(depreciation | ) | | Net unrealized
appreciation
(depreciation | ) |
| Stock | | | $107,970,621 | | | | $8,843,895 | | | | $(11,537,030 | ) | | | $(2,693,135 | ) |
| Global Equities | | | 19,087,872 | | | | 1,394,006 | | | | (2,005,337 | ) | | | (611,331 | ) |
| Growth | | | 20,255,847 | | | | 4,498,569 | | | | (1,455,641 | ) | | | 3,042,928 | |
| Equity Index | | | 8,644,587 | | | | 9,077,352 | | | | (779,939 | ) | | | 8,297,413 | |
| Bond Market | | | 13,262,728 | | | | 72,342 | | | | (322,769 | ) | | | (250,427 | ) |
| Inflation-Linked Bond | | | 6,330,329 | | | | 139,069 | | | | (148,080 | ) | | | (9,011 | ) |
| Social Choice | | | 12,252,662 | | | | 1,425,710 | | | | (743,661 | ) | | | 682,049 | |
For purposes of this disclosure, tax cost generally includes the cost of portfolio investments as well as up-front fees or premiums exchanged on derivatives and any amounts unrealized for income statement reporting but realized in income and/or capital gains for tax reporting.
Purchases and sales: Purchases and sales of securities (other than short-term instruments) for all of the Accounts for the year ended December 31, 2018 were as follows (dollar amounts are in thousands):
| | | Stock
Account | | | Global
Equities
Account | | | Growth
Account | | | Equity
Index
Account | | | Bond
Market
Account | | | Inflation-
Linked
Bond
Account | | | Social
Choice
Account | |
| Purchases: | | | | | | | | | | | | | | | | | | | | | | | | | | | | |
| Non-U.S. Government | | $ | 66,288,628 | | | $ | 16,213,101 | | | $ | 16,231,018 | | | $ | 486,826 | | | $ | 3,587,031 | | | $ | 4,375 | | | $ | 4,603,896 | |
| U.S. Government | | | — | | | | — | | | | — | | | | — | | | | 10,814,872 | | | | 1,373,327 | | | | 2,543,982 | |
| Total Purchases | | $ | 66,288,628 | | | $ | 16,213,101 | | | $ | 16,231,018 | | | $ | 486,826 | | | $ | 14,401,903 | | | $ | 1,377,702 | | | $ | 7,147,878 | |
| Sales: | | | | | | | | | | | | | | | | | | | | | | | | | | | | |
| Non-U.S. Government | | $ | 76,109,838 | | | $ | 15,746,484 | | | $ | 17,823,181 | | | $ | 1,968,602 | | | $ | 3,575,085 | | | $ | 1,583 | | | $ | 4,974,642 | |
| U.S. Government | | | — | | | | — | | | | — | | | | — | | | | 10,315,102 | | | | 1,348,018 | | | | 2,652,002 | |
| Total Sales | | $ | 76,109,838 | | | $ | 15,746,484 | | | $ | 17,823,181 | | | $ | 1,968,602 | | | $ | 13,890,187 | | | $ | 1,349,601 | | | $ | 7,626,644 | |
Note 6—inter-fund lending program
Pursuant to an exemptive order issued by the Commission, the Accounts may participate in an inter-fund lending program. This program allows certain Accounts to lend cash to and/or borrow cash from other Accounts or certain other affiliated registered investment companies for temporary purposes (e.g., to satisfy redemption requests or to cover unanticipated cash shortfalls). The program is subject to a number of conditions, including the requirement that no Account may borrow or lend money under the program unless it receives a more favorable interest rate than is available from a bank or other financial institution for a comparable transaction. In addition, each Account may participate in the program only if its participation is consistent with the Account’s investment policies and limitations and authorized by
| 112 | 2018 Annual Report ■ College Retirement Equities Fund |
concluded
its portfolio manager(s). During the year ended December 31, 2018, there were no inter-fund borrowing or lending transactions.
Note 7—line of credit
Each of the Accounts, except the Money Market Account, participates in a $1.25 billion unsecured revolving credit facility that can be used for temporary purposes, including, without limitation, the funding of participant withdrawals. The current facility was entered into on June 19, 2018 expiring on June 18, 2019, replacing the previous $1.5 billion facility, which expired June 2018. Certain affiliated accounts and mutual funds, each of which is managed by TCIM, or an affiliate of TCIM, also participate in this facility. An annual commitment fee for the credit facility is borne by the participating accounts and mutual funds on a pro rata basis. Interest associated with any borrowing under the facility is charged to the borrowing accounts or mutual funds at a specified rate of interest. The Accounts are not liable for borrowings under the facility by other affiliated accounts or mutual funds. For the year ended December 31, 2018, there were no borrowings under this credit facility by the Accounts.
Note 8—indemnification
In the normal course of business, each Account enters into contracts that contain a variety of representations and warranties and that provide general indemnities. An Account’s maximum exposure under these arrangements is unknown, as this would involve future claims against the Account that have not yet occurred. Also, under the Accounts’ organizational documents, the trustees and officers of the Accounts are indemnified against certain liabilities that may arise out of their duties to the Accounts. However, based on experience, the Accounts expect the risk of loss due to these warranties and indemnities to be unlikely.
Note 9—legal proceedings
The Stock Account and the Social Choice Account were named as defendants and putative members of the proposed defendant class of shareholders, or could be added as defendants, in pending litigation by the Bankruptcy Litigation Trustee for the Tribune Company (Tribune) and certain creditors of Tribune, as a result of ownership of shares in Tribune in 2007 when Tribune effected a leveraged buyout transaction (LBO) and was converted to a privately held company. The plaintiffs in that litigation seek to recover payments of the proceeds of the LBO. The litigation is now part of a multi-district litigation proceeding in the Southern District of New York and the Second Court of Appeals. The Accounts’ exposure related to this matter are estimated to be 0.05% and 0.12%, respectively, of net assets as of December 31, 2018.
| College Retirement Equities Fund ■ 2018 Annual Report | 113 |
Report of independent registered public accounting firm
To the Board of Trustees of College Retirement Equities Fund and Participants of Stock Account, Global Equities Account, Growth Account, Equity Index Account, Bond Market Account, Inflation-Linked Bond Account, Social Choice Account and Money Market Account
Opinions on the Financial Statements
We have audited the accompanying statements of assets and liabilities, including the summary portfolios of investments, of Stock Account, Global Equities Account, Growth Account, Equity Index Account, Bond Market Account, Social Choice Account, Money Market Account and portfolio of investments, of Inflation-Linked Bond Account (constituting College Retirement Equities Fund, hereafter collectively referred to as the “Accounts”) as of December 31, 2018, the related statements of operations for the year ended December 31, 2018, the statements of changes in net assets for each of the two years in the period ended December 31, 2018, including the related notes, and the financial highlights for each of the periods indicated therein (collectively referred to as the “financial statements”). In our opinion, the financial statements present fairly, in all material respects, the financial position of each of the Accounts as of December 31, 2018, the results of each of their operations for the year then ended, the changes in each of their net assets for each of the two years in the period ended December 31, 2018 and each of the financial highlights for each of the periods indicated therein in conformity with accounting principles generally accepted in the United States of America.
Basis for Opinions
These financial statements are the responsibility of the Accounts’ management. Our responsibility is to express an opinion on the Accounts’ financial statements based on our audits. We are a public accounting firm registered with the Public Company Accounting Oversight Board (United States) (“PCAOB”) and are required to be independent with respect to the Accounts in accordance with the U.S. federal securities laws and the applicable rules and regulations of the Securities and Exchange Commission and the PCAOB.
We conducted our audits of these financial statements in accordance with the standards of the PCAOB. Those standards require that we plan and perform the audit to obtain reasonable assurance about whether the financial statements are free of material misstatement, whether due to error or fraud.
Our audits included performing procedures to assess the risks of material misstatement of the financial statements, whether due to error or fraud, and performing procedures that respond to those risks. Such procedures included examining, on a test basis, evidence regarding the amounts and disclosures in the financial statements. Our audits also included evaluating the accounting principles used and significant estimates made by management, as well as evaluating the overall presentation of the financial statements. Our procedures included
| 114 | 2018 Annual Report ■ College Retirement Equities Fund |
confirmation of securities owned as of December 31, 2018 by correspondence with the custodian and brokers; when replies were not received from brokers, we performed other auditing procedures. We believe that our audits provide a reasonable basis for our opinions.

PricewaterhouseCoopers LLP
Baltimore, Maryland
February 21, 2019
We have served as the auditor of one or more investment companies in TIAA-CREF Funds’ investment company group since 2005.
| College Retirement Equities Fund ■ 2018 Annual Report | 115 |
2018 participant meeting(unaudited)
College Retirement Equities Fund
Trustees
On July 20, 2018, at an annual meeting of CREF participants, the following persons were elected to serve on the Board of Trustees:
| Nominee | | Dollars for | | Percent | | Dollars against | | Percent | | | Dollars abstain | | Percent | |
| Forrest Berkley | | 21,888,937,770.820 | | 89.802 | | 769,669,187.750 | | 3.158 | | | 1,716,187,631.070 | | 7.041 | |
| Janice C. Eberly | | 22,259,693,383.030 | | 91.323 | | 636,086,954.530 | | 2.610 | | | 1,479,014,252.080 | | 6.068 | |
| Nancy A. Eckl | | 22,107,438,635.160 | | 90.698 | | 713,129,474.240 | | 2.926 | | | 1,554,226,480.240 | | 6.376 | |
| Michael A. Forrester | | 21,789,870,909.420 | | 89.395 | | 821,129,628.700 | | 3.369 | | | 1,763,794,051.520 | | 7.236 | |
| Howell E. Jackson | | 21,915,710,496.820 | | 89.911 | | 790,970,590.400 | | 3.245 | | | 1,668,113,502.420 | | 6.844 | |
| Thomas J. Kenny | | 21,785,760,549.620 | | 89.378 | | 856,612,601.240 | | 3.514 | | | 1,732,421,438.780 | | 7.107 | |
| James M. Poterba | | 22,089,624,018.310 | | 90.625 | | 669,912,166.530 | | 2.748 | | | 1,615,258,404.800 | | 6.627 | |
| Maceo K. Sloan | | 21,776,532,205.860 | | 89.340 | | 902,865,203.130 | | 3.704 | | | 1,695,397,180.650 | | 6.956 | |
| Laura T. Starks | | 22,239,882,758.700 | | 91.241 | | 659,080,154.540 | | 2.704 | | | 1,475,831,676.400 | | 6.055 | |
Forrest Berkley, Janice C. Eberly, Nancy A. Eckl, Michael A. Forrester, Howell E. Jackson, Thomas J. Kenny, James M. Poterba, Maceo K. Sloan and Laura T. Starks continued in office.
The results above were certified by ComputerShare Fund Services, Inc., independent tabulator for the College Retirement Equities Fund.
| 116 | 2018 Annual Report ■ College Retirement Equities Fund |
Trustees and officers(unaudited)
College Retirement Equities Fund ■ December 31, 2018
Trustees
Name, address and
year of birth (“YOB”) | | Position(s)
held with
CREF | | Term of
office and
length
of time
served | | Principal occupation(s) during past 5 years | | Number of
portfolios in
fund complex
overseen
by Trustee | | Other directorship(s) held by Trustee |
Forrest Berkley
c/o Corporate Secretary
730 Third Avenue
New York, NY 10017-3206
YOB: 1954 | | Trustee | | Four-year term commencing 2018. Trustee since 2006. | | Retired Partner (since 2006), Partner (1990–2005) and Head of Global Product Management (2003–2005), GMO (formerly, Grantham, Mayo, Van Otterloo & Co.) (investment management); and member of asset allocation portfolio management team, GMO (2003–2005). | | 89 | | Investment Committee member, Maine Community Foundation and the Elmina B. Sewall Foundation. |
Joseph A. Boateng
c/o Corporate Secretary
730 Third Avenue
New York, NY 10017-3206
YOB: 1963 | | Trustee | | Four-year term commencing 2018. Trustee since 2018. | | Chief Investment Officer, Casey Family Programs (since 2007). Director of U.S. Pension Plans at Johnson & Johnson (2002–2006); Manager, Financial Services Consultant, KPMG Consulting (2000–2002); several positions, Xerox Corporation (1988–2000). | | 8 | | Board member, Year Up Puget Sound; Investment Advisory Committee Chair, Seattle City Employees’ Retirement System; Investment Committee member, The Seattle Foundation. |
Janice C. Eberly
c/o Corporate Secretary
730 Third Avenue
New York, NY 10017-3206
YOB: 1962 | | Trustee | | Indefinite term. Trustee since 2018. | | James R. and Helen D. Russell Professor of Finance at the Kellogg School of Management at Northwestern University (2002–2011 and since 2013) and Chair of the Finance Department (2005–2007). Assistant Secretary for Economic Policy, United States Department of the Treasury (2011–2013). | | 89 | | Member of the Board of the Office of Finance, Federal Home Loan Banks. |
| | College Retirement Equities Fund ■ 2018 Annual Report | 117 |
| Trustees and officers(unaudited) | continued |
College Retirement Equities Fund ■ December 31, 2018
Trustees—concluded
Name, address and
year of birth (“YOB”) | | Position(s)
held with
CREF | | Term of
office and
length
of time
served | | Principal occupation(s) during past 5 years | | Number of
portfolios in
fund complex
overseen
by Trustee | | Other directorship(s) held by Trustee |
Nancy A. Eckl
c/o Corporate Secretary
730 Third Avenue
New York, NY 10017-3206
YOB: 1962 | | Trustee | | Four-year term commencing 2018. Trustee since 2007. | | Vice President (1990–2006), American Beacon Advisors, Inc., and Vice President of certain funds advised by American Beacon Advisors, Inc. | | 89 | | Independent Director, The Lazard Funds, Inc., Lazard Retirement Series, Inc., Lazard Global Total Return and Income Fund, Inc. and Lazard World Dividend & Income Fund, Inc. |
Michael A. Forrester
c/o Corporate Secretary
730 Third Avenue
New York, NY 10017-3206
YOB: 1967 | | Trustee | | Four-year term commencing 2018. Trustee since 2007. | | Chief Executive Officer (since 2014) and Chief Operating Officer (2007–2014), Copper Rock Capital Partners, LLC; Chief Operating Officer, DDJ Capital Management (2003–2006). | | 89 | | Director of Copper Rock Capital Partners, LLC (investment adviser). |
Howell E. Jackson
c/o Corporate Secretary
730 Third Avenue
New York, NY 10017-3206
YOB: 1954 | | Trustee | | Four-year term commencing 2018. Trustee since 2005. | | James S. Reid, Jr. Professor of Law (since 2004), Senior Advisor to the President and Provost (2010–2012), Acting Dean (2009), Vice Dean for Budget (2003–2006) and on the faculty (since 1989) of Harvard Law School. | | 89 | | Director, Commonwealth. |
Thomas J. Kenny
c/o Corporate Secretary
730 Third Avenue
New York, NY 10017-3206
YOB: 1963 | | Chairman of the Board and Trustee | | Four-year term commencing 2018. Trustee since 2011. Chairman for term ending July 1, 2021. Chairman since 2017. | | Advisory Director (2010–2011), Partner (2004–2010), Managing Director (1999–2004), Co-Head of Global Cash and Fixed Income Portfolio Management Team (2002–2010), Goldman Sachs Asset Management. | | 89 | | Director and Finance and Investment Committee Chair, Aflac Incorporated; Director and Investment Committee member, Sansum Clinic; Director, ParentSquare; Investment Committee member, Cottage Health System; Member, University of California at Santa Barbara Arts and Lectures Advisory Council. |
| 118 | 2018 Annual Report ■ College Retirement Equities Fund | |
James M. Poterba
c/o Corporate Secretary
730 Third Avenue
New York, NY 10017-3206
YOB: 1958 | | Trustee | | Four-year term commencing 2014. Trustee since 2006. | | President and Chief Executive Officer, National Bureau of Economic Research (“NBER”) (since 2008); Affiliated Faculty Member of the Finance Group at the Alfred P. Sloan School of Management, Massachusetts Institute of Technology (“MIT”) (since 2014); Mitsui Professor of Economics, MIT (since 1996); Head (2006–2008) and Associate Head (1994–2000 and 2001–2006), Economics Department of MIT; and Program Director, NBER (1990–2008). | | 89 | | Director, The Alfred P. Sloan Foundation and National Bureau of Economic Research; Member, Congressional Budget Office Panel of Economic Advisers. |
Maceo K. Sloan
c/o Corporate Secretary
730 Third Avenue
New York, NY 10017-3206
YOB: 1949 | | Trustee | | Four-year term commencing 2014. Trustee since 1991. | | Chairman, President and Chief Executive Officer, Sloan Financial Group, Inc. (1991–2018); Chairman and Chief Executive Officer (1991–2016) and Chief Investment Officer (1991–2018) and Chief Compliance Officer (2015–2016), NCM Capital Management Group, Inc.; Chairman and Chief Executive Officer (2003–2016) and Chief Investment Officer (2003–2013) and Chief Compliance Officer (2015–2016), NCM Capital Advisers Inc.; and Chairman, President and Principal Executive Officer, NCM Capital Investment Trust (2007–2012). | | 89 | | N/A |
Laura T. Starks
c/o Corporate Secretary
730 Third Avenue
New York, NY 10017-3206
YOB: 1950 | | Trustee | | Four-year term commencing 2014. Trustee since 2006. | | Charles E. and Sarah M. Seay Regents Chair in Finance (since 2002), Co-Executive Director of the Social Innovation Initiative (since 2015), Director of the AIM Investment Center (2000–2016), Associate Dean for Research (2011–2016), Chairman,Department of Finance, (2002–2011), and Professor, McCombs School of Business, University of Texas at Austin (since 1987). | | 89 | | Member of the Board of Governors of the Investment Company Institute, the Governing Council of Independent Directors Council (an association for mutual fund directors); and Investment Advisory Committee, Employees Retirement System of Texas. |
| | College Retirement Equities Fund ■ 2018 Annual Report | 119 |
| Trustees and officers(unaudited) | continued |
College Retirement Equities Fund ■ December 31, 2018
Officers
Name, address and
year of birth (“YOB”) | | Position(s)
held with
CREF | | Term of
office and
length
of time
served | | Principal occupation(s) during past 5 years |
Vijay Advani
TIAA
730 Third Avenue
New York, NY 10017-3206
YOB: 1960 | | Executive Vice President | | One-year term. Executive Vice President since 2018. | | Chief Executive Officer, Nuveen. Executive Vice President of the College Retirement Equities Fund (“CREF”), TIAA Separate Account VA-1, TIAA-CREF Funds and TIAA-CREF Life Funds (collectively, the “TIAA-CREF Fund Complex”). Prior to joining Nuveen, Mr. Advani served as Co-President of Franklin Resources, Inc.-Franklin Templeton Investments. |
Mona Bhalla
TIAA
730 Third Avenue
New York, NY 10017-3206
YOB: 1969 | | Senior Managing Director and Corporate Secretary | | One-year term. Senior Managing Director and Corporate Secretary since 2017. | | Senior Managing Director and Corporate Secretary of Teachers Insurance and Annuity Association of America (“TIAA”) and the TIAA-CREF Fund Complex. Prior to joining TIAA, Ms. Bhalla served as Senior Vice President, Counsel and Corporate Secretary, Head of Corporate, Securities and M&A Group of AllianceBernstein L.P. |
Richard S. Biegen
TIAA
730 Third Avenue
New York, NY 10017-3206
YOB: 1962 | | Chief Compliance Officer | | One-year term. Chief Compliance Officer since 2008. | | Senior Managing Director, TIAA. Chief Compliance Officer of the TIAA-CREF Fund Complex. |
Glenn E. Brightman
TIAA
730 Third Avenue
New York, NY 10017-3206
YOB: 1972 | | Executive Vice President, Chief Financial Officer and Principal Accounting Officer. | | One-year term. Executive Vice President, Chief Financial Officer and Principal Accounting Officer since 2017. | | Executive Vice President, Chief Financial Officer of Nuveen. Executive Vice President, Chief Financial Officer and Principal Accounting Officer of CREF. |
| 120 | 2018 Annual Report ■ College Retirement Equities Fund | |
Carol W. Deckbar
TIAA
730 Third Avenue
New York, NY 10017-3206
YOB: 1962 | | Executive Vice President | | One-year term. Executive Vice President since 2013. | | Executive Vice President, Institutional Investment and Endowment Services of TIAA and Executive Vice President of CREF and VA-1. |
Roger W. Ferguson, Jr.
TIAA
730 Third Avenue
New York, NY 10017-3206
YOB: 1951 | | President and Chief Executive Officer | | One-year term. President and Chief Executive Officer since 2008. | | President and Chief Executive Officer of TIAA, CREF and TIAA Separate Account VA-1. |
Jose Minaya
TIAA
730 Third Avenue
New York, NY 10017-3206
YOB: 1971 | | Executive Vice President | | One-year term. Executive Vice President since 2018. | | Executive Vice President, Chief Investment Officer and President, Nuveen Global Investments. Executive Vice President of the TIAA-CREF Fund Complex. Formerly, Senior Managing Director, President, Global Investments, TIAA. |
Phillip T. Rollock
TIAA
730 Third Avenue
New York, NY 10017-3206
YOB: 1962 | | Executive Vice President and Chief Legal Officer | | One-year term. Executive Vice President and Chief Legal Officer since 2018. | | Executive Vice President and Chief Legal Officer of TIAA and the TIAA-CREF Fund Complex. Formerly, Senior Managing Director, Deputy Chief Legal Officer and Corporate Secretary of TIAA. |
Christopher A. Van Buren
TIAA
730 Third Avenue
New York, NY 10017-3206
YOB: 1962 | | Executive Vice President | | One-year term. Executive Vice President since 2018. | | Executive Vice President, Chief Risk Officer of TIAA, and Executive Vice President of the TIAA-CREF Fund Complex. Prior to joining TIAA, Mr. Van Buren served as Managing Director, Group Risk Control of UBS. |
E. Scott Wickerham
TIAA
730 Third Avenue
New York, NY 10017-3206
YOB: 1973 | | Treasurer | | One-year term. Treasurer since 2017. | | Managing Director, Head, TC Fund Administration, Nuveen. Principal Financial Officer, Principal Accounting Officer and Treasurer of the TIAA-CREF Funds, TIAA-CREF Life Funds and TIAA Separate Account VA-1; and Treasurer of CREF. |
| | College Retirement Equities Fund ■ 2018 Annual Report | 121 |
| Trustees and officers(unaudited) | concluded |
College Retirement Equities Fund ■ December 31, 2018
Officers—concluded
Name, address and
year of birth (“YOB”) | | Position(s)
held with
CREF | | Term of
office and
length
of time
served | | Principal occupation(s) during past 5 years |
Sean N. Woodroffe
TIAA
730 Third Avenue
New York, NY 10017-3206
YOB: 1963 | | Executive Vice President | | One-year term. Executive Vice President since 2018. | | Senior Executive Vice President, Chief Human Resources Officer of TIAA, and Executive Vice President of the TIAA-CREF Fund Complex. Prior to joining TIAA, Mr. Woodroffe served as Chief People Officer at National Life Group. |
Please note that CREF’s Statement of Additional Information (SAI) includes additional information about CREF’s trustees and is available, without charge, through our website, tiaa.org, or by calling 877-518-9161.
| 122 | 2018 Annual Report ■ College Retirement Equities Fund | |
Additional information about index providers(unaudited)
Russell indexes
Source: London Stock Exchange Group plc and its group undertakings (collectively, the “LSE Group”). © LSE Group 2019. FTSE Russell is a trading name of certain of the LSE Group companies. “FTSE®,” “Russell®” and “FTSE Russell®” are trademarks of the relevant LSE Group companies and are used by any other LSE Group company under license. All rights in the FTSE Russell indexes or data vest in the relevant LSE Group company which owns the index or the data. Neither LSE Group nor its licensors accept any liability for any errors or omissions in the indexes or data and no party may rely on any indexes or data contained in this communication. No further distribution of data from the LSE Group is permitted without the relevant LSE Group company’s express written consent. The LSE Group does not promote, sponsor or endorse the content of this communication.
Bloomberg Barclays indexes
Source: Bloomberg Index Services Limited. BLOOMBERG® is a trademark and service mark of Bloomberg Finance L.P. and its affiliates (collectively “Bloomberg”). BARCLAYS® is a trademark and service mark of Barclays Bank Plc (collectively with its affiliates, “Barclays”), used under license. Bloomberg or Bloomberg’s licensors, including Barclays, own all proprietary rights in the Bloomberg Barclays Indices. Neither Bloomberg nor Barclays approves or endorses this material, or guarantees the accuracy or completeness of any information herein, or makes any warranty, express or implied, as to the results to be obtained therefrom and, to the maximum extent allowed by law, neither shall have any liability or responsibility for injury or damages arising in connection therewith.
MSCI indexes
Source: MSCI. The MSCI information may only be used for your internal use, may not be reproduced or redisseminated in any form and may not be used as a basis for or a component of any financial instruments or products or indices. None of the MSCI information is intended to constitute investment advice or a recommendation to make (or refrain from making) any kind of investment decision and may not be relied on as such. Historical data and analysis should not be taken as an indication or guarantee of any future performance analysis, forecast or prediction. The MSCI information is provided on an “as is” basis and the user of this information assumes the entire risk of any use made of this information. MSCI, each of its affiliates and each other person involved in or related to compiling, computing or creating any MSCI information (collectively, the “MSCI Parties”) expressly disclaims all warranties (including, without limitation, any warranties of originality, accuracy, completeness, timeliness, non-infringement, merchantability and fitness for a particular purpose) with respect to this information. Without limiting any of the foregoing, in no event shall any MSCI Party have any liability for any direct, indirect, special, incidental, punitive, consequential (including, without limitation, lost profits) or any other damages. (www.msci.com)
| | College Retirement Equities Fund ■ 2018 Annual Report | 123 |
| Additional information about index providers(unaudited) | concluded |
Morningstar indexes
© 2019 Morningstar. All Rights Reserved. The information contained herein: (1) is proprietary to Morningstar and/or its content providers; (2) may not be copied or distributed; and (3) is not warranted to be accurate, complete or timely. Neither Morningstar nor its content providers are responsible for any damages or losses arising from any use of this information.
| 124 | 2018 Annual Report ■ College Retirement Equities Fund | |
[This page intentionally left blank.]
[This page intentionally left blank.]
[This page intentionally left blank.]
[This page intentionally left blank.]
[This page intentionally left blank.]
[This page intentionally left blank.]
How to reach us
TIAA website Account performance, personal account information and transactions, product descriptions, and information about investment choices and income options TIAA.org Automated telephone service Check account performance and accumulation balances, change allocations, transfer funds and verify credited premiums 800-842-2252 24 hours a day, 7 days a week National contact center Retirement saving and planning, income options and payments, beneficiary services and tax reporting 800-842-2252 8 a.m. to 10 p.m. (ET), Monday–Friday 9 a.m. to 6 p.m. (ET), Saturday | | For the hearing- or speech-impaired 800-842-2755 8 a.m. to 10 p.m. (ET), Monday–Friday 9 a.m. to 6 p.m. (ET), Saturday TIAA Brokerage Services Self-directed brokerage accounts for investing in stocks, bonds and mutual funds 800-927-3059 8 a.m. to 7 p.m. (ET), Monday–Friday Advisor services 888-842-0318 8 a.m. to 7:30 p.m. (ET), Monday–Friday |
You should carefully consider the investment objectives, risks, charges and expenses of any account before investing. For a prospectus that contains this and other important information, please visit TIAA.org, or call 877-518-9161. Please read the prospectus carefully before investing. Investment, insurance and annuity products are not Federal Deposit Insurance Corporation (FDIC) insured, are not bank guaranteed, are not bank deposits, are not insured by any federal government agency, are not a condition to any banking service or activity, and may lose value.Nuveen, a subsidiary of TIAA, provides investment advice and portfolio management services through a dozen affiliated registered investment advisers. TIAA Brokerage Services is a division of TIAA-CREF Individual & Institutional Services, LLC. TIAA-CREF Individual & Institutional Services, LLC and Nuveen Securities, LLC, members FINRA and SIPC, distribute securities products. CREF variable annuities are issued by College Retirement Equities Fund, New York, NY. Each of the foregoing is solely responsible for its own financial condition and contractual obligations.
This material is not intended to be a recommendation or investment advice, does not constitute a solicitation to buy or sell securities, and is not provided in a fiduciary capacity. The information provided does not take into account the specific objectives or circumstances of any particular investor, or suggest any specific course of action. Investment decisions should be made based on an investor’s objectives and circumstances and in consultation with his or her advisors.
©2019 Teachers Insurance and Annuity Association of America—College Retirement Equities Fund, 730 Third Avenue, New York, NY 10017-3206
 | 730 Third Avenue New York, NY 10017-3206 | PRESORTED STANDARD
U.S. POSTAGE
PAID
TIAA |
| | | |

 | Printed on paper containing recycled fiber |
 | We’re fond of paper…in its original form. Switch to eDelivery at TIAA.org/eDelivery | |
| 730 Third Avenue New York, NY 10017-3206 |
| Printed on paper containing recycled fiber |
| 730 Third Avenue New York, NY 10017-3206 |
Item 2. Code of Ethics.
2(a) The Board of Trustees of the College Retirement Equities Fund (the “Registrant”) has adopted a code of ethics for senior financial officers, including the Registrant’s principal executive officer, principal financial officer, principal accounting officer, or controller, and persons performing similar functions, in conformity with rules promulgated under the Sarbanes-Oxley Act of 2002.
2(b) No response required.
2(c) During the reporting period, there were no amendments to the code of ethics.
2(d) During the reporting period, there were no implicit or explicit waivers granted by the Registrant from any provision of the code of ethics.
2(e) Not applicable.
2(f) A copy of the current code of ethics is filed as an exhibit to this Form N-CSR.
Item 3. Audit Committee Financial Expert.
3(a)(1) The Registrant’s Board of Trustees has determined that the Registrant has at least one audit committee financial expert serving on its Audit and Compliance Committee.
3(a)(2) Maceo K. Sloan is the Registrant’s audit committee financial expert and is “independent” for purposes of Item 3 of Form N-CSR.
Item 4. Principal Accountant Fees and Services.
PricewaterhouseCoopers LLP (“PwC”) performs independent audits of the Registrant’s financial statements. To maintain auditor independence and avoid the appearance of conflicts of interest, the Registrant, as a policy, does not engage PwC for management advisory or consulting services.
4(a) Audit Fees.
For the fiscal years ended December 31, 2018 and December 31, 2017, PwC’s aggregate fees for the audit of the Registrant’s annual financial statements were $806,715 and $787,040, respectively.
4(b) Audit Related Fees.
For the fiscal years ended December 31, 2018 and December 31, 2017, PwC’s aggregate fees for services related to the performance of the audit of the Registrant’s annual financial statements were $0 and $0, respectively.
For the fiscal years ended December 31, 2018 and December 31, 2017, the Audit-Related Fees billed by PwC to Teachers Advisors, LLC (“Advisors”) or to any entity controlling, controlled by or under common control with Advisors that provides ongoing services to the Registrant (collectively, “Fund Service Providers”) were $0 and $0, respectively.
4(c) Tax Fees.
For the fiscal years ended December 31, 2018 and December 31, 2017, PwC’s aggregate fees for tax services billed to the Registrant were $84,061 and $205,921, respectively.
For the fiscal years ended December 31, 2018 and December 31, 2017, PwC’s aggregate fees for tax services billed to the Fund Service Providers were $0 and $0, respectively.
The aggregate fees for all other services billed by PwC for the fiscal year ended December 31, 2017 do not align with the figures reported in the Form N-PX filed with the Securities and Exchange Commission on August 27, 2018 (SEC File No. 811-04415) because the fees disclosed in this Form N-CSR reflect fees updated after the date of that Form N-PX for the relevant period.
4(d) All Other Fees.
For the fiscal years ended December 31, 2018 and December 31, 2017, PwC’s aggregate fees for all other services billed to the Registrant were $21,655 and $21,500, respectively.
For the fiscal years ended December 31, 2018 and December 31, 2017, PwC’s aggregate fees for all other services billed to the Fund Service Providers were $0 and $0, respectively.
4(e)(1) Preapproval Policy.
The Registrant’s audit and compliance committee (“Audit Committee”) has adopted a Preapproval Policy for External Audit Firm Services (the “Policy”). The Policy describes the types of services that may be provided by the independent auditor to the Registrant and certain of its affiliates without impairing the auditor’s independence. Under the Policy, the Audit Committee is required to preapprove all services to be performed by the Registrant’s independent auditor in order to ensure that such services do not impair the auditor’s independence.
The Policy requires the Audit Committee to: (i) appoint the independent auditor to perform the financial statements audit for the Registrant and certain of its affiliates, including approving the terms of the engagement, and (ii) preapprove the audit, audit-related, tax and other services to be provided by the independent auditor to the Registrant and certain of its affiliates and the fees to be charged for provision of such services from year to year.
4(e)(2) Services provided pursuant to paragraph (c)(7)(i)(C) of Rule 2-01 of Regulation S-X (the “de minimis exception”):
Audit-Related Fees:
There were no amounts that were approved by the Audit Committee pursuant to the de minimis exception for the fiscal years ended December 31, 2018 and December 31, 2017 on behalf of the Registrant.
There were no amounts that were approved by the Audit Committee pursuant to the de minimis exception for the fiscal years ended December 31, 2018 and December 31, 2017 on behalf of the Fund Service Providers that relate directly to the operations and financial reporting of the Registrant.
Tax Fees:
There were no amounts that were approved by the Audit Committee pursuant to the de minimis exception for the fiscal years ended December 31, 2018 and December 31, 2017 on behalf of the Registrant.
There were no amounts that were approved by the Audit Committee pursuant to the de minimis exception for the fiscal years ended December 31, 2018 and December 31, 2017 on behalf of the Fund Service Providers that relate directly to the operations and financial reporting of the Registrant.
All Other Fees:
There were no amounts that were approved by the Audit Committee pursuant to the de minimis exception for the fiscal years ended December 31, 2018 and December 31, 2017 on behalf of the Registrant.
There were no amounts that were approved by the Audit Committee pursuant to the de minimis exception for the fiscal years ended December 31, 2018 and December 31, 2017 on behalf of the Fund Service Providers that relate directly to the operations and financial reporting of the Registrant.
4(f) The percentage of hours expended by PwC’s engagement to audit the Registrant’s financial statements for the most recent fiscal year attributable to work performed by persons other than PwC’s full-time, permanent employees was less than 50%.
4(g) Non-Audit Fees for Related Entities.
For the fiscal years ended December 31, 2018 and December 31, 2017, aggregate non-audit fees billed to the Registrant and to its Fund Service Providers by PwC were $229,000 and $208,315, respectively.
4(h) The Registrant’s Audit Committee has considered whether the non-audit services that were rendered by PwC to the Registrant’s Fund Service Providers that were not pre-approved pursuant to paragraph (c)(7)(ii) of Rule 2-01 of Regulation S-X are compatible with maintaining PwC’s independence.
Item 5. Audit Committee of Listed Registrants.
Not Applicable.
Item 6. Schedule of Investments.
COLLEGE RETIREMENT EQUITIES FUND -Stock Account
COLLEGE RETIREMENT EQUITIES FUND
STOCK ACCOUNT
SCHEDULE OF INVESTMENTS
December 31, 2018
| PRINCIPAL | | | | | ISSUER | | RATE | | MATURITY
DATE | | VALUE
(000) | |
| GOVERNMENT BONDS - 0.0% | | | | | | | | | | |
| | | | | | | | | | | | | | | | | |
| U.S. TREASURY SECURITIES - 0.0% | | | | | | | | | | |
| $ | 300,000 | | | | | United States Treasury Note | | | 1.750 | % | | 05/15/22 | | $ | 293 | |
| | | | | | | TOTAL U.S. TREASURY SECURITIES | | | | | | | | | 293 | |
| | | | | | | | | | | | | | | | | |
| | | | | | | TOTAL GOVERNMENT BONDS | | | | | | | | | 293 | |
| | | | | | | (Cost $301) | | | | | | | | | | |
| | | | | | | | | | | | | | | | | |
| EQUITY LINKED NOTES - 0.0% | | | | | | | | | | |
| | | | | | | | | | | | | | | | | |
| DIVERSIFIED FINANCIALS - 0.0% | | | | | | | | | | |
| | 70,600 | | | *,j | | Morgan Stanley BV | | | 0.000 | | | 06/14/19 | | | 1,639 | |
| | | | | | | TOTAL DIVERSIFIED FINANCIALS | | | | | | | | | 1,639 | |
| | | | | | | | | | | | | | | | | |
| | | | | | | TOTAL EQUITY LINKED NOTES | | | | | | | | | 1,639 | |
| | | | | | | (Cost $1,634) | | | | | | | | | | |
| | | | | | | | | | | | | | |
| SHARES | | | | | COMPANY | | | | | | | |
| COMMON STOCKS - 99.2% | | | | | | | | | | |
| | | | | | | | | | | | | | | | | |
| AUTOMOBILES & COMPONENTS - 1.5% | | | | | | | | | | |
| | 40,525 | | | | | Adient plc | | | | | | | | | 610 | |
| | 183,700 | | | | | Aisan Industry Co Ltd | | | | | | | | | 1,234 | |
| | 1,134,444 | | | | | Aisin Seiki Co Ltd | | | | | | | | | 38,998 | |
| | 61,300 | | | *,e | | Akebono Brake Industry Co Ltd | | | | | | | | | 102 | |
| | 206,631 | | | * | | American Axle & Manufacturing Holdings, Inc | | | | | | | | | 2,294 | |
| | 579,487 | | | * | | Apollo Tyres Ltd | | | | | | | | | 1,956 | |
| | 46,972 | | | | | ARB Corp Ltd | | | | | | | | | 497 | |
| | 40,603 | | | | | Asahi India Glass Ltd | | | | | | | | | 148 | |
| | 291 | | | e | | Autoliv, Inc | | | | | | | | | 20 | |
| | 1,830 | | | e | | Autoneum Holding AG. | | | | | | | | | 275 | |
| | 1,794,500 | | | g | | BAIC Motor Corp Ltd | | | | | | | | | 949 | |
| | 155,254 | | | | | Bajaj Holdings and Investment Ltd | | | | | | | | | 6,043 | |
| | 47,030 | | | | | Balkrishna Industries Ltd | | | | | | | | | 622 | |
| | 532,278 | | | | | Bayerische Motoren Werke AG. | | | | | | | | | 43,170 | |
| | 6,579 | | | | | Bayerische Motoren Werke AG. (Preference) | | | | | | | | | 469 | |
| | 408,049 | | | | | Bharat Forge Ltd | | | | | | | | | 2,971 | |
COLLEGE RETIREMENT EQUITIES FUND -Stock Account
| SHARES | | | | COMPANY | | VALUE
(000) | |
| | 151,269 | | | | BorgWarner, Inc | | $ | 5,255 | |
| | 9,891 | | * | | Bosch Ltd | | | 2,777 | |
| | 119,174 | | | | Brembo S.p.A | | | 1,216 | |
| | 592,262 | | | | Bridgestone Corp | | | 22,723 | |
| | 11,261,335 | | | | Brilliance China Automotive Holdings Ltd | | | 8,382 | |
| | 656,562 | | e | | Byd Co Ltd | | | 4,206 | |
| | 6,100 | | | | BYD Co Ltd | | | 46 | |
| | 70,078 | | * | | Ceat Ltd | | | 1,310 | |
| | 383,000 | | | | Chaowei Power Holdings Ltd | | | 148 | |
| | 1,326,251 | | | | Cheng Shin Rubber Industry Co Ltd | | | 1,764 | |
| | 4,966,000 | | * | | China First Capital Group Ltd | | | 2,823 | |
| | 1,491,000 | | * | | China Motor Corp | | | 1,177 | |
| | 173,626 | | | | Cie Automotive S.A. | | | 4,261 | |
| | 303,090 | | | | Compagnie Plastic-Omnium S.A. | | | 6,995 | |
| | 101,229 | | | | Continental AG. | | | 14,095 | |
| | 67,041 | | | | Cooper Tire & Rubber Co | | | 2,167 | |
| | 40,517 | | * | | Cooper-Standard Holding, Inc | | | 2,517 | |
| | 40,155 | | | | Cub Elecparts, Inc | | | 314 | |
| | 35,600 | | | | Daido Metal Co Ltd | | | 252 | |
| | 26,100 | | | | Daikyonishikawa Corp | | | 255 | |
| | 1,819,524 | | | | Daimler AG. (Registered) | | | 95,916 | |
| | 1,011,708 | | | | Dana Holding Corp | | | 13,790 | |
| | 943,411 | | | | Delphi Automotive plc | | | 58,086 | |
| | 316 | | | | Delphi Technologies plc | | | 5 | |
| | 373,218 | | | | Denso Corp | | | 16,522 | |
| | 63,000 | | | | Depo Auto Parts Ind Co Ltd | | | 139 | |
| | 185,240 | | e,g | | Dometic Group AB | | | 1,156 | |
| | 2,536 | | | | Dong Ah Tire & Rubber Co Ltd | | | 73 | |
| | 2,677,787 | | | | Dongfeng Motor Group Co Ltd | | | 2,434 | |
| | 33,887 | | * | | Dorman Products, Inc | | | 3,051 | |
| | 4,546,500 | | | | Drb-Hicom BHD | | | 1,867 | |
| | 172,600 | | | | Eagle Industry Co Ltd | | | 1,999 | |
| | 18,540 | | | | EDAG Engineering Group AG. | | | 338 | |
| | 18,483 | | | | ElringKlinger AG. | | | 144 | |
| | 33,180 | | g | | Endurance Technologies Ltd | | | 608 | |
| | 26,685 | | * | | Esmo Corp | | | 169 | |
| | 150,482 | | | | Exedy Corp | | | 3,676 | |
| | 334,759 | | | | Exide Industries Ltd | | | 1,284 | |
| | 114,420 | | | | Faurecia | | | 4,317 | |
| | 26,200 | | | | FCC Co Ltd | | | 615 | |
| | 51,641 | | e | | Ferrari NV | | | 5,139 | |
| | 446,964 | | * | | Fiat DaimlerChrysler Automobiles NV | | | 6,445 | |
| | 13,618,051 | | | | Ford Motor Co | | | 104,178 | |
| | 64,292 | | | | Ford Otomotiv Sanayi AS | | | 607 | |
| | 86,949 | | * | | Fox Factory Holding Corp | | | 5,119 | |
| | 191,506 | | | | Fuji Heavy Industries Ltd | | | 4,091 | |
| | 33,597 | | | | Futaba Industrial Co Ltd | | | 168 | |
| | 13,500 | | | | Fuyao Glass Industry Group Co Ltd | | | 45 | |
| | 586,000 | | g | | Fuyao Glass Industry Group Co Ltd (Hong Kong) | | | 1,876 | |
| | 42,324 | | *,e | | Garrett Motion, Inc | | | 522 | |
| | 5,083,202 | | | | Geely Automobile Holdings Ltd | | | 8,965 | |
| | 6,062,000 | | *,† | | General Motors Co | | | 0 | |
| | 85,268,000 | | *,†,e | | General Motors Co | | | 0 | |
| | 18,507,434 | | *,† | | General Motors Co | | | 0 | |
COLLEGE RETIREMENT EQUITIES FUND -Stock Account
| SHARES | | | | COMPANY | | VALUE
(000) | |
| | 40,684,487 | | *,†,e | | General Motors Co | | $ | 0 | |
| | 35,983,677 | | *,† | | General Motors Co | | | 0 | |
| | 24,057,000 | | *,† | | General Motors Co | | | 0 | |
| | 26,439,191 | | *,† | | General Motors Co | | | 0 | |
| | 7,950,000 | | *,† | | General Motors Co | | | 0 | |
| | 4,230,271 | | *,†,e | | General Motors Co | | | 0 | |
| | 722,689 | | *,†,e | | General Motors Co | | | 0 | |
| | 2,602,961 | | | | General Motors Co | | | 87,069 | |
| | 214,086 | | | | Gentex Corp | | | 4,327 | |
| | 43,782 | | * | | Gentherm, Inc | | | 1,750 | |
| | 109,578 | | g | | Gestamp Automocion S.A. | | | 623 | |
| | 27,496 | | | | Global & Yuasa Battery Co Ltd | | | 886 | |
| | 472,169 | | | | Goodyear Tire & Rubber Co | | | 9,637 | |
| | 2,856,989 | | e | | Great Wall Motor Co Ltd | | | 1,643 | |
| | 104,200 | | | | G-Tekt Corp | | | 1,389 | |
| | 5,052,585 | | | | Guangzhou Automobile Group Co Ltd | | | 5,037 | |
| | 551,860 | | | | GUD Holdings Ltd | | | 4,372 | |
| | 5,287 | | | | Halla Holdings Corp | | | 207 | |
| | 72,426 | | | | Hankook Tire Co Ltd | | | 2,603 | |
| | 589,582 | | | | Hanon Systems | | | 5,713 | |
| | 102,875 | | | | Harley-Davidson, Inc | | | 3,510 | |
| | 48,336 | | | | Hero Honda Motors Ltd | | | 2,148 | |
| | 1,657,134 | | | | Honda Motor Co Ltd | | | 43,657 | |
| | 134,990 | | | | Hota Industrial Manufacturing Co Ltd | | | 529 | |
| | 11,300 | | | | Huayu Automotive Systems Co Ltd | | | 30 | |
| | 109,259 | | | | Hyundai Mobis | | | 18,641 | |
| | 160,737 | | | | Hyundai Motor Co | | | 17,064 | |
| | 52,360 | | | | Hyundai Motor Co Ltd (2nd Preference) | | | 3,613 | |
| | 24,552 | | | | Hyundai Motor Co Ltd (Preference) | | | 1,545 | |
| | 9,909 | | | | Hyundai Wia Corp | | | 322 | |
| | 19,000 | | | | Ichikoh Industries Ltd | | | 96 | |
| | 45,860 | | | | Indus Motor Co Ltd | | | 403 | |
| | 516,971 | | | | Isuzu Motors Ltd | | | 7,252 | |
| | 96,600 | | | | Kasai Kogyo Co Ltd | | | 720 | |
| | 21,389 | | e | | Kayaba Industry Co Ltd | | | 515 | |
| | 329,400 | | | | Keihin Corp | | | 5,512 | |
| | 363,455 | | | | Kenda Rubber Industrial Co Ltd | | | 345 | |
| | 742,122 | | | | Kia Motors Corp | | | 22,369 | |
| | 23,236 | | | | Koito Manufacturing Co Ltd | | | 1,199 | |
| | 273,652 | | * | | Kongsberg Automotive ASA | | | 242 | |
| | 328,242 | | | | Kordsa Teknik Tekstil AS. | | | 606 | |
| | 58,820 | | * | | Kumho Tire Co, Inc | | | 280 | |
| | 104,000 | | | | Launch Tech Co Ltd | | | 94 | |
| | 31,261 | | | | LCI Industries, Inc | | | 2,088 | |
| | 171,563 | | | | Lear Corp | | | 21,078 | |
| | 22,747 | | | | Leoni AG. | | | 795 | |
| | 39,436 | | | | Linamar Corp | | | 1,309 | |
| | 528,686 | | | | Magna International, Inc | | | 23,998 | |
| | 978,238 | | | | Mahindra & Mahindra Ltd | | | 11,256 | |
| | 48,350 | | * | | Mahindra CIE Automotive Ltd | | | 178 | |
| | 241,300 | | | | Mahle-Metal Leve S.A. Industria e Comercio | | | 1,561 | |
| | 20,223 | | | | Mando Corp | | | 525 | |
| | 264,162 | | | | Martinrea International, Inc | | | 2,101 | |
COLLEGE RETIREMENT EQUITIES FUND -Stock Account
| SHARES | | | | COMPANY | | VALUE
(000) | |
| | 104,860 | | | | Maruti Suzuki India Ltd | | $ | 11,205 | |
| | 410,531 | | | | Mazda Motor Corp | | | 4,220 | |
| | 21,734 | | | | MGI Coutier | | | 401 | |
| | 410,803 | | | | Michelin (C.G.D.E.) (Class B) | | | 40,434 | |
| | 37,302 | | | | Minda Industries Ltd | | | 172 | |
| | 511,681 | | | | Minth Group Ltd | | | 1,651 | |
| | 20,600 | | | | Mitsuba Corp | | | 116 | |
| | 566,368 | | | | Mitsubishi Motors Corp | | | 3,084 | |
| | 691,926 | | * | | Modine Manufacturing Co | | | 7,480 | |
| | 715,869 | | * | | Motherson Sumi Systems Ltd | | | 1,711 | |
| | 24,526 | | *,e | | Motorcar Parts of America, Inc | | | 408 | |
| | 110,200 | | | | Musashi Seimitsu Industry Co Ltd | | | 1,542 | |
| | 153,949 | | | | Nan Kang Rubber Tire Co Ltd | | | 129 | |
| | 13,516 | | | | Nexen Corp | | | 67 | |
| | 23,084 | | | | Nexen Tire Corp | | | 190 | |
| | 903,000 | | | | Nexteer Automotive Group Ltd | | | 1,287 | |
| | 685,623 | | | | NGK Spark Plug Co Ltd | | | 13,572 | |
| | 230,800 | | | | NHK Spring Co Ltd | | | 2,016 | |
| | 155,802 | | | | Nifco, Inc | | | 3,686 | |
| | 6,600 | | | | Nihon Tokushu Toryo Co Ltd | | | 78 | |
| | 164,400 | | | | Nippon Seiki Co Ltd | | | 2,812 | |
| | 3,476,181 | | | | Nissan Motor Co Ltd | | | 27,807 | |
| | 41,341 | | | | Nissan Shatai Co Ltd | | | 365 | |
| | 135,600 | | | | Nissin Kogyo Co Ltd | | | 1,718 | |
| | 104,196 | | | | NOK Corp | | | 1,452 | |
| | 14,697 | | | | Nokian Renkaat Oyj | | | 451 | |
| | 308,400 | | | | Pacific Industrial Co Ltd | | | 4,093 | |
| | 1,418,895 | | | | Peugeot S.A. | | | 30,262 | |
| | 98,307 | | | | Piaggio & C S.p.A. | | | 206 | |
| | 18,200 | | | | Piolax Inc | | | 365 | |
| | 333,305 | | *,g | | Pirelli & C S.p.A | | | 2,142 | |
| | 396,246 | | | | Porsche AG. | | | 23,304 | |
| | 77,100 | | | | Press Kogyo Co Ltd | | | 379 | |
| | 48,420,107 | | | | PT Astra International Tbk | | | 27,739 | |
| | 7,888,000 | | | | Qingling Motors Co Ltd | | | 2,037 | |
| | 1,319,721 | | | | Renault S.A. | | | 82,210 | |
| | 5,400 | | | | Riken Corp | | | 246 | |
| | 5,442 | | | | S&T Daewoo Co Ltd | | | 132 | |
| | 52,625 | | | | SAF-Holland S.A. | | | 675 | |
| | 65,200 | | | | SAIC Motor Corp Ltd | | | 254 | |
| | 14,900 | | *,e | | Sanden Corp | | | 101 | |
| | 361,920 | | | | Sanyang Industry Co Ltd | | | 235 | |
| | 37,552 | | | | Schaeffler AG. | | | 320 | |
| | 18,090 | | * | | Shiloh Industries, Inc | | | 105 | |
| | 18,500 | | e | | Shoei Co Ltd | | | 625 | |
| | 355,300 | | | | Showa Corp | | | 4,157 | |
| | 68,916 | | | | SL Corp | | | 1,232 | |
| | 136,454 | | | | Spartan Motors, Inc | | | 987 | |
| | 6,843,680 | | | | Sri Trang Agro-Industry PCL (Foreign) | | | 2,967 | |
| | 22,347 | | * | | Ssangyong Motor Co | | | 79 | |
| | 25,843 | | | | Standard Motor Products, Inc | | | 1,252 | |
| | 151,042 | | | | Stanley Electric Co Ltd | | | 4,225 | |
| | 243,427 | | * | | Stoneridge, Inc | | | 6,000 | |
| | 717,500 | | | | Sumitomo Electric Industries Ltd | | | 9,502 | |
COLLEGE RETIREMENT EQUITIES FUND -Stock Account
| SHARES | | | | COMPANY | | VALUE
(000) | |
| | 145,240 | | | | Sumitomo Rubber Industries, Inc | | $ | 1,710 | |
| | 31,205 | | | | Sundram Fasteners Ltd | | | 239 | |
| | 27,892 | | | | Sungwoo Hitech Co Ltd | | | 91 | |
| | 31,624 | | | | Superior Industries International, Inc | | | 152 | |
| | 19,419 | | * | | Suprajit Engineering Ltd | | | 63 | |
| | 190,071 | | | | Suzuki Motor Corp | | | 9,582 | |
| | 150,000 | | e | | T RAD Co Ltd | | | 3,141 | |
| | 16,300 | | | | Tachi-S Co Ltd | | | 212 | |
| | 20,500 | | | | Taiho Kogyo Co Ltd | | | 178 | |
| | 3,016,832 | | * | | Tata Motors Ltd | | | 7,425 | |
| | 13,500 | | | | Teikoku Piston Ring Co Ltd | | | 275 | |
| | 64,253 | | | | Tenneco, Inc | | | 1,760 | |
| | 142,522 | | *,n | | Tesla, Inc | | | 47,431 | |
| | 20,350 | | | | Thal Ltd | | | 63 | |
| | 12,849 | | | | Thor Industries, Inc | | | 668 | |
| | 5,630,000 | | | | Tianneng Power International Ltd | | | 4,695 | |
| | 285,163 | | | | Tokai Rika Co Ltd | | | 4,709 | |
| | 21,700 | | | | Tokai Rubber Industries, Inc | | | 180 | |
| | 823,699 | | | | Tong Yang Industry Co Ltd | | | 985 | |
| | 161,500 | | | | Topre Corp | | | 3,221 | |
| | 26,832 | | | | Tower International, Inc | | | 639 | |
| | 64,500 | | | | Toyo Tire & Rubber Co Ltd | | | 802 | |
| | 47,515 | | | | Toyoda Gosei Co Ltd | | | 935 | |
| | 49,700 | | | | Toyota Boshoku Corp | | | 736 | |
| | 49,105 | | | | Toyota Industries Corp | | | 2,261 | |
| | 4,818,489 | | | | Toyota Motor Corp | | | 278,926 | |
| | 9,546 | | | | Trigano S.A. | | | 882 | |
| | 182,400 | | | | TS Tech Co Ltd | | | 5,024 | |
| | 97,469 | | | | Tube Investments of India Ltd | | | 497 | |
| | 37,200 | | | | Tupy S.A. | | | 193 | |
| | 192,400 | | | | UMW Holdings BHD | | | 255 | |
| | 37,000 | | | | Unipres Corp | | | 624 | |
| | 37,648 | | | | Valeo S.A. | | | 1,098 | |
| | 291 | | *,e | | Veoneer, Inc | | | 7 | |
| | 10,789 | | * | | Visteon Corp | | | 650 | |
| | 76,348 | | | | Volkswagen AG. | | | 12,214 | |
| | 35,175 | | | | Volkswagen AG. (Preference) | | | 5,609 | |
| | 6,823 | | | | WABCO India Ltd | | | 681 | |
| | 39,963 | | | | Winnebago Industries, Inc | | | 968 | |
| | 4,058,247 | | | | Xingda International Holdings Ltd | | | 1,239 | |
| | 1,930,785 | | | | Xinyi Glass Holdings Co Ltd | | | 2,133 | |
| | 2,440,000 | | e,g | | Yadea Group Holdings Ltd | | | 943 | |
| | 62,062 | | e | | Yamaha Motor Co Ltd | | | 1,212 | |
| | 34,200 | | e | | Yokohama Rubber Co Ltd | | | 640 | |
| | 163,900 | | | | Yorozu Corp | | | 2,058 | |
| | 551,000 | | | | Yulon Motor Co Ltd | | | 326 | |
| | | | | | TOTAL AUTOMOBILES & COMPONENTS | | | 1,589,439 | |
| | | | | | | | | | |
| BANKS - 7.7% | | | | |
| | 7,835 | | e | | 1st Constitution Bancorp | | | 156 | |
| | 19,757 | | | | 1st Source Corp | | | 797 | |
| | 100,106 | | | | 77 Bank Ltd | | | 1,730 | |
| | 35,364 | | | | Aareal Bank AG. | | | 1,092 | |
COLLEGE RETIREMENT EQUITIES FUND -Stock Account
| SHARES | | | | COMPANY | | VALUE
(000) | |
| | 969,746 | | g | | ABN AMRO Group NV (ADR) | | $ | 22,820 | |
| | 1,789,336 | | | | Absa Group Ltd | | | 20,083 | |
| | 2,966,881 | | * | | Abu Dhabi Commercial Bank PJSC | | | 6,581 | |
| | 21,000 | | | | Access National Corp | | | 448 | |
| | 9,541 | | | | ACNB Corp | | | 374 | |
| | 79,482,649 | | | | Agricultural Bank of China | | | 34,813 | |
| | 1,010,900 | | | | Agricultural Bank of China Ltd | | | 530 | |
| | 2,902,675 | | | | AIB Group plc | | | 12,240 | |
| | 4,900 | | | | Aichi Bank Ltd | | | 169 | |
| | 2,055,405 | | | | Akbank TAS | | | 2,652 | |
| | 8,900 | | | | Akita Bank Ltd | | | 176 | |
| | 59,345 | | | | Aktia Bank OYJ | | | 613 | |
| | 136,590 | | * | | Alior Bank S.A. | | | 1,945 | |
| | 202,800 | | * | | Allahabad Bank | | | 134 | |
| | 16,681 | | * | | Allegiance Bancshares, Inc | | | 540 | |
| | 1,036,156 | | | | Alliance Financial Group BHD | | | 1,008 | |
| | 1,307,883 | | * | | Alpha Bank AE | | | 1,645 | |
| | 315,270 | | *,† | | Amagerbanken AS | | | 0 | |
| | 17,634 | | | | Amalgamated Bank | | | 344 | |
| | 11,315 | | | | American National Bankshares, Inc | | | 332 | |
| | 54,055 | | | | Ameris Bancorp | | | 1,712 | |
| | 10,914 | | e | | Ames National Corp | | | 277 | |
| | 1,985,238 | | | | AMMB Holdings BHD | | | 2,081 | |
| | 11,100 | | | | Aomori Bank Ltd | | | 281 | |
| | 174,894 | | | | Aozora Bank Ltd | | | 5,213 | |
| | 16,740 | | | | Arrow Financial Corp | | | 536 | |
| | 14,600 | | e | | Aruhi Corp | | | 265 | |
| | 2,078,160 | | | | Ashikaga Holdings Co Ltd | | | 5,496 | |
| | 1,053,784 | | | | Associated Banc-Corp | | | 20,854 | |
| | 76,110 | | * | | Atlantic Capital Bancshares, Inc | | | 1,246 | |
| | 179,893 | | *,g | | AU Small Finance Bank Ltd | | | 1,601 | |
| | 3,519 | | e,m | | Auburn National Bancorporation, Inc | | | 111 | |
| | 3,546,141 | | | | Australia & New Zealand Banking Group Ltd | | | 61,273 | |
| | 21,544 | | | | Awa Bank Ltd | | | 564 | |
| | 1,525,445 | | * | | Axis Bank Ltd | | | 13,526 | |
| | 75,771 | | * | | Axos Financial, Inc | | | 1,908 | |
| | 53,667 | | e | | Banc of California, Inc | | | 714 | |
| | 13,986,907 | | | | Banca Intesa S.p.A. | | | 31,144 | |
| | 183,203 | | *,e | | Banca Monte dei Paschi di Siena S.p.A | | | 314 | |
| | 3,111,162 | | | | Banca Popolare dell’Emilia Romagna Scrl | | | 11,983 | |
| | 934,757 | | | | Banca Popolare di Sondrio SCARL | | | 2,818 | |
| | 39,524 | | | | Bancfirst Corp | | | 1,972 | |
| | 657,868 | | e | | Banche Popolari Unite Scpa | | | 1,910 | |
| | 516,754 | | | | Banco ABC Brasil S.A. | | | 2,249 | |
| | 1,666,761 | | | | Banco Bilbao Vizcaya Argentaria S.A. | | | 8,854 | |
| | 965,300 | | * | | Banco BPM S.p.A | | | 2,172 | |
| | 952,330 | | | | Banco Bradesco S.A. | | | 8,301 | |
| | 4,299,382 | | | | Banco Bradesco S.A. (Preference) | | | 42,799 | |
| | 7,270,479 | | * | | Banco Comercial Portugues S.A. | | | 1,912 | |
| | 19,568,203 | | | | Banco de Chile | | | 2,796 | |
| | 41,799 | | | | Banco de Credito e Inversiones | | | 2,715 | |
| | 1,672,543 | | | | Banco de Oro Universal Bank | | | 4,160 | |
| | 983,156 | | | | Banco de Sabadell S.A. | | | 1,125 | |
| | 522,700 | | g | | Banco del Bajio S.A. | | | 1,021 | |
COLLEGE RETIREMENT EQUITIES FUND -Stock Account
| SHARES | | | | COMPANY | | VALUE
(000) | |
| | 2,791,532 | | | | Banco do Brasil S.A. | | $ | 33,418 | |
| | 1,187,600 | | | | Banco do Estado do Rio Grande do Sul | | | 6,794 | |
| | 16,063,377 | | *,† | | Banco Espirito Santo S.A. | | | 184 | |
| | 6,310,848 | | | | Banco Itau Holding Financeira S.A. | | | 57,758 | |
| | 1,324,548 | | | | Banco Santander Brasil S.A. | | | 14,566 | |
| | 55,963,603 | | | | Banco Santander Chile S.A. | | | 4,168 | |
| | 1,524,569 | | | | Banco Santander Mexico S.A. Institucion de Banca Multiple Grupo Financiero Santand | | | 1,893 | |
| | 16,209,767 | | | | Banco Santander S.A. | | | 73,608 | |
| | 258,510 | | | | BanColombia S.A. | | | 2,420 | |
| | 782,145 | | | | BanColombia S.A. (Preference) | | | 7,563 | |
| | 119,333 | | | | BancorpSouth Bank | | | 3,119 | |
| | 175,400 | | | | Bangkok Bank PCL (ADR) | | | 1,095 | |
| | 1,288,500 | | | | Bangkok Bank PCL (Foreign) | | | 8,201 | |
| | 435,600 | | | | Bank Alfalah Ltd | | | 128 | |
| | 12,320 | | | | Bank Handlowy w Warszawie S.A. | | | 227 | |
| | 365,205 | | | | Bank Hapoalim Ltd | | | 2,310 | |
| | 1,210,278 | | | | Bank Leumi Le-Israel | | | 7,316 | |
| | 524,790 | | * | | Bank Millennium S.A. | | | 1,244 | |
| | 25,469,879 | | | | Bank of America Corp | | | 627,578 | |
| | 182,500 | | | | Bank of Beijing Co Ltd | | | 149 | |
| | 134,100 | | | | Bank of China Ltd | | | 71 | |
| | 154,174,572 | | | | Bank of China Ltd (Hong Kong) | | | 66,465 | |
| | 16,586 | | | | Bank of Commerce Holdings | | | 182 | |
| | 704,200 | | | | Bank of Communications Co Ltd | | | 594 | |
| | 21,867,946 | | | | Bank of Communications Co Ltd (Hong Kong) | | | 17,075 | |
| | 1,595,215 | | | | Bank of East Asia Ltd | | | 5,059 | |
| | 72,928 | | | | Bank of Georgia Group plc | | | 1,281 | |
| | 21,800 | | | | Bank of Hangzhou Co Ltd | | | 24 | |
| | 26,443 | | | | Bank of Hawaii Corp | | | 1,780 | |
| | 11,502,606 | | | | Bank of Ireland Group plc | | | 63,974 | |
| | 10,200 | | | | Bank of Iwate Ltd | | | 328 | |
| | 57,000 | | | | Bank of Jiangsu Co Ltd | | | 50 | |
| | 326,655 | | | | Bank of Kaohsiung | | | 97 | |
| | 454,984 | | | | Bank of Kyoto Ltd | | | 18,697 | |
| | 18,341 | | | | Bank of Marin Bancorp | | | 756 | |
| | 775,048 | | | | Bank of Montreal | | | 50,635 | |
| | 7,099 | | e | | Bank of Nagoya Ltd | | | 213 | |
| | 174,200 | | | | Bank of Nanjing Co Ltd | | | 164 | |
| | 107,900 | | | | Bank of Ningbo Co Ltd | | | 255 | |
| | 1,441,978 | | e | | Bank of Nova Scotia | | | 71,877 | |
| | 359,418 | | | | Bank of NT Butterfield & Son Ltd | | | 11,268 | |
| | 42,900 | | | | Bank of Okinawa Ltd | | | 1,237 | |
| | 6,568 | | | | Bank of Princeton | | | 183 | |
| | 404,296 | | | | Bank of Queensland Ltd | | | 2,763 | |
| | 9,854 | | | | Bank of Saga Ltd | | | 158 | |
| | 92,460 | | | | Bank of Shanghai Co Ltd | | | 151 | |
| | 1,244,098 | | | | Bank of the Philippine Islands | | | 2,222 | |
| | 129,600 | | | | Bank of the Ryukyus Ltd | | | 1,338 | |
| | 219,838 | | | | Bank OZK | | | 5,019 | |
| | 157,864 | | | | Bank Pekao S.A. | | | 4,602 | |
| | 53,352,557 | | | | Bank Rakyat Indonesia | | | 13,592 | |
| | 31,870 | | | | Bank Zachodni WBK S.A. | | | 3,063 | |
COLLEGE RETIREMENT EQUITIES FUND -Stock Account
| SHARES | | | | COMPANY | | VALUE
(000) | |
| | 4,264 | | * | | Bank7 Corp | | $ | 57 | |
| | 54,541 | | | | BankFinancial Corp | | | 815 | |
| | 356,687 | | | | Bankia S.A. | | | 1,044 | |
| | 619,149 | | | | Bankinter S.A. | | | 4,968 | |
| | 168,524 | | | | BankUnited | | | 5,046 | |
| | 8,216 | | | | Bankwell Financial Group, Inc | | | 236 | |
| | 69,292 | | | | Banner Corp | | | 3,706 | |
| | 1,896 | | | | Banque Cantonale Vaudoise | | | 1,431 | |
| | 26,759 | | | | Bar Harbor Bankshares | | | 600 | |
| | 4,484,949 | | | | Barclays plc | | | 8,581 | |
| | 251,660 | | g | | BAWAG Group AG. | | | 10,378 | |
| | 14,580 | | * | | Baycom Corp | | | 337 | |
| | 949,053 | | | | BB&T Corp | | | 41,113 | |
| | 272,020 | | e | | BBVA Banco Frances S.A. (ADR) | | | 3,082 | |
| | 17,664 | | | | BCB Bancorp, Inc | | | 185 | |
| | 65,768 | | | | Bendigo Bank Ltd | | | 500 | |
| | 325,099 | | | | Beneficial Bancorp, Inc | | | 4,646 | |
| | 96,221 | | | | Berkshire Hills Bancorp, Inc | | | 2,595 | |
| | 76,638 | | | | Blue Hills Bancorp, Inc | | | 1,635 | |
| | 1,026,548 | | | | BNP Paribas | | | 46,360 | |
| | 6,508,432 | | | | BOC Hong Kong Holdings Ltd | | | 24,158 | |
| | 39,467 | | | | BOK Financial Corp | | | 2,894 | |
| | 256,546 | | | | Boston Private Financial Holdings, Inc | | | 2,712 | |
| | 13,613 | | | | BRE Bank S.A. | | | 1,546 | |
| | 22,282 | | | | Bridge Bancorp, Inc | | | 568 | |
| | 40,934 | | * | | Bridgewater Bancshares, Inc | | | 432 | |
| | 99,926 | | | | Brookline Bancorp, Inc | | | 1,381 | |
| | 25,514 | | | | Bryn Mawr Bank Corp | | | 878 | |
| | 729,173 | | | | BS Financial Group, Inc | | | 4,789 | |
| | 10,225 | | * | | BSB Bancorp, Inc | | | 287 | |
| | 8,392,687 | | | | Bumiputra-Commerce Holdings BHD | | | 11,589 | |
| | 13,475 | | e | | Business First Bancshares, Inc | | | 327 | |
| | 23,823 | | * | | Byline Bancorp, Inc | | | 397 | |
| | 4,534 | | | | C&F Financial Corp | | | 241 | |
| | 286,292 | | | | Cadence BanCorp | | | 4,804 | |
| | 10,118,747 | | | | CaixaBank S.A. | | | 36,644 | |
| | 4,714 | | | | Cambridge Bancorp | | | 392 | |
| | 19,116 | | | | Camden National Corp | | | 688 | |
| | 23,578 | | | | Can Fin Homes Ltd | | | 97 | |
| | 527,114 | | e | | Canadian Imperial Bank of Commerce | | | 39,259 | |
| | 55,351 | | | | Canadian Western Bank | | | 1,056 | |
| | 170,791 | | * | | Canara Bank | | | 672 | |
| | 8,377 | | * | | Capital Bancorp, Inc | | | 96 | |
| | 15,689 | | | | Capital City Bank Group, Inc | | | 364 | |
| | 49,019 | | e | | Capitec Bank Holdings Ltd | | | 3,799 | |
| | 172,391 | | | | Capitol Federal Financial | | | 2,201 | |
| | 8,946 | | | | Capstar Financial Holdings, Inc | | | 132 | |
| | 27,718 | | | | Carolina Financial Corp | | | 820 | |
| | 361,065 | | | | Cathay General Bancorp | | | 12,107 | |
| | 6,690 | | e | | CB Financial Services, Inc | | | 166 | |
| | 23,558 | | e | | CBTX, Inc | | | 693 | |
| | 344,156 | | | | Centerstate Banks of Florida, Inc | | | 7,241 | |
| | 337,287 | | | | Central Pacific Financial Corp | | | 8,213 | |
| | 14,027 | | | | Central Valley Community Bancorp | | | 265 | |
COLLEGE RETIREMENT EQUITIES FUND -Stock Account
| SHARES | | | | COMPANY | | VALUE
(000) | |
| | 3,563 | | | | Century Bancorp, Inc | | $ | 241 | |
| | 5,753,880 | | | | Chang Hwa Commercial Bank | | | 3,222 | |
| | 144,434 | | g | | Charter Court Financial Services Group plc | | | 460 | |
| | 110,728 | | | | Chemical Financial Corp | | | 4,054 | |
| | 4,272 | | e | | Chemung Financial Corp | | | 176 | |
| | 1,088,032 | | | | Chiba Bank Ltd | | | 6,061 | |
| | 31,000 | | | | Chiba Kogyo Bank Ltd | | | 102 | |
| | 31,669,481 | | | | China Citic Bank | | | 19,213 | |
| | 28,700 | | | | China CITIC Bank Corp Ltd | | | 23 | |
| | 151,702,359 | | | | China Construction Bank | | | 124,222 | |
| | 252,800 | | | | China Construction Bank Corp | | | 235 | |
| | 11,592,577 | | | | China Development Financial Holding Corp | | | 3,671 | |
| | 65,300 | | | | China Everbright Bank Co Ltd | | | 35 | |
| | 3,040,685 | | | | China Everbright Bank Co Ltd (Hong Kong) | | | 1,318 | |
| | 5,061,396 | | | | China Merchants Bank Co Ltd | | | 18,483 | |
| | 211,500 | | | | China Merchants Bank Co Ltd (Class A) | | | 778 | |
| | 277,400 | | | | China Minsheng Banking Corp Ltd | | | 232 | |
| | 9,901,671 | | e | | China Minsheng Banking Corp Ltd (Hong Kong) | | | 6,829 | |
| | 19,915,781 | | | | Chinatrust Financial Holding Co | | | 13,099 | |
| | 200,000 | | e | | Chong Hing Bank Ltd | | | 337 | |
| | 11,527,584 | | | | Chongqing Rural Commercial Bank | | | 6,178 | |
| | 102,400 | | | | Chugoku Bank Ltd | | | 858 | |
| | 5,200 | | | | Chukyo Bank Ltd | | | 101 | |
| | 229,220 | | | | CIT Group, Inc | | | 8,772 | |
| | 6,882,913 | | | | Citigroup, Inc | | | 358,324 | |
| | 14,722 | | | | Citizens & Northern Corp | | | 389 | |
| | 3,873,167 | | | | Citizens Financial Group, Inc | | | 115,149 | |
| | 19,726 | | | | City Holding Co | | | 1,333 | |
| | 400,027 | | * | | City Union Bank Ltd | | | 1,117 | |
| | 18,921 | | | | Civista Bancshares, Inc | | | 330 | |
| | 20,150 | | | | CNB Financial Corp | | | 462 | |
| | 9,317 | | * | | Coastal Financial Corp | | | 142 | |
| | 12,720 | | | | Codorus Valley Bancorp, Inc | | | 270 | |
| | 21,905 | | *,e | | Collector AB | | | 123 | |
| | 93,351 | | | | Columbia Banking System, Inc | | | 3,388 | |
| | 60,755 | | *,e | | Columbia Financial, Inc | | | 929 | |
| | 16,983 | | | | Comdirect Bank AG. | | | 199 | |
| | 619,961 | | | | Comerica, Inc | | | 42,585 | |
| | 59,057 | | | | Commerce Bancshares, Inc | | | 3,329 | |
| | 12,279 | | | | Commerce Union Bancshares, Inc | | | 283 | |
| | 406,607 | | * | | Commercial Bank of Qatar QSC | | | 4,388 | |
| | 1,191,914 | | | | Commercial International Bank | | | 4,930 | |
| | 1,580,116 | | * | | Commerzbank AG. | | | 10,492 | |
| | 1,293,425 | | | | Commonwealth Bank of Australia | | | 65,975 | |
| | 63,537 | | | | Community Bank System, Inc | | | 3,704 | |
| | 33,440 | | * | | Community Bankers Trust Corp | | | 241 | |
| | 5,893 | | | | Community Financial Corp | | | 172 | |
| | 18,864 | | | | Community Trust Bancorp, Inc | | | 747 | |
| | 1,258,529 | | | | Concordia Financial Group Ltd | | | 4,809 | |
| | 198,752 | | | | ConnectOne Bancorp, Inc | | | 3,671 | |
| | 234,940,666 | | | | Corpbanca S.A. | | | 2,193 | |
| | 6,654 | | | | County Bancorp, Inc | | | 116 | |
| | 94,341 | | | | Credicorp Ltd (NY) | | | 20,913 | |
COLLEGE RETIREMENT EQUITIES FUND -Stock Account
| SHARES | | | | COMPANY | | VALUE
(000) | |
| | 5,054,301 | | | | Credit Agricole S.A. | | $ | 54,397 | |
| | 52,634 | | | | Credito Emiliano S.p.A. | | | 303 | |
| | 4,566,399 | | * | | Credito Valtellinese S.p.A | | | 384 | |
| | 28,894 | | | | Cullen/Frost Bankers, Inc | | | 2,541 | |
| | 90,578 | | * | | Customers Bancorp, Inc | | | 1,649 | |
| | 175,252 | | | | CVB Financial Corp | | | 3,545 | |
| | 1,013,162 | | | | CYBG plc | | | 2,340 | |
| | 5,646,074 | | *,†,m | | Cyprus Popular Bank Public Co Ltd | | | 65 | |
| | 1,270,027 | | | | Dah Sing Banking Group Ltd | | | 2,242 | |
| | 417,908 | | | | Dah Sing Financial Holdings Ltd | | | 2,066 | |
| | 26,150 | | | | Daishi Hokuetsu Financial Group, Inc | | | 725 | |
| | 334,128 | | | | Danske Bank AS | | | 6,633 | |
| | 1,471,419 | | | | DBS Group Holdings Ltd | | | 25,588 | |
| | 597,501 | | g | | Deutsche Pfandbriefbank AG. | | | 5,974 | |
| | 83,757 | | * | | Development Credit Bank Ltd | | | 203 | |
| | 79,983 | | * | | Dewan Housing Finance Corp Ltd | | | 285 | |
| | 146,399 | | | | DGB Financial Group Co Ltd | | | 1,091 | |
| | 39,919 | | | | Dime Community Bancshares | | | 678 | |
| | 417,274 | | | | DNB NOR Holding ASA | | | 6,698 | |
| | 99,706 | | * | | Doha Bank QSC | | | 608 | |
| | 3,163,039 | | | | Dubai Islamic Bank PJSC | | | 4,306 | |
| | 10,194,276 | | | | E.Sun Financial Holding Co Ltd | | | 6,669 | |
| | 139,374 | | * | | Eagle Bancorp, Inc | | | 6,789 | |
| | 263,064 | | | | East West Bancorp, Inc | | | 11,451 | |
| | 424,100 | | * | | EastWest Banking Corp | | | 96 | |
| | 39,200 | | | | Ehime Bank Ltd | | | 385 | |
| | 8,000 | | | | Eighteenth Bank Ltd | | | 179 | |
| | 7,883 | | * | | Entegra Financial Corp | | | 164 | |
| | 13,090 | | | | Enterprise Bancorp, Inc | | | 421 | |
| | 62,837 | | | | Enterprise Financial Services Corp | | | 2,365 | |
| | 12,716 | | | | Equitable Group, Inc | | | 551 | |
| | 16,999 | | * | | Equity Bancshares, Inc | | | 599 | |
| | 997,751 | | | | Erste Bank der Oesterreichischen Sparkassen AG. | | | 33,083 | |
| | 8,500 | | * | | Esquire Financial Holdings, Inc | | | 184 | |
| | 13,038 | | | | ESSA Bancorp, Inc | | | 204 | |
| | 682,737 | | * | | Essent Group Ltd | | | 23,336 | |
| | 1,158,486 | | * | | Eurobank Ergasias S.A. | | | 716 | |
| | 5,762 | | | | Evans Bancorp, Inc | | | 187 | |
| | 2,196,015 | | | | Far Eastern International Bank | | | 713 | |
| | 11,556 | | e | | Farmers & Merchants Bancorp, Inc | | | 445 | |
| | 44,601 | | | | Farmers National Banc Corp | | | 568 | |
| | 21,869 | | | | FB Financial Corp | | | 766 | |
| | 245,083 | | * | | FCB Financial Holdings, Inc | | | 8,230 | |
| | 47,715 | | | | Federal Agricultural Mortgage Corp (Class C) | | | 2,884 | |
| | 893,747 | | | | Federal Bank Ltd | | | 1,192 | |
| | 4,098 | | e | | Fidelity D&D Bancorp, Inc | | | 263 | |
| | 27,681 | | | | Fidelity Southern Corp | | | 720 | |
| | 824,063 | | | | Fifth Third Bancorp | | | 19,390 | |
| | 27,986 | | | | Financial Institutions, Inc | | | 719 | |
| | 329,234 | | | | FinecoBank Banca Fineco S.p.A | | | 3,313 | |
| | 81,727 | | | | First Bancorp (NC) | | | 2,669 | |
| | 1,376,613 | | | | First Bancorp (Puerto Rico) | | | 11,839 | |
| | 13,993 | | e | | First Bancorp, Inc | | | 368 | |
| | 19,233 | | | | First Bancshares, Inc | | | 582 | |
COLLEGE RETIREMENT EQUITIES FUND -Stock Account
| SHARES | | | | COMPANY | | VALUE
(000) | |
| | 19,508 | | | | First Bank | | $ | 236 | |
| | 168,302 | | | | First Busey Corp | | | 4,130 | |
| | 12,363 | | | | First Business Financial Services, Inc | | | 241 | |
| | 8,582 | | e | | First Choice Bancorp | | | 194 | |
| | 4,493 | | | | First Citizens Bancshares, Inc (Class A) | | | 1,694 | |
| | 127,447 | | | | First Commonwealth Financial Corp | | | 1,540 | |
| | 19,835 | | | | First Community Bancshares, Inc | | | 624 | |
| | 8,072 | | | | First Community Corp | | | 157 | |
| | 32,288 | | | | First Defiance Financial Corp | | | 791 | |
| | 120,478 | | | | First Financial Bancorp | | | 2,858 | |
| | 82,374 | | e | | First Financial Bankshares, Inc | | | 4,752 | |
| | 22,924 | | | | First Financial Corp | | | 920 | |
| | 10,532,433 | | | | First Financial Holding Co Ltd | | | 6,862 | |
| | 9,419 | | | | First Financial Northwest, Inc | | | 146 | |
| | 81,121 | | * | | First Foundation, Inc | | | 1,043 | |
| | 6,697 | | e | | First Guaranty Bancshares, Inc | | | 155 | |
| | 130,298 | | | | First Hawaiian, Inc | | | 2,933 | |
| | 574,374 | | | | First Horizon National Corp | | | 7,559 | |
| | 173,771 | | * | | First International Bank Of Israel Ltd | | | 3,648 | |
| | 16,937 | | | | First Internet Bancorp | | | 346 | |
| | 85,245 | | | | First Interstate Bancsystem, Inc | | | 3,117 | |
| | 183,545 | | | | First Merchants Corp | | | 6,290 | |
| | 17,159 | | | | First Mid-Illinois Bancshares, Inc | | | 548 | |
| | 131,126 | | | | First Midwest Bancorp, Inc | | | 2,598 | |
| | 11,707 | | | | First National Financial Corp | | | 235 | |
| | 11,975 | | | | First Northwest Bancorp | | | 178 | |
| | 66,656 | | | | First of Long Island Corp | | | 1,330 | |
| | 63,257 | | | | First Republic Bank | | | 5,497 | |
| | 2,721 | | e | | First Savings Financial Group, Inc | | | 141 | |
| | 10,239 | | | | First United Corp | | | 163 | |
| | 81,282 | | * | | Flagstar Bancorp, Inc | | | 2,146 | |
| | 41,275 | | | | Flushing Financial Corp | | | 889 | |
| | 155,659 | | | | FNB Corp | | | 1,532 | |
| | 18,241 | | * | | Franklin Financial Network, Inc | | | 481 | |
| | 10,130 | | | | FS Bancorp, Inc | | | 434 | |
| | 378,422 | | | | Fukuoka Financial Group, Inc | | | 7,672 | |
| | 376,232 | | | | Fulton Financial Corp | | | 5,824 | |
| | 2,440 | | *,e | | FVCBankcorp, Inc | | | 43 | |
| | 202,509 | | e | | Genworth MI Canada, Inc | | | 5,963 | |
| | 151,063 | | e | | Genworth Mortgage Insurance Australia Ltd | | | 233 | |
| | 27,252 | | | | German American Bancorp, Inc | | | 757 | |
| | 107,573 | | | | Glacier Bancorp, Inc | | | 4,262 | |
| | 14,294 | | | | Great Southern Bancorp, Inc | | | 658 | |
| | 229,334 | | | | Great Western Bancorp, Inc | | | 7,167 | |
| | 155,922 | | | | Green Bancorp, Inc | | | 2,673 | |
| | 3,917 | | e | | Greene County Bancorp, Inc | | | 122 | |
| | 198,132 | | | | Gruh Finance Ltd | | | 896 | |
| | 3,836,797 | | | | Grupo Aval Acciones y Valores | | | 1,180 | |
| | 3,360,469 | | | | Grupo Financiero Banorte S.A. de C.V. | | | 16,378 | |
| | 2,508,365 | | e | | Grupo Financiero Inbursa S.A. | | | 3,611 | |
| | 714,325 | | | | Grupo Security S.A. | | | 299 | |
| | 400,000 | | e | | Grupo Supervielle S.A. (ADR) | | | 3,472 | |
| | 40,491 | | | | Guaranty Bancorp | | | 840 | |
COLLEGE RETIREMENT EQUITIES FUND -Stock Account
| SHARES | | | | COMPANY | | VALUE
(000) | |
| | 9,291 | | | | Guaranty Bancshares, Inc | | $ | 277 | |
| | 486,483 | | | | Gunma Bank Ltd | | | 2,024 | |
| | 370,200 | | | | Habib Bank Ltd | | | 321 | |
| | 267,700 | | | | Hachijuni Bank Ltd | | | 1,093 | |
| | 346,277 | | | | Hana Financial Group, Inc | | | 11,262 | |
| | 456,782 | | | | Hancock Holding Co | | | 15,828 | |
| | 922,773 | | | | Hang Seng Bank Ltd | | | 20,671 | |
| | 121,366 | | | | Hanmi Financial Corp | | | 2,391 | |
| | 25,049 | | * | | HarborOne Bancorp, Inc | | | 398 | |
| | 40,511 | | | | HDFC Bank Ltd | | | 1,232 | |
| | 38,089 | | | | Heartland Financial USA, Inc | | | 1,674 | |
| | 175,047 | | | | Heritage Commerce Corp | | | 1,985 | |
| | 45,900 | | | | Heritage Financial Corp | | | 1,364 | |
| | 408,126 | | | | Hilltop Holdings, Inc | | | 7,277 | |
| | 1,759 | | | | Hingham Institution for Savings | | | 348 | |
| | 175,300 | | | | Hiroshima Bank Ltd | | | 926 | |
| | 68,700 | | | | Hokkoku Bank Ltd | | | 2,183 | |
| | 83,900 | | | | Hokuhoku Financial Group, Inc | | | 941 | |
| | 9,977 | | | | Home Bancorp, Inc | | | 353 | |
| | 455,212 | | | | Home Bancshares, Inc | | | 7,438 | |
| | 44,876 | | * | | Home Capital Group, Inc | | | 473 | |
| | 32,764 | | * | | HomeStreet, Inc | | | 696 | |
| | 53,872 | | | | HomeTrust Bancshares, Inc | | | 1,410 | |
| | 656,596 | | | | Hong Leong Bank BHD | | | 3,239 | |
| | 255,956 | | | | Hong Leong Credit BHD | | | 1,148 | |
| | 158,160 | | | | Hope Bancorp, Inc | | | 1,876 | |
| | 113,414 | | | | Horizon Bancorp | | | 1,790 | |
| | 2,209,205 | | | | Housing Development Finance Corp | | | 62,243 | |
| | 15,933 | | * | | Howard Bancorp, Inc | | | 228 | |
| | 11,626,676 | | | | HSBC Holdings plc | | | 95,917 | |
| | 7,460,303 | | | | Hua Nan Financial Holdings Co Ltd | | | 4,249 | |
| | 185,900 | | | | Huaxia Bank Co Ltd | | | 200 | |
| | 7,432,275 | | | | Huntington Bancshares, Inc | | | 88,593 | |
| | 147,692 | | | | Hyakugo Bank Ltd | | | 523 | |
| | 17,200 | | | | Hyakujushi Bank Ltd | | | 406 | |
| | 194,880 | | | | IBERIABANK Corp | | | 12,527 | |
| | 3,094,108 | | | | ICICI Bank Ltd | | | 15,966 | |
| | 199,071 | | | | ICICI Bank Ltd (ADR) | | | 2,048 | |
| | 872,396 | | | | IDFC Bank Ltd | | | 541 | |
| | 7,363,289 | | * | | IDFC Bank Ltd (New) | | | 4,569 | |
| | 9,716 | | *,e,m | | Impac Mortgage Holdings, Inc | | | 37 | |
| | 51,907 | | | | Independent Bank Corp (MA) | | | 3,650 | |
| | 93,043 | | | | Independent Bank Corp (MI) | | | 1,956 | |
| | 68,904 | | | | Independent Bank Group, Inc | | | 3,154 | |
| | 63,617 | | * | | Indian Bank | | | 222 | |
| | 104,406,706 | | | | Industrial & Commercial Bank of China | | | 74,260 | |
| | 177,600 | | | | Industrial & Commercial Bank of China Ltd | | | 137 | |
| | 187,640 | | | | Industrial Bank Co Ltd | | | 409 | |
| | 218,986 | | | | Industrial Bank of Korea | | | 2,758 | |
| | 14,831,542 | | | | ING Groep NV | | | 159,537 | |
| | 74,524 | | | | International Bancshares Corp | | | 2,564 | |
| | 11,278 | | e | | Investar Holding Corp | | | 280 | |
| | 6,963,165 | | | | Investimentos Itau S.A. - PR | | | 21,698 | |
| | 810,991 | | | | Investors Bancorp, Inc | | | 8,434 | |
COLLEGE RETIREMENT EQUITIES FUND -Stock Account
| SHARES | | | | COMPANY | | VALUE
(000) | |
| | 541,290 | | *,† | | Irish Bank Resolution Corp Ltd | | $ | 0 | |
| | 5,071,230 | | | | Israel Discount Bank Ltd | | | 15,648 | |
| | 173,500 | | | | Iyo Bank Ltd | | | 913 | |
| | 145,900 | | * | | Jammu & Kashmir Bank Ltd | | | 79 | |
| | 334,074 | | | | Japan Post Bank Co Ltd | | | 3,678 | |
| | 423,103 | | | | JB Financial Group Co Ltd | | | 2,163 | |
| | 96,200 | | | | Jimoto Holdings Inc | | | 110 | |
| | 11,307,135 | | | | JPMorgan Chase & Co | | | 1,103,803 | |
| | 19,355 | | | | Juroku Bank Ltd | | | 402 | |
| | 45,246 | | | | Jyske Bank | | | 1,638 | |
| | 209,240 | | * | | Kansai Mirai Financial Group, Inc | | | 1,488 | |
| | 724,794 | | * | | Karnataka Bank Ltd | | | 1,164 | |
| | 546,059 | | * | | Karur Vysya Bank Ltd | | | 696 | |
| | 200,000 | | | | Kasikornbank PCL - NVDR | | | 1,138 | |
| | 1,856,497 | | | | Kasikornbank PCL (Foreign) | | | 10,532 | |
| | 571,985 | | | | KB Financial Group, Inc | | | 23,861 | |
| | 186,235 | | | | KBC Groep NV | | | 11,982 | |
| | 353,783 | | | | Kearny Financial Corp | | | 4,536 | |
| | 376,500 | | | | Keiyo Bank Ltd | | | 2,409 | |
| | 1,015,302 | | | | Keycorp | | | 15,006 | |
| | 279,632 | | | | Kiatnakin Bank PCL (Foreign) | | | 569 | |
| | 566,000 | | | | King’s Town Bank | | | 531 | |
| | 47,800 | | | | Kiyo Bank Ltd | | | 676 | |
| | 81,453 | | | | Komercni Banka AS | | | 3,076 | |
| | 9,630,424 | | | | Krung Thai Bank PCL (Foreign) | | | 5,682 | |
| | 220,600 | | | | Kyushu Financial Group, Inc | | | 833 | |
| | 96,753 | | | | Lakeland Bancorp, Inc | | | 1,433 | |
| | 98,183 | | | | Lakeland Financial Corp | | | 3,943 | |
| | 31,167 | | e | | Laurentian Bank of Canada | | | 869 | |
| | 11,358 | | | | LCNB Corp | | | 172 | |
| | 234,003 | | | | LegacyTexas Financial Group, Inc | | | 7,509 | |
| | 10,110 | | *,e | | LendingTree, Inc | | | 2,220 | |
| | 6,643 | | | | Level One Bancorp, Inc | | | 149 | |
| | 1,210,150 | | * | | Liberbank S.A. | | | 610 | |
| | 281,556 | | | | LIC Housing Finance Ltd | | | 1,969 | |
| | 15,471 | | | | Liechtensteinische Landesbank AG. | | | 1,011 | |
| | 32,989 | | | | Live Oak Bancshares, Inc | | | 489 | |
| | 122,138,853 | | | | Lloyds TSB Group plc | | | 80,511 | |
| | 22,643 | | | | Luther Burbank Corp | | | 204 | |
| | 719,131 | | | | M&T Bank Corp | | | 102,929 | |
| | 41,577 | | | | Macatawa Bank Corp | | | 400 | |
| | 3,521,833 | | | | Malayan Banking BHD | | | 8,090 | |
| | 1,067,101 | | | | Malaysia Building Society | | | 237 | |
| | 7,097 | | * | | Malvern Bancorp, Inc | | | 140 | |
| | 359,951 | | * | | Masraf Al Rayan | | | 4,115 | |
| | 229,423 | | | | MB Financial, Inc | | | 9,092 | |
| | 23,849 | | | | MBT Financial Corp | | | 222 | |
| | 270,800 | | | | MCB Bank Ltd | | | 378 | |
| | 6,528,550 | | | | Mediobanca S.p.A. | | | 55,241 | |
| | 10,504,214 | | | | Mega Financial Holding Co Ltd | | | 8,868 | |
| | 20,612 | | | | Mercantile Bank Corp | | | 583 | |
| | 19,280 | | | | Merchants Bancorp | | | 385 | |
| | 350,850 | | | | Meridian Bancorp, Inc | | | 5,024 | |
COLLEGE RETIREMENT EQUITIES FUND -Stock Account
| SHARES | | | | COMPANY | | VALUE
(000) | |
| | 99,189 | | | | Meta Financial Group, Inc | | $ | 1,923 | |
| | 55,368 | | *,e | | Metro Bank plc | | | 1,193 | |
| | 4,799,324 | | | | Metropolitan Bank & Trust | | | 7,410 | |
| | 7,980 | | * | | Metropolitan Bank Holding Corp | | | 246 | |
| | 1,198,941 | | * | | MGIC Investment Corp | | | 12,541 | |
| | 5,194 | | e | | Mid Penn Bancorp, Inc | | | 120 | |
| | 3,774 | | | | Middlefield Banc Corp | | | 160 | |
| | 28,522 | | | | Midland States Bancorp, Inc | | | 637 | |
| | 20,967 | | e | | Midsouth Bancorp, Inc | | | 222 | |
| | 14,101 | | | | MidWestOne Financial Group, Inc | | | 350 | |
| | 7,861,213 | | | | Mitsubishi UFJ Financial Group, Inc | | | 38,580 | |
| | 216,955 | | | | Mitsui Trust Holdings, Inc | | | 7,901 | |
| | 10,800 | | | | Miyazaki Bank Ltd | | | 286 | |
| | 39,831 | | | | Mizrahi Tefahot Bank Ltd | | | 673 | |
| | 13,244,958 | | | | Mizuho Financial Group, Inc | | | 20,493 | |
| | 5,553,679 | | g | | Moneta Money Bank AS | | | 17,918 | |
| | 215,666 | | * | | Mr Cooper Group, Inc | | | 2,517 | |
| | 20,368 | | | | Musashino Bank Ltd | | | 469 | |
| | 9,153 | | | | MutualFirst Financial, Inc | | | 243 | |
| | 11,523 | | | | MVB Financial Corp | | | 208 | |
| | 51,192 | | | | Nanto Bank Ltd | | | 997 | |
| | 1,872,566 | | | | National Australia Bank Ltd | | | 31,776 | |
| | 254,608 | | | | National Bank Holdings Corp | | | 7,860 | |
| | 4,157,623 | | | | National Bank of Abu Dhabi PJSC | | | 15,959 | |
| | 588,608 | | e | | National Bank of Canada | | | 24,166 | |
| | 349,646 | | * | | National Bank of Greece S.A. | | | 440 | |
| | 314,500 | | * | | National Bank Of Pakistan | | | 95 | |
| | 9,292 | | e | | National Bankshares, Inc | | | 339 | |
| | 23,103 | | * | | National Commerce Corp | | | 832 | |
| | 53,619 | | | | NBT Bancorp, Inc | | | 1,855 | |
| | 514,690 | | | | Nedbank Group Ltd | | | 9,816 | |
| | 359,157 | | | | New York Community Bancorp, Inc | | | 3,380 | |
| | 137,689 | | g | | NIBC Holding NV | | | 1,308 | |
| | 18,059 | | * | | Nicolet Bankshares, Inc | | | 881 | |
| | 101,260 | | | | Nishi-Nippon Financial Holdings, Inc | | | 878 | |
| | 92,770 | | * | | NMI Holdings, Inc | | | 1,656 | |
| | 1,468,624 | | | | Nordea Bank Abp | | | 12,363 | |
| | 198,900 | | | | North Pacific Bank Ltd | | | 530 | |
| | 10,319 | | | | Northeast Bancorp | | | 173 | |
| | 57,375 | | | | Northfield Bancorp, Inc | | | 777 | |
| | 9,481 | | | | Northrim BanCorp, Inc | | | 312 | |
| | 120,497 | | | | Northwest Bancshares, Inc | | | 2,041 | |
| | 78,503 | | * | | Norwegian Finans Holding ASA | | | 609 | |
| | 8,010 | | e | | Norwood Financial Corp | | | 264 | |
| | 450,000 | | *,g | | Nova Ljubljanska (GDR) | | | 6,393 | |
| | 10,020 | | e | | Oak Valley Bancorp | | | 183 | |
| | 746,000 | | | | O-Bank Co Ltd | | | 194 | |
| | 156,291 | | | | OceanFirst Financial Corp | | | 3,518 | |
| | 1,896 | | e | | Oconee Federal Financial Corp | | | 47 | |
| | 367 | | * | | Ocwen Financial Corp | | | 0 | ^ |
| | 215,098 | | | | OFG Bancorp | | | 3,541 | |
| | 22,300 | | | | Ogaki Kyoritsu Bank Ltd | | | 446 | |
| | 4,254 | | e | | Ohio Valley Banc Corp | | | 151 | |
| | 10,700 | | | | Oita Bank Ltd | | | 325 | |
COLLEGE RETIREMENT EQUITIES FUND -Stock Account
| SHARES | | | | COMPANY | | VALUE
(000) | |
| | 20,171 | | | | Old Line Bancshares, Inc | | $ | 531 | |
| | 193,226 | | | | Old National Bancorp | | | 2,976 | |
| | 55,090 | | | | Old Second Bancorp, Inc | | | 716 | |
| | 1,070,166 | | | | OneSavings Bank plc | | | 4,774 | |
| | 12,897 | | * | | OP Bancorp | | | 114 | |
| | 27,957 | | | | Opus Bank | | | 548 | |
| | 39,541 | | | | Origin Bancorp, Inc | | | 1,348 | |
| | 67,689 | | | | Oritani Financial Corp | | | 998 | |
| | 8,864 | | | | Orrstown Financial Services, Inc | | | 161 | |
| | 342,816 | | | | OTP Bank | | | 13,854 | |
| | 3,322,183 | | | | Oversea-Chinese Banking Corp | | | 27,480 | |
| | 16,411 | | | | Pacific City Financial Corp | | | 257 | |
| | 20,746 | | * | | Pacific Mercantile Bancorp | | | 148 | |
| | 59,579 | | * | | Pacific Premier Bancorp, Inc | | | 1,520 | |
| | 325,012 | | | | PacWest Bancorp | | | 10,816 | |
| | 631,388 | | | | Paragon Group of Cos plc | | | 3,108 | |
| | 17,627 | | | | Park National Corp | | | 1,497 | |
| | 8,416 | | | | Parke Bancorp, Inc | | | 158 | |
| | 22,890 | | | | PCSB Financial Corp | | | 448 | |
| | 13,480 | | *,e | | PDL Community Bancorp | | | 172 | |
| | 72,183 | | | | Peapack Gladstone Financial Corp | | | 1,818 | |
| | 6,055 | | | | Penns Woods Bancorp, Inc | | | 244 | |
| | 26,058 | | | | PennyMac Financial Services, Inc | | | 554 | |
| | 7,484 | | e | | Peoples Bancorp of North Carolina, Inc | | | 183 | |
| | 49,439 | | | | Peoples Bancorp, Inc | | | 1,488 | |
| | 9,800 | | e | | Peoples Financial Services Corp | | | 432 | |
| | 251,913 | | | | People’s United Financial, Inc | | | 3,635 | |
| | 20,564 | | | | People’s Utah Bancorp | | | 620 | |
| | 4,065,840 | | * | | Permanent TSB Group Holdings plc | | | 7,055 | |
| | 3,000,000 | | * | | Philippine National Bank | | | 2,439 | |
| | 173,200 | | | | Ping An Bank Co Ltd | | | 237 | |
| | 45,938 | | | | Pinnacle Financial Partners, Inc | | | 2,118 | |
| | 191,234 | | * | | Piraeus Bank S.A. | | | 184 | |
| | 57,840 | | *,g | | PNB Housing Finance Ltd | | | 765 | |
| | 1,849,149 | | | | PNC Financial Services Group, Inc | | | 216,184 | |
| | 359,911 | | | | Popular, Inc | | | 16,995 | |
| | 3,396,000 | | g | | Postal Savings Bank of China Co Ltd | | | 1,789 | |
| | 1,103,611 | | | | Powszechna Kasa Oszczednosci Bank Polski S.A. | | | 11,658 | |
| | 49,811 | | | | Preferred Bank | | | 2,159 | |
| | 15,871 | | | | Premier Financial Bancorp, Inc | | | 237 | |
| | 34,194 | | e | | Prosperity Bancshares, Inc | | | 2,130 | |
| | 4,444 | | * | | Provident Bancorp, Inc | | | 96 | |
| | 177,771 | | | | Provident Financial Services, Inc | | | 4,290 | |
| | 12,215 | | | | Prudential Bancorp, Inc | | | 215 | |
| | 59,000,000 | | * | | PT Bank Bukopin Tbk | | | 1,117 | |
| | 12,651,174 | | | | PT Bank Central Asia Tbk | | | 22,879 | |
| | 2,457,407 | | | | PT Bank Danamon Indonesia Tbk | | | 1,299 | |
| | 1,637,400 | | | | PT Bank Jabar Banten Tbk | | | 233 | |
| | 40,406,279 | | | | PT Bank Mandiri Persero Tbk | | | 20,727 | |
| | 8,455,619 | | | | PT Bank Negara Indonesia | | | 5,187 | |
| | 44,500,000 | | * | | PT Bank Pan Indonesia Tbk | | | 3,545 | |
| | 24,306,900 | | | | PT Bank Pembangunan Daerah Jawa Timur Tbk | | | 1,167 | |
| | 3,258,000 | | | | PT Bank Tabungan Negara Tbk | | | 576 | |
COLLEGE RETIREMENT EQUITIES FUND -Stock Account
| SHARES | | | | COMPANY | | VALUE
(000) | |
| | 3,285,484 | | | | Public Bank BHD | | $ | 19,669 | |
| | 194,312 | | * | | Qatar Islamic Bank SAQ | | | 8,092 | |
| | 607,061 | | * | | Qatar National Bank | | | 32,354 | |
| | 67,603 | | | | QCR Holdings, Inc | | | 2,169 | |
| | 837,960 | | | | Radian Group, Inc | | | 13,709 | |
| | 79,757 | | | | Raiffeisen International Bank Holding AG. | | | 2,035 | |
| | 19,447 | | | | RBB Bancorp | | | 342 | |
| | 238,958 | | g | | RBL Bank Ltd | | | 1,968 | |
| | 987,800 | | e | | Regional SAB de C.V. | | | 4,549 | |
| | 1,195,294 | | | | Regions Financial Corp | | | 15,993 | |
| | 81,948 | | | | Renasant Corp | | | 2,473 | |
| | 13,169 | | | | Republic Bancorp, Inc (Class A) | | | 510 | |
| | 53,914 | | * | | Republic First Bancorp, Inc | | | 322 | |
| | 3,061,255 | | | | Resona Holdings, Inc | | | 14,683 | |
| | 1,246,777 | | | | RHB Capital BHD | | | 1,594 | |
| | 23,806 | | | | Riverview Bancorp, Inc | | | 173 | |
| | 5,200 | | *,† | | Roskilde Bank | | | 0 | |
| | 1,698,586 | | | | Royal Bank of Canada | | | 116,258 | |
| | 2,616,969 | | | | Royal Bank of Scotland Group plc | | | 7,260 | |
| | 43,696 | | | | S&T Bancorp, Inc | | | 1,653 | |
| | 23,500 | | | | San ju San Financial Group, Inc | | | 362 | |
| | 133,777 | | | | Sandy Spring Bancorp, Inc | | | 4,193 | |
| | 87,100 | | | | San-In Godo Bank Ltd | | | 608 | |
| | 8,542 | | | | SB One Bancorp | | | 175 | |
| | 4,825,014 | | * | | Sberbank of Russia (ADR) | | | 52,882 | |
| | 58,295 | | * | | Seacoast Banking Corp of Florida | | | 1,517 | |
| | 235,990 | | | | Security Bank Corp | | | 696 | |
| | 16,865 | | * | | Select Bancorp, Inc | | | 209 | |
| | 151,180 | | | | Senshu Ikeda Holdings, Inc | | | 413 | |
| | 59,728 | | | | ServisFirst Bancshares, Inc | | | 1,904 | |
| | 887,993 | | | | Seven Bank Ltd | | | 2,535 | |
| | 237,100 | | | | Shanghai Pudong Development Bank Co Ltd | | | 339 | |
| | 185,200 | | | | Shiga Bank Ltd | | | 4,317 | |
| | 26,400 | | | | Shikoku Bank Ltd | | | 282 | |
| | 940,041 | | | | Shinhan Financial Group Co Ltd | | | 33,330 | |
| | 167,157 | | | | Shinsei Bank Ltd | | | 1,987 | |
| | 1,279,900 | | | | Shizuoka Bank Ltd | | | 9,977 | |
| | 21,789 | | | | Shore Bancshares, Inc | | | 317 | |
| | 17,406 | | | | SI Financial Group, Inc | | | 222 | |
| | 551,700 | | | | Siam Commercial Bank PCL (ADR) | | | 2,265 | |
| | 1,549,497 | | | | Siam Commercial Bank PCL (Foreign) | | | 6,360 | |
| | 18,926 | | | | Sierra Bancorp | | | 455 | |
| | 18,616 | | | | Signature Bank | | | 1,914 | |
| | 118,603 | | | | Simmons First National Corp (Class A) | | | 2,862 | |
| | 10,657,459 | | | | SinoPac Financial Holdings Co Ltd | | | 3,567 | |
| | 51,319 | | g | | Skandiabanken ASA | | | 445 | |
| | 1,039,109 | | | | Skandinaviska Enskilda Banken AB (Class A) | | | 10,101 | |
| | 16,249 | | * | | SmartFinancial, Inc | | | 297 | |
| | 431,333 | | | | Societe Generale | | | 13,675 | |
| | 5,095,528 | | * | | South Indian Bank Ltd | | | 1,134 | |
| | 82,959 | | | | South State Corp | | | 4,973 | |
| | 9,084 | | * | | Southern First Bancshares, Inc | | | 291 | |
| | 8,794 | | | | Southern Missouri Bancorp, Inc | | | 298 | |
| | 57,802 | | | | Southern National Bancorp of Virginia, Inc | | | 764 | |
COLLEGE RETIREMENT EQUITIES FUND -Stock Account
| SHARES | | | | COMPANY | | VALUE
(000) | |
| | 41,822 | | | | Southside Bancshares, Inc | | $ | 1,328 | |
| | 57,564 | | | | Spar Nord Bank AS | | | 462 | |
| | 17,434 | | | | Sparebank Oestlandet | | | 167 | |
| | 252,213 | | | | SpareBank SR-Bank ASA | | | 2,602 | |
| | 467,179 | | | | Sparebanken Midt-Norge | | | 4,557 | |
| | 422,719 | | | | Sparebanken Nord-Norge | | | 3,068 | |
| | 11,595 | | *,e | | Spirit of Texas Bancshares, Inc | | | 264 | |
| | 2,335 | | | | St Galler Kantonalbank | | | 1,073 | |
| | 2,174,075 | | | | Standard Bank Group Ltd | | | 27,012 | |
| | 1,693,910 | | | | Standard Chartered plc | | | 13,164 | |
| | 90,710 | | | | State Bank & Trust Co | | | 1,958 | |
| | 1,775,676 | | * | | State Bank of India | | | 7,520 | |
| | 40,757 | | | | Sterling Bancorp, Inc | | | 283 | |
| | 152,625 | | | | Sterling Bancorp/DE | | | 2,520 | |
| | 82,629 | | | | Stock Yards Bancorp, Inc | | | 2,710 | |
| | 3,821,289 | | | | Sumitomo Mitsui Financial Group, Inc | | | 125,969 | |
| | 14,925 | | | | Summit Financial Group, Inc | | | 288 | |
| | 845,792 | | | | SunTrust Banks, Inc | | | 42,662 | |
| | 100,500 | | e | | Suruga Bank Ltd | | | 370 | |
| | 100,810 | | * | | SVB Financial Group | | | 19,146 | |
| | 303,869 | | | | Svenska Handelsbanken AB | | | 3,381 | |
| | 544,734 | | | | Swedbank AB (A Shares) | | | 12,175 | |
| | 42,133 | | | | Sydbank AS | | | 1,005 | |
| | 146,717 | | | | Synovus Financial Corp | | | 4,693 | |
| | 1,351,847 | | | | Taichung Commercial Bank | | | 448 | |
| | 10,105,278 | | | | Taishin Financial Holdings Co Ltd | | | 4,297 | |
| | 4,529,815 | | | | Taiwan Business Bank | | | 1,525 | |
| | 13,813,015 | | | | Taiwan Cooperative Financial Holding | | | 7,935 | |
| | 188,799 | | | | TCF Financial Corp | | | 3,680 | |
| | 453,852 | | | | TCS Group Holding plc (ADR) | | | 7,062 | |
| | 8,574 | | | | Territorial Bancorp, Inc | | | 223 | |
| | 89,519 | | * | | Texas Capital Bancshares, Inc | | | 4,574 | |
| | 192,714 | | | | TFS Financial Corp | | | 3,108 | |
| | 1,404,700 | | | | Thanachart Capital PCL | | | 2,146 | |
| | 309,055 | | * | | The Bancorp, Inc | | | 2,460 | |
| | 76,329 | | e | | Timbercreek Financial Corp | | | 489 | |
| | 8,636 | | | | Timberland Bancorp, Inc | | | 193 | |
| | 332,280 | | | | Tisco Bank PCL | | | 799 | |
| | 9,901,387 | | | | TMB Bank PCL (Foreign) | | | 670 | |
| | 85,500 | | | | Tochigi Bank Ltd | | | 195 | |
| | 121,700 | | | | Toho Bank Ltd | | | 346 | |
| | 15,793 | | | | Tokyo TY Financial Group, Inc | | | 243 | |
| | 166,500 | | | | Tomony Holdings, Inc | | | 612 | |
| | 27,675 | | | | Tompkins Trustco, Inc | | | 2,076 | |
| | 2,934,709 | | | | Toronto-Dominion Bank | | | 145,876 | |
| | 24,100 | | | | Towa Bank Ltd | | | 163 | |
| | 82,543 | | | | TowneBank | | | 1,977 | |
| | 65,177 | | | | Trico Bancshares | | | 2,202 | |
| | 140,028 | | * | | Tristate Capital Holdings, Inc | | | 2,725 | |
| | 69,153 | | * | | Triumph Bancorp, Inc | | | 2,054 | |
| | 116,711 | | | | Trustco Bank Corp NY | | | 801 | |
| | 84,761 | | | | Trustmark Corp | | | 2,410 | |
| | 2,848,954 | | | | Turkiye Garanti Bankasi AS | | | 4,270 | |
COLLEGE RETIREMENT EQUITIES FUND -Stock Account
| SHARES | | | | COMPANY | | VALUE
(000) | |
| | 560,061 | | | | Turkiye Halk Bankasi AS | | $ | 740 | |
| | 4,079,916 | | | | Turkiye Is Bankasi (Series C) | | | 3,482 | |
| | 11,316,703 | | | | Turkiye Sinai Kalkinma Bankasi AS | | | 1,728 | |
| | 151,929 | | | | UMB Financial Corp | | | 9,263 | |
| | 280,532 | | | | Umpqua Holdings Corp | | | 4,460 | |
| | 562,792 | | g | | Unicaja Banco S.A. | | | 743 | |
| | 4,308,258 | | | | UniCredit S.p.A. | | | 48,799 | |
| | 135,457 | | * | | Union Bank of India | | | 167 | |
| | 106,084 | | | | Union Bankshares Corp | | | 2,995 | |
| | 5,280 | | e | | Union Bankshares, Inc | | | 252 | |
| | 355,300 | | | | United Bank Ltd | | | 314 | |
| | 127,053 | | | | United Bankshares, Inc | | | 3,953 | |
| | 315,208 | | | | United Community Banks, Inc | | | 6,764 | |
| | 118,967 | | | | United Community Financial Corp | | | 1,053 | |
| | 110,034 | | | | United Financial Bancorp, Inc (New) | | | 1,618 | |
| | 2,027,826 | | | | United Overseas Bank Ltd | | | 36,683 | |
| | 21,630 | | | | United Security Bancshares | | | 207 | |
| | 10,150 | | | | Unity Bancorp, Inc | | | 211 | |
| | 47,250 | | | | Univest Corp of Pennsylvania | | | 1,019 | |
| | 2,472,677 | | | | US Bancorp | | | 113,001 | |
| | 13,786 | | | | Valiant Holding | | | 1,517 | |
| | 410,033 | | | | Valley National Bancorp | | | 3,641 | |
| | 341,597 | | | | Van Lanschot Kempen NV (ADR) | | | 7,757 | |
| | 31,019 | | * | | Veritex Holdings, Inc | | | 663 | |
| | 635,712 | | | | Vijaya Bank | | | 455 | |
| | 364,480 | | | | VTB Bank | | | 404 | |
| | 4,215,097 | | | | VTB Bank OJSC (GDR) | | | 4,685 | |
| | 161,434 | | | | Walker & Dunlop, Inc | | | 6,982 | |
| | 106,882 | | | | Washington Federal, Inc | | | 2,855 | |
| | 24,620 | | | | Washington Trust Bancorp, Inc | | | 1,170 | |
| | 63,065 | | | | Waterstone Financial, Inc | | | 1,057 | |
| | 43,742 | | | | Webster Financial Corp | | | 2,156 | |
| | 13,886,861 | | | | Wells Fargo & Co | | | 639,907 | |
| | 65,542 | | | | WesBanco, Inc | | | 2,405 | |
| | 23,305 | | | | West Bancorporation, Inc | | | 445 | |
| | 32,750 | | e | | Westamerica Bancorporation | | | 1,824 | |
| | 337,851 | | * | | Western Alliance Bancorp | | | 13,342 | |
| | 32,117 | | | | Western New England Bancorp, Inc | | | 322 | |
| | 3,129,595 | | | | Westpac Banking Corp | | | 55,300 | |
| | 175,208 | | | | Wintrust Financial Corp | | | 11,650 | |
| | 1,181,034 | | | | Woori Bank | | | 16,515 | |
| | 223,846 | | | | WSFS Financial Corp | | | 8,486 | |
| | 14,900 | | | | Yamagata Bank Ltd | | | 284 | |
| | 39,392 | | | | Yamaguchi Financial Group, Inc | | | 377 | |
| | 18,200 | | | | Yamanashi Chuo Bank Ltd | | | 233 | |
| | 11,143,296 | | | | Yes Bank Ltd | | | 28,998 | |
| | 2,540,393 | | | | Zions Bancorporation | | | 103,495 | |
| | | | | | TOTAL BANKS | | | 7,998,471 | |
| | | | | | | | | | |
| CAPITAL GOODS - 7.3% | | | | |
| | 1,309,189 | | | | 3M Co | | | 249,453 | |
| | 244,894 | | | | A.O. Smith Corp | | | 10,457 | |
| | 61,933 | | | | Aalberts Industries NV | | | 2,060 | |
| | 52,337 | | | | Aaon, Inc | | | 1,835 | |
COLLEGE RETIREMENT EQUITIES FUND -Stock Account
| SHARES | | | | COMPANY | | VALUE
(000) | |
| | 56,363 | | | | AAR Corp | | $ | 2,105 | |
| | 390,187 | | | | ABB Ltd | | | 7,451 | |
| | 2,209,877 | | | | Aboitiz Equity Ventures, Inc | | | 2,303 | |
| | 266,000 | | | | AcBel Polytech, Inc | | | 164 | |
| | 210,925 | | | | ACS Actividades Construccion y Servicios S.A. | | | 8,164 | |
| | 77,984 | | | | Actuant Corp (Class A) | | | 1,637 | |
| | 51,342 | | | | Acuity Brands, Inc | | | 5,902 | |
| | 555,859 | | * | | Adani Enterprises Ltd | | | 1,280 | |
| | 1,113,700 | | | | Advan Co Ltd | | | 9,310 | |
| | 129,957 | | | | Advanced Drainage Systems, Inc | | | 3,151 | |
| | 64,400 | | | | AECC Aviation Power Co Ltd | | | 204 | |
| | 285,050 | | * | | Aecom Technology Corp | | | 7,554 | |
| | 418,708 | | | | Aecon Group, Inc | | | 5,401 | |
| | 50,696 | | * | | Aegion Corp | | | 827 | |
| | 277,640 | | * | | AerCap Holdings NV | | | 10,995 | |
| | 90,165 | | * | | Aerojet Rocketdyne Holdings, Inc | | | 3,177 | |
| | 26,614 | | * | | Aerovironment, Inc | | | 1,808 | |
| | 29,036 | | * | | AFG Arbonia-Forster Hldg | | | 320 | |
| | 10,727 | | | | AG Growth International Inc | | | 368 | |
| | 46,460 | | | | AGCO Corp | | | 2,586 | |
| | 572,628 | | g | | Ahlsell AB | | | 3,367 | |
| | 52,444 | | | | AIA Engineering Ltd | | | 1,259 | |
| | 32,899 | | | | Aica Kogyo Co Ltd | | | 1,100 | |
| | 24,500 | | | | Aichi Corp | | | 130 | |
| | 31,400 | | | | Aida Engineering Ltd | | | 206 | |
| | 215,958 | | | | Air Lease Corp | | | 6,524 | |
| | 1,130,784 | | | | Airbus SE | | | 107,809 | |
| | 202,880 | | | | Aircastle Ltd | | | 3,498 | |
| | 114,000 | | | | Airtac International Group | | | 1,118 | |
| | 16,344 | | | | Alamo Group, Inc | | | 1,264 | |
| | 81,782 | | | | Albany International Corp (Class A) | | | 5,106 | |
| | 326,735 | | | | Alfa Laval AB | | | 7,024 | |
| | 3,575,514 | | | | Alfa S.A. de C.V. (Class A) | | | 4,254 | |
| | 33,459 | | e,g | | Alimak Group AB | | | 415 | |
| | 230,045 | | | | Allegion plc | | | 18,337 | |
| | 20,079,465 | | | | Alliance Global Group, Inc | | | 4,537 | |
| | 19,748 | | | | Allied Motion Technologies, Inc | | | 883 | |
| | 665,972 | | | | Allison Transmission Holdings, Inc | | | 29,243 | |
| | 26,085 | | | | Alstom Projects India Ltd | | | 312 | |
| | 77,702 | | | | Alstom RGPT | | | 3,139 | |
| | 75,529 | | * | | Alstom T&D India Ltd | | | 316 | |
| | 281,520 | | | | Altra Holdings, Inc | | | 7,080 | |
| | 364,124 | | | | Amada Co Ltd | | | 3,269 | |
| | 25,611 | | * | | Ameresco, Inc | | | 361 | |
| | 18,382 | | * | | American Woodmark Corp | | | 1,024 | |
| | 208,288 | | | | Ametek, Inc | | | 14,101 | |
| | 12,122 | | | | Andritz AG. | | | 557 | |
| | 19,000 | | | | Anest Iwata Corp | | | 171 | |
| | 48,534 | | | | Apogee Enterprises, Inc | | | 1,449 | |
| | 224,201 | | | | Applied Industrial Technologies, Inc | | | 12,093 | |
| | 11,653 | | * | | Aprogen KIC, Inc | | | 82 | |
| | 436,699 | | * | | Arabtec Holding Co | | | 226 | |
| | 45,168 | | e | | Arcadis NV | | | 552 | |
COLLEGE RETIREMENT EQUITIES FUND -Stock Account
| SHARES | | | | COMPANY | | VALUE
(000) | |
| | 1,236,117 | | | | Arconic, Inc | | $ | 20,841 | |
| | 171,093 | | * | | Arcosa, Inc | | | 4,738 | |
| | 18,109 | | | | Argan, Inc | | | 685 | |
| | 307,072 | | * | | Armstrong Flooring, Inc | | | 3,636 | |
| | 150,897 | | | | Armstrong World Industries, Inc | | | 8,784 | |
| | 31,100 | | | | Asahi Diamond Industrial Co Ltd | | | 172 | |
| | 163,329 | | e | | Asahi Glass Co Ltd | | | 5,077 | |
| | 344,476 | | | | Aselsan Elektronik Sanayi Ve Ticaret AS | | | 1,563 | |
| | 2,426,916 | | | | Ashok Leyland Ltd | | | 3,560 | |
| | 40,954 | | | | Ashoka Buildcon Ltd | | | 73 | |
| | 1,865,959 | | | | Ashtead Group plc | | | 38,923 | |
| | 1,860,490 | | | | Assa Abloy AB | | | 33,315 | |
| | 59,646 | | | | Astec Industries, Inc | | | 1,801 | |
| | 59,253 | | | | Astral Polytechnik Ltd | | | 957 | |
| | 27,252 | | * | | Astronics Corp | | | 830 | |
| | 858,016 | | | | Asunaro Aoki Construction Co Ltd | | | 7,343 | |
| | 681,651 | | * | | Atkore International Group, Inc | | | 13,524 | |
| | 117,993 | | | | Atlas Copco AB (A Shares) | | | 2,815 | |
| | 66,389 | | | | Atlas Copco AB (B Shares) | | | 1,455 | |
| | 47,933 | | * | | ATS Automation Tooling Systems, Inc | | | 505 | |
| | 5,077 | | g | | Aumann AG. | | | 170 | |
| | 3,092,675 | | | | Austal Ltd | | | 4,241 | |
| | 92,400 | | | | AVIC Aircraft Co Ltd | | | 179 | |
| | 36,900 | | * | | AVIC Shenyang Aircraft Co Ltd | | | 150 | |
| | 2,047,019 | | e | | AviChina Industry & Technology Co | | | 1,286 | |
| | 140,516 | | * | | Axon Enterprise, Inc | | | 6,148 | |
| | 176,306 | | | | AZZ, Inc | | | 7,116 | |
| | 89,273 | | e | | Badger Daylighting Ltd | | | 2,109 | |
| | 4,109,768 | | | | BAE Systems plc | | | 24,037 | |
| | 631,073 | | | | Balfour Beatty plc | | | 2,005 | |
| | 104,835 | | *,e | | Ballard Power Systems, Inc | | | 252 | |
| | 85,500 | | | | Bando Chemical Industries Ltd | | | 808 | |
| | 142,000 | | * | | Baoye Group Co Ltd | | | 79 | |
| | 262,004 | | | | Barloworld Ltd | | | 2,100 | |
| | 229,168 | | | | Barnes Group, Inc | | | 12,288 | |
| | 8,951 | | | | BayWa AG. | | | 212 | |
| | 53 | | *,†,m | | Beacon Power Corp | | | 0 | ^ |
| | 86,431 | | * | | Beacon Roofing Supply, Inc | | | 2,742 | |
| | 183,000 | | g | | Beijing Urban Construction Design & Development Group Co Ltd | | | 64 | |
| | 1,156,837 | | * | | Berjaya Corp BHD | | | 80 | |
| | 808,000 | | | | BES Engineering Corp | | | 186 | |
| | 201,088 | | | | Besalco S.A. | | | 177 | |
| | 16,306 | | | | BGF Co Ltd | | | 118 | |
| | 2,583,300 | | | | Bharat Electronics Ltd | | | 3,251 | |
| | 312,127 | | | | Bidvest Group Ltd | | | 4,484 | |
| | 24,379 | | | | Biesse S.p.A. | | | 480 | |
| | 1,449,656 | | | | Bizlink Holdings Inc | | | 10,639 | |
| | 19,697 | | *,e | | Blue Bird Corp | | | 358 | |
| | 13,935 | | * | | Blue Star Ltd | | | 124 | |
| | 11,378 | | *,e | | BlueLinx Holdings, Inc | | | 281 | |
| | 207,805 | | * | | BMC Stock Holdings, Inc | | | 3,217 | |
| | 28,072 | | | | Bobst Group AG. | | | 1,953 | |
| | 261,400 | | g | | BOC Aviation Ltd | | | 1,929 | |
COLLEGE RETIREMENT EQUITIES FUND -Stock Account
| SHARES | | | | COMPANY | | VALUE
(000) | |
| | 204,185 | | | | Bodycote plc | | $ | 1,889 | |
| | 1,499,482 | | | | Boeing Co | | | 483,583 | |
| | 1,153,232 | | * | | Bombardier, Inc | | | 1,715 | |
| | 54,988 | | | | Boskalis Westminster | | | 1,365 | |
| | 5,788 | | | | Bossard Holding AG. | | | 826 | |
| | 270,845 | | | | Bouygues S.A. | | | 9,726 | |
| | 31,717 | | | | Brenntag AG. | | | 1,384 | |
| | 53,899 | | | | Briggs & Stratton Corp | | | 705 | |
| | 398,000 | | | | Brighton-Best International Taiwan, Inc | | | 435 | |
| | 4,850 | | | | Bucher Industries AG. | | | 1,308 | |
| | 23,590 | | | | Budimex S.A. | | | 717 | |
| | 35,882 | | | | Bufab AB | | | 346 | |
| | 273,895 | | * | | Builders FirstSource, Inc | | | 2,988 | |
| | 30,400 | | | | Bunka Shutter Co Ltd | | | 198 | |
| | 348,656 | | | | Bunzl plc | | | 10,529 | |
| | 21,587 | | | | Burckhardt Compression Holding AG. | | | 5,065 | |
| | 2,810 | | e | | Burkhalter Holding AG. | | | 223 | |
| | 42,326 | | | | BWX Technologies, Inc | | | 1,618 | |
| | 169,053 | | | | CAE, Inc | | | 3,107 | |
| | 44,621 | | e | | Caesarstone Sdot-Yam Ltd | | | 606 | |
| | 22,317 | | * | | CAI International, Inc | | | 518 | |
| | 24,675 | | | | Carbone Lorraine | | | 663 | |
| | 27,440 | | | | Carborundum Universal Ltd | | | 139 | |
| | 24,513 | | | | Cargotec Corp (B Shares) | | | 752 | |
| | 31,958 | | | | Carlisle Cos, Inc | | | 3,212 | |
| | 1,320,276 | | | | Caterpillar, Inc | | | 167,767 | |
| | 251,400 | | | | Central Glass Co Ltd | | | 4,954 | |
| | 2,492 | | * | | Cera Sanitaryware Ltd | | | 85 | |
| | 151,725 | | | | CH Karnchang PCL | | | 117 | |
| | 400,000 | | | | CH Karnchang PCL (ADR) | | | 308 | |
| | 39,539 | | * | | Chart Industries, Inc | | | 2,571 | |
| | 218,606 | | | | Cheil Industries, Inc | | | 20,692 | |
| | 188,825 | | | | Chemring Group plc | | | 388 | |
| | 440,844 | | | | Chicony Power Technology Co Ltd | | | 642 | |
| | 1,081,500 | | | | China Aircraft Leasing Group Holdings Ltd | | | 1,089 | |
| | 53,800 | | | | China Avionics Systems Co Ltd | | | 102 | |
| | 75,300 | | | | China Communications Construction Co Ltd | | | 124 | |
| | 4,373,192 | | | | China Communications Construction Co Ltd (Hong Kong) | | | 4,123 | |
| | 1,937,000 | | | | China Conch Venture Holdings Ltd | | | 5,767 | |
| | 268,075 | | | | China Fangda Group Co Ltd | | | 119 | |
| | 93,100 | | | | China Gezhouba Group Co Ltd | | | 86 | |
| | 298,000 | | e | | China High Speed Transmission Equipment Group Co Ltd | | | 285 | |
| | 46,600 | | | | China International Marine Containers Group Co Ltd | | | 72 | |
| | 194,100 | | | | China National Chemical Engineering Co Ltd | | | 152 | |
| | 7,111,943 | | | | China Railway Construction Corp | | | 9,878 | |
| | 161,200 | | | | China Railway Construction Corp Ltd | | | 256 | |
| | 7,156,127 | | | | China Railway Group Ltd | | | 6,521 | |
| | 82,600 | | | | China Shipbuilding Industry Co Ltd | | | 51 | |
| | 188,080 | | †,e,m | | China Singyes Solar Technologies Holdings Ltd | | | 39 | |
| | 32,000 | | | | China Spacesat Co Ltd | | | 81 | |
| | 767,160 | | | | China State Construction Engineering Corp Ltd | | | 638 | |
COLLEGE RETIREMENT EQUITIES FUND -Stock Account
| SHARES | | | | COMPANY | | VALUE
(000) | |
| | 1,942,685 | | | | China State Construction International Holdings Ltd | | $ | 1,545 | |
| | 114,371 | | | | China Yuchai International Ltd | | | 1,423 | |
| | 108,500 | | e | | Chiyoda Corp | | | 305 | |
| | 6,600 | | | | Chiyoda Integre Co Ltd | | | 118 | |
| | 13,000,000 | | | | Chongqing Machinery & Electric Co Ltd | | | 864 | |
| | 18,900 | | | | Chudenko Corp | | | 402 | |
| | 649,375 | | | | Chung Hsin Electric & Machinery Manufacturing Corp | | | 409 | |
| | 286,524 | | | | CIMIC Group Ltd | | | 8,762 | |
| | 208,509 | | | | CIR-Compagnie Industriali Riunite S.p.A. | | | 223 | |
| | 21,963 | | * | | CIRCOR International, Inc | | | 468 | |
| | 12,388,796 | | | | Citic Pacific Ltd | | | 19,440 | |
| | 1,671,000 | | e | | Citic Resources Holdings Ltd | | | 132 | |
| | 1,833 | | * | | CJ Corp | | | 60 | |
| | 12,224 | | | | CJ Corp | | | 1,333 | |
| | 3,520,753 | | | | CK Hutchison Holdings Ltd | | | 33,793 | |
| | 36,600 | | | | CKD Corp | | | 310 | |
| | 5,871,829 | | | | CNH Industrial NV | | | 53,054 | |
| | 8,116,074 | | e | | CNH Industrial NV (NYSE) | | | 74,749 | |
| | 1,803,910 | | * | | Cobham plc | | | 2,249 | |
| | 17,099 | | g | | Cochin Shipyard Ltd | | | 92 | |
| | 543,022 | | * | | Colfax Corp | | | 11,349 | |
| | 104,832 | | | | Columbus McKinnon Corp | | | 3,160 | |
| | 330,058 | | | | Comfort Systems USA, Inc | | | 14,417 | |
| | 37,740 | | * | | Commercial Vehicle Group, Inc | | | 215 | |
| | 1,858,539 | | | | Compagnie de Saint-Gobain | | | 61,697 | |
| | 23,535 | | | | Compagnie d’Entreprises CFE | | | 2,330 | |
| | 183,400 | | | | COMSYS Holdings Corp | | | 4,476 | |
| | 12,259 | | | | Construcciones y Auxiliar de Ferrocarriles S.A. | | | 508 | |
| | 46,219 | | * | | Continental Building Products Inc | | | 1,176 | |
| | 1,535,450 | | | | Continental Engineering Corp | | | 704 | |
| | 3,179 | | | | Conzzeta AG. | | | 2,487 | |
| | 719,100 | | *,e | | Cosco Corp Singapore Ltd | | | 175 | |
| | 14,285 | | e | | Cosel Co Ltd | | | 121 | |
| | 206,646 | | | | Costain Group plc | | | 831 | |
| | 124,203 | | | | Cramo Oyj (Series B) | | | 2,123 | |
| | 40,848 | | | | Crane Co | | | 2,948 | |
| | 231,325 | | * | | Crompton Greaves Ltd | | | 148 | |
| | 4,081,321 | | | | CRRC Corp Ltd | | | 3,980 | |
| | 191,800 | | | | CRRC Corp Ltd (Class A) | | | 253 | |
| | 2,882 | | | | CS Wind Corp | | | 71 | |
| | 120,746 | | * | | CSBC Corp Taiwan | | | 99 | |
| | 31,646 | | * | | CSW Industrials, Inc | | | 1,530 | |
| | 2,318,000 | | | | CTCI Corp | | | 3,353 | |
| | 32,396 | | | | Cubic Corp | | | 1,741 | |
| | 104,333 | | | | Cummins, Inc | | | 13,943 | |
| | 95,817 | | | | Curtiss-Wright Corp | | | 9,785 | |
| | 117,540 | | | | Daelim Industrial Co | | | 10,798 | |
| | 4,797 | | | | Daetwyler Holding AG. | | | 610 | |
| | 185,656 | | * | | Daewoo Engineering & Construction Co Ltd | | | 896 | |
| | 54,107 | | | | Daewoo International Corp | | | 883 | |
| | 19,272 | | * | | Daewoo Shipbuilding & Marine Engineering Co Ltd | | | 592 | |
| | 27,500 | | | | Dai-Dan Co Ltd | | | 592 | |
| | 112,393 | | | | Daifuku Co Ltd | | | 5,096 | |
COLLEGE RETIREMENT EQUITIES FUND -Stock Account
| SHARES | | | | COMPANY | | VALUE
(000) | |
| | 13,128 | | | | Daihen Corp | | $ | 263 | |
| | 87,200 | | | | Daiho Corp | | | 2,805 | |
| | 24,800 | | | | Daiichi Jitsugyo Co Ltd | | | 792 | |
| | 194,850 | | | | Daikin Industries Ltd | | | 20,704 | |
| | 16,800 | | | | Daiwa Industries Ltd | | | 171 | |
| | 7,750 | | | | Danieli & Co S.p.A. | | | 136 | |
| | 24,975 | | | | Danieli & Co S.p.A. (RSP) | | | 369 | |
| | 3,619 | | | | Dassault Aviation S.A. | | | 5,017 | |
| | 93,901 | | | | DCC plc | | | 7,163 | |
| | 1,419,438 | | | | Deere & Co | | | 211,738 | |
| | 7,900 | | | | Denyo Co Ltd | | | 97 | |
| | 613,471 | | | | Deutz AG. | | | 3,614 | |
| | 75,695 | | g | | Dilip Buildcon Ltd | | | 453 | |
| | 195,272 | | | | Diploma plc | | | 3,014 | |
| | 55,495 | | *,e | | DIRTT Environmental Solutions | | | 248 | |
| | 18,495 | | | | DMC Global, Inc | | | 650 | |
| | 4,508,480 | | | | DMCI Holdings, Inc | | | 1,095 | |
| | 16,579 | | | | DMG Mori AG. | | | 823 | |
| | 616,925 | | * | | Dogan Sirketler Grubu Holdings | | | 119 | |
| | 45,412 | | | | Donaldson Co, Inc | | | 1,970 | |
| | 45,183 | | | | Doosan Bobcat, Inc | | | 1,279 | |
| | 49,807 | | * | | Doosan Heavy Industries and Construction Co Ltd | | | 436 | |
| | 388,580 | | *,e | | Doosan Infracore Co Ltd | | | 2,647 | |
| | 27,360 | | | | Douglas Dynamics, Inc | | | 982 | |
| | 574,605 | | | | Dover Corp | | | 40,768 | |
| | 392,953 | | *,†,m | | Drake & Scull International PJSC | | | 40 | |
| | 190,575 | | *,e | | Drone Delivery Canada Corp | | | 195 | |
| | 1,296,794 | | * | | Dubai Investments PJSC | | | 445 | |
| | 47,235 | | * | | Ducommun, Inc | | | 1,716 | |
| | 49,071 | | | | Duerr AG. | | | 1,728 | |
| | 41,563 | | * | | DXP Enterprises, Inc | | | 1,157 | |
| | 38,061 | | * | | Dycom Industries, Inc | | | 2,057 | |
| | 1,666,300 | | | | Dynasty Ceramic PCL | | | 100 | |
| | 7,391 | | | | Eastern Co | | | 179 | |
| | 1,134,711 | | | | Eaton Corp | | | 77,909 | |
| | 161,165 | | | | Ebara Corp | | | 3,610 | |
| | 13,544 | | | | Eicher Motors Ltd | | | 4,489 | |
| | 94,728 | | | | Eiffage S.A. | | | 7,920 | |
| | 19,594 | | | | Elbit Systems Ltd | | | 2,249 | |
| | 22,857 | | | | Elco Holdings Ltd | | | 417 | |
| | 1,375 | | | | Electra Israel Ltd | | | 329 | |
| | 906,541 | | | | ElSwedy Cables Holding Co | | | 910 | |
| | 73,149 | | *,e,g | | Eltel AB | | | 105 | |
| | 352,586 | | | | EMCOR Group, Inc | | | 21,046 | |
| | 1,307,289 | | * | | Emeco Holdings Ltd | | | 1,868 | |
| | 442,327 | | | | Emerson Electric Co | | | 26,429 | |
| | 1,791,126 | | | | Empresa Brasileira de Aeronautica S.A. | | | 10,013 | |
| | 72,527 | | | | Encore Wire Corp | | | 3,639 | |
| | 29,180 | | *,e | | Energous Corp | | | 169 | |
| | 53,701 | | *,e | | Energy Recovery, Inc | | | 361 | |
| | 69,758 | | | | EnerSys | | | 5,414 | |
| | 22,755 | | * | | Engility Holdings, Inc | | | 648 | |
| | 84,662 | | | | Engineers India Ltd | | | 151 | |
COLLEGE RETIREMENT EQUITIES FUND -Stock Account
| SHARES | | | | COMPANY | | VALUE
(000) | |
| | 109,711 | | *,e | | Enphase Energy, Inc | | $ | 519 | |
| | 34,939 | | | | EnPro Industries, Inc | | | 2,100 | |
| | 458,000 | | | | Enric Energy Equipment Holdings Ltd | | | 350 | |
| | 284,378 | | * | | Epiroc AB | | | 2,703 | |
| | 446,691 | | * | | Epiroc AB | | | 3,987 | |
| | 67,122 | | | | ESCO Technologies, Inc | | | 4,427 | |
| | 95,228 | | * | | Escorts Ltd | | | 962 | |
| | 33,548 | | * | | Esterline Technologies Corp | | | 4,074 | |
| | 5,200 | | e | | EVI Industries, Inc | | | 173 | |
| | 391,182 | | * | | Evoqua Water Technologies Corp | | | 3,755 | |
| | 65,867 | | | | Exco Technologies Ltd | | | 436 | |
| | 13,093 | | e | | FACC AG. | | | 198 | |
| | 501,529 | | | | Famur S.A. | | | 721 | |
| | 18,700 | | | | Fangda Carbon New Material Co Ltd | | | 46 | |
| | 33,777 | | | | Fanuc Ltd | | | 5,126 | |
| | 3,150,517 | | | | Far Eastern Textile Co Ltd | | | 2,861 | |
| | 471,088 | | | | Fastenal Co | | | 24,633 | |
| | 564,303 | | | | Federal Signal Corp | | | 11,230 | |
| | 22,912 | | | | Feelux Co Ltd | | | 252 | |
| | 1,297 | | e | | Feintool International Holding AG. | | | 99 | |
| | 107,028 | | | | Ferguson plc | | | 6,839 | |
| | 528,053 | | | | Ferrovial S.A. | | | 10,694 | |
| | 3,974 | | *,e | | FIGEAC-AERO | | | 50 | |
| | 322,037 | | | | Fincantieri S.p.A | | | 341 | |
| | 232,295 | | | | Finmeccanica S.p.A. | | | 2,047 | |
| | 517,460 | | | | Finning International, Inc | | | 9,021 | |
| | 40,852 | | * | | Finolex Cables Ltd | | | 266 | |
| | 264,000 | | * | | First Tractor Co | | | 60 | |
| | 65,412 | | | | Flowserve Corp | | | 2,487 | |
| | 25,766 | | e | | FLSmidth & Co AS | | | 1,162 | |
| | 32,105 | | * | | Fluidra S.A. | | | 360 | |
| | 265,726 | | | | Fluor Corp | | | 8,556 | |
| | 49,081 | | * | | Fomento de Construcciones y Contratas S.A. | | | 658 | |
| | 996,774 | | | | Fortive Corp | | | 67,442 | |
| | 260,537 | | | | Fortune Brands Home & Security, Inc | | | 9,898 | |
| | 2,734,124 | | e | | Fosun International | | | 3,985 | |
| | 131,731 | | * | | Foundation Building Materials, Inc | | | 1,095 | |
| | 58,730 | | | | Franklin Electric Co, Inc | | | 2,518 | |
| | 28,679 | | * | | Freightcar America, Inc | | | 192 | |
| | 22,930 | | | | Fudo Tetra Corp | | | 354 | |
| | 76,048 | | *,e | | FuelCell Energy, Inc | | | 42 | |
| | 19,407 | | | | Fuji Electric Holdings Co Ltd | | | 572 | |
| | 372,492 | | | | Fuji Machine Manufacturing Co Ltd | | | 4,357 | |
| | 229,178 | | | | Fujikura Ltd | | | 908 | |
| | 40,400 | | | | Fujitec Co Ltd | | | 434 | |
| | 27,900 | | | | Fukuda Corp | | | 1,029 | |
| | 7,900 | | | | Fukushima Industries Corp | | | 256 | |
| | 6,977,500 | | e | | Fullshare Holdings Ltd | | | 1,604 | |
| | 29,500 | | | | Furukawa Co Ltd | | | 336 | |
| | 88,800 | | | | Furukawa Electric Co Ltd | | | 2,216 | |
| | 70,719 | | | | Futaba Corp/Chiba | | | 1,018 | |
| | 70,191 | | | | Galliford Try plc | | | 558 | |
| | 2,090,103 | | | | Gamuda BHD | | | 1,180 | |
| | 82,172 | | * | | Gardner Denver Holdings, Inc | | | 1,680 | |
COLLEGE RETIREMENT EQUITIES FUND -Stock Account
| SHARES | | | | COMPANY | | VALUE
(000) | |
| | 88,807 | | *,e | | Gates Industrial Corp plc | | $ | 1,176 | |
| | 48,375 | | | | GATX Corp | | | 3,425 | |
| | 54,838 | | * | | Gayatri Projects Ltd | | | 138 | |
| | 1,183,265 | | | | GEA Group AG. | | | 30,464 | |
| | 5,024 | | | | Geberit AG. | | | 1,956 | |
| | 38,700 | | | | Gecoss Corp | | | 361 | |
| | 183,257 | | * | | GEK Group of Cos S.A. | | | 1,005 | |
| | 11,755 | | * | | Gencor Industries, Inc | | | 129 | |
| | 165,947 | | * | | Generac Holdings, Inc | | | 8,248 | |
| | 471,137 | | | | General Dynamics Corp | | | 74,067 | |
| | 15,432,151 | | n | | General Electric Co | | | 116,821 | |
| | 30,042 | | * | | General Finance Corp | | | 304 | |
| | 17,229 | | | | Georg Fischer AG. | | | 13,822 | |
| | 40,221 | | * | | Gibraltar Industries, Inc | | | 1,431 | |
| | 21,100 | | e | | Giken Seisakusho Co, Inc | | | 663 | |
| | 21,467 | | e,g | | Gima TT S.p.A | | | 161 | |
| | 275,034 | | | | Global Brass & Copper Holdings, Inc | | | 6,917 | |
| | 32,656 | | | | Glory Ltd | | | 734 | |
| | 622,639 | | * | | GMR Infrastructure Ltd | | | 146 | |
| | 171,659 | | * | | GMS, Inc | | | 2,551 | |
| | 74,079 | | | | Godrej Industries Ltd | | | 579 | |
| | 89,625 | | | | Gorman-Rupp Co | | | 2,905 | |
| | 182,248 | | | | Graco, Inc | | | 7,627 | |
| | 353,937 | | | | GrafTech International Ltd | | | 4,049 | |
| | 368,359 | | | | Grafton Group plc | | | 3,019 | |
| | 15,183 | | | | Graham Corp | | | 347 | |
| | 98,771 | | | | Granite Construction, Inc | | | 3,978 | |
| | 148,064 | | | | Graphite India Ltd | | | 1,601 | |
| | 74,566 | | * | | Great Lakes Dredge & Dock Corp | | | 494 | |
| | 37,730 | | | | Greaves Cotton Ltd | | | 64 | |
| | 39,481 | | | | Greenbrier Cos, Inc | | | 1,561 | |
| | 136,751 | | | | Griffon Corp | | | 1,429 | |
| | 429,084 | | e | | Grupo Carso S.A. de C.V. (Series A1) | | | 1,537 | |
| | 113,600 | | e | | Grupo Rotoplas SAB de C.V. | | | 128 | |
| | 98,477 | | | | GS Engineering & Construction Corp | | | 3,862 | |
| | 41,800 | | | | GS Yuasa Corp | | | 852 | |
| | 1,382,493 | | | | Gunkul Engineering PCL | | | 119 | |
| | 128,307 | | | | GWA International Ltd | | | 251 | |
| | 70,198 | | | | H&E Equipment Services, Inc | | | 1,433 | |
| | 775,813 | | | | Haitian International Holdings Ltd | | | 1,492 | |
| | 22,116 | | | | Haldex AB | | | 173 | |
| | 171,996 | | | | Hangzhou Steam Turbine Co | | | 126 | |
| | 32,400 | | | | Han’s Laser Technology Industry Group Co Ltd | | | 144 | |
| | 247,079 | | | | Hanwa Co Ltd | | | 6,348 | |
| | 36,457 | | | | Hanwha Corp | | | 1,024 | |
| | 703,900 | | | | HAP Seng Consolidated BHD | | | 1,678 | |
| | 406,000 | | e | | Harbin Power Equipment | | | 207 | |
| | 21,500 | | e | | Harmonic Drive Systems, Inc | | | 586 | |
| | 351,770 | | | | Harris Corp | | | 47,366 | |
| | 645,198 | | * | | Harsco Corp | | | 12,814 | |
| | 285,919 | | * | | Havells India Ltd | | | 2,829 | |
| | 250,900 | | | | Hazama Ando Corp | | | 1,657 | |
| | 263,000 | | *,e | | HC International, Inc | | | 152 | |
COLLEGE RETIREMENT EQUITIES FUND -Stock Account
| SHARES | | | | COMPANY | | VALUE
(000) | |
| | 52,947 | | *,e | | HC2 Holdings, Inc | | $ | 140 | |
| | 1,117,572 | | * | | HD Supply Holdings, Inc | | | 41,931 | |
| | 19,854 | | * | | HDC Hyundai Development Co-Engineering & Construction | | | 860 | |
| | 29,114 | | | | HEG Ltd | | | 1,541 | |
| | 13,399 | | | | HEICO Corp | | | 1,038 | |
| | 310,756 | | | | HEICO Corp (Class A) | | | 19,578 | |
| | 161,341 | | * | | Heidelberger Druckmaschinen | | | 292 | |
| | 207,959 | | * | | Herc Holdings, Inc | | | 5,405 | |
| | 68,578 | | | | Hexcel Corp | | | 3,932 | |
| | 9,500 | | | | Hibiya Engineering Ltd | | | 160 | |
| | 149,962 | | | | Hillenbrand, Inc | | | 5,688 | |
| | 877,484 | | | | Hino Motors Ltd | | | 8,263 | |
| | 5,400 | | e | | Hirata Corp | | | 240 | |
| | 11,400 | | | | Hisaka Works Ltd | | | 85 | |
| | 50,267 | | | | Hitachi Construction Machinery Co Ltd | | | 1,176 | |
| | 107,200 | | | | Hitachi Zosen Corp | | | 325 | |
| | 173,379 | | | | Hiwin Technologies Corp | | | 1,251 | |
| | 60,303 | | | | Hochtief AG. | | | 8,144 | |
| | 3,854,109 | | | | Honeywell International, Inc | | | 509,205 | |
| | 458,000 | | e | | Hong Kong International Construction Investment Management Group Co Ltd | | | 141 | |
| | 47,500 | | | | Hong Leong Industries BHD | | | 98 | |
| | 900,500 | | | | Hopewell Holdings | | | 3,960 | |
| | 51,509 | | | | Hoshizaki Electric Co Ltd | | | 3,126 | |
| | 33,261 | | | | Hosken Consolidated Investments Ltd | | | 287 | |
| | 4,900 | | | | Hosokawa Micron Corp | | | 186 | |
| | 2,035,014 | | | | Howden Joinery Group plc | | | 11,291 | |
| | 2,285,000 | | *,† | | Hsin Chong Construction Group Ltd | | | 3 | |
| | 77,200 | | * | | Huangshi Dongbei Electrical Appliance Co Ltd | | | 90 | |
| | 36,333 | | | | Hubbell, Inc | | | 3,609 | |
| | 9,218 | | | | Huber & Suhner AG. | | | 616 | |
| | 51,613 | | | | Hudaco Industries Ltd | | | 503 | |
| | 65,765 | | | | Huntington Ingalls | | | 12,516 | |
| | 8,553 | | | | Hurco Cos, Inc | | | 305 | |
| | 4,857 | | | | Hy-Lok Corp | | | 72 | |
| | 3,869 | | * | | Hyosung Heavy Industries Corp | | | 143 | |
| | 34,285 | | | | Hyster-Yale Materials Handling, Inc | | | 2,124 | |
| | 7,232 | | * | | Hyundai Construction Equipment Co Ltd | | | 277 | |
| | 21,781 | | | | Hyundai Development Co | | | 337 | |
| | 6,526 | | * | | Hyundai Electric & Energy System Co Ltd | | | 130 | |
| | 8,552 | | | | Hyundai Elevator Co Ltd | | | 822 | |
| | 79,724 | | | | Hyundai Engineering & Construction Co Ltd | | | 3,905 | |
| | 33,374 | | | | Hyundai Heavy Industries | | | 3,849 | |
| | 15,796 | | * | | Hyundai Mipo Dockyard | | | 851 | |
| | 8,469 | | * | | Hyundai Robotics Co Ltd | | | 2,624 | |
| | 18,124 | | * | | Hyundai Rotem Co Ltd | | | 454 | |
| | 31,400 | | | | Idec Corp | | | 535 | |
| | 82,321 | | | | IDEX Corp | | | 10,394 | |
| | 10,300 | | * | | IES Holdings, Inc | | | 160 | |
| | 2,888,212 | | | | IJM Corp BHD | | | 1,133 | |
| | 47,564 | | | | Illinois Tool Works, Inc | | | 6,026 | |
| | 205,917 | | | | IMI plc | | | 2,480 | |
| | 9,494 | | | | Implenia AG. | | | 319 | |
COLLEGE RETIREMENT EQUITIES FUND -Stock Account
| SHARES | | | | COMPANY | | VALUE
(000) | |
| | 108,157 | | e | | Impregilo S.p.A. | | $ | 176 | |
| | 39,180 | | | | IMS-Intl Metal Service | | | 696 | |
| | 50,100 | | | | Inaba Denki Sangyo Co Ltd | | | 1,872 | |
| | 25,900 | | | | Inabata & Co Ltd | | | 329 | |
| | 14,038 | | | | Indus Holding AG. | | | 628 | |
| | 11,229 | | | | Industria Macchine Automatiche S.p.A. | | | 701 | |
| | 189,178 | | * | | Industries Qatar QSC | | | 6,922 | |
| | 185,839 | | | | Indutrade AB | | | 4,316 | |
| | 24,183 | | * | | Infrastructure and Energy Alternatives, Inc | | | 198 | |
| | 1,725,357 | | | | Ingersoll-Rand plc | | | 157,404 | |
| | 28,930 | | | | Insteel Industries, Inc | | | 702 | |
| | 56,732 | | | | Interpump Group S.p.A. | | | 1,692 | |
| | 408 | | | | Interroll Holding AG. | | | 603 | |
| | 100,002 | | e | | Invicta Holdings Ltd | | | 243 | |
| | 35,012 | | | | Inwido AB | | | 220 | |
| | 72,500 | | | | Iochpe-Maxion S.A. | | | 445 | |
| | 430,802 | | | | IRB Infrastructure Developers Ltd | | | 1,012 | |
| | 87,610 | | | | IS Dongseo Co Ltd | | | 2,407 | |
| | 10,900 | | | | Iseki & Co Ltd | | | 156 | |
| | 4,081 | | | | ISGEC Heavy Engineering Ltd | | | 295 | |
| | 2,050,611 | | | | Ishikawajima-Harima Heavy Industries Co Ltd | | | 56,477 | |
| | 1,113,750 | | * | | Italian-Thai Development PCL | | | 73 | |
| | 12,884 | | | | Italmobiliare S.p.A | | | 271 | |
| | 1,982,911 | | | | Itochu Corp | | | 33,675 | |
| | 790,711 | | | | ITT, Inc | | | 38,168 | |
| | 233,800 | | | | Iwatani International Corp | | | 7,799 | |
| | 239,489 | | | | Jacobs Engineering Group, Inc | | | 14,001 | |
| | 1,265,889 | | * | | Jain Irrigation Systems Ltd | | | 1,264 | |
| | 5,800 | | e | | Jamco Corp | | | 134 | |
| | 33,960 | | | | Japan Pulp & Paper Co Ltd | | | 1,298 | |
| | 42,600 | | | | Japan Steel Works Ltd | | | 682 | |
| | 220,905 | | | | Jardine Matheson Holdings Ltd | | | 15,381 | |
| | 227,288 | | | | Jardine Strategic Holdings Ltd | | | 8,333 | |
| | 85,682 | | *,e | | JELD-WEN Holding, Inc | | | 1,218 | |
| | 3,097,937 | | | | JG Summit Holdings (Series B) | | | 3,274 | |
| | 46,153 | | | | JGC Corp | | | 650 | |
| | 40,159 | | | | John Bean Technologies Corp | | | 2,884 | |
| | 512,807 | | g | | John Laing Group plc | | | 2,172 | |
| | 439,681 | | | | Johnson Controls International plc | | | 13,037 | |
| | 267,375 | | | | Johnson Electric Holdings Ltd | | | 545 | |
| | 21,949 | | g | | JOST Werke AG. | | | 661 | |
| | 1,058,576 | | | | JTEKT Corp | | | 11,708 | |
| | 30,458 | | | | Jungheinrich AG. | | | 798 | |
| | 1,982 | | | | Kaba Holding AG. | | | 1,199 | |
| | 69,783 | | | | Kadant, Inc | | | 5,685 | |
| | 70,730 | | * | | Kajaria Ceramics Ltd | | | 499 | |
| | 225,310 | | | | Kajima Corp | | | 3,027 | |
| | 22,487 | | * | | Kalpataru Power Transmission Ltd | | | 126 | |
| | 150,300 | | * | | Kama Co Ltd | | | 77 | |
| | 35,086 | | | | Kaman Corp | | | 1,968 | |
| | 24,800 | | | | Kamei Corp | | | 279 | |
| | 77,700 | | | | Kanamoto Co Ltd | | | 2,047 | |
| | 473,100 | | | | Kandenko Co Ltd | | | 4,586 | |
COLLEGE RETIREMENT EQUITIES FUND -Stock Account
| SHARES | | | | COMPANY | | VALUE
(000) | |
| | 406,600 | | | | Kanematsu Corp | | $ | 4,924 | |
| | 1,248,821 | | | | KAP Industrial Holdings Ltd | | | 709 | |
| | 20,513 | | | | Kardex AG. | | | 2,372 | |
| | 14,900 | | e | | Katakura Industries Co Ltd | | | 151 | |
| | 19,744 | | | | Kawasaki Heavy Industries Ltd | | | 421 | |
| | 192,378 | | | | KBR, Inc | | | 2,920 | |
| | 5,500 | | | | KCC Corp | | | 1,520 | |
| | 146,212 | | * | | KEC International Ltd | | | 630 | |
| | 21,259 | | * | | KEI Industries Ltd | | | 109 | |
| | 99,479 | | | | Keihan Electric Railway Co Ltd | | | 4,053 | |
| | 46,982 | | | | Keller Group plc | | | 296 | |
| | 8,008 | | | | Kendrion NV | | | 192 | |
| | 211,131 | | | | Kennametal, Inc | | | 7,026 | |
| | 7,546 | | | | KEPCO Engineering & Construction Co, Inc | | | 141 | |
| | 934,170 | | | | Keppel Corp Ltd | | | 4,055 | |
| | 253,800 | | | | Kerjaya Prospek Group BHD | | | 71 | |
| | 66,991 | | *,e | | KEYW Holding Corp, The | | | 448 | |
| | 105,199 | | e | | Kier Group plc | | | 546 | |
| | 230,700 | | | | Kinden Corp | | | 3,735 | |
| | 31,000 | | | | King Slide Works Co Ltd | | | 323 | |
| | 53,584 | | | | Kingspan Group plc | | | 2,297 | |
| | 60,006 | | | | KION Group AG. | | | 3,052 | |
| | 256,700 | | | | Kitz Corp | | | 1,996 | |
| | 445,523 | | | | Kloeckner & Co AG. | | | 3,075 | |
| | 641,478 | | | | KOC Holding AS | | | 1,717 | |
| | 31,185 | | | | Koenig & Bauer AG. | | | 1,308 | |
| | 3,468 | | | | Kolon Corp | | | 96 | |
| | 515,288 | | | | Komatsu Ltd | | | 11,074 | |
| | 2,306 | | | | Komax Holding AG. | | | 540 | |
| | 30,390 | | | | Komori Corp | | | 305 | |
| | 59,773 | | | | Kone Oyj (Class B) | | | 2,854 | |
| | 42,282 | | | | Konecranes Oyj | | | 1,282 | |
| | 50,397 | | | | Kongsberg Gruppen ASA | | | 685 | |
| | 149,555 | | e | | Koninklijke BAM Groep NV | | | 429 | |
| | 92,000 | | | | Koninklijke Volkerwessels NV | | | 1,456 | |
| | 71,636 | | * | | Korea Aerospace Industries Ltd | | | 2,052 | |
| | 2,851 | | | | Korea Electric Terminal Co Ltd | | | 103 | |
| | 19,361 | | *,e | | Kornit Digital Ltd | | | 362 | |
| | 110,788 | | * | | Kratos Defense & Security Solutions, Inc | | | 1,561 | |
| | 10,285 | | | | Krones AG. | | | 793 | |
| | 165,767 | | | | Kubota Corp | | | 2,356 | |
| | 59,000 | | | | Kumagai Gumi Co Ltd | | | 1,773 | |
| | 139,323 | | | | Kumho Industrial Co Ltd | | | 1,473 | |
| | 194,000 | | | | Kung Long Batteries Industrial Co Ltd | | | 916 | |
| | 12,588 | | | | Kurita Water Industries Ltd | | | 305 | |
| | 35,600 | | | | Kyokuto Kaihatsu Kogyo Co Ltd | | | 456 | |
| | 209,800 | | | | Kyowa Exeo Corp | | | 4,913 | |
| | 33,600 | | | | Kyudenko Corp | | | 1,273 | |
| | 3,151 | | | | Kyung Dong Navien Co Ltd | | | 118 | |
| | 380,731 | | | | L3 Technologies, Inc | | | 66,118 | |
| | 1,442 | | * | | Lakshmi Machine Works Ltd | | | 118 | |
| | 730,787 | | | | Larsen & Toubro Ltd | | | 15,038 | |
| | 7,694 | | * | | Lawson Products, Inc | | | 243 | |
| | 12,786 | | * | | LB Foster Co (Class A) | | | 203 | |
COLLEGE RETIREMENT EQUITIES FUND -Stock Account
| SHARES | | | | COMPANY | | VALUE
(000) | |
| | 45,855 | | | | Legrand S.A. | | $ | 2,592 | |
| | 15,713 | | e | | Lehto Group Oyj | | | 77 | |
| | 62,397 | | | | Lennox International, Inc | | | 13,656 | |
| | 251,945 | | | | LG Corp | | | 15,779 | |
| | 3,547 | | | | LG Hausys Ltd | | | 180 | |
| | 19,451 | | | | LG International Corp | | | 267 | |
| | 6,195 | | | | LIG Nex1 Co Ltd | | | 205 | |
| | 12,275 | | | | Lincoln Electric Holdings, Inc | | | 968 | |
| | 206,358 | | | | Lindab International AB | | | 1,480 | |
| | 13,804 | | | | Lindsay Corp | | | 1,329 | |
| | 12,729 | | | | LISI | | | 299 | |
| | 172,736 | | | | LIXIL Group Corp | | | 2,141 | |
| | 528,732 | | | | Lockheed Martin Corp | | | 138,443 | |
| | 7,185,000 | | | | Lonking Holdings Ltd | | | 1,856 | |
| | 25,079 | | * | | Lotte Corp | | | 1,185 | |
| | 98,543 | | | | LS Cable Ltd | | | 4,343 | |
| | 9,110 | | | | LS Industrial Systems Co Ltd | | | 400 | |
| | 113,350 | | | | Luxshare Precision Industry Co Ltd | | | 233 | |
| | 46,535 | | * | | Lydall, Inc | | | 945 | |
| | 29,981 | | | | Mabuchi Motor Co Ltd | | | 918 | |
| | 2,413,023 | | | | Maeda Corp | | | 22,533 | |
| | 12,200 | | | | Maeda Kosen Co Ltd | | | 293 | |
| | 66,800 | | | | Maeda Road Construction Co Ltd | | | 1,384 | |
| | 28,674 | | | | Magellan Aerospace Corp | | | 315 | |
| | 1,205,372 | | | | Maire Tecnimont S.p.A | | | 4,445 | |
| | 293,549 | | | | Makino Milling Machine Co Ltd | | | 10,325 | |
| | 32,161 | | | | Makita Corp | | | 1,142 | |
| | 842,200 | | | | Malaysian Resources Corp BHD | | | 125 | |
| | 12,208 | | | | MAN AG. | | | 1,259 | |
| | 20,862 | | * | | Manitex International, Inc | | | 119 | |
| | 35,415 | | | | Manitou BF S.A. | | | 908 | |
| | 1,785,766 | | *,a | | Manitowoc Co, Inc | | | 26,376 | |
| | 317,300 | | | | Marcopolo S.A. | | | 334 | |
| | 2,594,474 | | | | Marubeni Corp | | | 18,204 | |
| | 1,750,360 | | | | Masco Corp | | | 51,181 | |
| | 121,950 | | * | | Masonite International Corp | | | 5,467 | |
| | 80,280 | | * | | Mastec, Inc | | | 3,256 | |
| | 16,800 | | | | Max Co Ltd | | | 208 | |
| | 71,112 | | e | | Maxar Technologies Ltd | | | 851 | |
| | 36,724 | | | | Maxar Technologies Ltd (Toronto) | | | 439 | |
| | 1,326 | | | | MBB SE | | | 108 | |
| | 443,700 | | | | Megawide Construction Corp | | | 157 | |
| | 1,043,915 | | | | Meggitt plc | | | 6,271 | |
| | 94,600 | | | | Meidensha Corp | | | 1,190 | |
| | 4,193,894 | | | | Melrose Industries plc | | | 8,761 | |
| | 66,591 | | * | | Mercury Systems, Inc | | | 3,149 | |
| | 439,722 | | * | | Meritor, Inc | | | 7,436 | |
| | 34,100 | | | | Metallurgical Corp of China Ltd | | | 15 | |
| | 3,323,000 | | | | Metallurgical Corp of China Ltd (Hong Kong) | | | 798 | |
| | 7,200 | | | | METAWATER Co Ltd | | | 192 | |
| | 146,467 | | | | Metso Oyj | | | 3,848 | |
| | 213,009 | | | | Micron Machinery Co Ltd | | | 2,588 | |
| | 159,017 | | * | | Middleby Corp | | | 16,336 | |
COLLEGE RETIREMENT EQUITIES FUND -Stock Account
| SHARES | | | | COMPANY | | VALUE
(000) | |
| | 59,100 | | | | Mie Kotsu Group Holdings, Inc | | $ | 323 | |
| | 444,143 | | * | | Milacron Holdings Corp | | | 5,281 | |
| | 82,120 | | | | Millat Tractors Ltd | | | 492 | |
| | 18,488 | | | | Miller Industries, Inc | | | 499 | |
| | 351,500 | | | | Minebea Co Ltd | | | 5,069 | |
| | 1,417,300 | | e | | Miraito Holdings Corp | | | 20,737 | |
| | 206,264 | | | | MISUMI Group, Inc | | | 4,345 | |
| | 1,603,367 | | | | Mitsubishi Corp | | | 43,959 | |
| | 509,357 | | | | Mitsubishi Electric Corp | | | 5,617 | |
| | 130,252 | | | | Mitsubishi Heavy Industries Ltd | | | 4,674 | |
| | 17,000 | | | | Mitsubishi Nichiyu Forklift Co Ltd | | | 163 | |
| | 13,850 | | | | Mitsuboshi Belting Co Ltd | | | 266 | |
| | 2,549,895 | | | | Mitsui & Co Ltd | | | 39,175 | |
| | 47,300 | | * | | Mitsui Engineering & Shipbuilding Co Ltd | | | 442 | |
| | 58,200 | | | | Miura Co Ltd | | | 1,322 | |
| | 3,138,230 | | | | MMC Corp BHD | | | 628 | |
| | 68,292 | | | | Monadelphous Group Ltd | | | 663 | |
| | 110,100 | | | | MonotaRO Co Ltd | | | 2,714 | |
| | 153,767 | | | | Moog, Inc (Class A) | | | 11,914 | |
| | 688,608 | | | | Morgan Crucible Co plc | | | 2,310 | |
| | 88,606 | | | | Morgan Sindall plc | | | 1,190 | |
| | 255,800 | | e | | Mori Seiki Co Ltd | | | 2,873 | |
| | 17,600 | | | | Morita Holdings Corp | | | 288 | |
| | 370,221 | | * | | Mota Engil SGPS S.A. | | | 684 | |
| | 266,267 | | * | | MRC Global, Inc | | | 3,256 | |
| | 86,328 | | | | MSC Industrial Direct Co (Class A) | | | 6,640 | |
| | 110,384 | | | | MTU Aero Engines Holding AG. | | | 20,046 | |
| | 72,488 | | | | Mueller Industries, Inc | | | 1,693 | |
| | 631,824 | | | | Mueller Water Products, Inc (Class A) | | | 5,750 | |
| | 67,900 | | | | Muhibbah Engineering M BHD | | | 46 | |
| | 39,709 | | e,g | | Munters Group AB | | | 152 | |
| | 241,522 | | | | Murray & Roberts Holdings Ltd | | | 243 | |
| | 96,062 | | * | | MYR Group, Inc | | | 2,706 | |
| | 90,423 | | e | | Nabtesco Corp | | | 1,958 | |
| | 10,033 | | e | | Nachi-Fujikoshi Corp | | | 348 | |
| | 1,001,663 | | * | | Nagarjuna Construction Co | | | 1,263 | |
| | 320,500 | | | | Nagase & Co Ltd | | | 4,414 | |
| | 31,500 | | | | Namura Shipbuilding Co Ltd | | | 134 | |
| | 131,800 | | | | NARI Technology Co Ltd | | | 357 | |
| | 147,512 | | * | | National Central Cooling Co PJSC | | | 69 | |
| | 6,273 | | e | | National Presto Industries, Inc | | | 733 | |
| | 62,437 | | * | | Navistar International Corp | | | 1,620 | |
| | 251,501 | | | | NBCC India Ltd | | | 208 | |
| | 57,240 | | e | | NCC AB (B Shares) | | | 890 | |
| | 269,546 | | * | | NCI Building Systems, Inc | | | 1,954 | |
| | 589,274 | | e | | NEL ASA | | | 316 | |
| | 17,034 | | e | | Nexans S.A. | | | 475 | |
| | 62,134 | | *,e | | Nexeo Solutions, Inc | | | 534 | |
| | 68,438 | | e | | NFI Group, Inc | | | 1,706 | |
| | 38,651 | | | | NGK Insulators Ltd | | | 524 | |
| | 193,915 | | | | Nibe Industrier AB | | | 1,993 | |
| | 96,812 | | | | Nichias Corp | | | 1,651 | |
| | 21,200 | | | | Nichiden Corp | | | 306 | |
| | 19,900 | | | | Nichiha Corp | | | 501 | |
COLLEGE RETIREMENT EQUITIES FUND -Stock Account
| SHARES | | | | COMPANY | | VALUE
(000) | |
| | 40,725 | | | | Nidec Corp | | $ | 4,608 | |
| | 3,200 | | e | | Nihon Trim Co Ltd | | | 169 | |
| | 17,415 | | * | | Nilfisk Holding A.S. | | | 619 | |
| | 134,300 | | | | Nippo Corp | | | 2,569 | |
| | 69,100 | | e | | Nippon Carbon Co Ltd | | | 2,517 | |
| | 22,000 | | | | Nippon Densetsu Kogyo Co Ltd | | | 435 | |
| | 6,600 | | | | Nippon Koei Co Ltd | | | 147 | |
| | 4,100 | | | | Nippon Road Co Ltd | | | 214 | |
| | 27,072 | | *,e | | Nippon Sharyo Ltd | | | 543 | |
| | 57,200 | | | | Nippon Sheet Glass Co Ltd | | | 434 | |
| | 96,417 | | | | Nippon Steel Trading Co Ltd | | | 3,975 | |
| | 32,900 | | | | Nippon Thompson Co Ltd | | | 145 | |
| | 60,500 | | | | Nishimatsu Construction Co Ltd | | | 1,377 | |
| | 21,700 | | | | Nishio Rent All Co Ltd | | | 652 | |
| | 4,600 | | e | | Nissei ASB Machine Co Ltd | | | 146 | |
| | 135,652 | | | | Nisshinbo Industries, Inc | | | 1,024 | |
| | 62,200 | | e | | Nissin Electric Co Ltd | | | 452 | |
| | 12,000 | | | | Nitta Corp | | | 353 | |
| | 13,800 | | | | Nitto Boseki Co Ltd | | | 225 | |
| | 15,200 | | | | Nitto Kogyo Corp | | | 241 | |
| | 6,373 | | | | Nitto Kohki Co Ltd | | | 122 | |
| | 8,200 | | e | | Nittoku Engineering Co Ltd | | | 150 | |
| | 16,423 | | *,e | | NKT Holding AS | | | 225 | |
| | 54,529 | | | | NN, Inc | | | 366 | |
| | 2,400 | | *,†,e | | Noble Group Ltd | | | 0 | ^ |
| | 102,151 | | | | Nolato AB (B Shares) | | | 4,228 | |
| | 37,470 | | * | | Nordex AG. | | | 325 | |
| | 101,679 | | | | Nordson Corp | | | 12,135 | |
| | 71,791 | | | | Noritake Co Ltd | | | 2,964 | |
| | 17,900 | | | | Noritz Corp | | | 256 | |
| | 92,564 | | | | NORMA Group | | | 4,589 | |
| | 715,775 | | | | Northrop Grumman Corp | | | 175,293 | |
| | 13,071 | | * | | Northwest Pipe Co | | | 304 | |
| | 160,998 | | * | | NOW, Inc | | | 1,874 | |
| | 1,878,609 | | | | NRW Holdings Ltd | | | 2,139 | |
| | 294,817 | | | | NSK Ltd | | | 2,529 | |
| | 412,900 | | | | NTN Corp | | | 1,187 | |
| | 12,273 | | * | | NV5 Holdings, Inc | | | 743 | |
| | 111,778 | | | | nVent Electric plc | | | 2,511 | |
| | 2,733,905 | | | | NWS Holdings Ltd | | | 5,614 | |
| | 8,900 | | | | Obara Corp | | | 317 | |
| | 363,492 | | | | Obayashi Corp | | | 3,291 | |
| | 120,326 | | e | | Obrascon Huarte Lain S.A. | | | 90 | |
| | 190,378 | | | | OC Oerlikon Corp AG. | | | 2,144 | |
| | 4,110 | | | | OHB AG. | | | 146 | |
| | 122,200 | | | | Oiles Corp | | | 1,969 | |
| | 24,700 | | | | Okabe Co Ltd | | | 196 | |
| | 45,628 | | | | Okuma Holdings, Inc | | | 2,172 | |
| | 24,800 | | | | Okumura Corp | | | 723 | |
| | 4,090 | | | | Omega Flex, Inc | | | 221 | |
| | 68,733 | | *,e | | Opus Global Rt | | | 120 | |
| | 253 | | | | Orascom Construction Ltd | | | 2 | |
| | 24,500 | | | | Organo Corp | | | 583 | |
COLLEGE RETIREMENT EQUITIES FUND -Stock Account
| SHARES | | | | COMPANY | | VALUE
(000) | |
| | 234,402 | | * | | Orion Marine Group, Inc | | $ | 1,006 | |
| | 54,800 | | | | OSG Corp | | | 1,060 | |
| | 99,175 | | | | Oshkosh Truck Corp | | | 6,080 | |
| | 78,500 | | | | OSJB Holdings Corp | | | 204 | |
| | 252,042 | | | | Osram Licht AG. | | | 10,969 | |
| | 5,555 | | | | Otokar Otobus Karoseri Sanayi AS | | | 93 | |
| | 95,477 | | * | | Outotec Oyj | | | 335 | |
| | 2,127,756 | | | | Owens Corning, Inc | | | 93,579 | |
| | 130,441 | | | | PACCAR, Inc | | | 7,453 | |
| | 8,202 | | | | Palfinger AG. | | | 210 | |
| | 300,000 | | * | | Pantaloon Retail India Ltd | | | 164 | |
| | 853,856 | | | | Parker-Hannifin Corp | | | 127,344 | |
| | 30,154 | | * | | Patrick Industries, Inc | | | 893 | |
| | 639,133 | | | | Peab AB (Series B) | | | 5,233 | |
| | 152,807 | | | | Pentair plc | | | 5,773 | |
| | 1,065,300 | | | | Penta-Ocean Construction Co Ltd | | | 5,886 | |
| | 48,970 | | | | PER Aarsleff A.S. | | | 1,498 | |
| | 8,472 | | | | Pfeiffer Vacuum Technology AG. | | | 1,057 | |
| | 443,317 | | * | | PGT, Inc | | | 7,027 | |
| | 90,865 | | g | | Philips Lighting NV | | | 2,126 | |
| | 8,293 | | | | Pinguely-Haulotte | | | 84 | |
| | 260,796 | | *,e | | Plug Power, Inc | | | 323 | |
| | 38,019 | | * | | PNC Infratech Ltd | | | 80 | |
| | 130,041 | | | | Polypipe Group plc | | | 543 | |
| | 1,895,600 | | | | Polyplex PCL (Foreign) | | | 757 | |
| | 21,061 | | | | Ponsse Oyj | | | 597 | |
| | 19,640 | | e | | Porr AG. | | | 392 | |
| | 19,914 | | | | Powell Industries, Inc | | | 498 | |
| | 300,400 | | | | Power Construction Corp of China Ltd | | | 213 | |
| | 4,257 | | | | Preformed Line Products Co | | | 231 | |
| | 123,629 | | | | Primoris Services Corp | | | 2,365 | |
| | 34,692 | | * | | Proto Labs, Inc | | | 3,913 | |
| | 33,303 | | | | Prysmian S.p.A. | | | 648 | |
| | 5,644,732 | | | | PT Adhi Karya Persero Tbk | | | 623 | |
| | 2,127,400 | | | | PT AKR Corporindo Tbk | | | 635 | |
| | 5,000,000 | | | | PT Arwana Citramulia Tbk | | | 146 | |
| | 1,217,100 | | | | PT Asahimas Flat Glass Tbk | | | 313 | |
| | 2,803,600 | | *,†,m | | PT Inovisi Infracom Tbk | | | 0 | ^ |
| | 4,195,688 | | | | PT Pembangunan Perumahan Tbk | | | 528 | |
| | 2,721,300 | | * | | PT Sitara Propertindo Tbk | | | 167 | |
| | 3,005,800 | | | | PT Waskita Karya Persero Tbk | | | 352 | |
| | 7,176,023 | | | | PT Wijaya Karya | | | 828 | |
| | 41,488 | | * | | Qatar Industrial Manufacturing Co | | | 486 | |
| | 1,789,884 | | | | QinetiQ plc | | | 6,537 | |
| | 39,000 | | | | QST International Corp | | | 102 | |
| | 56,373 | | | | Quanex Building Products Corp | | | 766 | |
| | 330,885 | | * | | Quanta Services, Inc | | | 9,960 | |
| | 84,500 | | | | Raito Kogyo Co Ltd | | | 1,126 | |
| | 382,321 | | | | Ramirent Oyj | | | 2,387 | |
| | 192,113 | | | | Randon Participacoes S.A. | | | 459 | |
| | 2,122 | | | | Rational AG. | | | 1,206 | |
| | 58,426 | | | | Raven Industries, Inc | | | 2,114 | |
| | 482,580 | | | | Raytheon Co | | | 74,004 | |
| | 43,470 | | * | | RBC Bearings, Inc | | | 5,699 | |
COLLEGE RETIREMENT EQUITIES FUND -Stock Account
| SHARES | | | | COMPANY | | VALUE
(000) | |
| | 164,597 | | †,m | | RCR Tomlinson Ltd | | $ | 1 | |
| | 189,797 | | | | Rechi Precision Co Ltd | | | 149 | |
| | 85,997 | | | | Regal-Beloit Corp | | | 6,024 | |
| | 647,271 | | | | Reliance Worldwide Corp Ltd | | | 2,029 | |
| | 550,445 | | * | | Resideo Technologies, Inc | | | 11,312 | |
| | 650,287 | | | | Reunert Ltd | | | 3,201 | |
| | 39,193 | | e | | REV Group, Inc | | | 294 | |
| | 55,767 | | | | Rexel S.A. | | | 594 | |
| | 132,207 | | * | | Rexnord Corp | | | 3,034 | |
| | 33,171 | | | | Rheinmetall AG. | | | 2,942 | |
| | 12,200 | | | | Rheon Automatic Machinery Co Ltd | | | 153 | |
| | 33,933 | | | | Richelieu Hardware Ltd | | | 564 | |
| | 2,114 | | e | | Rieter Holding AG. | | | 277 | |
| | 410,410 | | | | Rockwell Automation, Inc | | | 61,759 | |
| | 55,512 | | | | Rockwool International AS (B Shares) | | | 14,517 | |
| | 1,685,677 | | | | Rolls-Royce Group plc | | | 17,759 | |
| | 78,427,378 | | *,m | | Rolls-Royce Holdings plc | | | 100 | |
| | 506,747 | | | | Roper Industries, Inc | | | 135,058 | |
| | 655,932 | | | | Rotork plc | | | 2,071 | |
| | 66,000 | | | | Run Long Construction Co Ltd | | | 117 | |
| | 11,369 | | | | Rush Enterprises, Inc | | | 405 | |
| | 312,900 | | | | Rush Enterprises, Inc (Class A) | | | 10,789 | |
| | 281,927 | | | | Russel Metals, Inc | | | 4,405 | |
| | 146,800 | | | | Ryobi Ltd | | | 3,490 | |
| | 50,054 | | e | | Saab AB (Class B) | | | 1,734 | |
| | 361,602 | | e | | Sacyr Vallehermoso S.A. | | | 721 | |
| | 95,596 | | * | | Sadbhav Engineering Ltd | | | 289 | |
| | 317,887 | | | | Safran S.A. | | | 38,126 | |
| | 157,506 | | | | Salfacorp S.A. | | | 225 | |
| | 140,599 | | * | | Samsung Engineering Co Ltd | | | 2,220 | |
| | 378,671 | | | | Samsung Heavy Industries Co Ltd | | | 2,520 | |
| | 53,498 | | * | | Samsung Techwin Co Ltd | | | 1,561 | |
| | 73,623 | | | | San Shing Fastech Corp | | | 129 | |
| | 1,712,661 | | | | Sandvik AB | | | 24,539 | |
| | 27,900 | | | | Sanki Engineering Co Ltd | | | 290 | |
| | 15,400 | | | | Sankyo Tateyama, Inc | | | 163 | |
| | 388,300 | | | | Sanwa Shutter Corp | | | 4,409 | |
| | 513,000 | | | | Sany Heavy Equipment International | | | 175 | |
| | 219,300 | | | | Sany Heavy Industry Co Ltd | | | 267 | |
| | 6,800 | | | | Sanyo Denki Co Ltd | | | 220 | |
| | 19,062 | | e | | Savaria Corp | | | 182 | |
| | 5,478 | | * | | Schaeffler India Ltd | | | 447 | |
| | 19,213 | | | | Schindler Holding AG. | | | 3,815 | |
| | 6,173 | | | | Schindler Holding AG. (Registered) | | | 1,200 | |
| | 2,221,817 | | | | Schneider Electric S.A. | | | 150,709 | |
| | 754 | | | | Schweiter Technologies AG. | | | 666 | |
| | 6,700 | | e | | SEC Carbon Ltd | | | 543 | |
| | 926,329 | | | | Seibu Holdings, Inc | | | 16,112 | |
| | 117,000 | | | | Sekisui Jushi Corp | | | 2,058 | |
| | 807,383 | | e | | SembCorp Industries Ltd | | | 1,504 | |
| | 637,700 | | e | | SembCorp Marine Ltd | | | 721 | |
| | 6,788 | | *,e | | Semperit AG. Holding | | | 77 | |
| | 307,467 | | | | Senior plc | | | 743 | |
COLLEGE RETIREMENT EQUITIES FUND -Stock Account
| SHARES | | | | COMPANY | | VALUE
(000) | |
| | 437,268 | | * | | Sensata Technologies Holding plc | | $ | 19,607 | |
| | 15,622 | | *,e | | Senvion S.A. | | | 39 | |
| | 107,120 | | | | Seven Network Ltd | | | 1,071 | |
| | 28,521 | | | | SFS Group AG. | | | 2,217 | |
| | 110,989 | | *,e | | SGL Carbon AG. | | | 774 | |
| | 150,108 | | * | | SGSB Group Co Ltd | | | 102 | |
| | 217,280 | | | | Shanghai Diesel Engine Co Ltd | | | 119 | |
| | 15,600 | | | | Shanghai Electric Group Co Ltd | | | 11 | |
| | 10,835,025 | | | | Shanghai Electric Group Co Ltd (Hong Kong) | | | 3,466 | |
| | 1,178,180 | | | | Shanghai Highly Group Co Ltd | | | 985 | |
| | 2,702,508 | | | | Shanghai Industrial Holdings Ltd | | | 5,464 | |
| | 97,800 | | | | Shanghai Tunnel Engineering Co Ltd | | | 89 | |
| | 89,940 | | | | Shapir Engineering and Industry Ltd | | | 277 | |
| | 8,600 | | | | Shibuya Kogyo Co Ltd | | | 276 | |
| | 273,682 | | * | | Shikun & Binui Ltd | | | 464 | |
| | 16,500 | | | | Shima Seiki Manufacturing Ltd | | | 480 | |
| | 272,618 | | | | Shimizu Corp | | | 2,218 | |
| | 93,000 | | | | Shin Zu Shing Co Ltd | | | 254 | |
| | 16,200 | | | | Shinko Electric Co Ltd | | | 196 | |
| | 63,200 | | | | Shinmaywa Industries Ltd | | | 771 | |
| | 103,300 | | | | Shinnihon Corp | | | 980 | |
| | 12,000 | | | | SHO-BOND Holdings Co Ltd | | | 890 | |
| | 4,884,000 | | * | | Shougang Concord International Enterprises Co Ltd | | | 123 | |
| | 898,500 | | | | Shun TAK Holdings Ltd | | | 282 | |
| | 960,097 | | | | Siemens AG. | | | 107,148 | |
| | 4,692,678 | | * | | Siemens Gamesa Renewable Energy | | | 57,135 | |
| | 6,968 | | | | SIF Holding NV | | | 93 | |
| | 354,501 | | | | SIG plc | | | 495 | |
| | 2,727,460 | | | | Sime Darby BHD | | | 1,584 | |
| | 65,825 | | | | Simpson Manufacturing Co, Inc | | | 3,563 | |
| | 4,202,000 | | | | Singamas Container Holdings Ltd | | | 561 | |
| | 2,011,956 | | | | Singapore Technologies Engineering Ltd | | | 5,158 | |
| | 13,400 | | | | Sinko Industries Ltd | | | 180 | |
| | 477,857 | | * | | Sino Thai Engineering & Construction PCL | | | 300 | |
| | 1,441,000 | | | | Sinopec Engineering Group Co Ltd | | | 1,183 | |
| | 735,500 | | e | | Sinotruk Hong Kong Ltd | | | 1,109 | |
| | 140,300 | | | | Sintokogio Ltd | | | 1,144 | |
| | 50,951 | | * | | SiteOne Landscape Supply, Inc | | | 2,816 | |
| | 30,921 | | | | SK C&C Co Ltd | | | 7,215 | |
| | 769,080 | | | | SK Networks Co Ltd | | | 3,582 | |
| | 67,084 | | e | | Skanska AB (B Shares) | | | 1,070 | |
| | 380,658 | | | | SKF AB (B Shares) | | | 5,785 | |
| | 2,493,700 | | | | SKP Resources BHD | | | 633 | |
| | 7,578 | | *,e | | SLM Solutions Group AG. | | | 78 | |
| | 198,880 | | | | SM Investments Corp | | | 3,470 | |
| | 26,817 | | | | SMC Corp | | | 8,074 | |
| | 77,711 | | | | Smiths Group plc | | | 1,353 | |
| | 136,037 | | | | Snap-On, Inc | | | 19,765 | |
| | 103,400 | | | | SNC-Lavalin Group, Inc | | | 3,478 | |
| | 28,600 | | | | Sodick Co Ltd | | | 179 | |
| | 6,877,200 | | | | Sojitz Holdings Corp | | | 23,814 | |
| | 35,069 | | * | | Solaria Energia y Medio Ambiente S.A. | | | 159 | |
| | 67,039 | | * | | Sparton Corp | | | 1,219 | |
| | 70,539 | | | | Spirax-Sarco Engineering plc | | | 5,615 | |
COLLEGE RETIREMENT EQUITIES FUND -Stock Account
| SHARES | | | | COMPANY | | VALUE
(000) | |
| | 32,040 | | | | Spirit Aerosystems Holdings, Inc (Class A) | | $ | 2,310 | |
| | 178,269 | | * | | SPX Corp | | | 4,993 | |
| | 366,276 | | * | | SPX FLOW, Inc | | | 11,142 | |
| | 15,369 | | | | Stabilus S.A. | | | 967 | |
| | 15,899 | | | | Standex International Corp | | | 1,068 | |
| | 625,505 | | | | Stanley Works | | | 74,898 | |
| | 35,300 | | e | | Star Micronics Co Ltd | | | 478 | |
| | 39,738 | | *,e | | Ste Industrielle d’Aviation Latecoere S.A. | | | 126 | |
| | 205,731 | | * | | Sterling Construction Co, Inc | | | 2,240 | |
| | 11,867 | | | | Sulzer AG. | | | 946 | |
| | 1,315,847 | | | | Sumitomo Corp | | | 18,670 | |
| | 13,600 | | | | Sumitomo Densetsu Co Ltd | | | 226 | |
| | 1,199,297 | | | | Sumitomo Heavy Industries Ltd | | | 35,561 | |
| | 1,378,740 | | | | Sumitomo Mitsui Construction C | | | 8,376 | |
| | 35,973 | | | | Sun Hydraulics Corp | | | 1,194 | |
| | 112,000 | | * | | Sunonwealth Electric Machine Industry Co Ltd | | | 136 | |
| | 123,491 | | *,e | | Sunrun, Inc | | | 1,345 | |
| | 1,681,822 | | | | Sunway Construction Group BHD | | | 541 | |
| | 2,444,500 | | *,†,e,m | | Superb Summit International Group Ltd | | | 31 | |
| | 64,400 | | | | Suzhou Gold Mantis Construction Decoration Co Ltd | | | 76 | |
| | 1,629,151 | | * | | Suzlon Energy Ltd | | | 126 | |
| | 61,419 | | | | Sweco AB (B Shares) | | | 1,368 | |
| | 63,300 | | | | Tadano Ltd | | | 573 | |
| | 350,920 | | | | Taeyoung Engineering & Construction | | | 3,564 | |
| | 16,100 | | | | Taihei Dengyo Kaisha Ltd | | | 359 | |
| | 14,800 | | | | Taikisha Ltd | | | 394 | |
| | 142,679 | | | | Taisei Corp | | | 6,111 | |
| | 639,670 | | * | | Taiwan Glass Industrial Corp | | | 269 | |
| | 192,093 | | | | Takamatsu Corp | | | 4,828 | |
| | 21,964 | | | | Takara Standard Co Ltd | | | 329 | |
| | 135,600 | | | | Takasago Thermal Engineering Co Ltd | | | 2,207 | |
| | 35,500 | | | | Takeuchi Manufacturing Co Ltd | | | 543 | |
| | 43,100 | | | | Takuma Co Ltd | | | 540 | |
| | 53,834 | | *,g | | Talgo S.A. | | | 330 | |
| | 20,957 | | e | | Tarkett S.A. | | | 421 | |
| | 24,800 | | | | Tatsuta Electric Wire and Cable Co Ltd | | | 108 | |
| | 98,900 | | | | TBEA Co Ltd | | | 98 | |
| | 1,186,000 | | | | Teco Electric and Machinery Co Ltd | | | 675 | |
| | 10,500 | | | | Teikoku Sen-I Co Ltd | | | 208 | |
| | 461,103 | | | | Tekfen Holding AS | | | 1,801 | |
| | 66,700 | | | | Tekken Corp | | | 1,547 | |
| | 67,181 | | * | | Teledyne Technologies, Inc | | | 13,911 | |
| | 21,778 | | | | Tennant Co | | | 1,135 | |
| | 4,535,772 | | a | | Terex Corp | | | 125,051 | |
| | 35,305 | | * | | Textainer Group Holdings Ltd | | | 352 | |
| | 2,166,955 | | | | Textron, Inc | | | 99,658 | |
| | 110,673 | | | | Thales S.A. | | | 12,933 | |
| | 36,180 | | | | Thermax Ltd | | | 580 | |
| | 187,032 | | * | | Thermon Group Holdings | | | 3,793 | |
| | 98,492 | | | | THK Co Ltd | | | 1,840 | |
| | 611,335 | | | | Thoresen Thai Agencies PCL | | | 98 | |
| | 28,058 | | | | Timken Co | | | 1,047 | |
| | 9,862 | | * | | Timken India Ltd | | | 82 | |
COLLEGE RETIREMENT EQUITIES FUND -Stock Account
| SHARES | | | | COMPANY | | VALUE
(000) | |
| | 308,092 | | | | Titan International, Inc | | $ | 1,436 | |
| | 124,786 | | * | | Titan Machinery, Inc | | | 1,641 | |
| | 642,000 | | | | TK Group Holdings Ltd | | | 348 | |
| | 31,876 | | | | TKH Group NV | | | 1,482 | |
| | 8,400 | | e | | Toa Corp/Tokyo | | | 101 | |
| | 42,000 | | | | Tocalo Co Ltd | | | 322 | |
| | 165,900 | | | | Toda Corp | | | 1,034 | |
| | 14,700 | | | | Toenec Corp | | | 386 | |
| | 169,900 | | | | Tokai Corp | | | 1,347 | |
| | 723,160 | | | | Tokyu Construction Co Ltd | | | 6,534 | |
| | 36,341 | | | | Toro Co | | | 2,031 | |
| | 72,993 | | | | Toromont Industries Ltd | | | 2,901 | |
| | 256,044 | | * | | Toshiba Corp | | | 7,230 | |
| | 13,392 | | | | Toshiba Machine Co Ltd | | | 238 | |
| | 31,600 | | | | Toshiba Plant Systems & Services Corp | | | 582 | |
| | 15,500 | | | | Totetsu Kogyo Co Ltd | | | 429 | |
| | 21,996 | | | | Toto Ltd | | | 761 | |
| | 467,800 | | | | Toyo Construction Co Ltd | | | 1,609 | |
| | 15,299 | | *,e | | Toyo Engineering Corp | | | 89 | |
| | 6,200 | | | | Toyo Tanso Co Ltd | | | 123 | |
| | 291,636 | | | | Toyota Tsusho Corp | | | 8,569 | |
| | 20,708 | | * | | TPI Composites, Inc | | | 509 | |
| | 3,154,581 | | | | Trakya Cam Sanayi AS | | | 1,805 | |
| | 162,302 | | * | | TransDigm Group, Inc | | | 55,192 | |
| | 2,089,901 | | | | Travis Perkins plc | | | 28,492 | |
| | 175,393 | | | | Trelleborg AB (B Shares) | | | 2,763 | |
| | 110,805 | | | | Trencor Ltd | | | 220 | |
| | 75,304 | | * | | Trex Co, Inc | | | 4,470 | |
| | 94,283 | | * | | Trimas Corp | | | 2,573 | |
| | 67,792 | | | | Trinity Industries, Inc | | | 1,396 | |
| | 129,373 | | | | Triton International Ltd | | | 4,020 | |
| | 716,103 | | | | Triumph Group, Inc | | | 8,235 | |
| | 8,456 | | | | Troax Group AB | | | 243 | |
| | 25,800 | | | | Trusco Nakayama Corp | | | 680 | |
| | 25,600 | | e | | Tsubaki Nakashima Co Ltd | | | 377 | |
| | 79,800 | | | | Tsubakimoto Chain Co | | | 2,610 | |
| | 59,100 | | | | Tsugami Corp | | | 343 | |
| | 14,700 | | | | Tsukishima Kikai Co Ltd | | | 170 | |
| | 10,000 | | | | Tsurumi Manufacturing Co Ltd | | | 175 | |
| | 6,498,365 | | | | Turk Sise ve Cam Fabrikalari AS | | | 6,959 | |
| | 9,945 | | | | Turk Traktor ve Ziraat Makineleri AS | | | 66 | |
| | 47,451 | | * | | Tutor Perini Corp | | | 758 | |
| | 25,051 | | * | | Twin Disc, Inc | | | 370 | |
| | 371,300 | | | | UEM Edgenta BHD | | | 245 | |
| | 45,465 | | e | | Ultra Electronics Holdings | | | 753 | |
| | 5,000 | | | | Union Tool Co | | | 133 | |
| | 370,300 | | | | Unique Engineering & Construction PCL | | | 109 | |
| | 240,200 | | | | United Engineers Ltd | | | 446 | |
| | 496,800 | | | | United Integrated Services Co Ltd | | | 1,450 | |
| | 416,038 | | * | | United Rentals, Inc | | | 42,656 | |
| | 515,507 | | | | United Technologies Corp | | | 54,891 | |
| | 187,196 | | *,e | | Univar, Inc | | | 3,321 | |
| | 290,207 | | | | Universal Forest Products, Inc | | | 7,534 | |
| | 35,182 | | | | Uponor Oyj | | | 348 | |
COLLEGE RETIREMENT EQUITIES FUND -Stock Account
| SHARES | | | | COMPANY | | VALUE
(000) | |
| | 48,057 | | | | USG Corp | | $ | 2,050 | |
| | 407,300 | | | | Ushio, Inc | | | 4,315 | |
| | 355,999 | | | | Valmet Corp | | | 7,333 | |
| | 43,885 | | | | Valmont Industries, Inc | | | 4,869 | |
| | 9,009 | | * | | Varta AG. | | | 257 | |
| | 16,813 | | g | | VAT Group AG. | | | 1,480 | |
| | 142,257 | | * | | Vectrus, Inc | | | 3,070 | |
| | 134,411 | | | | Veidekke ASA | | | 1,505 | |
| | 15,422 | | * | | Veritiv Corp | | | 385 | |
| | 58,849 | | | | Vestas Wind Systems AS | | | 4,455 | |
| | 141,022 | | | | Vesuvius plc | | | 910 | |
| | 57,042 | | | | V-Guard Industries Ltd | | | 186 | |
| | 22,357 | | * | | Vicor Corp | | | 845 | |
| | 1,092,413 | | | | Vinci S.A. | | | 89,831 | |
| | 59,977 | | *,e | | Vivint Solar, Inc | | | 229 | |
| | 58,470 | | * | | Voltas Ltd | | | 463 | |
| | 36,995 | | | | Voltronic Power Technology Corp | | | 646 | |
| | 1,620,831 | | | | Volvo AB (B Shares) | | | 21,223 | |
| | 5,236 | | | | Vossloh AG. | | | 255 | |
| | 573,070 | | | | W.W. Grainger, Inc | | | 161,812 | |
| | 84,391 | | | | Wabash National Corp | | | 1,104 | |
| | 102,009 | | * | | WABCO Holdings, Inc | | | 10,950 | |
| | 34,068 | | e | | Wabtec Corp | | | 2,393 | |
| | 44,914 | | | | Wacker Construction Equipment AG. | | | 848 | |
| | 61,422 | | | | Wajax Income Fund | | | 746 | |
| | 22,100 | | | | Wakita & Co Ltd | | | 225 | |
| | 12,669,000 | | | | Walsin Lihwa Corp | | | 6,921 | |
| | 159,073 | | | | Wartsila Oyj (B Shares) | | | 2,539 | |
| | 7,238 | | | | Washtec AG. | | | 501 | |
| | 57,964 | | | | Watsco, Inc | | | 8,065 | |
| | 121,095 | | | | Watts Water Technologies, Inc (Class A) | | | 7,814 | |
| | 654,761 | | | | WCT Berhad | | | 107 | |
| | 695,533 | | | | Weg S.A. | | | 3,145 | |
| | 2,643,284 | | | | Weichai Power Co Ltd | | | 3,026 | |
| | 205,300 | | | | Weichai Power Co Ltd (Class A) | | | 231 | |
| | 1,385,027 | | | | Weir Group plc | | | 22,935 | |
| | 5,847,867 | | * | | Welbilt, Inc | | | 64,970 | |
| | 71,977 | | * | | Wesco Aircraft Holdings, Inc | | | 569 | |
| | 623,407 | | * | | WESCO International, Inc | | | 29,924 | |
| | 3,469 | | * | | Willis Lease Finance Corp | | | 120 | |
| | 50,025 | | * | | Willscot Corp | | | 471 | |
| | 147,536 | | | | Wilson Bayly Holmes-Ovcon Ltd | | | 1,356 | |
| | 68,320 | | | | Woodward Governor Co | | | 5,075 | |
| | 77,573 | | | | WSP Global, Inc | | | 3,334 | |
| | 312,200 | | | | XCMG Construction Machinery Co Ltd | | | 147 | |
| | 64,100 | | | | Xiamen C & D, Inc | | | 66 | |
| | 67,900 | | | | Xinjiang Goldwind Science & Technology Co Ltd | | | 99 | |
| | 767,000 | | | | Xinjiang Goldwind Science & Technology Co Ltd (Hong Kong) | | | 678 | |
| | 89,112 | | | | Xxentria Technology Materials Corp | | | 194 | |
| | 61,785 | | | | Xylem, Inc | | | 4,122 | |
| | 10,071 | | | | Y G-1 Co Ltd | | | 84 | |
| | 77,700 | | | | Yahagi Construction Co Ltd | | | 496 | |
COLLEGE RETIREMENT EQUITIES FUND -Stock Account
| SHARES | | | | COMPANY | | VALUE
(000) | |
| | 158,500 | | | | YAMABIKO Corp | | $ | 1,469 | |
| | 19,200 | | e | | Yamashin-Filter Corp | | | 110 | |
| | 42,600 | | | | Yamazen Corp | | | 399 | |
| | 6,543,818 | | | | Yangzijiang Shipbuilding | | | 6,013 | |
| | 64,454 | | | | Yazicilar Holding AS | | | 125 | |
| | 102,486 | | e | | YIT Oyj | | | 600 | |
| | 23,000 | | | | Yokogawa Bridge Holdings Corp | | | 342 | |
| | 51,300 | | | | Yuasa Trading Co Ltd | | | 1,466 | |
| | 260,000 | | | | Yungtay Engineering Co Ltd | | | 500 | |
| | 85,900 | | | | Yurtec Corp | | | 667 | |
| | 12,100 | | | | Yushin Precision Equipment Co Ltd | | | 93 | |
| | 27,047 | | * | | Yuyang DNU Co Ltd | | | 177 | |
| | 124,412 | | | | Zardoya Otis S.A. | | | 885 | |
| | 6,926 | | | | Zehnder Group AG. | | | 236 | |
| | 63,000 | | | | Zhejiang Chint Electrics Co Ltd | | | 223 | |
| | 805,400 | | | | Zhengzhou Coal Mining Machinery Group Co Ltd | | | 382 | |
| | 18,500 | | | | Zhengzhou Yutong Bus Co Ltd | | | 32 | |
| | 540,541 | | | | Zhuzhou CSR Times Electric Co Ltd | | | 3,001 | |
| | 273,600 | | | | Zoomlion Heavy Industry Science and Technology Co Ltd | | | 142 | |
| | 17,794 | | *,e | | Zumtobel AG. | | | 145 | |
| | | | | | TOTAL CAPITAL GOODS | | | 7,615,077 | |
| | | | | | | | | | |
| COMMERCIAL & PROFESSIONAL SERVICES - 1.2% | | | | |
| | 27,800 | | * | | 51job, Inc (ADR) | | | 1,736 | |
| | 122,205 | | | | ABM Industries, Inc | | | 3,924 | |
| | 208,258 | | * | | Acacia Research (Acacia Technologies) | | | 621 | |
| | 262,177 | | | | ACCO Brands Corp | | | 1,778 | |
| | 215,549 | | | | Adecco S.A. | | | 10,131 | |
| | 316,085 | | e | | ADT, Inc | | | 1,900 | |
| | 318,206 | | * | | Advanced Disposal Services, Inc | | | 7,618 | |
| | 13,900 | | | | Aeon Delight Co Ltd | | | 464 | |
| | 114,932 | | e | | AF AB | | | 2,069 | |
| | 163,446 | | e | | Aggreko plc | | | 1,524 | |
| | 7,073 | | | | Akka Technologies S.A. | | | 358 | |
| | 1,981,607 | | | | ALS Ltd | | | 9,468 | |
| | 11,700 | | | | Altech Corp | | | 178 | |
| | 14,885 | | | | Amadeus Fire AG | | | 1,392 | |
| | 48,427 | | | | American Banknote S.A. | | | 225 | |
| | 100,888 | | | | Applus Services S.A. | | | 1,119 | |
| | 5,557 | | | | Assystem | | | 172 | |
| | 1,285,446 | | | | Babcock International Group | | | 8,018 | |
| | 8,965 | | | | Barrett Business Services, Inc | | | 513 | |
| | 7,900 | | e | | BayCurrent Consulting, Inc | | | 165 | |
| | 19,800 | | | | Bell System24 Holdings, Inc | | | 232 | |
| | 18,500 | | e | | Benefit One, Inc | | | 569 | |
| | 3,790 | | | | Bertrandt AG. | | | 298 | |
| | 9,826 | | | | BG Staffing, Inc | | | 203 | |
| | 149,105 | | g | | Biffa plc | | | 372 | |
| | 19,579 | | | | Bilfinger Berger AG. | | | 572 | |
| | 304,269 | | e | | Bingo Industries Ltd | | | 398 | |
| | 303,297 | | * | | Blue Label Telecoms Ltd | | | 115 | |
| | 238,415 | | | | Brady Corp (Class A) | | | 10,362 | |
| | 1,135,233 | | | | Brambles Ltd | | | 8,122 | |
COLLEGE RETIREMENT EQUITIES FUND -Stock Account
| SHARES | | | | COMPANY | | VALUE
(000) | |
| | 481,772 | | g | | Bravida Holding AB | | $ | 3,341 | |
| | 33,527 | | * | | BrightView Holdings, Inc | | | 342 | |
| | 68,838 | | | | Brink’s Co | | | 4,450 | |
| | 12,050 | | e | | Brunel International NV | | | 151 | |
| | 243,381 | | | | Bureau Veritas S.A. | | | 4,959 | |
| | 1,061,200 | | | | Capita Group plc | | | 1,521 | |
| | 3,782,000 | | *,e | | Capital Environment Holdings Ltd | | | 83 | |
| | 125,397 | | * | | Casella Waste Systems, Inc (Class A) | | | 3,573 | |
| | 59,153 | | *,e | | Caverion Corp | | | 346 | |
| | 271,290 | | * | | CBIZ, Inc | | | 5,344 | |
| | 71,619 | | * | | Ceco Environmental Corp | | | 483 | |
| | 4,200 | | | | Central Security Patrols Co Ltd | | | 188 | |
| | 3,955 | | | | Cewe Color Holding AG. | | | 281 | |
| | 10,025 | | * | | Charah Solutions, Inc | | | 84 | |
| | 3,108,451 | | | | China Everbright International Ltd | | | 2,786 | |
| | 239,002 | | * | | Cimpress NV | | | 24,718 | |
| | 143,708 | | | | Cintas Corp | | | 24,142 | |
| | 132,308 | | * | | Clean Harbors, Inc | | | 6,529 | |
| | 71,000 | | | | Cleanaway Co Ltd | | | 384 | |
| | 5,478,760 | | | | Cleanaway Waste Management Ltd | | | 6,425 | |
| | 2,132 | | | | Compx International, Inc | | | 29 | |
| | 332,469 | | * | | Copart, Inc | | | 15,885 | |
| | 71,466 | | * | | CoStar Group, Inc | | | 24,108 | |
| | 5,206,000 | | * | | Country Garden Services Holdings Co Ltd | | | 8,242 | |
| | 149,677 | | | | Covanta Holding Corp | | | 2,009 | |
| | 40,618 | | | | CRA International, Inc | | | 1,728 | |
| | 67,105 | | | | Dai Nippon Printing Co Ltd | | | 1,401 | |
| | 23,900 | | | | Daiseki Co Ltd | | | 494 | |
| | 255,800 | | | | De La Rue plc | | | 1,380 | |
| | 133,337 | | | | Deluxe Corp | | | 5,125 | |
| | 75,020 | | | | Derichebourg | | | 343 | |
| | 756,091 | | | | Downer EDI Ltd | | | 3,602 | |
| | 87,410 | | | | Dun & Bradstreet Corp | | | 12,477 | |
| | 26,898 | | | | Duskin Co Ltd | | | 588 | |
| | 272,000 | | *,e | | Dynagreen Environmental Protection Group Co Ltd | | | 111 | |
| | 1,361,552 | | | | Edenred | | | 50,145 | |
| | 27,021 | | e | | Elanders AB | | | 265 | |
| | 123,130 | | | | Elis S.A. | | | 2,053 | |
| | 48,500 | | | | en-japan, Inc | | | 1,501 | |
| | 32,749 | | | | Ennis, Inc | | | 630 | |
| | 217,662 | | | | Equifax, Inc | | | 20,271 | |
| | 49,660 | | | | Essendant, Inc | | | 625 | |
| | 2,575,500 | | | | Experian Group Ltd | | | 62,435 | |
| | 84,649 | | | | Exponent, Inc | | | 4,293 | |
| | 12,431 | | e | | Fila S.p.A | | | 192 | |
| | 13,053 | | | | Forrester Research, Inc | | | 583 | |
| | 12,785 | | * | | Franklin Covey Co | | | 286 | |
| | 48,064 | | * | | FTI Consulting, Inc | | | 3,203 | |
| | 55,400 | | | | Fullcast Co Ltd | | | 904 | |
| | 23,550 | | | | Funai Soken Holdings, Inc | | | 352 | |
| | 4,642 | | | | GL Events | | | 92 | |
| | 16,665 | | * | | GP Strategies Corp | | | 210 | |
| | 1,486,000 | | | | Greentown Service Group Co Ltd | | | 1,138 | |
COLLEGE RETIREMENT EQUITIES FUND -Stock Account
| SHARES | | | | COMPANY | | VALUE
(000) | |
| | 1,473,068 | | | | Group 4 Securicor plc | | $ | 3,718 | |
| | 7,895 | | | | Groupe CRIT | | | 479 | |
| | 3,858,036 | | | | Hays plc | | | 6,887 | |
| | 93,801 | | e | | Healthcare Services Group | | | 3,769 | |
| | 233,173 | | | | Heidrick & Struggles International, Inc | | | 7,273 | |
| | 74,615 | | * | | Heritage-Crystal Clean, Inc | | | 1,717 | |
| | 98,540 | | | | Herman Miller, Inc | | | 2,981 | |
| | 21,871 | | | | HLB Life Science CO Ltd | | | 337 | |
| | 55,048 | | | | HNI Corp | | | 1,950 | |
| | 606,300 | | | | HomeServe plc | | | 6,697 | |
| | 27,883 | | * | | Huron Consulting Group, Inc | | | 1,431 | |
| | 31,211 | | | | ICF International, Inc | | | 2,022 | |
| | 887,953 | | * | | IHS Markit Ltd | | | 42,595 | |
| | 4,477 | | * | | Indiabulls Wholesale Service | | | 24 | |
| | 57,758 | | * | | Innerworkings, Inc | | | 216 | |
| | 198,716 | | | | Insperity, Inc | | | 18,552 | |
| | 268,803 | | | | Interface, Inc | | | 3,830 | |
| | 205,859 | | | | Intertek Group plc | | | 12,599 | |
| | 48,708 | | g | | Intertrust NV | | | 818 | |
| | 49,496 | | e | | Intrum Justitia AB | | | 1,150 | |
| | 123,280 | | | | IPH Ltd | | | 470 | |
| | 63,000 | | e | | IR Japan Holdings Ltd | | | 687 | |
| | 149,428 | | | | ISS A.S. | | | 4,184 | |
| | 23,700 | | | | Itoki Corp | | | 129 | |
| | 428,976 | | | | IWG plc | | | 1,141 | |
| | 8,400 | | | | JAC Recruitment Co Ltd | | | 143 | |
| | 12,500 | | e | | Japan Elevator Service Holdings Co Ltd | | | 186 | |
| | 248,505 | | | | KAR Auction Services, Inc | | | 11,859 | |
| | 20,000 | | | | KD Holding Corp | | | 112 | |
| | 82,097 | | | | Kelly Services, Inc (Class A) | | | 1,681 | |
| | 14,296 | | | | KEPCO Plant Service & Engineering Co Ltd | | | 425 | |
| | 180,766 | | | | Kforce, Inc | | | 5,589 | |
| | 213,706 | | | | Kimball International, Inc (Class B) | | | 3,032 | |
| | 127,029 | | | | Knoll, Inc | | | 2,093 | |
| | 210,000 | | | | Kokuyo Co Ltd | | | 3,067 | |
| | 185,230 | | | | Korn/Ferry International | | | 7,324 | |
| | 19,900 | | | | Link And Motivation, Inc | | | 153 | |
| | 192,160 | | | | Loomis AB | | | 6,194 | |
| | 43,708 | | | | LSC Communications, Inc | | | 306 | |
| | 171,348 | | | | Manpower, Inc | | | 11,103 | |
| | 31,862 | | | | Matsuda Sangyo Co Ltd | | | 422 | |
| | 57,090 | | | | Matthews International Corp (Class A) | | | 2,319 | |
| | 105,256 | | | | McGrath RentCorp | | | 5,419 | |
| | 46,022 | | | | McMillan Shakespeare Ltd | | | 451 | |
| | 18,700 | | | | Meitec Corp | | | 759 | |
| | 1,790,134 | | | | Michael Page International plc | | | 10,283 | |
| | 166,465 | | * | | Mistras Group, Inc | | | 2,394 | |
| | 1,082,969 | | e | | Mitie Group | | | 1,527 | |
| | 23,144 | | | | Mitsubishi Pencil Co Ltd | | | 458 | |
| | 96,975 | | | | Mobile Mini, Inc | | | 3,079 | |
| | 40,221 | | e | | Morneau Sobeco Income Fund | | | 738 | |
| | 25,700 | | | | Moshi Moshi Hotline, Inc | | | 210 | |
| | 43,349 | | | | MSA Safety, Inc | | | 4,087 | |
| | 18,153 | | | | Multi-Color Corp | | | 637 | |
COLLEGE RETIREMENT EQUITIES FUND -Stock Account
| SHARES | | | | COMPANY | | VALUE
(000) | |
| | 53,173 | | | | Navigant Consulting, Inc | | $ | 1,279 | |
| | 20,934 | | | | NICE Information Service Co Ltd | | | 205 | |
| | 6,800 | | | | Nichiban Co Ltd | | | 117 | |
| | 621,104 | | | | Nielsen NV | | | 14,490 | |
| | 88,600 | | | | Nihon M&A Center, Inc | | | 1,783 | |
| | 11,400 | | | | Nippon Kanzai Co Ltd | | | 198 | |
| | 121,300 | | | | Nippon Parking Development Co Ltd | | | 157 | |
| | 10,872 | | * | | NL Industries, Inc | | | 38 | |
| | 25,000 | | | | Nomura Co Ltd | | | 573 | |
| | 129,000 | | | | Okamura Corp | | | 1,665 | |
| | 92,554 | | * | | On Assignment, Inc | | | 5,044 | |
| | 68,400 | | e | | Outsourcing, Inc | | | 654 | |
| | 14,668 | | | | Oyo Corp | | | 149 | |
| | 81,900 | | | | Park24 Co Ltd | | | 1,804 | |
| | 10,500 | | | | Pasona Group, Inc | | | 107 | |
| | 37,100 | | | | Pilot Corp | | | 1,794 | |
| | 237,814 | | | | Pitney Bowes, Inc | | | 1,405 | |
| | 31,200 | | | | Prestige International, Inc | | | 338 | |
| | 176,556 | | | | Prosegur Cia de Seguridad S.A. | | | 894 | |
| | 85,775 | | e | | Quad Graphics, Inc | | | 1,057 | |
| | 45,643 | | *,g | | Quess Corp Ltd | | | 432 | |
| | 103,400 | | *,e | | Raksul, Inc | | | 2,242 | |
| | 117,399 | | | | Randstad Holdings NV | | | 5,383 | |
| | 286,000 | | *,e | | Realord Group Holdings Ltd | | | 184 | |
| | 1,636,378 | | | | Recruit Holdings Co Ltd | | | 39,533 | |
| | 2,029,519 | | | | RELX plc | | | 41,758 | |
| | 1,565,810 | | | | RELX plc (London) | | | 32,288 | |
| | 2,256,928 | | | | Rentokil Initial plc | | | 9,709 | |
| | 622,666 | | | | Republic Services, Inc | | | 44,888 | |
| | 46,067 | | | | Resources Connection, Inc | | | 654 | |
| | 70,316 | | | | Restore plc | | | 290 | |
| | 82,609 | | | | Ritchie Bros Auctioneers, Inc | | | 2,702 | |
| | 384,410 | | | | Robert Half International, Inc | | | 21,988 | |
| | 285,778 | | | | Rollins, Inc | | | 10,317 | |
| | 146,311 | | | | RPS Group plc | | | 254 | |
| | 104,038 | | | | RR Donnelley & Sons Co | | | 412 | |
| | 110,639 | | e | | RWS Holdings plc | | | 676 | |
| | 17,242 | | | | S1 Corp (Korea) | | | 1,549 | |
| | 17,052 | | | | Sato Corp | | | 405 | |
| | 175,710 | | | | Secom Co Ltd | | | 14,575 | |
| | 306,814 | | | | Securitas AB (B Shares) | | | 4,943 | |
| | 578,210 | | | | Seek Ltd | | | 6,898 | |
| | 696,324 | | * | | Serco Group plc | | | 848 | |
| | 237,054 | | | | SG Fleet Group Ltd | | | 510 | |
| | 6,237 | | | | SGS S.A. | | | 14,040 | |
| | 100,500 | | *,†,m | | Shanghai Youngsun Investment C | | | 80 | |
| | 521,304 | | | | Shanks Group plc | | | 219 | |
| | 197,886 | | | | SmartGroup Corp Ltd | | | 1,239 | |
| | 41,200 | | | | SMS Co Ltd | | | 652 | |
| | 27,578 | | | | Societe BIC S.A. | | | 2,817 | |
| | 49,100 | | | | Sohgo Security Services Co Ltd | | | 2,294 | |
| | 113,909 | | * | | SP Plus Corp | | | 3,365 | |
| | 75,240 | | e | | SPIE S.A. | | | 999 | |
COLLEGE RETIREMENT EQUITIES FUND -Stock Account
| SHARES | | | | COMPANY | | VALUE
(000) | |
| | 43,743 | | | | Sporton International, Inc | | $ | 202 | |
| | 21,699 | | | | Staffline Group plc | | | 343 | |
| | 70,820 | | e | | Stantec, Inc | | | 1,552 | |
| | 108,093 | | | | Steelcase, Inc (Class A) | | | 1,603 | |
| | 173,366 | | * | | Stericycle, Inc | | | 6,361 | |
| | 51,000 | | | | Sunny Friend Environmental Technology Co Ltd | | | 336 | |
| | 4,765 | | | | Synergie S.A | | | 133 | |
| | 79,526 | | | | Systemax, Inc | | | 1,900 | |
| | 173,660 | | | | Taiwan Secom Co Ltd | | | 499 | |
| | 285,020 | | | | Taiwan-Sogo Shinkong Security Corp | | | 356 | |
| | 90,000 | | e | | Takeei Corp | | | 520 | |
| | 20,200 | | | | Tanseisha Co Ltd | | | 199 | |
| | 38,393 | | *,e | | Team, Inc | | | 562 | |
| | 11,385 | | * | | TeamLease Services Ltd | | | 467 | |
| | 51,200 | | | | TechnoPro Holdings, Inc | | | 2,103 | |
| | 115,084 | | | | Teleperformance | | | 18,410 | |
| | 172,034 | | | | Temp Holdings Co Ltd | | | 2,552 | |
| | 151,128 | | | | Tetra Tech, Inc | | | 7,824 | |
| | 263,304 | | | | Thomson Reuters Corp | | | 12,716 | |
| | 148,301 | | | | Tomra Systems ASA | | | 3,340 | |
| | 30,400 | | | | Toppan Forms Co Ltd | | | 239 | |
| | 252,334 | | | | Toppan Printing Co Ltd | | | 3,709 | |
| | 11,600 | | e | | Tosho Printing Co Ltd | | | 72 | |
| | 99,297 | | | | Transcontinental, Inc | | | 1,404 | |
| | 390,366 | | | | TransUnion | | | 22,173 | |
| | 97,902 | | * | | TriNet Group, Inc | | | 4,107 | |
| | 50,487 | | * | | TrueBlue, Inc | | | 1,123 | |
| | 15,100 | | | | Trust Tech, Inc | | | 378 | |
| | 33,300 | | | | Tus-Sound Environmental Resources Co Ltd | | | 51 | |
| | 73,288 | | | | Unifirst Corp | | | 10,485 | |
| | 16,000 | | * | | United Technology Holdings Co Ltd | | | 275 | |
| | 15,611 | | *,e | | Upwork, Inc | | | 283 | |
| | 27,820 | | | | US Ecology, Inc | | | 1,752 | |
| | 517,482 | | * | | Verisk Analytics, Inc | | | 56,426 | |
| | 24,640 | | | | Viad Corp | | | 1,234 | |
| | 12,088 | | | | VSE Corp | | | 362 | |
| | 50,308 | | * | | WageWorks, Inc | | | 1,366 | |
| | 433,000 | | | | Waste Connections, Inc | | | 32,150 | |
| | 1,471,151 | | | | Waste Management, Inc | | | 130,918 | |
| | 6,000 | | | | WDB Holdings Co Ltd | | | 130 | |
| | 10,547 | | * | | Willdan Group, Inc | | | 369 | |
| | 253,626 | | | | Wolters Kluwer NV | | | 14,915 | |
| | 10,000 | | | | World Holdings Co Ltd | | | 195 | |
| | 7,100 | | | | YAMADA Consulting Group Co Ltd | | | 108 | |
| | 26,800 | | | | Yumeshin Holdings Co Ltd | | | 193 | |
| | | | | | TOTAL COMMERCIAL & PROFESSIONAL SERVICES | | | 1,252,441 | |
| | | | | | | | | | |
| CONSUMER DURABLES & APPAREL - 1.9% | | | | |
| | 560,000 | | | | 361 Degrees International Ltd | | | 116 | |
| | 13,820 | | | | Accell Group | | | 298 | |
| | 51,505 | | | | Acushnet Holdings Corp | | | 1,085 | |
| | 262,654 | | | | Adidas-Salomon AG. | | | 54,892 | |
| | 59,837 | | | | Aksa Akrilik Kimya Sanayii | | | 84 | |
| | 105,000 | | | | Alpargatas S.A. | | | 461 | |
COLLEGE RETIREMENT EQUITIES FUND -Stock Account
| SHARES | | | | COMPANY | | VALUE
(000) | |
| | 307,700 | | | | Alpine Electronics, Inc | | $ | 6,245 | |
| | 399,446 | | | | Amer Sports Oyj (A Shares) | | | 17,561 | |
| | 88,607 | | * | | American Outdoor Brands Corp | | | 1,139 | |
| | 534,157 | | * | | AmTRAN Technology Co Ltd | | | 196 | |
| | 2,774,235 | | | | Anta Sports Products Ltd | | | 13,281 | |
| | 7,976 | | | | Aquafil S.p.A | | | 82 | |
| | 169,979 | | | | Arcelik AS | | | 506 | |
| | 38,900 | | | | Arezzo Industria e Comercio S.A. | | | 552 | |
| | 36,708 | | * | | Aritzia, Inc | | | 441 | |
| | 80,003 | | * | | Arvind Ltd | | | 112 | |
| | 113,837 | | e | | Asics Corp | | | 1,446 | |
| | 70,683 | | * | | Bajaj Electricals Ltd | | | 510 | |
| | 24,672 | | * | | Bang & Olufsen AS (B Shares) | | | 338 | |
| | 971,751 | | | | Barratt Developments plc | | | 5,732 | |
| | 22,384 | | | | Bassett Furniture Industries, Inc | | | 449 | |
| | 18,203 | | | | Bata India Ltd | | | 296 | |
| | 42,715 | | * | | Beazer Homes USA, Inc | | | 405 | |
| | 321,751 | | | | Bellway plc | | | 10,323 | |
| | 61,105 | | | | Beneteau S.A. | | | 804 | |
| | 141,067 | | | | Berkeley Group Holdings plc | | | 6,257 | |
| | 254,000 | | e | | Best Pacific International Holdings Ltd | | | 64 | |
| | 200,500 | | g | | Bestway Global Holding, Inc | | | 87 | |
| | 186,974 | | | | Bonava AB | | | 2,408 | |
| | 15,666,000 | | | | Bosideng International Holdings Ltd | | | 2,961 | |
| | 92,831 | | | | Bovis Homes Group plc | | | 1,019 | |
| | 59,984 | | | | Breville Group Ltd | | | 451 | |
| | 296,296 | | e | | BRP, Inc | | | 7,686 | |
| | 604,714 | | | | BRP, Inc (Toronto) | | | 15,654 | |
| | 25,395 | | | | Brunello Cucinelli S.p.A | | | 876 | |
| | 43,997 | | | | Brunswick Corp | | | 2,044 | |
| | 307,377 | | | | Burberry Group plc | | | 6,750 | |
| | 1,887,573 | | * | | Cairn Homes plc | | | 2,331 | |
| | 5,552,409 | | * | | Cairn Homes plc (London) | | | 6,807 | |
| | 472,155 | | | | Callaway Golf Co | | | 7,224 | |
| | 51,899 | | *,e | | Canada Goose Holdings, Inc | | | 2,269 | |
| | 85,624 | | | | Carter’s, Inc | | | 6,989 | |
| | 26,115 | | e | | Casio Computer Co Ltd | | | 310 | |
| | 32,065 | | * | | Cavco Industries, Inc | | | 4,181 | |
| | 14,417 | | | | CCC S.A. | | | 748 | |
| | 34,983 | | * | | Century Communities, Inc | | | 604 | |
| | 10,493 | | | | Chargeurs S.A. | | | 202 | |
| | 2,608,400 | | | | China Dongxiang Group Co | | | 399 | |
| | 900,000 | | | | China Lilang Ltd | | | 756 | |
| | 11,600 | | | | Chofu Seisakusho Co Ltd | | | 221 | |
| | 336 | | | | Christian Dior S.A. | | | 129 | |
| | 441,600 | | | | Cia Hering | | | 3,328 | |
| | 604,730 | | | | Cie Financiere Richemont S.A. | | | 38,998 | |
| | 810,000 | | | | Citychamp Watch & Jewellery Group Ltd | | | 169 | |
| | 13,600 | | | | Clarion Co Ltd | | | 308 | |
| | 34,023 | | | | Clarus Corp | | | 344 | |
| | 8,000 | | | | Cleanup Corp | | | 47 | |
| | 901,491 | | | | Coats Group plc | | | 936 | |
| | 88,641 | | | | Columbia Sportswear Co | | | 7,454 | |
COLLEGE RETIREMENT EQUITIES FUND -Stock Account
| SHARES | | | | COMPANY | | VALUE
(000) | |
| | 1,462,700 | | e | | Consorcio ARA, S.A. de C.V. | | $ | 379 | |
| | 7,600 | | | | Corona Corp | | | 74 | |
| | 394,000 | | e,g | | Cosmo Lady China Holdings Co Ltd | | | 139 | |
| | 780,492 | | g | | Countryside Properties plc | | | 3,028 | |
| | 163,138 | | | | Crest Nicholson Holdings plc | | | 683 | |
| | 235,061 | | * | | CROCS, Inc | | | 6,107 | |
| | 222,047 | | * | | Crompton Greaves Consumer Electricals Ltd | | | 725 | |
| | 358,500 | | g | | Crystal International Group Ltd | | | 182 | |
| | 11,936 | | | | Cuckoo Electronics Co Ltd | | | 1,268 | |
| | 15,420 | | | | Culp, Inc | | | 291 | |
| | 2,173,800 | | | | Cyrela Brazil Realty S.A. | | | 8,666 | |
| | 180,058 | | * | | Deckers Outdoor Corp | | | 23,038 | |
| | 96,224 | | | | De’Longhi S.p.A. | | | 2,438 | |
| | 4,939 | | | | Delta-Galil Industries Ltd | | | 122 | |
| | 21,990 | | e | | Descente Ltd | | | 360 | |
| | 160,893 | | | | DFS Furniture plc | | | 373 | |
| | 16,858 | | | | Dorel Industries, Inc (Class B) | | | 218 | |
| | 723,971 | | | | DR Horton, Inc | | | 25,093 | |
| | 202,413 | | | | Eclat Textile Co Ltd | | | 2,289 | |
| | 1,185,609 | | | | Electrolux AB (Series B) | | | 24,991 | |
| | 13,618 | | | | Escalade, Inc | | | 156 | |
| | 17,300 | | e | | ES-Con Japan Ltd | | | 102 | |
| | 241,518 | | e | | Essilor International S.A. | | | 30,614 | |
| | 30,313 | | | | Ethan Allen Interiors, Inc | | | 533 | |
| | 125,135 | | | | Ez Tec Empreendimentos e Participacoes S.A. | | | 807 | |
| | 34,484 | | | | F&F Co Ltd | | | 1,241 | |
| | 1,569,672 | | | | Feng TAY Enterprise Co Ltd | | | 8,966 | |
| | 6,600 | | e | | Fields Corp | | | 46 | |
| | 43,410 | | | | Fila Korea Ltd | | | 2,097 | |
| | 9,248 | | | | Flexsteel Industries, Inc | | | 204 | |
| | 962 | | | | Forbo Holding AG. | | | 1,354 | |
| | 2,563,852 | | | | Formosa Taffeta Co Ltd | | | 2,884 | |
| | 62,634 | | | | Forus S.A. | | | 172 | |
| | 185,092 | | * | | Fossil Group, Inc | | | 2,912 | |
| | 32,191 | | | | Foster Electric Co Ltd | | | 371 | |
| | 14,400 | | | | France Bed Holdings Co Ltd | | | 118 | |
| | 339,999 | | *,e | | Fuguiniao Co Ltd | | | 0 | ^ |
| | 46,000 | | | | Fujibo Holdings Inc | | | 1,037 | |
| | 72,700 | | | | Fujitsu General Ltd | | | 934 | |
| | 181,417 | | | | Games Workshop Group plc | | | 7,021 | |
| | 194,752 | | | | Garmin Ltd | | | 12,332 | |
| | 46,924 | | e | | Geox S.p.A. | | | 63 | |
| | 541,439 | | | | Giant Manufacturing Co Ltd | | | 2,541 | |
| | 113,778 | | * | | G-III Apparel Group Ltd | | | 3,173 | |
| | 358,080 | | | | Gildan Activewear, Inc | | | 10,869 | |
| | 2,483,504 | | g | | Glenveagh Properties plc | | | 2,009 | |
| | 2,700,000 | | g | | Glenveagh Properties plc (London) | | | 2,119 | |
| | 16,934,000 | | *,e | | Global Brands Group Holding Ltd | | | 767 | |
| | 7,300 | | e | | Goldwin, Inc | | | 784 | |
| | 554,000 | | | | Goodbaby International Holding | | | 174 | |
| | 147,215 | | *,e | | GoPro, Inc | | | 624 | |
| | 68,000 | | * | | Gree Electric Appliances, Inc of Zhuhai | | | 355 | |
| | 33,256 | | * | | Green Brick Partners, Inc | | | 241 | |
| | 172,800 | | | | Grendene S.A. | | | 365 | |
COLLEGE RETIREMENT EQUITIES FUND -Stock Account
| SHARES | | | | COMPANY | | VALUE
(000) | |
| | 5,200 | | | | Guararapes Confeccoes S.A. | | $ | 218 | |
| | 45,000 | | | | Gunze Ltd | | | 1,698 | |
| | 1,425,944 | | | | Haier Electronics Group Co Ltd | | | 3,507 | |
| | 9,095 | | | | Hamilton Beach Brands Holding Co | | | 213 | |
| | 16,830 | | | | Handsome Co Ltd | | | 547 | |
| | 2,559,812 | | | | Hanesbrands, Inc | | | 32,074 | |
| | 1,179,200 | | | | Hangzhou Robam Appliances Co Ltd | | | 3,486 | |
| | 9,387 | | | | Hansae Co Ltd | | | 167 | |
| | 6,768 | | | | Hanssem Co Ltd | | | 410 | |
| | 46,535 | | | | Hasbro, Inc | | | 3,781 | |
| | 1,548,100 | | | | Haseko Corp | | | 16,211 | |
| | 22,200 | | | | Heilan Home Co Ltd | | | 27 | |
| | 35,000 | | | | Heiwa Corp | | | 713 | |
| | 80,572 | | * | | Helen of Troy Ltd | | | 10,569 | |
| | 24,654 | | *,† | | Hellenic Duty Free Shops S.A. | | | 0 | ^ |
| | 25,736,000 | | *,e | | HengTen Networks Group Ltd | | | 783 | |
| | 16,216 | | | | Hermes International | | | 9,009 | |
| | 5,000 | | | | Hinokiya Group Co Ltd | | | 96 | |
| | 3,271 | | | | Hitachi Home & Life Solutions India Ltd | | | 85 | |
| | 47,194 | | * | | HLB, Inc | | | 3,394 | |
| | 101,437 | | | | Hooker Furniture Corp | | | 2,672 | |
| | 466,000 | | *,† | | Hosa International Ltd | | | 9 | |
| | 171,978 | | * | | Hovnanian Enterprises, Inc (Class A) | | | 118 | |
| | 25,575 | | | | HS Industries Co Ltd | | | 157 | |
| | 14,036 | | | | Hugo Boss AG. | | | 865 | |
| | 377,352 | | | | Husqvarna AB (B Shares) | | | 2,801 | |
| | 12,725 | | e | | Hwaseung Enterprise Co Ltd | | | 122 | |
| | 1,350 | | * | | Hyosung TNC Co Ltd | | | 223 | |
| | 7,925 | | | | Hyundai Livart Furniture Co Ltd | | | 143 | |
| | 6,510 | | * | | IFB Industries Ltd | | | 79 | |
| | 84,683 | | e | | IG Design Group PLC | | | 621 | |
| | 304,925 | | | | Iida Group Holdings Co Ltd | | | 5,282 | |
| | 28,532 | | * | | Installed Building Products Inc | | | 961 | |
| | 34,162 | | *,e | | iRobot Corp | | | 2,861 | |
| | 30,300 | | | | Japan Wool Textile Co Ltd | | | 228 | |
| | 31,299 | | * | | Jinshan Development & Construction Co Ltd | | | 17 | |
| | 138,037 | | e | | JM AB | | | 2,704 | |
| | 572,500 | | | | JNBY Design Ltd | | | 802 | |
| | 17,030 | | | | Johnson Outdoors, Inc | | | 1,000 | |
| | 1,462,500 | | | | JVC KENWOOD Holdings, Inc | | | 3,156 | |
| | 490,000 | | | | Kasen International Holdings Ltd | | | 218 | |
| | 66,205 | | | | Kaufman & Broad S.A. | | | 2,533 | |
| | 427,226 | | | | KB Home | | | 8,160 | |
| | 3,768,000 | | | | Kinpo Electronics | | | 1,237 | |
| | 39,956 | | | | KMC Kuei Meng International In | | | 127 | |
| | 286,000 | | | | Konka Group Co Ltd | | | 81 | |
| | 6,122 | | * | | KPR Mill Ltd | | | 49 | |
| | 45,700 | | | | Kurabo Industries Ltd | | | 1,033 | |
| | 25,894 | | * | | LA Opala RG Ltd | | | 82 | |
| | 75,517 | | | | La-Z-Boy, Inc | | | 2,093 | |
| | 3,797,776 | | | | Lealea Enterprise Co Ltd | | | 1,220 | |
| | 14,800 | | e | | LEC, Inc | | | 221 | |
| | 270,878 | | | | Leggett & Platt, Inc | | | 9,708 | |
COLLEGE RETIREMENT EQUITIES FUND -Stock Account
| SHARES | | | | COMPANY | | VALUE
(000) | |
| | 62,222 | | | | Lennar Corp (B Shares) | | $ | 1,949 | |
| | 807,565 | | | | Lennar Corp (Class A) | | | 31,616 | |
| | 90,624 | | | | LG Electronics, Inc | | | 5,082 | |
| | 54,795 | | | | LG Fashion Corp | | | 1,218 | |
| | 23,061 | | *,e | | LGI Homes, Inc | | | 1,043 | |
| | 1,214,520 | | * | | Li Ning Co Ltd | | | 1,305 | |
| | 32,467 | | | | Lifetime Brands, Inc | | | 326 | |
| | 5,343 | | *,e | | Lovesac Co | | | 123 | |
| | 2,268 | | | | LPP S.A. | | | 4,768 | |
| | 432,371 | | * | | Lululemon Athletica, Inc | | | 52,581 | |
| | 948,724 | | | | Luthai Textile Co Ltd | | | 1,123 | |
| | 30,000 | | | | Luxottica Group S.p.A. | | | 1,777 | |
| | 324,215 | | | | LVMH Moet Hennessy Louis Vuitton S.A. | | | 94,922 | |
| | 78,914 | | * | | M/I Homes, Inc | | | 1,659 | |
| | 393,735 | | | | Makalot Industrial Co Ltd | | | 2,171 | |
| | 176,888 | | * | | Malibu Boats Inc | | | 6,156 | |
| | 978,000 | | | | Man Wah Holdings Ltd | | | 393 | |
| | 6,442 | | *,† | | Mariella Burani S.p.A. | | | 0 | |
| | 24,621 | | | | Marine Products Corp | | | 416 | |
| | 7,300 | | | | Mars Engineering Corp | | | 146 | |
| | 188,078 | | * | | MasterCraft Boat Holdings, Inc | | | 3,517 | |
| | 979,642 | | *,e | | Mattel, Inc | | | 9,787 | |
| | 24,270 | | g | | Mavi Giyim Sanayi Ve Ticaret AS. | | | 148 | |
| | 52,784 | | | | Maytronics Ltd | | | 302 | |
| | 272,000 | | | | MC Group PCL | | | 91 | |
| | 282,642 | | g | | McCarthy & Stone plc | | | 500 | |
| | 123,186 | | | | MDC Holdings, Inc | | | 3,463 | |
| | 131,000 | | | | Merida Industry Co Ltd | | | 587 | |
| | 113,343 | | * | | Meritage Homes Corp | | | 4,162 | |
| | 659,215 | | * | | Michael Kors Holdings Ltd | | | 24,997 | |
| | 55,700 | | | | Midea Group Co Ltd | | | 301 | |
| | 11,500 | | | | Misawa Homes Co Ltd | | | 78 | |
| | 10,800 | | | | Mizuno Corp | | | 229 | |
| | 123,570 | | * | | Mohawk Industries, Inc | | | 14,453 | |
| | 431,934 | | | | Moncler S.p.A | | | 14,374 | |
| | 178,124 | | | | Movado Group, Inc | | | 5,632 | |
| | 1,794,265 | | | | MRV Engenharia e Participacoes S.A. | | | 5,710 | |
| | 3,717 | | | | Nacco Industries, Inc (Class A) | | | 126 | |
| | 227,854 | | | | Namco Bandai Holdings, Inc | | | 10,230 | |
| | 28,000 | | | | Nan Liu Enterprise Co Ltd | | | 142 | |
| | 39,553 | | * | | Nautilus, Inc | | | 431 | |
| | 50,070 | | *,g | | Neinor Homes S.A. | | | 745 | |
| | 14,106 | | *,e | | New Home Co Inc | | | 74 | |
| | 139,600 | | | | New Wave Group AB (B Shares) | | | 747 | |
| | 1,089,984 | | | | Newell Rubbermaid, Inc | | | 20,263 | |
| | 265,000 | | | | Nien Made Enterprise Co Ltd | | | 2,030 | |
| | 3,123,256 | | | | Nike, Inc (Class B) | | | 231,558 | |
| | 292,124 | | | | Nikon Corp | | | 4,351 | |
| | 619,400 | | | | Nishat Mills Ltd | | | 565 | |
| | 75,514 | | | | Nobia AB | | | 421 | |
| | 20,977 | | * | | NVR, Inc | | | 51,121 | |
| | 362,431 | | | | Onward Kashiyama Co Ltd | | | 1,948 | |
| | 900 | | | | Oppein Home Group, Inc | | | 10 | |
| | 830,835 | | | | Oriental Weavers | | | 485 | |
COLLEGE RETIREMENT EQUITIES FUND -Stock Account
| SHARES | | | | COMPANY | | VALUE
(000) | |
| | 128,567 | | *,e,g | | OVS S.p.A | | $ | 161 | |
| | 21,177 | | | | Oxford Industries, Inc | | | 1,504 | |
| | 345,000 | | e,g | | Ozner Water International Holding Ltd | | | 77 | |
| | 3,839,778 | | | | Pacific Textile Holdings Ltd | | | 3,412 | |
| | 5,331 | | | | Page Industries Ltd | | | 1,926 | |
| | 75,200 | | | | Paiho Shih Holdings Corp | | | 99 | |
| | 1,002,835 | | | | Panasonic Corp | | | 9,009 | |
| | 37,866 | | | | Pandora AS | | | 1,546 | |
| | 402,000 | | *,† | | Peace Mark Holdings Ltd | | | 0 | |
| | 464,395 | | | | Persimmon plc | | | 11,436 | |
| | 217,416 | | * | | Peter England Fashions and Retail Ltd | | | 630 | |
| | 152,349 | | | | Photo-Me International plc | | | 173 | |
| | 20,656 | | m | | PIK Group (GDR) | | | 111 | |
| | 220,800 | | *,e | | Pioneer Corp | | | 128 | |
| | 81,048,570 | | | | Playmates Holdings Ltd | | | 10,557 | |
| | 82,689 | | | | Polaris Industries, Inc | | | 6,341 | |
| | 2,142,341 | | | | Pou Chen Corp | | | 2,269 | |
| | 12,337,226 | | | | Prada S.p.A | | | 40,708 | |
| | 500,400 | | | | Pressance Corp | | | 5,946 | |
| | 70,098,500 | | | | PT Sri Rejeki Isman Tbk | | | 1,751 | |
| | 844,833 | | | | Pulte Homes, Inc | | | 21,957 | |
| | 19,060 | | | | Puma AG. Rudolf Dassler Sport | | | 9,325 | |
| | 8,073 | | *,e,m | | Purple Innovation, Inc | | | 48 | |
| | 322,892 | | n | | PVH Corp | | | 30,013 | |
| | 250,000 | | e | | Q Technology Group Co Ltd | | | 142 | |
| | 77,000 | | | | Qingdao Haier Co Ltd | | | 156 | |
| | 37,000 | | | | Quang Viet Enterprise Co Ltd | | | 126 | |
| | 199,367 | | * | | Rajesh Exports Ltd | | | 1,630 | |
| | 69,145 | | | | Ralph Lauren Corp | | | 7,154 | |
| | 60,639 | | | | Raymond Ltd | | | 733 | |
| | 1,435,063 | | | | Redrow plc | | | 8,989 | |
| | 240,000 | | g | | Regina Miracle International Holdings Ltd | | | 186 | |
| | 27,144 | | | | Rinnai Corp | | | 1,787 | |
| | 8,207 | | | | Rocky Brands, Inc | | | 213 | |
| | 322,011 | | *,e | | Roku, Inc | | | 9,866 | |
| | 465,000 | | * | | Roo Hsing Co Ltd | | | 218 | |
| | 364,173 | | | | Ruentex Industries Ltd | | | 931 | |
| | 33,024 | | | | Salvatore Ferragamo Italia S.p.A | | | 668 | |
| | 2,855,977 | | g | | Samsonite International | | | 8,113 | |
| | 31,500 | | | | Sangetsu Co Ltd | | | 573 | |
| | 122,621 | | | | Sankyo Co Ltd | | | 4,663 | |
| | 20,039 | | | | SEB S.A. | | | 2,590 | |
| | 38,604 | | | | Sega Sammy Holdings, Inc | | | 538 | |
| | 70,000 | | | | Seiko Holdings Corp | | | 1,344 | |
| | 715,030 | | | | Seiren Co Ltd | | | 11,595 | |
| | 407,716 | | | | Sekisui Chemical Co Ltd | | | 6,061 | |
| | 1,208,635 | | | | Sekisui House Ltd | | | 17,749 | |
| | 79,956 | | | | Sharp Corp | | | 801 | |
| | 1,263,124 | | | | Shenzhou International Group Holdings Ltd | | | 14,356 | |
| | 31,245 | | | | Shimano, Inc | | | 4,405 | |
| | 3,648 | | | | Sioen Industries NV | | | 95 | |
| | 58,606 | | * | | Skechers U.S.A., Inc (Class A) | | | 1,341 | |
| | 199,214 | | | | Skyline Corp | | | 2,926 | |
COLLEGE RETIREMENT EQUITIES FUND -Stock Account
| SHARES | | | | COMPANY | | VALUE
(000) | |
| | 1,186,000 | | | | Skyworth Digital Holdings Ltd | | $ | 256 | |
| | 22,266 | | * | | Sonos, Inc | | | 219 | |
| | 4,784,010 | | | | Sony Corp | | | 230,635 | |
| | 637,172 | | *,g | | Spin Master Corp | | | 17,918 | |
| | 38,967 | | | | SRF Ltd | | | 1,116 | |
| | 54,300 | | | | Starts Corp, Inc | | | 1,201 | |
| | 111,764 | | | | Steven Madden Ltd | | | 3,382 | |
| | 20,918 | | e | | Sturm Ruger & Co, Inc | | | 1,113 | |
| | 975,454 | | | | Sumitomo Forestry Co Ltd | | | 12,770 | |
| | 11,114 | | | | Superior Uniform Group, Inc | | | 196 | |
| | 4,496 | | | | Surteco SE | | | 115 | |
| | 16,494 | | | | Swatch Group AG. | | | 4,814 | |
| | 6,840 | | | | Swatch Group AG. (Registered) | | | 396 | |
| | 11,307 | | | | Symphony Ltd | | | 189 | |
| | 697,602 | | | | Tainan Spinning Co Ltd | | | 271 | |
| | 154,600 | | | | Taiwan Paiho Ltd | | | 249 | |
| | 10,500 | | | | Tamron Co Ltd | | | 149 | |
| | 1,861,576 | | | | Tapestry, Inc | | | 62,828 | |
| | 1,260,000 | | * | | Tatung Co Ltd | | | 1,061 | |
| | 273,376 | | * | | Taylor Morrison Home Corp | | | 4,347 | |
| | 5,367,692 | | | | Taylor Wimpey plc | | | 9,334 | |
| | 451,000 | | | | TCL Multimedia Technology Holdings Ltd | | | 173 | |
| | 193,485 | | g | | Technogym S.p.A | | | 2,076 | |
| | 1,762,573 | | | | Techtronic Industries Co | | | 9,353 | |
| | 18,826 | | | | Ted Baker plc | | | 372 | |
| | 40,878 | | e | | Telford Homes plc | | | 148 | |
| | 233,693 | | * | | Tempur Sealy International, Inc | | | 9,675 | |
| | 1,812,500 | | | | Texhong Textile Group Ltd | | | 2,071 | |
| | 458,000 | | | | Texwinca Holdings Ltd | | | 150 | |
| | 95,445 | | g | | Thule Group AB | | | 1,747 | |
| | 308,240 | | | | Titan Industries Ltd | | | 4,109 | |
| | 6,139 | | e | | Tod’s S.p.A. | | | 291 | |
| | 5,290 | | | | Token Corp | | | 314 | |
| | 372,058 | | | | Toll Brothers, Inc | | | 12,252 | |
| | 362,158 | | * | | TomTom NV | | | 3,269 | |
| | 129,068 | | | | Tomy Co Ltd | | | 1,281 | |
| | 95,888 | | * | | TopBuild Corp | | | 4,315 | |
| | 179,658 | | * | | TRI Pointe Homes, Inc | | | 1,964 | |
| | 37,800 | | | | TSI Holdings Co Ltd | | | 246 | |
| | 165,603 | | | | Tsutsumi Jewelry Co Ltd | | | 2,780 | |
| | 1,397 | | * | | TTK Prestige Ltd | | | 150 | |
| | 79,083 | | | | Tupperware Corp | | | 2,497 | |
| | 114,776 | | *,e | | Turtle Beach Corp | | | 1,638 | |
| | 318,359 | | *,e | | Under Armour, Inc | | | 5,148 | |
| | 1,054,591 | | *,e | | Under Armour, Inc (Class A) | | | 18,635 | |
| | 19,830 | | * | | Unifi, Inc | | | 453 | |
| | 205,100 | | * | | Unitika Ltd | | | 867 | |
| | 17,478 | | * | | Universal Electronics, Inc | | | 442 | |
| | 25,600 | | *,e | | Universal Entertainment Corp | | | 746 | |
| | 3,870 | | | | VAN DE Velde | | | 113 | |
| | 28,607 | | * | | Vardhman Textiles Ltd | | | 456 | |
| | 64,183 | | * | | Vera Bradley, Inc | | | 550 | |
| | 26,121 | | * | | Vestel Elektronik Sanayi | | | 27 | |
| | 523,236 | | | | VF Corp | | | 37,328 | |
COLLEGE RETIREMENT EQUITIES FUND -Stock Account
| SHARES | | | | COMPANY | | VALUE
(000) | |
| | 61,173 | | *,e | | Victoria plc | | $ | 366 | |
| | 22,438 | | | | VIP Industries Ltd | | | 166 | |
| | 133,761 | | * | | Vista Outdoor, Inc | | | 1,518 | |
| | 65,600 | | * | | Vulcabras Azaleia S.A. | | | 120 | |
| | 33,564 | | *,e | | Vuzix Corp | | | 161 | |
| | 27,513 | | | | Wacoal Holdings Corp | | | 712 | |
| | 306,500 | | | | Weiqiao Textile Co | | | 103 | |
| | 526,619 | | * | | Welspun India Ltd | | | 451 | |
| | 117,593 | | | | Whirlpool Corp | | | 12,567 | |
| | 36,071 | | | | Whirlpool of India Ltd | | | 718 | |
| | 44,822 | | * | | William Lyon Homes, Inc | | | 479 | |
| | 370,478 | | | | Wolverine World Wide, Inc | | | 11,815 | |
| | 54,811 | | | | Woongjin Coway Co Ltd | | | 3,640 | |
| | 993,500 | | | | XTEP International Holdings | | | 539 | |
| | 36,581 | | | | Yamaha Corp | | | 1,556 | |
| | 21,292 | | *,e | | YETI Holdings, Inc | | | 316 | |
| | 10,500 | | e | | Yondoshi Holdings, Inc | | | 209 | |
| | 37,000 | | e | | Yonex Co Ltd | | | 199 | |
| | 32,049 | | | | Youngone Corp | | | 1,104 | |
| | 9,616 | | | | Youngone Holdings Co Ltd | | | 539 | |
| | 542,407 | | | | Yue Yuen Industrial Holdings | | | 1,736 | |
| | 199,075 | | * | | Zagg, Inc | | | 1,947 | |
| | 190,764 | | | | Zeng Hsing Industrial Co Ltd | | | 836 | |
| | 8,900 | | | | Zhejiang Semir Garment Co Ltd | | | 12 | |
| | 26,000 | | e | | Zojirushi Corp | | | 228 | |
| | | | | | TOTAL CONSUMER DURABLES & APPAREL | | | 1,997,045 | |
| | | | | | | | | | |
| CONSUMER SERVICES - 2.1% | | | | |
| | 9,600 | | *,e | | 500.com Ltd (ADR) | | | 73 | |
| | 231,956 | | | | 888 Holdings plc | | | 517 | |
| | 443,477 | | | | AA plc | | | 424 | |
| | 54,968 | | *,g | | AcadeMedia AB | | | 243 | |
| | 2,896,507 | | | | Accor S.A. | | | 123,172 | |
| | 14,953,900 | | | | Accordia Golf Trust | | | 5,554 | |
| | 97,212 | | * | | Adtalem Global Education, Inc | | | 4,600 | |
| | 1,500 | | | | Adventure, Inc | | | 91 | |
| | 301,833 | | | | Advtech Ltd | | | 315 | |
| | 3,900 | | | | Aeon Fantasy Co Ltd | | | 96 | |
| | 330,000 | | | | Ajisen China Holdings Ltd | | | 92 | |
| | 376,400 | | e | | Alsea SAB de C.V. | | | 980 | |
| | 70,906 | | * | | American Public Education, Inc | | | 2,018 | |
| | 791,905 | | | | ARAMARK Holdings Corp | | | 22,941 | |
| | 12,100 | | | | ARCLAND SERVICE Co Ltd | | | 237 | |
| | 6,222,796 | | | | Arcos Dorados Holdings, Inc | | | 49,160 | |
| | 266,985 | | e | | Ardent Leisure Group Ltd | | | 278 | |
| | 689,296 | | | | Aristocrat Leisure Ltd | | | 10,611 | |
| | 60,000 | | | | Atom Corp | | | 517 | |
| | 80,795 | | | | Autogrill S.p.A. | | | 682 | |
| | 39,622 | | *,g | | Basic-Fit NV | | | 1,178 | |
| | 145,713 | | | | BBX Capital Corp | | | 835 | |
| | 1,153,822 | | * | | Belmond Ltd. | | | 28,880 | |
| | 64,425 | | | | Benesse Holdings Inc | | | 1,639 | |
| | 1,931,700 | | | | Berjaya Sports Toto BHD | | | 986 | |
COLLEGE RETIREMENT EQUITIES FUND -Stock Account
| SHARES | | | | COMPANY | | VALUE
(000) | |
| | 5,793 | | | | bet-at-home.com AG. | | $ | 303 | |
| | 844,911 | | | | Betsson AB | | | 6,988 | |
| | 154 | | * | | Biglari Holdings, Inc (A Shares) | | | 91 | |
| | 7,506 | | * | | Biglari Holdings, Inc (B Shares) | | | 853 | |
| | 49,632 | | | | BJ’s Restaurants, Inc | | | 2,510 | |
| | 76,100 | | * | | BK Brasil Operacao e Assessoria a Restaurantes S.A. | | | 406 | |
| | 2,425,000 | | | | Bloomberry Resorts Corp | | | 434 | |
| | 803,318 | | | | Bloomin’ Brands, Inc | | | 14,371 | |
| | 10,804 | | e | | Bluegreen Vacations Corp | | | 140 | |
| | 25,667 | | * | | Bojangles’, Inc | | | 413 | |
| | 152,239 | | | | Boyd Gaming Corp | | | 3,164 | |
| | 101,704 | | * | | Bright Horizons Family Solutions | | | 11,335 | |
| | 49,364 | | e | | Brinker International, Inc | | | 2,171 | |
| | 7,000 | | e | | BRONCO BILLY Co Ltd | | | 173 | |
| | 266,129 | | *,e | | Caesars Entertainment Corp | | | 1,807 | |
| | 234,000 | | | | Cafe de Coral Holdings Ltd | | | 567 | |
| | 385,027 | | * | | Career Education Corp | | | 4,397 | |
| | 1,229,421 | | | | Carnival Corp | | | 60,610 | |
| | 48,704 | | | | Carnival plc | | | 2,339 | |
| | 187,937 | | | | Carriage Services, Inc | | | 2,913 | |
| | 446,198 | | * | | Carrols Restaurant Group, Inc | | | 4,391 | |
| | 38,688 | | * | | Century Casinos, Inc | | | 286 | |
| | 54,218 | | e | | Cheesecake Factory | | | 2,359 | |
| | 138,229 | | * | | Chegg, Inc | | | 3,928 | |
| | 38,272 | | * | | Cherry AB | | | 376 | |
| | 37,900 | | | | China International Travel Service Corp Ltd | | | 333 | |
| | 940,000 | | | | China Maple Leaf Educational Systems Ltd | | | 419 | |
| | 277,000 | | g | | China New Higher Education Group Ltd | | | 121 | |
| | 2,990,000 | | | | China Travel International Inv HK | | | 798 | |
| | 732,640 | | g | | China Yuhua Education Corp Ltd | | | 297 | |
| | 79,565 | | * | | Chipotle Mexican Grill, Inc (Class A) | | | 34,355 | |
| | 12,800 | | | | Choice Hotels International, Inc | | | 916 | |
| | 14,944 | | | | Churchill Downs, Inc | | | 3,645 | |
| | 21,363 | | * | | Chuy’s Holdings, Inc | | | 379 | |
| | 7,433 | | | | Cie des Alpes | | | 210 | |
| | 53,550 | | | | City Lodge Hotels Ltd | | | 469 | |
| | 68,749 | | | | Collins Foods Ltd | | | 299 | |
| | 35,700 | | e | | Colowide Co Ltd | | | 744 | |
| | 995,933 | | | | Compass Group plc | | | 20,959 | |
| | 55,358 | | e | | Corporate Travel Management Ltd | | | 836 | |
| | 102,189 | | | | Cox & Kings India Ltd | | | 243 | |
| | 24,703 | | e | | Cracker Barrel Old Country Store, Inc | | | 3,949 | |
| | 25,700 | | | | Create Restaurants Holdings, Inc | | | 275 | |
| | 465,153 | | | | Crown Resorts Ltd | | | 3,887 | |
| | 110,048 | | *,e | | Curro Holdings Ltd | | | 195 | |
| | 98,500 | | | | CVC Brasil Operadora e Agencia de Viagens S.A. | | | 1,553 | |
| | 212,343 | | | | Dadi Early-Childhood Education Group Ltd | | | 1,400 | |
| | 953 | | | | Daekyo Co Ltd | | | 6 | |
| | 99,000 | | | | Dahan Development Corp | | | 181 | |
| | 4,200 | | e | | Daisyo Corp | | | 59 | |
| | 137,144 | | | | Dalata Hotel Group plc | | | 744 | |
| | 200,734 | | | | Darden Restaurants, Inc | | | 20,045 | |
| | 93,390 | | | | Dave & Buster’s Entertainment, Inc | | | 4,161 | |
| | 44,309 | | * | | Del Frisco’s Restaurant Group, Inc | | | 317 | |
COLLEGE RETIREMENT EQUITIES FUND -Stock Account
| SHARES | | | | COMPANY | | VALUE
(000) | |
| | 40,957 | | * | | Del Taco Restaurants, Inc | | $ | 409 | |
| | 178,660 | | * | | Denny’s Corp | | | 2,896 | |
| | 140,679 | | | | Dignity plc | | | 1,250 | |
| | 22,967 | | e | | DineEquity, Inc | | | 1,547 | |
| | 6,233 | | | | DO & CO AG. | | | 582 | |
| | 40,280 | | | | Domino’s Pizza Enterprises Ltd | | | 1,154 | |
| | 518,773 | | | | Domino’s Pizza Group plc | | | 1,542 | |
| | 62,861 | | | | Domino’s Pizza, Inc | | | 15,589 | |
| | 11,800,000 | | * | | Donaco International Ltd | | | 756 | |
| | 5,989 | | | | DoubleUGames Co Ltd | | | 322 | |
| | 19,900 | | | | Doutor Nichires Holdings Co Ltd | | | 363 | |
| | 78,699 | | * | | Drive Shack, Inc | | | 309 | |
| | 2,163,105 | | * | | Dubai Parks & Resorts PJSC | | | 138 | |
| | 193,932 | | | | Dunkin Brands Group, Inc | | | 12,435 | |
| | 1,734,800 | | | | Dynam Japan Holdings Co Ltd | | | 2,083 | |
| | 102,753 | | * | | EIH Ltd | | | 291 | |
| | 137,285 | | * | | El Pollo Loco Holdings, Inc | | | 2,083 | |
| | 84,634 | | * | | Eldorado Resorts, Inc | | | 3,065 | |
| | 71,291 | | g | | Elior Participations S.C.A | | | 1,067 | |
| | 19,515 | | * | | Emerson Pacific, Inc | | | 328 | |
| | 240,000 | | | | Emperor Entertainment Hotel Ltd | | | 45 | |
| | 5,197 | | *,e,m | | Empire Resorts, Inc | | | 53 | |
| | 753,488 | | * | | Enterprise Inns plc | | | 1,744 | |
| | 833,200 | | | | Erawan Group PCL | | | 161 | |
| | 797,800 | | | | Estacio Participacoes S.A. | | | 4,885 | |
| | 30,756 | | g | | Evolution Gaming Group AB | | | 1,776 | |
| | 2,056,021 | | | | Extended Stay America, Inc | | | 31,868 | |
| | 48,000 | | | | Fairwood Holdings Ltd | | | 161 | |
| | 45,542 | | * | | Famous Brands Ltd | | | 309 | |
| | 32,320 | | * | | Fiesta Restaurant Group, Inc | | | 501 | |
| | 158,087 | | | | Flight Centre Travel Group Ltd | | | 4,781 | |
| | 30,990 | | | | Formosa International Hotels Corp | | | 136 | |
| | 170,732 | | * | | frontdoor, Inc | | | 4,543 | |
| | 553,000 | | | | Fu Shou Yuan International Group Ltd | | | 417 | |
| | 13,899 | | | | Fuji Kyuko Co Ltd | | | 409 | |
| | 5,400 | | e | | Fujita Kanko, Inc | | | 137 | |
| | 262,124 | | e | | G8 Education Ltd | | | 523 | |
| | 21,300 | | | | GAEC Educacao S.A. | | | 93 | |
| | 2,736,574 | | | | Galaxy Entertainment Group Ltd | | | 17,286 | |
| | 28,230 | | *,e | | Gaming Innovation Group, Inc | | | 75 | |
| | 3,000 | | | | Genki Sushi Co Ltd | | | 121 | |
| | 2,180,992 | | | | Genting BHD | | | 3,218 | |
| | 6,052,971 | | | | Genting Singapore Ltd | | | 4,333 | |
| | 1,759,078 | | | | Gold Reef Resorts Ltd | | | 2,620 | |
| | 25,206 | | *,e | | Golden Entertainment, Inc | | | 404 | |
| | 61,155 | | | | Gourmet Master Co Ltd | | | 409 | |
| | 8,605 | | | | Graham Holdings Co | | | 5,512 | |
| | 92,247 | | * | | Grand Canyon Education, Inc | | | 8,869 | |
| | 19,451 | | | | Grand Korea Leisure Co Ltd | | | 434 | |
| | 88,922 | | * | | Great Canadian Gaming Corp | | | 3,118 | |
| | 229,235 | | | | Greene King plc | | | 1,543 | |
| | 167,094 | | | | Greggs plc | | | 2,697 | |
| | 483,019 | | | | GVC Holdings plc | | | 4,147 | |
COLLEGE RETIREMENT EQUITIES FUND -Stock Account
| SHARES | | | | COMPANY | | VALUE
(000) | |
| | 674,074 | | | | H&R Block, Inc | | $ | 17,101 | |
| | 86,905 | | * | | Habit Restaurants, Inc | | | 913 | |
| | 517,000 | | *,g | | Haichang Holdings Ltd | | | 104 | |
| | 6,224 | | | | Hana Tour Service, Inc | | | 385 | |
| | 14,396 | | | | Hiday Hidaka Corp | | | 286 | |
| | 42,395 | | * | | Hilton Grand Vacations, Inc | | | 1,119 | |
| | 68,741 | | | | Hilton Worldwide Holdings, Inc | | | 4,936 | |
| | 22,300 | | | | HIS Co Ltd | | | 811 | |
| | 498,000 | | | | Hongkong & Shanghai Hotels | | | 706 | |
| | 4,628,000 | | *,g | | Hope Education Group Co Ltd | | | 505 | |
| | 245,700 | | *,e | | Hoteles City Express SAB de C.V. | | | 300 | |
| | 599,281 | | * | | Houghton Mifflin Harcourt Co | | | 5,310 | |
| | 156,875 | | | | Huangshan Tourism Development Co Ltd | | | 190 | |
| | 136,500 | | * | | Huazhu Group Ltd (ADR) | | | 3,908 | |
| | 76,893 | | | | Hyatt Hotels Corp | | | 5,198 | |
| | 10,800 | | | | Ichibanya Co Ltd | | | 406 | |
| | 412,359 | | | | IDP Education Ltd | | | 2,868 | |
| | 581,945 | | * | | Indian Hotels Co Ltd | | | 1,231 | |
| | 25,092 | | | | InterContinental Hotels Group plc | | | 1,357 | |
| | 1,324,759 | | e | | International Game Technology plc | | | 19,381 | |
| | 30,134 | | | | International Speedway Corp (Class A) | | | 1,322 | |
| | 81,781 | | e | | Invocare Ltd | | | 594 | |
| | 61,543 | | * | | J Alexander’s Holdings, Inc | | | 506 | |
| | 88,648 | | | | Jack in the Box, Inc | | | 6,882 | |
| | 38,606 | | * | | Jackpotjoy plc | | | 314 | |
| | 934,767 | | | | Jollibee Foods Corp | | | 5,187 | |
| | 81,631 | | | | Jubilant Foodworks Ltd | | | 1,463 | |
| | 189,620 | | | | Jumbo Interactive Ltd | �� | | 962 | |
| | 230,556 | | * | | K12, Inc | | | 5,715 | |
| | 30,301 | | *,e | | Kambi Group plc | | | 657 | |
| | 245,284 | | | | Kangwon Land, Inc | | | 7,022 | |
| | 15,600 | | | | Kappa Create Co Ltd | | | 196 | |
| | 13,100 | | | | Kisoji Co Ltd | | | 296 | |
| | 8,600 | | * | | KNT-CT Holdings Co Ltd | | | 87 | |
| | 55,100 | | | | KOMEDA Holdings Co Ltd | | | 1,085 | |
| | 58,500 | | | | Koshidaka Holdings Co Ltd | | | 704 | |
| | 1,576,145 | | | | Kroton Educacional S.A. | | | 3,601 | |
| | 9,100 | | | | Kura Corp | | | 452 | |
| | 22,500 | | | | Kyoritsu Maintenance Co Ltd | | | 984 | |
| | 906,652 | | *,†,m | | Ladbrokes Coral Group plc | | | 130 | |
| | 1,391,968 | | | | Las Vegas Sands Corp | | | 72,452 | |
| | 337,053 | | * | | Laureate Education, Inc | | | 5,137 | |
| | 133,583 | | *,g | | Lemon Tree Hotels Ltd | | | 141 | |
| | 142,237 | | e,g | | LeoVegas AB | | | 637 | |
| | 28,074 | | * | | Lindblad Expeditions Holdings, Inc | | | 378 | |
| | 4,555 | | | | Lotte Tour Development Co Ltd | | | 60 | |
| | 5,866,000 | | | | Macau Legend Development Ltd | | | 1,018 | |
| | 1,430,800 | | | | Magnum BHD | | | 675 | |
| | 437,700 | | e | | Mandarin Oriental International Ltd | | | 893 | |
| | 862,314 | | | | Marriott International, Inc (Class A) | | | 93,613 | |
| | 84,658 | | | | Marriott Vacations Worldwide Corp | | | 5,969 | |
| | 412,137 | | | | Marston’s plc | | | 494 | |
| | 5,300 | | | | Matsuya Foods Co Ltd | | | 175 | |
| | 1,200,000 | | | | Max’s Group, Inc | | | 234 | |
COLLEGE RETIREMENT EQUITIES FUND -Stock Account
| SHARES | | | | COMPANY | | VALUE
(000) | |
| | 2,064,553 | | | | McDonald’s Corp | | $ | 366,603 | |
| | 54,653 | | e | | McDonald’s Holdings Co Japan Ltd | | | 2,322 | |
| | 13,000 | | | | Meiko Network Japan Co Ltd | | | 106 | |
| | 4,080,044 | | | | Melco Crown Entertainment Ltd (ADR) | | | 71,890 | |
| | 513,000 | | | | Melco International Development | | | 1,040 | |
| | 72,752 | | | | Melia Hotels International S.A. | | | 684 | |
| | 119,840 | | g | | Merlin Entertainments plc | | | 485 | |
| | 2,492,100 | | e | | MGM China Holdings Ltd | | | 4,160 | |
| | 196,118 | | | | MGM Resorts International | | | 4,758 | |
| | 1 | | | | Minor International PCL (ADR) | | | 0 | ^ |
| | 1,856,108 | | | | Minor International PCL (Foreign) | | | 1,940 | |
| | 157,719 | | | | Mitchells & Butlers plc | | | 517 | |
| | 9,816 | | | | Modetour Network, Inc | | | 212 | |
| | 14,303 | | * | | Monarch Casino & Resort, Inc | | | 546 | |
| | 3,300 | | e | | Monogatari Corp | | | 265 | |
| | 16,500 | | | | MOS Food Services, Inc | | | 421 | |
| | 15,377 | | | | MTY Food Group, Inc | | | 683 | |
| | 4,091 | | | | Nathan’s Famous, Inc | | | 272 | |
| | 148,160 | | | | Navitas Ltd | | | 529 | |
| | 121,276 | | | | NetEnt AB | | | 499 | |
| | 144,198 | | * | | New Oriental Education & Technology Group (ADR) | | | 7,903 | |
| | 4,924 | | | | NH Hoteles S.A. | | | 23 | |
| | 19,513 | | *,e | | Noodles & Co | | | 136 | |
| | 191,084 | | * | | Norwegian Cruise Line Holdings Ltd | | | 8,100 | |
| | 9,800 | | | | Ohsho Food Service Corp | | | 646 | |
| | 579,249 | | | | OPAP S.A. | | | 5,038 | |
| | 20,208 | | * | | Orascom Development Holding AG. | | | 307 | |
| | 189,691 | | | | Oriental Land Co Ltd | | | 19,077 | |
| | 19,932 | | | | Paddy Power plc | | | 1,636 | |
| | 106,112 | | | | Pandox AB | | | 1,758 | |
| | 28,053 | | e | | Papa John’s International, Inc | | | 1,117 | |
| | 28,249 | | | | Paradise Co Ltd | | | 478 | |
| | 48,524 | | | | Park Lawn Corp | | | 820 | |
| | 1,175,063 | | g | | Parques Reunidos Servicios Centrales SAU | | | 14,540 | |
| | 38,470 | | †,m | | Patisserie Holdings plc | | | 105 | |
| | 1,701,228 | | * | | Penn National Gaming, Inc | | | 32,034 | |
| | 8,900 | | e | | Pepper Food Service Co Ltd | | | 232 | |
| | 8,200 | | e | | PIA Corp | | | 285 | |
| | 176,635 | | * | | Planet Fitness, Inc | | | 9,471 | |
| | 121,743 | | * | | PlayAGS, Inc | | | 2,800 | |
| | 198,445 | | | | Playtech Ltd | | | 974 | |
| | 11,900 | | e | | Plenus Co Ltd | | | 206 | |
| | 32,595 | | * | | Potbelly Corp | | | 262 | |
| | 29,298 | | | | RCI Hospitality Holdings, Inc | | | 654 | |
| | 247,020 | | | | Recipe Unlimited Corp | | | 4,735 | |
| | 44,264 | | * | | Red Lion Hotels Corp | | | 363 | |
| | 16,803 | | * | | Red Robin Gourmet Burgers, Inc | | | 449 | |
| | 1,075,781 | | | | Red Rock Resorts, Inc | | | 21,849 | |
| | 284,000 | | | | Regal Hotels International Holdings Ltd | | | 190 | |
| | 135,577 | | * | | Regis Corp | | | 2,298 | |
| | 6,600 | | | | Renaissance, Inc | | | 124 | |
| | 2,878,029 | | | | Resorts World BHD | | | 2,101 | |
COLLEGE RETIREMENT EQUITIES FUND -Stock Account
| SHARES | | | | COMPANY | | VALUE
(000) | |
| | 54,400 | | | | Resorttrust, Inc | | $ | 797 | |
| | 1,080,571 | | e | | Restaurant Brands International, Inc | | | 56,514 | |
| | 200,217 | | e | | Restaurant Brands International, Inc (Toronto) | | | 10,460 | |
| | 71,715 | | | | Restaurant Brands New Zealand Ltd | | | 402 | |
| | 151,410 | | e | | Restaurant Group plc | | | 275 | |
| | 74,267 | | * | | Rezidor Hotel Group AB | | | 344 | |
| | 13,200 | | | | Ringer Hut Co Ltd | | | 276 | |
| | 8,900 | | *,e | | RISE Education Cayman Ltd (ADR) | | | 71 | |
| | 74,100 | | | | Riso Kyoiku Co Ltd | | | 307 | |
| | 49,700 | | | | Round One Corp | | | 510 | |
| | 748,114 | | | | Royal Caribbean Cruises Ltd | | | 73,158 | |
| | 18,300 | | | | Royal Holdings Co Ltd | | | 423 | |
| | 98,422 | | | | Ruth’s Chris Steak House, Inc | | | 2,237 | |
| | 19,100 | | | | Saizeriya Co Ltd | | | 327 | |
| | 2,239,295 | | | | Sands China Ltd | | | 9,766 | |
| | 335,013 | | g | | Scandic Hotels Group AB | | | 2,957 | |
| | 91,676 | | *,e | | Scientific Games Corp (Class A) | | | 1,639 | |
| | 286,123 | | * | | SeaWorld Entertainment, Inc | | | 6,320 | |
| | 40,396 | | g | | Ser Educacional S.A. | | | 162 | |
| | 369,775 | | | | Service Corp International | | | 14,887 | |
| | 420,888 | | * | | ServiceMaster Global Holdings, Inc | | | 15,463 | |
| | 31,095 | | * | | Shake Shack, Inc | | | 1,412 | |
| | 1,328,120 | | | | Shangri-La Asia Ltd | | | 1,961 | |
| | 161,700 | | | | Shenzhen Overseas Chinese Town Co Ltd | | | 150 | |
| | 1,138 | | | | Shinsegae Food Co Ltd | | | 87 | |
| | 35,130 | | | | Six Flags Entertainment Corp | | | 1,954 | |
| | 2,924,148 | | | | SJM Holdings Ltd | | | 2,717 | |
| | 43,000 | | e | | SkiStar AB (Series B) | | | 1,004 | |
| | 1,223,836 | | | | Sky City Entertainment Group Ltd | | | 2,919 | |
| | 157,500 | | e | | Skylark Co Ltd | | | 2,486 | |
| | 16,343 | | | | Sodexho Alliance S.A. | | | 1,676 | |
| | 44,815 | | * | | Sotheby’s (Class A) | | | 1,781 | |
| | 16,525 | | | | Speedway Motorsports, Inc | | | 269 | |
| | 1,380,819 | | | | SSP Group plc | | | 11,398 | |
| | 9,500 | | | | St Marc Holdings Co Ltd | | | 212 | |
| | 522,573 | | | | Star Entertainment Grp Ltd | | | 1,679 | |
| | 2,199,900 | | | | Starbucks Corp | | | 141,674 | |
| | 119,624 | | * | | Stars Group, Inc | | | 1,975 | |
| | 69,944 | | | | Strategic Education Inc | | | 7,933 | |
| | 5,500 | | | | Studio Alice Co Ltd | | | 115 | |
| | 79,675 | | | | Sun International Ltd | | | 349 | |
| | 35,800 | | | | Sushiro Global Holdings Ltd | | | 1,955 | |
| | 1,334,472 | | | | Tabcorp Holdings Ltd | | | 4,034 | |
| | 346,326 | | * | | TAL Education Group (ADR) | | | 9,240 | |
| | 22,800 | | e | | Tarena International, Inc (ADR) | | | 144 | |
| | 74,336 | | g | | Telepizza Group S.A. | | | 502 | |
| | 86,270 | | | | Texas Roadhouse, Inc (Class A) | | | 5,150 | |
| | 874,722 | | | | Thomas Cook Group plc | | | 344 | |
| | 160,214 | | | | Thomas Cook India Ltd | | | 537 | |
| | 4,300 | | *,e | | TKP Corp | | | 143 | |
| | 50,600 | | | | Tokyo Dome Corp | | | 430 | |
| | 10,400 | | | | Tokyotokeiba Co Ltd | | | 260 | |
| | 14,200 | | e | | Toridoll.corp | | | 233 | |
| | 11,500 | | | | Tosho Co Ltd | | | 357 | |
COLLEGE RETIREMENT EQUITIES FUND -Stock Account
| SHARES | | | | COMPANY | | VALUE
(000) | |
| | 20,455 | | * | | Town Sports International Holdings, Inc | | $ | 131 | |
| | 1,817,676 | | | | TUI AG. (DI) | | | 26,125 | |
| | 17,500 | | *,e | | Tuniu Corp (ADR) | | | 85 | |
| | 607,751 | | | | Unibet Group plc (ADR) | | | 5,587 | |
| | 143,123 | | | | Vail Resorts, Inc | | | 30,173 | |
| | 11,600 | | | | Watami Co Ltd | | | 137 | |
| | 153,739 | | * | | Weight Watchers International, Inc | | | 5,927 | |
| | 340,551 | | | | Wendy’s | | | 5,316 | |
| | 26,529 | | * | | Westlife Development Ltd | | | 147 | |
| | 44,651 | | | | Wetherspoon (J.D.) plc | | | 633 | |
| | 139,403 | | | | Whitbread plc | | | 8,141 | |
| | 544,806 | | | | William Hill plc | | | 1,077 | |
| | 72,951 | | | | Wingstop, Inc | | | 4,683 | |
| | 410,000 | | | | Wisdom Education International Holdings Co Ltd | | | 150 | |
| | 87,771 | | | | Wyndham Hotels & Resorts, Inc | | | 3,982 | |
| | 24,417 | | | | Wyndham Worldwide Corp | | | 875 | |
| | 1,438,761 | | | | Wynn Macau Ltd | | | 3,132 | |
| | 69,624 | | | | Wynn Resorts Ltd | | | 6,887 | |
| | 9,300 | | | | Yomiuri Land Co Ltd | | | 324 | |
| | 42,400 | | e | | Yoshinoya D&C Co Ltd | | | 698 | |
| | 1,684,114 | | | | Yum China Holdings, Inc | | | 56,468 | |
| | 1,013,554 | | | | Yum! Brands, Inc | | | 93,166 | |
| | 70,900 | | | | Zensho Co Ltd | | | 1,718 | |
| | | | | | TOTAL CONSUMER SERVICES | | | 2,186,406 | |
| | | | | | | | | | |
| DIVERSIFIED FINANCIALS - 3.5% | | | | |
| | 660,769 | | | | 3i Group plc | | | 6,520 | |
| | 22,247 | | | | ABC Arbitrage | | | 155 | |
| | 16,473 | | | | Ackermans & Van Haaren | | | 2,487 | |
| | 395,230 | | | | Acom Co Ltd | | | 1,286 | |
| | 129,200 | | | | Aeon Credit Service M BHD | | | 478 | |
| | 37,970 | | | | AEON Financial Service Co Ltd | | | 674 | |
| | 55,972 | | | | Affiliated Managers Group, Inc | | | 5,454 | |
| | 85,587 | | | | AG Mortgage Investment Trust | | | 1,363 | |
| | 162,940 | | | | AGF Management Ltd | | | 575 | |
| | 5,175 | | *,m | | AGM Group Holdings, Inc | | | 138 | |
| | 1,004,068 | | | | AGNC Investment Corp | | | 17,611 | |
| | 213,500 | | * | | Aiful Corp | | | 505 | |
| | 29,954 | | | | Aker ASA (A Shares) | | | 1,601 | |
| | 254,461 | | e | | Alaris Royalty Corp | | | 3,167 | |
| | 521,000 | | | | Alexander Forbes Group Holdings Ltd | | | 186 | |
| | 999,486 | | | | Ally Financial, Inc | | | 22,648 | |
| | 811,840 | | * | | Amanat Holdings PJSC | | | 255 | |
| | 3,049,463 | | | | American Express Co | | | 290,675 | |
| | 179,275 | | | | Ameriprise Financial, Inc | | | 18,711 | |
| | 146,779 | | *,e,g | | Amigo Holdings plc | | | 526 | |
| | 3,284,610 | | | | AMP Ltd | | | 5,670 | |
| | 334,737 | | g | | Amundi S.A. | | | 17,698 | |
| | 657,369 | | g | | Anima Holding S.p.A | | | 2,438 | |
| | 1,966,049 | | | | Annaly Capital Management, Inc | | | 19,307 | |
| | 128,087 | | | | Anworth Mortgage Asset Corp | | | 517 | |
| | 19,500 | | | | Anxin Trust Co Ltd | | | 12 | |
| | 156,172 | | | | Apollo Commercial Real Estate Finance, Inc | | | 2,602 | |
COLLEGE RETIREMENT EQUITIES FUND -Stock Account
| SHARES | | | | COMPANY | | VALUE
(000) | |
| | 84,112 | | e | | Arbor Realty Trust, Inc | | $ | 847 | |
| | 226,273 | | | | Ares Commercial Real Estate Corp | | | 2,951 | |
| | 34,522 | | e | | Arlington Asset Investment Corp (Class A) | | | 250 | |
| | 54,121 | | | | ARMOUR Residential REIT, Inc | | | 1,109 | |
| | 119,477 | | e | | Arrow Global Group plc | | | 269 | |
| | 60,271 | | | | Artisan Partners Asset Management, Inc | | | 1,333 | |
| | 1,171 | | *,e | | Ashford, Inc | | | 61 | |
| | 1,669,189 | | | | Ashmore Group plc | | | 7,784 | |
| | 12,981 | | *,†,m | | Asia Pacific Investment Partners Ltd | | | 0 | ^ |
| | 3,825 | | e | | Associated Capital Group, Inc | | | 135 | |
| | 17,565 | | | | Aurelius AG. | | | 639 | |
| | 497,728 | | | | Australian Stock Exchange Ltd | | | 21,031 | |
| | 19,541 | | | | Avanza AB | | | 934 | |
| | 33,800 | | | | Avic Capital Co Ltd | | | 21 | |
| | 2,641,717 | | | | AXA Equitable Holdings, Inc | | | 43,932 | |
| | 76,548 | | * | | Axactor SE | | | 165 | |
| | 586,476 | | | | Ayala Corp | | | 10,027 | |
| | 2,215 | | *,†,m | | Ayala Corp Preferred | | | 0 | ^ |
| | 99,215 | | e | | Azimut Holding S.p.A. | | | 1,087 | |
| | 26,129 | | | | B. Riley Financial, Inc | | | 371 | |
| | 118,386 | | e | | B2Holding ASA | | | 169 | |
| | 1,997,353 | | | | B3 S.A.-Brasil Bolsa Balcao | | | 13,800 | |
| | 177,295 | | | | Bajaj Finance Ltd | | | 6,710 | |
| | 143,559 | | g | | Banca Farmafactoring S.p.A | | | 747 | |
| | 173,345 | | | | Banca Generali S.p.A | | | 3,604 | |
| | 28,964 | | | | Banca IFIS S.p.A. | | | 514 | |
| | 169,162 | | | | Banca Mediolanum S.p.A | | | 986 | |
| | 41,031 | | | | Banco Latinoamericano de Exportaciones S.A. (Class E) | | | 710 | |
| | 2,687,527 | | | | Bank of New York Mellon Corp | | | 126,502 | |
| | 903,986 | | | | BGC Partners, Inc (Class A) | | | 4,674 | |
| | 207,235 | | | | BinckBank NV | | | 1,445 | |
| | 81,252 | | | | BlackRock, Inc | | | 31,917 | |
| | 961,869 | | | | Blackstone Group LP | | | 28,673 | |
| | 159,726 | | e | | Blackstone Mortgage Trust, Inc | | | 5,089 | |
| | 60,980 | | * | | Blucora, Inc | | | 1,624 | |
| | 484,000 | | e | | BOCOM International Holdings Co Ltd | | | 92 | |
| | 328,700 | | e | | Bolsa Mexicana de Valores S.A. de C.V. | | | 560 | |
| | 47,317 | | | | Bolsas y Mercados Espanoles | | | 1,318 | |
| | 216,598 | | *,e | | Brait S.A. | | | 452 | |
| | 494,274 | | | | Brewin Dolphin Holdings plc | | | 2,030 | |
| | 382,000 | | e | | Bright Smart Securities & Commodities Group Ltd | | | 74 | |
| | 1,111,188 | | | | Brookfield Asset Management, Inc | | | 42,585 | |
| | 7,474 | | | | BSE Ltd | | | 64 | |
| | 207,405 | | | | BT Investment Management Ltd | | | 1,166 | |
| | 65,665 | | | | Bure Equity AB | | | 804 | |
| | 462,466 | | | | Burford Capital Ltd | | | 9,756 | |
| | 579,350 | | | | Bursa Malaysia BHD | | | 958 | |
| | 304,941 | | | | Canaccord Financial, Inc | | | 1,289 | |
| | 220,956 | | * | | Cannae Holdings, Inc | | | 3,783 | |
| | 788,326 | | | | Capital One Financial Corp | | | 59,590 | |
| | 1,115,990 | | | | Capital Securities Corp | | | 325 | |
| | 121,168 | | | | Capstead Mortgage Corp | | | 808 | |
| | 175,427 | | | | CBOE Holdings, Inc | | | 17,162 | |
COLLEGE RETIREMENT EQUITIES FUND -Stock Account
| SHARES | | | | COMPANY | | VALUE
(000) | |
| | 54,941 | | | | Cembra Money Bank AG. | | $ | 4,359 | |
| | 109,800 | | | | Century Leasing System, Inc | | | 4,836 | |
| | 127,354 | | | | Cerved Information Solutions S.p.A | | | 1,047 | |
| | 3,095,028 | | | | Chailease Holding Co Ltd | | | 9,762 | |
| | 549,634 | | | | Challenger Financial Services Group Ltd | | | 3,675 | |
| | 15,600 | | | | Changjiang Securities Co Ltd | | | 12 | |
| | 633,097 | | | | Charles Schwab Corp | | | 26,292 | |
| | 20,242 | | | | Cherry Hill Mortgage Investment Corp | | | 355 | |
| | 375,908 | | | | Chimera Investment Corp | | | 6,699 | |
| | 520,000 | | | | China Bills Finance Corp | | | 232 | |
| | 25,988,105 | | | | China Cinda Asset Management Co Ltd | | | 6,299 | |
| | 1,031,125 | | | | China Everbright Ltd | | | 1,828 | |
| | 12,408,545 | | | | China Galaxy Securities Co Ltd | | | 5,604 | |
| | 10,955,000 | | g | | China Huarong Asset Management Co Ltd | | | 2,000 | |
| | 2,022,800 | | g | | China International Capital Corp Ltd | | | 3,788 | |
| | 1,248,000 | | *,e | | China Investment Fund International Holdings Co Ltd | | | 3,354 | |
| | 1,294,000 | | *,e | | China LNG Group Ltd | | | 197 | |
| | 25,800 | | | | China Merchants Securities Co Ltd | | | 50 | |
| | 930,000 | | * | | China Tonghai International Financial Ltd | | | 78 | |
| | 10,464,000 | | * | | Chong Sing Holdings FinTech Gr | | | 133 | |
| | 547,323 | | e | | CI Financial Corp | | | 6,928 | |
| | 2,527,915 | | | | CITIC Securities Co Ltd | | | 4,354 | |
| | 153,800 | | | | CITIC Securities Co Ltd (Class A) | | | 362 | |
| | 5,214,355 | | | | ClearView Wealth Ltd | | | 3,310 | |
| | 434,716 | | | | Close Brothers Group plc | | | 7,978 | |
| | 89,337 | | g | | CMC Markets plc | | | 120 | |
| | 778,896 | | | | CME Group, Inc | | | 146,526 | |
| | 277,809 | | | | Coface S.A. | | | 2,525 | |
| | 27,937 | | | | Cohen & Steers, Inc | | | 959 | |
| | 106,361 | | e | | Colony Credit Real Estate, Inc | | | 1,679 | |
| | 1,178,800 | | | | Concentradora Hipotecaria SAPI de C.V. | | | 842 | |
| | 166,015 | | | | Coronation Fund Managers Ltd | | | 477 | |
| | 9,494 | | | | Corp Financiera Alba | | | 463 | |
| | 188,169 | | * | | Corp Financiera Colombiana S.A. | | | 950 | |
| | 107,821 | | *,e | | Cowen Group, Inc | | | 1,438 | |
| | 34,063 | | *,† | | Cox & Kings Ltd | | | 32 | |
| | 69,503 | | * | | Credit Acceptance Corp | | | 26,533 | |
| | 22,917 | | * | | Credit Analysis & Research Ltd | | | 324 | |
| | 38,249 | | e | | Credit Corp Group Ltd | | | 506 | |
| | 88,042 | | | | Credit Saison Co Ltd | | | 1,032 | |
| | 8,870,255 | | | | Credit Suisse Group | | | 96,967 | |
| | 175,351 | | | | Credito Real SAB de C.V. | | | 158 | |
| | 25,782 | | | | CRISIL Ltd | | | 596 | |
| | 15,941 | | * | | Curo Group Holdings Corp | | | 151 | |
| | 413,112 | | | | Daewoo Securities Co Ltd | | | 2,425 | |
| | 51,842 | | | | Daishin Securities Co Ltd | | | 527 | |
| | 13,887 | | | | Daishin Securities Co Ltd PF | | | 108 | |
| | 1,650,675 | | | | Daiwa Securities Group, Inc | | | 8,378 | |
| | 10,212 | | | | Daou Data Corp | | | 86 | |
| | 116,902 | | | | Daou Technology, Inc | | | 1,978 | |
| | 281,032 | | * | | DeA Capital S.p.A. | | | 402 | |
| | 392,316 | | | | Deutsche Bank AG. (Registered) | | | 3,129 | |
COLLEGE RETIREMENT EQUITIES FUND -Stock Account
| SHARES | | | | COMPANY | | VALUE
(000) | |
| | 7,871 | | | | Deutsche Beteiligungs AG. | | $ | 303 | |
| | 222,724 | | | | Deutsche Boerse AG. | | | 26,628 | |
| | 6,060 | | | | Diamond Hill Investment Group, Inc | | | 906 | |
| | 1,155,000 | | * | | Dingyi Group Investment Ltd | | | 85 | |
| | 397,638 | | | | Discover Financial Services | | | 23,453 | |
| | 25,769 | | g | | doBank S.p.A | | | 273 | |
| | 42,776 | | * | | Donnelley Financial Solutions, Inc | | | 600 | |
| | 1,276,349 | | | | Dubai Financial Market | | | 277 | |
| | 138,940 | | *,g | | DWS Group GmbH & Co KGaA | | | 3,722 | |
| | 79,882 | | | | Dynex Capital, Inc | | | 457 | |
| | 3,349,747 | | | | E*TRADE Financial Corp | | | 146,987 | |
| | 192,451 | | | | Eaton Vance Corp | | | 6,770 | |
| | 196,197 | | | | Eclipx Group Ltd | | | 336 | |
| | 194,022 | | | | ECN Capital Corp | | | 490 | |
| | 619,624 | | | | Edelweiss Capital Ltd | | | 1,615 | |
| | 7,764 | | | | EFG Financial Products Holding AG. | | | 325 | |
| | 98,840 | | | | EFG International | | | 579 | |
| | 15,800 | | e | | eGuarantee, Inc | | | 141 | |
| | 323,975 | | * | | Egyptian Financial Group-Hermes Holding | | | 275 | |
| | 471,389 | | e | | Element Financial Corp | | | 2,386 | |
| | 25,361 | | *,e | | Elevate Credit, Inc | | | 114 | |
| | 2,022,000 | | | | Emperor Capital Group Ltd | | | 92 | |
| | 33,796 | | *,e | | Encore Capital Group, Inc | | | 794 | |
| | 292,228 | | * | | Enova International, Inc | | | 5,687 | |
| | 250,858 | | * | | Equitas Holdings Ltd | | | 449 | |
| | 13,749 | | | | Eurazeo | | | 973 | |
| | 1,744,371 | | g | | Euronext NV | | | 100,506 | |
| | 13,100 | | | | Everbright Securities Co Ltd | | | 17 | |
| | 82,241 | | | | Evercore Partners, Inc (Class A) | | | 5,885 | |
| | 217,984 | | | | Exantas Capital Corp | | | 2,184 | |
| | 198,254 | | | | EXOR NV | | | 10,763 | |
| | 64,301 | | * | | Ezcorp, Inc (Class A) | | | 497 | |
| | 31,299 | | | | Factset Research Systems, Inc | | | 6,264 | |
| | 5,074,276 | | | | Far East Horizon Ltd | | | 5,119 | |
| | 124,308 | | | | Federated Investors, Inc (Class B) | | | 3,300 | |
| | 386,952 | | * | | FGL Holdings | | | 2,577 | |
| | 30,480 | | | | Fiera Capital Corp | | | 252 | |
| | 42,200 | | | | Financial Products Group Co Ltd | | | 431 | |
| | 6,937 | | * | | FinTech Group AG. | | | 134 | |
| | 12,500 | | | | First Capital Securities Co Ltd | | | 10 | |
| | 2,968,500 | | | | First Pacific Co | | | 1,150 | |
| | 173,325 | | | | FirstCash, Inc | | | 12,540 | |
| | 3,526,081 | | | | FirstRand Ltd | | | 16,061 | |
| | 158,310 | | | | FlexiGroup Ltd | | | 151 | |
| | 300,223 | | e,g | | Flow Traders | | | 9,583 | |
| | 25,182 | | * | | Focus Financial Partners, Inc | | | 663 | |
| | 27,400 | | | | Founder Securities Co Ltd | | | 21 | |
| | 222,894 | | | | Franklin Resources, Inc | | | 6,611 | |
| | 7,616,461 | | | | Fubon Financial Holding Co Ltd | | | 11,686 | |
| | 39,619,242 | | | | Fuhwa Financial Holdings Co Ltd | | | 19,918 | |
| | 16,000 | | | | Fuyo General Lease Co Ltd | | | 815 | |
| | 32,957 | | e | | Gain Capital Holdings, Inc | | | 203 | |
| | 6,173 | | | | GAMCO Investors, Inc (Class A) | | | 104 | |
| | 4,405,200 | | e | | Gentera SAB de C.V. | | | 3,246 | |
COLLEGE RETIREMENT EQUITIES FUND -Stock Account
| SHARES | | | | COMPANY | | VALUE
(000) | |
| | 24,884 | | * | | Georgia Capital plc | | $ | 324 | |
| | 2,635,600 | | | | GF Securities Co Ltd | | | 3,569 | |
| | 136,000 | | | | GF Securities Co Ltd (Class A) | | | 252 | |
| | 12,613 | | | | Gimv NV | | | 678 | |
| | 29,800 | | | | GMO Financial Holdings, Inc | | | 154 | |
| | 1,308,762 | | | | Goldman Sachs Group, Inc | | | 218,629 | |
| | 108,501 | | | | Granite Point Mortgage Trust, Inc | | | 1,956 | |
| | 20,109 | | | | Great Ajax Corp | | | 242 | |
| | 146,833 | | * | | Green Dot Corp | | | 11,676 | |
| | 23,528 | | e | | Greenhill & Co, Inc | | | 574 | |
| | 15,868 | | | | GRENKELEASING AG. | | | 1,353 | |
| | 77,011 | | | | Groupe Bruxelles Lambert S.A. | | | 6,711 | |
| | 410,274 | | | | Grupo de Inversiones Suramericana S.A. | | | 4,058 | |
| | 211,667 | | | | Grupo de Inversiones Suramericana S.A. (Preference) | | | 2,026 | |
| | 16,130 | | | | Gruppo MutuiOnline S.p.A | | | 293 | |
| | 95,445 | | | | GT Capital Holdings, Inc | | | 1,769 | |
| | 12,700 | | | | Guosen Securities Co Ltd | | | 16 | |
| | 8,637,800 | | e | | Guotai Junan International Hol | | | 1,389 | |
| | 36,700 | | | | Guotai Junan Securities Co Ltd | | | 82 | |
| | 1,367,200 | | g | | Guotai Junan Securities Co Ltd (Hong Kong) | | | 2,758 | |
| | 15,000 | | | | Guoyuan Securities Co Ltd | | | 15 | |
| | 2,288,559 | | | | Haci Omer Sabanci Holding AS | | | 3,247 | |
| | 5,901,362 | | | | Haitong Securities Co Ltd | | | 5,635 | |
| | 137,700 | | | | Haitong Securities Co Ltd (Class A) | | | 177 | |
| | 19,784 | | | | Hamilton Lane, Inc | | | 732 | |
| | 9,069 | | | | Hankook Tire Worldwide Co Ltd | | | 135 | |
| | 69,990 | | * | | Hanwha Securities Co | | | 128 | |
| | 702,011 | | | | Hargreaves Lansdown plc | | | 16,557 | |
| | 39,290 | | | | Hellenic Exchanges S.A. | | | 166 | |
| | 107,900 | | | | Hitachi Capital Corp | | | 2,269 | |
| | 40,488 | | e,g | | Hoist Finance AB | | | 198 | |
| | 1,531,295 | | | | Hong Kong Exchanges and Clearing Ltd | | | 44,267 | |
| | 68,284 | | | | Houlihan Lokey, Inc | | | 2,513 | |
| | 4,680,200 | | e,g | | Huatai Securities Co Ltd | | | 7,403 | |
| | 100,516 | | | | Huatai Securities Co Ltd (Class A) | | | 238 | |
| | 32,873 | | | | HUB24 Ltd | | | 275 | |
| | 2,715 | | * | | Hypoport AG. | | | 460 | |
| | 60,600 | | | | IBJ Leasing Co Ltd | | | 1,333 | |
| | 26,100 | | | | Ichiyoshi Securities Co Ltd | | | 191 | |
| | 38,012 | | g | | ICICI Securities Ltd | | | 141 | |
| | 365,175 | | * | | IFCI Ltd | | | 78 | |
| | 2,181,471 | | | | IG Group Holdings plc | | | 15,860 | |
| | 121,117 | | e | | IGM Financial, Inc | | | 2,753 | |
| | 147,442 | | * | | India Infoline Ltd | | | 1,064 | |
| | 1,898,731 | | | | Indiabulls Housing Finance Ltd | | | 23,193 | |
| | 160,363 | | | | Indiabulls Securities Ltd | | | 887 | |
| | 38,140 | | *,g | | Indian Energy Exchange Ltd | | | 91 | |
| | 28,200 | | | | Industrial Securities Co Ltd | | | 19 | |
| | 53,342 | | | | Industrivarden AB | | | 1,080 | |
| | 625,533 | | * | | Infrastructure Development Finance Co Ltd | | | 390 | |
| | 129,325 | | * | | IntegraFin Holdings plc | | | 506 | |
| | 130,237 | | | | Interactive Brokers Group, Inc (Class A) | | | 7,117 | |
COLLEGE RETIREMENT EQUITIES FUND -Stock Account
| SHARES | | | | COMPANY | | VALUE
(000) | |
| | 749,141 | | | | IntercontinentalExchange Group, Inc | | $ | 56,433 | |
| | 615,371 | | | | Intermediate Capital Group plc | | | 7,340 | |
| | 139,055 | | | | International Personal Finance plc | | | 364 | |
| | 61,747 | | * | | INTL FCStone, Inc | | | 2,259 | |
| | 147,728 | | | | Inversiones La Construccion S.A. | | | 2,374 | |
| | 260,405 | | | | Invesco Ltd | | | 4,359 | |
| | 146,237 | | | | Invesco Mortgage Capital, Inc | | | 2,117 | |
| | 948,211 | | | | Investec Ltd | | | 5,180 | |
| | 112,440 | | | | Investec plc | | | 632 | |
| | 34,007 | | | | Investment AB Kinnevik (B Shares) | | | 823 | |
| | 17,754 | | * | | Investment AB Oresund | | | 260 | |
| | 141,239 | | | | Investment Technology Group, Inc | | | 4,271 | |
| | 167,538 | | e | | Investor AB (B Shares) | | | 7,119 | |
| | 275,619 | | e | | IOOF Holdings Ltd | | | 1,005 | |
| | 20,000 | | e | | iShares Dow Jones US Financial Services Index Fund | | | 2,245 | |
| | 68,767 | | | | iShares MSCI Canada Index Fund | | | 1,648 | |
| | 326,858 | | e | | iShares MSCI EAFE Index Fund | | | 19,213 | |
| | 205,900 | | | | iShares MSCI Emerging Markets | | | 8,042 | |
| | 175,332 | | e | | iShares Russell 1000 Value Index Fund | | | 19,471 | |
| | 24,000 | | e | | iShares Russell Midcap Growth Index Fund | | | 2,729 | |
| | 41,000 | | e | | J Trust Co Ltd | | | 151 | |
| | 19,900 | | | | Jaccs Co Ltd | | | 322 | |
| | 112,617 | | | | Jafco Co Ltd | | | 3,567 | |
| | 23,500 | | e | | Japan Investment Adviser Co Ltd | | | 661 | |
| | 1,582,200 | | | | Japan Securities Finance Co Ltd | | | 7,935 | |
| | 547,461 | | | | Jefferies Financial Group, Inc | | | 9,504 | |
| | 918,193 | | | | Jih Sun Financial Holdings Co Ltd | | | 258 | |
| | 389,886 | | | | JM Financial Ltd | | | 523 | |
| | 219,111 | | | | JSE Ltd | | | 2,521 | |
| | 65,519 | | | | Julius Baer Group Ltd | | | 2,335 | |
| | 102,668 | | | | Julius Baer Holding AG. | | | 405 | |
| | 1,219,570 | | | | Jupiter Investment Management Group Ltd | | | 4,587 | |
| | 296,500 | | | | kabu.com Securities Co Ltd | | | 1,018 | |
| | 49,817 | | | | KBC Ancora | | | 2,124 | |
| | 7,774 | | | | KIWOOM Securities Co Ltd | | | 547 | |
| | 302,766 | | | | KKR Real Estate Finance Trust, Inc | | | 5,798 | |
| | 45,143 | | | | Korea Investment Holdings Co Ltd | | | 2,414 | |
| | 11,648 | | | | KRUK S.A. | | | 488 | |
| | 147,751 | | | | Kumho Investment Bank | | | 100 | |
| | 11,979 | | | | Kyobo Securities Co | | | 98 | |
| | 14,000 | | | | Kyokuto Securities Co Ltd | | | 149 | |
| | 624,521 | | | | Ladder Capital Corp | | | 9,661 | |
| | 471,574 | | | | Ladenburg Thalmann Financial Services, Inc | | | 1,099 | |
| | 428,321 | | | | Lazard Ltd (Class A) | | | 15,809 | |
| | 98,658 | | | | Legg Mason, Inc | | | 2,517 | |
| | 396,808 | | * | | LendingClub Corp | | | 1,044 | |
| | 699,009 | | | | London Stock Exchange Group plc | | | 36,265 | |
| | 397,701 | | | | LPL Financial Holdings, Inc | | | 24,292 | |
| | 75,740 | | | | Lundbergs AB (B Shares) | | | 2,237 | |
| | 4,300 | | *,e | | M&A Capital Partners Co Ltd | | | 148 | |
| | 366,764 | | | | Macquarie Group Ltd | | | 28,093 | |
| | 508,477 | | | | Magellan Financial Group Ltd | | | 8,437 | |
| | 180,492 | | | | Magma Fincorp Ltd | | | 284 | |
COLLEGE RETIREMENT EQUITIES FUND -Stock Account
| SHARES | | | | COMPANY | | VALUE
(000) | |
| | 325,745 | | * | | Mahindra & Mahindra Financial Services Ltd | | $ | 2,208 | |
| | 14,024,278 | | | | Man Group plc | | | 23,761 | |
| | 1,047,259 | | | | Manappuram General Finance & Leasing Ltd | | | 1,394 | |
| | 60,406 | | | | MarketAxess Holdings, Inc | | | 12,764 | |
| | 10,557 | | | | Marlin Business Services Corp | | | 236 | |
| | 34,100 | | | | Marusan Securities Co Ltd | | | 238 | |
| | 245,900 | | | | Matsui Securities Co Ltd | | | 2,583 | |
| | 76,224 | | | | Meritz finance Holdings Co Ltd | | | 791 | |
| | 774,300 | | | | Meritz Securities Co Ltd | | | 2,971 | |
| | 33,393,906 | | | | Metro Pacific Investments Corp | | | 2,939 | |
| | 1,495,044 | | | | MFA Mortgage Investments, Inc | | | 9,987 | |
| | 478,807 | | | | Mitsubishi UFJ Lease & Finance Co Ltd | | | 2,295 | |
| | 37,677 | | | | MLP AG. | | | 190 | |
| | 57,062 | | | | Moelis & Co | | | 1,962 | |
| | 24,847 | | | | Moelis Australia Ltd | | | 80 | |
| | 728,000 | | e | | Monex Beans Holdings, Inc | | | 2,436 | |
| | 259,368 | | | | Moody’s Corp | | | 36,322 | |
| | 4,058,786 | | | | Morgan Stanley | | | 160,931 | |
| | 53,915 | | | | Morningstar, Inc | | | 5,922 | |
| | 46,933 | | | | Motilal Oswal Financial Services Ltd | | | 450 | |
| | 160,872 | | | | MSCI, Inc (Class A) | | | 23,717 | |
| | 602,800 | | | | Muangthai Capital PCL | | | 908 | |
| | 712,891 | | * | | Multi Commodity Exchange of India Ltd | | | 7,500 | |
| | 165,920 | | * | | Muthoot Finance Ltd | | | 1,225 | |
| | 217,573 | | | | NASDAQ OMX Group, Inc | | | 17,747 | |
| | 491,240 | | | | Natixis | | | 2,317 | |
| | 494,513 | | | | Navient Corp | | | 4,357 | |
| | 149,592 | | | | Navigator Global Investments Ltd | | | 443 | |
| | 5,500 | | | | NEC Capital Solutions Ltd | | | 77 | |
| | 23,383 | | | | Nelnet, Inc (Class A) | | | 1,224 | |
| | 53,233 | | | | Netwealth Group Ltd | | | 283 | |
| | 762,250 | | | | New Residential Investment Corp | | | 10,832 | |
| | 197,020 | | | | New York Mortgage Trust, Inc | | | 1,160 | |
| | 56,823 | | *,m | | NewStar Financial, Inc | | | 15 | |
| | 10,434 | | | | NICE Holdings Co Ltd | | | 168 | |
| | 49,700 | | *,e | | Noah Holdings Ltd (ADR) | | | 2,153 | |
| | 985,210 | | | | Nomura Holdings, Inc | | | 3,734 | |
| | 140,590 | | | | Northern Trust Corp | | | 11,752 | |
| | 274,150 | | | | Numis Corp plc | | | 835 | |
| | 3,417,866 | | | | NZX Ltd | | | 2,319 | |
| | 86,300 | | | | Okasan Holdings, Inc | | | 383 | |
| | 1,182,098 | | | | OM Asset Management plc | | | 12,625 | |
| | 541,745 | | * | | On Deck Capital, Inc | | | 3,196 | |
| | 439,421 | | * | | OneMain Holdings, Inc | | | 10,674 | |
| | 141,944 | | | | Onex Corp | | | 7,730 | |
| | 500,000 | | e | | OP Financial Investments Ltd | | | 187 | |
| | 12,159 | | | | Oppenheimer Holdings, Inc | | | 311 | |
| | 72,995 | | e | | Orchid Island Capital, Inc | | | 466 | |
| | 320,400 | | e | | Orient Corp | | | 390 | |
| | 16,900 | | | | Orient Securities Co Ltd | | | 20 | |
| | 600,000 | | g | | Orient Securities Co Ltd | | | 376 | |
| | 3,997,443 | | | | ORIX Corp | | | 58,410 | |
| | 410,212 | | | | Osaka Securities Exchange Co Ltd | | | 6,617 | |
COLLEGE RETIREMENT EQUITIES FUND -Stock Account
| SHARES | | | | COMPANY | | VALUE
(000) | |
| | 641,851 | | | | OzForex Group Ltd | | $ | 792 | |
| | 48,470 | | | | P2P Global Investments plc | | | 495 | |
| | 17,782 | | | | Pargesa Holding S.A. | | | 1,282 | |
| | 20,767 | | e | | Partners Group | | | 12,633 | |
| | 75,102 | | | | PennyMac Mortgage Investment Trust | | | 1,398 | |
| | 845,910 | | | | Peregrine Holdings Ltd | | | 1,104 | |
| | 517,000 | | *,† | | Peregrine Investment Holdings | | | 0 | |
| | 62,134 | | | | Perpetual Trustees Australia Ltd | | | 1,422 | |
| | 28,592 | | * | | Pico Holdings, Inc | | | 261 | |
| | 370,563 | | | | Pinnacle Investment Management Group Ltd | | | 1,146 | |
| | 227,049 | | * | | Pioneers Holding | | | 78 | |
| | 18,541 | | | | Piper Jaffray Cos | | | 1,221 | |
| | 25,999 | | | | PJT Partners, Inc | | | 1,008 | |
| | 286,609 | | e | | Platinum Asset Mangement Ltd | | | 982 | |
| | 927,627 | | | | Plus500 Ltd | | | 16,198 | |
| | 843,600 | | * | | Pool Advista Indonesia Tbk PT | | | 298 | |
| | 1,913,060 | | | | Power Finance Corp Ltd | | | 2,940 | |
| | 57,023 | | * | | PRA Group, Inc | | | 1,390 | |
| | 489,082 | | | | President Securities Corp | | | 183 | |
| | 157,961 | | | | Provident Financial plc | | | 1,157 | |
| | 122,818 | | | | PSG Group Ltd | | | 2,082 | |
| | 7,728,600 | | * | | PT Kresna Graha Investama Tbk | | | 352 | |
| | 135,772 | | | | Pzena Investment Management, Inc (Class A) | | | 1,174 | |
| | 7,683,019 | | g | | Quilter plc | | | 11,584 | |
| | 581,375 | | | | Ratchthani Leasing PCL | | | 133 | |
| | 56,935 | | | | Rathbone Brothers | | | 1,699 | |
| | 140,635 | | e | | Ratos AB (B Shares) | | | 370 | |
| | 233,512 | | | | Raymond James Financial, Inc | | | 17,376 | |
| | 23,098 | | | | Ready Capital Corp | | | 319 | |
| | 103,474 | | | | Redwood Trust, Inc | | | 1,559 | |
| | 72,419 | | * | | Regional Management Corp | | | 1,742 | |
| | 186,911 | | | | Reinet Investments S.C.A | | | 2,838 | |
| | 699,540 | | * | | Reliance Capital Ltd | | | 2,298 | |
| | 832,616 | | | | Remgro Ltd | | | 11,268 | |
| | 40,716 | | * | | Repco Home Finance Ltd | | | 232 | |
| | 2,179,356 | | g | | Resurs Holding AB | | | 13,454 | |
| | 10,800 | | | | Ricoh Leasing Co Ltd | | | 322 | |
| | 1,252,908 | | | | RMB Holdings Ltd | | | 6,864 | |
| | 1,968,635 | | | | Rural Electrification Corp Ltd | | | 3,442 | |
| | 632,478 | | | | S&P Global, Inc | | | 107,483 | |
| | 29,559 | | * | | Safeguard Scientifics, Inc | | | 255 | |
| | 22,590 | | | | Samsung Card Co | | | 698 | |
| | 72,149 | | | | Samsung Securities Co Ltd | | | 2,040 | |
| | 89,009 | | | | Sanne Group plc | | | 659 | |
| | 569,594 | | | | Santander Consumer USA Holdings, Inc | | | 10,019 | |
| | 244,200 | | | | Sawada Holdings Co Ltd | | | 2,057 | |
| | 279,514 | | | | SBI Holdings, Inc | | | 5,451 | |
| | 22,881 | | | | Schroders plc | | | 713 | |
| | 330,601 | | | | SEI Investments Co | | | 15,274 | |
| | 5 | | *,† | | SFCG Co Ltd | | | 0 | |
| | 11,600 | | | | Shanxi Securities Co Ltd | | | 10 | |
| | 94,000 | | *,e | | Sheng Ye Capital Ltd | | | 81 | |
| | 74,200 | | | | Shenwan Hongyuan Group Co Ltd | | | 44 | |
| | 398 | | | | Shinyoung Securities Co Ltd | | | 21 | |
COLLEGE RETIREMENT EQUITIES FUND -Stock Account
| SHARES | | | | COMPANY | | VALUE
(000) | |
| | 316,160 | | | | Shriram Transport Finance Co Ltd | | $ | 5,612 | |
| | 10,300 | | *,e | | Siebert Financial Corp | | | 149 | |
| | 9,962 | | | | Silvercrest Asset Management Group, Inc | | | 132 | |
| | 1,477,530 | | | | Singapore Exchange Ltd | | | 7,743 | |
| | 13,400 | | | | Sinolink Securities Co Ltd | | | 14 | |
| | 112,421 | | * | | SKS Microfinance Pvt Ltd | | | 1,630 | |
| | 7,490,000 | | *,e | | Skyway Securities Group Ltd | | | 310 | |
| | 817,327 | | * | | SLM Corp | | | 6,792 | |
| | 768,475 | | *,†,e,m | | SNS Reaal | | | 9 | |
| | 23,962,257 | | | | Sociedad de Inversiones Oro Blanco S.A. | | | 152 | |
| | 10,642 | | | | Societe Fonciere Financiere et de Participations FFP | | | 978 | |
| | 15,514 | | | | Sofina S.A. | | | 2,947 | |
| | 9,900 | | | | SooChow Securities Co Ltd | | | 10 | |
| | 61,500 | | | | Sparx Group Co Ltd | | | 103 | |
| | 12,500 | | e | | SPDR Trust Series 1 | | | 3,124 | |
| | 408,907 | | e | | Sprott, Inc | | | 770 | |
| | 350,950 | | | | Srisawad Corp PCL | | | 486 | |
| | 626,647 | | | | St. James’s Place plc | | | 7,547 | |
| | 2,177,732 | | | | Standard Life Aberdeen plc | | | 7,131 | |
| | 1,686,926 | | | | State Street Corp | | | 106,394 | |
| | 204,788 | | | | Stifel Financial Corp | | | 8,482 | |
| | 4,800 | | e | | Strike Co Ltd | | | 70 | |
| | 5,048,000 | | | | Sun Hung Kai & Co Ltd | | | 2,385 | |
| | 33,189 | | | | Sundaram Finance Ltd | | | 684 | |
| | 72,844 | | | | Swissquote Group Holding S.A. | | | 3,370 | |
| | 1,566,106 | | | | Synchrony Financial | | | 36,741 | |
| | 174,792 | | | | T Rowe Price Group, Inc | | | 16,137 | |
| | 2,765,193 | | e | | Tai Fook Securities Group Ltd | | | 867 | |
| | 647,000 | | | | Taiwan Acceptance Corp | | | 1,904 | |
| | 68,164 | | | | Tamburi Investment Partners S.p.A. | | | 449 | |
| | 8,197 | | * | | Tata Investment Corp Ltd | | | 105 | |
| | 195,682 | | | | TD Ameritrade Holding Corp | | | 9,581 | |
| | 44,218 | | | | TMX Group Ltd | | | 2,291 | |
| | 327,180 | | | | Tokai Tokyo Securities Co Ltd | | | 1,397 | |
| | 51,744 | | * | | Tong Yang Investment Bank | | | 146 | |
| | 45,673 | | | | TPG RE Finance Trust, Inc | | | 835 | |
| | 365,341 | | e | | Tullett Prebon plc | | | 1,402 | |
| | 450,746 | | | | Two Harbors Investment Corp | | | 5,788 | |
| | 2,799,542 | | | | UBS AG. | | | 34,919 | |
| | 637,700 | | e | | Unifin Financiera SAPI de C.V. SOFOM ENR | | | 1,364 | |
| | 1,143,432 | | | | UOB-Kay Hian Holdings Ltd | | | 983 | |
| | 385,676 | | * | | Uranium Participation Corp | | | 1,266 | |
| | 7,900 | | *,e | | Uzabase, Inc | | | 119 | |
| | 1,797 | | m | | Value Line, Inc | | | 47 | |
| | 656,000 | | | | Value Partners Group Ltd | | | 455 | |
| | 25,000 | | e | | Vanguard FTSE Developed Markets ETF | | | 927 | |
| | 18,551 | | | | Verusa Holding AS. | | | 58 | |
| | 159,754 | | | | Virtu Financial, Inc | | | 4,115 | |
| | 8,746 | | | | Virtus Investment Partners, Inc | | | 695 | |
| | 13,676 | | | | Volati AB | | | 51 | |
| | 52,891 | | | | Vontobel Holding AG. | | | 2,714 | |
| | 4,270,745 | | | | Voya Financial, Inc | | | 171,428 | |
| | 2,202 | | | | VZ Holding AG. | | | 595 | |
COLLEGE RETIREMENT EQUITIES FUND -Stock Account
| SHARES | | | | COMPANY | | VALUE
(000) | |
| | 98,892 | | e | | Waddell & Reed Financial, Inc (Class A) | | $ | 1,788 | |
| | 113,130 | | | | Warsaw Stock Exchange | | | 1,109 | |
| | 1,871,637 | | | | Waterland Financial Holdings | | | 580 | |
| | 37,221 | | | | Wendel | | | 4,465 | |
| | 54,362 | | | | Western Asset Mortgage Capital Corp | | | 453 | |
| | 16,700 | | | | Western Securities Co Ltd | | | 19 | |
| | 34,402 | | | | Westwood Holdings Group, Inc | | | 1,170 | |
| | 151,825 | | | | WisdomTree Investments, Inc | | | 1,010 | |
| | 273,612 | | | | Woori Investment & Securities Co Ltd | | | 3,207 | |
| | 8,570 | | * | | World Acceptance Corp | | | 876 | |
| | 13,700 | | e | | Yintech Investment Holdings Ltd (ADR) | | | 84 | |
| | 6,800 | | e | | Yirendai Ltd (ADR) | | | 73 | |
| | 689,974 | | | | Zeder Investments Ltd | | | 214 | |
| | 150,600 | | | | Zenkoku Hosho Co Ltd | | | 4,723 | |
| | | | | | TOTAL DIVERSIFIED FINANCIALS | | | 3,674,024 | |
| | | | | | | | | | |
| ENERGY - 5.6% | | | | |
| | 221,883 | | * | | Abraxas Petroleum Corp | | | 242 | |
| | 2,419 | | | | Adams Resources & Energy, Inc | | | 94 | |
| | 16,680,804 | | | | Adaro Energy Tbk | | | 1,411 | |
| | 110,231 | | * | | Advantage Oil & Gas Ltd | | | 160 | |
| | 45,655 | | | | Aegis Logistics Ltd | | | 133 | |
| | 12,835,000 | | e | | Agritrade Resources Ltd | | | 2,213 | |
| | 82,624 | | * | | Akastor ASA | | | 125 | |
| | 347,642 | | | | Aker BP ASA | | | 8,765 | |
| | 111,406 | | * | | Aker Solutions ASA | | | 511 | |
| | 134,551 | | *,e | | Alta Mesa Resources, Inc | | | 135 | |
| | 1,276,259 | | | | Anadarko Petroleum Corp | | | 55,951 | |
| | 136,863 | | * | | Antero Resources Corp | | | 1,285 | |
| | 1,326,000 | | * | | Anton Oilfield Services Group | | | 132 | |
| | 100,000 | | e | | AOC Holdings, Inc | | | 268 | |
| | 601,548 | | | | Apache Corp | | | 15,791 | |
| | 596,377 | | * | | Apergy Corp | | | 16,150 | |
| | 278,231 | | *,e,m | | Approach Resources, Inc | | | 243 | |
| | 580,407 | | e | | ARC Resources Ltd | | | 3,444 | |
| | 125,643 | | | | Arch Coal, Inc | | | 10,427 | |
| | 717,372 | | | | Archrock, Inc | | | 5,373 | |
| | 45,656 | | * | | Ardmore Shipping Corp | | | 213 | |
| | 285,746 | | *,e | | Athabasca Oil Corp | | | 207 | |
| | 802,637 | | | | Baker Hughes a GE Co | | | 17,257 | |
| | 1,505,600 | | | | Bangchak Corp PCL | | | 1,468 | |
| | 2,262,010 | | | | Banpu PCL (Foreign) | | | 1,029 | |
| | 56,660 | | * | | Basic Energy Services, Inc | | | 218 | |
| | 349,258 | | * | | Baytex Energy Trust | | | 617 | |
| | 2,612,439 | | | | Beach Petroleum Ltd | | | 2,468 | |
| | 18,318 | | e | | Berry Petroleum Co LLC | | | 160 | |
| | 827,142 | | | | Bharat Petroleum Corp Ltd | | | 4,302 | |
| | 159,768 | | | | Birchcliff Energy Ltd | | | 356 | |
| | 71,589 | | * | | Bonanza Creek Energy, Inc | | | 1,480 | |
| | 363,468 | | e | | Bonavista Energy Trust | | | 319 | |
| | 192,870 | | e | | Bonterra Oil & Gas Ltd | | | 913 | |
| | 259,749 | | *,e | | Borr Drilling Ltd | | | 643 | |
| | 16,142 | | *,e,m | | Bourbon S.A. | | | 63 | |
| | 16,215,934 | | | | BP plc | | | 102,512 | |
COLLEGE RETIREMENT EQUITIES FUND -Stock Account
| SHARES | | | | COMPANY | | VALUE
(000) | |
| | 651,685 | | | | BP plc (ADR) | | $ | 24,712 | |
| | 4,650,000 | | *,†,e,m | | Brightoil Petroleum Holdings Ltd | | | 891 | |
| | 56,769 | | *,e | | Bristow Group, Inc | | | 138 | |
| | 1,734,100 | | * | | Bumi Armada BHD | | | 65 | |
| | 50,594 | | *,e,g | | BW LPG Ltd | | | 152 | |
| | 225,041 | | *,e | | BW Offshore Ltd | | | 822 | |
| | 158,812 | | * | | C&J Energy Services, Inc | | | 2,144 | |
| | 1,689,748 | | | | Cabot Oil & Gas Corp | | | 37,766 | |
| | 111,718 | | * | | Cactus, Inc | | | 3,062 | |
| | 383,166 | | * | | Cairn Energy plc | | | 731 | |
| | 43,571 | | *,e | | Calfrac Well Services Ltd | | | 78 | |
| | 151,878 | | * | | California Resources Corp | | | 2,588 | |
| | 352,549 | | *,e | | Callon Petroleum Co | | | 2,288 | |
| | 266,750 | | | | Caltex Australia Ltd | | | 4,786 | |
| | 235,473 | | | | Cameco Corp (Toronto) | | | 2,670 | |
| | 507,805 | | *,e | | Canacol Energy Ltd | | | 1,503 | |
| | 1,547,268 | | | | Canadian Natural Resources Ltd (Canada) | | | 37,333 | |
| | 30,058 | | *,e | | CARBO Ceramics, Inc | | | 105 | |
| | 74,122 | | e | | Cardinal Energy Ltd | | | 121 | |
| | 113,778 | | * | | Carrizo Oil & Gas, Inc | | | 1,285 | |
| | 1,812,074 | | | | Cenovus Energy, Inc | | | 12,739 | |
| | 1,720,088 | | | | Cenovus Energy, Inc (Toronto) | | | 12,096 | |
| | 326,695 | | *,e | | Centennial Resource Development, Inc | | | 3,600 | |
| | 161,624 | | e | | CES Energy Solutions Corp | | | 373 | |
| | 1,820,428 | | | | CGG S.A. | | | 2,402 | |
| | 840,229 | | * | | Cheniere Energy, Inc | | | 49,733 | |
| | 161,425 | | * | | Chennai Petroleum Corp Ltd | | | 686 | |
| | 421,869 | | *,e | | Chesapeake Energy Corp | | | 886 | |
| | 6,366,850 | | | | Chevron Corp | | | 692,650 | |
| | 160,400 | | | | China Aviation Oil Singapore Corp Ltd | | | 125 | |
| | 3,120,000 | | | | China Coal Energy Co | | | 1,227 | |
| | 2,395,826 | | | | China Oilfield Services Ltd | | | 2,062 | |
| | 209,800 | | | | China Shenhua Energy Co Ltd | | | 550 | |
| | 8,163,795 | | | | China Shenhua Energy Co Ltd (Hong Kong) | | | 17,805 | |
| | 10,774,000 | | | | China Suntien Green Energy Cor | | | 2,778 | |
| | 162,483 | | | | Cimarex Energy Co | | | 10,017 | |
| | 1,677,217 | | * | | Clean Energy Fuels Corp | | | 2,885 | |
| | 31,043,446 | | | | CNOOC Ltd | | | 47,817 | |
| | 384,180 | | * | | CNX Resources Corp | | | 4,387 | |
| | 1,191,949 | | | | Coal India Ltd | | | 4,109 | |
| | 118 | | *,†,b,m | | Cobalt International Energy, Inc | | | 0 | ^ |
| | 52,174 | | e | | Computer Modelling Group Ltd | | | 233 | |
| | 2,116,953 | | * | | Concho Resources, Inc | | | 217,602 | |
| | 1,610,493 | | | | ConocoPhillips | | | 100,414 | |
| | 220,033 | | * | | CONSOL Energy, Inc | | | 6,977 | |
| | 644,659 | | * | | Continental Resources, Inc | | | 25,909 | |
| | 993,751 | | * | | Cooper Energy Ltd | | | 311 | |
| | 125 | | | | Core Laboratories NV | | | 7 | |
| | 181,328 | | | | Cosan SA Industria e Comercio | | | 1,566 | |
| | 331,100 | | e | | Cosmo Energy Holdings Co Ltd | | | 6,722 | |
| | 38,429 | | *,e | | Covia Holdings Corp | | | 131 | |
| | 342,761 | | | | Crescent Point Energy Corp | | | 1,039 | |
| | 22,897 | | | | CVR Energy, Inc | | | 789 | |
COLLEGE RETIREMENT EQUITIES FUND -Stock Account
| SHARES | | | | COMPANY | | VALUE
(000) | |
| | 29,461 | | * | | Dawson Geophysical Co | | $ | 100 | |
| | 2,650 | | | | Delek Group Ltd | | | 381 | |
| | 1,120,125 | | e | | Delek US Holdings, Inc | | | 36,415 | |
| | 1,004,218 | | *,e | | Denbury Resources, Inc | | | 1,717 | |
| | 843,397 | | | | Devon Energy Corp | | | 19,010 | |
| | 132,519 | | | | DHT Holdings, Inc | | | 519 | |
| | 4,114,351 | | | | Dialog Group BHD | | | 3,097 | |
| | 92,765 | | *,e | | Diamond Offshore Drilling, Inc | | | 876 | |
| | 1,326,441 | | | | Diamondback Energy, Inc | | | 122,961 | |
| | 5,695,334 | | | | DNO International ASA | | | 8,275 | |
| | 775,100 | | * | | Dommo Energia S.A. | | | 196 | |
| | 40,259 | | * | | Dorian LPG Ltd | | | 235 | |
| | 56,801 | | * | | Dril-Quip, Inc | | | 1,706 | |
| | 15,654 | | | | E1 Corp | | | 782 | |
| | 21,266 | | * | | Earthstone Energy, Inc | | | 96 | |
| | 101,858 | | *,e | | Eclipse Resources Corp | | | 107 | |
| | 5,139,550 | | | | Ecopetrol S.A. | | | 4,186 | |
| | 403,191 | | | | Empresas COPEC S.A. | | | 4,852 | |
| | 116,260 | | | | Enagas | | | 3,143 | |
| | 1,671,683 | | | | Enbridge, Inc (Toronto) | | | 51,931 | |
| | 1,373,030 | | | | EnCana Corp | | | 7,925 | |
| | 232,011 | | | | Enerflex Ltd | | | 2,716 | |
| | 2,261,414 | | | | Energy Absolute PCL (Foreign) | | | 2,957 | |
| | 1,168,600 | | *,† | | Energy Earth PCL | | | 39 | |
| | 108,189 | | *,e | | Energy Fuels, Inc | | | 308 | |
| | 1,053,134 | | *,e | | Energy Resources of Australia Ltd | | | 182 | |
| | 257,660 | | e | | Enerplus Resources Fund | | | 2,004 | |
| | 4,738,796 | | | | ENI S.p.A. | | | 74,860 | |
| | 2,913,310 | | | | Enquest plc (London) | | | 813 | |
| | 742 | | e | | Ensco plc | | | 3 | |
| | 81,067 | | | | Ensign Energy Services, Inc | | | 284 | |
| | 3,816,184 | | | | EOG Resources, Inc | | | 332,809 | |
| | 55,565 | | *,e | | EP Energy Corp | | | 39 | |
| | 187,853 | | | | EQT Corp | | | 3,549 | |
| | 459,356 | | * | | Equitrans Midstream Corp | | | 9,196 | |
| | 92,063 | | * | | Era Group, Inc | | | 805 | |
| | 323,400 | | | | Esso Malaysia BHD | | | 491 | |
| | 4,294 | | | | Esso SA Francaise | | | 159 | |
| | 686,200 | | | | Esso Thailand PCL (Foreign) | | | 215 | |
| | 284,416 | | * | | Etablissements Maurel et Prom | | | 1,052 | |
| | 97,570 | | | | Euronav NV | | | 695 | |
| | 299,055 | | | | Evolution Petroleum Corp | | | 2,040 | |
| | 16,942 | | *,e | | Exmar NV | | | 116 | |
| | 454,421 | | * | | Exterran Corp | | | 8,043 | |
| | 205,915 | | *,e | | Extraction Oil & Gas, Inc | | | 883 | |
| | 780,728 | | | | Exxaro Resources Ltd | | | 7,531 | |
| | 7,282,557 | | | | Exxon Mobil Corp | | | 496,598 | |
| | 205,565 | | * | | Faroe Petroleum plc | | | 383 | |
| | 205,747 | | *,e | | FLEX LNG Ltd | | | 295 | |
| | 1,428,814 | | | | Formosa Petrochemical Corp | | | 5,070 | |
| | 107,555 | | * | | Forum Energy Technologies, Inc | | | 444 | |
| | 99,580 | | *,e | | Frank’s International NV | | | 520 | |
| | 61,552 | | e | | Freehold Royalty Trust | | | 373 | |
| | 117,182 | | *,e | | Frontline Ltd | | | 648 | |
COLLEGE RETIREMENT EQUITIES FUND -Stock Account
| SHARES | | | | COMPANY | | VALUE
(000) | |
| | 50,222 | | * | | Frontline Ltd (Sigmax MTF) | | $ | 284 | |
| | 198,201 | | * | | FTS International, Inc | | | 1,409 | |
| | 53,931 | | *,e | | Fugro NV | | | 466 | |
| | 883,770 | | | | Galp Energia SGPS S.A. | | | 13,916 | |
| | 154,930 | | | | GasLog Ltd | | | 2,550 | |
| | 6,562,155 | | | | Gazprom (ADR) | | | 29,005 | |
| | 92,015 | | | | Gaztransport Et Technigaz S.A. | | | 7,076 | |
| | 142,366 | | | | Gibson Energy, Inc | | | 1,948 | |
| | 410,347 | | | | Golar LNG Ltd | | | 8,929 | |
| | 8,800 | | * | | Goodrich Petroleum Corp | | | 119 | |
| | 76,667 | | | | Great Eastern Shipping Co Ltd | | | 346 | |
| | 51,444 | | | | Green Plains Renewable Energy, Inc | | | 674 | |
| | 132,983 | | | | Grupa Lotos S.A. | | | 3,151 | |
| | 81,047 | | | | GS Holdings Corp | | | 3,745 | |
| | 59,724 | | * | | Gujarat Mineral Development Corp Ltd | | | 76 | |
| | 59,958 | | * | | Gulf International Services OSC | | | 279 | |
| | 144,919 | | * | | Gulf Keystone Petroleum Ltd | | | 332 | |
| | 436,158 | | * | | Gulfport Energy Corp | | | 2,857 | |
| | 172,876 | | *,e | | Halcon Resources Corp | | | 294 | |
| | 19,141 | | | | Hallador Energy Co | | | 97 | |
| | 1,685,685 | | | | Halliburton Co | | | 44,806 | |
| | 394 | | | | Hankook Shell Oil Co Ltd | | | 119 | |
| | 416,313 | | * | | Helix Energy Solutions Group, Inc | | | 2,252 | |
| | 190,391 | | | | Helmerich & Payne, Inc | | | 9,127 | |
| | 198,109 | | | | Hess Corp | | | 8,023 | |
| | 701,700 | | * | | Hibiscus Petroleum BHD | | | 142 | |
| | 711,098 | | * | | HighPoint Resources Corp | | | 1,771 | |
| | 702,245 | | | | Hindustan Petroleum Corp Ltd | | | 2,552 | |
| | 32,204 | | | | Hoegh LNG Holdings Ltd | | | 143 | |
| | 244,426 | | | | HollyFrontier Corp | | | 12,495 | |
| | 1,697,000 | | *,e | | Honghua Group Ltd | | | 89 | |
| | 88,723 | | | | Hunting plc | | | 542 | |
| | 929,699 | | *,e | | Hurricane Energy plc | | | 521 | |
| | 1,934,002 | | | | Husky Energy, Inc | | | 19,989 | |
| | 221,750 | | | | Idemitsu Kosan Co Ltd | | | 7,213 | |
| | 247,638 | | | | Imperial Oil Ltd | | | 6,274 | |
| | 252,369 | | * | | Independence Contract Drilling, Inc | | | 787 | |
| | 1,619,256 | | | | Indian Oil Corp Ltd | | | 3,181 | |
| | 2,218,300 | | | | Inner Mongolia Yitai Coal Co | | | 2,627 | |
| | 1,159,142 | | | | Inpex Holdings, Inc | | | 10,271 | |
| | 871,609 | | | | Inter Pipeline Ltd | | | 12,348 | |
| | 27,244 | | * | | International Seaways, Inc | | | 459 | |
| | 14,222 | | *,m | | ION Geophysical Corp | | | 74 | |
| | 12,012,907 | | | | IRPC PCL (Foreign) | | | 2,121 | |
| | 1,498 | | *,e | | Isramco, Inc | | | 178 | |
| | 268,253 | | | | Itochu Enex Co Ltd | | | 2,346 | |
| | 185,899 | | *,e | | Jagged Peak Energy, Inc | | | 1,695 | |
| | 5,900 | | *,†,b,m | | Japan Drilling Co Ltd | | | 0 | ^ |
| | 26,100 | | | | Japan Petroleum Exploration Co | | | 463 | |
| | 22,995 | | * | | Jerusalem Oil Exploration | | | 1,297 | |
| | 83,212 | | e | | John Wood Group plc | | | 535 | |
| | 5,466,510 | | | | JX Holdings, Inc | | | 28,390 | |
| | 508,619 | | * | | Keane Group, Inc | | | 4,161 | |
COLLEGE RETIREMENT EQUITIES FUND -Stock Account
| SHARES | | | | COMPANY | | VALUE
(000) | |
| | 98,436 | | * | | Kelt Exploration Ltd | | $ | 335 | |
| | 55,750 | | *,e,m | | Key Energy Services, Inc | | | 115 | |
| | 495,201 | | e | | Keyera Corp | | | 9,362 | |
| | 142,076 | | g | | Kinder Morgan Canada Ltd | | | 1,658 | |
| | 1,174,888 | | | | Kinder Morgan, Inc | | | 18,070 | |
| | 60,940 | | * | | KLX Energy Services Holdings, Inc | | | 1,429 | |
| | 64,642 | | | | Koninklijke Vopak NV | | | 2,931 | |
| | 456,595 | | * | | Kosmos Energy Ltd | | | 1,858 | |
| | 622,377 | | * | | Kvaerner ASA | | | 866 | |
| | 417,984 | | * | | Laredo Petroleum Holdings, Inc | | | 1,513 | |
| | 180,578 | | e | | Liberty Oilfield Services, Inc | | | 2,338 | |
| | 55,954 | | *,e,m | | Lilis Energy, Inc | | | 77 | |
| | 25,538 | | * | | Lubelski Wegiel Bogdanka S.A. | | | 352 | |
| | 773,842 | | | | LUKOIL PJSC (ADR) | | | 55,206 | |
| | 158,438 | | | | Lundin Petroleum AB | | | 3,957 | |
| | 291,640 | | | | Magellan Midstream Partners LP | | | 16,641 | |
| | 50,706 | | e | | Mammoth Energy Services, Inc | | | 912 | |
| | 2,053,658 | | | | Marathon Oil Corp | | | 29,449 | |
| | 1,304,279 | | | | Marathon Petroleum Corp | | | 76,966 | |
| | 2,121,074 | | *,e | | Matador Resources Co | | | 32,940 | |
| | 106,460 | | * | | Matrix Service Co | | | 1,910 | |
| | 365,486 | | *,e | | McDermott International, Inc | | | 2,390 | |
| | 354,536 | | * | | MEG Energy Corp | | | 2,002 | |
| | 139,478 | | * | | Midstates Petroleum Co, Inc | | | 1,047 | |
| | 197,200 | | | | Modec, Inc | | | 4,073 | |
| | 1,049,348 | | | | MOL Hungarian Oil & Gas plc | | | 11,516 | |
| | 92,848 | | | | Motor Oil Hellas Corinth Refineries S.A. | | | 2,236 | |
| | 73,633 | | e | | Mullen Group Ltd | | | 659 | |
| | 304,919 | | | | Murphy Oil Corp | | | 7,132 | |
| | 1,200,864 | | | | Nabors Industries Ltd | | | 2,402 | |
| | 51,751 | | * | | Naphtha Israel Petroleum Corp Ltd | | | 330 | |
| | 837,449 | | | | National Oilwell Varco, Inc | | | 21,522 | |
| | 17,016 | | * | | Natural Gas Services Group, Inc | | | 280 | |
| | 11,809 | | *,e | | NCS Multistage Holdings, Inc | | | 60 | |
| | 141,115 | | | | Neste Oil Oyj | | | 10,925 | |
| | 1,136,272 | | | | New Hope Corp Ltd | | | 2,724 | |
| | 142,060 | | | | New Zealand Refining Co Ltd | | | 224 | |
| | 286,440 | | * | | Newfield Exploration Co | | | 4,199 | |
| | 22,398,000 | | *,e | | Newocean Energy Holdings Ltd | | | 7,323 | |
| | 245,971 | | * | | Newpark Resources, Inc | | | 1,690 | |
| | 201,792 | | * | | NexGen Energy Ltd | | | 356 | |
| | 11,728 | | *,e | | NextDecade Corp | | | 63 | |
| | 87,373 | | * | | Nine Energy Service, Inc | | | 1,969 | |
| | 496,884 | | * | | Noble Corp plc | | | 1,302 | |
| | 363,780 | | | | Noble Energy, Inc | | | 6,825 | |
| | 173,937 | | e | | Nordic American Tanker Shipping | | | 348 | |
| | 45,441 | | * | | Northern Drilling Ltd | | | 267 | |
| | 249,384 | | *,e | | Northern Oil And Gas, Inc | | | 564 | |
| | 70,571 | | * | | Nostrum Oil & Gas plc | | | 93 | |
| | 132,674 | | | | Novatek PJSC (GDR) | | | 22,687 | |
| | 132,387 | | * | | NuVista Energy Ltd | | | 396 | |
| | 601,329 | | * | | Oasis Petroleum, Inc | | | 3,325 | |
| | 408,255 | | * | | Obsidian Energy Ltd | | | 153 | |
| | 2,013,704 | | | | Occidental Petroleum Corp | | | 123,601 | |
COLLEGE RETIREMENT EQUITIES FUND -Stock Account
| SHARES | | | | COMPANY | | VALUE
(000) | |
| | 36,246 | | | | Ocean Yield ASA | | $ | 248 | |
| | 267,609 | | *,e | | Oceaneering International, Inc | | | 3,238 | |
| | 55,175 | | | | Odfjell Drilling Ltd | | | 132 | |
| | 417,800 | | | | Offshore Oil Engineering Co Ltd | | | 298 | |
| | 1,212,100 | | | | Oil & Gas Development Co Ltd | | | 1,116 | |
| | 6,156,533 | | | | Oil Refineries Ltd | | | 2,940 | |
| | 981,664 | | | | Oil Search Ltd | | | 4,945 | |
| | 75,333 | | * | | Oil States International, Inc | | | 1,076 | |
| | 182,949 | | | | OMV AG. | | | 7,990 | |
| | 1,513,161 | | | | Oneok, Inc | | | 81,635 | |
| | 461,700 | | * | | Ophir Energy plc | | | 210 | |
| | 1,256,002 | | * | | Origin Energy Ltd | | | 5,729 | |
| | 102,865 | | * | | Overseas Shipholding Group, Inc | | | 171 | |
| | 345,760 | | | | Pakistan Oilfields Ltd | | | 1,057 | |
| | 141,860 | | | | Pakistan State Oil Co Ltd | | | 230 | |
| | 19,153 | | | | Panhandle Oil and Gas, Inc (Class A) | | | 297 | |
| | 491,027 | | * | | Par Pacific Holdings, Inc | | | 6,963 | |
| | 38,867 | | *,e | | Paramount Resources Ltd (Class A) | | | 204 | |
| | 908,729 | | * | | Parex Resources, Inc | | | 10,883 | |
| | 231,474 | | | | Parkland Fuel Corp | | | 5,992 | |
| | 8,748,828 | | * | | Parsley Energy, Inc | | | 139,806 | |
| | 154,993 | | | | Pason Systems, Inc | | | 2,076 | |
| | 84,069 | | | | Patterson-UTI Energy, Inc | | | 870 | |
| | 6,445 | | | | Paz Oil Co Ltd | | | 972 | |
| | 196,528 | | | | PBF Energy, Inc | | | 6,421 | |
| | 111,679 | | * | | PDC Energy, Inc | | | 3,324 | |
| | 232,064 | | | | Peabody Energy Corp | | | 7,073 | |
| | 477,235 | | e | | Pembina Pipeline Income Fund | | | 14,161 | |
| | 687,500 | | *,e | | Pengrowth Energy Trust | | | 302 | |
| | 16,013 | | * | | Penn Virginia Corp | | | 866 | |
| | 193,452 | | | | Petrofac Ltd | | | 1,174 | |
| | 4,615,605 | | | | Petroleo Brasileiro S.A. | | | 30,165 | |
| | 7,419,219 | | | | Petroleo Brasileiro S.A. (Preference) | | | 43,274 | |
| | 1,944,518 | | *,e | | Petroleum Geo-Services ASA | | | 2,660 | |
| | 1,523,100 | | | | Petron | | | 223 | |
| | 748,159 | | | | Petronas Dagangan BHD | | | 4,789 | |
| | 688,602 | | | | Petronet LNG Ltd | | | 2,210 | |
| | 274,001 | | e | | Peyto Exploration & Development Corp | | | 1,421 | |
| | 11,203 | | *,e,m | | PHI, Inc | | | 21 | |
| | 1,046,399 | | | | Phillips 66 | | | 90,147 | |
| | 261,800 | | | | Pilipinas Shell Petroleum Corp | | | 238 | |
| | 331,576 | | * | | Pioneer Energy Services Corp | | | 408 | |
| | 446,250 | | | | Pioneer Natural Resources Co | | | 58,691 | |
| | 3,407,796 | | | | Plains All American Pipeline LP | | | 68,292 | |
| | 1,596,993 | | | | Plains GP Holdings LP | | | 32,100 | |
| | 2,964,005 | | | | Polish Oil & Gas Co | | | 5,480 | |
| | 433,009 | | | | Polski Koncern Naftowy Orlen S.A. | | | 12,546 | |
| | 100,100 | | *,† | | Poseidon Concepts Corp | | | 1 | |
| | 228,169 | | e | | PrairieSky Royalty Ltd | | | 2,953 | |
| | 185,686 | | * | | Precision Drilling Trust | | | 322 | |
| | 687,820 | | *,e | | Premier Oil plc | | | 580 | |
| | 542,300 | | | | Prima Marine PCL | | | 86 | |
| | 36,280 | | * | | Profire Energy, Inc | | | 53 | |
COLLEGE RETIREMENT EQUITIES FUND -Stock Account
| SHARES | | | | COMPANY | | VALUE
(000) | |
| | 277,696 | | * | | ProPetro Holding Corp | | $ | 3,421 | |
| | 15,628,900 | | * | | PT Bumi Resources Tbk | | | 112 | |
| | 2,820,000 | | * | | PT Delta Dunia Petroindo Tbk | | | 103 | |
| | 1,027,900 | | | | PT Indika Energy Tbk | | | 114 | |
| | 4,670,566 | | * | | PT Medco Energi Internasional Tbk | | | 223 | |
| | 2,229,500 | | | | PT Tambang Batubara Bukit Asam Tbk | | | 668 | |
| | 5,534,506 | | | | PT United Tractors Tbk | | | 10,536 | |
| | 1,775,821 | | | | PTT Exploration & Production PCL (Foreign) | | | 6,163 | |
| | 20,464,350 | | | | PTT PCL (Foreign) | | | 29,012 | |
| | 194,162 | | * | | Qatar Gas Transport Co Ltd | | | 954 | |
| | 55,300 | | | | QGEP Participacoes S.A. | | | 133 | |
| | 493,972 | | * | | Questar Market Resources, Inc | | | 2,781 | |
| | 40,855 | | *,e,m | | Quintana Energy Services, Inc | | | 141 | |
| | 406,962 | | | | Range Resources Corp | | | 3,895 | |
| | 5,898,384 | | | | Reliance Industries Ltd | | | 94,663 | |
| | 251,899 | | *,e | | Renewable Energy Group, Inc | | | 6,474 | |
| | 1,262,340 | | | | Repsol YPF S.A. | | | 20,295 | |
| | 27,573 | | *,e | | Resolute Energy Corp | | | 799 | |
| | 8,120 | | * | | Rex American Resources Corp | | | 553 | |
| | 22,887 | | * | | RigNet, Inc | | | 289 | |
| | 77,308 | | * | | Ring Energy, Inc | | | 393 | |
| | 3,605 | | *,e | | Rosehill Resources, Inc | | | 8 | |
| | 1,186,762 | | * | | Rosneft Oil Co PJSC (GDR) | | | 7,334 | |
| | 159,257 | | *,e | | Rowan Cos plc | | | 1,336 | |
| | 8,483,075 | | | | Royal Dutch Shell plc (A Shares) | | | 249,681 | |
| | 5,481,087 | | | | Royal Dutch Shell plc (B Shares) | | | 163,871 | |
| | 129,323 | | e | | RPC, Inc | | | 1,276 | |
| | 456,754 | | * | | Saipem S.p.A | | | 1,712 | |
| | 84,300 | | | | San-Ai Oil Co Ltd | | | 832 | |
| | 158,655 | | * | | SandRidge Energy, Inc | | | 1,207 | |
| | 2,285,796 | | | | Santos Ltd | | | 8,815 | |
| | 2,348,700 | | * | | Sapurakencana Petroleum BHD | | | 164 | |
| | 1,064,520 | | | | Saras S.p.A. | | | 2,065 | |
| | 673,099 | | | | Sasol Ltd | | | 20,002 | |
| | 124,745 | | | | SBM Offshore NV | | | 1,843 | |
| | 3,401,864 | | | | Schlumberger Ltd | | | 122,739 | |
| | 7,108 | | | | Schoeller-Bleckmann Oilfield Equipment AG. | | | 466 | |
| | 572,754 | | e | | Scorpio Tankers, Inc | | | 1,008 | |
| | 121,291 | | * | | SEACOR Holdings, Inc | | | 4,488 | |
| | 20,123 | | * | | SEACOR Marine Holdings, Inc | | | 237 | |
| | 3 | | * | | Seadrill Ltd | | | 0 | ^ |
| | 104,309 | | e | | Secure Energy Services, Inc | | | 536 | |
| | 57,825 | | * | | Select Energy Services, Inc | | | 365 | |
| | 111,015 | | | | SemGroup Corp | | | 1,530 | |
| | 813,480 | | * | | Senex Energy Ltd | | | 157 | |
| | 519,900 | | | | Serba Dinamik Holdings BHD | | | 476 | |
| | 50 | | *,† | | Serval Integrated Energy Services | | | 0 | |
| | 143,665 | | * | | Seven Generations Energy Ltd | | | 1,172 | |
| | 432,255 | | | | Shaanxi Coal Industry Co Ltd | | | 469 | |
| | 288,336 | | | | Shanxi Lu’an Environmental Energy Development Co Ltd | | | 281 | |
| | 350,100 | | | | Shanxi Xishan Coal & Electricity Power Co Ltd | | | 281 | |
| | 44,445 | | | | ShawCor Ltd | | | 540 | |
| | 53,700 | | | | Shell Refining Co Federation Of Malaya BHD | | | 61 | |
COLLEGE RETIREMENT EQUITIES FUND -Stock Account
| SHARES | | | | COMPANY | | VALUE
(000) | |
| | 48,200 | | | | Shinko Plantech Co Ltd | | $ | 510 | |
| | 104,040 | | e | | Ship Finance International Ltd | | | 1,096 | |
| | 485,040 | | | | Showa Shell Sekiyu KK | | | 6,720 | |
| | 5,429,200 | | | | Siamgas & Petrochemicals PCL | | | 1,417 | |
| | 11,800 | | * | | SilverBow Resources, Inc | | | 279 | |
| | 23,200 | | | | Sinanen Co Ltd | | | 508 | |
| | 696,000 | | | | Sinopec Kantons Holdings Ltd | | | 308 | |
| | 68,970 | | | | SK Energy Co Ltd | | | 11,071 | |
| | 7,886 | | | | SK Gas Co Ltd | | | 500 | |
| | 204,243 | | | | SM Energy Co | | | 3,162 | |
| | 31,463 | | *,e | | Smart Sand, Inc | | | 70 | |
| | 1,467,331 | | | | Snam Rete Gas S.p.A. | | | 6,425 | |
| | 127,225 | | | | Soco International plc | | | 110 | |
| | 50,089 | | | | S-Oil Corp | | | 4,369 | |
| | 32,451 | | e | | Solaris Oilfield Infrastructure, Inc | | | 392 | |
| | 464,393 | | *,e | | Sound Energy plc | | | 133 | |
| | 1,075,190 | | * | | Southwestern Energy Co | | | 3,666 | |
| | 305,528 | | * | | SRC Energy, Inc | | | 1,436 | |
| | 822,609 | | | | Statoil ASA | | | 17,449 | |
| | 189,937 | | | | Stobart Group Ltd | | | 350 | |
| | 163,779 | | e | | Subsea 7 S.A. | | | 1,596 | |
| | 3,151,909 | | | | Suncor Energy, Inc | | | 88,033 | |
| | 607,426 | | * | | Superior Energy Services | | | 2,035 | |
| | 163,796 | | e | | Surge Energy, Inc | | | 176 | |
| | 1,639,416 | | | | Surgutneftegaz (ADR) (London) | | | 6,164 | |
| | 78,981 | | * | | Talos Energy, Inc | | | 1,289 | |
| | 144,191 | | * | | Tamarack Valley Energy Ltd | | | 249 | |
| | 742,054 | | | | Targa Resources Investments, Inc | | | 26,729 | |
| | 394,274 | | | | Tatneft PJSC (ADR) | | | 25,036 | |
| | 1,308 | | | | TechnipFMC plc | | | 26 | |
| | 234,401 | | | | TechnipFMC plc (Euro OTC) | | | 4,590 | |
| | 21,235 | | e | | Tecnicas Reunidas S.A. | | | 519 | |
| | 90,178 | | e | | Teekay Corp | | | 301 | |
| | 224,237 | | e | | Teekay Tankers Ltd (Class A) | | | 208 | |
| | 103,191 | | *,e | | Tellurian, Inc | | | 717 | |
| | 71,962 | | | | Tenaris S.A. | | | 773 | |
| | 86,938 | | * | | Tervita Corp | | | 400 | |
| | 162,953 | | * | | Tetra Technologies, Inc | | | 274 | |
| | 162,980 | | | | TGS Nopec Geophysical Co ASA | | | 3,938 | |
| | 1,312,855 | | | | Thai Oil PCL (Foreign) | | | 2,668 | |
| | 56,040 | | *,e | | Tidewater, Inc | | | 1,072 | |
| | 96,024 | | | | TORC Oil & Gas Ltd | | | 307 | |
| | 14,647 | | * | | TORM plc | | | 99 | |
| | 78,050 | | e | | Total Energy Services, Inc | | | 559 | |
| | 2,821,683 | | | | Total S.A. | | | 148,830 | |
| | 146,027 | | | | Tourmaline Oil Corp | | | 1,816 | |
| | 16,000 | | | | Toyo Kanetsu K K | | | 326 | |
| | 1,480,367 | | e | | TransCanada Corp | | | 52,863 | |
| | 1,124 | | * | | Transocean Ltd | | | 8 | |
| | 2,593,164 | | *,e | | Transocean Ltd (NYSE) | | | 17,997 | |
| | 200,447 | | * | | Trican Well Service Ltd | | | 175 | |
| | 1,052,684 | | * | | Tullow Oil plc | | | 2,393 | |
| | 133,927 | | | | Tupras Turkiye Petrol Rafine | | | 2,950 | |
COLLEGE RETIREMENT EQUITIES FUND -Stock Account
| SHARES | | | | COMPANY | | VALUE
(000) | |
| | 663,594 | | | | Ultrapar Participacoes S.A. | | $ | 9,097 | |
| | 1,921,462 | | * | | UMW Oil & Gas Corp BHD | | | 83 | |
| | 204,170 | | * | | Unit Corp | | | 2,916 | |
| | 194,409 | | *,e | | Uranium Energy Corp | | | 243 | |
| | 101,030 | | e | | US Silica Holdings Inc | | | 1,028 | |
| | 1,101,498 | | | | Valero Energy Corp | | | 82,579 | |
| | 209,642 | | *,e | | Vallourec SA | | | 391 | |
| | 15,582 | | | | Verbio AG. | | | 120 | |
| | 46,354 | | e | | Vermilion Energy, Inc | | | 977 | |
| | 665,999 | | *,g | | Viva Energy Group Ltd | | | 845 | |
| | 756,468 | | * | | W&T Offshore, Inc | | | 3,117 | |
| | 195,309 | | e | | Washington H Soul Pattinson & Co Ltd | | | 3,425 | |
| | 1,361,810 | | *,e,m | | Weatherford International Ltd | | | 761 | |
| | 271,531 | | | | Whitecap Resources, Inc | | | 865 | |
| | 4,868,371 | | | | Whitehaven Coal Ltd | | | 14,836 | |
| | 160,759 | | * | | Whiting Petroleum Corp | | | 3,648 | |
| | 247,049 | | * | | WildHorse Resource Development Corp | | | 3,486 | |
| | 5,667,107 | | | | Williams Cos, Inc | | | 124,960 | |
| | 752,000 | | e | | Wison Engineering Services Co Ltd | | | 98 | |
| | 1,317,722 | | | | Woodside Petroleum Ltd | | | 29,026 | |
| | 201,691 | | | | World Fuel Services Corp | | | 4,318 | |
| | 246,873 | | | | WorleyParsons Ltd | | | 1,983 | |
| | 3,029,547 | | * | | WPX Energy, Inc | | | 34,385 | |
| | 2,779,066 | | | | Yanzhou Coal Mining Co Ltd | | | 2,244 | |
| | 394,700 | | | | Yinson Holdings BHD | | | 401 | |
| | 1,348,000 | | *,e | | Yuan Heng Gas Holdings Ltd | | | 103 | |
| | 228,179 | | | | Z Energy Ltd | | | 842 | |
| | 52,604 | | e | | Zion Oil & Gas, Inc | | | 22 | |
| | | | | | TOTAL ENERGY | | | 5,831,306 | |
| | | | | | | | | | |
| FOOD & STAPLES RETAILING - 1.5% | | | | |
| | 512,534 | | | | Aeon Co Ltd | | | 10,018 | |
| | 19,900 | | | | Ain Pharmaciez Inc | | | 1,427 | |
| | 3,451 | | | | Al Meera Consumer Goods Co | | | 140 | |
| | 664,470 | | | | Alimentation Couche Tard, Inc | | | 33,053 | |
| | 127,439 | | | | Almacenes Exito S.A. | | | 487 | |
| | 39,900 | | | | Andersons, Inc | | | 1,193 | |
| | 164,344 | | | | Arcs Co Ltd | | | 3,660 | |
| | 331,700 | | | | Atacadao Distribuicao Comercio e Industria Ltd | | | 1,547 | |
| | 136,973 | | *,g | | Avenue Supermarts Ltd | | | 3,150 | |
| | 65,234 | | | | Axfood AB | | | 1,116 | |
| | 38,300 | | | | Axial Retailing, Inc | | | 1,272 | |
| | 22,100 | | | | Belc Co Ltd | | | 1,037 | |
| | 1,140,400 | | | | Berli Jucker PCL | | | 1,779 | |
| | 6,661 | | | | BGF retail Co Ltd | | | 1,216 | |
| | 335,106 | | | | Bid Corp Ltd | | | 6,165 | |
| | 198,155 | | | | BIM Birlesik Magazalar AS | | | 3,257 | |
| | 975,414 | | | | Carrefour S.A. | | | 16,667 | |
| | 40,998 | | e | | Casey’s General Stores, Inc | | | 5,253 | |
| | 114,637 | | e | | Casino Guichard Perrachon S.A. | | | 4,774 | |
| | 59,500 | | | | Cawachi Ltd | | | 980 | |
| | 1,384,203 | | | | Centros Comerciales Sudamericanos S.A. | | | 2,506 | |
| | 28,166 | | * | | Chefs’ Warehouse Holdings, Inc | | | 901 | |
| | 962,161 | | | | Cia Brasileira de Distribuicao Grupo Pao de Acucar | | | 20,066 | |
COLLEGE RETIREMENT EQUITIES FUND -Stock Account
| SHARES | | | | COMPANY | | VALUE
(000) | |
| | 3,096 | | | | CJ Freshway Corp | | $ | 74 | |
| | 353,905 | | | | Clicks Group Ltd | | | 4,705 | |
| | 11,560 | | | | Cocokara Fine Holdings, Inc | | | 563 | |
| | 1,236,869 | | * | | Coles Group Ltd | | | 10,228 | |
| | 43,711 | | | | Colruyt S.A. | | | 3,117 | |
| | 5,395,500 | | | | Cosco Capital, Inc | | | 688 | |
| | 11,800 | | | | Cosmos Pharmaceutical Corp | | | 1,969 | |
| | 1,621,534 | | | | Costco Wholesale Corp | | | 330,323 | |
| | 5,423,529 | | | | CP Seven Eleven PCL (Foreign) | | | 11,430 | |
| | 45,900 | | | | Create SD Holdings Co Ltd | | | 1,101 | |
| | 3,100 | | | | Daikokutenbussaan Co Ltd | | | 116 | |
| | 288,200 | | | | Dairy Farm International Holdings Ltd | | | 2,612 | |
| | 45,751 | | *,g | | Dino Polska S.A. | | | 1,175 | |
| | 236,320 | | g | | Dis-Chem Pharmacies Ltd | | | 476 | |
| | 342,311 | | e | | Distribuidora Internacional de Alimentacion S.A. | | | 181 | |
| | 22,669 | | | | Dongsuh Co, Inc | | | 363 | |
| | 66,370 | | | | E-Mart Co Ltd | | | 10,839 | |
| | 378,421 | | | | Empire Co Ltd | | | 7,991 | |
| | 404,726 | | | | Eurocash S.A. | | | 1,909 | |
| | 75,808 | | e | | FamilyMart Co Ltd | | | 9,541 | |
| | 5,900 | | e | | Genky DrugStores Co Ltd | | | 159 | |
| | 68,335 | | | | George Weston Ltd | | | 4,507 | |
| | 39,700 | | | | Growell Holdings Co Ltd | | | 1,794 | |
| | 217,500 | | | | Grupo Comercial Chedraui S.a. DE C.V. | | | 436 | |
| | 35,473 | | | | GS Retail Co Ltd | | | 1,286 | |
| | 14,800 | | | | Halows Co Ltd | | | 309 | |
| | 137,300 | | | | Heiwado Co Ltd | | | 3,133 | |
| | 29,892 | | | | Hyundai Greenfood Co Ltd | | | 383 | |
| | 171,391 | | e | | ICA Gruppen AB | | | 6,123 | |
| | 18,349 | | | | Ingles Markets, Inc (Class A) | | | 499 | |
| | 3,400 | | | | Itochu-Shokuhin Co Ltd | | | 147 | |
| | 3,302,153 | | | | J Sainsbury plc | | | 11,163 | |
| | 6,600 | | | | Japan Meat Co Ltd | | | 102 | |
| | 130,247 | | | | Jeronimo Martins SGPS S.A. | | | 1,543 | |
| | 31,700 | | | | Kansai Super Market Ltd | | | 288 | |
| | 51,600 | | | | Kato Sangyo Co Ltd | | | 1,428 | |
| | 53,812 | | | | Kesko Oyj (B Shares) | | | 2,904 | |
| | 38,800 | | | | Kobe Bussan Co Ltd | | | 1,143 | |
| | 2,029,570 | | | | Koninklijke Ahold Delhaize NV | | | 51,271 | |
| | 1,256,201 | | | | Kroger Co | | | 34,545 | |
| | 21,800 | | | | Kusuri no Aoki Holdings Co Ltd | | | 1,377 | |
| | 288,700 | | *,e | | La Comer SAB de C.V. | | | 299 | |
| | 62,880 | | | | Lawson, Inc | | | 3,977 | |
| | 53,700 | | | | Life Corp | | | 1,105 | |
| | 396,357 | | | | Loblaw Cos Ltd | | | 17,742 | |
| | 452,710 | | | | Magnit PJSC (GDR) | | | 5,763 | |
| | 31,205 | | e | | Majestic Wine plc | | | 98 | |
| | 74,170 | | | | MARR S.p.A. | | | 1,749 | |
| | 64,165 | | | | Massmart Holdings Ltd | | | 462 | |
| | 50,900 | | | | Matsumotokiyoshi Holdings Co Ltd | | | 1,565 | |
| | 571,807 | | | | Metcash Ltd | | | 988 | |
| | 451,326 | | | | Metro Wholesale & Food Specialist AG. | | | 6,945 | |
| | 262,554 | | | | Metro, Inc | | | 9,104 | |
COLLEGE RETIREMENT EQUITIES FUND -Stock Account
| SHARES | | | | COMPANY | | VALUE
(000) | |
| | 37,849 | | * | | Migros Ticaret AS | | $ | 106 | |
| | 83,900 | | | | Ministop Co Ltd | | | 1,573 | |
| | 141,784 | | * | | Natural Grocers by Vitamin C | | | 2,174 | |
| | 4,300 | | | | Nihon Chouzai Co Ltd | | | 124 | |
| | 2,300 | | | | Nishimoto Co Ltd | | | 93 | |
| | 165,181 | | e | | North West Co, Inc | | | 3,802 | |
| | 12,000 | | | | Okuwa Co Ltd | | | 122 | |
| | 554,412 | | * | | Performance Food Group Co | | | 17,891 | |
| | 1,293,312 | | | | Pick’n Pay Stores Ltd | | | 6,092 | |
| | 1,302,822 | | | | President Chain Store Corp | | | 13,126 | |
| | 27,634 | | | | Pricesmart, Inc | | | 1,633 | |
| | 16,500 | | | | Qol Co Ltd | | | 249 | |
| | 208,302 | | | | Raia Drogasil S.A. | | | 3,068 | |
| | 17,701 | | e | | Rallye S.A. | | | 183 | |
| | 25,273 | | | | Rami Levi Chain Stores Hashikma Marketing 2006 Ltd | | | 1,301 | |
| | 14,700 | | | | Retail Partners Co Ltd | | | 150 | |
| | 1,503,502 | | *,e | | Rite Aid Corp | | | 1,065 | |
| | 985,220 | | | | Robinsons Retail Holdings, Inc | | | 1,499 | |
| | 54,879 | | | | Ryoshoku Ltd | | | 1,400 | |
| | 10,600 | | | | San-A Co Ltd | | | 401 | |
| | 790,813 | | | | Seven & I Holdings Co Ltd | | | 34,365 | |
| | 2,216,400 | | | | Sheng Siong Group Ltd | | | 1,723 | |
| | 7,000 | | e | | Shoei Foods Corp | | | 172 | |
| | 563,513 | | | | Shoprite Holdings Ltd | | | 7,444 | |
| | 87,040 | | | | Shufersal Ltd | | | 572 | |
| | 273,960 | | * | | Smart & Final Stores, Inc | | | 1,299 | |
| | 1,463,854 | | * | | SMU S.A. | | | 401 | |
| | 11,000 | | | | Sogo Medical Holdings Co Ltd | | | 206 | |
| | 138,409 | | * | | Sok Marketler Ticaret AS. | | | 281 | |
| | 4,389,263 | | | | Sonae SPGS S.A. | | | 4,080 | |
| | 239,807 | | | | Spar Group Ltd | | | 3,455 | |
| | 240,838 | | | | Spartan Stores, Inc | | | 4,138 | |
| | 433,000 | | | | Springland International Holdings Ltd | | | 86 | |
| | 185,213 | | * | | Sprouts Farmers Market, Inc | | | 4,354 | |
| | 24,100 | | | | Sugi Pharmacy Co Ltd | | | 952 | |
| | 2,722,527 | | | | Sun Art Retail Group Ltd | | | 2,769 | |
| | 92,476 | | | | Sundrug Co Ltd | | | 2,754 | |
| | 495,635 | | | | Sysco Corp | | | 31,056 | |
| | 269,000 | | | | Taiwan TEA Corp | | | 135 | |
| | 43,285,170 | | | | Tesco plc | | | 104,973 | |
| | 28,277 | | | | Tsuruha Holdings, Inc | | | 2,421 | |
| | 149,323 | | * | | United Natural Foods, Inc | | | 1,581 | |
| | 211,850 | | | | United Super Markets Holdings, Inc | | | 2,313 | |
| | 638,216 | | * | | US Foods Holding Corp | | | 20,193 | |
| | 65,900 | | | | Valor Co Ltd | | | 1,590 | |
| | 10,686 | | | | Village Super Market (Class A) | | | 286 | |
| | 1,070,149 | | | | Walgreens Boots Alliance, Inc | | | 73,123 | |
| | 11,672,050 | | | | Wal-Mart de Mexico SAB de C.V. | | | 29,679 | |
| | 4,027,525 | | n | | Walmart, Inc | | | 375,164 | |
| | 12,339 | | | | Weis Markets, Inc | | | 590 | |
| | 1,077,673 | | | | WM Morrison Supermarkets plc | | | 2,930 | |
| | 1,123,239 | | | | Woolworths Ltd | | | 23,300 | |
| | 237,251 | | | | X5 Retail Group NV | | | 5,879 | |
COLLEGE RETIREMENT EQUITIES FUND -Stock Account
| SHARES | | | | COMPANY | | VALUE
(000) | |
| | 6,600 | | | | Yakuodo Co Ltd | | $ | 157 | |
| | 18,400 | | | | Yaoko Co Ltd | | | 1,007 | |
| | 237,500 | | e | | Yokohama Reito Co Ltd | | | 1,979 | |
| | 226,300 | | | | Yonghui Superstores Co Ltd | | | 259 | |
| | 3,045 | | | | Zur Rose Group AG. | | | 279 | |
| | | | | | TOTAL FOOD & STAPLES RETAILING | | | 1,499,399 | |
| | | | | | | | | | |
| FOOD, BEVERAGE & TOBACCO - 4.1% | | | | |
| | 146,787 | | *,e | | 22nd Century Group, Inc | | | 365 | |
| | 1,393,454 | | *,e | | a2 Milk Co Ltd | | | 10,468 | |
| | 176,814 | | | | AAK AB | | | 2,452 | |
| | 8,384 | | | | Agrana Beteiligungs AG. | | | 154 | |
| | 15,154 | | e | | AGT Food & Ingredients, Inc | | | 185 | |
| | 453,977 | | | | Ajinomoto Co, Inc | | | 8,067 | |
| | 4,498 | | | | Alico, Inc | | | 133 | |
| | 3,677,852 | | | | Altria Group, Inc | | | 181,649 | |
| | 5,066,974 | | | | AMBEV S.A. | | | 20,078 | |
| | 187,463 | | | | Anadolu Efes Biracilik Ve Malt Sanayii AS | | | 730 | |
| | 750,665 | | | | Anheuser-Busch InBev S.A. | | | 49,453 | |
| | 794,815 | | | | Archer Daniels Midland Co | | | 32,564 | |
| | 11,500 | | | | Ariake Japan Co Ltd | | | 746 | |
| | 639,746 | | * | | Aryzta AG. | | | 709 | |
| | 344,169 | | | | Asahi Breweries Ltd | | | 13,338 | |
| | 963,028 | | | | Associated British Foods plc | | | 25,100 | |
| | 277,066 | | | | Astral Foods Ltd | | | 3,080 | |
| | 576,000 | | | | Ausnutria Dairy Corp Ltd | | | 647 | |
| | 435,480 | | | | Austevoll Seafood ASA | | | 5,376 | |
| | 219,839 | | *,e | | Australian Agricultural Co Ltd | | | 170 | |
| | 22,077 | | | | Avanti Feeds Ltd | | | 122 | |
| | 215,747 | | | | AVI Ltd | | | 1,525 | |
| | 121,123 | | e | | B&G Foods, Inc (Class A) | | | 3,502 | |
| | 119,963 | | | | Bakkafrost P | | | 5,872 | |
| | 95,999 | | g | | Bakkavor Group plc | | | 173 | |
| | 6,763 | | | | Barry Callebaut AG. | | | 10,555 | |
| | 186,905 | | e | | Bega Cheese Ltd | | | 649 | |
| | 144,900 | | | | Beijing Dabeinong Technology Group Co Ltd | | | 68 | |
| | 1,340 | | | | Bell AG. | | | 416 | |
| | 52,500 | | *,e | | Bellamy’s Australia Ltd | | | 270 | |
| | 20,455 | | | | Binggrae Co Ltd | | | 1,329 | |
| | 472,500 | | * | | Biostime International Holdings Ltd | | | 2,710 | |
| | 9,483 | | e | | Bonduelle S.C.A. | | | 308 | |
| | 10,748 | | * | | Boston Beer Co, Inc (Class A) | | | 2,589 | |
| | 410,800 | | | | Boustead Plantations BHD | | | 74 | |
| | 472,786 | | * | | BRF S.A. | | | 2,672 | |
| | 76,537 | | | | Britannia Industries Ltd | | | 3,412 | |
| | 151,304 | | | | British American Tobacco Malaysia BHD | | | 1,319 | |
| | 4,206,467 | | | | British American Tobacco plc | | | 133,846 | |
| | 2,782 | | | | British American Tobacco plc (ADR) | | | 89 | |
| | 1,217,672 | | | | Britvic plc | | | 12,402 | |
| | 81,307 | | | | Brown-Forman Corp | | | 3,856 | |
| | 191,141 | | | | Brown-Forman Corp (Class B) | | | 9,094 | |
| | 572,500 | | | | Bumitama Agri Ltd | | | 260 | |
| | 875,166 | | | | Bunge Ltd | | | 46,769 | |
COLLEGE RETIREMENT EQUITIES FUND -Stock Account
| SHARES | | | | COMPANY | | VALUE
(000) | |
| | 285,469 | | | | C&C Group plc | | $ | 891 | |
| | 20,123 | | e | | Calavo Growers, Inc | | | 1,468 | |
| | 62,774 | | | | Calbee, Inc | | | 1,961 | |
| | 154,420 | | | | Cal-Maine Foods, Inc | | | 6,532 | |
| | 98,900 | | | | Camil Alimentos S.A. | | | 180 | |
| | 270,328 | | e | | Campbell Soup Co | | | 8,918 | |
| | 164,500 | | | | Carabao Group PCL | | | 155 | |
| | 69,120 | | | | Carlsberg AS (Class B) | | | 7,353 | |
| | 228,100 | | | | Carlsberg Brewery-Malay BHD | | | 1,086 | |
| | 120,455 | | *,e | | Castle Brands, Inc | | | 102 | |
| | 25,666 | | * | | CCL Products India Ltd | | | 99 | |
| | 20,786 | | *,e | | Celsius Holdings, Inc | | | 72 | |
| | 678,200 | | | | Century Pacific Food, Inc | | | 196 | |
| | 912,000 | | | | Charoen Pokphand Enterprise | | | 1,577 | |
| | 3,044,226 | | | | Charoen Pokphand Foods PCL | | | 2,301 | |
| | 8,005,000 | | | | China Agri-Industries Holdings Ltd | | | 2,851 | |
| | 4,375,889 | | *,†,e | | China Huishan Dairy Holdings Co Ltd | | | 6 | |
| | 370,000 | | *,† | | China Huiyuan Juice Group Ltd | | | 0 | ^ |
| | 4,559,946 | | | | China Mengniu Dairy Co Ltd | | | 14,188 | |
| | 1,248,000 | | * | | China Modern Dairy Holdings | | | 124 | |
| | 1,623,164 | | | | China Resources Beer Holdings Company Ltd | | | 5,675 | |
| | 45,700 | | | | Chubu Shiryo Co Ltd | | | 511 | |
| | 613,392 | | | | Cia Cervecerias Unidas S.A. | | | 7,897 | |
| | 7,343 | | | | CJ CheilJedang Corp | | | 2,177 | |
| | 128,577 | | | | Cloetta AB | | | 351 | |
| | 443,701 | | | | Coca-Cola Amatil Ltd | | | 2,559 | |
| | 6,122 | | | | Coca-Cola Bottling Co Consolidated | | | 1,086 | |
| | 11,345,293 | | | | Coca-Cola Co | | | 537,200 | |
| | 128,846 | | | | Coca-Cola Embonor S.A. | | | 311 | |
| | 1,186,862 | | | | Coca-Cola European Partners plc (Class A) | | | 54,418 | |
| | 747,727 | | | | Coca-Cola Femsa S.A. de C.V. | | | 4,534 | |
| | 529,281 | | | | Coca-Cola HBC AG. | | | 16,565 | |
| | 49,687 | | | | Coca-Cola Icecek AS | | | 289 | |
| | 101,500 | | | | Coca-Cola West Japan Co Ltd | | | 3,027 | |
| | 7,590,000 | | | | Cofco International Ltd | | | 2,771 | |
| | 417,000 | | * | | COFCO Meat Holdings Ltd | | | 77 | |
| | 6,954,080 | | | | ConAgra Brands, Inc | | | 148,539 | |
| | 718,222 | | | | Constellation Brands, Inc (Class A) | | | 115,504 | |
| | 14,401 | | e | | Corby Spirit and Wine Ltd | | | 196 | |
| | 214,732 | | | | Costa Group Holdings Ltd | | | 1,123 | |
| | 168,793 | | | | Cott Corp (Toronto) | | | 2,350 | |
| | 76,989 | | * | | Craft Brewers Alliance, Inc | | | 1,102 | |
| | 46,795 | | | | Cranswick plc | | | 1,572 | |
| | 134,321 | | | | Daesang Corp | | | 3,026 | |
| | 240,685 | | e | | Dairy Crest Group plc | | | 1,298 | |
| | 3,327,500 | | g | | Dali Foods Group Co Ltd | | | 2,455 | |
| | 1,150,979 | | | | Danone | | | 81,124 | |
| | 269,409 | | * | | Darling International, Inc | | | 5,183 | |
| | 9,658,176 | | | | Davide Campari-Milano S.p.A | | | 81,789 | |
| | 118,466 | | | | Dean Foods Co | | | 451 | |
| | 5,508,888 | | | | Diageo plc | | | 196,857 | |
| | 773 | | | | Dongwon F&B Co Ltd | | | 199 | |
| | 3,912 | | | | Dongwon Industries Co Ltd | | | 712 | |
| | 5,700 | | | | Dydo Drinco, Inc | | | 298 | |
COLLEGE RETIREMENT EQUITIES FUND -Stock Account
| SHARES | | | | COMPANY | | VALUE
(000) | |
| | 1,214,000 | | *,†,e | | Dynasty Fine Wines Group Ltd | | $ | 2 | |
| | 2,465,982 | | | | Eastern Tobacco | | | 2,239 | |
| | 447,105 | | e | | Easy Bio, Inc | | | 2,431 | |
| | 65,159 | | e | | Ebro Puleva S.A. | | | 1,301 | |
| | 315,342 | | | | Embotelladora Andina S.A. | | | 1,184 | |
| | 399,601 | | | | Embotelladoras Arca SAB de C.V. | | | 2,232 | |
| | 1,417 | | | | Emmi AG. | | | 984 | |
| | 28,300 | | | | Ezaki Glico Co Ltd | | | 1,437 | |
| | 12,478 | | * | | Farmer Bros Co | | | 291 | |
| | 11,949 | | | | Farmsco | | | 83 | |
| | 69,800 | | | | Feed One Co Ltd | | | 113 | |
| | 1,079,400 | | * | | Felda Global Ventures Holdings BHD | | | 186 | |
| | 1,171,986 | | | | Fevertree Drinks plc | | | 32,863 | |
| | 424,100 | | | | First Resources Ltd | | | 481 | |
| | 174,333 | | | | Flowers Foods, Inc | | | 3,220 | |
| | 2,829,663 | | | | Fomento Economico Mexicano S.A. de C.V. | | | 24,295 | |
| | 362,007 | | e | | Fonterra Shareholders’ Fund | | | 1,128 | |
| | 111,209 | | | | ForFarmers NV | | | 1,024 | |
| | 43,500 | | | | Foshan Haitian Flavouring & Food Co Ltd | | | 438 | |
| | 149,700 | | | | Fraser & Neave Holdings BHD | | | 1,212 | |
| | 61,824 | | e | | Freedom Foods Group Ltd | | | 202 | |
| | 186,490 | | | | Fresh Del Monte Produce, Inc | | | 5,272 | |
| | 110,851 | | * | | Freshpet, Inc | | | 3,565 | |
| | 30,473 | | | | Fuji Oil Co Ltd | | | 973 | |
| | 12,332 | | | | Fujicco Co Ltd | | | 268 | |
| | 53,100 | | | | Fujiya Co Ltd | | | 1,108 | |
| | 912,141 | | * | | Future Consumer Ltd | | | 594 | |
| | 267,497 | | | | Futuris Corp Ltd | | | 1,332 | |
| | 788,818 | | | | General Mills, Inc | | | 30,717 | |
| | 293,114 | | | | Genting Plantations BHD | | | 699 | |
| | 346,200 | | | | GFPT PCL (Foreign) | | | 128 | |
| | 176,834 | | e | | Glanbia plc | | | 3,321 | |
| | 4,469 | | | | Godfrey Phillips India Ltd | | | 57 | |
| | 720,534 | | | | Golden Agri-Resources Ltd | | | 129 | |
| | 245,245 | | | | GrainCorp Ltd-A | | | 1,584 | |
| | 2,589,541 | | | | Great Wall Enterprise Co | | | 2,817 | |
| | 447,343 | | | | Greencore Group plc | | | 1,016 | |
| | 9,254 | | e | | Greenyard Foods | | | 77 | |
| | 38,265 | | | | Grieg Seafood ASA | | | 452 | |
| | 322,390 | | e | | Gruma SAB de C.V. | | | 3,653 | |
| | 1,437,816 | | e | | Grupo Bimbo S.A. de C.V. (Series A) | | | 2,864 | |
| | 143,895 | | e | | Grupo Herdez SAB de C.V. | | | 300 | |
| | 91,588 | | * | | Hain Celestial Group, Inc | | | 1,453 | |
| | 46,347 | | | | Heineken Holding NV | | | 3,916 | |
| | 379,028 | | | | Heineken NV | | | 33,501 | |
| | 66,700 | | | | Henan Shuanghui Investment & Development Co Ltd | | | 230 | |
| | 286,497 | | | | Hershey Co | | | 30,707 | |
| | 13,700 | | | | Hokuto Corp | | | 240 | |
| | 285,160 | | e | | Hormel Foods Corp | | | 12,171 | |
| | 124,172 | | * | | Hostess Brands, Inc | | | 1,358 | |
| | 79,048 | | e | | Hotel Chocolat Group Ltd | | | 267 | |
| | 41,152 | | | | House Foods Corp | | | 1,409 | |
COLLEGE RETIREMENT EQUITIES FUND -Stock Account
| SHARES | | | | COMPANY | | VALUE
(000) | |
| | 444,331 | | | | Imperial Tobacco Group plc | | $ | 13,486 | |
| | 4,958,530 | | | | Indofood CBP Sukses Makmur Tbk | | | 3,608 | |
| | 136,000 | | | | Industrias Bachoco SAB de C.V. | | | 446 | |
| | 1,777,576 | | e | | Inghams Group Ltd | | | 5,172 | |
| | 92,142 | | | | Ingredion, Inc | | | 8,422 | |
| | 125,000 | | | | Inner Mongolia Yili Industrial Group Co Ltd | | | 418 | |
| | 1,653,697 | | | | IOI Corp BHD | | | 1,777 | |
| | 6,258,848 | | | | ITC Ltd | | | 25,236 | |
| | 38,400 | | | | Ito En Ltd | | | 1,718 | |
| | 306,900 | | | | Itoham Yonekyu Holdings, Inc | | | 1,856 | |
| | 18,997 | | | | J&J Snack Foods Corp | | | 2,747 | |
| | 97,334 | | | | J.M. Smucker Co | | | 9,100 | |
| | 1,211,421 | | | | Japan Tobacco, Inc | | | 28,785 | |
| | 2,035,800 | | | | Japfa Ltd | | | 1,093 | |
| | 796,297 | | | | JBS S.A. | | | 2,379 | |
| | 363,639 | | e | | Jeil Holdings Co Ltd | | | 3,748 | |
| | 26,700 | | | | Jiangsu Yanghe Brewery Joint-Stock Co Ltd | | | 370 | |
| | 18,078 | | | | Jinro Ltd | | | 269 | |
| | 11,199 | | | | John B. Sanfilippo & Son, Inc | | | 623 | |
| | 26,300 | | | | J-Oil Mills, Inc | | | 915 | |
| | 283,736 | | | | Juhayna Food Industries | | | 178 | |
| | 46,473 | | e | | Kagome Co Ltd | | | 1,218 | |
| | 7,900 | | | | Kameda Seika Co Ltd | | | 356 | |
| | 6,811 | | | | Kaveri Seed Co Ltd | | | 56 | |
| | 237,551 | | | | Kellogg Co | | | 13,543 | |
| | 6,500 | | e | | Kenko Mayonnaise Co Ltd | | | 115 | |
| | 446,990 | | | | Kerry Group plc (Class A) | | | 44,262 | |
| | 112,596 | | | | Keurig Dr Pepper, Inc | | | 2,887 | |
| | 11,500 | | | | KEY Coffee, Inc | | | 218 | |
| | 1,164,460 | | | | Khon Kaen Sugar Industry PCL | | | 107 | |
| | 165,271 | | | | Kikkoman Corp | | | 8,844 | |
| | 1,090,190 | | | | Kirin Brewery Co Ltd | | | 22,732 | |
| | 49,586 | | e | | Koninklijke Wessanen NV | | | 453 | |
| | 17,500 | | | | Kotobuki Spirits Co Ltd | | | 676 | |
| | 4,402,099 | | n | | Kraft Heinz Co | | | 189,466 | |
| | 77,839 | | * | | KRBL Ltd | | | 314 | |
| | 124,806 | | | | KT&G Corp | | | 11,363 | |
| | 351,252 | | | | Kuala Lumpur Kepong BHD | | | 2,101 | |
| | 19,900 | | | | Kweichow Moutai Co Ltd | | | 1,719 | |
| | 1,893 | | | | KWS Saat AG. | | | 562 | |
| | 49,576 | | | | La Doria S.p.A | | | 450 | |
| | 241,737 | | | | Lamb Weston Holdings, Inc | | | 17,782 | |
| | 24,054 | | | | Lancaster Colony Corp | | | 4,254 | |
| | 37,468 | | * | | Landec Corp | | | 444 | |
| | 907,825 | | | | Leroy Seafood Group ASA | | | 6,909 | |
| | 481,028 | | | | Lien Hwa Industrial Corp | | | 464 | |
| | 36,619 | | | | Limoneira Co | | | 716 | |
| | 1,910 | | | | Lindt & Spruengli AG. | | | 11,868 | |
| | 22 | | | | Lindt & Spruengli AG. (Registered) | | | 1,641 | |
| | 1,237 | | | | Lotte Chilsung Beverage Co Ltd | | | 1,552 | |
| | 881 | | | | Lotte Confectionery Co Ltd | | | 119 | |
| | 3,374 | | | | Lotte Samkang Co Ltd | | | 2,144 | |
| | 18,000 | | | | Luzhou Laojiao Co Ltd | | | 107 | |
| | 72,180 | | | | M Dias Branco S.A. | | | 797 | |
COLLEGE RETIREMENT EQUITIES FUND -Stock Account
| SHARES | | | | COMPANY | | VALUE
(000) | |
| | 22,403 | | | | Maeil Dairies Co Ltd | | $ | 1,583 | |
| | 50,842 | | | | Maple Leaf Foods, Inc | | | 1,018 | |
| | 144,200 | | * | | Marfrig Global Foods S.A. | | | 203 | |
| | 68,100 | | | | Marudai Food Co Ltd | | | 1,073 | |
| | 70,800 | | | | Maruha Nichiro Corp | | | 2,379 | |
| | 103,666 | | | | McCormick & Co, Inc | | | 14,434 | |
| | 29,400 | | | | Megmilk Snow Brand Co Ltd | | | 761 | |
| | 122,301 | | | | MEIJI Holdings Co Ltd | | | 9,967 | |
| | 22,167 | | e | | MGP Ingredients, Inc | | | 1,265 | |
| | 74,900 | | * | | Minerva S.A. | | | 96 | |
| | 26,400 | | | | Mitsui Sugar Co Ltd | | | 668 | |
| | 257,104 | | | | Molson Coors Brewing Co (Class B) | | | 14,439 | |
| | 6,051,577 | | | | Mondelez International, Inc | | | 242,245 | |
| | 4,016,245 | | * | | Monster Beverage Corp | | | 197,680 | |
| | 24,060 | | | | Morinaga & Co Ltd | | | 1,032 | |
| | 28,700 | | | | Morinaga Milk Industry Co Ltd | | | 802 | |
| | 10,254 | | | | Muhak Co Ltd | | | 125 | |
| | 22,800 | | | | Muyuan Foodstuff Co Ltd | | | 96 | |
| | 6,000 | | | | Nagatanien Co Ltd | | | 131 | |
| | 110,000 | | | | Namchow Chemical Industrial Ltd | | | 168 | |
| | 165 | | | | Namyang Dairy Products Co Ltd | | | 92 | |
| | 14,776 | | *,e | | National Beverage Corp | | | 1,060 | |
| | 24,678 | | * | | Naturecell Co Ltd | | | 265 | |
| | 34,778 | | | | Nestle India Ltd | | | 5,518 | |
| | 136,200 | | | | Nestle Malaysia BHD | | | 4,851 | |
| | 2,946,314 | | | | Nestle S.A. | | | 239,131 | |
| | 70,100 | | | | New Hope Liuhe Co Ltd | | | 74 | |
| | 66,500 | | | | Nichirei Corp | | | 1,820 | |
| | 5,900 | | | | Nippon Beet Sugar Manufacturing Co Ltd | | | 97 | |
| | 113,800 | | | | Nippon Flour Mills Co Ltd | | | 1,908 | |
| | 70,872 | | | | Nippon Meat Packers, Inc | | | 2,664 | |
| | 790,713 | | | | Nippon Suisan Kaisha Ltd | | | 4,410 | |
| | 132,200 | | | | Nisshin Oillio Group Ltd | | | 3,777 | |
| | 231,813 | | | | Nisshin Seifun Group, Inc | | | 4,775 | |
| | 47,538 | | | | Nissin Food Products Co Ltd | | | 2,979 | |
| | 1,705 | | | | Nong Shim Co Ltd | | | 388 | |
| | 1,229 | | | | Nong Shim Holdings Co Ltd | | | 77 | |
| | 7,339 | | | | Norway Royal Salmon ASA | | | 152 | |
| | 26,531 | | | | Oceana Group Ltd | | | 136 | |
| | 339,252 | | | | Origin Enterprises plc | | | 2,224 | |
| | 14,453 | | | | Orion Corp | | | 221 | |
| | 22,091 | | | | Orion Corp/Republic of Korea | | | 2,369 | |
| | 22,376 | | | | Orior AG. | | | 1,814 | |
| | 358,589 | | | | Orkla ASA | | | 2,808 | |
| | 1,125 | | | | Ottogi Corp | | | 729 | |
| | 740,831 | | | | PAN Fish ASA | | | 15,615 | |
| | 2,396,089 | | | | PepsiCo, Inc | | | 264,720 | |
| | 38,618 | | | | Pernod-Ricard S.A. | | | 6,338 | |
| | 4,326,984 | | | | Philip Morris International, Inc | | | 288,869 | |
| | 161,194 | | * | | Pilgrim’s Pride Corp | | | 2,500 | |
| | 80,711 | | | | Pioneer Foods Ltd | | | 474 | |
| | 53,934 | | * | | Post Holdings, Inc | | | 4,807 | |
| | 997,829 | | | | PPB Group BHD | | | 4,232 | |
COLLEGE RETIREMENT EQUITIES FUND -Stock Account
| SHARES | | | | COMPANY | | VALUE
(000) | |
| | 425,260 | | *,e | | Premier Foods plc | | $ | 179 | |
| | 19,035 | | | | Premium Brands Holdings Corp | | | 1,044 | |
| | 93,299 | | | | Prima Meat Packers Ltd | | | 1,671 | |
| | 171,552 | | * | | Primo Water Corp | | | 2,403 | |
| | 5,692,200 | | | | PT Austindo Nusantara Jaya | | | 455 | |
| | 6,904,600 | | * | | PT BW Plantation Tbk | | | 79 | |
| | 22,094,718 | | | | PT Charoen Pokphand Indonesia Tbk | | | 11,114 | |
| | 406,811 | | | | PT Gudang Garam Tbk | | | 2,370 | |
| | 23,666,400 | | | | PT Hanjaya Mandala Sampoerna Tbk | | | 6,120 | |
| | 4,842,291 | | | | PT Indofood Sukses Makmur Tbk | | | 2,508 | |
| | 19,080,200 | | * | | PT Inti Agri Resources Tbk | | | 318 | |
| | 13,177,100 | | | | PT Japfa Comfeed Indonesia Tbk | | | 1,972 | |
| | 1,432,444 | | | | PT Nippon Indosari Corpindo Tbk | | | 120 | |
| | 2,102,700 | | | | PT Perusahaan Perkebunan London Sumatra Indonesia Tbk | | | 183 | |
| | 2,511,800 | | | | PT Salim Ivomas Pratama Tbk | | | 80 | |
| | 2,243,900 | | | | PT Sawit Sumbermas Sarana Tbk | | | 195 | |
| | 5,855,200 | | | | PT Tunas Baru Lampung Tbk | | | 352 | |
| | 998 | | | | Pulmuone Co Ltd | | | 71 | |
| | 66,300 | | | | Q.P. Corp | | | 1,476 | |
| | 257,400 | | | | QL Resources BHD | | | 424 | |
| | 35,091 | | | | Radico Khaitan Ltd | | | 201 | |
| | 110,041 | | | | Remy Cointreau S.A. | | | 12,476 | |
| | 12,000,000 | | | | RFM Corp | | | 1,116 | |
| | 93,447 | | e | | Rhodes Food Group Pty Ltd | | | 116 | |
| | 6,600 | | | | Riken Vitamin Co Ltd | | | 213 | |
| | 12,100 | | | | Rock Field Co Ltd | | | 183 | |
| | 57,483 | | e | | Rogers Sugar, Inc | | | 229 | |
| | 8,600 | | | | Rokko Butter Co Ltd | | | 168 | |
| | 148,756 | | | | Royal Unibrew A.S. | | | 10,278 | |
| | 11,300 | | | | S Foods, Inc | | | 419 | |
| | 18,355 | | | | Sakata Seed Corp | | | 562 | |
| | 293,207 | | | | Salmar ASA | | | 14,543 | |
| | 1,469 | | | | Samlip General Foods Co Ltd | | | 168 | |
| | 2,178 | | | | Samyang Corp | | | 107 | |
| | 2,046 | | | | Samyang Foods Co Ltd | | | 96 | |
| | 10,021 | | | | Samyang Holdings Corp | | | 704 | |
| | 26,187 | | | | Sanderson Farms, Inc | | | 2,600 | |
| | 235,400 | | | | Sao Martinho S.A. | | | 1,105 | |
| | 198,500 | | | | Sapporo Holdings Ltd | | | 4,122 | |
| | 412,453 | | | | Saputo, Inc | | | 11,840 | |
| | 40,313 | | | | Scandi Standard AB | | | 282 | |
| | 105,307 | | g | | Scandinavian Tobacco Group A.S. | | | 1,269 | |
| | 9,740 | | | | Schouw & Co | | | 728 | |
| | 803 | | | | Seaboard Corp | | | 2,841 | |
| | 60,014 | | | | Select Harvests Ltd | | | 258 | |
| | 8,818 | | * | | Seneca Foods Corp | | | 249 | |
| | 27,737 | | | | Shanxi Xinghuacun Fen Wine Factory Co Ltd | | | 142 | |
| | 42,500 | | | | Showa Sangyo Co Ltd | | | 1,154 | |
| | 3,003,960 | | | | Sime Darby Plantation BHD | | | 3,453 | |
| | 551,337 | | * | | Simply Good Foods Co | | | 10,420 | |
| | 459,700 | | | | SLC Agricola S.A. | | | 4,965 | |
| | 504,861 | | | | Standard Foods Corp | | | 816 | |
| | 17,000 | | | | Starzen Co Ltd | | | 586 | |
COLLEGE RETIREMENT EQUITIES FUND -Stock Account
| SHARES | | | | COMPANY | | VALUE
(000) | |
| | 125,311 | | | | Stock Spirits Group plc | | $ | 332 | |
| | 29,972 | | | | Strauss Group Ltd | | | 681 | |
| | 46,505 | | | | Suedzucker AG. | | | 603 | |
| | 107,983 | | | | Suntory Beverage & Food Ltd | | | 4,876 | |
| | 151,910 | | | | Swedish Match AB | | | 5,980 | |
| | 203,590 | | *,e | | Synlait Milk Ltd | | | 1,232 | |
| | 94,700 | | | | Takara Holdings, Inc | | | 1,151 | |
| | 293,100 | | | | Taokaenoi Food & Marketing PCL | | | 73 | |
| | 443,523 | | | | Tassal Group Ltd | | | 1,381 | |
| | 185,681 | | | | Tata Tea Ltd | | | 583 | |
| | 652,032 | | | | Tate & Lyle plc | | | 5,487 | |
| | 1,480,409 | | | | Thai Union Group PCL | | | 737 | |
| | 1,750,200 | | | | Thai Vegetable Oil PCL (Foreign) | | | 1,424 | |
| | 839,600 | | | | Thaifoods Group PCL | | | 78 | |
| | 1,393,000 | | *,e | | Tibet 5100 Water Resources Holdings Ltd | | | 479 | |
| | 153,914 | | | | Tiger Brands Ltd | | | 2,927 | |
| | 2,015,190 | | | | Tingyi Cayman Islands Holding Corp | | | 2,699 | |
| | 69,561 | | | | Tongaat Hulett Ltd | | | 269 | |
| | 70,300 | | | | Tongwei Co Ltd | | | 85 | |
| | 22,004 | | e | | Tootsie Roll Industries, Inc | | | 735 | |
| | 67,636 | | | | Toyo Suisan Kaisha Ltd | | | 2,355 | |
| | 536,948 | | | | Treasury Wine Estates Ltd | | | 5,599 | |
| | 113,769 | | * | | TreeHouse Foods, Inc | | | 5,769 | |
| | 377,579 | | | | Tsingtao Brewery Co Ltd | | | 1,524 | |
| | 37,300 | | | | Tsingtao Brewery Co Ltd (Class A) | | | 190 | |
| | 110,000 | | | | Ttet Union Corp | | | 351 | |
| | 24,983 | | | | Turning Point Brands, Inc | | | 680 | |
| | 471,236 | | | | Tyson Foods, Inc (Class A) | | | 25,164 | |
| | 307,279 | | | | Ulker Biskuvi Sanayi AS | | | 852 | |
| | 1,517,000 | | | | Uni-President China Holdings Ltd | | | 1,314 | |
| | 12,097,977 | | | | Uni-President Enterprises Corp | | | 27,446 | |
| | 416,574 | | * | | United Spirits Ltd | | | 3,790 | |
| | 50,489 | | | | Universal Corp | | | 2,734 | |
| | 801,194 | | | | Universal Robina | | | 1,931 | |
| | 68,258 | | | | Varun Beverages Ltd | | | 767 | |
| | 134,483 | | e | | Vector Group Ltd | | | 1,309 | |
| | 2,445 | | * | | Venky’s India Ltd | | | 84 | |
| | 3,899 | | e | | Vilmorin & Cie | | | 252 | |
| | 280,936 | | | | Vina Concha y Toro S.A. | | | 548 | |
| | 29,608 | | | | Viscofan S.A. | | | 1,632 | |
| | 4,808,614 | | | | Want Want China Holdings Ltd | | | 3,364 | |
| | 8,500 | | | | Warabeya Nichiyo Co Ltd | | | 149 | |
| | 203,000 | | * | | Wei Chuan Food Corp | | | 147 | |
| | 8,145,193 | | g | | WH Group Ltd | | | 6,256 | |
| | 3,296,288 | | | | Wilmar International Ltd | | | 7,549 | |
| | 67,500 | | | | Wuliangye Yibin Co Ltd | | | 502 | |
| | 135,930 | | | | Yakult Honsha Co Ltd | | | 9,516 | |
| | 96,932 | | | | Yamazaki Baking Co Ltd | | | 2,030 | |
| | 576,000 | | * | | Yashili International | | | 103 | |
| | 404,000 | | | | Yihai International Holding Ltd | | | 983 | |
| | 5,552 | | | | Zydus Wellness Ltd | | | 108 | |
| | | | | | TOTAL FOOD, BEVERAGE & TOBACCO | | | 4,249,152 | |
COLLEGE RETIREMENT EQUITIES FUND -Stock Account
| SHARES | | | | COMPANY | | VALUE
(000) | |
| HEALTH CARE EQUIPMENT & SERVICES - 5.3% | | | | |
| | 6,671,660 | | | | Abbott Laboratories | | $ | 482,561 | |
| | 56,734 | | * | | Abiomed, Inc | | | 18,441 | |
| | 173,435 | | *,e | | Acadia Healthcare Co, Inc | | | 4,459 | |
| | 170,211 | | * | | Accuray, Inc | | | 580 | |
| | 72,235 | | * | | Addus HomeCare Corp | | | 4,903 | |
| | 663,280 | | e | | Advanced Medical Solutions Group plc | | | 2,307 | |
| | 104,870 | | * | | AGFA-Gevaert NV | | | 400 | |
| | 1,994,000 | | g | | AK Medical Holdings Ltd | | | 1,103 | |
| | 315,636 | | | | Alfresa Holdings Corp | | | 8,045 | |
| | 5,174,659 | | * | | Alibaba Health Information Technology Ltd | | | 4,192 | |
| | 115,862 | | * | | Align Technology, Inc | | | 24,265 | |
| | 28,000 | | * | | Alliar Medicos A Frente S.A. | | | 96 | |
| | 240,332 | | * | | Allscripts Healthcare Solutions, Inc | | | 2,317 | |
| | 217,338 | | e | | Ambu A.S. | | | 5,250 | |
| | 57,958 | | * | | Amedisys, Inc | | | 6,787 | |
| | 33,516 | | * | | American Renal Associates Holdings, Inc | | | 386 | |
| | 584,741 | | | | AmerisourceBergen Corp | | | 43,505 | |
| | 59,144 | | * | | AMN Healthcare Services, Inc | | | 3,351 | |
| | 423,769 | | | | Amplifon S.p.A. | | | 6,842 | |
| | 57,540 | | * | | Angiodynamics, Inc | | | 1,158 | |
| | 18,556 | | * | | Anika Therapeutics, Inc | | | 624 | |
| | 301,195 | | | | Ansell Ltd | | | 4,679 | |
| | 177,852 | | *,e | | Antares Pharma, Inc | | | 484 | |
| | 665,920 | | | | Anthem, Inc | | | 174,891 | |
| | 105,797 | | * | | Apollo Hospitals Enterprise Ltd | | | 1,904 | |
| | 8,010 | | *,e | | Apollo Medical Holdings, Inc | | | 159 | |
| | 149,422 | | | | Arjo AB | | | 479 | |
| | 38,835 | | | | As One Corp | | | 2,658 | |
| | 77,100 | | | | Asahi Intecc Co Ltd | | | 3,262 | |
| | 24,912 | | | | Ascom Holding AG. | | | 345 | |
| | 94,864 | | * | | athenahealth, Inc | | | 12,515 | |
| | 83,478 | | * | | AtriCure, Inc | | | 2,554 | |
| | 7,136 | | | | Atrion Corp | | | 5,288 | |
| | 68,048 | | g | | Attendo AB | | | 606 | |
| | 1,118,037 | | | | Australian Pharmaceutical Industries Ltd | | | 1,087 | |
| | 59,793 | | * | | Avanos Medical, Inc | | | 2,678 | |
| | 43,610 | | * | | AxoGen, Inc | | | 891 | |
| | 8,792 | | *,e | | Axonics Modulation Technologies, Inc | | | 133 | |
| | 760,850 | | | | Bangkok Chain Hospital PCL | | | 390 | |
| | 15,085,045 | | | | Bangkok Dusit Medical Services PCL (Foreign) | | | 11,305 | |
| | 1,263,054 | | | | Baxter International, Inc | | | 83,134 | |
| | 386,859 | | | | Becton Dickinson & Co | | | 87,167 | |
| | 19,670 | | *,g | | Biocartis NV | | | 224 | |
| | 29,591 | | | | BioMerieux | | | 1,952 | |
| | 169,766 | | * | | BioScrip, Inc | | | 606 | |
| | 41,584 | | * | | BioTelemetry, Inc | | | 2,483 | |
| | 67,100 | | | | BML, Inc | | | 1,723 | |
| | 6,744 | | | | Boditech Med, Inc | | | 65 | |
| | 3,677,017 | | * | | Boston Scientific Corp | | | 129,946 | |
| | 391,099 | | * | | Brookdale Senior Living, Inc | | | 2,620 | |
| | 268,065 | | | | Bumrungrad Hospital PCL (Foreign) | | | 1,543 | |
| | 77,823 | | | | Cantel Medical Corp | | | 5,794 | |
| | 90,231 | | * | | Capital Senior Living Corp | | | 614 | |
COLLEGE RETIREMENT EQUITIES FUND -Stock Account
| SHARES | | | | COMPANY | | VALUE
(000) | |
| | 779,442 | | | | Cardinal Health, Inc | | $ | 34,763 | |
| | 152,820 | | * | | Cardiovascular Systems, Inc | | | 4,354 | |
| | 89,886 | | | | Carl Zeiss Meditec AG. | | | 7,014 | |
| | 109,050 | | * | | Castlight Health, Inc | | | 237 | |
| | 153 | | | | Celesio AG. | | | 5 | |
| | 25,616 | | | | Cellavision AB | | | 555 | |
| | 46,910 | | *,e | | Celltrion Healthcare Co Ltd | | | 3,184 | |
| | 532,722 | | * | | Centene Corp | | | 61,423 | |
| | 510,223 | | * | | Cerner Corp | | | 26,756 | |
| | 313,968 | | * | | Cerus Corp | | | 1,592 | |
| | 27,113 | | | | Chemed Corp | | | 7,681 | |
| | 2,330,000 | | * | | China Medical & HealthCare Group Ltd | | | 59 | |
| | 503,500 | | | | China Resources Phoenix Healthcare Holdings Co Ltd | | | 329 | |
| | 3,136,400 | | | | Chularat Hospital PCL | | | 185 | |
| | 1,378,636 | | n | | Cigna Corp | | | 261,831 | |
| | 108,365 | | * | | Civitas Solutions, Inc | | | 1,897 | |
| | 178,000 | | *,e | | C-Mer Eye Care Holdings Ltd | | | 114 | |
| | 68,170 | | | | Cochlear Ltd | | | 8,353 | |
| | 124,261 | | | | Coloplast AS | | | 11,558 | |
| | 17,907 | | | | CompuGroup Medical AG. | | | 826 | |
| | 14,325 | | e | | Computer Programs & Systems, Inc | | | 360 | |
| | 31,987 | | | | Conmed Corp | | | 2,054 | |
| | 425,244 | | g | | ConvaTec Group plc | | | 753 | |
| | 39,849 | | | | Cooper Cos, Inc | | | 10,142 | |
| | 12,241 | | * | | Corvel Corp | | | 756 | |
| | 49,077 | | * | | Cross Country Healthcare, Inc | | | 360 | |
| | 46,408 | | * | | CryoLife, Inc | | | 1,317 | |
| | 32,175 | | *,e | | CryoPort, Inc | | | 355 | |
| | 18,695 | | * | | Cutera, Inc | | | 318 | |
| | 43,533 | | e | | CVS Group plc | | | 367 | |
| | 5,719,769 | | | | CVS Health Corp | | | 374,759 | |
| | 208,900 | | *,e | | CYBERDYNE, Inc | | | 916 | |
| | 36,922 | | *,e | | CytoSorbents Corp | | | 298 | |
| | 1,383,947 | | | | Danaher Corp | | | 142,713 | |
| | 171,789 | | * | | DaVita, Inc | | | 8,840 | |
| | 5,300 | | | | Dentium Co Ltd | | | 274 | |
| | 458,596 | | | | Dentsply Sirona, Inc | | | 17,064 | |
| | 203,647 | | * | | DexCom, Inc | | | 24,397 | |
| | 63,124 | | | | DiaSorin S.p.A. | | | 5,125 | |
| | 6,350 | | * | | DIO Corp | | | 164 | |
| | 73,707 | | *,e | | Diplomat Pharmacy, Inc | | | 992 | |
| | 32,038 | | g | | Dr Lal PathLabs Ltd | | | 417 | |
| | 4,940 | | | | Draegerwerk AG. | | | 263 | |
| | 5,062 | | | | Draegerwerk AG. & Co KGaA | | | 239 | |
| | 1,534,507 | | * | | Edwards Lifesciences Corp | | | 235,040 | |
| | 19,800 | | | | Eiken Chemical Co Ltd | | | 433 | |
| �� | 7,631 | | | | El.En. S.p.A | | | 111 | |
| | 9,058 | | *,e,m | | ElectroCore LLC | | | 57 | |
| | 386,607 | | | | Elekta AB (B Shares) | | | 4,591 | |
| | 104,335 | | | | EMIS Group plc | | | 1,214 | |
| | 366,978 | | | | Encompass Health Corp | | | 22,643 | |
| | 84,291 | | | | Ensign Group, Inc | | | 3,270 | |
COLLEGE RETIREMENT EQUITIES FUND -Stock Account
| SHARES | | | | COMPANY | | VALUE
(000) | |
| | 1,213,382 | | | | Estia Health Ltd | | $ | 1,958 | |
| | 114,505 | | *,e | | Evolent Health, Inc | | | 2,284 | |
| | 56,008 | | e | | Extendicare, Inc | | | 261 | |
| | 227,809 | | | | Fagron NV | | | 3,722 | |
| | 516,759 | | | | Fisher & Paykel Healthcare Corp | | | 4,516 | |
| | 116,900 | | | | Fleury S.A. | | | 595 | |
| | 7,929 | | * | | FONAR Corp | | | 160 | |
| | 190,648 | | * | | Fortis Healthcare Ltd | | | 384 | |
| | 228,379 | | | | Fresenius Medical Care AG. | | | 14,804 | |
| | 149,824 | | | | Fresenius SE | | | 7,242 | |
| | 537,992 | | *,e | | Genesis Health Care, Inc | | | 635 | |
| | 71,098 | | *,e | | GenMark Diagnostics, Inc | | | 346 | |
| | 143,143 | | | | Getinge AB (B Shares) | | | 1,294 | |
| | 29,000 | | | | Ginko International Co Ltd | | | 201 | |
| | 42,597 | | *,e | | Glaukos Corp | | | 2,393 | |
| | 109,507 | | * | | Globus Medical, Inc | | | 4,739 | |
| | 593,564 | | | | GN Store Nord | | | 22,240 | |
| | 832,000 | | e | | Golden Meditech Holdings Ltd | | | 85 | |
| | 130,900 | | | | Green Hospital Supply, Inc | | | 4,840 | |
| | 285,634 | | *,e | | Guardant Health, Inc | | | 10,737 | |
| | 10,498 | | | | Guerbet | | | 632 | |
| | 258,230 | | * | | Haemonetics Corp | | | 25,836 | |
| | 5,173,800 | | | | Hartalega Holdings BHD | | | 7,678 | |
| | 1,119,396 | | | | HCA Holdings, Inc | | | 139,309 | |
| | 497,604 | | | | Healius Ltd | | | 782 | |
| | 138,558 | | * | | HealthEquity, Inc | | | 8,265 | |
| | 1,247,070 | | | | Healthscope Ltd | | | 1,959 | |
| | 105,836 | | | | HealthStream, Inc | | | 2,556 | |
| | 17,723 | | *,e | | Helius Medical Technologies, Inc | | | 162 | |
| | 185,608 | | * | | Henry Schein, Inc | | | 14,574 | |
| | 17,499 | | * | | Heska Corp | | | 1,507 | |
| | 144,272 | | | | Hill-Rom Holdings, Inc | | | 12,775 | |
| | 285,808 | | * | | HMS Holdings Corp | | | 8,040 | |
| | 14,900 | | | | Hogy Medical Co Ltd | | | 428 | |
| | 1,051,627 | | * | | Hologic, Inc | | | 43,222 | |
| | 290,805 | | | | Hoya Corp | | | 17,536 | |
| | 35,650 | | | | Huadong Medicine Co Ltd | | | 138 | |
| | 48,321 | | e | | Humana AB | | | 327 | |
| | 517,970 | | | | Humana, Inc | | | 148,388 | |
| | 2,875 | | | | Huons Global Co Ltd | | | 114 | |
| | 44,462 | | * | | ICU Medical, Inc | | | 10,210 | |
| | 153,639 | | * | | IDEXX Laboratories, Inc | | | 28,580 | |
| | 2,847,942 | | | | IHH Healthcare BHD | | | 3,708 | |
| | 32,000 | | *,e | | iKang Healthcare Group, Inc (ADR) | | | 652 | |
| | 5,872 | | | | InBody Co Ltd | | | 115 | |
| | 40,416 | | * | | Inogen Inc | | | 5,018 | |
| | 113,060 | | *,e | | Inovalon Holdings, Inc | | | 1,603 | |
| | 15,238 | | * | | Inspire Medical Systems, Inc | | | 644 | |
| | 25,400 | | | | Instituto Hermes Pardini S.A. | | | 122 | |
| | 203,954 | | *,e | | Insulet Corp | | | 16,178 | |
| | 267,221 | | * | | Integer Holding Corp | | | 20,378 | |
| | 66,495 | | * | | Integra LifeSciences Holdings Corp | | | 2,999 | |
| | 10,525 | | * | | IntriCon Corp | | | 278 | |
| | 437,954 | | * | | Intuitive Surgical, Inc | | | 209,745 | |
COLLEGE RETIREMENT EQUITIES FUND -Stock Account
| SHARES | | | | COMPANY | | VALUE
(000) | |
| | 46,096 | | | | Invacare Corp | | $ | 198 | |
| | 12,519 | | *,e | | Ion Beam Applications | | | 185 | |
| | 10,277 | | *,e | | iRadimed Corp | | | 251 | |
| | 112,471 | | * | | iRhythm Technologies, Inc | | | 7,814 | |
| | 35,300 | | | | Japan Lifeline Co Ltd | | | 455 | |
| | 600,000 | | e | | Japara Healthcare Ltd | | | 472 | |
| | 25,900 | | | | Jeol Ltd | | | 389 | |
| | 84,300 | | | | Jointown Pharmaceutical Group Co Ltd | | | 179 | |
| | 1,914,753 | | | | Koninklijke Philips Electronics NV | | | 67,130 | |
| | 238,199 | | | | Korian-Medica | | | 8,478 | |
| | 1,111,000 | | | | Kossan Rubber Industries | | | 1,167 | |
| | 9,432,192 | | | | KPJ Healthcare BHD | | | 2,380 | |
| | 122,914 | | * | | Laboratory Corp of America Holdings | | | 15,531 | |
| | 107,935 | | * | | Lantheus Holdings, Inc | | | 1,689 | |
| | 11,961 | | | | Le Noble Age | | | 597 | |
| | 46,315 | | | | LeMaitre Vascular, Inc | | | 1,095 | |
| | 37,689 | | * | | LHC Group, Inc | | | 3,538 | |
| | 1,314,394 | | | | Life Healthcare Group Holdings Pte Ltd | | | 2,417 | |
| | 1,336,000 | | *,e | | Lifetech Scientific Corp | | | 256 | |
| | 92,492 | | * | | LivaNova plc | | | 8,460 | |
| | 112,668 | | | | M3, Inc | | | 1,518 | |
| | 50,077 | | * | | Magellan Health Services, Inc | | | 2,849 | |
| | 17,700 | | | | Mani, Inc | | | 668 | |
| | 78,812 | | * | | Masimo Corp | | | 8,462 | |
| | 498,830 | | | | McKesson Corp | | | 55,106 | |
| | 1,820 | | *,g | | Medartis Holding AG. | | | 103 | |
| | 10,500 | | *,e | | Medical Data Vision Co Ltd | | | 87 | |
| | 199,892 | | e | | Medical Facilities Corp | | | 2,202 | |
| | 43,227 | | * | | Medicare Group | | | 748 | |
| | 433,201 | | | | Mediceo Paltac Holdings Co Ltd | | | 9,268 | |
| | 325,198 | | | | Mediclinic International plc | | | 1,335 | |
| | 74,468 | | * | | Medidata Solutions, Inc | | | 5,021 | |
| | 4,495 | | * | | Medipost Co Ltd | | | 296 | |
| | 147,284 | | * | | MEDNAX, Inc | | | 4,860 | |
| | 3,637,077 | | | | Medtronic plc | | | 330,829 | |
| | 88,640 | | | | Meinian Onehealth Healthcare Holdings Co Ltd | | | 194 | |
| | 15,600 | | | | Menicon Co Ltd | | | 397 | |
| | 58,324 | | | | Meridian Bioscience, Inc | | | 1,012 | |
| | 68,201 | | * | | Merit Medical Systems, Inc | | | 3,806 | |
| | 652,923 | | | | Metlifecare Ltd | | | 2,366 | |
| | 269,832 | | e | | Microport Scientific Corp | | | 266 | |
| | 34,900 | | | | Miraca Holdings, Inc | | | 788 | |
| | 55,781 | | *,g | | MLP Saglik Hizmetleri AS. | | | 113 | |
| | 266,378 | | * | | Molina Healthcare, Inc | | | 30,958 | |
| | 13,636 | | | | Nagaileben Co Ltd | | | 294 | |
| | 48,800 | | | | Nakanishi, Inc | | | 832 | |
| | 156,072 | | *,e | | Nanosonics Ltd | | | 312 | |
| | 27,203 | | *,e,m | | NantHealth, Inc | | | 15 | |
| | 25,536 | | | | National Healthcare Corp | | | 2,003 | |
| | 33,638 | | | | National Research Corp | | | 1,283 | |
| | 42,536 | | * | | Natus Medical, Inc | | | 1,447 | |
| | 63,429 | | * | | Neogen Corp | | | 3,615 | |
| | 1,318,345 | | | | Network Healthcare Holdings Ltd | | | 2,413 | |
COLLEGE RETIREMENT EQUITIES FUND -Stock Account
| SHARES | | | | COMPANY | | VALUE
(000) | |
| | 1,406 | | | | Neuca S.A. | | $ | 92 | |
| | 8,889 | | * | | Neuronetics, Inc | | | 172 | |
| | 107,313 | | * | | Nevro Corp | | | 4,173 | |
| | 99,372 | | * | | NextGen Healthcare, Inc | | | 1,505 | |
| | 82,000 | | | | Nichii Gakkan Co | | | 768 | |
| | 67,200 | | | | Nihon Kohden Corp | | | 2,191 | |
| | 42,067 | | | | Nikkiso Co Ltd | | | 353 | |
| | 127,332 | | | | Nipro Corp | | | 1,558 | |
| | 186,039 | | e | | NMC Health plc | | | 6,493 | |
| | 29,419 | | g | | NNIT A.S. | | | 827 | |
| | 289,845 | | *,e | | Novocure Ltd | | | 9,704 | |
| | 65,802 | | * | | NuVasive, Inc | | | 3,261 | |
| | 25,073 | | * | | Nuvectra Corp | | | 410 | |
| | 120,497 | | * | | NxStage Medical, Inc | | | 3,449 | |
| | 180,400 | | | | Odontoprev S.A. | | | 639 | |
| | 219,468 | | | | Olympus Corp | | | 6,712 | |
| | 67,691 | | * | | Omnicell, Inc | | | 4,145 | |
| | 302,465 | | * | | OraSure Technologies, Inc | | | 3,533 | |
| | 84,587 | | | | Oriola-KD Oyj (B Shares) | | | 192 | |
| | 35,120 | | e | | Orpea | | | 3,587 | |
| | 64,187 | | * | | Orthofix International NV | | | 3,369 | |
| | 9,930 | | * | | OrthoPediatrics Corp | | | 346 | |
| | 6,543 | | * | | Osstem Implant Co Ltd | | | 315 | |
| | 80,525 | | | | Owens & Minor, Inc | | | 510 | |
| | 126,333 | | * | | Oxford Immunotec Global plc | | | 1,615 | |
| | 65,100 | | | | Paramount Bed Holdings Co Ltd | | | 2,685 | |
| | 105,620 | | | | Patterson Cos, Inc | | | 2,076 | |
| | 44,113 | | *,e | | Penumbra, Inc | | | 5,391 | |
| | 20,178 | | *,e | | PetIQ, Inc | | | 474 | |
| | 45,987 | | | | Phonak Holding AG. | | | 7,562 | |
| | 79,000 | | *,†,m | | Pihsiang Machinery Manufacturing Co Ltd | | | 44 | |
| | 641,832 | | * | | Premier, Inc | | | 23,972 | |
| | 1,008,300 | | * | | Principal Capital PCL | | | 146 | |
| | 163,822 | | | | Pro Medicus Ltd | | | 1,257 | |
| | 122,369 | | * | | Providence Service Corp | | | 7,345 | |
| | 12,948 | | e | | Pulse Biosciences, Inc | | | 148 | |
| | 619,400 | | | | Qualicorp S.A. | | | 2,058 | |
| | 222,335 | | | | Quest Diagnostics, Inc | | | 18,514 | |
| | 44,326 | | * | | Quidel Corp | | | 2,164 | |
| | 48,317 | | *,e | | Quorum Health Corp | | | 140 | |
| | 455,125 | | * | | R1 RCM, Inc | | | 3,618 | |
| | 176,043 | | * | | RadNet, Inc | | | 1,790 | |
| | 493,307 | | e | | Raffles Medical Group Ltd | | | 398 | |
| | 54,504 | | | | Ramsay Health Care Ltd | | | 2,217 | |
| | 15,675 | | *,e | | RaySearch Laboratories AB | | | 171 | |
| | 83,761 | | | | Regis Healthcare Ltd | | | 156 | |
| | 7,957,500 | | | | Religare Health Trust | | | 4,262 | |
| | 118,481 | | | | Resmed, Inc | | | 13,491 | |
| | 12,326 | | | | Rhoen Klinikum AG. | | | 312 | |
| | 195,000 | | | | Rion Co Ltd | | | 3,062 | |
| | 155,900 | | | | Riverstone Holdings Ltd | | | 130 | |
| | 57,355 | | *,e | | Rockwell Medical, Inc | | | 130 | |
| | 70,384 | | * | | RTI Biologics, Inc | | | 260 | |
| | 312,532 | | | | Ryman Healthcare Ltd | | | 2,255 | |
COLLEGE RETIREMENT EQUITIES FUND -Stock Account
| SHARES | | | | COMPANY | | VALUE
(000) | |
| | 30,184 | | | | Sartorius AG. | | $ | 3,757 | |
| | 21,758 | | * | | SeaSpine Holdings Corp | | | 397 | |
| | 4,000 | | e | | Seed Co Ltd | | | 46 | |
| | 1,226,518 | | | | Selcuk Ecza Deposu Ticaret ve Sanayi AS | | | 646 | |
| | 217,834 | | * | | Select Medical Holdings Corp | | | 3,344 | |
| | 119,412 | | *,e | | Senseonics Holdings, Inc | | | 309 | |
| | 4,184,415 | | | | Shandong Weigao Group Medical Polymer Co Ltd | | | 3,380 | |
| | 65,000 | | | | Shanghai Pharmaceuticals Holding Co Ltd | | | 161 | |
| | 857,140 | | | | Shanghai Pharmaceuticals Holding Co Ltd (Hong Kong) | | | 1,740 | |
| | 10,525 | | *,e | | SI-BONE, Inc | | | 220 | |
| | 229,602 | | *,g | | Siemens Healthineers AG. | | | 9,594 | |
| | 77,676 | | e | | Sienna Senior Living, Inc | | | 896 | |
| | 31,269 | | * | | Sientra, Inc | | | 397 | |
| | 810,569 | | | | Sigma Healthcare Ltd | | | 326 | |
| | 16,509 | | | | Simulations Plus, Inc | | | 329 | |
| | 1,564,671 | | | | Sinopharm Group Co | | | 6,588 | |
| | 596,780 | | | | Smith & Nephew plc | | | 11,171 | |
| | 1,500 | | | | Software Service, Inc | | | 109 | |
| | 30,400 | | | | Solasto Corp | | | 305 | |
| | 194,496 | | | | Sonic Healthcare Ltd | | | 3,034 | |
| | 182,917 | | g | | Spire Healthcare Group plc | | | 254 | |
| | 33,000 | | | | St. Shine Optical Co Ltd | | | 580 | |
| | 320,475 | | * | | Staar Surgical Co | | | 10,226 | |
| | 260,273 | | | | STERIS Plc | | | 27,810 | |
| | 3,013 | | | | STRATEC Biomedical AG. | | | 173 | |
| | 21,782 | | | | Straumann Holding AG. | | | 13,757 | |
| | 757,177 | | | | Stryker Corp | | | 118,687 | |
| | 3,484 | | | | Suheung Capsule Co Ltd | | | 73 | |
| | 259,202 | | | | Summerset Group Holdings Ltd | | | 1,109 | |
| | 3,440,700 | | | | Supermax Corp BHD | | | 2,896 | |
| | 25,947 | | *,e | | Surgery Partners, Inc | | | 254 | |
| | 16,423 | | * | | SurModics, Inc | | | 776 | |
| | 103,682 | | | | Suzuken Co Ltd | | | 5,280 | |
| | 53,742 | | | | Sysmex Corp | | | 2,552 | |
| | 22,495 | | * | | Tabula Rasa HealthCare, Inc | | | 1,434 | |
| | 22,461 | | *,e | | Tactile Systems Technology, Inc | | | 1,023 | |
| | 32,000 | | | | TaiDoc Technology Corp | | | 183 | |
| | 64,204 | | * | | Tandem Diabetes Care, Inc | | | 2,438 | |
| | 114,418 | | *,e | | Teladoc, Inc | | | 5,672 | |
| | 14,767 | | | | Teleflex, Inc | | | 3,817 | |
| | 178,073 | | * | | Tenet Healthcare Corp | | | 3,052 | |
| | 168,476 | | | | Terumo Corp | | | 9,503 | |
| | 184,300 | | | | Thonburi Healthcare Group PCL | | | 187 | |
| | 50,841 | | * | | Tivity Health, Inc | | | 1,261 | |
| | 303,300 | | e | | Toho Pharmaceutical Co Ltd | | | 7,418 | |
| | 12,900 | | | | Tokai Corp (GIFU) | | | 327 | |
| | 1,483,800 | | | | Top Glove Corp BHD | | | 2,012 | |
| | 2,414,000 | | *,†,e | | Town Health International Medical Group Ltd | | | 3 | |
| | 209,971 | | *,e | | TransEnterix, Inc | | | 475 | |
| | 165,357 | | * | | Triple-S Management Corp (Class B) | | | 2,876 | |
| | 30,200 | | | | Tsuki Corp | | | 230 | |
| | 154,880 | | | | United Drug plc | | | 1,179 | |
COLLEGE RETIREMENT EQUITIES FUND -Stock Account
| SHARES | | | | COMPANY | | VALUE
(000) | |
| | 2,974,278 | | e | | UnitedHealth Group, Inc | | $ | 740,952 | |
| | 280,231 | | | | Universal Health Services, Inc (Class B) | | | 32,664 | |
| | 4,659,000 | | g | | Universal Medical Financial & Technical Advisory Services Co Ltd | | | 3,484 | |
| | 15,847 | | | | US Physical Therapy, Inc | | | 1,622 | |
| | 4,679 | | | | Utah Medical Products, Inc | | | 389 | |
| | 4,119 | | | | Value Added Technologies Co Ltd | | | 80 | |
| | 12,663 | | * | | Vapotherm, Inc | | | 253 | |
| | 53,060 | | * | | Varex Imaging Corp | | | 1,256 | |
| | 86,013 | | * | | Varian Medical Systems, Inc | | | 9,746 | |
| | 386,710 | | * | | Veeva Systems, Inc | | | 34,541 | |
| | 3,485,500 | | | | Vibhavadi Medical Center PCL (Foreign) | | | 214 | |
| | 3,966 | | | | Vieworks Co Ltd | | | 117 | |
| | 80,403 | | *,e | | ViewRay, Inc | | | 488 | |
| | 242,715 | | | | Virtus Health Ltd | | | 754 | |
| | 210,400 | | | | VITAL KSK Holdings, Inc | | | 2,162 | |
| | 38,234 | | * | | Vocera Communications, Inc | | | 1,504 | |
| | 324,305 | | * | | WellCare Health Plans, Inc | | | 76,565 | |
| | 59,320 | | | | West Pharmaceutical Services, Inc | | | 5,815 | |
| | 193,405 | | *,e | | William Demant Holding A.S. | | | 5,507 | |
| | 650,210 | | *,e | | Wright Medical Group NV | | | 17,699 | |
| | 3,652 | | | �� | Ypsomed Holding AG. | | | 433 | |
| | 2,101,958 | | | | Zimmer Biomet Holdings, Inc | | | 218,015 | |
| | | | | | TOTAL HEALTH CARE EQUIPMENT & SERVICES | | | 5,469,783 | |
| | | | | | | | | | |
| HOUSEHOLD & PERSONAL PRODUCTS - 1.7% | | | | |
| | 3,816 | | * | | Aekyung Industrial Co Ltd | | | 164 | |
| | 32,823 | | | | Amorepacific Corp | | | 6,176 | |
| | 9,037 | | | | Amorepacific Corp (Preference) | | | 833 | |
| | 1,351 | | * | | Avon Products, Inc | | | 2 | |
| | 52,115 | | | | Bajaj Corp Ltd | | | 275 | |
| | 29,083 | | | | Beiersdorf AG. | | | 3,033 | |
| | 5,834,600 | | | | Best World International Ltd | | | 11,251 | |
| | 8,216 | | e | | Blackmores Ltd | | | 706 | |
| | 136,053 | | e | | BWX Ltd | | | 151 | |
| | 49,557 | | *,e | | Central Garden & Pet Co | | | 1,707 | |
| | 139,011 | | * | | Central Garden and Pet Co (Class A) | | | 4,344 | |
| | 27,000 | | | | Chlitina Holding Ltd | | | 226 | |
| | 241,268 | | | | Church & Dwight Co, Inc | | | 15,866 | |
| | 138,084 | | | | Clorox Co | | | 21,284 | |
| | 674,682 | | | | Colgate-Palmolive Co | | | 40,157 | |
| | 4,660 | | | | Cosmax, Inc | | | 544 | |
| | 484,882 | | | | Coty, Inc | | | 3,181 | |
| | 769,118 | | | | Dabur India Ltd | | | 4,742 | |
| | 29,700 | | | | Dr Ci:Labo Co Ltd | | | 1,588 | |
| | 8,500 | | e | | Earth Chemical Co Ltd | | | 391 | |
| | 156,984 | | * | | Edgewell Personal Care Co | | | 5,863 | |
| | 126,221 | | | | EIS Eczacibasi Ilac ve Sinai ve Finansal Yatirimlar Sanayi ve Ticaret AS | | | 65 | |
| | 73,395 | | *,e | | elf Beauty, Inc | | | 636 | |
| | 233,869 | | | | Energizer Holdings, Inc | | | 10,559 | |
| | 529,074 | | | | Essity AB | | | 13,005 | |
| | 1,106,579 | | | | Estee Lauder Cos (Class A) | | | 143,966 | |
| | 43,600 | | *,e | | Euglena Co Ltd | | | 230 | |
COLLEGE RETIREMENT EQUITIES FUND -Stock Account
| SHARES | | | | COMPANY | | VALUE
(000) | |
| | 87,100 | | | | Fancl Corp | | $ | 2,222 | |
| | 9,148 | | | | Gillette India Ltd | | | 851 | |
| | 449,546 | | | | Godrej Consumer Products Ltd | | | 5,219 | |
| | 68,000 | | | | Grape King Industrial Co | | | 421 | |
| | 768,447 | | | | Hengan International Group Co Ltd | | | 5,579 | |
| | 20,067 | | | | Henkel KGaA | | | 1,975 | |
| | 38,782 | | | | Henkel KGaA (Preference) | | | 4,236 | |
| | 408,279 | | * | | Herbalife Ltd | | | 24,068 | |
| | 980,113 | | | | Hindustan Lever Ltd | | | 25,538 | |
| | 8,064 | | | | Inter Parfums S.A. | | | 312 | |
| | 25,332 | | | | Inter Parfums, Inc | | | 1,661 | |
| | 4,960 | | | | It’s Skin Co Ltd | | | 120 | |
| | 25,584 | | | | Jamieson Wellness, Inc | | | 400 | |
| | 11,351 | | * | | Jayjun Cosmetic Co Ltd | | | 111 | |
| | 98,330 | | | | Jyothy Laboratories Ltd | | | 301 | |
| | 422,407 | | | | Kao Corp | | | 31,266 | |
| | 414,762 | | | | Kimberly-Clark Corp | | | 47,258 | |
| | 1,295,316 | | e | | Kimberly-Clark de Mexico S.A. de C.V. (Class A) | | | 2,055 | |
| | 36,600 | | | | Kitanotatsujin Corp | | | 123 | |
| | 89,300 | | | | Kobayashi Pharmaceutical Co Ltd | | | 6,056 | |
| | 7,367 | | | | Kolmar BNH Co Ltd | | | 132 | |
| | 8,957 | | | | Korea Kolmar Co Ltd | | | 566 | |
| | 4,618 | | | | Korea Kolmar Holdings Co Ltd | | | 122 | |
| | 68,900 | | | | Kose Corp | | | 10,823 | |
| | 9,473 | | | | LG Household & Health Care Ltd | | | 9,362 | |
| | 2,546 | | | | LG Household & Health Care Ltd (Preference) | | | 1,499 | |
| | 252,600 | | | | Lion Corp | | | 5,221 | |
| | 323,340 | | | | L’Oreal S.A. | | | 73,988 | |
| | 25,158 | | | | Mandom Corp | | | 685 | |
| | 807,217 | | | | Marico Ltd | | | 4,315 | |
| | 22,820 | | | | Medifast, Inc | | | 2,853 | |
| | 17,700 | | | | Milbon Co Ltd | | | 721 | |
| | 5,000 | | | | MTG Co Ltd | | | 240 | |
| | 198,698 | | | | Natura Cosmeticos S.A. | | | 2,306 | |
| | 9,142 | | e | | Natural Health Trends Corp | | | 169 | |
| | 15,323 | | * | | Nature’s Sunshine Products, Inc | | | 125 | |
| | 11,700 | | | | Noevir Holdings Co Ltd | | | 508 | |
| | 91,023 | | | | Nu Skin Enterprises, Inc (Class A) | | | 5,582 | |
| | 5,786 | | * | | NUTRIBIOTECH Co Ltd | | | 86 | |
| | 1,404,000 | | | | NVC Lighting Holdings Ltd | | | 88 | |
| | 6,643 | | | | Oil-Dri Corp of America | | | 176 | |
| | 47,037 | | | | Ontex Group NV | | | 965 | |
| | 27,126 | | e | | Oriflame Holding AG. | | | 610 | |
| | 20,589 | | | | Pacific Corp | | | 1,344 | |
| | 140,100 | | | | Pigeon Corp | | | 5,976 | |
| | 237,805 | | | | Pola Orbis Holdings, Inc | | | 6,408 | |
| | 7,892,706 | | | | Procter & Gamble Co | | | 725,498 | |
| | 6,186,000 | | | | PT Industri Jamu Dan Farmasi Sido Muncul Tbk | | | 361 | |
| | 1,618,129 | | | | PT Unilever Indonesia Tbk | | | 5,119 | |
| | 181,654 | | | | PZ Cussons plc | | | 494 | |
| | 1,455,256 | | | | Reckitt Benckiser Group plc | | | 111,438 | |
| | 10,829 | | *,e | | Revlon, Inc (Class A) | | | 273 | |
| | 74,639 | | | | Sarantis S.A. | | | 596 | |
COLLEGE RETIREMENT EQUITIES FUND -Stock Account
| SHARES | | | | COMPANY | | VALUE
(000) | |
| | 517,591 | | | | Shiseido Co Ltd | | $ | 32,416 | |
| | 23,074 | | | | Spectrum Brands Holdings, Inc | | | 975 | |
| | 6,800 | | | | ST Corp | | | 115 | |
| | 57,980 | | | | TCI Co Ltd | | | 976 | |
| | 461,636 | | | | Uni-Charm Corp | | | 14,930 | |
| | 2,898,069 | | | | Unilever NV | | | 156,995 | |
| | 1,523,748 | | | | Unilever plc | | | 80,001 | |
| | 135,981 | | * | | USANA Health Sciences, Inc | | | 16,009 | |
| | 156,000 | | | | Vinda International Holdings Ltd | | | 245 | |
| | 17,268 | | e | | WD-40 Co | | | 3,165 | |
| | 115,600 | | e | | YA-MAN Ltd | | | 1,443 | |
| | | | | | TOTAL HOUSEHOLD & PERSONAL PRODUCTS | | | 1,736,636 | |
| | | | | | | | | | |
| INSURANCE - 4.1% | | | | |
| | 152,492 | | | | Admiral Group plc | | | 3,979 | |
| | 2,485,987 | | | | Aegon NV | | | 11,643 | |
| | 494,772 | | | | Aflac, Inc | | | 22,542 | |
| | 37,418 | | | | Ageas | | | 1,684 | |
| | 13,641,806 | | | | AIA Group Ltd | | | 113,320 | |
| | 86,495 | | | | Alleghany Corp | | | 53,914 | |
| | 686,241 | | | | Allianz AG. | | | 137,904 | |
| | 567,320 | | | | Allstate Corp | | | 46,878 | |
| | 138,789 | | | | Alm Brand AS | | | 1,064 | |
| | 58,901 | | * | | AMBAC Financial Group, Inc | | | 1,015 | |
| | 332,910 | | | | American Equity Investment Life Holding Co | | | 9,301 | |
| | 78,229 | | | | American Financial Group, Inc | | | 7,082 | |
| | 4,259,001 | | | | American International Group, Inc | | | 167,847 | |
| | 4,614 | | | | American National Insurance Co | | | 587 | |
| | 46,563 | | | | Amerisafe, Inc | | | 2,640 | |
| | 53,717 | | | | Anadolu Hayat Emeklilik AS | | | 61 | |
| | 143,437 | | | | Anadolu Sigorta | | | 112 | |
| | 9,100 | | e | | Anicom Holdings, Inc | | | 301 | |
| | 44,707 | | | | Aon plc | | | 6,499 | |
| | 352,148 | | * | | Arch Capital Group Ltd | | | 9,409 | |
| | 698,393 | | | | Argo Group International Holdings Ltd | | | 46,967 | |
| | 69,990 | | | | Arthur J. Gallagher & Co | | | 5,158 | |
| | 91,454 | | | | Aspen Insurance Holdings Ltd | | | 3,840 | |
| | 448,305 | | | | ASR Nederland NV | | | 17,739 | |
| | 629,701 | | | | Assicurazioni Generali S.p.A. | | | 10,525 | |
| | 56,756 | | | | Assurant, Inc | | | 5,076 | |
| | 58,223 | | | | Assured Guaranty Ltd | | | 2,229 | |
| | 4,246,109 | | * | | Athene Holding Ltd | | | 169,122 | |
| | 3,789,713 | | | | Aviva plc | | | 18,138 | |
| | 1,937,521 | | | | AXA S.A. | | | 41,815 | |
| | 721,538 | | | | Axis Capital Holdings Ltd | | | 37,260 | |
| | 32,940 | | | | Bajaj Finserv Ltd | | | 3,054 | |
| | 11,912 | | | | Baloise Holding AG. | | | 1,645 | |
| | 614,074 | | | | BB Seguridade Participacoes S.A. | | | 4,372 | |
| | 571,048 | | | | Beazley plc | | | 3,670 | |
| | 4,407,029 | | * | | Berkshire Hathaway, Inc (Class B) | | | 899,827 | |
| | 51,584 | | * | | Brighthouse Financial, Inc | | | 1,572 | |
| | 229,429 | | | | Brown & Brown, Inc | | | 6,323 | |
| | 8,322,816 | | | | Cathay Financial Holding Co Ltd | | | 12,741 | |
| | 5,757,494 | | | | China Insurance International Holdings Co Ltd | | | 15,829 | |
COLLEGE RETIREMENT EQUITIES FUND -Stock Account
| SHARES | | | | COMPANY | | VALUE
(000) | |
| | 12,300 | | | | China Life Insurance Co Ltd | | $ | 37 | |
| | 8,301,890 | | | | China Life Insurance Co Ltd | | | 17,556 | |
| | 2,561,253 | | | | China Life Insurance Co Ltd (Taiwan) | | | 2,324 | |
| | 57,700 | | | | China Pacific Insurance Group Co Ltd | | | 239 | |
| | 2,644,539 | | | | China Pacific Insurance Group Co Ltd (Hong Kong) | | | 8,546 | |
| | 7,552,000 | | | | China Reinsurance Group Corp | | | 1,543 | |
| | 2,047,250 | | | | Chubb Ltd | | | 264,464 | |
| | 66,608 | | | | Cincinnati Financial Corp | | | 5,157 | |
| | 65,488 | | *,e | | Citizens, Inc (Class A) | | | 492 | |
| | 19,906 | | * | | Clal Insurance | | | 280 | |
| | 69,142 | | | | CNA Financial Corp | | | 3,053 | |
| | 98,778 | | | | CNP Assurances | | | 2,097 | |
| | 550,108 | | | | Conseco, Inc | | | 8,186 | |
| | 3,630,000 | | *,†,e | | Convoy Financial Holdings Ltd | | | 5 | |
| | 529,845 | | | | Corp Mapfre S.A. | | | 1,407 | |
| | 45,252 | | | | Crawford & Co (Class B) | | | 407 | |
| | 2,563,707 | | | | Dai-ichi Mutual Life Insurance Co | | | 39,813 | |
| | 1,080,479 | | | | Direct Line Insurance Group plc | | | 4,392 | |
| | 315,260 | | | | Discovery Holdings Ltd | | | 3,501 | |
| | 26,794 | | | | Donegal Group, Inc (Class A) | | | 366 | |
| | 50,166 | | | | Dongbu Insurance Co Ltd | | | 3,159 | |
| | 37,129 | | * | | eHealth, Inc | | | 1,426 | |
| | 11,942 | | | | EMC Insurance Group, Inc | | | 380 | |
| | 280,593 | | | | Employers Holdings, Inc | | | 11,776 | |
| | 15,329 | | * | | Enstar Group Ltd | | | 2,569 | |
| | 33,037 | | | | Erie Indemnity Co (Class A) | | | 4,404 | |
| | 20,729 | | | | Everest Re Group Ltd | | | 4,514 | |
| | 25,173 | | | | Fairfax Financial Holdings Ltd | | | 11,081 | |
| | 24,000 | | e | | Fanhua, Inc (ADR) | | | 527 | |
| | 16,159 | | | | FBL Financial Group, Inc (Class A) | | | 1,061 | |
| | 16,286 | | | | FedNat Holding Co | | | 324 | |
| | 393,630 | | | | First American Financial Corp | | | 17,572 | |
| | 529,659 | | | | FNF Group | | | 16,652 | |
| | 5,229 | | e | | Fondiaria-Sai S.p.A | | | 12 | |
| | 1,012,831 | | * | | Genworth Financial, Inc (Class A) | | | 4,720 | |
| | 170,327 | | | | Gjensidige Forsikring BA | | | 2,665 | |
| | 11,807 | | | | Global Indemnity Ltd | | | 428 | |
| | 13,166 | | *,e | | Goosehead Insurance, Inc | | | 346 | |
| | 444,310 | | | | Great-West Lifeco, Inc | | | 9,171 | |
| | 41,371 | | * | | Greenlight Capital Re Ltd (Class A) | | | 357 | |
| | 75,125 | | | | Grupo Catalana Occidente S.A. | | | 2,806 | |
| | 34,850 | | * | | Hallmark Financial Services | | | 373 | |
| | 73,857 | | | | Hannover Rueckversicherung AG. | | | 9,954 | |
| | 61,320 | | | | Hanover Insurance Group, Inc | | | 7,160 | |
| | 157,718 | | | | Hanwha Non-Life Insurance Co Ltd | | | 834 | |
| | 204,559 | | | | Harel Insurance Investments & Finances Ltd | | | 1,343 | |
| | 3,778,697 | | | | Hartford Financial Services Group, Inc | | | 167,963 | |
| | 683,944 | | g | | Hastings Group Holdings Ltd | | | 1,628 | |
| | 10,089 | | | | HCI Group, Inc | | | 513 | |
| | 18,096 | | *,e | | Health Insurance Innovations, Inc | | | 484 | |
| | 5,339 | | | | Helvetia Holding AG. | | | 3,122 | |
| | 28,413 | | e | | Heritage Insurance Holdings, Inc | | | 418 | |
| | 196,935 | | | | Hiscox Ltd | | | 4,070 | |
COLLEGE RETIREMENT EQUITIES FUND -Stock Account
| SHARES | | | | COMPANY | | VALUE
(000) | |
| | 52,594 | | | | Horace Mann Educators Corp | | $ | 1,970 | |
| | 11,900 | | | | Hubei Biocause Pharmaceutical Co Ltd | | | 10 | |
| | 123,086 | | | | Hyundai Marine & Fire Insurance Co Ltd | | | 4,520 | |
| | 18,496 | | | | IDI Insurance Co Ltd | | | 947 | |
| | 5,546 | | | | Independence Holding Co | | | 195 | |
| | 68,504 | | | | Industrial Alliance Insurance and Financial Services, Inc | | | 2,186 | |
| | 100,701 | | g | | ING Life Insurance Korea Ltd | | | 2,526 | |
| | 2,489,530 | | | | Insurance Australia Group Ltd | | | 12,279 | |
| | 274,828 | | | | Intact Financial Corp | | | 19,968 | |
| | 1,841 | | | | Investors Title Co | | | 325 | |
| | 112,500 | | | | IRB Brasil Resseguros S | | | 2,423 | |
| | 98,120 | | | | James River Group Holdings Ltd | | | 3,585 | |
| | 2,105,100 | | | | Japan Post Holdings Co Ltd | | | 24,306 | |
| | 1,800 | | e | | Japan Post Insurance Co Ltd | | | 42 | |
| | 1,008,214 | | | | Just Retirement Group plc | | | 1,179 | |
| | 94,714 | | | | Kemper Corp | | | 6,287 | |
| | 10,838 | | | | Kingstone Cos, Inc | | | 192 | |
| | 24,483 | | | | Kinsale Capital Group, Inc | | | 1,360 | |
| | 1,670,318 | | | | Korea Life Insurance Co Ltd | | | 6,324 | |
| | 61,884 | | | | Korean Reinsurance Co | | | 480 | |
| | 124,416 | | | | Lancashire Holdings Ltd | | | 960 | |
| | 9,128,651 | | | | Legal & General Group plc | | | 26,896 | |
| | 668,581 | | | | Liberty Holdings Ltd | | | 5,112 | |
| | 710,483 | | | | Lincoln National Corp | | | 36,455 | |
| | 173,066 | | | | Loews Corp | | | 7,878 | |
| | 23,637 | | | | Lotte Non-Life Insurance Co Ltd | | | 56 | |
| | 95,110 | | | | Maiden Holdings Ltd | | | 157 | |
| | 324,688 | | e | | Manulife Financial Corp | | | 4,607 | |
| | 2,924,977 | | | | Manulife Financial Corp (Toronto) | | | 41,501 | |
| | 5,393 | | * | | Markel Corp | | | 5,598 | |
| | 1,013,755 | | | | Marsh & McLennan Cos, Inc | | | 80,847 | |
| | 113,243 | | * | | Max India Ltd | | | 723 | |
| | 212,684 | | *,e | | MBIA, Inc | | | 1,897 | |
| | 2,847,358 | | | | Medibank Pvt Ltd | | | 5,155 | |
| | 51,075 | | | | Menorah Mivtachim Holdings Ltd | | | 543 | |
| | 1,117,999 | | | | Mercuries & Associates Holding Ltd | | | 647 | |
| | 224,058 | | * | | Mercuries Life Insurance Co Lt | | | 85 | |
| | 16,953 | | | | Mercury General Corp | | | 877 | |
| | 311,716 | | | | Meritz Fire & Marine Insurance Co Ltd | | | 6,097 | |
| | 2,265,137 | | | | Metlife, Inc | | | 93,006 | |
| | 533,488 | | * | | Metropolitan Holdings Ltd | | | 633 | |
| | 238,305 | | | | Migdal Insurance Holdings Ltd | | | 203 | |
| | 238,131 | | | | Mirae Asset Life Insurance Co Ltd | | | 983 | |
| | 439,183 | | | | Mitsui Sumitomo Insurance Group Holdings, Inc | | | 12,484 | |
| | 30,528 | | | | Muenchener Rueckver AG. | | | 6,658 | |
| | 110,737 | | | | National General Holdings Corp | | | 2,681 | |
| | 3,767 | | | | National Western Life Group, Inc | | | 1,133 | |
| | 44,066 | | | | Navigators Group, Inc | | | 3,062 | |
| | 9,800 | | | | New China Life Insurance Co Ltd | | | 60 | |
| | 776,382 | | | | New China Life insurance Co Ltd (Hong Kong) | | | 3,081 | |
| | 14,989 | | * | | NI Holdings, Inc | | | 236 | |
| | 334,705 | | | | nib holdings Ltd | | | 1,227 | |
| | 273,182 | | | | NKSJ Holdings, Inc | | | 9,280 | |
COLLEGE RETIREMENT EQUITIES FUND -Stock Account
| SHARES | | | | COMPANY | | VALUE
(000) | |
| | 472,859 | | | | NN Group NV | | $ | 18,800 | |
| | 10,302,665 | | | | Old Mutual Ltd | | | 16,008 | |
| | 101,485 | | | | Old Mutual Ltd (London) | | | 151 | |
| | 275,659 | | | | Old Republic International Corp | | | 5,670 | |
| | 8,389,288 | | | | People’s Insurance Co Group of China Ltd | | | 3,368 | |
| | 400,444 | | | | Phoenix Group Holdings plc | | | 2,876 | |
| | 73,564 | | | | Phoenix Holdings Ltd | | | 373 | |
| | 8,909,239 | | | | PICC Property & Casualty Co Ltd | | | 9,091 | |
| | 12,597,976 | | e | | Ping An Insurance Group Co of China Ltd | | | 111,139 | |
| | 160,400 | | | | Ping An Insurance Group Co of China Ltd (Class A) | | | 1,312 | |
| | 427,474 | | | | Porto Seguro S.A. | | | 5,755 | |
| | 632,402 | | g | | Poste Italiane S.p.A | | | 5,071 | |
| | 668,839 | | | | Power Corp Of Canada | | | 12,018 | |
| | 803,965 | | | | Power Financial Corp | | | 15,211 | |
| | 595,195 | | | | Powszechny Zaklad Ubezpieczen S.A. | | | 7,012 | |
| | 117,183 | | | | Primerica, Inc | | | 11,450 | |
| | 224,150 | | | | Principal Financial Group | | | 9,901 | |
| | 118,724 | | | | ProAssurance Corp | | | 4,815 | |
| | 1,023,216 | | | | Progressive Corp | | | 61,731 | |
| | 12,481 | | | | Protective Insurance Corp | | | 208 | |
| | 41,618 | | *,e | | Protector Forsikring ASA | | | 231 | |
| | 2,301,937 | | | | Prudential Financial, Inc | | | 187,723 | |
| | 5,441,594 | | | | Prudential plc | | | 97,168 | |
| | 57,256,000 | | * | | PT Panin Insurance Tbk | | | 4,181 | |
| | 271,713,400 | | * | | PT Panin Life Tbk | | | 5,069 | |
| | 147,128 | | * | | Qatar Insurance Co SAQ | | | 1,449 | |
| | 1,749,436 | | | | QBE Insurance Group Ltd | | | 12,457 | |
| | 114,300 | | | | Qualitas Controladora SAB de C.V. | | | 241 | |
| | 470,390 | | | | Rand Merchant Investment Holdings Ltd | | | 1,189 | |
| | 100,330 | | | | Reinsurance Group of America, Inc (Class A) | | | 14,069 | |
| | 24,233 | | | | RenaissanceRe Holdings Ltd | | | 3,240 | |
| | 48,939 | | | | RLI Corp | | | 3,376 | |
| | 982,773 | | | | RSA Insurance Group plc | | | 6,450 | |
| | 636,889 | | g | | Sabre Insurance Group plc | | | 2,216 | |
| | 18,368 | | | | Safety Insurance Group, Inc | | | 1,503 | |
| | 954,722 | | | | Saga plc | | | 1,260 | |
| | 1,753,044 | | | | Sampo Oyj (A Shares) | | | 77,694 | |
| | 32,085 | | | | Samsung Fire & Marine Insurance Co Ltd | | | 7,715 | |
| | 58,810 | | | | Samsung Life Insurance Co Ltd | | | 4,303 | |
| | 2,529,652 | | | | Sanlam Ltd | | | 14,012 | |
| | 180,278 | | | | SCOR SE | | | 8,105 | |
| | 81,066 | | | | Selective Insurance Group, Inc | | | 4,940 | |
| | 32,636,780 | | | | Shin Kong Financial Holding Co Ltd | | | 9,544 | |
| | 454,000 | | | | Shinkong Insurance Co Ltd | | | 516 | |
| | 93,998 | | | | Societa Cattolica di Assicurazioni SCRL | | | 765 | |
| | 822,392 | | | | Sony Financial Holdings, Inc | | | 15,327 | |
| | 20,887 | | | | State Auto Financial Corp | | | 711 | |
| | 502,464 | | | | Steadfast Group Ltd | | | 974 | |
| | 65,684 | | | | Stewart Information Services Corp | | | 2,719 | |
| | 380,953 | | | | Storebrand ASA | | | 2,718 | |
| | 951,894 | | | | Sul America SA | | | 7,016 | |
| | 550,387 | | | | Sun Life Financial, Inc | | | 18,259 | |
| | 923,464 | | | | Suncorp-Metway Ltd | | | 8,219 | |
COLLEGE RETIREMENT EQUITIES FUND -Stock Account
| SHARES | | | | COMPANY | | VALUE
(000) | |
| | 17,687 | | | | Swiss Life Holding | | $ | 6,827 | |
| | 69,949 | | | | Swiss Re Ltd | | | 6,435 | |
| | 1,560,418 | | | | T&D Holdings, Inc | | | 18,050 | |
| | 1,364,212 | | * | | Third Point Reinsurance Ltd | | | 13,151 | |
| | 98,539 | | | | TI Financial Holdings Ltd | | | 743 | |
| | 36,223 | | | | Tiptree Financial, Inc | | | 202 | |
| | 2,782,181 | | | | Tokio Marine Holdings, Inc | | | 132,178 | |
| | 21,966 | | | | Tong Yang Life Insurance | | | 94 | |
| | 214,614 | | | | Topdanmark AS | | | 10,016 | |
| | 73,093 | | | | Torchmark Corp | | | 5,448 | |
| | 108,822 | | | | Travelers Cos, Inc | | | 13,031 | |
| | 115,224 | | *,e | | Trupanion, Inc | | | 2,934 | |
| | 64,991 | | | | Tryg A.S. | | | 1,639 | |
| | 516,170 | | | | Unipol Gruppo Finanziario S.p.A | | | 2,082 | |
| | 260,831 | | | | Uniqa Versicherungen AG. | | | 2,349 | |
| | 51,869 | | | | United Fire & Casualty Co | | | 2,876 | |
| | 26,504 | | | | United Insurance Holdings Corp | | | 440 | |
| | 62,899 | | | | Universal Insurance Holdings, Inc | | | 2,385 | |
| | 260,854 | | | | UnumProvident Corp | | | 7,664 | |
| | 77,503 | | | | W.R. Berkley Corp | | | 5,728 | |
| | 5,003 | | | | White Mountains Insurance Group Ltd | | | 4,291 | |
| | 113,527 | | | | Wiener Staedtische Allgemeine Versicherung AG. | | | 2,638 | |
| | 233,933 | | | | Willis Towers Watson plc | | | 35,525 | |
| | 43,600 | | | | Wiz Solucoes e Corretagem de Seguros S.A. | | | 79 | |
| | 15,294 | | | | Wuestenrot & Wuerttembergische AG. | | | 281 | |
| | 217,800 | | *,e,g | | ZhongAn Online P&C Insurance Co Ltd | | | 695 | |
| | 427,024 | | | | Zurich Financial Services AG. | | | 127,291 | |
| | | | | | TOTAL INSURANCE | | | 4,246,674 | |
| | | | | | | | | | |
| MATERIALS - 4.8% |
| | 36,321 | | *,m | | A Schulman, Inc | | | 69 | |
| | 48,039 | | | | Aarti Industries | | | 993 | |
| | 128,818 | | | | Acerinox S.A. | | | 1,277 | |
| | 7,499 | | | | Achilles Corp | | | 126 | |
| | 224,400 | | | | ADEKA Corp | | | 3,244 | |
| | 268,645 | | | | Adelaide Brighton Ltd | | | 809 | |
| | 21,687 | | e | | Advanced Emissions Solutions, Inc | | | 229 | |
| | 55,714 | | | | Advanced Metallurgical Group NV | | | 1,798 | |
| | 80,063 | | * | | Advansa Sasa Polyester Sanayi AS | | | 124 | |
| | 130,451 | | * | | AdvanSix, Inc | | | 3,175 | |
| | 134,465 | | | | Aeci Ltd | | | 780 | |
| | 104,718 | | * | | African Barrick Gold Ltd | | | 245 | |
| | 689,113 | | | | African Rainbow Minerals Ltd | | | 6,818 | |
| | 157,031 | | | | Agnico-Eagle Mines Ltd | | | 6,338 | |
| | 37,942 | | *,e | | AgroFresh Solutions, Inc | | | 144 | |
| | 15,000 | | | | Aichi Steel Corp | | | 469 | |
| | 72,040 | | | | Air Liquide | | | 8,946 | |
| | 217,656 | | | | Air Products & Chemicals, Inc | | | 34,836 | |
| | 40,550 | | | | Air Water, Inc | | | 611 | |
| | 33,115 | | | | AK Holdings, Inc | | | 1,606 | |
| | 486,094 | | *,e | | AK Steel Holding Corp | | | 1,094 | |
| | 6,349 | | | | Akzo Nobel India Ltd | | | 159 | |
| | 394,271 | | | | Akzo Nobel NV | | | 31,752 | |
| | 247,061 | | | | Alamos Gold, Inc | | | 889 | |
COLLEGE RETIREMENT EQUITIES FUND -Stock Account
| SHARES | | | | COMPANY | | VALUE
(000) | |
| | 1,238,706 | | | | Albemarle Corp | | $ | 95,467 | |
| | 342,219 | | * | | Alcoa Corp | | | 9,096 | |
| | 2,182,913 | | | | Alexandria Mineral Oils Co | | | 761 | |
| | 696,993 | | * | | Allegheny Technologies, Inc | | | 15,174 | |
| | 26,648 | | | | Altius Minerals Corp | | | 211 | |
| | 660,971 | | | | Altri SGPS S.A. | | | 4,404 | |
| | 489,965 | | *,e | | Altura Mining Ltd | | | 48 | |
| | 1,868,847 | | | | Alumina Ltd | | | 3,027 | |
| | 4,055,445 | | * | | Aluminum Corp of China Ltd | | | 1,298 | |
| | 644,068 | | | | Ambuja Cements Ltd | | | 2,075 | |
| | 1,765,500 | | | | Amcor Ltd | | | 16,485 | |
| | 82,827 | | | | American Vanguard Corp | | | 1,258 | |
| | 3,729,000 | | | | AMVIG Holdings Ltd | | | 852 | |
| | 60,606 | | *,e | | Amyris, Inc | | | 202 | |
| | 640,785 | | | | Anadolu Cam Sanayii AS | | | 324 | |
| | 235,610 | | * | | Anatolia Minerals Development Ltd | | | 435 | |
| | 1,600,000 | | | | Angang New Steel Co Ltd | | | 1,104 | |
| | 215,200 | | | | Angang Steel Co Ltd | | | 161 | |
| | 111,256 | | | | Anglo American Platinum Ltd | | | 4,148 | |
| | 2,071,376 | | | | Anglo American plc (London) | | | 46,317 | |
| | 415,616 | | | | AngloGold Ashanti Ltd | | | 5,280 | |
| | 2,669,369 | | | | Anhui Conch Cement Co Ltd | | | 12,908 | |
| | 77,100 | | | | Anhui Conch Cement Co Ltd (Class A) | | | 330 | |
| | 1,173,033 | | | | Antofagasta plc | | | 11,732 | |
| | 172,111 | | | | APERAM | | | 4,529 | |
| | 4,288 | | * | | APL Apollo Tubes Ltd | | | 72 | |
| | 40,068 | | | | Aptargroup, Inc | | | 3,769 | |
| | 969,326 | | | | ArcelorMittal | | | 20,065 | |
| | 43,186 | | | | Ardagh Group S.A. | | | 479 | |
| | 289,300 | | | | Arkema | | | 24,836 | |
| | 22,274 | | | | Asahi Holdings, Inc | | | 456 | |
| | 1,507,485 | | | | Asahi Kasei Corp | | | 15,472 | |
| | 246,768 | | | | Ashland Global Holdings, Inc | | | 17,511 | |
| | 1,875,500 | | | | Asia Cement China Holdings Corp | | | 1,315 | |
| | 935 | | | | Asia Cement Co Ltd | | | 87 | |
| | 2,209,024 | | | | Asia Cement Corp | | | 2,443 | |
| | 394,914 | | | | Asian Paints Ltd | | | 7,759 | |
| | 19,171 | | | | Atul Ltd | | | 943 | |
| | 54,035 | | | | Aurubis AG. | | | 2,678 | |
| | 1,004,496 | | | | Ausdrill Ltd | | | 842 | |
| | 83,888 | | | | Avery Dennison Corp | | | 7,536 | |
| | 410,486 | | * | | Axalta Coating Systems Ltd | | | 9,614 | |
| | 620,765 | | * | | B2Gold Corp | | | 1,814 | |
| | 65,002 | | | | Balchem Corp | | | 5,093 | |
| | 676,010 | | | | Ball Corp | | | 31,083 | |
| | 3,788,100 | | | | Baoshan Iron & Steel Co Ltd | | | 3,592 | |
| | 1,327,753 | | | | Barrick Gold Corp (Canada) | | | 17,924 | |
| | 6,466 | | | | BASF India Ltd | | | 143 | |
| | 1,404,538 | | | | BASF SE | | | 97,831 | |
| | 5,109 | | | | Bayer CropScience Ltd | | | 309 | |
| | 27,900 | | | | BBMG Corp | | | 14 | |
| | 14,462,000 | | | | BBMG Corp | | | 4,554 | |
| | 23,614 | | e | | Bekaert S.A. | | | 569 | |
COLLEGE RETIREMENT EQUITIES FUND -Stock Account
| SHARES | | | | COMPANY | | VALUE
(000) | |
| | 49,700 | | | | Bemis Co, Inc | | $ | 2,281 | |
| | 1,800,048 | | * | | Berry Plastics Group, Inc | | | 85,556 | |
| | 3,760,667 | | | | BHP Billiton Ltd | | | 90,899 | |
| | 575,767 | | e | | BHP Billiton Ltd (ADR) | | | 27,804 | |
| | 3,049,919 | | | | BHP Group plc | | | 64,448 | |
| | 111,641 | | e | | Billerud AB | | | 1,334 | |
| | 4,850 | | *,e | | Bio On Spa | | | 316 | |
| | 11,489 | | * | | Birla Corp Ltd | | | 99 | |
| | 625,524 | | | | BlueScope Steel Ltd | | | 4,825 | |
| | 85,874 | | | | Boise Cascade Co | | | 2,048 | |
| | 379,910 | | | | Boliden AB | | | 8,232 | |
| | 1,084,944 | | | | Boral Ltd | | | 3,776 | |
| | 62,756 | | | | Borregaard ASA | | | 544 | |
| | 61,973 | | * | | Boryszew S.A. | | | 78 | |
| | 139,000 | | | | Bradespar S.A. | | | 1,136 | |
| | 368,775 | | | | Braskem S.A. | | | 4,504 | |
| | 173,871 | | | | Brickworks Ltd | | | 2,038 | |
| | 55,778 | | e | | Buzzi Unicem S.p.A. | | | 962 | |
| | 56,809 | | | | Buzzi Unicem S.p.A. RSP | | | 623 | |
| | 98,548 | | | | Cabot Corp | | | 4,232 | |
| | 330,500 | | | | Cahya Mata Sarawak BHD | | | 215 | |
| | 706,600 | | * | | Canfor Corp | | | 8,556 | |
| | 235,618 | | | | Canfor Pulp Products, Inc | | | 2,798 | |
| | 86,697 | | | | CAP S.A. | | | 760 | |
| | 103,022 | | | | Carpenter Technology Corp | | | 3,669 | |
| | 250,229 | | e | | Cascades, Inc | | | 1,875 | |
| | 207,259 | | | | CCL Industries | | | 7,600 | |
| | 120,995 | | | | Celanese Corp (Series A) | | | 10,886 | |
| | 78,238 | | | | Cementir S.p.A. | | | 462 | |
| | 450,254 | | | | Cementos Argos S.A. | | | 965 | |
| | 89,946 | | * | | Cemex Latam Holdings S.A. | | | 102 | |
| | 16,873,478 | | *,e | | Cemex S.A. de C.V. | | | 8,148 | |
| | 598,300 | | * | | Cemex SAB de C.V. (ADR) | | | 2,884 | |
| | 860,964 | | | | Centamin plc | | | 1,198 | |
| | 270,065 | | * | | Centerra Gold, Inc | | | 1,159 | |
| | 102,231 | | e | | Central Asia Metals plc | | | 283 | |
| | 79,807 | | * | | Century Aluminum Co | | | 583 | |
| | 77,000 | | | | Century Iron & Steel Industrial Co Ltd | | | 162 | |
| | 33,121 | | * | | Century Plyboards India Ltd | | | 84 | |
| | 16,187 | | * | | Century Textile & Industries Ltd | | | 214 | |
| | 519,206 | | | | CF Industries Holdings, Inc | | | 22,591 | |
| | 219,408 | | | | Chambal Fertilizers & Chemicals Ltd | | | 465 | |
| | 9,148 | | | | Chase Corp | | | 915 | |
| | 2,262,258 | | | | Chemours Co | | | 63,841 | |
| | 4,120,560 | | | | Cheng Loong Corp | | | 2,493 | |
| | 300,000 | | * | | Chiho-Tiande Group Ltd | | | 76 | |
| | 1,072,695 | | | | China BlueChemical Ltd | | | 337 | |
| | 207,029 | | | | China General Plastics Corp | | | 148 | |
| | 50,600 | | | | China Hi-ment Corp | | | 83 | |
| | 1,698,000 | | | | China Hongqiao Group Ltd | | | 966 | |
| | 1,742,841 | | | | China Manmade Fibers Corp | | | 579 | |
| | 176,112 | | | | China Metal Products | | | 222 | |
| | 858,455 | | *,†,e,m | | China Metal Recycling Holdings Ltd | | | 1 | |
| | 488,000 | | *,g | | China Metal Resources Utilization Ltd | | | 272 | |
COLLEGE RETIREMENT EQUITIES FUND -Stock Account
| SHARES | | | | COMPANY | | VALUE
(000) | |
| | 13,537,900 | | e | | China Molybdenum Co Ltd | | $ | 4,985 | |
| | 263,800 | | | | China Molybdenum Co Ltd (Class A) | | | 145 | |
| | 11,187,282 | | | | China National Building Material Co Ltd | | | 7,655 | |
| | 119,700 | | | | China Northern Rare Earth Group High-Tech Co Ltd | | | 153 | |
| | 594,000 | | | | China Oriental Group Co Ltd | | | 354 | |
| | 1,438,628 | | * | | China Petrochemical Development Corp | | | 513 | |
| | 2,426,000 | | | | China Resources Cement Holdings Ltd | | | 2,188 | |
| | 2,267,000 | | | | China Sanjiang Fine Chemicals | | | 545 | |
| | 3,973,420 | | *,e | | China Shanshui Cement Group Ltd | | | 1,071 | |
| | 99,000 | | | | China Steel Chemical Corp | | | 441 | |
| | 25,975,303 | | | | China Steel Corp | | | 20,512 | |
| | 472,897 | | | | China Synthetic Rubber Corp | | | 598 | |
| | 117,000 | | | | China XLX Fertiliser Ltd | | | 38 | |
| | 2,314,000 | | e | | China Zhongwang Holdings Ltd | | | 1,025 | |
| | 177,114 | | | | Christian Hansen Holding | | | 15,722 | |
| | 37,200 | | | | Chugoku Marine Paints Ltd | | | 307 | |
| | 2,102,000 | | * | | Chung Hung Steel Corp | | | 731 | |
| | 295,540 | | | | Chung Hwa Pulp Corp | | | 93 | |
| | 423,183 | | e | | Cia de Minas Buenaventura S.A. (ADR) (Series B) | | | 6,864 | |
| | 551,048 | | * | | Cia Siderurgica Nacional S.A. | | | 1,253 | |
| | 17,598 | | | | Ciech S.A. | | | 209 | |
| | 23,750 | | | | Clariant AG. | | | 438 | |
| | 21,293 | | * | | Clearwater Paper Corp | | | 519 | |
| | 509,168 | | *,e | | Cleveland-Cliffs, Inc | | | 3,916 | |
| | 437,795 | | * | | Coeur Mining, Inc | | | 1,957 | |
| | 176,312 | | | | Commercial Metals Co | | | 2,825 | |
| | 86,132 | | *,† | | Companhia Vale do Rio Doce | | | 0 | |
| | 42,739 | | | | Compass Minerals International, Inc | | | 1,782 | |
| | 76,801 | | * | | Constellium NV | | | 537 | |
| | 97,629 | | * | | Continental Gold, Inc | | | 161 | |
| | 42,306 | | | | Corbion NV | | | 1,185 | |
| | 85,227 | | | | Coromandel International Ltd | | | 549 | |
| | 26,098 | | e | | Corticeira Amorim SGPS S.A. | | | 271 | |
| | 185,772 | | g | | Covestro AG. | | | 9,200 | |
| | 294,000 | | e | | CPMC Holdings Ltd | | | 141 | |
| | 1,861,076 | | | | CRH plc | | | 49,294 | |
| | 30,380 | | | | Croda International plc | | | 1,814 | |
| | 3,479,113 | | * | | Crown Holdings, Inc | | | 144,627 | |
| | 351,691 | | | | CSR Ltd | | | 696 | |
| | 1,287,500 | | | | D&L Industries Inc | | | 269 | |
| | 187,499 | | | | Daicel Chemical Industries Ltd | | | 1,925 | |
| | 33,000 | | | | Daido Steel Co Ltd | | | 1,295 | |
| | 28,000 | | | | Daiken Corp | | | 506 | |
| | 16,071 | | | | Dainichiseika Color & Chemicals Manufacturing Co Ltd | | | 396 | |
| | 108,000 | | | | Dainippon Ink and Chemicals, Inc | | | 3,304 | |
| | 42,572 | | e | | Daio Paper Corp | | | 490 | |
| | 8,400 | | | | Daiso Co Ltd | | | 188 | |
| | 101,002 | | | | DCM Shriram Ltd | | | 489 | |
| | 127,200 | | | | Denki Kagaku Kogyo KK | | | 3,580 | |
| | 130,651 | | * | | Detour Gold Corp | | | 1,103 | |
| | 2,238,600 | | | | DG Khan Cement Co Ltd | | | 1,293 | |
| | 295,087 | | | | Domtar Corp | | | 10,366 | |
COLLEGE RETIREMENT EQUITIES FUND -Stock Account
| SHARES | | | | COMPANY | | VALUE
(000) | |
| | 18,919 | | | | Dongjin Semichem Co Ltd | | $ | 124 | |
| | 37,409 | | | | Dongkuk Steel Mill Co Ltd | | | 244 | |
| | 716,000 | | e | | Dongyue Group | | | 369 | |
| | 41,700 | | | | Dowa Holdings Co Ltd | | | 1,248 | |
| | 6,344,877 | | | | DowDuPont, Inc | | | 339,324 | |
| | 950,426 | | | | DS Smith plc | | | 3,625 | |
| | 58,899 | | | | DSM NV | | | 4,778 | |
| | 6,364 | | * | | Duk San Neolux Co Ltd | | | 81 | |
| | 310,731 | | | | DuluxGroup Ltd | | | 1,436 | |
| | 55,558 | | | | Eagle Materials, Inc | | | 3,391 | |
| | 311,000 | | | | Eastern Polymer Group PCL | | | 66 | |
| | 57,538 | | | | Eastman Chemical Co | | | 4,207 | |
| | 347,566 | | | | Ecolab, Inc | | | 51,214 | |
| | 11,582 | | * | | Ecopro Co Ltd | | | 343 | |
| | 112,917 | | | | EID Parry India Ltd | | | 334 | |
| | 131,123 | | * | | El Ezz Steel Co | | | 133 | |
| | 103,896 | | *,e | | Eldorado Gold Corp | | | 304 | |
| | 367,053 | | | | Elementis plc | | | 853 | |
| | 358,190 | | *,g | | Elkem ASA | | | 918 | |
| | 3,301,750 | | | | Empresas CMPC S.A. | | | 10,496 | |
| | 1,885 | | | | EMS-Chemie Holding AG. | | | 897 | |
| | 1,204,811 | | | | Ence Energia y Celulosa S.A. | | | 7,571 | |
| | 48,519 | | * | | Endeavour Mining Corp | | | 794 | |
| | 84,984 | | *,e | | Endeavour Silver Corp | | | 183 | |
| | 294,300 | | | | Engro Chemical Pakistan Ltd | | | 617 | |
| | 3,207,000 | | | | Engro Fertilizers Ltd | | | 1,595 | |
| | 19,721 | | | | Eramet | | | 1,361 | |
| | 402,560 | | | | Ercros S.A. | | | 1,436 | |
| | 3,330,913 | | | | Eregli Demir ve Celik Fabrikalari TAS | | | 4,529 | |
| | 166,290 | | e | | Essentra plc | | | 726 | |
| | 549,574 | | | | Eternal Chemical Co Ltd | | | 419 | |
| | 296,620 | | | | Eugene Corp | | | 1,666 | |
| | 221,128 | | | | Everlight Chemical Industrial Corp | | | 117 | |
| | 1,483,627 | | | | Evolution Mining Ltd | | | 3,860 | |
| | 236,162 | | | | Evonik Industries AG. | | | 5,895 | |
| | 154,624 | | | | Evraz plc | | | 947 | |
| | 3,931,000 | | | | Fauji Cement Co Ltd | | | 593 | |
| | 79,500 | | * | | Fauji Fertilizer Bin Qasim Ltd | | | 21 | |
| | 304,300 | | | | Fauji Fertilizer Co Ltd | | | 204 | |
| | 300,050 | | | | Feng Hsin Iron & Steel Co | | | 571 | |
| | 1,916,785 | | | | Ferrexpo plc | | | 4,756 | |
| | 107,174 | | * | | Ferro Corp | | | 1,680 | |
| | 202,348 | | * | | Ferroglobe plc | | | 0 | |
| | 254,530 | | | | Fibria Celulose S.A. | | | 4,439 | |
| | 22,750 | | * | | Finolex Industries Ltd | | | 177 | |
| | 113,218 | | *,e | | First Majestic Silver Corp | | | 665 | |
| | 3,280,993 | | | | First Quantum Minerals Ltd | | | 26,533 | |
| | 1,360,197 | | * | | Fletcher Building Ltd | | | 4,455 | |
| | 77,052 | | *,e,m | | Flotek Industries, Inc | | | 84 | |
| | 332,344 | | | | FMC Corp | | | 24,580 | |
| | 30,955 | | *,e | | Foosung Co Ltd | | | 207 | |
| | 3,705,354 | | | | Formosa Chemicals & Fibre Corp | | | 12,676 | |
| | 9,480,176 | | | | Formosa Plastics Corp | | | 31,161 | |
| | 894,746 | | g | | Forterra plc | | | 2,555 | |
COLLEGE RETIREMENT EQUITIES FUND -Stock Account
| SHARES | | | | COMPANY | | VALUE
(000) | |
| | 25,828 | | *,e | | Forterra, Inc | | $ | 97 | |
| | 2,211,470 | | | | Fortescue Metals Group Ltd | | | 6,521 | |
| | 98,102 | | * | | Fortuna Silver Mines, Inc | | | 359 | |
| | 15,500 | | | | FP Corp | | | 949 | |
| | 275,865 | | | | Franco-Nevada Corp | | | 19,344 | |
| | 5,374,104 | | | | Freeport-McMoRan Copper & Gold, Inc (Class B) | | | 55,407 | |
| | 200,681 | | | | Fresnillo plc | | | 2,205 | |
| | 62,690 | | | | Fuchs Petrolub AG. (Preference) | | | 2,592 | |
| | 5,469,200 | | | | Fufeng Group Ltd | | | 2,313 | |
| | 30,500 | | | | Fuji Seal International, Inc | | | 1,075 | |
| | 10,400 | | | | Fujimi, Inc | | | 199 | |
| | 17,200 | | | | Fujimori Kogyo Co Ltd | | | 461 | |
| | 162,099 | | e | | Furukawa-Sky Aluminum Corp | | | 3,162 | |
| | 1,483,800 | | | | Fushan International Energy Group Ltd | | | 301 | |
| | 10,700 | | e | | Fuso Chemical Co Ltd | | | 193 | |
| | 168,972 | | | | FutureFuel Corp | | | 2,680 | |
| | 219,247 | | *,e | | Galaxy Resources Ltd | | | 335 | |
| | 91,501 | | * | | GCP Applied Technologies, Inc | | | 2,246 | |
| | 3,284,412 | | | | Gerdau S.A. (Preference) | | | 12,518 | |
| | 7,289 | | | | Givaudan S.A. | | | 16,901 | |
| | 14,636,613 | | | | Glencore Xstrata plc | | | 54,420 | |
| | 240,900 | | | | Global Green Chemicals PCL | | | 73 | |
| | 97,000 | | | | Godo Steel Ltd | | | 1,417 | |
| | 789,120 | | | | Gold Fields Ltd | | | 2,733 | |
| | 73,048 | | | | Gold Resource Corp | | | 292 | |
| | 596,533 | | | | Goldcorp, Inc | | | 5,842 | |
| | 9,371,418 | | | | Goldsun Development & Construction Co Ltd | | | 2,547 | |
| | 508,000 | | | | Grand Pacific Petrochemical | | | 362 | |
| | 357,088 | | | | Granges AB | | | 3,242 | |
| | 607,054 | | | | Graphic Packaging Holding Co | | | 6,459 | |
| | 494,432 | | * | | Grasim Industries Ltd | | | 5,842 | |
| | 605,755 | | *,†,m | | Great Basin Gold Ltd | | | 4 | |
| | 455,000 | | e | | Greatview Aseptic Packaging Co | | | 248 | |
| | 7,840 | | | | Greif, Inc | | | 348 | |
| | 96,245 | | | | Greif, Inc (Class A) | | | 3,572 | |
| | 7,437 | | | | Groupe Guillin | | | 165 | |
| | 295,778 | | | | Grupo Argos S.A. | | | 1,539 | |
| | 102,600 | | e | | Grupo Cementos de Chihuahua SAB de C.V. | | | 524 | |
| | 3,255,544 | | e | | Grupo Mexico S.A. de C.V. (Series B) | | | 6,699 | |
| | 10,837 | | | | Gujarat Alkalies & Chemicals Ltd | | | 84 | |
| | 25,418 | | * | | Gujarat Flourochemicals | | | 331 | |
| | 331,776 | | | | Gujarat Narmada Valley Fertilizers Co Ltd | | | 1,620 | |
| | 7,991 | | * | | Gulf Oil Lubricants India Ltd | | | 94 | |
| | 228 | | e | | Gurit Holding AG. | | | 201 | |
| | 124,295 | | * | | Guyana Goldfields, Inc | | | 146 | |
| | 7,626 | | | | H&R GmbH & Co KGaA | | | 53 | |
| | 107,076 | | | | H.B. Fuller Co | | | 4,569 | |
| | 2,366 | | * | | Hanil Cement Co Ltd | | | 249 | |
| | 1,055 | | | | Hanil Cement Manufacturing | | | 49 | |
| | 5,630 | | | | Hansol Chemical Co Ltd | | | 391 | |
| | 176,623 | | | | Hansol Paper Co Ltd | | | 2,630 | |
| | 119,686 | | | | Hanwha Chemical Corp | | | 2,171 | |
| | 196,684 | | * | | Harmony Gold Mining Co Ltd | | | 349 | |
COLLEGE RETIREMENT EQUITIES FUND -Stock Account
| SHARES | | | | COMPANY | | VALUE
(000) | |
| | 30,927 | | | | Hawkins, Inc | | $ | 1,266 | |
| | 22,009 | | | | Haynes International, Inc | | | 581 | |
| | 1,165,551 | | | | Hecla Mining Co | | | 2,751 | |
| | 20,937 | | | | HeidelbergCement AG. | | | 1,283 | |
| | 37,145 | | | | HeidelbergCement India Ltd | | | 80 | |
| | 117,200 | | | | Hengli Petrochemical Co Ltd | | | 227 | |
| | 410,600 | | | | Hesteel Co Ltd | | | 170 | |
| | 346,462 | | | | Hexpol AB | | | 2,750 | |
| | 51,250 | | | | Hill & Smith Holdings plc | | | 784 | |
| | 53,009 | | | | Himadri Speciality Chemical Ltd | | | 100 | |
| | 2,044,911 | | | | Hindalco Industries Ltd | | | 6,618 | |
| | 136,211 | | | | Hitachi Chemical Co Ltd | | | 2,049 | |
| | 188,049 | | | | Hitachi Metals Ltd | | | 1,956 | |
| | 198,449 | | | | Hochschild Mining plc | | | 396 | |
| | 4,200 | | | | Hodogaya Chemical Co Ltd | | | 77 | |
| | 153,829 | | | | Hokuetsu Paper Mills Ltd | | | 699 | |
| | 127,877 | | | | Holcim Ltd | | | 5,277 | |
| | 80,589 | | | | Holmen AB | | | 1,594 | |
| | 18,083 | | | | Honam Petrochemical Corp | | | 4,496 | |
| | 157,000 | | | | Hsin Kuang Steel Co Ltd | | | 159 | |
| | 388,000 | | | | Huabao International Holdings Ltd | | | 164 | |
| | 15,947 | | | | Huchems Fine Chemical Corp | | | 343 | |
| | 1,062,893 | | | | HudBay Minerals, Inc | | | 5,030 | |
| | 74,049 | | e | | Huhtamaki Oyj | | | 2,291 | |
| | 629,168 | | | | Huntsman Corp | | | 12,137 | |
| | 1,790 | | * | | Hyosung Advanced Materials Corp | | | 165 | |
| | 1,298 | | * | | Hyosung Chemical Corp | | | 166 | |
| | 82,022 | | * | | Hyosung Corp | | | 3,680 | |
| | 78,076 | | | | Hyundai Steel Co | | | 3,175 | |
| | 505,750 | | * | | IAMGOLD Corp | | | 1,856 | |
| | 506,630 | | g | | Ibstock plc | | | 1,285 | |
| | 2,394,463 | | | | Iluka Resources Ltd | | | 12,866 | |
| | 57,030 | | | | IMCD Group NV | | | 3,651 | |
| | 4,310 | | | | Imerys S.A. | | | 207 | |
| | 418,312 | | * | | Impala Platinum Holdings Ltd | | | 1,067 | |
| | 2,295,382 | | | | Incitec Pivot Ltd | | | 5,306 | |
| | 367,114 | | | | Independence Group NL | | | 988 | |
| | 94,785 | | * | | India Cements Ltd | | | 130 | |
| | 1,497,878 | | | | Indorama Ventures PCL (Foreign) | | | 2,500 | |
| | 174,800 | | *,e | | Industrias CH SAB de C.V. | | | 756 | |
| | 144,656 | | | | Industrias Penoles S.A. de C.V. | | | 1,766 | |
| | 160,699 | | * | | Ingevity Corp | | | 13,449 | |
| | 352,300 | | | | Inner Mongolia BaoTou Steel Union Co Ltd | | | 76 | |
| | 208,920 | | | | Inner Mongolia Eerduosi Resourses Co Ltd | | | 184 | |
| | 26,122 | | | | Innophos Holdings, Inc | | | 641 | |
| | 85,746 | | | | Innospec, Inc | | | 5,296 | |
| | 535,195 | | * | | Interfor Corp | | | 5,653 | |
| | 156,519 | | | | International Flavors & Fragrances, Inc | | | 21,016 | |
| | 222 | | * | | International Flavors & Fragrances, Inc | | | 30 | |
| | 827,152 | | | | International Paper Co | | | 33,384 | |
| | 71,500 | | | | International Steels Ltd | | | 34 | |
| | 44,382 | | | | Intertape Polymer Group, Inc | | | 550 | |
| | 953,395 | | * | | Intrepid Potash, Inc | | | 2,479 | |
| | 42,700 | | * | | Ishihara Sangyo Kaisha Ltd | | | 417 | |
COLLEGE RETIREMENT EQUITIES FUND -Stock Account
| SHARES | | | | COMPANY | | VALUE
(000) | |
| | 1,357,211 | | | | Israel Chemicals Ltd | | $ | 7,717 | |
| | 19,966 | | | | Israel Corp Ltd | | | 5,310 | |
| | 362,254 | | * | | Ivanhoe Mines Ltd | | | 629 | |
| | 31,459 | | *,†,e | | Jacana Minerals Ltd | | | 0 | |
| | 332,166 | | | | James Hardie Industries NV | | | 3,619 | |
| | 57,018 | | * | | Jastrzebska Spolka Weglowa S.A. | | | 1,031 | |
| | 12,800 | | | | JCU Corp | | | 162 | |
| | 658,386 | | | | JFE Holdings, Inc | | | 10,487 | |
| | 1,699,445 | | | | Jiangxi Copper Co Ltd | | | 1,997 | |
| | 83,400 | | | | Jiangxi Copper Co Ltd (Class A) | | | 160 | |
| | 15,300 | | | | Jiangxi Ganfeng Lithium Co Ltd | | | 49 | |
| | 1,738,000 | | *,e | | Jinchuan Group International Resources Co Ltd | | | 140 | |
| | 434,037 | | * | | Jindal Saw Ltd | | | 527 | |
| | 234,185 | | * | | Jindal Steel & Power Ltd | | | 552 | |
| | 192,049 | | | | Jinduicheng Molybdenum Co Ltd | | | 166 | |
| | 261,877 | | *,e | | Jinshan Gold Mines, Inc | | | 303 | |
| | 10,540 | | * | | JK Cement Ltd | | | 108 | |
| | 18,352 | | * | | JK Lakshmi Cement Ltd | | | 77 | |
| | 25,317 | | | | Johnson Matthey plc | | | 904 | |
| | 9,200 | | | | JSP Corp | | | 180 | |
| | 1,178,493 | | | | JSR Corp | | | 17,690 | |
| | 1,441,023 | | | | JSW Steel Ltd | | | 6,326 | |
| | 119,684 | | | | K&S AG. | | | 2,164 | |
| | 42,917 | | | | Kaiser Aluminum Corp | | | 3,832 | |
| | 40,827 | | | | Kaneka Corp | | | 1,462 | |
| | 299,617 | | | | Kansai Paint Co Ltd | | | 5,755 | |
| | 28,700 | | | | Kanto Denka Kogyo Co Ltd | | | 208 | |
| | 168,764 | | * | | Kardemir Karabuk Demir Celik Sanayi ve Ticaret AS (Class A) | | | 58 | |
| | 720,142 | | * | | Kardemir Karabuk Demir Celik Sanayi ve Ticaret AS (Class D) | | | 296 | |
| | 2,234,968 | | | | KAZ Minerals plc | | | 15,205 | |
| | 64,156 | | | | Kemira Oyj | | | 724 | |
| | 277,738 | | * | | KGHM Polska Miedz S.A. | | | 6,589 | |
| | 18,000 | | | | KH Neochem Co Ltd | | | 379 | |
| | 221,449 | | *,e | | Kidman Resources Ltd | | | 170 | |
| | 727,218 | | * | | Kinross Gold Corp | | | 2,344 | |
| | 139,788 | | | | Kirkland Lake Gold Ltd | | | 3,645 | |
| | 4,534 | | | | KISWIRE Ltd | | | 94 | |
| | 608,551 | | | | Klabin S.A. | | | 2,493 | |
| | 1,384,800 | | | | Klabin S.A. (Preference) | | | 1,011 | |
| | 44,585 | | *,m | | Klondex Mines Ltd | | | 105 | |
| | 14,500 | | | | Koatsu Gas Kogyo Co Ltd | | | 113 | |
| | 886,786 | | | | Kobe Steel Ltd | | | 6,147 | |
| | 11,237 | | | | Kolon Industries, Inc | | | 578 | |
| | 18,600 | | | | Konishi Co Ltd | | | 279 | |
| | 29,133 | | * | | Koppers Holdings, Inc | | | 496 | |
| | 15,612 | | | | Korea Kumho Petrochemical | | | 1,222 | |
| | 19,160 | | | | Korea Petrochemical Ind Co Ltd | | | 2,642 | |
| | 9,116 | | | | Korea Zinc Co Ltd | | | 3,530 | |
| | 153,877 | | * | | Koza Altin Isletmeleri AS | | | 1,487 | |
| | 104,551 | | * | | Koza Anadolu Metal Madencilik Isletmeleri AS | | | 142 | |
| | 39,698 | | * | | Kraton Polymers LLC | | | 867 | |
COLLEGE RETIREMENT EQUITIES FUND -Stock Account
| SHARES | | | | COMPANY | | VALUE
(000) | |
| | 29,609 | | | | Kronos Worldwide, Inc | | $ | 341 | |
| | 3,300 | | | | Krosaki Harima Corp | | | 199 | |
| | 79,691 | | e | | Kumba Iron Ore Ltd | | | 1,567 | |
| | 127,048 | | | | Kumiai Chemical Industry Co Ltd | | | 747 | |
| | 824,142 | | | | Kuraray Co Ltd | | | 11,591 | |
| | 23,800 | | | | Kureha CORP | | | 1,321 | |
| | 13,000 | | | | Kyoei Steel Ltd | | | 196 | |
| | 62,633 | | e | | Labrador Iron Ore Royalty Corp | | | 1,112 | |
| | 209,200 | | * | | Lafarge Malayan Cement BHD | | | 92 | |
| | 551 | | | | LafargeHolcim Ltd | | | 23 | |
| | 602,803 | | | | Lanxess AG. | | | 27,715 | |
| | 1,934,671 | | * | | Largo Resources Ltd | | | 4,010 | |
| | 1,890,000 | | | | Lee & Man Paper Manufacturing Ltd | | | 1,600 | |
| | 1,613,448 | | | | LEE Chang Yung Chem IND Corp | | | 2,769 | |
| | 9,916 | | e | | Lenzing AG. | | | 904 | |
| | 46,227 | | | | LG Chem Ltd | | | 14,410 | |
| | 8,317 | | | | LG Chem Ltd (Preference) | | | 1,458 | |
| | 1,757,034 | | | | Linde plc | | | 274,168 | |
| | 1,047,196 | | | | Linde plc | | | 166,236 | |
| | 29,800 | | | | Lintec Corp | | | 640 | |
| | 34,236 | | *,e | | Lithium Americas Corp | | | 108 | |
| | 1,406,036 | | *,e | | Livent Corp | | | 19,403 | |
| | 11,066 | | | | Lock & Lock Co Ltd | | | 205 | |
| | 509,740 | | * | | Loma Negra Cia Industrial Argentina S.A. (ADR) | | | 5,673 | |
| | 252,063 | | | | Long Chen Paper Co Ltd | | | 116 | |
| | 334 | | * | | Lonmin plc | | | 0 | ^ |
| | 1,180,272 | | | | Louisiana-Pacific Corp | | | 26,226 | |
| | 62,012 | | *,e | | LSB Industries, Inc | | | 342 | |
| | 187,919 | | e | | Lucara Diamond Corp | | | 204 | |
| | 83,150 | | | | Lucky Cement Ltd | | | 260 | |
| | 476,000 | | | | Luks Group Vietnam Holdings Ltd | | | 120 | |
| | 35,068 | | *,e | | Lundin Gold, Inc | | | 128 | |
| | 687,746 | | | | Lundin Mining Corp | | | 2,841 | |
| | 428,452 | | *,e | | Lynas Corp Ltd | | | 479 | |
| | 538,627 | | | | LyondellBasell Industries AF S.C.A | | | 44,792 | |
| | 644,000 | | | | Maanshan Iron & Steel | | | 284 | |
| | 293,400 | | | | Maanshan Iron & Steel Co Ltd | | | 148 | |
| | 65,144 | | * | | Madras Cements Ltd | | | 597 | |
| | 50,241 | | * | | MAG. Silver Corp | | | 368 | |
| | 45,180 | | * | | Major Drilling Group International | | | 152 | |
| | 52,912 | | * | | Marrone Bio Innovations, Inc | | | 78 | |
| | 126,051 | | | | Marshalls plc | | | 747 | |
| | 11,226 | | | | Martin Marietta Materials, Inc | | | 1,929 | |
| | 44,472 | | | | Maruichi Steel Tube Ltd | | | 1,395 | |
| | 28,895 | | | | Materion Corp | | | 1,300 | |
| | 446,100 | | | | Metalurgica Gerdau S.A. | | | 796 | |
| | 214,482 | | | | Methanex Corp | | | 10,316 | |
| | 1,042,043 | | | | Mexichem SAB de C.V. | | | 2,648 | |
| | 100,971 | | | | Mineral Resources Ltd | | | 1,101 | |
| | 91,429 | | | | Minerals Technologies, Inc | | | 4,694 | |
| | 17,133 | | e | | Miquel y Costas & Miquel S.A. | | | 333 | |
| | 2,176,699 | | | | Mitsubishi Chemical Holdings Corp | | | 16,445 | |
| | 239,878 | | | | Mitsubishi Gas Chemical Co, Inc | | | 3,593 | |
| | 105,410 | | | | Mitsubishi Materials Corp | | | 2,778 | |
COLLEGE RETIREMENT EQUITIES FUND -Stock Account
| SHARES | | | | COMPANY | | VALUE
(000) | |
| | 8,800 | | | | Mitsubishi Steel Manufacturing Co Ltd | | $ | 128 | |
| | 279,337 | | | | Mitsui Chemicals, Inc | | | 6,306 | |
| | 36,300 | | | | Mitsui Mining & Smelting Co Ltd | | | 750 | |
| | 627,466 | | | | MMC Norilsk Nickel PJSC (ADR) | | | 11,821 | |
| | 2,248,000 | | * | | MMG Ltd | | | 966 | |
| | 42,210 | | | | MOIL Ltd | | | 103 | |
| | 117,854 | | | | Mondi Ltd | | | 2,539 | |
| | 429,414 | | | | Mondi plc | | | 8,944 | |
| | 12,981 | | *,† | | Mongolian Metals Corporation | | | 0 | |
| | 2,065 | | * | | Monsanto India Ltd | | | 78 | |
| | 10,207 | | | | Moorim P&P Co Ltd | | | 55 | |
| | 135,468 | | | | Mosaic Co | | | 3,957 | |
| | 102,667 | | e | | Mountain Province Diamonds, Inc | | | 147 | |
| | 98 | | | | Mpact Ltd | | | 0 | ^ |
| | 133,183 | | | | M-real Oyj (B Shares) | | | 782 | |
| | 55,677 | | | | Myers Industries, Inc | | | 841 | |
| | 67,894 | | | | Mytilineos Holdings S.A. | | | 566 | |
| | 84,300 | | | | Nakayama Steel Works Ltd | | | 366 | |
| | 12,799 | | | | Namhae Chemical Corp | | | 132 | |
| | 398,211 | | * | | Nampak Ltd | | | 383 | |
| | 5,336,071 | | | | Nan Ya Plastics Corp | | | 13,123 | |
| | 1,012,275 | | | | Nantex Industry Co Ltd | | | 916 | |
| | 1,732,938 | | | | National Aluminium Co Ltd | | | 1,632 | |
| | 20,962 | | | | Neenah Paper, Inc | | | 1,235 | |
| | 422,002 | | *,e | | Nemaska Lithium, Inc | | | 210 | |
| | 28,581 | | | | Neo Performance Materials, Inc | | | 322 | |
| | 19,900 | | | | Neturen Co Ltd | | | 152 | |
| | 196,654 | | | | Nevsun Resources Ltd | | | 863 | |
| | 554,001 | | *,e | | New Gold, Inc | | | 426 | |
| | 973,727 | | | | Newcrest Mining Ltd | | | 14,965 | |
| | 3,271 | | | | NewMarket Corp | | | 1,348 | |
| | 1,575,504 | | | | Newmont Mining Corp | | | 54,591 | |
| | 26,900 | | e | | Nihon Nohyaku Co Ltd | | | 125 | |
| | 56,200 | | | | Nihon Parkerizing Co Ltd | | | 649 | |
| | 2,794,902 | | | | Nine Dragons Paper Holdings Ltd | | | 2,582 | |
| | 76,400 | | e | | Nippon Denko Co Ltd | | | 152 | |
| | 136,700 | | | | Nippon Kayaku Co Ltd | | | 1,736 | |
| | 846,400 | | | | Nippon Light Metal Holdings Co Ltd | | | 1,717 | |
| | 121,932 | | e | | Nippon Paint Co Ltd | | | 4,154 | |
| | 773,900 | | | | Nippon Paper Industries Co Ltd | | | 13,810 | |
| | 16,500 | | | | Nippon Shokubai Co Ltd | | | 1,052 | |
| | 15,200 | | | | Nippon Soda Co Ltd | | | 371 | |
| | 885,746 | | | | Nippon Steel Corp | | | 15,218 | |
| | 9,700 | | | | Nippon Valqua Industries Ltd | | | 195 | |
| | 113,561 | | | | Nissan Chemical Industries Ltd | | | 5,926 | |
| | 23,300 | | | | Nittetsu Mining Co Ltd | | | 981 | |
| | 121,863 | | | | Nitto Denko Corp | | | 6,112 | |
| | 40,460 | | | | NOF Corp | | | 1,378 | |
| | 441,385 | | | | Norbord, Inc | | | 11,736 | |
| | 1,297,906 | | | | Norsk Hydro ASA | | | 5,881 | |
| | 213,503 | | * | | Northam Platinum Ltd | | | 642 | |
| | 514,444 | | | | Northern Star Resources Ltd | | | 3,358 | |
| | 157,354 | | * | | Novagold Resources, Inc | | | 625 | |
COLLEGE RETIREMENT EQUITIES FUND -Stock Account
| SHARES | | | | COMPANY | | VALUE
(000) | |
| | 189,090 | | | | Novolipetsk Steel PJSC (GDR) | | $ | 4,326 | |
| | 202,415 | | | | Novozymes AS | | | 9,044 | |
| | 735,846 | | | | Nucor Corp | | | 38,124 | |
| | 350,044 | | | | Nufarm Ltd | | | 1,470 | |
| | 283,830 | | | | Nutrien Ltd | | | 13,340 | |
| | 746,608 | | e | | Nutrien Ltd (Toronto) | | | 35,066 | |
| | 486,041 | | | | OceanaGold Corp | | | 1,773 | |
| | 18,917 | | | | OCI Co Ltd | | | 1,817 | |
| | 46,783 | | * | | OCI NV | | | 955 | |
| | 49,404 | | * | | Odisha Cement Ltd | | | 778 | |
| | 15,575 | | | | Oeneo S.A. | | | 156 | |
| | 832,748 | | | | OJI Paper Co Ltd | | | 4,255 | |
| | 6,800 | | | | Okamoto Industries, Inc | | | 357 | |
| | 6,473,741 | | | | Olin Corp | | | 130,187 | |
| | 18,304 | | | | Olympic Steel, Inc | | | 261 | |
| | 40,198 | | | | Omnia Holdings Ltd | | | 236 | |
| | 166,243 | | * | | Omnova Solutions, Inc | | | 1,219 | |
| | 260,024 | | | | Orica Ltd | | | 3,160 | |
| | 4,507,000 | | | | Oriental Union Chemical Corp | | | 3,784 | |
| | 530,320 | | e | | Orocobre Ltd | | | 1,206 | |
| | 2,264,950 | | | | Orora Ltd | | | 4,903 | |
| | 7,600 | | | | Osaka Steel Co Ltd | | | 126 | |
| | 74,445 | | | | Osisko Gold Royalties Ltd | | | 653 | |
| | 82,902 | | *,e | | Osisko Mining, Inc | | | 186 | |
| | 197,834 | | e | | Outokumpu Oyj | | | 721 | |
| | 334,430 | | * | | Owens-Illinois, Inc | | | 5,766 | |
| | 1,010,515 | | | | Oxiana Ltd | | | 6,265 | |
| | 1,104,200 | | | | Pabrik Kertas Tjiwi Kimia Tbk PT | | | 853 | |
| | 9,050 | | e | | Pacific Metals Co Ltd | | | 220 | |
| | 7,000 | | | | Pack Corp | | | 193 | |
| | 334,689 | | | | Packaging Corp of America | | | 27,933 | |
| | 139,155 | | | | Pact Group Holdings Ltd | | | 340 | |
| | 104,818 | | | | Pan American Silver Corp | | | 1,530 | |
| | 168,409 | | | | Papeles y Cartones de Europa S.A. | | | 3,238 | |
| | 1,132,360 | | | | Petkim Petrokimya Holding | | | 1,076 | |
| | 1,180,964 | | * | | Petra Diamonds Ltd | | | 570 | |
| | 11,068,116 | | | | Petronas Chemicals Group BHD | | | 24,864 | |
| | 57,900 | | | | PH Glatfelter Co | | | 565 | |
| | 25,977 | | * | | Phillips Carbon Black Ltd | | | 77 | |
| | 121,220 | | | | PhosAgro PJSC (GDR) | | | 1,546 | |
| | 33,122 | | | | PI Industries Ltd | | | 409 | |
| | 138,264 | | | | Pidilite Industries Ltd | | | 2,193 | |
| | 938,804 | | *,e | | Pilbara Minerals Ltd | | | 413 | |
| | 22,653 | | e | | Plastivaloire | | | 231 | |
| | 73,472 | | * | | Platform Specialty Products Corp | | | 759 | |
| | 175,957 | | | | Polymetal International plc | | | 1,846 | |
| | 211,134 | | | | PolyOne Corp | | | 6,038 | |
| | 66,778 | | | | Polyus PJSC | | | 2,611 | |
| | 138,831 | | | | Poongsan Corp | | | 3,399 | |
| | 509,852 | | | | Portucel Empresa Produtora de Pasta e Papel S.A. | | | 2,103 | |
| | 84,972 | | | | POSCO | | | 18,586 | |
| | 18,866 | | e | | POSCO Refractories & Environment Co Ltd | | | 1,079 | |
| | 960,670 | | * | | PPC Ltd | | | 394 | |
| | 230,100 | | | | PPG Industries, Inc | | | 23,523 | |
COLLEGE RETIREMENT EQUITIES FUND -Stock Account
| SHARES | | | | COMPANY | | VALUE
(000) | |
| | 46,038 | | * | | PQ Group Holdings, Inc | | $ | 682 | |
| | 113,949 | | * | | Premier Gold Mines Ltd | | | 134 | |
| | 1,382,700 | | | | Press Metal BHD | | | 1,613 | |
| | 122,302 | | *,e | | Pretium Resources, Inc | | | 1,037 | |
| | 76,163 | | | | Prism Cement Ltd | | | 97 | |
| | 5,227,704 | | | | PT Aneka Tambang Tbk | | | 279 | |
| | 2,786,000 | | | | PT Indah Kiat Pulp and Paper Corp Tbk | | | 2,237 | |
| | 1,833,643 | | | | PT Indocement Tunggal Prakarsa Tbk | | | 2,355 | |
| | 3,128,398 | | * | | PT Krakatau Steel Tbk | | | 88 | |
| | 8,218,300 | | *,† | | PT Sekawan Intipratama Tbk | | | 0 | ^ |
| | 2,932,238 | | | | PT Semen Gresik Persero Tbk | | | 2,345 | |
| | 1,925,057 | | | | PT Timah Tbk | | | 101 | |
| | 5,985,300 | | | | PT Waskita Beton Precast Tbk | | | 157 | |
| | 2,424,477 | | | | PTT Global Chemical PCL (Foreign) | | | 5,312 | |
| | 24,428 | | * | | Qatar National Cement Co | | | 400 | |
| | 5,600 | | * | | Qinghai Salt Lake Industry Co Ltd | | | 6 | |
| | 16,489 | | | | Quaker Chemical Corp | | | 2,930 | |
| | 264,380 | | *,†,b,e,m | | Quintis Ltd | | | 2 | |
| | 190,424 | | | | Rain Commodities Ltd | | | 364 | |
| | 31,833 | | | | Rallis India Ltd | | | 81 | |
| | 2,425 | | *,e | | Ramaco Resources, Inc | | | 12 | |
| | 20,233 | | | | Randgold Resources Ltd | | | 1,679 | |
| | 217,630 | | e | | Rayonier Advanced Materials, Inc | | | 2,318 | |
| | 111,002 | | | | Recticel S.A. | | | 812 | |
| | 830,981 | | | | Regis Resources Ltd | | | 2,830 | |
| | 171,575 | | | | Reliance Steel & Aluminum Co | | | 12,211 | |
| | 1,647,567 | | | | Rengo Co Ltd | | | 12,999 | |
| | 481,643 | | | | Resolute Mining Ltd | | | 392 | |
| | 17,021 | | e | | Rhi Magnesita NV | | | 860 | |
| | 660,241 | | | | Rio Tinto Ltd | | | 36,542 | |
| | 2,044,666 | | | | Rio Tinto plc | | | 97,924 | |
| | 131,100 | | | | Rongsheng Petro Chemical Co Ltd | | | 193 | |
| | 40,749 | | * | | Royal Bafokeng Platinum Ltd | | | 75 | |
| | 181,009 | | | | Royal Gold, Inc | | | 15,503 | |
| | 468,675 | | | | RPC Group plc | | | 3,896 | |
| | 63,060 | | | | RPM International, Inc | | | 3,707 | |
| | 70,252 | | * | | Ryerson Holding Corp | | | 445 | |
| | 12,907 | | | | Sa des Ciments Vicat | | | 613 | |
| | 8,800 | | | | Sakai Chemical Industry Co Ltd | | | 180 | |
| | 27,600 | | | | Sakata INX Corp | | | 303 | |
| | 228,529 | | | | Salzgitter AG. | | | 6,669 | |
| | 12,753 | | | | Samsung Fine Chemicals Co Ltd | | | 470 | |
| | 1,158,850 | | | | Sandfire Resources NL | | | 5,457 | |
| | 113,923 | | * | | Sandstorm Gold Ltd | | | 527 | |
| | 39,808 | | | | Sanyo Chemical Industries Ltd | | | 1,833 | |
| | 142,400 | | | | Sanyo Special Steel Co Ltd | | | 3,007 | |
| | 1,097,536 | | | | Sappi Ltd | | | 6,226 | |
| | 1,063,456 | | * | | Saracen Mineral Holdings Ltd | | | 2,199 | |
| | 185,600 | | | | Satipel Industrial S.A. | | | 566 | |
| | 87,798 | | | | Scapa Group plc | | | 343 | |
| | 1,142,453 | | *,e | | Schmolz + Bickenbach AG. | | | 628 | |
| | 148,999 | | | | Schnitzer Steel Industries, Inc (Class A) | | | 3,211 | |
| | 39,698 | | | | Schweitzer-Mauduit International, Inc | | | 994 | |
COLLEGE RETIREMENT EQUITIES FUND -Stock Account
| SHARES | | | | COMPANY | | VALUE
(000) | |
| | 482,200 | | | | Scientex BHD | | $ | 1,032 | |
| | 77,645 | | | | Scotts Miracle-Gro Co (Class A) | | | 4,772 | |
| | 24,966 | | *,e | | Seabridge Gold, Inc | | | 330 | |
| | 57,295 | | | | Seah Besteel Corp | | | 908 | |
| | 79,584 | | | | Sealed Air Corp | | | 2,773 | |
| | 877,400 | | | | Sekisui Plastics Co Ltd | | | 7,390 | |
| | 209,822 | | * | | SEMAFO, Inc | | | 453 | |
| | 89,403 | | | | Semapa-Sociedade de Investimento e Gestao | | | 1,343 | |
| | 53,600 | | | | Sensient Technologies Corp | | | 2,994 | |
| | 2,924,475 | | | | Sesa Sterlite Ltd | | | 8,461 | |
| | 666,535 | | | | Severstal (GDR) | | | 9,098 | |
| | 55,700 | | | | Shandong Gold Mining Co Ltd | | | 245 | |
| | 1,263,000 | | | | Shanghai Chlor-Alkali Chemical Co Ltd | | | 782 | |
| | 11,920 | | * | | Sharda Cropchem Ltd | | | 52 | |
| | 221,400 | | | | Shenzhen Zhongjin Lingnan Nonfemet Co Ltd | | | 128 | |
| | 197,598 | | | | Sherwin-Williams Co | | | 77,747 | |
| | 19,000 | | | | Shikoku Chemicals Corp | | | 178 | |
| | 9,838 | | * | | Shine Co Ltd | | | 110 | |
| | 588,671 | | | | Shin-Etsu Chemical Co Ltd | | | 45,229 | |
| | 145,800 | | | | Shin-Etsu Polymer Co Ltd | | | 900 | |
| | 1,500,032 | | | | Shinkong Synthetic Fibers Corp | | | 562 | |
| | 43,000 | | | | Shiny Chemical Industrial Co Ltd | | | 116 | |
| | 190,000 | | e | | Showa Denko KK | | | 5,642 | |
| | 9,586 | | | | Shree Cement Ltd | | | 2,365 | |
| | 294,600 | | | | Siam Cement PCL (ADR) | | | 3,947 | |
| | 502,625 | | | | Siam Cement PCL (Foreign) | | | 6,733 | |
| | 987,908 | | * | | Sibanye Gold Ltd | | | 719 | |
| | 443,439 | | | | Sidi Kerir Petrochemcials Co | | | 424 | |
| | 31,044 | | | | Sika AG. | | | 3,943 | |
| | 149,111 | | | | Silgan Holdings, Inc | | | 3,522 | |
| | 796,000 | | *,e | | Silver Grant International | | | 156 | |
| | 400,636 | | | | Silvercorp Metals, Inc | | | 836 | |
| | 144,908 | | | | Sims Group Ltd | | | 1,024 | |
| | 4,320,000 | | *,e | | Sino Haijing Holdings Ltd | | | 65 | |
| | 1,388,000 | | * | | Sinofert Holdings Ltd | | | 159 | |
| | 3,390,674 | | | | Sinopec Shanghai Petrochemical Co Ltd | | | 1,484 | |
| | 267,500 | | | | Sinopec Shanghai Petrochemical Co Ltd (Class A) | | | 195 | |
| | 2,670,403 | | *,e | | Sirius Minerals plc | | | 710 | |
| | 7,372 | | | | SK Chemicals Co Ltd | | | 172 | |
| | 5,340 | | * | | SK Chemicals Co Ltd (New) | | | 335 | |
| | 78,980 | | | | SKC Co Ltd | | | 2,533 | |
| | 9,013 | | | | SKCKOLONPI, Inc | | | 269 | |
| | 324,937 | | | | Smurfit Kappa Group plc | | | 8,646 | |
| | 69,600 | | e | | Sociedad Quimica y Minera de Chile S.A. (ADR) | | | 2,666 | |
| | 119,615 | | | | Sociedad Quimica y Minera de Chile S.A. (Class B) | | | 4,715 | |
| | 4,465,771 | | | | Soda Sanayii AS | | | 5,991 | |
| | 3,319 | | | | SODIFF Advanced Materials Co Ltd | | | 450 | |
| | 458,019 | | *,e | | SolGold plc | | | 215 | |
| | 15,143 | | | | Solvay S.A. | | | 1,514 | |
| | 8,327 | | | | Songwon Industrial Co Ltd | | | 143 | |
| | 69,255 | | | | Sonoco Products Co | | | 3,680 | |
| | 5,240,413 | | | | South32 Ltd | | | 12,466 | |
| | 6,561 | | e | | South32 Ltd (W/I) | | | 15 | |
| | 239,479 | | | | Southern Copper Corp (NY) | | | 7,369 | |
COLLEGE RETIREMENT EQUITIES FUND -Stock Account
| SHARES | | | | COMPANY | | VALUE
(000) | |
| | 134,503 | | | | Ssab Svenskt Stal AB (Series A) | | $ | 464 | |
| | 480,296 | | | | Ssab Svenskt Stal AB (Series B) | | | 1,355 | |
| | 78,079 | | * | | SSR Mining, Inc | | | 944 | |
| | 914,566 | | | | St Barbara Ltd | | | 3,029 | |
| | 1,386 | | | | Stalprodukt S.A. | | | 118 | |
| | 976,718 | | | | Steel Dynamics, Inc | | | 29,341 | |
| | 74,746 | | | | Stelco Holdings, Inc | | | 825 | |
| | 5,300 | | e | | Stella Chemifa Corp | | | 123 | |
| | 30,796 | | | | Stella-Jones, Inc | | | 894 | |
| | 47,759 | | | | Stepan Co | | | 3,534 | |
| | 4,001 | | | | STO AG. | | | 376 | |
| | 898,021 | | | | Stora Enso Oyj (R Shares) | | | 10,411 | |
| | 127,444 | | | | Sumitomo Bakelite Co Ltd | | | 4,385 | |
| | 1,803,711 | | | | Sumitomo Chemical Co Ltd | | | 8,735 | |
| | 334,718 | | | | Sumitomo Metal Mining Co Ltd | | | 8,964 | |
| | 46,418 | | e | | Sumitomo Osaka Cement Co Ltd | | | 1,905 | |
| | 6,800 | | | | Sumitomo Seika Chemicals Co Ltd | | | 260 | |
| | 11,512 | | | | Sumitomo Titanium Corp | | | 175 | |
| | 143,238 | | * | | Summit Materials, Inc | | | 1,776 | |
| | 512,531 | | * | | SunCoke Energy, Inc | | | 4,382 | |
| | 73,768 | | * | | Supreme Industries Ltd | | | 1,240 | |
| | 420,588 | | | | Suzano Papel e Celulose S.A. | | | 4,137 | |
| | 378,801 | | | | Svenska Cellulosa AB (B Shares) | | | 2,944 | |
| | 17,544 | | | | Symrise AG. | | | 1,300 | |
| | 9,616 | | | | Synalloy Corp | | | 160 | |
| | 213,259 | | *,e | | Syrah Resources Ltd | | | 226 | |
| | 15,300 | | | | T Hasegawa Co Ltd | | | 217 | |
| | 2,701,459 | | | | TA Chen Stainless Pipe | | | 3,700 | |
| | 294 | | | | Taekwang Industrial Co Ltd | | | 348 | |
| | 386,416 | | * | | Tahoe Resources, Inc | | | 1,410 | |
| | 192,902 | | * | | Tahoe Resources, Inc (Toronto) | | | 702 | |
| | 98,030 | | | | Taiheiyo Cement Corp | | | 3,017 | |
| | 4,368,200 | | | | Taiwan Cement Corp | | | 5,042 | |
| | 509,000 | | | | Taiwan Fertilizer Co Ltd | | | 716 | |
| | 123,725 | | | | Taiwan Hon Chuan Enterprise Co Ltd | | | 191 | |
| | 3,532,329 | | | | Taiwan Styrene Monomer | | | 2,587 | |
| | 11,300 | | | | Taiyo Ink Manufacturing Co Ltd | | | 318 | |
| | 47,433 | | | | Taiyo Nippon Sanso Corp | | | 771 | |
| | 37,900 | | | | Takasago International Corp | | | 1,162 | |
| | 167,700 | | | | Takiron Co Ltd | | | 888 | |
| | 7,900 | | *,e | | Tanaka Chemical Corp | | | 59 | |
| | 38,909 | | * | | Tata Chemicals Ltd | | | 394 | |
| | 912,148 | | | | Tata Steel Ltd | | | 6,801 | |
| | 8,500 | | | | Tayca Corp | | | 126 | |
| | 5,742 | | | | Technosemichem Co Ltd | | | 245 | |
| | 900,307 | | | | Teck Cominco Ltd | | | 19,382 | |
| | 1,022,437 | | | | Teijin Ltd | | | 16,318 | |
| | 10,000 | | | | Tenma Corp | | | 166 | |
| | 16,228 | | * | | Tessenderlo Chemie NV | | | 541 | |
| | 2,303,175 | | | | ThyssenKrupp AG. | | | 39,564 | |
| | 586,000 | | e | | Tiangong International Co Ltd | | | 138 | |
| | 3,605,695 | | | | Tianqi Lithium Corp | | | 15,498 | |
| | 24,395 | | e | | Tikkurila Oyj | | | 336 | |
COLLEGE RETIREMENT EQUITIES FUND -Stock Account
| SHARES | | | | COMPANY | | VALUE
(000) | |
| | 64,471 | | * | | Time Technoplast Ltd | | $ | 93 | |
| | 49,305 | | *,e | | TimkenSteel Corp | | | 431 | |
| | 38,311 | | | | Titan Cement Co S.A. | | | 851 | |
| | 21,741 | | *,e | | TMAC Resources, Inc | | | 109 | |
| | 68,600 | | | | Toagosei Co Ltd | | | 756 | |
| | 22,500 | | | | Toho Titanium Co Ltd | | | 205 | |
| | 9,100 | | | | Toho Zinc Co Ltd | | | 277 | |
| | 350,100 | | e | | Tokai Carbon Co Ltd | | | 3,972 | |
| | 22,200 | | | | Tokushu Tokai Holdings Co Ltd | | | 829 | |
| | 58,800 | | | | Tokuyama Corp | | | 1,290 | |
| | 22,000 | | | | Tokyo Ohka Kogyo Co Ltd | | | 589 | |
| | 66,300 | | | | Tokyo Steel Manufacturing Co Ltd | | | 537 | |
| | 2,726,750 | | | | Ton Yi Industrial Corp | | | 1,077 | |
| | 80,511 | | b | | Tong Yang Major Corp | | | 149 | |
| | 507,300 | | | | Tongling Nonferrous Metals Group Co Ltd | | | 146 | |
| | 18,911 | | | | Tongyang Cement & Energy Corp | | | 73 | |
| | 21,100 | | | | Topy Industries Ltd | | | 432 | |
| | 442,471 | | | | Toray Industries, Inc | | | 3,128 | |
| | 78,032 | | * | | Torex Gold Resources, Inc | | | 742 | |
| | 486,472 | | | | Tosoh Corp | | | 6,310 | |
| | 25,100 | | | | Toyo Ink Manufacturing Co Ltd | | | 555 | |
| | 136,607 | | | | Toyo Seikan Kaisha Ltd | | | 3,127 | |
| | 689,967 | | | | Toyobo Co Ltd | | | 9,394 | |
| | 2,785,800 | | | | TPI Polene PCL | | | 169 | |
| | 27,471 | | * | | Trecora Resources | | | 214 | |
| | 36,374 | | | | Tredegar Corp | | | 577 | |
| | 365,102 | | * | | Trevali Mining Corp | | | 111 | |
| | 90,230 | | | | Trinseo S.A. | | | 4,131 | |
| | 9,066,187 | | a | | Tronox Ltd | | | 70,535 | |
| | 173,000 | | g | | Tsaker Chemical Group Ltd | | | 123 | |
| | 376,000 | | | | TSRC Corp | | | 331 | |
| | 73,681 | | * | | Tubacex S.A. | | | 211 | |
| | 488,000 | | | | Tung Ho Steel Enterprise Corp | | | 302 | |
| | 1,913,199 | | * | | Turquoise Hill Resources Ltd | | | 3,153 | |
| | 468,564 | | | | UBE Industries Ltd | | | 9,476 | |
| | 8,085 | | * | | UFP Technologies, Inc | | | 243 | |
| | 119,033 | | * | | Ultra Tech Cement Ltd | | | 6,799 | |
| | 331,743 | | | | Umicore S.A. | | | 13,238 | |
| | 3,252 | | | | Unid Co Ltd | | | 123 | |
| | 378,208 | | * | | United Phosphorus Ltd | | | 4,105 | |
| | 3,036 | | | | United States Lime & Minerals, Inc | | | 216 | |
| | 328,592 | | | | United States Steel Corp | | | 5,994 | |
| | 150,676 | | | | Universal Cement Corp | | | 93 | |
| | 22,660 | | * | | Universal Stainless & Alloy | | | 367 | |
| | 4,034,062 | | | | UPC Technology Corp | | | 1,527 | |
| | 887,343 | | | | UPM-Kymmene Oyj | | | 22,462 | |
| | 20,562 | | *,e | | US Concrete, Inc | | | 725 | |
| | 513,655 | | | | USI Corp | | | 198 | |
| | 4,414,245 | | | | Vale S.A. | | | 57,868 | |
| | 308,484 | | | | Valhi, Inc | | | 595 | |
| | 88,526 | | | | Valvoline, Inc | | | 1,713 | |
| | 173,635 | | * | | Verso Corp | | | 3,889 | |
| | 195,311 | | | | Victrex plc | | | 5,700 | |
| | 7,736 | | | | Vinati Organics Ltd | | | 183 | |
COLLEGE RETIREMENT EQUITIES FUND -Stock Account
| SHARES | | | | COMPANY | | VALUE
(000) | |
| | 1,749,000 | | m | | Vinythai PCL (Foreign) | | $ | 1,074 | |
| | 246,226 | | | | Voestalpine AG. | | | 7,344 | |
| | 1,571,502 | | | | Volcan Cia Minera S.A. | | | 331 | |
| | 72,949 | | | | Vulcan Materials Co | | | 7,207 | |
| | 250,000 | | | | Wacker Chemie AG. | | | 22,723 | |
| | 89,276 | | e | | Wagners Holding Co Ltd | | | 196 | |
| | 69,946 | | | | Warrior Met Coal, Inc | | | 1,686 | |
| | 176,975 | | * | | Welspun-Gujarat Stahl Ltd | | | 353 | |
| | 11,486,000 | | | | West China Cement Ltd | | | 1,558 | |
| | 128,536 | | | | West Fraser Timber Co Ltd | | | 6,350 | |
| | 160,012 | | | | Western Areas NL | | | 225 | |
| | 1,022,035 | | | | Western Forest Products, Inc | | | 1,415 | |
| | 202,510 | | * | | Westgold Resources Ltd | | | 126 | |
| | 113,163 | | | | Westlake Chemical Corp | | | 7,488 | |
| | 649,459 | | | | WestRock Co | | | 24,524 | |
| | 823,463 | | | | Wheaton Precious Metals Corp | | | 16,075 | |
| | 3,369,486 | | | | Wienerberger AG. | | | 69,535 | |
| | 20,660 | | | | Winpak Ltd | | | 723 | |
| | 4,232 | | * | | Wonik Materials Co Ltd | | | 82 | |
| | 63,776 | | | | Worthington Industries, Inc | | | 2,222 | |
| | 854,737 | | | | WR Grace and Co | | | 55,481 | |
| | 17,300 | | e | | W-Scope Corp | | | 184 | |
| | 594,784 | | | | Yamana Gold, Inc | | | 1,399 | |
| | 206,600 | | | | Yamato Kogyo Co Ltd | | | 4,829 | |
| | 1,016,540 | | | | Yara International ASA | | | 39,187 | |
| | 905,100 | | | | Yeun Chyang Industrial Co Ltd | | | 720 | |
| | 636,157 | | | | Yieh Phui Enterprise | | | 213 | |
| | 24,400 | | | | Yodogawa Steel Works Ltd | | | 485 | |
| | 4,463 | | | | Youlchon Chemical Co Ltd | | | 52 | |
| | 246 | | | | Young Poong Corp | | | 164 | |
| | 231,000 | | *,e | | Youyuan International Holdings Ltd | | | 60 | |
| | 672,285 | | | | Yuen Foong Yu Paper Manufacturing Co Ltd | | | 246 | |
| | 495,953 | | | | Yule Catto & Co plc | | | 2,258 | |
| | 29,307 | | | | Zaklady Azotowe w Tarnowie-Moscicach S.A. | | | 246 | |
| | 252,112 | | | | Zeon Corp | | | 2,308 | |
| | 1,625,500 | | | | Zhaojin Mining Industry Co Ltd | | | 1,649 | |
| | 8,875 | | | | Zhejiang Huayou Cobalt Co Ltd | | | 39 | |
| | 122,500 | | | | Zhejiang Longsheng Group Co Ltd | | | 173 | |
| | 83,700 | | | | Zhongjin Gold Corp Ltd | | | 104 | |
| | 20,195 | | | | Zignago Vetro S.p.A. | | | 197 | |
| | 6,754,731 | | | | Zijin Mining Group Co Ltd | | | 2,560 | |
| | 454,400 | | | | Zijin Mining Group Co Ltd (Class A) | | | 221 | |
| | | | | | TOTAL MATERIALS | | | 5,000,721 | |
| | | | | | | | | | |
| MEDIA & ENTERTAINMENT - 6.3% |
| | 140,400 | | * | | 58.COM, Inc (ADR) | | | 7,611 | |
| | 1,200,000 | | | | ABS-CBN Holdings Corp (ADR) | | | 427 | |
| | 1,715,913 | | | | Activision Blizzard, Inc | | | 79,910 | |
| | 14,513 | | | | Addcn Technology Co Ltd | | | 113 | |
| | 20,400 | | | | Akatsuki, Inc | | | 937 | |
| | 13,517,467 | | *,e | | Alibaba Pictures Group Ltd | | | 2,283 | |
| | 737,667 | | * | | Alphabet, Inc (Class A) | | | 770,833 | |
| | 967,722 | | * | | Alphabet, Inc (Class C) | | | 1,002,183 | |
COLLEGE RETIREMENT EQUITIES FUND -Stock Account
| SHARES | | | | COMPANY | | VALUE
(000) | |
| | 1,590 | | * | | Altice NV (Class A) | | $ | 3 | |
| | 530 | | * | | Altice NV (Class B) | | | 1 | |
| | 458 | | | | Altice USA, Inc | | | 8 | |
| | 295,871 | | e | | AMC Entertainment Holdings, Inc | | | 3,633 | |
| | 321,330 | | *,e | | AMC Networks, Inc | | | 17,635 | |
| | 7,700 | | | | Amuse, Inc | | | 164 | |
| | 181,526 | | *,e | | ANGI Homeservices, Inc | | | 2,917 | |
| | 82,968 | | | | Antena 3 de Television S.A. | | | 414 | |
| | 2,963 | | * | | Anveshan Heavy Engineering Ltd | | | 1 | |
| | 1,025 | | | | APG SGA S.A. | | | 345 | |
| | 94,932 | | * | | Arnoldo Mondadori Editore S.p.A. | | | 186 | |
| | 353,068 | | | | Ascential plc | | | 1,697 | |
| | 9,248,900 | | | | Asian Pay Television Trust | | | 862 | |
| | 7,100 | | e | | Ateam, Inc | | | 93 | |
| | 1,301,325 | | g | | Auto Trader Group plc | | | 7,552 | |
| | 125,633 | | e | | Autohome, Inc (ADR) | | | 9,828 | |
| | 240,959 | | | | Avex Group Holdings, Inc | | | 3,052 | |
| | 45,117 | | | | Axel Springer AG. | | | 2,556 | |
| | 456,339 | | * | | Baidu, Inc (ADR) | | | 72,375 | |
| | 7,801 | | m | | Beasley Broadcasting Group, Inc | | | 29 | |
| | 675,900 | | * | | BEC World PCL (Foreign) | | | 100 | |
| | 4,100 | | *,e | | Bengo4.com, Inc | | | 118 | |
| | 16,200 | | *,e | | Bitauto Holdings Ltd (ADR) | | | 401 | |
| | 1,594,531 | | | | Borussia Dortmund GmbH & Co KGaA | | | 14,615 | |
| | 7,113 | | *,e | | Boston Omaha Corp | | | 166 | |
| | 2,769 | | | | Cable One, Inc | | | 2,271 | |
| | 254,569 | | e | | Cairo Communication S.p.A. | | | 1,001 | |
| | 320,172 | | | | Capcom Co Ltd | | | 6,348 | |
| | 8,079 | | * | | Cardlytics, Inc | | | 87 | |
| | 339,264 | | * | | Care.com, Inc | | | 6,551 | |
| | 288,571 | | * | | Cargurus, Inc | | | 9,734 | |
| | 88,575 | | * | | Cars.com, Inc | | | 1,904 | |
| | 136,145 | | | | carsales.com Ltd | | | 1,055 | |
| | 21,724 | | *,e | | Catena Media plc | | | 241 | |
| | 2,842,866 | | | | CBS Corp (Class B) | | | 124,290 | |
| | 117,717 | | * | | CD Projekt Red S.A. | | | 4,580 | |
| | 21,005 | | *,e | | Central European Media Enterprises Ltd (Class A) | | | 58 | |
| | 122,070 | | *,e | | Central European Media Enterprises Ltd (Class A) (NASDAQ) | | | 339 | |
| | 9,800 | | e | | Changyou.com Ltd (ADR) | | | 179 | |
| | 357,056 | | * | | Charter Communications, Inc | | | 101,750 | |
| | 65,484 | | | | Cheil Communications, Inc | | | 1,320 | |
| | 161,865 | | *,†,m | | Chennai Super Kings Cricket Ltd | | | 5 | |
| | 7,700 | | | | China Film Co Ltd | | | 16 | |
| | 173,000 | | *,e,g | | China Literature Ltd | | | 802 | |
| | 6,000 | | | | China South Publishing & Media Group Co Ltd | | | 11 | |
| | 254,645 | | | | Cinemark Holdings, Inc | | | 9,116 | |
| | 60,042 | | e | | Cineplex Galaxy Income Fund | | | 1,119 | |
| | 1,662,880 | | | | Cineworld Group plc | | | 5,583 | |
| | 8,799 | | | | CJ CGV Co Ltd | | | 324 | |
| | 50,697 | | | | CJ Hellovision Co Ltd | | | 415 | |
| | 271,880 | | | | Clear Channel Outdoor Holdings, Inc (Class A) | | | 1,411 | |
| | 30,485 | | | | Cogeco Communications, Inc | | | 1,469 | |
| | 9,578 | | | | Cogeco, Inc | | | 409 | |
COLLEGE RETIREMENT EQUITIES FUND -Stock Account
| SHARES | | | | COMPANY | | VALUE
(000) | |
| | 29,400 | | | | COLOPL, Inc | | $ | 202 | |
| | 6,960 | | | | Com2uSCorp | | | 808 | |
| | 19,732,963 | | | | Comcast Corp (Class A) | | | 671,907 | |
| | 37,600 | | | | COOKPAD, Inc | | | 102 | |
| | 79,518 | | | | Corus Entertainment, Inc | | | 277 | |
| | 35,845 | | | | CTS Eventim AG. | | | 1,339 | |
| | 118,600 | | | | CyberAgent, Inc | | | 4,585 | |
| | 248,131 | | * | | Cyfrowy Polsat S.A. | | | 1,501 | |
| | 24,900 | | | | Daiichikosho Co Ltd | | | 1,184 | |
| | 1,522 | | *,e | | Daily Journal Corp | | | 356 | |
| | 213,566 | | | | Daily Mail & General Trust | | | 1,565 | |
| | 227,900 | | | | Dena Co Ltd | | | 3,801 | |
| | 103,248 | | | | Dentsu, Inc | | | 4,611 | |
| | 8,040,000 | | *,e | | Digital Domain Holdings Ltd | | | 106 | |
| | 23,300 | | | | Dip Corp | | | 381 | |
| | 68,660 | | *,e | | Discovery, Inc (Class A) | | | 1,699 | |
| | 178,768 | | * | | Discovery, Inc (Class C) | | | 4,126 | |
| | 749,968 | | * | | DISH Network Corp (Class A) | | | 18,727 | |
| | 155,961 | | | | Domain Holdings Australia Ltd | | | 245 | |
| | 642,707 | | * | | Electronic Arts, Inc | | | 50,716 | |
| | 181,984 | | | | Emerald Expositions Events, Inc | | | 2,246 | |
| | 165,687 | | e | | Entercom Communications Corp (Class A) | | | 946 | |
| | 2,749,379 | | | | Entertainment One Ltd | | | 12,495 | |
| | 370,532 | | | | Entravision Communications Corp (Class A) | | | 1,078 | |
| | 114,828 | | *,e | | Eros International plc | | | 952 | |
| | 551,262 | | | | Eutelsat Communications | | | 10,860 | |
| | 56,455 | | | | EW Scripps Co (Class A) | | | 888 | |
| | 26,000 | | | | F@N Communications, Inc | | | 127 | |
| | 6,688,506 | | *,n | | Facebook, Inc | | | 876,796 | |
| | 137,900 | | * | | Fang Holdings Ltd (ADR) | | | 197 | |
| | 510,000 | | * | | FingerTango, Inc | | | 116 | |
| | 150,787 | | *,e | | Fluent, Inc | | | 543 | |
| | 10,872 | | *,e | | Frontier Developments plc | | | 111 | |
| | 354,000 | | | | Fuji Television Network, Inc | | | 4,881 | |
| | 2,317,246 | | *,e,g,m | | Funding Circle Holdings plc | | | 10,283 | |
| | 50,700 | | | | Future plc | | | 309 | |
| | 2,600 | | | | Gakken Co Ltd | | | 101 | |
| | 2,201 | | * | | Gamevil, Inc | | | 107 | |
| | 142,614 | | | | Gannett Co, Inc | | | 1,216 | |
| | 184,745 | | * | | GCI Liberty, Inc | | | 7,604 | |
| | 652,835 | | | | Gestevision Telecinco S.A. | | | 4,104 | |
| | 142,075 | | * | | Glu Mobile, Inc | | | 1,147 | |
| | 16,700 | | | | Gourmet Navigator, Inc | | | 103 | |
| | 156,500 | | *,e | | Gravity Co Ltd (ADR) | | | 6,565 | |
| | 518,972 | | * | | Gray Television, Inc | | | 7,650 | |
| | 79,000 | | | | Gree, Inc | | | 312 | |
| | 3,556,027 | | e | | Grupo Televisa S.A. | | | 8,928 | |
| | 291,300 | | e | | GungHo Online Entertainment Inc | | | 533 | |
| | 271,297 | | | | Hakuhodo DY Holdings, Inc | | | 3,872 | |
| | 26,472 | | * | | Hemisphere Media Group, Inc | | | 321 | |
| | 157,767 | | e | | HT&E Ltd | | | 176 | |
| | 770,000 | | *,e | | Huanxi Media Group Ltd | | | 159 | |
| | 29,414 | | | | Hyundai Hy Communications & Network Co | | | 107 | |
COLLEGE RETIREMENT EQUITIES FUND -Stock Account
| SHARES | | | | COMPANY | | VALUE
(000) | |
| | 717,106 | | * | | IAC/InterActiveCorp | | $ | 131,259 | |
| | 300,678 | | * | | IBN18 Broadcast Ltd | | | 164 | |
| | 4,469 | | *,e | | I-Cable Communications Ltd | | | 0 | ^ |
| | 2,915,000 | | | | IGG, Inc | | | 3,998 | |
| | 82,300 | | g | | IMAX China Holding, Inc | | | 218 | |
| | 223,237 | | * | | Imax Corp | | | 4,199 | |
| | 92,784 | | | | Info Edge India Ltd | | | 1,913 | |
| | 1,144,763 | | | | Informa plc | | | 9,189 | |
| | 13,275 | | | | Innocean Worldwide, Inc | | | 753 | |
| | 32,283 | | * | | Inox Leisure Ltd | | | 114 | |
| | 40,000 | | | | International Games System Co Ltd | | | 188 | |
| | 1,923,676 | | | | Interpublic Group of Cos, Inc | | | 39,685 | |
| | 65,102 | | | | IPSOS | | | 1,532 | |
| | 24,000 | | e | | iShares U.S. Healthcare ETF | | | 4,339 | |
| | 493,824 | | | | ITE Group plc | | | 400 | |
| | 5,200 | | *,e | | Itokuro, Inc | | | 146 | |
| | 5,717,770 | | | | ITV plc | | | 9,101 | |
| | 109,043 | | * | | Jagran Prakashan Ltd | | | 182 | |
| | 126,447 | | | | JC Decaux S.A. | | | 3,553 | |
| | 24,815 | | | | Jcontentree Corp | | | 99 | |
| | 25,327 | | | | John Wiley & Sons, Inc (Class A) | | | 1,190 | |
| | 8,298 | | * | | Just Dial Ltd | | | 60 | |
| | 262,771 | | *,e | | Juventus Football Club S.p.A. | | | 321 | |
| | 15,419 | | * | | JYP Entertainment Corp | | | 419 | |
| | 70 | | | | Kabel Deutschland Holding AG. | | | 8 | |
| | 121,332 | | | | Kadokawa Dwango Corp | | | 1,272 | |
| | 140,020 | | | | Kakaku.com, Inc | | | 2,477 | |
| | 43,823 | | | | Kakao Corp | | | 4,048 | |
| | 9,796 | | | | Kinepolis Group NV | | | 548 | |
| | 23,000 | | e | | KLab, Inc | | | 173 | |
| | 139,468 | | | | Konami Corp | | | 6,128 | |
| | 13,858 | | | | KT Skylife Co Ltd | | | 143 | |
| | 74,440 | | | | Lagardere S.C.A. | | | 1,879 | |
| | 4,540,000 | | *,e | | Leyou Technologies Holdings Ltd | | | 1,263 | |
| | 14,722 | | * | | Liberty Braves Group (Class A) | | | 367 | |
| | 166,456 | | * | | Liberty Braves Group (Class C) | | | 4,143 | |
| | 52,072 | | * | | Liberty Broadband Corp (Class A) | | | 3,739 | |
| | 190,585 | | * | | Liberty Broadband Corp (Class C) | | | 13,728 | |
| | 1,913 | | * | | Liberty Global plc | | | 39 | |
| | 194,001 | | * | | Liberty Global plc (Class A) | | | 4,140 | |
| | 321,913 | | *,e | | Liberty Latin America Ltd | | | 4,690 | |
| | 89,283 | | * | | Liberty Latin America Ltd (Class A) | | | 1,293 | |
| | 45,296 | | * | | Liberty Media Group (Class A) | | | 1,346 | |
| | 377,615 | | * | | Liberty Media Group (Class C) | | | 11,593 | |
| | 161,613 | | * | | Liberty SiriusXM Group (Class A) | | | 5,947 | |
| | 440,779 | | * | | Liberty SiriusXM Group (Class C) | | | 16,300 | |
| | 475,706 | | * | | Liberty TripAdvisor Holdings, Inc | | | 7,559 | |
| | 54,100 | | *,e | | LINE Corp | | | 1,848 | |
| | 94,095 | | e | | Lions Gate Entertainment Corp (Class A) | | | 1,515 | |
| | 541,992 | | e | | Lions Gate Entertainment Corp (Class B) | | | 8,065 | |
| | 305,387 | | * | | Live Nation, Inc | | | 15,040 | |
| | 36,685 | | *,e | | LiveXLive Media, Inc | | | 182 | |
| | 16,448 | | * | | Loral Space & Communications, Inc | | | 613 | |
| | 74,361 | | | | M6-Metropole Television | | | 1,196 | |
COLLEGE RETIREMENT EQUITIES FUND -Stock Account
| SHARES | | | | COMPANY | | VALUE
(000) | |
| | 23,600 | | | | Macromill, Inc | | $ | 307 | |
| | 47,037 | | * | | Madison Square Garden Co | | | 12,592 | |
| | 295,300 | | m | | Major Cineplex Group PCL (Foreign) | | | 187 | |
| | 62,666 | | | | Marcus Corp | | | 2,475 | |
| | 83,000 | | | | MarkLines Co Ltd | | | 903 | |
| | 124,500 | | | | Marvelous, Inc | | | 890 | |
| | 615,550 | | e | | Match Group, Inc | | | 26,327 | |
| | 77,955 | | * | | MDC Partners, Inc | | | 203 | |
| | 231,167 | | *,e | | Mediaset S.p.A. | | | 728 | |
| | 305,516 | | * | | Meet Group, Inc | | | 1,415 | |
| | 55,900 | | e | | Megacable Holdings SAB de C.V. | | | 251 | |
| | 50,457 | | e | | Meredith Corp | | | 2,621 | |
| | 28,000 | | | | Mixi Inc | | | 588 | |
| | 49,356 | | | | Modern Times Group AB (B Shares) | | | 1,635 | |
| | 321,800 | | * | | Momo, Inc (ADR) | | | 7,643 | |
| | 106,749 | | * | | MSG Networks, Inc | | | 2,515 | |
| | 11,600 | | | | MTI Ltd | | | 66 | |
| | 33,200 | | | | Multiplus S.A. | | | 215 | |
| | 2,573 | | | | Nasmedia Co Ltd | | | 66 | |
| | 745,795 | | | | Naspers Ltd (N Shares) | | | 149,320 | |
| | 99,852 | | | | National CineMedia, Inc | | | 647 | |
| | 120,143 | | | | Naver Corp | | | 13,167 | |
| | 49,337 | | | | NCsoft | | | 20,681 | |
| | 136,000 | | | | NetDragon Websoft, Inc | | | 207 | |
| | 101,000 | | | | Netease.com (ADR) | | | 23,772 | |
| | 1,024,743 | | * | | NetFlix, Inc | | | 274,283 | |
| | 26,339 | | g | | Netmarble Corp | | | 2,632 | |
| | 162,469 | | | | New Media Investment Group, Inc | | | 1,880 | |
| | 169,627 | | | | New York Times Co (Class A) | | | 3,781 | |
| | 208,208 | | | | News Corp (Class A) | | | 2,363 | |
| | 67,539 | | | | News Corp (Class B) | | | 780 | |
| | 374,228 | | * | | Nexon Co Ltd | | | 4,831 | |
| | 57,425 | | e | | Nexstar Broadcasting Group, Inc (Class A) | | | 4,516 | |
| | 32,400 | | | | Next Co Ltd | | | 216 | |
| | 7,465 | | * | | NHN Entertainment Corp | | | 384 | |
| | 6,145,404 | | | | Nine Entertainment Co Holdings Ltd | | | 5,979 | |
| | 299,016 | | h | | Nintendo Co Ltd | | | 79,400 | |
| | 224,325 | | | | Omnicom Group, Inc | | | 16,430 | |
| | 342,295 | | | | oOh!media Ltd | | | 825 | |
| | 8,900 | | e | | OPT, Inc | | | 117 | |
| | 1,358,200 | | * | | Pandora Media, Inc | | | 10,988 | |
| | 34,234 | | e | | Paradox Interactive AB | | | 519 | |
| | 6,323 | | * | | Pearl Abyss Corp | | | 1,184 | |
| | 1,325,493 | | | | Pearson plc | | | 15,879 | |
| | 3,900 | | | | Perfect World Co Ltd | | | 16 | |
| | 1,012,000 | | | | Phoenix Media Investment Holdings Ltd | | | 94 | |
| | 661,900 | | | | Plan B Media PCL | | | 124 | |
| | 65,900 | | | | Poly Culture Group Corp Ltd | | | 86 | |
| | 33,450 | | * | | PR Times, Inc | | | 653 | |
| | 374,533 | | | | Promotora de Informaciones S.A. | | | 756 | |
| | 589,264 | | | | ProSiebenSat. Media AG. | | | 10,485 | |
| | 25,700 | | | | Proto Corp | | | 327 | |
| | 4,386,400 | | | | PT Global MediaCom Tbk | | | 74 | |
COLLEGE RETIREMENT EQUITIES FUND -Stock Account
| SHARES | | | | COMPANY | | VALUE
(000) | |
| | 3,819,100 | | | | PT Media Nusantara Citra Tbk | | $ | 184 | |
| | 902,725 | | | | PT Multimedia Servicos de Telecomunicacoes e Multimedia SGPS S.A. | | | 5,474 | |
| | 7,412,836 | | | | PT Surya Citra Media Tbk | | | 966 | |
| | 46,072 | | | | Publicis Groupe S.A. | | | 2,629 | |
| | 19,291 | | * | | PVR Ltd | | | 443 | |
| | 1,142,294 | | | | Quebecor, Inc | | | 24,047 | |
| | 151,611 | | * | | QuinStreet, Inc | | | 2,461 | |
| | 70,673 | | g | | RAI Way S.p.A | | | 351 | |
| | 369 | | * | | RCS MediaGroup S.p.A. | | | 0 | ^ |
| | 75,130 | | | | REA Group Ltd | | | 3,920 | |
| | 20,513 | | * | | Reading International, Inc | | | 298 | |
| | 742,133 | | | | Rightmove plc | | | 4,090 | |
| | 25,308 | | * | | Rosetta Stone, Inc | | | 415 | |
| | 64,081 | | *,† | | RP-SG Retail Ltd | | | 167 | |
| | 284,300 | | | | RS PCL | | | 129 | |
| | 8,707 | | | | RTL Group | | | 467 | |
| | 5,107 | | | | Saga Communications, Inc | | | 170 | |
| | 240,115 | | | | Sanoma-WSOY Oyj | | | 2,340 | |
| | 34,154 | | * | | SBS Media Holdings Co Ltd | | | 62 | |
| | 88,369 | | | | Schibsted ASA (B Shares) | | | 2,688 | |
| | 35,065 | | | | Scholastic Corp | | | 1,412 | |
| | 258,397 | | g | | Scout24 AG. | | | 11,855 | |
| | 761,427 | | | | SES Global S.A. | | | 14,578 | |
| | 50,570 | | | | Shanghai Oriental Pearl Group Co Ltd | | | 76 | |
| | 307,004 | | | | Shaw Communications, Inc (B Shares) | | | 5,557 | |
| | 5,800 | | e | | Shochiku Co Ltd | | | 561 | |
| | 92,712 | | * | | Sina Corp | | | 4,973 | |
| | 86,714 | | | | Sinclair Broadcast Group, Inc (Class A) | | | 2,284 | |
| | 816,064 | | e | | Singapore Press Holdings Ltd | | | 1,406 | |
| | 2,358,355 | | e | | Sirius XM Holdings, Inc | | | 13,466 | |
| | 1,133,910 | | | | Sky Network Television Ltd | | | 1,409 | |
| | 139,600 | | | | Sky Perfect Jsat Corp | | | 596 | |
| | 12,680 | | * | | SM Entertainment Co | | | 596 | |
| | 617,600 | | *,†,e,m | | SMI Holdings Group Ltd | | | 185 | |
| | 39,600 | | | | Smiles Fidelidade S.A. | | | 447 | |
| | 27,366 | | | | Societe Television Francaise 1 | | | 222 | |
| | 66,540 | | | | Soft-World International Corp | | | 144 | |
| | 19,700 | | * | | Sohu.com Ltd (ADR) | | | 343 | |
| | 1,679,651 | | *,e | | Solocal Group | | | 969 | |
| | 499,186 | | | | Southern Cross Media Group | | | 354 | |
| | 22,400 | | * | | Spotify Technology S.A. | | | 2,542 | |
| | 54,227 | | | | Square Enix Co Ltd | | | 1,476 | |
| | 9,092 | | *,e | | Stillfront Group AB | | | 135 | |
| | 16,783 | | *,e | | Storytel AB | | | 171 | |
| | 17,636 | | | | Stroer Out-of-Home Media AG. | | | 855 | |
| | 2,000,000 | | | | T4F Entretenimento S.A. | | | 3,803 | |
| | 451,565 | | * | | Take-Two Interactive Software, Inc | | | 46,484 | |
| | 29,675 | | * | | TechTarget, Inc | | | 362 | |
| | 29,400 | | | | Tecmo Koei Holdings Co Ltd | | | 486 | |
| | 279,093 | | | | TEGNA, Inc | | | 3,034 | |
| | 24,736 | | | | Telenet Group Holding NV | | | 1,151 | |
| | 215,343 | | | | Television Broadcasts Ltd | | | 408 | |
| | 9,433,459 | | | | Tencent Holdings Ltd | | | 378,096 | |
COLLEGE RETIREMENT EQUITIES FUND -Stock Account
| SHARES | | | | COMPANY | | VALUE
(000) | |
| | 749,369 | | *,e | | Thomson | | $ | 819 | |
| | 338,000 | | g | | Tian GE Interactive Holdings Ltd | | | 132 | |
| | 14,100 | | | | Toei Animation Co Ltd | | | 520 | |
| | 84,188 | | | | Toei Co Ltd | | | 9,887 | |
| | 91,905 | | | | Toho Co Ltd | | | 3,330 | |
| | 124,900 | | | | Tohokushinsha Film Corp | | | 661 | |
| | 22,700 | | | | Tokyo Broadcasting System, Inc | | | 359 | |
| | 7,350 | | * | | Travelzoo, Inc | | | 72 | |
| | 267,660 | | | | Tribune Co | | | 12,146 | |
| | 77,519 | | * | | Tribune Publishing Co | | | 879 | |
| | 209,235 | | * | | TripAdvisor, Inc | | | 11,286 | |
| | 118,939 | | * | | TrueCar, Inc | | | 1,078 | |
| | 14,000 | | | | TV Asahi Corp | | | 252 | |
| | 837,100 | | e | | TV Azteca S.A. de C.V. | | | 99 | |
| | 2,696,852 | | | | Twenty-First Century Fox, Inc | | | 129,773 | |
| | 925,438 | | | | Twenty-First Century Fox, Inc (Class B) | | | 44,217 | |
| | 2,606,114 | | *,n | | Twitter, Inc | | | 74,900 | |
| | 107,015 | | * | | Ubisoft Entertainment | | | 8,621 | |
| | 5,100 | | * | | UUUM, Inc | | | 193 | |
| | 19,000 | | e | | ValueCommerce Co Ltd | | | 212 | |
| | 19,500 | | | | Vector, Inc | | | 253 | |
| | 1,376,200 | | | | VGI Global Media PCL | | | 330 | |
| | 25,756 | | e | | Viacom, Inc | | | 716 | |
| | 2,069,814 | | | | Viacom, Inc (Class B) | | | 53,194 | |
| | 56,131 | | * | | Village Roadshow Ltd | | | 107 | |
| | 1,813,600 | | * | | Viva China Holdings Ltd | | | 195 | |
| | 1,021,646 | | | | Vivendi Universal S.A. | | | 24,762 | |
| | 4,008,707 | | | | Walt Disney Co | | | 439,555 | |
| | 8,640 | | * | | Webzen, Inc | | | 166 | |
| | 80,256 | | *,e | | Weibo Corp (ADR) | | | 4,689 | |
| | 4,527 | | | | WeMade Entertainment Co Ltd | | | 106 | |
| | 6,146,786 | | * | | West Australian Newspapers Holdings Ltd | | | 2,382 | |
| | 44,704 | | * | | WideOpenWest, Inc | | | 319 | |
| | 65,000 | | * | | Wise Talent Information Technology Co Ltd | | | 241 | |
| | 123,600 | | | | Workpoint Entertainment PCL | | | 88 | |
| | 396,388 | | e | | World Wrestling Entertainment, Inc (Class A) | | | 29,618 | |
| | 14,500 | | | | Wowow, Inc | | | 402 | |
| | 297,479 | | | | WPP AUNZ Ltd | | | 119 | |
| | 2,249,287 | | | | WPP plc | | | 24,479 | |
| | 7,700 | | | | Wuhu Shunrong Sanqi Interactive Entertainment Network Technology Co Ltd | | | 11 | |
| | 1,832 | | | | XING AG. | | | 499 | |
| | 2,853,831 | | | | Yahoo! Japan Corp | | | 7,100 | |
| | 141,400 | | * | | Yandex NV | | | 3,867 | |
| | 103,364 | | * | | Yelp, Inc | | | 3,617 | |
| | 8,052 | | e | | YG Entertainment, Inc | | | 343 | |
| | 53,700 | | * | | YY, Inc (ADR) | | | 3,214 | |
| | 738,184 | | * | | Zee Entertainment Enterprises Ltd | | | 404 | |
| | 750,388 | | | | ZEE Telefilms Ltd | | | 5,119 | |
| | 21,750 | | | | Zenrin Co Ltd | | | 460 | |
| | 67,300 | | * | | ZIGExN Co Ltd | | | 310 | |
| | 102,237 | | * | | Zillow Group, Inc | | | 3,213 | |
| | 221,073 | | *,e | | Zillow Group, Inc (Class C) | | | 6,981 | |
COLLEGE RETIREMENT EQUITIES FUND -Stock Account
| SHARES | | | | COMPANY | | VALUE
(000) | |
| | 3,584,045 | | * | | Zynga, Inc | | $ | 14,085 | |
| | | | | | TOTAL MEDIA & ENTERTAINMENT | | | 6,544,951 | |
| | | | | | | | | | |
| PHARMACEUTICALS, BIOTECHNOLOGY & LIFE SCIENCES - 7.8% |
| | 1,146,000 | | g | | 3SBio, Inc | | | 1,465 | |
| | 2,762,859 | | | | AbbVie, Inc | | | 254,708 | |
| | 468,865 | | | | Abcam plc | | | 6,526 | |
| | 40,673 | | *,e | | Abeona Therapeutics, Inc | | | 290 | |
| | 278,695 | | *,e | | Acadia Pharmaceuticals, Inc | | | 4,506 | |
| | 33,944 | | *,e | | Accelerate Diagnostics, Inc | | | 390 | |
| | 87,227 | | * | | Acceleron Pharma, Inc | | | 3,799 | |
| | 45,980 | | *,e,m | | Achaogen, Inc | | | 57 | |
| | 170,276 | | * | | Achillion Pharmaceuticals, Inc | | | 271 | |
| | 109,151 | | *,e | | Aclaris Therapeutics, Inc | | | 807 | |
| | 171,716 | | * | | Acorda Therapeutics, Inc | | | 2,675 | |
| | 28,901 | | *,e | | Adamas Pharmaceuticals, Inc | | | 247 | |
| | 212,031 | | | | Adcock Ingram Holdings Ltd | | | 914 | |
| | 26,291 | | *,e,m | | ADMA Biologics, Inc | | | 63 | |
| | 82,313 | | * | | Aduro Biotech, Inc | | | 217 | |
| | 70,487 | | * | | Adverum Biotechnologies, Inc | | | 222 | |
| | 18,842 | | * | | Aeglea BioTherapeutics, Inc | | | 141 | |
| | 99,224 | | * | | Aerie Pharmaceuticals, Inc | | | 3,582 | |
| | 113,670 | | *,e | | Agenus, Inc | | | 271 | |
| | 29,712 | | *,e,m | | AgeX Therapeutics, Inc | | | 89 | |
| | 920,323 | | | | Agilent Technologies, Inc | | | 62,085 | |
| | 86,240 | | *,e | | Agios Pharmaceuticals, Inc | | | 3,977 | |
| | 56,256 | | * | | Aimmune Therapeutics, Inc | | | 1,346 | |
| | 50,214 | | | | Ajanta Pharma Ltd | | | 852 | |
| | 18,211 | | *,e | | Akcea Therapeutics, Inc | | | 549 | |
| | 465,554 | | *,e | | Akebia Therapeutics, Inc | | | 2,575 | |
| | 208,881 | | * | | Akorn, Inc | | | 708 | |
| | 11,478 | | * | | Albireo Pharma, Inc | | | 282 | |
| | 1,361,445 | | *,e | | Alder Biopharmaceuticals, Inc | | | 13,955 | |
| | 22,429 | | * | | Aldeyra Therapeutics, Inc | | | 186 | |
| | 73,911 | | | | Alembic Pharmaceuticals Ltd | | | 634 | |
| | 924,971 | | * | | Alexion Pharmaceuticals, Inc | | | 90,055 | |
| | 4,286 | | * | | ALK-Abello AS | | | 634 | |
| | 67,823 | | * | | Alkermes plc | | | 2,001 | |
| | 11,010 | | *,e | | Allakos, Inc | | | 575 | |
| | 16,256 | | *,m | | Allena Pharmaceuticals, Inc | | | 89 | |
| | 1,723,209 | | | | Allergan plc | | | 230,324 | |
| | 931,546 | | | | Alliance Pharma plc | | | 796 | |
| | 255,309 | | *,e | | Allogene Therapeutics, Inc | | | 6,875 | |
| | 267,304 | | * | | Alnylam Pharmaceuticals, Inc | | | 19,489 | |
| | 143,141 | | * | | AMAG Pharmaceuticals, Inc | | | 2,174 | |
| | 1,052,441 | | | | Amgen, Inc | | | 204,879 | |
| | 8,292 | | * | | Amicogen, Inc | | | 254 | |
| | 447,285 | | *,e | | Amicus Therapeutics, Inc | | | 4,285 | |
| | 111,130 | | *,e | | Amneal Pharmaceuticals, Inc | | | 1,504 | |
| | 46,269 | | * | | Amphastar Pharmaceuticals, Inc | | | 921 | |
| | 121,754 | | *,e | | Ampio Pharmaceuticals, Inc | | | 48 | |
| | 34,428 | | * | | AnaptysBio, Inc | | | 2,196 | |
| | 41,940 | | * | | ANI Pharmaceuticals, Inc | | | 1,888 | |
| | 2,279 | | * | | Anterogen Co Ltd | | | 145 | |
COLLEGE RETIREMENT EQUITIES FUND -Stock Account
| SHARES | | | | COMPANY | | VALUE
(000) | |
| | 45,635 | | * | | Apellis Pharmaceuticals, Inc | | $ | 602 | |
| | 135,428 | | *,e | | Aphria, Inc | | | 779 | |
| | 17,848 | | *,m | | Aptinyx, Inc | | | 295 | |
| | 21,725 | | * | | Aquestive Therapeutics, Inc | | | 137 | |
| | 233,295 | | * | | Aratana Therapeutics, Inc | | | 1,430 | |
| | 45,163 | | *,e | | Arbutus Biopharma Corp | | | 173 | |
| | 39,888 | | *,e | | Arcus Biosciences, Inc | | | 430 | |
| | 279,125 | | * | | Ardelyx, Inc | | | 500 | |
| | 148,236 | | * | | Arena Pharmaceuticals, Inc | | | 5,774 | |
| | 16,153 | | * | | Argenx SE | | | 1,581 | |
| | 619,527 | | * | | Arqule, Inc | | | 1,716 | |
| | 670,601 | | * | | Array Biopharma, Inc | | | 9,556 | |
| | 109,025 | | *,e | | Arrowhead Research Corp | | | 1,354 | |
| | 23,071 | | *,e,m | | Arsanis, Inc | | | 54 | |
| | 9,604 | | * | | Arvinas, Inc | | | 123 | |
| | 144,662 | | * | | Ascendis Health Ltd | | | 42 | |
| | 566,000 | | *,g | | Ascletis Pharma, Inc | | | 461 | |
| | 33,800 | | | | ASKA Pharmaceutical Co Ltd | | | 340 | |
| | 453,327 | | | | Aspen Pharmacare Holdings Ltd | | | 4,242 | |
| | 67,514 | | * | | Assembly Biosciences, Inc | | | 1,527 | |
| | 80,073 | | * | | Assertio Therapeutics, Inc. | | | 289 | |
| | 2,590,160 | | | | Astellas Pharma, Inc | | | 33,093 | |
| | 1,950,501 | | | | AstraZeneca plc | | | 145,597 | |
| | 533,642 | | | | AstraZeneca plc (ADR) | | | 20,268 | |
| | 53,105 | | * | | Atara Biotherapeutics, Inc | | | 1,845 | |
| | 13,079 | | * | | ATGen Co Ltd | | | 152 | |
| | 79,993 | | *,e | | Athenex, Inc | | | 1,015 | |
| | 594,538 | | *,e | | Athersys, Inc | | | 856 | |
| | 49,549 | | * | | Audentes Therapeutics, Inc | | | 1,056 | |
| | 34,999 | | *,e | | Aurinia Pharmaceuticals, Inc | | | 238 | |
| | 508,956 | | | | Aurobindo Pharma Ltd | | | 5,337 | |
| | 1,758,453 | | *,e | | Aurora Cannabis, Inc | | | 8,733 | |
| | 131,537 | | *,e | | AVEO Pharmaceuticals, Inc | | | 210 | |
| | 87,738 | | * | | Avid Bioservices, Inc | | | 360 | |
| | 8,195 | | * | | Avrobio, Inc | | | 136 | |
| | 3,011 | | | | Bachem Holding AG. | | | 349 | |
| | 8,647 | | *,e | | Basilea Pharmaceutica | | | 352 | |
| | 495,866 | | * | | Bausch Health Cos, Inc | | | 9,171 | |
| | 20,033 | | *,e | | Bavarian Nordic AS | | | 395 | |
| | 709,159 | | | | Bayer AG. | | | 49,321 | |
| | 25,900 | | *,e | | BeiGene Ltd (ADR) | | | 3,633 | |
| | 143,000 | | *,e | | Beijing Tong Ren Tang Chinese Medicine Co Ltd | | | 225 | |
| | 45,400 | | | | Beijing Tongrentang Co Ltd | | | 182 | |
| | 50,915 | | *,e | | Bellicum Pharmaceuticals, Inc | | | 149 | |
| | 16,925 | | * | | Binex Co Ltd | | | 140 | |
| | 289,518 | | *,e | | BioCryst Pharmaceuticals, Inc | | | 2,336 | |
| | 40,819 | | | | Biogaia AB (B Shares) | | | 1,462 | |
| | 399,462 | | * | | Biogen Idec, Inc | | | 120,206 | |
| | 1,120,371 | | * | | Biohaven Pharmaceutical Holding Co Ltd | | | 41,431 | |
| | 711,046 | | * | | BioMarin Pharmaceutical, Inc | | | 60,546 | |
| | 64,354 | | * | | Bio-Rad Laboratories, Inc (Class A) | | | 14,944 | |
| | 28,386 | | * | | Biospecifics Technologies Corp | | | 1,720 | |
| | 172,425 | | | | Biotage AB | | | 2,134 | |
COLLEGE RETIREMENT EQUITIES FUND -Stock Account
| SHARES | | | | COMPANY | | VALUE
(000) | |
| | 77,515 | | | | Bio-Techne Corp | | $ | 11,218 | |
| | 21,810 | | | | Biotest AG. (Preference) | | | 588 | |
| | 297,129 | | *,e | | BioTime, Inc | | | 271 | |
| | 182,736 | | * | | Biovitrum AB | | | 3,979 | |
| | 178,278 | | *,e | | Bluebird Bio, Inc | | | 17,685 | |
| | 67,095 | | * | | Blueprint Medicines Corp | | | 3,617 | |
| | 4,409 | | | | Boiron S.A. | | | 247 | |
| | 275,141 | | e | | Boryung Pharmaceutical Co Ltd | | | 2,463 | |
| | 3,400,077 | | | | Bristol-Myers Squibb Co | | | 176,736 | |
| | 475,152 | | | | Bruker BioSciences Corp | | | 14,145 | |
| | 195,418 | | * | | BTG plc | | | 2,072 | |
| | 24,421 | | | | Bukwang Pharmaceutical Co Ltd | | | 545 | |
| | 212,488 | | | | Cadila Healthcare Ltd | | | 1,060 | |
| | 67,811 | | * | | Calithera Biosciences, Inc | | | 272 | |
| | 7,590 | | *,e | | Calyxt, Inc | | | 79 | |
| | 53,035 | | * | | Cambrex Corp | | | 2,003 | |
| | 9,311 | | * | | Camurus AB | | | 70 | |
| | 42,437 | | * | | CannTrust Holdings, Inc | | | 204 | |
| | 177,327 | | *,e | | Canopy Growth Corp | | | 4,755 | |
| | 10,000 | | *,e | | Canopy Growth Corp | | | 269 | |
| | 11,394 | | | | Caplin Point Laboratories Ltd | | | 62 | |
| | 43,514 | | *,e | | Cara Therapeutics Inc | | | 566 | |
| | 239,171 | | * | | CareDx, Inc | | | 6,013 | |
| | 2,389 | | | | Caregen Co Ltd | | | 152 | |
| | 64,206 | | *,e | | CASI Pharmaceuticals, Inc | | | 258 | |
| | 352,753 | | * | | Catalent, Inc | | | 10,999 | |
| | 16,629 | | * | | Catalyst Biosciences, Inc | | | 131 | |
| | 124,139 | | *,e | | Catalyst Pharmaceuticals, Inc | | | 238 | |
| | 6,176 | | * | | Celcuity, Inc | | | 148 | |
| | 1,690,980 | | * | | Celgene Corp | | | 108,375 | |
| | 20,599 | | *,e | | Cellectis S.A. | | | 353 | |
| | 15,028 | | *,e | | Celltrion Pharm Inc | | | 859 | |
| | 83,868 | | * | | Celltrion, Inc | | | 16,848 | |
| | 14,347 | | *,e | | Cellular Biomedicine Group, Inc | | | 253 | |
| | 170,508 | | | | Center Laboratories, Inc | | | 379 | |
| | 92,770 | | * | | Charles River Laboratories International, Inc | | | 10,500 | |
| | 293,187 | | * | | ChemoCentryx, Inc | | | 3,199 | |
| | 49,340 | | * | | Chimerix, Inc | | | 127 | |
| | 10,235,300 | | *,†,e,m | | China Animal Healthcare Ltd | | | 13 | |
| | 404,000 | | | | China Grand Pharmaceutical and Healthcare Holdings Ltd | | | 185 | |
| | 1,443,900 | | | | China Medical System Holdings Ltd | | | 1,348 | |
| | 5,833,000 | | g | | China Resources Pharmaceutical Group Ltd | | | 7,597 | |
| | 4,000 | | | | China Resources Sanjiu Medical & Pharmaceutical Co Ltd | | | 14 | |
| | 849,000 | | | | China Shineway Pharmaceutical Group Ltd | | | 823 | |
| | 13,319 | | | | Chong Kun Dang Pharmaceutical Corp | | | 1,218 | |
| | 6,870 | | | | Choongwae Pharma Corp | | | 252 | |
| | 49,224 | | *,e | | ChromaDex Corp | | | 169 | |
| | 450,618 | | | | Chugai Pharmaceutical Co Ltd | | | 26,135 | |
| | 374,706 | | * | | Cipla Ltd | | | 2,786 | |
| | 33,345 | | *,e | | Clearside Biomedical, Inc | | | 36 | |
| | 166,407 | | | | Clinigen Group plc | | | 1,608 | |
COLLEGE RETIREMENT EQUITIES FUND -Stock Account
| SHARES | | | | COMPANY | | VALUE
(000) | |
| | 136,330 | | *,e | | Clovis Oncology, Inc | | $ | 2,448 | |
| | 47,022 | | * | | CMG Pharmaceutical Co Ltd | | | 179 | |
| | 57,800 | | | | CMIC Co Ltd | | | 906 | |
| | 64,640 | | * | | Codexis, Inc | | | 1,079 | |
| | 21,881 | | *,e,m | | Cohbar, Inc | | | 68 | |
| | 1,074,967 | | *,e | | Coherus Biosciences, Inc | | | 9,728 | |
| | 39,227 | | *,e | | Collegium Pharmaceutical, Inc | | | 674 | |
| | 95,665 | | * | | Concert Pharmaceuticals Inc | | | 1,201 | |
| | 6,084 | | *,m | | Constellation Pharmaceuticals, Inc | | | 24 | |
| | 2,092,000 | | | | Consun Pharmaceutical Group Ltd | | | 1,209 | |
| | 66,697 | | *,e | | Corbus Pharmaceuticals Holdings, Inc | | | 390 | |
| | 181,489 | | *,e | | Corcept Therapeutics, Inc | | | 2,425 | |
| | 33,424 | | *,e,m | | Corium International, Inc | | | 6 | |
| | 15,196 | | * | | Corvus Pharmaceuticals, Inc | | | 56 | |
| | 4,859 | | * | | COSMO Pharmaceuticals NV | | | 435 | |
| | 9,351 | | *,e | | Crinetics Pharmaceuticals, Inc | | | 280 | |
| | 105,651 | | *,e | | Cronos Group, Inc | | | 1,113 | |
| | 19,678 | | | | CrystalGenomics, Inc | | | 307 | |
| | 735,074 | | | | CSL Ltd | | | 96,014 | |
| | 4,933,961 | | | | CSPC Pharmaceutical Group Ltd | | | 7,083 | |
| | 71,056 | | *,e,m | | CTI BioPharma Corp | | | 52 | |
| | 28,641 | | *,e | | Cue Biopharma, Inc | | | 135 | |
| | 126,017 | | * | | Cymabay Therapeutics, Inc | | | 992 | |
| | 66,179 | | * | | Cytokinetics, Inc | | | 418 | |
| | 143,991 | | * | | CytomX Therapeutics, Inc | | | 2,174 | |
| | 8,067 | | | | Dae Hwa Pharmaceutical Co Ltd | | | 144 | |
| | 57,602 | | | | Daewon Pharmaceutical Co Ltd | | | 835 | |
| | 133,711 | | | | Daewoong Co Ltd | | | 2,136 | |
| | 3,340 | | | | Daewoong Pharmaceutical Co Ltd | | | 566 | |
| | 1,478,652 | | | | Daiichi Sankyo Co Ltd | | | 47,296 | |
| | 1,702,000 | | | | Dawnrays Pharmaceutical Holdings Ltd | | | 320 | |
| | 13,525 | | *,e,m | | DBV Technologies S.A. | | | 167 | |
| | 179,152 | | | | Dechra Pharmaceuticals plc | | | 4,733 | |
| | 12,560 | | * | | Deciphera Pharmaceuticals, Inc | | | 264 | |
| | 58,599 | | *,e | | Denali Therapeutics, Inc | | | 1,211 | |
| | 43,161 | | *,e | | Dermira, Inc | | | 310 | |
| | 67,040 | | * | | Dicerna Pharmaceuticals Inc | | | 717 | |
| | 164,441 | | * | | Dishman Carbogen Amcis India Ltd | | | 542 | |
| | 97,219 | | | | Divi S Laboratories Ltd | | | 2,062 | |
| | 2,090 | | | | Dong-A Pharmaceutical Co Ltd | | | 204 | |
| | 2,924 | | | | Dong-A ST Co Ltd | | | 274 | |
| | 2,500 | | | | Dong-E-E-Jiao Co Ltd | | | 14 | |
| | 25,065 | | | | DongKook Pharmaceutical Co Ltd | | | 1,301 | |
| | 10,634 | | * | | Dongsung Pharmaceutical Co Ltd | | | 143 | |
| | 17,111 | | *,e | | Dova Pharmaceuticals, Inc | | | 130 | |
| | 205,904 | | | | Dr Reddy’s Laboratories Ltd | | | 7,713 | |
| | 204,485 | | *,m | | Durect Corp | | | 99 | |
| | 81,006 | | *,e | | Dynavax Technologies Corp | | | 741 | |
| | 21,871 | | *,e | | Eagle Pharmaceuticals, Inc | | | 881 | |
| | 129,584 | | * | | Editas Medicine, Inc | | | 2,948 | |
| | 9,983 | | *,e | | Eidos Therapeutics, Inc | | | 137 | |
| | 287,975 | | | | Eisai Co Ltd | | | 22,295 | |
| | 116,318 | | *,e | | Elanco Animal Health, Inc | | | 3,667 | |
COLLEGE RETIREMENT EQUITIES FUND -Stock Account
| SHARES | | | | COMPANY | | VALUE
(000) | |
| | 2,024,030 | | | | Eli Lilly & Co | | $ | 234,221 | |
| | 27,734 | | *,e | | Eloxx Pharmaceuticals, Inc | | | 333 | |
| | 119,095 | | * | | Emergent Biosolutions, Inc | | | 7,060 | |
| | 21,202 | | * | | Enanta Pharmaceuticals, Inc | | | 1,502 | |
| | 479,385 | | * | | Endo International plc | | | 3,500 | |
| | 319,353 | | * | | Enzo Biochem, Inc | | | 888 | |
| | 3,811 | | * | | Enzychem Lifesciences Corp | | | 340 | |
| | 70,099 | | *,e | | Epizyme, Inc | | | 432 | |
| | 19,700 | | | | EPS Co Ltd | | | 300 | |
| | 6,160 | | *,e,m | | Equillium, Inc | | | 50 | |
| | 45,501 | | *,g | | Eris Lifesciences Ltd | | | 448 | |
| | 38,315 | | *,e | | Esperion Thereapeutics, Inc | | | 1,762 | |
| | 13,134 | | | | Eurofins Scientific | | | 4,905 | |
| | 17,580 | | *,e | | Evelo Biosciences, Inc | | | 229 | |
| | 25,819 | | *,e | | Evolus, Inc | | | 307 | |
| | 146,268 | | * | | Evotec AG. | | | 2,901 | |
| | 325,715 | | *,e | | Exact Sciences Corp | | | 20,553 | |
| | 609,286 | | * | | Exelixis, Inc | | | 11,985 | |
| | 714,657 | | | | Faes Farma S.A. (Sigma) | | | 2,431 | |
| | 75,703 | | * | | Fate Therapeutics, Inc | | | 971 | |
| | 68,442 | | * | | FDC Ltd | | | 169 | |
| | 10,633 | | *,e | | Fennec Pharmaceuticals, Inc | | | 68 | |
| | 156,552 | | * | | FibroGen, Inc | | | 7,245 | |
| | 101,242 | | * | | Five Prime Therapeutics, Inc | | | 942 | |
| | 44,048 | | *,e | | Flexion Therapeutics Inc | | | 499 | |
| | 47,753 | | * | | Fluidigm Corp | | | 412 | |
| | 11,356 | | *,e | | Forty Seven, Inc | | | 179 | |
| | 9,400 | | | | Fuji Pharma Co Ltd | | | 151 | |
| | 26,524 | | * | | G1 Therapeutics, Inc | | | 508 | |
| | 25,558 | | * | | Galapagos NV | | | 2,359 | |
| | 85,333 | | g | | Galenica AG. | | | 3,759 | |
| | 8,119 | | * | | Genexine Co Ltd | | | 531 | |
| | 17,982 | | *,e | | Genfit | | | 357 | |
| | 29,170 | | * | | Genmab AS | | | 4,796 | |
| | 198,928 | | * | | Genomic Health, Inc | | | 12,813 | |
| | 506,500 | | *,e | | Genomma Lab Internacional S.A. de C.V. | | | 301 | |
| | 866,000 | | * | | Genscript Biotech Corp | | | 1,159 | |
| | 75,450 | | | | Genus plc | | | 2,064 | |
| | 208,426 | | *,e | | Geron Corp | | | 208 | |
| | 19,758 | | | | Gerresheimer AG. | | | 1,298 | |
| | 5,127,139 | | | | Gilead Sciences, Inc | | | 320,703 | |
| | 4,106,985 | | | | GlaxoSmithKline plc | | | 78,271 | |
| | 163,022 | | | | Glenmark Pharmaceuticals Ltd | | | 1,618 | |
| | 63,702 | | *,e | | Global Blood Therapeutics, Inc | | | 2,615 | |
| | 41,927 | | * | | GlycoMimetics Inc | | | 397 | |
| | 8,000 | | * | | GNI Group Ltd | | | 223 | |
| | 564,828 | | * | | Granules India Ltd | | | 726 | |
| | 3,433 | | | | Green Cross Cell Corp | | | 156 | |
| | 2,923 | | | | Green Cross Corp | | | 357 | |
| | 17,780 | | | | Green Cross Holdings Corp | | | 401 | |
| | 2,931 | | | | Green Cross LabCell Corp | | | 121 | |
| | 140,404 | | | | Grifols S.A. | | | 3,686 | |
| | 8,594 | | *,e | | Gritstone Oncology, Inc | | | 133 | |
COLLEGE RETIREMENT EQUITIES FUND -Stock Account
| SHARES | | | | COMPANY | | VALUE
(000) | |
| | 46,500 | | | | Guangzhou Baiyunshan Pharmaceutical Holdings Co Ltd | | $ | 243 | |
| | 8 | | * | | GW Pharmaceuticals plc | | | 0 | ^ |
| | 33,631 | | *,e | | GW Pharmaceuticals plc (ADR) | | | 3,275 | |
| | 122,327 | | | | H Lundbeck AS | | | 5,384 | |
| | 438,908 | | * | | Halozyme Therapeutics, Inc | | | 6,421 | |
| | 17,121 | | * | | Han All Pharmarceutical Co | | | 557 | |
| | 4,718 | | | | Handok Pharmaceuticals Co Ltd | | | 130 | |
| | 5,423 | | | | Hanmi Pharm Co Ltd | | | 2,264 | |
| | 12,541 | | | | Hanmi Science Co Ltd | | | 889 | |
| | 18,515 | | * | | Hansa Medical AB | | | 579 | |
| | 65,270 | | * | | Harvard Bioscience, Inc | | | 208 | |
| | 9,700 | | *,e | | HEALIOS KK | | | 148 | |
| | 89,174 | | *,e | | Heron Therapeutics, Inc | | | 2,313 | |
| | 109,694 | | *,e | | HEXO Corp | | | 378 | |
| | 853,007 | | | | Hikma Pharmaceuticals plc | | | 18,654 | |
| | 54,070 | | | | Hisamitsu Pharmaceutical Co, Inc | | | 2,985 | |
| | 22,176 | | *,e | | Homology Medicines, Inc | | | 496 | |
| | 211,938 | | * | | Horizon Pharma plc | | | 4,141 | |
| | 2,548,684 | | *,†,m | | Hua Han Bio-Pharmaceutical Holdings Ltd | | | 20 | |
| | 1,480 | | * | | Hugel, Inc | | | 508 | |
| | 9,726 | | | | Huons Co Ltd | | | 623 | |
| | 40,400 | | *,e | | Hutchison China MediTech Ltd (ADR) | | | 933 | |
| | 421,667 | | | | Hypermarcas S.A. | | | 3,284 | |
| | 24,345 | | *,e,m | | Idera Pharmaceuticals, Inc | | | 67 | |
| | 49,268 | | * | | Idorsia Ltd | | | 819 | |
| | 96,240 | | | | Il Dong Pharmaceutical Co Ltd | | | 1,764 | |
| | 540,961 | | * | | Illumina, Inc | | | 162,250 | |
| | 8,282 | | * | | Ilyang Pharmaceutical Co Ltd | | | 205 | |
| | 167,321 | | * | | Immune Design Corp | | | 218 | |
| | 503,849 | | * | | Immunogen, Inc | | | 2,418 | |
| | 243,330 | | *,e | | Immunomedics, Inc | | | 3,472 | |
| | 198,013 | | * | | Incyte Corp | | | 12,592 | |
| | 758,434 | | * | | Indivior plc | | | 1,087 | |
| | 24,284 | | *,e | | Innate Pharma S.A. | | | 207 | |
| | 25,920 | | *,e | | Innovate Biopharmaceuticals, Inc | | | 60 | |
| | 339,501 | | * | | Innoviva, Inc | | | 5,924 | |
| | 113,952 | | *,e | | Inovio Pharmaceuticals, Inc | | | 456 | |
| | 162,275 | | *,e | | Insmed, Inc | | | 2,129 | |
| | 34,296 | | *,e | | Insys Therapeutics, Inc | | | 120 | |
| | 42,990 | | *,e | | Intellia Therapeutics, Inc | | | 587 | |
| | 67,486 | | *,e | | Intercept Pharmaceuticals, Inc | | | 6,802 | |
| | 154,817 | | * | | Intersect ENT, Inc | | | 4,363 | |
| | 72,329 | | * | | Intra-Cellular Therapies, Inc | | | 824 | |
| | 93,779 | | *,e | | Intrexon Corp | | | 613 | |
| | 6,841 | | * | | iNtRON Biotechnology, Inc | | | 266 | |
| | 549,667 | | * | | Invitae Corp | | | 6,079 | |
| | 16,418 | | * | | Ionis Pharmaceuticals, Inc | | | 888 | |
| | 194,511 | | * | | Iovance Biotherapeutics, Inc | | | 1,721 | |
| | 72,099 | | | | Ipca Laboratories Ltd | | | 828 | |
| | 79,528 | | | | Ipsen | | | 10,290 | |
| | 186,756 | | * | | IQVIA Holdings, Inc | | | 21,695 | |
| | 176,372 | | * | | Ironwood Pharmaceuticals, Inc | | | 1,827 | |
| | 9,100 | | * | | Japan Tissue Engineering Co Lt | | | 65 | |
COLLEGE RETIREMENT EQUITIES FUND -Stock Account
| SHARES | | | | COMPANY | | VALUE
(000) | |
| | 696,247 | | * | | Jazz Pharmaceuticals plc | | $ | 86,307 | |
| | 11,200 | | | | JCR Pharmaceuticals Co Ltd | | | 472 | |
| | 2,637 | | | | Jeil Pharmaceutical Co Ltd | | | 111 | |
| | 64,500 | | | | Jiangsu Hengrui Medicine Co Ltd | | | 497 | |
| | 6,697,307 | | | | Johnson & Johnson | | | 864,287 | |
| | 20,805 | | * | | Jounce Therapeutics, Inc | | | 70 | |
| | 117,646 | | | | Jubilant Organosys Ltd | | | 1,197 | |
| | 179,104 | | e | | JW Holdings Corp | | | 1,147 | |
| | 133,724 | | *,e | | Kadmon Holdings, Inc | | | 278 | |
| | 31,000 | | | | Kaken Pharmaceutical Co Ltd | | | 1,376 | |
| | 16,755 | | * | | Kala Pharmaceuticals, Inc | | | 82 | |
| | 102,600 | | | | Kangmei Pharmaceutical Co Ltd | | | 138 | |
| | 197,880 | | | | Karo Pharma AB | | | 832 | |
| | 358,831 | | *,e | | Karyopharm Therapeutics, Inc | | | 3,362 | |
| | 7,119 | | *,e | | Kezar Life Sciences, Inc | | | 168 | |
| | 53,823 | | * | | Kindred Biosciences Inc | | | 589 | |
| | 8,178 | | *,e | | Kiniksa Pharmaceuticals Ltd | | | 230 | |
| | 16,500 | | | | Kissei Pharmaceutical Co Ltd | | | 420 | |
| | 74,249 | | * | | Knight Therapeutics, Inc | | | 418 | |
| | 11,663 | | *,m | | Kodiak Sciences, Inc | | | 83 | |
| | 4,245 | | * | | Kolon Life Science, Inc | | | 284 | |
| | 23,263 | | * | | Komipharm International Co Ltd | | | 424 | |
| | 64,827 | | | | Korea United Pharm Inc | | | 1,337 | |
| | 36,733 | | *,e | | Kura Oncology, Inc | | | 516 | |
| | 17,506 | | | | Kwang Dong Pharmaceutical Co Ltd | | | 108 | |
| | 55,736 | | | | Kyorin Co Ltd | | | 1,218 | |
| | 294,572 | | | | Kyowa Hakko Kogyo Co Ltd | | | 5,566 | |
| | 29,787 | | *,e | | La Jolla Pharmaceutical Co | | | 281 | |
| | 411,189 | | | | Laboratorios Almirall S.A. | | | 6,295 | |
| | 39,965 | | *,e | | Lannett Co, Inc | | | 198 | |
| | 22,779 | | g | | Laurus Labs Ltd | | | 124 | |
| | 168,000 | | | | Lee’s Pharmaceutical Holdings Ltd | | | 118 | |
| | 5,029 | | * | | LegoChem Biosciences, Inc | | | 256 | |
| | 107,157 | | *,e | | Lexicon Pharmaceuticals, Inc | | | 712 | |
| | 60,230 | | * | | Ligand Pharmaceuticals, Inc (Class B) | | | 8,173 | |
| | 7,000 | | e | | Linical Co Ltd | | | 82 | |
| | 7,162 | | *,e,m | | Liquidia Technologies, Inc | | | 155 | |
| | 9,993 | | *,m | | LogicBio Therapeutics, Inc | | | 104 | |
| | 706,481 | | | | Lonza Group AG. | | | 183,653 | |
| | 44,000 | | * | | Lotus Pharmaceutical Co Ltd | | | 106 | |
| | 48,539 | | * | | Loxo Oncology, Inc | | | 6,799 | |
| | 110,413 | | | | Luminex Corp | | | 2,552 | |
| | 215,254 | | * | | Lupin Ltd | | | 2,601 | |
| | 1,700,000 | | g | | Luye Pharma Group Ltd | | | 1,183 | |
| | 139,797 | | * | | MacroGenics, Inc | | | 1,775 | |
| | 8,921 | | *,e | | Madrigal Pharmaceuticals, Inc | | | 1,006 | |
| | 5,690 | | *,e | | Magenta Therapeutics, Inc | | | 32 | |
| | 293,634 | | * | | Mallinckrodt plc | | | 4,639 | |
| | 194,324 | | *,e | | MannKind Corp | | | 206 | |
| | 125,220 | | *,e | | Marinus Pharmaceuticals, Inc | | | 359 | |
| | 11,194,097 | | * | | Mayne Pharma Group Ltd | | | 6,109 | |
| | 117,891 | | *,e | | Medicines Co | | | 2,256 | |
| | 51,333 | | *,e | | MediciNova, Inc | | | 419 | |
COLLEGE RETIREMENT EQUITIES FUND -Stock Account
| SHARES | | | | COMPANY | | VALUE
(000) | |
| | 242,342 | | * | | Medpace Holdings, Inc | | $ | 12,827 | |
| | 3,864 | | | | Medy-Tox, Inc | | | 2,008 | |
| | 213,100 | | | | Mega Lifesciences PCL | | | 188 | |
| | 5,224 | | *,e | | MeiraGTx Holdings plc | | | 50 | |
| | 29,006 | | *,e,m | | Melinta Therapeutics, Inc | | | 23 | |
| | 9,937 | | * | | Menlo Therapeutics, Inc | | | 41 | |
| | 274,735 | | | | Merck KGaA | | | 28,279 | |
| | 1,978 | | * | | Merck Ltd | | | 87 | |
| | 379,439 | | *,e | | Merrimack Pharmaceuticals, Inc | | | 1,465 | |
| | 18,023 | | *,e,m | | Mersana Therapeutics, Inc | | | 74 | |
| | 216,910 | | *,e | | Mesoblast Ltd | | | 180 | |
| | 43,344 | | * | | Mettler-Toledo International, Inc | | | 24,514 | |
| | 3,665 | | * | | Mezzion Pharma Co Ltd | | | 304 | |
| | 211,583 | | *,e | | Minerva Neurosciences, Inc | | | 1,426 | |
| | 71,612 | | *,e | | Miragen Therapeutics, Inc | | | 217 | |
| | 258,631 | | *,e | | Mirati Therapeutics, Inc | | | 10,971 | |
| | 7,879 | | *,e | | Mithra Pharmaceuticals S.A. | | | 180 | |
| | 11,700 | | | | Mochida Pharmaceutical Co Ltd | | | 960 | |
| | 5,649 | | *,e | | Molecular Partners AG. | | | 110 | |
| | 4,445 | | *,e | | Molecular Templates, Inc | | | 18 | |
| | 206,509 | | * | | Momenta Pharmaceuticals, Inc | | | 2,280 | |
| | 19,814 | | * | | Morphosys AG. | | | 2,023 | |
| | 19,643 | | *,e,m | | Mustang Bio, Inc | | | 58 | |
| | 2,304,738 | | * | | Mylan NV | | | 63,150 | |
| | 85,121 | | * | | MyoKardia, Inc | | | 4,159 | |
| | 110,456 | | * | | Myriad Genetics, Inc | | | 3,211 | |
| | 136,640 | | * | | NanoString Technologies, Inc | | | 2,026 | |
| | 27,020 | | *,e | | NantKwest, Inc | | | 31 | |
| | 141,096 | | | | Natco Pharma Ltd | | | 1,374 | |
| | 174,488 | | * | | Natera, Inc | | | 2,436 | |
| | 9,729 | | * | | Naturalendo Tech Co Ltd | | | 119 | |
| | 197,075 | | * | | Nektar Therapeutics | | | 6,478 | |
| | 653,205 | | *,e | | NeoGenomics, Inc | | | 8,237 | |
| | 9,148 | | *,e | | Neon Therapeutics, Inc | | | 46 | |
| | 57,867 | | *,e | | Neos Therapeutics, Inc | | | 95 | |
| | 162,505 | | * | | Neurocrine Biosciences, Inc | | | 11,604 | |
| | 41,770 | | *,e | | NewLink Genetics Corp | | | 63 | |
| | 513,750 | | | | Nichi-iko Pharmaceutical Co Ltd | | | 7,522 | |
| | 29,000 | | | | Nippon Shinyaku Co Ltd | | | 1,838 | |
| | 26,028 | | * | | Nordic Nanovector ASA | | | 154 | |
| | 3,476,101 | | | | Novartis AG. | | | 297,708 | |
| | 624,251 | | *,e | | Novavax, Inc | | | 1,149 | |
| | 1,908,219 | | | | Novo Nordisk AS | | | 87,639 | |
| | 44,262 | | *,e,m | | Nymox Pharmaceutical Corp | | | 58 | |
| | 71,000 | | * | | OBI Pharma, Inc | | | 364 | |
| | 67,288 | | *,e | | Ocular Therapeutix, Inc | | | 268 | |
| | 9,685 | | *,e | | Odonate Therapeutics, Inc | | | 136 | |
| | 212,308 | | *,e | | Omeros Corp | | | 2,365 | |
| | 12,223 | | *,e,g | | Oncopeptides AB | | | 183 | |
| | 261,438 | | | | Ono Pharmaceutical Co Ltd | | | 5,339 | |
| | 400,742 | | *,e | | Opko Health, Inc | | | 1,206 | |
| | 23,411 | | *,e | | Optinose, Inc | | | 145 | |
| | 138,543 | | *,e | | Organovo Holdings, Inc | | | 133 | |
| | 136,303 | | | | Orion Oyj (Class B) | | | 4,742 | |
COLLEGE RETIREMENT EQUITIES FUND -Stock Account
| SHARES | | | | COMPANY | | VALUE
(000) | |
| | 14,180 | | * | | Oscotec, Inc | | $ | 288 | |
| | 11,859 | | *,e | | Osmotica Pharmaceuticals plc | | | 92 | |
| | 76,544 | | | | Otsuka Holdings KK | | | 3,128 | |
| | 18,777 | | * | | Ovid therapeutics, Inc | | | 45 | |
| | 71,346 | | * | | Oxford Biomedica plc | | | 643 | |
| | 171,248 | | *,e | | Pacific Biosciences of California, Inc | | | 1,267 | |
| | 347,196 | | * | | Pacira Pharmaceuticals, Inc | | | 14,936 | |
| | 2,663,590 | | *,e | | Paion AG. | | | 6,705 | |
| | 235,094 | | * | | Palatin Technologies, Inc | | | 167 | |
| | 44,711 | | *,e | | Paratek Pharmaceuticals, Inc | | | 229 | |
| | 182,738 | | * | | PDL BioPharma, Inc | | | 530 | |
| | 73,400 | | *,e | | PeptiDream, Inc | | | 2,898 | |
| | 7,324 | | * | | Peptron, Inc | | | 161 | |
| | 263,046 | | | | PerkinElmer, Inc | | | 20,662 | |
| | 91,466 | | | | Perrigo Co plc | | | 3,544 | |
| | 49,792 | | *,m | | Pfenex, Inc | | | 159 | |
| | 14,744 | | | | Pfizer Ltd | | | 603 | |
| | 16,267,540 | | | | Pfizer, Inc | | | 710,078 | |
| | 2,394 | | | | PHARMA RESEARCH PRODUCTS Co Ltd | | | 72 | |
| | 148,472 | | | | PharmaEngine Inc | | | 549 | |
| | 91,000 | | * | | PharmaEssentia Corp | | | 517 | |
| | 26,902 | | | | Pharmally International Holding Co Ltd | | | 133 | |
| | 32,351 | | * | | Pharmicell Co Ltd | | | 356 | |
| | 2,191,786 | | *,e | | Pharming Group NV | | | 1,911 | |
| | 225,871 | | | | Phibro Animal Health Corp | | | 7,264 | |
| | 260,862 | | * | | Pieris Pharmaceuticals, Inc | | | 694 | |
| | 79,291 | | | | Piramal Healthcare Ltd | | | 2,703 | |
| | 12,602 | | *,e | | PolarityTE, Inc | | | 170 | |
| | 82,259 | | *,e | | Portola Pharmaceuticals, Inc | | | 1,606 | |
| | 109,563 | | * | | PRA Health Sciences, Inc | | | 10,075 | |
| | 84,288 | | * | | Prestige Brands Holdings, Inc | | | 2,603 | |
| | 6,954 | | * | | Principia Biopharma, Inc | | | 190 | |
| | 3,575 | | *,e | | Probi AB | | | 146 | |
| | 100,803 | | * | | Progenics Pharmaceuticals, Inc | | | 423 | |
| | 368,113 | | *,e | | Prometic Life Sciences, Inc | | | 69 | |
| | 16,422 | | *,e | | ProQR Therapeutics NV | | | 259 | |
| | 12,684 | | * | | Prostemics Co Ltd | | | 62 | |
| | 38,631 | | *,e | | Proteostasis Therapeutics, Inc | | | 125 | |
| | 71,158 | | * | | Prothena Corp plc | | | 733 | |
| | 16,878,931 | | | | PT Kalbe Farma Tbk | | | 1,783 | |
| | 186,892 | | * | | PTC Therapeutics, Inc | | | 6,414 | |
| | 108,111 | | *,e | | Puma Biotechnology, Inc | | | 2,200 | |
| | 506,225 | | * | | QIAGEN NV | | | 17,439 | |
| | 352,466 | | * | | QIAGEN NV (Turquoise) | | | 12,044 | |
| | 10,743 | | *,e | | Quanterix Corp | | | 197 | |
| | 675,790 | | * | | Ra Pharmaceuticals, Inc | | | 12,299 | |
| | 228,189 | | *,e | | Radius Health, Inc | | | 3,763 | |
| | 23,495 | | *,e | | Reata Pharmaceuticals, Inc | | | 1,318 | |
| | 34,316 | | * | | Recipharm AB | | | 439 | |
| | 151,882 | | | | Recordati S.p.A. | | | 5,260 | |
| | 39,415 | | * | | Recro Pharma, Inc | | | 280 | |
| | 61,609 | | * | | Regeneron Pharmaceuticals, Inc | | | 23,011 | |
| | 98,095 | | * | | REGENXBIO, Inc | | | 4,115 | |
COLLEGE RETIREMENT EQUITIES FUND -Stock Account
| SHARES | | | | COMPANY | | VALUE
(000) | |
| | 88,012 | | * | | Repligen Corp | | $ | 4,642 | |
| | 10,216 | | *,e | | Replimune Group, Inc | | | 102 | |
| | 9,730 | | *,e | | resTORbio, Inc | | | 84 | |
| | 472,473 | | * | | Retrophin, Inc | | | 10,692 | |
| | 42,151 | | * | | Revance Therapeutics, Inc | | | 848 | |
| | 4,235 | | | | Reyon Pharmaceutical Co Ltd | | | 53 | |
| | 20,263 | | * | | Rhythm Pharmaceuticals, Inc | | | 545 | |
| | 193,931 | | | | Richter Gedeon Rt | | | 3,756 | |
| | 221,621 | | * | | Rigel Pharmaceuticals, Inc | | | 510 | |
| | 860,954 | | | | Roche Holding AG. | | | 213,739 | |
| | 27,817 | | *,e | | Rocket Pharmaceuticals, Inc | | | 412 | |
| | 112,200 | | | | Rohto Pharmaceutical Co Ltd | | | 3,063 | |
| | 16,327 | | *,e | | Rubius Therapeutics, Inc | | | 263 | |
| | 110,296 | | * | | Sage Therapeutics, Inc | | | 10,565 | |
| | 8,213 | | | | Sam Chun Dang Pharm Co Ltd | | | 283 | |
| | 76,918 | | | | Samjin Pharmaceutical Co Ltd | | | 2,775 | |
| | 17,040 | | *,e,g | | Samsung Biologics Co Ltd | | | 5,927 | |
| | 15,100 | | *,e | | SanBio Co Ltd | | | 1,112 | |
| | 422,831 | | * | | Sangamo Biosciences, Inc | | | 4,854 | |
| | 7,376 | | | | Sanofi India Ltd | | | 673 | |
| | 2,801,441 | | | | Sanofi-Aventis | | | 243,025 | |
| | 583,851 | | | | Sanofi-Aventis S.A. (ADR) | | | 25,345 | |
| | 771,691 | | | | Santen Pharmaceutical Co Ltd | | | 11,134 | |
| | 141,961 | | *,e | | Sarepta Therapeutics, Inc | | | 15,492 | |
| | 28,990 | | | | Sartorius Stedim Biotech | | | 2,902 | |
| | 32,640 | | *,e | | Savara, Inc | | | 247 | |
| | 92,600 | | | | Sawai Pharmaceutical Co Ltd | | | 4,411 | |
| | 9,023,291 | | | | Schering-Plough Corp | | | 689,470 | |
| | 50,057 | | * | | Schnell Biopharmaceuticals, Inc | | | 107 | |
| | 8,420 | | *,e | | Scholar Rock Holding Corp | | | 193 | |
| | 154,960 | | | | Scinopharm Taiwan Ltd | | | 122 | |
| | 2,319 | | *,e | | scPharmaceuticals, Inc | | | 9 | |
| | 55,295 | | | | Searle Co Ltd | | | 98 | |
| | 492,703 | | * | | Seattle Genetics, Inc | | | 27,917 | |
| | 51,552 | | * | | Seegene, Inc | | | 741 | |
| | 984,700 | | | | Seikagaku Corp | | | 11,163 | |
| | 22,504 | | *,e,m | | Selecta Biosciences, Inc | | | 60 | |
| | 23,980 | | *,e,m | | Seres Therapeutics, Inc | | | 108 | |
| | 104,000 | | | | Shandong Xinhua Pharmaceutical Co Ltd | | | 48 | |
| | 59,600 | | | | Shanghai Fosun Pharmaceutical Group Co Ltd | | | 203 | |
| | 585,251 | | | | Shanghai Fosun Pharmaceutical Group Co Ltd (Hong Kong) | | | 1,711 | |
| | 159,000 | | | | Shanghai Fudan-Zhangjiang Bio-Pharmaceutical Co Ltd | | | 79 | |
| | 118,000 | | g | | Shanghai Haohai Biological Technology Co Ltd | | | 587 | |
| | 3,300 | | | | Shenzhen Salubris Pharmaceuticals Co Ltd | | | 10 | |
| | 14,815 | | * | | Shilpa Medicare Ltd | | | 82 | |
| | 277,218 | | | | Shionogi & Co Ltd | | | 15,822 | |
| | 730,286 | | | | Shire Ltd | | | 42,494 | |
| | 495 | | | | Shire plc (ADR) | | | 86 | |
| | 50,800 | | | | Sichuan Kelun Pharmaceutical Co Ltd | | | 153 | |
| | 10,339 | | | | Siegfried Holding AG. | | | 3,536 | |
| | 18,711 | | *,e | | Sienna Biopharmaceuticals, Inc | | | 43 | |
| | 68,203 | | *,e | | SIGA Technologies, Inc | | | 539 | |
COLLEGE RETIREMENT EQUITIES FUND -Stock Account
| SHARES | | | | COMPANY | | VALUE
(000) | |
| | 3,786,000 | | | | Sihuan Pharmaceutical Holdings | | $ | 661 | |
| | 56,959 | | *,e | | SillaJen, Inc | | | 3,770 | |
| | 7,446,307 | | | | Sino Biopharmaceutical | | | 4,902 | |
| | 16,356 | | *,e | | Solid Biosciences, Inc | | | 438 | |
| | 144,795 | | *,e | | Sorrento Therapeutics, Inc | | | 348 | |
| | 45,900 | | *,e | | Sosei Group | | | 332 | |
| | 40,314 | | *,e | | Spark Therapeutics, Inc | | | 1,578 | |
| | 293,792 | | * | | Spectrum Pharmaceuticals, Inc | | | 2,571 | |
| | 8,737 | | * | | Spero Therapeutics, Inc | | | 54 | |
| | 15,465 | | *,e | | Spring Bank Pharmaceuticals, Inc | | | 161 | |
| | 6,704,000 | | | | SSY Group Ltd | | | 4,974 | |
| | 4,266 | | e | | ST Pharm Co Ltd | | | 76 | |
| | 3,185 | | * | | Stallergenes Greer plc | | | 103 | |
| �� | 12,317 | | * | | STCUBE | | | 254 | |
| | 83,948 | | * | | Stemline Therapeutics, Inc | | | 797 | |
| | 257,947 | | * | | Strides Arcolab Ltd | | | 1,701 | |
| | 343,875 | | | | Sumitomo Dainippon Pharma Co Ltd | | | 10,966 | |
| | 37,586 | | * | | Sun Pharma Advanced Research Company Ltd | | | 101 | |
| | 830,042 | | | | Sun Pharmaceutical Industries Ltd | | | 5,115 | |
| | 150,466 | | * | | Supernus Pharmaceuticals, Inc | | | 4,998 | |
| | 33,758 | | *,e,m | | Surface Oncology, Inc | | | 143 | |
| | 7,966 | | *,e,m | | Sutro Biopharma, Inc | | | 72 | |
| | 150,298 | | | | Suven Life Sciences Ltd | | | 487 | |
| | 61,529 | | * | | Syndax Pharmaceuticals, Inc | | | 274 | |
| | 139,617 | | * | | Syneos Health, Inc | | | 5,494 | |
| | 30,692 | | g | | Syngene International Ltd | | | 247 | |
| | 33,011 | | *,e | | Synlogic, Inc | | | 231 | |
| | 30,304 | | * | | Syros Pharmaceuticals, Inc | | | 169 | |
| | 36,933 | | *,e | | T2 Biosystems, Inc | | | 111 | |
| | 206,799 | | * | | Taigen Biopharmaceuticals Holdings Ltd | | | 115 | |
| | 114,000 | | * | | TaiMed Biologics, Inc | | | 610 | |
| | 22,668 | | | | Taisho Pharmaceutical Holdings Co Ltd | | | 2,275 | |
| | 31,300 | | | | Takara Bio, Inc | | | 732 | |
| | 1,738,505 | | e | | Takeda Pharmaceutical Co Ltd | | | 58,926 | |
| | 486,175 | | | | Tanabe Seiyaku Co Ltd | | | 7,018 | |
| | 46,963 | | | | Tanvex BioPharma, Inc | | | 96 | |
| | 4,200 | | | | Tasly Pharmaceutical Group Co Ltd | | | 12 | |
| | 7,982 | | | | Tecan Group AG. | | | 1,554 | |
| | 2,772 | | * | | Tego Science, Inc | | | 89 | |
| | 59,410 | | *,e,m | | Teligent, Inc | | | 81 | |
| | 70,222 | | *,e | | TESARO, Inc | | | 5,214 | |
| | 72,114 | | * | | Tetraphase Pharmaceuticals, Inc | | | 81 | |
| | 4,342,828 | | * | | Teva Pharmaceutical Industries Ltd (ADR) | | | 66,966 | |
| | 77,735 | | *,e | | TG Therapeutics, Inc | | | 319 | |
| | 16,065 | | * | | Theragen Etex Co Ltd | | | 151 | |
| | 235,700 | | *,e | | TherapeuticsMD, Inc | | | 898 | |
| | 44,789 | | *,e | | Theratechnologies, Inc | | | 273 | |
| | 108,003 | | *,e | | Theravance Biopharma, Inc | | | 2,764 | |
| | 606,698 | | | | Thermo Fisher Scientific, Inc | | | 135,773 | |
| | 41,121 | | *,e | | Tocagen, Inc | | | 338 | |
| | 735,000 | | | | Tong Ren Tang Technologies Co Ltd | | | 964 | |
| | 78,400 | | | | Tonghua Dongbao Pharmaceutical Co Ltd | | | 159 | |
| | 7,700 | | | | Torii Pharmaceutical Co Ltd | | | 171 | |
COLLEGE RETIREMENT EQUITIES FUND -Stock Account
| SHARES | | | | COMPANY | | VALUE
(000) | |
| | 109,200 | | | | Towa Pharmaceutical Co Ltd | | $ | 7,610 | |
| | 13,708 | | *,e | | Translate Bio, Inc | | | 103 | |
| | 24,819 | | *,e | | Tricida, Inc | | | 585 | |
| | 40,800 | | | | Tsumura & Co | | | 1,135 | |
| | 168,917 | | | | TTY Biopharm Co Ltd | | | 421 | |
| | 6,294 | | *,e | | Twist Bioscience Corp | | | 145 | |
| | 131,693 | | *,e | | Tyme Technologies, Inc | | | 486 | |
| | 136,450 | | | | UCB S.A. | | | 11,145 | |
| | 70,990 | | * | | Ultragenyx Pharmaceutical, Inc | | | 3,087 | |
| | 4,471,500 | | e | | United Laboratories Ltd | | | 2,368 | |
| | 39,401 | | * | | United Therapeutics Corp | | | 4,291 | |
| | 31,326 | | *,e | | UNITY Biotechnology, Inc | | | 509 | |
| | 23,826 | | *,e | | Unum Therapeutics, Inc | | | 105 | |
| | 6,681 | | * | | UroGen Pharma Ltd | | | 288 | |
| | 516,162 | | * | | Vanda Pharmaceuticals, Inc | | | 13,487 | |
| | 389,608 | | * | | Vectura Group plc | | | 348 | |
| | 297,379 | | * | | Veracyte, Inc | | | 3,741 | |
| | 91,064 | | *,e | | Verastem, Inc | | | 306 | |
| | 205,149 | | * | | Vericel Corp | | | 3,570 | |
| | 8,511 | | *,m | | Verrica Pharmaceuticals, Inc | | | 69 | |
| | 519,327 | | * | | Vertex Pharmaceuticals, Inc | | | 86,058 | |
| | 243,554 | | | | Vifor Pharma AG. | | | 26,502 | |
| | 68,965 | | *,e | | Viking Therapeutics, Inc | | | 528 | |
| | 2,772 | | *,e | | Virbac S.A. | | | 361 | |
| | 13,315 | | *,e | | ViroMed Co Ltd | | | 3,050 | |
| | 93,636 | | | | Vitrolife AB | | | 1,564 | |
| | 48,752 | | *,e | | Voyager Therapeutics, Inc | | | 458 | |
| | 102,211 | | * | | Waters Corp | | | 19,282 | |
| | 22,976 | | *,e | | WaVe Life Sciences Pte Ltd | | | 966 | |
| | 56,642 | | | | Whanin Pharmaceutical Co Ltd | | | 974 | |
| | 6,284,000 | | | | Winteam Pharmaceutical Group Ltd | | | 3,651 | |
| | 15,180 | | * | | Wockhardt Ltd | | | 114 | |
| | 1,662,500 | | *,g | | Wuxi Biologics Cayman, Inc | | | 10,621 | |
| | 114,672 | | * | | Xencor Inc | | | 4,147 | |
| | 9,426 | | *,e | | Xeris Pharmaceuticals, Inc | | | 160 | |
| | 9,211 | | e | | XOMA Corp | | | 117 | |
| | 522,200 | | g | | YiChang HEC ChangJiang Pharmaceutical Co Ltd | | | 1,745 | |
| | 8,673 | | * | | Y-mAbs Therapeutics, Inc | | | 176 | |
| | 7,682 | | | | Yuhan Corp | | | 1,410 | |
| | 55,496 | | * | | Yungjin Pharmaceutical Co Ltd | | | 296 | |
| | 314,000 | | | | YungShin Global Holding Corp | | | 402 | |
| | 26,300 | | | | Yunnan Baiyao Group Co Ltd | | | 284 | |
| | 32,540 | | *,e | | Zafgen, Inc | | | 161 | |
| | 15,900 | | *,e | | Zai Lab Ltd (ADR) | | | 369 | |
| | 16,698 | | *,e | | Zealand Pharma AS | | | 212 | |
| | 18,600 | | | | Zeria Pharmaceutical Co Ltd | | | 334 | |
| | 17,700 | | | | Zhangzhou Pientzehuang Pharmaceutical Co Ltd | | | 224 | |
| | 182,696 | | *,e | | ZIOPHARM Oncology, Inc | | | 342 | |
| | 2,324,842 | | | | Zoetis, Inc | | | 198,867 | |
| | 75,658 | | *,e | | Zogenix, Inc | | | 2,758 | |
| | 60,529 | | *,e,m | | Zomedica Pharmaceuticals Corp | | | 74 | |
| | | | | | TOTAL PHARMACEUTICALS, BIOTECHNOLOGY & LIFE SCIENCES | | | 8,031,974 | |
COLLEGE RETIREMENT EQUITIES FUND -Stock Account
| SHARES | | | | COMPANY | | VALUE
(000) | |
| REAL ESTATE - 3.8% |
| | 18,050,000 | | | | 8990 Holdings, Inc | | $ | 2,788 | |
| | 458,233 | | | | Abacus Property Group | | | 1,056 | |
| | 102,792 | | | | Acadia Realty Trust | | | 2,442 | |
| | 634 | | | | Activia Properties Inc | | | 2,576 | |
| | 26,444 | | | | ADLER Real Estate AG. | | | 394 | |
| | 29,478 | | * | | ADO Group Ltd | | | 559 | |
| | 109,000 | | g | | ADO Properties S.A. | | | 5,671 | |
| | 1,533 | | | | Advance Residence Investment Corp | | | 4,232 | |
| | 190,224 | | *,g | | Aedas Homes SAU | | | 4,830 | |
| | 14,951 | | | | Aedifica S.A. | | | 1,348 | |
| | 14,394 | | | | Aeon Mall Co Ltd | | | 229 | |
| | 8,619 | | | | AEON REIT Investment Corp | | | 9,922 | |
| | 1 | | * | | Africa Israel Investments Ltd | | | 0 | ^ |
| | 24,812 | | * | | Africa Israel Properties Ltd | | | 555 | |
| | 1,564,000 | | | | Agile Property Holdings Ltd | | | 1,845 | |
| | 211,735 | | | | Agree Realty Corp | | | 12,518 | |
| | 485,841 | | | | AIMS AMP Capital Industrial REIT | | | 474 | |
| | 95,154 | | * | | Airport City Ltd | | | 1,170 | |
| | 4,140,600 | | | | Aldar Properties PJSC | | | 1,806 | |
| | 88,503 | | | | Alexander & Baldwin, Inc | | | 1,627 | |
| | 2,832 | | | | Alexander’s, Inc | | | 863 | |
| | 218,391 | | | | Alexandria Real Estate Equities, Inc | | | 25,167 | |
| | 43,420 | | | | Aliansce Shopping Centers S.A. | | | 214 | |
| | 10,417,394 | | | | Allco Commercial Real Estate Investment Trust | | | 10,467 | |
| | 48,582 | | | | Allied Properties Real Estate Investment Trust | | | 1,577 | |
| | 11,331 | | | | Allreal Holding AG. | | | 1,765 | |
| | 76,454 | | | | Alony Hetz Properties & Investments Ltd | | | 715 | |
| | 379,723 | | | | Alstria Office REIT-AG. | | | 5,316 | |
| | 13,172 | | *,e | | Altisource Portfolio Solutions S.A. | | | 296 | |
| | 24,762 | | e | | Altus Group Ltd | | | 429 | |
| | 332,600 | | | | Amata Corp PCL (Foreign) | | | 211 | |
| | 206,879 | | | | American Assets Trust, Inc | | | 8,310 | |
| | 165,463 | | | | American Campus Communities, Inc | | | 6,849 | |
| | 1,183,302 | | | | American Homes 4 Rent | | | 23,489 | |
| | 3,027 | | *,e,m | | American Realty Investors, Inc | | | 37 | |
| | 923,625 | | e | | American Tower Corp | | | 146,108 | |
| | 308,130 | | | | Americold Realty Trust | | | 7,870 | |
| | 265,248 | | | | Amot Investments Ltd | | | 1,286 | |
| | 13,351,200 | | | | Ananda Development PCL (Foreign) | | | 1,331 | |
| | 110,599 | | e | | Apartment Investment & Management Co (Class A) | | | 4,853 | |
| | 135,246 | | | | Apple Hospitality REIT, Inc | | | 1,929 | |
| | 1,724,621 | | | | Argosy Property Ltd | | | 1,389 | |
| | 139,044 | | | | Armada Hoffler Properties, Inc | | | 1,955 | |
| | 1,525,113 | | | | Aroundtown S.A. | | | 12,652 | |
| | 610,490 | | e | | Arrowhead Properties Ltd (Class A) | | | 170 | |
| | 84,705 | | | | Artis Real Estate Investment Trust | | | 573 | |
| | 1,033,100 | | | | Ascendas Hospitality Trust | | | 583 | |
| | 872,608 | | | | Ascendas REIT | | | 1,647 | |
| | 904,891 | | | | Ascott Residence Trust | | | 716 | |
| | 114,984 | | | | Ashford Hospitality Trust, Inc | | | 460 | |
| | 9,661,460 | | | | Asian Property Development PCL (Foreign) | | | 1,783 | |
| | 197,000 | | | | Asiasec Properties Ltd | | | 86 | |
| | 1,553,831 | | | | Assura Group Ltd | | | 1,047 | |
COLLEGE RETIREMENT EQUITIES FUND -Stock Account
| SHARES | | | | COMPANY | | VALUE
(000) | |
| | 2,614,802 | | | | Attacq Ltd | | $ | 2,672 | |
| | 451,146 | | | | AvalonBay Communities, Inc | | | 78,522 | |
| | 191,559 | | | | Aventus Retail Property Fund Ltd | | | 287 | |
| | 658,923 | | | | Aveo Group | | | 743 | |
| | 1,088 | | | | Axis Real Estate Investment Trust | | | 0 | ^ |
| | 13,683,115 | | | | Ayala Land, Inc | | | 10,576 | |
| | 4,761,352 | | *,m | | AZ BGP Holdings | | | 113 | |
| | 35,128 | | | | Azrieli Group | | | 1,681 | |
| | 2,981,200 | | | | Bangkok Land PCL | | | 138 | |
| | 123,556 | | * | | Barwa Real Estate Co | | | 1,353 | |
| | 696 | | | | Bayside Land Corp | | | 296 | |
| | 22,278 | | | | Befimmo SCA Sicafi | | | 1,239 | |
| | 5,270,000 | | | | Beijing Capital Land Ltd | | | 1,891 | |
| | 488,000 | | | | Beijing North Star Co | | | 139 | |
| | 731,029 | | m | | Beni Stabili S.p.A. | | | 582 | |
| | 10,904 | | | | Big Shopping Centers Ltd | | | 611 | |
| | 574,880 | | | | Big Yellow Group plc | | | 6,398 | |
| | 1,612 | | | | BLife Investment Corp | | | 3,611 | |
| | 3,450 | | | | Blue Square Real Estate Ltd | | | 110 | |
| | 43,471 | | e | | Bluerock Residential Growth REIT, Inc | | | 392 | |
| | 29,370 | | | | Boardwalk REIT | | | 813 | |
| | 568,017 | | | | Boston Properties, Inc | | | 63,930 | |
| | 1,323,862 | | | | BR Malls Participacoes S.A. | | | 4,460 | |
| | 72,008 | | | | BR Properties S.A. | | | 152 | |
| | 1,764 | | * | | Brack Capital Properties NV | | | 168 | |
| | 135,865 | | | | BraeMar Hotels & Resorts, Inc | | | 1,213 | |
| | 256,966 | | | | Brandywine Realty Trust | | | 3,307 | |
| | 501,523 | | | | British Land Co plc | | | 3,411 | |
| | 386,383 | | | | Brixmor Property Group, Inc | | | 5,676 | |
| | 4,455 | | | | Brookfield Property Partners LP | | | 72 | |
| | 386,978 | | | | Brookfield Property REIT, Inc | | | 6,230 | |
| | 30,435 | | | | Brt Realty Trust | | | 348 | |
| | 388,312 | | | | Bunnings Warehouse Property Trust | | | 966 | |
| | 28,537,213 | | | | C C Land Holdings Ltd | | | 6,886 | |
| | 65,000 | | | | C&D International Investment Group Ltd | | | 56 | |
| | 219,137 | | | | CA Immobilien Anlagen AG. | | | 6,935 | |
| | 780,620 | | | | Cache Logistics Trust | | | 398 | |
| | 1,425,403 | | | | Cambridge Industrial Trust | | | 533 | |
| | 376,301 | | | | Camden Property Trust | | | 33,133 | |
| | 104,421 | | | | Canadian Apartment Properties REIT | | | 3,388 | |
| | 1,065,737 | | | | CapitaCommercial Trust | | | 1,369 | |
| | 491,818 | | | | Capital & Counties Properties | | | 1,449 | |
| | 284,261 | | | | Capital & Regional plc | | | 100 | |
| | 2,789,618 | | | | CapitaLand Ltd | | | 6,362 | |
| | 4,196,325 | | | | CapitaMall Trust | | | 6,959 | |
| | 433,932 | | | | CapitaRetail China Trust | | | 433 | |
| | 779,528 | | | | CareTrust REIT, Inc | | | 14,390 | |
| | 4,762,500 | | *,e | | Carnival Group International Holdings Ltd | | | 88 | |
| | 290,481 | | | | Castellum AB | | | 5,368 | |
| | 201,599 | | | | CatchMark Timber Trust Inc | | | 1,431 | |
| | 470,300 | | | | Cathay Real Estate Development Co Ltd | | | 305 | |
| | 220,116 | | e | | CBL & Associates Properties, Inc | | | 423 | |
| | 972,439 | | * | | CBRE Group, Inc | | | 38,936 | |
| | 586,020 | | | | CDL Hospitality Trusts | | | 628 | |
COLLEGE RETIREMENT EQUITIES FUND -Stock Account
| SHARES | | | | COMPANY | | VALUE
(000) | |
| | 15,000,000 | | | | Cebu Holdings, Inc | | $ | 1,822 | |
| | 412,084 | | | | Cedar Realty Trust, Inc | | | 1,294 | |
| | 35,688 | | | | Cedar Woods Properties Ltd | | | 127 | |
| | 464,000 | | | | Central China Real Estate Ltd | | | 171 | |
| | 1,019,258 | | | | Central Pattana PCL (Foreign) | | | 2,342 | |
| | 359,931 | | | | Centuria Industrial REIT | | | 694 | |
| | 2,253,636 | | | | Champion Real Estate Investment Trust | | | 1,542 | |
| | 154,556 | | | | Charter Hall Education Trust | | | 322 | |
| | 1,968,375 | | | | Charter Hall Group | | | 10,292 | |
| | 125,223 | | | | Charter Hall Long Wale REIT | | | 378 | |
| | 58,486 | | | | Chatham Lodging Trust | | | 1,034 | |
| | 74,781 | | | | Chesapeake Lodging Trust | | | 1,821 | |
| | 4,217,722 | | | | Cheuk Nang Holdings Ltd | | | 2,316 | |
| | 3,746,000 | | | | China Aoyuan Property Group Ltd | | | 2,374 | |
| | 4,315,663 | | e | | China Evergrande Group | | | 12,893 | |
| | 37,100 | | | | China Fortune Land Development Co Ltd | | | 138 | |
| | 629,000 | | *,g | | China Logistics Property Holdings Co Ltd | | | 232 | |
| | 846,000 | | | | China Merchants Land Ltd | | | 119 | |
| | 44,900 | | | | China Merchants Shekou Industrial Zone Holdings Co Ltd | | | 114 | |
| | 9,385,021 | | | | China New Town Development Co Ltd | | | 240 | |
| | 2,960,000 | | | | China Overseas Grand Oceans Group Ltd | | | 969 | |
| | 6,942,674 | | | | China Overseas Land & Investment Ltd | | | 23,937 | |
| | 820,000 | | | | China Overseas Property Holdings Ltd | | | 240 | |
| | 4,041,644 | | | | China Resources Land Ltd | | | 15,547 | |
| | 15,770,400 | | | | China SCE Property Holdings Ltd | | | 5,748 | |
| | 1,165,815 | | | | China Vanke Co Ltd | | | 3,948 | |
| | 72,400 | | | | China Vanke Co Ltd (Class A) | | | 252 | |
| | 279,000 | | g | | China Vast Industrial Urban Development Co Ltd | | | 131 | |
| | 316,000 | | | | Chinese Estates Holdings Ltd | | | 343 | |
| | 268,100 | | e | | Chip Eng Seng Corp Ltd | | | 130 | |
| | 91,827 | | | | Choice Properties REIT | | | 775 | |
| | 118,088 | | | | Chong Hong Construction Co | | | 297 | |
| | 3,728,000 | | | | CIFI Holdings Group Co Ltd | | | 1,976 | |
| | 161,344 | | | | City Developments Ltd | | | 962 | |
| | 304,179 | | | | City Office REIT, Inc | | | 3,118 | |
| | 293,540 | | | | Citycon Oyj | | | 543 | |
| | 1,077,750 | | | | Civitas Social Housing plc | | | 1,463 | |
| | 2,996,171 | | | | CK Asset Holdings Ltd | | | 21,922 | |
| | 18,888 | | | | Clipper Realty, Inc | | | 247 | |
| | 22,999 | | | | Cofinimmo | | | 2,860 | |
| | 107,403 | | | | Colliers International Group, Inc | | | 5,923 | |
| | 1,001,548 | | | | Colony Capital, Inc | | | 4,687 | |
| | 206,000 | | e | | Colour Life Services Group | | | 110 | |
| | 492,786 | | | | Columbia Property Trust, Inc | | | 9,535 | |
| | 357 | | | | Comforia Residential REIT, Inc | | | 910 | |
| | 58,237 | | | | Cominar Real Estate Investment Trust | | | 478 | |
| | 24,198 | | | | Community Healthcare Trust, Inc | | | 698 | |
| | 662,400 | | | | Concentradora Fibra Danhos S.A. de C.V. | | | 783 | |
| | 522,700 | | g | | Concentradora Fibra Hotelera Mexicana S.A. de C.V. | | | 265 | |
| | 4,890 | | | | Consolidated-Tomoka Land Co | | | 257 | |
| | 22,244 | | | | Consus Real Estate AG. | | | 194 | |
COLLEGE RETIREMENT EQUITIES FUND -Stock Account
| SHARES | | | | COMPANY | | VALUE
(000) | |
| | 151,674 | | | | CoreCivic, Inc | | $ | 2,704 | |
| | 15,395 | | e | | CorEnergy Infrastructure Trust, Inc | | | 509 | |
| | 54,264 | | | | CorePoint Lodging, Inc | | | 665 | |
| | 85,971 | | | | Coresite Realty | | | 7,499 | |
| | 9,651 | | | | Corestate Capital Holding S.A. | | | 334 | |
| | 2,059,136 | | e | | Corp Inmobiliaria Vesta SAB de C.V. | | | 2,811 | |
| | 160,830 | | | | Corporate Office Properties Trust | | | 3,382 | |
| | 6,640,391 | | | | Country Garden Holdings Co Ltd | | | 8,063 | |
| | 541,075 | | | | Cousins Properties, Inc | | | 4,275 | |
| | 170 | | | | CRE Logistics REIT, Inc | | | 154 | |
| | 4,210 | | | | Crescendo Investment Corp | | | 4,698 | |
| | 26,365 | | | | Crombie Real Estate Investment Trust | | | 242 | |
| | 1,138,183 | | | | Cromwell Group | | | 794 | |
| | 878,714 | | | | Crown Castle International Corp | | | 95,455 | |
| | 2,428,943 | | | | CSI Properties Ltd | | | 96 | |
| | 34,170 | | | | CT Real Estate Investment Trust | | | 289 | |
| | 436,123 | | | | CubeSmart | | | 12,512 | |
| | 267,898 | | * | | Cushman & Wakefield plc | | | 3,877 | |
| | 320,197 | | | | CyrusOne, Inc | | | 16,932 | |
| | 28,787 | | * | | D Carnegie & Co AB | | | 483 | |
| | 439 | | | | DA Office Investment Corp | | | 2,769 | |
| | 78,200 | | | | Daibiru Corp | | | 773 | |
| | 2,595,900 | | * | | Daiman Development BHD | | | 1,853 | |
| | 48,640 | | | | Daito Trust Construction Co Ltd | | | 6,659 | |
| | 1,706,854 | | | | Daiwa House Industry Co Ltd | | | 54,446 | |
| | 1,839,795 | | | | DAMAC Properties Dubai Co PJSC | | | 754 | |
| | 1,134,068 | | | | Delta Property Fund Ltd | | | 355 | |
| | 201,121 | | | | Derwent London plc | | | 7,313 | |
| | 210,489 | | | | Deutsche Annington Immobilien SE | | | 9,489 | |
| | 73,109 | | | | Deutsche Euroshop AG. | | | 2,127 | |
| | 310,495 | | | | Deutsche Wohnen AG. | | | 14,190 | |
| | 602,145 | | | | Dexus Property Group | | | 4,507 | |
| | 1,060,662 | | * | | Deyaar Development PJSC | | | 99 | |
| | 319,894 | | | | DiamondRock Hospitality Co | | | 2,905 | |
| | 124,812 | | | | DIC Asset AG. | | | 1,301 | |
| | 266,209 | | | | Digital Realty Trust, Inc | | | 28,365 | |
| | 328,392 | | | | Dios Fastigheter AB | | | 2,090 | |
| | 850,000 | | | | DLF Ltd | | | 2,160 | |
| | 252,536 | | | | Dongwon Development Co Ltd | | | 905 | |
| | 785,230 | | * | | DoubleDragon Properties Corp | | | 266 | |
| | 331,348 | | | | Douglas Emmett, Inc | | | 11,309 | |
| | 748,024 | | | | Dream Global REIT | | | 6,520 | |
| | 24,995 | | | | Dream Industrial Real Estate Investment Trust | | | 174 | |
| | 159,593 | | | | Dream Office Real Estate Investment Trust | | | 2,606 | |
| | 46,488 | | * | | Dream Unlimited Corp | | | 233 | |
| | 796,973 | | | | Duke Realty Corp | | | 20,642 | |
| | 78,070 | | | | Easterly Government Properties, Inc | | | 1,224 | |
| | 471,813 | | * | | Eastern & Oriental BHD | | | 128 | |
| | 44,668 | | | | EastGroup Properties, Inc | | | 4,097 | |
| | 702,200 | | * | | Eco World Development Group BHD | | | 154 | |
| | 592,100 | | * | | Eco World International BHD | | | 102 | |
| | 1,009,460 | | * | | Emaar Development PJSC | | | 1,209 | |
| | 2,065,572 | | * | | Emaar Malls Group PJSC | | | 1,004 | |
| | 11,103,141 | | | | Emaar Properties PJSC | | | 12,482 | |
COLLEGE RETIREMENT EQUITIES FUND -Stock Account
| SHARES | | | | COMPANY | | VALUE
(000) | |
| | 1,660,971 | | | | Emira Property Fund Ltd | | $ | 1,709 | |
| | 1,095,383 | | | | Emlak Konut Gayrimenkul Yatiri | | | 309 | |
| | 835,333 | | | | Emperor International Holdings | | | 197 | |
| | 326,590 | | | | Empire State Realty Trust, Inc | | | 4,647 | |
| | 393,007 | | | | Empiric Student Property plc | | | 463 | |
| | 39,799 | | | | Entertainment Properties Trust | | | 2,548 | |
| | 345,136 | | g | | Entra ASA | | | 4,597 | |
| | 137,003 | | | | Equinix, Inc | | | 48,302 | |
| | 297,412 | | | | Equites Property Fund Ltd | | | 400 | |
| | 173,482 | | | | Equity Commonwealth | | | 5,206 | |
| | 494,850 | | | | Equity Lifestyle Properties, Inc | | | 48,065 | |
| | 563,995 | | | | Equity Residential | | | 37,229 | |
| | 814,184 | | * | | Eshraq Properties Co PJSC | | | 102 | |
| | 160,178 | | | | Essential Properties Realty Trust, Inc | | | 2,217 | |
| | 208,913 | | | | Essex Property Trust, Inc | | | 51,228 | |
| | 30,217 | | | | Eurobank Properties Real Estate Investment Co | | | 289 | |
| | 37,658 | | | | Eurocommercial Properties NV | | | 1,162 | |
| | 361,145 | | | | Extra Space Storage, Inc | | | 32,676 | |
| | 766,527 | | * | | Ezdan Holding Group QSC | | | 2,727 | |
| | 359,875 | | | | Fabege AB | | | 4,810 | |
| | 6,837,500 | | | | Fantasia Holdings Group Co Ltd | | | 785 | |
| | 2,828,452 | | | | Far East Consortium | | | 1,220 | |
| | 461,200 | | | | Far East Hospitality Trust | | | 205 | |
| | 186,812 | | | | Farglory Land Development Co Ltd | | | 210 | |
| | 107,976 | | e | | Farmland Partners, Inc | | | 490 | |
| | 176,755 | | * | | Fastighets AB Balder | | | 5,039 | |
| | 269,693 | | | | Federal Realty Investment Trust | | | 31,835 | |
| | 6,423,606 | | | | Fibra Uno Administracion S.A. de C.V. | | | 7,139 | |
| | 18,000,000 | | | | Filinvest Development Corp | | | 4,039 | |
| | 50,592,000 | | | | Filinvest Land, Inc | | | 1,352 | |
| | 72,600 | | | | Financial Street Holdings Co Ltd | | | 68 | |
| | 150,129 | | | | First Capital Realty, Inc | | | 2,073 | |
| | 448,762 | | | | First Industrial Realty Trust, Inc | | | 12,951 | |
| | 497,670 | | | | First Real Estate Investment Trust | | | 360 | |
| | 20,487 | | | | FirstService Corp | | | 1,406 | |
| | 17,563 | | | | Fonciere Des Regions | | | 1,695 | |
| | 14,805 | | *,e | | Forestar Group, Inc | | | 205 | |
| | 681,830 | | | | Fortress REIT Ltd | | | 687 | |
| | 1,058,985 | | | | Fortress REIT Ltd (Class A) | | | 1,342 | |
| | 583,034 | | | | Four Corners Property Trust, Inc | | | 15,276 | |
| | 179,498 | | | | Franklin Street Properties Corp | | | 1,118 | |
| | 5,121,725 | | | | Franshion Properties China Ltd | | | 2,306 | |
| | 364,000 | | | | Frasers Centrepoint Trust | | | 579 | |
| | 468,200 | | | | Frasers Hospitality Trust | | | 240 | |
| | 1,129,410 | | | | Frasers Logistics & Industrial Trust | | | 854 | |
| | 77,478 | | | | Front Yard Residential Corp | | | 676 | |
| | 462 | | | | Frontier Real Estate Investment Corp | | | 1,834 | |
| | 9,608 | | * | | FRP Holdings, Inc | | | 442 | |
| | 502 | | | | Fukuoka REIT Corp | | | 762 | |
| | 1,976,000 | | | | Future Land Development Holdin | | | 1,350 | |
| | 26,300 | | | | Future Land Holdings Co Ltd | | | 91 | |
| | 1,764,203 | | | | Gaming and Leisure Properties, Inc | | | 57,001 | |
| | 64,824 | | | | Gazit Globe Ltd | | | 451 | |
COLLEGE RETIREMENT EQUITIES FUND -Stock Account
| SHARES | | | | COMPANY | | VALUE
(000) | |
| | 6,989 | | | | Gazit, Inc | | $ | 68 | |
| | 251,054 | | | | GCP Student Living plc | | | 475 | |
| | 1,170,860 | | | | GDI Property Group | | | 1,113 | |
| | 21,806 | | | | Gecina S.A. | | | 2,823 | |
| | 88,500 | | | | Gemdale Corp | | | 124 | |
| | 3,038,000 | | | | Gemdale Properties and Investment Corp Ltd | | | 287 | |
| | 625,505 | | | | Geo Group, Inc | | | 12,322 | |
| | 143,944 | | | | Getty Realty Corp | | | 4,233 | |
| | 49,364 | | | | Gladstone Commercial Corp | | | 885 | |
| | 18,672 | | e | | Gladstone Land Corp | | | 214 | |
| | 165,987 | | | | Global Medical REIT, Inc | | | 1,476 | |
| | 92,673 | | | | Global Net Lease, Inc | | | 1,633 | |
| | 591 | | | | Global One Real Estate Investment Corp | | | 645 | |
| | 2,220,000 | | * | | Glorious Property Holdings Ltd | | | 117 | |
| | 2,598 | | | | GLP J-Reit | | | 2,645 | |
| | 34,841 | | * | | Godrej Properties Ltd | | | 326 | |
| | 9,780 | | | | Goldcrest Co Ltd | | | 141 | |
| | 426,500 | | | | Golden Land Property Development PCL | | | 92 | |
| | 1,703,316 | | | | Goodman Property Trust | | | 1,750 | |
| | 129,206 | | *,e | | Government Properties Income Trust | | | 888 | |
| | 975,087 | | | | GPT Group (ASE) | | | 3,669 | |
| | 1,534,556 | | | | Grainger plc | | | 4,104 | |
| | 125,384 | | | | Grand City Properties S.A. | | | 2,725 | |
| | 136,969 | | | | Granite REIT | | | 5,339 | |
| | 30,794 | | | | Great Eagle Holdings Ltd | | | 132 | |
| | 798,530 | | | | Great Portland Estates plc | | | 6,712 | |
| | 5,491,191 | | | | Green REIT plc | | | 8,494 | |
| | 156,300 | | | | Greenland Holdings Corp Ltd | | | 139 | |
| | 1,151,000 | | | | Greenland Hong Kong Holdings Ltd | | | 280 | |
| | 5,341,000 | | | | Greentown China Holdings Ltd | | | 4,017 | |
| | 1,391 | | m | | Griffin Land & Nurseries, Inc (Class A) | | | 44 | |
| | 790,000 | | *,e | | Ground International Development Ltd | | | 42 | |
| | 1,142,524 | | | | Growthpoint Properties Australia Ltd | | | 3,011 | |
| | 5,952,062 | | | | Growthpoint Properties Ltd | | | 9,675 | |
| | 332,600 | | *,e | | Grupo GICSA S.A. de C.V. | | | 108 | |
| | 342,000 | | * | | Guangdong Land Holdings Ltd | | | 75 | |
| | 1,119,085 | | | | Guangzhou R&F Properties Co Ltd | | | 1,693 | |
| | 157,600 | | e | | Guocoland Ltd | | | 208 | |
| | 2,917,000 | | | | Guorui Properties Ltd | | | 740 | |
| | 177,530 | | | | H&R Real Estate Investment Trust | | | 2,685 | |
| | 41,723 | | | | Hamborner AG. | | | 403 | |
| | 391,486 | | | | Hammerson plc | | | 1,648 | |
| | 253,731 | | | | Hang Lung Group Ltd | | | 647 | |
| | 4,061,559 | | | | Hang Lung Properties Ltd | | | 7,720 | |
| | 336 | | | | Hankyu Reit, Inc | | | 437 | |
| | 78,647 | | | | Hannon Armstrong Sustainable Infrastructure Capital, Inc | | | 1,498 | |
| | 1,408,543 | | | | Hansteen Holdings plc | | | 1,663 | |
| | 1,177,888 | | | | HCP, Inc | | | 32,898 | |
| | 1,050 | | | | Health Care & Medical Investment Corp | | | 1,079 | |
| | 239,624 | | | | Healthcare Realty Trust, Inc | | | 6,815 | |
| | 640,888 | | | | Healthcare Trust of America, Inc | | | 16,221 | |
| | 141,000 | | | | Heiwa Real Estate Co Ltd | | | 2,239 | |
| | 203,436 | | | | Helical Bar plc | | | 827 | |
COLLEGE RETIREMENT EQUITIES FUND -Stock Account
| SHARES | | | | COMPANY | | VALUE
(000) | |
| | 72,639 | | | | Heliopolis Housing | | $ | 73 | |
| | 781,294 | | | | Hemfosa Fastigheter AB | | | 6,165 | |
| | 2,353,853 | | | | Henderson Land Development Co Ltd | | | 11,715 | |
| | 47,398 | | | | Hersha Hospitality Trust | | | 831 | |
| | 172,339 | | | | HFF, Inc (Class A) | | | 5,715 | |
| | 32,883,976 | | | | Hibernia REIT plc | | | 47,171 | |
| | 679,042 | | | | Highwealth Construction Corp | | | 993 | |
| | 263,921 | | | | Highwoods Properties, Inc | | | 10,211 | |
| | 117,880 | | e | | HKC Holdings Ltd | | | 104 | |
| | 2,878,412 | | | | Hongkong Land Holdings Ltd | | | 18,146 | |
| | 152 | | e | | Hoshino Resorts REIT, Inc | | | 720 | |
| | 146,887 | | | | Hospitality Properties Trust | | | 3,508 | |
| | 1,950,398 | | | | Host Marriott Corp | | | 32,513 | |
| | 74,384 | | * | | Howard Hughes Corp | | | 7,261 | |
| | 269,235 | | | | Huaku Development Co Ltd | | | 597 | |
| | 536,802 | | | | Hudson Pacific Properties | | | 15,599 | |
| | 139,418 | | | | Hufvudstaden AB (Series A) | | | 2,158 | |
| | 468,617 | | | | Hulic Co Ltd | | | 4,188 | |
| | 948 | | | | Hulic Reit, Inc | | | 1,472 | |
| | 423,800 | | | | Hung Sheng Construction Co Ltd | | | 353 | |
| | 215,522 | | | | Hyprop Investments Ltd | | | 1,221 | |
| | 1,254,303 | | | | Hysan Development Co Ltd | | | 5,965 | |
| | 14,768 | | | | Icade | | | 1,126 | |
| | 164,700 | | e | | Ichigo Holdings Co Ltd | | | 477 | |
| | 914 | | | | Ichigo Real Estate Investment Corp | | | 807 | |
| | 137,000 | | *,e | | IDU Co | | | 122 | |
| | 1,126,700 | | | | IGB Real Estate Investment Trust | | | 472 | |
| | 50,200 | | | | Iguatemi Empresa de Shopping Centers S.A. | | | 538 | |
| | 192,215 | | | | Immobiliare Grande Distribuzione SIIQ S.p.A | | | 1,185 | |
| | 56,523 | | | | IMMOFINANZ AG. | | | 1,357 | |
| | 114,635 | | | | Independence Realty Trust, Inc | | | 1,052 | |
| | 2,573,829 | | * | | Indiabulls Real Estate Ltd | | | 3,218 | |
| | 1,068 | | | | Industrial & Infrastructure Fund Investment Corp | | | 1,108 | |
| | 388,605 | | * | | Industrial Buildings Corp | | | 540 | |
| | 83,874 | | e | | Industrial Logistics Properties Trust | | | 1,650 | |
| | 2,048,884 | | | | Ingenia Communities Group | | | 4,329 | |
| | 382,890 | | | | Inmobiliaria Colonial S.A. | | | 3,569 | |
| | 12,034 | | e | | Innovative Industrial Properties, Inc | | | 546 | |
| | 879,973 | | *,g | | Instone Real Estate Group AG. | | | 16,737 | |
| | 100,333 | | | | InterRent Real Estate Investment Trust | | | 959 | |
| | 737 | | | | Intershop Holding AG. | | | 366 | |
| | 14,876 | | e | | Intervest Offices | | | 351 | |
| | 837,468 | | e | | Intu Properties plc | | | 1,210 | |
| | 20,867 | | | | Invesco Office J-Reit, Inc | | | 2,917 | |
| | 3,301 | | | | Investis Holding S.A. | | | 208 | |
| | 14,800 | | e | | Investors Cloud Co Ltd | | | 41 | |
| | 15,640 | | | | Investors Real Estate Trust | | | 767 | |
| | 21,886 | | e,h | | Invincible Investment Corp | | | 9,027 | |
| | 803,588 | | | | Invitation Homes, Inc | | | 16,136 | |
| | 1,226,565 | | | | IOI Properties Group Sdn BHD | | | 457 | |
| | 1,560,865 | | | | Irish Residential Properties REIT plc | | | 2,414 | |
| | 537,173 | | | | Iron Mountain, Inc | | | 17,410 | |
| | 28,000 | | e | | iShares Dow Jones US Real Estate Index Fund | | | 2,098 | |
COLLEGE RETIREMENT EQUITIES FUND -Stock Account
| SHARES | | | | COMPANY | | VALUE
(000) | |
| | 86,367 | | | | iStar Financial, Inc | | $ | 792 | |
| | 944 | | | | Japan Excellent, Inc | | | 1,276 | |
| | 8,909 | | h | | Japan Hotel REIT Investment Corp | | | 6,359 | |
| | 837 | | | | Japan Logistics Fund Inc | | | 1,701 | |
| | 243 | | | | Japan Prime Realty Investment Corp | | | 923 | |
| | 507 | | | | Japan Real Estate Investment Corp | | | 2,847 | |
| | 1,229 | | | | Japan Rental Housing Investments, Inc | | | 922 | |
| | 3,120 | | | | Japan Retail Fund Investment Corp | | | 6,226 | |
| | 215,394 | | | | JBG SMITH Properties | | | 7,498 | |
| | 24,683 | | | | Jernigan Capital, Inc | | | 489 | |
| | 133,616 | | * | | Jerusalem Economy Ltd | | | 344 | |
| | 1,596,750 | | *,†,m | | Jiangsu Future Land Co Ltd | | | 5,934 | |
| | 1,306,996 | | e | | Jiayuan International Group Ltd | | | 2,418 | |
| | 55,400 | | | | Jinke Properties Group Co Ltd | | | 50 | |
| | 48,733 | | | | Jones Lang LaSalle, Inc | | | 6,170 | |
| | 13,000,000 | | | | Joy City Property Ltd | | | 1,410 | |
| | 1,737,403 | | | | K Wah International Holdings Ltd | | | 825 | |
| | 2,186,000 | | | | Kaisa Group Holdings Ltd | | | 697 | |
| | 36,900 | | e | | Katitas Co Ltd | | | 874 | |
| | 356 | | | | Kenedix Realty Investment Corp | | | 2,272 | |
| | 1,028 | | | | Kenedix Residential Investment Corp | | | 1,567 | |
| | 761 | | | | Kenedix Retail REIT Corp | | | 1,725 | |
| | 912,900 | | | | Kenedix, Inc | | | 3,916 | |
| | 278,327 | | | | Kennedy-Wilson Holdings, Inc | | | 5,057 | |
| | 724,717 | | | | Keppel DC REIT | | | 718 | |
| | 2,641,670 | | | | Kerry Properties Ltd | | | 9,016 | |
| | 225,393 | | | | Killam Apartment Real Estate Investment Trust | | | 2,632 | |
| | 290,367 | | | | Kilroy Realty Corp | | | 18,258 | |
| | 217,226 | | | | Kimco Realty Corp | | | 3,182 | |
| | 198,000 | | | | Kindom Construction Co | | | 132 | |
| | 143,241 | | | | Kite Realty Group Trust | | | 2,018 | |
| | 1,012,723 | | | | Kiwi Property Group Ltd | | | 929 | |
| | 117,500 | | | | KLCC Property Holdings BHD | | | 218 | |
| | 271,908 | | | | Klepierre | | | 8,403 | |
| | 1,986,045 | | e | | Klovern AB (B Shares) | | | 2,309 | |
| | 28,799 | | | | Korea Asset In Trust Co Ltd | | | 114 | |
| | 94,780 | | | | Korea Real Estate Investment Trust Co | | | 229 | |
| | 2,722,130 | | | | Kowloon Development Co Ltd | | | 2,864 | |
| | 1,561,311 | | e | | K-REIT Asia | | | 1,307 | |
| | 643,105 | | | | Kungsleden AB | | | 4,574 | |
| | 1,199,608 | | | | KWG Property Holding Ltd | | | 1,063 | |
| | 805,467 | | | | Lai Fung Holdings Ltd | | | 975 | |
| | 485,285 | | | | Lai Sun Development Co Ltd | | | 793 | |
| | 182,064 | | | | Lamar Advertising Co | | | 12,595 | |
| | 19,704 | | * | | Lamda Development S.A. | | | 129 | |
| | 3,194,300 | | | | Land and Houses PCL Co Reg | | | 972 | |
| | 291,742 | | | | Land Securities Group plc | | | 2,996 | |
| | 4,805,000 | | | | Langham Hospitality Investments Ltd | | | 1,778 | |
| | 272,061 | | e | | Lar Espana Real Estate Socimi S.A. | | | 2,320 | |
| | 2,619 | | | | LaSalle Logiport REIT | | | 2,536 | |
| | 125,236 | | | | LEG Immobilien AG. | | | 13,066 | |
| | 403,244 | | | | Lend Lease Corp Ltd | | | 3,303 | |
| | 212,211 | | | | Leopalace21 Corp | | | 841 | |
| | 267,750 | | | | Lexington Realty Trust | | | 2,198 | |
COLLEGE RETIREMENT EQUITIES FUND -Stock Account
| SHARES | | | | COMPANY | | VALUE
(000) | |
| | 217,265 | | | | Liberty Property Trust | | $ | 9,099 | |
| | 34,577 | | | | Life Storage, Inc | | | 3,215 | |
| | 805,997 | | | | Link REIT | | | 8,171 | |
| | 1,218,500 | | | | Lippo-Mapletree Indonesia Retail Trust | | | 163 | |
| | 54,000 | | | | Liu Chong Hing Investment | | | 84 | |
| | 129,458 | | * | | LOG Commercial Properties e Participacoes S.A. | | | 602 | |
| | 1,666,000 | | | | Logan Property Holdings Co Ltd | | | 2,080 | |
| | 2,221,032 | | | | London & Stamford Property plc | | | 4,924 | |
| | 1,382,678 | | | | Longfor Properties Co Ltd | | | 4,112 | |
| | 386,900 | | | | LPN Development PCL (Foreign) | | | 75 | |
| | 93,550 | | | | LTC Properties, Inc | | | 3,899 | |
| | 69,735 | | | | Macerich Co | | | 3,018 | |
| | 267,177 | | | | Mack-Cali Realty Corp | | | 5,234 | |
| | 221,532 | | | | Macquarie CountryWide Trust | | | 699 | |
| | 1,567,526 | | | | Macquarie Goodman Group | | | 11,742 | |
| | 1,055,090 | | | | Macquarie MEAG Prime REIT | | | 527 | |
| | 1,615,576 | | | | Mah Sing Group BHD | | | 358 | |
| | 917,772 | | | | Manulife US Real Estate Investment Trust | | | 706 | |
| | 35,779 | | *,†,e,m | | Mapeley Ltd | | | 0 | ^ |
| | 1,640,282 | | | | Mapletree Commercial Trust | | | 1,985 | |
| | 1,406,600 | | | | Mapletree Greater China Commercial Trust | | | 1,177 | |
| | 1,142,399 | | | | Mapletree Industrial Trust | | | 1,602 | |
| | 1,553,110 | | | | Mapletree Logistics Trust | | | 1,437 | |
| | 76,689 | | * | | Marcus & Millichap, Inc | | | 2,633 | |
| | 734,592 | | | | Matrix Concepts Holdings BHD | | | 334 | |
| | 6,663 | | * | | Maui Land & Pineapple Co, Inc | | | 66 | |
| | 436,200 | | | | MBK PCL | | | 276 | |
| | 290,869 | | | | MedEquities Realty Trust, Inc | | | 1,990 | |
| | 439,776 | | | | Medical Properties Trust, Inc | | | 7,072 | |
| | 2,058,631 | | * | | Medinet Nasr Housing | | | 774 | |
| | 133,524,163 | | | | Megaworld Corp | | | 12,019 | |
| | 35,696 | | | | Melisron Ltd | | | 1,490 | |
| | 38,907 | | | | Mercialys S.A | | | 534 | |
| | 350,198 | | | | Merlin Properties Socimi S.A. | | | 4,326 | |
| | 29,806 | | *,g | | Metrovacesa S.A. | | | 378 | |
| | 2,217,800 | | g | | Mexico Real Estate Management S.A. de C.V. | | | 1,996 | |
| | 1,224,249 | | | | MGM Growth Properties LLC | | | 32,332 | |
| | 2,017 | | | | MID Reit, Inc | | | 1,593 | |
| | 69,552 | | | | Mid-America Apartment Communities, Inc | | | 6,656 | |
| | 970,929 | | | | Midland Holdings Ltd | | | 186 | |
| | 4,518,000 | | | | Minmetals Land Ltd | | | 754 | |
| | 211 | | | | Mirai Corp | | | 354 | |
| | 3,399,712 | | | | Mirvac Group | | | 5,369 | |
| | 793,798 | | | | Mitsubishi Estate Co Ltd | | | 12,489 | |
| | 134 | | e | | Mitsubishi Estate Logistics REIT Investment Corp | | | 294 | |
| | 1,561,179 | | | | Mitsui Fudosan Co Ltd | | | 34,677 | |
| | 161 | | | | Mitsui Fudosan Logistics Park, Inc | | | 456 | |
| | 4,747 | | | | Mobimo Holding AG. | | | 1,132 | |
| | 602,000 | | e | | Modern Land China Co Ltd | | | 74 | |
| | 772,662 | | | | Monmouth Real Estate Investment Corp (Class A) | | | 9,581 | |
| | 12,271 | | e | | Montea C.V.A | | | 841 | |
| | 16,249 | | | | Morguard Real Estate Investment Trust | | | 136 | |
| | 1,423 | | | | Mori Hills REIT Investment Corp | | | 1,791 | |
COLLEGE RETIREMENT EQUITIES FUND -Stock Account
| SHARES | | | | COMPANY | | VALUE
(000) | |
| | 227 | | | | Mori Trust Hotel Reit, Inc | | $ | 264 | |
| | 1,104 | | | | Mori Trust Sogo Reit, Inc | | | 1,607 | |
| | 228,129 | | | | Multiplan Empreendimentos Imobiliarios S.A. | | | 1,429 | |
| | 15,665 | | e | | Nam Tai Property, Inc | | | 136 | |
| | 114,203 | | | | National Health Investors, Inc | | | 8,627 | |
| | 80,936 | | | | National Retail Properties, Inc | | | 3,926 | |
| | 376,701 | | | | National Storage Affiliates Trust | | | 9,968 | |
| | 2,414,447 | | | | National Storage REIT | | | 2,985 | |
| | 982,000 | | e | | Neo-China Land Group Holdings Ltd | | | 159 | |
| | 346,346 | | | | NEPI Rockcastle plc | | | 2,720 | |
| | 9,561 | | * | | NESCO Ltd | | | 60 | |
| | 151,840 | | | | New Senior Investment Group, Inc | | | 626 | |
| | 10,873,908 | | | | New World Development Co Ltd | | | 14,362 | |
| | 539,272 | | | | Newmark Group, Inc | | | 4,325 | |
| | 197,572 | | e | | NewRiver REIT plc | | | 533 | |
| | 283,296 | | | | Nexity | | | 12,791 | |
| | 86,845 | | | | NexPoint Residential Trust, Inc | | | 3,044 | |
| | 323 | | | | Nippon Accommodations Fund, Inc | | | 1,560 | |
| | 750 | | | | Nippon Building Fund, Inc | | | 4,723 | |
| | 800 | | e | | Nippon Healthcare Investment Corp | | | 1,219 | |
| | 8,437 | | | | Nippon ProLogis REIT, Inc | | | 17,806 | |
| | 3,134 | | h | | NIPPON REIT Investment Corp | | | 10,399 | |
| | 391,558 | | | | Nomura Real Estate Holdings, Inc | | | 7,180 | |
| | 7,539 | | | | Nomura Real Estate Master Fund, Inc | | | 9,919 | |
| | 58,097 | | | | NorthStar Realty Europe Corp | | | 845 | |
| | 107,582 | | | | Northview Apartment Real Estate Investment Trust | | | 1,929 | |
| | 109,824 | | | | NorthWest Healthcare Properties Real Estate Investment Trust | | | 763 | |
| | 97,361 | | | | Norwegian Property ASA | | | 119 | |
| | 48,294 | | | | NSI NV | | | 1,887 | |
| | 270,669 | | * | | Nyfosa AB | | | 1,306 | |
| | 57,438 | | * | | Oberoi Realty Ltd | | | 362 | |
| | 351,245 | | | | Omega Healthcare Investors, Inc | | | 12,346 | |
| | 86,024 | | | | One Liberty Properties, Inc | | | 2,084 | |
| | 286,800 | | | | Open House Co Ltd | | | 9,656 | |
| | 427,350 | | | | Origin Property PCL | | | 87 | |
| | 2,191 | | | | Orix JREIT, Inc | | | 3,644 | |
| | 594,912 | | | | OSK Holdings BHD | | | 125 | |
| | 653,800 | | | | OUE Hospitality Trust | | | 321 | |
| | 999,017 | | | | Outfront Media, Inc | | | 18,102 | |
| | 345,800 | | e | | Overseas Union Enterprise Ltd | | | 363 | |
| | 921,890 | | * | | Palm Hills Developments SAE | | | 112 | |
| | 523,121 | | | | Paramount Group, Inc | | | 6,570 | |
| | 403,068 | | | | Park Hotels & Resorts, Inc | | | 10,472 | |
| | 776,000 | | | | Parkway Life Real Estate Investment Trust | | | 1,497 | |
| | 726,950 | | | | Parque Arauco S.A. | | | 1,618 | |
| | 34,600 | | | | Patrizia Immobilien AG. | | | 661 | |
| | 515,900 | | | | Pavilion Real Estate Investment Trust | | | 204 | |
| | 256,931 | | e | | Pebblebrook Hotel Trust | | | 7,274 | |
| | 93,689 | | e | | Pennsylvania REIT | | | 557 | |
| | 249,132 | | * | | Phoenix Mills Ltd | | | 2,011 | |
| | 665,205 | | | | Physicians Realty Trust | | | 10,663 | |
| | 164,141 | | | | Piedmont Office Realty Trust, Inc | | | 2,797 | |
| | 1,368,600 | | | | PLA Administradora Industrial S de RL de C.V. | | | 1,627 | |
COLLEGE RETIREMENT EQUITIES FUND -Stock Account
| SHARES | | | | COMPANY | | VALUE
(000) | |
| | 319,000 | | | | Platinum Group PCL | | $ | 71 | |
| | 1,253,817 | | | | Poly Hong Kong Investment Ltd | | | 392 | |
| | 103,534 | | | | Poly Real Estate Group Co Ltd | | | 178 | |
| | 7,038,373 | | | | Polytec Asset Holdings Ltd | | | 608 | |
| | 84,569 | | | | Potlatch Corp | | | 2,676 | |
| | 4,692,000 | | | | Powerlong Real Estate Holdings Ltd | | | 1,848 | |
| | 671,344 | | | | Precinct Properties New Zealand Ltd | | | 668 | |
| | 322,240 | | | | Preferred Apartment Communities, Inc | | | 4,531 | |
| | 990 | | | | Premier Investment Co | | | 1,127 | |
| | 169,009 | | * | | Prestige Estates Projects Ltd | | | 532 | |
| | 1,140,826 | | e | | Primary Health Properties plc | | | 1,613 | |
| | 702,826 | | | | Prince Housing & Development Corp | | | 233 | |
| | 251,800 | | | | ProLogis Property Mexico S.A. de C.V. | | | 388 | |
| | 1,659,109 | | | | Prologis, Inc | | | 97,423 | |
| | 474,035 | | | | Propertylink Group | | | 382 | |
| | 845,000 | | | | Prosperity REIT | | | 324 | |
| | 35,784 | | | | PS Business Parks, Inc | | | 4,688 | |
| | 53,979 | | | | PSP Swiss Property AG. | | | 5,323 | |
| | 4,156,100 | | * | | PT Alam Sutera Realty Tbk | | | 90 | |
| | 7,158,147 | | * | | PT Bumi Serpong Damai | | | 626 | |
| | 17,881,629 | | | | PT Ciputra Development Tbk | | | 1,259 | |
| | 43,762,000 | | * | | PT Hanson International Tbk | | | 362 | |
| | 86,338,670 | | * | | PT Kawasan Industri Jababeka Tbk | | | 1,657 | |
| | 33,216,600 | | | | PT Lippo Karawaci Tbk | | | 588 | |
| | 19,955,700 | | | | PT Pakuwon Jati Tbk | | | 861 | |
| | 18,905,762 | | | | PT PP Properti Tbk | | | 154 | |
| | 11,773,400 | | * | | PT Sentul City Tbk | | | 89 | |
| | 5,044,400 | | | | PT Summarecon Agung Tbk | | | 283 | |
| | 234,061 | | | | Public Storage, Inc | | | 47,376 | |
| | 1,625,000 | | * | | Puravankara Projects Ltd | | | 1,685 | |
| | 819,404 | | *,e | | Purplebricks Group plc | | | 1,548 | |
| | 568,408 | | | | QTS Realty Trust, Inc | | | 21,060 | |
| | 2,795,422 | | | | Quality House PCL | | | 225 | |
| | 402,433 | | * | | Radium Life Tech Co Ltd | | | 180 | |
| | 3,829,009 | | * | | RAK Properties PJSC | | | 516 | |
| | 352,745 | | | | Rayonier, Inc | | | 9,768 | |
| | 7,400 | | | | Raysum Co Ltd | | | 66 | |
| | 107,293 | | | | Re/Max Holdings, Inc | | | 3,299 | |
| | 246,468 | | e | | Realogy Holdings Corp | | | 3,618 | |
| | 127,635 | | | | Realty Income Corp | | | 8,046 | |
| | 308,632 | | e | | Rebosis Property Fund Ltd | | | 58 | |
| | 550,000 | | g | | Redco Properties Group Ltd | | | 314 | |
| | 1,026,489 | | | | Redefine International plc | | | 375 | |
| | 4,706,844 | | | | Redefine Properties Ltd | | | 3,168 | |
| | 102,114 | | *,e | | Redfin Corp | | | 1,470 | |
| | 454,000 | | * | | Redsun Properties Group Ltd | | | 168 | |
| | 25,200,000 | | | | Regal Real Estate Investment Trust | | | 7,180 | |
| | 725,476 | | | | Regency Centers Corp | | | 42,571 | |
| | 248,456 | | g | | Regional REIT Ltd | | | 293 | |
| | 455,563 | | | | Reit Ltd | | | 1,685 | |
| | 67,800 | | | | Relo Holdings, Inc | | | 1,584 | |
| | 13,731,250 | | | | Renhe Commercial Holdings Co Ltd | | | 474 | |
| | 234,976 | | | | Resilient REIT Ltd | | | 936 | |
COLLEGE RETIREMENT EQUITIES FUND -Stock Account
| SHARES | | | | COMPANY | | VALUE
(000) | |
| | 4,252 | | | | Retail Estates NV | | $ | 375 | |
| | 462,877 | | | | Retail Opportunities Investment Corp | | | 7,351 | |
| | 428,996 | | | | Retail Properties of America, Inc | | | 4,655 | |
| | 77,120 | | * | | Retail Value, Inc | | | 1,974 | |
| | 1,201,388 | | | | Rexford Industrial Realty, Inc | | | 35,405 | |
| | 433,284 | | | | RioCan Real Estate Investment Trust | | | 7,554 | |
| | 92,100 | | | | RiseSun Real Estate Development Co Ltd | | | 107 | |
| | 425,855 | | | | RLJ Lodging Trust | | | 6,984 | |
| | 23,530 | | | | RMR Group, Inc | | | 1,249 | |
| | 796,000 | | | | Road King Infrastructure | | | 1,415 | |
| | 2,540,264 | | | | Robinsons Land Corp | | | 977 | |
| | 653,000 | | *,e | | Ronshine China Holdings Ltd | | | 770 | |
| | 102,463 | | | | RPT Realty | | | 1,224 | |
| | 505,454 | | | | Ruentex Development Co Ltd | | | 737 | |
| | 186,660 | | | | Rural Funds Group | | | 281 | |
| | 102,418 | | | | Ryman Hospitality Properties | | | 6,830 | |
| | 6,691,629 | | | | S.A. Corporate Real Estate Fund Nominees Pty Ltd | | | 1,563 | |
| | 849,573 | | | | Sabana Shari’ah Compliant Industrial REIT | | | 243 | |
| | 227,403 | | | | Sabra Healthcare REIT, Inc | | | 3,748 | |
| | 523,549 | | | | Safestore Holdings plc | | | 3,380 | |
| | 10,420 | | | | Safety Income and Growth, Inc | | | 196 | |
| | 18,300 | | e | | SAMTY Co Ltd | | | 209 | |
| | 2,260 | | | | Samty Residential Investment Corp | | | 1,792 | |
| | 14,877,077 | | | | Sansiri PCL | | | 539 | |
| | 35,399 | | | | Saul Centers, Inc | | | 1,672 | |
| | 279,886 | | | | Savills plc | | | 2,523 | |
| | 176,996 | | * | | SBA Communications Corp | | | 28,654 | |
| | 1,066,300 | | | | SC Asset Corp PCL | | | 89 | |
| | 9,141,669 | | | | Scentre Group | | | 25,132 | |
| | 320,195 | | | | Schroder Real Estate Investment Trust Ltd | | | 233 | |
| | 678,423 | | | | Segro plc | | | 5,093 | |
| | 2,970 | | | | Sekisui House Reit, Inc | | | 1,904 | |
| | 113,544 | | | | Select Income REIT | | | 836 | |
| | 148,639 | | | | Selvaag Bolig ASA | | | 696 | |
| | 141,694 | | | | Senior Housing Properties Trust | | | 1,661 | |
| | 42,015 | | e | | Seritage Growth Properties | | | 1,358 | |
| | 442,694 | | | | Shaftesbury plc | | | 4,686 | |
| | 308,800 | | | | Shanghai Erfangji Co Ltd | | | 131 | |
| | 1,144,387 | | | | Shanghai Lujiazui Finance & Trade Zone Development Co Ltd | | | 1,461 | |
| | 16,645,136 | | | | Shenzhen Investment Ltd | | | 5,502 | |
| | 4,211,261 | | | | Shimao Property Holdings Ltd | | | 11,216 | |
| | 192,050 | | * | | Shining Building Business Co Ltd | | | 64 | |
| | 16,600 | | e | | Shinoken Group Co Ltd | | | 103 | |
| | 960,885 | | | | Shopping Centres Australasia Property Group | | | 1,726 | |
| | 21,740,500 | | | | Shui On Land Ltd | | | 4,841 | |
| | 150,000 | | * | | Shurgard Self Storage Europe Sarl | | | 4,168 | |
| | 1,366 | | | | SIA Reit, Inc | | | 3,317 | |
| | 258,700 | | | | Siam Future Development PCL | | | 58 | |
| | 7,734,460 | | | | Sime Darby Property BHD | | | 1,862 | |
| | 915,735 | | | | Simon Property Group, Inc | | | 153,834 | |
| | 1,518,500 | | * | | Singha Estate PCL | | | 145 | |
| | 2,128,117 | | | | Sino Land Co | | | 3,646 | |
| | 19,791,581 | | | | Sino-Ocean Land Holdings Ltd | | | 8,728 | |
COLLEGE RETIREMENT EQUITIES FUND -Stock Account
| SHARES | | | | COMPANY | | VALUE
(000) | |
| | 152,692 | | | | Sinyi Realty Co | | $ | 146 | |
| | 2,376,036 | | | | Sirius Real Estate Ltd | | | 1,817 | |
| | 59,966 | | | | SITE Centers Corp | | | 664 | |
| | 126,479 | | * | | Six of October Development & Investment | | | 95 | |
| | 5,675 | | | | SK D&D Co Ltd | | | 136 | |
| | 1,476,000 | | | | Skyfame Realty Holdings Ltd | | | 250 | |
| | 279,666 | | | | SL Green Realty Corp | | | 22,116 | |
| | 23,320,590 | | | | SM Prime Holdings | | | 15,860 | |
| | 199,004 | | | | Smart Real Estate Investment Trust | | | 4,494 | |
| | 381,453 | | | | Sobha Developers Ltd | | | 2,486 | |
| | 2,604,135 | | * | | Soho China Ltd | | | 930 | |
| | 539,800 | | | | Soilbuild Business Space REIT | | | 230 | |
| | 20,400 | | | | Sonae Sierra Brasil S.A. | | | 136 | |
| | 1,544,191 | | | | SP Setia BHD | | | 870 | |
| | 116,778 | | | | Sparkassen Immobilien AG. | | | 1,946 | |
| | 502,700 | | | | SPH REIT | | | 369 | |
| | 171,826 | | | | Spirit MTA REIT | | | 1,225 | |
| | 51,331 | | | | Spirit Realty Capital, Inc | | | 1,809 | |
| | 202,846 | | | | ST Modwen Properties plc | | | 1,026 | |
| | 49,599 | | * | | St. Joe Co | | | 653 | |
| | 613,930 | | | | STAG Industrial, Inc | | | 15,275 | |
| | 1,162,172 | | | | Standard Life Investment Property Income Trust Ltd | | | 1,204 | |
| | 6,295 | | | | Star Asia Investment Corp | | | 6,026 | |
| | 2,200 | | e | | Starts Proceed Investment Corp | | | 3,400 | |
| | 884,261 | | | | Starwood Property Trust, Inc | | | 17,429 | |
| | 4,783,084 | | | | Stockland Trust Group | | | 11,866 | |
| | 623,000 | | e | | StorageVault Canada, Inc | | | 1,082 | |
| | 319,556 | | | | STORE Capital Corp | | | 9,047 | |
| | 8,602 | | * | | Stratus Properties, Inc | | | 206 | |
| | 379,992 | | | | Sumitomo Realty & Development Co Ltd | | | 13,911 | |
| | 301,560 | | | | Summit Hotel Properties, Inc | | | 2,934 | |
| | 48,757 | | | | Summit Industrial Income REIT | | | 341 | |
| | 76,139 | | | | Summit Real Estate Holdings Ltd | | | 627 | |
| | 477,278 | | | | Sun Communities, Inc | | | 48,544 | |
| | 339,900 | | | | Sun Frontier Fudousan Co Ltd | | | 3,282 | |
| | 1,927,334 | | | | Sun Hung Kai Properties Ltd | | | 27,506 | |
| | 3,860,522 | | e | | Sunac China Holdings Ltd | | | 12,529 | |
| | 940,000 | | * | | Suncity Group Holdings Ltd | | | 147 | |
| | 2,103,000 | | | | Sunlight Real Estate Investment Trust | | | 1,349 | |
| | 737,408 | | | | Sunstone Hotel Investors, Inc | | | 9,594 | |
| | 2,275,567 | | | | Suntec Real Estate Investment Trust | | | 2,968 | |
| | 28,176 | | * | | Sunteck Realty Ltd | | | 139 | |
| | 1,830,047 | | | | Sunway BHD | | | 651 | |
| | 950,100 | | | | Sunway Real Estate Investment | | | 398 | |
| | 473,900 | | | | Supalai PCL | | | 265 | |
| | 1,423,693 | | | | Swire Pacific Ltd (Class A) | | | 15,031 | |
| | 3,610,815 | | | | Swire Properties Ltd | | | 12,687 | |
| | 82,705 | | | | Swiss Prime Site AG. | | | 6,699 | |
| | 783,124 | | | | TAG Tegernsee Immobilien und Beteiligungs AG. | | | 17,837 | |
| | 1,065,700 | | e | | Takara Leben Co Ltd | | | 2,934 | |
| | 77 | | | | Takara Leben Infrastructure Fu | | | 72 | |
| | 556,790 | | | | Talaat Moustafa Group | | | 307 | |
| | 117,908 | | e | | Tanger Factory Outlet Centers, Inc | | | 2,384 | |
COLLEGE RETIREMENT EQUITIES FUND -Stock Account
| SHARES | | | | COMPANY | | VALUE
(000) | |
| | 89,973 | | | | Taubman Centers, Inc | | $ | 4,093 | |
| | 28,030 | | * | | Tejon Ranch Co | | | 465 | |
| | 325,913 | | | | Terreno Realty Corp | | | 11,462 | |
| | 112,555 | | | | Tier REIT, Inc | | | 2,322 | |
| | 279,560 | | | | TLG Immobilien AG. | | | 7,734 | |
| | 27,900 | | | | TOC Co Ltd | | | 186 | |
| | 1,588,101 | | | | Tokyo Tatemono Co Ltd | | | 16,463 | |
| | 1,213,531 | | | | Tokyu Fudosan Holdings Corp | | | 5,982 | |
| | 573 | | | | Tokyu REIT, Inc | | | 859 | |
| | 320,000 | | | | Top Spring International Holdings Ltd | | | 86 | |
| | 1,366,900 | | | | Tosei Corp | | | 10,406 | |
| | 3,380 | | e | | Tosei Reit Investment Corp | | | 3,510 | |
| | 2,736 | | * | | Transcontinental Realty Investors, Inc | | | 78 | |
| | 84,985 | | e | | Tricon Capital Group, Inc | | | 603 | |
| | 27,365 | | *,e,m | | Trinity Place Holdings, Inc | | | 119 | |
| | 4,875,251 | | | | Tritax Big Box REIT plc | | | 8,161 | |
| | 4,112,721 | | *,g | | Tritax EuroBox plc | | | 4,852 | |
| | 1,888,300 | | * | | U City PCL | | | 148 | |
| | 148,290 | | | | UDR, Inc | | | 5,875 | |
| | 924,500 | | | | UEM Land Holdings BHD | | | 149 | |
| | 336,212 | | | | UMH Properties, Inc | | | 3,981 | |
| | 126,999 | | * | | Unibail-Rodamco-Westfield | | | 19,702 | |
| | 760,921 | | * | | Union Properties PJSC | | | 83 | |
| | 954,812 | | | | Unite Group plc | | | 9,817 | |
| | 456,314 | | * | | United Development Co PSC | | | 1,847 | |
| | 2,725 | | | | United Urban Investment Corp | | | 4,220 | |
| | 369,977 | | | | Uniti Group, Inc | | | 5,761 | |
| | 460,400 | | | | Univentures PCL | | | 86 | |
| | 16,643 | | | | Universal Health Realty Income Trust | | | 1,021 | |
| | 366,700 | | | | Unizo Holdings Co Ltd | | | 6,818 | |
| | 353,885 | | | | UOA Development BHD | | | 181 | |
| | 218,173 | | | | UOL Group Ltd | | | 992 | |
| | 225,245 | | | | Urban Edge Properties | | | 3,744 | |
| | 60,031 | | | | Urstadt Biddle Properties, Inc (Class A) | | | 1,154 | |
| | 8,688 | | | | Vastned Retail NV | | | 312 | |
| | 680,111 | | | | Ventas, Inc | | | 39,848 | |
| | 520,559 | | | | VEREIT, Inc | | | 3,722 | |
| | 149,924 | | | | VICI Properties, Inc | | | 2,816 | |
| | 5,327,827 | | | | Vicinity Centres | | | 9,763 | |
| | 19,239 | | e | | Victoria Park AB | | | 79 | |
| | 10,800,600 | | | | Vista Land & Lifescapes, Inc | | | 1,114 | |
| | 1,262,201 | | | | Viva Energy REIT | | | 2,001 | |
| | 70,972 | | | | Vornado Realty Trust | | | 4,402 | |
| | 2,846,185 | | | | Vukile Property Fund Ltd | | | 3,947 | |
| | 143,054 | | e | | Wallenstam AB | | | 1,327 | |
| | 53,439 | | | | Warehouses De Pauw SCA | | | 7,053 | |
| | 244,463 | | | | Washington Prime Group, Inc | | | 1,188 | |
| | 101,174 | | | | Washington REIT | | | 2,327 | |
| | 530,116 | | e | | Watkin Jones plc | | | 1,389 | |
| | 72,110 | | | | Weingarten Realty Investors | | | 1,789 | |
| | 687,566 | | | | Welltower, Inc | | | 47,724 | |
| | 29,609 | | e | | Wereldhave NV | | | 921 | |
| | 1,601,754 | | | | Weyerhaeuser Co | | | 35,014 | |
| | 4,393,635 | | | | WHA Corp PCL | | | 578 | |
COLLEGE RETIREMENT EQUITIES FUND -Stock Account
| SHARES | | | | COMPANY | | VALUE
(000) | |
| | 2,993,332 | | | | Wharf Holdings Ltd | | $ | 7,804 | |
| | 2,592,332 | | | | Wharf Real Estate Investment Co Ltd | | | 15,505 | |
| | 780,591 | | | | Wheelock & Co Ltd | | | 4,469 | |
| | 174,320 | | | | Whitestone REIT | | | 2,137 | |
| | 552,899 | | | | Wihlborgs Fastigheter AB | | | 6,410 | |
| | 246,440 | | | | Wing Tai Holdings Ltd | | | 349 | |
| | 247,045 | | | | Workspace Group plc | | | 2,497 | |
| | 75,173 | | | | WP Carey, Inc | | | 4,912 | |
| | 28,459 | | | | WPT Industrial Real Estate Investment Trust | | | 366 | |
| | 417,597 | | | | Xenia Hotels & Resorts, Inc | | | 7,183 | |
| | 28,200 | | | | Xinhu Zhongbao Co Ltd | | | 12 | |
| | 1,301,500 | | | | Yanlord Land Group Ltd | | | 1,165 | |
| | 821,466 | | e | | Yoma Strategic Holdings Ltd | | | 205 | |
| | 160,100 | | | | Youngor Group Co Ltd | | | 168 | |
| | 392,600 | | | | YTL Hospitality REIT | | | 112 | |
| | 949,000 | | | | Yuexiu Real Estate Investment Trust | | | 608 | |
| | 33,844,912 | | | | Yuexiul Property Co Ltd | | | 6,220 | |
| | 2,104,622 | | | | Yuzhou Properties Co | | | 869 | |
| | 1,258,000 | | * | | Zhuguang Holdings Group Co Ltd | | | 222 | |
| | | | | | TOTAL REAL ESTATE | | | 3,937,025 | |
| | | | | | | | | | |
| RETAILING - 5.1% |
| | 114,498 | | * | | 1-800-FLOWERS.COM, Inc (Class A) | | | 1,400 | |
| | 163,460 | | | | Aaron’s, Inc | | | 6,873 | |
| | 23,720 | | e | | ABC-Mart, Inc | | | 1,314 | |
| | 174,295 | | | | Abercrombie & Fitch Co (Class A) | | | 3,495 | |
| | 1,474,568 | | | | Accent Group Ltd | | | 1,247 | |
| | 32,300 | | | | Adastria Holdings Co Ltd | | | 544 | |
| | 499,942 | | | | Advance Auto Parts, Inc | | | 78,721 | |
| | 423,900 | | | | Aeon Co M Bhd | | | 151 | |
| | 2,381,791 | | * | | Alibaba Group Holding Ltd (ADR) | | | 326,472 | |
| | 10,400 | | | | Alpen Co Ltd | | | 159 | |
| | 1,132,969 | | *,n | | Amazon.com, Inc | | | 1,701,685 | |
| | 296,771 | | | | American Eagle Outfitters, Inc | | | 5,737 | |
| | 39,157 | | * | | America’s Car-Mart, Inc | | | 2,837 | |
| | 149,631 | | *,e | | AO World plc | | | 245 | |
| | 22,500 | | | | AOKI Holdings, Inc | | | 264 | |
| | 26,941 | | | | Aoyama Trading Co Ltd | | | 646 | |
| | 8,000 | | | | Arata Corp | | | 318 | |
| | 115,800 | | | | Arc Land Sakamoto Co Ltd | | | 1,423 | |
| | 16,000 | | * | | Arvind Fashions Ltd | | | 39 | |
| | 10,100 | | | | Asahi Co Ltd | | | 126 | |
| | 24,621 | | * | | Asbury Automotive Group, Inc | | | 1,641 | |
| | 223,283 | | * | | Ascena Retail Group, Inc | | | 560 | |
| | 12,700 | | e | | ASKUL Corp | | | 271 | |
| | 475,043 | | * | | ASOS plc | | | 13,791 | |
| | 55,033 | | * | | At Home Group, Inc | | | 1,027 | |
| | 46,388 | | | | Autobacs Seven Co Ltd | | | 769 | |
| | 138,157 | | | | Automotive Holdings Group Ltd | | | 152 | |
| | 111,282 | | * | | Autonation, Inc | | | 3,973 | |
| | 36,826 | | * | | AutoZone, Inc | | | 30,873 | |
| | 2,123,972 | | | | B&M European Value Retail S.A. | | | 7,622 | |
| | 3,338,873 | | * | | B2W Companhia Global Do Varejo | | | 36,081 | |
COLLEGE RETIREMENT EQUITIES FUND -Stock Account
| SHARES | | | | COMPANY | | VALUE
(000) | |
| | 38,407 | | *,e | | Baozun, Inc (ADR) | | $ | 1,122 | |
| | 390,469 | | * | | Barnes & Noble Education, Inc | | | 1,566 | |
| | 104,599 | | | | Barnes & Noble, Inc | | | 742 | |
| | 471,344 | | | | BCA Marketplace plc | | | 1,320 | |
| | 1,329,800 | | | | Beauty Community PCL (Foreign) | | | 267 | |
| | 5,765,068 | | e | | Bed Bath & Beyond, Inc | | | 65,261 | |
| | 36,000 | | | | Belluna Co Ltd | | | 328 | |
| | 2,638,160 | | | | Berjaya Auto BHD | | | 1,373 | |
| | 1,489,087 | | | | Best Buy Co, Inc | | | 78,862 | |
| | 77,000 | | | | BIC CAMERA, Inc | | | 976 | |
| | 19,844 | | e,m | | Big 5 Sporting Goods Corp | | | 51 | |
| | 50,781 | | | | Big Lots, Inc | | | 1,469 | |
| | 192,079 | | | | Bilia AB | | | 1,804 | |
| | 960,614 | | *,e | | BJ’s Wholesale Club Holdings, Inc | | | 21,287 | |
| | 572,260 | | * | | boohoo.com plc | | | 1,181 | |
| | 96,516 | | * | | Booking Holdings, Inc | | | 166,241 | |
| | 36,023 | | * | | Boot Barn Holdings, Inc | | | 613 | |
| | 707,245 | | *,e,g | | Boozt AB | | | 3,592 | |
| | 537,000 | | *,†,e | | Boshiwa International Holding | | | 1 | |
| | 37,146 | | e | | Buckle, Inc | | | 718 | |
| | 198,459 | | * | | Burlington Stores, Inc | | | 32,283 | |
| | 168,650 | | | | Burson Group Ltd | | | 700 | |
| | 6,916 | | | | Byggmax Group AB | | | 25 | |
| | 53,070 | | | | Caleres, Inc | | | 1,477 | |
| | 44,406 | | e | | Camping World Holdings, Inc | | | 509 | |
| | 86,689 | | | | Canadian Tire Corp Ltd | | | 9,064 | |
| | 150,700 | | | | Canon Marketing Japan, Inc | | | 2,686 | |
| | 584,326 | | e | | Card Factory plc | | | 1,292 | |
| | 536,086 | | * | | CarMax, Inc | | | 33,629 | |
| | 73,296 | | *,e | | Carvana Co | | | 2,397 | |
| | 13,840 | | e | | Cashbuild Ltd | | | 282 | |
| | 43,981 | | | | Cato Corp (Class A) | | | 628 | |
| | 206,337 | | e | | Chico’s FAS, Inc | | | 1,160 | |
| | 37,952 | | | | Children’s Place Retail Stores, Inc | | | 3,419 | |
| | 307,000 | | | | China Animation Characters Co Ltd | | | 105 | |
| | 24,700 | | | | China Grand Automotive Services Co Ltd | | | 15 | |
| | 449,000 | | e | | China Harmony New Energy Auto Holding Ltd | | | 169 | |
| | 2,064,000 | | | | China Meidong Auto Holdings Ltd | | | 782 | |
| | 561,500 | | | | China ZhengTong Auto Services Holdings Ltd | | | 335 | |
| | 9,900 | | e | | Chiyoda Co Ltd | | | 159 | |
| | 31,300 | | | | Chori Co Ltd | | | 474 | |
| | 567,000 | | | | Chow Sang Sang Holding | | | 843 | |
| | 177,945 | | | | Citi Trends, Inc | | | 3,628 | |
| | 10,750 | | | | CJ O Shopping Co Ltd | | | 1,946 | |
| | 21,985 | | e | | Clas Ohlson AB (B Shares) | | | 193 | |
| | 367,000 | | *,e,g | | Cogobuy Group | | | 124 | |
| | 5,896,800 | | | | Com7 PCL (Foreign) | | | 2,804 | |
| | 85,921 | | * | | Conn’s, Inc | | | 1,620 | |
| | 219,759 | | *,e | | Container Store Group, Inc | | | 1,048 | |
| | 468,729 | | | | Core-Mark Holding Co, Inc | | | 10,898 | |
| | 75,000 | | *,e | | CROOZ, Inc | | | 1,582 | |
| | 813,289 | | * | | Ctrip.com International Ltd (ADR) | | | 22,008 | |
| | 643 | | * | | Cuckoo Homesys Co Ltd | | | 103 | |
| | 502,169 | | | | Dah Chong Hong Holdings Ltd | | | 173 | |
COLLEGE RETIREMENT EQUITIES FUND -Stock Account
| SHARES | | | | COMPANY | | VALUE
(000) | |
| | 124,900 | | e | | DCM Japan Holdings Co Ltd | | $ | 1,307 | |
| | 22,215 | | | | Delek Automotive Systems Ltd | | | 87 | |
| | 77,860 | | *,g | | Delivery Hero AG. | | | 2,907 | |
| | 245,738 | | | | Dick’s Sporting Goods, Inc | | | 7,667 | |
| | 492,286 | | | | Dickson Concepts International Ltd | | | 241 | |
| | 62,210 | | | | Dieteren S.A. | | | 2,346 | |
| | 15,529 | | e | | Dillard’s, Inc (Class A) | | | 937 | |
| | 929,316 | | | | Dollar General Corp | | | 100,440 | |
| | 333,934 | | * | | Dollar Tree, Inc | | | 30,161 | |
| | 388,192 | | | | Dollarama, Inc | | | 9,233 | |
| | 95,200 | | | | Don Quijote Co Ltd | | | 5,886 | |
| | 13,100 | | | | Doshisha Co Ltd | | | 210 | |
| | 252,520 | | | | DSW, Inc (Class A) | | | 6,237 | |
| | 27,369 | | e | | Dufry Group | | | 2,606 | |
| | 11,875 | | *,e | | Duluth Holdings, Inc | | | 300 | |
| | 64,833 | | | | Dunelm Group plc | | | 447 | |
| | 119,781 | | g | | Dustin Group AB | | | 998 | |
| | 2,406,495 | | * | | eBay, Inc | | | 67,550 | |
| | 405,983 | | | | EDION Corp | | | 3,997 | |
| | 48,386 | | * | | eDreams ODIGEO S.A. | | | 132 | |
| | 909,336 | | e | | El Puerto de Liverpool SAB de C.V. | | | 5,838 | |
| | 32,605 | | | | Empresas Tricot S.A. | | | 45 | |
| | 105,000 | | * | | Enigmo, Inc | | | 1,984 | |
| | 1,310,200 | | *,e | | Esprit Holdings Ltd | | | 262 | |
| | 398,080 | | * | | Etsy, Inc | | | 18,937 | |
| | 109,469 | | g | | Europris ASA | | | 293 | |
| | 969,430 | | | | Expedia, Inc | | | 109,206 | |
| | 247,348 | | * | | Express Parent LLC | | | 1,264 | |
| | 588,000 | | | | Far Eastern Department Stores Co Ltd | | | 300 | |
| | 590,727 | | * | | Farfetch Ltd | | | 10,462 | |
| | 61,712 | | | | Fast Retailing Co Ltd | | | 31,519 | |
| | 167,228 | | * | | Five Below, Inc | | | 17,111 | |
| | 34,054 | | *,e | | Floor & Decor Holdings, Inc | | | 882 | |
| | 240,274 | | | | Foot Locker, Inc | | | 12,783 | |
| | 298,269 | | | | Foschini Ltd | | | 3,444 | |
| | 12,500 | | | | Fuji Co Ltd | | | 212 | |
| | 14,329 | | *,e | | Funko, Inc | | | 188 | |
| | 28,671 | | * | | Future Lifestyle Fashions Ltd | | | 173 | |
| | 16,466 | | *,e | | Gaia, Inc | | | 171 | |
| | 175,283 | | e | | GameStop Corp (Class A) | | | 2,212 | |
| | 349,775 | | | | Gap, Inc | | | 9,010 | |
| | 38,624 | | * | | Genesco, Inc | | | 1,711 | |
| | 71,546 | | | | Genuine Parts Co | | | 6,870 | |
| | 256,400 | | | | Geo Holdings Corp | | | 3,893 | |
| | 756,000 | | | | Giordano International Ltd | | | 357 | |
| | 147,636 | | *,e | | GNC Holdings, Inc | | | 350 | |
| | 565,615 | | e | | Gocompare.Com Group plc | | | 493 | |
| | 11,089,844 | | *,e | | GOME Electrical Appliances Holdings Ltd | | | 919 | |
| | 458,500 | | | | Grand Baoxin Auto Group Ltd | | | 129 | |
| | 63,651 | | | | Greencross Ltd | | | 244 | |
| | 24,137 | | | | Group 1 Automotive, Inc | | | 1,272 | |
| | 12,362 | | * | | Groupe Fnac | | | 808 | |
| | 5,321,484 | | * | | Groupon, Inc | | | 17,029 | |
COLLEGE RETIREMENT EQUITIES FUND -Stock Account
| SHARES | | | | COMPANY | | VALUE
(000) | |
| | 663,428 | | * | | GrubHub, Inc | | $ | 50,958 | |
| | 9,848 | | | | GS Home Shopping, Inc | | | 1,583 | |
| | 99,140 | | | | Guess?, Inc | | | 2,059 | |
| | 42,100 | | e | | Gulliver International Co Ltd | | | 139 | |
| | 147,620 | | | | Halfords Group plc | | | 481 | |
| | 55,525 | | | | Hankyu Department Stores, Inc | | | 788 | |
| | 711,144 | | e | | Harvey Norman Holdings Ltd | | | 1,583 | |
| | 24,491 | | | | Haverty Furniture Cos, Inc | | | 460 | |
| | 47,041 | | *,e | | HelloFresh SE | | | 329 | |
| | 4,161,037 | | * | | Hengdeli Holdings Ltd | | | 186 | |
| | 1,511,527 | | e | | Hennes & Mauritz AB (B Shares) | | | 21,496 | |
| | 85,345 | | * | | Hibbett Sports, Inc | | | 1,220 | |
| | 19,871 | | | | Hikari Tsushin, Inc | | | 3,106 | |
| | 3,551,133 | | | | Home Depot, Inc | | | 610,156 | |
| | 21,971,394 | | | | Home Product Center PCL (Foreign) | | | 10,253 | |
| | 6,750 | | | | Hornbach Holding AG. & Co KGaA | | | 319 | |
| | 230,518 | | | | Hotai Motor Co Ltd | | | 1,910 | |
| | 29,258 | | e | | Hotel Shilla Co Ltd | | | 2,007 | |
| | 487,037 | | * | | Hudson Ltd | | | 8,353 | |
| | 75,427 | | e | | Hudson’s Bay Co | | | 403 | |
| | 61,250 | | | | Hyundai Department Store Co Ltd | | | 4,960 | |
| | 11,831 | | | | Hyundai Home Shopping Network Corp | | | 1,050 | |
| | 307,603 | | | | Inchcape plc | | | 2,165 | |
| | 1,074,989 | | | | Industria De Diseno Textil S.A. | | | 27,439 | |
| | 230,528 | | | | Isetan Mitsukoshi Holdings Ltd | | | 2,547 | |
| | 28,400 | | e | | Istyle, Inc | | | 211 | |
| | 1,130,000 | | | | IT Ltd | | | 594 | |
| | 26,600 | | | | Izumi Co Ltd | | | 1,237 | |
| | 161,679 | | | | J Front Retailing Co Ltd | | | 1,850 | |
| | 89,181 | | * | | J. Jill, Inc | | | 475 | |
| | 60,451 | | | | Jardine Cycle & Carriage Ltd | | | 1,565 | |
| | 302,884 | | e | | JB Hi-Fi Ltd | | | 4,725 | |
| | 422,771 | | *,e | | JC Penney Co, Inc | | | 440 | |
| | 1,839,165 | | | | JD Sports Fashion plc | | | 8,190 | |
| | 865,700 | | * | | JD.com, Inc (ADR) | | | 18,119 | |
| | 10,100 | | | | Jin Co Ltd | | | 533 | |
| | 48,892 | | | | John Menzies plc | | | 317 | |
| | 39,800 | | | | Joshin Denki Co Ltd | | | 870 | |
| | 32,600 | | | | Joyful Honda Co Ltd | | | 408 | |
| | 114,871 | | | | JUMBO S.A. | | | 1,674 | |
| | 47,400 | | *,e | | Jumei International Holding Ltd (ADR) | | | 87 | |
| | 550,408 | | * | | Just Eat plc | | | 4,116 | |
| | 21,187 | | | | Keiyo Co Ltd | | | 101 | |
| | 175,415 | | | | Kering | | | 82,176 | |
| | 852,801 | | | | Kingfisher plc | | | 2,242 | |
| | 5,200 | | * | | Kintetsu Department Store Co Ltd | | | 164 | |
| | 150,309 | | * | | Kirkland’s, Inc | | | 1,432 | |
| | 181,919 | | | | Kogan.com Ltd | | | 436 | |
| | 981,762 | | | | Kohl’s Corp | | | 65,130 | |
| | 16,900 | | | | Kohnan Shoji Co Ltd | | | 408 | |
| | 82,000 | | | | Komeri Co Ltd | | | 1,764 | |
| | 521,200 | | | | K’s Holdings Corp | | | 5,130 | |
| | 585,971 | | | | L Brands, Inc | | | 15,042 | |
| | 600,000 | | | | L’ Occitane International S.A. | | | 1,092 | |
COLLEGE RETIREMENT EQUITIES FUND -Stock Account
| SHARES | | | | COMPANY | | VALUE
(000) | |
| | 103,414 | | *,e | | Lands’ End, Inc | | $ | 1,469 | |
| | 72,202 | | * | | Leaf Group Ltd | | | 495 | |
| | 3,735,985 | | | | Li & Fung Ltd | | | 589 | |
| | 8,500 | | | | Liaoning Cheng Da Co Ltd | | | 13 | |
| | 256,416 | | * | | Liberty Expedia Holdings, Inc | | | 10,028 | |
| | 347,000 | | * | | Lifestyle China Group Ltd | | | 120 | |
| | 426,000 | | | | Lifestyle International Holdings Ltd | | | 646 | |
| | 30,482 | | * | | Liquidity Services, Inc | | | 188 | |
| | 140,310 | | e | | Lithia Motors, Inc (Class A) | | | 10,710 | |
| | 217,200 | | | | LIXIL VIVA Corp | | | 3,072 | |
| | 136,589 | | * | | LKQ Corp | | | 3,241 | |
| | 600,000 | | | | Lojas Americanas S.A. | | | 2,322 | |
| | 2,528,694 | | | | Lojas Americanas S.A.(Preference) | | | 12,821 | |
| | 1,007,089 | | | | Lojas Renner S.A. | | | 10,987 | |
| | 497,225 | | | | Lookers plc | | | 586 | |
| | 63,158 | | | | LOTTE Himart Co Ltd | | | 2,646 | |
| | 42,091 | | | | Lotte Shopping Co Ltd | | | 7,947 | |
| | 153,002 | | | | Lovisa Holdings Ltd | | | 670 | |
| | 794,204 | | | | Lowe’s Companies, Inc | | | 73,353 | |
| | 225,000 | | | | Luk Fook Holdings International Ltd | | | 642 | |
| | 39,123 | | *,e | | Lumber Liquidators, Inc | | | 372 | |
| | 2,815,699 | | | | Macy’s, Inc | | | 83,851 | |
| | 129,168 | | | | Magazine Luiza S.A. | | | 6,021 | |
| | 28,731 | | g | | Maisons du Monde S.A. | | | 550 | |
| | 26,529 | | * | | MarineMax, Inc | | | 486 | |
| | 384,315 | | | | Marks & Spencer Group plc | | | 1,205 | |
| | 207,323 | | | | Marui Co Ltd | | | 4,018 | |
| | 109,288 | | | | Matas A.S. | | | 974 | |
| | 17,200 | | | | Matsuya Co Ltd | | | 174 | |
| | 26,054 | | | | Mekonomen AB | | | 267 | |
| | 300 | | *,e | | Mercari, Inc | | | 5 | |
| | 114,626 | | | | Metro AG. | | | 413 | |
| | 198,288 | | *,e | | Michaels Cos, Inc | | | 2,685 | |
| | 40,740 | | e | | Mobilezone Holding AG. | | | 453 | |
| | 18,000 | | | | momo.com, Inc | | | 110 | |
| | 1,780,054 | | | | Moneysupermarket.com Group plc | | | 6,250 | |
| | 40,752 | | | | Monro Muffler, Inc | | | 2,802 | |
| | 98,494 | | * | | Motus Holdings Ltd | | | 602 | |
| | 245,397 | | | | Mr Price Group Ltd | | | 4,193 | |
| | 82,955 | | * | | Murphy USA, Inc | | | 6,358 | |
| | 471,206 | | *,e | | Myer Holdings Ltd | | | 138 | |
| | 95,968 | | e,m | | N Brown Group plc | | | 115 | |
| | 77,696 | | * | | National Vision Holdings, Inc | | | 2,189 | |
| | 1,202,201 | | | | New Carphone Warehouse plc | | | 1,841 | |
| | 60,390 | | | | Next plc | | | 3,075 | |
| | 23,300 | | e | | Nextage Co Ltd | | | 229 | |
| | 29,400 | | | | Nishimatsuya Chain Co Ltd | | | 238 | |
| | 58,222 | | | | Nitori Co Ltd | | | 7,292 | |
| | 210,700 | | | | Nojima Corp | | | 4,271 | |
| | 282,830 | | | | Nordstrom, Inc | | | 13,183 | |
| | 9,577 | | | | NS Shopping Co Ltd | | | 110 | |
| | 37,151 | | | | Nutri/System, Inc | | | 1,630 | |
| | 534,412 | | * | | Ocado Ltd | | | 5,387 | |
COLLEGE RETIREMENT EQUITIES FUND -Stock Account
| SHARES | | | | COMPANY | | VALUE
(000) | |
| | 702,231 | | | | Office Depot, Inc | | $ | 1,812 | |
| | 12,500 | | * | | Oisix ra daichi, Inc | | | 207 | |
| | 162,330 | | * | | Ollie’s Bargain Outlet Holdings, Inc | | | 10,797 | |
| | 364,744 | | g | | On the Beach Group plc | | | 1,563 | |
| | 21,200 | | *,e | | Open Door, Inc | | | 491 | |
| | 206,464 | | * | | O’Reilly Automotive, Inc | | | 71,092 | |
| | 27,175 | | *,e | | Overstock.com, Inc | | | 369 | |
| | 1,202,300 | | | | Padini Holdings BHD | | | 1,022 | |
| | 5,800 | | | | Pal Co Ltd | | | 142 | |
| | 99,900 | | | | Paltac Corp | | | 4,711 | |
| | 15,000 | | | | Parco Co Ltd | | | 152 | |
| | 75,614 | | *,e | | Party City Holdco, Inc | | | 755 | |
| | 15,500 | | e | | PC Depot Corp | | | 61 | |
| | 52,780 | | * | | PC Home Online | | | 217 | |
| | 66,239 | | * | | PC Jeweller Ltd | | | 82 | |
| | 1,001,421 | | | | Pendragon plc | | | 287 | |
| | 138,791 | | | | Penske Auto Group, Inc | | | 5,596 | |
| | 26,378 | | e | | PetMed Express, Inc | | | 614 | |
| | 554,500 | | | | Petrobras Distribuidora S.A. | | | 3,672 | |
| | 315,492 | | | | Pets at Home Group plc | | | 466 | |
| | 70,524 | | | | Pool Corp | | | 10,483 | |
| | 5,252,500 | | | | Pou Sheng International Holdings Ltd | | | 1,013 | |
| | 36,701 | | | | Poya Co Ltd | | | 378 | |
| | 60,105 | | | | Premier Investments Ltd | | | 623 | |
| | 15,795,500 | | | | PT ACE Hardware Indonesia Tbk | | | 1,639 | |
| | 14,036,900 | | | | PT Matahari Department Store Tbk | | | 5,463 | |
| | 26,900,200 | | | | PT Mitra Adiperkasa Tbk | | | 1,506 | |
| | 7,732,200 | | | | PT Ramayana Lestari Sentosa Tbk | | | 764 | |
| | 402,800 | | | | PTG Energy PCL | | | 106 | |
| | 99,419 | | * | | Quotient Technology, Inc | | | 1,062 | |
| | 2,045,156 | | * | | Qurate Retail Group, Inc QVC Group | | | 39,921 | |
| | 227,718 | | e | | Rakuten, Inc | | | 1,528 | |
| | 225,015 | | * | | Rent-A-Center, Inc | | | 3,643 | |
| | 52,939 | | *,e | | RH | | | 6,343 | |
| | 431,186 | | | | Ripley Corp S.A. | | | 361 | |
| | 361,700 | | | | Robinson PCL | | | 705 | |
| | 43,236 | | *,g | | Rocket Internet SE | | | 999 | |
| | 510,403 | | | | Ross Stores, Inc | | | 42,466 | |
| | 105,833 | | * | | RTW RetailWinds, Inc | | | 299 | |
| | 20,600 | | | | Ryohin Keikaku Co Ltd | | | 5,001 | |
| | 7,906,816 | | | | SA SA International Holdings Ltd | | | 2,986 | |
| | 739,120 | | | | SACI Falabella | | | 5,418 | |
| | 153,552 | | * | | Sally Beauty Holdings, Inc | | | 2,618 | |
| | 31,900 | | | | Sanrio Co Ltd | | | 623 | |
| | 261,000 | | | | Senao International Co Ltd | | | 297 | |
| | 15,648 | | * | | Seobu Truck Terminal Co Ltd | | | 125 | |
| | 30,800 | | | | Seria Co Ltd | | | 1,047 | |
| | 36,059 | | * | | Shankara Building Products Ltd | | | 271 | |
| | 28,000 | | | | Shimachu Co Ltd | | | 756 | |
| | 15,303 | | | | Shimamura Co Ltd | | | 1,172 | |
| | 7,885 | | | | Shinsegae Co Ltd | | | 1,810 | |
| | 2,039 | | | | Shinsegae International Co Ltd | | | 357 | |
| | 51,201 | | e | | Shoe Carnival, Inc | | | 1,716 | |
| | 5,613 | | *,g | | Shop Apotheke Europe NV | | | 242 | |
COLLEGE RETIREMENT EQUITIES FUND -Stock Account
| SHARES | | | | COMPANY | | VALUE
(000) | |
| | 12,294 | | * | | Shopper’s Stop Ltd | | $ | 95 | |
| | 42,001 | | * | | Shutterfly, Inc | | | 1,691 | |
| | 23,551 | | | | Shutterstock, Inc | | | 848 | |
| | 752,687 | | | | Siam Global House PCL | | | 451 | |
| | 101,188 | | | | Signet Jewelers Ltd | | | 3,215 | |
| | 26,083 | | e,g | | Sleep Country Canada Holdings, Inc | | | 382 | |
| | 180,291 | | * | | Sleep Number Corp | | | 5,721 | |
| | 30,138 | | | | Sonic Automotive, Inc (Class A) | | | 415 | |
| | 140,320 | | * | | Sports Direct International plc | | | 426 | |
| | 52,099 | | *,e | | Sportsman’s Warehouse Holdings, Inc | | | 228 | |
| | 28,163 | | * | | Stamps.com, Inc | | | 4,383 | |
| | 140,816 | | | | Start Today Co Ltd | | | 2,580 | |
| | 217,500 | | | | Suning.com Co Ltd | | | 313 | |
| | 243,749 | | | | Super Cheap Auto Group Ltd | | | 1,208 | |
| | 220,506 | | * | | Super Group Ltd | | | 520 | |
| | 49,558 | | | | SuperGroup plc | | | 296 | |
| | 103,714 | | | | Tailored Brands, Inc | | | 1,415 | |
| | 100,309 | | | | Takashimaya Co Ltd | | | 1,281 | |
| | 14,055 | | *,g | | Takeaway.com Holding BV | | | 950 | |
| | 25,510 | | | | Takkt AG. | | | 399 | |
| | 1,162,568 | | | | Target Corp | | | 76,834 | |
| | 60,700 | | | | Telepark Corp | | | 1,146 | |
| | 7,158,099 | | | | Test-Rite International Co | | | 5,241 | |
| | 653,340 | | n | | Tiffany & Co | | | 52,600 | |
| | 56,506 | | | | Tile Shop Holdings, Inc | | | 310 | |
| | 388,858 | | | | Tilly’s, Inc | | | 4,223 | |
| | 2,822,921 | | | | TJX Companies, Inc | | | 126,297 | |
| | 36,298 | | | | Tokmanni Group Corp | | | 299 | |
| | 11,700 | | *,e | | Tokyo Base Co Ltd | | | 57 | |
| | 9,500 | | e | | Tokyo Derica Co Ltd | | | 96 | |
| | 332,301 | | | | Tractor Supply Co | | | 27,727 | |
| | 295,708 | | | | Trade Me Ltd | | | 1,261 | |
| | 730,816 | | | | Truworths International Ltd | | | 4,469 | |
| | 258,334 | | * | | Ulta Beauty, Inc | | | 63,250 | |
| | 25,363 | | e | | Uni-Select, Inc | | | 361 | |
| | 56,599 | | | | United Arrows Ltd | | | 1,803 | |
| | 364,492 | | * | | Urban Outfitters, Inc | | | 12,101 | |
| | 213,886 | | | | USS Co Ltd | | | 3,589 | |
| | 2,212 | | | | Valora Holding AG. | | | 485 | |
| | 8,543,100 | | | | Via Varejo S.A. | | | 9,695 | |
| | 1,034,700 | | * | | Vipshop Holdings Ltd (ADR) | | | 5,649 | |
| | 5,200 | | * | | V-Mart Retail Ltd | | | 193 | |
| | 46,800 | | | | VT Holdings Co Ltd | | | 174 | |
| | 81,858 | | *,e | | Wayfair, Inc | | | 7,374 | |
| | 1,020,000 | | *,e | | We Solutions Ltd | | | 65 | |
| | 109,051 | | | | Webjet Ltd | | | 844 | |
| | 1,021,920 | | | | Wesfarmers Ltd | | | 23,217 | |
| | 14,037 | | | | Weyco Group, Inc | | | 409 | |
| | 333,879 | | | | WH Smith plc | | | 7,324 | |
| | 840,600 | | | | Wilcon Depot, Inc | | | 202 | |
| | 213,859 | | e | | Williams-Sonoma, Inc | | | 10,789 | |
| | 3,135 | | | | Winmark Corp | | | 498 | |
| | 906,849 | | | | Woolworths Holdings Ltd | | | 3,473 | |
COLLEGE RETIREMENT EQUITIES FUND -Stock Account
| SHARES | | | | COMPANY | | VALUE
(000) | |
| | 15,400 | | | | Xebio Co Ltd | | $ | 177 | |
| | 61,041 | | e,g | | XXL ASA | | | 185 | |
| | 485,604 | | | | Yamada Denki Co Ltd | | | 2,332 | |
| | 51,300 | | | | Yellow Hat Ltd | | | 1,225 | |
| | 80,500 | | | | Yume No Machi Souzou Iinkai Co Ltd | | | 937 | |
| | 19,886 | | *,g | | Zalando SE | | | 514 | |
| | 498,500 | | | | Zhongsheng Group Holdings Ltd | | | 989 | |
| | 3,934 | | * | | zooplus AG. | | | 539 | |
| | 125,999 | | * | | Zumiez, Inc | | | 2,415 | |
| | | | | | TOTAL RETAILING | | | 5,238,394 | |
| | | | | | | | | | |
| SEMICONDUCTORS & SEMICONDUCTOR EQUIPMENT - 3.3% |
| | 545,227 | | *,e | | Acacia Communications, Inc | | | 20,719 | |
| | 7,849 | | *,e | | ACM Research, Inc | | | 85 | |
| | 1,354,615 | | | | A-DATA Technology Co Ltd | | | 1,760 | |
| | 24,970 | | *,e | | Adesto Technologies Corp | | | 110 | |
| | 114,138 | | * | | Advanced Energy Industries, Inc | | | 4,900 | |
| | 4,958,181 | | *,e | | Advanced Micro Devices, Inc | | | 91,528 | |
| | 6,279 | | * | | Advanced Process Systems Corp | | | 122 | |
| | 620,500 | | | | Advantest Corp | | | 12,696 | |
| | 164,650 | | * | | Aixtron AG. | | | 1,596 | |
| | 27,755 | | * | | Alpha & Omega Semiconductor Ltd | | | 283 | |
| | 39,608 | | *,e | | Ambarella, Inc | | | 1,385 | |
| | 369,402 | | * | | Amkor Technology, Inc | | | 2,423 | |
| | 50,456 | | e | | ams AG. | | | 1,215 | |
| | 531,298 | | | | Analog Devices, Inc | | | 45,601 | |
| | 6,500 | | e | | AOI Electronics Co Ltd | | | 149 | |
| | 2,808,551 | | | | Applied Materials, Inc | | | 91,952 | |
| | 200,000 | | * | | APS Holdings Corp | | | 760 | |
| | 26,580 | | *,e | | Aquantia Corp | | | 233 | |
| | 271,738 | | | | Ardentec Corp | | | 231 | |
| | 5,249,445 | | | | ASE Industrial Holding Co Ltd | | | 9,947 | |
| | 26,239 | | | | ASM International NV | | | 1,082 | |
| | 357,704 | | | | ASM Pacific Technology | | | 3,453 | |
| | 21,884 | | | | ASMedia Technology, Inc | | | 355 | |
| | 659,920 | | | | ASML Holding NV | | | 103,383 | |
| | 14,000 | | | | ASPEED Technology, Inc | | | 269 | |
| | 21,446 | | * | | Atto Co Ltd | | | 68 | |
| | 68,823 | | * | | Axcelis Technologies, Inc | | | 1,225 | |
| | 52,026 | | * | | AXT, Inc | | | 226 | |
| | 390,150 | | | | BE Semiconductor Industries NV | | | 8,224 | |
| | 1,250,690 | | | | Broadcom, Inc | | | 318,025 | |
| | 163,976 | | | | Brooks Automation, Inc | | | 4,293 | |
| | 55,438 | | | | Cabot Microelectronics Corp | | | 5,286 | |
| | 46,154 | | * | | Ceva, Inc | | | 1,020 | |
| | 11,000 | | | | Chang Wah Technology Co Ltd | | | 105 | |
| | 11,538 | | *,† | | China Energy Savings Technology, Inc | | | 0 | |
| | 4,414,100 | | | | Chipbond Technology Corp | | | 8,863 | |
| | 203,436 | | | | ChipMOS Technologies, Inc | | | 173 | |
| | 156,297 | | * | | Cirrus Logic, Inc | | | 5,186 | |
| | 135,063 | | | | Cohu, Inc | | | 2,170 | |
| | 1,531,801 | | *,e | | Cree, Inc | | | 65,523 | |
| | 486,679 | | | | Cypress Semiconductor Corp | | | 6,191 | |
| | 23,923 | | | | Dainippon Screen Manufacturing Co Ltd | | | 1,003 | |
COLLEGE RETIREMENT EQUITIES FUND -Stock Account
| SHARES | | | | COMPANY | | VALUE
(000) | |
| | 41,100 | | *,e | | Daqo New Energy Corp (ADR) | | $ | 962 | |
| | 165,071 | | * | | Dialog Semiconductor plc | | | 4,278 | |
| | 359,070 | | * | | Diodes, Inc | | | 11,584 | |
| | 34,000 | | | | Disco Corp | | | 3,953 | |
| | 136,812 | | | | Dongbu HiTek Co Ltd | | | 1,337 | |
| | 193,400 | | | | Elan Microelectronics Corp | | | 475 | |
| | 170,000 | | | | Elite Semiconductor Memory Technology, Inc | | | 166 | |
| | 36,075 | | | | Elmos Semiconductor AG. | | | 800 | |
| | 50,571 | | | | eMemory Technology, Inc | | | 432 | |
| | 346,094 | | | | Entegris, Inc | | | 9,654 | |
| | 5,349 | | | | Eo Technics Co Ltd | | | 232 | |
| | 524,000 | | | | Epistar Corp | | | 434 | |
| | 258,000 | | | | Everlight Electronics Co Ltd | | | 248 | |
| | 134,060 | | | | Faraday Technology Corp | | | 184 | |
| | 20,700 | | | | Ferrotec | | | 148 | |
| | 196,265 | | * | | First Solar, Inc | | | 8,332 | |
| | 232,000 | | | | Forhouse Corp | | | 121 | |
| | 96,295 | | * | | Formfactor, Inc | | | 1,357 | |
| | 144,000 | | | | Formosa Advanced Technologies Co Ltd | | | 149 | |
| | 238,850 | | | | Foxsemicon Integrated Technology, Inc | | | 1,003 | |
| | 7,598,000 | | *,e | | GCL Poly Energy Holdings Ltd | | | 461 | |
| | 14,952 | | *,e | | GemVax & Kael Co Ltd | | | 161 | |
| | 55,000 | | | | Global Unichip Corp | | | 364 | |
| | 215,000 | | | | Globalwafers Co Ltd | | | 1,971 | |
| | 353,033 | | | | Globetronics Technology BHD | | | 149 | |
| | 857,000 | | | | Greatek Electronics, Inc | | | 1,200 | |
| | 839,200 | | | | Hana Microelectronics PCL (Foreign) | | | 851 | |
| | 15,479 | | | | Hanmi Semiconductor Co Ltd | | | 108 | |
| | 119,000 | | | | Holtek Semiconductor, Inc | | | 225 | |
| | 445,000 | | g | | Hua Hong Semiconductor Ltd | | | 823 | |
| | 947,371 | | | | Hynix Semiconductor, Inc | | | 51,647 | |
| | 31,649 | | *,e | | Ichor Holdings Ltd | | | 516 | |
| | 21,604 | | *,e | | Impinj, Inc | | | 314 | |
| | 1,446,683 | | | | Infineon Technologies AG. | | | 28,965 | |
| | 3,801 | | * | | Innox Advanced Materials Co Ltd | | | 129 | |
| | 496,652 | | *,e | | Inphi Corp | | | 15,967 | |
| | 279,273 | | * | | Integrated Device Technology, Inc | | | 13,525 | |
| | 11,409,643 | | n | | Intel Corp | | | 535,455 | |
| | 454,740 | | *,e | | IQE plc | | | 377 | |
| | 44,200 | | | | Japan Material Co Ltd | | | 430 | |
| | 40,500 | | *,e | | JinkoSolar Holding Co Ltd (ADR) | | | 401 | |
| | 23,419 | | | | Jusung Engineering Co Ltd | | | 136 | |
| | 602,000 | | | | King Yuan Electronics Co Ltd | | | 453 | |
| | 174,000 | | | | Kinsus Interconnect Technology Corp | | | 246 | |
| | 337,153 | | | | Kla-Tencor Corp | | | 30,172 | |
| | 5,426 | | | | Koh Young Technology, Inc | | | 402 | |
| | 84,673 | | *,e,m | | Kopin Corp | | | 85 | |
| | 8,300 | | | | L&F Co Ltd | | | 272 | |
| | 424,445 | | | | Lam Research Corp | | | 57,797 | |
| | 36,800 | | | | Land Mark Optoelectronics Corp | | | 270 | |
| | 24,200 | | | | Lasertec Corp | | | 618 | |
| | 1,186,253 | | * | | Lattice Semiconductor Corp | | | 8,209 | |
| | 8,232 | | | | LEENO Industrial Inc | | | 347 | |
COLLEGE RETIREMENT EQUITIES FUND -Stock Account
| SHARES | | | | COMPANY | | VALUE
(000) | |
| | 179,726 | | | | Lextar Electronics Corp | | $ | 104 | |
| | 35,100 | | | | LONGi Green Energy Technology Co Ltd | | | 89 | |
| | 20,000 | | * | | Machvision, Inc | | | 243 | |
| | 60,402 | | *,e | | MA-COM Technology Solutions | | | 876 | |
| | 1,117,000 | | | | Macronix International | | | 663 | |
| | 204,700 | | | | Malaysian Pacific Industries BHD | | | 493 | |
| | 3,657,169 | | | | Marvell Technology Group Ltd | | | 59,210 | |
| | 564,109 | | | | Maxim Integrated Products, Inc | | | 28,685 | |
| | 79,593 | | * | | MaxLinear, Inc | | | 1,401 | |
| | 3,516,794 | | | | MediaTek, Inc | | | 26,174 | |
| | 2,086 | | | | Meerecompany, Inc | | | 93 | |
| | 9,700 | | | | Megachips Corp | | | 205 | |
| | 13,321 | | e | | Melexis NV | | | 775 | |
| | 1 | | * | | Mellanox Technologies Ltd | | | 0 | ^ |
| | 386,619 | | *,e | | Meyer Burger Technology AG. | | | 237 | |
| | 296,910 | | e | | Microchip Technology, Inc | | | 21,354 | |
| | 2,118,932 | | * | | Micron Technology, Inc | | | 67,234 | |
| | 17,300 | | | | Micronics Japan Co Ltd | | | 109 | |
| | 40,400 | | | | Mimasu Semiconductor Industry Co Ltd | | | 478 | |
| | 13,800 | | e | | Mitsui High-Tec, Inc | | | 106 | |
| | 82,409 | | | | MKS Instruments, Inc | | | 5,324 | |
| | 202,103 | | | | Monolithic Power Systems, Inc | | | 23,494 | |
| | 29,113 | | * | | Nanometrics, Inc | | | 796 | |
| | 1,040,000 | | | | Nanya Technology Corp | | | 1,862 | |
| | 1,284,405 | | * | | Neo Solar Power Corp | | | 327 | |
| | 130,260 | | *,e | | NeoPhotonics Corp Ltd | | | 844 | |
| | 87,084 | | *,e | | Nordic Semiconductor ASA | | | 291 | |
| | 18,796 | | * | | Nova Measuring Instruments Ltd | | | 425 | |
| | 1,696,752 | | | | Novatek Microelectronics Corp Ltd | | | 7,833 | |
| | 44,200 | | | | Nuflare Technology, Inc | | | 2,000 | |
| | 6,398 | | | | NVE Corp | | | 560 | |
| | 1,755,026 | | | | NVIDIA Corp | | | 234,296 | |
| | 1,141,904 | | | | NXP Semiconductors NV | | | 83,679 | |
| | 1,052,765 | | * | | ON Semiconductor Corp | | | 17,381 | |
| | 21,440 | | | | On-Bright Electronics, Inc | | | 125 | |
| | 7,200 | | e | | Optorun Co Ltd | | | 109 | |
| | 193,000 | | * | | Pan Jit International, Inc | | | 158 | |
| | 43,401 | | | | Parade Technologies Ltd | | | 610 | |
| | 39,534 | | * | | PDF Solutions, Inc | | | 333 | |
| | 134,895 | | | | Phison Electronics Corp | | | 1,004 | |
| | 429,716 | | * | | Photronics, Inc | | | 4,160 | |
| | 82,613 | | | | Pixart Imaging, Inc | | | 235 | |
| | 44,575 | | | | Power Integrations, Inc | | | 2,718 | |
| | 474,397 | | | | Powertech Technology, Inc | | | 1,020 | |
| | 241,248 | | * | | Qorvo, Inc | | | 14,651 | |
| | 3,014,784 | | | | QUALCOMM, Inc | | | 171,571 | |
| | 2,493,000 | | | | Radiant Opto-Electronics Corp | | | 6,884 | |
| | 246,804 | | * | | Rambus, Inc | | | 1,893 | |
| | 2,364,333 | | | | Realtek Semiconductor Corp | | | 10,966 | |
| | 431,285 | | * | | Renesas Electronics Corp | | | 1,959 | |
| | 5,497 | | | | RFHIC Corp | | | 121 | |
| | 407,608 | | | | Rohm Co Ltd | | | 26,016 | |
| | 2,700 | | e | | RS Technologies Co Ltd | | | 70 | |
| | 362,575 | | * | | Rudolph Technologies, Inc | | | 7,422 | |
COLLEGE RETIREMENT EQUITIES FUND -Stock Account
| SHARES | | | | COMPANY | | VALUE
(000) | |
| | 7,270,024 | | | | Samsung Electronics Co Ltd | | $ | 253,082 | |
| | 998,692 | | | | Samsung Electronics Co Ltd (Preference) | | | 28,536 | |
| | 61,238 | | | | Sanan Optoelectronics Co Ltd | | | 101 | |
| | 14,799 | | e | | Sanken Electric Co Ltd | | | 276 | |
| | 79,000 | | | | SDI Corp | | | 177 | |
| | 2,702,547 | | *,e | | Semiconductor Manufacturing International Corp | | | 2,356 | |
| | 323,911 | | * | | Semtech Corp | | | 14,858 | |
| | 23,754 | | | | Seoul Semiconductor Co Ltd | | | 414 | |
| | 166,000 | | * | | Shanghai Fudan Microelectronics Group Co Ltd | | | 148 | |
| | 9,600 | | | | Shindengen Electric Manufacturing Co Ltd | | | 330 | |
| | 980,000 | | *,e | | Shinkawa Ltd | | | 3,391 | |
| | 716,500 | | | | Shinko Electric Industries | | | 4,565 | |
| | 230,000 | | | | Sigurd Microelectronics Corp | | | 202 | |
| | 40,934 | | | | Silergy Corp | | | 602 | |
| | 55,708 | | * | | Silicon Laboratories, Inc | | | 4,390 | |
| | 7,220 | | | | Silicon Works Co Ltd | | | 218 | |
| | 136,907 | | | | Siltronic AG. | | | 11,391 | |
| | 294,000 | | | | Sino-American Silicon Products, Inc | | | 585 | |
| | 175,000 | | | | Sitronix Technology Corp | | | 574 | |
| | 330,399 | | | | Skyworks Solutions, Inc | | | 22,143 | |
| | 6,378 | | | | SMA Solar Technology AG. | | | 121 | |
| | 13,336 | | *,e | | SMART Global Holdings, Inc | | | 396 | |
| | 14,924 | | * | | SOITEC | | | 864 | |
| | 670,229 | | | | STMicroelectronics NV | | | 9,500 | |
| | 381,234 | | e | | Sumco Corp | | | 4,246 | |
| | 78,395 | | *,e | | SunPower Corp | | | 390 | |
| | 898,300 | | | | SVI PCL (Foreign) | | | 135 | |
| | 653,000 | | | | Taiwan Semiconductor Co Ltd | | | 1,083 | |
| | 37,181,058 | | | | Taiwan Semiconductor Manufacturing Co Ltd | | | 269,980 | |
| | 532,032 | | | | Teradyne, Inc | | | 16,695 | |
| | 1,678,421 | | | | Texas Instruments, Inc | | | 158,611 | |
| | 2,826 | | | | Tokai Carbon Korea Co Ltd | | | 102 | |
| | 96,446 | | | | Tokyo Electron Ltd | | | 10,857 | |
| | 24,300 | | | | Tokyo Seimitsu Co Ltd | | | 612 | |
| | 656,550 | | | | Topco Scientific Co Ltd | | | 1,483 | |
| | 14,911 | | *,† | | Toptec Co Ltd | | | 94 | |
| | 64,936 | | * | | Tower Semiconductor Ltd | | | 975 | |
| | 1,746,000 | | *,†,m | | Trony Solar Holdings Co Ltd. | | | 2 | |
| | 4,508 | | | | U-Blox AG. | | | 363 | |
| | 51,400 | | | | UKC Holdings Corp | | | 856 | |
| | 49,866 | | * | | Ultra Clean Holdings | | | 422 | |
| | 26,600 | | | | Ulvac, Inc | | | 768 | |
| | 607,100 | | | | Unisem M BHD | | | 482 | |
| | 27,326,871 | | | | United Microelectronics Corp | | | 9,881 | |
| | 180,933 | | e | | Universal Display Corp | | | 16,930 | |
| | 2,477,228 | | | | Vanguard International Semiconductor Corp | | | 4,805 | |
| | 64,761 | | * | | Veeco Instruments, Inc | | | 480 | |
| | 117,124 | | | | Versum Materials, Inc | | | 3,247 | |
| | 138,000 | | * | | Via Technologies, Inc | | | 117 | |
| | 101,068 | | | | Visual Photonics Epitaxy Co Ltd | | | 213 | |
| | 96,400 | | | | ViTrox Corp BHD | | | 147 | |
| | 307,975 | | | | Wafer Works Corp | | | 334 | |
| | 3,361,500 | | | | Win Semiconductors Corp | | | 12,950 | |
COLLEGE RETIREMENT EQUITIES FUND -Stock Account
| SHARES | | | | COMPANY | | VALUE
(000) | |
| | 2,398,000 | | | | Winbond Electronics Corp | | $ | 1,057 | |
| | 15,304 | | | | WONIK IPS Co Ltd | | | 276 | |
| | 36,298 | | *,e,g | | X-Fab Silicon Foundries SE | | | 177 | |
| | 1,147,960 | | | | Xilinx, Inc | | | 97,772 | |
| | 103,000 | | * | | XinTec, Inc | | | 114 | |
| | 2,645,725 | | e | | Xinyi Solar Holdings Ltd | | | 933 | |
| | 94,125 | | | | Xperi Corp | | | 1,731 | |
| | | | | | TOTAL SEMICONDUCTORS & SEMICONDUCTOR EQUIPMENT | | | 3,440,919 | |
| | | | | | | | | | |
| SOFTWARE & SERVICES - 8.8% |
| | 68,500 | | * | | 21Vianet Group, Inc (ADR) | | | 592 | |
| | 85,022 | | *,e | | 2U, Inc | | | 4,227 | |
| | 3,600 | | | | 360 Security Technology, Inc | | | 11 | |
| | 119,026 | | * | | 8x8, Inc | | | 2,147 | |
| | 260,949 | | * | | A10 Networks, Inc | | | 1,628 | |
| | 1,520,366 | | | | Accenture plc | | | 214,387 | |
| | 147,524 | | * | | ACI Worldwide, Inc | | | 4,082 | |
| | 956,785 | | * | | Adobe, Inc | | | 216,463 | |
| | 1,967 | | *,e,g | | Adyen NV | | | 1,063 | |
| | 237,151 | | *,e | | Afterpay Touch Group Ltd | | | 2,074 | |
| | 2,200,000 | | *,e | | AGTech Holdings Ltd | | | 136 | |
| | 4,046 | | | | Ahnlab, Inc | | | 168 | |
| | 61,500 | | | | Aisino Corp | | | 205 | |
| | 575,426 | | * | | Akamai Technologies, Inc | | | 35,147 | |
| | 39,227 | | * | | Alarm.com Holdings, Inc | | | 2,035 | |
| | 53,147 | | *,g | | Alfa Financial Software Holdings plc | | | 78 | |
| | 119,837 | | | | Alliance Data Systems Corp | | | 17,985 | |
| | 244,787 | | | | Alpha Systems, Inc | | | 5,577 | |
| | 70,228 | | * | | Altair Engineering, Inc | | | 1,937 | |
| | 38,048 | | | | Alten | | | 3,172 | |
| | 38,239 | | *,e | | Alteryx, Inc | | | 2,274 | |
| | 288,748 | | | | Altium Ltd | | | 4,420 | |
| | 150,968 | | e | | Altran Technologies S.A. | | | 1,213 | |
| | 588,605 | | | | Amadeus IT Holding S.A. | | | 40,954 | |
| | 193,911 | | * | | Amber Road, Inc | | | 1,596 | |
| | 261,933 | | | | Amdocs Ltd | | | 15,344 | |
| | 35,981 | | | | American Software, Inc (Class A) | | | 376 | |
| | 982,354 | | *,e | | Anaplan, Inc | | | 26,072 | |
| | 100,303 | | * | | Ansys, Inc | | | 14,337 | |
| | 156,406 | | | | Appen Ltd | | | 1,415 | |
| | 21,581 | | * | | Appfolio, Inc | | | 1,278 | |
| | 81,825 | | *,m | | Apptio, Inc | | | 3,106 | |
| | 10,400 | | | | Argo Graphics, Inc | | | 364 | |
| | 159,144 | | * | | Aspen Technology, Inc | | | 13,078 | |
| | 286,690 | | | | Asseco Poland S.A. | | | 3,537 | |
| | 14,292 | | *,e | | Asure Software, Inc | | | 73 | |
| | 89,617 | | * | | Atlassian Corp plc | | | 7,974 | |
| | 127,055 | | | | Atos Origin S.A. | | | 10,410 | |
| | 17,526 | | | | Aubay | | | 565 | |
| | 195,054 | | * | | Autodesk, Inc | | | 25,086 | |
| | 1,016,283 | | | | Automatic Data Processing, Inc | | | 133,255 | |
| | 18,030 | | *,e | | Avalara, Inc | | | 562 | |
| | 448,595 | | *,g | | Avast plc | | | 1,629 | |
| | 132,968 | | * | | Avaya Holdings Corp | | | 1,936 | |
COLLEGE RETIREMENT EQUITIES FUND -Stock Account
| SHARES | | | | COMPANY | | VALUE
(000) | |
| | 49,130 | | | | Aveva Group plc | | $ | 1,516 | |
| | 40,916 | | | | Bechtle AG. | | | 3,187 | |
| | 8,600 | | | | Beijing Shiji Information Technology Co Ltd | | | 33 | |
| | 49,829 | | *,e | | Benefitfocus, Inc | | | 2,278 | |
| | 354,655 | | * | | Black Knight, Inc | | | 15,981 | |
| | 61,753 | | | | Blackbaud, Inc | | | 3,884 | |
| | 320,427 | | * | | Blackberry Ltd (New) | | | 2,279 | |
| | 165,356 | | * | | Blackline, Inc | | | 6,771 | |
| | 153,079 | | *,e | | Blue Prism Group plc | | | 2,151 | |
| | 649,157 | | | | Booz Allen Hamilton Holding Co | | | 29,258 | |
| | 53,330 | | * | | Bottomline Technologies, Inc | | | 2,560 | |
| | 370,608 | | * | | Box, Inc | | | 6,256 | |
| | 269,400 | | | | Bravura Solutions Ltd | | | 702 | |
| | 47,488 | | * | | Brightcove, Inc | | | 334 | |
| | 58,600 | | e | | Broadleaf Co Ltd | | | 284 | |
| | 245,753 | | | | Broadridge Financial Solutions, Inc | | | 23,654 | |
| | 160,000 | | | | CAC Holdings Corp | | | 1,358 | |
| | 82,470 | | * | | CACI International, Inc (Class A) | | | 11,878 | |
| | 564,124 | | * | | Cadence Design Systems, Inc | | | 24,528 | |
| | 3,829 | | * | | Cafe24 Corp | | | 378 | |
| | 27,339 | | | | Cancom SE | | | 897 | |
| | 240,946 | | | | Cap Gemini S.A. | | | 23,966 | |
| | 48,452 | | *,e | | Carbon Black, Inc | | | 650 | |
| | 40,842 | | * | | Carbonite, Inc | | | 1,032 | |
| | 81,490 | | * | | Cardtronics plc | | | 2,119 | |
| | 17,983 | | | | Cass Information Systems, Inc | | | 952 | |
| | 362,857 | | | | CDK Global, Inc | | | 17,374 | |
| | 50,568 | | *,e | | Ceridian HCM Holding, Inc | | | 1,744 | |
| | 431,335 | | * | | CGI Group, Inc | | | 26,382 | |
| | 128,690 | | * | | ChannelAdvisor Corp | | | 1,461 | |
| | 144,238 | | * | | Check Point Software Technologies | | | 14,806 | |
| | 1,278,000 | | e | | Chinasoft International Ltd | | | 636 | |
| | 1,160,213 | | | | Cielo S.A. | | | 2,659 | |
| | 83,542 | | * | | Cision Ltd | | | 977 | |
| | 318,264 | | | | Citrix Systems, Inc | | | 32,609 | |
| | 787,583 | | * | | Cloudera, Inc | | | 8,711 | |
| | 1,198,625 | | | | Cognizant Technology Solutions Corp (Class A) | | | 76,089 | |
| | 49,653 | | * | | Commvault Systems, Inc | | | 2,934 | |
| | 439,499 | | | | Computacenter plc | | | 5,638 | |
| | 17,400 | | | | Computer Engineering & Consulting Ltd | | | 289 | |
| | 705,150 | | | | Computershare Ltd | | | 8,546 | |
| | 15,700 | | | | Comture Corp | | | 339 | |
| | 191,075 | | * | | Conduent, Inc | | | 2,031 | |
| | 34,840 | | | | Constellation Software, Inc | | | 22,301 | |
| | 35,899 | | m | | ConvergeOne Holdings, Inc | | | 444 | |
| | 69,345 | | * | | Cornerstone OnDemand, Inc | | | 3,497 | |
| | 202,262 | | * | | Coupa Software, Inc | | | 12,714 | |
| | 93,628 | | | | CSG Systems International, Inc | | | 2,975 | |
| | 83,801 | | * | | CyberArk Software Ltd | | | 6,213 | |
| | 784,320 | | | | Dassault Systemes S.A. | | | 93,161 | |
| | 420,060 | | * | | Descartes Systems Group, Inc | | | 11,086 | |
| | 17,172 | | | | Devoteam S.A. | | | 1,624 | |
COLLEGE RETIREMENT EQUITIES FUND -Stock Account
| SHARES | | | | COMPANY | | VALUE
(000) | |
| | 17,400 | | | | DHC Software Co Ltd | | $ | 18 | |
| | 15,090 | | *,e | | Digimarc Corp | | | 219 | |
| | 10,900 | | e | | Digital Arts, Inc | | | 605 | |
| | 429,000 | | *,e | | Digital China Holdings Ltd | | | 198 | |
| | 21,600 | | | | Digital Garage, Inc | | | 492 | |
| | 113,856 | | *,e | | DocuSign, Inc | | | 4,563 | |
| | 11,319 | | *,e | | Domo, Inc | | | 222 | |
| | 58,100 | | | | DTS Corp | | | 1,857 | |
| | 15,390 | | | | DuzonBIzon Co Ltd | | | 717 | |
| | 3,436,259 | | | | DXC Technology Co | | | 182,706 | |
| | 30,795 | | e | | Ebix, Inc | | | 1,311 | |
| | 22,828 | | * | | eClerx Services Ltd | | | 351 | |
| | 80,123 | | e | | Econocom Group S.A. | | | 267 | |
| | 140,294 | | | | EDB Business Partner ASA | | | 511 | |
| | 21,468 | | * | | eGain Corp | | | 141 | |
| | 12,695 | | * | | Elastic NV | | | 907 | |
| | 43,621 | | *,e | | Ellie Mae, Inc | | | 2,741 | |
| | 51,597 | | | | Ementor ASA | | | 664 | |
| | 410,813 | | * | | Endurance International Group Holdings, Inc | | | 2,732 | |
| | 52,173 | | | | Enghouse Systems Ltd | | | 2,538 | |
| | 56,809 | | * | | Envestnet, Inc | | | 2,794 | |
| | 91,705 | | * | | EOH Holdings Ltd | | | 196 | |
| | 81,920 | | * | | EPAM Systems, Inc | | | 9,504 | |
| | 730,168 | | g | | Equiniti Group plc | | | 2,018 | |
| | 110,896 | | * | | Euronet Worldwide, Inc | | | 11,354 | |
| | 34,791 | | * | | Everbridge, Inc | | | 1,975 | |
| | 825,033 | | * | | Everi Holdings, Inc | | | 4,249 | |
| | 261,268 | | | | EVERTEC, Inc | | | 7,498 | |
| | 30,595 | | *,e | | Evo Payments, Inc | | | 755 | |
| | 60,396 | | * | | Exela Technologies, Inc | | | 235 | |
| | 46,958 | | * | | ExlService Holdings, Inc | | | 2,471 | |
| | 51,044 | | * | | Fair Isaac Corp | | | 9,545 | |
| | 2,300 | | *,e | | FFRI, Inc | | | 58 | |
| | 581,665 | | | | Fidelity National Information Services, Inc | | | 59,650 | |
| | 254,121 | | *,e | | FireEye, Inc | | | 4,119 | |
| | 114,485 | | * | | First American Corp | | | 3,826 | |
| | 1,037,350 | | * | | First Data Corp | | | 17,542 | |
| | 49,565 | | | | First Derivatives plc | | | 1,337 | |
| | 876,928 | | * | | Firstsource Solutions Ltd | | | 589 | |
| | 743,922 | | * | | Fiserv, Inc | | | 54,671 | |
| | 375,442 | | * | | Five9, Inc | | | 16,414 | |
| | 160,195 | | * | | FleetCor Technologies, Inc | | | 29,751 | |
| | 329,230 | | * | | ForeScout Technologies, Inc | | | 8,557 | |
| | 14,732 | | | | Formula Systems 1985 Ltd | | | 546 | |
| | 358,524 | | * | | Fortinet, Inc | | | 25,251 | |
| | 55,116 | | | | Fortnox AB | | | 415 | |
| | 59,035 | | | | F-Secure Oyj | | | 156 | |
| | 59,300 | | | | FUJI SOFT, Inc | | | 2,246 | |
| | 941,901 | | | | Fujitsu Ltd | | | 58,714 | |
| | 4,200 | | | | Fukui Computer Holdings, Inc | | | 53 | |
| | 59,300 | | | | Future Architect, Inc | | | 801 | |
| | 213,318 | | * | | Gartner, Inc | | | 27,271 | |
| | 88,672 | | | | GB Group plc | | | 478 | |
| | 206,500 | | *,e | | GDS Holdings Ltd (ADR) | | | 4,768 | |
COLLEGE RETIREMENT EQUITIES FUND -Stock Account
| SHARES | | | | COMPANY | | VALUE
(000) | |
| | 47,998 | | * | | Gemalto NV | | $ | 2,786 | |
| | 509,861 | | | | Genpact Ltd | | | 13,761 | |
| | 12,137 | | | | GFT Technologies AG. | | | 93 | |
| | 129,105 | | *,g | | Global Dominion Access S.A. | | | 636 | |
| | 315,648 | | | | Global Payments, Inc | | | 32,553 | |
| | 45,000 | | e | | GMO internet, Inc | | | 600 | |
| | 20,800 | | e | | GMO Payment Gateway, Inc | | | 886 | |
| | 551,248 | | * | | GoDaddy, Inc | | | 36,173 | |
| | 138,063 | | *,e | | GreenSky, Inc | | | 1,321 | |
| | 55,393 | | *,e | | GTT Communications, Inc | | | 1,311 | |
| | 71,756 | | * | | Guidewire Software, Inc | | | 5,757 | |
| | 30,100 | | * | | Gunosy, Inc | | | 764 | |
| | 11,215 | | | | Haansoft, Inc | | | 131 | |
| | 118,541 | | | | Hackett Group, Inc | | | 1,898 | |
| | 91,841 | | | | Hansen Technologies Ltd | | | 226 | |
| | 757,364 | | | | HCL Technologies Ltd | | | 10,466 | |
| | 9,900 | | | | Hearts United Group Co Ltd | | | 126 | |
| | 131,581 | | | | Hexaware Technologies Ltd | | | 627 | |
| | 1,029,000 | | * | | Hi Sun Technology China Ltd | | | 132 | |
| | 19,283 | | | | Hilan Ltd | | | 453 | |
| | 536,126 | | *,m | | Hortonworks, Inc | | | 7,731 | |
| | 392,258 | | * | | HubSpot, Inc | | | 49,319 | |
| | 5,200 | | | | Hundsun Technologies, Inc | | | 40 | |
| | 30,524 | | *,e | | I3 Verticals, Inc | | | 736 | |
| | 48,400 | | | | Iflytek Co Ltd | | | 175 | |
| | 168,840 | | *,m | | Imperva, Inc | | | 9,403 | |
| | 78,295 | | * | | Indra Sistemas S.A. | | | 738 | |
| | 360,900 | | | | Ines Corp | | | 3,738 | |
| | 211,786 | | | | Inesa Intelligent Tech, Inc - B | | | 111 | |
| | 8,900 | | | | Infocom Corp | | | 323 | |
| | 320,860 | | | | Infomart Corp | | | 2,929 | |
| | 43,257 | | * | | Information Services Group, Inc | | | 183 | |
| | 7,900 | | | | Information Services International-Dentsu Ltd | | | 198 | |
| | 4,938,067 | | | | Infosys Technologies Ltd | | | 46,656 | |
| | 350,000 | | | | Inspur International Ltd | | | 151 | |
| | 41,036 | | *,e | | Instructure, Inc | | | 1,539 | |
| | 55,465 | | | | Integrated Research Ltd | | | 69 | |
| | 22,875 | | *,e | | Internap Corp | | | 95 | |
| | 1,073,043 | | | | International Business Machines Corp | | | 121,973 | |
| | 61,457 | | * | | InterXion Holding NV | | | 3,329 | |
| | 993,415 | | | | Intuit, Inc | | | 195,554 | |
| | 109,780 | | | | iomart Group plc | | | 462 | |
| | 93,197 | | | | Iress Market Technology Ltd | | | 731 | |
| | 216,330 | | | | IT Holdings Corp | | | 8,518 | |
| | 59,700 | | | | Itochu Techno-Science Corp | | | 1,156 | |
| | 59,560 | | | | j2 Global, Inc | | | 4,132 | |
| | 72,867 | | | | Jack Henry & Associates, Inc | | | 9,219 | |
| | 19,000 | | | | Justsystems Corp | | | 364 | |
| | 172,350 | | | | Kainos Group plc | | | 875 | |
| | 6,700 | | e | | Kanematsu Electronics Ltd | | | 200 | |
| | 33,847 | | | | Keywords Studios plc | | | 462 | |
| | 10,299 | | | | Kginicis Co Ltd | | | 142 | |
| | 318,506 | | * | | Kinaxis, Inc | | | 15,375 | |
COLLEGE RETIREMENT EQUITIES FUND -Stock Account
| SHARES | | | | COMPANY | | VALUE
(000) | |
| | 9,213,000 | | e | | Kingdee International Software Group Co Ltd | | $ | 8,145 | |
| | 975,061 | | | | Kingsoft Corp Ltd | | | 1,403 | |
| | 9,385 | | * | | Korea Information & Communications Co Ltd | | | 79 | |
| | 441,926 | | | | KPIT Cummins Infosystems Ltd | | | 1,380 | |
| | 9,200 | | e | | LAC Co Ltd | | | 113 | |
| | 3,717,351 | | e | | Learning Technologies Group plc | | | 3,283 | |
| | 279,241 | | | | Leidos Holdings, Inc | | | 14,722 | |
| | 615,307 | | * | | Limelight Networks, Inc | | | 1,440 | |
| | 321,286 | | | | Link Administration Holdings Ltd | | | 1,533 | |
| | 77,967 | | | | Linx S.A. | | | 655 | |
| | 72,928 | | * | | Liveperson, Inc | | | 1,375 | |
| | 257,446 | | *,e | | LiveRamp Holdings, Inc | | | 9,945 | |
| | 186,162 | | | | LogMeIn, Inc | | | 15,185 | |
| | 9,434 | | * | | Majesco | | | 67 | |
| | 120,431 | | * | | Manhattan Associates, Inc | | | 5,103 | |
| | 33,528 | | | | Mantech International Corp (Class A) | | | 1,753 | |
| | 2,999,654 | | | | MasterCard, Inc (Class A) | | | 565,885 | |
| | 72,857 | | | | Matrix IT Ltd | | | 805 | |
| | 188,675 | | | | MAXIMUS, Inc | | | 12,281 | |
| | 403,669 | | | | Micro Focus International plc | | | 7,072 | |
| | 812 | | e | | Micro Focus International plc (ADR) | | | 14 | |
| | 20,091,123 | | | | Microsoft Corp | | | 2,040,656 | |
| | 42,656 | | * | | MicroStrategy, Inc (Class A) | | | 5,449 | |
| | 56,491 | | * | | MINDBODY, Inc | | | 2,056 | |
| | 143,139 | | | | MindTree Ltd | | | 1,772 | |
| | 10,200 | | e | | Miroku Jyoho Service Co Ltd | | | 230 | |
| | 47,369 | | * | | Mitek Systems, Inc | | | 512 | |
| | 4,600 | | | | Mitsubishi Research Institute, Inc | | | 132 | |
| | 276,476 | | * | | MobileIron, Inc | | | 1,269 | |
| | 347,190 | | * | | Model N, Inc | | | 4,593 | |
| | 4,900 | | *,e | | Money Forward, Inc | | | 150 | |
| | 39,246 | | * | | MoneyGram International, Inc | | | 78 | |
| | 191,294 | | | | Monotype Imaging Holdings, Inc | | | 2,969 | |
| | 137,419 | | | | Mphasis Ltd | | | 2,004 | |
| | 1,382,400 | | | | My EG Services BHD | | | 327 | |
| | 283,990 | | | | MYOB Ltd | | | 672 | |
| | 852,000 | | *,†,e | | National Agricultural Holdings Ltd | | | 1 | |
| | 175,105 | | | | NCC Group plc | | | 393 | |
| | 14,300 | | | | NEC Networks & System Integration Corp | | | 318 | |
| | 14,319 | | | | Nemetschek AG. | | | 1,575 | |
| | 243,600 | | | | NET One Systems Co Ltd | | | 4,297 | |
| | 34,500 | | *,g | | Netcompany Group A.S. | | | 1,167 | |
| | 155,130 | | * | | New Relic, Inc | | | 12,561 | |
| | 274,630 | | * | | NEXTDC Ltd | | | 1,183 | |
| | 200,473 | | | | NIC, Inc | | | 2,502 | |
| | 68,000 | | * | | Nice Systems Ltd | | | 7,367 | |
| | 66,500 | | | | Nihon Unisys Ltd | | | 1,482 | |
| | 131,557 | | * | | NIIT Technologies Ltd | | | 2,165 | |
| | 26,700 | | | | Nippon System Development Co Ltd | | | 514 | |
| | 67,113 | | | | Nomura Research Institute Ltd | | | 2,489 | |
| | 24,700 | | | | NS Solutions Corp | | | 591 | |
| | 283,935 | | | | NTT Data Corp | | | 3,103 | |
| | 355,741 | | * | | Nuance Communications, Inc | | | 4,706 | |
| | 388,809 | | * | | Nutanix, Inc | | | 16,171 | |
COLLEGE RETIREMENT EQUITIES FUND -Stock Account
| SHARES | | | | COMPANY | | VALUE
(000) | |
| | 15,400 | | | | OBIC Business Consultants Ltd | | $ | 608 | |
| | 30,070 | | | | Obic Co Ltd | | | 2,321 | |
| | 197,377 | | * | | Okta, Inc | | | 12,593 | |
| | 7,500 | | * | | OneMarket Ltd | | | 3 | |
| | 42,519 | | * | | OneSpan, Inc | | | 551 | |
| | 476,691 | | | | Open Text Corp | | | 15,538 | |
| | 4,111,812 | | | | Oracle Corp | | | 185,648 | |
| | 63,044 | | | | Oracle Corp Japan | | | 4,002 | |
| | 43,690 | | | | Otsuka Corp | | | 1,202 | |
| | 254,266 | | *,e | | Pagseguro Digital Ltd | | | 4,762 | |
| | 17,172 | | *,e | | Park City Group, Inc | | | 103 | |
| | 636,084 | | | | Paychex, Inc | | | 41,441 | |
| | 80,016 | | * | | Paycom Software, Inc | | | 9,798 | |
| | 113,798 | | * | | Paylocity Holding Corp | | | 6,852 | |
| | 5,481,768 | | * | | PayPal Holdings, Inc | | | 460,962 | |
| | 263,000 | | | | PCA Corp | | | 5,150 | |
| | 144,947 | | | | Pegasystems, Inc | | | 6,933 | |
| | 40,539 | | * | | Perficient, Inc | | | 902 | |
| | 50,698 | | | | Persistent Systems Ltd | | | 452 | |
| | 675,109 | | | | Perspecta, Inc | | | 11,625 | |
| | 15,470 | | * | | PFSweb, Inc | | | 79 | |
| | 2,200 | | *,e | | PKSHA Technology, Inc | | | 141 | |
| | 41,528 | | *,e | | Pluralsight, Inc | | | 978 | |
| | 35,944 | | | | POSDATA Co Ltd | | | 168 | |
| | 45,625 | | | | Presidio, Inc | | | 595 | |
| | 29,711 | | * | | PRGX Global, Inc | | | 281 | |
| | 146,782 | | | | Progress Software Corp | | | 5,209 | |
| | 1,050,155 | | * | | Proofpoint, Inc | | | 88,013 | |
| | 40,385 | | * | | PROS Holdings, Inc | | | 1,268 | |
| | 349,772 | | * | | PTC, Inc | | | 28,996 | |
| | 85,832 | | * | | Pushpay Holdings Ltd | | | 182 | |
| | 46,722 | | * | | Q2 Holdings, Inc | | | 2,315 | |
| | 28,108 | | | | QAD, Inc (Class A) | | | 1,105 | |
| | 43,102 | | * | | Qualys, Inc | | | 3,221 | |
| | 10,300 | | e | | Rakus Co Ltd | | | 159 | |
| | 114,897 | | * | | Rapid7, Inc | | | 3,580 | |
| | 179,597 | | * | | RealPage, Inc | | | 8,655 | |
| | 390,989 | | * | | Red Hat, Inc | | | 68,673 | |
| | 15,600 | | e | | Remixpoint, Inc | | | 57 | |
| | 50,716 | | | | Reply S.p.A | | | 2,565 | |
| | 25,321 | | | | RIB Software AG. | | | 345 | |
| | 14,995 | | *,e | | Rimini Street, Inc | | | 77 | |
| | 336,020 | | * | | RingCentral, Inc | | | 27,701 | |
| | 21,360 | | *,† | | RP-SG Business Process Services Ltd | | | 19 | |
| | 1,571,691 | | | | Sabre Corp | | | 34,011 | |
| | 30,977 | | | | SafeCharge International Group Ltd | | | 93 | |
| | 1,058,173 | | | | Sage Group plc | | | 8,116 | |
| | 162,884 | | * | | SailPoint Technologies Holding, Inc | | | 3,826 | |
| | 14,607 | | | | Saipens International Corp NV | | | 162 | |
| | 4,795,425 | | * | | salesforce.com, Inc | | | 656,829 | |
| | 74,151 | | | | Samsung SDS Co Ltd | | | 13,570 | |
| | 1,043,687 | | | | SAP AG. | | | 103,586 | |
| | 54,107 | | | | Science Applications International Corp | | | 3,447 | |
COLLEGE RETIREMENT EQUITIES FUND -Stock Account
| SHARES | | | | COMPANY | | VALUE
(000) | |
| | 12,435 | | *,e | | SecureWorks Corp | | $ | 210 | |
| | 91,695 | | * | | SendGrid, Inc | | | 3,958 | |
| | 1,891,374 | | * | | ServiceNow, Inc | | | 336,759 | |
| | 109,874 | | * | | ServiceSource International LLC | | | 119 | |
| | 50,440 | | | | Shanghai 2345 Network Holding Group Co Ltd | | | 27 | |
| | 107,123 | | * | | SHIFT, Inc | | | 3,516 | |
| | 35,647 | | * | | Shopify, Inc (Class A) | | | 4,935 | |
| | 112,607 | | * | | Shopify, Inc (Class A) (Toronto) | | | 15,572 | |
| | 9,384 | | *,e | | ShotSpotter, Inc | | | 293 | |
| | 2,035,460 | | | | Silverlake Axis Ltd | | | 619 | |
| | 25,736 | | | | SimCorp AS | | | 1,765 | |
| | 387,600 | | | | Sinosoft Technology Group Ltd | | | 101 | |
| | 5,600 | | e | | Softbank Technology Corp | | | 89 | |
| | 705,991 | | | | Softcat plc | | | 5,298 | |
| | 31,328 | | | | Software AG. | | | 1,132 | |
| | 39,781 | | *,e | | SolarWinds Corp | | | 550 | |
| | 55,404 | | * | | Solutions 30 SE | | | 566 | |
| | 22,727 | | | | Sonata Software Ltd | | | 98 | |
| | 307,381 | | | | Sonda S.A. | | | 484 | |
| | 202,452 | | g | | Sophos Group plc | | | 976 | |
| | 9,920 | | | | Sopra Group S.A. | | | 916 | |
| | 59,800 | | | | Sourcenext Corp | | | 297 | |
| | 189,209 | | * | | Splunk, Inc | | | 19,839 | |
| | 54,111 | | * | | SPS Commerce, Inc | | | 4,458 | |
| | 336,615 | | * | | Square, Inc | | | 18,881 | |
| | 463,771 | | | | SS&C Technologies Holdings, Inc | | | 20,921 | |
| | 66,242 | | | | Sumisho Computer Systems Corp | | | 2,347 | |
| | 420,000 | | | | SUNeVision Holdings Ltd | | | 249 | |
| | 22,594 | | *,e | | SVMK, Inc | | | 277 | |
| | 63,631 | | e | | Switch, Inc | | | 445 | |
| | 49,697 | | * | | Sykes Enterprises, Inc | | | 1,229 | |
| | 900,460 | | | | Symantec Corp | | | 17,014 | |
| | 284,200 | | * | | Synopsys, Inc | | | 23,941 | |
| | 75,700 | | | | Systena Corp | | | 873 | |
| | 899,000 | | | | Systex Corp | | | 1,797 | |
| | 67,935 | | * | | Tableau Software, Inc | | | 8,152 | |
| | 1,319,231 | | | | Tata Consultancy Services Ltd | | | 35,771 | |
| | 55,020 | | | | Tata Elxsi Ltd | | | 804 | |
| | 835,639 | | * | | Tech Mahindra Ltd | | | 8,655 | |
| | 187,927 | | | | Technology One Ltd | | | 816 | |
| | 71,602 | | * | | Telaria, Inc | | | 195 | |
| | 43,835 | | * | | TeleNav, Inc | | | 178 | |
| | 50,903 | | | | Temenos Group AG. | | | 6,117 | |
| | 48,104 | | * | | Tenable Holdings, Inc | | | 1,067 | |
| | 3,018,291 | | * | | Teradata Corp | | | 115,782 | |
| | 42,134 | | | | Tietoenator Oyj | | | 1,138 | |
| | 390,231 | | | | TiVo Corp | | | 3,672 | |
| | 10,700 | | | | TKC | | | 380 | |
| | 849,952 | | | | Total System Services, Inc | | | 69,093 | |
| | 79,500 | | | | Totvus S.A. | | | 557 | |
| | 87,989 | | *,e | | Trade Desk, Inc | | | 10,212 | |
| | 16,300 | | | | Trans Cosmos, Inc/Japan | | | 344 | |
| | 766,710 | | | | Travelport Worldwide Ltd | | | 11,976 | |
| | 1,143,000 | | | | Travelsky Technology Ltd | | | 2,929 | |
COLLEGE RETIREMENT EQUITIES FUND -Stock Account
| SHARES | | | | COMPANY | | VALUE
(000) | |
| | 61,984 | | | | Trend Micro, Inc | | $ | 3,349 | |
| | 20,489 | | | | TTEC Holdings, Inc | | | 585 | |
| | 11,912 | | *,e | | Tucows, Inc | | | 715 | |
| | 217,745 | | *,e | | Twilio, Inc | | | 19,445 | |
| | 67,092 | | * | | Tyler Technologies, Inc | | | 12,467 | |
| | 54,927 | | * | | Ultimate Software Group, Inc | | | 13,450 | |
| | 497,655 | | *,e | | Unisys Corp | | | 5,788 | |
| | 102,700 | | | | UNITED, Inc | | | 1,380 | |
| | 21,048 | | * | | Upland Software, Inc | | | 572 | |
| | 283,093 | | * | | Vakrangee Ltd | | | 135 | |
| | 121,506 | | * | | Varonis Systems, Inc | | | 6,428 | |
| | 161,004 | | * | | Verint Systems, Inc | | | 6,812 | |
| | 152,426 | | * | | VeriSign, Inc | | | 22,603 | |
| | 10,661 | | *,e | | Veritone, Inc | | | 41 | |
| | 66,132 | | *,e,m | | VirnetX Holding Corp | | | 159 | |
| | 60,067 | | * | | Virtusa Corp | | | 2,558 | |
| | 5,893,416 | | | | Visa, Inc (Class A) | | | 777,577 | |
| | 328,172 | | | | VMware, Inc (Class A) | | | 45,002 | |
| | 1,136,696 | | | | Western Union Co | | | 19,392 | |
| | 107,697 | | * | | WEX, Inc | | | 15,084 | |
| | 1,614,889 | | | | Wipro Ltd | | | 7,642 | |
| | 168,065 | | | | Wirecard AG. | | | 25,336 | |
| | 328,006 | | | | Wisetech Global Ltd | | | 3,910 | |
| | 40,537 | | * | | Wix.com Ltd | | | 3,662 | |
| | 132,019 | | * | | Workday, Inc | | | 21,081 | |
| | 202,377 | | * | | Workiva, Inc | | | 7,263 | |
| | 37,578 | | *,g | | Worldline S.A. | | | 1,817 | |
| | 1,720,529 | | * | | Worldpay, Inc | | | 131,500 | |
| | 132 | | * | | Xero Ltd | | | 4 | |
| | 19,800 | | * | | Xunlei Ltd (ADR) | | | 67 | |
| | 8,300,000 | | * | | Xurpas, Inc | | | 271 | |
| | 376,757 | | * | | Yext, Inc | | | 5,595 | |
| | 61,700 | | | | Yonyou Network Technology Co Ltd | | | 192 | |
| | 437,746 | | * | | Zendesk, Inc | | | 25,551 | |
| | 35,690 | | | | Zensar Technologies Ltd | | | 119 | |
| | 121,063 | | * | | Zix Corp | | | 694 | |
| | 2,262,135 | | *,e | | Zscaler, Inc | | | 88,698 | |
| | | | | | TOTAL SOFTWARE & SERVICES | | | 9,183,480 | |
| | | | | | | | | | |
| TECHNOLOGY HARDWARE & EQUIPMENT - 4.6% |
| | 198,693 | | *,e | | 3D Systems Corp | | | 2,021 | |
| | 758,422 | | | | AAC Technologies Holdings, Inc | | | 4,377 | |
| | 99,081 | | *,e | | accesso Technology Group plc | | | 1,837 | |
| | 1,748,292 | | | | Accton Technology Corp | | | 5,605 | |
| | 2,354,762 | | | | Acer, Inc | | | 1,487 | |
| | 115,769 | | | | Adtran, Inc | | | 1,243 | |
| | 27,372 | | *,e | | ADVA AG. Optical Networking | | | 197 | |
| | 28,000 | | | | Advanced Ceramic X Corp | | | 223 | |
| | 236,932 | | | | Advantech Co Ltd | | | 1,619 | |
| | 286,911 | | * | | Aerohive Networks, Inc | | | 935 | |
| | 19,172 | | * | | Agilysys, Inc | | | 275 | |
| | 23,800 | | | | Ai Holdings Corp | | | 420 | |
| | 696,195 | | | | Alps Electric Co Ltd | | | 13,500 | |
COLLEGE RETIREMENT EQUITIES FUND -Stock Account
| SHARES | | | | COMPANY | | VALUE
(000) | |
| | 16,636 | | | | ALSO Holding AG. | | $ | 1,887 | |
| | 34,900 | | | | Amano Corp | | | 673 | |
| | 438,969 | | | | Amphenol Corp (Class A) | | | 35,565 | |
| | 37,031 | | * | | Anixter International, Inc | | | 2,011 | |
| | 122,600 | | | | Anritsu Corp | | | 1,698 | |
| | 2,796,000 | | *,†,e,m | | Anxin-China Holdings Ltd | | | 4 | |
| | 12,205,477 | | d,n | | Apple, Inc | | | 1,925,292 | |
| | 24,900 | | *,e | | Applied Optoelectronics, Inc | | | 384 | |
| | 571,000 | | | | Arcadyan Technology Corp | | | 1,391 | |
| | 203,447 | | * | | Arista Networks, Inc | | | 42,866 | |
| | 16,664 | | *,e | | Arlo Technologies, Inc | | | 166 | |
| | 297,569 | | * | | ARRIS International plc | | | 9,097 | |
| | 199,228 | | * | | Arrow Electronics, Inc | | | 13,737 | |
| | 138,000 | | | | Asia Optical Co, Inc | | | 298 | |
| | 646,044 | | | | Asustek Computer, Inc | | | 4,234 | |
| | 58,000 | | | | Aten International Co Ltd | | | 164 | |
| | 50,245,893 | | | | AU Optronics Corp | | | 19,965 | |
| | 141,800 | | | | Aurora Corp | | | 445 | |
| | 141,020 | | | | Austria Technologie & Systemtechnik AG. | | | 2,486 | |
| | 37,327 | | * | | Avid Technology, Inc | | | 177 | |
| | 284,342 | | | | Avnet, Inc | | | 10,265 | |
| | 516,668 | | | | AVX Corp | | | 7,879 | |
| | 35,965 | | | | Badger Meter, Inc | | | 1,770 | |
| | 17,473 | | | | Barco NV | | | 1,979 | |
| | 708 | | | | Basler AG. | | | 101 | |
| | 13,478 | | | | Bel Fuse, Inc (Class B) | | | 248 | |
| | 51,504 | | | | Belden CDT, Inc | | | 2,151 | |
| | 132,271 | | | | Benchmark Electronics, Inc | | | 2,802 | |
| | 7,699,000 | | | | Benq Corp | | | 4,920 | |
| | 14,434 | | * | | BH Co Ltd | | | 218 | |
| | 13,600 | | | | BOE Technology Group Co Ltd | | | 5 | |
| | 557,959 | | | | Brother Industries Ltd | | | 8,259 | |
| | 718,500 | | | | BYD Electronic International Co Ltd | | | 902 | |
| | 46,171 | | * | | CalAmp Corp | | | 601 | |
| | 208,095 | | * | | Calix, Inc | | | 2,029 | |
| | 330,000 | | | | Camsing International Holding Ltd | | | 376 | |
| | 68,500 | | | | Canon Electronics, Inc | | | 1,193 | |
| | 674,048 | | e | | Canon, Inc | | | 18,547 | |
| | 221,000 | | | | Career Technology Co Ltd | | | 188 | |
| | 81,481 | | *,e,g | | Carel Industries S.p.A | | | 842 | |
| | 35,931 | | * | | Casa Systems, Inc | | | 472 | |
| | 104,943 | | | | Casetek Holdings Ltd | | | 135 | |
| | 610,857 | | | | Catcher Technology Co Ltd | | | 4,473 | |
| | 174,000 | | e | | Catic Shenzhen Holdings Ltd | | | 91 | |
| | 678,079 | | | | CDW Corp | | | 54,958 | |
| | 311,340 | | * | | Celestica, Inc | | | 2,728 | |
| | 159,602 | | | | Cheng Uei Precision Industry Co Ltd | | | 123 | |
| | 704,179 | | | | Chicony Electronics Co Ltd | | | 1,434 | |
| | 93,179 | | | | Chilisin Electronics Corp | | | 239 | |
| | 489,600 | | *,† | | China Fiber Optic Network System Group Ltd | | | 1 | |
| | 4,088,000 | | *,e | | China Innovationpay Group Ltd | | | 303 | |
| | 1,597,000 | | g | | China Railway Signal & Communication Corp Ltd | | | 1,119 | |
| | 264,000 | | | | Chin-Poon Industrial Co | | | 311 | |
| | 229,840 | | | | Chroma ATE, Inc | | | 883 | |
COLLEGE RETIREMENT EQUITIES FUND -Stock Account
| SHARES | | | | COMPANY | | VALUE
(000) | |
| | 12,000 | | | | Chunghwa Precision Test Tech Co Ltd | | $ | 204 | |
| | 1,313,388 | | * | | Ciena Corp | | | 44,537 | |
| | 17,340,684 | | | | Cisco Systems, Inc | | | 751,372 | |
| | 1,838,354 | | | | Citizen Watch Co Ltd | | | 9,054 | |
| | 11,657 | | *,e | | Clearfield, Inc | | | 116 | |
| | 312,393 | | | | Clevo Co | | | 309 | |
| | 1,011,394 | | * | | CMC Magnetics Corp | | | 220 | |
| | 28,300 | | e | | CMK Corp | | | 158 | |
| | 549,365 | | | | Cognex Corp | | | 21,244 | |
| | 31,558 | | * | | Coherent, Inc | | | 3,336 | |
| | 765,089 | | *,e | | Comba Telecom Systems Holdings Ltd | | | 126 | |
| | 4,553 | | e | | Comet Holding AG. | | | 371 | |
| | 332,361 | | * | | CommScope Holding Co, Inc | | | 5,447 | |
| | 2,662,688 | | | | Compal Electronics, Inc | | | 1,510 | |
| | 3,618,000 | | | | Compeq Manufacturing Co | | | 2,331 | |
| | 82,469 | | | | Comtech Telecommunications Corp | | | 2,007 | |
| | 25,575 | | | | Concraft Holding Co Ltd | | | 83 | |
| | 136,309 | | * | | Control4 Corp | | | 2,399 | |
| | 2,615,399 | | *,†,m | | Coolpad Group Ltd | | | 180 | |
| | 289,600 | | | | Coretronic Corp | | | 361 | |
| | 2,648,003 | | | | Corning, Inc | | | 79,996 | |
| | 139,656 | | * | | Cray, Inc | | | 3,015 | |
| | 61,787 | | | | CTS Corp | | | 1,600 | |
| | 33,535 | | | | Daea TI Co Ltd | | | 248 | |
| | 274,887 | | | | Daeduck Electronics Co | | | 2,243 | |
| | 52,900 | | | | Daiwabo Co Ltd | | | 2,448 | |
| | 44,273 | | | | Daktronics, Inc | | | 328 | |
| | 118,000 | | | | Darfon Electronics Corp | | | 150 | |
| | 9,011 | | * | | DASAN Zhone Solutions, Inc | | | 125 | |
| | 13,377 | | | | Datalogic S.p.A. | | | 313 | |
| | 134,851 | | | | DataTec Ltd | | | 256 | |
| | 243,586 | | * | | Dell Technologies, Inc | | | 11,904 | |
| | 401,900 | | | | Delta Electronics Thai PCL | | | 858 | |
| | 6,454,988 | | | | Delta Electronics, Inc | | | 27,168 | |
| | 7,500 | | | | Denki Kogyo Co Ltd | | | 163 | |
| | 34,000 | | | | Dexerials Corp | | | 249 | |
| | 106,330 | | e | | Diebold, Inc | | | 265 | |
| | 51,307 | | * | | Digi International, Inc | | | 518 | |
| | 101,768 | | | | Dolby Laboratories, Inc (Class A) | | | 6,293 | |
| | 194,300 | | | | Eastern Communications Co Ltd | | | 108 | |
| | 21,995 | | *,e | | Eastman Kodak Co | | | 56 | |
| | 98,578 | | * | | EchoStar Corp (Class A) | | | 3,620 | |
| | 10,271 | | | | Eizo Nanao Corp | | | 379 | |
| | 12,400 | | | | Elecom Co Ltd | | | 314 | |
| | 41,317 | | * | | Electro Scientific Industries, Inc | | | 1,238 | |
| | 3,747,702 | | | | Electrocomponents plc | | | 24,208 | |
| | 56,413 | | * | | Electronics for Imaging, Inc | | | 1,399 | |
| | 3,800 | | | | Elematec Corp | | | 67 | |
| | 679,654 | | | | Elite Material Co Ltd | | | 1,454 | |
| | 31,822 | | | | Ennoconn Corp | | | 254 | |
| | 5,900 | | e | | Enplas Corp | | | 146 | |
| | 16,755 | | * | | ePlus, Inc | | | 1,192 | |
| | 5,608,593 | | | | Ericsson (LM) (B Shares) | | | 49,647 | |
COLLEGE RETIREMENT EQUITIES FUND -Stock Account
| SHARES | | | | COMPANY | | VALUE
(000) | |
| | 11,700 | | | | ESPEC Corp | | $ | 199 | |
| | 48,048 | | e | | Evertz Technologies Ltd | | | 570 | |
| | 147,439 | | * | | Extreme Networks, Inc | | | 899 | |
| | 221,785 | | * | | F5 Networks, Inc | | | 35,936 | |
| | 63,345 | | * | | Fabrinet | | | 3,250 | |
| | 21,627 | | * | | FARO Technologies, Inc | | | 879 | |
| | 1,923,000 | | *,e | | FIH Mobile Ltd | | | 202 | |
| | 196,109 | | *,e | | Finisar Corp | | | 4,236 | |
| | 148,352 | | | | Firich Enterprises Co Ltd | | | 181 | |
| | 333,177 | | *,e | | Fitbit, Inc | | | 1,656 | |
| | 1,006,339 | | | | FLEXium Interconnect, Inc | | | 2,442 | |
| | 281,155 | | | | Flir Systems, Inc | | | 12,242 | |
| | 73,310 | | | | Flytech Technology Co Ltd | | | 162 | |
| | 38,440 | | | | Focus Media Information Technology Co Ltd | | | 29 | |
| | 694,868 | | | | Foxconn Technology Co Ltd | | | 1,372 | |
| | 740,043 | | | | Fujifilm Holdings Corp | | | 28,687 | |
| | 80,000 | | | | Fujitsu Frontech Ltd | | | 775 | |
| | 43,765 | | * | | Gemalto NV | | | 2,540 | |
| | 146,000 | | | | General Interface Solution Holding Ltd | | | 428 | |
| | 40,000 | | | | Genius Electronic Optical Co Ltd | | | 240 | |
| | 1,792,000 | | | | Getac Technology Corp | | | 2,338 | |
| | 2,651,000 | | | | Gigabyte Technology Co Ltd | | | 3,458 | |
| | 30,171 | | * | | Gilat Satellite Networks Ltd | | | 279 | |
| | 12,198 | | * | | G-treeBNT Co Ltd | | | 309 | |
| | 326,989 | | | | Halma plc | | | 5,696 | |
| | 27,200 | | | | Hamamatsu Photonics KK | | | 912 | |
| | 165,800 | | | | Hangzhou Hikvision Digital Technology Co Ltd | | | 626 | |
| | 8,812,330 | | | | HannStar Display Corp | | | 2,031 | |
| | 394,777 | | * | | Harmonic, Inc | | | 1,863 | |
| | 6,700 | | | | Hengtong Optic-electric Co Ltd | | | 17 | |
| | 1,760,121 | | | | Hewlett Packard Enterprise Co | | | 23,251 | |
| | 102,040 | | | | Hexagon AB (B Shares) | | | 4,717 | |
| | 432,000 | | * | | High Tech Computer Corp | | | 495 | |
| | 6,600 | | | | Hioki EE Corp | | | 215 | |
| | 24,224 | | | | Hirose Electric Co Ltd | | | 2,370 | |
| | 708,179 | | | | Hitachi High-Technologies Corp | | | 22,176 | |
| | 3,757,649 | | | | Hitachi Ltd | | | 99,616 | |
| | 7,000 | | | | Hochiki Corp | | | 73 | |
| | 82,470 | | | | Holystone Enterprise Co Ltd | | | 279 | |
| | 11,379,961 | | | | Hon Hai Precision Industry Co, Ltd | | | 26,190 | |
| | 26,495 | | | | Horiba Ltd | | | 1,080 | |
| | 493,900 | | | | Hosiden Corp | | | 3,233 | |
| | 1,843,585 | | | | HP, Inc | | | 37,720 | |
| | 71,600 | | | | Ibiden Co Ltd | | | 1,006 | |
| | 29,500 | | | | Icom, Inc | | | 534 | |
| | 142,928 | | | | IEI Integration Corp | | | 161 | |
| | 78,845 | | * | | II-VI, Inc | | | 2,559 | |
| | 15,462 | | | | Iljin Materials Co Ltd | | | 570 | |
| | 33,159 | | * | | Immersion Corp | | | 297 | |
| | 1,297,770 | | | | Inari Amertron BHD | | | 471 | |
| | 4,689 | | | | Inficon Holding AG. | | | 2,377 | |
| | 193,599 | | * | | Infinera Corp | | | 772 | |
| | 10,529 | | | | Ingenico | | | 597 | |
| | 29,219,219 | | | | InnoLux Display Corp | | | 9,260 | |
COLLEGE RETIREMENT EQUITIES FUND -Stock Account
| SHARES | | | | COMPANY | | VALUE
(000) | |
| | 344,670 | | * | | Insight Enterprises, Inc | | $ | 14,045 | |
| | 308,500 | | | | Integrated Micro-Electronics, Inc | | | 62 | |
| | 161,297 | | | | InterDigital, Inc | | | 10,715 | |
| | 1,845,535 | | | | Inventec Co Ltd | | | 1,321 | |
| | 52,801 | | * | | IPG Photonics Corp | | | 5,982 | |
| | 12,000 | | e | | Iriso Electronics Co Ltd | | | 443 | |
| | 10,591 | | | | Isra Vision AG. | | | 294 | |
| | 40,200 | | | | ITC Networks Corp | | | 504 | |
| | 1,433,357 | | | | ITEQ Corp | | | 2,344 | |
| | 33,068 | | * | | Iteris, Inc | | | 123 | |
| | 43,046 | | * | | Itron, Inc | | | 2,036 | |
| | 21,112 | | | | Ituran Location and Control Ltd | | | 677 | |
| | 431,920 | | | | Jabil Circuit, Inc | | | 10,707 | |
| | 549,300 | | | | Japan Aviation Electronics Industry Ltd | | | 6,321 | |
| | 13,900 | | | | Japan Cash Machine Co Ltd | | | 120 | |
| | 376,200 | | *,e | | Japan Display, Inc | | | 246 | |
| | 127,987 | | | | Jenoptik AG. | | | 3,337 | |
| | 829,927 | | | | Juniper Networks, Inc | | | 22,333 | |
| | 19,400 | | | | Kaga Electronics Co Ltd | | | 346 | |
| | 2,862 | | | | Kapsch TrafficCom AG. | | | 109 | |
| | 340,500 | | | | KCE Electronics PCL | | | 274 | |
| | 146,537 | | | | Kemet Corp | | | 2,570 | |
| | 31,834 | | | | Keyence Corp | | | 16,090 | |
| | 493,607 | | * | | Keysight Technologies, Inc | | | 30,643 | |
| | 36,610 | | * | | Kimball Electronics, Inc | | | 567 | |
| | 610,000 | | | | Kingboard Chemical Holdings Ltd | | | 1,627 | |
| | 1,137,000 | | | | Kingboard Laminates Holdings Ltd | | | 939 | |
| | 110,538 | | * | | Knowles Corp | | | 1,471 | |
| | 14,500 | | | | Koa Corp | | | 171 | |
| | 478,022 | | | | Konica Minolta Holdings, Inc | | | 4,303 | |
| | 25,330 | | e | | Kudelski S.A. | | | 145 | |
| | 23,009 | | * | | KVH Industries, Inc | | | 237 | |
| | 263,329 | | | | Kyocera Corp | | | 13,163 | |
| | 18,694 | | | | Landis&Gyr Group AG. | | | 1,053 | |
| | 266,366 | | | | Largan Precision Co Ltd | | | 27,794 | |
| | 392,400 | | g | | Legend Holdings Corp | | | 1,027 | |
| | 297 | | | | LEM Holding S.A. | | | 317 | |
| | 13,248,753 | | | | Lenovo Group Ltd | | | 8,950 | |
| | 11,641 | | | | LG Innotek Co Ltd | | | 904 | |
| | 566,774 | | | | LG.Philips LCD Co Ltd | | | 9,197 | |
| | 1,518,825 | | | | Lite-On Technology Corp | | | 2,006 | |
| | 48,252 | | | | Littelfuse, Inc | | | 8,274 | |
| | 389,668 | | | | Logitech International S.A. | | | 12,309 | |
| | 41,000 | | | | Lotes Co Ltd | | | 282 | |
| | 567,545 | | * | | Lumentum Holdings, Inc | | | 23,843 | |
| | 165,700 | | | | Macnica Fuji Electronics Holdings, Inc | | | 2,030 | |
| | 123,300 | | | | Marubun Corp | | | 762 | |
| | 6,700 | | | | Maruwa Co Ltd | | | 343 | |
| | 320,800 | | | | Maxell Holdings Ltd | | | 4,231 | |
| | 39,844 | | *,e | | Maxwell Technologies, Inc | | | 83 | |
| | 193,000 | | | | Mcj Co Ltd | | | 1,165 | |
| | 26,900 | | e | | Meiko Electronics Co | | | 433 | |
| | 1,647,000 | | *,e,g | | Meitu, Inc | | | 461 | |
COLLEGE RETIREMENT EQUITIES FUND -Stock Account
| SHARES | | | | COMPANY | | VALUE
(000) | |
| | 4,200 | | | | Melco Holdings, Inc | | $ | 126 | |
| | 130,076 | | | | Merry Electronics Co Ltd | | | 519 | |
| | 4,290 | | | | Mesa Laboratories, Inc | | | 894 | |
| | 44,080 | | | | Methode Electronics, Inc | | | 1,027 | |
| | 423,872 | | e | | Micronic Laser Systems AB | | | 5,664 | |
| | 588,000 | | | | Micro-Star International Co Ltd | | | 1,463 | |
| | 656,155 | | | | Mitac Holdings Corp | | | 524 | |
| | 828,267 | | | | Motorola, Inc | | | 95,284 | |
| | 21,998 | | | | MTS Systems Corp | | | 883 | |
| | 490,895 | | h | | Murata Manufacturing Co Ltd | | | 66,148 | |
| | 362,000 | | | | Nan Ya Printed Circuit Board Corp | | | 398 | |
| | 20,182 | | * | | Napco Security Technologies, Inc | | | 318 | |
| | 427,441 | | | | National Instruments Corp | | | 19,397 | |
| | 159,412 | | * | | NCR Corp | | | 3,679 | |
| | 149,227 | | | | NEC Corp | | | 4,437 | |
| | 193,090 | | | | Neopost S.A. | | | 5,271 | |
| | 530,183 | | | | NetApp, Inc | | | 31,636 | |
| | 55,978 | | * | | Netgear, Inc | | | 2,913 | |
| | 195,720 | | * | | Netscout Systems, Inc | | | 4,625 | |
| | 30,526 | | e | | Nichicon Corp | | | 221 | |
| | 12,800 | | | | Nippon Ceramic Co Ltd | | | 274 | |
| | 16,200 | | | | Nippon Chemi-Con Corp | | | 281 | |
| | 90,862 | | | | Nippon Electric Glass Co Ltd | | | 2,226 | |
| | 26,800 | | | | Nippon Signal Co Ltd | | | 218 | |
| | 24,160 | | e | | Nissha Printing Co Ltd | | | 287 | |
| | 28,706 | | *,e | | nLight, Inc | | | 510 | |
| | 16,400 | | | | Nohmi Bosai Ltd | | | 276 | |
| | 8,716,323 | | e | | Nokia Corp | | | 50,729 | |
| | 9,669,198 | | | | Nokia Oyj (Turquoise) | | | 56,131 | |
| | 14,300 | | e | | Noritsu Koki Co Ltd | | | 196 | |
| | 129,500 | | * | | Novanta, Inc | | | 8,159 | |
| | 10,800 | | | | O-film Tech Co Ltd | | | 15 | |
| | 4,100 | | e | | Ohara, Inc | | | 60 | |
| | 73,300 | | | | Oki Electric Industry Co Ltd | | | 866 | |
| | 630,722 | | | | Omron Corp | | | 22,865 | |
| | 20,900 | | e | | Optex Co Ltd | | | 323 | |
| | 33,120 | | * | | Orbotech Ltd | | | 1,873 | |
| | 68,900 | | | | Osaki Electric Co Ltd | | | 416 | |
| | 64,014 | | * | | OSI Systems, Inc | | | 4,692 | |
| | 17,799 | | | | Oxford Instruments plc | | | 206 | |
| | 93,583 | | * | | Palo Alto Networks, Inc | | | 17,626 | |
| | 264,224 | | | | Pan-International Industrial | | | 171 | |
| | 14,255 | | * | | PAR Technology Corp | | | 310 | |
| | 25,381 | | | | Park Electrochemical Corp | | | 459 | |
| | 22,599 | | | | Partron Co Ltd | | | 166 | |
| | 2,098,000 | | e | | PAX Global Technology Ltd | | | 757 | |
| | 15,332 | | | | PC Connection, Inc | | | 456 | |
| | 1,652,917 | | | | Pegatron Technology Corp | | | 2,767 | |
| | 72,555 | | | | Plantronics, Inc | | | 2,402 | |
| | 40,209 | | * | | Plexus Corp | | | 2,054 | |
| | 237,000 | | | | Primax Electronics Ltd | | | 334 | |
| | 535,000 | | | | Prime View International Co Ltd | | | 528 | |
| | 1,322,834 | | * | | Pure Storage, Inc | | | 21,271 | |
| | 2,349,338 | | | | Quanta Computer, Inc | | | 4,021 | |
COLLEGE RETIREMENT EQUITIES FUND -Stock Account
| SHARES | | | | COMPANY | | VALUE
(000) | |
| | 329,970 | | * | | Quantenna Communications, Inc | | $ | 4,735 | |
| | 40,358 | | * | | Radware Ltd | | | 917 | |
| | 155,840 | | | | Redington India Ltd | | | 198 | |
| | 141,907 | | | | Renishaw plc | | | 7,683 | |
| | 219,982 | | * | | Ribbon Communications, Inc | | | 1,060 | |
| | 415,933 | | | | Ricoh Co Ltd | | | 4,064 | |
| | 9,879 | | *,† | | Ricoh India Ltd | | | 0 | ^ |
| | 35,400 | | | | Riken Keiki Co Ltd | | | 651 | |
| | 14,000 | | | | Riso Kagaku Corp | | | 216 | |
| | 787,202 | | * | | Ritek Corp | | | 278 | |
| | 23,314 | | * | | Rogers Corp | | | 2,310 | |
| | 8,000 | | | | Roland DG Corp | | | 153 | |
| | 10,900 | | | | Ryosan Co Ltd | | | 291 | |
| | 13,000 | | | | Ryoyo Electro Corp | | | 182 | |
| | 30,081 | | | | S&T AG. | | | 544 | |
| | 102,075 | | e | | Samsung Electro-Mechanics Co Ltd | | | 9,516 | |
| | 161,517 | | | | Samsung SDI Co Ltd | | | 31,747 | |
| | 4,764 | | | | Samwha Capacitor Co Ltd | | | 228 | |
| | 312,902 | | * | | Sanmina Corp | | | 7,528 | |
| | 48,300 | | | | Sanshin Electronics Co Ltd | | | 866 | |
| | 105,394 | | * | | Scansource, Inc | | | 3,623 | |
| | 1,031 | | | | Seagate Technology, Inc | | | 40 | |
| | 72,272 | | | | Seiko Epson Corp | | | 1,009 | |
| | 5,672 | | *,e,g | | Sensirion Holding AG. | | | 244 | |
| | 1,125,000 | | | | Sercomm Corp | | | 2,338 | |
| | 21,600 | | | | Sesa S.p.A | | | 575 | |
| | 177,629 | | | | SFA Engineering Corp | | | 5,517 | |
| | 110,291 | | | | Shimadzu Corp | | | 2,175 | |
| | 22,816 | | * | | Sierra Wireless, Inc | | | 306 | |
| | 19,700 | | e | | Siix Corp | | | 256 | |
| | 842,600 | | | | Simplo Technology Co Ltd | | | 5,713 | |
| | 153,123 | | | | Sinbon Electronics Co Ltd | | | 413 | |
| | 2,791 | | | | Sindoh Co Ltd | | | 115 | |
| | 61,749 | | | | Smart Metering Systems plc | | | 414 | |
| | 161,674 | | | | Spectris plc | | | 4,698 | |
| | 67,967 | | * | | Sterlite Technologies Ltd | | | 286 | |
| | 72,904 | | * | | Stratasys Ltd | | | 1,313 | |
| | 1,327,500 | | | | Sunny Optical Technology Group Co Ltd | | | 11,807 | |
| | 3,525,000 | | | | Supreme Electronics Co Ltd | | | 3,094 | |
| | 44,615 | | * | | Synaptics, Inc | | | 1,660 | |
| | 68,250 | | | | Syncmold Enterprise Corp | | | 143 | |
| | 200,782 | | | | SYNNEX Corp | | | 16,231 | |
| | 976,238 | | | | Synnex Technology International Corp | | | 1,154 | |
| | 30,269 | | | | Taihan Fiberoptics Co Ltd | | | 139 | |
| | 159,000 | | | | Taiwan Union Technology Corp | | | 466 | |
| | 190,203 | | | | Taiyo Yuden Co Ltd | | | 2,822 | |
| | 47,100 | | | | Tamura Corp | | | 229 | |
| | 101,387 | | | | TDK Corp | | | 7,098 | |
| | 1,250,697 | | | | TE Connectivity Ltd | | | 94,590 | |
| | 96,327 | | * | | Tech Data Corp | | | 7,881 | |
| | 22,033 | | *,g | | Tejas Networks Ltd | | | 66 | |
| | 34,857 | | * | | TELCON, Inc | | | 259 | |
| | 2,106,083 | | | | Telefonaktiebolaget Lm Ericsson (ADR) | | | 18,681 | |
COLLEGE RETIREMENT EQUITIES FUND -Stock Account
| SHARES | | | | COMPANY | | VALUE
(000) | |
| | 105,495 | | | | Test Research, Inc | | $ | 156 | |
| | 18,004 | | * | | Texcell-NetCom Co Ltd | | | 289 | |
| | 54,000 | | | | Thinking Electronic Industrial Co Ltd | | | 133 | |
| | 45,129 | | *,e | | Tobii AB | | | 138 | |
| | 104,625 | | | | Tong Hsing Electronic Industries Ltd | | | 365 | |
| | 2,170,000 | | | | Tongda Group Holdings Ltd | | | 215 | |
| | 66,900 | | | | Topcon Corp | | | 888 | |
| | 16,400 | | | | Toshiba TEC Corp | | | 382 | |
| | 233,000 | | | | TPK Holding Co Ltd | | | 368 | |
| | 109,000 | | | | Transcend Information, Inc | | | 236 | |
| | 675,663 | | * | | Trimble Navigation Ltd | | | 22,236 | |
| | 1,419,832 | | | | Tripod Technology Corp | | | 3,702 | |
| | 946,000 | | *,e | | Truly International Holdings | | | 115 | |
| | 119,531 | | * | | TTM Technologies, Inc | | | 1,163 | |
| | 186,039 | | | | TXC Corp | | | 196 | |
| | 61,536 | | e | | Ubiquiti Networks, Inc | | | 6,117 | |
| | 7,519,883 | | | | Unimicron Technology Corp | | | 5,459 | |
| | 46,600 | | | | Unisplendour Corp Ltd | | | 213 | |
| | 331,500 | | | | Unitech Printed Circuit Board Corp | | | 147 | |
| | 69,033 | | * | | USA Technologies, Inc | | | 269 | |
| | 6,400 | | | | V Technology Co Ltd | | | 722 | |
| | 240,000 | | | | Venture Corp Ltd | | | 2,464 | |
| | 98,641 | | *,e | | Viasat, Inc | | | 5,815 | |
| | 366,580 | | * | | Viavi Solutions, Inc | | | 3,684 | |
| | 477,815 | | | | Vishay Intertechnology, Inc | | | 8,605 | |
| | 178,710 | | * | | Vishay Precision Group, Inc | | | 5,402 | |
| | 821,175 | | | | VS Industry BHD | | | 145 | |
| | 2,972,800 | | | | VST Holdings Ltd | | | 1,441 | |
| | 104,200 | | | | Vtech Holdings Ltd | | | 864 | |
| | 93,000 | | | | Wacom Co Ltd | | | 385 | |
| | 2,347,000 | | | | Wah Lee Industrial Corp | | | 3,791 | |
| | 831,000 | | | | Walsin Technology Corp | | | 4,198 | |
| | 734,000 | | | | Wasion Group Holdings Ltd | | | 357 | |
| | 531,906 | | | | Western Digital Corp | | | 19,665 | |
| | 190,500 | | *,†,b,m | | Wintek Corp | | | 0 | ^ |
| | 1,968,302 | | | | Wistron Corp | | | 1,218 | |
| | 1,916,556 | | | | Wistron NeWeb Corp | | | 4,987 | |
| | 4,736,000 | | | | World Wide Touch Technology Ho | | | 289 | |
| | 1,077,473 | | | | WPG Holdings Co Ltd | | | 1,293 | |
| | 2,718,744 | | | | WT Microelectronics Co Ltd | | | 3,431 | |
| | 784,301 | | | | Xerox Corp | | | 15,498 | |
| | 15,750 | | *,† | | Ya Hsin Industrial Co Ltd | | | 0 | |
| | 221,660 | | | | Yageo Corp | | | 2,296 | |
| | 76,086 | | | | Yamatake Corp | | | 1,504 | |
| | 48,338 | | | | Yaskawa Electric Corp | | | 1,182 | |
| | 43,784 | | | | Yokogawa Electric Corp | | | 756 | |
| | 213,306 | | * | | Zebra Technologies Corp (Class A) | | | 33,965 | |
| | 9,100 | | | | Zhejiang Dahua Technology Co Ltd | | | 15 | |
| | 301,405 | | | | Zhen Ding Technology Holding Ltd | | | 784 | |
| | 1,170,938 | | * | | ZTE Corp | | | 2,209 | |
| | 11,500 | | * | | ZTE Corp | | | 33 | |
| | | | | | TOTAL TECHNOLOGY HARDWARE & EQUIPMENT | | | 4,798,272 | |
COLLEGE RETIREMENT EQUITIES FUND -Stock Account
| SHARES | | | | COMPANY | | VALUE
(000) | |
| TELECOMMUNICATION SERVICES - 2.2% |
| | 1,010,489 | | | | Advanced Info Service PCL (Foreign) | | $ | 5,359 | |
| | 361,406 | | | | AFK Sistema (GDR) | | | 838 | |
| | 97,594 | | | | AFK Sistema (GDR) | | | 227 | |
| | 43,400,984 | | | | America Movil S.A. de C.V. (Series L) | | | 30,853 | |
| | 222,250 | | e | | APT Satellite Holdings Ltd | | | 88 | |
| | 1,350,000 | | * | | Asia Pacific Telecom Co Ltd | | | 303 | |
| | 15,031,723 | | | | AT&T, Inc | | | 429,005 | |
| | 14,618 | | | | ATN International, Inc | | | 1,046 | |
| | 661,100 | | *,e | | Axtel SAB de C.V. | | | 100 | |
| | 338,198 | | | | BCE, Inc | | | 13,360 | |
| | 673,106 | | | | Bezeq Israeli Telecommunication Corp Ltd | | | 657 | |
| | 1,849,977 | | | | Bharti Airtel Ltd | | | 8,268 | |
| | 613,926 | | | | Bharti Infratel Ltd | | | 2,277 | |
| | 147,759 | | * | | Boingo Wireless, Inc | | | 3,039 | |
| | 7,130,648 | | | | BT Group plc | | | 21,681 | |
| | 39,633 | | * | | Cellcom Israel Ltd | | | 234 | |
| | 372,307 | | g | | Cellnex Telecom SAU | | | 9,521 | |
| | 2,248,254 | | | | CenturyLink, Inc | | | 34,061 | |
| | 2,407,371 | | | | China Communications Services Corp Ltd | | | 1,996 | |
| | 6,554,249 | | | | China Mobile Hong Kong Ltd | | | 63,423 | |
| | 23,004,457 | | | | China Telecom Corp Ltd | | | 11,787 | |
| | 75,274,000 | | *,g | | China Tower Corp Ltd | | | 14,234 | |
| | 17,957,681 | | | | China Unicom Ltd | | | 19,132 | |
| | 162,400 | | | | China United Network Communications Ltd | | | 123 | |
| | 241,509 | | | | Chorus Ltd | | | 787 | |
| | 3,366,988 | | | | Chunghwa Telecom Co Ltd | | | 12,293 | |
| | 127,037 | | * | | Cincinnati Bell, Inc | | | 988 | |
| | 8,635,000 | | | | Citic 1616 Holdings Ltd | | | 3,030 | |
| | 68,835 | | | | Cogent Communications Group, Inc | | | 3,112 | |
| | 126,581 | | e | | Consolidated Communications Holdings, Inc | | | 1,251 | |
| | 5,716,618 | | | | Deutsche Telekom AG. | | | 97,164 | |
| | 8,829,539 | | | | Digi.Com BHD | | | 9,594 | |
| | 89,620 | | | | DNA Oyj | | | 1,753 | |
| | 127,515 | | | | Drillisch AG. | | | 6,512 | |
| | 307,811 | | | | Elisa Oyj (Series A) | | | 12,749 | |
| | 2,708,532 | | * | | Emirates Telecommunications Group Co PJSC | | | 12,524 | |
| | 128,268 | | | | Empresa Nacional de Telecomunicaciones S.A. | | | 997 | |
| | 76,307 | | e,g | | Euskaltel S.A. | | | 611 | |
| | 1,391,236 | | | | Far EasTone Telecommunications Co Ltd | | | 3,456 | |
| | 79,703 | | | | Freenet AG. | | | 1,551 | |
| | 312,929 | | *,e | | Frontier Communications Corp | | | 745 | |
| | 44,271 | | | | Globe Telecom, Inc | | | 1,596 | |
| | 75,135 | | *,e | | Gogo, Inc | | | 225 | |
| | 221,954 | | | | Hellenic Telecommunications Organization S.A. | | | 2,422 | |
| | 1,616,768 | | * | | Himachal Futuristic Communications | | | 490 | |
| | 2,278,500 | | | | HKBN Ltd | | | 3,454 | |
| | 3,929,535 | | | | HKT Trust and HKT Ltd | | | 5,661 | |
| | 952,651 | | | | Hutchison Telecommunications Hong Kong Holdings Ltd | | | 356 | |
| | 2,317,433 | | * | | Idea Cellular Ltd | | | 1,252 | |
| | 81,623 | | | | Iliad S.A. | | | 11,455 | |
| | 191,586 | | g | | Infrastrutture Wireless Italiane S.p.A | | | 1,311 | |
| | 294,288 | | | | Inmarsat plc | | | 1,421 | |
COLLEGE RETIREMENT EQUITIES FUND -Stock Account
| SHARES | | | | COMPANY | | VALUE
(000) | |
| | 48,536 | | * | | Inscobee, Inc | | $ | 217 | |
| | 111,037 | | * | | Intelsat S.A. | | | 2,375 | |
| | 16,700 | | | | Internet Initiative Japan, Inc | | | 379 | |
| | 171,101 | | * | | Iridium Communications, Inc | | | 3,157 | |
| | 21,284,000 | | | | Jasmine International PCL | | | 2,916 | |
| | 301,211 | | | | Kcom Group plc | | | 280 | |
| | 1,579,798 | | | | KDDI Corp | | | 37,749 | |
| | 1,901,464 | | | | Koninklijke KPN NV | | | 5,554 | |
| | 31,561 | | | | KT Corp | | | 842 | |
| | 222,725 | | *,†,e,m | | Let’s GOWEX S.A. | | | 13 | |
| | 164,659 | | | | LG Telecom Ltd | | | 2,602 | |
| | 1,485,147 | | e | | Magyar Telekom | | | 2,336 | |
| | 600,715 | | * | | Masmovil Ibercom S.A. | | | 13,421 | |
| | 2,423,390 | | | | Maxis BHD | | | 3,133 | |
| | 19,263 | | *,e | | Millicom International Cellular S.A. | | | 1,219 | |
| | 967,518 | | | | Mobile TeleSystems (ADR) | | | 6,773 | |
| | 2,037,309 | | | | MobileOne Ltd | | | 3,127 | |
| | 18,009 | | | | Mobistar S.A. | | | 356 | |
| | 1,540,434 | | | | MTN Group Ltd | | | 9,522 | |
| | 3,840,600 | | | | NetLink NBN Trust | | | 2,156 | |
| | 118,259 | | *,e | | NII Holdings, Inc | | | 522 | |
| | 1,085,936 | | | | Nippon Telegraph & Telephone Corp | | | 44,305 | |
| | 3,292,130 | | | | NTT DoCoMo, Inc | | | 73,972 | |
| | 45,193 | | * | | Ooma, Inc | | | 627 | |
| | 186,132 | | * | | Ooredoo QSC | | | 3,835 | |
| | 2,285,929 | | | | Orange S. A. | | | 37,045 | |
| | 1,168,944 | | * | | Orascom Telecom Holding SAE | | | 243 | |
| | 96,914 | | * | | Orbcomm, Inc | | | 800 | |
| | 239,995 | | * | | Partner Communications | | | 1,174 | |
| | 8,170,741 | | | | PCCW Ltd | | | 4,705 | |
| | 29,040 | | * | | pdvWireless, Inc | | | 1,086 | |
| | 73,624 | | g | | PLAY Communications S.A. | | | 411 | |
| | 74,892 | | | | PLDT, Inc | | | 1,608 | |
| | 17,771 | | | | Proximus plc | | | 481 | |
| | 1,980,800 | | | | PT Link Net Tbk | | | 675 | |
| | 43,720,924 | | | | PT Telekomunikasi Indonesia Persero Tbk | | | 11,430 | |
| | 374,569 | | * | | Reliance Communication Ventures Ltd | | | 77 | |
| | 905,477 | | | | Rogers Communications, Inc (Class B) | | | 46,401 | |
| | 152,068 | | * | | Sejong Telecom, Inc | | | 65 | |
| | 116,351 | | | | Shenandoah Telecom Co | | | 5,149 | |
| | 7,184,653 | | | | Singapore Telecommunications Ltd | | | 15,615 | |
| | 111,378 | | | | SK Telecom Co Ltd | | | 26,873 | |
| | 3,386,377 | | | | SmarTone Telecommunications Holding Ltd | | | 3,755 | |
| | 1,384,666 | | | | Softbank Corp | | | 90,694 | |
| | 151,240 | | e | | SpeedCast International Ltd | | | 310 | |
| | 21,985 | | | | Spok Holdings, Inc | | | 292 | |
| | 1,415,560 | | *,e | | Sprint Corp | | | 8,239 | |
| | 449,800 | | | | StarHub Ltd | | | 577 | |
| | 146,404 | | g | | Sunrise Communications Group AG. | | | 12,890 | |
| | 24,215 | | | | Swisscom AG. | | | 11,574 | |
| | 1,436,942 | | | | Taiwan Mobile Co Ltd | | | 4,976 | |
| | 441,113 | | e | | TalkTalk Telecom Group plc | | | 639 | |
| | 42,369 | | * | | Tata Communications Ltd | | | 318 | |
| | 572,984 | | | | Tele2 AB (B Shares) | | | 7,308 | |
COLLEGE RETIREMENT EQUITIES FUND -Stock Account
| SHARES | | | | COMPANY | | VALUE
(000) | |
| | 2,224,564 | | | | Telecom Corp of New Zealand Ltd | | $ | 6,205 | |
| | 1,563,954 | | | | Telecom Egypt | | | 1,107 | |
| | 756,959 | | | | Telecom Italia RSP | | | 363 | |
| | 2,696,997 | | * | | Telecom Italia S.p.A. | | | 1,493 | |
| | 427,899 | | | | Telefonica Brasil S.A. | | | 5,103 | |
| | 348,972 | | | | Telefonica Deutschland Holding AG. | | | 1,374 | |
| | 4,695,626 | | | | Telefonica S.A. | | | 39,525 | |
| | 105,566 | | | | Telekom Austria AG. | | | 807 | |
| | 355,983 | | | | Telekom Malaysia BHD | | | 230 | |
| | 505,092 | | * | | Telekomunikacja Polska S.A. | | | 648 | |
| | 1,296,918 | | | | Telenor ASA | | | 25,187 | |
| | 748,314 | | | | Telephone & Data Systems, Inc | | | 24,350 | |
| | 830,601 | | *,e | | Telesites SAB de C.V. | | | 496 | |
| | 4,418,361 | | | | TeliaSonera AB | | | 21,018 | |
| | 229,044 | | | | Telkom S.A. Ltd | | | 1,009 | |
| | 5,193,588 | | | | Telstra Corp Ltd | | | 10,423 | |
| | 168,262 | | | | TELUS Corp | | | 5,577 | |
| | 341,900 | | | | Thaicom PCL | | | 64 | |
| | 1,817,584 | | | | Tim Participacoes S.A. | | | 5,552 | |
| | 213,820 | | | | Time dotCom BHD | | | 419 | |
| | 2,992,046 | | | | TM International BHD | | | 2,843 | |
| | 813,498 | | * | | T-Mobile US, Inc | | | 51,747 | |
| | 1,544,683 | | | | Tower Bersama Infrastructure | | | 386 | |
| | 515,756 | | | | TPG Telecom Ltd | | | 2,339 | |
| | 6,375,092 | | | | True Corp PCL (Foreign) | | | 1,019 | |
| | 1,614,063 | | | | Turkcell Iletisim Hizmet AS | | | 3,701 | |
| | 21,407 | | | | United Internet AG. | | | 937 | |
| | 27,243 | | * | | US Cellular Corp | | | 1,416 | |
| | 10,237,858 | | | | Verizon Communications, Inc | | | 575,572 | |
| | 4,600 | | * | | Vision, Inc | | | 159 | |
| | 374,430 | | * | | Vocus Communications Ltd | | | 844 | |
| | 1,012,994 | | | | Vodacom Group Pty Ltd | | | 9,317 | |
| | 51,077,987 | | | | Vodafone Group plc | | | 99,310 | |
| | 287,100 | | | | Vodafone Group plc (ADR) | | | 5,535 | |
| | 210,723 | | * | | Vodafone Qatar | | | 452 | |
| | 509,030 | | * | | Vonage Holdings Corp | | | 4,444 | |
| | 10,037 | | *,e,m | | Windstream Holdings, Inc | | | 21 | |
| | 517,984 | | * | | Zayo Group Holdings, Inc | | | 11,831 | |
| | | | | | TOTAL TELECOMMUNICATION SERVICES | | | 2,309,993 | |
| | | | | | | | | | |
| TRANSPORTATION - 2.1% |
| | 52,528 | | e,m | | Abertis Infraestructuras S.A. (Continuous) | | | 1,105 | |
| | 13,828 | | | | Aegean Airlines S.A. | | | 117 | |
| | 85,747 | | g | | Aena S.A. | | | 13,323 | |
| | 7,630 | | e | | Aeroporto Guglielmo Marconi Di Bologna S.p.A | | | 100 | |
| | 30,744 | | | | Aeroports de Paris | | | 5,830 | |
| | 1,471,284 | | * | | Air Arabia PJSC | | | 409 | |
| | 45,785 | | * | | Air Canada | | | 871 | |
| | 2,843,225 | | | | Air China Ltd | | | 2,461 | |
| | 177,396 | | * | | Air France-KLM | | | 1,926 | |
| | 1,270,271 | | | | Air New Zealand Ltd | | | 2,646 | |
| | 125,080 | | * | | Air Transport Services Group, Inc | | | 2,853 | |
| | 623,300 | | | | AirAsia BHD | | | 447 | |
COLLEGE RETIREMENT EQUITIES FUND -Stock Account
| SHARES | | | | COMPANY | | VALUE
(000) | |
| | 3,912,100 | | | | Airports of Thailand PCL | | $ | 7,727 | |
| | 233,756 | | | | Alaska Air Group, Inc | | | 14,224 | |
| | 788,682 | | e,g | | ALD S.A. | | | 9,392 | |
| | 36,787 | | | | All Nippon Airways Co Ltd | | | 1,321 | |
| | 16,500 | | | | Allegiant Travel Co | | | 1,654 | |
| | 14,897 | | | | Amerco, Inc | | | 4,888 | |
| | 1,449,787 | | | | American Airlines Group, Inc | | | 46,553 | |
| | 634,771 | | *,†,b,e,m | | AMR Corporation | | | 6 | |
| | 16,000 | | | | Anhui Expressway Co | | | 10 | |
| | 4,357 | | | | AP Moller - Maersk AS (Class A) | | | 5,169 | |
| | 6,177 | | | | AP Moller - Maersk AS (Class B) | | | 7,770 | |
| | 95,831 | | | | Arkansas Best Corp | | | 3,283 | |
| | 473,768 | | * | | Asiana Airlines | | | 1,758 | |
| | 29,863 | | * | | Atlas Air Worldwide Holdings, Inc | | | 1,260 | |
| | 586,332 | | | | Atlas Arteria Ltd | | | 2,586 | |
| | 723,543 | | | | Auckland International Airport Ltd | | | 3,492 | |
| | 133,691 | | | | Autostrada Torino-Milano S.p.A. | | | 2,674 | |
| | 590,679 | | | | Autostrade S.p.A. | | | 12,224 | |
| | 232,345 | | | | Avianca Holdings S.A. | | | 119 | |
| | 84,635 | | * | | Avis Budget Group, Inc | | | 1,903 | |
| | 339,900 | | | | Bangkok Airways Co Ltd | | | 121 | |
| | 3,862,753 | | | | Bangkok Expressway & Metro PCL | | | 1,152 | |
| | 680,081 | | | | BBA Aviation plc | | | 1,890 | |
| | 1,766,097 | | | | Beijing Capital International Airport Co Ltd | | | 1,874 | |
| | 422,500 | | *,e | | Beijing Sports and Entertainment Industry Group Ltd | | | 151 | |
| | 6,733 | | | | Blue Dart Express Ltd | | | 325 | |
| | 744,908 | | | | Bollore | | | 2,987 | |
| | 90,996 | | e | | bpost S.A. | | | 834 | |
| | 5,152,527 | | | | BTS Group Holdings PCL | | | 1,511 | |
| | 984,477 | | | | Canadian National Railway Co | | | 72,913 | |
| | 130,298 | | | | Canadian Pacific Railway Ltd (Toronto) | | | 23,120 | |
| | 1,149,000 | | * | | CAR, Inc | | | 856 | |
| | 135,660 | | | | Cathay Pacific Airways Ltd | | | 193 | |
| | 639,840 | | | | Cebu Air, Inc | | | 890 | |
| | 122,064 | | | | Central Japan Railway Co | | | 25,754 | |
| | 18,880 | | * | | Ceva Logistics AG. | | | 573 | |
| | 120,499 | | | | CH Robinson Worldwide, Inc | | | 10,133 | |
| | 339,335 | | | | China Airlines | | | 121 | |
| | 2,533,500 | | * | | China COSCO Holdings Co Ltd | | | 951 | |
| | 1,020,000 | | | | China Eastern Airlines Corp Ltd (H Shares) | | | 566 | |
| | 3,392,525 | | | | China Merchants Holdings International Co Ltd | | | 6,100 | |
| | 1,584,000 | | | | China Shipping Development Co Ltd | | | 789 | |
| | 3,521,500 | | | | China Southern Airlines Co Ltd | | | 2,159 | |
| | 238,282 | | e | | Chorus Aviation, Inc | | | 984 | |
| | 1,017,599 | | | | Cia de Concessoes Rodoviarias | | | 2,935 | |
| | 39,642 | | | | Cia de Distribucion Integral Logista Holdings SAU | | | 992 | |
| | 1,398,890 | | | | ComfortDelgro Corp Ltd | | | 2,210 | |
| | 8,733,716 | | * | | Compania SudAmericana de Vapores S.A. | | | 249 | |
| | 153,195 | | | | Container Corp Of India Ltd | | | 1,508 | |
| | 399,000 | | *,e | | Controladora Vuela Cia de Aviacion SAB de C.V. | | | 213 | |
| | 115,612 | | | | Copa Holdings S.A. (Class A) | | | 9,100 | |
| | 75,763 | | * | | Cosan Logistica S.A. | | | 255 | |
| | 1,354,000 | | | | Cosco International Holdings Ltd | | | 465 | |
| | 5,716,295 | | | | COSCO Pacific Ltd | | | 5,620 | |
COLLEGE RETIREMENT EQUITIES FUND -Stock Account
| SHARES | | | | COMPANY | | VALUE
(000) | |
| | 25,700 | | * | | COSCO SHIPPING Holdings Co Ltd | | $ | 15 | |
| | 63,591 | | | | Costamare, Inc | | | 279 | |
| | 110,775 | | * | | Covenant Transportation Group, Inc | | | 2,127 | |
| | 3,054,994 | | | | CSX Corp | | | 189,807 | |
| | 82,776 | | e | | CTT-Correios de Portugal S.A. | | | 279 | |
| | 19,680 | | *,e | | D/S Norden | | | 280 | |
| | 341,600 | | | | Daqin Railway Co Ltd | | | 410 | |
| | 648,024 | | | | Dart Group plc | | | 6,384 | |
| | 58,422 | | *,e | | Daseke, Inc | | | 215 | |
| | 1,615,958 | | | | Delta Air Lines, Inc | | | 80,636 | |
| | 899,324 | | | | Deutsche Lufthansa AG. | | | 20,310 | |
| | 764,171 | | | | Deutsche Post AG. | | | 20,869 | |
| | 46,778 | | | | Dfds A.S. | | | 1,888 | |
| | 165,452 | | | | DP World Ltd | | | 2,829 | |
| | 428,633 | | | | DSV AS | | | 28,308 | |
| | 119,577 | | * | | Eagle Bulk Shipping, Inc | | | 551 | |
| | 481,688 | | | | East Japan Railway Co | | | 42,538 | |
| | 338,430 | | | | easyJet plc | | | 4,769 | |
| | 101,265 | | * | | Echo Global Logistics, Inc | | | 2,059 | |
| | 1,317,600 | | | | EcoRodovias Infraestrutura e Logistica S.A. | | | 3,183 | |
| | 15,300 | | *,e | | eHi Car Services Ltd (ADR) | | | 161 | |
| | 594,387 | | g | | Enav S.p.A | | | 2,893 | |
| | 71,461 | | g | | Europcar Groupe S.A. | | | 644 | |
| | 443,535 | | | | Eva Airways Corp | | | 228 | |
| | 334,000 | | | | Evergreen International Storage & Transport Corp | | | 147 | |
| | 2,215,114 | | | | Evergreen Marine Corp Tawain Ltd | | | 859 | |
| | 4,117 | | e | | Exchange Income Corp | | | 85 | |
| | 94,893 | | | | Expeditors International of Washington, Inc | | | 6,461 | |
| | 727,403 | | | | FedEx Corp | | | 117,352 | |
| | 386,480 | | | | Finnair Oyj | | | 3,140 | |
| | 766,848 | | * | | Firstgroup plc | | | 815 | |
| | 12,413 | | | | Flughafen Zuerich AG. | | | 2,054 | |
| | 101,237 | | | | Forward Air Corp | | | 5,553 | |
| | 37,742 | | | | Fraport AG. Frankfurt Airport Services Worldwide | | | 2,701 | |
| | 24,777 | | | | Freightways Ltd | | | 122 | |
| | 70,600 | | | | Fukuyama Transporting Co Ltd | | | 2,721 | |
| | 134,945 | | *,e | | Genco Shipping & Trading Ltd | | | 1,065 | |
| | 105,693 | | * | | Genesee & Wyoming, Inc (Class A) | | | 7,823 | |
| | 18,650 | | | | GLOVIS Co Ltd | | | 2,155 | |
| | 156,362 | | | | Go-Ahead Group plc | | | 3,045 | |
| | 284,100 | | * | | Gol Linhas Aereas Inteligentes S.A. | | | 1,834 | |
| | 499,977 | | e | | Golden Ocean Group Ltd | | | 3,032 | |
| | 278,921 | | * | | Grindrod Ltd | | | 119 | |
| | 400,349 | | | | Groupe Eurotunnel S.A. | | | 5,380 | |
| | 210,100 | | *,e | | Grupo Aeromexico SAB de C.V. | | | 237 | |
| | 182,200 | | | | Grupo Aeroportuario del Centro Norte Sab de C.V. | | | 868 | |
| | 365,831 | | | | Grupo Aeroportuario del Pacifico S.A. de C.V. (B Shares) | | | 2,976 | |
| | 211,780 | | | | Grupo Aeroportuario del Sureste S.A. de C.V. (Class B) | | | 3,192 | |
| | 315,400 | | | | Guangshen Railway Co Ltd | | | 145 | |
| | 226,436 | | * | | Gujarat Pipavav Port Ltd | | | 333 | |
| | 42,464 | | * | | Gulf Warehousing Co | | | 449 | |
COLLEGE RETIREMENT EQUITIES FUND -Stock Account
| SHARES | | | | COMPANY | | VALUE
(000) | |
| | 28,600 | | | | Hamakyorex Co Ltd | | $ | 984 | |
| | 92,802 | | | | Hamburger Hafen und Logistik AG. | | | 1,840 | |
| | 23,801 | | | | Hanjin Kal Corp | | | 637 | |
| | 4,261 | | | | Hanjin Transportation Co Ltd | | | 205 | |
| | 240,997 | | | | Hankyu Hanshin Holdings, Inc | | | 8,013 | |
| | 27,201 | | g | | Hapag-Lloyd AG. | | | 698 | |
| | 82,811 | | | | Hawaiian Holdings, Inc | | | 2,187 | |
| | 60,222 | | | | Heartland Express, Inc | | | 1,102 | |
| | 94,968 | | *,e | | Hertz Global Holdings, Inc | | | 1,296 | |
| | 29,000 | | | | Hitachi Transport System Ltd | | | 824 | |
| | 6,827 | | | | Hopewell Highway Infrastructure Ltd | | | 3 | |
| | 197,266 | | * | | Hub Group, Inc (Class A) | | | 7,313 | |
| | 3,404,200 | | | | Hutchison Port Holdings Trust | | | 834 | |
| | 151,779 | | * | | Hyundai Merchant Marine Co Ltd | | | 503 | |
| | 1,454 | | * | | ID Logistics Group | | | 192 | |
| | 230,257 | | | | Iino Kaiun Kaisha Ltd | | | 835 | |
| | 106,981 | | | | Imperial Holdings Ltd | | | 506 | |
| | 62,749 | | g | | InterGlobe Aviation Ltd | | | 1,046 | |
| | 2,208,388 | | | | International Consolidated Airlines Group S.A. | | | 17,508 | |
| | 648,677 | | | | International Container Term Services, Inc | | | 1,234 | |
| | 43,166 | | | | Irish Continental Group plc | | | 210 | |
| | 327,829 | | | | Japan Airlines Co Ltd | | | 11,619 | |
| | 104,200 | | | | Japan Airport Terminal Co Ltd | | | 3,602 | |
| | 81,886 | | | | JB Hunt Transport Services, Inc | | | 7,619 | |
| | 5,336 | | | | Jeju Air Co Ltd | | | 160 | |
| | 754,572 | | * | | JetBlue Airways Corp | | | 12,118 | |
| | 1,447,834 | | | | Jiangsu Express | | | 2,021 | |
| | 4,665 | | | | Jin Air Co Ltd | | | 81 | |
| | 317,761 | | | | Kamigumi Co Ltd | | | 6,501 | |
| | 112,701 | | | | Kansas City Southern Industries, Inc | | | 10,757 | |
| | 115,539 | | *,e | | Kawasaki Kisen Kaisha Ltd | | | 1,417 | |
| | 30,998 | | | | Keihin Electric Express Railway Co Ltd | | | 507 | |
| | 25,191 | | | | Keio Corp | | | 1,466 | |
| | 26,135 | | | | Keisei Electric Railway Co Ltd | | | 819 | |
| | 1,476,149 | | | | Kerry Logistics Network Ltd | | | 2,193 | |
| | 131,574 | | | | Kintetsu Corp | | | 5,717 | |
| | 196,400 | | | | Kintetsu World Express, Inc | | | 2,890 | |
| | 352,258 | | * | | Kirby Corp | | | 23,728 | |
| | 1,302,159 | | e | | Knight-Swift Transportation Holdings, Inc | | | 32,645 | |
| | 78,100 | | | | Konoike Transport Co Ltd | | | 1,136 | |
| | 8,686 | | * | | Korea Express Co Ltd | | | 1,299 | |
| | 6,994 | | * | | Korea Line Corp | | | 137 | |
| | 12,560 | | | | Korean Air Lines Co Ltd | | | 372 | |
| | 51,092 | | | | Kuehne & Nagel International AG. | | | 6,577 | |
| | 215,186 | | | | Kyushu Railway Co | | | 7,280 | |
| | 258,942 | | | | Lan Airlines S.A. | | | 2,593 | |
| | 47,059 | | | | Landstar System, Inc | | | 4,502 | |
| | 145,500 | | | | Lingkaran Trans Kota Holdings BHD | | | 146 | |
| | 521,011 | | | | Localiza Rent A Car | | | 3,987 | |
| | 164,466 | | | | Macquarie Infrastructure Co LLC | | | 6,013 | |
| | 267,540 | | | | MacroAsia Corp | | | 87 | |
| | 1,156,706 | | | | Malaysia Airports Holdings BHD | | | 2,343 | |
| | 156,876 | | | | Marten Transport Ltd | | | 2,540 | |
| | 5,500 | | | | Maruwa Unyu Kikan Co Ltd | | | 135 | |
COLLEGE RETIREMENT EQUITIES FUND -Stock Account
| SHARES | | | | COMPANY | | VALUE
(000) | |
| | 33,100 | | | | Maruzen Showa Unyu Co Ltd | | $ | 832 | |
| | 62,293 | | | | Matson, Inc | | | 1,995 | |
| | 16,409 | | * | | Mesa Air Group, Inc | | | 127 | |
| | 3,081,056 | | | | MISC BHD | | | 4,992 | |
| | 37,750 | | e | | Mitsubishi Logistics Corp | | | 858 | |
| | 46,790 | | | | Mitsui OSK Lines Ltd | | | 1,013 | |
| | 115,022 | | * | | Mitsui-Soko Co Ltd | | | 1,983 | |
| | 57,600 | | | | Movida Participacoes S.A. | | | 128 | |
| | 1,541,158 | | | | MTR Corp | | | 8,111 | |
| | 512,894 | | * | | Mundra Port and Special Economic Zone Ltd | | | 2,846 | |
| | 137,274 | | | | Nagoya Railroad Co Ltd | | | 3,615 | |
| | 108,100 | | | | Nankai Electric Railway Co Ltd | | | 2,864 | |
| | 1,058,680 | | | | National Express Group plc | | | 5,047 | |
| | 26,634 | | | | Nippon Express Co Ltd | | | 1,480 | |
| | 55,700 | | | | Nippon Konpo Unyu Soko Co Ltd | | | 1,330 | |
| | 205,286 | | | | Nippon Yusen Kabushiki Kaisha | | | 3,139 | |
| | 37,700 | | | | Nishi-Nippon Railroad Co Ltd | | | 949 | |
| | 30,500 | | | | Nissin Corp | | | 497 | |
| | 444,290 | | g | | Nobina AB | | | 2,997 | |
| | 549,475 | | | | Norfolk Southern Corp | | | 82,168 | |
| | 85,899 | | | | Northgate plc | | | 413 | |
| | 21,932 | | e | | Norwegian Air Shuttle AS | | | 442 | |
| | 52,109 | | | | Odakyu Electric Railway Co Ltd | | | 1,146 | |
| | 87,810 | | | | Oesterreichische Post AG. | | | 3,017 | |
| | 106,591 | | | | Old Dominion Freight Line | | | 13,163 | |
| | 11,159,290 | | | | Pacific Basin Shipping Ltd | | | 2,126 | |
| | 3,104 | | * | | PAM Transportation Services, Inc | | | 122 | |
| | 6,768 | | e | | Panalpina Welttransport Holding AG. | | | 903 | |
| | 12,513 | | | | Park-Ohio Holdings Corp | | | 384 | |
| | 24,050 | | * | | Pegasus Hava Tasimaciligi AS. | | | 104 | |
| | 5,605 | | | | Piraeus Port Authority | | | 94 | |
| | 62,680 | | * | | PKP Cargo S.A. | | | 738 | |
| | 247,600 | | | | Pos Malaysia & Services Holdings BHD | | | 103 | |
| | 318,150 | | *,m | | Precious Shipping PCL | | | 85 | |
| | 240,562 | | | | Promotora y Operadora de Infraestructura SAB de C.V. | | | 2,303 | |
| | 12,753,500 | | *,† | | PT Berlian Laju Tanker Tbk | | | 0 | ^ |
| | 2,533,554 | | | | PT Jasa Marga Tbk | | | 755 | |
| | 15,237,000 | | * | | PT Trada Maritime Tbk | | | 180 | |
| | 125,886 | | | | Qantas Airways Ltd | | | 514 | |
| | 56,260 | | * | | Qatar Navigation QSC | | | 1,017 | |
| | 2,248,303 | | | | QR National Ltd | | | 6,783 | |
| | 848,654 | | e | | Qube Logistics Holdings Ltd | | | 1,519 | |
| | 431,106 | | * | | Radiant Logistics, Inc | | | 1,832 | |
| | 837,746 | | | | Redde plc | | | 1,810 | |
| | 566,873 | | | | Royal Mail plc | | | 1,968 | |
| | 1,063,500 | | * | | Rumo S.A. | | | 4,656 | |
| | 3,051 | | * | | Ryanair Holdings plc | | | 37 | |
| | 50,257 | | * | | Ryanair Holdings plc (ADR) | | | 3,585 | |
| | 95,292 | | | | Ryder System, Inc | | | 4,588 | |
| | 726,731 | | * | | Safe Bulkers, Inc | | | 1,294 | |
| | 72,200 | | | | Sagami Railway Co Ltd | | | 2,147 | |
| | 32,998 | | * | | Saia, Inc | | | 1,842 | |
COLLEGE RETIREMENT EQUITIES FUND -Stock Account
| SHARES | | | | COMPANY | | VALUE
(000) | |
| | 96 | | *,† | | SAir Group | | $ | 0 | |
| | 7,000 | | | | Sakai Moving Service Co Ltd | | | 379 | |
| | 295,900 | | | | Sankyu, Inc | | | 13,361 | |
| | 173,100 | | | | Santos Brasil Participacoes S.A. | | | 189 | |
| | 2,581,940 | | * | | SAS AB | | | 6,089 | |
| | 11,100 | | | | SBS Holdings, Inc | | | 143 | |
| | 434,085 | | | | Schneider National, Inc | | | 8,104 | |
| | 520,982 | | | | Scorpio Bulkers, Inc | | | 2,881 | |
| | 389,284 | | e | | Seaspan Corp | | | 3,048 | |
| | 945,881 | | | | Seino Holdings Corp | | | 12,384 | |
| | 146,500 | | | | Senko Co Ltd | | | 1,113 | |
| | 5,300 | | | | SF Holding Co Ltd | | | 25 | |
| | 132,000 | | | | SG Holdings Co Ltd | | | 3,432 | |
| | 82,200 | | | | Shandong Airlines Co Ltd | | | 116 | |
| | 26,200 | | | | Shanghai International Airport Co Ltd | | | 194 | |
| | 274,800 | | | | Shanghai International Port Group Co Ltd | | | 208 | |
| | 102,700 | | | | Shanghai Jinjiang International Investment Holdings Co | | | 99 | |
| | 1,196,000 | | | | Shenzhen International Holdings Ltd | | | 2,304 | |
| | 80,700 | | | | Shinwa Kaiun Kaisha Ltd | | | 2,172 | |
| | 173,800 | | | | SIA Engineering Co Ltd | | | 289 | |
| | 165,000 | | | | Sincere Navigation | | | 86 | |
| | 258,623 | | | | Singapore Airlines Ltd | | | 1,787 | |
| | 547,074 | | | | Singapore Airport Terminal Services Ltd | | | 1,874 | |
| | 961,819 | | e | | Singapore Post Ltd | | | 645 | |
| | 2,823,000 | | | | Sinotrans Ltd | | | 1,225 | |
| | 803,000 | | † | | Sinotrans Shipping Ltd | | | 272 | |
| | 1,252,000 | | | | SITC International Co Ltd | | | 1,180 | |
| | 18,385 | | | | Sixt AG. | | | 1,468 | |
| | 55,090 | | | | Sixt AG. (Preference) | | | 3,034 | |
| | 7,087 | | | | Sixt Leasing AG. | | | 93 | |
| | 175,090 | | | | Skywest, Inc | | | 7,786 | |
| | 126,664 | | | | Societa Iniziative Autostradali e Servizi S.p.A. | | | 1,754 | |
| | 1,421,174 | | | | Southwest Airlines Co | | | 66,056 | |
| | 100,812 | | * | | SpiceJet Ltd | | | 129 | |
| | 390,754 | | * | | Spirit Airlines, Inc | | | 22,632 | |
| | 279,780 | | | | Stagecoach Group plc | | | 473 | |
| | 12,450 | | | | Stolt-Nielsen S.A. | | | 147 | |
| | 229,221 | | * | | STX Pan Ocean Co Ltd | | | 915 | |
| | 37,383 | | | | Sumitomo Warehouse Co Ltd | | | 460 | |
| | 796,832 | | | | Sydney Airport | | | 3,778 | |
| | 117,000 | | | | T.Join Transportation Co | | | 135 | |
| | 2,577,000 | | | | Taiwan High Speed Rail Corp | | | 2,557 | |
| | 165,858 | | | | TAV Havalimanlari Holding AS | | | 749 | |
| | 200,000 | | | | Tegma Gestao Logistica | | | 1,419 | |
| | 470,182 | | | | TFI International, Inc | | | 12,157 | |
| | 439,000 | | * | | Thai Airways International PCL (Foreign) | | | 163 | |
| | 1,188,000 | | | | Tianjin Port Development Holdings Ltd | | | 126 | |
| | 278,741 | | e | | TNT NV | | | 637 | |
| | 145,752 | | | | Tobu Railway Co Ltd | | | 3,935 | |
| | 532,797 | | | | Tokyu Corp | | | 8,706 | |
| | 3,800 | | | | Tonami Holdings Co Ltd | | | 194 | |
| | 149,425 | | | | Tourism Holdings Ltd | | | 517 | |
| | 4,700 | | | | Trancom Co Ltd | | | 242 | |
COLLEGE RETIREMENT EQUITIES FUND -Stock Account
| SHARES | | | | COMPANY | | VALUE
(000) | |
| | 2,069,353 | | | | Transurban Group (ASE) | | $ | 16,984 | |
| | 1,477,661 | | * | | Turk Hava Yollari | | | 4,485 | |
| | 274,000 | | | | U-Ming Marine Transport Corp | | | 288 | |
| | 2,936,975 | | | | Union Pacific Corp | | | 405,978 | |
| | 560,038 | | * | | United Continental Holdings, Inc | | | 46,892 | |
| | 1,186,635 | | | | United Parcel Service, Inc (Class B) | | | 115,733 | |
| | 87,332 | | | | Universal Truckload Services, Inc | | | 1,580 | |
| | 27,754 | | * | | US Xpress Enterprises, Inc | | | 156 | |
| | 24,460 | | * | | USA Truck, Inc | | | 366 | |
| | 60,603 | | * | | Virgin Australia Holdings Ltd | | | 8 | |
| | 67,336 | | *,†,m | | Virgin Australia Int Holdings | | | 0 | ^ |
| | 372,000 | | | | Wan Hai Lines Ltd | | | 193 | |
| | 60,806 | | | | Werner Enterprises, Inc | | | 1,796 | |
| | 228,002 | | | | West Japan Railway Co | | | 16,109 | |
| | 18,270 | | | | WestJet Airlines Ltd | | | 241 | |
| | 1,294,300 | | | | Westports Holdings BHD | | | 1,132 | |
| | 138,387 | | e | | Westshore Terminals Investment Corp | | | 2,086 | |
| | 69,776 | | * | | Wilh. Wilhelmsen ASA | | | 240 | |
| | 194,033 | | | | Wisdom Marine Lines Co Ltd | | | 183 | |
| | 4,324,000 | | | | Xiamen International Port Co Ltd | | | 635 | |
| | 188,800 | | * | | XPO Logistics, Inc | | | 10,769 | |
| | 90,921 | | e | | Yamato Transport Co Ltd | | | 2,493 | |
| | 737,523 | | * | | Yang Ming Marine Transport | | | 212 | |
| | 45,395 | | * | | YRC Worldwide, Inc | | | 143 | |
| | 400,000 | | e | | Yuexiu Transport Infrastructure Ltd | | | 303 | |
| | 1,556,194 | | | | Zhejiang Expressway Co Ltd | | | 1,350 | |
| | | | | | TOTAL TRANSPORTATION | | | 2,160,754 | |
| | | | | | | | | | |
| UTILITIES - 2.9% |
| | 9,459,852 | | | | A2A S.p.A. | | | 17,061 | |
| | 1,739,910 | | | | Aboitiz Power Corp | | | 1,160 | |
| | 32,418 | | | | Acciona S.A. | | | 2,742 | |
| | 56,677 | | | | ACEA S.p.A. | | | 779 | |
| | 880,998 | | | | Actelios S.p.A. | | | 2,368 | |
| | 480,000 | | * | | Adani Gas Ltd | | | 693 | |
| | 459,254 | | * | | Adani Power Ltd | | | 335 | |
| | 167,022 | | * | | Adani Transmissions Ltd | | | 474 | |
| | 1,082,807 | | | | AES Corp | | | 15,657 | |
| | 9,670,120 | | | | AES Gener S.A. | | | 2,688 | |
| | 127,400 | | | | AES Tiete S.A. | | | 329 | |
| | 348,364 | | *,†,e | | AET&D Holdings No 1 Ptd Ltd | | | 0 | |
| | 1,253,224 | | | | AGL Energy Ltd | | | 18,200 | |
| | 2,701,213 | | | | Aguas Andinas S.A. | | | 1,486 | |
| | 92,156 | | * | | Aksa Enerji Uretim AS | | | 47 | |
| | 317,788 | | e | | Algonquin Power & Utilities Corp | | | 3,196 | |
| | 166,332 | | | | Allete, Inc | | | 12,678 | |
| | 1,544,355 | | | | Alliant Energy Corp | | | 65,249 | |
| | 203,846 | | e | | AltaGas Ltd | | | 2,075 | |
| | 327,110 | | | | Alupar Investimento S.A. | | | 1,545 | |
| | 357,327 | | | | Ameren Corp | | | 23,308 | |
| | 547,786 | | | | American Electric Power Co, Inc | | | 40,942 | |
| | 46,500 | | | | American States Water Co | | | 3,117 | |
| | 93,878 | | | | American Water Works Co, Inc | | | 8,521 | |
COLLEGE RETIREMENT EQUITIES FUND -Stock Account
| SHARES | | | | COMPANY | | VALUE
(000) | |
| | 936,589 | | | | APA Group (ASE) | | $ | 5,610 | |
| | 102,827 | | | | Aqua America, Inc | | | 3,516 | |
| | 111,811 | | * | | AquaVenture Holdings Ltd | | | 2,112 | |
| | 11,043 | | | | Artesian Resources Corp | | | 385 | |
| | 41,990 | | | | Ascopiave S.p.A. | | | 150 | |
| | 264,285 | | | | Atco Ltd | | | 7,474 | |
| | 129,130 | | | | Athens Water Supply & Sewage Co S.A. | | | 740 | |
| | 600,822 | | *,e | | Atlantic Power Corp | | | 1,304 | |
| | 515,392 | | | | Atmos Energy Corp | | | 47,787 | |
| | 1,527,662 | | | | AusNet Services | | | 1,674 | |
| | 102,505 | | | | Avangrid, Inc | | | 5,134 | |
| | 84,341 | | | | Avista Corp | | | 3,583 | |
| | 160,096 | | | | Aygaz AS | | | 342 | |
| | 544,911 | | * | | Babcock & Brown Wind Partners | | | 179 | |
| | 382,800 | | | | BCPG PCL | | | 179 | |
| | 251,700 | | | | Beijing Capital Co Ltd | | | 126 | |
| | 1,259,299 | | | | Beijing Enterprises Holdings Ltd | | | 6,677 | |
| | 5,116,191 | | | | Beijing Enterprises Water Group Ltd | | | 2,611 | |
| | 10,700,000 | | | | Benpres Holdings Corp | | | 814 | |
| | 40,711 | | | | BKW S.A. | | | 2,847 | |
| | 101,207 | | | | Black Hills Corp | | | 6,354 | |
| | 3,040,000 | | *,e | | Blue Sky Power Holdings Ltd | | | 87 | |
| | 44,386 | | e | | Boralex, Inc | | | 547 | |
| | 26,897 | | *,e | | Cadiz, Inc | | | 277 | |
| | 60,821 | | | | California Water Service Group | | | 2,899 | |
| | 244,830 | | e | | Canadian Utilities Ltd | | | 5,617 | |
| | 416,000 | | e | | Canvest Environment Protection Group Co Ltd | | | 219 | |
| | 155,749 | | e | | Capital Power Corp | | | 3,034 | |
| | 58,454 | | | | Capital Stage AG. | | | 368 | |
| | 717,003 | | | | Centerpoint Energy, Inc | | | 20,241 | |
| | 450,200 | | * | | Centrais Eletricas Brasileiras S.A. | | | 2,805 | |
| | 210,579 | | * | | Centrais Eletricas Brasileiras S.A. (Preference) | | | 1,525 | |
| | 5,169,779 | | | | Centrica plc | | | 8,918 | |
| | 143,803 | | | | CESC Ltd | | | 1,375 | |
| | 263,420 | | | | CEZ AS | | | 6,279 | |
| | 1,844,000 | | e | | CGN New Energy Holdings Co Ltd | | | 254 | |
| | 9,225,000 | | g | | CGN Power Co Ltd | | | 2,190 | |
| | 54,424 | | | | Chesapeake Utilities Corp | | | 4,425 | |
| | 8,960,000 | | | | China Datang Corp Renewable Power Co Ltd | | | 1,074 | |
| | 328,000 | | e,g | | China Everbright Greentech Ltd | | | 233 | |
| | 558,000 | | | | China Everbright Water Ltd | | | 123 | |
| | 2,866,708 | | | | China Gas Holdings Ltd | | | 10,222 | |
| | 3,061,627 | | | | China Longyuan Power Group Corp | | | 2,090 | |
| | 102,600 | | | | China National Nuclear Power Co Ltd | | | 79 | |
| | 2,868,000 | | e | | China Oil and Gas Group Ltd | | | 194 | |
| | 279,500 | | | | China Power Clean Energy Development Co Ltd | | | 85 | |
| | 4,939,000 | | | | China Power International Development Ltd | | | 1,121 | |
| | 1,885,580 | | | | China Resources Gas Group Ltd | | | 7,472 | |
| | 1,928,161 | | | | China Resources Power Holdings Co | | | 3,709 | |
| | 164,500 | | | | China Tian Lun Gas Holdings Ltd | | | 136 | |
| | 1,636,000 | | | | China Water Affairs Group Ltd | | | 1,750 | |
| | 235,100 | | | | China Yangtze Power Co Ltd | | | 544 | |
| | 559,627 | | | | Chubu Electric Power Co, Inc | | | 7,952 | |
| | 228,457 | | | | Chugoku Electric Power Co, Inc | | | 2,969 | |
COLLEGE RETIREMENT EQUITIES FUND -Stock Account
| SHARES | | | | COMPANY | | VALUE
(000) | |
| | 99,500 | | | | Cia de Gas de Sao Paulo-COMGAS | | $ | 1,507 | |
| | 428,900 | | | | Cia de Saneamento Basico do Estado de Sao Paulo | | | 3,480 | |
| | 248,480 | | | | Cia de Saneamento de Minas Gerais-COPASA | | | 3,942 | |
| | 439,300 | | | | Cia de Saneamento do Parana (Preference) | | | 1,212 | |
| | 2,631,333 | | | | Cia Energetica de Minas Gerais | | | 9,382 | |
| | 139,900 | | | | Cia Energetica de Sao Paulo (Class B) | | | 785 | |
| | 6,404 | | | | Cia Energetica do Ceara | | | 79 | |
| | 63,700 | | | | Cia Paranaense de Energia | | | 501 | |
| | 987,917 | | | | CK Infrastructure Holdings Ltd | | | 7,476 | |
| | 1,463,600 | | | | CK Power PCL | | | 223 | |
| | 388,162 | | | | Clearway Energy, Inc (Class A) | | | 6,568 | |
| | 126,181 | | | | Clearway Energy, Inc (Class C) | | | 2,177 | |
| | 2,603,056 | | | | CLP Holdings Ltd | | | 29,417 | |
| | 152,461 | | | | CMS Energy Corp | | | 7,570 | |
| | 15,622,535 | | | | Colbun S.A. | | | 3,153 | |
| | 3,460,000 | | | | Concord New Energy Group Ltd | | | 137 | |
| | 15,267 | | | | Connecticut Water Service, Inc | | | 1,021 | |
| | 142,509 | | | | Consolidated Edison, Inc | | | 10,896 | |
| | 18,745 | | | | Consolidated Water Co, Inc | | | 219 | |
| | 1,065,510 | | | | Contact Energy Ltd | | | 4,224 | |
| | 1,320,000 | | | | CT Environmental Group Ltd | | | 53 | |
| | 3,512,000 | | | | Datang International Power Generation Co Ltd | | | 826 | |
| | 2,212,207 | | | | Dominion Resources, Inc | | | 158,084 | |
| | 591,830 | | | | Drax Group plc | | | 2,708 | |
| | 110,854 | | | | DTE Energy Co | | | 12,227 | |
| | 519,986 | | | | Duke Energy Corp | | | 44,875 | |
| | 6,114,217 | | | | E.ON AG. | | | 60,355 | |
| | 726,069 | | | | Edison International | | | 41,219 | |
| | 201,000 | | | | EDP - Energias do Brasil S.A. | | | 764 | |
| | 66,048 | | | | El Paso Electric Co | | | 3,311 | |
| | 382,500 | | | | Electric Power Development Co | | | 9,077 | |
| | 1,455,821 | | | | Electricite de France | | | 23,041 | |
| | 264,300 | | | | Electricity Generating PCL | | | 2,014 | |
| | 32,779 | | | | Elia System Operator S.A. | | | 2,190 | |
| | 125,693 | | | | Emera, Inc | | | 4,024 | |
| | 328,880 | | | | Empresa Electrica del Norte Grande S.A. | | | 601 | |
| | 759,878 | | | | Endesa S.A. | | | 17,523 | |
| | 391,191 | | * | | Enea S.A. | | | 1,037 | |
| | 11,243,724 | | | | Enel S.p.A. | | | 65,183 | |
| | 156,743 | | * | | Energa S.A. | | | 374 | |
| | 2,845,511 | | | | Energias de Portugal S.A. | | | 9,954 | |
| | 1 | | * | | Energix-Renewable Energies Ltd | | | 0 | ^ |
| | 146,362 | | g | | Enerjisa Enerji AS. | | | 141 | |
| | 64,451,660 | | | | Enersis Chile S.A. | | | 6,219 | |
| | 27,879,906 | | | | Enersis S.A. | | | 4,932 | |
| | 71,700 | | * | | Eneva S.A. | | | 297 | |
| | 382,801 | | | | Engie Brasil Energia S.A. | | | 3,256 | |
| | 1,160,028 | | | | ENN Energy Holdings Ltd | | | 10,310 | |
| | 1,490,603 | | | | Entergy Corp | | | 128,296 | |
| | 175,900 | | | | Equatorial Energia S.A. | | | 3,379 | |
| | 19,000 | | e | | eRex Co Ltd | | | 97 | |
| | 280,566 | | | | ERG S.p.A. | | | 5,310 | |
| | 514,727 | | | | Evergy, Inc | | | 29,221 | |
COLLEGE RETIREMENT EQUITIES FUND -Stock Account
| SHARES | | | | COMPANY | | VALUE
(000) | |
| | 136,058 | | | | Eversource Energy | | $ | 8,849 | |
| | 61,834 | | | | EVN AG. | | | 893 | |
| | 3,159,326 | | | | Exelon Corp | | | 142,486 | |
| | 2,523,300 | | | | First Gen Corp | | | 960 | |
| | 7,218,681 | | | | FirstEnergy Corp | | | 271,061 | |
| | 273,389 | | | | Fortis, Inc | | | 9,114 | |
| | 974,142 | | | | Fortum Oyj | | | 21,323 | |
| | 1,273,226 | | * | | GAIL India Ltd | | | 6,570 | |
| | 581,200 | | | | Gas Malaysia BHD | | | 397 | |
| | 608,830 | | | | Gas Natural SDG S.A. | | | 15,532 | |
| | 2,422,257 | | | | Gaz de France | | | 34,803 | |
| | 4,352,000 | | *,e | | GCL New Energy Holdings Ltd | | | 165 | |
| | 670,800 | | | | GD Power Development Co Ltd | | | 251 | |
| | 570,591 | | | | Genesis Energy Ltd | | | 1,001 | |
| | 13,030 | | e | | Global Water Resources, Inc | | | 132 | |
| | 645,271 | | | | Glow Energy PCL (Foreign) | | | 1,764 | |
| | 2,867,066 | | | | Guangdong Investments Ltd | | | 5,540 | |
| | 53,742 | | * | | Gujarat Gas Co Ltd | | | 516 | |
| | 206,219 | | * | | Gujarat State Petronet Ltd | | | 519 | |
| | 255,000 | | | | Gulf Energy Development PCL | | | 639 | |
| | 138,300 | | | | Gulf Energy Development PCL | | | 347 | |
| | 69,534 | | | | Hawaiian Electric Industries, Inc | | | 2,546 | |
| | 724,282 | | | | Hera S.p.A. | | | 2,210 | |
| | 2,231,052 | | e | | HK Electric Investments & HK Electric Investments Ltd | | | 2,249 | |
| | 779,100 | | | | Hokkaido Electric Power Co, Inc | | | 5,383 | |
| | 125,200 | | * | | Hokuriku Electric Power Co | | | 1,091 | |
| | 277,936 | | | | Holding CO ADMIE IPTO S.A. | | | 493 | |
| | 8,024,836 | | | | Hong Kong & China Gas Ltd | | | 16,580 | |
| | 1,367,679 | | | | Hong Kong Electric Holdings Ltd | | | 9,502 | |
| | 277,230 | | * | | Huadian Energy Co Ltd | | | 79 | |
| | 12,902,000 | | | | Huadian Power International Co | | | 5,819 | |
| | 336,100 | | | | Huadian Power International Corp Ltd | | | 233 | |
| | 38,800 | | | | Huaneng Power International, Inc | | | 42 | |
| | 3,891,756 | | | | Huaneng Power International, Inc (Hong Kong) | | | 2,470 | |
| | 4,940,000 | | | | Huaneng Renewables Corp Ltd | | | 1,328 | |
| | 411,800 | | | | Hub Power Co Ltd | | | 255 | |
| | 273,900 | | | | Hubei Energy Group Co Ltd | | | 147 | |
| | 297,827 | | g | | Hydro One Ltd | | | 4,418 | |
| | 5,325,048 | | | | Iberdrola S.A. | | | 42,759 | |
| | 160,495 | | | | Idacorp, Inc | | | 14,936 | |
| | 105,685 | | * | | Indiabulls Infrastructure and Power Ltd | | | 5 | |
| | 132,745 | | * | | Indraprastha Gas Ltd | | | 508 | |
| | 527,100 | | | | Infraestructura Energetica ,NV SAB de C.V. | | | 1,965 | |
| | 2,220,296 | | | | Infratil Ltd | | | 5,443 | |
| | 85,975 | | | | Innergex Renewable Energy, Inc | | | 790 | |
| | 13,013 | | * | | Innogy SE | | | 553 | |
| | 47,716 | | g | | Innogy SE | | | 2,228 | |
| | 1,027,900 | | *,† | | Inter Far East Energy Corp | | | 0 | ^ |
| | 879,084 | | | | Interconexion Electrica S.A. | | | 3,784 | |
| | 1,353,828 | | | | Inversiones Aguas Metropolitanas S.A. | | | 1,979 | |
| | 2,478,426 | | | | Iride S.p.A. | | | 5,952 | |
| | 1,043,079 | | | | Italgas S.p.A | | | 5,982 | |
| | 697,177 | | * | | JSW Energy Ltd | | | 685 | |
COLLEGE RETIREMENT EQUITIES FUND -Stock Account
| SHARES | | | | COMPANY | | VALUE
(000) | |
| | 460,916 | | e | | Just Energy Income Fund | | $ | 1,523 | |
| | 7,200 | | | | K&O Energy Group, Inc | | | 98 | |
| | 1,597,968 | | | | Kansai Electric Power Co, Inc | | | 23,964 | |
| | 45,628 | | | | Kenon Holdings Ltd | | | 686 | |
| | 2,528,000 | | | | Keppel Infrastructure Trust | | | 899 | |
| | 7,106 | | | | Korea District Heating Corp | | | 363 | |
| | 225,828 | | | | Korea Electric Power Corp | | | 6,689 | |
| | 152,363 | | * | | Korea Gas Corp | | | 6,586 | |
| | 207,500 | | | | Kot Addu Power Co Ltd | | | 74 | |
| | 340,375 | | | | Kyushu Electric Power Co, Inc | | | 4,053 | |
| | 43,000 | | | | Light S.A. | | | 183 | |
| | 60,375 | | * | | Mahanagar Gas Ltd | | | 781 | |
| | 624,100 | | | | Malakoff Corp BHD | | | 121 | |
| | 426,930 | | | | Manila Electric Co | | | 3,085 | |
| | 780,100 | | | | Manila Water Co, Inc | | | 418 | |
| | 549,544 | | | | MDU Resources Group, Inc | | | 13,101 | |
| | 894,011 | | | | Meridian Energy Ltd | | | 2,046 | |
| | 44,453 | | | | MGE Energy, Inc | | | 2,665 | |
| | 19,737 | | | | Middlesex Water Co | | | 1,053 | |
| | 433,539 | | | | Mighty River Power Ltd | | | 1,062 | |
| | 137,755 | | | | National Fuel Gas Co | | | 7,050 | |
| | 3,905,009 | | | | National Grid plc | | | 38,204 | |
| | 182,855 | | | | New Jersey Resources Corp | | | 8,351 | |
| | 1,361,554 | | | | NextEra Energy, Inc | | | 236,665 | |
| | 24,500 | | | | Nippon Gas Co Ltd | | | 888 | |
| | 739,729 | | | | NiSource, Inc | | | 18,752 | |
| | 256,570 | | | | Northland Power Income Fund | | | 4,078 | |
| | 36,250 | | | | Northwest Natural Holding Co | | | 2,192 | |
| | 64,326 | | | | NorthWestern Corp | | | 3,824 | |
| | 576,834 | | | | NRG Energy, Inc | | | 22,843 | |
| | 3,028,533 | | | | NTPC Ltd | | | 6,462 | |
| | 65,953 | | e | | Oest Elektrizitatswirts AG. (Class A) | | | 2,824 | |
| | 389,018 | | | | OGE Energy Corp | | | 15,246 | |
| | 289,101 | | | | Okinawa Electric Power Co, Inc | | | 5,614 | |
| | 23,000 | | * | | Omega Geracao S.A. | | | 104 | |
| | 181,198 | | | | ONE Gas, Inc | | | 14,423 | |
| | 50,646 | | | | Ormat Technologies, Inc | | | 2,649 | |
| | 241,817 | | g | | Orsted AS | | | 16,182 | |
| | 291,712 | | | | Osaka Gas Co Ltd | | | 5,321 | |
| | 49,835 | | | | Otter Tail Corp | | | 2,474 | |
| | 20,000 | | *,e | | Pampa Energia S.A. (ADR) | | | 636 | |
| | 2,290,000 | | *,e | | Panda Green Energy Group Ltd | | | 135 | |
| | 323,591 | | | | Pattern Energy Group, Inc | | | 6,025 | |
| | 600,066 | | | | Pennon Group plc | | | 5,305 | |
| | 755,291 | | | | Petronas Gas BHD | | | 3,509 | |
| | 1,263,165 | | * | | PG&E Corp | | | 30,000 | |
| | 1,150,088 | | | | Pinnacle West Capital Corp | | | 97,987 | |
| | 270,683 | | | | PNM Resources, Inc | | | 11,122 | |
| | 849,752 | | * | | Polska Grupa Energetyczna S.A. | | | 2,279 | |
| | 268,943 | | | | Portland General Electric Co | | | 12,331 | |
| | 2,104,787 | | | | Power Grid Corp of India Ltd | | | 5,987 | |
| | 521,155 | | | | PPL Corp | | | 14,764 | |
COLLEGE RETIREMENT EQUITIES FUND -Stock Account
| SHARES | | | | COMPANY | | VALUE
(000) | |
| | 37,890,232 | | | | PT Perusahaan Gas Negara Persero Tbk | | $ | 5,598 | |
| | 2,069,178 | | * | | PTC India Ltd | | | 2,749 | |
| | 80,873 | | * | | Public Power Corp | | | 120 | |
| | 381,825 | | | | Public Service Enterprise Group, Inc | | | 19,874 | |
| | 25,678 | | * | | Pure Cycle Corp | | | 255 | |
| | 53,814 | | * | | Qatar Electricity & Water Co | | | 2,738 | |
| | 500,000 | | | | Ratchaburi Electricity Generating Holding PCL (ADR) | | | 780 | |
| | 799,522 | | | | Red Electrica Corp S.A. | | | 17,829 | |
| | 775,954 | | | | Redes Energeticas Nacionais S.A. | | | 2,168 | |
| | 82,277 | | * | | Reliance Energy Ltd | | | 372 | |
| | 337,651 | | * | | Reliance Power Ltd | | | 138 | |
| | 16,200 | | * | | RENOVA, Inc | | | 117 | |
| | 9,704 | | e | | RGC Resources, Inc | | | 291 | |
| | 60,528 | | | | Rubis S.C.A | | | 3,255 | |
| | 1,641,433 | | | | RWE AG. | | | 35,750 | |
| | 14,673 | | | | Samchully Co Ltd | | | 1,196 | |
| | 270,903 | | | | SCANA Corp | | | 12,944 | |
| | 47,870 | | g | | Scatec Solar ASA | | | 409 | |
| | 781,073 | | | | Scottish & Southern Energy plc | | | 10,786 | |
| | 237,900 | | | | SDIC Power Holdings Co Ltd | | | 279 | |
| | 26,068 | | | | Sechilienne-Sidec | | | 565 | |
| | 1,392,092 | | | | Sempra Energy | | | 150,610 | |
| | 199,212 | | | | Severn Trent plc | | | 4,618 | |
| | 221,200 | | | | Shenergy Co Ltd | | | 157 | |
| | 203,400 | | | | Shenzhen Energy Group Co Ltd | | | 156 | |
| | 153,900 | | | | Shikoku Electric Power Co, Inc | | | 1,858 | |
| | 36,500 | | | | Shizuoka Gas Co Ltd | | | 283 | |
| | 94,000 | | | | Sichuan Chuantou Energy Co Ltd | | | 119 | |
| | 19,693,480 | | e | | SIIC Environment Holdings Ltd | | | 3,974 | |
| | 21,543 | | | | SJW Corp | | | 1,198 | |
| | 128,000 | | *,† | | Sound Global Ltd | | | 0 | ^ |
| | 110,156 | | | | South Jersey Industries, Inc | | | 3,062 | |
| | 793,309 | | | | Southern Co | | | 34,842 | |
| | 139,205 | | | | Southwest Gas Corp | | | 10,649 | |
| | 16,048 | | e | | Spark Energy, Inc | | | 119 | |
| | 1,066,029 | | | | Spark Infrastructure Group | | | 1,661 | |
| | 260,200 | | | | SPCG PCL | | | 145 | |
| | 127,099 | | | | Spire, Inc | | | 9,415 | |
| | 361,010 | | | | Suez Environnement S.A. | | | 4,769 | |
| | 5,279,700 | | * | | Super Energy Corp PCL (Foreign) | | | 86 | |
| | 185,786 | | | | Superior Plus Corp | | | 1,317 | |
| | 236,450 | | | | Taiwan Cogeneration Corp | | | 193 | |
| | 1,334,478 | | | | Tata Power Co Ltd | | | 1,467 | |
| | 609,803 | | * | | Tauron Polska Energia S.A. | | | 357 | |
| | 14,704 | | * | | Techno Electric & Engineering Co Ltd | | | 56 | |
| | 39,566 | | | | Telecom Plus plc | | | 722 | |
| | 4,314,441 | | | | Tenaga Nasional BHD | | | 14,214 | |
| | 200,431 | | | | Terna Energy S.A. | | | 1,284 | |
| | 2,460,658 | | | | Terna Rete Elettrica Nazionale S.p.A. | | | 13,974 | |
| | 90,762 | | | | TerraForm Power, Inc | | | 1,018 | |
| | 886,200 | | | | Thai Tap Water Supply PCL | | | 337 | |
| | 248,000 | | | | Tianjin Development Hldgs Ltd | | | 96 | |
| | 51,175 | | | | Toho Gas Co Ltd | | | 2,153 | |
COLLEGE RETIREMENT EQUITIES FUND -Stock Account
| SHARES | | | | COMPANY | | VALUE
(000) | |
| | 319,208 | | | | Tohoku Electric Power Co, Inc | | $ | 4,203 | |
| | 2,311,016 | | * | | Tokyo Electric Power Co, Inc | | | 13,728 | |
| | 415,461 | | | | Tokyo Gas Co Ltd | | | 10,508 | |
| | 274,279 | | * | | Torrent Power Ltd | | | 1,027 | |
| | 1,383,000 | | | | Towngas China Co Ltd | | | 1,025 | |
| | 182,925 | | | | TransAlta Corp | | | 749 | |
| | 79,632 | | | | TransAlta Renewables, Inc | | | 605 | |
| | 459,200 | | | | Transmissora Alianca de Energia Eletrica S.A. | | | 2,792 | |
| | 246,184 | | | | UGI Corp | | | 13,134 | |
| | 182,006 | | | | Uniper SE | | | 4,695 | |
| | 787,228 | | | | United Utilities Group plc | | | 7,402 | |
| | 18,791 | | | | Unitil Corp | | | 952 | |
| | 54,241 | | e | | Valener, Inc | | | 768 | |
| | 55,164 | | | | Vectren Corp | | | 3,971 | |
| | 622,223 | | | | Veolia Environnement | | | 12,743 | |
| | 1,062,582 | | * | | Vistra Energy Corp | | | 24,322 | |
| | 143,688 | | | | WEC Energy Group, Inc | | | 9,952 | |
| | 653,500 | | | | WHA Utilities and Power PCL | | | 112 | |
| | 858,744 | | | | Xcel Energy, Inc | | | 42,310 | |
| | 17,474 | | | | York Water Co | | | 560 | |
| | 3,443,590 | | | | YTL Corp BHD | | | 840 | |
| | 339,600 | | | | Zhejiang Zheneng Electric Power Co Ltd | | | 234 | |
| | 322,184 | | * | | Zorlu Enerji Elektrik Uretim AS | | | 75 | |
| | | | | | TOTAL UTILITIES | | | 3,048,709 | |
| | | | | | TOTAL COMMON STOCKS | | | 103,041,045 | |
| | | | | | (Cost $105,711,672) | | | | |
| | | | | | | | | | |
| PURCHASED OPTIONS - 0.0% |
| | | | | | | | | | |
| AUTOMOBILES & COMPONENTS - 0.0% |
| | 12,200 | | | | Tesla, Inc | | | 11 | |
| | | | | | TOTAL AUTOMOBILES & COMPONENTS | | | 11 | |
| | | | | | | | | | |
| FOOD & STAPLES RETAILING - 0.0% |
| | 160,000 | | | | Walmart, Inc | | | 696 | |
| | | | | | TOTAL FOOD & STAPLES RETAILING | | | 696 | |
| | | | | | | | | | |
| HEALTH CARE EQUIPMENT & SERVICES - 0.0% |
| | 3,000 | | | | Cigna Corp | | | 7 | |
| | | | | | TOTAL HEALTH CARE EQUIPMENT & SERVICES | | | 7 | |
| | | | | | | | | | |
| SEMICONDUCTORS & SEMICONDUCTOR EQUIPMENT - 0.0% |
| | 1,720,000 | | | | Intel Corp | | | 1,737 | |
| | | | | | TOTAL SEMICONDUCTORS & SEMICONDUCTOR EQUIPMENT | | | 1,737 | |
| | | | | | TOTAL PURCHASED OPTIONS | | | 2,451 | |
| | | | | | (Cost $5,125) | | | | |
| | | | | | | | | | |
| PREFERRED STOCKS - 0.0% | | | | |
| | | | | |
| DIVERSIFIED FINANCIALS - 0.0% |
| | 300,000 | | | | Daishin Securities Co Ltd Pref 2 | | | 2,211 | |
| | | | | | TOTAL DIVERSIFIED FINANCIALS | | | 2,211 | |
COLLEGE RETIREMENT EQUITIES FUND -Stock Account
| SHARES | | | | COMPANY | | VALUE
(000) | |
| REAL ESTATE - 0.0% |
| | 8,497,223 | | *,†,m | | Ayala Land, Inc | | $ | 16 | |
| | | | | | TOTAL REAL ESTATE | | | 16 | |
| | | | | | TOTAL PREFERRED STOCKS | | | 2,227 | |
| | | | | | (Cost $3,815) | | | | |
| | | | | | | | | | |
| RIGHTS / WARRANTS - 0.0% |
| |
| CAPITAL GOODS - 0.0% |
| | 79,135 | | †,e | | Abengoa S.A. (B Shares) | | | 0 | |
| | 7,554 | | | | Marcopolo S.A. | | | 2 | |
| | | | | | TOTAL CAPITAL GOODS | | | 2 | |
| | | | | | | | | | |
| COMMERCIAL & PROFESSIONAL SERVICES - 0.0% |
| | 230,631 | | † | | Media General, Inc | | | 0 | |
| | | | | | TOTAL COMMERCIAL & PROFESSIONAL SERVICES | | | 0 | |
| | | | | | | | | | |
| DIVERSIFIED FINANCIALS - 0.0% |
| | 11,467 | | | | Emergent Capital Inc | | | 0 | |
| | | | | | TOTAL DIVERSIFIED FINANCIALS | | | 0 | |
| | | | | | | | | | |
| ENERGY - 0.0% |
| | 1,270,549 | | m | | Repsol S.A. | | | 582 | |
| | 3,914,500 | | | | Sapura Energy Bhd | | | 0 | |
| | 939,480 | | | | Sapura Energy Bhd | | | 0 | |
| | | | | | TOTAL ENERGY | | | 582 | |
| | | | | | | | | | |
| HEALTH CARE EQUIPMENT & SERVICES - 0.0% |
| | 190,191 | | | | Community Health Systems, Inc | | | 0 | ^ |
| | | | | | TOTAL HEALTH CARE EQUIPMENT & SERVICES | | | 0 | ^ |
| | | | | | | | | | |
| PHARMACEUTICALS, BIOTECHNOLOGY & LIFE SCIENCES - 0.0% |
| | 714,657 | | m | | Faes Farma S.A. | | | 84 | |
| | 55,620 | | †,m | | Forest Laboratories, Inc CVR | | | 53 | |
| | 17,790 | | †,e,m | | Omthera Pharmaceuticals, Inc | | | 11 | |
| | 20,027 | | e,m | | Tobira Therapeutics, Inc | | | 1 | |
| | | | | | TOTAL PHARMACEUTICALS, BIOTECHNOLOGY & LIFE SCIENCES | | | 149 | |
| | | | | | | | | | |
| REAL ESTATE - 0.0% |
| | 310,070 | | | | Sunway BHD | | | 18 | |
| | 66,478,080 | | | | U City PCL | | | 20 | |
| | | | | | TOTAL REAL ESTATE | | | 38 | |
| | | | | | | | | | |
| TRANSPORTATION - 0.0% |
| | 147,032 | | | | BTS Group Holdings PCL | | | 2 | |
| | 685,198 | | e | | Ezion Holdings Ltd | | | 0 | |
| | | | | | TOTAL TRANSPORTATION | | | 2 | |
| | | | | | | | | | |
| | | | | | TOTAL RIGHTS / WARRANTS | | | 773 | |
| | | | | | (Cost $689) | | | | |
COLLEGE RETIREMENT EQUITIES FUND -Stock Account
| | | | | | | | | | | | MATURITY | | VALUE | |
| PRINCIPAL | | | | ISSUER | | | | RATE | | DATE | | (000) | |
| SHORT-TERM INVESTMENTS - 2.1% |
| |
| GOVERNMENT AGENCY DEBT - 0.0% |
| $ | 19,388,000 | | | | Federal Home Loan Bank (FHLB) | | | | | 2.150 | % | | 01/02/19 | | $ | 19,388 | |
| | | | | | TOTAL GOVERNMENT AGENCY DEBT | | | | | | | | | | | 19,388 | |
| | | | | | | | | | | | | | | | | | |
| TREASURY DEBT - 0.6% |
| | 191,160,000 | | | | United States Treasury Bill | | | | | 2.253-2.291 | | | 01/08/19 | | | 191,087 | |
| | 45,075,000 | | | | United States Treasury Bill | | | | | 2.287 | | | 01/10/19 | | | 45,052 | |
| | 138,170,000 | | | | United States Treasury Bill | | | | | 2.252-2.302 | | | 01/15/19 | | | 138,055 | |
| | 190,080,000 | | | | United States Treasury Bill | | | | | 2.316-2.384 | | | 01/22/19 | | | 189,834 | |
| | 42,300,000 | | | | United States Treasury Bill | | | | | 2.318 | | | 02/21/19 | | | 42,159 | |
| | | | | | TOTAL TREASURY DEBT | | | | | | | | | | | 606,187 | |
| | | | | | | | | | | | | | | | | | |
| INVESTMENT OF CASH COLLATERAL FOR SECURITIES LOANED - 1.5% |
| |
| CERTIFICATE OF DEPOSIT - 0.1% |
| | 78,000,000 | | | | Credit Agricole | | | | | 2.615 | | | 04/17/19 | | | 78,000 | |
| | 69,000,000 | | | | Mizuho Bank Ltd | | | | | 2.529 | | | 04/02/19 | | | 69,000 | |
| | | | | | TOTAL CERTIFICATE OF DEPOSIT | | | | | | | | | | | 147,000 | |
| |
| COMMERCIAL PAPER - 0.7% |
| | 73,750,000 | | | | Australia & New Zealand Banking Group Ltd | | | | | 0.010 | | | 02/01/19 | | | 73,589 | |
| | 70,000,000 | | | | Bedford Row Funding Corp | | | | | 2.615 | | | 04/15/19 | | | 70,000 | |
| | 10,000,000 | | | | Bennington Stark Capital Company LLC | | | | | 0.010 | | | 01/24/19 | | | 9,983 | |
| | 78,000,000 | | | | Can Ast & Can Ltd Jt | | | | | 2.905 | | | 05/01/19 | | | 77,254 | |
| | 68,000,000 | | | | Canadian Imperial Bank of Commerce | | | | | 2.560 | | | 10/01/19 | | | 68,000 | |
| | 74,000,000 | | | | ING US Funding LLC | | | | | 0.010 | | | 03/29/19 | | | 73,532 | |
| | 28,000,000 | | | | Matchpoint Finance Plc | | | | | 0.010 | | | 01/02/19 | | | 27,998 | |
| | 46,000,000 | | | | Matchpoint Finance Plc | | | | | 0.010 | | | 02/08/19 | | | 45,872 | |
| | 46,000,000 | | | | National Bank of Canada | | | | | 2.539 | | | 07/01/19 | | | 46,000 | |
| | 70,000,000 | | | | Natixis NY | | | | | 2.480 | | | 01/31/19 | | | 69,857 | |
| | 61,000,000 | | | | Old Line Funding LLC | | | | | 2.801 | | | 03/15/19 | | | 60,652 | |
| | 68,000,000 | | | | Ridgefield Funding Co | | | | | 0.010 | | | 01/03/19 | | | 67,991 | |
| | 18,000,000 | | | | Versailles CDS LLC | | | | | 2.649 | | | 02/06/19 | | | 17,953 | |
| | | | | | TOTAL COMMERCIAL PAPER | | | | | | | | | | | 708,681 | |
| | | | | | | | | | | | | | | | | | |
| REPURCHASE AGREEMENT - 0.7% |
| | 1,000,000 | | p | | Barclays | | | | | 2.900 | | | 01/02/19 | | | 1,000 | |
| | 187,000,000 | | q | | Citigroup | | | | | 2.960 | | | 01/02/19 | | | 187,000 | |
| | 128,000,000 | | r | | Goldman Sachs | | | | | 2.900 | | | 01/02/19 | | | 128,000 | |
| | 35,000,000 | | s | | HSBC | | | | | 2.950 | | | 01/02/19 | | | 35,000 | |
| | 73,000,000 | | t | | JP Morgan | | | | | 3.000 | | | 01/02/19 | | | 73,000 | |
| | 110,000,000 | | u | | Merrill Lynch | | | | | 3.000 | | | 01/02/19 | | | 110,000 | |
| | 21,000,000 | | v | | NatWest Markets | | | | | 2.950 | | | 01/02/19 | | | 21,000 | |
| | 120,000,000 | | w | | Nomura | | | | | 3.000 | | | 01/02/19 | | | 120,000 | |
| | 32,000,000 | | x | | Societe Generale | | | | | 3.000 | | | 01/02/19 | | | 32,000 | |
| | 30,000,000 | | y | | Societe Generale | | | | | 3.000 | | | 01/02/19 | | | 30,000 | |
| | | | | | TOTAL REPURCHASE AGREEMENT | | | | | | | | | | | 737,000 | |
| | | | | | | | | | | | | | | | | | |
| VARIABLE RATE SECURITIES - 0.0% |
| | 22,000,000 | | i | | DNB Nor Bank ASA | | | | | 2.570 | | | 03/14/19 | | | 21,999 | |
| | 9,860,696 | | i | | SLM Student Loan Trust | | | | | 2.530 | | | 01/25/19 | | | 9,861 | |
| | | | | | TOTAL VARIABLE RATE SECURITIES | | | | | | | | | 31,860 | |
| | | | | | | | | | | | | | | | | | |
| | | | | | TOTAL INVESTMENT OF CASH COLLATERAL FOR SECURITIES LOANED | | | 1,624,541 | |
| | | | | | | | | | | | | | | | | | |
| | | | | | TOTAL SHORT-TERM INVESTMENTS | | | | | | | | | 2,250,116 | |
| | | | | | (Cost $2,250,081) | | | | | | | | | | | | |
COLLEGE RETIREMENT EQUITIES FUND -Stock Account
| | | | | | COMPANY | | | | | | | | | | VALUE
(000) | |
| | | | | | TOTAL INVESTMENTS - 101.3% | | | | | | | | | | $ | 105,298,544 | |
| | | | | | (Cost $107,973,317) | | | | | | | | | | | | |
| | | | | | OTHER ASSETS & LIABILITIES, NET - (1.3)% | | | | | | | | | | | (1,462,795 | ) |
| | | | | | NET ASSETS - 100.0% | | | | | | | | | | $ | 103,835,749 | |
| | | | |
| | | Abbreviation(s): |
| ADR | | American Depositary Receipt |
| CVR | | Contingent Value Right |
| ETF | | Exchange Traded Fund |
| GDR | | Global Depositary Receipt |
| NVDR | | Non Voting Depositary Receipt |
| OTC | | Over The Counter |
| REIT | | Real Estate Investment Trust |
| SPDR | | Standard & Poor’s Depositary Receipts |
| | | |
| ^ | | Amount represents less than $1,000. |
| * | | Non-income producing |
| † | | Security is categorized as Level 3 in the fair value hierarchy. |
| a | | Affiliated holding |
| b | | In bankruptcy |
| d | | All or a portion of these securities have been segregated to cover margin requirements on open futures contracts. |
| e | | All or a portion of these securities are out on loan. The aggregate value of securities on loan is $1,647,489,505. |
| g | | Security is exempt from registration under Rule 144(A) of the Securities Act of 1933. Such securities are deemed liquid and may be resold in transactions exempt from registration to qualified institutional buyers. At 12/31/18, the aggregate value of these securities was $635,131,577 or 0.6% of net assets. |
| h | | All or a portion of these securities were purchased on a delayed delivery basis. |
| i | | Floating or variable rate security includes the reference rate and spread, unless the variable rate is based on the underlying asset of the security. Coupon rate reflects the rate at period end. |
| j | | Zero coupon |
| m | | Indicates a security that has been deemed illiquid. |
| n | | All or a portion of these securities have been segregated by the custodian to cover requirements on open written options contracts. |
| p | | Agreement with Barclays, 2.90% dated 12/31/18 to be repurchased at $1,000,000 on 01/02/19, collateralized by U.S. Government Agency Securities valued at $1,020,000. |
| q | | Agreement with Citigroup, 2.96% dated 12/31/18 to be repurchased at $187,000,000 on 01/02/19, collateralized by U.S. Government Agency Securities valued at $190,740,000. |
| r | | Agreement with Goldman Sachs, 2.90% dated 12/31/18 to be repurchased at $128,000,000 on 01/02/19, collateralized by U.S. Government Agency Securities valued at $130,560,000. |
| s | | Agreement with HSBC, 2.95% dated 12/31/18 to be repurchased at $35,000,000 on 01/02/19, collateralized by U.S. Government Agency Securities valued at $35,700,000. |
| t | | Agreement with JP Morgan, 3.00% dated 12/31/18 to be repurchased at $73,000,000 on 01/02/19, collateralized by U.S. Government Agency Securities valued at $74,460,000. |
| u | | Agreement with Merrill Lynch, 3.00% dated 12/31/18 to be repurchased at $110,000,000 on 01/02/19, collateralized by U.S. Government Agency Securities valued at $112,200,000. |
| v | | Agreement with NatWest Markets, 2.95% dated 12/31/18 to be repurchased at $21,000,000 on 01/02/19, collateralized by U.S. Government Agency Securities valued at $21,420,000. |
| w | | Agreement with Nomura, 3.00% dated 12/31/18 to be repurchased at $120,000,000 on 01/02/19, collateralized by U.S. Government Agency Securities valued at $122,400,000. |
COLLEGE RETIREMENT EQUITIES FUND -Stock Account
| x | | Agreement with Societe Generale, 3.00% dated 12/31/18 to be repurchased at $32,000,000 on 01/02/19, collateralized by U.S. Government Agency Securities valued at $32,640,000. |
| y | | Agreement with Societe Generale, 3.00% dated 12/31/18 to be repurchased at $30,000,000 on 01/02/19, collateralized by U.S. Government Agency Securities valued at $30,600,000. |
| | | | |
| | | Cost amounts are in thousands. |
| | | | |
Futures contracts outstanding as of December 31, 2018 were as follows (notional amounts and values are in thousands):
| Description | | Number of long
(short)
contracts | | | Expiration date | | Notional amount | | | Value | | | Unrealized
appreciation
(depreciation) | |
| Russell 2000 E Mini Index | | | 316 | | | 03/15/19 | | $ | 23,062 | | | $ | 21,314 | | | $ | (1,748 | ) |
| S&P 500 E Mini Index | | | 2,018 | | | 03/15/19 | | | 268,040 | | | | 252,775 | | | | (15,265 | ) |
| S&P Mid-Cap 400 E Mini Index | | | 187 | | | 03/15/19 | | | 33,290 | | | | 31,083 | | | | (2,207 | ) |
| Total | | | 2,521 | | | | | $ | 324,392 | | | $ | 305,172 | | | $ | (19,220 | ) |
|
Purchased options outstanding as of December 31, 2018 were as follows (notional amounts and values are in thousands):
| Description/underlying investment | | Number of contracts | | | Notional amount | | | Exercise price | | | Expiration date | | Value | |
| Cigna Corp, Call | | | 30 | | | $ | 28 | | | $ | 230.00 | | | 04/18/19 | | $ | 7 | |
| Intel Corp, Call | | | 17,200 | | | | 4,597 | | | | 50.00 | | | 02/15/19 | | | 1,737 | |
| Tesla, Inc, Call | | | 122 | | | | 155 | | | | 400.00 | | | 01/18/19 | | | 11 | |
| Walmart, Inc, Call | | | 1,600 | | | | 344 | | | | 92.50 | | | 03/15/19 | | | 696 | |
| Total | | | 18,952 | | | $ | 5,124 | | | | | | | | | $ | 2,451 | |
Written options outstanding as of December 31, 2018 were as follows (notional amounts and values are in thousands):
| Description/underlying investment | | Number of contracts | | | Notional amount | | | Exercise price | | | Expiration date | | Value | |
| Amazon.com, Inc, Call | | | 10 | | | $ | (18 | ) | | $ | 1,880.00 | | | 01/18/19 | | $ | (1 | ) |
| Amazon.com, Inc, Put | | | 10 | | | | (44 | ) | | | 1,300.00 | | | 02/15/19 | | | (30 | ) |
| Apple, Inc, Put | | | 25 | | | | (16 | ) | | | 150.00 | | | 03/15/19 | | | (17 | ) |
| Cigna Corp, Call | | | 30 | | | | (17 | ) | | | 240.00 | | | 04/18/19 | | | (4 | ) |
| Cigna Corp, Call | | | 30 | | | | (11 | ) | | | 250.00 | | | 04/18/19 | | | (3 | ) |
| Facebook, Inc, Put | | | 30 | | | | (2 | ) | | | 110.00 | | | 01/18/19 | | | (1 | ) |
| General Electric Co, Put | | | 50 | | | | (1 | ) | | | 6.50 | | | 01/11/19 | | | (0 | )^ |
| General Electric Co, Put | | | 100 | | | | (10 | ) | | | 7.00 | | | 03/15/19 | | | (6 | ) |
| Intel Corp, Call | | | 17,200 | | | | (1,320 | ) | | | 55.00 | | | 02/15/19 | | | (344 | ) |
| Intel Corp, Put | | | 17,200 | | | | (554 | ) | | | 45.00 | | | 01/18/19 | | | (1,273 | ) |
| Kraft Heinz Co, Put | | | 30 | | | | (9 | ) | | | 47.50 | | | 04/18/19 | | | (18 | ) |
| PVH Corp, Put | | | 20 | | | | (7 | ) | | | 85.00 | | | 03/15/19 | | | (7 | ) |
| PVH Corp, Put | | | 10 | | | | (8 | ) | | | 90.00 | | | 06/21/19 | | | (8 | ) |
| S&P 500 Index, Put | | | 30 | | | | (18 | ) | | | 2,300.00 | | | 01/11/19 | | | (14 | ) |
| Tesla, Inc, Call | | | 122 | | | | (92 | ) | | | 420.00 | | | 01/18/19 | | | (4 | ) |
| Tesla, Inc, Call | | | 122 | | | | (70 | ) | | | 430.00 | | | 01/18/19 | | | (2 | ) |
| Tiffany & Co, Put | | | 30 | | | | (2 | ) | | | 70.00 | | | 01/18/19 | | | (2 | ) |
| Twitter, Inc, Put | | | 30 | | | | (1 | ) | | | 22.00 | | | 01/18/19 | | | (0 | )^ |
| Twitter, Inc, Put | | | 320 | | | | (24 | ) | | | 26.00 | | | 01/18/19 | | | (19 | ) |
| Walmart, Inc, Call | | | 1,600 | | | | (152 | ) | | | 97.50 | | | 03/15/19 | | | (360 | ) |
| Walmart, Inc, Put | | | 1,600 | | | | (320 | ) | | | 80.00 | | | 03/15/19 | | | (122 | ) |
| Total | | | 38,599 | | | | (2,696 | ) | | | | | | | | $ | (2,235 | ) |
| | | | |
| ^ Amount represents less than $1,000. |
COLLEGE RETIREMENT EQUITIES FUND -Stock Account
Forward foreign currency contracts outstanding as of December 31, 2018 were as follows (dollar amounts are in thousands):
Currency to be
purchased | | Receive | | Currency to be sold | | Deliver | | | Counterparty | | Settlement date | | Unrealized appreciation (depreciation) | |
| $ | | 1,002 | | SEK | | | 8,850 | | | Bank of America | | 01/10/19 | | $ | 3 | |
| Total | | | | | | | | | | | | | | $ | 3 | |
| $ | | 4,612 | | CAD | | | 5,900 | | | Morgan Stanley | | 01/10/19 | | $ | 289 | |
| $ | | 7,010 | | GBP | | | 5,350 | | | Morgan Stanley | | 01/10/19 | | | 187 | |
| $ | | 1,004 | | JPY | | | 113,000 | | | Morgan Stanley | | 01/10/19 | | | (28 | ) |
| EUR | | 2,600 | | $ | | | 3,036 | | | Morgan Stanley | | 01/10/19 | | | (54 | ) |
| Total | | | | | | | | | | | | | | $ | 394 | |
| Total | | | | | | | | | | | | | | $ | 397 | |
| | | | |
| | | Abbreviation(s): |
| CAD | | Canadian Dollar |
| EUR | | Euro |
| GBP | | Pound Sterling |
| JPY | | Japanese Yen |
| SEK | | Swedish Krona |
COLLEGE RETIREMENT EQUITIES FUND -Stock Account
COLLEGE RETIREMENT EQUITIES FUND
STOCK ACCOUNT
SUMMARY OF MARKET VALUES BY COUNTRY
December 31, 2018
| Country | | Value
(000) | | | % of total
portfolio | |
| DOMESTIC | | | | | | | | |
| | | | | | | | | |
| UNITED STATES | | $ | 72,060,590 | | | | 68.4 | % |
| TOTAL DOMESTIC | | | 72,060,590 | | | | 68.4 | |
| FOREIGN | | | | | | | | |
| | | | | | | | | |
| ARGENTINA | | | 12,864 | | | | 0.0 | |
| AUSTRALIA | | | 1,405,913 | | | | 1.4 | |
| AUSTRIA | | | 161,172 | | | | 0.2 | |
| BELGIUM | | | 150,145 | | | | 0.2 | |
| BERMUDA | | | 47,865 | | | | 0.0 | |
| BRAZIL | | | 680,471 | | | | 0.6 | |
| CANADA | | | 2,053,014 | | | | 2.0 | |
| CAYMAN ISLANDS | | | 646 | | | | 0.0 | |
| CHILE | | | 104,987 | | | | 0.1 | |
| CHINA | | | 2,480,751 | | | | 2.4 | |
| COLOMBIA | | | 29,379 | | | | 0.0 | |
| COTE D’IVOIRE | | | 794 | | | | 0.0 | |
| CYPRUS | | | 65 | | | | 0.0 | |
| CZECH REPUBLIC | | | 27,331 | | | | 0.0 | |
| DENMARK | | | 303,338 | | | | 0.3 | |
| EGYPT | | | 14,320 | | | | 0.0 | |
| FAROE ISLANDS | | | 5,872 | | | | 0.0 | |
| FINLAND | | | 340,894 | | | | 0.3 | |
| FRANCE | | | 2,381,084 | | | | 2.3 | |
| GEORGIA | | | 1,605 | | | | 0.0 | |
| GERMANY | | | 1,690,250 | | | | 1.6 | |
| GHANA | | | 4,252 | | | | 0.0 | |
| GREECE | | | 22,377 | | | | 0.0 | |
| HONG KONG | | | 812,024 | | | | 0.8 | |
| HUNGARY | | | 31,583 | | | | 0.0 | |
| INDIA | | | 853,423 | | | | 0.8 | |
| INDONESIA | | | 207,474 | | | | 0.2 | |
| IRELAND | | | 290,414 | | | | 0.3 | |
| ISRAEL | | | 196,258 | | | | 0.2 | |
| ITALY | | | 612,832 | | | | 0.6 | |
| JAPAN | | | 5,527,443 | | | | 5.3 | |
| JERSEY, C.I. | | | 2,338 | | | | 0.0 | |
| JORDAN | | | 18,654 | | | | 0.0 | |
| KAZAKHSTAN | | | 15,298 | | | | 0.0 | |
| KOREA, REPUBLIC OF | | | 1,162,737 | | | | 1.1 | |
| LIECHTENSTEIN | | | 1,011 | | | | 0.0 | |
| LUXEMBOURG | | | 50,467 | | | | 0.0 | |
| MACAU | | | 35,362 | | | | 0.0 | |
| MALAYSIA | | | 204,052 | | | | 0.2 | |
| MALTA | | | 6,560 | | | | 0.0 | |
| MEXICO | | | 211,603 | | | | 0.2 | |
| MONACO | | | 3,558 | | | | 0.0 | |
COLLEGE RETIREMENT EQUITIES FUND -Stock Account
| Country | | Value
(000) | | | % of total
portfolio | |
| MONGOLIA | | $ | 3,153 | | | | 0.0 | % |
| MYANMAR | | | 205 | | | | 0.0 | |
| NETHERLANDS | | | 1,264,273 | | | | 1.2 | |
| NEW ZEALAND | | | 69,371 | | | | 0.1 | |
| NORWAY | | | 209,539 | | | | 0.2 | |
| PAKISTAN | | | 10,206 | | | | 0.0 | |
| PANAMA | | | 9,810 | | | | 0.0 | |
| PERU | | | 35,872 | | | | 0.0 | |
| PHILIPPINES | | | 122,250 | | | | 0.1 | |
| POLAND | | | 88,288 | | | | 0.1 | |
| PORTUGAL | | | 48,317 | | | | 0.0 | |
| PUERTO RICO | | | 42,748 | | | | 0.0 | |
| QATAR | | | 75,355 | | | | 0.1 | |
| ROMANIA | | | 2,720 | | | | 0.0 | |
| RUSSIA | | | 266,119 | | | | 0.3 | |
| SINGAPORE | | | 248,047 | | | | 0.2 | |
| SLOVENIA | | | 6,393 | | | | 0.0 | |
| SOUTH AFRICA | | | 520,928 | | | | 0.5 | |
| SPAIN | | | 556,391 | | | | 0.5 | |
| SWEDEN | | | 508,019 | | | | 0.5 | |
| SWITZERLAND | | | 1,665,226 | | | | 1.6 | |
| TAIWAN | | | 1,040,025 | | | | 1.0 | |
| TANZANIA, UNITED REPUBLIC OF | | | 245 | | | | 0.0 | |
| THAILAND | | | 204,739 | | | | 0.2 | |
| TURKEY | | | 65,847 | | | | 0.1 | |
| UKRAINE | | | 4,756 | | | | 0.0 | |
| UNITED ARAB EMIRATES | | | 69,250 | | | | 0.1 | |
| UNITED KINGDOM | | | 3,861,690 | | | | 3.7 | |
| URUGUAY | | | 49,160 | | | | 0.0 | |
| ZAMBIA | | | 26,532 | | | | 0.0 | |
| TOTAL FOREIGN | | | 33,237,954 | | | | 31.6 | |
| | | | | | | | | |
| TOTAL PORTFOLIO | | $ | 105,298,544 | | | | 100.0 | % |
COLLEGE RETIREMENT EQUITIES FUND -Global Equities Account
COLLEGE RETIREMENT EQUITIES FUND
GLOBAL EQUITIES ACCOUNT
SCHEDULE OF INVESTMENTS
December 31, 2018
| SHARES | | | | COMPANY | | VALUE
(000) | |
| COMMON STOCKS - 98.6% |
| | | | | | | | | | |
| ARGENTINA - 0.1% |
| | 390,020 | | | | Grupo Financiero Galicia S.A. (ADR) (Class B) | | $ | 10,753 | |
| | 866,800 | | e | | Grupo Supervielle S.A. (ADR) | | | 7,524 | |
| | 313,209 | | * | | Loma Negra Cia Industrial Argentina S.A. (ADR) | | | 3,486 | |
| | 1,196 | | | | MercadoLibre, Inc | | | 350 | |
| | | | | | TOTAL ARGENTINA | | | 22,113 | |
| | | | | | | | | | |
| AUSTRALIA - 1.4% |
| | 1,063,300 | | *,e | | Afterpay Touch Group Ltd | | | 9,301 | |
| | 79,900 | | | | AGL Energy Ltd | | | 1,160 | |
| | 130,160 | | | | Alumina Ltd | | | 211 | |
| | 386,084 | | | | Amcor Ltd | | | 3,605 | |
| | 412,071 | | | | AMP Ltd | | | 711 | |
| | 155,975 | | | | APA Group (ASE) | | | 934 | |
| | 29,702 | | | | Aristocrat Leisure Ltd | | | 457 | |
| | 98,415 | | | | AusNet Services | | | 108 | |
| | 1,584,830 | | | | Australia & New Zealand Banking Group Ltd | | | 27,384 | |
| | 41,167 | | | | Australian Stock Exchange Ltd | | | 1,740 | |
| | 681,005 | | * | | AZ BGP Holdings | | | 16 | |
| | 20,855 | | | | Bank of Queensland Ltd | | | 143 | |
| | 25,576 | | | | Bendigo Bank Ltd | | | 194 | |
| | 2,433,456 | | e | | BHP Billiton Ltd | | | 58,819 | |
| | 545,373 | | | | BHP Group plc | | | 11,524 | |
| | 785,414 | | | | BlueScope Steel Ltd | | | 6,059 | |
| | 65,452 | | | | Boral Ltd | | | 228 | |
| | 83,183 | | | | Brambles Ltd | | | 595 | |
| | 13,777 | | | | Caltex Australia Ltd | | | 247 | |
| | 90,639 | | | | Challenger Financial Services Group Ltd | | | 606 | |
| | 4,877 | | | | CIMIC Group Ltd | | | 149 | |
| | 27,646 | | | | Coca-Cola Amatil Ltd | | | 159 | |
| | 16,945 | | | | Cochlear Ltd | | | 2,076 | |
| | 59,731 | | * | | Coles Group Ltd | | | 494 | |
| | 92,722 | | | | Commonwealth Bank of Australia | | | 4,730 | |
| | 24,292 | | | | Computershare Ltd | | | 294 | |
| | 19,663 | | | | Crown Resorts Ltd | | | 164 | |
| | 84,527 | | | | CSL Ltd | | | 11,041 | |
| | 104,857 | | | | Dexus Property Group | | | 785 | |
| | 3,356 | | e | | Domino’s Pizza Enterprises Ltd | | | 96 | |
| | 3,383 | | | | Flight Centre Travel Group Ltd | | | 102 | |
| | 85,714 | | | | Fortescue Metals Group Ltd | | | 253 | |
| | 164,135 | | | | GPT Group (ASE) | | | 618 | |
| | 36,818 | | e | | Harvey Norman Holdings Ltd | | | 82 | |
| | 521,900 | | | | IDP Education Ltd | | | 3,630 | |
| | 86,264 | | | | Incitec Pivot Ltd | | | 199 | |
| | 328,039 | | | | Insurance Australia Group Ltd | | | 1,618 | |
| | 70,740 | | | | Lend Lease Corp Ltd | | | 580 | |
COLLEGE RETIREMENT EQUITIES FUND -Global Equities Account
| SHARES | | | | COMPANY | | VALUE
(000) | |
| | 201,879 | | | | Macquarie Goodman Group | | $ | 1,512 | |
| | 28,874 | | | | Macquarie Group Ltd | | | 2,212 | |
| | 152,111 | | | | Medibank Pvt Ltd | | | 275 | |
| | 586,664 | | | | Mineral Resources Ltd | | | 6,397 | |
| | 339,495 | | | | Mirvac Group | | | 536 | |
| | 184,000 | | * | | MMG Ltd | | | 79 | |
| | 143,919 | | | | National Australia Bank Ltd | | | 2,442 | |
| | 40,353 | | | | Newcrest Mining Ltd | | | 620 | |
| | 72,200 | | | | Oil Search Ltd | | | 364 | |
| | 19,933 | | | | Orica Ltd | | | 242 | |
| | 90,809 | | * | | Origin Energy Ltd | | | 414 | |
| | 1,135,480 | | | | Oxiana Ltd | | | 7,040 | |
| | 4,170 | | | | Perpetual Trustees Australia Ltd | | | 95 | |
| | 92,965 | | | | Qantas Airways Ltd | | | 379 | |
| | 172,140 | | | | QBE Insurance Group Ltd | | | 1,226 | |
| | 107,338 | | | | QR National Ltd | | | 324 | |
| | 12,057 | | | | Ramsay Health Care Ltd | | | 490 | |
| | 2,767 | | | | REA Group Ltd | | | 144 | |
| | 263,072 | | | | Rio Tinto Ltd | | | 14,560 | |
| | 515,054 | | | | Rio Tinto plc | | | 24,667 | |
| | 92,231 | | | | Santos Ltd | | | 356 | |
| | 1,594,628 | | | | Scentre Group | | | 4,384 | |
| | 17,229 | | | | Seek Ltd | | | 206 | |
| | 66,809 | | | | Sonic Healthcare Ltd | | | 1,042 | |
| | 4,055,748 | | | | South32 Ltd | | | 9,648 | |
| | 357,429 | | | | Stockland Trust Group | | | 887 | |
| | 169,304 | | | | Suncorp-Metway Ltd | | | 1,507 | |
| | 58,033 | | | | Sydney Airport | | | 275 | |
| | 102,516 | | | | Tabcorp Holdings Ltd | | | 310 | |
| | 587,393 | | | | Telstra Corp Ltd | | | 1,179 | |
| | 19,615 | | | | TPG Telecom Ltd | | | 89 | |
| | 137,501 | | | | Transurban Group (ASE) | | | 1,129 | |
| | 37,867 | | | | Treasury Wine Estates Ltd | | | 395 | |
| | 277,398 | | | | Vicinity Centres | | | 508 | |
| | 201,772 | | * | | Virgin Australia Holdings Ltd | | | 26 | |
| | 5,675 | | | | Washington H Soul Pattinson & Co Ltd | | | 100 | |
| | 59,731 | | | | Wesfarmers Ltd | | | 1,357 | |
| | 180,830 | | | | Westpac Banking Corp | | | 3,195 | |
| | 267,604 | | e | | Woodside Petroleum Ltd | | | 5,895 | |
| | 69,184 | | | | Woolworths Ltd | | | 1,435 | |
| | 16,916 | | | | WorleyParsons Ltd | | | 136 | |
| | | | | | TOTAL AUSTRALIA | | | 249,189 | |
| | | | | | | | | | |
| AUSTRIA - 0.0% |
| | 3,748 | | | | Andritz AG. | | | 172 | |
| | 203,169 | | | | Erste Bank der Oesterreichischen Sparkassen AG. | | | 6,737 | |
| | 3,717 | | e | | Oest Elektrizitatswirts AG. (Class A) | | | 159 | |
| | 7,848 | | | | OMV AG. | | | 343 | |
| | 7,747 | | | | Raiffeisen International Bank Holding AG. | | | 198 | |
| | 6,111 | | | | Voestalpine AG. | | | 182 | |
| | | | | | TOTAL AUSTRIA | | | 7,791 | |
COLLEGE RETIREMENT EQUITIES FUND -Global Equities Account
| SHARES | | | | COMPANY | | VALUE
(000) | |
| BELGIUM - 0.1% |
| | 9,678 | | | | Ageas | | $ | 436 | |
| | 80,326 | | | | Anheuser-Busch InBev S.A. | | | 5,292 | |
| | 2,899 | | | | Befimmo SCA Sicafi | | | 161 | |
| | 2,319 | | | | Cofinimmo | | | 288 | |
| | 3,208 | | | | Colruyt S.A. | | | 229 | |
| | 4,256 | | | | Groupe Bruxelles Lambert S.A. | | | 371 | |
| | 13,029 | | | | KBC Groep NV | | | 838 | |
| | 7,741 | | | | Proximus plc | | | 210 | |
| | 3,944 | | | | Solvay S.A. | | | 394 | |
| | 3,049 | | | | Telenet Group Holding NV | | | 142 | |
| | 6,688 | | | | UCB S.A. | | | 546 | |
| | 10,883 | | | | Umicore S.A. | | | 434 | |
| | 1,197 | | | | Warehouses De Pauw SCA | | | 158 | |
| | | | | | TOTAL BELGIUM | | | 9,499 | |
| | | | | | | | | | |
| BERMUDA - 0.0% |
| | 1,308 | | | | RenaissanceRe Holdings Ltd | | | 175 | |
| | 155,247 | | * | | Third Point Reinsurance Ltd | | | 1,496 | |
| | | | | | TOTAL BERMUDA | | | 1,671 | |
| | | | | | | | | | |
| BRAZIL - 1.4% |
| | 368,800 | | | | AMBEV S.A. | | | 1,461 | |
| | 27,600 | | | | Atacadao Distribuicao Comercio e Industria Ltd | | | 129 | |
| | 5,447,300 | | * | | B2W Companhia Global Do Varejo | | | 58,866 | |
| | 160,200 | | | | B3 S.A.-Brasil Bolsa Balcao | | | 1,107 | |
| | 74,200 | | | | Banco Bradesco S.A. | | | 647 | |
| | 519,693 | | | | Banco Bradesco S.A. (ADR) | | | 5,140 | |
| | 419,235 | | | | Banco Bradesco S.A. (Preference) | | | 4,173 | |
| | 519,732 | | | | Banco do Brasil S.A. | | | 6,222 | |
| | 2,507,249 | | | | Banco Itau Holding Financeira S.A. | | | 22,947 | |
| | 1,297,800 | | | | Banco Santander Brasil S.A. | | | 14,272 | |
| | 50,800 | | | | BB Seguridade Participacoes S.A. | | | 362 | |
| | 59,900 | | | | BR Malls Participacoes S.A. | | | 202 | |
| | 12,800 | | | | Braskem S.A. | | | 156 | |
| | 38,600 | | * | | BRF S.A. | | | 218 | |
| | 15,000 | | * | | Centrais Eletricas Brasileiras S.A. | | | 93 | |
| | 15,800 | | * | | Centrais Eletricas Brasileiras S.A. (Preference) | | | 114 | |
| | 2,539,600 | | | | Cia Brasileira de Distribuicao Grupo Pao de Acucar | | | 52,963 | |
| | 279,900 | | | | Cia Brasileira de Distribuicao Grupo Pao de Acucar (ADR) | | | 5,814 | |
| | 88,600 | | | | Cia de Concessoes Rodoviarias | | | 256 | |
| | 25,300 | | | | Cia de Saneamento Basico do Estado de Sao Paulo | | | 205 | |
| | 69,000 | | | | Cia Energetica de Minas Gerais | | | 246 | |
| | 41,000 | | * | | Cia Siderurgica Nacional S.A. | | | 93 | |
| | 94,900 | | | | Cielo S.A. | | | 218 | |
| | 16,300 | | | | Cosan SA Industria e Comercio | | | 141 | |
| | 49,100 | | | | Empresa Brasileira de Aeronautica S.A. | | | 274 | |
| | 14,750 | | | | Engie Brasil Energia S.A. | | | 125 | |
| | 12,300 | | | | Equatorial Energia S.A. | | | 236 | |
| | 18,600 | | | | Fibria Celulose S.A. | | | 324 | |
| | 1,423,856 | | e | | Gerdau S.A. (ADR) | | | 5,354 | |
| | 76,600 | | | | Gerdau S.A. (Preference) | | | 292 | |
| | 25,500 | | | | Hypermarcas S.A. | | | 199 | |
COLLEGE RETIREMENT EQUITIES FUND -Global Equities Account
| SHARES | | | | COMPANY | | VALUE
(000) | |
| | 815,240 | | | | Investimentos Itau S.A. - PR | | $ | 2,540 | |
| | 8,100 | | | | IRB Brasil Resseguros S | | | 174 | |
| | 71,200 | | | | JBS S.A. | | | 213 | |
| | 51,600 | | | | Klabin S.A. | | | 211 | |
| | 101,900 | | | | Kroton Educacional S.A. | | | 233 | |
| | 1,885,100 | | | | Localiza Rent A Car | | | 14,424 | |
| | 53,300 | | | | Lojas Americanas S.A.(Preference) | | | 270 | |
| | 53,400 | | | | Lojas Renner S.A. | | | 583 | |
| | 6,800 | | | | M Dias Branco S.A. | | | 75 | |
| | 300,800 | | | | Magazine Luiza S.A. | | | 14,020 | |
| | 18,600 | | | | Multiplan Empreendimentos Imobiliarios S.A. | | | 117 | |
| | 13,200 | | | | Natura Cosmeticos S.A. | | | 153 | |
| | 675,648 | | *,e | | Pagseguro Digital Ltd | | | 12,655 | |
| | 25,500 | | | | Petrobras Distribuidora S.A. | | | 169 | |
| | 565,300 | | | | Petroleo Brasileiro S.A. | | | 3,694 | |
| | 740,000 | | | | Petroleo Brasileiro S.A. (Preference) | | | 4,316 | |
| | 6,600 | | | | Porto Seguro S.A. | | | 89 | |
| | 18,500 | | | | Raia Drogasil S.A. | | | 272 | |
| | 84,700 | | * | | Rumo S.A. | | | 371 | |
| | 13,800 | | | | Sul America SA | | | 102 | |
| | 33,000 | | | | Suzano Papel e Celulose S.A. | | | 325 | |
| | 33,100 | | | | Telefonica Brasil S.A. | | | 395 | |
| | 59,500 | | | | Tim Participacoes S.A. | | | 182 | |
| | 30,000 | | | | Ultrapar Participacoes S.A. | | | 411 | |
| | 583,000 | | | | Vale S.A. | | | 7,643 | |
| | 9,792,585 | | | | Via Varejo S.A. | | | 11,113 | |
| | 62,260 | | | | Weg S.A. | | | 281 | |
| | | | | | TOTAL BRAZIL | | | 257,880 | |
| | | | | | | | | | |
| CANADA - 2.3% |
| | 31,615 | | | | Agnico-Eagle Mines Ltd | | | 1,276 | |
| | 523,891 | | | | Alimentation Couche Tard, Inc | | | 26,060 | |
| | 13,483 | | e | | AltaGas Ltd | | | 137 | |
| | 292,449 | | e | | ARC Resources Ltd | | | 1,735 | |
| | 4,520 | | | | Atco Ltd | | | 128 | |
| | 35,593 | | *,e | | Aurora Cannabis, Inc | | | 177 | |
| | 326,574 | | | | Bank of Montreal | | | 21,335 | |
| | 119,347 | | e | | Bank of Nova Scotia | | | 5,949 | |
| | 179,273 | | | | Barrick Gold Corp (Canada) | | | 2,420 | |
| | 80,216 | | | | BCE, Inc | | | 3,169 | |
| | 25,797 | | * | | Blackberry Ltd (New) | | | 183 | |
| | 11,596 | | | | Boardwalk REIT | | | 321 | |
| | 111,719 | | * | | Bombardier, Inc | | | 166 | |
| | 66,659 | | | | Brookfield Asset Management, Inc | | | 2,555 | |
| | 13,827 | | | | CAE, Inc | | | 254 | |
| | 20,535 | | | | Cameco Corp (Toronto) | | | 233 | |
| | 4,638 | | | | Canadian Apartment Properties REIT | | | 150 | |
| | 38,131 | | e | | Canadian Imperial Bank of Commerce | | | 2,840 | |
| | 37,816 | | | | Canadian National Railway Co | | | 2,801 | |
| | 877,711 | | | | Canadian Natural Resources Ltd (Canada) | | | 21,178 | |
| | 184,297 | | | | Canadian Pacific Railway Ltd (Toronto) | | | 32,702 | |
| | 94,031 | | | | Canadian Tire Corp Ltd | | | 9,832 | |
| | 6,686 | | e | | Canadian Utilities Ltd | | | 153 | |
COLLEGE RETIREMENT EQUITIES FUND -Global Equities Account
| SHARES | | | | COMPANY | | VALUE
(000) | |
| | 10,434 | | *,e | | Canopy Growth Corp | | $ | 280 | |
| | 7,552 | | | | CCL Industries | | | 277 | |
| | 2,010,505 | | | | Cenovus Energy, Inc (Toronto) | | | 14,138 | |
| | 147,529 | | * | | CGI Group, Inc | | | 9,023 | |
| | 6,077 | | | | Choice Properties REIT | | | 51 | |
| | 13,073 | | e | | CI Financial Corp | | | 165 | |
| | 1,038 | | | | Constellation Software, Inc | | | 664 | |
| | 203,009 | | * | | Descartes Systems Group, Inc | | | 5,358 | |
| | 644,764 | | | | Dollarama, Inc | | | 15,335 | |
| | 2,854 | | | | Emera, Inc | | | 91 | |
| | 8,994 | | | | Empire Co Ltd | | | 190 | |
| | 104,121 | | | | Enbridge, Inc (Toronto) | | | 3,235 | |
| | 48,088 | | | | EnCana Corp | | | 278 | |
| | 2,796,456 | | | | Entertainment One Ltd | | | 12,709 | |
| | 1,447 | | | | Fairfax Financial Holdings Ltd | | | 637 | |
| | 8,587 | | | | Finning International, Inc | | | 150 | |
| | 14,059 | | | | First Capital Realty, Inc | | | 194 | |
| | 21,511 | | | | Fortis, Inc | | | 717 | |
| | 9,652 | | | | Franco-Nevada Corp | | | 677 | |
| | 3,973 | | | | George Weston Ltd | | | 262 | |
| | 11,030 | | | | Gildan Activewear, Inc | | | 335 | |
| | 118,495 | | | | Goldcorp, Inc | | | 1,160 | |
| | 15,346 | | | | Great-West Lifeco, Inc | | | 317 | |
| | 25,277 | | | | H&R Real Estate Investment Trust | | | 382 | |
| | 18,115 | | | | Husky Energy, Inc | | | 187 | |
| | 16,296 | | g | | Hydro One Ltd | | | 242 | |
| | 3,917 | | e | | IGM Financial, Inc | | | 89 | |
| | 14,177 | | | | Imperial Oil Ltd | | | 359 | |
| | 5,851 | | | | Industrial Alliance Insurance and Financial Services, Inc | | | 187 | |
| | 62,810 | | | | Intact Financial Corp | | | 4,564 | |
| | 19,150 | | | | Inter Pipeline Ltd | | | 271 | |
| | 10,773 | | e | | Keyera Corp | | | 204 | |
| | 195,500 | | * | | Kinaxis, Inc | | | 9,437 | |
| | 70,649 | | * | | Kinross Gold Corp | | | 228 | |
| | 9,711 | | | | Loblaw Cos Ltd | | | 435 | |
| | 16,707 | | | | Magna International, Inc | | | 758 | |
| | 292,290 | | | | Manulife Financial Corp (Toronto) | | | 4,147 | |
| | 162,484 | | | | Methanex Corp | | | 7,815 | |
| | 12,092 | | | | Metro, Inc | | | 419 | |
| | 17,304 | | e | | National Bank of Canada | | | 710 | |
| | 136,897 | | e | | Nutrien Ltd (Toronto) | | | 6,430 | |
| | 4,422 | | | | Onex Corp | | | 241 | |
| | 13,796 | | | | Open Text Corp | | | 450 | |
| | 25,625 | | e | | Pembina Pipeline Income Fund | | | 760 | |
| | 660,304 | | | | Power Corp Of Canada | | | 11,864 | |
| | 33,998 | | | | Power Financial Corp | | | 643 | |
| | 10,885 | | e | | PrairieSky Royalty Ltd | | | 141 | |
| | 220,617 | | | | Recipe Unlimited Corp | | | 4,229 | |
| | 167,935 | | | | Restaurant Brands International, Inc | | | 8,783 | |
| | 11,921 | | | | Restaurant Brands International, Inc (Toronto) | | | 623 | |
| | 54,144 | | | | RioCan Real Estate Investment Trust | | | 944 | |
| | 92,601 | | | | Rogers Communications, Inc (Class B) | | | 4,745 | |
| | 372,831 | | | | Royal Bank of Canada | | | 25,518 | |
COLLEGE RETIREMENT EQUITIES FUND -Global Equities Account
| SHARES | | | | COMPANY | | VALUE
(000) | |
| | 11,545 | | | | Saputo, Inc | | $ | 331 | |
| | 14,435 | | * | | Seven Generations Energy Ltd | | | 118 | |
| | 23,828 | | | | Shaw Communications, Inc (B Shares) | | | 431 | |
| | 117,266 | | * | | Shopify, Inc (Class A) (Toronto) | | | 16,216 | |
| | 15,155 | | | | Smart Real Estate Investment Trust | | | 342 | |
| | 8,844 | | | | SNC-Lavalin Group, Inc | | | 297 | |
| | 365,626 | | *,e,g | | Spin Master Corp | | | 10,282 | |
| | 9,122 | | * | | Stars Group, Inc | | | 151 | |
| | 67,124 | | | | Sun Life Financial, Inc | | | 2,227 | |
| | 1,455,374 | | | | Suncor Energy, Inc | | | 40,649 | |
| | 26,468 | | | | Teck Cominco Ltd | | | 570 | |
| | 10,154 | | | | TELUS Corp | | | 337 | |
| | 10,831 | | e | | Thomson Reuters Corp | | | 523 | |
| | 747,732 | | | | Toronto-Dominion Bank | | | 37,168 | |
| | 13,528 | | | | Tourmaline Oil Corp | | | 168 | |
| | 275,090 | | e | | TransCanada Corp | | | 9,823 | |
| | 7,495 | | e | | Vermilion Energy, Inc | | | 158 | |
| | 156,764 | | | | West Fraser Timber Co Ltd | | | 7,744 | |
| | 23,823 | | | | Wheaton Precious Metals Corp | | | 465 | |
| | 5,271 | | | | WSP Global, Inc | | | 227 | |
| | | | | | TOTAL CANADA | | | 426,029 | |
| | | | | | | | | | |
| CHILE - 0.1% |
| | 176,805 | | | | Aguas Andinas S.A. | | | 97 | |
| | 355,993 | | | | Antofagasta plc | | | 3,560 | |
| | 1,726,816 | | | | Banco de Chile | | | 247 | |
| | 3,208 | | | | Banco de Credito e Inversiones | | | 208 | |
| | 11,369,670 | | | | Banco Santander Chile S.A. | | | 847 | |
| | 118,501 | | | | Centros Comerciales Sudamericanos S.A. | | | 215 | |
| | 11,029 | | | | Cia Cervecerias Unidas S.A. | | | 142 | |
| | 584,036 | | | | Colbun S.A. | | | 118 | |
| | 8,216,933 | | | | Corpbanca S.A. | | | 77 | |
| | 18,546 | | | | Embotelladora Andina S.A. | | | 70 | |
| | 8,765 | | | | Empresa Nacional de Telecomunicaciones S.A. | | | 68 | |
| | 216,029 | | | | Empresas CMPC S.A. | | | 687 | |
| | 83,324 | | | | Empresas COPEC S.A. | | | 1,003 | |
| | 2,148,090 | | | | Enersis Chile S.A. | | | 207 | |
| | 5,564,762 | | | | Enersis S.A. | | | 984 | |
| | 20,780 | | | | Lan Airlines S.A. | | | 208 | |
| | 33,287 | | | | Lundin Mining Corp | | | 138 | |
| | 141,707 | | | | SACI Falabella | | | 1,039 | |
| | 19,571 | | | | Sociedad Quimica y Minera de Chile S.A. (Class B) | | | 771 | |
| | | | | | TOTAL CHILE | | | 10,686 | |
| | | | | | | | | | |
| CHINA - 3.5% |
| | 92,500 | | g | | 3SBio, Inc | | | 118 | |
| | 2,000 | | * | | 51job, Inc (ADR) | | | 125 | |
| | 7,100 | | * | | 58.COM, Inc (ADR) | | | 385 | |
| | 134,500 | | | | AAC Technologies Holdings, Inc | | | 776 | |
| | 116,000 | | | | Agile Property Holdings Ltd | | | 137 | |
| | 5,203,000 | | | | Agricultural Bank of China | | | 2,279 | |
| | 85,000 | | | | Agricultural Bank of China Ltd | | | 45 | |
| | 2,500 | | | | Air China Ltd | | | 3 | |
COLLEGE RETIREMENT EQUITIES FUND -Global Equities Account
| SHARES | | | | COMPANY | | VALUE
(000) | |
| | 134,000 | | | | Air China Ltd | | $ | 116 | |
| | 3,000 | | | | Aisino Corp | | | 10 | |
| | 931,489 | | * | | Alibaba Group Holding Ltd (ADR) | | | 127,679 | |
| | 268,000 | | *,e | | Alibaba Health Information Technology Ltd | | | 217 | |
| | 374,000 | | * | | Aluminum Corp of China Ltd | | | 120 | |
| | 116,000 | | | | Angang New Steel Co Ltd | | | 80 | |
| | 9,100 | | | | Angang Steel Co Ltd | | | 7 | |
| | 2,182,000 | | | | Anhui Conch Cement Co Ltd | | | 10,552 | |
| | 5,700 | | | | Anhui Conch Cement Co Ltd (Class A) | | | 24 | |
| | 82,000 | | | | Anta Sports Products Ltd | | | 393 | |
| | 19,600 | | | | Anxin Trust Co Ltd | | | 13 | |
| | 9,700 | | e | | Autohome, Inc (ADR) | | | 759 | |
| | 5,000 | | | | AVIC Aircraft Co Ltd | | | 10 | |
| | 166,000 | | e | | AviChina Industry & Technology Co | | | 104 | |
| | 170,000 | | g | | BAIC Motor Corp Ltd | | | 90 | |
| | 50,400 | | * | | Baidu, Inc (ADR) | | | 7,993 | |
| | 31,400 | | | | Bank of Beijing Co Ltd | | | 26 | |
| | 57,800 | | | | Bank of China Ltd | | | 30 | |
| | 21,023,000 | | | | Bank of China Ltd (Hong Kong) | | | 9,063 | |
| | 50,100 | | | | Bank of Communications Co Ltd | | | 42 | |
| | 1,692,000 | | | | Bank of Communications Co Ltd (Hong Kong) | | | 1,321 | |
| | 18,500 | | | | Bank of Jiangsu Co Ltd | | | 16 | |
| | 12,500 | | | | Bank of Nanjing Co Ltd | | | 12 | |
| | 7,200 | | | | Bank of Ningbo Co Ltd | | | 17 | |
| | 13,140 | | | | Bank of Shanghai Co Ltd | | | 21 | |
| | 25,800 | | | | Baoshan Iron & Steel Co Ltd | | | 24 | |
| | 3,199 | | *,e | | Baozun, Inc (ADR) | | | 93 | |
| | 219,000 | | | | BBMG Corp | | | 69 | |
| | 12,500 | | | | BBMG Corp | | | 6 | |
| | 1,700 | | * | | BeiGene Ltd (ADR) | | | 238 | |
| | 136,000 | | | | Beijing Capital International Airport Co Ltd | | | 144 | |
| | 42,000 | | | | Beijing Enterprises Holdings Ltd | | | 223 | |
| | 444,000 | | | | Beijing Enterprises Water Group Ltd | | | 227 | |
| | 1,800 | | | | Beijing Tongrentang Co Ltd | | | 7 | |
| | 43,700 | | | | BOE Technology Group Co Ltd | | | 17 | |
| | 568,000 | | | | Brilliance China Automotive Holdings Ltd | | | 423 | |
| | 48,500 | | e | | Byd Co Ltd | | | 311 | |
| | 2,700 | | | | BYD Co Ltd | | | 20 | |
| | 49,500 | | e | | BYD Electronic International Co Ltd | | | 62 | |
| | 95,000 | | *,e | | CAR, Inc | | | 71 | |
| | 962,000 | | g | | CGN Power Co Ltd | | | 228 | |
| | 183,000 | | | | China Agri-Industries Holdings Ltd | | | 65 | |
| | 9,579,000 | | *,†,e | | China Animal Healthcare Ltd | | | 12 | |
| | 700,000 | | | | China Cinda Asset Management Co Ltd | | | 170 | |
| | 1,748,000 | | | | China Citic Bank | | | 1,060 | |
| | 272,000 | | | | China Coal Energy Co | | | 107 | |
| | 349,000 | | | | China Communications Construction Co Ltd (Hong Kong) | | | 329 | |
| | 194,000 | | | | China Communications Services Corp Ltd | | | 161 | |
| | 132,000 | | | | China Conch Venture Holdings Ltd | | | 393 | |
| | 16,375,000 | | | | China Construction Bank | | | 13,409 | |
| | 15,700 | | | | China Construction Bank Corp | | | 15 | |
| | 203,500 | | *,e | | China COSCO Holdings Co Ltd | | | 76 | |
COLLEGE RETIREMENT EQUITIES FUND -Global Equities Account
| SHARES | | | | COMPANY | | VALUE
(000) | |
| | 9,700 | | | | China Eastern Airlines Corp Ltd | | $ | 7 | |
| | 104,000 | | | | China Eastern Airlines Corp Ltd (H Shares) | | | 58 | |
| | 56,700 | | | | China Everbright Bank Co Ltd | | | 31 | |
| | 236,000 | | | | China Everbright Bank Co Ltd (Hong Kong) | | | 102 | |
| | 10,336,392 | | | | China Everbright International Ltd | | | 9,263 | |
| | 76,000 | | | | China Everbright Ltd | | | 135 | |
| | 200,000 | | e | | China Evergrande Group | | | 598 | |
| | 3,841 | | | | China Fortune Land Development Co Ltd | | | 14 | |
| | 342,500 | | | | China Galaxy Securities Co Ltd | | | 155 | |
| | 7,400 | | | | China Gezhouba Group Co Ltd | | | 7 | |
| | 6,843 | | | | China Grand Automotive Services Co Ltd | | | 4 | |
| | 166,000 | | | | China Hongqiao Group Ltd | | | 94 | |
| | 855,000 | | g | | China Huarong Asset Management Co Ltd | | | 156 | |
| | 123,800 | | | | China Insurance International Holdings Co Ltd | | | 340 | |
| | 80,000 | | g | | China International Capital Corp Ltd | | | 150 | |
| | 2,800 | | | | China International Travel Service Corp Ltd | | | 25 | |
| | 1,404,000 | | | | China Life Insurance Co Ltd | | | 2,969 | |
| | 16,800 | | *,e,g | | China Literature Ltd | | | 78 | |
| | 262,000 | | | | China Longyuan Power Group Corp | | | 179 | |
| | 119,000 | | | | China Medical System Holdings Ltd | | | 111 | |
| | 213,000 | | | | China Mengniu Dairy Co Ltd | | | 663 | |
| | 307,000 | | | | China Merchants Bank Co Ltd | | | 1,121 | |
| | 22,300 | | | | China Merchants Bank Co Ltd (Class A) | | | 82 | |
| | 108,000 | | | | China Merchants Holdings International Co Ltd | | | 194 | |
| | 5,200 | | | | China Merchants Securities Co Ltd | | | 10 | |
| | 6,100 | | | | China Merchants Shekou Industrial Zone Holdings Co Ltd | | | 15 | |
| | 39,200 | | | | China Minsheng Banking Corp Ltd | | | 33 | |
| | 1,277,900 | | | | China Minsheng Banking Corp Ltd (Hong Kong) | | | 881 | |
| | 1,136,500 | | | | China Mobile Hong Kong Ltd | | | 10,997 | |
| | 363,000 | | e | | China Molybdenum Co Ltd | | | 134 | |
| | 20,300 | | | | China Molybdenum Co Ltd (Class A) | | | 11 | |
| | 12,204,000 | | | | China National Building Material Co Ltd | | | 8,351 | |
| | 24,300 | | | | China National Nuclear Power Co Ltd | | | 19 | |
| | 178,000 | | | | China Oilfield Services Ltd | | | 153 | |
| | 110,000 | | | | China Oriental Group Co Ltd | | | 66 | |
| | 1,623,758 | | | | China Overseas Land & Investment Ltd | | | 5,598 | |
| | 7,500 | | | | China Pacific Insurance Group Co Ltd | | | 31 | |
| | 501,400 | | | | China Pacific Insurance Group Co Ltd (Hong Kong) | | | 1,620 | |
| | 398,000 | | | | China Power International Development Ltd | | | 90 | |
| | 172,000 | | | | China Railway Construction Corp | | | 239 | |
| | 14,413 | | | | China Railway Construction Corp Ltd | | | 23 | |
| | 325,000 | | | | China Railway Group Ltd | | | 296 | |
| | 129,000 | | e,g | | China Railway Signal & Communication Corp Ltd | | | 90 | |
| | 550,000 | | | | China Reinsurance Group Corp | | | 112 | |
| | 114,000 | | | | China Resources Beer Holdings Company Ltd | | | 399 | |
| | 74,000 | | | | China Resources Gas Group Ltd | | | 293 | |
| | 867,836 | | | | China Resources Land Ltd | | | 3,338 | |
| | 126,500 | | g | | China Resources Pharmaceutical Group Ltd | | | 165 | |
| | 158,000 | | | | China Resources Power Holdings Co | | | 304 | |
| | 17,700 | | | | China Shenhua Energy Co Ltd | | | 46 | |
| | 683,000 | | | | China Shenhua Energy Co Ltd (Hong Kong) | | | 1,490 | |
| | 17,000 | | | | China Shipbuilding Industry Co Ltd | | | 11 | |
COLLEGE RETIREMENT EQUITIES FUND -Global Equities Account
| SHARES | | | | COMPANY | | VALUE
(000) | |
| | 120,000 | | | | China Shipping Development Co Ltd | | $ | 60 | |
| | 134,000 | | | | China Southern Airlines Co Ltd | | | 82 | |
| | 5,400 | | | | China Southern Airlines Co Ltd | | | 5 | |
| | 47,520 | | | | China State Construction Engineering Corp Ltd | | | 40 | |
| | 170,000 | | e | | China State Construction International Holdings Ltd | | | 135 | |
| | 2,764,000 | | | | China Telecom Corp Ltd | | | 1,416 | |
| | 3,232,000 | | *,g | | China Tower Corp Ltd | | | 611 | |
| | 190,000 | | | | China Travel International Inv HK | | | 51 | |
| | 1,176,000 | | | | China Unicom Ltd | | | 1,253 | |
| | 38,500 | | | | China United Network Communications Ltd | | | 29 | |
| | 2,371,900 | | | | China Vanke Co Ltd | | | 8,033 | |
| | 10,200 | | | | China Vanke Co Ltd (Class A) | | | 36 | |
| | 21,100 | | | | China Yangtze Power Co Ltd | | | 49 | |
| | 151,600 | | e | | China Zhongwang Holdings Ltd | | | 67 | |
| | 200,000 | | | | Chongqing Rural Commercial Bank | | | 107 | |
| | 254,000 | | | | CIFI Holdings Group Co Ltd | | | 135 | |
| | 447,000 | | | | Citic Pacific Ltd | | | 701 | |
| | 188,000 | | | | CITIC Securities Co Ltd | | | 324 | |
| | 14,600 | | | | CITIC Securities Co Ltd (Class A) | | | 34 | |
| | 9,971,000 | | | | CNOOC Ltd | | | 15,359 | |
| | 136,160 | | | | COSCO Pacific Ltd | | | 134 | |
| | 584,000 | | | | Country Garden Holdings Co Ltd | | | 709 | |
| | 91,379 | | * | | Country Garden Services Holdings Co Ltd | | | 145 | |
| | 354,000 | | | | CRRC Corp Ltd | | | 345 | |
| | 25,000 | | | | CRRC Corp Ltd (Class A) | | | 33 | |
| | 866,000 | | | | CSPC Pharmaceutical Group Ltd | | | 1,243 | |
| | 73,200 | | * | | Ctrip.com International Ltd (ADR) | | | 1,981 | |
| | 162,500 | | g | | Dali Foods Group Co Ltd | | | 120 | |
| | 25,000 | | | | Daqin Railway Co Ltd | | | 30 | |
| | 278,000 | | | | Datang International Power Generation Co Ltd | | | 65 | |
| | 204,000 | | | | Dongfeng Motor Group Co Ltd | | | 185 | |
| | 62,700 | | | | ENN Energy Holdings Ltd | | | 557 | |
| | 3,300 | | | | Fangda Carbon New Material Co Ltd | | | 8 | |
| | 166,000 | | | | Far East Horizon Ltd | | | 167 | |
| | 17,000 | | | | Focus Media Information Technology Co Ltd | | | 13 | |
| | 3,000 | | | | Foshan Haitian Flavouring & Food Co Ltd | | | 30 | |
| | 199,000 | | | | Fosun International | | | 290 | |
| | 378,000 | | | | Franshion Properties China Ltd | | | 170 | |
| | 130,000 | | | | Future Land Development Holdin | | | 89 | |
| | 2,600 | | | | Future Land Holdings Co Ltd | | | 9 | |
| | 38,800 | | g | | Fuyao Glass Industry Group Co Ltd (Hong Kong) | | | 124 | |
| | 17,300 | | *,e | | GDS Holdings Ltd (ADR) | | | 399 | |
| | 908,000 | | | | Geely Automobile Holdings Ltd | | | 1,601 | |
| | 4,000 | | | | Gemdale Corp | | | 6 | |
| | 70,000 | | * | | Genscript Biotech Corp | | | 94 | |
| | 135,800 | | | | GF Securities Co Ltd | | | 184 | |
| | 8,500 | | | | GF Securities Co Ltd (Class A) | | | 16 | |
| | 864,000 | | *,e | | GOME Electrical Appliances Holdings Ltd | | | 72 | |
| | 267,000 | | e | | Great Wall Motor Co Ltd | | | 154 | |
| | 4,000 | | * | | Gree Electric Appliances, Inc of Zhuhai | | | 21 | |
| | 13,000 | | | | Greenland Holdings Corp Ltd | | | 12 | |
| | 65,000 | | | | Greentown China Holdings Ltd | | | 49 | |
| | 102,000 | | e | | Greentown Service Group Co Ltd | | | 78 | |
COLLEGE RETIREMENT EQUITIES FUND -Global Equities Account
| SHARES | | | | COMPANY | | VALUE
(000) | |
| | 244,000 | | | | Guangdong Investments Ltd | | $ | 471 | |
| | 226,000 | | | | Guangzhou Automobile Group Co Ltd | | | 225 | |
| | 3,800 | | | | Guangzhou Baiyunshan Pharmaceutical Holdings Co Ltd | | | 20 | |
| | 4,802,600 | | | | Guangzhou R&F Properties Co Ltd | | | 7,267 | |
| | 8,300 | | | | Guotai Junan Securities Co Ltd | | | 19 | |
| | 52,600 | | g | | Guotai Junan Securities Co Ltd (Hong Kong) | | | 106 | |
| | 50,000 | | | | Haitian International Holdings Ltd | | | 96 | |
| | 5,645,092 | | | | Haitong Securities Co Ltd | | | 5,390 | |
| | 13,300 | | | | Haitong Securities Co Ltd (Class A) | | | 17 | |
| | 11,100 | | | | Hangzhou Hikvision Digital Technology Co Ltd | | | 42 | |
| | 1,200 | | | | Han’s Laser Technology Industry Group Co Ltd | | | 5 | |
| | 6,800 | | | | Henan Shuanghui Investment & Development Co Ltd | | | 23 | |
| | 136,000 | | | | Hengan International Group Co Ltd | | | 987 | |
| | 5,200 | | | | Hengli Petrochemical Co Ltd | | | 10 | |
| | 1,624,000 | | * | | HengTen Networks Group Ltd | | | 49 | |
| | 16,900 | | | | Hesteel Co Ltd | | | 7 | |
| | 31,000 | | g | | Hua Hong Semiconductor Ltd | | | 57 | |
| | 158,000 | | | | Huadian Power International Co | | | 71 | |
| | 4,500 | | | | Huadong Medicine Co Ltd | | | 17 | |
| | 338,000 | | | | Huaneng Power International, Inc (Hong Kong) | | | 215 | |
| | 386,000 | | | | Huaneng Renewables Corp Ltd | | | 104 | |
| | 128,200 | | e,g | | Huatai Securities Co Ltd | | | 203 | |
| | 10,200 | | | | Huatai Securities Co Ltd (Class A) | | | 24 | |
| | 21,900 | | | | Huaxia Bank Co Ltd | | | 24 | |
| | 10,000 | | * | | Huazhu Group Ltd (ADR) | | | 286 | |
| | 900 | | | | Hundsun Technologies, Inc | | | 7 | |
| | 4,100 | | *,e | | Hutchison China MediTech Ltd (ADR) | | | 95 | |
| | 3,400 | | | | Iflytek Co Ltd | | | 12 | |
| | 11,152,000 | | | | Industrial & Commercial Bank of China | | | 7,932 | |
| | 58,800 | | | | Industrial & Commercial Bank of China Ltd | | | 45 | |
| | 24,400 | | | | Industrial Bank Co Ltd | | | 53 | |
| | 39,800 | | | | Inner Mongolia BaoTou Steel Union Co Ltd | | | 9 | |
| | 8,600 | | | | Inner Mongolia Yili Industrial Group Co Ltd | | | 29 | |
| | 124,900 | | | | Inner Mongolia Yitai Coal Co | | | 148 | |
| | 127,400 | | * | | JD.com, Inc (ADR) | | | 2,666 | |
| | 116,000 | | | | Jiangsu Express | | | 162 | |
| | 4,900 | | | | Jiangsu Hengrui Medicine Co Ltd | | | 38 | |
| | 1,900 | | | | Jiangsu Yanghe Brewery Joint-Stock Co Ltd | | | 26 | |
| | 108,000 | | | | Jiangxi Copper Co Ltd | | | 127 | |
| | 5,558 | | | | Jiangxi Copper Co Ltd (Class A) | | | 11 | |
| | 3,700 | | | | Jiangxi Ganfeng Lithium Co Ltd | | | 12 | |
| | 75,096 | | e | | Jiayuan International Group Ltd | | | 139 | |
| | 153,000 | | | | Kaisa Group Holdings Ltd | | | 49 | |
| | 7,700 | | | | Kangmei Pharmaceutical Co Ltd | | | 10 | |
| | 10,023,000 | | e | | Kingdee International Software Group Co Ltd | | | 8,861 | |
| | 72,000 | | | | Kingsoft Corp Ltd | | | 104 | |
| | 1,400 | | | | Kweichow Moutai Co Ltd | | | 121 | |
| | 93,064 | | | | KWG Property Holding Ltd | | | 82 | |
| | 28,300 | | g | | Legend Holdings Corp | | | 74 | |
| | 550,000 | | | | Lenovo Group Ltd | | | 372 | |
| | 102,000 | | | | Logan Property Holdings Co Ltd | | | 127 | |
| | 114,000 | | | | Longfor Properties Co Ltd | | | 339 | |
COLLEGE RETIREMENT EQUITIES FUND -Global Equities Account
| SHARES | | | | COMPANY | | VALUE
(000) | |
| | 6,770 | | | | Luxshare Precision Industry Co Ltd | | $ | 14 | |
| | 8,626,000 | | e,g | | Luye Pharma Group Ltd | | | 6,004 | |
| | 2,400 | | | | Luzhou Laojiao Co Ltd | | | 14 | |
| | 192,000 | | | | Maanshan Iron & Steel | | | 85 | |
| | 9,712 | | | | Maanshan Iron & Steel Co Ltd | | | 5 | |
| | 8,300 | | | | Meinian Onehealth Healthcare Holdings Co Ltd | | | 18 | |
| | 123,500 | | *,g | | Meitu, Inc | | | 35 | |
| | 10,300 | | | | Metallurgical Corp of China Ltd | | | 5 | |
| | 277,000 | | | | Metallurgical Corp of China Ltd (Hong Kong) | | | 67 | |
| | 7,700 | | | | Midea Group Co Ltd | | | 42 | |
| | 44,000 | | | | Minth Group Ltd | | | 142 | |
| | 201,200 | | * | | Momo, Inc (ADR) | | | 4,779 | |
| | 7,400 | | | | NARI Technology Co Ltd | | | 20 | |
| | 13,900 | | | | Netease.com (ADR) | | | 3,272 | |
| | 3,000 | | | | New China Life Insurance Co Ltd | | | 19 | |
| | 67,100 | | | | New China Life insurance Co Ltd (Hong Kong) | | | 266 | |
| | 25,100 | | * | | New Oriental Education & Technology Group (ADR) | | | 1,376 | |
| | 2,100 | | * | | Noah Holdings Ltd (ADR) | | | 91 | |
| | 52,500 | | | | Offshore Oil Engineering Co Ltd | | | 37 | |
| | 3,100 | | | | O-film Tech Co Ltd | | | 4 | |
| | 625,000 | | | | People’s Insurance Co Group of China Ltd | | | 251 | |
| | 1,284,000 | | | | PICC Property & Casualty Co Ltd | | | 1,310 | |
| | 114,772 | | *,e | | Pinduoduo, Inc (ADR) | | | 2,575 | |
| | 21,700 | | | | Ping An Bank Co Ltd | | | 30 | |
| | 7,653,000 | | | | Ping An Insurance Group Co of China Ltd | | | 67,515 | |
| | 11,800 | | | | Ping An Insurance Group Co of China Ltd (Class A) | | | 97 | |
| | 13,100 | | | | Poly Real Estate Group Co Ltd | | | 23 | |
| | 277,000 | | g | | Postal Savings Bank of China Co Ltd | | | 146 | |
| | 4,700 | | | | Power Construction Corp of China Ltd | | | 3 | |
| | 8,200 | | | | Qingdao Haier Co Ltd | | | 17 | |
| | 9,400 | | | | SAIC Motor Corp Ltd | | | 37 | |
| | 7,000 | | | | Sanan Optoelectronics Co Ltd | | | 12 | |
| | 12,700 | | | | Sany Heavy Industry Co Ltd | | | 15 | |
| | 10,900 | | | | SDIC Power Holdings Co Ltd | | | 13 | |
| | 228,500 | | *,e | | Semiconductor Manufacturing International Corp | | | 199 | |
| | 32,100 | | | | Shaanxi Coal Industry Co Ltd | | | 35 | |
| | 7,800 | | | | Shandong Gold Mining Co Ltd | | | 34 | |
| | 160,000 | | | | Shandong Weigao Group Medical Polymer Co Ltd | | | 129 | |
| | 316,000 | | | | Shanghai Electric Group Co Ltd (Hong Kong) | | | 101 | |
| | 2,500 | | | | Shanghai Fosun Pharmaceutical Group Co Ltd | | | 9 | |
| | 51,500 | | e | | Shanghai Fosun Pharmaceutical Group Co Ltd (Hong Kong) | | | 151 | |
| | 41,000 | | | | Shanghai Industrial Holdings Ltd | | | 83 | |
| | 2,000 | | | | Shanghai International Airport Co Ltd | | | 15 | |
| | 86,491 | | | | Shanghai Lujiazui Finance & Trade Zone Development Co Ltd | | | 110 | |
| | 4,200 | | | | Shanghai Pharmaceuticals Holding Co Ltd | | | 10 | |
| | 73,300 | | | | Shanghai Pharmaceuticals Holding Co Ltd (Hong Kong) | | | 149 | |
| | 31,700 | | | | Shanghai Pudong Development Bank Co Ltd | | | 45 | |
| | 37,379 | | | | Shanxi Lu’an Environmental Energy Development Co Ltd | | | 36 | |
| | 45,500 | | | | Shanxi Xishan Coal & Electricity Power Co Ltd | | | 36 | |
| | 16,100 | | | | Shenwan Hongyuan Group Co Ltd | | | 10 | |
COLLEGE RETIREMENT EQUITIES FUND -Global Equities Account
| SHARES | | | | COMPANY | | VALUE
(000) | |
| | 80,500 | | | | Shenzhen International Holdings Ltd | | $ | 155 | |
| | 282,000 | | | | Shenzhen Investment Ltd | | | 93 | |
| | 8,100 | | | | Shenzhen Overseas Chinese Town Co Ltd | | | 8 | |
| | 59,000 | | | | Shenzhou International Group Holdings Ltd | | | 671 | |
| | 89,500 | | | | Shimao Property Holdings Ltd | | | 238 | |
| | 289,500 | | | | Shui On Land Ltd | | | 64 | |
| | 9,500 | | | | Sichuan Chuantou Energy Co Ltd | | | 12 | |
| | 293,000 | | | | Sihuan Pharmaceutical Holdings | | | 51 | |
| | 4,885 | | * | | Sina Corp | | | 262 | |
| | 256,500 | | | | Sino-Ocean Land Holdings Ltd | | | 113 | |
| | 107,500 | | | | Sinopec Engineering Group Co Ltd | | | 88 | |
| | 15,426,000 | | | | Sinopec Shanghai Petrochemical Co Ltd | | | 6,753 | |
| | 97,200 | | | | Sinopharm Group Co | | | 409 | |
| | 250,000 | | | | Sinotrans Ltd | | | 108 | |
| | 51,500 | | e | | Sinotruk Hong Kong Ltd | | | 78 | |
| | 168,500 | | * | | Soho China Ltd | | | 60 | |
| | 434,000 | | e | | Sunac China Holdings Ltd | | | 1,408 | |
| | 14,200 | | | | Suning.com Co Ltd | | | 20 | |
| | 1,397,500 | | | | Sunny Optical Technology Group Co Ltd | | | 12,429 | |
| | 61,400 | | * | | TAL Education Group (ADR) | | | 1,638 | |
| | 6,500 | | | | TBEA Co Ltd | | | 6 | |
| | 4,183,800 | | | | Tencent Holdings Ltd | | | 167,688 | |
| | 1,806,491 | | | | Tianqi Lithium Corp | | | 7,765 | |
| | 148,000 | | | | Tingyi Cayman Islands Holding Corp | | | 198 | |
| | 48,000 | | | | Tong Ren Tang Technologies Co Ltd | | | 63 | |
| | 72,000 | | | | Travelsky Technology Ltd | | | 185 | |
| | 28,000 | | | | Tsingtao Brewery Co Ltd | | | 113 | |
| | 104,000 | | | | Uni-President China Holdings Ltd | | | 90 | |
| | 34,100 | | * | | Vipshop Holdings Ltd (ADR) | | | 186 | |
| | 388,000 | | | | Want Want China Holdings Ltd | | | 271 | |
| | 141,400 | | *,e | | Weibo Corp (ADR) | | | 8,262 | |
| | 158,000 | | | | Weichai Power Co Ltd | | | 181 | |
| | 9,100 | | | | Weichai Power Co Ltd (Class A) | | | 10 | |
| | 8,200 | | | | Western Securities Co Ltd | | | 9 | |
| | 172,000 | | | | Winteam Pharmaceutical Group Ltd | | | 100 | |
| | 4,700 | | | | Wuliangye Yibin Co Ltd | | | 35 | |
| | 40,000 | | *,g | | Wuxi Biologics Cayman, Inc | | | 256 | |
| | 66,800 | | | | Xinjiang Goldwind Science & Technology Co Ltd (Hong Kong) | | | 59 | |
| | 238,862 | | e | | Xinyi Solar Holdings Ltd | | | 84 | |
| | 2,460,000 | | e,g | | Yangtze Optical Fibre and Cable Joint Stock Ltd | | | 6,724 | |
| | 115,049 | | | | Yangzijiang Shipbuilding | | | 106 | |
| | 184,000 | | | | Yanzhou Coal Mining Co Ltd | | | 149 | |
| | 37,000 | | | | Yihai International Holding Ltd | | | 90 | |
| | 16,900 | | | | Yonghui Superstores Co Ltd | | | 19 | |
| | 5,200 | | | | Yonyou Network Technology Co Ltd | | | 16 | |
| | 47,856,000 | | | | Yuexiul Property Co Ltd | | | 8,795 | |
| | 583,764 | | | | Yum China Holdings, Inc | | | 19,574 | |
| | 1,300 | | | | Yunnan Baiyao Group Co Ltd | | | 14 | |
| | 137,393 | | | | Yuzhou Properties Co | | | 57 | |
| | 3,700 | | * | | YY, Inc (ADR) | | | 221 | |
| | 1,000 | | | | Zhangzhou Pientzehuang Pharmaceutical Co Ltd | | | 13 | |
| | 115,500 | | | | Zhaojin Mining Industry Co Ltd | | | 117 | |
COLLEGE RETIREMENT EQUITIES FUND -Global Equities Account
| SHARES | | | | COMPANY | | VALUE
(000) | |
| | 2,900 | | | | Zhejiang Dahua Technology Co Ltd | | $ | 5 | |
| | 124,000 | | | | Zhejiang Expressway Co Ltd | | | 108 | |
| | 8,000 | | | | Zhejiang Longsheng Group Co Ltd | | | 11 | |
| | 17,900 | | *,e,g | | ZhongAn Online P&C Insurance Co Ltd | | | 57 | |
| | 18,300 | | | | Zhongjin Gold Corp Ltd | | | 23 | |
| | 44,000 | | | | Zhongsheng Group Holdings Ltd | | | 87 | |
| | 41,200 | | | | Zhuzhou CSR Times Electric Co Ltd | | | 229 | |
| | 474,000 | | | | Zijin Mining Group Co Ltd | | | 180 | |
| | 53,700 | | | | Zijin Mining Group Co Ltd (Class A) | | | 26 | |
| | 56,000 | | * | | ZTE Corp | | | 106 | |
| | 7,200 | | * | | ZTE Corp | | | 21 | |
| | | | | | TOTAL CHINA | | | 643,397 | |
| | | | | | | | | | |
| COLOMBIA - 0.0% |
| | 16,398 | | | | BanColombia S.A. | | | 154 | |
| | 33,196 | | | | BanColombia S.A. (Preference) | | | 321 | |
| | 26,846 | | | | Cementos Argos S.A. | | | 58 | |
| | 441,308 | | | | Ecopetrol S.A. | | | 359 | |
| | 18,216 | | | | Grupo Argos S.A. | | | 95 | |
| | 268,057 | | | | Grupo Aval Acciones y Valores | | | 82 | |
| | 19,589 | | | | Grupo de Inversiones Suramericana S.A. | | | 194 | |
| | 9,675 | | | | Grupo de Inversiones Suramericana S.A. (Preference) | | | 93 | |
| | 34,961 | | | | Interconexion Electrica S.A. | | | 150 | |
| | | | | | TOTAL COLOMBIA | | | 1,506 | |
| | | | | | | | | | |
| CZECH REPUBLIC - 0.0% |
| | 13,714 | | | | CEZ AS | | | 327 | |
| | 5,271 | | | | Komercni Banka AS | | | 199 | |
| | 1,346,597 | | g | | Moneta Money Bank AS | | | 4,345 | |
| | | | | | TOTAL CZECH REPUBLIC | | | 4,871 | |
| | | | | | | | | | |
| DENMARK - 0.8% |
| | 201 | | | | AP Moller - Maersk AS (Class A) | | | 238 | |
| | 350 | | | | AP Moller - Maersk AS (Class B) | | | 440 | |
| | 5,657 | | | | Carlsberg AS (Class B) | | | 602 | |
| | 5,335 | | | | Christian Hansen Holding | | | 474 | |
| | 29,477 | | | | Coloplast AS | | | 2,742 | |
| | 38,554 | | | | Danske Bank AS | | | 765 | |
| | 160,860 | | e | | Dfds A.S. | | | 6,492 | |
| | 227,990 | | | | DSV AS | | | 15,057 | |
| | 3,176 | | * | | Genmab AS | | | 522 | |
| | 209,692 | | | | GN Store Nord | | | 7,857 | |
| | 3,770 | | | | H Lundbeck AS | | | 166 | |
| | 9,141 | | | | ISS A.S. | | | 256 | |
| | 1,481,569 | | | | Novo Nordisk AS | | | 68,044 | |
| | 11,751 | | | | Novozymes AS | | | 525 | |
| | 477,995 | | g | | Orsted AS | | | 31,986 | |
| | 6,120 | | | | Pandora AS | | | 250 | |
| | 340,643 | | | | Sydbank AS | | | 8,123 | |
| | 6,604 | | | | Tryg A.S. | | | 167 | |
| | 10,317 | | | | Vestas Wind Systems AS | | | 781 | |
| | 5,439 | | *,e | | William Demant Holding A.S. | | | 155 | |
| | | | | | TOTAL DENMARK | | | 145,642 | |
COLLEGE RETIREMENT EQUITIES FUND -Global Equities Account
| SHARES | | | | COMPANY | | VALUE
(000) | |
| EGYPT - 0.0% |
| | 74,893 | | | | Commercial International Bank | | $ | 310 | |
| | 59,925 | | | | Eastern Tobacco | | | 54 | |
| | 49,980 | | | | ElSwedy Cables Holding Co | | | 50 | |
| | | | | | TOTAL EGYPT | | | 414 | |
| | | | | | | | | | |
| FINLAND - 0.6% |
| | 198,396 | | | | Amer Sports Oyj (A Shares) | | | 8,722 | |
| | 46,387 | | e | | Citycon Oyj | | | 86 | |
| | 7,751 | | | | Elisa Oyj (Series A) | | | 321 | |
| | 236,488 | | | | Fortum Oyj | | | 5,177 | |
| | 17,675 | | | | Kone Oyj (Class B) | | | 844 | |
| | 5,558 | | | | Metso Oyj | | | 146 | |
| | 6,898 | | | | Neste Oil Oyj | | | 534 | |
| | 2,920,944 | | | | Nokia Oyj (Turquoise) | | | 16,956 | |
| | 6,397 | | | | Nokian Renkaat Oyj | | | 196 | |
| | 160,858 | | | | Nordea Bank Abp | | | 1,354 | |
| | 5,660 | | | | Orion Oyj (Class B) | | | 197 | |
| | 1,248,000 | | e | | Outokumpu Oyj | | | 4,549 | |
| | 723,333 | | | | Sampo Oyj (A Shares) | | | 32,058 | |
| | 613,693 | | | | Stora Enso Oyj (R Shares) | | | 7,115 | |
| | 368,876 | | | | UPM-Kymmene Oyj | | | 9,338 | |
| | 567,740 | | | | Valmet Corp | | | 11,694 | |
| | 22,695 | | | | Wartsila Oyj (B Shares) | | | 362 | |
| | | | | | TOTAL FINLAND | | | 99,649 | |
| | | | | | | | | | |
| FRANCE - 3.3% |
| | 238,970 | | | | Accor S.A. | | | 10,162 | |
| | 1,580 | | | | Aeroports de Paris | | | 300 | |
| | 22,677 | | | | Air Liquide | | | 2,816 | |
| | 643,904 | | | | Airbus SE | | | 61,390 | |
| | 8,221 | | | | Alstom RGPT | | | 332 | |
| | 3,141 | | g | | Amundi S.A. | | | 166 | |
| | 162,844 | | | | Arkema | | | 13,980 | |
| | 4,964 | | | | Atos Origin S.A. | | | 407 | |
| | 102,694 | | | | AXA S.A. | | | 2,216 | |
| | 2,196 | | | | BioMerieux | | | 145 | |
| | 230,772 | | | | BNP Paribas | | | 10,422 | |
| | 45,022 | | | | Bollore | | | 181 | |
| | 11,401 | | | | Bouygues S.A. | | | 409 | |
| | 13,970 | | | | Bureau Veritas S.A. | | | 285 | |
| | 61,512 | | | | Cap Gemini S.A. | | | 6,118 | |
| | 31,021 | | | | Carrefour S.A. | | | 530 | |
| | 2,934 | | e | | Casino Guichard Perrachon S.A. | | | 122 | |
| | 8,453 | | | | CNP Assurances | | | 179 | |
| | 25,961 | | | | Compagnie de Saint-Gobain | | | 862 | |
| | 696,135 | | | | Credit Agricole S.A. | | | 7,492 | |
| | 176,042 | | | | Danone | | | 12,408 | |
| | 128 | | | | Dassault Aviation S.A. | | | 177 | |
| | 277,621 | | | | Dassault Systemes S.A. | | | 32,976 | |
| | 12,405 | | | | Edenred | | | 457 | |
| | 4,066 | | | | Eiffage S.A. | | | 340 | |
COLLEGE RETIREMENT EQUITIES FUND -Global Equities Account
| SHARES | | | | COMPANY | | VALUE
(000) | |
| | 80,851 | | | | Electricite de France | | $ | 1,280 | |
| | 168,216 | | e | | Essilor International S.A. | | | 21,323 | |
| | 2,459 | | | | Eurazeo | | | 174 | |
| | 9,427 | | | | Eutelsat Communications | | | 186 | |
| | 138,933 | | | | Faurecia | | | 5,242 | |
| | 4,761 | | | | Fonciere Des Regions | | | 459 | |
| | 254,036 | | | | Gaz de France | | | 3,650 | |
| | 5,302 | | | | Gecina S.A. | | | 686 | |
| | 25,530 | | | | Groupe Eurotunnel S.A. | | | 343 | |
| | 1,674 | | | | Hermes International | | | 930 | |
| | 6,368 | | | | Icade | | | 485 | |
| | 1,492 | | | | Iliad S.A. | | | 209 | |
| | 2,243 | | | | Imerys S.A. | | | 108 | |
| | 3,137 | | | | Ingenico | | | 178 | |
| | 1,914 | | | | Ipsen | | | 248 | |
| | 3,699 | | | | JC Decaux S.A. | | | 104 | |
| | 79,054 | | | | Kering | | | 37,034 | |
| | 34,390 | | | | Klepierre | | | 1,063 | |
| | 13,820 | | | | Legrand S.A. | | | 781 | |
| | 162,347 | | | | L’Oreal S.A. | | | 37,149 | |
| | 49,883 | | | | LVMH Moet Hennessy Louis Vuitton S.A. | | | 14,605 | |
| | 8,833 | | | | Michelin (C.G.D.E.) (Class B) | | | 869 | |
| | 46,912 | | | | Natixis | | | 221 | |
| | 264,522 | | | | Orange S. A. | | | 4,287 | |
| | 11,243 | | | | Pernod-Ricard S.A. | | | 1,845 | |
| | 415,427 | | | | Peugeot S.A. | | | 8,860 | |
| | 11,134 | | | | Publicis Groupe S.A. | | | 635 | |
| | 1,144 | | | | Remy Cointreau S.A. | | | 130 | |
| | 243,645 | | | | Renault S.A. | | | 15,177 | |
| | 15,706 | | | | Rexel S.A. | | | 167 | |
| | 128,620 | | | | Safran S.A. | | | 15,426 | |
| | 1,069,638 | | | | Sanofi-Aventis | | | 92,791 | |
| | 1,511 | | | | Sartorius Stedim Biotech | | | 151 | |
| | 644,231 | | | | Schneider Electric S.A. | | | 43,699 | |
| | 8,563 | | | | SCOR SE | | | 385 | |
| | 1,181 | | | | SEB S.A. | | | 153 | |
| | 1,346 | | | | Societe BIC S.A. | | | 138 | |
| | 40,640 | | | | Societe Generale | | | 1,288 | |
| | 4,715 | | | | Sodexho Alliance S.A. | | | 484 | |
| | 53,477 | | | | Suez Environnement S.A. | | | 706 | |
| | 291,237 | | | | Teleperformance | | | 46,589 | |
| | 5,636 | | | | Thales S.A. | | | 659 | |
| | 630,597 | | | | Total S.A. | | | 33,261 | |
| | 106,598 | | * | | Ubisoft Entertainment | | | 8,588 | |
| | 21,058 | | * | | Unibail-Rodamco-Westfield | | | 3,267 | |
| | 13,054 | | | | Valeo S.A. | | | 381 | |
| | 73,060 | | | | Veolia Environnement | | | 1,496 | |
| | 235,009 | | | | Vinci S.A. | | | 19,325 | |
| | 55,224 | | | | Vivendi Universal S.A. | | | 1,338 | |
| | 1,472 | | | | Wendel | | | 177 | |
| | | | | | TOTAL FRANCE | | | 593,602 | |
COLLEGE RETIREMENT EQUITIES FUND -Global Equities Account
| SHARES | | | | COMPANY | | VALUE
(000) | |
| GERMANY - 1.3% |
| | 48,047 | | | | Adidas-Salomon AG. | | $ | 10,041 | |
| | 2,319 | | g | | ADO Properties S.A. | | | 121 | |
| | 174,671 | | | | Allianz AG. | | | 35,101 | |
| | 197,306 | | | | Alstria Office REIT-AG. | | | 2,762 | |
| | 40,851 | | | | Aroundtown S.A. | | | 339 | |
| | 2,437 | | | | Axel Springer AG. | | | 138 | |
| | 96,079 | | | | BASF SE | | | 6,692 | |
| | 135,762 | | | | Bayer AG. | | | 9,442 | |
| | 18,099 | | | | Bayerische Motoren Werke AG. | | | 1,468 | |
| | 2,287 | | | | Bayerische Motoren Werke AG. (Preference) | | | 163 | |
| | 125,866 | | | | Beiersdorf AG. | | | 13,128 | |
| | 1,004,461 | | | | Borussia Dortmund GmbH & Co KGaA | | | 9,207 | |
| | 8,130 | | | | Brenntag AG. | | | 355 | |
| | 52,492 | | * | | Commerzbank AG. | | | 349 | |
| | 5,765 | | | | Continental AG. | | | 803 | |
| | 161,695 | | g | | Covestro AG. | | | 8,008 | |
| | 172,092 | | | | Daimler AG. (Registered) | | | 9,072 | |
| | 4,733 | | *,g | | Delivery Hero AG. | | | 177 | |
| | 66,269 | | | | Deutsche Annington Immobilien SE | | | 2,987 | |
| | 104,468 | | | | Deutsche Bank AG. (Registered) | | | 833 | |
| | 10,218 | | | | Deutsche Boerse AG. | | | 1,222 | |
| | 4,058 | | | | Deutsche Euroshop AG. | | | 118 | |
| | 13,322 | | | | Deutsche Lufthansa AG. | | | 301 | |
| | 52,266 | | | | Deutsche Post AG. | | | 1,427 | |
| | 1,009,903 | | | | Deutsche Telekom AG. | | | 17,165 | |
| | 50,174 | | | | Deutsche Wohnen AG. | | | 2,293 | |
| | 116,076 | | | | Drillisch AG. | | | 5,928 | |
| | 1,618,804 | | | | E.ON AG. | | | 15,980 | |
| | 8,282 | | | | Evonik Industries AG. | | | 207 | |
| | 2,137 | | | | Fraport AG. Frankfurt Airport Services Worldwide | | | 153 | |
| | 49,105 | | | | Fresenius Medical Care AG. | | | 3,183 | |
| | 38,528 | | | | Fresenius SE | | | 1,862 | |
| | 3,532 | | | | Fuchs Petrolub AG. (Preference) | | | 146 | |
| | 9,260 | | | | GEA Group AG. | | | 238 | |
| | 9,277 | | | | Grand City Properties S.A. | | | 202 | |
| | 3,201 | | | | Hannover Rueckversicherung AG. | | | 431 | |
| | 7,619 | | | | HeidelbergCement AG. | | | 467 | |
| | 5,568 | | | | Henkel KGaA | | | 548 | |
| | 9,430 | | | | Henkel KGaA (Preference) | | | 1,030 | |
| | 1,107 | | | | Hochtief AG. | | | 150 | |
| | 3,377 | | | | Hugo Boss AG. | | | 208 | |
| | 60,174 | | | | Infineon Technologies AG. | | | 1,205 | |
| | 5,694 | | * | | Innogy SE | | | 242 | |
| | 2,049 | | g | | Innogy SE | | | 96 | |
| | 3,763 | | | | KION Group AG. | | | 191 | |
| | 4,581 | | | | Lanxess AG. | | | 211 | |
| | 5,798 | | | | LEG Immobilien AG. | | | 605 | |
| | 19,084 | | | | Merck KGaA | | | 1,964 | |
| | 9,841 | | | | Metro Wholesale & Food Specialist AG. | | | 151 | |
| | 2,799 | | | | MTU Aero Engines Holding AG. | | | 508 | |
| | 7,919 | | | | Muenchener Rueckver AG. | | | 1,727 | |
| | 6,211 | | | | Osram Licht AG. | | | 270 | |
COLLEGE RETIREMENT EQUITIES FUND -Global Equities Account
| SHARES | | | | COMPANY | | VALUE
(000) | |
| | 464,504 | | * | | Paion AG. | | $ | 1,169 | |
| | 7,947 | | | | Porsche AG. | | | 467 | |
| | 13,218 | | | | ProSiebenSat. Media AG. | | | 235 | |
| | 454 | | | | Puma AG. Rudolf Dassler Sport | | | 222 | |
| | 434,333 | | | | RWE AG. | | | 9,460 | |
| | 66,042 | | | | SAP AG. | | | 6,555 | |
| | 1,821 | | | | Sartorius AG. | | | 227 | |
| | 323,034 | | g | | Scout24 AG. | | | 14,821 | |
| | 67,116 | | | | Siemens AG. | | | 7,490 | |
| | 8,260 | | *,g | | Siemens Healthineers AG. | | | 345 | |
| | 6,507 | | | | Symrise AG. | | | 482 | |
| | 11,596 | | | | TAG Tegernsee Immobilien und Beteiligungs AG. | | | 264 | |
| | 37,724 | | | | Telefonica Deutschland Holding AG. | | | 149 | |
| | 431,454 | | | | ThyssenKrupp AG. | | | 7,412 | |
| | 5,798 | | | | TLG Immobilien AG. | | | 160 | |
| | 22,806 | | | | TUI AG. (DI) | | | 328 | |
| | 10,992 | | | | Uniper SE | | | 284 | |
| | 6,568 | | | | United Internet AG. | | | 287 | |
| | 3,807 | | | | Volkswagen AG. | | | 609 | |
| | 7,755 | | | | Volkswagen AG. (Preference) | | | 1,237 | |
| | 129,897 | | | | Wirecard AG. | | | 19,582 | |
| | 5,961 | | *,g | | Zalando SE | | | 154 | |
| | | | | | TOTAL GERMANY | | | 243,554 | |
| | | | | | | | | | |
| GREECE - 0.0% |
| | 106,093 | | * | | Alpha Bank AE | | | 133 | |
| | 5,760 | | *,† | | Hellenic Duty Free Shops S.A. | | | 0 | ^ |
| | 17,769 | | | | Hellenic Telecommunications Organization S.A. | | | 194 | |
| | 7,756 | | | | JUMBO S.A. | | | 113 | |
| | 6,053 | | | | Motor Oil Hellas Corinth Refineries S.A. | | | 146 | |
| | 16,893 | | | | OPAP S.A. | | | 147 | |
| | 2,758 | | | | Titan Cement Co S.A. | | | 61 | |
| | | | | | TOTAL GREECE | | | 794 | |
| | | | | | | | | | |
| HONG KONG - 1.0% |
| | 3,773,958 | | | | AIA Group Ltd | | | 31,350 | |
| | 1,040,000 | | *,e | | Alibaba Pictures Group Ltd | | | 176 | |
| | 16,418 | | | | ASM Pacific Technology | | | 158 | |
| | 186,527 | | | | Bank of East Asia Ltd | | | 592 | |
| | 190,853 | | | | BOC Hong Kong Holdings Ltd | | | 708 | |
| | 99,000 | | | | Cathay Pacific Airways Ltd | | | 141 | |
| | 228,000 | | * | | China First Capital Group Ltd | | | 130 | |
| | 331,200 | | | | China Gas Holdings Ltd | | | 1,181 | |
| | 72,000 | | * | | China Investment Fund International Holdings Co Ltd | | | 193 | |
| | 198,000 | | | | China Resources Cement Holdings Ltd | | | 179 | |
| | 134,625 | | | | CK Asset Holdings Ltd | | | 985 | |
| | 142,543 | | | | CK Hutchison Holdings Ltd | | | 1,368 | |
| | 66,453 | | | | CK Infrastructure Holdings Ltd | | | 503 | |
| | 233,954 | | | | CLP Holdings Ltd | | | 2,644 | |
| | 17,600 | | | | Dairy Farm International Holdings Ltd | | | 159 | |
| | 565,000 | | e | | Fullshare Holdings Ltd | | | 130 | |
| | 95,000 | | | | Haier Electronics Group Co Ltd | | | 234 | |
| | 47,000 | | | | Hang Lung Group Ltd | | | 120 | |
COLLEGE RETIREMENT EQUITIES FUND -Global Equities Account
| SHARES | | | | COMPANY | | VALUE
(000) | |
| | 413,576 | | | | Hang Lung Properties Ltd | | $ | 786 | |
| | 104,372 | | | | Hang Seng Bank Ltd | | | 2,338 | |
| | 207,257 | | | | Henderson Land Development Co Ltd | | | 1,031 | |
| | 144,000 | | e | | HK Electric Investments & HK Electric Investments Ltd | | | 145 | |
| | 200,660 | | | | HKT Trust and HKT Ltd | | | 289 | |
| | 1,272,528 | | | | Hong Kong & China Gas Ltd | | | 2,629 | |
| | 183,988 | | | | Hong Kong Electric Holdings Ltd | | | 1,278 | |
| | 186,610 | | | | Hong Kong Exchanges and Clearing Ltd | | | 5,395 | |
| | 259,085 | | | | Hongkong Land Holdings Ltd | | | 1,633 | |
| | 4,760 | | | | Hopewell Highway Infrastructure Ltd | | | 2 | |
| | 93,760 | | | | Hysan Development Co Ltd | | | 446 | |
| | 11,600 | | | | Jardine Matheson Holdings Ltd | | | 808 | |
| | 11,400 | | | | Jardine Strategic Holdings Ltd | | | 418 | |
| | 120,026 | | | | Kerry Properties Ltd | | | 410 | |
| | 59,000 | | | | Kingboard Chemical Holdings Ltd | | | 157 | |
| | 97,500 | | | | Kingboard Laminates Holdings Ltd | | | 80 | |
| | 121,000 | | | | Lee & Man Paper Manufacturing Ltd | | | 102 | |
| | 199,026 | | | | Link REIT | | | 2,018 | |
| | 5,489,044 | | | | Melco Crown Entertainment Ltd (ADR) | | | 96,717 | |
| | 78,080 | | | | MTR Corp | | | 411 | |
| | 888,492 | | | | New World Development Co Ltd | | | 1,173 | |
| | 149,000 | | | | Nine Dragons Paper Holdings Ltd | | | 138 | |
| | 81,638 | | | | NWS Holdings Ltd | | | 168 | |
| | 222,262 | | | | PCCW Ltd | | | 128 | |
| | 5,405,992 | | | | Shangri-La Asia Ltd | | | 7,981 | |
| | 1,258,000 | | | | Sino Biopharmaceutical | | | 828 | |
| | 177,043 | | | | Sino Land Co | | | 303 | |
| | 104,611 | | | | SJM Holdings Ltd | | | 97 | |
| | 114,000 | | | | SSY Group Ltd | | | 85 | |
| | 178,000 | | | | Sun Art Retail Group Ltd | | | 181 | |
| | 199,968 | | | | Sun Hung Kai Properties Ltd | | | 2,854 | |
| | 26,628 | | | | Swire Pacific Ltd (Class A) | | | 281 | |
| | 423,016 | | | | Swire Properties Ltd | | | 1,486 | |
| | 72,902 | | | | Techtronic Industries Co | | | 387 | |
| | 90,000 | | | | Towngas China Co Ltd | | | 67 | |
| | 454,500 | | g | | WH Group Ltd | | | 349 | |
| | 171,053 | | | | Wharf Holdings Ltd | | | 446 | |
| | 163,053 | | | | Wharf Real Estate Investment Co Ltd | | | 975 | |
| | 46,334 | | | | Wheelock & Co Ltd | | | 265 | |
| | 44,912 | | | | Yue Yuen Industrial Holdings | | | 144 | |
| | | | | | TOTAL HONG KONG | | | 176,380 | |
| | | | | | | | | | |
| HUNGARY - 0.1% |
| | 1,093,044 | | | | MOL Hungarian Oil & Gas plc | | | 11,996 | |
| | 16,018 | | | | OTP Bank | | | 647 | |
| | 9,441 | | | | Richter Gedeon Rt | | | 183 | |
| | | | | | TOTAL HUNGARY | | | 12,826 | |
| | | | | | | | | | |
| INDIA - 1.1% |
| | 45,460 | | | | Ambuja Cements Ltd | | | 146 | |
| | 82,316 | | | | Ashok Leyland Ltd | | | 121 | |
| | 21,494 | | | | Asian Paints Ltd | | | 422 | |
| | 19,722 | | | | Aurobindo Pharma Ltd | | | 207 | |
COLLEGE RETIREMENT EQUITIES FUND -Global Equities Account
| SHARES | | | | COMPANY | | VALUE
(000) | |
| | 9,560 | | *,g | | Avenue Supermarts Ltd | | $ | 220 | |
| | 135,071 | | * | | Axis Bank Ltd | | | 1,198 | |
| | 14,072 | | | | Bajaj Finance Ltd | | | 533 | |
| | 2,850 | | | | Bajaj Finserv Ltd | | | 264 | |
| | 6,613 | | | | Bajaj Holdings and Investment Ltd | | | 257 | |
| | 14,255 | | | | Bharat Forge Ltd | | | 104 | |
| | 65,422 | | | | Bharat Petroleum Corp Ltd | | | 340 | |
| | 110,357 | | | | Bharti Airtel Ltd | | | 493 | |
| | 23,689 | | | | Bharti Infratel Ltd | | | 88 | |
| | 498 | | * | | Bosch Ltd | | | 140 | |
| | 4,673 | | | | Britannia Industries Ltd | | | 208 | |
| | 17,332 | | | | Cadila Healthcare Ltd | | | 86 | |
| | 26,087 | | * | | Cipla Ltd | | | 194 | |
| | 65,707 | | | | Coal India Ltd | | | 227 | |
| | 345,718 | | | | Container Corp Of India Ltd | | | 3,404 | |
| | 38,340 | | | | Dabur India Ltd | | | 236 | |
| | 5,948 | | | | Divi S Laboratories Ltd | | | 126 | |
| | 8,549 | | | | Dr Reddy’s Laboratories Ltd | | | 320 | |
| | 1,028 | | | | Eicher Motors Ltd | | | 341 | |
| | 63,751 | | * | | GAIL India Ltd | | | 329 | |
| | 9,395 | | | | Glenmark Pharmaceuticals Ltd | | | 93 | |
| | 25,832 | | | | Godrej Consumer Products Ltd | | | 300 | |
| | 24,259 | | * | | Grasim Industries Ltd | | | 287 | |
| | 18,725 | | * | | Havells India Ltd | | | 185 | |
| | 41,785 | | | | HCL Technologies Ltd | | | 577 | |
| | 662,363 | | | | HDFC Bank Ltd | | | 20,149 | |
| | 3,810 | | | | Hero Honda Motors Ltd | | | 169 | |
| | 87,120 | | | | Hindalco Industries Ltd | | | 282 | |
| | 50,205 | | | | Hindustan Lever Ltd | | | 1,308 | |
| | 58,024 | | | | Hindustan Petroleum Corp Ltd | | | 211 | |
| | 121,734 | | | | Housing Development Finance Corp | | | 3,430 | |
| | 435,836 | | | | ICICI Bank Ltd | | | 2,249 | |
| | 132,471 | | * | | Idea Cellular Ltd | | | 72 | |
| | 3,539,306 | | | | Indiabulls Housing Finance Ltd | | | 43,233 | |
| | 129,626 | | | | Indian Oil Corp Ltd | | | 255 | |
| | 642,107 | | | | Infosys Technologies Ltd | | | 6,067 | |
| | 6,135 | | g | | InterGlobe Aviation Ltd | | | 102 | |
| | 628,680 | | | | ITC Ltd | | | 2,535 | |
| | 64,053 | | | | JSW Steel Ltd | | | 281 | |
| | 35,560 | | | | Larsen & Toubro Ltd | | | 732 | |
| | 20,125 | | | | LIC Housing Finance Ltd | | | 141 | |
| | 18,207 | | * | | Lupin Ltd | | | 220 | |
| | 21,244 | | * | | Mahindra & Mahindra Financial Services Ltd | | | 144 | |
| | 55,257 | | | | Mahindra & Mahindra Ltd | | | 636 | |
| | 32,652 | | | | Marico Ltd | | | 175 | |
| | 19,054 | | | | Maruti Suzuki India Ltd | | | 2,036 | |
| | 65,425 | | * | | Motherson Sumi Systems Ltd | | | 156 | |
| | 38,527 | | * | | Mundra Port and Special Economic Zone Ltd | | | 214 | |
| | 1,731 | | | | Nestle India Ltd | | | 275 | |
| | 169,012 | | | | NTPC Ltd | | | 361 | |
| | 410 | | | | Page Industries Ltd | | | 148 | |
| | 59,231 | | | | Petronet LNG Ltd | | | 190 | |
| | 9,572 | | | | Pidilite Industries Ltd | | | 152 | |
| | 5,716 | | | | Piramal Healthcare Ltd | | | 195 | |
COLLEGE RETIREMENT EQUITIES FUND -Global Equities Account
| SHARES | | | | COMPANY | | VALUE
(000) | |
| | 133,424 | | | | Power Grid Corp of India Ltd | | $ | 379 | |
| | 202,943 | | * | | Puravankara Projects Ltd | | | 210 | |
| | 1,860,676 | | | | Reliance Industries Ltd | | | 29,862 | |
| | 45,443 | | | | Rural Electrification Corp Ltd | | | 79 | |
| | 97,106 | | | | Sesa Sterlite Ltd | | | 281 | |
| | 587 | | | | Shree Cement Ltd | | | 145 | |
| | 502,876 | | | | Shriram Transport Finance Co Ltd | | | 8,927 | |
| | 132,138 | | * | | State Bank of India | | | 560 | |
| | 64,015 | | | | Sun Pharmaceutical Industries Ltd | | | 394 | |
| | 851,610 | | * | | Tata Chemicals Ltd | | | 8,617 | |
| | 69,387 | | | | Tata Consultancy Services Ltd | | | 1,881 | |
| | 115,743 | | * | | Tata Motors Ltd | | | 285 | |
| | 76,900 | | | | Tata Power Co Ltd | | | 85 | |
| | 26,202 | | | | Tata Steel Ltd | | | 195 | |
| | 1,006,247 | | * | | Tech Mahindra Ltd | | | 10,421 | |
| | 23,775 | | | | Titan Industries Ltd | | | 317 | |
| | 7,134 | | * | | Ultra Tech Cement Ltd | | | 407 | |
| | 26,384 | | * | | United Phosphorus Ltd | | | 286 | |
| | 20,613 | | * | | United Spirits Ltd | | | 188 | |
| | 85,265 | | | | Wipro Ltd | | | 404 | |
| | 11,561,783 | | | | Yes Bank Ltd | | | 30,087 | |
| | 39,437 | | | | ZEE Telefilms Ltd | | | 269 | |
| | | | | | TOTAL INDIA | | | 191,843 | |
| | | | | | | | | | |
| INDONESIA - 0.1% |
| | 1,516,900 | | | | Adaro Energy Tbk | | | 128 | |
| | 10,234,800 | | | | Bank Rakyat Indonesia | | | 2,607 | |
| | 164,600 | | | | Indofood CBP Sukses Makmur Tbk | | | 120 | |
| | 102,800 | | | | Pabrik Kertas Tjiwi Kimia Tbk PT | | | 79 | |
| | 3,643,400 | | | | PT Astra International Tbk | | | 2,087 | |
| | 1,826,600 | | | | PT Bank Central Asia Tbk | | | 3,303 | |
| | 197,900 | | | | PT Bank Danamon Indonesia Tbk | | | 105 | |
| | 14,687,612 | | | | PT Bank Mandiri Persero Tbk | | | 7,534 | |
| | 549,400 | | | | PT Bank Negara Indonesia | | | 337 | |
| | 276,100 | | | | PT Bank Tabungan Negara Tbk | | | 49 | |
| | 414,900 | | * | | PT Bumi Serpong Damai | | | 36 | |
| | 565,500 | | | | PT Charoen Pokphand Indonesia Tbk | | | 284 | |
| | 35,800 | | | | PT Gudang Garam Tbk | | | 209 | |
| | 680,400 | | | | PT Hanjaya Mandala Sampoerna Tbk | | | 176 | |
| | 206,400 | | | | PT Indah Kiat Pulp and Paper Corp Tbk | | | 166 | |
| | 134,100 | | | | PT Indocement Tunggal Prakarsa Tbk | | | 172 | |
| | 301,200 | | | | PT Indofood Sukses Makmur Tbk | | | 156 | |
| | 191,100 | | | | PT Jasa Marga Tbk | | | 57 | |
| | 1,514,300 | | | | PT Kalbe Farma Tbk | | | 160 | |
| | 4,171,900 | | | | PT Matahari Department Store Tbk | | | 1,624 | |
| | 1,013,500 | | | | PT Pakuwon Jati Tbk | | | 44 | |
| | 761,400 | | | | PT Perusahaan Gas Negara Persero Tbk | | | 113 | |
| | 200,000 | | | | PT Semen Gresik Persero Tbk | | | 160 | |
| | 383,500 | | | | PT Surya Citra Media Tbk | | | 50 | |
| | 341,800 | | | | PT Tambang Batubara Bukit Asam Tbk | | | 102 | |
| | 9,220,400 | | | | PT Telekomunikasi Indonesia Persero Tbk | | | 2,411 | |
| | 113,000 | | | | PT Unilever Indonesia Tbk | | | 357 | |
| | 141,700 | | | | PT United Tractors Tbk | | | 270 | |
COLLEGE RETIREMENT EQUITIES FUND -Global Equities Account
| SHARES | | | | COMPANY | | VALUE
(000) | |
| | 126,500 | | | | Tower Bersama Infrastructure | | $ | 32 | |
| | | | | | TOTAL INDONESIA | | | 22,928 | |
| | | | | | | | | | |
| IRELAND - 0.4% |
| | 378,543 | | * | | AerCap Holdings NV | | | 14,990 | |
| | 328,569 | | | | AIB Group plc | | | 1,386 | |
| | 612,431 | | | | Bank of Ireland Group plc | | | 3,406 | |
| | 406,394 | | | | CRH plc | | | 10,764 | |
| | 2,302,262 | | | | Green REIT plc | | | 3,561 | |
| | 6,039,827 | | | | Hibernia REIT plc | | | 8,664 | |
| | 147,992 | | *,† | | Irish Bank Resolution Corp Ltd | | | 0 | |
| | 23,352 | | | | James Hardie Industries NV | | | 254 | |
| | 60,395 | | | | Kerry Group plc (Class A) | | | 5,981 | |
| | 577,276 | | | | Keywords Studios plc | | | 7,880 | |
| | 8,087 | | e | | Kingspan Group plc | | | 347 | |
| | 4,612 | | | | Paddy Power plc | | | 379 | |
| | 4,593 | | * | | Ryanair Holdings plc | | | 56 | |
| | 586 | | * | | Ryanair Holdings plc (ADR) | | | 42 | |
| | 589,510 | | | | Smurfit Kappa Group plc | | | 15,685 | |
| | | | | | TOTAL IRELAND | | | 73,395 | |
| | | | | | | | | | |
| ISRAEL - 0.1% |
| | 2,225 | | | | Azrieli Group | | | 107 | |
| | 154,344 | | | | Bank Hapoalim Ltd | | | 976 | |
| | 201,055 | | | | Bank Leumi Le-Israel | | | 1,215 | |
| | 115,811 | | | | Bezeq Israeli Telecommunication Corp Ltd | | | 113 | |
| | 6,627 | | * | | Check Point Software Technologies | | | 680 | |
| | 1,256 | | | | Elbit Systems Ltd | | | 144 | |
| | 37,276 | | | | Israel Chemicals Ltd | | | 212 | |
| | 24,280 | | | | Mizrahi Tefahot Bank Ltd | | | 410 | |
| | 3,188 | | * | | Nice Systems Ltd | | | 345 | |
| | 910,541 | | * | | Teva Pharmaceutical Industries Ltd (ADR) | | | 14,041 | |
| | 2,342 | | * | | Wix.com Ltd | | | 212 | |
| | | | | | TOTAL ISRAEL | | | 18,455 | |
| | | | | | | | | | |
| ITALY - 0.8% |
| | 7,569,859 | | | | A2A S.p.A. | | | 13,652 | |
| | 439,600 | | | | Amplifon S.p.A. | | | 7,098 | |
| | 61,054 | | | | Assicurazioni Generali S.p.A. | | | 1,020 | |
| | 25,740 | | | | Autostrade S.p.A. | | | 533 | |
| | 1,990,001 | | | | Banca Intesa S.p.A. | | | 4,431 | |
| | 231,956 | | | | Beni Stabili S.p.A. | | | 184 | |
| | 1,788,693 | | | | Davide Campari-Milano S.p.A | | | 15,147 | |
| | 1,142,887 | | | | Enel S.p.A. | | | 6,626 | |
| | 134,693 | | | | ENI S.p.A. | | | 2,128 | |
| | 142,041 | | e | | Ferrari NV | | | 14,134 | |
| | 22,934 | | | | Finmeccanica S.p.A. | | | 202 | |
| | 3,027,943 | | | | Iride S.p.A. | | | 7,272 | |
| | 440,507 | | | | Mediobanca S.p.A. | | | 3,727 | |
| | 553,991 | | | | Moncler S.p.A | | | 18,435 | |
| | 24,466 | | *,g | | Pirelli & C S.p.A | | | 157 | |
| | 27,408 | | g | | Poste Italiane S.p.A | | | 220 | |
| | 11,746,081 | | | | Prada S.p.A | | | 38,757 | |
COLLEGE RETIREMENT EQUITIES FUND -Global Equities Account
| SHARES | | | | COMPANY | | VALUE
(000) | |
| | 13,776 | | | | Prysmian S.p.A. | | $ | 268 | |
| | 5,368 | �� | | | Recordati S.p.A. | | | 186 | |
| | 122,060 | | | | Snam Rete Gas S.p.A. | | | 534 | |
| | 296,111 | | | | Telecom Italia RSP | | | 142 | |
| | 577,771 | | * | | Telecom Italia S.p.A. | | | 320 | |
| | 76,222 | | | | Terna Rete Elettrica Nazionale S.p.A. | | | 433 | |
| | 106,266 | | | | UniCredit S.p.A. | | | 1,204 | |
| | | | | | TOTAL ITALY | | | 136,810 | |
| | | | | | | | | | |
| JAPAN - 6.8% |
| | 1,810 | | | | ABC-Mart, Inc | | | 100 | |
| | 20,500 | | e | | Acom Co Ltd | | | 67 | |
| | 121 | | | | Activia Properties Inc | | | 492 | |
| | 32,146 | | | | Aeon Co Ltd | | | 628 | |
| | 5,652 | | | | AEON Financial Service Co Ltd | | | 100 | |
| | 5,497 | | | | Aeon Mall Co Ltd | | | 88 | |
| | 20,972 | | | | Air Water, Inc | | | 316 | |
| | 416,190 | | | | Aisin Seiki Co Ltd | | | 14,307 | |
| | 23,568 | | | | Ajinomoto Co, Inc | | | 419 | |
| | 30,705 | | | | Alfresa Holdings Corp | | | 783 | |
| | 10,150 | | | | All Nippon Airways Co Ltd | | | 364 | |
| | 10,932 | | | | Alps Electric Co Ltd | | | 212 | |
| | 17,944 | | | | Amada Co Ltd | | | 161 | |
| | 6,184 | | | | Aozora Bank Ltd | | | 184 | |
| | 18,951 | | | | Asahi Breweries Ltd | | | 734 | |
| | 290,201 | | e | | Asahi Glass Co Ltd | | | 9,020 | |
| | 5,200 | | | | Asahi Intecc Co Ltd | | | 220 | |
| | 176,425 | | | | Asahi Kasei Corp | | | 1,811 | |
| | 41,300 | | | | Ashikaga Holdings Co Ltd | | | 109 | |
| | 8,500 | | e | | Asics Corp | | | 108 | |
| | 400,500 | | | | Astellas Pharma, Inc | | | 5,117 | |
| | 62,821 | | | | Bank of Kyoto Ltd | | | 2,582 | |
| | 4,453 | | | | Benesse Holdings Inc | | | 113 | |
| | 230 | | | | BLife Investment Corp | | | 515 | |
| | 31,830 | | | | Bridgestone Corp | | | 1,221 | |
| | 11,985 | | | | Brother Industries Ltd | | | 177 | |
| | 4,700 | | | | Calbee, Inc | | | 147 | |
| | 52,677 | | e | | Canon, Inc | | | 1,449 | |
| | 10,733 | | e | | Casio Computer Co Ltd | | | 127 | |
| | 7,544 | | | | Central Japan Railway Co | | | 1,592 | |
| | 2,200 | | | | Century Leasing System, Inc | | | 97 | |
| | 32,462 | | | | Chiba Bank Ltd | | | 181 | |
| | 101,006 | | | | Chubu Electric Power Co, Inc | | | 1,435 | |
| | 69,569 | | | | Chugai Pharmaceutical Co Ltd | | | 4,035 | |
| | 14,966 | | | | Chugoku Electric Power Co, Inc | | | 194 | |
| | 7,500 | | | | Coca-Cola West Japan Co Ltd | | | 224 | |
| | 55,200 | | | | Concordia Financial Group Ltd | | | 211 | |
| | 8,268 | | | | Credit Saison Co Ltd | | | 97 | |
| | 5,200 | | | | CyberAgent, Inc | | | 201 | |
| | 12,438 | | | | Dai Nippon Printing Co Ltd | | | 260 | |
| | 14,446 | | | | Daicel Chemical Industries Ltd | | | 148 | |
| | 5,600 | | | | Daifuku Co Ltd | | | 254 | |
| | 1,219,011 | | | | Dai-ichi Mutual Life Insurance Co | | | 18,931 | |
COLLEGE RETIREMENT EQUITIES FUND -Global Equities Account
| SHARES | | | | COMPANY | | VALUE
(000) | |
| | 254,394 | | | | Daiichi Sankyo Co Ltd | | $ | 8,137 | |
| | 83,955 | | | | Daikin Industries Ltd | | | 8,921 | |
| | 8,649 | | | | Daito Trust Construction Co Ltd | | | 1,184 | |
| | 223,356 | | | | Daiwa House Industry Co Ltd | | | 7,125 | |
| | 84,280 | | | | Daiwa Securities Group, Inc | | | 428 | |
| | 5,900 | | | | Dena Co Ltd | | | 98 | |
| | 22,887 | | | | Denso Corp | | | 1,013 | |
| | 11,355 | | | | Dentsu, Inc | | | 507 | |
| | 1,500 | | | | Disco Corp | | | 174 | |
| | 6,233 | | | | Don Quijote Co Ltd | | | 385 | |
| | 117,097 | | | | East Japan Railway Co | | | 10,341 | |
| | 13,228 | | | | Eisai Co Ltd | | | 1,024 | |
| | 7,793 | | | | Electric Power Development Co | | | 185 | |
| | 169,500 | | | | en-japan, Inc | | | 5,247 | |
| | 3,444 | | e | | FamilyMart Co Ltd | | | 433 | |
| | 10,185 | | | | Fanuc Ltd | | | 1,546 | |
| | 3,083 | | | | Fast Retailing Co Ltd | | | 1,575 | |
| | 6,164 | | | | Fuji Electric Holdings Co Ltd | | | 182 | |
| | 31,839 | | | | Fuji Heavy Industries Ltd | | | 680 | |
| | 375,986 | | | | Fujifilm Holdings Corp | | | 14,575 | |
| | 316,399 | | | | Fujitsu Ltd | | | 19,723 | |
| | 8,246 | | | | Fukuoka Financial Group, Inc | | | 167 | |
| | 20 | | | | GLP J-Reit | | | 20 | |
| | 328,800 | | | | GMO Payment Gateway, Inc | | | 13,999 | |
| | 2,500 | | | | Growell Holdings Co Ltd | | | 113 | |
| | 12,600 | | | | Hakuhodo DY Holdings, Inc | | | 180 | |
| | 7,300 | | | | Hamamatsu Photonics KK | | | 245 | |
| | 12,093 | | | | Hankyu Hanshin Holdings, Inc | | | 402 | |
| | 1,032 | | | | Hikari Tsushin, Inc | | | 161 | |
| | 12,782 | | | | Hino Motors Ltd | | | 120 | |
| | 1,673 | | | | Hirose Electric Co Ltd | | | 164 | |
| | 9,375 | | | | Hisamitsu Pharmaceutical Co, Inc | | | 518 | |
| | 15,985 | | | | Hitachi Chemical Co Ltd | | | 240 | |
| | 5,733 | | | | Hitachi Construction Machinery Co Ltd | | | 134 | |
| | 3,300 | | | | Hitachi High-Technologies Corp | | | 103 | |
| | 1,283,658 | | | | Hitachi Ltd | | | 34,030 | |
| | 29,385 | | | | Hitachi Metals Ltd | | | 306 | |
| | 85,796 | | | | Honda Motor Co Ltd | | | 2,260 | |
| | 2,812 | | | | Hoshizaki Electric Co Ltd | | | 171 | |
| | 19,927 | | | | Hoya Corp | | | 1,202 | |
| | 79,528 | | | | Hulic Co Ltd | | | 711 | |
| | 19,029 | | | | Idemitsu Kosan Co Ltd | | | 619 | |
| | 7,629 | | | | Iida Group Holdings Co Ltd | | | 132 | |
| | 4,329,600 | | | | Infomart Corp | | | 39,525 | |
| | 135,683 | | | | Inpex Holdings, Inc | | | 1,202 | |
| | 12,949 | | h | | Invincible Investment Corp | | | 5,341 | |
| | 18,081 | | | | Isetan Mitsukoshi Holdings Ltd | | | 200 | |
| | 603,922 | | | | Ishikawajima-Harima Heavy Industries Co Ltd | | | 16,633 | |
| | 28,500 | | | | Isuzu Motors Ltd | | | 400 | |
| | 73,869 | | | | Itochu Corp | | | 1,254 | |
| | 11,995 | | | | J Front Retailing Co Ltd | | | 137 | |
| | 6,324 | | | | Japan Airlines Co Ltd | | | 224 | |
| | 2,503 | | | | Japan Airport Terminal Co Ltd | | | 87 | |
COLLEGE RETIREMENT EQUITIES FUND -Global Equities Account
| SHARES | | | | COMPANY | | VALUE
(000) | |
| | 4,800 | | h | | Japan Hotel REIT Investment Corp | | $ | 3,426 | |
| | 22,046 | | | | Japan Post Bank Co Ltd | | | 243 | |
| | 83,140 | | | | Japan Post Holdings Co Ltd | | | 960 | |
| | 46 | | | | Japan Prime Realty Investment Corp | | | 175 | |
| | 70 | | | | Japan Real Estate Investment Corp | | | 393 | |
| | 1,036 | | | | Japan Retail Fund Investment Corp | | | 2,067 | |
| | 147,863 | | | | Japan Tobacco, Inc | | | 3,513 | |
| | 70,523 | | | | JFE Holdings, Inc | | | 1,123 | |
| | 10,978 | | | | JGC Corp | | | 154 | |
| | 27,258 | | | | JSR Corp | | | 409 | |
| | 579,903 | | | | JTEKT Corp | | | 6,414 | |
| | 2,267,188 | | | | JX Holdings, Inc | | | 11,775 | |
| | 23,386 | | | | Kajima Corp | | | 314 | |
| | 7,334 | | | | Kakaku.com, Inc | | | 130 | |
| | 5,585 | | | | Kamigumi Co Ltd | | | 114 | |
| | 7,325 | | | | Kaneka Corp | | | 262 | |
| | 169,835 | | | | Kansai Electric Power Co, Inc | | | 2,547 | |
| | 27,414 | | | | Kansai Paint Co Ltd | | | 527 | |
| | 69,785 | | | | Kao Corp | | | 5,165 | |
| | 8,051 | | | | Kawasaki Heavy Industries Ltd | | | 172 | |
| | 93,297 | | | | KDDI Corp | | | 2,229 | |
| | 5,000 | | | | Keihan Electric Railway Co Ltd | | | 204 | |
| | 11,660 | | | | Keihin Electric Express Railway Co Ltd | | | 191 | |
| | 5,523 | | | | Keio Corp | | | 321 | |
| | 6,713 | | | | Keisei Electric Railway Co Ltd | | | 210 | |
| | 28 | | | | Kenedix Realty Investment Corp | | | 179 | |
| | 225,300 | | | | Kenedix, Inc | | | 966 | |
| | 5,138 | | | | Keyence Corp | | | 2,597 | |
| | 7,695 | | | | Kikkoman Corp | | | 412 | |
| | 8,949 | | | | Kintetsu Corp | | | 389 | |
| | 42,949 | | | | Kirin Brewery Co Ltd | | | 896 | |
| | 2,500 | | | | Kobayashi Pharmaceutical Co Ltd | | | 170 | |
| | 46,201 | | | | Kobe Steel Ltd | | | 320 | |
| | 5,500 | | | | Koito Manufacturing Co Ltd | | | 284 | |
| | 48,550 | | | | Komatsu Ltd | | | 1,043 | |
| | 4,986 | | | | Konami Corp | | | 219 | |
| | 970,320 | | | | Konica Minolta Holdings, Inc | | | 8,734 | |
| | 1,628 | | | | Kose Corp | | | 256 | |
| | 629,298 | | | | Kubota Corp | | | 8,945 | |
| | 48,074 | | | | Kuraray Co Ltd | | | 676 | |
| | 5,177 | | | | Kurita Water Industries Ltd | | | 125 | |
| | 16,900 | | | | Kyocera Corp | | | 845 | |
| | 25,089 | | | | Kyowa Hakko Kogyo Co Ltd | | | 474 | |
| | 39,677 | | | | Kyushu Electric Power Co, Inc | | | 472 | |
| | 8,300 | | | | Kyushu Railway Co | | | 281 | |
| | 2,680 | | | | Lawson, Inc | | | 170 | |
| | 4,100 | | *,e | | LINE Corp | | | 140 | |
| | 11,600 | | | | Lion Corp | | | 240 | |
| | 14,664 | | | | LIXIL Group Corp | | | 182 | |
| | 22,076 | | | | M3, Inc | | | 297 | |
| | 11,488 | | | | Makita Corp | | | 408 | |
| | 1,212,265 | | | | Marubeni Corp | | | 8,506 | |
| | 10,209 | | | | Marui Co Ltd | | | 198 | |
COLLEGE RETIREMENT EQUITIES FUND -Global Equities Account
| SHARES | | | | COMPANY | | VALUE
(000) | |
| | 7,796 | | | | Maruichi Steel Tube Ltd | | $ | 245 | |
| | 30,315 | | | | Mazda Motor Corp | | | 312 | |
| | 3,800 | | e | | McDonald’s Holdings Co Japan Ltd | | | 161 | |
| | 8,659 | | | | Mediceo Paltac Holdings Co Ltd | | | 185 | |
| | 208,100 | | e | | Megachips Corp | | | 4,399 | |
| | 6,508 | | | | MEIJI Holdings Co Ltd | | | 530 | |
| | 19,800 | | | | Minebea Co Ltd | | | 286 | |
| | 5,500 | | | | Miraca Holdings, Inc | | | 124 | |
| | 15,400 | | | | MISUMI Group, Inc | | | 324 | |
| | 189,262 | | | | Mitsubishi Chemical Holdings Corp | | | 1,430 | |
| | 71,122 | | | | Mitsubishi Corp | | | 1,950 | |
| | 96,014 | | | | Mitsubishi Electric Corp | | | 1,059 | |
| | 93,596 | | | | Mitsubishi Estate Co Ltd | | | 1,473 | |
| | 24,580 | | | | Mitsubishi Gas Chemical Co, Inc | | | 368 | |
| | 262,012 | | | | Mitsubishi Heavy Industries Ltd | | | 9,402 | |
| | 319,011 | | | | Mitsubishi Materials Corp | | | 8,406 | |
| | 34,808 | | | | Mitsubishi Motors Corp | | | 190 | |
| | 9,627,462 | | | | Mitsubishi UFJ Financial Group, Inc | | | 47,248 | |
| | 21,700 | | | | Mitsubishi UFJ Lease & Finance Co Ltd | | | 104 | |
| | 85,982 | | | | Mitsui & Co Ltd | | | 1,321 | |
| | 26,628 | | | | Mitsui Chemicals, Inc | | | 601 | |
| | 124,706 | | | | Mitsui Fudosan Co Ltd | | | 2,770 | |
| | 6,049 | | | | Mitsui OSK Lines Ltd | | | 131 | |
| | 24,542 | | | | Mitsui Sumitomo Insurance Group Holdings, Inc | | | 698 | |
| | 17,018 | | | | Mitsui Trust Holdings, Inc | | | 620 | |
| | 1,269,056 | | | | Mizuho Financial Group, Inc | | | 1,964 | |
| | 1,005,800 | | e | | MonotaRO Co Ltd | | | 24,794 | |
| | 117 | | | | Mori Hills REIT Investment Corp | | | 147 | |
| | 183,035 | | | | Murata Manufacturing Co Ltd | | | 24,664 | |
| | 6,039 | | e | | Nabtesco Corp | | | 131 | |
| | 9,400 | | | | Nagoya Railroad Co Ltd | | | 248 | |
| | 10,606 | | | | Namco Bandai Holdings, Inc | | | 476 | |
| | 13,561 | | | | NEC Corp | | | 403 | |
| | 23,700 | | * | | Nexon Co Ltd | | | 306 | |
| | 13,824 | | | | NGK Insulators Ltd | | | 187 | |
| | 8,248 | | | | NGK Spark Plug Co Ltd | | | 163 | |
| | 11,817 | | | | Nidec Corp | | | 1,337 | |
| | 16,781 | | | | Nikon Corp | | | 250 | |
| | 224,503 | | | | Nintendo Co Ltd | | | 59,614 | |
| | 68 | | | | Nippon Building Fund, Inc | | | 428 | |
| | 4,462 | | | | Nippon Electric Glass Co Ltd | | | 109 | |
| | 4,144 | | | | Nippon Express Co Ltd | | | 230 | |
| | 4,972 | | | | Nippon Meat Packers, Inc | | | 187 | |
| | 21,926 | | e | | Nippon Paint Co Ltd | | | 747 | |
| | 92 | | | | Nippon ProLogis REIT, Inc | | | 194 | |
| | 450 | | h | | NIPPON REIT Investment Corp | | | 1,493 | |
| | 109,101 | | | | Nippon Steel Corp | | | 1,874 | |
| | 709,392 | | | | Nippon Telegraph & Telephone Corp | | | 28,943 | |
| | 8,276 | | | | Nippon Yusen Kabushiki Kaisha | | | 127 | |
| | 17,139 | | | | Nissan Chemical Industries Ltd | | | 894 | |
| | 1,447,027 | | | | Nissan Motor Co Ltd | | | 11,575 | |
| | 10,631 | | | | Nisshin Seifun Group, Inc | | | 219 | |
| | 3,245 | | | | Nissin Food Products Co Ltd | | | 203 | |
COLLEGE RETIREMENT EQUITIES FUND -Global Equities Account
| SHARES | | | | COMPANY | | VALUE
(000) | |
| | 4,313 | | | | Nitori Co Ltd | | $ | 540 | |
| | 22,737 | | | | Nitto Denko Corp | | | 1,140 | |
| | 17,538 | | | | NKSJ Holdings, Inc | | | 596 | |
| | 2,808,180 | | | | Nomura Holdings, Inc | | | 10,642 | |
| | 7,274 | | | | Nomura Real Estate Holdings, Inc | | | 133 | |
| | 525 | | | | Nomura Real Estate Master Fund, Inc | | | 691 | |
| | 5,900 | | | | Nomura Research Institute Ltd | | | 219 | |
| | 19,435 | | | | NSK Ltd | | | 167 | |
| | 32,600 | | | | NTT Data Corp | | | 356 | |
| | 230,286 | | | | NTT DoCoMo, Inc | | | 5,174 | |
| | 33,496 | | | | Obayashi Corp | | | 303 | |
| | 3,400 | | | | Obic Co Ltd | | | 262 | |
| | 14,846 | | | | Odakyu Electric Railway Co Ltd | | | 326 | |
| | 118,194 | | | | OJI Paper Co Ltd | | | 604 | |
| | 745,643 | | | | Olympus Corp | | | 22,805 | |
| | 116,544 | | | | Omron Corp | | | 4,225 | |
| | 20,068 | | | | Ono Pharmaceutical Co Ltd | | | 410 | |
| | 1,903 | | | | Oracle Corp Japan | | | 121 | |
| | 10,531 | | | | Oriental Land Co Ltd | | | 1,059 | |
| | 2,253,618 | | | | ORIX Corp | | | 32,930 | |
| | 216 | | | | Orix JREIT, Inc | | | 359 | |
| | 474,021 | | | | Osaka Gas Co Ltd | | | 8,647 | |
| | 26,022 | | | | Osaka Securities Exchange Co Ltd | | | 420 | |
| | 5,222 | | | | Otsuka Corp | | | 144 | |
| | 20,600 | | | | Otsuka Holdings KK | | | 842 | |
| | 311,100 | | | | Paltac Corp | | | 14,672 | |
| | 311,955 | | | | Panasonic Corp | | | 2,802 | |
| | 6,700 | | | | Park24 Co Ltd | | | 148 | |
| | 6,100 | | | | Pigeon Corp | | | 260 | |
| | 5,010 | | | | Pola Orbis Holdings, Inc | | | 135 | |
| | 45,200 | | e | | Rakuten, Inc | | | 303 | |
| | 237,953 | | | | Recruit Holdings Co Ltd | | | 5,749 | |
| | 44,700 | | * | | Renesas Electronics Corp | | | 203 | |
| | 108,342 | | | | Resona Holdings, Inc | | | 520 | |
| | 34,582 | | | | Ricoh Co Ltd | | | 338 | |
| | 1,712 | | | | Rinnai Corp | | | 113 | |
| | 36,935 | | | | Rohm Co Ltd | | | 2,357 | |
| | 1,244 | | | | Ryohin Keikaku Co Ltd | | | 302 | |
| | 2,380 | | | | Sankyo Co Ltd | | | 91 | |
| | 54,953 | | | | Santen Pharmaceutical Co Ltd | | | 793 | |
| | 12,091 | | | | SBI Holdings, Inc | | | 236 | |
| | 10,867 | | | | Secom Co Ltd | | | 901 | |
| | 9,552 | | | | Sega Sammy Holdings, Inc | | | 133 | |
| | 12,200 | | | | Seibu Holdings, Inc | | | 212 | |
| | 14,900 | | | | Seiko Epson Corp | | | 208 | |
| | 756,900 | | | | Seino Holdings Corp | | | 9,910 | |
| | 19,395 | | | | Sekisui Chemical Co Ltd | | | 288 | |
| | 88,220 | | | | Sekisui House Ltd | | | 1,296 | |
| | 214,300 | | | | Seria Co Ltd | | | 7,288 | |
| | 39,686 | | | | Seven & I Holdings Co Ltd | | | 1,725 | |
| | 34,600 | | | | Seven Bank Ltd | | | 99 | |
| | 4,900 | | | | SG Holdings Co Ltd | | | 127 | |
| | 11,399 | | | | Sharp Corp | | | 114 | |
COLLEGE RETIREMENT EQUITIES FUND -Global Equities Account
| SHARES | | | | COMPANY | | VALUE
(000) | |
| | 186,399 | | * | | SHIFT, Inc | | $ | 6,119 | |
| | 12,047 | | | | Shimadzu Corp | | | 238 | |
| | 1,227 | | | | Shimamura Co Ltd | | | 94 | |
| | 3,792 | | | | Shimano, Inc | | | 535 | |
| | 28,162 | | | | Shimizu Corp | | | 229 | |
| | 58,100 | | | | Shin-Etsu Chemical Co Ltd | | | 4,464 | |
| | 8,077 | | | | Shinsei Bank Ltd | | | 96 | |
| | 14,490 | | | | Shionogi & Co Ltd | | | 827 | |
| | 19,993 | | | | Shiseido Co Ltd | | | 1,252 | |
| | 23,201 | | | | Shizuoka Bank Ltd | | | 181 | |
| | 7,000 | | e | | Showa Denko KK | | | 208 | |
| | 26,622 | | | | Showa Shell Sekiyu KK | | | 369 | |
| | 2,963 | | | | SMC Corp | | | 892 | |
| | 525,000 | | | | SMS Co Ltd | | | 8,312 | |
| | 278,466 | | | | Softbank Corp | | | 18,239 | |
| | 3,700 | | | | Sohgo Security Services Co Ltd | | | 173 | |
| | 4,541,900 | | | | Sojitz Holdings Corp | | | 15,727 | |
| | 2,917,904 | | | | Sony Corp | | | 140,671 | |
| | 109,328 | | | | Sony Financial Holdings, Inc | | | 2,037 | |
| | 7,014 | | | | Stanley Electric Co Ltd | | | 196 | |
| | 672 | | e | | Star Asia Investment Corp | | | 643 | |
| | 11,000 | | | | Start Today Co Ltd | | | 202 | |
| | 13,535 | | e | | Sumco Corp | | | 151 | |
| | 217,983 | | | | Sumitomo Chemical Co Ltd | | | 1,056 | |
| | 58,965 | | | | Sumitomo Corp | | | 837 | |
| | 8,263 | | | | Sumitomo Dainippon Pharma Co Ltd | | | 264 | |
| | 788,647 | | | | Sumitomo Electric Industries Ltd | | | 10,444 | |
| | 465,525 | | | | Sumitomo Heavy Industries Ltd | | | 13,803 | |
| | 34,415 | | | | Sumitomo Metal Mining Co Ltd | | | 922 | |
| | 1,575,591 | | | | Sumitomo Mitsui Financial Group, Inc | | | 51,939 | |
| | 53,716 | | | | Sumitomo Realty & Development Co Ltd | | | 1,966 | |
| | 10,363 | | | | Sumitomo Rubber Industries, Inc | | | 122 | |
| | 3,900 | | | | Sundrug Co Ltd | | | 116 | |
| | 7,200 | | | | Suntory Beverage & Food Ltd | | | 325 | |
| | 3,907 | | | | Suzuken Co Ltd | | | 199 | |
| | 18,134 | | | | Suzuki Motor Corp | | | 914 | |
| | 8,871 | | | | Sysmex Corp | | | 421 | |
| | 29,595 | | | | T&D Holdings, Inc | | | 342 | |
| | 6,800 | | | | Taiheiyo Cement Corp | | | 209 | |
| | 11,093 | | | | Taisei Corp | | | 475 | |
| | 5,556 | | | | Taisho Pharmaceutical Holdings Co Ltd | | | 558 | |
| | 17,467 | | | | Taiyo Nippon Sanso Corp | | | 284 | |
| | 7,058 | | | | Takashimaya Co Ltd | | | 90 | |
| | 327,511 | | e | | Takeda Pharmaceutical Co Ltd | | | 11,101 | |
| | 12,694 | | | | Tanabe Seiyaku Co Ltd | | | 183 | |
| | 6,756 | | | | TDK Corp | | | 473 | |
| | 222,600 | | | | TechnoPro Holdings, Inc | | | 9,145 | |
| | 25,786 | | | | Teijin Ltd | | | 412 | |
| | 9,202 | | | | Temp Holdings Co Ltd | | | 136 | |
| | 15,946 | | | | Terumo Corp | | | 899 | |
| | 7,094 | | | | THK Co Ltd | | | 133 | |
| | 10,134 | | | | Tobu Railway Co Ltd | | | 274 | |
| | 5,875 | | | | Toho Co Ltd | | | 213 | |
COLLEGE RETIREMENT EQUITIES FUND -Global Equities Account
| SHARES | | | | COMPANY | | VALUE
(000) | |
| | 4,100 | | | | Toho Gas Co Ltd | | $ | 172 | |
| | 22,913 | | | | Tohoku Electric Power Co, Inc | | | 302 | |
| | 650,000 | | e | | Tokai Carbon Co Ltd | | | 7,375 | |
| | 459,564 | | | | Tokio Marine Holdings, Inc | | | 21,833 | |
| | 616,800 | | *,e | | Tokyo Base Co Ltd | | | 2,988 | |
| | 213,125 | | * | | Tokyo Electric Power Co, Inc | | | 1,266 | |
| | 8,216 | | | | Tokyo Electron Ltd | | | 925 | |
| | 92,232 | | | | Tokyo Gas Co Ltd | | | 2,333 | |
| | 32,900 | | | | Tokyo Tatemono Co Ltd | | | 341 | |
| | 26,029 | | | | Tokyu Corp | | | 425 | |
| | 33,800 | | | | Tokyu Fudosan Holdings Corp | | | 167 | |
| | 13,067 | | | | Toppan Printing Co Ltd | | | 192 | |
| | 199,245 | | | | Toray Industries, Inc | | | 1,409 | |
| | 34,255 | | * | | Toshiba Corp | | | 967 | |
| | 892,220 | | | | Tosoh Corp | | | 11,573 | |
| | 7,542 | | | | Toto Ltd | | | 261 | |
| | 22,339 | | | | Toyo Seikan Kaisha Ltd | | | 511 | |
| | 4,699 | | | | Toyo Suisan Kaisha Ltd | | | 164 | |
| | 3,397 | | | | Toyoda Gosei Co Ltd | | | 67 | |
| | 196,993 | | | | Toyota Industries Corp | | | 9,071 | |
| | 1,823,953 | | | | Toyota Motor Corp | | | 105,582 | |
| | 11,294 | | | | Toyota Tsusho Corp | | | 332 | |
| | 6,028 | | | | Trend Micro, Inc | | | 326 | |
| | 2,000 | | | | Tsuruha Holdings, Inc | | | 171 | |
| | 20,707 | | | | Uni-Charm Corp | | | 670 | |
| | 350 | | | | United Urban Investment Corp | | | 542 | |
| | 11,430 | | | | USS Co Ltd | | | 192 | |
| | 53,307 | | | | West Japan Railway Co | | | 3,766 | |
| | 146,538 | | | | Yahoo! Japan Corp | | | 365 | |
| | 6,204 | | | | Yakult Honsha Co Ltd | | | 434 | |
| | 31,931 | | | | Yamada Denki Co Ltd | | | 153 | |
| | 11,406 | | | | Yamaguchi Financial Group, Inc | | | 109 | |
| | 6,908 | | | | Yamaha Corp | | | 294 | |
| | 14,591 | | e | | Yamaha Motor Co Ltd | | | 285 | |
| | 16,155 | | e | | Yamato Transport Co Ltd | | | 443 | |
| | 6,553 | | | | Yamazaki Baking Co Ltd | | | 137 | |
| | 12,424 | | | | Yaskawa Electric Corp | | | 304 | |
| | 11,710 | | | | Yokogawa Electric Corp | | | 202 | |
| | 6,600 | | e | | Yokohama Rubber Co Ltd | | | 123 | |
| | 519,500 | | e | | Yume No Machi Souzou Iinkai Co Ltd | | | 6,046 | |
| | | | | | TOTAL JAPAN | | | 1,239,086 | |
| | | | | | | | | | |
| JERSEY, C.I. - 0.0% |
| | 9,022 | | | | Randgold Resources Ltd | | | 749 | |
| | | | | | TOTAL JERSEY, C.I. | | | 749 | |
| | | | | | | | | | |
| KAZAKHSTAN - 0.0% |
| | 1,077,100 | | | | KAZ Minerals plc | | | 7,328 | |
| | | | | | TOTAL KAZAKHSTAN | | | 7,328 | |
| | | | | | | | | | |
| KOREA, REPUBLIC OF - 0.9% |
| | 6,010 | | | | Amorepacific Corp | | | 1,131 | |
| | 801 | | | | Amorepacific Corp (Preference) | | | 74 | |
COLLEGE RETIREMENT EQUITIES FUND -Global Equities Account
| SHARES | | | | COMPANY | | VALUE
(000) | |
| | 552 | | | | BGF retail Co Ltd | | $ | 101 | |
| | 21,384 | | | | BS Financial Group, Inc | | | 140 | |
| | 3,952 | | * | | Celltrion Healthcare Co Ltd | | | 268 | |
| | 1,080 | | * | | Celltrion Pharm Inc | | | 62 | |
| | 15,129 | | * | | Celltrion, Inc | | | 3,039 | |
| | 4,783 | | | | Cheil Communications, Inc | | | 96 | |
| | 13,916 | | | | Cheil Industries, Inc | | | 1,317 | |
| | 616 | | | | CJ CheilJedang Corp | | | 183 | |
| | 1,093 | | | | CJ Corp | | | 119 | |
| | 163 | | * | | CJ Corp | | | 5 | |
| | 793 | | | | CJ O Shopping Co Ltd | | | 144 | |
| | 2,074 | | | | Daelim Industrial Co | | | 191 | |
| | 11,292 | | * | | Daewoo Engineering & Construction Co Ltd | | | 55 | |
| | 3,257 | | | | Daewoo International Corp | | | 53 | |
| | 27,963 | | | | Daewoo Securities Co Ltd | | | 164 | |
| | 2,750 | | * | | Daewoo Shipbuilding & Marine Engineering Co Ltd | | | 84 | |
| | 11,210 | | | | DGB Financial Group Co Ltd | | | 83 | |
| | 3,703 | | | | Dongbu Insurance Co Ltd | | | 233 | |
| | 3,144 | | | | Doosan Bobcat, Inc | | | 89 | |
| | 975,441 | | * | | Doosan Infracore Co Ltd | | | 6,646 | |
| | 3,812 | | | | E-Mart Co Ltd | | | 623 | |
| | 3,921 | | | | Fila Korea Ltd | | | 189 | |
| | 1,643 | | | | GLOVIS Co Ltd | | | 190 | |
| | 4,670 | | | | GS Engineering & Construction Corp | | | 183 | |
| | 4,776 | | | | GS Holdings Corp | | | 221 | |
| | 1,935 | | | | GS Retail Co Ltd | | | 70 | |
| | 53,398 | | | | Hana Financial Group, Inc | | | 1,737 | |
| | 5,779 | | | | Hankook Tire Co Ltd | | | 208 | |
| | 449 | | | | Hanmi Pharm Co Ltd | | | 187 | |
| | 897 | | | | Hanmi Science Co Ltd | | | 64 | |
| | 12,913 | | | | Hanon Systems | | | 125 | |
| | 9,135 | | | | Hanwha Chemical Corp | | | 166 | |
| | 2,713 | | | | Hanwha Corp | | | 76 | |
| | 1,914 | | * | | HDC Hyundai Development Co-Engineering & Construction | | | 83 | |
| | 2,427 | | * | | HLB, Inc | | | 175 | |
| | 3,050 | | | | Honam Petrochemical Corp | | | 758 | |
| | 2,294 | | | | Hotel Shilla Co Ltd | | | 157 | |
| | 106,909 | | | | Hynix Semiconductor, Inc | | | 5,828 | |
| | 990 | | | | Hyundai Department Store Co Ltd | | | 80 | |
| | 14,164 | | | | Hyundai Engineering & Construction Co Ltd | | | 694 | |
| | 6,656 | | | | Hyundai Heavy Industries | | | 768 | |
| | 4,620 | | | | Hyundai Marine & Fire Insurance Co Ltd | | | 170 | |
| | 12,391 | | | | Hyundai Mobis | | | 2,114 | |
| | 26,614 | | | | Hyundai Motor Co | | | 2,825 | |
| | 2,994 | | | | Hyundai Motor Co Ltd (2nd Preference) | | | 207 | |
| | 2,034 | | | | Hyundai Motor Co Ltd (Preference) | | | 128 | |
| | 722 | | * | | Hyundai Robotics Co Ltd | | | 224 | |
| | 14,635 | | | | Hyundai Steel Co | | | 595 | |
| | 18,534 | | | | Industrial Bank of Korea | | | 233 | |
| | 248,250 | | g | | ING Life Insurance Korea Ltd | | | 6,228 | |
| | 8,372 | | | | Kakao Corp | | | 773 | |
| | 8,781 | | | | Kangwon Land, Inc | | | 251 | |
COLLEGE RETIREMENT EQUITIES FUND -Global Equities Account
| SHARES | | | | COMPANY | | VALUE
(000) | |
| | 376,497 | | | | KB Financial Group, Inc | | $ | 15,706 | |
| | 442 | | | | KCC Corp | | | 122 | |
| | 47,346 | | | | Kia Motors Corp | | | 1,427 | |
| | 5,650 | | * | | Korea Aerospace Industries Ltd | | | 162 | |
| | 48,042 | | | | Korea Electric Power Corp | | | 1,423 | |
| | 565 | | * | | Korea Express Co Ltd | | | 84 | |
| | 2,068 | | * | | Korea Gas Corp | | | 89 | |
| | 2,928 | | | | Korea Investment Holdings Co Ltd | | | 157 | |
| | 1,365 | | | | Korea Kumho Petrochemical | | | 107 | |
| | 26,065 | | | | Korea Life Insurance Co Ltd | | | 99 | |
| | 741 | | | | Korea Zinc Co Ltd | | | 287 | |
| | 3,030 | | | | Korean Air Lines Co Ltd | | | 90 | |
| | 3,956 | | | | KT Corp | | | 105 | |
| | 21,515 | | | | KT&G Corp | | | 1,959 | |
| | 8,458 | | | | LG Chem Ltd | | | 2,637 | |
| | 659 | | | | LG Chem Ltd (Preference) | | | 116 | |
| | 17,247 | | | | LG Corp | | | 1,080 | |
| | 19,233 | | | | LG Electronics, Inc | | | 1,078 | |
| | 1,723 | | | | LG Household & Health Care Ltd | | | 1,703 | |
| | 174 | | | | LG Household & Health Care Ltd (Preference) | | | 102 | |
| | 1,006 | | | | LG Innotek Co Ltd | | | 78 | |
| | 8,268 | | | | LG Telecom Ltd | | | 131 | |
| | 41,758 | | | | LG.Philips LCD Co Ltd | | | 678 | |
| | 2,553 | | * | | Lotte Corp | | | 121 | |
| | 789 | | | | Lotte Shopping Co Ltd | | | 149 | |
| | 304 | | | | Medy-Tox, Inc | | | 158 | |
| | 25,741 | | | | Naver Corp | | | 2,821 | |
| | 1,389 | | | | NCsoft | | | 582 | |
| | 1,904 | | g | | Netmarble Corp | | | 190 | |
| | 1,343 | | | | OCI Co Ltd | | | 129 | |
| | 1,544 | | | | Orion Corp/Republic of Korea | | | 166 | |
| | 86 | | | | Ottogi Corp | | | 56 | |
| | 5,235 | | | | Pacific Corp | | | 342 | |
| | 408 | | * | | Pearl Abyss Corp | | | 76 | |
| | 13,994 | | | | POSCO | | | 3,061 | |
| | 1,769 | | | | POSCO Refractories & Environment Co Ltd | | | 101 | |
| | 1,306 | | | | S1 Corp (Korea) | | | 117 | |
| | 3,051 | | *,g | | Samsung Biologics Co Ltd | | | 1,061 | |
| | 2,370 | | | | Samsung Card Co | | | 73 | |
| | 90,060 | | e | | Samsung Electro-Mechanics Co Ltd | | | 8,396 | |
| | 962,745 | | | | Samsung Electronics Co Ltd | | | 33,515 | |
| | 157,813 | | | | Samsung Electronics Co Ltd (Preference) | | | 4,509 | |
| | 11,412 | | * | | Samsung Engineering Co Ltd | | | 180 | |
| | 5,574 | | | | Samsung Fire & Marine Insurance Co Ltd | | | 1,340 | |
| | 32,585 | | | | Samsung Heavy Industries Co Ltd | | | 217 | |
| | 12,860 | | | | Samsung Life Insurance Co Ltd | | | 941 | |
| | 69,717 | | | | Samsung SDI Co Ltd | | | 13,703 | |
| | 6,265 | | | | Samsung SDS Co Ltd | | | 1,147 | |
| | 4,431 | | | | Samsung Securities Co Ltd | | | 125 | |
| | 76,958 | | | | Shinhan Financial Group Co Ltd | | | 2,729 | |
| | 544 | | | | Shinsegae Co Ltd | | | 125 | |
| | 4,398 | | * | | SillaJen, Inc | | | 291 | |
| | 44,686 | | | | SK C&C Co Ltd | | | 10,427 | |
COLLEGE RETIREMENT EQUITIES FUND -Global Equities Account
| SHARES | | | | COMPANY | | VALUE
(000) | |
| | 12,614 | | | | SK Energy Co Ltd | | $ | 2,025 | |
| | 3,752 | | | | SK Telecom Co Ltd | | | 905 | |
| | 3,804 | | | | S-Oil Corp | | | 332 | |
| | 16,830 | | * | | STX Pan Ocean Co Ltd | | | 67 | |
| | 946 | | * | | ViroMed Co Ltd | | | 217 | |
| | 3,688 | | | | Woongjin Coway Co Ltd | | | 245 | |
| | 84,196 | | | | Woori Bank | | | 1,177 | |
| | 9,742 | | | | Woori Investment & Securities Co Ltd | | | 114 | |
| | 627 | | | | Yuhan Corp | | | 115 | |
| | | | | | TOTAL KOREA, REPUBLIC OF | | | 162,072 | |
| | | | | | | | | | |
| LUXEMBOURG - 0.0% |
| | 34,493 | | | | ArcelorMittal | | | 714 | |
| | 605 | | | | Eurofins Scientific | | | 226 | |
| | 3,411 | | * | | Millicom International Cellular S.A. | | | 216 | |
| | 10,341 | | | | Reinet Investments S.C.A | | | 157 | |
| | 2,004 | | | | RTL Group | | | 107 | |
| | 19,596 | | | | SES Global S.A. | | | 375 | |
| | 25,439 | | | | Tenaris S.A. | | | 274 | |
| | | | | | TOTAL LUXEMBOURG | | | 2,069 | |
| | | | | | | | | | |
| MACAU - 0.1% |
| | 125,803 | | | | Galaxy Entertainment Group Ltd | | | 795 | |
| | 3,007,792 | | e | | MGM China Holdings Ltd | | | 5,021 | |
| | 124,333 | | | | Sands China Ltd | | | 542 | |
| | 2,540,583 | | | | Wynn Macau Ltd | | | 5,531 | |
| | | | | | TOTAL MACAU | | | 11,889 | |
| | | | | | | | | | |
| MALAYSIA - 0.1% |
| | 94,200 | | | | AirAsia BHD | | | 68 | |
| | 61,400 | | | | Alliance Financial Group BHD | | | 60 | |
| | 107,200 | | | | AMMB Holdings BHD | | | 112 | |
| | 10,000 | | | | British American Tobacco Malaysia BHD | | | 87 | |
| | 856,389 | | | | Bumiputra-Commerce Holdings BHD | | | 1,183 | |
| | 330,200 | | | | Dialog Group BHD | | | 249 | |
| | 218,300 | | | | Digi.Com BHD | | | 237 | |
| | 9,700 | | | | Fraser & Neave Holdings BHD | | | 79 | |
| | 159,900 | | | | Gamuda BHD | | | 90 | |
| | 156,200 | | | | Genting BHD | | | 230 | |
| | 14,700 | | | | Genting Plantations BHD | | | 35 | |
| | 41,200 | | | | HAP Seng Consolidated BHD | | | 98 | |
| | 110,100 | | | | Hartalega Holdings BHD | | | 163 | |
| | 48,600 | | | | Hong Leong Bank BHD | | | 240 | |
| | 14,000 | | | | Hong Leong Credit BHD | | | 63 | |
| | 217,500 | | | | IHH Healthcare BHD | | | 283 | |
| | 228,400 | | | | IJM Corp BHD | | | 90 | |
| | 132,500 | | | | IOI Corp BHD | | | 142 | |
| | 87,900 | | | | IOI Properties Group Sdn BHD | | | 33 | |
| | 30,900 | | | | Kuala Lumpur Kepong BHD | | | 185 | |
| | 791,609 | | | | Malayan Banking BHD | | | 1,818 | |
| | 64,600 | | | | Malaysia Airports Holdings BHD | | | 131 | |
| | 171,500 | | | | Maxis BHD | | | 222 | |
| | 76,500 | | | | MISC BHD | | | 124 | |
COLLEGE RETIREMENT EQUITIES FUND -Global Equities Account
| SHARES | | | | COMPANY | | VALUE
(000) | |
| | 4,300 | | | | Nestle Malaysia BHD | | $ | 153 | |
| | 471,900 | | | | Petronas Chemicals Group BHD | | | 1,060 | |
| | 25,600 | | | | Petronas Dagangan BHD | | | 164 | |
| | 52,500 | | | | Petronas Gas BHD | | | 244 | |
| | 41,980 | | | | PPB Group BHD | | | 178 | |
| | 102,800 | | | | Press Metal BHD | | | 120 | |
| | 551,300 | | | | Public Bank BHD | | | 3,300 | |
| | 49,000 | | | | QL Resources BHD | | | 81 | |
| | 226,000 | | | | Resorts World BHD | | | 165 | |
| | 64,200 | | | | RHB Capital BHD | | | 82 | |
| | 162,600 | | | | Sime Darby BHD | | | 94 | |
| | 180,100 | | | | Sime Darby Plantation BHD | | | 207 | |
| | 202,000 | | | | Sime Darby Property BHD | | | 49 | |
| | 100,300 | | | | SP Setia BHD | | | 57 | |
| | 70,400 | | | | Telekom Malaysia BHD | | | 45 | |
| | 628,000 | | | | Tenaga Nasional BHD | | | 2,069 | |
| | 210,456 | | | | TM International BHD | | | 200 | |
| | 118,500 | | | | Top Glove Corp BHD | | | 161 | |
| | 69,100 | | | | Westports Holdings BHD | | | 60 | |
| | 223,000 | | | | YTL Corp BHD | | | 54 | |
| | | | | | TOTAL MALAYSIA | | | 14,565 | |
| | | | | | | | | | |
| MEXICO - 0.1% |
| | 528,600 | | | | Alfa S.A. de C.V. (Class A) | | | 629 | |
| | 47,200 | | | | Alsea SAB de C.V. | | | 123 | |
| | 2,544,000 | | | | America Movil S.A. de C.V. (Series L) | | | 1,809 | |
| | 317,585 | | | | Banco Santander Mexico S.A. Institucion de Banca Multiple Grupo Financiero Santand | | | 394 | |
| | 1,157,700 | | * | | Cemex S.A. de C.V. | | | 559 | |
| | 37,900 | | | | Coca-Cola Femsa S.A. de C.V. | | | 230 | |
| | 13,900 | | | | El Puerto de Liverpool SAB de C.V. | | | 89 | |
| | 35,800 | | | | Embotelladoras Arca SAB de C.V. | | | 200 | |
| | 291,600 | | | | Fibra Uno Administracion S.A. de C.V. | | | 324 | |
| | 355,200 | | | | Fomento Economico Mexicano S.A. de C.V. | | | 3,050 | |
| | 12,647 | | | | Fresnillo plc | | | 139 | |
| | 17,585 | | | | Gruma SAB de C.V. | | | 199 | |
| | 25,100 | | | | Grupo Aeroportuario del Pacifico S.A. de C.V. (B Shares) | | | 204 | |
| | 15,265 | | | | Grupo Aeroportuario del Sureste S.A. de C.V. (Class B) | | | 230 | |
| | 132,400 | | | | Grupo Bimbo S.A. de C.V. (Series A) | | | 264 | |
| | 28,700 | | | | Grupo Carso S.A. de C.V. (Series A1) | | | 103 | |
| | 205,400 | | | | Grupo Financiero Banorte S.A. de C.V. | | | 1,001 | |
| | 3,805,349 | | | | Grupo Financiero Inbursa S.A. | | | 5,478 | |
| | 666,100 | | | | Grupo Mexico S.A. de C.V. (Series B) | | | 1,371 | |
| | 180,600 | | | | Grupo Televisa S.A. | | | 453 | |
| | 30,970 | | | | Industrias Penoles S.A. de C.V. | | | 378 | |
| | 38,400 | | | | Infraestructura Energetica ,NV SAB de C.V. | | | 143 | |
| | 123,200 | | e | | Kimberly-Clark de Mexico S.A. de C.V. (Class A) | | | 195 | |
| | 22,700 | | e | | Megacable Holdings SAB de C.V. | | | 102 | |
| | 81,500 | | | | Mexichem SAB de C.V. | | | 207 | |
| | 16,270 | | | | Promotora y Operadora de Infraestructura SAB de C.V. | | | 156 | |
| | 1,916,100 | | | | Wal-Mart de Mexico SAB de C.V. | | | 4,872 | |
| | | | | | TOTAL MEXICO | | | 22,902 | |
COLLEGE RETIREMENT EQUITIES FUND -Global Equities Account
| SHARES | | | | COMPANY | | VALUE
(000) | |
| MONGOLIA - 0.0% |
| | 49,953 | | * | | Turquoise Hill Resources Ltd | | $ | 82 | |
| | | | | | TOTAL MONGOLIA | | | 82 | |
| | | | | | | | | | |
| NETHERLANDS - 2.1% |
| | 1,510,548 | | g | | ABN AMRO Group NV (ADR) | | | 35,546 | |
| | 18,196 | | *,e,g | | Adyen NV | | | 9,830 | |
| | 95,526 | | | | Aegon NV | | | 447 | |
| | 35,082 | | | | Akzo Nobel NV | | | 2,825 | |
| | 333,194 | | | | ASML Holding NV | | | 52,198 | |
| | 280,439 | | | | ASR Nederland NV | | | 11,097 | |
| | 9,597 | | | | DSM NV | | | 779 | |
| | 4,058 | | | | Eurocommercial Properties NV | | | 125 | |
| | 304,728 | | g | | Euronext NV | | | 17,558 | |
| | 213,998 | | | | EXOR NV | | | 11,617 | |
| | 5,987 | | | | Heineken Holding NV | | | 506 | |
| | 87,701 | | | | Heineken NV | | | 7,752 | |
| | 8,782,156 | | | | ING Groep NV | | | 94,466 | |
| | 8,000 | | * | | InterXion Holding NV | | | 433 | |
| | 177,519 | | | | Koninklijke Ahold Delhaize NV | | | 4,484 | |
| | 869,066 | | | | Koninklijke KPN NV | | | 2,539 | |
| | 690,239 | | | | Koninklijke Philips Electronics NV | | | 24,199 | |
| | 3,740 | | | | Koninklijke Vopak NV | | | 170 | |
| | 16,085 | | | | NN Group NV | | | 639 | |
| | 18,225 | | | | NXP Semiconductors NV | | | 1,336 | |
| | 6,065 | | | | Randstad Holdings NV | | | 278 | |
| | 2,613,967 | | | | Royal Dutch Shell plc (A Shares) | | | 76,937 | |
| | 198,315 | | | | Royal Dutch Shell plc (B Shares) | | | 5,929 | |
| | 3,479 | | e | | Wereldhave NV | | | 108 | |
| | 337,010 | | | | Wolters Kluwer NV | | | 19,819 | |
| | | | | | TOTAL NETHERLANDS | | | 381,617 | |
| | | | | | | | | | |
| NEW ZEALAND - 0.1% |
| | 38,016 | | * | | a2 Milk Co Ltd | | | 286 | |
| | 6,220,216 | | | | Air New Zealand Ltd | | | 12,959 | |
| | 49,591 | | | | Auckland International Airport Ltd | | | 239 | |
| | 29,568 | | | | Fisher & Paykel Healthcare Corp | | | 258 | |
| | 49,182 | | * | | Fletcher Building Ltd | | | 161 | |
| | 92,739 | | | | Kiwi Property Group Ltd | | | 85 | |
| | 66,158 | | | | Meridian Energy Ltd | | | 151 | |
| | 20,687 | | | | Ryman Healthcare Ltd | | | 149 | |
| | 97,702 | | | | Telecom Corp of New Zealand Ltd | | | 273 | |
| | | | | | TOTAL NEW ZEALAND | | | 14,561 | |
| | | | | | | | | | |
| NORWAY - 0.5% |
| | 893,376 | | | | Aker BP ASA | | | 22,525 | |
| | 912,525 | | | | DNB NOR Holding ASA | | | 14,647 | |
| | 11,132 | | | | Gjensidige Forsikring BA | | | 174 | |
| | 71,178 | | | | Norsk Hydro ASA | | | 322 | |
| | 42,962 | | | | Orkla ASA | | | 336 | |
| | 21,674 | | | | PAN Fish ASA | | | 457 | |
| | 5,212 | | | | Schibsted ASA (B Shares) | | | 159 | |
COLLEGE RETIREMENT EQUITIES FUND -Global Equities Account
| SHARES | | | | COMPANY | | VALUE
(000) | |
| | 2,137,296 | | | | Statoil ASA | | $ | 45,337 | |
| | 39,630 | | | | Telenor ASA | | | 770 | |
| | 348,900 | | | | TGS Nopec Geophysical Co ASA | | | 8,430 | |
| | 67,427 | | | | Yara International ASA | | | 2,599 | |
| | | | | | TOTAL NORWAY | | | 95,756 | |
| | | | | | | | | | |
| PAKISTAN - 0.0% |
| | 33,500 | | | | Habib Bank Ltd | | | 29 | |
| | 22,100 | | | | MCB Bank Ltd | | | 31 | |
| | 86,100 | | | | Oil & Gas Development Co Ltd | | | 79 | |
| | | | | | TOTAL PAKISTAN | | | 139 | |
| | | | | | | | | | |
| PERU - 0.0% |
| | 14,800 | | | | Cia de Minas Buenaventura S.A. (ADR) (Series B) | | | 240 | |
| | 12,000 | | | | Credicorp Ltd (NY) | | | 2,660 | |
| | 5,934 | | | | Southern Copper Corp (NY) | | | 183 | |
| | | | | | TOTAL PERU | | | 3,083 | |
| | | | | | | | | | |
| PHILIPPINES - 0.1% |
| | 150,950 | | | | Aboitiz Equity Ventures, Inc | | | 157 | |
| | 102,800 | | | | Aboitiz Power Corp | | | 68 | |
| | 266,100 | | | | Alliance Global Group, Inc | | | 60 | |
| | 47,480 | | | | Ayala Corp | | | 812 | |
| | 1,377,500 | | | | Ayala Land, Inc | | | 1,065 | |
| | 365,790 | | | | Banco de Oro Universal Bank | | | 910 | |
| | 62,120 | | | | Bank of the Philippine Islands | | | 111 | |
| | 258,400 | | | | DMCI Holdings, Inc | | | 63 | |
| | 2,290 | | | | Globe Telecom, Inc | | | 83 | |
| | 6,094 | | | | GT Capital Holdings, Inc | | | 113 | |
| | 37,450 | | | | International Container Term Services, Inc | | | 71 | |
| | 225,930 | | | | JG Summit Holdings (Series B) | | | 239 | |
| | 32,840 | | | | Jollibee Foods Corp | | | 182 | |
| | 19,480 | | | | Manila Electric Co | | | 141 | |
| | 89,394,578 | | | | Megaworld Corp | | | 8,047 | |
| | 965,900 | | | | Metro Pacific Investments Corp | | | 85 | |
| | 127,776 | | | | Metropolitan Bank & Trust | | | 197 | |
| | 5,945 | | | | PLDT, Inc | | | 128 | |
| | 131,200 | | | | Robinsons Land Corp | | | 50 | |
| | 5,471,450 | | | | Robinsons Retail Holdings, Inc | | | 8,324 | |
| | 22,050 | | | | Security Bank Corp | | | 65 | |
| | 18,010 | | | | SM Investments Corp | | | 314 | |
| | 1,670,900 | | | | SM Prime Holdings | | | 1,136 | |
| | 74,860 | | | | Universal Robina | | | 180 | |
| | | | | | TOTAL PHILIPPINES | | | 22,601 | |
| | | | | | | | | | |
| POLAND - 0.0% |
| | 6,068 | | * | | Alior Bank S.A. | | | 87 | |
| | 1,735 | | | | Bank Handlowy w Warszawie S.A. | | | 32 | |
| | 38,323 | | * | | Bank Millennium S.A. | | | 91 | |
| | 30,057 | | | | Bank Pekao S.A. | | | 876 | |
| | 2,488 | | | | Bank Zachodni WBK S.A. | | | 239 | |
| | 897 | | | | BRE Bank S.A. | | | 102 | |
| | 1,957 | | | | CCC S.A. | | | 102 | |
COLLEGE RETIREMENT EQUITIES FUND -Global Equities Account
| SHARES | | | | COMPANY | | VALUE
(000) | |
| | 5,562 | | * | | CD Projekt Red S.A. | | $ | 216 | |
| | 17,589 | | * | | Cyfrowy Polsat S.A. | | | 107 | |
| | 3,441 | | *,g | | Dino Polska S.A. | | | 88 | |
| | 8,702 | | | | Grupa Lotos S.A. | | | 206 | |
| | 3,597 | | * | | Jastrzebska Spolka Weglowa S.A. | | | 65 | |
| | 10,637 | | * | | KGHM Polska Miedz S.A. | | | 252 | |
| | 91 | | | | LPP S.A. | | | 191 | |
| | 163,315 | | | | Polish Oil & Gas Co | | | 302 | |
| | 67,543 | | * | | Polska Grupa Energetyczna S.A. | | | 181 | |
| | 60,520 | | | | Polski Koncern Naftowy Orlen S.A. | | | 1,754 | |
| | 166,687 | | | | Powszechna Kasa Oszczednosci Bank Polski S.A. | | | 1,761 | |
| | 107,269 | | | | Powszechny Zaklad Ubezpieczen S.A. | | | 1,264 | |
| | 39,143 | | * | | Telekomunikacja Polska S.A. | | | 50 | |
| | | | | | TOTAL POLAND | | | 7,966 | |
| | | | | | | | | | |
| PORTUGAL - 0.1% |
| | 132,869 | | | | Energias de Portugal S.A. | | | 465 | |
| | 26,058 | | | | Galp Energia SGPS S.A. | | | 410 | |
| | 805,780 | | | | Jeronimo Martins SGPS S.A. | | | 9,549 | |
| | | | | | TOTAL PORTUGAL | | | 10,424 | |
| | | | | | | | | | |
| QATAR - 0.0% |
| | 14,149 | | * | | Barwa Real Estate Co | | | 155 | |
| | 13,949 | | * | | Commercial Bank of Qatar QSC | | | 151 | |
| | 58,901 | | * | | Ezdan Holding Group QSC | | | 210 | |
| | 14,449 | | * | | Industries Qatar QSC | | | 529 | |
| | 27,598 | | * | | Masraf Al Rayan | | | 315 | |
| | 5,431 | | * | | Ooredoo QSC | | | 112 | |
| | 3,635 | | * | | Qatar Electricity & Water Co | | | 185 | |
| | 13,407 | | * | | Qatar Insurance Co SAQ | | | 132 | |
| | 8,941 | | * | | Qatar Islamic Bank SAQ | | | 372 | |
| | 35,200 | | * | | Qatar National Bank | | | 1,876 | |
| | | | | | TOTAL QATAR | | | 4,037 | |
| | | | | | | | | | |
| ROMANIA - 0.0% |
| | 26,311 | | | | NEPI Rockcastle plc | | | 207 | |
| | | | | | TOTAL ROMANIA | | | 207 | |
| | | | | | | | | | |
| RUSSIA - 0.2% |
| | 1,008,451 | | | | Gazprom (ADR) | | | 4,457 | |
| | 85,249 | | | | LUKOIL PJSC (ADR) | | | 6,082 | |
| | 29,935 | | | | Magnit PJSC (GDR) | | | 381 | |
| | 123,196 | | | | MMC Norilsk Nickel PJSC (ADR) | | | 2,321 | |
| | 43,300 | | | | Mobile TeleSystems (ADR) | | | 303 | |
| | 17,758 | | | | Novatek PJSC (GDR) | | | 3,037 | |
| | 10,718 | | | | Novolipetsk Steel PJSC (GDR) | | | 245 | |
| | 11,788 | | | | PhosAgro PJSC (GDR) | | | 150 | |
| | 17,004 | | | | Polymetal International plc | | | 178 | |
| | 5,080 | | | | Polyus PJSC | | | 199 | |
| | 244,958 | | * | | Rosneft Oil Co PJSC (GDR) | | | 1,514 | |
| | 1,276,541 | | * | | Sberbank of Russia (ADR) | | | 13,991 | |
| | 18,655 | | | | Severstal (GDR) | | | 255 | |
| | 325,416 | | | | Surgutneftegaz (ADR) (London) | | | 1,224 | |
COLLEGE RETIREMENT EQUITIES FUND -Global Equities Account
| SHARES | | | | COMPANY | | VALUE
(000) | |
| | 48,761 | | | | Tatneft PJSC (ADR) | | $ | 3,096 | |
| | 143,397 | | | | VTB Bank | | | 159 | |
| | 10,855 | | | | X5 Retail Group NV | | | 269 | |
| | | | | | TOTAL RUSSIA | | | 37,861 | |
| | | | | | | | | | |
| SINGAPORE - 0.1% |
| | 335,345 | | | | Ascendas REIT | | | 633 | |
| | 16,900 | | g | | BOC Aviation Ltd | | | 125 | |
| | 345,646 | | | | CapitaCommercial Trust | | | 444 | |
| | 337,346 | | | | CapitaLand Ltd | | | 769 | |
| | 129,717 | | | | CapitaMall Trust | | | 215 | |
| | 62,100 | | | | City Developments Ltd | | | 370 | |
| | 121,348 | | | | ComfortDelgro Corp Ltd | | | 192 | |
| | 268,730 | | | | DBS Group Holdings Ltd | | | 4,673 | |
| | 321,392 | | | | Genting Singapore Ltd | | | 230 | |
| | 344,565 | | e | | Golden Agri-Resources Ltd | | | 62 | |
| | 4,866 | | | | Jardine Cycle & Carriage Ltd | | | 126 | |
| | 76,168 | | | | Keppel Corp Ltd | | | 331 | |
| | 558,735 | | | | Oversea-Chinese Banking Corp | | | 4,622 | |
| | 51,648 | | | | SembCorp Industries Ltd | | | 96 | |
| | 28,984 | | | | Singapore Airlines Ltd | | | 200 | |
| | 34,900 | | | | Singapore Airport Terminal Services Ltd | | | 120 | |
| | 320,443 | | | | Singapore Exchange Ltd | | | 1,679 | |
| | 84,425 | | e | | Singapore Press Holdings Ltd | | | 145 | |
| | 80,507 | | | | Singapore Technologies Engineering Ltd | | | 206 | |
| | 68,500 | | | | Singapore Telecommunications Ltd | | | 149 | |
| | 1,062,791 | | | | Singapore Telecommunications Ltd | | | 2,287 | |
| | 323,300 | | | | Suntec Real Estate Investment Trust | | | 422 | |
| | 240,743 | | | | United Overseas Bank Ltd | | | 4,355 | |
| | 73,531 | | | | UOL Group Ltd | | | 334 | |
| | 14,200 | | | | Venture Corp Ltd | | | 146 | |
| | 95,562 | | | | Wilmar International Ltd | | | 219 | |
| | | | | | TOTAL SINGAPORE | | | 23,150 | |
| | | | | | | | | | |
| SOUTH AFRICA - 0.4% |
| | 302,554 | | | | Absa Group Ltd | | | 3,396 | |
| | 4,277 | | | | Anglo American Platinum Ltd | | | 159 | |
| | 303,919 | | e | | Anglo American plc (London) | | | 6,796 | |
| | 31,471 | | | | AngloGold Ashanti Ltd | | | 400 | |
| | 72,200 | | | | Aspen Pharmacare Holdings Ltd | | | 676 | |
| | 60,988 | | | | Bid Corp Ltd | | | 1,122 | |
| | 60,388 | | | | Bidvest Group Ltd | | | 867 | |
| | 3,006 | | e | | Capitec Bank Holdings Ltd | | | 233 | |
| | 19,100 | | | | Clicks Group Ltd | | | 254 | |
| | 63,282 | | | | Discovery Holdings Ltd | | | 703 | |
| | 22,262 | | | | Exxaro Resources Ltd | | | 215 | |
| | 624,230 | | | | FirstRand Ltd | | | 2,843 | |
| | 51,220 | | | | Fortress REIT Ltd | | | 52 | |
| | 71,373 | | | | Fortress REIT Ltd (Class A) | | | 90 | |
| | 17,289 | | | | Foschini Ltd | | | 200 | |
| | 68,631 | | | | Gold Fields Ltd | | | 238 | |
| | 557,324 | | | | Growthpoint Properties Ltd | | | 906 | |
| | 17,115 | | | | Hyprop Investments Ltd | | | 97 | |
COLLEGE RETIREMENT EQUITIES FUND -Global Equities Account
| SHARES | | | | COMPANY | | VALUE
(000) | |
| | 20,722 | | | | Investec Ltd | | $ | 113 | |
| | 37,182 | | | | Investec plc | | | 209 | |
| | 4,483 | | e | | Kumba Iron Ore Ltd | | | 88 | |
| | 8,013 | | | | Liberty Holdings Ltd | | | 61 | |
| | 118,216 | | | | Life Healthcare Group Holdings Pte Ltd | | | 217 | |
| | 59,130 | | * | | Metropolitan Holdings Ltd | | | 70 | |
| | 8,357 | | | | Mondi Ltd | | | 180 | |
| | 19,647 | | | | Mr Price Group Ltd | | | 336 | |
| | 305,526 | | | | MTN Group Ltd | | | 1,889 | |
| | 169,833 | | | | Naspers Ltd (N Shares) | | | 34,003 | |
| | 53,021 | | | | Nedbank Group Ltd | | | 1,011 | |
| | 100,627 | | | | Network Healthcare Holdings Ltd | | | 184 | |
| | 26,214 | | | | Pick’n Pay Stores Ltd | | | 123 | |
| | 11,200 | | | | PSG Group Ltd | | | 190 | |
| | 43,552 | | | | Rand Merchant Investment Holdings Ltd | | | 110 | |
| | 424,718 | | | | Redefine Properties Ltd | | | 286 | |
| | 96,664 | | | | Remgro Ltd | | | 1,308 | |
| | 18,364 | | | | Resilient REIT Ltd | | | 73 | |
| | 127,470 | | | | RMB Holdings Ltd | | | 698 | |
| | 281,967 | | | | Sanlam Ltd | | | 1,562 | |
| | 37,163 | | | | Sappi Ltd | | | 211 | |
| | 102,452 | | | | Sasol Ltd | | | 3,044 | |
| | 84,007 | | | | Shoprite Holdings Ltd | | | 1,110 | |
| | 13,672 | | | | Spar Group Ltd | | | 197 | |
| | 237,027 | | | | Standard Bank Group Ltd | | | 2,945 | |
| | 18,524 | | | | Telkom S.A. Ltd | | | 82 | |
| | 13,170 | | | | Tiger Brands Ltd | | | 250 | |
| | 33,723 | | | | Truworths International Ltd | | | 206 | |
| | 108,247 | | | | Vodacom Group Pty Ltd | | | 996 | |
| | 81,739 | | | | Woolworths Holdings Ltd | | | 313 | |
| | | | | | TOTAL SOUTH AFRICA | | | 71,312 | |
| | | | | | | | | | |
| SPAIN - 0.5% |
| | 13,446 | | | | ACS Actividades Construccion y Servicios S.A. | | | 521 | |
| | 3,567 | | g | | Aena S.A. | | | 554 | |
| | 400,428 | | | | Amadeus IT Holding S.A. | | | 27,861 | |
| | 353,070 | | | | Banco Bilbao Vizcaya Argentaria S.A. | | | 1,875 | |
| | 298,296 | | | | Banco de Sabadell S.A. | | | 341 | |
| | 1,694,520 | | | | Banco Santander S.A. | | | 7,695 | |
| | 62,194 | | e | | Bankia S.A. | | | 182 | |
| | 35,811 | | | | Bankinter S.A. | | | 287 | |
| | 186,625 | | | | CaixaBank S.A. | | | 676 | |
| | 55,782 | | | | Corp Mapfre S.A. | | | 148 | |
| | 12,565 | | e | | Enagas | | | 340 | |
| | 166,611 | | | | Endesa S.A. | | | 3,842 | |
| | 25,981 | | | | Ferrovial S.A. | | | 526 | |
| | 139,430 | | | | Gas Natural SDG S.A. | | | 3,557 | |
| | 15,865 | | | | Grifols S.A. | | | 417 | |
| | 574,355 | | | | Iberdrola S.A. | | | 4,612 | |
| | 179,580 | | | | Industria De Diseno Textil S.A. | | | 4,584 | |
| | 17,395 | | | | Inmobiliaria Colonial S.A. | | | 162 | |
| | 8,117 | | e | | Lar Espana Real Estate Socimi S.A. | | | 69 | |
| | 108,528 | | *,†,e | | Let’s GOWEX S.A. | | | 6 | |
COLLEGE RETIREMENT EQUITIES FUND -Global Equities Account
| SHARES | | | | COMPANY | | VALUE
(000) | |
| | 505,175 | | * | | Masmovil Ibercom S.A. | | $ | 11,287 | |
| | 28,991 | | | | Merlin Properties Socimi S.A. | | | 358 | |
| | 56,447 | | | | Red Electrica Corp S.A. | | | 1,259 | |
| | 71,908 | | | | Repsol YPF S.A. | | | 1,156 | |
| | 236,330 | | *,e | | Siemens Gamesa Renewable Energy | | | 2,877 | |
| | 810,251 | | | | Telefonica S.A. | | | 6,820 | |
| | | | | | TOTAL SPAIN | | | 82,012 | |
| | | | | | | | | | |
| SWEDEN - 0.5% |
| | 15,575 | | | | Alfa Laval AB | | | 335 | |
| | 667,999 | | | | Assa Abloy AB | | | 11,962 | |
| | 35,671 | | | | Atlas Copco AB (A Shares) | | | 851 | |
| | 20,828 | | | | Atlas Copco AB (B Shares) | | | 456 | |
| | 2,585 | | e | | Autoliv, Inc | | | 182 | |
| | 388,267 | | | | Boliden AB | | | 8,413 | |
| | 11,596 | | | | Castellum AB | | | 214 | |
| | 12,795 | | | | Electrolux AB (Series B) | | | 270 | |
| | 36,358 | | * | | Epiroc AB | | | 346 | |
| | 22,003 | | * | | Epiroc AB | | | 196 | |
| | 1,340,662 | | | | Ericsson (LM) (B Shares) | | | 11,867 | |
| | 32,056 | | | | Essity AB | | | 788 | |
| | 27,832 | | | | Fabege AB | | | 372 | |
| | 25,512 | | * | | Fastighets AB Balder | | | 727 | |
| | 46,337 | | e | | Hennes & Mauritz AB (B Shares) | | | 659 | |
| | 373,144 | | | | Hexagon AB (B Shares) | | | 17,250 | |
| | 21,754 | | | | Husqvarna AB (B Shares) | | | 161 | |
| | 4,062 | | e | | ICA Gruppen AB | | | 145 | |
| | 8,637 | | | | Industrivarden AB | | | 175 | |
| | 467,783 | | e | | Intrum Justitia AB | | | 10,868 | |
| | 12,429 | | | | Investment AB Kinnevik (B Shares) | | | 301 | |
| | 24,084 | | e | | Investor AB (B Shares) | | | 1,023 | |
| | 23,193 | | | | Kungsleden AB | | | 165 | |
| | 3,953 | | | | Lundbergs AB (B Shares) | | | 117 | |
| | 10,182 | | | | Lundin Petroleum AB | | | 254 | |
| | 59,969 | | | | Sandvik AB | | | 859 | |
| | 13,582 | | * | | SAS AB | | | 32 | |
| | 17,249 | | | | Securitas AB (B Shares) | | | 278 | |
| | 365,621 | | | | Skandinaviska Enskilda Banken AB (Class A) | | | 3,554 | |
| | 18,095 | | e | | Skanska AB (B Shares) | | | 289 | |
| | 19,781 | | | | SKF AB (B Shares) | | | 301 | |
| | 80,853 | | | | Svenska Handelsbanken AB | | | 900 | |
| | 207,925 | | | | Swedbank AB (A Shares) | | | 4,647 | |
| | 253,174 | | | | Swedish Match AB | | | 9,967 | |
| | 26,484 | | | | Tele2 AB (B Shares) | | | 338 | |
| | 149,247 | | | | TeliaSonera AB | | | 710 | |
| | 82,937 | | | | Volvo AB (B Shares) | | | 1,086 | |
| | | | | | TOTAL SWEDEN | | | 91,058 | |
| | | | | | | | | | |
| SWITZERLAND - 2.5% |
| | 175,042 | | | | ABB Ltd | | | 3,343 | |
| | 8,352 | | | | Adecco S.A. | | | 393 | |
| | 101,006 | | | | Baloise Holding AG. | | | 13,945 | |
| | 116 | | | | Barry Callebaut AG. | | | 181 | |
COLLEGE RETIREMENT EQUITIES FUND -Global Equities Account
| SHARES | | | | COMPANY | | VALUE
(000) | |
| | 73,519 | | | | Cie Financiere Richemont S.A. | | $ | 4,741 | |
| | 10,334 | | | | Clariant AG. | | | 191 | |
| | 10,432 | | | | Coca-Cola HBC AG. | | | 326 | |
| | 3,026,201 | | | | Credit Suisse Group | | | 33,081 | |
| | 1,644 | | e | | Dufry Group | | | 156 | |
| | 405 | | | | EMS-Chemie Holding AG. | | | 193 | |
| | 68,128 | | | | Flughafen Zuerich AG. | | | 11,274 | |
| | 22,202 | | *,e | | Garrett Motion, Inc | | | 274 | |
| | 1,957 | | | | Geberit AG. | | | 762 | |
| | 15,140 | | | | Georg Fischer AG. | | | 12,146 | |
| | 489 | | | | Givaudan S.A. | | | 1,134 | |
| | 2,126,797 | | | | Glencore Xstrata plc | | | 7,908 | |
| | 25,702 | | | | Holcim Ltd | | | 1,061 | |
| | 11,605 | | | | Julius Baer Group Ltd | | | 414 | |
| | 2,630 | | | | Kuehne & Nagel International AG. | | | 338 | |
| | 55 | | | | Lindt & Spruengli AG. | | | 342 | |
| | 6 | | | | Lindt & Spruengli AG. (Registered) | | | 447 | |
| | 440,530 | | | | Lonza Group AG. | | | 114,518 | |
| | 673,733 | | | | Nestle S.A. | | | 54,682 | |
| | 1,345,026 | | | | Novartis AG. | | | 115,193 | |
| | 1,942 | | | | Pargesa Holding S.A. | | | 140 | |
| | 901 | | e | | Partners Group | | | 548 | |
| | 2,884 | | | | Phonak Holding AG. | | | 474 | |
| | 4,058 | | | | PSP Swiss Property AG. | | | 400 | |
| | 121,710 | | | | Roche Holding AG. | | | 30,216 | |
| | 2,189 | | | | Schindler Holding AG. | | | 435 | |
| | 1,023 | | | | Schindler Holding AG. (Registered) | | | 199 | |
| | 284 | | | | SGS S.A. | | | 639 | |
| | 6,744 | | | | Sika AG. | | | 857 | |
| | 36,186 | | | | STMicroelectronics NV | | | 513 | |
| | 3,029 | | | | Straumann Holding AG. | | | 1,913 | |
| | 1,714 | | | | Swatch Group AG. | | | 500 | |
| | 2,317 | | | | Swatch Group AG. (Registered) | | | 134 | |
| | 1,792 | | | | Swiss Life Holding | | | 692 | |
| | 8,374 | | | | Swiss Prime Site AG. | | | 678 | |
| | 16,235 | | | | Swiss Re Ltd | | | 1,494 | |
| | 1,347 | | | | Swisscom AG. | | | 644 | |
| | 3,128 | | | | Temenos Group AG. | | | 376 | |
| | 310,909 | | | | UBS AG. | | | 3,878 | |
| | 25,530 | | | | Vifor Pharma AG. | | | 2,778 | |
| | 98,730 | | | | Zurich Financial Services AG. | | | 29,430 | |
| | | | | | TOTAL SWITZERLAND | | | 453,981 | |
| | | | | | | | | | |
| TAIWAN - 1.1% |
| | 204,000 | | | | Acer, Inc | | | 129 | |
| | 25,000 | | | | Advantech Co Ltd | | | 171 | |
| | 8,000 | | | | Airtac International Group | | | 78 | |
| | 257,000 | | | | ASE Industrial Holding Co Ltd | | | 487 | |
| | 177,000 | | | | Asia Cement Corp | | | 196 | |
| | 52,000 | | | | Asustek Computer, Inc | | | 341 | |
| | 645,000 | | | | AU Optronics Corp | | | 256 | |
| | 121,000 | | | | Catcher Technology Co Ltd | | | 886 | |
| | 1,517,000 | | | | Cathay Financial Holding Co Ltd | | | 2,322 | |
COLLEGE RETIREMENT EQUITIES FUND -Global Equities Account
| SHARES | | | | COMPANY | | VALUE
(000) | |
| | 1,986,517 | | | | Chailease Holding Co Ltd | | $ | 6,266 | |
| | 375,480 | | | | Chang Hwa Commercial Bank | | | 210 | |
| | 126,000 | | | | Cheng Shin Rubber Industry Co Ltd | | | 168 | |
| | 35,335 | | | | Chicony Electronics Co Ltd | | | 72 | |
| | 140,000 | | | | China Airlines | | | 50 | |
| | 981,000 | | | | China Development Financial Holding Corp | | | 311 | |
| | 194,700 | | | | China Life Insurance Co Ltd (Taiwan) | | | 177 | |
| | 2,423,000 | | | | China Steel Corp | | | 1,913 | |
| | 19,685,000 | | | | Chinatrust Financial Holding Co | | | 12,947 | |
| | 712,000 | | | | Chunghwa Telecom Co Ltd | | | 2,600 | |
| | 283,000 | | | | Compal Electronics, Inc | | | 160 | |
| | 698,182 | | | | Dadi Early-Childhood Education Group Ltd | | | 4,604 | |
| | 371,000 | | | | Delta Electronics, Inc | | | 1,561 | |
| | 1,859,957 | | | | E.Sun Financial Holding Co Ltd | | | 1,217 | |
| | 13,000 | | | | Eclat Textile Co Ltd | | | 147 | |
| | 106,300 | | | | Eva Airways Corp | | | 55 | |
| | 185,373 | | | | Evergreen Marine Corp Tawain Ltd | | | 72 | |
| | 233,000 | | | | Far Eastern Textile Co Ltd | | | 212 | |
| | 119,000 | | | | Far EasTone Telecommunications Co Ltd | | | 296 | |
| | 28,000 | | | | Feng TAY Enterprise Co Ltd | | | 160 | |
| | 763,930 | | | | First Financial Holding Co Ltd | | | 498 | |
| | 4,252,000 | | | | Formosa Chemicals & Fibre Corp | | | 14,546 | |
| | 277,000 | | | | Formosa Petrochemical Corp | | | 983 | |
| | 797,000 | | | | Formosa Plastics Corp | | | 2,620 | |
| | 52,000 | | | | Formosa Taffeta Co Ltd | | | 58 | |
| | 62,000 | | | | Foxconn Technology Co Ltd | | | 122 | |
| | 1,258,000 | | | | Fubon Financial Holding Co Ltd | | | 1,930 | |
| | 803,000 | | | | Fuhwa Financial Holdings Co Ltd | | | 404 | |
| | 24,000 | | | | Giant Manufacturing Co Ltd | | | 113 | |
| | 17,000 | | | | Globalwafers Co Ltd | | | 156 | |
| | 48,000 | | | | Highwealth Construction Corp | | | 70 | |
| | 32,031 | | | | Hiwin Technologies Corp | | | 231 | |
| | 2,334,000 | | | | Hon Hai Precision Industry Co, Ltd | | | 5,372 | |
| | 1,535,678 | | | | Hota Industrial Manufacturing Co Ltd | | | 6,014 | |
| | 23,000 | | | | Hotai Motor Co Ltd | | | 191 | |
| | 553,050 | | | | Hua Nan Financial Holdings Co Ltd | | | 315 | |
| | 660,000 | | | | InnoLux Display Corp | | | 209 | |
| | 173,000 | | | | Inventec Co Ltd | | | 124 | |
| | 179,300 | | | | Largan Precision Co Ltd | | | 18,709 | |
| | 154,000 | | | | Lite-On Technology Corp | | | 203 | |
| | 1,145,000 | | | | MediaTek, Inc | | | 8,522 | |
| | 874,000 | | | | Mega Financial Holding Co Ltd | | | 738 | |
| | 47,000 | | | | Micro-Star International Co Ltd | | | 117 | |
| | 924,000 | | | | Nan Ya Plastics Corp | | | 2,272 | |
| | 87,000 | | | | Nanya Technology Corp | | | 156 | |
| | 13,000 | | | | Nien Made Enterprise Co Ltd | | | 100 | |
| | 43,000 | | | | Novatek Microelectronics Corp Ltd | | | 199 | |
| | 144,000 | | | | Pegatron Technology Corp | | | 241 | |
| | 10,000 | | | | Phison Electronics Corp | | | 74 | |
| | 157,000 | | | | Pou Chen Corp | | | 166 | |
| | 49,000 | | | | Powertech Technology, Inc | | | 105 | |
| | 45,000 | | | | President Chain Store Corp | | | 453 | |
| | 202,000 | | | | Quanta Computer, Inc | | | 346 | |
COLLEGE RETIREMENT EQUITIES FUND -Global Equities Account
| SHARES | | | | COMPANY | | VALUE
(000) | |
| | 32,000 | | | | Realtek Semiconductor Corp | | $ | 148 | |
| | 32,400 | | | | Ruentex Development Co Ltd | | | 47 | |
| | 24,600 | | | | Ruentex Industries Ltd | | | 63 | |
| | 760,950 | | | | Shin Kong Financial Holding Co Ltd | | | 223 | |
| | 784,300 | | | | SinoPac Financial Holdings Co Ltd | | | 262 | |
| | 25,000 | | | | Standard Foods Corp | | | 40 | |
| | 97,000 | | | | Synnex Technology International Corp | | | 115 | |
| | 11,000 | | * | | TaiMed Biologics, Inc | | | 59 | |
| | 720,220 | | | | Taishin Financial Holdings Co Ltd | | | 306 | |
| | 249,680 | | | | Taiwan Business Bank | | | 84 | |
| | 718,800 | | | | Taiwan Cement Corp | | | 830 | |
| | 644,410 | | | | Taiwan Cooperative Financial Holding | | | 370 | |
| | 167,000 | | | | Taiwan High Speed Rail Corp | | | 166 | |
| | 122,000 | | | | Taiwan Mobile Co Ltd | | | 422 | |
| | 12,074,200 | | | | Taiwan Semiconductor Manufacturing Co Ltd | | | 87,674 | |
| | 139,000 | | * | | Tatung Co Ltd | | | 117 | |
| | 889,000 | | | | Uni-President Enterprises Corp | | | 2,017 | |
| | 2,172,000 | | | | United Microelectronics Corp | | | 785 | |
| | 63,000 | | | | Vanguard International Semiconductor Corp | | | 122 | |
| | 25,000 | | | | Walsin Technology Corp | | | 126 | |
| | 1,091,000 | | | | Win Semiconductors Corp | | | 4,203 | |
| | 204,000 | | | | Winbond Electronics Corp | | | 90 | |
| | 194,697 | | | | Wistron Corp | | | 120 | |
| | 105,640 | | | | WPG Holdings Co Ltd | | | 127 | |
| | 312,680 | | | | Yageo Corp | | | 3,239 | |
| | 30,000 | | | | Zhen Ding Technology Holding Ltd | | | 78 | |
| | | | | | TOTAL TAIWAN | | | 206,254 | |
| | | | | | | | | | |
| THAILAND - 0.2% |
| | 74,900 | | | | Advanced Info Service PCL (Foreign) | | | 397 | |
| | 800,600 | | | | Airports of Thailand PCL | | | 1,581 | |
| | 17,300 | | | | Bangkok Bank PCL (Foreign) | | | 110 | |
| | 310,300 | | | | Bangkok Dusit Medical Services PCL (Foreign) | | | 233 | |
| | 484,000 | | | | Bangkok Expressway & Metro PCL | | | 144 | |
| | 247,000 | | | | Banpu PCL (Foreign) | | | 112 | |
| | 83,100 | | | | Berli Jucker PCL | | | 130 | |
| | 405,600 | | | | BTS Group Holdings PCL | | | 119 | |
| | 24,400 | | | | Bumrungrad Hospital PCL (Foreign) | | | 141 | |
| | 92,100 | | | | Central Pattana PCL (Foreign) | | | 212 | |
| | 233,200 | | | | Charoen Pokphand Foods PCL | | | 176 | |
| | 892,900 | | | | CP Seven Eleven PCL (Foreign) | | | 1,882 | |
| | 29,600 | | | | Delta Electronics Thai PCL | | | 63 | |
| | 8,200 | | | | Electricity Generating PCL | | | 63 | |
| | 116,100 | | | | Energy Absolute PCL (Foreign) | | | 152 | |
| | 36,900 | | | | Glow Energy PCL (Foreign) | | | 101 | |
| | 39,000 | | | | Gulf Energy Development PCL | | | 98 | |
| | 266,500 | | | | Home Product Center PCL (Foreign) | | | 124 | |
| | 146,100 | | | | Indorama Ventures PCL (Foreign) | | | 244 | |
| | 1,092,300 | | | | IRPC PCL (Foreign) | | | 193 | |
| | 321,000 | | | | Kasikornbank PCL (Foreign) | | | 1,821 | |
| | 286,700 | | | | Krung Thai Bank PCL (Foreign) | | | 169 | |
| | 178,900 | | | | Land and Houses PCL Co Reg | | | 55 | |
| | 162,300 | | | | Minor International PCL (Foreign) | | | 170 | |
COLLEGE RETIREMENT EQUITIES FUND -Global Equities Account
| SHARES | | | | COMPANY | | VALUE
(000) | |
| | 48,500 | | | | Muangthai Capital PCL | | $ | 73 | |
| | 279,200 | | | | PTT Exploration & Production PCL (Foreign) | | | 969 | |
| | 178,500 | | | | PTT Global Chemical PCL (Foreign) | | | 391 | |
| | 2,017,600 | | | | PTT PCL (Foreign) | | | 2,860 | |
| | 31,400 | | | | Robinson PCL | | | 61 | |
| | 26,000 | | | | Siam Cement PCL (Foreign) | | | 348 | |
| | 139,400 | | | | Siam Commercial Bank PCL (Foreign) | | | 572 | |
| | 104,000 | | | | Thai Oil PCL (Foreign) | | | 211 | |
| | 110,400 | | | | Thai Union Group PCL | | | 55 | |
| | 5,730,300 | | | | Tisco Financial Group PCL (ADR) | | | 13,783 | |
| | 625,100 | | | | TMB Bank PCL (Foreign) | | | 42 | |
| | 861,700 | | | | True Corp PCL (Foreign) | | | 138 | |
| | | | | | TOTAL THAILAND | | | 27,993 | |
| | | | | | | | | | |
| TURKEY - 0.1% |
| | 397,197 | | | | Akbank TAS | | | 512 | |
| | 29,559 | | | | Anadolu Efes Biracilik Ve Malt Sanayii AS | | | 115 | |
| | 15,341 | | | | Arcelik AS | | | 46 | |
| | 27,729 | | | | Aselsan Elektronik Sanayi Ve Ticaret AS | | | 126 | |
| | 15,248 | | | | BIM Birlesik Magazalar AS | | | 251 | |
| | 101,523 | | | | Eregli Demir ve Celik Fabrikalari TAS | | | 138 | |
| | 4,695 | | | | Ford Otomotiv Sanayi AS | | | 44 | |
| | 83,096 | | | | Haci Omer Sabanci Holding AS | | | 118 | |
| | 140,941 | | | | KOC Holding AS | | | 377 | |
| | 59,848 | | | | Petkim Petrokimya Holding | | | 57 | |
| | 12,926 | | | | TAV Havalimanlari Holding AS | | | 58 | |
| | 11,141 | | | | Tupras Turkiye Petrol Rafine | | | 245 | |
| | 38,654 | | * | | Turk Hava Yollari | | | 117 | |
| | 46,348 | | | | Turk Sise ve Cam Fabrikalari AS | | | 50 | |
| | 194,739 | | | | Turkcell Iletisim Hizmet AS | | | 447 | |
| | 13,051,502 | | | | Turkiye Garanti Bankasi AS | | | 19,563 | |
| | 95,463 | | | | Turkiye Halk Bankasi AS | | | 126 | |
| | 266,949 | | | | Turkiye Is Bankasi (Series C) | | | 228 | |
| | | | | | TOTAL TURKEY | | | 22,618 | |
| | | | | | | | | | |
| UNITED ARAB EMIRATES - 0.1% |
| | 152,947 | | * | | Abu Dhabi Commercial Bank PJSC | | | 339 | |
| | 322,310 | | | | Aldar Properties PJSC | | | 141 | |
| | 114,535 | | | | DAMAC Properties Dubai Co PJSC | | | 47 | |
| | 31,893 | | | | DP World Ltd | | | 545 | |
| | 123,352 | | | | Dubai Islamic Bank PJSC | | | 168 | |
| | 58,562 | | * | | Emaar Development PJSC | | | 70 | |
| | 152,633 | | * | | Emaar Malls Group PJSC | | | 74 | |
| | 640,114 | | | | Emaar Properties PJSC | | | 720 | |
| | 318,977 | | * | | Emirates Telecommunications Group Co PJSC | | | 1,475 | |
| | 208,238 | | | | National Bank of Abu Dhabi PJSC | | | 799 | |
| | 318,600 | | e | | NMC Health plc | | | 11,120 | |
| | | | | | TOTAL UNITED ARAB EMIRATES | | | 15,498 | |
| | | | | | | | | | |
| UNITED KINGDOM - 5.5% |
| | 50,487 | | | | 3i Group plc | | | 498 | |
| | 95,500 | | *,e | | accesso Technology Group plc | | | 1,770 | |
| | 10,732 | | | | Admiral Group plc | | | 280 | |
COLLEGE RETIREMENT EQUITIES FUND -Global Equities Account
| SHARES | | | | COMPANY | | VALUE
(000) | |
| | 1,829,332 | | | | Ashtead Group plc | | $ | 38,159 | |
| | 236,002 | | *,e | | ASOS plc | | | 6,851 | |
| | 288,977 | | | | Associated British Foods plc | | | 7,532 | |
| | 1,282,922 | | | | AstraZeneca plc | | | 95,765 | |
| | 51,218 | | g | | Auto Trader Group plc | | | 297 | |
| | 208,212 | | | | Aviva plc | | | 997 | |
| | 1,571,126 | | | | B&M European Value Retail S.A. | | | 5,638 | |
| | 14,001 | | | | Babcock International Group | | | 87 | |
| | 168,934 | | | | BAE Systems plc | | | 988 | |
| | 905,920 | | | | Barclays plc | | | 1,733 | |
| | 52,957 | | | | Barratt Developments plc | | | 312 | |
| | 1,028,700 | | | | Beazley plc | | | 6,611 | |
| | 153,000 | | * | | Belmond Ltd. | | | 3,830 | |
| | 252,480 | | | | Berkeley Group Holdings plc | | | 11,198 | |
| | 69,580 | | | | Big Yellow Group plc | | | 774 | |
| | 4,861,800 | | * | | boohoo.com plc | | | 10,030 | |
| | 3,538,682 | | | | BP plc | | | 22,370 | |
| | 2,127,900 | | | | British American Tobacco plc | | | 67,708 | |
| | 214,440 | | | | British Land Co plc | | | 1,458 | |
| | 279,412 | | | | Britvic plc | | | 2,846 | |
| | 446,577 | | | | BT Group plc | | | 1,358 | |
| | 17,454 | | | | Bunzl plc | | | 527 | |
| | 22,146 | | | | Burberry Group plc | | | 486 | |
| | 23,193 | | | | Capital & Counties Properties | | | 68 | |
| | 299,788 | | | | Centrica plc | | | 517 | |
| | 2,588,311 | | | | CNH Industrial NV | | | 23,386 | |
| | 11,349 | | | | Coca-Cola European Partners plc (Class A) | | | 520 | |
| | 83,854 | | | | Compass Group plc | | | 1,765 | |
| | 79,645 | | g | | ConvaTec Group plc | | | 141 | |
| | 6,975 | | | | Croda International plc | | | 417 | |
| | 5,184 | | | | DCC plc | | | 395 | |
| | 404,000 | | | | Dechra Pharmaceuticals plc | | | 10,674 | |
| | 443,879 | | | | Delphi Automotive plc | | | 27,330 | |
| | 34,790 | | | | Derwent London plc | | | 1,265 | |
| | 2,081,483 | | | | Diageo plc | | | 74,381 | |
| | 71,380 | | | | Direct Line Insurance Group plc | | | 290 | |
| | 9,885 | | | | easyJet plc | | | 139 | |
| | 3,307,457 | | | | Electrocomponents plc | | | 21,364 | |
| | 47,963 | | | | Experian Group Ltd | | | 1,163 | |
| | 808,071 | | | | Fevertree Drinks plc | | | 22,659 | |
| | 57,428 | | * | | Fiat DaimlerChrysler Automobiles NV | | | 828 | |
| | 580,526 | | | | GlaxoSmithKline plc | | | 11,064 | |
| | 139,960 | | | | Great Portland Estates plc | | | 1,177 | |
| | 82,604 | | | | Group 4 Securicor plc | | | 209 | |
| | 29,886 | | | | GVC Holdings plc | | | 257 | |
| | 161,618 | | | | Hammerson plc | | | 680 | |
| | 15,384 | | | | Hargreaves Lansdown plc | | | 363 | |
| | 1,744,181 | | | | HSBC Holdings plc | | | 14,389 | |
| | 50,498 | | | | Imperial Tobacco Group plc | | | 1,533 | |
| | 1,513,973 | | | | Inchcape plc | | | 10,654 | |
| | 66,857 | | | | Informa plc | | | 537 | |
| | 9,453 | | | | InterContinental Hotels Group plc | | | 511 | |
| | 31,637 | | | | International Consolidated Airlines Group S.A. | | | 251 | |
COLLEGE RETIREMENT EQUITIES FUND -Global Equities Account
| SHARES | | | | COMPANY | | VALUE
(000) | |
| | 8,513 | | | | Intertek Group plc | | $ | 521 | |
| | 28,991 | | e | | Intu Properties plc | | | 42 | |
| | 189,984 | | | | ITV plc | | | 302 | |
| | 91,463 | | | | J Sainsbury plc | | | 309 | |
| | 35,235 | | e | | John Wood Group plc | | | 227 | |
| | 10,163 | | | | Johnson Matthey plc | | | 363 | |
| | 1,426,714 | | * | | Just Eat plc | | | 10,669 | |
| | 113,512 | | | | Kingfisher plc | | | 298 | |
| | 154,993 | | | | Land Securities Group plc | | | 1,591 | |
| | 4,556,800 | | e | | Learning Technologies Group plc | | | 4,024 | |
| | 4,852,874 | | | | Legal & General Group plc | | | 14,298 | |
| | 14,562 | | * | | Liberty Global plc | | | 301 | |
| | 153,117 | | * | | Liberty Global plc (Class A) | | | 3,268 | |
| | 55,308 | | | | Linde plc | | | 8,630 | |
| | 784,042 | | | | Linde plc | | | 124,462 | |
| | 3,778,215 | | | | Lloyds TSB Group plc | | | 2,491 | |
| | 134,805 | | | | London Stock Exchange Group plc | | | 6,994 | |
| | 6,076,781 | | | | Man Group plc | | | 10,296 | |
| | 83,697 | | | | Marks & Spencer Group plc | | | 263 | |
| | 39,549 | | | | Meggitt plc | | | 238 | |
| | 251,787 | | | | Melrose Industries plc | | | 526 | |
| | 37,659 | | g | | Merlin Entertainments plc | | | 153 | |
| | 23,768 | | | | Micro Focus International plc | | | 416 | |
| | 608,647 | | | | Mondi plc | | | 12,677 | |
| | 179,414 | | | | National Grid plc | | | 1,755 | |
| | 186,240 | | | | Next plc | | | 9,483 | |
| | 375,896 | | | | Old Mutual Ltd | | | 584 | |
| | 41,522 | | e | | Pearson plc | | | 497 | |
| | 4,549 | | | | Pentair plc | | | 172 | |
| | 16,742 | | | | Persimmon plc | | | 412 | |
| | 3,177,579 | | | | Prudential plc | | | 56,740 | |
| | 3,833,508 | | *,e | | Purplebricks Group plc | | | 7,241 | |
| | 107,580 | | | | Reckitt Benckiser Group plc | | | 8,238 | |
| | 946,232 | | | | Redrow plc | | | 5,927 | |
| | 1,000,728 | | | | RELX plc | | | 20,590 | |
| | 170,577 | | | | RELX plc (London) | | | 3,517 | |
| | 2,274,620 | | | | Rightmove plc | | | 12,536 | |
| | 88,568 | | | | Rolls-Royce Group plc | | | 933 | |
| | 3,602,444 | | * | | Rolls-Royce Holdings plc | | | 5 | |
| | 256,683 | | | | Royal Bank of Scotland Group plc | | | 712 | |
| | 51,787 | | | | Royal Mail plc | | | 180 | |
| | 54,105 | | | | RSA Insurance Group plc | | | 355 | |
| | 57,983 | | | | Safestore Holdings plc | | | 374 | |
| | 57,085 | | | | Sage Group plc | | | 438 | |
| | 6,246 | | | | Schroders plc | | | 195 | |
| | 53,922 | | | | Scottish & Southern Energy plc | | | 745 | |
| | 185,996 | | | | Segro plc | | | 1,396 | |
| | 12,685 | | | | Severn Trent plc | | | 294 | |
| | 17,395 | | | | Shaftesbury plc | | | 184 | |
| | 94,169 | | | | Shire Ltd | | | 5,479 | |
| | 46,332 | | | | Smith & Nephew plc | | | 867 | |
| | 20,997 | | | | Smiths Group plc | | | 366 | |
| | 28,097 | | | | St. James’s Place plc | | | 338 | |
COLLEGE RETIREMENT EQUITIES FUND -Global Equities Account
| SHARES | | | | COMPANY | | VALUE
(000) | |
| | 148,458 | | | | Standard Chartered plc | | $ | 1,154 | |
| | 120,780 | | | | Standard Life Aberdeen plc | | | 396 | |
| | 169,991 | | | | Taylor Wimpey plc | | | 296 | |
| | 12,299 | | | | TechnipFMC plc (Euro OTC) | | | 241 | |
| | 23,071,206 | | | | Tesco plc | | | 55,951 | |
| | 532,706 | | | | Unilever NV | | | 28,858 | |
| | 267,318 | | | | Unilever plc | | | 14,035 | |
| | 36,170 | | | | United Utilities Group plc | | | 340 | |
| | 1,591,900 | | | | Vesuvius plc | | | 10,276 | |
| | 11,651,117 | | | | Vodafone Group plc | | | 22,653 | |
| | 13,796 | | | | Weir Group plc | | | 228 | |
| | 62,716 | | | | Whitbread plc | | | 3,662 | |
| | 118,192 | | | | WM Morrison Supermarkets plc | | | 321 | |
| | 554,905 | | | | WPP plc | | | 6,039 | |
| | | | | | TOTAL UNITED KINGDOM | | | 1,007,392 | |
| | | | | | | | | | |
| UNITED STATES - 57.7% |
| | 100,256 | | | | 3M Co | | | 19,103 | |
| | 4,253 | | | | A.O. Smith Corp | | | 182 | |
| | 1,499,158 | | | | Abbott Laboratories | | | 108,434 | |
| | 175,138 | | | | AbbVie, Inc | | | 16,146 | |
| | 354,695 | | | | Abercrombie & Fitch Co (Class A) | | | 7,112 | |
| | 1,223 | | * | | Abiomed, Inc | | | 398 | |
| | 144,808 | | | | Accenture plc | | | 20,419 | |
| | 156,753 | | | | Activision Blizzard, Inc | | | 7,300 | |
| | 1,147 | | | | Acuity Brands, Inc | | | 132 | |
| | 13,772 | | * | | Adobe, Inc | | | 3,116 | |
| | 2,086 | | | | Advance Auto Parts, Inc | | | 328 | |
| | 26,022 | | * | | Advanced Micro Devices, Inc | | | 480 | |
| | 18,364 | | | | AES Corp | | | 266 | |
| | 1,542 | | | | Affiliated Managers Group, Inc | | | 150 | |
| | 21,613 | | | | Aflac, Inc | | | 985 | |
| | 171,068 | | | | AGCO Corp | | | 9,523 | |
| | 90,724 | | | | Agilent Technologies, Inc | | | 6,120 | |
| | 15,124 | | | | AGNC Investment Corp | | | 265 | |
| | 11,000 | | | | Agree Realty Corp | | | 650 | |
| | 221,297 | | | | Air Products & Chemicals, Inc | | | 35,419 | |
| | 46,268 | | * | | Akamai Technologies, Inc | | | 2,826 | |
| | 73,216 | | | | Albemarle Corp | | | 5,643 | |
| | 17,766 | | | | Alexandria Real Estate Equities, Inc | | | 2,047 | |
| | 418,095 | | * | | Alexion Pharmaceuticals, Inc | | | 40,706 | |
| | 10,104 | | * | | Align Technology, Inc | | | 2,116 | |
| | 4,678 | | * | | Alkermes plc | | | 138 | |
| | 7,877 | | | | Alleghany Corp | | | 4,910 | |
| | 2,564 | | | | Allegion plc | | | 204 | |
| | 392,012 | | | | Allergan plc | | | 52,396 | |
| | 1,348 | | | | Alliance Data Systems Corp | | | 202 | |
| | 157,585 | | | | Alliant Energy Corp | | | 6,658 | |
| | 321,719 | | | | Allison Transmission Holdings, Inc | | | 14,127 | |
| | 180,254 | | | | Allstate Corp | | | 14,894 | |
| | 11,518 | | | | Ally Financial, Inc | | | 261 | |
| | 2,815 | | * | | Alnylam Pharmaceuticals, Inc | | | 205 | |
| | 194,037 | | * | | Alphabet, Inc (Class A) | | | 202,761 | |
COLLEGE RETIREMENT EQUITIES FUND -Global Equities Account
| SHARES | | | | COMPANY | | VALUE
(000) | |
| | 153,029 | | * | | Alphabet, Inc (Class C) | | $ | 158,478 | |
| | 250,772 | | | | Altria Group, Inc | | | 12,386 | |
| | 238,108 | | * | | Amazon.com, Inc | | | 357,631 | |
| | 151,803 | | * | | AMC Networks, Inc | | | 8,331 | |
| | 302 | | | | Amerco, Inc | | | 99 | |
| | 6,878 | | | | Ameren Corp | | | 449 | |
| | 3,330 | | | | American Airlines Group, Inc | | | 107 | |
| | 13,824 | | | | American Electric Power Co, Inc | | | 1,033 | |
| | 677,981 | | | | American Express Co | | | 64,625 | |
| | 134,802 | | | | American Financial Group, Inc | | | 12,204 | |
| | 50,000 | | | | American Homes 4 Rent | | | 992 | |
| | 215,492 | | | | American International Group, Inc | | | 8,493 | |
| | 33,881 | | | | American Tower Corp | | | 5,360 | |
| | 5,074 | | | | American Water Works Co, Inc | | | 461 | |
| | 98,817 | | | | Ameriprise Financial, Inc | | | 10,314 | |
| | 21,951 | | | | AmerisourceBergen Corp | | | 1,633 | |
| | 6,393 | | | | Ametek, Inc | | | 433 | |
| | 108,650 | | | | Amgen, Inc | | | 21,151 | |
| | 8,473 | | | | Amphenol Corp (Class A) | | | 686 | |
| | 378,332 | | | | Anadarko Petroleum Corp | | | 16,586 | |
| | 10,406 | | | | Analog Devices, Inc | | | 893 | |
| | 36,858 | | | | Annaly Capital Management, Inc | | | 362 | |
| | 2,359 | | * | | Ansys, Inc | | | 337 | |
| | 7,155 | | * | | Antero Resources Corp | | | 67 | |
| | 224,780 | | | | Anthem, Inc | | | 59,034 | |
| | 6,832 | | | | Aon plc | | | 993 | |
| | 10,613 | | | | Apache Corp | | | 279 | |
| | 11,596 | | | | Apartment Investment & Management Co (Class A) | | | 509 | |
| | 2,537,521 | | | | Apple, Inc | | | 400,269 | |
| | 103,622 | | | | Applied Materials, Inc | | | 3,393 | |
| | 6,358 | | | | ARAMARK Holdings Corp | | | 184 | |
| | 11,577 | | * | | Arch Capital Group Ltd | | | 309 | |
| | 275,729 | | | | Archer Daniels Midland Co | | | 11,297 | |
| | 12,349 | | | | Arconic, Inc | | | 208 | |
| | 1,479 | | * | | Arista Networks, Inc | | | 312 | |
| | 2,251 | | * | | Arrow Electronics, Inc | | | 155 | |
| | 5,318 | | | | Arthur J. Gallagher & Co | | | 392 | |
| | 79,484 | | * | | Asbury Automotive Group, Inc | | | 5,298 | |
| | 31,821 | | | | Ashland Global Holdings, Inc | | | 2,258 | |
| | 61,629 | | | | Associated Banc-Corp | | | 1,220 | |
| | 1,531 | | | | Assurant, Inc | | | 137 | |
| | 1,256,084 | | | | AT&T, Inc | | | 35,849 | |
| | 176,258 | | * | | Athene Holding Ltd | | | 7,020 | |
| | 3,169 | | | | Atmos Energy Corp | | | 294 | |
| | 6,133 | | * | | Autodesk, Inc | | | 789 | |
| | 12,321 | | | | Automatic Data Processing, Inc | | | 1,616 | |
| | 733 | | * | | AutoZone, Inc | | | 614 | |
| | 36,740 | | | | AvalonBay Communities, Inc | | | 6,395 | |
| | 2,402 | | | | Avery Dennison Corp | | | 216 | |
| | 451,204 | | | | AXA Equitable Holdings, Inc | | | 7,504 | |
| | 67,391 | | * | | Axalta Coating Systems Ltd | | | 1,578 | |
| | 14,080 | | | | Baker Hughes a GE Co | | | 303 | |
| | 9,355 | | | | Ball Corp | | | 430 | |
COLLEGE RETIREMENT EQUITIES FUND -Global Equities Account
| SHARES | | | | COMPANY | | VALUE
(000) | |
| | 4,275,206 | | | | Bank of America Corp | | $ | 105,341 | |
| | 183,316 | | | | Bank of New York Mellon Corp | | | 8,629 | |
| | 16,205 | | * | | Bausch Health Cos, Inc | | | 300 | |
| | 746,915 | | | | Baxter International, Inc | | | 49,162 | |
| | 127,640 | | | | BB&T Corp | | | 5,529 | |
| | 43,892 | | | | Becton Dickinson & Co | | | 9,890 | |
| | 1,206,763 | | | | Bed Bath & Beyond, Inc | | | 13,661 | |
| | 507,837 | | * | | Berkshire Hathaway, Inc (Class B) | | | 103,690 | |
| | 439,784 | | * | | Berry Plastics Group, Inc | | | 20,903 | |
| | 204,528 | | | | Best Buy Co, Inc | | | 10,832 | |
| | 37,325 | | * | | Biogen Idec, Inc | | | 11,232 | |
| | 4,880 | | * | | BioMarin Pharmaceutical, Inc | | | 416 | |
| | 3,364 | | | | BlackRock, Inc | | | 1,321 | |
| | 165,000 | | | | Blackstone Group LP | | | 4,919 | |
| | 509,782 | | | | Boeing Co | | | 164,405 | |
| | 1,340 | | * | | Booking Holdings, Inc | | | 2,308 | |
| | 6,046 | | | | BorgWarner, Inc | | | 210 | |
| | 38,270 | | | | Boston Properties, Inc | | | 4,307 | |
| | 1,167,531 | | * | | Boston Scientific Corp | | | 41,261 | |
| | 3,189 | | * | | Brighthouse Financial, Inc | | | 97 | |
| | 182,681 | | | | Bristol-Myers Squibb Co | | | 9,496 | |
| | 177,309 | | | | Broadcom, Inc | | | 45,086 | |
| | 3,250 | | | | Broadridge Financial Solutions, Inc | | | 313 | |
| | 5,143 | | | | Brookfield Property REIT, Inc | | | 83 | |
| | 7,789 | | | | Brown-Forman Corp (Class B) | | | 371 | |
| | 80,392 | | | | BRP, Inc (Toronto) | | | 2,081 | |
| | 228,066 | | | | Bunge Ltd | | | 12,188 | |
| | 984,638 | | | | Burford Capital Ltd | | | 20,772 | |
| | 73,679 | | * | | Burlington Stores, Inc | | | 11,985 | |
| | 12,568 | | | | Cabot Oil & Gas Corp | | | 281 | |
| | 183,569 | | * | | CACI International, Inc (Class A) | | | 26,439 | |
| | 298,973 | | | | Cadence BanCorp | | | 5,017 | |
| | 7,730 | | * | | Cadence Design Systems, Inc | | | 336 | |
| | 188,000 | | | | Callaway Golf Co | | | 2,876 | |
| | 18,893 | | | | Camden Property Trust | | | 1,664 | |
| | 4,894 | | | | Campbell Soup Co | | | 161 | |
| | 58,998 | | | | Capital One Financial Corp | | | 4,460 | |
| | 8,701 | | | | Cardinal Health, Inc | | | 388 | |
| | 5,050 | | * | | CarMax, Inc | | | 317 | |
| | 11,925 | | | | Carnival Corp | | | 588 | |
| | 9,257 | | | | Carnival plc | | | 445 | |
| | 744,421 | | | | Caterpillar, Inc | | | 94,594 | |
| | 3,211 | | | | CBOE Holdings, Inc | | | 314 | |
| | 9,173 | | * | | CBRE Group, Inc | | | 367 | |
| | 812,745 | | | | CBS Corp (Class B) | | | 35,533 | |
| | 3,550 | | | | CDK Global, Inc | | | 170 | |
| | 474,804 | | | | CDW Corp | | | 38,483 | |
| | 3,657 | | | | Celanese Corp (Series A) | | | 329 | |
| | 39,984 | | * | | Celgene Corp | | | 2,563 | |
| | 194,104 | | * | | Centene Corp | | | 22,380 | |
| | 13,748 | | | | Centerpoint Energy, Inc | | | 388 | |
| | 26,838 | | | | CenturyLink, Inc | | | 407 | |
| | 8,258 | | * | | Cerner Corp | | | 433 | |
COLLEGE RETIREMENT EQUITIES FUND -Global Equities Account
| SHARES | | | | COMPANY | | VALUE
(000) | |
| | 331,642 | | | | CF Industries Holdings, Inc | | $ | 14,430 | |
| | 3,812 | | | | CH Robinson Worldwide, Inc | | | 321 | |
| | 34,093 | | | | Charles Schwab Corp | | | 1,416 | |
| | 18,972 | | * | | Charter Communications, Inc | | | 5,406 | |
| | 75,699 | | | | Chemed Corp | | | 21,444 | |
| | 383,731 | | | | Chemours Co | | | 10,829 | |
| | 89,876 | | * | | Cheniere Energy, Inc | | | 5,320 | |
| | 1,787,012 | | | | Chevron Corp | | | 194,409 | |
| | 749 | | * | | Chipotle Mexican Grill, Inc (Class A) | | | 323 | |
| | 148,100 | | | | Chubb Ltd | | | 19,132 | |
| | 6,683 | | | | Church & Dwight Co, Inc | | | 439 | |
| | 160,000 | | * | | Ciena Corp | | | 5,426 | |
| | 240,598 | | | | Cigna Corp | | | 45,694 | |
| | 37,747 | | | | Cimarex Energy Co | | | 2,327 | |
| | 4,306 | | | | Cincinnati Financial Corp | | | 333 | |
| | 2,443 | | | | Cintas Corp | | | 410 | |
| | 4,452,574 | | | | Cisco Systems, Inc | | | 192,930 | |
| | 3,561 | | | | CIT Group, Inc | | | 136 | |
| | 540,690 | | | | Citigroup, Inc | | | 28,148 | |
| | 527,973 | | | | Citizens Financial Group, Inc | | | 15,697 | |
| | 94,394 | | | | Citrix Systems, Inc | | | 9,672 | |
| | 3,534 | | | | Clorox Co | | | 545 | |
| | 21,358 | | | | CME Group, Inc | | | 4,018 | |
| | 8,153 | | | | CMS Energy Corp | | | 405 | |
| | 3,164,943 | | | | Coca-Cola Co | | | 149,860 | |
| | 4,656 | | | | Cognex Corp | | | 180 | |
| | 16,347 | | | | Cognizant Technology Solutions Corp (Class A) | | | 1,038 | |
| | 140,877 | | * | | Colfax Corp | | | 2,944 | |
| | 23,167 | | | | Colgate-Palmolive Co | | | 1,379 | |
| | 2,486,598 | | | | Comcast Corp (Class A) | | | 84,669 | |
| | 4,757 | | | | Comerica, Inc | | | 327 | |
| | 5,225 | | * | | CommScope Holding Co, Inc | | | 86 | |
| | 2,960,443 | | | | ConAgra Brands, Inc | | | 63,235 | |
| | 743,718 | | * | | Concho Resources, Inc | | | 76,447 | |
| | 32,696 | | | | ConocoPhillips | | | 2,039 | |
| | 8,578 | | | | Consolidated Edison, Inc | | | 656 | |
| | 174,886 | | | | Constellation Brands, Inc (Class A) | | | 28,125 | |
| | 64,861 | | * | | Continental Resources, Inc | | | 2,607 | |
| | 5,992 | | | | Cooper Cos, Inc | | | 1,525 | |
| | 5,954 | | * | | Copart, Inc | | | 284 | |
| | 361,291 | | | | Corning, Inc | | | 10,915 | |
| | 1,004 | | * | | CoStar Group, Inc | | | 339 | |
| | 532,406 | | | | Costco Wholesale Corp | | | 108,456 | |
| | 21,128 | | | | Coty, Inc | | | 139 | |
| | 42,580 | | * | | Credit Acceptance Corp | | | 16,255 | |
| | 80,000 | | * | | Cree, Inc | | | 3,422 | |
| | 225,598 | | | | Crown Castle International Corp | | | 24,507 | |
| | 1,292,283 | | * | | Crown Holdings, Inc | | | 53,720 | |
| | 707,613 | | | | CSX Corp | | | 43,964 | |
| | 16,235 | | | | CubeSmart | | | 466 | |
| | 4,293 | | | | Cummins, Inc | | | 574 | |
| | 1,143,711 | | | | CVS Health Corp | | | 74,936 | |
| | 130,644 | | | | Danaher Corp | | | 13,472 | |
COLLEGE RETIREMENT EQUITIES FUND -Global Equities Account
| SHARES | | | | COMPANY | | VALUE
(000) | |
| | 94,421 | | | | Darden Restaurants, Inc | | $ | 9,429 | |
| | 3,907 | | * | | DaVita, Inc | | | 201 | |
| | 117,053 | | * | | Deckers Outdoor Corp | | | 14,977 | |
| | 112,836 | | | | Deere & Co | | | 16,832 | |
| | 117,708 | | | | Delek US Holdings, Inc | | | 3,827 | |
| | 3,741 | | * | | Dell Technologies, Inc | | | 183 | |
| | 63,297 | | | | Delta Air Lines, Inc | | | 3,159 | |
| | 208,171 | | | | Deluxe Corp | | | 8,002 | |
| | 6,355 | | | | Dentsply Sirona, Inc | | | 236 | |
| | 14,284 | | | | Devon Energy Corp | | | 322 | |
| | 2,541 | | * | | DexCom, Inc | | | 304 | |
| | 81,230 | | | | Diamondback Energy, Inc | | | 7,530 | |
| | 40,588 | | | | DiamondRock Hospitality Co | | | 369 | |
| | 5,799 | | | | Digital Realty Trust, Inc | | | 618 | |
| | 9,785 | | | | Discover Financial Services | | | 577 | |
| | 4,256 | | *,e | | Discovery, Inc (Class A) | | | 105 | |
| | 8,661 | | * | | Discovery, Inc (Class C) | | | 200 | |
| | 23,766 | | * | | DISH Network Corp (Class A) | | | 593 | |
| | 194,448 | | | | Dollar General Corp | | | 21,016 | |
| | 6,707 | | * | | Dollar Tree, Inc | | | 606 | |
| | 201,919 | | | | Dominion Resources, Inc | | | 14,429 | |
| | 1,109 | | | | Domino’s Pizza, Inc | | | 275 | |
| | 4,109 | | | | Dover Corp | | | 292 | |
| | 567,263 | | | | DowDuPont, Inc | | | 30,337 | |
| | 10,222 | | | | DR Horton, Inc | | | 354 | |
| | 5,077 | | | | DTE Energy Co | | | 560 | |
| | 19,852 | | | | Duke Energy Corp | | | 1,713 | |
| | 220,563 | | | | Duke Realty Corp | | | 5,713 | |
| | 51,089 | | | | Dun & Bradstreet Corp | | | 7,292 | |
| | 833,423 | | | | DXC Technology Co | | | 44,313 | |
| | 1,154,975 | | | | E*TRADE Financial Corp | | | 50,680 | |
| | 3,969 | | | | East West Bancorp, Inc | | | 173 | |
| | 3,829 | | | | Eastman Chemical Co | | | 280 | |
| | 69,761 | | | | Eaton Corp | | | 4,790 | |
| | 3,632 | | | | Eaton Vance Corp | | | 128 | |
| | 238,224 | | * | | eBay, Inc | | | 6,687 | |
| | 34,682 | | | | Ecolab, Inc | | | 5,110 | |
| | 35,989 | | | | Edison International | | | 2,043 | |
| | 401,096 | | * | | Edwards Lifesciences Corp | | | 61,436 | |
| | 8,592 | | * | | Electronic Arts, Inc | | | 678 | |
| | 788,940 | | | | Eli Lilly & Co | | | 91,296 | |
| | 160,860 | | | | EMCOR Group, Inc | | | 9,602 | |
| | 440,813 | | | | Emerson Electric Co | | | 26,339 | |
| | 321,719 | | | | Encompass Health Corp | | | 19,850 | |
| | 81,676 | | | | Entergy Corp | | | 7,030 | |
| | 1,305,356 | | | | EOG Resources, Inc | | | 113,840 | |
| | 3,454 | | | | Equifax, Inc | | | 322 | |
| | 3,728 | | | | Equinix, Inc | | | 1,314 | |
| | 45,614 | | | | Equity Lifestyle Properties, Inc | | | 4,430 | |
| | 35,166 | | | | Equity Residential | | | 2,321 | |
| | 11,318 | | | | Essex Property Trust, Inc | | | 2,775 | |
| | 74,716 | | | | Estee Lauder Cos (Class A) | | | 9,721 | |
| | 1,185 | | | | Everest Re Group Ltd | | | 258 | |
COLLEGE RETIREMENT EQUITIES FUND -Global Equities Account
| SHARES | | | | COMPANY | | VALUE
(000) | |
| | 7,772 | | | | Evergy, Inc | | $ | 441 | |
| | 8,918 | | | | Eversource Energy | | | 580 | |
| | 96,959 | | | | Exelon Corp | | | 4,373 | |
| | 79,466 | | | | Expedia, Inc | | | 8,952 | |
| | 4,842 | | | | Expeditors International of Washington, Inc | | | 330 | |
| | 14,465 | | | | Extra Space Storage, Inc | | | 1,309 | |
| | 1,716,518 | | d | | Exxon Mobil Corp | | | 117,049 | |
| | 47,546 | | * | | F5 Networks, Inc | | | 7,704 | |
| | 1,329,056 | | * | | Facebook, Inc | | | 174,226 | |
| | 8,039 | | | | Fastenal Co | | | 420 | |
| | 11,260 | | | | Federal Realty Investment Trust | | | 1,329 | |
| | 263,559 | | | | FedEx Corp | | | 42,520 | |
| | 12,239 | | | | Ferguson plc | | | 782 | |
| | 9,243 | | | | Fidelity National Information Services, Inc | | | 948 | |
| | 18,773 | | | | Fifth Third Bancorp | | | 442 | |
| | 170,702 | | * | | First American Corp | | | 5,705 | |
| | 15,048 | | * | | First Data Corp | | | 254 | |
| | 4,475 | | | | First Republic Bank | | | 389 | |
| | 584,226 | | | | FirstEnergy Corp | | | 21,938 | |
| | 11,409 | | * | | Fiserv, Inc | | | 838 | |
| | 2,542 | | * | | FleetCor Technologies, Inc | | | 472 | |
| | 14,343 | | * | | Flextronics International Ltd | | | 109 | |
| | 3,837 | | | | Flir Systems, Inc | | | 167 | |
| | 4,027 | | | | Flowserve Corp | | | 153 | |
| | 4,357 | | | | Fluor Corp | | | 140 | |
| | 3,691 | | | | FMC Corp | | | 273 | |
| | 7,952 | | | | FNF Group | | | 250 | |
| | 102,663 | | | | Ford Motor Co | | | 785 | |
| | 145,964 | | * | | Fortinet, Inc | | | 10,280 | |
| | 205,426 | | | | Fortive Corp | | | 13,899 | |
| | 4,086 | | | | Fortune Brands Home & Security, Inc | | | 155 | |
| | 25,000 | | | | Four Corners Property Trust, Inc | | | 655 | |
| | 8,767 | | | | Franklin Resources, Inc | | | 260 | |
| | 2,519,953 | | | | Freeport-McMoRan Copper & Gold, Inc (Class B) | | | 25,981 | |
| | 365,891 | | | | Gaming and Leisure Properties, Inc | | | 11,822 | |
| | 7,110 | | | | Gap, Inc | | | 183 | |
| | 3,197 | | | | Garmin Ltd | | | 202 | |
| | 2,652 | | * | | Gartner, Inc | | | 339 | |
| | 85,016 | | | | General Dynamics Corp | | | 13,365 | |
| | 3,574,791 | | | | General Electric Co | | | 27,061 | |
| | 16,416 | | | | General Mills, Inc | | | 639 | |
| | 69,850,000 | | *,† | | General Motors Co | | | 0 | |
| | 530,757 | | *,† | | General Motors Co | | | 0 | |
| �� | 18,159,000 | | *,† | | General Motors Co | | | 0 | |
| | 35,567 | | | | General Motors Co | | | 1,190 | |
| | 61,921,000 | | *,†,e | | General Motors Co | | | 0 | |
| | 18,106,794 | | *,†,e | | General Motors Co | | | 0 | |
| | 4,461,000 | | *,† | | General Motors Co | | | 0 | |
| | 26,439,985 | | *,† | | General Motors Co | | | 0 | |
| | 13,592,224 | | *,† | | General Motors Co | | | 0 | |
| | 19,417,463 | | *,† | | General Motors Co | | | 0 | |
| | 29,845,445 | | *,† | | General Motors Co | | | 0 | |
| | 4,121 | | | | Genuine Parts Co | | | 396 | |
COLLEGE RETIREMENT EQUITIES FUND -Global Equities Account
| SHARES | | | | COMPANY | | VALUE
(000) | |
| | 797,549 | | | | Gilead Sciences, Inc | | $ | 49,887 | |
| | 4,401 | | | | Global Payments, Inc | | | 454 | |
| | 4,500 | | * | | GoDaddy, Inc | | | 295 | |
| | 209,298 | | | | Goldman Sachs Group, Inc | | | 34,963 | |
| | 6,779 | | | | Goodyear Tire & Rubber Co | | | 138 | |
| | 89,009 | | * | | Green Dot Corp | | | 7,078 | |
| | 950,000 | | * | | Groupon, Inc | | | 3,040 | |
| | 48,464 | | * | | GrubHub, Inc | | | 3,723 | |
| | 47,628 | | *,e | | Guardant Health, Inc | | | 1,790 | |
| | 6,495 | | | | H&R Block, Inc | | | 165 | |
| | 109,703 | | | | Halliburton Co | | | 2,916 | |
| | 129,637 | | | | Hanesbrands, Inc | | | 1,624 | |
| | 4,612 | | | | Harley-Davidson, Inc | | | 157 | |
| | 3,258 | | | | Harris Corp | | | 439 | |
| | 189,255 | | | | Hartford Financial Services Group, Inc | | | 8,412 | |
| | 3,304 | | | | Hasbro, Inc | | | 268 | |
| | 236,439 | | | | HCA Holdings, Inc | | | 29,425 | |
| | 65,346 | | | | HCP, Inc | | | 1,825 | |
| | 356,138 | | * | | HD Supply Holdings, Inc | | | 13,362 | |
| | 18,000 | | | | Healthcare Trust of America, Inc | | | 456 | |
| | 3,201 | | | | Helmerich & Payne, Inc | | | 153 | |
| | 4,332 | | * | | Henry Schein, Inc | | | 340 | |
| | 3,890 | | | | Hershey Co | | | 417 | |
| | 7,548 | | | | Hess Corp | | | 306 | |
| | 743,054 | | | | Hewlett Packard Enterprise Co | | | 9,816 | |
| | 129,006 | | | | Hilltop Holdings, Inc | | | 2,300 | |
| | 7,850 | | | | Hilton Worldwide Holdings, Inc | | | 564 | |
| | 5,002 | | | | HollyFrontier Corp | | | 256 | |
| | 135,720 | | * | | Hologic, Inc | | | 5,578 | |
| | 874,046 | | | | Home Depot, Inc | | | 150,179 | |
| | 767,330 | | | | Honeywell International, Inc | | | 101,380 | |
| | 8,615 | | e | | Hormel Foods Corp | | | 368 | |
| | 105,320 | | | | Host Marriott Corp | | | 1,756 | |
| | 808,998 | | | | HP, Inc | | | 16,552 | |
| | 40,588 | | | | Hudson Pacific Properties | | | 1,179 | |
| | 90,246 | | | | Humana, Inc | | | 25,854 | |
| | 2,379,115 | | | | Huntington Bancshares, Inc | | | 28,359 | |
| | 60,967 | | | | Huntington Ingalls | | | 11,603 | |
| | 408,344 | | | | Huntsman Corp | | | 7,877 | |
| | 2,137 | | * | | IAC/InterActiveCorp | | | 391 | |
| | 2,128 | | | | IDEX Corp | | | 269 | |
| | 2,393 | | * | | IDEXX Laboratories, Inc | | | 445 | |
| | 11,056 | | * | | IHS Markit Ltd | | | 530 | |
| | 8,504 | | | | Illinois Tool Works, Inc | | | 1,077 | |
| | 30,634 | | * | | Illumina, Inc | | | 9,188 | |
| | 119,452 | | * | | Imax Corp | | | 2,247 | |
| | 5,150 | | * | | Incyte Corp | | | 327 | |
| | 257,342 | | | | Ingersoll-Rand plc | | | 23,477 | |
| | 2,112 | | | | Ingredion, Inc | | | 193 | |
| | 3,383,371 | | | | Intel Corp | | | 158,782 | |
| | 40,333 | | | | IntercontinentalExchange Group, Inc | | | 3,038 | |
| | 25,674 | | | | International Business Machines Corp | | | 2,918 | |
| | 106 | | * | | International Flavors & Fragrances, Inc | | | 14 | |
COLLEGE RETIREMENT EQUITIES FUND -Global Equities Account
| SHARES | | | | COMPANY | | VALUE
(000) | |
| | 295,896 | | | | International Flavors & Fragrances, Inc | | $ | 39,730 | |
| | 24,150 | | | | International Paper Co | | | 975 | |
| | 154,232 | | | | Interpublic Group of Cos, Inc | | | 3,182 | |
| | 31,841 | | | | Intuit, Inc | | | 6,268 | |
| | 21,457 | | * | | Intuitive Surgical, Inc | | | 10,276 | |
| | 11,532 | | | | Invesco Ltd | | | 193 | |
| | 58,326 | | | | Invitation Homes, Inc | | | 1,171 | |
| | 1,071 | | * | | IPG Photonics Corp | | | 121 | |
| | 4,559 | | * | | IQVIA Holdings, Inc | | | 530 | |
| | 7,532 | | | | Iron Mountain, Inc | | | 244 | |
| | 25,000 | | e | | iShares Dow Jones US Real Estate Index Fund | | | 1,873 | |
| | 240,713 | | | | iShares MSCI Canada Index Fund | | | 5,767 | |
| | 55,279 | | | | iShares MSCI South Korea Index Fund | | | 3,254 | |
| | 83,000 | | | | ITT, Inc | | | 4,006 | |
| | 3,332 | | | | J.M. Smucker Co | | | 312 | |
| | 2,056 | | | | Jack Henry & Associates, Inc | | | 260 | |
| | 3,566 | | | | Jacobs Engineering Group, Inc | | | 208 | |
| | 51,006 | | * | | Jazz Pharmaceuticals plc | | | 6,323 | |
| | 116,874 | | | | JB Hunt Transport Services, Inc | | | 10,874 | |
| | 18,000 | | | | JBG SMITH Properties | | | 627 | |
| | 8,331 | | | | Jefferies Financial Group, Inc | | | 145 | |
| | 827,994 | | | | Johnson & Johnson | | | 106,853 | |
| | 25,548 | | | | Johnson Controls International plc | | | 757 | |
| | 1,349 | | | | Jones Lang LaSalle, Inc | | | 171 | |
| | 2,564,209 | | | | JPMorgan Chase & Co | | | 250,318 | |
| | 9,434 | | | | Juniper Networks, Inc | | | 254 | |
| | 2,773 | | | | Kansas City Southern Industries, Inc | | | 265 | |
| | 208,171 | | | | KAR Auction Services, Inc | | | 9,934 | |
| | 7,148 | | | | Kellogg Co | | | 407 | |
| | 52,000 | | | | Kennametal, Inc | | | 1,731 | |
| | 29,446 | | | | Keycorp | | | 435 | |
| | 5,318 | | * | | Keysight Technologies, Inc | | | 330 | |
| | 19,714 | | | | Kilroy Realty Corp | | | 1,240 | |
| | 43,282 | | | | Kimberly-Clark Corp | | | 4,932 | |
| | 12,360 | | | | Kimco Realty Corp | | | 181 | |
| | 55,682 | | | | Kinder Morgan, Inc | | | 856 | |
| | 4,512 | | | | Kla-Tencor Corp | | | 404 | |
| | 3,734 | | | | Knight-Swift Transportation Holdings, Inc | | | 94 | |
| | 518,264 | | | | Kohl’s Corp | | | 34,382 | |
| | 246,021 | | | | Korn/Ferry International | | | 9,728 | |
| | 1,212,128 | | | | Kraft Heinz Co | | | 52,170 | |
| | 109,729 | | | | Kroger Co | | | 3,018 | |
| | 6,511 | | | | L Brands, Inc | | | 167 | |
| | 59,945 | | | | L3 Technologies, Inc | | | 10,410 | |
| | 18,618 | | * | | Laboratory Corp of America Holdings | | | 2,353 | |
| | 95,354 | | | | Lam Research Corp | | | 12,984 | |
| | 4,198 | | | | Lamb Weston Holdings, Inc | | | 309 | |
| | 550,493 | | | | Las Vegas Sands Corp | | | 28,653 | |
| | 153,857 | | | | Lear Corp | | | 18,903 | |
| | 3,821 | | | | Leggett & Platt, Inc | | | 137 | |
| | 180,160 | | | | Leidos Holdings, Inc | | | 9,498 | |
| | 8,401 | | | | Lennar Corp (Class A) | | | 329 | |
| | 1,047 | | | | Lennox International, Inc | | | 229 | |
COLLEGE RETIREMENT EQUITIES FUND -Global Equities Account
| SHARES | | | | COMPANY | | VALUE
(000) | |
| | 2,939 | | * | | Liberty Broadband Corp (Class C) | | $ | 212 | |
| | 5,623 | | * | | Liberty Media Group (Class C) | | | 173 | |
| | 4,023 | | | | Liberty Property Trust | | | 168 | |
| | 2,478 | | * | | Liberty SiriusXM Group (Class A) | | | 91 | |
| | 4,870 | | * | | Liberty SiriusXM Group (Class C) | | | 180 | |
| | 6,003 | | | | Lincoln National Corp | | | 308 | |
| | 3,977 | | * | | Live Nation, Inc | | | 196 | |
| | 228,220 | | * | | Livent Corp | | | 3,149 | |
| | 9,265 | | * | | LKQ Corp | | | 220 | |
| | 7,201 | | | | Lockheed Martin Corp | | | 1,886 | |
| | 7,423 | | | | Loews Corp | | | 338 | |
| | 60,679 | | | | Lowe’s Companies, Inc | | | 5,604 | |
| | 195,088 | | | | LPL Financial Holdings, Inc | | | 11,916 | |
| | 152,984 | | * | | Lululemon Athletica, Inc | | | 18,604 | |
| | 115,870 | | | | LyondellBasell Industries AF S.C.A | | | 9,636 | |
| | 204,312 | | | | M&T Bank Corp | | | 29,243 | |
| | 3,126 | | | | Macerich Co | | | 135 | |
| | 389,070 | | | | Macy’s, Inc | | | 11,586 | |
| | 58,000 | | | | Magellan Midstream Partners LP | | | 3,309 | |
| | 1,835 | | | | Manpower, Inc | | | 119 | |
| | 23,573 | | | | Marathon Oil Corp | | | 338 | |
| | 92,049 | | | | Marathon Petroleum Corp | | | 5,432 | |
| | 391 | | * | | Markel Corp | | | 406 | |
| | 8,334 | | | | Marriott International, Inc (Class A) | | | 905 | |
| | 101,171 | | | | Marsh & McLennan Cos, Inc | | | 8,068 | |
| | 1,684 | | | | Martin Marietta Materials, Inc | | | 289 | |
| | 890,620 | | | | Marvell Technology Group Ltd | | | 14,419 | |
| | 8,393 | | | | Masco Corp | | | 245 | |
| | 236,558 | | * | | Mastec, Inc | | | 9,595 | |
| | 132,058 | | | | MasterCard, Inc (Class A) | | | 24,913 | |
| | 224,764 | | * | | Matador Resources Co | | | 3,491 | |
| | 203,069 | | e | | Match Group, Inc | | | 8,685 | |
| | 11,516 | | *,e | | Mattel, Inc | | | 115 | |
| | 7,791 | | | | Maxim Integrated Products, Inc | | | 396 | |
| | 3,432 | | | | McCormick & Co, Inc | | | 478 | |
| | 549,586 | | | | McDonald’s Corp | | | 97,590 | |
| | 17,298 | | | | McKesson Corp | | | 1,911 | |
| | 148,532 | | | | Medtronic plc | | | 13,510 | |
| | 23,018 | | * | | Merrimack Pharmaceuticals, Inc | | | 89 | |
| | 41,304 | | | | Metlife, Inc | | | 1,696 | |
| | 710 | | * | | Mettler-Toledo International, Inc | | | 402 | |
| | 335,570 | | | | MGM Growth Properties LLC | | | 8,862 | |
| | 14,530 | | | | MGM Resorts International | | | 352 | |
| | 303,811 | | * | | Michael Kors Holdings Ltd | | | 11,521 | |
| | 6,552 | | e | | Microchip Technology, Inc | | | 471 | |
| | 32,531 | | * | | Micron Technology, Inc | | | 1,032 | |
| | 3,946,873 | | | | Microsoft Corp | | | 400,884 | |
| | 11,024 | | | | Mid-America Apartment Communities, Inc | | | 1,055 | |
| | 1,614 | | * | | Middleby Corp | | | 166 | |
| | 1,752 | | * | | Mohawk Industries, Inc | | | 205 | |
| | 129,977 | | * | | Molina Healthcare, Inc | | | 15,106 | |
| | 5,289 | | | | Molson Coors Brewing Co (Class B) | | | 297 | |
| | 404,554 | | | | Mondelez International, Inc | | | 16,194 | |
COLLEGE RETIREMENT EQUITIES FUND -Global Equities Account
| SHARES | | | | COMPANY | | VALUE
(000) | |
| | 686,320 | | * | | Monster Beverage Corp | | $ | 33,781 | |
| | 4,852 | | | | Moody’s Corp | | | 679 | |
| | 156,537 | | | | Morgan Stanley | | | 6,207 | |
| | 10,443 | | | | Mosaic Co | | | 305 | |
| | 148,458 | | | | Motorola, Inc | | | 17,079 | |
| | 2,469 | | | | MSCI, Inc (Class A) | | | 364 | |
| | 136,732 | | * | | Mylan NV | | | 3,746 | |
| | 3,195 | | | | NASDAQ OMX Group, Inc | | | 261 | |
| | 10,688 | | | | National Oilwell Varco, Inc | | | 275 | |
| | 4,153 | | | | National Retail Properties, Inc | | | 201 | |
| | 20,000 | | | | National Storage Affiliates Trust | | | 529 | |
| | 4,998 | | * | | Nektar Therapeutics | | | 164 | |
| | 289,410 | | | | NetApp, Inc | | | 17,269 | |
| | 49,531 | | * | | NetFlix, Inc | | | 13,257 | |
| | 14,165 | | | | Newell Rubbermaid, Inc | | | 263 | |
| | 59,532 | | | | Newmont Mining Corp | | | 2,063 | |
| | 10,623 | | | | News Corp (Class A) | | | 121 | |
| | 65,000 | | | | Nexteer Automotive Group Ltd | | | 93 | |
| | 115,715 | | | | NextEra Energy, Inc | | | 20,114 | |
| | 10,627 | | | | Nielsen NV | | | 248 | |
| | 1,323,542 | | | | Nike, Inc (Class B) | | | 98,127 | |
| | 10,131 | | | | NiSource, Inc | | | 257 | |
| | 13,550 | | | | Noble Energy, Inc | | | 254 | |
| | 176,920 | | | | Nordstrom, Inc | | | 8,246 | |
| | 7,870 | | | | Norfolk Southern Corp | | | 1,177 | |
| | 5,916 | | | | Northern Trust Corp | | | 495 | |
| | 199,467 | | | | Northrop Grumman Corp | | | 48,849 | |
| | 6,035 | | * | | Norwegian Cruise Line Holdings Ltd | | | 256 | |
| | 8,675 | | | | NRG Energy, Inc | | | 344 | |
| | 82,008 | | | | Nucor Corp | | | 4,249 | |
| | 201,163 | | | | NVIDIA Corp | | | 26,855 | |
| | 9,460 | | * | | NVR, Inc | | | 23,054 | |
| | 775,665 | | | | Occidental Petroleum Corp | | | 47,610 | |
| | 5,508 | | | | OGE Energy Corp | | | 216 | |
| | 1,809 | | | | Old Dominion Freight Line | | | 223 | |
| | 1,453,170 | | | | Olin Corp | | | 29,223 | |
| | 6,444 | | | | Omnicom Group, Inc | | | 472 | |
| | 11,630 | | * | | ON Semiconductor Corp | | | 192 | |
| | 5,798 | | * | | OneMarket Ltd | | | 2 | |
| | 116,903 | | | | Oneok, Inc | | | 6,307 | |
| | 198,813 | | | | Oracle Corp | | | 8,976 | |
| | 2,310 | | * | | O’Reilly Automotive, Inc | | | 795 | |
| | 2,993 | | | | Owens Corning, Inc | | | 132 | |
| | 9,691 | | | | PACCAR, Inc | | | 554 | |
| | 7,655 | | | | Packaging Corp of America | | | 639 | |
| | 2,537 | | * | | Palo Alto Networks, Inc | | | 478 | |
| | 212,842 | | | | Parker-Hannifin Corp | | | 31,743 | |
| | 430,861 | | * | | Parsley Energy, Inc | | | 6,885 | |
| | 9,101 | | | | Paychex, Inc | | | 593 | |
| | 1,882,141 | | * | | PayPal Holdings, Inc | | | 158,269 | |
| | 12,000 | | | | Pebblebrook Hotel Trust | | | 340 | |
| | 1,588,246 | | * | | Penn National Gaming, Inc | | | 29,907 | |
| | 11,882 | | | | People’s United Financial, Inc | | | 171 | |
COLLEGE RETIREMENT EQUITIES FUND -Global Equities Account
| SHARES | | | | COMPANY | | VALUE
(000) | |
| | 130,991 | | | | PepsiCo, Inc | | $ | 14,472 | |
| | 3,819 | | | | Perrigo Co plc | | | 148 | |
| | 1,989,025 | | | | Pfizer, Inc | | | 86,821 | |
| | 58,167 | | * | | PG&E Corp | | | 1,381 | |
| | 171,892 | | | | Philip Morris International, Inc | | | 11,476 | |
| | 66,464 | | | | Phillips 66 | | | 5,726 | |
| | 131,881 | | | | Pinnacle West Capital Corp | | | 11,236 | |
| | 29,597 | | | | Pioneer Natural Resources Co | | | 3,893 | |
| | 416,650 | | | | Plains All American Pipeline LP | | | 8,350 | |
| | 131,135 | | | | Plains GP Holdings LP | | | 2,636 | |
| | 87,107 | | | | PNC Financial Services Group, Inc | | | 10,184 | |
| | 1,647 | | | | Polaris Industries, Inc | | | 126 | |
| | 6,811 | | | | PPG Industries, Inc | | | 696 | |
| | 77,224 | | | | PPL Corp | | | 2,188 | |
| | 7,667 | | | | Principal Financial Group | | | 339 | |
| | 1,571,977 | | | | Procter & Gamble Co | | | 144,496 | |
| | 404,661 | | | | Progressive Corp | | | 24,413 | |
| | 107,656 | | | | Prologis, Inc | | | 6,322 | |
| | 44,600 | | * | | Proofpoint, Inc | | | 3,738 | |
| | 512,593 | | | | Prudential Financial, Inc | | | 41,802 | |
| | 3,091 | | * | | PTC, Inc | | | 256 | |
| | 14,168 | | | | Public Service Enterprise Group, Inc | | | 737 | |
| | 13,395 | | | | Public Storage, Inc | | | 2,711 | |
| | 499,639 | | | | Pulte Homes, Inc | | | 12,986 | |
| | 2,228 | | | | PVH Corp | | | 207 | |
| | 17,337 | | * | | QIAGEN NV (Turquoise) | | | 592 | |
| | 3,803 | | * | | Qorvo, Inc | | | 231 | |
| | 115,000 | | | | QTS Realty Trust, Inc | | | 4,261 | |
| | 305,958 | | | | QUALCOMM, Inc | | | 17,412 | |
| | 25,528 | | | | Quest Diagnostics, Inc | | | 2,126 | |
| | 636,441 | | * | | Qurate Retail Group, Inc QVC Group | | | 12,423 | |
| | 72,651 | | | | Ralph Lauren Corp | | | 7,516 | |
| | 101,824 | | | | Raymond James Financial, Inc | | | 7,577 | |
| | 8,025 | | | | Raytheon Co | | | 1,231 | |
| | 18,013 | | | | Realty Income Corp | | | 1,136 | |
| | 4,947 | | * | | Red Hat, Inc | | | 869 | |
| | 39,122 | | | | Regency Centers Corp | | | 2,296 | |
| | 2,229 | | * | | Regeneron Pharmaceuticals, Inc | | | 833 | |
| | 30,324 | | | | Regions Financial Corp | | | 406 | |
| | 1,714 | | | | Reinsurance Group of America, Inc (Class A) | | | 240 | |
| | 6,378 | | | | Republic Services, Inc | | | 460 | |
| | 156,120 | | * | | Resideo Technologies, Inc | | | 3,208 | |
| | 4,045 | | | | Resmed, Inc | | | 461 | |
| | 30,000 | | | | Retail Opportunities Investment Corp | | | 476 | |
| | 81,177 | | * | | Retrophin, Inc | | | 1,837 | |
| | 110,000 | | | | Rexford Industrial Realty, Inc | | | 3,242 | |
| | 74,000 | | * | | RH | | | 8,867 | |
| | 3,396 | | | | Robert Half International, Inc | | | 194 | |
| | 54,280 | | | | Rockwell Automation, Inc | | | 8,168 | |
| | 4,144 | | | | Rollins, Inc | | | 150 | |
| | 77,673 | | | | Roper Industries, Inc | | | 20,701 | |
| | 10,420 | | | | Ross Stores, Inc | | | 867 | |
| | 4,735 | | | | Royal Caribbean Cruises Ltd | | | 463 | |
COLLEGE RETIREMENT EQUITIES FUND -Global Equities Account
| SHARES | | | | COMPANY | | VALUE
(000) | |
| | 7,053 | | | | S&P Global, Inc | | $ | 1,199 | |
| | 301,174 | | | | Sabre Corp | | | 6,517 | |
| | 908,761 | | * | | salesforce.com, Inc | | | 124,473 | |
| | 4,049,377 | | g | | Samsonite International | | | 11,504 | |
| | 3,255 | | * | | SBA Communications Corp | | | 527 | |
| | 3,777 | | | | SCANA Corp | | | 180 | |
| | 2,161,158 | | | | Schering-Plough Corp | | | 165,134 | |
| | 173,560 | | | | Schlumberger Ltd | | | 6,262 | |
| | 8,007 | | | | Seagate Technology, Inc | | | 309 | |
| | 4,883 | | | | Sealed Air Corp | | | 170 | |
| | 32,167 | | * | | Seattle Genetics, Inc | | | 1,823 | |
| | 3,641 | | | | SEI Investments Co | | | 168 | |
| | 115,603 | | | | Sempra Energy | | | 12,507 | |
| | 4,627 | | * | | Sensata Technologies Holding plc | | | 207 | |
| | 421,102 | | * | | ServiceNow, Inc | | | 74,977 | |
| | 2,321 | | | | Sherwin-Williams Co | | | 913 | |
| | 1,613 | | | | Signature Bank | | | 166 | |
| | 63,285 | | | | Simon Property Group, Inc | | | 10,631 | |
| | 43,063 | | e | | Sirius XM Holdings, Inc | | | 246 | |
| | 4,845 | | | | Skyworks Solutions, Inc | | | 325 | |
| | 25,592 | | | | SL Green Realty Corp | | | 2,024 | |
| | 1,591 | | | | Snap-On, Inc | | | 231 | |
| | 207,281 | | *,e | | SolarEdge Technologies, Inc | | | 7,276 | |
| | 28,420 | | | | Southern Co | | | 1,248 | |
| | 934,349 | | | | Southwest Airlines Co | | | 43,429 | |
| | 3,126 | | | | Spirit Aerosystems Holdings, Inc (Class A) | | | 225 | |
| | 4,002 | | * | | Splunk, Inc | | | 420 | |
| | 83,776 | | * | | Sprint Corp | | | 488 | |
| | 8,388 | | * | | Square, Inc | | | 470 | |
| | 6,077 | | | | SS&C Technologies Holdings, Inc | | | 274 | |
| | 233,209 | | | | Stanley Works | | | 27,924 | |
| | 123,188 | | | | Starbucks Corp | | | 7,933 | |
| | 40,000 | | | | Starwood Property Trust, Inc | | | 788 | |
| | 124,703 | | | | State Street Corp | | | 7,865 | |
| | 6,426 | | | | Steel Dynamics, Inc | | | 193 | |
| | 84,498 | | | | STERIS Plc | | | 9,029 | |
| | 9,443 | | | | Stryker Corp | | | 1,480 | |
| | 22,000 | | | | Sun Communities, Inc | | | 2,238 | |
| | 55,000 | | | | Sunstone Hotel Investors, Inc | | | 716 | |
| | 244,671 | | | | SunTrust Banks, Inc | | | 12,341 | |
| | 44,151 | | * | | SVB Financial Group | | | 8,385 | |
| | 17,645 | | | | Symantec Corp | | | 333 | |
| | 305,879 | | | | Synchrony Financial | | | 7,176 | |
| | 169,805 | | * | | Synopsys, Inc | | | 14,304 | |
| | 13,843 | | | | Sysco Corp | | | 867 | |
| | 6,883 | | | | T Rowe Price Group, Inc | | | 635 | |
| | 18,266 | | * | | Take-Two Interactive Software, Inc | | | 1,880 | |
| | 7,929 | | | | Tapestry, Inc | | | 268 | |
| | 6,547 | | | | Targa Resources Investments, Inc | | | 236 | |
| | 520,457 | | | | Target Corp | | | 34,397 | |
| | 8,204 | | | | TD Ameritrade Holding Corp | | | 402 | |
| | 301,579 | | | | TE Connectivity Ltd | | | 22,808 | |
| | 1,333 | | | | Teleflex, Inc | | | 345 | |
COLLEGE RETIREMENT EQUITIES FUND -Global Equities Account
| SHARES | | | | COMPANY | | VALUE
(000) | |
| | 185,090 | | * | | Tenet Healthcare Corp | | $ | 3,172 | |
| | 515,718 | | | | Terex Corp | | | 14,218 | |
| | 16,235 | | | | Terreno Realty Corp | | | 571 | |
| | 3,581 | | * | | Tesla, Inc | | | 1,192 | |
| | 170,322 | | | | Tetra Tech, Inc | | | 8,818 | |
| | 62,430 | | | | Texas Instruments, Inc | | | 5,900 | |
| | 763,172 | | | | Textron, Inc | | | 35,098 | |
| | 38,737 | | | | Thermo Fisher Scientific, Inc | | | 8,669 | |
| | 3,054 | | | | Tiffany & Co | | | 246 | |
| | 34,963 | | | | TJX Companies, Inc | | | 1,564 | |
| | 75,017 | | * | | T-Mobile US, Inc | | | 4,772 | |
| | 3,186 | | | | Torchmark Corp | | | 237 | |
| | 222,530 | | | | Total System Services, Inc | | | 18,089 | |
| | 3,487 | | | | Tractor Supply Co | | | 291 | |
| | 39,197 | | * | | TransDigm Group, Inc | | | 13,329 | |
| | 600,013 | | * | | Transocean Ltd (NYSE) | | | 4,164 | |
| | 5,198 | | | | TransUnion | | | 295 | |
| | 7,512 | | | | Travelers Cos, Inc | | | 900 | |
| | 837,600 | | | | Travelport Worldwide Ltd | | | 13,083 | |
| | 121,935 | | * | | Trimble Navigation Ltd | | | 4,013 | |
| | 3,068 | | * | | TripAdvisor, Inc | | | 165 | |
| | 693,199 | | | | Tronox Ltd | | | 5,393 | |
| | 29,575 | | | | Twenty-First Century Fox, Inc | | | 1,423 | |
| | 12,376 | | | | Twenty-First Century Fox, Inc (Class B) | | | 591 | |
| | 19,082 | | * | | Twitter, Inc | | | 548 | |
| | 8,189 | | | | Tyson Foods, Inc (Class A) | | | 437 | |
| | 7,380 | | | | UDR, Inc | | | 292 | |
| | 5,033 | | | | UGI Corp | | | 269 | |
| | 93,028 | | * | | Ulta Beauty, Inc | | | 22,777 | |
| | 5,484 | | * | | Under Armour, Inc | | | 89 | |
| | 756,481 | | *,e | | Under Armour, Inc (Class A) | | | 13,367 | |
| | 1,044,291 | | | | Union Pacific Corp | | | 144,352 | |
| | 2,001 | | * | | United Continental Holdings, Inc | | | 168 | |
| | 71,128 | | | | United Parcel Service, Inc (Class B) | | | 6,937 | |
| | 221,146 | | * | | United Rentals, Inc | | | 22,674 | |
| | 23,012 | | | | United Technologies Corp | | | 2,450 | |
| | 1,239 | | * | | United Therapeutics Corp | | | 135 | |
| | 826,397 | | | | UnitedHealth Group, Inc | | | 205,872 | |
| | 2,439 | | | | Universal Health Services, Inc (Class B) | | | 284 | |
| | 6,030 | | | | UnumProvident Corp | | | 177 | |
| | 268,246 | | * | | Urban Outfitters, Inc | | | 8,906 | |
| | 43,588 | | | | US Bancorp | | | 1,992 | |
| | 60,965 | | * | | USANA Health Sciences, Inc | | | 7,177 | |
| | 1,121 | | | | Vail Resorts, Inc | | | 236 | |
| | 121,392 | | | | Valero Energy Corp | | | 9,101 | |
| | 550,000 | | | | Vanguard Emerging Markets ETF | | | 20,955 | |
| | 50,000 | | | | Vanguard FTSE Developed Markets ETF | | | 1,855 | |
| | 2,581 | | * | | Varian Medical Systems, Inc | | | 292 | |
| | 3,305 | | * | | Veeva Systems, Inc | | | 295 | |
| | 32,988 | | | | Ventas, Inc | | | 1,933 | |
| | 28,052 | | | | VEREIT, Inc | | | 201 | |
| | 2,935 | | * | | VeriSign, Inc | | | 435 | |
| | 4,315 | | * | | Verisk Analytics, Inc | | | 470 | |
COLLEGE RETIREMENT EQUITIES FUND -Global Equities Account
| SHARES | | | | COMPANY | | VALUE
(000) | |
| | 868,322 | | | | Verizon Communications, Inc | | $ | 48,817 | |
| | 34,995 | | * | | Vertex Pharmaceuticals, Inc | | | 5,799 | |
| | 9,275 | | | | VF Corp | | | 662 | |
| | 165,220 | | | | Viacom, Inc (Class B) | | | 4,246 | |
| | 292,998 | | | | Virtu Financial, Inc | | | 7,548 | |
| | 1,257,646 | | | | Visa, Inc (Class A) | | | 165,934 | |
| | 36,593 | | * | | Vistra Energy Corp | | | 838 | |
| | 62,443 | | | | VMware, Inc (Class A) | | | 8,563 | |
| | 4,558 | | | | Vornado Realty Trust | | | 283 | |
| | 191,288 | | | | Voya Financial, Inc | | | 7,678 | |
| | 3,731 | | | | Vulcan Materials Co | | | 369 | |
| | 2,815 | | | | W.R. Berkley Corp | | | 208 | |
| | 98,507 | | | | W.W. Grainger, Inc | | | 27,814 | |
| | 1,553 | | * | | WABCO Holdings, Inc | | | 167 | |
| | 2,669 | | e | | Wabtec Corp | | | 187 | |
| | 258,661 | | | | Walgreens Boots Alliance, Inc | | | 17,674 | |
| | 769,812 | | | | Walmart, Inc | | | 71,708 | |
| | 605,945 | | | | Walt Disney Co | | | 66,442 | |
| | 7,427 | | | | Waste Connections, Inc | | | 551 | |
| | 224,610 | | | | Waste Management, Inc | | | 19,988 | |
| | 2,167 | | * | | Waters Corp | | | 409 | |
| | 1,603 | | *,e | | Wayfair, Inc | | | 144 | |
| | 8,682 | | | | WEC Energy Group, Inc | | | 601 | |
| | 50,396 | | * | | WellCare Health Plans, Inc | | | 11,898 | |
| | 1,683,537 | | | | Wells Fargo & Co | | | 77,577 | |
| | 40,269 | | | | Welltower, Inc | | | 2,795 | |
| | 208,375 | | | | Western Digital Corp | | | 7,704 | |
| | 12,803 | | | | Western Union Co | | | 218 | |
| | 95,428 | | | | Westlake Chemical Corp | | | 6,314 | |
| | 6,776 | | | | WestRock Co | | | 256 | |
| | 43,645 | | | | Weyerhaeuser Co | | | 954 | |
| | 1,838 | | | | Whirlpool Corp | | | 196 | |
| | 283,990 | | | | Williams Cos, Inc | | | 6,262 | |
| | 145,707 | | e | | Williams-Sonoma, Inc | | | 7,351 | |
| | 3,685 | | | | Willis Towers Watson plc | | | 560 | |
| | 4,114 | | * | | Workday, Inc | | | 657 | |
| | 81,611 | | * | | Worldpay, Inc | | | 6,238 | |
| | 4,545 | | | | WP Carey, Inc | | | 297 | |
| | 180,000 | | * | | WPX Energy, Inc | | | 2,043 | |
| | 233,170 | | | | WR Grace and Co | | | 15,135 | |
| | 286,706 | | | | Wynn Resorts Ltd | | | 28,358 | |
| | 109,480 | | | | Xcel Energy, Inc | | | 5,394 | |
| | 6,734 | | | | Xerox Corp | | | 133 | |
| | 346,977 | | | | Xilinx, Inc | | | 29,552 | |
| | 3,744 | | * | | XPO Logistics, Inc | | | 214 | |
| | 4,957 | | | | Xylem, Inc | | | 331 | |
| | 36,415 | | | | Yum! Brands, Inc | | | 3,347 | |
| | 6,064 | | * | | Zayo Group Holdings, Inc | | | 138 | |
| | 56,454 | | * | | Zebra Technologies Corp (Class A) | | | 8,989 | |
| | 3,849 | | *,e | | Zillow Group, Inc (Class C) | | | 122 | |
| | 366,737 | | | | Zimmer Biomet Holdings, Inc | | | 38,038 | |
| | 789,626 | | | | Zions Bancorporation | | | 32,169 | |
| | 423,151 | | | | Zoetis, Inc | | | 36,196 | |
COLLEGE RETIREMENT EQUITIES FUND- Global Equities Account
| SHARES | | | | | COMPANY | | | | | | | VALUE
(000) | |
| | 17,135 | | | *,e | | Zscaler, Inc | | | | | | | | $ | 672 | |
| | | | | | | TOTAL UNITED STATES | | | | | | | | | 10,514,934 | |
| | | | | | | | | | | | | | | | | |
| URUGUAY - 0.2% |
| | 5,114,107 | | | | | Arcos Dorados Holdings, Inc | | | | | | | | | 40,401 | |
| | | | | | | TOTAL URUGUAY | | | | | | | | | 40,401 | |
| | | | | | | | | | | | | | | | | |
| ZAMBIA - 0.1% |
| | 1,550,866 | | | | | First Quantum Minerals Ltd | | | | | | | | | 12,541 | |
| | | | | | | TOTAL ZAMBIA | | | | | | | | | 12,541 | |
| | | | | | | | | | | | | | | | | |
| | | | | | | TOTAL COMMON STOCKS | | | | | | | | | 17,959,062 | |
| | | | | | | (Cost $18,562,046) | | | | | | | | | | |
| | | | | | | | | | | | | | | | | |
| RIGHTS / WARRANTS - 0.0% |
| |
| SPAIN - 0.0% |
| | 71,908 | | | e | | Repsol S.A. | | | | | | | | | 33 | |
| | | | | | | TOTAL SPAIN | | | | | | | | | 33 | |
| | | | | | | | | | | | | | | | | |
| THAILAND - 0.0% |
| | 90,178 | | | | | BTS Group Holdings PCL | | | | | | | | | 1 | |
| | | | | | | TOTAL THAILAND | | | | | | | | | 1 | |
| | | | | | | | | | | | | | | | | |
| | | | | | | TOTAL RIGHTS / WARRANTS | | | | | | | | | 34 | |
| | | | | | | (Cost $33) | | | | | | | | | | |
| | | | | | | | | | | | | | | | | |
| PRINCIPAL | | | | | ISSUER | | RATE | | | MATURITY
DATE | | | |
| | | | | | | | | | | | | | | | | |
| SHORT-TERM INVESTMENTS - 2.9% |
| | | | | | | | | | | | | | | | | |
| GOVERNMENT AGENCY DEBT - 0.1% |
| $ | 25,000,000 | | | | | Federal Home Loan Bank (FHLB) | | | 2.150 | % | | 01/02/19 | | | 25,000 | |
| | | | | | | TOTAL GOVERNMENT AGENCY DEBT | | | | | | | | | 25,000 | |
| | | | | | | | | | | | | | | | | |
| TREASURY DEBT - 1.3% |
| | 139,620,000 | | | | | United States Treasury Bill | | | 2.253-2.286 | | | 01/08/19 | | | 139,567 | |
| | 40,870,000 | | | | | United States Treasury Bill | | | 2.252-2.293 | | | 01/15/19 | | | 40,836 | |
| | 48,640,000 | | | | | United States Treasury Bill | | | 2.316 | | | 01/22/19 | | | 48,577 | |
| | 14,100,000 | | | | | United States Treasury Bill | | | 2.318 | | | 02/21/19 | | | 14,053 | |
| | | | | | | TOTAL TREASURY DEBT | | | | | | | | | 243,033 | |
| | | | | | | | | | | | | | | | | |
| INVESTMENT OF CASH COLLATERAL FOR SECURITIES LOANED - 1.5% |
| |
| CERTIFICATE OF DEPOSIT - 0.1% |
| | 7,000,000 | | | | | Credit Agricole | | | 2.615 | | | 04/17/19 | | | 7,000 | |
| | 6,000,000 | | | | | Mizuho Bank Ltd | | | 2.529 | | | 04/02/19 | | | 6,000 | |
| | | | | | | TOTAL CERTIFICATE OF DEPOSIT | | | | | | | | | 13,000 | |
| | | | | | | | | | | | | | | | | |
| COMMERCIAL PAPER - 0.4% |
| | 6,250,000 | | | | | Australia & New Zealand Banking Group Ltd | | | 0.010 | | | 02/01/19 | | | 6,236 | |
| | 5,000,000 | | | | | Bedford Row Funding Corp | | | 2.615 | | | 04/15/19 | | | 5,000 | |
| | 9,000,000 | | | | | Can Ast & Can Ltd Jt | | | 2.905 | | | 05/01/19 | | | 8,914 | |
| | 7,000,000 | | | | | Canadian Imperial Bank of Commerce | | | 2.560 | | | 10/01/19 | | | 7,000 | |
| | 6,000,000 | | | | | ING US Funding Llc | | | 0.010 | | | 03/29/19 | | | 5,962 | |
| | 2,000,000 | | | | | Matchpoint Finance Plc | | | 0.010 | | | 01/02/19 | | | 2,000 | |
| | 4,000,000 | | | | | Matchpoint Finance Plc | | | 0.010 | | | 02/08/19 | | | 3,989 | |
| | 4,000,000 | | | | | National Bank of Canada | | | 2.539 | | | 07/01/19 | | | 4,000 | |
| | 5,000,000 | | | | | Natixis NY | | | 2.480 | | | 01/31/19 | | | 4,990 | |
| | 9,000,000 | | | | | Old Line Funding Llc | | | 2.801 | | | 03/15/19 | | | 8,948 | |
COLLEGE RETIREMENT EQUITIES FUND- Global Equities Account
| PRINCIPAL | | | | | ISSUER | | RATE | | MATURITY
DATE | | VALUE
(000) | |
| $ | 7,000,000 | | | | | Ridgefield Funding Co | | | 0.010 | % | | 01/03/19 | | $ | 6,999 | |
| | 2,000,000 | | | | | Versailles CDS LLC | | | 2.649 | | | 02/06/19 | | | 1,995 | |
| | | | | | | TOTAL COMMERCIAL PAPER | | | | | | | | | 66,033 | |
| | | | | | | | | | | | | | | | | |
| REPURCHASE AGREEMENT - 1.0% |
| | 6,000,000 | | | p | | Calyon | | | 2.970 | | | 01/02/19 | | | 6,000 | |
| | 30,000,000 | | | q | | Citigroup | | | 2.960 | | | 01/02/19 | | | 30,000 | |
| | 23,000,000 | | | r | | HSBC | | | 2.950 | | | 01/02/19 | | | 23,000 | |
| | 22,000,000 | | | s | | JP Morgan | | | 3.000 | | | 01/02/19 | | | 22,000 | |
| | 2,000,000 | | | t | | JP Morgan | | | 2.950 | | | 01/02/19 | | | 2,000 | |
| | 51,000,000 | | | u | | Merrill Lynch | | | 3.000 | | | 01/02/19 | | | 51,000 | |
| | 23,000,000 | | | v | | NatWest Markets | | | 2.950 | | | 01/02/19 | | | 23,000 | |
| | 18,000,000 | | | w | | Nomura | | | 3.000 | | | 01/02/19 | | | 18,000 | |
| | | | | | | TOTAL REPURCHASE AGREEMENT | | | | | | | | | 175,000 | |
| | | | | | | | | | | | | | | | | |
| VARIABLE RATE SECURITIES - 0.0% |
| | 2,000,000 | | | i | | DNB Nor Bank ASA | | | 2.570 | | | 03/14/19 | | | 2,000 | |
| | 1,740,123 | | | i | | SLM Student Loan Trust | | | 2.530 | | | 01/25/19 | | | 1,740 | |
| | | | | | | TOTAL VARIABLE RATE SECURITIES | | | | | | | | | 3,740 | |
| | | | | | | | | | | | | | | | | |
| | | | | | | TOTAL INVESTMENT OF CASH COLLATERAL FOR SECURITIES LOANED | | | 257,773 | |
| | | | | | | | | | | | | | | | | |
| | | | | | | TOTAL SHORT-TERM INVESTMENTS | | | | | | | | | 525,806 | |
| | | | | | | (Cost $525,793) | | | | | | | | | | |
| | | | | | | | | | | | | | | | | |
| | | | | | | TOTAL INVESTMENTS - 101.5% | | | | | | | | | 18,484,902 | |
| | | | | | | (Cost $19,087,872) | | | | | | | | | | |
| | | | | | | OTHER ASSETS & LIABILITIES, NET - (1.5)% | | | | | | | | | (271,039 | ) |
| | | | | | | NET ASSETS - 100.0% | | | | | | | | $ | 18,213,863 | |
| | | | |
| | | Abbreviation(s): |
| ADR | | American Depositary Receipt |
| ETF | | Exchange Traded Fund |
| GDR | | Global Depositary Receipt |
| OTC | | Over The Counter |
| REIT | | Real Estate Investment Trust |
| * | | Non-income producing |
| ^ | | Amount represents less than $1,000. |
| † | | Security is categorized as Level 3 in the fair value hierarchy. |
| d | | All or a portion of these securities have been segregated to cover margin requirements on open futures contracts. |
| e | | All or a portion of these securities are out on loan. The aggregate value of securities on loan is $257,172,550. |
| g | | Security is exempt from registration under Rule 144(A) of the Securities Act of 1933. Such securities are deemed liquid and may be resold in transactions exempt from registration to qualified institutional buyers. At 12/31/18, the aggregate value of these securities was $170,655,994 or 0.9% of net assets. |
| h | | All or a portion of these securities were purchased on a delayed delivery basis. |
| i | | Floating or variable rate security includes the reference rate and spread, unless the variable rate is based on the underlying asset of the security. Coupon rate reflects the rate at period end. |
COLLEGE RETIREMENT EQUITIES FUND- Global Equities Account
| p | | Agreement with Calyon, 2.97% dated 12/31/18 to be repurchased at $6,000,000 on 01/02/19, collateralized by U.S. Government Agency Securities valued at $6,120,000. |
| q | | Agreement with Citigroup, 2.96% dated 12/31/18 to be repurchased at $30,000,000 on 01/02/19, collateralized by U.S. Government Agency Securities valued at $30,609,000. |
| r | | Agreement with HSBC, 2.95% dated 12/31/18 to be repurchased at $23,000,000 on 01/02/19, collateralized by U.S. Government Agency Securities valued at $23,460,000. |
| s | | Agreement with JP Morgan, 3.00% dated 12/31/18 to be repurchased at $22,000,000 on 01/02/19, collateralized by U.S. Government Agency Securities valued at $22,440,000. |
| t | | Agreement with JP Morgan, 2.95% dated 12/31/18 to be repurchased at $2,000,000 on 01/02/19, collateralized by U.S. Government Agency Securities valued at $2,040,000. |
| u | | Agreement with Merrill Lynch, 3.00% dated 12/31/18 to be repurchased at $51,000,000 on 01/02/19, collateralized by U.S. Government Agency Securities valued at $52,020,000. |
| v | | Agreement with NatWest Markets, 2.95% dated 12/31/18 to be repurchased at $23,000,000 on 01/02/19, collateralized by U.S. Government Agency Securities valued at $23,460,000. |
| w | | Agreement with Nomura, 3.00% dated 12/31/18 to be repurchased at $18,000,000 on 01/02/19, collateralized by U.S. Government Agency Securities valued at $18,360,000. |
| | Cost amounts are in thousands. |
| | | |
Futures contracts outstanding as of December 31, 2018 were as follows (notional amounts and values are in thousands):
| Description | | Number of long
(short)
contracts | | | Expiration date | | Notional amount | | | Value | | Unrealized
appreciation
(depreciation) | |
| MSCI EAFE Index | | | 740 | | | 03/15/19 | | $ | 65,565 | | | $ | 63,492 | | | $ | (2,073 | ) |
| S&P 500 E Mini Index | | | 910 | | | 03/15/19 | | | 120,275 | | | | 113,987 | | | | (6,288 | ) |
| Total | | | 1,650 | | | | | $ | 185,840 | | | $ | 177,479 | | | $ | (8,361 | ) |
COLLEGE RETIREMENT EQUITIES FUND- Global Equities Account
COLLEGE RETIREMENT EQUITIES FUND
GLOBAL EQUITIES ACCOUNT
SUMMARY OF MARKET VALUES BY SECTOR
December 31, 2018
| | | | VALUE | | | | % OF | |
| SECTOR | | | (000) | | | | ASSETS | |
| INFORMATION TECHNOLOGY | | $ | 3,021,177 | | | | 16.6 | % |
| FINANCIALS | | | 2,663,016 | | | | 14.6 | |
| CONSUMER DISCRETIONARY | | | 2,401,973 | | | | 13.2 | |
| HEALTH CARE | | | 2,387,862 | | | | 13.1 | |
| INDUSTRIALS | | | 1,994,720 | | | | 11.0 | |
| COMMUNICATION SERVICES | | | 1,417,621 | | | | 7.8 | |
| CONSUMER STAPLES | | | 1,406,655 | | | | 7.7 | |
| ENERGY | | | 1,111,805 | | | | 6.1 | |
| MATERIALS | | | 962,303 | | | | 5.3 | |
| REAL ESTATE | | | 312,881 | | | | 1.7 | |
| UTILITIES | | | 279,083 | | | | 1.5 | |
| SHORT-TERM INVESTMENTS | | | 525,806 | | | | 2.9 | |
| OTHER ASSETS & LIABILITES, NET | | | (271,039 | ) | | | (1.5 | ) |
| NET ASSETS | | $ | 18,213,863 | | | | 100.0 | % |
COLLEGE RETIREMENT EQUITIES FUND -Growth Account
COLLEGE RETIREMENT EQUITIES FUND
GROWTH ACCOUNT
SCHEDULE OF INVESTMENTS
December 31, 2018
| SHARES | | | | COMPANY | | VALUE
(000) | |
| COMMON STOCKS - 99.7% | |
| | | | | | | | | | |
| AUTOMOBILES & COMPONENTS - 0.3% | |
| | 464,117 | | | | Delphi Automotive plc | | $ | 28,575 | |
| | 62,581 | | *,e | | Garrett Motion, Inc | | | 772 | |
| | 12,260 | | | | Gentex Corp | | | 248 | |
| | 243 | | | | Lear Corp | | | 30 | |
| | 93,753 | | * | | Tesla, Inc | | | 31,201 | |
| | 2,148 | | | | Thor Industries, Inc | | | 112 | |
| | 1,097 | | * | | Visteon Corp | | | 66 | |
| | | | | | TOTAL AUTOMOBILES & COMPONENTS | | | 61,004 | |
| | | | | | | | | | |
| BANKS - 0.4% | | | | |
| | 138 | | | | BOK Financial Corp | | | 10 | |
| | 994,700 | | | | Citizens Financial Group, Inc | | | 29,572 | |
| | 448,168 | | | | Comerica, Inc | | | 30,785 | |
| | 674 | | | | East West Bancorp, Inc | | | 29 | |
| | 1,393 | | | | Pinnacle Financial Partners, Inc | | | 64 | |
| | 1,853 | | | | Signature Bank | | | 191 | |
| | 62,067 | | * | | SVB Financial Group | | | 11,788 | |
| | 2,929 | | | | Synovus Financial Corp | | | 94 | |
| | 1,370 | | * | | Texas Capital Bancshares, Inc | | | 70 | |
| | 537,766 | | | | Wells Fargo & Co | | | 24,780 | |
| | 99,752 | | * | | Western Alliance Bancorp | | | 3,939 | |
| | | | | | TOTAL BANKS | | | 101,322 | |
| | | | | | | | | | |
| CAPITAL GOODS - 7.8% | | | | |
| | 78,104 | | | | 3M Co | | | 14,882 | |
| | 8,554 | | | | A.O. Smith Corp | | | 365 | |
| | 44 | | | | Air Lease Corp | | | 1 | |
| | 1,085,984 | | | | Airbus SE | | | 103,537 | |
| | 4,765 | | | | Allegion plc | | | 380 | |
| | 1,077,861 | | | | Allison Transmission Holdings, Inc | | | 47,329 | |
| | 174,985 | | | | Ametek, Inc | | | 11,846 | |
| | 2,536 | | | | Armstrong World Industries, Inc | | | 148 | |
| | 1,081,773 | | | | Boeing Co | | | 348,872 | |
| | 5,998 | | | | BWX Technologies, Inc | | | 229 | |
| | 557,237 | | | | Caterpillar, Inc | | | 70,808 | |
| | 1,568,828 | | | | CNH Industrial NV (NYSE) | | | 14,449 | |
| | 19,347 | | | | Cummins, Inc | | | 2,586 | |
| | 62,604 | | | | Curtiss-Wright Corp | | | 6,393 | |
| | 19,549 | | | | Deere & Co | | | 2,916 | |
| | 7,419 | | | | Donaldson Co, Inc | | | 322 | |
| | 245,233 | | | | Emerson Electric Co | | | 14,653 | |
| | 17,353 | | | | Fastenal Co | | | 907 | |
| | 773,282 | | | | Fortive Corp | | | 52,320 | |
| | 3,601 | | | | Fortune Brands Home & Security, Inc | | | 137 | |
COLLEGE RETIREMENT EQUITIES FUND -Growth Account
| SHARES | | | | COMPANY | | VALUE
(000) | |
| | 172,918 | | * | | Gardner Denver Holdings, Inc | | $ | 3,536 | |
| | 7,051 | | | | General Dynamics Corp | | | 1,109 | |
| | 10,017 | | | | Graco, Inc | | | 419 | |
| | 25,962 | | | | Harris Corp | | | 3,496 | |
| | 761,028 | | * | | HD Supply Holdings, Inc | | | 28,554 | |
| | 2,332 | | | | HEICO Corp | | | 181 | |
| | 4,570 | | | | HEICO Corp (Class A) | | | 288 | |
| | 1,269 | | | | Hexcel Corp | | | 73 | |
| | 1,260,203 | | | | Honeywell International, Inc | | | 166,498 | |
| | 59,348 | | | | Hubbell, Inc | | | 5,896 | |
| | 49,297 | | | | Huntington Ingalls | | | 9,382 | |
| | 74,249 | | | | IDEX Corp | | | 9,375 | |
| | 19,985 | | | | Illinois Tool Works, Inc | | | 2,532 | |
| | 514,405 | | | | Ingersoll-Rand plc | | | 46,929 | |
| | 2,214 | | | | Lennox International, Inc | | | 485 | |
| | 4,060 | | | | Lincoln Electric Holdings, Inc | | | 320 | |
| | 279,930 | | | | Lockheed Martin Corp | | | 73,297 | |
| | 13,910 | | | | Masco Corp | | | 407 | |
| | 319,200 | | *,e | | Middleby Corp | | | 32,791 | |
| | 1,149 | | | | MSC Industrial Direct Co (Class A) | | | 88 | |
| | 3,379 | | | | Nordson Corp | | | 403 | |
| | 689,411 | | | | Northrop Grumman Corp | | | 168,837 | |
| | 623,021 | | | | Parker-Hannifin Corp | | | 92,917 | |
| | 3,272 | | * | | Quanta Services, Inc | | | 99 | |
| | 266,661 | | | | Raytheon Co | | | 40,892 | |
| | 150,369 | | * | | Resideo Technologies, Inc | | | 3,090 | |
| | 84,065 | | | | Rockwell Automation, Inc | | | 12,650 | |
| | 469,565 | | | | Roper Industries, Inc | | | 125,148 | |
| | 28,292 | | * | | Sensata Technologies Holding plc | | | 1,269 | |
| | 6,428 | | | | Spirit Aerosystems Holdings, Inc (Class A) | | | 463 | |
| | 833,857 | | | | Textron, Inc | | | 38,349 | |
| | 6,236 | | | | Toro Co | | | 348 | |
| | 155,874 | | * | | TransDigm Group, Inc | | | 53,007 | |
| | 372,427 | | * | | United Rentals, Inc | | | 38,185 | |
| | 231,689 | | * | | Univar, Inc | | | 4,110 | |
| | 519,367 | | | | W.W. Grainger, Inc | | | 146,649 | |
| | 3,170 | | * | | WABCO Holdings, Inc | | | 340 | |
| | 1,712 | | e | | Wabtec Corp | | | 120 | |
| | 37,230 | | | | Watsco, Inc | | | 5,180 | |
| | 5,905 | | * | | Welbilt, Inc | | | 66 | |
| | 6,047 | | | | Xylem, Inc | | | 403 | |
| | | | | | TOTAL CAPITAL GOODS | | | 1,811,261 | |
| | | | | | | | | | |
| COMMERCIAL & PROFESSIONAL SERVICES - 1.5% | | | | |
| | 488,888 | | * | | Cimpress NV | | | 50,561 | |
| | 5,272 | | | | Cintas Corp | | | 886 | |
| | 12,238 | | * | | Copart, Inc | | | 585 | |
| | 73,138 | | * | | CoStar Group, Inc | | | 24,672 | |
| | 876 | | | | Dun & Bradstreet Corp | | | 125 | |
| | 1,963 | | | | Equifax, Inc | | | 183 | |
| | 2,150,000 | | | | Experian Group Ltd | | | 52,120 | |
| | 831,645 | | * | | IHS Markit Ltd | | | 39,894 | |
| | 402,833 | | | | KAR Auction Services, Inc | | | 19,223 | |
| | 1,509,600 | | | | Nielsen NV | | | 35,219 | |
COLLEGE RETIREMENT EQUITIES FUND -Growth Account
| SHARES | | | | COMPANY | | VALUE
(000) | |
| | 153,874 | | | | Republic Services, Inc | | $ | 11,093 | |
| | 7,164 | | | | Robert Half International, Inc | | | 410 | |
| | 8,506 | | | | Rollins, Inc | | | 307 | |
| | 351,908 | | | | TransUnion | | | 19,988 | |
| | 9,685 | | * | | Verisk Analytics, Inc | | | 1,056 | |
| | 1,000,000 | | | | Waste Connections, Inc | | | 74,250 | |
| | 233,341 | | | | Waste Management, Inc | | | 20,765 | |
| | | | | | TOTAL COMMERCIAL & PROFESSIONAL SERVICES | | | 351,337 | |
| | | | | | | | | | |
| CONSUMER DURABLES & APPAREL - 2.2% | | | | |
| | 446,184 | | | | BRP, Inc (Toronto) | | | 11,550 | |
| | 501 | | | | Brunswick Corp | | | 23 | |
| | 2,994 | | | | Carter’s, Inc | | | 244 | |
| | 115,131 | | | | Columbia Sportswear Co | | | 9,681 | |
| | 279,300 | | * | | Deckers Outdoor Corp | | | 35,737 | |
| | 484,920 | | | | DR Horton, Inc | | | 16,807 | |
| | 21,732 | | | | Hanesbrands, Inc | | | 272 | |
| | 5,508 | | | | Hasbro, Inc | | | 448 | |
| | 499 | | | | Lennar Corp (B Shares) | | | 16 | |
| | 9,999 | | | | Lennar Corp (Class A) | | | 392 | |
| | 249,267 | | * | | Lululemon Athletica, Inc | | | 30,313 | |
| | 4,598 | | *,e | | Mattel, Inc | | | 46 | |
| | 807,888 | | * | | Michael Kors Holdings Ltd | | | 30,635 | |
| | 2,102,518 | | | | Nike, Inc (Class B) | | | 155,881 | |
| | 14,592 | | * | | NVR, Inc | | | 35,561 | |
| | 102,629 | | | | Polaris Industries, Inc | | | 7,870 | |
| | 4,978,600 | | | | Prada S.p.A | | | 16,427 | |
| | 812,523 | | | | Pulte Homes, Inc | | | 21,118 | |
| | 2,723 | | * | | Skechers U.S.A., Inc (Class A) | | | 62 | |
| | 919,701 | | | | Sony Corp | | | 44,338 | |
| | 2,374,144 | | | | Tapestry, Inc | | | 80,127 | |
| | 364,379 | | * | | Tempur Sealy International, Inc | | | 15,085 | |
| | 3,345 | | | | Toll Brothers, Inc | | | 110 | |
| | 8,856 | | * | | Under Armour, Inc | | | 143 | |
| | 8,037 | | *,e | | Under Armour, Inc (Class A) | | | 142 | |
| | 15,049 | | | | VF Corp | | | 1,074 | |
| | | | | | TOTAL CONSUMER DURABLES & APPAREL | | | 514,102 | |
| | | | | | | | | | |
| CONSUMER SERVICES - 1.4% | | | | |
| | 2,860 | | * | | Bright Horizons Family Solutions | | | 319 | |
| | 150,950 | | * | | Chipotle Mexican Grill, Inc (Class A) | | | 65,179 | |
| | 2,304 | | | | Choice Hotels International, Inc | | | 165 | |
| | 3,777 | | | | Darden Restaurants, Inc | | | 377 | |
| | 2,514 | | | | Domino’s Pizza, Inc | | | 623 | |
| | 4,964 | | | | Dunkin Brands Group, Inc | | | 318 | |
| | 182,226 | | | | Extended Stay America, Inc | | | 2,824 | |
| | 95,189 | | * | | frontdoor, Inc | | | 2,533 | |
| | 2,829 | | * | | Grand Canyon Education, Inc | | | 272 | |
| | 199,498 | | | | H&R Block, Inc | | | 5,061 | |
| | 5,597 | | * | | Hilton Grand Vacations, Inc | | | 148 | |
| | 220,563 | | | | Hilton Worldwide Holdings, Inc | | | 15,836 | |
| | 329 | | | | International Game Technology plc | | | 5 | |
| | 229,379 | | | | Las Vegas Sands Corp | | | 11,939 | |
COLLEGE RETIREMENT EQUITIES FUND -Growth Account
| SHARES | | | | COMPANY | | VALUE
(000) | |
| | 1,164,848 | | | | Marriott International, Inc (Class A) | | $ | 126,456 | |
| | 104,363 | | | | McDonald’s Corp | | | 18,532 | |
| | 3,090 | | | | MGM Resorts International | | | 75 | |
| | 400,000 | | | | Restaurant Brands International, Inc | | | 20,920 | |
| | 184,038 | | | | Service Corp International | | | 7,409 | |
| | 193,165 | | * | | ServiceMaster Global Holdings, Inc | | | 7,097 | |
| | 4,737 | | | | Six Flags Entertainment Corp | | | 264 | |
| | 144,411 | | | | Starbucks Corp | | | 9,300 | |
| | 2,427 | | | | Vail Resorts, Inc | | | 512 | |
| | 11,290 | | | | Wendy’s | | | 176 | |
| | 6,217 | | | | Wyndham Hotels & Resorts, Inc | | | 282 | |
| | 6,337 | | | | Wyndham Worldwide Corp | | | 227 | |
| | 6,244 | | | | Wynn Resorts Ltd | | | 618 | |
| | 296,835 | | | | Yum China Holdings, Inc | | | 9,953 | |
| | 274,819 | | | | Yum! Brands, Inc | | | 25,261 | |
| | | | | | TOTAL CONSUMER SERVICES | | | 332,681 | |
| | | | | | | | | | |
| DIVERSIFIED FINANCIALS - 2.9% | | | | |
| | 310,829 | | | | American Express Co | | | 29,628 | |
| | 199,267 | | | | Ameriprise Financial, Inc | | | 20,797 | |
| | 92,967 | | | | Capital One Financial Corp | | | 7,027 | |
| | 6,285 | | | | CBOE Holdings, Inc | | | 615 | |
| | 560,820 | | | | Charles Schwab Corp | | | 23,291 | |
| | 29,305 | | | | CME Group, Inc | | | 5,513 | |
| | 125,927 | | * | | Credit Acceptance Corp | | | 48,074 | |
| | 139,192 | | | | Discover Financial Services | | | 8,210 | |
| | 772,472 | | | | E*TRADE Financial Corp | | | 33,896 | |
| | 7,434 | | | | Eaton Vance Corp | | | 262 | |
| | 66,518 | | | | Evercore Partners, Inc (Class A) | | | 4,760 | |
| | 2,263 | | | | Factset Research Systems, Inc | | | 453 | |
| | 4,318 | | | | Interactive Brokers Group, Inc (Class A) | | | 236 | |
| | 1,968,794 | | | | IntercontinentalExchange Group, Inc | | | 148,309 | |
| | 1,209,500 | | e | | iShares Russell 1000 Growth Index Fund | | | 158,336 | |
| | 19,298 | | | | Lazard Ltd (Class A) | | | 712 | |
| | 299,177 | | | | LPL Financial Holdings, Inc | | | 18,274 | |
| | 2,223 | | | | MarketAxess Holdings, Inc | | | 470 | |
| | 10,069 | | | | Moody’s Corp | | | 1,410 | |
| | 988 | | | | Morningstar, Inc | | | 108 | |
| | 5,257 | | | | MSCI, Inc (Class A) | | | 775 | |
| | 86,699 | | | | Northern Trust Corp | | | 7,247 | |
| | 323 | | * | | OneMain Holdings, Inc | | | 8 | |
| | 2,531 | | | | Raymond James Financial, Inc | | | 188 | |
| | 451,374 | | | | S&P Global, Inc | | | 76,706 | |
| | 888 | | | | Santander Consumer USA Holdings, Inc | | | 16 | |
| | 7,925 | | | | SEI Investments Co | | | 366 | |
| | 113,160 | | | | State Street Corp | | | 7,137 | |
| | 1,140,031 | | | | Synchrony Financial | | | 26,745 | |
| | 13,268 | | | | T Rowe Price Group, Inc | | | 1,225 | |
| | 329,521 | | | | TD Ameritrade Holding Corp | | | 16,133 | |
| | 1,768 | | | | Virtu Financial, Inc | | | 46 | |
| | 762,126 | | | | Voya Financial, Inc | | | 30,592 | |
| | | | | | TOTAL DIVERSIFIED FINANCIALS | | | 677,565 | |
| | | | | | | | | | |
COLLEGE RETIREMENT EQUITIES FUND -Growth Account
| SHARES | | | | COMPANY | | VALUE
(000) | |
| ENERGY - 0.6% | | | | |
| | 10,220 | | | | Anadarko Petroleum Corp | | $ | 448 | |
| | 6,826 | | * | | Antero Resources Corp | | | 64 | |
| | 1,327 | | | | Apache Corp | | | 35 | |
| | 19,909 | | | | Cabot Oil & Gas Corp | | | 445 | |
| | 9,700 | | * | | Cheniere Energy, Inc | | | 574 | |
| | 693 | | | | Cimarex Energy Co | | | 43 | |
| | 220,014 | | * | | Concho Resources, Inc | | | 22,615 | |
| | 188,636 | | * | | Continental Resources, Inc | | | 7,581 | |
| | 1,576 | | | | Diamondback Energy, Inc | | | 146 | |
| | 760,057 | | | | EOG Resources, Inc | | | 66,285 | |
| | 52,761 | | | | Halliburton Co | | | 1,402 | |
| | 2,731 | | * | | Kosmos Energy Ltd | | | 11 | |
| | 4,329 | | * | | Newfield Exploration Co | | | 64 | |
| | 10,238 | | | | Oneok, Inc | | | 552 | |
| | 2,425,693 | | * | | Parsley Energy, Inc | | | 38,763 | |
| | 5,641 | | | | Pioneer Natural Resources Co | | | 742 | |
| | 1,340 | | e | | RPC, Inc | | | 13 | |
| | | | | | TOTAL ENERGY | | | 139,783 | |
| | | | | | | | | | |
| FOOD & STAPLES RETAILING - 1.3% | | | | |
| | 820,035 | | | | Costco Wholesale Corp | | | 167,050 | |
| | 129,188 | | * | | Sprouts Farmers Market, Inc | | | 3,037 | |
| | 232,105 | | | | Sysco Corp | | | 14,544 | |
| | 757 | | * | | US Foods Holding Corp | | | 24 | |
| | 1,131,941 | | | | Walmart, Inc | | | 105,440 | |
| | | | | | TOTAL FOOD & STAPLES RETAILING | | | 290,095 | |
| | | | | | | | | | |
| FOOD, BEVERAGE & TOBACCO - 1.8% | | | | |
| | 718,852 | | | | Altria Group, Inc | | | 35,504 | |
| | 3,009 | | | | Brown-Forman Corp | | | 143 | |
| | 17,068 | | | | Brown-Forman Corp (Class B) | | | 812 | |
| | 7,210 | | | | Campbell Soup Co | | | 238 | |
| | 580,039 | | | | Coca-Cola Co | | | 27,465 | |
| | 654,100 | | | | Constellation Brands, Inc (Class A) | | | 105,193 | |
| | 4,000,000 | | | | Davide Campari-Milano S.p.A | | | 33,874 | |
| | 600,000 | | | | Fevertree Drinks plc | | | 16,824 | |
| | 170,321 | | | | General Mills, Inc | | | 6,632 | |
| | 30,393 | | | | Hershey Co | | | 3,257 | |
| | 95,163 | | | | Kellogg Co | | | 5,425 | |
| | 429,282 | | | | Keurig Dr Pepper, Inc | | | 11,007 | |
| | 53,576 | | | | McCormick & Co, Inc | | | 7,460 | |
| | 2,235,470 | | * | | Monster Beverage Corp | | | 110,030 | |
| | 473,357 | | | | PepsiCo, Inc | | | 52,296 | |
| | 84,188 | | * | | Post Holdings, Inc | | | 7,504 | |
| | | | | | TOTAL FOOD, BEVERAGE & TOBACCO | | | 423,664 | |
| | | | | | | | | | |
| HEALTH CARE EQUIPMENT & SERVICES - 7.0% | | | | |
| | 1,435,542 | | | | Abbott Laboratories | | | 103,833 | |
| | 51,877 | | * | | Abiomed, Inc | | | 16,862 | |
| | 87,388 | | * | | Align Technology, Inc | | | 18,302 | |
| | 94,767 | | | | AmerisourceBergen Corp | | | 7,051 | |
| | 190,500 | | | | Anthem, Inc | | | 50,031 | |
COLLEGE RETIREMENT EQUITIES FUND -Growth Account
| SHARES | | | | COMPANY | | VALUE
(000) | |
| | 46,126 | | * | | athenahealth, Inc | | $ | 6,085 | |
| | 971,582 | | | | Baxter International, Inc | | | 63,950 | |
| | 1,458 | | | | Becton Dickinson & Co | | | 329 | |
| | 456,748 | | * | | Boston Scientific Corp | | | 16,141 | |
| | 1,956 | | | | Cantel Medical Corp | | | 146 | |
| | 185,935 | | * | | Centene Corp | | | 21,438 | |
| | 782,920 | | * | | Cerner Corp | | | 41,056 | |
| | 21,719 | | | | Chemed Corp | | | 6,153 | |
| | 446,458 | | | | Cigna Corp | | | 84,791 | |
| | 464 | | | | Cooper Cos, Inc | | | 118 | |
| | 613,479 | | | | CVS Health Corp | | | 40,195 | |
| | 128,743 | | * | | DaVita, Inc | | | 6,625 | |
| | 86,797 | | * | | DexCom, Inc | | | 10,398 | |
| | 1,102,345 | | * | | Edwards Lifesciences Corp | | | 168,846 | |
| | 478,583 | | | | Encompass Health Corp | | | 29,529 | |
| | 136,093 | | *,e | | Guardant Health, Inc | | | 5,116 | |
| | 400,862 | | | | HCA Holdings, Inc | | | 49,887 | |
| | 1,282 | | * | | Henry Schein, Inc | | | 101 | |
| | 2,735 | | | | Hill-Rom Holdings, Inc | | | 242 | |
| | 212,756 | | | | Humana, Inc | | | 60,950 | |
| | 72,720 | | * | | ICU Medical, Inc | | | 16,699 | |
| | 53,985 | | * | | IDEXX Laboratories, Inc | | | 10,042 | |
| | 3,775 | | * | | Insulet Corp | | | 299 | |
| | 52,479 | | * | | Integra LifeSciences Holdings Corp | | | 2,367 | |
| | 584,483 | | * | | Intuitive Surgical, Inc | | | 279,920 | |
| | 38,093 | | * | | Laboratory Corp of America Holdings | | | 4,813 | |
| | 55,152 | | * | | Masimo Corp | | | 5,922 | |
| | 43,664 | | | | McKesson Corp | | | 4,824 | |
| | 188,314 | | * | | Molina Healthcare, Inc | | | 21,886 | |
| | 1,738 | | * | | Penumbra, Inc | | | 212 | |
| | 791,493 | | * | | Premier, Inc | | | 29,562 | |
| | 8,490 | | | | Resmed, Inc | | | 967 | |
| | 839,358 | | | | Stryker Corp | | | 131,569 | |
| | 588 | | | | Teleflex, Inc | | | 152 | |
| | 950,204 | | | | UnitedHealth Group, Inc | | | 236,715 | |
| | 5,522 | | * | | Varian Medical Systems, Inc | | | 626 | |
| | 303,552 | | * | | Veeva Systems, Inc | | | 27,113 | |
| | 212,706 | | * | | WellCare Health Plans, Inc | | | 50,218 | |
| | 1,040 | | | | West Pharmaceutical Services, Inc | | | 102 | |
| | | | | | TOTAL HEALTH CARE EQUIPMENT & SERVICES | | | 1,632,183 | |
| | | | | | | | | | |
| HOUSEHOLD & PERSONAL PRODUCTS - 0.8% | | | | |
| | 12,518 | | | | Church & Dwight Co, Inc | | | 823 | |
| | 6,746 | | | | Clorox Co | | | 1,040 | |
| | 9,582 | | | | Colgate-Palmolive Co | | | 570 | |
| | 38,041 | | | | Energizer Holdings, Inc | | | 1,718 | |
| | 452,916 | | | | Estee Lauder Cos (Class A) | | | 58,924 | |
| | 366,407 | | * | | Herbalife Ltd | | | 21,600 | |
| | 18,316 | | | | Kimberly-Clark Corp | | | 2,087 | |
| | 46,751 | | | | Nu Skin Enterprises, Inc (Class A) | | | 2,867 | |
| | 986,562 | | | | Procter & Gamble Co | | | 90,685 | |
| | 312 | | | | Spectrum Brands Holdings, Inc | | | 13 | |
| | | | | | TOTAL HOUSEHOLD & PERSONAL PRODUCTS | | | 180,327 | |
COLLEGE RETIREMENT EQUITIES FUND -Growth Account
| SHARES | | | | COMPANY | | VALUE
(000) | |
| INSURANCE - 0.6% | | | | |
| | 74 | | | | Alleghany Corp | | $ | 46 | |
| | 7,743 | | | | American International Group, Inc | | | 305 | |
| | 14,525 | | | | Aon plc | | | 2,111 | |
| | 3,450 | | * | | Arch Capital Group Ltd | | | 92 | |
| | 528 | | | | Axis Capital Holdings Ltd | | | 27 | |
| | 143,319 | | * | | Berkshire Hathaway, Inc (Class B) | | | 29,263 | |
| | 780 | | | | Brown & Brown, Inc | | | 22 | |
| | 1,079 | | | | Erie Indemnity Co (Class A) | | | 144 | |
| | 967 | | | | Everest Re Group Ltd | | | 211 | |
| | 117 | | * | | Markel Corp | | | 122 | |
| | 14,321 | | | | Marsh & McLennan Cos, Inc | | | 1,142 | |
| | 1,559,596 | | | | Progressive Corp | | | 94,090 | |
| | 14 | | | | RenaissanceRe Holdings Ltd | | | 2 | |
| | 3,115 | | | | Travelers Cos, Inc | | | 373 | |
| | | | | | TOTAL INSURANCE | | | 127,950 | |
| | | | | | | | | | |
| MATERIALS - 1.9% | | | | |
| | 5,218 | | | | Avery Dennison Corp | | | 469 | |
| | 4,797 | | * | | Axalta Coating Systems Ltd | | | 112 | |
| | 623,087 | | * | | Berry Plastics Group, Inc | | | 29,615 | |
| | 5,654 | | | | Celanese Corp (Series A) | | | 509 | |
| | 409,317 | | | | Chemours Co | | | 11,551 | |
| | 7,644 | | * | | Crown Holdings, Inc | | | 318 | |
| | 2,079 | | | | Eagle Materials, Inc | | | 127 | |
| | 6,960 | | | | Ecolab, Inc | | | 1,025 | |
| | 3,298 | | | | FMC Corp | | | 244 | |
| | 3,673 | | | | Graphic Packaging Holding Co | | | 39 | |
| | 1,010,300 | | | | Huntsman Corp | | | 19,489 | |
| | 157,182 | | | | International Flavors & Fragrances, Inc | | | 21,105 | |
| | 2,789 | | | | International Paper Co | | | 113 | |
| | 988,334 | | | | Linde plc | | | 154,220 | |
| | 499,914 | | | | LyondellBasell Industries AF S.C.A | | | 41,573 | |
| | 3,480 | | | | Martin Marietta Materials, Inc | | | 598 | |
| | 425 | | | | NewMarket Corp | | | 175 | |
| | 136,670 | | | | Packaging Corp of America | | | 11,406 | |
| | 7,173 | | * | | Platform Specialty Products Corp | | | 74 | |
| | 1,287 | | | | PPG Industries, Inc | | | 132 | |
| | 1,369 | | | | Royal Gold, Inc | | | 117 | |
| | 1,285 | | | | RPM International, Inc | | | 75 | |
| | 998 | | | | Scotts Miracle-Gro Co (Class A) | | | 61 | |
| | 5,217 | | | | Sealed Air Corp | | | 182 | |
| | 305,435 | | | | Sherwin-Williams Co | | | 120,176 | |
| | 1,234 | | | | Silgan Holdings, Inc | | | 29 | |
| | 5,381 | | | | Southern Copper Corp (NY) | | | 166 | |
| | 184,111 | | | | Steel Dynamics, Inc | | | 5,531 | |
| | 24,662 | | | | Vulcan Materials Co | | | 2,437 | |
| | 65,502 | | | | Westlake Chemical Corp | | | 4,334 | |
| | 230,552 | | | | WR Grace and Co | | | 14,965 | |
| | | | | | TOTAL MATERIALS | | | 440,967 | |
| | | | | | | | | | |
| MEDIA & ENTERTAINMENT - 13.1% | | | | |
| | 1,834,337 | | | | Activision Blizzard, Inc | | | 85,425 | |
COLLEGE RETIREMENT EQUITIES FUND -Growth Account
| SHARES | | | | COMPANY | | VALUE
(000) | |
| | 498,740 | | * | | Alphabet, Inc (Class A) | | $ | 521,163 | |
| | 888,339 | | * | | Alphabet, Inc (Class C) | | | 919,973 | |
| | 349,681 | | *,e | | AMC Networks, Inc | | | 19,191 | |
| | 179,919 | | * | | Baidu, Inc (ADR) | | | 28,535 | |
| | 2,884 | | | | Cable One, Inc | | | 2,365 | |
| | 250,833 | | | | CBS Corp (Class B) | | | 10,966 | |
| | 7,447 | | * | | Charter Communications, Inc | | | 2,122 | |
| | 1,153,754 | | | | Comcast Corp (Class A) | | | 39,285 | |
| | 417,923 | | * | | Electronic Arts, Inc | | | 32,978 | |
| | 4,926,519 | | * | | Facebook, Inc | | | 645,817 | |
| | 1,412,893 | | * | | IAC/InterActiveCorp | | | 258,616 | |
| | 1,514 | | | | Interpublic Group of Cos, Inc | | | 31 | |
| | 214 | | e | | Lions Gate Entertainment Corp (Class A) | | | 3 | |
| | 418 | | e | | Lions Gate Entertainment Corp (Class B) | | | 6 | |
| | 8,344 | | * | | Live Nation, Inc | | | 411 | |
| | 27 | | * | | Madison Square Garden Co | | | 7 | |
| | 873,814 | | e | | Match Group, Inc | | | 37,373 | |
| | 499,450 | | * | | NetFlix, Inc | | | 133,683 | |
| | 125,013 | | | | Omnicom Group, Inc | | | 9,156 | |
| | 701,148 | | e | | Sirius XM Holdings, Inc | | | 4,004 | |
| | 4,057 | | * | | Take-Two Interactive Software, Inc | | | 418 | |
| | 1,220,113 | | | | Tencent Holdings Ltd | | | 48,903 | |
| | 5,952 | | * | | TripAdvisor, Inc | | | 321 | |
| | 3,552,784 | | * | | Twitter, Inc | | | 102,107 | |
| | 1,304,914 | | | | Walt Disney Co | | | 143,084 | |
| | 2,192 | | * | | Zillow Group, Inc | | | 69 | |
| | 5,781 | | *,e | | Zillow Group, Inc (Class C) | | | 183 | |
| | | | | | TOTAL MEDIA & ENTERTAINMENT | | | 3,046,195 | |
| | | | | | | | | | |
| PHARMACEUTICALS, BIOTECHNOLOGY & LIFE SCIENCES - 6.9% | | | | |
| | 1,297,167 | | | | AbbVie, Inc | | | 119,586 | |
| | 3,104 | | *,e | | Agios Pharmaceuticals, Inc | | | 143 | |
| | 441,833 | | * | | Alexion Pharmaceuticals, Inc | | | 43,017 | |
| | 9,059 | | * | | Alkermes plc | | | 267 | |
| | 175,448 | | | | Allergan plc | | | 23,450 | |
| | 4,731 | | * | | Alnylam Pharmaceuticals, Inc | | | 345 | |
| | 214,236 | | | | Amgen, Inc | | | 41,705 | |
| | 199,426 | | * | | Biogen Idec, Inc | | | 60,011 | |
| | 580,335 | | * | | BioMarin Pharmaceutical, Inc | | | 49,416 | |
| | 2,244 | | | | Bio-Techne Corp | | | 325 | |
| | 2,264 | | * | | Bluebird Bio, Inc | | | 225 | |
| | 52,608 | | | | Bristol-Myers Squibb Co | | | 2,735 | |
| | 167,306 | | | | Bruker BioSciences Corp | | | 4,981 | |
| | 138,765 | | * | | Catalent, Inc | | | 4,327 | |
| | 539,079 | | * | | Celgene Corp | | | 34,550 | |
| | 72,547 | | * | | Charles River Laboratories International, Inc | | | 8,211 | |
| | 2,051 | | *,e | | Elanco Animal Health, Inc | | | 65 | |
| | 981,675 | | | | Eli Lilly & Co | | | 113,599 | |
| | 7,269 | | * | | Exact Sciences Corp | | | 459 | |
| | 17,455 | | * | | Exelixis, Inc | | | 343 | |
| | 2,753,893 | | | | Gilead Sciences, Inc | | | 172,256 | |
| | 677,923 | | * | | Illumina, Inc | | | 203,329 | |
| | 10,594 | | * | | Incyte Corp | | | 674 | |
| | 7,756 | | * | | Ionis Pharmaceuticals, Inc | | | 419 | |
COLLEGE RETIREMENT EQUITIES FUND -Growth Account
| SHARES | | | | COMPANY | | VALUE
(000) | |
| | 121,300 | | * | | IQVIA Holdings, Inc | | $ | 14,091 | |
| | 567,153 | | * | | Jazz Pharmaceuticals plc | | | 70,304 | |
| | 788,099 | | | | Johnson & Johnson | | | 101,704 | |
| | 372,972 | | | | Lonza Group AG. | | | 96,956 | |
| | 1,482 | | * | | Mettler-Toledo International, Inc | | | 838 | |
| | 9,427 | | * | | Nektar Therapeutics | | | 310 | |
| | 5,408 | | * | | Neurocrine Biosciences, Inc | | | 386 | |
| | 62,727 | | * | | PRA Health Sciences, Inc | | | 5,768 | |
| | 4,814 | | * | | Regeneron Pharmaceuticals, Inc | | | 1,798 | |
| | 2,618 | | * | | Sage Therapeutics, Inc | | | 251 | |
| | 66,658 | | * | | Sarepta Therapeutics, Inc | | | 7,274 | |
| | 1,292,804 | | | | Schering-Plough Corp | | | 98,783 | |
| | 6,662 | | * | | Seattle Genetics, Inc | | | 377 | |
| | 1,862 | | *,e | | TESARO, Inc | | | 138 | |
| | 782,206 | | * | | Teva Pharmaceutical Industries Ltd (ADR) | | | 12,062 | |
| | 67,023 | | | | Thermo Fisher Scientific, Inc | | | 14,999 | |
| | 157,714 | | * | | Vertex Pharmaceuticals, Inc | | | 26,135 | |
| | 4,214 | | * | | Waters Corp | | | 795 | |
| | 2,933,175 | | | | Zoetis, Inc | | | 250,904 | |
| | | | | | TOTAL PHARMACEUTICALS, BIOTECHNOLOGY & LIFE SCIENCES | | | 1,588,311 | |
| | | | | | | | | | |
| REAL ESTATE - 0.5% | | | | |
| | 570 | | | | Alexandria Real Estate Equities, Inc | | | 66 | |
| | 48,082 | | | | American Tower Corp | | | 7,606 | |
| | 473,666 | | * | | CBRE Group, Inc | | | 18,966 | |
| | 1,567 | | | | Colony Capital, Inc | | | 7 | |
| | 2,203 | | | | Coresite Realty | | | 192 | |
| | 18,874 | | | | Crown Castle International Corp | | | 2,050 | |
| | 44,645 | | | | Equinix, Inc | | | 15,740 | |
| | 106,122 | | | | Equity Lifestyle Properties, Inc | | | 10,308 | |
| | 6,390 | | | | Extra Space Storage, Inc | | | 578 | |
| | 76,599 | | | | Gaming and Leisure Properties, Inc | | | 2,475 | |
| | 971 | | * | | Howard Hughes Corp | | | 95 | |
| | 1,438 | | | | Hudson Pacific Properties | | | 42 | |
| | 4,625 | | | | Lamar Advertising Co | | | 320 | |
| | 153 | | | | Life Storage, Inc | | | 14 | |
| | 850,649 | | | | MGM Growth Properties LLC | | | 22,466 | |
| | 969 | | | | Omega Healthcare Investors, Inc | | | 34 | |
| | 8,968 | | | | Public Storage, Inc | | | 1,815 | |
| | 24,767 | | * | | SBA Communications Corp | | | 4,009 | |
| | 197,669 | | | | Simon Property Group, Inc | | | 33,206 | |
| | 3,884 | | | | Taubman Centers, Inc | | | 177 | |
| | | | | | TOTAL REAL ESTATE | | | 120,166 | |
| | | | | | | | | | |
| RETAILING - 12.4% | | | | |
| | 190,844 | | | | Advance Auto Parts, Inc | | | 30,050 | |
| | 502,699 | | * | | Alibaba Group Holding Ltd (ADR) | | | 68,905 | |
| | 848,631 | | * | | Amazon.com, Inc | | | 1,274,618 | |
| | 600,000 | | *,e | | ASOS plc | | | 17,418 | |
| | 4,545 | | * | | AutoZone, Inc | | | 3,810 | |
| | 486,829 | | | | Best Buy Co, Inc | | | 25,782 | |
| | 43,773 | | * | | Booking Holdings, Inc | | | 75,395 | |
| | 132,427 | | * | | Burlington Stores, Inc | | | 21,542 | |
COLLEGE RETIREMENT EQUITIES FUND -Growth Account
| SHARES | | | | COMPANY | | VALUE
(000) | |
| | 915,679 | | * | | CarMax, Inc | | $ | 57,441 | |
| | 910,000 | | * | | Ctrip.com International Ltd (ADR) | | | 24,625 | |
| | 567,764 | | | | Dollar General Corp | | | 61,364 | |
| | 2,550 | | * | | Dollar Tree, Inc | | | 230 | |
| | 2,180,261 | | * | | eBay, Inc | | | 61,200 | |
| | 1,919,807 | | | | Expedia, Inc | | | 216,266 | |
| | 700,000 | | * | | Farfetch Ltd | | | 12,397 | |
| | 1,803 | | *,e | | Floor & Decor Holdings, Inc | | | 47 | |
| | 195,360 | | | | Gap, Inc | | | 5,032 | |
| | 4,595,466 | | * | | Groupon, Inc | | | 14,705 | |
| | 1,116,032 | | * | | GrubHub, Inc | | | 85,722 | |
| | 1,719,048 | | | | Home Depot, Inc | | | 295,367 | |
| | 121,795 | | | | Kering | | | 57,057 | |
| | 952,973 | | | | Kohl’s Corp | | | 63,220 | |
| | 1,705 | | | | L Brands, Inc | | | 44 | |
| | 4,077 | | * | | LKQ Corp | | | 97 | |
| | 135,205 | | | | Lowe’s Companies, Inc | | | 12,488 | |
| | 1,018 | | * | | Michaels Cos, Inc | | | 14 | |
| | 611,687 | | | | Nordstrom, Inc | | | 28,511 | |
| | 82,673 | | * | | O’Reilly Automotive, Inc | | | 28,467 | |
| | 2,387 | | | | Pool Corp | | | 355 | |
| | 3,835,021 | | * | | Qurate Retail Group, Inc QVC Group | | | 74,860 | |
| | 116,099 | | | | Ross Stores, Inc | | | 9,659 | |
| | 392,784 | | | | Tiffany & Co | | | 31,623 | |
| | 1,773,836 | | | | TJX Companies, Inc | | | 79,361 | |
| | 342,697 | | | | Tractor Supply Co | | | 28,595 | |
| | 272,651 | | * | | Ulta Beauty, Inc | | | 66,756 | |
| | 748,631 | | * | | Urban Outfitters, Inc | | | 24,855 | |
| | 110,886 | | *,e | | Wayfair, Inc | | | 9,989 | |
| | 196,705 | | e | | Williams-Sonoma, Inc | | | 9,924 | |
| | | | | | TOTAL RETAILING | | | 2,877,791 | |
| | | | | | | | | | |
| SEMICONDUCTORS & SEMICONDUCTOR EQUIPMENT - 2.9% | | | | |
| | 1,894,370 | | * | | Advanced Micro Devices, Inc | | | 34,970 | |
| | 3,440 | | | | Analog Devices, Inc | | | 295 | |
| | 1,400,269 | | | | Applied Materials, Inc | | | 45,845 | |
| | 561,283 | | | | Broadcom, Inc | | | 142,723 | |
| | 752,167 | | * | | Cree, Inc | | | 32,174 | |
| | 474,212 | | | | Cypress Semiconductor Corp | | | 6,032 | |
| | 586,654 | | | | Intel Corp | | | 27,532 | |
| | 265,730 | | | | Kla-Tencor Corp | | | 23,780 | |
| | 209,672 | | | | Lam Research Corp | | | 28,551 | |
| | 10,670 | | | | Marvell Technology Group Ltd | | | 173 | |
| | 296,009 | | | | Maxim Integrated Products, Inc | | | 15,052 | |
| | 47,894 | | | | Microchip Technology, Inc | | | 3,444 | |
| | 376,197 | | * | | Micron Technology, Inc | | | 11,937 | |
| | 3,156 | | | | MKS Instruments, Inc | | | 204 | |
| | 2,461 | | | | Monolithic Power Systems, Inc | | | 286 | |
| | 1,227,642 | | | | NVIDIA Corp | | | 163,890 | |
| | 1,190 | | | | NXP Semiconductors NV | | | 87 | |
| | 25,191 | | * | | ON Semiconductor Corp | | | 416 | |
| | 7,638 | | | | Skyworks Solutions, Inc | | | 512 | |
| | 86,123 | | | | Teradyne, Inc | | | 2,703 | |
| | 446,443 | | | | Texas Instruments, Inc | | | 42,189 | |
COLLEGE RETIREMENT EQUITIES FUND -Growth Account
| SHARES | | | | COMPANY | | VALUE
(000) | |
| | 2,484 | | e | | Universal Display Corp | | $ | 232 | |
| | 6,526 | | | | Versum Materials, Inc | | | 181 | |
| | 1,104,169 | | | | Xilinx, Inc | | | 94,042 | |
| | | | | | TOTAL SEMICONDUCTORS & SEMICONDUCTOR EQUIPMENT | | | 677,250 | |
| | | | | | | | | | |
| SOFTWARE & SERVICES - 25.4% | | | | |
| | 3,074 | | * | | 2U, Inc | | | 153 | |
| | 597,219 | | | | Accenture plc | | | 84,214 | |
| | 1,617,072 | | * | | Adobe, Inc | | | 365,846 | |
| | 1,492,028 | | * | | Akamai Technologies, Inc | | | 91,133 | |
| | 45,072 | | | | Alliance Data Systems Corp | | | 6,764 | |
| | 116,831 | | * | | Ansys, Inc | | | 16,700 | |
| | 110,222 | | * | | Aspen Technology, Inc | | | 9,058 | |
| | 5,793 | | * | | Atlassian Corp plc | | | 515 | |
| | 11,132 | | * | | Autodesk, Inc | | | 1,432 | |
| | 1,511,780 | | | | Automatic Data Processing, Inc | | | 198,225 | |
| | 66,635 | | * | | Black Knight, Inc | | | 3,003 | |
| | 232,491 | | | | Booz Allen Hamilton Holding Co | | | 10,478 | |
| | 292,791 | | | | Broadridge Financial Solutions, Inc | | | 28,181 | |
| | 16,859 | | * | | Cadence Design Systems, Inc | | | 733 | |
| | 7,841 | | | | CDK Global, Inc | | | 375 | |
| | 2,056 | | *,e | | Ceridian HCM Holding, Inc | | | 71 | |
| | 343,367 | | | | Citrix Systems, Inc | | | 35,181 | |
| | 516,317 | | | | Cognizant Technology Solutions Corp (Class A) | | | 32,776 | |
| | 4,438 | | * | | DocuSign, Inc | | | 178 | |
| | 952,247 | | | | DXC Technology Co | | | 50,631 | |
| | 394 | | * | | Elastic NV | | | 28 | |
| | 3,055 | | * | | EPAM Systems, Inc | | | 354 | |
| | 1,592 | | * | | Euronet Worldwide, Inc | | | 163 | |
| | 1,736 | | * | | Fair Isaac Corp | | | 325 | |
| | 1,610 | | | | Fidelity National Information Services, Inc | | | 165 | |
| | 7,111 | | * | | FireEye, Inc | | | 115 | |
| | 3,096 | | * | | First American Corp | | | 103 | |
| | 445,608 | | * | | First Data Corp | | | 7,535 | |
| | 24,075 | | * | | Fiserv, Inc | | | 1,769 | |
| | 5,300 | | * | | FleetCor Technologies, Inc | | | 984 | |
| | 358,122 | | * | | Fortinet, Inc | | | 25,223 | |
| | 288,415 | | * | | Gartner, Inc | | | 36,871 | |
| | 3,623 | | | | Genpact Ltd | | | 98 | |
| | 9,594 | | | | Global Payments, Inc | | | 989 | |
| | 824,645 | | * | | GoDaddy, Inc | | | 54,113 | |
| | 4,895 | | * | | Guidewire Software, Inc | | | 393 | |
| | 279,848 | | | | International Business Machines Corp | | | 31,810 | |
| | 2,647,422 | | | | Intuit, Inc | | | 521,145 | |
| | 4,652 | | | | Jack Henry & Associates, Inc | | | 589 | |
| | 216,938 | | | | LogMeIn, Inc | | | 17,696 | |
| | 4,215 | | * | | Manhattan Associates, Inc | | | 179 | |
| | 2,601,829 | | | | MasterCard, Inc (Class A) | | | 490,835 | |
| | 15,319,789 | | | | Microsoft Corp | | | 1,556,031 | |
| | 153,452 | | * | | Nutanix, Inc | | | 6,382 | |
| | 53,330 | | * | | Okta, Inc | | | 3,402 | |
| | 14,942 | | | | Oracle Corp | | | 675 | |
| | 19,392 | | | | Paychex, Inc | | | 1,263 | |
COLLEGE RETIREMENT EQUITIES FUND -Growth Account
| SHARES | | | | COMPANY | | VALUE
(000) | |
| | 2,996 | | * | | Paycom Software, Inc | | $ | 367 | |
| | 5,302,461 | | * | | PayPal Holdings, Inc | | | 445,884 | |
| | 1,860 | | | | Pegasystems, Inc | | | 89 | |
| | 171 | | * | | Pluralsight, Inc | | | 4 | |
| | 106,733 | | * | | Proofpoint, Inc | | | 8,945 | |
| | 321,950 | | * | | PTC, Inc | | | 26,690 | |
| | 5,098 | | * | | RealPage, Inc | | | 246 | |
| | 138,295 | | * | | Red Hat, Inc | | | 24,290 | |
| | 105,410 | | * | | RingCentral, Inc | | | 8,690 | |
| | 797,342 | | | | Sabre Corp | | | 17,255 | |
| | 4,225,714 | | * | | salesforce.com, Inc | | | 578,796 | |
| | 922,069 | | * | | ServiceNow, Inc | | | 164,174 | |
| | 146,300 | | * | | Shopify, Inc (Class A) | | | 20,255 | |
| | 1,236 | | *,e | | SolarWinds Corp | | | 17 | |
| | 117,748 | | * | | Splunk, Inc | | | 12,346 | |
| | 153,357 | | * | | Square, Inc | | | 8,602 | |
| | 11,609 | | | | SS&C Technologies Holdings, Inc | | | 524 | |
| | 2,129 | | e | | Switch, Inc | | | 15 | |
| | 243,236 | | * | | Synopsys, Inc | | | 20,490 | |
| | 4,310 | | * | | Tableau Software, Inc | | | 517 | |
| | 5,350 | | * | | Teradata Corp | | | 205 | |
| | 695,679 | | | | Total System Services, Inc | | | 56,552 | |
| | 4,506 | | * | | Twilio, Inc | | | 402 | |
| | 2,476 | | * | | Tyler Technologies, Inc | | | 460 | |
| | 1,838 | | * | | Ultimate Software Group, Inc | | | 450 | |
| | 229,156 | | * | | VeriSign, Inc | | | 33,982 | |
| | 5,030,310 | | | | Visa, Inc (Class A) | | | 663,699 | |
| | 399,391 | | | | VMware, Inc (Class A) | | | 54,769 | |
| | 8,601 | | | | Western Union Co | | | 147 | |
| | 85,990 | | * | | WEX, Inc | | | 12,044 | |
| | 8,770 | | * | | Workday, Inc | | | 1,400 | |
| | 176,669 | | * | | Worldpay, Inc | | | 13,503 | |
| | 53,347 | | * | | Zendesk, Inc | | | 3,114 | |
| | 768,085 | | *,e | | Zscaler, Inc | | | 30,117 | |
| | | | | | TOTAL SOFTWARE & SERVICES | | | 5,903,922 | |
| | | | | | | | | | |
| TECHNOLOGY HARDWARE & EQUIPMENT - 6.1% | | | | |
| | 17,823 | | | | Amphenol Corp (Class A) | | | 1,444 | |
| | 5,479,287 | | | | Apple, Inc | | | 864,303 | |
| | 266,230 | | * | | Arista Networks, Inc | | | 56,095 | |
| | 453,297 | | | | CDW Corp | | | 36,740 | |
| | 2,962,686 | | | | Cisco Systems, Inc | | | 128,373 | |
| | 9,985 | | | | Cognex Corp | | | 386 | |
| | 1,158 | | * | | Coherent, Inc | | | 122 | |
| | 350,900 | | | | Corning, Inc | | | 10,601 | |
| | 50,661 | | * | | Dell Technologies, Inc | | | 2,476 | |
| | 207,086 | | * | | F5 Networks, Inc | | | 33,554 | |
| | 721 | | | | Flir Systems, Inc | | | 31 | |
| | 2,183 | | * | | IPG Photonics Corp | | | 247 | |
| | 1,366 | | | | Littelfuse, Inc | | | 234 | |
| | 1,241,195 | | | | Motorola, Inc | | | 142,787 | |
| | 5,893 | | | | National Instruments Corp | | | 268 | |
| | 6,698 | | * | | NCR Corp | | | 155 | |
| | 888,926 | | | | NetApp, Inc | | | 53,042 | |
COLLEGE RETIREMENT EQUITIES FUND -Growth Account
| SHARES | | | | COMPANY | | VALUE
(000) | |
| | 7,073,269 | | | | Nokia Corp | | $ | 41,167 | |
| | 67,895 | | * | | Palo Alto Networks, Inc | | | 12,788 | |
| | 9,770 | | * | | Pure Storage, Inc | | | 157 | |
| | 896 | | e | | Ubiquiti Networks, Inc | | | 89 | |
| | 199,065 | | * | | Zebra Technologies Corp (Class A) | | | 31,697 | |
| | | | | | TOTAL TECHNOLOGY HARDWARE & EQUIPMENT | | | 1,416,756 | |
| | | | | | | | | | |
| TELECOMMUNICATION SERVICES - 0.5% | | | | |
| | 1,287,000 | | | | Softbank Corp | | | 84,297 | |
| | 327,491 | | * | | T-Mobile US, Inc | | | 20,832 | |
| | 12,148 | | * | | Zayo Group Holdings, Inc | | | 278 | |
| | | | | | TOTAL TELECOMMUNICATION SERVICES | | | 105,407 | |
| | | | | | | | | | |
| TRANSPORTATION - 1.4% | | | | |
| | 500,000 | | | | American Airlines Group, Inc | | | 16,055 | |
| | 8,245 | | | | CH Robinson Worldwide, Inc | | | 693 | |
| | 735,175 | | | | CSX Corp | | | 45,676 | |
| | 190,543 | | | | Delta Air Lines, Inc | | | 9,508 | |
| | 10,387 | | | | Expeditors International of Washington, Inc | | | 707 | |
| | 317,172 | | | | FedEx Corp | | | 51,169 | |
| | 602 | | * | | Genesee & Wyoming, Inc (Class A) | | | 45 | |
| | 5,256 | | | | JB Hunt Transport Services, Inc | | | 489 | |
| | 2,525 | | | | Landstar System, Inc | | | 242 | |
| | 3,983 | | | | Old Dominion Freight Line | | | 492 | |
| | 464 | | | | Schneider National, Inc | | | 9 | |
| | 22,201 | | | | Southwest Airlines Co | | | 1,032 | |
| | 586,654 | | * | | Spirit Airlines, Inc | | | 33,979 | |
| | 1,058,398 | | | | Union Pacific Corp | | | 146,302 | |
| | 217,435 | | | | United Parcel Service, Inc (Class B) | | | 21,207 | |
| | 7,593 | | * | | XPO Logistics, Inc | | | 433 | |
| | | | | | TOTAL TRANSPORTATION | | | 328,038 | |
| | | | | | | | | | |
| | | | | | TOTAL COMMON STOCKS | | | 23,148,077 | |
| | | | | | (Cost $20,105,154) | | | | |
| | | | | | | | | | | | | | | | |
| PRINCIPAL | | | | ISSUER | | RATE | | MATURITY
DATE | | | |
| | | | | | | | | | | | |
| SHORT-TERM INVESTMENTS - 0.6% | | | | | | |
| | | | | | | |
| TREASURY DEBT - 0.2% | | | | | | |
| $ | 65,240,000 | | | | United States Treasury Bill | | | | | | | | | | |
| | | | | | TOTAL TREASURY DEBT | | | 2.286 | % | | 01/08/19 | | | 65,216 | |
| | | | | | | | | | | | | | | 65,216 | |
| | | | | | | | | | | | | | | | |
| SHARES | | | | COMPANY | | | | | | | |
| INVESTMENTS IN REGISTERED INVESTMENT COMPANIES - 0.4% | | | | | | |
| | 85,482,277 | | c | | State Street Navigator Securities Lending Government Money Market Portfolio | | | 85,482 | |
| | | | | | TOTAL INVESTMENTS IN REGISTERED INVESTMENT COMPANIES | | | 85,482 | |
| | | | | | | | | | | | | | | |
| | | | | | TOTAL SHORT-TERM INVESTMENTS | | | | | | | | | 150,698 | |
| | | | | | (Cost $150,693) | | | | | | | | | | |
COLLEGE RETIREMENT EQUITIES FUND -Growth Account
| | | | | | | | | | | | | | VALUE
(000) | |
| | | | | | TOTAL INVESTMENTS - 100.3% | | | | | | | | $ | 23,298,775 | |
| | | | | | (Cost $20,255,847) | | | | | | | | | | |
| | | | | | OTHER ASSETS & LIABILITIES, NET - (0.3)% | | | | | | | | | (71,561 | ) |
| | | | | | NET ASSETS - 100.0% | | | | | | | | $ | 23,227,214 | |
| | Abbreviation(s): |
| ADR | | American Depositary Receipt |
| | | |
| * | | Non-income producing |
| c | | Investments made with cash collateral received from securities on loan. |
| e | | All or a portion of these securities are out on loan. The aggregate value of securities on loan is $84,093,806. |
| | | |
| | | Cost amounts are in thousands. |
COLLEGE RETIREMENT EQUITIES FUND- Equity Index Account
COLLEGE RETIREMENT EQUITIES FUND
EQUITY INDEX ACCOUNT
SCHEDULE OF INVESTMENTS
December 31, 2018
| SHARES | | | | COMPANY | | VALUE
(000) | |
| COMMON STOCKS - 99.4% | |
| | | | | |
| AUTOMOBILES & COMPONENTS - 0.8% |
| | 60,563 | | e | | Adient plc | | $ | 912 | |
| | 60,325 | | * | | American Axle & Manufacturing Holdings, Inc | | | 670 | |
| | 144,549 | | | | BorgWarner, Inc | | | 5,022 | |
| | 37,696 | | | | Cooper Tire & Rubber Co | | | 1,219 | |
| | 12,534 | | * | | Cooper-Standard Holding, Inc | | | 779 | |
| | 76,541 | | | | Dana Holding Corp | | | 1,043 | |
| | 174,198 | | | | Delphi Automotive plc | | | 10,725 | |
| | 19,677 | | * | | Dorman Products, Inc | | | 1,771 | |
| | 2,585,495 | | | | Ford Motor Co | | | 19,779 | |
| | 25,297 | | * | | Fox Factory Holding Corp | | | 1,489 | |
| | 50,131 | | *,e | | Garrett Motion, Inc | | | 619 | |
| | 874,069 | | | | General Motors Co | | | 29,238 | |
| | 173,624 | | | | Gentex Corp | | | 3,509 | |
| | 26,543 | | * | | Gentherm, Inc | | | 1,061 | |
| | 137,668 | | | | Goodyear Tire & Rubber Co | | | 2,810 | |
| | 115,779 | | | | Harley-Davidson, Inc | | | 3,950 | |
| | 17,506 | | | | LCI Industries, Inc | | | 1,169 | |
| | 42,706 | | | | Lear Corp | | | 5,247 | |
| | 36,302 | | * | | Modine Manufacturing Co | | | 392 | |
| | 13,147 | | *,e | | Motorcar Parts of America, Inc | | | 219 | |
| | 5,808 | | * | | Shiloh Industries, Inc | | | 34 | |
| | 24,709 | | | | Spartan Motors, Inc | | | 179 | |
| | 15,087 | | | | Standard Motor Products, Inc | | | 731 | |
| | 20,247 | | * | | Stoneridge, Inc | | | 499 | |
| | 17,815 | | | | Superior Industries International, Inc | | | 86 | |
| | 28,062 | | | | Tenneco, Inc | | | 769 | |
| | 90,379 | | * | | Tesla, Inc | | | 30,078 | |
| | 35,644 | | | | Thor Industries, Inc | | | 1,853 | |
| | 15,398 | | | | Tower International, Inc | | | 366 | |
| | 22,699 | | * | | Visteon Corp | | | 1,368 | |
| | 22,457 | | | | Winnebago Industries, Inc | | | 544 | |
| | | | | | TOTAL AUTOMOBILES & COMPONENTS | | | 128,130 | |
| | | | | | | | | | |
| BANKS - 6.0% |
| | 12,408 | | | | 1st Source Corp | | | 501 | |
| | 10,115 | | | | Access National Corp | | | 216 | |
| | 4,570 | | | | ACNB Corp | | | 179 | |
| | 7,958 | | * | | Allegiance Bancshares, Inc | | | 258 | |
| | 5,882 | | | | American National Bankshares, Inc | | | 172 | |
| | 26,136 | | | | Ameris Bancorp | | | 828 | |
| | 7,069 | | | | Ames National Corp | | | 180 | |
| | 8,183 | | | | Arrow Financial Corp | | | 262 | |
| | 125,355 | | | | Associated Banc-Corp | | | 2,481 | |
| | 14,762 | | * | | Atlantic Capital Bancshares, Inc | | | 242 | |
COLLEGE RETIREMENT EQUITIES FUND- Equity Index Account
| SHARES | | | | COMPANY | | VALUE
(000) | |
| | 43,167 | | * | | Axos Financial, Inc | | $ | 1,087 | |
| | 31,112 | | | | Banc of California, Inc | | | 414 | |
| | 11,574 | | | | Bancfirst Corp | | | 578 | |
| | 62,103 | | | | BancorpSouth Bank | | | 1,623 | |
| | 6,084,631 | | | | Bank of America Corp | | | 149,925 | |
| | 11,787 | | | | Bank of Commerce Holdings | | | 129 | |
| | 23,380 | | | | Bank of Hawaii Corp | | | 1,574 | |
| | 7,728 | | | | Bank of Marin Bancorp | | | 319 | |
| | 36,956 | | | | Bank of NT Butterfield & Son Ltd | | | 1,159 | |
| | 82,422 | | | | Bank OZK | | | 1,882 | |
| | 12,265 | | | | BankFinancial Corp | | | 183 | |
| | 74,384 | | | | BankUnited | | | 2,227 | |
| | 3,897 | | | | Bankwell Financial Group, Inc | | | 112 | |
| | 23,725 | | | | Banner Corp | | | 1,269 | |
| | 11,016 | | | | Bar Harbor Bankshares | | | 247 | |
| | 6,936 | | * | | Baycom Corp | | | 160 | |
| | 520,077 | | | | BB&T Corp | | | 22,530 | |
| | 7,059 | | | | BCB Bancorp, Inc | | | 74 | |
| | 51,465 | | | | Beneficial Bancorp, Inc | | | 735 | |
| | 22,749 | | | | Berkshire Hills Bancorp, Inc | | | 614 | |
| | 17,706 | | | | Blue Hills Bancorp, Inc | | | 378 | |
| | 22,508 | | | | BOK Financial Corp | | | 1,651 | |
| | 59,217 | | | | Boston Private Financial Holdings, Inc | | | 626 | |
| | 13,328 | | | | Bridge Bancorp, Inc | | | 340 | |
| | 54,590 | | | | Brookline Bancorp, Inc | | | 754 | |
| | 12,987 | | | | Bryn Mawr Bank Corp | | | 447 | |
| | 6,346 | | * | | BSB Bancorp, Inc | | | 178 | |
| | 6,436 | | | | Business First Bancshares, Inc | | | 156 | |
| | 5,576 | | * | | Byline Bancorp, Inc | | | 93 | |
| | 2,353 | | | | C&F Financial Corp | | | 125 | |
| | 31,825 | | | | Cadence BanCorp | | | 534 | |
| | 2,502 | | | | Cambridge Bancorp | | | 208 | |
| | 11,436 | | | | Camden National Corp | | | 411 | |
| | 9,158 | | | | Capital City Bank Group, Inc | | | 213 | |
| | 92,364 | | | | Capitol Federal Financial | | | 1,179 | |
| | 5,956 | | | | Capstar Financial Holdings, Inc | | | 88 | |
| | 10,298 | | | | Carolina Financial Corp | | | 305 | |
| | 54,668 | | | | Cathay General Bancorp | | | 1,833 | |
| | 12,633 | | | | CBTX, Inc | | | 371 | |
| | 50,378 | | | | Centerstate Banks of Florida, Inc | | | 1,060 | |
| | 21,511 | | | | Central Pacific Financial Corp | | | 524 | |
| | 6,214 | | | | Central Valley Community Bancorp | | | 117 | |
| | 2,245 | | | | Century Bancorp, Inc | | | 152 | |
| | 48,933 | | | | Chemical Financial Corp | | | 1,791 | |
| | 2,189 | | e | | Chemung Financial Corp | | | 90 | |
| | 74,083 | | | | CIT Group, Inc | | | 2,835 | |
| | 1,624,924 | | | | Citigroup, Inc | | | 84,594 | |
| | 9,568 | | | | Citizens & Northern Corp | | | 253 | |
| | 308,096 | | | | Citizens Financial Group, Inc | | | 9,160 | |
| | 10,955 | | | | City Holding Co | | | 740 | |
| | 7,262 | | | | Civista Bancshares, Inc | | | 127 | |
| | 9,772 | | | | CNB Financial Corp | | | 224 | |
| | 6,453 | | | | Codorus Valley Bancorp, Inc | | | 137 | |
| | 51,998 | | | | Columbia Banking System, Inc | | | 1,887 | |
COLLEGE RETIREMENT EQUITIES FUND- Equity Index Account
| SHARES | | | | COMPANY | | VALUE
(000) | |
| | 33,673 | | *,e | | Columbia Financial, Inc | | $ | 515 | |
| | 107,061 | | | | Comerica, Inc | | | 7,354 | |
| | 59,019 | | e | | Commerce Bancshares, Inc | | | 3,327 | |
| | 4,712 | | | | Commerce Union Bancshares, Inc | | | 109 | |
| | 35,397 | | | | Community Bank System, Inc | | | 2,064 | |
| | 15,668 | | * | | Community Bankers Trust Corp | | | 113 | |
| | 2,846 | | | | Community Financial Corp | | | 83 | |
| | 11,638 | | | | Community Trust Bancorp, Inc | | | 461 | |
| | 21,722 | | | | ConnectOne Bancorp, Inc | | | 401 | |
| | 3,700 | | | | County Bancorp, Inc | | | 64 | |
| | 38,938 | | | | Cullen/Frost Bankers, Inc | | | 3,424 | |
| | 19,196 | | * | | Customers Bancorp, Inc | | | 349 | |
| | 75,634 | | | | CVB Financial Corp | | | 1,530 | |
| | 23,810 | | | | Dime Community Bancshares | | | 404 | |
| | 22,688 | | * | | Eagle Bancorp, Inc | | | 1,105 | |
| | 93,759 | | | | East West Bancorp, Inc | | | 4,081 | |
| | 4,525 | | * | | Entegra Financial Corp | | | 94 | |
| | 6,481 | | | | Enterprise Bancorp, Inc | | | 208 | |
| | 16,077 | | | | Enterprise Financial Services Corp | | | 605 | |
| | 7,477 | | * | | Equity Bancshares, Inc | | | 264 | |
| | 6,121 | | | | ESSA Bancorp, Inc | | | 96 | |
| | 55,323 | | * | | Essent Group Ltd | | | 1,891 | |
| | 3,168 | | | | Evans Bancorp, Inc | | | 103 | |
| | 6,654 | | e | | Farmers & Merchants Bancorp, Inc | | | 256 | |
| | 18,150 | | | | Farmers National Banc Corp | | | 231 | |
| | 4,563 | | | | FB Financial Corp | | | 160 | |
| | 25,303 | | * | | FCB Financial Holdings, Inc | | | 850 | |
| | 6,481 | | | | Federal Agricultural Mortgage Corp (Class C) | | | 392 | |
| | 15,456 | | | | Fidelity Southern Corp | | | 402 | |
| | 446,241 | | | | Fifth Third Bancorp | | | 10,500 | |
| | 10,211 | | | | Financial Institutions, Inc | | | 262 | |
| | 20,427 | | | | First Bancorp (NC) | | | 667 | |
| | 114,850 | | | | First Bancorp (Puerto Rico) | | | 988 | |
| | 6,485 | | | | First Bancorp, Inc | | | 171 | |
| | 6,018 | | | | First Bancshares, Inc | | | 182 | |
| | 26,747 | | | | First Busey Corp | | | 656 | |
| | 6,176 | | | | First Business Financial Services, Inc | | | 120 | |
| | 5,135 | | | | First Citizens Bancshares, Inc (Class A) | | | 1,936 | |
| | 69,402 | | | | First Commonwealth Financial Corp | | | 838 | |
| | 12,139 | | | | First Community Bancshares, Inc | | | 382 | |
| | 15,452 | | | | First Defiance Financial Corp | | | 379 | |
| | 68,200 | | | | First Financial Bancorp | | | 1,618 | |
| | 46,159 | | e | | First Financial Bankshares, Inc | | | 2,663 | |
| | 8,330 | | | | First Financial Corp | | | 334 | |
| | 6,257 | | | | First Financial Northwest, Inc | | | 97 | |
| | 19,660 | | * | | First Foundation, Inc | | | 253 | |
| | 3,022 | | e | | First Guaranty Bancshares, Inc | | | 70 | |
| | 71,845 | | | | First Hawaiian, Inc | | | 1,617 | |
| | 220,520 | | | | First Horizon National Corp | | | 2,902 | |
| | 4,089 | | | | First Internet Bancorp | | | 84 | |
| | 18,329 | | | | First Interstate Bancsystem, Inc | | | 670 | |
| | 29,933 | | | | First Merchants Corp | | | 1,026 | |
| | 7,120 | | | | First Mid-Illinois Bancshares, Inc | | | 227 | |
COLLEGE RETIREMENT EQUITIES FUND- Equity Index Account
| SHARES | | | | COMPANY | | VALUE
(000) | |
| | 73,424 | | | | First Midwest Bancorp, Inc | | $ | 1,455 | |
| | 7,602 | | | | First Northwest Bancorp | | | 113 | |
| | 15,462 | | | | First of Long Island Corp | | | 308 | |
| | 107,798 | | | | First Republic Bank | | | 9,368 | |
| | 15,789 | | * | | Flagstar Bancorp, Inc | | | 417 | |
| | 20,105 | | | | Flushing Financial Corp | | | 433 | |
| | 228,101 | | | | FNB Corp | | | 2,245 | |
| | 8,854 | | * | | Franklin Financial Network, Inc | | | 233 | |
| | 119,869 | | | | Fulton Financial Corp | | | 1,856 | |
| | 14,703 | | | | German American Bancorp, Inc | | | 408 | |
| | 55,696 | | | | Glacier Bancorp, Inc | | | 2,207 | |
| | 7,809 | | | | Great Southern Bancorp, Inc | | | 359 | |
| | 42,914 | | | | Great Western Bancorp, Inc | | | 1,341 | |
| | 14,667 | | | | Green Bancorp, Inc | | | 251 | |
| | 2,003 | | e | | Greene County Bancorp, Inc | | | 62 | |
| | 16,942 | | | | Guaranty Bancorp | | | 352 | |
| | 1,224 | | | | Guaranty Bancshares, Inc | | | 36 | |
| | 59,807 | | | | Hancock Holding Co | | | 2,072 | |
| | 23,963 | | | | Hanmi Financial Corp | | | 472 | |
| | 9,284 | | * | | HarborOne Bancorp, Inc | | | 148 | |
| | 17,800 | | | | Heartland Financial USA, Inc | | | 782 | |
| | 25,661 | | | | Heritage Commerce Corp | | | 291 | |
| | 22,188 | | | | Heritage Financial Corp | | | 659 | |
| | 54,190 | | | | Hilltop Holdings, Inc | | | 966 | |
| | 997 | | | | Hingham Institution for Savings | | | 197 | |
| | 4,264 | | | | Home Bancorp, Inc | | | 151 | |
| | 112,204 | | | | Home Bancshares, Inc | | | 1,833 | |
| | 15,022 | | * | | HomeStreet, Inc | | | 319 | |
| | 13,541 | | | | HomeTrust Bancshares, Inc | | | 355 | |
| | 93,574 | | | | Hope Bancorp, Inc | | | 1,110 | |
| | 23,268 | | | | Horizon Bancorp | | | 367 | |
| | 6,001 | | * | | Howard Bancorp, Inc | | | 86 | |
| | 701,072 | | | | Huntington Bancshares, Inc | | | 8,357 | |
| | 35,117 | | | | IBERIABANK Corp | | | 2,257 | |
| | 6,123 | | *,e | | Impac Mortgage Holdings, Inc | | | 23 | |
| | 19,246 | | | | Independent Bank Corp (MA) | | | 1,353 | |
| | 17,558 | | | | Independent Bank Corp (MI) | | | 369 | |
| | 12,630 | | | | Independent Bank Group, Inc | | | 578 | |
| | 40,567 | | | | International Bancshares Corp | | | 1,396 | |
| | 5,550 | | | | Investar Holding Corp | | | 138 | |
| | 186,863 | | | | Investors Bancorp, Inc | | | 1,943 | |
| | 2,201,073 | | | | JPMorgan Chase & Co | | | 214,869 | |
| | 83,674 | | | | Kearny Financial Corp | | | 1,073 | |
| | 684,052 | | | | Keycorp | | | 10,110 | |
| | 32,502 | | | | Lakeland Bancorp, Inc | | | 481 | |
| | 18,387 | | | | Lakeland Financial Corp | | | 738 | |
| | 6,780 | | | | LCNB Corp | | | 103 | |
| | 33,647 | | | | LegacyTexas Financial Group, Inc | | | 1,080 | |
| | 4,628 | | *,e | | LendingTree, Inc | | | 1,016 | |
| | 14,926 | | | | Live Oak Bancshares, Inc | | | 221 | |
| | 95,388 | | | | M&T Bank Corp | | | 13,653 | |
| | 19,210 | | | | Macatawa Bank Corp | | | 185 | |
| | 4,666 | | * | | Malvern Bancorp, Inc | | | 92 | |
| | 58,413 | | | | MB Financial, Inc | | | 2,315 | |
COLLEGE RETIREMENT EQUITIES FUND- Equity Index Account
| SHARES | | | | COMPANY | | VALUE
(000) | |
| | 13,586 | | | | MBT Financial Corp | | $ | 126 | |
| | 12,428 | | | | Mercantile Bank Corp | | | 351 | |
| | 10,918 | | | | Merchants Bancorp | | | 218 | |
| | 35,757 | | | | Meridian Bancorp, Inc | | | 512 | |
| | 20,574 | | | | Meta Financial Group, Inc | | | 399 | |
| | 4,420 | | * | | Metropolitan Bank Holding Corp | | | 136 | |
| | 210,298 | | * | | MGIC Investment Corp | | | 2,200 | |
| | 1,778 | | | | Middlefield Banc Corp | | | 75 | |
| | 10,800 | | | | Midland States Bancorp, Inc | | | 241 | |
| | 6,195 | | | | Midsouth Bancorp, Inc | | | 66 | |
| | 7,821 | | | | MidWestOne Financial Group, Inc | | | 194 | |
| | 34,360 | | * | | Mr Cooper Group, Inc | | | 401 | |
| | 3,816 | | | | MutualFirst Financial, Inc | | | 101 | |
| | 19,324 | | | | National Bank Holdings Corp | | | 597 | |
| | 5,351 | | e | | National Bankshares, Inc | | | 195 | |
| | 7,588 | | * | | National Commerce Corp | | | 273 | |
| | 31,726 | | | | NBT Bancorp, Inc | | | 1,097 | |
| | 305,096 | | | | New York Community Bancorp, Inc | | | 2,871 | |
| | 6,480 | | * | | Nicolet Bankshares, Inc | | | 316 | |
| | 38,864 | | * | | NMI Holdings, Inc | | | 694 | |
| | 5,235 | | | | Northeast Bancorp | | | 88 | |
| | 33,024 | | | | Northfield Bancorp, Inc | | | 447 | |
| | 5,019 | | | | Northrim BanCorp, Inc | | | 165 | |
| | 69,442 | | | | Northwest Bancshares, Inc | | | 1,176 | |
| | 4,425 | | e | | Norwood Financial Corp | | | 146 | |
| | 30,487 | | | | OceanFirst Financial Corp | | | 686 | |
| | 33,903 | | | | OFG Bancorp | | | 558 | |
| | 3,155 | | e | | Ohio Valley Banc Corp | | | 112 | |
| | 6,461 | | | | Old Line Bancshares, Inc | | | 170 | |
| | 90,192 | | | | Old National Bancorp | | | 1,389 | |
| | 21,667 | | | | Old Second Bancorp, Inc | | | 282 | |
| | 14,808 | | | | Opus Bank | | | 290 | |
| | 11,057 | | | | Origin Bancorp, Inc | | | 377 | |
| | 26,521 | | | | Oritani Financial Corp | | | 391 | |
| | 5,318 | | | | Orrstown Financial Services, Inc | | | 97 | |
| | 11,579 | | * | | Pacific Mercantile Bancorp | | | 83 | |
| | 28,237 | | * | | Pacific Premier Bancorp, Inc | | | 721 | |
| | 81,519 | | | | PacWest Bancorp | | | 2,713 | |
| | 9,690 | | | | Park National Corp | | | 823 | |
| | 4,177 | | | | Parke Bancorp, Inc | | | 78 | |
| | 13,465 | | | | PCSB Financial Corp | | | 263 | |
| | 11,582 | | | | Peapack Gladstone Financial Corp | | | 292 | |
| | 2,964 | | | | Penns Woods Bancorp, Inc | | | 119 | |
| | 9,540 | | | | PennyMac Financial Services, Inc | | | 203 | |
| | 3,256 | | | | Peoples Bancorp of North Carolina, Inc | | | 80 | |
| | 12,623 | | | | Peoples Bancorp, Inc | | | 380 | |
| | 5,712 | | | | Peoples Financial Services Corp | | | 252 | |
| | 240,181 | | | | People’s United Financial, Inc | | | 3,466 | |
| | 9,341 | | | | People’s Utah Bancorp | | | 282 | |
| | 50,971 | | | | Pinnacle Financial Partners, Inc | | | 2,350 | |
| | 310,532 | | | | PNC Financial Services Group, Inc | | | 36,304 | |
| | 62,207 | | | | Popular, Inc | | | 2,937 | |
| | 8,859 | | | | Preferred Bank | | | 384 | |
COLLEGE RETIREMENT EQUITIES FUND- Equity Index Account
| SHARES | | | | COMPANY | | VALUE
(000) | |
| | 8,456 | | | | Premier Financial Bancorp, Inc | | $ | 126 | |
| | 48,016 | | | | Prosperity Bancshares, Inc | | | 2,991 | |
| | 3,260 | | * | | Provident Bancorp, Inc | | | 71 | |
| | 45,191 | | | | Provident Financial Services, Inc | | | 1,090 | |
| | 6,101 | | | | Prudential Bancorp, Inc | | | 107 | |
| | 8,729 | | | | QCR Holdings, Inc | | | 280 | |
| | 122,609 | | | | Radian Group, Inc | | | 2,006 | |
| | 9,265 | | | | RBB Bancorp | | | 163 | |
| | 686,645 | | | | Regions Financial Corp | | | 9,187 | |
| | 30,881 | | | | Renasant Corp | | | 932 | |
| | 6,104 | | | | Republic Bancorp, Inc (Class A) | | | 236 | |
| | 34,776 | | * | | Republic First Bancorp, Inc | | | 208 | |
| | 13,238 | | | | Riverview Bancorp, Inc | | | 96 | |
| | 25,676 | | | | S&T Bancorp, Inc | | | 972 | |
| | 22,606 | | | | Sandy Spring Bancorp, Inc | | | 708 | |
| | 28,631 | | * | | Seacoast Banking Corp of Florida | | | 745 | |
| | 32,848 | | | | ServisFirst Bancshares, Inc | | | 1,047 | |
| | 8,913 | | | | Shore Bancshares, Inc | | | 130 | |
| | 8,511 | | | | SI Financial Group, Inc | | | 108 | |
| | 8,919 | | | | Sierra Bancorp | | | 214 | |
| | 38,410 | | | | Signature Bank | | | 3,949 | |
| | 55,218 | | | | Simmons First National Corp (Class A) | | | 1,332 | |
| | 5,382 | | * | | SmartFinancial, Inc | | | 98 | |
| | 24,776 | | | | South State Corp | | | 1,485 | |
| | 4,079 | | * | | Southern First Bancshares, Inc | | | 131 | |
| | 4,139 | | | | Southern Missouri Bancorp, Inc | | | 140 | |
| | 8,140 | | | | Southern National Bancorp of Virginia, Inc | | | 108 | |
| | 20,042 | | | | Southside Bancshares, Inc | | | 636 | |
| | 26,403 | | | | State Bank & Trust Co | | | 570 | |
| | 11,631 | | | | Sterling Bancorp, Inc | | | 81 | |
| | 151,652 | | | | Sterling Bancorp/DE | | | 2,504 | |
| | 16,305 | | | | Stock Yards Bancorp, Inc | | | 535 | |
| | 6,101 | | | | Summit Financial Group, Inc | | | 118 | |
| | 298,334 | | | | SunTrust Banks, Inc | | | 15,048 | |
| | 33,541 | | * | | SVB Financial Group | | | 6,370 | |
| | 76,607 | | | | Synovus Financial Corp | | | 2,451 | |
| | 116,646 | | | | TCF Financial Corp | | | 2,273 | |
| | 5,870 | | | | Territorial Bancorp, Inc | | | 152 | |
| | 35,836 | | * | | Texas Capital Bancshares, Inc | | | 1,831 | |
| | 34,383 | | | | TFS Financial Corp | | | 555 | |
| | 35,393 | | * | | The Bancorp, Inc | | | 282 | |
| | 4,645 | | | | Timberland Bancorp, Inc | | | 104 | |
| | 10,641 | | | | Tompkins Trustco, Inc | | | 798 | |
| | 46,422 | | | | TowneBank | | | 1,112 | |
| | 19,212 | | | | Trico Bancshares | | | 649 | |
| | 16,178 | | * | | Tristate Capital Holdings, Inc | | | 315 | |
| | 10,668 | | * | | Triumph Bancorp, Inc | | | 317 | |
| | 71,043 | | | | Trustco Bank Corp NY | | | 487 | |
| | 49,168 | | | | Trustmark Corp | | | 1,398 | |
| | 26,057 | | | | UMB Financial Corp | | | 1,589 | |
| | 161,706 | | | | Umpqua Holdings Corp | | | 2,571 | |
| | 34,740 | | | | Union Bankshares Corp | | | 981 | |
| | 2,885 | | e | | Union Bankshares, Inc | | | 138 | |
| | 72,013 | | | | United Bankshares, Inc | | | 2,240 | |
COLLEGE RETIREMENT EQUITIES FUND- Equity Index Account
| SHARES | | | | COMPANY | | VALUE
(000) | |
| | 51,942 | | | | United Community Banks, Inc | | $ | 1,115 | |
| | 34,307 | | | | United Community Financial Corp | | | 304 | |
| | 36,948 | | | | United Financial Bancorp, Inc (New) | | | 543 | |
| | 9,461 | | | | United Security Bancshares | | | 91 | |
| | 5,346 | | | | Unity Bancorp, Inc | | | 111 | |
| | 19,117 | | | | Univest Corp of Pennsylvania | | | 412 | |
| | 1,006,126 | | | | US Bancorp | | | 45,980 | |
| | 216,752 | | | | Valley National Bancorp | | | 1,925 | |
| | 10,468 | | * | | Veritex Holdings, Inc | | | 224 | |
| | 19,235 | | | | Walker & Dunlop, Inc | | | 832 | |
| | 50,737 | | | | Washington Federal, Inc | | | 1,355 | |
| | 10,818 | | | | Washington Trust Bancorp, Inc | | | 514 | |
| | 19,189 | | | | Waterstone Financial, Inc | | | 322 | |
| | 67,195 | | | | Webster Financial Corp | | | 3,312 | |
| | 2,822,111 | | | | Wells Fargo & Co | | | 130,043 | |
| | 35,721 | | | | WesBanco, Inc | | | 1,311 | |
| | 11,970 | | | | West Bancorporation, Inc | | | 229 | |
| | 18,981 | | e | | Westamerica Bancorporation | | | 1,057 | |
| | 68,448 | | * | | Western Alliance Bancorp | | | 2,703 | |
| | 19,137 | | | | Western New England Bancorp, Inc | | | 192 | |
| | 38,890 | | | | Wintrust Financial Corp | | | 2,586 | |
| | 21,617 | | | | WSFS Financial Corp | | | 819 | |
| | 132,437 | | | | Zions Bancorporation | | | 5,395 | |
| | | | | | TOTAL BANKS | | | 1,004,228 | |
| | | | | | | | | | |
| CAPITAL GOODS - 6.8% |
| | 378,129 | | | | 3M Co | | | 72,049 | |
| | 93,763 | | | | A.O. Smith Corp | | | 4,004 | |
| | 29,877 | | | | Aaon, Inc | | | 1,047 | |
| | 23,226 | | | | AAR Corp | | | 867 | |
| | 43,959 | | | | Actuant Corp (Class A) | | | 923 | |
| | 24,498 | | | | Acuity Brands, Inc | | | 2,816 | |
| | 24,758 | | | | Advanced Drainage Systems, Inc | | | 600 | |
| | 93,206 | | * | | Aecom Technology Corp | | | 2,470 | |
| | 24,436 | | * | | Aegion Corp | | | 399 | |
| | 49,582 | | * | | Aerojet Rocketdyne Holdings, Inc | | | 1,747 | |
| | 14,335 | | * | | Aerovironment, Inc | | | 974 | |
| | 48,271 | | | | AGCO Corp | | | 2,687 | |
| | 56,080 | | | | Air Lease Corp | | | 1,694 | |
| | 13,921 | | | | Aircastle Ltd | | | 240 | |
| | 6,904 | | | | Alamo Group, Inc | | | 534 | |
| | 21,082 | | | | Albany International Corp (Class A) | | | 1,316 | |
| | 58,342 | | | | Allegion plc | | | 4,650 | |
| | 4,493 | | | | Allied Motion Technologies, Inc | | | 201 | |
| | 68,688 | | | | Allison Transmission Holdings, Inc | | | 3,016 | |
| | 22,666 | | | | Altra Holdings, Inc | | | 570 | |
| | 13,776 | | * | | Ameresco, Inc | | | 194 | |
| | 10,171 | | * | | American Woodmark Corp | | | 566 | |
| | 147,502 | | | | Ametek, Inc | | | 9,986 | |
| | 20,270 | | | | Apogee Enterprises, Inc | | | 605 | |
| | 27,154 | | | | Applied Industrial Technologies, Inc | | | 1,465 | |
| | 274,168 | | | | Arconic, Inc | | | 4,622 | |
| | 30,718 | | * | | Arcosa, Inc | | | 851 | |
COLLEGE RETIREMENT EQUITIES FUND- Equity Index Account
| SHARES | | | | COMPANY | | VALUE
(000) | |
| | 10,471 | | | | Argan, Inc | | $ | 396 | |
| | 17,658 | | * | | Armstrong Flooring, Inc | | | 209 | |
| | 31,329 | | | | Armstrong World Industries, Inc | | | 1,824 | |
| | 15,250 | | | | Astec Industries, Inc | | | 460 | |
| | 15,755 | | * | | Astronics Corp | | | 480 | |
| | 23,836 | | * | | Atkore International Group, Inc | | | 473 | |
| | 35,579 | | * | | Axon Enterprise, Inc | | | 1,557 | |
| | 19,364 | | | | AZZ, Inc | | | 782 | |
| | 36,264 | | | | Barnes Group, Inc | | | 1,944 | |
| | 41,684 | | * | | Beacon Roofing Supply, Inc | | | 1,322 | |
| | 3,946 | | *,e | | Blue Bird Corp | | | 72 | |
| | 6,034 | | *,e | | BlueLinx Holdings, Inc | | | 149 | |
| | 47,040 | | * | | BMC Stock Holdings, Inc | | | 728 | |
| | 356,151 | | | | Boeing Co | | | 114,859 | |
| | 30,438 | | | | Briggs & Stratton Corp | | | 398 | |
| | 67,070 | | * | | Builders FirstSource, Inc | | | 732 | |
| | 66,179 | | | | BWX Technologies, Inc | | | 2,530 | |
| | 14,163 | | e | | Caesarstone Sdot-Yam Ltd | | | 192 | |
| | 8,775 | | * | | CAI International, Inc | | | 204 | |
| | 41,051 | | | | Carlisle Cos, Inc | | | 4,126 | |
| | 383,623 | | | | Caterpillar, Inc | | | 48,747 | |
| | 22,344 | | * | | Chart Industries, Inc | | | 1,453 | |
| | 12,045 | | * | | CIRCOR International, Inc | | | 257 | |
| | 64,286 | | * | | Colfax Corp | | | 1,344 | |
| | 14,727 | | | | Columbus McKinnon Corp | | | 444 | |
| | 24,840 | | | | Comfort Systems USA, Inc | | | 1,085 | |
| | 18,016 | | * | | Commercial Vehicle Group, Inc | | | 103 | |
| | 28,296 | | * | | Continental Building Products Inc | | | 720 | |
| | 35,446 | | | | Crane Co | | | 2,558 | |
| | 10,574 | | * | | CSW Industrials, Inc | | | 511 | |
| | 18,660 | | | | Cubic Corp | | | 1,003 | |
| | 99,864 | | | | Cummins, Inc | | | 13,346 | |
| | 31,189 | | | | Curtiss-Wright Corp | | | 3,185 | |
| | 217,576 | | | | Deere & Co | | | 32,456 | |
| | 9,586 | | | | DMC Global, Inc | | | 337 | |
| | 81,746 | | | | Donaldson Co, Inc | | | 3,547 | |
| | 16,771 | | | | Douglas Dynamics, Inc | | | 602 | |
| | 91,263 | | | | Dover Corp | | | 6,475 | |
| | 8,048 | | * | | Ducommun, Inc | | | 292 | |
| | 11,117 | | * | | DXP Enterprises, Inc | | | 309 | |
| | 16,954 | | * | | Dycom Industries, Inc | | | 916 | |
| | 3,733 | | | | Eastern Co | | | 90 | |
| | 285,450 | | | | Eaton Corp | | | 19,599 | |
| | 35,403 | | | | EMCOR Group, Inc | | | 2,113 | |
| | 412,201 | | | | Emerson Electric Co | | | 24,629 | |
| | 15,305 | | | | Encore Wire Corp | | | 768 | |
| | 11,608 | | *,e | | Energous Corp | | | 67 | |
| | 24,905 | | *,e | | Energy Recovery, Inc | | | 168 | |
| | 31,570 | | | | EnerSys | | | 2,450 | |
| | 12,394 | | * | | Engility Holdings, Inc | | | 353 | |
| | 58,642 | | *,e | | Enphase Energy, Inc | | | 277 | |
| | 15,803 | | | | EnPro Industries, Inc | | | 950 | |
| | 18,556 | | | | ESCO Technologies, Inc | | | 1,224 | |
| | 18,922 | | * | | Esterline Technologies Corp | | | 2,298 | |
COLLEGE RETIREMENT EQUITIES FUND- Equity Index Account
| SHARES | | | | COMPANY | | VALUE
(000) | |
| | 2,576 | | e | | EVI Industries, Inc | | $ | 86 | |
| | 51,314 | | *,e | | Evoqua Water Technologies Corp | | | 493 | |
| | 196,957 | | | | Fastenal Co | | | 10,299 | |
| | 42,557 | | | | Federal Signal Corp | | | 847 | |
| | 82,555 | | | | Flowserve Corp | | | 3,139 | |
| | 91,070 | | | | Fluor Corp | | | 2,932 | |
| | 189,288 | | | | Fortive Corp | | | 12,807 | |
| | 99,180 | | | | Fortune Brands Home & Security, Inc | | | 3,768 | |
| | 9,256 | | * | | Foundation Building Materials, Inc | | | 77 | |
| | 34,098 | | | | Franklin Electric Co, Inc | | | 1,462 | |
| | 9,868 | | * | | Freightcar America, Inc | | | 66 | |
| | 72,418 | | * | | Gardner Denver Holdings, Inc | | | 1,481 | |
| | 30,738 | | * | | Gates Industrial Corp plc | | | 407 | |
| | 28,224 | | | | GATX Corp | | | 1,999 | |
| | 4,980 | | * | | Gencor Industries, Inc | | | 55 | |
| | 41,949 | | * | | Generac Holdings, Inc | | | 2,085 | |
| | 172,512 | | | | General Dynamics Corp | | | 27,121 | |
| | 5,781,899 | | | | General Electric Co | | | 43,769 | |
| | 22,869 | | * | | Gibraltar Industries, Inc | | | 814 | |
| | 16,574 | | | | Global Brass & Copper Holdings, Inc | | | 417 | |
| | 17,148 | | * | | GMS, Inc | | | 255 | |
| | 14,132 | | | | Gorman-Rupp Co | | | 458 | |
| | 104,372 | | | | Graco, Inc | | | 4,368 | |
| | 26,067 | | | | GrafTech International Ltd | | | 298 | |
| | 7,763 | | | | Graham Corp | | | 177 | |
| | 33,088 | | | | Granite Construction, Inc | | | 1,333 | |
| | 44,924 | | * | | Great Lakes Dredge & Dock Corp | | | 297 | |
| | 19,838 | | | | Greenbrier Cos, Inc | | | 784 | |
| | 20,793 | | | | Griffon Corp | | | 217 | |
| | 23,777 | | | | H&E Equipment Services, Inc | | | 486 | |
| | 79,494 | | | | Harris Corp | | | 10,704 | |
| | 59,172 | | * | | Harsco Corp | | | 1,175 | |
| | 26,381 | | *,e | | HC2 Holdings, Inc | | | 70 | |
| | 118,284 | | * | | HD Supply Holdings, Inc | | | 4,438 | |
| | 26,390 | | | | HEICO Corp | | | 2,045 | |
| | 46,469 | | | | HEICO Corp (Class A) | | | 2,928 | |
| | 17,889 | | * | | Herc Holdings, Inc | | | 465 | |
| | 57,257 | | | | Hexcel Corp | | | 3,283 | |
| | 44,280 | | | | Hillenbrand, Inc | | | 1,680 | |
| | 493,825 | | | | Honeywell International, Inc | | | 65,244 | |
| | 38,998 | | | | Hubbell, Inc | | | 3,874 | |
| | 28,196 | | | | Huntington Ingalls | | | 5,366 | |
| | 4,796 | | | | Hurco Cos, Inc | | | 171 | |
| | 7,224 | | | | Hyster-Yale Materials Handling, Inc | | | 448 | |
| | 49,969 | | | | IDEX Corp | | | 6,309 | |
| | 5,334 | | * | | IES Holdings, Inc | | | 83 | |
| | 221,806 | | | | Illinois Tool Works, Inc | | | 28,101 | |
| | 159,921 | | | | Ingersoll-Rand plc | | | 14,590 | |
| | 13,472 | | | | Insteel Industries, Inc | | | 327 | |
| | 62,449 | | | | ITT, Inc | | | 3,014 | |
| | 85,068 | | | | Jacobs Engineering Group, Inc | | | 4,973 | |
| | 47,393 | | * | | JELD-WEN Holding, Inc | | | 673 | |
| | 22,550 | | | | John Bean Technologies Corp | | | 1,619 | |
COLLEGE RETIREMENT EQUITIES FUND- Equity Index Account
| SHARES | | | | COMPANY | | VALUE
(000) | |
| | 615,106 | | | | Johnson Controls International plc | | $ | 18,238 | |
| | 8,084 | | | | Kadant, Inc | | | 658 | |
| | 17,941 | | | | Kaman Corp | | | 1,006 | |
| | 104,383 | | | | KBR, Inc | | | 1,585 | |
| | 56,290 | | | | Kennametal, Inc | | | 1,873 | |
| | 35,741 | | *,e | | KEYW Holding Corp, The | | | 239 | |
| | 50,983 | | * | | Kratos Defense & Security Solutions, Inc | | | 718 | |
| | 52,610 | | | | L3 Technologies, Inc | | | 9,136 | |
| | 4,456 | | * | | Lawson Products, Inc | | | 141 | |
| | 5,677 | | * | | LB Foster Co (Class A) | | | 90 | |
| | 22,519 | | | | Lennox International, Inc | | | 4,928 | |
| | 36,237 | | | | Lincoln Electric Holdings, Inc | | | 2,857 | |
| | 7,273 | | | | Lindsay Corp | | | 700 | |
| | 165,371 | | | | Lockheed Martin Corp | | | 43,301 | |
| | 12,223 | | * | | Lydall, Inc | | | 248 | |
| | 22,630 | | * | | Manitowoc Co, Inc | | | 334 | |
| | 201,028 | | | | Masco Corp | | | 5,878 | |
| | 18,516 | | * | | Masonite International Corp | | | 830 | |
| | 48,078 | | * | | Mastec, Inc | | | 1,950 | |
| | 38,365 | | | | Maxar Technologies Ltd | | | 459 | |
| | 33,690 | | * | | Mercury Systems, Inc | | | 1,593 | |
| | 60,412 | | * | | Meritor, Inc | | | 1,022 | |
| | 35,939 | | * | | Middleby Corp | | | 3,692 | |
| | 31,692 | | * | | Milacron Holdings Corp | | | 377 | |
| | 7,280 | | | | Miller Industries, Inc | | | 197 | |
| | 22,998 | | | | Moog, Inc (Class A) | | | 1,782 | |
| | 64,419 | | * | | MRC Global, Inc | | | 788 | |
| | 31,901 | | | | MSC Industrial Direct Co (Class A) | | | 2,454 | |
| | 40,743 | | | | Mueller Industries, Inc | | | 952 | |
| | 104,855 | | | | Mueller Water Products, Inc (Class A) | | | 954 | |
| | 10,993 | | * | | MYR Group, Inc | | | 310 | |
| | 3,534 | | e | | National Presto Industries, Inc | | | 413 | |
| | 35,673 | | * | | Navistar International Corp | | | 926 | |
| | 29,151 | | * | | NCI Building Systems, Inc | | | 211 | |
| | 18,421 | | *,e | | Nexeo Solutions, Inc | | | 158 | |
| | 19,066 | | | | NN, Inc | | | 128 | |
| | 37,392 | | | | Nordson Corp | | | 4,463 | |
| | 108,275 | | | | Northrop Grumman Corp | | | 26,517 | |
| | 6,891 | | * | | Northwest Pipe Co | | | 160 | |
| | 78,206 | | * | | NOW, Inc | | | 910 | |
| | 5,211 | | * | | NV5 Holdings, Inc | | | 316 | |
| | 110,096 | | | | nVent Electric plc | | | 2,473 | |
| | 2,354 | | | | Omega Flex, Inc | | | 127 | |
| | 19,593 | | * | | Orion Marine Group, Inc | | | 84 | |
| | 53,964 | | | | Oshkosh Truck Corp | | | 3,309 | |
| | 74,736 | | | | Owens Corning, Inc | | | 3,287 | |
| | 224,822 | | | | PACCAR, Inc | | | 12,846 | |
| | 88,001 | | | | Parker-Hannifin Corp | | | 13,124 | |
| | 17,097 | | * | | Patrick Industries, Inc | | | 506 | |
| | 96,376 | | | | Pentair plc | | | 3,641 | |
| | 36,380 | | * | | PGT, Inc | | | 577 | |
| | 159,236 | | *,e | | Plug Power, Inc | | | 197 | |
| | 7,077 | | | | Powell Industries, Inc | | | 177 | |
| | 1,801 | | | | Preformed Line Products Co | | | 98 | |
COLLEGE RETIREMENT EQUITIES FUND- Equity Index Account
| SHARES | | | | COMPANY | | VALUE
(000) | |
| | 28,783 | | | | Primoris Services Corp | | $ | 551 | |
| | 18,284 | | * | | Proto Labs, Inc | | | 2,062 | |
| | 25,291 | | | | Quanex Building Products Corp | | | 344 | |
| | 106,691 | | * | | Quanta Services, Inc | | | 3,211 | |
| | 25,955 | | | | Raven Industries, Inc | | | 939 | |
| | 190,157 | | | | Raytheon Co | | | 29,161 | |
| | 16,634 | | * | | RBC Bearings, Inc | | | 2,181 | |
| | 32,248 | | | | Regal-Beloit Corp | | | 2,259 | |
| | 82,950 | | * | | Resideo Technologies, Inc | | | 1,705 | |
| | 8,757 | | e | | REV Group, Inc | | | 66 | |
| | 75,228 | | * | | Rexnord Corp | | | 1,726 | |
| | 82,065 | | | | Rockwell Automation, Inc | | | 12,349 | |
| | 66,271 | | | | Roper Industries, Inc | | | 17,663 | |
| | 4,597 | | | | Rush Enterprises, Inc | | | 164 | |
| | 21,510 | | | | Rush Enterprises, Inc (Class A) | | | 742 | |
| | 112,005 | | * | | Sensata Technologies Holding plc | | | 5,022 | |
| | 29,530 | | | | Simpson Manufacturing Co, Inc | | | 1,598 | |
| | 24,415 | | * | | SiteOne Landscape Supply, Inc | | | 1,349 | |
| | 37,636 | | | | Snap-On, Inc | | | 5,468 | |
| | 7,959 | | * | | Sparton Corp | | | 145 | |
| | 66,489 | | | | Spirit Aerosystems Holdings, Inc (Class A) | | | 4,793 | |
| | 30,406 | | * | | SPX Corp | | | 852 | |
| | 29,148 | | * | | SPX FLOW, Inc | | | 887 | |
| | 8,333 | | | | Standex International Corp | | | 560 | |
| | 103,756 | | | | Stanley Works | | | 12,424 | |
| | 18,886 | | * | | Sterling Construction Co, Inc | | | 206 | |
| | 16,194 | | | | Sun Hydraulics Corp | | | 537 | |
| | 60,603 | | * | | Sunrun, Inc | | | 660 | |
| | 22,563 | | * | | Teledyne Technologies, Inc | | | 4,672 | |
| | 12,744 | | | | Tennant Co | | | 664 | |
| | 54,792 | | | | Terex Corp | | | 1,511 | |
| | 18,852 | | * | | Textainer Group Holdings Ltd | | | 188 | |
| | 166,163 | | | | Textron, Inc | | | 7,642 | |
| | 24,419 | | * | | Thermon Group Holdings | | | 495 | |
| | 50,165 | | | | Timken Co | | | 1,872 | |
| | 33,155 | | | | Titan International, Inc | | | 154 | |
| | 11,613 | | * | | Titan Machinery, Inc | | | 153 | |
| | 65,756 | | | | Toro Co | | | 3,674 | |
| | 7,431 | | * | | TPI Composites, Inc | | | 183 | |
| | 31,351 | | * | | TransDigm Group, Inc | | | 10,661 | |
| | 40,670 | | * | | Trex Co, Inc | | | 2,414 | |
| | 34,233 | | * | | Trimas Corp | | | 934 | |
| | 92,156 | | | | Trinity Industries, Inc | | | 1,897 | |
| | 30,588 | | | | Triton International Ltd | | | 950 | |
| | 32,779 | | | | Triumph Group, Inc | | | 377 | |
| | 27,269 | | * | | Tutor Perini Corp | | | 435 | |
| | 6,567 | | * | | Twin Disc, Inc | | | 97 | |
| | 54,189 | | * | | United Rentals, Inc | | | 5,556 | |
| | 539,591 | | | | United Technologies Corp | | | 57,456 | |
| | 74,230 | | * | | Univar, Inc | | | 1,317 | |
| | 44,298 | | | | Universal Forest Products, Inc | | | 1,150 | |
| | 51,264 | | | | USG Corp | | | 2,187 | |
| | 15,302 | | | | Valmont Industries, Inc | | | 1,698 | |
COLLEGE RETIREMENT EQUITIES FUND- Equity Index Account
| SHARES | | | | COMPANY | | VALUE
(000) | |
| | 7,860 | | * | | Vectrus, Inc | | $ | 170 | |
| | 7,828 | | * | | Veritiv Corp | | | 195 | |
| | 12,845 | | * | | Vicor Corp | | | 485 | |
| | 15,334 | | *,e | | Vivint Solar, Inc | | | 58 | |
| | 31,005 | | | | W.W. Grainger, Inc | | | 8,755 | |
| | 42,603 | | | | Wabash National Corp | | | 557 | |
| | 31,460 | | * | | WABCO Holdings, Inc | | | 3,377 | |
| | 55,613 | | e | | Wabtec Corp | | | 3,907 | |
| | 21,705 | | | | Watsco, Inc | | | 3,020 | |
| | 18,825 | | | | Watts Water Technologies, Inc (Class A) | | | 1,215 | |
| | 88,290 | | * | | Welbilt, Inc | | | 981 | |
| | 39,330 | | * | | Wesco Aircraft Holdings, Inc | | | 311 | |
| | 34,751 | | * | | WESCO International, Inc | | | 1,668 | |
| | 3,392 | | * | | Willis Lease Finance Corp | | | 117 | |
| | 22,097 | | *,e | | Willscot Corp | | | 208 | |
| | 30,077 | | | | Woodward Governor Co | | | 2,234 | |
| | 121,024 | | | | Xylem, Inc | | | 8,075 | |
| | | | | | TOTAL CAPITAL GOODS | | | 1,150,815 | |
| | | | | | | | | | |
| COMMERCIAL & PROFESSIONAL SERVICES - 1.0% |
| | 40,285 | | | | ABM Industries, Inc | | | 1,294 | |
| | 37,820 | | * | | Acacia Research (Acacia Technologies) | | | 113 | |
| | 77,675 | | | | ACCO Brands Corp | | | 527 | |
| | 5,238 | | e | | ADT, Inc | | | 31 | |
| | 49,123 | | * | | Advanced Disposal Services, Inc | | | 1,176 | |
| | 5,145 | | | | Barrett Business Services, Inc | | | 295 | |
| | 4,266 | | | | BG Staffing, Inc | | | 88 | |
| | 33,472 | | | | Brady Corp (Class A) | | | 1,455 | |
| | 16,522 | | * | | BrightView Holdings, Inc | | | 169 | |
| | 33,001 | | | | Brink’s Co | | | 2,133 | |
| | 29,675 | | * | | Casella Waste Systems, Inc (Class A) | | | 845 | |
| | 35,493 | | * | | CBIZ, Inc | | | 699 | |
| | 18,496 | | * | | Ceco Environmental Corp | | | 125 | |
| | 14,958 | | * | | Cimpress NV | | | 1,547 | |
| | 57,986 | | | | Cintas Corp | | | 9,741 | |
| | 38,542 | | * | | Clean Harbors, Inc | | | 1,902 | |
| | 138,147 | | * | | Copart, Inc | | | 6,601 | |
| | 23,688 | | * | | CoStar Group, Inc | | | 7,991 | |
| | 84,474 | | | | Covanta Holding Corp | | | 1,134 | |
| | 7,013 | | | | CRA International, Inc | | | 298 | |
| | 27,694 | | | | Deluxe Corp | | | 1,065 | |
| | 21,918 | | | | Dun & Bradstreet Corp | | | 3,129 | |
| | 20,052 | | | | Ennis, Inc | | | 386 | |
| | 76,115 | | | | Equifax, Inc | | | 7,089 | |
| | 28,344 | | | | Essendant, Inc | | | 357 | |
| | 36,012 | | | | Exponent, Inc | | | 1,826 | |
| | 7,582 | | | | Forrester Research, Inc | | | 339 | |
| | 7,620 | | * | | Franklin Covey Co | | | 170 | |
| | 25,416 | | * | | FTI Consulting, Inc | | | 1,694 | |
| | 9,864 | | * | | GP Strategies Corp | | | 124 | |
| | 49,914 | | e | | Healthcare Services Group | | | 2,006 | |
| | 14,300 | | | | Heidrick & Struggles International, Inc | | | 446 | |
| | 8,893 | | * | | Heritage-Crystal Clean, Inc | | | 205 | |
| | 43,782 | | | | Herman Miller, Inc | | | 1,324 | |
COLLEGE RETIREMENT EQUITIES FUND- Equity Index Account
| SHARES | | | | COMPANY | | VALUE
(000) | |
| | 31,637 | | | | HNI Corp | | $ | 1,121 | |
| | 15,850 | | * | | Huron Consulting Group, Inc | | | 813 | |
| | 13,124 | | | | ICF International, Inc | | | 850 | |
| | 247,450 | | * | | IHS Markit Ltd | | | 11,870 | |
| | 32,837 | | * | | Innerworkings, Inc | | | 123 | |
| | 25,976 | | | | Insperity, Inc | | | 2,425 | |
| | 44,581 | | | | Interface, Inc | | | 635 | |
| | 88,200 | | | | KAR Auction Services, Inc | | | 4,209 | |
| | 20,372 | | | | Kelly Services, Inc (Class A) | | | 417 | |
| | 18,302 | | | | Kforce, Inc | | | 566 | |
| | 25,171 | | | | Kimball International, Inc (Class B) | | | 357 | |
| | 35,963 | | | | Knoll, Inc | | | 593 | |
| | 37,013 | | | | Korn/Ferry International | | | 1,463 | |
| | 23,849 | | | | LSC Communications, Inc | | | 167 | |
| | 43,803 | | | | Manpower, Inc | | | 2,838 | |
| | 22,585 | | | | Matthews International Corp (Class A) | | | 917 | |
| | 17,061 | | | | McGrath RentCorp | | | 878 | |
| | 13,300 | | * | | Mistras Group, Inc | | | 191 | |
| | 31,645 | | | | Mobile Mini, Inc | | | 1,005 | |
| | 24,011 | | | | MSA Safety, Inc | | | 2,263 | |
| | 9,774 | | | | Multi-Color Corp | | | 343 | |
| | 33,798 | | | | Navigant Consulting, Inc | | | 813 | |
| | 243,950 | | | | Nielsen NV | | | 5,691 | |
| | 4,961 | | * | | NL Industries, Inc | | | 17 | |
| | 36,708 | | * | | On Assignment, Inc | | | 2,001 | |
| | 133,127 | | | | Pitney Bowes, Inc | | | 787 | |
| | 21,796 | | | | Quad Graphics, Inc | | | 268 | |
| | 141,252 | | | | Republic Services, Inc | | | 10,183 | |
| | 20,546 | | | | Resources Connection, Inc | | | 292 | |
| | 79,304 | | | | Robert Half International, Inc | | | 4,536 | |
| | 85,209 | | | | Rollins, Inc | | | 3,076 | |
| | 51,083 | | | | RR Donnelley & Sons Co | | | 202 | |
| | 12,140 | | * | | SP Plus Corp | | | 359 | |
| | 61,807 | | | | Steelcase, Inc (Class A) | | | 917 | |
| | 49,051 | | * | | Stericycle, Inc | | | 1,800 | |
| | 9,938 | | | | Systemax, Inc | | | 237 | |
| | 20,907 | | *,e | | Team, Inc | | | 306 | |
| | 41,281 | | | | Tetra Tech, Inc | | | 2,137 | |
| | 124,580 | | | | TransUnion | | | 7,076 | |
| | 30,336 | | * | | TriNet Group, Inc | | | 1,273 | |
| | 30,958 | | * | | TrueBlue, Inc | | | 689 | |
| | 11,006 | | | | Unifirst Corp | | | 1,575 | |
| | 8,321 | | *,e | | Upwork, Inc | | | 151 | |
| | 16,280 | | | | US Ecology, Inc | | | 1,025 | |
| | 104,117 | | * | | Verisk Analytics, Inc | | | 11,353 | |
| | 15,178 | | | | Viad Corp | | | 760 | |
| | 5,586 | | | | VSE Corp | | | 167 | |
| | 26,743 | | * | | WageWorks, Inc | | | 726 | |
| | 287,361 | | | | Waste Management, Inc | | | 25,572 | |
| | 5,398 | | * | | Willdan Group, Inc | | | 189 | |
| | | | | | TOTAL COMMERCIAL & PROFESSIONAL SERVICES | | | 176,546 | |
COLLEGE RETIREMENT EQUITIES FUND- Equity Index Account
| SHARES | | | | COMPANY | | VALUE
(000) | |
| CONSUMER DURABLES & APPAREL - 1.3% |
| | 15,286 | | | | Acushnet Holdings Corp | | $ | 322 | |
| | 39,523 | | * | | American Outdoor Brands Corp | | | 508 | |
| | 7,681 | | | | Bassett Furniture Industries, Inc | | | 154 | |
| | 21,459 | | * | | Beazer Homes USA, Inc | | | 203 | |
| | 54,098 | | | | Brunswick Corp | | | 2,513 | |
| | 69,841 | | | | Callaway Golf Co | | | 1,069 | |
| | 27,877 | | | | Carter’s, Inc | | | 2,275 | |
| | 6,102 | | * | | Cavco Industries, Inc | | | 796 | |
| | 13,611 | | * | | Century Communities, Inc | | | 235 | |
| | 14,228 | | | | Clarus Corp | | | 144 | |
| | 19,279 | | | | Columbia Sportswear Co | | | 1,621 | |
| | 45,716 | | * | | CROCS, Inc | | | 1,188 | |
| | 6,895 | | | | Culp, Inc | | | 130 | |
| | 19,292 | | * | | Deckers Outdoor Corp | | | 2,468 | |
| | 222,088 | | | | DR Horton, Inc | | | 7,698 | |
| | 7,865 | | | | Escalade, Inc | | | 90 | |
| | 18,783 | | | | Ethan Allen Interiors, Inc | | | 330 | |
| | 5,531 | | | | Flexsteel Industries, Inc | | | 122 | |
| | 31,215 | | * | | Fossil Group, Inc | | | 491 | |
| | 69,502 | | | | Garmin Ltd | | | 4,401 | |
| | 30,360 | | * | | G-III Apparel Group Ltd | | | 847 | |
| | 74,136 | | *,e | | GoPro, Inc | | | 314 | |
| | 16,535 | | * | | Green Brick Partners, Inc | | | 120 | |
| | 6,360 | | | | Hamilton Beach Brands Holding Co | | | 149 | |
| | 244,655 | | | | Hanesbrands, Inc | | | 3,066 | |
| | 74,516 | | | | Hasbro, Inc | | | 6,054 | |
| | 15,207 | | * | | Helen of Troy Ltd | | | 1,995 | |
| | 7,913 | | | | Hooker Furniture Corp | | | 208 | |
| | 93,175 | | * | | Hovnanian Enterprises, Inc (Class A) | | | 64 | |
| | 13,822 | | * | | Installed Building Products Inc | | | 466 | |
| | 18,443 | | *,e | | iRobot Corp | | | 1,544 | |
| | 3,583 | | | | Johnson Outdoors, Inc | | | 211 | |
| | 60,650 | | | | KB Home | | | 1,158 | |
| | 36,137 | | | | La-Z-Boy, Inc | | | 1,001 | |
| | 94,275 | | | | Leggett & Platt, Inc | | | 3,379 | |
| | 11,279 | | | | Lennar Corp (B Shares) | | | 353 | |
| | 192,669 | | | | Lennar Corp (Class A) | | | 7,543 | |
| | 12,635 | | *,e | | LGI Homes, Inc | | | 571 | |
| | 7,210 | | | | Lifetime Brands, Inc | | | 72 | |
| | 66,891 | | * | | Lululemon Athletica, Inc | | | 8,135 | |
| | 16,714 | | * | | M/I Homes, Inc | | | 351 | |
| | 13,092 | | * | | Malibu Boats Inc | | | 456 | |
| | 8,407 | | | | Marine Products Corp | | | 142 | |
| | 13,690 | | * | | MasterCraft Boat Holdings, Inc | | | 256 | |
| | 246,470 | | *,e | | Mattel, Inc | | | 2,462 | |
| | 30,270 | | | | MDC Holdings, Inc | | | 851 | |
| | 26,198 | | * | | Meritage Homes Corp | | | 962 | |
| | 90,698 | | * | | Michael Kors Holdings Ltd | | | 3,439 | |
| | 42,399 | | * | | Mohawk Industries, Inc | | | 4,959 | |
| | 11,320 | | | | Movado Group, Inc | | | 358 | |
| | 3,180 | | | | Nacco Industries, Inc (Class A) | | | 108 | |
| | 22,756 | | * | | Nautilus, Inc | | | 248 | |
| | 6,504 | | * | | New Home Co Inc | | | 34 | |
| | 273,995 | | | | Newell Rubbermaid, Inc | | | 5,094 | |
COLLEGE RETIREMENT EQUITIES FUND- Equity Index Account
| SHARES | | | | COMPANY | | VALUE
(000) | |
| | 834,863 | | | | Nike, Inc (Class B) | | $ | 61,897 | |
| | 2,226 | | * | | NVR, Inc | | | 5,425 | |
| | 11,750 | | | | Oxford Industries, Inc | | | 835 | |
| | 38,838 | | | | Polaris Industries, Inc | | | 2,978 | |
| | 157,608 | | | | Pulte Homes, Inc | | | 4,096 | |
| | 47,687 | | | | PVH Corp | | | 4,433 | |
| | 35,853 | | | | Ralph Lauren Corp | | | 3,709 | |
| | 29,377 | | *,e | | Roku, Inc | | | 900 | |
| | 79,579 | | * | | Skechers U.S.A., Inc (Class A) | | | 1,822 | |
| | 4,660 | | | | Skyline Corp | | | 69 | |
| | 60,523 | | | | Steven Madden Ltd | | | 1,831 | |
| | 12,383 | | | | Sturm Ruger & Co, Inc | | | 659 | |
| | 5,163 | | | | Superior Uniform Group, Inc | | | 91 | |
| | 191,265 | | | | Tapestry, Inc | | | 6,455 | |
| | 79,194 | | * | | Taylor Morrison Home Corp | | | 1,259 | |
| | 33,646 | | * | | Tempur Sealy International, Inc | | | 1,393 | |
| | 96,054 | | | | Toll Brothers, Inc | | | 3,163 | |
| | 26,487 | | * | | TopBuild Corp | | | 1,192 | |
| | 102,085 | | * | | TRI Pointe Homes, Inc | | | 1,116 | |
| | 28,980 | | | | Tupperware Corp | | | 915 | |
| | 135,169 | | *,e | | Under Armour, Inc | | | 2,186 | |
| | 110,698 | | *,e | | Under Armour, Inc (Class A) | | | 1,956 | |
| | 10,905 | | * | | Unifi, Inc | | | 249 | |
| | 10,485 | | * | | Universal Electronics, Inc | | | 265 | |
| | 16,444 | | * | | Vera Bradley, Inc | | | 141 | |
| | 216,827 | | | | VF Corp | | | 15,468 | |
| | 41,550 | | * | | Vista Outdoor, Inc | | | 472 | |
| | 41,162 | | | | Whirlpool Corp | | | 4,399 | |
| | 17,713 | | * | | William Lyon Homes, Inc | | | 189 | |
| | 67,978 | | | | Wolverine World Wide, Inc | | | 2,168 | |
| | 21,026 | | * | | Zagg, Inc | | | 206 | |
| | | | | | TOTAL CONSUMER DURABLES & APPAREL | | | 215,665 | |
| | | | | | | | | | |
| CONSUMER SERVICES - 2.3% |
| | 44,790 | | * | | Adtalem Global Education, Inc | | | 2,119 | |
| | 12,233 | | * | | American Public Education, Inc | | | 348 | |
| | 162,451 | | | | ARAMARK Holdings Corp | | | 4,706 | |
| | 44,487 | | | | BBX Capital Corp | | | 255 | |
| | 64,026 | | * | | Belmond Ltd. | | | 1,603 | |
| | 76 | | * | | Biglari Holdings, Inc (A Shares) | | | 45 | |
| | 769 | | * | | Biglari Holdings, Inc (B Shares) | | | 87 | |
| | 15,173 | | | | BJ’s Restaurants, Inc | | | 767 | |
| | 44,145 | | | | Bloomin’ Brands, Inc | | | 790 | |
| | 12,424 | | * | | Bojangles’, Inc | | | 200 | |
| | 61,116 | | | | Boyd Gaming Corp | | | 1,270 | |
| | 36,213 | | * | | Bright Horizons Family Solutions | | | 4,036 | |
| | 25,489 | | e | | Brinker International, Inc | | | 1,121 | |
| | 404,805 | | *,e | | Caesars Entertainment Corp | | | 2,749 | |
| | 46,334 | | * | | Career Education Corp | | | 529 | |
| | 267,141 | | | | Carnival Corp | | | 13,170 | |
| | 11,838 | | | | Carriage Services, Inc | | | 183 | |
| | 27,792 | | * | | Carrols Restaurant Group, Inc | | | 273 | |
| | 16,727 | | * | | Century Casinos, Inc | | | 124 | |
COLLEGE RETIREMENT EQUITIES FUND- Equity Index Account
| SHARES | | | | COMPANY | | VALUE
(000) | |
| | 31,824 | | e | | Cheesecake Factory | | $ | 1,385 | |
| | 60,816 | | * | | Chegg, Inc | | | 1,728 | |
| | 16,294 | | * | | Chipotle Mexican Grill, Inc (Class A) | | | 7,036 | |
| | 24,500 | | | | Choice Hotels International, Inc | | | 1,754 | |
| | 7,983 | | | | Churchill Downs, Inc | | | 1,947 | |
| | 12,474 | | * | | Chuy’s Holdings, Inc | | | 221 | |
| | 12,704 | | e | | Cracker Barrel Old Country Store, Inc | | | 2,031 | |
| | 82,979 | | | | Darden Restaurants, Inc | | | 8,286 | |
| | 30,312 | | | | Dave & Buster’s Entertainment, Inc | | | 1,351 | |
| | 17,725 | | * | | Del Frisco’s Restaurant Group, Inc | | | 127 | |
| | 23,487 | | * | | Del Taco Restaurants, Inc | | | 235 | |
| | 41,277 | | * | | Denny’s Corp | | | 669 | |
| | 10,362 | | e | | DineEquity, Inc | | | 698 | |
| | 28,536 | | | | Domino’s Pizza, Inc | | | 7,077 | |
| | 43,999 | | * | | Drive Shack, Inc | | | 172 | |
| | 49,730 | | | | Dunkin Brands Group, Inc | | | 3,189 | |
| | 14,501 | | * | | El Pollo Loco Holdings, Inc | | | 220 | |
| | 44,594 | | * | | Eldorado Resorts, Inc | | | 1,615 | |
| | 2,242 | | *,e | | Empire Resorts, Inc | | | 23 | |
| | 117,907 | | | | Extended Stay America, Inc | | | 1,828 | |
| | 20,469 | | * | | Fiesta Restaurant Group, Inc | | | 317 | |
| | 43,198 | | * | | frontdoor, Inc | | | 1,150 | |
| | 7,389 | | *,e | | Golden Entertainment, Inc | | | 118 | |
| | 2,783 | | | | Graham Holdings Co | | | 1,783 | |
| | 32,189 | | * | | Grand Canyon Education, Inc | | | 3,095 | |
| | 129,519 | | | | H&R Block, Inc | | | 3,286 | |
| | 14,706 | | * | | Habit Restaurants, Inc | | | 154 | |
| | 65,914 | | * | | Hilton Grand Vacations, Inc | | | 1,739 | |
| | 183,543 | | | | Hilton Worldwide Holdings, Inc | | | 13,178 | |
| | 76,812 | | * | | Houghton Mifflin Harcourt Co | | | 681 | |
| | 32,335 | | | | Hyatt Hotels Corp | | | 2,186 | |
| | 76,027 | | | | International Game Technology plc | | | 1,112 | |
| | 18,045 | | | | International Speedway Corp (Class A) | | | 791 | |
| | 10,324 | | * | | J Alexander’s Holdings, Inc | | | 85 | |
| | 14,716 | | | | Jack in the Box, Inc | | | 1,142 | |
| | 26,055 | | * | | K12, Inc | | | 646 | |
| | 236,734 | | | | Las Vegas Sands Corp | | | 12,322 | |
| | 62,559 | | * | | Laureate Education, Inc | | | 953 | |
| | 10,890 | | * | | Lindblad Expeditions Holdings, Inc | | | 147 | |
| | 190,477 | | | | Marriott International, Inc (Class A) | | | 20,678 | |
| | 28,647 | | | | Marriott Vacations Worldwide Corp | | | 2,020 | |
| | 516,408 | | | | McDonald’s Corp | | | 91,698 | |
| | 326,708 | | | | MGM Resorts International | | | 7,926 | |
| | 7,140 | | * | | Monarch Casino & Resort, Inc | | | 272 | |
| | 2,378 | | | | Nathan’s Famous, Inc | | | 158 | |
| | 8,091 | | * | | Noodles & Co | | | 57 | |
| | 145,777 | | * | | Norwegian Cruise Line Holdings Ltd | | | 6,179 | |
| | 18,811 | | e | | Papa John’s International, Inc | | | 749 | |
| | 76,441 | | * | | Penn National Gaming, Inc | | | 1,439 | |
| | 60,595 | | * | | Planet Fitness, Inc | | | 3,249 | |
| | 10,854 | | * | | PlayAGS, Inc | | | 250 | |
| | 16,455 | | * | | Potbelly Corp | | | 132 | |
| | 6,547 | | | | RCI Hospitality Holdings, Inc | | | 146 | |
| | 11,433 | | * | | Red Lion Hotels Corp | | | 94 | |
COLLEGE RETIREMENT EQUITIES FUND- Equity Index Account
| SHARES | | | | COMPANY | | VALUE
(000) | |
| | 9,211 | | * | | Red Robin Gourmet Burgers, Inc | | $ | 246 | |
| | 48,687 | | | | Red Rock Resorts, Inc | | | 989 | |
| | 27,109 | | * | | Regis Corp | | | 460 | |
| | 110,388 | | | | Royal Caribbean Cruises Ltd | | | 10,795 | |
| | 21,790 | | | | Ruth’s Chris Steak House, Inc | | | 495 | |
| | 37,197 | | *,e | | Scientific Games Corp (Class A) | | | 665 | |
| | 30,308 | | * | | SeaWorld Entertainment, Inc | | | 670 | |
| | 120,571 | | | | Service Corp International | | | 4,854 | |
| | 86,396 | | * | | ServiceMaster Global Holdings, Inc | | | 3,174 | |
| | 15,620 | | * | | Shake Shack, Inc | | | 709 | |
| | 48,601 | | | | Six Flags Entertainment Corp | | | 2,704 | |
| | 27,603 | | * | | Sotheby’s (Class A) | | | 1,097 | |
| | 9,984 | | | | Speedway Motorsports, Inc | | | 162 | |
| | 803,247 | | | | Starbucks Corp | | | 51,729 | |
| | 15,126 | | | | Strategic Education Inc | | | 1,716 | |
| | 48,860 | | | | Texas Roadhouse, Inc (Class A) | | | 2,917 | |
| | 26,170 | | | | Vail Resorts, Inc | | | 5,517 | |
| | 26,120 | | * | | Weight Watchers International, Inc | | | 1,007 | |
| | 134,006 | | | | Wendy’s | | | 2,092 | |
| | 21,048 | | | | Wingstop, Inc | | | 1,351 | |
| | 68,964 | | | | Wyndham Hotels & Resorts, Inc | | | 3,129 | |
| | 68,964 | | | | Wyndham Worldwide Corp | | | 2,472 | |
| | 70,123 | | | | Wynn Resorts Ltd | | | 6,936 | |
| | 236,930 | | | | Yum China Holdings, Inc | | | 7,944 | |
| | 207,157 | | | | Yum! Brands, Inc | | | 19,042 | |
| | | | | | TOTAL CONSUMER SERVICES | | | 388,771 | |
| | | | | | | | | | |
| DIVERSIFIED FINANCIALS - 3.6% | | |
| | 38,253 | | | | Affiliated Managers Group, Inc | | | 3,727 | |
| | 21,134 | | | | AG Mortgage Investment Trust | | | 337 | |
| | 341,429 | | | | AGNC Investment Corp | | | 5,989 | |
| | 271,869 | | | | Ally Financial, Inc | | | 6,161 | |
| | 472,785 | | | | American Express Co | | | 45,066 | |
| | 94,411 | | | | Ameriprise Financial, Inc | | | 9,854 | |
| | 869,212 | | | | Annaly Capital Management, Inc | | | 8,536 | |
| | 70,479 | | | | Anworth Mortgage Asset Corp | | | 285 | |
| | 52,300 | | | | Apollo Commercial Real Estate Finance, Inc | | | 871 | |
| | 35,777 | | e | | Arbor Realty Trust, Inc | | | 360 | |
| | 22,112 | | | | Ares Commercial Real Estate Corp | | | 288 | |
| | 16,506 | | e | | Arlington Asset Investment Corp (Class A) | | | 120 | |
| | 26,163 | | | | ARMOUR Residential REIT, Inc | | | 536 | |
| | 32,135 | | | | Artisan Partners Asset Management, Inc | | | 711 | |
| | 4,316 | | | | Associated Capital Group, Inc | | | 152 | |
| | 129,030 | | | | AXA Equitable Holdings, Inc | | | 2,146 | |
| | 10,240 | | | | B. Riley Financial, Inc | | | 145 | |
| | 21,466 | | | | Banco Latinoamericano de Exportaciones S.A. (Class E) | | | 371 | |
| | 615,179 | | | | Bank of New York Mellon Corp | | | 28,956 | |
| | 166,153 | | | | BGC Partners, Inc (Class A) | | | 859 | |
| | 80,642 | | | | BlackRock, Inc | | | 31,678 | |
| | 73,790 | | | | Blackstone Mortgage Trust, Inc | | | 2,351 | |
| | 30,473 | | * | | Blucora, Inc | | | 812 | |
| | 48,331 | | * | | Cannae Holdings, Inc | | | 827 | |
| | 312,638 | | | | Capital One Financial Corp | | | 23,632 | |
COLLEGE RETIREMENT EQUITIES FUND- Equity Index Account
| SHARES | | | | COMPANY | | VALUE
(000) | |
| | 71,072 | | | | Capstead Mortgage Corp | | $ | 474 | |
| | 74,260 | | | | CBOE Holdings, Inc | | | 7,265 | |
| | 796,304 | | | | Charles Schwab Corp | | | 33,071 | |
| | 7,318 | | | | Cherry Hill Mortgage Investment Corp | | | 128 | |
| | 123,641 | | | | Chimera Investment Corp | | | 2,203 | |
| | 235,176 | | | | CME Group, Inc | | | 44,241 | |
| | 15,440 | | | | Cohen & Steers, Inc | | | 530 | |
| | 56,629 | | | | Colony Credit Real Estate, Inc | | | 894 | |
| | 18,127 | | * | | Cowen Group, Inc | | | 242 | |
| | 8,085 | | * | | Credit Acceptance Corp | | | 3,087 | |
| | 7,834 | | * | | Curo Group Holdings Corp | | | 74 | |
| | 2,179 | | | | Diamond Hill Investment Group, Inc | | | 326 | |
| | 222,255 | | | | Discover Financial Services | | | 13,109 | |
| | 19,156 | | * | | Donnelley Financial Solutions, Inc | | | 269 | |
| | 33,323 | | | | Dynex Capital, Inc | | | 191 | |
| | 169,137 | | | | E*TRADE Financial Corp | | | 7,422 | |
| | 78,977 | | | | Eaton Vance Corp | | | 2,778 | |
| | 11,344 | | * | | Elevate Credit, Inc | | | 51 | |
| | 17,368 | | *,e | | Encore Capital Group, Inc | | | 408 | |
| | 23,911 | | * | | Enova International, Inc | | | 465 | |
| | 29,096 | | | | Evercore Partners, Inc (Class A) | | | 2,082 | |
| | 22,197 | | | | Exantas Capital Corp | | | 222 | |
| | 38,445 | | * | | Ezcorp, Inc (Class A) | | | 297 | |
| | 24,832 | | | | Factset Research Systems, Inc | | | 4,970 | |
| | 68,886 | | | | Federated Investors, Inc (Class B) | | | 1,829 | |
| | 96,122 | | * | | FGL Holdings | | | 640 | |
| | 30,190 | | | | FirstCash, Inc | | | 2,184 | |
| | 12,579 | | * | | Focus Financial Partners, Inc | | | 331 | |
| | 199,787 | | | | Franklin Resources, Inc | | | 5,926 | |
| | 23,847 | | e | | Gain Capital Holdings, Inc | | | 147 | |
| | 4,049 | | | | GAMCO Investors, Inc (Class A) | | | 68 | |
| | 231,785 | | | | Goldman Sachs Group, Inc | | | 38,720 | |
| | 31,227 | | | | Granite Point Mortgage Trust, Inc | | | 563 | |
| | 8,938 | | | | Great Ajax Corp | | | 108 | |
| | 33,057 | | * | | Green Dot Corp | | | 2,629 | |
| | 19,893 | | | | Greenhill & Co, Inc | | | 485 | |
| | 10,099 | | | | Hamilton Lane, Inc | | | 374 | |
| | 15,460 | | | | Houlihan Lokey, Inc | | | 569 | |
| | 47,028 | | | | Interactive Brokers Group, Inc (Class A) | | | 2,570 | |
| | 373,381 | | | | IntercontinentalExchange Group, Inc | | | 28,127 | |
| | 11,369 | | * | | INTL FCStone, Inc | | | 416 | |
| | 270,619 | | | | Invesco Ltd | | | 4,530 | |
| | 45,475 | | | | Invesco Mortgage Capital, Inc | | | 658 | |
| | 24,759 | | | | Investment Technology Group, Inc | | | 749 | |
| | 211,642 | | | | Jefferies Financial Group, Inc | | | 3,674 | |
| | 7,773 | | | | KKR Real Estate Finance Trust, Inc | | | 149 | |
| | 49,496 | | | | Ladder Capital Corp | | | 766 | |
| | 73,441 | | | | Ladenburg Thalmann Financial Services, Inc | | | 171 | |
| | 76,930 | | | | Lazard Ltd (Class A) | | | 2,839 | |
| | 62,850 | | | | Legg Mason, Inc | | | 1,603 | |
| | 214,482 | | * | | LendingClub Corp | | | 564 | |
| | 63,483 | | | | LPL Financial Holdings, Inc | | | 3,878 | |
| | 23,522 | | | | MarketAxess Holdings, Inc | | | 4,970 | |
| | 6,533 | | | | Marlin Business Services Corp | | | 146 | |
COLLEGE RETIREMENT EQUITIES FUND- Equity Index Account
| SHARES | | | | COMPANY | | VALUE
(000) | |
| | 270,747 | | | | MFA Mortgage Investments, Inc | | $ | 1,809 | |
| | 26,390 | | | | Moelis & Co | | | 907 | |
| | 112,759 | | | | Moody’s Corp | | | 15,791 | |
| | 806,364 | | | | Morgan Stanley | | | 31,972 | |
| | 13,834 | | | | Morningstar, Inc | | | 1,520 | |
| | 60,080 | | | | MSCI, Inc (Class A) | | | 8,858 | |
| | 76,744 | | | | NASDAQ OMX Group, Inc | | | 6,260 | |
| | 166,451 | | | | Navient Corp | | | 1,466 | |
| | 14,990 | | | | Nelnet, Inc (Class A) | | | 785 | |
| | 213,603 | | | | New Residential Investment Corp | | | 3,035 | |
| | 75,449 | | | | New York Mortgage Trust, Inc | | | 444 | |
| | 22,218 | | * | | NewStar Financial, Inc | | | 6 | |
| | 138,730 | | | | Northern Trust Corp | | | 11,596 | |
| | 40,173 | | | | OM Asset Management plc | | | 429 | |
| | 36,046 | | * | | On Deck Capital, Inc | | | 213 | |
| | 51,991 | | * | | OneMain Holdings, Inc | | | 1,263 | |
| | 7,363 | | | | Oppenheimer Holdings, Inc | | | 188 | |
| | 23,694 | | e | | Orchid Island Capital, Inc | | | 151 | |
| | 47,765 | | | | PennyMac Mortgage Investment Trust | | | 889 | |
| | 17,372 | | * | | Pico Holdings, Inc | | | 159 | |
| | 10,272 | | | | Piper Jaffray Cos | | | 676 | |
| | 13,025 | | | | PJT Partners, Inc | | | 505 | |
| | 33,753 | | * | | PRA Group, Inc | | | 823 | |
| | 9,591 | | | | Pzena Investment Management, Inc (Class A) | | | 83 | |
| | 86,900 | | | | Raymond James Financial, Inc | | | 6,466 | |
| | 10,497 | | | | Ready Capital Corp | | | 145 | |
| | 49,700 | | | | Redwood Trust, Inc | | | 749 | |
| | 8,577 | | * | | Regional Management Corp | | | 206 | |
| | 165,515 | | | | S&P Global, Inc | | | 28,128 | |
| | 16,951 | | * | | Safeguard Scientifics, Inc | | | 146 | |
| | 78,809 | | | | Santander Consumer USA Holdings, Inc | | | 1,386 | |
| | 87,401 | | | | SEI Investments Co | | | 4,038 | |
| | 5,338 | | | | Silvercrest Asset Management Group, Inc | | | 71 | |
| | 313,613 | | * | | SLM Corp | | | 2,606 | |
| | 247,347 | | | | State Street Corp | | | 15,600 | |
| | 47,909 | | | | Stifel Financial Corp | | | 1,984 | |
| | 489,566 | | | | Synchrony Financial | | | 11,485 | |
| | 159,466 | | | | T Rowe Price Group, Inc | | | 14,722 | |
| | 181,531 | | | | TD Ameritrade Holding Corp | | | 8,888 | |
| | 7,897 | | | | TPG RE Finance Trust, Inc | | | 144 | |
| | 131,331 | | | | Two Harbors Investment Corp | | | 1,686 | |
| | 18,355 | | | | Virtu Financial, Inc | | | 473 | |
| | 4,800 | | | | Virtus Investment Partners, Inc | | | 381 | |
| | 103,007 | | | | Voya Financial, Inc | | | 4,135 | |
| | 58,496 | | e | | Waddell & Reed Financial, Inc (Class A) | | | 1,058 | |
| | 28,538 | | | | Western Asset Mortgage Capital Corp | | | 238 | |
| | 5,409 | | | | Westwood Holdings Group, Inc | | | 184 | |
| | 84,317 | | | | WisdomTree Investments, Inc | | | 561 | |
| | 4,248 | | * | | World Acceptance Corp | | | 434 | |
| | | | | | TOTAL DIVERSIFIED FINANCIALS | | | 605,694 | |
COLLEGE RETIREMENT EQUITIES FUND- Equity Index Account
| SHARES | | | | COMPANY | | VALUE
(000) | |
| ENERGY - 4.9% |
| | 109,725 | | * | | Abraxas Petroleum Corp | | $ | 120 | |
| | 1,730 | | | | Adams Resources & Energy, Inc | | | 67 | |
| | 64,681 | | *,e | | Alta Mesa Resources, Inc | | | 65 | |
| | 335,121 | | | | Anadarko Petroleum Corp | | | 14,692 | |
| | 132,421 | | * | | Antero Resources Corp | | | 1,243 | |
| | 260,509 | | | | Apache Corp | | | 6,838 | |
| | 52,623 | | * | | Apergy Corp | | | 1,425 | |
| | 28,129 | | *,e | | Approach Resources, Inc | | | 25 | |
| | 9,586 | | | | Arch Coal, Inc | | | 796 | |
| | 85,865 | | | | Archrock, Inc | | | 643 | |
| | 20,832 | | * | | Ardmore Shipping Corp | | | 97 | |
| | 342,142 | | | | Baker Hughes a GE Co | | | 7,356 | |
| | 12,272 | | * | | Basic Energy Services, Inc | | | 47 | |
| | 14,562 | | * | | Bonanza Creek Energy, Inc | | | 301 | |
| | 26,221 | | *,e | | Bristow Group, Inc | | | 64 | |
| | 33,520 | | * | | C&J Energy Services, Inc | | | 453 | |
| | 283,011 | | | | Cabot Oil & Gas Corp | | | 6,325 | |
| | 16,011 | | * | | Cactus, Inc | | | 439 | |
| | 30,573 | | * | | California Resources Corp | | | 521 | |
| | 145,414 | | *,e | | Callon Petroleum Co | | | 944 | |
| | 15,028 | | *,e | | CARBO Ceramics, Inc | | | 52 | |
| | 45,074 | | * | | Carrizo Oil & Gas, Inc | | | 509 | |
| | 124,454 | | * | | Centennial Resource Development, Inc | | | 1,372 | |
| | 155,280 | | * | | Cheniere Energy, Inc | | | 9,191 | |
| | 478,828 | | *,e | | Chesapeake Energy Corp | | | 1,006 | |
| | 1,266,759 | | | | Chevron Corp | | | 137,811 | |
| | 61,229 | | | | Cimarex Energy Co | | | 3,775 | |
| | 96,211 | | * | | Clean Energy Fuels Corp | | | 165 | |
| | 128,347 | | * | | CNX Resources Corp | | | 1,466 | |
| | 128,934 | | * | | Concho Resources, Inc | | | 13,253 | |
| | 766,190 | | | | ConocoPhillips | | | 47,772 | |
| | 20,666 | | * | | CONSOL Energy, Inc | | | 655 | |
| | 64,271 | | * | | Continental Resources, Inc | | | 2,583 | |
| | 22,043 | | *,e | | Covia Holdings Corp | | | 75 | |
| | 11,149 | | | | CVR Energy, Inc | | | 384 | |
| | 56,457 | | | | Delek US Holdings, Inc | | | 1,835 | |
| | 280,409 | | * | | Denbury Resources, Inc | | | 480 | |
| | 310,534 | | | | Devon Energy Corp | | | 6,999 | |
| | 55,111 | | | | DHT Holdings, Inc | | | 216 | |
| | 38,317 | | *,e | | Diamond Offshore Drilling, Inc | | | 362 | |
| | 105,470 | | | | Diamondback Energy, Inc | | | 9,777 | |
| | 20,589 | | * | | Dorian LPG Ltd | | | 120 | |
| | 27,635 | | * | | Dril-Quip, Inc | | | 830 | |
| | 7,121 | | * | | Earthstone Energy, Inc | | | 32 | |
| | 61,180 | | *,e | | Eclipse Resources Corp | | | 64 | |
| | 56,201 | | *,e | | Energy Fuels, Inc | | | 160 | |
| | 384,104 | | | | EOG Resources, Inc | | | 33,498 | |
| | 28,367 | | *,e | | EP Energy Corp | | | 20 | |
| | 180,649 | | | | EQT Corp | | | 3,412 | |
| | 144,519 | | * | | Equitrans Midstream Corp | | | 2,893 | |
| | 14,364 | | * | | Era Group, Inc | | | 126 | |
| | 17,517 | | | | Evolution Petroleum Corp | | | 119 | |
| | 23,313 | | * | | Exterran Corp | | | 413 | |
| | 87,596 | | * | | Extraction Oil & Gas, Inc | | | 376 | |
| | 2,817,203 | | d | | Exxon Mobil Corp | | | 192,105 | |
COLLEGE RETIREMENT EQUITIES FUND- Equity Index Account
| SHARES | | | | COMPANY | | VALUE
(000) | |
| | 49,153 | | * | | Forum Energy Technologies, Inc | | $ | 203 | |
| | 36,662 | | *,e | | Frank’s International NV | | | 191 | |
| | 52,498 | | *,e | | Frontline Ltd | | | 290 | |
| | 15,611 | | * | | FTS International, Inc | | | 111 | |
| | 32,033 | | | | GasLog Ltd | | | 527 | |
| | 69,477 | | | | Golar LNG Ltd | | | 1,512 | |
| | 26,945 | | | | Green Plains Renewable Energy, Inc | | | 353 | |
| | 109,431 | | * | | Gulfport Energy Corp | | | 717 | |
| | 42,984 | | *,e | | Halcon Resources Corp | | | 73 | |
| | 10,340 | | | | Hallador Energy Co | | | 52 | |
| | 593,991 | | | | Halliburton Co | | | 15,788 | |
| | 100,808 | | * | | Helix Energy Solutions Group, Inc | | | 545 | |
| | 67,802 | | | | Helmerich & Payne, Inc | | | 3,250 | |
| | 180,836 | | | | Hess Corp | | | 7,324 | |
| | 21,135 | | * | | HighPoint Resources Corp | | | 53 | |
| | 110,468 | | | | HollyFrontier Corp | | | 5,647 | |
| | 23,510 | | * | | Independence Contract Drilling, Inc | | | 73 | |
| | 20,967 | | * | | International Seaways, Inc | | | 353 | |
| | 7,203 | | * | | ION Geophysical Corp | | | 37 | |
| | 823 | | * | | Isramco, Inc | | | 98 | |
| | 22,747 | | *,e | | Jagged Peak Energy, Inc | | | 207 | |
| | 22,628 | | * | | Keane Group, Inc | | | 185 | |
| | 7,122 | | *,e | | Key Energy Services, Inc | | | 15 | |
| | 1,262,845 | | | | Kinder Morgan, Inc | | | 19,423 | |
| | 11,654 | | * | | KLX Energy Services Holdings, Inc | | | 273 | |
| | 139,280 | | * | | Kosmos Energy Ltd | | | 567 | |
| | 117,588 | | * | | Laredo Petroleum Holdings, Inc | | | 426 | |
| | 9,873 | | e | | Liberty Oilfield Services, Inc | | | 128 | |
| | 29,366 | | *,e | | Lilis Energy, Inc | | | 40 | |
| | 5,616 | | | | Mammoth Energy Services, Inc | | | 101 | |
| | 550,921 | | | | Marathon Oil Corp | | | 7,900 | |
| | 440,663 | | | | Marathon Petroleum Corp | | | 26,004 | |
| | 64,577 | | * | | Matador Resources Co | | | 1,003 | |
| | 19,934 | | * | | Matrix Service Co | | | 358 | |
| | 126,473 | | * | | McDermott International, Inc | | | 827 | |
| | 7,581 | | * | | Midstates Petroleum Co, Inc | | | 57 | |
| | 114,242 | | e | | Murphy Oil Corp | | | 2,672 | |
| | 203,104 | | | | Nabors Industries Ltd | | | 406 | |
| | 256,371 | | | | National Oilwell Varco, Inc | | | 6,589 | |
| | 9,713 | | * | | Natural Gas Services Group, Inc | | | 160 | |
| | 7,613 | | *,e | | NCS Multistage Holdings, Inc | | | 39 | |
| | 123,312 | | * | | Newfield Exploration Co | | | 1,808 | |
| | 63,344 | | * | | Newpark Resources, Inc | | | 435 | |
| | 5,415 | | * | | Nine Energy Service, Inc | | | 122 | |
| | 165,932 | | * | | Noble Corp plc | | | 435 | |
| | 330,855 | | | | Noble Energy, Inc | | | 6,207 | |
| | 68,002 | | e | | Nordic American Tanker Shipping | | | 136 | |
| | 73,198 | | * | | Northern Oil And Gas, Inc | | | 165 | |
| | 170,623 | | * | | Oasis Petroleum, Inc | | | 944 | |
| | 502,370 | | | | Occidental Petroleum Corp | | | 30,835 | |
| | 71,446 | | * | | Oceaneering International, Inc | | | 865 | |
| | 38,178 | | * | | Oil States International, Inc | | | 545 | |
| | 270,781 | | | | Oneok, Inc | | | 14,609 | |
COLLEGE RETIREMENT EQUITIES FUND- Equity Index Account
| SHARES | | | | COMPANY | | VALUE
(000) | |
| | 26,237 | | * | | Overseas Shipholding Group, Inc | | $ | 44 | |
| | 10,734 | | | | Panhandle Oil and Gas, Inc (Class A) | | | 166 | |
| | 23,180 | | * | | Par Pacific Holdings, Inc | | | 329 | |
| | 167,421 | | * | | Parsley Energy, Inc | | | 2,675 | |
| | 150,779 | | | | Patterson-UTI Energy, Inc | | | 1,561 | |
| | 78,916 | | | | PBF Energy, Inc | | | 2,578 | |
| | 47,717 | | * | | PDC Energy, Inc | | | 1,420 | |
| | 54,624 | | | | Peabody Energy Corp | | | 1,665 | |
| | 10,090 | | * | | Penn Virginia Corp | | | 545 | |
| | 9,723 | | *,e | | PHI, Inc | | | 18 | |
| | 276,674 | | | | Phillips 66 | | | 23,835 | |
| | 42,944 | | * | | Pioneer Energy Services Corp | | | 53 | |
| | 111,856 | | | | Pioneer Natural Resources Co | | | 14,711 | |
| | 48,018 | | * | | ProPetro Holding Corp | | | 592 | |
| | 173,948 | | * | | Questar Market Resources, Inc | | | 979 | |
| | 139,657 | | | | Range Resources Corp | | | 1,337 | |
| | 27,182 | | * | | Renewable Energy Group, Inc | | | 699 | |
| | 15,559 | | *,e | | Resolute Energy Corp | | | 451 | |
| | 4,186 | | * | | Rex American Resources Corp | | | 285 | |
| | 9,601 | | * | | RigNet, Inc | | | 121 | |
| | 32,471 | | * | | Ring Energy, Inc | | | 165 | |
| | 83,867 | | *,e | | Rowan Cos plc | | | 704 | |
| | 42,512 | | e | | RPC, Inc | | | 420 | |
| | 24,071 | | * | | SandRidge Energy, Inc | | | 183 | |
| | 928,324 | | | | Schlumberger Ltd | | | 33,494 | |
| | 121,758 | | e | | Scorpio Tankers, Inc | | | 214 | |
| | 11,768 | | * | | SEACOR Holdings, Inc | | | 435 | |
| | 11,831 | | * | | SEACOR Marine Holdings, Inc | | | 139 | |
| | 6,869 | | * | | Select Energy Services, Inc | | | 43 | |
| | 48,551 | | | | SemGroup Corp | | | 669 | |
| | 45,041 | | e | | Ship Finance International Ltd | | | 474 | |
| | 4,694 | | * | | SilverBow Resources, Inc | | | 111 | |
| | 80,594 | | | | SM Energy Co | | | 1,248 | |
| | 12,316 | | *,e | | Smart Sand, Inc | | | 27 | |
| | 6,855 | | e | | Solaris Oilfield Infrastructure, Inc | | | 83 | |
| | 398,926 | | * | | Southwestern Energy Co | | | 1,360 | |
| | 143,792 | | * | | SRC Energy, Inc | | | 676 | |
| | 111,107 | | * | | Superior Energy Services | | | 372 | |
| | 13,911 | | * | | Talos Energy, Inc | | | 227 | |
| | 141,390 | | | | Targa Resources Investments, Inc | | | 5,093 | |
| | 36,192 | | e | | Teekay Corp | | | 121 | |
| | 85,424 | | | | Teekay Tankers Ltd (Class A) | | | 79 | |
| | 39,279 | | *,e | | Tellurian, Inc | | | 273 | |
| | 32,701 | | * | | Tetra Technologies, Inc | | | 55 | |
| | 16,234 | | * | | Tidewater, Inc | | | 311 | |
| | 343,005 | | *,e | | Transocean Ltd (NYSE) | | | 2,380 | |
| | 36,980 | | * | | Unit Corp | | | 528 | |
| | 95,169 | | *,e | | Uranium Energy Corp | | | 119 | |
| | 58,687 | | e | | US Silica Holdings Inc | | | 597 | |
| | 281,735 | | | | Valero Energy Corp | | | 21,122 | |
| | 14,396 | | * | | W&T Offshore, Inc | | | 59 | |
| | 65,205 | | * | | Whiting Petroleum Corp | | | 1,480 | |
| | 13,341 | | * | | WildHorse Resource Development Corp | | | 188 | |
| | 820,670 | | | | Williams Cos, Inc | | | 18,096 | |
COLLEGE RETIREMENT EQUITIES FUND- Equity Index Account
| SHARES | | | | COMPANY | | VALUE
(000) | |
| | 49,281 | | | | World Fuel Services Corp | | $ | 1,055 | |
| | 284,313 | | * | | WPX Energy, Inc | | | 3,227 | |
| | | | | | TOTAL ENERGY | | | 827,941 | |
| | | | | | | | | | |
| FOOD & STAPLES RETAILING - 1.4% |
| | 19,849 | | | | Andersons, Inc | | | 593 | |
| | 22,168 | | | | Casey’s General Stores, Inc | | | 2,841 | |
| | 14,374 | | * | | Chefs’ Warehouse Holdings, Inc | | | 460 | |
| | 290,924 | | | | Costco Wholesale Corp | | | 59,264 | |
| | 10,217 | | | | Ingles Markets, Inc (Class A) | | | 278 | |
| | 533,947 | | | | Kroger Co | | | 14,683 | |
| | 6,410 | | * | | Natural Grocers by Vitamin C | | | 98 | |
| | 70,016 | | * | | Performance Food Group Co | | | 2,259 | |
| | 14,866 | | | | Pricesmart, Inc | | | 879 | |
| | 763,555 | | *,e | | Rite Aid Corp | | | 541 | |
| | 17,661 | | * | | Smart & Final Stores, Inc | | | 84 | |
| | 27,344 | | | | Spartan Stores, Inc | | | 470 | |
| | 72,919 | | * | | Sprouts Farmers Market, Inc | | | 1,714 | |
| | 319,624 | | | | Sysco Corp | | | 20,028 | |
| | 36,929 | | * | | United Natural Foods, Inc | | | 391 | |
| | 144,258 | | * | | US Foods Holding Corp | | | 4,564 | |
| | 4,843 | | | | Village Super Market (Class A) | | | 129 | |
| | 538,529 | | | | Walgreens Boots Alliance, Inc | | | 36,798 | |
| | 946,620 | | | | Walmart, Inc | | | 88,178 | |
| | 4,684 | | | | Weis Markets, Inc | | | 224 | |
| | | | | | TOTAL FOOD & STAPLES RETAILING | | | 234,476 | |
| | | | | | | | | | |
| FOOD, BEVERAGE & TOBACCO - 3.6% |
| | 78,794 | | *,e | | 22nd Century Group, Inc | | | 196 | |
| | 2,296 | | | | Alico, Inc | | | 68 | |
| | 1,262,464 | | | | Altria Group, Inc | | | 62,353 | |
| | 369,842 | | | | Archer Daniels Midland Co | | | 15,152 | |
| | 48,393 | | e | | B&G Foods, Inc (Class A) | | | 1,399 | |
| | 5,887 | | * | | Boston Beer Co, Inc (Class A) | | | 1,418 | |
| | 38,532 | | | | Brown-Forman Corp | | | 1,827 | |
| | 192,742 | | | | Brown-Forman Corp (Class B) | | | 9,171 | |
| | 92,994 | | | | Bunge Ltd | | | 4,970 | |
| | 11,455 | | | | Calavo Growers, Inc | | | 836 | |
| | 22,629 | | | | Cal-Maine Foods, Inc | | | 957 | |
| | 113,057 | | | | Campbell Soup Co | | | 3,730 | |
| | 61,868 | | *,e | | Castle Brands, Inc | | | 53 | |
| | 3,092 | | | | Coca-Cola Bottling Co Consolidated | | | 548 | |
| | 2,541,268 | | | | Coca-Cola Co | | | 120,329 | |
| | 310,765 | | | | ConAgra Brands, Inc | | | 6,638 | |
| | 104,485 | | | | Constellation Brands, Inc (Class A) | | | 16,803 | |
| | 7,653 | | * | | Craft Brewers Alliance, Inc | | | 109 | |
| | 118,243 | | * | | Darling International, Inc | | | 2,275 | |
| | 65,223 | | | | Dean Foods Co | | | 248 | |
| | 5,320 | | * | | Farmer Bros Co | | | 124 | |
| | 92,845 | | | | Flowers Foods, Inc | | | 1,715 | |
| | 20,613 | | | | Fresh Del Monte Produce, Inc | | | 583 | |
| | 15,781 | | * | | Freshpet, Inc | | | 507 | |
| | 394,045 | | | | General Mills, Inc | | | 15,344 | |
COLLEGE RETIREMENT EQUITIES FUND- Equity Index Account
| SHARES | | | | COMPANY | | VALUE
(000) | |
| | 73,323 | | * | | Hain Celestial Group, Inc | | $ | 1,163 | |
| | 89,522 | | | | Hershey Co | | | 9,595 | |
| | 177,534 | | | | Hormel Foods Corp | | | 7,577 | |
| | 57,996 | | * | | Hostess Brands, Inc | | | 634 | |
| | 46,997 | | | | Ingredion, Inc | | | 4,295 | |
| | 10,369 | | | | J&J Snack Foods Corp | | | 1,499 | |
| | 72,873 | | | | J.M. Smucker Co | | | 6,813 | |
| | 5,780 | | | | John B. Sanfilippo & Son, Inc | | | 322 | |
| | 169,417 | | | | Kellogg Co | | | 9,658 | |
| | 119,054 | | | | Keurig Dr Pepper, Inc | | | 3,053 | |
| | 402,921 | | | | Kraft Heinz Co | | | 17,342 | |
| | 92,646 | | | | Lamb Weston Holdings, Inc | | | 6,815 | |
| | 13,060 | | | | Lancaster Colony Corp | | | 2,310 | |
| | 19,323 | | * | | Landec Corp | | | 229 | |
| | 8,386 | | | | Limoneira Co | | | 164 | |
| | 81,380 | | | | McCormick & Co, Inc | | | 11,331 | |
| | 9,193 | | e | | MGP Ingredients, Inc | | | 524 | |
| | 109,880 | | | | Molson Coors Brewing Co (Class B) | | | 6,171 | |
| | 957,442 | | | | Mondelez International, Inc | | | 38,326 | |
| | 257,472 | | * | | Monster Beverage Corp | | | 12,673 | |
| | 8,574 | | * | | National Beverage Corp | | | 615 | |
| | 940,801 | | | | PepsiCo, Inc | | | 103,940 | |
| | 1,034,498 | | | | Philip Morris International, Inc | | | 69,063 | |
| | 9,633 | | * | | Pilgrim’s Pride Corp | | | 149 | |
| | 40,868 | | * | | Post Holdings, Inc | | | 3,643 | |
| | 18,742 | | * | | Primo Water Corp | | | 263 | |
| | 14,731 | | | | Sanderson Farms, Inc | | | 1,463 | |
| | 192 | | | | Seaboard Corp | | | 679 | |
| | 5,451 | | * | | Seneca Foods Corp | | | 154 | |
| | 40,880 | | * | | Simply Good Foods Co | | | 773 | |
| | 10,980 | | e | | Tootsie Roll Industries, Inc | | | 367 | |
| | 40,066 | | * | | TreeHouse Foods, Inc | | | 2,032 | |
| | 4,760 | | | | Turning Point Brands, Inc | | | 130 | |
| | 189,676 | | | | Tyson Foods, Inc (Class A) | | | 10,129 | |
| | 17,023 | | | | Universal Corp | | | 922 | |
| | 50,602 | | | | Vector Group Ltd | | | 492 | |
| | | | | | TOTAL FOOD, BEVERAGE & TOBACCO | | | 602,661 | |
| | | | | | | | | | |
| HEALTH CARE EQUIPMENT & SERVICES - 6.5% | | |
| | 1,136,754 | | | | Abbott Laboratories | | | 82,222 | |
| | 28,689 | | * | | Abiomed, Inc | | | 9,325 | |
| | 56,824 | | *,e | | Acadia Healthcare Co, Inc | | | 1,461 | |
| | 58,290 | | * | | Accuray, Inc | | | 199 | |
| | 5,501 | | * | | Addus HomeCare Corp | | | 373 | |
| | 52,525 | | * | | Align Technology, Inc | | | 11,000 | |
| | 133,589 | | * | | Allscripts Healthcare Solutions, Inc | | | 1,288 | |
| | 20,714 | | * | | Amedisys, Inc | | | 2,426 | |
| | 6,596 | | * | | American Renal Associates Holdings, Inc | | | 76 | |
| | 108,196 | | | | AmerisourceBergen Corp | | | 8,050 | |
| | 31,962 | | * | | AMN Healthcare Services, Inc | | | 1,811 | |
| | 26,107 | | * | | Angiodynamics, Inc | | | 526 | |
| | 10,943 | | * | | Anika Therapeutics, Inc | | | 368 | |
| | 104,354 | | *,e | | Antares Pharma, Inc | | | 284 | |
| | 173,024 | | | | Anthem, Inc | | | 45,441 | |
COLLEGE RETIREMENT EQUITIES FUND- Equity Index Account
| SHARES | | | | COMPANY | | VALUE
(000) | |
| | 16,786 | | *,e | | Apollo Medical Holdings, Inc | | $ | 333 | |
| | 27,261 | | * | | athenahealth, Inc | | | 3,597 | |
| | 22,609 | | * | | AtriCure, Inc | | | 692 | |
| | 1,019 | | | | Atrion Corp | | | 755 | |
| | 33,829 | | * | | Avanos Medical, Inc | | | 1,515 | |
| | 18,090 | | * | | AxoGen, Inc | | | 370 | |
| | 338,312 | | | | Baxter International, Inc | | | 22,268 | |
| | 175,683 | | | | Becton Dickinson & Co | | | 39,585 | |
| | 86,257 | | * | | BioScrip, Inc | | | 308 | |
| | 19,708 | | * | | BioTelemetry, Inc | | | 1,177 | |
| | 919,588 | | * | | Boston Scientific Corp | | | 32,498 | |
| | 135,933 | | * | | Brookdale Senior Living, Inc | | | 911 | |
| | 25,974 | | | | Cantel Medical Corp | | | 1,934 | |
| | 19,478 | | * | | Capital Senior Living Corp | | | 132 | |
| | 198,011 | | | | Cardinal Health, Inc | | | 8,831 | |
| | 23,626 | | * | | Cardiovascular Systems, Inc | | | 673 | |
| | 45,319 | | * | | Castlight Health, Inc | | | 98 | |
| | 134,125 | | * | | Centene Corp | | | 15,465 | |
| | 206,553 | | * | | Cerner Corp | | | 10,832 | |
| | 71,510 | | * | | Cerus Corp | | | 363 | |
| | 10,898 | | | | Chemed Corp | | | 3,087 | |
| | 246,811 | | | | Cigna Corp | | | 46,874 | |
| | 11,529 | | * | | Civitas Solutions, Inc | | | 202 | |
| | 8,700 | | e | | Computer Programs & Systems, Inc | | | 218 | |
| | 19,875 | | | | Conmed Corp | | | 1,276 | |
| | 32,161 | | | | Cooper Cos, Inc | | | 8,185 | |
| | 7,512 | | * | | Corvel Corp | | | 464 | |
| | 25,224 | | * | | Cross Country Healthcare, Inc | | | 185 | |
| | 23,064 | | * | | CryoLife, Inc | | | 655 | |
| | 16,944 | | *,e | | CryoPort, Inc | | | 187 | |
| | 10,004 | | * | | Cutera, Inc | | | 170 | |
| | 855,970 | | | | CVS Health Corp | | | 56,083 | |
| | 19,235 | | *,e | | CytoSorbents Corp | | | 155 | |
| | 415,093 | | | | Danaher Corp | | | 42,804 | |
| | 84,282 | | * | | DaVita, Inc | | | 4,337 | |
| | 149,427 | | | | Dentsply Sirona, Inc | | | 5,560 | |
| | 60,646 | | * | | DexCom, Inc | | | 7,265 | |
| | 34,269 | | *,e | | Diplomat Pharmacy, Inc | | | 461 | |
| | 138,363 | | * | | Edwards Lifesciences Corp | | | 21,193 | |
| | 62,923 | | | | Encompass Health Corp | | | 3,882 | |
| | 35,447 | | | | Ensign Group, Inc | | | 1,375 | |
| | 45,708 | | * | | Evolent Health, Inc | | | 912 | |
| | 4,418 | | * | | FONAR Corp | | | 89 | |
| | 28,070 | | * | | Genesis Health Care, Inc | | | 33 | |
| | 30,765 | | *,e | | GenMark Diagnostics, Inc | | | 150 | |
| | 20,642 | | * | | Glaukos Corp | | | 1,159 | |
| | 48,523 | | * | | Globus Medical, Inc | | | 2,100 | |
| | 9,581 | | * | | Guardant Health, Inc | | | 360 | |
| | 36,085 | | * | | Haemonetics Corp | | | 3,610 | |
| | 184,554 | | | | HCA Holdings, Inc | | | 22,968 | |
| | 35,870 | | * | | HealthEquity, Inc | | | 2,140 | |
| | 18,780 | | | | HealthStream, Inc | | | 454 | |
| | 99,573 | | * | | Henry Schein, Inc | | | 7,818 | |
COLLEGE RETIREMENT EQUITIES FUND- Equity Index Account
| SHARES | | | | COMPANY | | VALUE
(000) | |
| | 4,605 | | * | | Heska Corp | | $ | 397 | |
| | 47,607 | | | | Hill-Rom Holdings, Inc | | | 4,216 | |
| | 60,877 | | * | | HMS Holdings Corp | | | 1,712 | |
| | 184,551 | | * | | Hologic, Inc | | | 7,585 | |
| | 91,469 | | | | Humana, Inc | | | 26,204 | |
| | 10,885 | | * | | ICU Medical, Inc | | | 2,500 | |
| | 57,119 | | * | | IDEXX Laboratories, Inc | | | 10,625 | |
| | 12,244 | | * | | Inogen Inc | | | 1,520 | |
| | 43,464 | | *,e | | Inovalon Holdings, Inc | | | 616 | |
| | 5,311 | | * | | Inspire Medical Systems, Inc | | | 224 | |
| | 41,898 | | * | | Insulet Corp | | | 3,323 | |
| | 22,691 | | * | | Integer Holding Corp | | | 1,730 | |
| | 44,740 | | * | | Integra LifeSciences Holdings Corp | | | 2,018 | |
| | 4,136 | | * | | IntriCon Corp | | | 109 | |
| | 75,275 | | * | | Intuitive Surgical, Inc | | | 36,051 | |
| | 23,110 | | | | Invacare Corp | | | 99 | |
| | 16,105 | | * | | iRhythm Technologies, Inc | | | 1,119 | |
| | 66,643 | | * | | Laboratory Corp of America Holdings | | | 8,421 | |
| | 18,233 | | * | | Lantheus Holdings, Inc | | | 285 | |
| | 9,523 | | | | LeMaitre Vascular, Inc | | | 225 | |
| | 19,826 | | * | | LHC Group, Inc | | | 1,861 | |
| | 33,006 | | * | | LivaNova plc | | | 3,019 | |
| | 16,931 | | * | | Magellan Health Services, Inc | | | 963 | |
| | 32,408 | | * | | Masimo Corp | | | 3,480 | |
| | 132,491 | | | | McKesson Corp | | | 14,636 | |
| | 40,701 | | * | | Medidata Solutions, Inc | | | 2,744 | |
| | 63,033 | | * | | MEDNAX, Inc | | | 2,080 | |
| | 899,311 | | | | Medtronic plc | | | 81,801 | |
| | 31,965 | | | | Meridian Bioscience, Inc | | | 555 | |
| | 35,220 | | * | | Merit Medical Systems, Inc | | | 1,966 | |
| | 41,890 | | * | | Molina Healthcare, Inc | | | 4,868 | |
| | 7,753 | | | | National Healthcare Corp | | | 608 | |
| | 5,598 | | | | National Research Corp | | | 214 | |
| | 24,197 | | * | | Natus Medical, Inc | | | 823 | |
| | 35,733 | | * | | Neogen Corp | | | 2,037 | |
| | 19,942 | | * | | Nevro Corp | | | 776 | |
| | 37,773 | | * | | NextGen Healthcare, Inc | | | 572 | |
| | 41,426 | | * | | Novocure Ltd | | | 1,387 | |
| | 36,380 | | * | | NuVasive, Inc | | | 1,803 | |
| | 9,426 | | * | | Nuvectra Corp | | | 154 | |
| | 45,234 | | * | | NxStage Medical, Inc | | | 1,295 | |
| | 26,681 | | * | | Omnicell, Inc | | | 1,634 | |
| | 40,487 | | * | | OraSure Technologies, Inc | | | 473 | |
| | 12,159 | | * | | Orthofix International NV | | | 638 | |
| | 43,714 | | | | Owens & Minor, Inc | | | 277 | |
| | 14,688 | | * | | Oxford Immunotec Global plc | | | 188 | |
| | 57,408 | | | | Patterson Cos, Inc | | | 1,129 | |
| | 21,136 | | * | | Penumbra, Inc | | | 2,583 | |
| | 5,304 | | *,e | | PetIQ, Inc | | | 125 | |
| | 33,935 | | * | | Premier, Inc | | | 1,268 | |
| | 8,662 | | * | | Providence Service Corp | | | 520 | |
| | 6,666 | | e | | Pulse Biosciences, Inc | | | 76 | |
| | 86,772 | | | | Quest Diagnostics, Inc | | | 7,226 | |
| | 20,943 | | * | | Quidel Corp | | | 1,022 | |
COLLEGE RETIREMENT EQUITIES FUND- Equity Index Account
| SHARES | | | | COMPANY | | VALUE
(000) | |
| | 72,154 | | * | | R1 RCM, Inc | | $ | 574 | |
| | 25,914 | | * | | RadNet, Inc | | | 264 | |
| | 93,908 | | | | Resmed, Inc | | | 10,693 | |
| | 37,335 | | *,e | | Rockwell Medical, Inc | | | 84 | |
| | 38,631 | | * | | RTI Biologics, Inc | | | 143 | |
| | 77,335 | | * | | Select Medical Holdings Corp | | | 1,187 | |
| | 45,067 | | *,e | | Senseonics Holdings, Inc | | | 117 | |
| | 10,185 | | * | | Sientra, Inc | | | 129 | |
| | 7,680 | | | | Simulations Plus, Inc | | | 153 | |
| | 26,141 | | * | | Staar Surgical Co | | | 834 | |
| | 54,225 | | | | STERIS Plc | | | 5,794 | |
| | 224,507 | | | | Stryker Corp | | | 35,191 | |
| | 13,353 | | *,e | | Surgery Partners, Inc | | | 131 | |
| | 10,275 | | * | | SurModics, Inc | | | 486 | |
| | 6,560 | | * | | Tabula Rasa HealthCare, Inc | | | 418 | |
| | 6,719 | | *,e | | Tactile Systems Technology, Inc | | | 306 | |
| | 30,224 | | * | | Tandem Diabetes Care, Inc | | | 1,148 | |
| | 38,788 | | *,e | | Teladoc, Inc | | | 1,923 | |
| | 29,977 | | | | Teleflex, Inc | | | 7,748 | |
| | 59,665 | | * | | Tenet Healthcare Corp | | | 1,023 | |
| | 26,395 | | * | | Tivity Health, Inc | | | 655 | |
| | 105,717 | | *,e | | TransEnterix, Inc | | | 239 | |
| | 18,039 | | * | | Triple-S Management Corp (Class B) | | | 314 | |
| | 635,283 | | | | UnitedHealth Group, Inc | | | 158,262 | |
| | 57,391 | | | | Universal Health Services, Inc (Class B) | | | 6,690 | |
| | 9,158 | | | | US Physical Therapy, Inc | | | 937 | |
| | 2,349 | | | | Utah Medical Products, Inc | | | 195 | |
| | 27,229 | | * | | Varex Imaging Corp | | | 645 | |
| | 61,190 | | * | | Varian Medical Systems, Inc | | | 6,933 | |
| | 81,875 | | * | | Veeva Systems, Inc | | | 7,313 | |
| | 19,827 | | *,e | | ViewRay, Inc | | | 120 | |
| | 20,093 | | * | | Vocera Communications, Inc | | | 791 | |
| | 31,751 | | * | | WellCare Health Plans, Inc | | | 7,496 | |
| | 51,937 | | | | West Pharmaceutical Services, Inc | | | 5,091 | |
| | 76,096 | | *,e | | Wright Medical Group NV | | | 2,071 | |
| | 135,880 | | | | Zimmer Biomet Holdings, Inc | | | 14,094 | |
| | | | | | TOTAL HEALTH CARE EQUIPMENT & SERVICES | | | 1,087,570 | |
| | | | | | | | | | |
| HOUSEHOLD & PERSONAL PRODUCTS - 1.6% |
| | 7,431 | | * | | Central Garden & Pet Co | | | 256 | |
| | 24,471 | | * | | Central Garden and Pet Co (Class A) | | | 765 | |
| | 167,255 | | | | Church & Dwight Co, Inc | | | 10,999 | |
| | 84,999 | | | | Clorox Co | | | 13,102 | |
| | 564,224 | | | | Colgate-Palmolive Co | | | 33,583 | |
| | 303,286 | | | | Coty, Inc | | | 1,990 | |
| | 41,449 | | * | | Edgewell Personal Care Co | | | 1,548 | |
| | 15,146 | | *,e | | elf Beauty, Inc | | | 131 | |
| | 44,546 | | | | Energizer Holdings, Inc | | | 2,011 | |
| | 144,911 | | | | Estee Lauder Cos (Class A) | | | 18,853 | |
| | 69,622 | | * | | Herbalife Ltd | | | 4,104 | |
| | 12,258 | | | | Inter Parfums, Inc | | | 804 | |
| | 234,203 | | | | Kimberly-Clark Corp | | | 26,685 | |
| | 7,966 | | | | Medifast, Inc | | | 996 | |
COLLEGE RETIREMENT EQUITIES FUND- Equity Index Account
| SHARES | | | | COMPANY | | VALUE
(000) | |
| | 5,685 | | e | | Natural Health Trends Corp | | $ | 105 | |
| | 5,868 | | * | | Nature’s Sunshine Products, Inc | | | 48 | |
| | 36,417 | | | | Nu Skin Enterprises, Inc (Class A) | | | 2,233 | |
| | 3,981 | | | | Oil-Dri Corp of America | | | 105 | |
| | 1,658,605 | | | | Procter & Gamble Co | | | 152,459 | |
| | 8,319 | | *,e | | Revlon, Inc (Class A) | | | 209 | |
| | 22,541 | | | | Spectrum Brands Holdings, Inc | | | 952 | |
| | 8,349 | | * | | USANA Health Sciences, Inc | | | 983 | |
| | 9,183 | | e | | WD-40 Co | | | 1,683 | |
| | | | | | TOTAL HOUSEHOLD & PERSONAL PRODUCTS | | | 274,604 | |
| | | | | | | | | | |
| INSURANCE - 4.2% |
| | 506,507 | | | | Aflac, Inc | | | 23,076 | |
| | 10,050 | | | | Alleghany Corp | | | 6,264 | |
| | 227,832 | | | | Allstate Corp | | | 18,826 | |
| | 32,424 | | * | | AMBAC Financial Group, Inc | | | 559 | |
| | 61,796 | | | | American Equity Investment Life Holding Co | | | 1,727 | |
| | 43,725 | | | | American Financial Group, Inc | | | 3,958 | |
| | 595,178 | | | | American International Group, Inc | | | 23,456 | |
| | 5,469 | | | | American National Insurance Co | | | 696 | |
| | 13,468 | | | | Amerisafe, Inc | | | 764 | |
| | 159,841 | | | | Aon plc | | | 23,234 | |
| | 243,531 | | * | | Arch Capital Group Ltd | | | 6,507 | |
| | 24,041 | | | | Argo Group International Holdings Ltd | | | 1,617 | |
| | 119,205 | | | | Arthur J. Gallagher & Co | | | 8,785 | |
| | 43,239 | | | | Aspen Insurance Holdings Ltd | | | 1,816 | |
| | 38,716 | | | | Assurant, Inc | | | 3,463 | |
| | 75,307 | | | | Assured Guaranty Ltd | | | 2,883 | |
| | 96,464 | | * | | Athene Holding Ltd | | | 3,842 | |
| | 58,873 | | | | Axis Capital Holdings Ltd | | | 3,040 | |
| | 1,287,349 | | * | | Berkshire Hathaway, Inc (Class B) | | | 262,851 | |
| | 80,775 | | * | | Brighthouse Financial, Inc | | | 2,462 | |
| | 144,728 | | | | Brown & Brown, Inc | | | 3,989 | |
| | 307,361 | | | | Chubb Ltd | | | 39,705 | |
| | 102,852 | | | | Cincinnati Financial Corp | | | 7,963 | |
| | 32,879 | | *,e | | Citizens, Inc (Class A) | | | 247 | |
| | 17,827 | | | | CNA Financial Corp | | | 787 | |
| | 123,157 | | | | Conseco, Inc | | | 1,833 | |
| | 11,609 | | | | Crawford & Co (Class B) | | | 104 | |
| | 7,812 | | | | Donegal Group, Inc (Class A) | | | 107 | |
| | 11,930 | | * | | eHealth, Inc | | | 458 | |
| | 6,754 | | | | EMC Insurance Group, Inc | | | 215 | |
| | 23,170 | | | | Employers Holdings, Inc | | | 972 | |
| | 8,013 | | * | | Enstar Group Ltd | | | 1,343 | |
| | 17,977 | | | | Erie Indemnity Co (Class A) | | | 2,397 | |
| | 26,539 | | | | Everest Re Group Ltd | | | 5,779 | |
| | 7,071 | | | | FBL Financial Group, Inc (Class A) | | | 464 | |
| | 10,321 | | | | FedNat Holding Co | | | 206 | |
| | 67,815 | | | | First American Financial Corp | | | 3,027 | |
| | 172,857 | | | | FNF Group | | | 5,435 | |
| | 339,186 | | * | | Genworth Financial, Inc (Class A) | | | 1,581 | |
| | 6,929 | | | | Global Indemnity Ltd | | | 251 | |
| | 6,616 | | *,e | | Goosehead Insurance, Inc | | | 174 | |
| | 20,683 | | *,e | | Greenlight Capital Re Ltd (Class A) | | | 178 | |
COLLEGE RETIREMENT EQUITIES FUND- Equity Index Account
| SHARES | | | | COMPANY | | VALUE
(000) | |
| | 7,438 | | * | | Hallmark Financial Services | | $ | 80 | |
| | 30,826 | | | | Hanover Insurance Group, Inc | | | 3,600 | |
| | 226,634 | | | | Hartford Financial Services Group, Inc | | | 10,074 | |
| | 5,533 | | | | HCI Group, Inc | | | 281 | |
| | 8,194 | | *,e | | Health Insurance Innovations, Inc | | | 219 | |
| | 18,411 | | e | | Heritage Insurance Holdings, Inc | | | 271 | |
| | 29,606 | | | | Horace Mann Educators Corp | | | 1,109 | |
| | 5,237 | | | | Independence Holding Co | | | 184 | |
| | 1,119 | | | | Investors Title Co | | | 198 | |
| | 12,617 | | | | James River Group Holdings Ltd | | | 461 | |
| | 38,336 | | | | Kemper Corp | | | 2,545 | |
| | 7,037 | | | | Kingstone Cos, Inc | | | 124 | |
| | 10,502 | | | | Kinsale Capital Group, Inc | | | 583 | |
| | 146,331 | | | | Lincoln National Corp | | | 7,508 | |
| | 177,981 | | | | Loews Corp | | | 8,102 | |
| | 48,335 | | | | Maiden Holdings Ltd | | | 80 | |
| | 9,220 | | * | | Markel Corp | | | 9,571 | |
| | 336,456 | | | | Marsh & McLennan Cos, Inc | | | 26,832 | |
| | 59,989 | | * | | MBIA, Inc | | | 535 | |
| | 20,342 | | | | Mercury General Corp | | | 1,052 | |
| | 563,187 | | | | Metlife, Inc | | | 23,124 | |
| | 35,673 | | | | National General Holdings Corp | | | 864 | |
| | 1,551 | | | | National Western Life Group, Inc | | | 466 | |
| | 15,353 | | | | Navigators Group, Inc | | | 1,067 | |
| | 7,308 | | * | | NI Holdings, Inc | | | 115 | |
| | 192,340 | | | | Old Republic International Corp | | | 3,956 | |
| | 27,126 | | | | Primerica, Inc | | | 2,650 | |
| | 192,618 | | | | Principal Financial Group | | | 8,508 | |
| | 37,307 | | | | ProAssurance Corp | | | 1,513 | |
| | 380,107 | | | | Progressive Corp | | | 22,932 | |
| | 6,904 | | | | Protective Insurance Corp | | | 115 | |
| | 274,700 | | | | Prudential Financial, Inc | | | 22,402 | |
| | 41,571 | | | | Reinsurance Group of America, Inc (Class A) | | | 5,830 | |
| | 28,612 | | | | RenaissanceRe Holdings Ltd | | | 3,825 | |
| | 27,824 | | | | RLI Corp | | | 1,920 | |
| | 11,093 | | | | Safety Insurance Group, Inc | | | 908 | |
| | 42,211 | | | | Selective Insurance Group, Inc | | | 2,572 | |
| | 11,039 | | | | State Auto Financial Corp | | | 376 | |
| | 15,315 | | | | Stewart Information Services Corp | | | 634 | |
| | 51,271 | | * | | Third Point Reinsurance Ltd | | | 494 | |
| | 22,143 | | | | Tiptree Financial, Inc | | | 124 | |
| | 69,267 | | | | Torchmark Corp | | | 5,162 | |
| | 178,544 | | | | Travelers Cos, Inc | | | 21,381 | |
| | 15,868 | | *,e | | Trupanion, Inc | | | 404 | |
| | 16,104 | | | | United Fire & Casualty Co | | | 893 | |
| | 12,682 | | | | United Insurance Holdings Corp | | | 211 | |
| | 22,402 | | | | Universal Insurance Holdings, Inc | | | 849 | |
| | 142,945 | | | | UnumProvident Corp | | | 4,200 | |
| | 59,812 | | | | W.R. Berkley Corp | | | 4,421 | |
| | 2,317 | | | | White Mountains Insurance Group Ltd | | | 1,987 | |
| | 86,010 | | | | Willis Towers Watson plc | | | 13,061 | |
| | | | | | TOTAL INSURANCE | | | 707,414 | |
COLLEGE RETIREMENT EQUITIES FUND- Equity Index Account
| SHARES | | | | COMPANY | | VALUE
(000) | |
| MATERIALS - 3.0% |
| | 20,886 | | * | | A Schulman, Inc | | $ | 40 | |
| | 15,014 | | e | | Advanced Emissions Solutions, Inc | | | 158 | |
| | 22,501 | | * | | AdvanSix, Inc | | | 548 | |
| | 16,379 | | *,e | | AgroFresh Solutions, Inc | | | 62 | |
| | 143,595 | | | | Air Products & Chemicals, Inc | | | 22,982 | |
| | 228,124 | | *,e | | AK Steel Holding Corp | | | 513 | |
| | 73,578 | | e | | Albemarle Corp | | | 5,671 | |
| | 122,406 | | * | | Alcoa Corp | | | 3,254 | |
| | 78,013 | | *,e | | Allegheny Technologies, Inc | | | 1,698 | |
| | 20,501 | | | | American Vanguard Corp | | | 311 | |
| | 36,989 | | | | Aptargroup, Inc | | | 3,480 | |
| | 13,288 | | | | Ardagh Group S.A. | | | 147 | |
| | 43,629 | | | | Ashland Global Holdings, Inc | | | 3,096 | |
| | 57,376 | | | | Avery Dennison Corp | | | 5,154 | |
| | 153,684 | | * | | Axalta Coating Systems Ltd | | | 3,599 | |
| | 23,190 | | | | Balchem Corp | | | 1,817 | |
| | 221,402 | | | | Ball Corp | | | 10,180 | |
| | 53,485 | | | | Bemis Co, Inc | | | 2,455 | |
| | 79,377 | | * | | Berry Plastics Group, Inc | | | 3,773 | |
| | 27,727 | | | | Boise Cascade Co | | | 661 | |
| | 43,691 | | | | Cabot Corp | | | 1,876 | |
| | 31,590 | | | | Carpenter Technology Corp | | | 1,125 | |
| | 90,417 | | | | Celanese Corp (Series A) | | | 8,135 | |
| | 36,798 | | * | | Century Aluminum Co | | | 269 | |
| | 154,694 | | | | CF Industries Holdings, Inc | | | 6,731 | |
| | 5,158 | | | | Chase Corp | | | 516 | |
| | 119,808 | | | | Chemours Co | | | 3,381 | |
| | 11,678 | | * | | Clearwater Paper Corp | | | 285 | |
| | 213,712 | | *,e | | Cleveland-Cliffs, Inc | | | 1,643 | |
| | 119,550 | | * | | Coeur Mining, Inc | | | 534 | |
| | 83,562 | | | | Commercial Metals Co | | | 1,339 | |
| | 22,798 | | | | Compass Minerals International, Inc | | | 950 | |
| | 76,387 | | * | | Crown Holdings, Inc | | | 3,175 | |
| | 45,300 | | | | Domtar Corp | | | 1,591 | |
| | 1,526,619 | | | | DowDuPont, Inc | | | 81,644 | |
| | 34,107 | | | | Eagle Materials, Inc | | | 2,082 | |
| | 92,042 | | | | Eastman Chemical Co | | | 6,729 | |
| | 169,882 | | | | Ecolab, Inc | | | 25,032 | |
| | 60,041 | | * | | Ferro Corp | | | 941 | |
| | 47,286 | | * | | Ferroglobe plc | | | 0 | |
| | 40,724 | | *,e | | Flotek Industries, Inc | | | 44 | |
| | 89,953 | | | | FMC Corp | | | 6,653 | |
| | 941,449 | | | | Freeport-McMoRan Copper & Gold, Inc (Class B) | | | 9,706 | |
| | 17,819 | | | | FutureFuel Corp | | | 283 | |
| | 48,995 | | * | | GCP Applied Technologies, Inc | | | 1,203 | |
| | 39,231 | | | | Gold Resource Corp | | | 157 | |
| | 224,514 | | | | Graphic Packaging Holding Co | | | 2,389 | |
| | 3,993 | | | | Greif, Inc | | | 177 | |
| | 18,292 | | | | Greif, Inc (Class A) | | | 679 | |
| | 34,325 | | | | H.B. Fuller Co | | | 1,465 | |
| | 7,923 | | | | Hawkins, Inc | | | 324 | |
| | 9,402 | | | | Haynes International, Inc | | | 248 | |
| | 335,463 | | | | Hecla Mining Co | | | 792 | |
COLLEGE RETIREMENT EQUITIES FUND- Equity Index Account
| SHARES | | | | COMPANY | | VALUE
(000) | |
| | 143,018 | | | | Huntsman Corp | | $ | 2,759 | |
| | 30,403 | | * | | Ingevity Corp | | | 2,544 | |
| | 14,138 | | | | Innophos Holdings, Inc | | | 347 | |
| | 17,291 | | | | Innospec, Inc | | | 1,068 | |
| | 67,026 | | | | International Flavors & Fragrances, Inc | | | 9,000 | |
| | 276,554 | | | | International Paper Co | | | 11,162 | |
| | 67,354 | | * | | Intrepid Potash, Inc | | | 175 | |
| | 12,178 | | | | Kaiser Aluminum Corp | | | 1,087 | |
| | 15,231 | | * | | Koppers Holdings, Inc | | | 260 | |
| | 21,628 | | * | | Kraton Polymers LLC | | | 472 | |
| | 14,288 | | | | Kronos Worldwide, Inc | | | 165 | |
| | 366,581 | | | | Linde plc | | | 57,201 | |
| | 15,331 | | * | | Livent Corp | | | 212 | |
| | 104,108 | | | | Louisiana-Pacific Corp | | | 2,313 | |
| | 15,120 | | *,e | | LSB Industries, Inc | | | 83 | |
| | 210,084 | | | | LyondellBasell Industries AF S.C.A | | | 17,471 | |
| | 42,490 | | | | Martin Marietta Materials, Inc | | | 7,303 | |
| | 14,781 | | | | Materion Corp | | | 665 | |
| | 23,990 | | | | Minerals Technologies, Inc | | | 1,232 | |
| | 233,459 | | | | Mosaic Co | | | 6,819 | |
| | 18,118 | | | | Myers Industries, Inc | | | 274 | |
| | 10,909 | | | | Neenah Paper, Inc | | | 643 | |
| | 5,424 | | | | NewMarket Corp | | | 2,235 | |
| | 348,477 | | | | Newmont Mining Corp | | | 12,075 | |
| | 207,804 | | | | Nucor Corp | | | 10,766 | |
| | 119,149 | | | | Olin Corp | | | 2,396 | |
| | 6,559 | | | | Olympic Steel, Inc | | | 94 | |
| | 32,453 | | * | | Omnova Solutions, Inc | | | 238 | |
| | 90,414 | | * | | Owens-Illinois, Inc | | | 1,559 | |
| | 63,758 | | | | Packaging Corp of America | | | 5,321 | |
| | 32,454 | | | | PH Glatfelter Co | | | 317 | |
| | 159,281 | | * | | Platform Specialty Products Corp | | | 1,645 | |
| | 58,890 | | | | PolyOne Corp | | | 1,684 | |
| | 164,693 | | | | PPG Industries, Inc | | | 16,837 | |
| | 20,162 | | * | | PQ Group Holdings, Inc | | | 299 | |
| | 9,399 | | | | Quaker Chemical Corp | | | 1,670 | |
| | 31,957 | | e | | Rayonier Advanced Materials, Inc | | | 340 | |
| | 50,286 | | | | Reliance Steel & Aluminum Co | | | 3,579 | |
| | 41,577 | | | | Royal Gold, Inc | | | 3,561 | |
| | 85,949 | | | | RPM International, Inc | | | 5,052 | |
| | 8,418 | | * | | Ryerson Holding Corp | | | 53 | |
| | 19,399 | | | | Schnitzer Steel Industries, Inc (Class A) | | | 418 | |
| | 20,766 | | | | Schweitzer-Mauduit International, Inc | | | 520 | |
| | 30,897 | | | | Scotts Miracle-Gro Co (Class A) | | | 1,899 | |
| | 109,559 | | | | Sealed Air Corp | | | 3,817 | |
| | 23,291 | | | | Sensient Technologies Corp | | | 1,301 | |
| | 56,197 | | | | Sherwin-Williams Co | | | 22,111 | |
| | 52,654 | | | | Silgan Holdings, Inc | | | 1,244 | |
| | 58,033 | | | | Sonoco Products Co | | | 3,083 | |
| | 56,197 | | | | Southern Copper Corp (NY) | | | 1,729 | |
| | 156,511 | | | | Steel Dynamics, Inc | | | 4,702 | |
| | 14,267 | | | | Stepan Co | | | 1,056 | |
| | 78,354 | | * | | Summit Materials, Inc | | | 972 | |
COLLEGE RETIREMENT EQUITIES FUND- Equity Index Account
| SHARES | | | | COMPANY | | VALUE
(000) | |
| | 48,451 | | * | | SunCoke Energy, Inc | | $ | 414 | |
| | 207,059 | | * | | Tahoe Resources, Inc | | | 756 | |
| | 29,755 | | *,e | | TimkenSteel Corp | | | 260 | |
| | 15,246 | | * | | Trecora Resources | | | 119 | |
| | 19,671 | | | | Tredegar Corp | | | 312 | |
| | 23,427 | | | | Trinseo S.A. | | | 1,072 | |
| | 47,159 | | | | Tronox Ltd | | | 367 | |
| | 4,630 | | * | | UFP Technologies, Inc | | | 139 | |
| | 1,357 | | | | United States Lime & Minerals, Inc | | | 96 | |
| | 113,186 | | | | United States Steel Corp | | | 2,065 | |
| | 11,048 | | *,e | | US Concrete, Inc | | | 390 | |
| | 16,839 | | | | Valhi, Inc | | | 32 | |
| | 120,028 | | | | Valvoline, Inc | | | 2,323 | |
| | 22,885 | | * | | Verso Corp | | | 513 | |
| | 90,183 | | | | Vulcan Materials Co | | | 8,910 | |
| | 11,178 | | | | Warrior Met Coal, Inc | | | 270 | |
| | 24,489 | | | | Westlake Chemical Corp | | | 1,620 | |
| | 166,890 | | | | WestRock Co | | | 6,302 | |
| | 31,289 | | | | Worthington Industries, Inc | | | 1,090 | |
| | 48,393 | | | | WR Grace and Co | | | 3,141 | |
| | | | | | TOTAL MATERIALS | | | 507,716 | |
| | | | | | | | | | |
| MEDIA & ENTERTAINMENT - 7.1% |
| | 501,312 | | | | Activision Blizzard, Inc | | | 23,346 | |
| | 198,681 | | * | | Alphabet, Inc (Class A) | | | 207,614 | |
| | 202,492 | | * | | Alphabet, Inc (Class C) | | | 209,703 | |
| | 39,663 | | e | | AMC Entertainment Holdings, Inc | | | 487 | |
| | 27,567 | | * | | AMC Networks, Inc | | | 1,513 | |
| | 2,913 | | | | Cable One, Inc | | | 2,389 | |
| | 10,137 | | * | | Care.com, Inc | | | 196 | |
| | 33,333 | | * | | Cargurus, Inc | | | 1,124 | |
| | 51,951 | | * | | Cars.com, Inc | | | 1,117 | |
| | 218,673 | | | | CBS Corp (Class B) | | | 9,560 | |
| | 57,360 | | * | | Central European Media Enterprises Ltd (Class A) (NASDAQ) | | | 159 | |
| | 115,773 | | * | | Charter Communications, Inc | | | 32,992 | |
| | 76,895 | | | | Cinemark Holdings, Inc | | | 2,753 | |
| | 28,047 | | | | Clear Channel Outdoor Holdings, Inc (Class A) | | | 146 | |
| | 3,039,553 | | | | Comcast Corp (Class A) | | | 103,497 | |
| | 772 | | *,e | | Daily Journal Corp | | | 181 | |
| | 89,117 | | *,e | | Discovery, Inc (Class A) | | | 2,205 | |
| | 216,367 | | * | | Discovery, Inc (Class C) | | | 4,994 | |
| | 140,931 | | * | | DISH Network Corp (Class A) | | | 3,519 | |
| | 197,158 | | * | | Electronic Arts, Inc | | | 15,558 | |
| | 11,002 | | | | Emerald Expositions Events, Inc | | | 136 | |
| | 88,350 | | | | Entercom Communications Corp (Class A) | | | 504 | |
| | 50,932 | | | | Entravision Communications Corp (Class A) | | | 148 | |
| | 20,620 | | *,e | | Eros International plc | | | 171 | |
| | 42,935 | | | | EW Scripps Co (Class A) | | | 675 | |
| | 1,582,192 | | * | | Facebook, Inc | | | 207,409 | |
| | 10,504 | | *,e | | Fluent, Inc | | | 38 | |
| | 86,657 | | | | Gannett Co, Inc | | | 739 | |
| | 68,741 | | * | | GCI Liberty, Inc | | | 2,829 | |
| | 54,344 | | * | | Glu Mobile, Inc | | | 439 | |
COLLEGE RETIREMENT EQUITIES FUND- Equity Index Account
| SHARES | | | | COMPANY | | VALUE
(000) | |
| | 46,930 | | * | | Gray Television, Inc | | $ | 692 | |
| | 11,523 | | * | | Hemisphere Media Group, Inc | | | 140 | |
| | 49,755 | | * | | IAC/InterActiveCorp | | | 9,107 | |
| | 42,177 | | * | | Imax Corp | | | 793 | |
| | 256,720 | | | | Interpublic Group of Cos, Inc | | | 5,296 | |
| | 30,218 | | | | John Wiley & Sons, Inc (Class A) | | | 1,419 | |
| | 7,655 | | * | | Liberty Braves Group (Class A) | | | 191 | |
| | 25,374 | | * | | Liberty Braves Group (Class C) | | | 632 | |
| | 17,476 | | * | | Liberty Broadband Corp (Class A) | | | 1,255 | |
| | 67,609 | | * | | Liberty Broadband Corp (Class C) | | | 4,870 | |
| | 77,076 | | * | | Liberty Latin America Ltd | | | 1,123 | |
| | 29,453 | | * | | Liberty Latin America Ltd (Class A) | | | 426 | |
| | 15,619 | | * | | Liberty Media Group (Class A) | | | 464 | |
| | 123,792 | | * | | Liberty Media Group (Class C) | | | 3,800 | |
| | 50,898 | | * | | Liberty SiriusXM Group (Class A) | | | 1,873 | |
| | 102,962 | | * | | Liberty SiriusXM Group (Class C) | | | 3,807 | |
| | 53,282 | | * | | Liberty TripAdvisor Holdings, Inc | | | 847 | |
| | 37,150 | | e | | Lions Gate Entertainment Corp (Class A) | | | 598 | |
| | 71,817 | | e | | Lions Gate Entertainment Corp (Class B) | | | 1,069 | |
| | 96,974 | | * | | Live Nation, Inc | | | 4,776 | |
| | 9,932 | | * | | Loral Space & Communications, Inc | | | 370 | |
| | 13,200 | | * | | Madison Square Garden Co | | | 3,534 | |
| | 14,211 | | | | Marcus Corp | | | 561 | |
| | 35,129 | | e | | Match Group, Inc | | | 1,502 | |
| | 37,799 | | * | | MDC Partners, Inc | | | 99 | |
| | 46,865 | | * | | Meet Group, Inc | | | 217 | |
| | 27,920 | | e | | Meredith Corp | | | 1,450 | |
| | 43,336 | | * | | MSG Networks, Inc | | | 1,021 | |
| | 46,358 | | | | National CineMedia, Inc | | | 300 | |
| | 277,571 | | * | | NetFlix, Inc | | | 74,295 | |
| | 36,183 | | | | New Media Investment Group, Inc | | | 419 | |
| | 89,935 | | | | New York Times Co (Class A) | | | 2,005 | |
| | 268,456 | | | | News Corp (Class A) | | | 3,047 | |
| | 86,319 | | | | News Corp (Class B) | | | 997 | |
| | 31,898 | | | | Nexstar Broadcasting Group, Inc (Class A) | | | 2,508 | |
| | 146,186 | | | | Omnicom Group, Inc | | | 10,707 | |
| | 163,222 | | * | | Pandora Media, Inc | | | 1,320 | |
| | 20,643 | | * | | QuinStreet, Inc | | | 335 | |
| | 12,373 | | * | | Reading International, Inc | | | 180 | |
| | 13,437 | | * | | Rosetta Stone, Inc | | | 220 | |
| | 3,161 | | | | Saga Communications, Inc | | | 105 | |
| | 19,984 | | | | Scholastic Corp | | | 805 | |
| | 51,858 | | | | Sinclair Broadcast Group, Inc (Class A) | | | 1,366 | |
| | 877,533 | | e | | Sirius XM Holdings, Inc | | | 5,011 | |
| | 73,771 | | * | | Take-Two Interactive Software, Inc | | | 7,594 | |
| | 12,153 | | * | | TechTarget, Inc | | | 148 | |
| | 156,124 | | | | TEGNA, Inc | | | 1,697 | |
| | 52,414 | | | | Tribune Co | | | 2,378 | |
| | 15,283 | | * | | Tribune Publishing Co | | | 173 | |
| | 71,015 | | * | | TripAdvisor, Inc | | | 3,831 | |
| | 44,667 | | * | | TrueCar, Inc | | | 405 | |
| | 693,032 | | | | Twenty-First Century Fox, Inc | | | 33,349 | |
| | 320,320 | | | | Twenty-First Century Fox, Inc (Class B) | | | 15,305 | |
COLLEGE RETIREMENT EQUITIES FUND- Equity Index Account
| SHARES | | | | COMPANY | | VALUE
(000) | |
| | 466,692 | | * | | Twitter, Inc | | $ | 13,413 | |
| | 7,706 | | e | | Viacom, Inc | | | 214 | |
| | 233,649 | | | | Viacom, Inc (Class B) | | | 6,005 | |
| | 991,300 | | | | Walt Disney Co | | | 108,696 | |
| | 15,148 | | * | | WideOpenWest, Inc | | | 108 | |
| | 27,047 | | | | World Wrestling Entertainment, Inc (Class A) | | | 2,021 | |
| | 56,028 | | * | | Yelp, Inc | | | 1,960 | |
| | 38,071 | | * | | Zillow Group, Inc | | | 1,197 | |
| | 76,096 | | *,e | | Zillow Group, Inc (Class C) | | | 2,403 | |
| | 549,506 | | * | | Zynga, Inc | | | 2,160 | |
| | | | | | TOTAL MEDIA & ENTERTAINMENT | | | 1,194,750 | |
| | | | | | | | | | |
| PHARMACEUTICALS, BIOTECHNOLOGY & LIFE SCIENCES - 8.5% |
| | 1,007,898 | | | | AbbVie, Inc | | | 92,918 | |
| | 18,729 | | *,e | | Abeona Therapeutics, Inc | | | 134 | |
| | 70,913 | | * | | Acadia Pharmaceuticals, Inc | | | 1,147 | |
| | 18,841 | | *,e | | Accelerate Diagnostics, Inc | | | 217 | |
| | 22,847 | | * | | Acceleron Pharma, Inc | | | 995 | |
| | 21,294 | | *,e | | Achaogen, Inc | | | 26 | |
| | 86,253 | | * | | Achillion Pharmaceuticals, Inc | | | 137 | |
| | 14,790 | | * | | Aclaris Therapeutics, Inc | | | 109 | |
| | 31,389 | | * | | Acorda Therapeutics, Inc | | | 489 | |
| | 12,735 | | *,e | | Adamas Pharmaceuticals, Inc | | | 109 | |
| | 26,641 | | * | | Aduro Biotech, Inc | | | 70 | |
| | 36,900 | | * | | Adverum Biotechnologies, Inc | | | 116 | |
| | 21,807 | | * | | Aerie Pharmaceuticals, Inc | | | 787 | |
| | 56,789 | | *,e | | Agenus, Inc | | | 135 | |
| | 214,820 | | | | Agilent Technologies, Inc | | | 14,492 | |
| | 34,493 | | *,e | | Agios Pharmaceuticals, Inc | | | 1,590 | |
| | 25,712 | | * | | Aimmune Therapeutics, Inc | | | 615 | |
| | 10,845 | | *,e | | Akcea Therapeutics, Inc | | | 327 | |
| | 48,526 | | *,e | | Akebia Therapeutics, Inc | | | 268 | |
| | 64,824 | | * | | Akorn, Inc | | | 220 | |
| | 6,175 | | * | | Albireo Pharma, Inc | | | 151 | |
| | 34,164 | | * | | Alder Biopharmaceuticals, Inc | | | 350 | |
| | 142,239 | | * | | Alexion Pharmaceuticals, Inc | | | 13,848 | |
| | 110,420 | | * | | Alkermes plc | | | 3,258 | |
| | 5,532 | | *,e | | Allakos, Inc | | | 289 | |
| | 228,222 | | | | Allergan plc | | | 30,504 | |
| | 14,115 | | * | | Allogene Therapeutics, Inc | | | 380 | |
| | 60,843 | | * | | Alnylam Pharmaceuticals, Inc | | | 4,436 | |
| | 25,493 | | * | | AMAG Pharmaceuticals, Inc | | | 387 | |
| | 423,981 | | | | Amgen, Inc | | | 82,536 | |
| | 128,302 | | *,e | | Amicus Therapeutics, Inc | | | 1,229 | |
| | 53,162 | | * | | Amneal Pharmaceuticals, Inc | | | 719 | |
| | 25,774 | | * | | Amphastar Pharmaceuticals, Inc | | | 513 | |
| | 12,566 | | * | | AnaptysBio, Inc | | | 802 | |
| | 5,767 | | * | | ANI Pharmaceuticals, Inc | | | 260 | |
| | 24,477 | | * | | Apellis Pharmaceuticals, Inc | | | 323 | |
| | 8,900 | | * | | Aptinyx, Inc | | | 147 | |
| | 29,050 | | * | | Aratana Therapeutics, Inc | | | 178 | |
| | 23,940 | | * | | Arbutus Biopharma Corp | | | 92 | |
| | 20,717 | | *,e | | Arcus Biosciences, Inc | | | 223 | |
| | 22,973 | | * | | Ardelyx, Inc | | | 41 | |
COLLEGE RETIREMENT EQUITIES FUND- Equity Index Account
| SHARES | | | | COMPANY | | VALUE
(000) | |
| | 33,642 | | * | | Arena Pharmaceuticals, Inc | | $ | 1,310 | |
| | 58,861 | | * | | Arqule, Inc | | | 163 | |
| | 126,892 | | * | | Array Biopharma, Inc | | | 1,808 | |
| | 58,978 | | *,e | | Arrowhead Research Corp | | | 733 | |
| | 10,043 | | * | | Assembly Biosciences, Inc | | | 227 | |
| | 44,278 | | * | | Assertio Therapeutics, Inc. | | | 160 | |
| | 27,557 | | * | | Atara Biotherapeutics, Inc | | | 957 | |
| | 28,525 | | *,e | | Athenex, Inc | | | 362 | |
| | 52,762 | | *,e | | Athersys, Inc | | | 76 | |
| | 21,700 | | * | | Audentes Therapeutics, Inc | | | 463 | |
| | 68,882 | | *,e | | AVEO Pharmaceuticals, Inc | | | 110 | |
| | 33,858 | | * | | Avid Bioservices, Inc | | | 139 | |
| | 19,950 | | * | | Bellicum Pharmaceuticals, Inc | | | 58 | |
| | 53,741 | | * | | BioCryst Pharmaceuticals, Inc | | | 434 | |
| | 133,809 | | * | | Biogen Idec, Inc | | | 40,266 | |
| | 18,525 | | * | | Biohaven Pharmaceutical Holding Co Ltd | | | 685 | |
| | 120,472 | | * | | BioMarin Pharmaceutical, Inc | | | 10,258 | |
| | 15,362 | | * | | Bio-Rad Laboratories, Inc (Class A) | | | 3,567 | |
| | 3,856 | | * | | Biospecifics Technologies Corp | | | 234 | |
| | 25,935 | | | | Bio-Techne Corp | | | 3,753 | |
| | 56,186 | | *,e | | BioTime, Inc | | | 51 | |
| | 33,689 | | * | | Bluebird Bio, Inc | | | 3,342 | |
| | 28,144 | | * | | Blueprint Medicines Corp | | | 1,517 | |
| | 1,095,192 | | | | Bristol-Myers Squibb Co | | | 56,928 | |
| | 76,600 | | | | Bruker BioSciences Corp | | | 2,280 | |
| | 21,820 | | * | | Calithera Biosciences, Inc | | | 88 | |
| | 5,849 | | *,e | | Calyxt, Inc | | | 61 | |
| | 23,380 | | * | | Cambrex Corp | | | 883 | |
| | 19,366 | | *,e | | Cara Therapeutics Inc | | | 252 | |
| | 21,908 | | * | | CareDx, Inc | | | 551 | |
| | 33,837 | | *,e | | CASI Pharmaceuticals, Inc | | | 136 | |
| | 90,837 | | * | | Catalent, Inc | | | 2,832 | |
| | 50,782 | | * | | Catalyst Pharmaceuticals, Inc | | | 98 | |
| | 472,603 | | * | | Celgene Corp | | | 30,289 | |
| | 34,386 | | * | | Charles River Laboratories International, Inc | | | 3,892 | |
| | 18,304 | | * | | ChemoCentryx, Inc | | | 200 | |
| | 30,594 | | * | | Chimerix, Inc | | | 79 | |
| | 14,633 | | *,e | | Clearside Biomedical, Inc | | | 16 | |
| | 28,355 | | *,e | | Clovis Oncology, Inc | | | 509 | |
| | 23,538 | | * | | Codexis, Inc | | | 393 | |
| | 15,129 | | *,e | | Cohbar, Inc | | | 47 | |
| | 27,864 | | * | | Coherus Biosciences, Inc | | | 252 | |
| | 16,286 | | *,e | | Collegium Pharmaceutical, Inc | | | 280 | |
| | 11,239 | | * | | Concert Pharmaceuticals Inc | | | 141 | |
| | 32,828 | | *,e | | Corbus Pharmaceuticals Holdings, Inc | | | 192 | |
| | 65,375 | | *,e | | Corcept Therapeutics, Inc | | | 873 | |
| | 15,295 | | *,e | | Corium International, Inc | | | 3 | |
| | 6,717 | | * | | Corvus Pharmaceuticals, Inc | | | 25 | |
| | 34,612 | | *,e | | CTI BioPharma Corp | | | 25 | |
| | 11,975 | | *,e | | Cue Biopharma, Inc | | | 56 | |
| | 39,943 | | * | | Cymabay Therapeutics, Inc | | | 314 | |
| | 30,153 | | * | | Cytokinetics, Inc | | | 191 | |
| | 21,311 | | * | | CytomX Therapeutics, Inc | | | 322 | |
COLLEGE RETIREMENT EQUITIES FUND- Equity Index Account
| SHARES | | | | COMPANY | | VALUE
(000) | |
| | 5,156 | | * | | Deciphera Pharmaceuticals, Inc | | $ | 108 | |
| | 11,457 | | *,e | | Denali Therapeutics, Inc | | | 237 | |
| | 27,246 | | * | | Dermira, Inc | | | 196 | |
| | 30,105 | | * | | Dicerna Pharmaceuticals Inc | | | 322 | |
| | 7,981 | | *,e | | Dova Pharmaceuticals, Inc | | | 61 | |
| | 84,059 | | * | | Durect Corp | | | 41 | |
| | 35,256 | | *,e | | Dynavax Technologies Corp | | | 323 | |
| | 6,368 | | * | | Eagle Pharmaceuticals, Inc | | | 257 | |
| | 24,325 | | * | | Editas Medicine, Inc | | | 553 | |
| | 48,178 | | *,e | | Elanco Animal Health, Inc | | | 1,519 | |
| | 625,362 | | | | Eli Lilly & Co | | | 72,367 | |
| | 14,575 | | * | | Eloxx Pharmaceuticals, Inc | | | 175 | |
| | 24,015 | | * | | Emergent Biosolutions, Inc | | | 1,424 | |
| | 11,786 | | * | | Enanta Pharmaceuticals, Inc | | | 835 | |
| | 161,263 | | * | | Endo International plc | | | 1,177 | |
| | 27,058 | | * | | Enzo Biochem, Inc | | | 75 | |
| | 29,818 | | * | | Epizyme, Inc | | | 184 | |
| | 9,694 | | *,e | | Esperion Thereapeutics, Inc | | | 446 | |
| | 79,297 | | * | | Exact Sciences Corp | | | 5,004 | |
| | 189,826 | | * | | Exelixis, Inc | | | 3,734 | |
| | 24,636 | | * | | Fate Therapeutics, Inc | | | 316 | |
| | 50,667 | | * | | FibroGen, Inc | | | 2,345 | |
| | 19,800 | | * | | Five Prime Therapeutics, Inc | | | 184 | |
| | 19,463 | | *,e | | Flexion Therapeutics Inc | | | 220 | |
| | 20,851 | | * | | Fluidigm Corp | | | 180 | |
| | 5,695 | | * | | G1 Therapeutics, Inc | | | 109 | |
| | 14,071 | | * | | Genomic Health, Inc | | | 906 | |
| | 114,325 | | *,e | | Geron Corp | | | 114 | |
| | 866,742 | | | | Gilead Sciences, Inc | | | 54,215 | |
| | 26,450 | | * | | Global Blood Therapeutics, Inc | | | 1,086 | |
| | 22,784 | | * | | GlycoMimetics Inc | | | 216 | |
| | 79,065 | | * | | Halozyme Therapeutics, Inc | | | 1,157 | |
| | 32,353 | | * | | Heron Therapeutics, Inc | | | 839 | |
| | 11,341 | | *,e | | Homology Medicines, Inc | | | 254 | |
| | 118,653 | | * | | Horizon Pharma plc | | | 2,318 | |
| | 7,873 | | * | | Idera Pharmaceuticals, Inc | | | 22 | |
| | 98,364 | | * | | Illumina, Inc | | | 29,502 | |
| | 8,484 | | * | | Immune Design Corp | | | 11 | |
| | 65,469 | | * | | Immunogen, Inc | | | 314 | |
| | 89,330 | | *,e | | Immunomedics, Inc | | | 1,275 | |
| | 116,540 | | * | | Incyte Corp | | | 7,411 | |
| | 55,553 | | * | | Innoviva, Inc | | | 969 | |
| | 49,160 | | * | | Inovio Pharmaceuticals, Inc | | | 197 | |
| | 45,452 | | * | | Insmed, Inc | | | 596 | |
| | 17,481 | | *,e | | Insys Therapeutics, Inc | | | 61 | |
| | 10,757 | | * | | Intellia Therapeutics, Inc | | | 147 | |
| | 12,921 | | * | | Intercept Pharmaceuticals, Inc | | | 1,302 | |
| | 18,642 | | * | | Intersect ENT, Inc | | | 525 | |
| | 25,348 | | * | | Intra-Cellular Therapies, Inc | | | 289 | |
| | 39,434 | | *,e | | Intrexon Corp | | | 258 | |
| | 27,249 | | * | | Invitae Corp | | | 301 | |
| | 89,084 | | * | | Ionis Pharmaceuticals, Inc | | | 4,816 | |
| | 34,093 | | * | | Iovance Biotherapeutics, Inc | | | 302 | |
| | 105,688 | | * | | IQVIA Holdings, Inc | | | 12,278 | |
COLLEGE RETIREMENT EQUITIES FUND- Equity Index Account
| SHARES | | | | COMPANY | | VALUE
(000) | |
| | 95,014 | | * | | Ironwood Pharmaceuticals, Inc | | $ | 984 | |
| | 40,066 | | * | | Jazz Pharmaceuticals plc | | | 4,967 | |
| | 1,785,129 | | | | Johnson & Johnson | | | 230,371 | |
| | 4,482 | | * | | Jounce Therapeutics, Inc | | | 15 | |
| | 47,099 | | *,e | | Kadmon Holdings, Inc | | | 98 | |
| | 5,857 | | * | | Kala Pharmaceuticals, Inc | | | 29 | |
| | 23,632 | | * | | Karyopharm Therapeutics, Inc | | | 221 | |
| | 15,620 | | * | | Kindred Biosciences Inc | | | 171 | |
| | 10,057 | | * | | Kura Oncology, Inc | | | 141 | |
| | 12,410 | | *,e | | La Jolla Pharmaceutical Co | | | 117 | |
| | 19,506 | | *,e | | Lannett Co, Inc | | | 97 | |
| | 30,110 | | *,e | | Lexicon Pharmaceuticals, Inc | | | 200 | |
| | 14,752 | | * | | Ligand Pharmaceuticals, Inc (Class B) | | | 2,002 | |
| | 17,994 | | * | | Loxo Oncology, Inc | | | 2,520 | |
| | 31,134 | | | | Luminex Corp | | | 720 | |
| | 23,459 | | * | | MacroGenics, Inc | | | 298 | |
| | 3,934 | | *,e | | Madrigal Pharmaceuticals, Inc | | | 443 | |
| | 47,591 | | * | | Mallinckrodt plc | | | 752 | |
| | 94,899 | | *,e | | MannKind Corp | | | 101 | |
| | 24,678 | | *,e | | Marinus Pharmaceuticals, Inc | | | 71 | |
| | 49,764 | | *,e | | Medicines Co | | | 952 | |
| | 22,034 | | *,e | | MediciNova, Inc | | | 180 | |
| | 5,025 | | * | | Medpace Holdings, Inc | | | 266 | |
| | 6,150 | | * | | Melinta Therapeutics, Inc | | | 5 | |
| | 8,441 | | *,e | | Mersana Therapeutics, Inc | | | 34 | |
| | 16,303 | | * | | Mettler-Toledo International, Inc | | | 9,221 | |
| | 18,922 | | * | | Minerva Neurosciences, Inc | | | 128 | |
| | 10,019 | | *,e | | Miragen Therapeutics, Inc | | | 30 | |
| | 12,275 | | * | | Mirati Therapeutics, Inc | | | 521 | |
| | 53,355 | | * | | Momenta Pharmaceuticals, Inc | | | 589 | |
| | 350,312 | | * | | Mylan NV | | | 9,599 | |
| | 20,674 | | * | | MyoKardia, Inc | | | 1,010 | |
| | 46,607 | | * | | Myriad Genetics, Inc | | | 1,355 | |
| | 10,862 | | * | | NanoString Technologies, Inc | | | 161 | |
| | 22,232 | | *,e | | NantKwest, Inc | | | 26 | |
| | 19,889 | | * | | Natera, Inc | | | 278 | |
| | 106,507 | | * | | Nektar Therapeutics | | | 3,501 | |
| | 38,546 | | * | | NeoGenomics, Inc | | | 486 | |
| | 10,102 | | *,e | | Neos Therapeutics, Inc | | | 17 | |
| | 63,342 | | * | | Neurocrine Biosciences, Inc | | | 4,523 | |
| | 14,869 | | *,e | | NewLink Genetics Corp | | | 23 | |
| | 197,987 | | *,e | | Novavax, Inc | | | 364 | |
| | 19,320 | | *,e | | Nymox Pharmaceutical Corp | | | 25 | |
| | 13,115 | | *,e | | Ocular Therapeutix, Inc | | | 52 | |
| | 29,642 | | *,e | | Omeros Corp | | | 330 | |
| | 238,337 | | *,e | | Opko Health, Inc | | | 717 | |
| | 10,903 | | *,e | | Optinose, Inc | | | 68 | |
| | 60,008 | | * | | Organovo Holdings, Inc | | | 57 | |
| | 4,292 | | * | | Ovid therapeutics, Inc | | | 10 | |
| | 55,440 | | * | | Pacific Biosciences of California, Inc | | | 410 | |
| | 28,237 | | * | | Pacira Pharmaceuticals, Inc | | | 1,215 | |
| | 17,330 | | *,e | | Paratek Pharmaceuticals, Inc | | | 89 | |
| | 120,653 | | * | | PDL BioPharma, Inc | | | 350 | |
COLLEGE RETIREMENT EQUITIES FUND- Equity Index Account
| SHARES | | | | COMPANY | | VALUE
(000) | |
| | 73,051 | | | | PerkinElmer, Inc | | $ | 5,738 | |
| | 92,108 | | | | Perrigo Co plc | | | 3,569 | |
| | 3,856,957 | | | | Pfizer, Inc | | | 168,356 | |
| | 12,927 | | | | Phibro Animal Health Corp | | | 416 | |
| | 24,527 | | * | | Pieris Pharmaceuticals, Inc | | | 65 | |
| | 5,876 | | *,e | | PolarityTE, Inc | | | 79 | |
| | 36,240 | | *,e | | Portola Pharmaceuticals, Inc | | | 707 | |
| | 34,913 | | * | | PRA Health Sciences, Inc | | | 3,211 | |
| | 38,233 | | * | | Prestige Brands Holdings, Inc | | | 1,181 | |
| | 51,583 | | * | | Progenics Pharmaceuticals, Inc | | | 217 | |
| | 27,579 | | * | | Prothena Corp plc | | | 284 | |
| | 25,096 | | * | | PTC Therapeutics, Inc | | | 861 | |
| | 20,506 | | *,e | | Puma Biotechnology, Inc | | | 417 | |
| | 149,997 | | * | | QIAGEN NV | | | 5,167 | |
| | 8,205 | | * | | Ra Pharmaceuticals, Inc | | | 149 | |
| | 27,010 | | * | | Radius Health, Inc | | | 445 | |
| | 6,375 | | * | | Reata Pharmaceuticals, Inc | | | 358 | |
| | 8,471 | | * | | Recro Pharma, Inc | | | 60 | |
| | 53,535 | | * | | Regeneron Pharmaceuticals, Inc | | | 19,995 | |
| | 19,715 | | * | | REGENXBIO, Inc | | | 827 | |
| | 24,847 | | * | | Repligen Corp | | | 1,310 | |
| | 25,726 | | * | | Retrophin, Inc | | | 582 | |
| | 15,494 | | * | | Revance Therapeutics, Inc | | | 312 | |
| | 6,147 | | * | | Rhythm Pharmaceuticals, Inc | | | 165 | |
| | 86,450 | | * | | Rigel Pharmaceuticals, Inc | | | 199 | |
| | 14,146 | | *,e | | Rocket Pharmaceuticals, Inc | | | 210 | |
| | 28,996 | | * | | Sage Therapeutics, Inc | | | 2,778 | |
| | 52,234 | | * | | Sangamo Biosciences, Inc | | | 600 | |
| | 42,194 | | * | | Sarepta Therapeutics, Inc | | | 4,605 | |
| | 16,939 | | *,e | | Savara, Inc | | | 128 | |
| | 1,731,153 | | | | Schering-Plough Corp | | | 132,278 | |
| | 70,004 | | * | | Seattle Genetics, Inc | | | 3,966 | |
| | 8,829 | | *,e | | Selecta Biosciences, Inc | | | 23 | |
| | 13,345 | | *,e | | Seres Therapeutics, Inc | | | 60 | |
| | 10,453 | | * | | Sienna Biopharmaceuticals, Inc | | | 24 | |
| | 35,191 | | *,e | | SIGA Technologies, Inc | | | 278 | |
| | 6,168 | | *,e | | Solid Biosciences, Inc | | | 165 | |
| | 58,895 | | *,e | | Sorrento Therapeutics, Inc | | | 141 | |
| | 16,648 | | *,e | | Spark Therapeutics, Inc | | | 652 | |
| | 56,104 | | * | | Spectrum Pharmaceuticals, Inc | | | 491 | |
| | 12,168 | | * | | Stemline Therapeutics, Inc | | | 116 | |
| | 34,621 | | * | | Supernus Pharmaceuticals, Inc | | | 1,150 | |
| | 6,983 | | * | | Syndax Pharmaceuticals, Inc | | | 31 | |
| | 39,474 | | * | | Syneos Health, Inc | | | 1,553 | |
| | 9,466 | | * | | Syros Pharmaceuticals, Inc | | | 53 | |
| | 17,332 | | *,e | | T2 Biosystems, Inc | | | 52 | |
| | 29,885 | | *,e | | Teligent, Inc | | | 41 | |
| | 26,872 | | *,e | | TESARO, Inc | | | 1,995 | |
| | 26,726 | | * | | Tetraphase Pharmaceuticals, Inc | | | 30 | |
| | 34,724 | | *,e | | TG Therapeutics, Inc | | | 142 | |
| | 114,084 | | *,e | | TherapeuticsMD, Inc | | | 435 | |
| | 29,259 | | *,e | | Theravance Biopharma, Inc | | | 749 | |
| | 266,612 | | | | Thermo Fisher Scientific, Inc | | | 59,665 | |
| | 6,159 | | *,e | | Tocagen, Inc | | | 51 | |
COLLEGE RETIREMENT EQUITIES FUND- Equity Index Account
| SHARES | | | | COMPANY | | VALUE
(000) | |
| | 7,799 | | * | | Tricida, Inc | | $ | 184 | |
| | 68,656 | | *,e | | Tyme Technologies, Inc | | | 253 | |
| | 28,669 | | * | | Ultragenyx Pharmaceutical, Inc | | | 1,247 | |
| | 28,234 | | * | | United Therapeutics Corp | | | 3,075 | |
| | 16,428 | | *,e | | UNITY Biotechnology, Inc | | | 267 | |
| | 31,395 | | * | | Vanda Pharmaceuticals, Inc | | | 820 | |
| | 16,367 | | * | | Veracyte, Inc | | | 206 | |
| | 35,826 | | *,e | | Verastem, Inc | | | 120 | |
| | 24,994 | | * | | Vericel Corp | | | 435 | |
| | 171,783 | | * | | Vertex Pharmaceuticals, Inc | | | 28,466 | |
| | 29,514 | | *,e | | Viking Therapeutics, Inc | | | 226 | |
| | 8,673 | | * | | Voyager Therapeutics, Inc | | | 82 | |
| | 52,057 | | * | | Waters Corp | | | 9,821 | |
| | 8,910 | | *,e | | WaVe Life Sciences Pte Ltd | | | 375 | |
| | 27,098 | | * | | Xencor Inc | | | 980 | |
| | 20,380 | | * | | Zafgen, Inc | | | 101 | |
| | 90,754 | | *,e | | ZIOPHARM Oncology, Inc | | | 170 | |
| | 322,732 | | | | Zoetis, Inc | | | 27,606 | |
| | 17,421 | | * | | Zogenix, Inc | | | 635 | |
| | | | | | TOTAL PHARMACEUTICALS, BIOTECHNOLOGY & LIFE SCIENCES | | | 1,425,632 | |
| | | | | | | | | | |
| REAL ESTATE - 3.9% |
| | 60,331 | | | | Acadia Realty Trust | | | 1,433 | |
| | 18,415 | | | | Agree Realty Corp | | | 1,089 | |
| | 47,563 | | | | Alexander & Baldwin, Inc | | | 874 | |
| | 1,329 | | | | Alexander’s, Inc | | | 405 | |
| | 69,354 | | | | Alexandria Real Estate Equities, Inc | | | 7,992 | |
| | 8,343 | | *,e | | Altisource Portfolio Solutions S.A. | | | 188 | |
| | 28,646 | | | | American Assets Trust, Inc | | | 1,151 | |
| | 96,842 | | | | American Campus Communities, Inc | | | 4,008 | |
| | 164,177 | | | | American Homes 4 Rent | | | 3,259 | |
| | 291,872 | | | | American Tower Corp | | | 46,171 | |
| | 56,964 | | | | Americold Realty Trust | | | 1,455 | |
| | 102,548 | | | | Apartment Investment & Management Co (Class A) | | | 4,500 | |
| | 113,878 | | | | Apple Hospitality REIT, Inc | | | 1,624 | |
| | 31,681 | | | | Armada Hoffler Properties, Inc | | | 445 | |
| | 56,474 | | | | Ashford Hospitality Trust, Inc | | | 226 | |
| | 92,922 | | | | AvalonBay Communities, Inc | | | 16,173 | |
| | 16,903 | | | | Bluerock Residential Growth REIT, Inc | | | 152 | |
| | 102,627 | | | | Boston Properties, Inc | | | 11,551 | |
| | 20,771 | | | | BraeMar Hotels & Resorts, Inc | | | 185 | |
| | 121,360 | | | | Brandywine Realty Trust | | | 1,562 | |
| | 218,369 | | | | Brixmor Property Group, Inc | | | 3,208 | |
| | 102,767 | | | | Brookfield Property REIT, Inc | | | 1,655 | |
| | 61,667 | | | | Camden Property Trust | | | 5,430 | |
| | 50,740 | | | | CareTrust REIT, Inc | | | 937 | |
| | 29,192 | | | | CatchMark Timber Trust Inc | | | 207 | |
| | 124,137 | | e | | CBL & Associates Properties, Inc | | | 238 | |
| | 204,711 | | * | | CBRE Group, Inc | | | 8,197 | |
| | 62,949 | | | | Cedar Realty Trust, Inc | | | 198 | |
| | 28,285 | | | | Chatham Lodging Trust | | | 500 | |
| | 40,024 | | | | Chesapeake Lodging Trust | | | 975 | |
| | 21,833 | | | | City Office REIT, Inc | | | 224 | |
COLLEGE RETIREMENT EQUITIES FUND- Equity Index Account
| SHARES | | | | COMPANY | | VALUE
(000) | |
| | 10,462 | | | | Clipper Realty, Inc | | $ | 137 | |
| | 350,580 | | | | Colony Capital, Inc | | | 1,641 | |
| | 83,894 | | | | Columbia Property Trust, Inc | | | 1,623 | |
| | 9,586 | | | | Community Healthcare Trust, Inc | | | 276 | |
| | 3,235 | | | | Consolidated-Tomoka Land Co | | | 170 | |
| | 86,682 | | | | CoreCivic, Inc | | | 1,546 | |
| | 9,299 | | e | | CorEnergy Infrastructure Trust, Inc | | | 308 | |
| | 7,951 | | | | CorePoint Lodging, Inc | | | 97 | |
| | 24,799 | | | | Coresite Realty | | | 2,163 | |
| | 72,219 | | | | Corporate Office Properties Trust | | | 1,519 | |
| | 301,076 | | | | Cousins Properties, Inc | | | 2,378 | |
| | 274,691 | | | | Crown Castle International Corp | | | 29,840 | |
| | 131,589 | | | | CubeSmart | | | 3,775 | |
| | 30,361 | | * | | Cushman & Wakefield plc | | | 439 | |
| | 62,800 | | | | CyrusOne, Inc | | | 3,321 | |
| | 144,818 | | | | DiamondRock Hospitality Co | | | 1,315 | |
| | 140,314 | | | | Digital Realty Trust, Inc | | | 14,950 | |
| | 102,445 | | | | Douglas Emmett, Inc | | | 3,496 | |
| | 236,841 | | | | Duke Realty Corp | | | 6,134 | |
| | 26,096 | | | | Easterly Government Properties, Inc | | | 409 | |
| | 23,492 | | | | EastGroup Properties, Inc | | | 2,155 | |
| | 87,790 | | | | Empire State Realty Trust, Inc | | | 1,249 | |
| | 45,571 | | | | Entertainment Properties Trust | | | 2,918 | |
| | 53,440 | | | | Equinix, Inc | | | 18,841 | |
| | 80,064 | | | | Equity Commonwealth | | | 2,403 | |
| | 56,851 | | | | Equity Lifestyle Properties, Inc | | | 5,522 | |
| | 240,533 | | | | Equity Residential | | | 15,878 | |
| | 23,787 | | | | Essential Properties Realty Trust, Inc | | | 329 | |
| | 44,504 | | | | Essex Property Trust, Inc | | | 10,913 | |
| | 82,938 | | | | Extra Space Storage, Inc | | | 7,504 | |
| | 19,962 | | | | Farmland Partners, Inc | | | 91 | |
| | 48,378 | | | | Federal Realty Investment Trust | | | 5,711 | |
| | 80,676 | | | | First Industrial Realty Trust, Inc | | | 2,328 | |
| | 425 | | *,e | | Forestar Group, Inc | | | 6 | |
| | 44,705 | | | | Four Corners Property Trust, Inc | | | 1,171 | |
| | 72,511 | | | | Franklin Street Properties Corp | | | 452 | |
| | 37,147 | | | | Front Yard Residential Corp | | | 324 | |
| | 4,942 | | * | | FRP Holdings, Inc | | | 227 | |
| | 124,798 | | | | Gaming and Leisure Properties, Inc | | | 4,032 | |
| | 87,896 | | | | Geo Group, Inc | | | 1,732 | |
| | 18,198 | | | | Getty Realty Corp | | | 535 | |
| | 17,811 | | | | Gladstone Commercial Corp | | | 319 | |
| | 10,990 | | | | Global Medical REIT, Inc | | | 98 | |
| | 44,961 | | | | Global Net Lease, Inc | | | 792 | |
| | 51,670 | | *,e | | Government Properties Income Trust | | | 355 | |
| | 35,286 | | | | Hannon Armstrong Sustainable Infrastructure Capital, Inc | | | 672 | |
| | 322,762 | | | | HCP, Inc | | | 9,015 | |
| | 82,789 | | | | Healthcare Realty Trust, Inc | | | 2,354 | |
| | 142,087 | | | | Healthcare Trust of America, Inc | | | 3,596 | |
| | 27,708 | | | | Hersha Hospitality Trust | | | 486 | |
| | 14,600 | | | | HFF, Inc (Class A) | | | 484 | |
| | 71,000 | | | | Highwoods Properties, Inc | | | 2,747 | |
| | 94,726 | | | | Hospitality Properties Trust | | | 2,262 | |
| | 476,733 | | | | Host Marriott Corp | | | 7,947 | |
COLLEGE RETIREMENT EQUITIES FUND- Equity Index Account
| SHARES | | | | COMPANY | | VALUE
(000) | |
| | 24,727 | | * | | Howard Hughes Corp | | $ | 2,414 | |
| | 113,109 | | | | Hudson Pacific Properties | | | 3,287 | |
| | 48,914 | | | | Independence Realty Trust, Inc | | | 449 | |
| | 34,891 | | e | | Industrial Logistics Properties Trust | | | 686 | |
| | 4,353 | | e | | Innovative Industrial Properties, Inc | | | 198 | |
| | 9,061 | | | | Investors Real Estate Trust | | | 445 | |
| | 207,077 | | | | Invitation Homes, Inc | | | 4,158 | |
| | 190,342 | | | | Iron Mountain, Inc | | | 6,169 | |
| | 49,646 | | | | iStar Financial, Inc | | | 455 | |
| | 62,519 | | | | JBG SMITH Properties | | | 2,176 | |
| | 6,203 | | | | Jernigan Capital, Inc | | | 123 | |
| | 28,591 | | | | Jones Lang LaSalle, Inc | | | 3,620 | |
| | 84,885 | | | | Kennedy-Wilson Holdings, Inc | | | 1,542 | |
| | 61,892 | | | | Kilroy Realty Corp | | | 3,892 | |
| | 269,965 | | | | Kimco Realty Corp | | | 3,955 | |
| | 55,102 | | | | Kite Realty Group Trust | | | 776 | |
| | 51,720 | | | | Lamar Advertising Co | | | 3,578 | |
| | 144,484 | | | | Lexington Realty Trust | | | 1,186 | |
| | 90,704 | | | | Liberty Property Trust | | | 3,799 | |
| | 31,791 | | | | Life Storage, Inc | | | 2,956 | |
| | 26,668 | | | | LTC Properties, Inc | | | 1,112 | |
| | 92,755 | | | | Macerich Co | | | 4,014 | |
| | 65,387 | | | | Mack-Cali Realty Corp | | | 1,281 | |
| | 11,498 | | * | | Marcus & Millichap, Inc | | | 395 | |
| | 4,532 | | * | | Maui Land & Pineapple Co, Inc | | | 45 | |
| | 20,532 | | | | MedEquities Realty Trust, Inc | | | 140 | |
| | 217,243 | | | | Medical Properties Trust, Inc | | | 3,493 | |
| | 77,362 | | | | Mid-America Apartment Communities, Inc | | | 7,404 | |
| | 50,307 | | | | Monmouth Real Estate Investment Corp (Class A) | | | 624 | |
| | 26,990 | | | | National Health Investors, Inc | | | 2,039 | |
| | 96,956 | | | | National Retail Properties, Inc | | | 4,703 | |
| | 31,451 | | | | National Storage Affiliates Trust | | | 832 | |
| | 55,714 | | | | New Senior Investment Group, Inc | | | 230 | |
| | 93,396 | | | | Newmark Group, Inc | | | 749 | |
| | 12,730 | | | | NexPoint Residential Trust, Inc | | | 446 | |
| | 42,262 | | | | NorthStar Realty Europe Corp | | | 614 | |
| | 139,485 | | | | Omega Healthcare Investors, Inc | | | 4,903 | |
| | 9,027 | | | | One Liberty Properties, Inc | | | 219 | |
| | 97,077 | | | | Outfront Media, Inc | | | 1,759 | |
| | 141,733 | | | | Paramount Group, Inc | | | 1,780 | |
| | 136,729 | | | | Park Hotels & Resorts, Inc | | | 3,552 | |
| | 85,851 | | | | Pebblebrook Hotel Trust | | | 2,430 | |
| | 52,388 | | e | | Pennsylvania REIT | | | 311 | |
| | 107,460 | | | | Physicians Realty Trust | | | 1,723 | |
| | 100,383 | | | | Piedmont Office Realty Trust, Inc | | | 1,711 | |
| | 47,001 | | | | Potlatch Corp | | | 1,487 | |
| | 21,687 | | | | Preferred Apartment Communities, Inc | | | 305 | |
| | 413,024 | | | | Prologis, Inc | | | 24,253 | |
| | 13,748 | | | | PS Business Parks, Inc | | | 1,801 | |
| | 98,424 | | | | Public Storage, Inc | | | 19,922 | |
| | 34,553 | | | | QTS Realty Trust, Inc | | | 1,280 | |
| | 89,792 | | | | Rayonier, Inc | | | 2,486 | |
| | 13,117 | | | | Re/Max Holdings, Inc | | | 403 | |
COLLEGE RETIREMENT EQUITIES FUND- Equity Index Account
| SHARES | | | | COMPANY | | VALUE
(000) | |
| | 75,694 | | e | | Realogy Holdings Corp | | $ | 1,111 | |
| | 196,087 | | | | Realty Income Corp | | | 12,361 | |
| | 40,113 | | *,e | | Redfin Corp | | | 578 | |
| | 100,880 | | | | Regency Centers Corp | | | 5,920 | |
| | 78,162 | | | | Retail Opportunities Investment Corp | | | 1,241 | |
| | 173,060 | | | | Retail Properties of America, Inc | | | 1,878 | |
| | 10,376 | | * | | Retail Value, Inc | | | 266 | |
| | 48,113 | | | | Rexford Industrial Realty, Inc | | | 1,418 | |
| | 124,274 | | | | RLJ Lodging Trust | | | 2,038 | |
| | 5,123 | | | | RMR Group, Inc | | | 272 | |
| | 57,913 | | | | RPT Realty | | | 692 | |
| | 31,992 | | | | Ryman Hospitality Properties | | | 2,134 | |
| | 116,469 | | | | Sabra Healthcare REIT, Inc | | | 1,919 | |
| | 7,521 | | | | Safety Income and Growth, Inc | | | 141 | |
| | 6,451 | | | | Saul Centers, Inc | | | 305 | |
| | 75,338 | | * | | SBA Communications Corp | | | 12,196 | |
| | 41,385 | | | | Select Income REIT | | | 305 | |
| | 136,618 | | | | Senior Housing Properties Trust | | | 1,601 | |
| | 18,501 | | e | | Seritage Growth Properties | | | 598 | |
| | 207,069 | | | | Simon Property Group, Inc | | | 34,786 | |
| | 103,764 | | | | SITE Centers Corp | | | 1,149 | |
| | 58,281 | | | | SL Green Realty Corp | | | 4,609 | |
| | 28,096 | | | | Spirit MTA REIT | | | 200 | |
| | 56,193 | | | | Spirit Realty Capital, Inc | | | 1,981 | |
| | 33,773 | | * | | St. Joe Co | | | 445 | |
| | 64,412 | | | | STAG Industrial, Inc | | | 1,603 | |
| | 178,120 | | | | Starwood Property Trust, Inc | | | 3,511 | |
| | 121,165 | | | | STORE Capital Corp | | | 3,430 | |
| | 4,495 | | * | | Stratus Properties, Inc | | | 108 | |
| | 73,018 | | | | Summit Hotel Properties, Inc | | | 710 | |
| | 52,001 | | | | Sun Communities, Inc | | | 5,289 | |
| | 159,024 | | | | Sunstone Hotel Investors, Inc | | | 2,069 | |
| | 67,688 | | e | | Tanger Factory Outlet Centers, Inc | | | 1,369 | |
| | 41,435 | | | | Taubman Centers, Inc | | | 1,885 | |
| | 12,164 | | * | | Tejon Ranch Co | | | 202 | |
| | 35,329 | | | | Terreno Realty Corp | | | 1,242 | |
| | 34,663 | | | | Tier REIT, Inc | | | 715 | |
| | 13,643 | | * | | Trinity Place Holdings, Inc | | | 59 | |
| | 175,727 | | | | UDR, Inc | | | 6,962 | |
| | 20,169 | | | | UMH Properties, Inc | | | 239 | |
| | 119,952 | | | | Uniti Group, Inc | | | 1,868 | |
| | 9,264 | | | | Universal Health Realty Income Trust | | | 569 | |
| | 70,770 | | | | Urban Edge Properties | | | 1,176 | |
| | 20,808 | | | | Urstadt Biddle Properties, Inc (Class A) | | | 400 | |
| | 236,538 | | | | Ventas, Inc | | | 13,859 | |
| | 661,427 | | | | VEREIT, Inc | | | 4,729 | |
| | 266,224 | | | | VICI Properties, Inc | | | 5,000 | |
| | 117,610 | | | | Vornado Realty Trust | | | 7,295 | |
| | 134,922 | | | | Washington Prime Group, Inc | | | 656 | |
| | 53,425 | | | | Washington REIT | | | 1,229 | |
| | 67,227 | | | | Weingarten Realty Investors | | | 1,668 | |
| | 247,346 | | | | Welltower, Inc | | | 17,168 | |
| | 508,966 | | | | Weyerhaeuser Co | | | 11,126 | |
| | 25,132 | | | | Whitestone REIT | | | 308 | |
COLLEGE RETIREMENT EQUITIES FUND- Equity Index Account
| SHARES | | | | COMPANY | | VALUE
(000) | |
| | 105,594 | | | | WP Carey, Inc | | $ | 6,899 | |
| | 79,064 | | | | Xenia Hotels & Resorts, Inc | | | 1,360 | |
| | | | | | TOTAL REAL ESTATE | | | 656,354 | |
| | | | | | | | | | |
| RETAILING - 5.9% |
| | 18,290 | | * | | 1-800-FLOWERS.COM, Inc (Class A) | | | 224 | |
| | 45,849 | | | | Aaron’s, Inc | | | 1,928 | |
| | 51,631 | | | | Abercrombie & Fitch Co (Class A) | | | 1,035 | |
| | 46,868 | | | | Advance Auto Parts, Inc | | | 7,380 | |
| | 270,555 | | * | | Amazon.com, Inc | | | 406,366 | |
| | 117,400 | | | | American Eagle Outfitters, Inc | | | 2,269 | |
| | 5,481 | | * | | America’s Car-Mart, Inc | | | 397 | |
| | 13,496 | | * | | Asbury Automotive Group, Inc | | | 900 | |
| | 117,039 | | * | | Ascena Retail Group, Inc | | | 294 | |
| | 17,984 | | *,e | | At Home Group, Inc | | | 336 | |
| | 36,032 | | * | | Autonation, Inc | | | 1,286 | |
| | 16,925 | | * | | AutoZone, Inc | | | 14,189 | |
| | 29,015 | | * | | Barnes & Noble Education, Inc | | | 116 | |
| | 40,294 | | | | Barnes & Noble, Inc | | | 286 | |
| | 76,045 | | e | | Bed Bath & Beyond, Inc | | | 861 | |
| | 156,505 | | | | Best Buy Co, Inc | | | 8,288 | |
| | 14,390 | | e | | Big 5 Sporting Goods Corp | | | 37 | |
| | 20,052 | | | | Big Lots, Inc | | | 580 | |
| | 29,091 | | * | | BJ’s Wholesale Club Holdings, Inc | | | 645 | |
| | 31,613 | | * | | Booking Holdings, Inc | | | 54,451 | |
| | 9,762 | | * | | Boot Barn Holdings, Inc | | | 166 | |
| | 14,004 | | e | | Buckle, Inc | | | 271 | |
| | 44,520 | | * | | Burlington Stores, Inc | | | 7,242 | |
| | 28,267 | | | | Caleres, Inc | | | 787 | |
| | 22,123 | | e | | Camping World Holdings, Inc | | | 254 | |
| | 121,162 | | * | | CarMax, Inc | | | 7,600 | |
| | 21,643 | | *,e | | Carvana Co | | | 708 | |
| | 12,003 | | | | Cato Corp (Class A) | | | 171 | |
| | 83,036 | | | | Chico’s FAS, Inc | | | 467 | |
| | 12,596 | | | | Children’s Place Retail Stores, Inc | | | 1,135 | |
| | 11,556 | | | | Citi Trends, Inc | | | 236 | |
| | 13,169 | | * | | Conn’s, Inc | | | 248 | |
| | 11,400 | | * | | Container Store Group, Inc | | | 54 | |
| | 33,096 | | | | Core-Mark Holding Co, Inc | | | 769 | |
| | 52,804 | | | | Dick’s Sporting Goods, Inc | | | 1,647 | |
| | 3,340 | | e | | Dillard’s, Inc (Class A) | | | 201 | |
| | 176,699 | | | | Dollar General Corp | | | 19,098 | |
| | 154,566 | | * | | Dollar Tree, Inc | | | 13,960 | |
| | 49,292 | | | | DSW, Inc (Class A) | | | 1,217 | |
| | 7,236 | | *,e | | Duluth Holdings, Inc | | | 183 | |
| | 602,252 | | * | | eBay, Inc | | | 16,905 | |
| | 83,578 | | * | | Etsy, Inc | | | 3,976 | |
| | 79,113 | | | | Expedia, Inc | | | 8,912 | |
| | 55,323 | | * | | Express Parent LLC | | | 283 | |
| | 34,498 | | * | | Five Below, Inc | | | 3,530 | |
| | 20,355 | | *,e | | Floor & Decor Holdings, Inc | | | 527 | |
| | 71,401 | | | | Foot Locker, Inc | | | 3,798 | |
| | 6,584 | | *,e | | Gaia, Inc | | | 68 | |
COLLEGE RETIREMENT EQUITIES FUND- Equity Index Account
| SHARES | | | | COMPANY | | VALUE
(000) | |
| | 67,461 | | e | | GameStop Corp (Class A) | | $ | 851 | |
| | 152,120 | | | | Gap, Inc | | | 3,919 | |
| | 13,677 | | * | | Genesco, Inc | | | 606 | |
| | 91,234 | | | | Genuine Parts Co | | | 8,760 | |
| | 50,651 | | *,e | | GNC Holdings, Inc | | | 120 | |
| | 5,257 | | | | Group 1 Automotive, Inc | | | 277 | |
| | 244,899 | | * | | Groupon, Inc | | | 784 | |
| | 60,011 | | * | | GrubHub, Inc | | | 4,609 | |
| | 44,451 | | | | Guess?, Inc | | | 923 | |
| | 13,840 | | | | Haverty Furniture Cos, Inc | | | 260 | |
| | 16,994 | | * | | Hibbett Sports, Inc | | | 243 | |
| | 766,292 | | | | Home Depot, Inc | | | 131,664 | |
| | 27,375 | | * | | Hudson Ltd | | | 469 | |
| | 8,070 | | * | | J. Jill, Inc | | | 43 | |
| | 228,517 | | *,e | | JC Penney Co, Inc | | | 238 | |
| | 12,718 | | * | | Kirkland’s, Inc | | | 121 | |
| | 114,318 | | | | Kohl’s Corp | | | 7,584 | |
| | 139,756 | | | | L Brands, Inc | | | 3,588 | |
| | 9,431 | | *,e | | Lands’ End, Inc | | | 134 | |
| | 9,177 | | * | | Leaf Group Ltd | | | 63 | |
| | 39,468 | | * | | Liberty Expedia Holdings, Inc | | | 1,544 | |
| | 19,090 | | * | | Liquidity Services, Inc | | | 118 | |
| | 10,868 | | e | | Lithia Motors, Inc (Class A) | | | 830 | |
| | 193,627 | | * | | LKQ Corp | | | 4,595 | |
| | 544,462 | | | | Lowe’s Companies, Inc | | | 50,286 | |
| | 19,294 | | *,e | | Lumber Liquidators, Inc | | | 184 | |
| | 199,770 | | | | Macy’s, Inc | | | 5,949 | |
| | 18,578 | | * | | MarineMax, Inc | | | 340 | |
| | 61,561 | | * | | Michaels Cos, Inc | | | 833 | |
| | 23,604 | | | | Monro Muffler, Inc | | | 1,623 | |
| | 16,896 | | * | | Murphy USA, Inc | | | 1,295 | |
| | 32,478 | | * | | National Vision Holdings, Inc | | | 915 | |
| | 84,693 | | | | Nordstrom, Inc | | | 3,948 | |
| | 21,359 | | | | Nutri/System, Inc | | | 937 | |
| | 375,116 | | | | Office Depot, Inc | | | 968 | |
| | 34,400 | | * | | Ollie’s Bargain Outlet Holdings, Inc | | | 2,288 | |
| | 52,920 | | * | | O’Reilly Automotive, Inc | | | 18,222 | |
| | 12,199 | | *,e | | Overstock.com, Inc | | | 166 | |
| | 17,507 | | * | | Party City Holdco, Inc | | | 175 | |
| | 24,110 | | | | Penske Auto Group, Inc | | | 972 | |
| | 14,105 | | e | | PetMed Express, Inc | | | 328 | |
| | 24,507 | | | | Pool Corp | | | 3,643 | |
| | 53,361 | | * | | Quotient Technology, Inc | | | 570 | |
| | 260,506 | | * | | Qurate Retail Group, Inc QVC Group | | | 5,085 | |
| | 30,873 | | * | | Rent-A-Center, Inc | | | 500 | |
| | 10,459 | | * | | RH | | | 1,253 | |
| | 246,832 | | | | Ross Stores, Inc | | | 20,536 | |
| | 66,571 | | * | | Sally Beauty Holdings, Inc | | | 1,135 | |
| | 2,356 | | | | Shoe Carnival, Inc | | | 79 | |
| | 18,402 | | * | | Shutterfly, Inc | | | 741 | |
| | 13,499 | | | | Shutterstock, Inc | | | 486 | |
| | 38,798 | | | | Signet Jewelers Ltd | | | 1,233 | |
| | 29,918 | | * | | Sleep Number Corp | | | 949 | |
| | 20,728 | | | | Sonic Automotive, Inc (Class A) | | | 285 | |
COLLEGE RETIREMENT EQUITIES FUND- Equity Index Account
| SHARES | | | | COMPANY | | VALUE
(000) | |
| | 19,952 | | *,e | | Sportsman’s Warehouse Holdings, Inc | | $ | 87 | |
| | 11,437 | | * | | Stamps.com, Inc | | | 1,780 | |
| | 26,598 | | | | Tailored Brands, Inc | | | 363 | |
| | 350,250 | | | | Target Corp | | | 23,148 | |
| | 84,372 | | | | Tiffany & Co | | | 6,793 | |
| | 24,339 | | | | Tile Shop Holdings, Inc | | | 133 | |
| | 6,790 | | | | Tilly’s, Inc | | | 74 | |
| | 823,149 | | | | TJX Companies, Inc | | | 36,828 | |
| | 81,030 | | | | Tractor Supply Co | | | 6,761 | |
| | 37,822 | | * | | Ulta Beauty, Inc | | | 9,260 | |
| | 50,352 | | * | | Urban Outfitters, Inc | | | 1,672 | |
| | 38,206 | | * | | Wayfair, Inc | | | 3,442 | |
| | 5,214 | | | | Weyco Group, Inc | | | 152 | |
| | 56,628 | | e | | Williams-Sonoma, Inc | | | 2,857 | |
| | 1,945 | | | | Winmark Corp | | | 309 | |
| | 11,661 | | * | | Zumiez, Inc | | | 224 | |
| | | | | | TOTAL RETAILING | | | 988,431 | |
| | | | | | | | | | |
| SEMICONDUCTORS & SEMICONDUCTOR EQUIPMENT - 3.5% |
| | 13,345 | | * | | Acacia Communications, Inc | | | 507 | |
| | 26,575 | | * | | Advanced Energy Industries, Inc | | | 1,141 | |
| | 595,455 | | *,e | | Advanced Micro Devices, Inc | | | 10,992 | |
| | 15,539 | | * | | Alpha & Omega Semiconductor Ltd | | | 158 | |
| | 23,188 | | *,e | | Ambarella, Inc | | | 811 | |
| | 73,241 | | * | | Amkor Technology, Inc | | | 480 | |
| | 241,286 | | | | Analog Devices, Inc | | | 20,710 | |
| | 661,823 | | | | Applied Materials, Inc | | | 21,668 | |
| | 14,361 | | * | | Aquantia Corp | | | 126 | |
| | 20,849 | | * | | Axcelis Technologies, Inc | | | 371 | |
| | 26,991 | | * | | AXT, Inc | | | 117 | |
| | 273,898 | | | | Broadcom, Inc | | | 69,647 | |
| | 49,923 | | | | Brooks Automation, Inc | | | 1,307 | |
| | 18,819 | | | | Cabot Microelectronics Corp | | | 1,794 | |
| | 15,710 | | * | | Ceva, Inc | | | 347 | |
| | 46,452 | | * | | Cirrus Logic, Inc | | | 1,541 | |
| | 26,675 | | | | Cohu, Inc | | | 429 | |
| | 70,502 | | * | | Cree, Inc | | | 3,016 | |
| | 236,910 | | | | Cypress Semiconductor Corp | | | 3,013 | |
| | 28,713 | | * | | Diodes, Inc | | | 926 | |
| | 86,577 | | | | Entegris, Inc | | | 2,415 | |
| | 49,996 | | * | | First Solar, Inc | | | 2,123 | |
| | 51,293 | | * | | Formfactor, Inc | | | 723 | |
| | 8,421 | | *,e | | Ichor Holdings Ltd | | | 137 | |
| | 13,074 | | * | | Impinj, Inc | | | 190 | |
| | 29,376 | | *,e | | Inphi Corp | | | 944 | |
| | 80,334 | | * | | Integrated Device Technology, Inc | | | 3,891 | |
| | 3,039,128 | | | | Intel Corp | | | 142,626 | |
| | 102,948 | | | | Kla-Tencor Corp | | | 9,213 | |
| | 50,517 | | * | | Kopin Corp | | | 50 | |
| | 103,432 | | | | Lam Research Corp | | | 14,084 | |
| | 75,431 | | * | | Lattice Semiconductor Corp | | | 522 | |
| | 29,103 | | *,e | | MA-COM Technology Solutions | | | 422 | |
| | 372,735 | | | | Marvell Technology Group Ltd | | | 6,035 | |
COLLEGE RETIREMENT EQUITIES FUND- Equity Index Account
| SHARES | | | | COMPANY | | VALUE
(000) | |
| | 183,040 | | | | Maxim Integrated Products, Inc | | $ | 9,308 | |
| | 43,500 | | * | | MaxLinear, Inc | | | 766 | |
| | 154,628 | | e | | Microchip Technology, Inc | | | 11,121 | |
| | 752,643 | | * | | Micron Technology, Inc | | | 23,881 | |
| | 31,711 | | | | MKS Instruments, Inc | | | 2,049 | |
| | 28,750 | | | | Monolithic Power Systems, Inc | | | 3,342 | |
| | 18,167 | | * | | Nanometrics, Inc | | | 496 | |
| | 21,168 | | *,e | | NeoPhotonics Corp Ltd | | | 137 | |
| | 3,184 | | | | NVE Corp | | | 279 | |
| | 387,610 | | | | NVIDIA Corp | | | 51,746 | |
| | 230,556 | | | | NXP Semiconductors NV | | | 16,895 | |
| | 279,225 | | * | | ON Semiconductor Corp | | | 4,610 | |
| | 20,605 | | * | | PDF Solutions, Inc | | | 174 | |
| | 46,544 | | * | | Photronics, Inc | | | 451 | |
| | 20,135 | | | | Power Integrations, Inc | | | 1,228 | |
| | 83,066 | | * | | Qorvo, Inc | | | 5,045 | |
| | 806,201 | | | | QUALCOMM, Inc | | | 45,881 | |
| | 79,664 | | * | | Rambus, Inc | | | 611 | |
| | 22,659 | | * | | Rudolph Technologies, Inc | | | 464 | |
| | 47,350 | | * | | Semtech Corp | | | 2,172 | |
| | 28,958 | | * | | Silicon Laboratories, Inc | | | 2,282 | |
| | 116,443 | | | | Skyworks Solutions, Inc | | | 7,804 | |
| | 2,025 | | *,e | | SMART Global Holdings, Inc | | | 60 | |
| | 42,585 | | *,e | | SunPower Corp | | | 212 | |
| | 130,395 | | | | Teradyne, Inc | | | 4,092 | |
| | 639,303 | | | | Texas Instruments, Inc | | | 60,414 | |
| | 23,500 | | *,e | | Ultra Clean Holdings | | | 199 | |
| | 27,466 | | e | | Universal Display Corp | | | 2,570 | |
| | 34,384 | | * | | Veeco Instruments, Inc | | | 255 | |
| | 77,993 | | | | Versum Materials, Inc | | | 2,162 | |
| | 172,027 | | | | Xilinx, Inc | | | 14,651 | |
| | 35,485 | | | | Xperi Corp | | | 653 | |
| | | | | | TOTAL SEMICONDUCTORS & SEMICONDUCTOR EQUIPMENT | | | 598,486 | |
| | | | | | | | | | |
| SOFTWARE & SERVICES - 10.9% |
| | 36,774 | | * | | 2U, Inc | | | 1,828 | |
| | 65,506 | | * | | 8x8, Inc | | | 1,182 | |
| | 32,215 | | * | | A10 Networks, Inc | | | 201 | |
| | 426,678 | | | | Accenture plc | | | 60,166 | |
| | 86,241 | | * | | ACI Worldwide, Inc | | | 2,386 | |
| | 327,971 | | * | | Adobe, Inc | | | 74,200 | |
| | 111,077 | | * | | Akamai Technologies, Inc | | | 6,785 | |
| | 14,717 | | * | | Alarm.com Holdings, Inc | | | 763 | |
| | 32,517 | | | | Alliance Data Systems Corp | | | 4,880 | |
| | 16,908 | | * | | Altair Engineering, Inc | | | 466 | |
| | 18,942 | | *,e | | Alteryx, Inc | | | 1,127 | |
| | 11,882 | | * | | Amber Road, Inc | | | 98 | |
| | 95,104 | | | | Amdocs Ltd | | | 5,571 | |
| | 15,720 | | | | American Software, Inc (Class A) | | | 164 | |
| | 11,882 | | *,e | | Anaplan, Inc | | | 315 | |
| | 54,342 | | * | | Ansys, Inc | | | 7,768 | |
| | 5,867 | | * | | Appfolio, Inc | | | 347 | |
| | 12,607 | | * | | Apptio, Inc | | | 479 | |
| | 48,798 | | * | | Aspen Technology, Inc | | | 4,010 | |
COLLEGE RETIREMENT EQUITIES FUND- Equity Index Account
| SHARES | | | | COMPANY | | VALUE
(000) | |
| | 64,859 | | * | | Atlassian Corp plc | | $ | 5,771 | |
| | 145,747 | | * | | Autodesk, Inc | | | 18,745 | |
| | 292,429 | | | | Automatic Data Processing, Inc | | | 38,343 | |
| | 5,821 | | *,e | | Avalara, Inc | | | 181 | |
| | 70,813 | | * | | Avaya Holdings Corp | | | 1,031 | |
| | 11,374 | | * | | Benefitfocus, Inc | | | 520 | |
| | 96,845 | | * | | Black Knight, Inc | | | 4,364 | |
| | 34,044 | | | | Blackbaud, Inc | | | 2,141 | |
| | 21,965 | | * | | Blackline, Inc | | | 899 | |
| | 96,676 | | | | Booz Allen Hamilton Holding Co | | | 4,357 | |
| | 29,562 | | * | | Bottomline Technologies, Inc | | | 1,419 | |
| | 86,219 | | * | | Box, Inc | | | 1,455 | |
| | 20,694 | | * | | Brightcove, Inc | | | 146 | |
| | 77,769 | | | | Broadridge Financial Solutions, Inc | | | 7,485 | |
| | 17,838 | | * | | CACI International, Inc (Class A) | | | 2,569 | |
| | 184,754 | | * | | Cadence Design Systems, Inc | | | 8,033 | |
| | 5,472 | | *,e | | Carbon Black, Inc | | | 73 | |
| | 18,030 | | * | | Carbonite, Inc | | | 455 | |
| | 33,955 | | * | | Cardtronics plc | | | 883 | |
| | 10,596 | | | | Cass Information Systems, Inc | | | 561 | |
| | 88,343 | | | | CDK Global, Inc | | | 4,230 | |
| | 16,103 | | *,e | | Ceridian HCM Holding, Inc | | | 555 | |
| | 15,814 | | * | | ChannelAdvisor Corp | | | 180 | |
| | 26,536 | | * | | Cision Ltd | | | 310 | |
| | 86,913 | | | | Citrix Systems, Inc | | | 8,905 | |
| | 68,978 | | * | | Cloudera, Inc | | | 763 | |
| | 386,372 | | | | Cognizant Technology Solutions Corp (Class A) | | | 24,527 | |
| | 28,135 | | * | | Commvault Systems, Inc | | | 1,663 | |
| | 137,713 | | * | | Conduent, Inc | | | 1,464 | |
| | 16,758 | | | | ConvergeOne Holdings, Inc | | | 207 | |
| | 37,259 | | * | | Cornerstone OnDemand, Inc | | | 1,879 | |
| | 36,045 | | * | | Coupa Software, Inc | | | 2,266 | |
| | 24,883 | | | | CSG Systems International, Inc | | | 791 | |
| | 7,264 | | *,e | | Digimarc Corp | | | 105 | |
| | 48,819 | | * | | DocuSign, Inc | | | 1,957 | |
| | 184,894 | | | | DXC Technology Co | | | 9,831 | |
| | 17,480 | | e | | Ebix, Inc | | | 744 | |
| | 5,367 | | * | | Elastic NV | | | 384 | |
| | 24,127 | | *,e | | Ellie Mae, Inc | | | 1,516 | |
| | 43,380 | | * | | Endurance International Group Holdings, Inc | | | 289 | |
| | 30,234 | | * | | Envestnet, Inc | | | 1,487 | |
| | 34,220 | | * | | EPAM Systems, Inc | | | 3,970 | |
| | 35,298 | | * | | Euronet Worldwide, Inc | | | 3,614 | |
| | 12,571 | | * | | Everbridge, Inc | | | 714 | |
| | 45,885 | | * | | Everi Holdings, Inc | | | 236 | |
| | 44,094 | | | | EVERTEC, Inc | | | 1,266 | |
| | 10,859 | | * | | Evo Payments, Inc | | | 268 | |
| | 32,121 | | * | | Exela Technologies, Inc | | | 125 | |
| | 21,916 | | * | | ExlService Holdings, Inc | | | 1,153 | |
| | 20,028 | | * | | Fair Isaac Corp | | | 3,745 | |
| | 215,206 | | | | Fidelity National Information Services, Inc | | | 22,069 | |
| | 127,712 | | * | | FireEye, Inc | | | 2,070 | |
| | 48,580 | | * | | First American Corp | | | 1,624 | |
COLLEGE RETIREMENT EQUITIES FUND- Equity Index Account
| SHARES | | | | COMPANY | | VALUE
(000) | |
| | 365,874 | | * | | First Data Corp | | $ | 6,187 | |
| | 264,758 | | * | | Fiserv, Inc | | | 19,457 | |
| | 37,675 | | * | | Five9, Inc | | | 1,647 | |
| | 57,718 | | * | | FleetCor Technologies, Inc | | | 10,719 | |
| | 19,555 | | * | | ForeScout Technologies, Inc | | | 508 | |
| | 92,111 | | * | | Fortinet, Inc | | | 6,487 | |
| | 58,348 | | * | | Gartner, Inc | | | 7,459 | |
| | 97,664 | | | | Genpact Ltd | | | 2,636 | |
| | 103,518 | | | | Global Payments, Inc | | | 10,676 | |
| | 102,041 | | * | | GoDaddy, Inc | | | 6,696 | |
| | 22,127 | | *,e | | GTT Communications, Inc | | | 524 | |
| | 52,363 | | * | | Guidewire Software, Inc | | | 4,201 | |
| | 17,956 | | | | Hackett Group, Inc | | | 287 | |
| | 34,799 | | * | | Hortonworks, Inc | | | 502 | |
| | 24,272 | | * | | HubSpot, Inc | | | 3,052 | |
| | 24,295 | | * | | Imperva, Inc | | | 1,353 | |
| | 24,668 | | * | | Information Services Group, Inc | | | 105 | |
| | 15,324 | | *,e | | Instructure, Inc | | | 575 | |
| | 14,801 | | *,e | | Internap Corp | | | 61 | |
| | 610,395 | | | | International Business Machines Corp | | | 69,384 | |
| | 162,573 | | | | Intuit, Inc | | | 32,003 | |
| | 33,493 | | | | j2 Global, Inc | | | 2,324 | |
| | 51,199 | | | | Jack Henry & Associates, Inc | | | 6,478 | |
| | 92,643 | | | | Leidos Holdings, Inc | | | 4,884 | |
| | 50,961 | | * | | Limelight Networks, Inc | | | 119 | |
| | 40,701 | | * | | Liveperson, Inc | | | 768 | |
| | 57,158 | | *,e | | LiveRamp Holdings, Inc | | | 2,208 | |
| | 36,974 | | | | LogMeIn, Inc | | | 3,016 | |
| | 48,035 | | * | | Manhattan Associates, Inc | | | 2,035 | |
| | 18,418 | | | | Mantech International Corp (Class A) | | | 963 | |
| | 611,625 | | | | MasterCard, Inc (Class A) | | | 115,383 | |
| | 44,595 | | | | MAXIMUS, Inc | | | 2,903 | |
| | 5,041,476 | | | | Microsoft Corp | | | 512,063 | |
| | 6,844 | | * | | MicroStrategy, Inc (Class A) | | | 874 | |
| | 26,600 | | * | | MINDBODY, Inc | | | 968 | |
| | 22,456 | | * | | Mitek Systems, Inc | | | 243 | |
| | 40,466 | | * | | MobileIron, Inc | | | 186 | |
| | 14,483 | | * | | Model N, Inc | | | 192 | |
| | 22,389 | | * | | MoneyGram International, Inc | | | 45 | |
| | 29,292 | | | | Monotype Imaging Holdings, Inc | | | 455 | |
| | 30,028 | | * | | New Relic, Inc | | | 2,431 | |
| | 46,584 | | | | NIC, Inc | | | 581 | |
| | 176,319 | | * | | Nuance Communications, Inc | | | 2,333 | |
| | 92,944 | | * | | Nutanix, Inc | | | 3,866 | |
| | 58,404 | | * | | Okta, Inc | | | 3,726 | |
| | 21,489 | | * | | OneSpan, Inc | | | 278 | |
| | 1,694,317 | | | | Oracle Corp | | | 76,498 | |
| | 7,197 | | *,e | | Park City Group, Inc | | | 43 | |
| | 210,767 | | | | Paychex, Inc | | | 13,731 | |
| | 31,529 | | * | | Paycom Software, Inc | | | 3,861 | |
| | 18,614 | | * | | Paylocity Holding Corp | | | 1,121 | |
| | 790,825 | | * | | PayPal Holdings, Inc | | | 66,501 | |
| | 26,462 | | | | Pegasystems, Inc | | | 1,266 | |
| | 25,493 | | * | | Perficient, Inc | | | 567 | |
COLLEGE RETIREMENT EQUITIES FUND- Equity Index Account
| SHARES | | | | COMPANY | | VALUE
(000) | |
| | 95,646 | | | | Perspecta, Inc | | $ | 1,647 | |
| | 16,056 | | * | | Pluralsight, Inc | | | 378 | |
| | 13,412 | | | | Presidio, Inc | | | 175 | |
| | 31,483 | | | | Progress Software Corp | | | 1,117 | |
| | 34,295 | | * | | Proofpoint, Inc | | | 2,874 | |
| | 19,034 | | * | | PROS Holdings, Inc | | | 598 | |
| | 78,000 | | * | | PTC, Inc | | | 6,466 | |
| | 22,395 | | * | | Q2 Holdings, Inc | | | 1,110 | |
| | 7,729 | | | | QAD, Inc (Class A) | | | 304 | |
| | 22,512 | | * | | Qualys, Inc | | | 1,683 | |
| | 14,504 | | * | | Rapid7, Inc | | | 452 | |
| | 42,414 | | * | | RealPage, Inc | | | 2,044 | |
| | 119,825 | | * | | Red Hat, Inc | | | 21,046 | |
| | 44,988 | | * | | RingCentral, Inc | | | 3,709 | |
| | 186,641 | | | | Sabre Corp | | | 4,039 | |
| | 35,043 | | * | | SailPoint Technologies Holding, Inc | | | 823 | |
| | 478,245 | | * | | salesforce.com, Inc | | | 65,505 | |
| | 31,653 | | | | Science Applications International Corp | | | 2,016 | |
| | 4,599 | | *,e | | SecureWorks Corp | | | 78 | |
| | 19,474 | | * | | SendGrid, Inc | | | 841 | |
| | 119,493 | | * | | ServiceNow, Inc | | | 21,276 | |
| | 46,932 | | * | | ServiceSource International LLC | | | 51 | |
| | 4,906 | | * | | ShotSpotter, Inc | | | 153 | |
| | 16,667 | | *,e | | SolarWinds Corp | | | 231 | |
| | 98,246 | | * | | Splunk, Inc | | | 10,301 | |
| | 12,246 | | * | | SPS Commerce, Inc | | | 1,009 | |
| | 195,060 | | * | | Square, Inc | | | 10,941 | |
| | 140,643 | | | | SS&C Technologies Holdings, Inc | | | 6,344 | |
| | 25,754 | | | | Switch, Inc | | | 180 | |
| | 29,262 | | * | | Sykes Enterprises, Inc | | | 724 | |
| | 399,967 | | | | Symantec Corp | | | 7,557 | |
| | 94,245 | | * | | Synopsys, Inc | | | 7,939 | |
| | 43,485 | | * | | Tableau Software, Inc | | | 5,218 | |
| | 20,400 | | * | | TeleNav, Inc | | | 83 | |
| | 8,418 | | * | | Tenable Holdings, Inc | | | 187 | |
| | 76,002 | | * | | Teradata Corp | | | 2,915 | |
| | 85,228 | | | | TiVo Corp | | | 802 | |
| | 117,407 | | | | Total System Services, Inc | | | 9,544 | |
| | 21,360 | | * | | Trade Desk, Inc | | | 2,479 | |
| | 88,235 | | | | Travelport Worldwide Ltd | | | 1,378 | |
| | 10,054 | | | | TTEC Holdings, Inc | | | 287 | |
| | 6,516 | | *,e | | Tucows, Inc | | | 391 | |
| | 48,806 | | *,e | | Twilio, Inc | | | 4,358 | |
| | 24,426 | | * | | Tyler Technologies, Inc | | | 4,539 | |
| | 20,094 | | * | | Ultimate Software Group, Inc | | | 4,920 | |
| | 38,674 | | *,e | | Unisys Corp | | | 450 | |
| | 4,914 | | * | | Upland Software, Inc | | | 134 | |
| | 18,823 | | * | | Varonis Systems, Inc | | | 996 | |
| | 45,384 | | * | | Verint Systems, Inc | | | 1,920 | |
| | 71,825 | | * | | VeriSign, Inc | | | 10,651 | |
| | 32,131 | | *,e | | VirnetX Holding Corp | | | 77 | |
| | 19,953 | | * | | Virtusa Corp | | | 850 | |
| | 1,171,575 | | | | Visa, Inc (Class A) | | | 154,578 | |
COLLEGE RETIREMENT EQUITIES FUND- Equity Index Account
| SHARES | | | | COMPANY | | VALUE
(000) | |
| | 46,345 | | | | VMware, Inc (Class A) | | $ | 6,355 | |
| | 309,241 | | | | Western Union Co | | | 5,276 | |
| | 27,596 | | * | | WEX, Inc | | | 3,865 | |
| | 99,063 | | * | | Workday, Inc | | | 15,818 | |
| | 16,351 | | * | | Workiva, Inc | | | 587 | |
| | 196,315 | | * | | Worldpay, Inc | | | 15,004 | |
| | 55,032 | | * | | Yext, Inc | | | 817 | |
| | 69,807 | | * | | Zendesk, Inc | | | 4,075 | |
| | 42,422 | | * | | Zix Corp | | | 243 | |
| | 40,123 | | * | | Zscaler, Inc | | | 1,573 | |
| | | | | | TOTAL SOFTWARE & SERVICES | | | 1,838,484 | |
| | | | | | | | | | |
| TECHNOLOGY HARDWARE & EQUIPMENT - 5.3% |
| | 74,639 | | *,e | | 3D Systems Corp | | | 759 | |
| | 35,649 | | | | Adtran, Inc | | | 383 | |
| | 16,323 | | * | | Aerohive Networks, Inc | | | 53 | |
| | 11,056 | | * | | Agilysys, Inc | | | 159 | |
| | 194,851 | | | | Amphenol Corp (Class A) | | | 15,787 | |
| | 21,094 | | * | | Anixter International, Inc | | | 1,146 | |
| | 3,159,014 | | e | | Apple, Inc | | | 498,303 | |
| | 13,189 | | *,e | | Applied Optoelectronics, Inc | | | 204 | |
| | 36,466 | | * | | Arista Networks, Inc | | | 7,683 | |
| | 112,990 | | * | | ARRIS International plc | | | 3,454 | |
| | 55,742 | | * | | Arrow Electronics, Inc | | | 3,843 | |
| | 24,161 | | * | | Avid Technology, Inc | | | 115 | |
| | 76,135 | | | | Avnet, Inc | | | 2,748 | |
| | 34,410 | | | | AVX Corp | | | 525 | |
| | 19,362 | | | | Badger Meter, Inc | | | 953 | |
| | 7,316 | | | | Bel Fuse, Inc (Class B) | | | 135 | |
| | 30,293 | | | | Belden CDT, Inc | | | 1,265 | |
| | 35,867 | | | | Benchmark Electronics, Inc | | | 760 | |
| | 26,799 | | * | | CalAmp Corp | | | 349 | |
| | 28,887 | | * | | Calix, Inc | | | 282 | |
| | 9,824 | | * | | Casa Systems, Inc | | | 129 | |
| | 94,505 | | | | CDW Corp | | | 7,660 | |
| | 101,053 | | * | | Ciena Corp | | | 3,427 | |
| | 3,016,360 | | | | Cisco Systems, Inc | | | 130,699 | |
| | 8,964 | | * | | Clearfield, Inc | | | 89 | |
| | 110,414 | | | | Cognex Corp | | | 4,270 | |
| | 17,685 | | * | | Coherent, Inc | | | 1,869 | |
| | 122,398 | | * | | CommScope Holding Co, Inc | | | 2,006 | |
| | 16,237 | | | | Comtech Telecommunications Corp | | | 395 | |
| | 15,682 | | * | | Control4 Corp | | | 276 | |
| | 522,329 | | | | Corning, Inc | | | 15,780 | |
| | 29,620 | | * | | Cray, Inc | | | 639 | |
| | 23,637 | | | | CTS Corp | | | 612 | |
| | 27,847 | | | | Daktronics, Inc | | | 206 | |
| | 83,100 | | * | | Dell Technologies, Inc | | | 4,061 | |
| | 53,560 | | e | | Diebold, Inc | | | 133 | |
| | 18,652 | | * | | Digi International, Inc | | | 188 | |
| | 39,659 | | | | Dolby Laboratories, Inc (Class A) | | | 2,453 | |
| | 13,533 | | *,e | | Eastman Kodak Co | | | 35 | |
| | 33,587 | | * | | EchoStar Corp (Class A) | | | 1,233 | |
| | 21,493 | | * | | Electro Scientific Industries, Inc | | | 644 | |
COLLEGE RETIREMENT EQUITIES FUND- Equity Index Account
| SHARES | | | | COMPANY | | VALUE
(000) | |
| | 33,181 | | * | | Electronics for Imaging, Inc | | $ | 823 | |
| | 9,278 | | * | | ePlus, Inc | | | 660 | |
| | 79,396 | | * | | Extreme Networks, Inc | | | 484 | |
| | 38,706 | | * | | F5 Networks, Inc | | | 6,272 | |
| | 26,560 | | * | | Fabrinet | | | 1,363 | |
| | 12,851 | | * | | FARO Technologies, Inc | | | 522 | |
| | 80,146 | | *,e | | Finisar Corp | | | 1,731 | |
| | 124,310 | | *,e | | Fitbit, Inc | | | 618 | |
| | 84,050 | | | | Flir Systems, Inc | | | 3,660 | |
| | 58,321 | | * | | Harmonic, Inc | | | 275 | |
| | 983,262 | | | | Hewlett Packard Enterprise Co | | | 12,989 | |
| | 1,056,900 | | | | HP, Inc | | | 21,624 | |
| | 43,712 | | * | | II-VI, Inc | | | 1,419 | |
| | 21,661 | | * | | Immersion Corp | | | 194 | |
| | 103,799 | | * | | Infinera Corp | | | 414 | |
| | 25,682 | | * | | Insight Enterprises, Inc | | | 1,047 | |
| | 25,007 | | | | InterDigital, Inc | | | 1,661 | |
| | 25,495 | | * | | IPG Photonics Corp | | | 2,888 | |
| | 18,293 | | * | | Iteris, Inc | | | 68 | |
| | 24,355 | | * | | Itron, Inc | | | 1,152 | |
| | 107,922 | | | | Jabil Circuit, Inc | | | 2,675 | |
| | 223,430 | | | | Juniper Networks, Inc | | | 6,013 | |
| | 32,485 | | | | Kemet Corp | | | 570 | |
| | 121,590 | | * | | Keysight Technologies, Inc | | | 7,548 | |
| | 21,162 | | * | | Kimball Electronics, Inc | | | 328 | |
| | 64,648 | | * | | Knowles Corp | | | 860 | |
| | 10,929 | | * | | KVH Industries, Inc | | | 112 | |
| | 17,448 | | | | Littelfuse, Inc | | | 2,992 | |
| | 51,429 | | * | | Lumentum Holdings, Inc | | | 2,161 | |
| | 24,482 | | *,e | | Maxwell Technologies, Inc | | | 51 | |
| | 2,255 | | | | Mesa Laboratories, Inc | | | 470 | |
| | 25,950 | | | | Methode Electronics, Inc | | | 604 | |
| | 107,124 | | | | Motorola, Inc | | | 12,324 | |
| | 12,096 | | | | MTS Systems Corp | | | 485 | |
| | 7,937 | | * | | Napco Security Technologies, Inc | | | 125 | |
| | 76,957 | | | | National Instruments Corp | | | 3,492 | |
| | 87,292 | | * | | NCR Corp | | | 2,015 | |
| | 177,037 | | | | NetApp, Inc | | | 10,564 | |
| | 23,887 | | * | | Netgear, Inc | | | 1,243 | |
| | 64,175 | | * | | Netscout Systems, Inc | | | 1,516 | |
| | 4,719 | | *,e | | nLight, Inc | | | 84 | |
| | 23,522 | | * | | Novanta, Inc | | | 1,482 | |
| | 12,827 | | * | | OSI Systems, Inc | | | 940 | |
| | 59,973 | | * | | Palo Alto Networks, Inc | | | 11,296 | |
| | 14,228 | | | | Park Electrochemical Corp | | | 257 | |
| | 8,216 | | | | PC Connection, Inc | | | 244 | |
| | 24,496 | | | | Plantronics, Inc | | | 811 | |
| | 24,305 | | * | | Plexus Corp | | | 1,241 | |
| | 112,099 | | * | | Pure Storage, Inc | | | 1,803 | |
| | 15,117 | | * | | Quantenna Communications, Inc | | | 217 | |
| | 37,508 | | * | | Ribbon Communications, Inc | | | 181 | |
| | 12,852 | | * | | Rogers Corp | | | 1,273 | |
| | 52,368 | | * | | Sanmina Corp | | | 1,260 | |
COLLEGE RETIREMENT EQUITIES FUND- Equity Index Account
| SHARES | | | | COMPANY | | VALUE
(000) | |
| | 17,777 | | * | | Scansource, Inc | | $ | 611 | |
| | 37,383 | | * | | Stratasys Ltd | | | 673 | |
| | 25,356 | | * | | Synaptics, Inc | | | 943 | |
| | 29,139 | | | | SYNNEX Corp | | | 2,356 | |
| | 25,262 | | * | | Tech Data Corp | | | 2,067 | |
| | 162,259 | | * | | Trimble Navigation Ltd | | | 5,340 | |
| | 66,124 | | * | | TTM Technologies, Inc | | | 643 | |
| | 9,730 | | e | | Ubiquiti Networks, Inc | | | 967 | |
| | 28,420 | | * | | USA Technologies, Inc | | | 111 | |
| | 38,380 | | *,e | | Viasat, Inc | | | 2,262 | |
| | 165,919 | | * | | Viavi Solutions, Inc | | | 1,667 | |
| | 97,366 | | | | Vishay Intertechnology, Inc | | | 1,754 | |
| | 9,508 | | * | | Vishay Precision Group, Inc | | | 287 | |
| | 197,112 | | | | Western Digital Corp | | | 7,287 | |
| | 146,472 | | | | Xerox Corp | | | 2,894 | |
| | 33,846 | | * | | Zebra Technologies Corp (Class A) | | | 5,389 | |
| | | | | | TOTAL TECHNOLOGY HARDWARE & EQUIPMENT | | | 888,062 | |
| | | | | | | | | | |
| TELECOMMUNICATION SERVICES - 2.0% |
| | 4,838,859 | | | | AT&T, Inc | | | 138,101 | |
| | 7,918 | | | | ATN International, Inc | | | 566 | |
| | 27,406 | | * | | Boingo Wireless, Inc | | | 564 | |
| | 628,303 | | | | CenturyLink, Inc | | | 9,519 | |
| | 33,512 | | * | | Cincinnati Bell, Inc | | | 261 | |
| | 29,776 | | | | Cogent Communications Group, Inc | | | 1,346 | |
| | 48,355 | | e | | Consolidated Communications Holdings, Inc | | | 478 | |
| | 57,416 | | *,e | | Frontier Communications Corp | | | 137 | |
| | 42,541 | | *,e | | Gogo, Inc | | | 127 | |
| | 23,607 | | *,e | | Intelsat S.A. | | | 505 | |
| | 60,764 | | * | | Iridium Communications, Inc | | | 1,121 | |
| | 60,198 | | *,e | | NII Holdings, Inc | | | 266 | |
| | 13,047 | | * | | Ooma, Inc | | | 181 | |
| | 44,329 | | * | | Orbcomm, Inc | | | 366 | |
| | 7,472 | | * | | pdvWireless, Inc | | | 279 | |
| | 33,638 | | | | Shenandoah Telecom Co | | | 1,489 | |
| | 14,641 | | | | Spok Holdings, Inc | | | 194 | |
| | 458,152 | | *,e | | Sprint Corp | | | 2,666 | |
| | 70,982 | | | | Telephone & Data Systems, Inc | | | 2,310 | |
| | 199,928 | | * | | T-Mobile US, Inc | | | 12,717 | |
| | 9,529 | | * | | US Cellular Corp | | | 495 | |
| | 2,754,368 | | | | Verizon Communications, Inc | | | 154,850 | |
| | 143,849 | | * | | Vonage Holdings Corp | | | 1,256 | |
| | 134,804 | | * | | Zayo Group Holdings, Inc | | | 3,079 | |
| | | | | | TOTAL TELECOMMUNICATION SERVICES | | | 332,873 | |
| | | | | | | | | | |
| TRANSPORTATION - 2.0% |
| | 37,928 | | * | | Air Transport Services Group, Inc | | | 865 | |
| | 77,886 | | | | Alaska Air Group, Inc | | | 4,739 | |
| | 8,722 | | | | Allegiant Travel Co | | | 874 | |
| | 4,758 | | | | Amerco, Inc | | | 1,561 | |
| | 271,150 | | | | American Airlines Group, Inc | | | 8,707 | |
| | 19,331 | | | | Arkansas Best Corp | | | 662 | |
| | 16,948 | | * | | Atlas Air Worldwide Holdings, Inc | | | 715 | |
| | 41,208 | | * | | Avis Budget Group, Inc | | | 926 | |
COLLEGE RETIREMENT EQUITIES FUND- Equity Index Account
| SHARES | | | | COMPANY | | VALUE
(000) | |
| | 94,327 | | | | CH Robinson Worldwide, Inc | | $ | 7,932 | |
| | 21,812 | | | | Copa Holdings S.A. (Class A) | | | 1,717 | |
| | 23,634 | | | | Costamare, Inc | | | 104 | |
| | 8,672 | | * | | Covenant Transportation Group, Inc | | | 167 | |
| | 534,186 | | | | CSX Corp | | | 33,189 | |
| | 14,173 | | * | | Daseke, Inc | | | 52 | |
| | 419,964 | | | | Delta Air Lines, Inc | | | 20,956 | |
| | 28,818 | | * | | Eagle Bulk Shipping, Inc | | | 133 | |
| | 21,041 | | * | | Echo Global Logistics, Inc | | | 428 | |
| | 112,402 | | | | Expeditors International of Washington, Inc | | | 7,653 | |
| | 162,888 | | | | FedEx Corp | | | 26,279 | |
| | 20,963 | | | | Forward Air Corp | | | 1,150 | |
| | 6,118 | | * | | Genco Shipping & Trading Ltd | | | 48 | |
| | 43,633 | | * | | Genesee & Wyoming, Inc (Class A) | | | 3,230 | |
| | 36,387 | | | | Hawaiian Holdings, Inc | | | 961 | |
| | 33,759 | | | | Heartland Express, Inc | | | 618 | |
| | 40,162 | | *,e | | Hertz Global Holdings, Inc | | | 548 | |
| | 21,791 | | * | | Hub Group, Inc (Class A) | | | 808 | |
| | 56,707 | | | | JB Hunt Transport Services, Inc | | | 5,276 | |
| | 213,370 | | * | | JetBlue Airways Corp | | | 3,427 | |
| | 70,219 | | | | Kansas City Southern Industries, Inc | | | 6,702 | |
| | 37,438 | | * | | Kirby Corp | | | 2,522 | |
| | 87,818 | | e | | Knight-Swift Transportation Holdings, Inc | | | 2,202 | |
| | 25,122 | | | | Landstar System, Inc | | | 2,403 | |
| | 55,800 | | | | Macquarie Infrastructure Co LLC | | | 2,040 | |
| | 23,235 | | | | Marten Transport Ltd | | | 376 | |
| | 32,238 | | | | Matson, Inc | | | 1,032 | |
| | 180,956 | | | | Norfolk Southern Corp | | | 27,060 | |
| | 43,304 | | | | Old Dominion Freight Line | | | 5,348 | |
| | 6,136 | | | | Park-Ohio Holdings Corp | | | 188 | |
| | 29,335 | | * | | Radiant Logistics, Inc | | | 125 | |
| | 30,762 | | | | Ryder System, Inc | | | 1,481 | |
| | 33,371 | | * | | Safe Bulkers, Inc | | | 59 | |
| | 18,094 | | * | | Saia, Inc | | | 1,010 | |
| | 22,723 | | | | Schneider National, Inc | | | 424 | |
| | 40,927 | | | | Scorpio Bulkers, Inc | | | 226 | |
| | 37,279 | | | | Skywest, Inc | | | 1,658 | |
| | 343,565 | | | | Southwest Airlines Co | | | 15,969 | |
| | 50,261 | | * | | Spirit Airlines, Inc | | | 2,911 | |
| | 490,744 | | | | Union Pacific Corp | | | 67,836 | |
| | 161,656 | | * | | United Continental Holdings, Inc | | | 13,536 | |
| | 461,705 | | | | United Parcel Service, Inc (Class B) | | | 45,030 | |
| | 6,297 | | | | Universal Truckload Services, Inc | | | 114 | |
| | 14,010 | | * | | US Xpress Enterprises, Inc | | | 79 | |
| | 31,167 | | | | Werner Enterprises, Inc | | | 921 | |
| | 79,581 | | * | | XPO Logistics, Inc | | | 4,539 | |
| | 23,809 | | * | | YRC Worldwide, Inc | | | 75 | |
| | | | | | TOTAL TRANSPORTATION | | | 339,591 | |
| | | | | | | | | | |
| UTILITIES - 3.3% |
| | 451,060 | | | | AES Corp | | | 6,522 | |
| | 30,256 | | | | Allete, Inc | | | 2,306 | |
| | 148,965 | | | | Alliant Energy Corp | | | 6,294 | |
COLLEGE RETIREMENT EQUITIES FUND- Equity Index Account
| SHARES | | | | COMPANY | | VALUE
(000) | |
| | 157,895 | | | | Ameren Corp | | $ | 10,300 | |
| | 328,999 | | | | American Electric Power Co, Inc | | | 24,589 | |
| | 25,230 | | | | American States Water Co | | | 1,691 | |
| | 122,513 | | | | American Water Works Co, Inc | | | 11,121 | |
| | 109,499 | | | | Aqua America, Inc | | | 3,744 | |
| | 8,231 | | *,e | | AquaVenture Holdings Ltd | | | 156 | |
| | 4,909 | | | | Artesian Resources Corp | | | 171 | |
| | 92,825 | | *,e | | Atlantic Power Corp | | | 201 | |
| | 69,033 | | | | Atmos Energy Corp | | | 6,401 | |
| | 39,059 | | | | Avangrid, Inc | | | 1,957 | |
| | 33,562 | | | | Avista Corp | | | 1,426 | |
| | 36,321 | | | | Black Hills Corp | | | 2,280 | |
| | 15,011 | | *,e | | Cadiz, Inc | | | 155 | |
| | 35,650 | | | | California Water Service Group | | | 1,699 | |
| | 338,271 | | | | Centerpoint Energy, Inc | | | 9,549 | |
| | 11,318 | | | | Chesapeake Utilities Corp | | | 920 | |
| | 24,011 | | | | Clearway Energy, Inc (Class A) | | | 406 | |
| | 47,061 | | | | Clearway Energy, Inc (Class C) | | | 812 | |
| | 188,591 | | | | CMS Energy Corp | | | 9,364 | |
| | 8,405 | | | | Connecticut Water Service, Inc | | | 562 | |
| | 207,011 | | | | Consolidated Edison, Inc | | | 15,828 | |
| | 10,961 | | | | Consolidated Water Co, Inc | | | 128 | |
| | 436,116 | | | | Dominion Resources, Inc | | | 31,165 | |
| | 123,065 | | | | DTE Energy Co | | | 13,574 | |
| | 473,375 | | | | Duke Energy Corp | | | 40,852 | |
| | 205,070 | | | | Edison International | | | 11,642 | |
| | 27,569 | | | | El Paso Electric Co | | | 1,382 | |
| | 114,842 | | | | Entergy Corp | | | 9,885 | |
| | 174,850 | | | | Evergy, Inc | | | 9,926 | |
| | 211,303 | | | | Eversource Energy | | | 13,743 | |
| | 640,770 | | | | Exelon Corp | | | 28,899 | |
| | 327,125 | | | | FirstEnergy Corp | | | 12,284 | |
| | 6,410 | | | | Global Water Resources, Inc | | | 65 | |
| | 71,902 | | | | Hawaiian Electric Industries, Inc | | | 2,633 | |
| | 30,421 | | | | Idacorp, Inc | | | 2,831 | |
| | 119,020 | | | | MDU Resources Group, Inc | | | 2,837 | |
| | 24,502 | | | | MGE Energy, Inc | | | 1,469 | |
| | 11,759 | | | | Middlesex Water Co | | | 627 | |
| | 53,913 | | e | | National Fuel Gas Co | | | 2,759 | |
| | 62,202 | | | | New Jersey Resources Corp | | | 2,841 | |
| | 317,520 | | | | NextEra Energy, Inc | | | 55,191 | |
| | 234,601 | | | | NiSource, Inc | | | 5,947 | |
| | 14,483 | | | | Northwest Natural Holding Co | | | 876 | |
| | 35,112 | | | | NorthWestern Corp | | | 2,087 | |
| | 196,541 | | | | NRG Energy, Inc | | | 7,783 | |
| | 142,240 | | | | OGE Energy Corp | | | 5,574 | |
| | 36,272 | | | | ONE Gas, Inc | | | 2,887 | |
| | 26,977 | | | | Ormat Technologies, Inc | | | 1,411 | |
| | 27,545 | | | | Otter Tail Corp | | | 1,367 | |
| | 50,689 | | | | Pattern Energy Group, Inc | | | 944 | |
| | 352,287 | | * | | PG&E Corp | | | 8,367 | |
| | 73,930 | | | | Pinnacle West Capital Corp | | | 6,299 | |
| | 55,254 | | | | PNM Resources, Inc | | | 2,270 | |
| | 60,652 | | | | Portland General Electric Co | | | 2,781 | |
COLLEGE RETIREMENT EQUITIES FUND- Equity Index Account
| SHARES | | | | COMPANY | | VALUE
(000) | |
| | 479,569 | | | | PPL Corp | | $ | 13,586 | |
| | 334,261 | | | | Public Service Enterprise Group, Inc | | | 17,398 | |
| | 11,616 | | * | | Pure Cycle Corp | | | 115 | |
| | 4,887 | | | | RGC Resources, Inc | | | 146 | |
| | 95,839 | | | | SCANA Corp | | | 4,579 | |
| | 180,457 | | | | Sempra Energy | | | 19,524 | |
| | 12,005 | | | | SJW Corp | | | 668 | |
| | 58,642 | | | | South Jersey Industries, Inc | | | 1,630 | |
| | 679,211 | | | | Southern Co | | | 29,831 | |
| | 34,400 | | | | Southwest Gas Corp | | | 2,632 | |
| | 7,544 | | e | | Spark Energy, Inc | | | 56 | |
| | 33,979 | | | | Spire, Inc | | | 2,517 | |
| | 49,399 | | | | TerraForm Power, Inc | | | 554 | |
| | 113,045 | | | | UGI Corp | | | 6,031 | |
| | 10,272 | | | | Unitil Corp | | | 520 | |
| | 51,076 | | | | Vectren Corp | | | 3,677 | |
| | 255,191 | | * | | Vistra Energy Corp | | | 5,841 | |
| | 209,470 | | | | WEC Energy Group, Inc | | | 14,508 | |
| | 344,186 | | | | Xcel Energy, Inc | | | 16,958 | |
| | 9,006 | | | | York Water Co | | | 289 | |
| | | | | | TOTAL UTILITIES | | | 552,840 | |
| | | | | | | | | | |
| | | | | | TOTAL COMMON STOCKS | | | 16,727,734 | |
| | | | | | (Cost $8,432,863) | | | | |
| | | | | | | | | | |
| RIGHTS / WARRANTS - 0.0% |
| |
| COMMERCIAL & PROFESSIONAL SERVICES - 0.0% |
| �� | 80,085 | | † | | Media General, Inc | | | 0 | |
| | | | | | TOTAL COMMERCIAL & PROFESSIONAL SERVICES | | | 0 | |
| | | | | | | | | | |
| DIVERSIFIED FINANCIALS - 0.0% |
| | 1,387 | | | | Emergent Capital Inc | | | 0 | |
| | | | | | TOTAL DIVERSIFIED FINANCIALS | | | 0 | |
| | | | | | | | | | |
| PHARMACEUTICALS, BIOTECHNOLOGY & LIFE SCIENCES - 0.0% |
| | 10,743 | | † | | Forest Laboratories, Inc CVR | | | 10 | |
| | 4,045 | | † | | Omthera Pharmaceuticals, Inc | | | 3 | |
| | 6,981 | | | | Tobira Therapeutics, Inc | | | 0 | ^ |
| | | | | | TOTAL PHARMACEUTICALS, BIOTECHNOLOGY & LIFE SCIENCES | | | 13 | |
| | | | | | | | | | |
| | | | | | TOTAL RIGHTS / WARRANTS | | | 13 | |
| | | | | | (Cost $0) | | | | |
| | | | | | | | | | | | | | | | | | |
COLLEGE RETIREMENT EQUITIES FUND- Equity Index Account
| | | | | | | | | | | | MATURITY | | VALUE | |
| PRINCIPAL | | | | ISSUER | | | | RATE | | DATE | | (000) | |
| | | | | | | | | | | | | | |
| SHORT-TERM INVESTMENTS - 1.2% | |
| |
| GOVERNMENT AGENCY DEBT - 0.1% |
| $ | 25,000,000 | | | | Federal Home Loan Bank (FHLB) | | | | | 2.150 | % | | 01/02/19 | | $ | 25,000 | |
| | | | | | TOTAL GOVERNMENT AGENCY DEBT | | | | | | | | 25,000 | |
| | | | | | | | | | | | | | | | | | |
| TREASURY DEBT - 0.3% |
| | 29,310,000 | | | | United States Treasury Bill | | | | | 2.286 | | | 01/08/19 | | | 29,299 | |
| | 24,500,000 | | | | United States Treasury Bill | | | | | 2.318 | | | 02/21/19 | | | 24,418 | |
| | | | | | TOTAL TREASURY DEBT | | | | | | | | | | | 53,717 | |
| | | | | | | | | | | | | | | | | | |
| SHARES | | | | COMPANY | | | | | | | | |
| INVESTMENTS IN REGISTERED INVESTMENT COMPANIES - 0.8% |
| | 133,008,986 | | c | | State Street Navigator Securities Lending Government Money Market Portfolio | | | 133,009 | |
| | | | | | TOTAL INVESTMENTS IN REGISTERED INVESTMENT COMPANIES | | | 133,009 | |
| | | | | | | | | | | | | | | | | | |
| | | | | | TOTAL SHORT-TERM INVESTMENTS | | | 211,726 | |
| | | | | | (Cost $211,724) | | | | | | | | | | | | |
| | | | | | | | | | | | | | | | | | |
| | | | | | TOTAL INVESTMENTS - 100.6% | | | | | | | | | | | 16,939,473 | |
| | | | | | (Cost $8,644,587) | | | | | | | | | | | | |
| | | | | | OTHER ASSETS & LIABILITIES, NET - (0.6)% | | | | | | | (107,918 | ) |
| | | | | | NET ASSETS - 100.0% | | | | | | | | | | $ | 16,831,555 | |
| | Abbreviation(s): |
| CVR | | Contingent Value Right |
| REIT | | Real Estate Investment Trust |
| | | |
| ^ | | Amount represents less than $1,000. |
| * | | Non-income producing |
| † | | Security is categorized as Level 3 in the fair value hierarchy. |
| c | | Investments made with cash collateral received from securities on loan. |
| d | | All or a portion of these securities have been segregated to cover margin requirements on open futures contracts. |
| e | | All or a portion of these securities are out on loan. The aggregate value of securities on loan is $129,293,945. |
| | | |
| | | Cost amounts are in thousands. |
Futures contracts outstanding as of December 31, 2018 were as follows (notional amounts and values are in thousands):
| Description | | Number of long
(short)
contracts | | | Expiration date | | Notional amount | | | Value | | | Unrealized
appreciation (depreciation) | |
| Russell 2000 E Mini Index | | | 83 | | | 03/15/19 | | $ | 5,372 | | | $ | 5,598 | | | $ | 226 | |
| S&P 500 E Mini Index | | | 480 | | | 03/15/19 | | | 57,953 | | | | 60,125 | | | | 2,172 | |
| S&P Mid-Cap 400 E Mini Index | | | 24 | | | 03/15/19 | | | 3,860 | | | | 3,989 | | | | 129 | |
| Total | | | 587 | | | | | $ | 67,185 | | | $ | 69,712 | | | $ | 2,527 | |
COLLEGE RETIREMENT EQUITIES FUND -Bond Market Account
COLLEGE RETIREMENT EQUITIES FUND
BOND MARKET ACCOUNT
SCHEDULE OF INVESTMENTS
December 31, 2018
| PRINCIPAL | | | | ISSUER | | REFERENCE
RATE & SPREAD | | RATE | | MATURITY
DATE | | VALUE
(000) | |
| BANK LOAN OBLIGATIONS - 0.4% | | | | | | | | | | | | |
| | | | | | | | | | | | | | | | | | |
| CAPITAL GOODS - 0.0% | | | | | | | | | | | | |
| $ | 456,866 | | i | | Avolon TLB Borrower US LLC | | LIBOR 1 M + 2.000% | | | 4.470 | % | | 01/15/25 | | $ | 438 | |
| | | | | | TOTAL CAPITAL GOODS | | | | | | | | | | | 438 | |
| | | | | | | | | | | | | | | | | | |
| COMMERCIAL & PROFESSIONAL SERVICES - 0.0% | | | | | | | | | | | | |
| | 1,047,375 | | i | | United Rentals North America, Inc | | LIBOR 1 M + 1.750% | | | 4.272 | | | 10/31/25 | | | 1,023 | |
| | | | | | TOTAL COMMERCIAL & PROFESSIONAL SERVICES | | | | | | | 1,023 | |
| | | | | | | | | | | | | | | | | | |
| CONSUMER DURABLES & APPAREL - 0.0% | | | | | | | | | | | | |
| | 891,000 | | i | | Hanesbrands, Inc | | LIBOR 1 M + 1.750% | | | 4.272 | | | 12/16/24 | | | 880 | |
| | 1,492,500 | | i | | Samsonite IP Holdings Sarl | | LIBOR 1 M + 1.750% | | | 4.272 | | | 04/25/25 | | | 1,423 | |
| | | | | | TOTAL CONSUMER DURABLES & APPAREL | | | | | | | | | 2,303 | |
| | | | | | | | | | | | | | | | | | |
| CONSUMER SERVICES - 0.0% | | | | | | | | | | | | |
| | 491,250 | | i | | 1011778 BC / New Red Finance, Inc | | LIBOR 1 M + 2.250% | | | 4.772 | | | 02/16/24 | | | 467 | |
| | 485,728 | | i | | Boyd Gaming Corp | | LIBOR 1 W + 2.250% | | | 4.666 | | | 09/15/23 | | | 467 | |
| | 1,492,481 | | i | | Las Vegas Sands LLC | | LIBOR 1 M + 1.750% | | | 4.272 | | | 03/27/25 | | | 1,422 | |
| | | | | | TOTAL CONSUMER SERVICES | | | | | | | | | | | 2,356 | |
| | | | | | | | | | | | | | | | | | |
| DIVERSIFIED FINANCIALS - 0.0% | | | | | | | | | | | | |
| | 169,934 | | i | | Mallinckrodt International Finance S.A. | | LIBOR 3 M + 2.750% | | | 5.553 | | | 09/24/24 | | | 155 | |
| | | | | | TOTAL DIVERSIFIED FINANCIALS | | | | | | | | | | | 155 | |
| | | | | | | | | | | | | | | | | | |
| ENERGY - 0.0% | | | | | | | | | | | | |
| | 1,720,000 | | i | | California Resources Corp | | LIBOR 1 M + 10.375% | | | 12.897 | | | 12/31/21 | | | 1,681 | |
| | | | | | TOTAL ENERGY | | | | | | | | | | | 1,681 | |
| | | | | | | | | | | | | | | | | | |
| FOOD & STAPLES RETAILING - 0.0% | | | | | | | | | | | | |
| | 205,865 | | i | | Albertsons LLC | | LIBOR 3 M + 3.000% | | | 5.691 | | | 06/22/23 | | | 195 | |
| | 708,805 | | i | | YUM! Brands | | LIBOR 1 M + 1.750% | | | 4.220 | | | 04/03/25 | | | 691 | |
| | | | | | TOTAL FOOD & STAPLES RETAILING | | | | | | | | | 886 | |
| | | | | | | | | | | | | | | | | | |
| FOOD, BEVERAGE & TOBACCO - 0.0% | | | | | | | | | | | | |
| | 595,227 | | i | | Post Holdings, Inc | | LIBOR 1 M + 2.000% | | | 4.510 | | | 05/24/24 | | | 572 | |
| | | | | | TOTAL FOOD, BEVERAGE & TOBACCO | | | | | | | | | 572 | |
| | | | | | | | | | | | | | | | | | |
| HEALTH CARE EQUIPMENT &SERVICES - 0.1% | | | | | | | | | | | | |
| | 481,250 | | i | | Change Healthcare Holdings LLC | | LIBOR 1 M + 2.750% | | | 5.272 | | | 03/01/24 | | | 455 | |
| | 3,250,000 | | i | | Envision Healthcare Corp | | LIBOR 1 M + 3.750% | | | 6.272 | | | 10/10/25 | | | 3,021 | |
| | 1,957,613 | | i | | Team Health Holdings, Inc | | LIBOR 1 M + 2.750% | | | 5.272 | | | 02/06/24 | | | 2,183 | |
| | | | | | TOTAL HEALTH CARE EQUIPMENT & SERVICES | | | | | | | 5,659 | |
| | | | | | | | | | | | | | | | | | |
| MATERIALS - 0.1% | | | | | | | | | | | | |
| | 1,473,750 | | i | | Berry Global, Inc | | LIBOR 1 M + 2.000% | | | 4.387 | | | 01/19/24 | | | 1,433 | |
| | 495,000 | | i | | Ineos US Finance LLC | | LIBOR 1 M + 2.000% | | | 4.522 | | | 03/31/24 | | | 467 | |
COLLEGE RETIREMENT EQUITIES FUND -Bond Market Account
| PRINCIPAL | | | | ISSUER | | REFERENCE
RATE & SPREAD | | RATE | | MATURITY
DATE | | VALUE
(000) | |
| $ | 2,200,000 | | h,i | | Messer Industries USA, Inc | | LIBOR 3 M + 2.500% | | | 2.500 | % | | 10/01/25 | | $ | 2,083 | |
| | 1,404,952 | | i | | PolyOne Corp | | LIBOR 1 M + 1.750% | | | 4.137 | | | 01/30/26 | | | 1,352 | |
| | 1,950,000 | | i | | Starfruit US Holdco LLC | | LIBOR 1 M + 3.250% | | | 5.750 | | | 10/01/25 | | | 1,862 | |
| | | | | | TOTAL MATERIALS | | | | | | | | | | | 7,197 | |
| | | | | | | | | | | | | | | | | | |
| MEDIA & ENTERTAINMENT - 0.1% | | | | | | | | | | | | |
| | 969,609 | | i | | CSC Holdings LLC | | LIBOR 1 M + 2.250% | | | 4.705 | | | 07/17/25 | | | 918 | |
| | 2,783,726 | | i | | Lions Gate Capital Holdings LLC | | LIBOR 1 M + 2.250% | | | 4.772 | | | 03/24/25 | | | 2,674 | |
| | 1,496,203 | | i | | Nielsen Finance LLC | | LIBOR 1 M + 2.000% | | | 4.387 | | | 10/04/23 | | | 1,449 | |
| | 750,000 | | i | | Virgin Media Bristol LLC | | LIBOR 1 M + 2.500% | | | 4.955 | | | 01/15/26 | | | 709 | |
| | | | | | TOTAL MEDIA & ENTERTAINMENT | | | | | | | | | 5,750 | |
| | | | | | | | | | | | | | | | | | |
| PHARMACEUTICALS, BIOTECHNOLOGY & LIFE SCIENCES - 0.0% | | | | | | | | | | |
| | 123,125 | | i | | Endo Luxembourg Finance I Co Sarl | | LIBOR 1 M + 4.250% | | | 6.813 | | | 04/29/24 | | | 116 | |
| | 1,462,025 | | i | | Valeant Pharmaceuticals International, Inc | | LIBOR 1 M + 3.000% | | | 5.379 | | | 06/02/25 | | | 1,393 | |
| | | | | | TOTAL PHARMACEUTICALS, BIOTECHNOLOGY & LIFE SCIENCES | | | | 1,509 | |
| | | | | | | | | | | | | | | | | | |
| REAL ESTATE - 0.0% | | | | | | | | | | | | |
| | 1,396,500 | | i | | DTZ US Borrower LLC | | LIBOR 1 M + 3.250% | | | 5.772 | | | 08/21/25 | | | 1,334 | |
| | 2,892,564 | | i | | MGM Growth Properties LLC | | LIBOR 1 M + 2.000% | | | 4.522 | | | 03/23/25 | | | 2,763 | |
| | | | | | TOTAL REAL ESTATE | | | | | | | | | | | 4,097 | |
| | | | | | | | | | | | | | | | | | |
| RETAILING - 0.0% | | | | | | | | | | | | |
| | 795,065 | | i | | PetSmart, Inc | | LIBOR 1 M + 3.000% | | | 5.520 | | | 03/11/22 | | | 626 | |
| | | | | | TOTAL RETAILING | | | | | | | | | | | 626 | |
| | | | | | | | | | | | | | | | | | |
| SOFTWARE & SERVICES - 0.1% | | | | | | | | | | | | |
| | 621,885 | | i | | First Data Corp | | LIBOR 1 M + 2.000% | | | 4.504 | | | 07/08/22 | | | 912 | |
| | 4,500,000 | | i | | Refinitiv US Holdings, Inc | | LIBOR 1 M + 3.750% | | | 6.272 | | | 10/01/25 | | | 4,275 | |
| | 98,012 | | i | | Sabre GLBL, Inc | | LIBOR 1 M + 2.000% | | | 4.522 | | | 02/22/24 | | | 95 | |
| | | | | | TOTAL SOFTWARE & SERVICES | | | | | | | | | | 5,282 | |
| | | | | | | | | | | | | | | | | | |
| TECHNOLOGY HARDWARE & EQUIPMENT - 0.0% | | | | | | | | | | | | |
| | 476,525 | | i | | CommScope, Inc | | LIBOR 1 M + 2.000% | | | 4.522 | | | 12/29/22 | | | 450 | |
| | 1,496,222 | | i | | Dell International LLC | | LIBOR 1 M + 2.000% | | | 4.530 | | | 09/07/23 | | | 1,435 | |
| | 1,396,500 | | i | | Plantronics, Inc | | LIBOR 1 M + 2.500% | | | 5.022 | | | 07/02/25 | | | 1,341 | |
| | | | | | TOTAL TECHNOLOGY HARDWARE & EQUIPMENT | | | | | | | | 3,226 | |
| | | | | | | | | | | | | | | | | | |
| TRANSPORTATION - 0.0% | | | | | | | | | | | | |
| | 2,909,808 | | i | | American Airlines, Inc | | LIBOR 1 M + 2.000% | | | 4.455 | | | 12/14/23 | | | 2,761 | |
| | 1,392,965 | | i | | TransDigm, Inc | | LIBOR 1 M + 2.500% | | | 5.022 | | | 08/22/24 | | | 1,312 | |
| | 544,106 | | i | | Vouvray US Finance, LLC | | LIBOR 1 M + 3.000% | | | 5.522 | | | 03/11/24 | | | 510 | |
| | | | | | TOTAL TRANSPORTATION | | | | | | | | | | | 4,583 | |
| | | | | | | | | | | | | | | | | | |
| | | | | | TOTAL BANK LOAN OBLIGATIONS | | | | | | | | | 47,343 | |
| | | | | | (Cost $49,877) | | | | | | | | | | | | |
| | | | | | | | | | | | | | | | | | |
| BONDS - 97.6% | | | | | | | | | | | | |
| | | | | | | | | | | | | | | | | | |
| CORPORATE BONDS - 31.9% | | | | | | | | | | | | |
| | | | | | | | | | | | | | | | | | |
| AUTOMOBILES & COMPONENTS - 0.4% | | | | | | | | | | | | |
| EUR | 650,000 | | g | | Adient Global Holdings Ltd | | | | | 3.500 | | | 08/15/24 | | | 597 | |
COLLEGE RETIREMENT EQUITIES FUND -Bond Market Account
| PRINCIPAL | | | | ISSUER | | | | RATE | | MATURITY
DATE | | VALUE
(000) | |
| $ | 4,050,000 | | | | Aptiv plc | | | | | 3.150 | % | | 11/19/20 | | $ | 4,020 | |
| | 1,350,000 | | g | | Gates Global LLC | | | | | 6.000 | | | 07/15/22 | | | 1,323 | |
| | 8,775,000 | | | | General Motors Co | | | | | 4.200 | | | 10/01/27 | | | 7,913 | |
| | 6,950,000 | | | | General Motors Co | | | | | 6.600 | | | 04/01/36 | | | 6,772 | |
| | 3,350,000 | | | | General Motors Co | | | | | 6.250 | | | 10/02/43 | | | 3,143 | |
| | 6,500,000 | | | | General Motors Co | | | | | 5.200 | | | 04/01/45 | | | 5,396 | |
| | 1,925,000 | | | | General Motors Co | | | | | 6.750 | | | 04/01/46 | | | 1,866 | |
| | 2,425,000 | | g | | Hyundai Capital America | | | | | 2.600 | | | 03/19/20 | | | 2,394 | |
| | 3,850,000 | | g | | Hyundai Capital America | | | | | 2.550 | | | 04/03/20 | | | 3,801 | |
| | 4,600,000 | | g | | Hyundai Capital America | | | | | 3.250 | | | 09/20/22 | | | 4,473 | |
| | 4,000,000 | | g | | Hyundai Capital America | | | | | 4.125 | | | 06/08/23 | | | 4,004 | |
| EUR | 400,000 | | g,o | | IHO Verwaltungs GmbH | | | | | 3.750 | | | 09/15/26 | | | 439 | |
| $ | 8,675,000 | | | | Magna International, Inc | | | | | 3.625 | | | 06/15/24 | | | 8,712 | |
| | | | | | TOTAL AUTOMOBILES & COMPONENTS | | | | | | | | | 54,853 | |
| | | | | | | | | | | | | | | | | | |
| BANKS - 6.5% | | | | | | | | | | | | | |
| | 3,075,000 | | g | | Akbank TAS | | | | | 7.200 | | | 03/16/27 | | | 2,702 | |
| | 4,000,000 | | g | | Banco de Bogota S.A. | | | | | 6.250 | | | 05/12/26 | | | 4,045 | |
| | 11,400,000 | | g | | Banco del Estado de Chile | | | | | 2.668 | | | 01/08/21 | | | 11,144 | |
| | 500,000 | | g | | Banco do Brasil S.A. | | | | | 4.625 | | | 01/15/25 | | | 474 | |
| | 550,000 | | g | | Banco General S.A. | | | | | 4.125 | | | 08/07/27 | | | 505 | |
| | 3,800,000 | | g | | Banco Internacional del Peru SAA Interbank | | | | | 3.375 | | | 01/18/23 | | | 3,625 | |
| | 6,400,000 | | | | Banco Santander S.A. | | | | | 3.125 | | | 02/23/23 | | | 6,051 | |
| | 3,800,000 | | | | Banco Santander S.A. | | | | | 3.800 | | | 02/23/28 | | | 3,382 | |
| | 4,275,000 | | g | | Bangkok Bank PCL | | | | | 4.050 | | | 03/19/24 | | | 4,296 | |
| | 5,000,000 | | g | | Bank Nederlandse Gemeenten | | | | | 2.625 | | | 04/28/21 | | | 4,996 | |
| | 2,350,000 | | g | | Bank Nederlandse Gemeenten NV | | | | | 2.500 | | | 02/28/20 | | | 2,345 | |
| | 15,900,000 | | | | Bank of America Corp | | | | | 2.151 | | | 11/09/20 | | | 15,612 | |
| | 15,000,000 | | | | Bank of America Corp | | | | | 3.864 | | | 07/23/24 | | | 14,963 | |
| EUR | 400,000 | | | | Bank of America Corp | | | | | 1.375 | | | 03/26/25 | | | 461 | |
| $ | 10,200,000 | | | | Bank of America Corp | | | | | 3.875 | | | 08/01/25 | | | 10,095 | |
| | 200,000 | | | | Bank of America Corp | | | | | 4.250 | | | 10/22/26 | | | 195 | |
| EUR | 300,000 | | | | Bank of America Corp | | | | | 1.776 | | | 05/04/27 | | | 347 | |
| $ | 28,050,000 | | | | Bank of America Corp | | | | | 3.248 | | | 10/21/27 | | | 25,939 | |
| | 7,300,000 | | | | Bank of America Corp | | | | | 3.419 | | | 12/20/28 | | | 6,823 | |
| | 500,000 | | | | Bank of America Corp | | | | | 3.970 | | | 03/05/29 | | | 486 | |
| | 10,000,000 | | | | Bank of America Corp | | | | | 4.271 | | | 07/23/29 | | | 9,959 | |
| | 5,350,000 | | | | Bank of Montreal | | | | | 3.803 | | | 12/15/32 | | | 4,954 | |
| | 25,000,000 | | | | Bank of Nova Scotia | | | | | 2.125 | | | 09/11/19 | | | 24,871 | |
| | 5,450,000 | | g | | Bank of Tokyo-Mitsubishi UFJ Ltd | | | | | 2.350 | | | 09/08/19 | | | 5,418 | |
| | 5,900,000 | | | | Barclays plc | | | | | 4.338 | | | 05/16/24 | | | 5,736 | |
| | 6,700,000 | | | | Barclays plc | | | | | 3.650 | | | 03/16/25 | | | 6,191 | |
| | 500,000 | | | | Barclays plc | | | | | 5.200 | | | 05/12/26 | | | 481 | |
| | 26,000,000 | | g | | BNG Bank NV | | | | | 3.000 | | | 09/20/23 | | | 26,248 | |
| | 9,750,000 | | | | Capital One Bank USA NA | | | | | 2.650 | | | 08/08/22 | | | 9,363 | |
| | 4,500,000 | | | | Capital One Bank USA NA | | | | | 3.375 | | | 02/15/23 | | | 4,345 | |
| | 20,320,000 | | | | Capital One NA | | | | | 2.350 | | | 01/31/20 | | | 20,060 | |
| EUR | 250,000 | | | | Citigroup, Inc | | | | | 1.500 | | | 07/24/26 | | | 284 | |
| $ | 50,575,000 | | | | Citigroup, Inc | | | | | 3.200 | | | 10/21/26 | | | 46,706 | |
| | 6,575,000 | | | | Citigroup, Inc | | | | | 4.300 | | | 11/20/26 | | | 6,326 | |
| | 10,850,000 | | | | Citigroup, Inc | | | | | 3.668 | | | 07/24/28 | | | 10,256 | |
| | 175,000 | | | | Citigroup, Inc | | | | | 4.650 | | | 07/30/45 | | | 171 | |
| | 3,000,000 | | | | Citigroup, Inc | | | | | 4.650 | | | 07/23/48 | | | 2,936 | |
COLLEGE RETIREMENT EQUITIES FUND -Bond Market Account
| PRINCIPAL | | | | ISSUER | | | | RATE | | MATURITY
DATE | | VALUE
(000) | |
| $ | 7,400,000 | | | | Citizens Bank NA | | | | | 2.650 | % | | 05/26/22 | | $ | 7,189 | |
| | 6,500,000 | | | | Compass Bank | | | | | 2.875 | | | 06/29/22 | | | 6,228 | |
| | 6,875,000 | | | | Cooperatieve Centrale Raiffeisen-Boerenleenbank BA | | | 3.950 | | | 11/09/22 | | | 6,852 | |
| | 5,650,000 | | g | | Cooperatieve Rabobank UA | | | | | 3.875 | | | 09/26/23 | | | 5,669 | |
| | 15,225,000 | | | | Cooperatieve Rabobank UA | | | | | 3.750 | | | 07/21/26 | | | 14,275 | |
| | 4,825,000 | | g | | Credit Agricole S.A. | | | | | 2.500 | | | 04/15/19 | | | 4,818 | |
| | 5,500,000 | | g | | Credit Agricole S.A. | | | | | 2.375 | | | 07/01/21 | | | 5,346 | |
| | 11,050,000 | | g | | Credit Agricole S.A. | | | | | 3.250 | | | 10/04/24 | | | 10,331 | |
| | 2,450,000 | | g | | DBS Group Holdings Ltd | | | | | 4.520 | | | 12/11/28 | | | 2,508 | |
| | 4,875,000 | | | | Discover Bank | | | | | 3.200 | | | 08/09/21 | | | 4,824 | |
| | 1,400,000 | | | | Discover Bank | | | | | 3.450 | | | 07/27/26 | | | 1,284 | |
| | 5,150,000 | | | | HSBC Holdings plc | | | | | 2.650 | | | 01/05/22 | | | 4,996 | |
| | 6,575,000 | | | | HSBC Holdings plc | | | | | 3.262 | | | 03/13/23 | | | 6,434 | |
| GBP | 500,000 | | | | HSBC Holdings plc | | | | | 2.175 | | | 06/27/23 | | | 629 | |
| $ | 4,250,000 | | | | HSBC Holdings plc | | | | | 3.033 | | | 11/22/23 | | | 4,113 | |
| | 250,000 | | | | HSBC Holdings plc | | | | | 4.250 | | | 08/18/25 | | | 243 | |
| | 11,825,000 | | | | HSBC Holdings plc | | | | | 3.900 | | | 05/25/26 | | | 11,336 | |
| | 17,350,000 | | | | HSBC Holdings plc | | | | | 4.292 | | | 09/12/26 | | | 17,134 | |
| | 3,825,000 | | | | HSBC Holdings plc | | | | | 4.375 | | | 11/23/26 | | | 3,705 | |
| | 6,450,000 | | | | HSBC Holdings plc | | | | | 4.041 | | | 03/13/28 | | | 6,174 | |
| | 13,025,000 | | | | Huntington National Bank | | | | | 2.500 | | | 08/07/22 | | | 12,583 | |
| | 4,350,000 | | g | | ING Groep NV | | | | | 4.625 | | | 01/06/26 | | | 4,381 | |
| | 2,125,000 | | g | | Intercorp Financial Services, Inc | | | | | 4.125 | | | 10/19/27 | | | 1,887 | |
| | 3,100,000 | | g | | Intesa Sanpaolo S.p.A | | | | | 3.875 | | | 01/12/28 | | | 2,649 | |
| | 12,925,000 | | | | JPMorgan Chase & Co | | | | | 2.750 | | | 06/23/20 | | | 12,849 | |
| | 16,725,000 | | | | JPMorgan Chase & Co | | | | | 2.295 | | | 08/15/21 | | | 16,317 | |
| | 10,850,000 | | | | JPMorgan Chase & Co | | | | | 2.776 | | | 04/25/23 | | | 10,520 | |
| | 4,850,000 | | | | JPMorgan Chase & Co | | | | | 2.700 | | | 05/18/23 | | | 4,658 | |
| | 20,400,000 | | | | JPMorgan Chase & Co | | | | | 3.200 | | | 06/15/26 | | | 19,222 | |
| | 21,275,000 | | | | JPMorgan Chase & Co | | | | | 2.950 | | | 10/01/26 | | | 19,659 | |
| EUR | 600,000 | | | | JPMorgan Chase & Co | | | | | 1.638 | | | 05/18/28 | | | 690 | |
| $ | 12,500,000 | | | | JPMorgan Chase & Co | | | | | 4.203 | | | 07/23/29 | | | 12,470 | |
| | 11,000,000 | | | | JPMorgan Chase & Co | | | | | 4.452 | | | 12/05/29 | | | 11,196 | |
| | 5,750,000 | | | | JPMorgan Chase & Co | | | | | 3.882 | | | 07/24/38 | | | 5,239 | |
| | 200,000 | | | | JPMorgan Chase & Co | | | | | 4.950 | | | 06/01/45 | | | 203 | |
| | 2,700,000 | | | | KeyBank NA | | | | | 2.500 | | | 12/15/19 | | | 2,683 | |
| | 200,000 | | | | Lloyds Banking Group plc | | | | | 3.574 | | | 11/07/28 | | | 178 | |
| | 4,475,000 | | g | | Macquarie Bank Ltd | | | | | 2.600 | | | 06/24/19 | | | 4,462 | |
| | 9,950,000 | | | | Manufacturers & Traders Trust Co | | | | | 2.100 | | | 02/06/20 | | | 9,842 | |
| | 12,500,000 | | | | Mitsubishi UFJ Financial Group, Inc | | | | | 3.761 | | | 07/26/23 | | | 12,557 | |
| | 8,850,000 | | | | Mizuho Financial Group, Inc | | | | | 3.922 | | | 09/11/24 | | | 8,943 | |
| | 17,000,000 | | | | PNC Bank NA | | | | | 2.600 | | | 07/21/20 | | | 16,848 | |
| | 5,625,000 | | | | PNC Bank NA | | | | | 2.450 | | | 11/05/20 | | | 5,555 | |
| | 10,950,000 | | | | PNC Bank NA | | | | | 2.700 | | | 11/01/22 | | | 10,640 | |
| | 6,000,000 | | | | PNC Financial Services Group, Inc | | | | | 3.900 | | | 04/29/24 | | | 5,948 | |
| | 40,000,000 | | | | Royal Bank of Canada | | | | | 1.875 | | | 02/05/20 | | | 39,578 | |
| | 30,000,000 | | g | | Royal Bank of Canada | | | | | 3.350 | | | 10/22/21 | | | 30,312 | |
| | 11,800,000 | | | | Royal Bank of Canada | | | | | 3.700 | | | 10/05/23 | | | 11,847 | |
| | 9,350,000 | | | | Santander Holdings USA, Inc | | | | | 3.400 | | | 01/18/23 | | | 8,985 | |
| | 4,825,000 | | | | Santander Holdings USA, Inc | | | | | 4.400 | | | 07/13/27 | | | 4,568 | |
| | 3,325,000 | | | | Santander UK Group Holdings plc | | | | | 3.571 | | | 01/10/23 | | | 3,182 | |
| | 13,100,000 | | g | | Skandinaviska Enskilda Banken AB | | | | | 2.625 | | | 11/17/20 | | | 12,911 | |
| | 6,650,000 | | | | Sumitomo Mitsui Banking Corp | | | | | 2.450 | | | 01/16/20 | | | 6,596 | |
COLLEGE RETIREMENT EQUITIES FUND -Bond Market Account
| PRINCIPAL | | | | ISSUER | | | | RATE | | MATURITY
DATE | | VALUE
(000) | |
| $ | 13,875,000 | | | | Sumitomo Mitsui Financial Group, Inc | | | 2.442 | % | | 10/19/21 | | $ | 13,528 | |
| | 3,675,000 | | | | Sumitomo Mitsui Financial Group, Inc | | | 2.778 | | | 10/18/22 | | | 3,571 | |
| | 6,850,000 | | | | SunTrust Banks, Inc | | | | | 2.900 | | | 03/03/21 | | | 6,791 | |
| | 5,700,000 | | | | SunTrust Banks, Inc | | | | | 2.750 | | | 05/01/23 | | | 5,504 | |
| | 3,900,000 | | | | SunTrust Banks, Inc | | | | | 4.050 | | | 11/03/25 | | | 3,968 | |
| | 3,500,000 | | g | | TC Ziraat Bankasi AS. | | | | | 5.125 | | | 09/29/23 | | | 3,094 | |
| | 13,700,000 | | | | Toronto-Dominion Bank | | | | | 1.850 | | | 09/11/20 | | | 13,447 | |
| | 2,350,000 | | | | Toronto-Dominion Bank | | | | | 3.625 | | | 09/15/31 | | | 2,221 | |
| | 2,100,000 | | g | | Turkiye Is Bankasi | | | | | 5.500 | | | 04/21/22 | | | 1,898 | |
| | 4,275,000 | | g | | Turkiye Is Bankasi | | | | | 6.125 | | | 04/25/24 | | | 3,606 | |
| | 5,000,000 | | g | | UBS AG. | | | | | 2.450 | | | 12/01/20 | | | 4,909 | |
| | 2,650,000 | | g | | UBS AG. | | | | | 4.500 | | | 06/26/48 | | | 2,742 | |
| | 5,700,000 | | | | UnionBanCal Corp | | | | | 3.500 | | | 06/18/22 | | | 5,713 | |
| | 7,575,000 | | | | Wells Fargo Bank NA | | | | | 3.325 | | | 07/23/21 | | | 7,567 | |
| | 10,000,000 | | | | Westpac Banking Corp | | | | | 2.750 | | | 01/11/23 | | | 9,703 | |
| | 8,475,000 | | | | Westpac Banking Corp | | | | | 4.322 | | | 11/23/31 | | | 8,006 | |
| | 5,000,000 | | g | | Yapi ve Kredi Bankasi AS. | | | | | 6.100 | | | 03/16/23 | | | 4,458 | |
| | | | | | TOTAL BANKS | | | | | | | | | | | 857,763 | |
| | | | | | | | | | | | | | | | | | |
| CAPITAL GOODS - 0.7% | | | | | | | | | | | | |
| GBP | 1,000,000 | | | | BAE Systems plc | | | | | 4.125 | | | 06/08/22 | | | 1,354 | |
| $ | 250,000 | | | | Eaton Corp | | | | | 4.150 | | | 11/02/42 | | | 232 | |
| | 7,575,000 | | | | General Electric Co | | | | | 4.125 | | | 10/09/42 | | | 5,909 | |
| EUR | 1,000,000 | | | | Illinois Tool Works, Inc | | | | | 1.250 | | | 05/22/23 | | | 1,188 | |
| $ | 2,650,000 | | g | | Korea East-West Power Co Ltd | | | | | 3.875 | | | 07/19/23 | | | 2,685 | |
| | 8,350,000 | | | | Lockheed Martin Corp | | | | | 2.500 | | | 11/23/20 | | | 8,257 | |
| | 5,200,000 | | | | Lockheed Martin Corp | | | | | 3.550 | | | 01/15/26 | | | 5,162 | |
| | 6,375,000 | | g | | Molex Electronic Technologies LLC | | | 2.878 | | | 04/15/20 | | | 6,313 | |
| | 9,825,000 | | g | | Molex Electronic Technologies LLC | | | 3.900 | | | 04/15/25 | | | 9,779 | |
| | 1,725,000 | | | | Mosaic Co | | | | | 4.875 | | | 11/15/41 | | | 1,573 | |
| EUR | 500,000 | | | | Parker-Hannifin Corp | | | | | 1.125 | | | 03/01/25 | | | 575 | |
| $ | 8,725,000 | | | | Rockwell Collins, Inc | | | | | 3.500 | | | 03/15/27 | | | 8,195 | |
| | 500,000 | | | | Rockwell Collins, Inc | | | | | 4.350 | | | 04/15/47 | | | 461 | |
| | 5,475,000 | | | | Roper Technologies, Inc | | | | | 3.800 | | | 12/15/26 | | | 5,341 | |
| | 350,000 | | g | | Stena AB | | | | | 7.000 | | | 02/01/24 | | | 319 | |
| | 2,075,000 | | | | Textron, Inc | | | | | 3.875 | | | 03/01/25 | | | 2,023 | |
| | 650,000 | | | | Trimble, Inc | | | | | 4.900 | | | 06/15/28 | | | 640 | |
| EUR | 500,000 | | | | United Technologies Corp | | | | | 1.150 | | | 05/18/24 | | | 566 | |
| $ | 16,450,000 | | | | United Technologies Corp | | | | | 4.125 | | | 11/16/28 | | | 16,334 | |
| | 10,400,000 | | | | United Technologies Corp | | | | | 4.450 | | | 11/16/38 | | | 10,100 | |
| | | | | | TOTAL CAPITAL GOODS | | | | | | | | | | | 87,006 | |
| | | | | | | | | | | | | | | | | | |
| COMMERCIAL & PROFESSIONAL SERVICES - 0.4% | | | | | | | | | | | | |
| | 1,425,000 | | | | ADT Corp | | | | | 6.250 | | | 10/15/21 | | | 1,445 | |
| | 1,390,000 | | | | ADT Corp | | | | | 3.500 | | | 07/15/22 | | | 1,286 | |
| | 4,875,000 | | | | AECOM | | | | | 5.875 | | | 10/15/24 | | | 4,802 | |
| EUR | 500,000 | | | | RELX Capital, Inc | | | | | 1.300 | | | 05/12/25 | | | 564 | |
| $ | 11,102,000 | | | | Republic Services, Inc | | | | | 3.550 | | | 06/01/22 | | | 11,148 | |
| | 8,171,000 | | | | Republic Services, Inc | | | | | 2.900 | | | 07/01/26 | | | 7,711 | |
| | 1,000,000 | | | | United Rentals North America, Inc | | | 4.625 | | | 10/15/25 | | | 893 | |
| | 9,650,000 | | | | Waste Management, Inc | | | | | 2.900 | | | 09/15/22 | | | 9,493 | |
| | 9,700,000 | | | | Waste Management, Inc | | | | | 3.150 | | | 11/15/27 | | | 9,266 | |
| | 2,000,000 | | | | Waste Management, Inc | | | | | 3.900 | | | 03/01/35 | | | 1,943 | |
COLLEGE RETIREMENT EQUITIES FUND -Bond Market Account
| PRINCIPAL | | | | ISSUER | | | | RATE | | MATURITY
DATE | | VALUE
(000) | |
| $ | 2,225,000 | | | | Waste Management, Inc | | | | | 4.100 | % | | 03/01/45 | | $ | 2,151 | |
| | | | | | TOTAL COMMERCIAL & PROFESSIONAL SERVICES | | | | | | | | | 50,702 | |
| | | | | | | | | | | | | | | | | | |
| CONSUMER DURABLES & APPAREL - 0.1% | | | | | | | | | | | | |
| | 8,075,000 | | | | Newell Rubbermaid, Inc | | | | | 4.200 | | | 04/01/26 | | | 7,896 | |
| | | | | | TOTAL CONSUMER DURABLES & APPAREL | | | | | | | | 7,896 | |
| | | | | | | | | | | | | | | | | | |
| CONSUMER SERVICES - 1.2% | | | | | | | | | | | | |
| | 9,820,000 | | | | Amherst College | | | | | 4.100 | | | 11/01/45 | | | 9,955 | |
| | 29,385,000 | | g | | Anheuser-Busch Cos LLC | | | | | 3.650 | | | 02/01/26 | | | 27,776 | |
| EUR | 680,000 | | g | | Aramark International Finance Sarl | | | 3.125 | | | 04/01/25 | | | 781 | |
| $ | 3,400,000 | | g | | Arcos Dorados Holdings, Inc | | | | | 5.875 | | | 04/04/27 | | | 3,226 | |
| | 600,000 | | | | Boyd Gaming Corp | | | | | 6.000 | | | 08/15/26 | | | 561 | |
| | 2,000,000 | | | | Duke University | | | | | 3.199 | | | 10/01/38 | | | 1,836 | |
| | 16,000,000 | | | | George Washington University | | | | | 3.545 | | | 09/15/46 | | | 14,477 | |
| | 1,610,000 | | g | | International Game Technology | | | | | 6.250 | | | 02/15/22 | | | 1,614 | |
| | 1,610,000 | | g | | International Game Technology | | | | | 6.500 | | | 02/15/25 | | | 1,586 | |
| EUR | 500,000 | | g | | International Game Technology plc | | | | | 4.750 | | | 02/15/23 | | | 609 | |
| $ | 5,000,000 | | | | Johns Hopkins University | | | | | 4.083 | | | 07/01/53 | | | 4,984 | |
| | 750,000 | | | | MGM Resorts International | | | | | 4.625 | | | 09/01/26 | | | 673 | |
| | 9,605,000 | | | | Northwestern University | | | | | 3.812 | | | 12/01/50 | | | 9,558 | |
| | 8,000,000 | | | | President and Fellows of Harvard College | | | 3.529 | | | 10/01/31 | | | 8,090 | |
| | 14,250,000 | | | | President and Fellows of Harvard College | | | 3.619 | | | 10/01/37 | | | 14,065 | |
| | 8,108,000 | | g | | Prime Security Services Borrower LLC | | | | | 9.250 | | | 05/15/23 | | | 8,361 | |
| | 2,025,000 | | g | | Sands China Ltd | | | | | 5.125 | | | 08/08/25 | | | 2,006 | |
| | 2,100,000 | | g | | Sands China Ltd | | | | | 5.400 | | | 08/08/28 | | | 2,028 | |
| | 1,000,000 | | g | | Scientific Games International, Inc | | | | | 5.000 | | | 10/15/25 | | | 893 | |
| EUR | 500,000 | | g | | Scientific Games International, Inc | | | | | 3.375 | | | 02/15/26 | | | 531 | |
| $ | 2,600,000 | | g | | ServiceMaster Co LLC | | | | | 5.125 | | | 11/15/24 | | | 2,457 | |
| | 15,000,000 | | | | Smith College | | | | | 4.620 | | | 07/01/45 | | | 16,520 | |
| | 6,600,000 | | | | Trustees of Dartmouth College | | | | | 3.474 | | | 06/01/46 | | | 6,259 | |
| | 21,000,000 | | | | University of Chicago | | | | | 4.151 | | | 10/01/45 | | | 20,841 | |
| | | | | | TOTAL CONSUMER SERVICES | | | | | | | | | | | 159,687 | |
| | | | | | | | | | | | | | | | | | |
| DIVERSIFIED FINANCIALS - 3.4% | | | | | | | | | | | | |
| | 4,920,000 | | | | AerCap Ireland Capital DAC | | | | | 3.500 | | | 01/15/25 | | | 4,491 | |
| | 500,000 | | | | AerCap Ireland Capital Ltd | | | | | 5.000 | | | 10/01/21 | | | 508 | |
| | 10,625,000 | | | | American Express Co | | | | | 2.500 | | | 08/01/22 | | | 10,255 | |
| | 300,000 | | | | American Express Credit Corp | | | | | 2.375 | | | 05/26/20 | | | 297 | |
| | 2,425,000 | | | | American Express Credit Corp | | | | | 2.700 | | | 03/03/22 | | | 2,377 | |
| | 2,775,000 | | | | American Express Credit Corp | | | | | 3.300 | | | 05/03/27 | | | 2,700 | |
| | 6,000,000 | | | | Australia & New Zealand Banking Group Ltd | | | | | 2.625 | | | 05/19/22 | | | 5,846 | |
| | 2,250,000 | | g | | Avolon Holdings Funding Ltd | | | | | 5.125 | | | 10/01/23 | | | 2,149 | |
| | 4,125,000 | | | | Bank of New York Mellon Corp | | | | | 5.450 | | | 05/15/19 | | | 4,163 | |
| | 7,225,000 | | | | Bank of New York Mellon Corp | | | | | 3.500 | | | 04/28/23 | | | 7,246 | |
| | 300,000 | | g | | BBVA Bancomer S.A. | | | | | 5.350 | | | 11/12/29 | | | 276 | |
| | 4,575,000 | | g | | BBVA Bancomer S.A. | | | | | 5.125 | | | 01/18/33 | | | 3,969 | |
| | 10,525,000 | | | | Berkshire Hathaway, Inc | | | | | 3.125 | | | 03/15/26 | | | 10,206 | |
| | 2,450,000 | | g | | BPCE S.A. | | | | | 4.000 | | | 09/12/23 | | | 2,422 | |
| | 5,224,000 | | g | | BPCE S.A. | | | | | 4.625 | | | 07/11/24 | | | 5,137 | |
| | 1,733,000 | | g | | BPCE S.A. | | | | | 4.500 | | | 03/15/25 | | | 1,678 | |
| | 26,000,000 | | g | | Canadian Imperial Bank of Commerce | | | | | 3.150 | | | 06/27/21 | | | 26,148 | |
| | 250,000 | | | | Capital One Financial Corp | | | | | 3.050 | | | 03/09/22 | | | 244 | |
COLLEGE RETIREMENT EQUITIES FUND -Bond Market Account
| PRINCIPAL | | | | ISSUER | | | | RATE | | MATURITY
DATE | | VALUE
(000) | |
| $ | 500,000 | | | | Capital One Financial Corp | | | | | 3.750 | % | | 07/28/26 | | $ | 458 | |
| | 250,000 | | | | Credit Suisse | | | | | 3.625 | | | 09/09/24 | | | 245 | |
| | 9,800,000 | | g | | Credit Suisse Group AG. | | | | | 2.997 | | | 12/14/23 | | | 9,325 | |
| EUR | 250,000 | | g | | Credit Suisse Group AG. | | | | | 1.250 | | | 07/17/25 | | | 280 | |
| $ | 3,900,000 | | g | | Credit Suisse Group AG. | | | | | 4.282 | | | 01/09/28 | | | 3,765 | |
| | 7,700,000 | | | | Credit Suisse Group Funding Guernsey Ltd | | | | | 3.800 | | | 06/09/23 | | | 7,555 | |
| | 10,250,000 | | | | Credit Suisse Group Funding Guernsey Ltd | | | | | 3.750 | | | 03/26/25 | | | 9,806 | |
| | 13,800,000 | | g | | Daimler Finance North America LLC | | | | | 2.200 | | | 10/30/21 | | | 13,308 | |
| | 9,200,000 | | | | Deutsche Bank AG. | | | | | 3.950 | | | 02/27/23 | | | 8,686 | |
| | 100,000 | | | | Discover Financial Services | | | | | 3.950 | | | 11/06/24 | | | 99 | |
| | 6,600,000 | | | | DY8 Leasing LLC | | | | | 2.627 | | | 04/29/26 | | | 6,566 | |
| | 9,845,100 | | | | DY9 Leasing LLC | | | | | 2.372 | | | 03/19/27 | | | 9,682 | |
| EUR | 500,000 | | | | EDP Finance BV | | | | | 1.125 | | | 02/12/24 | | | 566 | |
| $ | 4,975,000 | | | | Ford Motor Credit Co LLC | | | | | 2.425 | | | 06/12/20 | | | 4,844 | |
| | 4,000,000 | | | | Ford Motor Credit Co LLC | | | | | 3.096 | | | 05/04/23 | | | 3,616 | |
| | 12,925,000 | | | | Ford Motor Credit Co LLC | | | | | 3.815 | | | 11/02/27 | | | 10,911 | |
| | 7,628,000 | | | | GE Capital International Funding Co | | | | | 4.418 | | | 11/15/35 | | | 6,417 | |
| | 1,432,000 | | | | General Electric Capital Corp | | | | | 5.875 | | | 01/14/38 | | | 1,370 | |
| | 108,000 | | | | General Electric Capital Corp | | | | | 6.875 | | | 01/10/39 | | | 113 | |
| | 6,500,000 | | | | General Motors Financial Co, Inc | | | | | 3.950 | | | 04/13/24 | | | 6,173 | |
| | 300,000 | | | | General Motors Financial Co, Inc | | | | | 4.300 | | | 07/13/25 | | | 284 | |
| EUR | 850,000 | | | | Goldman Sachs Group, Inc | | | | | 2.000 | | | 07/27/23 | | | 1,003 | |
| $ | 13,575,000 | | | | Goldman Sachs Group, Inc | | | | | 3.500 | | | 01/23/25 | | | 12,873 | |
| | 25,350,000 | | | | Goldman Sachs Group, Inc | | | | | 3.691 | | | 06/05/28 | | | 23,573 | |
| | 500,000 | | | | Goldman Sachs Group, Inc | | | | | 4.223 | | | 05/01/29 | | | 481 | |
| | 6,075,000 | | | | Goldman Sachs Group, Inc | | | | | 4.017 | | | 10/31/38 | | | 5,344 | |
| | 7,675,000 | | | | Goldman Sachs Group, Inc | | | | | 4.800 | | | 07/08/44 | | | 7,318 | |
| | 100,000 | | | | Goldman Sachs Group, Inc | | | | | 5.150 | | | 05/22/45 | | | 93 | |
| | 1,567,937 | | | | Golondrina Leasing LLC | | | | | 1.822 | | | 05/03/25 | | | 1,513 | |
| | 1,166,593 | | | | Helios Leasing I LLC | | | | | 2.018 | | | 05/29/24 | | | 1,143 | |
| | 1,725,000 | | | | Icahn Enterprises LP | | | | | 5.875 | | | 02/01/22 | | | 1,690 | |
| | 5,750,000 | | g | | ICICI Bank Ltd | | | | | 3.800 | | | 12/14/27 | | | 5,194 | |
| | 3,200,000 | | | | International Lease Finance Corp | | | | | 5.875 | | | 04/01/19 | | | 3,213 | |
| | 5,000,000 | | | | International Lease Finance Corp | | | | | 5.875 | | | 08/15/22 | | | 5,237 | |
| | 3,050,000 | | | | Jefferies Group LLC | | | | | 4.150 | | | 01/23/30 | | | 2,617 | |
| | 250,000 | | | | Jefferies Group, Inc | | | | | 6.450 | | | 06/08/27 | | | 262 | |
| | 1,625,000 | | | | Legg Mason, Inc | | | | | 2.700 | | | 07/15/19 | | | 1,620 | |
| | 2,400,000 | | | | Legg Mason, Inc | | | | | 3.950 | | | 07/15/24 | | | 2,365 | |
| EUR | 350,000 | | g | | Lincoln Finance Ltd | | | | | 6.875 | | | 04/15/21 | | | 409 | |
| $ | 7,625,000 | | | | Morgan Stanley | | | | | 3.125 | | | 01/23/23 | | | 7,443 | |
| | 2,750,000 | | | | Morgan Stanley | | | | | 3.737 | | | 04/24/24 | | | 2,729 | |
| | 24,800,000 | | | | Morgan Stanley | | | | | 3.700 | | | 10/23/24 | | | 24,386 | |
| | 32,125,000 | | | | Morgan Stanley | | | | | 3.125 | | | 07/27/26 | | | 29,651 | |
| | 250,000 | | | | Morgan Stanley | | | | | 4.350 | | | 09/08/26 | | | 243 | |
| EUR | 900,000 | | | | Morgan Stanley | | | | | 1.342 | | | 10/23/26 | | | 1,008 | |
| $ | 5,000,000 | | g | | Nederlandse Waterschapsbank NV | | | | | 1.875 | | | 04/14/22 | | | 4,861 | |
| | 3,226,050 | | | | Santa Rosa Leasing LLC | | | | | 1.693 | | | 08/15/24 | | | 3,133 | |
| | 100,000 | | | | Shire Acquisitions Investments Ireland DAC | | | | | 2.400 | | | 09/23/21 | | | 97 | |
| | 17,580,000 | | | | Shire Acquisitions Investments Ireland DAC | | | | | 3.200 | | | 09/23/26 | | | 15,917 | |
| | 200,000 | | | | Synchrony Financial | | | | | 4.250 | | | 08/15/24 | | | 184 | |
| | 6,625,000 | | | | TD Ameritrade Holding Corp | | | | | 3.300 | | | 04/01/27 | | | 6,340 | |
| | 6,800,000 | | g | | UBS Group Funding Jersey Ltd | | | | | 2.950 | | | 09/24/20 | | | 6,727 | |
| | 11,600,000 | | g | | UBS Group Funding Jersey Ltd | | | | | 2.650 | | | 02/01/22 | | | 11,227 | |
COLLEGE RETIREMENT EQUITIES FUND -Bond Market Account
| PRINCIPAL | | | | ISSUER | | | | RATE | | MATURITY
DATE | | VALUE
(000) | |
| $ | 9,775,000 | | | | Unilever Capital Corp | | | | | 2.900 | % | | 05/05/27 | | $ | 9,283 | |
| | 45,550,000 | | | | Wells Fargo & Co | | | | | 2.625 | | | 07/22/22 | | | 43,920 | |
| | 13,850,000 | | | | Wells Fargo & Co | | | | | 3.000 | | | 04/22/26 | | | 12,912 | |
| | 4,600,000 | | | | Wells Fargo & Co | | | | | 3.584 | | | 05/22/28 | | | 4,419 | |
| | | | | | TOTAL DIVERSIFIED FINANCIALS | | | | | | | | | | | 454,609 | |
| | | | | | | | | | | | | | | | | | |
| ENERGY - 3.2% | | | | | | | | | | | | | |
| | 1,825,000 | | g | | Abu Dhabi Crude Oil Pipeline LLC | | | | | 4.600 | | | 11/02/47 | | | 1,782 | |
| | 2,375,000 | | | | AmeriGas Partners LP | | | | | 5.625 | | | 05/20/24 | | | 2,244 | |
| | 2,050,000 | | | | AmeriGas Partners LP | | | | | 5.875 | | | 08/20/26 | | | 1,871 | |
| | 4,200,000 | | | | Anadarko Petroleum Corp | | | | | 5.550 | | | 03/15/26 | | | 4,401 | |
| | 5,925,000 | | | | Anadarko Petroleum Corp | | | | | 4.500 | | | 07/15/44 | | | 5,027 | |
| | 3,025,000 | | | | Andeavor Logistics LP | | | | | 4.250 | | | 12/01/27 | | | 2,857 | |
| | 3,100,000 | | | | Andeavor Logistics LP | | | | | 5.200 | | | 12/01/47 | | | 2,794 | |
| | 79,000 | | | | Apache Corp | | | | | 3.250 | | | 04/15/22 | | | 77 | |
| | 1,575,000 | | g | | APT Pipelines Ltd | | | | | 4.250 | | | 07/15/27 | | | 1,533 | |
| | 3,800,000 | | | | BP Capital Markets America, Inc | | | | | 2.520 | | | 09/19/22 | | | 3,675 | |
| | 13,000,000 | | | | BP Capital Markets America, Inc | | | | | 3.796 | | | 09/21/25 | | | 13,068 | |
| | 7,500,000 | | | | BP Capital Markets America, Inc | | | | | 3.588 | | | 04/14/27 | | | 7,331 | |
| | 13,300,000 | | | | BP Capital Markets plc | | | | | 2.315 | | | 02/13/20 | | | 13,185 | |
| | 6,575,000 | | | | BP Capital Markets plc | | | | | 3.279 | | | 09/19/27 | | | 6,262 | |
| | 699,000 | | †,g | | California Resources Corp | | | | | 8.000 | | | 12/15/22 | | | 474 | |
| | 478,000 | | † | | California Resources Corp | | | | | 6.000 | | | 11/15/24 | | | 292 | |
| | 6,500,000 | | | | Cenovus Energy, Inc | | | | | 4.450 | | | 09/15/42 | | | 5,089 | |
| | 2,800,000 | | g | | Cheniere Energy Partners LP | | | | | 5.625 | | | 10/01/26 | | | 2,618 | |
| | 3,025,000 | | | | Cimarex Energy Co | | | | | 3.900 | | | 05/15/27 | | | 2,809 | |
| | 6,200,000 | | g | | Colonial Pipeline Co | | | | | 4.250 | | | 04/15/48 | | | 5,953 | |
| | 6,150,000 | | | | Concho Resources, Inc | | | | | 3.750 | | | 10/01/27 | | | 5,793 | |
| | 3,875,000 | | | | Continental Resources, Inc | | | | | 3.800 | | | 06/01/24 | | | 3,668 | |
| | 690,000 | | | | Continental Resources, Inc | | | | | 4.375 | | | 01/15/28 | | | 649 | |
| | 2,375,000 | | | | Crestwood Midstream Partners LP | | | | | 5.750 | | | 04/01/25 | | | 2,203 | |
| | 2,900,000 | | | | Devon Energy Corp | | | | | 5.000 | | | 06/15/45 | | | 2,572 | |
| | 2,350,000 | | | | Ecopetrol S.A. | | | | | 5.375 | | | 06/26/26 | | | 2,365 | |
| | 5,200,000 | | | | Ecopetrol S.A. | | | | | 5.875 | | | 05/28/45 | | | 4,903 | |
| | 2,250,000 | | g | | Empresa Nacional del Petroleo | | | | | 5.250 | | | 11/06/29 | | | 2,287 | |
| | 7,750,000 | | | | Enbridge, Inc | | | | | 3.700 | | | 07/15/27 | | | 7,345 | |
| | 8,900,000 | | | | Energy Transfer Partners LP | | | | | 4.750 | | | 01/15/26 | | | 8,654 | |
| | 7,850,000 | | | | Energy Transfer Partners LP | | | | | 4.950 | | | 06/15/28 | | | 7,696 | |
| | 5,125,000 | | | | Enterprise Products Operating LLC | | | | | 3.700 | | | 02/15/26 | | | 5,052 | |
| | 8,400,000 | | | | Enterprise Products Operating LLC | | | | | 4.150 | | | 10/16/28 | | | 8,363 | |
| | 4,025,000 | | | | Enterprise Products Operating LLC | | | | | 4.250 | | | 02/15/48 | | | 3,573 | |
| | 100,000 | | | | Enterprise Products Operating LLC | | | | | 5.250 | | | 08/16/77 | | | 83 | |
| | 5,800,000 | | | | EQT Corp | | | | | 3.900 | | | 10/01/27 | | | 5,003 | |
| | 3,000,000 | | | | Exterran Partners LP | | | | | 6.000 | | | 04/01/21 | | | 2,880 | |
| | 2,250,000 | | | | Exterran Partners LP | | | | | 6.000 | | | 10/01/22 | | | 2,115 | |
| | 3,400,000 | | | | Exxon Mobil Corp | | | | | 2.397 | | | 03/06/22 | | | 3,337 | |
| | 300,000 | | g | | Gazprom OAO Via Gaz Capital S.A. | | | | | 4.950 | | | 03/23/27 | | | 286 | |
| | 200,000 | | g | | Gazprom OAO Via Gaz Capital S.A. | | | | | 4.950 | | | 02/06/28 | | | 191 | |
| | 3,000,000 | | | | HollyFrontier Corp | | | | | 5.875 | | | 04/01/26 | | | 3,034 | |
| | 5,275,000 | | g | | KazMunayGas National Co JSC | | | | | 5.375 | | | 04/24/30 | | | 5,178 | |
| | 2,825,000 | | | | Kinder Morgan, Inc | | | | | 9.000 | | | 02/01/19 | | | 2,837 | |
| EUR | 500,000 | | | | Kinder Morgan, Inc | | | | | 2.250 | | | 03/16/27 | | | 567 | |
| $ | 13,200,000 | | | | Kinder Morgan, Inc | | | | | 4.300 | | | 03/01/28 | | | 12,959 | |
| | 2,215,000 | | | | Kinder Morgan, Inc | | | | | 5.300 | | | 12/01/34 | | | 2,175 | |
COLLEGE RETIREMENT EQUITIES FUND -Bond Market Account
| PRINCIPAL | | | | ISSUER | | | | RATE | | MATURITY
DATE | | VALUE
(000) | |
| $ | 4,850,000 | | | | Kinder Morgan, Inc | | | | | 5.400 | % | | 09/01/44 | | $ | 4,642 | |
| | 5,030,000 | | | | Marathon Oil Corp | | | | | 2.700 | | | 06/01/20 | | | 4,955 | |
| | 2,000,000 | | | | Marathon Oil Corp | | | | | 4.400 | | | 07/15/27 | | | 1,901 | |
| | 100,000 | | g | | Marathon Petroleum Corp | | | | | 5.125 | | | 12/15/26 | | | 102 | |
| | 11,387,000 | | | | MPLX LP | | | | | 4.125 | | | 03/01/27 | | | 10,848 | |
| | 5,850,000 | | | | MPLX LP | | | | | 4.000 | | | 03/15/28 | | | 5,486 | |
| | 6,150,000 | | | | MPLX LP | | | | | 4.500 | | | 04/15/38 | | | 5,377 | |
| | 6,150,000 | | | | MPLX LP | | | | | 4.700 | | | 04/15/48 | | | 5,336 | |
| | 900,000 | | | | Noble Energy, Inc | | | | | 3.900 | | | 11/15/24 | | | 872 | |
| | 9,500,000 | | | | Noble Energy, Inc | | | | | 3.850 | | | 01/15/28 | | | 8,601 | |
| | 6,075,000 | | | | Noble Energy, Inc | | | | | 5.050 | | | 11/15/44 | | | 5,239 | |
| | 1,500,000 | | | | Noble Energy, Inc | | | | | 4.950 | | | 08/15/47 | | | 1,299 | |
| | 3,500,000 | | | | ONE Gas, Inc | | | | | 3.610 | | | 02/01/24 | | | 3,510 | |
| | 2,500,000 | | | | ONEOK, Inc | | | | | 4.000 | | | 07/13/27 | | | 2,386 | |
| | 6,150,000 | | | | ONEOK, Inc | | | | | 4.550 | | | 07/15/28 | | | 6,094 | |
| | 5,125,000 | | g | | Pertamina Persero PT | | | | | 4.300 | | | 05/20/23 | | | 5,051 | |
| | 3,050,000 | | g | | Peru LNG Srl | | | | | 5.375 | | | 03/22/30 | | | 2,951 | |
| | 625,000 | | g | | Petroamazonas EP | | | | | 4.625 | | | 11/06/20 | | | 581 | |
| | 2,025,000 | | | | Petrobras Global Finance BV | | | | | 5.299 | | | 01/27/25 | | | 1,934 | |
| | 2,335,000 | | | | Petrobras Global Finance BV | | | | | 5.999 | | | 01/27/28 | | | 2,198 | |
| | 400,000 | | | | Petrobras Global Finance BV | | | | | 5.750 | | | 02/01/29 | | | 370 | |
| | 750,000 | | | | Petrobras Global Finance BV | | | | | 7.250 | | | 03/17/44 | | | 739 | |
| | 750,000 | | g | | Petroleos del Peru S.A. | | | | | 4.750 | | | 06/19/32 | | | 720 | |
| | 4,000,000 | | | | Petroleos Mexicanos | | | | | 6.375 | | | 02/04/21 | | | 4,044 | |
| | 1,500,000 | | | | Petroleos Mexicanos | | | | | 4.875 | | | 01/24/22 | | | 1,460 | |
| EUR | 375,000 | | | | Petroleos Mexicanos | | | | | 1.875 | | | 04/21/22 | | | 405 | |
| $ | 8,000,000 | | | | Petroleos Mexicanos | | | | | 1.950 | | | 12/20/22 | | | 7,851 | |
| | 4,280,000 | | | | Petroleos Mexicanos | | | | | 2.000 | | | 12/20/22 | | | 4,205 | |
| | 9,000,000 | | | | Petroleos Mexicanos | | | | | 3.500 | | | 01/30/23 | | | 8,145 | |
| | 3,900,000 | | | | Petroleos Mexicanos | | | | | 4.500 | | | 01/23/26 | | | 3,362 | |
| | 3,775,000 | | | | Petroleos Mexicanos | | | | | 6.500 | | | 03/13/27 | | | 3,548 | |
| | 3,300,000 | | | | Petroleos Mexicanos | | | | | 5.350 | | | 02/12/28 | | | 2,879 | |
| | 500,000 | | | | Petroleos Mexicanos | | | | | 6.500 | | | 06/02/41 | | | 414 | |
| | 6,575,000 | | | | Phillips 66 Partners LP | | | | | 3.550 | | | 10/01/26 | | | 6,149 | |
| | 3,275,000 | | | | Phillips 66 Partners LP | | | | | 4.680 | | | 02/15/45 | | | 2,953 | |
| | 1,600,000 | | | | Phillips 66 Partners LP | | | | | 4.900 | | | 10/01/46 | | | 1,462 | |
| | 614,000 | | | | Pioneer Natural Resources Co | | | | | 7.500 | | | 01/15/20 | | | 638 | |
| | 8,675,000 | | | | Pioneer Natural Resources Co | | | | | 3.450 | | | 01/15/21 | | | 8,649 | |
| | 100,000 | | | | Plains All American Pipeline LP | | | | | 4.500 | | | 12/15/26 | | | 96 | |
| | 3,335,000 | | | | Range Resources Corp | | | | | 5.000 | | | 08/15/22 | | | 2,985 | |
| | 1,200,000 | | | | Regency Energy Partners LP | | | | | 4.500 | | | 11/01/23 | | | 1,200 | |
| | 4,750,000 | | g | | Reliance Industries Ltd | | | | | 3.667 | | | 11/30/27 | | | 4,339 | |
| | 9,875,000 | | | | Sabine Pass Liquefaction LLC | | | | | 4.200 | | | 03/15/28 | | | 9,451 | |
| | 5,550,000 | | | | Shell International Finance BV | | | | | 2.250 | | | 01/06/23 | | | 5,337 | |
| | 4,875,000 | | | | Shell International Finance BV | | | | | 3.250 | | | 05/11/25 | | | 4,809 | |
| | 6,825,000 | | | | Shell International Finance BV | | | | | 4.000 | | | 05/10/46 | | | 6,600 | |
| | 3,950,000 | | | | Spectra Energy Partners LP | | | | | 3.500 | | | 03/15/25 | | | 3,772 | |
| | 5,300,000 | | | | Statoil ASA | | | | | 2.450 | | | 01/17/23 | | | 5,149 | |
| | 250,000 | | | | Suncor Energy, Inc | | | | | 3.600 | | | 12/01/24 | | | 245 | |
| | 6,500,000 | | | | Sunoco Logistics Partners Operations LP | | | 4.000 | | | 10/01/27 | | | 5,963 | |
| | 1,000,000 | | | | Sunoco LP | | | | | 4.875 | | | 01/15/23 | | | 975 | |
| | 600,000 | | | | Targa Resources Partners LP | | | | | 5.125 | | | 02/01/25 | | | 562 | |
| | 1,000,000 | | g | | Targa Resources Partners LP | | | | | 5.875 | | | 04/15/26 | | | 972 | |
COLLEGE RETIREMENT EQUITIES FUND -Bond Market Account
| PRINCIPAL | | | | ISSUER | | | | RATE | | MATURITY
DATE | | VALUE
(000) | |
| EUR | 600,000 | | | | Total Capital International S.A. | | | | | 2.500 | % | | 03/25/26 | | $ | 760 | |
| $ | 13,250,000 | | | | TransCanada PipeLines Ltd | | | | | 4.250 | | | 05/15/28 | | | 13,130 | |
| | 325,000 | | g | | Transprtdra De Gas Intl | | | | | 5.550 | | | 11/01/28 | | | 329 | |
| | 2,500,000 | | | | Vale Overseas Ltd | | | | | 6.250 | | | 08/10/26 | | | 2,700 | |
| | 2,760,000 | | | | Vale Overseas Ltd | | | | | 6.875 | | | 11/21/36 | | | 3,156 | |
| | 6,150,000 | | | | Valero Energy Partners LP | | | | | 4.500 | | | 03/15/28 | | | 6,025 | |
| | 3,850,000 | | | | Western Gas Partners LP | | | | | 3.950 | | | 06/01/25 | | | 3,629 | |
| | 4,550,000 | | | | Western Gas Partners LP | | | | | 4.650 | | | 07/01/26 | | | 4,402 | |
| | 5,075,000 | | | | Williams Partners LP | | | | | 3.600 | | | 03/15/22 | | | 4,983 | |
| | 1,500,000 | | | | Williams Partners LP | | | | | 3.750 | | | 06/15/27 | | | 1,422 | |
| | 1,175,000 | | | | Williams Partners LP | | | | | 4.900 | | | 01/15/45 | | | 1,067 | |
| | 350,000 | | | | WPX Energy, Inc | | | | | 8.250 | | | 08/01/23 | | | 366 | |
| | 2,400,000 | | | | WPX Energy, Inc | | | | | 5.250 | | | 09/15/24 | | | 2,172 | |
| | 3,500,000 | | g | | YPF S.A. | | | | | 8.500 | | | 07/28/25 | | | 3,141 | |
| | 2,225,000 | | g | | YPF S.A. | | | | | 6.950 | | | 07/21/27 | | | 1,813 | |
| | 375,000 | | g | | YPF S.A. | | | | | 7.000 | | | 12/15/47 | | | 268 | |
| | | | | | TOTAL ENERGY | | | | | | | | | | | 428,284 | |
| | | | | | | | | | | | | | | | | | |
| FOOD & STAPLES RETAILING - 0.9% | | | | | | | | | | | | |
| | 9,200,000 | | | | CVS Health Corp | | | | | 3.700 | | | 03/09/23 | | | 9,101 | |
| | 15,950,000 | | | | CVS Health Corp | | | | | 2.875 | | | 06/01/26 | | | 14,535 | |
| | 27,375,000 | | | | CVS Health Corp | | | | | 4.300 | | | 03/25/28 | | | 26,805 | |
| | 20,300,000 | | | | CVS Health Corp | | | | | 4.780 | | | 03/25/38 | | | 19,474 | |
| | 150,000 | | | | CVS Health Corp | | | | | 5.125 | | | 07/20/45 | | | 146 | |
| | 3,350,000 | | | | CVS Health Corp | | | | | 5.050 | | | 03/25/48 | | | 3,263 | |
| | 4,900,000 | | | | Ingles Markets, Inc | | | | | 5.750 | | | 06/15/23 | | | 4,839 | |
| | 5,575,000 | | | | Kroger Co | | | | | 3.700 | | | 08/01/27 | | | 5,266 | |
| EUR | 1,000,000 | | | | SYSCO Corp | | | | | 1.250 | | | 06/23/23 | | | 1,172 | |
| $ | 7,575,000 | | | | Walgreens Boots Alliance, Inc | | | | | 3.450 | | | 06/01/26 | | | 7,123 | |
| | 22,300,000 | | | | Walmart, Inc | | | | | 3.700 | | | 06/26/28 | | | 22,638 | |
| | 6,150,000 | | | | Walmart, Inc | | | | | 3.950 | | | 06/28/38 | | | 6,100 | |
| | | | | | TOTAL FOOD & STAPLES RETAILING | | | | | �� | | | | 120,462 | |
| | | | | | | | | | | | | | | | | | |
| FOOD, BEVERAGE & TOBACCO - 0.9% | | | | | | | | | | | | |
| | 6,691,000 | | | | Anheuser-Busch InBev Finance, Inc | | | | | 2.650 | | | 02/01/21 | | | 6,577 | |
| | 20,025,000 | | | | Anheuser-Busch InBev Finance, Inc | | | | | 3.300 | | | 02/01/23 | | | 19,498 | |
| | 6,825,000 | | | | Anheuser-Busch InBev Worldwide, Inc | | | | | 4.600 | | | 04/15/48 | | | 6,127 | |
| | 8,125,000 | | | | BAT Capital Corp | | | | | 3.557 | | | 08/15/27 | | | 7,217 | |
| | 2,900,000 | | | | Campbell Soup Co | | | | | 4.150 | | | 03/15/28 | | | 2,701 | |
| | 5,800,000 | | | | ConAgra Brands, Inc | | | | | 4.850 | | | 11/01/28 | | | 5,707 | |
| | 1,700,000 | | | | Constellation Brands, Inc | | | | | 4.400 | | | 11/15/25 | | | 1,704 | |
| | 8,200,000 | | | | Constellation Brands, Inc | | | | | 3.600 | | | 02/15/28 | | | 7,556 | |
| | 3,000,000 | | g | | Corp Lindley S.A. | | | | | 4.625 | | | 04/12/23 | | | 2,993 | |
| | 5,800,000 | | | | Diageo Capital plc | | | | | 3.500 | | | 09/18/23 | | | 5,821 | |
| | 4,925,000 | | | | Diageo Capital plc | | | | | 3.875 | | | 05/18/28 | | | 5,017 | |
| | 4,000,000 | | g | | Grupo Bimbo SAB de C.V. | | | | | 4.700 | | | 11/10/47 | | | 3,598 | |
| | 2,400,000 | | g | | Grupo Bimbo SAB de C.V. | | | | | 5.950 | | | N/A | ‡ | | 2,329 | |
| | 8,425,000 | | g | | Heineken NV | | | | | 3.500 | | | 01/29/28 | | | 8,129 | |
| | 3,600,000 | | g | | Heineken NV | | | | | 4.350 | | | 03/29/47 | | | 3,428 | |
| | 150,000 | | | | JM Smucker Co | | | | | 4.375 | | | 03/15/45 | | | 131 | |
| | 3,900,000 | | | | Kellogg Co | | | | | 3.400 | | | 11/15/27 | | | 3,634 | |
| | 200,000 | | | | Kraft Heinz Foods Co | | | | | 5.200 | | | 07/15/45 | | | 183 | |
| | 4,115,000 | | | | Mead Johnson Nutrition Co | | | | | 4.900 | | | 11/01/19 | | | 4,170 | |
| | 9,200,000 | | | | Mondelez International, Inc | | | | | 4.125 | | | 05/07/28 | | | 9,186 | |
COLLEGE RETIREMENT EQUITIES FUND -Bond Market Account
| PRINCIPAL | | | | ISSUER | | | | RATE | | MATURITY
DATE | | VALUE
(000) | |
| $ | 3,125,000 | | | | PepsiCo, Inc | | | | | 3.450 | % | | 10/06/46 | | $ | 2,778 | |
| | 1,600,000 | | | | Philip Morris International, Inc | | | | | 6.375 | | | 05/16/38 | | | 1,856 | |
| | 2,700,000 | | | | Tyson Foods, Inc | | | | | 3.900 | | | 09/28/23 | | | 2,696 | |
| | 4,600,000 | | | | Tyson Foods, Inc | | | | | 3.550 | | | 06/02/27 | | | 4,286 | |
| | 5,800,000 | | | | Tyson Foods, Inc | | | | | 5.100 | | | 09/28/48 | | | 5,573 | |
| | | | | | TOTAL FOOD, BEVERAGE & TOBACCO | | | | | | | | 122,895 | |
| | | | | | | | | | | | | | | | | | |
| HEALTH CARE EQUIPMENT & SERVICES - 0.7% | | | | | | | | | | | | |
| | 11,100,000 | | | | Anthem, Inc | | | | | 3.650 | | | 12/01/27 | | | 10,611 | |
| EUR | 430,000 | | | | Becton Dickinson and Co | | | | | 1.401 | | | 05/24/23 | | | 496 | |
| | 670,000 | | | | Becton Dickinson and Co | | | | | 1.900 | | | 12/15/26 | | | 764 | |
| $ | 17,775,000 | | | | Becton Dickinson and Co | | | | | 3.700 | | | 06/06/27 | | | 16,804 | |
| | 400,000 | | | | Becton Dickinson and Co | | | | | 4.685 | | | 12/15/44 | | | 375 | |
| | 7,250,000 | | | | Cardinal Health, Inc | | | | | 3.410 | | | 06/15/27 | | | 6,591 | |
| | 3,800,000 | | | | Covidien International Finance S.A. | | | | | 3.200 | | | 06/15/22 | | | 3,789 | |
| | 4,105,000 | | | | Dartmouth-Hitchcock Health | | | | | 4.178 | | | 08/01/48 | | | 3,979 | |
| EUR | 500,000 | | | | DH Europe Finance S.A. | | | | | 1.200 | | | 06/30/27 | | | 562 | |
| $ | 200,000 | | | | Laboratory Corp of America Holdings | | | | | 3.600 | | | 02/01/25 | | | 193 | |
| | 3,700,000 | | | | Medtronic, Inc | | | | | 4.625 | | | 03/15/45 | | | 3,885 | |
| | 12,500,000 | | | | Mercy Health | | | | | 3.382 | | | 11/01/25 | | | 12,075 | |
| | 5,000,000 | | | | New York and Presbyterian Hospital | | | | | 3.563 | | | 08/01/36 | | | 4,672 | |
| EUR | 500,000 | | | | Stryker Corp | | | | | 2.125 | | | 11/30/27 | | | 589 | |
| | 450,000 | | | | Stryker Corp | | | | | 2.625 | | | 11/30/30 | | | 531 | |
| $ | 2,000,000 | | | | Tenet Healthcare Corp | | | | | 4.375 | | | 10/01/21 | | | 1,935 | |
| | 5,350,000 | | | | Thermo Fisher Scientific, Inc | | | | | 2.950 | | | 09/19/26 | | | 4,940 | |
| | 2,225,000 | | | | Thermo Fisher Scientific, Inc | | | | | 3.200 | | | 08/15/27 | | | 2,069 | |
| EUR | 300,000 | | | | Thermo Fisher Scientific, Inc | | | | | 1.950 | | | 07/24/29 | | | 339 | |
| | 325,000 | | | | Thermo Fisher Scientific, Inc | | | | | 2.875 | | | 07/24/37 | | | 380 | |
| $ | 2,150,000 | | | | Zimmer Biomet Holdings, Inc | | | | | 3.700 | | | 03/19/23 | | | 2,127 | |
| | 3,745,000 | | | | Zimmer Holdings, Inc | | | | | 3.550 | | | 04/01/25 | | | 3,561 | |
| | | | | | TOTAL HEALTH CARE EQUIPMENT & SERVICES | | | | | | | | | 81,267 | |
| | | | | | | | | | | | | | | | | | |
| HOUSEHOLD & PERSONAL PRODUCTS - 0.0% | | | | | | | | | | | | |
| EUR | 600,000 | | | | The Procter & Gamble Company | | | | | 0.625 | | | 10/30/24 | | | 687 | |
| | 400,000 | | | | The Procter & Gamble Company | | | | | 1.875 | | | 10/30/38 | | | 473 | |
| | | | | | TOTAL HOUSEHOLD & PERSONAL PRODUCTS | | | | | | | | | 1,160 | |
| | | | | | | | | | | | | | | | | | |
| INSURANCE - 1.3% | | | | | | | | | | | | |
| $ | 6,250,000 | | | | ACE INA Holdings, Inc | | | | | 2.875 | | | 11/03/22 | | | 6,197 | |
| | 1,925,000 | | | | Aetna, Inc | | | | | 6.625 | | | 06/15/36 | | | 2,260 | |
| | 5,500,000 | | | | Allstate Corp | | | | | 3.280 | | | 12/15/26 | | | 5,393 | |
| | 8,500,000 | | | | Allstate Corp | | | | | 5.750 | | | 08/15/53 | | | 8,288 | |
| | 2,700,000 | | | | American Financial Group, Inc | | | | | 3.500 | | | 08/15/26 | | | 2,548 | |
| EUR | 650,000 | | | | American International Group, Inc | | | | | 1.500 | | | 06/08/23 | | | 752 | |
| $ | 2,500,000 | | | | American International Group, Inc | | | | | 3.750 | | | 07/10/25 | | | 2,395 | |
| | 6,750,000 | | | | American International Group, Inc | | | | | 3.900 | | | 04/01/26 | | | 6,503 | |
| | 2,875,000 | | | | American International Group, Inc | | | | | 4.200 | | | 04/01/28 | | | 2,775 | |
| | 200,000 | | | | American International Group, Inc | | | | | 3.875 | | | 01/15/35 | | | 172 | |
| | 12,975,000 | | | | Aon plc | | | | | 3.500 | | | 06/14/24 | | | 12,669 | |
| | 500,000 | | g | | AXA Equitable Holdings, Inc | | | | | 5.000 | | | 04/20/48 | | | 439 | |
| | 19,230,000 | | | | Children’s Hospital Medic | | | | | 4.268 | | | 05/15/44 | | | 19,545 | |
| EUR | 500,000 | | | | Chubb INA Holdings, Inc | | | | | 1.550 | | | 03/15/28 | | | 569 | |
COLLEGE RETIREMENT EQUITIES FUND -Bond Market Account
| PRINCIPAL | | | | ISSUER | | REFERENCE
RATE & SPREAD | | RATE | | MATURITY
DATE | | VALUE
(000) | |
| $ | 3,525,000 | | | | CNA Financial Corp | | | | | 3.950 | % | | 05/15/24 | | $ | 3,492 | |
| | 3,050,000 | | | | CNA Financial Corp | | | | | 3.450 | | | 08/15/27 | | | 2,839 | |
| | 7,500,000 | | g,i | | Cranberry RE Ltd | | LIBOR 6 M + 1.600% | | | 4.481 | | | 07/13/20 | | | 7,386 | |
| EUR | 250,000 | | g | | Fairfax Financial Holdings Ltd | | | | | 2.750 | | | 03/29/28 | | | 285 | |
| $ | 5,575,000 | | g | | Five Corners Funding Trust | | | | | 4.419 | | | 11/15/23 | | | 5,735 | |
| | 1,350,000 | | | | Hartford Financial Services Group, Inc | | | | | 4.300 | | | 04/15/43 | | | 1,256 | |
| | 4,800,000 | | | | HCA, Inc | | | | | 5.625 | | | 09/01/28 | | | 4,632 | |
| | 6,250,000 | | | | Humana, Inc | | | | | 3.950 | | | 03/15/27 | | | 6,109 | |
| | 3,300,000 | | g | | Liberty Mutual Group, Inc | | | | | 4.250 | | | 06/15/23 | | | 3,327 | |
| EUR | 750,000 | | | | Liberty Mutual Group, Inc | | | | | 2.750 | | | 05/04/26 | | | 883 | |
| $ | 2,425,000 | | | | Lincoln National Corp | | | | | 3.800 | | | 03/01/28 | | | 2,353 | |
| | 3,250,000 | | | | Markel Corp | | | | | 3.500 | | | 11/01/27 | | | 3,069 | |
| | 1,600,000 | | | | Marsh & McLennan Cos, Inc | | | | | 3.500 | | | 06/03/24 | | | 1,576 | |
| | 1,365,000 | | | | Marsh & McLennan Cos, Inc | | | | | 3.500 | | | 03/10/25 | | | 1,341 | |
| | 4,325,000 | | | | MetLife, Inc | | | | | 3.600 | | | 11/13/25 | | | 4,269 | |
| | 500,000 | | | | MetLife, Inc | | | | | 4.125 | | | 08/13/42 | | | 468 | |
| | 8,050,000 | | | | Prudential Financial, Inc | | | | | 7.375 | | | 06/15/19 | | | 8,196 | |
| | 9,200,000 | | | | Prudential Financial, Inc | | | | | 3.878 | | | 03/27/28 | | | 9,251 | |
| | 3,000,000 | | g | | Prudential Funding LLC | | | | | 6.750 | | | 09/15/23 | | | 3,344 | |
| | 10,925,000 | | | | Travelers Cos, Inc | | | | | 4.000 | | | 05/30/47 | | | 10,502 | |
| | 5,775,000 | | | | UnitedHealth Group, Inc | | | | | 2.950 | | | 10/15/27 | | | 5,459 | |
| | 4,625,000 | | | | UnitedHealth Group, Inc | | | | | 3.750 | | | 10/15/47 | | | 4,239 | |
| | 7,750,000 | | g,i | | Vitality Re IX Ltd | | | | | 3.955 | | | 01/10/22 | | | 7,683 | |
| | 50,000 | | | | WellPoint, Inc | | | | | 4.625 | | | 05/15/42 | | | 48 | |
| | 2,400,000 | | | | WR Berkley Corp | | | | | 5.375 | | | 09/15/20 | | | 2,471 | |
| | | | | | TOTAL INSURANCE | | | | | | | | | | | 170,718 | |
| | | | | | | | | | | | | | | | | | |
| MATERIALS – 0.9% | | | | | | | | | | | | | | |
| | 6,630,000 | | | | Air Products & Chemicals, Inc | | | | | 4.375 | | | 08/21/19 | | | 6,685 | |
| | 3,349,000 | | | | Albemarle Corp | | | | | 5.450 | | | 12/01/44 | | | 3,352 | |
| | 2,060,000 | | | | ArcelorMittal | | | | | 6.250 | | | 02/25/22 | | | 2,180 | |
| EUR | 850,000 | | g | | Axalta Coating Systems Dutch Holding B BV | | | | | 3.750 | | | 01/15/25 | | | 935 | |
| | 250,000 | | | | Ball Corp | | | | | 4.375 | | | 12/15/23 | | | 317 | |
| $ | 852,000 | | | | Bemis Co, Inc | | | | | 3.100 | | | 09/15/26 | | | 777 | |
| | 400,000 | | | | Celulosa Arauco y Constitucion S.A. | | | | | 3.875 | | | 11/02/27 | | | 366 | |
| | 2,375,000 | | g | | Corp Nacional del Cobre de Chile-CODELCO | | | | | 3.000 | | | 07/17/22 | | | 2,310 | |
| | 3,900,000 | | g | | Corp Nacional del Cobre de Chile-CODELCO | | | | | 3.625 | | | 08/01/27 | | | 3,714 | |
| | 3,250,000 | | g | | CRH America Finance, Inc | | | | | 3.400 | | | 05/09/27 | | | 2,985 | |
| | 3,725,000 | | g | | CRH America Finance, Inc | | | | | 3.950 | | | 04/04/28 | | | 3,546 | |
| | 1,390,000 | | | | Crown Americas LLC | | | | | 4.500 | | | 01/15/23 | | | 1,357 | |
| | 3,900,000 | | g | | Dow Chemical Co | | | | | 4.550 | | | 11/30/25 | | | 3,969 | |
| | 3,250,000 | | | | Dow Chemical Co | | | | | 4.375 | | | 11/15/42 | | | 2,856 | |
| | 14,700,000 | | | | DowDuPont, Inc | | | | | 4.725 | | | 11/15/28 | | | 15,246 | |
| | 1,100,000 | | g | | Eldorado Gold Corp | | | | | 6.125 | | | 12/15/20 | | | 1,001 | |
| | 2,600,000 | | g | | Glencore Funding LLC | | | | | 4.000 | | | 03/27/27 | | | 2,370 | |
| | 9,825,000 | | | | International Paper Co | | | | | 4.350 | | | 08/15/48 | | | 8,418 | |
| | 4,300,000 | | g | | Inversiones CMPC S.A. | | | | | 4.375 | | | 04/04/27 | | | 4,082 | |
| | 3,400,000 | | g | | Klabin Finance S.A. | | | | | 4.875 | | | 09/19/27 | | | 3,085 | |
| | 2,400,000 | | | | Newmont Mining Corp | | | | | 3.500 | | | 03/15/22 | | | 2,375 | |
| | 3,200,000 | | | | Newmont Mining Corp | | | | | 4.875 | | | 03/15/42 | | | 3,032 | |
| | 4,900,000 | | g | | Nexa Resources S.A. | | | | | 5.375 | | | 05/04/27 | | | 4,741 | |
| | 3,500,000 | | g | | Nova Chemicals Corp | | | | | 4.875 | | | 06/01/24 | | | 3,159 | |
| | 4,767,000 | | | | Nutrien Ltd | | | | | 3.375 | | | 03/15/25 | | | 4,481 | |
| | 500,000 | | | | Nutrien Ltd | | | | | 5.250 | | | 01/15/45 | | | 502 | |
COLLEGE RETIREMENT EQUITIES FUND -Bond Market Account
| PRINCIPAL | | | | ISSUER | | | | RATE | | MATURITY
DATE | | VALUE
(000) | |
| EUR | 125,000 | | g | | OCI NV | | | | | 5.000 | % | | 04/15/23 | | $ | 146 | |
| $ | 500,000 | | g | | OCI NV | | | | | 6.625 | | | 04/15/23 | | | 491 | |
| | 3,000,000 | | g | | OCP S.A. | | | | | 4.500 | | | 10/22/25 | | | 2,872 | |
| EUR | 250,000 | | g | | OI European Group BV | | | | | 3.125 | | | 11/15/24 | | | 282 | |
| $ | 325,000 | | g | | POSCO | | | | | 4.000 | | | 08/01/23 | | | 328 | |
| | 8,300,000 | | | | Rio Tinto Finance USA Ltd | | | | | 3.750 | | | 06/15/25 | | | 8,321 | |
| | 5,000,000 | | | | Rock Tenn Co | | | | | 3.500 | | | 03/01/20 | | | 4,995 | |
| | 2,550,000 | | g | | SABIC Capital II BV | | | | | 4.000 | | | 10/10/23 | | | 2,537 | |
| | 2,675,000 | | g | | SABIC Capital II BV | | | | | 4.500 | | | 10/10/28 | | | 2,660 | |
| | 1,650,000 | | | | SASOL Financing USA LLC | | | | | 6.500 | | | 09/27/28 | | | 1,651 | |
| | 4,600,000 | | | | Sherwin-Williams Co | | | | | 3.450 | | | 06/01/27 | | | 4,290 | |
| EUR | 750,000 | | | | Silgan Holdings, Inc | | | | | 3.250 | | | 03/15/25 | | | 858 | |
| $ | 1,800,000 | | | | Steel Dynamics, Inc | | | | | 5.250 | | | 04/15/23 | | | 1,775 | |
| | 1,700,000 | | | | Westlake Chemical Corp | | | | | 3.600 | | | 08/15/26 | | | 1,560 | |
| | | | | | TOTAL MATERIALS | | | | | | | | | | | 120,607 | |
| | | | | | | | | | | | | | | | | | |
| MEDIA & ENTERTAINMENT - 1.5% | | | | | | | | | | | | |
| | 100,000 | | | | 21st Century Fox America, Inc | | | | | 3.375 | | | 11/15/26 | | | 98 | |
| | 2,105,000 | | | | 21st Century Fox America, Inc | | | | | 7.625 | | | 11/30/28 | | | 2,734 | |
| | 1,578,000 | | | | 21st Century Fox America, Inc | | | | | 6.550 | | | 03/15/33 | | | 1,997 | |
| | 7,375,000 | | | | 21st Century Fox America, Inc | | | | | 6.900 | | | 08/15/39 | | | 9,703 | |
| GBP | 425,000 | | | | AMC Entertainment Holdings, Inc | | | | | 6.375 | | | 11/15/24 | | | 505 | |
| $ | 1,750,000 | | | | CBS Corp | | | | | 2.900 | | | 06/01/23 | | | 1,668 | |
| | 4,200,000 | | | | CBS Corp | | | | | 2.900 | | | 01/15/27 | | | 3,726 | |
| | 2,500,000 | | | | CBS Corp | | | | | 3.375 | | | 02/15/28 | | | 2,268 | |
| | 5,225,000 | | | | Charter Communications Operating LLC | | | | | 3.579 | | | 07/23/20 | | | 5,219 | |
| | 5,395,000 | | | | Charter Communications Operating LLC | | | | | 4.464 | | | 07/23/22 | | | 5,447 | |
| | 19,275,000 | | | | Charter Communications Operating LLC | | | | | 4.908 | | | 07/23/25 | | | 19,158 | |
| | 100,000 | | | | Charter Communications Operating LLC | | | | | 5.375 | | | 04/01/38 | | | 93 | |
| | 3,400,000 | | | | Charter Communications Operating LLC | | | | | 5.375 | | | 05/01/47 | | | 3,085 | |
| | 3,500,000 | | | | Cinemark USA, Inc | | | | | 4.875 | | | 06/01/23 | | | 3,360 | |
| | 16,400,000 | | | | Comcast Corp | | | | | 3.700 | | | 04/15/24 | | | 16,499 | |
| | 11,800,000 | | | | Comcast Corp | | | | | 3.950 | | | 10/15/25 | | | 11,945 | |
| | 10,650,000 | | | | Comcast Corp | | | | | 2.350 | | | 01/15/27 | | | 9,532 | |
| | 18,200,000 | | | | Comcast Corp | | | | | 3.200 | | | 07/15/36 | | | 15,674 | |
| | 3,000,000 | | | | Comcast Corp | | | | | 3.900 | | | 03/01/38 | | | 2,780 | |
| | 1,500,000 | | g | | CSC Holdings LLC | | | | | 7.500 | | | 04/01/28 | | | 1,496 | |
| | 4,000,000 | | | | Discovery Communications LLC | | | | | 2.950 | | | 03/20/23 | | | 3,830 | |
| GBP | 300,000 | | | | Discovery Communications LLC | | | | | 2.500 | | | 09/20/24 | | | 372 | |
| $ | 5,625,000 | | | | Discovery Communications LLC | | | | | 3.950 | | | 03/20/28 | | | 5,219 | |
| | 1,975,000 | | g | | Indonesia Asahan Aluminium Persero PT | | | | | 5.710 | | | 11/15/23 | | | 2,011 | |
| | 2,000,000 | | | | Lamar Media Corp | | | | | 5.375 | | | 01/15/24 | | | 2,000 | |
| | 7,700,000 | | g | | NBC Universal Enterprise, Inc | | | | | 1.974 | | | 04/15/19 | | | 7,675 | |
| | 10,350,000 | | | | NBC Universal Media LLC | | | | | 2.875 | | | 01/15/23 | | | 10,160 | |
| | 4,400,000 | | | | RELX Capital, Inc | | | | | 3.500 | | | 03/16/23 | | | 4,365 | |
| | 1,930,000 | | g | | Tegna, Inc | | | | | 4.875 | | | 09/15/21 | | | 1,887 | |
| | 2,925,000 | | g | | Tegna, Inc | | | | | 5.500 | | | 09/15/24 | | | 2,834 | |
| | 5,675,000 | | | | Time Warner Cable, Inc | | | | | 5.875 | | | 11/15/40 | | | 5,355 | |
| | 4,075,000 | | | | Time Warner Cable, Inc | | | | | 4.500 | | | 09/15/42 | | | 3,280 | |
| | 20,550,000 | | | | Time Warner, Inc | | | | | 2.100 | | | 06/01/19 | | | 20,454 | |
| | 3,900,000 | | | | Time Warner, Inc | | | | | 3.600 | | | 07/15/25 | | | 3,695 | |
| | 4,045,000 | | | | Time Warner, Inc | | | | | 2.950 | | | 07/15/26 | | | 3,618 | |
| | 7,500,000 | | | | Time Warner, Inc | | | | | 3.800 | | | 02/15/27 | | | 7,041 | |
COLLEGE RETIREMENT EQUITIES FUND -Bond Market Account
| PRINCIPAL | | | | ISSUER | | | | RATE | | MATURITY
DATE | | VALUE
(000) | |
| $ | 150,000 | | | | Time Warner, Inc | | | | | 4.850 | % | | 07/15/45 | | $ | 134 | |
| | 1,150,000 | | | | Viacom, Inc | | | | | 5.850 | | | 09/01/43 | | | 1,125 | |
| | 675,000 | | g | | Virgin Media Secured Finance plc | | | | | 5.500 | | | 01/15/25 | | | 665 | |
| | | | | | TOTAL MEDIA & ENTERTAINMENT | | | | | | | | | | | 202,707 | |
| | | | | | | | | | | | | | | | | | |
| PHARMACEUTICALS, BIOTECHNOLOGY & LIFE SCIENCES - 1.4% | | | | | | | | | | |
| EUR | 400,000 | | | | Abbott Ireland Financing DAC | | | | | 0.875 | | | 09/27/23 | | | 458 | |
| | 400,000 | | | | Abbott Ireland Financing DAC | | | | | 1.500 | | | 09/27/26 | | | 458 | |
| $ | 4,750,000 | | | | Abbott Laboratories | | | | | 3.875 | | | 09/15/25 | | | 4,812 | |
| | 11,022,000 | | | | Abbott Laboratories | | | | | 3.750 | | | 11/30/26 | | | 10,891 | |
| | 2,250,000 | | | | Abbott Laboratories | | | | | 5.300 | | | 05/27/40 | | | 2,484 | |
| | 5,700,000 | | | | AbbVie, Inc | | | | | 3.750 | | | 11/14/23 | | | 5,671 | |
| | 14,350,000 | | | | AbbVie, Inc | | | | | 3.200 | | | 05/14/26 | | | 13,306 | |
| | 14,575,000 | | | | AbbVie, Inc | | | | | 4.250 | | | 11/14/28 | | | 14,158 | |
| | 150,000 | | | | AbbVie, Inc | | | | | 4.500 | | | 05/14/35 | | | 139 | |
| | 6,700,000 | | | | AbbVie, Inc | | | | | 4.400 | | | 11/06/42 | | | 5,923 | |
| | 8,700,000 | | | | Actavis Funding SCS | | | | | 3.800 | | | 03/15/25 | | | 8,497 | |
| | 9,500,000 | | | | Actavis Funding SCS | | | | | 4.550 | | | 03/15/35 | | | 9,021 | |
| | 134,000 | | | | Actavis Funding SCS | | | | | 4.750 | | | 03/15/45 | | | 127 | |
| EUR | 550,000 | | | | Allergan Funding SCS | | | | | 1.250 | | | 06/01/24 | | | 616 | |
| | 350,000 | | | | Allergan Funding SCS | | | | | 2.625 | | | 11/15/28 | | | 406 | |
| $ | 5,650,000 | | | | AstraZeneca plc | | | | | 3.125 | | | 06/12/27 | | | 5,259 | |
| | 8,625,000 | | | | AstraZeneca plc | | | | | 4.000 | | | 01/17/29 | | | 8,496 | |
| | 6,800,000 | | g | | Bayer US Finance II LLC | | | | | 4.375 | | | 12/15/28 | | | 6,496 | |
| | 4,650,000 | | g | | Bayer US Finance II LLC | | | | | 4.625 | | | 06/25/38 | | | 4,228 | |
| | 2,900,000 | | | | Celgene Corp | | | | | 3.875 | | | 08/15/25 | | | 2,793 | |
| | 13,600,000 | | | | Celgene Corp | | | | | 3.450 | | | 11/15/27 | | | 12,383 | |
| | 8,675,000 | | | | Gilead Sciences, Inc | | | | | 2.950 | | | 03/01/27 | | | 8,081 | |
| | 1,775,000 | | | | Gilead Sciences, Inc | | | | | 4.000 | | | 09/01/36 | | | 1,620 | |
| | 5,075,000 | | | | Gilead Sciences, Inc | | | | | 4.150 | | | 03/01/47 | | | 4,681 | |
| | 8,750,000 | | | | GlaxoSmithKline Capital, Inc | | | | | 3.875 | | | 05/15/28 | | | 8,897 | |
| | 8,150,000 | | | | Johnson & Johnson | | | | | 2.900 | | | 01/15/28 | | | 7,816 | |
| | 3,750,000 | | | | Johnson & Johnson | | | | | 3.400 | | | 01/15/38 | | | 3,495 | |
| | 3,300,000 | | | | Mylan NV | | | | | 3.950 | | | 06/15/26 | | | 3,009 | |
| EUR | 350,000 | | | | Mylan, Inc | | | | | 2.125 | | | 05/23/25 | | | 391 | |
| $ | 5,750,000 | | g | | Mylan, Inc | | | | | 4.550 | | | 04/15/28 | | | 5,362 | |
| | 9,600,000 | | | | Novartis Capital Corp | | | | | 3.000 | | | 11/20/25 | | | 9,304 | |
| | 500,000 | | | | Perrigo Finance plc | | | | | 3.900 | | | 12/15/24 | | | 463 | |
| EUR | 400,000 | | g | | Takeda Pharmaceutical Co Ltd | | | | | 0.375 | | | 11/21/20 | | | 458 | |
| | 1,200,000 | | g | | Takeda Pharmaceutical Co Ltd | | | | | 1.125 | | | 11/21/22 | | | 1,384 | |
| | 400,000 | | g | | Takeda Pharmaceutical Co Ltd | | | | | 3.000 | | | 11/21/30 | | | 467 | |
| $ | 17,725,000 | | | | Teva Pharmaceutical Finance Netherlands III BV | | | 3.150 | | | 10/01/26 | | | 13,535 | |
| | | | | | TOTAL PHARMACEUTICALS, BIOTECHNOLOGY & LIFE SCIENCES | | | | | | | | 185,585 | |
| | | | | | | | | | | | | | | | | | |
| REAL ESTATE - 1.4% | | | | | | | | | | | | |
| | 1,675,000 | | | | Alexandria Real Estate Equities, Inc | | | | | 3.950 | | | 01/15/27 | | | 1,626 | |
| | 2,300,000 | | | | Alexandria Real Estate Equities, Inc | | | | | 3.950 | | | 01/15/28 | | | 2,223 | |
| | 5,950,000 | | | | American Tower Corp | | | | | 3.000 | | | 06/15/23 | | | 5,724 | |
| EUR | 600,000 | | | | American Tower Corp | | | | | 1.950 | | | 05/22/26 | | | 688 | |
| $ | 2,418,000 | | | | American Tower Corp | | | | | 3.375 | | | 10/15/26 | | | 2,251 | |
| | 1,600,000 | | | | American Tower Corp | | | | | 3.600 | | | 01/15/28 | | | 1,496 | |
| | 5,300,000 | | | | Boston Properties LP | | | | | 4.500 | | | 12/01/28 | | | 5,422 | |
| | 5,575,000 | | | | Brandywine Operating Partnership LP | | | | | 4.100 | | | 10/01/24 | | | 5,514 | |
| | 2,700,000 | | | | Brandywine Operating Partnership LP | | | | | 3.950 | | | 11/15/27 | | | 2,567 | |
COLLEGE RETIREMENT EQUITIES FUND -Bond Market Account
| PRINCIPAL | | | | ISSUER | | | | RATE | | MATURITY
DATE | | VALUE
(000) | |
| $ | 5,825,000 | �� | | | Brixmor Operating Partnership LP | | | | | 3.850 | % | | 02/01/25 | | $ | 5,633 | |
| | 5,250,000 | | | | Brixmor Operating Partnership LP | | | | | 4.125 | | | 06/15/26 | | | 5,086 | |
| | 4,050,000 | | | | Brixmor Operating Partnership LP | | | | | 3.900 | | | 03/15/27 | | | 3,836 | |
| | 3,965,000 | | | | Camden Property Trust | | | | | 4.625 | | | 06/15/21 | | | 4,062 | |
| | 3,000,000 | | | | Camden Property Trust | | | | | 2.950 | | | 12/15/22 | | | 2,935 | |
| | 2,050,000 | | | | Camden Property Trust | | | | | 4.100 | | | 10/15/28 | | | 2,077 | |
| | 3,911,000 | | | | Crown Castle International Corp | | | | | 4.875 | | | 04/15/22 | | | 4,024 | |
| | 2,275,000 | | | | Crown Castle International Corp | | | | | 3.700 | | | 06/15/26 | | | 2,171 | |
| | 1,700,000 | | | | Crown Castle International Corp | | | | | 3.650 | | | 09/01/27 | | | 1,577 | |
| | 2,968,000 | | | | DDR Corp | | | | | 3.625 | | | 02/01/25 | | | 2,835 | |
| | 350,000 | | | | DDR Corp | | | | | 4.700 | | | 06/01/27 | | | 352 | |
| | 3,075,000 | | | | Digital Realty Trust LP | | | | | 3.700 | | | 08/15/27 | | | 2,904 | |
| | 1,600,000 | | | | Duke Realty LP | | | | | 3.250 | | | 06/30/26 | | | 1,523 | |
| | 2,525,000 | | | | Duke Realty LP | | | | | 4.000 | | | 09/15/28 | | | 2,508 | |
| | 2,750,000 | | | | Equity One, Inc | | | | | 3.750 | | | 11/15/22 | | | 2,745 | |
| | 2,754,000 | | | | Essex Portfolio LP | | | | | 3.375 | | | 01/15/23 | | | 2,717 | |
| | 1,625,000 | | | | Healthcare Realty Trust, Inc | | | | | 3.750 | | | 04/15/23 | | | 1,600 | |
| | 6,600,000 | | | | Healthcare Realty Trust, Inc | | | | | 3.875 | | | 05/01/25 | | | 6,433 | |
| | 3,700,000 | | | | Healthcare Trust of America Holdings LP | | | 3.375 | | | 07/15/21 | | | 3,681 | |
| | 3,550,000 | | | | Healthcare Trust of America Holdings LP | | | 3.700 | | | 04/15/23 | | | 3,495 | |
| | 6,250,000 | | | | Healthcare Trust of America Holdings LP | | | 3.500 | | | 08/01/26 | | | 5,877 | |
| | 1,950,000 | | | | Highwoods Realty LP | | | | | 3.875 | | | 03/01/27 | | | 1,893 | |
| | 2,900,000 | | | | Highwoods Realty LP | | | | | 4.125 | | | 03/15/28 | | | 2,839 | |
| | 4,050,000 | | | | Kilroy Realty LP | | | | | 4.750 | | | 12/15/28 | | | 4,127 | |
| | 1,700,000 | | | | Kimco Realty Corp | | | | | 3.800 | | | 04/01/27 | | | 1,636 | |
| | 5,224,000 | | | | Mid-America Apartments LP | | | | | 4.300 | | | 10/15/23 | | | 5,355 | |
| | 5,525,000 | | | | Mid-America Apartments LP | | | | | 3.750 | | | 06/15/24 | | | 5,473 | |
| | 4,300,000 | | | | Mid-America Apartments LP | | | | | 4.000 | | | 11/15/25 | | | 4,286 | |
| | 3,575,000 | | | | Mid-America Apartments LP | | | | | 3.600 | | | 06/01/27 | | | 3,442 | |
| | 3,600,000 | | | | National Retail Properties, Inc | | | | | 3.800 | | | 10/15/22 | | | 3,618 | |
| | 5,425,000 | | | | National Retail Properties, Inc | | | | | 3.300 | | | 04/15/23 | | | 5,307 | |
| | 2,575,000 | | | | National Retail Properties, Inc | | | | | 4.000 | | | 11/15/25 | | | 2,549 | |
| | 3,000,000 | | | | National Retail Properties, Inc | | | | | 3.600 | | | 12/15/26 | | | 2,886 | |
| EUR | 350,000 | | | | ProLogis LP | | | | | 3.000 | | | 06/02/26 | | | 443 | |
| $ | 7,225,000 | | | | Regency Centers LP | | | | | 3.900 | | | 11/01/25 | | | 7,116 | |
| | 4,750,000 | | | | Regency Centers LP | | | | | 3.600 | | | 02/01/27 | | | 4,543 | |
| EUR | 330,000 | | | | Simon International Finance S.C.A | | | 1.250 | | | 05/13/25 | | | 379 | |
| $ | 6,150,000 | | | | Ventas Realty LP | | | | | 4.000 | | | 03/01/28 | | | 5,964 | |
| | 1,170,000 | | | | Weingarten Realty Investors | | | | | 3.375 | | | 10/15/22 | | | 1,154 | |
| | 4,800,000 | | | | Weingarten Realty Investors | | | | | 3.500 | | | 04/15/23 | | | 4,718 | |
| | 3,025,000 | | | | Weingarten Realty Investors | | | | | 4.450 | | | 01/15/24 | | | 3,078 | |
| | 3,950,000 | | | | Weingarten Realty Investors | | | | | 3.850 | | | 06/01/25 | | | 3,850 | |
| | 1,300,000 | | | | Weingarten Realty Investors | | | | | 3.250 | | | 08/15/26 | | | 1,204 | |
| | 3,575,000 | | | | Welltower, Inc | | | | | 4.000 | | | 06/01/25 | | | 3,530 | |
| | | | | | TOTAL REAL ESTATE | | | | | | | | | | | 174,972 | |
| | | | | | | | | | | | | | | | | | |
| RETAILING - 0.4% | | | | | | | | | | | | |
| | 600,000 | | | | Asbury Automotive Group, Inc | | | | | 6.000 | | | 12/15/24 | | | 575 | |
| | 2,950,000 | | | | AutoNation, Inc | | | | | 3.800 | | | 11/15/27 | | | 2,631 | |
| | 8,850,000 | | | | Home Depot, Inc | | | | | 2.000 | | | 04/01/21 | | | 8,675 | |
| | 8,725,000 | | | | Home Depot, Inc | | | | | 3.350 | | | 09/15/25 | | | 8,618 | |
| | 5,175,000 | | | | Home Depot, Inc | | | | | 3.000 | | | 04/01/26 | | | 5,005 | |
| | 8,600,000 | | | | Home Depot, Inc | | | | | 4.500 | | | 12/06/48 | | | 8,902 | |
COLLEGE RETIREMENT EQUITIES FUND -Bond Market Account
| PRINCIPAL | | | | ISSUER | | | | RATE | | MATURITY
DATE | | VALUE
(000) | |
| $ | 2,975,000 | | | | Home Depot, Inc | | | | | 3.500 | % | | 09/15/56 | | $ | 2,506 | |
| | 6,875,000 | | | | O’Reilly Automotive, Inc | | | | | 3.600 | | | 09/01/27 | | | 6,554 | |
| | 1,500,000 | | g | | PetSmart, Inc | | | | | 5.875 | | | 06/01/25 | | | 1,084 | |
| | 5,050,000 | | g | | Rolls-Royce plc | | | | | 2.375 | | | 10/14/20 | | | 4,967 | |
| | 1,850,000 | | g | | Rolls-Royce plc | | | | | 3.625 | | | 10/14/25 | | | 1,774 | |
| | 1,500,000 | | g | | Staples, Inc | | | | | 8.500 | | | 09/15/25 | | | 1,353 | |
| | 5,625,000 | | | | Target Corp | | | | | 3.625 | | | 04/15/46 | | | 4,932 | |
| | | | | | TOTAL RETAILING | | | | | | | | | | | 57,576 | |
| | | | | | | | | | | | | | | | | | |
| SEMICONDUCTORS & SEMICONDUCTOR EQUIPMENT - 0.2% | | | | | | | | | |
| | 15,640,000 | | | | Intel Corp | | | | | 2.875 | | | 05/11/24 | | | 15,257 | |
| | 4,800,000 | | | | Intel Corp | | | | | 2.600 | | | 05/19/26 | | | 4,496 | |
| | 2,500,000 | | | | Intel Corp | | | | | 3.734 | | | 12/08/47 | | | 2,314 | |
| | 3,475,000 | | | | Texas Instruments, Inc | | | | | 2.625 | | | 05/15/24 | | | 3,358 | |
| | 3,100,000 | | | | Texas Instruments, Inc | | | | | 4.150 | | | 05/15/48 | | | 3,098 | |
| | | | | | TOTAL SEMICONDUCTORS & SEMICONDUCTOR EQUIPMENT | | | | | | | | 28,523 | |
| | | | | | | | | | | | | | | | | | |
| SOFTWARE & SERVICES - 0.9% | | | | | | | | | | | | |
| | 4,175,000 | | | | Activision Blizzard, Inc | | | | | 2.300 | | | 09/15/21 | | | 4,066 | |
| | 4,350,000 | | | | Activision Blizzard, Inc | | | | | 3.400 | | | 09/15/26 | | | 4,088 | |
| | 5,200,000 | | | | Baidu, Inc | | | | | 2.875 | | | 07/06/22 | | | 5,056 | |
| | 1,725,000 | | | | Baidu, Inc | | | | | 4.375 | | | 05/14/24 | | | 1,743 | |
| | 11,348,000 | | | | Fidelity National Information Services, Inc | | | 3.625 | | | 10/15/20 | | | 11,397 | |
| GBP | 150,000 | | | | Fidelity National Information Services, Inc | | | 1.700 | | | 06/30/22 | | | 188 | |
| EUR | 375,000 | | | | Fidelity National Information Services, Inc | | | 1.100 | | | 07/15/24 | | | 426 | |
| $ | 1,950,000 | | | | IHS Markit Ltd | | | | | 4.125 | | | 08/01/23 | | | 1,930 | |
| | 3,350,000 | | | | IHS Markit Ltd | | | | | 4.750 | | | 08/01/28 | | | 3,270 | |
| | 26,300,000 | | | | Microsoft Corp | | | | | 2.400 | | | 08/08/26 | | | 24,612 | |
| | 3,750,000 | | | | Microsoft Corp | | | | | 4.100 | | | 02/06/37 | | | 3,855 | |
| | 5,850,000 | | | | Microsoft Corp | | | | | 3.700 | | | 08/08/46 | | | 5,632 | |
| | 1,475,000 | | | | NCR Corp | | | | | 4.625 | | | 02/15/21 | | | 1,438 | |
| | 525,000 | | | | NCR Corp | | | | | 5.875 | | | 12/15/21 | | | 512 | |
| | 12,600,000 | | | | Oracle Corp | | | | | 2.500 | | | 05/15/22 | | | 12,333 | |
| | 14,375,000 | | | | Oracle Corp | | | | | 2.650 | | | 07/15/26 | | | 13,329 | |
| | 4,900,000 | | | | Oracle Corp | | | | | 3.800 | | | 11/15/37 | | | 4,588 | |
| | 6,300,000 | | | | Oracle Corp | | | | | 4.000 | | | 11/15/47 | | | 5,871 | |
| | 2,050,000 | | g | | Refinitiv US Holdings, Inc | | | | | 6.250 | | | 05/15/26 | | | 1,978 | |
| | 2,425,000 | | | | salesforce.com, Inc | | | | | 3.700 | | | 04/11/28 | | | 2,439 | |
| | 5,425,000 | | | | Total System Services, Inc | | | | | 4.450 | | | 06/01/28 | | | 5,327 | |
| | | | | | TOTAL SOFTWARE & SERVICES | | | | | | | | | 114,078 | |
| | | | | | | | | | | | | | | | | | |
| TECHNOLOGY HARDWARE & EQUIPMENT - 0.9% | | | | | | | | | | | | |
| | 3,475,000 | | | | Amphenol Corp | | | | | 3.125 | | | 09/15/21 | | | 3,444 | |
| EUR | 675,000 | | | | Amphenol Technologies Holding GmbH | | | 2.000 | | | 10/08/28 | | | 770 | |
| $ | 8,075,000 | | | | Apple, Inc | | | | | 2.450 | | | 08/04/26 | | | 7,467 | |
| | 31,025,000 | | | | Apple, Inc | | | | | 3.200 | | | 05/11/27 | | | 29,959 | |
| EUR | 750,000 | | | | Apple, Inc | | | | | 1.375 | | | 05/24/29 | | | 872 | |
| $ | 4,525,000 | | | | Apple, Inc | | | | | 4.650 | | | 02/23/46 | | | 4,812 | |
| | 4,075,000 | | | | Broadcom Corp | | | | | 3.875 | | | 01/15/27 | | | 3,658 | |
| | 4,150,000 | | | | Broadcom Corp | | | | | 3.500 | | | 01/15/28 | | | 3,598 | |
| | 19,750,000 | | | | Cisco Systems, Inc | | | | | 1.850 | | | 09/20/21 | | | 19,203 | |
| | 2,600,000 | | g | | CommScope, Inc | | | | | 5.500 | | | 06/15/24 | | | 2,379 | |
| | 2,075,000 | | | | Corning, Inc | | | | | 4.375 | | | 11/15/57 | | | 1,736 | |
COLLEGE RETIREMENT EQUITIES FUND -Bond Market Account
| PRINCIPAL | | | | ISSUER | | | | RATE | | MATURITY
DATE | | VALUE
(000) | |
| $ | 13,175,000 | | g | | Dell International LLC | | | | | 4.420 | % | | 06/15/21 | | $ | 13,161 | |
| | 10,550,000 | | g | | Dell International LLC | | | | | 6.020 | | | 06/15/26 | | | 10,603 | |
| | 3,150,000 | | | | L3 Technologies, Inc | | | | | 3.850 | | | 06/15/23 | | | 3,155 | |
| | 1,365,000 | | g | | Millicom International Cellular S.A. | | | | | 6.625 | | | 10/15/26 | | | 1,382 | |
| | 2,900,000 | | | | Motorola Solutions, Inc | | | | | 4.600 | | | 02/23/28 | | | 2,837 | |
| | 5,250,000 | | g | | NXP BV | | | | | 4.875 | | | 03/01/24 | | | 5,273 | |
| | 6,669,000 | | | | Tyco Electronics Group S.A. | | | | | 3.500 | | | 02/03/22 | | | 6,675 | |
| EUR | 400,000 | | | | Tyco Electronics Group S.A. | | | | | 1.100 | | | 03/01/23 | | | 465 | |
| $ | 2,175,000 | | | | Tyco Electronics Group S.A. | | | | | 3.700 | | | 02/15/26 | | | 2,116 | |
| | | | | | TOTAL TECHNOLOGY HARDWARE & EQUIPMENT | | | | | | | | | 123,565 | |
| | | | | | | | | | | | | | | | | | |
| TELECOMMUNICATION SERVICES - 1.3% | | | | | | | | | | | | |
| EUR | 500,000 | | g | | Altice Luxembourg S.A. | | | | | 7.250 | | | 05/15/22 | | | 532 | |
| | 300,000 | | | | AT&T, Inc | | | | | 1.300 | | | 09/05/23 | | | 347 | |
| $ | 36,375,000 | | | | AT&T, Inc | | | | | 3.400 | | | 05/15/25 | | | 34,193 | |
| EUR | 500,000 | | | | AT&T, Inc | | | | | 2.350 | | | 09/05/29 | | | 560 | |
| $ | 21,900,000 | | | | AT&T, Inc | | | | | 4.300 | | | 02/15/30 | | | 20,709 | |
| | 9,000,000 | | | | AT&T, Inc | | | | | 4.500 | | | 05/15/35 | | | 8,088 | |
| | 200,000 | | | | AT&T, Inc | | | | | 4.300 | | | 12/15/42 | | | 170 | |
| | 150,000 | | | | AT&T, Inc | | | | | 4.800 | | | 06/15/44 | | | 135 | |
| | 6,525,000 | | | | AT&T, Inc | | | | | 5.150 | | | 11/15/46 | | | 6,071 | |
| | 4,525,000 | | | | AT&T, Inc | | | | | 4.500 | | | 03/09/48 | | | 3,901 | |
| | 500,000 | | | | AT&T, Inc | | | | | 5.300 | | | 08/15/58 | | | 464 | |
| | 4,400,000 | | g | | Bharti Airtel International Netherlands BV | | | | | 5.125 | | | 03/11/23 | | | 4,331 | |
| | 1,325,000 | | g | | C&W Senior Financing Designated Activity Co | | | 7.500 | | | 10/15/26 | | | 1,274 | |
| | 4,000,000 | | | | Deutsche Telekom International Finance BV | | | 8.750 | | | 06/15/30 | | | 5,220 | |
| | 3,400,000 | | g | | ENTEL Chile S.A. | | | | | 4.875 | | | 10/30/24 | | | 3,309 | |
| | 3,950,000 | | | | France Telecom S.A. | | | | | 5.375 | | | 01/13/42 | | | 4,174 | |
| | 6,000,000 | | g | | MTN Mauritius Investment Ltd | | | | | 6.500 | | | 10/13/26 | | | 5,850 | |
| | 698,000 | | o | | Oi S.A. | | | | | 10.000 | | | 07/27/25 | | | 690 | |
| | 2,125,000 | | | | Telefonica Emisiones SAU | | | | | 4.103 | | | 03/08/27 | | | 2,049 | |
| | 2,325,000 | | | | T-Mobile USA, Inc | | | | | 6.375 | | | 03/01/25 | | | 2,354 | |
| | 3,150,000 | | g | | Turkcell Iletisim Hizmetleri AS. | | | | | 5.800 | | | 04/11/28 | | | 2,708 | |
| | 4,350,000 | | | | Verizon Communications, Inc | | | | | 3.376 | | | 02/15/25 | | | 4,220 | |
| EUR | 400,000 | | | | Verizon Communications, Inc | | | | | 1.375 | | | 10/27/26 | | | 455 | |
| $ | 9,392,000 | | | | Verizon Communications, Inc | | | | | 4.329 | | | 09/21/28 | | | 9,436 | |
| EUR | 400,000 | | | | Verizon Communications, Inc | | | | | 1.875 | | | 10/26/29 | | | 451 | |
| $ | 30,520,000 | | | | Verizon Communications, Inc | | | | | 4.272 | | | 01/15/36 | | | 28,593 | |
| EUR | 300,000 | | | | Verizon Communications, Inc | | | | | 2.875 | | | 01/15/38 | | | 345 | |
| $ | 10,550,000 | | | | Verizon Communications, Inc | | | | | 3.850 | | | 11/01/42 | | | 9,137 | |
| | 3,350,000 | | | | Verizon Communications, Inc | | | | | 4.125 | | | 08/15/46 | | | 2,960 | |
| EUR | 500,000 | | g | | Virgin Media Finance plc | | | | | 4.500 | | | 01/15/25 | | | 566 | |
| $ | 8,700,000 | | | | Vodafone Group plc | | | | | 4.375 | | | 05/30/28 | | | 8,445 | |
| | | | | | TOTAL TELECOMMUNICATION SERVICES | | | | | | | | | 171,737 | |
| | | | | | | | | | | | | | | | | | |
| TRANSPORTATION - 0.7% | | | | | | | | | | | | |
| | 4,850,000 | | g | | Adani Ports & Special Economic Zone Ltd | | | 4.000 | | | 07/30/27 | | | 4,338 | |
| | 72,000 | | | | Burlington Northern Santa Fe LLC | | | | | 4.150 | | | 04/01/45 | | | 70 | |
| | 200,000 | | | | Canadian Pacific Railway Co | | | | | 4.800 | | | 08/01/45 | | | 209 | |
| | 5,000,000 | | | | CSX Corp | | | | | 3.250 | | | 06/01/27 | | | 4,706 | |
| | 3,500,000 | | | | CSX Corp | | | | | 3.800 | | | 03/01/28 | | | 3,436 | |
| | 4,250,000 | | | | CSX Corp | | | | | 4.250 | | | 03/15/29 | | | 4,318 | |
| | 150,000 | | | | CSX Corp | | | | | 4.100 | | | 03/15/44 | | | 139 | |
COLLEGE RETIREMENT EQUITIES FUND -Bond Market Account
| PRINCIPAL | | | | ISSUER | | | | RATE | | MATURITY
DATE | | VALUE
(000) | |
| $ | 4,000,000 | | | | CSX Corp | | | | | 3.800 | % | | 11/01/46 | | $ | 3,528 | |
| | 6,500,000 | | | | CSX Corp | | | | | 4.300 | | | 03/01/48 | | | 6,198 | |
| | 9,250,000 | | | | Delta Air Lines, Inc | | | | | 3.625 | | | 03/15/22 | | | 9,052 | |
| | 6,100,000 | | | | Delta Air Lines, Inc | | | | | 3.800 | | | 04/19/23 | | | 6,002 | |
| | 3,650,000 | | g | | DP World Ltd | | | | | 5.625 | | | 09/25/48 | | | 3,431 | |
| EUR | 400,000 | | | | FedEx Corp | | | | | 1.000 | | | 01/11/23 | | | 462 | |
| | 325,000 | | | | FedEx Corp | | | | | 1.625 | | | 01/11/27 | | | 367 | |
| $ | 100,000 | | | | FedEx Corp | | | | | 3.875 | | | 08/01/42 | | | 83 | |
| | 2,830,000 | | | | FedEx Corp | | | | | 4.100 | | | 02/01/45 | | | 2,442 | |
| | 7,425,000 | | | | FedEx Corp | | | | | 4.050 | | | 02/15/48 | | | 6,228 | |
| | 10,000,000 | | | | Kansas City Southern | | | | | 2.350 | | | 05/15/20 | | | 9,849 | |
| | 4,225,000 | | | | Norfolk Southern Corp | | | | | 4.150 | | | 02/28/48 | | | 3,948 | |
| | 8,925,000 | | | | Northrop Grumman Corp | | | | | 3.250 | | | 01/15/28 | | | 8,345 | |
| | 3,500,000 | | | | Northrop Grumman Corp | | | | | 4.030 | | | 10/15/47 | | | 3,188 | |
| | 4,475,000 | | g | | Pelabuhan Indonesia III Persero PT | | | | | 4.500 | | | 05/02/23 | | | 4,394 | |
| | 6,150,000 | | | | Union Pacific Corp | | | | | 3.950 | | | 09/10/28 | | | 6,145 | |
| | 6,125,000 | | | | Union Pacific Corp | | | | | 4.500 | | | 09/10/48 | | | 6,048 | |
| | | | | | TOTAL TRANSPORTATION | | | | | | | | | | | 96,926 | |
| | | | | | | | | | | | | | | | | | |
| UTILITIES - 2.6% | | | | | | | | | | | | | | | |
| | 1,650,000 | | | | AEP Transmission Co LLC | | | | | 3.100 | | | 12/01/26 | | | 1,595 | |
| | 1,650,000 | | | | AEP Transmission Co LLC | | | | | 4.000 | | | 12/01/46 | | | 1,578 | |
| | 1,600,000 | | | | AES Corp | | | | | 4.500 | | | 03/15/23 | | | 1,560 | |
| | 1,775,000 | | | | AES Corp | | | | | 4.875 | | | 05/15/23 | | | 1,735 | |
| | 8,475,000 | | | | AGL Capital Corp | | | | | 3.875 | | | 11/15/25 | | | 8,369 | |
| | 2,125,000 | | | | AGL Capital Corp | | | | | 4.400 | | | 06/01/43 | | | 2,019 | |
| | 3,475,000 | | | | Alabama Power Co | | | | | 4.150 | | | 08/15/44 | | | 3,404 | |
| | 400,000 | | | | American Electric Power Co, Inc | | | | | 3.200 | | | 11/13/27 | | | 380 | |
| | 2,750,000 | | | | American Water Capital Corp | | | | | 3.000 | | | 12/01/26 | | | 2,606 | |
| | 2,375,000 | | | | American Water Capital Corp | | | | | 4.000 | | | 12/01/46 | | | 2,240 | |
| | 7,175,000 | | | | American Water Capital Corp | | | | | 3.750 | | | 09/01/47 | | | 6,457 | |
| | 5,500,000 | | | | Atmos Energy Corp | | | | | 8.500 | | | 03/15/19 | | | 5,560 | |
| | 1,175,000 | | | | Atmos Energy Corp | | | | | 4.125 | | | 10/15/44 | | | 1,135 | |
| | 6,500,000 | | | | Baltimore Gas & Electric Co | | | | | 3.750 | | | 08/15/47 | | | 5,969 | |
| | 5,925,000 | | | | Berkshire Hathaway Energy Co | | | | | 3.250 | | | 04/15/28 | | | 5,640 | |
| | 6,225,000 | | | | Black Hills Corp | | | | | 4.250 | | | 11/30/23 | | | 6,280 | |
| | 1,575,000 | | | | Black Hills Corp | | | | | 3.150 | | | 01/15/27 | | | 1,475 | |
| | 4,750,000 | | | | Carolina Power & Light Co | | | | | 5.300 | | | 01/15/19 | | | 4,753 | |
| | 3,670,000 | | | | CenterPoint Energy Resources Corp | | | | | 4.500 | | | 01/15/21 | | | 3,744 | |
| | 3,550,000 | | | | CenterPoint Energy Resources Corp | | | | | 6.250 | | | 02/01/37 | | | 4,015 | |
| | 2,850,000 | | g | | Cerro del Aguila S.A. | | | | | 4.125 | | | 08/16/27 | | | 2,629 | |
| | 4,675,000 | | | | CMS Energy Corp | | | | | 3.600 | | | 11/15/25 | | | 4,598 | |
| | 200,000 | | | | CMS Energy Corp | | | | | 3.450 | | | 08/15/27 | | | 193 | |
| | 200,000 | | | | Commonwealth Edison Co | | | | | 2.950 | | | 08/15/27 | | | 192 | |
| | 250,000 | | | | Commonwealth Edison Co | | | | | 3.700 | | | 08/15/28 | | | 251 | |
| | 4,200,000 | | | | Commonwealth Edison Co | | | | | 5.900 | | | 03/15/36 | | | 4,957 | |
| | 2,750,000 | | | | Connecticut Light & Power Co | | | | | 5.500 | | | 02/01/19 | | | 2,754 | |
| | 4,575,000 | | | | Consolidated Edison, Inc | | | | | 2.000 | | | 05/15/21 | | | 4,438 | |
| | 3,775,000 | | | | Dominion Resources, Inc | | | | | 2.000 | | | 08/15/21 | | | 3,627 | |
| | 5,750,000 | | | | DTE Electric Co | | | | | 3.750 | | | 08/15/47 | | | 5,357 | |
| | 200,000 | | | | DTE Energy Co | | | | | 3.800 | | | 03/15/27 | | | 195 | |
| | 1,400,000 | | | | Duke Energy Carolinas LLC | | | | | 4.300 | | | 06/15/20 | | | 1,427 | |
| | 5,825,000 | | | | Duke Energy Corp | | | | | 1.800 | | | 09/01/21 | | | 5,575 | |
| | 8,675,000 | | | | Duke Energy Corp | | | | | 2.650 | | | 09/01/26 | | | 7,902 | |
COLLEGE RETIREMENT EQUITIES FUND -Bond Market Account
| PRINCIPAL | | | | ISSUER | | | | RATE | | MATURITY
DATE | | VALUE
(000) | |
| $ | 750,000 | | | | Duke Energy Corp | | | | | 4.800 | % | | 12/15/45 | | $ | 765 | |
| | 6,389,824 | | | | Duke Energy Florida Project Finance LLC | | | | | 1.196 | | | 03/01/20 | | | 6,320 | |
| | 5,000,000 | | | | Duke Energy Florida Project Finance LLC | | | | | 1.731 | | | 09/01/22 | | | 4,877 | |
| | 1,450,000 | | | | Duke Energy Ohio, Inc | | | | | 3.800 | | | 09/01/23 | | | 1,485 | |
| | 200,000 | | | | Emera US Finance LP | | | | | 3.550 | | | 06/15/26 | | | 190 | |
| | 4,325,000 | | | | Enel Chile S.A. | | | | | 4.875 | | | 06/12/28 | | | 4,314 | |
| | 5,700,000 | | | | Entergy Corp | | | | | 2.950 | | | 09/01/26 | | | 5,261 | |
| | 5,850,000 | | g | | Eskom Holdings SOC Ltd | | | | | 5.750 | | | 01/26/21 | | | 5,512 | |
| | 6,250,000 | | g | | Eskom Holdings SOC Ltd | | | | | 6.350 | | | 08/10/28 | | | 6,022 | |
| | 2,675,000 | | g | | Eskom Holdings SOC Ltd | | | | | 8.450 | | | 08/10/28 | | | 2,517 | |
| | 9,450,000 | | | | Exelon Generation Co LLC | | | | | 3.400 | | | 03/15/22 | | | 9,301 | |
| | 300,000 | | | | FirstEnergy Corp | | | | | 3.900 | | | 07/15/27 | | | 291 | |
| | 8,150,000 | | | | Fortis, Inc | | | | | 3.055 | | | 10/04/26 | | | 7,444 | |
| | 350,000 | | | | Georgia Power Co | | | | | 3.250 | | | 03/30/27 | | | 328 | |
| | 3,600,000 | | | | Indiana Michigan Power Co | | | | | 3.750 | | | 07/01/47 | | | 3,290 | |
| | 2,725,000 | | | | Integrys Energy Group, Inc | | | | | 4.170 | | | 11/01/20 | | | 2,762 | |
| | 1,300,000 | | g | | Israel Electric Corp Ltd | | | | | 5.000 | | | 11/12/24 | | | 1,309 | |
| | 6,125,000 | | g | | Israel Electric Corp Ltd | | | | | 4.250 | | | 08/14/28 | | | 5,831 | |
| | 1,000,000 | | g | | Kansas Gas & Electric | | | | | 6.700 | | | 06/15/19 | | | 1,015 | |
| | 4,525,000 | | g | | KazTransGas JSC | | | | | 4.375 | | | 09/26/27 | | | 4,185 | |
| | 3,675,000 | | g | | Korea Hydro & Nuclear Power Co Ltd | | | 3.750 | | | 07/25/23 | | | 3,716 | |
| | 5,000,000 | | | | LG&E and KU Energy LLC | | | | | 3.750 | | | 11/15/20 | | | 5,018 | |
| | 6,150,000 | | | | MidAmerican Energy Co | | | | | 3.650 | | | 08/01/48 | | | 5,670 | |
| | 3,000,000 | | g | | Minejesa Capital BV | | | | | 4.625 | | | 08/10/30 | | | 2,678 | |
| | 800,000 | | g | | Minejesa Capital BV | | | | | 5.625 | | | 08/10/37 | | | 701 | |
| | 3,335,000 | | | | Nevada Power Co | | | | | 5.450 | | | 05/15/41 | | | 3,845 | |
| | 13,375,000 | | | | NextEra Energy Capital Holdings, Inc | | | | | 3.550 | | | 05/01/27 | | | 12,770 | |
| | 7,100,000 | | | | NiSource Finance Corp | | | | | 3.490 | | | 05/15/27 | | | 6,779 | |
| | 200,000 | | | | NiSource Finance Corp | | | | | 4.800 | | | 02/15/44 | | | 194 | |
| | 2,000,000 | | | | NRG Energy, Inc | | | | | 6.250 | | | 05/01/24 | | | 2,030 | |
| EUR | 230,000 | | | | NTPC Ltd | | | | | 2.750 | | | 02/01/27 | | | 257 | |
| $ | 6,150,000 | | | | Ohio Power Co | | | | | 4.150 | | | 04/01/48 | | | 6,078 | |
| | 7,100,000 | | | | Oncor Electric Delivery Co LLC | | | | | 2.150 | | | 06/01/19 | | | 7,079 | |
| | 1,280,000 | | | | Oncor Electric Delivery Co LLC | | | | | 5.250 | | | 09/30/40 | | | 1,463 | |
| | 750,000 | | g | | Pacific Gas & Electric Co | | | | | 4.650 | | | 08/01/28 | | | 660 | |
| | 2,700,000 | | | | Pacific Gas & Electric Co | | | | | 3.750 | | | 08/15/42 | | | 2,005 | |
| | 5,850,000 | | | | Pacific Gas & Electric Co | | | | | 4.250 | | | 03/15/46 | | | 4,551 | |
| | 500,000 | | | | Pacific Gas & Electric Co | | | | | 3.950 | | | 12/01/47 | | | 380 | |
| | 4,500,000 | | g | | Perusahaan Gas Negara Persero Tbk PT | | | 5.125 | | | 05/16/24 | | | 4,506 | |
| | 4,600,000 | | g | | Perusahaan Listrik Negara PT | | | | | 4.125 | | | 05/15/27 | | | 4,256 | |
| | 750,000 | | | | Potomac Electric Power Co | | | | | 7.900 | | | 12/15/38 | | | 1,021 | |
| | 6,925,000 | | | | PPL Capital Funding, Inc | | | | | 4.200 | | | 06/15/22 | | | 7,009 | |
| | 200,000 | | | | PPL Capital Funding, Inc | | | | | 3.100 | | | 05/15/26 | | | 188 | |
| | 2,000,000 | | | | PPL Electric Utilities Corp | | | | | 3.000 | | | 09/15/21 | | | 2,004 | |
| | 3,825,000 | | | | Progress Energy, Inc | | | | | 7.050 | | | 03/15/19 | | | 3,854 | |
| | 9,725,000 | | | | PSEG Power LLC | | | | | 3.850 | | | 06/01/23 | | | 9,732 | |
| | 8,800,000 | | | | Public Service Co of Oklahoma | | | | | 5.150 | | | 12/01/19 | | | 8,962 | |
| | 2,650,000 | | g | | Rio Oil Finance Trust | | | | | 8.200 | | | 04/06/28 | | | 2,776 | |
| | 300,000 | | | | San Diego Gas & Electric Co | | | | | 2.500 | | | 05/15/26 | | | 278 | |
| | 5,550,000 | | | | Sempra Energy | | | | | 2.875 | | | 10/01/22 | | | 5,352 | |
| | 250,000 | | | | Sierra Pacific Power Co | | | | | 2.600 | | | 05/01/26 | | | 233 | |
| | 200,000 | | | | South Carolina Electric & Gas Co | | | | | 4.350 | | | 02/01/42 | | | 196 | |
| | 1,900,000 | | | | Southern California Edison Co | | | | | 4.125 | | | 03/01/48 | | | 1,801 | |
COLLEGE RETIREMENT EQUITIES FUND -Bond Market Account
| PRINCIPAL | | | | ISSUER | | | | RATE | | MATURITY
DATE | | VALUE
(000) | |
| $ | 2,000,000 | | | | Southern Co Gas Capital Corp | | | | | 3.950 | % | | 10/01/46 | | $ | 1,753 | |
| | 8,250,000 | | | | Southern Power Co | | | | | 2.500 | | | 12/15/21 | | | 8,012 | |
| | 7,825,000 | | | | Southern Power Co | | | | | 4.150 | | | 12/01/25 | | | 7,758 | |
| | 7,375,000 | | | | Southwest Gas Corp | | | | | 3.700 | | | 04/01/28 | | | 7,340 | |
| | 3,680,000 | | | | Virginia Electric & Power Co | | | | | 2.950 | | | 01/15/22 | | | 3,640 | |
| | 3,550,000 | | | | Virginia Electric & Power Co | | | | | 2.950 | | | 11/15/26 | | | 3,366 | |
| | 3,250,000 | | | | Virginia Electric & Power Co | | | | | 3.500 | | | 03/15/27 | | | 3,202 | |
| | 4,125,000 | | | | Wisconsin Power & Light Co | | | | | 4.100 | | | 10/15/44 | | | 3,923 | |
| | 3,175,000 | | | | Xcel Energy, Inc | | | | | 3.350 | | | 12/01/26 | | | 3,082 | |
| | 2,890,000 | | | | Xcel Energy, Inc | | | | | 4.800 | | | 09/15/41 | | | 2,945 | |
| | | | | | TOTAL UTILITIES | | | | | | | | | | | 350,691 | |
| | | | | | | | | | | | | | | | | | |
| | | | | | TOTAL CORPORATE BONDS | | | | | | | | | | | 4,224,269 | |
| | | | | | (Cost $4,356,461) | | | | | | | | | | | | |
| | | | | | | | | | | | | | | | | | |
| GOVERNMENT BONDS - 45.8% | | | | | | | | | | | | |
| | | | | | | | | | | | | | | | | | |
| AGENCY SECURITIES - 2.5% | | | | | | | | | | | | |
| | 6,628,887 | | | | AMAL Ltd | | | | | 3.465 | | | 08/21/21 | | | 6,692 | |
| | 2,500,000 | | | | Amber Circle Funding Ltd | | | | | 3.250 | | | 12/04/22 | | | 2,458 | |
| | 3,879,000 | | | | Canal Barge Co, Inc | | | | | 4.500 | | | 11/12/34 | | | 4,119 | |
| | 41,206,846 | | | | CES MU2 LLC | | | | | 1.994 | | | 05/13/27 | | | 39,722 | |
| | 3,967,900 | | | | Export Lease Ten Co LLC | | | | | 1.650 | | | 05/07/25 | | | 3,827 | |
| | 250,000 | | | | Federal Home Loan Bank (FHLB) | | | | | 1.125 | | | 07/14/21 | | | 241 | |
| | 300,000 | | | | Federal National Mortgage Association (FNMA) | | | 2.625 | | | 09/06/24 | | | 299 | |
| | 11,880,120 | | | | Helios Leasing II LLC | | | | | 2.668 | | | 03/18/25 | | | 11,837 | |
| | 12,129,409 | | | | HNA LLC | | | | | 2.291 | | | 06/30/27 | | | 11,853 | |
| | 12,890,000 | | | | Lutheran Medical Center | | | | | 1.982 | | | 02/20/30 | | | 12,003 | |
| | 7,890,000 | | | | Montefiore Medical Center | | | | | 2.152 | | | 10/20/26 | | | 7,624 | |
| | 3,356,695 | | | | MSN 41079 and 41084 Ltd | | | | | 1.631 | | | 12/14/24 | | | 3,243 | |
| | 12,767,857 | | | | Overseas Private Investment Corp (OPIC) | | | | | 3.520 | | | 09/20/32 | | | 13,093 | |
| | 7,029,531 | | | | Premier Aircraft Leasing | | | | | 3.576 | | | 02/06/22 | | | 7,113 | |
| | 5,000,000 | | | | Private Export Funding Corp (PEFCO) | | | 4.375 | | | 03/15/19 | | | 5,016 | |
| | 7,240,000 | | | | PEFCO | | | | | 1.450 | | | 08/15/19 | | | 7,181 | |
| | 27,750,000 | | | | PEFCO | | | | | 2.250 | | | 03/15/20 | | | 27,612 | |
| | 24,000,000 | | g | | PEFCO | | | | | 3.266 | | | 11/08/21 | | | 24,307 | |
| | 35,000,000 | | | | PEFCO | | | | | 4.300 | | | 12/15/21 | | | 36,566 | |
| | 25,747,000 | | | | PEFCO | | | | | 2.050 | | | 11/15/22 | | | 25,128 | |
| | 30,453,846 | | | | Tagua Leasing LLC | | | | | 1.900 | | | 07/12/24 | | | 29,740 | |
| | 1,643,233 | | | | Union 12 Leasing LLC | | | | | 2.164 | | | 02/17/24 | | | 1,618 | |
| | 12,330,000 | | | | UNM Sandoval Regional Medical Center | | | 4.500 | | | 07/20/36 | | | 12,606 | |
| | 7,329,675 | | | | Windermere Aviation LLC | | | | | 2.351 | | | 05/27/26 | | | 7,215 | |
| | 16,717,920 | | | | Zarapito Leasing LLC | | | | | 2.628 | | | 11/12/26 | | | 16,613 | |
| | | | | | TOTAL AGENCY SECURITIES | | | | | | | | | | | 317,726 | |
| | | | | | | | | | | | | | | | | | |
| FOREIGN GOVERNMENT BONDS - 5.5% | | | | | | | | | | | | |
| | 4,000,000 | | g | | Abu Dhabi Government International Bond | | | 3.125 | | | 05/03/26 | | | 3,879 | |
| | 3,325,000 | | g | | Arab Petroleum Investments Corp | | | | | 4.125 | | | 09/18/23 | | | 3,327 | |
| | 1,175,000 | | | | Argentina Republic Government International Bond | | | 5.625 | | | 01/26/22 | | | 991 | |
| | 2,000,000 | | | | Argentina Republic Government International Bond | | | 5.875 | | | 01/11/28 | | | 1,438 | |
| AUD | 1,700,000 | | | | Australia Government International Bond | | | | | 5.750 | | | 05/15/21 | | | 1,305 | |
| | 1,700,000 | | | | Australia Government International Bond | | | | | 2.250 | | | 05/21/28 | | | 1,193 | |
| $ | 2,250,000 | | g | | Banque Centrale de Tunisie S.A. | | | | | 5.750 | | | 01/30/25 | | | 1,889 | |
| | 987,000 | | g | | Bermuda Government International Bond | | | 4.854 | | | 02/06/24 | | | 1,026 | |
COLLEGE RETIREMENT EQUITIES FUND -Bond Market Account
| PRINCIPAL | | | | ISSUER | | | | RATE | | MATURITY
DATE | | VALUE
(000) | |
| $ | 3,450,000 | | g | | Bermuda Government International Bond | | | | | 3.717 | % | | 01/25/27 | | $ | 3,282 | |
| | 2,500,000 | | g | | Bermuda Government International Bond | | | | | 4.750 | | | 02/15/29 | | | 2,541 | |
| | 6,000,000 | | g | | Brazil Minas SPE via State of Minas Gerais | | | | | 5.333 | | | 02/15/28 | | | 5,955 | |
| BRL | 3,500,000 | | | | Brazil Notas do Tesouro Nacional Serie F | | | | | 10.000 | | | 01/01/23 | | | 946 | |
| $ | 3,300,000 | | | | Brazilian Government International Bond | | | | | 5.625 | | | 02/21/47 | | | 3,114 | |
| EUR | 1,000,000 | | | | Bundesrepublik Deutschland | | | | | 1.250 | | | 08/15/48 | | | 1,256 | |
| $ | 5,000,000 | | g | | Caisse d’Amortissement de la Dette Sociale | | | | | 2.000 | | | 04/17/20 | | | 4,956 | |
| | 1,850,000 | | g | | Caisse d’Amortissement de la Dette Sociale | | | | | 1.875 | | | 07/28/20 | | | 1,826 | |
| | 4,000,000 | | g | | Caisse d’Amortissement de la Dette Sociale | | | | | 1.875 | | | 02/12/22 | | | 3,893 | |
| EUR | 400,000 | | | | Caisse d’Amortissement de la Dette Sociale | | | | | 1.375 | | | 11/25/24 | | | 489 | |
| CAD | 1,300,000 | | g | | Canada Housing Trust No | | | | | 2.550 | | | 12/15/23 | | | 963 | |
| | 1,460,000 | | | | Canadian Government International Bond | | | | | 0.500 | | | 02/01/19 | | | 1,068 | |
| | 1,960,000 | | | | Canadian Government International Bond | | | | | 1.750 | | | 08/01/20 | | | 1,433 | |
| | 1,000,000 | | | | Canadian Government International Bond | | | | | 5.000 | | | 06/01/37 | | | 1,052 | |
| $ | 8,800,000 | | | | Chile Government International Bond | | | | | 3.240 | | | 02/06/28 | | | 8,444 | |
| | 6,125,000 | | | | Colombia Government International Bond | | | | | 2.625 | | | 03/15/23 | | | 5,751 | |
| | 4,000,000 | | | | Colombia Government International Bond | | | | | 5.000 | | | 06/15/45 | | | 3,808 | |
| | 3,500,000 | | g | | Costa Rica Government International Bond | | | | | 7.158 | | | 03/12/45 | | | 3,014 | |
| | 20,200,000 | | g | | CPPIB Capital, Inc | | | | | 2.250 | | | 01/25/22 | | | 19,900 | |
| | 16,400,000 | | g | | CPPIB Capital, Inc | | | | | 2.750 | | | 11/02/27 | | | 15,989 | |
| DOP | 48,650,000 | | g | | Dominican Republic International Bond | | | | | 8.900 | | | 02/15/23 | | | 934 | |
| $ | 2,000,000 | | g | | Dominican Republic International Bond | | | | | 6.500 | | | 02/15/48 | | | 1,890 | |
| | 2,275,000 | | g | | Egypt Government International Bond | | | | | 5.577 | | | 02/21/23 | | | 2,160 | |
| | 3,950,000 | | g | | Egypt Government International Bond | | | | | 8.500 | | | 01/31/47 | | | 3,570 | |
| | 10,000,000 | | | | European Investment Bank | | | | | 2.500 | | | 04/15/21 | | | 9,980 | |
| | 250,000 | | | | European Investment Bank | | | | | 3.250 | | | 01/29/24 | | | 256 | |
| | 3,500,000 | | | | European Investment Bank | | | | | 4.875 | | | 02/15/36 | | | 4,290 | |
| | 3,575,000 | | g | | Export Credit Bank of Turkey | | | | | 4.250 | | | 09/18/22 | | | 3,235 | |
| | 300,000 | | g | | Export Credit Bank of Turkey | | | | | 5.375 | | | 10/24/23 | | | 273 | |
| | 15,000,000 | | | | Export Development Canada | | | | | 2.000 | | | 11/30/20 | | | 14,823 | |
| | 2,000,000 | | g | | Export-Import Bank of China | | | | | 2.850 | | | 09/16/20 | | | 1,980 | |
| | 5,800,000 | | g | | Export-Import Bank of India | | | | | 3.875 | | | 02/01/28 | | | 5,466 | |
| EUR | 3,000,000 | | | | French Republic Government Bond OAT | | | | | 0.500 | | | 05/25/25 | | | 3,501 | |
| | 3,100,000 | | | | French Republic Government Bond OAT | | | | | 0.750 | | | 11/25/28 | | | 3,570 | |
| | 1,250,000 | | | | French Republic Government Bond OAT | | | | | 1.250 | | | 05/25/34 | | | 1,461 | |
| | 1,200,000 | | g | | French Republic Government Bond OAT | | | | | 2.000 | | | 05/25/48 | | | 1,497 | |
| $ | 1,000,000 | | g | | Ghana Government International Bond | | | | | 8.627 | | | 06/16/49 | | | 872 | |
| | 3,600,000 | | g | | Guatemala Government International Bond | | | | | 4.500 | | | 05/03/26 | | | 3,375 | |
| | 2,000,000 | | g | | Guatemala Government International Bond | | | | | 4.375 | | | 06/05/27 | | | 1,845 | |
| EUR | 2,150,000 | | g | | Hellenic Republic Government International Bond | | | | | 4.375 | | | 08/01/22 | | | 2,563 | |
| | 3,600,000 | | g | | Hellenic Republic Government International Bond | | | | | 3.375 | | | 02/15/25 | | | 3,985 | |
| $ | 2,595,000 | | g | | Honduras Government International Bond | | | | | 7.500 | | | 03/15/24 | | | 2,722 | |
| CAD | 1,800,000 | | | | Hydro-Quebec | | | | | 5.000 | | | 02/15/45 | | | 1,754 | |
| IDR | 18,000,000,000 | | | | Indonesia Treasury Bond | | | | | 8.250 | | | 07/15/21 | | | 1,269 | |
| | 12,500,000,000 | | | | Indonesia Treasury Bond | | | | | 7.500 | | | 05/15/38 | | | 800 | |
| AUD | 500,000 | | | | Inter-American Development Bank | | | | | 4.750 | | | 08/27/24 | | | 393 | |
| | 900,000 | | | | Inter-American Development Bank | | | | | 2.750 | | | 10/30/25 | | | 637 | |
| | 1,300,000 | | | | International Bank for Reconstruction & Development | | | | | 2.800 | | | 01/13/21 | | | 926 | |
| ILS | 3,600,000 | | i | | Israel Government International Bond | | | | | 0.350 | | | 05/31/26 | | | 961 | |
| $ | 6,200,000 | | | | Israel Government International Bond | | | | | 3.250 | | | 01/17/28 | | | 6,092 | |
COLLEGE RETIREMENT EQUITIES FUND -Bond Market Account
| PRINCIPAL | | | | ISSUER | | REFERENCE
RATE & SPREAD | | RATE | | MATURITY
DATE | | VALUE
(000) | |
| $ | 4,375,000 | | | | Israel Government International Bond | | | | | 4.125 | % | | 01/17/48 | | $ | 4,280 | |
| ILS | 3,100,000 | | | | Israel Government International Bond-Fixed | | | | | 5.500 | | | 01/31/42 | | | 1,141 | |
| EUR | 2,250,000 | | | | Italy Buoni Poliennali Del Tesoro | | | | | 0.350 | | | 06/15/20 | | | 2,575 | |
| | 1,250,000 | | | | Italy Buoni Poliennali Del Tesoro | | | | | 0.050 | | | 04/15/21 | | | 1,410 | |
| | 4,350,000 | | | | Italy Buoni Poliennali Del Tesoro | | | | | 2.450 | | | 10/01/23 | | | 5,131 | |
| | 3,345,000 | | | | Italy Buoni Poliennali Del Tesoro | | | | | 1.250 | | | 12/01/26 | | | 3,545 | |
| | 1,225,000 | | g | | Italy Buoni Poliennali Del Tesoro | | | | | 2.950 | | | 09/01/38 | | | 1,334 | |
| | 1,000,000 | | g | | Ivory Coast Government International Bond | | | | | 6.625 | | | 03/22/48 | | | 964 | |
| $ | 2,353,000 | | g | | Ivory Coast Government International Bond (Step Bond) | | | | | 5.750 | | | 12/31/32 | | | 2,067 | |
| | 6,000,000 | | | | Japan Bank for International Cooperation | | | | | 2.375 | | | 04/20/26 | | | 5,734 | |
| | 2,000,000 | | g | | Japan Finance Organization for Municipalities | | | | | 2.000 | | | 09/08/20 | | | 1,967 | |
| | 2,700,000 | | g | | Japan Finance Organization for Municipalities | | | | | 2.125 | | | 02/12/21 | | | 2,657 | |
| | 4,000,000 | | g | | Japan Finance Organization for Municipalities | | | | | 2.125 | | | 04/13/21 | | | 3,926 | |
| | 6,650,000 | | g | | Japan Finance Organization for Municipalities | | | | | 3.375 | | | 09/27/23 | | | 6,757 | |
| JPY | 113,000,000 | | | | Japan Finance Organization for Municipalities | | | | | 0.450 | | | 03/14/25 | | | 1,061 | |
| | 103,000,000 | | | | Japan Finance Organization for Municipalities | | | | | 0.484 | | | 06/13/25 | | | 971 | |
| | 140,000,000 | | | | Japan Finance Organization for Municipalities | | | | | 0.020 | | | 03/13/26 | | | 1,282 | |
| | 76,000,000 | | | | Japan Government Five Year Bond | | | | | 0.100 | | | 06/20/23 | | | 701 | |
| | 440,000,000 | | | | Japan Government Ten Year Bond | | | | | 0.100 | | | 09/20/26 | | | 4,085 | |
| | 369,000,000 | | | | Japan Government Ten Year Bond | | | | | 0.100 | | | 12/20/26 | | | 3,424 | |
| | 350,000,000 | | | | Japan Government Thirty Year Bond | | | | | 2.400 | | | 11/20/31 | | | 4,101 | |
| | 350,000,000 | | | | Japan Government Thirty Year Bond | | | | | 2.300 | | | 05/20/32 | | | 4,082 | |
| | 300,000,000 | | | | Japan Government Thirty Year Bond | | | | | 2.500 | | | 09/20/34 | | | 3,655 | |
| | 450,000,000 | | | | Japan Government Thirty Year Bond | | | | | 0.500 | | | 09/20/46 | | | 3,913 | |
| | 114,000,000 | | | | Japan Government Thirty Year Bond | | | | | 0.700 | | | 06/20/48 | | | 1,036 | |
| | 530,000,000 | | | | Japan Government Twenty Year Bond | | | | | 1.900 | | | 03/22/21 | | | 5,054 | |
| | 93,000,000 | | | | Japan Government Twenty Year Bond | | | | | 0.600 | | | 12/20/36 | | | 873 | |
| | 445,000,000 | | | | Japan Government Two Year Bond | | | | | 0.100 | | | 02/15/19 | | | 4,061 | |
| $ | 475,000 | | g | | Jordan Government International Bond | | | | | 7.375 | | | 10/10/47 | | | 422 | |
| EUR | 600,000 | | g | | Kazakhstan Government International Bond | | | | | 2.375 | | | 11/09/28 | | | 681 | |
| $ | 1,900,000 | | g | | Kenya Government International Bond | | | | | 7.250 | | | 02/28/28 | | | 1,702 | |
| | 45,000,000 | | | | KFW | | | | | 2.750 | | | 10/01/20 | | | 45,089 | |
| | 18,750,000 | | | | KFW | | | | | 2.625 | | | 01/25/22 | | | 18,746 | |
| EUR | 1,080,000 | | | | Kingdom of Belgium Government International Bond | | | | | 1.250 | | | 04/22/33 | | | 1,245 | |
| | 1,025,000 | | g | | Kingdom of Belgium Government International Bond | | | | | 1.600 | | | 06/22/47 | | | 1,133 | |
| $ | 7,700,000 | | g | | Kommunalbanken AS. | | | | | 1.625 | | | 01/15/20 | | | 7,611 | |
| | 1,925,000 | | g | | Kommunalbanken AS. | | | | | 1.375 | | | 10/26/20 | | | 1,880 | |
| | 3,750,000 | | g | | Kommunalbanken AS. | | | | | 1.625 | | | 02/10/21 | | | 3,670 | |
| | 5,000,000 | | g | | Kommunalbanken AS. | | | | | 2.250 | | | 01/25/22 | | | 4,936 | |
| EUR | 500,000 | | | | Kommunalbanken AS. | | | | | 0.625 | | | 04/20/26 | | | 579 | |
| $ | 5,000,000 | | g | | Kommuninvest I Sverige AB | | | | | 2.000 | | | 11/12/19 | | | 4,971 | |
| | 4,000,000 | | i | | Korea Development Bank | | LIBOR 3 M + 0.550% | | | 3.326 | | | 03/12/21 | | | 3,999 | |
| | 2,675,000 | | g | | Korea Housing Finance Corp | | | | | 2.000 | | | 10/11/21 | | | 2,578 | |
| | 5,775,000 | | g | | Korea Housing Finance Corp | | | | | 3.000 | | | 10/31/22 | | | 5,680 | |
| KRW | 3,920,000,000 | | | | Korea Treasury Bond | | | | | 2.000 | | | 03/10/21 | | | 3,524 | |
| | 4,630,000,000 | | | | Korea Treasury Bond | | | | | 1.375 | | | 09/10/21 | | | 4,096 | |
| | 1,800,000,000 | | | | Korea Treasury Bond | | | | | 1.500 | | | 12/10/26 | | | 1,555 | |
| $ | 5,750,000 | | g | | Kuwait International Government Bond | | | | | 2.750 | | | 03/20/22 | | | 5,651 | |
| | 1,750,000 | | | | Lebanon Government International Bond | | | | | 6.750 | | | 11/29/27 | | | 1,367 | |
| | 5,250,000 | | g | | Lithuania Government International Bond | | | | | 6.625 | | | 02/01/22 | | | 5,721 | |
COLLEGE RETIREMENT EQUITIES FUND -Bond Market Account
| PRINCIPAL | | | | ISSUER | | | | RATE | | MATURITY
DATE | | VALUE
(000) | |
| MXN | 14,500,000 | | | | Mexican Bonos | | | | | 8.000 | % | | 12/07/23 | | $ | 720 | |
| | 23,500,000 | | | | Mexican Bonos | | | | | 5.750 | | | 03/05/26 | | | 1,010 | |
| $ | 4,797,000 | | | | Mexico Government International Bond | | | | | 4.000 | | | 10/02/23 | | | 4,775 | |
| | 5,100,000 | | | | Mexico Government International Bond | | | | | 4.150 | | | 03/28/27 | | | 4,931 | |
| | 6,650,000 | | | | Mexico Government International Bond | | | | | 4.750 | | | 03/08/44 | | | 6,045 | |
| | 525,000 | | g | | Mongolia Government International Bond | | | 5.625 | | | 05/01/23 | | | 496 | |
| | 5,750,000 | | g | | Morocco Government International Bond | | | 5.500 | | | 12/11/42 | | | 5,868 | |
| | 2,900,000 | | g | | Municipality Finance plc | | | | | 1.125 | | | 09/16/19 | | | 2,868 | |
| | 3,075,000 | | g | | Namibia Government International Bond | | | | | 5.250 | | | 10/29/25 | | | 2,764 | |
| | 4,500,000 | | g | | Nederlandse Waterschapsbank NV | | | | | 2.125 | | | 11/15/21 | | | 4,408 | |
| | 4,000,000 | | g | | Nederlandse Waterschapsbank NV | | | | | 3.125 | | | 12/05/22 | | | 4,051 | |
| EUR | 2,150,000 | | g | | Netherlands Government International Bond | | | 0.750 | | | 07/15/28 | | | 2,552 | |
| AUD | 500,000 | | | | New South Wales Treasury Corp | | | | | 4.000 | | | 05/20/26 | | | 387 | |
| NZD | 1,175,000 | | | | New Zealand Government Bond | | | | | 2.750 | | | 04/15/37 | | | 794 | |
| | 700,000 | | | | New Zealand Government International Bond | | | 4.500 | | | 04/15/27 | | | 551 | |
| $ | 3,050,000 | | g | | Nigeria Government International Bond | | | | | 6.500 | | | 11/28/27 | | | 2,702 | |
| | 1,550,000 | | g | | Nigeria Government International Bond | | | | | 7.143 | | | 02/23/30 | | | 1,372 | |
| NOK | 26,000,000 | | g | | Norway Government International Bond | | | | | 2.000 | | | 04/26/28 | | | 3,069 | |
| $ | 4,000,000 | | | | Panama Government International Bond | | | | | 6.700 | | | 01/26/36 | | | 4,880 | |
| | 3,000,000 | | | | Panama Government International Bond | | | | | 4.500 | | | 05/15/47 | | | 2,914 | |
| | 3,150,000 | | g | | Paraguay Government International Bond | | | 5.600 | | | 03/13/48 | | | 3,095 | |
| | 4,000,000 | | g | | Perusahaan Penerbit SBSN Indonesia III | | | | | 3.400 | | | 03/29/22 | | | 3,910 | |
| | 11,775,000 | | g | | Perusahaan Penerbit SBSN Indonesia III | | | | | 4.400 | | | 03/01/28 | | | 11,492 | |
| PEN | 4,860,000 | | g | | Peruvian Government International Bond | | | 8.200 | | | 08/12/26 | | | 1,695 | |
| $ | 3,000,000 | | | | Peruvian Government International Bond | | | 8.750 | | | 11/21/33 | | | 4,418 | |
| | 1,450,000 | | | | Peruvian Government International Bond | | | 5.625 | | | 11/18/50 | | | 1,702 | |
| PHP | 45,000,000 | | | | Philippine Government International Bond | | | 4.950 | | | 01/15/21 | | | 842 | |
| $ | 1,700,000 | | | | Philippine Government International Bond | | | 3.700 | | | 03/01/41 | | | 1,617 | |
| | 3,000,000 | | | | Philippine Government International Bond | | | 3.700 | | | 02/02/42 | | | 2,853 | |
| | 6,150,000 | | | | Poland Government International Bond | | | | | 5.000 | | | 03/23/22 | | | 6,471 | |
| PLN | 6,600,000 | | | | Poland Government International Bond | | | | | 4.000 | | | 10/25/23 | | | 1,912 | |
| $ | 15,000,000 | | | | Province of British Columbia Canada | | | | | 2.000 | | | 10/23/22 | | | 14,611 | |
| CAD | 2,350,000 | | | | Province of British Columbia Canada | | | | | 2.550 | | | 06/18/27 | | | 1,707 | |
| $ | 20,750,000 | | | | Province of Manitoba Canada | | | | | 1.750 | | | 05/30/19 | | | 20,663 | |
| | 10,000,000 | | | | Province of Manitoba Canada | | | | | 3.050 | | | 05/14/24 | | | 10,048 | |
| | 25,000,000 | | | | Province of Manitoba Canada | | | | | 2.125 | | | 06/22/26 | | | 23,389 | |
| | 22,500,000 | | | | Province of Quebec Canada | | | | | 3.500 | | | 07/29/20 | | | 22,783 | |
| CAD | 1,650,000 | | | | Province of Quebec Canada | | | | | 2.750 | | | 09/01/27 | | | 1,211 | |
| $ | 6,000,000 | | | | Province of Quebec Canada | | | | | 7.500 | | | 09/15/29 | | | 8,331 | |
| | 2,000,000 | | g | | Provincia de Mendoza Argentina | | | | | 8.375 | | | 05/19/24 | | | 1,620 | |
| AUD | 1,680,000 | | g | | Queensland Treasury Corp | | | | | 3.500 | | | 08/21/30 | | | 1,241 | |
| EUR | 850,000 | | g | | Republic of Austria Government International Bond | | | 0.750 | | | 02/20/28 | | | 998 | |
| PLN | 1,350,000 | | | | Republic of Poland Government International Bond | | | 2.500 | | | 01/25/23 | | | 367 | |
| | 2,750,000 | | | | Republic of Poland Government International Bond | | | 2.750 | | | 04/25/28 | | | 731 | |
| $ | 2,475,000 | | | | Republic of South Africa Government International Bond | | | 4.850 | | | 09/27/27 | | | 2,315 | |
| | 100,000 | | | | Republic of the Philippines | | | | | 6.500 | | | 01/20/20 | | | 104 | |
| | 5,040,000 | | g | | Romanian Government International Bond | | | 5.125 | | | 06/15/48 | | | 4,869 | |
| RUB | 88,750,000 | | | | Russian Federal Bond - Federal Loan Obligation | | | 7.000 | | | 01/25/23 | | | 1,223 | |
| $ | 3,250,000 | | g | | Russian Foreign Bond - Eurobond | | | | | 4.875 | | | 09/16/23 | | | 3,311 | |
| | 1,500,000 | | g | | Saudi Government International Bond | | | | | 2.375 | | | 10/26/21 | | | 1,446 | |
| | 4,000,000 | | g | | Saudi Government International Bond | | | | | 3.250 | | | 10/26/26 | | | 3,738 | |
COLLEGE RETIREMENT EQUITIES FUND -Bond Market Account
| PRINCIPAL | | | | ISSUER | | | | RATE | | MATURITY
DATE | | VALUE
(000) | |
| $ | 14,775,000 | | g | | Saudi Government International Bond | | | | | 4.500 | % | | 04/17/30 | | $ | 14,745 | |
| EUR | 1,000,000 | | g | | Senegal Government International Bond | | | | | 4.750 | | | 03/13/28 | | | 1,055 | |
| $ | 2,000,000 | | g | | Senegal Government International Bond | | | | | 6.250 | | | 05/23/33 | | | 1,725 | |
| | 4,000,000 | | g | | Senegal Government International Bond | | | | | 6.750 | | | 03/13/48 | | | 3,317 | |
| SGD | 4,250,000 | | | | Singapore Government International Bond | | | | | 1.750 | | | 04/01/22 | | | 3,110 | |
| $ | 4,000,000 | | | | South Africa Government International Bond | | | | | 5.875 | | | 09/16/25 | | | 4,050 | |
| ZAR | 12,200,000 | | | | South Africa Government International Bond | | | | | 10.500 | | | 12/21/26 | | | 922 | |
| | 15,100,000 | | | | South Africa Government International Bond | | | | | 8.750 | | | 01/31/44 | | | 932 | |
| EUR | 2,220,000 | | | | Spain Government International Bond | | | | | 0.400 | | | 04/30/22 | | | 2,578 | |
| | 2,550,000 | | g | | Spain Government International Bond | | | | | 2.750 | | | 10/31/24 | | | 3,273 | |
| | 1,595,000 | | g | | Spain Government International Bond | | | | | 1.400 | | | 07/30/28 | | | 1,825 | |
| | 1,600,000 | | g | | Spain Government International Bond | | | | | 2.700 | | | 10/31/48 | | | 1,868 | |
| $ | 3,000,000 | | g | | Sri Lanka Government International Bond | | | | | 5.750 | | | 01/18/22 | | | 2,829 | |
| | 1,250,000 | | g | | Sri Lanka Government International Bond | | | | | 5.750 | | | 04/18/23 | | | 1,154 | |
| | 1,500,000 | | g | | Sri Lanka Government International Bond | | | | | 6.850 | | | 11/03/25 | | | 1,406 | |
| | 4,000,000 | | | | Svensk Exportkredit AB | | | | | 1.750 | | | 03/10/21 | | | 3,924 | |
| SEK | 4,400,000 | | | | Sweden Government International Bond | | | | | 2.250 | | | 06/01/32 | | | 584 | |
| THB | 26,500,000 | | | | Thailand Government International Bond | | | | | 1.875 | | | 06/17/22 | | | 810 | |
| | 33,000,000 | | | | Thailand Government International Bond | | | | | 2.000 | | | 12/17/22 | | | 1,010 | |
| | 47,900,000 | | | | Thailand Government International Bond | | | | | 3.400 | | | 06/17/36 | | | 1,545 | |
| AUD | 500,000 | | | | Treasury Corp of Victoria | | | | | 6.000 | | | 06/15/20 | | | 372 | |
| | 2,175,000 | | | | Treasury Corp of Victoria | | | | | 3.000 | | | 10/20/28 | | | 1,566 | |
| $ | 7,000,000 | | | | Turkey Government International Bond | | | | | 3.250 | | | 03/23/23 | | | 6,269 | |
| | 2,600,000 | | | | Turkey Government International Bond | | | | | 6.000 | | | 03/25/27 | | | 2,453 | |
| | 5,650,000 | | | | Turkey Government International Bond | | | | | 5.125 | | | 02/17/28 | | | 4,966 | |
| | 2,950,000 | | | | Turkey Government International Bond | | | | | 6.875 | | | 03/17/36 | | | 2,773 | |
| | 750,000 | | g | | Ukraine Government International Bond | | | | | 9.750 | | | 11/01/28 | | | 705 | |
| | 6,300,000 | | g | | Ukraine Government International Bond | | | | | 7.375 | | | 09/25/32 | | | 5,015 | |
| GBP | 2,375,000 | | | | United Kingdom Gilt | | | | | 1.750 | | | 07/22/19 | | | 3,044 | |
| | 2,365,000 | | | | United Kingdom Gilt | | | | | 2.750 | | | 09/07/24 | | | 3,315 | |
| | 2,450,000 | | | | United Kingdom Gilt | | | | | 4.750 | | | 12/07/30 | | | 4,276 | |
| | 1,000,000 | | | | United Kingdom Gilt | | | | | 4.250 | | | 03/07/36 | | | 1,763 | |
| | 900,000 | | | | United Kingdom Gilt | | | | | 1.500 | | | 07/22/47 | | | 1,065 | |
| | 975,000 | | | | United Kingdom Gilt | | | | | 1.750 | | | 07/22/57 | | | 1,249 | |
| UYU | 20,760,000 | | g | | Uruguay Government International Bond | | | | | 9.875 | | | 06/20/22 | | | 632 | |
| $ | 2,352,945 | | | | Uruguay Government International Bond | | | | | 4.375 | | | 10/27/27 | | | 2,354 | |
| UYU | 21,800,000 | | g | | Uruguay Government International Bond | | | | | 8.500 | | | 03/15/28 | | | 572 | |
| $ | 6,750,000 | | | | Uruguay Government International Bond | | | | | 5.100 | | | 06/18/50 | | | 6,625 | |
| | | | | | TOTAL FOREIGN GOVERNMENT BONDS | | | | | | | | | | | 723,977 | |
| | | | | | | | | | | | | | | | | | |
| MORTGAGE BACKED - 17.6% | | | | | | | | | | | | |
| | 7,732,106 | | | | Federal Home Loan Mortgage Corp (FHLMC) | | | | | 3.000 | | | 10/15/33 | | | 7,575 | |
| | 31,624,630 | | | | FHLMC | | | | | 3.500 | | | 08/15/43 | | | 32,246 | |
| | 8,811,697 | | | | FHLMC | | | | | 3.000 | | | 03/15/44 | | | 8,724 | |
| | 24,524,898 | | | | FHLMC | | | | | 3.500 | | | 09/15/44 | | | 24,817 | |
| | 24,491,613 | | i | | FHLMC | | | | | 5.992 | | | 06/15/48 | | | 26,833 | |
| | 20,625,233 | | i | | FHLMC | | | | | 5.912 | | | 10/15/48 | | | 22,348 | |
| | 16,731 | | | | Federal Home Loan Mortgage Corp Gold (FGLMC) | | | | | 7.000 | | | 10/01/20 | | | 17 | |
| | 6,747 | | | | FGLMC | | | | | 7.000 | | | 05/01/23 | | | 7 | |
| | 10,895,246 | | | | FGLMC | | | | | 3.500 | | | 03/01/27 | | | 11,030 | |
| | 22,933 | | | | FGLMC | | | | | 8.000 | | | 01/01/31 | | | 24 | |
| | 5,276 | | | | FGLMC | | | | | 7.000 | | | 01/01/32 | | | 5 | |
| | 585,337 | | | | FGLMC | | | | | 4.500 | | | 07/01/33 | | | 611 | |
| | 3,952,698 | | | | FGLMC | | | | | 7.000 | | | 12/01/33 | | | 4,506 | |
COLLEGE RETIREMENT EQUITIES FUND -Bond Market Account
| PRINCIPAL | | | | ISSUER | | | | RATE | | MATURITY
DATE | | VALUE
(000) | |
| $ | 1,270,030 | | | | FGLMC | | | | | 4.500 | % | | 10/01/34 | | $ | 1,321 | |
| | 753,249 | | | | FGLMC | | | | | 4.500 | | | 04/01/35 | | | 784 | |
| | 1,243,888 | | | | FGLMC | | | | | 7.000 | | | 05/01/35 | | | 1,410 | |
| | 3,007,544 | | | | FGLMC | | | | | 5.000 | | | 06/01/36 | | | 3,192 | |
| | 1,254,468 | | | | FGLMC | | | | | 5.000 | | | 07/01/39 | | | 1,328 | |
| | 154,572 | | | | FGLMC | | | | | 4.500 | | | 12/01/43 | | | 162 | |
| | 97,850 | | | | FGLMC | | | | | 4.500 | | | 02/01/44 | | | 103 | |
| | 3,967,498 | | | | FGLMC | | | | | 4.500 | | | 10/01/44 | | | 4,158 | |
| | 1,574,464 | | | | FGLMC | | | | | 4.500 | | | 11/01/44 | | | 1,650 | |
| | 2,227,743 | | | | FGLMC | | | | | 4.500 | | | 11/01/44 | | | 2,335 | |
| | 863,132 | | | | FGLMC | | | | | 4.500 | | | 12/01/44 | | | 898 | |
| | 1,415,629 | | | | FGLMC | | | | | 4.500 | | | 12/01/44 | | | 1,484 | |
| | 7,588,751 | | | | FGLMC | | | | | 3.500 | | | 04/01/45 | | | 7,625 | |
| | 1,068,800 | | | | FGLMC | | | | | 4.500 | | | 05/01/45 | | | 1,081 | |
| | 60,495,863 | | | | FGLMC | | | | | 3.500 | | | 10/01/45 | | | 60,773 | |
| | 36,258,459 | | | | FGLMC | | | | | 4.000 | | | 12/01/45 | | | 37,230 | |
| | 91,387,937 | | | | FGLMC | | | | | 3.500 | | | 08/01/46 | | | 91,920 | |
| | 49,184,466 | | | | FGLMC | | | | | 3.000 | | | 01/01/47 | | | 47,963 | |
| | 99,063,952 | | | | FGLMC | | | | | 3.000 | | | 02/01/47 | | | 96,641 | |
| | 2,891,120 | | | | FGLMC | | | | | 4.500 | | | 06/01/47 | | | 3,052 | |
| | 5,992,768 | | | | FGLMC | | | | | 4.000 | | | 09/01/47 | | | 6,150 | |
| | 31,286,813 | | | | FGLMC | | | | | 3.500 | | | 03/01/48 | | | 31,382 | |
| | 39,950,807 | | | | FGLMC | | | | | 4.000 | | | 03/01/48 | | | 40,989 | |
| | 20,319,127 | | | | FGLMC | | | | | 4.000 | | | 07/01/48 | | | 20,845 | |
| | 30,935,476 | | | | FGLMC | | | | | 4.500 | | | 08/01/48 | | | 32,403 | |
| | 14,801,044 | | | | FHLMC | | | | | 4.500 | | | 10/01/48 | | | 15,516 | |
| | 17,912,272 | | | | FHLMC | | | | | 3.500 | | | 11/01/48 | | | 17,968 | |
| | 52,649 | | | | Federal National Mortgage Association (FNMA) | | | 8.000 | | | 07/01/24 | | | 58 | |
| | 11,787 | | | | FNMA | | | | | 9.000 | | | 11/01/25 | | | 13 | |
| | 19,889,843 | | | | FNMA | | | | | 3.500 | | | 02/01/32 | | | 20,146 | |
| | 6,550,428 | | | | FNMA | | | | | 3.500 | | | 05/01/32 | | | 6,652 | |
| | 16,809,601 | | | | FNMA | | | | | 3.500 | | | 07/01/32 | | | 17,026 | |
| | 2,549,237 | | | | FNMA | | | | | 3.000 | | | 11/01/32 | | | 2,545 | |
| | 1,655,409 | | | | FNMA | | | | | 3.500 | | | 04/01/33 | | | 1,676 | |
| | 613,076 | | | | FNMA | | | | | 4.500 | | | 10/01/33 | | | 638 | |
| | 1,095,643 | | | | FNMA | | | | | 4.500 | | | 05/01/35 | | | 1,142 | |
| | 6,989,746 | | | | FNMA | | | | | 5.000 | | | 05/01/35 | | | 7,424 | |
| | 3,102,189 | | | | FNMA | | | | | 5.000 | | | 10/01/35 | | | 3,295 | |
| | 2,620,295 | | | | FNMA | | | | | 5.000 | | | 02/01/36 | | | 2,783 | |
| | 4,987,120 | | | | FNMA | | | | | 5.500 | | | 11/01/38 | | | 5,309 | |
| | 93,573 | | | | FNMA | | | | | 4.500 | | | 04/01/39 | | | 97 | |
| | 148,811 | | | | FNMA | | | | | 4.500 | | | 02/01/40 | | | 154 | |
| | 1,071,709 | | | | FNMA | | | | | 5.000 | | | 08/01/40 | | | 1,138 | |
| | 5,970,058 | | | | FNMA | | | | | 5.000 | | | 09/01/40 | | | 6,339 | |
| | 572,737 | | | | FNMA | | | | | 4.500 | | | 11/01/40 | | | 600 | |
| | 1,033,646 | | | | FNMA | | | | | 4.500 | | | 01/01/41 | | | 1,083 | |
| | 668,766 | | | | FNMA | | | | | 4.500 | | | 02/01/41 | | | 695 | |
| | 8,827,222 | | | | FNMA | | | | | 5.000 | | | 05/01/41 | | | 9,374 | |
| | 986,194 | | | | FNMA | | | | | 4.500 | | | 06/01/41 | | | 1,029 | |
| | 993,185 | | | | FNMA | | | | | 4.500 | | | 06/01/41 | | | 1,037 | |
| | 455,695 | | | | FNMA | | | | | 5.000 | | | 06/01/41 | | | 484 | |
| | 2,829,626 | | | | FNMA | | | | | 5.000 | | | 07/01/41 | | | 3,005 | |
| | 812,597 | | | | FNMA | | | | | 5.000 | | | 08/01/41 | | | 863 | |
COLLEGE RETIREMENT EQUITIES FUND -Bond Market Account
| PRINCIPAL | | | | ISSUER | | | | RATE | | MATURITY
DATE | | VALUE
(000) | |
| $ | 1,050,526 | | | | FNMA | | | | | 4.500 | % | | 12/01/41 | | $ | 1,096 | |
| | 1,064,570 | | | | FNMA | | | | | 4.500 | | | 01/01/42 | | | 1,112 | |
| | 890,613 | | | | FNMA | | | | | 4.500 | | | 03/01/42 | | | 926 | |
| | 935,606 | | | | FNMA | | | | | 4.500 | | | 04/01/42 | | | 977 | |
| | 5,885,572 | | | | FNMA | | | | | 4.500 | | | 04/01/42 | | | 6,168 | |
| | 1,021,089 | | | | FNMA | | | | | 4.500 | | | 06/01/42 | | | 1,061 | |
| | 4,788,342 | | | | FNMA | | | | | 4.500 | | | 06/01/42 | | | 5,009 | |
| | 859,064 | | | | FNMA | | | | | 4.500 | | | 07/01/42 | | | 898 | |
| | 8,110,181 | | | | FNMA | | | | | 3.000 | | | 04/25/43 | | | 8,031 | |
| | 7,138,600 | | | | FNMA | | | | | 4.500 | | | 06/01/44 | | | 7,463 | |
| | 6,809,207 | | | | FNMA | | | | | 4.500 | | | 10/01/44 | | | 7,117 | |
| | 13,062,175 | | | | FNMA | | | | | 4.500 | | | 11/01/44 | | | 13,662 | |
| | 3,875,199 | | | | FNMA | | | | | 4.500 | | | 12/01/44 | | | 4,053 | |
| | 39,096,525 | | | | FNMA | | | | | 3.000 | | | 02/25/45 | | | 39,064 | |
| | 8,440,725 | | | | FNMA | | | | | 3.000 | | | 02/25/45 | | | 8,434 | |
| | 734,172 | | | | FNMA | | | | | 3.500 | | | 03/01/45 | | | 738 | |
| | 383,048 | | | | FNMA | | | | | 3.500 | | | 03/01/45 | | | 384 | |
| | 1,638,379 | | | | FNMA | | | | | 4.500 | | | 03/01/45 | | | 1,713 | |
| | 11,414,731 | | | | FNMA | | | | | 3.000 | | | 03/25/45 | | | 11,380 | |
| | 660,985 | | | | FNMA | | | | | 4.500 | | | 04/01/45 | | | 691 | |
| | 30,564,468 | | | | FNMA | | | | | 3.500 | | | 04/25/45 | | | 31,084 | |
| | 34,618,112 | | | | FNMA | | | | | 3.500 | | | 04/25/45 | | | 35,170 | |
| | 15,555,705 | | | | FNMA | | | | | 3.500 | | | 05/01/45 | | | 15,675 | |
| | 69,845,388 | | | | FNMA | | | | | 3.000 | | | 12/25/45 | | | 69,240 | |
| | 21,938,925 | | | | FNMA | | | | | 3.500 | | | 01/01/46 | | | 22,035 | |
| | 38,176,847 | | | | FNMA | | | | | 4.000 | | | 01/01/46 | | | 39,246 | |
| | 19,359,320 | | | | FNMA | | | | | 3.500 | | | 06/01/46 | | | 19,439 | |
| | 4,531,466 | | | | FNMA | | | | | 3.500 | | | 08/01/46 | | | 4,550 | |
| | 21,840,719 | | | | FNMA | | | | | 3.500 | | | 10/01/46 | | | 21,921 | |
| | 33,502,403 | | | | FNMA | | | | | 3.000 | | | 11/01/46 | | | 32,711 | |
| | 46,053,794 | | | | FNMA | | | | | 3.500 | | | 12/01/46 | | | 46,166 | |
| | 117,027,567 | | | | FNMA | | | | | 3.500 | | | 01/01/47 | | | 117,151 | |
| | 4,419,520 | | | | FNMA | | | | | 3.000 | | | 02/01/47 | | | 4,315 | |
| | 947,029 | | | | FNMA | | | | | 3.500 | | | 11/01/47 | | | 948 | |
| | 16,716,152 | | | | FNMA | | | | | 4.500 | | | 01/01/48 | | | 17,520 | |
| | 15,092,727 | | | | FNMA | | | | | 4.500 | | | 02/01/48 | | | 15,818 | |
| | 131,564,042 | | | | FNMA | | | | | 3.000 | | | 02/25/48 | | | 130,278 | |
| | 16,495,642 | | | | FNMA | | | | | 4.000 | | | 03/01/48 | | | 16,928 | |
| | 4,139,745 | | h | | FNMA | | | | | 4.000 | | | 03/01/48 | | | 4,222 | |
| | 65,039,275 | | | | FNMA | | | | | 4.500 | | | 03/01/48 | | | 68,164 | |
| | 183,224,677 | | | | FNMA | | | | | 4.000 | | | 04/01/48 | | | 187,507 | |
| | 12,001,943 | | | | FNMA | | | | | 4.500 | | | 05/01/48 | | | 12,579 | |
| | 9,147,530 | | | | FNMA | | | | | 4.500 | | | 05/01/48 | | | 9,596 | |
| | 35,634,998 | | h | | FNMA | | | | | 4.000 | | | 06/01/48 | | | 36,345 | |
| | 23,905,157 | | | | FNMA | | | | | 5.000 | | | 08/01/48 | | | 25,531 | |
| | 25,530,886 | | | | FNMA | | | | | 4.500 | | | 12/01/48 | | | 26,453 | |
| | 15,386,146 | | | | FNMA | | | | | 5.000 | | | 12/01/48 | | | 16,140 | |
| | 18,000,000 | | h | | FNMA | | | | | 4.000 | | | 01/25/49 | | | 18,355 | |
| | 13,979,831 | | | | Government National Mortgage Association (GNMA) | | | 3.700 | | | 10/15/33 | | | 14,147 | |
| | 227,684 | | | | GNMA | | | | | 6.000 | | | 10/20/36 | | | 247 | |
| | 267,537 | | | | GNMA | | | | | 6.000 | | | 01/20/37 | | | 291 | |
COLLEGE RETIREMENT EQUITIES FUND -Bond Market Account
| PRINCIPAL | | | | ISSUER | | | | RATE | | MATURITY
DATE | | VALUE
(000) | |
| $ | 809,316 | | | | GNMA | | | | | 6.000 | % | | 02/20/37 | | $ | 878 | |
| | 593,690 | | | | GNMA | | | | | 5.000 | | | 04/15/38 | | | 630 | |
| | 266,062 | | | | GNMA | | | | | 6.000 | | | 08/20/38 | | | 289 | |
| | 500,955 | | | | GNMA | | | | | 6.500 | | | 11/20/38 | | | 566 | |
| | 63,499 | | | | GNMA | | | | | 4.500 | | | 02/20/39 | | | 67 | |
| | 226,800 | | | | GNMA | | | | | 2.176 | | | 05/16/39 | | | 225 | |
| | 1,959,825 | | | | GNMA | | | | | 5.000 | | | 06/15/39 | | | 2,085 | |
| | 1,238,420 | | | | GNMA | | | | | 5.000 | | | 06/15/39 | | | 1,318 | |
| | 11,287,300 | | | | GNMA | | | | | 3.700 | | | 08/15/40 | | | 11,429 | |
| | 89,790 | | | | GNMA | | | | | 4.500 | | | 08/20/41 | | | 95 | |
| | 310,015 | | | | GNMA | | | | | 4.500 | | | 09/20/41 | | | 328 | |
| | 70,113 | | | | GNMA | | | | | 4.500 | | | 01/20/44 | | | 74 | |
| | 70,399 | | | | GNMA | | | | | 4.500 | | | 02/20/44 | | | 74 | |
| | 135,317 | | | | GNMA | | | | | 4.500 | | | 05/20/44 | | | 143 | |
| | 871,328 | | | | GNMA | | | | | 4.500 | | | 05/20/44 | | | 921 | |
| | 993,344 | | | | GNMA | | | | | 4.500 | | | 08/20/44 | | | 1,050 | |
| | 866,873 | | | | GNMA | | | | | 4.500 | | | 09/20/44 | | | 905 | |
| | 376,082 | | | | GNMA | | | | | 4.500 | | | 10/20/44 | | | 396 | |
| | 202,117 | | | | GNMA | | | | | 4.500 | | | 11/20/44 | | | 210 | |
| | 614,468 | | | | GNMA | | | | | 4.500 | | | 12/20/44 | | | 650 | |
| | 902,456 | | | | GNMA | | | | | 4.500 | | | 02/20/45 | | | 953 | |
| | 1,167,825 | | | | GNMA | | | | | 4.500 | | | 08/20/45 | | | 1,235 | |
| | 1,067,171 | | | | GNMA | | | | | 4.500 | | | 08/20/45 | | | 1,126 | |
| | 1,077,986 | | | | GNMA | | | | | 4.500 | | | 12/20/45 | | | 1,139 | |
| | 16,040,416 | | | | GNMA | | | | | 4.000 | | | 06/20/46 | | | 2,567 | |
| | 49,984,010 | | | | GNMA | | | | | 3.000 | | | 12/20/47 | | | 49,192 | |
| | 114,824,763 | | | | GNMA | | | | | 3.500 | | | 12/20/47 | | | 115,661 | |
| | 64,318,889 | | | | GNMA | | | | | 3.000 | | | 01/20/48 | | | 63,300 | |
| | 95,569,308 | | | | GNMA | | | | | 3.500 | | | 01/20/48 | | | 96,266 | |
| | 33,600,000 | | | | GNMA | | | | | 4.000 | | | 12/20/48 | | | 34,278 | |
| | | | | | TOTAL MORTGAGE BACKED | | | | | | | | | | | 2,331,510 | |
| | | | | | | | | | | | | | | | | | |
| MUNICIPAL BONDS - 4.0% | | | | | | | | | | | | |
| | 28,410,000 | | | | California State University | | | | | 3.899 | | | 11/01/47 | | | 27,749 | |
| | 2,975,000 | | | | Chicago Housing Authority | | | | | 3.682 | | | 01/01/25 | | | 3,037 | |
| | 845,000 | | | | City & County of San Francisco CA | | | | | 3.750 | | | 09/01/37 | | | 829 | |
| | 2,000,000 | | | | City & County of San Francisco CA | | | | | 4.000 | | | 09/01/48 | | | 1,970 | |
| | 8,725,000 | | | | City of Dallas TX Waterworks & Sewer System Revenue | | | 1.217 | | | 10/01/19 | | | 8,628 | |
| | 5,000,000 | | | | City of Dallas TX Waterworks & Sewer System Revenue | | | 1.868 | | | 10/01/22 | | | 4,848 | |
| | 2,775,000 | | | | City of Dallas TX Waterworks & Sewer System Revenue | | | 2.068 | | | 10/01/23 | | | 2,686 | |
| | 1,350,000 | | | | City of Dallas TX Waterworks & Sewer System Revenue | | | 2.389 | | | 10/01/25 | | | 1,303 | |
| | 3,995,000 | | | | City of Los Angeles CA Wastewater System Revenue | | | 4.029 | | | 06/01/39 | | | 4,062 | |
| | 2,025,000 | | | | City of San Antonio TX Customer Facility Charge Revenue | | | 4.253 | | | 07/01/24 | | | 2,054 | |
| | 1,575,000 | | | | City of San Antonio TX Customer Facility Charge Revenue | | | 4.353 | | | 07/01/25 | | | 1,603 | |
| | 20,000,000 | | | | City of San Francisco CA Public Utilities Commission Water Revenue | | | 4.035 | | | 11/01/41 | | | 19,941 | |
COLLEGE RETIREMENT EQUITIES FUND -Bond Market Account
| PRINCIPAL | | | | ISSUER | | | | RATE | | MATURITY
DATE | | VALUE
(000) | |
| $ | 5,815,000 | | | | Commonwealth Financing Authority | | | | | 3.864 | % | | 06/01/38 | | $ | 5,735 | |
| | 9,950,000 | | | | Commonwealth of Massachusetts | | | | | 3.277 | | | 06/01/46 | | | 9,129 | |
| | 1,875,000 | | | | County of Miami-Dade FL Aviation Revenue | | | | | 1.885 | | | 10/01/21 | | | 1,825 | |
| | 1,505,000 | | | | County of Miami-Dade FL Aviation Revenue | | | | | 2.218 | | | 10/01/22 | | | 1,467 | |
| | 1,500,000 | | | | County of Miami-Dade FL Aviation Revenue | | | | | 2.368 | | | 10/01/23 | | | 1,460 | |
| | 2,500,000 | | | | County of Miami-Dade FL Aviation Revenue | | | | | 3.285 | | | 10/01/23 | | | 2,529 | |
| | 3,500,000 | | | | County of Miami-Dade FL Aviation Revenue | | | | | 2.504 | | | 10/01/24 | | | 3,386 | |
| | 2,250,000 | | | | County of Miami-Dade FL Aviation Revenue | | | | | 3.405 | | | 10/01/24 | | | 2,281 | |
| | 3,500,000 | | | | County of Miami-Dade FL Aviation Revenue | | | | | 2.604 | | | 10/01/25 | | | 3,381 | |
| | 2,375,000 | | | | County of Miami-Dade FL Aviation Revenue | | | | | 3.505 | | | 10/01/25 | | | 2,412 | |
| | 2,500,000 | | | | County of Miami-Dade FL Aviation Revenue | | | | | 2.704 | | | 10/01/26 | | | 2,401 | |
| | 3,750,000 | | | | County of Miami-Dade FL Aviation Revenue | | | | | 3.612 | | | 10/01/26 | | | 3,812 | |
| | 3,730,000 | | | | County of Miami-Dade FL Aviation Revenue | | | | | 3.732 | | | 10/01/37 | | | 3,523 | |
| | 3,900,000 | | | | County of Miami-Dade FL Aviation Revenue | | | | | 3.982 | | | 10/01/41 | | | 3,743 | |
| | 9,160,000 | | | | County of Miami-Dade FL Aviation Revenue | | | | | 4.280 | | | 10/01/41 | | | 9,265 | |
| | 25,000,000 | | | | Florida Hurricane Catastrophe Fund Finance Corp | | | | | 2.995 | | | 07/01/20 | | | 25,033 | |
| | 11,200,000 | | | | Florida State Board of Administration Finance Corp | | | 2.163 | | | 07/01/19 | | | 11,167 | |
| | 5,080,000 | | | | Illinois Finance Authority | | | | | 3.944 | | | 08/15/47 | | | 4,959 | |
| | 5,265,000 | | | | Los Angeles County Redevelopment Refunding Authority Redev Agency Successor Agy | | 1.125 | | | 09/01/19 | | | 5,210 | |
| | 2,350,000 | | | | Los Angeles County Redevelopment Refunding Authority Redev Agency Successor Agy | | 1.500 | | | 09/01/21 | | | 2,276 | |
| | 1,000,000 | | | | Los Angeles County Redevelopment Refunding Authority Redev Agency Successor Agy | | 2.000 | | | 09/01/22 | | | 972 | |
| | 4,805,000 | | | | Los Angeles County Redevelopment Refunding Authority Redev Agency Successor Agy | | 3.375 | | | 09/01/35 | | | 4,527 | |
| | 2,560,000 | | | | Michigan Finance Authority | | | | | 1.941 | | | 11/01/21 | | | 2,481 | |
| | 3,000,000 | | | | Michigan Finance Authority | | | | | 2.244 | | | 11/01/22 | | | 2,907 | |
| | 500,000 | | | | New Jersey Economic Development Authority | | | | | 3.300 | | | 06/15/19 | | | 500 | |
| | 570,000 | | | | New Jersey Economic Development Authority | | | | | 3.500 | | | 06/15/20 | | | 572 | |
| | 500,000 | | | | New Jersey Economic Development Authority | | | | | 3.700 | | | 06/15/21 | | | 507 | |
| | 1,110,000 | | | | New Jersey Economic Development Authority | | | | | 3.800 | | | 07/01/22 | | | 1,119 | |
| | 870,000 | | | | New York City Housing Development Corp | | | | | 3.403 | | | 05/01/22 | | | 879 | |
| | 750,000 | | | | New York City Housing Development Corp | | | | | 3.453 | | | 11/01/22 | | | 759 | |
| | 1,360,000 | | | | New York City Housing Development Corp | | | | | 3.523 | | | 05/01/23 | | | 1,376 | |
| | 1,815,000 | | | | New York City Housing Development Corp | | | | | 3.573 | | | 11/01/23 | | | 1,840 | |
| | 1,000,000 | | | | New York City Housing Development Corp | | | | | 3.650 | | | 05/01/24 | | | 1,015 | |
| | 5,680,000 | | | | New York State Dormitory Authority | | | | | 3.998 | | | 07/01/39 | | | 5,685 | |
| | 6,000,000 | | | | New York State Dormitory Authority | | | | | 3.879 | | | 07/01/46 | | | 5,766 | |
| | 855,000 | | | | Oklahoma City Economic Development Trust | | | | | 3.172 | | | 09/01/21 | | | 863 | |
| | 1,120,000 | | | | Oklahoma City Economic Development Trust | | | | | 3.222 | | | 09/01/22 | | | 1,132 | |
| | 810,000 | | | | Oklahoma City Economic Development Trust | | | | | 3.440 | | | 09/01/24 | | | 823 | |
| | 3,500,000 | | | | Palm Beach County Solid Waste Authority | | | | | 2.083 | | | 10/01/21 | | | 3,446 | |
| | 4,720,000 | | | | Permanent University Fund | | | | | 1.880 | | | 07/01/19 | | | 4,701 | |
| | 2,320,000 | | | | Permanent University Fund | | | | | 2.258 | | | 07/01/20 | | | 2,305 | |
| | 2,160,000 | | | | Permanent University Fund | | | | | 2.408 | | | 07/01/21 | | | 2,150 | |
| | 2,750,000 | | | | Permanent University Fund | | | | | 2.508 | | | 07/01/22 | | | 2,737 | |
| | 2,855,000 | | | | Permanent University Fund | | | | | 2.608 | | | 07/01/23 | | | 2,841 | |
| | 3,250,000 | | | | Permanent University Fund | | | | | 2.708 | | | 07/01/24 | | | 3,232 | |
| | 2,335,000 | | | | Permanent University Fund | | | | | 2.808 | | | 07/01/25 | | | 2,313 | |
| | 3,775,000 | | | | Permanent University Fund | | | | | 2.908 | | | 07/01/26 | | | 3,685 | |
| | 4,000,000 | | | | Permanent University Fund | | | | | 3.008 | | | 07/01/27 | | | 3,893 | |
| | 2,000,000 | | | | Port of Corpus Christi Authority of Nueces County | | | | | 3.138 | | | 12/01/22 | | | 2,023 | |
| | 1,700,000 | | | | Port of Corpus Christi Authority of Nueces County | | | | | 3.287 | | | 12/01/23 | | | 1,729 | |
COLLEGE RETIREMENT EQUITIES FUND -Bond Market Account
| PRINCIPAL | | | | ISSUER | | | | RATE | | MATURITY
DATE | | VALUE
(000) | |
| $ | 1,500,000 | | | | Port of Corpus Christi Authority of Nueces County | | | | | 3.387 | % | | 12/01/24 | | $ | 1,531 | |
| | 1,000,000 | | | | Port of Corpus Christi Authority of Nueces County | | | | | 3.487 | | | 12/01/25 | | | 1,023 | |
| | 7,500,000 | | | | Port of Morrow OR | | | | | 1.582 | | | 09/01/20 | | | 7,342 | |
| | 2,075,000 | | | | Port of Morrow OR | | | | | 1.782 | | | 09/01/21 | | | 2,018 | |
| | 1,955,000 | | | | Public Finance Authority | | | | | 4.269 | | | 07/01/40 | | | 2,000 | |
| | 1,000,000 | | | | Regents of the University of California Medical Center Pooled Revenue | | | | | 2.037 | | | 05/15/23 | | | 959 | |
| | 1,000,000 | | | | Regents of the University of California Medical Center Pooled Revenue | | | | | 2.259 | | | 05/15/24 | | | 957 | |
| | 1,250,000 | | | | Regents of the University of California Medical Center Pooled Revenue | | | | | 2.359 | | | 05/15/25 | | | 1,190 | |
| | 1,785,000 | | | | Regents of the University of California Medical Center Pooled Revenue | | | | | 2.459 | | | 05/15/26 | | | 1,691 | |
| | 1,600,000 | | | | Regents of the University of California Medical Center Pooled Revenue | | | | | 2.559 | | | 05/15/27 | | | 1,506 | |
| | 700,000 | | | | Regents of the University of California Medical Center Pooled Revenue | | | | | 2.659 | | | 05/15/28 | | | 655 | |
| | 900,000 | | | | Regents of the University of California Medical Center Pooled Revenue | | | | | 2.759 | | | 05/15/29 | | | 837 | |
| | 11,360,000 | | | | San Jose Redevelopment Agency | | | | | 3.375 | | | 08/01/34 | | | 10,693 | |
| | 335,000 | | | | Santa Ana Community Redevelopment Agency Successor Agency | | | | | 3.346 | | | 09/01/21 | | | 340 | |
| | 1,340,000 | | | | Santa Ana Community Redevelopment Agency Successor Agency | | | | | 3.467 | | | 09/01/22 | | | 1,368 | |
| | 1,340,000 | | | | Santa Ana Community Redevelopment Agency Successor Agency | | | | | 3.567 | | | 09/01/23 | | | 1,377 | |
| | 13,060,000 | | | | State of California | | | | | 4.600 | | | 04/01/38 | | | 13,469 | |
| | 3,060,000 | | | | State of Georgia | | | | | 2.000 | | | 07/01/20 | | | 3,038 | |
| | 3,215,000 | | | | State of Georgia | | | | | 2.150 | | | 07/01/21 | | | 3,183 | |
| | 3,465,000 | | | | State of Georgia | | | | | 1.910 | | | 02/01/23 | | | 3,353 | |
| | 3,905,000 | | | | State of Georgia | | | | | 2.750 | | | 07/01/25 | | | 3,841 | |
| | 4,100,000 | | | | State of Georgia | | | | | 2.850 | | | 07/01/26 | | | 4,030 | |
| | 4,305,000 | | | | State of Georgia | | | | | 2.950 | | | 07/01/27 | | | 4,259 | |
| | 4,520,000 | | | | State of Georgia | | | | | 3.050 | | | 07/01/28 | | | 4,447 | |
| | 3,245,000 | | | | State of Georgia | | | | | 3.150 | | | 07/01/29 | | | 3,208 | |
| | 7,500,000 | | | | State of Illinois | | | | | 2.000 | | | 06/15/19 | | | 7,450 | |
| | 7,160,000 | | | | State of Illinois | | | | | 5.463 | | | 02/01/20 | | | 7,304 | |
| | 12,500,000 | | | | State of Illinois | | | | | 1.930 | | | 06/15/20 | | | 12,192 | |
| | 12,500,000 | | | | State of Illinois | | | | | 2.250 | | | 06/15/21 | | | 12,093 | |
| | 12,500,000 | | | | State of Illinois | | | | | 3.150 | | | 06/15/26 | | | 11,625 | |
| | 12,500,000 | | | | State of Illinois | | | | | 3.250 | | | 06/15/27 | | | 11,525 | |
| | 25,185,000 | | | | State of Illinois | | | | | 5.100 | | | 06/01/33 | | | 24,012 | |
| | 20,000,000 | | | | State of Michigan | | | | | 1.579 | | | 11/01/20 | | | 19,610 | |
| | 13,000,000 | | | | State of Michigan | | | | | 1.779 | | | 11/01/21 | | | 12,681 | |
| | 7,000,000 | | | | State of Michigan | | | | | 1.966 | | | 11/01/22 | | | 6,797 | |
| | 9,900,000 | | | | State of Wisconsin | | | | | 3.154 | | | 05/01/27 | | | 9,761 | |
| | 7,000,000 | | | | The Ohio State University | | | | | 3.798 | | | 12/01/46 | | | 6,904 | |
| | 6,000,000 | | | | University of California | | | | | 2.570 | | | 05/15/22 | | | 5,959 | |
| | 10,230,000 | | | | University of California | | | | | 4.601 | | | 05/15/31 | | | 10,983 | |
| | 17,045,000 | | | | University of California | | | | | 3.931 | | | 05/15/45 | | | 16,564 | |
| | 20,000,000 | | | | University of New Mexico | | | | | 3.532 | | | 06/20/32 | | | 20,080 | |
| | 500,000 | | | | Utah Municipal Power Agency | | | | | 1.630 | | | 07/01/19 | | | 496 | |
| | 835,000 | | | | Utah Municipal Power Agency | | | | | 1.823 | | | 07/01/20 | | | 819 | |
COLLEGE RETIREMENT EQUITIES FUND -Bond Market Account
| PRINCIPAL | | | | ISSUER | | | | RATE | | MATURITY
DATE | | VALUE
(000) | |
| $ | 500,000 | | | | Utah Municipal Power Agency | | | | | 2.023 | % | | 07/01/21 | | $ | 487 | |
| | 1,750,000 | | | | Utah Municipal Power Agency | | | | | 2.262 | | | 07/01/22 | | | 1,698 | |
| | 1,500,000 | | | | Utah Municipal Power Agency | | | | | 2.512 | | | 07/01/23 | | | 1,459 | |
| | 2,160,000 | | | | Virginia Port Authority | | | | | 4.228 | | | 07/01/36 | | | 2,164 | |
| | 390,000 | | | | Washington Convention & Sports Authority | | | 3.969 | | | 10/01/30 | | | 400 | |
| | | | | | TOTAL MUNICIPAL BONDS | | | | | | | | | | | 533,860 | |
| | | | | | | | | | | | | | | | | | |
| U.S. TREASURY SECURITIES - 16.2% | | | | | | | | | | | | |
| | 65,602,000 | | | | United States Treasury Bond | | | | | 4.500 | | | 02/15/36 | | | 80,929 | |
| | 4,500,000 | | | | United States Treasury Bond | | | | | 4.750 | | | 02/15/37 | | | 5,741 | |
| | 47,000,000 | | | | United States Treasury Bond | | | | | 3.500 | | | 02/15/39 | | | 51,478 | |
| | 11,900,000 | | | | United States Treasury Bond | | | | | 3.875 | | | 08/15/40 | | | 13,686 | |
| | 19,135,000 | | | | United States Treasury Bond | | | | | 4.375 | | | 05/15/41 | | | 23,587 | |
| | 16,434,000 | | | | United States Treasury Bond | | | | | 3.750 | | | 08/15/41 | | | 18,569 | |
| | 56,375,000 | | | | United States Treasury Bond | | | | | 3.625 | | | 08/15/43 | | | 62,510 | |
| | 35,680,000 | | | | United States Treasury Bond | | | | | 3.000 | | | 05/15/45 | | | 35,676 | |
| | 81,710,000 | | | | United States Treasury Bond | | | | | 2.875 | | | 08/15/45 | | | 79,730 | |
| | 102,850,000 | | | | United States Treasury Bond | | | | | 2.500 | | | 05/15/46 | | | 92,927 | |
| | 1,075,000 | | | | United States Treasury Bond | | | | | 3.000 | | | 05/15/47 | | | 1,072 | |
| | 58,160,000 | | | | United States Treasury Bond | | | | | 2.750 | | | 11/15/47 | | | 55,130 | |
| | 6,655,000 | | | | United States Treasury Bond | | | | | 3.000 | | | 02/15/48 | | | 6,631 | |
| | 83,095,000 | | | | United States Treasury Bond | | | | | 3.125 | | | 05/15/48 | | | 84,818 | |
| | 179,420,000 | | | | United States Treasury Bond | | | | | 3.000 | | | 08/15/48 | | | 178,881 | |
| | 16,700,000 | | | | United States Treasury Bond | | | | | 3.375 | | | 11/15/48 | | | 17,889 | |
| | 10,950,000 | | | | United States Treasury Note | | | | | 1.125 | | | 01/31/19 | | | 10,940 | |
| | 50,000,000 | | | | United States Treasury Note | | | | | 1.375 | | | 02/28/19 | | | 49,919 | |
| | 17,775,000 | | | | United States Treasury Note | | | | | 1.000 | | | 03/15/19 | | | 17,725 | |
| | 1,195,000 | | | | United States Treasury Note | | | | | 0.875 | | | 04/15/19 | | | 1,190 | |
| | 5,400,000 | | | | United States Treasury Note | | | | | 1.250 | | | 04/30/19 | | | 5,378 | |
| | 3,115,000 | | | | United States Treasury Note | | | | | 1.250 | | | 05/31/19 | | | 3,099 | |
| | 30,000,000 | | | | United States Treasury Note | | | | | 1.250 | | | 06/30/19 | | | 29,813 | |
| | 50,000,000 | | | | United States Treasury Note | | | | | 0.750 | | | 07/15/19 | | | 49,521 | |
| | 61,725,000 | | | | United States Treasury Note | | | | | 1.375 | | | 07/31/19 | | | 61,303 | |
| | 34,700,000 | | | | United States Treasury Note | | | | | 1.250 | | | 08/31/19 | | | 34,387 | |
| | 1,680,000 | | | | United States Treasury Note | | | | | 1.500 | | | 10/31/19 | | | 1,664 | |
| | 5,000,000 | | | | United States Treasury Note | | | | | 2.000 | | | 01/31/20 | | | 4,967 | |
| | 2,250,000 | | | | United States Treasury Note | | | | | 1.375 | | | 02/15/20 | | | 2,219 | |
| | 14,075,000 | | | | United States Treasury Note | | | | | 2.250 | | | 02/29/20 | | | 14,018 | |
| | 4,065,000 | | | | United States Treasury Note | | | | | 1.625 | | | 03/15/20 | | | 4,020 | |
| | 5,340,000 | | | | United States Treasury Note | | | | | 2.250 | | | 03/31/20 | | | 5,318 | |
| | 51,445,000 | | | | United States Treasury Note | | | | | 2.375 | | | 04/30/20 | | | 51,306 | |
| | 1,600,000 | | | | United States Treasury Note | | | | | 1.500 | | | 05/15/20 | | | 1,577 | |
| | 76,920,000 | | | | United States Treasury Note | | | | | 2.500 | | | 05/31/20 | | | 76,846 | |
| | 21,800,000 | | | | United States Treasury Note | | | | | 1.625 | | | 07/31/20 | | | 21,489 | |
| | 40,110,000 | | | | United States Treasury Note | | | | | 1.375 | | | 09/15/20 | | | 39,347 | |
| | 6,500,000 | | | | United States Treasury Note | | | | | 2.750 | | | 09/30/20 | | | 6,523 | |
| | 7,385,000 | | | | United States Treasury Note | | | | | 2.875 | | | 10/31/20 | | | 7,430 | |
| | 28,000,000 | | | | United States Treasury Note | | | | | 2.750 | | | 11/30/20 | | | 28,122 | |
| | 825,000 | | | | United States Treasury Note | | | | | 2.125 | | | 01/31/21 | | | 819 | |
| | 12,589,300 | | | | United States Treasury Note | | | | | 1.125 | | | 02/28/21 | | | 12,223 | |
| | 10,470,000 | | | | United States Treasury Note | | | | | 2.000 | | | 02/28/21 | | | 10,359 | |
| | 10,385,000 | | | | United States Treasury Note | | | | | 1.375 | | | 04/30/21 | | | 10,127 | |
| | 3,240,000 | | | | United States Treasury Note | | | | | 2.250 | | | 04/30/21 | | | 3,224 | |
| | 56,565,000 | | | | United States Treasury Note | | | | | 2.625 | | | 05/15/21 | | | 56,737 | |
COLLEGE RETIREMENT EQUITIES FUND -Bond Market Account
| PRINCIPAL | | | | ISSUER | | | | RATE | | MATURITY
DATE | | VALUE
(000) | |
| $ | 1,040,000 | | | | United States Treasury Note | | | | | 1.375 | % | | 05/31/21 | | $ | 1,013 | |
| | 16,465,000 | | | | United States Treasury Note | | | | | 2.000 | | | 05/31/21 | | | 16,280 | |
| | 37,305,000 | | | | United States Treasury Note | | | | | 2.625 | | | 06/15/21 | | | 37,423 | |
| | 1,730,000 | | | | United States Treasury Note | | | | | 2.125 | | | 06/30/21 | | | 1,715 | |
| | 109,500,000 | | | | United States Treasury Note | | | | | 2.625 | | | 12/15/21 | | | 109,987 | |
| | 6,710,000 | | | | United States Treasury Note | | | | | 1.750 | | | 03/31/22 | | | 6,559 | |
| | 5,725,000 | | | | United States Treasury Note | | | | | 1.750 | | | 04/30/22 | | | 5,592 | |
| | 3,200,000 | | | | United States Treasury Note | | | | | 2.000 | | | 07/31/22 | | | 3,147 | |
| | 30,000,000 | | | | United States Treasury Note | | | | | 2.000 | | | 11/30/22 | | | 29,455 | |
| | 27,530,000 | | | | United States Treasury Note | | | | | 2.625 | | | 02/28/23 | | | 27,671 | |
| | 157,834,000 | | | | United States Treasury Note | | | | | 2.750 | | | 04/30/23 | | | 159,458 | |
| | 144,842,000 | | | | United States Treasury Note | | | | | 2.750 | | | 05/31/23 | | | 146,421 | |
| | 1,905,000 | | | | United States Treasury Note | | | | | 2.875 | | | 09/30/23 | | | 1,936 | |
| | 750,000 | | | | United States Treasury Note | | | | | 2.875 | | | 10/31/23 | | | 762 | |
| | 37,173,000 | | | | United States Treasury Note | | | | | 2.875 | | | 11/30/23 | | | 37,818 | |
| | 1,075,000 | | | | United States Treasury Note | | | | | 2.625 | | | 03/31/25 | | | 1,078 | |
| | 27,260,000 | | | | United States Treasury Note | | | | | 2.875 | | | 05/31/25 | | | 27,737 | |
| | 7,395,000 | | | | United States Treasury Note | | | | | 2.750 | | | 06/30/25 | | | 7,472 | |
| | 17,720,000 | | | | United States Treasury Note | | | | | 2.750 | | | 08/31/25 | | | 17,899 | |
| | 4,150,000 | | | | United States Treasury Note | | | | | 3.000 | | | 10/31/25 | | | 4,259 | |
| | 44,450,000 | | | | United States Treasury Note | | | | | 2.750 | | | 02/15/28 | | | 44,712 | |
| | 25,585,000 | | | | United States Treasury Note | | | | | 3.125 | | | 11/15/28 | | | 26,556 | |
| | | | | | TOTAL U.S. TREASURY SECURITIES | | | | | | | | | 2,145,814 | |
| | | | | | | | | | | | | | | | | | |
| | | | | | TOTAL GOVERNMENT BONDS | | | | | | | | | | 6,052,887 | |
| | | | | | (Cost $6,094,602) | | | | | | | | | | | | |
| | | | | | | | | | | | | | | | | | |
| STRUCTURED ASSETS - 19.9% | | | | | | | | | | | | |
| | | | | | | | | | | | | | | | | | |
| ASSET BACKED - 9.8% | | | | | | | | | | | | |
| | 11,450,000 | | | | Ally Auto Receivables Trust | | | | | 2.100 | | | 03/15/22 | | | 11,285 | |
| | | | | | Series - 2017 2 (Class A4) | | | | | | | | | | | | |
| | 7,500,000 | | | | American Express Credit Account Master Trust | | | | | 2.350 | | | 05/15/25 | | | 7,368 | |
| | | | | | Series - 2017 7 (Class A) | | | | | | | | | | | | |
| | 1,185,663 | | | | AmeriCredit Automobile Receivables Trust | | | | | 2.400 | | | 01/08/21 | | | 1,183 | |
| | | | | | Series - 2015 2 (Class C) | | | | | | | | | | | | |
| | 1,420,449 | | | | AmeriCredit Automobile Receivables Trust | | | | | 1.460 | | | 05/10/21 | | | 1,415 | |
| | | | | | Series - 2016 3 (Class A3) | | | | | | | | | | | | |
| | 12,805,000 | | | | AmeriCredit Automobile Receivables Trust | | | | | 3.340 | | | 08/08/21 | | | 12,847 | |
| | | | | | Series - 2015 3 (Class D) | | | | | | | | | | | | |
| | 4,914,439 | | | | AmeriCredit Automobile Receivables Trust | | | | | 1.870 | | | 08/18/21 | | | 4,884 | |
| | | | | | Series - 2017 1 (Class A3) | | | | | | | | | | | | |
| | 5,000,000 | | | | AmeriCredit Automobile Receivables Trust | | | | | 1.900 | | | 03/18/22 | | | 4,946 | |
| | | | | | Series - 2017 3 (Class A3) | | | | | | | | | | | | |
| | 5,500,000 | | | | AmeriCredit Automobile Receivables Trust | | | | | 2.740 | | | 12/08/22 | | | 5,431 | |
| | | | | | Series - 2016 4 (Class D) | | | | | | | | | | | | |
| | 3,500,000 | | g | | Anchorage Capital CLO Ltd | | | | | 3.300 | | | 10/15/27 | | | 3,329 | |
| | | | | | Series - 2015 7A (Class B2R) | | | | | | | | | | | | |
| | 74,236 | | †,g | | Asset Backed Funding Corp NIM Trust | | | | | 5.900 | | | 07/26/35 | | | 0 | ^ |
| | | | | | Series - 2006 WMC1 (Class N1) | | | | | | | | | | | | |
| | 12,000,000 | | g | | Avis Budget Rental Car Funding AESOP LLC | | | | | 3.070 | | | 09/20/23 | | | 11,896 | |
| | | | | | Series - 2017 1A (Class A) | | | | | | | | | | | | |
COLLEGE RETIREMENT EQUITIES FUND -Bond Market Account
| PRINCIPAL | | | | ISSUER | | REFERENCE
RATE & SPREAD | | RATE | | MATURITY
DATE | | VALUE
(000) | |
| $ | 32,000,000 | | g | | Avis Budget Rental Car Funding AESOP LLC | | | | | 2.970 | % | | 03/20/24 | | $ | 31,322 | |
| | | | | | Series - 2017 2A (Class A) | | | | | | | | | | | | |
| | 4,745,000 | | i | | Bayview Financial Mortgage Pass-Through Trust | | LIBOR 1 M + 0.650% | | | 3.156 | | | 02/28/41 | | | 4,621 | |
| | | | | | Series - 2006 A (Class M3) | | | | | | | | | | | | |
| | 6,537,000 | | i | | Bear Stearns Asset Backed Securities Trust | | LIBOR 1 M + 0.670% | | | 3.176 | | | 04/25/36 | | | 6,450 | |
| | | | | | Series - 2006 SD1 (Class M1) | | | | | | | | | | | | |
| | 12,550,000 | | g,i | | BlueMountain CLO Ltd | | LIBOR 3 M + 1.770% | | | 4.206 | | | 10/25/30 | | | 12,298 | |
| | | | | | Series - 2018 3A (Class B) | | | | | | | | | | | | |
| | 2,500,000 | | g | | Bowman Park CLO Ltd | | | | | 3.545 | | | 11/23/25 | | | 2,476 | |
| | | | | | Series - 2014 1A (Class B2R) | | | | | | | | | | | | |
| | 5,250,000 | | | | Capital Auto Receivables Asset Trust | | | | | 1.690 | | | 03/20/21 | | | 5,208 | |
| | | | | | Series - 2016 3 (Class A4) | | | | | | | | | | | | |
| | 8,000,000 | | g | | Capital Automotive REIT | | | | | 3.660 | | | 10/15/44 | | | 7,973 | |
| | | | | | Series - 2014 1A (Class A) | | | | | | | | | | | | |
| | 6,883,333 | | g | | Capital Automotive REIT | | | | | 3.870 | | | 04/15/47 | | | 6,882 | |
| | | | | | Series - 2017 1A (Class A1) | | | | | | | | | | | | |
| | 14,000,000 | | | | Capital One Multi-Asset Execution Trust | | | | | 2.430 | | | 01/15/25 | | | 13,843 | |
| | | | | | Series - 2017 A3 (Class A3) | | | | | | | | | | | | |
| | 25,500,000 | | | | Capital One Multi-Asset Execution Trust | | | | | 2.290 | | | 07/15/25 | | | 24,899 | |
| | | | | | Series - 2017 A6 (Class A6) | | | | | | | | | | | | |
| | 3,875,000 | | | | CarMax Auto Owner Trust | | | | | 2.150 | | | 03/15/21 | | | 3,858 | |
| | | | | | Series - 2015 2 (Class B) | | | | | | | | | | | | |
| | 2,640,000 | | | | CarMax Auto Owner Trust | | | | | 2.390 | | | 03/15/21 | | | 2,630 | |
| | | | | | Series - 2015 2 (Class C) | | | | | | | | | | | | |
| | 5,500,000 | | | | CarMax Auto Owner Trust | | | | | 1.970 | | | 04/15/22 | | | 5,440 | |
| | | | | | Series - 2017 3 (Class A3) | | | | | | | | | | | | |
| | 4,850,000 | | | | CarMax Auto Owner Trust | | | | | 2.250 | | | 09/15/22 | | | 4,790 | |
| | | | | | Series - 2017 2 (Class A4) | | | | | | | | | | | | |
| | 4,100,000 | | | | CarMax Auto Owner Trust | | | | | 2.330 | | | 05/15/23 | | | 4,039 | |
| | | | | | Series - 2017 4 (Class A4) | | | | | | | | | | | | |
| | 1,937,173 | | i | | C-BASS Trust | | LIBOR 1 M + 0.080% | | | 2.586 | | | 07/25/36 | | | 1,899 | |
| | | | | | Series - 2006 CB6 (Class A1) | | | | | | | | | | | | |
| | 428,194 | | i | | Chase Funding Mortgage Loan Asset-Backed Certificates | | | | | 5.700 | | | 02/26/35 | | | 404 | |
| | | | | | Series - 2004 2 (Class 1M2) | | | | | | | | | | | | |
| | 393,212 | | | | CIT Group Home Equity Loan Trust (Step Bond) | | | | | 6.200 | | | 02/25/30 | | | 400 | |
| | | | | | Series - 2002 1 (Class AF6) | | | | | | | | | | | | |
| | 4,250,000 | | | | CNH Equipment Trust | | | | | 2.930 | | | 12/15/21 | | | 4,243 | |
| | | | | | Series - 2018 B (Class A2) | | | | | | | | | | | | |
| | 9,500,000 | | | | CNH Equipment Trust | | | | | 2.170 | | | 04/17/23 | | | 9,330 | |
| | | | | | Series - 2017 B (Class A4) | | | | | | | | | | | | |
| | 39,990,000 | | | | CNH Equipment Trust | | | | | 2.360 | | | 11/15/24 | | | 39,455 | |
| | | | | | Series - 2017 C (Class A4) | | | | | | | | | | | | |
| | 2,000,000 | | | | CNH Equipment Trust | | | | | 3.300 | | | 04/15/25 | | | 2,019 | |
| | | | | | Series - 2018 A (Class A4) | | | | | | | | | | | | |
| | 2,824,746 | | g | | DaimlerChrysler Capital Auto Receivables Trust | | | | | 1.640 | | | 07/15/21 | | | 2,811 | |
| | | | | | Series - 2016 BA (Class A3) | | | | | | | | | | | | |
| | 19,731,250 | | g | | DB Master Finance LLC | | | | | 3.980 | | | 02/20/45 | | | 20,006 | |
| | | | | | Series - 2015 1A (Class A2II) | | | | | | | | | | | | |
| | 20,923,650 | | g | | DB Master Finance LLC | | | | | 3.629 | | | 11/20/47 | | | 20,217 | |
| | | | | | Series - 2017 1A (Class A2I) | | | | | | | | | | | | |
| | 5,000,000 | | | | Discover Card Execution Note Trust | | | | | 2.390 | | | 07/15/24 | | | 4,922 | |
| | | | | | Series - 2017 A2 (Class A2) | | | | | | | | | | | | |
COLLEGE RETIREMENT EQUITIES FUND -Bond Market Account
| PRINCIPAL | | | | ISSUER | | | | RATE | | MATURITY
DATE | | VALUE
(000) | |
| $ | 2,437,500 | | g | | Domino’s Pizza Master Issuer LLC | | | | | 4.474 | % | | 10/25/45 | | $ | 2,460 | |
| | | | | | Series - 2015 1A (Class A2II) | | | | | | | | | | | | |
| | 64,187,500 | | g | | Domino’s Pizza Master Issuer LLC | | | | | 3.082 | | | 07/25/47 | | | 62,538 | |
| | | | | | Series - 2017 1A (Class A2II) | | | | | | | | | | | | |
| | 13,581,750 | | g | | Domino’s Pizza Master Issuer LLC | | | | | 4.116 | | | 07/25/48 | | | 13,399 | |
| | | | | | Series - 2018 1A (Class A2I) | | | | | | | | | | | | |
| | 4,015,404 | | | | Ford Credit Auto Lease Trust | | | | | 1.880 | | | 04/15/20 | | | 4,005 | |
| | | | | | Series - 2017 A (Class A3) | | | | | | | | | | | | |
| | 18,000,000 | | g | | Ford Credit Auto Owner Trust | | | | | 2.150 | | | 07/15/26 | | | 17,816 | |
| | | | | | Series - 2015 1 (Class A) | | | | | | | | | | | | |
| | 17,400,000 | | g | | Ford Credit Auto Owner Trust | | | | | 2.440 | | | 01/15/27 | | | 17,254 | |
| | | | | | Series - 2015 2 (Class A) | | | | | | | | | | | | |
| | 3,500,000 | | g | | Ford Credit Auto Owner Trust | | | | | 2.310 | | | 08/15/27 | | | 3,452 | |
| | | | | | Series - 2016 1 (Class A) | | | | | | | | | | | | |
| | 16,500,000 | | g | | Ford Credit Auto Owner Trust | | | | | 2.030 | | | 12/15/27 | | | 16,093 | |
| | | | | | Series - 2016 2 (Class A) | | | | | | | | | | | | |
| | 12,000,000 | | g | | Ford Credit Auto Owner Trust | | | | | 2.620 | | | 08/15/28 | | | 11,823 | |
| | | | | | Series - 2017 1 (Class A) | | | | | | | | | | | | |
| | 27,050,000 | | g | | Ford Credit Auto Owner Trust | | | | | 2.360 | | | 03/15/29 | | | 26,349 | |
| | | | | | Series - 2017 2 (Class A) | | | | | | | | | | | | |
| | 20,500,000 | | g | | Ford Credit Auto Owner Trust | | | | | 3.190 | | | 07/15/31 | | | 20,340 | |
| | | | | | Series - 2018 1 (Class A) | | | | | | | | | | | | |
| | 3,500,000 | | | | Ford Credit Floorplan Master Owner Trust | | | | | 2.070 | | | 05/15/22 | | | 3,453 | |
| | | | | | Series - 2017 1 (Class A1) | | | | | | | | | | | | |
| | 5,000,000 | | | | Ford Credit Floorplan Master Owner Trust | | | | | 2.390 | | | 08/15/22 | | | 4,957 | |
| | | | | | Series - 2015 5 (Class A) | | | | | | | | | | | | |
| | 7,000,000 | | | | Ford Credit Floorplan Master Owner Trust | | | | | 2.480 | | | 09/15/24 | | | 6,860 | |
| | | | | | Series - 2017 3 (Class A) | | | | | | | | | | | | |
| | 2,250,000 | | g,i | | FREMF Mortgage Trust | | | | | 4.019 | | | 03/25/49 | | | 2,278 | |
| | | | | | Series - 2016 K53 (Class B) | | | | | | | | | | | | |
| | 7,500,000 | | | | GM Financial Automobile Leasing Trust | | | | | 2.890 | | | 09/21/20 | | | 7,492 | |
| | | | | | Series - 2018 3 (Class A2A) | | | | | | | | | | | | |
| | 6,000,000 | | g | | GM Financial Consumer Automobile Receivables Trust | | | 2.130 | | | 03/16/23 | | | 5,901 | |
| | | | | | Series - 2017 3A (Class A4) | | | | | | | | | | | | |
| | 7,000,000 | | g | | GMF Floorplan Owner Revolving Trust | | | | | 2.130 | | | 07/15/20 | | | 6,902 | |
| | | | | | Series - 2017 2 (Class A1) | | | | | | | | | | | | |
| | 3,500,000 | | g | | GMF Floorplan Owner Revolving Trust | | | | | 1.960 | | | 05/17/21 | | | 3,484 | |
| | | | | | Series - 2016 1 (Class A1) | | | | | | | | | | | | |
| | 2,950,000 | | g | | GMF Floorplan Owner Revolving Trust | | | | | 2.220 | | | 01/18/22 | | | 2,925 | |
| | | | | | Series - 2017 1 (Class A1) | | | | | | | | | | | | |
| | 783,864 | | g | | HERO Funding Trust | | | | | 3.280 | | | 09/20/48 | | | 784 | |
| | | | | | Series - 2017 2A (Class A1) | | | | | | | | | | | | |
| | 1,567,727 | | g | | HERO Funding Trust | | | | | 4.070 | | | 09/20/48 | | | 1,610 | |
| | | | | | Series - 2017 2A (Class A2) | | | | | | | | | | | | |
| | 15,500,000 | | g | | Hertz Vehicle Financing II LP | | | | | 3.290 | | | 02/25/24 | | | 15,364 | |
| | | | | | Series - 2018 1A (Class A) | | | | | | | | | | | | |
| | 5,000,000 | | g | | Hertz Vehicle Financing LLC | | | | | 2.320 | | | 03/25/20 | | | 4,988 | |
| | | | | | Series - 2016 1A (Class A) | | | | | | | | | | | | |
| | 11,875,000 | | g | | Hertz Vehicle Financing LLC | | | | | 2.270 | | | 07/25/20 | | | 11,807 | |
| | | | | | Series - 2016 3A (Class A) | | | | | | | | | | | | |
| | 10,000,000 | | g | | Hertz Vehicle Financing LLC | | | | | 4.030 | | | 07/25/24 | | | 10,162 | |
| | | | | | Series - 2018 3A (Class A) | | | | | | | | | | | | |
COLLEGE RETIREMENT EQUITIES FUND -Bond Market Account
| PRINCIPAL | | | | ISSUER | | REFERENCE
RATE & SPREAD | | RATE | | MATURITY
DATE | | VALUE
(000) | |
| $ | 7,062,791 | | g | | Hilton Grand Vacations Trust | | | | | 2.660 | % | | 12/26/28 | | $ | 6,990 | |
| | | | | | Series - 2017 AA (Class A) | | | | | | | | | | | | |
| | 4,119,961 | | g | | Hilton Grand Vacations Trust | | | | | 2.960 | | | 12/26/28 | | | 4,051 | |
| | | | | | Series - 2017 AA (Class B) | | | | | | | | | | | | |
| | 2,886,662 | | g | | Hilton Grand Vacations Trust | | | | | 4.000 | | | 02/25/32 | | | 2,917 | |
| | | | | | Series - 2018 AA (Class C) | | | | | | | | | | | | |
| | 7,100,000 | | g | | Houston Galleria Mall Trust | | | | | 3.087 | | | 03/05/37 | | | 6,880 | |
| | | | | | Series - 2015 HGLR (Class A1A2) | | | | | | | | | | | | |
| | 1,750,000 | | g | | Hyundai Auto Lease Securitization Trust | | | | | 2.120 | | | 02/16/21 | | | 1,737 | |
| | | | | | Series - 2017 C (Class A3) | | | | | | | | | | | | |
| | 3,750,000 | | g | | Hyundai Auto Lease Securitization Trust | | | | | 2.210 | | | 09/15/21 | | | 3,714 | |
| | | | | | Series - 2017 C (Class A4) | | | | | | | | | | | | |
| | 834,326 | | i | | Irwin Home Equity Corp | | LIBOR 1 M + 0.760% | | | 3.266 | | | 02/25/34 | | | 825 | |
| | | | | | Series - 2005 A (Class A3) | | | | | | | | | | | | |
| | 8,199,588 | | g | | JG Wentworth XXII LLC | | | | | 3.820 | | | 12/15/48 | | | 8,296 | |
| | | | | | Series - 2010 3A (Class A) | | | | | | | | | | | | |
| | 11,500,000 | | | | John Deere Owner Trust | | | | | 2.110 | | | 07/15/24 | | | 11,351 | |
| | | | | | Series - 2017 B (Class A4) | | | | | | | | | | | | |
| | 11,500,000 | | g,i | | Madison Park Funding Ltd | | LIBOR 3 M + 1.750% | | | 3.998 | | | 10/18/30 | | | 11,253 | |
| | | | | | Series - 2018 29A (Class B) | | | | | | | | | | | | |
| | 5,978,511 | | i | | Morgan Stanley ABS Capital I, Inc Trust | | LIBOR 1 M + 1.050% | | | 3.266 | | | 12/27/33 | | | 5,949 | |
| | | | | | Series - 2004 NC1 (Class M1) | | | | | | | | | | | | |
| | 3,098,165 | | g | | MVW Owner Trust | | | | | 2.520 | | | 12/20/32 | | | 3,051 | |
| | | | | | Series - 2015 1A (Class A) | | | | | | | | | | | | |
| | 8,362,745 | | g | | MVW Owner Trust | | | | | 2.420 | | | 12/20/34 | | | 8,195 | |
| | | | | | Series - 2017 1A (Class A) | | | | | | | | | | | | |
| | 4,662,534 | | g | | MVW Owner Trust | | | | | 3.450 | | | 01/21/36 | | | 4,706 | |
| | | | | | Series - 2018 1A (Class A) | | | | | | | | | | | | |
| | 2,500,000 | | g,i | | Natixis Commercial Mortgage Securities Trust | | | | | 3.790 | | | 11/15/32 | | | 2,474 | |
| | | | | | Series - 2018 285M (Class C) | | | | | | | | | | | | |
| | 2,234,458 | | g | | Orange Lake Timeshare Trust | | | | | 3.100 | | | 11/08/30 | | | 2,222 | |
| | | | | | Series - 2018 A (Class A) | | | | | | | | | | | | |
| | 2,000,000 | | g | | Palisades Center Trust | | | | | 3.357 | | | 04/13/33 | | | 1,978 | |
| | | | | | Series - 2016 PLSD (Class B) | | | | | | | | | | | | |
| | 14,463,750 | | g | | Planet Fitness Master Issuer LLC | | | | | 4.262 | | | 09/05/48 | | | 14,524 | |
| | | | | | Series - 2018 1A (Class A2I) | | | | | | | | | | | | |
| | 4,987,500 | | g | | Planet Fitness Master Issuer LLC | | | | | 4.666 | | | 09/05/48 | | | 5,051 | |
| | | | | | Series - 2018 1A (Class A2II) | | | | | | | | | | | | |
| | 2,325,000 | | g | | Pretium Mortgage Credit Partners I LLC (Step Bond) | | | | | 5.000 | | | 03/27/33 | | | 2,298 | |
| | | | | | Series - 2018 NPL2 (Class A2) | | | | | | | | | | | | |
| | 3,298,490 | | g | | Pretium Mortgage Credit Partners I LLC (Step Bond) | | | | | 4.125 | | | 08/25/33 | | | 3,287 | |
| | | | | | Series - 2018 NPL3 (Class A1) | | | | | | | | | | | | |
| | 3,250,000 | | g | | Prudential plc | | | | | 4.660 | | | 07/15/31 | | | 3,230 | |
| | | | | | Series - 2018 1A (Class B1) | | | | | | | | | | | | |
| | 3,500,000 | | | | PSNH Funding LLC | | | | | 3.506 | | | 08/01/28 | | | 3,597 | |
| | | | | | Series - 2018 1 (Class A2) | | | | | | | | | | | | |
| | 2,000,000 | | g | | RBS Commercial Funding, Inc Trust | | | | | 3.511 | | | 03/11/31 | | | 1,963 | |
| | | | | | Series - 2013 SMV (Class B) | | | | | | | | | | | | |
| | 17,126 | | i | | Renaissance Home Equity Loan Trust | | LIBOR 1 M + 0.880% | | | 3.195 | | | 08/25/33 | | | 17 | |
| | | | | | Series - 2003 2 (Class A) | | | | | | | | | | | | |
| | 361,026 | | | | Santander Drive Auto Receivables Trust | | | | | 1.870 | | | 12/15/20 | | | 361 | |
| | | | | | Series - 2017 2 (Class A3) | | | | | | | | | | | | |
| | 3,873,018 | | | | Santander Drive Auto Receivables Trust | | | | | 1.870 | | | 06/15/21 | | | 3,864 | |
| | | | | | Series - 2017 3 (Class A3) | | | | | | | | | | | | |
COLLEGE RETIREMENT EQUITIES FUND -Bond Market Account
| PRINCIPAL | | | | ISSUER | | | | RATE | | MATURITY
DATE | | VALUE
(000) | |
| $ | 8,920,000 | | | | Santander Drive Auto Receivables Trust | | | | | 2.970 | % | | 07/15/21 | | $ | 8,911 | |
| | | | | | Series - 2018 5 (Class A2A) | | | | | | | | | | | | |
| | 217,369 | | | | Santander Drive Auto Receivables Trust | | | | | 2.740 | | | 12/15/21 | | | 217 | |
| | | | | | Series - 2015 5 (Class C) | | | | | | | | | | | | |
| | 5,325,000 | | | | Santander Drive Auto Receivables Trust | | | | | 3.190 | | | 03/15/22 | | | 5,309 | |
| | | | | | Series - 2018 5 (Class A3) | | | | | | | | | | | | |
| | 6,000,000 | | | | Santander Drive Auto Receivables Trust | | | | | 2.800 | | | 08/15/22 | | | 5,967 | |
| | | | | | Series - 2016 3 (Class D) | | | | | | | | | | | | |
| | 8,000,000 | | | | Santander Drive Auto Receivables Trust | | | | | 3.170 | | | 04/17/23 | | | 7,974 | |
| | | | | | Series - 2017 1 (Class D) | | | | | | | | | | | | |
| | 12,500,000 | | g | | Santander Retail Auto Lease Trust | | | | | 2.370 | | | 01/20/22 | | | 12,370 | |
| | | | | | Series - 2017 A (Class A4) | | | | | | | | | | | | |
| | 2,333,329 | | g,i | | Sierra Receivables Funding Co LLC | | | | | 2.050 | | | 06/20/31 | | | 2,331 | |
| | | | | | Series - 2014 2A (Class A) | | | | | | | | | | | | |
| | 676,495 | | g | | Sierra Receivables Funding Co LLC | | | | | 2.400 | | | 06/20/31 | | | 676 | |
| | | | | | Series - 2014 2A (Class B) | | | | | | | | | | | | |
| | 2,133,780 | | g | | Sierra Receivables Funding Co LLC | | | | | 2.400 | | | 03/22/32 | | | 2,121 | |
| | | | | | Series - 2015 1A (Class A) | | | | | | | | | | | | |
| | 13,547,069 | | g | | Sierra Receivables Funding Co LLC | | | | | 2.910 | | | 03/20/34 | | | 13,423 | |
| | | | | | Series - 2017 1A (Class A) | | | | | | | | | | | | |
| | 439,794 | | g | | Sierra Receivables Funding Co LLC | | | | | 3.200 | | | 03/20/34 | | | 434 | |
| | | | | | Series - 2017 1A (Class B) | | | | | | | | | | | | |
| | 2,707,606 | | g | | Sierra Timeshare Receivables Funding LLC | | | | | 2.580 | | | 09/20/32 | | | 2,680 | |
| | | | | | Series - 2015 3A (Class A) | | | | | | | | | | | | |
| | 3,265,969 | | g | | Sierra Timeshare Receivables Funding LLC | | | | | 3.080 | | | 09/20/32 | | | 3,252 | |
| | | | | | Series - 2015 3A (Class B) | | | | | | | | | | | | |
| | 1,737,431 | | g | | Sierra Timeshare Receivables Funding LLC | | | | | 3.080 | | | 03/21/33 | | | 1,728 | |
| | | | | | Series - 2016 1A (Class A) | | | | | | | | | | | | |
| | 5,619,468 | | g | | Sierra Timeshare Receivables Funding LLC | | | | | 2.330 | | | 07/20/33 | | | 5,466 | |
| | | | | | Series - 2016 2A (Class A) | | | | | | | | | | | | |
| | 894,820 | | g | | Sierra Timeshare Receivables Funding LLC | | | | | 2.780 | | | 07/20/33 | | | 873 | |
| | | | | | Series - 2016 2A (Class B) | | | | | | | | | | | | |
| | 4,001,672 | | g | | Sierra Timeshare Receivables Funding LLC | | | | | 2.430 | | | 10/20/33 | | | 3,959 | |
| | | | | | Series - 2016 3A (Class A) | | | | | | | | | | | | |
| | 2,371,361 | | g | | Sierra Timeshare Receivables Funding LLC | | | | | 2.630 | | | 10/20/33 | | | 2,319 | |
| | | | | | Series - 2016 3A (Class B) | | | | | | | | | | | | |
| | 6,456,534 | | g | | Sierra Timeshare Receivables Funding LLC | | | | | 3.500 | | | 06/20/35 | | | 6,517 | |
| | | | | | Series - 2018 2A (Class A) | | | | | | | | | | | | |
| | 7,857,030 | | g | | Sierra Timeshare Receivables Funding LLC | | | | | 4.170 | | | 09/20/35 | | | 7,983 | |
| | | | | | Series - 2018 3A (Class C) | | | | | | | | | | | | |
| | 3,190,827 | | g | | SLM Student Loan Trust | | | | | 3.740 | | | 02/15/29 | | | 3,193 | |
| | | | | | Series - 2011 B (Class A2) | | | | | | | | | | | | |
| | 4,793,231 | | g | | SMB Private Education Loan Trust | | | | | 2.490 | | | 06/15/27 | | | 4,727 | |
| | | | | | Series - 2015 A (Class A2A) | | | | | | | | | | | | |
| | 7,390,355 | | g | | SMB Private Education Loan Trust | | | | | 2.750 | | | 07/15/27 | | | 7,315 | |
| | | | | | Series - 2015 C (Class A2A) | | | | | | | | | | | | |
| | 10,870,373 | | g | | SMB Private Education Loan Trust | | | | | 2.430 | | | 02/17/32 | | | 10,644 | |
| | | | | | Series - 2016 B (Class A2A) | | | | | | | | | | | | |
| | 16,020,000 | | g | | SMB Private Education Loan Trust | | | | | 2.880 | | | 09/15/34 | | | 15,669 | |
| | | | | | Series - 2017 A (Class A2A) | | | | | | | | | | | | |
| | 15,250,000 | | g | | SMB Private Education Loan Trust | | | | | 2.820 | | | 10/15/35 | | | 14,910 | |
| | | | | | Series - 2017 B (Class A2A) | | | | | | | | | | | | |
COLLEGE RETIREMENT EQUITIES FUND -Bond Market Account
| PRINCIPAL | | | | ISSUER | | | | RATE | | MATURITY
DATE | | VALUE
(000) | |
| $ | 5,000,000 | | g | | SMB Private Education Loan Trust | | | | | 3.500 | % | | 02/15/36 | | $ | 5,006 | |
| | | | | | Series - 2018 A (Class A2A) | | | | | | | | | | | | |
| | 9,207,301 | | g | | Sofi Professional Loan Program LLC | | | | | 3.120 | | | 02/25/48 | | | 9,207 | |
| | | | | | Series - 2018 D (Class A1FX) | | | | | | | | | | | | |
| | 120,988 | | g | | SoFi Professional Loan Program LLC | | | | | 1.530 | | | 04/25/33 | | | 121 | |
| | | | | | Series - 2016 D (Class A2A) | | | | | | | | | | | | |
| | 16,220,000 | | g | | SoFi Professional Loan Program LLC | | | | | 2.340 | | | 04/25/33 | | | 15,929 | |
| | | | | | Series - 2016 D (Class A2B) | | | | | | | | | | | | |
| | 15,150,000 | | g | | SoFi Professional Loan Program LLC | | | | | 2.490 | | | 01/25/36 | | | 14,930 | |
| | | | | | Series - 2016 E (Class A2B) | | | | | | | | | | | | |
| | 2,610,338 | | g | | SoFi Professional Loan Program LLC | | | | | 2.760 | | | 12/26/36 | | | 2,573 | |
| | | | | | Series - 2016 A (Class A2) | | | | | | | | | | | | |
| | 700,755 | | g | | SoFi Professional Loan Program LLC | | | | | 1.550 | | | 03/26/40 | | | 695 | |
| | | | | | Series - 2017 A (Class A2A) | | | | | | | | | | | | |
| | 4,925,000 | | g | | SoFi Professional Loan Program LLC | | | | | 2.400 | | | 03/26/40 | | | 4,807 | |
| | | | | | Series - 2017 A (Class A2B) | | | | | | | | | | | | |
| | 6,065,807 | | g | | SoFi Professional Loan Program LLC | | | | | 1.830 | | | 05/25/40 | | | 6,028 | |
| | | | | | Series - 2017 B (Class A1FX) | | | | | | | | | | | | |
| | 13,050,000 | | g | | SoFi Professional Loan Program LLC | | | | | 2.740 | | | 05/25/40 | | | 12,821 | |
| | | | | | Series - 2017 B (Class A2FX) | | | | | | | | | | | | |
| | 4,000,000 | | g | | SoFi Professional Loan Program LLC | | | | | 2.630 | | | 07/25/40 | | | 3,880 | |
| | | | | | Series - 2017 C (Class A2B) | | | | | | | | | | | | |
| | 10,556,000 | | g | | SoFi Professional Loan Program LLC | | | | | 2.720 | | | 11/26/40 | | | 10,464 | |
| | | | | | Series - 2017 E (Class A2B) | | | | | | | | | | | | |
| | 13,500,000 | | g | | SoFi Professional Loan Program LLC | | | | | 2.840 | | | 01/25/41 | | | 13,190 | |
| | | | | | Series - 2017 F (Class A2FX) | | | | | | | | | | | | |
| | 21,000,000 | | g | | SoFi Professional Loan Program LLC | | | | | 2.950 | | | 02/25/42 | | | 20,623 | |
| | | | | | Series - 2018 A (Class A2B) | | | | | | | | | | | | |
| | 3,417,603 | | g | | SolarCity LMC | | | | | 4.590 | | | 04/20/44 | | | 3,461 | |
| | | | | | Series - 2014 1 (Class A) | | | | | | | | | | | | |
| | 28,503,620 | | g | | SpringCastle America Funding LLC | | | | | 3.050 | | | 04/25/29 | | | 28,229 | |
| | | | | | Series - 2016 AA (Class A) | | | | | | | | | | | | |
| | 3,000,000 | | g | | SpringCastle America Funding LLC | | | | | 4.100 | | | 10/25/33 | | | 3,013 | |
| | | | | | Series - 2016 AA (Class B) | | | | | | | | | | | | |
| | 14,000,000 | | | | Synchrony Credit Card Master Note Trust | | | | | 2.620 | | | 10/15/25 | | | 13,810 | |
| | | | | | Series - 2017 2 (Class A) | | | | | | | | | | | | |
| | 14,550,000 | | g | | Taco Bell Funding LLC | | | | | 4.318 | | | 11/25/48 | | | 14,730 | |
| | | | | | Series - 2018 1A (Class A2I) | | | | | | | | | | | | |
| | 9,320,000 | | g | | Tesla Auto Lease Trust | | | | | 3.710 | | | 08/20/21 | | | 9,342 | |
| | | | | | Series - 2018 B (Class A) | | | | | | | | | | | | |
| | 8,921,516 | | g | | TLF National Tax Lien Trust | | | | | 3.090 | | | 12/15/29 | | | 8,898 | |
| | | | | | Series - 2017 1A (Class A) | | | | | | | | | | | | |
| | 12,548,000 | | | | UBS Commercial Mortgage Trust | | | | | 3.256 | | | 06/15/50 | | | 12,467 | |
| | | | | | Series - 2017 C1 (Class ASB) | | | | | | | | | | | | |
| | 2,000,000 | | | | UBS Commercial Mortgage Trust | | | | | 3.366 | | | 10/15/50 | | | 1,984 | |
| | | | | | Series - 2017 C4 (Class ASB) | | | | | | | | | | | | |
| | 23,465,000 | | g | | Verizon Owner Trust | | | | | 2.060 | | | 09/20/21 | | | 23,290 | |
| | | | | | Series - 2017 1A (Class A) | | | | | | | | | | | | |
| | 21,500,000 | | g | | Verizon Owner Trust | | | | | 1.920 | | | 12/20/21 | | | 21,280 | |
| | | | | | Series - 2017 2A (Class A) | | | | | | | | | | | | |
| | 49,400,000 | | | | Verizon Owner Trust | | | | | 3.230 | | | 04/20/23 | | | 49,698 | |
| | | | | | Series - 2018 A (Class A1A) | | | | | | | | | | | | |
| | 6,729,624 | | g | | VOLT LXII LLC (Step Bond) | | | | | 3.125 | | | 09/25/47 | | | 6,668 | |
| | | | | | Series - 2017 NPL9 (Class A1) | | | | | | | | | | | | |
COLLEGE RETIREMENT EQUITIES FUND -Bond Market Account
| PRINCIPAL | | | | ISSUER | | REFERENCE
RATE & SPREAD | | RATE | | MATURITY
DATE | | VALUE
(000) | |
| $ | 1,161,878 | | g | | VOLT LXV LLC (Step Bond) | | | | | 3.750 | % | | 04/25/48 | | $ | 1,150 | |
| | | | | | Series - 2018 NPL1 (Class A1) | | | | | | | | | | | | |
| | 7,600,000 | | g | | VOLT LXXIII LLC (Step Bond) | | | | | 4.458 | | | 10/25/48 | | | 7,602 | |
| | | | | | Series - 2018 NPL9 (Class A1A) | | | | | | | | | | | | |
| | 1,890,000 | | g | | Vornado DP LLC | | | | | 5.280 | | | 09/13/28 | | | 1,964 | |
| | | | | | Series - 2010 VNO (Class C) | | | | | | | | | | | | |
| | 4,250,000 | | g,i | | Voya CLO Ltd | | LIBOR 3 M + 1.650% | | | 4.110 | | | 10/15/31 | | | 4,167 | |
| | | | | | Series - 2018 3A (Class B) | | | | | | | | | | | | |
| | 361,684 | | g | | Wachovia Amortization Controlled Heloc NIM | | | | | 5.683 | | | 08/12/47 | | | 357 | |
| | | | | | Series - 2006 N1 (Class N1) | | | | | | | | | | | | |
| | 159,215 | | g,i | | Wachovia Loan Trust | | LIBOR 1 M + 0.360% | | | 2.866 | | | 05/25/35 | | | 159 | |
| | | | | | Series - 2005 SD1 (Class A) | | | | | | | | | | | | |
| | 38,610,000 | | g | | Wendys Funding LLC | | | | | 3.573 | | | 03/15/48 | | | 37,002 | |
| | | | | | Series - 2018 1A (Class A2I) | | | | | | | | | | | | |
| | 4,950,000 | | g | | Wendys Funding LLC | | | | | 3.884 | | | 03/15/48 | | | 4,664 | |
| | | | | | Series - 2018 1A (Class A2II) | | | | | | | | | | | | |
| | 3,000,000 | | | | World Financial Network Credit Card Master Trust | | | | | 2.030 | | | 04/15/25 | | | 2,921 | |
| | | | | | Series - 2016 A (Class A) | | | | | | | | | | | | |
| | 17,800,000 | | | | World Omni Auto Receivables Trust | | | | | 3.010 | | | 04/15/22 | | | 17,794 | |
| | | | | | Series - 2018 D (Class A2A) | | | | | | | | | | | | |
| | 3,000,000 | | | | World Omni Auto Receivables Trust | | | | | 2.240 | | | 06/15/23 | | | 2,951 | |
| | | | | | Series - 2017 A (Class A4) | | | | | | | | | | | | |
| | 9,000,000 | | | | World Omni Auto Receivables Trust | | | | | 2.250 | | | 10/16/23 | | | 8,789 | |
| | | | | | Series - 2017 B (Class A4) | | | | | | | | | | | | |
| | 7,300,000 | | | | World Omni Auto Receivables Trust | | | | | 3.330 | | | 04/15/24 | | | 7,383 | |
| | | | | | Series - 2018 D (Class A3) | | | | | | | | | | | | |
| | 5,932,000 | | | | World Omni Automobile Lease Securitization Trust | | | | | 1.610 | | | 01/15/22 | | | 5,913 | |
| | | | | | Series - 2016 A (Class A4) | | | | | | | | | | | | |
| | 1,000,000 | | g,i | | Worldwide Plaza Trust | | | | | 3.596 | | | 11/10/36 | | | 904 | |
| | | | | | Series - 2017 WWP (Class E) | | | | | | | | | | | | |
| | 5,500,000 | | g,i | | Worldwide Plaza Trust | | | | | 3.596 | | | 11/10/36 | | | 5,353 | |
| | | | | | Series - 2017 WWP (Class B) | | | | | | | | | | | | |
| | | | | | TOTAL ASSET BACKED | | | | | | | | | | | 1,293,481 | |
| | | | | | | | | | | | | | | | | | |
| OTHER MORTGAGE BACKED - 10.1% | | | | | | | | | | | | |
| | 25,000,000 | | g,i | | 20 TSQ GROUNDCO LLC | | | | | 3.100 | | | 05/15/35 | | | 23,354 | |
| | | | | | Series - 2018 20TS (Class E) | | | | | | | | | | | | |
| | 9,418,163 | | g,i | | Agate Bay Mortgage Trust | | | | | 3.500 | | | 09/25/45 | | | 9,151 | |
| | | | | | Series - 2015 6 (Class A9) | | | | | | | | | | | | |
| | 177,071 | | g,i | | Banc of America Commercial Mortgage Trust | | | | | 5.752 | | | 02/10/51 | | | 179 | |
| | | | | | Series - 2007 4 (Class E) | | | | | | | | | | | | |
| | 3,579,005 | | i | | Banc of America Commercial Mortgage Trust | | | | | 6.034 | | | 02/10/51 | | | 3,612 | |
| | | | | | Series - 2007 5 (Class AJ) | | | | | | | | | | | | |
| | 2,000,000 | | †,g,i | | Banc of America Commercial Mortgage Trust | | | | | 6.038 | | | 02/10/51 | | | 749 | |
| | | | | | Series - 2007 5 (Class B) | | | | | | | | | | | | |
| | 5,000,000 | | | | BANK | | | | | 3.419 | | | 05/15/50 | | | 5,020 | |
| | | | | | Series - 2017 BNK4 (Class ASB) | | | | | | | | | | | | |
| | 15,000,000 | | | | BBCMS Mortgage Trust | | | | | 3.488 | | | 02/15/50 | | | 15,157 | |
| | | | | | Series - 2017 C1 (Class ASB) | | | | | | | | | | | | |
| | 3,850,000 | | g | | BBCMS Trust | | | | | 3.821 | | | 09/05/32 | | | 3,847 | |
| | | | | | Series - 2013 TYSN (Class C) | | | | | | | | | | | | |
COLLEGE RETIREMENT EQUITIES FUND -Bond Market Account
| PRINCIPAL | | | | ISSUER | | | | RATE | | MATURITY
DATE | | VALUE
(000) | |
| $ | 1,500,000 | | g,i | | BBCMS Trust | | | | | 4.267 | % | | 08/05/38 | | $ | 1,314 | |
| | | | | | Series - 2018 CHRS (Class E) | | | | | | | | | | | | |
| | 6,102,000 | | g | | BWAY Mortgage Trust | | | | | 2.917 | | | 01/10/35 | | | 5,914 | |
| | | | | | Series - 2015 1740 (Class A) | | | | | | | | | | | | |
| | 2,500,000 | | g | | BWAY Mortgage Trust | | | | | 3.342 | | | 01/10/35 | | | 2,398 | |
| | | | | | Series - 2015 1740 (Class C) | | | | | | | | | | | | |
| | 7,698,000 | | | | CCUBS Commercial Mortgage Trust | | | | | 3.462 | | | 11/15/50 | | | 7,771 | |
| | | | | | Series - 2017 C1 (Class ASB) | | | | | | | | | | | | |
| | 1,000,000 | | | | CD Commercial Mortgage Trust | | | | | 3.453 | | | 02/10/50 | | | 1,010 | |
| | | | | | Series - 2017 CD3 (Class AAB) | | | | | | | | | | | | |
| | 5,167,000 | | | | CD Mortgage Trust | | | | | 2.622 | | | 08/10/49 | | | 5,032 | |
| | | | | | Series - 2016 CD1 (Class ASB) | | | | | | | | | | | | |
| | 9,000,000 | | | | CD Mortgage Trust | | | | | 2.926 | | | 08/10/49 | | | 8,475 | |
| | | | | | Series - 2016 CD1 (Class AM) | | | | | | | | | | | | |
| | 5,000,000 | | | | CD Mortgage Trust | | | | | 3.220 | | | 08/15/50 | | | 4,931 | |
| | | | | | Series - 2017 CD5 (Class AAB) | | | | | | | | | | | | |
| | 967,113 | | | | CFCRE Commercial Mortgage Trust | | | | | 3.121 | | | 05/10/58 | | | 954 | |
| | | | | | Series - 2016 C4 (Class AHR) | | | | | | | | | | | | |
| | 8,900,000 | | g | | CGBAM Commercial Mortgage Trust | | | | | 3.516 | | | 04/10/28 | | | 8,905 | |
| | | | | | Series - 2015 SMRT (Class C) | | | | | | | | | | | | |
| | 9,000,000 | | g | | CGBAM Commercial Mortgage Trust | | | | | 3.768 | | | 04/10/28 | | | 8,999 | |
| | | | | | Series - 2015 SMRT (Class D) | | | | | | | | | | | | |
| | 5,300,000 | | | | CGMS Commercial Mortgage Trust | | | | | 3.243 | | | 08/15/50 | | | 5,265 | |
| | | | | | Series - 2017 B1 (Class AAB) | | | | | | | | | | | | |
| | 3,096,482 | | i | | CHL Mortgage Pass-Through Trust | | | | | 4.225 | | | 02/20/35 | | | 3,112 | |
| | | | | | Series - 2004 HYB9 (Class 1A1) | | | | | | | | | | | | |
| | 2,509,522 | | | | Citigroup Commercial Mortgage Trust | | | | | 1.506 | | | 05/10/49 | | | 2,469 | |
| | | | | | Series - 2016 C1 (Class A1) | | | | | | | | | | | | |
| | 6,500,000 | | | | Citigroup Commercial Mortgage Trust | | | | | 3.003 | | | 05/10/49 | | | 6,443 | |
| | | | | | Series - 2016 C1 (Class AAB) | | | | | | | | | | | | |
| | 6,765,000 | | | | Citigroup Commercial Mortgage Trust | | | | | 3.764 | | | 10/12/50 | | | 6,767 | |
| | | | | | Series - 2017 C4 (Class AS) | | | | | | | | | | | | |
| | 5,000,000 | | g | | COMM Mortgage Trust | | | | | 3.244 | | | 10/10/29 | | | 4,912 | |
| | | | | | Series - 2017 PANW (Class A) | | | | | | | | | | | | |
| | 3,750,000 | | | | COMM Mortgage Trust | | | | | 2.853 | | | 10/15/45 | | | 3,684 | |
| | | | | | Series - 2012 CR4 (Class A3) | | | | | | | | | | | | |
| | 4,000,000 | | g | | COMM Mortgage Trust | | | | | 3.397 | | | 03/10/46 | | | 3,969 | |
| | | | | | Series - 2013 CR6 (Class B) | | | | | | | | | | | | |
| | 4,325,000 | | g,i | | COMM Mortgage Trust | | | | | 4.793 | | | 08/10/46 | | | 4,493 | |
| | | | | | Series - 2013 CR10 (Class B) | | | | | | | | | | | | |
| | 3,380,000 | | g,i | | COMM Mortgage Trust | | | | | 4.793 | | | 08/10/46 | | | 3,469 | |
| | | | | | Series - 2013 CR10 (Class C) | | | | | | | | | | | | |
| | 8,500,000 | | i | | COMM Mortgage Trust | | | | | 4.670 | | | 02/10/47 | | | 8,934 | |
| | | | | | Series - 2014 CR15 (Class B) | | | | | | | | | | | | |
| | 4,150,000 | | | | COMM Mortgage Trust | | | | | 3.691 | | | 03/10/47 | | | 4,206 | |
| | | | | | Series - 2014 UBS2 (Class A4) | | | | | | | | | | | | |
| | 1,933,333 | | | | COMM Mortgage Trust | | | | | 4.199 | | | 03/10/47 | | | 1,958 | |
| | | | | | Series - 2014 UBS2 (Class AM) | | | | | | | | | | | | |
| | 1,843,000 | | i | | COMM Mortgage Trust | | | | | 4.731 | | | 07/15/47 | | | 1,864 | |
| | | | | | Series - 2014 CR18 (Class C) | | | | | | | | | | | | |
| | 14,048,817 | | | | COMM Mortgage Trust | | | | | 3.917 | | | 10/10/47 | | | 14,392 | |
| | | | | | Series - 2014 LC17 (Class A5) | | | | | | | | | | | | |
| | 1,185,000 | | i | | COMM Mortgage Trust | | | | | 4.490 | | | 10/10/47 | | | 1,210 | |
| | | | | | Series - 2014 LC17 (Class B) | | | | | | | | | | | | |
COLLEGE RETIREMENT EQUITIES FUND -Bond Market Account
| PRINCIPAL | | | | ISSUER | | REFERENCE
RATE & SPREAD | | RATE | | MATURITY
DATE | | VALUE
(000) | |
| $ | 169,533 | | | | COMM Mortgage Trust | | | | | 1.399 | % | | 02/10/48 | | $ | 169 | |
| | | | | | Series - 2015 LC19 (Class A1) | | | | | | | | | | | | |
| | 6,702,470 | | | | COMM Mortgage Trust | | | | | 3.183 | | | 02/10/48 | | | 6,611 | |
| | | | | | Series - 2015 LC19 (Class A4) | | | | | | | | | | | | |
| | 3,132,775 | | i | | COMM Mortgage Trust | | | | | 3.603 | | | 03/10/48 | | | 3,112 | |
| | | | | | Series - 2015 CR22 (Class AM) | | | | | | | | | | | | |
| | 1,000,000 | | i | | COMM Mortgage Trust | | | | | 3.926 | | | 03/10/48 | | | 988 | |
| | | | | | Series - 2015 CR22 (Class B) | | | | | | | | | | | | |
| | 5,500,000 | | g,i | | COMM Mortgage Trust | | | | | 3.685 | | | 05/10/48 | | | 5,508 | |
| | | | | | Series - 2015 CR23 (Class CMB) | | | | | | | | | | | | |
| | 8,150,000 | | | | COMM Mortgage Trust | | | | | 3.801 | | | 05/10/48 | | | 8,155 | |
| | | | | | Series - 2015 CR23 (Class AM) | | | | | | | | | | | | |
| | 4,000,000 | | i | | COMM Mortgage Trust | | | | | 4.183 | | | 05/10/48 | | | 4,017 | |
| | | | | | Series - 2015 CR23 (Class B) | | | | | | | | | | | | |
| | 14,500,000 | | | | COMM Mortgage Trust | | | | | 3.421 | | | 07/10/48 | | | 14,615 | |
| | | | | | Series - 2015 LC21 (Class ASB) | | | | | | | | | | | | |
| | 3,685,000 | | i | | COMM Mortgage Trust | | | | | 4.381 | | | 08/10/48 | | | 3,771 | |
| | | | | | Series - 2015 CR24 (Class B) | | | | | | | | | | | | |
| | 6,962,000 | | i | | COMM Mortgage Trust | | | | | 4.360 | | | 10/10/48 | | | 7,139 | |
| | | | | | Series - 2015 CR27 (Class B) | | | | | | | | | | | | |
| | 1,083,167 | | | | COMM Mortgage Trust | | | | | 3.651 | | | 02/10/49 | | | 1,087 | |
| | | | | | Series - 2016 CR28 (Class AHR) | | | | | | | | | | | | |
| | 1,275,530 | | | | COMM Mortgage Trust | | | | | 1.667 | | | 07/10/50 | | | 1,270 | |
| | | | | | Series - 2015 PC1 (Class A1) | | | | | | | | | | | | |
| | 1,000,000 | | | | COMM Mortgage Trust | | | | | 3.961 | | | 05/10/51 | | | 1,013 | |
| | | | | | Series - 2018 COR3 (Class A2) | | | | | | | | | | | | |
| | 9,671,000 | | | | COMM Mortgage Trust | | | | | 4.228 | | | 05/10/51 | | | 9,982 | |
| | | | | | Series - 2018 COR3 (Class A3) | | | | | | | | | | | | |
| | 25,066,139 | | i | | Connecticut Avenue Securities | | LIBOR 1 M + 2.600% | | | 5.106 | | | 05/25/24 | | | 26,260 | |
| | | | | | Series - 2014 C02 (Class 1M2) | | | | | | | | | | | | |
| | 11,983,881 | | i | | Connecticut Avenue Securities | | LIBOR 1 M + 3.000% | | | 5.506 | | | 07/25/24 | | | 12,600 | |
| | | | | | Series - 2014 C03 (Class 1M2) | | | | | | | | | | | | |
| | 5,528,344 | | i | | Connecticut Avenue Securities | | LIBOR 1 M + 1.450% | | | 3.956 | | | 01/25/29 | | | 5,549 | |
| | | | | | Series - 2016 C04 (Class 1M1) | | | | | | | | | | | | |
| | 10,373,317 | | i | | Connecticut Avenue Securities | | LIBOR 1 M + 1.300% | | | 3.806 | | | 04/25/29 | | | 10,411 | |
| | | | | | Series - 2016 C06 (Class 1M1) | | | | | | | | | | | | |
| | 7,562,632 | | i | | Connecticut Avenue Securities | | LIBOR 1 M + 1.300% | | | 2.165 | | | 07/25/29 | | | 7,585 | |
| | | | | | Series - 2017 C01 (Class 1M1) | | | | | | | | | | | | |
| | 16,397,700 | | i | | Connecticut Avenue Securities | | LIBOR 1 M + 0.950% | | | 3.456 | | | 10/25/29 | | | 16,410 | |
| | | | | | Series - 2017 C03 (Class 1M1) | | | | | | | | | | | | |
| | 8,732,754 | | i | | Connecticut Avenue Securities | | LIBOR 1 M + 0.850% | | | 3.356 | | | 11/25/29 | | | 8,733 | |
| | | | | | Series - 2017 C04 (Class 2M1) | | | | | | | | | | | | |
| | 41,006,803 | | i | | Connecticut Avenue Securities | | LIBOR 1 M + 0.600% | | | 3.106 | | | 07/25/30 | | | 40,861 | |
| | | | | | Series - 2018 C01 (Class 1M1) | | | | | | | | | | | | |
| | 17,343,987 | | i | | Connecticut Avenue Securities | | LIBOR 1 M + 0.680% | | | 3.186 | | | 10/25/30 | | | 17,300 | |
| | | | | | Series - 2018 C03 (Class 1M1) | | | | | | | | | | | | |
| | 3,926,968 | | i | | Connecticut Avenue Securities | | LIBOR 1 M + 0.750% | | | 3.256 | | | 12/25/30 | | | 3,924 | |
| | | | | | Series - 2018 C04 (Class 2M1) | | | | | | | | | | | | |
| | 9,659,994 | | i | | Connecticut Avenue Securities | | LIBOR 1 M + 0.720% | | | 3.226 | | | 01/25/31 | | | 9,637 | |
| | | | | | Series - 2018 C05 (Class 1M1) | | | | | | | | | | | | |
| | 4,910,235 | | i | | Connecticut Avenue Securities | | LIBOR 1 M + 2.350% | | | 4.856 | | | 01/25/31 | | | 4,786 | |
| | | | | | Series - 2018 C05 (Class 1M2) | | | | | | | | | | | | |
COLLEGE RETIREMENT EQUITIES FUND -Bond Market Account
| PRINCIPAL | | | | ISSUER | | REFERENCE
RATE & SPREAD | | RATE | | MATURITY
DATE | | VALUE
(000) | �� |
| $ | 7,985,000 | | i | | Connecticut Avenue Securities | | LIBOR 1 M + 2.100% | | | 4.606 | % | | 03/25/31 | | $ | 7,687 | |
| | | | | | Series - 2018 C06 (Class 2M2) | | | | | | | | | | | | |
| | 6,652,639 | | g,i | | Connecticut Avenue Securities | | LIBOR 1 M + 0.750% | | | 3.256 | | | 04/25/31 | | | 6,642 | |
| | | | | | Series - 2018 R07 (Class 1M1) | | | | | | | | | | | | |
| | 4,689,000 | | g,i | | Credit Suisse Commercial Mortgage Trust | | | | | 5.897 | | | 01/15/49 | | | 6,129 | |
| | | | | | Series - 2007 C2 (Class C) | | | | | | | | | | | | |
| | 1,360,000 | | g | | Credit Suisse First Boston Mortgage Securities Corp | | | | | 5.538 | | | 05/15/23 | | | 1,385 | |
| | | | | | Series - 2006 OMA (Class B2) | | | | | | | | | | | | |
| | 11,500,000 | | g | | Credit Suisse Mortgage Capital Certificates | | | | | 5.626 | | | 05/15/23 | | | 11,704 | |
| | | | | | Series - 2006 OMA (Class D) | | | | | | | | | | | | |
| | 4,000,000 | | | | CSAIL Commercial Mortgage Trust | | | | | 3.314 | | | 11/15/49 | | | 3,997 | |
| | | | | | Series - 2016 C7 (Class ASB) | | | | | | | | | | | | |
| | 14,580,000 | | | | CSAIL Commercial Mortgage Trust | | | | | 3.186 | | | 06/15/50 | | | 14,380 | |
| | | | | | Series - 2017 C8 (Class ASB) | | | | | | | | | | | | |
| | 1,648,417 | | | | CSAIL Commercial Mortgage Trust | | | | | 1.454 | | | 06/15/57 | | | 1,643 | |
| | | | | | Series - 2015 C2 (Class A1) | | | | | | | | | | | | |
| | 7,400,000 | | g,i | | CSMC Trust | | | | | 3.728 | | | 11/10/32 | | | 7,413 | |
| | | | | | Series - 2017 CALI (Class B) | | | | | | | | | | | | |
| | 10,450,253 | | g,i | | CSMC Trust | | | | | 3.500 | | | 02/25/48 | | | 10,083 | |
| | | | | | Series - 2018 J1 (Class A11) | | | | | | | | | | | | |
| | 11,000,000 | | | | DBJPM Mortgage Trust | | | | | 2.756 | | | 08/10/49 | | | 10,657 | |
| | | | | | Series - 2016 C3 (Class ASB) | | | | | | | | | | | | |
| | 10,000,000 | | | | DBJPM Mortgage Trust | | | | | 3.121 | | | 06/10/50 | | | 9,805 | |
| | | | | | Series - 2017 C6 (Class ASB) | | | | | | | | | | | | |
| | 11,000,000 | | g | | DBUBS Mortgage Trust | | | | | 3.452 | | | 10/10/34 | | | 10,926 | |
| | | | | | Series - 2017 BRBK (Class A) | | | | | | | | | | | | |
| | 15,500,000 | | g,i | | DBUBS Mortgage Trust | | | | | 3.530 | | | 10/10/34 | | | 15,209 | |
| | | | | | Series - 2017 BRBK (Class B) | | | | | | | | | | | | |
| | 4,967,881 | | g | | DBUBS Mortgage Trust | | | | | 4.452 | | | 05/10/44 | | | 5,069 | |
| | | | | | Series - 2011 LC3A (Class PM1) | | | | | | | | | | | | |
| | 23,998,177 | | g | | DBUBS Mortgage Trust | | | | | 4.537 | | | 07/10/44 | | | 24,671 | |
| | | | | | Series - 2011 LC2A (Class A4) | | | | | | | | | | | | |
| | 3,000,000 | | g,i | | DBUBS Mortgage Trust | | | | | 4.998 | | | 07/10/44 | | | 3,110 | |
| | | | | | Series - 2011 LC2A (Class B) | | | | | | | | | | | | |
| | 5,000,000 | | g,i | | DBUBS Mortgage Trust | | | | | 5.534 | | | 07/10/44 | | | 5,216 | |
| | | | | | Series - 2011 LC2A (Class C) | | | | | | | | | | | | |
| | 2,084,000 | | g,i | | DBUBS Mortgage Trust | | | | | 5.338 | | | 08/10/44 | | | 2,173 | |
| | | | | | Series - 2011 LC3A (Class B) | | | | | | | | | | | | |
| | 5,500,000 | | g,i | | DBUBS Mortgage Trust | | | | | 5.338 | | | 08/10/44 | | | 5,754 | |
| | | | | | Series - 2011 LC3A (Class AM) | | | | | | | | | | | | |
| | 5,525,000 | | g,i | | DBUBS Mortgage Trust | | | | | 5.698 | | | 11/10/46 | | | 5,766 | |
| | | | | | Series - 2011 LC1A (Class C) | | | | | | | | | | | | |
| | 7,874,862 | | g,i | | Flagstar Mortgage Trust | | | | | 3.500 | | | 03/25/47 | | | 7,760 | |
| | | | | | Series - 2017 1 (Class 1A5) | | | | | | | | | | | | |
| | 24,712,524 | | g,i | | Flagstar Mortgage Trust | | | | | 4.000 | | | 05/25/48 | | | 24,738 | |
| | | | | | Series - 2018 3INV (Class A3) | | | | | | | | | | | | |
| | 4,154,079 | | g,i | | Flagstar Mortgage Trust | | | | | 4.000 | | | 09/25/48 | | | 4,107 | |
| | | | | | Series - 2018 5 (Class A11) | | | | | | | | | | | | |
| | 4,762,251 | | g | | Four Times Square Trust Commercial Mortgage Pass-Through Certificates | | | | | 5.401 | | | 12/13/28 | | | 4,932 | |
| | | | | | Series - 2006 4TS (Class A) | | | | | | | | | | | | |
| | 3,665,000 | | i | | GMAC Commercial Mortgage Securities, Inc | | | | | 4.984 | | | 12/10/41 | | | 3,659 | |
| | | | | | Series - 2004 C3 (Class C) | | | | | | | | | | | | |
COLLEGE RETIREMENT EQUITIES FUND -Bond Market Account
| PRINCIPAL | | | | ISSUER | | REFERENCE
RATE & SPREAD | | RATE | | MATURITY
DATE | | VALUE
(000) | |
| $ | 10,000,000 | | g | | GRACE Mortgage Trust | | | | | 3.369 | % | | 06/10/28 | | $ | 10,026 | |
| | | | | | Series - 2014 GRCE (Class A) | | | | | | | | | | | | |
| | 8,970,000 | | g | | GRACE Mortgage Trust | | | | | 3.520 | | | 06/10/28 | | | 8,958 | |
| | | | | | Series - 2014 GRCE (Class B) | | | | | | | | | | | | |
| | 2,745,642 | | i | | Greenwich Capital Commercial Funding Corp | | | | | 5.666 | | | 07/10/38 | | | 2,753 | |
| | | | | | Series - 2006 GG7 (Class AM) | | | | | | | | | | | | |
| | 5,943,000 | | g | | GS Mortgage Securities Corp II | | | | | 3.551 | | | 04/10/34 | | | 5,988 | |
| | | | | | Series - 2012 ALOH (Class A) | | | | | | | | | | | | |
| | 4,430,000 | | g | | GS Mortgage Securities Corp II | | | | | 2.954 | | | 11/05/34 | | | 4,388 | |
| | | | | | Series - 2012 BWTR (Class A) | | | | | | | | | | | | |
| | 5,910,000 | | g,i | | GS Mortgage Securities Corp II | | | | | 5.181 | | | 12/10/43 | | | 6,082 | |
| | | | | | Series - 2010 C2 (Class B) | | | | | | | | | | | | |
| | 1,500,000 | | i | | GS Mortgage Securities Corp II | | | | | 4.057 | | | 05/10/50 | | | 1,478 | |
| | | | | | Series - 2015 GC30 (Class C) | | | | | | | | | | | | |
| | 2,855,000 | | | | GS Mortgage Securities Trust | | | | | 3.506 | | | 10/10/48 | | | 2,847 | |
| | | | | | Series - 2015 GC34 (Class A4) | | | | | | | | | | | | |
| | 2,250,000 | | | | GS Mortgage Securities Trust | | | | | 2.635 | | | 05/10/49 | | | 2,221 | |
| | | | | | Series - 2016 GS2 (Class A2) | | | | | | | | | | | | |
| | 12,000,000 | | | | GS Mortgage Securities Trust | | | | | 3.230 | | | 05/10/50 | | | 11,861 | |
| | | | | | Series - 2017 GS6 (Class AAB) | | | | | | | | | | | | |
| | 3,000,000 | | | | GS Mortgage Securities Trust | | | | | 3.837 | | | 11/10/50 | | | 3,060 | |
| | | | | | Series - 2017 GS8 (Class ABP) | | | | | | | | | | | | |
| | 4,145,843 | | i | | HarborView Mortgage Loan Trust | | LIBOR 1 M + 0.620% | | | 3.090 | | | 08/19/45 | | | 4,106 | |
| | | | | | Series - 2005 11 (Class 2A1A) | | | | | | | | | | | | |
| | 4,000,000 | | g | | Hudson Yards Mortgage Trust | | | | | 2.835 | | | 08/10/38 | | | 3,793 | |
| | | | | �� | Series - 2016 10HY (Class A) | | | | | | | | | | | | |
| | 2,500,000 | | g,i | | Hudson Yards Mortgage Trust | | | | | 2.977 | | | 08/10/38 | | | 2,365 | |
| | | | | | Series - 2016 10HY (Class B) | | | | | | | | | | | | |
| | 7,250,000 | | g,i | | Hudson Yards Mortgage Trust | | | | | 2.977 | | | 08/10/38 | | | 6,781 | |
| | | | | | Series - 2016 10HY (Class C) | | | | | | | | | | | | |
| | 716,042 | | i | | Impac CMB Trust | | LIBOR 1 M + 0.660% | | | 3.166 | | | 03/25/35 | | | 696 | |
| | | | | | Series - 2004 11 (Class 2A1) | | | | | | | | | | | | |
| | 23,290,545 | | g | | JP Morgan Chase Commercial Mortgage Securities Trust | | | | | 4.717 | | | 02/15/46 | | | 23,795 | |
| | | | | | Series - 2011 C3 (Class A4) | | | | | | | | | | | | |
| | 10,975,000 | | g,i | | JP Morgan Chase Commercial Mortgage Securities Trust | | | | | 5.360 | | | 02/15/46 | | | 11,203 | |
| | | | | | Series - 2011 C3 (Class C) | | | | | | | | | | | | |
| | 16,813,036 | | g | | JP Morgan Chase Commercial Mortgage Securities Trust | | | | | 4.388 | | | 07/15/46 | | | 17,242 | |
| | | | | | Series - 2011 C4 (Class A4) | | | | | | | | | | | | |
| | 15,000,000 | | g | | JP Morgan Chase Commercial Mortgage Securities Trust | | | | | 4.801 | | | 07/15/46 | | | 15,448 | |
| | | | | | Series - 2011 C4 (Class B) | | | | | | | | | | | | |
| | 6,455,000 | | g,i | | JP Morgan Chase Commercial Mortgage Securities Trust | | | | | 5.398 | | | 07/15/46 | | | 6,711 | |
| | | | | | Series - 2011 C4 (Class C) | | | | | | | | | | | | |
| | 7,000,000 | | | | JP Morgan Chase Commercial Mortgage Securities Trust | | | | | 2.713 | | | 08/15/49 | | | 6,781 | |
| | | | | | Series - 2016 JP2 (Class ASB) | | | | | | | | | | | | |
| | 24,350,399 | | i | | JP Morgan Mortgage Acquisition Trust | | LIBOR 1 M + 0.160% | | | 2.666 | | | 06/25/37 | | | 23,783 | |
| | | | | | Series - 2007 CH5 (Class A1) | | | | | | | | | | | | |
| | 4,887,578 | | g,i | | JP Morgan Mortgage Trust | | | | | 3.303 | | | 12/25/44 | | | 4,874 | |
| | | | | | Series - 2015 1 (Class B1) | | | | | | | | | | | | |
COLLEGE RETIREMENT EQUITIES FUND -Bond Market Account
| PRINCIPAL | | | | ISSUER | | | | RATE | | MATURITY
DATE | | VALUE
(000) | |
| $ | 1,567,038 | | g,i | | JP Morgan Mortgage Trust | | | | | 3.500 | % | | 05/25/45 | | $ | 1,522 | |
| | | | | | Series - 2015 3 (Class A19) | | | | | | | | | | | | |
| | 8,001,775 | | g,i | | JP Morgan Mortgage Trust | | | | | 3.500 | | | 10/25/45 | | | 7,772 | |
| | | | | | Series - 2015 6 (Class A13) | | | | | | | | | | | | |
| | 3,134,164 | | g,i | | JP Morgan Mortgage Trust | | | | | 3.500 | | | 05/25/46 | | | 3,042 | |
| | | | | | Series - 2016 1 (Class A13) | | | | | | | | | | | | |
| | 582,854 | | g,i | | JP Morgan Mortgage Trust | | | | | 3.500 | | | 01/25/47 | | | 575 | |
| | | | | | Series - 2017 1 (Class A3) | | | | | | | | | | | | |
| | 9,366,539 | | g,i | | JP Morgan Mortgage Trust | | | | | 3.500 | | | 05/25/47 | | | 9,255 | |
| | | | | | Series - 2017 2 (Class A5) | | | | | | | | | | | | |
| | 3,968,828 | | g,i | | JP Morgan Mortgage Trust | | | | | 3.500 | | | 05/25/47 | | | 3,867 | |
| | | | | | Series - 2017 2 (Class A13) | | | | | | | | | | | | |
| | 1,013,404 | | g,i | | JP Morgan Mortgage Trust | | | | | 3.500 | | | 08/25/47 | | | 1,001 | |
| | | | | | Series - 2017 3 (Class 1A5) | | | | | | | | | | | | |
| | 5,031,058 | | g,i | | JP Morgan Mortgage Trust | | | | | 3.500 | | | 10/25/48 | | | 4,961 | |
| | | | | | Series - 2018 5 (Class A5) | | | | | | | | | | | | |
| | 5,595,642 | | g,i | | JP Morgan Mortgage Trust | | | | | 3.000 | | | 12/25/48 | | | 5,441 | |
| | | | | | Series - 2017 6 (Class A6) | | | | | | | | | | | | |
| | 6,868,141 | | g,i | | JP Morgan Mortgage Trust | | | | | 3.500 | | | 12/25/48 | | | 6,782 | |
| | | | | | Series - 2018 6 (Class 1A3) | | | | | | | | | | | | |
| | 3,642,435 | | g,i | | JP Morgan Mortgage Trust | | | | | 4.000 | | | 01/25/49 | | | 3,660 | |
| | | | | | Series - 2018 8 (Class A5) | | | | | | | | | | | | |
| | 4,447,224 | | g,i | | JP Morgan Mortgage Trust | | | | | 4.000 | | | 01/25/49 | | | 4,403 | |
| | | | | | Series - 2018 8 (Class A13) | | | | | | | | | | | | |
| | 7,696,223 | | g,i | | JP Morgan Mortgage Trust | | | | | 4.000 | | | 02/25/49 | | | 7,663 | |
| | | | | | Series - 2018 9 (Class A13) | | | | | | | | | | | | |
| | 4,500,000 | | | | JPMBB Commercial Mortgage Securities Trust | | | | | 3.775 | | | 08/15/47 | | | 4,570 | |
| | | | | | Series - 2014 C21 (Class A5) | | | | | | | | | | | | |
| | 5,000,000 | | | | JPMBB Commercial Mortgage Securities Trust | | | | | 3.997 | | | 08/15/47 | | | 5,024 | |
| | | | | | Series - 2014 C21 (Class AS) | | | | | | | | | | | | |
| | 2,000,000 | | i | | JPMBB Commercial Mortgage Securities Trust | | | | | 4.478 | | | 09/15/47 | | | 2,026 | |
| | | | | | Series - 2014 C23 (Class B) | | | | | | | | | | | | |
| | 2,500,000 | | i | | JPMBB Commercial Mortgage Securities Trust | | | | | 3.917 | | | 05/15/48 | | | 2,490 | |
| | | | | | Series - 2015 C29 (Class AS) | | | | | | | | | | | | |
| | 2,000,000 | | i | | JPMBB Commercial Mortgage Securities Trust | | | | | 4.118 | | | 05/15/48 | | | 1,981 | |
| | | | | | Series - 2015 C29 (Class B) | | | | | | | | | | | | |
| | 2,500,000 | | | | JPMBB Commercial Mortgage Securities Trust | | | | | 4.106 | | | 08/15/48 | | | 2,510 | |
| | | | | | Series - 2015 C31 (Class AS) | | | | | | | | | | | | |
| | 2,000,000 | | i | | JPMBB Commercial Mortgage Securities Trust | | | | | 4.617 | | | 08/15/48 | | | 2,041 | |
| | | | | | Series - 2015 C31 (Class B) | | | | | | | | | | | | |
| | 3,253,000 | | i | | JPMBB Commercial Mortgage Securities Trust | | | | | 4.617 | | | 08/15/48 | | | 3,187 | |
| | | | | | Series - 2015 C31 (Class C) | | | | | | | | | | | | |
| | 5,000,000 | | i | | JPMBB Commercial Mortgage Securities Trust | | | | | 4.221 | | | 10/15/48 | | | 4,794 | |
| | | | | | Series - 2015 C28 (Class C) | | | | | | | | | | | | |
| | 2,200,000 | | | | JPMCC Commercial Mortgage Securities Trust | | | | | 3.241 | | | 09/15/50 | | | 2,169 | |
| | | | | | Series - 2017 JP7 (Class ASB) | | | | | | | | | | | | |
| | 12,404,000 | | | | JPMDB Commercial Mortgage Securities Trust | | | | | 3.242 | | | 10/15/50 | | | 12,223 | |
| | | | | | Series - 2017 C7 (Class ASB) | | | | | | | | | | | | |
| | 170,755 | | g | | LB-UBS Commercial Mortgage Trust | | | | | 6.114 | | | 07/15/40 | | | 171 | |
| | | | | | Series - 2007 C6 (Class AMFL) | | | | | | | | | | | | |
| | 17,725 | | i | | LB-UBS Commercial Mortgage Trust | | | | | 6.114 | | | 07/15/40 | | | 18 | |
| | | | | | Series - 2007 C6 (Class AM) | | | | | | | | | | | | |
COLLEGE RETIREMENT EQUITIES FUND -Bond Market Account
| PRINCIPAL | | | | ISSUER | | | | RATE | | MATURITY
DATE | | VALUE
(000) | |
| $ | 15,000,000 | | g | | LCCM | | | | | 3.357 | % | | 07/12/50 | | $ | 15,064 | |
| | | | | | Series - 2017 LC26 (Class ASB) | | | | | | | | | | | | |
| | 2,646,813 | | | | Morgan Stanley Bank of America Merrill Lynch Trust | | | | | 2.469 | | | 02/15/46 | | | 2,614 | |
| | | | | | Series - 2013 C7 (Class AAB) | | | | | | | | | | | | |
| | 2,000,000 | | i | | Morgan Stanley Bank of America Merrill Lynch Trust | | | | | 4.757 | | | 11/15/46 | | | 2,088 | |
| | | | | | Series - 2013 C13 (Class B) | | | | | | | | | | | | |
| | 1,072,650 | | g | | Morgan Stanley Bank of America Merrill Lynch Trust | | | | | 3.989 | | | 12/15/46 | | | 1,081 | |
| | | | | | Series - 2014 C19 (Class LNC1) | | | | | | | | | | | | |
| | 2,000,000 | | | | Morgan Stanley Bank of America Merrill Lynch Trust | | | | | 3.669 | | | 02/15/47 | | | 2,012 | |
| | | | | | Series - 2014 C14 (Class A3) | | | | | | | | | | | | |
| | 4,243,209 | | | | Morgan Stanley Bank of America Merrill Lynch Trust | | | | | 3.194 | | | 10/15/47 | | | 4,240 | |
| | | | | | Series - 2014 C18 (Class A2) | | | | | | | | | | | | |
| | 1,600,000 | | | | Morgan Stanley Bank of America Merrill Lynch Trust | | | | | 3.605 | | | 02/15/48 | | | 1,606 | |
| | | | | | Series - 2015 C20 (Class AS) | | | | | | | | | | | | |
| | 2,500,000 | | i | | Morgan Stanley Bank of America Merrill Lynch Trust | | | | | 4.462 | | | 02/15/48 | | | 2,508 | |
| | | | | | Series - 2015 C20 (Class C) | | | | | | | | | | | | |
| | 2,500,000 | | | | Morgan Stanley Bank of America Merrill Lynch Trust | | | | | 3.338 | | | 03/15/48 | | | 2,476 | |
| | | | | | Series - 2015 C21 (Class A4) | | | | | | | | | | | | |
| | 5,500,000 | | | | Morgan Stanley Bank of America Merrill Lynch Trust | | | | | 3.652 | | | 03/15/48 | | | 5,514 | |
| | | | | | Series - 2015 C21 (Class AS) | | | | | | | | | | | | |
| | 3,000,000 | | | | Morgan Stanley Bank of America Merrill Lynch Trust | | | | | 3.561 | | | 04/15/48 | | | 2,992 | |
| | | | | | Series - 2015 C22 (Class AS) | | | | | | | | | | | | |
| | 4,500,000 | | g | | Morgan Stanley Capital I Trust | | | | | 2.695 | | | 01/11/32 | | | 4,466 | |
| | | | | | Series - 2013 WLSR (Class A) | | | | | | | | | | | | |
| | 2,550,000 | | g | | Morgan Stanley Capital I Trust | | | | | 4.012 | | | 09/09/32 | | | 2,574 | |
| | | | | | Series - 2014 150E (Class AS) | | | | | | | | | | | | |
| | 3,500,000 | | g | | Morgan Stanley Capital I Trust | | | | | 4.264 | | | 09/09/32 | | | 3,560 | |
| | | | | | Series - 2014 150E (Class B) | | | | | | | | | | | | |
| | 125,718 | | i | | Morgan Stanley Capital I Trust | | | | | 5.389 | | | 11/12/41 | | | 125 | |
| | | | | | Series - 2006 HQ10 (Class AJ) | | | | | | | | | | | | |
| | 7,548,000 | | g | | Morgan Stanley Capital I Trust | | | | | 4.193 | | | 09/15/47 | | | 7,588 | |
| | | | | | Series - 2011 C1 (Class F) | | | | | | | | | | | | |
| | 3,450,000 | | g,i | | Morgan Stanley Capital I Trust | | | | | 5.375 | | | 09/15/47 | | | 3,569 | |
| | | | | | Series - 2011 C1 (Class D) | | | | | | | | | | | | |
| | 3,806,037 | | i | | Morgan Stanley Capital I Trust | | | | | 6.153 | | | 12/12/49 | | | 2,880 | |
| | | | | | Series - 2007 IQ16 (Class AJFX) | | | | | | | | | | | | |
| | 5,579,650 | | i | | Morgan Stanley Capital I Trust | | | | | 6.153 | | | 12/12/49 | | | 4,222 | |
| | | | | | Series - 2007 IQ16 (Class AJ) | | | | | | | | | | | | |
| | 6,000,000 | | | | Morgan Stanley Capital I Trust | | | | | 3.304 | | | 06/15/50 | | | 5,984 | |
| | | | | | Series - 2017 H1 (Class ASB) | | | | | | | | | | | | |
| | 9,000,000 | | g,i | | MSDB Trust | | | | | 3.316 | | | 07/11/39 | | | 8,765 | |
| | | | | | Series - 2017 712F (Class A) | | | | | | | | | | | | |
| | 949,895 | | g | | Prima Capital CRE Securitization Ltd | | | | | 2.550 | | | 08/24/49 | | | 946 | |
| | | | | | Series - 2015 4A (Class MR-A) | | | | | | | | | | | | |
COLLEGE RETIREMENT EQUITIES FUND -Bond Market Account
| PRINCIPAL | | | | ISSUER | | REFERENCE
RATE & SPREAD | | RATE | | MATURITY
DATE | | VALUE
(000) | |
| $ | 3,264,021 | | g,i | | Sequoia Mortgage Trust | | | | | 3.500 | % | | 06/25/46 | | $ | 3,180 | |
| | | | | | Series - 2016 1 (Class A19) | | | | | | | | | | | | |
| | 1,126,152 | | g,i | | Sequoia Mortgage Trust | | | | | 3.500 | | | 11/25/46 | | | 1,111 | |
| | | | | | Series - 2016 3 (Class A10) | | | | | | | | | | | | |
| | 6,499,448 | | g,i | | Sequoia Mortgage Trust | | | | | 3.500 | | | 02/25/47 | | | 6,446 | |
| | | | | | Series - 2017 2 (Class A4) | | | | | | | | | | | | |
| | 10,455,363 | | g,i | | Sequoia Mortgage Trust | | | | | 3.500 | | | 04/25/47 | | | 10,393 | |
| | | | | | Series - 2017 3 (Class A4) | | | | | | | | | | | | |
| | 4,162,012 | | g,i | | Sequoia Mortgage Trust | | | | | 3.500 | | | 08/25/47 | | | 4,109 | |
| | | | | | Series - 2017 5 (Class A4) | | | | | | | | | | | | |
| | 8,408,030 | | g,i | | Sequoia Mortgage Trust | | | | | 3.500 | | | 05/25/48 | | | 8,339 | |
| | | | | | Series - 2018 5 (Class A4) | | | | | | | | | | | | |
| | 4,641,410 | | g,i | | Sequoia Mortgage Trust | | | | | 4.000 | | | 06/25/48 | | | 4,650 | |
| | | | | | Series - 2018 CH2 (Class A21) | | | | | | | | | | | | |
| | 6,038,825 | | g,i | | Sequoia Mortgage Trust | | | | | 4.000 | | | 07/25/48 | | | 6,072 | |
| | | | | | Series - 2018 6 (Class A4) | | | | | | | | | | | | |
| | 9,831,998 | | g,i | | Sequoia Mortgage Trust | | | | | 4.000 | | | 11/25/48 | | | 9,779 | |
| | | | | | Series - 2018 8 (Class A19) | | | | | | | | | | | | |
| | 2,517,345 | | g,i | | Shellpoint Co-Originator Trust | | | | | 3.500 | | | 11/25/46 | | | 2,481 | |
| | | | | | Series - 2016 1 (Class 1A10) | | | | | | | | | | | | |
| | 2,722,481 | | i | | Structured Agency Credit Risk Debt Note (STACR) | | LIBOR 1 M + 2.200% | | | 4.706 | | | 09/25/24 | | | 2,779 | |
| | | | | | Series - 2014 HQ2 (Class M2) | | | | | | | | | | | | |
| | 11,322,444 | | i | | Structured Agency Credit Risk Debt Note (STACR) | | LIBOR 1 M + 1.950% | | | 4.456 | | | 05/25/25 | | | 11,496 | |
| | | | | | Series - 2015 HQ2 (Class M2) | | | | | | | | | | | | |
| | 2,750,000 | | i | | Structured Agency Credit Risk Debt Note (STACR) | | LIBOR 1 M + 1.300% | | | 3.806 | | | 03/25/29 | | | 2,753 | |
| | | | | | Series - 2016 DNA4 (Class M2) | | | | | | | | | | | | |
| | 8,356,768 | | i | | Structured Agency Credit Risk Debt Note (STACR) | | LIBOR 1 M + 1.200% | | | 3.706 | | | 07/25/29 | | | 8,395 | |
| | | | | | Series - 2017 DNA1 (Class M1) | | | | | | | | | | | | |
| | 14,471,223 | | i | | Structured Agency Credit Risk Debt Note (STACR) | | LIBOR 1 M + 1.200% | | | 3.706 | | | 10/25/29 | | | 14,550 | |
| | | | | | Series - 2017 DNA2 (Class M1) | | | | | | | | | | | | |
| | 40,467,008 | | i | | Structured Agency Credit Risk Debt Note (STACR) | | LIBOR 1 M + 0.750% | | | 3.256 | | | 03/25/30 | | | 40,344 | |
| | | | | | Series - 2017 DNA3 (Class M1) | | | | | | | | | | | | |
| | 4,791,701 | | g,i | | Structured Agency Credit Risk Debt Note (STACR) | | | | | 3.819 | | | 05/25/48 | | | 4,771 | |
| | | | | | Series - 2018 SPI2 (Class M1) | | | | | | | | | | | | |
| | 8,135,718 | | g,i | | Structured Agency Credit Risk Debt Note (STACR) | | | | | 4.167 | | | 08/25/48 | | | 8,156 | |
| | | | | | Series - 2018 SPI3 (Class M1) | | | | | | | | | | | | |
| | 2,685,000 | | g | | VNDO Mortgage Trust | | | | | 3.808 | | | 12/13/29 | | | 2,710 | |
| | | | | | Series - 2013 PENN (Class A) | | | | | | | | | | | | |
| | 300,000 | | g,i | | VNDO Mortgage Trust | | | | | 3.947 | | | 12/13/29 | | | 301 | |
| | | | | | Series - 2013 PENN (Class C) | | | | | | | | | | | | |
| | 2,616,107 | | g | | VSE VOI Mortgage LLC | | | | | 2.540 | | | 07/20/33 | | | 2,572 | |
| | | | | | Series - 2016 A (Class A) | | | | | | | | | | | | |
| | 2,006,324 | | g | | VSE VOI Mortgage LLC | | | | | 2.740 | | | 07/20/33 | | | 1,975 | |
| | | | | | Series - 2016 A (Class B) | | | | | | | | | | | | |
| | 7,105,693 | | g | | VSE VOI Mortgage LLC | | | | | 2.330 | | | 03/20/35 | | | 6,940 | |
| | | | | | Series - 2017 A (Class A) | | | | | | | | | | | | |
| | 3,294,023 | | i | | Wachovia Bank Commercial Mortgage Trust | | | | | 6.141 | | | 05/15/46 | | | 3,314 | |
| | | | | | Series - 2007 C34 (Class AJ) | | | | | | | | | | | | |
COLLEGE RETIREMENT EQUITIES FUND -Bond Market Account
| PRINCIPAL | | | | ISSUER | | | | RATE | | MATURITY
DATE | | VALUE
(000) | |
| $ | 3,328,000 | | i | | Wachovia Bank Commercial Mortgage Trust | | | | | 6.216 | % | | 05/15/46 | | $ | 3,351 | |
| | | | | | Series - 2007 C34 (Class B) | | | | | | | | | | | | |
| | 2,595,000 | | i | | Wachovia Bank Commercial Mortgage Trust | | | | | 6.216 | | | 05/15/46 | | | 2,616 | |
| | | | | | Series - 2007 C34 (Class C) | | | | | | | | | | | | |
| 3,357,974 | | i | | Wachovia Bank Commercial Mortgage Trust | | | | | 5.861 | | | 06/15/49 | | | 3,388 | |
| | | | | | Series - 2007 C32 (Class AJ) | | | | | | | | | | | | |
| | 10,000,000 | | | | Wells Fargo Commercial Mortgage Trust | | | | | 3.539 | | | 10/15/45 | | | 10,056 | |
| | | | | | Series - 2012 LC5 (Class AS) | | | | | | | | | | | | |
| | 7,703,000 | | | | Wells Fargo Commercial Mortgage Trust | | | | | 3.540 | | | 05/15/48 | | | 7,711 | |
| | | | | | Series - 2015 C28 (Class A4) | | | | | | | | | | | | |
| | 10,000,000 | | | | Wells Fargo Commercial Mortgage Trust | | | | | 2.788 | | | 07/15/48 | | | 9,811 | |
| | | | | | Series - 2016 C35 (Class ASB) | | | | | | | | | | | | |
| | 605,024 | | | | Wells Fargo Commercial Mortgage Trust | | | | | 1.321 | | | 08/15/49 | | | 591 | |
| | | | | | Series - 2016 BNK1 (Class A1) | | | | | | | | | | | | |
| | 15,000,000 | | | | Wells Fargo Commercial Mortgage Trust | | | | | 2.514 | | | 08/15/49 | | | 14,531 | |
| | | | | | Series - 2016 BNK1 (Class ASB) | | | | | | | | | | | | |
| | 15,000,000 | | | | Wells Fargo Commercial Mortgage Trust | | | | | 2.825 | | | 10/15/49 | | | 14,715 | |
| | | | | | Series - 2016 LC24 (Class ASB) | | | | | | | | | | | | |
| | 7,500,000 | | | | Wells Fargo Commercial Mortgage Trust | | | | | 3.446 | | | 03/15/50 | | | 7,543 | |
| | | | | | Series - 2017 RB1 (Class ASB) | | | | | | | | | | | | |
| | 15,000,000 | | | | Wells Fargo Commercial Mortgage Trust | | | | | 3.261 | | | 07/15/50 | | | 14,933 | |
| | | | | | Series - 2017 C38 (Class ASB) | | | | | | | | | | | | |
| | 10,000,000 | | | | Wells Fargo Commercial Mortgage Trust | | | | | 3.212 | | | 09/15/50 | | | 9,910 | |
| | | | | | Series - 2017 C39 (Class ASB) | | | | | | | | | | | | |
| | 7,250,000 | | | | Wells Fargo Commercial Mortgage Trust | | | | | 3.185 | | | 03/15/59 | | | 7,237 | |
| | | | | | Series - 2016 C33 (Class ASB) | | | | | | | | | | | | |
| | 6,000,000 | | | | Wells Fargo Commercial Mortgage Trust | | | | | 3.749 | | | 03/15/59 | | | 5,971 | |
| | | | | | Series - 2016 C33 (Class AS) | | | | | | | | | | | | |
| | 500,000 | | | | Wells Fargo Commercial Mortgage Trust | | | | | 2.933 | | | 11/15/59 | | | 493 | |
| | | | | | Series - 2016 C36 (Class ASB) | | | | | | | | | | | | |
| | 4,725,000 | | g,i | | Wells Fargo Mortgage Backed Securities Trust | | | | | 5.276 | | | 11/15/43 | | | 4,857 | |
| | | | | | Series - 2010 C1 (Class B) | | | | | | | | | | | | |
| | 30,000,000 | | g,i | | WFRBS Commercial Mortgage Trust | | | | | 4.902 | | | 06/15/44 | | | 31,094 | |
| | | | | | Series - 2011 C4 (Class A4) | | | | | | | | | | | | |
| | 750,000 | | | | WFRBS Commercial Mortgage Trust | | | | | 3.345 | | | 05/15/45 | | | 743 | |
| | | | | | Series - 2013 C13 (Class AS) | | | | | | | | | | | | |
| | | | | | TOTAL OTHER MORTGAGE BACKED | | | | | | | | | 1,334,456 | |
| | | | | | | | | | | | | | | | | | |
| | | | | | TOTAL STRUCTURED ASSETS | | | | | | | | | | | 2,627,937 | |
| | | | | | (Cost $2,664,372) | | | | | | | | | | | | |
| | | | | | | | | | | | | | | | | | |
| | | | | | TOTAL BONDS | | | | | | | | | | | 12,905,093 | |
| | | | | | (Cost $13,115,435) | | | | | | | | | | | | |
| | | | | | | | | | | | | | | | | | |
| SHARES | | | | COMPANY | | | | | | | | | | | | |
| COMMON STOCKS - 0.0% | | | | | | | | | | | | |
| | | | | | | | | | | | | | | | | | |
| TELECOMMUNICATION SERVICES - 0.0% | | | | | | | | | | | | |
| | 147,623 | | * | | Oi S.A. (ADR) | | | | | | | | | | | 236 | |
| | | | | | TOTAL TELECOMMUNICATION SERVICES | | | | | | | | | 236 | |
| | | | | | TOTAL COMMON STOCKS | | | | | | | | | | | 236 | |
| | | | | | (Cost $1,332) | | | | | | | | | | | | |
COLLEGE RETIREMENT EQUITIES FUND -Bond Market Account
| SHARES | | | | COMPANY | | | | | | | | | VALUE
(000) | |
| PREFERRED STOCKS - 0.1% | | | | | | | | | | | | |
| | | | | | | | | | | | | |
| BANKS - 0.1% | | | | | | | | | | | | |
| | 470,597 | | * | | Federal Home Loan Mortgage Corp | | | | | | | | $ | 3,294 | |
| | 1,527,061 | | * | | Federal National Mortgage Association | | | | | | | | | 10,613 | |
| | | | | | TOTAL BANKS | | | | | | | | | | | 13,907 | |
| | | | | | TOTAL PREFERRED STOCKS | | | | | | | | | 13,907 | |
| | | | | | (Cost $49,941) | | | | | | | | | | | | |
| | | | | | | | | | | | | | | | | | |
| PRINCIPAL | | | | ISSUER | | | | | RATE | | MATURITY
DATE | | | | |
| SHORT-TERM INVESTMENTS - 0.3% | | | | | | | | | | | | |
| | | | | | | | | | | | | | | | | | |
| GOVERNMENT AGENCY DEBT - 0.0% | | | | | | | | | | | | |
| $ | 5,612,000 | | | | Federal Home Loan Bank (FHLB) | | | 2.150 | % | | 01/02/19 | | | 5,612 | |
| | | | | | TOTAL GOVERNMENT AGENCY DEBT | | | | | | | | | 5,612 | |
| | | | | | | | | | | | | | | | | | |
| TREASURY DEBT - 0.3% | | | | | | | | | | | | |
| EGP | 14,700,000 | | j | | Egypt Treasury Bills | | | 0.000 | | | 06/11/19 | | | 756 | |
| | 42,000,000 | | j | | Egypt Treasury Bills | | | 0.000 | | | 08/27/19 | | | 2,078 | |
| NGN | 585,000,000 | | j | | Nigeria Treasury Bill | | | 0.000 | | | 06/13/19 | | | 1,514 | |
| $ | 36,300,000 | | | | United States Treasury Bill | | | 2.318 | | | 02/21/19 | | | 36,179 | |
| | | | | | TOTAL TREASURY DEBT | | | | | | | | | 40,527 | |
| | | | | | | | | | | | | | | | | | |
| | | | | | TOTAL SHORT-TERM INVESTMENTS | | | | | | | | | 46,139 | |
| | | | | | (Cost $46,143) | | | | | | | | | | | | |
| | | | | | | | | | | | | | | | | | |
| | | | | | TOTAL INVESTMENTS - 98.4% | | | | | | | | | | 13,012,718 | |
| | | | | | (Cost $13,262,728) | | | | | | | | | | |
| | | | | | OTHER ASSETS & LIABILITIES, NET - 1.6% | | | | | | | | | 208,537 | |
| | | | | | NET ASSETS - 100.0% | | | | | | | | $ | 13,221,255 | |
| | | | | | | | | | | | | | | | | | |
| | | | |
| | | Abbreviation(s): | |
| ADR | | American Depositary Receipt |
| AUD | | Australian Dollar |
| BRL | | Brazilian Real |
| CAD | | Canadian Dollar |
| DOP | | Dominican Republic Peso |
| EGP | | Egyptian Pound |
| EUR | | Euro |
| GBP | | Pound Sterling |
| IDR | | Indonesian Rupiah |
| ILS | | Israeli New Shekel |
| JPY | | Japanese Yen |
| KRW | | South Korean Won |
| LIBOR | | London Interbank Offered Rate |
| M | | Month |
| MXN | | Mexican Peso |
| NGN | | Nigerian Naira |
| NOK | | Norwegian Krone |
COLLEGE RETIREMENT EQUITIES FUND -Bond Market Account
| | | | | | | | | | | | | | | | | | |
| NZD | | New Zealand Dollar |
| PEN | | Peruvian Sol |
| PHP | | Philippine Peso |
| PLN | | Polish Zloty |
| REIT | | Real Estate Investment Trust |
| RUB | | Russian Ruble |
| SEK | | Swedish Krona |
| SGD | | Singapore Dollar |
| THB | | Thai Baht |
| UYU | | Uruguayan Peso |
| W | | Week |
| ZAR | | South African Rand |
| | | |
| ^ | | Amount represents less than $1,000. |
| * | | Non-income producing |
| † | | Security is categorized as Level 3 in the fair value hierarchy. |
| ‡ | | Perpetual security |
| g | | Security is exempt from registration under Rule 144(A) of the Securities Act of 1933. Such securities are deemed liquid and may be resold in transactions exempt from registration to qualified institutional buyers. At 12/31/18, the aggregate value of these securities was $2,462,298,460 or 18.6% of net assets. |
| h | | All or a portion of these securities were purchased on a delayed delivery basis. |
| i | | Floating or variable rate security includes the reference rate and spread, unless the variable rate is based on the underlying asset of the security. Coupon rate reflects the rate at period end. |
| j | | Zero coupon |
| o | | Payment in Kind Bond |
| | | |
| | | Cost amounts are in thousands. |
| | | | | | | | | | | | | | | | | | |
Forward foreign currency contracts outstanding as of December 31, 2018 were as follows (dollar amounts are in thousands):
Currency to be
purchased | | Receive | | Currency to be sold | | Deliver | | Counterparty | | Settlement date | | | Unrealized
appreciation
(depreciation) | |
| $ | | 9,476 | | CAD | | 12,409 | | Bank of America | | 01/31/19 | | | $ | 379 | |
| $ | | 928 | | EUR | | 816 | | Bank of America | | 01/31/19 | | | | (10 | ) |
| $ | | 2,170 | | ILS | | 7,978 | | Bank of America | | 01/31/19 | | | | 31 | |
| EUR | | 1,003 | | $ | | 1,144 | | Bank of America | | 01/31/19 | | | | 8 | |
| EUR | | 136 | | $ | | 155 | | Bank of America | | 01/31/19 | | | | 1 | |
| Total | | | | | | | | | | | | | $ | 409 | |
| $ | | 8,037 | | AUD | | 11,341 | | Citibank N.A. | | 01/31/19 | | | $ | 44 | |
| $ | | 945 | | CZK | | 21,320 | | Citibank N.A. | | 01/31/19 | | | | (5 | ) |
| $ | | 655 | | EUR | | 570 | | Citibank N.A. | | 01/31/19 | | | | 1 | |
| $ | | 1,219 | | EUR | | 1,067 | | Citibank N.A. | | 01/31/19 | | | | (8 | ) |
| $ | | 1,294 | | GBP | | 1,027 | | Citibank N.A. | | 01/31/19 | | | | (17 | ) |
| $ | | 8,962 | | KRW | | 10,135,381 | | Citibank N.A. | | 01/31/19 | | | | (146 | ) |
| $ | | 1,582 | | NOK | | 13,192 | | Citibank N.A. | | 01/31/19 | | | | 54 | |
| $ | | 795 | | NZD | | 1,170 | | Citibank N.A. | | 01/31/19 | | | | 10 | |
| $ | | 2,217 | | PLN | | 8,397 | | Citibank N.A. | | 01/31/19 | | | | (28 | ) |
| $ | | 4,512 | | SGD | | 6,227 | | Citibank N.A. | | 01/31/19 | | | | (59 | ) |
| EUR | | 1,923 | | $ | | 2,195 | | Citibank N.A. | | 01/31/19 | | | | 14 | |
| EUR | | 1,036 | | $ | | 1,189 | | Citibank N.A. | | 01/31/19 | | | | 2 | |
| GBP | | 465 | | $ | | 599 | | Citibank N.A. | | 01/31/19 | | | | (6 | ) |
| GBP | | 669 | | $ | | 854 | | Citibank N.A. | | 01/31/19 | | | | (0 | )^ |
| GBP | | 1,085 | | $ | | 1,385 | | Citibank N.A. | | 01/31/19 | | | | (1 | ) |
| JPY | | 144,543 | | $ | | 1,293 | | Citibank N.A. | | 01/31/19 | | | | 29 | |
| Total | | | | | | | | | | | | | $ | (116 | ) |
COLLEGE RETIREMENT EQUITIES FUND -Bond Market Account
Currency to be
purchased | | Receive | | Currency to be sold | | Deliver | | Counterparty | | Settlement date | | | Unrealized
appreciation
(depreciation) | |
| $ | | 530 | | NZD | | 810 | | Morgan Stanley | | 01/31/19 | | | $ | (14 | ) |
| $ | | 1,634 | | THB | | 54,202 | | Morgan Stanley | | 01/31/19 | | | | (32 | ) |
| $ | | 822 | | THB | | 27,074 | | Morgan Stanley | | 01/31/19 | | | | (10 | ) |
| JPY | | 252,215 | | $ | | 2,285 | | Morgan Stanley | | 01/31/19 | | | | 22 | |
| Total | | | | | | | | | | | | | $ | (34 | ) |
| $ | | 4,232 | | EUR | | 3,707 | | Toronto Dominion Bank | | 01/31/19 | | | $ | (27 | ) |
| $ | | 609 | | EUR | | 534 | | Toronto Dominion Bank | | 01/31/19 | | | | (4 | ) |
| $ | | 2,160 | | EUR | | 1,893 | | Toronto Dominion Bank | | 01/31/19 | | | | (14 | ) |
| $ | | 75,747 | | EUR | | 65,973 | | Toronto Dominion Bank | | 01/31/19 | | | | (44 | ) |
| $ | | 19,792 | | GBP | | 15,371 | | Toronto Dominion Bank | | 01/31/19 | | | | 169 | |
| $ | | 35,749 | | JPY | | 3,987,834 | | Toronto Dominion Bank | | 01/31/19 | | | | (725 | ) |
| $ | | 563 | | SEK | | 5,098 | | Toronto Dominion Bank | | 01/31/19 | | | | (14 | ) |
| $ | | 920 | | ZAR | | 13,525 | | Toronto Dominion Bank | | 01/31/19 | | | | (17 | ) |
| Total | | | | | | | | | | | | | $ | (676 | ) |
| Total | | | | | | | | | | | | | $ | (417 | ) |
| | ^ Amount represents less than $1,000. |
| | | | | |
| | | | | |
| | | | Abbreviation(s): |
| | AUD | | Australian Dollar |
| | CAD | | Canadian Dollar |
| | CZK | | Czechoslovak Koruna |
| | EUR | | Euro |
| | GBP | | Pound Sterling |
| | ILS | | Israeli New Shekel |
| | JPY | | Japanese Yen |
| | KRW | | South Korean Won |
| | NOK | | Norwegian Krone |
| | NZD | | New Zealand Dollar |
| | PLN | | Polish Zloty |
| | SEK | | Swedish Krona |
| | SGD | | Singapore Dollar |
| | THB | | Thai Baht |
| | ZAR | | South African Rand |
COLLEGE RETIREMENT EQUITIES FUND- Inflation-Linked Bond Account
COLLEGE RETIREMENT EQUITIES FUND
INFLATION-LINKED BOND ACCOUNT
SCHEDULE OF INVESTMENTS
December 31, 2018
| | | | | | | | | | MATURITY | | VALUE | |
| PRINCIPAL | | | | ISSUER | | RATE | | DATE | | (000) | |
| GOVERNMENT BONDS - 99.5% | | | | | | | | | | |
| | | | | | | | | | | | | | | | |
| AGENCY SECURITIES - 0.8% | | | | | | | | | | |
| $ | 4,375,000 | | | | Crowley Conro LLC | | | 4.181 | % | | 08/15/43 | | $ | 4,553 | |
| | 15,815,000 | | | | Montefiore Medical Center | | | 2.895 | | | 04/20/32 | | | 15,523 | |
| | 3,500,000 | | | | Private Export Funding Corp (PEFCO) | | | 2.300 | | | 09/15/20 | | | 3,473 | |
| | 3,000,000 | | | | PEFCO | | | 3.250 | | | 06/15/25 | | | 3,061 | |
| | 4,934,211 | | | | Reliance Industries Ltd | | | 2.444 | | | 01/15/26 | | | 4,881 | |
| | 3,500,000 | | | | Ukraine Government AID Bonds | | | 1.847 | | | 05/29/20 | | | 3,463 | |
| | 15,000,000 | | | | Ukraine Government AID Bonds | | | 1.471 | | | 09/29/21 | | | 14,513 | |
| | | | | | TOTAL AGENCY SECURITIES | | | | | | | | | 49,467 | |
| | | | | | | | | | | | | | | | |
| MORTGAGE BACKED - 0.7% | | | | | | | | | | |
| | 24,859,389 | | | | Government National Mortgage Association (GNMA) | | | 3.600 | | | 09/15/31 | | | 25,034 | |
| | 12,247,052 | | | | GNMA | | | 3.650 | | | 02/15/32 | | | 12,365 | |
| | 2,606,393 | | | | GNMA | | | 3.380 | | | 07/15/35 | | | 2,579 | |
| | 3,324,852 | | | | GNMA | | | 3.870 | | | 10/15/36 | | | 3,394 | |
| | | | | | TOTAL MORTGAGE BACKED | | | | | | | | | 43,372 | |
| | | | | | | | | | | | | | | | |
| U.S. TREASURY SECURITIES - 98.0% | | | | | | | | | | |
| | 116,117,448 | | k | | United States Treasury Inflation Indexed Bonds | | | 1.375 | | | 01/15/20 | | | 115,373 | |
| | 360,656,690 | | k | | United States Treasury Inflation Indexed Bonds | | | 0.125 | | | 04/15/20 | | | 352,552 | |
| | 215,237,985 | | k | | United States Treasury Inflation Indexed Bonds | | | 1.250 | | | 07/15/20 | | | 214,800 | |
| | 284,299,262 | | k | | United States Treasury Inflation Indexed Bonds | | | 1.125 | | | 01/15/21 | | | 283,010 | |
| | 339,283,740 | | k | | United States Treasury Inflation Indexed Bonds | | | 0.125 | | | 04/15/21 | | | 329,923 | |
| | 331,875,768 | | k | | United States Treasury Inflation Indexed Bonds | | | 0.625 | | | 07/15/21 | | | 328,260 | |
| | 353,025,495 | | k | | United States Treasury Inflation Indexed Bonds | | | 0.125 | | | 01/15/22 | | | 342,683 | |
| | 290,618,510 | | k | | United States Treasury Inflation Indexed Bonds | | | 0.125 | | | 04/15/22 | | | 281,147 | |
| | 359,572,470 | | k | | United States Treasury Inflation Indexed Bonds | | | 0.125 | | | 07/15/22 | | | 349,263 | |
| | 327,560,480 | | k | | United States Treasury Inflation Indexed Bonds | | | 0.125 | | | 01/15/23 | | | 316,391 | |
| | 223,457,585 | | k | | United States Treasury Inflation Indexed Bonds | | | 0.625 | | | 04/15/23 | | | 219,757 | |
| | 233,075,700 | | k | | United States Treasury Inflation Indexed Bonds | | | 0.375 | | | 07/15/23 | | | 227,904 | |
| | 150,910,795 | | k | | United States Treasury Inflation Indexed Bonds | | | 0.625 | | | 01/15/24 | | | 148,562 | |
| | 136,847,360 | | k | | United States Treasury Inflation Indexed Bonds | | | 0.125 | | | 07/15/24 | | | 131,236 | |
| | 174,022,060 | | k | | United States Treasury Inflation Indexed Bonds | | | 0.250 | | | 01/15/25 | | | 166,654 | |
| | 264,626,263 | | k | | United States Treasury Inflation Indexed Bonds | | | 2.375 | | | 01/15/25 | | | 286,142 | |
| | 115,162,560 | | k | | United States Treasury Inflation Indexed Bonds | | | 0.375 | | | 07/15/25 | | | 111,031 | |
| | 156,440,340 | | k | | United States Treasury Inflation Indexed Bonds | | | 0.625 | | | 01/15/26 | | | 152,289 | |
| | 211,269,341 | | k | | United States Treasury Inflation Indexed Bonds | | | 2.000 | | | 01/15/26 | | | 225,500 | |
| | 135,032,320 | | k | | United States Treasury Inflation Indexed Bonds | | | 0.125 | | | 07/15/26 | | | 126,785 | |
| | 209,889,415 | | k | | United States Treasury Inflation Indexed Bonds | | | 0.375 | | | 01/15/27 | | | 199,381 | |
| | 120,627,104 | | k | | United States Treasury Inflation Indexed Bonds | | | 2.375 | | | 01/15/27 | | | 133,177 | |
| | 119,396,970 | | k | | United States Treasury Inflation Indexed Bonds | | | 0.375 | | | 07/15/27 | | | 113,280 | |
| | 210,670,380 | | k | | United States Treasury Inflation Indexed Bonds | | | 0.500 | | | 01/15/28 | | | 201,071 | |
| | 208,093,696 | | k | | United States Treasury Inflation Indexed Bonds | | | 1.750 | | | 01/15/28 | | | 220,997 | |
| | 111,043,326 | | k | | United States Treasury Inflation Indexed Bonds | | | 3.625 | | | 04/15/28 | | | 136,278 | |
| | 90,665,100 | | k | | United States Treasury Inflation Indexed Bonds | | | 0.750 | | | 07/15/28 | | | 88,753 | |
| | 138,861,441 | | k | | United States Treasury Inflation Indexed Bonds | | | 2.500 | | | 01/15/29 | | | 158,057 | |
| | 192,413,438 | | k | | United States Treasury Inflation Indexed Bonds | | | 3.875 | | | 04/15/29 | | | 244,792 | |
| | 3,561,550 | | k | | United States Treasury Inflation Indexed Bonds | | | 3.375 | | | 04/15/32 | | | 4,567 | |
COLLEGE RETIREMENT EQUITIES FUND- Inflation-Linked Bond Account
| | | | | | | | | | MATURITY | | VALUE | |
| PRINCIPAL | | | | ISSUER | | RATE | | DATE | | (000) | |
| | | | | | | | | | | | | | | | |
| $ | 10,000,000 | | | | United States Treasury Note | | | 3.125 | % | | 11/15/28 | | $ | 10,379 | |
| | | | | | TOTAL U.S. TREASURY SECURITIES | | | | | | | | | 6,219,994 | |
| | | | | | | | | | | | | | | | |
| | | | | | TOTAL GOVERNMENT BONDS | | | | | | | | | 6,312,833 | |
| | | | | | (Cost $6,321,560) | | | | | | | | | | |
| | | | | | | | | | | | | | | | |
| SHORT-TERM INVESTMENTS - 0.2% | | | | | | | | | | |
| | | | | | | | | | | | | | | | |
| GOVERNMENT AGENCY DEBT - 0.2% | | | | | | | | | | |
| | 8,770,000 | | | | Federal Home Loan Bank (FHLB) | | | 2.150 | | | 01/02/19 | | | 8,770 | |
| | | | | | TOTAL GOVERNMENT AGENCY DEBT | | | | | | | | | 8,770 | |
| | | | | | | | | | | | | | | | |
| | | | | | TOTAL SHORT-TERM INVESTMENTS | | | | | | | | | 8,770 | |
| | | | | | (Cost $8,769) | | | | | | | | | | |
| | | | | | | | | | | | | | | | |
| | | | | | TOTAL INVESTMENTS - 99.7% | | | | | | | | | 6,321,603 | |
| | | | | | (Cost $6,330,329) | | | | | | | | | | |
| | | | | | OTHER ASSETS & LIABILITIES, NET - 0.3% | | | | | | | | | 21,612 | |
| | | | | | NET ASSETS - 100.0% | | | | | | | | $ | 6,343,215 | |
| | | | |
| k | | Principal amount for interest accrual purposes is periodically adjusted based on changes in the Consumer Price Index. |
| | | Cost amounts are in thousands. |
| | | |
| | | | |
Futures contracts outstanding as of December 31, 2018 were as follows (notional amounts and values are in thousands):
| Description | | Number of long
(short)
contracts | | Expiration date | | Notional amount | | Value | | Unrealized
appreciation (depreciation) | |
| US 10 Year Note (CBT) | | (100) | | 03/20/19 | | $(11,917) | | $(12,202) | | $(285) | |
COLLEGE RETIREMENT EQUITIES FUND- Social Choice Account
COLLEGE RETIREMENT EQUITIES FUND
SOCIAL CHOICE ACCOUNT
SCHEDULE OF INVESTMENTS
December 31, 2018
| | | | | | | | REFERENCE | | | | | MATURITY | | VALUE | |
| PRINCIPAL | | | | | ISSUER | | RATE & SPREAD | | RATE | | DATE | | (000) | |
| BANK LOAN OBLIGATIONS - 0.3% | | | | | | | | | | | | |
| | | | | | | | | | | | | | | | | | | |
| COMMERCIAL & PROFESSIONAL SERVICES - 0.1% | | | | | | | | | | | | |
| $ | 5,211,938 | | | i | | United Rentals North America, Inc | | LIBOR 1 M + 1.750% | | | 4.272 | % | | 10/31/25 | | $ | 5,092 | |
| | | | | | | TOTAL COMMERCIAL & PROFESSIONAL SERVICES | | | | | | | | | 5,092 | |
| | | | | | | | | | | | | | | | | | | |
| ENERGY - 0.0% | | | | | | | | | | | | |
| | 3,888,852 | | | i | | TerraForm Power Operating LLC | | LIBOR 1 M + 2.000% | | | 4.522 | | | 11/08/22 | | | 3,750 | |
| | | | | | | TOTAL ENERGY | | | | | | | | | | | 3,750 | |
| | | | | | | | | | | | | | | | | | | |
| MATERIALS - 0.0% | | | | | | | | | | | | |
| | 3,037,735 | | | i | | H.B. Fuller Co | | LIBOR 1 M + 2.000% | | | 4.470 | | | 10/21/24 | | | 2,851 | |
| | | | | | | TOTAL MATERIALS | | | | | | | | | | | 2,851 | |
| | | | | | | | | | | | | | | | | | | |
| MEDIA & ENTERTAINMENT - 0.1% | | | | | | | | | | | | |
| | 11,168,933 | | | i | | Charter Communications Operating LLC | | LIBOR 1 M + 2.000% | | | 4.530 | | | 04/30/25 | | | 10,682 | |
| | | | | | | TOTAL MEDIA & ENTERTAINMENT | | | | | | | | | | | 10,682 | |
| | | | | | | | | | | | | | | | | | | |
| TECHNOLOGY HARDWARE & EQUIPMENT - 0.0% | | | | | | | | | | | | |
| | 8,484,043 | | | i | | MTS Systems Corp | | LIBOR 1 M + 3.250% | | | 5.710 | | | 07/05/23 | | | 8,166 | |
| | | | | | | TOTAL TECHNOLOGY HARDWARE & EQUIPMENT | | | | | | | | | 8,166 | |
| | | | | | | | | | | | | | | | | | | |
| UTILITIES - 0.1% | | | | | | | | | | | | |
| | 5,001,566 | | | i | | ExGen Renewables IV LLC | | LIBOR 3 M + 3.000% | | | 5.710 | | | 11/28/24 | | | 4,726 | |
| | 14,045,753 | | | †,i | | Terra-Gen Finance Co LLC | | LIBOR 1 M + 4.250% | | | 6.600 | | | 12/09/21 | | | 11,237 | |
| | | | | | | TOTAL UTILITIES | | | | | | | | | | | 15,963 | |
| | | | | | | | | | | | | | | | | | | |
| | | | | | | TOTAL BANK LOAN OBLIGATIONS | | | | | | | | | | | 46,504 | |
| | | | | | | (Cost $50,712) | | | | | | | | | | | | |
| | | | | | | | | | | | | | | | | | | |
| BONDS - 41.6% | | | | | | | | | | | | |
| | | | | | | | | | | | | | | | | | | |
| CORPORATE BONDS - 14.6% | | | | | | | | | | | | |
| | | | | | | | | | | | | | | | | | | |
| AUTOMOBILES & COMPONENTS - 0.2% | | | | | | | | | | | | |
| | 1,955,000 | | | e,g | | Adient Global Holdings Ltd | | | | | 4.875 | | | 08/15/26 | | | 1,496 | |
| | 12,000,000 | | | | | Ford Motor Co | | | | | 4.750 | | | 01/15/43 | | | 9,289 | |
| | 7,125,000 | | | g,i | | Harley-Davidson Financial Services, Inc | | LIBOR 3 M + 0.940% | | | 3.647 | | | 03/02/21 | | | 7,117 | |
| | 4,675,000 | | | | | Magna International, Inc | | | | | 3.625 | | | 06/15/24 | | | 4,695 | |
| | | | | | | TOTAL AUTOMOBILES & COMPONENTS | | | | | | | | | | | 22,597 | |
| | | | | | | | | | | | | | | | | | | |
| BANKS - 3.2% | | | | | | | | | | | | |
| | 10,900,000 | | | | | Bank of America Corp | | | | | 2.151 | | | 11/09/20 | | | 10,702 | |
| | 21,500,000 | | | e,g | | Bank of Montreal | | | | | 2.500 | | | 01/11/22 | | | 21,241 | |
| | 18,500,000 | | | e | | Bank of Nova Scotia | | | | | 2.125 | | | 09/11/19 | | | 18,404 | |
| | 12,000,000 | | | e,g | | Bank of Nova Scotia | | | | | 1.875 | | | 09/20/21 | | | 11,676 | |
| | 8,000,000 | | | e,g | | BNG Bank NV | | | | | 3.125 | | | 11/08/21 | | | 8,098 | |
| | 1,350,000 | | | e | | Citizens Financial Group, Inc | | | | | 2.375 | | | 07/28/21 | | | 1,315 | |
COLLEGE RETIREMENT EQUITIES FUND- Social Choice Account
| | | | | | | | REFERENCE | | | | | MATURITY | | VALUE | |
| PRINCIPAL | | | | | ISSUER | | RATE & SPREAD | | RATE | | DATE | | (000) | |
| $ | 7,025,000 | | | | | Cooperatieve Centrale Raiffeisen-Boerenleenbank BA | | | | | 3.950 | % | | 11/09/22 | | $ | 7,002 | |
| | 15,000,000 | | | i | | Cooperatieve Rabobank UA | | LIBOR 3 M + 0.480% | | | 2.894 | | | 01/10/23 | | | 14,763 | |
| | 4,950,000 | | | | | Cooperatieve Rabobank UA | | | | | 3.750 | | | 07/21/26 | | | 4,641 | |
| | 9,400,000 | | | | | Discover Bank | | | | | 3.450 | | | 07/27/26 | | | 8,624 | |
| | 9,300,000 | | | | | Discover Bank | | | | | 4.650 | | | 09/13/28 | | | 9,065 | |
| | 5,000,000 | | | g | | DNB Boligkreditt AS. | | | | | 2.000 | | | 05/28/20 | | | 4,921 | |
| | 10,000,000 | | | | | First Niagara Financial Group, Inc | | | | | 6.750 | | | 03/19/20 | | | 10,398 | |
| | 13,400,000 | | | | | HSBC Holdings plc | | | | | 3.033 | | | 11/22/23 | | | 12,969 | |
| | 8,200,000 | | | g | | ING Groep NV | | | | | 4.625 | | | 01/06/26 | | | 8,259 | |
| | 11,500,000 | | | g | | Intesa Sanpaolo S.p.A | | | | | 5.017 | | | 06/26/24 | | | 10,406 | |
| | 10,000,000 | | | g | | Intesa Sanpaolo S.p.A | | | | | 5.710 | | | 01/15/26 | | | 9,171 | |
| | 14,500,000 | | | | | KeyCorp | | | | | 4.100 | | | 04/30/28 | | | 14,528 | |
| | 11,250,000 | | | i | | M&T Bank Corp | | LIBOR 3 M + 0.680% | | | 3.188 | | | 07/26/23 | | | 11,011 | |
| | 9,076,000 | | | i | | Manufacturers & Traders Trust Co | | LIBOR 3 M + 0.640% | | | 3.378 | | | 12/01/21 | | | 8,986 | |
| | 1,605,000 | | | | | Manufacturers & Traders Trust Co | | | | | 2.900 | | | 02/06/25 | | | 1,541 | |
| | 3,425,000 | | | | | Manufacturers & Traders Trust Co | | | | | 3.400 | | | 08/17/27 | | | 3,341 | |
| | 18,775,000 | | | | | Mitsubishi UFJ Financial Group, Inc | | | | | 2.527 | | | 09/13/23 | | | 17,837 | |
| | 12,250,000 | | | | | People’s United Bank | | | | | 4.000 | | | 07/15/24 | | | 12,282 | |
| | 24,878,000 | | | | | People’s United Financial, Inc | | | | | 3.650 | | | 12/06/22 | | | 24,901 | |
| | 8,245,000 | | | | | PNC Bank NA | | | | | 2.950 | | | 01/30/23 | | | 8,030 | |
| | 13,500,000 | | | i | | Regions Bank | | LIBOR 3 M + 0.380% | | | 3.177 | | | 04/01/21 | | | 13,245 | |
| | 6,600,000 | | | i | | Regions Bank | | LIBOR 3 M + 0.500% | | | 3.118 | | | 08/13/21 | | | 6,481 | |
| | 10,000,000 | | | | | Regions Financial Corp | | | | | 2.750 | | | 08/14/22 | | | 9,647 | |
| | 8,450,000 | | | | | Royal Bank of Canada | | | | | 1.875 | | | 02/05/20 | | | 8,361 | |
| | 12,000,000 | | | e | | Royal Bank of Canada | | | | | 2.100 | | | 10/14/20 | | | 11,831 | |
| | 17,785,000 | | | | | SVB Financial Group | | | | | 3.500 | | | 01/29/25 | | | 17,046 | |
| | 19,450,000 | | | | | Toronto-Dominion Bank | | | | | 1.850 | | | 09/11/20 | | | 19,091 | |
| | 5,000,000 | | | e | | Toronto-Dominion Bank | | | | | 1.800 | | | 07/13/21 | | | 4,837 | |
| | 12,000,000 | | | g | | Toronto-Dominion Bank | | | | | 2.500 | | | 01/18/22 | | | 11,857 | |
| | 14,000,000 | | | | | US Bancorp | | | | | 2.950 | | | 07/15/22 | | | 13,809 | |
| | 12,019,000 | | | g | | Westpac Banking Corp | | | | | 2.100 | | | 02/25/21 | | | 11,827 | |
| | 4,350,000 | | | | | ZB NA | | | | | 3.500 | | | 08/27/21 | | | 4,336 | |
| | | | | | | TOTAL BANKS | | | | | | | | | | | 406,480 | |
| | | | | | | | | | | | | | | | | | | |
| CAPITAL GOODS - 0.4% | | | | | | | | | | | | |
| | 6,525,000 | | | | | Air Lease Corp | | | | | 4.250 | | | 09/15/24 | | | 6,378 | |
| | 1,975,000 | | | | | Anixter, Inc | | | | | 5.125 | | | 10/01/21 | | | 1,970 | |
| | 4,575,000 | | | | | Anixter, Inc | | | | | 5.500 | | | 03/01/23 | | | 4,564 | |
| | 6,250,000 | | | | | CNH Industrial Capital LLC | | | | | 3.875 | | | 10/15/21 | | | 6,208 | |
| | 4,800,000 | | | | | CNH Industrial Capital LLC | | | | | 4.200 | | | 01/15/24 | | | 4,743 | |
| | 4,000,000 | | | | | Ingersoll-Rand Luxembourg Finance S.A. | | | | | 3.550 | | | 11/01/24 | | | 3,962 | |
| | 5,625,000 | | | | | Parker-Hannifin Corp | | | | | 4.200 | | | 11/21/34 | | | 5,593 | |
| | 6,980,000 | | | | | Pentair Finance S.A. | | | | | 2.650 | | | 12/01/19 | | | 6,927 | |
| | 3,300,000 | | | | | Rockwell Collins, Inc | | | | | 3.100 | | | 11/15/21 | | | 3,273 | |
| | 6,000,000 | | | | | Rockwell Collins, Inc | | | | | 3.200 | | | 03/15/24 | | | 5,778 | |
| | 725,000 | | | | | Trimble, Inc | | | | | 4.150 | | | 06/15/23 | | | 729 | |
| | 6,050,000 | | | | | Trimble, Inc | | | | | 4.900 | | | 06/15/28 | | | 5,960 | |
| | | | | | | TOTAL CAPITAL GOODS | | | | | | | | | | | 56,085 | |
| | | | | | | | | | | | | | | | | | | |
| COMMERCIAL & PROFESSIONAL SERVICES - 0.1% | | | | | | | | | | | | |
| | 11,250,000 | | | | | Covanta Holding Corp | | | | | 6.000 | | | 01/01/27 | | | 10,069 | |
| | 2,730,000 | | | | | Waste Management, Inc | | | | | 4.600 | | | 03/01/21 | | | 2,814 | |
| | 3,475,000 | | | | | Waste Management, Inc | | | | | 3.900 | | | 03/01/35 | | | 3,376 | |
| | | | | | | TOTAL COMMERCIAL & PROFESSIONAL SERVICES | | | | | | | | | 16,259 | |
COLLEGE RETIREMENT EQUITIES FUND- Social Choice Account
| | | | | | | | REFERENCE | | | | | MATURITY | | VALUE | |
| PRINCIPAL | | | | | ISSUER | | RATE & SPREAD | | RATE | | DATE | | (000) | |
| CONSUMER SERVICES - 0.6% | | | | | | | | | | | | |
| $ | 10,000,000 | | | | | Henry J Kaiser Family Foundation | | | | | 3.356 | % | | 12/01/25 | | $ | 9,891 | |
| | 7,550,000 | | | | | Nature Conservancy | | | | | 6.300 | | | 07/01/19 | | | 7,632 | |
| | 17,500,000 | | | | | New York Public Library Astor Lenox & Tilden Foundations | | | | | 4.305 | | | 07/01/45 | | | 17,466 | |
| | 5,145,000 | | | | | Salvation Army | | | | | 5.637 | | | 09/01/26 | | | 5,671 | |
| | 20,000,000 | | | | | Salvation Army | | | | | 4.528 | | | 09/01/48 | | | 20,047 | |
| | 9,800,000 | | | | | Starbucks Corp | | | | | 2.450 | | | 06/15/26 | | | 8,821 | |
| | 11,065,000 | | | | | YMCA of Greater New York | | | | | 5.151 | | | 08/01/48 | | | 11,602 | |
| | | | | | | TOTAL CONSUMER SERVICES | | | | | | | | | | | 81,130 | |
| | | | | | | | | | | | | | | | | | | |
| DIVERSIFIED FINANCIALS - 0.8% | | | | | | | | | | | | |
| | 3,160,000 | | | g | | Canadian Imperial Bank of Commerce | | | | | 3.150 | | | 06/27/21 | | | 3,178 | |
| | 2,169,000 | | | | | Discover Financial Services | | | | | 3.850 | | | 11/21/22 | | | 2,154 | |
| | 5,103,000 | | | g | | EDP Finance BV | | | | | 4.125 | | | 01/15/20 | | | 5,109 | |
| | 9,500,000 | | | e,g | | EDP Finance BV | | | | | 5.250 | | | 01/14/21 | | | 9,691 | |
| | 11,625,000 | | | g | | EDP Finance BV | | | | | 3.625 | | | 07/15/24 | | | 10,894 | |
| | 9,500,000 | | | | | Ford Foundation | | | | | 3.859 | | | 06/01/47 | | | 9,346 | |
| | 2,300,000 | | | | | Legg Mason, Inc | | | | | 3.950 | | | 07/15/24 | | | 2,267 | |
| | 2,214,000 | | | e | | Northern Trust Corp | | | | | 3.375 | | | 08/23/21 | | | 2,230 | |
| | 680,000 | | | | | Reinvestment Fund, Inc | | | | | 3.377 | | | 02/15/22 | | | 683 | |
| | 1,535,000 | | | | | Reinvestment Fund, Inc | | | | | 3.166 | | | 11/01/23 | | | 1,521 | |
| | 3,000,000 | | | | | Reinvestment Fund, Inc | | | | | 3.600 | | | 02/15/24 | | | 3,014 | |
| | 10,250,000 | | | | | Reinvestment Fund, Inc | | | | | 3.366 | | | 11/01/24 | | | 10,150 | |
| | 2,570,000 | | | | | Reinvestment Fund, Inc | | | | | 3.513 | | | 11/01/25 | | | 2,545 | |
| | 15,240,000 | | | | | Reinvestment Fund, Inc | | | | | 3.880 | | | 02/15/27 | | | 15,349 | |
| | 10,435,000 | | | | | Reinvestment Fund, Inc | | | | | 3.930 | | | 02/15/28 | | | 10,517 | |
| | 11,075,000 | | | | | Unilever Capital Corp | | | | | 2.000 | | | 07/28/26 | | | 9,990 | |
| | 4,750,000 | | | e | | Unilever Capital Corp | | | | | 3.500 | | | 03/22/28 | | | 4,699 | |
| | | | | | | TOTAL DIVERSIFIED FINANCIALS | | | | | | | | | | | 103,337 | |
| | | | | | | | | | | | | | | | | | | |
| ENERGY - 1.4% | | | | | | | | | | | | |
| | 3,281,000 | | | e | | Apache Corp | | | | | 3.250 | | | 04/15/22 | | | 3,212 | |
| | 14,500,000 | | | | | Cenovus Energy, Inc | | | | | 5.250 | | | 06/15/37 | | | 12,787 | |
| | 3,175,000 | | | e | | Cimarex Energy Co | | | | | 3.900 | | | 05/15/27 | | | 2,948 | |
| | 7,550,000 | | | g | | Colorado Interstate Gas Co LLC | | | | | 4.150 | | | 08/15/26 | | | 7,380 | |
| | 7,499,485 | | | g | | Continental Wind LLC | | | | | 6.000 | | | 02/28/33 | | | 7,771 | |
| | 8,450,000 | | | | | EOG Resources, Inc | | | | | 3.900 | | | 04/01/35 | | | 7,986 | |
| | 4,450,000 | | | | | EOG Resources, Inc | | | | | 5.100 | | | 01/15/36 | | | 4,839 | |
| | 11,050,000 | | | g | | Greenko Dutch BV | | | | | 4.875 | | | 07/24/22 | | | 10,374 | |
| | 15,000,000 | | | | | Kinder Morgan, Inc | | | | | 3.150 | | | 01/15/23 | | | 14,553 | |
| | 1,000,000 | | | | | Marathon Oil Corp | | | | | 2.700 | | | 06/01/20 | | | 985 | |
| | 17,292,000 | | | | | National Oilwell Varco, Inc | | | | | 3.950 | | | 12/01/42 | | | 13,818 | |
| | 3,290,000 | | | | | Noble Energy, Inc | | | | | 5.050 | | | 11/15/44 | | | 2,837 | |
| | 1,400,000 | | | | | ONE Gas, Inc | | | | | 4.500 | | | 11/01/48 | | | 1,443 | |
| | 3,875,000 | | | | | ONEOK, Inc | | | | | 4.000 | | | 07/13/27 | | | 3,698 | |
| | 6,200,000 | | | | | ONEOK, Inc | | | | | 4.950 | | | 07/13/47 | | | 5,735 | |
| | 2,775,000 | | | g,i | | Phillips 66 | | LIBOR 3 M + 0.750% | | | 3.186 | | | 04/15/20 | | | 2,775 | |
| | 9,000,000 | | | | | Phillips 66 | | | | | 4.650 | | | 11/15/34 | | | 8,775 | |
| | 9,500,000 | | | | | Statoil ASA | | | | | 3.150 | | | 01/23/22 | | | 9,474 | |
| | 4,500,000 | | | | | Statoil ASA | | | | | 2.650 | | | 01/15/24 | | | 4,352 | |
| | 5,932,000 | | | | | Statoil ASA | | | | | 3.950 | | | 05/15/43 | | | 5,669 | |
| | 20,000,000 | | | g | | TerraForm Power Operating LLC | | | | | 5.000 | | | 01/31/28 | | | 17,600 | |
| | 5,000,000 | | | g | | Texas Eastern Transmission LP | | | | | 4.125 | | | 12/01/20 | | | 5,039 | |
| | 8,700,000 | | | | | Valero Energy Corp | | | | | 4.350 | | | 06/01/28 | | | 8,624 | |
| | 10,050,000 | | | g | | Woodside Finance Ltd | | | | | 3.700 | | | 03/15/28 | | | 9,301 | |
| | | | | | | TOTAL ENERGY | | | | | | | | | | | 171,975 | |
COLLEGE RETIREMENT EQUITIES FUND- Social Choice Account
| | | | | | | | REFERENCE | | | | | MATURITY | | VALUE | |
| PRINCIPAL | | | | | ISSUER | | RATE & SPREAD | | RATE | | DATE | | (000) | |
| HEALTH CARE EQUIPMENT & SERVICES - 0.4% | | | | | | | | | | | | |
| $ | 7,500,000 | | | i | | Becton Dickinson & Co | | LIBOR 3 M + 1.030% | | | 3.769 | % | | 06/06/22 | | $ | 7,352 | |
| | 2,750,000 | | | | | Becton Dickinson & Co | | | | | 3.363 | | | 06/06/24 | | | 2,641 | |
| | 4,500,000 | | | | | Becton Dickinson and Co | | | | | 4.685 | | | 12/15/44 | | | 4,217 | |
| | 15,000,000 | | | g,i | | Halfmoon Parent, Inc | | LIBOR 3 M + 0.890% | | | 3.326 | | | 07/15/23 | | | 14,771 | |
| | 5,500,000 | | | g | | Halfmoon Parent, Inc | | | | | 4.800 | | | 08/15/38 | | | 5,454 | |
| | 9,000,000 | | | | | Laboratory Corp of America Holdings | | | | | 3.200 | | | 02/01/22 | | | 8,932 | |
| | | | | | | TOTAL HEALTH CARE EQUIPMENT & SERVICES | | | | | | | | | 43,367 | |
| | | | | | | | | | | | | | | | | | | |
| HOUSEHOLD & PERSONAL PRODUCTS - 0.0% | | | | | | | | | | | | |
| | 2,700,000 | | | | | Kimberly-Clark Corp | | | | | 3.950 | | | 11/01/28 | | | 2,795 | |
| | | | | | | TOTAL HOUSEHOLD & PERSONAL PRODUCTS | | | | | | | | | 2,795 | |
| | | | | | | | | | | | | | | | | | | |
| INSURANCE - 0.4% | | | | | | | | | | | | |
| | 3,000,000 | | | g,i | | Cranberry RE Ltd | | LIBOR 6 M + 1.600% | | | 4.481 | | | 07/13/20 | | | 2,955 | |
| | 15,000,000 | | | | | Prudential Financial, Inc | | | | | 5.200 | | | 03/15/44 | | | 14,044 | |
| | 7,450,000 | | | | | Prudential Financial, Inc | | | | | 5.375 | | | 05/15/45 | | | 6,981 | |
| | 18,222,000 | | | g | | Swiss Re Treasury US Corp | | | | | 2.875 | | | 12/06/22 | | | 17,845 | |
| | 14,024,000 | | | g | | Swiss Re Treasury US Corp | | | | | 4.250 | | | 12/06/42 | | | 13,683 | |
| | | | | | | TOTAL INSURANCE | | | | | | | | | | | 55,508 | |
| | | | | | | | | | | | | | | | | | | |
| MATERIALS - 0.8% | | | | | | | | | | | | |
| | 2,275,000 | | | | | Ball Corp | | | | | 5.000 | | | 03/15/22 | | | 2,286 | |
| | 8,930,000 | | | | | Ball Corp | | | | | 4.000 | | | 11/15/23 | | | 8,684 | |
| | 4,800,000 | | | g | | Commercial Metals Co | | | | | 5.750 | | | 04/15/26 | | | 4,452 | |
| | 20,000,000 | | | | | Fibria Overseas Finance Ltd | | | | | 5.500 | | | 01/17/27 | | | 20,075 | |
| | 1,350,000 | | | | | International Flavors & Fragrances, Inc | | | | | 3.400 | | | 09/25/20 | | | 1,351 | |
| | 7,500,000 | | | | | International Paper Co | | | | | 5.000 | | | 09/15/35 | | | 7,351 | |
| | 5,000,000 | | | | | International Paper Co | | | | | 6.000 | | | 11/15/41 | | | 5,273 | |
| | 4,600,000 | | | | | International Paper Co | | | | | 4.800 | | | 06/15/44 | | | 4,130 | |
| | 17,000,000 | | | g | | Inversiones CMPC S.A. | | | | | 4.375 | | | 04/04/27 | | | 16,137 | |
| | 8,125,000 | | | g | | Klabin Finance S.A. | | | | | 4.875 | | | 09/19/27 | | | 7,373 | |
| | 2,500,000 | | | g | | Sealed Air Corp | | | | | 5.500 | | | 09/15/25 | | | 2,469 | |
| | 9,600,000 | | | g | | Westrock Co | | | | | 4.650 | | | 03/15/26 | | | 9,751 | |
| | 6,850,000 | | | g | | WestRock Co | | | | | 3.000 | | | 09/15/24 | | | 6,453 | |
| | 7,450,000 | | | g | | WestRock Co | | | | | 3.750 | | | 03/15/25 | | | 7,313 | |
| | | | | | | TOTAL MATERIALS | | | | | | | | | | | 103,098 | |
| | | | | | | | | | | | | | | | | | | |
| MEDIA & ENTERTAINMENT - 0.2% | | | | | | | | | | | | |
| | 2,775,000 | | | g | | CCO Holdings LLC | | | | | 4.000 | | | 03/01/23 | | | 2,588 | |
| | 3,125,000 | | | | | Charter Communications Operating LLC | | | | | 3.579 | | | 07/23/20 | | | 3,121 | |
| | 14,850,000 | | | | | Charter Communications Operating LLC | | | | | 4.464 | | | 07/23/22 | | | 14,992 | |
| | 3,625,000 | | | | | Discovery Communications LLC | | | | | 5.000 | | | 09/20/37 | | | 3,366 | |
| | 5,500,000 | | | | | Time Warner Cable, Inc | | | | | 4.500 | | | 09/15/42 | | | 4,426 | |
| | | | | | | TOTAL MEDIA & ENTERTAINMENT | | | | | | | | | | | 28,493 | |
| | | | | | | | | | | | | | | | | | | |
| PHARMACEUTICALS, BIOTECHNOLOGY & LIFE SCIENCES - 0.3% | | | | | | | | | | |
| | 5,000,000 | | | | | Bristol-Myers Squibb Co | | | | | 3.250 | | | 08/01/42 | | | 4,345 | |
| | 4,000,000 | | | i | | GlaxoSmithKline Capital plc | | LIBOR 3 M + 0.350% | | | 2.964 | | | 05/14/21 | | | 3,973 | |
| | 8,650,000 | | | | | GlaxoSmithKline Capital plc | | | | | 3.625 | | | 05/15/25 | | | 8,709 | |
| | 9,550,000 | | | g | | Takeda Pharmaceutical Co Ltd | | | | | 4.400 | | | 11/26/23 | | | 9,654 | |
| | 3,300,000 | | | | | Zoetis, Inc | | | | | 3.450 | | | 11/13/20 | | | 3,308 | |
| | 7,200,000 | | | i | | Zoetis, Inc | | LIBOR 3 M + 0.440% | | | 3.085 | | | 08/20/21 | | | 7,147 | |
COLLEGE RETIREMENT EQUITIES FUND- Social Choice Account
| | | | | | | | REFERENCE | | | | | MATURITY | | VALUE | |
| PRINCIPAL | | | | | ISSUER | | RATE & SPREAD | | RATE | | DATE | | (000) | |
| $ | 4,525,000 | | | | | Zoetis, Inc | | | | | 4.450 | % | | 08/20/48 | | $ | 4,440 | |
| | | | | | | TOTAL PHARMACEUTICALS, BIOTECHNOLOGY & LIFE SCIENCES | | | | | | | | | 41,576 | |
| | | | | | | | | | | | | | | | | | | |
| REAL ESTATE - 0.7% | | | | | | | | | | | | |
| | 8,500,000 | | | e | | Alexandria Real Estate Equities, Inc | | | | | 4.000 | | | 01/15/24 | | | 8,597 | |
| | 1,975,000 | | | | | Brandywine Operating Partnership LP | | | | | 3.950 | | | 02/15/23 | | | 1,964 | |
| | 4,300,000 | | | | | Brandywine Operating Partnership LP | | | | | 3.950 | | | 11/15/27 | | | 4,088 | |
| | 8,775,000 | | | | | Brixmor Operating Partnership LP | | | | | 3.900 | | | 03/15/27 | | | 8,311 | |
| | 5,113,000 | | | | | Digital Realty Trust LP | | | | | 3.950 | | | 07/01/22 | | | 5,143 | |
| | 3,500,000 | | | e | | Federal Realty Investment Trust | | | | | 2.750 | | | 06/01/23 | | | 3,372 | |
| | 3,225,000 | | | | | Healthcare Realty Trust, Inc | | | | | 3.625 | | | 01/15/28 | | | 3,030 | |
| | 11,075,000 | | | | | Kilroy Realty LP | | | | | 3.450 | | | 12/15/24 | | | 10,700 | |
| | 11,150,000 | | | | | Kilroy Realty LP | | | | | 4.750 | | | 12/15/28 | | | 11,363 | |
| | 16,825,000 | | | | | Mid-America Apartments LP | | | | | 4.000 | | | 11/15/25 | | | 16,770 | |
| | 16,822,000 | | | | | Regency Centers LP | | | | | 3.750 | | | 06/15/24 | | | 16,646 | |
| | | | | | | TOTAL REAL ESTATE | | | | | | | | | | | 89,984 | |
| | | | | | | | | | | | | | | | | | | |
| TECHNOLOGY HARDWARE & EQUIPMENT - 0.2% | | | | | | | | | | | | |
| | 14,250,000 | | | | | Apple, Inc | | | | | 3.000 | | | 06/20/27 | | | 13,587 | |
| | 10,200,000 | | | | | Corning, Inc | | | | | 4.375 | | | 11/15/57 | | | 8,536 | |
| | | | | | | TOTAL TECHNOLOGY HARDWARE & EQUIPMENT | | | | | | | | | 22,123 | |
| | | | | | | | | | | | | | | | | | | |
| TELECOMMUNICATION SERVICES - 0.3% | | | | | | | | | | | | |
| | 3,400,000 | | | e | | CenturyLink, Inc | | | | | 6.750 | | | 12/01/23 | | | 3,277 | |
| | 18,500,000 | | | i | | Verizon Communications, Inc | | LIBOR 3 M + 1.100% | | | 3.716 | | | 05/15/25 | | | 17,938 | |
| | 11,750,000 | | | | | Verizon Communications, Inc | | | | | 2.625 | | | 08/15/26 | | | 10,658 | |
| | 9,050,000 | | | | | Verizon Communications, Inc | | | | | 4.272 | | | 01/15/36 | | | 8,479 | |
| | | | | | | TOTAL TELECOMMUNICATION SERVICES | | | | | | | | | | | 40,352 | |
| | | | | | | | | | | | | | | | | | | |
| TRANSPORTATION - 1.0% | | | | | | | | | | | | |
| | 2,050,000 | | | | | CSX Corp | | | | | 4.250 | | | 03/15/29 | | | 2,083 | |
| | 5,650,000 | | | | | CSX Corp | | | | | 4.750 | | | 11/15/48 | | | 5,731 | |
| | 6,775,000 | | | | | CSX Corp | | | | | 4.250 | | | 11/01/66 | | | 5,866 | |
| | 7,150,000 | | | | | Delta Air Lines, Inc | | | | | 3.625 | | | 03/15/22 | | | 6,997 | |
| | 2,001,384 | | | | | Delta Air Lines, Inc | | | | | 4.250 | | | 07/30/23 | | | 2,023 | |
| | 5,158,397 | | | | | Delta Air Lines, Inc | | | | | 3.625 | | | 07/30/27 | | | 5,216 | |
| | 4,000,000 | | | | | Kansas City Southern | | | | | 3.000 | | | 05/15/23 | | | 3,913 | |
| | 7,000,000 | | | | | Kansas City Southern | | | | | 4.300 | | | 05/15/43 | | | 6,520 | |
| | 15,925,000 | | | | | Kansas City Southern | | | | | 4.950 | | | 08/15/45 | | | 16,244 | |
| | 5,617,000 | | | g | | Mexico City Airport Trust | | | | | 5.500 | | | 10/31/46 | | | 4,943 | |
| | 6,517,000 | | | g | | Mexico City Airport Trust | | | | | 5.500 | | | 07/31/47 | | | 5,727 | |
| | 475,000 | | | | | Norfolk Southern Corp | | | | | 5.590 | | | 05/17/25 | | | 526 | |
| | 5,933,679 | | | m | | Spirit Airlines Pass Through Trust | | | | | 3.800 | | | 02/15/26 | | | 5,798 | |
| | 9,811,991 | | | | | Spirit Airlines Pass Through Trust | | | | | 3.375 | | | 02/15/30 | | | 9,390 | |
| | 7,395,895 | | | | | Spirit Airlines, Inc | | | | | 4.100 | | | 04/01/28 | | | 7,261 | |
| | 13,000,000 | | | | | Union Pacific Corp | | | | | 4.375 | | | 09/10/38 | | | 12,866 | |
| | 4,812,205 | | | | | Union Pacific Railroad Co | | | | | 3.227 | | | 05/14/26 | | | 4,726 | |
| | 15,921,648 | | | | | Union Pacific Railroad Co | | | | | 2.695 | | | 05/12/27 | | | 15,276 | |
| | 1,360,000 | | | | | United Parcel Service of America, Inc (Step Bond) | | | | | 8.375 | | | 04/01/30 | | | 1,842 | |
| | 2,250,000 | | | e,i | | United Parcel Service, Inc | | LIBOR 3 M + 0.380% | | | 3.009 | | | 05/16/22 | | | 2,256 | |
| | | | | | | TOTAL TRANSPORTATION | | | | | | | | | | | 125,204 | |
| | | | | | | | | | | | | | |
| UTILITIES - 3.6% | | | | | | | | | | | | |
| | 11,100,000 | | | | | Avangrid, Inc | | | | | 3.150 | | | 12/01/24 | | | 10,713 | |
| | 20,275,000 | | | | | Avista Corp | | | | | 4.350 | | | 06/01/48 | | | 20,728 | |
COLLEGE RETIREMENT EQUITIES FUND- Social Choice Account
| | | | | | | | | | | | | MATURITY | | VALUE | |
| PRINCIPAL | | | | | ISSUER | | | | RATE | | DATE | | (000) | |
| $ | 700,000 | | | g | | Azure Power Energy Ltd | | | | | 5.500 | % | | 11/03/22 | | $ | 656 | |
| | 16,500,000 | | | g | | Brooklyn Union Gas Co | | | | | 4.273 | | | 03/15/48 | | | 16,303 | |
| | 3,000,000 | | | g | | Clearway Energy Operating LLC | | | | | 5.750 | | | 10/15/25 | | | 2,865 | |
| | 2,000,000 | | | | | Connecticut Light & Power Co | | | | | 5.750 | | | 03/01/37 | | | 2,275 | |
| | 22,500,000 | | | g | | Electricite de France S.A. | | | | | 3.625 | | | 10/13/25 | | | 21,698 | |
| | 6,150,000 | | | | | Fortis, Inc | | | | | 2.100 | | | 10/04/21 | | | 5,912 | |
| | 10,750,000 | | | | | Fortis, Inc | | | | | 3.055 | | | 10/04/26 | | | 9,819 | |
| | 13,750,000 | | | | | Georgia Power Co | | | | | 3.250 | | | 04/01/26 | | | 12,856 | |
| | 2,745,000 | | | | | International Transmission Co | | | | | 4.625 | | | 08/15/43 | | | 2,817 | |
| | 6,575,000 | | | | | Interstate Power & Light Co | | | | | 3.250 | | | 12/01/24 | | | 6,407 | |
| | 3,000,000 | | | | | Interstate Power & Light Co | | | | | 4.100 | | | 09/26/28 | | | 3,068 | |
| | 24,325,000 | | | g | | Korea Hydro & Nuclear Power Co Ltd | | | | | 3.750 | | | 07/25/23 | | | 24,595 | |
| | 4,000,000 | | | | | MidAmerican Energy Co | | | | | 3.100 | | | 05/01/27 | | | 3,895 | |
| | 9,250,000 | | | g | | Narragansett Electric Co | | | | | 4.170 | | | 12/10/42 | | | 8,851 | |
| | 2,050,000 | | | g | | NextEra Energy Operating Partners LP | | | | | 4.250 | | | 09/15/24 | | | 1,896 | |
| | 3,875,000 | | | g | | NextEra Energy Operating Partners LP | | | | | 4.500 | | | 09/15/27 | | | 3,449 | |
| | 9,732,000 | | | g | | Niagara Mohawk Power Corp | | | | | 4.278 | | | 10/01/34 | | | 9,789 | |
| | 9,750,000 | | | g | | Niagara Mohawk Power Corp | | | | | 4.119 | | | 11/28/42 | | | 9,424 | |
| | 1,500,000 | | | | | Northwest Natural Gas Co | | | | | 5.620 | | | 11/21/23 | | | 1,669 | |
| | 11,000,000 | | | | | NorthWestern Corp | | | | | 4.176 | | | 11/15/44 | | | 11,014 | |
| | 18,900,000 | | | g | | Pattern Energy Group, Inc | | | | | 5.875 | | | 02/01/24 | | | 18,239 | |
| | 13,050,000 | | | | | PSEG Power LLC | | | | | 3.850 | | | 06/01/23 | | | 13,060 | |
| | 630,000 | | | | | Public Service Co of Colorado | | | | | 4.750 | | | 08/15/41 | | | 655 | |
| | 7,625,000 | | | | | Public Service Co of Colorado | | | | | 4.100 | | | 06/15/48 | | | 7,510 | |
| | 5,500,000 | | | | | San Diego Gas & Electric Co | | | | | 3.000 | | | 08/15/21 | | | 5,477 | |
| | 6,687,554 | | | | | San Diego Gas & Electric Co | | | | | 1.914 | | | 02/01/22 | | | 6,562 | |
| | 24,491,901 | | | g | | Solar Star Funding LLC | | | | | 3.950 | | | 06/30/35 | | | 23,568 | |
| | 23,209,956 | | | g | | Solar Star Funding LLC | | | | | 5.375 | | | 06/30/35 | | | 24,857 | |
| | 2,000,000 | | | | | Southern California Edison Co | | | | | 2.400 | | | 02/01/22 | | | 1,929 | |
| | 6,000,000 | | | | | Southern California Edison Co | | | | | 3.400 | | | 06/01/23 | | | 5,965 | |
| | 4,700,000 | | | | | Southern California Edison Co | | | | | 4.125 | | | 03/01/48 | | | 4,456 | |
| | 8,300,000 | | | | | Southern Power Co | | | | | 2.500 | | | 12/15/21 | | | 8,061 | |
| | 25,000,000 | | | | | Southern Power Co | | | | | 4.150 | | | 12/01/25 | | | 24,785 | |
| | 38,828,500 | | | e,g | | Star Energy Geothermal Wayang Windu Ltd | | | | | 6.750 | | | 04/24/33 | | | 35,624 | |
| | 12,400,000 | | | | | Tampa Electric Co | | | | | 4.300 | | | 06/15/48 | | | 11,866 | |
| | 22,235,057 | | | g | | Topaz Solar Farms LLC | | | | | 4.875 | | | 09/30/39 | | | 20,215 | |
| | 12,246,265 | | | g | | Topaz Solar Farms LLC | | | | | 5.750 | | | 09/30/39 | | | 11,871 | |
| | 5,000,000 | | | | | Washington Gas Light Co | | | | | 5.440 | | | 08/11/25 | | | 5,539 | |
| | 19,650,000 | | | | | Westar Energy, Inc | | | | | 2.550 | | | 07/01/26 | | | 18,369 | |
| | 16,525,000 | | | | | WGL Holdings, Inc | | | | | 2.250 | | | 11/01/19 | | | 16,330 | |
| | | | | | | TOTAL UTILITIES | | | | | | | | | | | 455,637 | |
| | | | | | | | | | | | | | | | | | | |
| | | | | | | TOTAL CORPORATE BONDS | | | | | | | | | | | 1,866,000 | |
| | | | | | | (Cost $1,918,130) | | | | | | | | | | | | |
| | | | | | | | | | | | | | | | | | | |
| GOVERNMENT BONDS - 22.5% | | | | | | | | | | | | |
| | | | | | | | | | | | | | | | | | | |
| AGENCY SECURITIES - 3.9% | | | | | | | | | | | | |
| | 4,849,000 | | | | | Canal Barge Co, Inc | | | | | 4.500 | | | 11/12/34 | | | 5,149 | |
| | 3,958,771 | | | | | CES MU2 LLC | | | | | 1.994 | | | 05/13/27 | | | 3,816 | |
| | 6,233,333 | | | | | DY9 Leasing LLC | | | | | 2.415 | | | 06/30/27 | | | 6,124 | |
| | 9,679,776 | | | | | Ethiopian Leasing LLC | | | | | 2.566 | | | 08/14/26 | | | 9,598 | |
| | 2,834,215 | | | | | Export Lease Ten Co LLC | | | | | 1.650 | | | 05/07/25 | | | 2,734 | |
| | 4,029,003 | | | | | Export Leasing LLC | | | | | 1.859 | | | 08/28/21 | | | 3,980 | |
| | 2,290,826 | | | g | | Genesis Solar Pass Through Trust | | | | | 3.875 | | | 02/15/38 | | | 2,321 | |
| | 1,096,000 | | | j | | Government Trust Certificate | | | | | 0.000 | | | 04/01/19 | | | 1,088 | |
| | 5,000,000 | | | j | | Government Trust Certificate | | | | | 0.000 | | | 04/01/21 | | | 4,717 | |
COLLEGE RETIREMENT EQUITIES FUND- Social Choice Account
| | | | | | | | REFERENCE | | | | | MATURITY | | VALUE | |
| PRINCIPAL | | | | | ISSUER | | RATE & SPREAD | | RATE | | DATE | | (000) | |
| $ | 5,950,000 | | | | | Hashemite Kingdom of Jordan Government AID Bond | | | | | 3.000 | % | | 06/30/25 | | $ | 5,919 | |
| | 5,065,000 | | | g | | Hospital for Special Surgery | | | | | 3.500 | | | 01/01/23 | | | 5,107 | |
| | 6,375,000 | | | i | | India Government AID Bond | | LIBOR 3 M + 0.100% | | | 2.641 | | | 02/01/27 | | | 6,173 | |
| | 45,500,000 | | | | | Iraq Government AID Bond | | | | | 2.149 | | | 01/18/22 | | | 44,701 | |
| | 4,295,000 | | | | | Lutheran Medical Center | | | | | 1.982 | | | 02/20/30 | | | 3,999 | |
| | 6,187,500 | | | | | Mexican Aircraft Finance V LLC | | | | | 2.329 | | | 01/14/27 | | | 6,079 | |
| | 5,040,000 | | | | | Montefiore Medical Center | | | | | 2.152 | | | 10/20/26 | | | 4,870 | |
| | 2,965,000 | | | g | | Montefiore Medical Center | | | | | 3.896 | | | 05/20/27 | | | 3,037 | |
| | 19,545,000 | | | | | Montefiore Medical Center | | | | | 2.895 | | | 04/20/32 | | | 19,184 | |
| | 7,000,000 | | | † | | NCUA Guaranteed Notes | | | | | 3.450 | | | 06/12/21 | | | 7,129 | |
| | 15,555,000 | | | | | New York Society for the Relief of the Ruptured & Crippled | | | | | 2.881 | | | 12/20/31 | | | 15,262 | |
| | 3,150,000 | | | j | | Overseas Private Investment Corp (OPIC) | | | | | 0.000 | | | 09/30/19 | | | 3,203 | |
| | 2,400,000 | | | j | | OPIC | | | | | 0.000 | | | 11/15/19 | | | 2,411 | |
| | 4,363,082 | | | j | | OPIC | | | | | 0.000 | | | 11/15/19 | | | 4,771 | |
| | 3,000,000 | | | j | | OPIC | | | | | 0.000 | | | 01/26/21 | | | 3,019 | |
| | 3,050,000 | | | j | | OPIC | | | | | 0.000 | | | 01/26/21 | | | 3,102 | |
| | 12,226,000 | | | j | | OPIC | | | | | 0.000 | | | 07/17/21 | | | 12,344 | |
| | 3,259,346 | | | | | OPIC | | | | | 2.290 | | | 09/15/26 | | | 3,186 | |
| | 1,705,420 | | | | | OPIC | | | | | 2.040 | | | 12/15/26 | | | 1,661 | |
| | 9,391,644 | | | | | OPIC | | | | | 2.740 | | | 09/15/29 | | | 9,225 | |
| | 14,448,683 | | | | | OPIC | | | | | 3.220 | | | 09/15/29 | | | 14,581 | |
| | 13,003,815 | | | | | OPIC | | | | | 3.280 | | | 09/15/29 | | | 13,161 | |
| | 2,421,331 | | | | | OPIC | | | | | 2.610 | | | 04/15/30 | | | 2,360 | |
| | 3,534,000 | | | | | OPIC | | | | | 2.930 | | | 05/15/30 | | | 3,512 | |
| | 5,840,400 | | | | | OPIC | | | | | 3.040 | | | 05/15/30 | | | 5,835 | |
| | 6,764,778 | | | | | OPIC | | | | | 3.540 | | | 06/15/30 | | | 6,950 | |
| | 17,552,236 | | | | | OPIC | | | | | 3.370 | | | 12/15/30 | | | 17,874 | |
| | 7,611,607 | | | | | OPIC | | | | | 3.520 | | | 09/20/32 | | | 7,805 | |
| | 19,893,675 | | | | | OPIC | | | | | 3.820 | | | 12/20/32 | | | 20,621 | |
| | 12,834,629 | | | | | OPIC | | | | | 3.938 | | | 12/20/32 | | | 13,414 | |
| | 11,272,070 | | | | | OPIC | | | | | 3.160 | | | 06/01/33 | | | 11,147 | |
| | 10,821,188 | | | | | OPIC | | | | | 3.430 | | | 06/01/33 | | | 10,928 | |
| | 1,146,187 | | | | | OPIC | | | | | 2.810 | | | 07/31/33 | | | 1,106 | |
| | 1,833,898 | | | | | OPIC | | | | | 2.940 | | | 07/31/33 | | | 1,787 | |
| | 4,210,549 | | | | | Penta Aircraft Leasing LLC | | | | | 1.691 | | | 04/29/25 | | | 4,068 | |
| | 3,863,634 | | | i | | Pluto Aircraft Leasing LLC | | LIBOR 3 M + 0.210% | | | 2.799 | | | 02/07/23 | | | 3,861 | |
| | 8,000,000 | | | | | Private Export Funding Corp (PEFCO) | | | | | 2.300 | | | 09/15/20 | | | 7,938 | |
| | 7,500,000 | | | g | | PEFCO | | | | | 3.266 | | | 11/08/21 | | | 7,596 | |
| | 17,500,000 | | | | | PEFCO | | | | | 4.300 | | | 12/15/21 | | | 18,283 | |
| | 4,250,000 | | | | | PEFCO | | | | | 2.050 | | | 11/15/22 | | | 4,148 | |
| | 4,000,000 | | | | | PEFCO | | | | | 3.550 | | | 01/15/24 | | | 4,160 | |
| | 8,000,000 | | | | | PEFCO | | | | | 3.250 | | | 06/15/25 | | | 8,163 | |
| | 4,485,471 | | | | | Safina Ltd | | | | | 1.550 | | | 01/15/22 | | | 4,404 | |
| | 6,762,231 | | | | | Sandalwood 2013 LLC | | | | | 2.836 | | | 07/10/25 | | | 6,785 | |
| | 1,533,721 | | | | | Tayarra Ltd | | | | | 3.628 | | | 02/15/22 | | | 1,554 | |
| | 1,446,234 | | | | | Tricahue Leasing LLC | | | | | 3.503 | | | 11/19/21 | | | 1,462 | |
| | 15,300,000 | | | | | Ukraine Government AID Bonds | | | | | 1.847 | | | 05/29/20 | | | 15,137 | |
| | 23,945,000 | | | | | Ukraine Government AID Bonds | | | | | 1.471 | | | 09/29/21 | | | 23,167 | |
| | 7,826,088 | | | | | Ulani MSN 37894 | | | | | 2.184 | | | 12/20/24 | | | 7,691 | |
| | 2,734,594 | | | | | Union 16 Leasing LLC | | | | | 1.863 | | | 01/22/25 | | | 2,660 | |
| | 7,110,000 | | | | | UNM Sandoval Regional Medical Center | | | | | 4.500 | | | 07/20/36 | | | 7,269 | |
| | 750,000 | | | | | US Department of Housing and Urban Development (HUD) | | | | | 2.050 | | | 08/01/19 | | | 747 | |
| | 8,774,000 | | | | | HUD | | | | | 4.870 | | | 08/01/19 | | | 8,880 | |
COLLEGE RETIREMENT EQUITIES FUND- Social Choice Account
| | | | | | | | REFERENCE | | | | | MATURITY | | VALUE | |
| PRINCIPAL | | | | | ISSUER | | RATE & SPREAD | | RATE | | DATE | | (000) | |
| $ | 12,895,000 | | | | | HUD | | | | | 4.960 | % | | 08/01/20 | | $ | 13,077 | |
| | 12,530,000 | | | | | HUD | | | | | 5.050 | | | 08/01/21 | | | 12,567 | |
| | 3,217,000 | | | | | HUD | | | | | 2.910 | | | 08/01/23 | | | 3,221 | |
| | | | | | | TOTAL AGENCY SECURITIES | | | | | | | | | | | 501,828 | |
| | | | | | | | | | | | | | | | | | | |
| FOREIGN GOVERNMENT BONDS - 4.2% | | | | | | | | | | | | |
| | 13,550,000 | | | | | African Development Bank | | | | | 2.375 | | | 09/23/21 | | | 13,461 | |
| | 9,500,000 | | | | | Asian Development Bank | | | | | 2.125 | | | 03/19/25 | | | 9,166 | |
| | 14,000,000 | | | | | Asian Development Bank | | | | | 3.125 | | | 09/26/28 | | | 14,312 | |
| | 17,000,000 | | | g | | Bank Nederlandse Gemeenten NV | | | | | 2.125 | | | 12/14/20 | | | 16,822 | |
| | 6,000,000 | | | g | | Caisse d’Amortissement de la Dette Sociale | | | | | 2.000 | | | 04/17/20 | | | 5,947 | |
| | 5,055,980 | | | g | | Carpintero Finance Ltd | | | | | 2.004 | | | 09/18/24 | | | 4,944 | |
| | 5,000,000 | | | g | | CPPIB Capital, Inc | | | | | 2.750 | | | 11/02/27 | | | 4,875 | |
| | 2,000,000 | | | | | European Investment Bank | | | | | 2.000 | | | 03/15/21 | | | 1,975 | |
| | 20,750,000 | | | | | European Investment Bank | | | | | 2.125 | | | 04/13/26 | | | 19,844 | |
| | 3,750,000 | | | e | | European Investment Bank | | | | | 2.375 | | | 05/24/27 | | | 3,603 | |
| | 2,000,000 | | | | | European Investment Bank | | | | | 4.875 | | | 02/15/36 | | | 2,451 | |
| | 9,000,000 | | | | | Export Development Canada | | | | | 1.625 | | | 12/03/19 | | | 8,920 | |
| | 15,000,000 | | | e | | Export Development Canada | | | | | 2.000 | | | 11/30/20 | | | 14,823 | |
| | 12,000,000 | | | e | | Export Development Canada | | | | | 1.375 | | | 10/21/21 | | | 11,595 | |
| | 15,000,000 | | | g | | Finnvera Oyj | | | | | 2.375 | | | 06/04/25 | | | 14,460 | |
| | 6,082,000 | | | | | Hydro Quebec | | | | | 8.400 | | | 01/15/22 | | | 7,003 | |
| | 20,000,000 | | | i | | Inter-American Development Bank | | LIBOR 3 M + 0.010% | | | 2.446 | | | 01/15/22 | | | 19,995 | |
| | 19,250,000 | | | | | International Bank for Reconstruction & Development | | | | | 3.125 | | | 11/20/25 | | | 19,827 | |
| | 27,900,000 | | | g | | International Development Association | | | | | 2.750 | | | 04/24/23 | | | 28,007 | |
| | 19,250,000 | | | | | International Finance Corp | | | | | 1.750 | | | 03/30/20 | | | 19,037 | |
| | 46,500,000 | | | | | International Finance Corp | | | | | 1.546 | | | 11/04/21 | | | 44,889 | |
| | 41,500,000 | | | | | International Finance Corp | | | | | 2.125 | | | 04/07/26 | | | 39,812 | |
| | 5,000,000 | | | | | Japan Bank for International Cooperation | | | | | 1.875 | | | 04/20/21 | | | 4,897 | |
| | 9,000,000 | | | g | | Japan Finance Organization for Municipalities | | | | | 2.125 | | | 04/13/21 | | | 8,833 | |
| | 3,350,000 | | | g | | Japan Finance Organization for Municipalities | | | | | 3.375 | | | 09/27/23 | | | 3,404 | |
| | 3,000,000 | | | | | KFW | | | | | 1.875 | | | 11/30/20 | | | 2,956 | |
| | 10,000,000 | | | e | | KFW | | | | | 2.625 | | | 01/25/22 | | | 9,998 | |
| | 12,500,000 | | | e,g | | Kommunalbanken AS. | | | | | 2.125 | | | 02/11/25 | | | 12,013 | |
| | 18,500,000 | | | i | | Korea Development Bank | | LIBOR 3 M + 0.725% | | | 3.139 | | | 07/06/22 | | | 18,503 | |
| | 16,750,000 | | | e | | Kreditanstalt fuer Wiederaufbau | | | | | 2.000 | | | 11/30/21 | | | 16,464 | |
| | 3,000,000 | | | g | | Nacional Financiera SNC | | | | | 3.375 | | | 11/05/20 | | | 2,966 | |
| | 15,000,000 | | | g | | Nederlandse Waterschapsbank NV | | | | | 3.125 | | | 12/05/22 | | | 15,191 | |
| | 25,000,000 | | | e,g | | Nederlandse Waterschapsbank NV | | | | | 2.375 | | | 03/24/26 | | | 24,115 | |
| | 2,000,000 | | | | | North American Development Bank | | | | | 4.375 | | | 02/11/20 | | | 2,031 | |
| | 27,800,000 | | | g | | Perusahaan Penerbit SBSN Indonesia III | | | | | 3.750 | | | 03/01/23 | | | 27,188 | |
| | 15,000,000 | | | | | Province of Manitoba Canada | | | | | 2.100 | | | 09/06/22 | | | 14,582 | |
| | 12,700,000 | | | e | | Province of Manitoba Canada | | | | | 3.050 | | | 05/14/24 | | | 12,761 | |
| | 5,000,000 | | | | | Province of Ontario Canada | | | | | 4.400 | | | 04/14/20 | | | 5,106 | |
| | 10,000,000 | | | | | Province of Quebec Canada | | | | | 3.500 | | | 07/29/20 | | | 10,126 | |
| | 10,000,000 | | | e | | Province of Quebec Canada | | | | | 2.750 | | | 04/12/27 | | | 9,730 | |
| | 5,000,000 | | | | | Province of Quebec Canada | | | | | 7.500 | | | 09/15/29 | | | 6,942 | |
| | | | | | | TOTAL FOREIGN GOVERNMENT BONDS | | | | | | | | | | | 533,574 | |
| | | | | | | | | | | | | | | | | | | |
| MORTGAGE BACKED - 6.6% | | | | | | | | | | | | |
| | 2,600,000 | | | | | Federal Home Loan Mortgage Corp (FHLMC) | | | | | 3.000 | | | 10/15/33 | | | 2,547 | |
| | 10,638,700 | | | | | FHLMC | | | | | 3.500 | | | 08/15/43 | | | 10,848 | |
| | 4,276,399 | | | | | FHLMC | | | | | 3.000 | | | 03/15/44 | | | 4,234 | |
| | 9,214,027 | | | | | FHLMC | | | | | 3.500 | | | 09/15/44 | | | 9,324 | |
| | 9,331,339 | | | i | | FHLMC | | | | | 5.992 | | | 06/15/48 | | | 10,223 | |
COLLEGE RETIREMENT EQUITIES FUND- Social Choice Account
| | | | | | | | | | | | | MATURITY | | VALUE | |
| PRINCIPAL | | | | | ISSUER | | | | RATE | | DATE | | (000) | |
| $ | 7,169,724 | | | i | | FHLMC | | | | | 5.912 | % | | 10/15/48 | | $ | 7,769 | |
| | 13,943 | | | | | Federal Home Loan Mortgage Corp Gold (FGLMC) | | | 7.000 | | | 10/01/20 | | | 14 | |
| | 2,700 | | | | | FGLMC | | | | | 7.000 | | | 05/01/23 | | | 3 | |
| | 4,358,099 | | | | | FGLMC | | | | | 3.500 | | | 03/01/27 | | | 4,412 | |
| | 13,631 | | | | | FGLMC | | | | | 8.000 | | | 01/01/31 | | | 14 | |
| | 256,893 | | | | | FGLMC | | | | | 4.500 | | | 07/01/33 | | | 268 | |
| | 1,736,814 | | | | | FGLMC | | | | | 7.000 | | | 12/01/33 | | | 1,980 | |
| | 546,335 | | | | | FGLMC | | | | | 7.000 | | | 05/01/35 | | | 619 | |
| | 1,233,035 | | | | | FGLMC | | | | | 5.000 | | | 06/01/36 | | | 1,309 | |
| | 391,719 | | | | | FGLMC | | | | | 5.000 | | | 07/01/39 | | | 415 | |
| | 661,249 | | | | | FGLMC | | | | | 4.500 | | | 10/01/44 | | | 693 | |
| | 699,762 | | | | | FGLMC | | | | | 4.500 | | | 11/01/44 | | | 733 | |
| | 990,108 | | | | | FGLMC | | | | | 4.500 | | | 11/01/44 | | | 1,038 | |
| | 383,614 | | | | | FGLMC | | | | | 4.500 | | | 12/01/44 | | | 399 | |
| | 629,168 | | | | | FGLMC | | | | | 4.500 | | | 12/01/44 | | | 659 | |
| | 2,510,437 | | | | | FGLMC | | | | | 3.500 | | | 04/01/45 | | | 2,523 | |
| | 22,787,020 | | | | | FGLMC | | | | | 3.500 | | | 10/01/45 | | | 22,891 | |
| | 10,858,079 | | | | | FGLMC | | | | | 4.000 | | | 12/01/45 | | | 11,149 | |
| | 35,369,064 | | | | | FGLMC | | | | | 3.500 | | | 08/01/46 | | | 35,575 | |
| | 13,373,791 | | | | | FGLMC | | | | | 3.000 | | | 01/01/47 | | | 13,042 | |
| | 27,083,876 | | | | | FGLMC | | | | | 3.000 | | | 02/01/47 | | | 26,422 | |
| | 1,041,801 | | | | | FGLMC | | | | | 4.500 | | | 06/01/47 | | | 1,100 | |
| | 2,562,349 | | | | | FGLMC | | | | | 4.000 | | | 09/01/47 | | | 2,629 | |
| | 8,876,424 | | | | | FGLMC | | | | | 3.500 | | | 03/01/48 | | | 8,903 | |
| | 14,642,837 | | | | | FGLMC | | | | | 4.000 | | | 03/01/48 | | | 15,023 | |
| | 3,598,280 | | | | | FGLMC | | | | | 4.000 | | | 07/01/48 | | | 3,692 | |
| | 11,089,893 | | | | | FGLMC | | | | | 4.500 | | | 08/01/48 | | | 11,616 | |
| | 7,000,000 | | | | | Federal National Mortgage Association (FNMA) | | | | | 1.625 | | | 01/21/20 | | | 6,929 | |
| | 14,566 | | | | | FNMA | | | | | 8.000 | | | 07/01/24 | | | 16 | |
| | 7,366,609 | | | | | FNMA | | | | | 3.500 | | | 02/01/32 | | | 7,462 | |
| | 3,176,254 | | | | | FNMA | | | | | 3.500 | | | 05/01/32 | | | 3,226 | |
| | 8,004,572 | | | | | FNMA | | | | | 3.500 | | | 07/01/32 | | | 8,108 | |
| | 5,941,886 | | | | | FNMA | | | | | 3.000 | | | 11/01/32 | | | 5,932 | |
| | 3,261,881 | | | | | FNMA | | | | | 5.000 | | | 05/01/35 | | | 3,464 | |
| | 2,068,126 | | | | | FNMA | | | | | 5.000 | | | 10/01/35 | | | 2,197 | |
| | 1,566,312 | | | | | FNMA | | | | | 5.000 | | | 02/01/36 | | | 1,664 | |
| | 1,994,848 | | | | | FNMA | | | | | 5.500 | | | 11/01/38 | | | 2,124 | |
| | 18,715 | | | | | FNMA | | | | | 4.500 | | | 04/01/39 | | | 19 | |
| | 29,762 | | | | | FNMA | | | | | 4.500 | | | 02/01/40 | | | 31 | |
| | 357,236 | | | | | FNMA | | | | | 5.000 | | | 08/01/40 | | | 379 | |
| | 1,663,877 | | | | | FNMA | | | | | 5.000 | | | 09/01/40 | | | 1,767 | |
| | 114,548 | | | | | FNMA | | | | | 4.500 | | | 11/01/40 | | | 120 | |
| | 206,730 | | | | | FNMA | | | | | 4.500 | | | 01/01/41 | | | 217 | |
| | 133,753 | | | | | FNMA | | | | | 4.500 | | | 02/01/41 | | | 139 | |
| | 2,787,544 | | | | | FNMA | | | | | 5.000 | | | 05/01/41 | | | 2,960 | |
| | 197,239 | | | | | FNMA | | | | | 4.500 | | | 06/01/41 | | | 206 | |
| | 198,637 | | | | | FNMA | | | | | 4.500 | | | 06/01/41 | | | 207 | |
| | 455,695 | | | | | FNMA | | | | | 5.000 | | | 06/01/41 | | | 484 | |
| | 1,455,236 | | | | | FNMA | | | | | 5.000 | | | 07/01/41 | | | 1,545 | |
| | 280,140 | | | | | FNMA | | | | | 4.500 | | | 12/01/41 | | | 292 | |
| | 212,914 | | | | | FNMA | | | | | 4.500 | | | 01/01/42 | | | 222 | |
| | 187,121 | | | | | FNMA | | | | | 4.500 | | | 04/01/42 | | | 195 | |
| | 1,510,735 | | | | | FNMA | | | | | 4.500 | | | 04/01/42 | | | 1,583 | |
| | 204,218 | | | | | FNMA | | | | | 4.500 | | | 06/01/42 | | | 212 | |
| | 2,112,504 | | | | | FNMA | | | | | 4.500 | | | 06/01/42 | | | 2,210 | |
COLLEGE RETIREMENT EQUITIES FUND- Social Choice Account
| | | | | | | | | | | | | MATURITY | | VALUE | |
| PRINCIPAL | | | | | ISSUER | | | | RATE | | DATE | | (000) | |
| $ | 171,813 | | | | | FNMA | | | | | 4.500 | % | | 07/01/42 | | $ | 180 | |
| | 2,581,344 | | | | | FNMA | | | | | 3.000 | | | 04/25/43 | | | 2,556 | |
| | 793,962 | �� | | | | FNMA | | | | | 4.500 | | | 06/01/44 | | | 830 | |
| | 9,059,107 | | | | | FNMA | | | | | 4.500 | | | 06/01/44 | | | 9,471 | |
| | 2,143,022 | | | | | FNMA | | | | | 4.500 | | | 08/01/44 | | | 2,241 | |
| | 4,765,133 | | | | | FNMA | | | | | 4.500 | | | 10/01/44 | | | 4,980 | |
| | 9,795,084 | | | | | FNMA | | | | | 4.500 | | | 11/01/44 | | | 10,245 | |
| | 2,159,703 | | | | | FNMA | | | | | 4.500 | | | 12/01/44 | | | 2,259 | |
| | 11,468,314 | | | | | FNMA | | | | | 3.000 | | | 02/25/45 | | | 11,459 | |
| | 3,371,892 | | | | | FNMA | | | | | 3.000 | | | 02/25/45 | | | 3,369 | |
| | 367,087 | | | | | FNMA | | | | | 3.500 | | | 03/01/45 | | | 369 | |
| | 191,524 | | | | | FNMA | | | | | 3.500 | | | 03/01/45 | | | 192 | |
| | 546,126 | | | | | FNMA | | | | | 4.500 | | | 03/01/45 | | | 571 | |
| | 3,512,225 | | | | | FNMA | | | | | 3.000 | | | 03/25/45 | | | 3,502 | |
| | 660,985 | | | | | FNMA | | | | | 4.500 | | | 04/01/45 | | | 691 | |
| | 8,944,235 | | | | | FNMA | | | | | 3.500 | | | 04/25/45 | | | 9,096 | |
| | 14,300,533 | | | | | FNMA | | | | | 3.500 | | | 04/25/45 | | | 14,529 | |
| | 4,954,046 | | | | | FNMA | | | | | 3.500 | | | 05/01/45 | | | 4,992 | |
| | 25,202,042 | | | | | FNMA | | | | | 3.000 | | | 12/25/45 | | | 24,983 | |
| | 7,835,329 | | | | | FNMA | | | | | 3.500 | | | 01/01/46 | | | 7,870 | |
| | 9,376,770 | | | | | FNMA | | | | | 4.000 | | | 01/01/46 | | | 9,639 | |
| | 9,679,660 | | | | | FNMA | | | | | 3.500 | | | 06/01/46 | | | 9,719 | |
| | 2,718,880 | | | | | FNMA | | | | | 3.500 | | | 08/01/46 | | | 2,730 | |
| | 7,091,724 | | | | | FNMA | | | | | 3.500 | | | 10/01/46 | | | 7,118 | |
| | 17,712,998 | | | | | FNMA | | | | | 3.500 | | | 12/01/46 | | | 17,756 | |
| | 29,995,431 | | | | | FNMA | | | | | 3.500 | | | 01/01/47 | | | 30,027 | |
| | 1,406,791 | | | | | FNMA | | | | | 3.000 | | | 02/01/47 | | | 1,374 | |
| | 5,989,083 | | | | | FNMA | | | | | 4.500 | | | 01/01/48 | | | 6,277 | |
| | 5,003,616 | | | | | FNMA | | | | | 4.500 | | | 02/01/48 | | | 5,244 | |
| | 56,845,610 | | | | | FNMA | | | | | 3.000 | | | 02/25/48 | | | 56,290 | |
| | 6,290,426 | | | | | FNMA | | | | | 4.000 | | | 03/01/48 | | | 6,455 | |
| | 1,034,700 | | | h | | FNMA | | | | | 4.000 | | | 03/01/48 | | | 1,055 | |
| | 21,570,893 | | | | | FNMA | | | | | 4.500 | | | 03/01/48 | | | 22,607 | |
| | 58,924,018 | | | | | FNMA | | | | | 4.000 | | | 04/01/48 | | | 60,301 | |
| | 4,318,506 | | | | | FNMA | | | | | 4.500 | | | 05/01/48 | | | 4,526 | |
| | 3,264,892 | | | | | FNMA | | | | | 4.500 | | | 05/01/48 | | | 3,425 | |
| | 18,585,594 | | | h | | FNMA | | | | | 4.000 | | | 06/01/48 | | | 18,956 | |
| | 7,842,963 | | | | | FNMA | | | | | 5.000 | | | 08/01/48 | | | 8,376 | |
| | 13,725,105 | | | | | FNMA | | | | | 4.500 | | | 12/01/48 | | | 14,221 | |
| | 1,195,040 | | | | | FNMA | | | | | 5.000 | | | 12/01/48 | | | 1,254 | |
| | 5,000,000 | | | h | | FNMA | | | | | 4.000 | | | 01/25/49 | | | 5,099 | |
| | 4,875,227 | | | | | Government National Mortgage Association (GNMA) | | | 2.580 | | | 08/15/25 | | | 4,746 | |
| | 61,989 | | | | | GNMA | | | | | 6.500 | | | 05/20/31 | | | 71 | |
| | 7,633,018 | | | | | GNMA | | | | | 2.640 | | | 01/15/33 | | | 7,479 | |
| | 10,733,423 | | | | | GNMA | | | | | 2.690 | | | 06/15/33 | | | 10,188 | |
| | 8,691,157 | | | | | GNMA | | | | | 3.700 | | | 10/15/33 | | | 8,795 | |
| | 60,974 | | | | | GNMA | | | | | 6.000 | | | 10/20/36 | | | 66 | |
| | 71,645 | | | | | GNMA | | | | | 6.000 | | | 01/20/37 | | | 78 | |
| | 405,171 | | | | | GNMA | | | | | 6.000 | | | 02/20/37 | | | 440 | |
| | 180,656 | | | | | GNMA | | | | | 5.000 | | | 04/15/38 | | | 192 | |
| | 111,333 | | | | | GNMA | | | | | 6.000 | | | 08/20/38 | | | 121 | |
| | 250,477 | | | | | GNMA | | | | | 6.500 | | | 11/20/38 | | | 283 | |
| | 23,455 | | | | | GNMA | | | | | 4.500 | | | 02/20/39 | | | 25 | |
| | 8,128,507 | | | | | GNMA | | | | | 3.700 | | | 08/15/40 | | | 8,231 | |
COLLEGE RETIREMENT EQUITIES FUND- Social Choice Account
| | | | | | | | | | | | | MATURITY | | VALUE | |
| PRINCIPAL | | | | | ISSUER | | | | RATE | | DATE | | (000) | |
| $ | 33,166 | | | | | GNMA | | | | | 4.500 | % | | 08/20/41 | | $ | 35 | |
| | 114,510 | | | | | GNMA | | | | | 4.500 | | | 09/20/41 | | | 121 | |
| | 25,898 | | | | | GNMA | | | | | 4.500 | | | 01/20/44 | | | 27 | |
| | 26,003 | | | | | GNMA | | | | | 4.500 | | | 02/20/44 | | | 27 | |
| | 49,982 | | | | | GNMA | | | | | 4.500 | | | 05/20/44 | | | 53 | |
| | 321,842 | | | | | GNMA | | | | | 4.500 | | | 05/20/44 | | | 340 | |
| | 366,912 | | | | | GNMA | | | | | 4.500 | | | 08/20/44 | | | 388 | |
| | 320,196 | | | | | GNMA | | | | | 4.500 | | | 09/20/44 | | | 334 | |
| | 138,913 | | | | | GNMA | | | | | 4.500 | | | 10/20/44 | | | 146 | |
| | 74,656 | | | | | GNMA | | | | | 4.500 | | | 11/20/44 | | | 77 | |
| | 226,966 | | | | | GNMA | | | | | 4.500 | | | 12/20/44 | | | 240 | |
| | 333,340 | | | | | GNMA | | | | | 4.500 | | | 02/20/45 | | | 352 | |
| | 425,975 | | | | | GNMA | | | | | 4.500 | | | 08/20/45 | | | 450 | |
| | 394,181 | | | | | GNMA | | | | | 4.500 | | | 08/20/45 | | | 416 | |
| | 398,175 | | | | | GNMA | | | | | 4.500 | | | 12/20/45 | | | 421 | |
| | 5,377,147 | | | | | GNMA | | | | | 4.000 | | | 06/20/46 | | | 861 | |
| | 17,649,191 | | | | | GNMA | | | | | 3.000 | | | 12/20/47 | | | 17,370 | |
| | 42,984,530 | | | | | GNMA | | | | | 3.500 | | | 12/20/47 | | | 43,298 | |
| | 26,370,167 | | | | | GNMA | | | | | 3.000 | | | 01/20/48 | | | 25,953 | |
| | 39,959,935 | | | | | GNMA | | | | | 3.500 | | | 01/20/48 | | | 40,251 | |
| | 9,925,000 | | | | | GNMA | | | | | 4.000 | | | 12/20/48 | | | 10,125 | |
| | | | | | | TOTAL MORTGAGE BACKED | | | | | | | | | | | 854,810 | |
| | | | | | | | | | | | | | | | | | | |
| MUNICIPAL BONDS - 5.2% | | | | | | | | | | | | |
| | 3,340,000 | | | | | Antelope Valley-East Kern Water Agency Financing Authority | | | 4.326 | | | 06/01/36 | | | 3,391 | |
| | 4,500,000 | | | g | | Basin Electric Power Coop | | | | | 6.127 | | | 06/01/41 | | | 5,093 | |
| | 3,790,000 | | | | | Bay Area Water Supply & Conservation Agency | | | | | 2.535 | | | 10/01/21 | | | 3,753 | |
| | 2,635,000 | | | | | Bay Area Water Supply & Conservation Agency | | | | | 3.015 | | | 10/01/24 | | | 2,612 | |
| | 1,170,000 | | | | | Brunswick & Glynn County Development Authority | | | 3.060 | | | 04/01/25 | | | 1,167 | |
| | 3,135,300 | | | | | California Earthquake Authority | | | | | 2.805 | | | 07/01/19 | | | 3,132 | |
| | 13,000,000 | | | | | California Housing Finance Agency | | | | | 2.966 | | | 08/01/22 | | | 12,947 | |
| | 6,080,000 | | | g | | California Pollution Control Financing Authority | | | | | 5.000 | | | 07/01/27 | | | 6,143 | |
| | 7,930,000 | | | g | | California Pollution Control Financing Authority | | | | | 5.000 | | | 07/01/37 | | | 7,982 | |
| | 2,470,000 | | | g | | California Pollution Control Financing Authority | | | | | 5.000 | | | 11/21/45 | | | 2,498 | |
| | 3,380,000 | | | | | Chicago Board of Education | | | | | 5.000 | | | 12/01/20 | | | 3,479 | |
| | 14,000,000 | | | | | Chicago Housing Authority | | | | | 4.361 | | | 01/01/38 | | | 14,250 | |
| | 9,700,000 | | | | | Chicago Metropolitan Water Reclamation District-Greater Chicago | | | 5.720 | | | 12/01/38 | | | 11,660 | |
| | 3,500,000 | | | | | City & County Honolulu HI Wastewater System Revenue | | | 3.200 | | | 07/01/26 | | | 3,519 | |
| | 5,645,000 | | | | | City & County of Honolulu HI | | | | | 3.974 | | | 09/01/35 | | | 5,673 | |
| | 1,615,000 | | | | | City & County of Honolulu HI | | | | | 4.004 | | | 09/01/36 | | | 1,619 | |
| | 3,035,000 | | | | | City & County of Honolulu, HI | | | | | 2.668 | | | 10/01/27 | | | 2,925 | |
| | 1,250,000 | | | | | City & County of Honolulu, HI | | | | | 6.114 | | | 07/01/29 | | | 1,270 | |
| | 7,085,000 | | | | | City & County of San Francisco CA | | | | | 4.000 | | | 04/01/47 | | | 6,852 | |
| | 5,500,000 | | | | | City & County of San Francisco CA | | | | | 4.000 | | | 09/01/48 | | | 5,419 | |
| | 8,850,000 | | | | | City of Austin TX Water & Wastewater System Revenue | | | 1.933 | | | 05/15/19 | | | 8,819 | |
| | 2,750,000 | | | | | City of Austin TX Water & Wastewater System Revenue | | | 2.133 | | | 11/15/19 | | | 2,731 | |
| | 6,500,000 | | | | | City of Chicago IL | | | | | 7.750 | | | 01/01/42 | | | 6,959 | |
| | 7,280,000 | | | | | City of Cincinnati OH Water System Revenue | | | | | 2.568 | | | 12/01/21 | | | 7,248 | |
| | 475,000 | | | | | City of Eugene, OR | | | | | 6.320 | | | 08/01/22 | | | 512 | |
| | 1,250,000 | | | | | City of Florence SC | | | | | 4.250 | | | 12/01/34 | | | 1,264 | |
COLLEGE RETIREMENT EQUITIES FUND- Social Choice Account
| | | | | | | | | | | | | MATURITY | | VALUE | |
| PRINCIPAL | | | | | ISSUER | | | | RATE | | DATE | | (000) | |
| $ | 1,000,000 | | | | | City of Houston TX Combined Utility System Revenue | | | 3.375 | % | | 11/15/24 | | $ | 1,021 | |
| | 1,275,000 | | | | | City of Houston TX Combined Utility System Revenue | | | 4.172 | | | 11/15/38 | | | 1,301 | |
| | 12,500,000 | | | | | City of Houston TX Utility System Revenue | | | | | 2.563 | | | 05/15/20 | | | 12,462 | |
| | 925,000 | | | | | City of Jersey City NJ | | | | | 2.423 | | | 09/01/19 | | | 921 | |
| | 5,145,000 | | | | | City of Los Angeles CA | | | | | 3.320 | | | 09/01/24 | | | 5,215 | |
| | 5,145,000 | | | | | City of Los Angeles CA | | | | | 3.450 | | | 09/01/25 | | | 5,220 | |
| | 7,500,000 | | | | | City of Los Angeles CA | | | | | 3.880 | | | 09/01/38 | | | 7,404 | |
| | 1,780,000 | | | g | | City of Miami FL | | | | | 4.808 | | | 01/01/39 | | | 1,840 | |
| | 3,010,000 | | | | | City of Norfolk VA | | | | | 3.000 | | | 10/01/35 | | | 2,640 | |
| | 3,665,000 | | | | | City of Norfolk VA | | | | | 3.050 | | | 10/01/36 | | | 3,183 | |
| | 3,345,000 | | | | | City of San Francisco CA Public Utilities Commission Water Revenue | | | 3.000 | | | 11/01/26 | | | 3,258 | |
| | 3,725,000 | | | | | City of San Francisco CA Public Utilities Commission Water Revenue | | | 3.950 | | | 11/01/36 | | | 3,774 | |
| | 18,500,000 | | | | | City of San Francisco CA Public Utilities Commission Water Revenue | | | 4.185 | | | 11/01/46 | | | 18,606 | |
| | 1,000,000 | | | | | City of San Juan Capistrano CA | | | | | 3.700 | | | 08/01/31 | | | 1,005 | |
| | 1,000,000 | | | | | Commonwealth Financing Authority | | | | | 2.675 | | | 06/01/21 | | | 989 | |
| | 1,150,000 | | | | | Commonwealth Financing Authority | | | | | 2.875 | | | 06/01/22 | | | 1,137 | |
| | 2,310,000 | | | | | Commonwealth Financing Authority | | | | | 3.075 | | | 06/01/23 | | | 2,283 | |
| | 2,730,000 | | | | | Commonwealth Financing Authority | | | | | 3.864 | | | 06/01/38 | | | 2,692 | |
| | 7,650,000 | | | | | County of Alameda CA | | | | | 3.820 | | | 08/01/38 | | | 7,628 | |
| | 1,500,000 | | | | | County of Miami-Dade FL Aviation Revenue | | | | | 2.218 | | | 10/01/22 | | | 1,462 | |
| | 15,000,000 | | | | | District of Columbia Water & Sewer Authority | | | | | 4.814 | | | 10/01/14 | | | 16,588 | |
| | 770,000 | | | | | Fiscal Year 2005 Securitization Corp | | | | | 4.760 | | | 08/15/19 | | | 779 | |
| | 9,000,000 | | | | | Florida State Board of Administration Finance Corp | | | 2.163 | | | 07/01/19 | | | 8,974 | |
| | 15,630,000 | | | j | | Garden State Preservation Trust | | | | | 0.000 | | | 11/01/22 | | | 14,260 | |
| | 1,000,000 | | | | | Grant County Public Utility District No 2 | | | | | 5.470 | | | 01/01/34 | | | 1,072 | |
| | 1,250,000 | | | | | Grant County Public Utility District No 2 | | | | | 4.164 | | | 01/01/35 | | | 1,292 | |
| | 4,135,000 | | | | | Greene County OH | | | | | 2.720 | | | 12/01/21 | | | 4,126 | |
| | 4,365,000 | | | | | Greene County OH | | | | | 3.120 | | | 12/01/23 | | | 4,369 | |
| | 4,615,000 | | | | | Greene County OH | | | | | 3.270 | | | 12/01/24 | | | 4,620 | |
| | 4,755,000 | | | | | Greene County OH | | | | | 3.420 | | | 12/01/25 | | | 4,762 | |
| | 1,300,000 | | | | | Guadalupe Valley Electric Coop, Inc | | | | | 5.671 | | | 10/01/32 | | | 1,392 | |
| | 975,000 | | | | | Guadalupe-Blanco River Authority Industrial Development Corp | | | 3.287 | | | 04/15/23 | | | 982 | |
| | 5,125,000 | | | | | Imperial Irrigation District Electric System Revenue | | | 4.500 | | | 11/01/40 | | | 5,462 | |
| | 2,000,000 | | | | | Kern County Water Agency Improvement District No 4 | | | 4.276 | | | 05/01/36 | | | 2,072 | |
| | 540,000 | | | | | Lavaca-Navidad River Authority | | | | | 3.850 | | | 08/01/26 | | | 553 | |
| | 6,430,000 | | | | | Lavaca-Navidad River Authority | | | | | 4.430 | | | 08/01/35 | | | 6,582 | |
| | 3,725,000 | | | | | Maryland Community Development Administration Housing Revenue | | | 3.797 | | | 03/01/39 | | | 3,513 | |
| | 185,000 | | | | | Massachusetts Housing Finance Agency | | | | | 4.782 | | | 12/01/20 | | | 188 | |
| | 4,650,000 | | | | | Massachusetts St. Water Pollution Abatement | | | | | 5.192 | | | 08/01/40 | | | 5,156 | |
| | 3,500,000 | | | | | Metropolitan Council | | | | | 1.750 | | | 09/01/20 | | | 3,446 | |
| | 5,000,000 | | | | | Metropolitan Water District of Southern California | | | | | 6.250 | | | 07/01/39 | | | 5,085 | |
| | 8,000,000 | | | | | Michigan Finance Authority | | | | | 5.000 | | | 07/01/22 | | | 8,778 | |
| | 500,000 | | | | | Michigan Finance Authority | | | | | 5.000 | | | 07/01/22 | | | 542 | |
| | 8,945,000 | | | | | Michigan Finance Authority | | | | | 5.000 | | | 07/01/22 | | | 9,815 | |
| | 2,500,000 | | | | | Michigan Finance Authority | | | | | 5.000 | | | 07/01/30 | | | 2,764 | |
| | 2,000,000 | | | | | Michigan Finance Authority | | | | | 5.000 | | | 07/01/31 | | | 2,205 | |
COLLEGE RETIREMENT EQUITIES FUND- Social Choice Account
| | | | | | | | REFERENCE | | | | | MATURITY | | VALUE | |
| PRINCIPAL | | | | | ISSUER | | RATE & SPREAD | | RATE | | DATE | | (000) | |
| $ | 8,500,000 | | | | | New Jersey Economic Development Authority | | | | | 4.271 | % | | 06/15/20 | | $ | 8,577 | |
| | 7,400,000 | | | | | New Jersey Economic Development Authority | | | | | 5.706 | | | 06/15/30 | | | 8,398 | |
| | 3,000,000 | | | | | New Jersey Economic Development Authority | | | | | 5.756 | | | 06/15/31 | | | 3,397 | |
| | 3,375,000 | | | | | New Mexico Finance Authority | | | | | 4.090 | | | 06/15/38 | | | 3,431 | |
| | 1,590,000 | | | | | New York State Energy Research & Development Authority | | | | | 2.372 | | | 07/01/19 | | | 1,586 | |
| | 1,285,000 | | | | | New York State Energy Research & Development Authority | | | | | 2.772 | | | 07/01/20 | | | 1,286 | |
| | 1,590,000 | | | | | New York State Energy Research & Development Authority | | | | | 3.206 | | | 07/01/22 | | | 1,614 | |
| | 995,000 | | | | | New York State Environmental Facilities Corp | | | | | 2.005 | | | 06/15/19 | | | 991 | |
| | 1,255,000 | | | | | New York State Environmental Facilities Corp | | | | | 3.045 | | | 06/15/24 | | | 1,265 | |
| | 1,225,000 | | | | | New York State Environmental Facilities Corp | | | | | 3.195 | | | 06/15/25 | | | 1,240 | |
| | 2,120,000 | | | | | New York State Environmental Facilities Corp | | | | | 3.520 | | | 07/15/27 | | | 2,173 | |
| | 17,500,000 | | | | | New York Transportation Development Corp | | | | | 5.000 | | | 01/01/26 | | | 19,670 | |
| | 4,750,000 | | | | | Northern California Power Agency | | | | | 4.320 | | | 07/01/24 | | | 4,907 | |
| | 4,760,000 | | | | | Ohio State Water Development Authority | | | | | 4.879 | | | 12/01/34 | | | 5,229 | |
| | 700,000 | | | | | Oklahoma Water Resources Board | | | | | 3.071 | | | 04/01/22 | | | 707 | |
| | 13,250,000 | | | g | | Oregon State Business Development Commission | | | | | 6.500 | | | 04/01/31 | | | 13,084 | |
| | 2,500,000 | | | | | Palm Beach County Solid Waste Authority | | | | | 2.636 | | | 10/01/24 | | | 2,458 | |
| | 1,000,000 | | | | | Pend Oreille County Public Utility District No Box Canyon | | | | | 3.037 | | | 01/01/19 | | | 1,000 | |
| | 1,070,000 | | | | | Pend Oreille County Public Utility District No Box Canyon | | | | | 3.621 | | | 01/01/21 | | | 1,067 | |
| | 4,500,000 | | | | | Pend Oreille County Public Utility District No Box Canyon | | | | | 5.000 | | | 01/01/30 | | | 4,589 | |
| | 1,000,000 | | | | | Sacramento Area Flood Control Agency | | | | | 2.699 | | | 10/01/22 | | | 987 | |
| | 435,000 | | | | | San Francisco City & County Redevelopment Agency | | | | | 3.113 | | | 08/01/22 | | | 436 | |
| | 2,000,000 | | | | | San Francisco City & County Redevelopment Agency | | | | | 4.375 | | | 08/01/44 | | | 2,017 | |
| | 2,920,000 | | | | | South Dakota Conservancy District | | | | | 1.898 | | | 08/01/19 | | | 2,907 | |
| | 38,830,000 | | | | | State of California | | | | | 3.750 | | | 10/01/37 | | | 39,594 | |
| | 11,565,000 | | | | | State of California | | | | | 4.600 | | | 04/01/38 | | | 11,928 | |
| | 10,050,000 | | | | | State of California | | | | | 4.988 | | | 04/01/39 | | | 10,690 | |
| | 2,000,000 | | | | | State of California | | | | | 2.193 | | | 04/01/47 | | | 1,986 | |
| | 4,400,000 | | | i | | State of California | | LIBOR 1 M + 0.780% | | | 3.127 | | | 04/01/47 | | | 4,424 | |
| | 10,500,000 | | | | | State of Illinois | | | | | 5.000 | | | 02/01/19 | | | 10,521 | |
| | 9,800,000 | | | | | State of Illinois | | | | | 5.000 | | | 02/01/20 | | | 10,015 | |
| | 8,000,000 | | | | | State of Illinois | | | | | 5.000 | | | 02/01/22 | | | 8,368 | |
| | 9,000,000 | | | | | State of Illinois | | | | | 5.520 | | | 04/01/38 | | | 8,449 | |
| | 1,500,000 | | | | | State of Louisiana | | | | | 1.769 | | | 08/01/20 | | | 1,479 | |
| | 4,505,000 | | | | | State of Michigan | | | | | 3.375 | | | 12/01/20 | | | 4,553 | |
| | 4,405,000 | | | | | State of Michigan | | | | | 3.590 | | | 12/01/26 | | | 4,493 | |
| | 2,500,000 | | | | | State of Ohio | | | | | 5.412 | | | 09/01/28 | | | 2,951 | |
| | 2,500,000 | | | | | State of Texas | | | | | 2.749 | | | 10/01/23 | | | 2,495 | |
| | 5,000,000 | | | | | State of Texas | | | | | 6.072 | | | 10/01/29 | | | 5,120 | |
| | 2,025,000 | | | | | State of Texas | | | | | 3.576 | | | 08/01/34 | | | 2,009 | |
| | 3,370,000 | | | | | State of Texas | | | | | 3.726 | | | 08/01/43 | | | 3,373 | |
| | 3,000 | | | | | State of Wisconsin | | | | | 5.700 | | | 05/01/26 | | | 3 | |
| | 4,000,000 | | | | | Suffolk County Water Authority | | | | | 4.000 | | | 06/01/39 | | | 4,142 | |
| | 1,650,000 | | | | | Syracuse Industrial Development Agency | | | | | 5.000 | | | 01/01/36 | | | 1,604 | |
| | 2,280,000 | | | | | Tampa Bay Water | | | | | 2.612 | | | 10/01/25 | | | 2,208 | |
| | 3,225,000 | | | | | Tampa Bay Water | | | | | 2.782 | | | 10/01/26 | | | 3,142 | |
| | 3,000,000 | | | | | Tampa Bay Water | | | | | 2.952 | | | 10/01/27 | | | 2,947 | |
| | 1,255,000 | | | | | Texas Water Development Board | | | | | 4.248 | | | 10/15/35 | | | 1,296 | |
| | 5,880,000 | | | | | Texas Water Development Board | | | | | 4.340 | | | 10/15/48 | | | 5,976 | |
COLLEGE RETIREMENT EQUITIES FUND- Social Choice Account
| | | | | | | | REFERENCE | | | | | MATURITY | | VALUE | |
| PRINCIPAL | | | | | ISSUER | | RATE & SPREAD | | RATE | | DATE | | (000) | |
| $ | 4,170,000 | | | | | Texas Water Development Board | | | | | 4.648 | % | | 04/15/50 | | $ | 4,358 | |
| | 5,000,000 | | | | | Tuolumne Wind Project Authority | | | | | 6.918 | | | 01/01/34 | | | 6,157 | |
| | 3,035,000 | | | | | University of California | | | | | 3.809 | | | 05/15/28 | | | 3,106 | |
| | 11,400,000 | | | | | University of California | | | | | 4.009 | | | 05/15/30 | | | 11,792 | |
| | 1,000,000 | | | | | University of Cincinnati | | | | | 3.250 | | | 06/01/29 | | | 1,012 | |
| | 1,560,000 | | | | | University of Cincinnati | | | | | 3.650 | | | 06/01/34 | | | 1,576 | |
| | 1,615,000 | | | | | University of Cincinnati | | | | | 3.700 | | | 06/01/35 | | | 1,634 | |
| | 18,000,000 | | | | | University of New Mexico | | | | | 3.532 | | | 06/20/32 | | | 18,072 | |
| | 17,500,000 | | | | | University of Virginia | | | | | 3.570 | | | 04/01/45 | | | 17,148 | |
| 5,000,000 | | | | | Vermont Educational & Health Buildings Financing Agency | | | | 4.000 | | | 12/01/42 | | | 5,087 |
| | 3,000,000 | | | | | Vermont Educational & Health Buildings Financing Agency | | | | 4.000 | | | 12/01/46 | | | 3,044 |
| | 1,000,000 | | | | | Washington County Clean Water Services | | | | | 5.078 | | | 10/01/24 | | | 1,101 | |
| | 695,000 | | | | | Water Works Board of the City of Birmingham | | | | | 1.509 | | | 01/01/19 | | | 695 | |
| | 2,470,000 | | | | | Water Works Board of the City of Birmingham | | | | | 1.788 | | | 01/01/20 | | | 2,439 | |
| | 3,750,000 | | | | | Water Works Board of the City of Birmingham | | | | | 1.988 | | | 01/01/21 | | | 3,674 | |
| | 3,100,000 | | | | | Water Works Board of the City of Birmingham | | | | | 2.192 | | | 01/01/22 | | | 3,025 | |
| | 600,000 | | | | | West Virginia Water Development Authority | | | | | 5.000 | | | 11/01/21 | | | 648 | |
| | 1,345,000 | | | | | West Virginia Water Development Authority | | | | | 5.000 | | | 11/01/22 | | | 1,485 | |
| | 1,000,000 | | | | | West Virginia Water Development Authority | | | | | 5.000 | | | 11/01/23 | | | 1,128 | |
| | | | | | | TOTAL MUNICIPAL BONDS | | | | | | | | | | | 670,298 | |
| | | | | | | | | | | | | | | | | | | |
| U.S. TREASURY SECURITIES - 2.6% | | | | | | | | | | | | |
| | 6,000,000 | | | | | United States Treasury Bond | | | | | 3.125 | | | 02/15/43 | | | 6,131 | |
| | 1,000,000 | | | | | United States Treasury Bond | | | | | 3.375 | | | 05/15/44 | | | 1,067 | |
| | 66,090,000 | | | | | United States Treasury Bond | | | | | 2.875 | | | 11/15/46 | | | 64,376 | |
| | 88,925,000 | | | | | United States Treasury Bond | | | | | 3.000 | | | 05/15/47 | | | 88,700 | |
| | 16,440,000 | | | | | United States Treasury Bond | | | | | 3.125 | | | 05/15/48 | | | 16,781 | |
| | 5,000,000 | | | | | United States Treasury Bond | | | | | 3.000 | | | 08/15/48 | | | 4,985 | |
| | 2,750,000 | | | | | United States Treasury Note | | | | | 1.250 | | | 04/30/19 | | | 2,739 | |
| | 5,750,000 | | | | | United States Treasury Note | | | | | 1.625 | | | 03/15/20 | | | 5,686 | |
| | 1,000,000 | | | | | United States Treasury Note | | | | | 2.875 | | | 10/31/20 | | | 1,006 | |
| | 13,285,000 | | | | | United States Treasury Note | | | | | 1.375 | | | 05/31/21 | | | 12,941 | |
| | 3,060,000 | | | | | United States Treasury Note | | | | | 2.625 | | | 12/15/21 | | | 3,073 | |
| | 4,150,000 | | | | | United States Treasury Note | | | | | 2.000 | | | 07/31/22 | | | 4,082 | |
| | 4,500,000 | | | | | United States Treasury Note | | | | | 1.750 | | | 09/30/22 | | | 4,381 | |
| | 12,234,500 | | | | | United States Treasury Note | | | | | 1.625 | | | 11/15/22 | | | 11,844 | |
| | 42,880,000 | | | | | United States Treasury Note | | | | | 2.875 | | | 09/30/23 | | | 43,575 | |
| | 11,700,000 | | | | | United States Treasury Note | | | | | 2.875 | | | 10/31/23 | | | 11,894 | |
| | 5,000,000 | | | | | United States Treasury Note | | | | | 2.875 | | | 11/30/23 | | | 5,087 | |
| | 1,525,000 | | | | | United States Treasury Note | | | | | 2.250 | | | 10/31/24 | | | 1,500 | |
| | 21,350,000 | | | | | United States Treasury Note | | | | | 2.125 | | | 11/30/24 | | | 20,841 | |
| | 5,560,000 | | | | | United States Treasury Note | | | | | 2.750 | | | 06/30/25 | | | 5,618 | |
| | 8,290,000 | | | | | United States Treasury Note | | | | | 3.000 | | | 10/31/25 | | | 8,508 | |
| | 5,000,000 | | | | | United States Treasury Note | | | | | 2.875 | | | 11/30/25 | | | 5,092 | |
| | 5,350,000 | | | | | United States Treasury Note | | | | | 3.125 | | | 11/15/28 | | | 5,553 | |
| | | | | | | TOTAL U.S. TREASURY SECURITIES | | | | | | | | | | | 335,460 | |
| | | | | | | | | | | | | | | | | | | |
| | | | | | | TOTAL GOVERNMENT BONDS | | | | | | | | | | | 2,895,970 | |
| | | | | | | (Cost $2,903,462) | | | | | | | | | | | | |
| | | | | | | | | | | | | | | | | | | |
| STRUCTURED ASSETS - 4.5% | | | | | | | | | | | | |
| | | | | | | | | | | | | | | | | | | |
| ASSET BACKED - 1.8% | | | | | | | | | | | | |
| | 1,500,000 | | | i | | Bayview Financial Mortgage Pass-Through Trust | | LIBOR 1 M + 0.650% | | | 3.156 | | | 02/28/41 | | | 1,461 | |
| | | | | | | Series - 2006 A (Class M3) | | | | | | | | | | | | |
COLLEGE RETIREMENT EQUITIES FUND- Social Choice Account
| | | | | | | | REFERENCE | | | | | MATURITY | | VALUE | |
| PRINCIPAL | | | | | ISSUER | | RATE & SPREAD | | RATE | | DATE | | (000) | |
| $ | 100,000 | | | i | | Bear Stearns Asset Backed Securities Trust | | LIBOR 1 M + 0.670% | | | 3.176 | % | | 04/25/36 | | $ | 99 | |
| | | | | | | Series - 2006 SD1 (Class M1) | | | | | | | | | | | | |
| | 4,000,000 | | | g | | Capital Automotive REIT | | | | | 3.660 | | | 10/15/44 | | | 3,987 | |
| | | | | | | Series - 2014 1A (Class A) | | | | | | | | | | | | |
| | 3,933,333 | | | g | | Capital Automotive REIT | | | | | 3.870 | | | 04/15/47 | | | 3,933 | |
| | | | | | | Series - 2017 1A (Class A1) | | | | | | | | | | | | |
| | 694,974 | | | i | | C-BASS Trust | | LIBOR 1 M + 0.080% | | | 2.586 | | | 07/25/36 | | | 681 | |
| | | | | | | Series - 2006 CB6 (Class A1) | | | | | | | | | | | | |
| | 4,001,302 | | | i | | Chase Funding Loan Acquisition Trust | | LIBOR 1 M + 0.855% | | | 3.361 | | | 06/25/34 | | | 3,882 | |
| | | | | | | Series - 2004 OPT1 (Class M1) | | | | | | | | | | | | |
| | 2,970,000 | | | g | | DB Master Finance LLC | | | | | 3.629 | | | 11/20/47 | | | 2,870 | |
| | | | | | | Series - 2017 1A (Class A2I) | | | | | | | | | | | | |
| | 877,500 | | | g | | Domino’s Pizza Master Issuer LLC | | | | | 4.474 | | | 10/25/45 | | | 886 | |
| | | | | | | Series - 2015 1A (Class A2II) | | | | | | | | | | | | |
| | 11,948,750 | | | g | | Domino’s Pizza Master Issuer LLC | | | | | 3.082 | | | 07/25/47 | | | 11,642 | |
| | | | | | | Series - 2017 1A (Class A2II) | | | | | | | | | | | | |
| | 1,592,000 | | | g | | Domino’s Pizza Master Issuer LLC | | | | | 4.116 | | | 07/25/48 | | | 1,571 | |
| | | | | | | Series - 2018 1A (Class A2I) | | | | | | | | | | | | |
| | 8,175,747 | | | †,g | | HERO Funding Trust | | | | | 3.840 | | | 09/21/40 | | | 8,297 | |
| | | | | | | Series - 2015 1A (Class A) | | | | | | | | | | | | |
| | 2,029,687 | | | †,g | | HERO Funding Trust | | | | | 3.990 | | | 09/21/40 | | | 2,060 | |
| | | | | | | Series - 2014 2A (Class A) | | | | | | | | | | | | |
| | 3,961,349 | | | g | | HERO Funding Trust | | | | | 3.750 | | | 09/20/41 | | | 4,011 | |
| | | | | | | Series - 2016 2A (Class A) | | | | | | | | | | | | |
| | 3,786,289 | | | g | | HERO Funding Trust | | | | | 4.050 | | | 09/20/41 | | | 3,929 | |
| | | | | | | Series - 2016 1A (Class A) | | | | | | | | | | | | |
| | 1,466,769 | | | g | | HERO Funding Trust | | | | | 3.080 | | | 09/20/42 | | | 1,435 | |
| | | | | | | Series - 2016 3A (Class A1) | | | | | | | | | | | | |
| | 9,383,401 | | | g | | HERO Funding Trust | | | | | 3.710 | | | 09/20/47 | | | 9,463 | |
| | | | | | | Series - 2017 1A (Class A1) | | | | | | | | | | | | |
| | 9,879,913 | | | g | | HERO Funding Trust | | | | | 3.190 | | | 09/20/48 | | | 9,778 | |
| | | | | | | Series - 2017 3A (Class A1) | | | | | | | | | | | | |
| | 2,351,591 | | | g | | HERO Funding Trust | | | | | 3.280 | | | 09/20/48 | | | 2,353 | |
| | | | | | | Series - 2017 2A (Class A1) | | | | | | | | | | | | |
| | 10,855,367 | | | g | | HERO Funding Trust | | | | | 4.670 | | | 09/20/48 | | | 11,300 | |
| | | | | | | Series - 2018 1A (Class A2) | | | | | | | | | | | | |
| | 760,329 | | | †,g | | HERO Residual Funding | | | | | 4.500 | | | 09/21/42 | | | 757 | |
| | | | | | | Series - 2016 1R (Class A1) | | | | | | | | | | | | |
| | 2,800,000 | | | g | | Houston Galleria Mall Trust | | | | | 3.087 | | | 03/05/37 | | | 2,713 | |
| | | | | | | Series - 2015 HGLR (Class A1A2) | | | | | | | | | | | | |
| | 1,157,131 | | | i | | Morgan Stanley ABS Capital I, Inc Trust | | LIBOR 1 M + 1.050% | | | 3.266 | | | 12/27/33 | | | 1,151 | |
| | | | | | | Series - 2004 NC1 (Class M1) | | | | | | | | | | | | |
| | 7,393,007 | | | g | | Mosaic Solar Loans LLC | | | | | 3.820 | | | 06/22/43 | | | 7,438 | |
| | | | | | | Series - 2017 2A (Class A) | | | | | | | | | | | | |
| | 2,675,793 | | | g | | MVW Owner Trust | | | | | 2.420 | | | 12/20/34 | | | 2,622 | |
| | | | | | | Series - 2017 1A (Class A) | | | | | | | | | | | | |
| | 6,457,823 | | | g,i | | Navient Student Loan Trust | | LIBOR 1 M + 0.250% | | | 2.756 | | | 06/27/67 | | | 6,445 | |
| | | | | | | Series - 2018 4A (Class A1) | | | | | | | | | | | | |
| | 5,138,629 | | | g | | Renew | | | | | 3.670 | | | 09/20/52 | | | 5,170 | |
| | | | | | | Series - 2017 1A (Class A) | | | | | | | | | | | | |
| | 11,771,383 | | | g | | Renew | | | | | 3.950 | | | 09/20/53 | | | 11,964 | |
| | | | | | | Series - 2018 1 (Class A) | | | | | | | | | | | | |
| | 289,825 | | | | | Santander Drive Auto Receivables Trust | | | | | 2.740 | | | 12/15/21 | | | 289 | |
| | | | | | | Series - 2015 5 (Class C) | | | | | | | | | | | | |
COLLEGE RETIREMENT EQUITIES FUND- Social Choice Account
| | | | | | | | REFERENCE | | | | | MATURITY | | VALUE | |
| PRINCIPAL | | | | | ISSUER | | RATE & SPREAD | | RATE | | DATE | | (000) | |
| $ | 417,100 | | | g | | Sierra Timeshare Receivables Funding LLC | | | | | 2.580 | % | | 09/20/32 | | $ | 413 | |
| | | | | | | Series - 2015 3A (Class A) | | | | | | | | | | | | |
| | 295,118 | | | g | | Sierra Timeshare Receivables Funding LLC | | | | | 3.080 | | | 09/20/32 | | | 294 | |
| | | | | | | Series - 2015 3A (Class B) | | | | | | | | | | | | |
| | 4,905,488 | | | g | | SolarCity LMC | | | | | 4.590 | | | 04/20/44 | | | 4,968 | |
| | | | | | | Series - 2014 1 (Class A) | | | | | | | | | | | | |
| | 24,387,159 | | | g | | SolarCity LMC | | | | | 4.020 | | | 07/20/44 | | | 24,253 | |
| | | | | | | Series - 2014 2 (Class A) | | | | | | | | | | | | |
| | 4,798,915 | | | g | | SolarCity LMC | | | | | 4.800 | | | 09/20/48 | | | 4,895 | |
| | | | | | | Series - 2016 A (Class A) | | | | | | | | | | | | |
| | 2,370,955 | | | g | | SpringCastle America Funding LLC | | | | | 3.050 | | | 04/25/29 | | | 2,348 | |
| | | | | | | Series - 2016 AA (Class A) | | | | | | | | | | | | |
| | 2,636,157 | | | i | | Structured Asset Securities Corp Mortgage Loan Trust | | LIBOR 1 M + 1.500% | | | 3.849 | | | 04/25/35 | | | 2,560 | |
| | | | | | | Series - 2005 7XS (Class 2A1A) | | | | | | | | | | | | |
| | 3,000,000 | | | g | | Sunrun Athena Issuer LLC | | | | | 5.310 | | | 04/30/49 | | | 3,003 | |
| | | | | | | Series - 2018 1 (Class A) | | | | | | | | | | | | |
| | 11,759,269 | | | g | | TES LLC | | | | | 4.330 | | | 10/20/47 | | | 11,846 | |
| | | | | | | Series - 2017 1A (Class A) | | | | | | | | | | | | |
| | 2,500,000 | | | g | | TES LLC | | | | | 7.740 | | | 10/20/47 | | | 2,566 | |
| | | | | | | Series - 2017 1A (Class B) | | | | | | | | | | | | |
| | 9,766,445 | | | g | | TES LLC | | | | | 4.120 | | | 02/20/48 | | | 9,497 | |
| | | | | | | Series - 2017 2A (Class A) | | | | | | | | | | | | |
| | 10,146,138 | | | g | | Tesla Auto Lease Trust | | | | | 2.320 | | | 12/20/19 | | | 10,118 | |
| | | | | | | Series - 2018 A (Class A) | | | | | | | | | | | | |
| | 4,760,000 | | | g | | Tesla Auto Lease Trust | | | | | 3.710 | | | 08/20/21 | | | 4,771 | |
| | | | | | | Series - 2018 B (Class A) | | | | | | | | | | | | |
| | 5,826,120 | | | | | Toyota Auto Receivables Owner Trust | | | | | 1.300 | | | 04/15/20 | | | 5,795 | |
| | | | | | | Series - 2016 B (Class A3) | | | | | | | | | | | | |
| | 8,940,605 | | | | | Toyota Auto Receivables Owner Trust | | | | | 1.740 | | | 09/15/20 | | | 8,928 | |
| | | | | | | Series - 2015 B (Class A4) | | | | | | | | | | | | |
| | 14,978,802 | | | g | | Vivint Colar Financing V LLC | | | | | 4.730 | | | 04/30/48 | | | 15,371 | |
| | | | | | | Series - 2018 1A (Class A) | | | | | | | | | | | | |
| | 264,647 | | | g | | Wachovia Amortization Controlled Heloc NIM | | | | | 5.683 | | | 08/12/47 | | | 262 | |
| | | | | | | Series - 2006 N1 (Class N1) | | | | | | | | | | | | |
| | 82,556 | | | g,i | | Wachovia Loan Trust | | LIBOR 1 M + 0.360% | | | 2.866 | | | 05/25/35 | | | 83 | |
| | | | | | | Series - 2005 SD1 (Class A) | | | | | | | | | | | | |
| | 2,970,000 | | | g | | Wendys Funding LLC | | | | | 3.573 | | | 03/15/48 | | | 2,846 | |
| | | | | | | Series - 2018 1A (Class A2I) | | | | | | | | | | | | |
| | | | | | | TOTAL ASSET BACKED | | | | | | | | | | | 237,004 | |
| | | | | | | | | | | | | | | | | | | |
| OTHER MORTGAGE BACKED - 2.7% | | | | | | | | | | | | |
| | 2,015,000 | | | g,i | | 20 TSQ GroundCo LLC | | | | | 3.100 | | | 05/15/35 | | | 1,969 | |
| | | | | | | Series - 2018 20TS (Class B) | | | | | | | | | | | | |
| | 672,726 | | | g,i | | Agate Bay Mortgage Trust | | | | | 3.500 | | | 09/25/45 | | | 654 | |
| | | | | | | Series - 2015 6 (Class A9) | | | | | | | | | | | | |
| | 2,000,000 | | | †,g,i | | Banc of America Commercial Mortgage Trust | | | | | 6.038 | | | 02/10/51 | | | 749 | |
| | | | | | | Series - 2007 5 (Class B) | | | | | | | | | | | | |
| | 4,864,685 | | | g,i | | Bancorp Commercial Mortgage Trust | | LIBOR 1 M + 0.900% | | | 3.355 | | | 09/15/35 | | | 4,856 | |
| | | | | | | Series - 2018 CRE4 (Class A) | | | | | | | | | | | | |
| | 12,500,000 | | | g | | BBCMS Trust | | | | | 3.593 | | | 09/15/32 | | | 12,621 | |
| | | | | | | Series - 2015 MSQ (Class A) | | | | | | | | | | | | |
| | 6,000,000 | | | g | | BBCMS Trust | | | | | 3.894 | | | 09/15/32 | | | 6,026 | |
| | | | | | | Series - 2015 MSQ (Class B) | | | | | | | | | | | | |
COLLEGE RETIREMENT EQUITIES FUND- Social Choice Account
| | | | | | | | REFERENCE | | | | | MATURITY | | VALUE | |
| PRINCIPAL | | | | | ISSUER | | RATE & SPREAD | | RATE | | DATE | | (000) | |
| $ | 5,440,000 | | | g,i | | BBCMS Trust | | | | | 4.267 | % | | 08/05/38 | | $ | 4,766 | |
| | | | | | | Series - 2018 CHRS (Class E) | | | | | | | | | | | | |
| | 4,000,000 | | | g | | BWAY Mortgage Trust | | | | | 2.917 | | | 01/10/35 | | | 3,877 | |
| | | | | | | Series - 2015 1740 (Class A) | | | | | | | | | | | | |
| | 2,000,000 | | | i | | CD Commercial Mortgage Trust | | | | | 3.879 | | | 11/10/49 | | | 1,960 | |
| | | | | | | Series - 2016 CD2 (Class B) | | | | | | | | | | | | |
| | 5,000,000 | | | g,i | | Cityline Commercial Mortgage Trust | | | | | 2.778 | | | 11/10/31 | | | 4,898 | |
| | | | | | | Series - 2016 CLNE (Class A) | | | | | | | | | | | | |
| | 2,750,000 | | | g,i | | COMM Mortgage Trust | | | | | 3.413 | | | 10/10/29 | | | 2,691 | |
| | | | | | | Series - 2017 PANW (Class B) | | | | | | | | | | | | |
| | 7,500,000 | | | g,i | | COMM Mortgage Trust | | | | | 3.538 | | | 10/10/29 | | | 7,390 | |
| | | | | | | Series - 2017 PANW (Class C) | | | | | | | | | | | | |
| | 8,811,000 | | | g | | COMM Mortgage Trust | | | | | 3.544 | | | 03/10/31 | | | 9,028 | |
| | | | | | | Series - 2013 WWP (Class C) | | | | | | | | | | | | |
| | 925,000 | | | g,i | | COMM Mortgage Trust | | | | | 4.793 | | | 08/10/46 | | | 961 | |
| | | | | | | Series - 2013 CR10 (Class B) | | | | | | | | | | | | |
| | 3,000,000 | | | i | | COMM Mortgage Trust | | | | | 4.252 | | | 05/10/48 | | | 2,765 | |
| | | | | | | Series - 2015 CR23 (Class D) | | | | | | | | | | | | |
| | 2,500,000 | | | i | | COMM Mortgage Trust | | | | | 3.463 | | | 08/10/48 | | | 2,120 | |
| | | | | | | Series - 2015 CR24 (Class D) | | | | | | | | | | | | |
| | 3,390,000 | | | i | | Connecticut Avenue Securities | | LIBOR 1 M + 2.600% | | | 5.106 | | | 05/25/24 | | | 3,551 | |
| | | | | | | Series - 2014 C02 (Class 1M2) | | | | | | | | | | | | |
| | 2,996,149 | | | i | | Connecticut Avenue Securities | | LIBOR 1 M + 3.000% | | | 5.506 | | | 07/25/24 | | | 3,150 | |
| | | | | | | Series - 2014 C03 (Class 1M2) | | | | | | | | | | | | |
| | 5,000,000 | | | i | | Connecticut Avenue Securities | | LIBOR 1 M + 4.250% | | | 6.756 | | | 01/25/29 | | | 5,536 | |
| | | | | | | Series - 2016 C04 (Class 1M2) | | | | | | | | | | | | |
| | 2,250,000 | | | i | | Connecticut Avenue Securities | | LIBOR 1 M + 4.450% | | | 6.956 | | | 01/25/29 | | | 2,455 | |
| | | | | | | Series - 2016 C05 (Class 2M2) | | | | | | | | | | | | |
| | 1,910,068 | | | i | | Connecticut Avenue Securities | | LIBOR 1 M + 0.950% | | | 3.456 | | | 10/25/29 | | | 1,912 | |
| | | | | | | Series - 2017 C03 (Class 1M1) | | | | | | | | | | | | |
| | 693,232 | | | i | | Connecticut Avenue Securities | | LIBOR 1 M + 0.850% | | | 3.356 | | | 11/25/29 | | | 693 | |
| | | | | | | Series - 2017 C04 (Class 2M1) | | | | | | | | | | | | |
| | 1,783,914 | | | i | | Connecticut Avenue Securities | | LIBOR 1 M + 0.600% | | | 3.106 | | | 07/25/30 | | | 1,778 | |
| | | | | | | Series - 2018 C01 (Class 1M1) | | | | | | | | | | | | |
| | 6,000,000 | | | i | | Connecticut Avenue Securities | | LIBOR 1 M + 2.200% | | | 3.965 | | | 08/25/30 | | | 5,838 | |
| | | | | | | Series - 2018 C02 (Class 2M2) | | | | | | | | | | | | |
| | 2,533,561 | | | i | | Connecticut Avenue Securities | | LIBOR 1 M + 0.680% | | | 3.186 | | | 10/25/30 | | | 2,527 | |
| | | | | | | Series - 2018 C03 (Class 1M1) | | | | | | | | | | | | |
| | 288,748 | | | i | | Connecticut Avenue Securities | | LIBOR 1 M + 0.750% | | | 3.256 | | | 12/25/30 | | | 289 | |
| | | | | | | Series - 2018 C04 (Class 2M1) | | | | | | | | | | | | |
| | 4,831,438 | | | i | | Connecticut Avenue Securities | | LIBOR 1 M + 0.720% | | | 3.226 | | | 01/25/31 | | | 4,820 | |
| | | | | | | Series - 2018 C05 (Class 1M1) | | | | | | | | | | | | |
| | 982,665 | | | g,i | | Connecticut Avenue Securities | | LIBOR 1 M + 0.750% | | | 3.256 | | | 04/25/31 | | | 981 | |
| | | | | | | Series - 2018 R07 (Class 1M1) | | | | | | | | | | | | |
| | 2,000,000 | | | g | | Credit Suisse Mortgage Capital Certificates | | | | | 5.626 | | | 05/15/23 | | | 2,035 | |
| | | | | | | Series - 2006 OMA (Class D) | | | | | | | | | | | | |
| | 8,750,000 | | | g,i | | CSAIL Commercial Mortgage Trust | | | | | 3.677 | | | 06/15/37 | | | 8,702 | |
| | | | | | | Series - 2017 C8 (Class 85BB) | | | | | | | | | | | | |
| | 6,650,000 | | | g,i | | CSAIL Commercial Mortgage Trust | | | | | 3.677 | | | 06/15/37 | | | 6,652 | |
| | | | | | | Series - 2017 C8 (Class 85BA) | | | | | | | | | | | | |
| | 5,000,000 | | | g,i | | CSMC Trust | | | | | 3.728 | | | 11/10/32 | | | 5,009 | |
| | | | | | | Series - 2017 CALI (Class B) | | | | | | | | | | | | |
| | 4,065,316 | | | g,i | | CSMC Trust | | | | | 3.500 | | | 02/25/48 | | | 3,923 | |
| | | | | | | Series - 2018 J1 (Class A11) | | | | | | | | | | | | |
| | 1,715,000 | | | g,i | | DBUBS Mortgage Trust | | | | | 5.698 | | | 11/10/46 | | | 1,790 | |
| | | | | | | Series - 2011 LC1A (Class C) | | | | | | | | | | | | |
COLLEGE RETIREMENT EQUITIES FUND- Social Choice Account
| | | | | | | | REFERENCE | | | | | MATURITY | | VALUE | |
| PRINCIPAL | | | | | ISSUER | | RATE & SPREAD | | RATE | | DATE | | (000) | |
| $ | 18,500,000 | | | i | | Federal National Mortgage Association (FNMA) | | | | | 2.785 | % | | 02/25/27 | | $ | 17,859 | |
| | | | | | | Series - 2017 M2 (Class A2) | | | | | | | | | | | | |
| | 3,500,000 | | | i | | Federal National Mortgage Association (FNMA) | | | | | 3.325 | | | 06/25/28 | | | 3,481 | |
| | | | | | | Series - 2018 M8 (Class A2) | | | | | | | | | | | | |
| | 6,926,995 | | | g,i | | Flagstar Mortgage Trust | | | | | 4.000 | | | 05/25/48 | | | 6,934 | |
| | | | | | | Series - 2018 3INV (Class A3) | | | | | | | | | | | | |
| | 1,454,170 | | | g,i | | Flagstar Mortgage Trust | | | | | 4.000 | | | 09/25/48 | | | 1,438 | |
| | | | | | | Series - 2018 5 (Class A11) | | | | | | | | | | | | |
| | 3,660,000 | | | i | | GMAC Commercial Mortgage Securities, Inc | | | | | 4.984 | | | 12/10/41 | | | 3,654 | |
| | | | | | | Series - 2004 C3 (Class C) | | | | | | | | | | | | |
| | 10,000,000 | | | g | | GRACE Mortgage Trust | | | | | 3.369 | | | 06/10/28 | | | 10,026 | |
| | | | | | | Series - 2014 GRCE (Class A) | | | | | | | | | | | | |
| | 2,535,000 | | | g,i | | GS Mortgage Securities Corp II | | | | | 5.181 | | | 12/10/43 | | | 2,609 | |
| | | | | | | Series - 2010 C2 (Class B) | | | | | | | | | | | | |
| | 4,500,000 | | | g,i | | GS Mortgage Securities Trust | | LIBOR 1 M + 1.090% | | | 3.545 | | | 10/15/31 | | | 4,497 | |
| | | | | | | Series - 2018 HART (Class A) | | | | | | | | | | | | |
| | 1,488,890 | | | i | | HarborView Mortgage Loan Trust | | LIBOR 1 M + 0.620% | | | 3.090 | | | 08/19/45 | | | 1,475 | |
| | | | | | | Series - 2005 11 (Class 2A1A) | | | | | | | | | | | | |
| | 6,000,000 | | | g | | Hudson Yards Mortgage Trust | | | | | 2.835 | | | 08/10/38 | | | 5,690 | |
| | | | | | | Series - 2016 10HY (Class A) | | | | | | | | | | | | |
| | 5,000,000 | | | g,i | | Hudson Yards Mortgage Trust | | | | | 2.977 | | | 08/10/38 | | | 4,730 | |
| | | | | | | Series - 2016 10HY (Class B) | | | | | | | | | | | | |
| | 5,000,000 | | | g,i | | Hudson Yards Mortgage Trust | | | | | 2.977 | | | 08/10/38 | | | 4,677 | |
| | | | | | | Series - 2016 10HY (Class C) | | | | | | | | | | | | |
| | 344,676 | | | i | | Impac CMB Trust | | LIBOR 1 M + 0.660% | | | 3.166 | | | 03/25/35 | | | 335 | |
| | | | | | | Series - 2004 11 (Class 2A1) | | | | | | | | | | | | |
| | 3,025,000 | | | g,i | | JP Morgan Chase Commercial Mortgage Securities Trust | | | | | 5.398 | | | 07/15/46 | | | 3,145 | |
| | | | | | | Series - 2011 C4 (Class C) | | | | | | | | | | | | |
| | 9,665,426 | | | i | | JP Morgan Mortgage Acquisition Trust | | LIBOR 1 M + 0.160% | | | 2.666 | | | 06/25/37 | | | 9,440 | |
| | | | | | | Series - 2007 CH5 (Class A1) | | | | | | | | | | | | |
| | 1,696,066 | | | g,i | | JP Morgan Mortgage Trust | | | | | 3.303 | | | 12/25/44 | | | 1,691 | |
| | | | | | | Series - 2015 1 (Class B1) | | | | | | | | | | | | |
| | 599,004 | | | g,i | | JP Morgan Mortgage Trust | | | | | 3.500 | | | 05/25/45 | | | 582 | |
| | | | | | | Series - 2015 3 (Class A19) | | | | | | | | | | | | |
| | 1,048,402 | | | g,i | | JP Morgan Mortgage Trust | | | | | 3.500 | | | 10/25/45 | | | 1,018 | |
| | | | | | | Series - 2015 6 (Class A13) | | | | | | | | | | | | |
| | 1,227,771 | | | g,i | | JP Morgan Mortgage Trust | | | | | 3.500 | | | 05/25/46 | | | 1,192 | |
| | | | | | | Series - 2016 1 (Class A13) | | | | | | | | | | | | |
| | 178,094 | | | g,i | | JP Morgan Mortgage Trust | | | | | 3.500 | | | 01/25/47 | | | 176 | |
| | | | | | | Series - 2017 1 (Class A3) | | | | | | | | | | | | |
| | 1,384,652 | | | g,i | | JP Morgan Mortgage Trust | | | | | 3.500 | | | 05/25/47 | | | 1,349 | |
| | | | | | | Series - 2017 2 (Class A13) | | | | | | | | | | | | |
| | 2,235,727 | | | g,i | | JP Morgan Mortgage Trust | | | | | 3.500 | | | 08/25/47 | | | 2,208 | |
| | | | | | | Series - 2017 3 (Class 1A5) | | | | | | | | | | | | |
| | 477,171 | | | g,i | | JP Morgan Mortgage Trust | | | | | 3.500 | | | 10/25/48 | | | 471 | |
| | | | | | | Series - 2018 5 (Class A5) | | | | | | | | | | | | |
| | 3,345,029 | | | g,i | | JP Morgan Mortgage Trust | | | | | 3.000 | | | 12/25/48 | | | 3,252 | |
| | | | | | | Series - 2017 6 (Class A6) | | | | | | | | | | | | |
| | 2,101,623 | | | g,i | | JP Morgan Mortgage Trust | | | | | 3.500 | | | 12/25/48 | | | 2,075 | |
| | | | | | | Series - 2018 6 (Class 1A3) | | | | | | | | | | | | |
| | 1,604,719 | | | g,i | | JP Morgan Mortgage Trust | | | | | 4.000 | | | 01/25/49 | | | 1,589 | |
| | | | | | | Series - 2018 8 (Class A13) | | | | | | | | | | | | |
| | 2,629,297 | | | g,i | | JP Morgan Mortgage Trust | | | | | 4.000 | | | 02/25/49 | | | 2,618 | |
| | | | | | | Series - 2018 9 (Class A13) | | | | | | | | | | | | |
| | 17,725 | | | i | | LB-UBS Commercial Mortgage Trust | | | | | 6.114 | | | 07/15/40 | | | 18 | |
| | | | | | | Series - 2007 C6 (Class AM) | | | | | | | | | | | | |
COLLEGE RETIREMENT EQUITIES FUND- Social Choice Account
| | | | | | | | REFERENCE | | | | | MATURITY | | VALUE | |
| PRINCIPAL | | | | | ISSUER | | RATE & SPREAD | | RATE | | DATE | | (000) | |
| $ | 4,000,000 | | | g,i | | MAD Mortgage Trust | | | | | 3.366 | % | | 08/15/34 | | $ | 3,939 | |
| | | | | | | Series - 2017 330M (Class B) | | | | | | | | | | | | |
| | 1,242,866 | | | i | | ML-CFC Commercial Mortgage Trust | | | | | 5.526 | | | 03/12/51 | | | 1,246 | |
| | | | | | | Series - 2007 6 (Class AM) | | | | | | | | | | | | |
| | 21,000,000 | | | g | | Morgan Stanley Capital I Trust | | | | | 3.350 | | | 07/13/29 | | | 21,054 | |
| | | | | | | Series - 2014 CPT (Class A) | | | | | | | | | | | | |
| | 27,459 | | | i | | Morgan Stanley Capital I Trust | | | | | 5.389 | | | 11/12/41 | | | 27 | |
| | | | | | | Series - 2006 HQ10 (Class AJ) | | | | | | | | | | | | |
| | 114,886 | | | i | | Morgan Stanley Capital I Trust | | | | | 6.255 | | | 10/15/42 | | | 115 | |
| | | | | | | Series - 2006 IQ11 (Class AJ) | | | | | | | | | | | | |
| | 1,903,019 | | | i | | Morgan Stanley Capital I Trust | | | | | 6.153 | | | 12/12/49 | | | 1,440 | |
| | | | | | | Series - 2007 IQ16 (Class AJFX) | | | | | | | | | | | | |
| | 5,000,000 | | | g,i | | MSDB Trust | | | | | 3.316 | | | 07/11/39 | | | 4,869 | |
| | | | | | | Series - 2017 712F (Class A) | | | | | | | | | | | | |
| | 15,780,000 | | | g,i | | Natixis Commercial Mortgage Securities Trust | | LIBOR 1 M + 0.784% | | | 3.239 | | | 07/15/33 | | | 15,649 | |
| | | | | | | Series - 2018 850T (Class A) | | | | | | | | | | | | |
| | 17,385,000 | | | g | | OBP Depositor LLC Trust | | | | | 4.646 | | | 07/15/45 | | | 17,677 | |
| | | | | | | Series - 2010 OBP (Class A) | | | | | | | | | | | | |
| | 1,088,000 | | | g,i | | Sequoia Mortgage Trust | | | | | 3.500 | | | 06/25/46 | | | 1,060 | |
| | | | | | | Series - 2016 1 (Class A19) | | | | | | | | | | | | |
| | 438,891 | | | g,i | | Sequoia Mortgage Trust | | | | | 3.500 | | | 11/25/46 | | | 433 | |
| | | | | | | Series - 2016 3 (Class A10) | | | | | | | | | | | | |
| | 4,162,013 | | | g,i | | Sequoia Mortgage Trust | | | | | 3.000 | | | 08/25/47 | | | 4,063 | |
| | | | | | | Series - 2017 5 (Class A5) | | | | | | | | | | | | |
| | 2,574,753 | | | g,i | | Sequoia Mortgage Trust | | | | | 3.500 | | | 05/25/48 | | | 2,554 | |
| | | | | | | Series - 2018 5 (Class A4) | | | | | | | | | | | | |
| | 1,742,738 | | | g,i | | Sequoia Mortgage Trust | | | | | 4.000 | | | 06/25/48 | | | 1,746 | |
| | | | | | | Series - 2018 CH2 (Class A21) | | | | | | | | | | | | |
| | 2,229,720 | | | g,i | | Sequoia Mortgage Trust | | | | | 4.000 | | | 07/25/48 | | | 2,242 | |
| | | | | | | Series - 2018 6 (Class A4) | | | | | | | | | | | | |
| | 534,904 | | | g,i | | Shellpoint Co-Originator Trust | | | | | 3.500 | | | 11/25/46 | | | 527 | |
| | | | | | | Series - 2016 1 (Class 1A10) | | | | | | | | | | | | |
| | 750,000 | | | i | | Structured Agency Credit Risk Debt Note (STACR) | | LIBOR 1 M + 3.800% | | | 6.306 | | | 03/25/25 | | | 790 | |
| | | | | | | Series - 2015 HQ1 (Class M3) | | | | | | | | | | | | |
| | 1,750,000 | | | i | | Structured Agency Credit Risk Debt Note (STACR) | | LIBOR 1 M + 1.350% | | | 3.856 | | | 03/25/29 | | | 1,759 | |
| | | | | | | Series - 2016 HQA3 (Class M2) | | | | | | | | | | | | |
| | 230,573 | | | i | | Structured Agency Credit Risk Debt Note (STACR) | | LIBOR 1 M + 1.200% | | | 3.706 | | | 07/25/29 | | | 232 | |
| | | | | | | Series - 2017 DNA1 (Class M1) | | | | | | | | | | | | |
| | 4,868,662 | | | i | | Structured Agency Credit Risk Debt Note (STACR) | | LIBOR 1 M + 1.200% | | | 3.706 | | | 10/25/29 | | | 4,895 | |
| | | | | | | Series - 2017 DNA2 (Class M1) | | | | | | | | | | | | |
| | 2,084,831 | | | i | | Structured Agency Credit Risk Debt Note (STACR) | | LIBOR 1 M + 0.750% | | | 3.256 | | | 03/25/30 | | | 2,078 | |
| | | | | | | Series - 2017 DNA3 (Class M1) | | | | | | | | | | | | |
| | 8,000,000 | | | i | | Structured Agency Credit Risk Debt Note (STACR) | | LIBOR 1 M + 1.800% | | | 4.306 | | | 07/25/30 | | | 7,683 | |
| | | | | | | Series - 2018 DNA1 (Class M2) | | | | | | | | | | | | |
| | 1,740,382 | | | g,i | | Structured Agency Credit Risk Debt Note (STACR) | | | | | 3.819 | | | 05/25/48 | | | 1,733 | |
| | | | | | | Series - 2018 SPI2 (Class M1) | | | | | | | | | | | | |
| | 1,627,144 | | | g,i | | Structured Agency Credit Risk Debt Note (STACR) | | | | | 4.167 | | | 08/25/48 | | | 1,631 | |
| | | | | | | Series - 2018 SPI3 (Class M1) | | | | | | | | | | | | |
COLLEGE RETIREMENT EQUITIES FUND- Social Choice Account
| | | | | | | | REFERENCE | | | | | MATURITY | | VALUE | |
| PRINCIPAL | | | | | ISSUER | | RATE & SPREAD | | RATE | | DATE | | (000) | |
| $ | 2,500,000 | | | i | | UBS Commercial Mortgage Trust | | | | | 5.273 | % | | 12/15/51 | | $ | 2,523 | |
| | | | | | | Series - 2018 C14 (Class C) | | | | | | | | | | | | |
| | 5,000,000 | | | g,i | | VMC Finance LLC | | LIBOR 1 M + 0.920% | | | 3.390 | | | 10/15/35 | | | 4,988 | |
| | | | | | | Series - 2018 FL2 (Class A) | | | | | | | | | | | | |
| | 763,129 | | | i | | Wachovia Bank Commercial Mortgage Trust | | | | | 6.141 | | | 05/15/46 | | | 768 | |
| | | | �� | | | Series - 2007 C34 (Class AJ) | | | | | | | | | | | | |
| | 1,650,000 | | | i | | Wachovia Bank Commercial Mortgage Trust | | | | | 6.216 | | | 05/15/46 | | | 1,663 | |
| | | | | | | Series - 2007 C34 (Class C) | | | | | | | | | | | | |
| | 3,000,000 | | | i | | Wachovia Bank Commercial Mortgage Trust | | | | | 6.216 | | | 05/15/46 | | | 3,021 | |
| | | | | | | Series - 2007 C34 (Class B) | | | | | | | | | | | | |
| | 869,481 | | | i | | Wachovia Bank Commercial Mortgage Trust | | | | | 5.861 | | | 06/15/49 | | | 877 | |
| | | | | | | Series - 2007 C32 (Class AJ) | | | | | | | | | | | | |
| | | | | | | TOTAL OTHER MORTGAGE BACKED | | | | | | | | | | | 340,483 | |
| | | | | | | | | | | | | | | | | | | |
| | | | | | | TOTAL STRUCTURED ASSETS | | | | | | | | | | | 577,487 | |
| | | | | | | (Cost $582,827) | | | | | | | | | | | | |
| | | | | | | | | | | | | | | | | | | |
| | | | | | | TOTAL BONDS | | | | | | | | | | | 5,339,457 | |
| | | | | | | (Cost $5,404,419) | | | | | | | | | | | | |
| SHARES | | | | COMPANY | | | |
| COMMON STOCKS - 56.9% | | | | |
| | | | | | | | | | |
| AUTOMOBILES & COMPONENTS - 1.0% | | | | |
| | 44,701 | | * | | American Axle & Manufacturing Holdings, Inc | | | 496 | |
| | 562 | | e | | Autoliv, Inc | | | 40 | |
| | 133,292 | | | | Bayerische Motoren Werke AG. | | | 10,811 | |
| | 3,491 | | | | BorgWarner, Inc | | | 121 | |
| | 270,800 | | | | Bridgestone Corp | | | 10,390 | |
| | 77,183 | | | | Delphi Automotive plc | | | 4,752 | |
| | 220,582 | | | | Denso Corp | | | 9,765 | |
| | 97,691 | | | | Harley-Davidson, Inc | | | 3,333 | |
| | 508,180 | | | | Honda Motor Co Ltd | | | 13,388 | |
| | 163,362 | | | | Magna International, Inc | | | 7,415 | |
| | 56,903 | | | | Michelin (C.G.D.E.) (Class B) | | | 5,601 | |
| | 7,033 | | * | | Modine Manufacturing Co | | | 76 | |
| | 13,300 | | | | NGK Spark Plug Co Ltd | | | 263 | |
| | 369,550 | | | | Peugeot S.A. | | | 7,882 | |
| | 100,987 | | | | Renault S.A. | | | 6,291 | |
| | 17,100 | | | | Stanley Electric Co Ltd | | | 478 | |
| | 137,000 | | | | Sumitomo Rubber Industries, Inc | | | 1,613 | |
| | 61,515 | | * | | Tesla, Inc | | | 20,472 | |
| | 60,000 | | | | Toyoda Gosei Co Ltd | | | 1,181 | |
| | 386,800 | | | | Toyota Motor Corp | | | 22,391 | |
| | 40,640 | | | | Valeo S.A. | | | 1,185 | |
| | 334 | | * | | Visteon Corp | | | 20 | |
| | | | | | TOTAL AUTOMOBILES & COMPONENTS | | | 127,964 | |
| | | | | | | | | | |
| BANKS - 4.0% | | | |
| | 20,740 | | | | Ameris Bancorp | | | 657 | |
| | 24,817 | | | | Associated Banc-Corp | | | 491 | |
| | 844,310 | | | | Australia & New Zealand Banking Group Ltd | | | 14,589 | |
| | 5,496,711 | | | | Banca Intesa S.p.A. | | | 12,239 | |
COLLEGE RETIREMENT EQUITIES FUND- Social Choice Account
| | | | | | | VALUE | |
| SHARES | | | | COMPANY | | (000) | |
| | 2,060 | | | | Bancfirst Corp | | $ | 103 | |
| | 2,299,292 | | | | Banco Bilbao Vizcaya Argentaria S.A. | | | 12,213 | |
| | 817,660 | | | | Bank Hapoalim Ltd | | | 5,171 | |
| | 841,607 | | | | Bank Leumi Le-Israel | | | 5,088 | |
| | 2,868,991 | | | | Bank of America Corp | | | 70,692 | |
| | 1,030 | | | | Bank of Hawaii Corp | | | 69 | |
| | 190,229 | | | | Bank of Montreal | | | 12,428 | |
| | 317,885 | | e | | Bank of Nova Scotia | | | 15,845 | |
| | 3,264 | | | | Bank OZK | | | 75 | |
| | 3,730 | | | | BankUnited | | | 112 | |
| | 2,405 | | | | Banner Corp | | | 129 | |
| | 537,161 | | | | BB&T Corp | | | 23,270 | |
| | 356 | | | | Bendigo Bank Ltd | | | 3 | |
| | 2,376,000 | | | | BOC Hong Kong Holdings Ltd | | | 8,819 | |
| | 900 | | | | BOK Financial Corp | | | 66 | |
| | 6,533 | | | | Brookline Bancorp, Inc | | | 90 | |
| | 8,589 | | | | Bryn Mawr Bank Corp | | | 295 | |
| | 1,795,908 | | | | CaixaBank S.A. | | | 6,504 | |
| | 19,106 | | | | Camden National Corp | | | 687 | |
| | 87,694 | | e | | Canadian Imperial Bank of Commerce | | | 6,531 | |
| | 643,938 | | | | Citizens Financial Group, Inc | | | 19,144 | |
| | 2,120 | | | | Columbia Banking System, Inc | | | 77 | |
| | 183,560 | | | | Comerica, Inc | | | 12,609 | |
| | 22,410 | | e | | Commerce Bancshares, Inc | | | 1,263 | |
| | 410,761 | | * | | Commerzbank AG. | | | 2,728 | |
| | 427,459 | | | | Commonwealth Bank of Australia | | | 21,804 | |
| | 889 | | | | Community Trust Bancorp, Inc | | | 35 | |
| | 9,015 | | | | Cullen/Frost Bankers, Inc | | | 793 | |
| | 35,598 | | * | | Customers Bancorp, Inc | | | 648 | |
| | 691,393 | | | | DBS Group Holdings Ltd | | | 12,023 | |
| | 11,562 | | | | Federal Agricultural Mortgage Corp (Class C) | | | 699 | |
| | 271,685 | | | | Fifth Third Bancorp | | | 6,393 | |
| | 21,395 | | | | First Commonwealth Financial Corp | | | 258 | |
| | 6,726 | | | | First Financial Bancorp | | | 160 | |
| | 14,113 | | e | | First Financial Bankshares, Inc | | | 814 | |
| | 1,399 | | | | First Financial Corp | | | 56 | |
| | 290 | | | | First Interstate Bancsystem, Inc | | | 11 | |
| | 3,952 | | | | First Merchants Corp | | | 135 | |
| | 35,610 | | | | First Republic Bank | | | 3,095 | |
| | 2,590 | | | | Glacier Bancorp, Inc | | | 103 | |
| | 5,441 | | | | Hancock Holding Co | | | 189 | |
| | 414,500 | | | | Hang Seng Bank Ltd | | | 9,285 | |
| | 16,503 | | | | Heartland Financial USA, Inc | | | 725 | |
| | 9,347 | | | | Heritage Financial Corp | | | 278 | |
| | 24,702 | | * | | HomeStreet, Inc | | | 524 | |
| | 21,937 | | | | HomeTrust Bancshares, Inc | | | 574 | |
| | 4,198 | | | | Huntington Bancshares, Inc | | | 50 | |
| | 6,451 | | | | Independent Bank Corp (MA) | | | 454 | |
| | 1,029,939 | | | | ING Groep NV | | | 11,079 | |
| | 1,147 | | | | International Bancshares Corp | | | 39 | |
| | 125,286 | | | | KBC Groep NV | | | 8,061 | |
| | 1,057,747 | | | | Keycorp | | | 15,634 | |
| | 2,791 | | | | Live Oak Bancshares, Inc | | | 41 | |
| | 140,146 | | | | M&T Bank Corp | | | 20,059 | |
| | 1,800 | | | | MB Financial, Inc | | | 71 | |
COLLEGE RETIREMENT EQUITIES FUND- Social Choice Account
| | | | | | | VALUE | |
| SHARES | | | | COMPANY | | (000) | |
| | 11,289 | | * | | MGIC Investment Corp | | $ | 118 | |
| | 212,400 | | | | Mitsui Trust Holdings, Inc | | | 7,735 | |
| | 54,790 | | | | Mizrahi Tefahot Bank Ltd | | | 925 | |
| | 825,235 | | | | National Australia Bank Ltd | | | 14,004 | |
| | 6,694 | | | | National Bank Holdings Corp | | | 207 | |
| | 7,259 | | e | | National Bank of Canada | | | 298 | |
| | 3,324 | | | | NBT Bancorp, Inc | | | 115 | |
| | 16,810 | | * | | NMI Holdings, Inc | | | 300 | |
| | 54,855 | | | | Northfield Bancorp, Inc | | | 743 | |
| | 1,532 | | | | OceanFirst Financial Corp | | | 34 | |
| | 65,374 | | | | OFG Bancorp | | | 1,076 | |
| | 9,051 | | | | Old National Bancorp | | | 139 | |
| | 15,649 | | | | Opus Bank | | | 307 | |
| | 14,998 | | | | People’s United Financial, Inc | | | 216 | |
| | 22,319 | | | | Pinnacle Financial Partners, Inc | | | 1,029 | |
| | 294,577 | | | | PNC Financial Services Group, Inc | | | 34,439 | |
| | 820 | | | | Prosperity Bancshares, Inc | | | 51 | |
| | 988,195 | | | | Regions Financial Corp | | | 13,222 | |
| | 993,900 | | | | Resona Holdings, Inc | | | 4,767 | |
| | 590,050 | | | | Skandinaviska Enskilda Banken AB (Class A) | | | 5,736 | |
| | 1,408,068 | | | | Standard Chartered plc | | | 10,943 | |
| | 7,921 | | | | State Bank & Trust Co | | | 171 | |
| | 8,646 | | | | Stock Yards Bancorp, Inc | | | 284 | |
| | 370,800 | | | | Sumitomo Mitsui Financial Group, Inc | | | 12,223 | |
| | 27,573 | | * | | SVB Financial Group | | | 5,237 | |
| | 846,748 | | | | Svenska Handelsbanken AB | | | 9,421 | |
| | 314,178 | | | | Swedbank AB (A Shares) | | | 7,022 | |
| | 800 | | * | | Texas Capital Bancshares, Inc | | | 41 | |
| | 6,965 | | | | TFS Financial Corp | | | 112 | |
| | 50,351 | | * | | The Bancorp, Inc | | | 401 | |
| | 426,165 | | | | Toronto-Dominion Bank | | | 21,183 | |
| | 2,462 | | | | Trico Bancshares | | | 83 | |
| | 17,930 | | * | | Tristate Capital Holdings, Inc | | | 349 | |
| | 1,700 | | | | Trustmark Corp | | | 48 | |
| | 5,827 | | | | Umpqua Holdings Corp | | | 93 | |
| | 10,176 | | | | Union Bankshares Corp | | | 287 | |
| | 5,260 | | | | Univest Corp of Pennsylvania | | | 113 | |
| | 14,406 | | | | Webster Financial Corp | | | 710 | |
| | 3,410 | | | | WesBanco, Inc | | | 125 | |
| | 3,019 | | e | | Westamerica Bancorporation | | | 168 | |
| | 44,194 | | * | | Western Alliance Bancorp | | | 1,745 | |
| | 928,581 | | | | Westpac Banking Corp | | | 16,408 | |
| | 1,110 | | | | Wintrust Financial Corp | | | 74 | |
| | 1,706 | | | | WSFS Financial Corp | | | 65 | |
| | 39,949 | | | | Zions Bancorporation | | | 1,628 | |
| | | | | | TOTAL BANKS | | | 520,472 | |
| | | | | | | | | | |
| CAPITAL GOODS - 3.9% | | | |
| | 249,070 | | | | 3M Co | | | 47,458 | |
| | 623,418 | | | | ABB Ltd | | | 11,905 | |
| | 881 | | | | Acuity Brands, Inc | | | 101 | |
| | 7,218 | | | | Air Lease Corp | | | 218 | |
| | 429 | | | | Allegion plc | | | 34 | |
| | 14,787 | | | | Argan, Inc | | | 560 | |
| | 456 | | | | Armstrong World Industries, Inc | | | 27 | |
COLLEGE RETIREMENT EQUITIES FUND- Social Choice Account
| SHARES | | | | COMPANY | | VALUE
(000) | |
| | 167,764 | | | | Assa Abloy AB | | $ | 3,004 | |
| | 387,643 | | | | Atlas Copco AB (A Shares) | | | 9,248 | |
| | 363,924 | | | | Atlas Copco AB (B Shares) | | | 7,974 | |
| | 46,549 | | * | | Axon Enterprise, Inc | | | 2,036 | |
| | 68,269 | | | | Barnes Group, Inc | | | 3,661 | |
| | 2,120 | | * | | Beacon Roofing Supply, Inc | | | 67 | |
| | 54,799 | | | | Brenntag AG. | | | 2,392 | |
| | 13,142 | | | | Briggs & Stratton Corp | | | 172 | |
| | 73,289 | | * | | Builders FirstSource, Inc | | | 800 | |
| | 6,729 | | | | CAE, Inc | | | 124 | |
| | 574 | | | | Carlisle Cos, Inc | | | 58 | |
| | 276,442 | | | | Caterpillar, Inc | | | 35,127 | |
| | 10,312 | | * | | Chart Industries, Inc | | | 671 | |
| | 864,813 | | | | CNH Industrial NV | | | 7,814 | |
| | 56,528 | | | | Cummins, Inc | | | 7,554 | |
| | 5,900 | | | | Daifuku Co Ltd | | | 267 | |
| | 89,000 | | | | Daikin Industries Ltd | | | 9,457 | |
| | 96,314 | | | | DCC plc | | | 7,347 | |
| | 155,432 | | | | Deere & Co | | | 23,186 | |
| | 888 | | | | Donaldson Co, Inc | | | 38 | |
| | 226,502 | | | | Eaton Corp | | | 15,552 | |
| | 14,474 | | | | Eiffage S.A. | | | 1,210 | |
| | 4,718 | | | | EMCOR Group, Inc | | | 282 | |
| | 78,795 | | * | | Esterline Technologies Corp | | | 9,570 | |
| | 112,562 | | | | Fastenal Co | | | 5,886 | |
| | 144,136 | | | | Ferguson plc | | | 9,210 | |
| | 978 | | | | Flowserve Corp | | | 37 | |
| | 68,049 | | | | Fortive Corp | | | 4,604 | |
| | 856 | | | | Fortune Brands Home & Security, Inc | | | 32 | |
| | 3,384 | | | | Graco, Inc | | | 142 | |
| | 27,977 | | | | Hexcel Corp | | | 1,604 | |
| | 115,000 | | | | Hino Motors Ltd | | | 1,083 | |
| | 97,900 | | | | Hitachi Construction Machinery Co Ltd | | | 2,291 | |
| | 18,668 | | | | Hochtief AG. | | | 2,521 | |
| | 288 | | | | Hubbell, Inc | | | 29 | |
| | 386 | | | | IDEX Corp | | | 49 | |
| | 246,905 | | | | Illinois Tool Works, Inc | | | 31,280 | |
| | 95,963 | | | | Ingersoll-Rand plc | | | 8,755 | |
| | 365,995 | | | | Johnson Controls International plc | | | 10,852 | |
| | 303,500 | | | | Kajima Corp | | | 4,077 | |
| | 55,200 | | | | Kawasaki Heavy Industries Ltd | | | 1,178 | |
| | 1,335,270 | | | | Keppel Corp Ltd | | | 5,797 | |
| | 196,578 | | *,e | | KEYW Holding Corp, The | | | 1,315 | |
| | 404,500 | | | | Komatsu Ltd | | | 8,693 | |
| | 579,800 | | | | Kubota Corp | | | 8,241 | |
| | 59,117 | | | | L3 Technologies, Inc | | | 10,266 | |
| | 14,151 | | | | Legrand S.A. | | | 800 | |
| | 364 | | | | Lennox International, Inc | | | 80 | |
| | 266,596 | | | | Masco Corp | | | 7,795 | |
| | 752,560 | | | | Meggitt plc | | | 4,521 | |
| | 9,611 | | * | | Mercury Systems, Inc | | | 454 | |
| | 9,220 | | | | Metso Oyj | | | 242 | |
| | 460,000 | | | | Mitsubishi Corp | | | 12,612 | |
| | 663,000 | | | | Mitsui & Co Ltd | | | 10,186 | |
| | 10,359 | | | | MTU Aero Engines Holding AG. | | | 1,881 | |
| | 8,124 | | * | | MYR Group, Inc | | | 229 | |
COLLEGE RETIREMENT EQUITIES FUND- Social Choice Account
| SHARES | | | | COMPANY | | VALUE
(000) | |
| | 83,000 | | | | NGK Insulators Ltd | | $ | 1,125 | |
| | 333,800 | | | | Obayashi Corp | | | 3,023 | |
| | 358 | | | | Oshkosh Truck Corp | | | 22 | |
| | 68,619 | | | | Osram Licht AG. | | | 2,986 | |
| | 386 | | | | Owens Corning, Inc | | | 17 | |
| | 104,034 | | | | PACCAR, Inc | | | 5,944 | |
| | 58,416 | | | | Parker-Hannifin Corp | | | 8,712 | |
| | 184,808 | | *,e | | Plug Power, Inc | | | 229 | |
| | 89,372 | | * | | Quanta Services, Inc | | | 2,690 | |
| | 247,163 | | | | Rexel S.A. | | | 2,633 | |
| | 50,348 | | | | Rockwell Automation, Inc | | | 7,576 | |
| | 48,971 | | | | Roper Industries, Inc | | | 13,052 | |
| | 8,372 | | | | Rush Enterprises, Inc (Class A) | | | 289 | |
| | 171,627 | | | | Schneider Electric S.A. | | | 11,642 | |
| | 28,778 | | * | | Sensata Technologies Holding plc | | | 1,290 | |
| | 386,200 | | | | Shimizu Corp | | | 3,142 | |
| | 182,223 | | | | Siemens AG. | | | 20,336 | |
| | 7,999 | | | | Snap-On, Inc | | | 1,162 | |
| | 64,773 | | | | Spirit Aerosystems Holdings, Inc (Class A) | | | 4,669 | |
| | 10,084 | | | | Stanley Works | | | 1,207 | |
| | 70,413 | | * | | Teledyne Technologies, Inc | | | 14,580 | |
| | 8,500 | | | | THK Co Ltd | | | 159 | |
| | 22,276 | | * | | Titan Machinery, Inc | | | 293 | |
| | 54,800 | | | | Toto Ltd | | | 1,896 | |
| | 29,026 | | * | | United Rentals, Inc | | | 2,976 | |
| | 10,935 | | * | | Veritiv Corp | | | 273 | |
| | 11,896 | | | | Vestas Wind Systems AS | | | 900 | |
| | 540,184 | | | | Volvo AB (B Shares) | | | 7,073 | |
| | 16,868 | | | | W.W. Grainger, Inc | | | 4,763 | |
| | 5,431 | | | | Wabash National Corp | | | 71 | |
| | 137 | | * | | WABCO Holdings, Inc | | | 15 | |
| | 366,312 | | | | Wartsila Oyj (B Shares) | | | 5,847 | |
| | 3,753 | | * | | Welbilt, Inc | | | 42 | |
| | 185,548 | | * | | Wesco Aircraft Holdings, Inc | | | 1,466 | |
| | 698 | | * | | WESCO International, Inc | | | 33 | |
| | 19,775 | | | | Woodward Governor Co | | | 1,469 | |
| | 12,800 | | | | WSP Global, Inc | | | 550 | |
| | 46,643 | | | | Xylem, Inc | | | 3,112 | |
| | | | | | TOTAL CAPITAL GOODS | | | 501,920 | |
| | | | | | | | | | |
| COMMERCIAL & PROFESSIONAL SERVICES - 0.8% |
| | 2,604 | | | | ABM Industries, Inc | | | 84 | |
| | 36,304 | | | | ACCO Brands Corp | | | 246 | |
| | 25,543 | | | | Adecco S.A. | | | 1,201 | |
| | 248,743 | | | | Brambles Ltd | | | 1,780 | |
| | 11,578 | | * | | Cimpress NV | | | 1,197 | |
| | 354,865 | | * | | Copart, Inc | | | 16,955 | |
| | 28,504 | | | | Exponent, Inc | | | 1,445 | |
| | 12,422 | | | | Heidrick & Struggles International, Inc | | | 387 | |
| | 11,793 | | | | ICF International, Inc | | | 764 | |
| | 353,344 | | * | | IHS Markit Ltd | | | 16,950 | |
| | 24,668 | | | | Insperity, Inc | | | 2,303 | |
| | 134,662 | | | | Intertek Group plc | | | 8,242 | |
| | 1,600 | | | | KAR Auction Services, Inc | | | 76 | |
| | 16,221 | | | | Kelly Services, Inc (Class A) | | | 332 | |
| | 7,947 | | | | Kforce, Inc | | | 246 | |
COLLEGE RETIREMENT EQUITIES FUND- Social Choice Account
| SHARES | | | | COMPANY | | VALUE
(000) | |
| | 15,748 | | | | Manpower, Inc | | $ | 1,020 | |
| | 23,089 | | * | | Mistras Group, Inc | | | 332 | |
| | 2,100 | | | | Mobile Mini, Inc | | | 67 | |
| | 29,024 | | | | Navigant Consulting, Inc | | | 698 | |
| | 1,000 | | * | | On Assignment, Inc | | | 54 | |
| | 10,610 | | | | Pitney Bowes, Inc | | | 63 | |
| | 241,000 | | | | Recruit Holdings Co Ltd | | | 5,822 | |
| | 3,689 | | | | RELX plc | | | 76 | |
| | 650,924 | | | | RELX plc (London) | | | 13,422 | |
| | 21,731 | | | | Resources Connection, Inc | | | 309 | |
| | 93,721 | | | | Robert Half International, Inc | | | 5,361 | |
| | 1,100 | | | | Secom Co Ltd | | | 91 | |
| | 3,476 | | | | SGS S.A. | | | 7,825 | |
| | 1,544 | | * | | SP Plus Corp | | | 46 | |
| | 66,652 | | *,e | | Team, Inc | | | 976 | |
| | 9,438 | | | | Tetra Tech, Inc | | | 489 | |
| | 166,614 | | | | TransUnion | | | 9,464 | |
| | 14,915 | | | | Viad Corp | | | 747 | |
| | | | | | TOTAL COMMERCIAL & PROFESSIONAL SERVICES | | | 99,070 | |
| | | | | | | | | | |
| CONSUMER DURABLES & APPAREL - 1.1% |
| | 48,541 | | | | Adidas-Salomon AG. | | | 10,145 | |
| | 497,409 | | | | Barratt Developments plc | | | 2,934 | |
| | 30,182 | | | | Berkeley Group Holdings plc | | | 1,339 | |
| | 232,096 | | | | Burberry Group plc | | | 5,097 | |
| | 46,626 | | | | Callaway Golf Co | | | 713 | |
| | 224 | | | | Carter’s, Inc | | | 18 | |
| | 20,968 | | * | | Century Communities, Inc | | | 362 | |
| | 65,494 | | | | Essilor International S.A. | | | 8,302 | |
| | 92,506 | | * | | Fossil Group, Inc | | | 1,455 | |
| | 709 | | | | Garmin Ltd | | | 45 | |
| | 24,584 | | | | Hanesbrands, Inc | | | 308 | |
| | 804 | | | | Hasbro, Inc | | | 65 | |
| | 15,890 | | * | | iRobot Corp | | | 1,331 | |
| | 32,156 | | | | Lennar Corp (Class A) | | | 1,259 | |
| | 4,521 | | *,e | | LGI Homes, Inc | | | 204 | |
| | 14,087 | | * | | Lululemon Athletica, Inc | | | 1,713 | |
| | 67,670 | | | | Luxottica Group S.p.A. | | | 4,007 | |
| | 120,304 | | *,e | | Mattel, Inc | | | 1,202 | |
| | 34,564 | | * | | Meritage Homes Corp | | | 1,269 | |
| | 666 | | * | | Michael Kors Holdings Ltd | | | 25 | |
| | 24,650 | | * | | Mohawk Industries, Inc | | | 2,883 | |
| | 8,565 | | | | Movado Group, Inc | | | 271 | |
| | 229,875 | | | | Newell Rubbermaid, Inc | | | 4,273 | |
| | 601,225 | | | | Nike, Inc (Class B) | | | 44,575 | |
| | 10 | | * | | NVR, Inc | | | 24 | |
| | 963,700 | | | | Panasonic Corp | | | 8,657 | |
| | 14,720 | | | | Pandora AS | | | 601 | |
| | 646 | | | | PVH Corp | | | 60 | |
| | 1,940 | | | | SEB S.A. | | | 251 | |
| | 34,300 | | | | Sekisui Chemical Co Ltd | | | 510 | |
| | 373,500 | | | | Sekisui House Ltd | | | 5,485 | |
| | 206,400 | | e | | Sharp Corp | | | 2,066 | |
| | 323,000 | | | | Sony Corp | | | 15,572 | |
| | 750 | | | | Tapestry, Inc | | | 25 | |
| | 762,926 | | | | Taylor Wimpey plc | | | 1,327 | |
COLLEGE RETIREMENT EQUITIES FUND- Social Choice Account
| SHARES | | | | COMPANY | | VALUE
(000) | |
| | 762,500 | | | | Techtronic Industries Co | | $ | 4,046 | |
| | 279 | | | | Tupperware Corp | | | 9 | |
| | 84,700 | | * | | Under Armour, Inc | | | 1,370 | |
| | 134,281 | | *,e | | Under Armour, Inc (Class A) | | | 2,373 | |
| | 18,549 | | * | | Unifi, Inc | | | 424 | |
| | 99,576 | | | | VF Corp | | | 7,104 | |
| | 10,849 | | | | Whirlpool Corp | | | 1,159 | |
| | | | | | TOTAL CONSUMER DURABLES & APPAREL | | | 144,858 | |
| | | | | | | | | | |
| CONSUMER SERVICES - 1.4% |
| | 138,079 | | | | Accor S.A. | | | 5,872 | |
| | 15,319 | | * | | American Public Education, Inc | | | 436 | |
| | 71,614 | | | | ARAMARK Holdings Corp | | | 2,075 | |
| | 5,746 | | * | | Bright Horizons Family Solutions | | | 640 | |
| | 19,899 | | | | Carriage Services, Inc | | | 308 | |
| | 6,573 | | * | | Chipotle Mexican Grill, Inc (Class A) | | | 2,838 | |
| | 31,329 | | | | Choice Hotels International, Inc | | | 2,243 | |
| | 595,015 | | | | Compass Group plc | | | 12,522 | |
| | 53,679 | | | | Darden Restaurants, Inc | | | 5,360 | |
| | 676 | | | | Dunkin Brands Group, Inc | | | 43 | |
| | 3,355 | | * | | El Pollo Loco Holdings, Inc | | | 51 | |
| | 30,658 | | * | | frontdoor, Inc | | | 816 | |
| | 1,543 | | | | H&R Block, Inc | | | 39 | |
| | 183,239 | | | | Hilton Worldwide Holdings, Inc | | | 13,157 | |
| | 26,982 | | * | | Houghton Mifflin Harcourt Co | | | 239 | |
| | 154,524 | | | | InterContinental Hotels Group plc | | | 8,359 | |
| | 252,584 | | | | Marriott International, Inc (Class A) | | | 27,420 | |
| | 698,155 | | g | | Merlin Entertainments plc | | | 2,828 | |
| | 87,086 | | * | | Norwegian Cruise Line Holdings Ltd | | | 3,692 | |
| | 96,600 | | | | Oriental Land Co Ltd | | | 9,715 | |
| | 98,533 | | | | Royal Caribbean Cruises Ltd | | | 9,636 | |
| | 55,231 | | | | Service Corp International | | | 2,224 | |
| | 53,952 | | * | | ServiceMaster Global Holdings, Inc | | | 1,982 | |
| | 1,234,000 | | | | Shangri-La Asia Ltd | | | 1,822 | |
| | 635 | | | | Six Flags Entertainment Corp | | | 35 | |
| | 662,396 | | | | Starbucks Corp | | | 42,658 | |
| | 428,287 | | | | TUI AG. (DI) | | | 6,156 | |
| | 15,174 | | | | Vail Resorts, Inc | | | 3,199 | |
| | 3,787 | | | | Wendy’s | | | 59 | |
| | 130,649 | | | | Whitbread plc | | | 7,629 | |
| | | | | | TOTAL CONSUMER SERVICES | | | 174,053 | |
| | | | | | | | | | |
| DIVERSIFIED FINANCIALS - 3.3% |
| | 786,512 | | | | 3i Group plc | | | 7,761 | |
| | 96,000 | | | | AEON Financial Service Co Ltd | | | 1,703 | |
| | 78,780 | | | | Ally Financial, Inc | | | 1,785 | |
| | 388,609 | | | | American Express Co | | | 37,042 | |
| | 34,715 | | | | Ameriprise Financial, Inc | | | 3,623 | |
| | 1,444,992 | | | | AMP Ltd | | | 2,494 | |
| | 565,260 | | | | Bank of New York Mellon Corp | | | 26,607 | |
| | 76,960 | | | | BlackRock, Inc | | | 30,231 | |
| | 301,461 | | | | Capital One Financial Corp | | | 22,787 | |
| | 655,442 | | | | Charles Schwab Corp | | | 27,221 | |
| | 6,710 | | | | Chimera Investment Corp | | | 120 | |
| | 203,549 | | | | CME Group, Inc | | | 38,292 | |
| | 73,651 | | | | Deutsche Boerse AG. | | | 8,805 | |
COLLEGE RETIREMENT EQUITIES FUND- Social Choice Account
| SHARES | | | | COMPANY | | VALUE
(000) | |
| | 289,064 | | | | Discover Financial Services | | $ | 17,049 | |
| | 3,050 | | | | Dynex Capital, Inc | | | 17 | |
| | 17,965 | | | | E*TRADE Financial Corp | | | 788 | |
| | 15,538 | | | | Factset Research Systems, Inc | | | 3,110 | |
| | 53,294 | | | | Franklin Resources, Inc | | | 1,581 | |
| | 19,750 | | * | | Green Dot Corp | | | 1,571 | |
| | 398,375 | | | | Hong Kong Exchanges and Clearing Ltd | | | 11,516 | |
| | 194,743 | | | | Invesco Ltd | | | 3,260 | |
| | 645,222 | | | | Investec plc | | | 3,627 | |
| | 12,770 | | | | Investment Technology Group, Inc | | | 386 | |
| | 138,061 | | | | Investor AB (B Shares) | | | 5,867 | |
| | 47,941 | | | | Legg Mason, Inc | | | 1,223 | |
| | 179,960 | | | | London Stock Exchange Group plc | | | 9,336 | |
| | 655 | | | | LPL Financial Holdings, Inc | | | 40 | |
| | 127,644 | | | | Macquarie Group Ltd | | | 9,777 | |
| | 390,100 | | | | Mitsubishi UFJ Lease & Finance Co Ltd | | | 1,870 | |
| | 55,403 | | | | Moody’s Corp | | | 7,759 | |
| | 747,129 | | | | Morgan Stanley | | | 29,624 | |
| | 910 | | | | Morningstar, Inc | | | 100 | |
| | 928,314 | | | | Natixis | | | 4,378 | |
| | 12,048 | | *,m | | NewStar Financial, Inc | | | 3 | |
| | 181,295 | | | | Northern Trust Corp | | | 15,155 | |
| | 104,012 | | * | | On Deck Capital, Inc | | | 614 | |
| | 1,841 | | | | Raymond James Financial, Inc | | | 137 | |
| | 172,022 | | | | S&P Global, Inc | | | 29,233 | |
| | 121,033 | | | | Schroders plc | | | 3,769 | |
| | 2,272,147 | | | | Standard Life Aberdeen plc | | | 7,440 | |
| | 203,876 | | | | State Street Corp | | | 12,859 | |
| | 72,058 | | | | T Rowe Price Group, Inc | | | 6,652 | |
| | 119,663 | | | | TD Ameritrade Holding Corp | | | 5,859 | |
| | 1,104,203 | | | | UBS AG. | | | 13,773 | |
| | 18,320 | | | | Voya Financial, Inc | | | 735 | |
| | 25,534 | | | | Wendel | | | 3,063 | |
| | | | | | TOTAL DIVERSIFIED FINANCIALS | | | 420,642 | |
| | | | | | | | | | |
| ENERGY - 3.0% |
| | 32,498 | | | | Aker BP ASA | | | 819 | |
| | 116,691 | | * | | Antero Resources Corp | | | 1,096 | |
| | 142,503 | | | | Apache Corp | | | 3,741 | |
| | 15,185 | | | | Archrock, Inc | | | 114 | |
| | 265,911 | | | | Baker Hughes a GE Co | | | 5,717 | |
| | 57,206 | | * | | California Resources Corp | | | 975 | |
| | 3,504 | | | | Caltex Australia Ltd | | | 63 | |
| | 870,815 | | | | Cenovus Energy, Inc (Toronto) | | | 6,123 | |
| | 130,998 | | * | | Cheniere Energy, Inc | | | 7,754 | |
| | 26,240 | | | | Cimarex Energy Co | | | 1,618 | |
| | 629,558 | | | | ConocoPhillips | | | 39,253 | |
| | 36,588 | | *,e | | Covia Holdings Corp | | | 125 | |
| | 36,631 | | | | Delek US Holdings, Inc | | | 1,191 | |
| | 113,641 | | * | | Denbury Resources, Inc | | | 194 | |
| | 233,611 | | | | Devon Energy Corp | | | 5,266 | |
| | 16,418 | | e | | Enagas | | | 444 | |
| | 506,444 | | | | Enbridge, Inc (Toronto) | | | 15,733 | |
| | 501,676 | | | | EnCana Corp | | | 2,896 | |
| | 88,578 | | | | EQT Corp | | | 1,673 | |
| | 33,952 | | * | | Exterran Corp | | | 601 | |
COLLEGE RETIREMENT EQUITIES FUND- Social Choice Account
| SHARES | | | | COMPANY | | VALUE
(000) | |
| | 78,969 | | * | | Forum Energy Technologies, Inc | | $ | 326 | |
| | 382,818 | | | | Galp Energia SGPS S.A. | | | 6,028 | |
| | 47,174 | | | | Green Plains Renewable Energy, Inc | | | 618 | |
| | 97,403 | | * | | Helix Energy Solutions Group, Inc | | | 527 | |
| | 121,244 | | | | Hess Corp | | | 4,910 | |
| | 698,986 | | | | Inpex Holdings, Inc | | | 6,194 | |
| | 298,672 | | e | | John Wood Group plc | | | 1,922 | |
| | 1,842,770 | | | | Kinder Morgan, Inc | | | 28,342 | |
| | 57,666 | | | | Koninklijke Vopak NV | | | 2,615 | |
| | 1,460 | | * | | Laredo Petroleum Holdings, Inc | | | 5 | |
| | 146,778 | | | | Lundin Petroleum AB | | | 3,666 | |
| | 485,143 | | | | Marathon Oil Corp | | | 6,957 | |
| | 28,451 | | * | | Matrix Service Co | | | 510 | |
| | 108,605 | | * | | McDermott International, Inc | | | 710 | |
| | 326,254 | | | | National Oilwell Varco, Inc | | | 8,385 | |
| | 16,599 | | * | | Natural Gas Services Group, Inc | | | 273 | |
| | 96,415 | | | | Neste Oil Oyj | | | 7,465 | |
| | 107,917 | | * | | Newpark Resources, Inc | | | 741 | |
| | 173,638 | | | | Noble Energy, Inc | | | 3,257 | |
| | 503,520 | | | | Occidental Petroleum Corp | | | 30,906 | |
| | 5,830 | | * | | Oceaneering International, Inc | | | 71 | |
| | 143,438 | | | | OMV AG. | | | 6,264 | |
| | 248,674 | | | | Oneok, Inc | | | 13,416 | |
| | 29,146 | | | | PBF Energy, Inc | | | 952 | |
| | 4,435 | | * | | PDC Energy, Inc | | | 132 | |
| | 78,483 | | | | Pioneer Natural Resources Co | | | 10,322 | |
| | 50,847 | | * | | Renewable Energy Group, Inc | | | 1,307 | |
| | 581,547 | | | | Repsol YPF S.A. | | | 9,350 | |
| | 1,410 | | e | | RPC, Inc | | | 14 | |
| | 380,435 | | | | Santos Ltd | | | 1,467 | |
| | 752,026 | | | | Schlumberger Ltd | | | 27,133 | |
| | 171,800 | | | | Showa Shell Sekiyu KK | | | 2,380 | |
| | 8,573 | | | | SM Energy Co | | | 133 | |
| | 1,868,314 | | | | Snam Rete Gas S.p.A. | | | 8,180 | |
| | 236,915 | | * | | Southwestern Energy Co | | | 808 | |
| | 486,432 | | | | Statoil ASA | | | 10,318 | |
| | 481,170 | | | | Suncor Energy, Inc | | | 13,439 | |
| | 143,731 | | * | | Superior Energy Services | | | 481 | |
| | 1,009 | | | | Targa Resources Investments, Inc | | | 36 | |
| | 801 | | | | TechnipFMC plc (Euro OTC) | | | 16 | |
| | 282,465 | | | | Tenaris S.A. | | | 3,036 | |
| | 244,854 | | * | | Tetra Technologies, Inc | | | 411 | |
| | 517,858 | | | | Total S.A. | | | 27,314 | |
| | 4,961 | | * | | Unit Corp | | | 71 | |
| | 23,728 | | e | | US Silica Holdings Inc | | | 242 | |
| | 332,521 | | | | Valero Energy Corp | | | 24,929 | |
| | 69,306 | | | | Williams Cos, Inc | | | 1,528 | |
| | 283,365 | | e | | Woodside Petroleum Ltd | | | 6,242 | |
| | 25,600 | | | | World Fuel Services Corp | | | 548 | |
| | 1,470 | | | | WorleyParsons Ltd | | | 12 | |
| | | | | | TOTAL ENERGY | | | 380,305 | |
| | | | | | | | | | |
| FOOD & STAPLES RETAILING - 0.4% |
| | 123,100 | | | | Aeon Co Ltd | | | 2,406 | |
| | 78,526 | | | | Alimentation Couche Tard, Inc | | | 3,906 | |
COLLEGE RETIREMENT EQUITIES FUND- Social Choice Account
| SHARES | | | | COMPANY | | VALUE
(000) | |
| | 53,859 | | | | Casey’s General Stores, Inc | | $ | 6,901 | |
| | 46,095 | | e | | Casino Guichard Perrachon S.A. | | | 1,920 | |
| | 41,504 | | * | | Chefs’ Warehouse Holdings, Inc | | | 1,327 | |
| | 700 | | e | | FamilyMart Co Ltd | | | 88 | |
| | 63,518 | | | | George Weston Ltd | | | 4,190 | |
| | 1,571,813 | | | | J Sainsbury plc | | | 5,314 | |
| | 161,220 | | | | Loblaw Cos Ltd | | | 7,217 | |
| | 147,990 | | | | Metro Wholesale & Food Specialist AG. | | | 2,277 | |
| | 15,498 | | | | Pricesmart, Inc | | | 916 | |
| | 101,919 | | * | | Smart & Final Stores, Inc | | | 483 | |
| | 48,144 | | | | Spartan Stores, Inc | | | 827 | |
| | 198,234 | | * | | Sprouts Farmers Market, Inc | | | 4,660 | |
| | 81,296 | | * | | United Natural Foods, Inc | | | 861 | |
| | 392,264 | | * | | US Foods Holding Corp | | | 12,411 | |
| | 12,906 | | | | Weis Markets, Inc | | | 617 | |
| | 459,754 | | | | WM Morrison Supermarkets plc | | | 1,250 | |
| | 2,015 | | | | Woolworths Ltd | | | 42 | |
| | | | | | TOTAL FOOD & STAPLES RETAILING | | | 57,613 | |
| | | | | | | | | | |
| FOOD, BEVERAGE & TOBACCO - 2.4% |
| | 331,300 | | | | Ajinomoto Co, Inc | | | 5,887 | |
| | 278,485 | | | | Associated British Foods plc | | | 7,258 | |
| | 1,826 | | | | Barry Callebaut AG. | | | 2,850 | |
| | 43,258 | | | | Bunge Ltd | | | 2,312 | |
| | 110,151 | | | | Campbell Soup Co | | | 3,634 | |
| | 272,091 | | | | Coca-Cola Amatil Ltd | | | 1,569 | |
| | 1,300,747 | | | | Coca-Cola Co | | | 61,590 | |
| | 179,092 | | | | Coca-Cola European Partners plc (Class A) | | | 8,211 | |
| | 196,397 | | | | Coca-Cola HBC AG. | | | 6,147 | |
| | 192,904 | | | | Danone | | | 13,596 | |
| | 12,371 | | * | | Freshpet, Inc | | | 398 | |
| | 359,713 | | | | General Mills, Inc | | | 14,007 | |
| | 2,360 | | * | | Hain Celestial Group, Inc | | | 37 | |
| | 116,392 | | | | Hormel Foods Corp | | | 4,968 | |
| | 183,808 | | | | Kellogg Co | | | 10,479 | |
| | 90,176 | | | | Kerry Group plc (Class A) | | | 8,930 | |
| | 99,300 | | | | Kikkoman Corp | | | 5,314 | |
| | 15,867 | | | | McCormick & Co, Inc | | | 2,209 | |
| | 891,007 | | | | Mondelez International, Inc | | | 35,667 | |
| | 590,550 | | | | Nestle S.A. | | | 47,931 | |
| | 29,600 | | | | Nissin Food Products Co Ltd | | | 1,855 | |
| | 302,914 | | | | Orkla ASA | | | 2,372 | |
| | 511,551 | | | | PepsiCo, Inc | | | 56,516 | |
| | 136,700 | | | | Suntory Beverage & Food Ltd | | | 6,172 | |
| | 69,000 | | | | Yakult Honsha Co Ltd | | | 4,830 | |
| | | | | | TOTAL FOOD, BEVERAGE & TOBACCO | | | 314,739 | |
| | | | | | | | | | |
| HEALTH CARE EQUIPMENT & SERVICES - 2.9% |
| | 29,946 | | * | | Abiomed, Inc | | | 9,734 | |
| | 28,953 | | * | | Acadia Healthcare Co, Inc | | | 744 | |
| | 39,666 | | * | | Accuray, Inc | | | 135 | |
| | 11,700 | | | | Alfresa Holdings Corp | | | 298 | |
| | 69,330 | | * | | Align Technology, Inc | | | 14,520 | |
| | 55,129 | | * | | Allscripts Healthcare Solutions, Inc | | | 531 | |
| | 31,910 | | * | | Amedisys, Inc | | | 3,737 | |
| | 40,869 | | * | | AMN Healthcare Services, Inc | | | 2,316 | |
COLLEGE RETIREMENT EQUITIES FUND- Social Choice Account
| SHARES | | | | COMPANY | | VALUE
(000) | |
| | 35,222 | | * | | Angiodynamics, Inc | | $ | 709 | |
| | 49,395 | | * | | athenahealth, Inc | | | 6,517 | |
| | 32,319 | | * | | AtriCure, Inc | | | 989 | |
| | 164,724 | | | | Becton Dickinson & Co | | | 37,116 | |
| | 73,393 | | * | | Brookdale Senior Living, Inc | | | 492 | |
| | 31,810 | | * | | Capital Senior Living Corp | | | 216 | |
| | 229,411 | | | | Cardinal Health, Inc | | | 10,232 | |
| | 17,497 | | * | | Cardiovascular Systems, Inc | | | 498 | |
| | 161,618 | | * | | Centene Corp | | | 18,635 | |
| | 182,855 | | * | | Cerner Corp | | | 9,589 | |
| | 79,050 | | * | | Cerus Corp | | | 401 | |
| | 6,362 | | | | Cigna Corp | | | 1,208 | |
| | 50,101 | | | | Coloplast AS | | | 4,660 | |
| | 14,582 | | | | Computer Programs & Systems, Inc | | | 366 | |
| | 1,330,712 | | g | | ConvaTec Group plc | | | 2,357 | |
| | 19,943 | | | | Cooper Cos, Inc | | | 5,075 | |
| | 4,570 | | * | | Corvel Corp | | | 282 | |
| | 25,039 | | * | | Cross Country Healthcare, Inc | | | 184 | |
| | 278,060 | | | | CVS Health Corp | | | 18,218 | |
| | 78,540 | | | | Dentsply Sirona, Inc | | | 2,922 | |
| | 21,016 | | *,e | | Diplomat Pharmacy, Inc | | | 283 | |
| | 119,420 | | * | | Edwards Lifesciences Corp | | | 18,292 | |
| | 52,788 | | * | | GenMark Diagnostics, Inc | | | 257 | |
| | 10,182 | | * | | Glaukos Corp | | | 572 | |
| | 4,374 | | * | | Haemonetics Corp | | | 438 | |
| | 174,137 | | | | HCA Holdings, Inc | | | 21,671 | |
| | 26,729 | | * | | Henry Schein, Inc | | | 2,099 | |
| | 10,561 | | * | | HMS Holdings Corp | | | 297 | |
| | 132,293 | | * | | Hologic, Inc | | | 5,437 | |
| | 104,222 | | | | Humana, Inc | | | 29,858 | |
| | 59,553 | | * | | IDEXX Laboratories, Inc | | | 11,078 | |
| | 32,221 | | * | | Integer Holding Corp | | | 2,457 | |
| | 335,319 | | | | Koninklijke Philips Electronics NV | | | 11,756 | |
| | 66,632 | | * | | Laboratory Corp of America Holdings | | | 8,420 | |
| | 19,312 | | * | | LHC Group, Inc | | | 1,813 | |
| | 9,373 | | * | | LivaNova plc | | | 857 | |
| | 7,710 | | * | | Medidata Solutions, Inc | | | 520 | |
| | 37,651 | | * | | Merit Medical Systems, Inc | | | 2,101 | |
| | 42,933 | | * | | NextGen Healthcare, Inc | | | 650 | |
| | 46,381 | | * | | Omnicell, Inc | | | 2,840 | |
| | 70,523 | | * | | OraSure Technologies, Inc | | | 824 | |
| | 1,240 | | * | | Penumbra, Inc | | | 152 | |
| | 2,830 | | * | | Premier, Inc | | | 106 | |
| | 15,337 | | * | | Providence Service Corp | | | 921 | |
| | 23,503 | | | | Quest Diagnostics, Inc | | | 1,957 | |
| | 11,938 | | * | | Quidel Corp | | | 583 | |
| | 103,188 | | | | Ramsay Health Care Ltd | | | 4,197 | |
| | 57,860 | | | | Resmed, Inc | | | 6,589 | |
| | 252,994 | | | | Ryman Healthcare Ltd | | | 1,826 | |
| | 8,303 | | | | Sartorius AG. | | | 1,033 | |
| | 36,701 | | * | | Select Medical Holdings Corp | | | 563 | |
| | 19,078 | | * | | Staar Surgical Co | | | 609 | |
| | 41,823 | | *,e | | Surgery Partners, Inc | | | 409 | |
| | 63,500 | | | | Sysmex Corp | | | 3,016 | |
| | 12,988 | | * | | Tactile Systems Technology, Inc | | | 592 | |
| | 54,510 | | *,e | | Teladoc, Inc | | | 2,702 | |
COLLEGE RETIREMENT EQUITIES FUND- Social Choice Account
| SHARES | | | | COMPANY | | VALUE
(000) | |
| | 19,606 | | * | | Tivity Health, Inc | | $ | 486 | |
| | 18,482 | | * | | Triple-S Management Corp (Class B) | | | 321 | |
| | 287,788 | | | | UnitedHealth Group, Inc | | | 71,694 | |
| | 10,051 | | | | US Physical Therapy, Inc | | | 1,029 | |
| | 20,611 | | * | | Varian Medical Systems, Inc | | | 2,335 | |
| | 32,132 | | * | | Vocera Communications, Inc | | | 1,264 | |
| | 846 | | | | West Pharmaceutical Services, Inc | | | 83 | |
| | | | | | TOTAL HEALTH CARE EQUIPMENT & SERVICES | | | 377,668 | |
| | | | | | | | | | |
| HOUSEHOLD & PERSONAL PRODUCTS - 1.3% |
| | 493 | | | | Clorox Co | | | 76 | |
| | 399,696 | | | | Colgate-Palmolive Co | | | 23,790 | |
| | 4,015 | | | | Energizer Holdings, Inc | | | 181 | |
| | 139,998 | | | | Essity AB | | | 3,441 | |
| | 89,385 | | | | Estee Lauder Cos (Class A) | | | 11,629 | |
| | 83,735 | | | | Henkel KGaA | | | 8,242 | |
| | 22,604 | | | | Henkel KGaA (Preference) | | | 2,469 | |
| | 46,900 | | | | Kao Corp | | | 3,471 | |
| | 75,803 | | | | Kimberly-Clark Corp | | | 8,637 | |
| | 70,705 | | | | L’Oreal S.A. | | | 16,179 | |
| | 768,452 | | | | Procter & Gamble Co | | | 70,636 | |
| | 47,600 | | | | Shiseido Co Ltd | | | 2,981 | |
| | 48,700 | | | | Uni-Charm Corp | | | 1,575 | |
| | 376,499 | | | | Unilever NV | | | 20,396 | |
| | | | | | TOTAL HOUSEHOLD & PERSONAL PRODUCTS | | | 173,703 | |
| | | | | | | | | | |
| INSURANCE - 2.6% |
| | 1,073,234 | | | | Aegon NV | | | 5,027 | |
| | 102,018 | | | | Allianz AG. | | | 20,501 | |
| | 96,308 | | | | Allstate Corp | | | 7,958 | |
| | 693,538 | | | | American International Group, Inc | | | 27,332 | |
| | 3,753 | | * | | Arch Capital Group Ltd | | | 100 | |
| | 2,370 | | | | Arthur J. Gallagher & Co | | | 175 | |
| | 24,234 | | | | Aspen Insurance Holdings Ltd | | | 1,018 | |
| | 423,400 | | | | Assicurazioni Generali S.p.A. | | | 7,077 | |
| | 1,938,012 | | | | Aviva plc | | | 9,275 | |
| | 574,060 | | | | AXA S.A. | | | 12,389 | |
| | 288,074 | | | | Chubb Ltd | | | 37,213 | |
| | 162,931 | | | | CNP Assurances | | | 3,458 | |
| | 1,270 | | | | First American Financial Corp | | | 57 | |
| | 3,114,070 | | | | Legal & General Group plc | | | 9,175 | |
| | 2,173 | | | | Lincoln National Corp | | | 112 | |
| | 236,587 | | | | Loews Corp | | | 10,769 | |
| | 365,116 | | | | Marsh & McLennan Cos, Inc | | | 29,118 | |
| | 54,934 | | | | Muenchener Rueckver AG. | | | 11,981 | |
| | 123,000 | | | | NKSJ Holdings, Inc | | | 4,178 | |
| | 29,488 | | | | Principal Financial Group | | | 1,303 | |
| | 481,344 | | | | Progressive Corp | | | 29,039 | |
| | 352,663 | | | | Prudential Financial, Inc | | | 28,760 | |
| | 778,093 | | | | Prudential plc | | | 13,894 | |
| | 209,543 | | | | RSA Insurance Group plc | | | 1,375 | |
| | 169,346 | | | | Sun Life Financial, Inc | | | 5,618 | |
| | 110,861 | | | | Swiss Re Ltd | | | 10,199 | |
| | 173,200 | | | | Tokio Marine Holdings, Inc | | | 8,229 | |
| | 199,934 | | | | Travelers Cos, Inc | | | 23,942 | |
| | 495 | | | | White Mountains Insurance Group Ltd | | | 425 | |
COLLEGE RETIREMENT EQUITIES FUND- Social Choice Account
| SHARES | | | | COMPANY | | VALUE
(000) | |
| | 1,467 | | | | Willis Towers Watson plc | | $ | 223 | |
| | 46,595 | | | | Zurich Financial Services AG. | | | 13,889 | |
| | | | | | TOTAL INSURANCE | | | 333,809 | |
| | | | | | | | | | |
| MATERIALS - 2.7% |
| | 107,681 | | | | Agnico-Eagle Mines Ltd | | | 4,346 | |
| | 124,417 | | | | Air Liquide | | | 15,450 | |
| | 151,184 | | | | Air Products & Chemicals, Inc | | | 24,197 | |
| | 22,448 | | | | Akzo Nobel NV | | | 1,808 | |
| | 2,399,091 | | | | Alumina Ltd | | | 3,886 | |
| | 1,306 | | | | Aptargroup, Inc | | | 123 | |
| | 226,300 | | | | Asahi Kasei Corp | | | 2,323 | |
| | 2,277 | | * | | Axalta Coating Systems Ltd | | | 53 | |
| | 129,640 | | | | Ball Corp | | | 5,961 | |
| | 214,323 | | | | BASF SE | | | 14,928 | |
| | 950 | | | | Bemis Co, Inc | | | 44 | |
| | 531 | | * | | Berry Plastics Group, Inc | | | 25 | |
| | 515,949 | | | | BlueScope Steel Ltd | | | 3,980 | |
| | 269,716 | | | | Boliden AB | | | 5,844 | |
| | 17,502 | | | | Celanese Corp (Series A) | | | 1,575 | |
| | 34,439 | | * | | Century Aluminum Co | | | 252 | |
| | 6,223 | | | | Christian Hansen Holding | | | 552 | |
| | 14,714 | | * | | Clearwater Paper Corp | | | 359 | |
| | 86,865 | | | | Commercial Metals Co | | | 1,392 | |
| | 306,291 | | | | CRH plc | | | 8,113 | |
| | 65,860 | | | | Croda International plc | | | 3,933 | |
| | 5,941 | | | | DSM NV | | | 482 | |
| | 220,307 | | | | Ecolab, Inc | | | 32,462 | |
| | 313 | | | | FMC Corp | | | 23 | |
| | 1,154,377 | | | | Fortescue Metals Group Ltd | | | 3,404 | |
| | 101,779 | | | | Franco-Nevada Corp | | | 7,137 | |
| | 4,290 | | | | Givaudan S.A. | | | 9,947 | |
| | 83,785 | | | | HeidelbergCement AG. | | | 5,136 | |
| | 204,900 | | | | Hitachi Metals Ltd | | | 2,131 | |
| | 28,589 | | | | Imerys S.A. | | | 1,374 | |
| | 827 | | | | International Flavors & Fragrances, Inc | | | 111 | |
| | 172,881 | | | | International Paper Co | | | 6,977 | |
| | 131,475 | | | | Johnson Matthey plc | | | 4,694 | |
| | 208,832 | | | | Linde plc | | | 32,586 | |
| | 59,233 | | | | Louisiana-Pacific Corp | | | 1,316 | |
| | 197 | | | | Martin Marietta Materials, Inc | | | 34 | |
| | 3,682 | | | | Materion Corp | | | 166 | |
| | 25,920 | | | | Minerals Technologies, Inc | | | 1,331 | |
| | 486,000 | | | | Mitsubishi Chemical Holdings Corp | | | 3,672 | |
| | 152,392 | | | | Mitsui Chemicals, Inc | | | 3,440 | |
| | 77,471 | | | | Mondi plc | | | 1,614 | |
| | 174,165 | | | | Mosaic Co | | | 5,087 | |
| | 311,816 | | | | Newcrest Mining Ltd | | | 4,792 | |
| | 202,242 | | | | Newmont Mining Corp | | | 7,008 | |
| | 476,600 | | | | Nippon Steel Corp | | | 8,188 | |
| | 28,700 | | | | Nitto Denko Corp | | | 1,439 | |
| | 1,326,157 | | | | Norsk Hydro ASA | | | 6,009 | |
| | 316,932 | | | | Nucor Corp | | | 16,420 | |
| | 229,433 | | e | | Nutrien Ltd (Toronto) | | | 10,776 | |
| | 4,188 | | | | Reliance Steel & Aluminum Co | | | 298 | |
| | 84,903 | | | | Royal Gold, Inc | | | 7,272 | |
COLLEGE RETIREMENT EQUITIES FUND- Social Choice Account
| SHARES | | | | COMPANY | | VALUE
(000) | |
| | 10,424 | | | | Schnitzer Steel Industries, Inc (Class A) | | $ | 225 | |
| | 337 | | | | Scotts Miracle-Gro Co (Class A) | | | 21 | |
| | 1,772 | | | | Sealed Air Corp | | | 62 | |
| | 131,300 | | | | Shin-Etsu Chemical Co Ltd | | | 10,088 | |
| | 5,600 | | e | | Showa Denko KK | | | 166 | |
| | 31,200 | | | | Sika AG. | | | 3,963 | |
| | 1,033 | | | | Sonoco Products Co | | | 55 | |
| | 153,789 | | | | Stora Enso Oyj (R Shares) | | | 1,783 | |
| | 1,184,000 | | | | Sumitomo Chemical Co Ltd | | | 5,734 | |
| | 229,200 | | | | Sumitomo Metal Mining Co Ltd | | | 6,138 | |
| | 67,852 | | * | | Summit Materials, Inc | | | 841 | |
| | 396,581 | | | | Teck Cominco Ltd | | | 8,538 | |
| | 9,000 | | | | Toray Industries, Inc | | | 64 | |
| | 29,019 | | | | Trinseo S.A. | | | 1,328 | |
| | 96,947 | | | | Umicore S.A. | | | 3,869 | |
| | 166,329 | | | | UPM-Kymmene Oyj | | | 4,210 | |
| | 19,003 | | *,e | | US Concrete, Inc | | | 670 | |
| | 110,931 | | | | Voestalpine AG. | | | 3,308 | |
| | 39,240 | | | | Vulcan Materials Co | | | 3,877 | |
| | 112,500 | | | | WestRock Co | | | 4,248 | |
| | | | | | TOTAL MATERIALS | | | 343,658 | |
| | | | | | | | | | |
| MEDIA & ENTERTAINMENT - 2.1% |
| | 49,500 | | * | | Alphabet, Inc (Class A) | | | 51,725 | |
| | 51,184 | | * | | Alphabet, Inc (Class C) | | | 53,007 | |
| | 1,669 | | | | Cable One, Inc | | | 1,369 | |
| | 19,251 | | | | Cinemark Holdings, Inc | | | 689 | |
| | 66,744 | | | | Clear Channel Outdoor Holdings, Inc (Class A) | | | 346 | |
| | 700 | | | | CyberAgent, Inc | | | 27 | |
| | 291,226 | | *,e | | Discovery, Inc (Class A) | | | 7,205 | |
| | 305,594 | | * | | Discovery, Inc (Class C) | | | 7,053 | |
| | 84,634 | | | | Entravision Communications Corp (Class A) | | | 246 | |
| | 152,247 | | * | | Gray Television, Inc | | | 2,244 | |
| | 685,906 | | | | Informa plc | | | 5,506 | |
| | 55,094 | | | | Interpublic Group of Cos, Inc | | | 1,137 | |
| | 3,534,228 | | | | ITV plc | | | 5,625 | |
| | 71,383 | | e | | JC Decaux S.A. | | | 2,005 | |
| | 15,074 | | | | John Wiley & Sons, Inc (Class A) | | | 708 | |
| | 179,060 | | * | | Liberty Broadband Corp (Class C) | | | 12,898 | |
| | 4,448 | | * | | Liberty Global plc | | | 92 | |
| | 2,960 | | * | | Liberty Global plc (Class A) | | | 63 | |
| | 64,304 | | * | | Live Nation, Inc | | | 3,167 | |
| | 5,583 | | * | | Loral Space & Communications, Inc | | | 208 | |
| | 6,202 | | | | Marcus Corp | | | 245 | |
| | 176,049 | | * | | NetFlix, Inc | | | 47,121 | |
| | 104,428 | | | | New York Times Co (Class A) | | | 2,328 | |
| | 12,500 | | | | Nintendo Co Ltd | | | 3,319 | |
| | 157,199 | | | | Omnicom Group, Inc | | | 11,513 | |
| | 293,251 | | * | | Pandora Media, Inc | | | 2,372 | |
| | 373,284 | | | | Pearson plc | | | 4,472 | |
| | 63,571 | | | | ProSiebenSat. Media AG. | | | 1,131 | |
| | 7,561 | | | | Schibsted ASA (B Shares) | | | 230 | |
| | 11,472 | | | | Scholastic Corp | | | 462 | |
| | 52,959 | | | | Sinclair Broadcast Group, Inc (Class A) | | | 1,395 | |
| | 2,837,450 | | e | | Sirius XM Holdings, Inc | | | 16,202 | |
| | 182 | | * | | Take-Two Interactive Software, Inc | | | 19 | |
COLLEGE RETIREMENT EQUITIES FUND- Social Choice Account
| SHARES | | | | COMPANY | | VALUE
(000) | |
| | 17,183 | | | | Tribune Co | | $ | 780 | |
| | 110,098 | | * | | TripAdvisor, Inc | | | 5,939 | |
| | 37,175 | | | | World Wrestling Entertainment, Inc (Class A) | | | 2,778 | |
| | 819,094 | | | | WPP plc | | | 8,914 | |
| | | | | | TOTAL MEDIA & ENTERTAINMENT | | | 264,540 | |
| | | | | | | | | | |
| PHARMACEUTICALS, BIOTECHNOLOGY & LIFE SCIENCES - 4.9% |
| | 402,535 | | | | AbbVie, Inc | | | 37,110 | |
| | 81,706 | | * | | Acadia Pharmaceuticals, Inc | | | 1,321 | |
| | 8,756 | | * | | Acceleron Pharma, Inc | | | 381 | |
| | 4,399 | | * | | Acorda Therapeutics, Inc | | | 69 | |
| | 18,975 | | * | | Aduro Biotech, Inc | | | 50 | |
| | 229,517 | | | | Agilent Technologies, Inc | | | 15,483 | |
| | 24,557 | | * | | Agios Pharmaceuticals, Inc | | | 1,132 | |
| | 85,128 | | * | | Akorn, Inc | | | 289 | |
| | 254,585 | | | | Amgen, Inc | | | 49,560 | |
| | 701,314 | | | | Astellas Pharma, Inc | | | 8,960 | |
| | 291,740 | | | | AstraZeneca plc | | | 21,777 | |
| | 9,400 | | | | AstraZeneca plc (ADR) | | | 357 | |
| | 56,798 | | *,e | | Aurora Cannabis, Inc | | | 282 | |
| | 85,693 | | * | | Bellicum Pharmaceuticals, Inc | | | 250 | |
| | 165,249 | | * | | BioCryst Pharmaceuticals, Inc | | | 1,334 | |
| | 84,486 | | * | | Biogen Idec, Inc | | | 25,424 | |
| | 68,357 | | * | | BioMarin Pharmaceutical, Inc | | | 5,821 | |
| | 14,780 | | * | | Bluebird Bio, Inc | | | 1,466 | |
| | 664,344 | | | | Bristol-Myers Squibb Co | | | 34,533 | |
| | 1,178 | | | | Bruker BioSciences Corp | | | 35 | |
| | 291,645 | | * | | Celgene Corp | | | 18,692 | |
| | 149,797 | | | | Chugai Pharmaceutical Co Ltd | | | 8,688 | |
| | 69,722 | | * | | Coherus Biosciences, Inc | | | 631 | |
| | 23,539 | | *,e | | Collegium Pharmaceutical, Inc | | | 404 | |
| | 124,507 | | | | CSL Ltd | | | 16,263 | |
| | 91,300 | | | | Eisai Co Ltd | | | 7,068 | |
| | 431,197 | | | | Eli Lilly & Co | | | 49,898 | |
| | 5,911 | | *,e | | Esperion Thereapeutics, Inc | | | 272 | |
| | 40,521 | | * | | FibroGen, Inc | | | 1,875 | |
| | 19,936 | | *,e | | Flexion Therapeutics Inc | | | 226 | |
| | 26,611 | | * | | Genmab AS | | | 4,375 | |
| | 422,081 | | | | Gilead Sciences, Inc | | | 26,401 | |
| | 67,537 | | | | H Lundbeck AS | | | 2,973 | |
| | 11,045 | | * | | Halozyme Therapeutics, Inc | | | 162 | |
| | 65,390 | | * | | Illumina, Inc | | | 19,612 | |
| | 32,294 | | * | | Inovio Pharmaceuticals, Inc | | | 129 | |
| | 34,337 | | * | | Intersect ENT, Inc | | | 968 | |
| | 64,045 | | * | | Iovance Biotherapeutics, Inc | | | 567 | |
| | 95,476 | | * | | IQVIA Holdings, Inc | | | 11,091 | |
| | 417 | | * | | Jazz Pharmaceuticals plc | | | 52 | |
| | 252,800 | | | | Kyowa Hakko Kogyo Co Ltd | | | 4,777 | |
| | 33,093 | | | | Lonza Group AG. | | | 8,603 | |
| | 85,531 | | | | Merck KGaA | | | 8,804 | |
| | 7,999 | | * | | Mettler-Toledo International, Inc | | | 4,524 | |
| | 71,288 | | * | | Nektar Therapeutics | | | 2,343 | |
| | 453,400 | | | | Novo Nordisk AS | | | 20,823 | |
| | 92,678 | | *,e | | Opko Health, Inc | | | 279 | |
| | 1,883 | | | | Orion Oyj (Class B) | | | 66 | |
| | 9,341 | | | | PerkinElmer, Inc | | | 734 | |
COLLEGE RETIREMENT EQUITIES FUND- Social Choice Account
| SHARES | | | | COMPANY | | VALUE
(000) | |
| | 652 | | | | Perrigo Co plc | | $ | 25 | |
| | 160,718 | | * | | Progenics Pharmaceuticals, Inc | | | 675 | |
| | 16,974 | | * | | Prothena Corp plc | | | 175 | |
| | 181,028 | | * | | QIAGEN NV (Turquoise) | | | 6,186 | |
| | 567 | | * | | Repligen Corp | | | 30 | |
| | 143,359 | | | | Roche Holding AG. | | | 35,590 | |
| | 10,089 | | * | | Sage Therapeutics, Inc | | | 966 | |
| | 62,806 | | * | | Sangamo Biosciences, Inc | | | 721 | |
| | 259,402 | | | | Sanofi-Aventis | | | 22,503 | |
| | 25,811 | | * | | Sarepta Therapeutics, Inc | | | 2,817 | |
| | 874,008 | | | | Schering-Plough Corp | | | 66,783 | |
| | 93,800 | | | | Shionogi & Co Ltd | | | 5,354 | |
| | 4,346 | | * | | Spark Therapeutics, Inc | | | 170 | |
| | 23,800 | | | | Sumitomo Dainippon Pharma Co Ltd | | | 759 | |
| | 19,426 | | *,e | | TESARO, Inc | | | 1,442 | |
| | 30,109 | | *,e | | Theravance Biopharma, Inc | | | 770 | |
| | 42,324 | | | | UCB S.A. | | | 3,457 | |
| | 31,135 | | * | | Ultragenyx Pharmaceutical, Inc | | | 1,354 | |
| | 109,468 | | * | | Vertex Pharmaceuticals, Inc | | | 18,140 | |
| | 4,804 | | | | Vifor Pharma AG. | | | 523 | |
| | 25,754 | | * | | Waters Corp | | | 4,858 | |
| | 371,887 | | | | Zoetis, Inc | | | 31,811 | |
| | | | | | TOTAL PHARMACEUTICALS, BIOTECHNOLOGY & LIFE SCIENCES | | | 632,043 | |
| | | | | | | | | | |
| REAL ESTATE - 2.0% |
| | 15,548 | | *,e | | Altisource Portfolio Solutions S.A. | | | 350 | |
| | 17,412 | | | | American Campus Communities, Inc | | | 721 | |
| | 244,770 | | | | American Tower Corp | | | 38,720 | |
| | 108,838 | | | | Boston Properties, Inc | | | 12,250 | |
| | 4,210 | | | | Brandywine Realty Trust | | | 54 | |
| | 887,545 | | | | British Land Co plc | | | 6,036 | |
| | 80,242 | | | | Brixmor Property Group, Inc | | | 1,179 | |
| | 1,153,449 | | | | CapitaLand Ltd | | | 2,630 | |
| | 142,403 | | * | | CBRE Group, Inc | | | 5,702 | |
| | 228,200 | | | | City Developments Ltd | | | 1,360 | |
| | 32,533 | | | | Coresite Realty | | | 2,838 | |
| | 317,700 | | | | Daiwa House Industry Co Ltd | | | 10,134 | |
| | 132,166 | | | | Duke Realty Corp | | | 3,423 | |
| | 2,171 | | | | Easterly Government Properties, Inc | | | 34 | |
| | 56,380 | | | | Equinix, Inc | | | 19,877 | |
| | 539 | | | | Gecina S.A. | | | 70 | |
| | 462,907 | | | | Hammerson plc | | | 1,949 | |
| | 1,962,000 | | | | Hang Lung Properties Ltd | | | 3,729 | |
| | 329,519 | | | | HCP, Inc | | | 9,203 | |
| | 257,492 | | | | Host Marriott Corp | | | 4,292 | |
| | 50,390 | | * | | Howard Hughes Corp | | | 4,919 | |
| | 286,700 | | | | Hulic Co Ltd | | | 2,562 | |
| | 260,670 | | | | Hysan Development Co Ltd | | | 1,240 | |
| | 140,332 | | | | Iron Mountain, Inc | | | 4,548 | |
| | 40,680 | | | | iStar Financial, Inc | | | 373 | |
| | 2,640 | | | | Jones Lang LaSalle, Inc | | | 334 | |
| | 45,796 | | | | Lend Lease Corp Ltd | | | 375 | |
| | 3,590 | | | | Liberty Property Trust | | | 150 | |
| | 423,000 | | | | Link REIT | | | 4,288 | |
COLLEGE RETIREMENT EQUITIES FUND- Social Choice Account
| SHARES | | | | COMPANY | | VALUE
(000) | |
| | 610,400 | | | | Mitsubishi Estate Co Ltd | | $ | 9,604 | |
| | 362,810 | | | | Mitsui Fudosan Co Ltd | | | 8,059 | |
| | 17 | | | | Nippon ProLogis REIT, Inc | | | 36 | |
| | 59,300 | | | | Nomura Real Estate Holdings, Inc | | | 1,087 | |
| | 49,218 | | | | NorthStar Realty Europe Corp | | | 716 | |
| | 7,000 | | | | Piedmont Office Realty Trust, Inc | | | 119 | |
| | 508,773 | | | | Prologis, Inc | | | 29,875 | |
| | 36,640 | | | | QTS Realty Trust, Inc | | | 1,358 | |
| | 3,184 | | | | Rayonier, Inc | | | 88 | |
| | 3,772 | | e | | Realogy Holdings Corp | | | 55 | |
| | 3,556 | | | | RMR Group, Inc | | | 189 | |
| | 72,910 | | * | | SBA Communications Corp | | | 11,803 | |
| | 405,518 | | | | Scentre Group | | | 1,115 | |
| | 994,327 | | | | Segro plc | | | 7,465 | |
| | 12,041 | | | | Senior Housing Properties Trust | | | 141 | |
| | 6,210 | | | | Starwood Property Trust, Inc | | | 122 | |
| | 463,500 | | | | Swire Pacific Ltd (Class A) | | | 4,894 | |
| | 1,128,400 | | | | Swire Properties Ltd | | | 3,965 | |
| | 2,845 | | * | | Tejon Ranch Co | | | 47 | |
| | 35,140 | | | | Tier REIT, Inc | | | 725 | |
| | 88,536 | | | | UDR, Inc | | | 3,508 | |
| | 40,112 | | | | Unibail-Rodamco-Westfield | | | 6,207 | |
| | 34,700 | | | | UOL Group Ltd | | | 158 | |
| | 326,174 | | | | Welltower, Inc | | | 22,640 | |
| | 257,094 | | | | Weyerhaeuser Co | | | 5,620 | |
| | | | | | TOTAL REAL ESTATE | | | 262,936 | |
| | | | | | | | | | |
| RETAILING - 2.5% |
| | 74,043 | | * | | 1-800-FLOWERS.COM, Inc (Class A) | | | 906 | |
| | 35,173 | | | | Advance Auto Parts, Inc | | | 5,538 | |
| | 440 | | * | | Autonation, Inc | | | 16 | |
| | 94,692 | | | | Best Buy Co, Inc | | | 5,015 | |
| | 23,621 | | * | | Booking Holdings, Inc | | | 40,685 | |
| | 77,773 | | * | | CarMax, Inc | | | 4,879 | |
| | 124,524 | | * | | Etsy, Inc | | | 5,924 | |
| | 215,636 | | | | Expedia, Inc | | | 24,291 | |
| | 18,500 | | | | Fast Retailing Co Ltd | | | 9,449 | |
| | 3,529 | | * | | Five Below, Inc | | | 361 | |
| | 3,480 | | e | | GameStop Corp (Class A) | | | 44 | |
| | 171,730 | | | | Gap, Inc | | | 4,424 | |
| | 24,552 | | * | | Genesco, Inc | | | 1,088 | |
| | 679 | | | | Genuine Parts Co | | | 65 | |
| | 331 | | | | Group 1 Automotive, Inc | | | 17 | |
| | 912,891 | | * | | Groupon, Inc | | | 2,921 | |
| | 14,217 | | | | Haverty Furniture Cos, Inc | | | 267 | |
| | 61,083 | | | | Hennes & Mauritz AB (B Shares) | | | 869 | |
| | 31,775 | | * | | Hibbett Sports, Inc | | | 454 | |
| | 370,326 | | | | Home Depot, Inc | | | 63,629 | |
| | 419,176 | | | | Industria De Diseno Textil S.A. | | | 10,699 | |
| | 97,400 | | | | Jardine Cycle & Carriage Ltd | | | 2,522 | |
| | 27,238 | | | | Kering | | | 12,760 | |
| | 602,335 | | | | Kingfisher plc | | | 1,584 | |
| | 151,578 | | | | Kohl’s Corp | | | 10,056 | |
COLLEGE RETIREMENT EQUITIES FUND- Social Choice Account
| SHARES | | | | COMPANY | | VALUE
(000) | |
| | 829 | | | | L Brands, Inc | | $ | 21 | |
| | 80,537 | | *,e | | Lands’ End, Inc | | | 1,144 | |
| | 120,512 | | * | | LKQ Corp | | | 2,860 | |
| | 401,684 | | | | Lowe’s Companies, Inc | | | 37,100 | |
| | 1,225 | | | | Macy’s, Inc | | | 36 | |
| | 16,107 | | * | | MarineMax, Inc | | | 295 | |
| | 342,665 | | e | | Marks & Spencer Group plc | | | 1,075 | |
| | 2,400 | | | | Marui Co Ltd | | | 46 | |
| | 308 | | * | | Murphy USA, Inc | | | 24 | |
| | 31,269 | | | | Next plc | | | 1,592 | |
| | 300 | | | | Nitori Co Ltd | | | 38 | |
| | 25,231 | | | | Nordstrom, Inc | | | 1,176 | |
| | 119,203 | | | | Nutri/System, Inc | | | 5,231 | |
| | 102,526 | | | | Office Depot, Inc | | | 264 | |
| | 201 | | | | Pool Corp | | | 30 | |
| | 171,930 | | * | | Quotient Technology, Inc | | | 1,836 | |
| | 26,624 | | * | | Rent-A-Center, Inc | | | 431 | |
| | 229,722 | | | | Ross Stores, Inc | | | 19,113 | |
| | 1,746 | | * | | Sally Beauty Holdings, Inc | | | 30 | |
| | 15,085 | | | | Shoe Carnival, Inc | | | 505 | |
| | 108,130 | | * | | Shutterfly, Inc | | | 4,353 | |
| | 98,632 | | | | Target Corp | | | 6,519 | |
| | 22,162 | | | | Tiffany & Co | | | 1,784 | |
| | 15,696 | | | | Tile Shop Holdings, Inc | | | 86 | |
| | 170,936 | | | | TJX Companies, Inc | | | 7,648 | |
| | 12,920 | | | | Tractor Supply Co | | | 1,078 | |
| | 28,222 | | * | | Ulta Beauty, Inc | | | 6,910 | |
| | 272,467 | | | | Wesfarmers Ltd | | | 6,190 | |
| | 46,193 | | e | | Williams-Sonoma, Inc | | | 2,330 | |
| | 29,100 | | *,g | | Zalando SE | | | 752 | |
| | | | | | TOTAL RETAILING | | | 318,960 | |
| | | | | | | | | | |
| SEMICONDUCTORS & SEMICONDUCTOR EQUIPMENT - 1.4% |
| | 525,988 | | | | Applied Materials, Inc | | | 17,221 | |
| | 102,635 | | | | ASML Holding NV | | | 16,079 | |
| | 29,888 | | * | | Cirrus Logic, Inc | | | 992 | |
| | 21,963 | | * | | First Solar, Inc | | | 932 | |
| | 18,222 | | * | | Integrated Device Technology, Inc | | | 882 | |
| | 1,322,542 | | | | Intel Corp | | | 62,067 | |
| | 68,536 | | | | Lam Research Corp | | | 9,332 | |
| | 191,438 | | | | NVIDIA Corp | | | 25,557 | |
| | 435,099 | | | | Texas Instruments, Inc | | | 41,117 | |
| | 56,700 | | | | Tokyo Electron Ltd | | | 6,383 | |
| | | | | | TOTAL SEMICONDUCTORS & SEMICONDUCTOR EQUIPMENT | | | 180,562 | |
| | | | | | | | | | |
| SOFTWARE & SERVICES - 5.0% |
| | 299,265 | | | | Accenture plc | | | 42,199 | |
| | 126,749 | | * | | Adobe, Inc | | | 28,676 | |
| | 102,701 | | | | Amadeus IT Holding S.A. | | | 7,146 | |
| | 733 | | | | Atos Origin S.A. | | | 60 | |
| | 160,982 | | * | | Autodesk, Inc | | | 20,704 | |
| | 51,133 | | * | | Benefitfocus, Inc | | | 2,338 | |
| | 371,579 | | * | | Black Knight, Inc | | | 16,743 | |
| | 27,736 | | | | Blackbaud, Inc | | | 1,745 | |
COLLEGE RETIREMENT EQUITIES FUND- Social Choice Account
| SHARES | | | | COMPANY | | VALUE
(000) | |
| | 85,228 | | * | | Blackberry Ltd (New) | | $ | 606 | |
| | 326,534 | | | | Booz Allen Hamilton Holding Co | | | 14,717 | |
| | 179,568 | | * | | Cadence Design Systems, Inc | | | 7,808 | |
| | 80,102 | | | | Cap Gemini S.A. | | | 7,967 | |
| | 127,574 | | * | | CGI Group, Inc | | | 7,803 | |
| | 23,801 | | * | | ChannelAdvisor Corp | | | 270 | |
| | 95,102 | | | | Computershare Ltd | | | 1,153 | |
| | 415,660 | | * | | Conduent, Inc | | | 4,418 | |
| | 63,670 | | | | CSG Systems International, Inc | | | 2,023 | |
| | 33,942 | | *,e | | Ellie Mae, Inc | | | 2,133 | |
| | 29,933 | | * | | ExlService Holdings, Inc | | | 1,575 | |
| | 95,600 | | | | Fujitsu Ltd | | | 5,959 | |
| | 396,413 | | | | International Business Machines Corp | | | 45,060 | |
| | 176,596 | | | | Intuit, Inc | | | 34,763 | |
| | 216,763 | | * | | Limelight Networks, Inc | | | 507 | |
| | 88,213 | | | | LogMeIn, Inc | | | 7,195 | |
| | 771 | | * | | Manhattan Associates, Inc | | | 33 | |
| | 1,758,895 | | | | Microsoft Corp | | | 178,651 | |
| | 85,314 | | * | | MINDBODY, Inc | | | 3,105 | |
| | 42,795 | | * | | MoneyGram International, Inc | | | 86 | |
| | 90,382 | | * | | New Relic, Inc | | | 7,318 | |
| | 64,400 | | | | Nomura Research Institute Ltd | | | 2,388 | |
| | 89,639 | | * | | Nutanix, Inc | | | 3,728 | |
| | 29,738 | | * | | OneSpan, Inc | | | 385 | |
| | 96,077 | | | | Open Text Corp | | | 3,132 | |
| | 1,118,967 | | | | Oracle Corp | | | 50,521 | |
| | 1,800 | | | | Otsuka Corp | | | 50 | |
| | 19,344 | | * | | Paycom Software, Inc | | | 2,369 | |
| | 5,706 | | * | | Paylocity Holding Corp | | | 344 | |
| | 70,881 | | * | | Perficient, Inc | | | 1,578 | |
| | 37,857 | | * | | Qualys, Inc | | | 2,829 | |
| | 30,361 | | * | | Rapid7, Inc | | | 946 | |
| | 103,864 | | * | | RingCentral, Inc | | | 8,563 | |
| | 336,752 | | * | | salesforce.com, Inc | | | 46,125 | |
| | 228,038 | | | | SAP AG. | | | 22,633 | |
| | 67,561 | | | | Science Applications International Corp | | | 4,304 | |
| | 61,087 | | * | | SPS Commerce, Inc | | | 5,032 | |
| | 41,006 | | * | | Sykes Enterprises, Inc | | | 1,014 | |
| | 31,618 | | * | | Tableau Software, Inc | | | 3,794 | |
| | 224,993 | | * | | Teradata Corp | | | 8,631 | |
| | 82,173 | | | | TiVo Corp | | | 773 | |
| | 250,782 | | | | Travelport Worldwide Ltd | | | 3,917 | |
| | 6,080 | | | | TTEC Holdings, Inc | | | 174 | |
| | 73,387 | | *,e | | Twilio, Inc | | | 6,553 | |
| | 18,383 | | * | | Ultimate Software Group, Inc | | | 4,501 | |
| | 40,347 | | * | | Virtusa Corp | | | 1,718 | |
| | 117 | | | | VMware, Inc (Class A) | | | 16 | |
| | 37,590 | | * | | Zendesk, Inc | | | 2,194 | |
| | | | | | TOTAL SOFTWARE & SERVICES | | | 640,973 | |
| | | | | | | | | | |
| TECHNOLOGY HARDWARE & EQUIPMENT - 3.0% |
| | 15,530 | | * | | Anixter International, Inc | | | 843 | |
| | 1,036,835 | | | | Apple, Inc | | | 163,550 | |
COLLEGE RETIREMENT EQUITIES FUND- Social Choice Account
| SHARES | | | | COMPANY | | VALUE
(000) | |
| | 18,747 | | | | Badger Meter, Inc | | $ | 923 | |
| | 4,043 | | | | Belden CDT, Inc | | | 169 | |
| | 127,495 | | | | Benchmark Electronics, Inc | | | 2,700 | |
| | 1,503,382 | | | | Cisco Systems, Inc | | | 65,142 | |
| | 2,446 | | * | | Coherent, Inc | | | 259 | |
| | 61,509 | | * | | Cray, Inc | | | 1,328 | |
| | 33,384 | | | | CTS Corp | | | 864 | |
| | 39,009 | | | | Daktronics, Inc | | | 289 | |
| | 148,884 | | | | Dolby Laboratories, Inc (Class A) | | | 9,207 | |
| | 73,380 | | * | | Fabrinet | | | 3,765 | |
| | 25,626 | | * | | FARO Technologies, Inc | | | 1,041 | |
| | 76,904 | | * | | Finisar Corp | | | 1,661 | |
| | 1,196,712 | | | | Hewlett Packard Enterprise Co | | | 15,809 | |
| | 1,340,396 | | | | HP, Inc | | | 27,424 | |
| | 20,660 | | * | | Insight Enterprises, Inc | | | 842 | |
| | 44,469 | | * | | Itron, Inc | | | 2,103 | |
| | 56,436 | | | | Kemet Corp | | | 990 | |
| | 27,137 | | | | Keyence Corp | | | 13,716 | |
| | 4,153 | | * | | Keysight Technologies, Inc | | | 258 | |
| | 34,382 | | * | | Kimball Electronics, Inc | | | 533 | |
| | 193,000 | | | | Konica Minolta Holdings, Inc | | | 1,737 | |
| | 151,900 | | | | Kyocera Corp | | | 7,593 | |
| | 25,369 | | | | Littelfuse, Inc | | | 4,350 | |
| | 12,679 | | * | | Lumentum Holdings, Inc | | | 533 | |
| | 8,736 | | | | Methode Electronics, Inc | | | 203 | |
| | 82,557 | | | | Motorola, Inc | | | 9,497 | |
| | 3,868 | | | | MTS Systems Corp | | | 155 | |
| | 69,700 | | | | Murata Manufacturing Co Ltd | | | 9,392 | |
| | 158,385 | | | | National Instruments Corp | | | 7,188 | |
| | 103,381 | | | | NEC Corp | | | 3,074 | |
| | 9,996 | | * | | Netgear, Inc | | | 520 | |
| | 26,169 | | * | | Novanta, Inc | | | 1,649 | |
| | 58,800 | | | | Omron Corp | | | 2,132 | |
| | 7,653 | | * | | OSI Systems, Inc | | | 561 | |
| | 21,896 | | * | | Plexus Corp | | | 1,118 | |
| | 64,222 | | * | | Ribbon Communications, Inc | | | 310 | |
| | 20,224 | | * | | Rogers Corp | | | 2,003 | |
| | 67,700 | | | | Shimadzu Corp | | | 1,335 | |
| | 25,259 | | | | SYNNEX Corp | | | 2,042 | |
| | 4,348 | | | | TE Connectivity Ltd | | | 329 | |
| | 74,240 | | * | | Tech Data Corp | | | 6,074 | |
| | 150,468 | | * | | TTM Technologies, Inc | | | 1,464 | |
| | 138,749 | | | | Vishay Intertechnology, Inc | | | 2,499 | |
| | 138,600 | | | | Yaskawa Electric Corp | | | 3,388 | |
| | 32,700 | | | | Yokogawa Electric Corp | | | 564 | |
| | | | | | TOTAL TECHNOLOGY HARDWARE & EQUIPMENT | | | 383,126 | |
| | | | | | | | | | |
| TELECOMMUNICATION SERVICES - 1.4% |
| | 14,903 | | * | | Boingo Wireless, Inc | | | 307 | |
| | 3,499,168 | | | | BT Group plc | | | 10,640 | |
| | 863,016 | | | | CenturyLink, Inc | | | 13,075 | |
| | 72,478 | | * | | Cincinnati Bell, Inc | | | 564 | |
| | 24,511 | | | | Cogent Communications Group, Inc | | | 1,108 | |
| | 100,517 | | e | | Consolidated Communications Holdings, Inc | | | 993 | |
COLLEGE RETIREMENT EQUITIES FUND- Social Choice Account
| SHARES | | | | COMPANY | | VALUE
(000) | |
| | 169,711 | | *,e | | Gogo, Inc | | $ | 507 | |
| | 207,233 | | * | | Iridium Communications, Inc | | | 3,823 | |
| | 535,332 | | | | KDDI Corp | | | 12,792 | |
| | 502,700 | | | | NTT DoCoMo, Inc | | | 11,295 | |
| | 725,735 | | | | Orange S. A. | | | 11,761 | |
| | 47,991 | | * | | Orbcomm, Inc | | | 396 | |
| | 190,961 | | | | Rogers Communications, Inc (Class B) | | | 9,786 | |
| | 3,479,100 | | e | | Singapore Telecommunications Ltd | | | 7,488 | |
| | 536,300 | | | | Singapore Telecommunications Ltd | | | 1,166 | |
| | 1,989,275 | | * | | Sprint Corp | | | 11,578 | |
| | 17,350 | | | | Swisscom AG. | | | 8,293 | |
| | 2,071 | | | | Tele2 AB (B Shares) | | | 26 | |
| | 183,099 | | | | Telenor ASA | | | 3,556 | |
| | 25,967 | | | | TeliaSonera AB | | | 123 | |
| | 779,160 | | | | Telstra Corp Ltd | | | 1,564 | |
| | 14,166 | | | | TELUS Corp | | | 469 | |
| | 723,589 | | | | Verizon Communications, Inc | | | 40,680 | |
| | 7,959,853 | | | | Vodafone Group plc | | | 15,476 | |
| | 446,130 | | * | | Vonage Holdings Corp | | | 3,895 | |
| | 308,391 | | * | | Zayo Group Holdings, Inc | | | 7,044 | |
| | | | | | TOTAL TELECOMMUNICATION SERVICES | | | 178,405 | |
| | | | | | | | | | |
| TRANSPORTATION - 1.7% |
| | 27,025 | | | | Aeroports de Paris | | | 5,125 | |
| | 26,400 | | | | All Nippon Airways Co Ltd | | | 948 | |
| | 60 | | | | Amerco, Inc | | | 20 | |
| | 4,904 | | | | Arkansas Best Corp | | | 168 | |
| | 298,609 | | | | Auckland International Airport Ltd | | | 1,441 | |
| | 11,737 | | * | | Avis Budget Group, Inc | | | 264 | |
| | 196,808 | | | | Canadian National Railway Co | | | 14,576 | |
| | 58,600 | | | | Central Japan Railway Co | | | 12,364 | |
| | 612 | | | | CH Robinson Worldwide, Inc | | | 51 | |
| | 307,314 | | | | CSX Corp | | | 19,093 | |
| | 252,046 | | | | Delta Air Lines, Inc | | | 12,577 | |
| | 313,413 | | | | Deutsche Post AG. | | | 8,559 | |
| | 127,000 | | | | East Japan Railway Co | | | 11,215 | |
| | 12,132 | | * | | Echo Global Logistics, Inc | | | 247 | |
| | 813 | | | | Expeditors International of Washington, Inc | | | 55 | |
| | 33,952 | | | | Fraport AG. Frankfurt Airport Services Worldwide | | | 2,430 | |
| | 100 | | * | | Genesee & Wyoming, Inc (Class A) | | | 7 | |
| | 80,600 | | | | Hankyu Hanshin Holdings, Inc | | | 2,680 | |
| | 33,090 | | * | | Hertz Global Holdings, Inc | | | 452 | |
| | 592 | | | | Kansas City Southern Industries, Inc | | | 56 | |
| | 9,600 | | | | Kintetsu Corp | | | 417 | |
| | 723 | | | | Kuehne & Nagel International AG. | | | 93 | |
| | 459 | | | | Landstar System, Inc | | | 44 | |
| | 1,516,364 | | | | MTR Corp | | | 7,980 | |
| | 23,078 | | | | Nippon Yusen Kabushiki Kaisha | | | 353 | |
| | 82,744 | | | | Norfolk Southern Corp | | | 12,374 | |
| | 42,500 | | | | Odakyu Electric Railway Co Ltd | | | 935 | |
| | 185,000 | | | | Singapore Airlines Ltd | | | 1,278 | |
| | 288,202 | | | | Southwest Airlines Co | | | 13,396 | |
| | 71,470 | | | | Sydney Airport | | | 339 | |
COLLEGE RETIREMENT EQUITIES FUND- Social Choice Account
| SHARES | | | | COMPANY | | VALUE
(000) | |
| | 75,800 | | | | Tokyu Corp | | $ | 1,239 | |
| | 1,122,669 | | | | Transurban Group (ASE) | | | 9,214 | |
| | 286,217 | | | | Union Pacific Corp | | | 39,564 | |
| | 352,474 | | | | United Parcel Service, Inc (Class B) | | | 34,377 | |
| | 200 | | | | West Japan Railway Co | | | 14 | |
| | 8,260 | | * | | YRC Worldwide, Inc | | | 26 | |
| | | | | | TOTAL TRANSPORTATION | | | 213,971 | |
| | | | | | | | | | |
| UTILITIES - 2.1% |
| | 161,542 | | e | | AltaGas Ltd | | | 1,645 | |
| | 355,606 | | | | American Electric Power Co, Inc | | | 26,578 | |
| | 38,489 | | | | American Water Works Co, Inc | | | 3,494 | |
| | 500,415 | | | | APA Group (ASE) | | | 2,998 | |
| | 4,270 | | | | Aqua America, Inc | | | 146 | |
| | 7,166 | | | | Avista Corp | | | 304 | |
| | 332,200 | | | | Chubu Electric Power Co, Inc | | | 4,720 | |
| | 5,605 | | | | CMS Energy Corp | | | 278 | |
| | 258,611 | | | | Consolidated Edison, Inc | | | 19,773 | |
| | 459,445 | | | | Dominion Resources, Inc | | | 32,832 | |
| | 1,246 | | | | DTE Energy Co | | | 137 | |
| | 117,711 | | | | Edison International | | | 6,682 | |
| | 1,825,905 | | | | Enel S.p.A. | | | 10,585 | |
| | 10,425 | | | | Energias de Portugal S.A. | | | 36 | |
| | 188,278 | | | | Eversource Energy | | | 12,246 | |
| | 112,045 | | | | Fortis, Inc | | | 3,735 | |
| | 12,890 | | | | Gas Natural SDG S.A. | | | 329 | |
| | 4,945,147 | | | | Hong Kong & China Gas Ltd | | | 10,217 | |
| | 103,000 | | | | Hong Kong Electric Holdings Ltd | | | 716 | |
| | 1,903,650 | | | | Iberdrola S.A. | | | 15,286 | |
| | 17,899 | | | | Idacorp, Inc | | | 1,666 | |
| | 142,000 | | | | Kyushu Electric Power Co, Inc | | | 1,691 | |
| | 680,684 | | | | Meridian Energy Ltd | | | 1,558 | |
| | 1,192,346 | | | | National Grid plc | | | 11,665 | |
| | 6,499 | | | | NiSource, Inc | | | 165 | |
| | 50,944 | | g | | Orsted AS | | | 3,409 | |
| | 3,980 | | | | Pinnacle West Capital Corp | | | 339 | |
| | 271,737 | | | | Public Service Enterprise Group, Inc | | | 14,144 | |
| | 649,423 | | | | Scottish & Southern Energy plc | | | 8,968 | |
| | 170,694 | | | | Sempra Energy | | | 18,467 | |
| | 35,973 | | | | South Jersey Industries, Inc | | | 1,000 | |
| | 680,000 | | | | Southern Co | | | 29,866 | |
| | 400 | | | | Tokyo Gas Co Ltd | | | 10 | |
| | 638,315 | | | | United Utilities Group plc | | | 6,002 | |
| | 980 | | | | Vectren Corp | | | 71 | |
| | 145,186 | | | | WEC Energy Group, Inc | | | 10,056 | |
| | 283,626 | | | | Xcel Energy, Inc | | | 13,974 | |
| | | | | | TOTAL UTILITIES | | | 275,788 | |
| | | | | | | | | | |
| | | | | | TOTAL COMMON STOCKS | | | 7,321,778 | |
| | | | | | (Cost $6,553,152) | | | | |
| | | | | | | | | | |
| PREFERRED STOCKS - 0.2% |
| |
| BANKS - 0.2% |
| | 233,115 | | * | | Federal Home Loan Mortgage Corp | | | 1,632 | |
| | 740,991 | | * | | Federal National Mortgage Association | | | 5,150 | |
COLLEGE RETIREMENT EQUITIES FUND- Social Choice Account
| SHARES | | | | COMPANY | | VALUE
(000) | |
| | 14,500 | | * | | M&T Bank Corp | | $ | 14,681 | |
| | | | | | TOTAL BANKS | | | 21,463 | |
| | | | | | TOTAL PREFERRED STOCKS | | | 21,463 | |
| | | | | | (Cost $38,865) | | | | |
| | | | | | | | | | |
| RIGHTS / WARRANTS - 0.0% |
| COMMERCIAL & PROFESSIONAL SERVICES - 0.0% |
| | 38,808 | | † | | Media General, Inc | | | 0 | |
| | | | | | TOTAL COMMERCIAL & PROFESSIONAL SERVICES | | | 0 | |
| | | | | | | | | | |
| ENERGY - 0.0% |
| | 581,547 | | e,m | | Repsol S.A. | | | 267 | |
| | | | | | TOTAL ENERGY | | | 267 | |
| | | | | | | | | | |
| | | | | | TOTAL RIGHTS / WARRANTS | | | 267 | |
| | | | | | (Cost $272) | | | | |
| PRINCIPAL | | | | | ISSUER | | RATE | | MATURITY
DATE | | | |
| |
| SHORT-TERM INVESTMENTS - 1.6% |
| |
| GOVERNMENT AGENCY DEBT - 0.2% |
| $ | 28,910,000 | | | | | Federal Home Loan Bank (FHLB) | | | 2.100 | % | | 01/02/19 | | | 28,910 | |
| | | | | | | TOTAL GOVERNMENT AGENCY DEBT | | | | | | | | | 28,910 | |
| | | | | | | | | | | | | | | | | |
| TREASURY DEBT - 0.2% |
| | 20,010,000 | | | | | United States Treasury Bill | | | 2.363 | | | 03/28/19 | | | 19,896 | |
| | | | | | | TOTAL TREASURY DEBT | | | | | | | | | 19,896 | |
| | | | | | | | | | | | | | | | | |
| SHARES | | | | | COMPANY | | | | | | | | | | |
| INVESTMENTS IN REGISTERED INVESTMENT COMPANIES - 1.2% |
| | 156,436,465 | | | c | | State Street Navigator Securities Lending Government Money Market Portfolio | | | 156,436 | |
| | | | | | | TOTAL INVESTMENTS IN REGISTERED INVESTMENT COMPANIES | | | 156,436 | |
| | | | | | | | | | | | | | | | | |
| | | | | | | TOTAL SHORT-TERM INVESTMENTS | | | | | | | | | 205,242 | |
| | | | | | | (Cost $205,242) | | | | | | | | | | |
| | | | | | | | | | | | | | | | | |
| | | | | | | TOTAL INVESTMENTS - 100.6% | | | | | | | | | 12,934,711 | |
| | | | | | | (Cost $12,252,662) | | | | | | | | | | |
| | | | | | | OTHER ASSETS & LIABILITIES, NET - (0.6)% | | | | | | | | | (76,344 | ) |
| | | | | | | NET ASSETS - 100.0% | | | | | | | | $ | 12,858,367 | |
| | | Abbreviation(s): |
| ADR | | American Depositary Receipt |
| LIBOR | | London Interbank Offered Rate |
| M | | Month |
| OTC | | Over The Counter |
| REIT | | Real Estate Investment Trust |
COLLEGE RETIREMENT EQUITIES FUND- Social Choice Account
| * | | Non-income producing |
| † | | Security is categorized as Level 3 in the fair value hierarchy. |
| c | | Investments made with cash collateral received from securities on loan. |
| e | | All or a portion of these securities are out on loan. The aggregate value of securities on loan is $150,948,463. |
| g | | Security is exempt from registration under Rule 144(A) of the Securities Act of 1933. Such securities are deemed liquid and may be resold in transactions exempt from registration to qualified institutional buyers. At 12/31/18, the aggregate value of these securities was $1,241,326,160 or 9.7% of net assets. |
| h | | All or a portion of these securities were purchased on a delayed delivery basis. |
| i | | Floating or variable rate security includes the reference rate and spread, unless the variable rate is based on the underlying asset of the security. Coupon rate reflects the rate at period end. |
| j | | Zero coupon |
| m | | Indicates a security that has been deemed illiquid. |
| | | |
| | | Cost amounts are in thousands. |
COLLEGE RETIREMENT EQUITIES FUND -Money Market Account
COLLEGE RETIREMENT EQUITIES FUND
MONEY MARKET ACCOUNT
SCHEDULE OF INVESTMENTS
December 31, 2018
| PRINCIPAL | | | | | ISSUER | | | | RATE | | MATURITY
DATE | | VALUE
(000) | |
| SHORT-TERM INVESTMENTS - 100.2% | | | | | | | | | | | | |
| | | | | | | | | | | | | | | | | | | |
| GOVERNMENT AGENCY DEBT - 59.6% | | | | | | | | | | | | |
| $ | 26,090,000 | | | | | Federal Agricultural Mortgage Corp (FAMC) | | | | | 0.010 | % | | 01/02/19 | | $ | 26,088 | |
| | 10,000,000 | | | | | FAMC | | | | | 0.010 | | | 01/25/19 | | | 9,985 | |
| | 10,000,000 | | | | | FAMC | | | | | 0.010 | | | 02/11/19 | | | 9,973 | |
| | 10,000,000 | | | | | FAMC | | | | | 0.010 | | | 02/20/19 | | | 9,967 | |
| | 8,000,000 | | | | | Federal Farm Credit Bank (FFCB) | | | | | 0.010 | | | 01/07/19 | | | 7,997 | |
| | 5,000,000 | | | | | FFCB | | | | | 0.010 | | | 01/11/19 | | | 4,997 | |
| | 44,000,000 | | | | | FFCB | | | | | 0.010 | | | 01/16/19 | | | 43,959 | |
| | 4,000,000 | | | | | FFCB | | | | | 0.010 | | | 01/17/19 | | | 3,996 | |
| | 5,000,000 | | | | | FFCB | | | | | 0.010 | | | 01/18/19 | | | 4,995 | |
| | 3,600,000 | | | | | FFCB | | | | | 0.010 | | | 01/25/19 | | | 3,595 | |
| | 42,000,000 | | | | | FFCB | | | | | 0.010 | | | 01/29/19 | | | 41,926 | |
| | 19,000,000 | | | | | FFCB | | | | | 0.010 | | | 02/05/19 | | | 18,957 | |
| | 20,000,000 | | | | | FFCB | | | | | 0.010 | | | 02/06/19 | | | 19,954 | |
| | 48,000,000 | | | | | FFCB | | | | | 0.010 | | | 02/08/19 | | | 47,888 | |
| | 24,000,000 | | | | | FFCB | | | | | 0.010 | | | 02/14/19 | | | 23,932 | |
| | 56,000,000 | | | | | FFCB | | | | | 0.010 | | | 02/19/19 | | | 55,825 | |
| | 20,000,000 | | | | | FFCB | | | | | 0.010 | | | 02/27/19 | | | 19,930 | |
| | 23,000,000 | | | | | FFCB | | | | | 0.010 | | | 03/07/19 | | | 22,904 | |
| | 21,500,000 | | | | | FFCB | | | | | 0.010 | | | 03/18/19 | | | 21,393 | |
| | 22,500,000 | | | | | FFCB | | | | | 0.010 | | | 03/20/19 | | | 22,385 | |
| | 8,000,000 | | | | | FFCB | | | | | 0.010 | | | 03/21/19 | | | 7,960 | |
| | 22,800,000 | | | | | FFCB | | | | | 0.010 | | | 03/22/19 | | | 22,680 | |
| | 16,500,000 | | | | | FFCB | | | | | 0.010 | | | 04/05/19 | | | 16,396 | |
| | 31,150,000 | | | | | FFCB | | | | | 0.010 | | | 04/12/19 | | | 30,939 | |
| | 15,000,000 | | | | | FFCB | | | | | 0.010 | | | 04/18/19 | | | 14,892 | |
| | 3,000,000 | | | | | FFCB | | | | | 0.010 | | | 04/22/19 | | | 2,977 | |
| | 24,500,000 | | | | | FFCB | | | | | 0.010 | | | 04/26/19 | | | 24,309 | |
| | 15,600,000 | | | | | FFCB | | | | | 0.010 | | | 05/02/19 | | | 15,471 | |
| | 25,000,000 | | | | | FFCB | | | | | 0.010 | | | 05/03/19 | | | 24,792 | |
| | 17,500,000 | | | | | FFCB | | | | | 0.010 | | | 05/06/19 | | | 17,349 | |
| | 15,900,000 | | | | | FFCB | | | | | 0.010 | | | 05/08/19 | | | 15,761 | |
| | 9,000,000 | | | | | FFCB | | | | | 0.010 | | | 05/17/19 | | | 8,916 | |
| | 20,000,000 | | | | | FFCB | | | | | 0.010 | | | 05/20/19 | | | 19,809 | |
| | 33,800,000 | | | | | FFCB | | | | | 0.010 | | | 05/23/19 | | | 33,470 | |
| | 16,120,000 | | | | | Federal Home Loan Bank (FHLB) | | | | | 0.010 | | | 01/02/19 | | | 16,119 | |
| | 80,000,000 | | | | | FHLB | | | | | 0.010 | | | 01/04/19 | | | 79,985 | |
| | 47,640,000 | | | | | FHLB | | | | | 0.010 | | | 01/07/19 | | | 47,622 | |
| | 80,000,000 | | | | | FHLB | | | | | 0.010 | | | 01/08/19 | | | 79,966 | |
| | 110,258,000 | | | | | FHLB | | | | | 0.010 | | | 01/09/19 | | | 110,203 | |
| | 110,725,000 | | | | | FHLB | | | | | 0.010 | | | 01/11/19 | | | 110,656 | |
| | 100,590,000 | | | | | FHLB | | | | | 0.010 | | | 01/14/19 | | | 100,508 | |
| | 20,000,000 | | | | | FHLB | | | | | 0.010 | | | 01/15/19 | | | 19,983 | |
| | 40,000,000 | | | | | FHLB | | | | | 0.010 | | | 01/16/19 | | | 39,962 | |
| | 24,300,000 | | | | | FHLB | | | | | 0.010 | | | 01/18/19 | | | 24,274 | |
| | 19,785,000 | | | | | FHLB | | | | | 0.010 | | | 01/22/19 | | | 19,759 | |
| | 95,090,000 | | | | | FHLB | | | | | 0.010 | | | 01/23/19 | | | 94,958 | |
COLLEGE RETIREMENT EQUITIES FUND -Money Market Account
| PRINCIPAL | | | | | ISSUER | | | | RATE | | MATURITY
DATE | | VALUE
(000) | |
| $ | 39,162,000 | | | | | FHLB | | | | | 0.010 | % | | 01/25/19 | | $ | 39,102 | |
| | 183,000,000 | | | | | FHLB | | | | | 0.010 | | | 01/28/19 | | | 182,684 | |
| | 90,000,000 | | | | | FHLB | | | | | 0.010 | | | 01/29/19 | | | 89,840 | |
| | 138,350,000 | | | | | FHLB | | | | | 0.010 | | | 01/30/19 | | | 138,094 | |
| | 30,500,000 | | | | | FHLB | | | | | 0.010 | | | 01/31/19 | | | 30,441 | |
| | 130,497,000 | | | | | FHLB | | | | | 0.010 | | | 02/01/19 | | | 130,235 | |
| | 90,200,000 | | | | | FHLB | | | | | 0.010 | | | 02/05/19 | | | 89,992 | |
| | 111,775,000 | | | | | FHLB | | | | | 0.010 | | | 02/06/19 | | | 111,515 | |
| | 25,000,000 | | | | | FHLB | | | | | 0.010 | | | 02/08/19 | | | 24,938 | |
| | 168,500,000 | | | | | FHLB | | | | | 0.010 | | | 02/11/19 | | | 168,048 | |
| | 65,000,000 | | | | | FHLB | | | | | 0.010 | | | 02/12/19 | | | 64,824 | |
| | 23,810,000 | | | | | FHLB | | | | | 0.010 | | | 02/13/19 | | | 23,744 | |
| | 26,200,000 | | | | | FHLB | | | | | 0.010 | | | 02/14/19 | | | 26,123 | |
| | 70,000,000 | | | | | FHLB | | | | | 0.010 | | | 02/15/19 | | | 69,793 | |
| | 50,000,000 | | | | | FHLB | | | | | 0.010 | | | 02/19/19 | | | 49,842 | |
| | 94,398,000 | | | | | FHLB | | | | | 0.010 | | | 02/20/19 | | | 94,088 | |
| | 67,907,000 | | | | | FHLB | | | | | 0.010 | | | 02/22/19 | | | 67,676 | |
| | 100,000,000 | | | | | FHLB | | | | | 0.010 | | | 02/25/19 | | | 99,641 | |
| | 70,000,000 | | | | | FHLB | | | | | 0.010 | | | 02/26/19 | | | 69,743 | |
| | 25,500,000 | | | | | FHLB | | | | | 0.010 | | | 02/27/19 | | | 25,408 | |
| | 50,000,000 | | | | | FHLB | | | | | 0.010 | | | 03/01/19 | | | 49,807 | |
| | 30,000,000 | | | | | FHLB | | | | | 0.010 | | | 03/04/19 | | | 29,877 | |
| | 82,800,000 | | | | | FHLB | | | | | 0.010 | | | 03/05/19 | | | 82,456 | |
| | 43,545,000 | | | | | FHLB | | | | | 0.010 | | | 03/06/19 | | | 43,366 | |
| | 47,600,000 | | | | | FHLB | | | | | 0.010 | | | 03/07/19 | | | 47,396 | |
| | 108,000,000 | | | | | FHLB | | | | | 0.010 | | | 03/08/19 | | | 107,526 | |
| | 101,500,000 | | | | | FHLB | | | | | 0.010 | | | 03/11/19 | | | 101,034 | |
| | 100,000,000 | | | | | FHLB | | | | | 0.010 | | | 03/12/19 | | | 99,538 | |
| | 97,230,000 | | | | | FHLB | | | | | 0.010 | | | 03/13/19 | | | 96,772 | |
| | 53,000,000 | | | | | FHLB | | | | | 0.010 | | | 03/15/19 | | | 52,743 | |
| | 83,855,000 | | | | | FHLB | | | | | 0.010 | | | 03/18/19 | | | 83,431 | |
| | 65,000,000 | | | | | FHLB | | | | | 0.010 | | | 03/19/19 | | | 64,666 | |
| | 15,000,000 | | | | | FHLB | | | | | 0.010 | | | 04/08/19 | | | 14,902 | |
| | 5,000,000 | | | | | FHLB | | | | | 0.010 | | | 04/10/19 | | | 4,967 | |
| | 900,000 | | | | | FHLB | | | | | 0.010 | | | 04/24/19 | | | 893 | |
| | 28,340,000 | | | | | FHLB | | | | | 0.010 | | | 05/03/19 | | | 28,103 | |
| | 19,115,000 | | | | | Federal Home Loan Mortgage Corp (FHLMC) | | | | | 0.010 | | | 01/02/19 | | | 19,114 | |
| | 70,000,000 | | | | | FHLMC | | | | | 0.010 | | | 01/07/19 | | | 69,975 | |
| | 25,000,000 | | | | | FHLMC | | | | | 0.010 | | | 01/08/19 | | | 24,989 | |
| | 10,000,000 | | | | | FHLMC | | | | | 0.010 | | | 01/09/19 | | | 9,995 | |
| | 20,000,000 | | | | | FHLMC | | | | | 0.010 | | | 01/11/19 | | | 19,988 | |
| | 29,000,000 | | | | | FHLMC | | | | | 0.010 | | | 01/18/19 | | | 28,969 | |
| | 110,635,000 | | | | | FHLMC | | | | | 0.010 | | | 01/22/19 | | | 110,490 | |
| | 33,100,000 | | | | | FHLMC | | | | | 0.010 | | | 01/23/19 | | | 33,056 | |
| | 15,000,000 | | | | | FHLMC | | | | | 0.010 | | | 02/04/19 | | | 14,968 | |
| | 50,000,000 | | | | | FHLMC | | | | | 0.010 | | | 02/05/19 | | | 49,890 | |
| | 50,000,000 | | | | | FHLMC | | | | | 0.010 | | | 02/08/19 | | | 49,880 | |
| | 78,985,000 | | | | | FHLMC | | | | | 0.010 | | | 02/13/19 | | | 78,764 | |
| | 25,630,000 | | | | | FHLMC | | | | | 0.010 | | | 02/20/19 | | | 25,547 | |
| | 25,000,000 | | | | | FHLMC | | | | | 0.010 | | | 02/25/19 | | | 24,911 | |
| | 63,605,000 | | | | | FHLMC | | | | | 0.010 | | | 02/26/19 | | | 63,373 | |
| | 50,000,000 | | | | | FHLMC | | | | | 0.010 | | | 02/27/19 | | | 49,815 | |
| | 100,000,000 | | | | | FHLMC | | | | | 0.010 | | | 03/04/19 | | | 99,592 | |
| | 94,274,000 | | | | | FHLMC | | | | | 0.010 | | | 03/11/19 | | | 93,841 | |
COLLEGE RETIREMENT EQUITIES FUND -Money Market Account
| PRINCIPAL | | | | | ISSUER | | | | RATE | | MATURITY
DATE | | VALUE
(000) | |
| $ | 50,000,000 | | | | | FHLMC | | | | | 0.010 | % | | 03/20/19 | | $ | 49,742 | |
| | 50,000,000 | | | | | FHLMC | | | | | 0.010 | | | 03/22/19 | | | 49,737 | |
| | 34,385,000 | | | | | FHLMC | | | | | 0.010 | | | 03/25/19 | | | 34,197 | |
| | 15,285,000 | | | | | FHLMC | | | | | 0.010 | | | 03/26/19 | | | 15,201 | |
| | 55,000,000 | | | | | Federal National Mortgage Association (FNMA) | | | | | 0.010 | | | 01/02/19 | | | 54,997 | |
| | 10,000,000 | | | | | FNMA | | | | | 0.010 | | | 01/03/19 | | | 9,999 | |
| | 37,415,000 | | | | | FNMA | | | | | 0.010 | | | 01/04/19 | | | 37,408 | |
| | 20,000,000 | | | | | FNMA | | | | | 0.010 | | | 01/08/19 | | | 19,991 | |
| | 20,000,000 | | | | | FNMA | | | | | 0.010 | | | 01/09/19 | | | 19,990 | |
| | 67,850,000 | | | | | FNMA | | | | | 0.010 | | | 01/16/19 | | | 67,786 | |
| | 20,000,000 | | | | | FNMA | | | | | 0.010 | | | 01/17/19 | | | 19,980 | |
| | 10,000,000 | | | | | FNMA | | | | | 0.010 | | | 01/23/19 | | | 9,986 | |
| | 10,000,000 | | | | | FNMA | | | | | 0.010 | | | 01/28/19 | | | 9,983 | |
| | 10,000,000 | | | | | FNMA | | | | | 0.010 | | | 02/01/19 | | | 9,980 | |
| | 80,000,000 | | | | | FNMA | | | | | 0.010 | | | 02/04/19 | | | 79,827 | |
| | 55,000,000 | | | | | FNMA | | | | | 0.010 | | | 02/05/19 | | | 54,878 | |
| | 20,000,000 | | | | | FNMA | | | | | 0.010 | | | 02/06/19 | | | 19,954 | |
| | 20,000,000 | | | | | FNMA | | | | | 0.010 | | | 02/08/19 | | | 19,951 | |
| | 24,285,000 | | | | | FNMA | | | | | 0.010 | | | 02/11/19 | | | 24,222 | |
| | 70,000,000 | | | | | FNMA | | | | | 0.010 | | | 02/12/19 | | | 69,812 | |
| | 11,700,000 | | | | | FNMA | | | | | 0.010 | | | 02/13/19 | | | 11,667 | |
| | 10,000,000 | | | | | FNMA | | | | | 0.010 | | | 02/14/19 | | | 9,972 | |
| | 20,000,000 | | | | | FNMA | | | | | 0.010 | | | 02/15/19 | | | 19,942 | |
| | 20,000,000 | | | | | FNMA | | | | | 0.010 | | | 02/19/19 | | | 19,938 | |
| | 15,000,000 | | | | | FNMA | | | | | 1.875 | | | 02/19/19 | | | 14,989 | |
| | 20,000,000 | | | | | FNMA | | | | | 0.010 | | | 02/22/19 | | | 19,934 | |
| | 10,000,000 | | | | | FNMA | | | | | 0.010 | | | 02/25/19 | | | 9,965 | |
| | 42,000,000 | | | | | FNMA | | | | | 0.010 | | | 02/27/19 | | | 41,842 | |
| | 10,000,000 | | | | | FNMA | | | | | 0.010 | | | 03/01/19 | | | 9,962 | |
| | 20,000,000 | | | | | FNMA | | | | | 0.010 | | | 03/04/19 | | | 19,920 | |
| | 53,800,000 | | | | | FNMA | | | | | 0.010 | | | 03/05/19 | | | 53,581 | |
| | 65,833,000 | | | | | FNMA | | | | | 0.010 | | | 03/06/19 | | | 65,554 | |
| | 30,000,000 | | | | | FNMA | | | | | 0.010 | | | 03/08/19 | | | 29,872 | |
| | 57,235,000 | | | | | FNMA | | | | | 0.010 | | | 03/13/19 | | | 56,965 | |
| | 36,800,000 | | | | | FNMA | | | | | 0.010 | | | 03/20/19 | | | 36,611 | |
| | 5,665,000 | | | | | Tennessee Valley Authority (TVA) | | | | | 0.010 | | | 01/15/19 | | | 5,660 | |
| | | | | | | TOTAL GOVERNMENT AGENCY DEBT | | | | | | | | | | | 5,894,762 | |
| | | | | | | | | | | | | | | | | | | |
| TREASURY DEBT - 20.5% | | | | | | | | | | | | |
| | 120,000,000 | | | | | United States Treasury Bill | | | | | 0.010 | | | 01/03/19 | | | 119,986 | |
| | 20,000,000 | | | | | United States Treasury Bill | | | | | 0.010 | | | 01/08/19 | | | 19,991 | |
| | 133,625,000 | | | | | United States Treasury Bill | | | | | 0.010 | | | 01/10/19 | | | 133,553 | |
| | 10,000,000 | | | | | United States Treasury Bill | | | | | 0.010 | | | 01/15/19 | | | 9,991 | |
| | 111,465,000 | | | | | United States Treasury Bill | | | | | 0.010 | | | 01/17/19 | | | 111,357 | |
| | 129,485,000 | | | | | United States Treasury Bill | | | | | 0.010 | | | 01/24/19 | | | 129,301 | |
| | 10,000,000 | | | | | United States Treasury Bill | | | | | 0.010 | | | 01/29/19 | | | 9,982 | |
| | 80,000,000 | | | | | United States Treasury Bill | | | | | 0.010 | | | 01/31/19 | | | 79,846 | |
| | 25,400,000 | | | | | United States Treasury Bill | | | | | 0.010 | | | 02/05/19 | | | 25,343 | |
| | 140,000,000 | | | | | United States Treasury Bill | | | | | 0.010 | | | 02/07/19 | | | 139,678 | |
| | 10,000,000 | | | | | United States Treasury Bill | | | | | 0.010 | | | 02/12/19 | | | 9,973 | |
| | 109,055,000 | | | | | United States Treasury Bill | | | | | 0.010 | | | 02/14/19 | | | 108,753 | |
| | 164,455,000 | | | | | United States Treasury Bill | | | | | 0.010 | | | 02/21/19 | | | 163,922 | |
| | 25,800,000 | | | | | United States Treasury Bill | | | | | 0.010 | | | 02/26/19 | | | 25,705 | |
COLLEGE RETIREMENT EQUITIES FUND -Money Market Account
| PRINCIPAL | | | | | ISSUER | | REFERENCE
RATE & SPREAD | | RATE | | MATURITY
DATE | | VALUE
(000) | |
| $ | 81,660,000 | | | | | United States Treasury Bill | | | | | 0.010 | % | | 02/28/19 | | $ | 81,356 | |
| | 116,110,000 | | | | | United States Treasury Bill | | | | | 0.010 | | | 03/07/19 | | | 115,620 | |
| | 101,020,000 | | | | | United States Treasury Bill | | | | | 0.010 | | | 03/14/19 | | | 100,548 | |
| | 50,000,000 | | | | | United States Treasury Bill | | | | | 0.010 | | | 03/21/19 | | | 49,743 | |
| | 60,000,000 | | | | | United States Treasury Bill | | | | | 0.010 | | | 03/28/19 | | | 59,661 | |
| | 92,435,000 | | | | | United States Treasury Bill | | | | | 0.010 | | | 04/04/19 | | | 91,868 | |
| | 75,000,000 | | | | | United States Treasury Bill | | | | | 0.010 | | | 04/11/19 | | | 74,499 | |
| | 36,235,000 | | | | | United States Treasury Bill | | | | | 0.010 | | | 04/18/19 | | | 35,975 | |
| | 20,000,000 | | | | | United States Treasury Bill | | | | | 0.010 | | | 04/25/19 | | | 19,846 | |
| | 100,000 | | | | | United States Treasury Bill | | | | | 0.010 | | | 05/16/19 | | | 99 | |
| | 91,250,000 | | | | | United States Treasury Note | | | | | 1.125 | | | 01/15/19 | | | 91,211 | |
| | 10,000,000 | | | | | United States Treasury Note | | | | | 1.125 | | | 01/31/19 | | | 9,991 | |
| | 25,000,000 | | | | | United States Treasury Note | | | | | 1.250 | | | 01/31/19 | | | 24,979 | |
| | 40,000,000 | | | | | United States Treasury Note | | | | | 1.500 | | | 01/31/19 | | | 39,973 | |
| | 53,140,000 | | | | | United States Treasury Note | | | | | 0.750 | | | 02/15/19 | | | 53,034 | |
| | 20,000,000 | | | | | United States Treasury Note | | | | | 1.500 | | | 02/28/19 | | | 19,971 | |
| | 78,590,000 | | | | | United States Treasury Note | | | | | 1.000 | | | 03/15/19 | | | 78,370 | |
| | | | | | | TOTAL TREASURY DEBT | | | | | | | | | | | 2,034,125 | |
| | | | | | | | | | | | | | | | | | | |
| VARIABLE RATE SECURITIES - 20.1% | | | | | | | | | | | | |
| | 40,000,000 | | | i | | Federal Agricultural Mortgage Corp (FAMC) | | EFFR + 0.020% | | | 2.420 | | | 01/25/19 | | | 40,000 | |
| | 31,000,000 | | | i | | FAMC | | LIBOR 1 M - 0.075% | | | 2.272 | | | 02/04/19 | | | 31,000 | |
| | 25,000,000 | | | i | | FAMC | | EFFR + 0.010% | | | 2.410 | | | 03/01/19 | | | 25,000 | |
| | 25,000,000 | | | i | | FAMC | | LIBOR 1 M - 0.105% | | | 2.244 | | | 03/01/19 | | | 25,000 | |
| | 25,000,000 | | | i | | FAMC | | EFFR + 0.080% | | | 2.480 | | | 03/01/19 | | | 25,000 | |
| | 40,000,000 | | | i | | FAMC | | EFFR + 0.010% | | | 2.410 | | | 04/01/19 | | | 40,000 | |
| | 45,000,000 | | | i | | FAMC | | LIBOR 3 M - 0.210% | | | 2.435 | | | 05/20/19 | | | 45,000 | |
| | 30,000,000 | | | i | | FAMC | | LIBOR 1 M - 0.050% | | | 2.299 | | | 07/01/19 | | | 30,000 | |
| | 50,000,000 | | | i | | FAMC | | EFFR + 0.150% | | | 2.550 | | | 09/27/19 | | | 50,000 | |
| | 30,000,000 | | | i | | FAMC | | LIBOR 3 M - 0.200% | | | 2.567 | | | 11/01/19 | | | 30,000 | |
| | 44,500,000 | | | i | | FAMC | | EFFR + 0.120% | | | 2.520 | | | 02/26/20 | | | 44,500 | |
| | 45,000,000 | | | i | | Federal Farm Credit Bank (FFCB) | | FRED - 3.020% | | | 2.480 | | | 01/14/19 | | | 45,002 | |
| | 20,000,000 | | | i | | FFCB | | LIBOR 3 M - 0.160% | | | 2.276 | | | 01/15/19 | | | 20,000 | |
| | 50,000,000 | | | i | | FFCB | | LIBOR 1 M - 0.110% | | | 2.396 | | | 01/25/19 | | | 50,000 | |
| | 33,700,000 | | | i | | FFCB | | FRED - 3.020% | | | 2.480 | | | 03/27/19 | | | 33,709 | |
| | 50,000,000 | | | i | | FFCB | | LIBOR 1 M - 0.145% | | | 2.377 | | | 03/29/19 | | | 49,999 | |
| | 7,500,000 | | | i | | FFCB | | EFFR - 0.000% | | | 2.400 | | | 04/15/19 | | | 7,499 | |
| | 50,000,000 | | | i | | FFCB | | LIBOR 1 M - 0.125% | | | 2.258 | | | 06/07/19 | | | 50,000 | |
| | 55,000,000 | | | i | | FFCB | | FRED - 3.080% | | | 2.420 | | | 06/27/19 | | | 55,003 | |
| | 50,000,000 | | | i | | FFCB | | FRED - 3.080% | | | 2.420 | | | 08/16/19 | | | 49,997 | |
| | 30,000,000 | | | i | | FFCB | | EFFR - 0.015% | | | 2.385 | | | 09/20/19 | | | 30,000 | |
| | 57,500,000 | | | i | | FFCB | | FRED - 3.075% | | | 2.425 | | | 09/25/19 | | | 57,466 | |
| | 50,000,000 | | | i | | FFCB | | FRED - 3.080% | | | 2.420 | | | 10/10/19 | | | 49,965 | |
| | 40,000,000 | | | i | | FFCB | | US Treasury Bill 3 M + 0.050% | | | 2.480 | | | 10/18/19 | | | 40,000 | |
| | 10,000,000 | | | i | | FFCB | | US Treasury Bill 3 M + 0.050% | | | 2.480 | | | 11/04/19 | | | 10,001 | |
| | 47,000,000 | | | i | | FFCB | | FRED - 3.065% | | | 2.435 | | | 12/26/19 | | | 46,981 | |
| | 50,000,000 | | | i | | FFCB | | US Treasury Bill 3 M + 0.055% | | | 2.485 | | | 01/27/20 | | | 50,000 | |
| | 80,000,000 | | | i | | FFCB | | FRED - 2.980% | | | 2.520 | | | 02/20/20 | | | 79,996 | |
| | 21,700,000 | | | i | | FFCB | | FRED - 2.870% | | | 2.630 | | | 05/29/20 | | | 21,700 | |
| | 50,000,000 | | | i | | FFCB | | FRED - 2.960% | | | 2.540 | | | 07/09/20 | | | 49,994 | |
COLLEGE RETIREMENT EQUITIES FUND -Money Market Account
| PRINCIPAL | | | | | ISSUER | | REFERENCE
RATE & SPREAD | | RATE | | MATURITY
DATE | | VALUE
(000) | |
| $ | 50,000,000 | | | i | | FFCB | | US Treasury Bill 3 M + 0.045% | | | 2.475 | % | | 08/17/20 | | $ | 49,996 | |
| | 72,500,000 | | | i | | Federal Home Loan Bank (FHLB) | | LIBOR 3 M - 0.200% | | | 2.245 | | | 01/18/19 | | | 72,500 | |
| | 20,000,000 | | | i | | FHLB | | LIBOR 3 M - 0.230% | | | 2.385 | | | 02/13/19 | | | 20,000 | |
| | 50,000,000 | | | i | | FHLB | | LIBOR 1 M - 0.040% | | | 2.464 | | | 02/22/19 | | | 50,004 | |
| | 38,000,000 | | | i | | FHLB | | LIBOR 3 M - 0.235% | | | 2.504 | | | 03/06/19 | | | 37,997 | |
| | 69,000,000 | | | i | | FHLB | | SOFR + 4.000% | | | 2.500 | | | 05/15/19 | | | 69,000 | |
| | 45,000,000 | | | i | | FHLB | | LIBOR 1 M - 0.070% | | | 2.351 | | | 07/12/19 | | | 45,000 | |
| | 19,000,000 | | | i | | FHLB | | SOFR + 6.000% | | | 2.520 | | | 09/10/19 | | | 19,000 | |
| | 8,300,000 | | | i | | FHLB | | US Treasury Bill 3 M + 0.070% | | | 2.534 | | | 01/30/20 | | | 8,303 | |
| | 30,000,000 | | | i | | Federal Home Loan Mortgage Corp (FHLMC) | | SOFR + 2.500% | | | 2.485 | | | 05/08/19 | | | 30,000 | |
| | 50,000,000 | | | i | | FHLMC | | LIBOR 1 M - 0.095% | | | 2.375 | | | 06/19/19 | | | 50,000 | |
| | 27,500,000 | | | i | | FHLMC | | SOFR + 3.000% | | | 2.490 | | | 06/19/19 | | | 27,500 | |
| | 12,000,000 | | | i | | FHLMC | | LIBOR 3 M - 0.165% | | | 2.243 | | | 07/05/19 | | | 12,003 | |
| | 80,900,000 | | | i | | FHLMC | | LIBOR 1 M - 0.100% | | | 2.287 | | | 08/08/19 | | | 80,901 | |
| | 30,000,000 | | | i | | FHLMC | | LIBOR 3 M - 0.225% | | | 2.466 | | | 08/27/19 | | | 30,000 | |
| | 35,000,000 | | | i | | Federal National Mortgage Association (FNMA) | | LIBOR 1 M - 0.000% | | | 2.506 | | | 02/28/19 | | | 35,008 | |
| | 20,000,000 | | | i | | FNMA | | SOFR + 7.000% | | | 2.530 | | | 10/30/19 | | | 20,000 | |
| | 30,000,000 | | | i | | United States Treasury Floating Rate Note | | US Treasury Bill 3 M - 0.000% | | | 2.430 | | | 01/31/20 | | | 30,000 | |
| | 120,000,000 | | | i | | United States Treasury Floating Rate Note | | US Treasury Bill 3 M + 0.033% | | | 2.463 | | | 04/30/20 | | | 120,025 | |
| | | | | | | TOTAL VARIABLE RATE SECURITIES | | | | | | | | | | | 1,990,049 | |
| | | | | | | | | | | | | | | | | | | |
| | | | | | | TOTAL SHORT-TERM INVESTMENTS | | | | | | | | | 9,918,936 | |
| | | | | | | (Cost $9,918,936) | | | | | | | | | | | | |
| | | | | | | | | | | | | | | | | | | |
| | | | | | | TOTAL INVESTMENTS - 100.2%
(Cost $9,918,936) | | | | | | | | | | | 9,918,936 | |
| | | | | | | OTHER ASSETS & LIABILITIES, NET - (0.2)% | | | | | | | | | (20,562 | ) |
| | | | | | | NET ASSETS - 100.0% | | | | | | | | | | $ | 9,898,374 | |
| | | | |
| | | Abbreviation(s): |
| EFFR | | Effective Federal Funds Rate |
| FRED | | Federal Bank Prime Loan Rate |
| LIBOR | | London Interbank Offered Rate |
| M | | Month |
| SOFR | | Secure Overnight Financing Rate |
| | | |
| i | | Floating or variable rate security includes the reference rate and spread, unless the variable rate is based on the underlying asset of the security. Coupon rate reflects the rate at period end. |
| | | |
| | | Cost amounts are in thousands. |
Report of Independent Registered Public Accounting Firm
TotheBoard of Trustees of College Retirement Equities Fund andParticipants of Stock Account, Global Equities Account, Growth Account, Equity Index Account, Bond Market Account, Inflation-Linked Bond Account, Social Choice Account, and Money Market Account
Opinions on the Financial Statements
We have audited the accompanying statements of assets and liabilities, including the summary portfolios of investments, ofStock Account, Global Equities Account, Growth Account, Equity Index Account, Bond Market Account, Social Choice Account, Money Market Account and portfolio of investments, of Inflation-Linked Bond Account (constituting College Retirement Equities Fund, hereafter collectively referred to as the “Accounts”) as of December 31, 2018, the related statements of operations for the year ended December 31, 2018, the statements of changes in net assets for each of the two years in the period ended December 31, 2018, including the related notes,and the financial highlights for each of the periods indicated therein(included in Item 1 of this Form N-CSR) and the schedules of investments (included in Item 6 of this Form N-CSR) as of December 31, 2018 (collectively referred to as the “financial statements”). In our opinion, the financial statements present fairly, in all material respects, the financial position of each of the Accounts as of December 31, 2018, the results of each of their operations for the year then ended, the changes in each of their net assets for each of the two years in the period ended December 31, 2018 and each of the financial highlights for each of the periods indicated therein in conformity with accounting principles generally accepted in the United States of America.
Basis for Opinions
These financial statements are the responsibility of the Accounts’ management. Our responsibility is to express an opinion on the Accounts’ financial statements based on our audits. We are a public accounting firm registered with the Public Company Accounting Oversight Board (United States) (PCAOB) and are required to be independent with respect to the Accounts in accordance with the U.S. federal securities laws and the applicable rules and regulations of the Securities and Exchange Commission and the PCAOB.
We conducted our audits of these financial statements in accordance with the standards of the PCAOB. Those standards require that we plan and perform the audit to obtain reasonable assurance about whether the financial statements are free of material misstatement, whether due to error or fraud.
Our audits included performing procedures to assess the risks of material misstatement of the financial statements, whether due to error or fraud, and performing procedures that respond to those risks. Such procedures included examining, on a test basis, evidence regarding the amounts and disclosures in the financial statements. Our audits also included evaluating the accounting principles used and significant estimates made by management, as well as evaluating the overall presentation of the financial statements. Our procedures included confirmation of securities owned as of December 31, 2018by correspondence with the custodian, and brokers; when replies were not received from brokers, we performed other auditing procedures. We believe that our audits provide a reasonable basis for our opinions.
/s/ PricewaterhouseCoopers LLP
Baltimore, Maryland
February 21, 2019
We have served as the auditor of one or more investment companies in TIAA-CREF Funds’ investment company groupsince 2005.
Item 7. Disclosure of Proxy Voting Policies and Procedures for Closed-End Management Investment Companies.
Not Applicable.
Item 8. Portfolio Managers of Closed-End Management Investment Companies.
Not Applicable.
Item 9. Purchases of Equity Securities by Closed-End Management Investment Company and Affiliated Purchasers.
Not Applicable.
Item 10. Submission of Matters to a Vote of Security Holders.
There were no material changes to the procedures by which shareholders may recommend nominees to the Registrant’s Board of Trustees.
Item 11. Controls and Procedures.
(a) An evaluation was performed within 90 days of the filing date of the report under the supervision of the Registrant’s management, including the principal executive officer and principal financial officer, of the effectiveness of the design and operation of the Registrant’s disclosure controls and procedures. Based on that evaluation, the Registrant’s management, including the principal executive officer and principal financial officer, concluded that the Registrant’s disclosure controls and procedures were effective for this annual reporting period.
(b) There were no changes in the Registrant’s internal control over financial reporting that occurred during the Registrant’s annual period covered by this report that materially affected, or are reasonably likely to materially affect, the Registrant’s internal control over financial reporting.
Item 12. Exhibits.
12(a)(1) Copy of current SOX code of ethics for Senior Financial Officers
12(a)(2)(i) Section 302 certification of the principal executive officer
12(a)(2)(ii) Section 302 certification of the principal financial officer
12(b) Section 906 certification of principal executive officer and principal financial officer
SIGNATURES
Pursuant to the requirements of the Securities Exchange Act of 1934 and the Investment Company Act of 1940, the Registrant has duly caused this report to be signed on its behalf by the undersigned, thereunto duly authorized.
| | COLLEGE RETIREMENT EQUITIES FUND |
| | | | |
| Dated: February 21, 2019 | By: | /s/Carol W. Deckbar | |
| | | Carol W. Deckbar |
| | | Principal Executive Officer and |
| | | Executive Vice President |
Pursuant to the requirements of the Securities Exchange Act of 1934 and the Investment Company Act of 1940, this report has been signed below by the following persons on behalf of the Registrant and in the capacities and on the dates indicated.
| Dated: February 21, 2019 | By: | /s/Carol W. Deckbar | |
| | | Carol W. Deckbar |
| | | Principal Executive Officer and |
| | | Executive Vice President |
| | | (principal executive officer) |
| Dated: February 21, 2019 | By: | /s/Glenn E. Brightman | |
| | | Glenn E. Brightman |
| | | Executive Vice President, Chief Financial Officer and Principal Accounting Officer |
| | | (principal financial officer) |
EXHIBIT INDEX
Item 12. Exhibits.
12(a)(1) Copy of current SOX code of ethics for Senior Financial Officers
12(a)(2)(i) Section 302 certification of the principal executive officer
12(a)(2)(ii) Section 302 certification of the principal financial officer
12(b) Section 906 certification of principal executive officer and principal financial officer