| OMB APPROVAL |
OMB Number: 3235-0570 Expires: January 31, 2014 Estimated average burden hours per response: 20.6 |
UNITED STATES
SECURITIES AND EXCHANGE COMMISSION
Washington, D.C. 20549
FORM N-CSR
CERTIFIED SHAREHOLDER REPORT OF REGISTERED MANAGEMENT INVESTMENT COMPANIES
Investment Company Act file number811-4417
| Shelton Funds |
| (Exact name of registrant as specified in charter) |
| |
| 1875 Lawrence Street, Suite 300, Denver, CO 80202 |
| (Address of principal executive offices) (Zip code) |
| |
| |
| (Name and address of agent for service) |
Registrant's telephone number, including area code:(415) 398-2727
Date of fiscal year end:August 31
Date of reporting period:August 31, 2019
Form N-CSR is to be used by management investment companies to file reports with the Commission not later than 10 days after the transmission to stockholders of any report that is required to be transmitted to stockholders under Rule 30e-1 under the Investment Company Act of 1940 (17 CFR 270.30e-1). The Commission may use the information provided on Form N-CSR in its regulatory, disclosure review, inspection, and policymaking roles.
A registrant is required to disclose the information specified by Form N-CSR, and the Commission will make this information public. A registrant is not required to respond to the collection of information contained in Form N-CSR unless the Form displays a currently valid Office of Management and Budget ("OMB") control number. Please direct comments concerning the accuracy of the information collection burden estimate and any suggestions for reducing the burden to Secretary, Securities and Exchange Commission, 450 Fifth Street, NW, Washington, DC 20549-0609. The OMB has reviewed this collection of information under the clearance requirements of 44 U.S.C. ss. 3507.
This amendment adds the Code of Ethics of the Trust as an exhibit, and revised Section 4(g) disclosures relating to non-audit services.


ANNUAL REPORT
August 31, 2019
Green California Tax-Free Income Fund
U.S. Government Securities Fund
Short-Term U.S. Government Bond Fund
The United States Treasury Trust
S&P 500 Index Fund
S&P MidCap Index Fund
S&P SmallCap Index Fund
Shelton Core Value Fund
Nasdaq-100 Index Fund
Shelton Green Alpha Fund
This report is intended only for the information of shareholders or those who have received the offering prospectus covering shares of beneficial interest of the Shelton Funds (referred to collectively as the “Funds” or individually the “Fund”) which contains information about the management fee and other costs. Investments in shares of the funds of the Shelton Funds are neither insured nor guaranteed by the U.S. Government, and there is no assurance that any Fund, which is designated a Money Market Fund, will be able to maintain a stable net asset value of $1.00 per share.
Beginning on April 29, 2021, as permitted by regulations adopted by the U.S. Securities and Exchange Commission, paper copies of the Funds’ annual and semi-annual shareholder reports will no longer be sent by mail, unless you specifically request paper copies of the reports. Instead, the reports will be made available on the Funds’ website at www.sheltoncap.com and you will be notified by mail each time a report is posted and provided with a website link to access the report.
You may, notwithstanding the availability of shareholder reports online, elect to receive all future shareholder reports in paper free of charge. If you invest through a financial intermediary, you can contact your financial intermediary to request that you continue to receive paper copies of your shareholder reports. If you invest directly with the Funds, you can call 800-955-9988 to let the Funds know you wish to continue receiving paper copies of your shareholder reports.
If you already elected to receive shareholder reports electronically, you will not be affected by this change and you need not take any action. You may elect to receive shareholder reports and other communications from the Funds electronically anytime by contacting your financial intermediary (such as a broker-dealer or bank) or, if you are a direct investor, by enrolling at www.sheltoncap.com.
Table of Contents | August 31, 2019 |
| | |
Historical Performance and Manager’s Discussion | 1 |
About Your Fund’s Expenses | 7 |
Top Holdings and Sector Breakdowns | 9 |
Portfolio of Investments | 13 |
Statements of Assets & Liabilities | 31 |
Statements of Operations | 34 |
Statements of Changes in Net Assets | 37 |
Financial Highlights | 43 |
Notes to Financial Statements | 53 |
Fund Holdings | 60 |
Proxy Voting Policies, Procedures and Voting Records | 60 |
Report of Independent Registered Public Accounting Firm | 61 |
Board of Trustees and Executive Officers | 62 |
Historical Performance and Manager’s Discussion (Unaudited) | August 31, 2019 |
Bond Funds
US bond markets over the last fiscal year were heavily impacted by three inter-related issues: 1) concerns about slowing economic growth; 2) trade disputes, primarily with China; 3) Federal Reserve Board monetary policy. As the fiscal year began, there were signs that the long economic expansion was slowing, exacerbated by the escalating rhetoric and imposition of tariffs between the US and China and a hawkish Federal Reserve that was expected to raise rates several times over the coming year. US interest rates rose briefly across the curve over the first couple of months of the fiscal year, then fell across the curve for the remainder of the year. The Federal Reserve did raise the Fed Funds target rate by 25 bps in September and again in December 2018, but even as they raised the rates, their communications were becoming more dovish in response to the lack of progress on the trade dispute and concerns about slower equity earnings growth and economic momentum. The Federal Reserve indicated that their actions would be driven by the data as investors shifted to an expectation of easing monetary policy. While the labor market remained strong with historically low unemployment rates below 4%, the Q4 2018 US GDP was revised down from 2.6% to 2.2%, inflation was still failing to sustain the Federal Reserve target level of 2%, and trade issues were unresolved. The yield curve flattened to the point in late March that yields on the 3 month US Treasury Bill were higher than the 10 year US Treasury Note, historically an indicator of a coming recession. This inversion only lasted a few days, but returned in late May for the remainder of the fiscal year. The Summer of 2019 saw Federal Reserve communications grow more dovish as economic data showed continuing growth but a lack of momentum and weakening confidence from both business and consumers due to concerns over the impact of US-China trade issues. In July 2019, the Federal Reserve lowered the Fed Funds target rate by 25 bps, the first easing in 11 years. In August the US-China trade dispute was escalated with President Trump announcing a new 10% on $300 billion of Chinese imports that weren’t subject to tariff, which elicited retaliatory tariffs on US agricultural, auto and oil exports to China. Amid concerns about the economic impact of the trade tensions investors sought the safe haven of US bonds, driving bond yields lower at the end of the fiscal year, with the 30 year US Treasury yield falling below 2% for the first time in history in August 2019.
In response to the Federal Reserve’s transition from the initial hawkish stance and expectations of future tightening to a dovish stance and easing of monetary policy the three month T-Bill rates began the year at 2.10% and rose steadily until December, then traded within a range from 2.34% to 2.46% through mid-May. The increasingly dovish Federal Reserve pushed 3 month T-Bill yields down for the remainder of the fiscal year, ending at 1.98%. The yield on the two-year note started at 2.63% and rose early in the fiscal year, peaking at 2.97% in early November, then moving steadily downward to close out the fiscal year at 1.51%.
Intermediate and longer dated US Treasuries followed a very similar pattern to the two year notes, with the highest yields of the year for 5, 10 and 30 year US Treasuries all being in early November and followed by falling rates the rest of the year. The 5 year note yields rose from 2.74% to 3.09% from the start of the fiscal year until the early November peak, then fell at a fairly consistent pace, ending at 1.39%. The 10 year bond yield rose from 2.86% to 3.24% in the September – November period and then fell to end the year at 1.50%. The 30-year yield followed the same pattern, rising from 3.02% to 3.46% in September-November before falling, as previously mentioned, below 2% for the first time ever in August and ending the fiscal year at 1.96%.
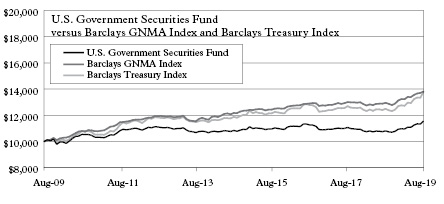
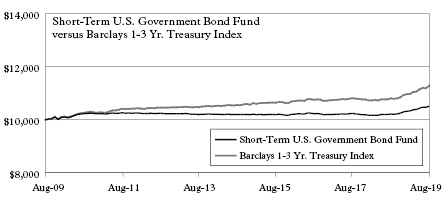
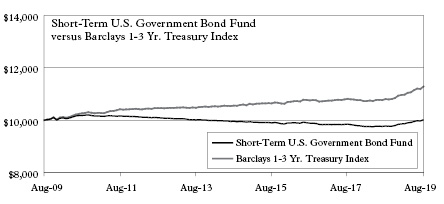
The U.S. Government Securities Fund ended the fiscal year on August 31, 2019 with a duration of 4.55 years and a total return of the Direct Shares for the period of 7.48%. The Short-Term Government Bond Fund ended the fiscal year on August 31, 2019 with a duration of 1.09 years and a total return of the Direct Shares for the period of 2.89%. Returns for both funds, as is generally the case for fixed income investments, have benefited from the falling interest rates over the course of the fiscal year. All of the securities in the Fund are backed by the full faith and credit of the United States.
California municipal market bond yields do not necessarily move in lock step with US Treasury yields, but are subject to the level and shape of the benchmark U.S. Treasury curve, as well as the specific economic circumstances of both the State of California and each specific issuer. The relative value of municipal bonds to US Treasuries, as measured by the Bloomberg AAA Muni Yield % of Treasury, didn’t experience any extraordinary changes, with municipal bonds remaining at relatively expensive historical levels. There were no major events such as the prior fiscal year’s tax reform impacting municipal bonds, though the market is still experiencing secondary supply effects for issuance that was accelerated prior to the tax reform in 2017. Most California municipal bond investors continue to benefit from generally strong and improving economic conditions throughout the state. Standard & Poor’s and Moody’s maintained their rating on CA general obligation bonds at AA- and Aa3 respectively, while Fitch upgraded the state from AA- to AA in August 2019. The Bloomberg US California Muni yield curve flattened over the course of the year like the US Treasury curve, but the muni curve does remain positively sloped. The difference in yield between the 2 year and 10 year bonds fell from 0.88% to 0.33% over the course of the fiscal year.
The Green California Tax-Free Income Fund’s total return for the fiscal year ended August 31, 2019 was 6.10%, and the duration was 4.31 years at fiscal year-end. The portfolio average credit rating was maintained at AA.
1
Historical Performance and Manager’s Discussion (Unaudited) (Continued) | August 31, 2019 |
DIRECT SHARES
Average Annual Total Returns*
for the periods ended 8/31/19
Fund/Benchmark | One
Year | Five Year
(Annualized) | Ten Year
(Annualized) | Since
Inception
(Annualized) |
Green California Tax-Free Income Fund | 6.10% | 2.40% | 3.51% | 5.60% |
Barclays Municipal Bond Index | 8.72% | 3.93% | 4.66% | 6.24% |

DIRECT SHARES
Average Annual Total Returns*
for the periods ended 8/31/19
Fund/Benchmark | One
Year | Five Year
(Annualized) | Ten Year
(Annualized) | Since
Inception
(Annualized) |
U.S. Government Securities Fund | 7.48% | 1.81% | 1.97% | 5.31% |
Barclays GNMA Index | 6.70% | 2.56% | 3.29% | 6.33% |
Barclays Treasury Index | 10.38% | 3.03% | 3.27% | 6.19% |

K SHARES
Average Annual Total Returns*
for the periods ended 8/31/19
Fund/Benchmark | One
Year | Five Year
(Annualized) | Ten Year
(Annualized) | Since
Inception
(Annualized) |
U.S. Government Securities Fund | 6.87% | 1.27% | 1.46% | 2.11% |
Barclays GNMA Index | 6.70% | 2.56% | 3.29% | 4.09% |
Barclays Treasury Index | 10.38% | 3.03% | 3.27% | 3.81% |
DIRECT SHARES
Average Annual Total Returns*
for the periods ended 8/31/19
Fund/Benchmark | One
Year | Five Year
(Annualized) | Ten Year
(Annualized) | Since
Inception
(Annualized) |
Short-Term U.S. Government Bond Fund | 2.88% | 0.61% | 0.50% | 2.01% |
Barclays 1-3 Yr. Treasury Index | 4.42% | 1.34% | 1.22% | 2.89% |
K SHARES
Average Annual Total Returns*
for the periods ended 8/31/19
Fund/Benchmark | One
Year | Five Year
(Annualized) | Ten Year
(Annualized) | Since
Inception
(Annualized) |
Short-Term U.S. Government Bond Fund | 2.45% | 0.12% | 0.02% | 0.93% |
Barclays 1-3 Yr. Treasury Index | 4.42% | 1.34% | 1.22% | 2.08% |
2
Historical Performance and Manager’s Discussion (Unaudited) (Continued) | August 31, 2019 |
Stock Funds
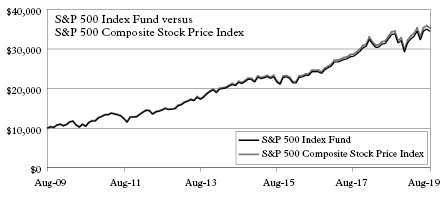
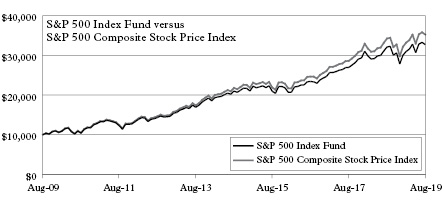
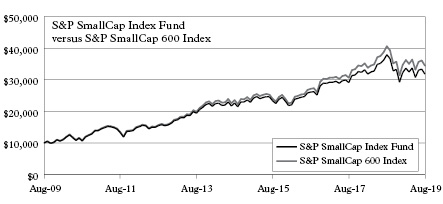
By definition, the objective for managing the index funds is to match the performance of the funds to their index benchmarks. Each of our index funds tracked their respective benchmarks tightly during this last fiscal year. We measure the index fund performance by using a correlation coefficient. This is a statistical measure that compares the daily performance of a fund against its benchmark index. A measure of 1.000 indicates that the performance is perfectly correlated and a measure of -1.000 implies they are negatively correlated. According to Bloomberg, LLC, The S&P 500 Index Fund had a correlation of 0.998 for the fiscal year. The S&P Nasdaq-100 Index Fund, SmallCap Fund and S&P MidCap Index Fund each had a correlation of 0.999.
During the fiscal year, the Direct shares of the S&P 500 Index Fund out-performed the Direct Shares of the S&P MidCap and SmallCap Index Fund by posting gains of 2.40%, compared to (6.85)% and (15.82)%, respectively. It’s important to note, however, that during the year the relative performance varied substantially. After the new tax bill that went into effect in the beginning of the year, the S&P SmallCap fund substantially outperformed the S&P 500 and MidCap Index funds. Though the returns of these three funds remained relatively flat for the balance of the fiscal year, the SmallCap fund had a strong rally compared to the other two funds during the last four months.
The Nasdaq-100 Index Fund (Direct Shares) finished up 1.72%, versus a benchmark performance of 1.60%. It is important to note that while this index is a popular and widely tracked investment benchmark, it is constructed in a different way than the S&P indices that we track. As of October 2019, Apple Inc. alone made up 10.99% of the index and the top ten holdings accounted for over 50% of the index. It provides investors a strong technology exposure as well as the related volatility.
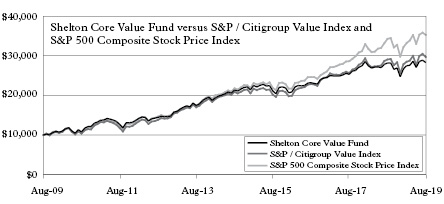
The Shelton Core Value Fund is a value fund that focuses on income as well as the potential for capital appreciation. The Direct Shares returned 0.41% for the year. The performance of the fund trailed the U.S. stock market as measured by the S&P 500 Index by 2.51% and beat the LargeCap value market, as measured by the S&P 500 Value Index, by 0.84%. The optimism of the previous year was followed by a year where equity assets provided little return to investors. Macro risks such as a pending trade war with China and continued uncertainty around Brexit caused markets to respond negatively in the fourth quarter of 2018 where stocks fell dramatically. Through much of the first quarter and through April of 2019, markets strengthened with the exception of LargeCap stocks, which remained below where they had begun the year. After a massive turn-around in small business optimism since the Trump election, optimism fe1l through most of the period. As a favorable economic indicator, the optimism levels have remained above 100 for the entire period and this has helped lead to gains in hiring and ultimately, the lowest level of unemployment in the US over several decades.
The Shelton Core Value Fund lagged to overall market and, consistent with the conservative posturing of the portfolio, demonstrated lower overall risk as measured by volatility over the period. As hoped, it out-performed the S&P 500 during down markets (August-December and the month of May) and underperformed during rallies (January-April and June-July). The portfolio is generating a higher level of cashflow (with an indicated yield of 5.7% at the time of this writing) in an effort to meet the income needs of investors by investing primarily in dividend-paying stocks and selling call options on a portion of the portfolio to take advantage of the expected risk-adjusted return provided by a covered call strategy. One of the primary drivers of this strategy is slowing global growth combined with a historically-high price earnings multiple of the equity markets as measured by the S&P 500. With our view that future returns in the equity markets are limited by these factors, selling upside volatility for immediate cashflow will reduce risk and generate attractive high levels of cash flow.
Our view at the time of writing is that while growth will continue to come slowly, corporations will be profitable, and US equities represent an attractive investment opportunity for investors who are comfortable with the associated risks and volatility. The current political dysfunction, in our opinion, is singularly responsible for the poor economic growth we are seeing in the economy. We will become much more bullish if the political dialog about economic policy improves as we believe this is the simplest, most direct route to economic growth and labor market participation. Capital markets perform best with a strong rule of law governing property rights and minimal incremental government influence.
While we cannot predict what the future holds, we can easily make the case that investors who have continued to invest through troubled markets in the past have been rewarded for their tenacity. We encourage you to maintain a diversified portfolio using both stock and bond funds, in a balance that is appropriate for your particular investment objectives.
Shelton Green Alpha Fund
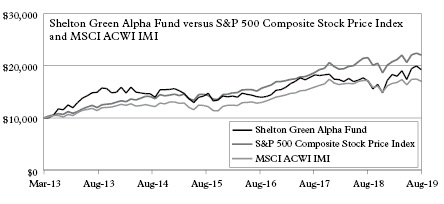
The Shelton Green Alpha Fund invests primarily in stocks of companies that are believed by the Sub-Advisor, Green Alpha Advisors, LLC, to be leaders in managing economic and environmental risks and opportunities, have above average growth potential and are reasonably valued relative to their growth potential. For the year ending August 31, 2019 the Shelton Green Alpha Fund’s return was 8.91%, outperforming the -0.83% return of the MSCI ACWI IMI (Investable Market Index), the Fund’s primary benchmark, and outperforming the 2.92% return of the S&P 500 Index, the Fund’s secondary benchmark.
The 9.74% performance lead over the Fund’s benchmark for the fiscal year was primarily the result of the Fund’s exposure to the renewable energy industry group and associated industries such as renewable energy financing and utilities. Sustainable REITs also contributed during the period.
Detracting from performance during the fiscal year was exposure to the communications sector, primarily the internet and telecommunications industry groups. Also detracting were the natural and organic food production and distribution aspects of the Consumer, non-cyclical sector.
In line with the Fund’s environmental focus, the Fund’s investments throughout the year reflected the Sub-Advisor’s view of a diversified portfolio of companies who are leaders in a number of industries including wind energy, solar photovoltaics, advanced biotech, artificial intelligence and machine learning, waste-to-value building materials, efficient industrial machinery and automation, electric transportation, mobile communications, internet of things, data infrastructure, energy efficiency and lighting, water desalination, and natural foods, among others.
3
Historical Performance and Manager’s Discussion (Unaudited) (Continued) | August 31, 2019 |
DIRECT SHARES
Average Annual Total Returns*
for the periods ended 8/31/19
Fund/Benchmark | One
Year | Five Year
(Annualized) | Ten Year
(Annualized) | Since
Inception
(Annualized) |
S&P 500 Index Fund | 2.40% | 9.82% | 13.16% | 9.45% |
S&P 500 Composite Stock Price Index | 2.92% | 10.10% | 13.43% | 9.63% |
K SHARES
Average Annual Total Returns*
for the periods ended 8/31/19
Fund/Benchmark | One
Year | Five Year
(Annualized) | Ten Year
(Annualized) | Since
Inception
(Annualized) |
S&P 500 Index Fund | 1.88% | 9.28% | 12.59% | 8.13% |
S&P 500 Composite Stock Price Index | 2.92% | 10.10% | 13.43% | 8.88% |
DIRECT SHARES
Average Annual Total Returns*
for the periods ended 8/31/19
Fund/Benchmark | One
Year | Five Year
(Annualized) | Ten Year
(Annualized) | Since
Inception
(Annualized) |
S&P MidCap Index Fund | -6.85% | 6.97% | 12.50% | 11.23% |
S&P MidCap 400 Index | -6.45% | 7.21% | 12.83% | 11.56% |


K SHARES
Average Annual Total Returns*
for the periods ended 8/31/19
Fund/Benchmark | One
Year | Five Year
(Annualized) | Ten Year
(Annualized) | Since
Inception
(Annualized) |
S&P MidCap Index Fund | -7.27% | 6.45% | 11.94% | 8.74% |
S&P MidCap 400 Index | -6.45% | 7.21% | 12.83% | 9.71% |
DIRECT SHARES
Average Annual Total Returns*
for the periods ended 8/31/19
Fund/Benchmark | One
Year | Five Year
(Annualized) | Ten Year
(Annualized) | Since
Inception
(Annualized) |
S&P SmallCap Index Fund | -15.82% | 7.55% | 12.83% | 9.11% |
S&P SmallCap 600 Index | -15.09% | 7.91% | 13.18% | 9.79% |

4
Historical Performance and Manager’s Discussion (Unaudited) (Continued) | August 31, 2019 |
K SHARES
Average Annual Total Returns*
for the periods ended 8/31/19
Fund/Benchmark | One
Year | Five Year
(Annualized) | Ten Year
(Annualized) | Since
Inception
(Annualized) |
S&P SmallCap Index Fund | -16.22% | 7.02% | 12.27% | 8.68% |
S&P SmallCap 600 Index | -15.09% | 7.91% | 13.18% | 9.69% |
DIRECT SHARES
Average Annual Total Returns*
for the periods ended 8/31/19
Fund/Benchmark | One
Year | Five Year
(Annualized) | Ten Year
(Annualized) | Since
Inception
(Annualized) |
Shelton Core Value Fund | 0.41% | 5.79% | 10.97% | 7.82% |
S&P / Citigroup Value Index | 2.13% | 7.29% | 11.50% | 7.88% |
S&P 500 Composite Stock Price Index | 2.92% | 10.10% | 13.43% | 8.78% |

K SHARES
Average Annual Total Returns*
for the periods ended 8/31/19
Fund/Benchmark | One
Year | Five Year
(Annualized) | Ten Year
(Annualized) | Since
Inception
(Annualized) |
Shelton Core Value Fund | -0.08% | 5.27% | 10.42% | 7.50% |
S&P / Citigroup Value Index | 2.13% | 7.29% | 11.50% | 7.82% |
S&P 500 Composite Stock Price Index | 2.92% | 10.10% | 13.43% | 8.88% |
DIRECT SHARES
Average Annual Total Returns*
for the periods ended 8/31/19
Fund/Benchmark | One
Year | Five Year
(Annualized) | Ten Year
(Annualized) | Since
Inception
(Annualized) |
Nasdaq-100 Index Fund | 1.72% | 13.77% | 17.46% | 3.90% |
Nasdaq-100 Index | 1.60% | 14.82% | 18.14% | 4.55% |


K SHARES
Average Annual Total Returns*
for the periods ended 8/31/19
Fund/Benchmark | One
Year | Five Year
(Annualized) | Ten Year
(Annualized) | Since
Inception
(Annualized) |
Nasdaq-100 Index Fund | 1.24% | 13.21% | 16.88% | 11.10% |
Nasdaq-100 Index | 1.60% | 14.82% | 18.14% | 12.18% |
5
Historical Performance and Manager’s Discussion (Unaudited) (Continued) | August 31, 2019 |
DIRECT SHARES
Average Annual Total Returns*
for the periods ended 8/31/19
Fund/Benchmark | One
Year | Five Year
(Annualized) | Ten Year
(Annualized) | Since
Inception
(Annualized) |
Shelton Green Alpha Fund** | 8.91% | 3.93% | N/A | 10.67% |
S&P 500 Composite Stock Price Index | 2.92% | 10.10% | N/A | 13.01% |
MSCI ACWI IMI | -0.83% | 6.01% | N/A | 8.30% |
* | Past performance does not predict future performance. The returns shown do not reflect the deduction of taxes that a shareholder would pay on fund distributions or the redemption of fund shares. |
** | Shelton Green Alpha Fund commencement of operations was March 12, 2013. |
6
About Your Fund’s Expenses (Unaudited) August 31, 2019 |
As a shareholder of the Funds, you incur two types of costs: (1) transaction costs, including sales charges (loads) on purchase payments, reinvested dividends, or other distributions, redemption fees, and exchange fees; and (2) ongoing costs, including management fees, distribution fees and other Fund expenses. Operating expenses, which are deducted from the Funds’ gross income, directly reduce the investment return of the Funds. The Funds’ expenses are expressed as a percentage of its average net assets. This figure is known as the expense ratio. This example is intended to help you understand your ongoing cost (in dollars) of investing in the Funds and to compare these costs with the ongoing costs of investing in other mutual funds. The examples are based on an investment of $1,000 invested at the beginning of the period and held for the entire period from March 1, 2019 to August 31, 2019.
Actual Expenses
The first line of the tables below provides information about actual account values and actual expenses. You may use the information in this line, together with the amount you invested, to estimate the expenses you have paid over the period. Simply divide your account value by $1,000 (for example, an $8,600 account value divided by $1,000 = 8.6), then multiply the result by the number in the first line under the heading entitled “Expenses Paid During Period” to estimate the expenses you paid on your account during this period.
Hypothetical Example for Comparison Purposes
The second line of the table provides information about hypothetical account values and hypothetical expenses based on the Funds’ actual expense ratio and an assumed rate of return of 5% per year before expenses, which is not the Funds’ actual return. The hypothetical account values and expenses may not be used to estimate the actual ending account balance or expenses you paid for the period. You may use this information to compare the ongoing costs of investing in the Funds and other funds. To do so, compare this 5% hypothetical example with the 5% hypothetical examples that appear in the shareholder reports of the other funds. The Funds do not charge any sales charges. Please note that the expenses shown in the tables are meant to highlight your ongoing costs only and do not reflect any transactional cost, such as sales charges (loads), redemption fees, or exchange fees. Therefore, the second line of the tables are useful in comparing ongoing costs only, and will not help you determine the relative total costs of owning different funds. In addition, if these transactional costs were included, your costs would have been higher. The calculations assume no shares were bought or sold during the period.
| | Beginning
Account Value
March 1, 2019 | Ending
Account Value
August 31, 2019 | Expenses Paid
During Period* | Net Annual
Expense Ratio |
Green California Tax-Free Income Fund |
Direct Shares | | | | |
Based on Actual Fund Return | $ 1,000 | $ 1,040 | $ 3.89 | 0.76% |
Based on Hypothetical 5% Return before expenses | $ 1,000 | $ 1,046 | $ 3.90 | 0.76% |
U.S. Government Securities Fund |
Direct Shares | | | | |
Based on Actual Fund Return | $ 1,000 | $ 1,059 | $ 3.87 | 0.75% |
Based on Hypothetical 5% Return before expenses | $ 1,000 | $ 1,046 | $ 3.85 | 0.75% |
K Shares | | | | |
Based on Actual Fund Return | $ 1,000 | $ 1,055 | $ 6.44 | 1.25% |
Based on Hypothetical 5% Return before expenses | $ 1,000 | $ 1,044 | $ 6.41 | 1.25% |
Short-Term U.S. Government Bond Fund |
Direct Shares | | | | |
Based on Actual Fund Return | $ 1,000 | $ 1,017 | $ 3.03 | 0.60% |
Based on Hypothetical 5% Return before expenses | $ 1,000 | $ 1,047 | $ 3.08 | 0.60% |
K Shares | | | | |
Based on Actual Fund Return | $ 1,000 | $ 1,016 | $ 5.56 | 1.10% |
Based on Hypothetical 5% Return before expenses | $ 1,000 | $ 1,044 | $ 5.64 | 1.10% |
The United States Treasury Trust |
Direct Shares | | | | |
Based on Actual Fund Return | $ 1,000 | $ 1,009 | $ 2.67 | 0.53% |
Based on Hypothetical 5% Return before expenses | $ 1,000 | $ 1,047 | $ 2.72 | 0.53% |
K Shares | | | | |
Based on Actual Fund Return | $ 1,000 | $ 1,007 | $ 5.18 | 1.03% |
Based on Hypothetical 5% Return before expenses | $ 1,000 | $ 1,045 | $ 5.28 | 1.03% |
S&P 500 Index Fund |
Direct Shares | | | | |
Based on Actual Fund Return | $ 1,000 | $ 1,059 | $ 2.58 | 0.50% |
Based on Hypothetical 5% Return before expenses | $ 1,000 | $ 1,047 | $ 2.57 | 0.50% |
K Shares | | | | |
Based on Actual Fund Return | $ 1,000 | $ 1,056 | $ 5.15 | 1.00% |
Based on Hypothetical 5% Return before expenses | $ 1,000 | $ 1,045 | $ 5.13 | 1.00% |
S&P MidCap Index Fund |
Direct Shares | | | | |
Based on Actual Fund Return | $ 1,000 | $ 989 | $ 3.29 | 0.66% |
Based on Hypothetical 5% Return before expenses | $ 1,000 | $ 1,047 | $ 3.39 | 0.66% |
K Shares | | | | |
Based on Actual Fund Return | $ 1,000 | $ 987 | $ 5.78 | 1.16% |
Based on Hypothetical 5% Return before expenses | $ 1,000 | $ 1,044 | $ 5.94 | 1.16% |
7
About Your Fund’s Expenses (Unaudited) August 31, 2019 (Continued) |
| | Beginning
Account Value
March 1, 2019 | Ending
Account Value
August 31, 2019 | Expenses Paid
During Period* | Net Annual
Expense Ratio |
S&P SmallCap Index Fund |
Direct Shares | | | | |
Based on Actual Fund Return | $ 1,000 | $ 947 | $ 3.90 | 0.80% |
Based on Hypothetical 5% Return before expenses | $ 1,000 | $ 1,046 | $ 4.10 | 0.80% |
K Shares | | | | |
Based on Actual Fund Return | $ 1,000 | $ 945 | $ 6.39 | 1.31% |
Based on Hypothetical 5% Return before expenses | $ 1,000 | $ 1,043 | $ 6.71 | 1.31% |
Shelton Core Value Fund |
Direct Shares | | | | |
Based on Actual Fund Return | $ 1,000 | $ 1,029 | $ 3.97 | 0.78% |
Based on Hypothetical 5% Return before expenses | $ 1,000 | $ 1,046 | $ 4.00 | 0.78% |
K Shares | | | | |
Based on Actual Fund Return | $ 1,000 | $ 1,027 | $ 6.50 | 1.28% |
Based on Hypothetical 5% Return before expenses | $ 1,000 | $ 1,044 | $ 6.56 | 1.28% |
Nasdaq-100 Index Fund |
Direct Shares | | | | |
Based on Actual Fund Return | $ 1,000 | $ 1,077 | $ 2.66 | 0.51% |
Based on Hypothetical 5% Return before expenses | $ 1,000 | $ 1,047 | $ 2.62 | 0.51% |
K Shares | | | | |
Based on Actual Fund Return | $ 1,000 | $ 1,074 | $ 5.25 | 1.01% |
Based on Hypothetical 5% Return before expenses | $ 1,000 | $ 1,045 | $ 5.18 | 1.01% |
Shelton Green Alpha Fund |
Direct Shares | | | | |
Based on Actual Fund Return | $ 1,000 | $ 1,051 | $ 6.68 | 1.30% |
Based on Hypothetical 5% Return before expenses | $ 1,000 | $ 1,043 | $ 6.66 | 1.30% |
* | Expenses are equal to the Fund’s expense ratio annualized |
8
Top Holdings and Sector Breakdowns (Unaudited) | August 31, 2019 |
Green California Tax-Free Income Fund
Security | Description | Market
Value | Percentage
of Total
Investment | 
|
1 | East Side Union High School District | General Obligation Refunding Bonds (2012 Crossover) | $ 3,478,489 | 5.3% |
2 | William S Hart Union High School District | General Obligation Bonds; 2001 Election, Series B | 3,031,268 | 4.6% |
3 | California State Public Works Board | Lease Revenue Bonds; 2009 Series I-1 | 3,024,840 | 4.6% |
4 | San Francisco Bay Area Rapid Transit District | San Francisco BART District GO Bonds 2017 Refunding Series E (Green Bonds) | 2,918,677 | 4.5% |
5 | Los Rios Community College District | General Obligation Bonds; 2008 Election, Series B | 2,858,375 | 4.4% |
6 | Mount San Antonio Community College District | General Obligation Bonds; Election of 2008, Series 2013A | 2,680,194 | 4.1% |
7 | East Bay Municipal Utility District Water System Revenue | Water System Revenue Bonds; 2015 Series B | 2,519,840 | 3.8% |
8 | California Health Facilities Financing Authority | Kaiser Permanente Revenue Bonds, Series 2017A-1 | 2,240,057 | 3.4% |
9 | Los Angeles Department of Water | Water System Revenue Bonds; 2015 Series B | 2,199,916 | 3.4% |
10 | City of Los Angeles CA | General Obligation refunding Bonds; Series 2012-A | 2,163,500 | 3.3% |
U.S. Government Securities Fund
Security | Maturity | Market
Value | Percentage
of Total
Investment | 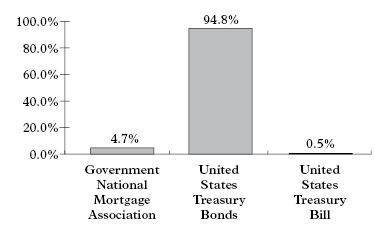
|
1 | United States Treasury Note/Bond | 05/15/2025 | $ 2,283,402 | 11.8% |
2 | United States Treasury Note/Bond | 08/15/2023 | 2,083,163 | 10.8% |
3 | United States Treasury Note/Bond | 02/15/2021 | 2,056,875 | 10.6% |
4 | United States Treasury Note/Bond | 02/15/2022 | 2,026,406 | 10.5% |
5 | United States Treasury Note/Bond | 02/15/2020 | 1,496,426 | 7.7% |
6 | United States Treasury Note/Bond | 02/29/2024 | 1,339,965 | 6.9% |
7 | United States Treasury Note/Bond | 08/15/2020 | 1,309,979 | 6.8% |
8 | United States Treasury Note/Bond | 11/15/2028 | 1,252,539 | 6.5% |
9 | United States Treasury Note/Bond | 02/15/2026 | 1,024,234 | 5.3% |
10 | United States Treasury Note/Bond | 08/15/2027 | 952,559 | 4.9% |
Short-Term U.S. Government Bond Fund
Security | Maturity | Market
Value | Percentage
of Total
Investment | 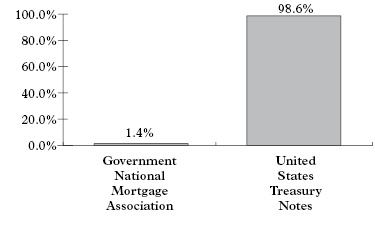
|
1 | United States Treasury Note/Bond | 07/31/2020 | $ 1,502,608 | 25.0% |
2 | United States Treasury Note/Bond | 01/31/2021 | 1,207,852 | 20.1% |
3 | United States Treasury Note/Bond | 01/31/2020 | 1,097,465 | 18.3% |
4 | United States Treasury Note/Bond | 02/15/2020 | 897,855 | 14.9% |
5 | United States Treasury Note/Bond | 07/31/2021 | 810,688 | 13.5% |
6 | United States Treasury Note/Bond | 06/30/2022 | 407,789 | 6.8% |
7 | Ginnie Mae II Pool | 11/20/2034 | 54,404 | 0.9% |
8 | Ginnie Mae II Pool | 06/20/2034 | 31,145 | 0.5% |
9
Top Holdings and Sector Breakdowns (Unaudited) (Continued) | August 31, 2019 |
The United States Treasury Trust
Security | Maturity | Market
Value | Percentage
of Total
Investment | 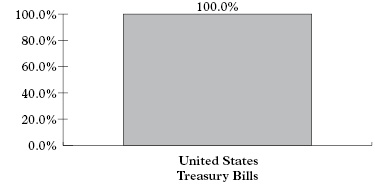
|
1 | United States Treasury Bill | 10/03/2019 | $ 8,183,649 | 20.9% |
2 | United States Treasury Bill | 11/07/2019 | 6,574,200 | 16.8% |
3 | United States Treasury Bill | 09/17/2019 | 5,194,812 | 13.3% |
4 | United States Treasury Bill | 09/05/2019 | 4,798,414 | 12.3% |
5 | United States Treasury Bill | 10/24/2019 | 3,489,698 | 8.9% |
6 | United States Treasury Bill | 10/17/2019 | 2,493,283 | 6.4% |
7 | United States Treasury Bill | 09/12/2019 | 1,598,954 | 4.1% |
8 | United States Treasury Bill | 01/30/2020 | 1,586,244 | 4.1% |
9 | United States Treasury Bill | 01/23/2020 | 1,191,182 | 3.0% |
10 | United States Treasury Bill | 09/10/2019 | 999,445 | 2.6% |
S&P 500 Index Fund
Security | Market
Value | Percentage
of Total
Investment | 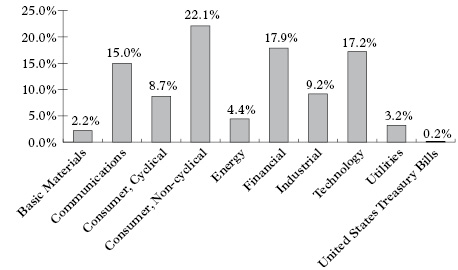
|
1 | Microsoft Corp | $ 8,278,355 | 4.3% |
2 | Apple Inc | 7,173,976 | 3.8% |
3 | Amazon.com Inc | 5,774,719 | 3.0% |
4 | Facebook Inc | 3,482,039 | 1.8% |
5 | Berkshire Hathaway Inc | 3,068,033 | 1.6% |
6 | Alphabet Inc - Class C | 2,858,569 | 1.5% |
7 | Alphabet Inc - Class A | 2,802,508 | 1.5% |
8 | JPMorgan Chase & Co | 2,802,089 | 1.5% |
9 | Johnson & Johnson | 2,690,169 | 1.4% |
10 | Visa Inc | 2,472,352 | 1.3% |
S&P MidCap Index Fund
Security | Market
Value | Percentage
of Total
Investment | 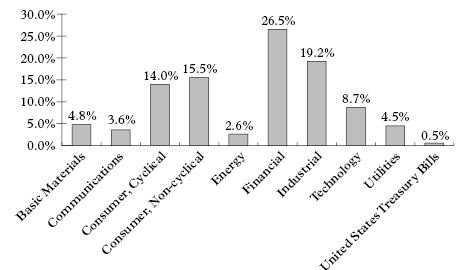
|
1 | STERIS PLC | $ 878,845 | 0.8% |
2 | NVR Inc | 806,176 | 0.7% |
3 | Teledyne Technologies Inc | 744,936 | 0.7% |
4 | Zebra Technologies Corp | 737,288 | 0.7% |
5 | Alleghany Corp | 720,836 | 0.7% |
6 | West Pharmaceutical Services Inc | 712,172 | 0.6% |
7 | Old Dominion Freight Line Inc | 706,624 | 0.6% |
8 | FactSet Research Systems Inc | 701,984 | 0.6% |
9 | Camden Property Trust | 697,347 | 0.6% |
10 | WR Berkley Corp | 686,779 | 0.6% |
10
Top Holdings and Sector Breakdowns (Unaudited) (Continued) | August 31, 2019 |
S&P SmallCap Index Fund
Security | Market
Value | Percentage
of Total
Investment | 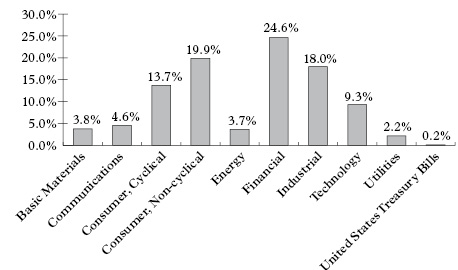
|
1 | Mercury Systems Inc | $ 414,021 | 0.6% |
2 | FTI Consulting Inc | 385,087 | 0.6% |
3 | Repligen Corp | 366,507 | 0.6% |
4 | Aerojet Rocketdyne Holdings Inc | 354,119 | 0.5% |
5 | SolarEdge Technologies Inc | 353,157 | 0.5% |
6 | Exponent Inc | 350,197 | 0.5% |
7 | Strategic Education Inc | 347,598 | 0.5% |
8 | Neogen Corp | 344,349 | 0.5% |
9 | Cabot Microelectronics Corp | 339,422 | 0.5% |
10 | RLI Corp | 336,337 | 0.5% |
Shelton Core Value Fund
Security | Market
Value | Percentage
of Total
Investment | 
|
1 | JPMorgan Chase & Co | $ 7,802,257 | 5.2% |
2 | Apple Inc | 4,174,800 | 2.8% |
3 | Sprouts Farmers Market Inc | 4,128,500 | 2.7% |
4 | Consolidated Edison Inc | 4,000,500 | 2.6% |
5 | Bank of America Corp | 3,851,400 | 2.5% |
6 | Wells Fargo & Co | 3,725,600 | 2.5% |
7 | Masco Corp | 3,665,700 | 2.4% |
8 | Amazon.com Inc | 3,552,580 | 2.3% |
9 | Abbott Laboratories | 3,507,505 | 2.3% |
10 | Chevron Corp | 3,452,021 | 2.3% |
Nasdaq-100 Index Fund
Security | Market
Value | Percentage
of Total
Investment | 
|
1 | Microsoft Corp | $ 66,559,494 | 10.5% |
2 | Apple Inc | 66,441,525 | 10.5% |
3 | Amazon.com Inc | 60,464,912 | 9.6% |
4 | Facebook Inc | 31,123,119 | 4.9% |
5 | Alphabet Inc - Class C | 28,867,266 | 4.6% |
6 | Alphabet Inc - Class A | 25,360,670 | 4.0% |
7 | Intel Corp | 16,281,068 | 2.6% |
8 | Comcast Corp | 15,377,031 | 2.4% |
9 | Cisco Systems Inc | 15,370,298 | 2.4% |
10 | PepsiCo Inc | 14,702,167 | 2.3% |
11
Top Holdings and Sector Breakdowns (Unaudited) (Continued) | August 31, 2019 |
Shelton Green Alpha Fund
Security | Market
Value | Percentage
of Total
Investment | 
|
1 | Pattern Energy Group Inc | $ 3,665,250 | 6.7% |
2 | Vestas Wind Systems A/S | 3,001,250 | 5.5% |
3 | First Solar Inc | 2,768,322 | 5.0% |
4 | Applied Materials Inc | 2,328,970 | 4.2% |
5 | Sunrun Inc | 2,146,200 | 3.9% |
6 | TerraForm Power Inc | 1,865,600 | 3.4% |
7 | JinkoSolar Holding Co Ltd | 1,815,210 | 3.3% |
8 | Hannon Armstrong Sustainable Infrastructure Capital Inc | 1,768,320 | 3.2% |
9 | International Business Machines Corp | 1,761,890 | 3.2% |
10 | SunPower Corp | 1,727,760 | 3.1% |
12
Green California Tax-Free Income Fund | Portfolio of Investments | 8/31/19 |
Security Description | | Par Value | | | Value
(Note 1) | |
Municipal Bonds (95.88%) | | | | | | | | |
| | | | | | | | | |
BUTTE-GLENN COMMUNITY COLLEGE DISTRICT | | | | | | | | |
Lease Revenue Bonds; 2009 Series I-1, 4.000%, 08/01/2026 | | $ | 1,000,000 | | | $ | 1,089,540 | |
CALIFORNIA HEALTH FACILITIES FINANCING AUTHORITY | | | | | | | | |
Kaiser Permanente Revenue Bonds, Series 2017A-1, 5.000%, 11/01/2027 | | | 1,700,000 | | | | 2,240,057 | |
CALIFORNIA INFRASTRUCTURE & ECONOMIC DEVELOPMENT BANK | | | | | | | | |
Clean Water State Revolving Fund Revenue Bonds, Series 2016 (Green Bonds), 2.000, 10/01/2019 | | | 200,000 | | | | 200,182 | |
Clean Water State Revolving Fund Revenue Bonds, Series 2016 (Green Bonds), 5.000%, 10/01/2033 | | | 1,200,000 | | | | 1,481,400 | |
CALIFORNIA DEPARTMENT OF PUBLIC WORKS BOARD | | | | | | | | |
Lease Revenue Bonds; 2009 Series I-1, 6.125%, 11/01/2029 | | | 3,000,000 | | | | 3,024,840 | |
TRUSTEES OF THE CALIFORNIA STATE UNIVERSITY | | | | | | | | |
Systemwide Revenue Bonds; Series 2012A, 4.000%, 11/01/2030 | | | 1,100,000 | | | | 1,189,045 | |
CITY AND COUNTY OF SAN FRANCISCO | | | | | | | | |
General Obligation Bonds (Clean and Safe Neighborhood Parks Bonds, 2012); Series 2013A, 4.000%, 06/15/2033 | | | 1,000,000 | | | | 1,046,080 | |
CITY OF LOS ANGELES | | | | | | | | |
General Obligation Refunding Bonds; Series 2012-A, 5.000%, 09/01/2021 | | | 2,000,000 | | | | 2,163,500 | |
CITY OF LOS ANGELES WASTEWATER SYSTEM REVENUE | | | | | | | | |
Los Angeles CA Wastewater System Revenue Bond, 5.000%, 06/01/2044 | | | 500,000 | | | | 591,285 | |
Los Angeles CA Wastewater System Revenue Bond, 5.250%, 06/01/2047 | | | 1,500,000 | | | | 1,869,015 | |
CITY OF ROSEVILLE FINANCE AUTHORITY ELECTRIC SYSTEM REVENUE | | | | | | | | |
Electric System Revenue Refunding Bonds; Series 2013, 5.000%, 02/01/2025 | | | 750,000 | | | | 864,960 | |
CITY OF SAN FRANCISCO PUBLIC UTILITIES COMMISSION WATER REVENUE | | | | | | | | |
City of San Francisco CA Public Utilities Commission Water Revenue, 5.000%, 11/01/2036 | | | 1,170,000 | | | | 1,405,685 | |
San Francisco City & County Public Utilities Commission Wastewater Revenue, 5.000%, 11/01/2034 | | | 1,000,000 | | | | 1,279,410 | |
San Francisco City and Green Bond Series A, 5.000%, 11/01/2030 | | | 680,000 | | | | 825,275 | |
EAST BAY MUNICIPAL UTILITY DISTRICT WATER SYSTEM REVENUE | | | | | | | | |
Water System Revenue Bonds; 2015 Series B, 5.000%, 06/01/2026 | | | 2,050,000 | | | | 2,519,840 | |
EAST SIDE UNION HIGH SCHOOL DISTRICT | | | | | | | | |
General Obligation Refunding Bonds (2012 Crossover); 2006, 5.250%, 09/01/2023 | | | 2,975,000 | | | | 3,478,489 | |
FOOTHILL-DE ANZA COMMUNITY COLLEGE DISTRICT | | | | | | | | |
Election of 1999 General Obligation Bonds; Series C, 0%, 08/01/2027 | | | 2,000,000 | | | | 1,780,880 | |
LA MIRADA REDEVELOPMENT AGENCY SUCCESSOR AGENCY | | | | | | | | |
Subordinate Tax Allocation Refunding Bonds; 2014 Series A, 5.000%, 08/15/2023 | | | 1,000,000 | | | | 1,157,300 | |
LOS ANGELES COMMUNITY COLLEGE DISTRICT | | | | | | | | |
General Obligation Bonds; 2008 Election, Series G, 5.000%, 08/01/2028 | | | 865,000 | | | | 1,029,687 | |
LOS ANGELES COUNTY METROPOLITAN TRANSPORTATION AUTHORITY | | | | | | | | |
Proposition A First Tier Los Angeles County Met Transport, 4.000%, 07/01/2028 | | | 500,000 | | | | 583,340 | |
Proposition A First Tier Senior Sales Tax Revenue Refunding Bonds; Series 2012-A, 5.000%, 07/01/2021 | | | 1,000,000 | | | | 1,075,550 | |
Proposition C Sales Tax Revenue Refunding Bonds; Senior Bonds; Series 2013-A, 5.000%, 07/01/2023 | | | 1,500,000 | | | | 1,731,855 | |
LOS ANGELES DEPARTMENT OF WATER | | | | | | | | |
Water System Revenue Bonds, 2012 Series A, 5.000%, 07/01/2037 | | | 1,985,000 | | | | 2,199,916 | |
LOS RIOS COMMUNITY COLLEGE DISTRICT | | | | | | | | |
General Obligation Bonds; 2008 Election, Series B, 5.000%, 08/01/2032 | | | 2,500,000 | | | | 2,858,375 | |
MIDPENINSULA REGIONAL OPEN SPACE DISTRICT | | | | | | | | |
Midpeninsula Regional Open Space District, 4.000%, 09/01/2021 | | | 200,000 | | | | 212,450 | |
MOUNT DIABLO UNIFIED SCHOOL DISTRICT | | | | | | | | |
General Obligation Refunding Bonds; Election Of 2002, Series B, 5.000%, 07/01/2020 | | | 500,000 | | | | 517,100 | |
MOUNT SAN ANTONIO COMMUNITY COLLEGE DISTRICT | | | | | | | | |
General Obligation Bonds; Election of 2008, Series 2013A, 5.000%, 08/01/2034 | | | 2,345,000 | | | | 2,680,194 | |
PORT OF LOS ANGELES | | | | | | | | |
Revenue Bonds; 2014 Series C, 4.000%, 08/01/2023 | | | 290,000 | | | | 324,191 | |
RANCHO SANTIAGO COMMUNITY COLLEGE DISTRICT | | | | | | | | |
General Obligation Refunding Bonds; 2012, 4.000%, 09/01/2020 | | | 1,380,000 | | | | 1,423,111 | |
SACRAMENTO MUNICIPAL UTILITY DISTRICT | | | | | | | | |
Electric Revenue Bonds; 1997 Series K, 5.250%, 07/01/2024 | | | 1,000,000 | | | | 1,146,300 | |
SAN DIEGO COMMUNITY COLLEGE DISTRICT | | | | | | | | |
General Obligation Bonds; Election of 2002, Series 2013, 5.000%, 08/01/2027 | | | 1,175,000 | | | | 1,357,066 | |
SAN FRANCISCO BAY AREA RAPID TRANSIT DISTRICT | | | | | | | | |
San Francisco BART District GO Bonds 2017 Series A-1 (Green Bonds), 4.000%, 08/01/2034 | | | 645,000 | | | | 761,758 | |
San Francisco BART District GO Bonds 2017 Refunding Series E (Green Bonds), 5.000%, 08/01/2036 | | | 2,300,000 | | | | 2,918,677 | |
SAN FRANCISCO CITY & COUNTY AIRPORT COMMISSION | | | | | | | | |
General Obligation Bonds (Clean and Safe Neighborhood Parks Bonds, 2012); Series 2013A, 5.000%, 05/01/2020 | | | 500,000 | | | | 513,355 | |
See accompanying notes to financial statements.
13
Green California Tax-Free Income Fund | Portfolio of Investments (Continued) | 8/31/19 |
Security Description | | Par Value | | | Value
(Note 1) | |
SAN FRANCISCO CITY & COUNTY PUBLIC UTILITIES COMMISSION WASTEWATER REVENUE | | | | | | | | |
San Francisco City & County Public Utilities Commission Wastewater Revenue, 4.000%, 10/01/2021 | | $ | 700,000 | | | $ | 744,324 | |
SANTA CLARA VALLEY TRANSPORTATION AUTHORITY | | | | | | | | |
2000 Measure A Sales Tax Revenue Refunding Bonds; 2015 Series A, 5.000%, 04/01/2034 | | | 1,000,000 | | | | 1,193,400 | |
SANTA MARIA JOINT UNION HIGH SCHOOL DISTRICT | | | | | | | | |
General Obligation Bonds; Election of 2004, Series 2005, 0%, 08/01/2029 | | | 2,500,000 | | | | 2,056,850 | |
SOUTHERN CALIFORNIA PUBLIC POWER AUTHORITY | | | | | | | | |
Souther California Public Power Authority Windy Pt/Windy Flats Project 1, 5.000%, 07/01/2026 | | | 1,400,000 | | | | 1,446,354 | |
Windy Point/Windy Flats Project Revenue Bonds; 2010-1, 5.000%, 07/01/2023 | | | 1,000,000 | | | | 1,034,030 | |
STATE OF CALIFORNIA | | | | | | | | |
Tax-Exempt Various Purpose General Obligation Bonds, 3.000%, 10/01/2028 | | | 900,000 | | | | 964,566 | |
Tax-Exempt Various Purpose General Obligation Bonds, 0.850%, 05/01/2034 | | | 1,300,000 | | | | 1,300,000 | |
TUOLUMNE WIND PROJECT AUTHORITY | | | | | | | | |
Tuolumne Wind Project Authority, 5.000%, 01/01/2020 | | | 1,000,000 | | | | 1,013,530 | |
UNIVERSITY OF CALIFORNIA | | | | | | | | |
General Revenue Bonds; 2014 Series AM, 5.000%, 05/15/2029 | | | 925,000 | | | | 1,093,729 | |
WILLIAM S HART UNION HIGH SCHOOL DISTRICT | | | | | | | | |
General Obligation Bonds; 2001 Election, Series B, 0%, 09/01/2029 | | | 3,595,000 | | | | 3,031,268 | |
| | | | | | | | | |
Total Municipal Bonds (Cost $59,930,928) | | | | | | | 63,417,759 | |
| | | | | | | | | |
Variable Rate Demand Notes (3.18%) | | | | | | | | |
California Health Facilities Financing Authority, 5.000%, 07/01/2043*,** | | | 1,000,000 | | | | 1,004,530 | |
Metropolitan Water District of Southern California, 1.050%, 07/01/2047* | | | 100,000 | | | | 100,000 | |
Santa Clara Valley Transportation Authority, 0.850%, 04/01/2036* | | | 300,000 | | | | 300,000 | |
State of California General Obligation, 1.000%, 05/01/2034* | | | 200,000 | | | | 200,000 | |
State of California General Obligation, 1.000%, 05/01/2040* | | | 500,000 | | | | 500,000 | |
Total Variable Rate Demand Notes (Cost $1,168,956) | | | | | | | 2,104,530 | |
| | | | | | | | | |
Total Investments (Cost $61,099,884)(a) (99.06%) | | | | | | $ | 65,522,289 | |
Other Net Assets (0.94%) | | | | | | | 622,058 | |
Net Assets (100.00%) | | | | | | $ | 66,144,347 | |
(a) Aggregate cost for federal income tax purposes is $61,098,380. |
| |
At August 31, 2019, unrealized appreciation/(depreciation) of securities for federal income tax purposes is as follows: |
Unrealized appreciation | | $ | 4,588,454 | |
Unrealized depreciation | | | (164,545 | ) |
Net unrealized appreciation | | $ | 4,423,909 | |
| * | Rate Effective as of August 31, 2019 |
| ** | In accordance with the offering documents, daily interest rates are determined by the Remarketing Agents. |
See accompanying notes to financial statements.
14
U.S. Government Securities Fund | Portfolio of Investments | 8/31/19 |
Security Description | | Par Value | | | Value
(Note 1) | |
Government National Mortgage Association (4.66%) | | | | | | | | |
5.000%, 07/15/2020 | | $ | 7,228 | | | $ | 7,288 | |
5.500%, 01/15/2025 | | | 32,162 | | | | 34,589 | |
6.000%, 01/15/2026 | | | 89,455 | | | | 99,030 | |
5.500%, 04/15/2036 | | | 127,702 | | | | 145,126 | |
5.000%, 03/15/2038 | | | 157,581 | | | | 176,404 | |
6.000%, 06/15/2038 | | | 68,590 | | | | 78,885 | |
3.500%, 11/20/2044 | | | 350,959 | | | | 367,976 | |
Total Government National Mortgage Association (Cost $847,071) | | | | | | | 909,298 | |
| | | | | | | | | |
United States Treasury Bills (0.51%) | | | | | | | | |
0%, 10/03/2019 (Cost $99,811) | | | 100,000 | | | | 99,834 | |
| | | | | | | | | |
United States Treasury Bonds (15.91%) | | | | | | | | |
6.000%, 02/15/2026 | | | 800,000 | | | | 1,024,234 | |
6.375%, 08/15/2027 | | | 400,000 | | | | 547,188 | |
5.000%, 05/15/2037 | | | 500,000 | | | | 752,588 | |
2.750%, 08/15/2042 | | | 400,000 | | | | 461,797 | |
2.250%, 08/15/2046 | | | 300,000 | | | | 317,713 | |
Total United States Treasury Bonds (Cost $2,859,875) | | | | | | | 3,103,520 | |
| | | | | | | | | |
United States Treasury Notes (77.90%) | | | | | | | | |
1.750%, 11/30/2019 | | | 400,000 | | | | 399,680 | |
1.375%, 02/15/2020 | | | 1,500,000 | | | | 1,496,426 | |
2.625%, 08/15/2020 | | | 1,300,000 | | | | 1,309,979 | |
3.625%, 02/15/2021 | | | 2,000,000 | | | | 2,056,875 | |
2.000%, 02/15/2022 | | | 2,000,000 | | | | 2,026,406 | |
2.500%, 08/15/2023 | | | 2,000,000 | | | | 2,083,163 | |
2.125%, 02/29/2024 | | | 1,300,000 | | | | 1,339,965 | |
2.125%, 05/15/2025 | | | 2,200,000 | | | | 2,283,402 | |
2.250%, 08/15/2027 | | | 900,000 | | | | 952,559 | |
3.125%, 11/15/2028 | | | 1,100,000 | | | | 1,252,539 | |
Total United States Treasury Notes (Cost $14,816,292) | | | | | | | 15,200,994 | |
| | | | | | | | | |
Total Investments (Cost $18,623,049)(a) (98.98%) | | | | | | $ | 19,313,646 | |
Other Net Assets (1.02%) | | | | | | | 199,854 | |
Net Assets (100.00%) | | | | | | $ | 19,513,500 | |
(a) Aggregate cost for federal income tax purposes is $18,623,049. |
| |
At August 31, 2019, unrealized appreciation/(depreciation) of securities for federal income tax purposes is as follows: |
Unrealized appreciation | | $ | 693,764 | |
Unrealized depreciation | | | (3,167 | ) |
Net unrealized appreciation | | $ | 690,597 | |
See accompanying notes to financial statements.
15
Short-Term U.S. Government Bond Fund | Portfolio of Investments | 8/31/19 |
Security Description | | Par Value | | | Value
(Note 1) | |
Government National Mortgage Association (1.41%) | | | | | | | | |
2.250%, 06/20/2034 | | $ | 30,536 | | | $ | 31,145 | |
1.625%, 11/20/2034 | | | 52,244 | | | | 54,404 | |
Total Government National Mortgage Association (Cost $83,136) | | | | | | | 85,549 | |
| | | | | | | | | |
United States Treasury Notes (97.91%) | | | | | | | | |
1.375%, 01/31/2020 | | | 1,100,000 | | | | 1,097,465 | |
1.375%, 02/15/2020 | | | 900,000 | | | | 897,855 | |
2.000%, 07/31/2020 | | | 1,500,000 | | | | 1,502,608 | |
2.125%, 01/31/2021 | | | 1,200,000 | | | | 1,207,852 | |
2.250%, 07/31/2021 | | | 800,000 | | | | 810,688 | |
2.125%, 06/30/2022 | | | 400,000 | | | | 407,789 | |
Total United States Treasury Notes (Cost $5,881,723) | | | | | | | 5,924,257 | |
| | | | | | | | | |
Total Investments (Cost $5,964,859)(a) (99.32%) | | | | | | $ | 6,009,806 | |
Other Net Assets (0.68%) | | | | | | | 41,076 | |
Net Assets (100.00%) | | | | | | $ | 6,050,882 | |
(a) Aggregate cost for federal income tax purposes is $5,964,861. |
| | |
At August 31, 2019, unrealized appreciation/(depreciation) of securities for federal income tax purposes is as follows: |
Unrealized appreciation | | $ | 47,761 | |
Unrealized depreciation | | | (2,816 | ) |
Net unrealized appreciation | | $ | 44,945 | |
The United States Treasury Trust | Portfolio of Investments | 8/31/19 |
Security Description | | Par Value | | | Value
(Note 1) | |
United States Treasury Bills, DN(a) (100.02%) | | | | | | | | |
09/05/2019 | | $ | 4,800,000 | | | $ | 4,798,730 | |
09/10/2019 | | | 1,000,000 | | | | 999,501 | |
09/12/2019 | | | 1,600,000 | | | | 1,599,042 | |
09/17/2019 | | | 5,200,000 | | | | 5,195,117 | |
09/26/2019 | | | 1,000,000 | | | | 998,433 | |
10/03/2019 | | | 8,200,000 | | | | 8,184,144 | |
10/17/2019 | | | 2,500,000 | | | | 2,493,426 | |
10/24/2019 | | | 3,500,000 | | | | 3,489,889 | |
11/07/2019 | | | 6,600,000 | | | | 6,574,579 | |
11/21/2019 | | | 1,000,000 | | | | 995,636 | |
01/23/2020 | | | 1,200,000 | | | | 1,191,242 | |
01/30/2020 | | | 1,600,000 | | | | 1,586,335 | |
04/23/2020 | | | 1,000,000 | | | | 988,788 | |
Total United States Treasury Bills, DN (Cost $39,094,862) | | | | | | | 39,094,862 | |
| | | | | | | | | |
Total Investments (Cost $39,094,862)(b) (100.02%) | | | | | | | 39,094,862 | |
Liabilities in Excess of Other Assets (-0.02%) | | | | | | | (5,937 | ) |
Net Assets (100.00%) | | | | | | $ | 39,088,925 | |
(a) Discount Note. Yield to maturity is between 1.75% - 2.21%. |
| |
(b) Aggregate cost for federal income tax purposes is $39,094,862. |
See accompanying notes to financial statements.
16
S&P 500 Index Fund | Portfolio of Investments | 8/31/19 |
Security Description | | Shares | | | Value
(Note 1) | |
Common Stock (99.70%) | | | | | | | | |
| | | | | | | | | |
Basic Materials (2.15%) | | | | | | | | |
Air Products & Chemicals Inc | | | 1,615 | | | $ | 364,861 | |
Albemarle Corp | | | 868 | | | | 53,582 | |
Celanese Corp | | | 995 | | | | 112,803 | |
CF Industries Holdings Inc | | | 1,795 | | | | 86,501 | |
Dow Inc | | | 5,828 | | | | 248,448 | |
DuPont de Nemours Inc | | | 5,828 | | | | 395,896 | |
Eastman Chemical Co | | | 1,048 | | | | 68,508 | |
Ecolab Inc | | | 1,937 | | | | 399,622 | |
FMC Corp | | | 1,102 | | | | 95,136 | |
Freeport-McMoRan Inc | | | 11,406 | | | | 104,821 | |
International Flavors & Fragrances Inc | | | 683 | | | | 74,959 | |
International Paper Co | | | 3,175 | | | | 124,143 | |
Linde PLC | | | 4,315 | | | | 815,147 | |
LyondellBasell Industries NV | | | 2,532 | | | | 195,926 | |
Newmont Goldcorp Corp | | | 6,444 | | | | 257,051 | |
Nucor Corp | | | 2,404 | | | | 117,748 | |
PPG Industries Inc | | | 2,102 | | | | 232,881 | |
The Mosaic Co | | | 2,068 | | | | 38,031 | |
The Sherwin-Williams Co | | | 628 | | | | 330,799 | |
Total Basic Materials | | | | | | | 4,116,863 | |
| | | | | | | | | |
Communications (14.95%) | | | | | | | | |
Alphabet Inc - Class A*,(a) | | | 2,354 | | | | 2,802,508 | |
Alphabet Inc - Class C* | | | 2,406 | | | | 2,858,569 | |
Amazon.com Inc* | | | 3,251 | | | | 5,774,719 | |
Arista Networks Inc* | | | 415 | | | | 94,047 | |
AT&T Inc | | | 56,729 | | | | 2,000,265 | |
Booking Holdings Inc* | | | 339 | | | | 666,613 | |
CBS Corp | | | 2,752 | | | | 115,749 | |
CenturyLink Inc | | | 4,581 | | | | 52,132 | |
Charter Communications Inc* | | | 1,352 | | | | 553,766 | |
Cisco Systems Inc | | | 33,658 | | | | 1,575,531 | |
Comcast Corp | | | 35,613 | | | | 1,576,231 | |
Corning Inc | | | 7,332 | | | | 204,196 | |
Discovery Inc - Class A* | | | 1,878 | | | | 51,833 | |
Discovery Inc - Class C* | | | 1,878 | | | | 48,884 | |
DISH Network Corp* | | | 1,784 | | | | 59,871 | |
eBay Inc | | | 6,441 | | | | 259,508 | |
Expedia Group Inc | | | 689 | | | | 89,639 | |
F5 Networks Inc*,(a) | | | 602 | | | | 77,495 | |
Facebook Inc* | | | 18,754 | | | | 3,482,039 | |
Fox Corp - Class A | | | 2,714 | | | | 90,023 | |
Fox Corp - Class B | | | 1,242 | | | | 40,738 | |
Juniper Networks Inc | | | 2,718 | | | | 62,949 | |
Motorola Solutions Inc | | | 1,430 | | | | 258,701 | |
Netflix Inc* | | | 3,319 | | | | 974,956 | |
News Corp - Class A | | | 3,745 | | | | 51,494 | |
News Corp - Class B | | | 910 | | | | 12,886 | |
Omnicom Group Inc | | | 1,982 | | | | 150,751 | |
Symantec Corp | | | 5,172 | | | | 120,249 | |
The Interpublic Group of Cos Inc | | | 3,241 | | | | 64,431 | |
The Walt Disney Co | | | 13,819 | | | | 1,896,796 | |
T-Mobile US Inc* | | | 2,482 | | | | 193,720 | |
TripAdvisor Inc* | | | 850 | | | | 32,292 | |
Twitter Inc* | | | 5,110 | | | | 217,942 | |
VeriSign Inc* | | | 689 | | | | 140,453 | |
Verizon Communications Inc | | | 32,518 | | | | 1,891,247 | |
Viacom Inc | | | 2,740 | | | | 68,445 | |
Total Communications | | | | | | | 28,611,668 | |
| | | | | | | | | |
Consumer, Cyclical (8.71%) | | | | | | | | |
Advance Auto Parts Inc | | | 548 | | | $ | 75,597 | |
Alaska Air Group Inc | | | 963 | | | | 57,510 | |
American Airlines Group Inc | | | 4,021 | | | | 105,793 | |
Aptiv PLC | | | 2,173 | | | | 180,728 | |
AutoZone Inc* | | | 192 | | | | 211,524 | |
Best Buy Co Inc | | | 1,956 | | | | 124,499 | |
BorgWarner Inc | | | 1,664 | | | | 54,296 | |
Capri Holdings Ltd* | | | 1,328 | | | | 35,033 | |
CarMax Inc* | | | 1,689 | | | | 140,660 | |
Carnival Corp | | | 3,334 | | | | 146,963 | |
Chipotle Mexican Grill Inc* | | | 234 | | | | 196,190 | |
Copart Inc* | | | 1,585 | | | | 119,493 | |
Costco Wholesale Corp | | | 3,457 | | | | 1,018,985 | |
Darden Restaurants Inc | | | 933 | | | | 112,874 | |
Delta Air Lines Inc | | | 5,026 | | | | 290,804 | |
Dollar General Corp | | | 1,932 | | | | 301,566 | |
Dollar Tree Inc* | | | 1,907 | | | | 193,618 | |
DR Horton Inc | | | 2,495 | | | | 123,428 | |
Fastenal Co | | | 4,028 | | | | 123,337 | |
Foot Locker Inc | | | 1,044 | | | | 37,782 | |
Ford Motor Co | | | 27,615 | | | | 253,230 | |
General Motors Co | | | 10,151 | | | | 376,501 | |
Genuine Parts Co | | | 1,170 | | | | 105,639 | |
Hanesbrands Inc | | | 3,007 | | | | 41,076 | |
Harley-Davidson Inc | | | 1,765 | | | | 56,304 | |
Hasbro Inc | | | 950 | | | | 104,947 | |
Hilton Worldwide Holdings Inc | | | 2,288 | | | | 211,343 | |
Kohl’s Corp | | | 1,587 | | | | 75,002 | |
L Brands Inc | | | 1,787 | | | | 29,503 | |
Leggett & Platt Inc | | | 1,017 | | | | 37,822 | |
Lennar Corp | | | 2,200 | | | | 112,200 | |
LKQ Corp* | | | 2,347 | | | | 61,656 | |
Lowe’s Cos Inc | | | 6,155 | | | | 690,591 | |
Macy’s Inc | | | 2,961 | | | | 43,704 | |
Marriott International Inc | | | 2,467 | | | | 310,990 | |
McDonald’s Corp | | | 6,003 | | | | 1,308,474 | |
MGM Resorts International | | | 3,988 | | | | 111,903 | |
Mohawk Industries Inc* | | | 459 | | | | 54,571 | |
Newell Brands Inc | | | 3,701 | | | | 61,437 | |
NIKE Inc | | | 9,881 | | | | 834,945 | |
Nordstrom Inc | | | 1,123 | | | | 32,533 | |
Norwegian Cruise Line Holdings Ltd* | | | 1,599 | | | | 81,149 | |
O’Reilly Automotive Inc* | | | 665 | | | | 255,200 | |
PACCAR Inc | | | 2,601 | | | | 170,522 | |
PulteGroup Inc | | | 2,804 | | | | 94,775 | |
PVH Corp | | | 574 | | | | 43,509 | |
Ralph Lauren Corp | | | 449 | | | | 39,665 | |
Ross Stores Inc | | | 2,889 | | | | 306,263 | |
Royal Caribbean Cruises Ltd | | | 1,236 | | | | 128,890 | |
Southwest Airlines Co | | | 3,843 | | | | 201,066 | |
Starbucks Corp | | | 9,523 | | | | 919,541 | |
Tapestry Inc | | | 2,156 | | | | 44,521 | |
Target Corp | | | 4,028 | | | | 431,157 | |
The Gap Inc | | | 2,194 | | | | 34,643 | |
The Home Depot Inc | | | 8,651 | | | | 1,971,649 | |
The TJX Cos Inc | | | 9,534 | | | | 524,084 | |
Tiffany & Co | | | 950 | | | | 80,627 | |
Tractor Supply Co | | | 1,050 | | | | 106,974 | |
Ulta Beauty Inc* | | | 468 | | | | 111,258 | |
Under Armour Inc - Class A* | | | 1,210 | | | | 22,518 | |
Under Armour Inc - Class C* | | | 1,218 | | | | 20,609 | |
United Airlines Holdings Inc* | | | 1,732 | | | | 146,025 | |
VF Corp | | | 2,588 | | | | 212,087 | |
Walgreens Boots Alliance Inc | | | 6,346 | | | | 324,852 | |
Walmart Inc | | | 10,998 | | | $ | 1,256,631 | |
Whirlpool Corp | | | 570 | | | | 79,281 | |
WW Grainger Inc | | | 441 | | | | 120,680 | |
Wynn Resorts Ltd | | | 526 | | | | 57,939 | |
Yum! Brands Inc | | | 2,700 | | | | 315,306 | |
Total Consumer, Cyclical | | | | | | | 16,666,472 | |
| | | | | | | | | |
Consumer, Non-Cyclical (22.08%) |
Abbott Laboratories | | | 13,435 | | | | 1,146,274 | |
AbbVie Inc | | | 11,623 | | | | 764,096 | |
ABIOMED Inc* | | | 354 | | | | 68,347 | |
Alexion Pharmaceuticals Inc* | | | 1,383 | | | | 139,351 | |
Align Technology Inc* | | | 600 | | | | 109,866 | |
Allergan PLC | | | 2,617 | | | | 417,987 | |
Altria Group Inc | | | 14,863 | | | | 650,108 | |
AmerisourceBergen Corp | | | 1,565 | | | | 128,753 | |
Amgen Inc | | | 4,795 | | | | 1,000,333 | |
Anthem Inc | | | 2,002 | | | | 523,563 | |
Archer-Daniels-Midland Co | | | 4,902 | | | | 186,521 | |
Automatic Data Processing Inc | | | 3,564 | | | | 605,310 | |
Avery Dennison Corp | | | 891 | | | | 102,973 | |
Baxter International Inc | | | 3,880 | | | | 341,246 | |
Becton Dickinson and Co | | | 2,120 | | | | 538,310 | |
Biogen Inc* | | | 1,524 | | | | 334,899 | |
Boston Scientific Corp* | | | 11,526 | | | | 492,506 | |
Bristol-Myers Squibb Co | | | 12,265 | | | | 589,579 | |
Brown-Forman Corp | | | 1,728 | | | | 101,935 | |
Campbell Soup Co | | | 1,449 | | | | 65,205 | |
Cardinal Health Inc | | | 2,511 | | | | 108,299 | |
Celgene Corp* | | | 5,545 | | | | 536,756 | |
Centene Corp* | | | 2,584 | | | | 120,466 | |
Church & Dwight Co Inc | | | 1,996 | | | | 159,241 | |
Cigna Corp | | | 2,983 | | | | 459,293 | |
Cintas Corp | | | 801 | | | | 211,304 | |
Colgate-Palmolive Co | | | 6,558 | | | | 486,276 | |
Conagra Brands Inc | | | 2,987 | | | | 84,711 | |
Constellation Brands Inc | | | 1,083 | | | | 221,311 | |
Corteva Inc | | | 5,828 | | | | 170,877 | |
Coty Inc | | | 3,684 | | | | 35,182 | |
CVS Health Corp | | | 10,096 | | | | 615,048 | |
Danaher Corp | | | 4,953 | | | | 703,772 | |
DaVita Inc* | | | 1,224 | | | | 68,997 | |
DENTSPLY SIRONA Inc | | | 1,160 | | | | 60,494 | |
Edwards Lifesciences Corp* | | | 1,716 | | | | 380,677 | |
Eli Lilly & Co | | | 6,793 | | | | 767,405 | |
Equifax Inc | | | 870 | | | | 127,351 | |
FleetCor Technologies Inc* | | | 699 | | | | 208,582 | |
Gartner Inc* | | | 714 | | | | 95,440 | |
General Mills Inc | | | 4,683 | | | | 251,945 | |
Gilead Sciences Inc | | | 10,033 | | | | 637,497 | |
Global Payments Inc | | | 1,172 | | | | 194,529 | |
H&R Block Inc | | | 1,994 | | | | 48,295 | |
HCA Healthcare Inc | | | 2,209 | | | | 265,522 | |
Henry Schein Inc* | | | 1,256 | | | | 77,395 | |
Hologic Inc* | | | 2,135 | | | | 105,405 | |
Hormel Foods Corp | | | 2,128 | | | | 90,674 | |
Humana Inc | | | 1,191 | | | | 337,303 | |
IDEXX Laboratories Inc* | | | 691 | | | | 200,210 | |
IHS Markit Ltd* | | | 2,494 | | | | 163,631 | |
Illumina Inc* | | | 1,143 | | | | 321,572 | |
Incyte Corp* | | | 1,363 | | | | 111,521 | |
Intuitive Surgical Inc* | | | 855 | | | | 437,196 | |
IQVIA Holdings Inc* | | | 1,146 | | | | 177,802 | |
Johnson & Johnson(a) | | | 20,958 | | | | 2,690,169 | |
Kellogg Co | | | 1,816 | | | | 114,045 | |
Kimberly-Clark Corp | | | 2,926 | | | | 412,888 | |
See accompanying notes to financial statements.
17
S&P 500 Index Fund | Portfolio of Investments (Continued) | 8/31/19 |
Security Description | | Shares | | | Value
(Note 1) | |
Laboratory Corp of America Holdings* | | | 705 | | | $ | 118,130 | |
Lamb Weston Holdings Inc | | | 406 | | | | 28,578 | |
MarketAxess Holdings Inc | | | 296 | | | | 117,696 | |
McCormick & Co Inc | | | 975 | | | | 158,798 | |
McKesson Corp | | | 1,736 | | | | 240,037 | |
Medtronic PLC | | | 10,510 | | | | 1,133,924 | |
Merck & Co Inc | | | 20,243 | | | | 1,750,412 | |
Molson Coors Brewing Co | | | 1,200 | | | | 61,632 | |
Mondelez International Inc | | | 11,909 | | | | 657,615 | |
Monster Beverage Corp* | | | 3,387 | | | | 198,715 | |
Moody’s Corp | | | 1,293 | | | | 278,745 | |
Mylan NV* | | | 3,101 | | | | 60,376 | |
Nektar Therapeutics* | | | 1,277 | | | | 22,437 | |
Nielsen Holdings PLC | | | 1,879 | | | | 39,008 | |
PayPal Holdings Inc* | | | 9,238 | | | | 1,007,404 | |
PepsiCo Inc | | | 11,085 | | | | 1,515,652 | |
Perrigo Co PLC | | | 677 | | | | 31,670 | |
Pfizer Inc | | | 43,652 | | | | 1,551,829 | |
Philip Morris International Inc | | | 11,608 | | | | 836,821 | |
Quanta Services Inc | | | 1,601 | | | | 54,274 | |
Quest Diagnostics Inc | | | 1,168 | | | | 119,568 | |
Regeneron Pharmaceuticals Inc* | | | 562 | | | | 163,008 | |
ResMed Inc | | | 1,127 | | | | 156,991 | |
Robert Half International Inc | | | 1,032 | | | | 55,181 | |
Rollins Inc | | | 462 | | | | 15,158 | |
S&P Global Inc | | | 2,019 | | | | 525,324 | |
Stryker Corp | | | 2,434 | | | | 537,086 | |
Sysco Corp | | | 3,758 | | | | 279,332 | |
Teleflex Inc | | | 362 | | | | 131,739 | |
The Clorox Co | | | 943 | | | | 149,145 | |
The Coca-Cola Co | | | 30,037 | | | | 1,653,236 | |
The Cooper Cos Inc | | | 374 | | | | 115,847 | |
The Estee Lauder Cos Inc | | | 1,800 | | | | 356,382 | |
The Hershey Co | | | 1,114 | | | | 176,547 | |
The JM Smucker Co | | | 823 | | | | 86,547 | |
The Kraft Heinz Co | | | 4,282 | | | | 109,277 | |
The Kroger Co | | | 8,014 | | | | 189,772 | |
The Procter & Gamble Co | | | 19,722 | | | | 2,371,176 | |
Thermo Fisher Scientific Inc | | | 3,062 | | | | 878,978 | |
Total System Services Inc | | | 1,190 | | | | 159,722 | |
Tyson Foods Inc | | | 2,328 | | | | 216,597 | |
United Rentals Inc* | | | 724 | | | | 81,493 | |
UnitedHealth Group Inc | | | 7,607 | | | | 1,780,038 | |
Universal Health Services Inc | | | 683 | | | | 98,748 | |
Varian Medical Systems Inc* | | | 875 | | | | 92,689 | |
Verisk Analytics Inc | | | 1,197 | | | | 193,363 | |
Vertex Pharmaceuticals Inc* | | | 2,013 | | | | 362,380 | |
WellCare Health Plans Inc* | | | 395 | | | | 106,942 | |
Zimmer Biomet Holdings Inc | | | 1,338 | | | | 186,250 | |
Zoetis Inc | | | 3,718 | | | | 470,030 | |
Total Consumer, Non-Cyclical | | | 42,248,542 | |
| | | | | | | | | |
Energy (4.38%) | | | | | | | | |
Apache Corp | | | 2,792 | | | | 60,223 | |
Baker Hughes a GE Co | | | 3,384 | | | | 73,399 | |
Cabot Oil & Gas Corp | | | 3,164 | | | | 54,168 | |
Chevron Corp(a) | | | 14,977 | | | | 1,763,092 | |
Cimarex Energy Co | | | 657 | | | | 28,106 | |
Concho Resources Inc | | | 1,114 | | | | 81,489 | |
ConocoPhillips | | | 8,936 | | | | 466,280 | |
Devon Energy Corp | | | 2,767 | | | | 60,846 | |
Diamondback Energy Inc | | | 1,217 | | | | 119,363 | |
EOG Resources Inc | | | 4,562 | | | | 338,455 | |
Exxon Mobil Corp(a) | | | 33,268 | | | | 2,278,193 | |
Halliburton Co | | | 6,883 | | | | 129,676 | |
Helmerich & Payne Inc | | | 805 | | | $ | 30,260 | |
Hess Corp | | | 1,823 | | | | 114,758 | |
HollyFrontier Corp | | | 508 | | | | 22,535 | |
Kinder Morgan Inc | | | 15,052 | | | | 305,104 | |
Marathon Oil Corp | | | 5,187 | | | | 61,414 | |
Marathon Petroleum Corp | | | 5,770 | | | | 283,942 | |
National Oilwell Varco Inc | | | 3,192 | | | | 65,213 | |
Noble Energy Inc | | | 2,616 | | | | 59,069 | |
Occidental Petroleum Corp | | | 6,992 | | | | 304,023 | |
ONEOK Inc | | | 3,307 | | | | 235,723 | |
Phillips 66 | | | 3,493 | | | | 344,515 | |
Pioneer Natural Resources Co | | | 1,287 | | | | 158,842 | |
Schlumberger Ltd | | | 11,025 | | | | 357,541 | |
TechnipFMC PLC | | | 3,637 | | | | 90,343 | |
The Williams Cos Inc | | | 9,527 | | | | 224,837 | |
Valero Energy Corp | | | 3,459 | | | | 260,394 | |
Total Energy | | | | | | | 8,371,803 | |
| | | | | | | | | |
Financial (17.83%) | | | | | | | | |
Banks (6.09%) | | | | | | | | |
Bank of America Corp | | | 69,527 | | | | 1,912,688 | |
BB&T Corp | | | 5,247 | | | | 250,020 | |
Citigroup Inc | | | 18,182 | | | | 1,170,012 | |
Citizens Financial Group Inc | | | 3,885 | | | | 131,080 | |
Comerica Inc | | | 1,331 | | | | 82,056 | |
Fifth Third Bancorp | | | 5,427 | | | | 143,544 | |
First Republic Bank | | | 1,295 | | | | 116,187 | |
Huntington Bancshares Inc | | | 5,456 | | | | 72,292 | |
JPMorgan Chase & Co | | | 25,506 | | | | 2,802,089 | |
KeyCorp | | | 6,704 | | | | 111,286 | |
M&T Bank Corp | | | 1,180 | | | | 172,528 | |
Morgan Stanley | | | 10,374 | | | | 430,417 | |
Northern Trust Corp | | | 1,610 | | | | 141,567 | |
Regions Financial Corp | | | 9,066 | | | | 132,545 | |
State Street Corp | | | 3,093 | | | | 158,702 | |
SunTrust Banks Inc | | | 3,809 | | | | 234,292 | |
SVB Financial Group* | | | 411 | | | | 79,989 | |
The Bank of New York Mellon Corp | | | 6,926 | | | | 291,308 | |
The Goldman Sachs Group Inc | | | 2,819 | | | | 574,822 | |
The PNC Financial Services Group Inc | | | 3,549 | | | | 457,573 | |
US Bancorp | | | 12,265 | | | | 646,243 | |
Wells Fargo & Co(a) | | | 32,401 | | | | 1,508,915 | |
Zions Bancorp NA | | | 1,054 | | | | 43,309 | |
| | | | | | | | 11,663,464 | |
Diversified Financial Service (4.52%) |
Affiliated Managers Group Inc | | | 409 | | | | 31,342 | |
Alliance Data Systems Corp | | | 400 | | | | 49,180 | |
American Express Co | | | 5,384 | | | | 648,072 | |
Ameriprise Financial Inc | | | 1,052 | | | | 135,687 | |
BlackRock Inc | | | 941 | | | | 397,629 | |
Capital One Financial Corp | | | 4,021 | | | | 348,299 | |
Cboe Global Markets Inc | | | 706 | | | | 84,127 | |
CME Group Inc | | | 2,814 | | | | 611,454 | |
Discover Financial Services | | | 2,538 | | | | 202,964 | |
E*TRADE Financial Corp | | | 1,181 | | | | 49,295 | |
Franklin Resources Inc | | | 3,105 | | | | 81,599 | |
Intercontinental Exchange Inc | | | 4,245 | | | | 396,823 | |
Invesco Ltd | | | 3,410 | | | | 53,537 | |
Jefferies Financial Group Inc | | | 1,447 | | | | 26,972 | |
Mastercard Inc | | | 7,066 | | | | 1,988,160 | |
Nasdaq Inc | | | 1,127 | | | | 112,520 | |
Raymond James Financial Inc | | | 1,004 | | | | 78,824 | |
Synchrony Financial | | | 6,040 | | | | 193,582 | |
T Rowe Price Group Inc | | | 1,965 | | | | 217,368 | |
The Charles Schwab Corp | | | 9,317 | | | $ | 356,562 | |
The Western Union Co | | | 4,688 | | | | 103,699 | |
Visa Inc | | | 13,673 | | | | 2,472,352 | |
| | | | | | | | 8,640,047 | |
Insurance (4.10%) | | | | | | | | |
Aflac Inc | | | 5,861 | | | | 294,105 | |
American International Group Inc | | | 6,822 | | | | 355,017 | |
Aon PLC | | | 2,040 | | | | 397,494 | |
Arthur J Gallagher & Co | | | 1,374 | | | | 124,636 | |
Assurant Inc | | | 596 | | | | 73,308 | |
Berkshire Hathaway Inc* | | | 15,083 | | | | 3,068,033 | |
Chubb Ltd | | | 3,685 | | | | 575,892 | |
Cincinnati Financial Corp | | | 1,179 | | | | 132,626 | |
Everest Re Group Ltd | | | 326 | | | | 76,897 | |
Globe Life Inc | | | 1,176 | | | | 104,970 | |
Lincoln National Corp | | | 1,590 | | | | 84,079 | |
Loews Corp | | | 2,394 | | | | 115,080 | |
Marsh & McLennan Cos Inc | | | 4,025 | | | | 402,057 | |
MetLife Inc | | | 7,704 | | | | 341,287 | |
Principal Financial Group Inc | | | 2,041 | | | | 108,622 | |
Prudential Financial Inc | | | 3,541 | | | | 283,599 | |
The Allstate Corp | | | 2,619 | | | | 268,159 | |
The Hartford Financial Services Group Inc | | | 2,922 | | | | 170,294 | |
The Progressive Corp | | | 4,123 | | | | 312,523 | |
The Travelers Cos Inc | | | 2,059 | | | | 302,591 | |
Unum Group | | | 2,266 | | | | 57,579 | |
Willis Towers Watson PLC | | | 996 | | | | 197,178 | |
| | | | | | | | 7,846,026 | |
Real Estate (3.10%) | | | | | | | | |
Alexandria Real Estate Equities Inc | | | 700 | | | | 104,888 | |
American Tower Corp | | | 3,499 | | | | 805,435 | |
Apartment Investment & Management Co | | | 1,069 | | | | 54,519 | |
AvalonBay Communities Inc | | | 1,044 | | | | 221,913 | |
Boston Properties Inc | | | 1,078 | | | | 138,437 | |
CBRE Group Inc* | | | 2,058 | | | | 107,572 | |
Crown Castle International Corp | | | 3,268 | | | | 474,416 | |
Digital Realty Trust Inc | | | 1,637 | | | | 202,382 | |
Duke Realty Corp | | | 2,792 | | | | 92,890 | |
Equinix Inc | | | 661 | | | | 367,701 | |
Equity Residential | | | 2,912 | | | | 246,821 | |
Essex Property Trust Inc | | | 463 | | | | 148,743 | |
Extra Space Storage Inc | | | 949 | | | | 115,702 | |
Federal Realty Investment Trust | | | 548 | | | | 70,807 | |
HCP Inc | | | 3,020 | | | | 104,824 | |
Host Hotels & Resorts Inc | | | 5,173 | | | | 82,975 | |
Iron Mountain Inc | | | 1,369 | | | | 43,603 | |
Kimco Realty Corp | | | 2,994 | | | | 55,030 | |
Mid-America Apartment Communities Inc | | | 858 | | | | 108,691 | |
Prologis Inc | | | 5,000 | | | | 418,100 | |
Public Storage | | | 1,035 | | | | 274,006 | |
Realty Income Corp | | | 2,475 | | | | 182,680 | |
Regency Centers Corp | | | 1,109 | | | | 71,542 | |
SBA Communications Corp | | | 918 | | | | 240,911 | |
Simon Property Group Inc | | | 2,175 | | | | 323,945 | |
SL Green Realty Corp | | | 740 | | | | 59,363 | |
The Macerich Co | | | 1,011 | | | | 28,844 | |
UDR Inc | | | 2,033 | | | | 97,950 | |
Ventas Inc | | | 2,904 | | | | 213,125 | |
Vornado Realty Trust | | | 1,244 | | | | 75,225 | |
Welltower Inc | | | 2,792 | | | | 250,052 | |
Weyerhaeuser Co | | | 5,770 | | | | 151,809 | |
| | | | | | | | 5,934,901 | |
See accompanying notes to financial statements.
18
S&P 500 Index Fund | Portfolio of Investments (Continued) | 8/31/19 |
Security Description | | Shares | | | Value
(Note 1) | |
Savings&Loans (0.02%) | | | | | | | | |
People’s United Financial Inc | | | 2,887 | | | $ | 41,486 | |
| | | | | | | | | |
Total Financial | | | | | | | 34,125,924 | |
| | | | | | | | | |
Industrial (9.18%) | | | | | | | | |
3M Co | | | 4,679 | | | | 756,688 | |
Agilent Technologies Inc | | | 2,633 | | | | 187,233 | |
Allegion PLC | | | 703 | | | | 67,678 | |
Amcor PLC* | | | 12,762 | | | | 125,323 | |
AMETEK Inc | | | 1,816 | | | | 156,049 | |
Amphenol Corp | | | 2,372 | | | | 207,645 | |
AO Smith Corp | | | 1,152 | | | | 53,591 | |
Arconic Inc | | | 2,478 | | | | 64,032 | |
Ball Corp | | | 2,268 | | | | 182,370 | |
Caterpillar Inc | | | 4,752 | | | | 565,488 | |
CH Robinson Worldwide Inc | | | 1,280 | | | | 108,147 | |
CSX Corp | | | 6,044 | | | | 405,069 | |
Cummins Inc | | | 1,302 | | | | 194,350 | |
Deere & Co | | | 2,547 | | | | 394,556 | |
Dover Corp | | | 1,334 | | | | 125,049 | |
Eaton Corp PLC | | | 3,484 | | | | 281,228 | |
Emerson Electric Co | | | 5,336 | | | | 317,972 | |
Expeditors International of Washington Inc | | | 1,549 | | | | 110,134 | |
FedEx Corp | | | 1,881 | | | | 298,345 | |
FLIR Systems Inc | | | 1,158 | | | | 57,055 | |
Flowserve Corp | | | 1,128 | | | | 48,143 | |
Fortive Corp | | | 2,318 | | | | 164,346 | |
Fortune Brands Home & Security Inc | | | 1,197 | | | | 61,119 | |
Garmin Ltd | | | 806 | | | | 65,745 | |
General Dynamics Corp | | | 2,204 | | | | 421,559 | |
General Electric Co | | | 68,083 | | | | 561,685 | |
Honeywell International Inc | | | 5,633 | | | | 927,304 | |
Huntington Ingalls Industries Inc | | | 358 | | | | 74,822 | |
Illinois Tool Works Inc | | | 2,349 | | | | 352,021 | |
Ingersoll-Rand PLC | | | 2,109 | | | | 255,379 | |
Jacobs Engineering Group Inc | | | 962 | | | | 85,483 | |
JB Hunt Transport Services Inc | | | 690 | | | | 74,548 | |
Johnson Controls International plc | | | 6,238 | | | | 266,300 | |
Kansas City Southern | | | 811 | | | | 102,024 | |
Keysight Technologies Inc* | | | 1,479 | | | | 143,256 | |
L3Harris Technologies Inc | | | 1,767 | | | | 373,561 | |
Lockheed Martin Corp | | | 1,981 | | | | 760,922 | |
Martin Marietta Materials Inc | | | 463 | | | | 117,496 | |
Masco Corp | | | 2,627 | | | | 106,998 | |
Mettler-Toledo International Inc* | | | 202 | | | | 132,672 | |
Norfolk Southern Corp | | | 2,091 | | | | 363,939 | |
Northrop Grumman Corp | | | 1,335 | | | | 491,106 | |
Packaging Corp of America | | | 752 | | | | 75,636 | |
Parker-Hannifin Corp | | | 1,096 | | | | 181,684 | |
Pentair PLC | | | 1,542 | | | | 55,389 | |
PerkinElmer Inc | | | 1,021 | | | | 84,437 | |
Raytheon Co | | | 2,190 | | | | 405,851 | |
Republic Services Inc | | | 1,694 | | | | 151,190 | |
Rockwell Automation Inc | | | 1,085 | | | | 165,777 | |
Roper Technologies Inc | | | 694 | | | | 254,531 | |
Sealed Air Corp | | | 1,582 | | | | 62,995 | |
Snap-on Inc | | | 424 | | | | 63,040 | |
Stanley Black & Decker Inc | | | 1,237 | | | | 164,348 | |
TE Connectivity Ltd | | | 2,648 | | | | 241,551 | |
Textron Inc | | | 2,069 | | | | 93,105 | |
The Boeing Co | | | 4,114 | | | | 1,497,866 | |
TransDigm Group Inc | | | 370 | | | | 199,178 | |
Union Pacific Corp | | | 5,565 | | | | 901,307 | |
United Parcel Service Inc | | | 5,289 | | | | 627,593 | |
United Technologies Corp | | | 6,201 | | | $ | 807,618 | |
Vulcan Materials Co | | | 956 | | | | 135,035 | |
Wabtec Corp | | | 1,272 | | | | 88,035 | |
Waste Management Inc | | | 3,352 | | | | 400,061 | |
Waters Corp* | | | 682 | | | | 144,509 | |
Westrock Co | | | 996 | | | | 34,043 | |
Xylem Inc | | | 1,498 | | | | 114,762 | |
Total Industrial | | | | | | | 17,557,971 | |
| | | | | | | | | |
Technology (17.20%) | | | | | | | | |
Accenture PLC | | | 5,015 | | | | 993,823 | |
Activision Blizzard Inc | | | 5,269 | | | | 266,611 | |
Adobe Inc* | | | 3,836 | | | | 1,091,380 | |
Advanced Micro Devices Inc* | | | 5,848 | | | | 183,920 | |
Akamai Technologies Inc* | | | 1,400 | | | | 124,782 | |
Analog Devices Inc | | | 2,620 | | | | 287,755 | |
ANSYS Inc* | | | 680 | | | | 140,461 | |
Apple Inc(a) | | | 34,368 | | | | 7,173,976 | |
Applied Materials Inc | | | 7,360 | | | | 353,427 | |
Autodesk Inc* | | | 1,669 | | | | 238,367 | |
Broadcom Inc | | | 3,102 | | | | 876,749 | |
Broadridge Financial Solutions Inc | | | 913 | | | | 118,179 | |
Cadence Design Systems Inc* | | | 2,246 | | | | 153,806 | |
Cerner Corp | | | 2,120 | | | | 146,089 | |
Citrix Systems Inc | | | 1,348 | | | | 125,337 | |
Cognizant Technology Solutions Corp | | | 4,408 | | | | 270,607 | |
DXC Technology Co | | | 2,234 | | | | 74,213 | |
Electronic Arts Inc* | | | 2,629 | | | | 246,285 | |
Fidelity National Information Services Inc | | | 4,804 | | | | 654,401 | |
Fiserv Inc* | | | 3,330 | | | | 356,110 | |
Fortinet Inc* | | | 1,141 | | | | 90,344 | |
Hewlett Packard Enterprise Co | | | 10,529 | | | | 145,511 | |
HP Inc | | | 11,843 | | | | 216,608 | |
Intel Corp | | | 35,201 | | | | 1,668,879 | |
International Business Machines Corp | | | 6,898 | | | | 934,886 | |
Intuit Inc | | | 2,031 | | | | 585,659 | |
IPG Photonics Corp* | | | 299 | | | | 36,995 | |
Jack Henry & Associates Inc | | | 607 | | | | 87,991 | |
KLA Corp | | | 1,217 | | | | 179,994 | |
Lam Research Corp | | | 1,341 | | | | 282,294 | |
Maxim Integrated Products Inc | | | 2,142 | | | | 116,825 | |
Microchip Technology Inc | | | 1,401 | | | | 120,948 | |
Micron Technology Inc* | | | 9,109 | | | | 412,364 | |
Microsoft Corp | | | 60,049 | | | | 8,278,355 | |
MSCI Inc | | | 713 | | | | 167,291 | |
NetApp Inc | | | 2,586 | | | | 124,283 | |
NVIDIA Corp | | | 4,645 | | | | 778,084 | |
Oracle Corp | | | 19,079 | | | | 993,253 | |
Paychex Inc | | | 2,454 | | | | 200,492 | |
Qorvo Inc* | | | 1,120 | | | | 80,002 | |
QUALCOMM Inc | | | 9,558 | | | | 743,326 | |
salesforce.com Inc* | | | 6,068 | | | | 947,033 | |
Seagate Technology PLC | | | 2,601 | | | | 130,596 | |
Skyworks Solutions Inc | | | 1,431 | | | | 107,711 | |
Synopsys Inc* | | | 1,189 | | | | 168,612 | |
Take-Two Interactive Software Inc* | | | 902 | | | | 119,037 | |
Texas Instruments Inc | | | 7,376 | | | | 912,780 | |
Western Digital Corp | | | 2,052 | | | | 117,518 | |
Xerox Holdings Corp | | | 2,577 | | | | 74,707 | |
Xilinx Inc | | | 2,112 | | | | 219,775 | |
Total Technology | | | | | | | 32,918,431 | |
| | | | | | | | | |
Utilities (3.22%) | | | | | | | | |
AES Corp | | | 4,674 | | | $ | 71,652 | |
Alliant Energy Corp | | | 1,758 | | | | 92,207 | |
Ameren Corp | | | 1,808 | | | | 139,487 | |
American Electric Power Co Inc | | | 3,645 | | | | 332,242 | |
American Water Works Co Inc | | | 1,374 | | | | 174,938 | |
Atmos Energy Corp | | | 927 | | | | 102,183 | |
CenterPoint Energy Inc | | | 2,979 | | | | 82,489 | |
CMS Energy Corp | | | 2,062 | | | | 130,009 | |
Consolidated Edison Inc | | | 2,227 | | | | 197,980 | |
Dominion Energy Inc | | | 6,340 | | | | 492,174 | |
DTE Energy Co | | | 1,258 | | | | 163,112 | |
Duke Energy Corp | | | 5,180 | | | | 480,393 | |
Edison International | | | 2,433 | | | | 175,833 | |
Entergy Corp | | | 1,304 | | | | 147,143 | |
Evergy Inc | | | 1,919 | | | | 124,735 | |
Eversource Energy | | | 2,274 | | | | 182,216 | |
Exelon Corp | | | 7,634 | | | | 360,783 | |
FirstEnergy Corp | | | 3,123 | | | | 143,658 | |
NextEra Energy Inc | | | 3,624 | | | | 793,946 | |
NiSource Inc | | | 2,050 | | | | 60,578 | |
NRG Energy Inc | | | 1,956 | | | | 71,198 | |
Pinnacle West Capital Corp | | | 806 | | | | 76,820 | |
PPL Corp | | | 4,208 | | | | 124,346 | |
Public Service Enterprise Group Inc | | | 3,861 | | | | 233,475 | |
Sempra Energy | | | 2,157 | | | | 305,496 | |
The Southern Co | | | 7,566 | | | | 440,795 | |
WEC Energy Group Inc | | | 2,388 | | | | 228,699 | |
Xcel Energy Inc | | | 3,728 | | | | 239,412 | |
Total Utilities | | | | | | | 6,167,999 | |
| | | | | | | | | |
Total Common Stock (Cost $70,950,211) | | | | | | | 190,785,673 | |
| | | | | | | | | |
United States Treasury Bills (0.16%) |
1.966%, 10/31/2019 (Cost $298,998) | | $ | 300,000 | | | | 299,062 | |
| | | | | | | | | |
Total Investments (Cost $71,249,209)(b) (99.86%) | | $ | 191,084,735 | |
Other Net Assets (0.14%) | | | | | | | 249,680 | |
Net Assets (100.00%) | | | | | | $ | 191,334,415 | |
| * | Non-income producing security. |
(a) A portion of these shares have been pledged in connection with obligations for futures contracts. |
| | |
(b) Aggregate cost for federal income tax purpose is $71,301,854. |
At August 31, 2019, unrealized appreciation/(depreciation) of securities for federal income tax purposes is as follows: |
Unrealized appreciation | | $ | 123,424,557 | |
Unrealized depreciation | | | (3,641,676 | ) |
Net unrealized appreciation | | $ | 119,782,881 | |
(c) Futures contracts at August 31, 2019: |
Contracts - $50 times premium / delivery month / commitment / exchange |
S&P 500 E-MINI | | Notional Amount | | | Value | | | Unrealized Appreciation | |
3 / Sep 2019 / Long / CME | | $ | 434,269 | | | $ | 438,720 | | | $ | 4,451 | |
See accompanying notes to financial statements.
19
S&P MidCap Index Fund | Portfolio of Investments | 8/31/19 |
Security Description | | Shares | | | Value
(Note 1) | |
Common Stock (99.37%) | | | | | | | | |
| | | | | | | | | |
Basic Materials (4.80%) | | | | | | | | |
Allegheny Technologies Inc* | | | 8,230 | | | $ | 163,119 | |
Ashland Global Holdings Inc | | | 4,179 | | | | 306,070 | |
Cabot Corp | | | 3,895 | | | | 155,800 | |
Carpenter Technology Corp | | | 3,157 | | | | 153,556 | |
Commercial Metals Co | | | 7,857 | | | | 123,119 | |
Compass Minerals International Inc | | | 2,257 | | | | 112,241 | |
Domtar Corp | | | 4,269 | | | | 140,664 | |
Ingevity Corp* | | | 2,823 | | | | 215,028 | |
Minerals Technologies Inc | | | 2,347 | | | | 113,125 | |
NewMarket Corp | | | 581 | | | | 275,830 | |
Olin Corp | | | 10,985 | | | | 186,525 | |
PolyOne Corp | | | 5,185 | | | | 165,972 | |
Reliance Steel & Aluminum Co | | | 4,551 | | | | 442,494 | |
Royal Gold Inc | | | 4,445 | | | | 592,874 | |
RPM International Inc | | | 8,734 | | | | 591,030 | |
Sensient Technologies Corp | | | 2,819 | | | | 184,137 | |
Steel Dynamics Inc | | | 14,809 | | | | 399,843 | |
The Chemours Co | | | 10,925 | | | | 154,807 | |
United States Steel Corp(a) | | | 11,778 | | | | 130,382 | |
Valvoline Inc | | | 12,831 | | | | 289,981 | |
Versum Materials Inc | | | 7,402 | | | | 384,904 | |
Total Basic Materials | | | | | | | 5,281,501 | |
| | | | | | | | | |
Communications (3.62%) | | | | | | | | |
AMC Networks Inc* | | | 3,034 | | | | 147,149 | |
Cable One Inc | | | 330 | | | | 428,215 | |
Cars.com Inc* | | | 4,206 | | | | 37,475 | |
Ciena Corp* | | | 9,536 | | | | 390,308 | |
FactSet Research Systems Inc | | | 2,580 | | | | 701,984 | |
GrubHub Inc* | | | 6,109 | | | | 362,508 | |
InterDigital Inc | | | 2,212 | | | | 108,764 | |
John Wiley & Sons Inc | | | 3,002 | | | | 133,589 | |
LogMeIn Inc | | | 3,449 | | | | 230,531 | |
Meredith Corp | | | 2,763 | | | | 120,964 | |
Plantronics Inc | | | 2,393 | | | | 74,351 | |
TEGNA Inc | | | 14,641 | | | | 209,513 | |
Telephone & Data Systems Inc | | | 6,361 | | | | 160,297 | |
The New York Times Co | | | 9,283 | | | | 271,064 | |
ViaSat Inc* | | | 3,110 | | | | 246,716 | |
World Wrestling Entertainment Inc | | | 2,835 | | | | 202,504 | |
Yelp Inc* | | | 4,736 | | | | 158,703 | |
Total Communications | | | | | | | 3,984,635 | |
| | | | | | | | | |
Consumer, Cyclical (14.72%) |
Adient PLC | | | 5,796 | | | | 116,905 | |
American Eagle Outfitters Inc | | | 11,372 | | | | 191,277 | |
AutoNation Inc* | | | 3,804 | | | | 180,538 | |
Bed Bath & Beyond Inc | | | 8,029 | | | | 77,640 | |
Boyd Gaming Corp | | | 5,823 | | | | 139,985 | |
Brinker International Inc | | | 2,681 | | | | 101,878 | |
Brunswick Corp | | | 5,802 | | | | 270,373 | |
Caesars Entertainment Corp* | | | 39,556 | | | | 455,290 | |
Carter’s Inc | | | 3,088 | | | | 282,490 | |
Casey’s General Stores Inc | | | 2,483 | | | | 416,772 | |
Churchill Downs Inc | | | 2,357 | | | | 290,524 | |
Cinemark Holdings Inc | | | 7,226 | | | | 275,744 | |
Cracker Barrel Old Country Store Inc | | | 1,631 | | | | 269,767 | |
Dana Inc | | | 9,921 | | | | 126,294 | |
Deckers Outdoor Corp* | | | 1,941 | | | | 286,200 | |
Delphi Technologies PLC | | | 6,288 | | | | 83,190 | |
Dick’s Sporting Goods Inc | | | 4,500 | | | $ | 153,180 | |
Dillard’s Inc | | | 1,253 | | | | 73,326 | |
Domino’s Pizza Inc | | | 2,784 | | | | 631,523 | |
Dunkin’ Brands Group Inc | | | 5,506 | | | | 453,915 | |
Eldorado Resorts Inc* | | | 4,262 | | | | 164,130 | |
Five Below Inc* | | | 3,783 | | | | 464,817 | |
Foot Locker Inc | | | 7,525 | | | | 272,330 | |
Herman Miller Inc | | | 3,918 | | | | 165,653 | |
HNI Corp | | | 2,950 | | | | 92,011 | |
International Speedway Corp | | | 1,729 | | | | 77,840 | |
Jack in the Box Inc | | | 1,750 | | | | 149,310 | |
JetBlue Airways Corp* | | | 20,053 | | | | 347,318 | |
KB Home | | | 5,633 | | | | 158,231 | |
Landstar Systems Inc | | | 2,721 | | | | 303,446 | |
Live Nation Entertainment Inc* | | | 9,472 | | | | 658,399 | |
Marriott Vacations Worldwide Corp | | | 2,668 | | | | 263,038 | |
Mattel Inc* | | | 23,017 | | | | 225,567 | |
Medical Properties Trust Inc | | | 25,745 | | | | 478,600 | |
MSC Industrial Direct Co Inc | | | 3,063 | | | | 207,120 | |
Nu Skin Enterprises Inc | | | 3,686 | | | | 149,725 | |
NVR Inc* | | | 224 | | | | 806,176 | |
Ollie’s Bargain Outlet Holdings Inc* | | | 3,572 | | | | 198,067 | |
Papa John’s International Inc | | | 1,527 | | | | 75,984 | |
Penn National Gaming Inc* | | | 6,066 | | | | 116,285 | |
Polaris Inc | | | 3,887 | | | | 318,812 | |
Pool Corp | | | 2,672 | | | | 524,727 | |
Resideo Technologies Inc* | | | 8,815 | | | | 121,471 | |
Sally Beauty Holdings Inc* | | | 8,063 | | | | 98,610 | |
Scientific Games Corp* | | | 3,739 | | | | 69,097 | |
Signet Jewelers Ltd | | | 3,605 | | | | 44,125 | |
Six Flags Entertainment Corp | | | 4,962 | | | | 293,602 | |
Skechers U.S.A. Inc* | | | 9,054 | | | | 286,650 | |
Tempur Sealy International Inc* | | | 3,063 | | | | 236,219 | |
Texas Roadhouse Inc | | | 4,276 | | | | 220,043 | |
The Cheesecake Factory Inc | | | 2,829 | | | | 107,474 | |
The Goodyear Tire & Rubber Co | | | 15,754 | | | | 180,698 | |
The Michaels Cos Inc* | | | 6,098 | | | | 34,576 | |
The Scotts Miracle-Gro Co | | | 2,666 | | | | 283,449 | |
The Toro Co(a) | | | 7,200 | | | | 518,472 | |
The Wendy’s Co | | | 12,144 | | | | 267,168 | |
Thor Industries Inc | | | 3,464 | | | | 159,032 | |
Toll Brothers Inc | | | 8,819 | | | | 319,160 | |
TRI Pointe Group Inc* | | | 9,612 | | | | 134,568 | |
Tupperware Brands Corp | | | 3,537 | | | | 46,016 | |
Urban Outfitters Inc* | | | 4,569 | | | | 106,960 | |
Visteon Corp* | | | 1,883 | | | | 129,871 | |
Watsco Inc | | | 1,930 | | | | 315,652 | |
Williams-Sonoma Inc | | | 5,251 | | | | 345,516 | |
World Fuel Services Corp | | | 4,557 | | | | 174,989 | |
Wyndham Destinations Inc | | | 6,409 | | | | 284,175 | |
Wyndham Hotels & Resorts Inc | | | 6,641 | | | | 341,215 | |
Total Consumer, Cyclical | | | | | | | 16,213,205 | |
| | | | | | | | | |
Consumer, Non-Cyclical (15.51%) |
Aaron’s Inc | | | 4,509 | | | | 289,072 | |
Acadia Healthcare Co Inc* | | | 5,855 | | | | 154,923 | |
Adtalem Global Education Inc* | | | 3,770 | | | | 161,054 | |
Amedisys Inc* | | | 1,976 | | | | 254,331 | |
ASGN Inc* | | | 3,518 | | | | 219,769 | |
Avanos Medical Inc* | | | 3,165 | | | | 105,015 | |
Avis Budget Group Inc* | | | 4,318 | | | | 106,957 | |
Bio-Rad Laboratories Inc* | | | 1,366 | | | | 461,312 | |
Bio-Techne Corp | | | 2,562 | | | | 490,802 | |
Cantel Medical Corp | | | 2,540 | | | | 233,502 | |
Catalent Inc* | | | 9,318 | | | $ | 491,431 | |
Charles River Laboratories International Inc* | | | 3,272 | | | | 429,286 | |
Chemed Corp | | | 1,083 | | | | 465,073 | |
CoreLogic Inc* | | | 5,376 | | | | 260,198 | |
Edgewell Personal Care Co* | | | 3,960 | | | | 110,246 | |
Encompass Health Corp | | | 6,586 | | | | 400,363 | |
Exelixis Inc* | | | 20,107 | | | | 399,124 | |
Flowers Foods Inc | | | 12,448 | | | | 283,814 | |
Globus Medical Inc* | | | 5,100 | | | | 260,457 | |
Graham Holdings Co | | | 295 | | | | 207,698 | |
Green Dot Corp* | | | 3,207 | | | | 98,070 | |
Haemonetics Corp* | | | 3,460 | | | | 462,014 | |
Healthcare Services Group Inc | | | 5,305 | | | | 119,628 | |
HealthEquity Inc* | | | 3,845 | | | | 228,239 | |
Helen of Troy Ltd* | | | 1,736 | | | | 266,493 | |
Hill-Rom Holdings Inc | | | 4,543 | | | | 489,190 | |
ICU Medical Inc* | | | 1,078 | | | | 174,367 | |
Ingredion Inc | | | 4,523 | | | | 349,492 | |
Inogen Inc* | | | 1,242 | | | | 57,592 | |
Insperity Inc | | | 2,527 | | | | 250,325 | |
Integra LifeSciences Holdings Corp* | | | 4,727 | | | | 283,715 | |
Lancaster Colony Corp | | | 1,325 | | | | 193,318 | |
Ligand Pharmaceuticals Inc* | | | 1,305 | | | | 118,638 | |
LivaNova PLC* | | | 2,983 | | | | 231,570 | |
LiveRamp Holdings Inc* | | | 4,622 | | | | 195,788 | |
Mallinckrodt PLC* | | | 5,485 | | | | 14,206 | |
ManpowerGroup Inc | | | 4,096 | | | | 334,807 | |
Masimo Corp* | | | 2,951 | | | | 452,241 | |
MEDNAX Inc* | | | 5,965 | | | | 125,742 | |
Molina Healthcare Inc* | | | 4,237 | | | | 551,996 | |
NuVasive Inc* | | | 2,872 | | | | 182,429 | |
Patterson Cos Inc | | | 5,856 | | | | 97,912 | |
Post Holdings Inc*,(a) | | | 4,511 | | | | 449,702 | |
PRA Health Sciences Inc* | | | 3,625 | | | | 358,295 | |
Prestige Consumer Healthcare Inc* | | | 3,633 | | | | 115,820 | |
Sabre Corp | | | 14,745 | | | | 348,572 | |
Sanderson Farms Inc | | | 1,299 | | | | 194,356 | |
Service Corp International | | | 12,143 | | | | 562,221 | |
Sotheby’s* | | | 2,205 | | | | 127,339 | |
Sprouts Farmers Market Inc* | | | 7,859 | | | | 141,069 | |
STERIS PLC | | | 5,692 | | | | 878,845 | |
Syneos Health Inc* | | | 4,220 | | | | 221,677 | |
Tenet Healthcare Corp* | | | 5,708 | | | | 123,578 | |
The Boston Beer Co Inc* | | | 612 | | | | 268,313 | |
The Brink’s Co | | | 3,322 | | | | 249,981 | |
The Hain Celestial Group Inc* | | | 6,209 | | | | 118,281 | |
Tootsie Roll Industries Inc | | | 1,425 | | | | 52,269 | |
TreeHouse Foods Inc* | | | 3,798 | | | | 192,369 | |
United Therapeutics Corp*,(a) | | | 2,770 | | | | 228,691 | |
Weight Watchers International Inc* | | | 2,743 | | | | 82,263 | |
West Pharmaceutical Services Inc | | | 4,896 | | | | 712,172 | |
WEX Inc*,(a) | | | 2,900 | | | | 593,195 | |
Total Consumer, Non-Cyclical | | | 17,081,207 | |
| | | | | | | | | |
Energy (2.63%) | | | | | | | | |
Apergy Corp* | | | 5,543 | | | | 144,007 | |
Callon Petroleum Co* | | | 14,269 | | | | 58,646 | |
Chesapeake Energy Corp* | | | 66,369 | | | | 95,571 | |
CNX Resources Corp* | | | 13,127 | | | | 104,622 | |
Core Laboratories NV | | | 2,429 | | | | 96,164 | |
EQT Corp | | | 17,285 | | | | 175,788 | |
Equitrans Midstream Corp | | | 13,801 | | | | 186,175 | |
First Solar Inc*,(a) | | | 5,241 | | | | 325,309 | |
See accompanying notes to financial statements.
20
S&P MidCap Index Fund | Portfolio of Investments (Continued) | 8/31/19 |
Security Description | | Shares | | | Value
(Note 1) | |
Matador Resources Co* | | | 7,147 | | | $ | 111,851 | |
McDermott International Inc* | | | 12,878 | | | | 60,784 | |
Murphy Oil Corp | | | 8,937 | | | | 162,922 | |
Murphy USA Inc* | | | 2,035 | | | | 181,929 | |
NOW Inc* | | | 7,894 | | | | 93,860 | |
Oasis Petroleum Inc* | | | 19,091 | | | | 59,564 | |
Oceaneering International Inc* | | | 6,591 | | | | 85,419 | |
Patterson-UTI Energy Inc | | | 12,375 | | | | 107,044 | |
PBF Energy Inc | | | 7,881 | | | | 186,780 | |
QEP Resources Inc | | | 17,033 | | | | 60,637 | |
Range Resources Corp | | | 14,087 | | | | 50,150 | |
Southwestern Energy Co* | | | 35,965 | | | | 56,825 | |
Transocean Ltd* | | | 31,902 | | | | 145,154 | |
Valaris plc | | | 13,228 | | | | 61,642 | |
WPX Energy Inc* | | | 26,816 | | | | 288,540 | |
Total Energy | | | | | | | 2,899,383 | |
| | | | | | | | | |
Financial (26.05%) | | | | | | | | |
Banks (6.66%) | | | | | | | | |
Associated Banc-Corp | | | 11,169 | | | | 214,892 | |
BancorpSouth Bank | | | 5,929 | | | | 163,581 | |
Bank of Hawaii Corp | | | 2,731 | | | | 225,799 | |
Bank OZK | | | 8,055 | | | | 207,819 | |
Cathay General Bancorp | | | 5,088 | | | | 168,871 | |
Commerce Bancshares Inc(a) | | | 6,696 | | | | 382,141 | |
Cullen/Frost Bankers Inc | | | 4,063 | | | | 337,270 | |
East West Bancorp Inc | | | 9,835 | | | | 404,514 | |
First Financial Bankshares Inc | | | 9,202 | | | | 281,765 | |
First Horizon National Corp | | | 21,591 | | | | 341,786 | |
FNB Corp | | | 21,639 | | | | 232,619 | |
Fulton Financial Corp | | | 11,526 | | | | 183,840 | |
Hancock Whitney Corp | | | 5,983 | | | | 210,063 | |
Home BancShares Inc | | | 9,497 | | | | 168,287 | |
International Bancshares Corp | | | 3,830 | | | | 136,310 | |
PacWest Bancorp(a) | | | 8,196 | | | | 279,320 | |
Pinnacle Financial Partners Inc | | | 4,820 | | | | 253,869 | |
Prosperity Bancshares Inc | | | 4,502 | | | | 292,270 | |
Signature Bank | | | 3,671 | | | | 428,222 | |
Synovus Financial Corp | | | 8,453 | | | | 300,420 | |
TCF Financial Corp | | | 10,501 | | | | 404,919 | |
Texas Capital Bancshares Inc* | | | 3,508 | | | | 189,011 | |
Trustmark Corp | | | 4,422 | | | | 144,511 | |
UMB Financial Corp | | | 2,995 | | | | 186,648 | |
Umpqua Holdings Corp | | | 14,691 | | | | 230,796 | |
United Bankshares Inc | | | 6,927 | | | | 255,468 | |
Valley National Bancorp | | | 18,619 | | | | 195,686 | |
Webster Financial Corp | | | 6,139 | | | | 274,782 | |
Wintrust Financial Corp | | | 3,775 | | | | 237,183 | |
| | | | | | | | 7,332,662 | |
Diversified Financial Service (2.65%) |
Deluxe Corp | | | 2,963 | | | | 136,535 | |
Eaton Vance Corp(a) | | | 7,813 | | | | 336,897 | |
Evercore Inc | | | 2,736 | | | | 218,223 | |
Federated Investors Inc | | | 6,496 | | | | 208,132 | |
Interactive Brokers Group Inc | | | 5,053 | | | | 238,502 | |
Janus Henderson Group PLC | | | 11,194 | | | | 213,917 | |
Legg Mason Inc | | | 6,044 | | | | 222,359 | |
LendingTree Inc* | | | 497 | | | | 154,115 | |
Navient Corp | | | 14,764 | | | | 188,093 | |
SEI Investments Co | | | 8,536 | | | | 490,905 | |
SLM Corp | | | 30,078 | | | | 253,858 | |
Stifel Financial Corp | | | 4,809 | | | | 256,897 | |
| | | | | | | | 2,918,433 | |
Insurance (5.56%) | | | | | | | | |
Alleghany Corp* | | | 962 | | | | 720,836 | |
American Financial Group Inc | | | 4,721 | | | | 476,679 | |
Brighthouse Financial Inc* | | | 7,852 | | | $ | 276,862 | |
Brown & Brown Inc | | | 15,751 | | | | 581,054 | |
CNO Financial Group Inc | | | 10,661 | | | | 154,371 | |
First American Financial Corp | | | 7,469 | | | | 436,563 | |
Genworth Financial Inc* | | | 33,537 | | | | 148,569 | |
Kemper Corp | | | 3,706 | | | | 259,346 | |
Mercury General Corp | | | 1,883 | | | | 100,741 | |
Old Republic International Corp | | | 17,345 | | | | 405,179 | |
Primerica Inc | | | 2,889 | | | | 344,282 | |
Reinsurance Group of America Inc | | | 4,238 | | | | 652,525 | |
RenaissanceRe Holdings Ltd | | | 2,830 | | | | 510,957 | |
The Hanover Insurance Group Inc | | | 2,752 | | | | 366,429 | |
WR Berkley Corp | | | 9,639 | | | | 686,779 | |
| | | | | | | | 6,121,172 | |
Real Estate (10.42%) | | | | | | | | |
Alexander & Baldwin Inc | | | 4,965 | | | | 113,649 | |
American Campus Communities Inc | | | 9,297 | | | | 432,125 | |
Brixmor Property Group Inc | | | 20,261 | | | | 373,410 | |
Camden Property Trust(a) | | | 6,442 | | | | 697,347 | |
CoreCivic Inc | | | 8,052 | | | | 136,481 | |
CoreSite Realty Corp | | | 2,417 | | | | 280,807 | |
Corporate Office Properties Trust | | | 7,042 | | | | 203,443 | |
Cousins Properties Inc | | | 9,682 | | | | 335,965 | |
CyrusOne Inc | | | 6,021 | | | | 442,303 | |
Douglas Emmett Inc | | | 10,862 | | | | 458,376 | |
EastGroup Properties Inc | | | 2,449 | | | | 304,949 | |
EPR Properties | | | 4,422 | | | | 346,022 | |
First Industrial Realty Trust Inc | | | 8,145 | | | | 317,248 | |
Healthcare Realty Trust Inc | | | 7,860 | | | | 261,188 | |
Highwoods Properties Inc | | | 7,026 | | | | 303,593 | |
Hospitality Properties Trust | | | 10,957 | | | | 264,502 | |
JBG SMITH Properties | | | 8,041 | | | | 307,649 | |
Jones Lang LaSalle Inc | | | 3,095 | | | | 414,885 | |
Kilroy Realty Corp | | | 6,874 | | | | 535,210 | |
Lamar Advertising Co(a) | | | 5,778 | | | | 442,884 | |
Liberty Property Trust | | | 10,038 | | | | 523,181 | |
Life Storage Inc | | | 3,107 | | | | 329,218 | |
Mack-Cali Realty Corp | | | 6,019 | | | | 122,607 | |
National Retail Properties Inc(a) | | | 10,988 | | | | 616,976 | |
Omega Healthcare Investors Inc | | | 14,003 | | | | 569,642 | |
Pebblebrook Hotel Trust | | | 8,704 | | | | 234,747 | |
PotlatchDeltic Corp | | | 3,261 | | | | 125,483 | |
PS Business Parks Inc | | | 1,333 | | | | 239,420 | |
Rayonier Inc | | | 8,785 | | | | 235,438 | |
Sabra Health Care REIT Inc | | | 11,960 | | | | 258,575 | |
Senior Housing Properties Trust | | | 16,800 | | | | 142,632 | |
Spirit Realty Capital Inc | | | 5,819 | | | | 278,963 | |
Tanger Factory Outlet Centers Inc | | | 6,683 | | | | 94,498 | |
Taubman Centers Inc | | | 4,147 | | | | 161,940 | |
The GEO Group Inc | | | 8,190 | | | | 140,540 | |
Uniti Group Inc | | | 9,408 | | | | 69,525 | |
Urban Edge Properties | | | 7,463 | | | | 130,677 | |
Weingarten Realty Investors | | | 8,116 | | | | 214,993 | |
| | | | | | | | 11,461,091 | |
Savings&Loans (0.76%) | | | | | | | | |
New York Community Bancorp Inc | | | 31,707 | | | | 365,899 | |
Sterling Bancorp | | | 14,431 | | | | 275,199 | |
Washington Federal Inc | | | 5,503 | | | | 195,907 | |
| | | | | | | | 837,005 | |
| | | | | | | | | |
Total Financial | | | | | | | 28,670,363 | |
| | | | | | | | | |
Industrial (18.86%) | | | | | | | | |
Acuity Brands Inc | | | 2,706 | | | $ | 339,359 | |
AECOM* | | | 10,590 | | | | 375,733 | |
AGCO Corp | | | 4,360 | | | | 301,363 | |
AptarGroup Inc | | | 4,210 | | | | 514,546 | |
Arrow Electronics Inc* | | | 5,761 | | | | 398,661 | |
Avnet Inc | | | 7,356 | | | | 308,143 | |
Axon Enterprise Inc* | | | 3,939 | | | | 236,222 | |
Belden Inc | | | 2,673 | | | | 121,916 | |
Carlisle Cos Inc | | | 3,886 | | | | 563,315 | |
Clean Harbors Inc* | | | 3,448 | | | | 253,600 | |
Cognex Corp | | | 11,590 | | | | 522,477 | |
Coherent Inc* | | | 1,611 | | | | 233,531 | |
Colfax Corp* | | | 6,448 | | | | 175,386 | |
Crane Co | | | 3,447 | | | | 262,799 | |
Curtiss-Wright Corp(a) | | | 2,903 | | | | 356,024 | |
Donaldson Co Inc | | | 8,677 | | | | 419,620 | |
Dycom Industries Inc* | | | 2,187 | | | | 97,322 | |
Eagle Materials Inc | | | 2,939 | | | | 247,434 | |
EMCOR Group Inc | | | 3,799 | | | | 332,185 | |
Energizer Holdings Inc | | | 4,237 | | | | 163,125 | |
EnerSys | | | 2,978 | | | | 166,768 | |
Fluor Corp | | | 9,323 | | | | 164,737 | |
GATX Corp | | | 2,483 | | | | 184,288 | |
Genesee & Wyoming Inc* | | | 3,819 | | | | 423,451 | |
Gentex Corp | | | 17,030 | | | | 452,998 | |
Graco Inc | | | 11,215 | | | | 511,068 | |
Granite Construction Inc | | | 2,975 | | | | 84,609 | |
Greif Inc | | | 1,958 | | | | 68,902 | |
Hubbell Inc | | | 3,704 | | | | 485,743 | |
ITT Inc | | | 5,929 | | | | 337,479 | |
Jabil Inc | | | 9,552 | | | | 275,193 | |
KBR Inc | | | 9,567 | | | | 244,150 | |
Kennametal Inc | | | 5,634 | | | | 168,400 | |
Kirby Corp* | | | 3,748 | | | | 275,815 | |
Knight-Swift Transportation Holdings Inc | | | 8,451 | | | | 288,517 | |
Lennox International Inc | | | 2,351 | | | | 596,637 | |
Lincoln Electric Holdings Inc | | | 4,184 | | | | 345,431 | |
Littelfuse Inc | | | 1,717 | | | | 267,972 | |
Louisiana-Pacific Corp | | | 8,225 | | | | 197,729 | |
MasTec Inc* | | | 4,309 | | | | 270,907 | |
MDU Resources Group Inc | | | 13,199 | | | | 354,921 | |
MSA Safety Inc | | | 2,387 | | | | 252,139 | |
National Instruments Corp | | | 7,468 | | | | 313,656 | |
Nordson Corp | | | 3,445 | | | | 468,382 | |
nVent Electric PLC | | | 10,942 | | | | 221,685 | |
Old Dominion Freight Line Inc | | | 4,315 | | | | 706,624 | |
Oshkosh Corp | | | 4,752 | | | | 333,923 | |
Owens-Illinois Inc | | | 10,422 | | | | 105,992 | |
Regal Beloit Corp | | | 2,853 | | | | 202,278 | |
Ryder System Inc | | | 3,743 | | | | 180,300 | |
Silgan Holdings Inc | | | 5,244 | | | | 156,061 | |
Sonoco Products Co | | | 6,666 | | | | 381,295 | |
Stericycle Inc* | | | 5,784 | | | | 259,644 | |
SYNNEX Corp | | | 2,764 | | | | 231,651 | |
Tech Data Corp* | | | 2,431 | | | | 225,427 | |
Teledyne Technologies Inc* | | | 2,414 | | | | 744,936 | |
Terex Corp | | | 4,504 | | | | 111,834 | |
Tetra Tech Inc | | | 2,575 | | | | 208,884 | |
The Timken Co | | | 4,564 | | | | 183,382 | |
Trex Co Inc* | | | 3,993 | | | | 341,521 | |
Trimble Inc* | | | 16,766 | | | | 629,060 | |
Trinity Industries Inc | | | 9,047 | | | | 158,051 | |
Universal Display Corp | | | 2,876 | | | | 590,932 | |
Valmont Industries Inc | | | 1,488 | | | | 201,624 | |
See accompanying notes to financial statements.
21
S&P MidCap Index Fund | Portfolio of Investments (Continued) | 8/31/19 |
Security Description | | Shares | | | Value
(Note 1) | |
Vishay Intertechnology Inc | | | 8,970 | | | $ | 141,995 | |
Werner Enterprises Inc | | | 3,170 | | | | 103,596 | |
Woodward Inc | | | 3,725 | | | | 401,741 | |
Worthington Industries Inc | | | 2,663 | | | | 92,406 | |
XPO Logistics Inc* | | | 6,127 | | | | 434,159 | |
Total Industrial | | | | | | | 20,771,654 | |
| | | | | | | | | |
Technology (8.72%) | | | | | | | | |
ACI Worldwide Inc* | | | 7,367 | | | | 219,389 | |
Allscripts Healthcare Solutions Inc* | | | 11,090 | | | | 100,697 | |
Blackbaud Inc | | | 2,675 | | | | 243,345 | |
CACI International Inc* | | | 1,686 | | | | 374,781 | |
CDK Global Inc | | | 8,104 | | | | 349,769 | |
Cirrus Logic Inc* | | | 4,012 | | | | 215,204 | |
CommVault Systems Inc* | | | 2,668 | | | | 115,711 | |
Covetrus Inc* | | | 6,488 | | | | 86,226 | |
Cree Inc* | | | 6,918 | | | | 296,990 | |
Cypress Semiconductor Corp(a) | | | 24,346 | | | | 560,201 | |
Fair Isaac Corp* | | | 1,774 | | | | 625,725 | |
j2 Global Inc | | | 3,097 | | | | 262,006 | |
Lumentum Holdings Inc* | | | 4,462 | | | | 248,801 | |
Manhattan Associates Inc* | | | 4,411 | | | | 364,481 | |
MAXIMUS Inc | | | 4,328 | | | | 332,996 | |
Medidata Solutions Inc* | | | 4,277 | | | | 391,688 | |
MKS Instruments Inc | | | 3,622 | | | | 283,566 | |
Monolithic Power Systems Inc | | | 2,639 | | | | 397,328 | |
NCR Corp* | | | 8,002 | | | | 252,143 | |
NetScout Systems Inc* | | | 5,034 | | | | 111,503 | |
Perspecta Inc | | | 9,325 | | | | 241,984 | |
PTC Inc* | | | 6,899 | | | | 451,678 | |
Science Applications International Corp | | | 3,057 | | | $ | 269,047 | |
Semtech Corp* | | | 4,442 | | | | 186,431 | |
Silicon Laboratories Inc* | | | 2,887 | | | | 314,683 | |
Synaptics Inc* | | | 2,575 | | | | 82,452 | |
Teradata Corp* | | | 7,958 | | | | 245,663 | |
Teradyne Inc | | | 11,420 | | | | 604,917 | |
Tyler Technologies Inc* | | | 2,470 | | | | 633,654 | |
Zebra Technologies Corp* | | | 3,596 | | | | 737,288 | |
Total Technology | | | | | | | 9,600,347 | |
| | | | | | | | | |
Utilities (4.48%) | | | | | | | | |
ALLETE Inc | | | 3,439 | | | | 294,825 | |
Aqua America Inc | | | 12,086 | | | | 535,289 | |
Black Hills Corp | | | 3,620 | | | | 277,690 | |
Hawaiian Electric Industries Inc | | | 7,391 | | | | 328,160 | |
IDACORP Inc | | | 3,357 | | | | 368,632 | |
National Fuel Gas Co | | | 6,006 | | | | 280,720 | |
New Jersey Resources Corp | | | 5,790 | | | | 264,835 | |
NorthWestern Corp | | | 3,361 | | | | 243,471 | |
OGE Energy Corp | | | 13,551 | | | | 580,931 | |
ONE Gas Inc | | | 3,566 | | | | 326,681 | |
PNM Resources Inc | | | 5,404 | | | | 275,658 | |
Southwest Gas Holdings Inc | | | 3,218 | | | | 293,578 | |
Spire Inc | | | 3,442 | | | | 292,226 | |
UGI Corp | | | 11,795 | | | | 574,063 | |
Total Utilities | | | | | | | 4,936,759 | |
| | | | | | | | | |
Total Common Stock (Cost $80,915,727) | | | | | | | 109,439,054 | |
| | | | | | | | | |
United States Treasury Bills (0.54%) |
1.966%, 10/31/2019 (Cost $598,124) | | | $600,000 | | | $ | 598,124 | |
| | | | | | | | | |
Total Investments (Cost $81,513,851)(b) (99.93%) | | $ | 110,037,178 | |
Other Net Assets (0.07%) | | | | | | | 93,596 | |
Net Assets (100.00%) | | | | | | $ | 110,130,774 | |
| * | Non-income producing security. |
(a) A portion of these shares have been pledged in connection with obligations for futures contracts. |
| | |
(b) Aggregate cost for federal income tax purpose is $81,795,447. |
At August 31, 2019, unrealized appreciation/(depreciation) of securities for federal income tax purposes is as follows: |
Unrealized appreciation | | $ | 39,025,245 | |
Unrealized depreciation | | | (10,783,521 | ) |
Net unrealized appreciation | | $ | 28,241,724 | |
(c) Futures contracts at August 31, 2019: |
Contracts - $100 times premium / delivery month / commitment / exchange |
S&P MidCap E-MINI | | Notional Amount | | | Value | | | Unrealized Depreciation | |
3 / Sep 2019 / Long / CME | | $ | 565,559 | | | $ | 564,420 | | | $ | (1,139 | ) |
S&P SmallCap Index Fund | Portfolio of Investments | 8/31/19 |
Security Description | | Shares | | | Value
(Note 1) | |
Common Stock (99.54%) | | | | | | | | |
| | | | | | | | | |
Basic Materials (3.80%) | | | | | | | | |
A Schulman Inc - CVR(a) | | | 2,942 | | | $ | 2,518 | |
AdvanSix Inc* | | | 2,892 | | | | 64,607 | |
AK Steel Holding Corp* | | | 31,639 | | | | 68,340 | |
American Vanguard Corp | | | 2,434 | | | | 34,490 | |
Balchem Corp | | | 3,029 | | | | 268,945 | |
Century Aluminum Co* | | | 4,940 | | | | 27,219 | |
Clearwater Paper Corp* | | | 1,635 | | | | 26,193 | |
Ferro Corp* | | | 8,296 | | | | 84,536 | |
Hawkins Inc | | | 889 | | | | 39,427 | |
HB Fuller Co | | | 4,768 | | | | 203,164 | |
Innophos Holdings Inc | | | 1,960 | | | | 55,056 | |
Innospec Inc | | | 2,391 | | | | 198,883 | |
Kaiser Aluminum Corp | | | 1,511 | | | | 133,618 | |
Koppers Holdings Inc* | | | 2,119 | | | | 56,175 | |
Kraton Corp* | | | 3,201 | | | | 87,835 | |
Livent Corp* | | | 14,547 | | | | 89,464 | |
Materion Corp | | | 2,026 | | | | 119,210 | |
Mercer International Inc | | | 4,141 | | | | 49,858 | |
Neenah Inc | | | 1,669 | | | | 106,449 | |
PH Glatfelter Co | | | 4,384 | | | | 63,042 | |
Quaker Chemical Corp | | | 1,249 | | | | 198,416 | |
Rayonier Advanced Materials Inc | | | 4,999 | | | | 17,546 | |
Rogers Corp* | | | 1,737 | | | | 230,014 | |
Schweitzer-Mauduit International Inc | | | 3,051 | | | $ | 102,331 | |
Stepan Co | | | 1,999 | | | | 190,685 | |
Total Basic Materials | | | | | | | 2,518,021 | |
| | | | | | | | | |
Communications (4.55%) | | | | | | | | |
8x8 Inc* | | | 9,332 | | | | 226,861 | |
ADTRAN Inc | | | 4,820 | | | | 49,501 | |
ATN International Inc | | | 1,090 | | | | 61,934 | |
CalAmp Corp* | | | 3,588 | | | | 34,445 | |
Cincinnati Bell Inc* | | | 4,841 | | | | 26,287 | |
Cogent Communications Holdings Inc | | | 3,909 | | | | 238,019 | |
Consolidated Communications Holdings Inc | | | 7,218 | | | | 29,089 | |
Digi International Inc* | | | 2,432 | | | | 31,081 | |
ePlus Inc* | | | 1,374 | | | | 112,283 | |
Extreme Networks Inc* | | | 11,197 | | | | 74,796 | |
Finisar Corp* | | | 6,518 | | | | 147,372 | |
Frontier Communications Corp* | | | 10,665 | | | | 8,537 | |
Gannett Co Inc | | | 11,003 | | | | 115,752 | |
Harmonic Inc* | | | 8,550 | | | | 56,345 | |
HealthStream Inc* | | | 2,593 | | | | 65,525 | |
Iridium Communications Inc* | | | 9,005 | | | | 217,741 | |
Liquidity Services Inc* | | | 2,609 | | | | 19,750 | |
NETGEAR Inc* | | | 3,121 | | | | 108,361 | |
New Media Investment Group Inc | | | 5,426 | | | $ | 47,640 | |
NIC Inc | | | 6,674 | | | | 138,953 | |
Perficient Inc* | | | 3,355 | | | | 123,598 | |
QuinStreet Inc* | | | 3,564 | | | | 40,808 | |
Scholastic Corp | | | 2,754 | | | | 96,583 | |
Shutterfly Inc* | | | 3,327 | | | | 169,278 | |
Shutterstock Inc* | | | 1,885 | | | | 66,182 | |
Spok Holdings Inc | | | 1,924 | | | | 22,607 | |
Stamps.com Inc* | | | 1,672 | | | | 107,610 | |
TechTarget Inc* | | | 2,200 | | | | 52,228 | |
The EW Scripps Co | | | 5,565 | | | | 68,783 | |
Viavi Solutions Inc* | | | 12,643 | | | | 175,611 | |
Vonage Holdings Corp* | | | 21,469 | | | | 283,820 | |
Total Communications | | | | | | | 3,017,380 | |
| | | | | | | | | |
Consumer, Cyclical (13.69%) | | | | |
Abercrombie & Fitch Co | | | 6,560 | | | | 95,907 | |
Allegiant Travel Co | | | 1,263 | | | | 179,333 | |
American Axle & Manufacturing Holdings Inc* | | | 11,257 | | | | 71,369 | |
Anixter International Inc* | | | 2,713 | | | | 162,699 | |
Asbury Automotive Group Inc* | | | 1,942 | | | | 183,131 | |
Ascena Retail Group Inc* | | | 16,548 | | | | 4,119 | |
Barnes & Noble Education Inc* | | | 3,275 | | | | 12,773 | |
Big Lots Inc | | | 3,990 | | | | 90,773 | |
BJ’s Restaurants Inc | | | 2,118 | | | | 77,180 | |
See accompanying notes to financial statements.
22
S&P SmallCap Index Fund | Portfolio of Investments (Continued) | 8/31/19 |
Security Description | | Shares | | | Value
(Note 1) | |
Bloomin’ Brands Inc | | | 5,070 | | | $ | 91,463 | |
Boot Barn Holdings Inc* | | | 1,568 | | | | 53,704 | |
Caleres Inc | | | 4,288 | | | | 86,403 | |
Callaway Golf Co | | | 8,283 | | | | 147,106 | |
Cavco Industries Inc* | | | 839 | | | | 153,931 | |
Century Communities Inc* | | | 1,525 | | | | 42,975 | |
Chico’s FAS Inc | | | 11,607 | | | | 36,214 | |
Chuy’s Holdings Inc* | | | 1,589 | | | | 40,313 | |
Conn’s Inc* | | | 2,348 | | | | 47,336 | |
Cooper Tire & Rubber Co | | | 4,894 | | | | 114,960 | |
Cooper-Standard Holdings Inc* | | | 1,609 | | | | 60,241 | |
Core-Mark Holding Co Inc | | | 4,298 | | | | 139,212 | |
Daktronics Inc | | | 3,984 | | | | 28,804 | |
Dave & Buster’s Entertainment Inc | | | 3,410 | | | | 146,801 | |
Designer Brands Inc | | | 5,534 | | | | 91,256 | |
Dorman Products Inc* | | | 2,715 | | | | 192,982 | |
El Pollo Loco Holdings Inc* | | | 2,051 | | | | 20,941 | |
Ethan Allen Interiors Inc | | | 2,402 | | | | 41,314 | |
Express Inc* | | | 7,585 | | | | 16,080 | |
EZCORP Inc* | | | 4,843 | | | | 38,114 | |
Fiesta Restaurant Group Inc* | | | 2,324 | | | | 20,079 | |
FirstCash Inc(b) | | | 2,385 | | | | 235,471 | |
Fossil Group Inc* | | | 4,397 | | | | 56,282 | |
Fox Factory Holding Corp* | | | 3,576 | | | | 257,615 | |
GameStop Corp | | | 10,222 | | | | 40,581 | |
Garrett Motion Inc* | | | 7,461 | | | | 73,416 | |
Genesco Inc* | | | 1,625 | | | | 57,980 | |
Gentherm Inc* | | | 3,353 | | | | 123,055 | |
G-III Apparel Group Ltd* | | | 4,180 | | | | 85,732 | |
GMS Inc* | | | 1,785 | | | | 52,586 | |
Group 1 Automotive Inc | | | 1,736 | | | | 129,714 | |
Guess? Inc | | | 4,701 | | | | 84,947 | |
Haverty Furniture Cos Inc | | | 1,917 | | | | 36,711 | |
Hawaiian Holdings Inc | | | 4,824 | | | | 117,754 | |
Hibbett Sports Inc* | | | 1,822 | | | | 30,136 | |
Installed Building Products Inc* | | | 2,092 | | | | 119,056 | |
Interface Inc | | | 6,070 | | | | 67,074 | |
iRobot Corp* | | | 2,628 | | | | 162,437 | |
JC Penney Co Inc* | | | 31,537 | | | | 23,467 | |
Kirkland’s Inc* | | | 1,580 | | | | 2,323 | |
Kontoor Brands Inc | | | 2,567 | | | | 87,894 | |
La-Z-Boy Inc | | | 4,599 | | | | 146,570 | |
LCI Industries | | | 2,343 | | | | 198,569 | |
LGI Homes Inc* | | | 1,815 | | | | 147,941 | |
Lithia Motors Inc | | | 2,094 | | | | 274,461 | |
Lumber Liquidators Holdings Inc* | | | 2,806 | | | | 26,404 | |
M/I Home Inc* | | | 2,766 | | | | 99,963 | |
MarineMax Inc* | | | 2,374 | | | | 34,328 | |
MDC Holdings Inc | | | 4,784 | | | | 184,997 | |
Meritage Homes Corp* | | | 3,370 | | | | 220,196 | |
Methode Electronics Inc | | | 3,654 | | | | 115,978 | |
Mobile Mini Inc | | | 4,477 | | | | 139,951 | |
Monarch Casino & Resort Inc* | | | 1,142 | | | | 50,682 | |
Motorcar Parts of America Inc* | | | 1,857 | | | | 26,982 | |
Movado Group Inc | | | 1,570 | | | | 33,786 | |
Nautilus Inc* | | | 2,880 | | | | 4,003 | |
Office Depot Inc | | | 53,903 | | | | 70,074 | |
Oxford Industries Inc | | | 1,699 | | | | 118,556 | |
PetMed Express Inc | | | 1,968 | | | | 31,094 | |
Red Robin Gourmet Burgers Inc* | | | 1,277 | | | | 42,767 | |
Regis Corp* | | | 3,006 | | | | 48,607 | |
RH* | | | 1,513 | | | | 216,737 | |
Ruth’s Hospitality Group Inc | | | 2,946 | | | | 57,300 | |
ScanSource Inc* | | | 2,508 | | | $ | 70,876 | |
Shoe Carnival Inc | | | 999 | | | | 30,709 | |
SkyWest Inc | | | 4,800 | | | | 274,848 | |
Sleep Number Corp* | | | 3,041 | | | | 127,235 | |
Sonic Automotive Inc | | | 2,552 | | | | 68,674 | |
Standard Motor Products Inc | | | 2,030 | | | | 89,949 | |
Steven Madden Ltd | | | 7,317 | | | | 243,071 | |
Superior Industries International Inc | | | 2,154 | | | | 5,924 | |
Tailored Brands Inc | | | 4,990 | | | | 27,046 | |
The Buckle Inc | | | 2,729 | | | | 53,488 | |
The Cato Corp | | | 2,492 | | | | 42,688 | |
The Children’s Place Inc | | | 1,484 | | | | 129,479 | |
The Marcus Corp | | | 2,145 | | | | 71,986 | |
Tile Shop Holdings Inc | | | 3,476 | | | | 9,350 | |
Titan International Inc | | | 4,982 | | | | 12,953 | |
Unifi Inc* | | | 1,447 | | | | 27,840 | |
UniFirst Corp | | | 1,438 | | | | 281,719 | |
Universal Electronics Inc* | | | 1,358 | | | | 61,314 | |
Vera Bradley Inc* | | | 1,892 | | | | 20,036 | |
Veritiv Corp* | | | 1,144 | | | | 18,945 | |
Vista Outdoor Inc* | | | 5,502 | | | | 30,756 | |
Vitamin Shoppe Inc* | | | 1,557 | | | | 10,043 | |
Wabash National Corp | | | 5,495 | | | | 74,952 | |
William Lyon Homes* | | | 2,798 | | | | 49,441 | |
Wingstop Inc | | | 2,754 | | | | 275,868 | |
Winnebago Industries Inc | | | 2,789 | | | | 89,304 | |
Wolverine World Wide Inc | | | 8,316 | | | | 215,800 | |
Zumiez Inc* | | | 1,661 | | | | 43,153 | |
Total Consumer, Cyclical | | | | | | | 9,079,137 | |
| | | | | | | | | |
Consumer, Non-Cyclical (19.80%) | | | | |
ABM Industries Inc | | | 6,217 | | | | 231,645 | |
Acorda Therapeutics Inc* | | | 3,939 | | | | 12,723 | |
Addus HomeCare Corp* | | | 991 | | | | 87,188 | |
Akorn Inc* | | | 9,531 | | | | 27,545 | |
AMAG Pharmaceuticals Inc* | | | 3,411 | | | | 37,248 | |
American Public Education Inc* | | | 1,645 | | | | 39,858 | |
AMN Healthcare Services Inc* | | | 4,368 | | | | 255,091 | |
Amphastar Pharmaceuticals Inc* | | | 3,566 | | | | 80,092 | |
AngioDynamics Inc* | | | 3,693 | | | | 67,840 | |
ANI Pharmaceuticals Inc* | | | 910 | | | | 59,605 | |
Anika Therapeutics Inc* | | | 1,454 | | | | 82,529 | |
Arlo Technologies Inc* | | | 6,180 | | | | 19,405 | |
Arrowhead Pharmaceuticals Inc* | | | 5,242 | | | | 179,119 | |
Assertio Therapeutics Inc* | | | 5,860 | | | | 8,438 | |
Avon Products Inc* | | | 43,298 | | | | 188,346 | |
B&G Foods Inc | | | 6,121 | | | | 103,629 | |
BioTelemetry Inc* | | | 3,315 | | | | 131,440 | |
Calavo Growers Inc | | | 1,467 | | | | 130,050 | |
Cal-Maine Foods Inc | | | 2,954 | | | | 119,755 | |
Cambrex Corp* | | | 3,307 | | | | 198,189 | |
Cardiovascular Systems Inc* | | | 3,469 | | | | 168,004 | |
Cardtronics PLC* | | | 3,733 | | | | 110,571 | |
Care.com Inc* | | | 2,509 | | | | 24,814 | |
Career Education Corp* | | | 6,635 | | | | 136,084 | |
Central Garden & Pet Co* | | | 1,035 | | | | 27,345 | |
Central Garden & Pet Co - Class A* | | | 4,012 | | | | 96,529 | |
Coca-Cola Consolidated Inc | | | 446 | | | | 150,128 | |
Community Health Systems Inc* | | | 11,035 | | | | 27,477 | |
CONMED Corp | | | 2,433 | | | | 245,173 | |
Corcept Therapeutics Inc* | | | 10,698 | | | | 134,902 | |
CorVel Corp* | | | 849 | | | | 71,511 | |
Cross Country Healthcare Inc* | | | 3,652 | | | | 37,433 | |
CryoLife Inc* | | | 3,262 | | | | 87,422 | |
Cutera Inc* | | | 1,289 | | | $ | 37,213 | |
Cytokinetics Inc* | | | 5,112 | | | | 71,824 | |
Darling Ingredients Inc* | | | 9,108 | | | | 169,409 | |
Dean Foods Co | | | 9,166 | | | | 9,258 | |
Diplomat Pharmacy Inc* | | | 5,700 | | | | 33,117 | |
Eagle Pharmaceuticals Inc* | | | 1,123 | | | | 63,326 | |
Emergent BioSolutions Inc* | | | 4,436 | | | | 194,297 | |
Enanta Pharmaceuticals Inc* | | | 1,590 | | | | 112,175 | |
Endo International PLC* | | | 20,210 | | | | 47,898 | |
EVERTEC Inc | | | 5,617 | | | | 195,809 | |
Forrester Research Inc | | | 996 | | | | 34,731 | |
FTI Consulting Inc* | | | 3,561 | | | | 385,087 | |
Genomic Health Inc* | | | 2,016 | | | | 154,547 | |
Harsco Corp* | | | 7,513 | | | | 134,483 | |
Heidrick & Struggles International Inc | | | 1,846 | | | | 49,011 | |
Heska Corp* | | | 673 | | | | 47,238 | |
HMS Holdings Corp* | | | 8,301 | | | | 303,236 | |
Innoviva Inc* | | | 6,708 | | | | 77,746 | |
Integer Holdings Corp* | | | 2,812 | | | | 203,589 | |
Inter Parfums Inc | | | 1,699 | | | | 109,229 | |
Invacare Corp | | | 3,327 | | | | 16,103 | |
J&J Snack Foods Corp | | | 1,410 | | | | 272,215 | |
John B Sanfilippo & Son Inc | | | 861 | | | | 79,729 | |
Kelly Services Inc | | | 3,086 | | | | 74,712 | |
Korn Ferry | | | 5,287 | | | | 206,616 | |
Lannett Co Inc* | | | 2,918 | | | | 30,055 | |
Lantheus Holdings Inc* | | | 3,880 | | | | 84,429 | |
LeMaitre Vascular Inc | | | 1,530 | | | | 48,440 | |
LHC Group Inc* | | | 2,744 | | | | 325,164 | |
LSC Communications Inc | | | 3,223 | | | | 4,190 | |
Luminex Corp | | | 4,147 | | | | 85,014 | |
Magellan Health Inc* | | | 2,252 | | | | 141,899 | |
Matthews International Corp | | | 3,224 | | | | 94,495 | |
Medifast Inc | | | 1,114 | | | | 111,355 | |
Medpace Holdings Inc* | | | 2,595 | | | | 209,961 | |
Meridian Bioscience Inc | | | 4,249 | | | | 39,218 | |
Merit Medical Systems Inc*,(b) | | | 5,154 | | | | 179,256 | |
MGP Ingredients Inc | | | 1,267 | | | | 61,031 | |
Momenta Pharmaceuticals Inc* | | | 9,815 | | | | 123,963 | |
Monro Inc | | | 3,235 | | | | 251,424 | |
Myriad Genetics Inc* | | | 6,875 | | | | 161,769 | |
Natus Medical Inc* | | | 3,265 | | | | 90,375 | |
Navigant Consulting Inc | | | 4,037 | | | | 112,511 | |
Neogen Corp* | | | 4,883 | | | | 344,349 | |
NeoGenomics Inc* | | | 9,060 | | | | 226,319 | |
OraSure Technologies Inc* | | | 6,127 | | | | 40,438 | |
Orthofix Medical Inc* | | | 1,892 | | | | 96,189 | |
Owens & Minor Inc | | | 6,011 | | | | 30,536 | |
Phibro Animal Health Corp | | | 1,987 | | | | 41,032 | |
Progenics Pharmaceuticals Inc* | | | 7,397 | | | | 32,547 | |
Quanex Building Products Corp | | | 3,418 | | | | 58,858 | |
REGENXBIO Inc* | | | 2,935 | | | | 101,228 | |
Rent-A-Center Inc* | | | 4,464 | | | | 113,966 | |
Repligen Corp* | | | 3,949 | | | | 366,507 | |
Resources Connection Inc | | | 2,990 | | | | 49,485 | |
RR Donnelley & Sons Co | | | 6,596 | | | | 15,962 | |
Select Medical Holdings Corp* | | | 10,762 | | | | 174,560 | |
Seneca Foods Corp* | | | 660 | | | | 18,137 | |
SpartanNash Co | | | 3,727 | | | | 40,140 | |
Spectrum Pharmaceuticals Inc* | | | 10,511 | | | | 77,151 | |
Strategic Education Inc | | | 2,054 | | | | 347,598 | |
Supernus Pharmaceuticals Inc* | | | 5,197 | | | | 140,475 | |
Surmodics Inc* | | | 1,330 | | | | 62,590 | |
Tactile Systems Technology Inc* | | | 1,689 | | | | 85,193 | |
See accompanying notes to financial statements.
23
S&P SmallCap Index Fund | Portfolio of Investments (Continued) | 8/31/19 |
Security Description | | Shares | | | Value
(Note 1) | |
Team Inc* | | | 2,930 | | | $ | 48,286 | |
The Andersons Inc | | | 2,657 | | | | 60,898 | |
The Chefs’ Warehouse Inc* | | | 2,331 | | | | 89,930 | |
The Ensign Group Inc | | | 4,669 | | | | 232,983 | |
The Medicines Co* | | | 6,505 | | | | 272,950 | |
The Providence Service Corp* | | | 1,099 | | | | 61,775 | |
Tivity Health Inc* | | | 4,670 | | | | 85,274 | |
TrueBlue Inc* | | | 3,979 | | | | 77,232 | |
United Natural Foods Inc* | | | 5,088 | | | | 40,908 | |
Universal Corp | | | 2,341 | | | | 117,190 | |
US Physical Therapy Inc | | | 1,244 | | | | 166,099 | |
USANA Health Sciences Inc* | | | 735 | | | | 49,958 | |
Vanda Pharmaceuticals Inc* | | | 5,279 | | | | 74,381 | |
Varex Imaging Corp* | | | 3,808 | | | | 100,341 | |
Vector Group Ltd | | | 10,179 | | | | 118,891 | |
Viad Corp | | | 1,900 | | | | 122,797 | |
WD-40 Co | | | 1,292 | | | | 235,532 | |
Xencor Inc* | | | 2,648 | | | | 98,717 | |
Total Consumer, Non-Cyclical | | | 13,131,677 | |
| | | | | | | | | |
Energy (3.73%) | | | | | | | | |
Archrock Inc | | | 12,975 | | | | 125,987 | |
Bonanza Creek Energy Inc* | | | 1,864 | | | | 42,052 | |
C&J Energy Services Inc* | | | 6,383 | | | | 61,021 | |
Carrizo Oil & Gas Inc* | | | 8,776 | | | | 72,753 | |
CONSOL Energy Inc* | | | 2,836 | | | | 47,531 | |
Denbury Resources Inc* | | | 46,431 | | | | 50,145 | |
Diamond Offshore Drilling Inc* | | | 6,436 | | | | 41,770 | |
DMC Global Inc | | | 786 | | | | 34,136 | |
Dril-Quip Inc* | | | 3,394 | | | | 155,615 | |
Era Group Inc* | | | 2,067 | | | | 19,595 | |
Exterran Corp* | | | 3,227 | | | | 34,045 | |
FutureFuel Corp | | | 2,258 | | | | 24,341 | |
Geospace Technologies Corp* | | | 1,047 | | | | 12,815 | |
Green Plains Inc | | | 3,903 | | | | 32,044 | |
Gulf Island Fabrication Inc* | | | 900 | | | | 5,697 | |
Gulfport Energy Corp* | | | 15,178 | | | | 36,427 | |
Helix Energy Solutions Group Inc* | | | 13,968 | | | | 101,128 | |
HighPoint Resources Corp* | | | 9,646 | | | | 11,286 | |
KLX Energy Services Holdings Inc* | | | 2,045 | | | | 20,511 | |
Laredo Petroleum Inc* | | | 15,407 | | | | 38,209 | |
Matrix Service Co* | | | 2,446 | | | | 48,602 | |
Nabors Industries Ltd | | | 32,902 | | | | 55,275 | |
Newpark Resources Inc* | | | 8,961 | | | | 59,232 | |
Noble Corp plc* | | | 24,763 | | | | 39,621 | |
Oil States International Inc* | | | 6,072 | | | | 83,733 | |
Par Pacific Holdings Inc* | | | 2,984 | | | | 64,872 | |
PDC Energy Inc* | | | 6,436 | | | | 204,987 | |
Penn Virginia Corp* | | | 1,312 | | | | 37,392 | |
ProPetro Holding Corp* | | | 6,944 | | | | 73,954 | |
Renewable Energy Group Inc* | | | 3,755 | | | | 45,698 | |
REX American Resources Corp* | | | 531 | | | | 36,469 | |
Ring Energy Inc* | | | 5,422 | | | | 7,916 | |
SM Energy Co | | | 5,709 | | | | 54,121 | |
SolarEdge Technologies Inc* | | | 4,311 | | | | 353,157 | |
SRC Energy Inc* | | | 23,938 | | | | 120,169 | |
SunCoke Energy Inc* | | | 6,488 | | | | 40,485 | |
Superior Energy Services Inc* | | | 15,582 | | | | 5,217 | |
TETRA Technologies Inc* | | | 12,600 | | | | 20,916 | |
Unit Corp* | | | 5,423 | | | | 16,432 | |
US Silica Holdings Inc | | | 7,460 | | | | 75,868 | |
Whiting Petroleum Corp* | | | 9,066 | | | | 60,108 | |
Total Energy | | | | | | | 2,471,332 | |
| | | | | | | | | |
Financial (24.49%) | | | | | | | | |
Banks (8.87%) | | | | | | | | |
Ameris Bancorp | | | 5,421 | | | $ | 190,765 | |
Banner Corp | | | 3,113 | | | | 167,822 | |
Central Pacific Financial Corp | | | 2,875 | | | | 79,983 | |
City Holding Co | | | 1,547 | | | | 115,019 | |
Columbia Banking System Inc | | | 6,892 | | | | 237,843 | |
Community Bank System Inc | | | 4,828 | | | | 294,460 | |
Customers Bancorp Inc* | | | 2,828 | | | | 53,421 | |
CVB Financial Corp | | | 9,577 | | | | 196,999 | |
Eagle Bancorp Inc | | | 3,182 | | | | 129,635 | |
First BanCorp | | | 20,364 | | | | 195,087 | |
First Commonwealth Financial Corp | | | 9,229 | | | | 114,163 | |
First Financial Bancorp | | | 9,240 | | | | 216,401 | |
First Midwest Bancorp Inc | | | 10,344 | | | | 198,605 | |
Flagstar Bancorp Inc | | | 2,967 | | | | 107,850 | |
Franklin Financial Network Inc | | | 1,168 | | | | 33,790 | |
Glacier Bancorp Inc(b) | | | 7,926 | | | | 314,576 | |
Great Western Bancorp Inc | | | 5,335 | | | | 159,143 | |
Hanmi Financial Corp | | | 3,211 | | | | 57,509 | |
Heritage Financial Corp | | | 3,361 | | | | 87,991 | |
HomeStreet Inc* | | | 2,707 | | | | 71,384 | |
Hope Bancorp Inc | | | 11,275 | | | | 151,198 | |
Independent Bank Corp | | | 3,214 | | | | 217,299 | |
LegacyTexas Financial Group Inc | | | 4,244 | | | | 171,458 | |
Meta Financial Group Inc | | | 2,742 | | | | 84,755 | |
National Bank Holdings Corp | | | 2,643 | | | | 86,268 | |
NBT Bancorp Inc | | | 4,311 | | | | 150,756 | |
OFG Bancorp | | | 4,362 | | | | 89,508 | |
Old National Bancorp | | | 14,019 | | | | 235,519 | |
Opus Bank | | | 2,188 | | | | 45,423 | |
Preferred Bank | | | 1,334 | | | | 66,647 | |
S&T Bancorp Inc | | | 3,468 | | | | 118,675 | |
Seacoast Banking Corp of Florida* | | | 5,182 | | | | 120,948 | |
ServisFirst Bancshares Inc | | | 4,533 | | | | 137,803 | |
Simmons First National Corp | | | 9,302 | | | | 223,248 | |
Southside Bancshares Inc | | | 3,155 | | | | 103,894 | |
Tompkins Financial Corp | | | 1,219 | | | | 96,423 | |
Triumph Bancorp Inc* | | | 2,315 | | | | 69,427 | |
TrustCo Bank Corp NY | | | 9,676 | | | | 74,215 | |
United Community Banks Inc | | | 7,406 | | | | 195,592 | |
Veritex Holdings Inc | | | 4,539 | | | | 107,120 | |
Walker & Dunlop Inc | | | 2,755 | | | | 153,894 | |
Westamerica Bancorporation | | | 2,609 | | | | 160,740 | |
| | | | | | | | 5,883,256 | |
Diversified Financial Service (1.57%) | | | | |
Blucora Inc* | | | 4,714 | | | | 106,442 | |
Boston Private Financial Holdings Inc | | | 8,332 | | | | 88,486 | |
Encore Capital Group Inc* | | | 2,392 | | | | 88,265 | |
Enova International Inc* | | | 3,399 | | | | 81,236 | |
Greenhill & Co Inc | | | 1,752 | | | | 24,598 | |
INTL. FCStone Inc* | | | 1,498 | | | | 58,737 | |
Piper Jaffray Cos | | | 1,416 | | | | 103,028 | |
PRA Group Inc* | | | 4,604 | | | | 157,181 | |
Virtus Investment Partners Inc | | | 724 | | | | 77,244 | |
Waddell & Reed Financial Inc | | | 7,605 | | | | 122,973 | |
WisdomTree Investments Inc | | | 11,401 | | | | 54,839 | |
World Acceptance Corp* | | | 575 | | | | 76,418 | |
| | | | | | | | 1,039,447 | |
Insurance (3.78%) | | | | | | | | |
Ambac Financial Group Inc* | | | 4,388 | | | | 79,160 | |
American Equity Investment Life Holding Co | | | 8,799 | | | | 189,618 | |
AMERISAFE Inc | | | 1,932 | | | $ | 132,728 | |
eHealth Inc* | | | 1,827 | | | | 152,207 | |
Employers Holdings Inc | | | 3,193 | | | | 137,714 | |
HCI Group Inc | | | 756 | | | | 29,461 | |
Horace Mann Educators Corp | | | 4,007 | | | | 175,787 | |
James River Group Holdings Ltd | | | 2,891 | | | | 142,468 | |
NMI Holdings Inc* | | | 6,628 | | | | 187,838 | |
ProAssurance Corp | | | 5,035 | | | | 196,717 | |
RLI Corp | | | 3,673 | | | | 336,337 | |
Safety Insurance Group Inc | | | 1,369 | | | | 132,026 | |
Selective Insurance Group Inc(b) | | | 3,275 | | | | 260,788 | |
Stewart Information Services Corp | | | 2,381 | | | | 85,287 | |
Third Point Reinsurance Ltd* | | | 7,370 | | | | 69,425 | |
United Fire Group Inc | | | 2,126 | | | | 96,010 | |
United Insurance Holdings Corp | | | 2,058 | | | | 24,120 | |
Universal Insurance Holdings Inc | | | 3,272 | | | | 81,800 | |
| | | | | | | | 2,509,491 | |
Real Estate (8.67%) | | | | | | | | |
Acadia Realty Trust | | | 7,755 | | | | 212,099 | |
Agree Realty Corp | | | 3,744 | | | | 279,639 | |
American Assets Trust Inc | | | 3,772 | | | | 176,756 | |
Apollo Commercial Real Estate Finance Inc | | | 11,233 | | | | 208,372 | |
Armada Hoffler Properties Inc | | | 4,539 | | | | 78,706 | |
ARMOUR Residential REIT Inc | | | 4,911 | | | | 80,639 | |
Capstead Mortgage Corp | | | 8,523 | | | | 61,962 | |
CareTrust REIT Inc | | | 8,852 | | | | 210,589 | |
CBL & Associates Properties Inc | | | 16,968 | | | | 15,441 | |
Cedar Realty Trust Inc | | | 7,158 | | | | 16,964 | |
Chatham Lodging Trust | | | 4,440 | | | | 73,660 | |
Chesapeake Lodging Trust | | | 5,971 | | | | 153,753 | |
Community Healthcare Trust Inc | | | 1,592 | | | | 67,883 | |
DiamondRock Hospitality Co | | | 18,876 | | | | 178,756 | |
Easterly Government Properties Inc | | | 6,058 | | | | 124,492 | |
Four Corners Property Trust Inc | | | 6,547 | | | | 186,524 | |
Franklin Street Properties Corp | | | 10,760 | | | | 81,453 | |
Getty Realty Corp | | | 3,197 | | | | 101,537 | |
Global Net Lease Inc | | | 8,353 | | | | 160,211 | |
Granite Point Mortgage Trust Inc | | | 5,096 | | | | 93,206 | |
Hersha Hospitality Trust | | | 3,592 | | | | 49,929 | |
Independence Realty Trust Inc | | | 8,262 | | | | 114,924 | |
Innovative Industrial Properties Inc | | | 974 | | | | 86,842 | |
Invesco Mortgage Capital Inc | | | 12,048 | | | | 181,081 | |
iStar Inc | | | 6,061 | | | | 77,581 | |
Kite Realty Group Trust | | | 8,396 | | | | 119,979 | |
Lexington Realty Trust | | | 19,586 | | | | 203,499 | |
LTC Properties Inc | | | 3,723 | | | | 181,682 | |
Marcus & Millichap Inc* | | | 2,142 | | | | 77,283 | |
National Storage Affiliates Trust | | | 5,662 | | | | 189,451 | |
New York Mortgage Trust Inc | | | 18,492 | | | | 113,726 | |
NorthStar Realty Europe Corp | | | 4,963 | | | | 84,024 | |
Office Properties Income Trust | | | 4,791 | | | | 129,884 | |
Pennsylvania Real Estate Investment Trust | | | 7,059 | | | | 36,283 | |
PennyMac Mortgage Investment Trust | | | 6,770 | | | | 147,315 | |
RE/MAX Holdings Inc - Class A | | | 1,780 | | | | 45,693 | |
Realogy Holdings Corp | | | 6,314 | | | | 30,181 | |
Redwood Trust Inc | | | 9,626 | | | | 159,792 | |
Retail Opportunity Investments Corp | | | 10,711 | | | | 187,550 | |
RPT Realty | | | 7,667 | | | | 91,237 | |
Saul Centers Inc | | | 1,169 | | | | 58,719 | |
Summit Hotel Properties Inc | | | 10,506 | | | | 117,247 | |
See accompanying notes to financial statements.
24
S&P SmallCap Index Fund | Portfolio of Investments (Continued) | 8/31/19 |
Security Description | | Shares | | | Value
(Note 1) | |
Universal Health Realty Income Trust | | | 1,242 | | | $ | 120,089 | |
Urstadt Biddle Properties Inc | | | 2,991 | | | | 62,781 | |
Washington Prime Group Inc | | | 18,663 | | | | 60,281 | |
Washington Real Estate Investment Trust | | | 7,499 | | | | 198,649 | |
Whitestone REIT | | | 3,993 | | | | 49,593 | |
Xenia Hotels & Resorts Inc | | | 10,554 | | | | 213,296 | |
| | | | | | | | 5,751,233 | |
Savings&Loans (1.60%) | | | | | | | | |
Axos Financial Inc* | | | 5,367 | | | | 139,059 | |
Banc of California Inc | | | 4,101 | | | | 59,752 | |
Berkshire Hills Bancorp Inc | | | 4,061 | | | | 119,109 | |
Brookline Bancorp Inc | | | 8,059 | | | | 113,148 | |
Dime Community Bancshares Inc | | | 2,890 | | | | 57,309 | |
Northfield Bancorp Inc | | | 4,483 | | | | 69,576 | |
Northwest Bancshares Inc | | | 10,116 | | | | 159,934 | |
Oritani Financial Corp | | | 3,976 | | | | 68,109 | |
Pacific Premier Bancorp Inc | | | 4,527 | | | | 133,365 | |
Provident Financial Services Inc | | | 6,007 | | | | 143,027 | |
| | | | | | | | 1,062,388 | |
| | | | | | | | | |
Total Financial | | | | | | | 16,245,815 | |
| | | | | | | | | |
Industrial (17.92%) | | | | | | | | |
AAON Inc | | | 3,922 | | | | 188,138 | |
AAR Corp | | | 3,171 | | | | 136,226 | |
Actuant Corp | | | 6,089 | | | | 135,237 | |
Advanced Energy Industries Inc* | | | 3,582 | | | | 184,974 | |
Aegion Corp* | | | 3,357 | | | | 66,267 | |
Aerojet Rocketdyne Holdings Inc* | | | 6,780 | | | | 354,119 | |
AeroVironment Inc* | | | 2,121 | | | | 109,295 | |
Alamo Group Inc | | | 937 | | | | 106,987 | |
Alarm.com Holdings Inc* | | | 3,306 | | | | 157,366 | |
Albany International Corp | | | 2,871 | | | | 236,054 | |
American Woodmark Corp* | | | 1,406 | | | | 115,812 | |
Apogee Enterprises Inc | | | 2,707 | | | | 99,970 | |
Applied Industrial Technologies Inc | | | 3,616 | | | | 193,058 | |
Applied Optoelectronics Inc* | | | 1,964 | | | | 17,480 | |
ArcBest Corp | | | 2,482 | | | | 73,492 | |
Arcosa Inc | | | 4,530 | | | | 147,180 | |
Astec Industries Inc | | | 2,327 | | | | 64,225 | |
Atlas Air Worldwide Holdings Inc* | | | 2,496 | | | | 64,522 | |
AZZ Inc | | | 2,578 | | | | 106,394 | |
Badger Meter Inc | | | 2,728 | | | | 140,710 | |
Barnes Group Inc | | | 4,429 | | | | 198,641 | |
Bel Fuse Inc | | | 988 | | | | 10,868 | |
Benchmark Electronics Inc | | | 3,613 | | | | 95,672 | |
Boise Cascade Co | | | 3,900 | | | | 122,460 | |
Brady Corp | | | 4,730 | | | | 223,303 | |
Briggs & Stratton Corp | | | 4,252 | | | | 18,369 | |
Chart Industries Inc* | | | 3,048 | | | | 191,536 | |
CIRCOR International Inc* | | | 1,919 | | | | 65,956 | |
Comfort Systems USA Inc | | | 3,458 | | | | 133,686 | |
Comtech Telecommunications Corp | | | 2,370 | | | | 63,398 | |
DXP Enterprises Inc* | | | 1,585 | | | | 51,433 | |
Echo Global Logistics Inc* | | | 2,538 | | | | 50,862 | |
Encore Wire Corp | | | 2,060 | | | | 111,219 | |
EnPro Industries Inc | | | 1,943 | | | | 121,010 | |
ESCO Technologies Inc | | | 2,555 | | | | 194,512 | |
Exponent Inc | | | 4,940 | | | | 350,197 | |
Fabrinet* | | | 3,451 | | | $ | 174,241 | |
FARO Technologies Inc* | | | 1,657 | | | | 81,591 | |
Federal Signal Corp | | | 5,933 | | | | 176,269 | |
Forward Air Corp | | | 2,688 | | | | 167,462 | |
Franklin Electric Co Inc | | | 3,824 | | | | 175,330 | |
Gibraltar Industries Inc* | | | 3,137 | | | | 126,327 | |
Griffon Corp | | | 3,397 | | | | 59,278 | |
Haynes International Inc | | | 1,242 | | | | 37,099 | |
Heartland Express Inc | | | 4,781 | | | | 98,345 | |
Hillenbrand Inc | | | 5,867 | | | | 160,990 | |
Hub Group Inc* | | | 3,325 | | | | 143,175 | |
Ichor Holdings Ltd* | | | 2,215 | | | | 47,091 | |
II-VI Inc* | | | 5,595 | | | | 209,868 | |
Insteel Industries Inc | | | 1,735 | | | | 32,445 | |
Itron Inc* | | | 3,134 | | | | 217,656 | |
John Bean Technologies Corp | | | 3,023 | | | | 309,313 | |
Kaman Corp | | | 2,618 | | | | 152,865 | |
KEMET Corp | | | 5,811 | | | | 97,334 | |
Knowles Corp* | | | 9,026 | | | | 183,047 | |
Lindsay Corp | | | 1,030 | | | | 90,908 | |
LSB Industries Inc* | | | 1,435 | | | | 6,701 | |
Lydall Inc* | | | 1,743 | | | | 35,052 | |
Marten Transport Ltd | | | 3,836 | | | | 75,454 | |
Matson Inc | | | 4,012 | | | | 142,546 | |
Mesa Laboratories Inc | | | 196 | | | | 43,361 | |
Moog Inc | | | 3,043 | | | | 247,244 | |
Mueller Industries Inc | | | 5,305 | | | | 139,840 | |
Myers Industries Inc | | | 3,548 | | | | 59,713 | |
MYR Group Inc* | | | 1,615 | | | | 46,302 | |
National Presto Industries Inc | | | 504 | | | | 43,198 | |
Olympic Steel Inc | | | 881 | | | | 9,471 | |
OSI Systems Inc* | | | 1,577 | | | | 165,601 | |
Park Aerospace Corp | | | 1,909 | | | | 32,262 | |
Patrick Industries Inc* | | | 2,259 | | | | 81,640 | |
PGT Innovations Inc* | | | 5,837 | | | | 93,392 | |
Plexus Corp* | | | 2,820 | | | | 161,332 | |
Powell Industries Inc | | | 838 | | | | 30,436 | |
Proto Labs Inc*,(b) | | | 2,515 | | | | 238,271 | |
Raven Industries Inc | | | 3,584 | | | | 104,545 | |
Saia Inc* | | | 2,527 | | | | 216,160 | |
Sanmina Corp* | | | 6,465 | | | | 186,839 | |
SEACOR Holdings Inc* | | | 1,714 | | | | 80,507 | |
Simpson Manufacturing Co Inc | | | 3,766 | | | | 241,777 | |
SMART Global Holdings Inc* | | | 1,196 | | | | 33,978 | |
SPX Corp* | | | 4,195 | | | | 159,200 | |
SPX FLOW Inc* | | | 4,202 | | | | 141,649 | |
Standex International Corp | | | 1,287 | | | | 88,481 | |
Sturm Ruger & Co Inc | | | 1,780 | | | | 72,998 | |
Tennant Co | | | 1,758 | | | | 120,230 | |
The Greenbrier Cos Inc | | | 3,244 | | | | 75,553 | |
TimkenSteel Corp* | | | 3,932 | | | | 20,525 | |
TopBuild Corp* | | | 3,225 | | | | 298,700 | |
Tredegar Corp | | | 2,521 | | | | 43,588 | |
Triumph Group Inc | | | 4,765 | | | | 99,017 | |
TTM Technologies Inc* | | | 9,342 | | | | 99,586 | |
Universal Forest Products Inc | | | 5,748 | | | | 224,747 | |
US Concrete Inc* | | | 1,585 | | | | 64,224 | |
US Ecology Inc | | | 2,200 | | | | 133,254 | |
Vicor Corp* | | | 1,588 | | | | 48,418 | |
Watts Water Technologies Inc | | | 2,594 | | | | 237,688 | |
Total Industrial | | | | | | | 11,884,742 | |
| | | | | | | | | |
Technology (9.32%) | | | | | | | | |
3D Systems Corp* | | | 11,420 | | | | 79,940 | |
Agilysys Inc* | | | 1,424 | | | | 38,804 | |
Axcelis Technologies Inc* | | | 3,225 | | | $ | 49,375 | |
Bottomline Technologies DE Inc* | | | 3,707 | | | | 152,877 | |
Brooks Automation Inc | | | 6,759 | | | | 225,277 | |
Cabot Microelectronics Corp | | | 2,723 | | | | 339,422 | |
CEVA Inc* | | | 2,229 | | | | 70,013 | |
Cohu Inc | | | 4,066 | | | | 48,467 | |
Computer Programs & Systems Inc | | | 1,062 | | | | 22,461 | |
Cray Inc* | | | 4,078 | | | | 142,445 | |
CSG Systems International Inc | | | 3,263 | | | | 175,810 | |
CTS Corp | | | 3,313 | | | | 94,520 | |
Cubic Corp | | | 2,685 | | | | 185,990 | |
Diebold Nixdorf Inc* | | | 7,353 | | | | 82,427 | |
Diodes Inc* | | | 3,881 | | | | 141,851 | |
Donnelley Financial Solutions Inc* | | | 3,281 | | | | 34,877 | |
DSP Group Inc* | | | 2,148 | | | | 29,728 | |
Ebix Inc | | | 2,210 | | | | 78,278 | |
ExlService Holdings Inc* | | | 3,217 | | | | 217,791 | |
FormFactor Inc* | | | 7,104 | | | | 121,407 | |
Insight Enterprises Inc* | | | 3,525 | | | | 169,412 | |
Kopin Corp* | | | 6,036 | | | | 5,597 | |
Kulicke & Soffa Industries Inc | | | 6,092 | | | | 126,896 | |
LivePerson Inc* | | | 5,605 | | | | 222,743 | |
ManTech International Corp | | | 2,644 | | | | 185,820 | |
MaxLinear Inc* | | | 6,001 | | | | 118,940 | |
Mercury Systems Inc* | | | 4,835 | | | | 414,021 | |
MicroStrategy Inc* | | | 821 | | | | 117,641 | |
Monotype Imaging Holdings Inc | | | 4,231 | | | | 83,562 | |
MTS Systems Corp | | | 1,789 | | | | 101,740 | |
Nanometrics Inc* | | | 2,280 | | | | 62,221 | |
NextGen Healthcare Inc* | | | 4,741 | | | | 67,370 | |
Omnicell Inc* | | | 3,862 | | | | 277,292 | |
OneSpan Inc* | | | 2,814 | | | | 37,989 | |
PDF Solutions Inc* | | | 2,557 | | | | 29,942 | |
Photronics Inc* | | | 7,012 | | | | 75,730 | |
Pitney Bowes Inc | | | 9,991 | | | | 35,568 | |
Power Integrations Inc | | | 2,742 | | | | 244,093 | |
Progress Software Corp | | | 4,169 | | | | 157,505 | |
Qualys Inc* | | | 3,155 | | | | 251,201 | |
Rambus Inc* | | | 11,045 | | | | 138,504 | |
Rudolph Technologies Inc* | | | 3,191 | | | | 70,170 | |
SPS Commerce Inc* | | | 3,412 | | | | 172,442 | |
Sykes Enterprises Inc* | | | 3,994 | | | | 115,826 | |
Tabula Rasa HealthCare Inc* | | | 1,693 | | | | 96,162 | |
TiVo Corp | | | 12,338 | | | | 92,905 | |
TTEC Holdings Inc | | | 1,380 | | | | 64,736 | |
Ultra Clean Holdings Inc* | | | 3,885 | | | | 46,387 | |
Unisys Corp* | | | 5,140 | | | | 33,616 | |
Veeco Instruments Inc* | | | 4,630 | | | | 42,874 | |
Virtusa Corp* | | | 2,769 | | | | 100,072 | |
Xperi Corp | | | 4,873 | | | | 89,273 | |
Total Technology | | | | | | | 6,180,010 | |
| | | | | | | | | |
Utilities (2.25%) | | | | | | | | |
American States Water Co | | | 3,447 | | | | 318,951 | |
Avista Corp(b) | | | 6,160 | | | | 288,904 | |
California Water Service Group | | | 4,510 | | | | 254,544 | |
El Paso Electric Co | | | 3,805 | | | | 253,794 | |
Northwest Natural Holding Co | | | 2,888 | | | | 206,088 | |
South Jersey Industries Inc | | | 5,108 | | | | 165,193 | |
Total Utilities | | | | | | | 1,487,474 | |
| | | | | | | | | |
Total Common Stock (Cost $55,357,711) | | | | | | | 66,015,588 | |
| | | | | | | | | |
See accompanying notes to financial statements.
25
S&P SmallCap Index Fund | Portfolio of Investments (Continued) | 8/31/19 |
Security Description | | Shares | | | Value
(Note 1) | |
United States Treasury Bills (0.15%) |
1.966%, 10/31/2019 (Cost $99,659) | | | $100,000 | | | $ | 99,687 | |
| | | | | | | | | |
Total Investments (Cost $55,457,370)(c) (99.70%) | | $ | 66,115,275 | |
Other Net Assets (0.30%) | | | | | | | 204,624 | |
Net Assets (100.00%) | | | | | | $ | 66,319,899 | |
| * | Non-income producing security. |
| (a) | This security has been fair valued at August 31, 2019. The fair value was $2,518, or 0.00% of net assets.
|
| (b) | A portion of these shares have been pledged in connection with obligations for futures contracts. |
| (c) | Aggregate cost for federal income tax purpose is $55,492,189. |
At August 31, 2019, unrealized appreciation/(depreciation) of securities for federal income tax purposes is as follows: |
| |
Unrealized appreciation | | $ | 20,683,566 | |
Unrealized depreciation | | | (10,060,480 | ) |
Net unrealized appreciation | | $ | 10,623,086 | |
(d) Futures contracts at August 31, 2019: |
| |
Contracts - $100 times premium / delivery month / commitment / exchange |
Russell 2000 MINI | | Notional Amount | | | Value | | | Unrealized Depreciation | |
4 / Sep 2019 / Long / CME | | $ | 299,560 | | | $ | 298,840 | | | $ | (720 | ) |
Shelton Core Value Fund | Portfolio of Investments | 8/31/19 |
Security Description | | Shares | | | Value
(Note 1) | |
Common Stock (96.05%) | | | | | | | | |
| | | | | | | | | |
Basic Materials (3.43%) | | | | | | | | |
Linde PLC(a) | | | 15,167 | | | $ | 2,865,198 | |
PPG Industries Inc(a) | | | 16,000 | | | | 1,772,640 | |
Sensient Technologies Corp | | | 8,500 | | | | 555,220 | |
Total Basic Materials | | | | | | | 5,193,058 | |
| | | | | | | | | |
Communications (9.27%) | | | | | | | | |
Alphabet Inc - Class A*,(a) | | | 1,600 | | | | 1,904,848 | |
Alphabet Inc - Class C*,(a) | | | 1,600 | | | | 1,900,960 | |
Amazon.com Inc* | | | 2,000 | | | | 3,552,580 | |
AT&T Inc(a) | | | 57,669 | | | | 2,033,409 | |
Cisco Systems Inc(a) | | | 52,500 | | | | 2,457,525 | |
Verizon Communications Inc(a) | | | 37,842 | | | | 2,200,891 | |
Total Communications | | | | | | | 14,050,213 | |
| | | | | | | | | |
Consumer, Cyclical (7.27%) | | | | | | | | |
Ford Motor Co(a) | | | 290,000 | | | | 2,659,300 | |
DR Horton Inc(a) | | | 55,200 | | | | 2,730,744 | |
Lennar Corp | | | 58,000 | | | | 2,958,000 | |
Marriott International Inc(a) | | | 13,000 | | | | 1,638,780 | |
Target Corp(a) | | | 9,639 | | | | 1,031,759 | |
Total Consumer, Cyclical | | | | | | | 11,018,583 | |
| | | | | | | | | |
Consumer, Non-Cyclical (19.27%) |
Celgene Corp* | | | 7,500 | | | | 726,000 | |
Gilead Sciences Inc | | | 31,200 | | | | 1,982,448 | |
Colgate-Palmolive Co(a) | | | 20,400 | | | | 1,512,660 | |
The Procter & Gamble Co(a) | | | 26,600 | | | | 3,198,118 | |
Conagra Brands Inc(a) | | | 42,450 | | | | 1,203,882 | |
General Mills Inc(a) | | | 37,900 | | | | 2,039,020 | |
Sprouts Farmers Market Inc*,(a) | | | 230,000 | | | | 4,128,500 | |
Tyson Foods Inc(a) | | | 20,000 | | | | 1,860,800 | |
Abbott Laboratories(a) | | | 41,110 | | | | 3,507,505 | |
Centene Corp*,(a) | | | 27,800 | | | | 1,296,036 | |
AbbVie Inc | | | 33,610 | | | | 2,209,521 | |
AmerisourceBergen Corp(a) | | | 22,912 | | | | 1,884,970 | |
Merck & Co Inc(a) | | | 35,200 | | | | 3,043,744 | |
Takeda Pharmaceutical Co Ltd(a) | | | 35,665 | | | | 601,312 | |
Total Consumer, Non-Cyclical | | | 29,194,516 | |
| | | | | | | | | |
Energy (9.57%) | | | | | | | | |
BP PLC(a) | | | 81,437 | | | $ | 3,009,097 | |
Chevron Corp | | | 29,324 | | | | 3,452,021 | |
ConocoPhillips(a) | | | 19,648 | | | | 1,025,233 | |
Devon Energy Corp(a) | | | 7,352 | | | | 161,670 | |
Exxon Mobil Corp | | | 43,236 | | | | 2,960,801 | |
Royal Dutch Shell PLC | | | 36,500 | | | | 2,029,400 | |
Baker Hughes a GE Co(a) | | | 27,455 | | | | 595,499 | |
Schlumberger Ltd | | | 39,100 | | | | 1,268,013 | |
Total Energy | | | | | | | 14,501,734 | |
| | | | | | | | | |
Financial (26.20%) | | | | | | | | |
Banks (16.83%) | | | | | | | | |
Bank of America Corp | | | 140,000 | | | | 3,851,400 | |
The Bank of New York Mellon Corp(a) | | | 5,000 | | | | 210,300 | |
Citigroup Inc(a) | | | 21,300 | | | | 1,370,655 | |
The Goldman Sachs Group Inc(a) | | | 15,850 | | | | 3,231,974 | |
JPMorgan Chase & Co | | | 71,020 | | | | 7,802,257 | |
Morgan Stanley(a) | | | 47,050 | | | | 1,952,105 | |
State Street Corp(a) | | | 3,200 | | | | 164,192 | |
US Bancorp(a) | | | 60,600 | | | | 3,193,014 | |
Wells Fargo & Co(a) | | | 80,000 | | | | 3,725,600 | |
| | | | | | | | 25,501,497 | |
Diversified Financial Service (3.60%) |
BlackRock Inc | | | 5,900 | | | | 2,493,104 | |
Visa Inc(a) | | | 16,400 | | | | 2,965,448 | |
| | | | | | | | 5,458,552 | |
Insurance (2.42%) | | | | | | | | |
Arthur J Gallagher & Co(a) | | | 32,400 | | | | 2,939,004 | |
Principal Financial Group Inc(a) | | | 13,650 | | | | 726,453 | |
| | | | | | | | 3,665,457 | |
Real Estate (3.35%) | | | | | | | | |
Digital Realty Trust Inc(a) | | | 16,500 | | | | 2,039,895 | |
Public Storage(a) | | | 11,500 | | | | 3,044,510 | |
| | | | | | | | 5,084,405 | |
| | | | | | | | | |
Total Financial | | | | | | | 39,709,911 | |
| | | | | | | | | |
Industrial (6.51%) | | | | | | | | |
The Boeing Co | | | 2,900 | | | $ | 1,055,861 | |
Northrop Grumman Corp | | | 2,600 | | | | 956,462 | |
United Technologies Corp | | | 10,625 | | | | 1,383,800 | |
Masco Corp | | | 90,000 | | | | 3,665,700 | |
Caterpillar Inc | | | 21,442 | | | | 2,551,598 | |
Seaspan Corp | | | 25,000 | | | | 259,500 | |
Total Industrial | | | | | | | 9,872,921 | |
| | | | | | | | | |
Technology (10.49%) | | | | | | | | |
Apple Inc(a) | | | 20,000 | | | | 4,174,800 | |
DXC Technology Co(a) | | | 4,294 | | | | 142,647 | |
Hewlett Packard Enterprise Co(a) | | | 50,000 | | | | 691,000 | |
Seagate Technology PLC | | | 38,000 | | | | 1,907,980 | |
Applied Materials Inc(a) | | | 66,000 | | | | 3,169,320 | |
Intel Corp | | | 61,000 | | | | 2,892,010 | |
Taiwan Semiconductor Manufacturing Co Ltd(a) | | | 11,000 | | | | 468,930 | |
Microsoft Corp(a) | | | 5,633 | | | | 776,565 | |
Oracle Corp | | | 5,930 | | | | 308,716 | |
Paychex Inc(a) | | | 17,000 | | | | 1,388,900 | |
Total Technology | | | | | | | 15,920,868 | |
| | | | | | | | | |
Utilities (4.04%) | | | | | | | | |
American Electric Power Co Inc(a) | | | 11,200 | | | | 1,020,880 | |
Consolidated Edison Inc(a) | | | 45,000 | | | | 4,000,500 | |
FirstEnergy Corp(a) | | | 23,574 | | | | 1,084,404 | |
NextEra Energy Inc(a) | | | 100 | | | | 21,908 | |
Total Utilities | | | | | | | 6,127,692 | |
| | | | | | | | | |
Total Common Stock (Cost $109,950,884) | | | | | | | 145,589,496 | |
| | | | | | | | | |
Preferred Stock (0.45%) | | | | | | | | |
Amerityre Corp*,** (Cost $2,000,000; acquired 12/13/13) | | | 2,000,000 | | | | 700,000 | |
| | | | | | | | | |
See accompanying notes to financial statements.
26
Shelton Core Value Fund | Portfolio of Investments (Continued) | 8/31/19 |
Security Description | | Shares | | | Value
(Note 1) | |
United States Treasury Bills (3.35%) |
1.966%, 10/31/2019 (Cost $5,082,835) | | $ | 5,100,000 | | | $ | 5,084,058 | |
| | | | | | | | | |
Total Investments (Cost $117,033,719)(b) (99.85%) | | $ | 151,373,554 | |
Other Net Assets (0.15%) | | | | | | | 225,355 | |
Net Assets (100.00%) | | | | | | $ | 151,598,909 | |
| * | Non-income producing security. |
| ** | Restricted security - this security has been fair valued and deemed to be illiquid by the Advisor. At August 31, 2019, the fair value was $700,000, or 0.46% of net assets. |
(a) A portion of these shares have been pledged in connection with obligations for options contracts. |
| | |
(b) Aggregate cost for federal income tax purpose is $117,392,204. |
| |
At August 31, 2019, unrealized appreciation/(depreciation) of securities for federal income tax purposes is as follows: |
| |
Unrealized appreciation | | $ | 39,498,007 | |
Unrealized depreciation | | | (5,516,657 | ) |
Net unrealized appreciation | | $ | 33,981,350 | |
Written Call Options | | Expiration
Date | | | Contracts | | | Exercise
Amount
(Shares) | | | Strike
Price | | | Notional
Amount | | | Value | |
Abbott Laboratories | | | 11/18/2019 | | | | 411 | | | | 41,100 | | | $ | 85.00 | | | $ | 3,493,500 | | | $ | (147,960 | ) |
AbbVie Inc | | | 10/21/2019 | | | | 112 | | | | 11,200 | | | | 70.00 | | | | 784,000 | | | | (6,720 | ) |
Alphabet Inc - Class A | | | 09/23/2019 | | | | 6 | | | | 600 | | | | 1,170.00 | | | | 702,000 | | | | (21,510 | ) |
Alphabet Inc - Class C | | | 09/23/2019 | | | | 6 | | | | 600 | | | | 1,170.00 | | | | 702,000 | | | | (20,736 | ) |
Amazon.com Inc | | | 10/21/2019 | | | | 6 | | | | 600 | | | | 1,880.00 | | | | 1,128,000 | | | | (13,698 | ) |
American Electric Power Co Inc | | | 09/23/2019 | | | | 34 | | | | 3,400 | | | | 90.00 | | | | 306,000 | | | | (7,480 | ) |
AmerisourceBergen Corp | | | 09/23/2019 | | | | 75 | | | | 7,500 | | | | 90.00 | | | | 675,000 | | | | (1,275 | ) |
Apple Inc | | | 09/23/2019 | | | | 100 | | | | 10,000 | | | | 210.00 | | | | 2,100,000 | | | | (49,000 | ) |
Applied Materials Inc | | | 09/23/2019 | | | | 300 | | | | 30,000 | | | | 48.00 | | | | 1,440,000 | | | | (45,000 | ) |
Arthur J Gallagher & Co | | | 10/21/2019 | | | | 220 | | | | 22,000 | | | | 90.00 | | | | 1,980,000 | | | | (60,500 | ) |
AT&T Inc | | | 09/23/2019 | | | | 290 | | | | 29,000 | | | | 33.00 | | | | 957,000 | | | | (69,600 | ) |
Baker Hughes a GE Co | | | 10/21/2019 | | | | 100 | | | | 10,000 | | | | 27.00 | | | | 270,000 | | | | (500 | ) |
Bank of America Corp | | | 10/21/2019 | | | | 450 | | | | 45,000 | | | | 29.00 | | | | 1,305,000 | | | | (18,000 | ) |
BlackRock Inc | | | 10/21/2019 | | | | 20 | | | | 2,000 | | | | 440.00 | | | | 880,000 | | | | (15,180 | ) |
BP PLC | | | 10/21/2019 | | | | 300 | | | | 30,000 | | | | 41.00 | | | | 1,230,000 | | | | (1,800 | ) |
Caterpillar Inc | | | 10/21/2019 | | | | 72 | | | | 7,200 | | | | 125.00 | | | | 900,000 | | | | (15,480 | ) |
Centene Corp | | | 09/23/2019 | | | | 100 | | | | 10,000 | | | | 57.50 | | | | 575,000 | | | | (800 | ) |
Chevron Corp | | | 10/21/2019 | | | | 100 | | | | 10,000 | | | | 120.00 | | | | 1,200,000 | | | | (24,000 | ) |
Cisco Systems Inc | | | 10/21/2019 | | | | 262 | | | | 26,200 | | | | 57.50 | | | | 1,506,500 | | | | (1,048 | ) |
Citigroup Inc | | | 09/23/2019 | | | | 100 | | | | 10,000 | | | | 72.50 | | | | 725,000 | | | | (200 | ) |
Colgate-Palmolive Co | | | 09/23/2019 | | | | 102 | | | | 10,200 | | | | 72.50 | | | | 739,500 | | | | (25,041 | ) |
Conagra Brands Inc | | | 09/23/2019 | | | | 424 | | | | 42,400 | | | | 31.00 | | | | 1,314,400 | | | | (3,816 | ) |
ConocoPhillips | | | 09/23/2019 | | | | 75 | | | | 7,500 | | | | 65.00 | | | | 487,500 | | | | (113 | ) |
Consolidated Edison Inc | | | 11/18/2019 | | | | 220 | | | | 22,000 | | | | 87.50 | | | | 1,925,000 | | | | (83,600 | ) |
Devon Energy Corp | | | 09/23/2019 | | | | 73 | | | | 7,300 | | | | 29.00 | | | | 211,700 | | | | (146 | ) |
Digital Realty Trust Inc | | | 09/23/2019 | | | | 80 | | | | 8,000 | | | | 125.00 | | | | 1,000,000 | | | | (10,000 | ) |
DR Horton Inc | | | 09/23/2019 | | | | 300 | | | | 30,000 | | | | 47.00 | | | | 1,410,000 | | | | (84,750 | ) |
DXC Technology Co | | | 09/23/2019 | | | | 42 | | | | 4,200 | | | | 60.00 | | | | 252,000 | | | | (105 | ) |
Exxon Mobil Corp | | | 10/21/2019 | | | | 150 | | | | 15,000 | | | | 72.50 | | | | 1,087,500 | | | | (7,350 | ) |
FirstEnergy Corp | | | 10/21/2019 | | | | 235 | | | | 23,500 | | | | 44.00 | | | | 1,034,000 | | | | (61,570 | ) |
Ford Motor Co | | | 09/23/2019 | | | | 500 | | | | 50,000 | | | | 11.00 | | | | 550,000 | | | | (500 | ) |
General Mills Inc | | | 10/21/2019 | | | | 379 | | | | 37,900 | | | | 55.00 | | | | 2,084,500 | | | | (49,270 | ) |
Gilead Sciences Inc | | | 10/21/2019 | | | | 104 | | | | 10,400 | | | | 65.00 | | | | 676,000 | | | | (13,832 | ) |
Hewlett Packard Enterprise Co | | | 09/23/2019 | | | | 160 | | | | 16,000 | | | | 16.00 | | | | 256,000 | | | | (240 | ) |
Intel Corp | | | 10/21/2019 | | | | 200 | | | | 20,000 | | | | 50.00 | | | | 1,000,000 | | | | (15,600 | ) |
JPMorgan Chase & Co | | | 10/21/2019 | | | | 200 | | | | 20,000 | | | | 115.00 | | | | 2,300,000 | | | | (24,600 | ) |
Lennar Corp | | | 10/21/2019 | | | | 580 | | | | 58,000 | | | | 52.50 | | | | 3,045,000 | | | | (98,600 | ) |
Linde PLC | | | 10/21/2019 | | | | 151 | | | | 15,100 | | | | 200.00 | | | | 3,020,000 | | | | (27,935 | ) |
Marriott International Inc | | | 10/21/2019 | | | | 130 | | | | 13,000 | | | | 140.00 | | | | 1,820,000 | | | | (5,850 | ) |
Masco Corp | | | 10/21/2019 | | | | 300 | | | | 30,000 | | | | 42.00 | | | | 1,260,000 | | | | (34,200 | ) |
Merck & Co Inc | | | 09/23/2019 | | | | 175 | | | | 17,500 | | | | 82.50 | | | | 1,443,750 | | | | (76,650 | ) |
Microsoft Corp | | | 09/23/2019 | | | | 56 | | | | 5,600 | | | | 145.00 | | | | 812,000 | | | | (2,184 | ) |
Morgan Stanley | | | 09/23/2019 | | | | 160 | | | | 16,000 | | | | 47.00 | | | | 752,000 | | | | (320 | ) |
NextEra Energy Inc | | | 09/23/2019 | | | | 1 | | | | 100 | | | | 210.00 | | | | 21,000 | | | | (1,076 | ) |
Northrop Grumman Corp | | | 10/21/2019 | | | | 26 | | | | 2,600 | | | | 380.00 | | | | 988,000 | | | | (18,980 | ) |
Oracle Corp | | | 10/21/2019 | | | | 59 | | | | 5,900 | | | | 55.00 | | | | 324,500 | | | | (4,779 | ) |
Paychex Inc | | | 09/23/2019 | | | | 170 | | | | 17,000 | | | | 82.50 | | | | 1,402,500 | | | | (18,700 | ) |
PPG Industries Inc | | | 09/23/2019 | | | | 60 | | | | 6,000 | | | | 125.00 | | | | 750,000 | | | | (150 | ) |
See accompanying notes to financial statements.
27
Shelton Core Value Fund | Portfolio of Investments (Continued) | 8/31/19 |
Written Call Options | | Expiration
Date | | | Contracts | | | Exercise
Amount
(Shares) | | | Strike
Price | | | Notional
Amount | | | Value | |
Principal Financial Group Inc | | | 10/21/2019 | | | | 136 | | | | 13,600 | | | $ | 60.00 | | | $ | 816,000 | | | $ | (2,040 | ) |
Public Storage | | | 09/23/2019 | | | | 115 | | | | 11,500 | | | | 240.00 | | | | 2,760,000 | | | | (289,800 | ) |
Royal Dutch Shell PLC | | | 10/21/2019 | | | | 120 | | | | 12,000 | | | | 57.50 | | | | 690,000 | | | | (7,200 | ) |
Schlumberger Ltd | | | 10/21/2019 | | | | 130 | | | | 13,000 | | | | 35.00 | | | | 455,000 | | | | (7,670 | ) |
Seagate Technology PLC | | | 10/21/2019 | | | | 130 | | | | 13,000 | | | | 52.50 | | | | 682,500 | | | | (14,950 | ) |
Sprouts Farmers Market Inc | | | 09/23/2019 | | | | 500 | | | | 50,000 | | | | 20.00 | | | | 1,000,000 | | | | (2,500 | ) |
State Street Corp | | | 09/23/2019 | | | | 32 | | | | 3,200 | | | | 62.50 | | | | 200,000 | | | | (112 | ) |
Taiwan Semiconductor Manufacturing Co Ltd | | | 09/23/2019 | | | | 40 | | | | 4,000 | | | | 46.00 | | | | 184,000 | | | | (400 | ) |
Takeda Pharmaceutical Co Ltd | | | 09/23/2019 | | | | 120 | | | | 12,000 | | | | 17.50 | | | | 210,000 | | | | (1,500 | ) |
Target Corp | | | 09/23/2019 | | | | 96 | | | | 9,600 | | | | 87.50 | | | | 840,000 | | | | (194,688 | ) |
The Bank of New York Mellon Corp | | | 09/23/2019 | | | | 50 | | | | 5,000 | | | | 45.00 | | | | 225,000 | | | | (450 | ) |
The Boeing Co | | | 10/21/2019 | | | | 9 | | | | 900 | | | | 380.00 | | | | 342,000 | | | | (7,236 | ) |
The Goldman Sachs Group Inc | | | 09/23/2019 | | | | 75 | | | | 7,500 | | | | 220.00 | | | | 1,650,000 | | | | (1,800 | ) |
The Procter & Gamble Co | | | 10/21/2019 | | | | 100 | | | | 10,000 | | | | 115.00 | | | | 1,150,000 | | | | (70,900 | ) |
Tyson Foods Inc | | | 10/21/2019 | | | | 200 | | | | 20,000 | | | | 80.00 | | | | 1,600,000 | | | | (275,400 | ) |
United Technologies Corp | | | 10/21/2019 | | | | 40 | | | | 4,000 | | | | 135.00 | | | | 540,000 | | | | (9,400 | ) |
US Bancorp | | | 09/23/2019 | | | | 350 | | | | 35,000 | | | | 55.00 | | | | 1,925,000 | | | | (7,000 | ) |
Verizon Communications Inc | | | 10/21/2019 | | | | 100 | | | | 10,000 | | | | 60.00 | | | | 600,000 | | | | (5,900 | ) |
Visa Inc | | | 10/21/2019 | | | | 82 | | | | 8,200 | | | | 185.00 | | | | 1,517,000 | | | | (28,700 | ) |
Wells Fargo & Co | | | 09/23/2019 | | | | 275 | | | | 27,500 | | | | 50.00 | | | | 1,375,000 | | | | (2,475 | ) |
| | | | | | | | | | | | | | | | | | | | | | | | | |
Total Written Call Options | | | | | | | | | | | | | | | | | | | 73,587,350 | | | | (2,120,565 | ) |
Premiums Received $2,076,679 | | | | | | | | | | | | | | | | | | | | | | | | |
Nasdaq-100 Index Fund | Portfolio of Investments | 8/31/19 |
Security Description | | Shares | | | Value
(Note 1) | |
Common Stock (99.97%) | | | | | | | | |
| | | | | | | | | |
Communications (35.76%) | | | | | | | | |
Internet (28.11%) | | | | | | | | |
Alphabet Inc - Class A* | | | 21,302 | | | $ | 25,360,670 | |
Alphabet Inc - Class C* | | | 24,297 | | | | 28,867,266 | |
Amazon.com Inc*,(a) | | | 34,040 | | | | 60,464,912 | |
Baidu Inc* | | | 21,444 | | | | 2,240,255 | |
Booking Holdings Inc* | | | 3,378 | | | | 6,642,533 | |
Ctrip.com International Ltd* | | | 40,186 | | | | 1,301,223 | |
eBay Inc | | | 66,931 | | | | 2,696,650 | |
Expedia Group Inc | | | 10,488 | | | | 1,364,489 | |
Facebook Inc*,(a) | | | 167,626 | | | | 31,123,119 | |
JD.com Inc* | | | 78,248 | | | | 2,386,564 | |
MercadoLibre Inc* | | | 3,829 | | | | 2,276,723 | |
Netflix Inc* | | | 33,660 | | | | 9,887,625 | |
Symantec Corp | | | 52,618 | | | | 1,223,369 | |
VeriSign Inc* | | | 9,247 | | | | 1,885,001 | |
| | | | | | | | 177,720,399 | |
Media (4.41%) | | | | | | | | |
Charter Communications Inc* | | | 17,214 | | | | 7,050,682 | |
Comcast Corp | | | 347,425 | | | | 15,377,031 | |
Fox Corp - Class A | | | 29,817 | | | | 989,030 | |
Fox Corp - Class B | | | 17,443 | | | | 572,130 | |
Liberty Global PLC - Class A* | | | 17,321 | | | | 462,817 | |
Liberty Global PLC - Class C* | | | 47,412 | | | | 1,238,401 | |
Sirius XM Holdings Inc | | | 353,750 | | | | 2,182,638 | |
| | | | | | | | 27,872,729 | |
Telecommunicatoins (3.24%) | | | | | | | | |
Cisco Systems Inc | | | 328,355 | | | | 15,370,298 | |
T-Mobile US Inc* | | | 65,624 | | | | 5,121,953 | |
| | | | | | | | 20,492,251 | |
| | | | | | | | | |
Total Communications | | | | | | | 226,085,379 | |
| | | | | | | | | |
Consumer, Cyclical (7.48%) | | | | | | | | |
American Airlines Group Inc | | | 41,028 | | | $ | 1,079,447 | |
Costco Wholesale Corp | | | 33,801 | | | | 9,963,183 | |
Dollar Tree Inc* | | | 20,122 | | | | 2,042,987 | |
Fastenal Co | | | 50,020 | | | | 1,531,612 | |
Hasbro Inc | | | 10,768 | | | | 1,189,541 | |
Lululemon Athletica Inc* | | | 9,497 | | | | 1,753,811 | |
Marriott International Inc | | | 25,658 | | | | 3,234,447 | |
O’Reilly Automotive Inc* | | | 6,055 | | | | 2,323,667 | |
PACCAR Inc | | | 26,605 | | | | 1,744,224 | |
Ross Stores Inc | | | 28,284 | | | | 2,998,387 | |
Starbucks Corp | | | 92,905 | | | | 8,970,907 | |
Tesla Inc* | | | 13,665 | | | | 3,082,961 | |
Ulta Beauty Inc* | | | 4,503 | | | | 1,070,498 | |
United Airlines Holdings Inc* | | | 20,297 | | | | 1,711,240 | |
Walgreens Boots Alliance Inc | | | 70,242 | | | | 3,595,688 | |
Wynn Resorts Ltd | | | 8,957 | | | | 986,614 | |
Total Consumer, Cyclical | | | | | | | 47,279,214 | |
| | | | | | | | | |
Consumer, Non-Cyclical (14.71%) |
Alexion Pharmaceuticals Inc* | | | 18,960 | | | | 1,910,410 | |
Align Technology Inc* | | | 6,948 | | | | 1,272,248 | |
Amgen Inc | | | 46,869 | | | | 9,777,811 | |
Automatic Data Processing Inc | | | 33,501 | | | | 5,689,810 | |
Biogen Inc* | | | 14,872 | | | | 3,268,122 | |
BioMarin Pharmaceutical Inc* | | | 15,309 | | | | 1,149,094 | |
Celgene Corp* | | | 54,171 | | | | 5,243,753 | |
Cintas Corp | | | 8,059 | | | | 2,125,964 | |
Gilead Sciences Inc | | | 97,675 | | | | 6,206,270 | |
Henry Schein Inc* | | | 13,327 | | | | 821,210 | |
IDEXX Laboratories Inc* | | | 6,675 | | | | 1,934,015 | |
Illumina Inc* | | | 11,362 | | | | 3,196,585 | |
Incyte Corp* | | | 18,354 | | | | 1,501,724 | |
Intuitive Surgical Inc* | | | 8,902 | | | $ | 4,551,949 | |
Mondelez International Inc | | | 110,595 | | | | 6,107,056 | |
Monster Beverage Corp* | | | 41,763 | | | | 2,450,235 | |
Mylan NV* | | | 45,153 | | | | 879,129 | |
PayPal Holdings Inc* | | | 90,267 | | | | 9,843,616 | |
PepsiCo Inc | | | 107,527 | | | | 14,702,167 | |
Regeneron Pharmaceuticals Inc* | | | 8,275 | | | | 2,400,164 | |
The Kraft Heinz Co | | | 93,702 | | | | 2,391,275 | |
Verisk Analytics Inc | | | 12,648 | | | | 2,043,158 | |
Vertex Pharmaceuticals Inc* | | | 19,673 | | | | 3,541,533 | |
Total Consumer, Non-Cyclical | | | 93,007,298 | |
| | | | | | | | | |
Financial (0.31%) | | | | | | | | |
Willis Towers Watson PLC | | | 9,944 | | | | 1,968,614 | |
| | | | | | | | | |
Industrial (0.82%) | | | | | | | | |
CSX Corp | | | 62,183 | | | | 4,167,505 | |
JB Hunt Transport Services Inc | | | 9,517 | | | | 1,028,217 | |
Total Industrial | | | | | | | 5,195,722 | |
| | | | | | | | | |
Technology (40.49%) | | | | | | | | |
Computers (11.53%) | | | | | | | | |
Apple Inc(a) | | | 318,298 | | | | 66,441,525 | |
Check Point Software Technologies Ltd* | | | 11,781 | | | | 1,268,814 | |
Cognizant Technology Solutions Corp | | | 43,743 | | | | 2,685,383 | |
NetApp Inc | | | 22,185 | | | | 1,066,211 | |
Western Digital Corp | | | 25,103 | | | | 1,437,649 | |
| | | | | | | | 72,899,582 | |
Semiconductors (12.17%) | | | | | | | | |
Advanced Micro Devices Inc* | | | 88,023 | | | | 2,768,323 | |
Analog Devices Inc | | | 28,486 | | | | 3,128,617 | |
Applied Materials Inc | | | 71,804 | | | | 3,448,028 | |
ASML Holding NV | | | 5,976 | | | | 1,330,317 | |
See accompanying notes to financial statements.
28
Nasdaq-100 Index Fund | Portfolio of Investments (Continued) | 8/31/19 |
Security Description | | Shares | | | Value
(Note 1) | |
Broadcom Inc | | | 30,363 | | | $ | 8,581,798 | |
Intel Corp | | | 343,410 | | | | 16,281,068 | |
KLA Corp | | | 13,618 | | | | 2,014,102 | |
Lam Research Corp | | | 11,567 | | | | 2,434,969 | |
Maxim Integrated Products Inc | | | 24,385 | | | | 1,329,958 | |
Microchip Technology Inc | | | 20,376 | | | | 1,759,060 | |
Micron Technology Inc* | | | 84,888 | | | | 3,842,880 | |
NVIDIA Corp | | | 46,797 | | | | 7,838,965 | |
NXP Semiconductors NV | | | 25,250 | | | | 2,579,035 | |
QUALCOMM Inc | | | 93,334 | | | | 7,258,585 | |
Skyworks Solutions Inc | | | 15,824 | | | | 1,191,072 | |
Texas Instruments Inc | | | 71,965 | | | | 8,905,669 | |
Xilinx Inc | | | 21,298 | | | | 2,216,270 | |
| | | | | | | | 76,908,716 | |
Software (16.79%) | | | | | | | | |
Activision Blizzard Inc | | | 58,902 | | | | 2,980,441 | |
Adobe Inc* | | | 37,514 | | | | 10,673,108 | |
Autodesk Inc* | | | 16,903 | | | | 2,414,086 | |
Cadence Design Systems Inc* | | | 21,629 | | | | 1,481,154 | |
Cerner Corp | | | 25,019 | | | | 1,724,059 | |
Citrix Systems Inc | | | 1,906 | | | | 177,220 | |
Electronic Arts Inc* | | | 22,833 | | | | 2,138,995 | |
Fiserv Inc* | | | 30,102 | | | | 3,219,108 | |
Intuit Inc | | | 19,994 | | | | 5,765,470 | |
Microsoft Corp | | | 482,805 | | | | 66,559,494 | |
NetEase Inc | | | 5,612 | | | | 1,431,060 | |
Paychex Inc | | | 27,631 | | | | 2,257,453 | |
Synopsys Inc* | | | 12,896 | | | | 1,828,782 | |
Take-Two Interactive Software Inc* | | | 9,920 | | | $ | 1,309,142 | |
Workday Inc* | | | 12,508 | | | | 2,217,418 | |
| | | | | | | | 106,176,990 | |
| | | | | | | | | |
Total Technology | | | | | | | 255,985,288 | |
| | | | | | | | | |
Utilities (0.40%) | | | | | | | | |
Xcel Energy Inc | | | 39,586 | | | | 2,542,213 | |
| | | | | | | | | |
Total Common Stock (Cost $367,531,127) | | | | | | | 632,063,728 | |
| | | | | | | | | |
United States Treasury Bills (0.03%) |
1.966%, 10/31/2019 (Cost $199,375) | | $ | 200,000 | | | | 199,375 | |
| | | | | | | | | |
Total Investments (Cost $367,730,502)(b) (100.0%) | | $ | 632,263,103 | |
Other Net Assets (0.00%) | | | | | | | 12,819 | |
Net Assets (100.00%) | | | | | | $ | 632,275,922 | |
| * | Non-income producing security. |
(a) A portion of these shares have been pledged in connection with obligations for futures contracts. |
| | |
(b) Aggregate cost for federal income tax purpose is $368,028,003. |
At August 31, 2019, unrealized appreciation/(depreciation) of securities for federal income tax purposes is as follows: |
| |
Unrealized appreciation | | $ | 277,502,806 | |
Unrealized depreciation | | | (13,267,694 | ) |
Net unrealized appreciation | | $ | 264,235,112 | |
(c) Futures contracts at August 31, 2019: |
| |
Contracts - $20 times premium / delivery month / commitment / exchange |
Nasdaq 100 E-MINI | | Notional Amount | | | Value | | | Unrealized Depreciation | |
3 / Sep 2019 / Long / CME | | $ | 464,119 | | | $ | 461,445 | | | $ | (2,674 | ) |
Shelton Green Alpha Fund | Portfolio of Investments | 8/31/19 |
Security Description | | Shares | | | Value
(Note 1) | |
Common Stock (97.26%) | | | | | | | | |
| | | | | | | | | |
Basic Materials (2.50%) | | | | | | | | |
Daqo New Energy Corp* | | | 18,000 | | | $ | 928,800 | |
Schnitzer Steel Industries Inc | | | 22,000 | | | | 487,080 | |
Total Basic Materials | | | | | | | 1,415,880 | |
| | | | | | | | | |
Communications (7.26%) | | | | | | | | |
Alphabet Inc* | | | 1,400 | | | | 1,663,340 | |
Arista Networks Inc* | | | 2,000 | | | | 453,240 | |
Palo Alto Networks Inc* | | | 2,000 | | | | 407,240 | |
Sierra Wireless Inc* | | | 73,000 | | | | 788,400 | |
SoftBank Group Corp | | | 35,200 | | | | 797,280 | |
Total Communications | | | | | | | 4,109,500 | |
| | | | | | | | | |
Consumer, Cyclical (5.77%) | | | | | | | | |
Herman Miller Inc | | | 23,200 | | | | 980,896 | |
Interface Inc | | | 40,000 | | | | 442,000 | |
Kandi Technologies Group Inc* | | | 117,500 | | | | 600,425 | |
NIO Inc* | | | 110,000 | | | | 314,600 | |
Tesla Inc* | | | 4,100 | | | | 925,001 | |
Total Consumer, Cyclical | | | | | | | 3,262,922 | |
| | | | | | | | | |
Consumer, Non-Cyclical (11.43%) |
Bluebird Bio Inc* | | | 2,900 | | | $ | 299,599 | |
CRISPR Therapeutics AG* | | | 22,000 | | | | 1,016,620 | |
Danone SA | | | 40,000 | | | | 714,800 | |
Editas Medicine Inc* | | | 25,500 | | | | 633,165 | |
Exact Sciences Corp* | | | 5,100 | | | | 608,022 | |
Gilead Sciences Inc | | | 7,500 | | | | 476,550 | |
Illumina Inc* | | | 1,800 | | | | 506,412 | |
Intellia Therapeutics Inc* | | | 39,700 | | | | 563,343 | |
Invitae Corp* | | | 46,000 | | | | 1,115,960 | |
The Hain Celestial Group Inc* | | | 28,000 | | | | 533,400 | |
Total Consumer, Non-Cyclical | | | 6,467,871 | |
| | | | | | | | | |
Energy (35.21%) | | | | | | | | |
Canadian Solar Inc* | | | 55,000 | | | | 1,286,450 | |
First Solar Inc* | | | 44,600 | | | | 2,768,322 | |
JinkoSolar Holding Co Ltd* | | | 83,000 | | | | 1,815,210 | |
Pattern Energy Group Inc | | | 135,000 | | | | 3,665,250 | |
SolarEdge Technologies Inc* | | | 5,200 | | | | 425,984 | |
SunPower Corp* | | | 138,000 | | | | 1,727,760 | |
Sunrun Inc* | | | 140,000 | | | | 2,146,200 | |
TerraForm Power Inc | | | 110,000 | | | | 1,865,600 | |
TPI Composites Inc* | | | 69,000 | | | | 1,217,160 | |
Vestas Wind Systems A/S | | | 122,500 | | | | 3,001,250 | |
Total Energy | | | | | | | 19,919,186 | |
| | | | | | | | | |
Financial (6.82%) | | | | | | | | |
Alexandria Real Estate Equities Inc | | | 4,900 | | | $ | 734,216 | |
Hannon Armstrong Sustainable Infrastructure Capital Inc | | | 64,000 | | | | 1,768,320 | |
Horizon Technology Finance Corp | | | 48,800 | | | | 575,840 | |
Liberty Property Trust | | | 15,000 | | | | 781,800 | |
Total Financial | | | | | | | 3,860,176 | |
| | | | | | | | | |
Industrial (9.19%) | | | | | | | | |
ABB Ltd | | | 41,600 | | | | 791,232 | |
Advanced Energy Industries Inc* | | | 8,600 | | | | 444,104 | |
Garmin Ltd | | | 8,000 | | | | 652,560 | |
Ichor Holdings Ltd* | | | 30,000 | | | | 637,800 | |
Itron Inc* | | | 6,200 | | | | 430,590 | |
Trex Co Inc* | | | 7,000 | | | | 598,710 | |
Universal Display Corp | | | 8,000 | | | | 1,643,760 | |
Total Industrial | | | | | | | 5,198,756 | |
| | | | | | | | | |
Technology (16.80%) | | | | | | | | |
Analog Devices Inc | | | 7,700 | | | | 845,691 | |
Applied Materials Inc | | | 48,500 | | | | 2,328,970 | |
Fortinet Inc* | | | 6,500 | | | | 514,670 | |
International Business Machines Corp | | | 13,000 | | | | 1,761,890 | |
See accompanying notes to financial statements.
29
Shelton Green Alpha Fund | Portfolio of Investments (Continued) | 8/31/19 |
Security Description | | Shares | | | Value
(Note 1) | |
Microchip Technology Inc | | | 3,000 | | | $ | 258,990 | |
NVIDIA Corp | | | 3,100 | | | | 519,281 | |
Omnicell Inc* | | | 3,100 | | | | 222,580 | |
QUALCOMM Inc | | | 6,800 | | | | 528,836 | |
Skyworks Solutions Inc | | | 12,500 | | | | 940,875 | |
STMicroelectronics NV | | | 46,500 | | | | 823,050 | |
Ultra Clean Holdings Inc* | | | 32,500 | | | | 388,050 | |
Veeco Instruments Inc* | | | 40,600 | | | | 375,956 | |
Total Technology | | | | | | | 9,508,839 | |
| | | | | | | | | |
Utilities (2.28%) | | | | | | | | |
Consolidated Water Co Ltd | | | 88,000 | | | | 1,290,080 | |
| | | | | | | | | |
Total Common Stock (Cost $44,973,351) | | | | | | | 55,033,210 | |
| | | | | | | | | |
Total Investments (Cost $44,973,351)(a) (97.26%) | | $ | 55,033,210 | |
Other Net Assets (2.74%) | | | | | | | 1,534,092 | |
Net Assets (100.00%) | | | | | | $ | 56,567,302 | |
| * | Non-income producing security. |
| | |
(a) Aggregate cost for federal income tax purpose is $45,002,348. |
At August 31, 2019, unrealized appreciation/(depreciation) of securities for federal income tax purposes is as follows: |
| |
Unrealized appreciation | | $ | 13,199,082 | |
Unrealized depreciation | | | (3,168,220 | ) |
Net unrealized appreciation | | $ | 10,030,862 | |
See accompanying notes to financial statements.
30
Statements of Assets & Liabilities August 31, 2019 |
| | | Green
California
Tax-Free
Income Fund | | | U.S.
Government
Securities
Fund | | | Short-Term
U.S.
Government
Bond Fund | | | The United
States
Treasury
Trust | |
Assets | | | | | | | | | | | | | | | | |
Investments in securities | | | | | | | | | | | | | | | | |
Cost of investments | | $ | 61,099,884 | | | $ | 18,623,049 | | | $ | 5,964,859 | | | $ | 39,094,862 | |
Market value of investments (Note 1) | | | 65,522,289 | | | | 19,313,646 | | | | 6,009,806 | | | | 39,094,862 | |
Cash | | | 117,792 | | | | 152,798 | | | | 36,657 | | | | 25,164 | |
Cash held at broker | | | — | | | | — | | | | — | | | | — | |
Interest receivable | | | 609,086 | | | | 65,521 | | | | 10,024 | | | | — | |
Dividend receivable | | | — | | | | — | | | | — | | | | — | |
Variation margin receivable | | | — | | | | — | | | | — | | | | — | |
Receivable from investment advisor | | | — | | | | — | | | | 3,241 | | | | — | |
Receivable for fund shares sold | | | 993 | | | | 3,359 | | | | 2,785 | | | | 19,723 | |
Receivable for investment securities sold | | | — | | | | — | | | | — | | | | — | |
Prepaid expenses | | | — | | | | — | | | | — | | | | — | |
Total assets | | $ | 66,250,160 | | | $ | 19,535,324 | | | $ | 6,062,513 | | | $ | 39,139,749 | |
| | | | | | | | | | | | | | | | | |
Liabilities | | | | | | | | | | | | | | | | |
Written options, at value | | | — | | | | — | | | | — | | | | — | |
Variation margin payable | | | — | | | | — | | | | — | | | | — | |
Payable to investment advisor | | | 28,102 | | | | 4,410 | | | | — | | | | 8,319 | |
Payable for investment securities purchased | | | — | | | | — | | | | — | | | | — | |
Payable for fund shares redeemed | | | 24,391 | | | | 156 | | | | 733 | | | | 21,953 | |
Distributions payable | | | 25,963 | | | | 578 | | | | 113 | | | | — | |
Accrued 12b-1 fees | | | — | | | | 758 | | | | 208 | | | | 363 | |
Accrued shareholder service fees | | | — | | | | 795 | | | | 178 | | | | 362 | |
Accrued administration fees | | | 4,913 | | | | 1,434 | | | | 440 | | | | 2,918 | |
Accrued CCO fees | | | 1,661 | | | | 339 | | | | 97 | | | | 534 | |
Accrued custody fees | | | 1,181 | | | | 356 | | | | 91 | | | | 707 | |
Accrued fund accounting fees | | | 4,109 | | | | 2,227 | | | | 1,772 | | | | 3,063 | |
Accrued printing fees | | | 1,600 | | | | 1,535 | | | | 1,132 | | | | 988 | |
Accrued registration fees | | | 141 | | | | 88 | | | | 39 | | | | 39 | |
Accrued state registration fees | | | 138 | | | | 405 | | | | 121 | | | | 364 | |
Accrued transfer agent fees | | | 2,807 | | | | 1,388 | | | | 434 | | | | 1,696 | |
Accrued trustee fees | | | 625 | | | | 634 | | | | 560 | | | | 562 | |
Accrued expenses | | | 10,182 | | | | 6,721 | | | | 5,713 | | | | 8,956 | |
Total liabilities | | | 105,813 | | | | 21,824 | | | | 11,631 | | | | 50,824 | |
| | | | | | | | | | | | | | | | | |
Net assets | | $ | 66,144,347 | | | $ | 19,513,500 | | | $ | 6,050,882 | | | $ | 39,088,925 | |
| | | | | | | | | | | | | | | | | |
Net assets at August 31, 2019 consist of | | | | | | | | | | | | | | | | |
Paid-in capital | | $ | 61,656,113 | | | $ | 18,869,584 | | | $ | 6,008,984 | | | $ | 39,091,172 | |
Distributable earnings/(loss) | | | 4,488,234 | | | | 643,916 | | | | 41,898 | | | | (2,247 | ) |
Total net assets | | $ | 66,144,347 | | | $ | 19,513,500 | | | $ | 6,050,882 | | | $ | 39,088,925 | |
| | | | | | | | | | | | | | | | | |
Net assets | | | | | | | | | | | | | | | | |
Direct Shares | | $ | 66,144,347 | | | $ | 17,263,109 | | | $ | 5,562,611 | | | $ | 37,478,562 | |
K Shares | | | | | | $ | 2,250,391 | | | $ | 488,271 | | | $ | 1,610,363 | |
| | | | | | | | | | | | | | | | | |
Shares outstanding | | | | | | | | | | | | | | | | |
Direct Shares (no par value, unlimited shares authorized) | | | 5,643,054 | | | | 1,633,865 | | | | 545,674 | | | | 37,487,563 | |
K Shares (no par value, unlimited shares authorized) | | | | | | | 212,468 | | | | 48,703 | | | | 1,608,813 | |
| | | | | | | | | | | | | | | | | |
Net asset value per share | | | | | | | | | | | | | | | | |
Direct Shares | | $ | 11.72 | | | $ | 10.57 | | | $ | 10.19 | | | $ | 1.00 | |
K Shares | | | | | | $ | 10.59 | | | $ | 10.03 | | | $ | 1.00 | |
31
See accompanying notes to financial statements.
Statements of Assets & Liabilities
August 31, 2019 (Continued) |
| | | S&P 500
Index Fund | | | S&P MidCap
Index Fund | | | S&P
SmallCap
Index Fund | | | Shelton
Core Value
Fund | |
Assets | | | | | | | | | | | | | | | | |
Investments in securities | | | | | | | | | | | | | | | | |
Cost of investments | | $ | 71,249,209 | | | $ | 81,513,851 | | | $ | 55,457,370 | | | $ | 117,033,719 | |
Market value of investments (Note 1) | | | 191,084,735 | | | | 110,037,178 | | | | 66,115,275 | | | | 151,373,554 | |
Cash | | | 9,199 | | | | 79,943 | | | | 241,239 | | | | 70,221 | |
Cash held at broker | | | — | | | | — | | | | — | | | | 1,660,658 | |
Interest receivable | | | — | | | | — | | | | — | | | | — | |
Dividend receivable | | | 371,773 | | | | 114,596 | | | | 51,253 | | | | 419,043 | |
Variation margin receivable | | | — | | | | 1,170 | | | | — | | | | — | |
Receivable from investment advisor | | | — | | | | — | | | | — | | | | — | |
Receivable for fund shares sold | | | 13,630 | | | | 8,984 | | | | 7,629 | | | | 2,622 | |
Receivable for investment securities sold | | | — | | | | — | | | | — | | | | 355,449 | |
Prepaid expenses | | | — | | | | — | | | | — | | | | — | |
Total assets | | $ | 191,479,337 | | | $ | 110,241,871 | | | $ | 66,415,396 | | | $ | 153,881,547 | |
| | | | | | | | | | | | | | | | | |
Liabilities | | | | | | | | | | | | | | | | |
Written options, at value (proceeds $—, $—, $—, $2,076,679 respectively) | | | — | | | | — | | | | — | | | | 2,120,565 | |
Variation margin payable | | | 285 | | | | — | | | | 131 | | | | — | |
Payable to investment advisor | | | 40,295 | | | | 37,572 | | | | 28,471 | | | | 64,085 | |
Payable for investment securities purchased | | | — | | | | — | | | | — | | | | — | |
Payable for fund shares redeemed | | | 40,020 | | | | 29,842 | | | | 27,761 | | | | 32,380 | |
Distributions payable | | | 28 | | | | — | | | | — | | | | — | |
Accrued 12b-1 fees | | | 1,622 | | | | 870 | | | | 1,495 | | | | 806 | |
Accrued shareholder service fees | | | 2,525 | | | | 838 | | | | 1,649 | | | | 1,024 | |
Accrued administration fees | | | 14,091 | | | | 8,212 | | | | 4,977 | | | | 11,207 | |
Accrued CCO fees | | | 3,690 | | | | 1,920 | | | | 1,013 | | | | 2,494 | |
Accrued custody fees | | | 2,096 | | | | 1,720 | | | | 1,959 | | | | 2,227 | |
Accrued fund accounting fees | | | 6,810 | | | | 5,054 | | | | 4,158 | | | | 5,828 | |
Accrued printing fees | | | 3,925 | | | | 3,570 | | | | 3,058 | | | | 6,768 | |
Accrued registration fees | | | 174 | | | | 287 | | | | 282 | | | | 205 | |
Accrued state registration fees | | | 125 | | | | 994 | | | | 1,057 | | | | 643 | |
Accrued transfer agent fees | | | 4,534 | | | | 3,839 | | | | 2,963 | | | | 14,734 | |
Accrued trustee fees | | | 554 | | | | 629 | | | | 556 | | | | 579 | |
Accrued expenses | | | 24,148 | | | | 15,750 | | | | 15,967 | | | | 19,093 | |
Total liabilities | | | 144,922 | | | | 111,097 | | | | 95,497 | | | | 2,282,638 | |
| | | | | | | | | | | | | | | | | |
Net assets | | $ | 191,334,415 | | | $ | 110,130,774 | | | $ | 66,319,899 | | | $ | 151,598,909 | |
| | | | | | | | | | | | | | | | | |
Net assets at August 31, 2019 consist of | | | | | | | | | | | | | | | | |
Paid-in capital | | $ | 65,898,699 | | | $ | 74,720,853 | | | $ | 51,773,075 | | | $ | 107,612,388 | |
Distributable earnings/(loss) | | | 125,435,716 | | | | 35,409,921 | | | | 14,546,824 | | | | 43,986,521 | |
Total net assets | | $ | 191,334,415 | | | $ | 110,130,774 | | | $ | 66,319,899 | | | $ | 151,598,909 | |
| | | | | | | | | | | | | | | | | |
Net assets | | | | | | | | | | | | | | | | |
Direct Shares | | $ | 185,169,741 | | | $ | 107,053,821 | | | $ | 61,412,248 | | | $ | 148,997,467 | |
K Shares | | $ | 6,164,674 | | | $ | 3,076,953 | | | $ | 4,907,651 | | | $ | 2,601,442 | |
| | | | | | | | | | | | | | | | | |
Shares outstanding | | | | | | | | | | | | | | | | |
Direct Shares (no par value, unlimited shares authorized) | | | 3,306,708 | | | | 4,488,140 | | | | 2,992,227 | | | | 7,430,427 | |
K Shares (no par value, unlimited shares authorized) | | | 110,239 | | | | 131,117 | | | | 245,839 | | | | 131,775 | |
| | | | | | | | | | | | | | | | | |
Net asset value per share | | | | | | | | | | | | | | | | |
Direct Shares | | $ | 56.00 | | | $ | 23.85 | | | $ | 20.52 | | | $ | 20.05 | |
K Shares | | $ | 55.92 | | | $ | 23.47 | | | $ | 19.96 | | | $ | 19.74 | |
See accompanying notes to financial statements.
32
Statements of Assets & Liabilities
August 31, 2019 (Continued) |
| | | Nasdaq-100
Index Fund | | | Shelton Green
Alpha Fund | |
Assets | | | | | | | | |
Investments in securities | | | | | | | | |
Cost of investments | | $ | 367,730,502 | | | $ | 44,973,351 | |
Market value of investments (Note 1) | | | 632,263,103 | | | | 55,033,210 | |
Cash | | | 17,555 | | | | 1,714,979 | |
Cash held at broker | | | — | | | | — | |
Interest receivable | | | — | | | | — | |
Dividend receivable | | | 596,669 | | | | 91,603 | |
Variation margin receivable | | | — | | | | — | |
Receivable from investment advisor | | | — | | | | — | |
Receivable for fund shares sold | | | 224,061 | | | | 45,559 | |
Receivable for investment securities sold | | | 1,514,115 | | | | — | |
Prepaid expenses | | | — | | | | — | |
Total assets | | $ | 634,615,503 | | | $ | 56,885,351 | |
| | | | | | | | | |
Liabilities | | | | | | | | |
Written options, at value | | | — | | | | — | |
Variation margin payable | | | 1,001 | | | | — | |
Payable to investment advisor | | | 105,474 | | | | 47,560 | |
Payable for investment securities purchased | | | 1,519,375 | | | | 215,222 | |
Payable for fund shares redeemed | | | 492,501 | | | | 21,954 | |
Distributions payable | | | 677 | | | | — | |
Accrued 12b-1 fees | | | 5,543 | | | | — | |
Accrued shareholder service fees | | | 6,183 | | | | — | |
Accrued administration fees | | | 46,761 | | | | 4,160 | |
Accrued CCO fees | | | 8,403 | | | | 946 | |
Accrued custody fees | | | 4,684 | | | | 660 | |
Accrued fund accounting fees | | | 16,505 | | | | 3,163 | |
Accrued printing fees | | | 28,695 | | | | 5,454 | |
Accrued registration fees | | | 194 | | | | 3,280 | |
Accrued state registration fees | | | 1,871 | | | | 1,641 | |
Accrued transfer agent fees | | | 19,044 | | | | 2,012 | |
Accrued trustee fees | | | 805 | | | | 801 | |
Accrued expenses | | | 81,865 | | | | 11,196 | |
Total liabilities | | | 2,339,581 | | | | 318,049 | |
| | | | | | | | | |
Net assets | | $ | 632,275,922 | | | $ | 56,567,302 | |
| | | | | | | | | |
Net assets at August 31, 2019 consist of | | | | | | | | |
Paid-in capital | | $ | 359,269,001 | | | $ | 46,708,590 | |
Distributable earnings/(loss) | | | 273,006,921 | | | | 9,858,712 | |
Total net assets | | $ | 632,275,922 | | | $ | 56,567,302 | |
| | | | | | | | | |
Net assets | | | | | | | | |
Direct Shares | | $ | 607,521,330 | | | $ | 56,567,302 | |
K Shares | | $ | 24,754,592 | | | | | |
| | | | | | | | | |
Shares outstanding | | | | | | | | |
Direct Shares (no par value, unlimited shares authorized) | | | 32,344,916 | | | | 3,067,609 | |
K Shares (no par value, unlimited shares authorized) | | | 1,357,984 | | | | | |
| | | | | | | | | |
Net asset value per share | | | | | | | | |
Direct Shares | | $ | 18.78 | | | $ | 18.44 | |
K Shares | | $ | 18.23 | | | | | |
33
See accompanying notes to financial statements.
Statements of Operations August 31, 2019 |
| | | Green
California
Tax-Free
Income Fund | | | U.S.
Government
Securities
Fund | | | Short-Term
U.S.
Government
Bond Fund | | | The United
States
Treasury
Trust | |
Investment income | | | | | | | | | | | | | | | | |
Interest income | | $ | 1,827,441 | | | $ | 421,254 | | | $ | 124,381 | | | $ | 1,118,575 | |
Dividend income | | | — | | | | — | | | | — | | | | — | |
Total | | | 1,827,441 | | | | 421,254 | | | | 124,381 | | | | 1,118,575 | |
| | | | | | | | | | | | | | | | | |
Expenses | | | | | | | | | | | | | | | | |
Management fees (Note 2) | | | 328,183 | | | | 94,498 | | | | 31,545 | | | | 245,569 | |
Administration fees (Note 2) | | | 57,732 | | | | 16,527 | | | | 5,502 | | | | 43,096 | |
Transfer agent fees | | | 16,729 | | | | 10,491 | | | | 2,992 | | | | 9,801 | |
Accounting services | | | 38,177 | | | | 22,493 | | | | 18,156 | | | | 28,077 | |
Custodian fees | | | 5,280 | | | | 2,163 | | | | 799 | | | | 4,931 | |
Broker Fees | | | — | | | | — | | | | — | | | | — | |
Legal and audit fees | | | 23,355 | | | | 13,358 | | | | 10,224 | | | | 18,068 | |
CCO fees (Note 2) | | | 15,668 | | | | 3,937 | | | | 1,333 | | | | 9,211 | |
Trustees fees | | | 6,027 | | | | 6,035 | | | | 5,961 | | | | 5,963 | |
Insurance | | | 4,869 | | | | 1,581 | | | | 456 | | | | 3,876 | |
Printing | | | 9,147 | | | | 8,669 | | | | 7,088 | | | | 5,808 | |
Registration and dues | | | 2,949 | | | | 7,954 | | | | 2,556 | | | | 3,681 | |
12b-1 fees Class K (Note 2) | | | — | | | | 8,034 | | | | 2,692 | | | | 4,746 | |
Shareholder service fees Class K (Note 2) | | | — | | | | 8,034 | | | | 2,675 | | | | 4,746 | |
Licensing fee | | | — | | | | — | | | | — | | | | — | |
Total expenses | | | 508,116 | | | | 203,774 | | | | 91,979 | | | | 387,573 | |
Less class specific expenses waived | | | — | | | | — | | | | — | | | | — | |
Less reimbursement from manager (Note 2) | | | — | | | | (43,929 | ) | | | (48,141 | ) | | | (108,593 | ) |
Net expenses | | | 508,116 | | | | 159,845 | | | | 43,838 | | | | 278,980 | |
Net investment income | | | 1,319,325 | | | | 261,409 | | | | 80,543 | | | | 839,595 | |
| | | | | | | | | | | | | | | | | |
Realized and unrealized gain/(loss) on investments | | | | | | | | | | | | | | | | |
Net realized gain/(loss) from security transactions and foreign currency | | | 86,434 | | | | (46,105 | ) | | | (996 | ) | | | 50 | |
Net realized gain/(loss) from futures contracts | | | — | | | | — | | | | — | | | | — | |
Net realized gain/(loss) from written options contracts | | | — | | | | — | | | | — | | | | — | |
Change in unrealized appreciation/(depreciation) of investments | | | 2,469,368 | | | | 1,131,813 | | | | 92,380 | | | | — | |
Change in unrealized appreciation/(depreciation) of futures | | | — | | | | — | | | | — | | | | — | |
Change in unrealized appreciation/(depreciation) of written options contracts | | | — | | | | — | | | | — | | | | — | |
Net realized and unrealized gain/(loss) on investments | | | 2,555,802 | | | | 1,085,708 | | | | 91,384 | | | | 50 | |
Net increase/(decrease) in net assets resulting from operations | | $ | 3,875,127 | | | $ | 1,347,117 | | | $ | 171,927 | | | $ | 839,645 | |
See accompanying notes to financial statements.
34
Statements of Operations
August 31, 2019 (Continued) |
| | | S&P 500
Index Fund | | | S&P MidCap
Index Fund | | | S&P
SmallCap
Index Fund | | | Shelton
Core Value
Fund | |
Investment income | | | | | | | | | | | | | | | | |
Interest income | | $ | 6,905 | | | $ | 7,087 | | | $ | 9,061 | | | $ | 135,813 | |
Dividend income (net of foreign tax withheld: $7,598, $608, $374 and $30,731 respectively) | | | 3,726,736 | | | | 1,849,235 | | | | 1,103,004 | | | | 3,951,425 | |
Total | | | 3,733,641 | | | | 1,856,322 | | | | 1,112,065 | | | | 4,087,238 | |
| | | | | | | | | | | | | | | | | |
Expenses | | | | | | | | | | | | | | | | |
Management fees (Note 2) | | | 463,120 | | | | 458,149 | | | | 366,836 | | | | 788,495 | |
Administration fees (Note 2) | | | 162,333 | | | | 100,135 | | | | 64,104 | | | | 137,846 | |
Transfer agent fees | | | 26,724 | | | | 19,510 | | | | 18,306 | | | | 136,075 | |
Accounting services | | | 69,690 | | | | 51,371 | | | | 48,248 | | | | 54,974 | |
Custodian fees | | | 16,568 | | | | 12,483 | | | | 8,342 | | | | 14,086 | |
Broker Fees | | | — | | | | — | | | | — | | | | 120 | |
Legal and audit fees | | | 48,122 | | | | 32,879 | | | | 24,196 | | | | 41,334 | |
CCO fees (Note 2) | | | 40,406 | | | | 23,230 | | | | 15,440 | | | | 30,940 | |
Trustees fees | | | 5,955 | | | | 6,031 | | | | 5,958 | | | | 5,981 | |
Insurance | | | 13,679 | | | | 9,307 | | | | 6,553 | | | | 13,113 | |
Printing | | | 19,103 | | | | 16,409 | | | | 13,369 | | | | 37,711 | |
Registration and dues | | | 14,810 | | | | 11,893 | | | | 7,373 | | | | 37,419 | |
12b-1 fees Class K (Note 2) | | | 20,326 | | | | 11,717 | | | | 18,542 | | | | 11,039 | |
Shareholder service fees Class K (Note 2) | | | 20,258 | | | | 11,717 | | | | 18,542 | | | | 11,039 | |
Licensing fee | | | 42,203 | | | | 26,252 | | | | 15,866 | | | | — | |
Total expenses | | | 963,297 | | | | 791,083 | | | | 631,675 | | | | 1,320,172 | |
Less class specific expenses waived | | | — | | | | — | | | | — | | | | — | |
Less reimbursement from manager (Note 2) | | | — | | | | — | | | | — | | | | — | |
Net expenses | | | 963,297 | | | | 791,083 | | | | 631,675 | | | | 1,320,172 | |
Net investment income | | | 2,770,344 | | | | 1,065,239 | | | | 480,390 | | | | 2,767,066 | |
| | | | | | | | | | | | | | | | | |
Realized and unrealized gain/(loss) on investments | | | | | | | | | | | | | | | | |
Net realized gain/(loss) from security transactions and foreign currency | | | 5,390,498 | | | | 8,714,563 | | | | 4,497,013 | | | | 12,516,989 | |
Net realized gain/(loss) from futures contracts | | | 73,975 | | | | (27,539 | ) | | | (226,099 | ) | | | — | |
Net realized gain/(loss) from written options contracts | | | — | | | | — | | | | — | | | | 2,544,749 | |
Change in unrealized appreciation/(depreciation) of investments | | | (3,830,884 | ) | | | (19,229,730 | ) | | | (18,908,932 | ) | | | (18,519,706 | ) |
Change in unrealized appreciation/(depreciation) of futures | | | (9,272 | ) | | | (16,069 | ) | | | (42,815 | ) | | | — | |
Change in unrealized appreciation/(depreciation) of written options contracts | | | — | | | | — | | | | — | | | | (37,166 | ) |
Net realized and unrealized gain/(loss) on investments | | | 1,624,317 | | | | (10,558,775 | ) | | | (14,680,833 | ) | | | (3,495,134 | ) |
Net increase/(decrease) in net assets resulting from operations | | $ | 4,394,661 | | | $ | (9,493,536 | ) | | $ | (14,200,443 | ) | | $ | (728,068 | ) |
35
See accompanying notes to financial statements.
Statements of Operations
August 31, 2019 (Continued) |
| | | Nasdaq-100
Index Fund | | | Shelton Green
Alpha Fund | |
Investment income | | | | | | | | |
Interest income | | $ | 104,178 | | | $ | — | |
Dividend income (net of foreign tax withheld: $5,757 and $34,373 respectively) | | | 6,956,247 | | | | 726,087 | |
Total | | | 7,060,425 | | | | 726,087 | |
| | | | | | | | | |
Expenses | | | | | | | | |
Management fees (Note 2) | | | 3,070,634 | | | | 485,219 | |
Administration fees (Note 2) | | | 538,283 | | | | 42,413 | |
Transfer agent fees | | | 153,237 | | | | 12,218 | |
Accounting services | | | 155,136 | | | | 28,836 | |
Custodian fees | | | 47,466 | | | | 4,587 | |
Broker Fees | | | — | | | | — | |
Legal and audit fees | | | 155,253 | | | | 19,923 | |
CCO fees (Note 2) | | | 117,102 | | | | 9,263 | |
Trustees fees | | | 6,207 | | | | 6,203 | |
Insurance | | | 46,734 | | | | 4,192 | |
Printing | | | 108,286 | | | | 17,709 | |
Registration and dues | | | 43,375 | | | | 21,479 | |
12b-1 fees Class K (Note 2) | | | 64,223 | | | | — | |
Shareholder service fees Class K (Note 2) | | | 64,384 | | | | — | |
Licensing fee | | | 132,584 | | | | — | |
Total expenses | | | 4,702,904 | | | | 652,042 | |
Less class specific expenses waived | | | — | | | | — | |
Less reimbursement from manager (Note 2) | | | (1,448,548 | ) | | | — | |
Net expenses | | | 3,254,356 | | | | 652,042 | |
Net investment income | | | 3,806,069 | | | | 74,045 | |
| | | | | | | | | |
Realized and unrealized gain/(loss) on investments | | | | | | | | |
Net realized gain/(loss) from security transactions and foreign currency | | | 18,230,973 | | | | 229,266 | |
Net realized gain/(loss) from futures contracts | | | (1,336,043 | ) | | | — | |
Net realized gain/(loss) from written options contracts | | | — | | | | — | |
Change in unrealized appreciation/(depreciation) of investments | | | (14,036,710 | ) | | | 3,860,410 | |
Change in unrealized appreciation/(depreciation) of futures | | | (502,329 | ) | | | — | |
Change in unrealized appreciation/(depreciation) of written options contracts | | | — | | | | — | |
Net realized and unrealized gain/(loss) on investments | | | 2,355,891 | | | | 4,089,676 | |
Net increase/(decrease) in net assets resulting from operations | | $ | 6,161,960 | | | $ | 4,163,721 | |
See accompanying notes to financial statements.
36
Statements of Changes in Net Assets |
| | | Green California Tax-Free
Income Fund | |
| | | Year
Ended
August 31,
2019 | | | Year
Ended
August 31,
2018 | |
Operations | | | | | | | | |
Net investment income/(loss) | | $ | 1,319,325 | | | $ | 1,440,673 | |
Net realized gain/(loss) on investments and foreign currency | | | 86,434 | | | | 98,984 | |
Net realized gain/(loss) on futures contracts | | | — | | | | — | |
Net realized gain/(loss) on written option contracts | | | — | | | | — | |
Change in unrealized appreciation/(depreciation) of investments | | | 2,469,368 | | | | (2,120,294 | ) |
Change in unrealized appreciation/(depreciation) of written options contracts | | | — | | | | — | |
Change in unrealized appreciation/(depreciation) of futures contracts | | | — | | | | — | |
Net increase/(decrease) in net assets resulting from operations | | | 3,875,127 | | | | (580,637 | ) |
| | | | | | | | | |
Distributions to shareholders | | | | | | | | |
Distributions(a) | | | | | | | | |
Direct shares | | | (1,432,047 | ) | | | — | |
K shares | | | — | | | | — | |
Distributions from net investment income | | | | | | | | |
Direct shares | | | — | | | | (1,471,475 | ) |
K shares | | | — | | | | — | |
Distributions from realized capital gains on investments | | | | | | | | |
Direct shares | | | — | | | | (234,947 | ) |
K shares | | | — | | | | — | |
| | | | | | | | | |
Capital share transactions | | | | | | | | |
Increase/(decrease) in net assets resulting from capital share transactions | | | (4,551,692 | ) | | | (4,769,961 | ) |
Total increase/(decrease) | | | (2,108,612 | ) | | | (7,057,020 | ) |
| | | | | | | | | |
Net assets | | | | | | | | |
Beginning of year | | $ | 68,252,959 | | | $ | 75,309,979 | |
End of year | | $ | 66,144,347 | | | $ | 68,252,959 | |
(a) | The SEC eliminated the requirement to disclose components of distributions paid to shareholders in September 2018. |
37
See accompanying notes to financial statements.
Statements of Changes in Net Assets
(Continued) |
| | | U.S. Government
Securities Fund | | | Short-Term U.S.
Government Bond Fund | | | The United States
Treasury Trust | |
| | | Year
Ended
August 31,
2019 | | | Year
Ended
August 31,
2018 | | | Year
Ended
August 31,
2019 | | | Year
Ended
August 31,
2018 | | | Year
Ended
August 31,
2019 | | | Year
Ended
August 31,
2018 | |
Operations | | | | | | | | | | | | | | | | | | | | | | | | |
Net investment income/(loss) | | $ | 261,409 | | | $ | 275,977 | | | $ | 80,543 | | | $ | 38,967 | | | $ | 839,595 | | | $ | 525,502 | |
Net realized gain/(loss) on investments and foreign currency | | | (46,105 | ) | | | 50,784 | | | | (996 | ) | | | (1,308 | ) | | | 50 | | | | (1 | ) |
Net realized gain/(loss) on futures contracts | | | — | | | | — | | | | — | | | | — | | | | — | | | | — | |
Net realized gain/(loss) on written option contracts | | | — | | | | — | | | | — | | | | — | | | | — | | | | — | |
Change in unrealized appreciation/(depreciation) of investments | | | 1,131,813 | | | | (763,008 | ) | | | 92,380 | | | | (47,606 | ) | | | — | | | | — | |
Change in unrealized appreciation/(depreciation) of written options contracts | | | — | | | | — | | | | — | | | | — | | | | — | | | | — | |
Change in unrealized appreciation/(depreciation) of futures contracts | | | — | | | | — | | | | — | | | | — | | | | — | | | | — | |
Net increase/(decrease) in net assets resulting from operations | | | 1,347,117 | | | | (436,247 | ) | | | 171,927 | | | | (9,947 | ) | | | 839,645 | | | | 525,501 | |
| | | | | | | | | | | | | | | | | | | | | | | | | |
Distributions to shareholders | | | | | | | | | | | | | | | | | | | | | | | | |
Distributions(a) | | | | | | | | | | | | | | | | | | | | | | | | |
Direct shares | | | (232,769 | ) | | | — | | | | (71,224 | ) | | | — | | | | (821,966 | ) | | | — | |
K shares | | | (31,691 | ) | | | — | | | | (9,206 | ) | | | — | | | | (23,550 | ) | | | — | |
Distributions from net investment income | | | | | | | | | | | | | | | | | | | | | | | | |
Direct shares | | | — | | | | (247,995 | ) | | | — | | | | (35,380 | ) | | | — | | | | (511,891 | ) |
K shares | | | — | | | | (34,940 | ) | | | — | | | | (3,512 | ) | | | — | | | | (12,864 | ) |
Distributions from realized capital gains on investments | | | | | | | | | | | | | | | | | | | | | | | | |
Direct shares | | | — | | | | — | | | | — | | | | — | | | | — | | | | — | |
K shares | | | — | | | | — | | | | — | | | | — | | | | — | | | | — | |
| | | | | | | | | | | | | | | | | | | | | | | | | |
Capital share transactions | | | | | | | | | | | | | | | | | | | | | | | | |
Increase/(decrease) in net assets resulting from capital share transactions | | | (928,466 | ) | | | (1,936,468 | ) | | | (443,046 | ) | | | 1,127,333 | | | | (15,841,034 | ) | | | (4,336,408 | ) |
Total increase/(decrease) | | | 154,191 | | | | (2,655,650 | ) | | | (351,549 | ) | | | 1,078,494 | | | | (15,846,905 | ) | | | (4,335,662 | ) |
| | | | | | | | | | | | | | | | | | | | | | | | | |
Net assets | | | | | | | | | | | | | | | | | | | | | | | | |
Beginning of year | | $ | 19,359,309 | | | $ | 22,014,959 | | | $ | 6,402,431 | | | $ | 5,323,937 | | | $ | 54,935,830 | | | $ | 59,271,492 | |
End of year | | $ | 19,513,500 | | | $ | 19,359,309 | | | $ | 6,050,882 | | | $ | 6,402,431 | | | $ | 39,088,925 | | | $ | 54,935,830 | |
(a) | The SEC eliminated the requirement to disclose components of distributions paid to shareholders in September 2018. |
See accompanying notes to financial statements.
38
Statements of Changes in Net Assets
(Continued) |
| | | S&P 500 Index Fund | | | S&P MidCap Index Fund | | | S&P SmallCap Index Fund | |
| | | Year
Ended
August 31,
2019 | | | Year
Ended
August 31,
2018 | | | Year
Ended
August 31,
2019 | | | Year
Ended
August 31,
2018 | | | Year
Ended
August 31,
2019 | | | Year
Ended
August 31,
2018 | |
Operations | | | | | | | | | | | | | | | | | | | | | | | | |
Net investment income/(loss) | | $ | 2,770,344 | | | $ | 2,775,317 | | | $ | 1,065,239 | | | $ | 1,136,376 | | | $ | 480,390 | | | $ | 372,943 | |
Net realized gain/(loss) on investments and foreign currency | | | 5,390,498 | | | | 1,080,430 | | | | 8,714,563 | | | | 10,569,898 | | | | 4,497,013 | | | | 4,990,033 | |
Net realized gain/(loss) on futures contracts | | | 73,975 | | | | 15,399 | | | | (27,539 | ) | | | 78,996 | | | | (226,099 | ) | | | 125,810 | |
Net realized gain/(loss) on written option contracts | | | — | | | | — | | | | — | | | | — | | | | — | | | | — | |
Change in unrealized appreciation/(depreciation) of investments | | | (3,830,884 | ) | | | 27,825,235 | | | | (19,229,730 | ) | | | 10,333,330 | | | | (18,908,932 | ) | | | 14,383,763 | |
Change in unrealized appreciation/(depreciation) of written options contracts | | | — | | | | — | | | | — | | | | — | | | | — | | | | — | |
Change in unrealized appreciation/(depreciation) of futures contracts | | | (9,272 | ) | | | 11,995 | | | | (16,069 | ) | | | 18,540 | | | | (42,815 | ) | | | 36,710 | |
Net increase/(decrease) in net assets resulting from operations | | | 4,394,661 | | | | 31,708,376 | | | | (9,493,536 | ) | | | 22,137,140 | | | | (14,200,443 | ) | | | 19,909,259 | |
| | | | | | | | | | | | | | | | | | | | | | | | | |
Distributions to shareholders | | | | | | | | | | | | | | | | | | | | | | | | |
Distributions(a) | | | | | | | | | | | | | | | | | | | | | | | | |
Direct shares | | | (4,238,275 | ) | | | — | | | | (12,498,880 | ) | | | — | | | | (5,333,531 | ) | | | — | |
K shares | | | (170,153 | ) | | | — | | | | (602,076 | ) | | | — | | | | (650,066 | ) | | | — | |
Distributions from net investment income | | | | | | | | | | | | | | | | | | | | | | | | |
Direct shares | | | — | | | | (2,509,509 | ) | | | — | | | | (964,222 | ) | | | — | | | | (329,299 | ) |
K shares | | | — | | | | (100,982 | ) | | | — | | | | (24,370 | ) | | | — | | | | (10,369 | ) |
Distributions from realized capital gains on investments | | | | | | | | | | | | | | | | | | | | | | | | |
Direct shares | | | — | | | | (2,439,715 | ) | | | — | | | | (7,026,422 | ) | | | — | | | | (5,770,141 | ) |
K shares | | | — | | | | (131,049 | ) | | | — | | | | (362,108 | ) | | | — | | | | (847,867 | ) |
| | | | | | | | | | | | | | | | | | | | | | | | | |
Capital share transactions | | | | | | | | | | | | | | | | | | | | | | | | |
Increase/(decrease) in net assets resulting from capital share transactions | | | (932,499 | ) | | | 2,225,805 | | | | 1,818,458 | | | | (1,444,057 | ) | | | (2,248,373 | ) | | | 11,559,832 | |
Total increase/(decrease) | | | (946,266 | ) | | | 28,752,926 | | | | (20,776,034 | ) | | | 12,315,961 | | | | (22,432,413 | ) | | | 24,511,415 | |
| | | | | | | | | | | | | | | | | | | | | | | | | |
Net assets | | | | | | | | | | | | | | | | | | | | | | | | |
Beginning of year | | $ | 192,280,681 | | | $ | 163,527,755 | | | $ | 130,906,808 | | | $ | 118,590,847 | | | $ | 88,752,312 | | | $ | 64,240,897 | |
End of year | | $ | 191,334,415 | | | $ | 192,280,681 | | | $ | 110,130,774 | | | $ | 130,906,808 | | | $ | 66,319,899 | | | $ | 88,752,312 | |
(a) | The SEC eliminated the requirement to disclose components of distributions paid to shareholders in September 2018. |
39
See accompanying notes to financial statements.
Statements of Changes in Net Assets
(Continued) |
| | | Shelton Core Value Fund | | | Nasdaq-100 Index Fund | | | Shelton Green Alpha Fund | |
| | | Year
Ended
August 31,
2019 | | | Year
Ended
August 31,
2018 | | | Year
Ended
August 31,
2019 | | | Year
Ended
August 31,
2018 | | | Year
Ended
August 31,
2019 | | | Year
Ended
August 31,
2018 | |
Operations | | | | | | | | | | | | | | | | | | | | | | | | |
Net investment income/(loss) | | $ | 2,767,066 | | | $ | 2,806,914 | | | $ | 3,806,069 | | | | 3,132,933 | | | $ | 74,045 | | | $ | 138,285 | |
Net realized gain/(loss) on investments and foreign currency | | | 12,516,989 | | | | 20,547,811 | | | | 18,230,973 | | | | (1,391,150 | ) | | | 229,266 | | | | 225,352 | |
Net realized gain/(loss) on futures contracts | | | — | | | | — | | | | (1,336,043 | ) | | | 2,333,214 | | | | — | | | | — | |
Net realized gain/(loss) on written option contracts | | | 2,544,749 | | | | 1,568,983 | | | | — | | | | — | | | | — | | | | — | |
Change in unrealized appreciation/(depreciation) of investments | | | (18,519,706 | ) | | | (5,065,257 | ) | | | (14,036,710 | ) | | | 122,342,691 | | | | 3,860,410 | | | | 375,773 | |
Change in unrealized appreciation/(depreciation) of written options contracts | | | (37,166 | ) | | | 36,246 | | | | — | | | | — | | | | — | | | | — | |
Change in unrealized appreciation/(depreciation) of futures contracts | | | — | | | | — | | | | (502,329 | ) | | | 226,915 | | | | — | | | | — | |
Net increase/(decrease) in net assets resulting from operations | | | (728,068 | ) | | | 19,894,697 | | | | 6,161,960 | | | | 126,644,603 | | | | 4,163,721 | | | | 739,410 | |
| | | | | | | | | | | | | | | | | | | | | | | | | |
Distributions to shareholders | | | | | | | | | | | | | | | | | | | | | | | | |
Distributions(a) | | | | | | | | | | | | | | | | | | | | | | | | |
Direct shares | | | (28,993,868 | ) | | | — | | | | (11,771,774 | ) | | | — | | | | (701,393 | ) | | | — | |
K shares | | | (943,290 | ) | | | — | | | | (431,446 | ) | | | — | | | | — | | | | — | |
Distributions from net investment income | | | | | | | | | | | | | | | | | | | | | | | | |
Direct shares | | | — | | | | (2,706,462 | ) | | | — | | | | (2,998,938 | ) | | | — | | | | (123,102 | ) |
K shares | | | — | | | | (63,142 | ) | | | — | | | | (43,752 | ) | | | — | | | | — | |
Distributions from realized capital gains on investments | | | | | | | | | | | | | | | | | | | | | | | | |
Direct shares | | | — | | | | (19,604,495 | ) | | | — | | | | (4,963,602 | ) | | | — | | | | (1,115,328 | ) |
K shares | | | — | | | | (607,991 | ) | | | — | | | | (257,353 | ) | | | — | | | | — | |
| | | | | | | | | | | | | | | | | | | | | | | | | |
Capital share transactions | | | | | | | | | | | | | | | | | | | | | | | | |
Increase/(decrease) in net assets resulting from capital share transactions | | | 874,834 | | | | 2,178,723 | | | | (21,100,264 | ) | | | 58,588,483 | | | | 3,739,230 | | | | 9,608,699 | |
Total increase/(decrease) | | | (29,790,392 | ) | | | (908,670 | ) | | | (27,141,524 | ) | | | 176,969,441 | | | | 7,201,558 | | | | 9,109,679 | |
| | | | | | | | | | | | | | | | | | | | | | | | | |
Net assets | | | | | | | | | | | | | | | | | | | | | | | | |
Beginning of year | | $ | 181,389,301 | | | $ | 182,297,971 | | | $ | 659,417,446 | | | $ | 482,448,005 | | | $ | 49,365,744 | | | $ | 40,256,065 | |
End of year | | $ | 151,598,909 | | | $ | 181,389,301 | | | $ | 632,275,922 | | | $ | 659,417,446 | | | $ | 56,567,302 | | | $ | 49,365,744 | |
(a) | The SEC eliminated the requirement to disclose components of distributions paid to shareholders in September 2018. |
See accompanying notes to financial statements.
40
Statements of Changes in Net Assets
(Continued) |
Green California Tax-Free Income Fund | | Direct Shares | |
| | | Year Ended
August 31, 2019 | | | Year Ended
August 31, 2018 | |
| | | Shares | | | Value | | | Shares | | | Value | |
Shares sold | | | 237,620 | | | $ | 2,723,601 | | | | 192,489 | | | $ | 2,198,940 | |
Shares issued in reinvestment of distributions | | | 93,572 | | | | 1,065,456 | | | | 114,416 | | | | 1,299,956 | |
Shares repurchased | | | (735,462 | ) | | | (8,340,749 | ) | | | (725,578 | ) | | | (8,268,857 | ) |
Net increase/(decrease) | | | (404,270 | ) | | $ | (4,551,692 | ) | | | (418,673 | ) | | $ | (4,769,961 | ) |
U.S. Government Securities Fund | | Direct Shares | | | K Shares | |
| | | Year Ended
August 31, 2019 | | | Year Ended
August 31, 2018 | | | Year Ended
August 31, 2019 | | | Year Ended
August 31, 2018 | |
| | | Shares | | | Value | | | Shares | | | Value | | | Shares | | | Value | | | Shares | | | Value | |
Shares sold | | | 601,122 | | | $ | 6,107,337 | | | | 410,925 | | | $ | 4,134,669 | | | | 64,599 | | | $ | 656,760 | | | | 64,564 | | | $ | 649,806 | |
Shares issued in reinvestment of distributions | | | 22,226 | | | | 225,880 | | | | 23,995 | | | | 241,135 | | | | 3,120 | | | | 31,691 | | | | 3,468 | | | | 34,940 | |
Shares repurchased | | | (559,497 | ) | | | (5,656,952 | ) | | | (639,618 | ) | | | (6,428,304 | ) | | | (224,029 | ) | | | (2,293,182 | ) | | | (56,637 | ) | | | (568,714 | ) |
Net increase/(decrease) | | | 63,851 | | | $ | 676,265 | | | | (204,698 | ) | | $ | (2,052,500 | ) | | | (156,310 | ) | | $ | (1,604,731 | ) | | | 11,395 | | | $ | 116,032 | |
Short-Term U.S. Government Bond Fund | | Direct Shares | | | K Shares | |
| | | Year Ended
August 31, 2019 | | | Year Ended
August 31, 2018 | | | Year Ended
August 31, 2019 | | | Year Ended
August 31, 2018 | |
| | | Shares | | | Value | | | Shares | | | Value | | | Shares | | | Value | | | Shares | | | Value | |
Shares sold | | | 122,280 | | | $ | 1,238,655 | | | | 168,773 | | | $ | 1,694,764 | | | | 39,631 | | | $ | 393,377 | | | | 37,617 | | | $ | 372,176 | |
Shares issued in reinvestment of distributions | | | 6,921 | | | | 69,971 | | | | 3,453 | | | | 34,707 | | | | 927 | | | | 9,206 | | | | 355 | | | | 3,512 | |
Shares repurchased | | | (94,369 | ) | | | (954,017 | ) | | | (71,877 | ) | | | (722,778 | ) | | | (120,461 | ) | | | (1,200,238 | ) | | | (25,768 | ) | | | (255,048 | ) |
Net increase/(decrease) | | | 34,832 | | | $ | 354,609 | | | | 100,349 | | | $ | 1,006,693 | | | | (79,903 | ) | | $ | (797,655 | ) | | | 12,204 | | | $ | 120,640 | |
The United States Treasury Trust | | Direct Shares | | | K Shares | |
| | | Year Ended
August 31,
2019 | | | Year Ended
August 31,
2018 | | | Year Ended
August 31,
2019 | | | Year Ended
August 31,
2018 | |
| | | Shares/
Value | | | Shares/
Value | | | Shares/
Value | | | Shares/
Value | |
Shares sold | | $ | 25,745,448 | | | $ | 29,856,493 | | | $ | 982,597 | | | $ | 1,133,945 | |
Shares issued in reinvestment of distributions | | | 801,707 | | | | 519,278 | | | | 23,254 | | | | 13,556 | |
Shares repurchased | | | (42,134,404 | ) | | | (34,454,055 | ) | | | (1,259,636 | ) | | | (1,405,625 | ) |
Net increase/(decrease) | | $ | (15,587,249 | ) | | $ | (4,078,284 | ) | | $ | (253,785 | ) | | $ | (258,124 | ) |
S&P 500 Index Fund | | Direct Shares | | | K Shares | |
| | | Year Ended
August 31, 2019 | | | Year Ended
August 31, 2018 | | | Year Ended
August 31, 2019 | | | Year Ended
August 31, 2018 | |
| | | Shares | | | Value | | | Shares | | | Value | | | Shares | | | Value | | | Shares | | | Value | |
Shares sold | | | 356,454 | | | $ | 19,167,111 | | | | 316,665 | | | $ | 16,512,221 | | | | 23,091 | | | $ | 1,257,421 | | | | 34,811 | | | $ | 1,828,998 | |
Shares issued in reinvestment of distributions | | | 67,613 | | | | 3,599,149 | | | | 85,490 | | | | 4,352,782 | | | | 3,197 | | | | 169,649 | | | | 4,554 | | | | 231,422 | |
Shares repurchased | | | (372,022 | ) | | | (20,091,314 | ) | | | (359,933 | ) | | | (18,693,030 | ) | | | (93,296 | ) | | | (5,034,515 | ) | | | (38,443 | ) | | | (2,006,588 | ) |
Net increase/(decrease) | | | 52,045 | | | $ | 2,674,946 | | | | 42,222 | | | $ | 2,171,973 | | | | (67,008 | ) | | $ | (3,607,445 | ) | | | 922 | | | $ | 53,832 | |
41
See accompanying notes to financial statements.
Statements of Changes in Net Assets
(Continued) |
S&P MidCap Index Fund | | Direct Shares | | | K Shares | |
| | | Year Ended
August 31, 2019 | | | Year Ended
August 31, 2018 | | | Year Ended
August 31, 2019 | | | Year Ended
August 31, 2018 | |
| | | Shares | | | Value | | | Shares | | | Value | | | Shares | | | Value | | | Shares | | | | Value | |
Shares sold | | | 409,193 | | | $ | 9,953,415 | | | | 381,155 | | | $ | 10,344,473 | | | | 21,817 | | | $ | 525,113 | | | | 36,800 | | | $ | 976,786 | |
Shares issued in reinvestment of distributions | | | 493,942 | | | | 11,747,146 | | | | 280,625 | | | | 7,493,527 | | | | 25,701 | | | | 601,722 | | | | 14,653 | | | | 385,802 | |
Shares repurchased | | | (750,908 | ) | | | (17,836,215 | ) | | | (720,298 | ) | | | (19,367,998 | ) | | | (134,174 | ) | | | (3,172,723 | ) | | | (47,611 | ) | | | (1,276,647 | ) |
Net increase/(decrease) | | | 152,227 | | | $ | 3,864,346 | | | | (58,518 | ) | | $ | (1,529,998 | ) | | | (86,656 | ) | | $ | (2,045,888 | ) | | | 3,842 | | | $ | 85,941 | |
S&P SmallCap Index Fund | | Direct Shares | | | K Shares | |
| | | Year Ended
August 31, 2019 | | | Year Ended
August 31, 2018 | | | Year Ended
August 31, 2019 | | | Year Ended
August 31, 2018 | |
| | | Shares | | | Value | | | Shares | | | Value | | | Shares | | | Value | | | Shares | | | Value | |
Shares sold | | | 654,930 | | | $ | 13,948,340 | | | | 742,607 | | | $ | 17,856,841 | | | | 36,453 | | | $ | 769,788 | | | | 45,402 | | | $ | 1,051,669 | |
Shares issued in reinvestment of distributions | | | 235,831 | | | | 5,059,555 | | | | 259,328 | | | | 5,899,905 | | | | 31,086 | | | | 650,066 | | | | 38,713 | | | | 858,236 | |
Shares repurchased | | | (884,193 | ) | | | (18,493,861 | ) | | | (527,057 | ) | | | (12,344,987 | ) | | | (203,938 | ) | | | (4,182,261 | ) | | | (75,529 | ) | | | (1,761,832 | ) |
Net increase/(decrease) | | | 6,568 | | | $ | 514,034 | | | | 474,878 | | | $ | 11,411,759 | | | | (136,399 | ) | | $ | (2,762,407 | ) | | | 8,586 | | | $ | 148,073 | |
Shelton Core Value Fund | | Direct Shares | | | K Shares | |
| | | Year Ended
August 31, 2019 | | | Year Ended
August 31, 2018 | | | Year Ended
August 31, 2019 | | | Year Ended
August 31, 2018 | |
| | | Shares | | | Value | | | Shares | | | Value | | | Shares | | | Value | | | Shares | | | Value | |
Shares sold | | | 357,396 | | | $ | 7,195,445 | | | | 215,616 | | | $ | 5,281,601 | | | | 31,189 | | | $ | 620,455 | | | | 23,399 | | | $ | 562,845 | |
Shares issued in reinvestment of distributions | | | 1,450,637 | | | | 28,384,919 | | | | 913,658 | | | | 21,786,702 | | | | 48,954 | | | | 943,290 | | | | 28,485 | | | | 671,133 | |
Shares repurchased | | | (1,552,776 | ) | | | (32,919,389 | ) | | | (1,030,515 | ) | | | (24,996,066 | ) | | | (170,089 | ) | | | (3,349,886 | ) | | | (47,086 | ) | | | (1,127,492 | ) |
Net increase/(decrease) | | | 255,257 | | | $ | 2,660,975 | | | | 98,759 | | | $ | 2,072,237 | | | | (89,946 | ) | | $ | (1,786,141 | ) | | | 4,798 | | | $ | 106,486 | |
Nasdaq-100 Index Fund | | Direct Shares | | | K Shares | |
| | | Year Ended
August 31, 2019 | | | Year Ended
August 31, 2018 | | | Year Ended
August 31, 2019 | | | Year Ended
August 31, 2018 | |
| | | Shares | | | Value | | | Shares | | | Value | | | Shares | | | Value | | | Shares | | | Value | |
Shares sold | | | 8,949,721 | | | $ | 158,244,982 | | | | 11,879,873 | | | $ | 200,200,836 | | | | 287,727 | | | $ | 4,983,122 | | | | 508,751 | | | $ | 8,345,968 | |
Shares issued in reinvestment of distributions | | | 667,343 | | | | 11,299,360 | | | | 472,251 | | | | 7,596,615 | | | | 26,073 | | | | 431,440 | | | | 19,452 | | | | 301,104 | |
Shares repurchased | | | (10,743,437 | ) | | | (187,194,833 | ) | | | (9,057,208 | ) | | | (149,920,159 | ) | | | (516,329 | ) | | | (8,864,336 | ) | | | (480,106 | ) | | | (7,935,881 | ) |
Net increase/(decrease) | | | (1,126,373 | ) | | $ | (17,650,491 | ) | | | 3,294,916 | | | $ | 57,877,292 | | | | (202,529 | ) | | $ | (3,449,774 | ) | | | 48,097 | | | $ | 711,191 | |
Shelton Green Alpha Fund | | Direct Shares | |
| | | Year Ended
August 31, 2019 | | | Year Ended
August 31, 2018 | |
| | | Shares | | | Value | | | Shares | | | Value | |
Shares sold | | | 853,374 | | | $ | 14,711,335 | | | | 983,082 | | | $ | 17,109,553 | |
Shares issued in reinvestment of distributions | | | 43,026 | | | | 683,796 | | | | 68,362 | | | | 1,209,178 | |
Shares repurchased | | | (698,967 | ) | | | (11,655,901 | ) | | | (504,940 | ) | | | (8,710,032 | ) |
Net increase/(decrease) | | | 197,433 | | | $ | 3,739,230 | | | | 546,504 | | | $ | 9,608,699 | |
See accompanying notes to financial statements.
42
Financial Highlights (For a Share Outstanding Throughout Each Year) |
Green California Tax-Free Income Fund Direct Shares | | Year Ended
August 31,
2019 | | | Year Ended
August 31,
2018 | | | Year Ended
August 31,
2017 | | | Year Ended
August 31,
2016 | | | Year Ended
August 31,
2015 | |
Net asset value, beginning of year | | $ | 11.29 | | | $ | 11.65 | | | $ | 11.93 | | | $ | 11.69 | | | $ | 11.81 | |
INCOME FROM INVESTMENT OPERATIONS | | | | | | | | | | | | | | | | | | | | |
Net investment income/(loss)(a) | | | 0.23 | | | | 0.23 | | | | 0.25 | | | | 0.29 | | | | 0.28 | |
Net gain/(loss) on securities (both realized and unrealized) | | | 0.45 | | | | (0.31 | ) | | | (0.20 | ) | | | 0.24 | | | | (0.07 | ) |
Total from investment operations | | | 0.68 | | | | (0.08 | ) | | | 0.05 | | | | 0.53 | | | | 0.21 | |
LESS DISTRIBUTIONS | | | | | | | | | | | | | | | | | | | | |
Dividends from net investment income | | | (0.23 | ) | | | (0.24 | ) | | | (0.27 | ) | | | (0.29 | ) | | | (0.28 | ) |
Distributions from capital gains | | | (0.02 | ) | | | (0.04 | ) | | | (0.06 | ) | | | — | | | | (0.05 | ) |
Total distributions | | | (0.25 | ) | | | (0.28 | ) | | | (0.33 | ) | | | (0.29 | ) | | | (0.33 | ) |
Net asset value, end of year or period | | $ | 11.72 | | | $ | 11.29 | | | $ | 11.65 | | | $ | 11.93 | | | $ | 11.69 | |
| | | | | | | | | | | | | | | | | | | | | |
Total return | | | 6.10 | % | | | (0.74 | )% | | | 0.43 | % | | | 4.60 | % | | | 1.78 | % |
| | | | | | | | | | | | | | | | | | | | | |
RATIOS / SUPPLEMENTAL DATA | | | | | | | | | | | | | | | | | | | | |
Net assets, end of year (000s) | | $ | 66,144 | | | $ | 68,253 | | | $ | 75,310 | | | $ | 84,422 | | | $ | 89,213 | |
Ratio of expenses to average net assets | | | 0.77 | % | | | 0.76 | % | | | 0.69 | % | | | 0.69 | % | | | 0.71 | % |
Ratio of net investment income/(loss) to average net assets | | | 2.01 | % | | | 2.02 | % | | | 2.20 | % | | | 2.47 | % | | | 2.41 | % |
Portfolio turnover | | | 4 | % | | | 12 | % | | | 7 | % | | | 19 | % | | | 12 | % |
(a) | Calculated based upon average shares outstanding. |
43
See accompanying notes to financial statements.
Financial Highlights (For a Share Outstanding Throughout Each Year) (Continued) |
U.S. Government Securities Fund Direct Shares | | Year Ended
August 31,
2019 | | | Year Ended
August 31,
2018 | | | Year Ended
August 31,
2017 | | | Year Ended
August 31,
2016 | | | Year Ended
August 31,
2015 | |
Net asset value, beginning of year | | $ | 9.98 | | | $ | 10.32 | | | $ | 10.61 | | | $ | 10.42 | | | $ | 10.40 | |
INCOME FROM INVESTMENT OPERATIONS | | | | | | | | | | | | | | | | | | | | |
Net investment income/(loss)(a) | | | 0.15 | | | | 0.14 | | | | 0.14 | | | | 0.14 | | | | 0.14 | |
Net gain/(loss) on securities (both realized and unrealized) | | | 0.59 | | | | (0.33 | ) | | | (0.26 | ) | | | 0.20 | | | | 0.02 | |
Total from investment operations | | | 0.74 | | | | (0.19 | ) | | | (0.12 | ) | | | 0.34 | | | | 0.16 | |
LESS DISTRIBUTIONS | | | | | | | | | | | | | | | | | | | | |
Dividends from net investment income | | | (0.15 | ) | | | (0.15 | ) | | | (0.17 | ) | | | (0.15 | ) | | | (0.14 | ) |
Total distributions | | | (0.15 | ) | | | (0.15 | ) | | | (0.17 | ) | | | (0.15 | ) | | | (0.14 | ) |
Net asset value, end of year or period | | $ | 10.57 | | | $ | 9.98 | | | $ | 10.32 | | | $ | 10.61 | | | $ | 10.42 | |
| | | | | | | | | | | | | | | | | | | | | |
Total return | | | 7.48 | % | | | (1.88 | )% | | | (1.14 | )% | | | 3.25 | % | | | 1.58 | % |
| | | | | | | | | | | | | | | | | | | | | |
RATIOS / SUPPLEMENTAL DATA | | | | | | | | | | | | | | | | | | | | |
Net assets, end of year (000s) | | $ | 17,263 | | | $ | 15,668 | | | $ | 18,316 | | | $ | 19,754 | | | $ | 19,855 | |
Ratio of expenses to average net assets: | | | | | | | | | | | | | | | | | | | | |
Before expense reimbursements | | | 0.99 | % | | | 0.89 | % | | | 0.81 | % | | | 0.82 | % | | | 0.83 | % |
After expense reimbursements | | | 0.76 | %(b) | | | 0.75 | %(b) | | | 0.74 | % | | | 0.74 | % | | | 0.74 | % |
Ratio of net investment income/(loss) to average net assets | | | | | | | | | | | | | | | | | | | | |
Before expense reimbursements | | | 1.24 | % | | | 1.29 | % | | | 1.27 | % | | | 1.25 | % | | | 1.29 | % |
After expense reimbursements | | | 1.47 | % | | | 1.42 | % | | | 1.34 | % | | | 1.33 | % | | | 1.38 | % |
Portfolio turnover | | | 8 | % | | | 13 | % | | | 10 | % | | | 18 | % | | | 18 | % |
K Shares | | Year Ended
August 31,
2019 | | | Year Ended
August 31,
2018 | | | Year Ended
August 31,
2017 | | | Year Ended
August 31,
2016 | | | Year Ended
August 31,
2015 | |
Net asset value, beginning of year | | $ | 10.01 | | | $ | 10.35 | | | $ | 10.64 | | | $ | 10.43 | | | $ | 10.41 | |
INCOME FROM INVESTMENT OPERATIONS | | | | | | | | | | | | | | | | | | | | |
Net investment income/(loss)(a) | | | 0.10 | | | | 0.09 | | | | 0.09 | | | | 0.09 | | | | 0.09 | |
Net gain/(loss) on securities (both realized and unrealized) | | | 0.58 | | | | (0.33 | ) | | | (0.27 | ) | | | 0.20 | | | | 0.03 | |
Total from investment operations | | | 0.68 | | | | (0.24 | ) | | | (0.18 | ) | | | 0.29 | | | | 0.12 | |
LESS DISTRIBUTIONS | | | | | | | | | | | | | | | | | | | | |
Dividends from net investment income | | | (0.10 | ) | | | (0.10 | ) | | | (0.11 | ) | | | (0.08 | ) | | | (0.10 | ) |
Total distributions | | | (0.10 | ) | | | (0.10 | ) | | | (0.11 | ) | | | (0.08 | ) | | | (0.10 | ) |
Net asset value, end of year or period | | $ | 10.59 | | | $ | 10.01 | | | $ | 10.35 | | | $ | 10.64 | | | $ | 10.43 | |
| | | | | | | | | | | | | | | | | | | | | |
Total return | | | 6.87 | % | | | (2.37 | )% | | | (1.67 | )% | | | 2.77 | % | | | 1.13 | % |
| | | | | | | | | | | | | | | | | | | | | |
RATIOS / SUPPLEMENTAL DATA | | | | | | | | | | | | | | | | | | | | |
Net assets, end of year (000s) | | $ | 2,250 | | | $ | 3,691 | | | $ | 3,699 | | | $ | 4,712 | | | $ | 5,349 | |
Ratio of expenses to average net assets: | | | | | | | | | | | | | | | | | | | | |
Before expense reimbursements | | | 1.49 | % | | | 1.39 | % | | | 1.31 | % | | | 1.32 | % | | | 1.33 | % |
After expense reimbursements | | | 1.26 | %(b) | | | 1.25 | %(b) | | | 1.24 | % | | | 1.24 | % | | | 1.24 | % |
Ratio of net investment income/(loss) to average net assets | | | | | | | | | | | | | | | | | | | | |
Before expense reimbursements | | | 0.73 | % | | | 0.78 | % | | | 0.77 | % | | | 0.75 | % | | | 0.77 | % |
After expense reimbursements | | | 0.97 | % | | | 0.92 | % | | | 0.84 | % | | | 0.84 | % | | | 0.88 | % |
Portfolio turnover | | | 8 | % | | | 13 | % | | | 10 | % | | | 18 | % | | | 18 | % |
(a) | Calculated based upon average shares outstanding. |
(b) | CCO Fees are not included in the expense limitation. |
See accompanying notes to financial statements.
44
Financial Highlights (For a Share Outstanding Throughout Each Year) (Continued) |
Short-Term U.S. Government Bond Fund Direct Shares | | Year Ended
August 31,
2019 | | | Year Ended
August 31,
2018 | | | Year Ended
August 31,
2017 | | | Year Ended
August 31,
2016 | | | Year Ended
August 31,
2015 | |
Net asset value, beginning of year | | $ | 10.04 | | | $ | 10.14 | | | $ | 10.18 | | | $ | 10.16 | | | $ | 10.17 | |
INCOME FROM INVESTMENT OPERATIONS | | | | | | | | | | | | | | | | | | | | |
Net investment income/(loss)(a) | | | 0.14 | | | | 0.08 | | | | 0.05 | | | | 0.02 | | | | — | |
Net gain/(loss) on securities (both realized and unrealized) | | | 0.15 | | | | (0.10 | ) | | | (0.05 | ) | | | 0.02 | | | | (0.01 | ) |
Total from investment operations | | | 0.29 | | | | (0.02 | ) | | | — | | | | 0.04 | | | | (0.01 | ) |
LESS DISTRIBUTIONS | | | | | | | | | | | | | | | | | | | | |
Dividends from net investment income | | | (0.14 | ) | | | (0.08 | ) | | | (0.04 | ) | | | (0.02 | ) | | | — | |
Distributions from capital gains | | | — | | | | — | | | | — | | | | — | | | | — | (b) |
Total distributions | | | (0.14 | ) | | | (0.08 | ) | | | (0.04 | ) | | | (0.02 | ) | | | — | |
Net asset value, end of year or period | | $ | 10.19 | | | $ | 10.04 | | | $ | 10.14 | | | $ | 10.18 | | | $ | 10.16 | |
| | | | | | | | | | | | | | | | | | | | | |
Total return | | | 2.88 | % | | | (0.21 | )% | | | 0.09 | % | | | 0.38 | % | | | (0.07 | )% |
| | | | | | | | | | | | | | | | | | | | | |
RATIOS / SUPPLEMENTAL DATA | | | | | | | | | | | | | | | | | | | | |
Net assets, end of year (000s) | | $ | 5,563 | | | $ | 5,131 | | | $ | 4,162 | | | $ | 4,148 | | | $ | 5,223 | |
Ratio of expenses to average net assets: | | | | | | | | | | | | | | | | | | | | |
Before expense reimbursements | | | 1.38 | % | | | 1.10 | % | | | 0.97 | % | | | 0.95 | % | | | 0.97 | % |
After expense reimbursements | | | 0.61 | %(c) | | | 0.60 | %(c) | | | 0.59 | % | | | 0.59 | % | | | 0.59 | % |
Ratio of net investment income/(loss) to average net assets | | | | | | | | | | | | | | | | | | | | |
Before expense reimbursements | | | 0.60 | % | | | 0.15 | % | | | 0.08 | % | | | (0.12 | )% | | | (0.36 | )% |
After expense reimbursements | | | 1.37 | % | | | 0.81 | % | | | 0.46 | % | | | 0.24 | % | | | 0.02 | % |
Portfolio turnover | | | 30 | % | | | 28 | % | | | 27 | % | | | 47 | % | | | 33 | % |
K Shares | | Year Ended
August 31,
2019 | | | Year Ended
August 31,
2018 | | | Year Ended
August 31,
2017 | | | Year Ended
August 31,
2016 | | | Year Ended
August 31,
2015 | |
Net asset value, beginning of year | | $ | 9.88 | | | $ | 9.98 | | | $ | 10.02 | | | $ | 10.03 | | | $ | 10.10 | |
INCOME FROM INVESTMENT OPERATIONS | | | | | | | | | | | | | | | | | | | | |
Net investment income/(loss)(a) | | | 0.08 | | | | 0.03 | | | | (0.01 | ) | | | (0.03 | ) | | | (0.05 | ) |
Net gain/(loss) on securities (both realized and unrealized) | | | 0.16 | | | | (0.10 | ) | | | (0.03 | ) | | | 0.02 | | | | (0.02 | ) |
Total from investment operations | | | 0.24 | | | | (0.07 | ) | | | (0.04 | ) | | | (0.01 | ) | | | (0.07 | ) |
LESS DISTRIBUTIONS | | | | | | | | | | | | | | | | | | | | |
Dividends from net investment income | | | (0.09 | ) | | | (0.03 | ) | | | — | | | | — | | | | — | |
Distributions from capital gains | | | — | | | | — | | | | — | (b) | | | — | | | | — | (b) |
Total distributions | | | (0.09 | ) | | | (0.03 | ) | | | — | | | | — | | | | — | |
Net asset value, end of year or period | | $ | 10.03 | | | $ | 9.88 | | | $ | 9.98 | | | $ | 10.02 | | | $ | 10.03 | |
| | | | | | | | | | | | | | | | | | | | | |
Total return | | | 2.45 | % | | | (0.72 | )% | | | (0.35 | )% | | | (0.10 | )% | | | (0.66 | )% |
| | | | | | | | | | | | | | | | | | | | | |
RATIOS / SUPPLEMENTAL DATA | | | | | | | | | | | | | | | | | | | | |
Net assets, end of year (000s) | | $ | 488 | | | $ | 1,271 | | | $ | 1,162 | | | $ | 1,330 | | | $ | 1,503 | |
Ratio of expenses to average net assets: | | | | | | | | | | | | | | | | | | | | |
Before expense reimbursements | | | 1.85 | % | | | 1.76 | % | | | 1.47 | % | | | 1.45 | % | | | 1.47 | % |
After expense reimbursements | | | 1.11 | %(c) | | | 1.10 | %(c) | | | 1.09 | % | | | 1.09 | % | | | 1.09 | % |
Ratio of net investment income/(loss) to average net assets | | | | | | | | | | | | | | | | | | | | |
Before expense reimbursements | | | 0.11 | % | | | (0.36 | )% | | | (0.44 | )% | | | (0.61 | )% | | | (0.86 | )% |
After expense reimbursements | | | 0.85 | % | | | 0.29 | % | | | (0.06 | )% | | | (0.26 | )% | | | (0.48 | )% |
Portfolio turnover | | | 30 | % | | | 28 | % | | | 27 | % | | | 47 | % | | | 33 | % |
(a) | Calculated based upon average shares outstanding. |
(b) | Less than $0.01 per share. |
(c) | CCO Fees are not included in the expense limitation. |
45
See accompanying notes to financial statements.
Financial Highlights (For a Share Outstanding Throughout Each Year) (Continued) |
The United States Treasury Trust Direct Shares | | Year Ended
August 31,
2019 | | | Year Ended
August 31,
2018 | | | Year Ended
August 31,
2017 | | | Year Ended
August 31,
2016 | | | Year Ended
August 31,
2015 | |
Net asset value, beginning of year | | $ | 1.00 | | | $ | 1.00 | | | $ | 1.00 | | | $ | 1.00 | | | $ | 1.00 | |
INCOME FROM INVESTMENT OPERATIONS | | | | | | | | | | | | | | | | | | | | |
Net investment income/(loss)(a) | | | 0.02 | | | | 0.01 | | | | — | | | | — | | | | — | |
Net gain/(loss) on securities (both realized and unrealized) | | | — | | | | — | (b) | | | — | | | | — | | | | — | |
Total from investment operations | | | 0.02 | | | | 0.01 | | | | — | | | | — | | | | — | |
LESS DISTRIBUTIONS | | | | | | | | | | | | | | | | | | | | |
Dividends from net investment income | | | (0.02 | ) | | | (0.01 | ) | | | — | (b) | | | — | | | | — | |
Distributions from capital gains | | | — | | | | — | | | | — | | | | — | | | | — | |
Total distributions | | | (0.02 | ) | | | (0.01 | ) | | | — | | | | — | | | | — | |
Net asset value, end of year or period | | $ | 1.00 | | | $ | 1.00 | | | $ | 1.00 | | | $ | 1.00 | | | $ | 1.00 | |
| | | | | | | | | | | | | | | | | | | | | |
Total return | | | 1.75 | % | | | 0.98 | % | | | 0.03 | % | | | 0.00 | % | | | 0.00 | % |
| | | | | | | | | | | | | | | | | | | | | |
RATIOS / SUPPLEMENTAL DATA | | | | | | | | | | | | | | | | | | | | |
Net assets, end of year (000s) | | $ | 37,479 | | | $ | 53,079 | | | $ | 57,149 | | | $ | 72,482 | | | $ | 86,224 | |
Ratio of expenses to average net assets: | | | | | | | | | | | | | | | | | | | | |
Before expense reimbursements | | | 0.77 | % | | | 0.77 | % | | | 0.71 | % | | | 0.71 | % | | | 0.70 | % |
After expense reimbursements | | | 0.55 | %(c) | | | 0.46 | %(d) | | | 0.52 | %(d) | | | 0.22 | % | | | 0.03 | %(d) |
Ratio of net investment income/(loss) to average net assets | | | | | | | | | | | | | | | | | | | | |
Before expense reimbursements | | | 1.51 | % | | | 0.65 | % | | | (0.16 | )% | | | (0.49 | )% | | | (0.67 | )% |
After expense reimbursements | | | 1.73 | % | | | 0.96 | %(d) | | | 0.03 | %(d) | | | 0.00 | % | | | 0.00 | %(d) |
K Shares(e) | | Year Ended
August 31,
2019 | | | Year Ended
August 31,
2018 | | | Year Ended
August 31,
2017 | | | Year Ended
August 31,
2016 | | | Year Ended
August 31,
2015 | |
Net asset value, beginning of year | | $ | 1.00 | | | $ | 1.00 | | | $ | 1.00 | | | $ | 1.00 | | | $ | 1.00 | |
INCOME FROM INVESTMENT OPERATIONS | | | | | | | | | | | | | | | | | | | | |
Net investment income/(loss)(a) | | | 0.01 | | | | 0.01 | | | | — | | | | — | | | | — | |
Net gain/(loss) on securities (both realized and unrealized) | | | — | | | | — | (b) | | | — | | | | — | | | | — | |
Total from investment operations | | | 0.01 | | | | 0.01 | | | | — | | | | — | | | | — | |
LESS DISTRIBUTIONS | | | | | | | | | | | | | | | | | | | | |
Dividends from net investment income | | | (0.01 | ) | | | (0.01 | ) | | | — | (b) | | | — | | | | — | |
Distributions from capital gains | | | — | | | | — | | | | — | | | | — | | | | — | |
Total distributions | | | (0.01 | ) | | | (0.01 | ) | | | — | | | | — | | | | — | |
Net asset value, end of year or period | | $ | 1.00 | | | $ | 1.00 | | | $ | 1.00 | | | $ | 1.00 | | | $ | 1.00 | |
| | | | | | | | | | | | | | | | | | | | | |
Total return | | | 1.25 | % | | | 0.65 | % | | | 0.03 | % | | | 0.00 | % | | | 0.00 | % |
| | | | | | | | | | | | | | | | | | | | | |
RATIOS / SUPPLEMENTAL DATA | | | | | | | | | | | | | | | | | | | | |
Net assets, end of year (000s) | | $ | 1,610 | | | $ | 1,864 | | | $ | 2,122 | | | $ | 2,470 | | | $ | 2,651 | |
Ratio of expenses to average net assets: | | | | | | | | | | | | | | | | | | | | |
Before expense reimbursements | | | 1.27 | % | | | 1.27 | % | | | 1.21 | % | | | 0.71 | % | | | 0.70 | % |
After expense reimbursements | | | 1.05 | %(c) | | | 0.78 | %(d) | | | 0.52 | %(d) | | | 0.22 | % | | | 0.03 | %(d) |
Ratio of net investment income/(loss) to average net assets | | | | | | | | | | | | | | | | | | | | |
Before expense reimbursements | | | 1.01 | % | | | 0.16 | % | | | (0.13 | )% | | | (0.49 | )% | | | (0.67 | )% |
After expense reimbursements | | | 1.23 | % | | | 0.65 | %(d) | | | 0.03 | %(d) | | | 0.00 | % | | | 0.00 | %(d) |
(a) | Calculated based upon average shares outstanding. |
(b) | Less than $0.01 per share. |
(c) | CCO Fees are not included in the expense limitation. |
(d) | Includes negative yield waiver adjustment. |
(e) | K Shares are not accruing 12B-1 or shareholder servicing fees |
See accompanying notes to financial statements.
46
Financial Highlights (For a Share Outstanding Throughout Each Year) (Continued) |
S&P 500 Index Fund Direct Shares | | Year Ended
August 31,
2019 | | | Year Ended
August 31,
2018 | | | Year Ended
August 31,
2017 | | | Year Ended
August 31,
2016 | | | Year Ended
August 31,
2015 | |
Net asset value, beginning of year | | $ | 56.03 | | | $ | 48.26 | | | $ | 42.86 | | | $ | 39.88 | | | $ | 40.61 | |
INCOME FROM INVESTMENT OPERATIONS | | | | | | | | | | | | | | | | | | | | |
Net investment income/(loss)(a) | | | 0.82 | | | | 0.82 | | | | 0.78 | | | | 0.76 | | | | 0.72 | |
Net gain/(loss) on securities (both realized and unrealized) | | | 0.44 | | | | 8.48 | | | | 5.89 | | | | 3.99 | | | | (0.58 | ) |
Total from investment operations | | | 1.26 | | | | 9.30 | | | | 6.67 | | | | 4.75 | | | | 0.14 | |
LESS DISTRIBUTIONS | | | | | | | | | | | | | | | | | | | | |
Dividends from net investment income | | | (0.88 | ) | | | (0.77 | ) | | | (0.83 | ) | | | (0.78 | ) | | | (0.70 | ) |
Distributions from capital gains | | | (0.41 | ) | | | (0.76 | ) | | | (0.44 | ) | | | (0.99 | ) | | | (0.17 | ) |
Total distributions | | | (1.29 | ) | | | (1.53 | ) | | | (1.27 | ) | | | (1.77 | ) | | | (0.87 | ) |
Net asset value, end of year or period | | $ | 56.00 | | | $ | 56.03 | | | $ | 48.26 | | | $ | 42.86 | | | $ | 39.88 | |
| | | | | | | | | | | | | | | | | | | | | |
Total return | | | 2.40 | % | | | 19.64 | % | | | 15.89 | % | | | 12.21 | % | | | 0.29 | % |
| | | | | | | | | | | | | | | | | | | | | |
RATIOS / SUPPLEMENTAL DATA | | | | | | | | | | | | | | | | | | | | |
Net assets, end of year (000s) | | $ | 185,170 | | | $ | 182,362 | | | $ | 155,022 | | | $ | 135,346 | | | $ | 123,138 | |
Ratio of expenses to average net assets: | | | | | | | | | | | | | | | | | | | | |
Before expense reimbursements | | | 0.50 | % | | | 0.50 | % | | | 0.46 | % | | | 0.47 | % | | | 0.47 | % |
After expense reimbursements | | | 0.50 | % | | | 0.45 | % | | | 0.36 | % | | | 0.36 | % | | | 0.36 | % |
Ratio of net investment income/(loss) to average net assets | | | | | | | | | | | | | | | | | | | | |
Before expense reimbursements | | | 1.52 | % | | | 1.53 | % | | | 1.63 | % | | | 1.77 | % | | | 1.63 | % |
After expense reimbursements | | | 1.52 | % | | | 1.58 | % | | | 1.73 | % | | | 1.88 | % | | | 1.74 | % |
Portfolio turnover | | | 3 | % | | | 3 | % | | | 5 | % | | | 1 | % | | | 3 | % |
K Shares | | Year Ended
August 31,
2019 | | | Year Ended
August 31,
2018 | | | Year Ended
August 31,
2017 | | | Year Ended
August 31,
2016 | | | Year Ended
August 31,
2015 | |
Net asset value, beginning of year | | $ | 55.96 | | | $ | 48.24 | | | $ | 42.88 | | | $ | 39.87 | | | $ | 40.50 | |
INCOME FROM INVESTMENT OPERATIONS | | | | | | | | | | | | | | | | | | | | |
Net investment income/(loss)(a) | | | 0.54 | | | | 0.56 | | | | 0.55 | | | | 0.56 | | | | 0.51 | |
Net gain/(loss) on securities (both realized and unrealized) | | | 0.45 | | | | 8.48 | | | | 5.89 | | | | 3.99 | | | | (0.57 | ) |
Total from investment operations | | | 0.99 | | | | 9.04 | | | | 6.44 | | | | 4.55 | | | | (0.06 | ) |
LESS DISTRIBUTIONS | | | | | | | | | | | | | | | | | | | | |
Dividends from net investment income | | | (0.62 | ) | | | (0.56 | ) | | | (0.64 | ) | | | (0.55 | ) | | | (0.40 | ) |
Distributions from capital gains | | | (0.41 | ) | | | (0.76 | ) | | | (0.44 | ) | | | (0.99 | ) | | | (0.17 | ) |
Total distributions | | | (1.03 | ) | | | (1.32 | ) | | | (1.08 | ) | | | (1.54 | ) | | | (0.57 | ) |
Net asset value, end of year or period | | $ | 55.92 | | | $ | 55.96 | | | $ | 48.24 | | | $ | 42.88 | | | $ | 39.87 | |
| | | | | | | | | | | | | | | | | | | | | |
Total return | | | 1.88 | % | | | 19.05 | % | | | 15.31 | % | | | 11.65 | % | | | (0.19 | )% |
| | | | | | | | | | | | | | | | | | | | | |
RATIOS / SUPPLEMENTAL DATA | | | | | | | | | | | | | | | | | | | | |
Net assets, end of year (000s) | | $ | 6,165 | | | $ | 9,919 | | | $ | 8,506 | | | $ | 7,981 | | | $ | 8,063 | |
Ratio of expenses to average net assets: | | | | | | | | | | | | | | | | | | | | |
Before expense reimbursements | | | 0.99 | % | | | 1.00 | % | | | 0.96 | % | | | 0.97 | % | | | 0.97 | % |
After expense reimbursements | | | 0.99 | % | | | 0.95 | % | | | 0.86 | % | | | 0.86 | % | | | 0.86 | % |
Ratio of net investment income/(loss) to average net assets | | | | | | | | | | | | | | | | | | | | |
Before expense reimbursements | | | 1.02 | % | | | 1.03 | % | | | 1.13 | % | | | 1.26 | % | | | 1.13 | % |
After expense reimbursements | | | 1.02 | % | | | 1.08 | % | | | 1.23 | % | | | 1.37 | % | | | 1.24 | % |
Portfolio turnover | | | 3 | % | | | 3 | % | | | 5 | % | | | 1 | % | | | 3 | % |
(a) | Calculated based upon average shares outstanding. |
47
See accompanying notes to financial statements.
Financial Highlights (For a Share Outstanding Throughout Each Year) (Continued) |
S&P Midcap Index Fund Direct Shares | | Year Ended
August 31,
2019 | | | Year Ended
August 31,
2018 | | | Year Ended
August 31,
2017 | | | Year Ended
August 31,
2016 | | | Year Ended
August 31,
2015 | |
Net asset value, beginning of year | | $ | 28.77 | | | $ | 25.75 | | | $ | 26.69 | | | $ | 28.41 | | | $ | 30.95 | |
INCOME FROM INVESTMENT OPERATIONS | | | | | | | | | | | | | | | | | | | | |
Net investment income/(loss)(a) | | | 0.23 | | | | 0.25 | | | | 0.23 | | | | 0.26 | | | | 0.25 | |
Net gain/(loss) on securities (both realized and unrealized) | | | (2.23 | ) | | | 4.61 | | | | 2.95 | | | | 2.73 | | | | (0.36 | ) |
Total from investment operations | | | (2.00 | ) | | | 4.86 | | | | 3.18 | | | | 2.99 | | | | (0.11 | ) |
LESS DISTRIBUTIONS | | | | | | | | | | | | | | | | | | | | |
Dividends from net investment income | | | (0.24 | ) | | | (0.22 | ) | | | (0.21 | ) | | | (0.24 | ) | | | (0.28 | ) |
Distributions from capital gains | | | (2.68 | ) | | | (1.62 | ) | | | (3.91 | ) | | | (4.47 | ) | | | (2.15 | ) |
Total distributions | | | (2.92 | ) | | | (1.84 | ) | | | (4.12 | ) | | | (4.71 | ) | | | (2.43 | ) |
Net asset value, end of year or period | | $ | 23.85 | | | $ | 28.77 | | | $ | 25.75 | | | $ | 26.69 | | | $ | 28.41 | |
| | | | | | | | | | | | | | | | | | | | | |
Total return | | | (6.85 | )% | | | 19.48 | % | | | 13.01 | % | | | 11.86 | % | | | (0.45 | )% |
| | | | | | | | | | | | | | | | | | | | | |
RATIOS / SUPPLEMENTAL DATA | | | | | | | | | | | | | | | | | | | | |
Net assets, end of year (000s) | | $ | 107,054 | | | $ | 124,728 | | | $ | 113,149 | | | $ | 136,371 | | | $ | 140,361 | |
Ratio of expenses to average net assets: | | | | | | | | | | | | | | | | | | | | |
Before expense reimbursements | | | 0.67 | % | | | 0.66 | % | | | 0.62 | % | | | 0.62 | % | | | 0.62 | % |
After expense reimbursements | | | 0.67 | % | | | 0.63 | % | | | 0.58 | % | | | 0.58 | % | | | 0.58 | % |
Ratio of net investment income/(loss) to average net assets | | | | | | | | | | | | | | | | | | | | |
Before expense reimbursements | | | 0.95 | % | | | 0.89 | % | | | 0.85 | % | | | 0.98 | % | | | 0.81 | % |
After expense reimbursements | | | 0.95 | % | | | 0.92 | % | | | 0.89 | % | | | 1.02 | % | | | 0.85 | % |
Portfolio turnover | | | 13 | % | | | 12 | % | | | 34 | % | | | 11 | % | | | 15 | % |
K Shares | | Year Ended
August 31,
2019 | | | Year Ended
August 31,
2018 | | | Year Ended
August 31,
2017 | | | Year Ended
August 31,
2016 | | | Year Ended
August 31,
2015 | |
Net asset value, beginning of year | | $ | 28.37 | | | $ | 25.44 | | | $ | 26.43 | | | $ | 28.18 | | | $ | 30.69 | |
INCOME FROM INVESTMENT OPERATIONS | | | | | | | | | | | | | | | | | | | | |
Net investment income/(loss)(a) | | | 0.11 | | | | 0.11 | | | | 0.10 | | | | 0.13 | | | | 0.10 | |
Net gain/(loss) on securities (both realized and unrealized) | | | (2.19 | ) | | | 4.55 | | | | 2.92 | | | | 2.71 | | | | (0.35 | ) |
Total from investment operations | | | (2.08 | ) | | | 4.66 | | | | 3.02 | | | | 2.84 | | | | (0.25 | ) |
LESS DISTRIBUTIONS | | | | | | | | | | | | | | | | | | | | |
Dividends from net investment income | | | (0.14 | ) | | | (0.11 | ) | | | (0.10 | ) | | | (0.12 | ) | | | (0.11 | ) |
Distributions from capital gains | | | (2.68 | ) | | | (1.62 | ) | | | (3.91 | ) | | | (4.47 | ) | | | (2.15 | ) |
Total distributions | | | (2.82 | ) | | | (1.73 | ) | | | (4.01 | ) | | | (4.59 | ) | | | (2.26 | ) |
Net asset value, end of year or period | | $ | 23.47 | | | $ | 28.37 | | | $ | 25.44 | | | $ | 26.43 | | | $ | 28.18 | |
| | | | | | | | | | | | | | | | | | | | | |
Total return | | | (7.27 | )% | | | 18.86 | % | | | 12.45 | % | | | 11.31 | % | | | (0.93 | )% |
| | | | | | | | | | | | | | | | | | | | | |
RATIOS / SUPPLEMENTAL DATA | | | | | | | | | | | | | | | | | | | | |
Net assets, end of year (000s) | | $ | 3,077 | | | $ | 6,179 | | | $ | 5,442 | | | $ | 5,086 | | | $ | 5,244 | |
Ratio of expenses to average net assets: | | | | | | | | | | | | | | | | | | | | |
Before expense reimbursements | | | 1.17 | % | | | 1.16 | % | | | 1.12 | % | | | 1.12 | % | | | 1.12 | % |
After expense reimbursements | | | 1.17 | % | | | 1.13 | % | | | 1.08 | % | | | 1.08 | % | | | 1.08 | % |
Ratio of net investment income/(loss) to average net assets | | | | | | | | | | | | | | | | | | | | |
Before expense reimbursements | | | 0.45 | % | | | 0.39 | % | | | 0.35 | % | | | 0.48 | % | | | 0.31 | % |
After expense reimbursements | | | 0.45 | % | | | 0.42 | % | | | 0.39 | % | | | 0.51 | % | | | 0.35 | % |
Portfolio turnover | | | 13 | % | | | 12 | % | | | 34 | % | | | 11 | % | | | 15 | % |
(a) | Calculated based upon average shares outstanding. |
See accompanying notes to financial statements.
48
Financial Highlights (For a Share Outstanding Throughout Each Year) (Continued) |
S&P Smallcap Index Fund Direct Shares | | Year Ended
August 31,
2019 | | | Year Ended
August 31,
2018 | | | Year Ended
August 31,
2017 | | | Year Ended
August 31,
2016 | | | Year Ended
August 31,
2015 | |
Net asset value, beginning of year | | $ | 26.43 | | | $ | 22.33 | | | $ | 20.87 | | | $ | 20.60 | | | $ | 21.55 | |
INCOME FROM INVESTMENT OPERATIONS | | | | | | | | | | | | | | | | | | | | |
Net investment income/(loss)(a) | | | 0.15 | | | | 0.13 | | | | 0.13 | | | | 0.12 | | | | 0.14 | |
Net gain/(loss) on securities (both realized and unrealized) | | | (4.27 | ) | | | 6.38 | | | | 2.36 | | | | 2.29 | | | | 0.58 | |
Total from investment operations | | | (4.12 | ) | | | 6.51 | | | | 2.49 | | | | 2.41 | | | | 0.72 | |
LESS DISTRIBUTIONS | | | | | | | | | | | | | | | | | | | | |
Dividends from net investment income | | | (0.15 | ) | | | (0.12 | ) | | | (0.12 | ) | | | (0.14 | ) | | | (0.13 | ) |
Distributions from capital gains | | | (1.64 | ) | | | (2.29 | ) | | | (0.91 | ) | | | (2.00 | ) | | | (1.54 | ) |
Total distributions | | | (1.79 | ) | | | (2.41 | ) | | | (1.03 | ) | | | (2.14 | ) | | | (1.67 | ) |
Net asset value, end of year or period | | $ | 20.52 | | | $ | 26.43 | | | $ | 22.33 | | | $ | 20.87 | | | $ | 20.60 | |
| | | | | | | | | | | | | | | | | | | | | |
Total return | | | (15.82 | )% | | | 30.95 | % | | | 12.12 | % | | | 12.48 | % | | | 3.50 | % |
| | | | | | | | | | | | | | | | | | | | | |
RATIOS / SUPPLEMENTAL DATA | | | | | | | | | | | | | | | | | | | | |
Net assets, end of year (000s) | | $ | 61,412 | | | $ | 78,902 | | | $ | 56,076 | | | $ | 47,351 | | | $ | 40,823 | |
Ratio of expenses to average net assets: | | | | | | | | | | | | | | | | | | | | |
Before expense reimbursements | | | 0.81 | % | | | 0.80 | % | | | 0.78 | % | | | 0.77 | % | | | 0.78 | % |
After expense reimbursements | | | 0.81 | % | | | 0.77 | % | | | 0.74 | % | | | 0.74 | % | | | 0.74 | % |
Ratio of net investment income/(loss) to average net assets | | | | | | | | | | | | | | | | | | | | |
Before expense reimbursements | | | 0.70 | % | | | 0.53 | % | | | 0.56 | % | | | 0.56 | % | | | 0.62 | % |
After expense reimbursements | | | 0.70 | % | | | 0.56 | % | | | 0.60 | % | | | 0.60 | % | | | 0.66 | % |
Portfolio turnover | | | 14 | % | | | 18 | % | | | 31 | % | | | 12 | % | | | 12 | % |
K Shares | | Year Ended
August 31,
2019 | | | Year Ended
August 31,
2018 | | | Year Ended
August 31,
2017 | | | Year Ended
August 31,
2016 | | | Year Ended
August 31,
2015 | |
Net asset value, beginning of year | | $ | 25.77 | | | $ | 21.85 | | | $ | 20.47 | | | $ | 20.24 | | | $ | 21.18 | |
INCOME FROM INVESTMENT OPERATIONS | | | | | | | | | | | | | | | | | | | | |
Net investment income/(loss)(a) | | | 0.05 | | | | 0.01 | | | | 0.02 | | | | 0.02 | | | | 0.03 | |
Net gain/(loss) on securities (both realized and unrealized) | | | (4.16 | ) | | | 6.23 | | | | 2.31 | | | | 2.25 | | | | 0.59 | |
Total from investment operations | | | (4.11 | ) | | | 6.24 | | | | 2.33 | | | | 2.27 | | | | 0.62 | |
LESS DISTRIBUTIONS | | | | | | | | | | | | | | | | | | | | |
Dividends from net investment income | | | (0.06 | ) | | | (0.03 | ) | | | (0.04 | ) | | | (0.04 | ) | | | (0.02 | ) |
Distributions from capital gains | | | (1.64 | ) | | | (2.29 | ) | | | (0.91 | ) | | | (2.00 | ) | | | (1.54 | ) |
Total distributions | | | (1.70 | ) | | | (2.32 | ) | | | (0.95 | ) | | | (2.04 | ) | | | (1.56 | ) |
Net asset value, end of year or period | | $ | 19.96 | | | $ | 25.77 | | | $ | 21.85 | | | $ | 20.47 | | | $ | 20.24 | |
| | | | | | | | | | | | | | | | | | | | | |
Total return | | | (16.22 | )% | | | 30.26 | % | | | 11.59 | % | | | 11.89 | % | | | 3.03 | % |
| | | | | | | | | | | | | | | | | | | | | |
RATIOS / SUPPLEMENTAL DATA | | | | | | | | | | | | | | | | | | | | |
Net assets, end of year (000s) | | $ | 4,908 | | | $ | 9,851 | | | $ | 8,165 | | | $ | 9,279 | | | $ | 9,821 | |
Ratio of expenses to average net assets: | | | | | | | | | | | | | | | | | | | | |
Before expense reimbursements | | | 1.31 | % | | | 1.31 | % | | | 1.28 | % | | | 1.28 | % | | | 1.28 | % |
After expense reimbursements | | | 1.31 | % | | | 1.27 | % | | | 1.24 | % | | | 1.24 | % | | | 1.24 | % |
Ratio of net investment income/(loss) to average net assets | | | | | | | | | | | | | | | | | | | | |
Before expense reimbursements | | | 0.21 | % | | | 0.03 | % | | | 0.06 | % | | | 0.06 | % | | | 0.12 | % |
After expense reimbursements | | | 0.21 | % | | | 0.06 | % | | | 0.10 | % | | | 0.10 | % | | | 0.16 | % |
Portfolio turnover | | | 14 | % | | | 18 | % | | | 31 | % | | | 12 | % | | | 12 | % |
(a) | Calculated based upon average shares outstanding. |
49
See accompanying notes to financial statements.
Financial Highlights (For a Share Outstanding Throughout Each Year) (Continued) |
Shelton Core Value Fund Direct Shares | | Year Ended
August 31,
2019 | | | Year Ended
August 31,
2018 | | | Year Ended
August 31,
2017 | | | Year Ended
August 31,
2016 | | | Year Ended
August 31,
2015 | |
Net asset value, beginning of year | | $ | 24.53 | | | $ | 25.00 | | | $ | 26.82 | | | $ | 25.26 | | | $ | 25.98 | |
INCOME FROM INVESTMENT OPERATIONS | | | | | | | | | | | | | | | | | | | | |
Net investment income/(loss)(a) | | | 0.36 | | | | 0.37 | | | | 0.43 | | | | 0.48 | | | | 0.48 | |
Net gain/(loss) on securities (both realized and unrealized) | | | (0.51 | ) | | | 2.33 | | | | 1.81 | | | | 1.94 | | | | (0.74 | ) |
Total from investment operations | | | (0.15 | ) | | | 2.70 | | | | 2.24 | | | | 2.42 | | | | (0.26 | ) |
LESS DISTRIBUTIONS | | | | | | | | | | | | | | | | | | | | |
Dividends from net investment income | | | (0.68 | ) | | | (0.38 | ) | | | (0.59 | ) | | | (0.50 | ) | | | (0.46 | ) |
Distributions from capital gains | | | (3.65 | ) | | | (2.79 | ) | | | (3.47 | ) | | | (0.36 | ) | | | — | |
Total distributions | | | (4.33 | ) | | | (3.17 | ) | | | (4.06 | ) | | | (0.86 | ) | | | (0.46 | ) |
Net asset value, end of year or period | | $ | 20.05 | | | $ | 24.53 | | | $ | 25.00 | | | $ | 26.82 | | | $ | 25.26 | |
| | | | | | | | | | | | | | | | | | | | | |
Total return | | | 0.41 | % | | | 11.32 | % | | | 9.10 | % | | | 9.83 | % | | | (1.07 | )% |
| | | | | | | | | | | | | | | | | | | | | |
RATIOS / SUPPLEMENTAL DATA | | | | | | | | | | | | | | | | | | | | |
Net assets, end of year (000s) | | $ | 148,997 | | | $ | 176,019 | | | $ | 176,929 | | | $ | 175,317 | | | $ | 180,408 | |
Ratio of expenses to average net assets | | | 0.82 | % | | | 0.78 | % | | | 0.75 | % | | | 0.78 | % | | | 0.76 | % |
Ratio of net investment income/(loss) to average net assets | | | 1.77 | % | | | 1.52 | % | | | 1.71 | % | | | 1.90 | % | | | 1.80 | % |
Portfolio turnover | | | 21 | % | | | 35 | % | | | 9 | % | | | 20 | % | | | 3 | % |
K Shares | | Year Ended
August 31,
2019 | | | Year Ended
August 31,
2018 | | | Year Ended
August 31,
2017 | | | Year Ended
August 31,
2016 | | | Year Ended
August 31,
2015 | |
Net asset value, beginning of year | | $ | 24.22 | | | $ | 24.75 | | | $ | 26.61 | | | $ | 25.09 | | | $ | 25.76 | |
INCOME FROM INVESTMENT OPERATIONS | | | | | | | | | | | | | | | | | | | | |
Net investment income/(loss)(a) | | | 0.26 | | | | 0.25 | | | | 0.30 | | | | 0.35 | | | | 0.34 | |
Net gain/(loss) on securities (both realized and unrealized) | | | (0.50 | ) | | | 2.29 | | | | 1.79 | | | | 1.93 | | | | (0.73 | ) |
Total from investment operations | | | (0.24 | ) | | | 2.54 | | | | 2.09 | | | | 2.28 | | | | (0.39 | ) |
LESS DISTRIBUTIONS | | | | | | | | | | | | | | | | | | | | |
Dividends from net investment income | | | (0.59 | ) | | | (0.28 | ) | | | (0.48 | ) | | | (0.40 | ) | | | (0.28 | ) |
Distributions from capital gains | | | (3.65 | ) | | | (2.79 | ) | | | (3.47 | ) | | | (0.36 | ) | | | — | |
Total distributions | | | (4.24 | ) | | | (3.07 | ) | | | (3.95 | ) | | | (0.76 | ) | | | (0.28 | ) |
Net asset value, end of year or period | | $ | 19.74 | | | $ | 24.22 | | | $ | 24.75 | | | $ | 26.61 | | | $ | 25.09 | |
| | | | | | | | | | | | | | | | | | | | | |
Total return | | | (0.08 | )% | | | 10.75 | % | | | 8.57 | % | | | 9.30 | % | | | (1.56 | )% |
| | | | | | | | | | | | | | | | | | | | | |
RATIOS / SUPPLEMENTAL DATA | | | | | | | | | | | | | | | | | | | | |
Net assets, end of year (000s) | | $ | 2,601 | | | $ | 5,370 | | | $ | 5,369 | | | $ | 5,897 | | | $ | 5,789 | |
Ratio of expenses to average net assets | | | 1.32 | % | | | 1.28 | % | | | 1.25 | % | | | 1.28 | % | | | 1.26 | % |
Ratio of net investment income/(loss) to average net assets | | | 1.27 | % | | | 1.02 | % | | | 1.22 | % | | | 1.40 | % | | | 1.30 | % |
Portfolio turnover | | | 21 | % | | | 35 | % | | | 9 | % | | | 20 | % | | | 3 | % |
(a) | Calculated based upon average shares outstanding. |
See accompanying notes to financial statements.
50
Financial Highlights (For a Share Outstanding Throughout Each Year) (Continued) |
Nasdaq-100 Index Fund Direct Shares | | Year Ended
August 31,
2019 | | | Year Ended
August 31,
2018 | | | Year Ended
August 31,
2017 | | | Year Ended
August 31,
2016 | | | Year Ended
August 31,
2015 | |
Net asset value, beginning of year | | $ | 18.85 | | | $ | 15.24 | | | $ | 12.25 | | | $ | 11.00 | | | $ | 10.47 | |
INCOME FROM INVESTMENT OPERATIONS | | | | | | | | | | | | | | | | | | | | |
Net investment income/(loss)(a) | | | 0.11 | | | | 0.10 | | | | 0.10 | | | | 0.09 | | | | 0.11 | |
Net gain/(loss) on securities (both realized and unrealized) | | | 0.18 | | | | 3.78 | | | | 2.98 | | | | 1.27 | | | | 0.49 | |
Total from investment operations | | | 0.29 | | | | 3.88 | | | | 3.08 | | | | 1.36 | | | | 0.60 | |
LESS DISTRIBUTIONS | | | | | | | | | | | | | | | | | | | | |
Dividends from net investment income | | | (0.12 | ) | | | (0.10 | ) | | | (0.09 | ) | | | (0.11 | ) | | | (0.07 | ) |
Distributions from capital gains | | | (0.24 | ) | | | (0.17 | ) | | | — | | | | — | | | | — | |
Total distributions | | | (0.36 | ) | | | (0.27 | ) | | | (0.09 | ) | | | (0.11 | ) | | | (0.07 | ) |
Net asset value, end of year or period | | $ | 18.78 | | | $ | 18.85 | | | $ | 15.24 | | | $ | 12.25 | | | $ | 11.00 | |
| | | | | | | | | | | | | | | | | | | | | |
Total return | | | 1.72 | % | | | 25.73 | % | | | 25.29 | % | | | 12.46 | % | | | 5.78 | % |
| | | | | | | | | | | | | | | | | | | | | |
RATIOS / SUPPLEMENTAL DATA | | | | | | | | | | | | | | | | | | | | |
Net assets, end of year (000s) | | $ | 607,521 | | | $ | 630,845 | | | $ | 460,021 | | | $ | 298,123 | | | $ | 231,322 | |
Ratio of expenses to average net assets: | | | | | | | | | | | | | | | | | | | | |
Before expense reimbursements | | | 0.74 | % | | | 0.74 | % | | | 0.70 | % | | | 0.74 | % | | | 0.75 | % |
After expense reimbursements | | | 0.50 | %(b) | | | 0.51 | %(b) | | | 0.49 | % | | | 0.49 | % | | | 0.49 | % |
Ratio of net investment income/(loss) to average net assets | | | | | | | | | | | | | | | | | | | | |
Before expense reimbursements | | | 0.40 | % | | | 0.36 | % | | | 0.53 | % | | | 0.57 | % | | | 0.72 | % |
After expense reimbursements | | | 0.64 | % | | | 0.59 | % | | | 0.74 | % | | | 0.82 | % | | | 0.98 | % |
Portfolio turnover | | | 18 | % | | | 2 | % | | | 4 | % | | | 7 | % | | | 9 | % |
K Shares | | Year Ended
August 31,
2019 | | | Year Ended
August 31,
2018 | | | Year Ended
August 31,
2017 | | | Year Ended
August 31,
2016 | | | Year Ended
August 31,
2015 | |
Net asset value, beginning of year | | $ | 18.31 | | | $ | 14.83 | | | $ | 11.93 | | | $ | 10.69 | | | $ | 10.18 | |
INCOME FROM INVESTMENT OPERATIONS | | | | | | | | | | | | | | | | | | | | |
Net investment income/(loss)(a) | | | 0.02 | | | | 0.01 | | | | 0.03 | | | | 0.03 | | | | 0.05 | |
Net gain/(loss) on securities (both realized and unrealized) | | | 0.18 | | | | 3.67 | | | | 2.91 | | | | 1.24 | | | | 0.48 | |
Total from investment operations | | | 0.20 | | | | 3.68 | | | | 2.94 | | | | 1.27 | | | | 0.53 | |
LESS DISTRIBUTIONS | | | | | | | | | | | | | | | | | | | | |
Dividends from net investment income | | | (0.04 | ) | | | (0.03 | ) | | | (0.04 | ) | | | (0.03 | ) | | | (0.02 | ) |
Distributions from capital gains | | | (0.24 | ) | | | (0.17 | ) | | | — | | | | — | | | | — | |
Total distributions | | | (0.28 | ) | | | (0.20 | ) | | | (0.04 | ) | | | (0.03 | ) | | | (0.02 | ) |
Net asset value, end of year or period | | $ | 18.23 | | | $ | 18.31 | | | $ | 14.83 | | | $ | 11.93 | | | $ | 10.69 | |
| | | | | | | | | | | | | | | | | | | | | |
Total return | | | 1.24 | % | | | 25.03 | % | | | 24.70 | % | | | 11.96 | % | | | 5.25 | % |
| | | | | | | | | | | | | | | | | | | | | |
RATIOS / SUPPLEMENTAL DATA | | | | | | | | | | | | | | | | | | | | |
Net assets, end of year (000s) | | $ | 24,755 | | | $ | 28,573 | | | $ | 22,427 | | | $ | 15,500 | | | $ | 17,799 | |
Ratio of expenses to average net assets: | | | | | | | | | | | | | | | | | | | | |
Before expense reimbursements | | | 1.24 | % | | | 1.24 | % | | | 1.20 | % | | | 1.24 | % | | | 1.24 | % |
After expense reimbursements | | | 1.00 | %(b) | | | 1.01 | %(b) | | | 0.99 | % | | | 0.99 | % | | | 0.99 | % |
Ratio of net investment income/(loss) to average net assets | | | | | | | | | | | | | | | | | | | | |
Before expense reimbursements | | | (0.10 | )% | | | (0.15 | )% | | | 0.03 | % | | | 0.05 | % | | | 0.22 | % |
After expense reimbursements | | | 0.14 | % | | | 0.08 | % | | | 0.24 | % | | | 0.30 | % | | | 0.48 | % |
Portfolio turnover | | | 18 | % | | | 2 | % | | | 4 | % | | | 7 | % | | | 10 | % |
(a) | Calculated based upon average shares outstanding. |
(b) | CCO Fees are not included in the expense limitation. |
51
See accompanying notes to financial statements.
Financial Highlights (For a Share Outstanding Throughout Each Year) (Continued) |
Shelton Green Alpha Fund Direct Shares | | Year Ended
August 31,
2019 | | | Year Ended
August 31,
2018 | | | Year Ended
August 31,
2017 | | | Year Ended
August 31,
2016 | | | Year Ended
August 31,
2015 | |
Net asset value, beginning of year | | $ | 17.20 | | | $ | 17.32 | | | $ | 14.53 | | | $ | 13.67 | | | $ | 15.90 | |
INCOME FROM INVESTMENT OPERATIONS | | | | | | | | | | | | | | | | | | | | |
Net investment income/(loss)(a) | | | 0.03 | | | | 0.05 | | | | 0.02 | | | | (0.03 | ) | | | (0.08 | ) |
Net gain/(loss) on securities (both realized and unrealized) | | | 1.47 | | | | 0.34 | | | | 2.77 | | | | 0.89 | | | | (2.15 | ) |
Total from investment operations | | | 1.50 | | | | 0.39 | | | | 2.79 | | | | 0.86 | | | | (2.23 | ) |
LESS DISTRIBUTIONS | | | | | | | | | | | | | | | | | | | | |
Dividends from net investment income | | | (0.02 | ) | | | (0.05 | ) | | | — | | | | — | | | | — | |
Distributions from capital gains | | | (0.24 | ) | | | (0.46 | ) | | | — | (b) | | | — | (b) | | | — | (b) |
Total distributions | | | (0.26 | ) | | | (0.51 | ) | | | — | | | | — | | | | — | |
Net asset value, end of year or period | | $ | 18.44 | | | $ | 17.20 | | | $ | 17.32 | | | $ | 14.53 | | | $ | 13.67 | |
| | | | | | | | | | | | | | | | | | | | | |
Total return | | | 8.91 | % | | | 2.19 | % | | | 19.20 | % | | | 6.29 | % | | | (14.02 | )% |
| | | | | | | | | | | | | | | | | | | | | |
RATIOS / SUPPLEMENTAL DATA | | | | | | | | | | | | | | | | | | | | |
Net assets, end of year (000s) | | $ | 56,567 | | | $ | 49,366 | | | $ | 40,256 | | | $ | 36,880 | | | $ | 29,596 | |
Ratio of expenses to average net assets: | | | | | | | | | | | | | | | | | | | | |
Before expense reimbursements | | | 1.34 | % | | | 1.30 | % | | | 1.30 | % | | | 1.31 | % | | | 1.34 | % |
After expense reimbursements | | | 1.34 | % | | | 1.30 | % | | | 1.30 | % | | | 1.31 | % | | | 1.34 | % |
Ratio of net investment income/(loss) to average net assets | | | | | | | | | | | | | | | | | | | | |
Before expense reimbursements | | | 0.15 | % | | | 0.30 | % | | | 0.13 | % | | | (0.22 | )% | | | (0.53 | )% |
After expense reimbursements | | | 0.15 | % | | | 0.30 | % | | | 0.13 | % | | | (0.22 | )% | | | (0.53 | )% |
Portfolio turnover | | | 12 | % | | | 13 | % | | | 24 | % | | | 13 | % | | | 22 | % |
(a) | Calculated based upon average shares outstanding. |
(b) | Less than $0.01 per share. |
See accompanying notes to financial statements.
52
Shelton Funds | Notes to Financial Statements | August 31, 2019 |
Note 1 - SUMMARY OF SIGNIFICANT ACCOUNTING POLICIES
Green California Tax-Free Income Fund, U.S. Government Securities Fund, Short-Term U.S. Government Bond Fund, The United States Treasury Trust, S&P 500 Index Fund, S&P MidCap Index Fund, S&P SmallCap Index Fund, Shelton Core Value Fund, Nasdaq-100 Index Fund, and Shelton Green Alpha Fund (the “Funds”) are each a series of shares of beneficial interest of the Shelton Funds (the “Trust”). The Trust is registered under the Investment Company Act of 1940, as amended, as a diversified open-end management investment company. Each Fund is an investment company and accordingly follows the investment company accounting and reporting guidance of the Financial Accounting Standards Board (FASB) Accounting Standard Codification Topic 946 “Financial Services – Investment Companies”. The Trust is organized as a Delaware statutory trust and is authorized to issue an unlimited number of no par value shares in one or more series. The Trust, originally organized as two separate Massachusetts business trusts formed by Declarations of Trust dated September 11, 1985, as subsequently amended, was reorganized into a single Delaware statutory trust after the close of trading on December 29, 2006. The investment objectives of the Funds are as follows: Green California Tax-Free Income Fund seeks high current tax-free income for California residents. U.S. Government Securities Fund seeks liquidity, safety from credit risk and as high a level of income as is consistent with these objectives. Short-Term U.S. Government Bond Fund seeks liquidity, safety from credit risk, preservation of investors’ principal and as high a level of income as is consistent with these objectives. The United States Treasury Trust seeks high current income exempt from state income taxes while maintaining a stable net asset value of $1.00 per share. S&P 500 Index Fund’s objective is to attempt to replicate the total return of the U.S. stock market as measured by the S&P 500 Composite Stock Price Index. S&P MidCap Index Fund attempts to replicate the performance of medium-sized U.S. companies as measured by the S&P MidCap 400 Index. S&P SmallCap Index Fund attempts to replicate the performance of small-sized U.S. companies as measured by the S&P SmallCap 600 Stock Index. The Shelton Core Value Fund’s objective is to achieve a high level of income and capital appreciation (when consistent with high income) by investing primarily in income-producing U.S. equity securities. Shelton Green Alpha Fund seeks to achieve long-term capital appreciation by investing in stocks in the green economy. Nasdaq-100 Index Fund attempts to replicate the performance of the largest non-financial companies as measured by the Nasdaq-100 Index.
The Shelton Funds began offering additional classes of shares, Class K, on October 16, 2003. Income, expenses (other than the expenses attributable to a specific class), realized and unrealized gains or losses on investments of the Funds are allocated proportionately to the two classes of shares offered based on the daily net assets, except for Rule 12b-1 distribution fees and shareholder service fees, which are charged only to K Shares. The following is a summary of significant accounting policies followed by the Funds.
(a) Security Valuation – Equity securities listed on a national exchange are valued at the last reported sales price. Futures contracts are valued at the settle price, depending on the exchange the contract trades on, typically as of 4:15 p.m., Eastern Time. Municipal securities are valued by an independent pricing service at a price determined by a matrix pricing method. This technique generally considers such factors as yields or prices of bonds of comparable quality, type of issue, coupon, maturity, ratings and general market conditions. U.S. government securities for which market quotations are readily available are valued at the mean between the closing bid and asked prices provided by an independent pricing service. U.S. agency securities consisting of mortgage pass-through certificates are valued using dealer quotations provided by an independent pricing service. U.S. Treasury Bills are valued at amortized cost which approximates market value. Securities with remaining maturities of 60 days or less are valued on the amortized cost basis as reflecting fair value. The United States Treasury Trust securities are valued at amortized cost, in accordance with procedures adopted by the Board of Trustees and which the Board of Trustees has determined in good faith reflects the market-based net asset value per share. The Fund receives options pricing data from the Trust’s third party pricing service who use the last traded price to quote options positions.
Securities for which market quotes are not readily available from the Trust’s third party pricing service are valued at fair value, determined in good faith and in accordance with procedures adopted by the Board of Trustees. The Board has delegated to its Pricing Committee the responsibility for determining the fair value, subject to the Board oversight and the review of the pricing decisions at its quarterly meetings.
(b) Futures Contracts – Initial margin deposits required upon entering into futures contracts are satisfied by the segregation of cash, as collateral, for the account of the broker (a Fund’s agent in acquiring the futures position). During the period the futures contract is open, changes in the value of the contract are recognized as unrealized gains or losses by “marking to market” on a daily basis to reflect the market value of the contract at the end of each day’s trading. Variation margin payments are made or received depending upon whether unrealized gains or losses are incurred. When the contract is closed, a Fund records a realized gain or loss equal to the difference between the proceeds from (or cost of) the closing transaction and the Fund’s basis in the contract. The S&P 500 Index Fund, S&P MidCap Index Fund, S&P SmallCap Index Fund, Shelton Core Value Fund, Shelton Green Alpha Fund and Nasdaq-100 Index Fund may purchase or sell stock index futures to maintain cash reserves while remaining fully invested, to facilitate trading, to reduce transaction costs, or to seek higher investment returns when a futures contract is priced more attractively than the underlying equity security or index. Risks include the possibility of an illiquid market and an imperfect correlation between the change in market value of the stocks held by a Fund and the prices of futures contracts.
(c) Options – The Shelton Core Value Fund may write call options. When an option is written, the Fund receives a premium and becomes obligated to sell the underlying security at a fixed price, upon exercise of the option. Options can be traded through an exchange or through a privately negotiated arrangement with a dealer in an OTC transaction. Options traded through an exchange are generally cleared through a clearinghouse (such as the Options Clearing Corporation). The difference between the premium received or paid, and the market value of the option, is recorded as unrealized appreciation or depreciation. When an option is exercised, the proceeds of the security sold are adjusted by the amount of premium received. Upon the expiration of the option, a gain or loss is reported in the Statement of Operations. The risk in writing a call option is that the market price of the security increases and if the option is exercised, the Fund must either purchase the security at a higher price for delivery or give up the opportunity for profit.
(d) Federal Income Taxes – No provision is considered necessary for federal income taxes. The Funds intend to qualify for and elect the tax treatment applicable to regulated investment companies under the Internal Revenue Code and to distribute all of their taxable income to shareholders.
(e) Security Transactions, Investment Income and Distributions to Shareholders – Security transactions are recorded on the trade date. Interest income is recorded on the accrual basis. Dividend income is recorded on the ex-dividend date. Withholding taxes on foreign dividends have been provided for, in accordance with the Trust’s understanding of the applicable country’s tax rules and rates. Distributions to shareholders are recorded on the ex-dividend date for the Green California Tax-Free Income Fund, the U.S. Government Securities Fund, S&P 500 Index Fund, S&P MidCap Index Fund, S&P SmallCap Index Fund, Shelton Core Value Fund, Shelton Green Alpha Fund, Nasdaq-100 Index Fund and Short-Term U.S. Government Bond Fund. Income distributions and capital gain distributions are determined in accordance with income tax regulations which may differ from accounting principles generally accepted in the United States of America. These differences are primarily due to differing treatments for futures contracts, redemptions-in-kind and post-October capital losses. For The United States Treasury Trust, dividends from net investment income are declared daily and reinvested or paid in cash monthly. The U.S. Treasury Trust intends to maintain a continuous net asset value per share of $1.00. If net asset value per share using available market information deviates from $1.00 by $.005 or more, the Board of Trustees would consider what steps, if any, should be taken to restore net asset value per share to $1.00.
(f) Concentration – The Green California Tax-Free Income Fund invests in debt instruments of municipal issuers. The issuers’ abilities to meet their obligations may be affected by economic developments in the state of California.
(g) Use of Estimates in Financial Statements – In preparing financial statements in conformity with accounting principles generally accepted in the United States of America, management makes estimates and assumptions that affect the reported amounts of assets and liabilities at the date of the financial statements, as well as the reported amounts of income and expense during the year. Actual results may differ from these estimates.
(h) Share Valuations – The net asset value (“NAV”) per share of each Fund is calculated by dividing the sum of the value of the securities held by the Fund, plus cash or other assets, minus all liabilities (including estimated accrued expenses) by the total number of shares outstanding of the Fund, rounded to the nearest cent. A Fund’s shares will not be priced on the days on which the NYSE is closed for trading. Bond and money market funds are closed on Columbus Day (observed) and Veteran’s Day (observed). The offering and redemption price per share of each Fund is equal to a Fund’s NAV per share.
53
Shelton Funds | Notes to Financial Statements (Continued) | August 31, 2019 |
(i) Accounting for Uncertainty in Income Taxes – The Funds recognize the tax benefits of uncertain tax positions only where the position is “more likely than not” to be sustained assuming examination by tax authorities. Management has analyzed the Fund’s tax positions, and has concluded that no liability for unrecognized tax benefits should be recorded related to uncertain tax positions taken on returns filed for open tax years (2016-2018), or expected to be taken in the Fund’s 2019 tax returns. Each Fund identifies its major tax jurisdictions as U.S. Federal, however the Funds are not aware of any tax positions for which it is reasonably possible that the total amounts of unrecognized tax benefits will change materially in the next twelve months.
(j) Fair Value Measurements – The Funds utilize various methods to measure the fair value of most of their investments on a recurring basis. U.S. GAAP establishes a hierarchy that prioritizes inputs to valuation methods. The three levels of inputs are:
Level 1 – Unadjusted quoted prices in active markets for identical assets or liabilities that the Fund has the ability to access.
Level 2 – Observable inputs other than quoted prices included in Level 1 that are observable for the asset or liability, either directly or indirectly. These inputs may include quoted prices for the identical instrument on an inactive market, prices for similar instruments, interest rates, prepayment speeds, credit risk, yield curves, default rates and similar data.
Level 3 – Unobservable inputs for the asset or liability, to the extent relevant observable inputs are not available, representing the Fund’s own assumptions about the assumptions a market participant would use in valuing the asset or liability, and would be based on the best information available.
The availability of observable inputs can vary from security to security and is affected by a wide variety of factors, including, for example, the type of security, whether the security is new and not yet established in the marketplace, the liquidity of markets, and other characteristics particular to the security. To the extent that valuation is based on models or inputs that are less observable or unobservable in the market, the determination of fair value requires more judgment. Accordingly, the degree of judgment exercised in determining fair value is greatest for instruments categorized in Level 3.
The inputs used to measure fair value may fall into different levels of the fair value hierarchy. In such cases, for disclosure purposes, the level in the fair value hierarchy within which the fair value measurement falls in its entirety, is determined based on the lowest level input that is significant to the fair value measurement in its entirety.
The following table summarizes the valuation of the Trust’s securities at August 31, 2019 using fair value hierarchy:
| | | Level 1(a) | | | Level 2(a) | | | Level 3(a) | | | | | | | Level 1(a) | | | Level 1(a) | | | Level 2(a) | |
Fund | | Investments
in Securities(b) | | | Investments
in Securities(c) | | | Investments
in Securities | | | Total
Assets | | | Futures
Contracts -
Assets(d) | | | Futures
Contracts -
Liabilities(d) | | | Written
Options -
Liabilities | |
Green California Tax-Free Income Fund | | $ | — | | | $ | 65,522,289 | | | $ | — | | | $ | 65,522,289 | | | $ | — | | | $ | — | | | $ | — | |
U.S. Government Securities Fund | | | — | | | | 19,313,646 | | | | — | | | | 19,313,646 | | | | — | | | | — | | | | — | |
Short-Term U.S. Government Bond Fund | | | — | | | | 6,009,806 | | | | — | | | | 6,009,806 | | | | — | | | | — | | | | — | |
The United States Treasury Trust Fund | | | — | | | | 39,094,862 | | | | — | | | | 39,094,862 | | | | — | | | | — | | | | — | |
S&P 500 Index Fund | | | 190,785,673 | | | | 299,062 | | | | — | | | | 191,084,735 | | | | — | | | | 285 | | | | — | |
S&P MidCap Index Fund | | | 109,439,054 | | | | 598,124 | | | | — | | | | 110,037,178 | | | | 1,170 | | | | — | | | | — | |
S&P SmallCap Index Fund | | | 66,013,070 | | | | 99,687 | | | | 2,518 | | | | 66,115,275 | | | | — | | | | 131 | | | | — | |
Shelton Core Value Fund | | | 145,589,496 | | | | 5,084,058 | | | | 700,000 | (e) | | | 151,373,554 | | | | — | | | | — | | | | 2,120,565 | |
Nasdaq-100 Index Fund | | | 632,063,728 | | | | 199,375 | | | | — | | | | 632,263,103 | | | | — | | | | 1,001 | | | | — | |
Shelton Green Alpha Fund | | | 55,033,210 | | | | — | | | | — | | | | 55,033,210 | | | | — | | | | — | | | | — | |
(a) | It is the Funds’ policy to recognize transfers between levels on the last day of the fiscal reporting period. There were no transfers in or out of Level 1, Level 2, and Level 3 as of FYE. |
(b) | All publicly traded common stocks and preferred stocks held in the Funds are Level 1 securities, except those that are fair valued in the Basic Materials and Consumer Discretionary industries. For a detailed break-out of equity securities by major industry classification, please refer to the Portfolio of Investments. |
(c) | All fixed income securities held in the Funds are Level 2 securities. For a detailed break-out of fixed income securities by type, please refer to the Portfolio of Investments. |
(d) | Represents variation margin on the last day of the reporting period. |
Level 3 Securities | | S&P
SmallCap
Index Fund | | | Shelton Core
Value Fund | |
| | | Common
Stock -
Basic Materials | | | Preferred
Stock | |
Beginning Balance | | $ | 2,962 | | | $ | 1,000,000 | |
Net Purchases | | | — | | | | — | |
Net Sales | | | — | | | | — | |
Total Realized Gain/(Loss) | | | — | | | | — | |
Change in Unrealized Appreciation/(Depreciation) | | $ | (444 | ) | | $ | (300,000 | ) |
Accrued Interest | | | — | | | | — | |
Transfers into Level 3 | | | — | | | | — | |
Transfers out of Level 3 | | | — | | | | — | |
Ending Balance | | $ | 2,518 | | | $ | 700,000 | |
54
Shelton Funds | Notes to Financial Statements (Continued) | August 31, 2019 |
| | | Fair Value as
of 8/31/2019 | | Valuation Techniques | Unobservable Input | | Input Values | | Impact to valuation from
an increase to input |
A Schulman Inc Rights | | $ | 2,518 | | Based on the difference between the value of the underlying security and the cash value of the right | Impact of pending litigation relating to right issuance | | | $0.85 | | Results of pending litigation may result in direct and proportional changes in the value of the security |
Amerityre Corp. 5% Preferred Conv. | | $ | 700,000 | | Estimated recovery proceeds | *Market quotes, yield quotes and option valuation | | | $0.35 | | Changes in the market quotes and option valuation will result in direct and proportional changes in the value of the security |
* | Market quote on Amerityre common stock, five-year treasury yield and the option value of the conversion of preferred stock to common stock. |
(j) Disclosure about Derivative Instruments and Hedging Activities – The Funds have adopted enhanced disclosure regarding derivative and hedging activity intended to improve financial reporting of derivative instruments by enabling investors to understand how and why an entity uses derivatives, how derivatives are accounted for, and how derivative instruments affect an entity’s results of operations and financial position.
S&P 500 Index Fund, S&P MidCap Index Fund, S&P SmallCap Index Fund, Shelton Core Value Fund, Nasdaq-100 Index Fund and Shelton Green Alpha Fund can use futures contracts and strategies for achieving the investment objectives.
Although the Funds’ primary risks are associated with changes in the stock market, there are other risks associated with the Funds. For the index funds, these risks generally apply to how well the Funds track the index. For example, the Funds invest in futures contracts to the extent that it holds cash in the portfolio. If these futures contracts do not track the index, the Fund’s performance relative to the respective index will change. For the non-indexed Funds, they may invest in futures contracts to the extent each Fund holds cash in the portfolio. If these futures contracts owned by each Fund do not perform well, the Funds’ performance will be impacted.
Under normal circumstances each Fund may follow a number of investment policies to achieve its objective. Losses involving futures can sometimes be substantial, in part because a relatively small price movement in a futures contract may result in an immediate and substantial loss for the Funds. In an effort to minimize this risk, the Funds will not use futures for speculative purposes or as leverage. It is the Funds’ policy to hold cash deposits equal or greater than the total market value of any futures position. The value of all futures and options contracts in which the Funds acquire an interest will not exceed 20% of current total assets.
At August 31, 2019, the number of open future contracts in the S&P 500 Index Fund, S&P MidCap Index Fund, S&P SmallCap Index Fund, and Nasdaq-100 Index Fund were 3, 3, 4, and 3, respectively. The Shelton Core Value Fund, and Shelton Green Alpha Fund held no futures contracts at August 31, 2019. Only current day’s variation margin is reported as an asset or liability within the statement of assets and liabilities.
The effect of derivative instruments on the Statements of Assets & Liabilities for the year ended August 31, 2019:
Derivatives Not Accounted for as Hedging Instruments | | Variation Margin
Receivable | | | Variation Margin
Payable | |
S&P 500 Index Fund - Equity contracts | | $ | — | | | $ | 285 | |
S&P MidCap Index Fund - Equity contracts | | | 1,170 | | | | — | |
S&P SmallCap Index Fund - Equity contracts | | | — | | | | 131 | |
Nasdaq-100 Index Fund - Equity contracts | | | — | | | | 1,001 | |
The effect of derivative instruments on the Statements of Operations for the year ended August 31, 2019:
Derivatives Not Accounted for as Hedging Instruments | | Realized Gain/
(Loss) on Futures
Recognized in Income | | | Changes in Unrealized
Appreciation/
(Depreciation) on
Futures Recognized
in Income | |
S&P 500 Index Fund - Equity contracts | | $ | 73,975 | | | $ | (9,272 | ) |
S&P MidCap Index Fund - Equity contracts | | | (27,539 | ) | | | (16,069 | ) |
S&P SmallCap Index Fund - Equity contracts | | | (226,099 | ) | | | (42,815 | ) |
Nasdaq-100 Index Fund - Equity contracts | | | (1,336,043 | ) | | | (502,329 | ) |
The previously disclosed derivative instruments outstanding as of August 31, 2019, and their effect on the Statement of Operations for the year ending August 31, 2019, serve as indicators of the volume of financial derivative activity for the company. The following table indicates the average volume for the year:
Derivatives Not Accounted for as Hedging Instruments | | Average Notional Value | |
S&P 500 Index Fund - Equity contracts | | $ | 970,663 | |
S&P MidCap Index Fund - Equity contracts | | | 711,887 | |
S&P SmallCap Index Fund - Equity contracts | | | 815,412 | |
Nasdaq-100 Index Fund - Equity contracts | | | 5,410,574 | |
55
Shelton Funds | Notes to Financial Statements (Continued) | August 31, 2019 |
Note 2 - INVESTMENT MANAGEMENT FEE AND OTHER RELATED PARTY TRANSACTIONS
Shelton Capital Management (“Shelton Capital” or the “Advisor”), a California limited partnership, provides each Fund with management and administrative services pursuant to investment management and administration servicing agreements.
In accordance with the terms of the management agreement, the Advisor receives compensation at the following annual rates:
| | To $100 million in net assets | $100 million to $500 million in net assets | $500 million to $1 billion in net assets | In excess of $1 billion in net assets |
Green California Tax-Free Income Fund | 0.50% | 0.45% | 0.40% | 0.40% |
U.S. Government Securities Fund | 0.50% | 0.45% | 0.40% | 0.40% |
U.S. Treasury Trust | 0.50% | 0.45% | 0.40% | 0.40% |
Short-Term U.S. Government Bond Fund | 0.50% | 0.50% | 0.45% | 0.40% |
S&P 500 Index Fund | 0.25% | 0.25% | 0.25% | 0.25% |
S&P MidCap Index Fund | 0.40% | 0.40% | 0.40% | 0.40% |
S&P SmallCap Index Fund | 0.50% | 0.50% | 0.45% | 0.40% |
Shelton Core Value Fund | 0.50% | 0.50% | 0.45% | 0.40% |
Nasdaq-100 Index Fund | 0.50% | 0.50% | 0.45% | 0.40% |
Shelton Green Alpha Fund(a) | 1.00% | 1.00% | 1.00% | 1.00% |
(a) | The Advisor pays Green Alpha Advisors a sub-advisor fee of 0.50% |
The Advisor contractually agreed to reduce total operating expense to certain Funds of the Trust. This additional contractual reimbursement is effective until January 2, 2020, unless renewed and is subject to recoupment within three fiscal years following reimbursement. Recoupment is limited to the extent the reimbursement does not exceed any applicable expense limit and the effect of the reimbursement is measured after all ordinary operating expenses are calculated; any such reimbursement is subject to the Board of Trustees’ review and approval. Reimbursements from the Advisor to affected Funds, and the voluntary expense limits, for the year ended August 31, 2019 are as follows:
| | Voluntary Expense Limitation |
Fund | Reimburse | Direct Shares | K Shares | Expiration |
U.S. Government Securities Fund | 0.23% | 0.74% | 1.24% | 1/2/20 |
Short-Term U.S. Government Bond Fund | 0.77% | 0.59% | 1.09% | 1/2/20 |
The United States Treasury Trust | 0.22% | 0.53% | 1.03% | 1/2/20 |
Nasdaq-100 Index Fund | 0.24% | 0.49% | 0.99% | 1/2/20 |
At August 31, 2019, the remaining cumulative unreimbursed amount paid and/or waived by the Advisor on behalf of the Funds that may be reimbursed was $4,687,164. The Advisor may recapture a portion of the above amount no later than the dates as stated below. As of January 2, 2018, the S&P 500 Index Fund, S&P MidCap Index Fund and S&P SmallCap Index Fund were no longer subject to contractual expense limitations.
Fund | | Expires 8/31/20 | | | Expires 8/31/21 | | | Expires 8/31/22 | | | Total | |
U.S. Government Securities Fund | | $ | 16,422 | | | $ | 27,929 | | | $ | 43,929 | | | $ | 88,280 | |
Short-Term U.S. Government Bond Fund | | | 23,105 | | | | 36,555 | | | | 48,141 | | | | 107,801 | |
The United States Treasury Trust | | | 120,514 | | | | 170,178 | | | | 108,593 | | | | 399,285 | |
S&P 500 Index Fund | | | 182,805 | | | | 88,195 | | | | — | | | | 271,000 | |
S&P MidCap Index Fund | | | 72,425 | | | | 43,839 | | | | — | | | | 116,264 | |
S&P SmallCap Index Fund | | | 39,066 | | | | 23,398 | | | | — | | | | 62,464 | |
Nasdaq-100 Index Fund | | | 918,243 | | | | 1,275,279 | | | | 1,448,548 | | | | 3,642,070 | |
Total | | $ | 1,372,580 | | | $ | 1,665,373 | | | $ | 1,649,211 | | | $ | 4,687,164 | |
A Fund must pay its current ordinary operating expenses before the Advisor is entitled to any reimbursement of fees and/or expenses. Any such reimbursement is contingent upon Board of Trustee review and approval prior to the time the reimbursement is initiated.
As compensation for administrative duties not covered by the management agreement, Shelton Capital receives an administration fee, which was revised on January 1, 2011. The administration fee is based on assets held, in aggregate, by the Shelton Funds. The fee rates are 0.10% on the first $500 million, 0.08% on the next $500 million, and 0.06% on combined assets over $1 billion. Administration fees are disclosed on the Statement of Operations.
Certain officers and trustees of the Trust are also partners of Shelton Capital. Gregory T. Pusch has served as the Chief Compliance Officer (“CCO”) of the Trust since March 2017. Mr. Pusch is also employed by Shelton Capital, the Advisor and Administrator to the Trust. The Trust is responsible for the portion of his salary allocated to his duties as the CCO of the Trust during his employment, and Shelton Capital is reimbursed by the Trust for this portion of his salary. The level of reimbursement is reviewed and determined by the Board of Trustees at least annually.
Shelton Funds have adopted a Distribution Plan (the “Plan”), as amended August 1, 2012, pursuant to Rule 12b-1 under the Investment Company Act of 1940, whereby the Class K Shares of each Fund of the Shelton Funds pays the Distributor for expenses that relate to the promotion and distribution of shares. Under the Plan, the Class K Shares of the Funds will pay RFS Partners, the Funds’ distributor (the “Distributor”) a fee at an annual rate of 0.25%, payable monthly, of the daily net assets attributable to such Fund’s Class K Shares. The Plan was amended to eliminate the Class A Shares. All A Share accounts were liquidated effective December 6, 2013.
Shelton Funds adopted a Shareholder Services Plan (the “Services Plan”), whereby the K Shares of each Fund of the Shelton Funds pay RFS Partners, the Funds’ Distributor or other service providers, an annual rate of 0.25% of the average daily net assets of Class K Shares. Such amounts are compensation for providing certain services to clients owning K Shares, including processing purchase and redemption transactions, assisting in other administrative details and providing other information with respect to each Fund. The United States Treasury Trust Fund is not charging its Shareholder Servicing Fee.
56
Shelton Funds | Notes to Financial Statements (Continued) | August 31, 2019 |
For the year ended August 31, 2019, the following were paid by the Class K Shares of each Fund of the Trust:
Fund | | Class K
12b-1 Fees | | | Class K
Shareholder
Service Fees | |
U.S. Government Securities Fund | | $ | 8,034 | | | $ | 8,034 | |
Short-Term U.S. Government Bond Fund | | | 2,692 | | | | 2,675 | |
U.S. Treasury Trust Fund | | | 4,746 | | | | 4,746 | |
S&P 500 Index Fund | | | 20,326 | | | | 20,258 | |
S&P MidCap Index Fund | | | 11,717 | | | | 11,717 | |
S&P SmallCap Index Fund | | | 18,542 | | | | 18,542 | |
Shelton Core Value Fund | | | 11,039 | | | | 11,039 | |
Nasdaq-100 Index Fund | | | 64,223 | | | | 64,384 | |
Management fees, Administration fees, Expense reimbursement from the manager, CCO fees and Trustees fees incurred during the period are included in the Statement of Operations.
Note 3 - PURCHASES AND SALES OF SECURITIES
Purchases and sales of securities other than short-term instruments for the year ended August 31, 2019 were as follows:
Fund | | Purchases | | | Sales | | | Purchases
(Excluding U.S.
Government
Obligations) | | | Sales
(Excluding U.S.
Government
Obligations) | |
Green California Tax-Free Income Fund | | $ | 2,213,775 | | | $ | 6,855,963 | | | $ | 2,213,775 | | | $ | 6,855,963 | |
U.S. Government Securities Fund | | | 1,449,238 | | | | 3,213,505 | | | | — | | | | — | |
Short-Term U.S. Government Bond Fund | | | 1,788,070 | | | | 1,911,833 | | | | — | | | | — | |
S&P 500 Index Fund | | | 6,388,411 | | | | 8,244,348 | | | | 6,388,411 | | | | 8,244,348 | |
S&P MidCap Index Fund | | | 15,347,377 | | | | 25,033,325 | | | | 15,347,377 | | | | 25,033,325 | |
S&P SmallCap Index Fund | | | 10,215,391 | | | | 16,568,810 | | | | 10,215,391 | | | | 16,568,810 | |
Core Value Fund | | | 32,248,902 | | | | 52,269,484 | | | | 32,248,902 | | | | 52,269,484 | |
Nasdaq-100 Index Fund | | | 112,849,187 | | | | 130,716,525 | | | | 112,849,187 | | | | 130,716,525 | |
Green Alpha Fund | | | 8,479,510 | | | | 5,555,451 | | | | 8,479,510 | | | | 5,555,451 | |
Note 4 – OPTIONS WRITTEN
Written Options Contracts – Certain Funds may write options to manage exposure to certain changes in the market. When a Fund writes an option, an amount equal to the premium received by the Fund is recorded as a liability, which is marked-to-market daily to reflect the current market value of the option written. If the option expires, the Fund realizes a gain from investments equal to the amount of the premium received. When a written call option is exercised, the difference between the premium and the amount for effecting a closing purchase transaction, including brokerage commission, is also treated as a realized gain or loss. When a written put option is exercised, the amount of the premium received reduces the cost of the security purchased by the Fund. A risk in writing a covered call option is that the Fund may forego the opportunity of profit if the market price of the underlying security increases and the option is exercised. The risk in writing a put option is that the Fund may incur a loss if the market price of the underlying security decreases and the option is exercised.
At August 31, 2019, the Shelton Core Value Fund had written option contracts outstanding:
Derivatives not
Accounted for as
Hedging Instruments | Liability Derivatives
Statement of Assets and
Liabilities Location | | Fair Value | |
Equity Contracts(written option contracts) | Written options, at value | | $ | 2,120,565 | |
The effect of derivative instruments on the Funds’ Statement of Operations for the year ended August 31, 2019, was as follows:
Derivatives not Accounted
for as Hedging Instruments | Location of Gains/(Loss) on
Derivatives Recognize in Income | | Realized Gain/
(Loss) on Derivatives
Recognized in Income | | | Change in Unrealized
Gain/(Loss) on
Derivatives Recognized
in Income | |
Equity Contracts(written option contracts) | Net realized gains (losses) from: Written option contracts / Net change in unrealized appreciation (depreciation) on: Written option contracts | | $ | 2,544,749 | | | $ | (37,166 | ) |
Volume of derivative instruments held by the Funds during the year ended August 31, 2019, was as follows:
Derivative Type | Unit of Measurement | | Average | |
Written Option Contracts | Contracts | | $ | (1,575,028 | ) |
57
Shelton Funds | Notes to Financial Statements (Continued) | August 31, 2019 |
Note 5- TAX CHARACTER
Reclassifications: Accounting principles generally accepted in the United States of America require certain components of net assets be reclassified between financial and tax reporting. These reclassifications have no effect on net assets or net asset value per share. For the year ended August 31, 2019, there are permanent differences resulting from different book and tax accounting for net operating losses, expiration of capital loss carryforwards, distribution reclassifications, and treatment of accretion of discount. The reclassifications were as follows:
| | | Increase/(Decrease)
Paid-In Capital | | | Increase/(Decrease)
Accumulated Gain/(Loss) | |
U.S. Government Securities Fund | | $ | (246,727 | ) | | $ | 246,727 | |
The United States Treasury Trust | | | (5,175 | ) | | | 5,175 | |
S&P 500 Index Fund | | | (156 | ) | | | 156 | |
Shelton Green Alpha Fund | | | 63,071 | | | | (63,071 | ) |
Tax Basis of Distributable Earnings: The tax character of distributable earnings at August 31, 2019 was as follows:
| | | Undistributed
Ordinary
Income | | | Undistributed
Long-Term
Capital Gain | | | Capital
Loss Carry
Forwards | | | Unrealized
Appreciation/
(Depreciation) | | | Post October
and Other
Losses | | | Total
Distributable
Earnings | |
Green California Tax-Free Income Fund | | $ | 3,682 | | | $ | 86,607 | | | $ | — | | | $ | 4,423,907 | | | $ | (25,962 | ) | | $ | 4,488,234 | |
U.S. Government Securities Fund | | | — | | | | — | | | | (46,105 | ) | | | 690,599 | | | | (578 | ) | | | 643,916 | |
Short-Term U.S. Government Bond Fund | | | 394 | | | | — | | | | (3,327 | ) | | | 44,943 | | | | (112 | ) | | | 41,898 | |
The United States Treasury Trust | | | — | | | | — | | | | (2,236 | ) | | | (11 | ) | | | — | | | | (2,247 | ) |
S&P 500 Index Fund | | | 534,810 | | | | 5,118,027 | | | | — | | | | 119,782,879 | | | | — | | | | 125,435,716 | |
S&P MidCap Index Fund | | | 109,576 | | | | 7,058,634 | | | | — | | | | 28,241,711 | | | | — | | | | 35,409,921 | |
S&P SmallCap Index Fund | | | 32,014 | | | | 3,891,720 | | | | — | | | | 10,623,090 | | | | — | | | | 14,546,824 | |
Core Value Fund | | | 264,261 | | | | 9,784,796 | | | | — | | | | 33,937,464 | | | | — | | | | 43,986,521 | |
Nasdaq-100 Index Fund | | | 1,711,020 | | | | 7,060,789 | | | | — | | | | 264,235,112 | | | | — | | | | 273,006,921 | |
Green Alpha Fund | | | — | | | | — | | | | — | | | | 10,030,862 | | | | (172,150 | ) | | | 9,858,712 | |
The difference between book basis and tax basis unrealized appreciation/(depreciation) is attributable primarily to the realization of unrealized gains/(losses) on future contracts for tax purposes, wash sales, the treatment of accretion of discounts, and certain other investments.
Elective Deferrals: The Funds have not elected to defer capital losses recognized during the period November 1, 2018-August 31, 2019 to the period ending August 31, 2020.
The Funds have not elected to defer ordinary losses to the period ending August 31, 2020.
Capital Losses: Capital loss carry forwards, as of August 31, 2019, available to offset future capital gains, if any, are as follows:
Expiring | | U.S.
Government
Securities Fund | | | Short-
Term U.S.
Government
Bond Fund | | | United States
Treasury
Trust Fund | |
Long Term with No Expiration | | $ | (46,105 | ) | | $ | (3,327 | ) | | $ | — | |
Short Term with No Expiration | | | — | | | | — | | | | (2,236 | ) |
Total | | $ | (46,105 | ) | | $ | (3,327 | ) | | $ | (2,236 | ) |
58
Shelton Funds | Notes to Financial Statements (Continued) | August 31, 2019 |
Distributions to Shareholders: Income distributions and capital gain distributions are determined in accordance with income tax regulations, which may differ from U.S. generally accepted accounting principles. These differences are primarily due to differing treatments of income and gains on various investment securities held by each Fund, timing differences and differing characterization of distributions made by each Fund.
The tax character of distributions paid during the years ended August 31, 2019 and 2018 were as follows:
Fund | | Year | | | Return of
Capital | | | Ordinary
Income | | | Long-Term
Capital
Gains(a) | | | Exempt-
Interest
Dividends | | | Total
Distributions | |
Green California Tax-Free Income Fund | | | 2018 | | | $ | — | | | $ | — | | | $ | 234,947 | | | $ | 1,471,475 | | | $ | 1,706,422 | |
| | | | 2019 | | | | — | | | | — | | | | 119,292 | | | | 1,312,755 | | | | 1,432,047 | |
U.S. Government Securities Fund | | | 2018 | | | | — | | | | — | | | | — | | | | 282,935 | | | | 282,935 | |
| | | | 2019 | | | | — | | | | 264,460 | | | | — | | | | — | | | | 264,460 | |
Short-Term U.S. Government Bond Fund | | | 2018 | | | | — | | | | 38,892 | | | | — | | | | — | | | | 38,892 | |
| | | | 2019 | | | | — | | | | 80,430 | | | | — | | | | — | | | | 80,430 | |
The United States Treasury Trust | | | 2018 | | | | — | | | | 524,755 | | | | — | | | | — | | | | 524,755 | |
| | | | 2019 | | | | — | | | | 845,516 | | | | — | | | | — | | | | 845,516 | |
S&P 500 Index Fund | | | 2018 | | | | — | | | | 2,799,181 | | | | 2,382,074 | | | | — | | | | 5,181,255 | |
| | | | 2019 | | | | — | | | | 3,067,559 | | | | 1,340,869 | | | | — | | | | 4,408,428 | |
S&P MidCap Index Fund | | | 2018 | | | | — | | | | 1,191,336 | | | | 7,185,786 | | | | — | | | | 8,377,122 | |
| | | | 2019 | | | | — | | | | 2,402,000 | | | | 10,698,956 | | | | — | | | | 13,100,956 | |
S&P SmallCap Index Fund | | | 2018 | | | | — | | | | 1,056,028 | | | | 5,901,648 | | | | — | | | | 6,957,676 | |
| | | | 2019 | | | | — | | | | 738,251 | | | | 5,245,346 | | | | — | | | | 5,983,597 | |
Shelton Core Value Fund | | | 2018 | | | | — | | | | 3,972,866 | | | | 19,009,224 | | | | — | | | | 22,982,090 | |
| | | | 2019 | | | | — | | | | 9,355,980 | | | | 20,581,178 | | | | — | | | | 29,937,158 | |
Nasdaq-100 Index Fund | | | 2018 | | | | — | | | | 4,586,520 | | | | 3,677,125 | | | | — | | | | 8,263,645 | |
| | | | 2019 | | | | — | | | | 3,857,160 | | | | 8,346,060 | | | | — | | | | 12,203,220 | |
Green Alpha Fund | | | 2018 | | | | — | | | | 123,102 | | | | 1,115,328 | | | | — | | | | 1,238,430 | |
| | | | 2019 | | | | — | | | | 148,555 | | | | 552,838 | | | | — | | | | 701,393 | |
(a) | The Funds designate Long-Term Capital Gain dividends pursuant to Section 852(b)(3) of the Internal Revenue Code for the year ended August 31, 2019. |
Note 6 - OFFSETTING OF FINANCIAL INSTRUMENTS AND DERIVATIVE ASSETS AND LIABILITIES
The following is a summary of financial and derivative instruments and collateral received and pledged in connection with such arrangements.
| | | | | | | | | | | | | | | | Gross Amounts Not Offset in the
Statement of Assets & Liabilities | |
| | | | Gross
Amounts
Recognized in
the Statement
of Assets &
Liabilities | | | Gross Amounts
Offset in the
Statement
of Assets &
Liabilities | | | Net Amounts
Presented in
the Statement
of Assets &
Liabilities | | | Financial
Instruments | | | Collateral
Pledged/
Received | | | Net Amount | |
S&P 500 Index Fund: | Assets | | | | | | | | | | | | | | | | | | | | | | | | |
| | Futures Contracts | | $ | — | | | $ | — | | | $ | — | | | $ | — | | | $ | — | | | $ | — | |
| | | | | — | | | | — | | | | — | | | | — | | | | — | | | | — | |
| | Liabilities | | | | | | | | | | | | | | | | | | | | | | | | |
| | Future Contracts | | $ | 285 | | | $ | — | | | $ | 285 | | | $ | — | | | $ | (285 | ) | | $ | — | |
| | | | | 285 | | | | — | | | | 285 | | | | — | | | | (285 | ) | | | — | |
S&P MidCap Index Fund: | Assets | | | | | | | | | | | | | | | | | | | | | | | | |
| | Futures Contracts | | $ | 1,170 | | | $ | — | | | $ | 1,170 | | | $ | — | | | $ | (1,170 | ) | | $ | — | |
| | | | | 1,170 | | | | — | | | | 1,170 | | | | — | | | | (1,170 | ) | | | — | |
| | Liabilities | | | | | | | | | | | | | | | | | | | | | | | | |
| | Future Contracts | | $ | — | | | $ | — | | | $ | — | | | $ | — | | | $ | — | | | $ | — | |
| | | | | — | | | | — | | | | — | | | | — | | | | — | | | | — | |
S&P SmallCap Index Fund: | Assets | | | | | | | | | | | | | | | | | | | | | | | | |
| | Futures Contracts | | $ | — | | | $ | — | | | $ | — | | | $ | — | | | $ | — | | | $ | — | |
| | | | | — | | | | — | | | | — | | | | — | | | | — | | | | — | |
| | Liabilities | | | | | | | | | | | | | | | | | | | | | | | | |
| | Future Contracts | | $ | 131 | | | $ | — | | | $ | 131 | | | $ | — | | | $ | (131 | ) | | $ | — | |
| | | | | 131 | | | | — | | | | 131 | | | | — | | | | (131 | ) | | | — | |
Nasdaq-100 Index Fund: | Assets | | | | | | | | | | | | | | | | | | | | | | | | |
| | Futures Contracts | | $ | — | | | $ | — | | | $ | — | | | $ | — | | | $ | — | | | $ | — | |
| | | | | — | | | | — | | | | — | | | | — | | | | — | | | | — | |
| | Liabilities | | | | | | | | | | | | | | | | | | | | | | | | |
| | Future Contracts | | $ | 1,001 | | | $ | — | | | $ | 1,001 | | | $ | — | | | $ | (1,001 | ) | | $ | — | |
| | | | | 1,001 | | | | — | | | | 1,001 | | | | — | | | | (1,001 | ) | | | — | |
59
Shelton Funds | Notes to Financial Statements (Continued) | August 31, 2019 |
Amounts relate to master netting agreements and collateral agreements which have been determined by the company to be legally enforceable in the event of default but where certain other criteria are not met in accordance with applicable offsetting accounting guidance. The collateral amounts may exceed the related net amounts of financial assets and liabilities presented in the statement of assets and liabilities. Where this is the case, the total amount reported is limited to the net amounts of financial assets and liabilities with that counterparty.
Note 7 – SUBSEQUENT EVENTS
In preparing the financial statements as of August 31, 2019, management considered the impact of subsequent events for potential recognition or disclosure in these financial statements through the date of issuance of the financial statements and has determined that there were no subsequent events requiring recognition or disclosure.
Fund Holdings (Unaudited) |
The Fund holdings shown in this report are as of August 31, 2019. Holdings are subject to change at any time, so holdings shown in this report may not reflect current Fund holdings. The Fund files a complete schedule of portfolio holdings with the SEC for the first and third quarters of each fiscal year on Form N-Q or Form N-PORT (available for filings after March 31, 2019). The Fund’s Form N-Q or Form N-PORT is available on the SEC’s website at sec.gov. The Fund’s complete schedule of portfolio holdings, as filed on Form N-Q or Form N-PORT, can also be obtained without charge, upon request, by calling (800) 955-9988.
Proxy Voting Policies, Procedures and Voting Records (Unaudited) |
The Funds’ Statement of Additional Information (“SAI”) containing a description of the policies and procedures that the Shelton Funds use to determine how to vote proxies relating to portfolio securities, along with each Fund’s proxy voting record relating to portfolio securities held during the 12-month period ended June 30, is available upon request, at no charge, at the phone number below, or on the SEC’s website at www.sec.gov.
This report is submitted for the general information of the shareholders of the Shelton Funds. It is authorized for distribution only if preceded or accompanied by a current Shelton Funds prospectus. Additional copies of the prospectus may be obtained by calling (800) 955-9988 or can be downloaded from the Funds’ website at www.sheltoncap.com. Please read the prospectus carefully before you invest or send money, as it explains the risks, fees and expenses of investing in the Funds.
60
Report of Independent Registered Public Accounting Firm |
To the Shareholders and Board of Trustees
of Shelton Funds
Opinion on the Financial Statements
We have audited the accompanying statements of assets and liabilities of Green California Tax-Free Income Fund, U.S. Government Securities Fund, Short-Term U.S. Government Bond Fund, The United States Treasury Trust, S&P 500 Index Fund, S&P MidCap Index Fund, S&P SmallCap Index Fund, Shelton Core Value Fund, Nasdaq-100 Index Fund and Shelton Green Alpha Fund (the “Funds”), each a series of Shelton Funds (the “Trust”), including the schedules of investments, as of August 31, 2019, the related statements of operations for the year then ended, the statements of changes in net assets for each of the two years in the period then ended, financial highlights for each of the five years in the period then ended, and the related notes (collectively referred to as the “financial statements”). In our opinion, the financial statements present fairly, in all material respects, the financial position of the Funds as of August 31, 2019, the results of their operations for the year then ended, the changes in their net assets for each of the two years in the period then ended, and their financial highlights for each of the five years in the period then ended, in conformity with accounting principles generally accepted in the United States of America.
Basis for Opinion
These financial statements are the responsibility of the Funds’ management. Our responsibility is to express an opinion on the Funds’ financial statements based on our audits. We are a public accounting firm registered with the Public Company Accounting Oversight Board (United States) (“PCAOB”) and are required to be independent with respect to the Funds in accordance with the U.S. federal securities laws and the applicable rules and regulations of the Securities and Exchange Commission and the PCAOB. We have served as the auditor of one or more of the funds in the Trust since 1986.
We conducted our audits in accordance with the standards of the PCAOB. Those standards require that we plan and perform the audits to obtain reasonable assurance about whether the financial statements are free of material misstatement, whether due to error or fraud. The Funds are not required to have, nor were we engaged to perform, an audit of the Funds’ internal control over financial reporting. As part of our audits we are required to obtain an understanding of internal control over financial reporting, but not for the purpose of expressing an opinion on the effectiveness of the Funds’ internal control over financial reporting. Accordingly, we express no such opinion.
Our audits included performing procedures to assess the risks of material misstatement of the financial statements, whether due to error or fraud, and performing procedures that respond to those risks. Such procedures included examining, on a test basis, evidence regarding the amounts and disclosures in the financial statements. Our audits also included evaluating the accounting principles used and significant estimates made by management, as well as evaluating the overall presentation of the financial statements. Our procedures included confirmation of securities owned as of August 31, 2019 by correspondence with the custodian and brokers or through other appropriate auditing procedures where replies from brokers were unable to be obtained. We believe that our audits provide a reasonable basis for our opinion.
TAIT, WELLER & BAKER LLP
Philadelphia, Pennsylvania
October 29, 2019
61
Board of Trustees and Executive Officers (Unaudited) |
Overall responsibility for management of the Funds rests with the Board of Trustees. The Trustees serve during the lifetime of the Trust and until its termination, or until death, resignation, retirement or removal. The Trustees, in turn, elect the officers of the Fund to actively supervise its day-to-day operations. The officers have been elected for an annual term. The following are the Trustees and Executive Officers of the Funds:
Name | Address | Year of Birth | Position Held with the Trust | Length of Time Served |
Stephen C. Rogers | 1875 Lawrence Street, Suite 300 Denver, CO, 80202 | 1966 | Chairman of the Board,
Trustee,
President | Since August 1999,
Since August 1999,
Since August 1999 |
Kevin T. Kogler | 1875 Lawrence Street, Suite 300 Denver, CO, 80202 | 1966 | Trustee | Since May 2006 |
Marco L. Quazzo | 1875 Lawrence Street, Suite 300 Denver, CO, 80202 | 1962 | Trustee | Since August 2014 |
Stephen H. Sutro | 1875 Lawrence Street, Suite 300 Denver, CO, 80202 | 1969 | Trustee | Since May 2006 |
William P. Mock | 1875 Lawrence Street, Suite 300 Denver, CO, 80202 | 1966 | Treasurer | Since February 2010 |
Gregory T. Pusch | 1875 Lawrence Street, Suite 300 Denver, CO, 80202 | 1966 | Chief Compliance Officer,
Secretary | Since March 2017 |
Each Trustee oversees the Trust’s ten Funds. The principal occupations of the Trustees and Executive Officers of the Funds during the past five years and public directorships held by the Trustees are set forth below:
Stephen C. Rogers* | Chief Executive Officer, Shelton Capital Management, 1999 to present. |
Kevin T. Kogler | President & Founder of MicroBiz, LLC, 2012 to present; Principal, Robertson Piper Software Group, 2006 to 2012; Senior Vice President, Investment Banking, Friedman, Billings Ramsey, 2003 to 2006. |
Marco L. Quazzo | Principal, Bartko Zankel Bunzel & Miller, March 2015-Present; Partner, Barg Coffin Lewis & Trapp LLP (law firm), 2008 to March 2015. |
Stephen H. Sutro | Managing Partner, Duane Morris, LLP (law firm) 2014 to present; Partner, Duane Morris LLP (law firm), 2003 to present. |
William P. Mock | Portfolio Manager, Shelton Capital Management, 2010 to present. |
Gregory T. Pusch | Principal Occupations Past five years: Global Head of Risk & Compliance, Matthews Asia 2015-2016; Head of Legal & Regulatory Compliance / CCO, HarbourVest Partners 2012-2015. |
| Additional information about the Trustees may be found in the SAI, which is available without charge by calling (800) 955-9988. |
* | Trustee deemed to be an “interested person” of the Trust, as defined in the Investment Company Act of 1940. Mr. Rogers is an interested person because he is the CEO of Shelton Capital Management, the Trust’s Advisor and Administrator. |
62

P.O. Box 87
Denver, CO 80201-0087
| (a) | The Registrant has adopted a code of ethics that applies to its principal executive officers and principal financial and accounting officer. |
| (f) | Pursuant to Item 12(a)(1), the Registrant is attaching as an exhibit a copy of its code of ethics that applies to its principal executive officer and principal financial and accounting officer. A copy of the code of ethics is available upon request, at no charge, at 1(800) 955-9988. |
| ITEM 3. | AUDIT COMMITTEE FINANCIAL EXPERT. |
| (a)(1) | Registrant does not have an audit committee financial expert serving on its audit committee. |
| (a)(3) | The audit committee has determined that no single independent trustee meets the criteria of "audit committee financial expert", but the collective skills of the committee are sufficient to satisfy the requirements. |
| ITEM 4. | PRINCIPAL ACCOUNTANT FEES AND SERVICES. |
The aggregate fees paid to the principal accountant for professional services rendered by the principal accountant for the audit of the Registrant's annual financial statements or for services that are normally provided by the principal accountant in connection with statutory and regulatory filings or engagements were $134,200 for the fiscal year ended August 31, 2019 and $135,300 for the fiscal year ended August 31, 2018.
There were no fees paid to the principal accountant for assurance and related services rendered by the principal accountant to the Registrant that are reasonably related to the performance of the audit of the Registrant's financial statements and are not reported under paragraph (a) of Item 4.
The aggregate fees paid to the principal accountant for tax compliance, tax advice, and tax planning services rendered by the principal accountant to the Registrant were $28,400 for the fiscal year ended August 31, 2019 and $28,600 for the fiscal year ended August 31, 2018.
There were no other fees paid to the principal accountant for services rendered by the principal accountant to the Registrant that are reasonably related to the performance of the audit of the Registrant's financial statements and are not reported under paragraphs (a)-(c) of Item 4.
| (e)(1) | The Registrant's audit committee is directly responsible for approving the services to be provided by the auditors, including: |
| | (i) | pre-approval of all audit and audit-related services; |
| | (ii) | pre-approval of all non-audit related services to be provided to the Registrant by the auditors; |
| | (iii) | pre-approval of all non-audit related services to be provided to the Registrant by the auditors to the Registrant 's investment adviser or to any entity that controls, is controlled by or is under common control with the Registrant 's investment adviser and that provides ongoing services to the Registrant where the non-audit services relate directly to the operations or financial reporting of the Registrant; and |
| (e)(2) | All of the services provided to the Registrant described in paragraphs (b)-(d) of Item 4 were pre-approved by the audit committee. |
| (g) | The aggregate non-audit fees paid to the principal accountant for services rendered by the principal accountant to the Registrant and the Registrant's investment adviser and any entity controlling, controlled by or under common control with the investment adviser that provides ongoing services to the Registrant were $7,000 for the fiscal year ended August 31, 2019 and $6,750 for the fiscal year ended August 31, 2018. |
| ITEM 5. | AUDIT COMMITTEE OF LISTED REGISTRANTS. |
| ITEM 6. | SCHEDULE OF INVESTMENTS |
| ITEM 7. | DISCLOSURE OF PROXY VOTING POLICIES AND PROCEDURES FOR CLOSED-END MANAGEMENT INVESTMENT COMPANIES. |
| ITEM 8. | PORTFOLIO MANAGERS OF CLOSED-END MANAGEMENT INVESTMENT COMPANIES. |
| ITEM 9. | PURCHASES OF EQUITY SECURITIES BY CLOSED-END MANAGEMENT INVEESTMENT COMPANY AND AFFILIATED PURCHASERS. |
| ITEM 10. | SUBMISSION OF MATTERS TO A VOTE OF SECURITY HOLDERS. |
There have been no material changes to the procedures by which the shareholders may recommend nominees to the Registrant's board of trustees since the Registrant last provided disclosure in response to the requirements of Item 7(d)(2)(ii)(G) of Schedule 14A or this Item.
| ITEM 11. | CONTROLS AND PROCEDURES. |
| (a) | The Registrant's principal executive and principal financial officers, or persons performing similar functions, have concluded that the Registrant's disclosure controls and procedures (as defined in Rule 30a-3(c) under the Investment Company Act of 1940, as amended (the "1940 Act") (17 CFR 270.30a-3(c)) are effective as of a date within 90 days of the filing date of the report that includes the disclosure required by this paragraph, based on their evaluation of these controls and procedures required by Rule 30a-3(b) under the 1940 Act (17 CFR 270.30a-3(b)) and Rules 13a-15(b) or 15d-15(b) under the Securities Exchange Act of 1934, as amended (17 CFR 240.13a-15(b) or 240.15d-15(b)). |
| (b) | There were no changes in the Registrant's internal control over financial reporting (as defined in Rule 30a-3(d) under the 1940 Act that occurred during the Registrant's last fiscal half-year (the Registrant's second fiscal half-year in the case of an annual report) that has materially affected, or is reasonably likely to materially affect, the Registrant's internal control over financial reporting. |
| (a)(1) | Code of Ethicsattached hereto. |
| (a)(2) | Certifications pursuant to Rule 30a-2(a) under the 1940 Act and Section 302 of the Sarbanes-Oxley Act of 2002 are attached hereto. |
| (b) | Certifications pursuant to Rule 30a-2(a) under the 1940 Act and Section 906 of the Sarbanes-Oxley Act of 2002 are attached hereto. |
SIGNATURES
Pursuant to the requirements of the Securities Exchange Act of 1934 and the Investment Company Act of 1940, the registrant has duly caused this report to be signed on its behalf by the undersigned, thereunto duly authorized.
| SHELTON FUNDS | | |
| | | |
| By | /s/ Stephen C. Rogers | |
| | Stephen C. Rogers, Chairman | |
| | Date: October 30, 2019 | |
Pursuant to the requirements of the Securities Exchange Act of 1934 and the Investment Company Act of 1940, this report has been signed below by the following persons on behalf of the Registrant and in the capacities and on the dates indicated.
| By | /s/ Stephen C. Rogers | |
| | Stephen C. Rogers, Chairman | |
| | Date: October 30, 2019 | |
| | | |
| By | /s/ William P. Mock | |
| | William P. Mock, Treasurer | |
| | Date: October 30, 2019 |