Securities Act File No. [ ]
As filed with the Securities and Exchange Commission on October 7, 2016
SECURITIES AND EXCHANGE COMMISSION
WASHINGTON, D.C. 20549
FORM N-14
REGISTRATION STATEMENT
UNDER
| | | | |
| | THE SECURITIES ACT OF 1933 | | ☒ |
| | Pre-Effective Amendment No. | | ☐ |
| | Post-Effective Amendment No. | | ☐ |
TRANSAMERICA SERIES TRUST
(Exact Name of Registrant as Specified in Charter)
1801 California Street, Suite 5200
Denver, CO 80202
(Address of Principal Executive Offices) (Zip Code)
Registrant’s Telephone Number, including Area Code: (319)-355-2747
Tané T. Tyler, Esq.,
1801 California Street, Suite 5200
Denver, CO 80202
(Name and Address of Agent for Service)
Approximate Date of Proposed Public Offering: As soon as practicable after this Registration Statement becomes effective.
It is proposed that this filing will become effective on November 7, 2016 pursuant to Rule 488 under the Securities Act of 1933.
No filing fee is required because an indefinite number of shares has previously been registered pursuant to Rule 24f-2 under the Investment Company Act of 1940, as amended
The information in this Information Statement/Prospectus is not complete and may be changed. We may not sell these securities until the registration statement filed with the Securities and Exchange Commission is effective. This Information Statement/Prospectus is not an offer to sell these securities and it is not soliciting an offer to buy these securities in any state where the offer or sale is not permitted.
SUBJECT TO COMPLETION, DATED OCTOBER 7, 2016
COMBINED INFORMATION STATEMENT
OF
TRANSAMERICA SERIES TRUST
on behalf of its Series:
TRANSAMERICA VOYA LIMITED MATURITY BOND VP
TRANSAMERICA VOYA MID CAP OPPORTUNITIES VP
AND
PROSPECTUS
OF
TRANSAMERICA SERIES TRUST
on behalf of its Series:
TRANSAMERICA JPMORGAN CORE BOND VP
TRANSAMERICA JANUS MID-CAP GROWTH VP
The address and telephone number of each Target Portfolio and each Destination Portfolio is:
1801 California Street, Suite 5200
Denver, CO 80202
(Toll free) 1–888–233–4339
Transamerica Series Trust
1801 California Street, Suite 5200
Denver, CO 80202
[ ], 2016
Dear Policyowner:
The Board of your Transamerica portfolio has approved the reorganization of your portfolio into another Transamerica portfolio. The reorganization is expected to occur on or about December [16], 2016. Upon completion of the reorganization, you will become a holder of the destination Transamerica portfolio, and you will receive shares of the destination portfolio equal in value to your shares of your current Transamerica portfolio.
The reorganization does not require holder approval, and you are not being asked to vote. We do, however, ask that you review the enclosed combined Information Statement/Prospectus, which contains information about the destination portfolio, including its investment objective, strategies, risks, performance, fees and expenses.
The Board has unanimously approved your portfolio’s reorganization and believes the reorganization is in the best interests of your portfolio and its shareholders.
If you have any questions, please call 1-888-233-4339 between 8 a.m. and 5 p.m., Eastern Time, Monday through Friday. Thank you for your investment in the Transamerica funds.
|
| Sincerely, |
|
/s/ Marijn P. Smit |
| Marijn P. Smit |
| Trustee, President and Chief Executive Officer |
DATED [ ] 2016
COMBINED INFORMATION STATEMENT
OF
TRANSAMERICA SERIES TRUST
on behalf of its Series:
TRANSAMERICA VOYA LIMITED MATURITY BOND VP
TRANSAMERICA VOYA MID CAP OPPORTUNITIES VP
(each, a “Target Portfolio” and together, the “Target Portfolios”)
AND
PROSPECTUS
OF
TRANSAMERICA SERIES TRUST
on behalf of its Series:
TRANSAMERICA JPMORGAN CORE BOND VP
TRANSAMERICA JANUS MID-CAP GROWTH VP
(each, a “Destination Portfolio” and together, the “Destination Portfolios”)
The address and telephone number of the each Target Portfolio and each Destination Portfolio is:
1801 California Street, Suite 5200
Denver, CO 80202
(Toll free) 1-888-233-4339
Shares of the Destination Portfolios have not been approved or disapproved by the Securities and Exchange Commission (the “SEC”). The SEC has not passed upon the accuracy or adequacy of this Information Statement/Prospectus. Any representation to the contrary is a criminal offense.
An investment in any Target Portfolio or Destination Portfolio (each sometimes referred to herein as a “Portfolio”) is not a bank deposit and is not insured or guaranteed by the Federal Deposit Insurance Corporation or any other government agency.
This Information Statement/Prospectus sets forth information about the Destination Portfolios that an investor ought to know before investing. Please read this Information Statement/Prospectus carefully before investing and keep it for future reference.
INTRODUCTION
This combined information statement and prospectus, dated [ ], 2016 (the “Information Statement/Prospectus”), is being furnished in connection with the reorganizations (each, a “Reorganization,” and together the “Reorganizations”) of certain series of Transamerica Series Trust, a Delaware statutory trust (each, a “Target Portfolio,” and together the “Target Portfolios”), into certain other series of Transamerica Series Trust (each, a “Destination Portfolio,” and together the “Destination Portfolios”). The Information Statement/Prospectus is being mailed to Target Portfolio holders on or about [ ], 2016.
Each Target Portfolio and Destination Portfolio is a series of Transamerica Series Trust (“TST”), an open-end management investment company organized as a Delaware statutory trust.
The Board of Trustees of TST (the “Board” or the “Trustees”) has determined that the Reorganizations are in the best interests of each Target Portfolio and Destination Portfolio. A copy of the form of Agreement and Plan of Reorganization (the “Plan”) for each Reorganization is attached to this Information Statement/Prospectus as Exhibit A.
THIS INFORMATION STATEMENT/PROSPECTUS IS FOR INFORMATIONAL PURPOSES ONLY, AND YOU DO NOT NEED TO DO ANYTHING IN RESPONSE TO RECEIVING IT. WE ARE NOT ASKING YOU FOR A PROXY OR WRITTEN CONSENT, AND YOU ARE REQUESTED NOT TO SEND US A PROXY OR WRITTEN CONSENT.
The following table indicates (a) the Target Portfolio and corresponding Destination Portfolio involved in each Reorganization, (b) the corresponding Destination Portfolio shares that each Target Portfolio holder will receive, and (c) on what page of this Information Statement/Prospectus the discussion regarding each Reorganization begins. The Reorganizations are numbered for convenience. The consummation of each Reorganization is not contingent on the consummation of the other Reorganization.
| | | | | | |
Reorganization | | Target Portfolio & Shares | | Destination Portfolio & Shares | | Page |
| 1 | | Transamerica Voya Limited Maturity Bond VP | | Transamerica JPMorgan Core Bond VP | | [ ] |
| | Initial Class Service Class | | Initial Class Service Class | | |
| | | |
| 2 | | Transamerica Voya Mid Cap Opportunities VP | | Transamerica Janus Mid-Cap Growth VP | | [ ]
|
| | Initial Class Service Class | | Initial Class Service Class | | |
Please read this Information Statement/Prospectus, including Exhibit A, carefully. Although each Reorganization is similar in structure, you should read carefully the specific discussion regarding your Target Portfolio’s Reorganization.
The date of this Information Statement/Prospectus is [ ], 2016
1
For more complete information about each Portfolio, please read the Portfolio’s prospectus and statement of additional information, as they may be amended and/or supplemented. Each Portfolio’s prospectus and statement of additional information, and other additional information about each Portfolio, has been filed with the SEC (http://www.sec.gov) and is available upon oral or written request and without charge. See “Where to Get More Information” below.
Where to Get More Information
| | |
| Each Portfolio’s current prospectus and statement of additional information, including any applicable supplements thereto. | | On file with the SEC (http://www.sec.gov) and available at no charge by calling the Portfolios’ toll-free number: 1-888-233-4339 or visiting the Portfolios’ website at http://www.transamericaseriestrust.com/content/prospectus.aspx. |
| |
| Each Portfolio’s most recent annual and semi–annual reports to holders. | | On file with the SEC (http://www.sec.gov) and available at no charge by calling the Portfolios’ toll-free number: 1-888-233-4339 or by visiting the Portfolios’ website at http://www.transamericaseriestrust.com/content/prospectus.aspx. |
| |
| A statement of additional information for this Information Statement/Prospectus, dated [ ], 2016 (the “SAI”). The SAI contains additional information about the Target Portfolios and the Destination Portfolios. | | On file with the SEC (http://www.sec.gov) and available at no charge by calling the Portfolios’ toll-free number: 1-888-233-4339 or by visiting the Portfolios’ website at http://www.transamericaseriestrust.com/content/prospectus.aspx. The SAI is incorporated by reference into this Information Statement/Prospectus. |
| |
| To ask questions about this Information Statement/Prospectus. | | Call the following toll-free telephone number: 1-888-233-4339. |
The Target Portfolios’ prospectus, dated May 1, 2016, as supplemented, and statement of additional information, as amended and restated on July 1, 2016 and as further supplemented (Files No. 033-00507 and 811-04419), are incorporated by reference into this Information Statement/Prospectus.
Shares of the Portfolios are not offered directly to the public but are sold only to insurance companies and their separate accounts as the underlying investment medium for owners (each a “Policyowner,” collectively, “Policyowners”) of variable annuity contracts and variable life policies (collectively, the “Policies”). As such, Transamerica Life Insurance Company (“TLIC”), Transamerica Financial Life Insurance Company (“TFLIC”), Transamerica Advisors Life Insurance Company (“TALIC”) and Transamerica Premier Life Insurance Company (“TPLIC”) (collectively, the “Insurance Companies”) and certain asset allocation portfolios are the only shareholders of the investment portfolios offered by TST. TLIC, TFLIC, TALIC and TPLIC each offer the Portfolios in their respective products.
Policyowners are not shareholders of the Portfolios. For ease of reference, throughout the Information Statement/Prospectus, shareholders and Policyowners may collectively be referred to as “shareholders” of the Portfolios.
TST has agreed to provide information to Policyowners invested in each Target Portfolio in connection with a Reorganization into the applicable Destination Portfolio. You have received this Information Statement/Prospectus because you have a Policy of one of these Insurance Companies and that Policy is invested in a Target Portfolio.
2
TABLE OF CONTENTS
SUMMARY
This Summary section is qualified in its entirety by reference to the additional information contained elsewhere in this Information Statement/Prospectus and the Agreement and Plan of Reorganization relating to each Reorganization, which is attached to this Information Statement/Prospectus as Exhibit A. Shareholders should read this entire Information Statement/Prospectus, including Exhibit A, and the Portfolios’ prospectus carefully for more complete information.
How Will the Reorganizations Work?
| | • | | Each Target Portfolio will transfer all of its property and assets to the corresponding Destination Portfolio. In exchange, the corresponding Destination Portfolio will assume all of the liabilities of the Target Portfolio and issue shares, as described below. |
| | • | | Each Destination Portfolio will issue a number of its Initial Class and Service Class shares, as applicable, to the corresponding Target Portfolio on the closing date of the applicable Reorganization (the “Closing Date”) having an aggregate net asset value equal to the aggregate net asset value of such Target Portfolio’s Initial Class and Service Class shares, respectively. |
| | • | | Shares of the corresponding class of each Destination Portfolio will then be distributed on the Closing Date to the corresponding Target Portfolio’s shareholders in complete liquidation of the Target Portfolio in proportion to the relative net asset value of their holdings of the applicable class of shares of the Target Portfolio. Therefore, on the Closing Date, upon completion of the applicable Reorganization, each Target Portfolio shareholder will hold shares of the corresponding class of the corresponding Destination Portfolio with the same aggregate net asset value as its holdings of the applicable class of shares of the Target Portfolio immediately prior to the Reorganization. The net asset value attributable to a class of shares of a Target Portfolio will be determined using the Target Portfolio’s valuation policies and procedures and the net asset value attributable to a class of shares of a Destination Portfolio will be determined using the Destination Portfolio’s valuation policies and procedures. The portfolio assets of each Target Portfolio and corresponding Destination Portfolio are valued using the same valuation policies and procedures. |
| | • | | Each Target Portfolio will be terminated after the Closing Date. |
| | • | | The consummation of each Reorganization is not contingent on the consummation of the other Reorganization. |
| | • | | No sales load, contingent deferred sales charge, commission, redemption fee or other transactional fee will be charged as a result of the Reorganizations. Following a Reorganization, shareholders of the applicable Target Portfolio will be subject to the fees and expenses of the corresponding Destination Portfolio. |
| | • | | Following the Reorganizations, (i) Transamerica Asset Management, Inc. (“TAM”) will continue to act as investment manager to each Destination Portfolio; (ii) J.P. Morgan Investment Management, Inc. will continue to act as sub-adviser to the Destination Portfolio in Reorganization 1; and (iii) Janus Capital Management LLC will continue to act as sub-adviser to the Destination Portfolio in Reorganization 2. |
| | • | | The exchange of Target Portfolio shares for Destination Portfolio shares in a Reorganization will not result in income, gain or loss being recognized for federal income tax purposes by an exchanging shareholder. Each Reorganization generally will not result in the recognition of gain or loss for federal income tax purposes by the applicable Target Portfolio or Destination Portfolio. |
Why did the Trustees Approve the Reorganizations?
In approving the Reorganization of your Target Portfolio, the Board, including all of the Trustees who are not “interested” persons (as defined in the Investment Company Act of 1940, as amended (the “1940 Act”)) of the Portfolios, TAM or Transamerica Capital, Inc. (“TCI”), the Portfolios’ distributor (the “Independent Trustees”), after careful consideration, has determined that the Reorganization is in the best interests of your Target Portfolio and will not dilute the interests of the existing shareholders of the Target Portfolio. The Board has made this determination based on various factors, which include those that are discussed in this Information Statement/Prospectus in the section entitled “Reasons for the Proposed Reorganization.”
1
The Board also serves as the Board of each corresponding Destination Portfolio. The Board, including all of the Independent Trustees, has approved the Reorganization with respect to each Destination Portfolio. The Board has determined that the Reorganization is in the best interests of such Destination Portfolio and that the interests of the Destination Portfolio’s shareholders would not be diluted as a result of the Reorganization.
Who Bears the Expenses Associated with the Reorganizations?
It is anticipated that the total cost of preparing, printing and mailing this Information Statement/Prospectus will be approximately $40,000. In light of the benefits expected to be received by each Target Portfolio as a result of the Reorganizations, this cost will be borne by the Target Portfolios. Each Target Portfolio (and ultimately the shareholders of that Target Portfolio) will bear $40,000 of the costs.
What are the Federal Income Tax Consequences of the Reorganizations?
As a condition to the closing of each Reorganization, the applicable Target Portfolio and Destination Portfolio must receive an opinion of Morgan, Lewis & Bockius LLP to the effect that the Reorganization will constitute a “reorganization” within the meaning of Section 368 of the Internal Revenue Code of 1986, as amended (the “Code”). Accordingly, it is expected that neither you nor the applicable Destination Portfolio nor, in general, your Target Portfolio will recognize gain or loss as a direct result of the Reorganization of your Target Portfolio, and that the aggregate tax basis of the Destination Portfolio shares that you receive in the Reorganization will equal the aggregate tax basis of the Target Portfolio shares that you surrender in the Reorganization. However, in order to maintain its qualification for tax treatment as a regulated investment company and avoid portfolio-level taxes, each Target Portfolio will declare and pay a distribution of its realized net capital gains, if any, its undistributed investment company taxable income (computed without regard to the dividends-paid deduction), if any, and its net tax–exempt income, if any, for the taxable year ending on the Closing Date to its shareholders shortly before the applicable Reorganization. The corresponding Destination Portfolio may make a comparable distribution to its shareholders shortly before the Reorganization. In addition, following the Reorganization, the corresponding Destination Portfolio will declare and pay to its shareholders, for the taxable year in which the Reorganization occurs, a distribution of any remaining income and gains from such taxable year. All such distributions generally will be taxable to the shareholders, but as long as the Policies funded by the Target Portfolios or by the corresponding Destination Portfolios qualify to be treated as annuity contracts or life insurance policies under the Code, such distributions will not be currently taxable to the Policyowners and the Reorganization should not otherwise result in any tax liability to the Policyowners. For more information, see “Tax Status of the Reorganizations” in this Information Statement/Prospectus.
2
REORGANIZATION 1
TRANSAMERICA VOYA LIMITED MATURITY BOND VP
(the “Target Portfolio”)
TRANSAMERICA JPMORGAN CORE BOND VP
(the “Destination Portfolio”)
Summary
The following is a summary of more complete information appearing later in this Information Statement/Prospectus or incorporated herein. You should read carefully the entire Information Statement/Prospectus, including the exhibits, which include additional information that is not included in the summary and is a part of this Information Statement/Prospectus. Exhibit A is the form of Agreement and Plan of Reorganization. For a discussion of the terms of the Agreement and Plan of Reorganization, please see the section entitled “Terms of the Agreement and Plan of Reorganization” in the back of this Information Statement/Prospectus, after the discussion of the Reorganizations.
In the Reorganization, the Destination Portfolio will issue a number of its Initial Class and Service Class shares, as applicable, to the Target Portfolio having an aggregate net asset value equal to the aggregate net asset value of the Target Portfolio’s Initial Class and Service Class shares, respectively.
The consummation of the Reorganization is not contingent on the consummation of the other Reorganization.
Both the Target Portfolio and the Destination Portfolio are managed by Transamerica Asset Management, Inc. (“TAM”). The Target Portfolio is sub-advised by Voya Investment Management Co. LLC (“Voya”) and the Destination Portfolio is sub-advised by J.P. Morgan Investment Management, Inc. (“JPMorgan”). The Target Portfolio and Destination Portfolio have substantially similar investment objectives, and similar principal investment strategies and policies, and related risks. The tables below provide a comparison of certain features of the Portfolios. In the tables below, if a row extends across the entire table, the information disclosed applies to both the Destination Portfolio and the Target Portfolio.
Comparison of Transamerica Voya Limited Maturity Bond VP
and Transamerica JPMorgan Core Bond VP
| | | | |
| | | Transamerica Voya Limited Maturity Bond VP | | Transamerica JPMorgan Core Bond VP |
| Investment Objective | | Seeks high current income consistent with low risk to principal and liquidity. As a secondary objective, the portfolio seeks to enhance its total return through capital appreciation when market factors, such as falling interest rates and rising bond prices, indicate that capital appreciation may be available without significant risk to principal. | | Seeks total return, consisting of current income and capital appreciation. |
| | |
| Principal investment strategies | | Under normal market conditions, the portfolio’s sub-adviser, Voya Investment Management Co. LLC (the “sub-adviser”) invests at least 80% of the portfolio’s net assets (plus the amount of borrowing, if any, for investment purposes) in a portfolio of bonds that are limited maturity debt securities. These limited maturity debt securities have remaining maturities of seven years or less. The average dollar-weighted maturity of the portfolio generally will not exceed 5 years. For the portfolio’s holdings in asset-backed, mortgage-backed and similar securities, weighted average life will be used in the calculation. Under normal market conditions, the portfolio maintains significant exposure to government securities. The portfolio invests in non-government debt securities, issued by companies of all sizes, only if rated investment-grade by a nationally recognized statistical rating organization (e.g. , Baa3 or better by Moody’s Investors Service, Inc. (“Moody’s”) or BBB- or better by Standard & Poor’s Ratings Services (“S&P”) or BBB- or better by Fitch Ratings (“Fitch”)) or, if not rated by Moody’s, S&P or Fitch, if the sub-adviser determines at the time of purchase that they are of comparable quality. Money market securities must be rated in the two highest rating categories by Moody’s (P-1 or P-2), S&P (A-1+, A-1 or A-2) or Fitch (A-1+, A-1 or A-2), or determined, at the time of purchase, to be of comparable quality by the sub-adviser. | | The portfolio’s sub-adviser, J.P. Morgan Investment Management Inc. (the “sub-adviser”), seeks to achieve the portfolio’s objective by investing, under normal circumstances, at least 80% of the portfolio’s net assets (plus the amount of borrowings, if any, for investment purposes) in bonds, including (without limitation): • U.S. government securities, including Treasury obligations and government sponsored enterprises such as Fannie Mae, Ginnie Mae, Freddie Mac and securities issued by other government agencies and instrumentalities • Medium- to high-quality corporate bonds • Mortgage-backed securities, including U.S. agency and non-agency pass through and collateralized mortgage obligations (“CMOs”) • Asset-backed securities • Commercial mortgage-backed securities (“CMBS”) Generally, such bonds will have intermediate to long maturities. To a lesser extent, the portfolio may invest in: • U.S. dollar-denominated foreign bonds • Short-term securities, including agency discount notes, commercial paper and money market funds |
3
| | | | |
| | The portfolio may also invest in: preferred stocks; U.S. government securities, securities of foreign governments, and supranational organizations; mortgage bonds; municipal bonds, notes, and commercial paper; and debt securities of foreign issuers. The portfolio may engage in dollar roll transactions and swap agreements, including credit default swaps. The portfolio may use options and futures contracts involving securities, securities indices and interest rates to hedge against market risk, to enhance returns and as a substitute for conventional securities. A portion of the portfolio’s assets may be invested in mortgage-backed and asset-backed debt securities. In addition, private placements of debt securities (which are often restricted securities) are eligible for purchase along with other illiquid securities, subject to appropriate limits. The portfolio may borrow up to 10% of its net assets. This amount may be increased to 25% for temporary purposes. The sub-adviser utilizes the following decision making process to achieve the portfolio’s objectives: Active Duration Management. The average duration of the portfolio is actively managed relative to the benchmark’s average duration. In rising interest rate environments, the average duration will tend to be equal to or less than the benchmark and in falling interest rate environments, the average duration will tend to be greater than the benchmark; Yield Curve Analysis. The yield curve shape is assessed to identify the risk/reward trade-off of maturity decisions and market expectations of future interest rates; Sector Selection. Sectors are overweighted or underweighted relative to the benchmark based on sector analysis and market opportunities. Sectors are broadly defined to include U.S. Treasury securities, U.S. government agency securities, corporate securities, mortgage-backed securities, asset-backed securities, and money market securities. The sub-adviser may further evaluate groupings within sectors such as various industry groups within the corporate securities sector (e.g., finance, industrials, utilities, etc.); and Security Selection. The sub-adviser emphasizes individual securities with positive credit fundamentals, liquidity, and relative value within their respective sectors. The sub-adviser may sell securities for a variety of reasons, such as to secure gains, limit losses, or redeploy assets into opportunities believed to be more promising, among others. | | The portfolio may invest in bonds and other debt securities that are rated in the lowest investment grade category. The portfolio’s average weighted maturity will ordinarily range between four and 12 years. The sub-adviser analyzes four major factors in managing and constructing the portfolio’s portfolio: duration, market sector, maturity concentrations and individual securities. The sub-adviser looks for market sectors and individual securities that it believes will perform well over time. The sub-adviser is value oriented and selects individual securities after performing a risk/reward analysis that includes an evaluation of interest rate risk, credit risk, and the complex legal and technical structure of the transaction. The portfolio may use futures contracts, options, swaps and other derivatives as tools in the management of portfolio assets. The portfolio may use derivatives as a substitute for various investments, to alter the investment characteristics of the portfolio, for risk management and/or to increase income or gain to the portfolio. |
| Investment manager | | TAM |
| | |
| Sub–adviser | | Voya | | JPMorgan |
| | |
| Portfolio managers | | Christine Hurtsellers, CFA – Portfolio Manager since 2013 Matthew Toms, CFA – Portfolio Manager since 2013 | | Barbara Miller – Portfolio Manager since 2015 Peter Simons, CFA – Portfolio Manager since 2015 Richard Figuly, CFA – Portfolio Manager since 2016 |
| |
| | The Portfolios’ statement of additional information provides additional information about the portfolio manager(s)’ compensation, other accounts managed by the portfolio manager(s), and the portfolio manager(s)’ ownership of securities in the Portfolios. |
| | |
| Net assets (as of August 31, 2016) | | $86,083,046 | | $761,879,945 |
4
Classes of Shares, Fees and Expenses
| | | | |
| | | Transamerica Voya Limited Maturity Bond VP | | Transamerica JPMorgan Core Bond VP |
| Initial Class sales charges and fees | | Initial Class shares are offered without an initial sales charge and are not subject to a contingent deferred sales charge. Initial Class shares can have up to a maximum Rule 12b-1 fee equal to an annual rate of 0.15% (expressed as a percentage of average daily net assets of the Portfolio), but TST does not intend to pay any distribution fees for Initial Class shares through May 1, 2017. TST reserves the right to pay such fees after that date. |
| |
| Service Class sales charges and fees | | Service Class shares are offered without an initial sales charge and are not subject to a contingent deferred sales charge. Service Class shares have a maximum Rule 12b–1 fee equal to an annual rate of 0.25% (expressed as a percentage of average daily net assets of the Portfolio), which is used to pay distribution and service fees for the sale and distribution of the Portfolio’s shares and to pay for non–distribution activities and services provided to shareholders. These services include compensation to financial intermediaries that sell Portfolio shares and/or service shareholder accounts. |
| | |
| Management fees | | TAM receives compensation, calculated daily and paid monthly, from the Target Portfolio at an annual rate (expressed as a specified percentage of the Portfolio’s average daily net assets) of 0.53% of the first $250 million; 0.505% over $250 million up to $1 billion; and 0.49% in excess of $1 billion. | | TAM receives compensation, calculated daily and paid monthly, from the Destination Portfolio at an annual rate (expressed as a specified percentage of the Portfolio’s average daily net assets) of 0.48% of the first $750 million; 0.43% over $750 million up to $1 billion; and 0.405% in excess of $1 billion. |
| | |
| Fee waiver and expense limitations | | TAM has contractually undertaken through May 1, 2017 to pay expenses on behalf of the portfolio to the extent normal operating expenses (including investment advisory fees but excluding, as applicable, 12b–1 fees, acquired fund fees and expenses, interest, taxes, brokerage commissions, dividend and interest expenses on securities sold short, extraordinary expenses and other expenses not incurred in the ordinary course of the portfolio’s business) exceed, as a percentage of the portfolio’s average daily net assets, 0.88%. TAM is entitled to reimbursement by the portfolio of fees waived or expenses reduced during any of the previous 36 months if on any day or month the estimated annualized portfolio operating expenses are less than the cap. | | TAM has contractually undertaken through May 1, 2017 to pay expenses on behalf of the portfolio to the extent normal operating expenses (including investment advisory fees but excluding, as applicable, 12b–1 fees, acquired fund fees and expenses, interest, taxes, brokerage commissions, dividend and interest expenses on securities sold short, extraordinary expenses and other expenses not incurred in the ordinary course of the portfolio’s business) exceed, as a percentage of the portfolio’s average daily net assets, 0.70%. TAM is entitled to reimbursement by the portfolio of fees waived or expenses reduced during any of the previous 36 months if on any day or month the estimated annualized portfolio operating expenses are less than the cap. |
| |
| | For a comparison of the gross and net expenses of the Portfolios, please see the class fee tables in “The Portfolios’ Fees and Expenses” below. |
Comparison of Principal Risks of Investing in the Portfolios
Because the Portfolios have substantially similar investment objectives and similar principal investment strategies and policies, they are subject to similar principal risks. Risk is inherent in all investing. The value of your investment in a Portfolio, as well as the amount of return you receive on your investment, may fluctuate significantly from day to day and over time. You may lose part or all of your investment in a Portfolio or your investment may not perform as well as other similar investments.
Your primary risk in investing in the Portfolios is you could lose money. You should carefully assess the risks associated with an investment in the Portfolios.
Each Portfolio is subject to the following principal risks (in alphabetical order) of investing in the Portfolio:
| | • | | Counterparty – The portfolio will be subject to credit risk (meaning the risk of adverse changes in an issuer’s real or perceived financial strength) with respect to counterparties to derivatives, repurchase agreements and other financial contracts entered into by the portfolio or held by special purpose or structured vehicles. Adverse changes to counterparties may cause the value of financial contracts to go down. If a counterparty becomes bankrupt or otherwise fails to perform its obligations due to financial difficulties, the value of your investment in the portfolio may decline. |
| | • | | Credit – If an issuer or other obligor (such as a party providing insurance or other credit enhancement) of a security held by the portfolio or a counterparty to a financial contract with the portfolio defaults or is downgraded, or is perceived to be less creditworthy, or if the value of any underlying assets declines, the value of your investment will typically decline. Below investment grade, high-yield debt securities (commonly known as “junk bonds”) have a higher risk of default and are considered speculative. Subordinated securities are more likely to suffer a credit loss than non-subordinated securities of the same issuer and will be disproportionately affected by a default, downgrade or perceived decline in creditworthiness. |
| | • | | Currency – The value of investments in securities denominated in foreign currencies increases or decreases as the rates of exchange between those currencies and the U.S. dollar change. Currency conversion costs and currency fluctuations could reduce or eliminate investment gains or add to investment losses. Currency exchange rates can be volatile, and are affected by factors such as general economic conditions, the actions of the U.S. and foreign governments or central banks, the imposition of currency controls, and speculation. |
5
| | • | | Derivatives – Using derivatives exposes the portfolio to additional risks and can increase portfolio losses and reduce opportunities for gains when market prices, interest rates, currencies, or the derivatives themselves, behave in a way not anticipated by the portfolio. Using derivatives also can have a leveraging effect and increase portfolio volatility. Certain derivatives have the potential for unlimited loss, regardless of the size of the initial investment. Derivatives may be difficult to sell, unwind or value, and the counterparty may default on its obligations to the portfolio. Use of derivatives may have different tax consequences for the portfolio than an investment in the underlying security, and those differences may affect the amount, timing and character of income distributed to shareholders. The U.S. government and foreign governments are in the process of adopting and implementing regulations governing derivatives markets, including mandatory clearing of certain derivatives, margin and reporting requirements. The ultimate impact of the regulations remains unclear. Additional regulation of derivatives may make derivatives more costly, limit their availability or utility, otherwise adversely affect their performance or disrupt markets. For additional information regarding derivatives, see “More on Risks of Investing in the Portfolio — More on Principal Risks: Derivatives” in the prospectus. In addition, the SEC has proposed a new rule that would change the regulation of the use of derivatives by registered investment companies, such as the portfolio. If the proposed rule takes effect, it could limit the ability of the portfolio to invest in derivatives. |
| | • | | Extension – When interest rates rise, repayments of fixed income securities, particularly asset- and mortgage-backed securities, may occur more slowly than anticipated, extending the effective duration of these fixed income securities at below market interest rates and causing their market prices to decline more than they would have declined due to the rise in interest rates alone. This may cause the portfolio’s share price to be more volatile. |
| | • | | Fixed-Income Securities – The market prices of fixed-income securities may go up or down, sometimes rapidly and unpredictably, due to general market conditions, such as real or perceived adverse economic or political conditions, inflation, changes in interest rates, lack of liquidity in the bond markets or adverse investor sentiment. In addition, the market value of a fixed income security may decline if the issuer or other obligor of the security fails to pay principal and/or interest, otherwise defaults or has its credit rating downgraded or is perceived to be less creditworthy, or the credit quality or value of any underlying assets declines. When market prices fall, the value of your investment will go down. The value of your investment will generally go down when interest rates rise. Interest rates have been at historically low levels, so the portfolio faces a heightened risk that interest rates may rise. A rise in rates tends to have a greater impact on the prices of longer term or duration securities. |
| | • | | Foreign Investments – Investing in securities of foreign issuers or issuers with significant exposure to foreign markets involves additional risk. Foreign countries in which the portfolio may invest may have markets that are less liquid, less regulated and more volatile than U.S. markets. The value of the portfolio’s investments may decline because of factors affecting the particular issuer as well as foreign markets and issuers generally, such as unfavorable government actions, reduction of government or central bank support, political or financial instability or other adverse economic or political developments. Lack of information and weaker accounting standards also may affect the value of these securities. |
| | • | | Interest Rate – Interest rates in the U.S. have been at historically low levels, so the portfolio faces a heightened risk that interest rates may rise. The value of fixed income securities generally goes down when interest rates rise, and therefore the value of your investment in the portfolio may also go down. Debt securities have varying levels of sensitivity to changes in interest rates. A rise in rates tends to have a greater impact on the prices of longer term or duration securities. A general rise in interest rates may cause investors to move out of fixed income securities on a large scale, which could adversely affect the price and liquidity of fixed income securities and could also result in increased redemptions from the portfolio. |
| | • | | Legal and Regulatory – Legal and regulatory changes could occur that may adversely affect the portfolio, its investments, and its ability to pursue its investment strategies and/or increase the costs of implementing such strategies. Certain changes have already been proposed and additional changes are expected. New or revised laws or regulations may be imposed by the U.S. Securities and Exchange Commission, the U.S. Commodity Futures Trading Commission, the Internal Revenue Service, the U.S. Federal Reserve or other governmental regulatory authorities or self-regulatory organizations that could adversely affect the portfolio. The portfolio also may be adversely affected by changes in the enforcement or interpretation of existing statutes and rules by governmental regulatory authorities or self-regulatory organizations. |
| | • | | Leveraging – The value of your investment may be more volatile to the extent that the portfolio borrows or uses derivatives or other investments that have a leveraging effect on the portfolio. Other risks also will be compounded. This is because leverage generally magnifies the effect of a change in the value of an asset and creates a risk of loss of value on a larger pool of assets than the portfolio would otherwise have had. The use of leverage is considered to be a speculative investment practice and may result in the loss of a substantial amount, and possibly all, of the portfolio’s assets. The portfolio also may have to sell assets at inopportune times to satisfy its obligations. |
| | • | | Liquidity – The portfolio may make investments that are illiquid or that become illiquid after purchase. Investments may become illiquid due to the lack of an active market, a reduced number of traditional market participants, or reduced capacity of traditional market participants to make a market in securities. The liquidity and value of investments can deteriorate rapidly and those investments may be difficult or impossible for the portfolio to sell, particularly during times of market turmoil. These |
6
| | illiquid investments can be difficult to value. If the portfolio is forced to sell an illiquid investment to meet redemption requests or other cash needs, the portfolio may be forced to sell at a loss. The portfolio may not receive its proceeds from the sale of certain securities for an extended period (for example, several weeks or even longer). |
| | • | | Management – The portfolio is subject to the risk that the Investment Manager’s or sub-adviser’s judgments and decisions may be incorrect or otherwise may not produce the desired results. The value of your investment may decrease if the sub-adviser’s judgment about the quality, relative yield or value of, or market trends affecting, a particular security or issuer, industry, sector, region or market segment, or about the economy or interest rates, is incorrect. The portfolio may also suffer losses if there are imperfections, errors or limitations in the tools, resources, information and data used, or the analyses employed or relied on, by the sub-adviser, or if the sub-adviser’s investment style is out of favor or otherwise fails to produce the desired results. The portfolio’s investment strategies designed by the investment manager may not work as intended. In addition, the portfolio’s investment strategies or policies may change from time to time. Those changes may not lead to the results intended by the investment manager and could have an adverse effect on the value or performance of the portfolio. Any of these things could cause the portfolio to lose value or its results to lag relevant benchmarks or other funds with similar objectives. |
| | • | | Market – The market prices of the portfolio’s securities may go up or down, sometimes rapidly or unpredictably, due to general market conditions, such as real or perceived adverse economic or political conditions, inflation, changes in interest rates or currency rates, lack of liquidity in the markets or adverse investor sentiment. Adverse market conditions may be prolonged and may not have the same impact on all types of securities. Market prices of securities also may go down due to events or conditions that affect particular sectors, industries or issuers. When market prices fall, the value of your investment will go down. The portfolio may experience a substantial or complete loss on any individual security. |
In the past several years, financial markets, such as those in the United States, Europe, Asia and elsewhere, have experienced increased volatility, depressed valuations, decreased liquidity and heightened uncertainty. Governmental and non-governmental issuers defaulted on, or were forced to restructure, their debts. These market conditions may continue, worsen or spread.
The U.S. government and the Federal Reserve, as well as certain foreign governments and their central banks have taken steps to support financial markets, including keeping interest rates at historically low levels. This and other government intervention may not work as intended, particularly if the efforts are perceived by investors as being unlikely to achieve the desired results. The Federal Reserve recently has reduced its market support activities. Further reduction or withdrawal of Federal Reserve or other U.S. or non-U.S. governmental or central bank support, including interest rate increases, could negatively affect financial markets, generally increase market volatility and reduce the value and liquidity of securities in which the portfolio invests.
Policy and legislative changes in the United States and in other countries are affecting many aspects of financial regulation, and may in some instances contribute to decreased liquidity and increased volatility in the financial markets. The impact of these changes on the markets, and the practical implications for market participants, may not be fully known for some time.
Economies and financial markets throughout the world are becoming increasingly interconnected. As a result, whether or not the portfolio invests in securities of issuers located in or with significant exposure to countries experiencing economic and financial difficulties, the value and liquidity of the portfolio’s investments may be negatively affected.
| | • | | Mortgage-Related and Asset-Backed Securities – The value of mortgage-related and asset-backed securities will be influenced by factors affecting the housing market and the assets underlying such securities. As a result, during periods of declining asset values, difficult or frozen credit markets, swings in interest rates, or deteriorating economic conditions, mortgage-related and asset-backed securities may decline in value, face valuation difficulties, become more volatile and/or become illiquid. Mortgage-backed securities may be issued by private issuers, by government-sponsored entities such as Fannie Mae or Freddie Mac or by agencies of the U.S. government, such as Ginnie Mae. Mortgage-backed securities represent direct or indirect participations in, or are collateralized by and payable from, mortgage loans secured by real property. Unlike mortgage-related securities issued or guaranteed by agencies of the U.S. government or government-sponsored entities, mortgage-related securities issued by private issuers do not have a government or government-sponsored entity guarantee (but may have other credit enhancement), and may, and frequently do, have less favorable collateral, credit risk or other underwriting characteristics. Asset-backed securities represent participations in, or are secured by and payable from, assets such as installment sales or loan contracts, leases, credit card receivables and other categories of receivables. The value of mortgage-backed and asset-backed securities may be affected by changes in credit quality or value of the mortgage loans or other assets that support the securities. Mortgage-backed and asset-backed securities are subject to prepayment or call and extension risks. Some of these securities may receive little or no collateral protection from the underlying assets. The risk of default is generally higher in the case of mortgage backed investments that include so-called “sub-prime” mortgages. The structure of some of these securities may be complex and there may be less information available than for other types of debt securities. Upon the occurrence of certain triggering events or defaults, the portfolio may become the holder of underlying assets at a time when those assets may be difficult to sell or may be sold only at a loss. |
7
| | • | | Prepayment or Call – Many issuers have a right to prepay their securities. If interest rates fall, an issuer may exercise this right. If this happens, the portfolio will not benefit from the rise in market price that normally accompanies a decline in interest rates, and will be forced to reinvest prepayment proceeds at a time when yields on securities available in the market are lower than the yield on the prepaid security. The portfolio also may lose any premium it paid on the security. |
| | • | | U.S. Government Agency Obligations – Government agency obligations have different levels of credit support and, therefore, different degrees of credit risk. Securities issued by agencies and instrumentalities of the U.S. government that are supported by the full faith and credit of the U.S. generally present a lesser degree of credit risk than securities issued by agencies and instrumentalities sponsored by the U.S. government that are supported only by the issuer’s right to borrow from the U.S. Treasury and securities issued by agencies and instrumentalities sponsored by the U.S. government that are supported only by the credit of the issuing agencies. |
| | • | | Valuation – The sales price the portfolio could receive for any particular portfolio investment may differ from the portfolio’s valuation of the investment, particularly for securities that trade in thin or volatile markets, that are priced based upon valuations provided by third-party pricing services that use matrix or evaluated pricing systems, or that are valued using a fair value methodology. The portfolio’s ability to value its investments may be impacted by technological issues and/or errors by pricing services or other third party service providers. |
The Target Portfolio is subject to the following related principal risks:
| | • | | Active Trading – The portfolio is actively managed and may purchase and sell securities without regard to the length of time held. Active trading may have a negative impact on performance by increasing transaction costs and may generate greater amounts of net short-term capital gains, which, for shareholders holding shares in taxable accounts, would generally be subject to tax at ordinary income tax rates upon distribution. |
| | • | | Dollar Rolls – The use of dollar rolls is a speculative technique involving leverage, and can have an economic effect similar to borrowing money for investment purposes. Dollar roll transactions involve the risk that the market value of the securities the portfolio is required to purchase may decline below the agreed upon repurchase price of those securities. If the broker/dealer to whom the portfolio sells securities becomes insolvent, the portfolio’s right to purchase or repurchase securities may be restricted. |
| | • | | Emerging Markets – Investments in the securities of issuers located in or principally doing business in emerging markets are subject to foreign investments risks. These risks are greater for investments in issuers in emerging market countries. Emerging market countries tend to have economic, political and legal systems that are less fully developed and are less stable than those of more developed countries. Emerging market securities are often particularly sensitive to market movements because their market prices tend to reflect speculative expectations. Low trading volumes may result in a lack of liquidity and in extreme price volatility. |
| | • | | Equity Securities – Equity securities represent an ownership interest in an issuer, rank junior in a company’s capital structure and consequently may entail greater risk of loss than debt securities. Equity securities include common and preferred stocks. Stock markets are volatile. The price of equity securities fluctuates based on changes in a company’s financial condition and overall market and economic conditions. If the market prices of the equity securities owned by the portfolio fall, the value of your investment in the portfolio will decline. |
| | • | | High-Yield Debt Securities – High-yield debt securities, commonly referred to as “junk” bonds, are securities that are rated below “investment grade” or, if unrated, determined to be below investment grade by the sub-adviser. Changes in interest rates, the market’s perception of the issuers and the creditworthiness of the issuers may significantly affect the value of these bonds. Junk bonds are considered speculative, have a higher risk of default, tend to be less liquid and may be more difficult to value than higher grade securities. Junk bonds tend to be volatile and more susceptible to adverse events and negative sentiments. |
| | • | | Investment Companies – To the extent that the portfolio invests in other investment companies, such as closed-end or exchange-traded funds, it is subject to the risks of these investment companies and bears its pro rata share of the investment companies’ expenses. |
| | • | | Municipal Securities – Municipal issuers may be adversely affected by rising health care costs, increasing unfunded pension liabilities, and by the phasing out of federal programs providing financial support. Unfavorable conditions and developments relating to projects financed with municipal securities can result in lower revenues to issuers of municipal securities, potentially resulting in defaults. The value of municipal securities can also be adversely affected by changes in the financial condition of one or more individual municipal issuers or insurers of municipal issuers, regulatory and political developments, tax law changes or other legislative actions, and by uncertainties and public perceptions concerning these and other factors. To the extent the portfolio invests significantly in a single state or in securities the payments on which are dependent upon a single project or source of revenues, or that relate to a sector or industry, the portfolio will be more susceptible to associated risks and developments. In recent periods an increasing number of municipal issuers have defaulted on obligations, commenced insolvency proceedings, or suffered credit downgrading. Financial difficulties of municipal issuers may continue or worsen. |
8
| | • | | Preferred Stock – Preferred stock’s right to dividends and liquidation proceeds is junior to the rights of a company’s debt securities. The value of preferred stock may be subject to factors that affect fixed income and equity securities, including changes in interest rates and in a company’s creditworthiness. The value of preferred stock tends to vary more with fluctuations in the underlying common stock and less with fluctuations in interest rates and tends to exhibit greater volatility. Shareholders of preferred stock may suffer a loss of value if dividends are not paid and have limited voting rights. |
| | • | | Rule 144A and Privately Placed Securities – The portfolio’s investments may include privately placed securities such as Rule 144A securities, which are subject to resale restrictions. Rule 144A permits certain qualified institutional buyers, such as the portfolio, to trade in privately placed securities that have not been registered for sale to the public. Rule 144A and other privately placed securities may be deemed illiquid, and the portfolio might be unable to dispose of such securities promptly or at reasonable prices. |
| | • | | Small and Medium Capitalization Companies – The portfolio will be exposed to additional risks as a result of its investments in the securities of small or medium capitalization companies. Small or medium capitalization companies may be more at risk than large capitalization companies because, among other things, they may have limited product lines, operating history, market or financial resources, or because they may depend on a limited management group. The prices of securities of small and medium capitalization companies generally are more volatile than those of large capitalization companies and are more likely to be adversely affected than large capitalization companies by changes in earnings results and investor expectations or poor economic or market conditions. Securities of small and medium capitalization companies may underperform large capitalization companies, may be harder to sell at times and at prices the portfolio managers believe appropriate and may offer greater potential for losses. |
| | • | | Sovereign Debt – Sovereign debt instruments are subject to the risk that the governmental entity may delay or fail to pay interest or repay principal on its sovereign debt. If a governmental entity defaults, it may ask for more time in which to pay or for further loans. There may be no established legal process for collecting sovereign debt that a government does not pay, nor are there bankruptcy proceedings through which all or part of the sovereign debt that a governmental entity has not repaid may be collected. |
The Portfolios’ Past Performance
The bar charts and the tables below provide some indication of the risks of investing in the Portfolios by showing you how the performance of each Portfolio’s Initial Class shares has varied from year to year since inception, and how the average annual total returns of each Portfolio’s Initial Class shares for different periods compare to the returns of a broad measure of market performance. Absent any applicable limitation of or cap on a Portfolio’s expenses, performance would have been lower. Each Portfolio’s Service Class shares will have different performance because they have different expenses than the Portfolio’s Initial Class shares. In the “Since Inception” column of the table, share class returns are for since inception of the applicable share class. Index returns are since the inception of the oldest share class. The performance calculations do not reflect charges or deductions that are, or may be, imposed under your variable life insurance policy or variable annuity contract; if they did, the performance would have been lower. A Portfolio’s past performance (before and after taxes) is not necessarily an indication of how the Portfolio will perform in the future. Following the Reorganization, the Destination Portfolio will be the surviving fund for accounting and performance purposes.
Updated performance information is available on our website at www.transamericaseriestrust.com/content/Performance.aspx or by calling 1-888-233-4339.
9
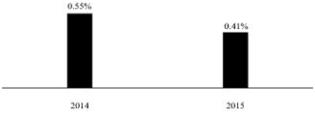
Transamerica Voya Limited Maturity Bond VP
Annual Total Returns (calendar years ended December 31) – Initial Class
| | | | | | |
| | | Quarter Ended | | Return | |
Best Quarter: | | 3/31/2015 | | | 0.60 | % |
Worst Quarter: | | 12/31/2015 | | | -0.30 | % |
Year-to-date return | | 9/30/2016 | | | 1.64 | % |
Average Annual Total Returns (periods ended December 31, 2015)
| | | | | | | | | | | | |
| | | 1 Year | | | Since Inception | | | Inception Date | |
Initial Class | | | 0.41 | % | | | 0.40 | % | | | 5/01/2013 | |
Service Class | | | 0.29 | % | | | 0.17 | % | | | 5/01/2013 | |
Barclays 1-3 Year U.S. Government/Credit Index (reflects no deduction for fees, expenses or taxes) | | | 0.65 | % | | | 0.64 | % | | | | |
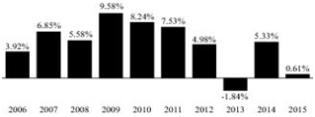
Transamerica JPMorgan Core Bond VP
Annual Total Returns (calendar years ended December 31) – Initial Class
| | | | | | |
| | | Quarter Ended | | Return | |
Best Quarter: | | 12/31/2008 | | | 4.64 | % |
Worst Quarter: | | 6/30/2013 | | | -2.03 | % |
Year-to-date return | | 9/30/2016 | | | 5.50 | % |
Average Annual Total Returns (periods ended December 31, 2015)
| | | | | | | | | | | | | | | | |
| | | 1 Year | | | 5 Years | | | 10 Years | | | Inception
Date | |
Initial Class | | | 0.61 | % | | | 3.26 | % | | | 5.03 | % | | | 10/02/1986 | |
Service Class | | | 0.33 | % | | | 3.00 | % | | | 4.76 | % | | | 5/01/2003 | |
Barclays U.S. Aggregate Bond Index (reflects no deduction for fees, expenses or taxes) | | | 0.55 | % | | | 3.25 | % | | | 4.51 | % | | | | |
10
The Portfolios’ Fees and Expenses
Shareholders of the Portfolios pay various fees and expenses, either directly or indirectly. The table below shows the fees and expenses that you would pay if you were to buy and hold shares of each Portfolio, but it does not reflect any charges that are, or may be, imposed under the policies or the annuity contracts. If such charges were reflected, fees would be higher. The fees and expenses for the Target Portfolio and Destination Portfolio in the tables appearing below are based on the fees and expenses for the fiscal year ended December 31, 2015. The table also shows the pro forma expenses of the combined Destination Portfolio after giving effect to the Reorganization based on pro forma net assets as of June 30, 2016. Pro forma numbers are estimated in good faith and are hypothetical. Actual expenses may vary significantly.
| | | | | | | | | | | | |
| | | Transamerica Voya
Limited Maturity Bond VP | | | Transamerica JPMorgan
Core Bond VP | | | Combined Portfolios
(Pro Forma) | |
| | | Initial
Class | | | Initial
Class | | | Initial
Class | |
Shareholder Fees (fees paid directly from your investment) | | | | | | | | | | | | |
Maximum sales charge (load) imposed on purchases (as a % of offering price) | | | None | | | | None | | | | None | |
Maximum deferred sales charge (load) (as a % of offering price) | | | None | | | | None | | | | None | |
Redemption fee (as a % of amount redeemed) | | | None | | | | None | | | | None | |
Annual Fund Operating Expenses (expenses that you pay each year as a % of the value of your investment) | | | | | | | | | | | | |
Management Fees | | | 0.53 | % | | | 0.48 | % | | | 0.48 | % |
Distribution and Service (12b–1) Fees(1) | | | 0.00 | % | | | 0.00 | % | | | 0.00 | % |
Other Expenses | | | 0.11 | % | | | 0.07 | % | | | 0.06 | % |
Total Annual Fund Operating Expenses | | | 0.64 | % | | | 0.55 | % | | | 0.54 | % |
| | | |
| | | Transamerica Voya
Limited Maturity Bond VP | | | Transamerica JPMorgan
Core Bond VP | | | Combined Portfolios
(Pro Forma) | |
| | | Service
Class | | | Service
Class | | | Service
Class | |
Shareholder Fees (fees paid directly from your investment) | | | | | | | | | | | | |
Maximum sales charge (load) imposed on purchases (as a % of offering price) | | | None | | | | None | | | | None | |
Maximum deferred sales charge (load) (as a % of offering price) | | | None | | | | None | | | | None | |
Redemption fee (as a % of amount redeemed) | | | None | | | | None | | | | None | |
Annual Fund Operating Expenses (expenses that you pay each year as a % of the value of your investment) | | | | | | | | | | | | |
Management Fees | | | 0.53 | % | | | 0.48 | % | | | 0.48 | % |
Distribution and Service (12b–1) Fees | | | 0.25 | % | | | 0.25 | % | | | 0.25 | % |
Other Expenses | | | 0.11 | % | | | 0.07 | % | | | 0.06 | % |
Total Annual Fund Operating Expenses | | | 0.89 | % | | | 0.80 | % | | | 0.79 | % |
| (1) | The portfolio does not intend to pay any 12b-1 fees on Initial Class shares through May 1, 2017. The maximum 12b-1 fee on Initial Class shares is 0.15%. The portfolio reserves the right to pay such fees after that date. |
Example
The hypothetical example below helps you compare the cost of investing in each Portfolio. The example assumes that:
| | • | | you invest $10,000 in each Portfolio; |
| | • | | you reinvest all dividends and distributions without a sales charge; |
| | • | | you hold your shares for the time periods shown and then redeem all of your shares at the end of those periods; |
| | • | | your investment has a 5% annual return (this assumption is required by the SEC and is not a prediction of the Portfolio’s future performance); and |
| | • | | each Portfolio’s operating expenses remain the same. |
11
The example also assumes no fees for variable life insurance policies or variable annuity contracts, if applicable. Costs are the same whether you redeem at the end of any period or not. Pro forma expenses are included assuming the Reorganization of the Portfolio. The example is for comparison purposes only and is not a representation of any Portfolio’s actual expenses or returns, either past or future. Because actual return and expenses will be different, the example is for comparison only.
| | | | | | | | | | | | |
Number of Years You Own your Shares | | Transamerica Voya
Limited Maturity Bond VP | | | Transamerica JPMorgan Core Bond VP | | | Combined Portfolios
(Pro Forma) | |
Initial Class | | | | | | | | | | | | |
Year 1 | | $ | 65 | | | $ | 56 | | | $ | 55 | |
Year 3 | | $ | 237 | | | $ | 209 | | | $ | 173 | |
Year 5 | | $ | 424 | | | $ | 375 | | | $ | 302 | |
Year 10 | | $ | 964 | | | $ | 856 | | | $ | 677 | |
Service Class | | | | | | | | | | | | |
Year 1 | | $ | 91 | | | $ | 82 | | | $ | 81 | |
Year 3 | | $ | 284 | | | $ | 255 | | | $ | 252 | |
Year 5 | | $ | 493 | | | $ | 444 | | | $ | 439 | |
Year 10 | | $ | 1,096 | | | $ | 990 | | | $ | 978 | |
Portfolio Turnover
Each Portfolio pays transaction costs, such as commissions, when it buys and sells securities (or “turns over” its portfolio). A higher portfolio turnover rate may indicate higher transaction costs and may result in higher taxes when Portfolio shares are held in a taxable account. These costs, which are not reflected in annual fund operating expenses or in the example above, affect a Portfolio’s performance. During the Target Portfolio’s most recent fiscal year ended December 31, 2015 the portfolio turnover rate was 264% of the average value of the Target Portfolio’s portfolio. During the Destination Portfolio’s most recent fiscal year ended December 31, 2015, the portfolio turnover rate was 19% of the average value of the Destination Portfolio’s portfolio.
Reasons for the Proposed Reorganization
The Board of the Target Portfolio, including its Independent Trustees, has unanimously determined that the proposed Reorganization would be in the best interests of the Target Portfolio and would not dilute the interests of the existing shareholders of the Target Portfolio. The same Board oversees the Destination Portfolio, and both the full Board and the Independent Trustees also have unanimously determined that the Reorganization would be in the best interests of the Destination Portfolio and would not dilute the interests of the existing shareholders of the Destination Portfolio. The Board believes that the proposed Reorganization will be advantageous to the shareholders of each Portfolio. In determining whether to approve the Reorganization, the Trustees considered the potential impact of the proposed Reorganization on the Portfolios’ shareholders and a variety of related factors and considerations that they believed, in light of the legal advice furnished to them by fund counsel and independent legal counsel and their own business judgment, to be relevant, including those set forth below. The Board based its determinations on such considerations, although the Board did not identify any consideration or particular information that was controlling of its determinations and each Trustee may have attributed different weights to the various factors considered.
General Considerations
| | • | | The Trustees considered that the Target Portfolio would not be viable after the expected re-allocation of assets away from the Target Portfolio by certain asset allocation funds and would have to be liquidated or otherwise addressed, and pending that resolution could not effectively seek its investment objective. |
| | • | | The Trustees noted that TAM believes that the larger combined asset base resulting from the Reorganization will provide greater potential for operating efficiencies and economies of scale, including the potential for lower management fees and total expenses for shareholders of the Target Portfolio and, for the Destination Portfolio, there would be the opportunity to better diversify its holdings, effect larger portfolio transactions and spread fixed costs over a larger asset base. |
| | • | | The Trustees considered that the investment objective of the Target Portfolio and Destination Portfolio are substantially similar and the constituent portfolios’ strategies are similar (although there are differences). |
| | • | | The Trustees noted TAM’s desire to offer a more consolidated investment lineup of TST portfolios within the Transamerica variable annuity products, and to eliminate redundancies in the TST product line strengthening TAM’s ability to pursue investment and marketing opportunities that may benefit the Destination Portfolio. |
12
Fees and Expenses
| | • | | The Trustees assessed the information that was provided in advance of the meeting of the Board regarding fees and expenses for the Portfolios involved in the Reorganization, as well as projected expense ratios of the Destination Portfolio following the Reorganization. |
| | • | | The Trustees considered that, based on the anticipated asset levels following the Reorganization, the management fee paid by the combined Destination Portfolio is expected to be lower than that paid by the Target Portfolio. |
| | • | | The Trustees also considered that the net expense ratio of each class of shares of the combined Destination Portfolio is expected to be lower than the net expense ratio of the corresponding class of shares of the Target Portfolio. |
| | • | | The Trustees considered that, in light of the benefits expected to be received by the Target Portfolio as a result of the Reorganization, the expenses associated with the preparation, printing and mailing of any shareholder communications, including the Information Statement/Prospectus, and any regulatory filings in connection with the Reorganization would be borne by the Target Portfolio. |
Investment Performance
| | • | | The Trustees considered the relative investment performance of the Portfolios and whether performance and investment flexibility have the potential to be enhanced if the assets of each Portfolio are combined. |
| | • | | The Trustees considered that the Destination Portfolio has performed better than the Target Portfolio since the inception of the Target Portfolio. The Destination Portfolio’s trailing 1-year, 3-year and since inception returns are superior to that of the Target Portfolio. Risk-adjusted returns are superior for the Destination Portfolio in the 1-year period, but are otherwise slightly below that of the Target Portfolio, primarily due to slightly higher volatility of the Destination Portfolio, the primary source of which is the longer duration profile of the portfolio. |
Tax
| | • | | The Trustees considered the expected tax-free nature of the Reorganization for federal income tax purposes. |
Investment Program
| | • | | The Trustees considered the investment objective, strategies and policies of the Destination Portfolio and their compatibility with those of the Target Portfolio. In this regard, the Trustees noted that the assets of the Portfolios are managed in accordance with similar investment objectives and investment strategies. |
| | • | | The Trustees considered that TAM is the manager to the Target Portfolio and the Destination Portfolio and that Voya is the sub-adviser to the Target Portfolio and JPMorgan is the sub-adviser to the Destination Portfolio. |
Other Considerations
| | • | | The Trustees considered the terms and conditions of the Agreement and Plan of Reorganization. |
| | • | | The Trustees took into consideration the fact that the Target Portfolio and Destination Portfolio have the same valuation policies and procedures and use the same pricing vendors. |
13
CAPITALIZATION
The following table sets forth the capitalization of the Target Portfolio and the Destination Portfolio as of September 15, 2016 and the pro forma combined capitalization of the combined Destination Portfolio as if the Reorganization had occurred on that date. If the Reorganization is consummated, the actual exchange ratios on the Closing Date may vary from the exchange ratios used in the computation below. This is due to changes in the market value of the portfolio securities of both Portfolios between September 15, 2016 and the Closing Date, changes in the amount of undistributed net investment income and net realized capital gains of the Portfolios during that period resulting from income and distributions, and changes in the accrued liabilities of the Portfolios during the same period.
| | | | | | | | | | | | | | | | |
| | | Transamerica Voya
Limited Maturity Bond
VP | | | Transamerica JPMorgan
Core Bond VP | | | Pro Forma
Adjustments(A) | | | Combined | |
Net Assets by Class | | | | | | | | | | | | | | | | |
Initial Class | | $ | 85,377,416 | | | $ | 499,868,590 | | | $ | (26,303 | ) | | $ | 585,219,703 | |
Service Class | | $ | 754,948 | | | $ | 260,291,908 | | | $ | (13,697 | ) | | $ | 261,033,159 | |
Total | | $ | 86,132,364 | | | $ | 760,160,498 | | | $ | (40,000 | ) | | $ | 846,252,862 | |
| | | | |
Shares Outstanding | | | | | | | | | | | | | | | | |
Initial Class | | | 8,499,136 | | | | 37,926,745 | | | | (2,021,335 | ) | | | 44,404,546 | |
Service Class | | | 75,389 | | | | 18,527,840 | | | | (21,656 | ) | | | 18,581,573 | |
| | | | |
Net asset value per share | | | | | | | | | | | | | | | | |
Initial Class | | $ | 10.05 | | | $ | 13.18 | | | $ | (10.05 | ) | | $ | 13.18 | |
Service Class | | $ | 10.01 | | | $ | 14.05 | | | $ | (10.01 | ) | | $ | 14.05 | |
| (A) | Pro Forma Adjustments are due to the cost of the Reorganization. |
It is impossible to predict with any certainty how many shares of the Destination Portfolio will actually be received and distributed by the Target Portfolio on the Closing Date. The foregoing table should not be relied upon to determine the amount of Destination Portfolio shares that will actually be received and distributed.
ADDITIONAL INFORMATION
For information relating to each Portfolio and the Reorganization, including tax capital loss carryforwards, the tax status of the Reorganization, a comparison of the fundamental investment policies of the Portfolios, how to buy, sell or exchange Portfolio shares, how each Portfolio values its securities, financial highlights information for each Portfolio and ownership of shares of the Portfolios, please see the sections immediately following the discussion of Reorganization 2.
14
REORGANIZATION 2
TRANSAMERICA VOYA MID CAP OPPORTUNITIES VP
(the “Target Portfolio”)
TRANSAMERICA JANUS MID-CAP GROWTH VP
(the “Destination Portfolio”)
Summary
The following is a summary of more complete information appearing later in this Information Statement/Prospectus or incorporated herein. You should read carefully the entire Information Statement/Prospectus, including the exhibits, which include additional information that is not included in the summary and is a part of this Information Statement/Prospectus. Exhibit A is the form of Agreement and Plan of Reorganization. For a discussion of the terms of the Agreement and Plan of Reorganization, please see the section entitled “Terms of the Agreement and Plan of Reorganization” in the back of this Information Statement/Prospectus, after the discussion of the Reorganizations.
In the Reorganization, the Destination Portfolio will issue a number of its Initial Class and Service Class shares, as applicable, to the Target Portfolio having an aggregate net asset value equal to the aggregate net asset value of the Target Portfolio’s Initial Class and Service Class shares, respectively.
The consummation of the Reorganization is not contingent on the consummation of the other Reorganization.
Both the Target Portfolio and the Destination Portfolio are managed by Transamerica Asset Management, Inc. (“TAM”). The Target Portfolio is sub-advised by Voya Investment Management Co. LLC (“Voya”) and the Destination Portfolio is sub-advised by Janus Capital Management LLC (“Janus”). The Target Portfolio and the Destination Portfolio have the same investment objective and similar principal investment strategies and policies, and related risks. The tables below provide a comparison of certain features of the Portfolios. In the tables below, if a row extends across the entire table, the information disclosed applies to both the Destination Portfolio and the Target Portfolio.
Comparison of Transamerica Voya Mid Cap Opportunities VP
and Transamerica Janus Mid-Cap Growth VP
| | | | |
| | | Transamerica Voya Mid Cap Opportunities VP | | Transamerica Janus Mid-Cap Growth VP |
| Investment Objective | | Seeks long-term capital appreciation. |
| | |
| Principal investment strategies | | Under normal market conditions, the portfolio’s sub-adviser, Voya Investment Management Co. LLC (the “sub-adviser”) invests at least 80% of the portfolio’s net assets (plus the amount of any borrowings, if any, for investment purposes) in common stocks of mid-sized U.S. companies. The portfolio normally invests in companies that the sub-adviser believes have above average prospects for growth. The sub-adviser generally defines mid cap stocks as stocks of companies with capitalizations within the range of companies included in the Russell Midcap® Growth Index at the time of purchase, which as of December 31, 2015 was between $451 million and $30.4 billion. The portfolio may also invest in derivative instruments including futures or index futures that have a similar profile to the benchmark of the portfolio. The portfolio typically uses derivatives for the purpose of maintaining equity market exposure on its cash balance. The portfolio may also invest in foreign securities. The portfolio may invest in other investment companies, including exchange-traded funds, to the extent permitted under the Investment Company Act of 1940, as amended, and the rules, regulations, and exemptive orders thereunder. | | The portfolio’s sub-adviser, Janus Capital Management LLC (the “sub-adviser”), under normal conditions, invests primarily in common stocks selected for their growth potential, and normally invests at least 80% of the portfolio’s net assets (plus the amount of borrowings for investment purposes) in equity securities of medium-sized companies. Medium-sized companies are those whose market capitalization falls within the range of companies included in the Russell Midcap® Growth Index, which as of December 31, 2015, was between $2 billion and $30 billion. The portfolio may also invest in foreign securities, which may include investments in emerging markets, and it may invest up to 5% of its net assets in exchange traded funds. The sub-adviser applies a “bottom-up” approach in choosing investments. In other words, the portfolio manager looks at companies one at a time to determine if a company is an attractive investment opportunity and if it is consistent with the portfolio’s investment policies. |
15
| | | | |
| | The sub-adviser uses a stock selection process that combines the discipline of quantitative screens with rigorous fundamental security analysis. The quantitative screens focus the fundamental analysis by seeking to identify the stocks of companies with strong business momentum that demonstrate relative price strength, and have a perceived value not reflected in the current price. The objective of the fundamental analysis is to confirm the persistence of the company’s revenue and earnings growth and validate the sub-adviser’s expectations for earnings estimate revisions, particularly relative to consensus. A determination of reasonable valuation for individual securities is based on the judgment of the sub-adviser. The sub-adviser may sell securities for a variety of reasons, such as to secure gains, limit losses, or redeploy assets into opportunities believed to be more promising, among others. | | |
| |
| Investment adviser | | TAM |
| | |
| Sub–adviser | | Voya | | Janus |
| | |
| Portfolio managers | | Jeffrey Bianchi, CFA – Portfolio Manager since 2013 Michael Pytosh – Portfolio Manager since 2013 | | Brian Demain, CFA – Portfolio Manager since 2016 Cody Wheaton, CFA – Portfolio Manager since 2016 |
| |
| | The Portfolios’ statement of additional information provides additional information about the portfolio manager(s)’ compensation, other accounts managed by the portfolio manager(s), and the portfolio manager(s)’ ownership of securities in the Portfolios. |
| | |
| Net assets (as of August 31, 2016) | | $213,657,178 | | $573,046,333 |
Classes of Shares, Fees and Expenses
| | | | |
| | | Transamerica Voya Mid Cap Opportunities VP | | Transamerica Janus Mid-Cap Growth VP |
| Initial Class sales charges and fees | | Initial Class shares are offered without an initial sales charge and are not subject to a contingent deferred sales charge. Initial Class shares can have up to a maximum Rule 12b-1 fee equal to an annual rate of 0.15% (expressed as a percentage of average daily net assets of the Portfolio), but TST does not intend to pay any distribution fees for Initial Class shares through May 1, 2017. TST reserves the right to pay such fees after that date. |
| |
| Service Class sales charges and fees | | Service Class shares are offered without an initial sales charge and are not subject to a contingent deferred sales charge. Service Class shares have a maximum Rule 12b–1 fee equal to an annual rate of 0.25% (expressed as a percentage of average daily net assets of the Portfolio), which is used to pay distribution and service fees for the sale and distribution of the Portfolio’s shares and to pay for non–distribution activities and services provided to shareholders. These services include compensation to financial intermediaries that sell Portfolio shares and/or service shareholder accounts. |
| | |
| Management fees | | TAM receives compensation, calculated daily and paid monthly, from the Target Portfolio at an annual rate (expressed as a specified percentage of the Portfolio’s average daily net assets) of 0.86% of the first $100 million; 0.845% over $100 million up to $1 billion; and 0.83% in excess of $1 billion. | | TAM receives compensation, calculated daily and paid monthly, from the Destination Portfolio at an annual rate (expressed as a specified percentage of the Portfolio’s average daily net assets) of 0.805% of the first $500 million; 0.77% over $500 million up to $1 billion; and 0.75% in excess of $1 billion. |
| | |
| Fee waiver and expense limitations | | TAM has contractually undertaken through May 1, 2017 to pay expenses on behalf of the portfolio to the extent normal operating expenses (including investment advisory fees but excluding, as applicable, 12b–1 fees, acquired fund fees and expenses, interest, taxes, brokerage commissions, dividend and interest expenses on securities sold short, extraordinary expenses and other expenses not incurred in the ordinary course of the portfolio’s business) exceed, as a percentage of the portfolio’s average daily net assets, 1.15%. TAM is entitled to reimbursement by the portfolio of fees waived or expenses reduced during any of the previous 36 months if on any day or month the estimated annualized portfolio operating expenses are less than the cap. | | TAM has contractually undertaken through May 1, 2017 to pay expenses on behalf of the portfolio to the extent normal operating expenses (including investment advisory fees but excluding, as applicable, 12b–1 fees, acquired fund fees and expenses, interest, taxes, brokerage commissions, dividend and interest expenses on securities sold short, extraordinary expenses and other expenses not incurred in the ordinary course of the portfolio’s business) exceed, as a percentage of the portfolio’s average daily net assets, 1.00%. TAM is entitled to reimbursement by the portfolio of fees waived or expenses reduced during any of the previous 36 months if on any day or month the estimated annualized portfolio operating expenses are less than the cap. |
| |
| | For a comparison of the gross and net expenses of the Portfolios, please see the class fee tables in “The Portfolios’ Fees and Expenses” below. |
16
Comparison of Principal Risks of Investing in the Portfolios
Because the Portfolios have the same investment objectives and similar principal investment strategies and policies, they are subject to similar principal risks. Risk is inherent in all investing. The value of your investment in a Portfolio, as well as the amount of return you receive on your investment, may fluctuate significantly from day to day and over time. You may lose part or all of your investment in a Portfolio or your investment may not perform as well as other similar investments.
Your primary risk in investing in the Portfolios is you could lose money. You should carefully assess the risks associated with an investment in the Portfolios.
Each Portfolio is subject to the following principal risks (in alphabetical order) of investing in the Portfolio:
| | • | | Currency – The value of investments in securities denominated in foreign currencies increases or decreases as the rates of exchange between those currencies and the U.S. dollar change. Currency conversion costs and currency fluctuations could reduce or eliminate investment gains or add to investment losses. Currency exchange rates can be volatile, and are affected by factors such as general economic conditions, the actions of the U.S. and foreign governments or central banks, the imposition of currency controls, and speculation. |
| | • | | Equity Securities – Equity securities represent an ownership interest in an issuer, rank junior in a company’s capital structure and consequently may entail greater risk of loss than debt securities. Equity securities include common and preferred stocks. Stock markets are volatile. The price of equity securities fluctuates based on changes in a company’s financial condition and overall market and economic conditions. If the market prices of the equity securities owned by the portfolio fall, the value of your investment in the portfolio will decline. |
| | • | | Foreign Investments – Investing in securities of foreign issuers or issuers with significant exposure to foreign markets involves additional risk. Foreign countries in which the portfolio may invest may have markets that are less liquid, less regulated and more volatile than U.S. markets. The value of the portfolio’s investments may decline because of factors affecting the particular issuer as well as foreign markets and issuers generally, such as unfavorable or unsuccessful government actions, reduction of government or central bank support, political or financial instability or other adverse economic or political developments. Lack of information and weaker accounting standards also may affect the value of these securities. |
| | • | | Growth Stocks – Returns on growth stocks may not move in tandem with returns on other categories of stocks or the market as a whole. Growth stocks may be particularly susceptible to larger price swings or to adverse developments. Growth stocks as a group may be out of favor and underperform the overall equity market for a long period of time, for example, while the market favors “value” stocks. |
| | • | | Legal and Regulatory – Legal and regulatory changes could occur that may adversely affect the portfolio, its investments, and its ability to pursue its investment strategies and/or increase the costs of implementing such strategies. Certain changes have already been proposed and additional changes are expected. New or revised laws or regulations may be imposed by the U.S. Securities and Exchange Commission, the U.S. Commodity Futures Trading Commission, the Internal Revenue Service, the U.S. Federal Reserve or other governmental regulatory authorities or self-regulatory organizations that could adversely affect the portfolio. The portfolio also may be adversely affected by changes in the enforcement or interpretation of existing statutes and rules by governmental regulatory authorities or self-regulatory organizations. |
| | • | | Management – The portfolio is subject to the risk that the Investment Manager’s or sub-adviser’s judgments and decisions may be incorrect or otherwise may not produce the desired results. The value of your investment may decrease if the sub-adviser’s judgment about the quality, relative yield or value of, or market trends affecting, a particular security or issuer, industry, sector, region or market segment, or about the economy or interest rates, is incorrect. The portfolio may also suffer losses if there are imperfections, errors or limitations in the tools, resources, information and data used, or the analyses employed or relied on, by the sub-adviser, or if the sub-adviser’s investment style is out of favor or otherwise fails to produce the desired results. The portfolio’s investment strategies designed by the investment manager may not work as intended. In addition, the portfolio’s investment strategies or policies may change from time to time. Those changes may not lead to the results intended by the investment manager and could have an adverse effect on the value or performance of the portfolio. Any of these things could cause the portfolio to lose value or its results to lag relevant benchmarks or other funds with similar objectives. |
| | • | | Market – The market prices of the portfolio’s securities may go up or down, sometimes rapidly or unpredictably, due to general market conditions, such as real or perceived adverse economic or political conditions, inflation, changes in interest rates or currency rates, lack of liquidity in the markets or adverse investor sentiment. Adverse market conditions may be prolonged and may not have the same impact on all types of securities. Market prices of securities also may go down due to events or conditions that affect particular sectors, industries or issuers. When market prices fall, the value of your investment will go down. The portfolio may experience a substantial or complete loss on any individual security. |
17
In the past several years, financial markets, such as those in the United States, Europe, Asia and elsewhere, have experienced increased volatility, depressed valuations, decreased liquidity and heightened uncertainty. Governmental and non-governmental issuers defaulted on, or were forced to restructure, their debts. These market conditions may continue, worsen or spread.
The U.S. government and the Federal Reserve, as well as certain foreign governments and their central banks have taken steps to support financial markets, including keeping interest rates at historically low levels. This and other government intervention may not work as intended, particularly if the efforts are perceived by investors as being unlikely to achieve the desired results. The Federal Reserve recently has reduced its market support activities. Further reduction or withdrawal of Federal Reserve or other U.S. or non-U.S. governmental or central bank support, including interest rate increases, could negatively affect financial markets, generally increase market volatility and reduce the value and liquidity of securities in which the portfolio invests.
Policy and legislative changes in the United States and in other countries are affecting many aspects of financial regulation, and may in some instances contribute to decreased liquidity and increased volatility in the financial markets. The impact of these changes on the markets, and the practical implications for market participants, may not be fully known for some time.
Economies and financial markets throughout the world are becoming increasingly interconnected. As a result, whether or not the portfolio invests in securities of issuers located in or with significant exposure to countries experiencing economic and financial difficulties, the value and liquidity of the portfolio’s investments may be negatively affected.
| | • | | Medium Capitalization Companies – The portfolio will be exposed to additional risks as a result of its investments in the securities of medium capitalization companies. Investing in medium capitalization companies involves greater risk than is customarily associated with more established companies. The prices of securities of medium capitalization companies generally are more volatile and are more likely to be adversely affected by changes in earnings results and investor expectations or poor economic or market conditions. Securities of medium capitalization companies may underperform larger capitalization companies, may be harder to sell at times and at prices the portfolio managers believe appropriate and may offer greater potential for losses. |
| | • | | Valuation – The sales price the portfolio could receive for any particular portfolio investment may differ from the portfolio’s valuation of the investment, particularly for securities that trade in thin or volatile markets, that are priced based upon valuations provided by third-party pricing services that use matrix or evaluated pricing systems, or that are valued using a fair value methodology. The portfolio’s ability to value its investments may be impacted by technological issues and/or errors by pricing services or other third party service providers. |
The Target Portfolio is subject to the following related principal risks:
| | • | | Counterparty – The portfolio will be subject to credit risk (meaning the risk of adverse changes in an issuer’s real or perceived financial strength) with respect to counterparties to derivatives, repurchase agreements and other financial contracts entered into by the portfolio or held by special purpose or structured vehicles. Adverse changes to counterparties may cause the value of financial contracts to go down. If a counterparty becomes bankrupt or otherwise fails to perform its obligations due to financial difficulties, the value of your investment in the portfolio may decline. |
| | • | | Derivatives – Using derivatives exposes the portfolio to additional risks and can increase portfolio losses and reduce opportunities for gains when market prices, interest rates, currencies, or the derivatives themselves, behave in a way not anticipated by the portfolio. Using derivatives also can have a leveraging effect and increase portfolio volatility. Certain derivatives have the potential for unlimited loss, regardless of the size of the initial investment. Derivatives may be difficult to sell, unwind or value, and the counterparty may default on its obligations to the portfolio. Use of derivatives may have different tax consequences for the portfolio than an investment in the underlying security, and those differences may affect the amount, timing and character of income distributed to shareholders. The U.S. government and foreign governments are in the process of adopting and implementing regulations governing derivatives markets, including mandatory clearing of certain derivatives, margin and reporting requirements. The ultimate impact of the regulations remains unclear. Additional regulation of derivatives may make derivatives more costly, limit their availability or utility, otherwise adversely affect their performance or disrupt markets. For additional information regarding derivatives, see “More on Risks of Investing in the Portfolio—More on Principal Risks: Derivatives” in the prospectus. In addition, the SEC has proposed a new rule that would change the regulation of the use of derivatives by registered investment companies, such as the portfolio. If the proposed rule takes effect, it could limit the ability of the portfolio to invest in derivatives. |
| | • | | Fixed-Income Securities – The market prices of fixed-income securities may go up or down, sometimes rapidly and unpredictably, due to general market conditions, such as real or perceived adverse economic or political conditions, inflation, changes in interest rates, lack of liquidity in the bond markets or adverse investor sentiment. In addition, the market value of a fixed income security may decline if the issuer or other obligor of the security fails to pay principal and/or interest, otherwise defaults or has its credit rating downgraded or is perceived to be less creditworthy, or the credit quality or value of any |
18
| | underlying assets declines. When market prices fall, the value of your investment will go down. The value of your investment will generally go down when interest rates rise. Interest rates have been at historically low levels, so the portfolio faces a heightened risk that interest rates may rise. A rise in rates tends to have a greater impact on the prices of longer term or duration securities. |
| | • | | Investment Companies – To the extent that the portfolio invests in other investment companies, such as closed-end or exchange-traded funds, it is subject to the risks of these investment companies and bears its pro rata share of the investment companies’ expenses. |
| | • | | Leveraging – The value of your investment may be more volatile to the extent that the portfolio borrows or uses derivatives or other investments that have a leveraging effect on the portfolio. Other risks also will be compounded. This is because leverage generally magnifies the effect of a change in the value of an asset and creates a risk of loss of value on a larger pool of assets than the portfolio would otherwise have had. The use of leverage is considered to be a speculative investment practice and may result in the loss of a substantial amount, and possibly all, of the portfolio’s assets. The portfolio also may have to sell assets at inopportune times to satisfy its obligations. |
| | • | | Liquidity – The portfolio may make investments that are illiquid or that become illiquid after purchase. Investments may become illiquid due to the lack of an active market, a reduced number of traditional market participants, or reduced capacity of traditional market participants to make a market in securities. The liquidity and value of investments can deteriorate rapidly and those investments may be difficult or impossible for the portfolio to sell, particularly during times of market turmoil. These illiquid investments can be difficult to value. If the portfolio is forced to sell an illiquid investment to meet redemption requests or other cash needs, the portfolio may be forced to sell at a loss. The portfolio may not receive its proceeds from the sale of certain securities for an extended period (for example, several weeks or even longer). |
| | • | | Model and Data – If quantitative models, algorithms or calculations (whether proprietary and developed by the sub-adviser or supplied by third parties) (“Models”) or information or data supplied by third parties (“Data”) prove to be incorrect or incomplete, any decisions made, in whole or part, in reliance thereon expose the portfolio to additional risks. Models can be predictive in nature. The use of predictive Models has inherent risks. The success of relying on or otherwise using Models depends on a number of factors, including the validity, accuracy and completeness of the Model’s development, implementation and maintenance, the Model’s assumptions, factors, algorithms and methodologies, and the accuracy and reliability of the supplied historical or other Data. Models rely on, among other things, correct and complete Data inputs. If incorrect Data is entered into even a well-founded Model, the resulting information will be incorrect. However, even if Data is input correctly, Model prices may differ substantially from market prices, especially for securities with complex characteristics. Investments selected with the use of Models may perform differently than expected as a result of the design of the Model, inputs into the Model or other factors. There can be no assurance that the use of Models will result in effective investment decisions for the portfolio. |
The Destination Portfolio is subject to the following related principal risks:
| | • | | Active Trading – The portfolio is actively managed and may purchase and sell securities without regard to the length of time held. Active trading may have a negative impact on performance by increasing transaction costs and may generate greater amounts of net short-term capital gains, which, for shareholders holding shares in taxable accounts, would generally be subject to tax at ordinary income tax rates upon distribution. |
| | • | | Emerging Markets – Investments in the securities of issuers located in or principally doing business in emerging markets are subject to foreign investments risks. These risks are greater for investments in issuers in emerging market countries. Emerging market countries tend to have economic, political and legal systems that are less fully developed and are less stable than those of more developed countries. Emerging market securities are often particularly sensitive to market movements because their market prices tend to reflect speculative expectations. Low trading volumes may result in a lack of liquidity and in extreme price volatility. |
| | • | | Exchange Traded Funds (ETFs) – Equity-based ETFs are subject to risks similar to those of stocks; fixed income-based ETFs are subject to risks similar to those of fixed-income securities. ETF shares may trade at a premium or discount to net asset value. ETFs are subject to secondary market trading risks. In addition, a portfolio will bear a pro rata portion of the operating expenses of an ETF in which it invests. |
The Portfolios’ Past Performance
The bar charts and the tables below provide some indication of the risks of investing in the Portfolios by showing you how the performance of each Portfolio’s Initial Class shares has varied from year to year since inception, and how the average annual total returns of each Portfolio’s Initial Class shares for different periods compare to the returns of a broad measure of market performance. Absent any applicable limitation of or cap on a Portfolio’s expenses, performance would have been lower. Each Portfolio’s Service
19
Class shares will have different performance because they have different expenses than the Portfolio’s Initial Class shares. In the “Since Inception” column of the table, share class returns are for since inception of the applicable share class. Index returns are since the inception of the oldest share class. The performance calculations do not reflect charges or deductions that are, or may be, imposed under your variable life insurance policy or variable annuity contract; if they did, the performance would have been lower. A Portfolio’s past performance (before and after taxes) is not necessarily an indication of how the Portfolio will perform in the future. Following the Reorganization, the Destination Portfolio will be the surviving fund for accounting and performance purposes.
Updated performance information is available on our website at www.transamericaseriestrust.com/content/Performance.aspx or by calling 1-888-233-4339.
Transamerica Voya Mid Cap Opportunities VP
Annual Total Returns (calendar years ended December 31) – Initial Class
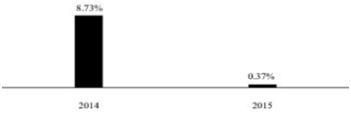
| | | | | | |
| | | Quarter Ended | | Return | |
Best Quarter: | | 12/31/2014 | | | 6.85 | % |
Worst Quarter: | | 9/30/2015 | | | -7.35 | % |
Year-to-date return | | 9/30/2016 | | | 7.38 | % |
Average Annual Total Returns (periods ended December 31, 2015)
| | | | | | | | | | |
| | | 1 Year | | | Since Inception | | | Inception Date |
Initial Class | | | 0.37 | % | | | 10.07 | % | | 5/01/2013 |
Service Class | | | 0.07 | % | | | 9.79 | % | | 5/01/2013 |
Russell Midcap® Growth Index (reflects no deduction for fees, expenses or taxes) | | | -0.20 | % | | | 11.57 | % | | |
Transamerica Janus Mid-Cap Growth VP
Annual Total Returns (calendar years ended December 31) – Initial Class
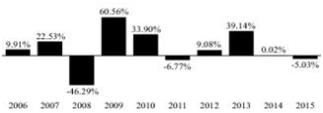
| | | | | | |
| | | Quarter Ended | | Return | |
Best Quarter: | | 6/30/2009 | | | 27.18 | % |
Worst Quarter: | | 12/31/2008 | | | -25.90 | % |
Year-to-date return | | 9/30/2016 | | | -2.20 | % |
Average Annual Total Returns (periods ended December 31, 2015)
| | | | | | | | | | | | | | | | |
| | | 1 Year | | | 5 Years | | | 10 Years | | | Inception
Date | |
Initial Class | | | -5.03 | % | | | 6.11 | % | | | 7.66 | % | | | 3/01/1993 | |
Service Class | | | -5.26 | % | | | 5.84 | % | | | 7.38 | % | | | 5/01/2003 | |
Russell Midcap® Growth Index (reflects no deduction for fees, expenses or taxes) | | | -0.20 | % | | | 11.54 | % | | | 8.16 | % | | | | |
20
The Portfolios’ Fees and Expenses
Shareholders of the Portfolios pay various fees and expenses, either directly or indirectly. The table below shows the fees and expenses that you would pay if you were to buy and hold shares of each Portfolio, but it does not reflect any charges that are, or may be, imposed under the policies or the annuity contracts. If such charges were reflected, fees would be higher. The fees and expenses for the Target Portfolio and Destination Portfolio in the tables appearing below are based on the fees and expenses for the fiscal year ended December 31, 2015. The table also shows the pro forma expenses of the combined Destination Portfolio after giving effect to the Reorganization based on pro forma net assets as of June 30, 2016. Pro forma numbers are estimated in good faith and are hypothetical. Actual expenses may vary significantly.
| | | | | | | | | | | | |
| | | Transamerica Voya Mid
Cap Opportunities VP | | | Transamerica Janus
Mid-Cap Growth VP | | | Combined Portfolios
(Pro Forma) | |
| | | Initial
Class | | | Initial
Class | | | Initial
Class | |
Shareholder Fees (fees paid directly from your investment) | | | | | | | | | | | | |
Maximum sales charge (load) imposed on purchases (as a % of offering price) | | | None | | | | None | | | | None | |
Maximum deferred sales charge (load) (as a % of offering price) | | | None | | | | None | | | | None | |
Redemption fee (as a % of amount redeemed) | | | None | | | | None | | | | None | |
Annual Fund Operating Expenses (expenses that you pay each year as a % of the value of your investment) | | | | | | | | | | | | |
Management Fees | | | 0.85 | % | | | 0.79 | % | | | 0.79 | % |
Distribution and Service (12b–1) Fees(1) | | | 0.00 | % | | | 0.00 | % | | | 0.00 | % |
Other Expenses | | | 0.05 | % | | | 0.05 | % | | | 0.04 | % |
Total Annual Fund Operating Expenses | | | 0.90 | % | | | 0.84 | % | | | 0.83 | % |
| | | |
| | | Transamerica Voya Mid
Cap Opportunities VP | | | Transamerica Janus
Mid-Cap Growth VP | | | Combined Portfolios
(Pro Forma) | |
| | | Service
Class | | | Service
Class | | | Service
Class | |
Shareholder Fees (fees paid directly from your investment) | | | | | | | | | | | | |
Maximum sales charge (load) imposed on purchases (as a % of offering price) | | | None | | | | None | | | | None | |
Maximum deferred sales charge (load) (as a % of offering price) | | | None | | | | None | | | | None | |
Redemption fee (as a % of amount redeemed) | | | None | | | | None | | | | None | |
Annual Fund Operating Expenses (expenses that you pay each year as a % of the value of your investment) | | | | | | | | | | | | |
Management Fees | | | 0.85 | % | | | 0.79 | % | | | 0.79 | % |
Distribution and Service (12b–1) Fees | | | 0.25 | % | | | 0.25 | % | | | 0.25 | % |
Other Expenses | | | 0.05 | % | | | 0.05 | % | | | 0.04 | % |
Total Annual Fund Operating Expenses | | | 1.15 | % | | | 1.09 | % | | | 1.08 | % |
| (1) | The portfolio does not intend to pay any 12b-1 fees on Initial Class shares through May 1, 2017. The maximum 12b-1 fee on Initial Class shares is 0.15%. The portfolio reserves the right to pay such fees after that date. |
Example
The hypothetical example below helps you compare the cost of investing in each Portfolio. The example assumes that:
| | • | | you invest $10,000 in each Portfolio; |
| | • | | you reinvest all dividends and distributions without a sales charge; |
| | • | | you hold your shares for the time periods shown and then redeem all of your shares at the end of those periods; |
| | • | | your investment has a 5% annual return (this assumption is required by the SEC and is not a prediction of the Portfolio’s future performance); and |
| | • | | each Portfolio’s operating expenses remain the same. |
21
The example also assumes no fees for variable life insurance policies or variable annuity contracts, if applicable. Costs are the same whether you redeem at the end of any period or not. Pro forma expenses are included assuming the Reorganization of the Portfolio. The example is for comparison purposes only and is not a representation of any Portfolio’s actual expenses or returns, either past or future. Because actual return and expenses will be different, the example is for comparison only.
| | | | | | | | | | | | |
Number of Years You Own your Shares | | Transamerica Voya Mid
Cap Opportunities VP | | | Transamerica Janus Mid-
Cap Growth VP | | | Combined Portfolios
(Pro Forma) | |
Initial Class | | | | | | | | | | | | |
Year 1 | | $ | 92 | | | $ | 86 | | | $ | 85 | |
Year 3 | | $ | 319 | | | $ | 300 | | | $ | 265 | |
Year 5 | | $ | 565 | | | $ | 532 | | | $ | 460 | |
Year 10 | | $ | 1,269 | | | $ | 1,199 | | | $ | 1,025 | |
Service Class | | | | | | | | | | | | |
Year 1 | | $ | 117 | | | $ | 111 | | | $ | 110 | |
Year 3 | | $ | 365 | | | $ | 347 | | | $ | 343 | |
Year 5 | | $ | 633 | | | $ | 601 | | | $ | 595 | |
Year 10 | | $ | 1,398 | | | $ | 1,329 | | | $ | 1,317 | |
Portfolio Turnover
Each Portfolio pays transaction costs, such as commissions, when it buys and sells securities (or “turns over” its portfolio). A higher portfolio turnover rate may indicate higher transaction costs and may result in higher taxes when Portfolio shares are held in a taxable account. These costs, which are not reflected in annual fund operating expenses or in the example above, affect a Portfolio’s performance. During the Target Portfolio’s most recent fiscal year ended December 31, 2015 the portfolio turnover rate was 88% of the average value of the Target Portfolio’s portfolio. During the Destination Portfolio’s most recent fiscal year ended December 31, 2015, the portfolio turnover rate was 21% of the average value of the Destination Portfolio’s portfolio.
Reasons for the Proposed Reorganization
The Board of the Target Portfolio, including its Independent Trustees, has unanimously determined that the proposed Reorganization would be in the best interests of the Target Portfolio and would not dilute the interests of the existing shareholders of the Target Portfolio. The same Board oversees the Destination Portfolio, and both the full Board and the Independent Trustees also have unanimously determined that the Reorganization would be in the best interests of the Destination Portfolio and would not dilute the interests of the existing shareholders of the Destination Portfolio. The Board believes that the proposed Reorganization will be advantageous to the shareholders of each Portfolio. In determining whether to approve the Reorganization, the Trustees considered the potential impact of the proposed Reorganization on the Portfolios’ shareholders and a variety of related factors and considerations that they believed, in light of the legal advice furnished to them by fund counsel and independent legal counsel and their own business judgment, to be relevant, including those set forth below. The Board based its determinations on such considerations, although the Board did not identify any consideration or particular information that was controlling of its determinations and each Trustee may have attributed different weights to the various factors considered.
General Considerations
| | • | | The Trustees considered that the Target Portfolio would not be viable after the expected re-allocation of assets away from the Target Portfolio by certain asset allocation funds and would have to be liquidated or otherwise addressed, and pending that resolution could not effectively seek its investment objective. |
| | • | | The Trustees noted that TAM believes that the larger combined asset base resulting from the Reorganization will provide greater potential for operating efficiencies and economies of scale, including the potential for lower management fees and total expenses for shareholders of the Target Portfolio and, for the Destination Portfolio, there would be the opportunity to better diversify its holdings, effect larger portfolio transactions and spread fixed costs over a larger asset base. |
| | • | | The Trustees considered that the investment objective of the Target Portfolio and Destination Portfolio are the same and the constituent portfolios’ strategies are similar (although there are differences). |
| | • | | The Trustees noted TAM’s desire to offer a more consolidated investment lineup of TST portfolios within the Transamerica variable annuity products, and to eliminate redundancies in the TST product line strengthening TAM’s ability to pursue investment and marketing opportunities that may benefit the Destination Portfolio. |
Fees and Expenses
| | • | | The Trustees assessed the information that was provided in advance of the meeting of the Board regarding fees and expenses for the Portfolios involved in the Reorganization, as well as projected expense ratios of the Destination Portfolio following the Reorganization. |
22
| | • | | The Trustees considered that, based on the anticipated asset levels following the Reorganization, the management fee paid by the combined Destination Portfolio is expected to be lower than that paid by the Target Portfolio. |
| | • | | The Trustees also considered that the net expense ratio of each class of shares of the combined Destination Portfolio is expected to be lower than the net expense ratio of the corresponding class of shares of the Target Portfolio. |
| | • | | The Trustees considered that, in light of the benefits expected to be received by the Target Portfolio as a result of the Reorganization, the expenses associated with the preparation, printing and mailing of any shareholder communications, including the Information Statement/Prospectus, and any regulatory filings in connection with the Reorganization would be shared by TAM and the Target Portfolio. |
Investment Performance
| | • | | The Trustees considered the relative investment performance of the Portfolios and whether performance and investment flexibility have the potential to be enhanced if the assets of each Portfolio are combined. |
| | • | | The Trustees considered that the performance results for the Portfolios show that the Target Portfolio underperformed the Destination Portfolio Proxy over all time periods reviewed and the benchmark over the since-inception period. The Target Portfolio also showed less favorable risk adjusted results, as measured by the Sharpe ratio, compared to the Destination Portfolio Proxy over all time periods and more favorable risk adjusted results compared to the benchmark over the 1- and 3-year periods. The Target Portfolio’s risk profile, as measured by standard deviation, was higher versus the Destination Portfolio Proxy and slightly lower versus the benchmark across all time periods measured. The Target Portfolio provided less favorable maximum drawdowns (measured as peak-to-trough decline over a specific period) versus the Destination Portfolio Proxy and more favorable drawdowns versus the benchmark over all time periods measured. |
Tax
| | • | | The Trustees considered the expected tax-free nature of the Reorganization for federal income tax purposes. |
Investment Program
| | • | | The Trustees considered the investment objective, strategies and policies of the Destination Portfolio and their compatibility with those of the Target Portfolio. In this regard, the Trustees noted that the assets of the Portfolios are managed in accordance with identical investment objectives and similar investment strategies. |
| | • | | The Trustees considered that TAM is the adviser to the Target Portfolio and the Destination Portfolio and that Voya is the sub–adviser to the Target Portfolio and Janus is the sub-adviser to the Destination Portfolio. |
Other Considerations
| | • | | The Trustees considered the terms and conditions of the Agreement and Plan of Reorganization. |
| | • | | The Trustees took into consideration the fact that the Target Portfolio and Destination Portfolio have the same valuation policies and procedures and use the same pricing vendors. |
23
CAPITALIZATION
The following table sets forth the capitalization of the Target Portfolio and the Destination Portfolio as of September 15, 2016 and the pro forma combined capitalization of the combined Destination Portfolio as if the Reorganization had occurred on that date. If the Reorganization is consummated, the actual exchange ratios on the Closing Date may vary from the exchange ratios used in the computation below. This is due to changes in the market value of the portfolio securities of both Portfolios between September 15, 2016 and the Closing Date, changes in the amount of undistributed net investment income and net realized capital gains of the Portfolios during that period resulting from income and distributions, and changes in the accrued liabilities of the Portfolios during the same period.
| | | | | | | | | | | | | | | | |
| | | Transamerica Voya Mid
Cap Opportunities VP | | | Transamerica Janus Mid-
Cap Growth VP | | | Pro Forma
Adjustments(A) | | | Combined | |
Net Assets by Class | | | | | | | | | | | | | | | | |
Initial Class | | $ | 202,325,864 | | | $ | 464,785,038 | | | $ | (32,932 | ) | | $ | 667,077,970 | |
Service Class | | $ | 347,035 | | | $ | 99,759,208 | | | $ | (7,068 | ) | | $ | 100,099,175 | |
Total | | $ | 202,672,899 | | | $ | 564,544,246 | | | $ | (40,000 | ) | | $ | 767,177,145 | |
| | | | |
Shares Outstanding | | | | | | | | | | | | | | | | |
Initial Class | | | 16,763,245 | | | | 18,743,355 | | | | (8,604,944 | ) | | | 26,901,656 | |
Service Class | | | 28,924 | | | | 4,177,907 | | | | (14,392 | ) | | | 4,192,439 | |
| | | | |
Net asset value per share | | | | | | | | | | | | | | | | |
Initial Class | | $ | 12.07 | | | $ | 24.80 | | | $ | (12.07 | ) | | $ | 24.80 | |
Service Class | | $ | 12.00 | | | $ | 23.88 | | | $ | (12.00 | ) | | $ | 23.88 | |
| (A) | Pro Forma Adjustments are due to the cost of the Reorganization. |
It is impossible to predict with any certainty how many shares of the Destination Portfolio will actually be received and distributed by the Target Portfolio on the Closing Date. The foregoing table should not be relied upon to determine the amount of Destination Portfolio shares that will actually be received and distributed.
ADDITIONAL INFORMATION
For information relating to each Portfolio and the Reorganization, including tax capital loss carryforwards, the tax status of the Reorganization, a comparison of the fundamental investment policies of the Portfolios, how to buy, sell or exchange Portfolio shares, how each Portfolio values its securities, financial highlights information for each Portfolio and ownership of shares of the Portfolios, please see the sections immediately following this discussion of Reorganization 2.
OTHER IMPORTANT INFORMATION CONCERNING THE REORGANIZATIONS
Tax Capital Loss Carryforwards
Federal income tax law permits a regulated investment company to carry forward its net capital losses from any taxable year that began after December 22, 2010 for an unlimited number of taxable years.
As of December 31, 2015, the Portfolios had the following unused capital loss carryforwards (which all arose in taxable years that began after December 22, 2010):
| | | | |
Fund | | Total | |
Transamerica Voya Limited Maturity Bond VP | | $ | 329,059 | |
Transamerica Voya Mid Cap Opportunities VP | | $ | 0 | |
Transamerica JPMorgan Core Bond VP | | $ | 3,731,756 | |
Transamerica Janus Mid-Cap Growth VP | | $ | 0 | |
As of the Closing Date, each Portfolio may have net realized capital gains or losses and may also have net unrealized gains or losses.
Each Reorganization may result in a number of different limitations on the applicable Destination Portfolio’s ability, following the applicable Reorganization, to use realized and unrealized losses of the applicable Target and Destination Portfolios. In the taxable year of the Destination Portfolio in which the Reorganization occurs, the Destination Portfolios will be able to use carryforwards of the applicable Target Portfolio’s capital losses (including from that Target Portfolio’s short taxable year ending on the Closing Date), subject to the additional limitations described below, to offset only a prorated portion of applicable Destination Portfolio’s capital gains for such taxable year, based on the number of days remaining after the Closing Date in such taxable year.
24
Because shareholders of each Target Portfolio are expected to own less than 50% of the applicable Destination Portfolio immediately after a Reorganization, a Reorganization may result in limitations on a Destination Portfolio’s ability, following a Reorganization, to use any capital loss carryforwards of the applicable Target Portfolio (including carryforwards generated in the tax year of that Target Portfolio ending on the date of the Reorganization) and potentially on the applicable Destination Portfolio’s ability to use unrealized capital losses inherent in the tax basis of the assets acquired in a Reorganization. Capital losses in excess of the limitation may be carried forward indefinitely, subject to any other applicable limitations. The annual limitation on the use of those carryforwards for periods following a Reorganization generally will equal the product of the net asset value of a Target Portfolio immediately prior to a Reorganization and the “long–term tax–exempt rate,” as published by the Internal Revenue Service (“IRS”) and in effect at the time of a Reorganization. This limitation may be prorated in the taxable year of the applicable Destination Portfolio in which a Reorganization occurs based on the number of days remaining after the Closing Date in such taxable year.
Under certain circumstances, the Reorganizations may result in limitations on the applicable Destination Portfolio’s ability, in the post–Reorganization period, to use a portion of any carryforward generated in its tax year that includes a Reorganization, and potentially on the applicable Destination Portfolio’s ability to use unrealized capital losses inherent in the tax basis of its assets. Those limitations are imposed on an annual basis. Losses in excess of the limitation may be carried forward, subject to generally applicable limitations. The annual limitation on the use of those carryforwards for periods following the Reorganizations generally will equal the product of the net asset value of the applicable Destination Portfolio and the “long–term tax–exempt rate,” as published by the IRS.
If a Destination Portfolio or a corresponding Target Portfolio has a net unrealized gain inherent in its assets at the time of the applicable Reorganization, then, under certain circumstances, the combined Portfolio may not offset that gain, to the extent realized within five years of the applicable Reorganization, by a carryforward of pre-Reorganization losses (other than a carryforward of that Destination Portfolio or that Target Portfolio, as applicable) or, in certain cases, by a net unrealized loss inherent at the time of the applicable Reorganization in the assets of the other Portfolio involved in the Reorganization.
As a result of the Reorganizations, losses and loss carryforwards will benefit the shareholders of the combined Portfolios, rather than only the shareholders of the applicable Portfolio that incurred them. Even if a particular limitation described above would not be triggered solely by a particular Reorganization, the limitation may be triggered by the Reorganization and one or more other transactions entered into by the applicable Target Portfolio or Destination Portfolio (including, potentially, another reorganization). By reason of the foregoing rules, taxable shareholders may pay more taxes, or pay taxes sooner, than they otherwise would have if the applicable Target Portfolio’s Reorganization did not occur.
Since the Reorganizations are not expected to close until the close of business [December 16], 2016, the capital loss carryforwards, realized and unrealized gains and losses, and the applicability of the limitations described above may change significantly between now and the completion of the Reorganizations. Further, the ability of each Portfolio to use these losses (even in the absence of a Reorganization) also depends on factors other than loss limitations, such as the future realization of capital gains or losses.
PORTFOLIO SECURITIES
If a Reorganization is effected, TAM will analyze and evaluate the portfolio securities of the Target Portfolio being transferred to the corresponding Destination Portfolio. Consistent with each Destination Portfolio’s investment objective and investment strategies and policies, any restrictions imposed by the Code and in the best interests of each Destination Portfolio’s shareholders (including former shareholders of the corresponding Target Portfolio), TAM will influence the extent and duration to which the portfolio securities of the corresponding Target Portfolio will be maintained by each Destination Portfolio. It is possible that there may be dispositions of some of the portfolio securities of the Target Portfolio following the Reorganization. Subject to market conditions at the time of any such disposition, the disposition of the portfolio securities by each combined Destination Portfolio may result in a capital gain or loss. The actual tax consequences of any disposition of portfolio securities will vary depending upon the specific security(ies) being sold, the selling Portfolio’s other gains and losses, and the combined Destination Portfolio’s ability to use any available tax loss carryforwards. The disposition of portfolio securities also may result in brokerage expense to the combined Destination Portfolio.
25
TERMS OF EACH AGREEMENT AND PLAN OF REORGANIZATION
The Reorganizations
| | • | | The Reorganizations are scheduled to occur as of the close of business on [December 16], 2016, but may occur on such other date as the parties may agree to in writing (the “Closing Date”). |
| | • | | On the Closing Date, each Target Portfolio will transfer all of its property and assets to the corresponding Destination Portfolio. In exchange, each Destination Portfolio will assume all of the liabilities of the corresponding Target Portfolio and issue shares, as described below. |
| | • | | Each Destination Portfolio will issue a number of its Initial Class and Service Class shares, as applicable, to the Target Portfolio having an aggregate net asset value equal to the aggregate net asset value of the Target Portfolio Initial Class and Service Class shares, respectively. |
| | • | | Shares of the corresponding class of each Destination Portfolio will then be distributed on the Closing Date to the corresponding Target Portfolio’s shareholders in complete liquidation of the Target Portfolio in proportion to the relative net asset value of their holdings of the applicable class of shares of the Target Portfolio. Therefore, on the Closing Date, upon completion of the applicable Reorganization, each Target Portfolio shareholder will hold shares of the corresponding class of the corresponding Destination Portfolio with the same aggregate net asset value as its holdings of the applicable class of shares of the Target Portfolio immediately prior to the Reorganization. The net asset value attributable to a class of shares of a Target Portfolio will be determined using the Target Portfolio’s valuation policies and procedures and the net asset value attributable to a class of shares of a Destination Portfolio will be determined using the Destination Portfolio’s valuation policies and procedures. The portfolio assets of each Target Portfolio and corresponding Destination Portfolio are valued using the same valuation policies and procedures. |
| | • | | Each Target Portfolio will be terminated after the Closing Date. |
| | • | | The consummation of each Reorganization is not contingent on the consummation of the other Reorganization. |
| | • | | No sales load, contingent deferred sales charge, commission, redemption fee or other transactional fee will be charged as a result of the Reorganizations. Following a Reorganization, shareholders of the applicable Target Portfolio will be subject to the fees and expenses of the corresponding Destination Portfolio. |
| | • | | Following the Reorganizations, TAM will continue to act as investment manager to each Destination Portfolio. JPMorgan will continue to serve as sub–adviser to the Destination Portfolio in Reorganization 1. Janus will continue to serve as sub–adviser to the Destination Portfolio in Reorganization 2. |
| | • | | The exchange of Target Portfolio shares for Destination Portfolio shares in a Reorganization will not result in income, gain or loss being recognized for federal income tax purposes by an exchanging shareholder. The Reorganizations generally will not result in the recognition of gain or loss for federal income tax purposes by any Target Portfolio or Destination Portfolio. |
Agreement and Plan of Reorganization
Each Reorganization will be undertaken pursuant to the Plan substantially in the form attached as Exhibit A to this Information Statement/Prospectus, which is incorporated herein by this reference. The description of the Plans contained herein, which includes the material provisions of the Plans, is qualified in its entirety by the attached copy.
Determination of Net Asset Value. In each Reorganization, the applicable Destination Portfolio will deliver to the corresponding Target Portfolio a number of full and fractional Destination Portfolio shares of each class with an aggregate net asset value equal to the net asset value of the Target Portfolio attributable to the corresponding class of the Target Portfolio’s shares. The net asset value per share of each class of such Destination Portfolio shall be computed using the Destination Portfolios’ valuation procedures and the net asset value per share of each class of such Target Portfolio shall be computed using the Target Portfolios’ valuation policies and procedures. The number of full and fractional Destination Portfolio shares shall be determined, with respect to each class, by dividing the value of the Target Portfolio’s net assets with respect to that class of the Target Portfolio’s shares by the net asset value of one share of the corresponding class of the Destination Portfolio’s shares (see Section 1.1 of the form of Plan attached as Exhibit A).
26
Conditions to Closing a Reorganization. The obligation of each Portfolio to consummate a given Reorganization is subject to the satisfaction of certain conditions, including the Portfolio’s performance of all its obligations under the Plan, the receipt of certain documents and financial statements from the subject Target Portfolio and the receipt of all consents, orders and permits necessary to consummate the Reorganization (see Sections 6 and 7 of the form of Plan attached as Exhibit A). The consummation of each Reorganization is not contingent on the consummation of the other Reorganization.
The obligations of each Portfolio are subject to the receipt of a favorable opinion of Morgan, Lewis & Bockius LLP as to the United States federal income tax consequences of the Reorganizations (see Section 8.4 of the form of Plan attached as Exhibit A).
Termination of the Plan. The Board may terminate the Plan at any time before the Closing Date, if the Board believes that proceeding with the Plan is inadvisable with respect to the subject Target Portfolio or Destination Portfolio, respectively. Any such termination will be effective when communicated to the other party (see Section 12 of the form of Plan attached as Exhibit A).
Expenses of the Reorganizations. The expenses incurred in connection with the Reorganizations will be borne by the Target Portfolios, provided that expenses will be paid by the party directly incurring such expenses (without reimbursement by another person) if and to the extent that the payment by another person of such expenses would prevent such party from being treated as a “regulated investment company” under the Code or would prevent the Reorganization from qualifying as a tax-free reorganization (see Section 10.2 of the form of Plan attached as Exhibit A).
TAX STATUS OF EACH REORGANIZATION
Each Reorganization is conditioned upon the receipt by the Target Portfolio and the Destination Portfolio of an opinion from Morgan, Lewis & Bockius LLP, counsel to the Portfolios, substantially to the effect that, for federal income tax purposes:
| | • | | The transfer of all of the applicable Target Portfolio’s assets to the corresponding Destination Portfolio in exchange solely for the issuance of the Destination Portfolio shares to the Target Portfolio and the assumption of the Target Portfolio’s liabilities by the Destination Portfolio, followed by the distribution of the Destination Portfolio shares to the Target Portfolio shareholders in complete liquidation of the Target Portfolio, will constitute a “reorganization” within the meaning of Section 368(a) of the Code, and the applicable Target Portfolio and the corresponding Destination Portfolio will each be a “party to a reorganization” within the meaning of Section 368(b) of the Code; |
| | • | | No gain or loss will be recognized by the applicable Destination Portfolio upon receipt of the assets of the corresponding Target Portfolio solely in exchange for shares of the Destination Portfolio and the assumption by such Destination Portfolio of all of the liabilities of that Target Portfolio as part of the Reorganization; |
| | • | | The tax basis in the hands of the corresponding Destination Portfolio of the assets of the applicable Target Portfolio transferred to the Destination Portfolio in the Reorganization will be the same as the tax basis of such assets in the hands of the Target Portfolio immediately before the transfer of the assets, increased by the amount of gain (or decreased by the amount of loss), if any, recognized by the Target Portfolio upon the transfer; |
| | • | | The holding period in the hands of the corresponding Destination Portfolio of each asset of the applicable Target Portfolio transferred to the Destination Portfolio in the Reorganization, other than assets with respect to which gain or loss is required to be recognized in the applicable Reorganization, will include the period during which the asset was held by the corresponding Target Portfolio (except where investment activities of the Destination Portfolio have the effect of reducing or eliminating the holding period with respect to an asset); |
| | • | | No gain or loss will be recognized by the applicable Target Portfolio upon the transfer of its assets to the corresponding Destination Portfolio in the Reorganization solely in exchange for the Destination Portfolio shares and the assumption by such Destination Portfolio of all of the liabilities of the Target Portfolio, or upon the distribution of the Destination Portfolio shares by the Target Portfolio to its shareholders in complete liquidation, except for (1) any gain or loss that may be recognized with respect to contracts subject to Section 1256 of the Code, (2) any gain that may be recognized on the transfer of stock in a “passive foreign investment company” as defined in Section 1297(a) of the Code, and (3) any other gain or loss that may be required to be recognized as a result of the closing of the Target Portfolio’s taxable year or upon transfer of an asset regardless of whether the transfer would otherwise be a non-recognition transaction under the Code; |
| | • | | No gain or loss will be recognized by the applicable Target Portfolio shareholders upon the exchange of their shares of the applicable Target Portfolio solely for the shares of the corresponding Destination Portfolio as part of the Reorganization; |
| | • | | The aggregate tax basis of the applicable Destination Portfolio shares received by each shareholder of the corresponding Target Portfolio in the Reorganization will be the same as the aggregate tax basis of the shares of the Target Portfolio surrendered in exchange therefor; and |
| | • | | The holding period of the applicable Destination Portfolio shares received by a Target Portfolio shareholder in the Reorganization will include the holding period of the shares of the Target Portfolio that were surrendered in exchange therefor, provided that the shareholder held the Target Portfolio shares as capital assets on the date of the exchange. |
27
In rendering such opinion, counsel shall rely upon, among other things, certain facts, assumptions and representations of the Trust, made on behalf of the applicable Target Portfolio and Destination Portfolio.
No tax ruling has been or will be received from the IRS in connection with each Reorganization. An opinion of counsel is not binding on the IRS or a court, and no assurance can be given that the IRS would not assert, or a court would not sustain, a contrary position.
Immediately prior to the Reorganization, each Target Portfolio will declare and pay a dividend, which, together with all previous dividends, is intended to have the effect of distributing to the Target Portfolio shareholders all of the Target Portfolio’s investment company taxable income (computed without regard to any deduction for dividends paid) for taxable years ending on or prior to the Closing Date, all of its net tax–exempt income and all of its net capital gain, if any, realized in taxable years ending on or prior to the Closing Date (after reduction for any available capital loss carryover). The amount of such distribution to the shareholders of the applicable Target Portfolio is estimated as of June 30, 2016, to be as set forth in the table below. The amounts set forth in the table below are estimates of the applicable Target Portfolio’s investment company taxable income (computed without regard to any deduction for dividends paid), net tax-exempt income and net capital gain as if its taxable year ended on the Closing Date. Any amount actually distributed to a Target Portfolio’s shareholders immediately prior to the applicable Reorganization may be higher or lower than the amount set forth in the table below.
| | | | |
Portfolio | | Distribution Amount (per Share) | |
Transamerica Voya Limited Maturity Bond VP | | $ | 0.1137 | |
Transamerica Voya Mid Cap Opportunities VP | | $ | 0.5932 | |
Such distribution may result in taxable income to a Target Portfolio shareholder, but as long as the Policies funded by the Portfolios qualify to be treated as annuity contracts or life insurance policies under the Code, such distribution will not be currently taxable to the Policyowners and the Reorganization should not otherwise result in any tax liability to the Policyowners.
The foregoing discussion is very general. The foregoing consequences may not apply to certain classes of taxpayers who are subject to special circumstances, such as shareholders who are not citizens or residents of the United States, insurance companies, tax–exempt organizations, financial institutions, dealers in securities or foreign currencies, or persons who hold their shares as part of a straddle or conversion transaction. This discussion does not address any state, local or foreign or non–income tax consequences of the Reorganizations. You should consult your tax adviser for the particular tax consequences to you of the applicable transaction, including the applicability of any state, local or foreign tax laws.
28
FUNDAMENTAL AND NON-FUNDAMENTAL INVESTMENT POLICIES OF THE PORTFOLIOS
Each Portfolio has adopted certain fundamental investment policies that may not be changed without the affirmative vote of the holders of a “majority of the outstanding voting securities” (as defined in the 1940 Act) of the Portfolio. Under the 1940 Act, the vote of a majority of the outstanding voting securities of a Portfolio means the affirmative vote of the lesser of (a) 67% or more of the voting power of the voting securities present at the meeting, if the holders of more than 50% of the outstanding voting securities of the Portfolio are present at the meeting or represented by proxy, or (b) more than 50% of the voting power of the outstanding voting securities of the Portfolio. The following table lists the fundamental policies for each Target Portfolio and each Destination Portfolio. The Target Portfolios and Destination Portfolios have the same fundamental investment policies. For a more complete discussion of each Portfolio’s other investment policies and fundamental and non-fundamental investment restrictions, please see the Portfolios’ statement of additional information.
| | | | |
| | | Target Portfolios | | Destination Portfolio |
| Borrowing | | Each portfolio may not borrow money, except as permitted under the 1940 Act, and as interpreted, modified or otherwise permitted by regulatory authority having jurisdiction. |
| |
| Underwriting Securities | | Each portfolio may not engage in the business of underwriting the securities of other issuers except as permitted by the 1940 Act. |
| |
| Making Loans | | Each portfolio may make loans only as permitted under the 1940 Act, and as interpreted, modified or otherwise permitted by regulatory authority having jurisdiction, from time to time. |
| |
| Senior Securities | | Each portfolio may not issue any senior security, except as permitted under the 1940 Act, and as interpreted, modified or otherwise permitted from time to time by regulatory authority having jurisdiction. |
| |
| Real Estate | | Each portfolio may not purchase or sell real estate except as permitted by the 1940 Act. |
| |
| Commodities | | Each portfolio may not purchase physical commodities or contracts relating to physical commodities, except as permitted from time to time under the 1940 Act, and as interpreted, modified or otherwise permitted by regulatory authority having jurisdiction. |
| |
| Concentration of Investments | | Each portfolio may not make any investment if, as a result, the portfolio’s investments will be concentrated in any one industry, as the relevant terms are used in the 1940 Act, as interpreted or modified by regulatory authority having jurisdiction, from time to time. |
Non-Fundamental Policies
Each Target Portfolio and each Destination Portfolio has adopted the following non-fundamental policies, which may be changed by the Board of the Trust without shareholder approval.
No portfolio may purchase any security if, as a result, more than 15% of its net assets would be invested in illiquid securities.
| | 2. | Purchasing securities on margin |
No portfolio may purchase securities on margin except to obtain such short-term credits as are necessary for the clearance of transactions, provided that margin payments and other deposits made in connection with transactions in options, futures contracts, swaps, forward contracts and other derivative instruments shall not constitute purchasing securities on margin.
| | 3. | Underlying funds in funds-of-funds investment limitation |
No portfolio may acquire any securities of registered open-end investment companies or registered unit investment trusts in reliance on the provisions of Section 12(d)(1)(F) or Section 12(d)(1)(G) of the Investment Company Act of 1940, as amended. This policy does not prevent a portfolio from investing in securities of registered open-end investment companies or registered unit investment trusts in reliance on any other provision of applicable law or regulation.
29
BUYING AND SELLING OF PORTFOLIO SHARES
The following describes how shareholders may buy and sell shares of the Portfolios and how each Portfolio determines its net asset value.
| | |
| Purchase and Redemption of Shares | | Shares of these portfolios are intended to be sold to separate accounts of insurance companies, including certain separate accounts of Transamerica Life Insurance Company, Transamerica Financial Life Insurance Company, Transamerica Advisors Life Insurance Company, and Transamerica Premier Life Insurance Company. Transamerica Series Trust currently does not foresee any disadvantages to investors if a portfolio serves as an investment medium for both variable annuity contracts and variable life insurance policies. However, it is theoretically possible that the interest of owners of annuity contracts and insurance policies for which a portfolio serves as an investment medium might at some time be in conflict due to differences in tax treatment or other considerations. The Board of Trustees and each participating insurance company would be required to monitor events to identify any material conflicts between variable annuity contract owners and variable life insurance policy owners, and would have to determine what action, if any, should be taken in the event of such a conflict. If such a conflict occurred, an insurance company participating in a portfolio might be required to redeem the investment of one or more of its separate accounts from the portfolio, which might force the portfolio to sell securities at disadvantageous prices. Shares are purchased and redeemed at their net asset value per share (“NAV”) without the imposition of any sales commission or redemption charge. (However, certain sales or other charges may apply to the policies or annuity contracts, as described in the product prospectus.) |
| |
| Net Asset Value | | The NAV of each Portfolio (or class thereof) is determined on each day the New York Stock Exchange (“NYSE”) is open for business. The NAV of each Portfolio (or class thereof) is calculated by taking the value of its net assets and dividing by the number of shares of the Portfolio (or class) that are then outstanding. In general, securities and other investments (including shares of ETFs) are valued based on market prices at the close of regular trading on the NYSE. Portfolio securities (including shares of ETFs) listed or traded on domestic securities exchanges or the NASDAQ/NMS, including dollar-denominated foreign securities or ADRs, are valued at the closing price on the exchange or system where the security is principally traded. |
ADDITIONAL INFORMATION ABOUT THE DESTINATION PORTFOLIOS
Investment Manager
TAM, located at 1801 California Street, Suite 5200, Denver, CO 80202, serves as investment manager for the Destination Portfolios. TAM provides continuous and regular investment management services to the portfolios. For each of the portfolios, TAM currently acts as a “manager of managers” and hires investment sub-advisers to furnish investment advice and recommendations and has entered into a sub-advisory agreement with each portfolio’s sub-adviser. In acting as a manager of managers, TAM provides investment management services that include, without limitation, selection, proactive oversight and monitoring of sub-advisers, daily monitoring of the sub-advisers’ buying and selling of securities for the portfolios and regular review and evaluation of sub-adviser performance and adherence to investment style and process. TAM’s management services include, among other things, the provision of supervisory, compliance and administrative services to each portfolio. More information on the investment management services rendered by TAM is included in the Portfolios’ SAI. TAM is paid investment management fees for its service as investment manager to each portfolio. These fees are calculated on the average daily net assets of the Destination Portfolio, and are paid at the rates previously shown in this Information Statement/Prospectus.
TAM has been a registered investment adviser since 1996. As of December 31, 2015, TAM has approximately $74 billion in total assets under management.
TAM is directly owned by Transamerica Premier Life Insurance Company (“TPLIC”) (77%) and AUSA Holding Company (23%) (“AUSA”), both of which are indirect, wholly owned subsidiaries of Aegon NV. TPLIC is owned by Commonwealth General Corporation (“Commonwealth”). Commonwealth and AUSA are wholly owned by Transamerica Corporation, a financial services holding company whose primary emphasis is on life and health insurance, and annuity and investment products. Transamerica Corporation is owned by The Aegon Trust, which is owned by Aegon International B.V., which is owned by Aegon N.V., a Netherlands corporation, and a publicly traded international insurance group.
TST and TAM may rely on an Order from the SEC (Release IC-23379 dated August 5, 1998) that permits TST and TAM, subject to certain conditions, and without the approval of shareholders to:
| | (1) | employ a new unaffiliated sub-adviser for a portfolio pursuant to the terms of a new investment sub-advisory agreement, either as a replacement for an existing sub-adviser or as an additional sub-adviser; |
30
| | (2) | materially change the terms of any sub-advisory agreement; and |
| | (3) | continue the employment of an existing sub-adviser on sub-advisory contract terms where a contract has been assigned because of a change of control of the sub-adviser. |
Pursuant to the Order, the portfolios have agreed to provide certain information about new sub-advisers and new sub-advisory agreements to their shareholders.
A discussion regarding the basis of the Board’s approval of the advisory arrangements with TAM is available in the Portfolios’ semi-annual report for the period ended June 30, 2016.
Sub–Adviser
Voya Investment Management Co. LLC, 230 Park Avenue, New York, NY 10169, serves as a sub–adviser for each Target Portfolio. J.P. Morgan Investment Management Inc., 270 Park Avenue, New York, NY 10017 serves as sub-adviser for the Destination Portfolio in Reorganization 1. Janus Capital Management LLC, 151 Detroit Street, Denver, CO 80206 serves as sub-adviser for the Destination Portfolio in Reorganization 2.
A discussion regarding the basis of the Board’s approval of the sub-advisory arrangements is available in the Portfolios’ semi-annual report for the period ended June 30, 2016.
Disclosure of Portfolio Holdings
A detailed description of each Portfolios’ policies and procedures with respect to the disclosure of its portfolio holdings is available in the Portfolios’ SAI and available on the TST website at www.transamericaseriestrust.com.
Valuation of Shares
The NAV of each portfolio (or class thereof) is determined on each day the NYSE is open for business. The NAV is not determined on days when the NYSE is closed (generally New Year’s Day, Martin Luther King Jr. Day, Presidents’ Day, Good Friday, Memorial Day, Independence Day, Labor Day, Thanksgiving and Christmas). Foreign securities may trade in their primary markets on weekends or other days when the portfolios do not price their shares (therefore, the value of a portfolio’s foreign securities may change on days when shareholders will not be able to buy or sell shares of the portfolios). These securities will be valued pursuant to the portfolios’ Pricing and Valuation procedures for such securities.
Purchase orders received in good order and accepted, and redemption orders received in good order, before the close of business of the NYSE, usually 4:00 p.m. Eastern Time, receive the NAV determined as of the close of the NYSE that day. Purchase and redemption requests received after the NYSE is closed receive the NAV determined as of the close of the NYSE the next day the NYSE is open.
Net Asset Value
The NAV of the portfolio (or class thereof) is calculated by taking the value of its net assets and dividing by the number of shares of the portfolio (or class) that are then outstanding.
The Board has approved procedures to be used to value the portfolios’ securities for purposes of determining the portfolios’ NAV. The valuation of the securities of the portfolios is determined in good faith by or under the direction of the Board. While the Board has primary responsibility to shareholders for valuation of portfolio securities, the Board has delegated certain valuation functions for the portfolios to TAM.
In general, securities and other investments (including shares of ETFs) are valued based on market prices at the close of regular trading on the NYSE. Portfolio securities (including shares of ETFs) listed or traded on domestic securities exchanges or the NASDAQ/NMS, including dollar-denominated foreign securities or ADRs, are valued at the closing price on the exchange or system where the security is principally traded. With respect to securities traded on the NASDAQ/NMS, such closing price may be the last reported sale price or the NASDAQ Official Closing Price (“NOCP”). If there have been no sales for that day on the exchange or
31
system where the security is principally traded, then the value should be determined with reference to the last sale price, or the NOCP, if applicable, on any other exchange or system. If there have been no sales for that day on any exchange or system, a security is valued at the closing bid quotes on the exchange or system where the security is principally traded, or at the NOCP, if applicable. Foreign securities traded on U.S. exchanges are generally priced using last sale price regardless of trading activity. Securities traded over–the–counter are valued at the last bid price. The market price for debt obligations is generally the price supplied by an independent third party pricing service, which may use market prices or quotations or a variety of fair value techniques and methodologies. Short–term debt obligations that will mature in 60 days or less are valued at amortized cost, unless it is determined that using this method would not reflect an investment’s fair value. The prices that the portfolio uses may differ from the amounts that would be realized if the investments were sold and the differences could be significant, particularly for securities that trade in relatively thin markets and/or markets that experience extreme volatility. Foreign securities generally are valued based on quotations from the primary market in which they are traded, and are converted from the local currency into U.S. dollars using current exchange rates. Market quotations for securities prices may be obtained from automated pricing services. Shares of open-end funds (other than ETF shares) are generally valued at the NAV reported by that investment company. ETF shares are valued at the most recent sale price or official closing price on the exchange on which they are traded.
When a market quotation for a security is not readily available (which may include closing prices deemed to be unreliable because of the occurrence of a subsequent event), a valuation committee appointed by the Board may, in good faith, establish a value for the security in accordance with fair valuation procedures adopted by the Board. The Board reviews all fair value determinations typically at its regularly scheduled meetings. The types of securities for which such fair value pricing may be required include, but are not limited to: foreign securities, where a significant event occurs after the close of the foreign market on which such security principally trades that is likely to have changed the value of such security, or the closing value is otherwise deemed unreliable; securities of an issuer that has entered into a restructuring; securities whose trading has been halted or suspended; fixed–income securities that have gone into default and for which there is no current market value quotation; and securities that are restricted as to transfer or resale. The portfolios use a fair value model developed by an independent third party pricing service to price foreign equity securities on days when there is a certain percentage change in the value of a domestic equity security index, as such percentage may be determined by TAM from time to time.
Valuing securities in accordance with fair value procedures involves greater reliance on judgment than valuing securities based on readily available market quotations. The valuation committee makes fair value determinations in good faith in accordance with the portfolio’s valuation procedures. Fair value determinations can also involve reliance on quantitative models employed by a fair value pricing service. There can be no assurance that the portfolio could obtain the fair value assigned to a security if it were to sell the security at approximately the time at which the portfolio determines its NAV.
Payments to Broker–Dealers and Other Financial Intermediaries
If you purchase the portfolio through a broker-dealer or other financial intermediary (such as a bank or insurance company), the portfolio and/or its affiliates may pay the intermediary for the sale of portfolio shares and related services. These payments may create a conflict of interest by influencing the broker-dealer or other intermediary and your salesperson to recommend the portfolio over another investment. Ask your salesperson or visit your financial intermediary’s website for more information.
Distribution Arrangements
Distribution and Service Plans. The Trust has adopted a plan pursuant to Rule 12b-1 under the 1940 Act (the “Plan”) and pursuant to the Plan, entered into a Distribution Agreement with Transamerica Capital, Inc. (“TCI”), located at 1801 California Street, Suite 5200, Denver, CO 80202. TCI is an affiliate of the investment adviser, and serves as principal underwriter for the Trust. The Plan permits the use of Trust assets to help finance the distribution of the shares of the portfolio. Under the Plan, the Trust, on behalf of the portfolio, makes payments to various service providers up to 0.15% of the average daily net assets of the portfolio attributable to the Initial Class and up to 0.25% of the average daily net assets of the portfolio attributable to the Service Class. Because the Trust pays these fees out of its assets on an ongoing basis, over time these fees will increase the cost of your investment and may cost you more than paying other types of sales charges.
The maximum 12b-1 fee on Initial Class shares is 0.15%. As of the date of this information statement/prospectus, the Trust has not paid any distribution fees under the Plan with respect to Initial Class shares, and does not intend to do so for Initial Class shares through May 1, 2017. The portfolio reserves the right to pay such fees after that date. You will receive written notice prior to the payment of any fees under the Plan relating to Initial Class shares. The Trust may, however, pay fees relating to Service Class shares.
32
Other Distribution and Service Arrangements. The insurance companies that selected the portfolios as investment options for the variable annuity contracts and variable life insurance policies that they issue and distribute, Transamerica Advisors Life Insurance Company, Transamerica Financial Life Insurance Company, Transamerica Life Insurance Company, Transamerica Premier Life Insurance Company (together, the “Transamerica Insurance Companies”), are affiliated with TAM.
TCI, TAM and their affiliates may enter into arrangements with affiliated entities, including the Transamerica Insurance Companies, that provide administrative, recordkeeping and other services with respect to one or more of the portfolios. Payment for these services is made by TCI, TAM and their affiliates out of past profits and other available sources and may take the form of internal credit, recognition or cash payments. TCI, TAM and their affiliates may also enter into similar arrangements with unaffiliated entities.
If a portfolio is sub-advised by an affiliate of Transamerica Insurance Companies and TAM, the Transamerica group of companies may retain more revenue than on those portfolios sub-advised by non-affiliated entities. TAM is a majority-owned subsidiary of Transamerica Premier Life Insurance Company and is affiliated with other Transamerica Insurance Companies, and TAM’s business profits (from managing the portfolios) may directly benefit Transamerica Premier Life Insurance Company and the other Transamerica Insurance Companies. Also, management personnel of the Transamerica Insurance Companies could receive additional compensation if the amount of investments in the portfolios meets certain levels, or increases over time. These affiliations, methods and arrangements may provide incentives for the Transamerica Insurance Companies to make the portfolios’ shares available to current or prospective variable contract owners to the detriment of other potential investment options.
TAM, the Transamerica Insurance Companies, TCI, and/or portfolio sub-advisers, directly or through TCI, out of their past profits and other available sources, typically provide cash payments or non-cash compensation to the Transamerica Insurance Companies, brokers and other financial intermediaries as a means to promote the distribution and wholesaling of variable contracts (and thus, indirectly, the portfolios’ shares). Such payments and compensation are in addition to the Rule 12b-1 Plan fees, service fees and other fees that may be paid, directly or indirectly, to such brokers and other financial intermediaries. These arrangements are sometimes referred to as “revenue sharing” arrangements. The amount of revenue sharing payments is substantial, may be substantial to any given recipient and may exceed the costs and expenses incurred by the recipient for any portfolio-related distribution or shareholder servicing activities. The presence of these payments and the basis on which an intermediary compensates its registered representatives or salespersons may create an incentive for a particular intermediary, registered representative or salesperson to highlight, feature or recommend the variable contracts, that invest in the portfolios at least in part, based on the level of compensation paid. Revenue sharing arrangements are separately negotiated. Revenue sharing payments are not an additional charge to the portfolios.
Such additional cash payments may be made to the Transamerica Insurance Companies, brokers and other financial intermediaries that provide services to the portfolios and/or contract holders, including (without limitation) shareholder servicing, marketing support and/or access to meetings and/or events, sales representatives and management representatives of the broker or other financial intermediaries. These cash payments may take a variety of forms. Revenue sharing payments can be calculated: (i) as a percentage of gross or net sales; (ii) as a percentage of gross or net assets under management; and/or (iii) as a fixed or negotiated flat fee dollar amount. These payments are made on a periodic basis, such as monthly or quarterly. To the extent permitted by applicable law, TCI and other parties may pay or allow other incentives and compensation to brokers and other financial intermediaries. TCI, TAM and the other parties making these payments generally assess the advisability of continuing making these payments periodically.
From time to time, TCI, its affiliates, the Transamerica Insurance Companies and/or TAM and/or portfolio sub-advisers may, to the extent permitted by applicable law, pay non-cash compensation to brokers and other financial intermediaries and their sales representatives in the form of, for example: (i) occasional gifts or prizes; (ii) occasional meals, tickets or other entertainment; and/or (iii) sponsorship support of broker marketing events, programs, sales contests, promotions or other activities. They may also make payments in connection with the sponsorship by Transamerica or its affiliates of special events which may be attended by brokers and other financial intermediaries. Such non-cash compensation may also include, in part, assistance with the costs and expenses associated with travel, lodging, and educational sales and promotional meetings, seminars, programs and conferences, entertainment and meals to the extent permitted by law.
Certain portfolios are funds of funds that invest in affiliated underlying funds, unaffiliated underlying funds, or a combination of both. TAM will receive more revenue when it selects an affiliated fund rather than an unaffiliated fund for the inclusion in a fund of funds. This conflict may result in affiliated funds that have performed or are expected to perform worse than unaffiliated funds being included in the fund of funds. The inclusion of affiliated funds will also permit TAM to make increased revenue sharing payments, including to TCI, Transamerica Insurance Companies and/or their affiliates. The affiliates of certain unaffiliated underlying funds, including those advised by the sub-adviser to the investing funds, may make revenue sharing payments to TCI and its affiliates for the provision of services to investors and distribution activities.
33
Investors should consult the prospectus of the separate accounts that issue the variable contracts that they have purchased to learn about specific incentives and financial interests that their insurance agent, broker or other financial intermediaries may receive when they sell variable contracts to you and to learn about revenue sharing arrangements relevant to the insurance company sponsor of the separate account.
Investors may also obtain more information about these arrangements, including the conflicts of interests that such arrangements may create, from their insurance agents, brokers and other financial intermediaries, and should so inquire if they would like additional information. Intermediaries may categorize and disclose these arrangements to their clients and to members of the public in a manner different from the disclosures in this prospectus and the SAI. An investor should ask his/her insurance agent, broker or financial intermediary how he/she will be compensated for investments made in the portfolios. Revenue sharing payments, as well as payments under the shareholder services and distribution plan (where applicable), also benefit TAM, the Transamerica Insurance Companies, TCI and their affiliates and portfolio sub-advisers to the extent the payments result in more assets being invested in the portfolios on which fees are being charged.
Revenue sharing arrangements may encourage insurers and other financial intermediaries to render services to variable contract owners and qualified plan participants, and may also provide incentives for the insurers and other financial intermediaries to make the portfolios’ shares available to current or prospective variable contract owners to the detriment of other potential investment options.
Distributions and Taxes
Each portfolio intends to distribute all or substantially all of its net investment income and net capital gains, if any, to its shareholders each year. Dividends will be reinvested in additional shares unless you elect to take your dividends in cash. Each portfolio generally pays any distributions of net capital gains annually. Each portfolio generally pays any dividends from net investment income annually.
Taxes. Each portfolio has qualified and expects to continue to qualify each year for treatment as a regulated investment company under Subchapter M of the Code. As a regulated investment company, the portfolios generally will not be subject to federal income tax on the taxable income that it distributes. Taxable income consists generally of net investment income and any net capital gains. It is each portfolio’s intention to distribute all such income and gains.
Shares of the portfolios are offered only to the separate accounts of Transamerica Premier Life Insurance Company and its affiliates, and to certain funds that invest in other regulated investment companies and that are owned only by separate accounts and certain other qualified investors. Separate accounts are insurance company separate accounts that fund variable insurance policies and annuity contracts. Certain separate accounts are required to meet diversification requirements under Section 817(h) of the Internal Revenue Code and the regulations thereunder in order for insurance policies and annuity contracts funded by those separate accounts to qualify for their expected tax treatment. If a portfolio qualifies as a regulated investment company and is owned only by separate accounts and certain other qualified investors (including certain funds that invest in other regulated investment companies if those funds are owned only by separate accounts and certain other qualified investors), the separate accounts invested in the portfolio will be allowed to look through to the portfolio’s investments in order to satisfy the separate account diversification requirements. Each portfolio intends to comply with those diversification requirements. If a portfolio fails to meet the diversification requirements under Section 817(h) of the Internal Revenue `Code, fails to qualify as a regulated investment company or fails to limit sales of portfolio shares to the permitted investors described above, then income earned with respect to the insurance policies and annuity contracts invested in that portfolio could become currently taxable to the owners of the policies and contracts, and income for prior periods with respect to the policies and contracts could also be taxable in the year in which that failure occurs.
This tax discussion is for general information only. More information is provided in the SAI of the portfolios. You should also consult your own tax adviser for information regarding all tax consequences applicable to your investment in any portfolio. For a discussion of the taxation of separate accounts and variable annuity and life insurance contracts, see “Federal Income Tax Considerations” included in the respective prospectuses for the policies and contracts.
34
Market Timing/Excessive Trading
Some investors try to profit from various short-term or frequent trading strategies known as market timing. Examples of market timing include switching money into portfolios when their share prices are expected to rise and taking money out when their share prices are expected to fall, and switching from one portfolio to another and then back again after a short period of time. As money is shifted in and out, a portfolio may incur expenses for buying and selling securities. Excessive purchases, redemptions or exchanges of portfolio shares may disrupt portfolio management, hurt portfolio performance and drive portfolio expenses higher. For example, a portfolio may be forced to liquidate investments as a result of short-term trading and incur increased brokerage costs or realize capital gains without attaining any investment advantage. These costs are generally borne by all shareholders, including long-term investors who do not generate these costs.
The Board of Trustees has approved policies and procedures that are designed to discourage market timing or excessive trading, which include limitations on the number of transactions in portfolio shares. If you intend to engage in such practices, we request that you do not purchase shares of the portfolio. The portfolio reserves the right to reject any request to purchase shares, including purchases in connection with an exchange transaction, which the portfolio reasonably believes to be in connection with market timing or excessive trading.
The portfolios rely on the insurance companies that offer shares of the portfolio as investment option for variable contracts to monitor market timing and disruptive trading by their customers. Each portfolio seek periodic certifications from the insurance companies that they have policies and procedures in place designed to monitor and prevent market timing and disruptive trading activity by their customers, and that they will use their best efforts to prevent market timing and disruptive trading activity that appears to be in contravention of the portfolio’s policies on market timing or disruptive trading as disclosed in this prospectus. Each portfolio also may instruct from time to time the insurance companies to scrutinize purchases, including purchases in connection with exchange transactions, that exceed a certain size. Each portfolio reserves the right, in its sole discretion and without prior notice, to reject, delay, restrict or refuse, in whole or in part, any request to purchase shares, including purchases in connection with an exchange transaction and orders that have been accepted by an intermediary, which it reasonably determines to be in connection with market timing or disruptive trading by a contract or policy owner (a “contract owner”) or by accounts of contract owners under common control (for example, related contract owners, or a financial adviser with discretionary trading authority over multiple accounts). Each portfolio applies these policies and procedures to all investors on a uniform basis and do not make special arrangements or grant exceptions to accommodate market timing or disruptive trading.
While the portfolios discourage market timing and excessive short-term trading, the portfolios cannot always recognize or detect such trading.
The portfolios’ distributor has entered into agreements with intermediaries requiring the intermediaries to provide certain information to help identify harmful trading activity and to prohibit further purchases or exchanges by a shareholder identified as having engaged in excessive trading. There is no guarantee that the procedures used by financial intermediaries will be able to curtail frequent, short-term trading activity. For example, shareholders who seek to engage in frequent, short–term trading activity may use a variety of strategies to avoid detection, and the financial intermediaries’ ability to deter such activity may be limited by the capabilities of operational and information systems. Due to the risk that the portfolio and financial intermediaries may not detect all harmful trading activity, it is possible that shareholders may bear the risks associated with such activity. Investors should also review the prospectus that describes the variable contracts that they are purchasing to learn more about the policies and procedures used by insurance companies to detect and deter frequent, short-term trading.
Reallocations in underlying portfolios by an asset allocation portfolio in furtherance of the portfolio’s objective are not considered to be market timing or excessive trading.
Additional Information
The portfolios’ prospectus and SAI provide information concerning the portfolios that you should consider in determining whether to purchase shares of a portfolio. A portfolio may make changes to the information from time to time. Each portfolio’s investment objective may be changed by the Board without shareholder approval. Each portfolio’s investment strategies and policies may be changed from time to time without shareholder approval, unless specifically stated otherwise in the portfolios’ prospectus or SAI.
35
A portfolio that has a policy of investing, under normal circumstances, at least 80% of its net assets (plus the amount of any borrowings for investment purposes) in the particular type of securities suggested by its name will provide its shareholders with at least 60 days’ prior written notice before making changes to such policy. Such notice will comply with the conditions set forth in any applicable SEC rules then in effect.
Neither the portfolios’ prospectus nor SAI is intended to give rise to any contract rights or other rights of any shareholder, other than any rights conferred explicitly by federal or state securities laws that may not be waived.
The portfolios enter into contractual arrangements with various parties, including the portfolios’ investment manager, who provides services to the portfolios. Shareholders are not parties to, or intended (or “third-party”) beneficiaries of those contractual arrangements.
To the extent authorized by law, the portfolios reserve the right to discontinue offering shares at any time, to merge or liquidate a class of shares or to cease operations entirely.
FINANCIAL HIGHLIGHTS
The Financial Highlights are intended to help you understand a portfolio’s performance for the past five years (or since its inception if less than five years). Certain information reflects financial results for a single portfolio share. The total returns in the table represent the rate an investor would have earned (or lost) on an investment in the portfolio for the period shown, assuming reinvestment of all dividends and distributions. Except for the financial highlights for the six months ended June 30, 2016, this information has been audited by Ernst & Young LLP, an Independent Registered Public Accounting firm, whose report, along with the portfolio’s financial statements, is included in the December 31, 2015 Annual Report, which is available to you upon request.
The financial highlights for the fiscal period ended June 30, 2016 are unaudited.
36
Transamerica Voya Limited Maturity Bond VP
Initial Class
| | | | | | | | | | | | | | | | |
| | | Initial Class | |
| | | June
30, 2016
(unaudited) | | | December
31, 2015 | | | December
31, 2014 | | | December
31, 2013(A) | |
Net asset value, beginning of period/year | | $ | 9.99 | | | $ | 10.04 | | | $ | 10.01 | | | $ | 10.00 | |
| | | | | | | | | | | | | | | | |
Investment operations: | | | | | | | | | | | | | | | | |
Net investment income (loss)(B) | | | 0.06 | | | | 0.08 | | | | 0.08 | | | | 0.02 | |
Net realized and unrealized gain (loss) | | | 0.09 | | | | (0.04 | ) | | | (0.02 | ) | | | (0.01 | ) |
| | | | | | | | | | | | | | | | |
Total investment operations | | | 0.15 | | | | 0.04 | | | | 0.06 | | | | 0.01 | |
| | | | | | | | | | | | | | | | |
Distributions: | | | | | | | | | | | | | | | | |
Net investment income | | | — | | | | (0.09 | ) | | | (0.03 | ) | | | — | |
Net realized gains | | | — | | | | (0.00 | )(C) | | | — | | | | — | |
| | | | | | | | | | | | | | | | |
Total distributions | | | — | | | | (0.09 | ) | | | (0.03 | ) | | | — | |
| | | | | | | | | | | | | | | | |
Net asset value, end of period/year | | $ | 10.14 | | | $ | 9.99 | | | $ | 10.04 | | | $ | 10.01 | |
| | | | | | | | | | | | | | | | |
Total return(D) | | | 1.50 | %(E) | | | 0.41 | % | | | 0.55 | % | | | 0.10 | %(E) |
| | | | | | | | | | | | | | | | |
Ratio and supplemental data: | | | | | | | | | | | | | | | | |
Net assets end of period/year (000’s) | | $ | 85,306 | | | $ | 87,043 | | | $ | 86,751 | | | $ | 100,446 | |
| | | | | | | | | | | | | | | | |
Expenses to average net assets | | | 0.63 | %(F) | | | 0.64 | % | | | 0.63 | % | | | 0.63 | %(F) |
Net investment income (loss) to average net assets | | | 1.18 | %(F) | | | 0.83 | % | | | 0.75 | % | | | 0.34 | %(F) |
Portfolio turnover rate | | | 71 | %(E) | | | 264 | % | | | 388 | % | | | 405 | %(E) |
| (A) | Commenced operations on May 1, 2013. |
| (B) | Calculated based on average number of shares outstanding. |
| (C) | Rounds to less than $0.01 or $(0.01). |
| (D) | Total return reflects all Portfolio expenses and includes reinvestment of dividends and capital gains; it does not reflect the charges and deductions under the policies or annuity contracts. |
37
Transamerica Voya Limited Maturity Bond VP
Service Class
| | | | | | | | | | | | | | | | |
| | | Service Class | |
| | | June 30,
2016
(unaudited) | | | December 31,
2015 | | | December 31,
2014 | | | December 31,
2013(A) | |
Net asset value, beginning of period/year | | $ | 9.96 | | | $ | 10.00 | | | $ | 9.99 | | | $ | 10.00 | |
| | | | | | | | | | | | | | | | |
Investment operations: | | | | | | | | | | | | | | | | |
Net investment income (loss)(B) | | | 0.05 | | | | 0.06 | | | | 0.05 | | | | 0.01 | |
Net realized and unrealized gain (loss) | | | 0.08 | | | | (0.03 | ) | | | (0.02 | ) | | | (0.02 | ) |
| | | | | | | | | | | | | | | | |
Total investment operations | | | 0.13 | | | | 0.03 | | | | 0.03 | | | | (0.01 | ) |
| | | | | | | | | | | | | | | | |
Distributions: | | | | | | | | | | | | | | | | |
Net investment income | | | — | | | | (0.07 | ) | | | (0.02 | ) | | | — | |
Net realized gains | | | — | | | | (0.00 | )(C) | | | — | | | | — | |
| | | | | | | | | | | | | | | | |
Total distributions | | | — | | | | (0.07 | ) | | | (0.02 | ) | | | — | |
| | | | | | | | | | | | | | | | |
Net asset value, end of period/year | | $ | 10.09 | | | $ | 9.96 | | | $ | 10.00 | | | $ | 9.99 | |
| | | | | | | | | | | | | | | | |
Total return(D) | | | 1.31 | %(E) | | | 0.29 | % | | | 0.26 | % | | | (0.10 | )%(E) |
| | | | | | | | | | | | | | | | |
Ratio and supplemental data: | | | | | | | | | | | | | | | | |
Net assets end of period/year (000’s) | | $ | 754 | | | $ | 741 | | | $ | 689 | | | $ | 593 | |
| | | | | | | | | | | | | | | | |
Expenses to average net assets | | | 0.88 | %(F) | | | 0.89 | % | | | 0.88 | % | | | 0.88 | %(F) |
Net investment income (loss) to average net assets | | | 0.93 | %(F) | | | 0.58 | % | | | 0.51 | % | | | 0.18 | %(F) |
Portfolio turnover rate | | | 71 | %(E) | | | 264 | % | | | 388 | % | | | 405 | %(E) |
| (A) | Commenced operations on May 1, 2013. |
| (B) | Calculated based on average number of shares outstanding. |
| (C) | Rounds to less than $0.01 or $(0.01). |
| (D) | Total return reflects all Portfolio expenses and includes reinvestment of dividends and capital gains; it does not reflect the charges and deductions under the policies or annuity contracts. |
38
Transamerica JPMorgan Core Bond VP
Initial Class
| | | | | | | | | | | | | | | | | | | | | | | | |
| | | Initial Class | |
| | | June 30,
2016
(unaudited) | | | December 31,
2015 | | | December 31,
2014 | | | December 31,
2013 | | | December 31,
2012 | | | December 31,
2011 | |
Net asset value, beginning of year | | $ | 12.83 | | | $ | 13.02 | | | $ | 12.62 | | | $ | 13.27 | | | $ | 12.98 | | | $ | 12.62 | |
| | | | | | | | | | | | | | | | | | | | | | | | |
Investment operations: | | | | | | | | | | | | | | | | | | | | | | | | |
Net investment income (loss)(A) | | | 0.14 | | | | 0.28 | | | | 0.29 | | | | 0.32 | | | | 0.42 | | | | 0.52 | |
Net realized and unrealized gain (loss) | | | 0.51 | | | | (0.20 | ) | | | 0.38 | | | | (0.57 | ) | | | 0.22 | | | | 0.42 | |
| | | | | | | | | | | | | | | | | | | | | | | | |
Total investment operations | | | 0.65 | | | | 0.08 | | | | 0.67 | | | | (0.25 | ) | | | 0.64 | | | | 0.94 | |
| | | | | | | | | | | | | | | | | | | | | | | | |
Distributions: | | | | | | | | | | | | | | | | | | | | | | | | |
Net investment income | | | — | | | | (0.27 | ) | | | (0.27 | ) | | | (0.40 | ) | | | (0.34 | ) | | | (0.56 | ) |
Net realized gains | | | — | | | | — | | | | — | | | | — | | | | (0.01 | ) | | | (0.02 | ) |
| | | | | | | | | | | | | | | | | | | | | | | | |
Total distributions | | | — | | | | (0.27 | ) | | | (0.27 | ) | | | (0.40 | ) | | | (0.35 | ) | | | (0.58 | ) |
| | | | | | | | | | | | | | | | | | | | | | | | |
Net asset value, end of year | | $ | 13.48 | | | $ | 12.83 | | | $ | 13.02 | | | $ | 12.62 | | | $ | 13.27 | | | $ | 12.98 | |
| | | | | | | | | | | | | | | | | | | | | | | | |
Total return(B) | | | 5.07 | %(C) | | | 0.61 | % | | | 5.33 | % | | | (1.84 | )% | | | 4.98 | % | | | 7.53 | % |
| | | | | | | | | | | | | | | | | | | | | | | | |
Ratio and supplemental data: | | | | | | | | | | | | | | | | | | | | | | | | |
Net assets end of year (000’s) | | $ | 501,293 | | | $ | 472,685 | | | $ | 488,758 | | | $ | 335,836 | | | $ | 319,385 | | | $ | 256,418 | |
| | | | | | | | | | | | | | | | | | | | | | | | |
Expenses to average net assets | | | 0.54 | %(D) | | | 0.55 | % | | | 0.56 | % | | | 0.57 | % | | | 0.58 | % | | | 0.57 | % |
Net investment income (loss) to average net assets | | | 2.22 | %(D) | | | 2.11 | % | | | 2.21 | % | | | 2.50 | % | | | 3.19 | % | | | 4.04 | % |
Portfolio turnover rate | | | 14 | %(C) | | | 19 | % | | | 17 | % | | | 23 | % | | | 17 | % | | | 23 | % |
| (A) | Calculated based on average number of shares outstanding. |
| (B) | Total return reflects all Portfolio expenses and includes reinvestment of dividends and capital gains; it does not reflect the charges and deductions under the policies or annuity contracts. |
39
Transamerica JPMorgan Core Bond VP
Service Class
| | | | | | | | | | | | | | | | | | | | | | | | |
| | | Service Class | |
| | | June 30,
2016
(unaudited) | | | December 31,
2015 | | | December 31,
2014 | | | December 31,
2013 | | | December 31,
2012 | | | December 31,
2011 | |
Net asset value, beginning of year | | $ | 13.66 | | | $ | 13.86 | | | $ | 13.42 | | | $ | 14.10 | | | $ | 13.79 | | | $ | 13.39 | |
| | | | | | | | | | | | | | | | | | | | | | | | |
Investment operations: | | | | | | | | | | | | | | | | | | | | | | | | |
Net investment income (loss)(A) | | | 0.14 | | | | 0.26 | | | | 0.27 | | | | 0.31 | | | | 0.41 | | | | 0.51 | |
Net realized and unrealized gain (loss) | | | 0.53 | | | | (0.21 | ) | | | 0.41 | | | | (0.61 | ) | | | 0.24 | | | | 0.45 | |
| | | | | | | | | | | | | | | | | | | | | | | | |
Total investment operations | | | 0.67 | | | | 0.05 | | | | 0.68 | | | | (0.30 | ) | | | 0.65 | | | | 0.96 | |
| | | | | | | | | | | | | | | | | | | | | | | | |
Distributions: | | | | | | | | | | | | | | | | | | | | | | | | |
Net investment income | | | — | | | | (0.25 | ) | | | (0.24 | ) | | | (0.38 | ) | | | (0.33 | ) | | | (0.54 | ) |
Net realized gains | | | — | | | | — | | | | — | | | | — | | | | (0.01 | ) | | | (0.02 | ) |
| | | | | | | | | | | | | | | | | | | | | | | | |
Total distributions | | | — | | | | (0.25 | ) | | | (0.24 | ) | | | (0.38 | ) | | | (0.34 | ) | | | (0.56 | ) |
| | | | | | | | | | | | | | | | | | | | | | | | |
Net asset value, end of year | | $ | 14.33 | | | $ | 13.66 | | | $ | 13.86 | | | $ | 13.42 | | | $ | 14.10 | | | $ | 13.79 | |
| | | | | | | | | | | | | | | | | | | | | | | | |
Total return(B) | | | 4.90 | %(C) | | | 0.33 | % | | | 5.10 | % | | | (2.13 | )% | | | 4.75 | % | | | 7.24 | % |
| | | | | | | | | | | | | | | | | | | | | | | | |
Ratio and supplemental data: | | | | | | | | | | | | | | | | | | | | | | | | |
Net assets end of year (000’s) | | $ | 249,970 | | | $ | 199,855 | | | $ | 162,347 | | | $ | 106,656 | | | $ | 96,896 | | | $ | 55,709 | |
| | | | | | | | | | | | | | | | | | | | | | | | |
Expenses to average net assets | | | 0.79 | %(D) | | | 0.80 | % | | | 0.81 | % | | | 0.82 | % | | | 0.83 | % | | | 0.82 | % |
Net investment income (loss) to average net assets | | | 1.97 | %(D) | | | 1.87 | % | | | 1.97 | % | | | 2.25 | % | | | 2.91 | % | | | 3.69 | % |
Portfolio turnover rate | | | 14 | %(C) | | | 19 | % | | | 17 | % | | | 23 | % | | | 17 | % | | | 23 | % |
| (A) | Calculated based on average number of shares outstanding. |
| (B) | Total return reflects all Portfolio expenses and includes reinvestment of dividends and capital gains; it does not reflect the charges and deductions under the policies or annuity contracts. |
40
Transamerica Voya Mid Cap Opportunities VP
Initial Class
| | | | | | | | | | | | | | | | |
| | | Initial Class | |
| | | June 30,
2016
(unaudited) | | | December 31,
2015 | | | December 31,
2014 | | | December 31,
2013(A) | |
Net asset value, beginning of period/year | | $ | 12.01 | | | $ | 12.63 | | | $ | 11.84 | | | $ | 10.00 | |
| | | | | | | | | | | | | | | | |
Investment operations: | | | | | | | | | | | | | | | | |
Net investment income (loss)(B) | | | 0.01 | | | | (0.01 | ) | | | 0.04 | | | | 0.01 | |
Net realized and unrealized gain (loss) | | | 0.42 | | | | 0.05 | | | | 0.99 | | | | 1.83 | |
| | | | | | | | | | | | | | | | |
Total investment operations | | | 0.43 | | | | 0.04 | | | | 1.03 | | | | 1.84 | |
| | | | | | | | | | | | | | | | |
Distributions: | | | | | | | | | | | | | | | | |
Net investment income | | | — | | | | (0.04 | ) | | | (0.01 | ) | | | — | |
Net realized gains | | | — | | | | (0.62 | ) | | | (0.23 | ) | | | — | |
| | | | | | | | | | | | | | | | |
Total distributions | | | — | | | | (0.66 | ) | | | (0.24 | ) | | | — | |
| | | | | | | | | | | | | | | | |
Net asset value, end of period/year | | $ | 12.44 | | | $ | 12.01 | | | $ | 12.63 | | | $ | 11.84 | |
| | | | | | | | | | | | | | | | |
Total return(C) | | | 3.58 | %(D) | | | 0.37 | % | | | 8.73 | % | | | 18.40 | %(D) |
| | | | | | | | | | | | | | | | |
Ratio and supplemental data: | | | | | | | | | | | | | | | | |
Net assets end of period/year (000’s) | | $ | 206,121 | | | $ | 199,920 | | | $ | 204,477 | | | $ | 152,039 | |
| | | | | | | | | | | | | | | | |
Expenses to average net assets | | | 0.90 | %(E) | | | 0.90 | % | | | 0.91 | % | | | 0.91 | %(E) |
Net investment income (loss) to average net assets | | | 0.17 | %(E) | | | (0.04 | )% | | | 0.36 | % | | | 0.12 | %(E) |
Portfolio turnover rate | | | 53 | %(D) | | | 88 | % | | | 95 | % | | | 56 | %(D) |
| (A) | Commenced operations on May 1, 2013. |
| (B) | Calculated based on average number of shares outstanding. |
| (C) | Total return reflects all Portfolio expenses and includes reinvestment of dividends and capital gains; it does not reflect the charges and deductions under the policies or annuity contracts. |
41
Transamerica Voya Mid Cap Opportunities VP
Service Class
| | | | | | | | | | | | | | | | |
| | | Service Class | |
| | | June 30,
2016
(unaudited) | | | December 31,
2015 | | | December 31,
2014 | | | December 31,
2013(A) | |
Net asset value, beginning of period/year | | $ | 11.96 | | | $ | 12.59 | | | $ | 11.82 | | | $ | 10.00 | |
| | | | | | | | | | | | | | | | |
Investment operations: | | | | | | | | | | | | | | | | |
Net investment income (loss)(B) | | | (0.00 | )(C) | | | (0.04 | ) | | | 0.01 | | | | (0.01 | ) |
Net realized and unrealized gain (loss) | | | 0.42 | | | | 0.04 | | | | 0.99 | | | | 1.83 | |
| | | | | | | | | | | | | | | | |
Total investment operations | | | 0.42 | | | | — | | | | 1.00 | | | | 1.82 | |
| | | | | | | | | | | | | | | | |
Distributions: | | | | | | | | | | | | | | | | |
Net investment income | | | — | | | | (0.01 | ) | | | — | | | | — | |
Net realized gains | | | — | | | | (0.62 | ) | | | (0.23 | ) | | | — | |
| | | | | | | | | | | | | | | | |
Total distributions | | | — | | | | (0.63 | ) | | | (0.23 | ) | | | — | |
| | | | | | | | | | | | | | | | |
Net asset value, end of period/year | | $ | 12.38 | | | $ | 11.96 | | | $ | 12.59 | | | $ | 11.82 | |
| | | | | | | | | | | | | | | | |
Total return(D) | | | 3.51 | %(E) | | | 0.07 | % | | | 8.51 | % | | | 18.20 | %(E) |
| | | | | | | | | | | | | | | | |
Ratio and supplemental data: | | | | | | | | | | | | | | | | |
Net assets end of period/year (000’s) | | $ | 342 | | | $ | 334 | | | $ | 406 | | | $ | 275 | |
| | | | | | | | | | | | | | | | |
Expenses to average net assets | | | 1.15 | %(F) | | | 1.15 | % | | | 1.16 | % | | | 1.16 | %(F) |
Net investment income (loss) to average net assets | | | (0.08 | )%(F) | | | (0.30 | )% | | | 0.05 | % | | | (0.16 | )%(F) |
Portfolio turnover rate | | | 53 | %(E) | | | 88 | % | | | 95 | % | | | 56 | %(E) |
| (A) | Commenced operations on May 1, 2013. |
| (B) | Calculated based on average number of shares outstanding. |
| (C) | Rounds to less than $0.01 or $(0.01). |
| (D) | Total return reflects all Portfolio expenses and includes reinvestment of dividends and capital gains; it does not reflect the charges and deductions under the policies or annuity contracts. |
42
Transamerica Janus Mid-Cap Growth VP
Initial Class
| | | | | | | | | | | | | | | | | | | | | | | | |
| | | Initial Class | |
| | | June 30,
2016
(unaudited) | | | December 31,
2015 | | | December 31,
2014 | | | December 31,
2013 | | | December 31,
2012 | | | December 31,
2011 | |
Net asset value, beginning of year | | $ | 28.35 | | | $ | 35.49 | | | $ | 37.94 | | | $ | 28.05 | | | $ | 27.13 | | | $ | 29.20 | |
| | | | | | | | | | | | | | | | | | | | | | | | |
Investment operations: | | | | | | | | | | | | | | | | | | | | | | | | |
Net investment income (loss)(A) | | | 0.02 | | | | (0.25 | ) | | | 0.02 | | | | (0.02 | ) | | | 0.26 | | | | 0.01 | |
Net realized and unrealized gain (loss) | | | (2.27 | ) | | | (1.61 | ) | | | (0.00 | )(B) | | | 10.87 | | | | 2.14 | | | | (1.98 | ) |
| | | | | | | | | | | | | | | | | | | | | | | | |
Total investment operations | | | (2.25 | ) | | | (1.86 | ) | | | 0.02 | | | | 10.85 | | | | 2.40 | | | | (1.97 | ) |
| | | | | | | | | | | | | | | | | | | | | | | | |
Distributions: | | | | | | | | | | | | | | | | | | | | | | | | |
Net investment income | | | — | | | | — | | | | — | | | | (0.27 | ) | | | — | | | | (0.10 | ) |
Net realized gains | | | — | | | | (5.28 | ) | | | (2.47 | ) | | | (0.69 | ) | | | (1.48 | ) | | | — | |
| | | | | | | | | | | | | | | | | | | | | | | | |
Total distributions | | | — | | | | (5.28 | ) | | | (2.47 | ) | | | (0.96 | ) | | | (1.48 | ) | | | (0.10 | ) |
| | | | | | | | | | | | | | | | | | | | | | | | |
Net asset value, end of year | | $ | 26.10 | | | $ | 28.35 | | | $ | 35.49 | | | $ | 37.94 | | | $ | 28.05 | | | $ | 27.13 | |
| | | | | | | | | | | | | | | | | | | | | | | | |
Total return(C) | | | (7.94 | )%(D) | | | (5.03 | )% | | | 0.02 | % | | | 39.14 | % | | | 9.08 | % | | | (6.77 | )% |
| | | | | | | | | | | | | | | | | | | | | | | | |
Ratio and supplemental data: | | | | | | | | | | | | | | | | | | | | | | | | |
Net assets end of year (000’s) | | $ | 453,534 | | | $ | 521,496 | | | $ | 768,562 | | | $ | 839,396 | | | $ | 643,715 | | | $ | 648,157 | |
| | | | | | | | | | | | | | | | | | | | | | | | |
Expenses to average net assets | | | 0.88 | %(E) | | | 0.87 | % | | | 0.88 | % | | | 0.88 | % | | | 0.90 | % | | | 0.89 | % |
Net investment income (loss) to average net assets | | | 0.18 | %(E) | | | (0.76 | )% | | | 0.05 | % | | | (0.05 | )% | | | 0.92 | % | | | 0.04 | % |
Portfolio turnover rate | | | 95 | %(D) | | | 21 | % | | | 43 | % | | | 49 | % | | | 31 | % | | | 41 | % |
| (A) | Calculated based on average number of shares outstanding. |
| (B) | Rounds to less than $0.01 or $(0.01). |
| (C) | Total return reflects all Portfolio expenses and includes reinvestment of dividends and capital gains; it does not reflect the charges and deductions under the policies or annuity contracts. |
43
Transamerica Janus Mid-Cap Growth VP
Service Class
| | | | | | | | | | | | | | | | | | | | | | | | |
| | | Service Class | |
| | | June 30,
2016
(unaudited) | | | December 31,
2015 | | | December 31,
2014 | | | December 31,
2013 | | | December 31,
2012 | | | December 31,
2011 | |
Net asset value, beginning of year | | $ | 27.44 | | | $ | 34.62 | | | $ | 37.16 | | | $ | 27.49 | | | $ | 26.69 | | | $ | 28.77 | |
| | | | | | | | | | | | | | | | | | | | | | | | |
Investment operations: | | | | | | | | | | | | | | | | | | | | | | | | |
Net investment income (loss)(A) | | | (0.01 | ) | | | (0.33 | ) | | | (0.07 | ) | | | (0.10 | ) | | | 0.19 | | | | (0.05 | ) |
Net realized and unrealized gain (loss) | | | (2.20 | ) | | | (1.57 | ) | | | (0.00 | )(B) | | | 10.66 | | | | 2.09 | | | | (1.96 | ) |
| | | | | | | | | | | | | | | | | | | | | | | | |
Total investment operations | | | (2.21 | ) | | | (1.90 | ) | | | (0.07 | ) | | | 10.56 | | | | 2.28 | | | | (2.01 | ) |
| | | | | | | | | | | | | | | | | | | | | | | | |
Distributions: | | | | | | | | | | | | | | | | | | | | | | | | |
Net investment income | | | — | | | | — | | | | — | | | | (0.20 | ) | | | — | | | | (0.07 | ) |
Net realized gains | | | — | | | | (5.28 | ) | | | (2.47 | ) | | | (0.69 | ) | | | (1.48 | ) | | | — | |
| | | | | | | | | | | | | | | | | | | | | | | | |
Total distributions | | | — | | | | (5.28 | ) | | | (2.47 | ) | | | (0.89 | ) | | | (1.48 | ) | | | (0.07 | ) |
| | | | | | | | | | | | | | | | | | | | | | | | |
Net asset value, end of year | | $ | 25.23 | | | $ | 27.44 | | | $ | 34.62 | | | $ | 37.16 | | | $ | 27.49 | | | $ | 26.69 | |
| | | | | | | | | | | | | | | | | | | | | | | | |
Total return(C) | | | (8.05 | )%(D) | | | (5.26 | )% | | | (0.23 | )% | | | 38.83 | % | | | 8.78 | % | | | (7.01 | )% |
| | | | | | | | | | | | | | | | | | | | | | | | |
Ratio and supplemental data: | | | | | | | | | | | | | | | | | | | | | | | | |
Net assets end of year (000’s) | | $ | 95,074 | | | $ | 107,324 | | | $ | 115,823 | | | $ | 118,292 | | | $ | 86,353 | | | $ | 85,691 | |
| | | | | | | | | | | | | | | | | | | | | | | | |
Expenses to average net assets | | | 1.13 | %(E) | | | 1.12 | % | | | 1.13 | % | | | 1.13 | % | | | 1.15 | % | | | 1.14 | % |
Net investment income (loss) to average net assets | | | (0.07 | )%(E) | | | (1.02 | )% | | | (0.20 | )% | | | (0.30 | )% | | | 0.66 | % | | | (0.19 | )% |
Portfolio turnover rate | | | 95 | %(D) | | | 21 | % | | | 43 | % | | | 49 | % | | | 31 | % | | | 41 | % |
| (A) | Calculated based on average number of shares outstanding. |
| (B) | Rounds to less than $0.01 or $(0.01). |
| (C) | Total return reflects all Portfolio expenses and includes reinvestment of dividends and capital gains; it does not reflect the charges and deductions under the policies or annuity contracts. |
44
OWNERSHIP OF SHARES OF THE PORTFOLIOS
To the knowledge of each Target Portfolio, as of September 20, 2016, the Trustees and officers of each Target Portfolio owned in the aggregate less than 1% of the outstanding shares of the Target Portfolio. To the knowledge of each Destination Portfolio, as of September 20, 2016, the Trustees and officers of the Destination Portfolio owned in the aggregate less than 1% of the outstanding shares of the Destination Portfolio.
To the knowledge of each Target Portfolio, as of September 20, 2016, the following persons owned of record or beneficially 5% or more of the outstanding shares of the indicated classes of the Target Portfolio. Unless otherwise noted, the address of each owner is 4333 Edgewood Rd NE, Cedar Rapids, IA 52402.
| | | | | | | | | | | | |
Name & Address | | Portfolio Name | | Class | | Shares | | | Percent Owned | |
Transamerica Asset Allocation-Conservative VP Investment Account Attn Fund Operations Mailstop 20B 1801 California St Ste 5200 Denver CO 80202-2642 | | Transamerica Voya Limited Maturity Bond VP | | Initial | | | 5,635,516.619 | | | | 66.31 | % |
| | | | |
Transamerica Asset Allocation-Moderate VP Investment Account Attn Fund Operations Mailstop 20B 1801 California St Ste 5200 Denver CO 80202-2642 | | Transamerica Voya Limited Maturity Bond VP | | Initial | | | 2,863,619.215 | | | | 33.69 | % |
| | | | |
TCM Division Transamerica Life Insurance Company Separate Account VA B 4333 Edgewood Rd NE Cedar Rapids IA 52499-3830 | | Transamerica Voya Limited Maturity Bond VP | | Service | | | 58,126.027 | | | | 76.98 | % |
| | | | |
Transamerica Asset Management Inc Seed Money Account Attn Corporate Accounting 4333 Edgewood Rd NE Cedar Rapids IA 52499-3830 | | Transamerica Voya Limited Maturity Bond VP | | Service | | | 12,707.188 | | | | 16.83 | % |
| | | | |
TCM Division Transamerica Financial Life Ins Co Separate Account VA Bny 4333 Edgewood Rd NE Cedar Rapids IA 52499-3830 | | Transamerica Voya Limited Maturity Bond VP | | Service | | | 4,673.198 | | | | 6.19 | % |
| | | | |
Transamerica Asset Allocation-Moderate VP Investment Account Attn Fund Operations Mailstop 20B 1801 California St Ste 5200 Denver CO 80202-2642 | | Transamerica Voya Mid Cap Opportunities VP | | Initial | | | 7,634,286.237 | | | | 46.47 | % |
| | | | |
Transamerica Asset Allocation-Moderate Growth VP Investment Account Attn Fund Operations Mailstop 20B 1801 California St Ste 5200 Denver CO 80202-2642 | | Transamerica Voya Mid Cap Opportunities VP | | Initial | | | 6,417,663.892 | | | | 39.06 | % |
| | | | |
Transamerica Asset Allocation-Growth VP Investment Account Attn Fund Operations Mailstop 20B 1801 California St Ste 5200 Denver CO 80202-2642 | | Transamerica Voya Mid Cap Opportunities VP | | Initial | | | 1,682,942.623 | | | | 10.24 | % |
TCM Division Transamerica Life Insurance Company Separate Account VA B 4333 Edgewood Rd NE Cedar Rapids IA 52499-3830 | | Transamerica Voya Mid Cap Opportunities VP | | Service | | | 14,795.484 | | | | 51.16 | % |
| | | | |
Transamerica Asset Management Inc Seed Money Account Attn Corporate Accounting 4333 Edgewood Rd NE Cedar Rapids IA 52499-3830 | | Transamerica Voya Mid Cap Opportunities VP | | Service | | | 14,126.022 | | | | 48.84 | % |
| * | Information regarding the parent companies of the control persons listed in the chart above is provided in Exhibit B hereto. |
45
Any shareholder who holds beneficially 25% or more of a Target Portfolio may be deemed to control the Target Portfolio until the time as the shareholder holds beneficially less than 25% of the outstanding common shares of that Target Portfolio. Any shareholder controlling a Target Portfolio may be able to determine the outcome of issues that are submitted to shareholders for vote and may be able to take action regarding the Target Portfolio without the consent or approval of other shareholders.
As of September 20, 2016, the following persons held beneficially 25% or more of each Target Portfolio:
| | | | | | | | | | |
Name & Address | | Portfolio Name | | Shares | | | Percentage of Portfolio Owned | |
Transamerica Asset Allocation-Conservative VP Investment Account Attn Fund Operations Mailstop 20B 1801 California St Ste 5200 Denver CO 80202-2642 | | Transamerica Voya Limited Maturity Bond VP | | | 5,635,516.619 | | | | 65.72 | % |
| | | |
Transamerica Asset Allocation-Moderate VP Investment Account Attn Fund Operations Mailstop 20B 1801 California St Ste 5200 Denver CO 80202-2642 | | Transamerica Voya Limited Maturity Bond VP | | | 2,863,619.215 | | | | 33.40 | % |
| | | |
Transamerica Asset Allocation-Moderate VP Investment Account Attn Fund Operations Mailstop 20B 1801 California St Ste 5200 Denver CO 80202-2642 | | Transamerica Voya Mid Cap Opportunities VP | | | 7,634,286.237 | | | | 46.38 | % |
| | | |
Transamerica Asset Allocation-Moderate Growth VP Investment Account Attn Fund Operations Mailstop 20B 1801 California St Ste 5200 Denver CO 80202-2642 | | Transamerica Voya Mid Cap Opportunities VP | | | 6,417,663.892 | | | | 38.99 | % |
To the knowledge of each Destination Portfolio, as of September 20, 2016, the following persons owned of record or beneficially 5% or more of the outstanding shares of the indicated classes of the Destination Portfolio. Unless otherwise noted, the address of each owner is 4333 Edgewood Rd NE, Cedar Rapids, IA 52402.
| | | | | | | | | | | | |
Name & Address | | Portfolio Name | | Class | | Shares | | | Percent Owned | |
AEGON Financial Partners - Florida Transamerica Premier Life Ins Co WRL Series Life Account 4333 Edgewood Rd NE Cedar Rapids IA 52499-3830 | | Transamerica Janus Mid-Cap Growth VP | | Initial | | | 11,475,221.124 | | | | 61.31 | % |
| | | | |
TCM Division Transamerica Premier Life Ins Co WRL Series Annuity Account 4333 Edgewood Rd NE Cedar Rapids IA 52499-3830 | | Transamerica Janus Mid-Cap Growth VP | | Initial | | | 3,973,147.239 | | | | 21.23 | % |
| | | | |
TCM Division Transamerica Life Insurance Company Separate Account VA B 4333 Edgewood Rd NE Cedar Rapids IA 52499-3830 | | Transamerica Janus Mid-Cap Growth VP | | Initial | | | 2,475,162.037 | | | | 13.23 | % |
TCM Division Transamerica Life Insurance Company Separate Account VA B 4333 Edgewood Rd NE Cedar Rapids IA 52499-3830 | | Transamerica Janus Mid-Cap Growth VP | | Service | | | 2,648,447.792 | | | | 63.46 | % |
| | | | |
TCM Division Merrill Lynch Life Insurance Co Ml Life VA Separate Acct A 4333 Edgewood Rd NE Cedar Rapids IA 52499-3830 | | Transamerica Janus Mid-Cap Growth VP | | Service | | | 1,018,234.082 | | | | 24.40 | % |
| | | | |
TCM Division Transamerica Premier Life Ins Co Separate Account VA U 4333 Edgewood Rd NE Cedar Rapids IA 52499-3830 | | Transamerica Janus Mid-Cap Growth VP | | Service | | | 210,034.796 | | | | 5.03 | % |
46
| | | | | | | | | | | | |
Name & Address | | Portfolio Name | | Class | | Shares | | | Percent Owned | |
Blackrock Tactical Allocation VP Investment Account Attn Fund Operations Mailstop 20B 1801 California St Ste 5200 Denver CO 80202-2642 | | Transamerica JPMorgan Core Bond VP | | Initial | | | 31,112,790.211 | | | | 82.02 | % |
| | | | |
TCM Division Transamerica Premier Life Ins Co WRL Series Annuity Account 4333 Edgewood Rd NE Cedar Rapids IA 52499-3830 | | Transamerica JPMorgan Core Bond VP | | Initial | | | 3,296,257.858 | | | | 8.69 | % |
| | | | |
AEGON Financial Partners - Florida Transamerica Premier Life Ins Co WRL Series Life Account 4333 Edgewood Rd NE Cedar Rapids IA 52499-3830 | | Transamerica JPMorgan Core Bond VP | | Initial | | | 3,221,119.235 | | | | 8.49 | % |
| | | | |
TCM Division Transamerica Life Insurance Company Separate Account VA B 4333 Edgewood Rd NE Cedar Rapids IA 52499-3830 | | Transamerica JPMorgan Core Bond VP | | Service | | | 16,142,090.947 | | | | 87.08 | % |
| | | | |
TCM Division Transamerica Financial Life Ins Co Separate Account VA Bny 4333 Edgewood Rd NE Cedar Rapids IA 52499-3830 | | Transamerica JPMorgan Core Bond VP | | Service | | | 1,913,659.077 | | | | 10.32 | % |
| * | Information regarding the parent companies of the control persons listed in the chart above is provided in Exhibit B hereto. |
Any shareholder who holds beneficially 25% or more of a Destination Portfolio may be deemed to control the Destination Portfolio until the time as the shareholder holds beneficially less than 25% of the outstanding common shares of that Destination Portfolio. Any shareholder controlling a Destination Portfolio may be able to determine the outcome of issues that are submitted to shareholders for vote and may be able to take action regarding the Destination Portfolio without the consent or approval of other shareholders.
As of September 20, 2016, the following persons held beneficially 25% or more of each Destination Portfolio:
| | | | | | | | | | |
Name & Address | | Portfolio Name | | Shares | | | Percentage of Portfolio Owned | |
AEGON Financial Partners - Florida Transamerica Premier Life Ins Co WRL Series Life Account 4333 Edgewood Rd NE Cedar Rapids IA 52499-3830 | | Transamerica Janus Mid-Cap Growth VP | | | 11,475,221.124 | | | | 50.47 | % |
| | | |
Blackrock Tactical Allocation VP Investment Account Attn Fund Operations Mailstop 20B 1801 California St Ste 5200 Denver CO 80202-2642 | | Transamerica JPMorgan Core Bond VP | | | 31,112,790.211 | | | | 53.93 | % |
| | | |
TCM Division Transamerica Life Insurance Company Separate Account VA B 4333 Edgewood Rd NE Cedar Rapids IA 52499-3830 | | Transamerica JPMorgan Core Bond VP | | | 16,142,090.947 | | | | 29.82 | % |
FINANCIAL STATEMENT EXPERTS
The financial statements and financial highlights of each Portfolio for the past five fiscal years (or since its inception if less than five years) and any semi-annual period, as applicable, are incorporated by reference into this Information Statement/Prospectus. The financial statements and financial highlights of each Target Portfolio and corresponding Destination Portfolio for their fiscal year end December 31, 2015 have been audited by Ernst & Young LLP, an Independent Registered Public Accounting firm, as set forth in their report thereon incorporated by reference into this Information Statement/Prospectus. Such financial statements and financial highlights are incorporated by reference herein in reliance upon such report given on the authority of such firm as experts in accounting and auditing.
47
AVAILABLE INFORMATION
You can obtain more free information about each Portfolio from your investment firm or by writing to your Portfolio at 1801 California Street, Suite 5200, Denver, Colorado 80202. You may also call 1-888-233-4339.
Each Portfolio’s statement of additional information and shareholder reports are available free of charge on the Portfolios’ website at http://www.transamericaseriestrust.com/content/prospectus.aspx.
Shareholder reports. Annual and semi-annual reports to shareholders, and quarterly reports filed with the SEC, provide information about each Portfolio’s investments. An annual report discusses market conditions and investment strategies that significantly affected each Portfolio’s performance during its last fiscal year.
Each Portfolio is subject to the informational requirements of the Securities Exchange Act of 1934, as amended, and the 1940 Act and files reports, proxy statements and other information with the SEC. These reports, proxy statements and other information filed by the Portfolios and their predecessors can be inspected and copied (for a duplication fee) at the public reference facilities of the SEC at 100 F Street, N.E., Washington, DC 20549. Copies of these materials can also be obtained by mail from the Public Reference Branch, Office of Consumer Affairs and Information Services, Securities and Exchange Commission, Washington, DC 20549, at prescribed rates. In addition, copies of these documents may be viewed on–screen or downloaded from the SEC’s Internet site at www.sec.gov.
|
| By Order of the Board of Trustees, |
|
/s/ Tané T. Tyler, Esq. |
| Tané T. Tyler, Esq. |
| Secretary, Transamerica Series Trust |
[ ], 2016
48
Exhibit A
FORM OF AGREEMENT AND PLAN OF REORGANIZATION
This AGREEMENT AND PLAN OF REORGANIZATION (“Agreement”) is made as of this day of , 2016, by and among Transamerica Series Trust, a Delaware statutory trust (the “Trust”), with its principal place of business at 1801 California Street, Suite 5200, Denver, Colorado 80202, on behalf of each of its series listed on Exhibit A attached hereto under the heading “Acquiring Portfolio/Classes” (each, an “Acquiring Portfolio”), and the Trust on behalf of each of its series listed on Exhibit A attached hereto under the heading “Acquired Portfolio/Classes” (each, an “Acquired Portfolio”) and, solely for purposes of paragraph 10.2 hereof, Transamerica Asset Management, Inc. (“TAM”). Although the only shareholders of each Acquiring Portfolio and each Acquired Portfolio are affiliated separate accounts and affiliated asset allocation portfolios, and contract holders of the variable life and annuity contracts are not shareholders of the Acquiring or Acquired Portfolios, for ease of reference shareholders and contract holders are collectively referred to in this Agreement as “shareholders.”
WHEREAS, the Trust is an open-end management investment company registered pursuant to the Investment Company Act of 1940, as amended (the “1940 Act”);
WHEREAS, it is intended that, for United States federal income tax purposes (i) each transaction contemplated by this Agreement constitute a “reorganization” within the meaning of Section 368(a) of the Internal Revenue Code of 1986, as amended (the “Code”), and (ii) this Agreement constitute a plan of reorganization within the meaning of Section 368 of the Code and Treasury Regulations Section 1.368-2(g);
WHEREAS, each such reorganization will consist of (1) the sale, assignment, conveyance, transfer and delivery of all of the property and assets of an Acquired Portfolio to the corresponding Acquiring Portfolio listed on Exhibit A (as to each Acquired Portfolio, the “corresponding Acquiring Portfolio”) in exchange solely for (a) shares of the classes of shares of beneficial interest of that Acquiring Portfolio (the “Acquiring Portfolio Shares”) corresponding to the classes of outstanding shares of beneficial interest of the Acquired Portfolio (the “Acquired Portfolio Shares”), as described herein, and (b) the assumption by the Acquiring Portfolio of all liabilities of the Acquired Portfolio, and (2) the subsequent distribution of the Acquiring Portfolio Shares (which shall then constitute all of the assets of the Acquired Portfolio) to the shareholders of the Acquired Portfolio in complete liquidation of the Acquired Portfolio Shares and the termination of the Acquired Portfolio, as provided herein (each, a “Reorganization”), all upon the terms and conditions hereinafter set forth in this Agreement;
WHEREAS, the Board of Trustees of the Trust (the “Board”) has determined, with respect to each Acquiring Portfolio, that the sale, assignment, conveyance, transfer and delivery of all of the property and assets of the corresponding Acquired Portfolio listed on Exhibit A (as to each Acquiring Portfolio, the “corresponding Acquired Portfolio”) for Acquiring Portfolio Shares and the assumption of all liabilities of that Acquired Portfolio by the Acquiring Portfolio is in the best interests of the Acquiring Portfolio and its shareholders and that the interests of the existing shareholders of the Acquiring Portfolio will not be diluted as a result of this transaction; and
WHEREAS, the Board has determined, with respect to each Acquired Portfolio, that the sale, assignment, conveyance, transfer and delivery of all of the property and assets of the Acquired Portfolio for Acquiring Portfolio Shares and the assumption of all liabilities of the Acquired Portfolio by the corresponding Acquiring Portfolio is in the best interests of the Acquired Portfolio and its shareholders and that the interests of the existing shareholders of the Acquired Portfolio will not be diluted as a result of this transaction;
NOW, THEREFORE, in consideration of the premises and of the covenants and agreements hereinafter set forth, the parties hereto covenant and agree as follows:
| 1. | TRANSFER OF ASSETS OF EACH ACQUIRED PORTFOLIO TO THE CORRESPONDING ACQUIRING PORTFOLIO IN EXCHANGE FOR ACQUIRING PORTFOLIO SHARES IN SUCH ACQUIRING PORTFOLIO, ASSUMPTION OF ALL LIABILITIES OF THAT ACQUIRED PORTFOLIO AND LIQUIDATION AND TERMINATION OF THAT ACQUIRED PORTFOLIO |
1.1 Subject to requisite approvals and the other terms and conditions herein set forth and on the basis of the representations and warranties contained herein, the Trust, on behalf of each Acquired Portfolio, agrees to sell, assign, convey, transfer and deliver all of its property and assets attributable to that Acquired Portfolio, as set forth in paragraph 1.2, to the corresponding Acquiring Portfolio, and the Trust, on behalf of that Acquiring Portfolio, agrees in exchange therefor: (a) to deliver to the corresponding Acquired Portfolio the number of full and fractional shares of each class of Acquiring Portfolio Shares of that Acquiring Portfolio corresponding to a class of Acquired Portfolio Shares of the corresponding Acquired Portfolio as of the time and date set forth in paragraph 3.1
A-1
determined by dividing the value of the Trust’s net assets with respect to that class of Acquired Portfolio Shares of the corresponding Acquired Portfolio (computed in the manner and as of the time and date set forth in paragraph 2.1) by the net asset value of one share of the corresponding class of Acquiring Portfolio Shares of that Acquiring Portfolio (computed in the manner and as of the time and date set forth in paragraph 2.2); and (b) to assume all liabilities of the corresponding Acquired Portfolio as set forth in paragraph 1.2. Such transactions shall take place on a closing date as provided for in paragraph 3.1 (the “Closing Date”). Exhibit A attached hereto shows each Acquiring Portfolio and its class(es) of shares and the corresponding Acquired Portfolio and its corresponding class(es) of shares. For purposes of this Agreement, each class of shares of each Acquired Portfolio as set forth on Exhibit A corresponds to the class of shares of the corresponding Acquiring Portfolio as set forth on such Exhibit, the term “Acquiring Portfolio Shares” should be read to include each such class of shares of such Acquiring Portfolio, and the term “Acquired Portfolio Shares” should be read to include each such class of shares of such Acquired Portfolio.
1.2 The property and assets of the Trust attributable to each Acquired Portfolio to be sold, assigned, conveyed, transferred and delivered to and acquired by the Trust, on behalf of the corresponding Acquiring Portfolio, shall consist of all assets and property of every kind and nature of the Acquired Portfolio, including, without limitation, all rights, receivables (including dividend, interest and other receivables), cash, cash equivalents, claims (whether absolute or contingent, known or unknown), securities, commodities and futures interests, good will and other intangible property, any deferred or prepaid expenses and all interests, rights, privileges and powers, the Acquired Portfolio owns at the Valuation Date (as defined in paragraph 2.1) (collectively, “Assets”). The Trust, on behalf of each Acquiring Portfolio, shall assume all of the liabilities and obligations of the corresponding Acquired Portfolio, including, without limitation, all indemnification obligations of such Acquired Portfolio with respect to the current and former members of the Board and officers of the Trust, whether accrued or contingent, known or unknown, existing at the Valuation Date (collectively, “Liabilities”). Each Acquired Portfolio will promptly assign, convey, transfer and deliver to the Trust, on behalf of the corresponding Acquiring Portfolio, any rights, stock dividends, cash dividends or other securities received by the Acquired Portfolio after the Closing Date as stock dividends, cash dividends or other distributions on or with respect to the property and assets transferred, which rights, stock dividends, cash dividends and other securities shall be deemed included in the property and assets transferred to the Trust, on behalf of the corresponding Acquiring Portfolio, at the Closing Date and shall not be separately valued, in which case any such distribution that remains unpaid as of the Closing Date shall be included in the determination of the value of the assets of the Acquired Portfolio acquired by the Trust on behalf of the corresponding Acquiring Portfolio.
1.3 Immediately following the actions contemplated by paragraph 1.1, the Trust shall take such actions as may be necessary or appropriate to complete the liquidation of each Acquired Portfolio. To complete the liquidation, the Trust, on behalf of each Acquired Portfolio, shall (a) distribute to the shareholders of record with respect to each class of the applicable Acquired Portfolio Shares of each Acquired Portfolio as of the Closing Date (“Acquired Portfolio Shareholders”), on a pro rata basis, the Acquiring Portfolio Shares of the corresponding class of the corresponding Acquiring Portfolio received by the Trust, on behalf of that Acquired Portfolio, pursuant to paragraph 1.1, in complete redemption of such Acquired Portfolio Shares, and (b) terminate the Acquired Portfolio in accordance with applicable state law. Such distribution and liquidation shall be accomplished, with respect to each class of Acquired Portfolio Shares, by the transfer of the corresponding class of Acquiring Portfolio Shares then credited to the account of the Acquired Portfolio on the books of the corresponding Acquiring Portfolio to open accounts on the share records of the Acquiring Portfolio in the names of the Acquired Portfolio Shareholders. The aggregate net asset value of each class of Acquiring Portfolio Shares to be so credited to each of the Acquired Portfolio Shareholders holding Acquired Portfolio Shares of the corresponding class shall be equal to the aggregate net asset value of the Acquired Portfolio Shares of that class owned by that Acquired Portfolio Shareholder on the Closing Date. All issued Acquired Portfolio Shares will be canceled on the books of the Acquired Portfolio. The Acquiring Portfolio shall not issue certificates representing any class of Acquiring Portfolio Shares in connection with such exchange.
1.4 Ownership of Acquiring Portfolio Shares will be shown on the books of the Acquiring Portfolio as maintained by the Acquiring Portfolio’s transfer agent.
1.5 Any reporting responsibility of an Acquired Portfolio, including, but not limited to, the responsibility for filing regulatory reports, tax returns for periods ending on or prior to the Closing Date, or other documents with the Securities and Exchange Commission (“Commission”), any state securities commission, and any federal, state or local tax authorities or any other relevant regulatory authority, is and shall remain the responsibility of the Trust, on behalf of such Acquired Portfolio. The Trust, on behalf of the applicable Acquiring Portfolio, shall fully cooperate to the extent necessary or desirable for these responsibilities to be discharged.
2.1 The value of the Assets and the amount of the Liabilities of each Acquired Portfolio, and the amounts thereof attributable to each class of shares of that Acquired Portfolio, shall be determined as of the time for calculation of its net asset value as set forth in the then-current prospectus for the Acquired Portfolio, and after the declaration of any dividends by the Acquired Portfolio, on the applicable Closing Date (such time and date being hereinafter called the “Valuation Date”), computed using the Trust’s valuation procedures. All computations of value and amounts shall be subject to confirmation by the independent registered public accounting firm for the corresponding Acquired Portfolio.
A-2
2.2 The net asset value per share of each class of the Acquiring Portfolio Shares of each Acquiring Portfolio shall be determined as of the time for calculation of the applicable Acquiring Portfolio’s net asset value as set forth in the then-current prospectus for the Acquiring Portfolio on the Valuation Date, computed using the Trust’s valuation procedures. All computations of value and amounts shall be made by the independent registered public accounting for the Acquiring Portfolio.
| 3. | CLOSING AND CLOSING DATE |
3.1 Subject to the terms and conditions set forth herein, the Closing Date shall be [ ], 2016, or such other date as the parties may agree. All acts taking place at the closing of the transactions provided for in this Agreement (“Closing”) shall be deemed to take place simultaneously as of the “close of business” on the Closing Date unless otherwise agreed to by the parties. The close of business on the Closing Date shall be as of 4:00 p.m., Eastern Time, or, as to any Reorganization, such later time on that date as the applicable Acquired Portfolio’s net asset value and/or the net asset value per share of the class of shares of the corresponding Acquiring Portfolio is calculated in accordance with Article 2 and after the declaration of any dividends. The Closing shall be held at the offices of TAM, 1801 California Street, Suite 5200, Denver, Colorado 80202, or at such other time and/or place as the parties may agree.
3.2 At the Closing of each Reorganization, the Trust shall direct State Street Bank and Trust Company (the “Custodian”) to transfer ownership of the Assets from the accounts of the applicable Acquired Portfolio that the Custodian maintains as custodian for the Acquired Portfolio to the accounts of the corresponding Acquiring Portfolio that the Custodian maintains as custodian for the Acquiring Portfolio. The Trust, on behalf of the Acquired Portfolio, shall, within one business day after the Closing for each Reorganization, deliver to the Trust, on behalf of the Acquiring Portfolio, a certificate of an authorized officer stating that (i) the Assets of the corresponding Acquired Portfolio have been so transferred as of the Closing Date, and (ii) all necessary taxes in connection with the delivery of the Assets of that Acquired Portfolio, including all applicable federal and state stock transfer stamps, if any, have been paid or provision for payment has been made.
3.3 The Trust shall direct Transamerica Fund Services, Inc., in its capacity as transfer agent for each Acquired Portfolio (“Transfer Agent”), to deliver to the Trust, within one business day after the Closing of each Reorganization, a certificate of an authorized officer stating that its records contain the name and address of each Acquired Portfolio Shareholder of the applicable Acquired Portfolio and the class, number and percentage ownership of the outstanding Acquired Portfolio Shares owned by each such shareholder immediately prior to the Closing. At the Closing of each Reorganization, the applicable Acquiring Portfolio shall deliver to the Secretary of the corresponding Acquired Portfolio a confirmation evidencing that (a) the appropriate number of Acquiring Portfolio Shares of the appropriate class or classes have been credited to the Acquired Portfolio’s account on the books of such Acquiring Portfolio pursuant to paragraph 1.1 prior to the actions contemplated by paragraph 1.3 and (b) the appropriate number of Acquiring Portfolio Shares of the appropriate class or classes have been credited to the accounts of the Acquired Portfolio Shareholders on the books of such Acquiring Portfolio pursuant to paragraph 1.3. At the applicable Closing, each party shall deliver to the other party such bills of sale, checks, assignments, share certificates, if any, receipts or other documents as the other party or its counsel may reasonably request.
3.4 In the event that on the Valuation Date (a) the New York Stock Exchange or another primary trading market for portfolio securities of an Acquiring Portfolio or an Acquired Portfolio (each, an “Exchange”) shall be closed to trading or trading thereupon shall be restricted, or (b) trading or the reporting of trading on such Exchange or elsewhere shall be disrupted so that accurate appraisal of the value of the net assets of such Acquired Portfolio or such Acquiring Portfolio is impracticable (in the judgment of the Board), the Closing Date for the applicable Reorganization shall be postponed until the first Friday (that is also a business day) after the day when trading shall have been fully resumed and reporting shall have been restored.
| 4. | REPRESENTATIONS AND WARRANTIES |
4.1 Except as has been fully disclosed in Schedule 4.1 of this Agreement, the Trust, on behalf of each Acquired Portfolio, represents and warrants as follows:
(a) Such Acquired Portfolio is duly established as a series of the Trust, which is a statutory trust duly organized, validly existing and in good standing under the laws of the State of Delaware, with power under its Declaration of Trust, as amended (the “Declaration”), to own all of its assets and to carry on its business as it is being conducted as of the date hereof. The Trust is duly qualified to do business as a foreign trust in each jurisdiction in which the conduct of its business makes such qualification necessary except where the failure to so qualify would not have a material adverse effect on the condition (financial or otherwise), business, properties, net assets or results of operations of the Trust. The Trust has all necessary federal, state and local authorization to carry on its business as now being conducted and to fulfill the terms of this Agreement, except as set forth in paragraph 4.1(c).
(b) The Trust is a registered open-end management investment company, and its registration with the Commission as an investment company under the 1940 Act, and the registration of each class of Acquired Portfolio Shares under the Securities Act of 1933, as amended (the “1933 Act”), is in full force and effect.
A-3
(c) No consent, approval, authorization, or order of any court or governmental authority is required for the consummation by the Acquired Portfolio of the transactions contemplated herein, except such as may be required under the 1933 Act, the Securities Exchange Act of 1934 (the “1934 Act”), the 1940 Act, state securities laws and the Hart–Scott–Rodino Act.
(d) The current prospectus and statement of additional information of such Acquired Portfolio and each prospectus and statement of additional information of the Acquired Portfolio used during the three (3) years prior to the date of this Agreement conforms or conformed at the time of its use in all material respects to the applicable requirements of the 1933 Act and the 1940 Act and the rules and regulations of the Commission thereunder and does not or did not at the time of its use include any untrue statement of a material fact or omit to state any material fact required to be stated therein or necessary to make the statements therein, in light of the circumstances under which they were made, not materially misleading.
(e) On the Closing Date, the Trust, on behalf of such Acquired Portfolio, will have good and marketable title to such Acquired Portfolio’s Assets and full right, power and authority to sell, assign, convey, transfer and deliver such Assets hereunder free of any liens or other encumbrances, and upon delivery and payment for the Assets, the Trust, on behalf of the corresponding Acquiring Portfolio, will acquire good and marketable title thereto, subject to no restrictions on the full transfer thereof, excluding such restrictions as might arise under the 1933 Act.
(f) The Acquired Portfolio is not engaged currently, and the execution, delivery and performance of this Agreement by the Trust, on behalf of such Acquired Portfolio, will not result, in a material violation of Delaware law or of the Declaration or the by-laws of the Trust, or of any agreement, indenture, instrument, contract, lease or other undertaking to which the Trust, on behalf of such Acquired Portfolio, is a party or by which it is bound, and the execution, delivery and performance of this Agreement by the Trust, on behalf of such Acquired Portfolio, will not result in the acceleration of any material obligation, or the imposition of any material penalty, under any agreement, indenture, instrument, contract, lease, judgment or decree to which the Trust, on behalf of such Acquired Portfolio, is a party or by which it is bound.
(g) All material contracts or other commitments of such Acquired Portfolio (other than this Agreement, certain investment contracts, including options, futures, swaps and forward contracts, and those contracts listed in Schedule 4.1) will terminate without liability to such Acquired Portfolio on or prior to the Closing Date. Each contract listed in Schedule 4.1 is a valid, binding and enforceable obligation of such Acquired Portfolio and, to the Acquired Portfolio’s knowledge, the other parties thereto (assuming due authorization, execution and delivery by the other parties thereto) and the assignment by such Acquired Portfolio to the corresponding Acquiring Portfolio of each such contract will not result in the termination of such contract, any breach or default thereunder by such Acquired Portfolio or the imposition of any penalty thereunder.
(h) No litigation or administrative proceeding or investigation of or before any court or governmental body is pending or, to the Trust’s knowledge, threatened against the Trust, with respect to such Acquired Portfolio or any of its properties or assets, that, if adversely determined, would materially and adversely affect its financial condition or the conduct of such Acquired Portfolio’s business. The Trust, on behalf of such Acquired Portfolio, is not a party to or subject to the provisions of any order, decree or judgment of any court or governmental body that materially and adversely affects such Acquired Portfolio’s business or the Trust’s ability to consummate the transactions herein contemplated on behalf of such Acquired Portfolio.
(i) The Statement of Assets and Liabilities, Statements of Operations and Changes in Net Assets and Schedule of Investments of such Acquired Portfolio for the most recently completed fiscal year of such Acquired Portfolio prior to the date of this Agreement have been audited by Ernst & Young LLP, independent registered public accounting firm, and are in accordance with accounting principles generally accepted in the United States of America (“GAAP”) consistently applied, and such statements (true and correct copies of which have been furnished to the Trust) present fairly, in all material respects, the financial condition of such Acquired Portfolio as of such date and for such period in accordance with GAAP, and there are no known contingent, accrued or other liabilities of such Acquired Portfolio required to be reflected on a balance sheet (including the notes thereto) in accordance with GAAP as of such date that are not disclosed therein.
(j) Since the last day of the most recently completed fiscal year of such Acquired Portfolio prior to the date of this Agreement, there has not been any material adverse change in such Acquired Portfolio’s financial condition, assets, liabilities or business, or any incurrence by the Acquired Portfolio of indebtedness for money borrowed maturing more than one year from the date such indebtedness was incurred. For the purposes of this subparagraph (j), a decline in net asset value per share of Acquired Portfolio Shares due to declines in market values of securities held by such Acquired Portfolio, the discharge of Acquired Portfolio liabilities, or the redemption of Acquired Portfolio Shares by shareholders of such Acquired Portfolio shall not constitute a material adverse change.
(k) On the Closing Date, all federal and other tax returns, dividend reporting forms and other tax-related reports of such Acquired Portfolio required by law to have been filed (taking into account any extensions) shall have been timely filed (taking such extensions into account) and shall be correct in all material respects, and all federal and other taxes shown as due or required to be
A-4
shown as due from the Acquired Portfolio on such tax returns, forms and reports shall have been paid or provision shall have been made for the payment thereof and, to the best of the Trust’s knowledge, no such return is currently under audit and no outstanding assessment of any tax has been asserted with respect to such returns.
(l) Such Acquired Portfolio is a separate series of the Trust that is treated as a corporation separate from any and all other series of the Trust under Section 851(g) of the Code. For each taxable year of its operation (including the current taxable year, assuming such year ends on the Closing Date), such Acquired Portfolio has met (or will meet) the requirements of Subchapter M of Chapter 1 of the Code for qualification and treatment as a “regulated investment company” and has been (or will be) eligible to compute and has computed (or will compute) its federal income tax under Section 852 of the Code. For each taxable year of its operation (including the current taxable year, assuming such year ends on the Closing Date), such Acquired Portfolio will have distributed, on or before the Closing Date, substantially all of (a) its investment company taxable income (as defined in the Code) (computed without regard to any deduction for dividends paid), (b) the excess of its interest income excludable from gross income under Section 103(a) of the Code, if any, over its deductions disallowed under Section 265 and Section 171(a)(2) of the Code, and (c) any net capital gain (as defined in the Code) (after reduction for any allowable capital loss carryover) that has accrued or been recognized, respectively, through the Closing Date such that for all tax periods ending on or before the Closing Date (and treating the current taxable year as ending on the Closing Date) such Acquired Portfolio will not have any unpaid tax liability under Section 852 of the Code. For each calendar year of its operation (including the calendar year that includes the Closing Date), such Acquired Portfolio will have made such distributions, if any, on or before the Closing Date, as are necessary so that for all calendar years ending on or before the Closing Date, and for the calendar year that includes the Closing Date, such Acquired Portfolio will not have any unpaid tax liability under Section 4982 of the Code.
(m) All issued and outstanding Acquired Portfolio Shares of such Acquired Portfolio are, and on the Closing Date will be, duly authorized and validly and legally issued and outstanding, fully paid and non-assessable by the Trust and have been offered and sold in any state, territory or the District of Columbia in compliance in all material respects with applicable registration requirements of all applicable federal and state securities laws. All of the issued and outstanding Acquired Portfolio Shares of such Acquired Portfolio will, at the time of Closing, be held by the persons and in the amounts set forth in the records of the Transfer Agent, on behalf of such Acquired Portfolio, as provided in paragraph 3.3. Such Acquired Portfolio does not have outstanding any options, warrants or other rights to subscribe for or purchase any of the Acquired Portfolio Shares of such Acquired Portfolio, nor is there outstanding any security convertible into any of the Acquired Portfolio Shares of such Acquired Portfolio.
(n) The execution, delivery and performance of this Agreement, and the transactions contemplated herein, have been duly authorized by all necessary action on the part of the Board, on behalf of such Acquired Portfolio, and this Agreement constitutes a valid and binding obligation of the Trust, on behalf of such Acquired Portfolio, enforceable in accordance with its terms, subject, as to enforcement, to bankruptcy, insolvency, reorganization, moratorium and other laws relating to or affecting creditors’ rights and to general equity principles.
(o) The information to be furnished by the Trust, on behalf of such Acquired Portfolio, for use in any documents filed or to be filed with any federal, state or local regulatory authority, which may be necessary in connection with the transactions contemplated hereby, shall be accurate and complete in all material respects and shall comply in all material respects with federal securities and other laws and regulations thereunder applicable thereto.
(p) The Registration Statement (as defined in paragraph 5.8), insofar as it relates to such Acquired Portfolio, on the effective date of the Registration Statement and on the Closing Date, will (i) not contain any statement which, at the time and in the light of the circumstances under which it is made, is false or misleading with respect to any material fact, or which omits to state any material fact necessary in order to make the statements therein not false or misleading (provided that this representation and warranty shall not apply to statements in or omissions from the Registration Statement made in reliance upon and in conformity with information that was furnished by the Trust, on behalf of the corresponding Acquiring Portfolio, for use therein), and (ii) comply in all material respects with the provisions of the 1933 Act, the 1934 Act and the 1940 Act and the rules and regulations thereunder.
(q) For each calendar quarter of its operation ending on or before the Closing Date, such Acquired Portfolio has complied with the diversification requirements imposed by Section 817(h) of the Code and the Treasury Regulations thereunder on certain insurance company segregated asset accounts. At all relevant times on or before the Closing Date, the Acquired Portfolio has been an investment company to which Treasury Regulations Section 1.817-5(f) applies.
4.2 Except as has been fully disclosed in Schedule 4.2 to this Agreement, the Trust, on behalf of each Acquiring Portfolio, represents and warrants as follows:
(a) Such Acquiring Portfolio is duly established as a series of the Trust, which is a statutory trust duly organized, validly existing and in good standing under the laws of the State of Delaware, with the power under the Declaration, to own all of the assets of
A-5
such Acquiring Portfolio and to carry on its business as it is being conducted as of the date hereof. The Trust is duly qualified to do business as a foreign trust in each jurisdiction in which the conduct of its business makes such qualification necessary except where the failure to so qualify would not have a material adverse effect on the condition (financial or otherwise), business, properties, net assets or results of operations of the Trust. The Trust has all necessary federal, state and local authorization to carry on its business as now being conducted and to fulfill the terms of this Agreement except as described in paragraph 4.2(c).
(b) The Trust is a registered open-end management investment company, and its registration with the Commission as an investment company under the 1940 Act, and the registration of each class of Acquiring Portfolio Shares under the 1933 Act, is in full force and effect or will be in full force and effect as of the Closing Date.
(c) No consent, approval, authorization, or order of any court or governmental authority is required for the consummation by the Acquiring Portfolio of the transactions contemplated herein, except such as may be required under the 1933 Act, the 1934 Act, the 1940 Act, state securities laws and the Hart-Scott-Rodino Act.
(d) The current prospectus and statement of additional information of such Acquiring Portfolio and each prospectus and statement of additional information of such Acquiring Portfolio used during the three (3) years prior to the date of this Agreement conforms or conformed at the time of its use in all material respects to the applicable requirements of the 1933 Act and the 1940 Act and the rules and regulations of the Commission thereunder and does not or did not at the time of its use include any untrue statement of a material fact or omit to state any material fact required to be stated therein or necessary to make the statements therein, in light of the circumstances under which they were made, not materially misleading.
(e) Such Acquiring Portfolio is not engaged currently, and the execution, delivery and performance of this Agreement by the Trust, on behalf of such Acquiring Portfolio, will not result, in a material violation of Delaware law or the Declaration or the by-laws of the Trust, or of any agreement, indenture, instrument, contract, lease or other undertaking to which the Trust, on behalf of such Acquiring Portfolio, is a party or by which it is bound, and the execution, delivery and performance of this Agreement by the Trust, on behalf of such Acquiring Portfolio, will not result in the acceleration of any material obligation, or the imposition of any material penalty, under any agreement, indenture, instrument, contract, lease, judgment or decree to which the Trust, on behalf of such Acquiring Portfolio, is a party or by which it is bound.
(f) No litigation or administrative proceeding or investigation of or before any court or governmental body is pending or, to the Trust’s knowledge, threatened against the Trust, with respect to such Acquiring Portfolio, or any of its properties or assets, that, if adversely determined, would materially and adversely affect its financial condition or the conduct of such Acquiring Portfolio’s business. The Trust, on behalf of such Acquiring Portfolio, is not a party to or subject to the provisions of any order, decree or judgment of any court or governmental body that materially and adversely affects such Acquiring Portfolio’s business or the Trust’s ability to consummate the transactions herein contemplated on behalf of such Acquiring Portfolio.
(g) The Statement of Assets and Liabilities, Statements of Operations and Changes in Net Assets and Schedule of Investments of such Acquiring Portfolio for the most recently completed fiscal year of such Acquiring Portfolio prior to the date of this Agreement have been audited by Ernst & Young LLP, independent registered public accounting firm, and are in accordance with GAAP consistently applied, and such statements (true and correct copies of which have been furnished to the Trust) present fairly, in all material respects, the financial condition of such Acquiring Portfolio as of such date and for such period in accordance with GAAP, and there are no known contingent, accrued or other liabilities of such Acquiring Portfolio required to be reflected on a balance sheet (including the notes thereto) in accordance with GAAP as of such date that are not disclosed therein.
(h) Since the last day of the most recently completed fiscal year of such Acquiring Portfolio prior to the date of this Agreement, there has not been any material adverse change in such Acquiring Portfolio’s financial condition, assets, liabilities or business, or any incurrence by such Acquiring Portfolio of indebtedness for money borrowed maturing more than one year from the date such indebtedness was incurred. For the purposes of this subparagraph (h), a decline in net asset value per share of Acquiring Portfolio Shares due to declines in market values of securities held by such Acquiring Portfolio, the discharge of Acquiring Portfolio liabilities, or the redemption of Acquiring Portfolio Shares by shareholders of such Acquiring Portfolio shall not constitute a material adverse change.
(i) On the Closing Date, all federal and other tax returns, dividend reporting forms and other tax-related reports of such Acquiring Portfolio required by law to have been filed (taking into account any extensions) shall have been timely filed (taking such extensions into account) and shall be correct in all material respects, and all federal and other taxes shown as due or required to be shown as due from the Acquiring Portfolio on such tax returns, forms and reports shall have been paid or provision shall have been made for the payment thereof and, to the best of the Trust’s knowledge, no such return is currently under audit and no outstanding assessment of any tax has been asserted with respect to such returns.
A-6
(j) Such Acquiring Portfolio is a separate series of the Trust that is treated as a corporation separate from any and all other series of the Trust under Section 851(g) of the Code. For each taxable year of its operation (including the taxable year that includes the Closing Date), such Acquiring Portfolio has met (or will meet) the requirements of Subchapter M of Chapter 1 of the Code for qualification and treatment as a “regulated investment company” and has been (or will be) eligible to compute and has computed (or will compute) its federal income tax under Section 852 of the Code. For each taxable year of its operation ending prior to the Closing Date, such Acquiring Portfolio will have distributed (or will distribute pursuant to the provisions of Section 855 of the Code) substantially all of (a) its investment company taxable income (as defined in the Code) (computed without regard to any deduction for dividends paid), (b) the excess of its interest income excludable from gross income under Section 103(a) of the Code, if any, over its deductions disallowed under Section 265 and Section 171(a)(2) of the Code, and (c) any net capital gain (as defined in the Code) (after reduction for any capital loss carryover) such that for all tax periods ending prior to the Closing Date such Acquiring Portfolio will not have any unpaid tax liability under Section 852 of the Code. For each calendar year of its operation ending prior to the Closing Date, such Acquiring Portfolio will have made such distributions, if any, as are necessary so that for all calendar years ending prior to the Closing Date such Acquiring Portfolio will not have any unpaid tax liability under Section 4982 of the Code.
(k) All issued and outstanding Acquiring Portfolio Shares are, and on the Closing Date will be, duly authorized and validly and legally issued and outstanding, fully paid and non-assessable by the Trust and will have been offered and sold in any state, territory or the District of Columbia in compliance in all material respects with applicable registration requirements of all applicable federal and state securities laws. Such Acquiring Portfolio does not have outstanding any options, warrants or other rights to subscribe for or purchase any Acquiring Portfolio Shares, nor is there outstanding any security convertible into any Acquiring Portfolio Shares. All of the Acquiring Portfolio Shares to be issued and delivered to the Trust, for the account of the Acquired Portfolio Shareholders, pursuant to this Agreement, will on the Closing Date have been duly authorized and, when so issued and delivered, will be duly and validly and legally issued Acquiring Portfolio Shares and be fully paid and non–assessable by the Trust.
(l) The execution, delivery and performance of this Agreement, and the transactions contemplated herein, have been duly authorized by all necessary action on the part of the Board, on behalf of such Acquiring Portfolio, and this Agreement constitutes a valid and binding obligation of the Trust, on behalf of such Acquiring Portfolio, enforceable in accordance with its terms, subject, as to enforcement, to bankruptcy, insolvency, reorganization, moratorium and other laws relating to or affecting creditors’ rights and to general equity principles.
(m) The information to be furnished by the Trust, on behalf of such Acquiring Portfolio, for use in any documents filed or to be filed with any federal, state or local regulatory authority, which may be necessary in connection with the transactions contemplated hereby, shall be accurate and complete in all material respects and shall comply in all material respects with federal securities and other laws and regulations applicable thereto.
(n) The Registration Statement (as defined in paragraph 5.8), insofar as it relates to such Acquiring Portfolio, on the effective date of the Registration Statement and on the Closing Date, will (i) not contain any statement which, at the time and in the light of the circumstances under which it is made, is false or misleading with respect to any material fact, or which omits to state any material fact necessary to make the statements therein not false or misleading (provided that this representation and warranty shall not apply to statements in or omissions from the Registration Statement made in reliance upon and in conformity with information that was furnished by the Trust, on behalf of the corresponding Acquired Portfolio, for use therein) and (ii) comply in all material respects with the provisions of the 1933 Act, the 1934 Act and the 1940 Act and the rules and regulations thereunder.
(o) For each calendar quarter of its operation ending on or before the Closing Date, such Acquiring Portfolio has complied with the diversification requirements imposed by Section 817(h) of the Code and the Treasury Regulations thereunder on certain insurance company segregated asset accounts. At all relevant times on or before the Closing Date, such Acquiring Portfolio has been an investment company to which Treasury Regulations Section 1.817-5(f) applies.
The Trust, on behalf of each Acquired Portfolio, and the Trust, on behalf of each Acquiring Portfolio, respectively, hereby further covenant as follows:
5.1 The Acquired Portfolio and the Acquiring Portfolio each will operate its business in the ordinary course and shall comply in all material respects with all applicable laws, rules and regulations between the date hereof and the Closing Date, it being understood that such ordinary course of business will include the declaration and payment of customary dividends and other distributions, and any other distribution that may be advisable.
5.2 The Acquiring Portfolio Shares to be acquired by such Acquired Portfolio hereunder are not being acquired for the purpose of making any distribution thereof, other than in accordance with the terms of this Agreement.
A-7
5.3 The Trust, on behalf of each Acquired Portfolio, will assist the Trust in obtaining such information as the Trust reasonably requests concerning the beneficial ownership of the Acquired Portfolio Shares.
5.4 Subject to the provisions of this Agreement, the Trust, on behalf of each Acquiring Portfolio, and the Trust, on behalf of each Acquired Portfolio, each will take, or cause to be taken, all action, and do or cause to be done, all things reasonably necessary, proper or advisable to consummate and make effective the transactions contemplated by this Agreement.
5.5 Each of the Trust, on behalf of each Acquiring Portfolio, and the Trust, on behalf of each Acquired Portfolio, will use all reasonable efforts to fulfill or obtain the fulfillment of the conditions precedent to effect the transactions contemplated by this Agreement as promptly as practicable.
5.6 The Trust, on behalf of each Acquired Portfolio, will, from time to time, as and when reasonably requested by the Trust, execute and deliver or cause to be executed and delivered all such assignments and other instruments and will take or cause to be taken such further action as the Trust, on behalf of the corresponding Acquiring Portfolio, may reasonably deem necessary or desirable in order to vest in and confirm (a) the Trust’s title to and possession of the Acquiring Portfolio Shares to be delivered hereunder and (b) the Trust’s title to and possession of all the Assets, and to otherwise to carry out the intent and purpose of this Agreement.
5.7 The Trust, on behalf of each Acquiring Portfolio, will use all reasonable efforts to obtain the approvals and authorizations required by the 1933 Act, the 1940 Act and such of the state blue sky or securities laws as may be necessary in order to continue its operations after the Closing Date.
5.8 The Trust, on behalf of such Acquiring Portfolio, shall prepare and file a registration statement on Form N-14 in compliance with the 1933 Act, the 1934 Act and the 1940 Act and the rules and regulations thereunder with respect to the Reorganization (the “Registration Statement”). The Trust, on behalf of such Acquired Portfolio, will provide to the Trust such information regarding the Acquired Portfolio as may be reasonably necessary for the preparation of the Registration Statement.
| 6. | CONDITIONS PRECEDENT TO OBLIGATIONS OF EACH ACQUIRED PORTFOLIO |
The obligations of the Trust, on behalf of each Acquired Portfolio, to consummate the Reorganization of such Acquired Portfolio shall be subject, at the Trust’s election, to the following conditions with respect to the applicable Acquired Portfolio:
6.1 All representations and warranties of the Trust, on behalf of such Acquiring Portfolio, contained in this Agreement shall be true and correct in all material respects as of the date hereof and, except as they may be affected by the transactions contemplated by this Agreement, as of the Closing Date, with the same force and effect as if made on and as of the Closing Date.
6.2 The Trust, on behalf of such Acquiring Portfolio, shall have performed all of the covenants and complied with all of the provisions required by this Agreement to be performed or complied with by the Trust, on behalf of such Acquiring Portfolio, on or before the Closing Date.
6.3 The Trust, on behalf of such Acquiring Portfolio, shall have executed and delivered to the Trust, on behalf of the corresponding Acquired Portfolio, an assumption of the Liabilities of such Acquired Portfolio and all such other agreements and instruments as the Trust may reasonably deem necessary or desirable in order to vest in and confirm (a) such Acquired Portfolio’s title to and possession of the Acquiring Portfolio Shares to be delivered hereunder and (b) the Trust’s assumption of all of the Liabilities, and to otherwise to carry out the intent and purpose of this Agreement.
6.4 The Trust, on behalf of such Acquiring Portfolio, shall have delivered to the Trust, on behalf of the corresponding Acquired Portfolio, a certificate executed in the name of the Trust, on behalf of such Acquiring Portfolio, by the Trust’s President or Vice President and its Treasurer or Assistant Treasurer, in a form reasonably satisfactory to the Trust and dated as of the Closing Date, as to the matters set forth in paragraphs 6.1 and 6.2 and as to such other matters as the Trust shall reasonably request.
6.5 The Trust, on behalf of such Acquiring Portfolio, and the Trust, on behalf of the corresponding Acquired Portfolio, shall have agreed on the number of full and fractional Acquiring Portfolio Shares to be issued in connection with the Reorganization after such number has been calculated in accordance with paragraph 1.1.
A-8
| 7. | CONDITIONS PRECEDENT TO OBLIGATIONS OF EACH ACQUIRING PORTFOLIO |
The obligations of the Trust, on behalf of each Acquiring Portfolio, to consummate the Reorganization of such Acquiring Portfolio shall be subject, at the Trust’s election, to the following conditions with respect to the applicable Acquiring Portfolio:
7.1 All representations and warranties of the Trust, on behalf of such Acquired Portfolio, contained in this Agreement shall be true and correct in all material respects as of the date hereof and, except as they may be affected by the transactions contemplated by this Agreement, as of the Closing Date, with the same force and effect as if made on and as of the Closing Date.
7.2 The Trust, on behalf of such Acquired Portfolio, shall have performed all of the covenants and complied with all of the provisions required by this Agreement to be performed or complied with by the Trust, on behalf of such Acquired Portfolio, on or before the Closing Date.
7.3 The Trust on behalf of such Acquired Portfolio, shall have delivered to the Trust, on behalf of the corresponding Acquiring Portfolio, a Statement of Assets and Liabilities of such Acquired Portfolio as of the Closing Date, including a schedule of investments, certified by the Treasurer of the Trust on behalf of such Acquired Portfolio. The Trust, on behalf of such Acquired Portfolio, shall have executed and delivered all such assignments and other instruments of transfer as the Trust may reasonably deem necessary or desirable in order to vest in and confirm (a) the Acquired Portfolio’s title to and possession of the Acquiring Portfolio Shares to be delivered hereunder and (b) the Acquiring Portfolio’s title to and possession of all the Assets and to otherwise to carry out the intent and purpose of this Agreement.
7.4 The Trust, on behalf of such Acquired Portfolio, shall have delivered to the Trust, on behalf of the corresponding Acquiring Portfolio, a certificate executed in the name of the Trust, on behalf of such Acquired Portfolio, by the Trust’s President or Vice President and its Treasurer or Assistant Treasurer, in a form reasonably satisfactory to the Trust and dated as of the Closing Date, as to the matters set forth in paragraphs 7.1 and 7.2 and as to such other matters as the Trust shall reasonably request.
7.5 The Trust, on behalf of such Acquired Portfolio, and the Trust, on behalf of the corresponding Acquiring Portfolio, shall have agreed on the number of full and fractional Acquiring Portfolio Shares to be issued by such Acquiring Portfolio in connection with the Reorganization after such number has been calculated in accordance with paragraph 1.1.
| 8. | FURTHER CONDITIONS PRECEDENT TO OBLIGATIONS OF EACH ACQUIRING PORTFOLIO AND EACH CORRESPONDING ACQUIRED PORTFOLIO |
If any of the conditions set forth below have not been satisfied on or before the Closing Date with respect to the Trust, on behalf of each Acquired Portfolio, or the Trust, on behalf of the corresponding Acquiring Portfolio, the other party to this Agreement shall be entitled on behalf of the corresponding Acquired Portfolio or Acquiring Portfolio, as applicable, at its option, to (and shall, in the case of a failure to satisfy the conditions set forth in paragraph 8.4) refuse to consummate the transactions contemplated by this Agreement with respect to the applicable Acquired Portfolio and its corresponding Acquiring Portfolio:
8.1 On the applicable Closing Date, no court or governmental agency of competent jurisdiction shall have issued any order that remains in effect and that restrains or enjoins the Trust, with respect to such Acquired Portfolio, or the Trust, with respect to such Acquiring Portfolio, from completing the transactions contemplated by this Agreement.
8.2 All consents of other parties and all other consents, orders and permits of federal, state and local regulatory authorities deemed necessary by the Trust, on behalf of each Acquired Portfolio, or the Trust, on behalf of the corresponding Acquiring Portfolio, to permit consummation, in all material respects, of the transactions contemplated hereby shall have been obtained, except where failure to obtain any such consent, order or permit would not involve a risk of a material adverse effect on the assets or properties of such Acquiring Portfolio or such Acquired Portfolio, provided that either party hereto may for itself waive any of such conditions.
8.3 The Registration Statement shall have become effective under the 1933 Act and no stop orders suspending the effectiveness thereof shall have been issued and, to the best knowledge of the parties hereto, no investigation or proceeding for that purpose shall have been instituted or be pending.
8.4 The parties shall have received the opinion of Morgan, Lewis & Bockius LLP, dated the Closing Date, substantially to the effect that, based upon certain facts, assumptions and representations and upon certifications made by the Trust, on behalf of the applicable Acquired Portfolio, and the Trust, on behalf of the applicable Acquiring Portfolio, (i) the Reorganization will constitute a “reorganization” within the meaning of Section 368(a) of the Code, and the applicable Acquired Portfolio and the corresponding Acquiring Portfolio will each be a “party to a reorganization” within the meaning of Section 368(b) of the Code; (ii) no gain or loss will be recognized by such Acquiring Portfolio upon receipt of the Assets of the corresponding Acquired Portfolio solely in exchange for the applicable Acquiring Portfolio Shares and the assumption by the Trust, on behalf of such Acquiring Portfolio, of the Liabilities
A-9
of the applicable Acquired Portfolio as part of the Reorganization; (iii) the tax basis in the hands of such Acquiring Portfolio of the Assets of the corresponding Acquired Portfolio transferred to the Acquiring Portfolio in the Reorganization will be the same as the tax basis of such Assets in the hands of the Acquired Portfolio immediately prior to the transfer, increased by the amount of gain (or decreased by the amount of loss), if any, recognized by the Acquired Portfolio upon the transfer; (iv) the holding period in the hands of such Acquiring Portfolio of each Asset transferred to the Acquiring Portfolio in the Reorganization, other than Assets with respect to which gain or loss is required to be recognized in the Reorganization, will include the period during which the Asset was held by such Acquired Portfolio (except where investment activities of the Acquiring Portfolio have the effect of reducing or eliminating the holding period with respect to an Asset); (v) no gain or loss will be recognized by such Acquired Portfolio in the Reorganization upon the transfer of its Assets to the corresponding Acquiring Portfolio solely in exchange for the applicable Acquiring Portfolio Shares and the assumption by the Trust, on behalf of the Acquiring Portfolio, of the Liabilities of the Acquired Portfolio, or upon the distribution of the Acquiring Portfolio Shares by the Acquired Portfolio to its shareholders in complete liquidation of the Acquired Portfolio, except for (A) any gain or loss that may be recognized with respect to contracts subject to Section 1256 of the Code, (B) any gain that may be recognized on the transfer of stock in a “passive foreign investment company” as defined in Section 1297(a) of the Code and (C) any other gain or loss that may be required to be recognized as a result of the closing of the Acquired Portfolio’s taxable year or upon the transfer of an Asset regardless of whether such transfer would otherwise be a non-recognition transaction under the Code; (vi) no gain or loss will be recognized by the Acquired Portfolio Shareholders of such Acquired Portfolio upon the exchange of their Acquired Portfolio Shares solely for Acquiring Portfolio Shares of the corresponding Acquiring Portfolio as part of the Reorganization; (vii) the aggregate tax basis of the Acquiring Portfolio Shares that each Acquired Portfolio Shareholder of the applicable Acquired Portfolio receives in the Reorganization will be the same as the aggregate tax basis of its Acquired Portfolio Shares exchanged therefor; and (viii) each Acquired Portfolio Shareholder’s holding period for its Acquiring Portfolio Shares received in the Reorganization will include the holding period for the Acquired Portfolio Shares exchanged therefor, provided that it held such Acquired Portfolio Shares as capital assets on the date of the exchange. The delivery of such opinion is conditioned upon the receipt by Morgan, Lewis & Bockius LLP of representations it shall request of the Trust. Notwithstanding anything herein to the contrary, the Trust may not waive the condition set forth in this paragraph 8.4 on behalf of any Acquired Portfolio or Acquiring Portfolio.
8.5 The Trust, on behalf of each Acquiring Portfolio, shall have received on the applicable Closing Date an opinion of Morgan, Lewis & Bockius LLP, in a form reasonably satisfactory to the Trust, and dated as of the Closing Date, substantially to the effect that, based upon certain facts and certifications made by the Trust, on behalf of the Acquired Portfolio, and its authorized officers: (a) the Trust is a statutory trust existing under the laws of the State of Delaware; (b) the Trust, with respect to the corresponding Acquired Portfolio, has the power as a statutory trust to carry on its business as presently conducted in accordance with the description thereof in the Trust’s registration statement as an open-end investment company registered under the 1940 Act; (c) this Agreement has been duly authorized, executed and, so far as known to such counsel, delivered by the Trust, on behalf of the corresponding Acquired Portfolio, and constitutes a valid and legally binding obligation of the Trust, on behalf of the corresponding Acquired Portfolio, enforceable against the Trust in accordance with its terms; and (d) the execution and delivery of this Agreement did not, and the transfer of the Assets for Acquiring Portfolio Shares and the assumption by the Acquiring Portfolio of the Liabilities pursuant to this Agreement will not, violate the Declaration or the by-laws of the Trust. Such opinion may state that it is solely for the benefit of the Trust and the Board. Such opinion may contain such assumptions and limitations as shall be in the opinion of Morgan, Lewis & Bockius LLP appropriate to render the opinions expressed therein.
8.6 The Trust, on behalf of each Acquired Portfolio, shall have received on the applicable Closing Date an opinion of Morgan, Lewis & Bockius LLP, in a form reasonably satisfactory to the Trust, and dated as of the Closing Date, substantially to the effect that, based upon certain facts and certifications made by the Trust, on behalf of the corresponding Acquiring Portfolio and its authorized officers: (a) the Trust is a statutory trust validly existing under the laws of the State of Delaware; (b) the Trust, with respect to the corresponding Acquiring Portfolio, has the power as a statutory trust to carry on its business as presently conducted in accordance with the description thereof in the Trust’s registration statement as an open-end investment company registered under the 1940 Act; (c) this Agreement has been duly authorized, executed and, so far as known to such counsel, delivered by the Trust, on behalf of the corresponding Acquiring Portfolio, and constitutes a valid and legally binding obligation of the Trust, on behalf of the corresponding Acquiring Portfolio, enforceable against the Trust in accordance with its terms; and (d) the execution and delivery of this Agreement did not, and the issuance of the Acquiring Portfolio Shares and the assumption of the Liabilities in exchange for the transfer of the Assets pursuant to this Agreement will not, violate the Declaration or the by-laws of the Trust. Such opinion may state that it is solely for the benefit of the Trust and the Board. Such opinion may contain such assumptions and limitations as shall be in the opinion of Morgan, Lewis & Bockius LLP appropriate to render the opinions expressed therein.
9.1 The Trust, out of each Acquiring Portfolio’s assets and property (including any amounts paid to the Acquiring Portfolio pursuant to any applicable liability insurance policies or indemnification agreements), agrees to indemnify and hold harmless the Trust and the members of the Board and its officers from and against any and all losses, claims, damages, liabilities or expenses (including, without limitation, the payment of reasonable legal fees and reasonable costs of investigation) to which the Trust and those board members and officers may become subject, insofar as such loss, claim, damage, liability or expense (or actions with respect thereto)
A-10
arises out of or is based on (a) any breach by the Trust, on behalf of an Acquiring Portfolio, of any of its representations, warranties, covenants or agreements set forth in this Agreement or (b) any act, error, omission, neglect, misstatement, materially misleading statement, breach of duty or other act wrongfully done or attempted to be committed by the Trust or the members of the Board or its officers prior to the Closing Date, provided that such indemnification by the Trust is not (i) in violation of any applicable law or (ii) otherwise prohibited as a result of any applicable order or decree issued by any governing regulatory authority or court of competent jurisdiction.
9.2 The Trust, out of each Acquired Portfolio’s assets and property (including any amounts paid to the Acquired Portfolio pursuant to any applicable liability insurance policies), agrees to indemnify and hold harmless the Trust and the members of the Board and its officers from and against any and all losses, claims, damages, liabilities or expenses (including, without limitation, the payment of reasonable legal fees and reasonable costs of investigation) to which the Trust and those board members and officers may become subject, insofar as such loss, claim, damage, liability or expense (or actions with respect thereto) arises out of or is based on (a) any breach by the Trust, on behalf of an Acquired Portfolio, of any of its representations, warranties, covenants or agreements set forth in this Agreement or (b) any act, error, omission, neglect, misstatement, materially misleading statement, breach of duty or other act wrongfully done or attempted to be committed by the Trust or the members of the Board or its officers prior to the Closing Date, provided that such indemnification by the Trust is not (i) in violation of any applicable law or (ii) otherwise prohibited as a result of any applicable order or decree issued by any governing regulatory authority or court of competent jurisdiction.
| 10. | BROKER FEES AND EXPENSES |
10.1 The Trust, on behalf of each Acquiring Portfolio, and the Trust, on behalf of each Acquired Portfolio, represent and warrant to each other that there are no brokers or finders entitled to receive any payments in connection with the transactions provided for herein.
10.2 The costs of each Reorganization will be borne by the applicable Acquired Portfolio. Notwithstanding any of the foregoing, expenses will in any event be paid by the party directly incurring such expenses (without reimbursement by another person) if and to the extent that the payment by another person of such expenses would prevent such party from being treated as a “regulated investment company” under the Code or would prevent the Reorganization from qualifying as a reorganization within the meaning of Section 368(a) of the Code or otherwise result in the imposition of tax on the Acquired Portfolio or the Acquiring Portfolio or on shareholders of the Acquired Portfolio or the Acquiring Portfolio.
| 11. | ENTIRE AGREEMENT; SURVIVAL OF WARRANTIES |
11.1 The Trust, on behalf of each Acquiring Portfolio, and the Trust, on behalf of each Acquired Portfolio, agree that neither party has made any representation, warranty or covenant, on behalf of an Acquiring Portfolio or an Acquired Portfolio, respectively, not set forth herein and that this Agreement constitutes the entire agreement between the parties.
11.2 The covenants to be performed after the Closing by both the Trust, on behalf of each Acquired Portfolio, or the Trust, on behalf of the corresponding Acquiring Portfolio, and the obligations of the Trust, on behalf of each Acquiring Portfolio, in Article 9, shall survive the Closing. All other representations, warranties and covenants contained in this Agreement or in any document delivered pursuant hereto or in connection herewith shall not survive the consummation of the transactions contemplated hereunder and shall terminate on the Closing.
This Agreement may be terminated and the transactions contemplated hereby may be abandoned with respect to any Acquiring Portfolio or Acquired Portfolio at any time prior to the Closing Date with respect to the applicable Reorganization by resolution of either the Board, on behalf of each Acquired Portfolio, or the Board, on behalf of the corresponding Acquiring Portfolio, if circumstances should develop that, in the opinion of that Board, make proceeding with the Agreement inadvisable with respect to such Acquiring Portfolio or such Acquired Portfolio, respectively. Any such termination resolution will be effective when communicated to the other party. The termination of this Agreement with respect to an Acquired Portfolio or its corresponding Acquiring Portfolio shall not affect the continued effectiveness of this Agreement with respect to any other Acquired Portfolio or Acquiring Portfolio, nor shall it affect the rights and obligations of any party in respect of any breach of this Agreement occurring prior to such termination.
This Agreement may be amended, modified or supplemented in such manner as may be deemed necessary or advisable by the authorized officers of the Trust, on behalf of each Acquired Portfolio, or the Trust, on behalf of the corresponding Acquiring Portfolio.
A-11
Any notice, report, statement or demand required or permitted by any provisions of this Agreement shall be in writing and shall be given by facsimile, electronic delivery (i.e., e-mail), personal service or prepaid or certified mail addressed to the Trust, on behalf of each Acquired Portfolio, or the Trust, on behalf of the corresponding Acquiring Portfolio, at its address set forth in the preamble to this Agreement, in each case to the attention of its President.
| 15. | HEADINGS; COUNTERPARTS; GOVERNING LAW; SEVERABILITY; ASSIGNMENT; LIMITATION OF LIABILITY |
15.1 The Article headings contained in this Agreement are for reference purposes only and shall not affect in any way the meaning or interpretation of this Agreement.
15.2 This Agreement may be executed in any number of counterparts, each of which shall be deemed an original.
15.3 This Agreement shall be governed by and construed and interpreted in accordance with the internal laws of the State of New York.
15.4 This Agreement shall bind and inure to the benefit of the parties hereto and their respective successors and assigns, but no assignment or transfer hereof or of any rights or obligations hereunder shall be made by any party without the written consent of the other parties. Nothing herein expressed or implied is intended or shall be construed to confer upon or give any person, firm or corporation, other than the parties hereto and their respective successors and assigns, any rights or remedies under or by reason of this Agreement.
15.5 The warranties, representations and agreements contained in this Agreement made by the Trust, on behalf of each of the Acquired Portfolios, are made on a several (and not joint, or joint and several) basis. Similarly, the warranties, representations and agreements contained in this Agreement made by the Trust, on behalf of each of the Acquiring Portfolios, are made on a several (and not joint, or joint and several) basis.
[Rest of page intentionally left blank]
A-12
IN WITNESS WHEREOF, each of the parties hereto has caused this Agreement to be executed by its duly authorized officer.
| | |
| TRANSAMERICA SERIES TRUST, on behalf of each Acquiring Portfolio listed on Exhibit A attached hereto |
| |
| By: | | |
| Name: | | |
| Title: | | |
|
| TRANSAMERICA SERIES TRUST, on behalf of each Acquired Portfolio listed on Exhibit A attached hereto |
| |
| By: | | |
| Name: | | |
| Title: | | |
A-13
Exhibit A
| | |
Acquired Portfolio/Classes | | Acquiring Portfolio/Classes |
| Transamerica Voya Limited Maturity Bond VP | | Transamerica JP Morgan Core Bond VP |
Initial Class | | Initial Class |
Service Class | | Service Class |
| |
| Transamerica Voya Mid Cap Opportunities VP | | Transamerica Janus Mid-Cap Growth VP |
Initial Class | | Initial Class |
Service Class | | Service Class |
A-14
SCHEDULE 4.1
[ ]
A-15
SCHEDULE 4.2
[ ]
A-16
EXHIBIT B
Information Regarding Parent Entities of “Control Persons”
| | |
Entity | | Place of Organization |
The Aegon Trust | | Delaware |
Transamerica Corporation | | Delaware |
Aegon U.S. Holding Corporation | | Delaware |
Aegon USA, LLC | | Iowa |
Commonwealth General Corporation | | Delaware |
Transamerica Premier Life Insurance Company | | Iowa |
Transamerica International Holdings, Inc. | | Delaware |
Transamerica Life Insurance Company | | Iowa |
B-1
The information in this Statement of Additional Information is not complete and may be changed. We may not sell these securities until the registration statement filed with the Securities and Exchange Commission is effective. This Statement of Additional Information is not an offer to sell these securities and it is not soliciting an offer to buy these securities in any state where the offer or sale is not permitted.
PART B
TRANSAMERICA SERIES TRUST
on behalf of its Series:
TRANSAMERICA JPMORGAN CORE BOND VP
TRANSAMERICA JANUS MID-CAP GROWTH VP
(each a “Destination Portfolio”)
1801 California St., Suite 5200
Denver, CO 80202
(Toll free) 1-888-233-4339
STATEMENT OF ADDITIONAL INFORMATION
[ ], 2016
This Statement of Additional Information (“SAI”) is not a prospectus and should be read in conjunction with the combined Information Statement and Prospectus dated [ ], 2016 (the “Information Statement/Prospectus”), which relates to Initial Class and Service Class shares of the Destination Portfolios to be issued in exchange for shares of Transamerica Voya Limited Maturity Bond and Transamerica Voya Mid Cap Opportunities VP (each a “Target Portfolio”), as shown below. Please retain this SAI for further reference.
To obtain a copy of the Information Statement/Prospectus, free of charge, please write to your Destination Portfolio at the address set forth above or call your Destination Portfolio at the number set forth above.
| | | | |
| | |
| | Target Portfolio & Shares | | Destination Portfolio & Shares |
| | Transamerica Voya Limited Maturity Bond VP | | Transamerica JPMorgan Core Bond VP |
| | Initial Class | | Initial Class |
| | Service Class | | Service Class |
| | | | |
| | Transamerica Voya Mid Cap Opportunities VP | | Transamerica Janus Mid-Cap Growth VP |
| | Initial Class | | Initial Class |
| | Service Class | | Service Class |
1
TABLE OF CONTENTS
2
INTRODUCTION
This SAI is intended to supplement the Information Statement/Prospectus relating specifically to the proposed transfer of all of the assets of each Target Portfolio to, and the assumption of the liabilities of each Target Portfolio by, each corresponding Destination Portfolio in exchange for shares of each Destination Portfolio as shown in the table on the cover page of this SAI.
DOCUMENTS INCORPORATED BY REFERENCE
This SAI consists of these cover pages and the following documents, each of which was filed electronically with the Securities and Exchange Commission (the “SEC”) and is incorporated by reference herein.
1. The Portfolios’ Statement of Additional Information dated May 1, 2016, as amended and restated on July 1, 2016 (File Nos. 811-04419 and 033-00507) as filed with the SEC on July 1, 2016 (Accession No. 0001193125-16-638511) is incorporated herein by reference.
2. The Portfolios’ Annual Report for the fiscal year ended December 31, 2015 (File No. 811-04419), as filed with the SEC on March 4, 2016 (Accession No. 0001193125-16-493174) is incorporated herein by reference.
3. The Portfolios’ Semi-Annual Report for the fiscal period ended June 30, 2016 (File No. 811-04419), as filed with the SEC on September 1, 2016 (Accession No. 0001193125-16-699234) is incorporated herein by reference.
FINANCIAL STATEMENTS
Shown below are the financial statements for the Target Portfolio and the Destination Portfolio.
The pro forma financial statements are unaudited.
Reorganization Between Voya Limited Maturity Bond VP and JPMorgan Core Bond VP
PRO FORMA SCHEDULE OF INVESTMENTS
At June 30, 2016
| | | | | | | | | | | | | | | | | | | | | | | | | | | | | | | | | | | | | | | | | | | | | | | | | | | | |
| | | | | | | | | Voya Limited
Maturity Bond VP | | | | | | JPMorgan Core
Bond VP | | | | | | Adjustments | | | | | | Combined Pro
Forma Portfolio | |
| | | | | | | | | | | | | |
| | | Coupon Rate | | | Maturity Date | | | Principal | | | Value | | | | | | Principal | | | Value | | | | | | Principal | | | Value | | | | | | Principal | | | Value | |
| | | | | | | | | | | | | | | | | | | | | | | | | | | | | | | | |
Asset-Backed Securities - 10.6 % | | | | | | | | | | | | | | | | | | | | | | | | | | | | | | | | | | | | | | | | | | | | | |
Academic Loan Funding Trust | | | 1.25 | % | | | 12/27/2022 | | | $ | - | | | $ | - | | | | | | | $ | 120,905 | | | $ | 120,717 | | | | | | | | | | | | | | | | | | | $ | 120,905 | | | $ | 120,717 | |
Ally Auto Receivables Trust | | | 0.93 | % | | | 6/20/2017 | | | | - | | | | - | | | | | | | | 107,486 | | | | 107,482 | | | | | | | | | | | | | | | | | | | | 107,486 | | | | 107,482 | |
Ally Auto Receivables Trust | | | 1.03 | % | | | 9/20/2017 | | | | - | | | | - | | | | | | | | 128,116 | | | | 128,120 | | | | | | | | | | | | | | | | | | | | 128,116 | | | | 128,120 | |
Ally Auto Receivables Trust | | | 1.21 | % | | | 12/20/2017 | | | | - | | | | - | | | | | | | | 152,000 | | | | 152,026 | | | | | | | | | | | | | | | | | | | | 152,000 | | | | 152,026 | |
Ally Auto Receivables Trust | | | 1.24 | % | | | 11/15/2018 | | | | - | | | | - | | | | | | | | 75,000 | | | | 75,161 | | | | | | | | | | | | | | | | | | | | 75,000 | | | | 75,161 | |
Ally Auto Receivables Trust | | | 1.60 | % | | | 1/15/2021 | | | | 250,000 | | | | 251,591 | | | | | | | | - | | | | - | | | | | | | | | | | | | | | | | | | | 250,000 | | | | 251,591 | |
Ally Master Owner Trust | | | 1.63 | % | | | 5/15/2020 | | | | - | | | | - | | | | | | | | 500,000 | | | | 501,462 | | | | | | | | | | | | | | | | | | | | 500,000 | | | | 501,462 | |
American Credit Acceptance Receivables Trust | | | 1.33 | % | | | 7/10/2018 | | | | - | | | | - | | | | | | | | 13,878 | | | | 13,877 | | | | | | | | | | | | | | | | | | | | 13,878 | | | | 13,877 | |
American Credit Acceptance Receivables Trust | | | 1.43 | % | | | 8/12/2019 | | | | - | | | | - | | | | | | | | 110,066 | | | | 109,929 | | | | | | | | | | | | | | | | | | | | 110,066 | | | | 109,929 | |
American Credit Acceptance Receivables Trust | | | 1.57 | % | | | 6/12/2019 | | | | - | | | | - | | | | | | | | 174,623 | | | | 174,195 | | | | | | | | | | | | | | | | | | | | 174,623 | | | | 174,195 | |
American Homes 4 Rent Trust | | | 3.47 | % | | | 4/17/2052 | | | | - | | | | - | | | | | | | | 930,107 | | | | 984,237 | | | | | | | | | | | | | | | | | | | | 930,107 | | | | 984,237 | |
American Homes 4 Rent Trust | | | 3.79 | % | | | 10/17/2036 | | | | - | | | | - | | | | | | | | 486,376 | | | | 521,754 | | | | | | | | | | | | | | | | | | | | 486,376 | | | | 521,754 | |
American Homes 4 Rent Trust | | | 5.04 | % | | | 10/17/2045 | | | | - | | | | - | | | | | | | | 700,000 | | | | 742,780 | | | | | | | | | | | | | | | | | | | | 700,000 | | | | 742,780 | |
American Homes 4 Rent Trust | | | 5.64 | % | | | 4/17/2052 | | | | - | | | | - | | | | | | | | 292,500 | | | | 299,822 | | | | | | | | | | | | | | | | | | | | 292,500 | | | | 299,822 | |
American Homes 4 Rent Trust | | | 6.07 | % | | | 10/17/2045 | | | | - | | | | - | | | | | | | | 430,000 | | | | 455,994 | | | | | | | | | | | | | | | | | | | | 430,000 | | | | 455,994 | |
American Homes 4 Rent Trust | | | 6.23 | % | | | 10/17/2036 | | | | - | | | | - | | | | | | | | 150,000 | | | | 159,847 | | | | | | | | | | | | | | | | | | | | 150,000 | | | | 159,847 | |
American Homes 4 Rent Trust | | | 6.42 | % | | | 12/17/2036 | | | | - | | | | - | | | | | | | | 175,000 | | | | 188,759 | | | | | | | | | | | | | | | | | | | | 175,000 | | | | 188,759 | |
American Residential Properties Trust | | | 2.79 | % | | | 9/17/2031 | | | | 250,000 | | | | 247,755 | | | | | | | | - | | | | - | | | | | | | | | | | | | | | | | | | | 250,000 | | | | 247,755 | |
American Tower Trust I | | | 1.55 | % | | | 3/15/2043 | | | | - | | | | - | | | | | | | | 363,000 | | | | 363,769 | | | | | | | | | | | | | | | | | | | | 363,000 | | | | 363,769 | |
American Tower Trust I | | | 3.07 | % | | | 3/15/2048 | | | | - | | | | - | | | | | | | | 350,000 | | | | 359,463 | | | | | | | | | | | | | | | | | | | | 350,000 | | | | 359,463 | |
AmeriCredit Automobile Receivables Trust | | | 0.90 | % | | | 2/8/2019 | | | | - | | | | - | | | | | | | | 411,824 | | | | 411,718 | | | | | | | | | | | | | | | | | | | | 411,824 | | | | 411,718 | |
AmeriCredit Automobile Receivables Trust | | | 0.90 | % | | | 9/10/2018 | | | | - | | | | - | | | | | | | | 84,940 | | | | 84,935 | | | | | | | | | | | | | | | | | | | | 84,940 | | | | 84,935 | |
Anchor Assets IX LLC | | | 5.13 | % | | | 2/15/2020 | | | | - | | | | - | | | | | | | | 1,000,000 | | | | 1,000,000 | | | | | | | | | | | | | | | | | | | | 1,000,000 | | | | 1,000,000 | |
ARES XI CLO, Ltd. | | | 1.88 | % | | | 10/11/2021 | | | | 250,000 | | | | 237,142 | | | | | | | | - | | | | - | | | | | | | | | | | | | | | | | | | | 250,000 | | | | 237,142 | |
ARLP Securitization Trust | | | 3.97 | % | | | 5/25/2055 | | | | - | | | | - | | | | | | | | 526,044 | | | | 513,787 | | | | | | | | | | | | | | | | | | | | 526,044 | | | | 513,787 | |
AXIS Equipment Finance Receivables III LLC | | | 1.90 | % | | | 3/20/2020 | | | | - | | | | - | | | | | | | | 244,263 | | | | 244,195 | | | | | | | | | | | | | | | | | | | | 244,263 | | | | 244,195 | |
B2R Mortgage Trust | | | 2.52 | % | | | 5/15/2048 | | | | - | | | | - | | | | | | | | 222,038 | | | | 223,356 | | | | | | | | | | | | | | | | | | | | 222,038 | | | | 223,356 | |
B2R Mortgage Trust | | | 3.34 | % | | | 11/15/2048 | | | | - | | | | - | | | | | | | | 793,860 | | | | 818,879 | | | | | | | | | | | | | | | | | | | | 793,860 | | | | 818,879 | |
BA Credit Card Trust | | | 0.71 | % | | | 9/16/2019 | | | | 100,000 | | | | 100,095 | | | | | | | | - | | | | - | | | | | | | | | | | | | | | | | | | | 100,000 | | | | 100,095 | |
Banc of America Funding Corp. | | | 3.00 | % | | | 10/26/2039 | | | | - | | | | - | | | | | | | | 171,367 | | | | 168,984 | | | | | | | | | | | | | | | | | | | | 171,367 | | | | 168,984 | |
Bank of The West Auto Trust | | | 1.65 | % | | | 3/16/2020 | | | | 400,000 | | | | 401,790 | | | | | | | | - | | | | - | | | | | | | | | | | | | | | | | | | | 400,000 | | | | 401,790 | |
Bank of The West Auto Trust | | | 1.66 | % | | | 9/15/2020 | | | | 100,000 | | | | 100,013 | | | | | | | | - | | | | - | | | | | | | | | | | | | | | | | | | | 100,000 | | | | 100,013 | |
BCC Funding Corp. X | | | 2.22 | % | | | 10/20/2020 | | | | - | | | | - | | | | | | | | 435,555 | | | | 434,869 | | | | | | | | | | | | | | | | | | | | 435,555 | | | | 434,869 | |
Blue Elephant Loan Trust | | | 3.12 | % | | | 12/15/2022 | | | | - | | | | - | | | | | | | | 180,353 | | | | 180,214 | | | | | | | | | | | | | | | | | | | | 180,353 | | | | 180,214 | |
3
| | | | | | | | | | | | | | | | | | | | | | | | | | | | | | | | | | | | | | | | | | | | | | | | | | | | |
| | | | | | | | | Voya Limited
Maturity Bond VP | | | | | | JPMorgan Core
Bond VP | | | | | | Adjustments | | | | | | Combined Pro
Forma Portfolio | |
| | | | | | | | | | | | | |
| | | Coupon Rate | | | Maturity Date | | | Principal | | | Value | | | | | | Principal | | | Value | | | | | | Principal | | | Value | | | | | | Principal | | | Value | |
| | | | | | | | | | | | | | | | | | | | | | | | | | | | | | | | |
BMW Vehicle Lease Trust | | | 1.55 | % | | | 2/20/2019 | | | $ | 60,000 | | | $ | 60,179 | | | | | | | $ | - | | | $ | - | | | | | | | | | | | | | | | | | | | $ | 60,000 | | | $ | 60,179 | |
BMW Vehicle Owner Trust | | | 0.97 | % | | | 11/26/2018 | | | | - | | | | - | | | | | | | | 193,299 | | | | 193,352 | | | | | | | | | | | | | | | | | | | | 193,299 | | | | 193,352 | |
BXG Receivables Note Trust | | | 2.66 | % | | | 12/2/2027 | | | | - | | | | - | | | | | | | | 62,939 | | | | 62,780 | | | | | | | | | | | | | | | | | | | | 62,939 | | | | 62,780 | |
Cabela’s Credit Card Master Note Trust | | | 1.78 | % | | | 6/15/2022 | | | | 300,000 | | | | 301,650 | | | | | | | | - | | | | - | | | | | | | | | | | | | | | | | | | | 300,000 | | | | 301,650 | |
Cabela’s Credit Card Master Note Trust | | | 2.26 | % | | | 3/15/2023 | | | | 600,000 | | | | 615,002 | | | | | | | | - | | | | - | | | | | | | | | | | | | | | | | | | | 600,000 | | | | 615,002 | |
California Republic Auto Receivables Trust | | | 1.33 | % | | | 4/15/2019 | | | | - | | | | - | | | | | | | | 600,000 | | | | 600,400 | | | | | | | | | | | | | | | | | | | | 600,000 | | | | 600,400 | |
Callidus Debt Partners CLO Fund VI, Ltd. | | | 0.90 | % | | | 10/23/2021 | | | | 291,042 | | | | 286,392 | | | | | | | | - | | | | - | | | | | | | | | | | | | | | | | | | | 291,042 | | | | 286,392 | |
CAM Mortgage LLC | | | 3.50 | % | | | 7/15/2064 | | | | - | | | | - | | | | | | | | 193,363 | | | | 193,436 | | | | | | | | | | | | | | | | | | | | 193,363 | | | | 193,436 | |
Capital Auto Receivables Asset Trust | | | 1.26 | % | | | 5/21/2018 | | | | - | | | | - | | | | | | | | 414,558 | | | | 414,804 | | | | | | | | | | | | | | | | | | | | 414,558 | | | | 414,804 | |
Capital Auto Receivables Asset Trust | | | 1.31 | % | | | 12/20/2017 | | | | - | | | | - | | | | | | | | 46,923 | | | | 46,927 | | | | | | | | | | | | | | | | | | | | 46,923 | | | | 46,927 | |
Capital Auto Receivables Asset Trust | | | 1.61 | % | | | 6/20/2019 | | | | 230,000 | | | | 231,057 | | | | | | | | - | | | | - | | | | | | | | | | | | | | | | | | | | 230,000 | | | | 231,057 | |
Capital One Multi-Asset Execution Trust | | | 0.82 | % | | | 1/18/2022 | | | | 500,000 | | | | 499,729 | | | | | | | | - | | | | - | | | | | | | | | | | | | | | | | | | | 500,000 | | | | 499,729 | |
Capital One Multi-Asset Execution Trust | | | 1.45 | % | | | 8/16/2021 | | | | 180,000 | | | | 181,359 | | | | | | | | - | | | | - | | | | | | | | | | | | | | | | | | | | 180,000 | | | | 181,359 | |
CarFinance Capital Auto Trust | | | 1.44 | % | | | 11/16/2020 | | | | - | | | | - | | | | | | | | 389,804 | | | | 388,076 | | | | | | | | | | | | | | | | | | | | 389,804 | | | | 388,076 | |
CarFinance Capital Auto Trust | | | 1.46 | % | | | 12/17/2018 | | | | - | | | | - | | | | | | | | 30,907 | | | | 30,886 | | | | | | | | | | | | | | | | | | | | 30,907 | | | | 30,886 | |
CarFinance Capital Auto Trust | | | 1.75 | % | | | 6/15/2021 | | | | - | | | | - | | | | | | | | 135,637 | | | | 135,070 | | | | | | | | | | | | | | | | | | | | 135,637 | | | | 135,070 | |
CarFinance Capital Auto Trust | | | 2.72 | % | | | 4/15/2020 | | | | - | | | | - | | | | | | | | 125,000 | | | | 125,106 | | | | | | | | | | | | | | | | | | | | 125,000 | | | | 125,106 | |
Carlyle Global Market Strategies Commodities Funding, Ltd. | | | 2.57 | % | | | 10/15/2021 | | | | - | | | | - | | | | | | | | 387,720 | | | | 383,145 | | | | | | | | | | | | | | | | | | | | 387,720 | | | | 383,145 | |
CarMax Auto Owner Trust | | | 0.80 | % | | | 7/16/2018 | | | | - | | | | - | | | | | | | | 33,415 | | | | 33,396 | | | | | | | | | | | | | | | | | | | | 33,415 | | | | 33,396 | |
CarMax Auto Owner Trust | | | 0.98 | % | | | 1/15/2019 | | | | - | | | | - | | | | | | | | 571,882 | | | | 571,910 | | | | | | | | | | | | | | | | | | | | 571,882 | | | | 571,910 | |
CarMax Auto Owner Trust | | | 1.28 | % | | | 5/15/2019 | | | | - | | | | - | | | | | | | | 83,000 | | | | 83,137 | | | | | | | | | | | | | | | | | | | | 83,000 | | | | 83,137 | |
CarMax Auto Owner Trust | | | 1.52 | % | | | 2/16/2021 | | | | 100,000 | | | | 100,580 | | | | | | | | - | | | | - | | | | | | | | | | | | | | | | | | | | 100,000 | | | | 100,580 | |
CarMax Auto Owner Trust | | | 1.63 | % | | | 5/15/2020 | | | | 350,000 | | | | 352,915 | | | | | | | | - | | | | - | | | | | | | | | | | | | | | | | | | | 350,000 | | | | 352,915 | |
CarMax Auto Owner Trust | | | 1.81 | % | | | 7/15/2020 | | | | 260,000 | | | | 263,365 | | | | | | | | - | | | | - | | | | | | | | | | | | | | | | | | | | 260,000 | | | | 263,365 | |
CarMax Auto Owner Trust | | | 1.83 | % | | | 7/15/2020 | | | | 180,000 | | | | 181,611 | | | | | | | | - | | | | - | | | | | | | | | | | | | | | | | | | | 180,000 | | | | 181,611 | |
CarNow Auto Receivables Trust | | | 1.69 | % | | | 1/15/2020 | | | | - | | | | - | | | | | | | | 264,815 | | | | 264,354 | | | | | | | | | | | | | | | | | | | | 264,815 | | | | 264,354 | |
Chase Funding Loan Acquisition Trust | | | 4.75 | % | | | 12/25/2019 | | | | 59,483 | | | | 59,990 | | | | | | | | - | | | | - | | | | | | | | | | | | | | | | | | | | 59,483 | | | | 59,990 | |
Chase Funding Trust | | | 4.28 | % | | | 11/25/2034 | | | | - | | | | - | | | | | | | | 63,066 | | | | 64,291 | | | | | | | | | | | | | | | | | | | | 63,066 | | | | 64,291 | |
Chase Issuance Trust | | | 1.37 | % | | | 6/15/2021 | | | | 200,000 | | | | 201,035 | | | | | | | | - | | | | - | | | | | | | | | | | | | | | | | | | | 200,000 | | | | 201,035 | |
Chase Issuance Trust | | | 1.62 | % | | | 7/15/2020 | | | | 300,000 | | | | 303,328 | | | | | | | | - | | | | - | | | | | | | | | | | | | | | | | | | | 300,000 | | | | 303,328 | |
Chrysler Capital Auto Receivables Trust | | | 0.83 | % | | | 9/17/2018 | | | | - | | | | - | | | | | | | | 64,023 | | | | 64,000 | | | | | | | | | | | | | | | | | | | | 64,023 | | | | 64,000 | |
Chrysler Capital Auto Receivables Trust | | | 1.76 | % | | | 12/16/2019 | | | | 200,000 | | | | 201,164 | | | | | | | | - | | | | - | | | | | | | | | | | | | | | | | | | | 200,000 | | | | 201,164 | |
CIFC Funding, Ltd. | | | 2.27 | % | | | 3/1/2021 | | | | 250,000 | | | | 246,202 | | | | | | | | - | | | | - | | | | | | | | | | | | | | | | | | | | 250,000 | | | | 246,202 | |
Citi Held For Asset Issuance | | | 1.85 | % | | | 12/15/2021 | | | | - | | | | - | | | | | | | | 206,529 | | | | 206,093 | | | | | | | | | | | | | | | | | | | | 206,529 | | | | 206,093 | |
Citi Held For Asset Issuance | | | 4.48 | % | | | 8/15/2022 | | | | - | | | | - | | | | | | | | 507,535 | | | | 513,633 | | | | | | | | | | | | | | | | | | | | 507,535 | | | | 513,633 | |
Citi Held For Asset Issuance | | | 4.65 | % | | | 4/15/2025 | | | | - | | | | - | | | | | | | | 426,823 | | | | 431,802 | | | | | | | | | | | | | | | | | | | | 426,823 | | | | 431,802 | |
Citi Held For Asset Issuance | | | 6.64 | % | | | 8/15/2022 | | | | - | | | | - | | | | | | | | 650,000 | | | | 649,570 | | | | | | | | | | | | | | | | | | | | 650,000 | | | | 649,570 | |
Citibank Credit Card Issuance Trust | | | 0.73 | % | | | 5/26/2020 | | | | 261,000 | | | | 261,157 | | | | | | | | - | | | | - | | | | | | | | | | | | | | | | | | | | 261,000 | | | | 261,157 | |
Citibank Credit Card Issuance Trust | | | 2.15 | % | | | 7/15/2021 | | | | 130,000 | | | | 133,680 | | | | | | | | - | | | | - | | | | | | | | | | | | | | | | | | | | 130,000 | | | | 133,680 | |
CNH Equipment Trust | | | 1.89 | % | | | 4/15/2022 | | | | 190,000 | | | | 192,624 | | | | | | | | - | | | | - | | | | | | | | | | | | | | | | | | | | 190,000 | | | | 192,624 | |
4
| | | | | | | | | | | | | | | | | | | | | | | | | | | | | | | | | | | | | | | | | | | | | | | | | | | | |
| | | | | | | | | Voya Limited
Maturity Bond VP | | | | | | JPMorgan Core
Bond VP | | | | | | Adjustments | | | | | | Combined Pro
Forma Portfolio | |
| | | | | | | | | | | | | |
| | | Coupon Rate | | | Maturity Date | | | Principal | | | Value | | | | | | Principal | | | Value | | | | | | Principal | | | Value | | | | | | Principal | | | Value | |
| | | | | | | | | | | | | | | | | | | | | | | | | | | | | | | | |
Concord Funding Co. LLC | | | 3.15 | % | | | 1/15/2017 | | | $ | - | | | $ | - | | | | | | | $ | 350,000 | | | $ | 350,000 | | | | | | | | | | | | | | | | | | | $ | 350,000 | | | $ | 350,000 | |
Consumer Credit Origination Loan Trust | | | 2.82 | % | | | 3/15/2021 | | | | - | | | | - | | | | | | | | 81,605 | | | | 81,603 | | | | | | | | | | | | | | | | | | | | 81,605 | | | | 81,603 | |
CPS Auto Receivables Trust | | | 1.11 | % | | | 11/15/2018 | | | | - | | | | - | | | | | | | | 171,536 | | | | 171,220 | | | | | | | | | | | | | | | | | | | | 171,536 | | | | 171,220 | |
CPS Auto Receivables Trust | | | 1.21 | % | | | 8/15/2018 | | | | - | | | | - | | | | | | | | 64,326 | | | | 64,273 | | | | | | | | | | | | | | | | | | | | 64,326 | | | | 64,273 | |
CPS Auto Receivables Trust | | | 1.31 | % | | | 6/15/2020 | | | | - | | | | - | | | | | | | | 44,495 | | | | 44,066 | | | | | | | | | | | | | | | | | | | | 44,495 | | | | 44,066 | |
CPS Auto Receivables Trust | | | 1.31 | % | | | 2/15/2019 | | | | - | | | | - | | | | | | | | 254,606 | | | | 254,311 | | | | | | | | | | | | | | | | | | | | 254,606 | | | | 254,311 | |
CPS Auto Receivables Trust | | | 1.49 | % | | | 4/15/2019 | | | | - | | | | - | | | | | | | | 289,354 | | | | 289,012 | | | | | | | | | | | | | | | | | | | | 289,354 | | | | 289,012 | |
CPS Auto Receivables Trust | | | 1.53 | % | | | 7/15/2019 | | | | - | | | | - | | | | | | | | 271,678 | | | | 271,315 | | | | | | | | | | | | | | | | | | | | 271,678 | | | | 271,315 | |
CPS Auto Receivables Trust | | | 1.54 | % | | | 7/16/2018 | | | | - | | | | - | | | | | | | | 72,425 | | | | 72,423 | | | | | | | | | | | | | | | | | | | | 72,425 | | | | 72,423 | |
CPS Auto Receivables Trust | | | 1.65 | % | | | 11/15/2019 | | | | - | | | | - | | | | | | | | 406,122 | | | | 403,957 | | | | | | | | | | | | | | | | | | | | 406,122 | | | | 403,957 | |
CPS Auto Receivables Trust | | | 2.07 | % | | | 11/15/2019 | | | | - | | | | - | | | | | | | | 202,165 | | | | 202,185 | | | | | | | | | | | | | | | | | | | | 202,165 | | | | 202,185 | |
CPS Auto Receivables Trust | | | 2.25 | % | | | 10/15/2019 | | | | - | | | | - | | | | | | | | 362,457 | | | | 362,946 | | | | | | | | | | | | | | | | | | | | 362,457 | | | | 362,946 | |
CPS Auto Receivables Trust | | | 2.52 | % | | | 9/16/2019 | | | | - | | | | - | | | | | | | | 51,878 | | | | 51,994 | | | | | | | | | | | | | | | | | | | | 51,878 | | | | 51,994 | |
CPS Auto Receivables Trust | | | 3.77 | % | | | 8/17/2020 | | | | - | | | | - | | | | | | | | 100,000 | | | | 97,302 | | | | | | | | | | | | | | | | | | | | 100,000 | | | | 97,302 | |
CPS Auto Receivables Trust | | | 4.35 | % | | | 11/16/2020 | | | | - | | | | - | | | | | | | | 100,000 | | | | 96,582 | | | | | | | | | | | | | | | | | | | | 100,000 | | | | 96,582 | |
CPS Auto Receivables Trust | | | 4.63 | % | | | 8/16/2021 | | | | - | | | | - | | | | | | | | 344,000 | | | | 334,297 | | | | | | | | | | | | | | | | | | | | 344,000 | | | | 334,297 | |
CPS Auto Trust | | | 1.48 | % | | | 3/16/2020 | | | | - | | | | - | | | | | | | | 17,860 | | | | 17,780 | | | | | | | | | | | | | | | | | | | | 17,860 | | | | 17,780 | |
CPS Auto Trust | | | 1.82 | % | | | 12/16/2019 | | | | - | | | | - | | | | | | | | 33,335 | | | | 33,301 | | | | | | | | | | | | | | | | | | | | 33,335 | | | | 33,301 | |
Credit Acceptance Auto Loan Trust | | | 1.55 | % | | | 10/15/2021 | | | | - | | | | - | | | | | | | | 385,761 | | | | 385,778 | | | | | | | | | | | | | | | | | | | | 385,761 | | | | 385,778 | |
Credit Acceptance Auto Loan Trust | | | 1.88 | % | | | 3/15/2022 | | | | - | | | | - | | | | | | | | 950,000 | | | | 951,733 | | | | | | | | | | | | | | | | | | | | 950,000 | | | | 951,733 | |
Credit Acceptance Auto Loan Trust | | | 2.40 | % | | | 2/15/2023 | | | | - | | | | - | | | | | | | | 524,000 | | | | 527,196 | | | | | | | | | | | | | | | | | | | | 524,000 | | | | 527,196 | |
Discover Card Execution Note Trust | | | 0.87 | % | | | 7/15/2021 | | | | 510,000 | | | | 511,172 | | | | | | | | - | | | | - | | | | | | | | | | | | | | | | | | | | 510,000 | | | | 511,172 | |
Discover Card Execution Note Trust | | | 1.45 | % | | | 3/15/2021 | | | | 140,000 | | | | 141,458 | | | | | | | | - | | | | - | | | | | | | | | | | | | | | | | | | | 140,000 | | | | 141,458 | |
Discover Card Execution Note Trust | | | 1.67 | % | | | 1/18/2022 | | | | 220,000 | | | | 223,559 | | | | | | | | - | | | | - | | | | | | | | | | | | | | | | | | | | 220,000 | | | | 223,559 | |
Discover Card Execution Note Trust | | | 2.12 | % | | | 12/15/2021 | | | | 200,000 | | | | 205,046 | | | | | | | | - | | | | - | | | | | | | | | | | | | | | | | | | | 200,000 | | | | 205,046 | |
Drive Auto Receivables Trust | | | 2.12 | % | | | 6/17/2019 | | | | - | | | | - | | | | | | | | 408,000 | | | | 408,835 | | | | | | | | | | | | | | | | | | | | 408,000 | | | | 408,835 | |
Drive Auto Receivables Trust | | | 2.56 | % | | | 6/15/2020 | | | | - | | | | - | | | | | | | | 191,000 | | | | 191,826 | | | | | | | | | | | | | | | | | | | | 191,000 | | | | 191,826 | |
Drive Auto Receivables Trust | | | 3.84 | % | | | 7/15/2021 | | | | - | | | | - | | | | | | | | 400,000 | | | | 396,959 | | | | | | | | | | | | | | | | | | | | 400,000 | | | | 396,959 | |
Drive Auto Receivables Trust | | | 4.12 | % | | | 7/15/2022 | | | | - | | | | - | | | | | | | | 294,000 | | | | 294,231 | | | | | | | | | | | | | | | | | | | | 294,000 | | | | 294,231 | |
Drive Auto Receivables Trust | | | 4.59 | % | | | 1/17/2023 | | | | - | | | | - | | | | | | | | 286,000 | | | | 288,081 | | | | | | | | | | | | | | | | | | | | 286,000 | | | | 288,081 | |
DT Auto Owner Trust | | | 1.06 | % | | | 9/17/2018 | | | | - | | | | - | | | | | | | | 23,864 | | | | 23,863 | | | | | | | | | | | | | | | | | | | | 23,864 | | | | 23,863 | |
DT Auto Owner Trust | | | 1.73 | % | | | 8/15/2019 | | | | - | | | | - | | | | | | | | 393,473 | | | | 393,494 | | | | | | | | | | | | | | | | | | | | 393,473 | | | | 393,494 | |
DT Auto Owner Trust | | | 1.75 | % | | | 11/15/2019 | | | | - | | | | - | | | | | | | | 800,000 | | | | 799,750 | | | | | | | | | | | | | | | | | | | | 800,000 | | | | 799,750 | |
DT Auto Owner Trust | | | 2.00 | % | | | 9/16/2019 | | | | - | | | | - | | | | | | | | 428,119 | | | | 429,395 | | | | | | | | | | | | | | | | | | | | 428,119 | | | | 429,395 | |
DT Auto Owner Trust | | | 2.65 | % | | | 7/15/2020 | | | | - | | | | - | | | | | | | | 400,000 | | | | 400,125 | | | | | | | | | | | | | | | | | | | | 400,000 | | | | 400,125 | |
Exeter Automobile Receivables Trust | | | 1.06 | % | | | 8/15/2018 | | | | - | | | | - | | | | | | | | 16,980 | | | | 16,971 | | | | | | | | | | | | | | | | | | | | 16,980 | | | | 16,971 | |
Exeter Automobile Receivables Trust | | | 1.32 | % | | | 1/15/2019 | | | | - | | | | - | | | | | | | | 180,394 | | | | 180,122 | | | | | | | | | | | | | | | | | | | | 180,394 | | | | 180,122 | |
Exeter Automobile Receivables Trust | | | 1.54 | % | | | 11/15/2019 | | | | - | | | | - | | | | | | | | 218,730 | | | | 218,190 | | | | | | | | | | | | | | | | | | | | 218,730 | | | | 218,190 | |
Exeter Automobile Receivables Trust | | | 1.60 | % | | | 6/17/2019 | | | | - | | | | - | | | | | | | | 193,378 | | | | 193,486 | | | | | | | | | | | | | | | | | | | | 193,378 | | | | 193,486 | |
Exeter Automobile Receivables Trust | | | 2.21 | % | | | 7/15/2020 | | | | - | | | | - | | | | | | | | 667,397 | | | | 667,269 | | | | | | | | | | | | | | | | | | | | 667,397 | | | | 667,269 | |
Exeter Automobile Receivables Trust | | | 2.35 | % | | | 7/15/2020 | | | | - | | | | - | | | | | | | | 247,838 | | | | 248,310 | | | | | | | | | | | | | | | | | | | | 247,838 | | | | 248,310 | |
Exeter Automobile Receivables Trust | | | 5.52 | % | | | 10/15/2021 | | | | - | | | | - | | | | | | | | 445,000 | | | | 441,656 | | | | | | | | | | | | | | | | | | | | 445,000 | | | | 441,656 | |
5
| | | | | | | | | | | | | | | | | | | | | | | | | | | | | | | | | | | | | | | | | | | | | | | | | | | | |
| | | | | | | | | Voya Limited
Maturity Bond VP | | | | | | JPMorgan Core
Bond VP | | | | | | Adjustments | | | | | | Combined Pro
Forma Portfolio | |
| | | | | | | | | | | | | |
| | | Coupon Rate | | | Maturity Date | | | Principal | | | Value | | | | | | Principal | | | Value | | | | | | Principal | | | Value | | | | | | Principal | | | Value | |
| | | | | | | | | | | | | | | | | | | | | | | | | | | | | | | | |
Fifth Third Auto Trust | | | 0.96 | % | | | 3/15/2019 | | | $ | - | | | $ | - | | | | | | | $ | 90,033 | | | $ | 90,033 | | | | | | | | | | | | | | | | | | | $ | 90,033 | | | $ | 90,033 | |
Fifth Third Auto Trust | | | 1.38 | % | | | 12/15/2020 | | | | 180,000 | | | | 180,778 | | | | | | | | - | | | | - | | | | | | | | | | | | | | | | | | | | 180,000 | | | | 180,778 | |
First Investors Auto Owner Trust | | | 1.06 | % | | | 11/15/2018 | | | | - | | | | - | | | | | | | | 75,993 | | | | 75,986 | | | | | | | | | | | | | | | | | | | | 75,993 | | | | 75,986 | |
First Investors Auto Owner Trust | | | 1.21 | % | | | 4/15/2019 | | | | - | | | | - | | | | | | | | 182,573 | | | | 182,340 | | | | | | | | | | | | | | | | | | | | 182,573 | | | | 182,340 | |
First Investors Auto Owner Trust | | | 1.44 | % | | | 10/15/2019 | | | | - | | | | - | | | | | | | | 133,857 | | | | 133,780 | | | | | | | | | | | | | | | | | | | | 133,857 | | | | 133,780 | |
First Investors Auto Owner Trust | | | 1.59 | % | | | 12/16/2019 | | | | - | | | | - | | | | | | | | 249,978 | | | | 249,605 | | | | | | | | | | | | | | | | | | | | 249,978 | | | | 249,605 | |
First Investors Auto Owner Trust | | | 1.67 | % | | | 11/16/2020 | | | | - | | | | - | | | | | | | | 351,000 | | | | 351,510 | | | | | | | | | | | | | | | | | | | | 351,000 | | | | 351,510 | |
First Investors Auto Owner Trust | | | 1.92 | % | | | 5/15/2020 | | | | - | | | | - | | | | | | | | 327,931 | | | | 328,903 | | | | | | | | | | | | | | | | | | | | 327,931 | | | | 328,903 | |
FirstKey Lending Trust | | | 2.55 | % | | | 3/9/2047 | | | | - | | | | - | | | | | | | | 796,078 | | | | 801,481 | | | | | | | | | | | | | | | | | | | | 796,078 | | | | 801,481 | |
FirstKey Lending Trust | | | 3.42 | % | | | 3/9/2047 | | | | - | | | | - | | | | | | | | 240,000 | | | | 244,289 | | | | | | | | | | | | | | | | | | | | 240,000 | | | | 244,289 | |
Flagship Credit Auto Trust | | | 1.43 | % | | | 12/16/2019 | | | | - | | | | - | | | | | | | | 178,469 | | | | 177,642 | | | | | | | | | | | | | | | | | | | | 178,469 | | | | 177,642 | |
Flagship Credit Auto Trust | | | 1.63 | % | | | 6/15/2020 | | | | - | | | | - | | | | | | | | 357,365 | | | | 355,634 | | | | | | | | | | | | | | | | | | | | 357,365 | | | | 355,634 | |
Flagship Credit Auto Trust | | | 1.94 | % | | | 1/15/2019 | | | | - | | | | - | | | | | | | | 31,913 | | | | 31,950 | | | | | | | | | | | | | | | | | | | | 31,913 | | | | 31,950 | |
Flagship Credit Auto Trust | | | 2.38 | % | | | 10/15/2020 | | | | - | | | | - | | | | | | | | 737,724 | | | | 739,021 | | | | | | | | | | | | | | | | | | | | 737,724 | | | | 739,021 | |
Flagship Credit Auto Trust | | | 2.77 | % | | | 12/15/2020 | | | | - | | | | - | | | | | | | | 486,905 | | | | 490,804 | | | | | | | | | | | | | | | | | | | | 486,905 | | | | 490,804 | |
Flagship Credit Auto Trust | | | 2.84 | % | | | 11/16/2020 | | | | - | | | | - | | | | | | | | 134,000 | | | | 133,019 | | | | | | | | | | | | | | | | | | | | 134,000 | | | | 133,019 | |
Flagship Credit Auto Trust | | | 3.68 | % | | | 3/15/2022 | | | | - | | | | - | | | | | | | | 189,000 | | | | 188,764 | | | | | | | | | | | | | | | | | | | | 189,000 | | | | 188,764 | |
Flagship Credit Auto Trust | | | 3.95 | % | | | 12/15/2020 | | | | - | | | | - | | | | | | | | 66,000 | | | | 66,390 | | | | | | | | | | | | | | | | | | | | 66,000 | | | | 66,390 | |
Flagship Credit Auto Trust | | | 4.65 | % | | | 3/15/2022 | | | | - | | | | - | | | | | | | | 126,000 | | | | 121,255 | | | | | | | | | | | | | | | | | | | | 126,000 | | | | 121,255 | |
Flagship Credit Auto Trust | | | 6.22 | % | | | 6/15/2022 | | | | - | | | | - | | | | | | | | 600,000 | | | | 604,966 | | | | | | | | | | | | | | | | | | | | 600,000 | | | | 604,966 | |
Ford Credit Auto Lease Trust | | | 0.89 | % | | | 9/15/2017 | | | | - | | | | - | | | | | | | | 84,029 | | | | 84,023 | | | | | | | | | | | | | | | | | | | | 84,029 | | | | 84,023 | |
Ford Credit Auto Lease Trust | | | 1.10 | % | | | 11/15/2017 | | | | - | | | | - | | | | | | | | 77,000 | | | | 76,997 | | | | | | | | | | | | | | | | | | | | 77,000 | | | | 76,997 | |
Ford Credit Auto Owner Trust | | | 0.81 | % | | | 1/15/2018 | | | | - | | | | - | | | | | | | | 77,402 | | | | 77,376 | | | | | | | | | | | | | | | | | | | | 77,402 | | | | 77,376 | |
Ford Credit Auto Owner Trust | | | 0.90 | % | | | 10/15/2018 | | | | - | | | | - | | | | | | | | 149,662 | | | | 149,659 | | | | | | | | | | | | | | | | | | | | 149,662 | | | | 149,659 | |
Ford Credit Auto Owner Trust | | | 1.06 | % | | | 5/15/2019 | | | | - | | | | - | | | | | | | | 590,919 | | | | 591,830 | | | | | | | | | | | | | | | | | | | | 590,919 | | | | 591,830 | |
Ford Credit Auto Owner Trust | | | 1.28 | % | | | 9/15/2019 | | | | - | | | | - | | | | | | | | 196,000 | | | | 196,787 | | | | | | | | | | | | | | | | | | | | 196,000 | | | | 196,787 | |
GCAT | | | 3.75 | % | | | 7/25/2020 | | | | - | | | | - | | | | | | | | 446,055 | | | | 443,889 | | | | | | | | | | | | | | | | | | | | 446,055 | | | | 443,889 | |
GLC II Trust | | | 4.00 | % | | | 12/18/2020 | | | | - | | | | - | | | | | | | | 240,035 | | | | 235,834 | | | | | | | | | | | | | | | | | | | | 240,035 | | | | 235,834 | |
GLC Trust | | | 3.00 | % | | | 7/15/2021 | | | | - | | | | - | | | | | | | | 247,265 | | | | 242,938 | | | | | | | | | | | | | | | | | | | | 247,265 | | | | 242,938 | |
GLS Auto Receivables Trust | | | 2.25 | % | | | 12/15/2020 | | | | - | | | | - | | | | | | | | 355,312 | | | | 354,941 | | | | | | | | | | | | | | | | | | | | 355,312 | | | | 354,941 | |
GLS Auto Receivables Trust | | | 2.73 | % | | | 10/15/2020 | | | | - | | | | - | | | | | | | | 544,955 | | | | 544,971 | | | | | | | | | | | | | | | | | | | | 544,955 | | | | 544,971 | |
GLS Auto Receivables Trust | | | 4.39 | % | | | 1/15/2021 | | | | - | | | | - | | | | | | | | 180,000 | | | | 180,178 | | | | | | | | | | | | | | | | | | | | 180,000 | | | | 180,178 | |
GM Financial Automobile Leasing Trust | | | 1.10 | % | | | 12/20/2017 | | | | - | | | | - | | | | | | | | 234,779 | | | | 234,817 | | | | | | | | | | | | | | | | | | | | 234,779 | | | | 234,817 | |
GM Financial Automobile Leasing Trust | | | 1.53 | % | | | 9/20/2018 | | | | - | | | | - | | | | | | | | 214,000 | | | | 215,156 | | | | | | | | | | | | | | | | | | | | 214,000 | | | | 215,156 | |
GM Financial Automobile Leasing Trust | | | 1.76 | % | | | 3/20/2020 | | | | 150,000 | | | | 150,373 | | | | | | | | - | | | | - | | | | | | | | | | | | | | | | | | | | 150,000 | | | | 150,373 | |
GM Financial Automobile Leasing Trust | | | 1.81 | % | | | 11/20/2019 | | | | 130,000 | | | | 130,592 | | | | | | | | - | | | | - | | | | | | | | | | | | | | | | | | | | 130,000 | | | | 130,592 | |
GO Financial Auto Securitization Trust | | | 1.81 | % | | | 3/15/2018 | | | | - | | | | - | | | | | | | | 174,674 | | | | 174,556 | | | | | | | | | | | | | | | | | | | | 174,674 | | | | 174,556 | |
GO Financial Auto Securitization Trust | | | 3.27 | % | | | 11/15/2018 | | | | - | | | | - | | | | | | | | 350,715 | | | | 349,922 | | | | | | | | | | | | | | | | | | | | 350,715 | | | | 349,922 | |
GO Financial Auto Securitization Trust | | | 4.80 | % | | | 8/17/2020 | | | | - | | | | - | | | | | | | | 348,000 | | | | 344,484 | | | | | | | | | | | | | | | | | | | | 348,000 | | | | 344,484 | |
Gold Key Resorts LLC | | | 3.22 | % | | | 3/17/2031 | | | | - | | | | - | | | | | | | | 251,444 | | | | 249,701 | | | | | | | | | | | | | | | | | | | | 251,444 | | | | 249,701 | |
Green Tree Agency Advance Funding Trust I | | | 4.67 | % | | | 10/15/2048 | | | | - | | | | - | | | | | | | | 637,000 | | | | 638,217 | | | | | | | | | | | | | | | | | | | | 637,000 | | | | 638,217 | |
GSAMP Trust | | | 0.80 | % | | | 1/25/2045 | | | | 44,548 | | | | 44,069 | | | | | | | | - | | | | - | | | | | | | | | | | | | | | | | | | | 44,548 | | | | 44,069 | |
Gulf Stream-Compass CLO, Ltd. | | | 1.53 | % | | | 10/28/2019 | | | | 250,000 | | | | 249,862 | | | | | | | | - | | | | - | | | | | | | | | | | | | | | | | | | | 250,000 | | | | 249,862 | |
6
| | | | | | | | | | | | | | | | | | | | | | | | | | | | | | | | | | | | | | | | | | | | | | | | | | | | |
| | | | | | | | | Voya Limited
Maturity Bond VP | | | | | | JPMorgan Core
Bond VP | | | | | | Adjustments | | | | | | Combined Pro
Forma Portfolio | |
| | | | | | | | | | | | | |
| | | Coupon Rate | | | Maturity Date | | | Principal | | | Value | | | | | | Principal | | | Value | | | | | | Principal | | | Value | | | | | | Principal | | | Value | |
| | | | | | | | | | | | | | | | | | | | | | | | | | | | | | | | |
Gulf Stream - Compass CLO, Ltd. | | | 2.63 | % | | | 10/28/2019 | | | $ | 250,000 | | | $ | 249,970 | | | | | | | $ | - | | | $ | - | | | | | | | | | | | | | | | | | | | $ | 250,000 | | | $ | 249,970 | |
Gulf Stream - Compass CLO, Ltd. | | | 4.08 | % | | | 10/28/2019 | | | | 250,000 | | | | 250,064 | | | | | | | | - | | | | - | | | | | | | | | | | | | | | | | | | | 250,000 | | | | 250,064 | |
Harley-Davidson Motorcycle Trust | | | 1.55 | % | | | 10/15/2021 | | | | 410,000 | | | | 413,035 | | | | | | | | - | | | | - | | | | | | | | | | | | | | | | | | | | 410,000 | | | | 413,035 | |
Harley-Davidson Motorcycle Trust | | | 1.67 | % | | | 8/15/2022 | | | | 300,000 | | | | 302,309 | | | | | | | | - | | | | - | | | | | | | | | | | | | | | | | | | | 300,000 | | | | 302,309 | |
Honda Auto Receivables Owner Trust | | | 0.77 | % | | | 3/19/2018 | | | | - | | | | - | | | | | | | | 109,262 | | | | 109,206 | | | | | | | | | | | | | | | | | | | | 109,262 | | | | 109,206 | |
Hyundai Auto Lease Securitization Trust | | | 1.68 | % | | | 4/15/2020 | | | | 200,000 | | | | 200,486 | | | | | | | | - | | | | - | | | | | | | | | | | | | | | | | | | | 200,000 | | | | 200,486 | |
Hyundai Auto Receivables Trust | | | 0.69 | % | | | 4/16/2018 | | | | - | | | | - | | | | | | | | 41,452 | | | | 41,433 | | | | | | | | | | | | | | | | | | | | 41,452 | | | | 41,433 | |
Hyundai Auto Receivables Trust | | | 0.90 | % | | | 12/17/2018 | | | | - | | | | - | | | | | | | | 659,983 | | | | 659,844 | | | | | | | | | | | | | | | | | | | | 659,983 | | | | 659,844 | |
Hyundai Auto Receivables Trust | | | 1.12 | % | | | 11/15/2019 | | | | - | | | | - | | | | | | | | 140,000 | | | | 140,158 | | | | | | | | | | | | | | | | | | | | 140,000 | | | | 140,158 | |
Hyundai Auto Receivables Trust | | | 1.13 | % | | | 9/17/2018 | | | | 210,000 | | | | 209,768 | | | | | | | | - | | | | - | | | | | | | | | | | | | | | | | | | | 210,000 | | | | 209,768 | |
Hyundai Auto Receivables Trust | | | 1.32 | % | | | 8/15/2019 | | | | 180,000 | | | | 180,616 | | | | | | | | - | | | | - | | | | | | | | | | | | | | | | | | | | 180,000 | | | | 180,616 | |
Hyundai Auto Receivables Trust | | | 1.37 | % | | | 7/15/2020 | | | | 180,000 | | | | 180,935 | | | | | | | | - | | | | - | | | | | | | | | | | | | | | | | | | | 180,000 | | | | 180,935 | |
Hyundai Auto Receivables Trust | | | 1.46 | % | | | 11/15/2019 | | | | 50,000 | | | | 50,201 | | | | | | | | - | | | | - | | | | | | | | | | | | | | | | | | | | 50,000 | | | | 50,201 | |
KGS-Alpha SBA Coof Trust, Interest Only STRIPS | | | 0.85 | % | | | 8/25/2038 | | | | - | | | | - | | | | | | | | 1,801,294 | | | | 49,536 | | | | | | | | | | | | | | | | | | | | 1,801,294 | | | | 49,536 | |
KGS-Alpha SBA Coof Trust, Interest Only STRIPS | | | 1.56 | % | | | 3/25/2039 | | | | - | | | | - | | | | | | | | 1,408,235 | | | | 66,891 | | | | | | | | | | | | | | | | | | | | 1,408,235 | | | | 66,891 | |
KGS-Alpha SBA Coof Trust, Interest Only STRIPS | | | 3.00 | % | | | 4/25/2040 | | | | - | | | | - | | | | | | | | 695,518 | | | | 83,027 | | | | | | | | | | | | | | | | | | | | 695,518 | | | | 83,027 | |
Kingsland III, Ltd. | | | 1.31 | % | | | 8/24/2021 | | | | 420,000 | | | | 397,156 | | | | | | | | - | | | | - | | | | | | | | | | | | | | | | | | | | 420,000 | | | | 397,156 | |
KKR Financial CLO, Ltd. | | | 2.88 | % | | | 5/15/2021 | | | | 500,000 | | | | 500,077 | | | | | | | | - | | | | - | | | | | | | | | | | | | | | | | | | | 500,000 | | | | 500,077 | |
KKR Financial CLO, Ltd. | | | 5.63 | % | | | 5/15/2021 | | | | 500,000 | | | | 499,975 | | | | | | | | - | | | | - | | | | | | | | | | | | | | | | | | | | 500,000 | | | | 499,975 | |
Lendmark Funding Trust | | | 4.82 | % | | | 8/21/2023 | | | | - | | | | - | | | | | | | | 445,000 | | | | 443,592 | | | | | | | | | | | | | | | | | | | | 445,000 | | | | 443,592 | |
LV Tower 52 | | | 5.50 | % | | | 7/15/2019 | | | | - | | | | - | | | | | | | | 633,737 | | | | 619,732 | | | | | | | | | | | | | | | | | | | | 633,737 | | | | 619,732 | |
MarketPlace Loan Trust | | | 3.25 | % | | | 9/17/2017 | | | | - | | | | - | | | | | | | | 164,773 | | | | 163,863 | | | | | | | | | | | | | | | | | | | | 164,773 | | | | 163,863 | |
MarketPlace Loan Trust | | | 3.25 | % | | | 12/18/2017 | | | | - | | | | - | | | | | | | | 531,099 | | | | 531,099 | | | | | | | | | | | | | | | | | | | | 531,099 | | | | 531,099 | |
Mercedes-Benz Auto Receivables Trust | | | 1.75 | % | | | 12/15/2021 | | | | 140,000 | | | | 142,038 | | | | | | | | - | | | | - | | | | | | | | | | | | | | | | | | | | 140,000 | | | | 142,038 | |
Muir Grove CLO, Ltd. | | | 2.64 | % | | | 3/25/2020 | | | | 600,000 | | | | 594,596 | | | | | | | | - | | | | - | | | | | | | | | | | | | | | | | | | | 600,000 | | | | 594,596 | |
Nationstar HECM Loan Trust | | | 2.24 | % | | | 6/25/2026 | | | | - | | | | - | | | | | | | | 285,000 | | | | 285,000 | | | | | | | | | | | | | | | | | | | | 285,000 | | | | 285,000 | |
Nationstar HECM Loan Trust | | | 3.84 | % | | | 5/25/2018 | | | | - | | | | - | | | | | | | | 170,487 | | | | 170,481 | | | | | | | | | | | | | | | | | | | | 170,487 | | | | 170,481 | |
Nationstar HECM Loan Trust | | | 4.36 | % | | | 2/25/2026 | | | | - | | | | - | | | | | | | | 365,000 | | | | 366,398 | | | | | | | | | | | | | | | | | | | | 365,000 | | | | 366,398 | |
Nissan Auto Lease Trust | | | 0.80 | % | | | 2/15/2017 | | | | - | | | | - | | | | | | | | 27,822 | | | | 27,821 | | | | | | | | | | | | | | | | | | | | 27,822 | | | | 27,821 | |
Nissan Auto Lease Trust | | | 1.65 | % | | | 10/15/2021 | | | | 150,000 | | | | 150,427 | | | | | | | | - | | | | - | | | | | | | | | | | | | | | | | | | | 150,000 | | | | 150,427 | |
NRPL Trust | | | 3.75 | % | | | 10/25/2057 | | | | - | | | | - | | | | | | | | 546,797 | | | | 536,989 | | | | | | | | | | | | | | | | | | | | 546,797 | | | | 536,989 | |
NRZ Advance Receivables Trust | | | 2.31 | % | | | 8/15/2046 | | | | - | | | | - | | | | | | | | 650,000 | | | | 649,463 | | | | | | | | | | | | | | | | | | | | 650,000 | | | | 649,463 | |
NRZ Advance Receivables Trust | | | 2.75 | % | | | 6/15/2049 | | | | - | | | | - | | | | | | | | 439,000 | | | | 441,054 | | | | | | | | | | | | | | | | | | | | 439,000 | | | | 441,054 | |
NRZ Advance Receivables Trust | | | 3.60 | % | | | 8/15/2046 | | | | - | | | | - | | | | | | | | 250,000 | | | | 249,297 | | | | | | | | | | | | | | | | | | | | 250,000 | | | | 249,297 | |
NRZ Advance Receivables Trust | | | 4.27 | % | | | 11/15/2046 | | | | - | | | | - | | | | | | | | 750,000 | | | | 750,139 | | | | | | | | | | | | | | | | | | | | 750,000 | | | | 750,139 | |
NRZ Advance Receivables Trust | | | 4.67 | % | | | 11/15/2047 | | | | - | | | | - | | | | | | | | 400,000 | | | | 400,125 | | | | | | | | | | | | | | | | | | | | 400,000 | | | | 400,125 | |
7
| | | | | | | | | | | | | | | | | | | | | | | | | | | | | | | | | | | | | | | | | | | | | | | | | | | | |
| | | | | | | | | Voya Limited
Maturity Bond VP | | | | | | JPMorgan Core Bond
VP | | | | | | Adjustments | | | | | | Combined Pro Forma
Portfolio | |
| | | | | | | | | | | | | |
| | | Coupon Rate | | | Maturity Date | | | Principal | | | Value | | | | | | Principal | | | Value | | | | | | Principal | | | Value | | | | | | Principal | | | Value | |
| | | | | | | | | | | | | | | | | | | | | | | | | | | | | | | | |
NRZ Advance Receivables Trust | | | 4.68 | % | | | 8/17/2048 | | | $ | - | | | $ | - | | | | | | | $ | 241,000 | | | $ | 241,151 | | | | | | | | | | | | | | | | | | | $ | 241,000 | | | $ | 241,151 | |
NRZ Advance Receivables Trust Advance Receivables Backed | | | 3.20 | % | | | 11/15/2047 | | | | - | | | | - | | | | | | | | 1,300,000 | | | | 1,306,086 | | | | | | | | | | | | | | | | | | | | 1,300,000 | | | | 1,306,086 | |
Oak Hill Advisors Residential Loan Trust | | | 3.72 | % | | | 7/25/2055 | | | | - | | | | - | | | | | | | | 300,409 | | | | 298,920 | | | | | | | | | | | | | | | | | | | | 300,409 | | | | 298,920 | |
Ocwen Master Advance Receivables Trust | | | 3.21 | % | | | 11/15/2047 | | | | - | | | | - | | | | | | | | 954,000 | | | | 958,046 | | | | | | | | | | | | | | | | | | | | 954,000 | | | | 958,046 | |
Ocwen Master Advance Receivables Trust | | | 3.70 | % | | | 11/15/2047 | | | | - | | | | - | | | | | | | | 229,000 | | | | 228,755 | | | | | | | | | | | | | | | | | | | | 229,000 | | | | 228,755 | |
Ocwen Master Advance Receivables Trust | | | 4.10 | % | | | 9/17/2046 | | | | - | | | | - | | | | | | | | 438,000 | | | | 437,891 | | | | | | | | | | | | | | | | | | | | 438,000 | | | | 437,891 | |
Ocwen Master Advance Receivables Trust | | | 4.69 | % | | | 11/15/2047 | | | | - | | | | - | | | | | | | | 400,000 | | | | 400,800 | | | | | | | | | | | | | | | | | | | | 400,000 | | | | 400,800 | |
OnDeck Asset Securitization Trust II LLC | | | 4.21 | % | | | 5/17/2020 | | | | - | | | | - | | | | | | | | 422,000 | | | | 422,000 | | | | | | | | | | | | | | | | | | | | 422,000 | | | | 422,000 | |
OnDeck Asset Securitization Trust II LLC | | | 7.63 | % | | | 5/17/2020 | | | | - | | | | - | | | | | | | | 117,000 | | | | 117,585 | | | | | | | | | | | | | | | | | | | | 117,000 | | | | 117,585 | |
OneMain Financial Issuance Trust | | | 2.47 | % | | | 9/18/2024 | | | | - | | | | - | | | | | | | | 1,218,000 | | | | 1,220,645 | | | | | | | | | | | | | | | | | | | | 1,218,000 | | | | 1,220,645 | |
OneMain Financial Issuance Trust | | | 2.57 | % | | | 7/18/2025 | | | | - | | | | - | | | | | | | | 1,138,000 | | | | 1,137,663 | | | | | | | | | | | | | | | | | | | | 1,138,000 | | | | 1,137,663 | |
OneMain Financial Issuance Trust | | | 3.02 | % | | | 9/18/2024 | | | | - | | | | - | | | | | | | | 380,000 | | | | 378,112 | | | | | | | | | | | | | | | | | | | | 380,000 | | | | 378,112 | |
OneMain Financial Issuance Trust | | | 3.10 | % | | | 7/18/2025 | | | | - | | | | - | | | | | | | | 279,000 | | | | 273,054 | | | | | | | | | | | | | | | | | | | | 279,000 | | | | 273,054 | |
OneMain Financial Issuance Trust | | | 3.19 | % | | | 3/18/2026 | | | | - | | | | - | | | | | | | | 691,000 | | | | 698,116 | | | | | | | | | | | | | | | | | | | | 691,000 | | | | 698,116 | |
OneMain Financial Issuance Trust | | | 5.94 | % | | | 3/20/2028 | | | | - | | | | - | | | | | | | | 175,000 | | | | 180,495 | | | | | | | | | | | | | | | | | | | | 175,000 | | | | 180,495 | |
Oportun Funding II LLC | | | 3.69 | % | | | 7/8/2021 | | | | - | | | | - | | | | | | | | 571,000 | | | | 570,940 | | | | | | | | | | | | | | | | | | | | 571,000 | | | | 570,940 | |
Oportun Funding II LLC | | | 4.70 | % | | | 3/8/2021 | | | | - | | | | - | | | | | | | | 629,000 | | | | 629,000 | | | | | | | | | | | | | | | | | | | | 629,000 | | | | 629,000 | |
Park Place Securities, Inc. Asset-Backed Pass-Through Certificates | | | 1.39 | % | | | 10/25/2034 | | | | - | | | | - | | | | | | | | 4,932 | | | | 4,931 | | | | | | | | | | | | | | | | | | | | 4,932 | | | | 4,931 | |
PFS Tax Lien Trust | | | 1.44 | % | | | 5/15/2029 | | | | - | | | | - | | | | | | | | 37,741 | | | | 37,537 | | | | | | | | | | | | | | | | | | | | 37,741 | | | | 37,537 | |
Porsche Innovative Lease Owner Trust | | | 1.43 | % | | | 5/21/2021 | | | | 110,000 | | | | 110,154 | | | | | | | | - | | | | - | | | | | | | | | | | | | | | | | | | | 110,000 | | | | 110,154 | |
Prestige Auto Receivables Trust | | | 1.09 | % | | | 2/15/2019 | | | | - | | | | - | | | | | | | | 127,040 | | | | 126,933 | | | | | | | | | | | | | | | | | | | | 127,040 | | | | 126,933 | |
Pretium Mortgage Credit Partners I LLC | | | 3.75 | % | | | 7/27/2030 | | | | - | | | | - | | | | | | | | 512,371 | | | | 511,039 | | | | | | | | | | | | | | | | | | | | 512,371 | | | | 511,039 | |
Progreso Receivables Funding II LLC | | | 3.50 | % | | | 7/8/2019 | | | | - | | | | - | | | | | | | | 600,000 | | | | 600,881 | | | | | | | | | | | | | | | | | | | | 600,000 | | | | 600,881 | |
Progreso Receivables Funding III LLC | | | 3.63 | % | | | 2/8/2020 | | | | - | | | | - | | | | | | | | 589,000 | | | | 587,972 | | | | | | | | | | | | | | | | | | | | 589,000 | | | | 587,972 | |
Progreso Receivables Funding IV LLC | | | 3.00 | % | | | 7/28/2020 | | | | - | | | | - | | | | | | | | 250,000 | | | | 245,575 | | | | | | | | | | | | | | | | | | | | 250,000 | | | | 245,575 | |
Progress Residential Trust | | | 2.74 | % | | | 6/12/2032 | | | | - | | | | - | | | | | | | | 1,403,400 | | | | 1,423,351 | | | | | | | | | | | | | | | | | | | | 1,403,400 | | | | 1,423,351 | |
Progress Residential Trust | | | 3.07 | % | | | 11/12/2032 | | | | - | | | | - | | | | | | | | 1,748,167 | | | | 1,796,356 | | | | | | | | | | | | | | | | | | | | 1,748,167 | | | | 1,796,356 | |
Progress Residential Trust | | | 3.14 | % | | | 6/12/2032 | | | | - | | | | - | | | | | | | | 327,000 | | | | 329,170 | | | | | | | | | | | | | | | | | | | | 327,000 | | | | 329,170 | |
Progress Residential Trust | | | 4.67 | % | | | 11/12/2032 | | | | - | | | | - | | | | | | | | 300,000 | | | | 309,964 | | | | | | | | | | | | | | | | | | | | 300,000 | | | | 309,964 | |
Progress Residential Trust | | | 5.66 | % | | | 11/12/2032 | | | | - | | | | - | | | | | | | | 200,000 | | | | 205,301 | | | | | | | | | | | | | | | | | | | | 200,000 | | | | 205,301 | |
Purchasing Power Funding LLC | | | 4.75 | % | | | 12/15/2019 | | | | - | | | | - | | | | | | | | 650,000 | | | | 647,562 | | | | | | | | | | | | | | | | | | | | 650,000 | | | | 647,562 | |
RAMP Trust | | | 0.75 | % | | | 3/25/2036 | | | | - | | | | - | | | | | | | | 83,265 | | | | 82,471 | | | | | | | | | | | | | | | | | | | | 83,265 | | | | 82,471 | |
RAMP Trust | | | 1.38 | % | | | 11/25/2034 | | | | - | | | | - | | | | | | | | 68,609 | | | | 68,112 | | | | | | | | | | | | | | | | | | | | 68,609 | | | | 68,112 | |
RBSHD Trust | | | 7.69 | % | | | 10/25/2047 | | | | - | | | | - | | | | | | | | 169,337 | | | | 169,370 | | | | | | | | | | | | | | | | | | | | 169,337 | | | | 169,370 | |
RMAT LLC | | | 3.75 | % | | | 5/25/2055 | | | | - | | | | - | | | | | | | | 181,982 | | | | 180,409 | | | | | | | | | | | | | | | | | | | | 181,982 | | | | 180,409 | |
Santander Drive Auto Receivables Trust | | | 1.56 | % | | | 5/15/2020 | | | | - | | | | - | | | | | | | | 337,000 | | | | 337,454 | | | | | | | | | | | | | | | | | | | | 337,000 | | | | 337,454 | |
Santander Drive Auto Receivables Trust | | | 1.84 | % | | | 11/18/2019 | | | | - | | | | - | | | | | | | | 17,351 | | | | 17,221 | | | | | | | | | | | | | | | | | | | | 17,351 | | | | 17,221 | |
Santander Drive Auto Receivables Trust | | | 1.93 | % | | | 9/17/2019 | | | | - | | | | - | | | | | | | | 84,580 | | | | 83,945 | | | | | | | | | | | | | | | | | | | | 84,580 | | | | 83,945 | |
Santander Drive Auto Receivables Trust | | | 1.97 | % | | | 3/16/2021 | | | | - | | | | - | | | | | | | | 75,579 | | | | 75,012 | | | | | | | | | | | | | | | | | | | | 75,579 | | | | 75,012 | |
Saxon Asset Securities Trust | | | 4.80 | % | | | 6/25/2033 | | | | - | | | | - | | | | | | | | 20,371 | | | | 20,562 | | | | | | | | | | | | | | | | | | | | 20,371 | | | | 20,562 | |
8
| | | | | | | | | | | | | | | | | | | | | | | | | | | | | | | | | | | | | | | | | | | | | | | | | | | | |
| | | | | | | | | Voya Limited Maturity
Bond VP | | | | | | JPMorgan Core
Bond VP | | | | | | Adjustments | | | | | | Combined Pro
Forma Portfolio | |
| | | | | | | | | | | | | |
| | | Coupon Rate | | | Maturity Date | | | Principal | | | Value | | | | | | Principal | | | Value | | | | | | Principal | | | Value | | | | | | Principal | | | Value | |
| | | | | | | | | | | | | | | | | | | | | | | | | | | | | | | | |
Securitized Asset-Backed Receivables LLC Trust | | | 3.42 | % | | | 1/25/2036 | | | $ | - | | | $ | - | | | | | | | $ | 24,607 | | | $ | 18,004 | | | | | | | | | | | | | | | | | | | $ | 24,607 | | | $ | 18,004 | |
Selene Non-Performing Loans LLC | | | 2.98 | % | | | 5/25/2054 | | | | - | | | | - | | | | | | | | 110,002 | | | | 109,246 | | | | | | | | | | | | | | | | | | | | 110,002 | | | | 109,246 | |
Sierra Auto Receivables Securitization Trust | | | 2.85 | % | | | 1/18/2022 | | | | - | | | | - | | | | | | | | 187,000 | | | | 186,997 | | | | | | | | | | | | | | | | | | | | 187,000 | | | | 186,997 | |
Skopos Auto Receivables Trust | | | 3.55 | % | | | 2/15/2020 | | | | - | | | | - | | | | | | | | 118,197 | | | | 118,072 | | | | | | | | | | | | | | | | | | | | 118,197 | | | | 118,072 | |
SpringCastle America Funding LLC | | | 2.70 | % | | | 5/25/2023 | | | | - | | | | - | | | | | | | | 923,039 | | | | 926,178 | | | | | | | | | | | | | | | | | | | | 923,039 | | | | 926,178 | |
SpringCastle America Funding LLC | | | 4.61 | % | | | 10/25/2027 | | | | - | | | | - | | | | | | | | 300,000 | | | | 300,474 | | | | | | | | | | | | | | | | | | | | 300,000 | | | | 300,474 | |
Springleaf Funding Trust | | | 2.41 | % | | | 12/15/2022 | | | | - | | | | - | | | | | | | | 858,320 | | | | 858,838 | | | | | | | | | | | | | | | | | | | | 858,320 | | | | 858,838 | |
Springleaf Funding Trust | | | 3.16 | % | | | 11/15/2024 | | | | - | | | | - | | | | | | | | 769,000 | | | | 773,549 | | | | | | | | | | | | | | | | | | | | 769,000 | | | | 773,549 | |
Springleaf Funding Trust | | | 3.45 | % | | | 12/15/2022 | | | | - | | | | - | | | | | | | | 146,000 | | | | 145,874 | | | | | | | | | | | | | | | | | | | | 146,000 | | | | 145,874 | |
SPS Servicer Advance Receivables Trust Advance Receivables Backed Notes | | | 4.23 | % | | | 1/15/2047 | | | | - | | | | - | | | | | | | | 344,000 | | | | 344,476 | | | | | | | | | | | | | | | | | | | | 344,000 | | | | 344,476 | |
SPS Servicer Advance Receivables Trust Advance Receivables Backed Notes | | | 4.43 | % | | | 7/15/2047 | | | | - | | | | - | | | | | | | | 321,000 | | | | 327,495 | | | | | | | | | | | | | | | | | | | | 321,000 | | | | 327,495 | |
Sunset Mortgage Loan Co. LLC | | | 3.72 | % | | | 11/16/2044 | | | | - | | | | - | | | | | | | | 323,147 | | | | 321,434 | | | | | | | | | | | | | | | | | | | | 323,147 | | | | 321,434 | |
Synchrony Credit Card Master Note Trust | | | 1.60 | % | | | 4/15/2021 | | | | 130,000 | | | | 130,527 | | | | | | | | - | | | | - | | | | | | | | | | | | | | | | | | | | 130,000 | | | | 130,527 | |
Synchrony Credit Card Master Note Trust | | | 2.04 | % | | | 3/15/2022 | | | | 200,000 | | | | 203,660 | | | | | | | | - | | | | - | | | | | | | | | | | | | | | | | | | | 200,000 | | | | 203,660 | |
Tidewater Auto Receivables Trust | | | 1.40 | % | | | 7/15/2018 | | | | - | | | | - | | | | | | | | 14,239 | | | | 14,236 | | | | | | | | | | | | | | | | | | | | 14,239 | | | | 14,236 | |
Toyota Auto Receivables Owner Trust | | | 0.93 | % | | | 7/16/2018 | | | | - | | | | - | | | | | | | | 159,997 | | | | 159,931 | | | | | | | | | | | | | | | | | | | | 159,997 | | | | 159,931 | |
Toyota Auto Receivables Owner Trust | | | 1.30 | % | | | 4/15/2020 | | | | - | | | | - | | | | | | | | 226,000 | | | | 227,033 | | | | | | | | | | | | | | | | | | | | 226,000 | | | | 227,033 | |
Toyota Auto Receivables Owner Trust | | | 1.47 | % | | | 9/15/2021 | | | | 220,000 | | | | 222,304 | | | | | | | | - | | | | - | | | | | | | | | | | | | | | | | | | | 220,000 | | | | 222,304 | |
Toyota Auto Receivables Owner Trust | | | 1.74 | % | | | 9/15/2020 | | | | 100,000 | | | | 101,135 | | | | | | | | - | | | | - | | | | | | | | | | | | | | | | | | | | 100,000 | | | | 101,135 | |
Trafigura Securitisation Finance PLC | | | 1.39 | % | | | 10/15/2018 | | | | - | | | | - | | | | | | | | 691,000 | | | | 683,750 | | | | | | | | | | | | | | | | | | | | 691,000 | | | | 683,750 | |
Tricon American Homes Trust | | | 1.69 | % | | | 5/17/2032 | | | | - | | | | - | | | | | | | | 159,423 | | | | 157,021 | | | | | | | | | | | | | | | | | | | | 159,423 | | | | 157,021 | |
Truman Capital Mortgage Loan Trust | | | 3.13 | % | | | 4/25/2053 | | | | - | | | | - | | | | | | | | 659 | | | | 659 | | | | | | | | | | | | | | | | | | | | 659 | | | | 659 | |
USAA Auto Owner Trust | | | 1.54 | % | | | 11/16/2020 | | | | 100,000 | | | | 100,858 | | | | | | | | - | | | | - | | | | | | | | | | | | | | | | | | | | 100,000 | | | | 100,858 | |
Vericrest Opportunity Loan Trust | | | 3.38 | % | | | 10/25/2058 | | | | - | | | | - | | | | | | | | 426,260 | | | | 421,785 | | | | | | | | | | | | | | | | | | | | 426,260 | | | | 421,785 | |
VML LLC | | | 3.88 | % | | | 4/27/2054 | | | | - | | | | - | | | | | | | | 97,156 | | | | 97,069 | | | | | | | | | | | | | | | | | | | | 97,156 | | | | 97,069 | |
Volkswagen Auto Lease Trust | | | 0.87 | % | | | 6/20/2017 | | | | - | | | | - | | | | | | | | 126,339 | | | | 126,297 | | | | | | | | | | | | | | | | | | | | 126,339 | | | | 126,297 | |
Volkswagen Auto Loan Enhanced Trust | | | 0.66 | % | | | 3/20/2019 | | | | 87,794 | | | | 87,647 | | | | | | | | - | | | | - | | | | | | | | | | | | | | | | | | | | 87,794 | | | | 87,647 | |
VOLT NPL X LLC | | | 3.38 | % | | | 10/26/2054 | | | | - | | | | - | | | | | | | | 177,665 | | | | 176,597 | | | | | | | | | | | | | | | | | | | | 177,665 | | | | 176,597 | |
VOLT XIX LLC | | | 3.88 | % | | | 4/25/2055 | | | | - | | | | - | | | | | | | | 268,943 | | | | 268,683 | | | | | | | | | | | | | | | | | | | | 268,943 | | | | 268,683 | |
VOLT XL LLC | | | 4.38 | % | | | 11/27/2045 | | | | - | | | | - | | | | | | | | 449,694 | | | | 451,420 | | | | | | | | | | | | | | | | | | | | 449,694 | | | | 451,420 | |
VOLT XLV LLC | | | 4.00 | % | | | 5/25/2046 | | | | - | | | | - | | | | | | | | 172,661 | | | | 172,315 | | | | | | | | | | | | | | | | | | | | 172,661 | | | | 172,315 | |
VOLT XLVI LLC | | | 3.84 | % | | | 6/25/2046 | | | | - | | | | - | | | | | | | | 448,000 | | | | 448,000 | | | | | | | | | | | | | | | | | | | | 448,000 | | | | 448,000 | |
VOLT XLVII LLC | | | 3.75 | % | | | 6/25/2046 | | | | - | | | | - | | | | | | | | 458,000 | | | | 458,000 | | | | | | | | | | | | | | | | | | | | 458,000 | | | | 458,000 | |
VOLT XXII LLC | | | 3.50 | % | | | 2/25/2055 | | | | - | | | | - | | | | | | | | 308,528 | | | | 306,798 | | | | | | | | | | | | | | | | | | | | 308,528 | | | | 306,798 | |
VOLT XXIV LLC | | | 3.50 | % | | | 2/25/2055 | | | | - | | | | - | | | | | | | | 556,948 | | | | 554,190 | | | | | | | | | | | | | | | | | | | | 556,948 | | | | 554,190 | |
VOLT XXV LLC | | | 3.50 | % | | | 6/26/2045 | | | | - | | | | - | | | | | | | | 1,178,905 | | | | 1,170,570 | | | | | | | | | | | | | | | | | | | | 1,178,905 | | | | 1,170,570 | |
VOLT XXVI LLC | | | 3.13 | % | | | 9/25/2043 | | | | - | | | | - | | | | | | | | 300,442 | | | | 297,985 | | | | | | | | | | | | | | | | | | | | 300,442 | | | | 297,985 | |
VOLT XXVI LLC | | | 4.25 | % | | | 9/25/2043 | | | | - | | | | - | | | | | | | | 184,546 | | | | 177,653 | | | | | | | | | | | | | | | | | | | | 184,546 | | | | 177,653 | |
VOLT XXVII LLC | | | 3.38 | % | | | 8/27/2057 | | | | - | | | | - | | | | | | | | 569,934 | | | | 566,453 | | | | | | | | | | | | | | | | | | | | 569,934 | | | | 566,453 | |
VOLT XXX LLC | | | 3.63 | % | | | 10/25/2057 | | | | - | | | | - | | | | | | | | 421,730 | | | | 419,672 | | | | | | | | | | | | | | | | | | | | 421,730 | | | | 419,672 | |
VOLT XXXI LLC | | | 3.38 | % | | | 2/25/2055 | | | | - | | | | - | | | | | | | | 341,064 | | | | 337,702 | | | | | | | | | | | | | | | | | | | | 341,064 | | | | 337,702 | |
VOLT XXXIII LLC | | | 3.50 | % | | | 3/25/2055 | | | | - | | | | - | | | | | | | | 551,742 | | | | 547,016 | | | | | | | | | | | | | | | | | | | | 551,742 | | | | 547,016 | |
VOLT XXXIV LLC | | | 3.25 | % | | | 2/25/2055 | | | | - | | | | - | | | | | | | | 325,005 | | | | 322,511 | | | | | | | | | | | | | | | | | | | | 325,005 | | | | 322,511 | |
VOLT XXXIX LLC | | | 4.13 | % | | | 10/25/2045 | | | | - | | | | - | | | | | | | | 329,527 | | | | 329,996 | | | | | | | | | | | | | | | | | | | | 329,527 | | | | 329,996 | |
VOLT XXXV LLC | | | 3.50 | % | | | 6/26/2045 | | | | - | | | | - | | | | | | | | 367,457 | | | | 364,469 | | | | | | | | | | | | | | | | | | | | 367,457 | | | | 364,469 | |
Westlake Automobile Receivables Trust | | | 1.57 | % | | | 6/17/2019 | | | | - | | | | - | | | | | | | | 519,000 | | | | 519,000 | | | | | | | | | | | | | | | | | | | | 519,000 | | | | 519,000 | |
Westlake Automobile Receivables Trust | | | 4.10 | % | | | 6/15/2021 | | | | - | | | | - | | | | | | | | 170,000 | | | | 171,431 | | | | | | | | | | | | | | | | | | | | 170,000 | | | | 171,431 | |
Westlake Automobile Receivables Trust | | | 4.40 | % | | | 5/17/2021 | | | | - | | | | - | | | | | | | | 250,000 | | | | 252,062 | | | | | | | | | | | | | | | | | | | | 250,000 | | | | 252,062 | |
World Omni Auto Receivables Trust | | | 0.79 | % | | | 7/16/2018 | | | | - | | | | - | | | | | | | | 63,099 | | | | 63,075 | | | | | | | | | | | | | | | | | | | | 63,099 | | | | 63,075 | |
World Omni Auto Receivables Trust | | | 0.83 | % | | | 8/15/2018 | | | | - | | | | - | | | | | | | | 47,665 | | | | 47,634 | | | | | | | | | | | | | | | | | | | | 47,665 | | | | 47,634 | |
World Omni Auto Receivables Trust | | | 1.32 | % | | | 1/15/2020 | | | | - | | | | - | | | | | | | | 79,000 | | | | 79,246 | | | | | | | | | | | | | | | | | | | | 79,000 | | | | 79,246 | |
World Omni Auto Receivables Trust | | | 1.34 | % | | | 5/15/2020 | | | | - | | | | - | | | | | | | | 129,000 | | | | 129,580 | | | | | | | | | | | | | | | | | | | | 129,000 | | | | 129,580 | |
World Omni Auto Receivables Trust | | | 1.84 | % | | | 1/17/2022 | | | | 80,000 | | | | 80,797 | | | | | | | | - | | | | - | | | | | | | | | | | | | | | | | | | | 80,000 | | | | 80,797 | |
| | | | | | | | | | | | | | | | | | | | | | | | | | | | | | | | | | | | |
Total Asset-Backed Securities | | | | | | | | | | | | | | | 13,207,049 | | | | | | | | | | | | 75,501,995 | | | | | | | | | | | | | | | | | | | | | | | | 88,709,044 | |
| | | | | | | | | | | | | | | | | | | | | | | | | | | | | | | | | | | | |
| | | | | | | | | | | | | |
($ | Total Cost
13,113,555 |
) | | | | | | | | | |
($ | Total Cost
75,513,863 |
) | | | | | | | | | | | | | | | | | | | | | |
($ | Total Cost
88,627,418 |
) |
9
| | | | | | | | | | | | | | | | | | | | | | | | | | | | | | | | | | | | | | | | | | | | | | | | | | | | |
| | | | | | | | | Voya Limited
Maturity Bond VP | | | | | | JPMorgan Core
Bond VP | | | | | | Adjustments | | | | | | Combined Pro
Forma Portfolio | |
| | | | | | | | | | | | | |
| | | Coupon Rate | | | Maturity Date | | | Principal | | | Value | | | | | | Principal | | | Value | | | | | | Principal | | | Value | | | | | | Principal | | | Value | |
| | | | | | | | | | | | | | | | | | | | | | | | | | | | | | | | |
Corporate Debt Securities - 23.3 % | | | | | | | | | | | | | | | | | | | | | | | | | | | | | | | | | | | | | | | | | | | | | | | | | |
Aerospace & Defense | | | | | | | | | | | | | | | | | | | | | | | | | | | | | | | | | | | | | | | | | | | | | | | | | | | | |
Airbus Group Finance BV | | | 2.70 | % | | | 4/17/2023 | | | $ | - | | | $ | - | | | | | | | $ | 43,000 | | | $ | 44,691 | | | | | | | | | | | | | | | | | | | $ | 43,000 | | | $ | 44,691 | |
BAE Systems Holdings, Inc. | | | 3.80 | % | | | 10/7/2024 | | | | - | | | | - | | | | | | | | 68,000 | | | | 71,535 | | | | | | | | | | | | | | | | | | | | 68,000 | | | | 71,535 | |
BAE Systems Holdings, Inc. | | | 3.85 | % | | | 12/15/2025 | | | | - | | | | - | | | | | | | | 200,000 | | | | 211,988 | | | | | | | | | | | | | | | | | | | | 200,000 | | | | 211,988 | |
BAE Systems Holdings, Inc. | | | 6.38 | % | | | 6/1/2019 | | | | - | | | | - | | | | | | | | 30,000 | | | | 33,723 | | | | | | | | | | | | | | | | | | | | 30,000 | | | | 33,723 | |
BAE Systems PLC | | | 5.80 | % | | | 10/11/2041 | | | | - | | | | - | | | | | | | | 92,000 | | | | 113,354 | | | | | | | | | | | | | | | | | | | | 92,000 | | | | 113,354 | |
Boeing Co. | | | 7.95 | % | | | 8/15/2024 | | | | - | | | | - | | | | | | | | 30,000 | | | | 42,426 | | | | | | | | | | | | | | | | | | | | 30,000 | | | | 42,426 | |
L-3 Communications Corp. | | | 1.50 | % | | | 5/28/2017 | | | | 148,000 | | | | 148,130 | | | | | | | | - | | | | - | | | | | | | | | | | | | | | | | | | | 148,000 | | | | 148,130 | |
Lockheed Martin Corp. | | | 1.85 | % | | | 11/23/2018 | | | | 180,000 | | | | 182,442 | | | | | | | | - | | | | - | | | | | | | | | | | | | | | | | | | | 180,000 | | | | 182,442 | |
Lockheed Martin Corp. | | | 3.10 | % | | | 1/15/2023 | | | | - | | | | - | | | | | | | | 74,000 | | | | 77,995 | | | | | | | | | | | | | | | | | | | | 74,000 | | | | 77,995 | |
Lockheed Martin Corp. | | | 4.07 | % | | | 12/15/2042 | | | | - | | | | - | | | | | | | | 57,000 | | | | 60,681 | | | | | | | | | | | | | | | | | | | | 57,000 | | | | 60,681 | |
Lockheed Martin Corp. | | | 4.50 | % | | | 5/15/2036 | | | | - | | | | - | | | | | | | | 200,000 | | | | 223,243 | | | | | | | | | | | | | | | | | | | | 200,000 | | | | 223,243 | |
Lockheed Martin Corp. | | | 6.15 | % | | | 9/1/2036 | | | | - | | | | - | | | | | | | | 85,000 | | | | 112,846 | | | | | | | | | | | | | | | | | | | | 85,000 | | | | 112,846 | |
Northrop Grumman Corp. | | | 3.85 | % | | | 4/15/2045 | | | | - | | | | - | | | | | | | | 38,000 | | | | 39,559 | | | | | | | | | | | | | | | | | | | | 38,000 | | | | 39,559 | |
Northrop Grumman Systems Corp. | | | 7.75 | % | | | 2/15/2031 | | | | - | | | | - | | | | | | | | 40,000 | | | | 59,834 | | | | | | | | | | | | | | | | | | | | 40,000 | | | | 59,834 | |
Precision Castparts Corp. | | | 3.25 | % | | | 6/15/2025 | | | | - | | | | - | | | | | | | | 170,000 | | | | 181,273 | | | | | | | | | | | | | | | | | | | | 170,000 | | | | 181,273 | |
Precision Castparts Corp. | | | 4.20 | % | | | 6/15/2035 | | | | - | | | | - | | | | | | | | 170,000 | | | | 191,592 | | | | | | | | | | | | | | | | | | | | 170,000 | | | | 191,592 | |
Raytheon Co. | | | 3.15 | % | | | 12/15/2024 | | | | - | | | | - | | | | | | | | 84,000 | | | | 91,034 | | | | | | | | | | | | | | | | | | | | 84,000 | | | | 91,034 | |
United Technologies Corp. | | | 1.78 | % | | | 5/4/2018 | | | | 150,000 | | | | 151,348 | | | | | | | | - | | | | - | | | | | | | | | | | | | | | | | | | | 150,000 | | | | 151,348 | |
United Technologies Corp. | | | 1.80 | % | | | 6/1/2017 | | | | - | | | | - | | | | | | | | 27,000 | | | | 27,207 | | | | | | | | | | | | | | | | | | | | 27,000 | | | | 27,207 | |
United Technologies Corp. | | | 3.10 | % | | | 6/1/2022 | | | | - | | | | - | | | | | | | | 64,000 | | | | 68,220 | | | | | | | | | | | | | | | | | | | | 64,000 | | | | 68,220 | |
United Technologies Corp. | | | 4.15 | % | | | 5/15/2045 | | | | - | | | | - | | | | | | | | 163,000 | | | | 179,035 | | | | | | | | | | | | | | | | | | | | 163,000 | | | | 179,035 | |
United Technologies Corp. | | | 4.50 | % | | | 6/1/2042 | | | | - | | | | - | | | | | | | | 86,000 | | | | 98,497 | | | | | | | | | | | | | | | | | | | | 86,000 | | | | 98,497 | |
Air Freight & Logistics | | | | | | | | | | | | | | | | | | | | | | | | | | | | | | | | | | | | | | | | | | | | | | | | | | | | |
FedEx Corp. | | | 3.25 | % | | | 4/1/2026 | | | | - | | | | - | | | | | | | | 60,000 | | | | 62,762 | | | | | | | | | | | | | | | | | | | | 60,000 | | | | 62,762 | |
FedEx Corp. | | | 3.90 | % | | | 2/1/2035 | | | | - | | | | - | | | | | | | | 96,000 | | | | 97,589 | | | | | | | | | | | | | | | | | | | | 96,000 | | | | 97,589 | |
FedEx Corp. | | | 4.10 | % | | | 4/15/2043 | | | | - | | | | - | | | | | | | | 70,000 | | | | 71,128 | | | | | | | | | | | | | | | | | | | | 70,000 | | | | 71,128 | |
United Parcel Service of America, Inc. | | | 8.38 | % | | | 4/1/2020 | | | | - | | | | - | | | | | | | | 35,000 | | | | 43,860 | | | | | | | | | | | | | | | | | | | | 35,000 | | | | 43,860 | |
United Parcel Service of America, Inc. | | | 8.38 | % | | | 4/1/2030 | | | | - | | | | - | | | | | | | | 55,000 | | | | 82,322 | | | | | | | | | | | | | | | | | | | | 55,000 | | | | 82,322 | |
United Parcel Service, Inc. | | | 2.45 | % | | | 10/1/2022 | | | | - | | | | - | | | | | | | | 29,000 | | | | 30,150 | | | | | | | | | | | | | | | | | | | | 29,000 | | | | 30,150 | |
Airlines | | | | | | | | | | | | | | | | | | | | | | | | | | | | | | | | | | | | | | | | | | | | | | | | | | | | |
Air Canada Pass-Through Trust | | | 4.13 | % | | | 11/15/2026 | | | | - | | | | - | | | | | | | | 46,681 | | | | 48,081 | | | | | | | | | | | | | | | | | | | | 46,681 | | | | 48,081 | |
American Airlines Pass-Through Trust | | | 3.65 | % | | | 12/15/2029 | | | | - | | | | - | | | | | | | | 42,000 | | | | 43,470 | | | | | | | | | | | | | | | | | | | | 42,000 | | | | 43,470 | |
American Airlines Pass-Through Trust | | | 4.95 | % | | | 7/15/2024 | | | | - | | | | - | | | | | | | | 168,031 | | | | 182,734 | | | | | | | | | | | | | | | | | | | | 168,031 | | | | 182,734 | |
Continental Airlines Pass-Through Trust | | | 4.00 | % | | | 4/29/2026 | | | | - | | | | - | | | | | | | | 27,907 | | | | 29,302 | | | | | | | | | | | | | | | | | | | | 27,907 | | | | 29,302 | |
Continental Airlines Pass-Through Trust | | | 5.98 | % | | | 10/19/2023 | | | | - | | | | - | | | | | | | | 38,618 | | | | 43,252 | | | | | | | | | | | | | | | | | | | | 38,618 | | | | 43,252 | |
Delta Air Lines Pass-Through Trust | | | 4.75 | % | | | 11/7/2021 | | | | - | | | | - | | | | | | | | 78,347 | | | | 83,048 | | | | | | | | | | | | | | | | | | | | 78,347 | | | | 83,048 | |
Delta Air Lines Pass-Through Trust | | | 5.30 | % | | | 10/15/2020 | | | | - | | | | - | | | | | | | | 14,503 | | | | 15,446 | | | | | | | | | | | | | | | | | | | | 14,503 | | | | 15,446 | |
Southwest Airlines Co. | | | 2.65 | % | | | 11/5/2020 | | | | 310,000 | | | | 319,969 | | | | | | | | - | | | | - | | | | | | | | | | | | | | | | | | | | 310,000 | | | | 319,969 | |
Southwest Airlines Co. | | | 2.75 | % | | | 11/6/2019 | | | | 163,000 | | | | 168,506 | | | | | | | | - | | | | - | | | | | | | | | | | | | | | | | | | | 163,000 | | | | 168,506 | |
United Airlines Pass-Through Trust | | | 3.45 | % | | | 1/7/2030 | | | | - | | | | - | | | | | | | | 139,000 | | | | 142,475 | | | | | | | | | | | | | | | | | | | | 139,000 | | | | 142,475 | |
Auto Components | | | | | | | | | | | | | | | | | | | | | | | | | | | | | | | | | | | | | | | | | | | | | | | | | | | | |
Johnson Controls, Inc. | | | 1.40 | % | | | 11/2/2017 | | | | 104,000 | | | | 104,325 | | | | | | | | - | | | | - | | | | | | | | | | | | | | | | | | | | 104,000 | | | | 104,325 | |
Johnson Controls, Inc. | | | 3.75 | % | | | 12/1/2021 | | | | - | | | | - | | | | | | | | 66,000 | | | | 70,399 | | | | | | | | | | | | | | | | | | | | 66,000 | | | | 70,399 | |
Johnson Controls, Inc. | | | 4.95 | % | | | 7/2/2064 | | | | - | | | | - | | | | | | | | 20,000 | | | | 19,938 | | | | | | | | | | | | | | | | | | | | 20,000 | | | | 19,938 | |
Johnson Controls, Inc. | | | 5.25 | % | | | 12/1/2041 | | | | - | | | | - | | | | | | | | 100,000 | | | | 111,532 | | | | | | | | | | | | | | | | | | | | 100,000 | | | | 111,532 | |
10
| | | | | | | | | | | | | | | | | | | | | | | | | | | | | | | | | | | | | | | | | | | | | | | | | | | | |
| | | | | | | | | Voya Limited
Maturity Bond VP | | | | | | JPMorgan Core
Bond VP | | | | | | Adjustments | | | | | | Combined Pro
Forma Portfolio | |
| | | | | | | | | | | | | |
| | | Coupon Rate | | | Maturity Date | | | Principal | | | Value | | | | | | Principal | | | Value | | | | | | Principal | | | Value | | | | | | Principal | | | Value | |
| | | | | | | | | | | | | | | | | | | | | | | | | | | | | | | | |
Automobiles | | | | | | | | | | | | | | | | | | | | | | | | | | | | | | | | | | | | | | | | | | | | | |
Daimler Finance North America LLC | | | 1.50 | % | | | 7/5/2019 | | | $ | 155,000 | | | $ | 154,892 | | | | | | | $ | - | | | $ | - | | | | | | | | | | | | | | | | | | | $ | 155,000 | | | $ | 154,892 | |
Daimler Finance North America LLC | | | 1.65 | % | | | 3/2/2018 | | | | - | | | | - | | | | | | | | - | | | | - | | | | | | | | | | | | | | | | | | | | - | | | | - | |
Daimler Finance North America LLC | | | 2.38 | % | | | 8/1/2018 | | | | - | | | | - | | | | | | | | 151,000 | | | | 154,353 | | | | | | | | | | | | | | | | | | | | 151,000 | | | | 154,353 | |
Daimler Finance North America LLC | | | 2.63 | % | | | 9/15/2016 | | | | - | | | | - | | | | | | | | 150,000 | | | | 150,493 | | | | | | | | | | | | | | | | | | | | 150,000 | | | | 150,493 | |
Daimler Finance North America LLC | | | 2.95 | % | | | 1/11/2017 | | | | - | | | | - | | | | | | | | 150,000 | | | | 151,475 | | | | | | | | | | | | | | | | | | | | 150,000 | | | | 151,475 | |
General Motors Co. | | | 4.88 | % | | | 10/2/2023 | | | | - | | | | - | | | | | | | | 100,000 | | | | 106,454 | | | | | | | | | | | | | | | | | | | | 100,000 | | | | 106,454 | |
General Motors Co. | | | 6.60 | % | | | 4/1/2036 | | | | - | | | | - | | | | | | | | 190,000 | | | | 217,874 | | | | | | | | | | | | | | | | | | | | 190,000 | | | | 217,874 | |
General Motors Financial Co., Inc. | | | 2.40 | % | | | 5/9/2019 | | | | 165,000 | | | | 165,460 | | | | | | | | - | | | | - | | | | | | | | | | | | | | | | | | | | 165,000 | | | | 165,460 | |
General Motors Financial Co., Inc. | | | 3.20 | % | | | 7/13/2020 | | | | - | | | | - | | | | | | | | 305,000 | | | | 308,987 | | | | | | | | | | | | | | | | | | | | 305,000 | | | | 308,987 | |
General Motors Financial Co., Inc. | | | 3.20 | % | | | 7/6/2021 | | | | - | | | | - | | | | | | | | 120,000 | | | | 120,191 | | | | | | | | | | | | | | | | | | | | 120,000 | | | | 120,191 | |
General Motors Financial Co., Inc. | | | 3.70 | % | | | 5/9/2023 | | | | - | | | | - | | | | | | | | 184,000 | | | | 184,956 | | | | | | | | | | | | | | | | | | | | 184,000 | | | | 184,956 | |
Hyundai Capital America | | | 1.88 | % | | | 8/9/2016 | | | | 375,000 | | | | 375,195 | | | | | | | | - | | | | - | | | | | | | | | | | | | | | | | | | | 375,000 | | | | 375,195 | |
Hyundai Capital America | | | 2.40 | % | | | 10/30/2018 | | | | - | | | | - | | | | | | | | 129,000 | | | | 130,802 | | | | | | | | | | | | | | | | | | | | 129,000 | | | | 130,802 | |
Hyundai Capital America | | | 3.00 | % | | | 3/18/2021 | | | | - | | | | - | | | | | | | | 200,000 | | | | 207,167 | | | | | | | | | | | | | | | | | | | | 200,000 | | | | 207,167 | |
Nissan Motor Acceptance Corp. | | | 1.80 | % | | | 3/15/2018 | | | | - | | | | - | | | | | | | | 97,000 | | | | 97,805 | | | | | | | | | | | | | | | | | | | | 97,000 | | | | 97,805 | |
Nissan Motor Acceptance Corp. | | | 2.55 | % | | | 3/8/2021 | | | | - | | | | - | | | | | | | | 150,000 | | | | 154,908 | | | | | | | | | | | | | | | | | | | | 150,000 | | | | 154,908 | |
Banks | | | | | | | | | | | | | | | | | | | | | | | | | | | | | | | | | | | | | | | | | | | | | |
ABN AMRO Bank NV | | | 1.80 | % | | | 6/4/2018 | | | | - | | | | - | | | | | | | | 319,000 | | | | 321,359 | | | | | | | | | | | | | | | | | | | | 319,000 | | | | 321,359 | |
ABN AMRO Bank NV | | | 2.45 | % | | | 6/4/2020 | | | | 210,000 | | | | 214,742 | | | | | | | | - | | | | - | | | | | | | | | | | | | | | | | | | | 210,000 | | | | 214,742 | |
ABN AMRO Bank NV | | | 2.50 | % | | | 10/30/2018 | | | | - | | | | - | | | | | | | | 200,000 | | | | 204,642 | | | | | | | | | | | | | | | | | | | | 200,000 | | | | 204,642 | |
ANZ New Zealand International, Ltd. | | | 2.60 | % | | | 9/23/2019 | | | | - | | | | - | | | | | | | | 200,000 | | | | 204,642 | | | | | | | | | | | | | | | | | | | | 200,000 | | | | 204,642 | |
Australia & New Zealand Banking Group, Ltd. | | | 2.40 | % | | | 11/23/2016 | | | | - | | | | - | | | | | | | | 250,000 | | | | 251,445 | | | | | | | | | | | | | | | | | | | | 250,000 | | | | 251,445 | |
Australia & New Zealand Banking Group, Ltd. | | | 4.88 | % | | | 1/12/2021 | | | | - | | | | - | | | | | | | | 100,000 | | | | 112,820 | | | | | | | | | | | | | | | | | | | | 100,000 | | | | 112,820 | |
Bank of America Corp. | | | 1.95 | % | | | 5/12/2018 | | | | 228,000 | | | | 229,341 | | | | | | | | - | | | | - | | | | | | | | | | | | | | | | | | | | 228,000 | | | | 229,341 | |
Bank of America Corp. | | | 2.00 | % | | | 1/11/2018 | | | | - | | | | - | | | | | | | | 750,000 | | | | 754,795 | | | | | | | | | | | | | | | | | | | | 750,000 | | | | 754,795 | |
Bank of America Corp. | | | 2.25 | % | | | 4/21/2020 | | | | - | | | | - | | | | | | | | 545,000 | | | | 548,047 | | | | | | | | | | | | | | | | | | | | 545,000 | | | | 548,047 | |
Bank of America Corp. | | | 2.60 | % | | | 1/15/2019 | | | | 405,000 | | | | 414,424 | | | | | | | | - | | | | - | | | | | | | | | | | | | | | | | | | | 405,000 | | | | 414,424 | |
Bank of America Corp. | | | 2.65 | % | | | 4/1/2019 | | | | - | | | | - | | | | | | | | 255,000 | | | | 261,241 | | | | | | | | | | | | | | | | | | | | 255,000 | | | | 261,241 | |
Bank of America Corp. | | | 3.30 | % | | | 1/11/2023 | | | | - | | | | - | | | | | | | | 479,000 | | | | 492,961 | | | | | | | | | | | | | | | | | | | | 479,000 | | | | 492,961 | |
Bank of America Corp. | | | 3.50 | % | | | 4/19/2026 | | | | - | | | | - | | | | | | | | 142,000 | | | | 146,741 | | | | | | | | | | | | | | | | | | | | 142,000 | | | | 146,741 | |
Bank of America Corp. | | | 3.75 | % | | | 7/12/2016 | | | | 310,000 | | | | 310,149 | | | | | | | | - | | | | - | | | | | | | | | | | | | | | | | | | | 310,000 | | | | 310,149 | |
Bank of America Corp. | | | 3.88 | % | | | 8/1/2025 | | | | - | | | | - | | | | | | | | 242,000 | | | | 256,716 | | | | | | | | | | | | | | | | | | | | 242,000 | | | | 256,716 | |
Bank of America Corp. | | | 3.95 | % | | | 4/21/2025 | | | | - | | | | - | | | | | | | | 368,000 | | | | 374,751 | | | | | | | | | | | | | | | | | | | | 368,000 | | | | 374,751 | |
Bank of America Corp. | | | 4.00 | % | | | 4/1/2024 | | | | - | | | | - | | | | | | | | 365,000 | | | | 389,562 | | | | | | | | | | | | | | | | | | | | 365,000 | | | | 389,562 | |
Bank of America Corp. | | | 4.00 | % | | | 1/22/2025 | | | | - | | | | - | | | | | | | | 400,000 | | | | 407,724 | | | | | | | | | | | | | | | | | | | | 400,000 | | | | 407,724 | |
Bank of America Corp. | | | 4.13 | % | | | 1/22/2024 | | | | - | | | | - | | | | | | | | 126,000 | | | | 135,523 | | | | | | | | | | | | | | | | | | | | 126,000 | | | | 135,523 | |
Bank of America Corp. | | | 4.25 | % | | | 10/22/2026 | | | | - | | | | - | | | | | | | | 284,000 | | | | 294,533 | | | | | | | | | | | | | | | | | | | | 284,000 | | | | 294,533 | |
Bank of America Corp. | | | 5.00 | % | | | 5/13/2021 | | | | - | | | | - | | | | | | | | 340,000 | | | | 380,691 | | | | | | | | | | | | | | | | | | | | 340,000 | | | | 380,691 | |
Bank of America Corp. | | | 5.63 | % | | | 7/1/2020 | | | | - | | | | - | | | | | | | | 170,000 | | | | 191,257 | | | | | | | | | | | | | | | | | | | | 170,000 | | | | 191,257 | |
Bank of America Corp. | | | 5.65 | % | | | 5/1/2018 | | | | - | | | | - | | | | | | | | 20,000 | | | | 21,433 | | | | | | | | | | | | | | | | | | | | 20,000 | | | | 21,433 | |
Bank of America Corp. | | | 5.75 | % | | | 12/1/2017 | | | | - | | | | - | | | | | | | | 65,000 | | | | 68,799 | | | | | | | | | | | | | | | | | | | | 65,000 | | | | 68,799 | |
Bank of America Corp. | | | 5.88 | % | | | 1/5/2021 | | | | - | | | | - | | | | | | | | 70,000 | | | | 80,302 | | | | | | | | | | | | | | | | | | | | 70,000 | | | | 80,302 | |
Bank of America Corp. | | | 6.40 | % | | | 8/28/2017 | | | | - | | | | - | | | | | | | | 395,000 | | | | 416,790 | | | | | | | | | | | | | | | | | | | | 395,000 | | | | 416,790 | |
Bank of America Corp. | | | 6.88 | % | | | 4/25/2018 | | | | - | | | | - | | | | | | | | 60,000 | | | | 65,505 | | | | | | | | | | | | | | | | | | | | 60,000 | | | | 65,505 | |
Bank of America Corp. | | | 7.63 | % | | | 6/1/2019 | | | | - | | | | - | | | | | | | | 50,000 | | | | 57,871 | | | | | | | | | | | | | | | | | | | | 50,000 | | | | 57,871 | |
Bank of Montreal | | | 1.30 | % | | | 7/14/2017 | | | | 240,000 | | | | 240,639 | | | | | | | | - | | | | - | | | | | | | | | | | | | | | | | | | | 240,000 | | | | 240,639 | |
Bank of Montreal | | | 1.40 | % | | | 4/10/2018 | | | | - | | | | - | | | | | | | | 100,000 | | | | 100,442 | | | | | | | | | | | | | | | | | | | | 100,000 | | | | 100,442 | |
Bank of Montreal | | | 1.40 | % | | | 9/11/2017 | | | | - | | | | - | | | | | | | | 131,000 | | | | 131,664 | | | | | | | | | | | | | | | | | | | | 131,000 | | | | 131,664 | |
Bank of Montreal | | | 1.80 | % | | | 7/31/2018 | | | | 170,000 | | | | 172,088 | | | | | | | | - | | | | - | | | | | | | | | | | | | | | | | | | | 170,000 | | | | 172,088 | |
Bank of Montreal | | | 2.38 | % | | | 1/25/2019 | | | | - | | | | - | | | | | | | | 158,000 | | | | 162,202 | | | | | | | | | | | | | | | | | | | | 158,000 | | | | 162,202 | |
Bank of Montreal | | | 2.55 | % | | | 11/6/2022 | | | | - | | | | - | | | | | | | | 85,000 | | | | 87,872 | | | | | | | | | | | | | | | | | | | | 85,000 | | | | 87,872 | |
Bank of Nova Scotia | | | 1.30 | % | | | 7/21/2017 | | | | 438,000 | | | | 438,796 | | | | | | | | - | | | | - | | | | | | | | | | | | | | | | | | | | 438,000 | | | | 438,796 | |
Bank of Nova Scotia | | | 1.45 | % | | | 4/25/2018 | | | | - | | | | - | | | | | | | | 300,000 | | | | 301,068 | | | | | | | | | | | | | | | | | | | | 300,000 | | | | 301,068 | |
Bank of Nova Scotia | | | 1.85 | % | | | 4/14/2020 | | | | - | | | | - | | | | | | | | 300,000 | | | | 303,975 | | | | | | | | | | | | | | | | | | | | 300,000 | | | | 303,975 | |
Bank of Tokyo-Mitsubishi UFJ, Ltd. | | | 1.55 | % | | | 9/9/2016 | | | | 246,000 | | | | 246,267 | | | | | | | | - | | | | - | | | | | | | | | | | | | | | | | | | | 246,000 | | | | 246,267 | |
Bank of Tokyo-Mitsubishi UFJ, Ltd. | | | 1.70 | % | | | 3/5/2018 | | | | 200,000 | | | | 201,026 | | | | | | | | - | | | | - | | | | | | | | | | | | | | | | | | | | 200,000 | | | | 201,026 | |
Bank of Tokyo-Mitsubishi UFJ, Ltd. | | | 2.35 | % | | | 9/8/2019 | | | | - | | | | - | | | | | | | | 260,000 | | | | 265,893 | | | | | | | | | | | | | | | | | | | | 260,000 | | | | 265,893 | |
Banque Federative du Credit Mutuel SA | | | 1.70 | % | | | 1/20/2017 | | | | 200,000 | | | | 200,513 | | | | | | | | 200,000 | | | | 200,513 | | | | | | | | | | | | | | | | | | | | 400,000 | | | | 401,026 | |
Barclays Bank PLC | | | 2.25 | % | | | 5/10/2017 | | | | - | | | | - | | | | | | | | 200,000 | | | | 202,034 | | | | | | | | | | | | | | | | | | | | 200,000 | | | | 202,034 | |
Barclays Bank PLC | | | 5.00 | % | | | 9/22/2016 | | | | 160,000 | | | | 161,356 | | | | | | | | - | | | | - | | | | | | | | | | | | | | | | | | | | 160,000 | | | | 161,356 | |
Barclays PLC | | | 2.75 | % | | | 11/8/2019 | | | | - | | | | - | | | | | | | | 200,000 | | | | 198,589 | | | | | | | | | | | | | | | | | | | | 200,000 | | | | 198,589 | |
Barclays PLC | | | 3.25 | % | | | 1/12/2021 | | | | - | | | | - | | | | | | | | 278,000 | | | | 277,026 | | | | | | | | | | | | | | | | | | | | 278,000 | | | | 277,026 | |
11
| | | | | | | | | | | | | | | | | | | | | | | | | | | | | | | | | | | | | | | | | | | | | | | | | | | | |
| | | | | | | | | Voya Limited
Maturity Bond VP | | | | | | JPMorgan Core
Bond VP | | | | | | Adjustments | | | | | | Combined Pro
Forma Portfolio | |
| | | | | | | | | | | | | |
| | | Coupon Rate | | | Maturity Date | | | Principal | | | Value | | | | | | Principal | | | Value | | | | | | Principal | | | Value | | | | | | Principal | | | Value | |
| | | | | | | | | | | | | | | | | | | | | | | | | | | | | | | | |
Barclays PLC | | | 3.65 | % | | | 3/16/2025 | | | $ | - | | | $ | - | | | | | | | $ | 200,000 | | | $ | 192,314 | | | | | | | | | | | | | | | | | | | $ | 200,000 | | | $ | 192,314 | |
Barclays PLC | | | 5.25 | % | | | 8/17/2045 | | | | - | | | | - | | | | | | | | 200,000 | | | | 209,167 | | | | | | | | | | | | | | | | | | | | 200,000 | | | | 209,167 | |
BB&T Corp. | | | 1.60 | % | | | 8/15/2017 | | | | 310,000 | | | | 311,676 | | | | | | | | 131,000 | | | | 131,708 | | | | | | | | | | | | | | | | | | | | 441,000 | | | | 443,384 | |
BB&T Corp. | | | 2.63 | % | | | 6/29/2020 | | | | - | | | | - | | | | | | | | 300,000 | | | | 309,895 | | | | | | | | | | | | | | | | | | | | 300,000 | | | | 309,895 | |
BB&T Corp. | | | 5.25 | % | | | 11/1/2019 | | | | - | | | | - | | | | | | | | 30,000 | | | | 33,242 | | | | | | | | | | | | | | | | | | | | 30,000 | | | | 33,242 | |
BB&T Corp. | | | 6.85 | % | | | 4/30/2019 | | | | - | | | | - | | | | | | | | 75,000 | | | | 86,076 | | | | | | | | | | | | | | | | | | | | 75,000 | | | | 86,076 | |
BNP Paribas SA | | | 4.38 | % | | | 9/28/2025 | | | | - | | | | - | | | | | | | | 335,000 | | | | 339,703 | | | | | | | | | | | | | | | | | | | | 335,000 | | | | 339,703 | |
BNZ International Funding, Ltd. | | | 2.35 | % | | | 3/4/2019 | | | | - | | | | - | | | | | | | | 250,000 | | | | 253,855 | | | | | | | | | | | | | | | | | | | | 250,000 | | | | 253,855 | |
BPCE SA | | | 1.63 | % | | | 2/10/2017 | | | | 250,000 | | | | 250,548 | | | | | | | | - | | | | - | | | | | | | | | | | | | | | | | | | | 250,000 | | | | 250,548 | |
BPCE SA | | | 1.63 | % | | | 1/26/2018 | | | | - | | | | - | | | | | | | | 350,000 | | | | 351,310 | | | | | | | | | | | | | | | | | | | | 350,000 | | | | 351,310 | |
Canadian Imperial Bank of Commerce | | | 2.25 | % | | | 7/21/2020 | | | | - | | | | - | | | | | | | | 234,000 | | | | 239,831 | | | | | | | | | | | | | | | | | | | | 234,000 | | | | 239,831 | |
Citigroup, Inc. | | | 1.75 | % | | | 5/1/2018 | | | | - | | | | - | | | | | | | | 160,000 | | | | 160,703 | | | | | | | | | | | | | | | | | | | | 160,000 | | | | 160,703 | |
Citigroup, Inc. | | | 1.85 | % | | | 11/24/2017 | | | | 131,000 | | | | 131,722 | | | | | | | | - | | | | - | | | | | | | | | | | | | | | | | | | | 131,000 | | | | 131,722 | |
Citigroup, Inc. | | | 2.05 | % | | | 12/7/2018 | | | | 350,000 | | | | 352,781 | | | | | | | | - | | | | - | | | | | | | | | | | | | | | | | | | | 350,000 | | | | 352,781 | |
Citigroup, Inc. | | | 2.15 | % | | | 7/30/2018 | | | | - | | | | - | | | | | | | | 110,000 | | | | 111,341 | | | | | | | | | | | | | | | | | | | | 110,000 | | | | 111,341 | |
Citigroup, Inc. | | | 2.40 | % | | | 2/18/2020 | | | | - | | | | - | | | | | | | | 220,000 | | | | 222,252 | | | | | | | | | | | | | | | | | | | | 220,000 | | | | 222,252 | |
Citigroup, Inc. | | | 2.50 | % | | | 9/26/2018 | | | | - | | | | - | | | | | | | | 220,000 | | | | 224,360 | | | | | | | | | | | | | | | | | | | | 220,000 | | | | 224,360 | |
Citigroup, Inc. | | | 2.70 | % | | | 3/30/2021 | | | | - | | | | - | | | | | | | | 108,000 | | | | 109,922 | | | | | | | | | | | | | | | | | | | | 108,000 | | | | 109,922 | |
Citigroup, Inc. | | | 3.40 | % | | | 5/1/2026 | | | | - | | | | - | | | | | | | | 150,000 | | | | 153,802 | | | | | | | | | | | | | | | | | | | | 150,000 | | | | 153,802 | |
Citigroup, Inc. | | | 3.70 | % | | | 1/12/2026 | | | | - | | | | - | | | | | | | | 400,000 | | | | 421,075 | | | | | | | | | | | | | | | | | | | | 400,000 | | | | 421,075 | |
Citigroup, Inc. | | | 3.88 | % | | | 3/26/2025 | | | | - | | | | - | | | | | | | | 100,000 | | | | 101,011 | | | | | | | | | | | | | | | | | | | | 100,000 | | | | 101,011 | |
Citigroup, Inc. | | | 4.30 | % | | | 11/20/2026 | | | | - | | | | - | | | | | | | | 300,000 | | | | 309,078 | | | | | | | | | | | | | | | | | | | | 300,000 | | | | 309,078 | |
Citigroup, Inc. | | | 4.40 | % | | | 6/10/2025 | | | | - | | | | - | | | | | | | | 98,000 | | | | 102,470 | | | | | | | | | | | | | | | | | | | | 98,000 | | | | 102,470 | |
Citigroup, Inc. | | | 4.75 | % | | | 5/18/2046 | | | | - | | | | - | | | | | | | | 140,000 | | | | 140,491 | | | | | | | | | | | | | | | | | | | | 140,000 | | | | 140,491 | |
Citigroup, Inc. | | | 5.30 | % | | | 5/6/2044 | | | | - | | | | - | | | | | | | | 43,000 | | | | 46,429 | | | | | | | | | | | | | | | | | | | | 43,000 | | | | 46,429 | |
Citigroup, Inc. | | | 5.50 | % | | | 9/13/2025 | | | | - | | | | - | | | | | | | | 115,000 | | | | 128,908 | | | | | | | | | | | | | | | | | | | | 115,000 | | | | 128,908 | |
Citigroup, Inc. | | | 5.88 | % | | | 1/30/2042 | | | | - | | | | - | | | | | | | | 45,000 | | | | 56,961 | | | | | | | | | | | | | | | | | | | | 45,000 | | | | 56,961 | |
Citigroup, Inc. | | | 8.13 | % | | | 7/15/2039 | | | | - | | | | - | | | | | | | | 28,000 | | | | 43,670 | | | | | | | | | | | | | | | | | | | | 28,000 | | | | 43,670 | |
Citizens Bank NA | | | 1.60 | % | | | 12/4/2017 | | | | 250,000 | | | | 250,105 | | | | | | | | - | | | | - | | | | | | | | | | | | | | | | | | | | 250,000 | | | | 250,105 | |
Citizens Financial Group, Inc. | | | 4.30 | % | | | 12/3/2025 | | | | - | | | | - | | | | | | | | 58,000 | | | | 61,048 | | | | | | | | | | | | | | | | | | | | 58,000 | | | | 61,048 | |
Comerica, Inc. | | | 2.13 | % | | | 5/23/2019 | | | | 195,000 | | | | 197,596 | | | | | | | | - | | | | - | | | | | | | | | | | | | | | | | | | | 195,000 | | | | 197,596 | |
Comerica, Inc. | | | 3.80 | % | | | 7/22/2026 | | | | - | | | | - | | | | | | | | 26,000 | | | | 26,454 | | | | | | | | | | | | | | | | | | | | 26,000 | | | | 26,454 | |
Commonwealth Bank of Australia | | | 1.40 | % | | | 9/8/2017 | | | | 250,000 | | | | 250,877 | | | | | | | | - | | | | - | | | | | | | | | | | | | | | | | | | | 250,000 | | | | 250,877 | |
Commonwealth Bank of Australia | | | 2.25 | % | | | 3/16/2017 | | | | - | | | | - | | | | | | | | 250,000 | | | | 252,316 | | | | | | | | | | | | | | | | | | | | 250,000 | | | | 252,316 | |
Commonwealth Bank of Australia | | | 4.50 | % | | | 12/9/2025 | | | | - | | | | - | | | | | | | | 200,000 | | | | 209,198 | | | | | | | | | | | | | | | | | | | | 200,000 | | | | 209,198 | |
Compass Bank | | | 1.85 | % | | | 9/29/2017 | | | | 316,000 | | | | 315,075 | | | | | | | | - | | | | - | | | | | | | | | | | | | | | | | | | | 316,000 | | | | 315,075 | |
Cooperatieve Rabobank UA | | | 3.38 | % | | | 1/19/2017 | | | | - | | | | - | | | | | | | | 34,000 | | | | 34,440 | | | | | | | | | | | | | | | | | | | | 34,000 | | | | 34,440 | |
Cooperatieve Rabobank UA | | | 3.88 | % | | | 2/8/2022 | | | | - | | | | - | | | | | | | | 268,000 | | | | 291,155 | | | | | | | | | | | | | | | | | | | | 268,000 | | | | 291,155 | |
Cooperatieve Rabobank UA | | | 4.38 | % | | | 8/4/2025 | | | | - | | | | - | | | | | | | | 250,000 | | | | 261,132 | | | | | | | | | | | | | | | | | | | | 250,000 | | | | 261,132 | |
Credit Agricole SA | | | 4.38 | % | | | 3/17/2025 | | | | - | | | | - | | | | | | | | 200,000 | | | | 202,097 | | | | | | | | | | | | | | | | | | | | 200,000 | | | | 202,097 | |
Discover Bank | | | 2.60 | % | | | 11/13/2018 | | | | 100,000 | | | | 101,504 | | | | | | | | - | | | | - | | | | | | | | | | | | | | | | | | | | 100,000 | | | | 101,504 | |
Discover Bank | | | 3.20 | % | | | 8/9/2021 | | | | - | | | | - | | | | | | | | 250,000 | | | | 254,347 | | | | | | | | | | | | | | | | | | | | 250,000 | | | | 254,347 | |
Fifth Third Bancorp | | | 2.88 | % | | | 7/27/2020 | | | | - | | | | - | | | | | | | | 206,000 | | | | 214,685 | | | | | | | | | | | | | | | | | | | | 206,000 | | | | 214,685 | |
Fifth Third Bank | | | 2.15 | % | | | 8/20/2018 | | | | 350,000 | | | | 355,467 | | | | | | | | - | | | | - | | | | | | | | | | | | | | | | | | | | 350,000 | | | | 355,467 | |
Fifth Third Bank | | | 2.88 | % | | | 10/1/2021 | | | | - | | | | - | | | | | | | | 204,000 | | | | 210,709 | | | | | | | | | | | | | | | | | | | | 204,000 | | | | 210,709 | |
HSBC Bank PLC | | | 4.75 | % | | | 1/19/2021 | | | | - | | | | - | | | | | | | | 375,000 | | | | 413,415 | | | | | | | | | | | | | | | | | | | | 375,000 | | | | 413,415 | |
HSBC Bank USA NA | | | 4.88 | % | | | 8/24/2020 | | | | - | | | | - | | | | | | | | 250,000 | | | | 271,599 | | | | | | | | | | | | | | | | | | | | 250,000 | | | | 271,599 | |
HSBC Holdings PLC | | | 3.60 | % | | | 5/25/2023 | | | | - | | | | - | | | | | | | | 229,000 | | | | 234,031 | | | | | | | | | | | | | | | | | | | | 229,000 | | | | 234,031 | |
HSBC Holdings PLC | | | 4.00 | % | | | 3/30/2022 | | | | - | | | | - | | | | | | | | 107,000 | | | | 112,473 | | | | | | | | | | | | | | | | | | | | 107,000 | | | | 112,473 | |
HSBC Holdings PLC | | | 4.30 | % | | | 3/8/2026 | | | | - | | | | - | | | | | | | | 200,000 | | | | 211,515 | | | | | | | | | | | | | | | | | | | | 200,000 | | | | 211,515 | |
HSBC Holdings PLC | | | 4.88 | % | | | 1/14/2022 | | | | - | | | | - | | | | | | | | 160,000 | | | | 175,570 | | | | | | | | | | | | | | | | | | | | 160,000 | | | | 175,570 | |
HSBC Holdings PLC | | | 6.10 | % | | | 1/14/2042 | | | | - | | | | - | | | | | | | | 150,000 | | | | 194,029 | | | | | | | | | | | | | | | | | | | | 150,000 | | | | 194,029 | |
HSBC USA, Inc. | | | 1.63 | % | | | 1/16/2018 | | | | - | | | | - | | | | | | | | 100,000 | | | | 99,822 | | | | | | | | | | | | | | | | | | | | 100,000 | | | | 99,822 | |
HSBC USA, Inc. | | | 2.35 | % | | | 3/5/2020 | | | | - | | | | - | | | | | | | | 323,000 | | | | 322,893 | | | | | | | | | | | | | | | | | | | | 323,000 | | | | 322,893 | |
Huntington Bancshares, Inc. | | | 3.15 | % | | | 3/14/2021 | | | | 100,000 | | | | 103,592 | | | | | | | | - | | | | - | | | | | | | | | | | | | | | | | | | | 100,000 | | | | 103,592 | |
Huntington National Bank | | | 1.35 | % | | | 8/2/2016 | | | | 250,000 | | | | 250,014 | | | | | | | | - | | | | - | | | | | | | | | | | | | | | | | | | | 250,000 | | | | 250,014 | |
Huntington National Bank | | | 2.00 | % | | | 6/30/2018 | | | | - | | | | - | | | | | | | | 250,000 | | | | 252,482 | | | | | | | | | | | | | | | | | | | | 250,000 | | | | 252,482 | |
Huntington National Bank | | | 2.20 | % | | | 11/6/2018 | | | | 250,000 | | | | 253,060 | | | | | | | | - | | | | - | | | | | | | | | | | | | | | | | | | | 250,000 | | | | 253,060 | |
Industrial & Commercial Bank of China, Ltd. | | | 2.35 | % | | | 11/13/2017 | | | | - | | | | - | | | | | | | | 250,000 | | | | 252,265 | | | | | | | | | | | | | | | | | | | | 250,000 | | | | 252,265 | |
ING Bank NV | | | 2.05 | % | | | 8/17/2018 | | | | 250,000 | | | | 253,477 | | | | | | | | - | | | | - | | | | | | | | | | | | | | | | | | | | 250,000 | | | | 253,477 | |
ING Bank NV | | | 2.50 | % | | | 10/1/2019 | | | | - | | | | - | | | | | | | | 250,000 | | | | 255,086 | | | | | | | | | | | | | | | | | | | | 250,000 | | | | 255,086 | |
ING Bank NV | | | 2.70 | % | | | 8/17/2020 | | | | 300,000 | | | | 309,480 | | | | | | | | - | | | | - | | | | | | | | | | | | | | | | | | | | 300,000 | | | | 309,480 | |
ING Bank NV | | | 3.75 | % | | | 3/7/2017 | | | | - | | | | - | | | | | | | | 200,000 | | | | 203,454 | | | | | | | | | | | | | | | | | | | | 200,000 | | | | 203,454 | |
12
| | | | | | | | | | | | | | | | | | | | | | | | | | | | | | | | | | | | | | | | | | | | | | | | | | | | |
| | | | | | | | | Voya Limited
Maturity Bond VP | | | | | | JPMorgan Core
Bond VP | | | | | | Adjustments | | | | | | Combined Pro
Forma Portfolio | |
| | | | | | | | | | | | | |
| | | Coupon Rate | | | Maturity Date | | | Principal | | | Value | | | | | | Principal | | | Value | | | | | | Principal | | | Value | | | | | | Principal | | | Value | |
| | | | | | | | | | | | | | | | | | | | | | | | | | | | | | | | |
JPMorgan Chase & Co. | | | 1.70 | % | | | 3/1/2018 | | | $ | 473,000 | | | $ | 475,619 | | | | | | | $ | - | | | $ | - | | | | | | | | | | | | | | | | | | | $ | 473,000 | | | $ | 475,619 | |
JPMorgan Chase & Co. | | | 2.55 | % | | | 3/1/2021 | | | | 180,000 | | | | 182,949 | | | | | | | | - | | | | - | | | | | | | | | | | | | | | | | | | | 180,000 | | | | 182,949 | |
KeyBank NA | | | 2.35 | % | | | 3/8/2019 | | | | 250,000 | | | | 255,354 | | | | | | | | - | | | | - | | | | | | | | | | | | | | | | | | | | 250,000 | | | | 255,354 | |
KeyCorp | | | 2.30 | % | | | 12/13/2018 | | | | 184,000 | | | | 186,999 | | | | | | | | - | | | | - | | | | | | | | | | | | | | | | | | | | 184,000 | | | | 186,999 | |
KeyCorp | | | 2.90 | % | | | 9/15/2020 | | | | - | | | | - | | | | | | | | 98,000 | | | | 101,360 | | | | | | | | | | | | | | | | | | | | 98,000 | | | | 101,360 | |
KeyCorp | | | 5.10 | % | | | 3/24/2021 | | | | - | | | | - | | | | | | | | 100,000 | | | | 112,492 | | | | | | | | | | | | | | | | | | | | 100,000 | | | | 112,492 | |
Lloyds Bank PLC | | | 1.75 | % | | | 3/16/2018 | | | | - | | | | - | | | | | | | | 325,000 | | | | 324,155 | | | | | | | | | | | | | | | | | | | | 325,000 | | | | 324,155 | |
Lloyds Bank PLC | | | 1.75 | % | | | 5/14/2018 | | | | 220,000 | | | | 219,381 | | | | | | | | - | | | | - | | | | | | | | | | | | | | | | | | | | 220,000 | | | | 219,381 | |
Lloyds Bank PLC | | | 2.00 | % | | | 8/17/2018 | | | | 250,000 | | | | 249,720 | | | | | | | | - | | | | - | | | | | | | | | | | | | | | | | | | | 250,000 | | | | 249,720 | |
Lloyds Bank PLC | | | 3.50 | % | | | 5/14/2025 | | | | - | | | | - | | | | | | | | 200,000 | | | | 205,503 | | | | | | | | | | | | | | | | | | | | 200,000 | | | | 205,503 | |
Macquarie Bank, Ltd. | | | 1.60 | % | | | 10/27/2017 | | | | 400,000 | | | | 400,427 | | | | | | | | 305,000 | | | | 305,325 | | | | | | | | | | | | | | | | | | | | 705,000 | | | | 705,752 | |
Macquarie Bank, Ltd. | | | 2.40 | % | | | 1/21/2020 | | | | - | | | | - | | | | | | | | 150,000 | | | | 151,435 | | | | | | | | | | | | | | | | | | | | 150,000 | | | | 151,435 | |
Macquarie Bank, Ltd. | | | 2.60 | % | | | 6/24/2019 | | | | - | | | | - | | | | | | | | 187,000 | | | | 190,730 | | | | | | | | | | | | | | | | | | | | 187,000 | | | | 190,730 | |
Manufacturers & Traders Trust Co. | | | 1.40 | % | | | 7/25/2017 | | | | 337,000 | | | | 337,352 | | | | | | | | - | | | | - | | | | | | | | | | | | | | | | | | | | 337,000 | | | | 337,352 | |
Mitsubishi UFJ Trust & Banking Corp. | | | 1.60 | % | | | 10/16/2017 | | | | 207,000 | | | | 207,717 | | | | | | | | - | | | | - | | | | | | | | | | | | | | | | | | | | 207,000 | | | | 207,717 | |
Mizuho Bank, Ltd. | | | 1.30 | % | | | 4/16/2017 | | | | 200,000 | | | | 199,967 | | | | | | | | - | | | | - | | | | | | | | | | | | | | | | | | | | 200,000 | | | | 199,967 | |
Mizuho Bank, Ltd. | | | 1.80 | % | | | 3/26/2018 | | | | - | | | | - | | | | | | | | 242,000 | | | | 243,451 | | | | | | | | | | | | | | | | | | | | 242,000 | | | | 243,451 | |
Mizuho Bank, Ltd. | | | 3.60 | % | | | 9/25/2024 | | | | - | | | | - | | | | | | | | 300,000 | | | | 322,279 | | | | | | | | | | | | | | | | | | | | 300,000 | | | | 322,279 | |
National Australia Bank, Ltd. | | | 2.00 | % | | | 6/20/2017 | | | | - | | | | - | | | | | | | | 250,000 | | | | 252,203 | | | | | | | | | | | | | | | | | | | | 250,000 | | | | 252,203 | |
Nordea Bank AB | | | 1.63 | % | | | 5/15/2018 | | | | - | | | | - | | | | | | | | 350,000 | | | | 352,150 | | | | | | | | | | | | | | | | | | | | 350,000 | | | | 352,150 | |
Nordea Bank AB | | | 3.13 | % | | | 3/20/2017 | | | | - | | | | - | | | | | | | | 350,000 | | | | 355,085 | | | | | | | | | | | | | | | | | | | | 350,000 | | | | 355,085 | |
PNC Financial Services Group, Inc. | | | 2.85 | % | | | 11/9/2022 | | | | - | | | | - | | | | | | | | 101,000 | | | | 104,722 | | | | | | | | | | | | | | | | | | | | 101,000 | | | | 104,722 | |
PNC Financial Services Group, Inc. | | | 3.90 | % | | | 4/29/2024 | | | | - | | | | - | | | | | | | | 91,000 | | | | 97,629 | | | | | | | | | | | | | | | | | | | | 91,000 | | | | 97,629 | |
PNC Funding Corp. | | | 4.38 | % | | | 8/11/2020 | | | | - | | | | - | | | | | | | | 67,000 | | | | 73,385 | | | | | | | | | | | | | | | | | | | | 67,000 | | | | 73,385 | |
PNC Funding Corp. | | | 5.13 | % | | | 2/8/2020 | | | | - | | | | - | | | | | | | | 65,000 | | | | 72,722 | | | | | | | | | | | | | | | | | | | | 65,000 | | | | 72,722 | |
PNC Funding Corp. | | | 5.63 | % | | | 2/1/2017 | | | | 230,000 | | | | 235,681 | | | | | | | | 25,000 | | | | 25,618 | | | | | | | | | | | | | | | | | | | | 255,000 | | | | 261,299 | |
PNC Funding Corp. | | | 6.70 | % | | | 6/10/2019 | | | | - | | | | - | | | | | | | | 50,000 | | | | 57,331 | | | | | | | | | | | | | | | | | | | | 50,000 | | | | 57,331 | |
Regions Bank | | | 2.25 | % | | | 9/14/2018 | | | | 290,000 | | | | 291,931 | | | | | | | | - | | | | - | | | | | | | | | | | | | | | | | | | | 290,000 | | | | 291,931 | |
Regions Financial Corp. | | | 2.00 | % | | | 5/15/2018 | | | | 202,000 | | | | 202,353 | | | | | | | | - | | | | - | | | | | | | | | | | | | | | | | | | | 202,000 | | | | 202,353 | |
Regions Financial Corp. | | | 3.20 | % | | | 2/8/2021 | | | | - | | | | - | | | | | | | | 107,000 | | | | 110,135 | | | | | | | | | | | | | | | | | | | | 107,000 | | | | 110,135 | |
Royal Bank of Canada | | | 1.50 | % | | | 1/16/2018 | | | | 280,000 | | | | 281,158 | | | | | | | | - | | | | - | | | | | | | | | | | | | | | | | | | | 280,000 | | | | 281,158 | |
Royal Bank of Canada | | | 1.80 | % | | | 7/30/2018 | | | | 230,000 | | | | 232,504 | | | | | | | | - | | | | - | | | | | | | | | | | | | | | | | | | | 230,000 | | | | 232,504 | |
Royal Bank of Canada | | | 1.88 | % | | | 2/5/2020 | | | | - | | | | - | | | | | | | | 600,000 | | | | 607,875 | | | | | | | | | | | | | | | | | | | | 600,000 | | | | 607,875 | |
Royal Bank of Canada | | | 2.00 | % | | | 10/1/2018 | | | | - | | | | - | | | | | | | | 159,000 | | | | 161,211 | | | | | | | | | | | | | | | | | | | | 159,000 | | | | 161,211 | |
Royal Bank of Canada | | | 2.20 | % | | | 7/27/2018 | | | | - | | | | - | | | | | | | | 300,000 | | | | 305,892 | | | | | | | | | | | | | | | | | | | | 300,000 | | | | 305,892 | |
Royal Bank of Scotland Group PLC | | | 4.80 | % | | | 4/5/2026 | | | | - | | | | - | | | | | | | | 200,000 | | | | 203,414 | | | | | | | | | | | | | | | | | | | | 200,000 | | | | 203,414 | |
Santander Holdings USA, Inc. | | | 2.70 | % | | | 5/24/2019 | | | | 250,000 | | | | 251,203 | | | | | | | | - | | | | - | | | | | | | | | | | | | | | | | | | | 250,000 | | | | 251,203 | |
Santander Issuances SAU | | | 5.18 | % | | | 11/19/2025 | | | | - | | | | - | | | | | | | | 200,000 | | | | 199,807 | | | | | | | | | | | | | | | | | | | | 200,000 | | | | 199,807 | |
Santander UK Group Holdings PLC | | | 2.88 | % | | | 10/16/2020 | | | | - | | | | - | | | | | | | | 150,000 | | | | 148,841 | | | | | | | | | | | | | | | | | | | | 150,000 | | | | 148,841 | |
Santander UK PLC | | | 1.65 | % | | | 9/29/2017 | | | | 323,000 | | | | 322,933 | | | | | | | | - | | | | - | | | | | | | | | | | | | | | | | | | | 323,000 | | | | 322,933 | |
Santander UK PLC | | | 2.50 | % | | | 3/14/2019 | | | | 140,000 | | | | 141,428 | | | | | | | | 93,000 | | | | 93,949 | | | | | | | | | | | | | | | | | | | | 233,000 | | | | 235,377 | |
Stadshypotek AB | | | 1.88 | % | | | 10/2/2019 | | | | - | | | | - | | | | | | | | 250,000 | | | | 253,672 | | | | | | | | | | | | | | | | | | | | 250,000 | | | | 253,672 | |
Standard Chartered PLC | | | 3.05 | % | | | 1/15/2021 | | | | - | | | | - | | | | | | | | 200,000 | | | | 202,644 | | | | | | | | | | | | | | | | | | | | 200,000 | | | | 202,644 | |
Standard Chartered PLC | | | 5.20 | % | | | 1/26/2024 | | | | - | | | | - | | | | | | | | 200,000 | | | | 208,319 | | | | | | | | | | | | | | | | | | | | 200,000 | | | | 208,319 | |
Sumitomo Mitsui Banking Corp. | | | 1.35 | % | | | 7/11/2017 | | | | 250,000 | | | | 250,012 | | | | | | | | - | | | | - | | | | | | | | | | | | | | | | | | | | 250,000 | | | | 250,012 | |
Sumitomo Mitsui Financial Group, Inc. | | | 2.93 | % | | | 3/9/2021 | | | | 120,000 | | | | 125,073 | | | | | | | | - | | | | - | | | | | | | | | | | | | | | | | | | | 120,000 | | | | 125,073 | |
Sumitomo Mitsui Financial Group, Inc. | | | 3.78 | % | | | 3/9/2026 | | | | - | | | | - | | | | | | | | 107,000 | | | | 116,521 | | | | | | | | | | | | | | | | | | | | 107,000 | | | | 116,521 | |
SunTrust Banks, Inc. | | | 2.50 | % | | | 5/1/2019 | | | | 130,000 | | | | 132,706 | | | | | | | | - | | | | - | | | | | | | | | | | | | | | | | | | | 130,000 | | | | 132,706 | |
SunTrust Banks, Inc. | | | 2.90 | % | | | 3/3/2021 | | | | - | | | | - | | | | | | | | 59,000 | | | | 61,087 | | | | | | | | | | | | | | | | | | | | 59,000 | | | | 61,087 | |
SunTrust Banks, Inc. | | | 3.50 | % | | | 1/20/2017 | | | | 168,000 | | | | 169,871 | | | | | | | | - | | | | - | | | | | | | | | | | | | | | | | | | | 168,000 | | | | 169,871 | |
Toronto-Dominion Bank | | | 1.13 | % | | | 5/2/2017 | | | | 350,000 | | | | 350,294 | | | | | | | | - | | | | - | | | | | | | | | | | | | | | | | | | | 350,000 | | | | 350,294 | |
Toronto-Dominion Bank | | | 1.50 | % | | | 3/13/2017 | | | | - | | | | - | | | | | | | | 200,000 | | | | 200,797 | | | | | | | | | | | | | | | | | | | | 200,000 | | | | 200,797 | |
Toronto-Dominion Bank | | | 2.25 | % | | | 11/5/2019 | | | | 175,000 | | | | 179,582 | | | | | | | | 104,000 | | | | 106,723 | | | | | | | | | | | | | | | | | | | | 279,000 | | | | 286,305 | |
Toronto-Dominion Bank | | | 2.50 | % | | | 12/14/2020 | | | | - | | | | - | | | | | | | | 150,000 | | | | 155,153 | | | | | | | | | | | | | | | | | | | | 150,000 | | | | 155,153 | |
US Bancorp | | | 1.65 | % | | | 5/15/2017 | | | | - | | | | - | | | | | | | | 96,000 | | | | 96,460 | | | | | | | | | | | | | | | | | | | | 96,000 | | | | 96,460 | |
US Bancorp | | | 3.00 | % | | | 3/15/2022 | | | | - | | | | - | | | | | | | | 83,000 | | | | 88,279 | | | | | | | | | | | | | | | | | | | | 83,000 | | | | 88,279 | |
US Bancorp | | | 4.13 | % | | | 5/24/2021 | | | | - | | | | - | | | | | | | | 34,000 | | | | 37,865 | | | | | | | | | | | | | | | | | | | | 34,000 | | | | 37,865 | |
US Bank NA | | | 1.38 | % | | | 9/11/2017 | | | | 250,000 | | | | 251,257 | | | | | | | | - | | | | - | | | | | | | | | | | | | | | | | | | | 250,000 | | | | 251,257 | |
US Bank NA | | | 2.13 | % | | | 10/28/2019 | | | | - | | | | - | | | | | | | | 250,000 | | | | 256,258 | | | | | | | | | | | | | | | | | | | | 250,000 | | | | 256,258 | |
US Bank NA | | | 2.80 | % | | | 1/27/2025 | | | | - | | | | - | | | | | | | | 250,000 | | | | 260,334 | | | | | | | | | | | | | | | | | | | | 250,000 | | | | 260,334 | |
13
| | | | | | | | | | | | | | | | | | | | | | | | | | | | | | | | | | | | | | | | | | | | | | | | | | | | |
| | | | | | | | | Voya Limited
Maturity Bond VP | | | | | | JPMorgan Core
Bond VP | | | | | | Adjustments | | | | | | Combined Pro
Forma Portfolio | |
| | | | | | | | | | | | | |
| | | Coupon Rate | | | Maturity Date | | | Principal | | | Value | | | | | | Principal | | | Value | | | | | | Principal | | | Value | | | | | | Principal | | | Value | |
| | | | | | | | | | | | | | | | | | | | | | | | | | | | | | | | |
Wachovia Corp. | | | 5.75 | % | | | 2/1/2018 | | | $ | - | | | $ | - | | | | | | | $ | 749,000 | | | $ | 801,603 | | | | | | | | | | | | | | | | | | | $ | 749,000 | | | $ | 801,603 | |
Wells Fargo & Co. | | | 2.10 | % | | | 5/8/2017 | | | | 496,000 | | | | 500,262 | | | | | | | | - | | | | - | | | | | | | | | | | | | | | | | | | | 496,000 | | | | 500,262 | |
Wells Fargo & Co. | | | 3.00 | % | | | 2/19/2025 | | | | - | | | | - | | | | | | | | 213,000 | | | | 218,160 | | | | | | | | | | | | | | | | | | | | 213,000 | | | | 218,160 | |
Wells Fargo & Co. | | | 3.30 | % | | | 9/9/2024 | | | | - | | | | - | | | | | | | | 700,000 | | | | 734,178 | | | | | | | | | | | | | | | | | | | | 700,000 | | | | 734,178 | |
Wells Fargo & Co. | | | 3.50 | % | | | 3/8/2022 | | | | - | | | | - | | | | | | | | 150,000 | | | | 160,898 | | | | | | | | | | | | | | | | | | | | 150,000 | | | | 160,898 | |
Wells Fargo & Co. | | | 4.10 | % | | | 6/3/2026 | | | | - | | | | - | | | | | | | | 258,000 | | | | 275,960 | | | | | | | | | | | | | | | | | | | | 258,000 | | | | 275,960 | |
Wells Fargo & Co. | | | 4.60 | % | | | 4/1/2021 | | | | - | | | | - | | | | | | | | 650,000 | | | | 726,351 | | | | | | | | | | | | | | | | | | | | 650,000 | | | | 726,351 | |
Wells Fargo & Co. | | | 4.65 | % | | | 11/4/2044 | | | | - | | | | - | | | | | | | | 184,000 | | | | 194,057 | | | | | | | | | | | | | | | | | | | | 184,000 | | | | 194,057 | |
Wells Fargo & Co. | | | 4.90 | % | | | 11/17/2045 | | | | - | | | | - | | | | | | | | 112,000 | | | | 122,562 | | | | | | | | | | | | | | | | | | | | 112,000 | | | | 122,562 | |
Wells Fargo Bank NA | | | 6.00 | % | | | 11/15/2017 | | | | - | | | | - | | | | | | | | 250,000 | | | | 266,007 | | | | | | | | | | | | | | | | | | | | 250,000 | | | | 266,007 | |
Westpac Banking Corp. | | | 1.50 | % | | | 12/1/2017 | | | | 175,000 | | | | 175,857 | | | | | | | | - | | | | - | | | | | | | | | | | | | | | | | | | | 175,000 | | | | 175,857 | |
Westpac Banking Corp. | | | 2.00 | % | | | 3/3/2020 | | | | - | | | | - | | | | | | | | 304,000 | | | | 306,584 | | | | | | | | | | | | | | | | | | | | 304,000 | | | | 306,584 | |
Westpac Banking Corp. | | | 2.45 | % | | | 11/28/2016 | | | | - | | | | - | | | | | | | | 250,000 | | | | 251,541 | | | | | | | | | | | | | | | | | | | | 250,000 | | | | 251,541 | |
Beverages | | | | | | | | | | | | | | | | | | | | | | | | | | | | | | | | | | | | | | | | | | | | | |
Anheuser-Busch InBev Finance, Inc. | | | 1.90 | % | | | 2/1/2019 | | | | 280,000 | | | | 284,754 | | | | | | | | 30,000 | | | | 30,509 | | | | | | | | | | | | | | | | | | | | 310,000 | | | | 315,263 | |
Anheuser-Busch InBev Finance, Inc. | | | 3.30 | % | | | 2/1/2023 | | | | - | | | | - | | | | | | | | 776,000 | | | | 817,648 | | | | | | | | | | | | | | | | | | | | 776,000 | | | | 817,648 | |
Anheuser-Busch InBev Finance, Inc. | | | 3.70 | % | | | 2/1/2024 | | | | - | | | | - | | | | | | | | 160,000 | | | | 172,336 | | | | | | | | | | | | | | | | | | | | 160,000 | | | | 172,336 | |
Anheuser-Busch InBev Finance, Inc. | | | 4.70 | % | | | 2/1/2036 | | | | - | | | | - | | | | | | | | 727,000 | | | | 816,950 | | | | | | | | | | | | | | | | | | | | 727,000 | | | | 816,950 | |
Brown-Forman Corp. | | | 4.50 | % | | | 7/15/2045 | | | | - | | | | - | | | | | | | | 75,000 | | | | 85,712 | | | | | | | | | | | | | | | | | | | | 75,000 | | | | 85,712 | |
Diageo Capital PLC | | | 1.50 | % | | | 5/11/2017 | | | | - | | | | - | | | | | | | | 38,000 | | | | 38,160 | | | | | | | | | | | | | | | | | | | | 38,000 | | | | 38,160 | |
Diageo Capital PLC | | | 4.83 | % | | | 7/15/2020 | | | | - | | | | - | | | | | | | | 25,000 | | | | 28,123 | | | | | | | | | | | | | | | | | | | | 25,000 | | | | 28,123 | |
Diageo Investment Corp. | | | 8.00 | % | | | 9/15/2022 | | | | - | | | | - | | | | | | | | 100,000 | | | | 132,266 | | | | | | | | | | | | | | | | | | | | 100,000 | | | | 132,266 | |
Heineken NV | | | 1.40 | % | | | 10/1/2017 | | | | - | | | | - | | | | | | | | 40,000 | | | | 40,185 | | | | | | | | | | | | | | | | | | | | 40,000 | | | | 40,185 | |
Molson Coors Brewing Co. | | | 1.45 | % | | | 7/15/2019 | | | | 155,000 | | | | 155,392 | | | | | | | | - | | | | - | | | | | | | | | | | | | | | | | | | | 155,000 | | | | 155,392 | |
Molson Coors Brewing Co. | | | 3.00 | % | | | 7/15/2026 | | | | - | | | | - | | | | | | | | 105,000 | | | | 104,897 | | | | | | | | | | | | | | | | | | | | 105,000 | | | | 104,897 | |
PepsiCo, Inc. | | | 1.25 | % | | | 8/13/2017 | | | | - | | | | - | | | | | | | | 180,000 | | | | 180,827 | | | | | | | | | | | | | | | | | | | | 180,000 | | | | 180,827 | |
PepsiCo, Inc. | | | 1.25 | % | | | 4/30/2018 | | | | 140,000 | | | | 140,748 | | | | | | | | - | | | | - | | | | | | | | | | | | | | | | | | | | 140,000 | | | | 140,748 | |
PepsiCo, Inc. | | | 1.50 | % | | | 2/22/2019 | | | | 90,000 | | | | 91,264 | | | | | | | | - | | | | - | | | | | | | | | | | | | | | | | | | | 90,000 | | | | 91,264 | |
PepsiCo, Inc. | | | 3.10 | % | | | 7/17/2022 | | | | - | | | | - | | | | | | | | 20,000 | | | | 21,293 | | | | | | | | | | | | | | | | | | | | 20,000 | | | | 21,293 | |
PepsiCo, Inc. | | | 4.60 | % | | | 7/17/2045 | | | | - | | | | - | | | | | | | | 78,000 | | | | 92,556 | | | | | | | | | | | | | | | | | | | | 78,000 | | | | 92,556 | |
PepsiCo, Inc. | | | 4.88 | % | | | 11/1/2040 | | | | - | | | | - | | | | | | | | 33,000 | | | | 39,327 | | | | | | | | | | | | | | | | | | | | 33,000 | | | | 39,327 | |
PepsiCo, Inc. | | | 7.90 | % | | | 11/1/2018 | | | | - | | | | - | | | | | | | | 5,000 | | | | 5,783 | | | | | | | | | | | | | | | | | | | | 5,000 | | | | 5,783 | |
SABMiller Holdings, Inc. | | | 3.75 | % | | | 1/15/2022 | | | | - | | | | - | | | | | | | | 270,000 | | | | 289,505 | | | | | | | | | | | | | | | | | | | | 270,000 | | | | 289,505 | |
Biotechnology | | | | | | | | | | | | | | | | | | | | | | | | | | | | | | | | | | | | | | | | | | | | | |
AbbVie, Inc. | | | 1.75 | % | | | 11/6/2017 | | | | 174,000 | | | | 175,028 | | | | | | | | 134,000 | | | | 134,791 | | | | | | | | | | | | | | | | | | | | 308,000 | | | | 309,819 | |
AbbVie, Inc. | | | 1.80 | % | | | 5/14/2018 | | | | 210,000 | | | | 211,474 | | | | | | | | - | | | | - | | | | | | | | | | | | | | | | | | | | 210,000 | | | | 211,474 | |
AbbVie, Inc. | | | 2.85 | % | | | 5/14/2023 | | | | - | | | | - | | | | | | | | 189,000 | | | | 191,569 | | | | | | | | | | | | | | | | | | | | 189,000 | | | | 191,569 | |
AbbVie, Inc. | | | 2.90 | % | | | 11/6/2022 | | | | - | | | | - | | | | | | | | 187,000 | | | | 190,669 | | | | | | | | | | | | | | | | | | | | 187,000 | | | | 190,669 | |
AbbVie, Inc. | | | 3.20 | % | | | 11/6/2022 | | | | - | | | | - | | | | | | | | 143,000 | | | | 147,866 | | | | | | | | | | | | | | | | | | | | 143,000 | | | | 147,866 | |
AbbVie, Inc. | | | 4.30 | % | | | 5/14/2036 | | | | - | | | | - | | | | | | | | 180,000 | | | | 183,590 | | | | | | | | | | | | | | | | | | | | 180,000 | | | | 183,590 | |
AbbVie, Inc. | | | 4.50 | % | | | 5/14/2035 | | | | - | | | | - | | | | | | | | 286,000 | | | | 298,917 | | | | | | | | | | | | | | | | | | | | 286,000 | | | | 298,917 | |
Amgen, Inc. | | | 2.13 | % | | | 5/1/2020 | | | | - | | | | - | | | | | | | | 12,000 | | | | 12,190 | | | | | | | | | | | | | | | | | | | | 12,000 | | | | 12,190 | |
Amgen, Inc. | | | 3.63 | % | | | 5/22/2024 | | | | - | | | | - | | | | | | | | 382,000 | | | | 409,864 | | | | | | | | | | | | | | | | | | | | 382,000 | | | | 409,864 | |
Amgen, Inc. | | | 3.88 | % | | | 11/15/2021 | | | | - | | | | - | | | | | | | | 100,000 | | | | 109,036 | | | | | | | | | | | | | | | | | | | | 100,000 | | | | 109,036 | |
Amgen, Inc. | | | 4.66 | % | | | 6/15/2051 | | | | - | | | | - | | | | | | | | 301,000 | | | | 314,489 | | | | | | | | | | | | | | | | | | | | 301,000 | | | | 314,489 | |
Amgen, Inc. | | | 5.70 | % | | | 2/1/2019 | | | | - | | | | - | | | | | | | | 50,000 | | | | 55,398 | | | | | | | | | | | | | | | | | | | | 50,000 | | | | 55,398 | |
Biogen, Inc. | | | 3.63 | % | | | 9/15/2022 | | | | - | | | | - | | | | | | | | 122,000 | | | | 129,504 | | | | | | | | | | | | | | | | | | | | 122,000 | | | | 129,504 | |
Biogen, Inc. | | | 5.20 | % | | | 9/15/2045 | | | | - | | | | - | | | | | | | | 67,000 | | | | 75,344 | | | | | | | | | | | | | | | | | | | | 67,000 | | | | 75,344 | |
Celgene Corp. | | | 2.13 | % | | | 8/15/2018 | | | | 170,000 | | | | 172,541 | | | | | | | | - | | | | - | | | | | | | | | | | | | | | | | | | | 170,000 | | | | 172,541 | |
Celgene Corp. | | | 3.25 | % | | | 8/15/2022 | | | | - | | | | - | | | | | | | | 317,000 | | | | 327,413 | | | | | | | | | | | | | | | | | | | | 317,000 | | | | 327,413 | |
Celgene Corp. | | | 3.63 | % | | | 5/15/2024 | | | | - | | | | - | | | | | | | | 164,000 | | | | 170,798 | | | | | | | | | | | | | | | | | | | | 164,000 | | | | 170,798 | |
Celgene Corp. | | | 5.00 | % | | | 8/15/2045 | | | | - | | | | - | | | | | | | | 114,000 | | | | 125,553 | | | | | | | | | | | | | | | | | | | | 114,000 | | | | 125,553 | |
Gilead Sciences, Inc. | | | 1.85 | % | | | 9/4/2018 | | | | 60,000 | | | | 61,064 | | | | | | | | - | | | | - | | | | | | | | | | | | | | | | | | | | 60,000 | | | | 61,064 | |
Gilead Sciences, Inc. | | | 2.35 | % | | | 2/1/2020 | | | | 184,000 | | | | 188,749 | | | | | | | | - | | | | - | | | | | | | | | | | | | | | | | | | | 184,000 | | | | 188,749 | |
Gilead Sciences, Inc. | | | 3.25 | % | | | 9/1/2022 | | | | - | | | | - | | | | | | | | 84,000 | | | | 89,451 | | | | | | | | | | | | | | | | | | | | 84,000 | | | | 89,451 | |
Gilead Sciences, Inc. | | | 3.65 | % | | | 3/1/2026 | | | | - | | | | - | | | | | | | | 72,000 | | | | 78,349 | | | | | | | | | | | | | | | | | | | | 72,000 | | | | 78,349 | |
Gilead Sciences, Inc. | | | 4.60 | % | | | 9/1/2035 | | | | - | | | | - | | | | | | | | 65,000 | | | | 72,273 | | | | | | | | | | | | | | | | | | | | 65,000 | | | | 72,273 | |
14
| | | | | | | | | | | | | | | | | | | | | | | | | | | | | | | | | | | | | | | | | | | | | | | | | | | | |
| | | | | | | | | Voya Limited
Maturity Bond VP | | | | | | JPMorgan Core
Bond VP | | | | | | Adjustments | | | | | | Combined Pro
Forma Portfolio | |
| | | | | | | | | | | | | |
| | | Coupon Rate | | | Maturity Date | | | Principal | | | Value | | | | | | Principal | | | Value | | | | | | Principal | | | Value | | | | | | Principal | | | Value | |
| | | | | | | | | | | | | | | | | | | | | | | | | | | | | | | | |
Capital Markets | | | | | | | | | | | | | | | | | | | | | | | | | | | | | | | | | | | | | | | | | | | | | |
Ameriprise Financial, Inc. | | | 4.00 | % | | | 10/15/2023 | | | $ | - | | | $ | - | | | | | | | $ | 200,000 | | | $ | 216,485 | | | | | | | | | | | | | | | | | | | $ | 200,000 | | | $ | 216,485 | |
Bank of New York Mellon Corp. | | | 2.20 | % | | | 3/4/2019 | | | | - | | | | - | | | | | | | | 75,000 | | | | 76,539 | | | | | | | | | | | | | | | | | | | | 75,000 | | | | 76,539 | |
Bank of New York Mellon Corp. | | | 2.60 | % | | | 8/17/2020 | | | | - | | | | - | | | | | | | | 194,000 | | | | 201,187 | | | | | | | | | | | | | | | | | | | | 194,000 | | | | 201,187 | |
Bank of New York Mellon Corp. | | | 3.25 | % | | | 9/11/2024 | | | | - | | | | - | | | | | | | | 150,000 | | | | 159,657 | | | | | | | | | | | | | | | | | | | | 150,000 | | | | 159,657 | |
Bank of New York Mellon Corp. | | | 3.55 | % | | | 9/23/2021 | | | | - | | | | - | | | | | | | | 90,000 | | | | 97,442 | | | | | | | | | | | | | | | | | | | | 90,000 | | | | 97,442 | |
Bank of New York Mellon Corp. | | | 3.65 | % | | | 2/4/2024 | | | | - | | | | - | | | | | | | | 167,000 | | | | 182,654 | | | | | | | | | | | | | | | | | | | | 167,000 | | | | 182,654 | |
Bank of New York Mellon Corp. | | | 4.60 | % | | | 1/15/2020 | | | | - | | | | - | | | | | | | | 30,000 | | | | 33,117 | | | | | | | | | | | | | | | | | | | | 30,000 | | | | 33,117 | |
BlackRock, Inc. | | | 3.38 | % | | | 6/1/2022 | | | | - | | | | - | | | | | | | | 65,000 | | | | 70,621 | | | | | | | | | | | | | | | | | | | | 65,000 | | | | 70,621 | |
BlackRock, Inc. | | | 3.50 | % | | | 3/18/2024 | | | | - | | | | - | | | | | | | | 55,000 | | | | 59,667 | | | | | | | | | | | | | | | | | | | | 55,000 | | | | 59,667 | |
BlackRock, Inc. | | | 6.25 | % | | | 9/15/2017 | | | | - | | | | - | | | | | | | | 100,000 | | | | 106,344 | | | | | | | | | | | | | | | | | | | | 100,000 | | | | 106,344 | |
Charles Schwab Corp. | | | 1.50 | % | | | 3/10/2018 | | | | 240,000 | | | | 242,255 | | | | | | | | - | | | | - | | | | | | | | | | | | | | | | | | | | 240,000 | | | | 242,255 | |
Charles Schwab Corp. | | | 3.23 | % | | | 9/1/2022 | | | | - | | | | - | | | | | | | | 20,000 | | | | 21,292 | | | | | | | | | | | | | | | | | | | | 20,000 | | | | 21,292 | |
Credit Suisse AG | | | 1.38 | % | | | 5/26/2017 | | | | 256,000 | | | | 256,209 | | | | | | | | - | | | | - | | �� | | | | | | | | | | | | | | | | | | 256,000 | | | | 256,209 | |
Credit Suisse AG | | | 1.70 | % | | | 4/27/2018 | | | | 230,000 | | | | 230,246 | | | | | | | | - | | | | - | | | | | | | | | | | | | | | | | | | | 230,000 | | | | 230,246 | |
Credit Suisse AG | | | 1.75 | % | | | 1/29/2018 | | | | - | | | | - | | | | | | | | 250,000 | | | | 250,208 | | | | | | | | | | | | | | | | | | | | 250,000 | | | | 250,208 | |
Credit Suisse AG | | | 2.30 | % | | | 5/28/2019 | | | | - | | | | - | | | | | | | | 250,000 | | | | 253,347 | | | | | | | | | | | | | | | | | | | | 250,000 | | | | 253,347 | |
Credit Suisse Group Funding Guernsey, Ltd. | | | 3.80 | % | | | 6/9/2023 | | | | - | | | | - | | | | | | | | 250,000 | | | | 249,358 | | | | | | | | | | | | | | | | | | | | 250,000 | | | | 249,358 | |
Credit Suisse Group Funding Guernsey, Ltd. | | | 4.88 | % | | | 5/15/2045 | | | | - | | | | - | | | | | | | | 250,000 | | | | 248,953 | | | | | | | | | | | | | | | | | | | | 250,000 | | | | 248,953 | |
Deutsche Bank AG | | | 1.88 | % | | | 2/13/2018 | | | | - | | | | - | | | | | | | | 122,000 | | | | 121,236 | | | | | | | | | | | | | | | | | | | | 122,000 | | | | 121,236 | |
Deutsche Bank AG | | | 3.70 | % | | | 5/30/2024 | | | | - | | | | - | | | | | | | | 267,000 | | | | 265,412 | | | | | | | | | | | | | | | | | | | | 267,000 | | | | 265,412 | |
Deutsche Bank AG | | | 6.00 | % | | | 9/1/2017 | | | | - | | | | - | | | | | | | | 170,000 | | | | 177,371 | | | | | | | | | | | | | | | | | | | | 170,000 | | | | 177,371 | |
Goldman Sachs Group, Inc. | | | 2.38 | % | | | 1/22/2018 | | | | 498,000 | | | | 504,693 | | | | | | | | - | | | | - | | | | | | | | | | | | | | | | | | | | 498,000 | | | | 504,693 | |
Goldman Sachs Group, Inc. | | | 2.60 | % | | | 4/23/2020 | | | | - | | | | - | | | | | | | | 281,000 | | | | 285,677 | | | | | | | | | | | | | | | | | | | | 281,000 | | | | 285,677 | |
Goldman Sachs Group, Inc. | | | 2.63 | % | | | 4/25/2021 | | | | - | | | | - | | | | | | | | 45,000 | | | | 45,636 | | | | | | | | | | | | | | | | | | | | 45,000 | | | | 45,636 | |
Goldman Sachs Group, Inc. | | | 2.63 | % | | | 1/31/2019 | | | | - | | | | - | | | | | | | | 231,000 | | | | 236,421 | | | | | | | | | | | | | | | | | | | | 231,000 | | | | 236,421 | |
Goldman Sachs Group, Inc. | | | 2.75 | % | | | 9/15/2020 | | | | - | | | | - | | | | | | | | 55,000 | | | | 56,141 | | | | | | | | | | | | | | | | | | | | 55,000 | | | | 56,141 | |
Goldman Sachs Group, Inc. | | | 3.50 | % | | | 1/23/2025 | | | | - | | | | - | | | | | | | | 125,000 | | | | 128,439 | | | | | | | | | | | | | | | | | | | | 125,000 | | | | 128,439 | |
Goldman Sachs Group, Inc. | | | 3.63 | % | | | 1/22/2023 | | | | - | | | | - | | | | | | | | 275,000 | | | | 288,463 | | | | | | | | | | | | | | | | | | | | 275,000 | | | | 288,463 | |
Goldman Sachs Group, Inc. | | | 3.75 | % | | | 2/25/2026 | | | | - | | | | - | | | | | | | | 42,000 | | | | 44,205 | | | | | | | | | | | | | | | | | | | | 42,000 | | | | 44,205 | |
Goldman Sachs Group, Inc. | | | 3.75 | % | | | 5/22/2025 | | | | - | | | | - | | | | | | | | 114,000 | | | | 119,058 | | | | | | | | | | | | | | | | | | | | 114,000 | | | | 119,058 | |
Goldman Sachs Group, Inc. | | | 3.85 | % | | | 7/8/2024 | | | | - | | | | - | | | | | | | | 289,000 | | | | 306,430 | | | | | | | | | | | | | | | | | | | | 289,000 | | | | 306,430 | |
Goldman Sachs Group, Inc. | | | 4.00 | % | | | 3/3/2024 | | | | - | | | | - | | | | | | | | 320,000 | | | | 342,102 | | | | | | | | | | | | | | | | | | | | 320,000 | | | | 342,102 | |
Goldman Sachs Group, Inc. | | | 4.25 | % | | | 10/21/2025 | | | | - | | | | - | | | | | | | | 100,000 | | | | 103,369 | | | | | | | | | | | | | | | | | | | | 100,000 | | | | 103,369 | |
Goldman Sachs Group, Inc. | | | 5.15 | % | | | 5/22/2045 | | | | - | | | | - | | | | | | | | 48,000 | | | | 50,077 | | | | | | | | | | | | | | | | | | | | 48,000 | | | | 50,077 | |
Goldman Sachs Group, Inc. | | | 5.25 | % | | | 7/27/2021 | | | | - | | | | - | | | | | | | | 53,000 | | | | 59,810 | | | | | | | | | | | | | | | | | | | | 53,000 | | | | 59,810 | |
Goldman Sachs Group, Inc. | | | 5.38 | % | | | 3/15/2020 | | | | - | | | | - | | | | | | | | 365,000 | | | | 405,996 | | | | | | | | | | | | | | | | | | | | 365,000 | | | | 405,996 | |
Goldman Sachs Group, Inc. | | | 5.75 | % | | | 1/24/2022 | | | | - | | | | - | | | | | | | | 120,000 | | | | 139,315 | | | | | | | | | | | | | | | | | | | | 120,000 | | | | 139,315 | |
Goldman Sachs Group, Inc. | | | 5.95 | % | | | 1/18/2018 | | | | - | | | | - | | | | | | | �� | 155,000 | | | | 165,120 | | | | | | | | | | | | | | | | | | | | 155,000 | | | | 165,120 | |
Goldman Sachs Group, Inc. | | | 6.00 | % | | | 6/15/2020 | | | | - | | | | - | | | | | | | | 188,000 | | | | 214,515 | | | | | | | | | | | | | | | | | | | | 188,000 | | | | 214,515 | |
Goldman Sachs Group, Inc. | | | 7.50 | % | | | 2/15/2019 | | | | - | | | | - | | | | | | | | 460,000 | | | | 526,061 | | | | | | | | | | | | | | | | | | | | 460,000 | | | | 526,061 | |
Invesco Finance PLC | | | 3.75 | % | | | 1/15/2026 | | | | - | | | | - | | | | | | | | 94,000 | | | | 100,904 | | | | | | | | | | | | | | | | | | | | 94,000 | | | | 100,904 | |
Invesco Finance PLC | | | 4.00 | % | | | 1/30/2024 | | | | - | | | | - | | | | | | | | 71,000 | | | | 77,678 | | | | | | | | | | | | | | | | | | | | 71,000 | | | | 77,678 | |
Legg Mason, Inc. | | | 3.95 | % | | | 7/15/2024 | | | | - | | | | - | | | | | | | | 115,000 | | | | 116,252 | | | | | | | | | | | | | | | | | | | | 115,000 | | | | 116,252 | |
Legg Mason, Inc. | | | 4.75 | % | | | 3/15/2026 | | | | - | | | | - | | | | | | | | 60,000 | | | | 63,270 | | | | | | | | | | | | | | | | | | | | 60,000 | | | | 63,270 | |
Macquarie Group, Ltd. | | | 6.00 | % | | | 1/14/2020 | | | | - | | | | - | | | | | | | | 100,000 | | | | 111,480 | | | | | | | | | | | | | | | | | | | | 100,000 | | | | 111,480 | |
Macquarie Group, Ltd. | | | 6.25 | % | | | 1/14/2021 | | | | - | | | | - | | | | | | | | 175,000 | | | | 200,011 | | | | | | | | | | | | | | | | | | | | 175,000 | | | | 200,011 | |
Morgan Stanley | | | 1.88 | % | | | 1/5/2018 | | | | 190,000 | | | | 191,075 | | | | | | | | - | | | | - | | | | | | | | | | | | | | | | | | | | 190,000 | | | | 191,075 | |
Morgan Stanley | | | 2.20 | % | | | 12/7/2018 | | | | 20,000 | | | | 20,263 | | | | | | | | - | | | | - | | | | | | | | | | | | | | | | | | | | 20,000 | | | | 20,263 | |
Morgan Stanley | | | 2.45 | % | | | 2/1/2019 | | | | 250,000 | | | | 254,694 | | | | | | | | - | | | | - | | | | | | | | | | | | | | | | | | | | 250,000 | | | | 254,694 | |
Morgan Stanley | | | 2.65 | % | | | 1/27/2020 | | | | - | | | | - | | | | | | | | 250,000 | | | | 254,122 | | | | | | | | | | | | | | | | | | | | 250,000 | | | | 254,122 | |
Morgan Stanley | | | 2.80 | % | | | 6/16/2020 | | | | - | | | | - | | | | | | | | 189,000 | | | | 193,651 | | | | | | | | | | | | | | | | | | | | 189,000 | | | | 193,651 | |
Morgan Stanley | | | 3.70 | % | | | 10/23/2024 | | | | - | | | | - | | | | | | | | 444,000 | | | | 464,590 | | | | | | | | | | | | | | | | | | | | 444,000 | | | | 464,590 | |
Morgan Stanley | | | 3.75 | % | | | 2/25/2023 | | | | - | | | | - | | | | | | | | 600,000 | | | | 635,505 | | | | | | | | | | | | | | | | | | | | 600,000 | | | | 635,505 | |
Morgan Stanley | | | 3.95 | % | | | 4/23/2027 | | | | - | | | | - | | | | | | | | 145,000 | | | | 146,638 | | | | | | | | | | | | | | | | | | | | 145,000 | | | | 146,638 | |
Morgan Stanley | | | 4.00 | % | | | 7/23/2025 | | | | - | | | | - | | | | | | | | 264,000 | | | | 282,688 | | | | | | | | | | | | | | | | | | | | 264,000 | | | | 282,688 | |
Morgan Stanley | | | 4.10 | % | | | 5/22/2023 | | | | - | | | | - | | | | | | | | 150,000 | | | | 155,529 | | | | | | | | | | | | | | | | | | | | 150,000 | | | | 155,529 | |
Morgan Stanley | | | 4.30 | % | | | 1/27/2045 | | | | - | | | | - | | | | | | | | 92,000 | | | | 96,834 | | | | | | | | | | | | | | | | | | | | 92,000 | | | | 96,834 | |
Morgan Stanley | | | 4.35 | % | | | 9/8/2026 | | | | - | | | | - | | | | | | | | 200,000 | | | | 209,223 | | | | | | | | | | | | | | | | | | | | 200,000 | | | | 209,223 | |
Morgan Stanley | | | 5.00 | % | | | 11/24/2025 | | | | - | | | | - | | | | | | | | 124,000 | | | | 135,754 | | | | | | | | | | | | | | | | | | | | 124,000 | | | | 135,754 | |
Morgan Stanley | | | 5.45 | % | | | 1/9/2017 | | | | 241,000 | | | | 246,152 | | | | | | | | - | | | | - | | | | | | | | | | | | | | | | | | | | 241,000 | | | | 246,152 | |
Morgan Stanley | | | 5.50 | % | | | 7/24/2020 | | | | - | | | | - | | | | | | | | 138,000 | | | | 154,852 | | | | | | | | | | | | | | | | | | | | 138,000 | | | | 154,852 | |
Morgan Stanley | | | 5.50 | % | | | 7/28/2021 | | | | - | | | | - | | | | | | | | 196,000 | | | | 223,807 | | | | | | | | | | | | | | | | | | | | 196,000 | | | | 223,807 | |
Morgan Stanley | | | 5.63 | % | | | 9/23/2019 | | | | - | | | | - | | | | | | | | 200,000 | | | | 221,902 | | | | | | | | | | | | | | | | | | | | 200,000 | | | | 221,902 | |
Morgan Stanley | | | 5.75 | % | | | 1/25/2021 | | | | - | | | | - | | | | | | | | 100,000 | | | | 114,015 | | | | | | | | | | | | | | | | | | | | 100,000 | | | | 114,015 | |
Morgan Stanley | | | 7.30 | % | | | 5/13/2019 | | | | - | | | | - | | | | | | | | 200,000 | | | | 229,792 | | | | | | | | | | | | | | | | | | | | 200,000 | | | | 229,792 | |
State Street Corp. | | | 3.10 | % | | | 5/15/2023 | | | | - | | | | - | | | | | | | | 48,000 | | | | 49,657 | | | | | | | | | | | | | | | | | | | | 48,000 | | | | 49,657 | |
State Street Corp. | | | 3.55 | % | | | 8/18/2025 | | | | - | | | | - | | | | | | | | 88,000 | | | | 95,697 | | | | | | | | | | | | | | | | | | | | 88,000 | | | | 95,697 | |
State Street Corp. | | | 3.70 | % | | | 11/20/2023 | | | | - | | | | - | | | | | | | | 231,000 | | | | 254,357 | | | | | | | | | | | | | | | | | | | | 231,000 | | | | 254,357 | |
TD Ameritrade Holding Corp. | | | 2.95 | % | | | 4/1/2022 | | | | - | | | | - | | | | | | | | 138,000 | | | | 143,784 | | | | | | | | | | | | | | | | | | | | 138,000 | | | | 143,784 | |
UBS AG | | | 1.38 | % | | | 8/14/2017 | | | | 250,000 | | | | 250,211 | | | | | | | | - | | | | - | | | | | | | | | | | | | | | | | | | | 250,000 | | | | 250,211 | |
UBS AG | | | 1.80 | % | | | 3/26/2018 | | | | 250,000 | | | | 252,379 | | | | | | | | - | | | | - | | | | | | | | | | | | | | | | | | | | 250,000 | | | | 252,379 | |
UBS Group Funding Jersey, Ltd. | | | 2.95 | % | | | 9/24/2020 | | | | 240,000 | | | | 244,073 | | | | | | | | - | | | | - | | | | | | | | | | | | | | | | | | | | 240,000 | | | | 244,073 | |
UBS Group Funding Jersey, Ltd. | | | 4.13 | % | | | 4/15/2026 | | | | - | | | | - | | | | | | | | 200,000 | | | | 207,856 | | | | | | | | | | | | | | | | | | | | 200,000 | | | | 207,856 | |
Chemicals | | | | | | | | | | | | | | | | | | | | | | | | | | | | | | | | | | | | | | | | | | | | | |
Agrium, Inc. | | | 3.38 | % | | | 3/15/2025 | | | | - | | | | - | | | | | | | | 108,000 | | | | 109,858 | | | | | | | | | | | | | | | | | | | | 108,000 | | | | 109,858 | |
Agrium, Inc. | | | 4.13 | % | | | 3/15/2035 | | | | - | | | | - | | | | | | | | 411,000 | | | | 396,903 | | | | | | | | | | | | | | | | | | | | 411,000 | | | | 396,903 | |
Agrium, Inc. | | | 5.25 | % | | | 1/15/2045 | | | | - | | | | - | | | | | | | | 152,000 | | | | 163,045 | | | | | | | | | | | | | | | | | | | | 152,000 | | | | 163,045 | |
CF Industries, Inc. | | | 7.13 | % | | | 5/1/2020 | | | | - | | | | - | | | | | | | | 250,000 | | | | 288,449 | | | | | | | | | | | | | | | | | | | | 250,000 | | | | 288,449 | |
Dow Chemical Co. | | | 3.00 | % | | | 11/15/2022 | | | | - | | | | - | | | | | | | | 130,000 | | | | 133,562 | | | | | | | | | | | | | | | | | | | | 130,000 | | | | 133,562 | |
Dow Chemical Co. | | | 4.13 | % | | | 11/15/2021 | | | | - | | | | - | | | | | | | | 50,000 | | | | 54,854 | | | | | | | | | | | | | | | | | | | | 50,000 | | | | 54,854 | |
Dow Chemical Co. | | | 5.25 | % | | | 11/15/2041 | | | | - | | | | - | | | | | | | | 45,000 | | | | 49,983 | | | | | | | | | | | | | | | | | | | | 45,000 | | | | 49,983 | |
E.I. du Pont de Nemours & Co. | | | 4.90 | % | | | 1/15/2041 | | | | - | | | | - | | | | | | | | 18,000 | | | | 19,935 | | | | | | | | | | | | | | | | | | | | 18,000 | | | | 19,935 | |
E.I. du Pont de Nemours & Co. | | | 6.00 | % | | | 7/15/2018 | | | | - | | | | - | | | | | | | | 150,000 | | | | 164,333 | | | | | | | | | | | | | | | | | | | | 150,000 | | | | 164,333 | |
Ecolab, Inc. | | | 1.45 | % | | | 12/8/2017 | | | | - | | | | - | | | | | | | | 56,000 | | | | 56,098 | | | | | | | | | | | | | | | | | | | | 56,000 | | | | 56,098 | |
Ecolab, Inc. | | | 2.25 | % | | | 1/12/2020 | | | | - | | | | - | | | | | | | | 333,000 | | | | 338,985 | | | | | | | | | | | | | | | | | | | | 333,000 | | | | 338,985 | |
Monsanto Co. | | | 1.15 | % | | | 6/30/2017 | | | | 344,000 | | | | 343,735 | | | | | | | | - | | | | - | | | | | | | | | | | | | | | | | | | | 344,000 | | | | 343,735 | |
Monsanto Co. | | | 4.70 | % | | | 7/15/2064 | | | | - | | | | - | | | | | | | | 27,000 | | | | 24,594 | | | | | | | | | | | | | | | | | | | | 27,000 | | | | 24,594 | |
Mosaic Co. | | | 3.75 | % | | | 11/15/2021 | | | | - | | | | - | | | | | | | | 31,000 | | | | 32,923 | | | | | | | | | | | | | | | | | | | | 31,000 | | | | 32,923 | |
Mosaic Co. | | | 4.25 | % | | | 11/15/2023 | | | | - | | | | - | | | | | | | | 242,000 | | | | 260,648 | | | | | | | | | | | | | | | | | | | | 242,000 | | | | 260,648 | |
Mosaic Co. | | | 4.88 | % | | | 11/15/2041 | | | | - | | | | - | | | | | | | | 8,000 | | | | 8,071 | | | | | | | | | | | | | | | | | | | | 8,000 | | | | 8,071 | |
Mosaic Co. | | | 5.45 | % | | | 11/15/2033 | | | | - | | | | - | | | | | | | | 91,000 | | | | 100,640 | | | | | | | | | | | | | | | | | | | | 91,000 | | | | 100,640 | |
Mosaic Co. | | | 5.63 | % | | | 11/15/2043 | | | | - | | | | - | | | | | | | | 222,000 | | | | 246,225 | | | | | | | | | | | | | | | | | | | | 222,000 | | | | 246,225 | |
Potash Corp. of Saskatchewan, Inc. | | | 3.00 | % | | | 4/1/2025 | | | | - | | | | - | | | | | | | | 220,000 | | | | 222,932 | | | | | | | | | | | | | | | | | | | | 220,000 | | | | 222,932 | |
PPG Industries, Inc. | | | 2.30 | % | | | 11/15/2019 | | | | 171,000 | | | | 172,427 | | | | | | | | - | | | | - | | | | | | | | | | | | | | | | | | | | 171,000 | | | | 172,427 | |
PPG Industries, Inc. | | | 6.65 | % | | | 3/15/2018 | | | | - | | | | - | | | | | | | | 21,000 | | | | 22,722 | | | | | | | | | | | | | | | | | | | | 21,000 | | | | 22,722 | |
Praxair, Inc. | | | 2.65 | % | | | 2/5/2025 | | | | - | | | | - | | | | | | | | 59,000 | | | | 61,087 | | | | | | | | | | | | | | | | | | | | 59,000 | | | | 61,087 | |
Union Carbide Corp. | | | 7.50 | % | | | 6/1/2025 | | | | - | | | | - | | | | | | | | 175,000 | | | | 219,127 | | | | | | | | | | | | | | | | | | | | 175,000 | | | | 219,127 | |
Valspar Corp. | | | 6.05 | % | | | 5/1/2017 | | | | 118,000 | | | | 121,923 | | | | | | | | - | | | | - | | | | | | | | | | | | | | | | | | | | 118,000 | | | | 121,923 | |
15
| | | | | | | | | | | | | | | | | | | | | | | | | | | | | | | | | | | | | | | | | | | | | | | | | | | | |
| | | | | | | | | Voya Limited
Maturity Bond VP | | | | | | JPMorgan Core
Bond VP | | | | | | Adjustments | | | | | | Combined Pro
Forma Portfolio | |
| | | | | | | | | | | | | |
| | | Coupon Rate | | | Maturity Date | | | Principal | | | Value | | | | | | Principal | | | Value | | | | | | Principal | | | Value | | | | | | Principal | | | Value | |
| | | | | | | | | | | | | | | | | | | | | | | | | | | | | | | | |
Commercial Services & Supplies | | | | | | | | | | | | | | | | | | | | | | | | | | | | | | | | | | | | | | | | | | | | | |
ERAC USA Finance LLC | | | 4.50 | % | | | 8/16/2021 | | | $ | - | | | $ | - | | | | | | | $ | 36,000 | | | $ | 39,871 | | | | | | | | | | | | | | | | | | | $ | 36,000 | | | $ | 39,871 | |
ERAC USA Finance LLC | | | 5.25 | % | | | 10/1/2020 | | | | - | | | | - | | | | | | | | 48,000 | | | | 53,883 | | | | | | | | | | | | | | | | | | | | 48,000 | | | | 53,883 | |
ERAC USA Finance LLC | | | 5.63 | % | | | 3/15/2042 | | | | - | | | | - | | | | | | | | 59,000 | | | | 71,534 | | | | | | | | | | | | | | | | | | | | 59,000 | | | | 71,534 | |
ERAC USA Finance LLC | | | 6.70 | % | | | 6/1/2034 | | | | - | | | | - | | | | | | | | 152,000 | | | | 201,385 | | | | | | | | | | | | | | | | | | | | 152,000 | | | | 201,385 | |
MUFG Americas Holdings Corp. | | | 2.25 | % | | | 2/10/2020 | | | | - | | | | - | | | | | | | | 65,000 | | | | 65,469 | | | | | | | | | | | | | | | | | | | | 65,000 | | | | 65,469 | |
Republic Services, Inc. | | | 2.90 | % | | | 7/1/2026 | | | | - | | | | - | | | | | | | | 49,000 | | | | 49,694 | | | | | | | | | | | | | | | | | | | | 49,000 | | | | 49,694 | |
Republic Services, Inc. | | | 3.55 | % | | | 6/1/2022 | | | | - | | | | - | | | | | | | | 54,000 | | | | 58,314 | | | | | | | | | | | | | | | | | | | | 54,000 | | | | 58,314 | |
Tyco International Finance SA | | | 5.13 | % | | | 9/14/2045 | | | | - | | | | - | | | | | | | | 46,000 | | | | 52,744 | | | | | | | | | | | | | | | | | | | | 46,000 | | | | 52,744 | |
Waste Management, Inc. | | | 2.40 | % | | | 5/15/2023 | | | | - | | | | - | | | | | | | | 80,000 | | | | 81,154 | | | | | | | | | | | | | | | | | | | | 80,000 | | | | 81,154 | |
Waste Management, Inc. | | | 2.60 | % | | | 9/1/2016 | | | | 144,000 | | | | 144,328 | | | | | | | | - | | | | - | | | | | | | | | | | | | | | | | | | | 144,000 | | | | 144,328 | |
Waste Management, Inc. | | | 3.13 | % | | | 3/1/2025 | | | | - | | | | - | | | | | | | | 77,000 | | | | 80,511 | | | | | | | | | | | | | | | | | | | | 77,000 | | | | 80,511 | |
Waste Management, Inc. | | | 3.90 | % | | | 3/1/2035 | | | | - | | | | - | | | | | | | | 28,000 | | | | 29,341 | | | | | | | | | | | | | | | | | | | | 28,000 | | | | 29,341 | |
Communications Equipment | | | | | | | | | | | | | | | | | | | | | | | | | | | | | | | | | | | | | | | | | | | | | |
Cisco Systems, Inc. | | | 1.65 | % | | | 6/15/2018 | | | | 200,000 | | | | 202,600 | | | | | | | | - | | | | - | | | | | | | | | | | | | | | | | | | | 200,000 | | | | 202,600 | |
Cisco Systems, Inc. | | | 2.90 | % | | | 3/4/2021 | | | | - | | | | - | | | | | | | | 110,000 | | | | 116,827 | | | | | | | | | | | | | | | | | | | | 110,000 | | | | 116,827 | |
Cisco Systems, Inc. | | | 3.00 | % | | | 6/15/2022 | | | | - | | | | - | | | | | | | | 111,000 | | | | 119,307 | | | | | | | | | | | | | | | | | | | | 111,000 | | | | 119,307 | |
Cisco Systems, Inc. | | | 3.63 | % | | | 3/4/2024 | | | | - | | | | - | | | | | | | | 450,000 | | | | 504,412 | | | | | | | | | | | | | | | | | | | | 450,000 | | | | 504,412 | |
Cisco Systems, Inc. | | | 5.90 | % | | | 2/15/2039 | | | | - | | | | - | | | | | | | | 70,000 | | | | 95,022 | | | | | | | | | | | | | | | | | | | | 70,000 | | | | 95,022 | |
Construction & Engineering | | | | | | | | | | | | | | | | | | | | | | | | | | | | | | | | | | | | | | | | | | | | | |
ABB Finance USA, Inc. | | | 1.63 | % | | | 5/8/2017 | | | | - | | | | - | | | | | | | | 28,000 | | | | 28,119 | | | | | | | | | | | | | | | | | | | | 28,000 | | | | 28,119 | |
ABB Finance USA, Inc. | | | 2.88 | % | | | 5/8/2022 | | | | - | | | | - | | | | | | | | 29,000 | | | | 30,213 | | | | | | | | | | | | | | | | | | | | 29,000 | | | | 30,213 | |
ABB Finance USA, Inc. | | | 4.38 | % | | | 5/8/2042 | | | | - | | | | - | | | | | | | | 17,000 | | | | 19,337 | | | | | | | | | | | | | | | | | | | | 17,000 | | | | 19,337 | |
Fluor Corp. | | | 3.38 | % | | | 9/15/2021 | | | | - | | | | - | | | | | | | | 190,000 | | | | 202,041 | | | | | | | | | | | | | | | | | | | | 190,000 | | | | 202,041 | |
Consumer Finance | | | | | | | | | | | | | | | | | | | | | | | | | | | | | | | | | | | | | | | | | | | | | |
American Express Co. | | | 3.63 | % | | | 12/5/2024 | | | | - | | | | - | | | | | | | | 104,000 | | | | 106,664 | | | | | | | | | | | | | | | | | | | | 104,000 | | | | 106,664 | |
American Express Co. | | | 7.00 | % | | | 3/19/2018 | | | | - | | | | - | | | | | | | | 50,000 | | | | 54,617 | | | | | | | | | | | | | | | | | | | | 50,000 | | | | 54,617 | |
American Express Credit Corp. | | | 1.55 | % | | | 9/22/2017 | | | | 97,000 | | | | 97,430 | | | | | | | | - | | | | - | | | | | | | | | | | | | | | | | | | | 97,000 | | | | 97,430 | |
American Express Credit Corp. | | | 1.80 | % | | | 7/31/2018 | | | | 230,000 | | | | 232,039 | | | | | | | | 130,000 | | | | 131,152 | | | | | | | | | | | | | | | | | | | | 360,000 | | | | 363,191 | |
American Express Credit Corp. | | | 1.88 | % | | | 11/5/2018 | | | | - | | | | - | | | | | | | | 111,000 | | | | 112,181 | | | | | | | | | | | | | | | | | | | | 111,000 | | | | 112,181 | |
American Express Credit Corp. | | | 2.25 | % | | | 5/5/2021 | | | | - | | | | - | | | | | | | | 247,000 | | | | 251,382 | | | | | | | | | | | | | | | | | | | | 247,000 | | | | 251,382 | |
American Express Credit Corp. | | | 2.38 | % | | | 5/26/2020 | | | | - | | | | - | | | | | | | | 290,000 | | | | 296,711 | | | | | | | | | | | | | | | | | | | | 290,000 | | | | 296,711 | |
Capital One Bank USA NA | | | 3.38 | % | | | 2/15/2023 | | | | - | | | | - | | | | | | | | 300,000 | | | | 306,420 | | | | | | | | | | | | | | | | | | | | 300,000 | | | | 306,420 | |
Capital One Financial Corp. | | | 3.50 | % | | | 6/15/2023 | | | | - | | | | - | | | | | | | | 121,000 | | | | 124,857 | | | | | | | | | | | | | | | | | | | | 121,000 | | | | 124,857 | |
Capital One Financial Corp. | | | 3.75 | % | | | 4/24/2024 | | | | - | | | | - | | | | | | | | 100,000 | | | | 104,329 | | | | | | | | | | | | | | | | | | | | 100,000 | | | | 104,329 | |
Capital One Financial Corp. | | | 4.20 | % | | | 10/29/2025 | | | | - | | | | - | | | | | | | | 315,000 | | | | 323,833 | | | | | | | | | | | | | | | | | | | | 315,000 | | | | 323,833 | |
Capital One NA | | | 2.35 | % | | | 8/17/2018 | | | | 250,000 | | | | 253,493 | | | | | | | | - | | | | - | | | | | | | | | | | | | | | | | | | | 250,000 | | | | 253,493 | |
Ford Motor Credit Co. LLC | | | 1.68 | % | | | 9/8/2017 | | | | 219,000 | | | | 219,482 | | | | | | | | 236,000 | | | | 236,520 | | | | | | | | | | | | | | | | | | | | 455,000 | | | | 456,002 | |
Ford Motor Credit Co. LLC | | | 2.24 | % | | | 6/15/2018 | | | | - | | | | - | | | | | | | | 200,000 | | | | 202,016 | | | | | | | | | | | | | | | | | | | | 200,000 | | | | 202,016 | |
Ford Motor Credit Co. LLC | | | 2.38 | % | | | 3/12/2019 | | | | - | | | | - | | | | | | | | 400,000 | | | | 405,610 | | | | | | | | | | | | | | | | | | | | 400,000 | | | | 405,610 | |
Ford Motor Credit Co. LLC | | | 2.60 | % | | | 11/4/2019 | | | | - | | | | - | | | | | | | | 250,000 | | | | 255,770 | | | | | | | | | | | | | | | | | | | | 250,000 | | | | 255,770 | |
Ford Motor Credit Co. LLC | | | 3.00 | % | | | 6/12/2017 | | | | - | | | | - | | | | | | | | 400,000 | | | | 406,093 | | | | | | | | | | | | | | | | | | | | 400,000 | | | | 406,093 | |
Ford Motor Credit Co. LLC | | | 3.16 | % | | | 8/4/2020 | | | | 350,000 | | | | 362,885 | | | | | | | | - | | | | - | | | | | | | | | | | | | | | | | | | | 350,000 | | | | 362,885 | |
Ford Motor Credit Co. LLC | | | 3.34 | % | | | 3/18/2021 | | | | - | | | | - | | | | | | | | 200,000 | | | | 207,425 | | | | | | | | | | | | | | | | | | | | 200,000 | | | | 207,425 | |
Ford Motor Credit Co. LLC | | | 4.13 | % | | | 8/4/2025 | | | | - | | | | - | | | | | | | | 200,000 | | | | 214,430 | | | | | | | | | | | | | | | | | | | | 200,000 | | | | 214,430 | |
John Deere Capital Corp. | | | 1.20 | % | | | 10/10/2017 | | | | - | | | | - | | | | | | | | 98,000 | | | | 98,382 | | | | | | | | | | | | | | | | | | | | 98,000 | | | | 98,382 | |
John Deere Capital Corp. | | | 1.60 | % | | | 7/13/2018 | | | | - | | | | - | | | | | | | | 43,000 | | | | 43,433 | | | | | | | | | | | | | | | | | | | | 43,000 | | | | 43,433 | |
John Deere Capital Corp. | | | 2.45 | % | | | 9/11/2020 | | | | - | | | | - | | | | | | | | 40,000 | | | | 41,313 | | | | | | | | | | | | | | | | | | | | 40,000 | | | | 41,313 | |
John Deere Capital Corp. | | | 2.80 | % | | | 1/27/2023 | | | | - | | | | - | | | | | | | | 73,000 | | | | 76,292 | | | | | | | | | | | | | | | | | | | | 73,000 | | | | 76,292 | |
John Deere Capital Corp. | | | 3.15 | % | | | 10/15/2021 | | | | - | | | | - | | | | | | | | 33,000 | | | | 35,379 | | | | | | | | | | | | | | | | | | | | 33,000 | | | | 35,379 | |
John Deere Capital Corp. | | | 5.75 | % | | | 9/10/2018 | | | | - | | | | - | | | | | | | | 200,000 | | | | 220,440 | | | | | | | | | | | | | | | | | | | | 200,000 | | | | 220,440 | |
PACCAR Financial Corp. | | | 1.30 | % | | | 5/10/2019 | | | | - | | | | - | | | | | | | | 93,000 | | | | 93,371 | | | | | | | | | | | | | | | | | | | | 93,000 | | | | 93,371 | |
PACCAR Financial Corp. | | | 1.45 | % | | | 3/9/2018 | | | | 130,000 | | | | 130,991 | | | | | | | | - | | | | - | | | | | | | | | | | | | | | | | | | | 130,000 | | | | 130,991 | |
PACCAR Financial Corp. | | | 1.60 | % | | | 3/15/2017 | | | | - | | | | - | | | | | | | | 53,000 | | | | 53,322 | | | | | | | | | | | | | | | | | | | | 53,000 | | | | 53,322 | |
PACCAR Financial Corp. | | | 1.75 | % | | | 8/14/2018 | | | | 150,000 | | | | 152,299 | | | | | | | | - | | | | - | | | | | | | | | | | | | | | | | | | | 150,000 | | | | 152,299 | |
Toyota Motor Credit Corp. | | | 1.38 | % | | | 1/10/2018 | | | | - | | | | - | | | | | | | | 100,000 | | | | 100,701 | | | | | | | | | | | | | | | | | | | | 100,000 | | | | 100,701 | |
Toyota Motor Credit Corp. | | | 1.45 | % | | | 1/12/2018 | | | | 154,000 | | | | 155,123 | | | | | | | | 103,000 | | | | 103,751 | | | | | | | | | | | | | | | | | | | | 257,000 | | | | 258,874 | |
Toyota Motor Credit Corp. | | | 2.10 | % | | | 1/17/2019 | | | | - | | | | - | | | | | | | | 105,000 | | | | 107,423 | | | | | | | | | | | | | | | | | | | | 105,000 | | | | 107,423 | |
Toyota Motor Credit Corp. | | | 2.13 | % | | | 7/18/2019 | | | | - | | | | - | | | | | | | | 225,000 | | | | 231,017 | | | | | | | | | | | | | | | | | | | | 225,000 | | | | 231,017 | |
Visa, Inc. | | | 1.20 | % | | | 12/14/2017 | | | | 390,000 | | | | 392,422 | | | | | | | | - | | | | - | | | | | | | | | | | | | | | | | | | | 390,000 | | | | 392,422 | |
Diversified Financial Services | | | | | | | | | | | | | | | | | | | | | | | | | | | | | | | | | | | | | | | | | | | | | |
AerCap Ireland Capital, Ltd. / AerCap Global Aviation Trust | | | 3.95 | % | | | 2/1/2022 | | | | - | | | | - | | | | | | | | 150,000 | | | | 150,000 | | | | | | | | | | | | | | | | | | | | 150,000 | | | | 150,000 | |
AIG Global Funding | | | 1.65 | % | | | 12/15/2017 | | | | - | | | | - | | | | | | | | 97,000 | | | | 97,423 | | | | | | | | | | | | | | | | | | | | 97,000 | | | | 97,423 | |
American Honda Finance Corp. | | | 1.20 | % | | | 7/14/2017 | | | | 111,000 | | | | 111,160 | | | | | | | | - | | | | - | | | | | | | | | | | | | | | | | | | | 111,000 | | | | 111,160 | |
American Honda Finance Corp. | | | 1.55 | % | | | 12/11/2017 | | | | - | | | | - | | | | | | | | 144,000 | | | | 145,193 | | | | | | | | | | | | | | | | | | | | 144,000 | | | | 145,193 | |
American Honda Finance Corp. | | | 1.60 | % | | | 2/16/2018 | | | | - | | | | - | | | | | | | | 213,000 | | | | 215,042 | | | | | | | | | | | | | | | | | | | | 213,000 | | | | 215,042 | |
American Honda Finance Corp. | | | 2.25 | % | | | 8/15/2019 | | | | 250,000 | | | | 258,137 | | | | | | | | 67,000 | | | | 69,181 | | | | | | | | | | | | | | | | | | | | 317,000 | | | | 327,318 | |
American Honda Finance Corp. | | | 2.60 | % | | | 9/20/2016 | | | | - | | | | - | | | | | | | | 205,000 | | | | 205,791 | | | | | | | | | | | | | | | | | | | | 205,000 | | | | 205,791 | |
Berkshire Hathaway, Inc. | | | 2.75 | % | | | 3/15/2023 | | | | - | | | | - | | | | | | | | 146,000 | | | | 150,852 | | | | | | | | | | | | | | | | | | | | 146,000 | | | | 150,852 | |
Berkshire Hathaway, Inc. | | | 3.40 | % | | | 1/31/2022 | | | | - | | | | - | | | | | | | | 397,000 | | | | 428,485 | | | | | | | | | | | | | | | | | | | | 397,000 | | | | 428,485 | |
Berkshire Hathaway, Inc. | | | 3.75 | % | | | 8/15/2021 | | | | - | | | | - | | | | | | | | 134,000 | | | | 147,856 | | | | | | | | | | | | | | | | | | | | 134,000 | | | | 147,856 | |
Blackstone Holdings Finance Co. LLC | | | 4.45 | % | | | 7/15/2045 | | | | - | | | | - | | | | | | | | 44,000 | | | | 44,406 | | | | | | | | | | | | | | | | | | | | 44,000 | | | | 44,406 | |
Blackstone Holdings Finance Co. LLC | | | 5.88 | % | | | 3/15/2021 | | | | - | | | | - | | | | | | | | 170,000 | | | | 199,199 | | | | | | | | | | | | | | | | | | | | 170,000 | | | | 199,199 | |
CDP Financial, Inc. | | | 4.40 | % | | | 11/25/2019 | | | | - | | | | - | | | | | | | | 250,000 | | | | 275,129 | | | | | | | | | | | | | | | | | | | | 250,000 | | | | 275,129 | |
CME Group, Inc. | | | 3.00 | % | | | 9/15/2022 | | | | - | | | | - | | | | | | | | 125,000 | | | | 132,689 | | | | | | | | | | | | | | | | | | | | 125,000 | | | | 132,689 | |
CME Group, Inc. | | | 3.00 | % | | | 3/15/2025 | | | | - | | | | - | | | | | | | | 180,000 | | | | 188,027 | | | | | | | | | | | | | | | | | | | | 180,000 | | | | 188,027 | |
CME Group, Inc. | | | 5.30 | % | | | 9/15/2043 | | | | - | | | | - | | | | | | | | 32,000 | | | | 40,884 | | | | | | | | | | | | | | | | | | | | 32,000 | | | | 40,884 | |
Conoco Funding Co. | | | 7.25 | % | | | 10/15/2031 | | | | - | | | | - | | | | | | | | 25,000 | | | | 31,841 | | | | | | | | | | | | | | | | | | | | 25,000 | | | | 31,841 | |
GE Capital International Funding Co. Unlimited Co. | | | 2.34 | % | | | 11/15/2020 | | | | - | | | | - | | | | | | | | 299,000 | | | | 308,018 | | | | | | | | | | | | | | | | | | | | 299,000 | | | | 308,018 | |
GE Capital International Funding Co. Unlimited Co. | | | 3.37 | % | | | 11/15/2025 | | | | - | | | | - | | | | | | | | 819,000 | | | | 888,803 | | | | | | | | | | | | | | | | | | | | 819,000 | | | | 888,803 | |
GE Capital International Funding Co. Unlimited Co. | | | 4.42 | % | | | 11/15/2035 | | | | - | | | | - | | | | | | | | 206,000 | | | | 231,047 | | | | | | | | | | | | | | | | | | | | 206,000 | | | | 231,047 | |
Intercontinental Exchange, Inc. | | | 2.50 | % | | | 10/15/2018 | | | | - | | | | - | | | | | | | | 38,000 | | | | 39,064 | | | | | | | | | | | | | | | | | | | | 38,000 | | | | 39,064 | |
Intercontinental Exchange, Inc. | | | 4.00 | % | | | 10/15/2023 | | | | - | | | | - | | | | | | | | 88,000 | | | | 95,507 | | | | | | | | | | | | | | | | | | | | 88,000 | | | | 95,507 | |
Jefferies Group LLC | | | 6.45 | % | | | 6/8/2027 | | | | - | | | | - | | | | | | | | 75,000 | | | | 83,313 | | | | | | | | | | | | | | | | | | | | 75,000 | | | | 83,313 | |
Jefferies Group LLC | | | 6.88 | % | | | 4/15/2021 | | | | - | | | | - | | | | | | | | 180,000 | | | | 204,424 | | | | | | | | | | | | | | | | | | | | 180,000 | | | | 204,424 | |
Murray Street Investment Trust I | | | 4.65 | % | | | 3/9/2017 | | | | 204,000 | | | | 208,582 | | | | | | | | 100,000 | | | | 102,246 | | | | | | | | | | | | | | | | | | | | 304,000 | | | | 310,828 | |
National Rural Utilities Cooperative Finance Corp. | | | 1.65 | % | | | 2/8/2019 | | | | 130,000 | | | | 131,538 | | | | | | | | - | | | | - | | | | | | | | | | | | | | | | | | | | 130,000 | | | | 131,538 | |
Private Export Funding Corp. | | | 3.55 | % | | | 1/15/2024 | | | | - | | | | - | | | | | | | | 150,000 | | | | 167,505 | | | | | | | | | | | | | | | | | | | | 150,000 | | | | 167,505 | |
Protective Life Global Funding | | | 2.70 | % | | | 11/25/2020 | | | | - | | | | - | | | | | | | | 250,000 | | | | 258,483 | | | | | | | | | | | | | | | | | | | | 250,000 | | | | 258,483 | |
Voya Financial, Inc. | | | 3.65 | % | | | 6/15/2026 | | | | - | | | | - | | | | | | | | 95,000 | | | | 95,448 | | | | | | | | | | | | | | | | | | | | 95,000 | | | | 95,448 | |
16
| | | | | | | | | | | | | | | | | | | | | | | | | | | | | | | | | | | | | | | | | | | | | | | | | | | | |
| | | | | | | | | Voya Limited
Maturity Bond VP | | | | | | JPMorgan Core
Bond VP | | | | | | Adjustments | | | | | | Combined Pro
Forma Portfolio | |
| | | | | | | | | | | | | |
| | | Coupon Rate | | | Maturity Date | | | Principal | | | Value | | | | | | Principal | | | Value | | | | | | Principal | | | Value | | | | | | Principal | | | Value | |
| | | | | | | | | | | | | | | | | | | | | | | | | | | | | | | | |
Diversified Telecommunication Services | | | | | | | | | | | | | | | | | | | | | | | | | | | | | | | | | | | | | | | | | | | | | |
AT&T, Inc. | | | 2.30 | % | | | 3/11/2019 | | | $ | 330,000 | | | $ | 337,023 | | | | | | | $ | - | | | $ | - | | | | | | | | | | | | | | | | | | | $ | 330,000 | | | $ | 337,023 | |
AT&T, Inc. | | | 3.00 | % | | | 2/15/2022 | | | | - | | | | - | | | | | | | | 320,000 | | | | 326,340 | | | | | | | | | | | | | | | | | | | | 320,000 | | | | 326,340 | |
AT&T, Inc. | | | 3.00 | % | | | 6/30/2022 | | | | - | | | | - | | | | | | | | 344,000 | | | | 352,281 | | | | | | | | | | | | | | | | | | | | 344,000 | | | | 352,281 | |
AT&T, Inc. | | | 3.40 | % | | | 5/15/2025 | | | | - | | | | - | | | | | | | | 56,000 | | | | 57,283 | | | | | | | | | | | | | | | | | | | | 56,000 | | | | 57,283 | |
AT&T, Inc. | | | 3.60 | % | | | 2/17/2023 | | | | - | | | | - | | | | | | | | 270,000 | | | | 281,658 | | | | | | | | | | | | | | | | | | | | 270,000 | | | | 281,658 | |
AT&T, Inc. | | | 3.80 | % | | | 3/15/2022 | | | | - | | | | - | | | | | | | | 333,000 | | | | 353,754 | | | | | | | | | | | | | | | | | | | | 333,000 | | | | 353,754 | |
AT&T, Inc. | | | 3.88 | % | | | 8/15/2021 | | | | - | | | | - | | | | | | | | 100,000 | | | | 107,733 | | | | | | | | | | | | | | | | | | | | 100,000 | | | | 107,733 | |
AT&T, Inc. | | | 3.95 | % | | | 1/15/2025 | | | | - | | | | - | | | | | | | | 85,000 | | | | 90,350 | | | | | | | | | | | | | | | | | | | | 85,000 | | | | 90,350 | |
AT&T, Inc. | | | 4.30 | % | | | 12/15/2042 | | | | - | | | | - | | | | | | | | 373,000 | | | | 361,144 | | | | | | | | | | | | | | | | | | | | 373,000 | | | | 361,144 | |
AT&T, Inc. | | | 4.35 | % | | | 6/15/2045 | | | | - | | | | - | | | | | | | | 49,000 | | | | 47,479 | | | | | | | | | | | | | | | | | | | | 49,000 | | | | 47,479 | |
AT&T, Inc. | | | 4.60 | % | | | 2/15/2021 | | | | - | | | | - | | | | | | | | 125,000 | | | | 136,786 | | | | | | | | | | | | | | | | | | | | 125,000 | | | | 136,786 | |
AT&T, Inc. | | | 4.75 | % | | | 5/15/2046 | | | | - | | | | - | | | | | | | | 67,000 | | | | 68,666 | | | | | | | | | | | | | | | | | | | | 67,000 | | | | 68,666 | |
AT&T, Inc. | | | 5.35 | % | | | 9/1/2040 | | | | - | | | | - | | | | | | | | 203,000 | | | | 222,060 | | | | | | | | | | | | | | | | | | | | 203,000 | | | | 222,060 | |
AT&T, Inc. | | | 5.50 | % | | | 2/1/2018 | | | | - | | | | - | | | | | | | | 105,000 | | | | 111,758 | | | | | | | | | | | | | | | | | | | | 105,000 | | | | 111,758 | |
AT&T, Inc. | | | 6.30 | % | | | 1/15/2038 | | | | - | | | | - | | | | | | | | 50,000 | | | | 60,121 | | | | | | | | | | | | | | | | | | | | 50,000 | | | | 60,121 | |
AT&T, Inc. | | | 6.38 | % | | | 3/1/2041 | | | | - | | | | - | | | | | | | | 100,000 | | | | 121,696 | | | | | | | | | | | | | | | | | | | | 100,000 | | | | 121,696 | |
BellSouth Capital Funding Corp. | | | 7.88 | % | | | 2/15/2030 | | | | - | | | | - | | | | | | | | 100,000 | | | | 128,807 | | | | | | | | | | | | | | | | | | | | 100,000 | | | | 128,807 | |
BellSouth LLC | | | 6.55 | % | | | 6/15/2034 | | | | - | | | | - | | | | | | | | 350,000 | | | | 410,236 | | | | | | | | | | | | | | | | | | | | 350,000 | | | | 410,236 | |
BellSouth LLC | | | 6.88 | % | | | 10/15/2031 | | | | - | | | | - | | | | | | | | 150,000 | | | | 179,042 | | | | | | | | | | | | | | | | | | | | 150,000 | | | | 179,042 | |
British Telecommunications PLC | | | 5.95 | % | | | 1/15/2018 | | | | 151,000 | | | | 161,612 | | | | | | | | - | | | | - | | | | | | | | | | | | | | | | | | | | 151,000 | | | | 161,612 | |
British Telecommunications PLC | | | 9.38 | % | | | 12/15/2030 | | | | - | | | | - | | | | | | | | 150,000 | | | | 231,102 | | | | | | | | | | | | | | | | | | | | 150,000 | | | | 231,102 | |
Centel Capital Corp. | | | 9.00 | % | | | 10/15/2019 | | | | - | | | | - | | | | | | | | 40,000 | | | | 46,302 | | | | | | | | | | | | | | | | | | | | 40,000 | | | | 46,302 | |
Deutsche Telekom International Finance BV | | | 2.25 | % | | | 3/6/2017 | | | | - | | | | - | | | | | | | | 150,000 | | | | 150,995 | | | | | | | | | | | | | | | | | | | | 150,000 | | | | 150,995 | |
Deutsche Telekom International Finance BV | | | 8.75 | % | | | 6/15/2030 | | | | - | | | | - | | | | | | | | 75,000 | | | | 112,942 | | | | | | | | | | | | | | | | | | | | 75,000 | | | | 112,942 | |
GTP Acquisition Partners I LLC | | | 2.35 | % | | | 6/15/2045 | | | | - | | | | - | | | | | | | | 39,000 | | | | 38,917 | | | | | | | | | | | | | | | | | | | | 39,000 | | | | 38,917 | |
GTP Acquisition Partners I LLC | | | 3.48 | % | | | 6/15/2050 | | | | - | | | | - | | | | | | | | 41,000 | | | | 41,426 | | | | | | | | | | | | | | | | | | | | 41,000 | | | | 41,426 | |
Nippon Telegraph & Telephone Corp. | | | 1.40 | % | | | 7/18/2017 | | | | - | | | | - | | | | | | | | 27,000 | | | | 27,064 | | | | | | | | | | | | | | | | | | | | 27,000 | | | | 27,064 | |
Orange SA | | | 2.75 | % | | | 9/14/2016 | | | | - | | | | - | | | | | | | | 70,000 | | | | 70,261 | | | | | | | | | | | | | | | | | | | | 70,000 | | | | 70,261 | |
Orange SA | | | 9.00 | % | | | 3/1/2031 | | | | - | | | | - | | | | | | | | 263,000 | | | | 407,314 | | | | | | | | | | | | | | | | | | | | 263,000 | | | | 407,314 | |
Qwest Corp. | | | 6.75 | % | | | 12/1/2021 | | | | - | | | | - | | | | | | | | 148,000 | | | | 160,121 | | | | | | | | | | | | | | | | | | | | 148,000 | | | | 160,121 | |
Telefonica Emisiones SAU | | | 3.19 | % | | | 4/27/2018 | | | | - | | | | - | | | | | | | | 150,000 | | | | 154,017 | | | | | | | | | | | | | | | | | | | | 150,000 | | | | 154,017 | |
Telefonica Emisiones SAU | | | 5.13 | % | | | 4/27/2020 | | | | - | | | | - | | | | | | | | 41,000 | | | | 45,257 | | | | | | | | | | | | | | | | | | | | 41,000 | | | | 45,257 | |
Verizon Communications, Inc. | | | 2.63 | % | | | 2/21/2020 | | | | 240,000 | | | | 248,368 | | | | | | | | 221,000 | | | | 228,705 | | | | | | | | | | | | | | | | | | | | 461,000 | | | | 477,073 | |
Verizon Communications, Inc. | | | 4.15 | % | | | 3/15/2024 | | | | - | | | | - | | | | | | | | 261,000 | | | | 287,926 | | | | | | | | | | | | | | | | | | | | 261,000 | | | | 287,926 | |
Verizon Communications, Inc. | | | 4.27 | % | | | 1/15/2036 | | | | - | | | | - | | | | | | | | 30,000 | | | | 30,702 | | | | | | | | | | | | | | | | | | | | 30,000 | | | | 30,702 | |
Verizon Communications, Inc. | | | 4.40 | % | | | 11/1/2034 | | | | - | | | | - | | | | | | | | 241,000 | | | | 248,506 | | | | | | | | | | | | | | | | | | | | 241,000 | | | | 248,506 | |
Verizon Communications, Inc. | | | 4.50 | % | | | 9/15/2020 | | | | - | | | | - | | | | | | | | 229,000 | | | | 254,180 | | | | | | | | | | | | | | | | | | | | 229,000 | | | | 254,180 | |
Verizon Communications, Inc. | | | 4.52 | % | | | 9/15/2048 | | | | - | | | | - | | | | | | | | 153,000 | | | | 159,319 | | | | | | | | | | | | | | | | | | | | 153,000 | | | | 159,319 | |
Verizon Communications, Inc. | | | 4.67 | % | | | 3/15/2055 | | | | - | | | | - | | | | | | | | 494,000 | | | | 499,651 | | | | | | | | | | | | | | | | | | | | 494,000 | | | | 499,651 | |
Verizon Communications, Inc. | | | 4.86 | % | | | 8/21/2046 | | | | - | | | | - | | | | | | | | 248,000 | | | | 271,086 | | | | | | | | | | | | | | | | | | | | 248,000 | | | | 271,086 | |
Verizon Communications, Inc. | | | 5.01 | % | | | 8/21/2054 | | | | - | | | | - | | | | | | | | 33,000 | | | | 34,899 | | | | | | | | | | | | | | | | | | | | 33,000 | | | | 34,899 | |
Verizon Communications, Inc. | | | 5.15 | % | | | 9/15/2023 | | | | - | | | | - | | | | | | | | 729,000 | | | | 849,012 | | | | | | | | | | | | | | | | | | | | 729,000 | | | | 849,012 | |
Verizon Communications, Inc. | | | 5.85 | % | | | 9/15/2035 | | | | - | | | | - | | | | | | | | 75,000 | | | | 91,038 | | | | | | | | | | | | | | | | | | | | 75,000 | | | | 91,038 | |
Electric Utilities | | | | | | | | | | | | | | | | | | | | | | | | | | | | | | | | | | | | | | | | | | | | | |
Alabama Power Co. | | | 3.75 | % | | | 3/1/2045 | | | | - | | | | - | | | | | | | | 118,000 | | | | 122,710 | | | | | | | | | | | | | | | | | | | | 118,000 | | | | 122,710 | |
Alabama Power Co. | | | 5.60 | % | | | 3/15/2033 | | | | - | | | | - | | | | | | | | 100,000 | | | | 122,023 | | | | | | | | | | | | | | | | | | | | 100,000 | | | | 122,023 | |
Alabama Power Co. | | | 6.13 | % | | | 5/15/2038 | | | | - | | | | - | | | | | | | | 11,000 | | | | 14,584 | | | | | | | | | | | | | | | | | | | | 11,000 | | | | 14,584 | |
American Electric Power Co., Inc. | | | 1.65 | % | | | 12/15/2017 | | | | - | | | | - | | | | | | | | 32,000 | | | | 32,092 | | | | | | | | | | | | | | | | | | | | 32,000 | | | | 32,092 | |
Appalachian Power Co. | | | 6.70 | % | | | 8/15/2037 | | | | - | | | | - | | | | | | | | 50,000 | | | | 64,670 | | | | | | | | | | | | | | | | | | | | 50,000 | | | | 64,670 | |
Arizona Public Service Co. | | | 2.20 | % | | | 1/15/2020 | | | | - | | | | - | | | | | | | | 100,000 | | | | 102,432 | | | | | | | | | | | | | | | | | | | | 100,000 | | | | 102,432 | |
Arizona Public Service Co. | | | 4.50 | % | | | 4/1/2042 | | | | - | | | | - | | | | | | | | 28,000 | | | | 32,481 | | | | | | | | | | | | | | | | | | | | 28,000 | | | | 32,481 | |
Baltimore Gas & Electric Co. | | | 2.80 | % | | | 8/15/2022 | | | | - | | | | - | | | | | | | | 95,000 | | | | 98,418 | | | | | | | | | | | | | | | | | | | | 95,000 | | | | 98,418 | |
Cleveland Electric Illuminating Co. | | | 7.88 | % | | | 11/1/2017 | | | | - | | | | - | | | | | | | | 50,000 | | | | 53,987 | | | | | | | | | | | | | | | | | | | | 50,000 | | | | 53,987 | |
Commonwealth Edison Co. | | | 3.65 | % | | | 6/15/2046 | | | | - | | | | - | | | | | | | | 81,000 | | | | 82,757 | | | | | | | | | | | | | | | | | | | | 81,000 | | | | 82,757 | |
Duke Energy Carolinas LLC | | | 4.25 | % | | | 12/15/2041 | | | | - | | | | - | | | | | | | | 21,000 | | | | 23,531 | | | | | | | | | | | | | | | | | | | | 21,000 | | | | 23,531 | |
Duke Energy Carolinas LLC | | | 6.00 | % | | | 12/1/2028 | | | | - | | | | - | | | | | | | | 100,000 | | | | 129,706 | | | | | | | | | | | | | | | | | | | | 100,000 | | | | 129,706 | |
Duke Energy Carolinas LLC | | | 6.00 | % | | | 1/15/2038 | | | | - | | | | - | | | | | | | | 48,000 | | | | 64,301 | | | | | | | | | | | | | | | | | | | | 48,000 | | | | 64,301 | |
Duke Energy Indiana LLC | | | 3.75 | % | | | 7/15/2020 | | | | - | | | | - | | | | | | | | 100,000 | | | | 108,669 | | | | | | | | | | | | | | | | | | | | 100,000 | | | | 108,669 | |
Duke Energy Indiana LLC | | | 3.75 | % | | | 5/15/2046 | | | | - | | | | - | | | | | | | | 100,000 | | | | 103,813 | | | | | | | | | | | | | | | | | | | | 100,000 | | | | 103,813 | |
Duke Energy Indiana LLC | | | 6.35 | % | | | 8/15/2038 | | | | - | | | | - | | | | | | | | 80,000 | | | | 112,607 | | | | | | | | | | | | | | | | | | | | 80,000 | | | | 112,607 | |
Duke Energy Progress LLC | | | 2.80 | % | | | 5/15/2022 | | | | - | | | | - | | | | | | | | 48,000 | | | | 50,277 | | | | | | | | | | | | | | | | | | | | 48,000 | | | | 50,277 | |
Duke Energy Progress LLC | | | 3.00 | % | | | 9/15/2021 | | | | - | | | | - | | | | | | | | 55,000 | | | | 58,707 | | | | | | | | | | | | | | | | | | | | 55,000 | | | | 58,707 | |
Duke Energy Progress LLC | | | 3.25 | % | | | 8/15/2025 | | | | - | | | | - | | | | | | | | 111,000 | | | | 120,000 | | | | | | | | | | | | | | | | | | | | 111,000 | | | | 120,000 | |
Duke Energy Progress LLC | | | 4.10 | % | | | 5/15/2042 | | | | - | | | | - | | | | | | | | 32,000 | | | | 35,021 | | | | | | | | | | | | | | | | | | | | 32,000 | | | | 35,021 | |
Duke Energy Progress LLC | | | 4.10 | % | | | 3/15/2043 | | | | - | | | | - | | | | | | | | 75,000 | | | | 81,966 | | | | | | | | | | | | | | | | | | | | 75,000 | | | | 81,966 | |
Duke Energy Progress LLC | | | 4.15 | % | | | 12/1/2044 | | | | - | | | | - | | | | | | | | 65,000 | | | | 71,578 | | | | | | | | | | | | | | | | | | | | 65,000 | | | | 71,578 | |
Duke Energy Progress LLC | | | 5.30 | % | | | 1/15/2019 | | | | - | | | | - | | | | | | | | 70,000 | | | | 77,072 | | | | | | | | | | | | | | | | | | | | 70,000 | | | | 77,072 | |
Edison International | | | 2.95 | % | | | 3/15/2023 | | | | - | | | | - | | | | | | | | 100,000 | | | | 102,529 | | | | | | | | | | | | | | | | | | | | 100,000 | | | | 102,529 | |
Electricite de France SA | | | 2.15 | % | | | 1/22/2019 | | | | - | | | | - | | | | | | | | 80,000 | | | | 81,643 | | | | | | | | | | | | | | | | | | | | 80,000 | | | | 81,643 | |
Electricite de France SA | | | 2.35 | % | | | 10/13/2020 | | | | 160,000 | | | | 163,500 | | | | | | | | - | | | | - | | | | | | | | | | | | | | | | | | | | 160,000 | | | | 163,500 | |
Electricite de France SA | | | 6.00 | % | | | 1/22/2114 | | | | - | | | | - | | | | | | | | 150,000 | | | | 160,480 | | | | | | | | | | | | | | | | | | | | 150,000 | | | | 160,480 | |
Entergy Arkansas, Inc. | | | 3.50 | % | | | 4/1/2026 | | | | - | | | | - | | | | | | | | 57,000 | | | | 62,471 | | | | | | | | | | | | | | | | | | | | 57,000 | | | | 62,471 | |
Entergy Corp. | | | 4.70 | % | | | 1/15/2017 | | | | 329,000 | | | | 333,633 | | | | | | | | - | | | | - | | | | | | | | | | | | | | | | | | | | 329,000 | | | | 333,633 | |
Entergy Louisiana LLC | | | 3.05 | % | | | 6/1/2031 | | | | - | | | | - | | | | | | | | 94,000 | | | | 96,289 | | | | | | | | | | | | | | | | | | | | 94,000 | | | | 96,289 | |
Entergy Mississippi, Inc. | | | 2.85 | % | | | 6/1/2028 | | | | - | | | | - | | | | | | | | 83,000 | | | | 84,314 | | | | | | | | | | | | | | | | | | | | 83,000 | | | | 84,314 | |
Exelon Corp. | | | 3.40 | % | | | 4/15/2026 | | | | - | | | | - | | | | | | | | 63,000 | | | | 65,843 | | | | | | | | | | | | | | | | | | | | 63,000 | | | | 65,843 | |
Florida Power & Light Co. | | | 3.13 | % | | | 12/1/2025 | | | | - | | | | - | | | | | | | | 150,000 | | | | 160,923 | | | | | | | | | | | | | | | | | | | | 150,000 | | | | 160,923 | |
Florida Power & Light Co. | | | 5.95 | % | | | 2/1/2038 | | | | - | | | | - | | | | | | | | 50,000 | | | | 68,602 | | | | | | | | | | | | | | | | | | | | 50,000 | | | | 68,602 | |
Georgia Power Co. | | | 3.25 | % | | | 4/1/2026 | | | | - | | | | - | | | | | | | | 65,000 | | | | 69,060 | | | | | | | | | | | | | | | | | | | | 65,000 | | | | 69,060 | |
Hydro-Quebec | | | 9.40 | % | | | 2/1/2021 | | | | - | | | | - | | | | | | | | 250,000 | | | | 329,910 | | | | | | | | | | | | | | | | | | | | 250,000 | | | | 329,910 | |
Indiana Michigan Power Co. | | | 3.20 | % | | | 3/15/2023 | | | | - | | | | - | | | | | | | | 125,000 | | | | 130,367 | | | | | | | | | | | | | | | | | | | | 125,000 | | | | 130,367 | |
Indiana Michigan Power Co. | | | 7.00 | % | | | 3/15/2019 | | | | - | | | | - | | | | | | | | 30,000 | | | | 34,085 | | | | | | | | | | | | | | | | | | | | 30,000 | | | | 34,085 | |
Jersey Central Power & Light Co. | | | 7.35 | % | | | 2/1/2019 | | | | - | | | | - | | | | | | | | 15,000 | | | | 16,917 | | | | | | | | | | | | | | | | | | | | 15,000 | | | | 16,917 | |
John Sevier Combined Cycle Generation LLC | | | 4.63 | % | | | 1/15/2042 | | | | - | | | | - | | | | | | | | 65,235 | | | | 76,388 | | | | | | | | | | | | | | | | | | | | 65,235 | | | | 76,388 | |
Kansas City Power & Light Co. | | | 3.15 | % | | | 3/15/2023 | | | | - | | | | - | | | | | | | | 71,000 | | | | 72,914 | | | | | | | | | | | | | | | | | | | | 71,000 | | | | 72,914 | |
Kansas City Power & Light Co. | | | 5.30 | % | | | 10/1/2041 | | | | - | | | | - | | | | | | | | 100,000 | | | | 118,767 | | | | | | | | | | | | | | | | | | | | 100,000 | | | | 118,767 | |
Nevada Power Co. | | | 5.38 | % | | | 9/15/2040 | | | | - | | | | - | | | | | | | | 12,000 | | | | 14,809 | | | | | | | | | | | | | | | | | | | | 12,000 | | | | 14,809 | |
Nevada Power Co. | | | 5.45 | % | | | 5/15/2041 | | | | - | | | | - | | | | | | | | 50,000 | | | | 63,433 | | | | | | | | | | | | | | | | | | | | 50,000 | | | | 63,433 | |
Nevada Power Co. | | | 6.50 | % | | | 8/1/2018 | | | | - | | | | - | | | | | | | | 50,000 | | | | 55,405 | | | | | | | | | | | | | | | | | | | | 50,000 | | | | 55,405 | |
Nevada Power Co. | | | 7.13 | % | | | 3/15/2019 | | | | - | | | | - | | | | | | | | 140,000 | | | | 161,685 | | | | | | | | | | | | | | | | | | | | 140,000 | | | | 161,685 | |
NextEra Energy Capital Holdings, Inc. | | | 1.59 | % | | | 6/1/2017 | | | | 130,000 | | | | 130,313 | | | | | | | | - | | | | - | | | | | | | | | | | | | | | | | | | | 130,000 | | | | 130,313 | |
NextEra Energy Capital Holdings, Inc. | | | 2.30 | % | | | 4/1/2019 | | | | 130,000 | | | | 132,520 | | | | | | | | - | | | | - | | | | | | | | | | | | | | | | | | | | 130,000 | | | | 132,520 | |
NextEra Energy Capital Holdings, Inc. | | | 2.40 | % | | | 9/15/2019 | | | | - | | | | - | | | | | | | | 53,000 | | | | 54,110 | | | | | | | | | | | | | | | | | | | | 53,000 | | | | 54,110 | |
NextEra Energy Capital Holdings, Inc. | | | 6.00 | % | | | 3/1/2019 | | | | - | | | | - | | | | | | | | 25,000 | | | | 27,718 | | | | | | | | | | | | | | | | | | | | 25,000 | | | | 27,718 | |
Niagara Mohawk Power Corp. | | | 3.51 | % | | | 10/1/2024 | | | | - | | | | - | | | | | | | | 141,000 | | | | 151,784 | | | | | | | | | | | | | | | | | | | | 141,000 | | | | 151,784 | |
Niagara Mohawk Power Corp. | | | 4.88 | % | | | 8/15/2019 | | | | - | | | | - | | | | | | | | 40,000 | | | | 43,792 | | | | | | | | | | | | | | | | | | | | 40,000 | | | | 43,792 | |
NiSource Finance Corp. | | | 5.80 | % | | | 2/1/2042 | | | | - | | | | - | | | | | | | | 118,000 | | | | 150,999 | | | | | | | | | | | | | | | | | | | | 118,000 | | | | 150,999 | |
Ohio Power Co. | | | 5.38 | % | | | 10/1/2021 | | | | - | | | | - | | | | | | | | 50,000 | | | | 58,052 | | | | | | | | | | | | | | | | | | | | 50,000 | | | | 58,052 | |
Ohio Power Co. | | | 6.05 | % | | | 5/1/2018 | | | | - | | | | - | | | | | | | | 30,000 | | | | 32,352 | | | | | | | | | | | | | | | | | | | | 30,000 | | | | 32,352 | |
Oncor Electric Delivery Co. LLC | | | 6.80 | % | | | 9/1/2018 | | | | - | | | | - | | | | | | | | 65,000 | | | | 72,236 | | | | | | | | | | | | | | | | | | | | 65,000 | | | | 72,236 | |
Oncor Electric Delivery Co. LLC | | | 7.00 | % | | | 9/1/2022 | | | | - | | | | - | | | | | | | | 50,000 | | | | 63,672 | | | | | | | | | | | | | | | | | | | | 50,000 | | | | 63,672 | |
Pacific Gas & Electric Co. | | | 2.45 | % | | | 8/15/2022 | | | | - | | | | - | | | | | | | | 68,000 | | | | 69,456 | | | | | | | | | | | | | | | | | | | | 68,000 | | | | 69,456 | |
17
| | | | | | | | | | | | | | | | | | | | | | | | | | | | | | | | | | | | | | | | | | | | | | | | | | | | |
| | | | | | | | | Voya Limited
Maturity Bond VP | | | | | | JPMorgan Core
Bond VP | | | | | | Adjustments | | | | | | Combined Pro
Forma Portfolio | |
| | | | | | | | | | | | | |
| | | Coupon Rate | | | Maturity Date | | | Principal | | | Value | | | | | | Principal | | | Value | | | | | | Principal | | | Value | | | | | | Principal | | | Value | |
| | | | | | | | | | | | | | | | | | | | | | | | | | | | | | | | |
Pacific Gas & Electric Co. | | | 3.25 | % | | | 6/15/2023 | | | $ | - | | | $ | - | | | | | | | $ | 50,000 | | | $ | 53,321 | | | | | | | | | | | | | | | | | | | $ | 50,000 | | | $ | 53,321 | |
Pacific Gas & Electric Co. | | | 3.50 | % | | | 6/15/2025 | | | | - | | | | - | | | | | | | | 94,000 | | | | 102,468 | | | | | | | | | | | | | | | | | | | | 94,000 | | | | 102,468 | |
Pacific Gas & Electric Co. | | | 4.45 | % | | | 4/15/2042 | | | | - | | | | - | | | | | | | | 17,000 | | | | 19,111 | | | | | | | | | | | | | | | | | | | | 17,000 | | | | 19,111 | |
Pacific Gas & Electric Co. | | | 4.50 | % | | | 12/15/2041 | | | | - | | | | - | | | | | | | | 96,000 | | | | 108,699 | | | | | | | | | | | | | | | | | | | | 96,000 | | | | 108,699 | |
Pacific Gas & Electric Co. | | | 6.05 | % | | | 3/1/2034 | | | | - | | | | - | | | | | | | | 250,000 | | | | 333,089 | | | | | | | | | | | | | | | | | | | | 250,000 | | | | 333,089 | |
PacifiCorp | | | 2.95 | % | | | 6/1/2023 | | | | - | | | | - | | | | | | | | 200,000 | | | | 210,729 | | | | | | | | | | | | | | | | | | | | 200,000 | | | | 210,729 | |
PacifiCorp | | | 3.60 | % | | | 4/1/2024 | | | | - | | | | - | | | | | | | | 105,000 | | | | 115,332 | | | | | | | | | | | | | | | | | | | | 105,000 | | | | 115,332 | |
PacifiCorp | | | 3.85 | % | | | 6/15/2021 | | | | - | | | | - | | | | | | | | 100,000 | | | | 109,905 | | | | | | | | | | | | | | | | | | | | 100,000 | | | | 109,905 | |
PacifiCorp | | | 5.65 | % | | | 7/15/2018 | | | | - | | | | - | | | | | | | | 25,000 | | | | 27,342 | | | | | | | | | | | | | | | | | | | | 25,000 | | | | 27,342 | |
PECO Energy Co. | | | 2.38 | % | | | 9/15/2022 | | | | - | | | | - | | | | | | | | 100,000 | | | | 102,918 | | | | | | | | | | | | | | | | | | | | 100,000 | | | | 102,918 | |
PECO Energy Co. | | | 5.35 | % | | | 3/1/2018 | | | | - | | | | - | | | | | | | | 50,000 | | | | 53,440 | | | | | | | | | | | | | | | | | | | | 50,000 | | | | 53,440 | |
PPL Capital Funding, Inc. | | | 3.40 | % | | | 6/1/2023 | | | | - | | | | - | | | | | | | | 70,000 | | | | 73,045 | | | | | | | | | | | | | | | | | | | | 70,000 | | | | 73,045 | |
Progress Energy, Inc. | | | 3.15 | % | | | 4/1/2022 | | | | - | | | | - | | | | | | | | 54,000 | | | | 56,194 | | | | | | | | | | | | | | | | | | | | 54,000 | | | | 56,194 | |
Public Service Co. of Colorado | | | 2.25 | % | | | 9/15/2022 | | | | - | | | | - | | | | | | | | 63,000 | | | | 64,603 | | | | | | | | | | | | | | | | | | | | 63,000 | | | | 64,603 | |
Public Service Co. of Colorado | | | 3.55 | % | | | 6/15/2046 | | | | - | | | | - | | | | | | | | 53,000 | | | | 54,603 | | | | | | | | | | | | | | | | | | | | 53,000 | | | | 54,603 | |
Public Service Co. of Colorado | | | 5.80 | % | | | 8/1/2018 | | | | - | | | | - | | | | | | | | 20,000 | | | | 21,867 | | | | | | | | | | | | | | | | | | | | 20,000 | | | | 21,867 | |
Public Service Co. of Colorado | | | 6.50 | % | | | 8/1/2038 | | | | - | | | | - | | | | | | | | 45,000 | | | | 65,138 | | | | | | | | | | | | | | | | | | | | 45,000 | | | | 65,138 | |
Public Service Co. of Oklahoma | | | 4.40 | % | | | 2/1/2021 | | | | - | | | | - | | | | | | | | 30,000 | | | | 32,846 | | | | | | | | | | | | | | | | | | | | 30,000 | | | | 32,846 | |
Public Service Co. of Oklahoma | | | 6.63 | % | | | 11/15/2037 | | | | - | | | | - | | | | | | | | 150,000 | | | | 192,074 | | | | | | | | | | | | | | | | | | | | 150,000 | | | | 192,074 | |
Public Service Electric & Gas Co. | | | 1.80 | % | | | 6/1/2019 | | | | - | | | | - | | | | | | | | 30,000 | | | | 30,494 | | | | | | | | | | | | | | | | | | | | 30,000 | | | | 30,494 | |
Public Service Electric & Gas Co. | | | 3.00 | % | | | 5/15/2025 | | | | - | | | | - | | | | | | | | 167,000 | | | | 178,440 | | | | | | | | | | | | | | | | | | | | 167,000 | | | | 178,440 | |
Public Service Electric & Gas Co. | | | 5.38 | % | | | 11/1/2039 | | | | - | | | | - | | | | | | | | 14,000 | | | | 18,090 | | | | | | | | | | | | | | | | | | | | 14,000 | | | | 18,090 | |
South Carolina Electric & Gas Co. | | | 4.50 | % | | | 6/1/2064 | | | | - | | | | - | | | | | | | | 26,000 | | | | 26,886 | | | | | | | | | | | | | | | | | | | | 26,000 | | | | 26,886 | |
Southern California Edison Co. | | | 1.13 | % | | | 5/1/2017 | | | | 172,000 | | | | 172,375 | | | | | | | | - | | | | - | | | | | | | | | | | | | | | | | | | | 172,000 | | | | 172,375 | |
Southern California Edison Co. | | | 1.85 | % | | | 2/1/2022 | | | | - | | | | - | | | | | | | | 60,000 | | | | 59,614 | | | | | | | | | | | | | | | | | | | | 60,000 | | | | 59,614 | |
Southern California Edison Co. | | | 3.50 | % | | | 10/1/2023 | | | | - | | | | - | | | | | | | | 106,000 | | | | 116,038 | | | | | | | | | | | | | | | | | | | | 106,000 | | | | 116,038 | |
Southern California Edison Co. | | | 3.90 | % | | | 12/1/2041 | | | | - | | | | - | | | | | | | | 30,000 | | | | 32,169 | | | | | | | | | | | | | | | | | | | | 30,000 | | | | 32,169 | |
Southern California Edison Co. | | | 5.50 | % | | | 8/15/2018 | | | | - | | | | - | | | | | | | | 65,000 | | | | 70,944 | | | | | | | | | | | | | | | | | | | | 65,000 | | | | 70,944 | |
Southern California Edison Co. | | | 6.05 | % | | | 3/15/2039 | | | | - | | | | - | | | | | | | | 60,000 | | | | 82,026 | | | | | | | | | | | | | | | | | | | | 60,000 | | | | 82,026 | |
Southern Co. | | | 1.30 | % | | | 8/15/2017 | | | | 239,000 | | | | 238,913 | | | | | | | | - | | | | - | | | | | | | | | | | | | | | | | | | | 239,000 | | | | 238,913 | |
Southern Co. | | | 1.95 | % | | | 9/1/2016 | | | | - | | | | - | | | | | | | | 13,000 | | | | 13,020 | | | | | | | | | | | | | | | | | | | | 13,000 | | | | 13,020 | |
Southern Power Co. | | | 1.50 | % | | | 6/1/2018 | | | | 160,000 | | | | 160,800 | | | | | | | | - | | | | - | | | | | | | | | | | | | | | | | | | | 160,000 | | | | 160,800 | |
Southern Power Co. | | | 4.15 | % | | | 12/1/2025 | | | | - | | | | - | | | | | | | | 91,000 | | | | 98,403 | | | | | | | | | | | | | | | | | | | | 91,000 | | | | 98,403 | |
Southwestern Electric Power Co. | | | 6.45 | % | | | 1/15/2019 | | | | - | | | | - | | | | | | | | 150,000 | | | | 167,334 | | | | | | | | | | | | | | | | | | | | 150,000 | | | | 167,334 | |
State Grid Overseas Investment, Ltd. | | | 1.75 | % | | | 5/22/2018 | | | | - | | | | - | | | | | | | | 200,000 | | | | 200,747 | | | | | | | | | | | | | | | | | | | | 200,000 | | | | 200,747 | |
Tri-State Generation & Transmission Association, Inc. | | | 4.25 | % | | | 6/1/2046 | | | | - | | | | - | | | | | | | | 62,000 | | | | 64,043 | | | | | | | | | | | | | | | | | | | | 62,000 | | | | 64,043 | |
Virginia Electric & Power Co. | | | 2.95 | % | | | 1/15/2022 | | | | - | | | | - | | | | | | | | 27,000 | | | | 28,444 | | | | | | | | | | | | | | | | | | | | 27,000 | | | | 28,444 | |
Virginia Electric & Power Co. | | | 3.45 | % | | | 2/15/2024 | | | | - | | | | - | | | | | | | | 21,000 | | | | 22,744 | | | | | | | | | | | | | | | | | | | | 21,000 | | | | 22,744 | |
Virginia Electric & Power Co. | | | 4.45 | % | | | 2/15/2044 | | | | - | | | | - | | | | | | | | 28,000 | | | | 32,183 | | | | | | | | | | | | | | | | | | | | 28,000 | | | | 32,183 | |
Virginia Electric & Power Co. | | | 5.40 | % | | | 4/30/2018 | | | | - | | | | - | | | | | | | | 100,000 | | | | 107,383 | | | | | | | | | | | | | | | | | | | | 100,000 | | | | 107,383 | |
Virginia Electric & Power Co. | | | 8.88 | % | | | 11/15/2038 | | | | - | | | | - | | | | | | | | 90,000 | | | | 150,788 | | | | | | | | | | | | | | | | | | | | 90,000 | | | | 150,788 | |
Wisconsin Electric Power Co. | | | 2.95 | % | | | 9/15/2021 | | | | - | | | | - | | | | | | | | 2,000 | | | | 2,116 | | | | | | | | | | | | | | | | | | | | 2,000 | | | | 2,116 | |
Wisconsin Electric Power Co. | | | 3.10 | % | | | 6/1/2025 | | | | - | | | | - | | | | | | | | 82,000 | | | | 87,273 | | | | | | | | | | | | | | | | | | | | 82,000 | | | | 87,273 | |
Xcel Energy, Inc. | | | 2.40 | % | | | 3/15/2021 | | | | - | | | | - | | | | | | | | 100,000 | | | | 102,805 | | | | | | | | | | | | | | | | | | | | 100,000 | | | | 102,805 | |
Xcel Energy, Inc. | | | 4.80 | % | | | 9/15/2041 | | | | - | | | | - | | | | | | | | 9,000 | | | | 10,344 | | | | | | | | | | | | | | | | | | | | 9,000 | | | | 10,344 | |
Xcel Energy, Inc. | | | 6.50 | % | | | 7/1/2036 | | | | - | | | | - | | | | | | | | 80,000 | | | | 106,589 | | | | | | | | | | | | | | | | | | | | 80,000 | | | | 106,589 | |
Electrical Equipment | | | | | | | | | | | | | | | | | | | | | | | | | | | | | | | | | | | | | | | | | | | | | |
Eaton Corp. | | | 1.50 | % | | | 11/2/2017 | | | | - | | | | - | | | | | | | | 22,000 | | | | 22,107 | | | | | | | | | | | | | | | | | | | | 22,000 | | | | 22,107 | |
Eaton Corp. | | | 4.00 | % | | | 11/2/2032 | | | | - | | | | - | | | | | | | | 21,000 | | | | 22,410 | | | | | | | | | | | | | | | | | | | | 21,000 | | | | 22,410 | |
Eaton Corp. | | | 5.80 | % | | | 3/15/2037 | | | | - | | | | - | | | | | | | | 100,000 | | | | 121,347 | | | | | | | | | | | | | | | | | | | | 100,000 | | | | 121,347 | |
Eaton Corp. | | | 7.63 | % | | | 4/1/2024 | | | | - | | | | - | | | | | | | | 75,000 | | | | 95,542 | | | | | | | | | | | | | | | | | | | | 75,000 | | | | 95,542 | |
Electronic Equipment, Instruments & Components | | | | | | | | | | | | | | | | | | | | | | | | | | | | | | | | | | | | | | | | | | | | | |
Arrow Electronics, Inc. | | | 3.00 | % | | | 3/1/2018 | | | | - | | | | - | | | | | | | | 39,000 | | | | 39,400 | | | | | | | | | | | | | | | | | | | | 39,000 | | | | 39,400 | |
Arrow Electronics, Inc. | | | 4.50 | % | | | 3/1/2023 | | | | - | | | | - | | | | | | | | 30,000 | | | | 31,762 | | | | | | | | | | | | | | | | | | | | 30,000 | | | | 31,762 | |
Arrow Electronics, Inc. | | | 6.88 | % | | | 6/1/2018 | | | | - | | | | - | | | | | | | | 40,000 | | | | 43,146 | | | | | | | | | | | | | | | | | | | | 40,000 | | | | 43,146 | |
Arrow Electronics, Inc. | | | 7.50 | % | | | 1/15/2027 | | | | - | | | | - | | | | | | | | 426,000 | | | | 517,747 | | | | | | | | | | | | | | | | | | | | 426,000 | | | | 517,747 | |
Corning, Inc. | | | 1.50 | % | | | 5/8/2018 | | | | 160,000 | | | | 159,976 | | | | | | | | - | | | | - | | | | | | | | | | | | | | | | | | | | 160,000 | | | | 159,976 | |
Energy Equipment & Services | | | | | | | | | | | | | | | | | | | | | | | | | | | | | | | | | | | | | | | | | | | | | |
Boardwalk Pipelines, LP | | | 4.95 | % | | | 12/15/2024 | | | | - | | | | - | | | | | | | | 70,000 | | | | 68,850 | | | | | | | | | | | | | | | | | | | | 70,000 | | | | 68,850 | |
Boardwalk Pipelines, LP | | | 5.95 | % | | | 6/1/2026 | | | | - | | | | - | | | | | | | | 42,000 | | | | 44,117 | | | | | | | | | | | | | | | | | | | | 42,000 | | | | 44,117 | |
Diamond Offshore Drilling, Inc. | | | 4.88 | % | | | 11/1/2043 | | | | - | | | | - | | | | | | | | 186,000 | | | | 132,523 | | | | | | | | | | | | | | | | | | | | 186,000 | | | | 132,523 | |
Diamond Offshore Drilling, Inc. | | | 5.70 | % | | | 10/15/2039 | | | | - | | | | - | | | | | | | | 100,000 | | | | 75,762 | | | | | | | | | | | | | | | | | | | | 100,000 | | | | 75,762 | |
Ensco PLC | | | 5.20 | % | | | 3/15/2025 | | | | - | | | | - | | | | | | | | 70,000 | | | | 48,650 | | | | | | | | | | | | | | | | | | | | 70,000 | | | | 48,650 | |
Ensco PLC | | | 5.75 | % | | | 10/1/2044 | | | | - | | | | - | | | | | | | | 50,000 | | | | 30,000 | | | | | | | | | | | | | | | | | | | | 50,000 | | | | 30,000 | |
Gulf South Pipeline Co., LP | | | 4.00 | % | | | 6/15/2022 | | | | - | | | | - | | | | | | | | 350,000 | | | | 335,297 | | | | | | | | | | | | | | | | | | | | 350,000 | | | | 335,297 | |
Gulf South Pipeline Co., LP | | | 6.30 | % | | | 8/15/2017 | | | | - | | | | - | | | | | | | | 150,000 | | | | 151,877 | | | | | | | | | | | | | | | | | | | | 150,000 | | | | 151,877 | |
Halliburton Co. | | | 3.50 | % | | | 8/1/2023 | | | | - | | | | - | | | | | | | | 157,000 | | | | 162,850 | | | | | | | | | | | | | | | | | | | | 157,000 | | | | 162,850 | |
Halliburton Co. | | | 7.45 | % | | | 9/15/2039 | | | | - | | | | - | | | | | | | | 100,000 | | | | 138,458 | | | | | | | | | | | | | | | | | | | | 100,000 | | | | 138,458 | |
Halliburton Co. | | | 7.60 | % | | | 8/15/2096 | | | | - | | | | - | | | | | | | | 50,000 | | | | 65,507 | | | | | | | | | | | | | | | | | | | | 50,000 | | | | 65,507 | |
National Oilwell Varco, Inc. | | | 1.35 | % | | | 12/1/2017 | | | | - | | | | - | | | | | | | | 26,000 | | | | 25,812 | | | | | | | | | | | | | | | | | | | | 26,000 | | | | 25,812 | |
Noble Holding International, Ltd. | | | 3.95 | % | | | 3/15/2022 | | | | - | | | | - | | | | | | | | 11,000 | | | | 7,659 | | | | | | | | | | | | | | | | | | | | 11,000 | | | | 7,659 | |
Noble Holding International, Ltd. | | | 5.00 | % | | | 3/16/2018 | | | | - | | | | - | | | | | | | | 42,000 | | | | 41,370 | | | | | | | | | | | | | | | | | | | | 42,000 | | | | 41,370 | |
Noble Holding International, Ltd. | | | 5.25 | % | | | 3/15/2042 | | | | - | | | | - | | | | | | | | 9,000 | | | | 5,130 | | | | | | | | | | | | | | | | | | | | 9,000 | | | | 5,130 | |
Noble Holding International, Ltd. | | | 6.05 | % | | | 3/1/2041 | | | | - | | | | - | | | | | | | | 120,000 | | | | 72,000 | | | | | | | | | | | | | | | | | | | | 120,000 | | | | 72,000 | |
Noble Holding International, Ltd. | | | 7.95 | % | | | 4/1/2045 | | | | - | | | | - | | | | | | | | 40,000 | | | | 28,100 | | | | | | | | | | | | | | | | | | | | 40,000 | | | | 28,100 | |
Schlumberger Holdings Corp. | | | 3.63 | % | | | 12/21/2022 | | | | - | | | | - | | | | | | | | 220,000 | | | | 232,726 | | | | | | | | | | | | | | | | | | | | 220,000 | | | | 232,726 | |
Schlumberger Investment SA | | | 3.30 | % | | | 9/14/2021 | | | | - | | | | - | | | | | | | | 41,000 | | | | 43,448 | | | | | | | | | | | | | | | | | | | | 41,000 | | | | 43,448 | |
Texas Eastern Transmission, LP | | | 2.80 | % | | | 10/15/2022 | | | | - | | | | - | | | | | | | | 81,000 | | | | 79,391 | | | | | | | | | | | | | | | | | | | | 81,000 | | | | 79,391 | |
Transocean, Inc. | | | 5.05 | % | | | 10/15/2022 | | | | - | | | | - | | | | | | | | 49,000 | | | | 34,668 | | | | | | | | | | | | | | | | | | | | 49,000 | | | | 34,668 | |
Transocean, Inc. | | | 6.50 | % | | | 11/15/2020 | | | | - | | | | - | | | | | | | | 50,000 | | | | 44,435 | | | | | | | | | | | | | | | | | | | | 50,000 | | | | 44,435 | |
Transocean, Inc. | | | 7.50 | % | | | 4/15/2031 | | | | - | | | | - | | | | | | | | 25,000 | | | | 16,375 | | | | | | | | | | | | | | | | | | | | 25,000 | | | | 16,375 | |
Transocean, Inc. | | | 8.13 | % | | | 12/15/2021 | | | | - | | | | - | | | | | | | | 102,000 | | | | 86,190 | | | | | | | | | | | | | | | | | | | | 102,000 | | | | 86,190 | |
Transocean, Inc. | | | 9.10 | % | | | 12/15/2041 | | | | - | | | | - | | | | | | | | 20,000 | | | | 13,600 | | | | | | | | | | | | | | | | | | | | 20,000 | | | | 13,600 | |
18
| | | | | | | | | | | | | | | | | | | | | | | | | | | | | | | | | | | | | | | | | | | | | | | | | | | | |
| | | | | | | | | Voya Limited
Maturity Bond VP | | | | | | JPMorgan Core
Bond VP | | | | | | Adjustments | | | | | | Combined Pro
Forma Portfolio | |
| | | | | | | | | | | | | |
| | | Coupon Rate | | | Maturity Date | | | Principal | | | Value | | | | | | Principal | | | Value | | | | | | Principal | | | Value | | | | | | Principal | | | Value | |
| | | | | | | | | | | | | | | | | | | | | | | | | | | | | | | | |
Food & Staples Retailing | | | | | | | | | | | | | | | | | | | | | | | | | | | | | | | | | | | | | | | | | | | | | |
Costco Wholesale Corp. | | | 2.25 | % | | | 2/15/2022 | | | $ | - | | | $ | - | | | | | | | $ | 129,000 | | | $ | 133,099 | | | | | | | | | | | | | | | | | | | $ | 129,000 | | | $ | 133,099 | |
CVS Health Corp. | | | 2.13 | % | | | 6/1/2021 | | | | - | | | | - | | | | | | | | 331,000 | | | | 335,070 | | | | | | | | | | | | | | | | | | | | 331,000 | | | | 335,070 | |
CVS Health Corp. | | | 2.75 | % | | | 12/1/2022 | | | | - | | | | - | | | | | | | | 100,000 | | | | 103,172 | | | | | | | | | | | | | | | | | | | | 100,000 | | | | 103,172 | |
CVS Health Corp. | | | 2.88 | % | | | 6/1/2026 | | | | - | | | | - | | | | | | | | 160,000 | | | | 163,508 | | | | | | | | | | | | | | | | | | | | 160,000 | | | | 163,508 | |
CVS Health Corp. | | | 3.50 | % | | | 7/20/2022 | | | | - | | | | - | | | | | | | | 134,000 | | | | 144,276 | | | | | | | | | | | | | | | | | | | | 134,000 | | | | 144,276 | |
CVS Health Corp. | | | 4.00 | % | | | 12/5/2023 | | | | - | | | | - | | | | | | | | 89,000 | | | | 98,421 | | | | | | | | | | | | | | | | | | | | 89,000 | | | | 98,421 | |
CVS Health Corp. | | | 5.30 | % | | | 12/5/2043 | | | | - | | | | - | | | | | | | | 58,000 | | | | 72,403 | | | | | | | | | | | | | | | | | | | | 58,000 | | | | 72,403 | |
CVS Pass-Through Trust | | | 5.93 | % | | | 1/10/2034 | | | | - | | | | - | | | | | | | | 61,287 | | | | 71,053 | | | | | | | | | | | | | | | | | | | | 61,287 | | | | 71,053 | |
Kroger Co. | | | 2.00 | % | | | 1/15/2019 | | | | 160,000 | | | | 162,604 | | | | | | | | - | | | | - | | | | | | | | | | | | | | | | | | | | 160,000 | | | | 162,604 | |
Kroger Co. | | | 2.20 | % | | | 1/15/2017 | | | | - | | | | - | | | | | | | | 33,000 | | | | 33,204 | | | | | | | | | | | | | | | | | | | | 33,000 | | | | 33,204 | |
Kroger Co. | | | 4.00 | % | | | 2/1/2024 | | | | - | | | | - | | | | | | | | 135,000 | | | | 149,708 | | | | | | | | | | | | | | | | | | | | 135,000 | | | | 149,708 | |
Kroger Co. | | | 5.00 | % | | | 4/15/2042 | | | | - | | | | - | | | | | | | | 130,000 | | | | 149,968 | | | | | | | | | | | | | | | | | | | | 130,000 | | | | 149,968 | |
Kroger Co. | | | 5.40 | % | | | 7/15/2040 | | | | - | | | | - | | | | | | | | 12,000 | | | | 14,441 | | | | | | | | | | | | | | | | | | | | 12,000 | | | | 14,441 | |
Kroger Co. | | | 6.15 | % | | | 1/15/2020 | | | | - | | | | - | | | | | | | | 50,000 | | | | 57,557 | | | | | | | | | | | | | | | | | | | | 50,000 | | | | 57,557 | |
Kroger Co. | | | 6.40 | % | | | 8/15/2017 | | | | - | | | | - | | | | | | | | 55,000 | | | | 58,192 | | | | | | | | | | | | | | | | | | | | 55,000 | | | | 58,192 | |
Kroger Co. | | | 7.50 | % | | | 4/1/2031 | | | | - | | | | - | | | | | | | | 220,000 | | | | 307,718 | | | | | | | | | | | | | | | | | | | | 220,000 | | | | 307,718 | |
Sysco Corp. | | | 3.75 | % | | | 10/1/2025 | | | | - | | | | - | | | | | | | | 75,000 | | | | 80,247 | | | | | | | | | | | | | | | | | | | | 75,000 | | | | 80,247 | |
Walgreen Co. | | | 3.10 | % | | | 9/15/2022 | | | | - | | | | - | | | | | | | | 490,000 | | | | 504,748 | | | | | | | | | | | | | | | | | | | | 490,000 | | | | 504,748 | |
Walgreen Co. | | | 4.40 | % | | | 9/15/2042 | | | | - | | | | - | | | | | | | | 70,000 | | | | 70,795 | | | | | | | | | | | | | | | | | | | | 70,000 | | | | 70,795 | |
Walgreens Boots Alliance, Inc. | | | 3.10 | % | | | 6/1/2023 | | | | - | | | | - | | | | | | | | 89,000 | | | | 90,648 | | | | | | | | | | | | | | | | | | | | 89,000 | | | | 90,648 | |
Walgreens Boots Alliance, Inc. | | | 3.80 | % | | | 11/18/2024 | | | | - | | | | - | | | | | | | | 100,000 | | | | 105,948 | | | | | | | | | | | | | | | | | | | | 100,000 | | | | 105,948 | |
Walgreens Boots Alliance, Inc. | | | 4.50 | % | | | 11/18/2034 | | | | - | | | | - | | | | | | | | 185,000 | | | | 194,166 | | | | | | | | | | | | | | | | | | | | 185,000 | | | | 194,166 | |
Food Products | | | | | | | | | | | | | | | | | | | | | | | | | | | | | | | | | | | | | | | | | | | | | |
Bunge NA Finance, LP | | | 5.90 | % | | | 4/1/2017 | | | | - | | | | - | | | | | | | | 16,000 | | | | 16,513 | | | | | | | | | | | | | | | | | | | | 16,000 | | | | 16,513 | |
Bunge, Ltd. Finance Corp. | | | 3.50 | % | | | 11/24/2020 | | | | - | | | | - | | | | | | | | 61,000 | | | | 63,941 | | | | | | | | | | | | | | | | | | | | 61,000 | | | | 63,941 | |
Bunge, Ltd. Finance Corp. | | | 8.50 | % | | | 6/15/2019 | | | | - | | | | - | | | | | | | | 55,000 | | | | 64,310 | | | | | | | | | | | | | | | | | | | | 55,000 | | | | 64,310 | |
Cargill, Inc. | | | 3.30 | % | | | 3/1/2022 | | | | - | | | | - | | | | | | | | 70,000 | | | | 74,011 | | | | | | | | | | | | | | | | | | | | 70,000 | | | | 74,011 | |
Cargill, Inc. | | | 6.00 | % | | | 11/27/2017 | | | | - | | | | - | | | | | | | | 100,000 | | | | 106,672 | | | | | | | | | | | | | | | | | | | | 100,000 | | | | 106,672 | |
ConAgra Foods, Inc. | | | 2.10 | % | | | 3/15/2018 | | | | - | | | | - | | | | | | | | 23,000 | | | | 23,215 | | | | | | | | | | | | | | | | | | | | 23,000 | | | | 23,215 | |
JM Smucker Co. | | | 1.75 | % | | | 3/15/2018 | | | | 280,000 | | | | 282,206 | | | | | | | | - | | | | - | | | | | | | | | | | | | | | | | | | | 280,000 | | | | 282,206 | |
Kellogg Co. | | | 1.75 | % | | | 5/17/2017 | | | | - | | | | - | | | | | | | | 38,000 | | | | 38,238 | | | | | | | | | | | | | | | | | | | | 38,000 | | | | 38,238 | |
Kraft Heinz Foods Co. | | | 2.00 | % | | | 7/2/2018 | | | | 300,000 | | | | 303,770 | | | | | | | | - | | | | - | | | | | | | | | | | | | | | | | | | | 300,000 | | | | 303,770 | |
Kraft Heinz Foods Co. | | | 2.80 | % | | | 7/2/2020 | | | | - | | | | - | | | | | | | | 330,000 | | | | 342,686 | | | | | | | | | | | | | | | | | | | | 330,000 | | | | 342,686 | |
Kraft Heinz Foods Co. | | | 3.50 | % | | | 6/6/2022 | | | | - | | | | - | | | | | | | | 64,000 | | | | 68,065 | | | | | | | | | | | | | | | | | | | | 64,000 | | | | 68,065 | |
Kraft Heinz Foods Co. | | | 3.95 | % | | | 7/15/2025 | | | | - | | | | - | | | | | | | | 215,000 | | | | 233,765 | | | | | | | | | | | | | | | | | | | | 215,000 | | | | 233,765 | |
Kraft Heinz Foods Co. | | | 5.00 | % | | | 6/4/2042 | | | | - | | | | - | | | | | | | | 59,000 | | | | 67,833 | | | | | | | | | | | | | | | | | | | | 59,000 | | | | 67,833 | |
Kraft Heinz Foods Co. | | | 6.13 | % | | | 8/23/2018 | | | | - | | | | - | | | | | | | | 73,000 | | | | 80,057 | | | | | | | | | | | | | | | | | | | | 73,000 | | | | 80,057 | |
Kraft Heinz Foods Co. | | | 6.50 | % | | | 2/9/2040 | | | | - | | | | - | | | | | | | | 75,000 | | | | 99,165 | | | | | | | | | | | | | | | | | | | | 75,000 | | | | 99,165 | |
Kraft Heinz Foods Co. | | | 6.88 | % | | | 1/26/2039 | | | | - | | | | - | | | | | | | | 356,000 | | | | 486,116 | | | | | | | | | | | | | | | | | | | | 356,000 | | | | 486,116 | |
Mead Johnson Nutrition Co. | | | 4.13 | % | | | 11/15/2025 | | | | - | | | | - | | | | | | | | 184,000 | | | | 200,699 | | | | | | | | | | | | | | | | | | | | 184,000 | | | | 200,699 | |
Mondelez International, Inc. | | | 4.00 | % | | | 2/1/2024 | | | | - | | | | - | | | | | | | | 150,000 | | | | 164,050 | | | | | | | | | | | | | | | | | | | | 150,000 | | | | 164,050 | |
Tyson Foods, Inc. | | | 3.95 | % | | | 8/15/2024 | | | | - | | | | - | | | | | | | | 146,000 | | | | 157,599 | | | | | | | | | | | | | | | | | | | | 146,000 | | | | 157,599 | |
Tyson Foods, Inc. | | | 4.88 | % | | | 8/15/2034 | | | | - | | | | - | | | | | | | | 170,000 | | | | 189,655 | | | | | | | | | | | | | | | | | | | | 170,000 | | | | 189,655 | |
WM Wrigley Jr. Co. | | | 1.40 | % | | | 10/21/2016 | | | | 205,000 | | | | 205,312 | | | | | | | | - | | | | - | | | | | | | | | | | | | | | | | | | | 205,000 | | | | 205,312 | |
Gas Utilities | | | | | | | | | | | | | | | | | | | | | | | | | | | | | | | | | | | | | | | | | | | | | |
AGL Capital Corp. | | | 3.25 | % | | | 6/15/2026 | | | | - | | | | - | | | | | | | | 39,000 | | | | 39,861 | | | | | | | | | | | | | | | | | | | | 39,000 | | | | 39,861 | |
AGL Capital Corp. | | | 3.50 | % | | | 9/15/2021 | | | | - | | | | - | | | | | | | | 75,000 | | | | 79,609 | | | | | | | | | | | | | | | | | | | | 75,000 | | | | 79,609 | |
AGL Capital Corp. | | | 4.40 | % | | | 6/1/2043 | | | | - | | | | - | | | | | | | | 63,000 | | | | 64,438 | | | | | | | | | | | | | | | | | | | | 63,000 | | | | 64,438 | |
AGL Capital Corp. | | | 5.88 | % | | | 3/15/2041 | | | | - | | | | - | | | | | | | | 146,000 | | | | 178,147 | | | | | | | | | | | | | | | | | | | | 146,000 | | | | 178,147 | |
AGL Capital Corp. | | | 6.38 | % | | | 7/15/2016 | | | | - | | | | - | | | | | | | | 100,000 | | | | 100,115 | | | | | | | | | | | | | | | | | | | | 100,000 | | | | 100,115 | |
Atmos Energy Corp. | | | 4.13 | % | | | 10/15/2044 | | | | - | | | | - | | | | | | | | 75,000 | | | | 81,758 | | | | | | | | | | | | | | | | | | | | 75,000 | | | | 81,758 | |
Atmos Energy Corp. | | | 4.15 | % | | | 1/15/2043 | | | | - | | | | - | | | | | | | | 138,000 | | | | 146,732 | | | | | | | | | | | | | | | | | | | | 138,000 | | | | 146,732 | |
Atmos Energy Corp. | | | 8.50 | % | | | 3/15/2019 | | | | - | | | | - | | | | | | | | 35,000 | | | | 41,262 | | | | | | | | | | | | | | | | | | | | 35,000 | | | | 41,262 | |
Boston Gas Co. | | | 4.49 | % | | | 2/15/2042 | | | | - | | | | - | | | | | | | | 26,000 | | | | 28,234 | | | | | | | | | | | | | | | | | | | | 26,000 | | | | 28,234 | |
CenterPoint Energy Resources Corp. | | | 5.85 | % | | | 1/15/2041 | | | | - | | | | - | | | | | | | | 100,000 | | | | 116,059 | | | | | | | | | | | | | | | | | | | | 100,000 | | | | 116,059 | |
Dominion Gas Holdings LLC | | | 2.80 | % | | | 11/15/2020 | | | | - | | | | - | | | | | | | | 59,000 | | | | 60,967 | | | | | | | | | | | | | | | | | | | | 59,000 | | | | 60,967 | |
Health Care Equipment & Supplies | | | | | | | | | | | | | | | | | | | | | | | | | | | | | | | | | | | | | | | | | | | | | |
Abbott Laboratories | | | 2.00 | % | | | 3/15/2020 | | | | 300,000 | | | | 304,192 | | | | | | | | - | | | | - | | | | | | | | | | | | | | | | | | | | 300,000 | | | | 304,192 | |
Becton Dickinson and Co. | | | 1.45 | % | | | 5/15/2017 | | | | 148,000 | | | | 148,385 | | | | | | | | - | | | | - | | | | | | | | | | | | | | | | | | | | 148,000 | | | | 148,385 | |
Becton Dickinson and Co. | | | 1.80 | % | | | 12/15/2017 | | | | 164,000 | | | | 165,341 | | | | | | | | - | | | | - | | | | | | | | | | | | | | | | | | | | 164,000 | | | | 165,341 | |
Becton Dickinson and Co. | | | 2.68 | % | | | 12/15/2019 | | | | - | | | | - | | | | | | | | 33,000 | | | | 33,941 | | | | | | | | | | | | | | | | | | | | 33,000 | | | | 33,941 | |
Becton Dickinson and Co. | | | 3.73 | % | | | 12/15/2024 | | | | - | | | | - | | | | | | | | 40,000 | | | | 43,086 | | | | | | | | | | | | | | | | | | | | 40,000 | | | | 43,086 | |
Medtronic, Inc. | | | 2.50 | % | | | 3/15/2020 | | | | 131,000 | | | | 135,862 | | | | | | | | - | | | | - | | | | | | | | | | | | | | | | | | | | 131,000 | | | | 135,862 | |
Medtronic, Inc. | | | 3.15 | % | | | 3/15/2022 | | | | - | | | | - | | | | | | | | 175,000 | | | | 186,755 | | | | | | | | | | | | | | | | | | | | 175,000 | | | | 186,755 | |
Medtronic, Inc. | | | 4.38 | % | | | 3/15/2035 | | | | - | | | | - | | | | | | | | 205,000 | | | | 231,884 | | | | | | | | | | | | | | | | | | | | 205,000 | | | | 231,884 | |
St. Jude Medical, Inc. | | | 2.00 | % | | | 9/15/2018 | | | | 110,000 | | | | 111,257 | | | | | | | | - | | | | - | | | | | | | | | | | | | | | | | | | | 110,000 | | | | 111,257 | |
St. Jude Medical, Inc. | | | 2.80 | % | | | 9/15/2020 | | | | 130,000 | | | | 134,015 | | | | | | | | - | | | | - | | | | | | | | | | | | | | | | | | | | 130,000 | | | | 134,015 | |
Stryker Corp. | | | 2.00 | % | | | 3/8/2019 | | | | 165,000 | | | | 167,730 | | | | | | | | - | | | | - | | | | | | | | | | | | | | | | | | | | 165,000 | | | | 167,730 | |
Stryker Corp. | | | 3.50 | % | | | 3/15/2026 | | | | - | | | | - | | | | | | | | 38,000 | | | | 40,313 | | | | | | | | | | | | | | | | | | | | 38,000 | | | | 40,313 | |
Zimmer Biomet Holdings, Inc. | | | 2.00 | % | | | 4/1/2018 | | | | 150,000 | | | | 151,253 | | | | | | | | - | | | | - | | | | | | | | | | | | | | | | | | | | 150,000 | | | | 151,253 | |
19
| | | | | | | | | | | | | | | | | | | | | | | | | | | | | | | | | | | | | | | | | | | | | | | | | | | | |
| | | | | | | | | Voya Limited
Maturity Bond VP | | | | | | JPMorgan Core
Bond VP | | | | | | Adjustments | | | | | | Combined Pro
Forma Portfolio | |
| | | | | | | | | | | | | |
| | | Coupon Rate | | | Maturity Date | | | Principal | | | Value | | | | | | Principal | | | Value | | | | | | Principal | | | Value | | | | | | Principal | | | Value | |
| | | | | | | | | | | | | | | | | | | | | | | | | | | | | | | | |
Health Care Providers & Services | | | | | | | | | | | | | | | | | | | | | | | | | | | | | | | | | | | | | | | | | | | | | |
Aetna, Inc. | | | 1.90 | % | | | 6/7/2019 | | | $ | 222,000 | | | $ | 224,884 | | | | | | | $ | - | | | $ | - | | | | | | | | | | | | | | | | | | | $ | 222,000 | | | $ | 224,884 | |
Aetna, Inc. | | | 2.80 | % | | | 6/15/2023 | | | | - | | | | - | | | | | | | | 75,000 | | | | 76,613 | | | | | | | | | | | | | | | | | | | | 75,000 | | | | 76,613 | |
Aetna, Inc. | | | 4.25 | % | | | 6/15/2036 | | | | - | | | | - | | | | | | | | 46,000 | | | | 47,526 | | | | | | | | | | | | | | | | | | | | 46,000 | | | | 47,526 | |
Aetna, Inc. | | | 4.50 | % | | | 5/15/2042 | | | | - | | | | - | | | | | | | | 26,000 | | | | 27,524 | | | | | | | | | | | | | | | | | | | | 26,000 | | | | 27,524 | |
Aetna, Inc. | | | 6.75 | % | | | 12/15/2037 | | | | - | | | | - | | | | | | | | 50,000 | | | | 67,816 | | | | | | | | | | | | | | | | | | | | 50,000 | | | | 67,816 | |
AmerisourceBergen Corp. | | | 1.15 | % | | | 5/15/2017 | | | | 305,000 | | | | 304,921 | | | | | | | | - | | | | - | | | | | | | | | | | | | | | | | | | | 305,000 | | | | 304,921 | |
Anthem, Inc. | | | 2.25 | % | | | 8/15/2019 | | | | 170,000 | | | | 171,515 | | | | | | | | - | | | | - | | | | | | | | | | | | | | | | | | | | 170,000 | | | | 171,515 | |
Anthem, Inc. | | | 2.30 | % | | | 7/15/2018 | | | | - | | | | - | | | | | | | | 70,000 | | | | 71,007 | | | | | | | | | | | | | | | | | | | | 70,000 | | | | 71,007 | |
Anthem, Inc. | | | 3.13 | % | | | 5/15/2022 | | | | - | | | | - | | | | | | | | 62,000 | | | | 64,143 | | | | | | | | | | | | | | | | | | | | 62,000 | | | | 64,143 | |
Anthem, Inc. | | | 3.30 | % | | | 1/15/2023 | | | | - | | | | - | | | | | | | | 28,000 | | | | 28,922 | | | | | | | | | | | | | | | | | | | | 28,000 | | | | 28,922 | |
Anthem, Inc. | | | 4.63 | % | | | 5/15/2042 | | | | - | | | | - | | | | | | | | 50,000 | | | | 52,448 | | | | | | | | | | | | | | | | | | | | 50,000 | | | | 52,448 | |
Anthem, Inc. | | | 4.65 | % | | | 1/15/2043 | | | | - | | | | - | | | | | | | | 54,000 | | | | 56,356 | | | | | | | | | | | | | | | | | | | | 54,000 | | | | 56,356 | |
Anthem, Inc. | | | 4.65 | % | | | 8/15/2044 | | | | - | | | | - | | | | | | | | 130,000 | | | | 138,443 | | | | | | | | | | | | | | | | | | | | 130,000 | | | | 138,443 | |
Cardinal Health, Inc. | | | 1.95 | % | | | 6/15/2018 | | | | 110,000 | | | | 111,275 | | | | | | | | - | | | | - | | | | | | | | | | | | | | | | | | | | 110,000 | | | | 111,275 | |
Cardinal Health, Inc. | | | 3.75 | % | | | 9/15/2025 | | | | - | | | | - | | | | | | | | 75,000 | | | | 81,595 | | | | | | | | | | | | | | | | | | | | 75,000 | | | | 81,595 | |
Express Scripts Holding Co. | | | 1.25 | % | | | 6/2/2017 | | | | 100,000 | | | | 99,930 | | | | | | | | - | | | | - | | | | | | | | | | | | | | | | | | | | 100,000 | | | | 99,930 | |
Express Scripts Holding Co. | | | 3.00 | % | | | 7/15/2023 | | | | - | | | | - | | | | | | | | 76,000 | | | | 76,085 | | | | | | | | | | | | | | | | | | | | 76,000 | | | | 76,085 | |
Express Scripts Holding Co. | | | 3.50 | % | | | 6/15/2024 | | | | - | | | | - | | | | | | | | 150,000 | | | | 154,853 | | | | | | | | | | | | | | | | | | | | 150,000 | | | | 154,853 | |
Express Scripts Holding Co. | | | 4.50 | % | | | 2/25/2026 | | | | - | | | | - | | | | | | | | 85,000 | | | | 93,385 | | | | | | | | | | | | | | | | | | | | 85,000 | | | | 93,385 | |
Express Scripts Holding Co. | | | 4.80 | % | | | 7/15/2046 | | | | - | | | | - | | | | | | | | 93,000 | | | | 92,876 | | | | | | | | | | | | | | | | | | | | 93,000 | | | | 92,876 | |
Laboratory Corp. of America Holdings | | | 3.20 | % | | | 2/1/2022 | | | | - | | | | - | | | | | | | | 249,000 | | | | 257,561 | | | | | | | | | | | | | | | | | | | | 249,000 | | | | 257,561 | |
Quest Diagnostics, Inc. | | | 3.45 | % | | | 6/1/2026 | | | | - | | | | - | | | | | | | | 39,000 | | | | 40,344 | | | | | | | | | | | | | | | | | | | | 39,000 | | | | 40,344 | |
Roche Holdings, Inc. | | | 3.35 | % | | | 9/30/2024 | | | | - | | | | - | | | | | | | | 300,000 | | | | 325,468 | | | | | | | | | | | | | | | | | | | | 300,000 | | | | 325,468 | |
Texas Health Resources | | | 4.33 | % | | | 11/15/2055 | | | | - | | | | - | | | | | | | | 250,000 | | | | 281,253 | | | | | | | | | | | | | | | | | | | | 250,000 | | | | 281,253 | |
UnitedHealth Group, Inc. | | | 1.40 | % | | | 12/15/2017 | | | | 179,000 | | | | 179,962 | | | | | | | | - | | | | - | | | | | | | | | | | | | | | | | | | | 179,000 | | | | 179,962 | |
UnitedHealth Group, Inc. | | | 1.70 | % | | | 2/15/2019 | | | | - | | | | - | | | | | | | | 55,000 | | | | 55,580 | | | | | | | | | | | | | | | | | | | | 55,000 | | | | 55,580 | |
UnitedHealth Group, Inc. | | | 1.90 | % | | | 7/16/2018 | | | | 100,000 | | | | 101,724 | | | | | | | | - | | | | - | | | | | | | | | | | | | | | | | | | | 100,000 | | | | 101,724 | |
UnitedHealth Group, Inc. | | | 2.13 | % | | | 3/15/2021 | | | | - | | | | - | | | | | | | | 100,000 | | | | 101,882 | | | | | | | | | | | | | | | | | | | | 100,000 | | | | 101,882 | |
UnitedHealth Group, Inc. | | | 2.75 | % | | | 2/15/2023 | | | | - | | | | - | | | | | | | | 23,000 | | | | 23,642 | | | | | | | | | | | | | | | | | | | | 23,000 | | | | 23,642 | |
UnitedHealth Group, Inc. | | | 2.88 | % | | | 3/15/2023 | | | | - | | | | - | | | | | | | | 50,000 | | | | 52,053 | | | | | | | | | | | | | | | | | | | | 50,000 | | | | 52,053 | |
UnitedHealth Group, Inc. | | | 3.10 | % | | | 3/15/2026 | | | | - | | | | - | | | | | | | | 100,000 | | | | 104,266 | | | | | | | | | | | | | | | | | | | | 100,000 | | | | 104,266 | |
UnitedHealth Group, Inc. | | | 3.35 | % | | | 7/15/2022 | | | | - | | | | - | | | | | | | | 56,000 | | | | 59,910 | | | | | | | | | | | | | | | | | | | | 56,000 | | | | 59,910 | |
UnitedHealth Group, Inc. | | | 3.38 | % | | | 11/15/2021 | | | | - | | | | - | | | | | | | | 94,000 | | | | 101,454 | | | | | | | | | | | | | | | | | | | | 94,000 | | | | 101,454 | |
UnitedHealth Group, Inc. | | | 4.63 | % | | | 7/15/2035 | | | | - | | | | - | | | | | | | | 140,000 | | | | 162,596 | | | | | | | | | | | | | | | | | | | | 140,000 | | | | 162,596 | |
UnitedHealth Group, Inc. | | | 6.63 | % | | | 11/15/2037 | | | | - | | | | - | | | | | | | | 80,000 | | | | 113,091 | | | | | | | | | | | | | | | | | | | | 80,000 | | | | 113,091 | |
Hotels, Restaurants & Leisure | | | | | | | | | | | | | | | | | | | | | | | | | | | | | | | | | | | | | | | | | | | | | |
McDonald’s Corp. | | | 2.10 | % | | | 12/7/2018 | | | | 230,000 | | | | 235,376 | | | | | | | | - | | | | - | | | | | | | | | | | | | | | | | | | | 230,000 | | | | 235,376 | |
McDonald’s Corp. | | | 4.70 | % | | | 12/9/2035 | | | | - | | | | - | | | | | | | | 105,000 | | | | 118,445 | | | | | | | | | | | | | | | | | | | | 105,000 | | | | 118,445 | |
McDonald’s Corp. | | | 6.30 | % | | | 10/15/2037 | | | | - | | | | - | | | | | | | | 63,000 | | | | 83,609 | | | | | | | | | | | | | | | | | | | | 63,000 | | | | 83,609 | |
Starbucks Corp. | | | 4.30 | % | | | 6/15/2045 | | | | - | | | | - | | | | | | | | 109,000 | | | | 129,473 | | | | | | | | | | | | | | | | | | | | 109,000 | | | | 129,473 | |
Household Durables | | | | | | | | | | | | | | | | | | | | | | | | | | | | | | | | | | | | | | | | | | | | | |
Newell Brands, Inc. | | | 2.60 | % | | | 3/29/2019 | | | | 170,000 | | | | 174,451 | | | | | | | | - | | | | - | | | | | | | | | | | | | | | | | | | | 170,000 | | | | 174,451 | |
Whirlpool Corp. | | | 1.65 | % | | | 11/1/2017 | | | | 162,000 | | | | 163,010 | | | | | | | | - | | | | - | | | | | | | | | | | | | | | | | | | | 162,000 | | | | 163,010 | |
Household Products | | | | | | | | | | | | | | | | | | | | | | | | | | | | | | | | | | | | | | | | | | | | | |
Kimberly-Clark Corp. | | | 2.40 | % | | | 3/1/2022 | | | | - | | | | - | | | | | | | | 20,000 | | | | 20,776 | | | | | | | | | | | | | | | | | | | | 20,000 | | | | 20,776 | |
Kimberly-Clark Corp. | | | 7.50 | % | | | 11/1/2018 | | | | - | | | | - | | | | | | | | 15,000 | | | | 17,155 | | | | | | | | | | | | | | | | | | | | 15,000 | | | | 17,155 | |
Procter & Gamble Co. | | | 1.90 | % | | | 11/1/2019 | | | | 180,000 | | | | 185,064 | | | | | | | | - | | | | - | | | | | | | | | | | | | | | | | | | | 180,000 | | | | 185,064 | |
20
| | | | | | | | | | | | | | | | | | | | | | | | | | | | | | | | | | | | | | | | | | | | | | | | | | | | |
| | | | | | | | | Voya Limited
Maturity Bond VP | | | | | | JPMorgan Core
Bond VP | | | | | | Adjustments | | | | | | Combined Pro
Forma Portfolio | |
| | | | | | | | | | | | | |
| | | Coupon Rate | | | Maturity Date | | | Principal | | | Value | | | | | | Principal | | | Value | | | | | | Principal | | | Value | | | | | | Principal | | | Value | |
| | | | | | | | | | | | | | | | | | | | | | | | | | | | | | | | |
Independent Power & Renewable Electricity Producers | | | | | | | | | | | | | | | | | | | | | | | | | | | | | | | | | | | | | | | | | | | | | | | | | | | | |
Exelon Generation Co. LLC | | | 2.95 | % | | | 1/15/2020 | | | $ | - | | | $ | - | | | | | | | $ | 204,000 | | | $ | 209,847 | | | | | | | | | | | | | | | | | | | $ | 204,000 | | | $ | 209,847 | |
Exelon Generation Co. LLC | | | 4.00 | % | | | 10/1/2020 | | | | - | | | | - | | | | | | | | 60,000 | | | | 64,001 | | | | | | | | | | | | | | | | | | | | 60,000 | | | | 64,001 | |
Exelon Generation Co. LLC | | | 4.25 | % | | | 6/15/2022 | | | | - | | | | - | | | | | | | | 80,000 | | | | 85,325 | | | | | | | | | | | | | | | | | | | | 80,000 | | | | 85,325 | |
PSEG Power LLC | | | 4.15 | % | | | 9/15/2021 | | | | - | | | | - | | | | | | | | 125,000 | | | | 133,445 | | | | | | | | | | | | | | | | | | | | 125,000 | | | | 133,445 | |
PSEG Power LLC | | | 4.30 | % | | | 11/15/2023 | | | | - | | | | - | | | | | | | | 37,000 | | | | 38,861 | | | | | | | | | | | | | | | | | | | | 37,000 | | | | 38,861 | |
Industrial Conglomerates | | | | | | | | | | | | | | | | | | | | | | | | | | | | | | | | | | | | | | | | | | | | | | | | | | | | |
Danaher Corp. | | | 2.40 | % | | | 9/15/2020 | | | | - | | | | - | | | | | | | | 56,000 | | | | 58,414 | | | | | | | | | | | | | | | | | | | | 56,000 | | | | 58,414 | |
General Electric Co. | | | 1.60 | % | | | 11/20/2017 | | | | - | | | | - | | | | | | | | 127,000 | | | | 128,133 | | | | | | | | | | | | | | | | | | | | 127,000 | | | | 128,133 | |
General Electric Co. | | | 2.10 | % | | | 12/11/2019 | | | | - | | | | - | | | | | | | | 20,000 | | | | 20,633 | | | | | | | | | | | | | | | | | | | | 20,000 | | | | 20,633 | |
General Electric Co. | | | 2.20 | % | | | 1/9/2020 | | | | 188,000 | | | | 193,773 | | | | | | | | 129,000 | | | | 132,961 | | | | | | | | | | | | | | | | | | | | 317,000 | | | | 326,734 | |
General Electric Co. | | | 2.30 | % | | | 4/27/2017 | | | | - | | | | - | | | | | | | | 75,000 | | | | 75,748 | | | | | | | | | | | | | | | | | | | | 75,000 | | | | 75,748 | |
General Electric Co. | | | 2.70 | % | | | 10/9/2022 | | | | - | | | | - | | | | | | | | 64,000 | | | | 67,168 | | | | | | | | | | | | | | | | | | | | 64,000 | | | | 67,168 | |
General Electric Co. | | | 3.10 | % | | | 1/9/2023 | | | | - | | | | - | | | | | | | | 230,000 | | | | 245,688 | | | | | | | | | | | | | | | | | | | | 230,000 | | | | 245,688 | |
General Electric Co. | | | 3.15 | % | | | 9/7/2022 | | | | - | | | | - | | | | | | | | 86,000 | | | | 92,294 | | | | | | | | | | | | | | | | | | | | 86,000 | | | | 92,294 | |
General Electric Co. | | | 3.38 | % | | | 3/11/2024 | | | | - | | | | - | | | | | | | | 131,000 | | | | 142,582 | | | | | | | | | | | | | | | | | | | | 131,000 | | | | 142,582 | |
General Electric Co. | | | 4.38 | % | | | 9/16/2020 | | | | - | | | | - | | | | | | | | 108,000 | | | | 120,285 | | | | | | | | | | | | | | | | | | | | 108,000 | | | | 120,285 | |
General Electric Co. | | | 4.65 | % | | | 10/17/2021 | | | | - | | | | - | | | | | | | | 390,000 | | | | 446,617 | | | | | | | | | | | | | | | | | | | | 390,000 | | | | 446,617 | |
General Electric Co. | | | 5.30 | % | | | 2/11/2021 | | | | - | | | | - | | | | | | | | 25,000 | | | | 29,005 | | | | | | | | | | | | | | | | | | | | 25,000 | | | | 29,005 | |
General Electric Co. | | | 5.50 | % | | | 1/8/2020 | | | | - | | | | - | | | | | | | | 180,000 | | | | 205,744 | | | | | | | | | | | | | | | | | | | | 180,000 | | | | 205,744 | |
General Electric Co. | | | 6.75 | % | | | 3/15/2032 | | | | - | | | | - | | | | | | | | 61,000 | | | | 85,611 | | | | | | | | | | | | | | | | | | | | 61,000 | | | | 85,611 | |
Koninklijke Philips NV | | | 3.75 | % | | | 3/15/2022 | | | | - | | | | - | | | | | | | | 100,000 | | | | 107,402 | | | | | | | | | | | | | | | | | | | | 100,000 | | | | 107,402 | |
Koninklijke Philips NV | | | 5.75 | % | | | 3/11/2018 | | | | - | | | | - | | | | | | | | 14,000 | | | | 14,971 | | | | | | | | | | | | | | | | | | | | 14,000 | | | | 14,971 | |
Koninklijke Philips NV | | | 7.20 | % | | | 6/1/2026 | | | | - | | | | - | | | | | | | | 20,000 | | | | 25,340 | | | | | | | | | | | | | | | | | | | | 20,000 | | | | 25,340 | |
Siemens Financieringsmaatschappij NV | | | 1.45 | % | | | 5/25/2018 | | | | 240,000 | | | | 241,845 | | | | | | | | - | | | | - | | | | | | | | | | | | | | | | | | | | 240,000 | | | | 241,845 | |
Insurance | | | | | | | | | | | | | | | | | | | | | | | | | | | | | | | | | | | | | | | | | | | | | | | | | | | | |
AIG SunAmerica Global Financing X | | | 6.90 | % | | | 3/15/2032 | | | | - | | | | - | | | | | | | | 200,000 | | | | 260,231 | | | | | | | | | | | | | | | | | | | | 200,000 | | | | 260,231 | |
Allstate Corp. | | | 3.15 | % | | | 6/15/2023 | | | | - | | | | - | | | | | | | | 41,000 | | | | 43,600 | | | | | | | | | | | | | | | | | | | | 41,000 | | | | 43,600 | |
American International Group, Inc. | | | 3.75 | % | | | 7/10/2025 | | | | - | | | | - | | | | | | | | 81,000 | | | | 82,556 | | | | | | | | | | | | | | | | | | | | 81,000 | | | | 82,556 | |
American International Group, Inc. | | | 3.88 | % | | | 1/15/2035 | | | | - | | | | - | | | | | | | | 111,000 | | | | 106,279 | | | | | | | | | | | | | | | | | | | | 111,000 | | | | 106,279 | |
American International Group, Inc. | | | 4.13 | % | | | 2/15/2024 | | | | - | | | | - | | | | | | | | 71,000 | | | | 74,900 | | | | | | | | | | | | | | | | | | | | 71,000 | | | | 74,900 | |
Aon Corp. | | | 6.25 | % | | | 9/30/2040 | | | | - | | | | - | | | | | | | | 18,000 | | | | 22,888 | | | | | | | | | | | | | | | | | | | | 18,000 | | | | 22,888 | |
Aon PLC | | | 3.50 | % | | | 6/14/2024 | | | | - | | | | - | | | | | | | | 100,000 | | | | 102,923 | | | | | | | | | | | | | | | | | | | | 100,000 | | | | 102,923 | |
Aon PLC | | | 3.88 | % | | | 12/15/2025 | | | | - | | | | - | | | | | | | | 143,000 | | | | 150,827 | | | | | | | | | | | | | | | | | | | | 143,000 | | | | 150,827 | |
Berkshire Hathaway Finance Corp. | | | 1.30 | % | | | 5/15/2018 | | | | - | | | | - | | | | | | | | 97,000 | | | | 97,610 | | | | | | | | | | | | | | | | | | | | 97,000 | | | | 97,610 | |
Berkshire Hathaway Finance Corp. | | | 1.70 | % | | | 3/15/2019 | | | | 100,000 | | | | 101,634 | | | | | | | | - | | | | - | | | | | | | | | | | | | | | | | | | | 100,000 | | | | 101,634 | |
Berkshire Hathaway Finance Corp. | | | 3.00 | % | | | 5/15/2022 | | | | - | | | | - | | | | | | | | 25,000 | | | | 26,709 | | | | | | | | | | | | | | | | | | | | 25,000 | | | | 26,709 | |
Berkshire Hathaway Finance Corp. | | | 4.30 | % | | | 5/15/2043 | | | | - | | | | - | | | | | | | | 83,000 | | | | 92,119 | | | | | | | | | | | | | | | | | | | | 83,000 | | | | 92,119 | |
Berkshire Hathaway Finance Corp. | | | 4.40 | % | | | 5/15/2042 | | | | - | | | | - | | | | | | | | 221,000 | | | | 248,077 | | | | | | | | | | | | | | | | | | | | 221,000 | | | | 248,077 | |
Berkshire Hathaway Finance Corp. | | | 5.40 | % | | | 5/15/2018 | | | | - | | | | - | | | | | | | | 50,000 | | | | 54,078 | | | | | | | | | | | | | | | | | | | | 50,000 | | | | 54,078 | |
Chubb INA Holdings, Inc. | | | 2.88 | % | | | 11/3/2022 | | | | - | | | | - | | | | | | | | 73,000 | | | | 76,361 | | | | | | | | | | | | | | | | | | | | 73,000 | | | | 76,361 | |
Chubb INA Holdings, Inc. | | | 3.15 | % | | | 3/15/2025 | | | | - | | | | - | | | | | | | | 231,000 | | | | 241,199 | | | | | | | | | | | | | | | | | | | | 231,000 | | | | 241,199 | |
Chubb INA Holdings, Inc. | | | 3.35 | % | | | 5/3/2026 | | | | - | | | | - | | | | | | | | 50,000 | | | | 53,295 | | | | | | | | | | | | | | | | | | | | 50,000 | | | | 53,295 | |
CNA Financial Corp. | | | 3.95 | % | | | 5/15/2024 | | | | - | | | | - | | | | | | | | 26,000 | | | | 27,341 | | | | | | | | | | | | | | | | | | | | 26,000 | | | | 27,341 | |
CNA Financial Corp. | | | 4.50 | % | | | 3/1/2026 | | | | - | | | | - | | | | | | | | 19,000 | | | | 20,224 | | | | | | | | | | | | | | | | | | | | 19,000 | | | | 20,224 | |
Jackson National Life Global Funding | | | 3.05 | % | | | 4/29/2026 | | | | - | | | | - | | | | | | | | 95,000 | | | | 96,274 | | | | | | | | | | | | | | | | | | | | 95,000 | | | | 96,274 | |
Liberty Mutual Group, Inc. | | | 5.00 | % | | | 6/1/2021 | | | | - | | | | - | | | | | | | | 47,000 | | | | 51,898 | | | | | | | | | | | | | | | | | | | | 47,000 | | | | 51,898 | |
Liberty Mutual Group, Inc. | | | 6.50 | % | | | 3/15/2035 | | | | - | | | | - | | | | | | | | 130,000 | | | | 159,495 | | | | | | | | | | | | | | | | | | | | 130,000 | | | | 159,495 | |
Lincoln National Corp. | | | 4.00 | % | | | 9/1/2023 | | | | - | | | | - | | | | | | | | 150,000 | | | | 155,945 | | | | | | | | | | | | | | | | | | | | 150,000 | | | | 155,945 | |
Lincoln National Corp. | | | 4.20 | % | | | 3/15/2022 | | | | - | | | | - | | | | | | | | 162,000 | | | | 173,756 | | | | | | | | | | | | | | | | | | | | 162,000 | | | | 173,756 | |
Lincoln National Corp. | | | 4.85 | % | | | 6/24/2021 | | | | - | | | | - | | | | | | | | 12,000 | | | | 13,269 | | | | | | | | | | | | | | | | | | | | 12,000 | | | | 13,269 | |
Marsh & McLennan Cos., Inc. | | | 2.35 | % | | | 3/6/2020 | | | | - | | | | - | | | | | | | | 176,000 | | | | 179,570 | | | | | | | | | | | | | | | | | | | | 176,000 | | | | 179,570 | |
Marsh & McLennan Cos., Inc. | | | 3.30 | % | | | 3/14/2023 | | | | - | | | | - | | | | | | | | 17,000 | | | | 17,747 | | | | | | | | | | | | | | | | | | | | 17,000 | | | | 17,747 | |
Marsh & McLennan Cos., Inc. | | | 3.50 | % | | | 3/10/2025 | | | | - | | | | - | | | | | | | | 129,000 | | | | 134,045 | | | | | | | | | | | | | | | | | | | | 129,000 | | | | 134,045 | |
Massachusetts Mutual Life Insurance Co. | | | 5.38 | % | | | 12/1/2041 | | | | - | | | | - | | | | | | | | 26,000 | | | | 30,190 | | | | | | | | | | | | | | | | | | | | 26,000 | | | | 30,190 | |
Massachusetts Mutual Life Insurance Co. | | | 7.63 | % | | | 11/15/2023 | | | | - | | | | - | | | | | | | | 250,000 | | | | 310,833 | | | | | | | | | | | | | | | | | | | | 250,000 | | | | 310,833 | |
MassMutual Global Funding II | | | 2.50 | % | | | 10/17/2022 | | | | - | | | | - | | | | | | | | 100,000 | | | | 101,354 | | | | | | | | | | | | | | | | | | | | 100,000 | | | | 101,354 | |
MetLife, Inc. | | | 1.90 | % | | | 12/15/2017 | | | | 129,000 | | | | 130,168 | | | | | | | | - | | | | - | | | | | | | | | | | | | | | | | | | | 129,000 | | | | 130,168 | |
Metropolitan Life Global Funding I | | | 1.50 | % | | | 1/10/2018 | | | | - | | | | - | | | | | | | | 214,000 | | | | 215,234 | | | | | | | | | | | | | | | | | | | | 214,000 | | | | 215,234 | |
Metropolitan Life Global Funding I | | | 2.30 | % | | | 4/10/2019 | | | | - | | | | - | | | | | | | | 150,000 | | | | 153,500 | | | | | | | | | | | | | | | | | | | | 150,000 | | | | 153,500 | |
Metropolitan Life Global Funding I | | | 3.00 | % | | | 1/10/2023 | | | | - | | | | - | | | | | | | | 150,000 | | | | 153,783 | | | | | | | | | | | | | | | | | | | | 150,000 | | | | 153,783 | |
Metropolitan Life Global Funding I | | | 3.65 | % | | | 6/14/2018 | | | | - | | | | - | | | | | | | | 125,000 | | | | 130,645 | | | | | | | | | | | | | | | | | | | | 125,000 | | | | 130,645 | |
Metropolitan Life Global Funding I | | | 3.88 | % | | | 4/11/2022 | | | | - | | | | - | | | | | | | | 200,000 | | | | 217,553 | | | | | | | | | | | | | | | | | | | | 200,000 | | | | 217,553 | |
Nationwide Mutual Insurance Co. | | | 9.38 | % | | | 8/15/2039 | | | | - | | | | - | | | | | | | | 195,000 | | | | 296,467 | | | | | | | | | | | | | | | | | | | | 195,000 | | | | 296,467 | |
New York Life Global Funding | | | 1.55 | % | | | 11/2/2018 | | | | 100,000 | | | | 100,928 | | | | | | | | - | | | | - | | | | | | | | | | | | | | | | | | | | 100,000 | | | | 100,928 | |
New York Life Global Funding | | | 2.15 | % | | | 6/18/2019 | | | | - | | | | - | | | | | | | | 293,000 | | | | 300,143 | | | | | | | | | | | | | | | | | | | | 293,000 | | | | 300,143 | |
Pacific Life Insurance Co. | | | 9.25 | % | | | 6/15/2039 | | | | - | | | | - | | | | | | | | 150,000 | | | | 227,431 | | | | | | | | | | | | | | | | | | | | 150,000 | | | | 227,431 | |
Pricoa Global Funding I | | | 1.90 | % | | | 9/21/2018 | | | | 210,000 | | | | 213,163 | | | | | | | | - | | | | - | | | | | | | | | | | | | | | | | | | | 210,000 | | | | 213,163 | |
Principal Financial Group, Inc. | | | 1.85 | % | | | 11/15/2017 | | | | - | | | | - | | | | | | | | 13,000 | | | | 13,071 | | | | | | | | | | | | | | | | | | | | 13,000 | | | | 13,071 | |
Principal Life Global Funding II | | | 1.50 | % | | | 9/11/2017 | | | | - | | | | - | | | | | | | | 200,000 | | | | 200,904 | | | | | | | | | | | | | | | | | | | | 200,000 | | | | 200,904 | |
Prudential Insurance Co. of America | | | 8.30 | % | | | 7/1/2025 | | | | - | | | | - | | | | | | | | 450,000 | | | | 599,886 | | | | | | | | | | | | | | | | | | | | 450,000 | | | | 599,886 | |
Reliance Standard Life Global Funding II | | | 3.05 | % | | | 1/20/2021 | | | | - | | | | - | | | | | | | | 101,000 | | | | 104,375 | | | | | | | | | | | | | | | | | | | | 101,000 | | | | 104,375 | |
Travelers Cos., Inc. | | | 5.80 | % | | | 5/15/2018 | | | | - | | | | - | | | | | | | | 50,000 | | | | 54,234 | | | | | | | | | | | | | | | | | | | | 50,000 | | | | 54,234 | |
21
| | | | | | | | | | | | | | | | | | | | | | | | | | | | | | | | | | | | | | | | | | | | | | | | | | | | |
| | | | | | | | | Voya Limited
Maturity Bond VP | | | | | | JPMorgan Core
Bond VP | | | | | | Adjustments | | | | | | Combined Pro
Forma Portfolio | |
| | | | | | | | | | | | | |
| | | Coupon Rate | | | Maturity Date | | | Principal | | | Value | | | | | | Principal | | | Value | | | | | | Principal | | | Value | | | | | | Principal | | | Value | |
| | | | | | | | | | | | | | | | | | | | | | | | | | | | | | | | |
Internet & Catalog Retail | | | | | | | | | | | | | | | | | | | | | | | | | | | | | | | | | | | | | | | | | | | | | | | | | | | | |
Amazon.com, Inc. | | | 3.80 | % | | | 12/5/2024 | | | $ | - | | | $ | - | | | | | | | $ | 197,000 | | | $ | 220,804 | | | | | | | | | | | | | | | | | | | $ | 197,000 | | | $ | 220,804 | |
Amazon.com, Inc. | | | 4.80 | % | | | 12/5/2034 | | | | - | | | | - | | | | | | | | 157,000 | | | | 184,664 | | | | | | | | | | | | | | | | | | | | 157,000 | | | | 184,664 | |
Internet Software & Services | | | | | | | | | | | | | | | | | | | | | | | | | | | | | | | | | | | | | | | | | | | | | | | | | | | | |
Alibaba Group Holding, Ltd. | | | 1.63 | % | | | 11/28/2017 | | | | 205,000 | | | | 205,431 | | | | | | | | - | | | | - | | | | | | | | | | | | | | | | | | | | 205,000 | | | | 205,431 | |
eBay, Inc. | | | 2.50 | % | | | 3/9/2018 | | | | 100,000 | | | | 101,825 | | | | | | | | - | | | | - | | | | | | | | | | | | | | | | | | | | 100,000 | | | | 101,825 | |
eBay, Inc. | | | 2.60 | % | | | 7/15/2022 | | | | - | | | | - | | | | | | | | 455,000 | | | | 450,539 | | | | | | | | | | | | | | | | | | | | 455,000 | | | | 450,539 | |
eBay, Inc. | | | 3.45 | % | | | 8/1/2024 | | | | - | | | | - | | | | | | | | 139,000 | | | | 142,080 | | | | | | | | | | | | | | | | | | | | 139,000 | | | | 142,080 | |
IT Services | | | | | | | | | | | | | | | | | | | | | | | | | | | | | | | | | | | | | | | | | | | | | | | | | | | | |
Automatic Data Processing, Inc. | | | 2.25 | % | | | 9/15/2020 | | | | 310,000 | | | | 322,081 | | | | | | | | - | | | | - | | | | | | | | | | | | | | | | | | | | 310,000 | | | | 322,081 | |
International Business Machines Corp. | | | 1.80 | % | | | 5/17/2019 | | | | - | | | | - | | | | | | | | 100,000 | | | | 101,755 | | | | | | | | | | | | | | | | | | | | 100,000 | | | | 101,755 | |
International Business Machines Corp. | | | 2.25 | % | | | 2/19/2021 | | | | - | | | | - | | | | | | | | 348,000 | | | | 358,842 | | | | | | | | | | | | | | | | | | | | 348,000 | | | | 358,842 | |
International Business Machines Corp. | | | 6.22 | % | | | 8/1/2027 | | | | - | | | | - | | | | | | | | 250,000 | | | | 328,409 | | | | | | | | | | | | | | | | | | | | 250,000 | | | | 328,409 | |
Total System Services, Inc. | | | 4.80 | % | | | 4/1/2026 | | | | - | | | | - | | | | | | | | 75,000 | | | | 81,329 | | | | | | | | | | | | | | | | | | | | 75,000 | | | | 81,329 | |
Xerox Corp. | | | 2.75 | % | | | 9/1/2020 | | | | - | | | | - | | | | | | | | 150,000 | | | | 144,584 | | | | | | | | | | | | | | | | | | | | 150,000 | | | | 144,584 | |
Xerox Corp. | | | 2.95 | % | | | 3/15/2017 | | | | - | | | | - | | | | | | | | 26,000 | | | | 26,225 | | | | | | | | | | | | | | | | | | | | 26,000 | | | | 26,225 | |
Xerox Corp. | | | 5.63 | % | | | 12/15/2019 | | | | - | | | | - | | | | | | | | 61,000 | | | | 65,390 | | | | | | | | | | | | | | | | | | | | 61,000 | | | | 65,390 | |
Xerox Corp. | | | 6.75 | % | | | 2/1/2017 | | | | - | | | | - | | | | | | | | 50,000 | | | | 51,342 | | | | | | | | | | | | | | | | | | | | 50,000 | | | | 51,342 | |
Life Sciences Tools & Services | | | | | | | | | | | | | | | | | | | | | | | | | | | | | | | | | | | | | | | | | | | | | | | | | | | | |
Thermo Fisher Scientific, Inc. | | | 2.15 | % | | | 12/14/2018 | | | | 121,000 | | | | 122,375 | | | | | | | | - | | | | - | | | | | | | | | | | | | | | | | | | | 121,000 | | | | 122,375 | |
Thermo Fisher Scientific, Inc. | | | 3.00 | % | | | 4/15/2023 | | | | - | | | | - | | | | | | | | 57,000 | | | | 58,190 | | | | | | | | | | | | | | | | | | | | 57,000 | | | | 58,190 | |
Thermo Fisher Scientific, Inc. | | | 3.15 | % | | | 1/15/2023 | | | | - | | | | - | | | | | | | | 35,000 | | | | 35,763 | | | | | | | | | | | | | | | | | | | | 35,000 | | | | 35,763 | |
Thermo Fisher Scientific, Inc. | | | 3.60 | % | | | 8/15/2021 | | | | - | | | | - | | | | | | | | 22,000 | | | | 23,322 | | | | | | | | | | | | | | | | | | | | 22,000 | | | | 23,322 | |
Thermo Fisher Scientific, Inc. | | | 4.15 | % | | | 2/1/2024 | | | | - | | | | - | | | | | | | | 34,000 | | | | 37,107 | | | | | | | | | | | | | | | | | | | | 34,000 | | | | 37,107 | |
Machinery | | | | | | | | | | | | | | | | | | | | | | | | | | | | | | | | | | | | | | | | | | | | | | | | | | | | |
Caterpillar Financial Services Corp. | | | 1.00 | % | | | 11/25/2016 | | | | - | | | | - | | | | | | | | 200,000 | | | | 200,102 | | | | | | | | | | | | | | | | | | | | 200,000 | | | | 200,102 | |
Caterpillar Financial Services Corp. | | | 2.25 | % | | | 12/1/2019 | | | | 219,000 | | | | 225,475 | | | | | | | | - | | | | - | | | | | | | | | | | | | | | | | | | | 219,000 | | | | 225,475 | |
Caterpillar Financial Services Corp. | | | 2.85 | % | | | 6/1/2022 | | | | - | | | | - | | | | | | | | 46,000 | | | | 48,143 | | | | | | | | | | | | | | | | | | | | 46,000 | | | | 48,143 | |
Caterpillar Financial Services Corp. | | | 3.25 | % | | | 12/1/2024 | | | | - | | | | - | | | | | | | | 130,000 | | | | 139,364 | | | | | | | | | | | | | | | | | | | | 130,000 | | | | 139,364 | |
Caterpillar Financial Services Corp. | | | 7.05 | % | | | 10/1/2018 | | | | - | | | | - | | | | | | | | 125,000 | | | | 140,363 | | | | | | | | | | | | | | | | | | | | 125,000 | | | | 140,363 | |
Caterpillar, Inc. | | | 2.60 | % | | | 6/26/2022 | | | | - | | | | - | | | | | | | | 35,000 | | | | 36,097 | | | | | | | | | | | | | | | | | | | | 35,000 | | | | 36,097 | |
Deere & Co. | | | 2.60 | % | | | 6/8/2022 | | | | - | | | | - | | | | | | | | 74,000 | | | | 75,998 | | | | | | | | | | | | | | | | | | | | 74,000 | | | | 75,998 | |
Deere & Co. | | | 3.90 | % | | | 6/9/2042 | | | | - | | | | - | | | | | | | | 32,000 | | | | 34,164 | | | | | | | | | | | | | | | | | | | | 32,000 | | | | 34,164 | |
Illinois Tool Works, Inc. | | | 3.50 | % | | | 3/1/2024 | | | | - | | | | - | | | | | | | | 100,000 | | | | 109,328 | | | | | | | | | | | | | | | | | | | | 100,000 | | | | 109,328 | |
Illinois Tool Works, Inc. | | | 3.90 | % | | | 9/1/2042 | | | | - | | | | - | | | | | | | | 280,000 | | | | 301,025 | | | | | | | | | | | | | | | | | | | | 280,000 | | | | 301,025 | |
Ingersoll-Rand Co. | | | 6.39 | % | | | 11/15/2027 | | | | - | | | | - | | | | | | | | 25,000 | | | | 30,307 | | | | | | | | | | | | | | | | | | | | 25,000 | | | | 30,307 | |
Ingersoll-Rand Global Holding Co., Ltd. | | | 2.88 | % | | | 1/15/2019 | | | | 219,000 | | | | 226,797 | | | | | | | | - | | | | - | | | | | | | | | | | | | | | | | | | | 219,000 | | | | 226,797 | |
Ingersoll-Rand Global Holding Co., Ltd. | | | 4.25 | % | | | 6/15/2023 | | | | - | | | | - | | | | | | | | 81,000 | | | | 89,919 | | | | | | | | | | | | | | | | | | | | 81,000 | | | | 89,919 | |
Ingersoll-Rand Luxembourg Finance SA | | | 2.63 | % | | | 5/1/2020 | | | | - | | | | - | | | | | | | | 80,000 | | | | 81,291 | | | | | | | | | | | | | | | | | | | | 80,000 | | | | 81,291 | |
Parker-Hannifin Corp. | | | 4.45 | % | | | 11/21/2044 | | | | - | | | | - | | | | | | | | 85,000 | | | | 100,195 | | | | | | | | | | | | | | | | | | | | 85,000 | | | | 100,195 | |
Parker-Hannifin Corp. | | | 5.50 | % | | | 5/15/2018 | | | | - | | | | - | | | | | | | | 20,000 | | | | 21,707 | | | | | | | | | | | | | | | | | | | | 20,000 | | | | 21,707 | |
Pentair Finance SA | | | 2.90 | % | | | 9/15/2018 | | | | - | | | | - | | | | | | | | 242,000 | | | | 244,451 | | | | | | | | | | | | | | | | | | | | 242,000 | | | | 244,451 | |
Roper Technologies, Inc. | | | 3.00 | % | | | 12/15/2020 | | | | - | | | | - | | | | | | | | 42,000 | | | | 43,422 | | | | | | | | | | | | | | | | | | | | 42,000 | | | | 43,422 | |
Media | | | | | | | | | | | | | | | | | | | | | | | | | | | | | | | | | | | | | | | | | | | | | | | | | | | | |
21st Century Fox America, Inc. | | | 6.65 | % | | | 11/15/2037 | | | | - | | | | - | | | | | | | | 50,000 | | | | 65,570 | | | | | | | | | | | | | | | | | | | | 50,000 | | | | 65,570 | |
21st Century Fox America, Inc. | | | 7.30 | % | | | 4/30/2028 | | | | - | | | | - | | | | | | | | 50,000 | | | | 66,266 | | | | | | | | | | | | | | | | | | | | 50,000 | | | | 66,266 | |
21st Century Fox America, Inc. | | | 8.88 | % | | | 4/26/2023 | | | | - | | | | - | | | | | | | | 80,000 | | | | 108,912 | | | | | | | | | | | | | | | | | | | | 80,000 | | | | 108,912 | |
21st Century Fox America, Inc. | | | 9.50 | % | | | 7/15/2024 | | | | - | | | | - | | | | | | | | 70,000 | | | | 101,107 | | | | | | | | | | | | | | | | | | | | 70,000 | | | | 101,107 | |
CBS Corp. | | | 3.70 | % | | | 8/15/2024 | | | | - | | | | - | | | | | | | | 287,000 | | | | 299,719 | | | | | | | | | | | | | | | | | | | | 287,000 | | | | 299,719 | |
CBS Corp. | | | 4.00 | % | | | 1/15/2026 | | | | - | | | | - | | | | | | | | 83,000 | | | | 88,592 | | | | | | | | | | | | | | | | | | | | 83,000 | | | | 88,592 | |
Charter Communications Operating LLC / Charter Communications Operating Capital | | | 4.46 | % | | | 7/23/2022 | | | | - | | | | - | | | | | | | | 317,000 | | | | 340,691 | | | | | | | | | | | | | | | | | | | | 317,000 | | | | 340,691 | |
Charter Communications Operating LLC / Charter Communications Operating Capital | | | 6.38 | % | | | 10/23/2035 | | | | - | | | | - | | | | | | | | 92,000 | | | | 108,945 | | | | | | | | | | | | | | | | | | | | 92,000 | | | | 108,945 | |
Charter Communications Operating LLC / Charter Communications Operating Capital | | | 6.83 | % | | | 10/23/2055 | | | | - | | | | - | | | | | | | | 125,000 | | | | 148,627 | | | | | | | | | | | | | | | | | | | | 125,000 | | | | 148,627 | |
Comcast Corp. | | | 2.75 | % | | | 3/1/2023 | | | | - | | | | - | | | | | | | | 53,000 | | | | 55,505 | | | | | | | | | | | | | | | | | | | | 53,000 | | | | 55,505 | |
Comcast Corp. | | | 4.20 | % | | | 8/15/2034 | | | | - | | | | - | | | | | | | | 167,000 | | | | 183,877 | | | | | | | | | | | | | | | | | | | | 167,000 | | | | 183,877 | |
Comcast Corp. | | | 4.25 | % | | | 1/15/2033 | | | | - | | | | - | | | | | | | | 173,000 | | | | 190,882 | | | | | | | | | | | | | | | | | | | | 173,000 | | | | 190,882 | |
Comcast Corp. | | | 6.45 | % | | | 3/15/2037 | | | | - | | | | - | | | | | | | | 50,000 | | | | 68,799 | | | | | | | | | | | | | | | | | | | | 50,000 | | | | 68,799 | |
Comcast Corp. | | | 6.50 | % | | | 11/15/2035 | | | | - | | | | - | | | | | | | | 250,000 | | | | 347,535 | | | | | | | | | | | | | | | | | | | | 250,000 | | | | 347,535 | |
Comcast Corp. | | | 6.50 | % | | | 1/15/2017 | | | | - | | | | - | | | | | | | | 50,000 | | | | 51,466 | | | | | | | | | | | | | | | | | | | | 50,000 | | | | 51,466 | |
Cox Communications, Inc. | | | 3.25 | % | | | 12/15/2022 | | | | - | | | | - | | | | | | | | 55,000 | | | | 54,847 | | | | | | | | | | | | | | | | | | | | 55,000 | | | | 54,847 | |
Cox Communications, Inc. | | | 4.80 | % | | | 2/1/2035 | | | | - | | | | - | | | | | | | | 350,000 | | | | 327,031 | | | | | | | | | | | | | | | | | | | | 350,000 | | | | 327,031 | |
Cox Communications, Inc. | | | 8.38 | % | | | 3/1/2039 | | | | - | | | | - | | | | | | | | 60,000 | | | | 72,505 | | | | | | | | | | | | | | | | | | | | 60,000 | | | | 72,505 | |
Discovery Communications LLC | | | 4.38 | % | | | 6/15/2021 | | | | - | | | | - | | | | | | | | 80,000 | | | | 85,901 | | | | | | | | | | | | | | | | | | | | 80,000 | | | | 85,901 | |
Discovery Communications LLC | | | 4.95 | % | | | 5/15/2042 | | | | - | | | | - | | | | | | | | 200,000 | | | | 173,631 | | | | | | | | | | | | | | | | | | | | 200,000 | | | | 173,631 | |
Historic TW, Inc. | | | 9.15 | % | | | 2/1/2023 | | | | - | | | | - | | | | | | | | 500,000 | | | | 672,093 | | | | | | | | | | | | | | | | | | | | 500,000 | | | | 672,093 | |
NBCUniversal Media LLC | | | 4.38 | % | | | 4/1/2021 | | | | - | | | | - | | | | | | | | 50,000 | | | | 56,028 | | | | | | | | | | | | | | | | | | | | 50,000 | | | | 56,028 | |
NBCUniversal Media LLC | | | 6.40 | % | | | 4/30/2040 | | | | - | | | | - | | | | | | | | 170,000 | | | | 237,043 | | | | | | | | | | | | | | | | | | | | 170,000 | | | | 237,043 | |
SES SA | | | 3.60 | % | | | 4/4/2023 | | | | - | | | | - | | | | | | | | 100,000 | | | | 100,643 | | | | | | | | | | | | | | | | | | | | 100,000 | | | | 100,643 | |
Thomson Reuters Corp. | | | 1.30 | % | | | 2/23/2017 | | | | 119,000 | | | | 119,020 | | | | | | | | - | | | | - | | | | | | | | | | | | | | | | | | | | 119,000 | | | | 119,020 | |
Thomson Reuters Corp. | | | 1.65 | % | | | 9/29/2017 | | | | 129,000 | | | | 129,552 | | | | | | | | - | | | | - | | | | | | | | | | | | | | | | | | | | 129,000 | | | | 129,552 | |
Thomson Reuters Corp. | | | 3.85 | % | | | 9/29/2024 | | | | - | | | | - | | | | | | | | 254,000 | | | | 270,682 | | | | | | | | | | | | | | | | | | | | 254,000 | | | | 270,682 | |
Thomson Reuters Corp. | | | 3.95 | % | | | 9/30/2021 | | | | - | | | | - | | | | | | | | 126,000 | | | | 134,370 | | | | | | | | | | | | | | | | | | | | 126,000 | | | | 134,370 | |
Thomson Reuters Corp. | | | 4.50 | % | | | 5/23/2043 | | | | - | | | | - | | | | | | | | 59,000 | | | | 58,481 | | | | | | | | | | | | | | | | | | | | 59,000 | | | | 58,481 | |
Thomson Reuters Corp. | | | 4.70 | % | | | 10/15/2019 | | | | - | | | | - | | | | | | | | 15,000 | | | | 16,225 | | | | | | | | | | | | | | | | | | | | 15,000 | | | | 16,225 | |
Time Warner Cable, Inc. | | | 5.50 | % | | | 9/1/2041 | | | | - | | | | - | | | | | | | | 90,000 | | | | 94,535 | | | | | | | | | | | | | | | | | | | | 90,000 | | | | 94,535 | |
Time Warner Cable, Inc. | | | 6.75 | % | | | 7/1/2018 | | | | - | | | | - | | | | | | | | 60,000 | | | | 65,792 | | | | | | | | | | | | | | | | | | | | 60,000 | | | | 65,792 | |
Time Warner Cable, Inc. | | | 7.30 | % | | | 7/1/2038 | | | | - | | | | - | | | | | | | | 100,000 | | | | 125,224 | | | | | | | | | | | | | | | | | | | | 100,000 | | | | 125,224 | |
Time Warner Cable, Inc. | | | 8.75 | % | | | 2/14/2019 | | | | - | | | | - | | | | | | | | 50,000 | | | | 58,380 | | | | | | | | | | | | | | | | | | | | 50,000 | | | | 58,380 | |
Time Warner Cos., Inc. | | | 7.57 | % | | | 2/1/2024 | | | | - | | | | - | | | | | | | | 40,000 | | | | 50,798 | | | | | | | | | | | | | | | | | | | | 40,000 | | | | 50,798 | |
Time Warner Entertainment Co., LP | | | 8.38 | % | | | 7/15/2033 | | | | - | | | | - | | | | | | | | 75,000 | | | | 101,619 | | | | | | | | | | | | | | | | | | | | 75,000 | | | | 101,619 | |
Time Warner, Inc. | | | 3.55 | % | | | 6/1/2024 | | | | - | | | | - | | | | | | | | 250,000 | | | | 265,599 | | | | | | | | | | | | | | | | | | | | 250,000 | | | | 265,599 | |
Time Warner, Inc. | | | 3.60 | % | | | 7/15/2025 | | | | - | | | | - | | | | | | | | 135,000 | | | | 142,850 | | | | | | | | | | | | | | | | | | | | 135,000 | | | | 142,850 | |
Viacom, Inc. | | | 2.75 | % | | | 12/15/2019 | | | | - | | | | - | | | | | | | | 53,000 | | | | 53,769 | | | | | | | | | | | | | | | | | | | | 53,000 | | | | 53,769 | |
Viacom, Inc. | | | 3.13 | % | | | 6/15/2022 | | | | - | | | | - | | | | | | | | 80,000 | | | | 79,876 | | | | | | | | | | | | | | | | | | | | 80,000 | | | | 79,876 | |
Viacom, Inc. | | | 3.88 | % | | | 12/15/2021 | | | | - | | | | - | | | | | | | | 72,000 | | | | 75,967 | | | | | | | | | | | | | | | | | | | | 72,000 | | | | 75,967 | |
Viacom, Inc. | | | 4.38 | % | | | 3/15/2043 | | | | - | | | | - | | | | | | | | 93,000 | | | | 75,123 | | | | | | | | | | | | | | | | | | | | 93,000 | | | | 75,123 | |
Viacom, Inc. | | | 4.50 | % | | | 2/27/2042 | | | | - | | | | - | | | | | | | | 25,000 | | | | 20,742 | | | | | | | | | | | | | | | | | | | | 25,000 | | | | 20,742 | |
Viacom, Inc. | | | 4.85 | % | | | 12/15/2034 | | | | - | | | | - | | | | | | | | 32,000 | | | | 29,833 | | | | | | | | | | | | | | | | | | | | 32,000 | | | | 29,833 | |
Viacom, Inc. | | | 6.88 | % | | | 4/30/2036 | | | | - | | | | - | | | | | | | | 150,000 | | | | 164,667 | | | | | | | | | | | | | | | | | | | | 150,000 | | | | 164,667 | |
Walt Disney Co. | | | 3.00 | % | | | 2/13/2026 | | | | - | | | | - | | | | | | | | 450,000 | | | | 484,108 | | | | | | | | | | | | | | | | | | | | 450,000 | | | | 484,108 | |
22
| | | | | | | | | | | | | | | | | | | | | | | | | | | | | | | | | | | | | | | | | | | | | | | | | | | | |
| | | | | | | | | Voya Limited
Maturity Bond VP | | | | | | JPMorgan Core
Bond VP | | | | | | Adjustments | | | | | | Combined Pro
Forma Portfolio | |
| | | | | | | | | | | | | |
| | | Coupon Rate | | | Maturity Date | | | Principal | | | Value | | | | | | Principal | | | Value | | | | | | Principal | | | Value | | | | | | Principal | | | Value | |
| | | | | | | | | | | | | | | | | | | | | | | | | | | | | | | | |
Metals & Mining | | | | | | | | | | | | | | | | | | | | | | | | | | | | | | | | | | | | | | | | | | | | | | | | | | | | |
BHP Billiton Finance USA, Ltd. | | | 2.05 | % | | | 9/30/2018 | | | $ | 175,000 | | | $ | 177,292 | | | | | | | $ | - | | | $ | - | | | | | | | | | | | | | | | | | | | $ | 175,000 | | | $ | 177,292 | |
BHP Billiton Finance USA, Ltd. | | | 3.85 | % | | | 9/30/2023 | | | | - | | | | - | | | | | | | | 131,000 | | | | 142,550 | | | | | | | | | | | | | | | | | | | | 131,000 | | | | 142,550 | |
BHP Billiton Finance USA, Ltd. | | | 5.00 | % | | | 9/30/2043 | | | | - | | | | - | | | | | | | | 50,000 | | | | 58,099 | | | | | | | | | | | | | | | | | | | | 50,000 | | | | 58,099 | |
Freeport Minerals Corp. | | | 9.50 | % | | | 6/1/2031 | | | | - | | | | - | | | | | | | | 250,000 | | | | 237,500 | | | | | | | | | | | | | | | | | | | | 250,000 | | | | 237,500 | |
Freeport-McMoRan, Inc. | | | 2.15 | % | | | 3/1/2017 | | | | - | | | | - | �� | | | | | | | 134,000 | | | | 132,995 | | | | | | | | | | | | | | | | | | | | 134,000 | | | | 132,995 | |
Freeport-McMoRan, Inc. | | | 3.88 | % | | | 3/15/2023 | | | | - | | | | - | | | | | | | | 112,000 | | | | 98,000 | | | | | | | | | | | | | | | | | | | | 112,000 | | | | 98,000 | |
Freeport-McMoRan, Inc. | | | 5.40 | % | | | 11/14/2034 | | | | - | | | | - | | | | | | | | 207,000 | | | | 164,565 | | | | | | | | | | | | | | | | | | | | 207,000 | | | | 164,565 | |
Freeport-McMoRan, Inc. | | | 5.45 | % | | | 3/15/2043 | | | | - | | | | - | | | | | | | | 184,000 | | | | 147,660 | | | | | | | | | | | | | | | | | | | | 184,000 | | | | 147,660 | |
Nucor Corp. | | | 4.00 | % | | | 8/1/2023 | | | | - | | | | - | | | | | | | | 45,000 | | | | 48,058 | | | | | | | | | | | | | | | | | | | | 45,000 | | | | 48,058 | |
Placer Dome, Inc. | | | 6.45 | % | | | 10/15/2035 | | | | - | | | | - | | | | | | | | 40,000 | | | | 42,715 | | | | | | | | | | | | | | | | | | | | 40,000 | | | | 42,715 | |
Teck Resources, Ltd. | | | 3.75 | % | | | 2/1/2023 | | | | - | | | | - | | | | | | | | 77,000 | | | | 58,520 | | | | | | | | | | | | | | | | | | | | 77,000 | | | | 58,520 | |
Teck Resources, Ltd. | | | 4.75 | % | | | 1/15/2022 | | | | - | | | | - | | | | | | | | 277,000 | | | | 234,037 | | | | | | | | | | | | | | | | | | | | 277,000 | | | | 234,037 | |
Multiline Retail | | | | | | | | | | | | | | | | | | | | | | | | | | | | | | | | | | | | | | | | | | | | | | | | | | | | |
Macy’s Retail Holdings, Inc. | | | 2.88 | % | | | 2/15/2023 | | | | - | | | | - | | | | | | | | 274,000 | | | | 260,663 | | | | | | | | | | | | | | | | | | | | 274,000 | | | | 260,663 | |
Macy’s Retail Holdings, Inc. | | | 3.45 | % | | | 1/15/2021 | | | | - | | | | - | | | | | | | | - | | | | - | | | | | | | | | | | | | | | | | | | | - | | | | - | |
Macy’s Retail Holdings, Inc. | | | 3.88 | % | | | 1/15/2022 | | | | - | | | | - | | | | | | | | - | | | | - | | | | | | | | | | | | | | | | | | | | - | | | | - | |
Macy’s Retail Holdings, Inc. | | | 4.38 | % | | | 9/1/2023 | | | | - | | | | - | | | | | | | | 112,000 | | | | 116,343 | | | | | | | | | | | | | | | | | | | | 112,000 | | | | 116,343 | |
Macy’s Retail Holdings, Inc. | | | 4.50 | % | | | 12/15/2034 | | | | - | | | | - | | | | | | | | 79,000 | | | | 69,985 | | | | | | | | | | | | | | | | | | | | 79,000 | | | | 69,985 | |
Macy’s Retail Holdings, Inc. | | | 6.90 | % | | | 1/15/2032 | | | | - | | | | - | | | | | | | | 120,000 | | | | 128,398 | | | | | | | | | | | | | | | | | | | | 120,000 | | | | 128,398 | |
Macy’s Retail Holdings, Inc. | | | 7.45 | % | | | 7/15/2017 | | | | - | | | | - | | | | | | | | 30,000 | | | | 31,770 | | | | | | | | | | | | | | | | | | | | 30,000 | | | | 31,770 | |
Nordstrom, Inc. | | | 4.00 | % | | | 10/15/2021 | | | | - | | | | - | | | | | | | | 35,000 | | | | 37,423 | | | | | | | | | | | | | | | | | | | | 35,000 | | | | 37,423 | |
Multi-Utilities | | | | | | | | | | | | | | | | | | | | | | | | | | | | | | | | | | | | | | | | | | | | | | | | | | | | |
Berkshire Hathaway Energy Co. | | | 2.40 | % | | | 2/1/2020 | | | | - | | | | - | | | | | | | | 82,000 | | | | 84,227 | | | | | | | | | | | | | | | | | | | | 82,000 | | | | 84,227 | |
Berkshire Hathaway Energy Co. | | | 3.50 | % | | | 2/1/2025 | | | | - | | | | - | | | | | | | | 104,000 | | | | 112,166 | | | | | | | | | | | | | | | | | | | | 104,000 | | | | 112,166 | |
Berkshire Hathaway Energy Co. | | | 4.50 | % | | | 2/1/2045 | | | | - | | | | - | | | | | | | | 75,000 | | | | 84,191 | | | | | | | | | | | | | | | | | | | | 75,000 | | | | 84,191 | |
Black Hills Corp. | | | 2.50 | % | | | 1/11/2019 | | | | 270,000 | | | | 275,633 | | | | | | | | - | | | | - | | | | | | | | | | | | | | | | | | | | 270,000 | | | | 275,633 | |
CMS Energy Corp. | | | 3.00 | % | | | 5/15/2026 | | | | - | | | | - | | | | | | | | 73,000 | | | | 74,577 | | | | | | | | | | | | | | | | | | | | 73,000 | | | | 74,577 | |
Consumers Energy Co. | | | 2.85 | % | | | 5/15/2022 | | | | - | | | | - | | | | | | | | 20,000 | | | | 20,822 | | | | | | | | | | | | | | | | | | | | 20,000 | | | | 20,822 | |
Consumers Energy Co. | | | 5.65 | % | | | 4/15/2020 | | | | - | | | | - | | | | | | | | 20,000 | | | | 22,927 | | | | | | | | | | | | | | | | | | | | 20,000 | | | | 22,927 | |
Consumers Energy Co. | | | 6.13 | % | | | 3/15/2019 | | | | - | | | | - | | | | | | | | 100,000 | | | | 113,379 | | | | | | | | | | | | | | | | | | | | 100,000 | | | | 113,379 | |
Delmarva Power & Light Co. | | | 4.00 | % | | | 6/1/2042 | | | | - | | | | - | | | | | | | | 47,000 | | | | 49,653 | | | | | | | | | | | | | | | | | | | | 47,000 | | | | 49,653 | |
Dominion Resources, Inc. | | | 1.90 | % | | | 6/15/2018 | | | | 240,000 | | | | 241,131 | | | | | | | | - | | | | - | | | | | | | | | | | | | | | | | | | | 240,000 | | | | 241,131 | |
Dominion Resources, Inc. | | | 5.25 | % | | | 8/1/2033 | | | | - | | | | - | | | | | | | | 100,000 | | | | 110,982 | | | | | | | | | | | | | | | | | | | | 100,000 | | | | 110,982 | |
DTE Electric Co. | | | 2.65 | % | | | 6/15/2022 | | | | - | | | | - | | | | | | | | 20,000 | | | | 20,849 | | | | | | | | | | | | | | | | | | | | 20,000 | | | | 20,849 | |
DTE Electric Co. | | | 3.70 | % | | | 3/15/2045 | | | | - | | | | - | | | | | | | | 123,000 | | | | 130,380 | | | | | | | | | | | | | | | | | | | | 123,000 | | | | 130,380 | |
DTE Energy Co. | | | 2.40 | % | | | 12/1/2019 | | | | - | | | | - | | | | | | | | 69,000 | | | | 70,453 | | | | | | | | | | | | | | | | | | | | 69,000 | | | | 70,453 | |
DTE Energy Co. | | | 3.30 | % | | | 6/15/2022 | | | | - | | | | - | | | | | | | | 79,000 | | | | 83,260 | | | | | | | | | | | | | | | | | | | | 79,000 | | | | 83,260 | |
DTE Energy Co. | | | 3.85 | % | | | 12/1/2023 | | | | - | | | | - | | | | | | | | 46,000 | | | | 49,687 | | | | | | | | | | | | | | | | | | | | 46,000 | | | | 49,687 | |
San Diego Gas & Electric Co. | | | 3.95 | % | | | 11/15/2041 | | | | - | | | | - | | | | | | | | 44,000 | | | | 47,413 | | | | | | | | | | | | | | | | | | | | 44,000 | | | | 47,413 | |
San Diego Gas & Electric Co. | | | 6.00 | % | | | 6/1/2026 | | | | - | | | | - | | | | | | | | 50,000 | | | | 65,527 | | | | | | | | | | | | | | | | | | | | 50,000 | | | | 65,527 | |
Sempra Energy | | | 2.88 | % | | | 10/1/2022 | | | | - | | | | - | | | | | | | | 70,000 | | | | 71,611 | | | | | | | | | | | | | | | | | | | | 70,000 | | | | 71,611 | |
Sempra Energy | | | 3.55 | % | | | 6/15/2024 | | | | - | | | | - | | | | | | | | 165,000 | | | | 172,941 | | | | | | | | | | | | | | | | | | | | 165,000 | | | | 172,941 | |
Sempra Energy | | | 4.05 | % | | | 12/1/2023 | | | | - | | | | - | | | | | | | | 72,000 | | | | 77,894 | | | | | | | | | | | | | | | | | | | | 72,000 | | | | 77,894 | |
Sempra Energy | | | 9.80 | % | | | 2/15/2019 | | | | - | | | | - | | | | | | | | 50,000 | | | | 60,182 | | | | | | | | | | | | | | | | | | | | 50,000 | | | | 60,182 | |
WEC Energy Group, Inc. | | | 3.55 | % | | | 6/15/2025 | | | | - | | | | - | | | | | | | | 144,000 | | | | 154,518 | | | | | | | | | | | | | | | | | | | | 144,000 | | | | 154,518 | |
Oil, Gas & Consumable Fuels | | | | | | | | | | | | | | | | | | | | | | | | | | | | | | | | | | | | | | | | | | | | | | | | | | | | |
Anadarko Finance Co. | | | 7.50 | % | | | 5/1/2031 | | | | - | | | | - | | | | | | | | 100,000 | | | | 119,726 | | | | | | | | | | | | | | | | | | | | 100,000 | | | | 119,726 | |
Anadarko Petroleum Corp. | | | 8.70 | % | | | 3/15/2019 | | | | - | | | | - | | | | | | | | 80,000 | | | | 91,234 | | | | | | | | | | | | | | | | | | | | 80,000 | | | | 91,234 | |
Apache Corp. | | | 2.63 | % | | | 1/15/2023 | | | | - | | | | - | | | | | | | | 100,000 | | | | 99,053 | | | | | | | | | | | | | | | | | | | | 100,000 | | | | 99,053 | |
Apache Corp. | | | 3.25 | % | | | 4/15/2022 | | | | - | | | | - | | | | | | | | 14,000 | | | | 14,342 | | | | | | | | | | | | | | | | | | | | 14,000 | | | | 14,342 | |
Apache Corp. | | | 4.75 | % | | | 4/15/2043 | | | | - | | | | - | | | | | | | | 57,000 | | | | 58,600 | | | | | | | | | | | | | | | | | | | | 57,000 | | | | 58,600 | |
BP Capital Markets PLC | | | 1.38 | % | | | 11/6/2017 | | | | - | | | | - | | | | | | | | 40,000 | | | | 40,140 | | | | | | | | | | | | | | | | | | | | 40,000 | | | | 40,140 | |
BP Capital Markets PLC | | | 1.67 | % | | | 2/13/2018 | | | | 85,000 | | | | 85,652 | | | | | | | | - | | | | - | | | | | | | | | | | | | | | | | | | | 85,000 | | | | 85,652 | |
BP Capital Markets PLC | | | 1.85 | % | | | 5/5/2017 | | | | - | | | | - | | | | | | | | 89,000 | | | | 89,503 | | | | | | | | | | | | | | | | | | | | 89,000 | | | | 89,503 | |
BP Capital Markets PLC | | | 2.24 | % | | | 5/10/2019 | | | | - | | | | - | | | | | | | | 150,000 | | | | 154,034 | | | | | | | | | | | | | | | | | | | | 150,000 | | | | 154,034 | |
BP Capital Markets PLC | | | 2.52 | % | | | 1/15/2020 | | | | 149,000 | | | | 153,713 | | | | | | | | - | | | | - | | | | | | | | | | | | | | | | | | | | 149,000 | | | | 153,713 | |
BP Capital Markets PLC | | | 2.75 | % | | | 5/10/2023 | | | | - | | | | - | | | | | | | | 254,000 | | | | 255,938 | | | | | | | | | | | | | | | | | | | | 254,000 | | | | 255,938 | |
BP Capital Markets PLC | | | 3.25 | % | | | 5/6/2022 | | | | - | | | | - | | | | | | | | 96,000 | | | | 100,749 | | | | | | | | | | | | | | | | | | | | 96,000 | | | | 100,749 | |
BP Capital Markets PLC | | | 3.54 | % | | | 11/4/2024 | | | | - | | | | - | | | | | | | | 300,000 | | | | 316,118 | | | | | | | | | | | | | | | | | | | | 300,000 | | | | 316,118 | |
BP Capital Markets PLC | | | 3.81 | % | | | 2/10/2024 | | | | - | | | | - | | | | | | | | 116,000 | | | | 124,272 | | | | | | | | | | | | | | | | | | | | 116,000 | | | | 124,272 | |
Buckeye Partners, LP | | | 4.88 | % | | | 2/1/2021 | | | | - | | | | - | | | | | | | | 300,000 | | | | 315,162 | | | | | | | | | | | | | | | | | | | | 300,000 | | | | 315,162 | |
Buckeye Partners, LP | | | 5.85 | % | | | 11/15/2043 | | | | - | | | | - | | | | | | | | 100,000 | | | | 97,218 | | | | | | | | | | | | | | | | | | | | 100,000 | | | | 97,218 | |
Burlington Resources Finance Co. | | | 7.40 | % | | | 12/1/2031 | | | | - | | | | - | | | | | | | | 25,000 | | | | 32,636 | | | | | | | | | | | | | | | | | | | | 25,000 | | | | 32,636 | |
Canadian Natural Resources, Ltd. | | | 1.75 | % | | | 1/15/2018 | | | | - | | | | - | | | | | | | | 125,000 | | | | 123,906 | | | | | | | | | | | | | | | | | | | | 125,000 | | | | 123,906 | |
Canadian Natural Resources, Ltd. | | | 5.90 | % | | | 2/1/2018 | | | | - | | | | - | | | | | | | | 25,000 | | | | 26,412 | | | | | | | | | | | | | | | | | | | | 25,000 | | | | 26,412 | |
Canadian Natural Resources, Ltd. | | | 6.25 | % | | | 3/15/2038 | | | | - | | | | - | | | | | | | | 140,000 | | | | 152,190 | | | | | | | | | | | | | | | | | | | | 140,000 | | | | 152,190 | |
Canadian Natural Resources, Ltd. | | | 6.45 | % | | | 6/30/2033 | | | | - | | | | - | | | | | | | | 124,000 | | | | 135,353 | | | | | | | | | | | | | | | | | | | | 124,000 | | | | 135,353 | |
Canadian Natural Resources, Ltd. | | | 7.20 | % | | | 1/15/2032 | | | | - | | | | - | | | | | | | | 20,000 | | | | 22,215 | | | | | | | | | | | | | | | | | | | | 20,000 | | | | 22,215 | |
Cenovus Energy, Inc. | | | 3.00 | % | | | 8/15/2022 | | | | - | | | | - | | | | | | | | 325,000 | | | | 296,679 | | | | | | | | | | | | | | | | | | | | 325,000 | | | | 296,679 | |
Cenovus Energy, Inc. | | | 4.45 | % | | | 9/15/2042 | | | | - | | | | - | | | | | | | | 42,000 | | | | 33,422 | | | | | | | | | | | | | | | | | | | | 42,000 | | | | 33,422 | |
Cenovus Energy, Inc. | | | 6.75 | % | | | 11/15/2039 | | | | - | | | | - | | | | | | | | 89,000 | | | | 93,462 | | | | | | | | | | | | | | | | | | | | 89,000 | | | | 93,462 | |
Chevron Corp. | | | 1.37 | % | | | 3/2/2018 | | | | 250,000 | | | | 251,373 | | | | | | | | - | | | | - | | | | | | | | | | | | | | | | | | | | 250,000 | | | | 251,373 | |
Chevron Corp. | | | 1.79 | % | | | 11/16/2018 | | | | 151,000 | | | | 153,020 | | | | | | | | - | | | | - | | | | | | | | | | | | | | | | | | | | 151,000 | | | | 153,020 | |
Chevron Corp. | | | 2.36 | % | | | 12/5/2022 | | | | - | | | | - | | | | | | | | 60,000 | | | | 60,902 | | | | | | | | | | | | | | | | | | | | 60,000 | | | | 60,902 | |
23
| | | | | | | | | | | | | | | | | | | | | | | | | | | | | | | | | | | | | | | | | | | | | | | | | | | | |
| | | | | | | | | Voya Limited
Maturity Bond VP | | | | | | JPMorgan Core
Bond VP | | | | | | Adjustments | | | | | | Combined Pro
Forma Portfolio | |
| | | | | | | | | | | | | |
| | | Coupon Rate | | | Maturity Date | | | Principal | | | Value | | | | | | Principal | | | Value | | | | | | Principal | | | Value | | | | | | Principal | | | Value | |
| | | | | | | | | | | | | | | | | | | | | | | | | | | | | | | | |
Chevron Corp. | | | 2.57 | % | | | 5/16/2023 | | | $ | - | | | $ | - | | | | | | | $ | 400,000 | | | $ | 408,518 | | | | | | | | | | | | | | | | | | | $ | 400,000 | | | $ | 408,518 | |
Chevron Phillips Chemical Co. LLC / Chevron Phillips Chemical Co., LP | | | 1.70 | % | | | 5/1/2018 | | | | 100,000 | | | | 99,770 | | | | | | | | - | | | | - | | | | | | | | | | | | | | | | | | | | 100,000 | | | | 99,770 | |
CNOOC Finance LLC | | | 3.50 | % | | | 5/5/2025 | | | | - | | | | - | | | | | | | | 235,000 | | | | 238,066 | | | | | | | | | | | | | | | | | | | | 235,000 | | | | 238,066 | |
CNOOC Finance Pty, Ltd. | | | 2.63 | % | | | 5/5/2020 | | | | - | | | | - | | | | | | | | 230,000 | | | | 232,120 | | | | | | | | | | | | | | | | | | | | 230,000 | | | | 232,120 | |
CNOOC Nexen Finance ULC | | | 4.25 | % | | | 4/30/2024 | | | | - | | | | - | | | | | | | | 209,000 | | | | 221,494 | | | | | | | | | | | | | | | | | | | | 209,000 | | | | 221,494 | |
Columbia Pipeline Group, Inc. | | | 2.45 | % | | | 6/1/2018 | | | | 170,000 | | | | 170,548 | | | | | | | | - | | | | - | | | | | | | | | | | | | | | | | | | | 170,000 | | | | 170,548 | |
ConocoPhillips Canada Funding Co. I | | | 5.63 | % | | | 10/15/2016 | | | | - | | | | - | | | | | | | | 100,000 | | | | 101,223 | | | | | | | | | | | | | | | | | | | | 100,000 | | | | 101,223 | |
ConocoPhillips Co. | | | 2.20 | % | | | 5/15/2020 | | | | - | | | | - | | | | | | | | 82,000 | | | | 82,805 | | | | | | | | | | | | | | | | | | | | 82,000 | | | | 82,805 | |
ConocoPhillips Co. | | | 3.35 | % | | | 11/15/2024 | | | | - | | | | - | | | | | | | | 225,000 | | | | 231,782 | | | | | | | | | | | | | | | | | | | | 225,000 | | | | 231,782 | |
ConocoPhillips Co. | | | 5.75 | % | | | 2/1/2019 | | | | - | | | | - | | | | | | | | 75,000 | | | | 82,512 | | | | | | | | | | | | | | | | | | | | 75,000 | | | | 82,512 | |
ConocoPhillips Holding Co. | | | 6.95 | % | | | 4/15/2029 | | | | - | | | | - | | | | | | | | 100,000 | | | | 124,807 | | | | | | | | | | | | | | | | | | | | 100,000 | | | | 124,807 | |
Devon Energy Corp. | | | 3.25 | % | | | 5/15/2022 | | | | - | | | | - | | | | | | | | 64,000 | | | | 62,067 | | | | | | | | | | | | | | | | | | | | 64,000 | | | | 62,067 | |
Devon Energy Corp. | | | 4.75 | % | | | 5/15/2042 | | | | - | | | | - | | | | | | | | 52,000 | | | | 46,604 | | | | | | | | | | | | | | | | | | | | 52,000 | | | | 46,604 | |
Devon Energy Corp. | | | 6.30 | % | | | 1/15/2019 | | | | - | | | | - | | | | | | | | 30,000 | | | | 32,500 | | | | | | | | | | | | | | | | | | | | 30,000 | | | | 32,500 | |
Devon Energy Corp. | | | 7.95 | % | | | 4/15/2032 | | | | - | | | | - | | | | | | | | 150,000 | | | | 171,873 | | | | | | | | | | | | | | | | | | | | 150,000 | | | | 171,873 | |
Devon Financing Co. LLC | | | 7.88 | % | | | 9/30/2031 | | | | - | | | | - | | | | | | | | 100,000 | | | | 116,367 | | | | | | | | | | | | | | | | | | | | 100,000 | | | | 116,367 | |
Ecopetrol SA | | | 4.13 | % | | | 1/16/2025 | | | | - | | | | - | | | | | | | | 100,000 | | | | 90,470 | | | | | | | | | | | | | | | | | | | | 100,000 | | | | 90,470 | |
Ecopetrol SA | | | 5.38 | % | | | 6/26/2026 | | | | - | | | | - | | | | | | | | 116,000 | | | | 112,810 | | | | | | | | | | | | | | | | | | | | 116,000 | | | | 112,810 | |
Ecopetrol SA | | | 5.88 | % | | | 9/18/2023 | | | | - | | | | - | | | | | | | | 71,000 | | | | 73,130 | | | | | | | | | | | | | | | | | | | | 71,000 | | | | 73,130 | |
Encana Corp. | | | 6.50 | % | | | 8/15/2034 | | | | - | | | | - | | | | | | | | 40,000 | | | | 40,098 | | | | | | | | | | | | | | | | | | | | 40,000 | | | | 40,098 | |
Encana Corp. | | | 6.50 | % | | | 5/15/2019 | | | | - | | | | - | | | | | | | | 40,000 | | | | 42,400 | | | | | | | | | | | | | | | | | | | | 40,000 | | | | 42,400 | |
Energy Transfer Partners, LP | | | 2.50 | % | | | 6/15/2018 | | | | 110,000 | | | | 109,492 | | | | | | | | - | | | | - | | | | | | | | | | | | | | | | | | | | 110,000 | | | | 109,492 | |
Energy Transfer Partners, LP | | | 3.60 | % | | | 2/1/2023 | | | | - | | | | - | | | | | | | | 143,000 | | | | 137,029 | | | | | | | | | | | | | | | | | | | | 143,000 | | | | 137,029 | |
Energy Transfer Partners, LP | | | 4.75 | % | | | 1/15/2026 | | | | - | | | | - | | | | | | | | 123,000 | | | | 126,494 | | | | | | | | | | | | | | | | | | | | 123,000 | | | | 126,494 | |
Energy Transfer Partners, LP | | | 5.15 | % | | | 3/15/2045 | | | | - | | | | - | | | | | | | | 39,000 | | | | 35,439 | | | | | | | | | | | | | | | | | | | | 39,000 | | | | 35,439 | |
Eni SpA | | | 5.70 | % | | | 10/1/2040 | | | | - | | | | - | | | | | | | | 125,000 | | | | 130,820 | | | | | | | | | | | | | | | | | | | | 125,000 | | | | 130,820 | |
EnLink Midstream Partners, LP | | | 2.70 | % | | | 4/1/2019 | | | | - | | | | - | | | | | | | | 131,000 | | | | 127,322 | | | | | | | | | | | | | | | | | | | | 131,000 | | | | 127,322 | |
EnLink Midstream Partners, LP | | | 4.15 | % | | | 6/1/2025 | | | | - | | | | - | | | | | | | | 238,000 | | | | 219,344 | | | | | | | | | | | | | | | | | | | | 238,000 | | | | 219,344 | |
EnLink Midstream Partners, LP | | | 5.05 | % | | | 4/1/2045 | | | | - | | | | - | | | | | | | | 58,000 | | | | 47,392 | | | | | | | | | | | | | | | | | | | | 58,000 | | | | 47,392 | |
Enterprise Products Operating LLC | | | 1.65 | % | | | 5/7/2018 | | | | 220,000 | | | | 220,185 | | | | | | | | - | | | | - | | | | | | | | | | | | | | | | | | | | 220,000 | | | | 220,185 | |
Enterprise Products Operating LLC | | | 3.35 | % | | | 3/15/2023 | | | | - | | | | - | | | | | | | | 304,000 | | | | 312,290 | | | | | | | | | | | | | | | | | | | | 304,000 | | | | 312,290 | |
Enterprise Products Operating LLC | | | 3.75 | % | | | 2/15/2025 | | | | - | | | | - | | | | | | | | 110,000 | | | | 114,728 | | | | | | | | | | | | | | | | | | | | 110,000 | | | | 114,728 | |
Enterprise Products Operating LLC | | | 3.90 | % | | | 2/15/2024 | | | | - | | | | - | | | | | | | | 158,000 | | | | 167,220 | | | | | | | | | | | | | | | | | | | | 158,000 | | | | 167,220 | |
Enterprise Products Operating LLC | | | 4.90 | % | | | 5/15/2046 | | | | - | | | | - | | | | | | | | 36,000 | | | | 38,784 | | | | | | | | | | | | | | | | | | | | 36,000 | | | | 38,784 | |
Enterprise Products Operating LLC | | | 4.95 | % | | | 10/15/2054 | | | | - | | | | - | | | | | | | | 46,000 | | | | 46,487 | | | | | | | | | | | | | | | | | | | | 46,000 | | | | 46,487 | |
Enterprise Products Operating LLC | | | 5.10 | % | | | 2/15/2045 | | | | - | | | | - | | | | | | | | 39,000 | | | | 42,682 | | | | | | | | | | | | | | | | | | | | 39,000 | | | | 42,682 | |
Enterprise Products Operating LLC | | | 5.25 | % | | | 1/31/2020 | | | | - | | | | - | | | | | | | | - | | | | - | | | | | | | | | | | | | | | | | | | | - | | | | - | |
Enterprise Products Operating LLC | | | 5.75 | % | | | 3/1/2035 | | | | - | | | | - | | | | | | | | 200,000 | | | | 220,689 | | | | | | | | | | | | | | | | | | | | 200,000 | | | | 220,689 | |
Enterprise Products Operating LLC | | | 5.95 | % | | | 2/1/2041 | | | | - | | | | - | | | | | | | | 36,000 | | | | 42,246 | | | | | | | | | | | | | | | | | | | | 36,000 | | | | 42,246 | |
EOG Resources, Inc. | | | 2.63 | % | | | 3/15/2023 | | | | - | | | | - | | | | | | | | 36,000 | | | | 35,861 | | | | | | | | | | | | | | | | | | | | 36,000 | | | | 35,861 | |
EOG Resources, Inc. | | | 5.10 | % | | | 1/15/2036 | | | | - | | | | - | | | | | | | | 157,000 | | | | 179,155 | | | | | | | | | | | | | | | | | | | | 157,000 | | | | 179,155 | |
Exxon Mobil Corp. | | | 1.71 | % | | | 3/1/2019 | | | | 260,000 | | | | 264,224 | | | | | | | | - | | | | - | | | | | | | | | | | | | | | | | | | | 260,000 | | | | 264,224 | |
Exxon Mobil Corp. | | | 2.40 | % | | | 3/6/2022 | | | | - | | | | - | | | | | | | | 300,000 | | | | 307,679 | | | | | | | | | | | | | | | | | | | | 300,000 | | | | 307,679 | |
Exxon Mobil Corp. | | | 2.73 | % | | | 3/1/2023 | | | | - | | | | - | | | | | | | | 235,000 | | | | 245,342 | | | | | | | | | | | | | | | | | | | | 235,000 | | | | 245,342 | |
Exxon Mobil Corp. | | | 4.11 | % | | | 3/1/2046 | | | | - | | | | - | | | | | | | | 128,000 | | | | 144,361 | | | | | | | | | | | | | | | | | | | | 128,000 | | | | 144,361 | |
Hess Corp. | | | 7.88 | % | | | 10/1/2029 | | | | - | | | | - | | | | | | | | 25,000 | | | | 29,775 | | | | | | | | | | | | | | | | | | | | 25,000 | | | | 29,775 | |
Kerr-McGee Corp. | | | 7.88 | % | | | 9/15/2031 | | | | - | | | | - | | | | | | | | 250,000 | | | | 297,863 | | | | | | | | | | | | | | | | | | | | 250,000 | | | | 297,863 | |
Kinder Morgan, Inc. | | | 2.00 | % | | | 12/1/2017 | | | | 186,000 | | | | 185,005 | | | | | | | | - | | | | - | | | | | | | | | | | | | | | | | | | | 186,000 | | | | 185,005 | |
Magellan Midstream Partners, LP | | | 3.20 | % | | | 3/15/2025 | | | | - | | | | - | | | | | | | | 68,000 | | | | 67,480 | | | | | | | | | | | | | | | | | | | | 68,000 | | | | 67,480 | |
Magellan Midstream Partners, LP | | | 4.25 | % | | | 2/1/2021 | | | | - | | | | - | | | | | | | | 167,000 | | | | 180,726 | | | | | | | | | | | | | | | | | | | | 167,000 | | | | 180,726 | |
Magellan Midstream Partners, LP | | | 5.15 | % | | | 10/15/2043 | | | | - | | | | - | | | | | | | | 178,000 | | | | 189,925 | | | | | | | | | | | | | | | | | | | | 178,000 | | | | 189,925 | |
Marathon Oil Corp. | | | 2.80 | % | | | 11/1/2022 | | | | - | | | | - | | | | | | | | 160,000 | | | | 145,108 | | | | | | | | | | | | | | | | | | | | 160,000 | | | | 145,108 | |
Marathon Oil Corp. | | | 6.60 | % | | | 10/1/2037 | | | | - | | | | - | | | | | | | | 130,000 | | | | 131,420 | | | | | | | | | | | | | | | | | | | | 130,000 | | | | 131,420 | |
Marathon Petroleum Corp. | | | 3.63 | % | | | 9/15/2024 | | | | - | | | | - | | | | | | | | 145,000 | | | | 142,389 | | | | | | | | | | | | | | | | | | | | 145,000 | | | | 142,389 | |
Noble Energy, Inc. | | | 4.15 | % | | | 12/15/2021 | | | | - | | | | - | | | | | | | | 120,000 | | | | 126,177 | | | | | | | | | | | | | | | | | | | | 120,000 | | | | 126,177 | |
Noble Energy, Inc. | | | 5.05 | % | | | 11/15/2044 | | | | - | | | | - | | | | | | | | 100,000 | | | | 100,703 | | | | | | | | | | | | | | | | | | | | 100,000 | | | | 100,703 | |
Noble Energy, Inc. | | | 5.63 | % | | | 5/1/2021 | | | | - | | | | - | | | | | | | | 74,000 | | | | 77,085 | | | | | | | | | | | | | | | | | | | | 74,000 | | | | 77,085 | |
Occidental Petroleum Corp. | | | 2.70 | % | | | 2/15/2023 | | | | - | | | | - | | | | | | | | 40,000 | | | | 40,669 | | | | | | | | | | | | | | | | | | | | 40,000 | | | | 40,669 | |
Occidental Petroleum Corp. | | | 3.40 | % | | | 4/15/2026 | | | | - | | | | - | | | | | | | | 46,000 | | | | 48,516 | | | | | | | | | | | | | | | | | | | | 46,000 | | | | 48,516 | |
Occidental Petroleum Corp. | | | 3.50 | % | | | 6/15/2025 | | | | - | | | | - | | | | | | | | 91,000 | | | | 96,162 | | | | | | | | | | | | | | | | | | | | 91,000 | | | | 96,162 | |
Occidental Petroleum Corp. | | | 4.63 | % | | | 6/15/2045 | | | | - | | | | - | | | | | | | | 39,000 | | | | 43,490 | | | | | | | | | | | | | | | | | | | | 39,000 | | | | 43,490 | |
ONEOK Partners, LP | | | 3.20 | % | | | 9/15/2018 | | | | - | | | | - | | | | | | | | 105,000 | | | | 106,104 | | | | | | | | | | | | | | | | | | | | 105,000 | | | | 106,104 | |
ONEOK Partners, LP | | | 3.38 | % | | | 10/1/2022 | | | | - | | | | - | | | | | | | | 95,000 | | | | 92,948 | | | | | | | | | | | | | | | | | | | | 95,000 | | | | 92,948 | |
ONEOK Partners, LP | | | 4.90 | % | | | 3/15/2025 | | | | - | | | | - | | | | | | | | 470,000 | | | | 492,878 | | | | | | | | | | | | | | | | | | | | 470,000 | | | | 492,878 | |
ONEOK Partners, LP | | | 6.65 | % | | | 10/1/2036 | | | | - | | | | - | | | | | | | | 210,000 | | | | 219,792 | | | | | | | | | | | | | | | | | | | | 210,000 | | | | 219,792 | |
Petrobras Global Finance BV | | | 7.88 | % | | | 3/15/2019 | | | | - | | | | - | | | | | | | | 100,000 | | | | 103,250 | | | | | | | | | | | | | | | | | | | | 100,000 | | | | 103,250 | |
Petro-Canada | | | 6.05 | % | | | 5/15/2018 | | | | - | | | | - | | | | | | | | 40,000 | | | | 43,019 | | | | | | | | | | | | | | | | | | | | 40,000 | | | | 43,019 | |
Petro-Canada | | | 6.80 | % | | | 5/15/2038 | | | | - | | | | - | | | | | | | | 50,000 | | | | 65,041 | | | | | | | | | | | | | | | | | | | | 50,000 | | | | 65,041 | |
Petroleos Mexicanos | | | 4.25 | % | | | 1/15/2025 | | | | - | | | | - | | | | | | | | 67,000 | | | | 64,521 | | | | | | | | | | | | | | | | | | | | 67,000 | | | | 64,521 | |
Petroleos Mexicanos | | | 4.50 | % | | | 1/23/2026 | | | | - | | | | - | | | | | | | | 205,000 | | | | 197,292 | | | | | | | | | | | | | | | | | | | | 205,000 | | | | 197,292 | |
Petroleos Mexicanos | | | 4.88 | % | | | 1/18/2024 | | | | - | | | | - | | | | | | | | 44,000 | | | | 44,607 | | | | | | | | | | | | | | | | | | | | 44,000 | | | | 44,607 | |
Petroleos Mexicanos | | | 5.63 | % | | | 1/23/2046 | | | | - | | | | - | | | | | | | | 129,000 | | | | 117,583 | | | | | | | | | | | | | | | | | | | | 129,000 | | | | 117,583 | |
Petroleos Mexicanos | | | 6.38 | % | | | 1/23/2045 | | | | - | | | | - | | | | | | | | 106,000 | | | | 106,530 | | | | | | | | | | | | | | | | | | | | 106,000 | | | | 106,530 | |
Petroleos Mexicanos | | | 6.38 | % | | | 2/4/2021 | | | | - | | | | - | | | | | | | | 112,000 | | | | 121,778 | | | | | | | | | | | | | | | | | | | | 112,000 | | | | 121,778 | |
Petroleos Mexicanos | | | 6.88 | % | | | 8/4/2026 | | | | - | | | | - | | | | | | | | 120,000 | | | | 134,160 | | | | | | | | | | | | | | | | | | | | 120,000 | | | | 134,160 | |
Phillips 66 | | | 2.95 | % | | | 5/1/2017 | | | | - | | | | - | | | | | | | | 33,000 | | | | 33,483 | | | | | | | | | | | | | | | | | | | | 33,000 | | | | 33,483 | |
Phillips 66 | | | 4.30 | % | | | 4/1/2022 | | | | - | | | | - | | | | | | | | 17,000 | | | | 18,567 | | | | | | | | | | | | | | | | | | | | 17,000 | | | | 18,567 | |
Plains All American Pipeline, LP / PAA Finance Corp. | | | 2.60 | % | | | 12/15/2019 | | | | - | | | | - | | | | | | | | 71,000 | | | | 69,170 | | | | | | | | | | | | | | | | | | | | 71,000 | | | | 69,170 | |
Plains All American Pipeline, LP / PAA Finance Corp. | | | 3.60 | % | | | 11/1/2024 | | | | - | | | | - | | | | | | | | 250,000 | | | | 234,774 | | | | | | | | | | | | | | | | | | | | 250,000 | | | | 234,774 | |
Plains All American Pipeline, LP / PAA Finance Corp. | | | 4.65 | % | | | 10/15/2025 | | | | - | | | | - | | | | | | | | 350,000 | | | | 353,376 | | | | | | | | | | | | | | | | | | | | 350,000 | | | | 353,376 | |
Plains All American Pipeline, LP / PAA Finance Corp. | | | 4.90 | % | | | 2/15/2045 | | | | - | | | | - | | | | | | | | 162,000 | | | | 144,817 | | | | | | | | | | | | | | | | | | | | 162,000 | | | | 144,817 | |
Shell International Finance BV | | | 1.13 | % | | | 8/21/2017 | | | | - | | | | - | | | | | | | | 85,000 | | | | 85,257 | | | | | | | | | | | | | | | | | | | | 85,000 | | | | 85,257 | |
Shell International Finance BV | | | 1.38 | % | | | 5/10/2019 | | | | 225,000 | | | | 225,782 | | | | | | | | - | | | | - | | | | | | | | | | | | | | | | | | | | 225,000 | | | | 225,782 | |
Shell International Finance BV | | | 1.63 | % | | | 11/10/2018 | | | | 141,000 | | | | 142,430 | | | | | | | | - | | | | - | | | | | | | | | | | | | | | | | | | | 141,000 | | | | 142,430 | |
Shell International Finance BV | | | 2.13 | % | | | 5/11/2020 | | | | 110,000 | | | | 112,269 | | | | | | | | 175,000 | | | | 178,610 | | | | | | | | | | | | | | | | | | | | 285,000 | | | | 290,879 | |
Shell International Finance BV | | | 2.88 | % | | | 5/10/2026 | | | | - | | | | - | | | | | | | | 440,000 | | | | 447,032 | | | | | | | | | | | | | | | | | | | | 440,000 | | | | 447,032 | |
Shell International Finance BV | | | 4.00 | % | | | 5/10/2046 | | | | - | | | | - | | | | | | | | 444,000 | | | | 452,839 | | | | | | | | | | | | | | | | | | | | 444,000 | | | | 452,839 | |
Shell International Finance BV | | | 4.13 | % | | | 5/11/2035 | | | | - | | | | - | | | | | | | | 253,000 | | | | 272,831 | | | | | | | | | | | | | | | | | | | | 253,000 | | | | 272,831 | |
Shell International Finance BV | | | 6.38 | % | | | 12/15/2038 | | | | - | | | | - | | | | | | | | 150,000 | | | | 203,768 | | | | | | | | | | | | | | | | | | | | 150,000 | | | | 203,768 | |
Sinopec Group Overseas Development, Ltd. | | | 4.38 | % | | | 10/17/2023 | | | | - | | | | - | | | | | | | | 208,000 | | | | 224,533 | | | | | | | | | | | | | | | | | | | | 208,000 | | | | 224,533 | |
Spectra Energy Capital LLC | | | 3.30 | % | | | 3/15/2023 | | | | - | | | | - | | | | | | | | 130,000 | | | | 124,938 | | | | | | | | | | | | | | | | | | | | 130,000 | | | | 124,938 | |
Spectra Energy Capital LLC | | | 5.65 | % | | | 3/1/2020 | | | | - | | | | - | | | | | | | | 150,000 | | | | 160,736 | | | | | | | | | | | | | | | | | | | | 150,000 | | | | 160,736 | |
Spectra Energy Capital LLC | | | 7.50 | % | | | 9/15/2038 | | | | - | | | | - | | | | | | | | 140,000 | | | | 160,303 | | | | | | | | | | | | | | | | | | | | 140,000 | | | | 160,303 | |
Spectra Energy Capital LLC | | | 8.00 | % | | | 10/1/2019 | | | | - | | | | - | | | | | | | | 120,000 | | | | 137,762 | | | | | | | | | | | | | | | | | | | | 120,000 | | | | 137,762 | |
Spectra Energy Partners, LP | | | 2.95 | % | | | 9/25/2018 | | | | - | | | | - | | | | | | | | 80,000 | | | | 81,534 | | | | | | | | | | | | | | | | | | | | 80,000 | | | | 81,534 | |
Spectra Energy Partners, LP | | | 3.50 | % | | | 3/15/2025 | | | | - | | | | - | | | | | | | | 125,000 | | | | 127,878 | | | | | | | | | | | | | | | | | | | | 125,000 | | | | 127,878 | |
Spectra Energy Partners, LP | | | 5.95 | % | | | 9/25/2043 | | | | - | | | | - | | | | | | | | 63,000 | | | | 74,485 | | | | | | | | | | | | | | | | | | | | 63,000 | | | | 74,485 | |
Statoil ASA | | | 1.15 | % | | | 5/15/2018 | | | | - | | | | - | | | | | | | | 167,000 | | | | 167,150 | | | | | | | | | | | | | | | | | | | | 167,000 | | | | 167,150 | |
Statoil ASA | | | 1.25 | % | | | 11/9/2017 | | | | 162,000 | | | | 162,402 | | | | | | | | - | | | | - | | | | | | | | | | | | | | | | | | | | 162,000 | | | | 162,402 | |
Statoil ASA | | | 1.95 | % | | | 11/8/2018 | | | | 118,000 | | | | 119,603 | | | | | | | | - | | | | - | | | | | | | | | | | | | | | | | | | | 118,000 | | | | 119,603 | |
Statoil ASA | | | 2.65 | % | | | 1/15/2024 | | | | - | | | | - | | | | | | | | 214,000 | | | | 215,985 | | | | | | | | | | | | | | | | | | | | 214,000 | | | | 215,985 | |
Statoil ASA | | | 2.75 | % | | | 11/10/2021 | | | | - | | | | - | | | | | | | | 31,000 | | | | 32,413 | | | | | | | | | | | | | | | | | | | | 31,000 | | | | 32,413 | |
Statoil ASA | | | 3.15 | % | | | 1/23/2022 | | | | - | | | | - | | | | | | | | 33,000 | | | | 34,646 | | | | | | | | | | | | | | | | | | | | 33,000 | | | | 34,646 | |
Statoil ASA | | | 3.25 | % | | | 11/10/2024 | | | | - | | | | - | | | | | | | | 107,000 | | | | 112,997 | | | | | | | | | | | | | | | | | | | | 107,000 | | | | 112,997 | |
Statoil ASA | | | 4.25 | % | | | 11/23/2041 | | | | - | | | | - | | | | | | | | 27,000 | | | | 28,421 | | | | | | | | | | | | | | | | | | | | 27,000 | | | | 28,421 | |
Suncor Energy, Inc. | | | 3.60 | % | | | 12/1/2024 | | | | - | | | | - | | | | | | | | 210,000 | | | | 220,852 | | | | | | | | | | | | | | | | | | | | 210,000 | | | | 220,852 | |
Sunoco Logistics Partners Operations, LP | | | 4.25 | % | | | 4/1/2024 | | | | - | | | | - | | | | | | | | 47,000 | | | | 47,476 | | | | | | | | | | | | | | | | | | | | 47,000 | | | | 47,476 | |
Sunoco Logistics Partners Operations, LP | | | 4.95 | % | | | 1/15/2043 | | | | - | | | | - | | | | | | | | 198,000 | | | | 183,083 | | | | | | | | | | | | | | | | | | | | 198,000 | | | | 183,083 | |
Sunoco Logistics Partners Operations, LP | | | 5.30 | % | | | 4/1/2044 | | | | - | | | | - | | | | | | | | 50,000 | | | | 49,194 | | | | | | | | | | | | | | | | | | | | 50,000 | | | | 49,194 | |
Sunoco Logistics Partners Operations, LP | | | 5.35 | % | | | 5/15/2045 | | | | - | | | | - | | | | | | | | 133,000 | | | | 131,794 | | | | | | | | | | | | | | | | | | | | 133,000 | | | | 131,794 | |
Sunoco Logistics Partners Operations, LP | | | 5.50 | % | | | 2/15/2020 | | | | - | | | | - | | | | | | | | 180,000 | | | | 193,938 | | | | | | | | | | | | | | | | | | | | 180,000 | | | | 193,938 | |
Sunoco Logistics Partners Operations, LP | | | 5.95 | % | | | 12/1/2025 | | | | - | | | | - | | | | | | | | 100,000 | | | | 112,286 | | | | | | | | | | | | | | | | | | | | 100,000 | | | | 112,286 | |
Tosco Corp. | | | 7.80 | % | | | 1/1/2027 | | | | - | | | | - | | | | | | | | 100,000 | | | | 126,650 | | | | | | | | | | | | | | | | | | | | 100,000 | | | | 126,650 | |
Total Capital Canada, Ltd. | | | 2.75 | % | | | 7/15/2023 | | | | - | | | | - | | | | | | | | 70,000 | | | | 71,944 | | | | | | | | | | | | | | | | | | | | 70,000 | | | | 71,944 | |
Total Capital International SA | | | 1.50 | % | | | 2/17/2017 | | | | - | | | | - | | | | | | | | 55,000 | | | | 55,163 | | | | | | | | | | | | | | | | | | | | 55,000 | | | | 55,163 | |
Total Capital International SA | | | 1.55 | % | | | 6/28/2017 | | | | - | | | | - | | | | | | | | 66,000 | | | | 66,343 | | | | | | | | | | | | | | | | | | | | 66,000 | | | | 66,343 | |
Total Capital International SA | | | 2.70 | % | | | 1/25/2023 | | | | - | | | | - | | | | | | | | 150,000 | | | | 154,275 | | | | | | | | | | | | | | | | | | | | 150,000 | | | | 154,275 | |
Total Capital International SA | | | 2.75 | % | | | 6/19/2021 | | | | - | | | | - | | | | | | | | 250,000 | | | | 259,880 | | | | | | | | | | | | | | | | | | | | 250,000 | | | | 259,880 | |
Total Capital International SA | | | 3.75 | % | | | 4/10/2024 | | | | - | | | | - | | | | | | | | 29,000 | | | | 31,920 | | | | | | | | | | | | | | | | | | | | 29,000 | | | | 31,920 | |
TransCanada PipeLines, Ltd. | | | 1.88 | % | | | 1/12/2018 | | | | 132,000 | | | | 132,633 | | | | | | | | 51,000 | | | | 51,245 | | | | | | | | | | | | | | | | | | | | 183,000 | | | | 183,878 | |
TransCanada PipeLines, Ltd. | | | 3.13 | % | | | 1/15/2019 | | | | - | | | | - | | | | | | | | 112,000 | | | | 115,672 | | | | | | | | | | | | | | | | | | | | 112,000 | | | | 115,672 | |
TransCanada PipeLines, Ltd. | | | 3.75 | % | | | 10/16/2023 | | | | - | | | | - | | | | | | | | 100,000 | | | | 107,058 | | | | | | | | | | | | | | | | | | | | 100,000 | | | | 107,058 | |
TransCanada PipeLines, Ltd. | | | 4.88 | % | | | 1/15/2026 | | | | - | | | | - | | | | | | | | 162,000 | | | | 185,003 | | | | | | | | | | | | | | | | | | | | 162,000 | | | | 185,003 | |
TransCanada PipeLines, Ltd. | | | 6.20 | % | | | 10/15/2037 | | | | - | | | | - | | | | | | | | 100,000 | | | | 122,426 | | | | | | | | | | | | | | | | | | | | 100,000 | | | | 122,426 | |
TransCanada PipeLines, Ltd. | | | 7.13 | % | | | 1/15/2019 | | | | - | | | | - | | | | | | | | 70,000 | | | | 78,786 | | | | | | | | | | | | | | | | | | | | 70,000 | | | | 78,786 | |
Western Gas Partners, LP | | | 4.65 | % | | | 7/1/2026 | | | | - | | | | - | | | | | | | | 76,000 | | | | 76,685 | | | | | | | | | | | | | | | | | | | | 76,000 | | | | 76,685 | |
Western Gas Partners, LP | | | 5.38 | % | | | 6/1/2021 | | | | - | | | | - | | | | | | | | 69,000 | | | | 72,750 | | | | | | | | | | | | | | | | | | | | 69,000 | | | | 72,750 | |
Western Gas Partners, LP | | | 5.45 | % | | | 4/1/2044 | | | | - | | | | - | | | | | | | | 118,000 | | | | 110,663 | | | | | | | | | | | | | | | | | | | | 118,000 | | | | 110,663 | |
24
| | | | | | | | | | | | | | | | | | | | | | | | | | | | | | | | | | | | | | | | | | | | | | | | | | | | |
| | | | | | | | | Voya Limited
Maturity Bond VP | | | | | | JPMorgan Core
Bond VP | | | | | | Adjustments | | | | | | Combined Pro
Forma Portfolio | |
| | | | | | | | | | | | | |
| | | Coupon Rate | | | Maturity Date | | | Principal | | | Value | | | | | | Principal | | | Value | | | | | | Principal | | | Value | | | | | | Principal | | | Value | |
| | | | | | | | | | | | | | | | | | | | | | | | | | | | | | | | |
Pharmaceuticals | | | | | | | | | | | | | | | | | | | | | | | | | | | | | | | | | | | | | | | | | | | | | | | | | | | | |
Actavis Funding SCS | | | 2.35 | % | | | 3/12/2018 | | | $ | 215,000 | | | $ | 217,930 | | | | | | | $ | - | | | $ | - | | | | | | | | | | | | | | | | | | | $ | 215,000 | | | $ | 217,930 | |
Actavis Funding SCS | | | 3.45 | % | | | 3/15/2022 | | | | - | | | | - | | | | | | | | 302,000 | | | | 313,645 | | | | | | | | | | | | | | | | | | | | 302,000 | | | | 313,645 | |
Actavis Funding SCS | | | 4.55 | % | | | 3/15/2035 | | | | - | | | | - | | | | | | | | 217,000 | | | | 223,015 | | | | | | | | | | | | | | | | | | | | 217,000 | | | | 223,015 | |
Actavis, Inc. | | | 3.25 | % | | | 10/1/2022 | | | | - | | | | - | | | | | | | | 38,000 | | | | 38,824 | | | | | | | | | | | | | | | | | | | | 38,000 | | | | 38,824 | |
Allergan, Inc. | | | 2.80 | % | | | 3/15/2023 | | | | - | | | | - | | | | | | | | 250,000 | | | | 248,572 | | | | | | | | | | | | | | | | | | | | 250,000 | | | | 248,572 | |
Allergan, Inc. | | | 3.38 | % | | | 9/15/2020 | | | | - | | | | - | | | | | | | | 91,000 | | | | 94,900 | | | | | | | | | | | | | | | | | | | | 91,000 | | | | 94,900 | |
AstraZeneca PLC | | | 1.75 | % | | | 11/16/2018 | | | | 160,000 | | | | 162,113 | | | | | | | | - | | | | - | | | | | | | | | | | | | | | | | | | | 160,000 | | | | 162,113 | |
Baxalta, Inc. | | | 2.00 | % | | | 6/22/2018 | | | | 170,000 | | | | 170,087 | | | | | | | | - | | | | - | | | | | | | | | | | | | | | | | | | | 170,000 | | | | 170,087 | |
Baxalta, Inc. | | | 3.60 | % | | | 6/23/2022 | | | | - | | | | - | | | | | | | | 67,000 | | | | 69,149 | | | | | | | | | | | | | | | | | | | | 67,000 | | | | 69,149 | |
Baxalta, Inc. | | | 5.25 | % | | | 6/23/2045 | | | | - | | | | - | | | | | | | | 28,000 | | | | 30,370 | | | | | | | | | | | | | | | | | | | | 28,000 | | | | 30,370 | |
Bayer US Finance LLC | | | 1.50 | % | | | 10/6/2017 | | | | 200,000 | | | | 200,186 | | | | | | | | - | | | | - | | | | | | | | | | | | | | | | | | | | 200,000 | | | | 200,186 | |
Bayer US Finance LLC | | | 3.38 | % | | | 10/8/2024 | | | | - | | | | - | | | | | | | | 200,000 | | | | 207,899 | | | | | | | | | | | | | | | | | | | | 200,000 | | | | 207,899 | |
ELI Lilly & Co. | | | 1.25 | % | | | 3/1/2018 | | | | 125,000 | | | | 125,939 | | | | | | | | - | | | | - | | | | | | | | | | | | | | | | | | | | 125,000 | | | | 125,939 | |
Forest Laboratories LLC | | | 5.00 | % | | | 12/15/2021 | | | | - | | | | - | | | | | | | | 139,000 | | | | 155,560 | | | | | | | | | | | | | | | | | | | | 139,000 | | | | 155,560 | |
Johnson & Johnson | | | 3.55 | % | | | 3/1/2036 | | | | - | | | | - | | | | | | | | 90,000 | | | | 99,432 | | | | | | | | | | | | | | | | | | | | 90,000 | | | | 99,432 | |
Merck & Co., Inc. | | | 2.35 | % | | | 2/10/2022 | | | | - | | | | - | | | | | | | | 86,000 | | | | 88,588 | | | | | | | | | | | | | | | | | | | | 86,000 | | | | 88,588 | |
Merck & Co., Inc. | | | 2.40 | % | | | 9/15/2022 | | | | - | | | | - | | | | | | | | 62,000 | | | | 63,760 | | | | | | | | | | | | | | | | | | | | 62,000 | | | | 63,760 | |
Merck & Co., Inc. | | | 2.80 | % | | | 5/18/2023 | | | | - | | | | - | | | | | | | | 94,000 | | | | 98,682 | | | | | | | | | | | | | | | | | | | | 94,000 | | | | 98,682 | |
Merck & Co., Inc. | | | 3.70 | % | | | 2/10/2045 | | | | - | | | | - | | | | | | | | 20,000 | | | | 21,193 | | | | | | | | | | | | | | | | | | | | 20,000 | | | | 21,193 | |
Mylan NV | | | 2.50 | % | | | 6/7/2019 | | | | 162,000 | | | | 164,151 | | | | | | | | - | | | | - | | | | | | | | | | | | | | | | | | | | 162,000 | | | | 164,151 | |
Mylan NV | | | 3.95 | % | | | 6/15/2026 | | | | - | | | | - | | | | | | | | 93,000 | | | | 94,115 | | | | | | | | | | | | | | | | | | | | 93,000 | | | | 94,115 | |
Mylan NV | | | 5.25 | % | | | 6/15/2046 | | | | - | | | | - | | | | | | | | 64,000 | | | | 66,668 | | | | | | | | | | | | | | | | | | | | 64,000 | | | | 66,668 | |
Mylan, Inc. | | | 3.13 | % | | | 1/15/2023 | | | | - | | | | - | | | | | | | | 50,000 | | | | 49,650 | | | | | | | | | | | | | | | | | | | | 50,000 | | | | 49,650 | |
Pfizer, Inc. | | | 1.10 | % | | | 5/15/2017 | | | | 249,000 | | | | 249,542 | | | | | | | | - | | | | - | | | | | | | | | | | | | | | | | | | | 249,000 | | | | 249,542 | |
Pfizer, Inc. | | | 1.45 | % | | | 6/3/2019 | | | | 159,000 | | | | 160,324 | | | | | | | | - | | | | - | | | | | | | | | | | | | | | | | | | | 159,000 | | | | 160,324 | |
Sanofi | | | 1.25 | % | | | 4/10/2018 | | | | 240,000 | | | | 241,481 | | | | | | | | - | | | | - | | | | | | | | | | | | | | | | | | | | 240,000 | | | | 241,481 | |
Zoetis, Inc. | | | 1.88 | % | | | 2/1/2018 | | | | 172,000 | | | | 172,504 | | | | | | | | 26,000 | | | | 26,076 | | | | | | | | | | | | | | | | | | | | 198,000 | | | | 198,580 | |
Zoetis, Inc. | | | 3.25 | % | | | 2/1/2023 | | | | - | | | | - | | | | | | | | 130,000 | | | | 132,473 | | | | | | | | | | | | | | | | | | | | 130,000 | | | | 132,473 | |
Zoetis, Inc. | | | 3.45 | % | | | 11/13/2020 | | | | - | | | | - | | | | | | | | 37,000 | | | | 38,198 | | | | | | | | | | | | | | | | | | | | 37,000 | | | | 38,198 | |
Zoetis, Inc. | | | 4.50 | % | | | 11/13/2025 | | | | - | | | | - | | | | | | | | 70,000 | | | | 77,199 | | | | | | | | | | | | | | | | | | | | 70,000 | | | | 77,199 | |
Zoetis, Inc. | | | 4.70 | % | | | 2/1/2043 | | | | - | | | | - | | | | | | | | 26,000 | | | | 25,762 | | | | | | | | | | | | | | | | | | | | 26,000 | | | | 25,762 | |
Professional Services | | | | | | | | | | | | | | | | | | | | | | | | | | | | | | | | | | | | | | | | | | | | | | | | | | | | |
Equifax, Inc. | | | 2.30 | % | | | 6/1/2021 | | | | - | | | | - | | | | | | | | 57,000 | | | | 57,806 | | | | | | | | | | | | | | | | | | | | 57,000 | | | | 57,806 | |
Real Estate Investment Trusts | | | | | | | | | | | | | | | | | | | | | | | | | | | | | | | | | | | | | | | | | | | | | | | | | | | | |
American Tower Corp. | | | 3.38 | % | | | 10/15/2026 | | | | - | | | | - | | | | | | | | 100,000 | | | | 100,520 | | | | | | | | | | | | | | | | | | | | 100,000 | | | | 100,520 | |
American Tower Corp. | | | 3.50 | % | | | 1/31/2023 | | | | - | | | | - | | | | | | | | 100,000 | | | | 103,475 | | | | | | | | | | | | | | | | | | | | 100,000 | | | | 103,475 | |
American Tower Corp. | | | 4.70 | % | | | 3/15/2022 | | | | - | | | | - | | | | | | | | 70,000 | | | | 77,247 | | | | | | | | | | | | | | | | | | | | 70,000 | | | | 77,247 | |
American Tower Corp. | | | 5.00 | % | | | 2/15/2024 | | | | - | | | | - | | | | | | | | 57,000 | | | | 64,467 | | | | | | | | | | | | | | | | | | | | 57,000 | | | | 64,467 | |
AvalonBay Communities, Inc. | | | 2.85 | % | | | 3/15/2023 | | | | - | | | | - | | | | | | | | 130,000 | | | | 132,061 | | | | | | | | | | | | | | | | | | | | 130,000 | | | | 132,061 | |
Boston Properties, LP | | | 3.65 | % | | | 2/1/2026 | | | | - | | | | - | | | | | | | | 74,000 | | | | 78,863 | | | | | | | | | | | | | | | | | | | | 74,000 | | | | 78,863 | |
Crown Castle International Corp. | | | 4.88 | % | | | 4/15/2022 | | | | - | | | | - | | | | | | | | 130,000 | | | | 142,766 | | | | | | | | | | | | | | | | | | | | 130,000 | | | | 142,766 | |
Crown Castle International Corp. | | | 5.25 | % | | | 1/15/2023 | | | | - | | | | - | | | | | | | | 70,000 | | | | 78,544 | | | | | | | | | | | | | | | | | | | | 70,000 | | | | 78,544 | |
Duke Realty, LP | | | 3.25 | % | | | 6/30/2026 | | | | - | | | | - | | | | | | | | 43,000 | | | | 43,597 | | | | | | | | | | | | | | | | | | | | 43,000 | | | | 43,597 | |
Equity Commonwealth | | | 5.88 | % | | | 9/15/2020 | | | | - | | | | - | | | | | | | | 312,000 | | | | 346,431 | | | | | | | | | | | | | | | | | | | | 312,000 | | | | 346,431 | |
ERP Operating, LP | | | 3.00 | % | | | 4/15/2023 | | | | - | | | | - | | | | | | | | 50,000 | | | | 51,350 | | | | | | | | | | | | | | | | | | | | 50,000 | | | | 51,350 | |
ERP Operating, LP | | | 4.63 | % | | | 12/15/2021 | | | | - | | | | - | | | | | | | | 46,000 | | | | 51,944 | | | | | | | | | | | | | | | | | | | | 46,000 | | | | 51,944 | |
HCP, Inc. | | | 2.63 | % | | | 2/1/2020 | | | | - | | | | - | | | | | | | | 76,000 | | | | 76,609 | | | | | | | | | | | | | | | | | | | | 76,000 | | | | 76,609 | |
HCP, Inc. | | | 3.40 | % | | | 2/1/2025 | | | | - | | | | - | | | | | | | | 95,000 | | | | 91,858 | | | | | | | | | | | | | | | | | | | | 95,000 | | | | 91,858 | |
HCP, Inc. | | | 3.88 | % | | | 8/15/2024 | | | | - | | | | - | | | | | | | | 176,000 | | | | 176,976 | | | | | | | | | | | | | | | | | | | | 176,000 | | | | 176,976 | |
HCP, Inc. | | | 4.20 | % | | | 3/1/2024 | | | | - | | | | - | | | | | | | | 30,000 | | | | 30,898 | | | | | | | | | | | | | | | | | | | | 30,000 | | | | 30,898 | |
HCP, Inc. | | | 4.25 | % | | | 11/15/2023 | | | | - | | | | - | | | | | | | | 58,000 | | | | 60,193 | | | | | | | | | | | | | | | | | | | | 58,000 | | | | 60,193 | |
Kilroy Realty, LP | | | 4.80 | % | | | 7/15/2018 | | | | 64,000 | | | | 67,241 | | | | | | | | - | | | | - | | | | | | | | | | | | | | | | | | | | 64,000 | | | | 67,241 | |
National Retail Properties, Inc. | | | 4.00 | % | | | 11/15/2025 | | | | - | | | | - | | | | | | | | 204,000 | | | | 216,453 | | | | | | | | | | | | | | | | | | | | 204,000 | | | | 216,453 | |
Prologis, LP | | | 3.75 | % | | | 11/1/2025 | | | | - | | | | - | | | | | | | | 32,000 | | | | 34,107 | | | | | | | | | | | | | | | | | | | | 32,000 | | | | 34,107 | |
Prologis, LP | | | 4.25 | % | | | 8/15/2023 | | | | - | | | | - | | | | | | | | 76,000 | | | | 84,154 | | | | | | | | | | | | | | | | | | | | 76,000 | | | | 84,154 | |
Realty Income Corp. | | | 3.25 | % | | | 10/15/2022 | | | | - | | | | - | | | | | | | | 390,000 | | | | 399,949 | | | | | | | | | | | | | | | | | | | | 390,000 | | | | 399,949 | |
Scentre Group Trust 1 / Scentre Group Trust 2 | | | 2.38 | % | | | 11/5/2019 | | | | 188,000 | | | | 190,776 | | | | | | | | - | | | | - | | | | | | | | | | | | | | | | | | | | 188,000 | | | | 190,776 | |
Simon Property Group, LP | | | 2.15 | % | | | 9/15/2017 | | | | - | | | | - | | | | | | | | 167,000 | | | | 168,747 | | | | | | | | | | | | | | | | | | | | 167,000 | | | | 168,747 | |
Simon Property Group, LP | | | 3.75 | % | | | 2/1/2024 | | | | - | | | | - | | | | | | | | 200,000 | | | | 218,150 | | | | | | | | | | | | | | | | | | | | 200,000 | | | | 218,150 | |
Simon Property Group, LP | | | 4.13 | % | | | 12/1/2021 | | | | - | | | | - | | | | | | | | 67,000 | | | | 74,278 | | | | | | | | | | | | | | | | | | | | 67,000 | | | | 74,278 | |
Ventas Realty, LP | | | 1.25 | % | | | 4/17/2017 | | | | 205,000 | | | | 205,057 | | | | | | | | - | | | | - | | | | | | | | | | | | | | | | | | | | 205,000 | | | | 205,057 | |
Ventas Realty, LP | | | 3.50 | % | | | 2/1/2025 | | | | - | | | | - | | | | | | | | 54,000 | | | | 55,354 | | | | | | | | | | | | | | | | | | | | 54,000 | | | | 55,354 | |
Ventas Realty, LP | | | 3.75 | % | | | 5/1/2024 | | | | - | | | | - | | | | | | | | 44,000 | | | | 45,992 | | | | | | | | | | | | | | | | | | | | 44,000 | | | | 45,992 | |
Ventas Realty, LP | | | 4.13 | % | | | 1/15/2026 | | | | - | | | | - | | | | | | | | 45,000 | | | | 48,359 | | | | | | | | | | | | | | | | | | | | 45,000 | | | | 48,359 | |
Ventas Realty, LP / Ventas Capital Corp. | | | 3.25 | % | | | 8/15/2022 | | | | - | | | | - | | | | | | | | 170,000 | | | | 175,690 | | | | | | | | | | | | | | | | | | | | 170,000 | | | | 175,690 | |
WEA Finance LLC / Westfield UK & Europe Finance PLC | | | 1.75 | % | | | 9/15/2017 | | | | 200,000 | | | | 200,578 | | | | | | | | - | | | | - | | | | | | | | | | | | | | | | | | | | 200,000 | | | | 200,578 | |
Welltower, Inc. | | | 4.00 | % | | | 6/1/2025 | | | | - | | | | - | | | | | | | | 74,000 | | | | 77,775 | | | | | | | | | | | | | | | | | | | | 74,000 | | | | 77,775 | |
Welltower, Inc. | | | 4.25 | % | | | 4/1/2026 | | | | - | | | | - | | | | | | | | 200,000 | | | | 215,006 | | | | | | | | | | | | | | | | | | | | 200,000 | | | | 215,006 | |
Welltower, Inc. | | | 4.50 | % | | | 1/15/2024 | | | | - | | | | - | | | | | | | | 73,000 | | | | 79,159 | | | | | | | | | | | | | | | | | | | | 73,000 | | | | 79,159 | |
Road & Rail | | | | | | | | | | | | | | | | | | | | | | | | | | | | | | | | | | | | | | | | | | | | | | | | | | | | |
Burlington Northern Santa Fe LLC | | | 3.00 | % | | | 3/15/2023 | | | | - | | | | - | | | | | | | | 50,000 | | | | 52,583 | | | | | | | | | | | | | | | | | | | | 50,000 | | | | 52,583 | |
Burlington Northern Santa Fe LLC | | | 3.05 | % | | | 3/15/2022 | | | | - | | | | - | | | | | | | | 87,000 | | | | 92,751 | | | | | | | | | | | | | | | | | | | | 87,000 | | | | 92,751 | |
Burlington Northern Santa Fe LLC | | | 3.45 | % | | | 9/15/2021 | | | | - | | | | - | | | | | | | | 22,000 | | | | 23,842 | | | | | | | | | | | | | | | | | | | | 22,000 | | | | 23,842 | |
Burlington Northern Santa Fe LLC | | | 3.60 | % | | | 9/1/2020 | | | | - | | | | - | | | | | | | | 25,000 | | | | 26,863 | | | | | | | | | | | | | | | | | | | | 25,000 | | | | 26,863 | |
Burlington Northern Santa Fe LLC | | | 3.75 | % | | | 4/1/2024 | | | | - | | | | - | | | | | | | | 124,000 | | | | 137,011 | | | | | | | | | | | | | | | | | | | | 124,000 | | | | 137,011 | |
Burlington Northern Santa Fe LLC | | | 4.38 | % | | | 9/1/2042 | | | | - | | | | - | | | | | | | | 88,000 | | | | 97,840 | | | | | | | | | | | | | | | | | | | | 88,000 | | | | 97,840 | |
Burlington Northern Santa Fe LLC | | | 5.15 | % | | | 9/1/2043 | | | | - | | | | - | | | | | | | | 154,000 | | | | 187,953 | | | | | | | | | | | | | | | | | | | | 154,000 | | | | 187,953 | |
Burlington Northern Santa Fe LLC | | | 5.65 | % | | | 5/1/2017 | | | | - | | | | - | | | | | | | | 50,000 | | | | 51,934 | | | | | | | | | | | | | | | | | | | | 50,000 | | | | 51,934 | |
Burlington Northern Santa Fe LLC | | | 6.70 | % | | | 8/1/2028 | | | | - | | | | - | | | | | | | | 50,000 | | | | 68,417 | | | | | | | | | | | | | | | | | | | | 50,000 | | | | 68,417 | |
Canadian Pacific Railway Co. | | | 2.90 | % | | | 2/1/2025 | | | | - | | | | - | | | | | | | | 208,000 | | | | 211,218 | | | | | | | | | | | | | | | | | | | | 208,000 | | | | 211,218 | |
Canadian Pacific Railway Co. | | | 4.50 | % | | | 1/15/2022 | | | | - | | | | - | | | | | | | | 370,000 | | | | 408,222 | | | | | | | | | | | | | | | | | | | | 370,000 | | | | 408,222 | |
Canadian Pacific Railway Co. | | | 6.13 | % | | | 9/15/2115 | | | | - | | | | - | | | | | | | | 27,000 | | | | 33,661 | | | | | | | | | | | | | | | | | | | | 27,000 | | | | 33,661 | |
Canadian Pacific Railway Co. | | | 7.13 | % | | | 10/15/2031 | | | | - | | | | - | | | | | | | | 50,000 | | | | 70,049 | | | | | | | | | | | | | | | | | | | | 50,000 | | | | 70,049 | |
CSX Corp. | | | 3.40 | % | | | 8/1/2024 | | | | - | | | | - | | | | | | | | 350,000 | | | | 376,159 | | | | | | | | | | | | | | | | | | | | 350,000 | | | | 376,159 | |
CSX Corp. | | | 3.95 | % | | | 5/1/2050 | | | | - | | | | - | | | | | | | | 42,000 | | | | 42,040 | | | | | | | | | | | | | | | | | | | | 42,000 | | | | 42,040 | |
CSX Corp. | | | 4.10 | % | | | 3/15/2044 | | | | - | | | | - | | | | | | | | 16,000 | | | | 17,093 | | | | | | | | | | | | | | | | | | | | 16,000 | | | | 17,093 | |
CSX Corp. | | | 4.25 | % | | | 6/1/2021 | | | | - | | | | - | | | | | | | | 22,000 | | | | 24,107 | | | | | | | | | | | | | | | | | | | | 22,000 | | | | 24,107 | |
CSX Corp. | | | 5.50 | % | | | 4/15/2041 | | | | - | | | | - | | | | | | | | 37,000 | | | | 47,391 | | | | | | | | | | | | | | | | | | | | 37,000 | | | | 47,391 | |
CSX Corp. | | | 7.90 | % | | | 5/1/2017 | | | | - | | | | - | | | | | | | | 60,000 | | | | 63,325 | | | | | | | | | | | | | | | | | | | | 60,000 | | | | 63,325 | |
Norfolk Southern Corp. | | | 3.25 | % | | | 12/1/2021 | | | | - | | | | - | | | | | | | | 55,000 | | | | 58,152 | | | | | | | | | | | | | | | | | | | | 55,000 | | | | 58,152 | |
Norfolk Southern Corp. | | | 3.95 | % | | | 10/1/2042 | | | | - | | | | - | | | | | | | | 35,000 | | | | 36,111 | | | | | | | | | | | | | | | | | | | | 35,000 | | | | 36,111 | |
Norfolk Southern Corp. | | | 6.00 | % | | | 3/15/2105 | | | | - | | | | - | | | | | | | | 140,000 | | | | 168,240 | | | | | | | | | | | | | | | | | | | | 140,000 | | | | 168,240 | |
Norfolk Southern Corp. | | | 6.00 | % | | | 5/23/2111 | | | | - | | | | - | | | | | | | | 150,000 | | | | 184,879 | | | | | | | | | | | | | | | | | | | | 150,000 | | | | 184,879 | |
Union Pacific Corp. | | | 2.95 | % | | | 1/15/2023 | | | | - | | | | - | | | | | | | | 16,000 | | | | 16,940 | | | | | | | | | | | | | | | | | | | | 16,000 | | | | 16,940 | |
Union Pacific Corp. | | | 3.65 | % | | | 2/15/2024 | | | | - | | | | - | | | | | | | | 37,000 | | | | 40,910 | | | | | | | | | | | | | | | | | | | | 37,000 | | | | 40,910 | |
Union Pacific Corp. | | | 4.16 | % | | | 7/15/2022 | | | | - | | | | - | | | | | | | | 7,000 | | | | 7,878 | | | | | | | | | | | | | | | | | | | | 7,000 | | | | 7,878 | |
Union Pacific Corp. | | | 4.30 | % | | | 6/15/2042 | | | | - | | | | - | | | | | | | | 20,000 | | | | 22,118 | | | | | | | | | | | | | | | | | | | | 20,000 | | | | 22,118 | |
Union Pacific Railroad Co. Pass-Through Trust | | | 2.70 | % | | | 5/12/2027 | | | | - | | | | - | | | | | | | | 289,699 | | | | 289,829 | | | | | | | | | | | | | | | | | | | | 289,699 | | | | 289,829 | |
Union Pacific Railroad Co. Pass-Through Trust | | | 4.70 | % | | | 1/2/2024 | | | | - | | | | - | | | | | | | | 53,474 | | | | 57,484 | | | | | | | | | | | | | | | | | | | | 53,474 | | | | 57,484 | |
25
| | | | | | | | | | | | | | | | | | | | | | | | | | | | | | | | | | | | | | | | | | | | | | | | | | | | |
| | | | | | | | | Voya Limited
Maturity Bond VP | | | | | | JPMorgan Core
Bond VP | | | | | | Adjustments | | | | | | Combined Pro
Forma Portfolio | |
| | | | | | | | | | | | | |
| | | Coupon Rate | | | Maturity Date | | | Principal | | | Value | | | | | | Principal | | | Value | | | | | | Principal | | | Value | | | | | | Principal | | | Value | |
| | | | | | | | | | | | | | | | | | | | | | | | | | | | | | | | |
Semiconductors & Semiconductor Equipment | | | | | | | | | | | | | | | | | | | | | | | | | | | | | | | | | | | | | | | | | | | | | | | | | | | | |
Altera Corp. | | | 1.75 | % | | | 5/15/2017 | | | $ | 191,000 | | | $ | 192,567 | | | | | | | $ | - | | | $ | - | | | | | | | | | | | | | | | | | | | $ | 191,000 | | | $ | 192,567 | |
Applied Materials, Inc. | | | 2.63 | % | | | 10/1/2020 | | | | 350,000 | | | | 363,919 | | | | | | | | - | | | | - | | | | | | | | | | | | | | | | | | | | 350,000 | | | | 363,919 | |
Intel Corp. | | | 1.35 | % | | | 12/15/2017 | | | | 260,000 | | | | 261,541 | | | | | | | | - | | | | - | | | | | | | | | | | | | | | | | | | | 260,000 | | | | 261,541 | |
Intel Corp. | | | 3.10 | % | | | 7/29/2022 | | | | - | | | | - | | | | | | | | 40,000 | | | | 42,829 | | | | | | | | | | | | | | | | | | | | 40,000 | | | | 42,829 | |
Intel Corp. | | | 3.30 | % | | | 10/1/2021 | | | | - | | | | - | | | | | | | | 46,000 | | | | 49,870 | | | | | | | | | | | | | | | | | | | | 46,000 | | | | 49,870 | |
Intel Corp. | | | 3.70 | % | | | 7/29/2025 | | | | - | | | | - | | | | | | | | 107,000 | | | | 118,847 | | | | | | | | | | | | | | | | | | | | 107,000 | | | | 118,847 | |
Intel Corp. | | | 4.00 | % | | | 12/15/2032 | | | | - | | | | - | | | | | | | | 221,000 | | | | 239,089 | | | | | | | | | | | | | | | | | | | | 221,000 | | | | 239,089 | |
KLA-Tencor Corp. | | | 2.38 | % | | | 11/1/2017 | | | | 162,000 | | | | 163,381 | | | | | | | | - | | | | - | | | | | | | | | | | | | | | | | | | | 162,000 | | | | 163,381 | |
Qualcomm, Inc. | | | 1.40 | % | | | 5/18/2018 | | | | 110,000 | | | | 110,978 | | | | | | | | - | | | | - | | | | | | | | | | | | | | | | | | | | 110,000 | | | | 110,978 | |
Texas Instruments, Inc. | | | 1.65 | % | | | 8/3/2019 | | | | - | | | | - | | | | | | | | 183,000 | | | | 185,409 | | | | | | | | | | | | | | | | | | | | 183,000 | | | | 185,409 | |
Software | | | | | | | | | | | | | | | | | | | | | | | | | | | | | | | | | | | | | | | | | | | | | | | | | | | | |
Intuit, Inc. | | | 5.75 | % | | | 3/15/2017 | | | | - | | | | - | | | | | | | | 215,000 | | | | 221,999 | | | | | | | | | | | | | | | | | | | | 215,000 | | | | 221,999 | |
Microsoft Corp. | | | 0.88 | % | | | 11/15/2017 | | | | - | | | | - | | | | | | | | 23,000 | | | | 23,030 | | | | | | | | | | | | | | | | | | | | 23,000 | | | | 23,030 | |
Microsoft Corp. | | | 1.30 | % | | | 11/3/2018 | | | | 250,000 | | | | 252,271 | | | | | | | | - | | | | - | | | | | | | | | | | | | | | | | | | | 250,000 | | | | 252,271 | |
Microsoft Corp. | | | 2.13 | % | | | 11/15/2022 | | | | - | | | | - | | | | | | | | 34,000 | | | | 34,546 | | | | | | | | | | | | | | | | | | | | 34,000 | | | | 34,546 | |
Microsoft Corp. | | | 2.38 | % | | | 5/1/2023 | | | | - | | | | - | | | | | | | | 146,000 | | | | 149,787 | | | | | | | | | | | | | | | | | | | | 146,000 | | | | 149,787 | |
Microsoft Corp. | | | 2.38 | % | | | 2/12/2022 | | | | - | | | | - | | | | | | | | 60,000 | | | | 61,922 | | | | | | | | | | | | | | | | | | | | 60,000 | | | | 61,922 | |
Microsoft Corp. | | | 3.50 | % | | | 2/12/2035 | | | | - | | | | - | | | | | | | | 55,000 | | | | 56,907 | | | | | | | | | | | | | | | | | | | | 55,000 | | | | 56,907 | |
Microsoft Corp. | | | 3.63 | % | | | 12/15/2023 | | | | - | | | | - | | | | | | | | 111,000 | | | | 123,017 | | | | | | | | | | | | | | | | | | | | 111,000 | | | | 123,017 | |
Microsoft Corp. | | | 4.00 | % | | | 2/12/2055 | | | | - | | | | - | | | | | | | | 57,000 | | | | 57,481 | | | | | | | | | | | | | | | | | | | | 57,000 | | | | 57,481 | |
Microsoft Corp. | | | 4.20 | % | | | 11/3/2035 | | | | - | | | | - | | | | | | | | 103,000 | | | | 116,657 | | | | | | | | | | | | | | | | | | | | 103,000 | | | | 116,657 | |
Microsoft Corp. | | | 4.75 | % | | | 11/3/2055 | | | | - | | | | - | | | | | | | | 109,000 | | | | 123,327 | | | | | | | | | | | | | | | | | | | | 109,000 | | | | 123,327 | |
Oracle Corp. | | | 1.20 | % | | | 10/15/2017 | | | | 260,000 | | | | 260,921 | | | | | | | | - | | | | - | | | | | | | | | | | | | | | | | | | | 260,000 | | | | 260,921 | |
Oracle Corp. | | | 2.40 | % | | | 9/15/2023 | | | | - | | | | - | | | | | | | | 101,000 | | | | 101,360 | | | | | | | | | | | | | | | | | | | | 101,000 | | | | 101,360 | |
Oracle Corp. | | | 2.80 | % | | | 7/8/2021 | | | | - | | | | - | | | | | | | | 281,000 | | | | 294,944 | | | | | | | | | | | | | | | | | | | | 281,000 | | | | 294,944 | |
Oracle Corp. | | | 2.95 | % | | | 5/15/2025 | | | | - | | | | - | | | | | | | | 450,000 | | | | 467,680 | | | | | | | | | | | | | | | | | | | | 450,000 | | | | 467,680 | |
Oracle Corp. | | | 3.85 | % | | | 7/15/2036 | | | | - | | | | - | | | | | | | | 200,000 | | | | 200,519 | | | | | | | | | | | | | | | | | | | | 200,000 | | | | 200,519 | |
Oracle Corp. | | | 4.30 | % | | | 7/8/2034 | | | | - | | | | - | | | | | | | | 407,000 | | | | 432,854 | | | | | | | | | | | | | | | | | | | | 407,000 | | | | 432,854 | |
Oracle Corp. | | | 5.75 | % | | | 4/15/2018 | | | | - | | | | - | | | | | | | | 100,000 | | | | 108,255 | | | | | | | | | | | | | | | | | | | | 100,000 | | | | 108,255 | |
Oracle Corp. | | | 6.13 | % | | | 7/8/2039 | | | | - | | | | - | | | | | | | | 82,000 | | | | 107,210 | | | | | | | | | | | | | | | | | | | | 82,000 | | | | 107,210 | |
Oracle Corp. | | | 6.50 | % | | | 4/15/2038 | | | | - | | | | - | | | | | | | | 30,000 | | | | 40,849 | | | | | | | | | | | | | | | | | | | | 30,000 | | | | 40,849 | |
Specialty Retail | | | | | | | | | | | | | | | | | | | | | | | | | | | | | | | | | | | | | | | | | | | | | | | | | | | | |
AutoZone, Inc. | | | 1.63 | % | | | 4/21/2019 | | | | 100,000 | | | | 100,520 | | | | | | | | - | | | | - | | | | | | | | | | | | | | | | | | | | 100,000 | | | | 100,520 | |
Bed Bath & Beyond, Inc. | | | 4.92 | % | | | 8/1/2034 | | | | - | | | | - | | | | | | | | 323,000 | | | | 300,037 | | | | | | | | | | | | | | | | | | | | 323,000 | | | | 300,037 | |
Gap, Inc. | | | 5.95 | % | | | 4/12/2021 | | | | - | | | | - | | | | | | | | 50,000 | | | | 52,149 | | | | | | | | | | | | | | | | | | | | 50,000 | | | | 52,149 | |
Home Depot, Inc. | | | 2.63 | % | | | 6/1/2022 | | | | - | | | | - | | | | | | | | 40,000 | | | | 41,862 | | | | | | | | | | | | | | | | | | | | 40,000 | | | | 41,862 | |
Home Depot, Inc. | | | 3.00 | % | | | 4/1/2026 | | | | - | | | | - | | | | | | | | 53,000 | | | | 56,327 | | | | | | | | | | | | | | | | | | | | 53,000 | | | | 56,327 | |
Home Depot, Inc. | | | 4.25 | % | | | 4/1/2046 | | | | - | | | | - | | | | | | | | 121,000 | | | | 138,719 | | | | | | | | | | | | | | | | | | | | 121,000 | | | | 138,719 | |
Lowe’s Cos., Inc. | | | 3.13 | % | | | 9/15/2024 | | | | - | | | | - | | | | | | | | 75,000 | | | | 80,500 | | | | | | | | | | | | | | | | | | | | 75,000 | | | | 80,500 | |
Lowe’s Cos., Inc. | | | 3.38 | % | | | 9/15/2025 | | | | - | | | | - | | | | | | | | 119,000 | | | | 130,131 | | | | | | | | | | | | | | | | | | | | 119,000 | | | | 130,131 | |
Lowe’s Cos., Inc. | | | 4.65 | % | | | 4/15/2042 | | | | - | | | | - | | | | | | | | 54,000 | | | | 62,925 | | | | | | | | | | | | | | | | | | | | 54,000 | | | | 62,925 | |
Lowe’s Cos., Inc. | | | 5.13 | % | | | 11/15/2041 | | | | - | | | | - | | | | | | | | 33,000 | | | | 40,612 | | | | | | | | | | | | | | | | | | | | 33,000 | | | | 40,612 | |
Lowe’s Cos., Inc. | | | 5.50 | % | | | 10/15/2035 | | | | - | | | | - | | | | | | | | 150,000 | | | | 186,951 | | | | | | | | | | | | | | | | | | | | 150,000 | | | | 186,951 | |
Technology Hardware, Storage & Peripherals | | | | | | | | | | | | | | | | | | | | | | | | | | | | | | | | | | | | | | | | | | | | | | | | | | | | |
Apple, Inc. | | | 0.89 | % | | | 5/3/2018 | | | | - | | | | - | | | | | | | | 138,000 | | | | 138,210 | | | | | | | | | | | | | | | | | | | | 138,000 | | | | 138,210 | |
Apple, Inc. | | | 2.15 | % | | | 2/9/2022 | | | | - | | | | - | | | | | | | | 273,000 | | | | 278,233 | | | | | | | | | | | | | | | | | | | | 273,000 | | | | 278,233 | |
Apple, Inc. | | | 2.40 | % | | | 5/3/2023 | | | | - | | | | - | | | | | | | | 256,000 | | | | 260,698 | | | | | | | | | | | | | | | | | | | | 256,000 | | | | 260,698 | |
Apple, Inc. | | | 2.85 | % | | | 5/6/2021 | | | | - | | | | - | | | | | | | | 252,000 | | | | 266,150 | | | | | | | | | | | | | | | | | | | | 252,000 | | | | 266,150 | |
Apple, Inc. | | | 2.85 | % | | | 2/23/2023 | | | | - | | | | - | | | | | | | | 80,000 | | | | 84,065 | | | | | | | | | | | | | | | | | | | | 80,000 | | | | 84,065 | |
Apple, Inc. | | | 3.20 | % | | | 5/13/2025 | | | | - | | | | - | | | | | | | | 192,000 | | | | 203,563 | | | | | | | | | | | | | | | | | | | | 192,000 | | | | 203,563 | |
Apple, Inc. | | | 3.45 | % | | | 2/9/2045 | | | | - | | | | - | | | | | | | | 125,000 | | | | 117,456 | | | | | | | | | | | | | | | | | | | | 125,000 | | | | 117,456 | |
Apple, Inc. | | | 4.50 | % | | | 2/23/2036 | | | | - | | | | - | | | | | | | | 85,000 | | | | 95,667 | | | | | | | | | | | | | | | | | | | | 85,000 | | | | 95,667 | |
Dell, Inc. | | | 7.10 | % | | | 4/15/2028 | | | | - | | | | - | | | | | | | | 25,000 | | | | 24,500 | | | | | | | | | | | | | | | | | | | | 25,000 | | | | 24,500 | |
Diamond 1 Finance Corp. / Diamond 2 Finance Corp. | | | 3.48 | % | | | 6/1/2019 | | | | 409,000 | | | | 418,984 | | | | | | | | - | | | | - | | | | | | | | | | | | | | | | | | | | 409,000 | | | | 418,984 | |
Diamond 1 Finance Corp. / Diamond 2 Finance Corp. | | | 4.42 | % | | | 6/15/2021 | | | | - | | | | - | | | | | | | | 115,000 | | | | 118,366 | | | | | | | | | | | | | | | | | | | | 115,000 | | | | 118,366 | |
Diamond 1 Finance Corp. / Diamond 2 Finance Corp. | | | 5.45 | % | | | 6/15/2023 | | | | - | | | | - | | | | | | | | 146,000 | | | | 151,486 | | | | | | | | | | | | | | | | | | | | 146,000 | | | | 151,486 | |
Diamond 1 Finance Corp. / Diamond 2 Finance Corp. | | | 6.02 | % | | | 6/15/2026 | | | | - | | | | - | | | | | | | | 129,000 | | | | 134,481 | | | | | | | | | | | | | | | | | | | | 129,000 | | | | 134,481 | |
Hewlett Packard Enterprise Co. | | | 2.45 | % | | | 10/5/2017 | | | | 91,000 | | | | 92,179 | | | | | | | | - | | | | - | | | | | | | | | | | | | | | | | | | | 91,000 | | | | 92,179 | |
Hewlett Packard Enterprise Co. | | | 2.85 | % | | | 10/5/2018 | | | | 68,000 | | | | 69,636 | | | | | | | | - | | | | - | | | | | | | | | | | | | | | | | | | | 68,000 | | | | 69,636 | |
HP, Inc. | | | 4.38 | % | | | 9/15/2021 | | | | - | | | | - | | | | | | | | 24,000 | | | | 25,852 | | | | | | | | | | | | | | | | | | | | 24,000 | | | | 25,852 | |
HP, Inc. | | | 6.00 | % | | | 9/15/2041 | | | | - | | | | - | | | | | | | | 82,000 | | | | 78,566 | | | | | | | | | | | | | | | | | | | | 82,000 | | | | 78,566 | |
NetApp, Inc. | | | 2.00 | % | | | 12/15/2017 | | | | 200,000 | | | | 200,907 | | | | | | | | - | | | | - | | | | | | | | | | | | | | | | | | | | 200,000 | | | | 200,907 | |
Tobacco | | | | | | | | | | | | | | | | | | | | | | | | | | | | | | | | | | | | | | | | | | | | | | | | | | | | |
Altria Group, Inc. | | | 2.63 | % | | | 1/14/2020 | | | | 213,000 | | | | 221,423 | | | | | | | | - | | | | - | | | | | | | | | | | | | | | | | | | | 213,000 | | | | 221,423 | |
BAT International Finance PLC | | | 1.85 | % | | | 6/15/2018 | | | | 180,000 | | | | 181,967 | | | | | | | | - | | | | - | | | | | | | | | | | | | | | | | | | | 180,000 | | | | 181,967 | |
Philip Morris International, Inc. | | | 1.25 | % | | | 11/9/2017 | | | | 240,000 | | | | 240,871 | | | | | | | | - | | | | - | | | | | | | | | | | | | | | | | | | | 240,000 | | | | 240,871 | |
Reynolds American, Inc. | | | 2.30 | % | | | 6/12/2018 | | | | 150,000 | | | | 152,406 | | | | | | | | - | | | | - | | | | | | | | | | | | | | | | | | | | 150,000 | | | | 152,406 | |
Reynolds American, Inc. | | | 3.50 | % | | | 8/4/2016 | | | | 90,000 | | | | 90,186 | | | | | | | | - | | | | - | | | | | | | | | | | | | | | | | | | | 90,000 | | | | 90,186 | |
Trading Companies & Distributors | | | | | | | | | | | | | | | | | | | | | | | | | | | | | | | | | | | | | | | | | | | | | | | | | | | | |
Air Lease Corp. | | | 2.13 | % | | | 1/15/2018 | | | | 183,000 | | | | 182,085 | | | | | | | | - | | | | - | | | | | | | | | | | | | | | | | | | | 183,000 | | | | 182,085 | |
Air Lease Corp. | | | 3.88 | % | | | 4/1/2021 | | | | - | | | | - | | | | | | | | 130,000 | | | | 133,900 | | | | | | | | | | | | | | | | | | | | 130,000 | | | | 133,900 | |
WW Grainger, Inc. | | | 4.60 | % | | | 6/15/2045 | | | | - | | | | - | | | | | | | | 128,000 | | | | 151,884 | | | | | | | | | | | | | | | | | | | | 128,000 | | | | 151,884 | |
26
| | | | | | | | | | | | | | | | | | | | | | | | | | | | | | | | | | | | | | | | | | | | | | | | | | | | |
| | | | | | | | | Voya Limited
Maturity Bond VP | | | | | | JPMorgan Core
Bond VP | | | | | | Adjustments | | | | | | Combined Pro
Forma Portfolio | |
| | | | | | | | | | | | | |
| | | Coupon Rate | | | Maturity Date | | | Principal | | | Value | | | | | | Principal | | | Value | | | | | | Principal | | | Value | | | | | | Principal | | | Value | |
| | | | | | | | | | | | | | | | | | | | | | | | | | | | | | | | |
Transportation Infrastructure | | | | | | | | | | | | | | | | | | | | | | | | | | | | | | | | | | | | | | | | | | | | | | | | | | | | |
Penske Truck Leasing Co., LP / PTL Finance Corp. | | | 2.88 | % | | | 7/17/2018 | | | $ | - | | | $ | - | | | | | | | $ | 53,000 | | | $ | 53,976 | | | | | | | | | | | | | | | | | | | $ | 53,000 | | | $ | 53,976 | |
Penske Truck Leasing Co., LP / PTL Finance Corp. | | | 3.38 | % | | | 2/1/2022 | | | | - | | | | - | | | | | | | | 277,000 | | | | 282,483 | | | | | | | | | | | | | | | | | | | | 277,000 | | | | 282,483 | |
Penske Truck Leasing Co., LP / PTL Finance Corp. | | | 4.25 | % | | | 1/17/2023 | | | | - | | | | - | | | | | | | | 100,000 | | | | 104,710 | | | | | | | | | | | | | | | | | | | | 100,000 | | | | 104,710 | |
Ryder System, Inc. | | | 2.50 | % | | | 3/1/2017 | | | | - | | | | - | | | | | | | | 23,000 | | | | 23,154 | | | | | | | | | | | | | | | | | | | | 23,000 | | | | 23,154 | |
Ryder System, Inc. | | | 2.50 | % | | | 3/1/2018 | | | | - | | | | - | | | | | | | | 25,000 | | | | 25,375 | | | | | | | | | | | | | | | | | | | | 25,000 | | | | 25,375 | |
Ryder System, Inc. | | | 2.50 | % | | | 5/11/2020 | | | | - | | | | - | | | | | | | | 113,000 | | | | 114,359 | | | | | | | | | | | | | | | | | | | | 113,000 | | | | 114,359 | |
Ryder System, Inc. | | | 2.65 | % | | | 3/2/2020 | | | | - | | | | - | | | | | | | | 79,000 | | | | 80,007 | | | | | | | | | | | | | | | | | | | | 79,000 | | | | 80,007 | |
Ryder System, Inc. | | | 2.88 | % | | | 9/1/2020 | | | | - | | | | - | | | | | | | | 69,000 | | | | 70,189 | | | | | | | | | | | | | | | | | | | | 69,000 | | | | 70,189 | |
Water Utilities | | | | | | | | | | | | | | | | | | | | | | | | | | | | | | | | | | | | | | | | | | | | | | | | | | | | |
American Water Capital Corp. | | | 3.40 | % | | | 3/1/2025 | | | | - | | | | - | | | | | | | | 183,000 | | | | 198,424 | | | | | | | | | | | | | | | | | | | | 183,000 | | | | 198,424 | |
Wireless Telecommunication Services | | | | | | | | | | | | | | | | | | | | | | | | | | | | | | | | | | | | | | | | | | | | | | | | | | | | |
America Movil SAB de CV | | | 6.13 | % | | | 3/30/2040 | | | | - | | | | - | | | | | | | | 100,000 | | | | 122,610 | | | | | | | | | | | | | | | | | | | | 100,000 | | | | 122,610 | |
Crown Castle Towers LLC | | | 3.22 | % | | | 5/15/2042 | | | | - | | | | - | | | | | | | | 125,000 | | | | 129,922 | | | | | | | | | | | | | | | | | | | | 125,000 | | | | 129,922 | |
Rogers Communications, Inc. | | | 3.63 | % | | | 12/15/2025 | | | | - | | | | - | | | | | | | | 76,000 | | | | 81,196 | | | | | | | | | | | | | | | | | | | | 76,000 | | | | 81,196 | |
Rogers Communications, Inc. | | | 4.10 | % | | | 10/1/2023 | | | | - | | | | - | | | | | | | | 176,000 | | | | 195,540 | | | | | | | | | | | | | | | | | | | | 176,000 | | | | 195,540 | |
Rogers Communications, Inc. | | | 8.75 | % | | | 5/1/2032 | | | | - | | | | - | | | | | | | | 50,000 | | | | 70,690 | | | | | | | | | | | | | | | | | | | | 50,000 | | | | 70,690 | |
Vodafone Group PLC | | | 1.50 | % | | | 2/19/2018 | | | | - | | | | - | | | | | | | | 125,000 | | | | 124,934 | | | | | | | | | | | | | | | | | | | | 125,000 | | | | 124,934 | |
Vodafone Group PLC | | | 5.63 | % | | | 2/27/2017 | | | | 155,000 | | | | 159,345 | | | | | | | | - | | | | - | | | | | | | | | | | | | | | | | | | | 155,000 | | | | 159,345 | |
Vodafone Group PLC | | | 6.25 | % | | | 11/30/2032 | | | | - | | | | - | | | | | | | | 180,000 | | | | 207,033 | | | | | | | | | | | | | | | | | | | | 180,000 | | | | 207,033 | |
| | | | | | | | | | | | | | | | | | | | | | | | | | | | | | | | | | | | |
Total Corporate Debt Securities | | | | | | | | | | | | | | | 41,383,322 | | | | | | | | | | | | 153,958,990 | | | | | | | | | | | | | | | | | | | | | | | | 195,342,312 | |
| | | | | | | | | | | | | | | | | | | | | | | | | | | | | | | | | | | | |
| | | | | | | | | | | | | |
($ | Total Cost
40,975,054 |
) | | | | | | | | | |
($ | Total Cost
147,658,939 |
) | | | | | | | | | | | | | | | | | | | | | |
($ | Total Cost
188,633,993 |
) |
Foreign Government Obligations - 1.0 % | | | | | | | | | | | | | | | | | | | | | | | | | | | | | | | | | | | | | | | | | | | | | | | | | | | | |
Canada | | | | | | | | | | | | | | | | | | | | | | | | | | | | | | | | | | | | | | | | | | | | | | | | | | | | |
Province of Ontario | | | 1.65 | % | | | 9/27/2019 | | | | - | | | | - | | | | | | | | 173,000 | | | | 175,345 | | | | | | | | | | | | | | | | | | | | 173,000 | | | | 175,345 | |
Colombia | | | | | | | | | | | | | | | | | | | | | | | | | | | | | | | | | | | | | | | | | | | | | | | | | | | | |
Colombia Government International Bond | | | 4.50 | % | | | 1/28/2026 | | | | - | | | | - | | | | | | | | 200,000 | | | | 213,000 | | | | | | | | | | | | | | | | | | | | 200,000 | | | | 213,000 | |
Colombia Government International Bond | | | 5.00 | % | | | 6/15/2045 | | | | - | | | | - | | | | | | | | 200,000 | | | | 207,500 | | | | | | | | | | | | | | | | | | | | 200,000 | | | | 207,500 | |
Israel | | | | | | | | | | | | | | | | | | | | | | | | | | | | | | | | | | | | | | | | | | | | | | | | | | | | |
Israel Government AID Bond | | | 0.00 | % | | | 2/15/2024 | | | | - | | | | - | | | | | | | | 1,000,000 | | | | 859,229 | | | | | | | | | | | | | | | | | | | | 1,000,000 | | | | 859,229 | |
Israel Government AID Bond | | | 0.00 | % | | | 2/15/2025 | | | | - | | | | - | | | | | | | | 1,000,000 | | | | 833,548 | | | | | | | | | | | | | | | | | | | | 1,000,000 | | | | 833,548 | |
Israel Government AID Bond | | | 0.00 | % | | | 8/15/2023 | | | | - | | | | - | | | | | | | | 980,000 | | | | 854,033 | | | | | | | | | | | | | | | | | | | | 980,000 | | | | 854,033 | |
Israel Government AID Bond | | | 0.00 | % | | | 8/15/2025 | | | | - | | | | - | | | | | | | | 1,000,000 | | | | 820,556 | | | | | | | | | | | | | | | | | | | | 1,000,000 | | | | 820,556 | |
Israel Government AID Bond | | | 0.00 | % | | | 2/15/2025 | | | | - | | | | - | | | | | | | | 500,000 | | | | 416,774 | | | | | | | | | | | | | | | | | | | | 500,000 | | | | 416,774 | |
Israel Government AID Bond | | | 5.50 | % | | | 9/18/2033 | | | | - | | | | - | | | | | | | | 100,000 | | | | 139,893 | | | | | | | | | | | | | | | | | | | | 100,000 | | | | 139,893 | |
Israel Government AID Bond, Principal Only STRIPS | | | 0.00 | % | | | 8/15/2023 | | | | - | | | | - | | | | | | | | 1,000,000 | | | | 871,812 | | | | | | | | | | | | | | | | | | | | 1,000,000 | | | | 871,812 | |
Mexico | | | | | | | | | | | | | | | | | | | | | | | | | | | | | | | | | | | | | | | | | | | | | | | | | | | | |
Mexico Government International Bond | | | 3.50 | % | | | 1/21/2021 | | | | - | | | | - | | | | | | | | 244,000 | | | | 257,420 | | | | | | | | | | | | | | | | | | | | 244,000 | | | | 257,420 | |
Mexico Government International Bond | | | 3.60 | % | | | 1/30/2025 | | | | - | | | | - | | | | | | | | 414,000 | | | | 432,630 | | | | | | | | | | | | | | | | | | | | 414,000 | | | | 432,630 | |
Mexico Government International Bond | | | 4.00 | % | | | 10/2/2023 | | | | - | | | | - | | | | | | | | 232,000 | | | | 249,760 | | | | | | | | | | | | | | | | | | | | 232,000 | | | | 249,760 | |
Mexico Government International Bond | | | 4.13 | % | | | 1/21/2026 | | | | - | | | | - | | | | | | | | 200,000 | | | | 216,800 | | | | | | | | | | | | | | | | | | | | 200,000 | | | | 216,800 | |
Mexico Government International Bond | | | 4.75 | % | | | 3/8/2044 | | | | - | | | | - | | | | | | | | 60,000 | | | | 64,650 | | | | | | | | | | | | | | | | | | | | 60,000 | | | | 64,650 | |
Mexico Government International Bond | | | 5.55 | % | | | 1/21/2045 | | | | - | | | | - | | | | | | | | 448,000 | | | | 536,480 | | | | | | | | | | | | | | | | | | | | 448,000 | | | | 536,480 | |
Peru | | | | | | | | | | | | | | | | | | | | | | | | | | | | | | | | | | | | | | | | | | | | | | | | | | | | |
Peru Government International Bond | | | 5.63 | % | | | 11/18/2050 | | | | - | | | | - | | | | | | | | 36,000 | | | | 44,640 | | | | | | | | | | | | | | | | | | | | 36,000 | | | | 44,640 | |
Poland | | | | | | | | | | | | | | | | | | | | | | | | | | | | | | | | | | | | | | | | | | | | | | | | | | | | |
Poland Government International Bond | | | 4.00 | % | | | 1/22/2024 | | | | - | | | | - | | | | | | | | 133,000 | | | | 143,640 | | | | | | | | | | | | | | | | | | | | 133,000 | | | | 143,640 | |
South Africa | | | | | | | | | | | | | | | | | | | | | | | | | | | | | | | | | | | | | | | | | | | | | | | | | | | | |
South Africa Government International Bond | | | 5.38 | % | | | 7/24/2044 | | | | - | | | | - | | | | | | | | 252,000 | | | | 263,703 | | | | | | | | | | | | | | | | | | | | 252,000 | | | | 263,703 | |
Supranational | | | | | | | | | | | | | | | | | | | | | | | | | | | | | | | | | | | | | | | | | | | | | | | | | | | | |
African Development Bank | | | 8.80 | % | | | 9/1/2019 | | | | - | | | | - | | | | | | | | 225,000 | | | | 273,556 | | | | | | | | | | | | | | | | | | | | 225,000 | | | | 273,556 | |
Turkey | | | | | | | | | | | | | | | | | | | | | | | | | | | | | | | | | | | | | | | | | | | | | | | | | | | | |
Turkey Government International Bond | | | 4.25 | % | | | 4/14/2026 | | | | - | | | | - | | | | | | | | 200,000 | | | | 203,030 | | | | | | | | | | | | | | | | | | | | 200,000 | | | | 203,030 | |
Turkey Government International Bond | | | 5.75 | % | | | 3/22/2024 | | | | - | | | | - | | | | | | | | 200,000 | | | | 223,022 | | | | | | | | | | | | | | | | | | | | 200,000 | | | | 223,022 | |
| | | | | | | | | | | | | | | | | | | | | | | | | | | | | | | | | | | | |
Total Foreign Government Obligations | | | | | | | | | | | | | | | - | | | | | | | | | | | | 8,301,021 | | | | | | | | | | | | | | | | | | | | | | | | 8,301,021 | |
| | | | | | | | | | | | | | | | | | | | | | | | | | | | | | | | | | | | |
| | | | | | | | | | | | | | | | | | | | | | | | | |
| Total Cost
($7,760,828 |
) | | | | | | | | | | | | | | | | | | | | | |
| Total Cost
($7,760,828 |
) |
27
| | | | | | | | | | | | | | | | | | | | | | | | | | | | | | | | | | | | | | | | | | | | | | | | | | | | |
| | | | | | | | | Voya Limited
Maturity Bond VP | | | | | | JPMorgan Core
Bond VP | | | | | | Adjustments | | | | | | Combined Pro
Forma Portfolio | |
| | | | | | | | | | | | | |
| | | Coupon Rate | | | Maturity Date | | | Principal | | | Value | | | | | | Principal | | | Value | | | | | | Principal | | | Value | | | | | | Principal | | | Value | |
| | | | | | | | | | | | | | | | | | | | | | | | | | | | | | | | |
Mortgage-Backed Securities - 4.5 % | | | | | | | | | | | | | | | | | | | | | | | | | | | | | | | | | | | | | | | | | | | | | | | | | | | | |
A10 Securitization LLC | | | 2.10 | % | | | 4/15/2034 | | | $ | - | | | $ | - | | | | | | | $ | 381,810 | | | $ | 380,583 | | | | | | | | | | | | | | | | | | | $ | 381,810 | | | $ | 380,583 | |
A10 Securitization LLC | | | 2.40 | % | | | 11/15/2025 | | | | - | | | | - | | | | | | | | 2,842 | | | | 2,841 | | | | | | | | | | | | | | | | | | | | 2,842 | | | | 2,841 | |
A10 Term Asset Financing LLC | | | 1.72 | % | | | 4/15/2033 | | | | - | | | | - | | | | | | | | 169,693 | | | | 168,682 | | | | | | | | | | | | | | | | | | | | 169,693 | | | | 168,682 | |
A10 Term Asset Financing LLC | | | 2.62 | % | | | 11/15/2027 | | | | - | | | | - | | | | | | | | 239,211 | | | | 237,974 | | | | | | | | | | | | | | | | | | | | 239,211 | | | | 237,974 | |
A10 Term Asset Financing LLC | | | 3.02 | % | | | 4/15/2033 | | | | - | | | | - | | | | | | | | 301,000 | | | | 296,297 | | | | | | | | | | | | | | | | | | | | 301,000 | | | | 296,297 | |
A10 Term Asset Financing LLC | | | 4.38 | % | | | 11/15/2027 | | | | - | | | | - | | | | | | | | 250,000 | | | | 245,775 | | | | | | | | | | | | | | | | | | | | 250,000 | | | | 245,775 | |
Access Point Funding Trust | | | 6.25 | % | | | 2/16/2021 | | | | - | | | | - | | | | | | | | 642,715 | | | | 642,715 | | | | | | | | | | | | | | | | | | | | 642,715 | | | | 642,715 | |
Ajax Mortgage Loan Trust | | | 3.50 | % | | | 2/25/2051 | | | | - | | | | - | | | | | | | | 257,425 | | | | 255,482 | | | | | | | | | | | | | | | | | | | | 257,425 | | | | 255,482 | |
Ajax Mortgage Loan Trust | | | 3.50 | % | | | 2/25/2051 | | | | - | | | | - | | | | | | | | 199,774 | | | | 198,510 | | | | | | | | | | | | | | | | | | | | 199,774 | | | | 198,510 | |
Ajax Mortgage Loan Trust | | | 3.75 | % | | | 10/25/2057 | | | | - | | | | - | | | | | | | | 385,102 | | | | 383,523 | | | | | | | | | | | | | | | | | | | | 385,102 | | | | 383,523 | |
Ajax Mortgage Loan Trust | | | 3.88 | % | | | 7/25/2060 | | | | - | | | | - | | | | | | | | 233,168 | | | | 230,807 | | | | | | | | | | | | | | | | | | | | 233,168 | | | | 230,807 | |
Alternative Loan Trust | | | 5.50 | % | | | 8/25/2035 | | | | - | | | | - | | | | | | | | 256,175 | | | | 231,528 | | | | | | | | | | | | | | | | | | | | 256,175 | | | | 231,528 | |
Alternative Loan Trust | | | 5.50 | % | | | 11/25/2035 | | | | - | | | | - | | | | | | | | 91,158 | | | | 79,765 | | | | | | | | | | | | | | | | | | | | 91,158 | | | | 79,765 | |
Alternative Loan Trust | | | 5.75 | % | | | 3/25/2034 | | | | - | | | | - | | | | | | | | 365,220 | | | | 362,417 | | | | | | | | | | | | | | | | | | | | 365,220 | | | | 362,417 | |
Alternative Loan Trust, Interest Only STRIPS | | | 4.30 | % | | | 7/25/2035 | | | | - | | | | - | | | | | | | | 428,208 | | | | 62,516 | | | | | | | | | | | | | | | | | | | | 428,208 | | | | 62,516 | |
Alternative Loan Trust, Interest Only STRIPS | | | 4.62 | % | | | 6/25/2035 | | | | - | | | | - | | | | | | | | 751,381 | | | | 132,478 | | | | | | | | | | | | | | | | | | | | 751,381 | | | | 132,478 | |
Alternative Loan Trust, Interest Only STRIPS | | | 4.65 | % | | | 2/25/2035 | | | | - | | | | - | | | | | | | | 206,295 | | | | 13,045 | | | | | | | | | | | | | | | | | | | | 206,295 | | | | 13,045 | |
Angel Oak Mortgage Trust LLC | | | 4.50 | % | | | 11/25/2045 | | | | - | | | | - | | | | | | | | 315,915 | | | | 316,894 | | | | | | | | | | | | | | | | | | | | 315,915 | | | | 316,894 | |
ASG Resecuritization Trust | | | 2.35 | % | | | 3/26/2037 | | | | - | | | | - | | | | | | | | 70,397 | | | | 69,847 | | | | | | | | | | | | | | | | | | | | 70,397 | | | | 69,847 | |
ASG Resecuritization Trust | | | 2.51 | % | | | 6/26/2037 | | | | - | | | | - | | | | | | | | 31,826 | | | | 31,612 | | | | | | | | | | | | | | | | | | | | 31,826 | | | | 31,612 | |
BAMLL Commercial Mortgage Securities Trust | | | 2.96 | % | | | 12/10/2030 | | | | - | | | | - | | | | | | | | 100,000 | | | | 104,707 | | | | | | | | | | | | | | | | | | | | 100,000 | | | | 104,707 | |
BAMLL Commercial Mortgage Securities Trust | | | 4.35 | % | | | 8/15/2046 | | | | - | | | | - | | | | | | | | 200,000 | | | | 195,431 | | | | | | | | | | | | | | | | | | | | 200,000 | | | | 195,431 | |
Banc of America Alternative Loan Trust | | | 5.00 | % | | | 9/25/2018 | | | | - | | | | - | | | | | | | | 7,344 | | | | 7,362 | | | | | | | | | | | | | | | | | | | | 7,344 | | | | 7,362 | |
Banc of America Alternative Loan Trust | | | 5.50 | % | | | 9/25/2033 | | | | - | | | | - | | | | | | | | 147,107 | | | | 148,352 | | | | | | | | | | | | | | | | | | | | 147,107 | | | | 148,352 | |
Banc of America Commercial Mortgage Trust | | | 5.41 | % | | | 9/10/2047 | | | | - | | | | - | | | | | | | | 175,859 | | | | 176,445 | | | | | | | | | | | | | | | | | | | | 175,859 | | | | 176,445 | |
Banc of America Commercial Mortgage Trust | | | 5.43 | % | | | 1/15/2049 | | | | 115,832 | | | | 117,294 | | | | | | | | - | | | | - | | | | | | | | | | | | | | | | | | | | 115,832 | | | | 117,294 | |
Banc of America Commercial Mortgage Trust | | | 5.49 | % | | | 2/10/2051 | | | | - | | | | - | | | | | | | | 252,413 | | | | 259,796 | | | | | | | | | | | | | | | | | | | | 252,413 | | | | 259,796 | |
Banc of America Commercial Mortgage Trust | | | 5.72 | % | | | 6/10/2049 | | | | 29,509 | | | | 29,994 | | | | | | | | - | | | | - | | | | | | | | | | | | | | | | | | | | 29,509 | | | | 29,994 | |
Banc of America Commercial Mortgage Trust | | | 5.72 | % | | | 6/10/2049 | | | | 21,524 | | | | 22,070 | | | | | | | | - | | | | - | | | | | | | | | | | | | | | | | | | | 21,524 | | | | 22,070 | |
Banc of America Commercial Mortgage Trust | | | 5.89 | % | | | 7/10/2044 | | | | - | | | | - | | | | | | | | 21,226 | | | | 21,202 | | | | | | | | | | | | | | | | | | | | 21,226 | | | | 21,202 | |
Banc of America Funding Trust | | | 2.89 | % | | | 3/20/2035 | | | | - | | | | - | | | | | | | | 147,394 | | | | 145,155 | | | | | | | | | | | | | | | | | | | | 147,394 | | | | 145,155 | |
Banc of America Funding Trust | | | 5.08 | % | | | 8/26/2035 | | | | - | | | | - | | | | | | | | 27,290 | | | | 27,379 | | | | | | | | | | | | | | | | | | | | 27,290 | | | | 27,379 | |
Banc of America Funding Trust, Principal Only STRIPS | | | 0.00 | % | | | 1/25/2036 | | | | - | | | | - | | | | | | | | 11,804 | | | | 8,161 | | | | | | | | | | | | | | | | | | | | 11,804 | | | | 8,161 | |
Banc of America Funding Trust, Principal Only STRIPS | | | 0.00 | % | | | 3/25/2034 | | | | - | | | | - | | | | | | | | 29,849 | | | | 24,165 | | | | | | | | | | | | | | | | | | | | 29,849 | | | | 24,165 | |
Banc of America Funding Trust, Principal Only STRIPS | | | 0.00 | % | | | 11/25/2035 | | | | - | | | | - | | | | | | | | 34,277 | | | | 27,433 | | | | | | | | | | | | | | | | | | | | 34,277 | | | | 27,433 | |
Banc of America Merrill Lynch Commercial Mortgage, Inc. | | | 4.73 | % | | | 7/10/2043 | | | | - | | | | - | | | | | | | | 7,441 | | | | 7,417 | | | | | | | | | | | | | | | | | | | | 7,441 | | | | 7,417 | |
Banc of America Mortgage Trust | | | 2.90 | % | | | 11/25/2033 | | | | - | | | | - | | | | | | | | 110,043 | | | | 109,493 | | | | | | | | | | | | | | | | | | | | 110,043 | | | | 109,493 | |
Banc of America Mortgage Trust | | | 5.50 | % | | | 4/25/2034 | | | | - | | | | - | | | | | | | | 25,063 | | | | 25,207 | | | | | | | | | | | | | | | | | | | | 25,063 | | | | 25,207 | |
Banc of America Re-REMIC Trust | | | 5.81 | % | | | 2/24/2051 | | | | 122,475 | | | | 123,382 | | | | | | | | - | | | | - | | | | | | | | | | | | | | | | | | | | 122,475 | | | | 123,382 | |
BB-UBS Trust | | | 2.89 | % | | | 6/5/2030 | | | | - | | | | - | | | | | | | | 350,000 | | | | 358,543 | | | | | | | | | | | | | | | | | | | | 350,000 | | | | 358,543 | |
BB-UBS Trust | | | 3.43 | % | | | 11/5/2036 | | | | - | | | | - | | | | | | | | 550,000 | | | | 585,297 | | | | | | | | | | | | | | | | | | | | 550,000 | | | | 585,297 | |
BCAP LLC Trust | | | 0.67 | % | | | 6/26/2047 | | | | - | | | | - | | | | | | | | 113,533 | | | | 110,151 | | | | | | | | | | | | | | | | | | | | 113,533 | | | | 110,151 | |
BCAP LLC Trust | | | 0.68 | % | | | 2/26/2037 | | | | - | | | | - | | | | | | | | 184,469 | | | | 178,291 | | | | | | | | | | | | | | | | | | | | 184,469 | | | | 178,291 | |
BCAP LLC Trust | | | 1.39 | % | | | 9/26/2037 | | | | - | | | | - | | | | | | | | 210,614 | | | | 203,252 | | | | | | | | | | | | | | | | | | | | 210,614 | | | | 203,252 | |
BCAP LLC Trust | | | 2.38 | % | | | 5/26/2037 | | | | - | | | | - | | | | | | | | 86,027 | | | | 85,729 | | | | | | | | | | | | | | | | | | | | 86,027 | | | | 85,729 | |
BCAP LLC Trust | | | 2.56 | % | | | 7/26/2045 | | | | - | | | | - | | | | | | | | 128,052 | | | | 127,109 | | | | | | | | | | | | | | | | | | | | 128,052 | | | | 127,109 | |
Bear Stearns Alt-A Trust | | | 1.09 | % | | | 7/25/2034 | | | | - | | | | - | | | | | | | | 353,370 | | | | 335,300 | | | | | | | | | | | | | | | | | | | | 353,370 | | | | 335,300 | |
Bear Stearns ARM Trust | | | 2.58 | % | | | 2/25/2036 | | | | - | | | | - | | | | | | | | 122,567 | | | | 119,429 | | | | | | | | | | | | | | | | | | | | 122,567 | | | | 119,429 | |
Bear Stearns Commercial Mortgage Securities Trust | | | 5.06 | % | | | 9/11/2042 | | | | 210,000 | | | | 211,265 | | | | | | | | - | | | | - | | | | | | | | | | | | | | | | | | | | 210,000 | | | | 211,265 | |
Bear Stearns Commercial Mortgage Securities Trust | | | 5.47 | % | | | 1/12/2045 | | | | 195,414 | | | | 198,824 | | | | | | | | - | | | | - | | | | | | | | | | | | | | | | | | | | 195,414 | | | | 198,824 | |
CD Commercial Mortgage Trust | | | 5.29 | % | | | 12/11/2049 | | | | 268,101 | | | | 272,071 | | | | | | | | - | | | | - | | | | | | | | | | | | | | | | | | | | 268,101 | | | | 272,071 | |
CD Mortgage Trust | | | 5.65 | % | | | 10/15/2048 | | | | 430,000 | | | | 433,191 | | | | | | | | - | | | | - | | | | | | | | | | | | | | | | | | | | 430,000 | | | | 433,191 | |
CD Mortgage Trust | | | 6.33 | % | | | 11/15/2044 | | | | 230,000 | | | | 236,464 | | | | | | | | - | | | | - | | | | | | | | | | | | | | | | | | | | 230,000 | | | | 236,464 | |
CD Mortgage Trust | | | 6.33 | % | | | 11/15/2044 | | | | 130,000 | | | | 133,537 | | | | | | | | - | | | | - | | | | | | | | | | | | | | | | | | | | 130,000 | | | | 133,537 | |
CGBAM Commercial Mortgage Trust | | | 1.24 | % | | | 2/15/2031 | | | | - | | | | - | | | | | | | | 166,182 | | | | 164,664 | | | | | | | | | | | | | | | | | | | | 166,182 | | | | 164,664 | |
Chase Mortgage Finance Trust | | | 2.71 | % | | | 7/25/2037 | | | | - | | | | - | | | | | | | | 64,796 | | | | 62,785 | | | | | | | | | | | | | | | | | | | | 64,796 | | | | 62,785 | |
Chase Mortgage Finance Trust | | | 2.89 | % | | | 2/25/2037 | | | | - | | | | - | | | | | | | | 149,451 | | | | 147,235 | | | | | | | | | | | | | | | | | | | | 149,451 | | | | 147,235 | |
CHL Mortgage Pass-Through Trust | | | 2.75 | % | | | 5/20/2034 | | | | - | | | | - | | | | | | | | 32,054 | | | | 30,282 | | | | | | | | | | | | | | | | | | | | 32,054 | | | | 30,282 | |
CHL Mortgage Pass-Through Trust | | | 2.76 | % | | | 11/25/2035 | | | | - | | | | - | | | | | | | | 197,484 | | | | 158,495 | | | | | | | | | | | | | | | | | | | | 197,484 | | | | 158,495 | |
CHL Mortgage Pass-Through Trust | | | 2.94 | % | | | 6/25/2034 | | | | - | | | | - | | | | | | | | 33,365 | | | | 32,556 | | | | | | | | | | | | | | | | | | | | 33,365 | | | | 32,556 | |
CHL Mortgage Pass-Through Trust | | | 4.50 | % | | | 6/25/2019 | | | | - | | | | - | | | | | | | | 14,648 | | | | 14,912 | | | | | | | | | | | | | | | | | | | | 14,648 | | | | 14,912 | |
CHL Mortgage Pass-Through Trust | | | 5.50 | % | | | 4/25/2034 | | | | - | | | | - | | | | | | | | 100,555 | | | | 104,818 | | | | | | | | | | | | | | | | | | | | 100,555 | | | | 104,818 | |
CHL Mortgage Pass-Through Trust | | | 5.75 | % | | | 4/25/2034 | | | | - | | | | - | | | | | | | | 60,333 | | | | 62,362 | | | | | | | | | | | | | | | | | | | | 60,333 | | | | 62,362 | |
Citigroup Commercial Mortgage Trust | | | 2.11 | % | | | 1/12/2030 | | | | - | | | | - | | | | | | | | 89,819 | | | | 90,459 | | | | | | | | | | | | | | | | | | | | 89,819 | | | | 90,459 | |
Citigroup Commercial Mortgage Trust | | | 5.43 | % | | | 10/15/2049 | | | | 126,336 | | | | 126,579 | | | | | | | | - | | | | - | | | | | | | | | | | | | | | | | | | | 126,336 | | | | 126,579 | |
Citigroup Commercial Mortgage Trust | | | 5.90 | % | | | 12/10/2049 | | | | 394,787 | | | | 407,301 | | | | | | | | - | | | | - | | | | | | | | | | | | | | | | | | | | 394,787 | | | | 407,301 | |
Citigroup Mortgage Loan Trust | | | 4.00 | % | | | 11/25/2036 | | | | - | | | | - | | | | | | | | 79,025 | | | | 79,239 | | | | | | | | | | | | | | | | | | | | 79,025 | | | | 79,239 | |
Citigroup Mortgage Loan Trust | | | 4.50 | % | | | 12/25/2036 | | | | - | | | | - | | | | | | | | 118,028 | | | | 118,755 | | | | | | | | | | | | | | | | | | | | 118,028 | | | | 118,755 | |
Citigroup Mortgage Loan Trust | | | 5.25 | % | | | 10/25/2033 | | | | - | | | | - | | | | | | | | 38,535 | | | | 38,986 | | | | | | | | | | | | | | | | | | | | 38,535 | | | | 38,986 | |
COBALT CMBS Commercial Mortgage Trust | | | 5.22 | % | | | 8/15/2048 | | | | - | | | | - | | | | | | | | 39,248 | | | | 39,363 | | | | | | | | | | | | | | | | | | | | 39,248 | | | | 39,363 | |
COBALT CMBS Commercial Mortgage Trust | | | 5.48 | % | | | 4/15/2047 | | | | 252,317 | | | | 257,023 | | | | | | | | - | | | | - | | | | | | | | | | | | | | | | | | | | 252,317 | | | | 257,023 | |
COMM Mortgage Trust | | | 1.25 | % | | | 8/13/2027 | | | | - | | | | - | | | | | | | | 198,000 | | | | 196,015 | | | | | | | | | | | | | | | | | | | | 198,000 | | | | 196,015 | |
COMM Mortgage Trust | | | 1.29 | % | | | 2/13/2032 | | | | - | | | | - | | | | | | | | 2,015,000 | | | | 2,002,185 | | | | | | | | | | | | | | | | | | | | 2,015,000 | | | | 2,002,185 | |
COMM Mortgage Trust | | | 2.05 | % | | | 2/13/2032 | | | | - | | | | - | | | | | | | | 500,000 | | | | 493,958 | | | | | | | | | | | | | | | | | | | | 500,000 | | | | 493,958 | |
COMM Mortgage Trust | | | 3.09 | % | | | 4/12/2035 | | | | - | | | | - | | | | | | | | 125,000 | | | | 131,254 | | | | | | | | | | | | | | | | | | | | 125,000 | | | | 131,254 | |
COMM Mortgage Trust | | | 3.76 | % | | | 8/10/2048 | | | | - | | | | - | | | | | | | | 422,000 | | | | 462,824 | | | | | | | | | | | | | | | | | | | | 422,000 | | | | 462,824 | |
COMM Mortgage Trust | | | 5.54 | % | | | 12/11/2049 | | | | 390,000 | | | | 392,727 | | | | | | | | - | | | | - | | | | | | | | | | | | | | | | | | | | 390,000 | | | | 392,727 | |
Commercial Mortgage Trust | | | 6.06 | % | | | 7/10/2038 | | | | - | | | | - | | | | | | | | 26,993 | | | | 26,967 | | | | | | | | | | | | | | | | | | | | 26,993 | | | | 26,967 | |
Credit Suisse First Boston Mortgage Securities Corp. | | | 5.25 | % | | | 11/25/2033 | | | | - | | | | - | | | | | | | | 55,881 | | | | 56,552 | | | | | | | | | | | | | | | | | | | | 55,881 | | | | 56,552 | |
Credit Suisse First Boston Mortgage Securities Corp. | | | 5.25 | % | | | 9/25/2033 | | | | - | | | | - | | | | | | | | 42,601 | | | | 43,679 | | | | | | | | | | | | | | | | | | | | 42,601 | | | | 43,679 | |
Credit Suisse First Boston Mortgage Securities Corp. | | | 5.25 | % | | | 8/25/2019 | | | | - | | | | - | | | | | | | | 19,210 | | | | 19,473 | | | | | | | | | | | | | | | | | | | | 19,210 | | | | 19,473 | |
CSMC Trust | | | 1.45 | % | | | 6/28/2047 | | | | - | | | | - | | | | | | | | 457,806 | | | | 438,978 | | | | | | | | | | | | | | | | | | | | 457,806 | | | | 438,978 | |
CSMC Trust | | | 2.50 | % | | | 7/27/2037 | | | | - | | | | - | | | | | | | | 36,628 | | | | 36,790 | | | | | | | | | | | | | | | | | | | | 36,628 | | | | 36,790 | |
CSMC Trust | | | 3.38 | % | | | 7/28/2036 | | | | - | | | | - | | | | | | | | 26,456 | | | | 26,577 | | | | | | | | | | | | | | | | | | | | 26,456 | | | | 26,577 | |
CSMC Trust | | | 5.34 | % | | | 12/15/2043 | | | | 200,000 | | | | 201,101 | | | | | | | | - | | | | - | | | | | | | | | | | | | | | | | | | | 200,000 | | | | 201,101 | |
CSMC Trust | | | 5.34 | % | | | 12/16/2043 | | | | 360,000 | | | | 361,070 | | | | | | | | - | | | | - | | | | | | | | | | | | | | | | | | | | 360,000 | | | | 361,070 | |
CSMC Trust | | | 5.38 | % | | | 2/15/2040 | | | | 279,827 | | | | 281,708 | | | | | | | | - | | | | - | | | | | | | | | | | | | | | | | | | | 279,827 | | | | 281,708 | |
DBRR Trust | | | 5.89 | % | | | 6/17/2049 | | | | 350,000 | | | | 355,856 | | | | | | | | - | | | | - | | | | | | | | | | | | | | | | | | | | 350,000 | | | | 355,856 | |
GMACM Mortgage Loan Trust | | | 6.50 | % | | | 1/25/2035 | | | | - | | | | - | | | | | | | | 32,512 | | | | 33,547 | | | | | | | | | | | | | | | | | | | | 32,512 | | | | 33,547 | |
GS Mortgage Securities Corp. II | | | 2.71 | % | | | 12/10/2027 | | | | - | | | | - | | | | | | | | 135,807 | | | | 138,976 | | | | | | | | | | | | | | | | | | | | 135,807 | | | | 138,976 | |
GS Mortgage Securities Corp. Trust | | | 2.32 | % | | | 1/10/2030 | | | | - | | | | - | | | | | | | | 100,000 | | | | 100,840 | | | | | | | | | | | | | | | | | | | | 100,000 | | | | 100,840 | |
GS Mortgage Securities Corp. Trust | | | 3.55 | % | | | 4/10/2034 | | | | - | | | | - | | | | | | | | 750,000 | | | | 811,486 | | | | | | | | | | | | | | | | | | | | 750,000 | | | | 811,486 | |
GS Mortgage Securities Trust | | | 5.55 | % | | | 8/10/2044 | | | | - | | | | - | | | | | | | | 200,000 | | | | 198,242 | | | | | | | | | | | | | | | | | | | | 200,000 | | | | 198,242 | |
GS Mortgage Securities Trust | | | 5.56 | % | | | 11/10/2039 | | | | 76,190 | | | | 76,392 | | | | | | | | - | | | | - | | | | | | | | | | | | | | | | | | | | 76,190 | | | | 76,392 | |
GSMPS Mortgage Loan Trust | | | 0.80 | % | | | 9/25/2035 | | | | - | | | | - | | | | | | | | 122,848 | | | | 99,312 | | | | | | | | | | | | | | | | | | | | 122,848 | | | | 99,312 | |
GSMPS Mortgage Loan Trust | | | 0.80 | % | | | 3/25/2035 | | | | - | | | | - | | | | | | | | 204,294 | | | | 172,345 | | | | | | | | | | | | | | | | | | | | 204,294 | | | | 172,345 | |
GSR Mortgage Loan Trust | | | 5.50 | % | | | 5/25/2034 | | | | - | | | | - | | | | | | | | 89,783 | | | | 92,095 | | | | | | | | | | | | | | | | | | | | 89,783 | | | | 92,095 | |
GSR Mortgage Loan Trust | | | 5.50 | % | | | 1/25/2037 | | | | - | | | | - | | | | | | | | 173,217 | | | | 167,098 | | | | | | | | | | | | | | | | | | | | 173,217 | | | | 167,098 | |
GSR Mortgage Loan Trust | | | 6.00 | % | | | 2/25/2036 | | | | - | | | | - | | | | | | | | 111,456 | | | | 97,238 | | | | | | | | | | | | | | | | | | | | 111,456 | | | | 97,238 | |
GSR Mortgage Loan Trust | | | 6.00 | % | | | 9/25/2035 | | | | - | | | | - | | | | | | | | 108,244 | | | | 112,084 | | | | | | | | | | | | | | | | | | | | 108,244 | | | | 112,084 | |
GSR Mortgage Loan Trust | | | 6.00 | % | | | 9/25/2034 | | | | - | | | | - | | | | | | | | 60,920 | | | | 62,279 | | | | | | | | | | | | | | | | | | | | 60,920 | | | | 62,279 | |
HILT Mortgage Trust | | | 1.34 | % | | | 7/15/2029 | | | | - | | | | - | | | | | | | | 850,000 | | | | 835,430 | | | | | | | | | | | | | | | | | | | | 850,000 | | | | 835,430 | |
Homeowner Assistance Program Reverse Mortgage Loan Trust | | | 4.00 | % | | | 5/26/2053 | | | | - | | | | - | | | | | | | | 496,844 | | | | 491,378 | | | | | | | | | | | | | | | | | | | | 496,844 | | | | 491,378 | |
Impac Secured Assets Trust | | | 0.80 | % | | | 5/25/2036 | | | | - | | | | - | | | | | | | | 121,389 | | | | 108,666 | | | | | | | | | | | | | | | | | | | | 121,389 | | | | 108,666 | |
Impac Secured Assets Trust | | | 0.80 | % | | | 8/25/2036 | | | | - | | | | - | | | | | | | | 29,332 | | | | 28,572 | | | | | | | | | | | | | | | | | | | | 29,332 | | | | 28,572 | |
JPMorgan Chase Commercial Mortgage Securities Trust | | | 5.42 | % | | | 1/15/2049 | | | | 206,516 | | | | 209,610 | | | | | | | | - | | | | - | | | | | | | | | | | | | | | | | | | | 206,516 | | | | 209,610 | |
JPMorgan Chase Commercial Mortgage Securities Trust | | | 5.72 | % | | | 2/15/2051 | | | | - | | | | - | | | | | | | | 437,580 | | | | 451,783 | | | | | | | | | | | | | | | | | | | | 437,580 | | | | 451,783 | |
JPMorgan Chase Commercial Mortgage Securities Trust | | | 5.81 | % | | | 6/12/2043 | | | | - | | | | - | | | | | | | | 7,081 | | | | 7,072 | | | | | | | | | | | | | | | | | | | | 7,081 | | | | 7,072 | |
JPMorgan Chase Commercial Mortgage Securities Trust, Interest Only STRIPS | | | 0.58 | % | | | 5/15/2045 | | | | - | | | | - | | | | | | | | 1,864,808 | | | | 615 | | | | | | | | | | | | | | | | | | | | 1,864,808 | | | | 615 | |
JPMorgan Chase Commercial Mortgage-Backed Securities Trust | | | 5.93 | % | | | 6/18/2049 | | | | 170,000 | | | | 171,440 | | | | | | | | - | | | | - | | | | | | | | | | | | | | | | | | | | 170,000 | | | | 171,440 | |
JPMorgan Commercial Mortgage-Backed Securities Trust | | | 1.00 | % | | | 3/18/2051 | | | | 100,000 | | | | 95,591 | | | | | | | | - | | | | - | | | | | | | | | | | | | | | | | | | | 100,000 | | | | 95,591 | |
JPMorgan Mortgage Trust | | | 2.71 | % | | | 11/25/2033 | | | | - | | | | - | | | | | | | | 61,074 | | | | 61,234 | | | | | | | | | | | | | | | | | | | | 61,074 | | | | 61,234 | |
Ladder Capital Commercial Mortgage Trust | | | 3.99 | % | | | 2/15/2036 | | | | - | | | | - | | | | | | | | 154,000 | | | | 167,897 | | | | | | | | | | | | | | | | | | | | 154,000 | | | | 167,897 | |
LB-UBS Commercial Mortgage Trust | | | 5.34 | % | | | 11/15/2038 | | | | 99,955 | | | | 100,452 | | | | | | | | - | | | | - | | | | | | | | | | | | | | | | | | | | 99,955 | | | | 100,452 | |
LB-UBS Commercial Mortgage Trust | | | 5.43 | % | | | 2/15/2040 | | | | - | | | | - | | | | | | | | 162,005 | | | | 164,301 | | | | | | | | | | | | | | | | | | | | 162,005 | | | | 164,301 | |
LB-UBS Commercial Mortgage Trust | | | 6.25 | % | | | 4/15/2041 | | | | 60,423 | | | | 63,693 | | | | | | | | - | | | | - | | | | | | | | | | | | | | | | | | | | 60,423 | | | | 63,693 | |
MASTR Adjustable Rate Mortgages Trust | | | 2.59 | % | | | 4/25/2034 | | | | - | | | | - | | | | | | | | 38,075 | | | | 35,214 | | | | | | | | | | | | | | | | | | | | 38,075 | | | | 35,214 | |
28
| | | | | | | | | | | | | | | | | | | | | | | | | | | | | | | | | | | | | | | | | | | | | | | | | | | | |
| | | | | | | | | Voya Limited
Maturity Bond VP | | | | | | JPMorgan Core
Bond VP | | | | | | Adjustments | | | | | | Combined Pro
Forma Portfolio | |
| | | | | | | | | | | | | |
| | | Coupon Rate | | | Maturity Date | | | Principal | | | Value | | | | | | Principal | | | Value | | | | | | Principal | | | Value | | | | | | Principal | | | Value | |
| | | | | | | | | | | | | | | | | | | | | | | | | | | | | | | | |
MASTR Adjustable Rate Mortgages Trust | | | 2.85 | % | | | 4/21/2034 | | | $ | - | | | $ | - | | | | | | | $ | 80,093 | | | $ | 80,123 | | | | | | | | | | | | | | | | | | | $ | 80,093 | | | $ | 80,123 | |
MASTR Adjustable Rate Mortgages Trust | | | 2.92 | % | | | 11/21/2034 | | | | - | | | | - | | | | | | | | 42,159 | | | | 42,852 | | | | | | | | | | | | | | | | | | | | 42,159 | | | | 42,852 | |
MASTR Alternative Loan Trust | | | 4.50 | % | | | 9/25/2019 | | | | - | | | | - | | | | | | | | 26,242 | | | | 26,356 | | | | | | | | | | | | | | | | | | | | 26,242 | | | | 26,356 | |
MASTR Alternative Loan Trust | | | 4.75 | % | | | 6/25/2019 | | | | - | | | | - | | | | | | | | 17,645 | | | | 17,741 | | | | | | | | | | | | | | | | | | | | 17,645 | | | | 17,741 | |
MASTR Asset Securitization Trust | | | 5.50 | % | | | 11/25/2033 | | | | - | | | | - | | | | | | | | 77,062 | | | | 77,495 | | | | | | | | | | | | | | | | | | | | 77,062 | | | | 77,495 | |
MASTR Re-REMIC Trust, Principal Only STRIPS | | | 0.00 | % | | | 5/28/2035 | | | | - | | | | - | | | | | | | | 39,528 | | | | 31,223 | | | | | | | | | | | | | | | | | | | �� | 39,528 | | | | 31,223 | |
Merrill Lynch Mortgage Investors Trust | | | 0.91 | % | | | 4/25/2029 | | | | - | | | | - | | | | | | | | 366,916 | | | | 342,895 | | | | | | | | | | | | | | | | | | | | 366,916 | | | | 342,895 | |
Merrill Lynch Mortgage Investors Trust | | | 1.07 | % | | | 10/25/2028 | | | | - | | | | - | | | | | | | | 493,184 | | | | 468,625 | | | | | | | | | | | | | | | | | | | | 493,184 | | | | 468,625 | |
Merrill Lynch Mortgage Investors Trust | | | 2.51 | % | | | 12/25/2034 | | | | - | | | | - | | | | | | | | 116,941 | | | | 116,777 | | | | | | | | | | | | | | | | | | | | 116,941 | | | | 116,777 | |
Merrill Lynch Mortgage Investors Trust | | | 6.72 | % | | | 11/15/2026 | | | | 20,363 | | | | 20,372 | | | | | | | | - | | | | - | | | | | | | | | | | | | | | | | | | | 20,363 | | | | 20,372 | |
ML-CFC Commercial Mortgage Trust | | | 5.17 | % | | | 12/12/2049 | | | | 290,364 | | | | 291,864 | | | | | | | | - | | | | - | | | | | | | | | | | | | | | | | | | | 290,364 | | | | 291,864 | |
ML-CFC Commercial Mortgage Trust | | | 5.38 | % | | | 8/12/2048 | | | | 48,480 | | | | 48,995 | | | | | | | | - | | | | - | | | | | | | | | | | | | | | | | | | | 48,480 | | | | 48,995 | |
ML-CFC Commercial Mortgage Trust | | | 5.70 | % | | | 9/12/2049 | | | | 119,566 | | | | 124,372 | | | | | | | | - | | | | - | | | | | | | | | | | | | | | | | | | | 119,566 | | | | 124,372 | |
Morgan Stanley Bank of America Merrill Lynch Trust | | | 3.67 | % | | | 2/15/2047 | | | | - | | | | - | | | | | | | | 350,000 | | | | 372,790 | | | | | | | | | | | | | | | | | | | | 350,000 | | | | 372,790 | |
Morgan Stanley Capital I Trust | | | 4.05 | % | | | 7/15/2049 | | | | - | | | | - | | | | | | | | 100,000 | | | | 105,234 | | | | | | | | | | | | | | | | | | | | 100,000 | | | | 105,234 | |
Morgan Stanley Capital I Trust | | | 5.33 | % | | | 12/15/2043 | | | | 37,627 | | | | 37,725 | | | | | | | | - | | | | - | | | | | | | | | | | | | | | | | | | | 37,627 | | | | 37,725 | |
Morgan Stanley Capital I Trust | | | 5.44 | % | | | 2/12/2044 | | | | 5,411 | | | | 5,406 | | | | | | | | - | | | | - | | | | | | | | | | | | | | | | | | | | 5,411 | | | | 5,406 | |
Morgan Stanley Capital I Trust | | | 5.44 | % | | | 2/12/2044 | | | | 390,000 | | | | 389,575 | | | | | | | | - | | | | - | | | | | | | | | | | | | | | | | | | | 390,000 | | | | 389,575 | |
Morgan Stanley Capital I Trust | | | 5.51 | % | | | 11/12/2049 | | | | 82,420 | | | | 82,997 | | | | | | | | - | | | | - | | | | | | | | | | | | | | | | | | | | 82,420 | | | | 82,997 | |
Morgan Stanley Re-REMIC Trust | | | 0.25 | % | | | 7/27/2049 | | | | - | | | | - | | | | | | | | 150,000 | | | | 133,320 | | | | | | | | | | | | | | | | | | | | 150,000 | | | | 133,320 | |
Morgan Stanley Re-REMIC Trust | | | 1.00 | % | | | 3/27/2051 | | | | - | | | | - | | | | | | | | 115,979 | | | | 114,529 | | | | | | | | | | | | | | | | | | | | 115,979 | | | | 114,529 | |
Morgan Stanley Re-REMIC Trust | | | 2.00 | % | | | 7/27/2049 | | | | - | | | | - | | | | | | | | 119,629 | | | | 118,709 | | | | | | | | | | | | | | | | | | | | 119,629 | | | | 118,709 | |
Morgan Stanley Re-REMIC Trust | | | 5.25 | % | | | 12/17/2043 | | | | 94,278 | | | | 94,204 | | | | | | | | - | | | | - | | | | | | | | | | | | | | | | | | | | 94,278 | | | | 94,204 | |
Morgan Stanley Re-REMIC Trust | | | 5.99 | % | | | 8/12/2045 | | | | 295,614 | | | | 300,893 | | | | | | | | - | | | | - | | | | | | | | | | | | | | | | | | | | 295,614 | | | | 300,893 | |
Morgan Stanley Re-REMIC Trust | | | 6.25 | % | | | 8/15/2045 | | | | 170,799 | | | | 174,237 | | | | | | | | - | | | | - | | | | | | | | | | | | | | | | | | | | 170,799 | | | | 174,237 | |
MortgageIT Trust | | | 1.09 | % | | | 2/25/2035 | | | | - | | | | - | | | | | | | | 44,044 | | | | 42,292 | | | | | | | | | | | | | | | | | | | | 44,044 | | | | 42,292 | |
Nationstar HECM Loan Trust | | | 2.88 | % | | | 11/25/2025 | | | | - | | | | - | | | | | | | | 283,458 | | | | 283,503 | | | | | | | | | | | | | | | | | | | | 283,458 | | | | 283,503 | |
Nationstar HECM Loan Trust | | | 4.11 | % | | | 11/25/2025 | | | | - | | | | - | | | | | | | | 395,000 | | | | 396,509 | | | | | | | | | | | | | | | | | | | | 395,000 | | | | 396,509 | |
Nomura Asset Acceptance Corp. Alternative Loan Trust | | | 6.00 | % | | | 5/25/2033 | | | | - | | | | - | | | | | | | | 10,351 | | | | 10,508 | | | | | | | | | | | | | | | | | | | | 10,351 | | | | 10,508 | |
Nomura Asset Acceptance Corp. Alternative Loan Trust | | | 7.00 | % | | | 4/25/2033 | | | | - | | | | - | | | | | | | | 10,096 | | | | 10,321 | | | | | | | | | | | | | | | | | | | | 10,096 | | | | 10,321 | |
PFP, Ltd. | | | 1.88 | % | | | 7/14/2034 | | | | - | | | | - | | | | | | | | 276,000 | | | | 273,631 | | | | | | | | | | | | | | | | | | | | 276,000 | | | | 273,631 | |
PFP, Ltd. | | | 3.68 | % | | | 7/14/2034 | | | | 240,000 | | | | 235,833 | | | | | | | | 100,000 | | | | 98,264 | | | | | | | | | | | | | | | | | | | | 340,000 | | | | 334,097 | |
PFP, Ltd. | | | 4.43 | % | | | 7/14/2034 | | | | - | | | | - | | | | | | | | 100,000 | | | | 98,568 | | | | | | | | | | | | | | | | | | | | 100,000 | | | | 98,568 | |
PHH Alternative Mortgage Trust, Interest Only STRIPS | | | 6.00 | % | | | 5/25/2037 | | | | - | | | | - | | | | | | | | 254,751 | | | | 66,008 | | | | | | | | | | | | | | | | | | | | 254,751 | | | | 66,008 | |
RAIT Trust | | | 1.69 | % | | | 12/15/2031 | | | | - | | | | - | | | | | | | | 90,793 | | | | 89,299 | | | | | | | | | | | | | | | | | | | | 90,793 | | | | 89,299 | |
RAIT Trust | | | 1.79 | % | | | 12/15/2031 | | | | - | | | | - | | | | | | | | 207,042 | | | | 206,388 | | | | | | | | | | | | | | | | | | | | 207,042 | | | | 206,388 | |
RAIT Trust | | | 2.59 | % | | | 5/13/2031 | | | | - | | | | - | | | | | | | | 300,000 | | | | 297,386 | | | | | | | | | | | | | | | | | | | | 300,000 | | | | 297,386 | |
RAIT Trust | | | 4.34 | % | | | 1/15/2031 | | | | - | | | | - | | | | | | | | 295,000 | | | | 294,475 | | | | | | | | | | | | | | | | | | | | 295,000 | | | | 294,475 | |
RALI Trust | | | 5.00 | % | | | 3/25/2019 | | | | - | | | | - | | | | | | | | 40,378 | | | | 40,159 | | | | | | | | | | | | | | | | | | | | 40,378 | | | | 40,159 | |
RALI Trust | | | 5.75 | % | | | 10/25/2033 | | | | - | | | | - | | | | | | | | 83,002 | | | | 86,944 | | | | | | | | | | | | | | | | | | | | 83,002 | | | | 86,944 | |
RALI Trust | | | 15.50 | % | | | 2/25/2018 | | | | - | | | | - | | | | | | | | 3,475 | | | | 3,639 | | | | | | | | | | | | | | | | | | | | 3,475 | | | | 3,639 | |
RALI Trust | | | 15.67 | % | | | 10/25/2017 | | | | - | | | | - | | | | | | | | 2,887 | | | | 3,010 | | | | | | | | | | | | | | | | | | | | 2,887 | | | | 3,010 | |
RBS Commercial Funding, Inc. | | | 3.26 | % | | | 3/11/2031 | | | | - | | | | - | | | | | | | | 160,000 | | | | 166,927 | | | | | | | | | | | | | | | | | | | | 160,000 | | | | 166,927 | |
RBSSP Resecuritization Trust | | | 4.00 | % | | | 5/26/2037 | | | | - | | | | - | | | | | | | | 25,327 | | | | 25,092 | | | | | | | | | | | | | | | | | | | | 25,327 | | | | 25,092 | |
Resource Capital Corp., Ltd. | | | 1.84 | % | | | 8/15/2032 | | | | - | | | | - | | | | | | | | 160,000 | | | | 157,655 | | | | | | | | | | | | | | | | | | | | 160,000 | | | | 157,655 | |
Resource Capital Corp., Ltd. | | | 3.44 | % | | | 8/15/2032 | | | | - | | | | - | | | | | | | | 153,000 | | | | 143,820 | | | | | | | | | | | | | | | | | | | | 153,000 | | | | 143,820 | |
RFMSI Trust, Principal Only STRIPS | | | 0.00 | % | | | 6/25/2034 | | | | - | | | | - | | | | | | | | 13,439 | | | | 11,441 | | | | | | | | | | | | | | | | | | | | 13,439 | | | | 11,441 | |
Sequoia Mortgage Trust | | | 1.05 | % | | | 12/20/2034 | | | | - | | | | - | | | | | | | | 166,740 | | | | 160,732 | | | | | | | | | | | | | | | | | | | | 166,740 | | | | 160,732 | |
Sequoia Mortgage Trust | | | 1.13 | % | | | 10/20/2034 | | | | - | | | | - | | | | | | | | 289,844 | | | | 273,605 | | | | | | | | | | | | | | | | | | | | 289,844 | | | | 273,605 | |
Sequoia Mortgage Trust | | | 1.15 | % | | | 9/20/2034 | | | | - | | | | - | | | | | | | | 367,552 | | | | 347,794 | | | | | | | | | | | | | | | | | | | | 367,552 | | | | 347,794 | |
Sequoia Mortgage Trust | | | 1.21 | % | | | 4/20/2033 | | | | - | | | | - | | | | | | | | 220,892 | | | | 207,279 | | | | | | | | | | | | | | | | | | | | 220,892 | | | | 207,279 | |
Springleaf Mortgage Loan Trust | | | 1.27 | % | | | 6/25/2058 | | | | - | | | | - | | | | | | | | 110,134 | | | | 109,898 | | | | | | | | | | | | | | | | | | | | 110,134 | | | | 109,898 | |
Springleaf Mortgage Loan Trust | | | 1.78 | % | | | 12/25/2065 | | | | - | | | | - | | | | | | | | 260,364 | | | | 260,140 | | | | | | | | | | | | | | | | | | | | 260,364 | | | | 260,140 | |
Springleaf Mortgage Loan Trust | | | 2.31 | % | | | 6/25/2058 | | | | - | | | | - | | | | | | | | 166,000 | | | | 165,842 | | | | | | | | | | | | | | | | | | | | 166,000 | | | | 165,842 | |
Springleaf Mortgage Loan Trust | | | 3.14 | % | | | 6/25/2058 | | | | - | | | | - | | | | | | | | 108,000 | | | | 107,848 | | | | | | | | | | | | | | | | | | | | 108,000 | | | | 107,848 | |
Springleaf Mortgage Loan Trust | | | 3.52 | % | | | 12/25/2065 | | | | - | | | | - | | | | | | | | 125,000 | | | | 124,877 | | | | | | | | | | | | | | | | | | | | 125,000 | | | | 124,877 | |
Springleaf Mortgage Loan Trust | | | 3.79 | % | | | 6/25/2058 | | | | - | | | | - | | | | | | | | 127,000 | | | | 126,814 | | | | | | | | | | | | | | | | | | | | 127,000 | | | | 126,814 | |
Springleaf Mortgage Loan Trust | | | 3.79 | % | | | 9/25/2057 | | | | - | | | | - | | | | | | | | 153,000 | | | | 153,689 | | | | | | | | | | | | | | | | | | | | 153,000 | | | | 153,689 | |
Structured Adjustable Rate Mortgage Loan Trust | | | 2.83 | % | | | 2/25/2034 | | | | - | | | | - | | | | | | | | 419,025 | | | | 414,647 | | | | | | | | | | | | | | | | | | | | 419,025 | | | | 414,647 | |
Structured Asset Mortgage Investments II Trust | | | 0.70 | % | | | 7/19/2035 | | | | - | | | | - | | | | | | | | 202,088 | | | | 194,507 | | | | | | | | | | | | | | | | | | | | 202,088 | | | | 194,507 | |
Structured Asset Mortgage Investments II Trust | | | 1.11 | % | | | 10/19/2034 | | | | - | | | | - | | | | | | | | 66,212 | | | | 62,997 | | | | | | | | | | | | | | | | | | | | 66,212 | | | | 62,997 | |
Structured Asset Mortgage Investments II Trust | | | 1.15 | % | | | 1/19/2034 | | | | - | | | | - | | | | | | | | 430,318 | | | | 413,413 | | | | | | | | | | | | | | | | | | | | 430,318 | | | | 413,413 | |
Structured Asset Mortgage Investments II Trust | | | 1.15 | % | | | 3/19/2034 | | | | - | | | | - | | | | | | | | 405,285 | | | | 390,005 | | | | | | | | | | | | | | | | | | | | 405,285 | | | | 390,005 | |
Structured Asset Securities Corp. | | | 5.00 | % | | | 5/25/2035 | | | | - | | | | - | | | | | | | | 9,382 | | | | 9,451 | | | | | | | | | | | | | | | | | | | | 9,382 | | | | 9,451 | |
Structured Asset Securities Corp. Mortgage Pass-Through Certificates | | | 4.75 | % | | | 9/25/2018 | | | | - | | | | - | | | | | | | | 36,064 | | | | 36,423 | | | | | | | | | | | | | | | | | | | | 36,064 | | | | 36,423 | |
Structured Asset Securities Corp. Mortgage Pass-Through Certificates | | | 5.50 | % | | | 10/25/2033 | | | | - | | | | - | | | | | | | | 80,597 | | | | 82,219 | | | | | | | | | | | | | | | | | | | | 80,597 | | | | 82,219 | |
Thornburg Mortgage Securities Trust | | | 2.24 | % | | | 12/25/2044 | | | | - | | | | - | | | | | | | | 147,013 | | | | 144,747 | | | | | | | | | | | | | | | | | | | | 147,013 | | | | 144,747 | |
TIAA CMBS I Trust | | | 5.77 | % | | | 6/19/2033 | | | | 219,767 | | | | 222,393 | | | | | | | | - | | | | - | | | | | | | | | | | | | | | | | | | | 219,767 | | | | 222,393 | |
TIAA Seasoned Commercial Mortgage Trust | | | 5.54 | % | | | 8/15/2039 | | | | 240,000 | | | | 243,020 | | | | | | | | - | | | | - | | | | | | | | | | | | | | | | | | | | 240,000 | | | | 243,020 | |
UBS-BAMLL Trust | | | 3.66 | % | | | 6/10/2030 | | | | - | | | | - | | | | | | | | 231,000 | | | | 245,042 | | | | | | | | | | | | | | | | | | | | 231,000 | | | | 245,042 | |
UBS-Barclays Commercial Mortgage Trust | | | 3.24 | % | | | 4/10/2046 | | | | - | | | | - | | | | | | | | 286,000 | | | | 303,899 | | | | | | | | | | | | | | | | | | | | 286,000 | | | | 303,899 | |
UBS-Barclays Commercial Mortgage Trust | | | 3.53 | % | | | 5/10/2063 | | | | - | | | | - | | | | | | | | 130,000 | | | | 140,909 | | | | | | | | | | | | | | | | | | | | 130,000 | | | | 140,909 | |
UBS-Barclays Commercial Mortgage Trust, Interest Only STRIPS | | | 1.81 | % | | | 5/10/2063 | | | | - | | | | - | | | | | | | | 1,004,536 | | | | 57,283 | | | | | | | | | | | | | | | | | | | | 1,004,536 | | | | 57,283 | |
VNDO Mortgage Trust | | | 3.00 | % | | | 11/15/2030 | | | | - | | | | - | | | | | | | | 544,235 | | | | 571,387 | | | | | | | | | | | | | | | | | | | | 544,235 | | | | 571,387 | |
VNDO Mortgage Trust | | | 3.81 | % | | | 12/13/2029 | | | | - | | | | - | | | | | | | | 400,000 | | | | 425,657 | | | | | | | | | | | | | | | | | | | | 400,000 | | | | 425,657 | |
Wachovia Bank Commercial Mortgage Trust | | | 5.25 | % | | | 12/15/2043 | | | | 171,126 | | | | 172,236 | | | | | | | | - | | | | - | | | | | | | | | | | | | | | | | | | | 171,126 | | | | 172,236 | |
Wachovia Bank Commercial Mortgage Trust | | | 5.31 | % | | | 11/15/2048 | | | | 318,693 | | | | 320,059 | | | | | | | | - | | | | - | | | | | | | | | | | | | | | | | | | | 318,693 | | | | 320,059 | |
Wachovia Bank Commercial Mortgage Trust | | | 5.34 | % | | | 12/15/2043 | | | | 10,000 | | | | 10,159 | | | | | | | | - | | | | - | | | | | | | | | | | | | | | | | | | | 10,000 | | | | 10,159 | |
Wachovia Bank Commercial Mortgage Trust | | | 6.01 | % | | | 6/15/2045 | | | | 13,574 | | | | 13,555 | | | | | | | | - | | | | - | | | | | | | | | | | | | | | | | | | | 13,574 | | | | 13,555 | |
Wachovia Bank Commercial Mortgage Trust, Interest Only STRIPS | | | 0.17 | % | | | 3/15/2045 | | | | - | | | | - | | | | | | | | 814,284 | | | | 2 | | | | | | | | | | | | | | | | | | | | 814,284 | | | | 2 | |
WaMu Mortgage Pass-Through Certificates Trust | | | 2.53 | % | | | 10/25/2033 | | | | - | | | | - | | | | | | | | 148,947 | | | | 149,832 | | | | | | | | | | | | | | | | | | | | 148,947 | | | | 149,832 | |
WaMu Mortgage Pass-Through Certificates Trust | | | 2.60 | % | | | 6/25/2033 | | | | - | | | | - | | | | | | | | 49,885 | | | | 49,610 | | | | | | | | | | | | | | | | | | | | 49,885 | | | | 49,610 | |
WaMu Mortgage Pass-Through Certificates Trust | | | 2.79 | % | | | 6/25/2034 | | | | - | | | | - | | | | | | | | 26,237 | | | | 26,399 | | | | | | | | | | | | | | | | | | | | 26,237 | | | | 26,399 | |
WaMu Mortgage Pass-Through Certificates Trust | | | 5.25 | % | | | 10/25/2033 | | | | - | | | | - | | | | | | | | 79,966 | | | | 83,069 | | | | | | | | | | | | | | | | | | | | 79,966 | | | | 83,069 | |
WaMu Mortgage Pass-Through Certificates Trust | | | 5.50 | % | | | 6/25/2033 | | | | - | | | | - | | | | | | | | 70,807 | | | | 73,065 | | | | | | | | | | | | | | | | | | | | 70,807 | | | | 73,065 | |
Washington Mutual Mortgage Pass-Through Certificates Trust | | | 5.50 | % | | | 6/25/2035 | | | | - | | | | - | | | | | | | | 209,874 | | | | 194,044 | | | | | | | | | | | | | | | | | | | | 209,874 | | | | 194,044 | |
Washington Mutual Mortgage Pass-Through Certificates Trust, Interest Only STRIPS | | | 4.60 | % | | | 4/25/2035 | | | | - | | | | - | | | | | | | | 685,311 | | | | 112,509 | | | | | | | | | | | | | | | | | | | | 685,311 | | | | 112,509 | |
Washington Mutual Mortgage Pass-Through Certificates Trust, Interest Only STRIPS | | | 5.50 | % | | | 5/25/2035 | | | | - | | | | - | | | | | | | | 232,702 | | | | 48,200 | | | | | | | | | | | | | | | | | | | | 232,702 | | | | 48,200 | |
Washington Mutual MSC Mortgage Pass-Through Certificates Trust, Principal Only STRIPS | | | 0.00 | % | | | 3/25/2033 | | | | - | | | | - | | | | | | | | 10,910 | | | | 9,132 | | | | | | | | | | | | | | | | | | | | 10,910 | | | | 9,132 | |
Wells Fargo Commercial Mortgage Trust | | | 2.80 | % | | | 3/18/2028 | | | | - | | | | - | | | | | | | | 400,000 | | | | 412,872 | | | | | | | | | | | | | | | | | | | | 400,000 | | | | 412,872 | |
Wells Fargo Mortgage-Backed Securities Trust | | | 2.62 | % | | | 11/25/2033 | | | | - | | | | - | | | | | | | | 19,609 | | | | 19,594 | | | | | | | | | | | | | | | | | | | | 19,609 | | | | 19,594 | |
Wells Fargo Mortgage-Backed Securities Trust | | | 2.72 | % | | | 6/25/2033 | | | | - | | | | - | | | | | | | | 135,427 | | | | 135,589 | | | | | | | | | | | | | | | | | | | | 135,427 | | | | 135,589 | |
Wells Fargo Mortgage-Backed Securities Trust | | | 2.77 | % | | | 9/25/2034 | | | | - | | | | - | | | | | | | | 148,592 | | | | 148,651 | | | | | | | | | | | | | | | | | | | | 148,592 | | | | 148,651 | |
Wells Fargo Mortgage-Backed Securities Trust | | | 2.83 | % | | | 7/25/2034 | | | | - | | | | - | | | | | | | | 119,592 | | | | 120,779 | | | | | | | | | | | | | | | | | | | | 119,592 | | | | 120,779 | |
Wells Fargo Mortgage-Backed Securities Trust | | | 2.85 | % | | | 2/25/2034 | | | | 109,433 | | | | 109,878 | | | | | | | | - | | | | - | | | | | | | | | | | | | | | | | | | | 109,433 | | | | 109,878 | |
Wells Fargo Mortgage-Backed Securities Trust | | | 2.91 | % | | | 6/25/2035 | | | | - | | | | - | | | | | | | | 34,011 | | | | 34,577 | | | | | | | | | | | | | | | | | | | | 34,011 | | | | 34,577 | |
Wells Fargo Mortgage-Backed Securities Trust | | | 2.98 | % | | | 12/25/2034 | | | | - | | | | - | | | | | | | | 131,299 | | | | 135,168 | | | | | | | | | | | | | | | | | | | | 131,299 | | | | 135,168 | |
Wells Fargo Mortgage-Backed Securities Trust | | | 2.98 | % | | | 10/25/2034 | | | | - | | | | - | | | | | | | | 42,766 | | | | 42,937 | | | | | | | | | | | | | | | | | | | | 42,766 | | | | 42,937 | |
Wells Fargo Mortgage-Backed Securities Trust | | | 3.01 | % | | | 3/25/2035 | | | | - | | | | - | | | | | | | | 534,515 | | | | 545,711 | | | | | | | | | | | | | | | | | | | | 534,515 | | | | 545,711 | |
Wells Fargo Re-REMIC Trust | | | 1.75 | % | | | 8/20/2021 | | | | - | | | | - | | | | | | | | 11,795 | | | | 11,794 | | | | | | | | | | | | | | | | | | | | 11,795 | | | | 11,794 | |
| | | | | | | | | | | | | | | | | | | | | | | | | | | | | | | | | | | | |
Total Mortgage-Backed Securities | | | | | | | | | | | | | | | 7,776,408 | | | | | | | | | | | | 29,991,110 | | | | | | | | | | | | | | | | | | | | | | | | 37,767,518 | |
| | | | | | | | | | | | | | | | | | | | | | | | | | | | | | | | | | | | |
| | | | | | | | | | | | | |
| Total Cost
($8,000,521 |
) | | | | | | | | | |
| Total Cost
($29,488,822 |
) | | | | | | | | | | | | | | | | | | | | | |
| Total Cost
($37,489,343 |
) |
29
| | | | | | | | | | | | | | | | | | | | | | | | | | | | | | | | | | | | | | | | | | | | | | | | | | | | |
| | | | | | | | | Voya Limited
Maturity Bond VP | | | | | | JPMorgan Core
Bond VP | | | | | | Adjustments | | | | | | Combined Pro
Forma Portfolio | |
| | | | | | | | | | | | | |
| | | Coupon Rate | | | Maturity Date | | | Principal | | | Value | | | | | | Principal | | | Value | | | | | | Principal | | | Value | | | | | | Principal | | | Value | |
| | | | | | | | | | | | | | | | | | | | | | | | | | | | | | | | |
Municipal Government Obligations - 0.1 % | | | | | | | | | | | | | | | | | | | | | | | | | | | | | | | | | | | | | | | | | | | | | | | | | |
California | | | | | | | | | | | | | | | | | | | | | | | | | | | | | | | | | | | | | | | | | | | | | | | | | | | | |
City of Los Angeles Department of Airports | | | 6.58 | % | | | 5/15/2039 | | | $ | - | | | $ | - | | | | | | | $ | 65,000 | | | $ | 90,529 | | | | | | | | | | | | | | | | | | | $ | 65,000 | | | $ | 90,529 | |
Illinois | | | | | | | | | | | | | | | | | | | | | | | | | | | | | | | | | | | | | | | | | | | | | | | | | | | | |
State of Illinois | | | 5.10 | % | | | 6/1/2033 | | | | - | | | | - | | | | | | | | 200,000 | | | | 191,990 | | | | | | | | | | | | | | | | | | | | 200,000 | | | | 191,990 | |
New York | | | | | | | | | | | | | | | | | | | | | | | | | | | | | | | | | | | | | | | | | | | | | | | | | | | | |
Port Authority of New York & New Jersey | | | 4.46 | % | | | 10/1/2062 | | | | - | | | | - | | | | | | | | 225,000 | | | | 257,416 | | | | | | | | | | | | | | | | | | | | 225,000 | | | | 257,416 | |
Port Authority of New York & New Jersey | | | 5.65 | % | | | 11/1/2040 | | | | - | | | | - | | | | | | | | 100,000 | | | | 131,463 | | | | | | | | | | | | | | | | | | | | 100,000 | | | | 131,463 | |
Port Authority of New York & New Jersey | | | 5.65 | % | | | 11/1/2040 | | | | - | | | | - | | | | | | | | 55,000 | | | | 72,205 | | | | | | | | | | | | | | | | | | | | 55,000 | | | | 72,205 | |
Ohio | | | | | | | | | | | | | | | | | | | | | | | | | | | | | | | | | | | | | | | | | | | | | | | | | | | | |
Ohio State University | | | 4.05 | % | | | 12/1/2056 | | | | - | | | | - | | | | | | | | 106,000 | | | | 117,847 | | | | | | | | | | | | | | | | | | | | 106,000 | | | | 117,847 | |
Ohio State University | | | 4.80 | % | | | 6/1/2111 | | | | - | | | | - | | | | | | | | 130,000 | | | | 145,506 | | | | | | | | | | | | | | | | | | | | 130,000 | | | | 145,506 | |
| | | | | | | | | | | | | | | | | | | | | | | | | | | | | | | | | | | | |
Total Municipal Government Obligations | | | | | | | | | | | - | | | | - | | | | | | | | | | | | 1,006,956 | | | | | | | | | | | | | | | | | | | | | | | | 1,006,956 | |
| | | | | | | | | | | | | | | | | | | | | | | | | | | | | | | | | | | | |
| | | | | | | | | | | | | | | | | | | | | | | | | |
| Total Cost
($910,027 |
) | | | | | | | | | | | | | | | | | | | | | |
| Total Cost
($910,027 |
) |
U.S. Government Agency Obligations - 28.8 % | | | | | | | | | | | | | | | | | | | | | | | | | | | | | | | | | | | | | | | | | | | | | | | | | | | | |
Federal Home Loan Bank | | | 5.50 | % | | | 7/15/2036 | | | | - | | | | - | | | | | | | | 150,000 | | | | 216,415 | | | | | | | | | | | | | | | | | | | | 150,000 | | | | 216,415 | |
Federal Home Loan Mortgage Corp. | | | 0.99 | % | | | 7/15/2042 | | | | - | | | | - | | | | | | | | 719,239 | | | | 716,709 | | | | | | | | | | | | | | | | | | | | 719,239 | | | | 716,709 | |
Federal Home Loan Mortgage Corp. | | | 0.99 | % | | | 8/15/2042 | | | | - | | | | - | | | | | | | | 943,595 | | | | 950,372 | | | | | | | | | | | | | | | | | | | | 943,595 | | | | 950,372 | |
Federal Home Loan Mortgage Corp. | | | 0.99 | % | | | 3/15/2044 | | | | - | | | | - | | | | | | | | 824,898 | | | | 829,117 | | | | | | | | | | | | | | | | | | | | 824,898 | | | | 829,117 | |
Federal Home Loan Mortgage Corp. | | | 2.34 | % | | | 7/1/2036 | | | | - | | | | - | | | | | | | | 68,339 | | | | 72,102 | | | | | | | | | | | | | | | | | | | | 68,339 | | | | 72,102 | |
Federal Home Loan Mortgage Corp. | | | 2.50 | % | | | 11/1/2036 | | | | - | | | | - | | | | | | | | 63,790 | | | | 67,539 | | | | | | | | | | | | | | | | | | | | 63,790 | | | | 67,539 | |
Federal Home Loan Mortgage Corp. | | | 2.51 | % | | | 8/1/2036 | | | | - | | | | - | | | | | | | | 92,863 | | | | 98,088 | | | | | | | | | | | | | | | | | | | | 92,863 | | | | 98,088 | |
Federal Home Loan Mortgage Corp. | | | 2.57 | % | | | 12/1/2036 | | | | - | | | | - | | | | | | | | 11,236 | | | | 11,797 | | | | | | | | | | | | | | | | | | | | 11,236 | | | | 11,797 | |
Federal Home Loan Mortgage Corp. | | | 2.58 | % | | | 2/1/2036 | | | | - | | | | - | | | | | | | | 176,896 | | | | 186,525 | | | | | | | | | | | | | | | | | | | | 176,896 | | | | 186,525 | |
Federal Home Loan Mortgage Corp. | | | 2.61 | % | | | 10/1/2036 | | | | - | | | | - | | | | | | | | 71,388 | | | | 75,674 | | | | | | | | | | | | | | | | | | | | 71,388 | | | | 75,674 | |
Federal Home Loan Mortgage Corp. | | | 2.63 | % | | | 10/1/2036 | | | | - | | | | - | | | | | | | | 48,357 | | | | 50,613 | | | | | | | | | | | | | | | | | | | | 48,357 | | | | 50,613 | |
Federal Home Loan Mortgage Corp. | | | 2.63 | % | | | 1/1/2035 | | | | - | | | | - | | | | | | | | 57,042 | | | | 60,217 | | | | | | | | | | | | | | | | | | | | 57,042 | | | | 60,217 | |
Federal Home Loan Mortgage Corp. | | | 2.66 | % | | | 3/1/2037 | | | | - | | | | - | | | | | | | | 79,662 | | | | 83,823 | | | | | | | | | | | | | | | | | | | | 79,662 | | | | 83,823 | |
Federal Home Loan Mortgage Corp. | | | 2.73 | % | | | 9/1/2034 | | | | - | | | | - | | | | | | | | 69,485 | | | | 73,578 | | | | | | | | | | | | | | | | | | | | 69,485 | | | | 73,578 | |
Federal Home Loan Mortgage Corp. | | | 2.76 | % | | | 5/1/2036 | | | | - | | | | - | | | | | | | | 45,923 | | | | 48,647 | | | | | | | | | | | | | | | | | | | | 45,923 | | | | 48,647 | |
Federal Home Loan Mortgage Corp. | | | 2.79 | % | | | 2/1/2037 | | | | - | | | | - | | | | | | | | 149,394 | | | | 157,882 | | | | | | | | | | | | | | | | | | | | 149,394 | | | | 157,882 | |
Federal Home Loan Mortgage Corp. | | | 3.00 | % | | | 8/15/2042 | | | | - | | | | - | | | | | | | | 2,129,620 | | | | 2,187,818 | | | | | | | | | | | | | | | | | | | | 2,129,620 | | | | 2,187,818 | |
Federal Home Loan Mortgage Corp. | | | 3.00 | % | | | 1/15/2043 | | | | - | | | | - | | | | | | | | 373,119 | | | | 389,142 | | | | | | | | | | | | | | | | | | | | 373,119 | | | | 389,142 | |
Federal Home Loan Mortgage Corp. | | | 3.00 | % | | | 1/15/2044 | | | | - | | | | - | | | | | | | | 1,712,710 | | | | 1,780,461 | | | | | | | | | | | | | | | | | | | | 1,712,710 | | | | 1,780,461 | |
Federal Home Loan Mortgage Corp. | | | 3.05 | % | | | 6/1/2036 | | | | - | | | | - | | | | | | | | 183,050 | | | | 194,275 | | | | | | | | | | | | | | | | | | | | 183,050 | | | | 194,275 | |
Federal Home Loan Mortgage Corp. | | | 3.50 | % | | | 7/15/2042 | | | | - | | | | - | | | | | | | | 977,626 | | | | 1,031,918 | | | | | | | | | | | | | | | | | | | | 977,626 | | | | 1,031,918 | |
Federal Home Loan Mortgage Corp. | | | 3.50 | % | | | 1/1/2032 | | | | - | | | | - | | | | | | | | 252,887 | | | | 270,977 | | | | | | | | | | | | | | | | | | | | 252,887 | | | | 270,977 | |
Federal Home Loan Mortgage Corp. | | | 3.50 | % | | | 6/1/2042 | | | | - | | | | - | | | | | | | | 750,505 | | | | 799,621 | | | | | | | | | | | | | | | | | | | | 750,505 | | | | 799,621 | |
Federal Home Loan Mortgage Corp. | | | 3.50 | % | | | 6/1/2043 | | | | - | | | | - | | | | | | | | 1,670,729 | | | | 1,780,077 | | | | | | | | | | | | | | | | | | | | 1,670,729 | | | | 1,780,077 | |
Federal Home Loan Mortgage Corp. | | | 4.00 | % | | | 1/1/2043 | | | | - | | | | - | | | | | | | | 1,550,776 | | | | 1,680,402 | | | | | | | | | | | | | | | | | | | | 1,550,776 | | | | 1,680,402 | |
Federal Home Loan Mortgage Corp. | | | 4.00 | % | | | 6/1/2042 | | | | - | | | | - | | | | | | | | 769,529 | | | | 833,690 | | | | | | | | | | | | | | | | | | | | 769,529 | | | | 833,690 | |
Federal Home Loan Mortgage Corp. | | | 4.00 | % | | | 1/1/2046 | | | | - | | | | - | | | | | | | | 979,202 | | | | 1,077,360 | | | | | | | | | | | | | | | | | | | | 979,202 | | | | 1,077,360 | |
Federal Home Loan Mortgage Corp. | | | 4.50 | % | | | 5/1/2041 | | | | - | | | | - | | | | | | | | 437,213 | | | | 481,270 | | | | | | | | | | | | | | | | | | | | 437,213 | | | | 481,270 | |
Federal Home Loan Mortgage Corp. | | | 5.00 | % | | | 4/1/2018 | | | | - | | | | - | | | | | | | | 25,078 | | | | 25,735 | | | | | | | | | | | | | | | | | | | | 25,078 | | | | 25,735 | |
Federal Home Loan Mortgage Corp. | | | 5.00 | % | | | 10/1/2017 | | | | - | | | | - | | | | | | | | 15,973 | | | | 16,385 | | | | | | | | | | | | | | | | | | | | 15,973 | | | | 16,385 | |
Federal Home Loan Mortgage Corp. | | | 5.00 | % | | | 12/1/2017 | | | | - | | | | - | | | | | | | | 7,501 | | | | 7,694 | | | | | | | | | | | | | | | | | | | | 7,501 | | | | 7,694 | |
Federal Home Loan Mortgage Corp. | | | 5.50 | % | | | 8/1/2038 | | | | - | | | | - | | | | | | | | 60,567 | | | | 67,946 | | | | | | | | | | | | | | | | | | | | 60,567 | | | | 67,946 | |
Federal Home Loan Mortgage Corp. | | | 5.50 | % | | | 6/1/2020 | | | | - | | | | - | | | | | | | | 19,236 | | | | 19,724 | | | | | | | | | | | | | | | | | | | | 19,236 | | | | 19,724 | |
Federal Home Loan Mortgage Corp. | | | 6.00 | % | | | 2/1/2033 | | | | - | | | | - | | | | | | | | 54,055 | | | | 61,529 | | | | | | | | | | | | | | | | | | | | 54,055 | | | | 61,529 | |
Federal Home Loan Mortgage Corp. | | | 6.00 | % | | | 1/1/2034 | | | | - | | | | - | | | | | | | | 98,689 | | | | 107,658 | | | | | | | | | | | | | | | | | | | | 98,689 | | | | 107,658 | |
Federal Home Loan Mortgage Corp. | | | 6.00 | % | | | 12/1/2034 | | | | - | | | | - | | | | | | | | 93,187 | | | | 106,076 | | | | | | | | | | | | | | | | | | | | 93,187 | | | | 106,076 | |
Federal Home Loan Mortgage Corp. | | | 6.00 | % | | | 10/1/2019 | | | | - | | | | - | | | | | | | | 10,227 | | | | 10,479 | | | | | | | | | | | | | | | | | | | | 10,227 | | | | 10,479 | |
Federal Home Loan Mortgage Corp. | | | 6.00 | % | | | 2/1/2019 | | | | - | | | | - | | | | | | | | 10,809 | | | | 10,980 | | | | | | | | | | | | | | | | | | | | 10,809 | | | | 10,980 | |
Federal Home Loan Mortgage Corp. | | | 6.00 | % | | | 10/1/2017 | | | | - | | | | - | | | | | | | | 59 | | | | 59 | | | | | | | | | | | | | | | | | | | | 59 | | | | 59 | |
Federal Home Loan Mortgage Corp. | | | 6.50 | % | | | 9/1/2019 | | | | - | | | | - | | | | | | | | 10,510 | | | | 10,776 | | | | | | | | | | | | | | | | | | | | 10,510 | | | | 10,776 | |
Federal Home Loan Mortgage Corp. | | | 6.50 | % | | | 4/1/2018 | | | | - | | | | - | | | | | | | | 8,044 | | | | 8,152 | | | | | | | | | | | | | | | | | | | | 8,044 | | | | 8,152 | |
Federal Home Loan Mortgage Corp. | | | 6.50 | % | | | 11/1/2036 | | | | - | | | | - | | | | | | | | 38,950 | | | | 47,919 | | | | | | | | | | | | | | | | | | | | 38,950 | | | | 47,919 | |
Federal Home Loan Mortgage Corp. | | | 6.50 | % | | | 12/1/2017 | | | | - | | | | - | | | | | | | | 14,881 | | | | 15,209 | | | | | | | | | | | | | | | | | | | | 14,881 | | | | 15,209 | |
Federal Home Loan Mortgage Corp. | | | 7.00 | % | | | 1/1/2031 | | | | - | | | | - | | | | | | | | 110,887 | | | | 130,870 | | | | | | | | | | | | | | | | | | | | 110,887 | | | | 130,870 | |
30
| | | | | | | | | | | | | | | | | | | | | | | | | | | | | | | | | | | | | | | | | | | | | | | | | | | | |
| | | | | | | | | Voya Limited
Maturity Bond VP | | | | | | JPMorgan Core
Bond VP | | | | | | Adjustments | | | | | | Combined Pro
Forma Portfolio | |
| | | | | | | | | | | | | |
| | | Coupon Rate | | | Maturity Date | | | Principal | | | Value | | | | | | Principal | | | Value | | | | | | Principal | | | Value | | | | | | Principal | | | Value | |
| | | | | | | | | | | | | | | | | | | | | | | | | | | | | | | | |
Federal Home Loan Mortgage Corp. Multifamily Structured Pass-Through Certificates | | | 1.14 | % | | | 9/25/2022 | | | $ | - | | | $ | - | | | | | | | $ | 1,080,647 | | | $ | 1,082,341 | | | | | | | | | | | | | | | | | | | $ | 1,080,647 | | | $ | 1,082,341 | |
Federal Home Loan Mortgage Corp. Multifamily Structured Pass-Through Certificates | | | 2.60 | % | | | 9/25/2020 | | | | - | | | | - | | | | | | | | 142,000 | | | | 147,891 | | | | | | | | | | | | | | | | | | | | 142,000 | | | | 147,891 | |
Federal Home Loan Mortgage Corp. Multifamily Structured Pass-Through Certificates | | | 2.62 | % | | | 1/25/2023 | | | | - | | | | - | | | | | | | | 1,250,000 | | | | 1,296,282 | | | | | | | | | | | | | | | | | | | | 1,250,000 | | | | 1,296,282 | |
Federal Home Loan Mortgage Corp. Multifamily Structured Pass-Through Certificates | | | 2.77 | % | | | 5/25/2025 | | | | - | | | | - | | | | | | | | 750,000 | | | | 789,303 | | | | | | | | | | | | | | | | | | | | 750,000 | | | | 789,303 | |
Federal Home Loan Mortgage Corp. Multifamily Structured Pass-Through Certificates | | | 3.08 | % | | | 1/25/2031 | | | | - | | | | - | | | | | | | | 1,179,000 | | | | 1,253,468 | | | | | | | | | | | | | | | | | | | | 1,179,000 | | | | 1,253,468 | |
Federal Home Loan Mortgage Corp. Multifamily Structured Pass-Through Certificates | | | 3.39 | % | | | 3/25/2024 | | | | - | | | | - | | | | | | | | 857,000 | | | | 947,224 | | | | | | | | | | | | | | | | | | | | 857,000 | | | | 947,224 | |
Federal Home Loan Mortgage Corp. Multifamily Structured Pass-Through Certificates | | | 3.49 | % | | | 1/25/2024 | | | | - | | | | - | | | | | | | | 1,300,000 | | | | 1,443,765 | | | | | | | | | | | | | | | | | | | | 1,300,000 | | | | 1,443,765 | |
Federal Home Loan Mortgage Corp. REMIC | | | 0.79 | % | | | 6/15/2043 | | | | - | | | | - | | | | | | | | 1,412,298 | | | | 1,414,785 | | | | | | | | | | | | | | | | | | | | 1,412,298 | | | | 1,414,785 | |
Federal Home Loan Mortgage Corp. REMIC | | | 0.84 | % | | | 7/15/2037 | | | | - | | | | - | | | | | | | | 489,981 | | | | 483,640 | | | | | | | | | | | | | | | | | | | | 489,981 | | | | 483,640 | |
Federal Home Loan Mortgage Corp. REMIC | | | 0.84 | % | | | 10/15/2041 | | | | - | | | | - | | | | | | | | 572,666 | | | | 572,319 | | | | | | | | | | | | | | | | | | | | 572,666 | | | | 572,319 | |
Federal Home Loan Mortgage Corp. REMIC | | | 0.88 | % | | | 2/15/2037 | | | | - | | | | - | | | | | | | | 17,510 | | | | 17,533 | | | | | | | | | | | | | | | | | | | | 17,510 | | | | 17,533 | |
Federal Home Loan Mortgage Corp. REMIC | | | 0.89 | % | | | 3/15/2039 | | | | - | | | | - | | | | | | | | 122,495 | | | | 122,995 | | | | | | | | | | | | | | | | | | | | 122,495 | | | | 122,995 | |
Federal Home Loan Mortgage Corp. REMIC | | | 0.89 | % | | | 8/15/2039 | | | | - | | | | - | | | | | | | | 490,638 | | | | 491,893 | | | | | | | | | | | | | | | | | | | | 490,638 | | | | 491,893 | |
Federal Home Loan Mortgage Corp. REMIC | | | 0.99 | % | | | 8/15/2037 | | | | - | | | | - | | | | | | | | 810,800 | | | | 815,424 | | | | | | | | | | | | | | | | | | | | 810,800 | | | | 815,424 | |
Federal Home Loan Mortgage Corp. REMIC | | | 1.12 | % | | | 11/15/2037 | | | | - | | | | - | | | | | | | | 507,016 | | | | 512,415 | | | | | | | | | | | | | | | | | | | | 507,016 | | | | 512,415 | |
Federal Home Loan Mortgage Corp. REMIC | | | 3.50 | % | | | 8/15/2039 | | | | - | | | | - | | | | | | | | 2,641,407 | | | | 2,801,093 | | | | | | | | | | | | | | | | | | | | 2,641,407 | | | | 2,801,093 | |
Federal Home Loan Mortgage Corp. REMIC | | | 4.00 | % | | | 12/15/2041 | | | | - | | | | - | | | | | | | | 542,529 | | | | 594,286 | | | | | | | | | | | | | | | | | | | | 542,529 | | | | 594,286 | |
Federal Home Loan Mortgage Corp. REMIC | | | 4.50 | % | | | 2/15/2020 | | | | - | | | | - | | | | | | | | 29,708 | | | | 30,576 | | | | | | | | | | | | | | | | | | | | 29,708 | | | | 30,576 | |
Federal Home Loan Mortgage Corp. REMIC | | | 5.00 | % | | | 5/15/2023 | | | | - | | | | - | | | | | | | | 39,391 | | | | 42,414 | | | | | | | | | | | | | | | | | | | | 39,391 | | | | 42,414 | |
Federal Home Loan Mortgage Corp. REMIC | | | 5.00 | % | | | 5/15/2041 | | | | - | | | | - | | | | | | | | 257,741 | | | | 328,918 | | | | | | | | | | | | | | | | | | | | 257,741 | | | | 328,918 | |
Federal Home Loan Mortgage Corp. REMIC | | | 5.00 | % | | | 1/15/2034 | | | | - | | | | - | | | | | | | | 282,086 | | | | 316,098 | | | | | | | | | | | | | | | | | | | | 282,086 | | | | 316,098 | |
Federal Home Loan Mortgage Corp. REMIC | | | 5.00 | % | | | 12/15/2022 | | | | - | | | | - | | | | | | | | 384,929 | | | | 403,768 | | | | | | | | | | | | | | | | | | | | 384,929 | | | | 403,768 | |
Federal Home Loan Mortgage Corp. REMIC | | | 5.50 | % | | | 3/15/2017 | | | | - | | | | - | | | | | | | | 309,864 | | | | 313,062 | | | | | | | | | | | | | | | | | | | | 309,864 | | | | 313,062 | |
Federal Home Loan Mortgage Corp. REMIC | | | 5.50 | % | | | 5/15/2041 | | | | - | | | | - | | | | | | | | 155,355 | | | | 172,129 | | | | | | | | | | | | | | | | | | | | 155,355 | | | | 172,129 | |
Federal Home Loan Mortgage Corp. REMIC | | | 5.50 | % | | | 12/15/2022 | | | | - | | | | - | | | | | | | | 91,326 | | | | 99,048 | | | | | | | | | | | | | | | | | | | | 91,326 | | | | 99,048 | |
Federal Home Loan Mortgage Corp. REMIC | | | 5.50 | % | | | 4/15/2033 | | | | - | | | | - | | | | | | | | 95,837 | | | | 105,315 | | | | | | | | | | | | | | | | | | | | 95,837 | | | | 105,315 | |
Federal Home Loan Mortgage Corp. REMIC | | | 5.50 | % | | | 3/15/2035 | | | | - | | | | - | | | | | | | | 500,000 | | | | 587,322 | | | | | | | | | | | | | | | | | | | | 500,000 | | | | 587,322 | |
Federal Home Loan Mortgage Corp. REMIC | | | 5.50 | % | | | 5/15/2038 | | | | - | | | | - | | | | | | | | 65,229 | | | | 71,930 | | | | | | | | | | | | | | | | | | | | 65,229 | | | | 71,930 | |
Federal Home Loan Mortgage Corp. REMIC | | | 6.00 | % | | | 4/15/2036 | | | | - | | | | - | | | | | | | | 441,457 | | | | 508,054 | | | | | | | | | | | | | | | | | | | | 441,457 | | | | 508,054 | |
Federal Home Loan Mortgage Corp. REMIC | | | 6.00 | % | | | 10/15/2032 | | | | - | | | | - | | | | | | | | 659,184 | | | | 747,488 | | | | | | | | | | | | | | | | | | | | 659,184 | | | | 747,488 | |
Federal Home Loan Mortgage Corp. REMIC | | | 6.00 | % | | | 11/15/2032 | | | | - | | | | - | | | | | | | | 113,515 | | | | 129,721 | | | | | | | | | | | | | | | | | | | | 113,515 | | | | 129,721 | |
Federal Home Loan Mortgage Corp. REMIC | | | 6.00 | % | | | 2/15/2033 | | | | - | | | | - | | | | | | | | 222,963 | | | | 255,213 | | | | | | | | | | | | | | | | | | | | 222,963 | | | | 255,213 | |
Federal Home Loan Mortgage Corp. REMIC | | | 6.00 | % | | | 5/15/2027 | | | | - | | | | - | | | | | | | | 416,087 | | | | 471,639 | | | | | | | | | | | | | | | | | | | | 416,087 | | | | 471,639 | |
Federal Home Loan Mortgage Corp. REMIC | | | 6.00 | % | | | 9/15/2036 | | | | - | | | | - | | | | | | | | 102,501 | | | | 106,419 | | | | | | | | | | | | | | | | | | | | 102,501 | | | | 106,419 | |
Federal Home Loan Mortgage Corp. REMIC | | | 6.38 | % | | | 3/15/2032 | | | | - | | | | - | | | | | | | | 141,682 | | | | 166,261 | | | | | | | | | | | | | | | | | | | | 141,682 | | | | 166,261 | |
Federal Home Loan Mortgage Corp. REMIC | | | 6.40 | % | | | 11/15/2023 | | | | - | | | | - | | | | | | | | 48,499 | | | | 53,048 | | | | | | | | | | | | | | | | | | | | 48,499 | | | | 53,048 | |
Federal Home Loan Mortgage Corp. REMIC | | | 6.50 | % | | | 8/15/2031 | | | | - | | | | - | | | | | | | | 64,334 | | | | 76,696 | | | | | | | | | | | | | | | | | | | | 64,334 | | | | 76,696 | |
Federal Home Loan Mortgage Corp. REMIC | | | 6.50 | % | | | 3/15/2032 | | | | - | | | | - | | | | | | | | 171,327 | | | | 201,409 | | | | | | | | | | | | | | | | | | | | 171,327 | | | | 201,409 | |
Federal Home Loan Mortgage Corp. REMIC | | | 6.50 | % | | | 3/15/2032 | | | | - | | | | - | | | | | | | | 141,762 | | | | 163,507 | | | | | | | | | | | | | | | | | | | | 141,762 | | | | 163,507 | |
Federal Home Loan Mortgage Corp. REMIC | | | 6.50 | % | | | 6/15/2032 | | | | - | | | | - | | | | | | | | 55,715 | | | | 64,415 | | | | | | | | | | | | | | | | | | | | 55,715 | | | | 64,415 | |
Federal Home Loan Mortgage Corp. REMIC | | | 6.50 | % | | | 7/15/2032 | | | | - | | | | - | | | | | | | | 174,023 | | | | 204,042 | | | | | | | | | | | | | | | | | | | | 174,023 | | | | 204,042 | |
Federal Home Loan Mortgage Corp. REMIC | | | 6.50 | % | | | 7/15/2036 | | | | - | | | | - | | | | | | | | 151,463 | | | | 173,081 | | | | | | | | | | | | | | | | | | | | 151,463 | | | | 173,081 | |
Federal Home Loan Mortgage Corp. REMIC | | | 7.00 | % | | | 3/15/2032 | | | | - | | | | - | | | | | | | | 378,107 | | | | 440,534 | | | | | | | | | | | | | | | | | | | | 378,107 | | | | 440,534 | |
Federal Home Loan Mortgage Corp. REMIC | | | 7.00 | % | | | 3/15/2024 | | | | - | | | | - | | | | | | | | 194,451 | | | | 218,126 | | | | | | | | | | | | | | | | | | | | 194,451 | | | | 218,126 | |
Federal Home Loan Mortgage Corp. REMIC | | | 7.00 | % | | | 6/15/2029 | | | | - | | | | - | | | | | | | | 325,039 | | | | 374,633 | | | | | | | | | | | | | | | | | | | | 325,039 | | | | 374,633 | |
Federal Home Loan Mortgage Corp. REMIC | | | 7.00 | % | | | 10/15/2030 | | | | - | | | | - | | | | | | | | 95,784 | | | | 110,747 | | | | | | | | | | | | | | | | | | | | 95,784 | | | | 110,747 | |
Federal Home Loan Mortgage Corp. REMIC | | | 7.00 | % | | | 4/15/2032 | | | | - | | | | - | | | | | | | | 127,647 | | | | 150,535 | | | | | | | | | | | | | | | | | | | | 127,647 | | | | 150,535 | |
Federal Home Loan Mortgage Corp. REMIC | | | 7.00 | % | | | 5/15/2032 | | | | - | | | | - | | | | | | | | 117,786 | | | | 136,219 | | | | | | | | | | | | | | | | | | | | 117,786 | | | | 136,219 | |
Federal Home Loan Mortgage Corp. REMIC | | | 7.25 | % | | | 9/15/2030 | | | | - | | | | - | | | | | | | | 209,308 | | | | 243,420 | | | | | | | | | | | | | | | | | | | | 209,308 | | | | 243,420 | |
Federal Home Loan Mortgage Corp. REMIC | | | 7.25 | % | | | 12/15/2030 | | | | - | | | | - | | | | | | | | 66,953 | | | | 77,648 | | | | | | | | | | | | | | | | | | | | 66,953 | | | | 77,648 | |
Federal Home Loan Mortgage Corp. REMIC | | | 7.50 | % | | | 2/15/2023 | | | | - | | | | - | | | | | | | | 92,637 | | | | 102,900 | | | | | | | | | | | | | | | | | | | | 92,637 | | | | 102,900 | |
Federal Home Loan Mortgage Corp. REMIC | | | 7.50 | % | | | 8/15/2030 | | | | - | | | | - | | | | | | | | 43,059 | | | | 50,367 | | | | | | | | | | | | | | | | | | | | 43,059 | | | | 50,367 | |
Federal Home Loan Mortgage Corp. REMIC | | | 8.00 | % | | | 1/15/2030 | | | | - | | | | - | | | | | | | | 227,366 | | | | 264,736 | | | | | | | | | | | | | | | | | | | | 227,366 | | | | 264,736 | |
Federal Home Loan Mortgage Corp. REMIC | | | 8.50 | % | | | 9/15/2020 | | | | - | | | | - | | | | | | | | 5,898 | | | | 6,080 | | | | | | | | | | | | | | | | | | | | 5,898 | | | | 6,080 | |
Federal Home Loan Mortgage Corp. REMIC | | | 9.57 | % | | | 7/15/2032 | | | | - | | | | - | | | | | | | | 72,815 | | | | 94,225 | | | | | | | | | | | | | | | | | | | | 72,815 | | | | 94,225 | |
Federal Home Loan Mortgage Corp. REMIC | | | 12.40 | % | | | 7/15/2033 | | | | - | | | | - | | | | | | | | 47,282 | | | | 54,804 | | | | | | | | | | | | | | | | | | | | 47,282 | | | | 54,804 | |
Federal Home Loan Mortgage Corp. REMIC | | | 13.95 | % | | | 9/15/2033 | | | | - | | | | - | | | | | | | | 12,582 | | | | 16,931 | | | | | | | | | | | | | | | | | | | | 12,582 | | | | 16,931 | |
Federal Home Loan Mortgage Corp. REMIC | | | 16.03 | % | | | 2/15/2040 | | | | - | | | | - | | | | | | | | 100,000 | | | | 149,479 | | | | | | | | | | | | | | | | | | | | 100,000 | | | | 149,479 | |
Federal Home Loan Mortgage Corp. REMIC | | | 22.87 | % | | | 6/15/2034 | | | | - | | | | - | | | | | | | | 78,789 | | | | 111,926 | | | | | | | | | | | | | | | | | | | | 78,789 | | | | 111,926 | |
31
| | | | | | | | | | | | | | | | | | | | | | | | | | | | | | | | | | | | | | | | | | | | | | | | | | | | |
| | | | | | | | | Voya Limited
Maturity Bond VP | | | | | | JPMorgan Core
Bond VP | | | | | | Adjustments | | | | | | Combined Pro
Forma Portfolio | |
| | | | | | | | | | | | | |
| | | Coupon Rate | | | Maturity Date | | | Principal | | | Value | | | | | | Principal | | | Value | | | | | | Principal | | | Value | | | | | | Principal | | | Value | |
| | | | | | | | | | | | | | | | | | | | | | | | | | | | | | | | |
Federal Home Loan Mortgage Corp. REMIC, Interest Only STRIPS | | | 1.88 | % | | | 1/15/2040 | | | $ | - | | | $ | - | | | | | | | $ | 296,100 | | | $ | 22,728 | | | | | | | | | | | | | | | | | | | $ | 296,100 | | | $ | 22,728 | |
Federal Home Loan Mortgage Corp. REMIC, Interest Only STRIPS | | | 4.50 | % | | | 7/15/2037 | | | | - | | | | - | | | | | | | | 106,267 | | | | 4,053 | | | | | | | | | | | | | | | | | | | | 106,267 | | | | 4,053 | |
Federal Home Loan Mortgage Corp. REMIC, Interest Only STRIPS | | | 5.56 | % | | | 11/15/2037 | | | | - | | | | - | | | | | | | | 27,909 | | | | 3,878 | | | | | | | | | | | | | | | | | | | | 27,909 | | | | 3,878 | |
Federal Home Loan Mortgage Corp. REMIC, Interest Only STRIPS | | | 5.56 | % | | | 1/15/2038 | | | | - | | | | - | | | | | | | | 112,441 | | | | 17,437 | | | | | | | | | | | | | | | | | | | | 112,441 | | | | 17,437 | |
Federal Home Loan Mortgage Corp. REMIC, Interest Only STRIPS | | | 5.56 | % | | | 2/15/2039 | | | | - | | | | - | | | | | | | | 59,036 | | | | 11,013 | | | | | | | | | | | | | | | | | | | | 59,036 | | | | 11,013 | |
Federal Home Loan Mortgage Corp. REMIC, Interest Only STRIPS | | | 5.76 | % | | | 6/15/2038 | | | | - | | | | - | | | | | | | | 361,172 | | | | 63,731 | | | | | | | | | | | | | | | | | | | | 361,172 | | | | 63,731 | |
Federal Home Loan Mortgage Corp. REMIC, Interest Only STRIPS | | | 5.93 | % | | | 10/15/2037 | | | | - | | | | - | | | | | | | | 718,701 | | | | 138,942 | | | | | | | | | | | | | | | | | | | | 718,701 | | | | 138,942 | |
Federal Home Loan Mortgage Corp. REMIC, Interest Only STRIPS | | | 5.98 | % | | | 11/15/2037 | | | | - | | | | - | | | | | | | | 89,391 | | | | 15,411 | | | | | | | | | | | | | | | | | | | | 89,391 | | | | 15,411 | |
Federal Home Loan Mortgage Corp. REMIC, Interest Only STRIPS | | | 6.36 | % | | | 4/15/2038 | | | | - | | | | - | | | | | | | | 60,990 | | | | 10,027 | | | | | | | | | | | | | | | | | | | | 60,990 | | | | 10,027 | |
Federal Home Loan Mortgage Corp. REMIC, Interest Only STRIPS | | | 6.66 | % | | | 7/15/2036 | | | | - | | | | - | | | | | | | | 27,115 | | | | 3,449 | | | | | | | | | | | | | | | | | | | | 27,115 | | | | 3,449 | |
Federal Home Loan Mortgage Corp. REMIC, Interest Only STRIPS | | | 7.56 | % | | | 3/15/2032 | | | | - | | | | - | | | | | | | | 46,705 | | | | 13,432 | | | | | | | | | | | | | | | | | | | | 46,705 | | | | 13,432 | |
Federal Home Loan Mortgage Corp. REMIC, Principal Only STRIPS | | | 0.00 | % | | | 12/15/2032 | | | | - | | | | - | | | | | | | | 4,803 | | | | 4,757 | | | | | | | | | | | | | | | | | | | | 4,803 | | | | 4,757 | |
Federal Home Loan Mortgage Corp. REMIC, Principal Only STRIPS | | | 0.00 | % | | | 12/15/2032 | | | | - | | | | - | | | | | | | | 12,221 | | | | 12,047 | | | | | | | | | | | | | | | | | | | | 12,221 | | | | 12,047 | |
Federal Home Loan Mortgage Corp. REMIC, Principal Only STRIPS | | | 0.00 | % | | | 1/15/2033 | | | | - | | | | - | | | | | | | | 2,681 | | | | 2,678 | | | | | | | | | | | | | | | | | | | | 2,681 | | | | 2,678 | |
Federal Home Loan Mortgage Corp. REMIC, Principal Only STRIPS | | | 0.00 | % | | | 12/15/2032 | | | | - | | | | - | | | | | | | | 8,098 | | | | 7,448 | | | | | | | | | | | | | | | | | | | | 8,098 | | | | 7,448 | |
Federal Home Loan Mortgage Corp. REMIC, Principal Only STRIPS | | | 0.00 | % | | | 3/15/2019 | | | | - | | | | - | | | | | | | | 114,851 | | | | 113,375 | | | | | | | | | | | | | | | | | | | | 114,851 | | | | 113,375 | |
Federal Home Loan Mortgage Corp. REMIC, Principal Only STRIPS | | | 0.00 | % | | | 4/15/2020 | | | | - | | | | - | | | | | | | | 27,340 | | | | 26,595 | | | | | | | | | | | | | | | | | | | | 27,340 | | | | 26,595 | |
Federal Home Loan Mortgage Corp. REMIC, Principal Only STRIPS | | | 0.00 | % | | | 2/15/2036 | | | | - | | | | - | | | | | | | | 31,477 | | | | 29,062 | | | | | | | | | | | | | | | | | | | | 31,477 | | | | 29,062 | |
Federal Home Loan Mortgage Corp. REMIC, Principal Only STRIPS | | | 0.00 | % | | | 2/15/2036 | | | | - | | | | - | | | | | | | | 43,281 | | | | 40,889 | | | | | | | | | | | | | | | | | | | | 43,281 | | | | 40,889 | |
Federal Home Loan Mortgage Corp. REMIC, Principal Only STRIPS | | | 0.00 | % | | | 2/15/2036 | | | | - | | | | - | | | | | | | | 16,298 | | | | 14,499 | | | | | | | | | | | | | | | | | | | | 16,298 | | | | 14,499 | |
Federal Home Loan Mortgage Corp. REMIC, Principal Only STRIPS | | | 0.00 | % | | | 3/15/2036 | | | | - | | | | - | | | | | | | | 71,824 | | | | 66,747 | | | | | | | | | | | | | | | | | | | | 71,824 | | | | 66,747 | |
Federal Home Loan Mortgage Corp. REMIC, Principal Only STRIPS | | | 0.00 | % | | | 4/15/2036 | | | | - | | | | - | | | | | | | | 29,153 | | | | 28,116 | | | | | | | | | | | | | | | | | | | | 29,153 | | | | 28,116 | |
Federal Home Loan Mortgage Corp. REMIC, Principal Only STRIPS | | | 0.00 | % | | | 7/15/2036 | | | | - | | | | - | | | | | | | | 11,478 | | | | 10,795 | | | | | | | | | | | | | | | | | | | | 11,478 | | | | 10,795 | |
Federal Home Loan Mortgage Corp. REMIC, Principal Only STRIPS | | | 0.00 | % | | | 8/15/2036 | | | | - | | | | - | | | | | | | | 39,392 | | | | 35,414 | | | | | | | | | | | | | | | | | | | | 39,392 | | | | 35,414 | |
Federal Home Loan Mortgage Corp. REMIC, Principal Only STRIPS | | | 0.00 | % | | | 5/15/2037 | | | | - | | | | - | | | | | | | | 20,457 | | | | 19,570 | | | | | | | | | | | | | | | | | | | | 20,457 | | | | 19,570 | |
Federal Home Loan Mortgage Corp. REMIC, Principal Only STRIPS | | | 0.00 | % | | | 5/15/2037 | | | | - | | | | - | | | | | | | | 64,253 | | | | 57,834 | | | | | | | | | | | | | | | | | | | | 64,253 | | | | 57,834 | |
Federal Home Loan Mortgage Corp. REMIC, Principal Only STRIPS | | | 0.00 | % | | | 1/15/2040 | | | | - | | | | - | | | | | | | | 41,461 | | | | 37,455 | | | | | | | | | | | | | | | | | | | | 41,461 | | | | 37,455 | |
Federal Home Loan Mortgage Corp. Structured Pass-Through Securities | | | 1.61 | % | | | 10/25/2044 | | | | - | | | | - | | | | | | | | 288,861 | | | | 299,880 | | | | | | | | | | | | | | | | | | | | 288,861 | | | | 299,880 | |
Federal Home Loan Mortgage Corp. Structured Pass-Through Securities | | | 6.50 | % | | | 2/25/2043 | | | | - | | | | - | | | | | | | | 177,806 | | | | 216,194 | | | | | | | | | | | | | | | | | | | | 177,806 | | | | 216,194 | |
Federal Home Loan Mortgage Corp. Structured Pass-Through Securities | | | 6.62 | % | | | 7/25/2032 | | | | - | | | | - | | | | | | | | 194,204 | | | | 209,332 | | | | | | | | | | | | | | | | | | | | 194,204 | | | | 209,332 | |
Federal Home Loan Mortgage Corp. Structured Pass-Through Securities | | | 7.00 | % | | | 2/25/2043 | | | | - | | | | - | | | | | | | | 56,546 | | | | 68,562 | | | | | | | | | | | | | | | | | | | | 56,546 | | | | 68,562 | |
Federal Home Loan Mortgage Corp. Structured Pass-Through Securities | | | 7.50 | % | | | 8/25/2042 | | | | - | | | | - | | | | | | | | 77,367 | | | | 95,980 | | | | | | | | | | | | | | | | | | | | 77,367 | | | | 95,980 | |
Federal Home Loan Mortgage Corp., Interest Only STRIPS | | | 5.00 | % | | | 9/15/2035 | | | | - | | | | - | | | | | | | | 77,856 | | | | 11,929 | | | | | | | | | | | | | | | | | | | | 77,856 | | | | 11,929 | |
Federal National Mortgage Association | | | 0.00 | % | | | 6/1/2017 | | | | - | | | | - | | | | | | | | 300,000 | | | | 298,314 | | | | | | | | | | | | | | | | | | | | 300,000 | | | | 298,314 | |
Federal National Mortgage Association | | | 0.71 | % | | | 11/25/2046 | | | | - | | | | - | | | | | | | | 244,343 | | | | 244,888 | | | | | | | | | | | | | | | | | | | | 244,343 | | | | 244,888 | |
Federal National Mortgage Association | | | 0.79 | % | | | 1/1/2023 | | | | - | | | | - | | | | | | | | 929,122 | | | | 928,618 | | | | | | | | | | | | | | | | | | | | 929,122 | | | | 928,618 | |
Federal National Mortgage Association | | | 0.80 | % | | | 9/25/2042 | | | | - | | | | - | | | | | | | | 697,745 | | | | 694,164 | | | | | | | | | | | | | | | | | | | | 697,745 | | | | 694,164 | |
Federal National Mortgage Association | | | 0.81 | % | | | 5/1/2024 | | | | - | | | | - | | | | | | | | 1,367,000 | | | | 1,369,670 | | | | | | | | | | | | | | | | | | | | 1,367,000 | | | | 1,369,670 | |
Federal National Mortgage Association | | | 0.81 | % | | | 1/25/2017 | | | | - | | | | - | | | | | | | | 19,954 | | | | 19,942 | | | | | | | | | | | | | | | | | | | | 19,954 | | | | 19,942 | |
Federal National Mortgage Association | | | 0.83 | % | | | 1/1/2023 | | | | - | | | | - | | | | | | | | 697,282 | | | | 701,765 | | | | | | | | | | | | | | | | | | | | 697,282 | | | | 701,765 | |
Federal National Mortgage Association | | | 0.87 | % | | | 7/1/2024 | | | | - | | | | - | | | | | | | | 1,250,000 | | | | 1,261,542 | | | | | | | | | | | | | | | | | | | | 1,250,000 | | | | 1,261,542 | |
Federal National Mortgage Association | | | 0.88 | % | | | 9/1/2024 | | | | - | | | | - | | | | | | | | 1,000,000 | | | | 1,003,742 | | | | | | | | | | | | | | | | | | | | 1,000,000 | | | | 1,003,742 | |
Federal National Mortgage Association | | | 0.91 | % | | | 11/1/2020 | | | | - | | | | - | | | | | | | | 995,000 | | | | 996,541 | | | | | | | | | | | | | | | | | | | | 995,000 | | | | 996,541 | |
Federal National Mortgage Association | | | 0.92 | % | | | 9/1/2024 | | | | - | | | | - | | | | | | | | 965,510 | | | | 967,877 | | | | | | | | | | | | | | | | | | | | 965,510 | | | | 967,877 | |
Federal National Mortgage Association | | | 0.97 | % | | | 8/25/2019 | | | | - | | | | - | | | | | | | | 104,289 | | | | 104,275 | | | | | | | | | | | | | | | | | | | | 104,289 | | | | 104,275 | |
Federal National Mortgage Association | | | 1.00 | % | | | 8/25/2042 | | | | - | | | | - | | | | | | | | 721,039 | | | | 717,346 | | | | | | | | | | | | | | | | | | | | 721,039 | | | | 717,346 | |
Federal National Mortgage Association | | | 1.07 | % | | | 11/25/2016 | | | | 19,273 | | | | 19,262 | | | | | | | | - | | | | - | | | | | | | | | | | | | | | | | | | | 19,273 | | | | 19,262 | |
Federal National Mortgage Association | | | 1.37 | % | | | 11/25/2022 | | | | - | | | | - | | | | | | | | 1,094,671 | | | | 1,097,395 | | | | | | | | | | | | | | | | | | | | 1,094,671 | | | | 1,097,395 | |
Federal National Mortgage Association | | | 1.40 | % | | | 7/1/2017 | | | | - | | | | - | | | | | | | | 1,000,000 | | | | 1,002,666 | | | | | | | | | | | | | | | | | | | | 1,000,000 | | | | 1,002,666 | |
Federal National Mortgage Association | | | 1.94 | % | | | 7/1/2019 | | | | - | | | | - | | | | | | | | 965,562 | | | | 986,721 | | | | | | | | | | | | | | | | | | | | 965,562 | | | | 986,721 | |
Federal National Mortgage Association | | | 2.01 | % | | | 7/1/2019 | | | | - | | | | - | | | | | | | | 962,520 | | | | 985,558 | | | | | | | | | | | | | | | | | | | | 962,520 | | | | 985,558 | |
Federal National Mortgage Association | | | 2.01 | % | | | 6/1/2020 | | | | - | | | | - | | | | | | | | 2,000,000 | | | | 2,056,118 | | | | | | | | | | | | | | | | | | | | 2,000,000 | | | | 2,056,118 | |
Federal National Mortgage Association | | | 2.03 | % | | | 8/1/2019 | | | | - | | | | - | | | | | | | | 49,424 | | | | 51,133 | | | | | | | | | | | | | | | | | | | | 49,424 | | | | 51,133 | |
Federal National Mortgage Association | | | 2.03 | % | | | 3/25/2019 | | | | - | | | | - | | | | | | | | 1,357,403 | | | | 1,384,043 | | | | | | | | | | | | | | | | | | | | 1,357,403 | | | | 1,384,043 | |
Federal National Mortgage Association | | | 2.34 | % | | | 1/1/2023 | | | | - | | | | - | | | | | | | | 956,330 | | | | 994,123 | | | | | | | | | | | | | | | | | | | | 956,330 | | | | 994,123 | |
Federal National Mortgage Association | | | 2.38 | % | | | 12/1/2022 | | | | - | | | | - | | | | | | | | 972,502 | | | | 1,013,041 | | | | | | | | | | | | | | | | | | | | 972,502 | | | | 1,013,041 | |
Federal National Mortgage Association | | | 2.39 | % | | | 1/25/2023 | | | | - | | | | - | | | | | | | | 1,000,000 | | | | 1,033,839 | | | | | | | | | | | | | | | | | | | | 1,000,000 | | | | 1,033,839 | |
Federal National Mortgage Association | | | 2.40 | % | | | 2/1/2023 | | | | - | | | | - | | | | | | | | 1,000,000 | | | | 1,038,729 | | | | | | | | | | | | | | | | | | | | 1,000,000 | | | | 1,038,729 | |
Federal National Mortgage Association | | | 2.46 | % | | | 2/1/2023 | | | | - | | | | - | | | | | | | | 926,414 | | | | 961,160 | | | | | | | | | | | | | | | | | | | | 926,414 | | | | 961,160 | |
Federal National Mortgage Association | | | 2.49 | % | | | 5/25/2026 | | | | - | | | | - | | | | | | | | 1,000,000 | | | | 1,024,300 | | | | | | | | | | | | | | | | | | | | 1,000,000 | | | | 1,024,300 | |
Federal National Mortgage Association | | | 2.51 | % | | | 6/1/2023 | | | | - | | | | - | | | | | | | | 944,028 | | | | 986,725 | | | | | | | | | | | | | | | | | | | | 944,028 | | | | 986,725 | |
Federal National Mortgage Association | | | 2.52 | % | | | 5/1/2023 | | | | - | | | | - | | | | | | | | 1,000,000 | | | | 1,049,444 | | | | | | | | | | | | | | | | | | | | 1,000,000 | | | | 1,049,444 | |
Federal National Mortgage Association | | | 2.57 | % | | | 7/25/2028 | | | | - | | | | - | | | | | | | | 1,250,000 | | | | 1,259,763 | | | | | | | | | | | | | | | | | | | | 1,250,000 | | | | 1,259,763 | |
Federal National Mortgage Association | | | 2.61 | % | | | 10/25/2021 | | | | - | | | | - | | | | | | | | 1,000,000 | | | | 1,048,667 | | | | | | | | | | | | | | | | | | | | 1,000,000 | | | | 1,048,667 | |
Federal National Mortgage Association | | | 2.65 | % | | | 8/1/2022 | | | | - | | | | - | | | | | | | | 500,000 | | | | 527,326 | | | | | | | | | | | | | | | | | | | | 500,000 | | | | 527,326 | |
Federal National Mortgage Association | | | 2.66 | % | | | 12/1/2022 | | | | - | | | | - | | | | | | | | 1,000,000 | | | | 1,074,243 | | | | | | | | | | | | | | | | | | | | 1,000,000 | | | | 1,074,243 | |
Federal National Mortgage Association | | | 2.67 | % | | | 7/1/2022 | | | | - | | | | - | | | | | | | | 1,500,000 | | | | 1,579,129 | | | | | | | | | | | | | | | | | | | | 1,500,000 | | | | 1,579,129 | |
Federal National Mortgage Association | | | 2.67 | % | | | 1/1/2036 | | | | - | | | | - | | | | | | | | 60,103 | | | | 63,477 | | | | | | | | | | | | | | | | | | | | 60,103 | | | | 63,477 | |
Federal National Mortgage Association | | | 2.70 | % | | | 7/25/2026 | | | | - | | | | - | | | | | | | | 1,500,000 | | | | 1,538,445 | | | | | | | | | | | | | | | | | | | | 1,500,000 | | | | 1,538,445 | |
Federal National Mortgage Association | | | 2.70 | % | | | 4/1/2023 | | | | - | | | | - | | | | | | | | 1,422,828 | | | | 1,501,593 | | | | | | | | | | | | | | | | | | | | 1,422,828 | | | | 1,501,593 | |
Federal National Mortgage Association | | | 2.75 | % | | | 1/1/2038 | | | | - | | | | - | | | | | | | | 23,104 | | | | 24,358 | | | | | | | | | | | | | | | | | | | | 23,104 | | | | 24,358 | |
Federal National Mortgage Association | | | 2.76 | % | | | 6/1/2023 | | | | - | | | | - | | | | | | | | 956,391 | | | | 1,009,955 | | | | | | | | | | | | | | | | | | | | 956,391 | | | | 1,009,955 | |
Federal National Mortgage Association | | | 2.92 | % | | | 12/1/2024 | | | | - | | | | - | | | | | | | | 1,000,000 | | | | 1,060,245 | | | | | | | | | | | | | | | | | | | | 1,000,000 | | | | 1,060,245 | |
Federal National Mortgage Association | | | 2.93 | % | | | 6/1/2030 | | | | - | | | | - | | | | | | | | 3,200,000 | | | | 3,355,378 | | | | | | | | | | | | | | | | | | | | 3,200,000 | | | | 3,355,378 | |
Federal National Mortgage Association | | | 2.97 | % | | | 6/1/2030 | | | | - | | | | - | | | | | | | | 1,321,000 | | | | 1,392,955 | | | | | | | | | | | | | | | | | | | | 1,321,000 | | | | 1,392,955 | |
32
| | | | | | | | | | | | | | | | | | | | | | | | | | | | | | | | | | | | | | | | | | | | | | | | | | | | |
| | | | | | | | | Voya Limited
Maturity Bond VP | | | | | | JPMorgan Core
Bond VP | | | | | | Adjustments | | | | | | Combined Pro
Forma Portfolio | |
| | | | | | | | | | | | | |
| | | Coupon Rate | | | Maturity Date | | | Principal | | | Value | | | | | | Principal | | | Value | | | | | | Principal | | | Value | | | | | | Principal | | | Value | |
| | | | | | | | | | | | | | | | | | | | | | | | | | | | | | | | |
Federal National Mortgage Association | | | 3.00 | % | | | 1/1/2043 | | | $ | - | | | $ | - | | | | | | | $ | 836,998 | | | $ | 871,641 | | | | | | | | | | | | | | | | | | | $ | 836,998 | | | $ | 871,641 | |
Federal National Mortgage Association | | | 3.02 | % | | | 7/1/2023 | | | | - | | | | - | | | | | | | | 2,750,000 | | | | 2,958,232 | | | | | | | | | | | | | | | | | | | | 2,750,000 | | | | 2,958,232 | |
Federal National Mortgage Association | | | 3.02 | % | | | 8/25/2024 | | | | - | | | | - | | | | | | | | 636,000 | | | | 681,829 | | | | | | | | | | | | | | | | | | | | 636,000 | | | | 681,829 | |
Federal National Mortgage Association | | | 3.03 | % | | | 12/1/2021 | | | | - | | | | - | | | | | | | | 459,813 | | | | 491,491 | | | | | | | | | | | | | | | | | | | | 459,813 | | | | 491,491 | |
Federal National Mortgage Association | | | 3.09 | % | | | 4/25/2027 | | | | - | | | | - | | | | | | | | 1,167,000 | | | | 1,267,164 | | | | | | | | | | | | | | | | | | | | 1,167,000 | | | | 1,267,164 | |
Federal National Mortgage Association | | | 3.10 | % | | | 9/1/2025 | | | | - | | | | - | | | | | | | | 1,000,000 | | | | 1,074,441 | | | | | | | | | | | | | | | | | | | | 1,000,000 | | | | 1,074,441 | |
Federal National Mortgage Association | | | 3.12 | % | | | 1/1/2022 | | | | - | | | | - | | | | | | | | 500,000 | | | | 537,693 | | | | | | | | | | | | | | | | | | | | 500,000 | | | | 537,693 | |
Federal National Mortgage Association | | | 3.12 | % | | | 11/1/2026 | | | | - | | | | - | | | | | | | | 1,000,000 | | | | 1,081,024 | | | | | | | | | | | | | | | | | | | | 1,000,000 | | | | 1,081,024 | |
Federal National Mortgage Association | | | 3.24 | % | | | 10/1/2026 | | | | - | | | | - | | | | | | | | 972,710 | | | | 1,058,674 | | | | | | | | | | | | | | | | | | | | 972,710 | | | | 1,058,674 | |
Federal National Mortgage Association | | | 3.24 | % | | | 12/1/2026 | | | | - | | | | - | | | | | | | | 1,000,000 | | | | 1,086,131 | | | | | | | | | | | | | | | | | | | | 1,000,000 | | | | 1,086,131 | |
Federal National Mortgage Association | | | 3.29 | % | | | 8/1/2026 | | | | - | | | | - | | | | | | | | 1,000,000 | | | | 1,093,245 | | | | | | | | | | | | | | | | | | | | 1,000,000 | | | | 1,093,245 | |
Federal National Mortgage Association | | | 3.29 | % | | | 8/1/2026 | | | | - | | | | - | | | | | | | | 1,500,000 | | | | 1,637,772 | | | | | | | | | | | | | | | | | | | | 1,500,000 | | | | 1,637,772 | |
Federal National Mortgage Association | | | 3.30 | % | | | 12/1/2026 | | | | - | | | | - | | | | | | | | 1,000,000 | | | | 1,092,353 | | | | | | | | | | | | | | | | | | | | 1,000,000 | | | | 1,092,353 | |
Federal National Mortgage Association | | | 3.34 | % | | | 2/1/2027 | | | | - | | | | - | | | | | | | | 1,000,000 | | | | 1,095,916 | | | | | | | | | | | | | | | | | | | | 1,000,000 | | | | 1,095,916 | |
Federal National Mortgage Association | | | 3.34 | % | | | 7/1/2030 | | | | - | | | | - | | | | | | | | 1,000,000 | | | | 1,091,494 | | | | | | | | | | | | | | | | | | | | 1,000,000 | | | | 1,091,494 | |
Federal National Mortgage Association | | | 3.35 | % | | | 3/25/2024 | | | | - | | | | - | | | | | | | | 1,750,000 | | | | 1,920,304 | | | | | | | | | | | | | | | | | | | | 1,750,000 | | | | 1,920,304 | |
Federal National Mortgage Association | | | 3.36 | % | | | 12/1/2027 | | | | - | | | | - | | | | | | | | 1,092,117 | | | | 1,196,805 | | | | | | | | | | | | | | | | | | | | 1,092,117 | | | | 1,196,805 | |
Federal National Mortgage Association | | | 3.38 | % | | | 1/1/2018 | | | | - | | | | - | | | | | | | | 500,000 | | | | 512,588 | | | | | | | | | | | | | | | | | | | | 500,000 | | | | 512,588 | |
Federal National Mortgage Association | | | 3.38 | % | | | 12/1/2023 | | | | - | | | | - | | | | | | | | 1,500,000 | | | | 1,645,794 | | | | | | | | | | | | | | | | | | | | 1,500,000 | | | | 1,645,794 | |
Federal National Mortgage Association | | | 3.45 | % | | | 1/1/2024 | | | | - | | | | - | | | | | | | | 1,000,000 | | | | 1,099,546 | | | | | | | | | | | | | | | | | | | | 1,000,000 | | | | 1,099,546 | |
Federal National Mortgage Association | | | 3.50 | % | | | 6/1/2042 | | | | - | | | | - | | | | | | | | 625,484 | | | | 662,544 | | | | | | | | | | | | | | | | | | | | 625,484 | | | | 662,544 | |
Federal National Mortgage Association | | | 3.50 | % | | | 5/1/2043 | | | | - | | | | - | | | | | | | | 626,624 | | | | 668,017 | | | | | | | | | | | | | | | | | | | | 626,624 | | | | 668,017 | |
Federal National Mortgage Association | | | 3.50 | % | | | 6/1/2033 | | | | - | | | | - | | | | | | | | 1,155,094 | | | | 1,229,816 | | | | | | | | | | | | | | | | | | | | 1,155,094 | | | | 1,229,816 | |
Federal National Mortgage Association | | | 3.50 | % | | | 8/1/2032 | | | | - | | | | - | | | | | | | | 580,211 | | | | 617,948 | | | | | | | | | | | | | | | | | | | | 580,211 | | | | 617,948 | |
Federal National Mortgage Association | | | 3.50 | % | | | 1/1/2043 | | | | - | | | | - | | | | | | | | 1,231,363 | | | | 1,312,493 | | | | | | | | | | | | | | | | | | | | 1,231,363 | | | | 1,312,493 | |
Federal National Mortgage Association | | | 3.50 | % | | | 5/1/2043 | | | | - | | | | - | | | | | | | | 842,287 | | | | 897,928 | | | | | | | | | | | | | | | | | | | | 842,287 | | | | 897,928 | |
Federal National Mortgage Association | | | 3.50 | % | | | 6/1/2043 | | | | - | | | | - | | | | | | | | 3,234,864 | | | | 3,448,250 | | | | | | | | | | | | | | | | | | | | 3,234,864 | | | | 3,448,250 | |
Federal National Mortgage Association | | | 3.50 | % | | | 1/25/2024 | | | | - | | | | - | | | | | | | | 3,000,000 | | | | 3,305,263 | | | | | | | | | | | | | | | | | | | | 3,000,000 | | | | 3,305,263 | |
Federal National Mortgage Association | | | 3.51 | % | | | 12/25/2023 | | | | - | | | | - | | | | | | | | 1,776,000 | | | | 1,971,768 | | | | | | | | | | | | | | | | | | | | 1,776,000 | | | | 1,971,768 | |
Federal National Mortgage Association | | | 3.59 | % | | | 10/1/2020 | | | | - | | | | - | | | | | | | | 95,776 | | | | 104,068 | | | | | | | | | | | | | | | | | | | | 95,776 | | | | 104,068 | |
Federal National Mortgage Association | | | 3.64 | % | | | 10/1/2020 | | | | - | | | | - | | | | | | | | 1,321,873 | | | | 1,434,472 | | | | | | | | | | | | | | | | | | | | 1,321,873 | | | | 1,434,472 | |
Federal National Mortgage Association | | | 3.65 | % | | | 4/25/2021 | | | | - | | | | - | | | | | | | | 866,000 | | | | 941,542 | | | | | | | | | | | | | | | | | | | | 866,000 | | | | 941,542 | |
Federal National Mortgage Association | | | 3.67 | % | | | 7/1/2023 | | | | - | | | | - | | | | | | | | 2,000,000 | | | | 2,225,517 | | | | | | | | | | | | | | | | | | | | 2,000,000 | | | | 2,225,517 | |
Federal National Mortgage Association | | | 3.73 | % | | | 6/25/2021 | | | | - | | | | - | | | | | | | | 500,000 | | | | 550,039 | | | | | | | | | | | | | | | | | | | | 500,000 | | | | 550,039 | |
Federal National Mortgage Association | | | 3.74 | % | | | 7/1/2023 | | | | - | | | | - | | | | | | | | 500,000 | | | | 556,601 | | | | | | | | | | | | | | | | | | | | 500,000 | | | | 556,601 | |
Federal National Mortgage Association | | | 3.74 | % | | | 6/1/2018 | | | | - | | | | - | | | | | | | | 1,361,274 | | | | 1,410,730 | | | | | | | | | | | | | | | | | | | | 1,361,274 | | | | 1,410,730 | |
Federal National Mortgage Association | | | 3.76 | % | | | 12/1/2035 | | | | - | | | | - | | | | | | | | 1,490,205 | | | | 1,648,038 | | | | | | | | | | | | | | | | | | | | 1,490,205 | | | | 1,648,038 | |
Federal National Mortgage Association | | | 3.76 | % | | | 6/25/2021 | | | | - | | | | - | | | | | | | | 1,000,000 | | | | 1,103,480 | | | | | | | | | | | | | | | | | | | | 1,000,000 | | | | 1,103,480 | |
Federal National Mortgage Association | | | 3.76 | % | | | 4/25/2021 | | | | - | | | | - | | | | | | | | 1,000,000 | | | | 1,099,517 | | | | | | | | | | | | | | | | | | | | 1,000,000 | | | | 1,099,517 | |
Federal National Mortgage Association | | | 3.77 | % | | | 8/1/2021 | | | | - | | | | - | | | | | | | | 671,376 | | | | 737,782 | | | | | | | | | | | | | | | | | | | | 671,376 | | | | 737,782 | |
Federal National Mortgage Association | | | 3.86 | % | | | 7/1/2021 | | | | - | | | | - | | | | | | | | 923,666 | | | | 1,017,141 | | | | | | | | | | | | | | | | | | | | 923,666 | | | | 1,017,141 | |
Federal National Mortgage Association | | | 3.87 | % | | | 8/1/2021 | | | | - | | | | - | | | | | | | | 931,363 | | | | 1,027,418 | | | | | | | | | | | | | | | | | | | | 931,363 | | | | 1,027,418 | |
Federal National Mortgage Association | | | 3.92 | % | | | 8/1/2021 | | | | - | | | | - | | | | | | | | 1,440,416 | | | | 1,591,626 | | | | | | | | | | | | | | | | | | | | 1,440,416 | | | | 1,591,626 | |
Federal National Mortgage Association | | | 3.94 | % | | | 7/1/2021 | | | | - | | | | - | | | | | | | | 500,000 | | | | 554,313 | | | | | | | | | | | | | | | | | | | | 500,000 | | | | 554,313 | |
Federal National Mortgage Association | | | 3.97 | % | | | 6/1/2021 | | | | - | | | | - | | | | | | | | 468,473 | | | | 517,457 | | | | | | | | | | | | | | | | | | | | 468,473 | | | | 517,457 | |
Federal National Mortgage Association | | | 3.97 | % | | | 7/1/2021 | | | | - | | | | - | | | | | | | | 467,218 | | | | 516,599 | | | | | | | | | | | | | | | | | | | | 467,218 | | | | 516,599 | |
Federal National Mortgage Association | | | 3.98 | % | | | 8/1/2021 | | | | - | | | | - | | | | | | | | 981,255 | | | | 1,083,975 | | | | | | | | | | | | | | | | | | | | 981,255 | | | | 1,083,975 | |
Federal National Mortgage Association | | | 3.99 | % | | | 7/1/2021 | | | | - | | | | - | | | | | | | | 459,084 | | | | 507,687 | | | | | | | | | | | | | | | | | | | | 459,084 | | | | 507,687 | |
Federal National Mortgage Association | | | 4.00 | % | | | 8/1/2044 | | | | - | | | | - | | | | | | | | 1,471,158 | | | | 1,583,329 | | | | | | | | | | | | | | | | | | | | 1,471,158 | | | | 1,583,329 | |
Federal National Mortgage Association | | | 4.00 | % | | | 7/1/2042 | | | | - | | | | - | | | | | | | | 2,189,813 | | | | 2,373,959 | | | | | | | | | | | | | | | | | | | | 2,189,813 | | | | 2,373,959 | |
Federal National Mortgage Association | | | 4.02 | % | | | 8/1/2021 | | | | - | | | | - | | | | | | | | 1,220,870 | | | | 1,350,428 | | | | | | | | | | | | | | | | | | | | 1,220,870 | | | | 1,350,428 | |
Federal National Mortgage Association | | | 4.05 | % | | | 8/1/2021 | | | | - | | | | - | | | | | | | | 798,486 | | | | 885,888 | | | | | | | | | | | | | | | | | | | | 798,486 | | | | 885,888 | |
Federal National Mortgage Association | | | 4.06 | % | | | 7/1/2021 | | | | - | | | | - | | | | | | | | 1,000,000 | | | | 1,109,754 | | | | | | | | | | | | | | | | | | | | 1,000,000 | | | | 1,109,754 | |
Federal National Mortgage Association | | | 4.06 | % | | | 9/1/2021 | | | | - | | | | - | | | | | | | | 461,302 | | | | 512,400 | | | | | | | | | | | | | | | | | | | | 461,302 | | | | 512,400 | |
Federal National Mortgage Association | | | 4.16 | % | | | 3/1/2021 | | | | - | | | | - | | | | | | | | 459,488 | | | | 510,000 | | | | | | | | | | | | | | | | | | | | 459,488 | | | | 510,000 | |
Federal National Mortgage Association | | | 4.23 | % | | | 3/1/2020 | | | | - | | | | - | | | | | | | | 868,963 | | | | 944,448 | | | | | | | | | | | | | | | | | | | | 868,963 | | | | 944,448 | |
Federal National Mortgage Association | | | 4.24 | % | | | 6/1/2021 | | | | - | | | | - | | | | | | | | 959,546 | | | | 1,070,432 | | | | | | | | | | | | | | | | | | | | 959,546 | | | | 1,070,432 | |
Federal National Mortgage Association | | | 4.25 | % | | | 4/1/2021 | | | | - | | | | - | | | | | | | | 500,000 | | | | 558,580 | | | | | | | | | | | | | | | | | | | | 500,000 | | | | 558,580 | |
Federal National Mortgage Association | | | 4.26 | % | | | 6/1/2021 | | | | - | | | | - | | | | | | | | 348,724 | | | | 385,970 | | | | | | | | | | | | | | | | | | | | 348,724 | | | | 385,970 | |
Federal National Mortgage Association | | | 4.32 | % | | | 6/1/2021 | | | | - | | | | - | | | | | | | | 747,912 | | | | 836,763 | | | | | | | | | | | | | | | | | | | | 747,912 | | | | 836,763 | |
Federal National Mortgage Association | | | 4.38 | % | | | 4/1/2020 | | | | - | | | | - | | | | | | | | 167,741 | | | | 184,293 | | | | | | | | | | | | | | | | | | | | 167,741 | | | | 184,293 | |
Federal National Mortgage Association | | | 4.39 | % | | | 5/1/2021 | | | | - | | | | - | | | | | | | | 241,342 | | | | 270,170 | | | | | | | | | | | | | | | | | | | | 241,342 | | | | 270,170 | |
Federal National Mortgage Association | | | 4.45 | % | | | 7/1/2026 | | | | - | | | | - | | | | | | | | 467,218 | | | | 547,985 | | | | | | | | | | | | | | | | | | | | 467,218 | | | | 547,985 | |
Federal National Mortgage Association | | | 4.50 | % | | | 8/1/2018 | | | | - | | | | - | | | | | | | | 240,558 | | | | 246,746 | | | | | | | | | | | | | | | | | | | | 240,558 | | | | 246,746 | |
Federal National Mortgage Association | | | 4.50 | % | | | 3/1/2019 | | | | - | | | | - | | | | | | | | 52,917 | | | | 54,365 | | | | | | | | | | | | | | | | | | | | 52,917 | | | | 54,365 | |
Federal National Mortgage Association | | | 4.65 | % | | | 6/1/2021 | | | | - | | | | - | | | | | | | | 934,004 | | | | 1,056,040 | | | | | | | | | | | | | | | | | | | | 934,004 | | | | 1,056,040 | |
Federal National Mortgage Association | | | 5.00 | % | | | 5/11/2017 | | | | - | | | | - | | | | | | | | 300,000 | | | | 311,358 | | | | | | | | | | | | | | | | | | | | 300,000 | | | | 311,358 | |
Federal National Mortgage Association | | | 5.00 | % | | | 9/1/2018 | | | | - | | | | - | | | | | | | | 115,081 | | | | 118,408 | | | | | | | | | | | | | | | | | | | | 115,081 | | | | 118,408 | |
Federal National Mortgage Association | | | 5.00 | % | | | 4/1/2019 | | | | - | | | | - | | | | | | | | 79,309 | | | | 82,347 | | | | | | | | | | | | | | | | | | | | 79,309 | | | | 82,347 | |
Federal National Mortgage Association | | | 5.00 | % | | | 12/1/2018 | | | | - | | | | - | | | | | | | | 76,002 | | | | 78,145 | | | | | | | | | | | | | | | | | | | | 76,002 | | | | 78,145 | |
Federal National Mortgage Association | | | 5.00 | % | | | 8/1/2024 | | | | - | | | | - | | | | | | | | 71,663 | | | | 76,916 | | | | | | | | | | | | | | | | | | | | 71,663 | | | | 76,916 | |
Federal National Mortgage Association | | | 5.00 | % | | | 5/1/2023 | | | | - | | | | - | | | | | | | | 76,969 | | | | 82,624 | | | | | | | | | | | | | | | | | | | | 76,969 | | | | 82,624 | |
Federal National Mortgage Association | | | 5.00 | % | | | 8/1/2040 | | | | - | | | | - | | | | | | | | 263,951 | | | | 296,453 | | | | | | | | | | | | | | | | | | | | 263,951 | | | | 296,453 | |
Federal National Mortgage Association | | | 5.50 | % | | | 3/1/2017 | | | | - | | | | - | | | | | | | | 7,741 | | | | 7,810 | | | | | | | | | | | | | | | | | | | | 7,741 | | | | 7,810 | |
Federal National Mortgage Association | | | 5.50 | % | | | 9/1/2017 | | | | - | | | | - | | | | | | | | 10,568 | | | | 10,723 | | | | | | | | | | | | | | | | | | | | 10,568 | | | | 10,723 | |
Federal National Mortgage Association | | | 5.50 | % | | | 5/1/2036 | | | | - | | | | - | | | | | | | | 166,273 | | | | 188,237 | | | | | | | | | | | | | | | | | | | | 166,273 | | | | 188,237 | |
Federal National Mortgage Association | | | 5.50 | % | | | 7/1/2022 | | | | - | | | | - | | | | | | | | 270,718 | | | | 288,822 | | | | | | | | | | | | | | | | | | | | 270,718 | | | | 288,822 | |
Federal National Mortgage Association | | | 5.90 | % | | | 10/1/2017 | | | | - | | | | - | | | | | | | | 703,488 | | | | 740,534 | | | | | | | | | | | | | | | | | | | | 703,488 | | | | 740,534 | |
Federal National Mortgage Association | | | 6.00 | % | | | 10/1/2033 | | | | - | | | | - | | | | | | | | 158,783 | | | | 180,167 | | | | | | | | | | | | | | | | | | | | 158,783 | | | | 180,167 | |
Federal National Mortgage Association | | | 6.00 | % | | | 12/1/2032 | | | | - | | | | - | | | | | | | | 41,210 | | | | 47,671 | | | | | | | | | | | | | | | | | | | | 41,210 | | | | 47,671 | |
Federal National Mortgage Association | | | 6.00 | % | | | 12/1/2032 | | | | - | | | | - | | | | | | | | 82,550 | | | | 95,990 | | | | | | | | | | | | | | | | | | | | 82,550 | | | | 95,990 | |
Federal National Mortgage Association | | | 6.00 | % | | | 3/1/2033 | | | | - | | | | - | | | | | | | | 29,750 | | | | 34,376 | | | | | | | | | | | | | | | | | | | | 29,750 | | | | 34,376 | |
Federal National Mortgage Association | | | 6.00 | % | | | 3/1/2033 | | | | - | | | | - | | | | | | | | 17,716 | | | | 20,350 | | | | | | | | | | | | | | | | | | | | 17,716 | | | | 20,350 | |
Federal National Mortgage Association | | | 6.00 | % | | | 3/1/2033 | | | | - | | | | - | | | | | | | | 18,545 | | | | 21,177 | | | | | | | | | | | | | | | | | | | | 18,545 | | | | 21,177 | |
Federal National Mortgage Association | | | 6.00 | % | | | 11/1/2037 | | | | - | | | | - | | | | | | | | 84,405 | | | | 96,383 | | | | | | | | | | | | | | | | | | | | 84,405 | | | | 96,383 | |
Federal National Mortgage Association | | | 6.00 | % | | | 9/1/2037 | | | | - | | | | - | | | | | | | | 159,278 | | | | 183,250 | | | | | | | | | | | | | | | | | | | | 159,278 | | | | 183,250 | |
Federal National Mortgage Association | | | 6.50 | % | | | 12/1/2022 | | | | - | | | | - | | | | | | | | 15,961 | | | | 18,367 | | | | | | | | | | | | | | | | | | | | 15,961 | | | | 18,367 | |
Federal National Mortgage Association | | | 6.50 | % | | | 3/1/2017 | | | | - | | | | - | | | | | | | | 1,168 | | | | 1,174 | | | | | | | | | | | | | | | | | | | | 1,168 | | | | 1,174 | |
Federal National Mortgage Association | | | 6.50 | % | | | 8/1/2020 | | | | - | | | | - | | | | | | | | 16,997 | | | | 17,861 | | | | | | | | | | | | | | | | | | | | 16,997 | | | | 17,861 | |
Federal National Mortgage Association | | | 6.50 | % | | | 1/1/2036 | | | | - | | | | - | | | | | | | | 19,667 | | | | 22,247 | | | | | | | | | | | | | | | | | | | | 19,667 | | | | 22,247 | |
Federal National Mortgage Association | | | 6.50 | % | | | 10/1/2036 | | | | - | | | | - | | | | | | | | 69,177 | | | | 84,659 | | | | | | | | | | | | | | | | | | | | 69,177 | | | | 84,659 | |
Federal National Mortgage Association | | | 7.00 | % | | | 9/1/2017 | | | | - | | | | - | | | | | | | | 1,761 | | | | 1,779 | | | | | | | | | | | | | | | | | | | | 1,761 | | | | 1,779 | |
Federal National Mortgage Association | | | 8.00 | % | | | 11/1/2037 | | | | - | | | | - | | | | | | | | 6,488 | | | | 7,318 | | | | | | | | | | | | | | | | | | | | 6,488 | | | | 7,318 | |
33
| | | | | | | | | | | | | | | | | | | | | | | | | | | | | | | | | | | | | | | | | | | | | | | | | | | | |
| | | | | | | | | Voya Limited
Maturity Bond VP | | | | | | JPMorgan Core
Bond VP | | | | | | Adjustments | | | | | | Combined Pro
Forma Portfolio | |
| | | | | | | | | | | | | |
| | | Coupon Rate | | | Maturity Date | | | Principal | | | Value | | | | | | Principal | | | Value | | | | | | Principal | | | Value | | | | | | Principal | | | Value | |
| | | | | | | | | | | | | | | | | | | | | | | | | | | | | | | | |
Federal National Mortgage Association REMIC | | | 0.75 | % | | | 8/25/2041 | | | $ | - | | | $ | - | | | | | | | $ | 343,019 | | | $ | 341,220 | | | | | | | | | | | | | | | | | | | $ | 343,019 | | | $ | 341,220 | |
Federal National Mortgage Association REMIC | | | 0.77 | % | | | 6/27/2036 | | | | - | | | | - | | | | | | | | 83,216 | | | | 83,125 | | | | | | | | | | | | | | | | | | | | 83,216 | | | | 83,125 | |
Federal National Mortgage Association REMIC | | | 0.80 | % | | | 4/25/2035 | | | | - | | | | - | | | | | | | | 107,084 | | | | 106,835 | | | | | | | | | | | | | | | | | | | | 107,084 | | | | 106,835 | |
Federal National Mortgage Association REMIC | | | 0.80 | % | | | 8/25/2036 | | | | - | | | | - | | | | | | | | 18,001 | | | | 17,973 | | | | | | | | | | | | | | | | | | | | 18,001 | | | | 17,973 | |
Federal National Mortgage Association REMIC | | | 0.85 | % | | | 10/25/2042 | | | | - | | | | - | | | | | | | | 713,475 | | | | 713,128 | | | | | | | | | | | | | | | | | | | | 713,475 | | | | 713,128 | |
Federal National Mortgage Association REMIC | | | 0.95 | % | | | 9/25/2042 | | | | - | | | | - | | | | | | | | 699,660 | | | | 694,092 | | | | | | | | | | | | | | | | | | | | 699,660 | | | | 694,092 | |
Federal National Mortgage Association REMIC | | | 0.95 | % | | | 10/25/2042 | | | | - | | | | - | | | | | | | | 710,047 | | | | 710,695 | | | | | | | | | | | | | | | | | | | | 710,047 | | | | 710,695 | |
Federal National Mortgage Association REMIC | | | 0.95 | % | | | 5/25/2035 | | | | - | | | | - | | | | | | | | 253,875 | | | | 253,741 | | | | | | | | | | | | | | | | | | | | 253,875 | | | | 253,741 | |
Federal National Mortgage Association REMIC | | | 3.00 | % | | | 1/25/2046 | | | | - | | | | - | | | | | | | | 696,203 | | | | 735,084 | | | | | | | | | | | | | | | | | | | | 696,203 | | | | 735,084 | |
Federal National Mortgage Association REMIC | | | 4.00 | % | | | 4/25/2033 | | | | - | | | | - | | | | | | | | 410,924 | | | | 444,981 | | | | | | | | | | | | | | | | | | | | 410,924 | | | | 444,981 | |
Federal National Mortgage Association REMIC | | | 4.00 | % | | | 10/25/2025 | | | | - | | | | - | | | | | | | | 698,127 | | | | 761,777 | | | | | | | | | | | | | | | | | | | | 698,127 | | | | 761,777 | |
Federal National Mortgage Association REMIC | | | 4.50 | % | | | 7/25/2029 | | | | - | | | | - | | | | | | | | 1,000,000 | | | | 1,161,953 | | | | | | | | | | | | | | | | | | | | 1,000,000 | | | | 1,161,953 | |
Federal National Mortgage Association REMIC | | | 5.00 | % | | | 7/25/2033 | | | | - | | | | - | | | | | | | | 743,927 | | | | 825,166 | | | | | | | | | | | | | | | | | | | | 743,927 | | | | 825,166 | |
Federal National Mortgage Association REMIC | | | 5.00 | % | | | 9/25/2023 | | | | - | | | | - | | | | | | | | 243,635 | | | | 251,668 | | | | | | | | | | | | | | | | | | | | 243,635 | | | | 251,668 | |
Federal National Mortgage Association REMIC | | | 5.00 | % | | | 8/25/2040 | | | | - | | | | - | | | | | | | | 671,710 | | | | 830,839 | | | | | | | | | | | | | | | | | | | | 671,710 | | | | 830,839 | |
Federal National Mortgage Association REMIC | | | 5.50 | % | | | 4/25/2023 | | | | - | | | | - | | | | | | | | 596,929 | | | | 654,801 | | | | | | | | | | | | | | | | | | | | 596,929 | | | | 654,801 | |
Federal National Mortgage Association REMIC | | | 5.50 | % | | | 5/25/2023 | | | | - | | | | - | | | | | | | | 280,566 | | | | 304,578 | | | | | | | | | | | | | | | | | | | | 280,566 | | | | 304,578 | |
Federal National Mortgage Association REMIC | | | 5.50 | % | | | 2/25/2034 | | | | - | | | | - | | | | | | | | 144,091 | | | | 151,275 | | | | | | | | | | | | | | | | | | | | 144,091 | | | | 151,275 | |
Federal National Mortgage Association REMIC | | | 5.50 | % | | | 12/25/2035 | | | | - | | | | - | | | | | | | | 300,000 | | | | 358,136 | | | | | | | | | | | | | | | | | | | | 300,000 | | | | 358,136 | |
Federal National Mortgage Association REMIC | | | 5.50 | % | | | 1/25/2026 | | | | - | | | | - | | | | | | | | 479,204 | | | | 526,012 | | | | | | | | | | | | | | | | | | | | 479,204 | | | | 526,012 | |
Federal National Mortgage Association REMIC | | | 5.50 | % | | | 11/25/2036 | | | | - | | | | - | | | | | | | | 500,000 | | | | 571,020 | | | | | | | | | | | | | | | | | | | | 500,000 | | | | 571,020 | |
Federal National Mortgage Association REMIC | | | 5.50 | % | | | 7/25/2038 | | | | - | | | | - | | | | | | | | 139,765 | | | | 155,471 | | | | | | | | | | | | | | | | | | | | 139,765 | | | | 155,471 | |
Federal National Mortgage Association REMIC | | | 5.50 | % | | | 4/25/2038 | | | | - | | | | - | | | | | | | | 164,545 | | | | 170,705 | | | | | | | | | | | | | | | | | | | | 164,545 | | | | 170,705 | |
Federal National Mortgage Association REMIC | | | 5.65 | % | | | 12/25/2042 | | | | - | | | | - | | | | | | | | 149,908 | | | | 172,083 | | | | | | | | | | | | | | | | | | | | 149,908 | | | | 172,083 | |
Federal National Mortgage Association REMIC | | | 5.75 | % | | | 6/25/2033 | | | | - | | | | - | | | | | | | | 288,079 | | | | 328,465 | | | | | | | | | | | | | | | | | | | | 288,079 | | | | 328,465 | |
Federal National Mortgage Association REMIC | | | 6.00 | % | | | 8/25/2037 | | | | - | | | | - | | | | | | | | 111,032 | | | | 122,259 | | | | | | | | | | | | | | | | | | | | 111,032 | | | | 122,259 | |
Federal National Mortgage Association REMIC | | | 6.00 | % | | | 11/25/2032 | | | | - | | | | - | | | | | | | | 418,657 | | | | 484,138 | | | | | | | | | | | | | | | | | | | | 418,657 | | | | 484,138 | |
Federal National Mortgage Association REMIC | | | 6.00 | % | | | 11/25/2039 | | | | - | | | | - | | | | | | | | 185,521 | | | | 208,589 | | | | | | | | | | | | | | | | | | | | 185,521 | | | | 208,589 | |
Federal National Mortgage Association REMIC | | | 6.29 | % | | | 10/25/2042 | | | | - | | | | - | | | | | | | | 31,186 | | | | 36,846 | | | | | | | | | | | | | | | | | | | | 31,186 | | | | 36,846 | |
Federal National Mortgage Association REMIC | | | 6.30 | % | | | 12/25/2042 | | | | - | | | | - | | | | | | | | 79,620 | | | | 94,603 | | | | | | | | | | | | | | | | | | | | 79,620 | | | | 94,603 | |
Federal National Mortgage Association REMIC | | | 6.50 | % | | | 1/25/2032 | | | | - | | | | - | | | | | | | | 164,244 | | | | 191,304 | | | | | | | | | | | | | | | | | | | | 164,244 | | | | 191,304 | |
Federal National Mortgage Association REMIC | | | 6.50 | % | | | 2/25/2022 | | | | - | | | | - | | | | | | | | 46,733 | | | | 52,074 | | | | | | | | | | | | | | | | | | | | 46,733 | | | | 52,074 | |
Federal National Mortgage Association REMIC | | | 6.50 | % | | | 8/25/2032 | | | | - | | | | - | | | | | | | | 190,246 | | | | 222,709 | | | | | | | | | | | | | | | | | | | | 190,246 | | | | 222,709 | |
Federal National Mortgage Association REMIC | | | 6.50 | % | | | 5/25/2044 | | | | - | | | | - | | | | | | | | 79,360 | | | | 96,292 | | | | | | | | | | | | | | | | | | | | 79,360 | | | | 96,292 | |
Federal National Mortgage Association REMIC | | | 6.50 | % | | | 8/25/2036 | | | | - | | | | - | | | | | | | | 242,562 | | | | 284,794 | | | | | | | | | | | | | | | | | | | | 242,562 | | | | 284,794 | |
Federal National Mortgage Association REMIC | | | 6.79 | % | | | 7/25/2023 | | | | - | | | | - | | | | | | | | 166,929 | | | | 183,731 | | | | | | | | | | | | | | | | | | | | 166,929 | | | | 183,731 | |
Federal National Mortgage Association REMIC | | | 6.86 | % | | | 8/25/2033 | | | | - | | | | - | | | | | | | | 59,356 | | | | 68,339 | | | | | | | | | | | | | | | | | | | | 59,356 | | | | 68,339 | |
Federal National Mortgage Association REMIC | | | 7.00 | % | | | 3/25/2031 | | | | - | | | | - | | | | | | | | 18,272 | | | | 21,190 | | | | | | | | | | | | | | | | | | | | 18,272 | | | | 21,190 | |
Federal National Mortgage Association REMIC | | | 7.00 | % | | | 11/25/2041 | | | | - | | | | - | | | | | | | | 389,976 | | | | 466,930 | | | | | | | | | | | | | | | | | | | | 389,976 | | | | 466,930 | |
Federal National Mortgage Association REMIC | | | 7.00 | % | | | 11/25/2041 | | | | - | | | | - | | | | | | | | 476,391 | | | | 570,379 | | | | | | | | | | | | | | | | | | | | 476,391 | | | | 570,379 | |
Federal National Mortgage Association REMIC | | | 7.00 | % | | | 11/25/2041 | | | | - | | | | - | | | | | | | | 352,409 | | | | 419,334 | | | | | | | | | | | | | | | | | | | | 352,409 | | | | 419,334 | |
Federal National Mortgage Association REMIC | | | 7.00 | % | | | 9/25/2031 | | | | - | | | | - | | | | | | | | 32,956 | | | | 37,661 | | | | | | | | | | | | | | | | | | | | 32,956 | | | | 37,661 | |
Federal National Mortgage Association REMIC | | | 7.00 | % | | | 9/25/2031 | | | | - | | | | - | | | | | | | | 43,835 | | | | 50,992 | | | | | | | | | | | | | | | | | | | | 43,835 | | | | 50,992 | |
Federal National Mortgage Association REMIC | | | 7.00 | % | | | 11/25/2031 | | | | - | | | | - | | | | | | | | 154,427 | | | | 176,651 | | | | | | | | | | | | | | | | | | | | 154,427 | | | | 176,651 | |
Federal National Mortgage Association REMIC | | | 8.00 | % | | | 5/25/2022 | | | | - | | | | - | | | | | | | | 26,216 | | | | 29,316 | | | | | | | | | | | | | | | | | | | | 26,216 | | | | 29,316 | |
Federal National Mortgage Association REMIC | | | 9.50 | % | | | 6/25/2018 | | | | - | | | | - | | | | | | | | 6,518 | | | | 6,738 | | | | | | | | | | | | | | | | | | | | 6,518 | | | | 6,738 | |
Federal National Mortgage Association REMIC | | | 10.00 | % | | | 3/25/2032 | | | | - | | | | - | | | | | | | | 7,302 | | | | 9,541 | | | | | | | | | | | | | | | | | | | | 7,302 | | | | 9,541 | |
Federal National Mortgage Association REMIC | | | 10.43 | % | | | 7/25/2035 | | | | - | | | | - | | | | | | | | 118,674 | | | | 142,686 | | | | | | | | | | | | | | | | | | | | 118,674 | | | | 142,686 | |
Federal National Mortgage Association REMIC | | | 11.74 | % | | | 9/25/2033 | | | | - | | | | - | | | | | | | | 16,663 | | | | 20,622 | | | | | | | | | | | | | | | | | | | | 16,663 | | | | 20,622 | |
Federal National Mortgage Association REMIC | | | 12.61 | % | | | 7/25/2033 | | | | - | | | | - | | | | | | | | 36,676 | | | | 47,451 | | | | | | | | | | | | | | | | | | | | 36,676 | | | | 47,451 | |
Federal National Mortgage Association REMIC | | | 13.09 | % | | | 3/25/2038 | | | | - | | | | - | | | | | | | | 11,765 | | | | 14,692 | | | | | | | | | | | | | | | | | | | | 11,765 | | | | 14,692 | |
Federal National Mortgage Association REMIC | | | 13.65 | % | | | 12/25/2032 | | | | - | | | | - | | | | | | | | 9,941 | | | | 13,383 | | | | | | | | | | | | | | | | | | | | 9,941 | | | | 13,383 | |
Federal National Mortgage Association REMIC | | | 14.60 | % | | | 11/25/2031 | | | | - | | | | - | | | | | | | | 33,346 | | | | 48,066 | | | | | | | | | | | | | | | | | | | | 33,346 | | | | 48,066 | |
Federal National Mortgage Association REMIC | | | 15.25 | % | | | 5/25/2034 | | | | - | | | | - | | | | | | | | 40,735 | | | | 54,886 | | | | | | | | | | | | | | | | | | | | 40,735 | | | | 54,886 | |
Federal National Mortgage Association REMIC | | | 16.24 | % | | | 7/25/2035 | | | | - | | | | - | | | | | | | | 100,082 | | | | 150,525 | | | | | | | | | | | | | | | | | | | | 100,082 | | | | 150,525 | |
Federal National Mortgage Association REMIC | | | 18.28 | % | | | 5/25/2034 | | | | - | | | | - | | | | | | | | 123,630 | | | | 179,031 | | | | | | | | | | | | | | | | | | | | 123,630 | | | | 179,031 | |
Federal National Mortgage Association REMIC | | | 18.28 | % | | | 4/25/2034 | | | | - | | | | - | | | | | | | | 87,331 | | | | 128,149 | | | | | | | | | | | | | | | | | | | | 87,331 | | | | 128,149 | |
Federal National Mortgage Association REMIC | | | 18.55 | % | | | 8/25/2032 | | | | - | | | | - | | | | | | | | 30,161 | | | | 35,967 | | | | | | | | | | | | | | | | | | | | 30,161 | | | | 35,967 | |
Federal National Mortgage Association REMIC | | | 21.51 | % | | | 6/25/2035 | | | | - | | | | - | | | | | | | | 109,307 | | | | 151,449 | | | | | | | | | | | | | | | | | | | | 109,307 | | | | 151,449 | |
Federal National Mortgage Association REMIC | | | 22.19 | % | | | 5/25/2034 | | | | - | | | | - | | | | | | | | 16,757 | | | | 25,972 | | | | | | | | | | | | | | | | | | | | 16,757 | | | | 25,972 | |
Federal National Mortgage Association REMIC | | | 22.90 | % | | | 3/25/2036 | | | | - | | | | - | | | | | | | | 30,027 | | | | 47,426 | | | | | | | | | | | | | | | | | | | | 30,027 | | | | 47,426 | |
Federal National Mortgage Association REMIC | | | 23.71 | % | | | 2/25/2032 | | | | - | | | | - | | | | | | | | 8,807 | | | | 15,377 | | | | | | | | | | | | | | | | | | | | 8,807 | | | | 15,377 | |
Federal National Mortgage Association REMIC | | | 24.39 | % | | | 10/25/2036 | | | | - | | | | - | | | | | | | | 12,511 | | | | 20,630 | | | | | | | | | | | | | | | | | | | | 12,511 | | | | 20,630 | |
Federal National Mortgage Association REMIC | | | 24.75 | % | | | 12/25/2036 | | | | - | | | | - | | | | | | | | 20,385 | | | | 32,183 | | | | | | | | | | | | | | | | | | | | 20,385 | | | | 32,183 | |
34
| | | | | | | | | | | | | | | | | | | | | | | | | | | | | | | | | | | | | | | | | | | | | | | | | | | | |
| | | | | | | | | Voya Limited
Maturity Bond VP | | | | | | JPMorgan Core
Bond VP | | | | | | Adjustments | | | | | | Combined Pro
Forma Portfolio | |
| | | | | | | | | | | | | |
| | | Coupon Rate | | | Maturity Date | | | Principal | | | Value | | | | | | Principal | | | Value | | | | | | Principal | | | Value | | | | | | Principal | | | Value | |
| | | | | | | | | | | | | | | | | | | | | | | | | | | | | | | | |
Federal National Mortgage Association REMIC, Interest Only STRIPS | | | 0.94 | % | | | 8/25/2042 | | | $ | - | | | $ | - | | | | | | | $ | 541,534 | | | $ | 13,925 | | | | | | | | | | | | | | | | | | | $ | 541,534 | | | $ | 13,925 | |
Federal National Mortgage Association REMIC, Interest Only STRIPS | | | 1.53 | % | | | 1/25/2038 | | | | - | | | | - | | | | | | | | 84,361 | | | | 5,683 | | | | | | | | | | | | | | | | | | | | 84,361 | | | | 5,683 | |
Federal National Mortgage Association REMIC, Interest Only STRIPS | | | 1.86 | % | | | 4/25/2041 | | | | - | | | | - | | | | | | | | 209,985 | | | | 14,540 | | | | | | | | | | | | | | | | | | | | 209,985 | | | | 14,540 | |
Federal National Mortgage Association REMIC, Interest Only STRIPS | | | 5.00 | % | | | 3/25/2023 | | | | - | | | | - | | | | | | | | 37,594 | | | | 1,396 | | | | | | | | | | | | | | | | | | | | 37,594 | | | | 1,396 | |
Federal National Mortgage Association REMIC, Interest Only STRIPS | | | 5.40 | % | | | 9/25/2038 | | | | - | | | | - | | | | | | | | 139,024 | | | | 20,497 | | | | | | | | | | | | | | | | | | | | 139,024 | | | | 20,497 | |
Federal National Mortgage Association REMIC, Interest Only STRIPS | | | 5.40 | % | | | 9/25/2038 | | | | - | | | | - | | | | | | | | 105,997 | | | | 15,680 | | | | | | | | | | | | | | | | | | | | 105,997 | | | | 15,680 | |
Federal National Mortgage Association REMIC, Interest Only STRIPS | | | 5.46 | % | | | 2/25/2038 | | | | - | | | | - | | | | | | | | 167,876 | | | | 27,744 | | | | | | | | | | | | | | | | | | | | 167,876 | | | | 27,744 | |
Federal National Mortgage Association REMIC, Interest Only STRIPS | | | 5.65 | % | | | 6/25/2037 | | | | - | | | | - | | | | | | | | 89,083 | | | | 14,226 | | | | | | | | | | | | | | | | | | | | 89,083 | | | | 14,226 | |
Federal National Mortgage Association REMIC, Interest Only STRIPS | | | 5.73 | % | | | 12/25/2039 | | | | - | | | | - | | | | | | | | 39,572 | | | | 5,608 | | | | | | | | | | | | | | | | | | | | 39,572 | | | | 5,608 | |
Federal National Mortgage Association REMIC, Interest Only STRIPS | | | 5.75 | % | | | 3/25/2038 | | | | - | | | | - | | | | | | | | 28,784 | | | | 4,867 | | | | | | | | | | | | | | | | | | | | 28,784 | | | | 4,867 | |
Federal National Mortgage Association REMIC, Interest Only STRIPS | | | 5.97 | % | | | 4/25/2040 | | | | - | | | | - | | | | | | | | 53,640 | | | | 7,228 | | | | | | | | | | | | | | | | | | | | 53,640 | | | | 7,228 | |
Federal National Mortgage Association REMIC, Interest Only STRIPS | | | 6.05 | % | | | 6/25/2023 | | | | - | | | | - | | | | | | | | 31,571 | | | | 2,853 | | | | | | | | | | | | | | | | | | | | 31,571 | | | | 2,853 | |
Federal National Mortgage Association REMIC, Interest Only STRIPS | | | 6.08 | % | | | 1/25/2041 | | | | - | | | | - | | | | | | | | 464,599 | | | | 111,260 | | | | | | | | | | | | | | | | | | | | 464,599 | | | | 111,260 | |
Federal National Mortgage Association REMIC, Interest Only STRIPS | | | 6.09 | % | | | 9/25/2037 | | | | - | | | | - | | | | | | | | 81,184 | | | | 17,463 | | | | | | | | | | | | | | | | | | | | 81,184 | | | | 17,463 | |
Federal National Mortgage Association REMIC, Interest Only STRIPS | | | 6.10 | % | | | 2/25/2039 | | | | - | | | | - | | | | | | | | 59,137 | | | | 12,826 | | | | | | | | | | | | | | | | | | | | 59,137 | | | | 12,826 | |
Federal National Mortgage Association REMIC, Interest Only STRIPS | | | 6.13 | % | | | 6/25/2036 | | | | - | | | | - | | | | | | | | 55,708 | | | | 8,571 | | | | | | | | | | | | | | | | | | | | 55,708 | | | | 8,571 | |
Federal National Mortgage Association REMIC, Interest Only STRIPS | | | 6.25 | % | | | 3/25/2036 | | | | - | | | | - | | | | | | | | 911,443 | | | | 194,273 | | | | | | | | | | | | | | | | | | | | 911,443 | | | | 194,273 | |
Federal National Mortgage Association REMIC, Interest Only STRIPS | | | 6.50 | % | | | 5/25/2033 | | | | - | | | | - | | | | | | | | 41,503 | | | | 7,262 | | | | | | | | | | | | | | | | | | | | 41,503 | | | | 7,262 | |
Federal National Mortgage Association REMIC, Interest Only STRIPS | | | 6.70 | % | | | 7/25/2037 | | | | - | | | | - | | | | | | | | 146,640 | | | | 33,924 | | | | | | | | | | | | | | | | | | | | 146,640 | | | | 33,924 | |
Federal National Mortgage Association REMIC, Interest Only STRIPS | | | 7.00 | % | | | 6/25/2033 | | | | - | | | | - | | | | | | | | 52,284 | | | | 12,498 | | | | | | | | | | | | | | | | | | | | 52,284 | | | | 12,498 | |
Federal National Mortgage Association REMIC, Principal Only STRIPS | | | 0.00 | % | | | 9/25/2043 | | | | - | | | | - | | | | | | | | 413,399 | | | | 341,898 | | | | | | | | | | | | | | | | | | | | 413,399 | | | | 341,898 | |
Federal National Mortgage Association REMIC, Principal Only STRIPS | | | 0.00 | % | | | 10/25/2043 | | | | - | | | | - | | | | | | | | 418,021 | | | | 342,013 | | | | | | | | | | | | | | | | | | | | 418,021 | | | | 342,013 | |
Federal National Mortgage Association REMIC, Principal Only STRIPS | | | 0.00 | % | | | 12/25/2043 | | | | - | | | | - | | | | | | | | 1,228,725 | | | | 1,012,094 | | | | | | | | | | | | | | | | | | | | 1,228,725 | | | | 1,012,094 | |
Federal National Mortgage Association REMIC, Principal Only STRIPS | | | 0.00 | % | | | 12/25/2032 | | | | - | | | | - | | | | | | | | 25,420 | | | | 24,173 | | | | | | | | | | | | | | | | | | | | 25,420 | | | | 24,173 | |
Federal National Mortgage Association REMIC, Principal Only STRIPS | | | 0.00 | % | | | 3/25/2036 | | | | - | | | | - | | | | | | | | 248,575 | | | | 219,528 | | | | | | | | | | | | | | | | | | | | 248,575 | | | | 219,528 | |
Federal National Mortgage Association REMIC, Principal Only STRIPS | | | 0.00 | % | | | 4/25/2036 | | | | - | | | | - | | | | | | | | 47,551 | | | | 42,623 | | | | | | | | | | | | | | | | | | | | 47,551 | | | | 42,623 | |
Federal National Mortgage Association REMIC, Principal Only STRIPS | | | 0.00 | % | | | 3/25/2036 | | | | - | | | | - | | | | | | | | 52,915 | | | | 48,302 | | | | | | | | | | | | | | | | | | | | 52,915 | | | | 48,302 | |
Federal National Mortgage Association REMIC, Principal Only STRIPS | | | 0.00 | % | | | 6/25/2036 | | | | - | | | | - | | | | | | | | 51,933 | | | | 49,657 | | | | | | | | | | | | | | | | | | | | 51,933 | | | | 49,657 | |
Federal National Mortgage Association REMIC, Principal Only STRIPS | | | 0.00 | % | | | 6/25/2036 | | | | - | | | | - | | | | | | | | 58,722 | | | | 56,497 | | | | | | | | | | | | | | | | | | | | 58,722 | | | | 56,497 | |
Federal National Mortgage Association REMIC, Principal Only STRIPS | | | 0.00 | % | | | 12/25/2033 | | | | - | | | | - | | | | | | | | 146,565 | | | | 140,284 | | | | | | | | | | | | | | | | | | | | 146,565 | | | | 140,284 | |
Federal National Mortgage Association REMIC, Principal Only STRIPS | | | 0.00 | % | | | 6/25/2036 | | | | - | | | | - | | | | | | | | 30,588 | | | | 29,047 | | | | | | | | | | | | | | | | | | | | 30,588 | | | | 29,047 | |
Federal National Mortgage Association REMIC, Principal Only STRIPS | | | 0.00 | % | | | 7/25/2036 | | | | - | | | | - | | | | | | | | 22,227 | | | | 21,321 | | | | | | | | | | | | | | | | | | | | 22,227 | | | | 21,321 | |
Federal National Mortgage Association REMIC, Principal Only STRIPS | | | 0.00 | % | | | 6/25/2035 | | | | - | | | | - | | | | | | | | 21,102 | | | | 20,769 | | | | | | | | | | | | | | | | | | | | 21,102 | | | | 20,769 | |
Federal National Mortgage Association REMIC, Principal Only STRIPS | | | 0.00 | % | | | 7/25/2036 | | | | - | | | | - | | | | | | | | 24,241 | | | | 23,048 | | | | | | | | | | | | | | | | | | | | 24,241 | | | | 23,048 | |
Federal National Mortgage Association REMIC, Principal Only STRIPS | | | 0.00 | % | | | 11/25/2036 | | | | - | | | | - | | | | | | | | 47,879 | | | | 45,956 | | | | | | | | | | | | | | | | | | | | 47,879 | | | | 45,956 | |
Federal National Mortgage Association, Principal Only STRIPS | | | 0.00 | % | | | 5/15/2030 | | | | - | | | | - | | | | | | | | 400,000 | | | | 280,069 | | | | | | | | | | | | | | | | | | | | 400,000 | | | | 280,069 | |
Federal National Mortgage Association, Principal Only STRIPS | | | 0.00 | % | | | 9/25/2024 | | | | - | | | | - | | | | | | | | 21,352 | | | | 19,937 | | | | | | | | | | | | | | | | | | | | 21,352 | | | | 19,937 | |
Federal National Mortgage Association, Principal Only STRIPS | | | 0.00 | % | | | 8/25/2032 | | | | - | | | | - | | | | | | | | 64,806 | | | | 59,532 | | | | | | | | | | | | | | | | | | | | 64,806 | | | | 59,532 | |
Federal National Mortgage Association, Principal Only STRIPS | | | 0.00 | % | | | 1/25/2033 | | | | - | | | | - | | | | | | | | 11,877 | | | | 11,006 | | | | | | | | | | | | | | | | | | | | 11,877 | | | | 11,006 | |
Financing Corp., Principal Only STRIPS | | | 0.00 | % | | | 5/11/2018 | | | | - | | | | - | | | | | | | | 1,700,000 | | | | 1,674,425 | | | | | | | | | | | | | | | | | | | | 1,700,000 | | | | 1,674,425 | |
Financing Corp., Principal Only STRIPS | | | 0.00 | % | | | 11/30/2017 | | | | - | | | | - | | | | | | | | 1,000,000 | | | | 989,102 | | | | | | | | | | | | | | | | | | | | 1,000,000 | | | | 989,102 | |
Financing Corp., Principal Only STRIPS | | | 0.00 | % | | | 9/26/2019 | | | | - | | | | - | | | | | | | | 1,000,000 | | | | 969,847 | | | | | | | | | | | | | | | | | | | | 1,000,000 | | | | 969,847 | |
FREMF Mortgage Trust | | | 3.83 | % | | | 7/25/2049 | | | | - | | | | - | | | | | | | | 420,000 | | | | 396,757 | | | | | | | | | | | | | | | | | | | | 420,000 | | | | 396,757 | |
Government National Mortgage Association | | | 0.74 | % | | | 8/20/2060 | | | | - | | | | - | | | | | | | | 307,646 | | | | 307,570 | | | | | | | | | | | | | | | | | | | | 307,646 | | | | 307,570 | |
Government National Mortgage Association | | | 0.78 | % | | | 12/20/2062 | | | | - | | | | - | | | | | | | | 352,860 | | | | 348,810 | | | | | | | | | | | | | | | | | | | | 352,860 | | | | 348,810 | |
Government National Mortgage Association | | | 0.84 | % | | | 12/20/2060 | | | | - | | | | - | | | | | | | | 948,701 | | | | 940,438 | | | | | | | | | | | | | | | | | | | | 948,701 | | | | 940,438 | |
Government National Mortgage Association | | | 0.85 | % | | | 3/20/2063 | | | | - | | | | - | | | | | | | | 837,492 | | | | 829,299 | | | | | | | | | | | | | | | | | | | | 837,492 | | | | 829,299 | |
Government National Mortgage Association | | | 0.87 | % | | | 4/20/2060 | | | | - | | | | - | | | | | | | | 480,203 | | | | 478,185 | | | | | | | | | | | | | | | | | | | | 480,203 | | | | 478,185 | |
Government National Mortgage Association | | | 0.89 | % | | | 11/20/2059 | | | | - | | | | - | | | | | | | | 157,551 | | | | 157,582 | | | | | | | | | | | | | | | | | | | | 157,551 | | | | 157,582 | |
Government National Mortgage Association | | | 0.89 | % | | | 3/20/2060 | | | | - | | | | - | | | | | | | | 137,392 | | | | 137,408 | | | | | | | | | | | | | | | | | | | | 137,392 | | | | 137,408 | |
Government National Mortgage Association | | | 0.89 | % | | | 6/20/2065 | | | | - | | | | - | | | | | | | | 704,655 | | | | 698,239 | | | | | | | | | | | | | | | | | | | | 704,655 | | | | 698,239 | |
Government National Mortgage Association | | | 0.91 | % | | | 1/20/2061 | | | | - | | | | - | | | | | | | | 708,600 | | | | 705,045 | | | | | | | | | | | | | | | | | | | | 708,600 | | | | 705,045 | |
Government National Mortgage Association | | | 0.91 | % | | | 7/20/2064 | | | | - | | | | - | | | | | | | | 1,412,008 | | | | 1,401,372 | | | | | | | | | | | | | | | | | | | | 1,412,008 | | | | 1,401,372 | |
Government National Mortgage Association | | | 0.91 | % | | | 9/20/2064 | | | | - | | | | - | | | | | | | | 1,368,645 | | | | 1,356,155 | | | | | | | | | | | | | | | | | | | | 1,368,645 | | | | 1,356,155 | |
Government National Mortgage Association | | | 0.91 | % | | | 8/20/2065 | | | | - | | | | - | | | | | | | | 758,273 | | | | 750,672 | | | | | | | | | | | | | | | | | | | | 758,273 | | | | 750,672 | |
Government National Mortgage Association | | | 0.92 | % | | | 2/20/2065 | | | | - | | | | - | | | | | | | | 1,414,711 | | | | 1,401,800 | | | | | | | | | | | | | | | | | | | | 1,414,711 | | | | 1,401,800 | |
Government National Mortgage Association | | | 0.94 | % | | | 6/20/2064 | | | | - | | | | - | | | | | | | | 1,646,851 | | | | 1,634,005 | | | | | | | | | | | | | | | | | | | | 1,646,851 | | | | 1,634,005 | |
Government National Mortgage Association | | | 0.94 | % | | | 7/20/2064 | | | | - | | | | - | | | | | | | | 1,143,039 | | | | 1,134,159 | | | | | | | | | | | | | | | | | | | | 1,143,039 | | | | 1,134,159 | |
Government National Mortgage Association | | | 0.94 | % | | | 12/20/2064 | | | | - | | | | - | | | | | | | | 1,754,100 | | | | 1,744,055 | | | | | | | | | | | | | | | | | | | | 1,754,100 | | | | 1,744,055 | |
Government National Mortgage Association | | | 0.94 | % | | | 7/20/2064 | | | | - | | | | - | | | | | | | | 1,165,825 | | | | 1,156,826 | | | | | | | | | | | | | | | | | | | | 1,165,825 | | | | 1,156,826 | |
Government National Mortgage Association | | | 0.95 | % | | | 10/20/2062 | | | | - | | | | - | | | | | | | | 399,345 | | | | 397,379 | | | | | | | | | | | | | | | | | | | | 399,345 | | | | 397,379 | |
Government National Mortgage Association | | | 0.96 | % | | | 9/20/2065 | | | | - | | | | - | | | | | | | | 678,618 | | | | 673,857 | | | | | | | | | | | | | | | | | | | | 678,618 | | | | 673,857 | |
Government National Mortgage Association | | | 0.99 | % | | | 7/20/2062 | | | | - | | | | - | | | | | | | | 240,568 | | | | 239,855 | | | | | | | | | | | | | | | | | | | | 240,568 | | | | 239,855 | |
Government National Mortgage Association | | | 1.02 | % | | | 9/20/2062 | | | | - | | | | - | | | | | | | | 725,040 | | | | 723,859 | | | | | | | | | | | | | | | | | | | | 725,040 | | | | 723,859 | |
Government National Mortgage Association | | | 1.02 | % | | | 5/20/2066 | | | | - | | | | - | | | | | | | | 1,000,000 | | | | 1,000,000 | | | | | | | | | | | | | | | | | | | | 1,000,000 | | | | 1,000,000 | |
Government National Mortgage Association | | | 1.04 | % | | | 11/20/2065 | | | | - | | | | - | | | | | | | | 9,885,069 | | | | 9,859,418 | | | | | | | | | | | | | | | | | | | | 9,885,069 | | | | 9,859,418 | |
Government National Mortgage Association | | | 1.04 | % | | | 11/20/2065 | | | | - | | | | - | | | | | | | | 2,973,583 | | | | 2,965,901 | | | | | | | | | | | | | | | | | | | | 2,973,583 | | | | 2,965,901 | |
Government National Mortgage Association | | | 1.09 | % | | | 5/20/2061 | | | | - | | | | - | | | | | | | | 316,618 | | | | 316,351 | | | | | | | | | | | | | | | | | | | | 316,618 | | | | 316,351 | |
Government National Mortgage Association | | | 1.09 | % | | | 1/20/2064 | | | | - | | | | - | | | | | | | | 841,309 | | | | 841,492 | | | | | | | | | | | | | | | | | | | | 841,309 | | | | 841,492 | |
Government National Mortgage Association | | | 1.09 | % | | | 2/20/2064 | | | | - | | | | - | | | | | | | | 1,299,166 | | | | 1,299,445 | | | | | | | | | | | | | | | | | | | | 1,299,166 | | | | 1,299,445 | |
Government National Mortgage Association | | | 1.09 | % | | | 3/20/2064 | | | | - | | | | - | | | | | | | | 768,204 | | | | 768,357 | | | | | | | | | | | | | | | | | | | | 768,204 | | | | 768,357 | |
Government National Mortgage Association | | | 1.10 | % | | | 12/20/2065 | | | | - | | | | - | | | | | | | | 533,393 | | | | 533,898 | | | | | | | | | | | | | | | | | | | | 533,393 | | | | 533,898 | |
Government National Mortgage Association | | | 1.14 | % | | | 5/20/2061 | | | | - | | | | - | | | | | | | | 354,670 | | | | 354,749 | | | | | | | | | | | | | | | | | | | | 354,670 | | | | 354,749 | |
Government National Mortgage Association | | | 1.65 | % | | | 1/20/2063 | | | | - | | | | - | | | | | | | | 1,411,926 | | | | 1,417,931 | | | | | | | | | | | | | | | | | | | | 1,411,926 | | | | 1,417,931 | |
Government National Mortgage Association | | | 1.65 | % | | | 2/20/2063 | | | | - | | | | - | | | | | | | | 1,878,619 | | | | 1,886,617 | | | | | | | | | | | | | | | | | | | | 1,878,619 | | | | 1,886,617 | |
Government National Mortgage Association | | | 1.75 | % | | | 3/20/2063 | | | | - | | | | - | | | | | | | | 930,713 | | | | 942,435 | | | | | | | | | | | | | | | | | | | | 930,713 | | | | 942,435 | |
35
| | | | | | | | | | | | | | | | | | | | | | | | | | | | | | | | | | | | | | | | | | | | | | | | | | | | |
| | | | | | | | | Voya Limited
Maturity Bond VP | | | | | | JPMorgan Core
Bond VP | | | | | | Adjustments | | | | | | Combined Pro
Forma Portfolio | |
| | | | | | | | | | | | | |
| | | Coupon Rate | | | Maturity Date | | | Principal | | | Value | | | | | | Principal | | | Value | | | | | | Principal | | | Value | | | | | | Principal | | | Value | |
| | | | | | | | | | | | | | | | | | | | | | | | | | | | | | | | |
Government National Mortgage Association | | | 3.50 | % | | | 11/20/2039 | | | $ | - | | | $ | - | | | | | | | $ | 500,000 | | | $ | 526,488 | | | | | | | | | | | | | | | | | | | $ | 500,000 | | | $ | 526,488 | |
Government National Mortgage Association | | | 4.76 | % | | | 10/20/2043 | | | | - | | | | - | | | | | | | | 1,290,574 | | | | 1,440,876 | | | | | | | | | | | | | | | | | | | | 1,290,574 | | | | 1,440,876 | |
Government National Mortgage Association | | | 5.00 | % | | | 4/16/2023 | | | | - | | | | - | | | | | | | | 1,000,000 | | | | 1,048,163 | | | | | | | | | | | | | | | | | | | | 1,000,000 | | | | 1,048,163 | |
Government National Mortgage Association | | | 5.48 | % | | | 1/20/2038 | | | | - | | | | - | | | | | | | | 576,697 | | | | 657,858 | | | | | | | | | | | | | | | | | | | | 576,697 | | | | 657,858 | |
Government National Mortgage Association | | | 5.50 | % | | | 9/20/2039 | | | | - | | | | - | | | | | | | | 235,122 | | | | 267,913 | | | | | | | | | | | | | | | | | | | | 235,122 | | | | 267,913 | |
Government National Mortgage Association | | | 5.50 | % | | | 4/20/2034 | | | | - | | | | - | | | | | | | | 248,625 | | | | 283,362 | | | | | | | | | | | | | | | | | | | | 248,625 | | | | 283,362 | |
Government National Mortgage Association | | | 5.50 | % | | | 7/20/2037 | | | | - | | | | - | | | | | | | | 800,000 | | | | 910,486 | | | | | | | | | | | | | | | | | | | | 800,000 | | | | 910,486 | |
Government National Mortgage Association | | | 5.50 | % | | | 8/20/2038 | | | | - | | | | - | | | | | | | | 414,485 | | | | 468,238 | | | | | | | | | | | | | | | | | | | | 414,485 | | | | 468,238 | |
Government National Mortgage Association | | | 5.50 | % | | | 11/20/2020 | | | | - | | | | - | | | | | | | | 475,023 | | | | 497,480 | | | | | | | | | | | | | | | | | | | | 475,023 | | | | 497,480 | |
Government National Mortgage Association | | | 5.50 | % | | | 1/16/2033 | | | | - | | | | - | | | | | | | | 488,187 | | | | 556,012 | | | | | | | | | | | | | | | | | | | | 488,187 | | | | 556,012 | |
Government National Mortgage Association | | | 5.54 | % | | | 7/20/2040 | | | | - | | | | - | | | | | | | | 411,404 | | | | 471,197 | | | | | | | | | | | | | | | | | | | | 411,404 | | | | 471,197 | |
Government National Mortgage Association | | | 5.86 | % | | | 12/20/2038 | | | | - | | | | - | | | | | | | | 159,228 | | | | 183,446 | | | | | | | | | | | | | | | | | | | | 159,228 | | | | 183,446 | |
Government National Mortgage Association | | | 6.00 | % | | | 9/20/2038 | | | | - | | | | - | | | | | | | | 163,345 | | | | 186,601 | | | | | | | | | | | | | | | | | | | | 163,345 | | | | 186,601 | |
Government National Mortgage Association | | | 6.00 | % | | | 8/20/2039 | | | | - | | | | - | | | | | | | | 188,998 | | | | 218,316 | | | | | | | | | | | | | | | | | | | | 188,998 | | | | 218,316 | |
Government National Mortgage Association | | | 6.50 | % | | | 6/20/2032 | | | | - | | | | - | | | | | | | | 258,155 | | | | 308,511 | | | | | | | | | | | | | | | | | | | | 258,155 | | | | 308,511 | |
Government National Mortgage Association | | | 6.50 | % | | | 6/20/2033 | | | | - | | | | - | | | | | | | | 850,000 | | | | 1,022,596 | | | | | | | | | | | | | | | | | | | | 850,000 | | | | 1,022,596 | |
Government National Mortgage Association | | | 6.50 | % | | | 7/20/2032 | | | | - | | | | - | | | | | | | | 129,932 | | | | 154,982 | | | | | | | | | | | | | | | | | | | | 129,932 | | | | 154,982 | |
Government National Mortgage Association | | | 6.50 | % | | | 7/16/2032 | | | | - | | | | - | | | | | | | | 172,885 | | | | 204,848 | | | | | | | | | | | | | | | | | | | | 172,885 | | | | 204,848 | |
Government National Mortgage Association | | | 6.50 | % | | | 6/20/2032 | | | | - | | | | - | | | | | | | | 70,950 | | | | 85,000 | | | | | | | | | | | | | | | | | | | | 70,950 | | | | 85,000 | |
Government National Mortgage Association | | | 6.50 | % | | | 10/16/2024 | | | | - | | | | - | | | | | | | | 249,019 | | | | 282,947 | | | | | | | | | | | | | | | | | | | | 249,019 | | | | 282,947 | |
Government National Mortgage Association | | | 7.33 | % | | | 11/20/2030 | | | | - | | | | - | | | | | | | | 20,903 | | | | 25,481 | | | | | | | | | | | | | | | | | | | | 20,903 | | | | 25,481 | |
Government National Mortgage Association | | | 7.50 | % | | | 11/20/2029 | | | | - | | | | - | | | | | | | | 77,510 | | | | 90,622 | | | | | | | | | | | | | | | | | | | | 77,510 | | | | 90,622 | |
Government National Mortgage Association | | | 8.00 | % | | | 6/20/2030 | | | | - | | | | - | | | | | | | | 23,087 | | | | 27,728 | | | | | | | | | | | | | | | | | | | | 23,087 | | | | 27,728 | |
Government National Mortgage Association | | | 8.50 | % | | | 2/16/2030 | | | | - | | | | - | | | | | | | | 201,259 | | | | 238,988 | | | | | | | | | | | | | | | | | | | | 201,259 | | | | 238,988 | |
Government National Mortgage Association | | | 9.00 | % | | | 5/16/2027 | | | | - | | | | - | | | | | | | | 13,502 | | | | 15,603 | | | | | | | | | | | | | | | | | | | | 13,502 | | | | 15,603 | |
Government National Mortgage Association | | | 12.50 | % | | | 10/20/2037 | | | | - | | | | - | | | | | | | | 39,818 | | | | 53,788 | | | | | | | | | | | | | | | | | | | | 39,818 | | | | 53,788 | |
Government National Mortgage Association | | | 15.37 | % | | | 6/17/2035 | | | | - | | | | - | | | | | | | | 33,015 | | | | 47,706 | | | | | | | | | | | | | | | | | | | | 33,015 | | | | 47,706 | |
Government National Mortgage Association | | | 15.75 | % | | | 5/18/2034 | | | | - | | | | - | | | | | | | | 3,430 | | | | 4,370 | | | | | | | | | | | | | | | | | | | | 3,430 | | | | 4,370 | |
Government National Mortgage Association | | | 18.45 | % | | | 4/16/2034 | | | | - | | | | - | | | | | | | | 54,849 | | | | 84,382 | | | | | | | | | | | | | | | | | | | | 54,849 | | | | 84,382 | |
Government National Mortgage Association | | | 18.86 | % | | | 9/20/2037 | | | | - | | | | - | | | | | | | | 18,244 | | | | 26,273 | | | | | | | | | | | | | | | | | | | | 18,244 | | | | 26,273 | |
Government National Mortgage Association | | | 21.71 | % | | | 4/20/2037 | | | | - | | | | - | | | | | | | | 60,027 | | | | 96,363 | | | | | | | | | | | | | | | | | | | | 60,027 | | | | 96,363 | |
Government National Mortgage Association | | | 27.26 | % | | | 9/20/2034 | | | | - | | | | - | | | | | | | | 32,999 | | | | 57,444 | | | | | | | | | | | | | | | | | | | | 32,999 | | | | 57,444 | |
Government National Mortgage Association, Interest Only STRIPS | | | 5.25 | % | | | 12/20/2038 | | | | - | | | | - | | | | | | | | 72,025 | | | | 11,094 | | | | | | | | | | | | | | | | | | | | 72,025 | | | | 11,094 | |
Government National Mortgage Association, Interest Only STRIPS | | | 5.38 | % | | | 2/20/2038 | | | | - | | | | - | | | | | | | | 115,341 | | | | 20,539 | | | | | | | | | | | | | | | | | | | | 115,341 | | | | 20,539 | |
Government National Mortgage Association, Interest Only STRIPS | | | 5.50 | % | | | 10/16/2037 | | | | - | | | | - | | | | | | | | 195,187 | | | | 22,083 | | | | | | | | | | | | | | | | | | | | 195,187 | | | | 22,083 | |
Government National Mortgage Association, Interest Only STRIPS | | | 5.55 | % | | | 11/20/2037 | | | | - | | | | - | | | | | | | | 106,813 | | | | 17,085 | | | | | | | | | | | | | | | | | | | | 106,813 | | | | 17,085 | |
Government National Mortgage Association, Interest Only STRIPS | | | 5.63 | % | | | 6/20/2039 | | | | - | | | | - | | | | | | | | 81,603 | | | | 14,435 | | | | | | | | | | | | | | | | | | | | 81,603 | | | | 14,435 | |
Government National Mortgage Association, Interest Only STRIPS | | | 5.65 | % | | | 10/20/2034 | | | | - | | | | - | | | | | | | | 136,249 | | | | 21,720 | | | | | | | | | | | | | | | | | | | | 136,249 | | | | 21,720 | |
Government National Mortgage Association, Interest Only STRIPS | | | 5.66 | % | | | 2/16/2039 | | | | - | | | | - | | | | | | | | 42,819 | | | | 6,806 | | | | | | | | | | | | | | | | | | | | 42,819 | | | | 6,806 | |
Government National Mortgage Association, Interest Only STRIPS | | | 5.75 | % | | | 5/20/2037 | | | | - | | | | - | | | | | | | | 72,943 | | | | 13,377 | | | | | | | | | | | | | | | | | | | | 72,943 | | | | 13,377 | |
Government National Mortgage Association, Interest Only STRIPS | | | 5.75 | % | | | 3/20/2037 | | | | - | | | | - | | | | | | | | 83,451 | | | | 14,694 | | | | | | | | | | | | | | | | | | | | 83,451 | | | | 14,694 | |
Government National Mortgage Association, Interest Only STRIPS | | | 5.75 | % | | | 6/20/2038 | | | | - | | | | - | | | | | | | | 67,060 | | | | 11,781 | | | | | | | | | | | | | | | | | | | | 67,060 | | | | 11,781 | |
Government National Mortgage Association, Interest Only STRIPS | | | 5.82 | % | | | 4/20/2039 | | | | - | | | | - | | | | | | | | 103,771 | | | | 16,485 | | | | | | | | | | | | | | | | | | | | 103,771 | | | | 16,485 | |
Government National Mortgage Association, Interest Only STRIPS | | | 5.85 | % | | | 9/20/2035 | | | | - | | | | - | | | | | | | | 217,465 | | | | 39,807 | | | | | | | | | | | | | | | | | | | | 217,465 | | | | 39,807 | |
Government National Mortgage Association, Interest Only STRIPS | | | 5.85 | % | | | 3/20/2039 | | | | - | | | | - | | | | | | | | 92,061 | | | | 10,828 | | | | | | | | | | | | | | | | | | | | 92,061 | | | | 10,828 | |
Government National Mortgage Association, Interest Only STRIPS | | | 5.96 | % | | | 5/16/2038 | | | | - | | | | - | | | | | | | | 228,679 | | | | 44,849 | | | | | | | | | | | | | | | | | | | | 228,679 | | | | 44,849 | |
Government National Mortgage Association, Interest Only STRIPS | | | 5.96 | % | | | 6/16/2039 | | | | - | | | | - | | | | | | | | 147,270 | | | | 12,704 | | | | | | | | | | | | | | | | | | | | 147,270 | | | | 12,704 | |
Government National Mortgage Association, Interest Only STRIPS | | | 6.03 | % | | | 6/16/2037 | | | | - | | | | - | | | | | | | | 105,491 | | | | 20,408 | | | | | | | | | | | | | | | | | | | | 105,491 | | | | 20,408 | |
Government National Mortgage Association, Interest Only STRIPS | | | 6.06 | % | | | 3/16/2034 | | | | - | | | | - | | | | | | | | 154,924 | | | | 6,821 | | | | | | | | | | | | | | | | | | | | 154,924 | | | | 6,821 | |
Government National Mortgage Association, Interest Only STRIPS | | | 6.10 | % | | | 12/20/2037 | | | | - | | | | - | | | | | | | | 51,126 | | | | 9,521 | | | | | | | | | | | | | | | | | | | | 51,126 | | | | 9,521 | |
Government National Mortgage Association, Interest Only STRIPS | | | 6.10 | % | | | 11/20/2037 | | | | - | | | | - | | | | | | | | 51,724 | | | | 9,400 | | | | | | | | | | | | | | | | | | | | 51,724 | | | | 9,400 | |
Government National Mortgage Association, Interest Only STRIPS | | | 6.25 | % | | | 7/20/2036 | | | | - | | | | - | | | | | | | | 33,970 | | | | 1,644 | | | | | | | | | | | | | | | | | | | | 33,970 | | | | 1,644 | |
Government National Mortgage Association, Interest Only STRIPS | | | 6.30 | % | | | 7/20/2037 | | | | - | | | | - | | | | | | | | 190,006 | | | | 35,479 | | | | | | | | | | | | | | | | | | | | 190,006 | | | | 35,479 | |
Government National Mortgage Association, Interest Only STRIPS | | | 6.33 | % | | | 8/20/2037 | | | | - | | | | - | | | | | | | | 136,509 | | | | 20,808 | | | | | | | | | | | | | | | | | | | | 136,509 | | | | 20,808 | |
Government National Mortgage Association, Interest Only STRIPS | | | 6.37 | % | | | 4/16/2037 | | | | - | | | | - | | | | | | | | 64,227 | | | | 13,512 | | | | | | | | | | | | | | | | | | | | 64,227 | | | | 13,512 | |
Government National Mortgage Association, Interest Only STRIPS | | | 6.50 | % | | | 3/20/2039 | | | | - | | | | - | | | | | | | | 53,469 | | | | 11,574 | | | | | | | | | | | | | | | | | | | | 53,469 | | | | 11,574 | |
Government National Mortgage Association, Interest Only STRIPS | | | 6.50 | % | | | 10/20/2032 | | | | - | | | | - | | | | | | | | 22,135 | | | | 297 | | | | | | | | | | | | | | | | | | | | 22,135 | | | | 297 | |
Government National Mortgage Association, Interest Only STRIPS | | | 7.51 | % | | | 4/16/2032 | | | | - | | | | - | | | | | | | | 103,139 | | | | 23,032 | | | | | | | | | | | | | | | | | | | | 103,139 | | | | 23,032 | |
Government National Mortgage Association, Principal Only STRIPS | | | 0.00 | % | | | 6/16/2033 | | | | - | | | | - | | | | | | | | 70,390 | | | | 63,316 | | | | | | | | | | | | | | | | | | | | 70,390 | | | | 63,316 | |
Government National Mortgage Association, Principal Only STRIPS | | | 0.00 | % | | | 3/16/2033 | | | | - | | | | - | | | | | | | | 9,881 | | | | 9,316 | | | | | | | | | | | | | | | | | | | | 9,881 | | | | 9,316 | |
Government National Mortgage Association, Principal Only STRIPS | | | 0.00 | % | | | 2/17/2033 | | | | - | | | | - | | | | | | | | 73,967 | | | | 71,228 | | | | | | | | | | | | | | | | | | | | 73,967 | | | | 71,228 | |
Government National Mortgage Association, Principal Only STRIPS | | | 0.00 | % | | | 3/20/2037 | | | | - | | | | - | | | | | | | | 89,854 | | | | 86,155 | | | | | | | | | | | | | | | | | | | | 89,854 | | | | 86,155 | |
Government National Mortgage Association, Principal Only STRIPS | | | 0.00 | % | | | 1/20/2038 | | | | - | | | | - | | | | | | | | 30,157 | | | | 27,990 | | | | | | | | | | | | | | | | | | | | 30,157 | | | | 27,990 | |
Government National Mortgage Association, Principal Only STRIPS | | | 0.00 | % | | | 11/16/2037 | | | | - | | | | - | | | | | | | | 31,273 | | | | 28,348 | | | | | | | | | | | | | | | | | | | | 31,273 | | | | 28,348 | |
National Credit Union Administration Guaranteed Notes Trust | | | 2.65 | % | | | 10/29/2020 | | | | - | | | | - | | | | | | | | 27,813 | | | | 27,832 | | | | | | | | | | | | | | | | | | | | 27,813 | | | | 27,832 | |
36
| | | | | | | | | | | | | | | | | | | | | | | | | | | | | | | | | | | | | | | | | | | | | | | | | | | | |
| | | | | | | | | Voya Limited
Maturity Bond VP | | | | | | JPMorgan Core
Bond VP | | | | | | Adjustments | | | | | | Combined Pro
Forma Portfolio | |
| | | | | | | | | | | | | |
| | | Coupon Rate | | | Maturity Date | | | Principal | | | Value | | | | | | Principal | | | Value | | | | | | Principal | | | Value | | | | | | Principal | | | Value | |
| | | | | | | | | | | | | | | | | | | | | | | | | | | | | | | | |
National Credit Union Administration Guaranteed Notes Trust | | | 2.90 | % | | | 10/29/2020 | | | $ | - | | | $ | - | | | | | | | $ | 28,242 | | | $ | 28,255 | | | | | | | | | | | | | | | | | | | $ | 28,242 | | | $ | 28,255 | |
Residual Funding Corp., Principal Only STRIPS | | | 0.00 | % | | | 10/15/2019 | | | | - | | | | - | | | | | | | | 1,950,000 | | | | 1,887,456 | | | | | | | | | | | | | | | | | | | | 1,950,000 | | | | 1,887,456 | |
Residual Funding Corp., Principal Only STRIPS | | | 0.00 | % | | | 7/15/2020 | | | | - | | | | - | | | | | | | | 5,105,000 | | | | 4,873,580 | | | | | | | | | | | | | | | | | | | | 5,105,000 | | | | 4,873,580 | |
Residual Funding Corp., Principal Only STRIPS | | | 0.00 | % | | | 10/15/2020 | | | | - | | | | - | | | | | | | | 1,220,000 | | | | 1,161,041 | | | | | | | | | | | | | | | | | | | | 1,220,000 | | | | 1,161,041 | |
Tennessee Valley Authority | | | 4.25 | % | | | 9/15/2065 | | | | - | | | | - | | | | | | | | 632,000 | | | | 741,693 | | | | | | | | | | | | | | | | | | | | 632,000 | | | | 741,693 | |
Tennessee Valley Authority | | | 4.63 | % | | | 9/15/2060 | | | | - | | | | - | | | | | | | | 22,000 | | | | 27,405 | | | | | | | | | | | | | | | | | | | | 22,000 | | | | 27,405 | |
Tennessee Valley Authority | | | 5.25 | % | | | 9/15/2039 | | | | - | | | | - | | | | | | | | 400,000 | | | | 548,179 | | | | | | | | | | | | | | | | | | | | 400,000 | | | | 548,179 | |
Tennessee Valley Authority | | | 5.88 | % | | | 4/1/2036 | | | | - | | | | - | | | | | | | | 150,000 | | | | 217,370 | | | | | | | | | | | | | | | | | | | | 150,000 | | | | 217,370 | |
Tennessee Valley Authority, Principal Only STRIPS | | | 0.00 | % | | | 3/15/2032 | | | | - | | | | - | | | | | | | | 300,000 | | | | 190,742 | | | | | | | | | | | | | | | | | | | | 300,000 | | | | 190,742 | |
Tennessee Valley Authority, Principal Only STRIPS | | | 0.00 | % | | | 5/1/2019 | | | | - | | | | - | | | | | | | | 200,000 | | | | 193,674 | | | | | | | | | | | | | | | | | | | | 200,000 | | | | 193,674 | |
Tennessee Valley Authority, Principal Only STRIPS | | | 0.00 | % | | | 11/1/2025 | | | | - | | | | - | | | | | | | | 750,000 | | | | 606,692 | | | | | | | | | | | | | | | | | | | | 750,000 | | | | 606,692 | |
Tennessee Valley Authority, Principal Only STRIPS | | | 0.00 | % | | | 1/15/2038 | | | | - | | | | - | | | | | | | | 150,000 | | | | 73,181 | | | | | | | | | | | | | | | | | | | | 150,000 | | | | 73,181 | |
Vendee Mortgage Trust | | | 7.50 | % | | | 2/15/2027 | | | | - | | | | - | | | | | | | | 430,137 | | | | 509,589 | | | | | | | | | | | | | | | | | | | | 430,137 | | | | 509,589 | |
| | | | | | | | | | | | | | | | | | | | | | | | | | | | | | | | | | | | |
Total U.S. Government Agency Obligations | | | | | | | | | | | | 19,262 | | | | | | | | | | | | 241,379,168 | | | | | | | | | | | | | | | | | | | | | | | | 241,398,430 | |
| | | | | | | | | | | | | | | | | | | | | | | | | | | | | | | | | | | | |
| | | | | | | | | | | Total Cost ($19,396) | | | | | | | | Total Cost ($233,053,875) | | | | | | | | | | | | | | | | | | | | Total Cost ($233,073,271) | |
U.S. Government Obligations - 27.7 % | | | | | | | | | | | | | | | | | | | | | | | | | | | | | | | | | | | | | | | | | | | | | | | | | | | | |
U.S. Treasury Bond | | | 2.50 | % | | | 2/15/2046 | | | | 111,000 | | | | 115,583 | | | | | | | | - | | | | - | | | | | | | | | | | | | | | | | | | | 111,000 | | | | 115,583 | |
U.S. Treasury Bond | | | 3.50 | % | | | 2/15/2039 | | | | - | | | | - | | | | | | | | 4,220,000 | | | | 5,325,771 | | | | | | | | | | | | | | | | | | | | 4,220,000 | | | | 5,325,771 | |
U.S. Treasury Bond | | | 3.88 | % | | | 8/15/2040 | | | | - | | | | - | | | | | | | | 420,000 | | | | 557,435 | | | | | | | | | | | | | | | | | | | | 420,000 | | | | 557,435 | |
U.S. Treasury Bond | | | 4.25 | % | | | 5/15/2039 | | | | - | | | | - | | | | | | | | 50,000 | | | | 69,883 | | | | | | | | | | | | | | | | | | | | 50,000 | | | | 69,883 | |
U.S. Treasury Bond | | | 4.25 | % | | | 11/15/2040 | | | | - | | | | - | | | | | | | | 300,000 | | | | 420,070 | | | | | | | | | | | | | | | | | | | | 300,000 | | | | 420,070 | |
U.S. Treasury Bond | | | 4.38 | % | | | 2/15/2038 | | | | - | | | | - | | | | | | | | 4,700,000 | | | | 6,700,071 | | | | | | | | | | | | | | | | | | | | 4,700,000 | | | | 6,700,071 | |
U.S. Treasury Bond | | | 4.38 | % | | | 11/15/2039 | | | | - | | | | - | | | | | | | | 3,875,000 | | | | 5,507,948 | | | | | | | | | | | | | | | | | | | | 3,875,000 | | | | 5,507,948 | |
U.S. Treasury Bond | | | 4.38 | % | | | 5/15/2040 | | | | - | | | | - | | | | | | | | 200,000 | | | | 284,547 | | | | | | | | | | | | | | | | | | | | 200,000 | | | | 284,547 | |
U.S. Treasury Bond | | | 4.50 | % | | | 5/15/2038 | | | | - | | | | - | | | | | | | | 200,000 | | | | 290,133 | | | | | | | | | | | | | | | | | | | | 200,000 | | | | 290,133 | |
U.S. Treasury Bond | | | 5.25 | % | | | 2/15/2029 | | | | - | | | | - | | | | | | | | 130,000 | | | | 183,818 | | | | | | | | | | | | | | | | | | | | 130,000 | | | | 183,818 | |
U.S. Treasury Bond | | | 5.38 | % | | | 2/15/2031 | | | | - | | | | - | | | | | | | | 150,000 | | | | 222,475 | | | | | | | | | | | | | | | | | | | | 150,000 | | | | 222,475 | |
U.S. Treasury Bond | | | 8.00 | % | | | 11/15/2021 | | | | - | | | | - | | | | | | | | 1,000,000 | | | | 1,361,445 | | | | | | | | | | | | | | | | | | | | 1,000,000 | | | | 1,361,445 | |
U.S. Treasury Bond | | | 8.50 | % | | | 2/15/2020 | | | | - | | | | - | | | | | | | | 815,000 | | | | 1,038,966 | | | | | | | | | | | | | | | | | | | | 815,000 | | | | 1,038,966 | |
U.S. Treasury Bond | | | 8.75 | % | | | 8/15/2020 | | | | - | | | | - | | | | | | | | 2,100,000 | | | | 2,768,720 | | | | | | | | | | | | | | | | | | | | 2,100,000 | | | | 2,768,720 | |
U.S. Treasury Bond, Principal Only STRIPS | | | 0.00 | % | | | 8/15/2039 | | | | - | | | | - | | | | | | | | 150,000 | | | | 90,070 | | | | | | | | | | | | | | | | | | | | 150,000 | | | | 90,070 | |
U.S. Treasury Bond, Principal Only STRIPS | | | 0.00 | % | | | 8/15/2031 | | | | - | | | | - | | | | | | | | 1,000,000 | | | | 744,878 | | | | | | | | | | | | | | | | | | | | 1,000,000 | | | | 744,878 | |
U.S. Treasury Bond, Principal Only STRIPS | | | 0.00 | % | | | 2/15/2032 | | | | - | | | | - | | | | | | | | 7,000,000 | | | | 5,147,401 | | | | | | | | | | | | | | | | | | | | 7,000,000 | | | | 5,147,401 | |
U.S. Treasury Bond, Principal Only STRIPS | | | 0.00 | % | | | 8/15/2032 | | | | - | | | | - | | | | | | | | 1,150,000 | | | | 833,507 | | | | | | | | | | | | | | | | | | | | 1,150,000 | | | | 833,507 | |
U.S. Treasury Bond, Principal Only STRIPS | | | 0.00 | % | | | 2/15/2033 | | | | - | | | | - | | | | | | | | 300,000 | | | | 214,159 | | | | | | | | | | | | | | | | | | | | 300,000 | | | | 214,159 | |
U.S. Treasury Bond, Principal Only STRIPS | | | 0.00 | % | | | 8/15/2033 | | | | - | | | | - | | | | | | | | 400,000 | | | | 281,606 | | | | | | | | | | | | | | | | | | | | 400,000 | | | | 281,606 | |
U.S. Treasury Bond, Principal Only STRIPS | | | 0.00 | % | | | 2/15/2034 | | | | - | | | | - | | | | | | | | 1,775,000 | | | | 1,229,984 | | | | | | | | | | | | | | | | | | | | 1,775,000 | | | | 1,229,984 | |
U.S. Treasury Bond, Principal Only STRIPS | | | 0.00 | % | | | 8/15/2034 | | | | - | | | | - | | | | | | | | 150,000 | | | | 102,369 | | | | | | | | | | | | | | | | | | | | 150,000 | | | | 102,369 | |
U.S. Treasury Bond, Principal Only STRIPS | | | 0.00 | % | | | 2/15/2035 | | | | - | | | | - | | | | | | | | 160,000 | | | | 107,663 | | | | | | | | | | | | | | | | | | | | 160,000 | | | | 107,663 | |
U.S. Treasury Bond, Principal Only STRIPS | | | 0.00 | % | | | 11/15/2030 | | | | - | | | | - | | | | | | | | 2,525,000 | | | | 1,918,470 | | | | | | | | | | | | | | | | | | | | 2,525,000 | | | | 1,918,470 | |
U.S. Treasury Bond, Principal Only STRIPS | | | 0.00 | % | | | 5/15/2031 | | | | - | | | | - | | | | | | | | 1,950,000 | | | | 1,461,246 | | | | | | | | | | | | | | | | | | | | 1,950,000 | | | | 1,461,246 | |
U.S. Treasury Bond, Principal Only STRIPS | | | 0.00 | % | | | 11/15/2031 | | | | - | | | | - | | | | | | | | 3,330,000 | | | | 2,464,383 | | | | | | | | | | | | | | | | | | | | 3,330,000 | | | | 2,464,383 | |
U.S. Treasury Bond, Principal Only STRIPS | | | 0.00 | % | | | 5/15/2032 | | | | - | | | | - | | | | | | | | 2,700,000 | | | | 1,970,104 | | | | | | | | | | | | | | | | | | | | 2,700,000 | | | | 1,970,104 | |
U.S. Treasury Bond, Principal Only STRIPS | | | 0.00 | % | | | 11/15/2032 | | | | - | | | | - | | | | | | | | 1,250,000 | | | | 899,651 | | | | | | | | | | | | | | | | | | | | 1,250,000 | | | | 899,651 | |
U.S. Treasury Bond, Principal Only STRIPS | | | 0.00 | % | | | 5/15/2033 | | | | - | | | | - | | | | | | | | 800,000 | | | | 567,758 | | | | | | | | | | | | | | | | | | | | 800,000 | | | | 567,758 | |
U.S. Treasury Bond, Principal Only STRIPS | | | 0.00 | % | | | 11/15/2033 | | | | - | | | | - | | | | | | | | 2,400,000 | | | | 1,678,097 | | | | | | | | | | | | | | | | | | | | 2,400,000 | | | | 1,678,097 | |
U.S. Treasury Bond, Principal Only STRIPS | | | 0.00 | % | | | 5/15/2034 | | | | - | | | | - | | | | | | | | 1,550,000 | | | | 1,066,155 | | | | | | | | | | | | | | | | | | | | 1,550,000 | | | | 1,066,155 | |
U.S. Treasury Bond, Principal Only STRIPS | | | 0.00 | % | | | 11/15/2034 | | | | - | | | | - | | | | | | | | 1,450,000 | | | | 982,358 | | | | | | | | | | | | | | | | | | | | 1,450,000 | | | | 982,358 | |
U.S. Treasury Bond, Principal Only STRIPS | | | 0.00 | % | | | 11/15/2016 | | | | - | | | | - | | | | | | | | 500,000 | | | | 499,339 | | | | | | | | | | | | | | | | | | | | 500,000 | | | | 499,339 | |
U.S. Treasury Bond, Principal Only STRIPS | | | 0.00 | % | | | 2/15/2017 | | | | - | | | | - | | | | | | | | 10,850,000 | | | | 10,820,065 | | | | | | | | | | | | | | | | | | | | 10,850,000 | | | | 10,820,065 | |
U.S. Treasury Bond, Principal Only STRIPS | | | 0.00 | % | | | 8/15/2017 | | | | - | | | | - | | | | | | | | 500,000 | | | | 496,924 | | | | | | | | | | | | | | | | | | | | 500,000 | | | | 496,924 | |
U.S. Treasury Bond, Principal Only STRIPS | | | 0.00 | % | | | 11/15/2017 | | | | - | | | | - | | | | | | | | 250,000 | | | | 247,997 | | | | | | | | | | | | | | | | | | | | 250,000 | | | | 247,997 | |
U.S. Treasury Bond, Principal Only STRIPS | | | 0.00 | % | | | 2/15/2018 | | | | - | | | | - | | | | | | | | 50,000 | | | | 49,512 | | | | | | | | | | | | | | | | | | | | 50,000 | | | | 49,512 | |
U.S. Treasury Bond, Principal Only STRIPS | | | 0.00 | % | | | 8/15/2018 | | | | - | | | | - | | | | | | | | 5,000,000 | | | | 4,935,980 | | | | | | | | | | | | | | | | | | | | 5,000,000 | | | | 4,935,980 | |
U.S. Treasury Bond, Principal Only STRIPS | | | 0.00 | % | | | 5/15/2019 | | | | - | | | | - | | | | | | | | 2,805,000 | | | | 2,745,282 | | | | | | | | | | | | | | | | | | | | 2,805,000 | | | | 2,745,282 | |
U.S. Treasury Bond, Principal Only STRIPS | | | 0.00 | % | | | 8/15/2019 | | | | - | | | | - | | | | | | | | 850,000 | | | | 829,134 | | | | | | | | | | | | | | | | | | | | 850,000 | | | | 829,134 | |
U.S. Treasury Bond, Principal Only STRIPS | | | 0.00 | % | | | 11/15/2019 | | | | - | | | | - | | | | | | | | 1,200,000 | | | | 1,165,918 | | | | | | | | | | | | | | | | | | | | 1,200,000 | | | | 1,165,918 | |
U.S. Treasury Bond, Principal Only STRIPS | | | 0.00 | % | | | 2/15/2020 | | | | - | | | | - | | | | | | | | 2,160,000 | | | | 2,092,872 | | | | | | | | | | | | | | | | | | | | 2,160,000 | | | | 2,092,872 | |
U.S. Treasury Bond, Principal Only STRIPS | | | 0.00 | % | | | 5/15/2020 | | | | - | | | | - | | | | | | | | 5,952,000 | | | | 5,740,424 | | | | | | | | | | | | | | | | | | | | 5,952,000 | | | | 5,740,424 | |
U.S. Treasury Bond, Principal Only STRIPS | | | 0.00 | % | | | 8/15/2020 | | | | - | | | | - | | | | | | | | 5,200,000 | | | | 5,002,962 | | | | | | | | | | | | | | | | | | | | 5,200,000 | | | | 5,002,962 | |
U.S. Treasury Bond, Principal Only STRIPS | | | 0.00 | % | | | 2/15/2021 | | | | - | | | | - | | | | | | | | 3,250,000 | | | | 3,096,359 | | | | | | | | | | | | | | | | | | | | 3,250,000 | | | | 3,096,359 | |
U.S. Treasury Bond, Principal Only STRIPS | | | 0.00 | % | | | 5/15/2021 | | | | - | | | | - | | | | | | | | 5,040,000 | | | | 4,785,661 | | | | | | | | | | | | | | | | | | | | 5,040,000 | | | | 4,785,661 | |
U.S. Treasury Bond, Principal Only STRIPS | | | 0.00 | % | | | 8/15/2021 | | | | - | | | | - | | | | | | | | 1,500,000 | | | | 1,416,459 | | | | | | | | | | | | | | | | | | | | 1,500,000 | | | | 1,416,459 | |
U.S. Treasury Bond, Principal Only STRIPS | | | 0.00 | % | | | 11/15/2021 | | | | - | | | | - | | | | | | | | 2,260,000 | | | | 2,122,221 | | | | | | | | | | | | | | | | | | | | 2,260,000 | | | | 2,122,221 | |
U.S. Treasury Bond, Principal Only STRIPS | | | 0.00 | % | | | 2/15/2022 | | | | - | | | | - | | | | | | | | 19,500,000 | | | | 18,193,461 | | | | | | | | | | | | | | | | | | | | 19,500,000 | | | | 18,193,461 | |
U.S. Treasury Bond, Principal Only STRIPS | | | 0.00 | % | | | 5/15/2022 | | | | - | | | | - | | | | | | | | 2,640,000 | | | | 2,452,668 | | | | | | | | | | | | | | | | | | | | 2,640,000 | | | | 2,452,668 | |
U.S. Treasury Bond, Principal Only STRIPS | | | 0.00 | % | | | 8/15/2022 | | | | - | | | | - | | | | | | | | 4,900,000 | | | | 4,538,478 | | | | | | | | | | | | | | | | | | | | 4,900,000 | | | | 4,538,478 | |
U.S. Treasury Bond, Principal Only STRIPS | | | 0.00 | % | | | 11/15/2022 | | | | - | | | | - | | | | | | | | 700,000 | | | | 644,763 | | | | | | | | | | | | | | | | | | | | 700,000 | | | | 644,763 | |
U.S. Treasury Bond, Principal Only STRIPS | | | 0.00 | % | | | 2/15/2023 | | | | - | | | | - | | | | | | | | 5,425,000 | | | | 4,966,810 | | | | | | | | | | | | | | | | | | | | 5,425,000 | | | | 4,966,810 | |
U.S. Treasury Bond, Principal Only STRIPS | | | 0.00 | % | | | 8/15/2023 | | | | - | | | | - | | | | | | | | 2,520,000 | | | | 2,284,509 | | | | | | | | | | | | | | | | | | | | 2,520,000 | | | | 2,284,509 | |
U.S. Treasury Bond, Principal Only STRIPS | | | 0.00 | % | | | 5/15/2023 | | | | - | | | | - | | | | | | | | 12,550,000 | | | | 11,421,692 | | | | | | | | | | | | | | | | | | | | 12,550,000 | | | | 11,421,692 | |
U.S. Treasury Bond, Principal Only STRIPS | | | 0.00 | % | | | 2/15/2024 | | | | - | | | | - | | | | | | | | 200,000 | | | | 179,289 | | | | | | | | | | | | | | | | | | | | 200,000 | | | | 179,289 | |
U.S. Treasury Bond, Principal Only STRIPS | | | 0.00 | % | | | 5/15/2024 | | | | - | | | | - | | | | | | | | 200,000 | | | | 178,350 | | | | | | | | | | | | | | | | | | | | 200,000 | | | | 178,350 | |
U.S. Treasury Bond, Principal Only STRIPS | | | 0.00 | % | | | 8/15/2024 | | | | - | | | | - | | | | | | | | 1,300,000 | | | | 1,151,715 | | | | | | | | | | | | | | | | | | | | 1,300,000 | | | | 1,151,715 | |
37
| | | | | | | | | | | | | | | | | | | | | | | | | | | | | | | | | | | | | | | | | | | | | | | | | | | | |
| | | | | | | | | Voya Limited
Maturity Bond VP | | | | | | JPMorgan Core
Bond VP | | | | | | Adjustments | | | | | | Combined Pro
Forma Portfolio | |
| | | | | | | | | | | | | |
| | | Coupon Rate | | | Maturity Date | | | Principal | | | Value | | | | | | Principal | | | Value | | | | | | Principal | | | Value | | | | | | Principal | | | Value | |
| | | | | | | | | | | | | | | | | | | | | | | | | | | | | | | | |
U.S. Treasury Bond, Principal Only STRIPS | | | 0.00 | % | | | 11/15/2024 | | | $ | - | | | $ | - | | | | | | | $ | 500,000 | | | $ | 440,867 | | | | | | | | | | | | | | | | | | | $ | 500,000 | | | $ | 440,867 | |
U.S. Treasury Bond, Principal Only STRIPS | | | 0.00 | % | | | 2/15/2025 | | | | - | | | | - | | | | | | | | 1,100,000 | | | | 962,822 | | | | | | | | | | | | | | | | | | | | 1,100,000 | | | | 962,822 | |
U.S. Treasury Bond, Principal Only STRIPS | | | 0.00 | % | | | 5/15/2025 | | | | - | | | | - | | | | | | | | 500,000 | | | | 434,629 | | | | | | | | | | | | | | | | | | | | 500,000 | | | | 434,629 | |
U.S. Treasury Bond, Principal Only STRIPS | | | 0.00 | % | | | 8/15/2025 | | | | - | | | | - | | | | | | | | 2,000,000 | | | | 1,730,510 | | | | | | | | | | | | | | | | | | | | 2,000,000 | | | | 1,730,510 | |
U.S. Treasury Bond, Principal Only STRIPS | | | 0.00 | % | | | 2/15/2026 | | | | - | | | | - | | | | | | | | 100,000 | | | | 85,438 | | | | | | | | | | | | | | | | | | | | 100,000 | | | | 85,438 | |
U.S. Treasury Bond, Principal Only STRIPS | | | 0.00 | % | | | 8/15/2026 | | | | - | | | | - | | | | | | | | 70,000 | | | | 59,177 | | | | | | | | | | | | | | | | | | | | 70,000 | | | | 59,177 | |
U.S. Treasury Bond, Principal Only STRIPS | | | 0.00 | % | | | 11/15/2026 | | | | - | | | | - | | | | | | | | 1,350,000 | | | | 1,133,191 | | | | | | | | | | | | | | | | | | | | 1,350,000 | | | | 1,133,191 | |
U.S. Treasury Bond, Principal Only STRIPS | | | 0.00 | % | | | 2/15/2027 | | | | - | | | | - | | | | | | | | 950,000 | | | | 793,559 | | | | | | | | | | | | | | | | | | | | 950,000 | | | | 793,559 | |
U.S. Treasury Bond, Principal Only STRIPS | | | 0.00 | % | | | 5/15/2027 | | | | - | | | | - | | | | | | | | 200,000 | | | | 166,005 | | | | | | | | | | | | | | | | | | | | 200,000 | | | | 166,005 | |
U.S. Treasury Bond, Principal Only STRIPS | | | 0.00 | % | | | 8/15/2027 | | | | - | | | | - | | | | | | | | 500,000 | | | | 412,274 | | | | | | | | | | | | | | | | | | | | 500,000 | | | | 412,274 | |
U.S. Treasury Bond, Principal Only STRIPS | | | 0.00 | % | | | 11/15/2027 | | | | - | | | | - | | | | | | | | 1,090,000 | | | | 893,605 | | | | | | | | | | | | | | | | | | | | 1,090,000 | | | | 893,605 | |
U.S. Treasury Bond, Principal Only STRIPS | | | 0.00 | % | | | 2/15/2028 | | | | - | | | | - | | | | | | | | 430,000 | | | | 349,694 | | | | | | | | | | | | | | | | | | | | 430,000 | | | | 349,694 | |
U.S. Treasury Bond, Principal Only STRIPS | | | 0.00 | % | | | 8/15/2028 | | | | - | | | | - | | | | | | | | 1,250,000 | | | | 1,005,576 | | | | | | | | | | | | | | | | | | | | 1,250,000 | | | | 1,005,576 | |
U.S. Treasury Bond, Principal Only STRIPS | | | 0.00 | % | | | 5/15/2028 | | | | - | | | | - | | | | | | | | 510,000 | | | | 412,148 | | | | | | | | | | | | | | | | | | | | 510,000 | | | | 412,148 | |
U.S. Treasury Bond, Principal Only STRIPS | | | 0.00 | % | | | 11/15/2028 | | | | - | | | | - | | | | | | | | 200,000 | | | | 159,887 | | | | | | | | | | | | | | | | | | | | 200,000 | | | | 159,887 | |
U.S. Treasury Bond, Principal Only STRIPS | | | 0.00 | % | | | 5/15/2035 | | | | - | | | | - | | | | | | | | 550,000 | | | | 367,511 | | | | | | | | | | | | | | | | | | | | 550,000 | | | | 367,511 | |
U.S. Treasury Bond, Principal Only STRIPS | | | 0.00 | % | | | 2/15/2029 | | | | - | | | | - | | | | | | | | 1,742,000 | | | | 1,384,395 | | | | | | | | | | | | | | | | | | | | 1,742,000 | | | | 1,384,395 | |
U.S. Treasury Bond, Principal Only STRIPS | | | 0.00 | % | | | 8/15/2029 | | | | - | | | | - | | | | | | | | 550,000 | | | | 431,384 | | | | | | | | | | | | | | | | | | | | 550,000 | | | | 431,384 | |
U.S. Treasury Bond, Principal Only STRIPS | | | 0.00 | % | | | 5/15/2029 | | | | - | | | | - | | | | | | | | 150,000 | | | | 118,342 | | | | | | | | | | | | | | | | | | | | 150,000 | | | | 118,342 | |
U.S. Treasury Bond, Principal Only STRIPS | | | 0.00 | % | | | 11/15/2029 | | | | - | | | | - | | | | | | | | 425,000 | | | | 331,074 | | | | | | | | | | | | | | | | | | | | 425,000 | | | | 331,074 | |
U.S. Treasury Bond, Principal Only STRIPS | | | 0.00 | % | | | 5/15/2030 | | | | - | | | | - | | | | | | | | 430,000 | | | | 330,961 | | | | | | | | | | | | | | | | | | | | 430,000 | | | | 330,961 | |
U.S. Treasury Bond, Principal Only STRIPS | | | 0.00 | % | | | 2/15/2030 | | | | - | | | | - | | | | | | | | 1,425,000 | | | | 1,102,478 | | | | | | | | | | | | | | | | | | | | 1,425,000 | | | | 1,102,478 | |
U.S. Treasury Bond, Principal Only STRIPS | | | 0.00 | % | | | 8/15/2030 | | | | - | | | | - | | | | | | | | 550,000 | | | | 420,396 | | | | | | | | | | | | | | | | | | | | 550,000 | | | | 420,396 | |
U.S. Treasury Bond, Principal Only STRIPS | | | 0.00 | % | | | 2/15/2031 | | | | - | | | | - | | | | | | | | 1,250,000 | | | | 943,064 | | | | | | | | | | | | | | | | | | | | 1,250,000 | | | | 943,064 | |
U.S. Treasury Inflation Indexed Bond | | | 2.13 | % | | | 2/15/2040 | | | | - | | | | - | | | | | | | | 221,360 | | | | 289,391 | | | | | | | | | | | | | | | | | | | | 221,360 | | | | 289,391 | |
U.S. Treasury Inflation Indexed Bond | | | 2.50 | % | | | 1/15/2029 | | | | - | | | | - | | | | | | | | 111,422 | | | | 141,175 | | | | | | | | | | | | | | | | | | | | 111,422 | | | | 141,175 | |
U.S. Treasury Inflation Indexed Note | | | 0.13 | % | | | 4/15/2019 | | | | - | | | | - | | | | | | | | 204,186 | | | | 208,501 | | | | | | | | | | | | | | | | | | | | 204,186 | | | | 208,501 | |
U.S. Treasury Inflation Indexed Note | | | 0.13 | % | | | 1/15/2022 | | | | - | | | | - | | | | | | | | 239,925 | | | | 244,524 | | | | | | | | | | | | | | | | | | | | 239,925 | | | | 244,524 | |
U.S. Treasury Inflation Indexed Note | | | 1.38 | % | | | 1/15/2020 | | | | - | | | | - | | | | | | | | 335,197 | | | | 357,888 | | | | | | | | | | | | | | | | | | | | 335,197 | | | | 357,888 | |
U.S. Treasury Note | | | 0.38 | % | | | 10/31/2016 | | | | 3,475,000 | | | | 3,475,236 | | | | | | | | - | | | | - | | | | | | | | | | | | | | | | | | | | 3,475,000 | | | | 3,475,236 | |
U.S. Treasury Note | | | 0.50 | % | | | 2/28/2017 | | | | 760,000 | | | | 760,208 | | | | | | | | - | | | | - | | | | | | | | | | | | | | | | | | | | 760,000 | | | | 760,208 | |
U.S. Treasury Note | | | 0.63 | % | | | 6/30/2018 | | | | 188,000 | | | | 188,088 | | | | | | | | - | | | | - | | | | | | | | | | | | | | | | | | | | 188,000 | | | | 188,088 | |
U.S. Treasury Note | | | 0.75 | % | | | 1/31/2018 | | | | 79,700 | | | | 79,915 | | | | | | | | - | | | | - | | | | | | | | | | | | | | | | | | | | 79,700 | | | | 79,915 | |
U.S. Treasury Note | | | 0.75 | % | | | 2/15/2019 | | | | 886,000 | | | | 887,730 | | | | | | | | 1,000,000 | | | | 1,001,953 | | | | | | | | | | | | | | | | | | | | 1,886,000 | | | | 1,889,683 | |
U.S. Treasury Note | | | 0.75 | % | | | 4/30/2018 | | | | 190,000 | | | | 190,549 | | | | | | | | - | | | | - | | | | | | | | | | | | | | | | | | | | 190,000 | | | | 190,549 | |
U.S. Treasury Note | | | 0.75 | % | | | 2/28/2018 | | | | 9,523,000 | | | | 9,549,036 | | | | | | | | - | | | | - | | | | | | | | | | | | | | | | | | | | 9,523,000 | | | | 9,549,036 | |
U.S. Treasury Note | | | 0.88 | % | | | 7/31/2019 | | | | - | | | | - | | | | | | | | 70,000 | | | | 70,287 | | | | | | | | | | | | | | | | | | | | 70,000 | | | | 70,287 | |
U.S. Treasury Note | | | 1.00 | % | | | 6/15/2019 | | | | 157,000 | | | | 157,779 | | | | | | | | - | | | | - | | | | | | | | | | | | | | | | | | | | 157,000 | | | | 157,779 | |
U.S. Treasury Note | | | 1.00 | % | | | 6/30/2021 | | | | 1,177,000 | | | | 1,182,839 | | | | | | | | - | | | | - | | | | | | | | | | | | | | | | | | | | 1,177,000 | | | | 1,182,839 | |
U.S. Treasury Note | | | 1.00 | % | | | 6/30/2019 | | | | - | | | | - | | | | | | | | 130,000 | | | | 131,102 | | | | | | | | | | | | | | | | | | | | 130,000 | | | | 131,102 | |
U.S. Treasury Note | | | 1.00 | % | | | 8/31/2019 | | | | - | | | | - | | | | | | | | 500,000 | | | | 503,848 | | | | | | | | | | | | | | | | | | | | 500,000 | | | | 503,848 | |
U.S. Treasury Note | | | 1.00 | % | | | 11/30/2019 | | | | - | | | | - | | | | | | | | 400,000 | | | | 402,609 | | | | | | | | | | | | | | | | | | | | 400,000 | | | | 402,609 | |
U.S. Treasury Note | | | 1.25 | % | | | 11/30/2018 | | | | - | | | | - | | | | | | | | 740,000 | | | | 750,551 | | | | | | | | | | | | | | | | | | | | 740,000 | | | | 750,551 | |
U.S. Treasury Note | | | 1.25 | % | | | 6/30/2023 | | | | 220,000 | | | | 221,134 | | | | | | | | - | | | | - | | | | | | | | | | | | | | | | | | | | 220,000 | | | | 221,134 | |
U.S. Treasury Note | | | 1.38 | % | | | 4/30/2020 | | | | - | | | | - | | | | | | | | 4,000,000 | | | | 4,075,312 | | | | | | | | | | | | | | | | | | | | 4,000,000 | | | | 4,075,312 | |
U.S. Treasury Note | | | 1.38 | % | | | 5/31/2021 | | | | - | | | | - | | | | | | | | - | | | | - | | | | | | | | | | | | | | | | | | | | - | | | | - | |
U.S. Treasury Note | | | 1.50 | % | | | 1/31/2022 | | | | - | | | | - | | | | | | | | 300,000 | | | | 306,070 | | | | | | | | | | | | | | | | | | | | 300,000 | | | | 306,070 | |
U.S. Treasury Note | | | 1.50 | % | | | 8/31/2018 | | | | - | | | | - | | | | | | | | 200,000 | | | | 203,773 | | | | | | | | | | | | | | | | | | | | 200,000 | | | | 203,773 | |
U.S. Treasury Note | | | 1.50 | % | | | 5/31/2019 | | | | - | | | | - | | | | | | | | 5,000,000 | | | | 5,112,890 | | | | | | | | | | | | | | | | | | | | 5,000,000 | | | | 5,112,890 | |
U.S. Treasury Note | | | 1.63 | % | | | 5/15/2026 | | | | 310,000 | | | | 313,790 | | | | | | | | - | | | | - | | | | | | | | | | | | | | | | | | | | 310,000 | | | | 313,790 | |
U.S. Treasury Note | | | 1.63 | % | | | 8/15/2022 | | | | - | | | | - | | | | | | | | 500,000 | | | | 512,735 | | | | | | | | | | | | | | | | | | | | 500,000 | | | | 512,735 | |
U.S. Treasury Note | | | 1.63 | % | | | 7/31/2020 | | | | 4,496,000 | | | | 4,623,327 | | | | | | | | - | | | | - | | | | | | | | | | | | | | | | | | | | 4,496,000 | | | | 4,623,327 | |
U.S. Treasury Note | | | 1.75 | % | | | 9/30/2022 | | | | - | | | | - | | | | | | | | 350,000 | | | | 361,088 | | | | | | | | | | | | | | | | | | | | 350,000 | | | | 361,088 | |
U.S. Treasury Note | | | 1.75 | % | | | 1/31/2023 | | | | 378,000 | | | | 389,606 | | | | | | | | - | | | | - | | | | | | | | | | | | | | | | | | | | 378,000 | | | | 389,606 | |
U.S. Treasury Note | | | 1.75 | % | | | 5/15/2023 | | | | - | | | | - | | | | | | | | 1,300,000 | | | | 1,341,083 | | | | | | | | | | | | | | | | | | | | 1,300,000 | | | | 1,341,083 | |
U.S. Treasury Note | | | 1.75 | % | | | 10/31/2020 | | | | - | | | | - | | | | | | | | 5,000,000 | | | | 5,168,165 | | | | | | | | | | | | | | | | | | | | 5,000,000 | | | | 5,168,165 | |
U.S. Treasury Note | | | 2.00 | % | | | 11/30/2020 | | | | - | | | | - | | | | | | | | 14,000,000 | | | | 14,629,454 | | | | | | | | | | | | | | | | | | | | 14,000,000 | | | | 14,629,454 | |
U.S. Treasury Note | | | 2.00 | % | | | 10/31/2021 | | | | - | | | | - | | | | | | | | 150,000 | | | | 157,107 | | | | | | | | | | | | | | | | | | | | 150,000 | | | | 157,107 | |
U.S. Treasury Note | | | 2.00 | % | | | 7/31/2022 | | | | - | | | | - | | | | | | | | 1,500,000 | | | | 1,570,546 | | | | | | | | | | | | | | | | | | | | 1,500,000 | | | | 1,570,546 | |
U.S. Treasury Note | | | 2.13 | % | | | 1/31/2021 | | | | - | | | | - | | | | | | | | 2,500,000 | | | | 2,628,710 | | | | | | | | | | | | | | | | | | | | 2,500,000 | | | | 2,628,710 | |
U.S. Treasury Note | | | 2.13 | % | | | 8/31/2020 | | | | - | | | | - | | | | | | | | 1,500,000 | | | | 1,573,242 | | | | | | | | | | | | | | | | | | | | 1,500,000 | | | | 1,573,242 | |
U.S. Treasury Note | | | 2.13 | % | | | 5/15/2025 | | | | - | | | | - | | | | | | | | 3,000,000 | | | | 3,168,867 | | | | | | | | | | | | | | | | | | | | 3,000,000 | | | | 3,168,867 | |
U.S. Treasury Note | | | 2.13 | % | | | 6/30/2022 | | | | - | | | | - | | | | | | | | 650,000 | | | | 685,344 | | | | | | | | | | | | | | | | | | | | 650,000 | | | | 685,344 | |
38
| | | | | | | | | | | | | | | | | | | | | | | | | | | | | | | | | | | | | | | | | | | | | | | | | | | | |
| | | | | | | | | Voya Limited
Maturity Bond VP | | | | | | JPMorgan Core
Bond VP | | | | | | Adjustments | | | | | | Combined Pro
Forma Portfolio | |
| | | | | | | | | | | | | |
| | | Coupon Rate | | | Maturity Date | | | Principal | | | Value | | | | | | Principal | | | Value | | | | | | Principal | | | Value | | | | | | Principal | | | Value | |
| | | | | | | | | | | | | | | | | | | | | | | | | | | | | | | | |
U.S. Treasury Note | | | 2.25 | % | | | 7/31/2018 | | | $ | - | | | $ | - | | | | | | | $ | 500,000 | | | $ | 516,933 | | | | | | | | | | | | | | | | | | | $ | 500,000 | | | $ | 516,933 | |
U.S. Treasury Note | | | 2.25 | % | | | 4/30/2021 | | | | - | | | | - | | | | | | | | 335,000 | | | | 354,563 | | | | | | | | | | | | | | | | | | | | 335,000 | | | | 354,563 | |
U.S. Treasury Note | | | 2.38 | % | | | 8/15/2024 | | | | - | | | | - | | | | | | | | 2,380,000 | | | | 2,561,846 | | | | | | | | | | | | | | | | | | | | 2,380,000 | | | | 2,561,846 | |
U.S. Treasury Note | | | 2.63 | % | | | 8/15/2020 | | | | - | | | | - | | | | | | | | 550,000 | | | | 587,984 | | | | | | | | | | | | | | | | | | | | 550,000 | | | | 587,984 | |
U.S. Treasury Note | | | 2.63 | % | | | 11/15/2020 | | | | - | | | | - | | | | | | | | 650,000 | | | | 696,414 | | | | | | | | | | | | | | | | | | | | 650,000 | | | | 696,414 | |
U.S. Treasury Note | | | 2.75 | % | | | 12/31/2017 | | | | - | | | | - | | | | | | | | 50,000 | | | | 51,607 | | | | | | | | | | | | | | | | | | | | 50,000 | | | | 51,607 | |
U.S. Treasury Note | | | 3.13 | % | | | 5/15/2019 | | | | - | | | | - | | | | | | | | 1,000,000 | | | | 1,068,828 | | | | | | | | | | | | | | | | | | | | 1,000,000 | | | | 1,068,828 | |
U.S. Treasury Note | | | 3.13 | % | | | 10/31/2016 | | | | - | | | | - | | | | | | | | 150,000 | | | | 151,371 | | | | | | | | | | | | | | | | | | | | 150,000 | | | | 151,371 | |
U.S. Treasury Note | | | 3.13 | % | | | 4/30/2017 | | | | - | | | | - | | | | | | | | 300,000 | | | | 306,442 | | | | | | | | | | | | | | | | | | | | 300,000 | | | | 306,442 | |
U.S. Treasury Note | | | 3.25 | % | | | 12/31/2016 | | | | - | | | | - | | | | | | | | 4,000,000 | | | | 4,056,376 | | | | | | | | | | | | | | | | | | | | 4,000,000 | | | | 4,056,376 | |
U.S. Treasury Note | | | 3.63 | % | | | 2/15/2020 | | | | - | | | | - | | | | | | | | 700,000 | | | | 770,274 | | | | | | | | | | | | | | | | | | | | 700,000 | | | | 770,274 | |
| | | | | | | | | | | | | | | | | | | | | | | | | | | | | | | | | | | | |
Total U.S. Government Obligations | | | | | | | | | | | | | | | 22,134,820 | | | | | | | | | | | | 209,737,825 | | | | | | | | | | | | | | | | | | | | | | | | 231,872,645 | |
| | | | | | | | | | | | | | | | | | | | | | | | | | | | | | | | | | | | |
| | | | | | | | | | | Total Cost ($21,955,349) | | | | | | | | Total Cost ($193,606,877) | | | | | | | | | | | | | | | | | | | | Total Cost ($215,562,226) | |
| | | | | | | | | | | | | |
| | | | | | | | | Shares | | | Value | | | | | | Shares | | | Value | | | | | | Shares | | | Value | | | | | | Shares | | | Value | |
| | | | | | | | | | | | | | | | | | | | | | | | | | | | | | | | |
Securities Lending Collateral - 4.2 % | | | | | | | | | | | | | | | | | | | | | | | | | | | | | | | | | | | | | | | | | | | | | | | | | | | | |
State Street Navigator Securities Lending Trust - Prime Portfolio | | | 0.51 | % | | | | | | | 3,325,155 | | | | 3,325,155 | | | | | | | | 31,670,629 | | | | 31,670,629 | | | | | | | | | | | | | | | | | | | | 34,995,784 | | | | 34,995,784 | |
| | | | | | | | | | | | | | | | | | | | | | | | | | | | | | | | | | | | |
Total Securities Lending Collateral | | | | | | | | | | | | | | | 3,325,155 | | | | | | | | | | | | 31,670,629 | | | | | | | | | | | | | | | | | | | | | | | | 34,995,784 | |
| | | | | | | | | | | | | | | | | | | | | | | | | | | | | | | | | | | | |
| | | | | | | | | | | Total Cost ($3,325,155) | | | | | | | | Total Cost ($31,670,629) | | | | | | | | | | | | | | | | | | | | Total Cost ($34,995,784) | |
| | | | | | | | | | | | | |
| | | | | | | | | Principal | | | Value | | | | | | Principal | | | Value | | | | | | Principal | | | Value | | | | | | Principal | | | Value | |
| | | | | | | | | | | | | | | | | | | | | | | | | | | | | | | | |
Repurchase Agreement - 4.2 % | | | | | | | | | | | | | | | | | | | | | | | | | | | | | | | | | | | | | | | | | | | | | | | | | | | | |
State Street Bank & Trust Co. | | | 0.03 | % | | | 7/1/2016 | | | $ | 1,461,855 | | | | 1,461,855 | | | | | | | $ | 33,858,541 | | | | 33,858,541 | | | | | | | | | | | | | | | | | | | $ | 35,320,396 | | | | 35,320,396 | |
| | | | | | | | | | | | | | | | | | | | | | | | | | | | | | | | | | | | |
Total Repurchase Agreement | | | | | | | | | | | | | | | 1,461,855 | | | | | | | | | | | | 33,858,541 | | | | | | | | | | | | | | | | | | | | | | | | 35,320,396 | |
| | | | | | | | | | | | | | | | | | | | | | | | | | | | | | | | | | | | |
| | | | | | | | | | | Total Cost ($1,461,855) | | | | | | | | Total Cost ($33,858,541) | | | | | | | | | | | | | | | | | | | | Total Cost ($35,320,396) | |
| | | | | | | | | | | | | | | | | | | | | | | | | | | | | | | | | | | | |
Total Investments | | | | | | | | | | | | 89,307,871 | | | | | | | | | | | | 785,406,235 | | | | | | | | | | | | | | | | | | | | | | | | 874,714,106 | |
| | | | | | | | | | | | | | | | | | | | | | | | | | | | | | | | | | | | |
| | | | | | | | | | | Total Cost ($88,850,885) | | | | | | | | Total Cost ($753,522,401) | | | | | | | | | | | | | | | | | | | | Total Cost ($842,373,286) | |
Other Assets and Liabilities - (4.4)% | | | | | | | | | | | | (3,248,278 | ) | | | | | | | | | | | (34,143,187 | ) | | | | | | | | | | | (40,000 | )(a) | | | | | | | | | | | (37,431,465 | ) |
| | | | | | | | | | | | | | | | | | | | | | | | | | | | | | | | | | | | | | | | | | | | | | | | | | | | |
Net Assets | | | | | | | | | | | $ | 86,059,593 | | | | | | | | | | | $ | 751,263,048 | | | | | | | | | | | ($ | 40,000 | ) | | | | | | | | | | $ | 837,282,641 | |
| | | | | | | | | | | | | | | | | | | | | | | | | | | | | | | | | | | | | | | | | | | | | | | | | | | | |
39
| | | | | | | | | | | | | | | | | | | | | | | | | | | | | | | | | | | | | | | | | | | | | | | | | | | | | | | | | | | | | | | | |
| | | Fixed
Rate | | | Expiration
Date | | | | | | Notional
Amount | | | Fair
Value | | | Premiums
(Received) | | | Net
Unrealized
Appreciation
(Depreciation) | | | Notional
Amount | | | Fair
Value | | | Premiums
(Received) | | | Net
Unrealized
Appreciation
(Depreciation) | | | | | | Notional
Amount | | | Fair
Value | | | Premiums
(Received) | | | Net
Unrealized
Appreciation
(Depreciation) | |
Centrally Cleared Swap Agreements: | | | | | | | | | | | | | | | | | | | | | | | | | | | | | | | | | | | | | | | | | | | | | | | | | | | | | | | | | | | | | | | | |
Interest Rate Swap Agreements - Fixed Rate Payable | | | | | | | | | | | | | | | | | | | | | | | | | | | | | | | | | | | | | | | | | | | | | | | | | | | | | | | | | | | | | | | | |
3-Month USD-LIBOR | | | 1.49 | % | | | 7/31/2020 | | | | USD | | | | 4,496,000 | | | $ | (134,095 | ) | | $ | - | | | $ | (134,095 | ) | | | - | | | | - | | | | - | | | | - | | | | USD | | | | 4,496,000 | | | $ | (134,095 | ) | | | - | | | $ | (134,095 | ) |
3-Month USD-LIBOR | | | 1.56 | % | | | 11/4/2020 | | | | USD | | | | 4,356,000 | | | | (124,003 | ) | | | - | | | | (124,003 | ) | | | - | | | | - | | | | - | | | | - | | | | USD | | | | 4,356,000 | | | | (124,003 | ) | | | - | | | | (124,003 | ) |
| | | | | | | | | | | | | | | | | | | | | | | | | | | | | | | | | | | | | | | | | | | | |
Total Centrally Cleared Swap Agreements: | | | | | | | | | | | | | | | | | | $ | (258,098 | ) | | $ | - | | | $ | (258,098 | ) | | | | | | | - | | | | - | | | | - | | | | | | | | | | | $ | (258,098 | ) | | $ | - | | | $ | (258,098 | ) |
| | | | | | | | | | | | | | | | | | | | | | | | | | | | | | | | | | | | | | | | | | | | |
| | | | | | | | | | | | | | | | |
| | | Long/Short | | | Expiration
Date | | | | | | Number
of
Contracts | | | | | | Unrealized
Appreciation | | | Unrealized
Depreciation | | | Number
of
Contracts | | | | | | Unrealized
Appreciation | | | Unrealized
Depreciation | | | | | | Number
of
Contracts | | | | | | Unrealized
Appreciation | | | Unrealized
Depreciation | |
Futures Contracts | | | | | | | | | | | | | | | | | | | | | | | | | | | | | | | | | | | | | | | | | | | | | | | | | | | | | | | | | | | | | | | | |
2-Year U.S. Treasury Note | | | Long | | | | 9/30/2016 | | | | | | | | 102 | | | | | | | $ | 151,302 | | | $ | - | | | | | | | | | | | | - | | | | - | | | | | | | | 102 | | | | | | | $ | 151,302 | | | $ | - | |
5-Year U.S. Treasury Note | | | Long | | | | 9/30/2016 | | | | | | | | 13 | | | | | | | | 26,887 | | | | | | | | | | | | | | | | - | | | | - | | | | | | | | 13 | | | | | | | | 26,887 | | | | - | |
10-Year U.S. Treasury Note | | | Short | | | | 9/21/2016 | | | | | | | | (7 | ) | | | | | | | - | | | | (26,593 | ) | | | | | | | | | | | - | | | | - | | | | | | | | (7 | ) | | | | | | | - | | | | (26,593 | ) |
U.S. Treasury Bond | | | Short | | | | 9/21/2016 | | | | | | | | (1 | ) | | | | | | | 435 | | | | | | | | | | | | | | | | - | | | | - | | | | | | | | (1 | ) | | | | | | | 435 | | | | - | |
| | | | | | | | | | | | | | | | | | | | | | | | | | | | |
Total Futures Contracts | | | | | | | | | | | | | | | | | | | | | | $ | 178,624 | | | $ | (26,593 | ) | | | | | | | | | | | - | | | | - | | | | | | | | | | | | | | | $ | 178,624 | | | $ | (26,593 | ) |
| | | | | | | | | | | | | | | | | | | | | | | | | | | | |
40
VALUATION SUMMARY:
| | | | | | | | | | | | | | | | | | | | | | | | | | | | | | | | | | | | | | | | | | | | | | | | | | | | | | | | |
| Investments | | Level 1 -
Unadjusted
Quoted
Prices | | | Level 2 -
Other
Significant
Observable
Inputs | | | Level 3 -
Significant
Unobservable
Inputs | | | Value | | | | | | Level 1 -
Unadjusted
Quoted
Prices | | | Level 2 -
Other
Significant
Observable
Inputs | | | Level 3 -
Significant
Unobservable
Inputs | | | Value | | | | | | Level 1 -
Unadjusted
Quoted
Prices | | | Level 2 -
Other
Significant
Observable
Inputs | | | Level 3 -
Significant
Unobservable
Inputs | | | Value | |
Asset-Backed Securities | | $ | - | | | $ | 13,207,049 | | | $ | - | | | $ | 13,207,049 | | | | | | | $ | - | | | $ | 75,118,850 | | | $ | 383,145 | | | $ | 75,501,995 | | | | | | | $ | - | | | $ | 88,325,899 | | | $ | 383,145 | | | $ | 88,709,044 | |
Corporate Debt Securities | | | - | | | | 41,383,322 | | | | - | | | | 41,383,322 | | | | | | | | - | | | | 153,958,990 | | | | - | | | | 153,958,990 | | | | | | | | - | | | | 195,342,312 | | | | - | | | | 195,342,312 | |
Foreign Government Obligations | | | - | | | | - | | | | - | | | | - | | | | | | | | - | | | | 8,301,021 | | | | - | | | | 8,301,021 | | | | | | | | - | | | | 8,301,021 | | | | - | | | | 8,301,021 | |
Mortgage-Backed Securities | | | - | | | | 7,776,408 | | | | - | | | | 7,776,408 | | | | | | | | - | | | | 29,348,395 | | | | 642,715 | | | | 29,991,110 | | | | | | | | - | | | | 37,124,803 | | | | 642,715 | | | | 37,767,518 | |
Municipal Government Obligations | | | - | | | | - | | | | - | | | | - | | | | | | | | - | | | | 1,006,956 | | | | - | | | | 1,006,956 | | | | | | | | - | | | | 1,006,956 | | | | - | | | | 1,006,956 | |
U.S. Government Agency Obligations | | | - | | | | 19,262 | | | | - | | | | 19,262 | | | | | | | | - | | | | 241,379,168 | | | | - | | | | 241,379,168 | | | | | | | | - | | | | 241,398,430 | | | | - | | | | 241,398,430 | |
U.S. Government Obligations | | | - | | | | 22,134,820 | | | | - | | | | 22,134,820 | | | | | | | | - | | | | 209,737,825 | | | | - | | | | 209,737,825 | | | | | | | | - | | | | 231,872,645 | | | | - | | | | 231,872,645 | |
Securities Lending Collateral | | | 3,325,155 | | | | - | | | | - | | | | 3,325,155 | | | | | | | | 31,670,629 | | | | - | | | | - | | | | 31,670,629 | | | | | | | | 34,995,784 | | | | - | | | | - | | | | 34,995,784 | |
Repurchase Agreement | | | - | | | | 1,461,855 | | | | - | | | | 1,461,855 | | | | | | | | - | | | | 33,858,541 | | | | - | | | | 33,858,541 | | | | | | | | - | | | | 35,320,396 | | | | - | | | | 35,320,396 | |
Total Investments | | $ | 3,325,155 | | | $ | 85,982,716 | | | $ | - | | | $ | 89,307,871 | | | | | | | $ | 31,670,629 | | | $ | 752,709,746 | | | $ | 1,025,860 | | | $ | 785,406,235 | | | | | | | $ | 34,995,784 | | | $ | 838,692,462 | | | $ | 1,025,860 | | | $ | 874,714,106 | |
| | | | | | | | | | | | | | | | | | | | | | | | | | | | | | | | | | | | | | | | | | | | | | | | | | | | | | | | |
Other Financial Instruments | | | | | | | | | | | | | | | | | | | | | | | | | | | | | | | | | | | | | | | | | | | | | | | | | | | | | | | | |
Futures Contracts | | $ | 178,624 | | | $ | - | | | $ | - | | | $ | 178,624 | | | | | | | $ | - | | | $ | - | | | $ | - | | | $ | - | | | | | | | $ | 178,624 | | | $ | - | | | $ | - | | | $ | 178,624 | |
Total Other Financial Instruments | | $ | 178,624 | | | $ | - | | | $ | - | | | $ | 178,624 | | | | | | | $ | - | | | $ | - | | | $ | - | | | $ | - | | | | | | | $ | 178,624 | | | $ | - | | | $ | - | | | $ | 178,624 | |
| | | | | | | | | | | | | | | | | | | | | | | | | | | | | | | | | | | | | | | | | | | | | | | | | | | | | | | | |
Liabilities | | | | | | | | | | | | | | | | | | | | | | | | | | | | | | | | | | | | | | | | | | | | | | | | | | | | | | | | |
Other Financial Instruments | | | | | | | | | | | | | | | | | | | | | | | | | | | | | | | | | | | | | | | | | | | | | | | | | | | | | | | | |
Centrally Cleared Swap Agreements: | | $ | - | | | $ | (258,098 | ) | | $ | - | | | $ | (258,098 | ) | | | | | | $ | - | | | $ | - | | | $ | - | | | $ | - | | | | | | | $ | - | | | $ | (258,098 | ) | | $ | - | | | $ | (258,098 | ) |
Futures Contracts | | | (26,593 | ) | | | - | | | | - | | | | (26,593 | ) | | | | | | | - | | | | - | | | | - | | | | - | | | | | | | | (26,593 | ) | | | - | | | | - | | | | (26,593 | ) |
Total Other Financial Instruments | | $ | (26,593 | ) | | $ | (258,098 | ) | | $ | - | | | $ | (284,691 | ) | | | | | | $ | - | | | $ | - | | | $ | - | | | $ | - | | | | | | | $ | (26,593 | ) | | $ | (258,098 | ) | | $ | - | | | $ | (284,691 | ) |
(a)-(i) See Note 2 of the Notes to the Pro Forma Financial Statements.
As of June 30, 2016, all securities held by the Target Portfolio would comply with the investment restrictions of the Destination Portfolio.
41
Reorganization Between Voya Limited Maturity VP and JPMorgan Core Bond VP
PRO FORMA STATEMENT OF ASSETS AND LIABILITIES
At June 30, 2016
| | | | | | | | | | | | | | | | | | | | | | | | | | | | | | | | |
| | | | | Voya Limited
Maturity VP | | | | | | | JPMorgan Core
Bond VP | | | | | | | Adjustments | | | | | | | Combined Pro
Forma
Portfolio | | | |
Assets: | | | | | | | | | | | | | | | | | | | | | | | | | | | | | | | | |
Investments, at value | | $ | | | 87,846,016 | | | | | $ | | | 751,547,694 | | | | | $ | | | - | | | | | $ | | | 839,393,710 | | | |
Repurchase agreements, at value | | | | | 1,461,855 | | | | | | | | 33,858,541 | | | | | | | | - | | | | | | | | 35,320,396 | | | |
Cash on deposit with broker | | | | | 277,000 | | | | | | | | - | | | | | | | | - | | | | | | | | 277,000 | | | |
Cash | | | | | - | | | | | | | | 591,738 | | | | | | | | - | | | | | | | | 591,738 | | | |
Receivables: | | | | | | | | | | | | | | | | | | | | | - | | | | | | | | - | | | |
Shares sold | | | | | - | | | | | | | | 58,637 | | | | | | | | - | | | | | | | | 58,637 | | | |
Investments sold | | | | | 1,095,328 | | | | | | | | 367,631 | | | | | | | | - | | | | | | | | 1,462,959 | | | |
Interest | | | | | 354,041 | | | | | | | | 2,792,120 | | | | | | | | - | | | | | | | | 3,146,161 | | | |
Dividends | | | | | - | | | | | | | | - | | | | | | | | - | | | | | | | | - | | | |
Tax reclaims | | | | | 480 | | | | | | | | 138 | | | | | | | | - | | | | | | | | 618 | | | |
Net income from securities lending | | | | | 1,661 | | | | | | | | 7,760 | | | | | | | | - | | | | | | | | 9,421 | | | |
Variation margin receivable | | | | | 6,570 | | | | | | | | - | | | | | | | | - | | | | | | | | 6,570 | | | |
Prepaid Expenses | | | | | 405 | | | | | | | | 3,329 | | | | | | | | - | | | | | | | | 3,734 | | | |
| | | | | | | | | | | | | | | | | | | | |
Total assets | | $ | | | 91,043,356 | | | | | $ | | | 789,227,588 | | | | | $ | | | - | | | | | $ | | | 880,270,944 | | | |
| | | | | | | | | | | | | | | | | | | | |
| | | | | | | | | | | | | | | | | | | | | | | | | | | | | | | | |
Liabilities: | | | | | | | | | | | | | | | | | | | | | | | | | | | | | | | | |
Accounts payable and accrued liabilities: | | | | | | | | | | | | | | | | | | | | | | | | | | | | | | | | |
Shares redeemed | | | | | 2 | | | | | | | | 42,402 | | | | | | | | - | | | | | | | | 42,404 | | | |
Investments purchased | | | | | 1,282,066 | | | | | | | | 1,552,707 | | | | | | | | - | | | | | | | | 2,834,773 | | | |
When-issued, delayed-delivery, and forward commitment securities purchased | | | | | 309,692 | | | | | | | | 4,154,263 | | | | | | | | - | | | | | | | | 4,463,955 | | | |
Investment management fees | | | | | 37,516 | | | | | | | | 291,952 | | | | | | | | - | | | | | | | | 329,468 | | | |
Distribution and service fees | | | | | 154 | | | | | | | | 50,159 | | | | | | | | - | | | | | | | | 50,313 | | | |
Transfer agent fees | | | | | 212 | | | | | | | | 1,525 | | | | | | | | - | | | | | | | | 1,737 | | | |
Trustees, CCO and deferred compensation fees | | | | | 211 | | | | | | | | 1,311 | | | | | | | | - | | | | | | | | 1,522 | | | |
Audit and tax fees | | | | | 8,263 | | | | | | | | 14,779 | | | | | | | | - | | | | | | | | 23,042 | | | |
Custody fees | | | | | 16,892 | | | | | | | | 83,569 | | | | | | | | - | | | | | | | | 100,461 | | | |
Legal fees | | | | | 2,050 | | | | | | | | 15,157 | | | | | | | | - | | | | | | | | 17,207 | | | |
Printing and shareholder reports fees | | | | | 617 | | | | | | | | 79,061 | | | | | | | | - | | | | | | | | 79,678 | | | |
Registration fees | | | | | - | | | | | | | | - | | | | | | | | - | | | | | | | | - | | | |
Distribution payable to shareholders | | | | | - | | | | | | | | - | | | | | | | | - | | | | | | | | - | | | |
Other | | | | | 933 | | | | | | | | 7,026 | | | | | | | | 40,000 | | | (a) | | | | | 47,959 | | | |
Collateral for securities on loan | | | | | 3,325,155 | | | | | | | | 31,670,629 | | | | | | | | - | | | | | | | | 34,995,784 | | | |
| | | | | | | | | | | | | | | | | | | | |
Total liabilities | | | | | 4,983,763 | | | | | | | | 37,964,540 | | | | | | | | 40,000 | | | | | | | | 42,988,303 | | | |
| | | | | | | | | | | | | | | | | | | | |
Net Assets | | $ | | | 86,059,593 | | | | | $ | | | 751,263,048 | | | | | $ | | | (40,000 | ) | | | | $ | | | 837,282,641 | | | |
| | | | | | | | | | | | | | | | | | | | |
| | | | | | | | | | | | | | | | | | | | | | | | | | | | | | | | |
Net Assets Consist of: | | | | | | | | | | | | | | | | | | | | | | | | | | | | | | | | |
Capital stock ($0.01 par value) | | $ | | | 84,871 | | | | | $ | | | 546,171 | | | | | $ | | | (21,062 | ) | | (b) | | $ | | | 609,980 | | | |
Additional paidin capital | | | | | 84,702,802 | | | | | | | | 699,433,916 | | | | | | | | 902,063 | | | (b) | | | | | 785,038,781 | | | |
Undistributed (distributions in excess of) net investment income (loss) | | | | | 1,411,326 | | | | | | | | 22,773,976 | | | | | | | | (1,411,326 | ) | | (b) | | | | | 22,773,976 | | | |
Accumulated net realized gain (loss) | | | | | (490,325 | ) | | | | | | | (3,374,849 | ) | | | | | | | 490,325 | | | (b) | | | | | (3,374,849 | ) | | |
Net unrealized appreciation (depreciation) on: | | | | | | | | | | | | | | | | | | | | | | | | | | | | | | | | |
Investments | | | | | 456,986 | | | | | | | | 31,883,834 | | | | | | | | - | | | | | | | | 32,340,820 | | | |
Swap agreements | | | | | (258,098 | ) | | | | | | | - | | | | | | | | - | | | | | | | | (258,098 | ) | | |
Futures contracts | | | | | 152,031 | | | | | | | | - | | | | | | | | - | | | | | | | | 152,031 | | | |
Translation of assets and liabilities denominated in foreign currencies | | | | | - | | | | | | | | - | | | | | | | | - | | | | | | | | - | | | |
| | | | | | | | | | | | | | | | | | | | |
| | | | | | | | | | | | | | | | | | | | | | | | | | | | | | | | |
Net Assets | | $ | | | 86,059,593 | | | | | $ | | | 751,263,048 | | | | | $ | | | (40,000 | ) | | | | $ | | | 837,282,641 | | | |
| | | | | | | | | | | | | | | | | | | | |
| | | | | | | | | | | | | | | | | | | | | | | | | | | | | | | | |
Net assets by class: | | | | | | | | | | | | | | | | | | | | | | | | | | | | | | | | |
Initial Class | | $ | | | 85,305,899 | | | | | $ | | | 501,292,829 | | | | | $ | | | (26,691 | ) | | (a) | | $ | | | 586,572,037 | | | |
Service Class | | | | | 753,694 | | | | | | | | 249,970,219 | | | | | | | | (13,309 | ) | | (a) | | | | | 250,710,604 | | | |
Shares outstanding (unlimited shares, no par value): | | | | | | | | | | | | | | | | | | | | | | | | | | | | | | | | |
Initial Class | | | | | 8,412,414 | | | | | | | | 37,179,193 | | | | | | | | (2,084,083 | ) | | (c) | | | | | 43,507,524 | | | |
Service Class | | | | | 74,696 | | | | | | | | 17,437,859 | | | | | | | | (22,100 | ) | | (c) | | | | | 17,490,455 | | | |
Net asset value per share: | | | | | | | | | | | | | | | | | | | | | | | | | | | | | | | | |
Initial Class | | $ | | | 10.14 | | | | | $ | | | 13.48 | | | | | $ | | | (10.14 | ) | | (d) | | $ | | | 13.48 | | | |
Service Class | | | | | 10.09 | | | | | | | | 14.33 | | | | | | | | (10.09 | ) | | (d) | | | | | 14.33 | | | |
| | | | | | | | | | | | | | | | | | | | | | | | | | | | | | | | |
| | | | | | | | | | | | | | | | | | | | |
Investments, at cost | | $ | | | 87,389,030 | | | | | $ | | | 719,663,860 | | | | | | | | - | | | | | $ | | | 807,052,890 | | | |
Securities loaned, at value | | | | | 3,257,190 | | | | | | | | 31,022,818 | | | | | | | | - | | | | | | | | 34,280,008 | | | |
Repurchase agreements, at cost | | | | | 1,461,855 | | | | | | | | 33,858,541 | | | | | | | | - | | | | | | | | 35,320,396 | | | |
(a)-(i) See Note 2 of the Notes to the Pro Forma Financial Statements.
THE NOTES TO THE PRO FORMA FINANCIAL STATEMENTS ARE AN INTEGRAL PART OF THIS REPORT.
Information Classification: Limited Access
42
Reorganization Between Voya Limited Maturity VP and JPMorgan Core Bond VP
PRO FORMA STATEMENT OF OPERATIONS
For the twelve-month period ended June 30, 2016
| | | | | | | | | | | | | | | | | | | | | | | | | | |
| | | Voya Limited
Maturity VP | | | | | JPMorgan
Core Bond VP | | | | | Adjustments | | | | | Combined Pro
Forma Portfolio | | | | |
Investment Income: | | | | | | | | | | | | | | | | | | | | | | | | | | |
Dividend income | | $ | - | | | | | $ | - | | | | | $ | - | | | | | $ | - | | | | | |
Interest income | | | 1,419,927 | | | | | | 18,910,627 | | | | | | - | | | | | | 20,330,554 | | | | | |
Net income (loss) from securities lending | | | 21,410 | | | | | | 46,619 | | | | | | - | | | | | | 68,029 | | | | | |
Withholding taxes on foreign income | | | - | | | | | | - | | | | | | | | | | | | - | | | | | |
| | | | | | | | | | | | | | | | | | | | | | | | | | |
Total investment income | | | 1,441,337 | | | | | | 18,957,246 | | | | | | - | | | | | | 20,398,583 | | | | | |
| | | | | | | | | | | | | | | | | | | | | | | | | | |
| | | | | | | | |
Expenses: | | | | | | | | | | | | | | | | | | | | | | | | | | |
Investment advisory fees | | | 293,786 | | | | | | 2,033,809 | | | | | | 89,079 | | | (e) | | | 2,416,674 | | | | | |
Investment management fees | | | 154,249 | | | | | | 1,159,639 | | | | | | - | | | | | | 1,313,888 | | | | | |
Distribution and service fees: | | | | | | | | | | | | | | | | | | | | | | | | | | |
Service Class | | | 1,867 | | | | | | 518,997 | | | | | | (661 | ) | | (f) | | | 520,203 | | | | | |
Administration fees | | | 17,254 | | | | | | 132,744 | | | | | | (149,998 | ) | | (g) | | | - | | | | | |
Transfer agent fees | | | 1,233 | | | | | | 9,870 | | | | | | - | | | | | | 11,103 | | | | | |
Trustees, CCO and deferred compensation fees | | | 2,188 | | | | | | 17,475 | | | | | | - | | | | | | 19,663 | | | | | |
Audit and tax fees | | | 15,197 | | | | | | 25,328 | | | | | | (14,342 | ) | | (h) | | | 26,183 | | | | | |
Custody fees | | | 66,834 | | | | | | 260,133 | | | | | | (60,254 | ) | | (i) | | | 266,713 | | | | | |
Legal fees | | | 5,118 | | | | | | 43,457 | | | | | | - | | | | | | 48,575 | | | | | |
Printing and shareholder reports fees | | | 382 | | | | | | 72,330 | | | | | | - | | | | | | 72,712 | | | | | |
Registration fees | | | - | | | | | | - | | | | | | - | | | | | | - | | | | | |
Other | | | 2,663 | | | | | | 20,238 | | | | | | - | | | | | | 22,901 | | | | | |
| | | | | | | | | | | | | | | | | | | | | | | | | | |
Total expenses before waiver and/or reimbursment and recapture | | | 560,771 | | | | | | 4,294,020 | | | | | | (136,176 | ) | | | | | 4,718,615 | | | | | |
Expenses waived and/or reimbursed: | | | | | | | | | | | | | | | | | | | | | | | | | | |
Fund level | | | - | | | | | | - | | | | | | - | | | | | | - | | | | | |
Initial Class | | | - | | | | | | - | | | | | | - | | | | | | - | | | | | |
Service Class | | | - | | | | | | - | | | | | | - | | | | | | - | | | | | |
Recapture of previously waived and/or reimbursed fees: | | | | | | | | | | | | | | | | | | | | | | | | | | |
Fund level | | | - | | | | | | - | | | | | | - | | | | | | - | | | | | |
Initial Class | | | - | | | | | | - | | | | | | - | | | | | | - | | | | | |
Service Class | | | - | | | | | | - | | | | | | - | | | | | | - | | | | | |
| | | | | | | | | | | | | | | | | | | | | | | | | | |
Net expenses | | | 560,771 | | | | | | 4,294,020 | | | | | | (136,176 | ) | | | | | 4,718,615 | | | | | |
| | | | | | | | | | | | | | | | | | | | | | | | | | |
| | | | | | | | |
Net investment income (loss) | | | 880,566 | | | | | | 14,663,226 | | | | | | 136,176 | | | | | | 15,679,968 | | | | | |
| | | | | | | | | | | | | | | | | | | | | | | | | | |
| | | | | | | | |
Net realized gain (loss) on: | | | | | | | | | | | | | | | | | | | | | | | | | | |
Investments | | | (197,932 | ) | | | | | 728,203 | | | | | | - | | | | | | 530,271 | | | | | |
Swap agreements | | | (34,532 | ) | | | | | - | | | | | | | | | | | | (34,532 | ) | | | | |
Futures contracts | | | (48,505 | ) | | | | | - | | | | | | | | | | | | (48,505 | ) | | | | |
Foreign currency transactions | | | (100 | ) | | | | | - | | | | | | - | | | | | | (100 | ) | | | | |
| | | | | | | | | | | | | | | | | | | | | | | | | | |
Net realized gain (loss) | | | (281,069 | ) | | | | | 728,203 | | | | | | - | | | | | | 447,134 | | | | | |
| | | | | | | | | | | | | | | | | | | | | | | | | | |
| | | | | | | | |
Net change in unrealized appreciation (depreciation) on: | | | | | | | | | | | | | | | | | | | | | | | | | | |
Investments | | | 652,745 | | | | | | 21,893,842 | | | | | | - | | | | | | 22,546,587 | | | | | |
Swap agreements | | | (258,098 | ) | | | | | - | | | | | | | | | | | | (258,098 | ) | | | | |
Futures contracts | | | 124,711 | | | | | | - | | | | | | | | | | | | 124,711 | | | | | |
Translation of assets and liabilities denominated in foreign cuurencies | | | - | | | | | | - | | | | | | - | | | | | | - | | | | | |
| | | | | | | | | | | | | | | | | | | | | | | | | | |
| | | | | | | | |
Net change in unrealized appreciation (depreciation) | | | 519,358 | | | | | | 21,893,842 | | | | | | - | | | | | | 22,413,200 | | | | | |
| | | | | | | | | | | | | | | | | | | | | | | | | | |
| | | | | | | | |
Net realized and change in unrealized gain (loss) | | | 238,289 | | | | | | 22,622,045 | | | | | | - | | | | | | 22,860,334 | | | | | |
| | | | | | | | | | | | | | | | | | | | | | | | | | |
| | | | | | | | |
Net increase in net assets resulting from operations | | $ | 1,118,855 | | | | | $ | 37,285,271 | | | | | $ | 136,176 | | | | | $ | 38,540,302 | | | | | |
| | | | | | | | | | | | | | | | | | | | | | | | | | |
(a)-(i) See Note 2 of the Notes to the Pro Forma Financial Statements.
THE NOTES TO THE PRO FORMA FINANCIAL STATEMENTS ARE AN INTEGRAL PART OF THIS REPORT.
Information Classification: Limited Access
43
Reorganization Between Voya Mid Cap Opportunities VP and Janus Mid-Cap Growth VP
PRO FORMA SCHEDULE OF INVESTMENTS
At June 30, 2016
| | | | | | | | | | | | | | | | | | | | | | | | | | | | | | | | | | | | | | | | | | | | | | | | | | | | |
| | | | | | | | | Voya Mid Cap
Opportunities VP | | | | | | Janus Mid-Cap Growth VP | | | | | | Adjustments | | | | | | Combined Pro Forma
Portfolio | |
| | | | | | | | | | | | | |
| | | Coupon
Rate | | | Maturity
Date | | | Shares | | | Value | | | | | | Shares | | | Value | | | | | | Shares | | | Value | | | | | | Shares | | | Value | |
| | | | | | | | | | | | | | | | | | | | | | | | | | | | | | | | |
Common Stocks - 98.5 % | | | | | | | | | | | | | | | | | | | | | | | | | | | | | | | | | | | | | | | | | | | | | | | | | | | | |
Aerospace & Defense | | | | | | | | | | | | | | | | | | | | | | | | | | | | | | | | | | | | | | | | | | | | | | | | | | | | |
Orbital ATK, Inc. | | | | | | | | | | | 31,031 | | | $ | 2,641,979 | | | | | | | | - | | | $ | - | | | | | | | | | | | | | | | | | | | | 31,031 | | | $ | 2,641,979 | |
Teledyne Technologies, Inc. | | | | | | | | | | | - | | | | - | | | | | | | | 68,000 | | | | 6,735,400 | | | | | | | | | | | | | | | | | | | | 68,000 | | | | 6,735,400 | |
Textron, Inc. | | | | | | | | | | | 51,761 | | | | 1,892,382 | | | | | | | | - | | | | - | | | | | | | | | | | | | | | | | | | | 51,761 | | | | 1,892,382 | |
TransDigm Group, Inc. | | | | | | | | | | | - | | | | - | | | | | | | | 11,718 | | | | 3,089,919 | | | | | | | | | | | | | | | | | | | | 11,718 | | | | 3,089,919 | |
Air Freight & Logistics | | | | | | | | | | | | | | | | | | | | | | | | | | | | | | | | | | | | | | | | | | | | | | | | | | | | |
Expeditors International of Washington, Inc. | | | | | | | | | | | - | | | | - | | | | | | | | 170,343 | | | | 8,353,621 | | | | | | | | | | | | | | | | | | | | 170,343 | | | | 8,353,621 | |
Airlines | | | | | | | | | | | | | | | | | | | | | | | | | | | | | | | | | | | | | | | | | | | | | | | | | | | | |
Ryanair Holdings PLC | | | | | | | | | | | - | | | | - | | | | | | | | 59,171 | | | | 4,114,751 | | | | | | | | | | | | | | | | | | | | 59,171 | | | | 4,114,751 | |
Southwest Airlines Co. | | | | | | | | | | | 52,714 | | | | 2,066,916 | | | | | | | | - | | | | - | | | | | | | | | | | | | | | | | | | | 52,714 | | | | 2,066,916 | |
Auto Components | | | | | | | | | | | | | | | | | | | | | | | | | | | | | | | | | | | | | | | | | | | | | | | | | | | | |
Lear Corp. | | | | | | | | | | | 13,597 | | | | 1,383,631 | | | | | | | | - | | | | - | | | | | | | | | | | | | | | | | | | | 13,597 | | | | 1,383,631 | |
Beverages | | | | | | | | | | | | | | | | | | | | | | | | | | | | | | | | | | | | | | | | | | | | | | | | | | | | |
Monster Beverage Corp. | | | | | | | | | | | 16,143 | | | | 2,594,342 | | | | | | | | - | | | | - | | | | | | | | | | | | | | | | | | | | 16,143 | | | | 2,594,342 | |
Biotechnology | | | | | | | | | | | | | | | | | | | | | | | | | | | | | | | | | | | | | | | | | | | | | | | | | | | | |
AbbVie, Inc. | | | | | | | | | | | - | | | | - | | | | | | | | 68,300 | | | | 4,228,453 | | | | | | | | | | | | | | | | | | | | 68,300 | | | | 4,228,453 | |
BioMarin Pharmaceutical, Inc. | | | | | | | | | | | 30,552 | | | | 2,376,946 | | | | | | | | - | | | | - | | | | | | | | | | | | | | | | | | | | 30,552 | | | | 2,376,946 | |
Celgene Corp. | | | | | | | | | | | - | | | | - | | | | | | | | 72,100 | | | | 7,111,223 | | | | | | | | | | | | | | | | | | | | 72,100 | | | | 7,111,223 | |
DBV Technologies SA | | | | | | | | | | | - | | | | - | | | | | | | | 48,200 | | | | 1,572,284 | | | | | | | | | | | | | | | | | | | | 48,200 | | | | 1,572,284 | |
Medivation, Inc. | | | | | | | | | | | - | | | | - | | | | | | | | 112,800 | | | | 6,801,840 | | | | | | | | | | | | | | | | | | | | 112,800 | | | | 6,801,840 | |
Building Products | | | | | | | | | | | | | | | | | | | | | | | | | | | | | | | | | | | | | | | | | | | | | | | | | | | | |
A.O. Smith Corp. | | | | | | | | | | | - | | | | - | | | | | | | | 63,700 | | | | 5,612,607 | | | | | | | | | | | | | | | | | | | | 63,700 | | | | 5,612,607 | |
Allegion PLC | | | | | | | | | | | - | | | | - | | | | | | | | 49,472 | | | | 3,434,841 | | | | | | | | | | | | | | | | | | | | 49,472 | | | | 3,434,841 | |
Masco Corp. | | | | | | | | | | | 95,104 | | | | 2,942,518 | | | | | | | | - | | | | - | | | | | | | | | | | | | | | | | | | | 95,104 | | | | 2,942,518 | |
Capital Markets | | | | | | | | | | | | | | | | | | | | | | | | | | | | | | | | | | | | | | | | | | | | | | | | | | | | |
Affiliated Managers Group, Inc. | | | | | | | | | | | 14,880 | | | | 2,094,658 | | | | | | | | - | | | | - | | | | | | | | | | | | | | | | | | | | 14,880 | | | | 2,094,658 | |
LPL Financial Holdings, Inc. | | | | | | | | | | | - | | | | - | | | | | | | | 226,400 | | | | 5,100,792 | | | | | | | | | | | | | | | | | | | | 226,400 | | | | 5,100,792 | |
TD Ameritrade Holding Corp. | | | | | | | | | | | 94,843 | | | | 2,700,654 | | | | | | | | 248,506 | | | | 7,076,208 | | | | | | | | | | | | | | | | | | | | 343,349 | | | | 9,776,862 | |
Chemicals | | | | | | | | | | | | | | | | | | | | | | | | | | | | | | | | | | | | | | | | | | | | | | | | | | | | |
Eastman Chemical Co. | | | | | | | | | | | 42,524 | | | | 2,887,380 | | | | | | | | - | | | | - | | | | | | | | | | | | | | | | | | | | 42,524 | | | | 2,887,380 | |
Potash Corp. of Saskatchewan, Inc. | | | | | | | | | | | - | | | | - | | | | | | | | 134,100 | | | | 2,177,784 | | | | | | | | | | | | | | | | | | | | 134,100 | | | | 2,177,784 | |
Commercial Services & Supplies | | | | | | | | | | | | | | | | | | | | | | | | | | | | | | | | | | | | | | | | | | | | | | | | | | | | |
Edenred | | | | | | | | | | | - | | | | - | | | | | | | | 191,381 | | | | 3,918,736 | | | | | | | | | | | | | | | | | | | | 191,381 | | | | 3,918,736 | |
Ritchie Bros Auctioneers, Inc. | | | | | | | | | | | - | | | | - | | | | | | | | 252,100 | | | | 8,515,938 | | | | | | | | | | | | | | | | | | | | 252,100 | | | | 8,515,938 | |
Waste Connections, Inc. | | | | | | | | | | | 38,038 | | | | 2,740,638 | | | | | | | | - | | | | - | | | | | | | | | | | | | | | | | | | | 38,038 | | | | 2,740,638 | |
Containers & Packaging | | | | | | | | | | | | | | | | | | | | | | | | | | | | | | | | | | | | | | | | | | | | | | | | | | | | |
Crown Holdings, Inc. | | | | | | | | | | | 65,096 | | | | 3,298,414 | | | | | | | | - | | | | - | | | | | | | | | | | | | | | | | | | | 65,096 | | | | 3,298,414 | |
Packaging Corp. of America | | | | | | | | | | | 46,336 | | | | 3,101,268 | | | | | | | | - | | | | - | | | | | | | | | | | | | | | | | | | | 46,336 | | | | 3,101,268 | |
Sealed Air Corp. | | | | | | | | | | | 57,782 | | | | 2,656,239 | | | | | | | | 116,383 | | | | 5,350,127 | | | | | | | | | | | | | | | | | | | | 174,165 | | | | 8,006,366 | |
Distributors | | | | | | | | | | | | | | | | | | | | | | | | | | | | | | | | | | | | | | | | | | | | | | | | | | | | |
LKQ Corp. | | | | | | | | | | | 100,541 | | | | 3,187,150 | | | | | | | | - | | | | - | | | | | | | | | | | | | | | | | | | | 100,541 | | | | 3,187,150 | |
Diversified Consumer Services | | | | | | | | | | | | | | | | | | | | | | | | | | | | | | | | | | | | | | | | | | | | | | | | | | | | |
ServiceMaster Global Holdings, Inc. | | | | | | | | | | | - | | | | - | | | | | | | | 153,000 | | | | 6,089,400 | | | | | | | | | | | | | | | | | | | | 153,000 | | | | 6,089,400 | |
Diversified Financial Services | | | | | | | | | | | | | | | | | | | | | | | | | | | | | | | | | | | | | | | | | | | | | | | | | | | | |
FactSet Research Systems, Inc. | | | | | | | | | | | - | | | | - | | | | | | | | 22,200 | | | | 3,583,524 | | | | | | | | | | | | | | | | | | | | 22,200 | | | | 3,583,524 | |
Markit, Ltd. | | | | | | | | | | | - | | | | - | | | | | | | | 200,900 | | | | 6,549,340 | | | | | | | | | | | | | | | | | | | | 200,900 | | | | 6,549,340 | |
Moody’s Corp. | | | | | | | | | | | 38,180 | | | | 3,577,848 | | | | | | | | - | | | | - | | | | | | | | | | | | | | | | | | | | 38,180 | | | | 3,577,848 | |
MSCI, Inc. | | | | | | | | | | | - | | | | - | | | | | | | | 125,900 | | | | 9,709,408 | | | | | | | | | | | | | | | | | | | | 125,900 | | | | 9,709,408 | |
Electrical Equipment | | | | | | | | | | | | | | | | | | | | | | | | | | | | | | | | | | | | | | | | | | | | | | | | | | | | |
AMETEK, Inc. | | | | | | | | | | | - | | | | - | | | | | | | | 82,500 | | | | 3,813,975 | | | | | | | | | | | | | | | | | | | | 82,500 | | | | 3,813,975 | |
Sensata Technologies Holding NV | | | | | | | | | | | - | | | | - | | | | | | | | 385,191 | | | | 13,439,314 | | | | | | | | | | | | | | | | | | | | 385,191 | | | | 13,439,314 | |
44
| | | | | | | | | | | | | | | | | | | | | | | | | | | | | | | | | | | | | | | | | | | | | | | | | | | | |
| | | | | | | | | Voya Mid Cap
Opportunities VP | | | | | | Janus Mid-Cap
Growth VP | | | | | | Adjustments | | | | | | Combined Pro
Forma Portfolio | |
| | | | | | | | | | | | | |
| | | Coupon
Rate | | | Maturity
Date | | | Shares | | | Value | | | | | | Shares | | | Value | | | | | | Shares | | | Value | | | | | | Shares | | | Value | |
| | | | | | | | | | | | | | | | | | | | | | | | | | | | | | | | |
Electronic Equipment, Instruments & Components | | | | | | | | | | | | | | | | | | | | | | | | | | | | | | | | | | | | | | | | | | | | | | | | | | | | |
Amphenol Corp. | | | | | | | | | | | 56,700 | | | $ | 3,250,611 | | | | | | | | 96,400 | | | $ | 5,526,612 | | | | | | | | | | | | | | | | | | | | 153,100 | | | $ | 8,777,223 | |
Belden, Inc. | | | | | | | | | | | - | | | | - | | | | | | | | 82,200 | | | | 4,962,414 | | | | | | | | | | | | | | | | | | | | 82,200 | | | | 4,962,414 | |
Flextronics International, Ltd. | | | | | | | | | | | - | | | | - | | | | | | | | 452,014 | | | | 5,333,765 | | | | | | | | | | | | | | | | | | | | 452,014 | | | | 5,333,765 | |
FLIR Systems, Inc. | | | | | | | | | | | - | | | | - | | | | | | | | - | | | | - | | | | | | | | | | | | | | | | | | | | - | | | | - | |
National Instruments Corp. | | | | | | | | | | | 33,060 | | | | 1,023,207 | | | | | | | | 226,591 | | | | 6,208,594 | | | | | | | | | | | | | | | | | | | | 259,651 | | | | 7,231,801 | |
TE Connectivity, Ltd. | | | | | | | | | | | - | | | | - | | | | | | | | 145,000 | | | | 8,280,950 | | | | | | | | | | | | | | | | | | | | 145,000 | | | | 8,280,950 | |
Food Products | | | | | | | | | | | | | | | | | | | | | | | | | | | | | | | | | | | | | | | | | | | | | | | | | | | | |
Mead Johnson Nutrition Co. | | | | | | | | | | | 51,031 | | | | 4,631,063 | | | | | | | | 69,337 | | | | 6,292,333 | | | | | | | | | | | | | | | | | | | | 120,368 | | | | 10,923,396 | |
TreeHouse Foods, Inc. | | | | | | | | | | | 33,989 | | | | 3,488,971 | | | | | | | | - | | | | - | | | | | | | | | | | | | | | | | | | | 33,989 | | | | 3,488,971 | |
Health Care Equipment & Supplies | | | | | | | | | | | | | | | | | | | | | | | | | | | | | | | | | | | | | | | | | | | | | | | | | | | | |
ABIOMED, Inc. | | | | | | | | | | | 10,120 | | | | 1,106,015 | | | | | | | | - | | | | - | | | | | | | | | | | | | | | | | | | | 10,120 | | | | 1,106,015 | |
Boston Scientific Corp. | | | | | | | | | | | - | | | | - | | | | | | | | 584,100 | | | | 13,650,417 | | | | | | | | | | | | | | | | | | | | 584,100 | | | | 13,650,417 | |
DexCom, Inc. | | | | | | | | | | | - | | | | - | | | | | | | | 34,222 | | | | 2,714,831 | | | | | | | | | | | | | | | | | | | | 34,222 | | | | 2,714,831 | |
Edwards Lifesciences Corp. | | | | | | | | | | | 42,970 | | | | 4,285,398 | | | | | | | | - | | | | - | | | | | | | | | | | | | | | | | | | | 42,970 | | | | 4,285,398 | |
Hologic, Inc. | | | | | | | | | | | 97,427 | | | | 3,370,974 | | | | | | | | - | | | | - | | | | | | | | | | | | | | | | | | | | 97,427 | | | | 3,370,974 | |
Intuitive Surgical, Inc. | | | | | | | | | | | 6,787 | | | | 4,488,990 | | | | | | | | - | | | | - | | | | | | | | | | | | | | | | | | | | 6,787 | | | | 4,488,990 | |
Masimo Corp. | | | | | | | | | | | - | | | | - | | | | | | | | 38,820 | | | | 2,038,632 | | | | | | | | | | | | | | | | | | | | 38,820 | | | | 2,038,632 | |
Nevro Corp. | | | | | | | | | | | 14,187 | | | | 1,046,433 | | | | | | | | - | | | | - | | | | | | | | | | | | | | | | | | | | 14,187 | | | | 1,046,433 | |
NuVasive, Inc. | | | | | | | | | | | 42,436 | | | | 2,534,278 | | | | | | | | - | | | | - | | | | | | | | | | | | | | | | | | | | 42,436 | | | | 2,534,278 | |
STERIS PLC | | | | | | | | | | | - | | | | - | | | | | | | | 69,969 | | | | 4,810,369 | | | | | | | | | | | | | | | | | | | | 69,969 | | | | 4,810,369 | |
Teleflex, Inc. | | | | | | | | | | | - | | | | - | | | | | | | | 55,968 | | | | 9,923,686 | | | | | | | | | | | | | | | | | | | | 55,968 | | | | 9,923,686 | |
Varian Medical Systems, Inc. | | | | | | | | | | | - | | | | - | | | | | | | | 149,800 | | | | 12,318,054 | | | | | | | | | | | | | | | | | | | | 149,800 | | | | 12,318,054 | |
Health Care Providers & Services | | | | | | | | | | | | | | | | | | | | | | | | | | | | | | | | | | | | | | | | | | | | | | | | | | | | |
Laboratory Corp. of America Holdings | | | | | | | | | | | 15,910 | | | | 2,072,595 | | | | | | | | - | | | | - | | | | | | | | | | | | | | | | | | | | 15,910 | | | | 2,072,595 | |
Henry Schein, Inc. | | | | | | | | | | | - | | | | - | | | | | | | | 56,700 | | | | 10,024,560 | | | | | | | | | | | | | | | | | | | | 56,700 | | | | 10,024,560 | |
VCA, Inc. | | | | | | | | | | | 37,280 | | | | 2,520,501 | | | | | | | | - | | | | - | | | | | | | | | | | | | | | | | | | | 37,280 | | | | 2,520,501 | |
Health Care Technology | | | | | | | | | | | | | | | | | | | | | | | | | | | | | | | | | | | | | | | | | | | | | | | | | | | | |
athenahealth, Inc. | | | | | | | | | | | - | | | | - | | | | | | | | 73,902 | | | | 10,199,215 | | | | | | | | | | | | | | | | | | | | 73,902 | | | | 10,199,215 | |
IMS Health Holdings, Inc. | | | | | | | | | | | - | | | | - | | | | | | | | 140,846 | | | | 3,571,855 | | | | | | | | | | | | | | | | | | | | 140,846 | | | | 3,571,855 | |
Hotels, Restaurants & Leisure | | | | | | | | | | | | | | | | | | | | | | | | | | | | | | | | | | | | | | | | | | | | | | | | | | | | |
Aramark | | | | | | | | | | | - | | | | - | | | | | | | | 97,400 | | | | 3,255,108 | | | | | | | | | | | | | | | | | | | | 97,400 | | | | 3,255,108 | |
Domino’s Pizza, Inc. | | | | | | | | | | | 22,949 | | | | 3,015,040 | | | | | | | | - | | | | - | | | | | | | | | | | | | | | | | | | | 22,949 | | | | 3,015,040 | |
Dunkin’ Brands Group, Inc. | | | | | | | | | | | - | | | | - | | | | | | | | 185,400 | | | | 8,087,148 | | | | | | | | | | | | | | | | | | | | 185,400 | | | | 8,087,148 | |
Marriott International, Inc. | | | | | | | | | | | 22,014 | | | | 1,463,050 | | | | | | | | - | | | | - | | | | | | | | | | | | | | | | | | | | 22,014 | | | | 1,463,050 | |
Household Products | | | | | | | | | | | | | | | | | | | | | | | | | | | | | | | | | | | | | | | | | | | | | | | | | | | | |
Church & Dwight Co., Inc. | | | | | | | | | | | 42,017 | | | | 4,323,129 | | | | | | | | - | | | | - | | | | | | | | | | | | | | | | | | | | 42,017 | | | | 4,323,129 | |
Industrial Conglomerates | | | | | | | | | | | | | | | | | | | | | | | | | | | | | | | | | | | | | | | | | | | | | | | | | | | | |
Roper Technologies, Inc. | | | | | | | | | | | 12,711 | | | | 2,167,988 | | | | | | | | 29,100 | | | | 4,963,296 | | | | | | | | | | | | | | | | | | | | 41,811 | | | | 7,131,284 | |
Insurance | | | | | | | | | | | | | | | | | | | | | | | | | | | | | | | | | | | | | | | | | | | | | | | | | | | | |
Aon PLC | | | | | | | | | | | 19,068 | | | | 2,082,798 | | | | | | | | 98,600 | | | | 10,770,078 | | | | | | | | | | | | | | | | | | | | 117,668 | | | | 12,852,876 | |
Arthur J. Gallagher & Co. | | | | | | | | | | | 65,730 | | | | 3,128,748 | | | | | | | | - | | | | - | | | | | | | | | | | | | | | | | | | | 65,730 | | | | 3,128,748 | |
Internet Software & Services | | | | | | | | | | | | | | | | | | | | | | | | | | | | | | | | | | | | | | | | | | | | | | | | | | | | |
Cimpress NV | | | | | | | | | | | - | | | | - | | | | | | | | 77,700 | | | | 7,185,696 | | | | | | | | | | | | | | | | | | | | 77,700 | | | | 7,185,696 | |
CoStar Group, Inc. | | | | | | | | | | | 12,320 | | | | 2,693,891 | | | | | | | | 35,800 | | | | 7,828,028 | | | | | | | | | | | | | | | | | | | | 48,120 | | | | 10,521,919 | |
Dropbox, Inc. | | | | | | | | | | | - | | | | - | | | | | | | | 423,376 | | | | 1,627,881 | | | | | | | | | | | | | | | | | | | | 423,376 | | | | 1,627,881 | |
WebMD Health Corp. | | | | | | | | | | | 32,182 | | | | 1,870,096 | | | | | | | | - | | | | - | | | | | | | | | | | | | | | | | | | | 32,182 | | | | 1,870,096 | |
IT Services | | | | | | | | | | | | | | | | | | | | | | | | | | | | | | | | | | | | | | | | | | | | | | | | | | | | |
Amdocs, Ltd. | | | | | | | | | | | - | | | | - | | | | | | | | 207,100 | | | | 11,953,812 | | | | | | | | | | | | | | | | | | | | 207,100 | | | | 11,953,812 | |
Broadridge Financial Solutions, Inc. | | | | | | | | | | | - | | | | - | | | | | | | | 136,579 | | | | 8,904,951 | | | | | | | | | | | | | | | | | | | | 136,579 | | | | 8,904,951 | |
Fidelity National Information Services, Inc. | | | | | | | | | | | - | | | | - | | | | | | | | 81,171 | | | | 5,980,679 | | | | | | | | | | | | | | | | | | | | 81,171 | | | | 5,980,679 | |
Gartner, Inc. | | | | | | | | | | | 21,281 | | | | 2,072,982 | | | | | | | | 46,400 | | | | 4,519,824 | | | | | | | | | | | | | | | | | | | | 67,681 | | | | 6,592,806 | |
Global Payments, Inc. | | | | | | | | | | | - | | | | - | | | | | | | | 75,969 | | | | 5,422,667 | | | | | | | | | | | | | | | | | | | | 75,969 | | | | 5,422,667 | |
Jack Henry & Associates, Inc. | | | | | | | | | | | - | | | | - | | | | | | | | 101,583 | | | | 8,865,149 | | | | | | | | | | | | | | | | | | | | 101,583 | | | | 8,865,149 | |
Paychex, Inc. | | | | | | | | | | | 64,255 | | | | 3,823,173 | | | | | | | | - | | | | - | | | | | | | | | | | | | | | | | | | | 64,255 | | | | 3,823,173 | |
Sabre Corp. | | | | | | | | | | | 110,513 | | | | 2,960,643 | | | | | | | | - | | | | - | | | | | | | | | | | | | | | | | | | | 110,513 | | | | 2,960,643 | |
Vantiv, Inc. | | | | | | | | | | | 57,824 | | | | 3,272,838 | | | | | | | | - | | | | - | | | | | | | | | | | | | | | | | | | | 57,824 | | | | 3,272,838 | |
WEX, Inc. | | | | | | | | | | | - | | | | - | | | | | | | | 92,500 | | | | 8,201,975 | | | | | | | | | | | | | | | | | | | | 92,500 | | | | 8,201,975 | |
45
| | | | | | | | | | | | | | | | | | | | | | | | | | | | | | | | | | | | | | | | | | | | | | | | | | | | |
| | | | | | | | | Voya Mid Cap
Opportunities VP | | | | | | Janus Mid-Cap
Growth VP | | | | | | Adjustments | | | | | | Combined Pro
Forma Portfolio | |
| | | | | | | | | | | | | |
| | | Coupon
Rate | | | Maturity
Date | | | Shares | | | Value | | | | | | Shares | | | Value | | | | | | Shares | | | Value | | | | | | Shares | | | Value | |
| | | | | | | | | | | | | | | | | | | | | | | | | | | | | | | | |
Leisure Products | | | | | | | | | | | | | | | | | | | | | | | | | | | | | | | | | | | | | | | | | | | | | | | | | | | | |
Hasbro, Inc. | | | | | | | | | | | 37,482 | | | $ | 3,148,113 | | | | | | | | - | | | $ | - | | | | | | | | | | | | | | | | | | | | 37,482 | | | $ | 3,148,113 | |
Polaris Industries, Inc. | | | | | | | | | | | - | | | | - | | | | | | | | 40,545 | | | | 3,314,959 | | | | | | | | | | | | | | | | | | | | 40,545 | | | | 3,314,959 | |
Life Sciences Tools & Services | | | | | | | | | | | | | | | | | | | | | | | | | | | | | | | | | | | | | | | | | | | | | | | | | | | | |
Mettler-Toledo International, Inc. | | | | | | | | | | | - | | | | - | | | | | | | | 6,100 | | | | 2,226,012 | | | | | | | | | | | | | | | | | | | | 6,100 | | | | 2,226,012 | |
PerkinElmer, Inc. | | | | | | | | | | | 38,480 | | | | 2,017,122 | | | | | | | | 168,900 | | | | 8,853,738 | | | | | | | | | | | | | | | | | | | | 207,380 | | | | 10,870,860 | |
Quintiles Transnational Holdings, Inc. | | | | | | | | | | | 43,800 | | | | 2,861,016 | | | | | | | | 37,300 | | | | 2,436,436 | | | | | | | | | | | | | | | | | | | | 81,100 | | | | 5,297,452 | |
Waters Corp. | | | | | | | | | | | - | | | | - | | | | | | | | 47,600 | | | | 6,694,940 | | | | | | | | | | | | | | | | | | | | 47,600 | | | | 6,694,940 | |
Machinery | | | | | | | | | | | | | | | | | | | | | | | | | | | | | | | | | | | | | | | | | | | | | | | | | | | | |
Ingersoll-Rand PLC | | | | | | | | | | | 41,452 | | | | 2,639,663 | | | | | | | | - | | | | - | | | | | | | | | | | | | | | | | | | | 41,452 | | | | 2,639,663 | |
Middleby Corp. | | | | | | | | | | | - | | | | - | | | | | | | | 33,200 | | | | 3,826,300 | | | | | | | | | | | | | | | | | | | | 33,200 | | | | 3,826,300 | |
Stanley Black & Decker, Inc. | | | | | | | | | | | 24,208 | | | | 2,692,414 | | | | | | | | - | | | | - | | | | | | | | | | | | | | | | | | | | 24,208 | | | | 2,692,414 | |
Wabtec Corp. | | | | | | | | | | | - | | | | - | | | | | | | | 38,000 | | | | 2,668,740 | | | | | | | | | | | | | | | | | | | | 38,000 | | | | 2,668,740 | |
Media | | | | | | | | | | | | | | | | | | | | | | | | | | | | | | | | | | | | | | | | | | | | | | | | | | | | |
AMC Networks, Inc. | | | | | | | | | | | 40,442 | | | | 2,443,506 | | | | | | | | - | | | | - | | | | | | | | | | | | | | | | | | | | 40,442 | | | | 2,443,506 | |
Interpublic Group of Cos., Inc. | | | | | | | | | | | 128,280 | | | | 2,963,268 | | | | | | | | - | | | | - | | | | | | | | | | | | | | | | | | | | 128,280 | | | | 2,963,268 | |
Omnicom Group, Inc. | | | | | | | | | | | - | | | | - | | | | | | | | 93,200 | | | | 7,594,868 | | | | | | | | | | | | | | | | | | | | 93,200 | | | | 7,594,868 | |
Multiline Retail | | | | | | | | | | | | | | | | | | | | | | | | | | | | | | | | | | | | | | | | | | | | | | | | | | | | |
Dollar General Corp. | | | | | | | | | | | 65,575 | | | | 6,164,050 | | | | | | | | 36,900 | | | | 3,468,600 | | | | | | | | | | | | | | | | | | | | 102,475 | | | | 9,632,650 | |
Dollar Tree, Inc. | | | | | | | | | | | - | | | | - | | | | | | | | 38,800 | | | | 3,656,512 | | | | | | | | | | | | | | | | | | | | 38,800 | | | | 3,656,512 | |
Oil, Gas & Consumable Fuels | | | | | | | | | | | | | | | | | | | | | | | | | | | | | | | | | | | | | | | | | | | | | | | | | | | | |
EQT Corp. | | | | | | | | | | | 30,405 | | | | 2,354,259 | | | | | | | | - | | | | - | | | | | | | | | | | | | | | | | | | | 30,405 | | | | 2,354,259 | |
World Fuel Services Corp. | | | | | | | | | | | - | | | | - | | | | | | | | 112,400 | | | | 5,337,876 | | | | | | | | | | | | | | | | | | | | 112,400 | | | | 5,337,876 | |
Pharmaceuticals | | | | | | | | | | | | | | | | | | | | | | | | | | | | | | | | | | | | | | | | | | | | | | | | | | | | |
Prestige Brands Holdings, Inc. | | | | | | | | | | | 19,140 | | | | 1,060,356 | | | | | | | | - | | | | - | | | | | | | | | | | | | | | | | | | | 19,140 | | | | 1,060,356 | |
Zoetis, Inc. | | | | | | | | | | | 85,122 | | | | 4,039,890 | | | | | | | | - | | | | - | | | | | | | | | | | | | | | | | | | | 85,122 | | | | 4,039,890 | |
Professional Services | | | | | | | | | | | | | | | | | | | | | | | | | | | | | | | | | | | | | | | | | | | | | | | | | | | | |
Equifax, Inc. | | | | | | | | | | | 29,516 | | | | 3,789,854 | | | | | | | | - | | | | - | | | | | | | | | | | | | | | | | | | | 29,516 | | | | 3,789,854 | |
Verisk Analytics, Inc. | | | | | | | | | | | - | | | | - | | | | | | | | 186,200 | | | | 15,097,096 | | | | | | | | | | | | | | | | | | | | 186,200 | | | | 15,097,096 | |
Nielsen Holdings PLC | | | | | | | | | | | 18,944 | | | | 984,520 | | | | | | | | - | | | | - | | | | | | | | | | | | | | | | | | | | 18,944 | | | | 984,520 | |
Real Estate Investment Trusts | | | | | | | | | | | | | | | | | | | | | | | | | | | | | | | | | | | | | | | | | | | | | | | | | | | | |
Communications Sales & Leasing, Inc. | | | | | | | | | | | 70,920 | | | | 2,049,588 | | | | | | | | - | | | | - | | | | | | | | | | | | | | | | | | | | 70,920 | | | | 2,049,588 | |
Crown Castle International Corp. | | | | | | | | | | | - | | | | - | | | | | | | | 179,856 | | | | 18,242,794 | | | | | | | | | | | | | | | | | | | | 179,856 | | | | 18,242,794 | |
Equinix, Inc. | | | | | | | | | | | 11,882 | | | | 4,607,008 | | | | | | | | - | | | | - | | | | | | | | | | | | | | | | | | | | 11,882 | | | | 4,607,008 | |
Equity Lifestyle Properties, Inc. | | | | | | | | | | | 4,373 | | | | 350,058 | | | | | | | | - | | | | - | | | | | | | | | | | | | | | | | | | | 4,373 | | | | 350,058 | |
Lamar Advertising Co. | | | | | | | | | | | - | | | | - | | | | | | | | 211,900 | | | | 14,048,970 | | | | | | | | | | | | | | | | | | | | 211,900 | | | | 14,048,970 | |
Road & Rail | | | | | | | | | | | | | | | | | | | | | | | | | | | | | | | | | | | | | | | | | | | | | | | | | | | | |
Canadian Pacific Railway, Ltd. | | | | | | | | | | | - | | | | - | | | | | | | | 37,200 | | | | 4,790,988 | | | | | | | | | | | | | | | | | | | | 37,200 | | | | 4,790,988 | |
Semiconductors & Semiconductor Equipment | | | | | | | | | | | | | | | | | | | | | | | | | | | | | | | | | | | | | | | | | | | | | | | | | | | | |
Applied Materials, Inc. | | | | | | | | | | | 106,389 | | | | 2,550,144 | | | | | | | | - | | | | - | | | | | | | | | | | | | | | | | | | | 106,389 | | | | 2,550,144 | |
Integrated Device Technology, Inc. | | | | | | | | | | | 125,676 | | | | 2,529,858 | | | | | | | | - | | | | - | | | | | | | | | | | | | | | | | | | | 125,676 | | | | 2,529,858 | |
KLA-Tencor Corp. | | | | | | | | | | | - | | | | - | | | | | | | | 113,600 | | | | 8,321,200 | | | | | | | | | | | | | | | | | | | | 113,600 | | | | 8,321,200 | |
Lam Research Corp. | | | | | | | | | | | - | | | | - | | | | | | | | 67,587 | | | | 5,681,363 | | | | | | | | | | | | | | | | | | | | 67,587 | | | | 5,681,363 | |
Maxim Integrated Products, Inc. | | | | | | | | | | | 82,394 | | | | 2,940,642 | | | | | | | | - | | | | - | | | | | | | | | | | | | | | | | | | | 82,394 | | | | 2,940,642 | |
Microchip Technology, Inc. | | | | | | | | | | | - | | | | - | | | | | | | | 113,500 | | | | 5,761,260 | | | | | | | | | | | | | | | | | | | | 113,500 | | | | 5,761,260 | |
ON Semiconductor Corp. | | | | | | | | | | | - | | | | - | | | | | | | | 636,800 | | | | 5,616,576 | | | | | | | | | | | | | | | | | | | | 636,800 | | | | 5,616,576 | |
Xilinx, Inc. | | | | | | | | | | | - | | | | - | | | | | | | | 220,600 | | | | 10,176,278 | | | | | | | | | | | | | | | | | | | | 220,600 | | | | 10,176,278 | |
Software | | | | | | | | | | | | | | | | | | | | | | | | | | | | | | | | | | | | | | | | | | | | | | | | | | | | |
Atlassian Corp. PLC | | | | | | | | | | | - | | | | - | | | | | | | | 117,741 | | | | 3,049,492 | | | | | | | | | | | | | | | | | | | | 117,741 | | | | 3,049,492 | |
Cadence Design Systems, Inc. | | | | | | | | | | | - | | | | - | | | | | | | | 469,600 | | | | 11,411,280 | | | | | | | | | | | | | | | | | | | | 469,600 | | | | 11,411,280 | |
Constellation Software, Inc. | | | | | | | | | | | - | | | | - | | | | | | | | 21,481 | | | | 8,313,568 | | | | | | | | | | | | | | | | | | | | 21,481 | | | | 8,313,568 | |
Intuit, Inc. | | | | | | | | | | | 22,422 | | | | 2,502,519 | | | | | | | | 74,000 | | | | 8,259,140 | | | | | | | | | | | | | | | | | | | | 96,422 | | | | 10,761,659 | |
Nice, Ltd. | | | | | | | | | | | - | | | | - | | | | | | | | 149,100 | | | | 9,520,035 | | | | | | | | | | | | | | | | | | | | 149,100 | | | | 9,520,035 | |
Red Hat, Inc. | | | | | | | | | | | 51,825 | | | | 3,762,495 | | | | | | | | - | | | | - | | | | | | | | | | | | | | | | | | | | 51,825 | | | | 3,762,495 | |
SS&C Technologies Holdings, Inc. | | | | | | | | | | | 90,776 | | | | 2,548,990 | | | | | | | | 265,000 | | | | 7,441,200 | | | | | | | | | | | | | | | | | | | | 355,776 | | | | 9,990,190 | |
Ultimate Software Group, Inc. | | | | | | | | | | | 10,150 | | | | 2,134,444 | | | | | | | | - | | | | - | | | | | | | | | | | | | | | | | | | | 10,150 | | | | 2,134,444 | |
46
| | | | | | | | | | | | | | | | | | | | | | | | | | | | | | | | | | | | | | | | | | | | | | | | | | | | |
| | | | | | | | | Voya Mid Cap
Opportunities VP | | | | | | Janus Mid-Cap
Growth VP | | | | | | Adjustments | | | | | | Combined Pro
Forma Portfolio | |
| | | | | | | | | | | | | |
| | | Coupon
Rate | | | Maturity
Date | | | Shares | | | Value | | | | | | Shares | | | Value | | | | | | Shares | | | Value | | | | | | Shares | | | Value | |
| | | | | | | | | | | | | | | | | | | | | | | | | | | | | | | | |
Specialty Retail | | | | | | | | | | | | | | | | | | | | | | | | | | | | | | | | | | | | | | | | | | | | | | | | | | | | |
Burlington Stores, Inc. | | | | | | | | | | | 50,116 | | | $ | 3,343,238 | | | | | | | | - | | | $ | - | | | | | | | | | | | | | | | | | | | | 50,116 | | | $ | 3,343,238 | |
Five Below, Inc. | | | | | | | | | | | 67,592 | | | | 3,136,945 | | | | | | | | - | | | | - | | | | | | | | | | | | | | | | | | | | 67,592 | | | | 3,136,945 | |
Foot Locker, Inc. | | | | | | | | | | | 55,187 | | | | 3,027,559 | | | | | | | | - | | | | - | | | | | | | | | | | | | | | | | | | | 55,187 | | | | 3,027,559 | |
Monro Muffler Brake, Inc. | | | | | | | | | | | - | | | | - | | | | | | | | 24,800 | | | | 1,576,288 | | | | | | | | | | | | | | | | | | | | 24,800 | | | | 1,576,288 | |
O’Reilly Automotive, Inc. | | | | | | | | | | | 18,290 | | | | 4,958,419 | | | | | | | | - | | | | - | | | | | | | | | | | | | | | | | | | | 18,290 | | | | 4,958,419 | |
Ross Stores, Inc. | | | | | | | | | | | 75,734 | | | | 4,293,360 | | | | | | | | - | | | | - | | | | | | | | | | | | | | | | | | | | 75,734 | | | | 4,293,360 | |
Ulta Salon Cosmetics & Fragrance, Inc. | | | | | | | | | | | 20,247 | | | | 4,932,979 | | | | | | | | - | | | | - | | | | | | | | | | | | | | | | | | | | 20,247 | | | | 4,932,979 | |
Williams-Sonoma, Inc. | | | | | | | | | | | - | | | | - | | | | | | | | 68,272 | | | | 3,559,019 | | | | | | | | | | | | | | | | | | | | 68,272 | | | | 3,559,019 | |
Textiles, Apparel & Luxury Goods | | | | | | | | | | | | | | | | | | | | | | | | | | | | | | | | | | | | | | | | | | | | | | | | | | | | |
Carter’s, Inc. | | | | | | | | | | | - | | | | - | | | | | | | | 41,300 | | | | 4,397,211 | | | | | | | | | | | | | | | | | | | | 41,300 | | | | 4,397,211 | |
Coach, Inc. | | | | | | | | | | | 81,304 | | | | 3,312,325 | | | | | | | | - | | | | - | | | | | | | | | | | | | | | | | | | | 81,304 | | | | 3,312,325 | |
Gildan Activewear, Inc. | | | | | | | | | | | - | | | | - | | | | | | | | 335,000 | | | | 9,825,550 | | | | | | | | | | | | | | | | | | | | 335,000 | | | | 9,825,550 | |
Wolverine World Wide, Inc. | | | | | | | | | | | - | | | | - | | | | | | | | 236,400 | | | | 4,803,648 | | | | | | | | | | | | | | | | | | | | 236,400 | | | | 4,803,648 | |
Trading Companies & Distributors | | | | | | | | | | | | | | | | | | | | | | | | | | | | | | | | | | | | | | | | | | | | | | | | | | | | |
Fastenal Co. | | | | | | | | | | | - | | | | - | | | | | | | | 68,300 | | | | 3,031,837 | | | | | | | | | | | | | | | | | | | | 68,300 | | | | 3,031,837 | |
MSC Industrial Direct Co., Inc. | | | | | | | | | | | 26,542 | | | | 1,872,804 | | | | | | | | - | | | | - | | | | | | | | | | | | | | | | | | | | 26,542 | | | | 1,872,804 | |
| | | | | | | | | |
| | | | | | | | | | | | | | | | | | | | | | | | | | | | | | | | | | | | |
Total Common Stocks | | | | | | | | | | | | | | | 200,847,781 | | | | | | | | | | | | 542,805,838 | | | | | | | | - | | | | - | | | | | | | | | | | | 743,653,619 | |
| | | | | | | | | | | | | | | | | | | | | | | | | | | | | | | | | | | | |
| | | | | | | | | | | Total Cost ($185,146,932) | | | | | | | | Total Cost ($521,215,628) | | | | | | | | | | | | | | | | | | | | Total Cost ($706,362,560) | |
Convertible Preferred Stock - 0.0 % | | | | | | | | | | | | | | | | | | | | | | | | | | | | | | | | | | | | | | | | | | | | | | | | | | | | |
Internet Software & Services | | | | | | | | | | | | | | | | | | | | | | | | | | | | | | | | | | | | | | | | | | | | | | | | | | | | |
Dropbox, Inc. | | | 0.00 | % | | | | | | | - | | | | - | | | | | | | | 41,951 | | | $ | 161,301 | | | | | | | | | | | | | | | | | | | | 41,951 | | | $ | 161,301 | |
| | | | | | | | | |
| | | | | | | | | | | | | | | | | | | | | | | | | | | | | | | | | | | | |
Total Convertible Preferred Stock | | | | | | | | | | | | | | | - | | | | | | | | | | | | 161,301 | | | | | | | | - | | | | - | | | | | | | | | | | | 161,301 | |
| | | | | | | | | | | | | | | | | | | | | | | | | | | | | | | | | | | | |
| | | | | | | | | | | | | | | | | | | Total Cost ($379,619) | | | | | | | | | | | | | | | | | | | | Total Cost ($379,619) | |
47
| | | | | | | | | | | | | | | | | | | | | | | | | | | | | | | | | | | | | | | | | | | | | | | | | | | | |
| | | | | | | | | Voya Mid Cap
Opportunities VP | | | | | | Janus Mid-Cap
Growth VP | | | | | | Adjustments | | | | | | Combined Pro
Forma Portfolio | |
| | | | | | | | | | | | | |
| | | Coupon
Rate | | | Maturity
Date | | | Shares | | | Value | | | | | | Shares | | | Value | | | | | | Shares | | | Value | | | | | | Shares | | | Value | |
| | | | | | | | | | | | | | | | | | | | | | | | | | | | | | | | |
Preferred Stock - 0.0 % | | | | | | | | | | | | | | | | | | | | | | | | | | | | | | | | | | | | | | | | | | | | | | | | | | | | |
Internet Software & Services | | | | | | | | | | | | | | | | | | | | | | | | | | | | | | | | | | | | | | | | | | | | | | | | | | | | |
Peixe Urbano, Inc. | | | 0.00 | % | | | | | | | - | | | $ | - | | | | | | | | 65,743 | | | $ | 28,269 | | | | | | | | | | | | | | | | | | | | 65,743 | | | $ | 28,269 | |
| | | | | | | | | |
| | | | | | | | | | | | | | | | | | | | | | | | | | | | | | | | | | | | |
Total Preferred Stock | | | | | | | | | | | | | | | - | | | | | | | | | | | | 28,269 | | | | | | | | - | | | | - | | | | | | | | | | | | 28,269 | |
| | | | | | | | | | | | | | | | | | | | | | | | | | | | | | | | | | | | |
| | | | | | | | | | | | | | | | | | | Total Cost ($2,164,318) | | | | | | | | | | | | | | | | | | | | Total Cost ($2,164,318) | |
Securities Lending Collateral - 10.2 % | | | | | | | | | | | | | | | | | | | | | | | | | | | | | | | | | | | | | | | | | | | | | | | | | | | | |
State Street Navigator Securities Lending Trust -Prime Portfolio | | | 0.51 | % | | | | | | | 17,041,377 | | | $ | 17,041,377 | | | | | | | | 60,168,288 | | | $ | 60,168,288 | | | | | | | | | | | | | | | | | | | | 77,209,665 | | | $ | 77,209,665 | |
| | | | | | | | | |
| | | | | | | | | | | | | | | | | | | | | | | | | | | | | | | | | | | | |
Total Securities Lending Collateral | | | | | | | | | | | | | | | 17,041,377 | | | | | | | | | | | | 60,168,288 | | | | | | | | - | | | | - | | | | | | | | | | | | 77,209,665 | |
| | | | | | | | | | | | | | | | | | | | | | | | | | | | | | | | | | | | |
| | | | | | | | | | | Total Cost ($17,041,377) | | | | | | | | Total Cost ($60,168,288) | | | | | | | | | | | | | | | | | | | | Total Cost ($77,209,665) | |
| | | | | | | | | | | | | |
| | | | | | | | | Principal | | | Value | | | | | | Principal | | | Value | | | | | | | | | | | | | | | Principal | | | Value | |
| | | | | | | | | | | | | | | | | | | | | | | | | | | | | | | | |
Repurchase Agreement - 1.2 % | | | | | | | | | | | | | | | | | | | | | | | | | | | | | | | | | | | | | | | | | | | | | | | | | | | | |
State Street Bank & Trust Co. | | | 0.03 | % | | | 07/01/2016 | | | $ | 3,716,766 | | | $ | 3,716,766 | | | | | | | $ | 5,427,596 | | | $ | 5,427,596 | | | | | | | | | | | | | | | | | | | $ | 9,144,362 | | | $ | 9,144,362 | |
| | | | | | | | | |
| | | | | | | | | | | | | | | | | | | | | | | | | | | | | | | | | | | | |
Total Repurchase Agreement | | | | | | | | | | | | | | | 3,716,766 | | | | | | | | | | | | 5,427,596 | | | | | | | | - | | | | - | | | | | | | | | | | | 9,144,362 | |
| | | | | | | | | | | | | | | | | | | | | | | | | | | | | | | | | | | | |
| | | | | | | | | | | Total Cost ($3,716,766) | | | | | | | | Total Cost ($5,427,596) | | | | | | | | | | | | | | | | | | | | Total Cost ($9,144,362) | |
| | | | | | | | | |
| | | | | | | | | | | | | | | | | | | | | | | | | | | | | | | | | | | | |
Total Investments | | | | | | | | | | | | | | | 221,605,924 | | | | | | | | | | | | 608,591,292 | | | | | | | | | | | | - | | | | | | | | | | | | 830,197,216 | |
| | | | | | | | | | | | | | | | | | | | | | | | | | | | | | | | | | | | |
| | | | | | | | | | | Total Cost ($205,905,075) | | | | | | | | Total Cost ($589,355,449) | | | | | | | | | | | | | | | | Total Cost ($795,260,524) | |
Other Assets and Liabilities - (9.9)% | | | | | | | | | | | | | | | (15,143,417 | ) | | | | | | | | | | | (59,983,390 | ) | | | | | | | | | | | (40,000 | )(a) | | | | | | | | | | | (75,166,807 | ) |
| | | | | | | | | | | | | | | | | | | | | | | | | | | | | | | | | | | | | | | | | | | | | | | | | | | | |
Net Assets | | | | | | | | | | | | | | $ | 206,462,507 | | | | | | | | | | | $ | 548,607,902 | | | | | | | | | | | | ($40,000 | ) | | | | | | | | | | $ | 755,030,409 | |
| | | | | | | | | | | | | | | | | | | | | | | | | | | | | | | | | | | | | | | | | | | | | | | | | | | | |
48
VALUATION SUMMARY:
| | | | | | | | | | | | | | | | | | | | | | | | | | | | | | | | | | | | | | | | | | | | | | | | | | | | | | | | |
| Investments | | Level 1 -
Unadjusted
Quoted
Prices | | | Level 2 -
Other
Significant
Observable
Inputs | | | Level 3 -
Significant
Unobservable
Inputs | | | Value | | | | | | Level 1 -
Unadjusted
Quoted
Prices | | | Level 2 -
Other
Significant
Observable
Inputs | | | Level 3 -
Significant
Unobservable
Inputs | | | Value | | | | | | Level 1 -
Unadjusted
Quoted
Prices | | | Level 2 -
Other
Significant
Observable
Inputs | | | Level 3 -
Significant
Unobservable
Inputs | | | Value | |
Common Stocks | | $ | 200,847,781 | | | $ | - | | | $ | - | | | $ | 200,847,781 | | | | | | | $ | 537,259,221 | | | $ | 3,918,736 | | | $ | 1,627,881 | | | $ | 542,805,838 | | | | | | | $ | 738,107,002 | | | $ | 3,918,736 | | | $ | 1,627,881 | | | $ | 743,653,619 | |
Convertible Preferred Stock | | | - | | | | - | | | | - | | | | - | | | | | | | | - | | | | - | | | | 161,301 | | | | 161,301 | | | | | | | | - | | | | - | | | | 161,301 | | | | 161,301 | |
Preferred Stock | | | - | | | | - | | | | - | | | | - | | | | | | | | - | | | | - | | | | 28,269 | | | | 28,269 | | | | | | | | - | | | | - | | | | 28,269 | | | | 28,269 | |
Securities Lending Collateral | | | 17,041,377 | | | | - | | | | - | | | | 17,041,377 | | | | | | | | 60,168,288 | | | | - | | | | - | | | | 60,168,288 | | | | | | | | 77,209,665 | | | | - | | | | - | | | | 77,209,665 | |
Repurchase Agreement | | | - | | | | 3,716,766 | | | | - | | | | 3,716,766 | | | | | | | | - | | | | 5,427,596 | | | | - | | | | 5,427,596 | | | | | | | | - | | | | 9,144,362 | | | | - | | | | 9,144,362 | |
Total Investments | | $ | 217,889,158 | | | $ | 3,716,766 | | | $ | - | | | $ | 221,605,924 | | | | | | | $ | 597,427,509 | | | $ | 9,346,332 | | | $ | 1,817,451 | | | $ | 608,591,292 | | | | | | | $ | 815,316,667 | | | $ | 13,063,098 | | | $ | 1,817,451 | | | $ | 830,197,216 | |
(a)-(i) See Note 2 of the Notes to the Pro Forma Financial Statements.
As of June 30, 2016, all securities held by the Target Portfolio would comply with the investment restrictions of the Destination Portfolio.
49
Reorganization Between Voya Mid Cap Opportunities VP and Janus Mid-Cap Growth VP
PRO FORMA STATEMENT OF ASSETS AND LIABILITIES
At June 30, 2016
| | | | | | | | | | | | | | | | | | | | | | | | | | | | | | | | |
| | | | | Voya Mid Cap
Opportunities VP | | | | | | | Janus Mid-Cap Growth VP | | | | | | | Adjustments | | | | | | | Combined
Pro Forma Portfolio | | | |
Assets: | | | | | | | | | | | | | | | | | | | | | | | | | | | | | | | | |
Investments, at value | | $ | | | 217,889,158 | | | | | $ | | | 603,163,696 | | | | | $ | | | - | | | | | $ | | | 821,052,854 | | | |
Repurchase agreements, at value | | | | | 3,716,766 | | | | | | | | 5,427,596 | | | | | | | | - | | | | | | | | 9,144,362 | | | |
Cash | | | | | 10,677 | | | | | | | | 4,966 | | | | | | | | - | | | | | | | | 15,643 | | | |
Foreign currency, at value | | | | | - | | | | | | | | 46 | | | | | | | | - | | | | | | | | 46 | | | |
Receivables: | | | | | | | | | | | | | | | | | | | | | - | | | | | | | | - | | | |
Shares sold | | | | | - | | | | | | | | 437,651 | | | | | | | | - | | | | | | | | 437,651 | | | |
Investments sold | | | | | 3,210,042 | | | | | | | | 795,439 | | | | | | | | - | | | | | | | | 4,005,481 | | | |
Interest | | | | | 3 | | | | | | | | 5 | | | | | | | | - | | | | | | | | 8 | | | |
Dividends | | | | | 136,219 | | | | | | | | 234,783 | | | | | | | | - | | | | | | | | 371,002 | | | |
Tax reclaims | | | | | - | | | | | | | | 23,903 | | | | | | | | - | | | | | | | | 23,903 | | | |
Net income from securities lending | | | | | 5,666 | | | | | | | | 17,931 | | | | | | | | - | | | | | | | | 23,597 | | | |
Variation margin receivable | | | | | - | | | | | | | | - | | | | | | | | - | | | | | | | | - | | | |
Prepaid Expenses | | | | | 814 | | | | | | | | 1,602 | | | | | | | | - | | | | | | | | 2,416 | | | |
| | | | | | | | | | | | | | | | | | | | |
Total assets | | $ | | | 224,969,345 | | | | | $ | | | 610,107,618 | | | | | $ | | | - | | | | | $ | | | 835,076,963 | | | |
| | | | | | | | | | | | | | | | | | | | |
| | | | | | | | | | | | |
Liabilities: | | | | | | | | | | | | | | | | | | | | | | | | | | | | | | | | |
Accounts payable and accrued liabilities: | | | | | | | | | | | | | | | | | | | | | | | | | | | | | | | | |
Shares redeemed | | | | | 6 | | | | | | | | 403,333 | | | | | | | | - | | | | | | | | 403,339 | | | |
Investments purchased | | | | | 1,297,766 | | | | | | | | 325,971 | | | | | | | | - | | | | | | | | 1,623,737 | | | |
When-issued, delayed-delivery, and forward commitment securities purchased | | | | | - | | | | | | | | - | | | | | | | | - | | | | | | | | - | | | |
Investment management fees | | | | | 144,040 | | | | | | | | 362,005 | | | | | | | | - | | | | | | | | 506,045 | | | |
Distribution and service fees | | | | | 70 | | | | | | | | 19,656 | | | | | | | | - | | | | | | | | 19,726 | | | |
Transfer agent fees | | | | | 537 | | | | | | | | 2,069 | | | | | | | | - | | | | | | | | 2,606 | | | |
Trustees, CCO and deferred compensation fees | | | | | 388 | | | | | | | | 1,715 | | | | | | | | - | | | | | | | | 2,103 | | | |
Audit and tax fees | | | | | 8,015 | | | | | | | | 11,562 | | | | | | | | - | | | | | | | | 19,577 | | | |
Custody fees | | | | | 6,803 | | | | | | | | 23,592 | | | | | | | | - | | | | | | | | 30,395 | | | |
Legal fees | | | | | 4,985 | | | | | | | | 21,289 | | | | | | | | - | | | | | | | | 26,274 | | | |
Printing and shareholder reports fees | | | | | 697 | | | | | | | | 152,181 | | | | | | | | - | | | | | | | | 152,878 | | | |
Registration fees | | | | | - | | | | | | | | - | | | | | | | | - | | | | | | | | - | | | |
Distribution payable to shareholders | | | | | - | | | | | | | | - | | | | | | | | - | | | | | | | | - | | | |
Other | | | | | 2,154 | | | | | | | | 8,055 | | | | | | | | 40,000 | | | (a) | | | | | 50,209 | | | |
Collateral for securities on loan | | | | | 17,041,377 | | | | | | | | 60,168,288 | | | | | | | | - | | | | | | | | 77,209,665 | | | |
| | | | | | | | | | | | | | | | | | | | |
Total liabilities | | | | | 18,506,838 | | | | | | | | 61,499,716 | | | | | | | | 40,000 | | | | | | | | 80,046,554 | | | |
| | | | | | | | | | | | | | | | | | | | |
Net Assets | | $ | | | 206,462,507 | | | | | $ | | | 548,607,902 | | | | | $ | | | (40,000 | ) | | | | $ | | | 755,030,409 | | | |
| | | | | | | | | | | | | | | | | | | | |
| | | | | | | | | | | | |
Net Assets Consist of: | | | | | | | | | | | | | | | | | | | | | | | | | | | | | | | | |
Capital stock ($0.01 par value) | | $ | | | 165,946 | | | | | $ | | | 211,444 | | | | | $ | | | (86,837 | ) | | (b) | | $ | | | 290,553 | | | |
Additional paid in capital | | | | | 174,691,363 | | | | | | | | 494,450,458 | | | | | | | | 15,951,186 | | | (b) | | | | | 685,093,007 | | | |
Undistributed (distributions in excess of) net investment income (loss) | | | | | 167,502 | | | | | | | | 365,565 | | | | | | | | (167,502 | ) | | (b) | | | | | 365,565 | | | |
Accumulated net realized gain (loss) | | | | | 15,736,847 | | | | | | | | 34,345,350 | | | | | | | | (15,736,847 | ) | | (b) | | | | | 34,345,350 | | | |
Net unrealized appreciation (depreciation) on: | | | | | | | | | | | | | | | | | | | | | | | | | | | | | | | | |
Investments | | | | | 15,700,849 | | | | | | | | 19,235,843 | | | | | | | | - | | | | | | | | 34,936,692 | | | |
Swap agreements | | | | | - | | | | | | | | - | | | | | | | | - | | | | | | | | - | | | |
Futures contracts | | | | | - | | | | | | | | - | | | | | | | | - | | | | | | | | - | | | |
Translation of assets and liabilities denominated in foreign currencies | | | | | - | | | | | | | | (758 | ) | | | | | | | - | | | | | | | | (758 | ) | | |
| | | | | | | | | | | | | | | | | | | | |
| | | | | | | | | | | | | | | | | | | | | | | | | | | | | | | | |
Net Assets | | $ | | | 206,462,507 | | | | | $ | | | 548,607,902 | | | | | $ | | | (40,000 | ) | | | | $ | | | 755,030,409 | | | |
| | | | | | | | | | | | | | | | | | | | |
| | | | | | | | | | | | | | | | | | | | | | | | | | | | | | | | |
Net assets by class: | | | | | | | | | | | | | | | | | | | | | | | | | | | | | | | | |
Initial Class | | $ | | | 206,120,504 | | | | | $ | | | 453,533,459 | | | | | $ | | | (33,068 | ) | | (a) | | $ | | | 659,620,895 | | | |
Service Class | | | | | 342,003 | | | | | | | | 95,074,443 | | | | | | | | (6,932 | ) | | (a) | | | | | 95,409,514 | | | |
Shares outstanding (unlimited shares, no par value): | | | | | | | | | | | | | | | | | | | | | | | | | | | | | | | | |
Initial Class | | | | | 16,566,955 | | | | | | | | 17,376,652 | | | | | | | | (8,669,618 | ) | | (c) | | | | | 25,273,989 | | | |
Service Class | | | | | 27,630 | | | | | | | | 3,767,725 | | | | | | | | (14,075 | ) | | (c) | | | | | 3,781,280 | | | |
Net asset value per share: | | | | | | | | | | | | | | | | | | | | | | | | | | | | | | | | |
Initial Class | | $ | | | 12.44 | | | | | $ | | | 26.10 | | | | | $ | | | (12.44 | ) | | (d) | | $ | | | 26.10 | | | |
Service Class | | | | | 12.38 | | | | | | | | 25.23 | | | | | | | | (12.38 | ) | | (d) | | | | | 25.23 | | | |
| | | | | | | | | | | | | | | | | | | | |
| | | | | | | | | | | | |
Investments, at cost | | $ | | | 202,188,309 | | | | | $ | | | 583,927,853 | | | | | | | | - | | | | | $ | | | 786,116,162 | | | |
Securities loaned, at value | | | | | 16,651,276 | | | | | | | | 58,892,884 | | | | | | | | - | | | | | | | | 75,544,160 | | | |
Repurchase agreements, at cost | | | | | 3,716,766 | | | | | | | | 5,427,596 | | | | | | | | - | | | | | | | | 9,144,362 | | | |
Foreign currency, at cost | | | | | - | | | | | | | | 47 | | | | | | | | - | | | | | | | | 47 | | | |
(a)-(i) See Note 2 of the Notes to the Pro Forma Financial Statements.
THE NOTES TO THE PRO FORMA FINANCIAL STATEMENTS ARE AN INTEGRAL PART OF THIS REPORT.
Information Classification: Limited Access
50
Reorganization Between Voya Mid Cap Opportunities VP and Janus Mid-Cap Growth VP
PRO FORMA STATEMENT OF OPERATIONS
For the twelve-month period ended June 30, 2016
| | | | | | | | | | | | | | | | | | | | | | | | | | | | | | | | | | |
| | | | | | Voya Mid Cap Opportunities VP | | | | | | Janus Mid-Cap Growth VP | | | | | | Adjustments | | | | | | | | Combined Pro Forma Portfolio | |
Investment Income: | | | | | | | | | | | | | | | | | | | | | | | | | | | | | | | | | | |
Dividend income | | $ | | | | | 1,926,632 | | | $ | | | | | 2,946,631 | | | $ | | | | | - | | | | | $ | | | | | 4,873,263 | |
Interest income | | | | | | | 1,487 | | | | | | | | 4,038 | | | | | | | | - | | | | | | | | | | 5,525 | |
Net income (loss) from securities lending | | | | | | | 48,174 | | | | | | | | 1,821,662 | | | | | | | | - | | | | | | | | | | 1,869,836 | |
Withholding taxes on foreign income | | | | | | | - | | | | | | | | (32,276) | | | | | | | | | | | | | | | | | | (32,276) | |
| | | | | | | | | | | | | | | | | | |
Total investment income | | | | | | | 1,976,293 | | | | | | | | 4,740,055 | | | | | | | | - | | | | | | | | | | 6,716,348 | |
| | | | | | | | | | | | | | | | | | |
| | | | | | | | | |
Expenses: | | | | | | | | | | | | | | | | | | | | | | | | | | | | | | | | | | |
Investment advisory fees | | | | | | | 1,098,768 | | | | | | | | 3,408,323 | | | | | | | | (172,123) | | | (e) | | | | | | | 4,334,968 | |
Investment management fees | | | | | | | 575,489 | | | | | | | | 1,504,413 | | | | | | | | - | | | | | | | | | | 2,079,902 | |
Distribution and service fees: | | | | | | | | | | | | | | | | | | | | | | | | | | | | | | | | | | |
Service Class | | | | | | | 879 | | | | | | | | 255,527 | | | | | | | | (377) | | | (f) | | | | | | | 256,029 | |
Administration fees | | | | | | | 39,170 | | | | | | | | 124,647 | | | | | | | | (163,817) | | | (g) | | | | | | | - | |
Transfer agent fees | | | | | | | 3,195 | | | | | | | | 9,064 | | | | | | | | - | | | | | | | | | | 12,259 | |
Trustees, CCO and deferred compensation fees | | | | | | | 5,005 | | | | | | | | 14,027 | | | | | | | | - | | | | | | | | | | 19,032 | |
Audit and tax fees | | | | | | | 15,017 | | | | | | | | 20,746 | | | | | | | | (12,126) | | | (h) | | | | | | | 23,637 | |
Custody fees | | | | | | | 50,514 | | | | | | | | 67,857 | | | | | | | | (35,452) | | | (i) | | | | | | | 82,919 | |
Legal fees | | | | | | | 14,043 | | | | | | | | 43,250 | | | | | | | | - | | | | | | | | | | 57,293 | |
Printing and shareholder reports fees | | | | | | | 1,525 | | | | | | | | 114,686 | | | | | | | | - | | | | | | | | | | 116,211 | |
Registration fees | | | | | | | - | | | | | | | | - | | | | | | | | - | | | | | | | | | | - | |
Other | | | | | | | 6,315 | | | | | | | | 23,002 | | | | | | | | - | | | | | | | | | | 29,317 | |
| | | | | | | | | | | | | | | | | | |
Total expenses before waiver and/or reimbursment and recapture | | | | | | | 1,809,920 | | | | | | | | 5,585,542 | | | | | | | | (383,895) | | | | | | | | | | 7,011,567 | |
Expenses waived and/or reimbursed: | | | | | | | | | | | | | | | | | | | | | | | | | | | | | | | | | | |
Fund level | | | | | | | - | | | | | | | | - | | | | | | | | - | | | | | | | | | | - | |
Initial Class | | | | | | | - | | | | | | | | - | | | | | | | | - | | | | | | | | | | - | |
Service Class | | | | | | | - | | | | | | | | - | | | | | | | | - | | | | | | | | | | - | |
Recapture of previously waived and/or reimbursed fees: | | | | | | | | | | | | | | | | | | | | | | | | | | | | | | | | | | |
Fund level | | | | | | | - | | | | | | | | - | | | | | | | | - | | | | | | | | | | - | |
Initial Class | | | | | | | - | | | | | | | | - | | | | | | | | - | | | | | | | | | | - | |
Service Class | | | | | | | - | | | | | | | | - | | | | | | | | - | | | | | | | | | | - | |
| | | | | | | | | | | | | | | | | | |
Net expenses | | | | | | | 1,809,920 | | | | | | | | 5,585,542 | | | | | | | | (383,895) | | | | | | | | | | 7,011,567 | |
| | | | | | | | | |
Net investment income (loss) | | | | | | | 166,373 | | | | | | | | (845,487) | | | | | | | | 383,895 | | | | | | | | | | (295,219) | |
| | | | | | | | | | | | | | | | | | |
| | | | | | | | | |
Net realized gain (loss) on: | | | | | | | | | | | | | | | | | | | | | | | | | | | | | | | | | | |
Investments | | | | | | | 8,163,204 | | | | | | | | (23,580,668 | ) | | | | | | | - | | | | | | | | | | (15,417,464) | |
Swap agreements | | | | | | | - | | | | | | | | - | | | | | | | | | | | | | | | | | | | |
Futures contracts | | | | | | | - | | | | | | | | - | | | | | | | | | | | | | | | | | | | |
Foreign currency transactions | | | | | | | - | | | | | | | | 63,981 | | | | | | | | - | | | | | | | | | | 63,981 | |
| | | | | | | | | | | | | | | | | | |
Net realized gain (loss) | | | | | | | 8,163,204 | | | | | | | | (23,516,687) | | | | | | | | - | | | | | | | | | | (15,353,483) | |
| | | | | | | | | | | | | | | | | | |
Net change in unrealized appreciation (depreciation) on: | | | | | | | | | | | | | | | | | | | | | | | | | | | | | | | | | | |
Investments | | | | | | | (7,675,728) | | | | | | | | (76,797,082) | | | | | | | | - | | | | | | | | | | (84,472,810) | |
Swap agreements | | | | | | | - | | | | | | | | - | | | | | | | | | | | | | | | | | | | |
Futures contracts | | | | | | | - | | | | | | | | - | | | | | | | | | | | | | | | | | | | |
Translation of assets and liabilities denominated in foreign cuurencies | | | | | | | - | | | | | | | | (758) | | | | | | | | - | | | | | | | | | | (758) | |
| | | | | | | | | | | | | | | | | | |
Net change in unrealized appreciation (depreciation) | | | | | | | (7,675,728) | | | | | | | | (76,797,840) | | | | | | | | - | | | | | | | | | | (84,473,568) | |
| | | | | | | | | | | | | | | | | | |
| | | | | | | | | |
Net realized and change in unrealized gain (loss) | | | | | | | 487,476 | | | | | | | | (100,314,527) | | | | | | | | - | | | | | | | | | | (99,827,051) | |
| | | | | | | | | | | | | | | | | | |
| | | | | | | | | |
Net increase in net assets resulting from operations | | $ | | | | | 653,849 | | | $ | | | | | (101,160,014) | | | $ | | | | | 383,895 | | | | | $ | | | | | (100,122,270 | ) |
| | | | | | | | | | | | | | | | | | |
(a)-(i) See Note 2 of the Notes to the Pro Forma Financial Statements.
THE NOTES TO THE PRO FORMA FINANCIAL STATEMENTS ARE AN INTEGRAL PART OF THIS REPORT.
Information Classification: Limited Access
51
NOTES TO THE PRO FORMA FINANCIAL STATEMENTS [TO BE CONFIRMED/UPDATED]
NOTE 1 — GENERAL
The accompanying unaudited pro forma financial statements are presented to show the effect of the proposed transfer of substantially all of the assets of the Portfolios listed in the Target Portfolios & Shares column in the table below (the “Target Portfolios”) in exchange for shares of the Portfolios listed in the Destination Portfolios & Shares column (the “Destination Portfolios”) and the assumption by the Destination Portfolios of all of the liabilities of the Target Portfolios as described elsewhere in the Information Statement/Prospectus and this SAI. The “Pro Forma Funds” as identified in these financial statements represent the combined Destination Portfolios after the respective Reorganizations. The accounting survivor of each Reorganization for financial reporting purposes is the Destination Portfolio. Management believes the accounting survivor of each Reorganization is appropriate in light of the attributes of the applicable Destination Portfolio and Target Portfolio.
| | |
| | |
| Target Portfolio & Shares | | Destination Portfolio & Shares |
| | |
Transamerica Voya Limited Maturity Bond VP | | Transamerica JPMorgan Core Bond VP |
Initial Class | | Initial Class |
Service Class | | Service Class |
| | | |
Transamerica Voya Mid Cap Opportunities VP | | Transamerica Janus Mid-Cap Growth VP |
Initial Class | | Initial Class |
Service Class | | Service Class |
Capitalized terms not otherwise defined in the Notes to the financial statements have the meanings accorded to them in the Information Statement/Prospectus or this SAI.
The Reorganizations are intended to qualify for Federal income tax purposes as “reorganization” within the meaning of Section 368 of the Internal Revenue Code of 1986, as amended (the “Code”). Accordingly, it’s expected that neither the Target Portfolios, nor the Destination Portfolios, nor the shareholders will recognize any gain or loss for federal income tax purposes from the transactions contemplated by the Reorganizations. As a condition to the closing of the transactions, the Target Portfolios will receive an opinion from the law firm of Morgan, Lewis & Bockius LLP to the effect that the Reorganizations will constitute a “reorganization” within the meaning of Section 368 of the Code. That opinion will be based in part upon certain assumptions and upon certain representations made by the Target and Destination Portfolios.
Under the terms of the Agreement and Plan of Reorganization, the exchange of assets of the Target Portfolios for shares of the Destination Portfolios will be treated and accounted for as tax-free reorganization. The acquisition would be accomplished by acquisition of the net assets of the Target Portfolios in exchange for shares of the Destination Portfolios at net asset value. The unaudited pro forma Schedules of Investments and the unaudited Pro Forma Statements of Assets and Liabilities have been prepared as though the Reorganizations had been effective on June 30, 2016. The unaudited pro forma Statement of Operations has been prepared as though the Reorganizations had been effective June 30, 2016 to report operations for the period ended June 30, 2016.
In preparing the Destination Portfolios’ financial statements in accordance with accounting principles generally accepted in the United States of America (“GAAP”), estimates or assumptions (which could differ from actual results) may be used that affect reported amounts and disclosures.
The accompanying pro forma financial statements should be read in conjunction with the financial statements of each of the Target Portfolios and the Destination Portfolios, which are included in the Target Portfolios’ and Destination Portfolios’ annual report dated December 31, 2015 and semi-annual report dated June 30, 2016.
52
NOTE 2 — PRO FORMA ADJUSTMENTS
The Pro Forma adjustments below reflect the impact of each Reorganization.
(a) To adjust the Pro Forma Fund for costs associated with the Reorganization.
(b) To adjust the Pro Forma Funds Shares of beneficial interest by the Accumulated net realized gain amounts of the Target Portfolio.
(c) To adjust Shares Outstanding of the Pro Forma Fund based on combining the Portfolio at the Destination Portfolio’s net asset value.
(d) To adjust Net Asset Value and Offering Price Per Share of the Pro Forma Fund based on combining the Target Portfolio at the Destination Portfolio’s net asset value.
(e) To restate management fees using the Destination Portfolio management fee rates for the Pro Forma Fund at the combined average daily net assets of the Target Portfolio and Destination Portfolio.
(f) To restate distribution and service fees using the Destination Portfolio distribution and service fees for the Pro Forma Fund at the combined average daily net assets of the Target Portfolio and Destination Portfolio.
(g) To restate administration fees to remove the administration fees. Effective March 1, 2016, Investment advisory and administrative services fees were combined under the Management Agreement providing for a single management fee.
(h) To remove duplicate Audit fees.
(i) To remove duplicate Custody fees.
NOTE 3 — INVESTMENT MANAGEMENT AND OTHER TRANSACTIONS
Transamerica Asset Management, Inc. (“TAM”) is the Destination Portfolios’ investment manager. TAM is directly owned by Transamerica Premier Life Insurance Company (“TPLIC”) (77%) and AUSA Holding, LLC (“AUSA”) (23%), both of which are indirect, wholly owned subsidiaries of Aegon NV. TPLIC is owned by Commonwealth General Corporation (“Commonwealth”). Commonwealth and AUSA are wholly owned by Transamerica Corporation, a financial services holding company whose primary emphasis is on life and health insurance, and annuity and investment products. Transamerica Corporation is owned by The Aegon Trust, which is owned by Aegon International B.V., which is owned by Aegon N.V., a Netherlands corporation, and a publicly traded international insurance group.
Transamerica Fund Services, Inc. (“TFS”) is the Destination Portfolio’s transfer agent. Transamerica Capital, Inc. (“TCI”) is the Destination Portfolio’s distributor. TAM, TFS, and TCI are affiliates of Aegon, NV, a Netherlands corporation.
Certain officers and trustees of the Destination Portfolio are also officers and/or directors of TAM, TFS, and TCI.
53
Investment Management Fees
The Target Portfolios pay management fees to TAM based on average daily net assets (“ANA”) according to the following schedules (all amounts are noted as of June 30, 2016):
Transamerica Voya Limited Maturity Bond VP:
| | | | |
| First $250 million | | | 0.53 | % |
| $250 million to $1 billion | | | 0.49 | % |
| Over $1 billion | | | 0.49 | % |
Transamerica Voya Mid Cap Opportunities VP:
| | | | |
| First $100 million | | | 0.86 | % |
| $100 million to $1 billion | | | 0.845 | % |
| Over $1 billion | | | 0.83 | % |
The Destination Portfolios pay management fees to TAM based on ANA according to the following schedules:
Transamerica JPMorgan Core Bond VP:
| | | | |
| First $750 million | | | 0.48 | % |
| $750 million to $1 billion | | | 0.43 | % |
| Over $1 billion | | | 0.405 | % |
Transamerica Janus Mid-Cap Growth VP:
| | | | |
| First $500 million | | | 0.805 | % |
| $500 million to $1 billion | | | 0.77 | % |
| Over $1 billion | | | 0.75 | % |
TAM has contractually agreed through May 1, 2017 to waive fees and/or reimburse expenses on behalf of the Portfolios to the extent that normal operating expenses (including investment management fees but excluding, as applicable, 12b-1 fees, acquired fund fees and expenses, interest, taxes, brokerage commissions, dividend and interest expenses on securities sold short, extraordinary expenses and other expenses not incurred in the ordinary course of the Portfolios’ business) exceeds, as a percentage of each Portfolio’s average daily net assets, 0.88% for Transamerica Voya Limited Maturity Bond VP, 0.70% for Transamerica JPMorgan Core Bond VP, 1.15% for Transamerica Voya Mid Cap Opportunities VP and 1.00% for Transamerica Janus Mid-Cap Growth VP. TAM is entitled to reimbursement by the fund of fees waived or expenses reduced during any of the previous 36 months if on any day or month the estimated annualized fund operating expenses are less than the cap.
54
NOTE 4 — VALUATION PROCEDURES OF THE PORTFOLIOS
All investments in securities are recorded at their estimated fair value. Each Portfolio values its investments at the close of the New York Stock Exchange (“NYSE”), normally 4:00 p.m. Eastern Time, each day the NYSE is open for business. The Portfolios utilize various methods to measure the fair value of their investments on a recurring basis.
GAAP establishes a hierarchy that prioritizes inputs to valuation methods. The inputs or methodology used for valuing securities are not necessarily an indication of the risk associated with investing in those securities. The three Levels of inputs of the fair value hierarchy are defined as follows:
Level 1—Unadjusted quoted prices in active markets for identical securities.
Level 2—Inputs, other than quoted prices included in Level 1, that are observable, either directly or indirectly. These inputs may include quoted prices for the identical instrument on an inactive market, prices for similar instruments, interest rates, prepayment speeds, credit risk, yield curves, default rates, and similar data.
Level 3—Unobservable inputs, which may include TAM’s internal valuation committee’s (the “Valuation Committee”) own assumptions in determining the fair value of investments. Factors considered in making this determination may include, but are not limited to, information obtained by contacting the sub-adviser, issuer, analysts, or the appropriate stock exchange (for exchange-traded securities), analysis of the issuer’s financial statements or other available documents and, if necessary, available information concerning other securities in similar circumstances.
The Portfolios’ Board of Trustees has delegated the valuation functions on a day-to-day basis to TAM, subject to board oversight. TAM has formed the Valuation Committee to monitor and implement the fair valuation policies and procedures as approved by the Board of Trustees. These policies and procedures are reviewed at least annually by the Board of Trustees. The Valuation Committee, among other tasks, monitors for when market quotations are not readily available or are unreliable and determines in good faith the fair value of the Portfolio investments. For instances in which daily market quotes are not readily available, securities may be valued, pursuant to procedures adopted by the Board of Trustees, with reference to other instruments or indices. Depending on the relative significance of valuation inputs, these instruments may be classified in either Level 2 or Level 3 of the fair value hierarchy.
The Valuation Committee may employ a market-based approach which may use related or comparable assets or liabilities, recent transactions, market multiples, book values, and other relevant information for the security to determine the fair value of the security. An income-based valuation approach may also be used in which the anticipated future cash flows of the security are discounted to calculate fair value. Discounts may also be applied due to the nature or duration of any restrictions on the disposition of the securities. When the Portfolio uses fair value methods that rely on significant unobservable inputs to determine a security’s value, the Valuation Committee will choose the method that is believed to accurately reflect fair value. These securities are categorized in Level 3 of the fair value hierarchy. The Valuation Committee reviews fair value measurements on a regular and ad hoc basis and may, as deemed appropriate, update the security valuations as well as the fair valuation guidelines.
55
The availability of observable inputs can vary from security to security and is affected by a wide variety of factors, including, but not limited to, the type of security, whether the security is new and not yet established in the marketplace, the liquidity of markets, and other characteristics particular to the security. To the extent that valuation is based on models or inputs that are less observable or unobservable in the market, the determination of fair value requires more judgment. Accordingly, the degree of judgment exercised in determining fair value is generally greatest for instruments categorized in Level 3. Due to the inherent uncertainty of valuation, the Valuation Committee’s determination of values may differ significantly from values that would have been realized had a ready market for investments existed, and the differences could be material. The Valuation Committee employs various methods for calibrating these valuation approaches, including a regular review of valuation methodologies, key inputs and assumptions, transactional back-testing, and reviews of any market related activity.
The inputs used to measure fair value may fall into different Levels of the fair value hierarchy. In such cases, for disclosure purposes, the Level in the fair value hierarchy that is assigned to the fair value measurement of a security is determined based on the lowest Level input that is significant to the fair value measurement in its entirety.
Fair value measurements: Descriptions of the valuation techniques applied to the Portfolio’s major categories of assets and liabilities measured at fair value on a recurring basis are as follows:
Investment companies: Investment companies are valued at the net asset value (“NAV”) of the underlying funds. These securities are actively traded and no valuation adjustments are applied. Exchange-Traded Funds are stated at the last reported sale price or closing price on the day of valuation taken from the primary exchange where the security is principally traded. They are categorized in Level 1 of the fair value hierarchy. Investments in privately held investment funds with significant restrictions on redemptions where the inputs of NAVs are unobservable will be valued based upon the NAVs of such investments and are categorized in Level 3 of the fair value hierarchy.
Securities lending collateral: Securities lending collateral is invested in a money market fund which is valued at the net asset value of the underlying securities and no valuation adjustments are applied. It is categorized in Level 1 of the fair value hierarchy.
Repurchase agreements: Repurchase agreements are traded on inactive markets or valued by reference to similar instruments and are generally categorized in Level 2.
The hierarchy classification of inputs used to value the Portfolio’s investments at June 30, 2016, is disclosed in the Valuation Summary of the Schedule of Investments.
NOTE 5 — TAX TREATMENT OF THE PORTFOLIOS
Each Destination Portfolio has elected to be treated as a “regulated investment company” for U.S. federal income tax purposes. For the taxable year that includes the closing date of the Reorganizations and for subsequent taxable periods, the Trust reasonably expects that the Destination Portfolios will meet the requirements of Subchapter M of the Code for qualification as a regulated investment company and will be eligible to, and will, compute its federal income tax under Section 852 of the Code.
NOTE 6 — COSTS ASSOCIATED WITH THE REORGANIZATION
The cost of the Reorganizations will be borne by the Target Portfolios. The estimated Portfolio costs associated with the Reorganizations, which are considered extraordinary expenses of the Portfolios and, thus, are not subject to the expense limitations of the Portfolios discussed in Note 3 above, are as follows
| | | | |
Transamerica Voya Limited Maturity Bond VP | | $ | 40,000 | |
| |
Transamerica Voya Mid Cap Opportunities VP | | $ | 40,000 | |
56
PART C
OTHER INFORMATION
Provisions relating to indemnification of the Registrant’s Trustees and employees are included in Registrant’s Declaration of Trust and Bylaws, which are incorporated herein by reference.
Pursuant to Rule 484, insofar as indemnification for liability arising under the Securities Act of 1933 (the “Act”) may be permitted to directors, officers and controlling persons of the Registrant pursuant to the foregoing provisions, or otherwise, the registrant has been advised that in the opinion of the Securities and Exchange Commission such indemnification is against public policy as expressed in the Act and is, therefore, unenforceable. In the event that a claim for indemnification against such liabilities (other than the payment by the Registrant of expenses incurred or paid by a director, officer or controlling person of the Registrant in the successful defense of any action, suit or proceeding) is asserted by such director, officer or controlling person in connection with the securities being registered, the Registrant will, unless in the opinion of its counsel the matter has been settled by controlling precedent, submit to a court of appropriate jurisdiction the question whether such indemnification by it is against public policy as expressed in the Act and will be governed by the final adjudication of such issue.
List all exhibits filed as part of the Registration Statement.
| | | | |
| 1 | | | | Amended and Restated Declaration of Trust filed with Post-Effective Amendment (PEA) No. 133 on February 12, 2016 |
| | |
| 2 | | | | Bylaws of Registrant filed with PEA No. 72 on April 29, 2008 |
| | |
| 3 | | | | n/a |
| | |
| 4 | | | | Form of Agreement and Plan of Reorganization (See Exhibit A to the Information Statement/Prospectus) |
| | |
| 5 | | | | See Exhibits 1 and 2 |
| | |
| 6(1) | | | | Investment Management Agreement dated March 1, 2016 between Registrant and Transamerica Asset Management, Inc. (TAM) filed with PEA 134 on March 18, 2016 |
| | |
| | | | a. Amended Schedule A dated May 1, 2016 filed with PEA 136 on April 27, 2016 |
| | |
| | | | b. Amended Schedule A dated to be filed by amendment |
| | |
| | (2) | | Sub-Advisory Agreement between TAM and J.P. Morgan Investment Management, Inc. dated May 1, 2002 filed with PEA 50 filed on April 30, 2002 on behalf of Transamerica JPMorgan Core Bond VP |
| | |
| | | | a. Amendment dated May 1, 2007 to Sub-Advisory Agreement filed with PEA 68 on April 30, 2007 |
| | |
| | | | b. Amendment dated December 31, 2009 to Sub-Advisory Agreement filed with PEA 90 on February 18, 2010 |
| | |
| | | | c. Amendment dated October 1, 2015 to Sub-Advisory Agreement filed with PEA 136 on April 27, 2016 |
| | |
| | | | d. Amendment dated to Sub-Advisory Agreement to be filed by amendment |
| | |
| | (3) | | Sub-Advisory Agreement between TAM and Janus Capital Management, LLC dated December 9, 2011 filed with PEA 100 on December 9, 2011 |
| | |
| | | | a. Amendment dated May 1, 2016 to Sub-Advisory Agreement filed on behalf of Transamerica Janus Mid-Cap Growth VP filed with PEA 136 on April 27, 2016 |
| | |
| | | | b. Amendment dated October 1, 2015 to Sub-Advisory Agreement filed with PEA 136 on April 27, 2016 |
| | |
| | | | c. Amendment dated to Sub-Advisory Agreement to be filed by amendment |
| | | | |
| 7 | | | | Amended and Restated Distribution Agreement dated November 1, 2007 filed with PEA No. 72 to the Registration Statement on April 29, 2008 |
| | |
| | | | a. Amendment to Distribution Agreement dated May 1, 2008 filed with PEA No. 73 to the Registration Statement on August 25, 2008 |
| | |
| | | | b. Amended Schedule I dated December 31, 2015, filed with PEA 134 to the Registration Statement on March 18, 2016 |
| | |
| | | | c. Amended Schedule I dated May 1, 2016 filed with PEA 136 on April 27, 2016 |
| | |
| | | | d. Amended Schedule I dated to be filed by amendment |
| | |
| 8 | | | | Amended and Restated Trustees’ Deferred Compensation Plan dated January 1, 2010 filed with Transamerica Funds’ PEA No. 108 to the Registration Statement on February 26, 2010 (File no. 033-02659) |
| | |
| 9 | | | | Custodian Agreement between Registrant and State Street Bank and Trust Company dated January 1, 2011 filed with Transamerica Funds’ PEA 126 on April 29, 2011 (File no. 033-02659) |
| | |
| | (1) | | Amendment to Custodian Agreement dated December 17, 2012 filed with PEA No. 116 to the Registration Statement on February 12, 2013 |
| | |
| | | | a. Amended Appendix A-1 dated May 1, 2016 filed with PEA 136 on April 27, 2016 |
| | |
| | | | b. Amended Appendix A-1 dated to be filed by amendment |
| | |
| 10 | | | | Plan of Distribution under Rule 12b-1 |
| | |
| | (1) | | Amended and Restated Plan of Distribution Pursuant to Rule 12b-1 dated November 1, 2007 filed with PEA No. 72 to the Registration Statement on April 29, 2008 |
| | |
| | | | a. Amendment to Amended and Restated Plan of Distribution Pursuant to Rule 12b-1 dated May 1, 2008 filed with PEA No. 73 to the Registration Statement on August 25, 2008 |
| | |
| | | | b. Amended Schedule A dated May 1, 2016 filed with PEA 136 on April 27, 2016 |
| | |
| | | | c. Amended Schedule A dated to be filed by amendment |
| | |
| | (2) | | Multiple Class Plan dated January 22, 2009 filed with PEA No. 80 to the Registration Statement on April 30, 2009 |
| | |
| 11 | | | | Opinion of counsel as to the legality of the securities (filed herein) |
| | |
| 12 | | | | Form of opinion of counsel as to tax matters (filed herein) |
| | |
| 13 | | | | Other Material Contracts |
| | |
| | (1) | | Transfer Agency Agreement, as amended through May 1, 2008, filed with PEA No. 80 to the Registration Statement on April 30, 2009 |
| | |
| | (2) | | Expense Limitation Agreement filed with PEA No. 67 to the Registration Statement on February 28, 2007 |
| | |
| | | | a. Amendment to Expense Limitation Agreement dated May 1, 2008 filed with PEA No. 73 to the Registration Statement on August 25, 2008 |
| | |
| | | | b. Amendment to Expense Limitation Agreement dated July 1, 2009 filed with PEA No. 83 to the Registration Statement on August 14, 2009 |
| | |
| | | | c. Amendment and Restated Expense Limitation Agreement dated May 1, 2011 filed with PEA No. 95 to the Registration Statement on April 29, 2011 |
| | |
| | | | d. Amended Schedule A and B dated May 1, 2016 filed with PEA 136 on April 27, 2016by amendment |
| | |
| | | | e. Amended Schedule A and B dated to be filed by amendment |
| | |
| | (3) | | Participation Agreement between TST and Transamerica Life Insurance Company, Transamerica Financial Life Insurance Company and Transamerica Premier Life Insurance Company, filed with PEA No. 70 to the Registration Statement on July 31, 2007 |
| | |
| | | | a. Amendment dated May 1, 2010 filed with PEA No. 91 to the Registration Statement on April 28, 2010 |
| | |
| | | | b. Amendment dated May 1, 2011 filed with PEA No. 95 to the Registration Statement on April 29, 2011 |
| | |
| | | | c. Amendment dated May 1, 2012 filed with PEA No. 106 to the Registration Statement on April 26, 2012 |
| | |
| | | | d. Amendment dated September 17, 2012 filed with PEA No. 106 to the Registration Statement on April 26, 2012 |
| | | | |
| | | | e. Amendment dated May 1, 2013 and updated Schedule dated May 1, 2014 filed with PEA No. 123 to the Registration Statement on April 30, 2014 |
| | |
| | | | f. Amendment dated November 10, 2014 to Participation Agreement between TST and Transamerica Life Insurance Company, Transamerica Financial Life Insurance Company and Transamerica Premier Life Insurance Company filed with PEA 130 on April 28, 2015 |
| | |
| | | | g. Updated Schedule dated May 1, 2015 to Participation Agreement between TST and Transamerica Life Insurance Company, Transamerica Financial Life Insurance Company and Transamerica Premier Life Insurance Company filed with PEA 130 on April 28, 2015 |
| | |
| | (4) | | Participation Agreement with Transamerica Life Insurance Company, Transamerica Financial Life Insurance Company and BlackRock Variable Series Funds, Inc. on behalf of Transamerica BlackRock Global Allocation VP dated May 1, 2009 filed with PEA No. 80 to the Registration Statement on April 30, 2009 |
| | |
| | (5) | | Participation Agreement with Transamerica Advisors Life Insurance Company dated October 20, 2008, as amended, filed with PEA No. 91 to the Registration Statement on April 28, 2010 |
| | |
| | | | a. Amendment dated May 1, 2010 filed with PEA No. 91 to the Registration Statement on April 28, 2010 |
| | |
| | | | b. Amendment dated May 1, 2011 filed with PEA No. 95 to the Registration Statement on April 29, 2011 |
| | |
| | | | c. Amendment dated May 1, 2012 filed with PEA No. 106 to the Registration Statement on April 26, 2012 |
| | |
| | | | d. Amendment dated September 17, 2012 filed with PEA No. 114 to the Registration Statement on September 17, 2012 |
| | |
| | | | e. Amendment dated May 1, 2013 and updated Schedules dated February 5, 2014 and May 1, 2014 filed with PEA No. 123 to the Registration Statement on April 30, 2014 |
| | |
| | | | f. Updated Schedule dated May 1, 2015 to Participation Agreement between TST and Transamerica Advisors Life Insurance Company filed with PEA 130 on April 28, 2015 |
| | |
| | (6) | | Master Sub-Administration Agreement dated December 17, 2012 filed with PEA No. 116 to the Registration Statement on February 13, 2013 |
| | |
| | | | a. Amended Schedule A dated May 1, 2016 filed with PEA 136 on April 27, 2016 |
| | |
| | | | b. Amended Schedule A dated to be filed by amendment |
| | |
| 14 | | | | Consent of Independent Registered Certified Public Accounting Firm (filed herein) |
| | |
| 15 | | | | n/a |
| | |
| 16 | | | | Powers of Attorney (filed herein) |
| | |
| 17 | | | | |
| | |
| | (1) | | Joint Transamerica Series Trust and Transamerica Asset Management, Inc. Code of Ethics dated January 3, 2012 filed with PEA No. 106 to the Registration Statement on April 26, 2012 |
| | |
| | (2) | | J.P Morgan Investment Management, Inc. Code of Ethics filed with PEA 136 on April 27, 2016 |
| | |
| | (3) | | Janus Capital Management LLC Code of Ethics filed with PEA 136 on April 27, 2016 |
| | |
| | (4) | | Prospectus dated May 1, 2016, as supplemented, filed previously with PEA 136. |
| | |
| | (5) | | Statement of Additional Information dated May 1, 2016, as amended and restated July 1, 2016, filed previously with PEA 136. |
| | |
| | (6) | | Annual Report to Shareholders for the year ended December 31, 2015, filed on Form N-CSR on March 4, 2016 |
| | |
| | (7) | | Semi-Annual Report to Shareholders for the period ended June 30, 2016, filed on Form N-CSR on September 1, 2016 |
(1) The undersigned Registrant agrees that prior to any public reoffering of the securities registered through the use of a prospectus which is a part of this Registration Statement by any person or party who is deemed to be an underwriter within the meaning of Rule 145(c) of the 1933 Act, the reoffering prospectus will contain the information called for by the applicable registration form for the reofferings by persons who may be deemed underwriters, in addition to the information called for by the other items of the applicable form.
(2) The undersigned Registrant agrees that every prospectus that is filed under paragraph (1) above will be filed as a part of an amendment to the Registration Statement and will not be used until the amendment is effective, and that, in determining any liability under the 1933 Act, each post-effective amendment shall be deemed to be a new registration statement for the securities offered therein, and the offering of the securities at that time shall be deemed to be the initial bona fide offering of them.
(3) The undersigned Registrant undertakes to file, by post-effective amendment, the final opinion of Morgan Lewis & Bockius LLP supporting the tax consequences of the proposed reorganizations as soon as practicable after the closing of the reorganizations.
SIGNATURES
Pursuant to the requirements of the Securities Act of 1933, as amended, the Registrant has duly caused this Registration Statement on Form N-14 to be signed on its behalf by the undersigned, thereunder duly authorized, in the City of Denver, State of Colorado, on the 7th day of October, 2016.
| | |
| TRANSAMERICA SERIES TRUST |
| |
| By: | | /s/ Marijn P. Smit |
| | Marijn P. Smit |
| | Trustee, President and Chief Executive Officer |
Pursuant to the requirements of the Securities Act of 1933, as amended this Registration Statement has been signed below by the following persons in the capacities and on the dates indicated:
| | | | |
/s/ Marijn P. Smit | | Trustee, President and Chief Executive Officer | | October 7, 2016 |
| Marijn P. Smit | | | | |
| | |
/s/ Sandra N. Bane | | Trustee | | October 7, 2016 |
| Sandra N. Bane* | | | | |
| | |
/s/ Leo J. Hill | | Trustee | | October 7, 2016 |
| Leo J. Hill* | | | | |
| | |
/s/ David W. Jennings | | Trustee | | October 7, 2016 |
| David W. Jennings* | | | | |
| | |
/s/ Russell A. Kimball, Jr. | | Trustee | | October 7, 2016 |
| Russell A. Kimball, Jr.* | | | | |
| | |
/s/ Patricia L. Sawyer | | Trustee | | October 7, 2016 |
| Patricia L. Sawyer* | | | | |
| | |
/s/ John W. Waechter | | Trustee | | October 7, 2016 |
| John W. Waechter* | | | | |
| | |
/s/ Alan F. Warrick | | Trustee | | October 7, 2016 |
| Alan F. Warrick* | | | | |
| | |
/s/ Vincent J. Toner | | Vice President and Treasurer | | October 7, 2016 |
| Vincent J. Toner | | | | |
| | | | | | |
| * By: | | /s/ Tané T. Tyler | | Vice President, Associate General Counsel, Chief Legal Officer and Secretary | | October 7, 2016 |
| | Tané T. Tyler** | | |
| ** | Attorney-in-fact pursuant to powers of attorney filed herein. |
WASHINGTON, DC 20549
SECURITIES AND EXCHANGE COMMISSION
Exhibits Filed With
Registration Statement on
Form N-14
Transamerica Series Trust
EXHIBIT INDEX
| | |
Exhibit
Number | | Description of Exhibit |
| |
| (11) | | Opinion of Counsel as to the Legality of the Securities |
| |
| (12) | | Form of Opinion and Consent as to Tax Matters |
| |
| (14) | | Consent of Independent Registered Certified Public Accounting Firm |
| |
| (16) | | Powers of Attorney |