UNITED STATES
SECURITIES AND EXCHANGE COMMISSION
Washington, D.C. 20549
Form N-CSR
CERTIFIED SHAREHOLDER REPORT OF REGISTERED
MANAGEMENT INVESTMENT COMPANIES
Investment Company Act File Number: 811-04409
Eaton Vance Municipals Trust
(Exact Name of Registrant as Specified in Charter)
Two International Place, Boston, Massachusetts 02110
(Address of Principal Executive Offices)
Maureen A. Gemma
Two International Place, Boston, Massachusetts 02110
(Name and Address of Agent for Services)
(617) 482-8260
(Registrant’s Telephone Number)
July 31
Date of Fiscal Year End
July 31, 2014
Date of Reporting Period
Item 1. Reports to Stockholders

| | |
Eaton Vance Municipals Trust Annual Report July 31, 2014 | | |
Arizona • Connecticut • Minnesota • New Jersey • Pennsylvania

Commodity Futures Trading Commission Registration. Effective December 31, 2012, the Commodity Futures Trading Commission (“CFTC”) adopted certain regulatory changes that subject registered investment companies and advisers to regulation by the CFTC if a fund invests more than a prescribed level of its assets in certain CFTC-regulated instruments (including futures, certain options and swap agreements) or markets itself as providing investment exposure to such instruments. The Fund has claimed an exclusion from the definition of the term “commodity pool operator” under the Commodity Exchange Act. Accordingly, neither the Fund nor the adviser with respect to the operation of the Fund is subject to CFTC regulation. Because of its management of other strategies, the Fund’s adviser is registered with the CFTC as a commodity pool operator and commodity trading advisor.
Fund shares are not insured by the FDIC and are not deposits or other obligations of, or guaranteed by, any depository institution. Shares are subject to investment risks, including possible loss of principal invested.
This report must be preceded or accompanied by a current summary prospectus or prospectus. Before investing, investors should consider carefully the investment objective, risks, and charges and expenses of a mutual fund. This and other important information is contained in the summary prospectus and prospectus, which can be obtained from a financial advisor. Prospective investors should read the prospectus carefully before investing. For further information, please call 1-800-262-1122.
Annual Report July 31, 2014
Eaton Vance
Municipal Income Funds
Table of Contents
| | | | |
Management’s Discussion of Fund Performance | | | 2 | |
| |
Performance and Fund Profile | | | | |
| |
| | | | |
Arizona | | | 4 | |
Connecticut | | | 6 | |
Minnesota | | | 8 | |
New Jersey | | | 10 | |
Pennsylvania | | | 12 | |
| |
| | | | |
Endnotes and Additional Disclosures | | | 14 | |
| |
Fund Expenses | | | 15 | |
| |
Financial Statements | | | 18 | |
| |
Report of Independent Registered Public Accounting Firm | | | 71 | |
| |
Federal Tax Information | | | 72 | |
| |
Special Meeting of Shareholders | | | 73 | |
| |
Board of Trustees’ Contract Approval | | | 74 | |
| |
Management and Organization | | | 77 | |
| |
Important Notices | | | 80 | |
Eaton Vance
Municipal Income Funds
July 31, 2014
Management’s Discussion of Fund Performance1
Economic and Market Conditions
As the fiscal year began on August 1, 2013, the municipal market was in the midst of a dramatic selloff that had begun in May 2013, after then-U.S. Federal Reserve (the Fed) Chairman Ben Bernanke surprised the markets by indicating that the Fed’s $85 billion in monthly asset purchases could be tapered sooner than most investors had expected. Investors rushed to sell fixed-income assets in anticipation of rising interest rates, causing nearly every fixed-income asset class to decline in value.
Even after the Fed tried to temper its comments and calm the markets, moderating the outflows in other fixed-income asset classes, heavy selling in municipals continued through August 2013, causing a significant increase in municipal bond yields. Additional pressure on the municipal market came from the City of Detroit’s bankruptcy filing on July 18, 2013 and Puerto Rico’s increasing fiscal challenges.
Selling of municipals abated somewhat in September 2013, after the Fed surprised the markets again by postponing its tapering of asset purchases, but the municipal market continued to experience net outflows through December 2013.
As the new year began, however, municipals turned a corner. From January 1 through July 31, 2014, municipals rallied back from 2013 lows. Contrary to what many investors had expected, Treasury rates declined and municipal rates followed. A principal driver was a global “flight to quality,” as investors sought the relative safety of Treasurys in the face of increased geopolitical risk overseas. And while the anticipation of the Fed’s tapering of asset purchases spooked the markets in 2013, the actual tapering in 2014 had little further effect on bond prices.
Fund Performance
For the fiscal year ended July 31, 2014, the Arizona, Connecticut, Minnesota and New Jersey Funds’ Class A shares at net asset value (NAV) outperformed the 7.27% return of the Funds’ primary benchmark, the Barclays Municipal Bond Index (the Index)2, while the Pennsylvania Fund’s Class A shares at NAV underperformed the Index.
Generally speaking, the Funds’ overall strategy is to invest primarily in municipal bonds with maturities of 10 years or more, in order to capture their historically higher yields and greater income stream than shorter-maturity municipal issues. Management seeks to hedge to various degrees against the potential risk of volatility at the long end of the yield curve by using Treasury futures. As a risk management strategy, hedging is intended to moderate performance on both the upside and the downside. So in a period when municipal and Treasury bond prices rose, the Funds’ hedging mitigated a portion of the Funds’ positive performance. Hedging detracted from relative results versus the Index for all five Funds.
See Endnotes and Additional Disclosures in this report.
Past performance is no guarantee of future results. Returns are historical and are calculated by determining the percentage change in net asset value (NAV) or offering price (as applicable) with all distributions reinvested. Investment return and principal value will fluctuate so that shares, when redeemed, may be worth more or less than their original cost. Performance less than one year is cumulative. Performance is for the stated time period only; due to market volatility, the Fund’s current performance may be lower or higher than quoted. Returns are before taxes unless otherwise noted. For performance as of the most recent month end, please refer to eatonvance.com.
Eaton Vance
Municipal Income Funds
July 31, 2014
Management’s Discussion of Fund Performance — continued
State-specific Results
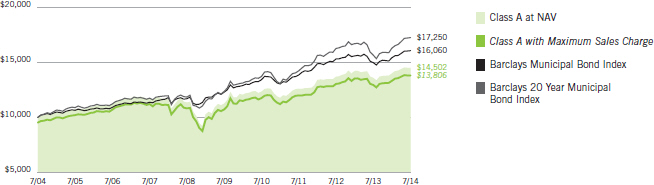
Eaton Vance Arizona Municipal Income Fund Class A shares at NAV had a total return of 7.84%, outperforming the 7.27% return of the Index. Performance relative to the Index was helped by an overweight in bonds with maturities of 10 years or more. Other notable contributors to Fund performance versus the Index included an overweight and security selection in the special tax sector and in bonds rated BBB as well. The Fund’s hedging strategy, as noted earlier, detracted from performance relative to the Index. An overweight in escrowed bonds and security selection in zero coupon bonds also dragged on performance versus the Index.
Eaton Vance Connecticut Municipal Income Fund Class A shares at NAV returned 7.56%, outperforming the 7.27% return of the Index. Key contributors to performance versus the Index included an overweight and security selection in the education sector as well as an overweight and security selection in bonds with 15 to 20 years remaining to maturity. In contrast, the Fund’s hedging strategy detracted from results relative to the Index. Security selection in zero coupon bonds and an underweight in bonds with maturities of 22 years or more also weighed on Fund performance versus the Index.
Eaton Vance Minnesota Municipal Income Fund Class A shares at NAV returned 7.36%, outperforming the 7.27% return of the Index. Relative overweights in bonds with maturities of 10 to 20 years and in zero coupon bonds, which were the best-performing coupon structure during the period, contributed to results versus the Index. An overweight and security selection in electric revenue bonds aided results relative to the Index as well. In contrast, the Fund’s hedging strategy, along with an overweight in escrowed bonds and security selection in the transportation sector, detracted from performance versus the Index.
Eaton Vance New Jersey Municipal Income Fund Class A shares at NAV returned 7.43%, outperforming the 7.27% return of the Index. An overweight and security selection in A-rated bonds and an overweight and security selection in bonds with 15 to 20 years remaining to maturity both contributed to Fund performance relative to the Index, as did an overweight in zero coupon bonds. Key detractors from results versus the Index included the Fund’s hedging strategy and security selection in bonds with maturities of 22 years or more.
Eaton Vance Pennsylvania Municipal Income Fund Class A shares at NAV returned 6.68%, underperforming the 7.27% return of the Index. The Fund’s hedging strategy dragged on relative results versus the Index. Other notable detractors from Fund performance versus the Index included security selection in bonds with 22 or more years remaining to maturity and security selection in zero coupon bonds. The primary contributors to Fund performance relative to the Index were an overweight and security selection in bonds with maturities of 15 to 20 years and an overweight and security selection in the hospital sector.
See Endnotes and Additional Disclosures in this report.
Past performance is no guarantee of future results. Returns are historical and are calculated by determining the percentage change in net asset value (NAV) or offering price (as applicable) with all distributions reinvested. Investment return and principal value will fluctuate so that shares, when redeemed, may be worth more or less than their original cost. Performance less than one year is cumulative. Performance is for the stated time period only; due to market volatility, the Fund’s current performance may be lower or higher than quoted. Returns are before taxes unless otherwise noted. For performance as of the most recent month end, please refer to eatonvance.com.
Eaton Vance
Arizona Municipal Income Fund
July 31, 2014
Performance2,3
Portfolio Manager Craig R. Brandon, CFA
| | | | | | | | | | | | | | | | | | | | |
| % Average Annual Total Returns | | Class Inception Date | | | Performance
Inception Date | | | One Year | | | Five Years | | | Ten Years | |
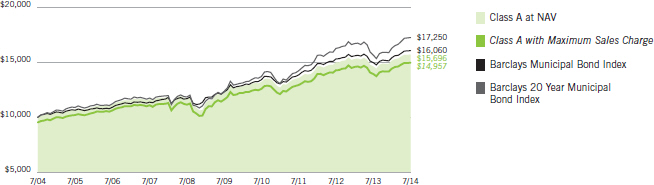
Class A at NAV | | | 12/13/1993 | | | | 07/25/1991 | | | | 7.84 | % | | | 5.67 | % | | | 4.37 | % |
Class A with 4.75% Maximum Sales Charge | | | — | | | | — | | | | 2.76 | | | | 4.64 | | | | 3.86 | |
Class B at NAV | | | 07/25/1991 | | | | 07/25/1991 | | | | 7.05 | | | | 4.88 | | | | 3.60 | |
Class B with 5% Maximum Sales Charge | | | — | | | | — | | | | 2.05 | | | | 4.55 | | | | 3.60 | |
Class C at NAV | | | 12/16/2005 | | | | 07/25/1991 | | | | 7.05 | | | | 4.88 | | | | 3.60 | |
Class C with 1% Maximum Sales Charge | | | — | | | | — | | | | 6.05 | | | | 4.88 | | | | 3.60 | |
Class I at NAV | | | 08/03/2010 | | | | 07/25/1991 | | | | 7.94 | | | | 5.83 | | | | 4.45 | |
Barclays Municipal Bond Index | | | — | | | | — | | | | 7.27 | % | | | 5.49 | % | | | 4.85 | % |
Barclays 20 Year Municipal Bond Index | | | — | | | | — | | | | 10.19 | | | | 6.89 | | | | 5.60 | |
| | | | | |
| | | | | | | | | | | | | | | | | | | | |
| % Total Annual Operating Expense Ratios4 | | | | | Class A | | | Class B | | | Class C | | | Class I | |
Gross | | | | | | | 0.76 | % | | | 1.51 | % | | | 1.51 | % | | | 0.56 | % |
Net | | | | | | | 0.74 | | | | 1.49 | | | | 1.49 | | | | 0.54 | |
| | | | | |
| | | | | | | | | | | | | | | | | | | | |
| % Distribution Rates/Yields5 | | | | | Class A | | | Class B | | | Class C | | | Class I | |
Distribution Rate | | | | | | | 3.73 | % | | | 2.96 | % | | | 2.97 | % | | | 3.94 | % |
Taxable-Equivalent Distribution Rate | | | | | | | 6.90 | | | | 5.48 | | | | 5.50 | | | | 7.29 | |
SEC 30-day Yield | | | | | | | 2.13 | | | | 1.50 | | | | 1.50 | | | | 2.44 | |
Taxable-Equivalent SEC 30-day Yield | | | | | | | 3.95 | | | | 2.77 | | | | 2.78 | | | | 4.51 | |
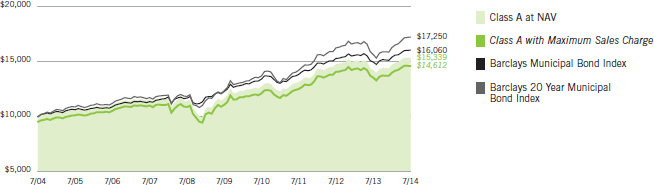
Growth of $10,000
This graph shows the change in value of a hypothetical investment of $10,000 in Class A of the Fund for the period indicated. For comparison, the same investment is shown in the indicated index.
| | | | | | | | | | | | | | | | |
| Growth of Investment | | Amount Invested | | | Period Beginning | | | At NAV | | | With Maximum Sales Charge | |
Class B | | $ | 10,000 | | | | 07/31/2004 | | | $ | 14,245 | | | | N.A. | |
Class C | | $ | 10,000 | | | | 07/31/2004 | | | $ | 14,244 | | | | N.A. | |
Class I | | $ | 250,000 | | | | 07/31/2004 | | | $ | 386,333 | | | | N.A. | |
See Endnotes and Additional Disclosures in this report.
Past performance is no guarantee of future results. Returns are historical and are calculated by determining the percentage change in net asset value (NAV) or offering price (as applicable) with all distributions reinvested. Investment return and principal value will fluctuate so that shares, when redeemed, may be worth more or less than their original cost. Performance less than one year is cumulative. Performance is for the stated time period only; due to market volatility, the Fund’s current performance may be lower or higher than quoted. Returns are before taxes unless otherwise noted. For performance as of the most recent month end, please refer to eatonvance.com.
Eaton Vance
Arizona Municipal Income Fund
July 31, 2014
Fund Profile
See Endnotes and Additional Disclosures in this report.
Eaton Vance
Connecticut Municipal Income Fund
July 31, 2014
Performance2,3
Portfolio Manager Cynthia J. Clemson
| | | | | | | | | | | | | | | | | | | | |
| % Average Annual Total Returns | | Class Inception Date | | | Performance
Inception Date | | | One Year | | | Five Years | | | Ten Years | |
Class A at NAV | | | 04/19/1994 | | | | 05/01/1992 | | | | 7.56 | % | | | 5.08 | % | | | 3.86 | % |
Class A with 4.75% Maximum Sales Charge | | | — | | | | — | | | | 2.48 | | | | 4.06 | | | | 3.36 | |
Class B at NAV | | | 05/01/1992 | | | | 05/01/1992 | | | | 6.67 | | | | 4.31 | | | | 3.10 | |
Class B with 5% Maximum Sales Charge | | | — | | | | — | | | | 1.67 | | | | 3.97 | | | | 3.10 | |
Class C at NAV | | | 02/09/2006 | | | | 05/01/1992 | | | | 6.67 | | | | 4.31 | | | | 3.10 | |
Class C with 1% Maximum Sales Charge | | | — | | | | — | | | | 5.67 | | | | 4.31 | | | | 3.10 | |
Class I at NAV | | | 03/03/2008 | | | | 05/01/1992 | | | | 7.78 | | | | 5.29 | | | | 3.99 | |
Barclays Municipal Bond Index | | | — | | | | — | | | | 7.27 | % | | | 5.49 | % | | | 4.85 | % |
Barclays 20 Year Municipal Bond Index | | | — | | | | — | | | | 10.19 | | | | 6.89 | | | | 5.60 | |
| | | | | |
| | | | | | | | | | | | | | | | | | | | |
| % Total Annual Operating Expense Ratios4 | | | | | Class A | | | Class B | | | Class C | | | Class I | |
Gross | | | | | | | 0.78 | % | | | 1.54 | % | | | 1.53 | % | | | 0.58 | % |
Net | | | | | | | 0.73 | | | | 1.49 | | | | 1.48 | | | | 0.53 | |
| | | | | |
| | | | | | | | | | | | | | | | | | | | |
| % Distribution Rates/Yields5 | | | | | Class A | | | Class B | | | Class C | | | Class I | |
Distribution Rate | | | | | | | 3.63 | % | | | 2.86 | % | | | 2.86 | % | | | 3.83 | % |
Taxable-Equivalent Distribution Rate | | | | | | | 6.87 | | | | 5.42 | | | | 5.42 | | | | 7.25 | |
SEC 30-day Yield | | | | | | | 2.32 | | | | 1.69 | | | | 1.69 | | | | 2.64 | |
Taxable-Equivalent SEC 30-day Yield | | | | | | | 4.39 | | | | 3.20 | | | | 3.20 | | | | 4.99 | |
| | | | | |
| | | | | | | | | | | | | | | | | | | | |
| % Total Leverage6 | | | | | | | | | | | | | | | |
Residual Interest Bond (RIB) Financing | | | | | | | | | | | | | | | | | | | 4.05 | % |
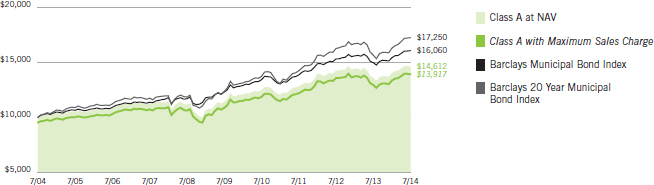
Growth of $10,000
This graph shows the change in value of a hypothetical investment of $10,000 in Class A of the Fund for the period indicated. For comparison, the same investment is shown in the indicated index.
| | | | | | | | | | | | | | | | |
| Growth of Investment | | Amount Invested | | | Period Beginning | | | At NAV | | | With Maximum Sales Charge | |
Class B | | $ | 10,000 | | | | 07/31/2004 | | | $ | 13,572 | | | | N.A. | |
Class C | | $ | 10,000 | | | | 07/31/2004 | | | $ | 13,569 | | | | N.A. | |
Class I | | $ | 250,000 | | | | 07/31/2004 | | | $ | 369,869 | | | | N.A. | |
See Endnotes and Additional Disclosures in this report.
Past performance is no guarantee of future results. Returns are historical and are calculated by determining the percentage change in net asset value (NAV) or offering price (as applicable) with all distributions reinvested. Investment return and principal value will fluctuate so that shares, when redeemed, may be worth more or less than their original cost. Performance less than one year is cumulative. Performance is for the stated time period only; due to market volatility, the Fund’s current performance may be lower or higher than quoted. Returns are before taxes unless otherwise noted. For performance as of the most recent month end, please refer to eatonvance.com.
Eaton Vance
Connecticut Municipal Income Fund
July 31, 2014
Fund Profile
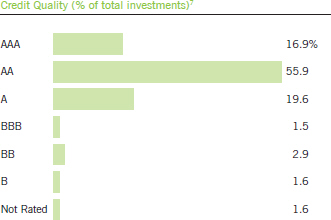
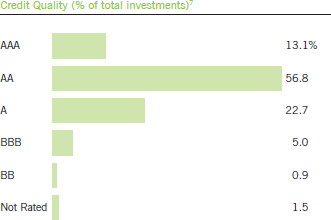
The above chart includes the ratings of securities held by special purpose vehicles established in connection with the RIB financing.6 Absent such securities, credit quality (% of total investments) is as follows:7
| | | | | | | | | | |
AAA | | | 13.3 | % | | BB | | | 3.0 | % |
AA | | | 58.3 | | | B | | | 1.7 | |
A | | | 20.4 | | | Not Rated | | | 1.7 | |
BBB | | | 1.6 | | | | | | | |
See Endnotes and Additional Disclosures in this report.
Eaton Vance
Minnesota Municipal Income Fund
July 31, 2014
Performance2,3
Portfolio Manager Craig R. Brandon, CFA
| | | | | | | | | | | | | | | | | | | | |
| % Average Annual Total Returns | | Class Inception Date | | | Performance
Inception Date | | | One Year | | | Five Years | | | Ten Years | |
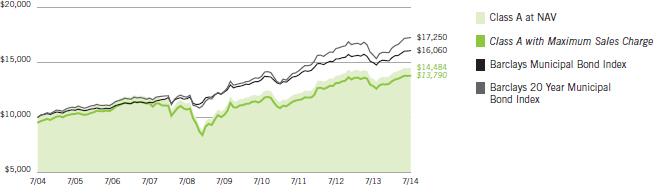
Class A at NAV | | | 12/09/1993 | | | | 07/29/1991 | | | | 7.36 | % | | | 5.20 | % | | | 4.61 | % |
Class A with 4.75% Maximum Sales Charge | | | — | | | | — | | | | 2.26 | | | | 4.19 | | | | 4.11 | |
Class B at NAV | | | 07/29/1991 | | | | 07/29/1991 | | | | 6.59 | | | | 4.42 | | | | 3.84 | |
Class B with 5% Maximum Sales Charge | | | — | | | | — | | | | 1.59 | | | | 4.08 | | | | 3.84 | |
Class C at NAV | | | 12/21/2005 | | | | 07/29/1991 | | | | 6.60 | | | | 4.42 | | | | 3.80 | |
Class C with 1% Maximum Sales Charge | | | — | | | | — | | | | 5.60 | | | | 4.42 | | | | 3.80 | |
Class I at NAV | | | 08/03/2010 | | | | 07/29/1991 | | | | 7.57 | | | | 5.36 | | | | 4.69 | |
Barclays Municipal Bond Index | | | — | | | | — | | | | 7.27 | % | | | 5.49 | % | | | 4.85 | % |
Barclays 20 Year Municipal Bond Index | | | — | | | | — | | | | 10.19 | | | | 6.89 | | | | 5.60 | |
| | | | | |
| | | | | | | | | | | | | | | | | | | | |
| % Total Annual Operating Expense Ratios4 | | | | | Class A | | | Class B | | | Class C | | | Class I | |
| | | | | | | 0.72 | % | | | 1.47 | % | | | 1.47 | % | | | 0.52 | % |
| | | | | |
| | | | | | | | | | | | | | | | | | | | |
| % Distribution Rates/Yields5 | | | | | Class A | | | Class B | | | Class C | | | Class I | |
Distribution Rate | | | | | | | 3.23 | % | | | 2.46 | % | | | 2.46 | % | | | 3.43 | % |
Taxable-Equivalent Distribution Rate | | | | | | | 6.33 | | | | 4.82 | | | | 4.82 | | | | 6.72 | |
SEC 30-day Yield | | | | | | | 1.82 | | | | 1.17 | | | | 1.16 | | | | 2.11 | |
Taxable-Equivalent SEC 30-day Yield | | | | | | | 3.57 | | | | 2.28 | | | | 2.28 | | | | 4.13 | |
Growth of $10,000
This graph shows the change in value of a hypothetical investment of $10,000 in Class A of the Fund for the period indicated. For comparison, the same investment is shown in the indicated index.
| | | | | | | | | | | | | | | | |
| Growth of Investment | | Amount Invested | | | Period Beginning | | | At NAV | | | With Maximum Sales Charge | |
Class B | | $ | 10,000 | | | | 07/31/2004 | | | $ | 14,581 | | | | N.A. | |
Class C | | $ | 10,000 | | | | 07/31/2004 | | | $ | 14,523 | | | | N.A. | |
Class I | | $ | 250,000 | | | | 07/31/2004 | | | $ | 395,395 | | | | N.A. | |
See Endnotes and Additional Disclosures in this report.
Past performance is no guarantee of future results. Returns are historical and are calculated by determining the percentage change in net asset value (NAV) or offering price (as applicable) with all distributions reinvested. Investment return and principal value will fluctuate so that shares, when redeemed, may be worth more or less than their original cost. Performance less than one year is cumulative. Performance is for the stated time period only; due to market volatility, the Fund’s current performance may be lower or higher than quoted. Returns are before taxes unless otherwise noted. For performance as of the most recent month end, please refer to eatonvance.com.
Eaton Vance
Minnesota Municipal Income Fund
July 31, 2014
Fund Profile
See Endnotes and Additional Disclosures in this report.
Eaton Vance
New Jersey Municipal Income Fund
July 31, 2014
Performance2,3
Portfolio Manager Adam A. Weigold, CFA
| | | | | | | | | | | | | | | | | | | | |
| % Average Annual Total Returns | | Class Inception Date | | | Performance
Inception Date | | | One Year | | | Five Years | | | Ten Years | |
Class A at NAV | | | 04/13/1994 | | | | 01/08/1991 | | | | 7.43 | % | | | 6.20 | % | | | 3.77 | % |
Class A with 4.75% Maximum Sales Charge | | | — | | | | — | | | | 2.32 | | | | 5.17 | | | | 3.26 | |
Class C at NAV | | | 12/14/2005 | | | | 01/08/1991 | | | | 6.59 | | | | 5.40 | | | | 3.00 | |
Class C with 1% Maximum Sales Charge | | | — | | | | — | | | | 5.59 | | | | 5.40 | | | | 3.00 | |
Class I at NAV | | | 03/03/2008 | | | | 01/08/1991 | | | | 7.64 | | | | 6.41 | | | | 3.90 | |
Barclays Municipal Bond Index | | | — | | | | — | | | | 7.27 | % | | | 5.49 | % | | | 4.85 | % |
Barclays 20 Year Municipal Bond Index | | | — | | | | — | | | | 10.19 | | | | 6.89 | | | | 5.60 | |
| | | | | |
| | | | | | | | | | | | | | | | | | | | |
| % Total Annual Operating Expense Ratios4 | | | | | | | | Class A | | | Class C | | | Class I | |
Gross | | | | | | | | | | | 0.82 | % | | | 1.57 | % | | | 0.62 | % |
Net | | | | | | | | | | | 0.75 | | | | 1.50 | | | | 0.55 | |
| | | | | |
| | | | | | | | | | | | | | | | | | | | |
| % Distribution Rates/Yields5 | | | | | | | | Class A | | | Class C | | | Class I | |
Distribution Rate | | | | | | | | | | | 3.61 | % | | | 2.84 | % | | | 3.78 | % |
Taxable-Equivalent Distribution Rate | | | | | | | | | | | 7.01 | | | | 5.51 | | | | 7.34 | |
SEC 30-day Yield | | | | | | | | | | | 2.46 | | | | 1.83 | | | | 2.75 | |
Taxable-Equivalent SEC 30-day Yield | | | | | | | | | | | 4.77 | | | | 3.55 | | | | 5.33 | |
| | | | | |
| | | | | | | | | | | | | | | | | | | | |
| % Total Leverage6 | | | | | | | | | | | | | | | |
RIB Financing | | | | | | | | | | | | | | | | | | | 3.69 | % |
Growth of $10,000
This graph shows the change in value of a hypothetical investment of $10,000 in Class A of the Fund for the period indicated. For comparison, the same investment is shown in the indicated index.
| | | | | | | | | | | | | | | | |
| Growth of Investment | | Amount Invested | | | Period Beginning | | | At NAV | | | With Maximum Sales Charge | |
Class C | | $ | 10,000 | | | | 07/31/2004 | | | $ | 13,436 | | | | N.A. | |
Class I | | $ | 250,000 | | | | 07/31/2004 | | | $ | 366,595 | | | | N.A. | |
See Endnotes and Additional Disclosures in this report.
Past performance is no guarantee of future results. Returns are historical and are calculated by determining the percentage change in net asset value (NAV) or offering price (as applicable) with all distributions reinvested. Investment return and principal value will fluctuate so that shares, when redeemed, may be worth more or less than their original cost. Performance less than one year is cumulative. Performance is for the stated time period only; due to market volatility, the Fund’s current performance may be lower or higher than quoted. Returns are before taxes unless otherwise noted. For performance as of the most recent month end, please refer to eatonvance.com.
Eaton Vance
New Jersey Municipal Income Fund
July 31, 2014
Fund Profile
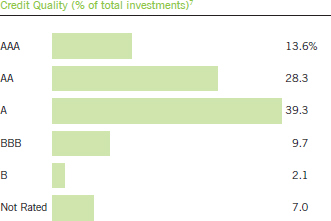
The above chart includes the ratings of securities held by special purpose vehicles established in connection with the RIB financing.6 Absent such securities, credit quality (% of total investments) is as follows:7
| | | | | | | | | | |
AAA | | | 10.0 | % | | BBB | | | 10.1 | % |
AA | | | 29.5 | | | B | | | 2.2 | |
A | | | 40.9 | | | Not Rated | | | 7.3 | |
See Endnotes and Additional Disclosures in this report.
Eaton Vance
Pennsylvania Municipal Income Fund
July 31, 2014
Performance2,3
Portfolio Manager Adam A. Weigold, CFA
| | | | | | | | | | | | | | | | | | | | |
| % Average Annual Total Returns | | Class Inception Date | | | Performance
Inception Date | | | One Year | | | Five Years | | | Ten Years | |
Class A at NAV | | | 06/01/1994 | | | | 01/08/1991 | | | | 6.68 | % | | | 5.19 | % | | | 3.79 | % |
Class A with 4.75% Maximum Sales Charge | | | — | | | | — | | | | 1.57 | | | | 4.17 | | | | 3.28 | |
Class B at NAV | | | 01/08/1991 | | | | 01/08/1991 | | | | 5.92 | | | | 4.41 | | | | 3.05 | |
Class B with 5% Maximum Sales Charge | | | — | | | | — | | | | 0.92 | | | | 4.07 | | | | 3.05 | |
Class C at NAV | | | 01/13/2006 | | | | 01/08/1991 | | | | 5.92 | | | | 4.41 | | | | 3.03 | |
Class C with 1% Maximum Sales Charge | | | — | | | | — | | | | 4.92 | | | | 4.41 | | | | 3.03 | |
Class I at NAV | | | 03/03/2008 | | | | 01/08/1991 | | | | 6.88 | | | | 5.42 | | | | 3.96 | |
Barclays Municipal Bond Index | | | — | | | | — | | | | 7.27 | % | | | 5.49 | % | | | 4.85 | % |
Barclays 20 Year Municipal Bond Index | | | — | | | | — | | | | 10.19 | | | | 6.89 | | | | 5.60 | |
| | | | | |
| | | | | | | | | | | | | | | | | | | | |
| % Total Annual Operating Expense Ratios4 | | | | | Class A | | | Class B | | | Class C | | | Class I | |
Gross | | | | | | | 0.81 | % | | | 1.57 | % | | | 1.56 | % | | | 0.61 | % |
Net | | | | | | | 0.76 | | | | 1.52 | | | | 1.51 | | | | 0.56 | |
| | | | | |
| | | | | | | | | | | | | | | | | | | | |
| % Distribution Rates/Yields5 | | | | | Class A | | | Class B | | | Class C | | | Class I | |
Distribution Rate | | | | | | | 3.99 | % | | | 3.22 | % | | | 3.22 | % | | | 4.19 | % |
Taxable-Equivalent Distribution Rate | | | | | | | 7.27 | | | | 5.87 | | | | 5.87 | | | | 7.64 | |
SEC 30-day Yield | | | | | | | 2.23 | | | | 1.60 | | | | 1.60 | | | | 2.54 | |
Taxable-Equivalent SEC 30-day Yield | | | | | | | 4.06 | | | | 2.91 | | | | 2.91 | | | | 4.63 | |
| | | | | |
| | | | | | | | | | | | | | | | | | | | |
| % Total Leverage6 | | | | | | | | | | | | | | | |
RIB Financing | | | | | | | | | | | | | | | | | | | 5.01 | % |
Growth of $10,000
This graph shows the change in value of a hypothetical investment of $10,000 in Class A of the Fund for the period indicated. For comparison, the same investment is shown in the indicated index.
| | | | | | | | | | | | | | | | |
| Growth of Investment | | Amount Invested | | | Period Beginning | | | At NAV | | | With Maximum Sales Charge | |
Class B | | $ | 10,000 | | | | 07/31/2004 | | | $ | 13,502 | | | | N.A. | |
Class C | | $ | 10,000 | | | | 07/31/2004 | | | $ | 13.479 | | | | N.A. | |
Class I | | $ | 250,000 | | | | 07/31/2004 | | | $ | 368,689 | | | | N.A. | |
See Endnotes and Additional Disclosures in this report.
Past performance is no guarantee of future results. Returns are historical and are calculated by determining the percentage change in net asset value (NAV) or offering price (as applicable) with all distributions reinvested. Investment return and principal value will fluctuate so that shares, when redeemed, may be worth more or less than their original cost. Performance less than one year is cumulative. Performance is for the stated time period only; due to market volatility, the Fund’s current performance may be lower or higher than quoted. Returns are before taxes unless otherwise noted. For performance as of the most recent month end, please refer to eatonvance.com.
Eaton Vance
Pennsylvania Municipal Income Fund
July 31, 2014
Fund Profile
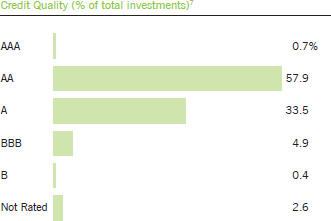
The above chart includes the ratings of securities held by special purpose vehicles established in connection with the RIB financing.6 Absent such securities, credit quality (% of total investments) is as follows:7
| | | | | | | | | | |
AAA | | | 0.7 | % | | BBB | | | 5.2 | % |
AA | | | 55.6 | | | B | | | 0.5 | |
A | | | 35.3 | | | Not Rated | | | 2.7 | |
See Endnotes and Additional Disclosures in this report.
Eaton Vance
Municipal Income Funds
July 31, 2014
Endnotes and Additional Disclosures
| 1 | The views expressed in this report are those of the portfolio manager(s) and are current only through the date stated at the top of this page. These views are subject to change at any time based upon market or other conditions, and Eaton Vance and the Fund(s) disclaim any responsibility to update such views. These views may not be relied upon as investment advice and, because investment decisions are based on many factors, may not be relied upon as an indication of trading intent on behalf of any Eaton Vance fund. This commentary may contain statements that are not historical facts, referred to as “forward looking statements”. The Fund’s actual future results may differ significantly from those stated in any forward looking statement, depending on factors such as changes in securities or financial markets or general economic conditions, the volume of sales and purchases of Fund shares, the continuation of investment advisory, administrative and service contracts, and other risks discussed from time to time in the Fund’s filings with the Securities and Exchange Commission. |
| 2 | Barclays Municipal Bond Index is an unmanaged index of municipal bonds traded in the U.S. Barclays 20 Year Municipal Bond Index is an unmanaged index of municipal bonds traded in the U.S. with maturities ranging from 17-22 years. Unless otherwise stated, index returns do not reflect the effect of any applicable sales charges, commissions, expenses, taxes or leverage, as applicable. It is not possible to invest directly in an index. |
| 3 | Total Returns at NAV do not include applicable sales charges. If sales charges were deducted, the returns would be lower. Total Returns shown with maximum sales charge reflect the stated maximum sales charge. Unless otherwise stated, performance does not reflect the deduction of taxes on Fund distributions or redemptions of Fund shares. |
| | Performance prior to the inception date of a class may be linked to the performance of an older class of the Fund. This linked performance is adjusted for any applicable sales charge, but is not adjusted for class expense differences. If adjusted for such differences, the performance would be different. Performance presented in the financial highlights included in the financial statements is not linked. In the performance table, the performance of Class C is linked to Class B and the performance of Class I is linked to Class A. For the New Jersey Municipal Income Fund, Class B shares were converted to Class A shares. Performance since inception for an index, if presented, is the performance since the Fund’s or oldest share class’ inception, as applicable. |
| 4 | Total annual operating expense ratios are as stated in the Fund’s most recent prospectus. Net expense ratio excludes interest expense relating to the Fund’s liability with respect to floating rate notes held by third parties in conjunction with residual interest bond transactions by the Fund. The Fund also records offsetting interest income in an amount equal to this expense relating to the municipal obligations underlying such transactions and, as a result, net asset value and performance have not been affected by this expense. |
| 5 | The Distribution Rate is based on the Fund’s last regular distribution per share in the period (annualized) divided by the Fund’s NAV at the end of the period. The Fund’s distributions may be comprised of amounts characterized for federal income tax purposes as tax-exempt income, qualified and non-qualified ordinary dividends, capital gains and nondividend distributions, also known as return of capital. The Fund will determine the federal income tax character of distributions paid to a shareholder after the end of the calendar year. This is reported on the IRS form 1099- DIV and provided to the shareholder shortly after each year-end. The Fund’s distributions are determined by the investment adviser based on its current assessment of the Fund’s long-term return potential. As portfolio and market conditions change, the rate of distributions paid by the Fund could change. Taxable-equivalent performance is based on the highest combined federal and state income tax rates, where applicable. Lower tax rates would result in lower tax-equivalent performance. Actual tax rates will vary depending on your income, exemptions and deductions. Rates do not include local taxes. SEC Yield is a standardized measure based on the estimated yield to maturity of a fund’s investments over a 30-day period and is based on the maximum offer price at the date specified. The SEC Yield is not based on the distributions made by the Fund, which may differ. |
| 6 | Fund employs RIB financing. The leverage created by RIB investments provides an opportunity for increased income but, at the same time, creates special risks (including the likelihood of greater volatility of NAV). The cost of leverage rises and falls with changes in short-term interest rates. See “Floating Rate Notes Issued in Conjunction with Securities Held” in the notes to the financial statements for more information about RIB financing. RIB leverage represents the amount of Floating Rate Notes outstanding at period end as a percentage of Fund net assets plus Floating Rate Notes. |
| 7 | Ratings are based on Moody’s, S&P or Fitch, as applicable. If securities are rated differently by the rating agencies, the higher rating is applied. Ratings, which are subject to change, apply to the creditworthiness of the issuers of the underlying securities and not to the Fund or its shares. Credit ratings measure the quality of a bond based on the issuer’s creditworthiness, with ratings ranging from AAA, being the highest, to D, being the lowest based on S&P’s measures. Ratings of BBB or higher by S&P or Fitch (Baa or higher by Moody’s) are considered to be investment grade quality. Credit ratings are based largely on the rating agency’s analysis at the time of rating. The rating assigned to any particular security is not necessarily a reflection of the issuer’s current financial condition and does not necessarily reflect its assessment of the volatility of a security’s market value or of the liquidity of an investment in the security. Holdings designated as “Not Rated” are not rated by the national rating agencies stated above. |
| | Fund profile subject to change due to active management. |
Eaton Vance
Municipal Income Funds
July 31, 2014
Fund Expenses
Example: As a Fund shareholder, you incur two types of costs: (1) transaction costs, including sales charges (loads) on purchases and redemption fees (if applicable); and (2) ongoing costs, including management fees; distribution and/or service fees; and other Fund expenses. This Example is intended to help you understand your ongoing costs (in dollars) of Fund investing and to compare these costs with the ongoing costs of investing in other mutual funds. The Example is based on an investment of $1,000 invested at the beginning of the period and held for the entire period (February 1, 2014 – July 31, 2014).
Actual Expenses: The first section of each table below provides information about actual account values and actual expenses. You may use the information in this section, together with the amount you invested, to estimate the expenses that you paid over the period. Simply divide your account value by $1,000 (for example, an $8,600 account value divided by $1,000 = 8.6), then multiply the result by the number in the first section under the heading entitled “Expenses Paid During Period” to estimate the expenses you paid on your account during this period.
Hypothetical Example for Comparison Purposes: The second section of each table below provides information about hypothetical account values and hypothetical expenses based on the actual Fund expense ratio and an assumed rate of return of 5% per year (before expenses), which is not the actual Fund return. The hypothetical account values and expenses may not be used to estimate the actual ending account balance or expenses you paid for the period. You may use this information to compare the ongoing costs of investing in your Fund and other funds. To do so, compare this 5% hypothetical example with the 5% hypothetical examples that appear in the shareholder reports of the other funds.
Please note that the expenses shown in each table are meant to highlight your ongoing costs only and do not reflect any transactional costs, such as sales charges (loads) or redemption fees (if applicable). Therefore, the second section of each table is useful in comparing ongoing costs only, and will not help you determine the relative total costs of owning different funds. In addition, if these transactional costs were included, your costs would be higher.
Eaton Vance Arizona Municipal Income Fund
| | | | | | | | | | | | | | | | |
| | | Beginning
Account Value
(2/1/14) | | | Ending
Account Value
(7/31/14) | | | Expenses Paid
During Period*
(2/1/14 – 7/31/14) | | | Annualized
Expense
Ratio | |
| | | | |
| | | | | | | | | | | | | | | | |
Actual | | | | | | | | | | | | | | | | |
Class A | | $ | 1,000.00 | | | $ | 1,043.70 | | | $ | 3.80 | | | | 0.75 | % |
Class B | | $ | 1,000.00 | | | $ | 1,039.40 | | | $ | 7.64 | | | | 1.51 | % |
Class C | | $ | 1,000.00 | | | $ | 1,039.30 | | | $ | 7.58 | | | | 1.50 | % |
Class I | | $ | 1,000.00 | | | $ | 1,043.70 | | | $ | 2.79 | | | | 0.55 | % |
| | | | | | | | | | | | | | | | | |
| | | | |
| | | | | | | | | | | | | | | | |
Hypothetical | | | | | | | | | | | | | | | | |
(5% return per year before expenses) | | | | | | | | | | | | | | | | |
Class A | | $ | 1,000.00 | | | $ | 1,021.10 | | | $ | 3.76 | | | | 0.75 | % |
Class B | | $ | 1,000.00 | | | $ | 1,017.30 | | | $ | 7.55 | | | | 1.51 | % |
Class C | | $ | 1,000.00 | | | $ | 1,017.40 | | | $ | 7.50 | | | | 1.50 | % |
Class I | | $ | 1,000.00 | | | $ | 1,022.10 | | | $ | 2.76 | | | | 0.55 | % |
| * | Expenses are equal to the Fund’s annualized expense ratio for the indicated Class, multiplied by the average account value over the period, multiplied by 181/365 (to reflect the one-half year period). The Example assumes that the $1,000 was invested at the net asset value per share determined at the close of business on January 31, 2014. |
Eaton Vance
Municipal Income Funds
July 31, 2014
Fund Expenses — continued
Eaton Vance Connecticut Municipal Income Fund
| | | | | | | | | | | | | | | | |
| | | Beginning
Account Value
(2/1/14) | | | Ending
Account Value
(7/31/14) | | | Expenses Paid
During Period*
(2/1/14 – 7/31/14) | | | Annualized
Expense
Ratio | |
| | | | |
| | | | | | | | | | | | | | | | |
Actual | | | | | | | | | | | | | | | | |
Class A | | $ | 1,000.00 | | | $ | 1,043.20 | | | $ | 3.85 | | | | 0.76 | % |
Class B | | $ | 1,000.00 | | | $ | 1,039.40 | | | $ | 7.64 | | | | 1.51 | % |
Class C | | $ | 1,000.00 | | | $ | 1,039.40 | | | $ | 7.64 | | | | 1.51 | % |
Class I | | $ | 1,000.00 | | | $ | 1,044.20 | | | $ | 2.84 | | | | 0.56 | % |
| | | | | | | | | | | | | | | | | |
| | | | |
| | | | | | | | | | | | | | | | |
Hypothetical | | | | | | | | | | | | | | | | |
(5% return per year before expenses) | | | | | | | | | | | | | | | | |
Class A | | $ | 1,000.00 | | | $ | 1,021.00 | | | $ | 3.81 | | | | 0.76 | % |
Class B | | $ | 1,000.00 | | | $ | 1,017.30 | | | $ | 7.55 | | | | 1.51 | % |
Class C | | $ | 1,000.00 | | | $ | 1,017.30 | | | $ | 7.55 | | | | 1.51 | % |
Class I | | $ | 1,000.00 | | | $ | 1,022.00 | | | $ | 2.81 | | | | 0.56 | % |
| * | Expenses are equal to the Fund’s annualized expense ratio for the indicated Class, multiplied by the average account value over the period, multiplied by 181/365 (to reflect the one-half year period). The Example assumes that the $1,000 was invested at the net asset value per share determined at the close of business on January 31, 2014. |
Eaton Vance Minnesota Municipal Income Fund
| | | | | | | | | | | | | | | | |
| | | Beginning
Account Value
(2/1/14) | | | Ending
Account Value
(7/31/14) | | | Expenses Paid
During Period*
(2/1/14 – 7/31/14) | | | Annualized
Expense
Ratio | |
| | | | |
| | | | | | | | | | | | | | | | |
Actual | | | | | | | | | | | | | | | | |
Class A | | $ | 1,000.00 | | | $ | 1,037.00 | | | $ | 3.59 | | | | 0.71 | % |
Class B | | $ | 1,000.00 | | | $ | 1,033.70 | | | $ | 7.36 | | | | 1.46 | % |
Class C | | $ | 1,000.00 | | | $ | 1,032.70 | | | $ | 7.36 | | | | 1.46 | % |
Class I | | $ | 1,000.00 | | | $ | 1,038.00 | | | $ | 2.58 | | | | 0.51 | % |
| | | | | | | | | | | | | | | | | |
| | | | |
| | | | | | | | | | | | | | | | |
Hypothetical | | | | | | | | | | | | | | | | |
(5% return per year before expenses) | | | | | | | | | | | | | | | | |
Class A | | $ | 1,000.00 | | | $ | 1,021.30 | | | $ | 3.56 | | | | 0.71 | % |
Class B | | $ | 1,000.00 | | | $ | 1,017.60 | | | $ | 7.30 | | | | 1.46 | % |
Class C | | $ | 1,000.00 | | | $ | 1,017.60 | | | $ | 7.30 | | | | 1.46 | % |
Class I | | $ | 1,000.00 | | | $ | 1,022.30 | | | $ | 2.56 | | | | 0.51 | % |
| * | Expenses are equal to the Fund’s annualized expense ratio for the indicated Class, multiplied by the average account value over the period, multiplied by 181/365 (to reflect the one-half year period). The Example assumes that the $1,000 was invested at the net asset value per share determined at the close of business on January 31, 2014. |
Eaton Vance
Municipal Income Funds
July 31, 2014
Fund Expenses — continued
Eaton Vance New Jersey Municipal Income Fund
| | | | | | | | | | | | | | | | |
| | | Beginning
Account Value
(2/1/14) | | | Ending
Account Value
(7/31/14) | | | Expenses Paid
During Period*
(2/1/14 – 7/31/14) | | | Annualized
Expense
Ratio | |
| | | | |
| | | | | | | | | | | | | | | | |
Actual | | | | | | | | | | | | | | | | |
Class A | | $ | 1,000.00 | | | $ | 1,038.60 | | | $ | 3.79 | | | | 0.75 | % |
Class C | | $ | 1,000.00 | | | $ | 1,033.90 | | | $ | 7.56 | | | | 1.50 | % |
Class I | | $ | 1,000.00 | | | $ | 1,038.40 | | | $ | 2.83 | | | | 0.56 | % |
| | | | | | | | | | | | | | | | | |
| | | | |
| | | | | | | | | | | | | | | | |
Hypothetical | | | | | | | | | | | | | | | | |
(5% return per year before expenses) | | | | | | | | | | | | | | | | |
Class A | | $ | 1,000.00 | | | $ | 1,021.10 | | | $ | 3.76 | | | | 0.75 | % |
Class C | | $ | 1,000.00 | | | $ | 1,017.40 | | | $ | 7.50 | | | | 1.50 | % |
Class I | | $ | 1,000.00 | | | $ | 1,022.00 | | | $ | 2.81 | | | | 0.56 | % |
| * | Expenses are equal to the Fund’s annualized expense ratio for the indicated Class, multiplied by the average account value over the period, multiplied by 181/365 (to reflect the one-half year period). The Example assumes that the $1,000 was invested at the net asset value per share determined at the close of business on January 31, 2014. |
Eaton Vance Pennsylvania Municipal Income Fund
| | | | | | | | | | | | | | | | |
| | | Beginning
Account Value
(2/1/14) | | | Ending
Account Value
(7/31/14) | | | Expenses Paid
During Period*
(2/1/14 – 7/31/14) | | | Annualized
Expense
Ratio | |
| | | | |
| | | | | | | | | | | | | | | | |
Actual | | | | | | | | | | | | | | | | |
Class A | | $ | 1,000.00 | | | $ | 1,036.70 | | | $ | 3.94 | | | | 0.78 | % |
Class B | | $ | 1,000.00 | | | $ | 1,033.40 | | | $ | 7.71 | | | | 1.53 | % |
Class C | | $ | 1,000.00 | | | $ | 1,032.30 | | | $ | 7.71 | | | | 1.53 | % |
Class I | | $ | 1,000.00 | | | $ | 1,037.60 | | | $ | 2.93 | | | | 0.58 | % |
| | | | | | | | | | | | | | | | | |
| | | | |
| | | | | | | | | | | | | | | | |
Hypothetical | | | | | | | | | | | | | | | | |
(5% return per year before expenses) | | | | | | | | | | | | | | | | |
Class A | | $ | 1,000.00 | | | $ | 1,020.90 | | | $ | 3.91 | | | | 0.78 | % |
Class B | | $ | 1,000.00 | | | $ | 1,017.20 | | | $ | 7.65 | | | | 1.53 | % |
Class C | | $ | 1,000.00 | | | $ | 1,017.20 | | | $ | 7.65 | | | | 1.53 | % |
Class I | | $ | 1,000.00 | | | $ | 1,021.90 | | | $ | 2.91 | | | | 0.58 | % |
| * | Expenses are equal to the Fund’s annualized expense ratio for the indicated Class, multiplied by the average account value over the period, multiplied by 181/365 (to reflect the one-half year period). The Example assumes that the $1,000 was invested at the net asset value per share determined at the close of business on January 31, 2014. |
Eaton Vance
Arizona Municipal Income Fund
July 31, 2014
Portfolio of Investments
| | | | | | | | |
| Tax-Exempt Investments — 97.9% | |
| | |
| | | | | | | | |
| Security | | Principal
Amount
(000’s omitted) | | | Value | |
|
Bond Bank — 1.7% | |
Arizona Water Infrastructure Finance Authority, 5.00%, 10/1/30 | | $ | 1,000 | | | $ | 1,174,660 | |
| | |
| | | | | | $ | 1,174,660 | |
| | |
|
Education — 6.5% | |
Arizona Board of Regents, (Arizona State University), 5.00%, 7/1/37 | | $ | 1,000 | | | $ | 1,104,730 | |
Arizona Board of Regents, (University of Arizona), 5.00%, 6/1/33 | | | 1,500 | | | | 1,660,605 | |
Glendale Industrial Development Authority, (Midwestern University), 5.00%, 5/15/25 | | | 1,500 | | | | 1,657,740 | |
| | |
| | | | | | $ | 4,423,075 | |
| | |
|
Electric Utilities — 7.3% | |
Pima County Industrial Development Authority, (Tucson Electric Power Co.), 5.25%, 10/1/40 | | $ | 1,500 | | | $ | 1,601,910 | |
Pinal County Electrical District No. 3, 5.25%, 7/1/36 | | | 1,000 | | | | 1,097,310 | |
Salt River Agricultural Improvement and Power District, 5.00%, 1/1/33 | | | 1,000 | | | | 1,121,470 | |
Salt River Agricultural Improvement and Power District, 5.00%, 1/1/39(1) | | | 1,000 | | | | 1,117,440 | |
| | |
| | | | | | $ | 4,938,130 | |
| | |
|
Escrowed / Prerefunded — 9.5% | |
Maricopa County, SFMR, Escrowed to Maturity, 0.00%, 2/1/16 | | $ | 3,000 | | | $ | 2,989,440 | |
Phoenix Industrial Development Authority, SFMR, Escrowed to Maturity, 0.00%, 12/1/14 | | | 3,500 | | | | 3,498,740 | |
| | |
| | | | | | $ | 6,488,180 | |
| | |
|
General Obligations — 4.9% | |
Kyrene Elementary School District No. 28, Maricopa County, 5.50%, (1.00% to 6/30/15), 7/1/30 | | $ | 200 | | | $ | 224,984 | |
Maricopa County Community College District, 3.00%, 7/1/23 | | | 785 | | | | 811,517 | |
Tempe, 5.375%, 7/1/21 | | | 1,600 | | | | 1,914,736 | |
Western Maricopa Education Center District No. 402, 4.50%, 7/1/34(2) | | | 350 | | | | 375,613 | |
| | |
| | | | | | $ | 3,326,850 | |
| | |
|
Health Care – Miscellaneous — 1.1% | |
Yavapai County Industrial Development Authority, (West Yavapai Guidance Clinic), 6.25%, 12/1/36 | | $ | 435 | | | $ | 444,744 | |
Yavapai County Industrial Development Authority, (West Yavapai Guidance Clinic), 6.625%, 8/15/24 | | | 310 | | | | 310,422 | |
| | |
| | | | | | $ | 755,166 | |
| | |
| | | | | | | | |
| Security | | Principal
Amount
(000’s omitted) | | | Value | |
|
Hospital — 14.1% | |
Arizona Health Facilities Authority, (Banner Health System), 5.00%, 1/1/35 | | $ | 2,000 | | | $ | 2,101,360 | |
Glendale Industrial Development Authority, (John C. Lincoln Health Network), 5.00%, 12/1/28 | | | 1,275 | | | | 1,293,475 | |
Maricopa County Industrial Development Authority, (Catholic Healthcare West), 5.25%, 7/1/32 | | | 1,000 | | | | 1,044,980 | |
Maricopa County Industrial Development Authority, (Catholic Healthcare West), 5.50%, 7/1/26 | | | 500 | | | | 501,960 | |
Maricopa County Industrial Development Authority, (Mayo Clinic), 5.00%, 11/15/36 | | | 1,450 | | | | 1,526,676 | |
Scottsdale Industrial Development Authority, (Scottsdale Healthcare), 5.25%, 9/1/30 | | | 1,500 | | | | 1,501,440 | |
Yavapai County Industrial Development Authority, (Yavapai Regional Medical Center), 5.25%, 8/1/33 | | | 500 | | | | 544,875 | |
Yuma Industrial Development Authority, (Yuma Regional Medical Center), 5.00%, 8/1/32 | | | 985 | | | | 1,080,003 | |
| | |
| | | | | | $ | 9,594,769 | |
| | |
|
Industrial Development Revenue — 2.2% | |
Maricopa County Pollution Control Corp., (El Paso Electric Co.), 4.50%, 8/1/42 | | $ | 850 | | | $ | 858,253 | |
Phoenix Industrial Development Authority, (America West Airlines, Inc.), (AMT), Prerefunded to 12/1/14, 6.25%, 6/1/19 | | | 650 | | | | 662,734 | |
| | |
| | | | | | $ | 1,520,987 | |
| | |
|
Insured – Electric Utilities — 2.2% | |
Mesa Utility Systems, (NPFG), 5.00%, 7/1/23 | | $ | 1,000 | | | $ | 1,205,370 | |
Puerto Rico Electric Power Authority, (NPFG), 5.25%, 7/1/29 | | | 320 | | | | 292,710 | |
| | |
| | | | | | $ | 1,498,080 | |
| | |
|
Insured – Escrowed / Prerefunded — 1.6% | |
Maricopa County Industrial Development Authority, (Samaritan Health Services), (NPFG), Escrowed to Maturity, 7.00%, 12/1/16 | | $ | 1,000 | | | $ | 1,066,770 | |
| | |
| | | | | | $ | 1,066,770 | |
| | |
|
Insured – General Obligations — 7.7% | |
Apache Junction Unified School District No. 43, (AGM), 5.00%, 7/1/24 | | $ | 1,200 | | | $ | 1,446,240 | |
Goodyear, (NPFG), 3.00%, 7/1/26 | | | 250 | | | | 249,998 | |
Maricopa County Elementary School District No. 3, (AGM), 5.00%, 7/1/25 | | | 2,920 | | | | 3,565,232 | |
| | |
| | | | | | $ | 5,261,470 | |
| | |
| | | | |
| | 18 | | See Notes to Financial Statements. |
Eaton Vance
Arizona Municipal Income Fund
July 31, 2014
Portfolio of Investments — continued
| | | | | | | | |
| Security | | Principal
Amount
(000’s omitted) | | | Value | |
|
Insured – Hospital — 1.8% | |
Arizona Health Facilities Authority, (Arizona Healthcare Systems), (NPFG), 5.50%, 6/1/15 | | $ | 1,195 | | | $ | 1,235,355 | |
| | |
| | | | | | $ | 1,235,355 | |
| | |
|
Insured – Lease Revenue / Certificates of Participation — 3.0% | |
Phoenix Civic Improvement Corp., (Civic Plaza), (NPFG), 5.50%, 7/1/41 | | $ | 1,635 | | | $ | 2,041,625 | |
| | |
| | | | | | $ | 2,041,625 | |
| | |
|
Insured – Special Tax Revenue — 2.4% | |
Arizona Sports and Tourism Authority, (Multipurpose Stadium Facility), (NPFG), 4.50%, 7/1/24 | | $ | 915 | | | $ | 925,568 | |
Glendale, Transportation Excise Tax Revenue, (NPFG), 4.50%, 7/1/32 | | | 580 | | | | 598,618 | |
Puerto Rico Sales Tax Financing Corp., (NPFG), 0.00%, 8/1/46 | | | 630 | | | | 76,470 | |
| | |
| | | | | | $ | 1,600,656 | |
| | |
|
Insured – Transportation — 3.6% | |
Pima County, Street and Highway Revenue, (AMBAC), 3.25%, 7/1/22 | | $ | 700 | | | $ | 722,057 | |
Puerto Rico Highway and Transportation Authority, (AGC), (CIFG), 5.25%, 7/1/41 | | | 1,900 | | | | 1,689,271 | |
| | |
| | | | | | $ | 2,411,328 | |
| | |
|
Insured – Water and Sewer — 1.4% | |
Phoenix Civic Improvement Corp., Wastewater System Revenue, (AGM), (NPFG), 5.00%, 7/1/37 | | $ | 885 | | | $ | 965,508 | |
| | |
| | | | | | $ | 965,508 | |
| | |
|
Lease Revenue / Certificates of Participation — 1.3% | |
Mohave County Industrial Development Authority, (Mohave Prison LLC), 8.00%, 5/1/25 | | $ | 750 | | | $ | 862,373 | |
| | |
| | | | | | $ | 862,373 | |
| | |
|
Other Revenue — 1.6% | |
Salt Verde Financial Corp., Senior Gas Revenue, 5.00%, 12/1/37 | | $ | 1,000 | | | $ | 1,094,620 | |
| | |
| | | | | | $ | 1,094,620 | |
| | |
|
Senior Living / Life Care — 0.4% | |
Tempe Industrial Development Authority, (Friendship Village of Tempe), 6.00%, 12/1/32 | | $ | 230 | | | $ | 242,082 | |
| | |
| | | | | | $ | 242,082 | |
| | |
| | | | | | | | |
| Security | | Principal
Amount
(000’s omitted) | | | Value | |
|
Special Tax Revenue — 17.0% | |
Arizona Sports and Tourism Authority, (Multipurpose Stadium Facility), 5.00%, 7/1/29 | | $ | 1,000 | | | $ | 1,082,410 | |
Gilbert Public Facilities Municipal Property Corp., 5.50%, 7/1/27 | | | 1,000 | | | | 1,145,850 | |
Guam, Limited Obligation Bonds, 5.625%, 12/1/29 | | | 270 | | | | 295,823 | |
Guam, Limited Obligation Bonds, 5.75%, 12/1/34 | | | 295 | | | | 323,337 | |
Mesa, Excise Tax Revenue, 5.00%, 7/1/32 | | | 1,000 | | | | 1,106,190 | |
Pima County Regional Transportation Authority, Excise Tax Revenue, 5.00%, 6/1/24 | | | 1,000 | | | | 1,181,490 | |
Scottsdale Municipal Property Corp., 5.00%, 7/1/30 | | | 2,500 | | | | 3,020,450 | |
Scottsdale Municipal Property Corp., 5.00%, 7/1/34 | | | 1,000 | | | | 1,206,880 | |
Tempe, Transit Excise Tax Revenue, 5.00%, 7/1/33 | | | 1,000 | | | | 1,115,670 | |
Tempe, Transit Excise Tax Revenue, 5.00%, 7/1/37 | | | 1,000 | | | | 1,098,920 | |
| | |
| | | | | | $ | 11,577,020 | |
| | |
|
Transportation — 6.6% | |
Arizona Transportation Board, Highway Revenue, 5.00%, 7/1/32 | | $ | 2,000 | | | $ | 2,231,340 | |
Phoenix Civic Improvement Corp., Airport Revenue, (AMT), 5.00%, 7/1/31 | | | 2,000 | | | | 2,225,600 | |
| | |
| | | | | | $ | 4,456,940 | |
| | |
| |
Total Tax-Exempt Investments — 97.9%
(identified cost $61,583,406) | | | $ | 66,535,644 | |
| | |
| |
Other Assets, Less Liabilities — 2.1% | | | $ | 1,439,380 | |
| | |
| |
Net Assets — 100.0% | | | $ | 67,975,024 | |
| | |
The percentage shown for each investment category in the Portfolio of Investments is based on net assets.
| | | | |
| AGC | | – | | Assured Guaranty Corp. |
| AGM | | – | | Assured Guaranty Municipal Corp. |
| AMBAC | | – | | AMBAC Financial Group, Inc. |
| AMT | | – | | Interest earned from these securities may be considered a tax preference item for purposes of the Federal Alternative Minimum Tax. |
| CIFG | | – | | CIFG Assurance North America, Inc. |
| NPFG | | – | | National Public Finance Guaranty Corp. |
| SFMR | | – | | Single Family Mortgage Revenue |
The Fund invests primarily in debt securities issued by Arizona municipalities. The ability of the issuers of the debt securities to meet their obligations may be affected by economic developments in a specific industry or municipality. In order to reduce the risk associated with such economic developments, at July 31, 2014, 24.2% of total investments are backed by bond insurance of various financial institutions and financial guaranty assurance agencies. The aggregate percentage insured by an individual financial institution or financial guaranty assurance agency ranged from 1.1% to 13.0% of total investments.
| (1) | Security (or a portion thereof) has been segregated to cover payable for when-issued securities. |
| (2) | When-issued security. |
| | | | |
| | 19 | | See Notes to Financial Statements. |
Eaton Vance
Connecticut Municipal Income Fund
July 31, 2014
Portfolio of Investments
| | | | | | | | |
| Tax-Exempt Investments — 101.2% | |
| | |
| | | | | | | | |
| Security | | Principal
Amount
(000’s omitted) | | | Value | |
| | | | | | | | |
|
Bond Bank — 3.1% | |
Connecticut, (Revolving Fund), 5.00%, 6/1/24 | | $ | 1,000 | | | $ | 1,163,720 | |
Connecticut, (Revolving Fund), 5.00%, 6/1/25 | | | 1,500 | | | | 1,739,505 | |
| | | | | | | | | |
| | | | | | $ | 2,903,225 | |
| | | | | | | | | |
|
Education — 16.7% | |
Connecticut Health and Educational Facilities Authority, (Brunswick School), 5.00%, 7/1/31 | | $ | 500 | | | $ | 556,390 | |
Connecticut Health and Educational Facilities Authority, (Brunswick School), 5.00%, 7/1/32 | | | 1,125 | | | | 1,246,927 | |
Connecticut Health and Educational Facilities Authority, (Connecticut College), 5.00%, 7/1/30 | | | 1,255 | | | | 1,390,101 | |
Connecticut Health and Educational Facilities Authority, (Fairfield University), 5.00%, 7/1/34 | | | 1,000 | | | | 1,092,550 | |
Connecticut Health and Educational Facilities Authority, (Fairfield University), 5.00%, 7/1/40 | | | 1,500 | | | | 1,588,410 | |
Connecticut Health and Educational Facilities Authority, (Sacred Heart University), 5.00%, 7/1/21 | | | 1,005 | | | | 1,126,384 | |
Connecticut Health and Educational Facilities Authority, (Wesleyan University), 5.00%, 7/1/39 | | | 2,000 | | | | 2,215,560 | |
Connecticut Health and Educational Facilities Authority, (Yale University), 4.85%, 7/1/37(1) | | | 5,000 | | | | 5,436,600 | |
University of Connecticut, 5.00%, 11/15/29 | | | 1,000 | | | | 1,152,500 | |
| | | | | | | | | |
| | | | | | $ | 15,805,422 | |
| | | | | | | | | |
|
General Obligations — 22.5% | |
Connecticut, 4.875%, 11/1/20 | | $ | 1,475 | | | $ | 1,686,898 | |
Connecticut, 5.00%, 2/15/29 | | | 1,000 | | | | 1,145,930 | |
Danbury, 4.00%, 8/1/26 | | | 380 | | | | 409,872 | |
Danbury, 4.00%, 8/1/27 | | | 1,000 | | | | 1,071,590 | |
East Lyme, 4.00%, 7/15/22 | | | 350 | | | | 390,894 | |
East Lyme, 4.00%, 7/15/23 | | | 525 | | | | 582,183 | |
East Lyme, 4.25%, 7/15/24 | | | 250 | | | | 280,945 | |
East Lyme, 4.25%, 7/15/25 | | | 250 | | | | 278,343 | |
Fairfield, 4.25%, 7/15/26 | | | 250 | | | | 263,168 | |
Fairfield, 5.00%, 1/1/23 | | | 1,000 | | | | 1,220,490 | |
Hartford, 5.00%, 4/1/31 | | | 1,500 | | | | 1,653,315 | |
North Haven, 5.00%, 7/15/23 | | | 1,475 | | | | 1,801,801 | |
North Haven, 5.00%, 7/15/25 | | | 1,490 | | | | 1,831,046 | |
Norwalk, 4.00%, 7/1/26 | | | 1,975 | | | | 2,155,535 | |
Norwalk, 4.00%, 7/15/27 | | | 1,000 | | | | 1,080,460 | |
Redding, 5.50%, 10/15/18 | | | 400 | | | | 474,952 | |
Redding, 5.625%, 10/15/19 | | | 650 | | | | 791,394 | |
Stamford, 4.00%, 7/1/25 | | | 370 | | | | 407,892 | |
| | | | | | | | |
| Security | | Principal
Amount
(000’s omitted) | | | Value | |
| | | | | | | | |
|
General Obligations (continued) | |
University of Connecticut, State General Obligation, 5.00%, 2/15/21 | | $ | 1,315 | | | $ | 1,520,811 | |
University of Connecticut, State General Obligation, 5.00%, 2/15/28 | | | 875 | | | | 993,247 | |
Wilton, 5.25%, 7/15/18 | | | 535 | | | | 626,052 | |
Wilton, 5.25%, 7/15/19 | | | 535 | | | | 638,795 | |
| | | | | | | | | |
| | | | | | $ | 21,305,613 | |
| | | | | | | | | |
|
Hospital — 6.5% | |
Connecticut Health and Educational Facilities Authority, (Ascension Health), 5.00%, 11/15/40 | | $ | 1,000 | | | $ | 1,079,060 | |
Connecticut Health and Educational Facilities Authority, (Middlesex Hospital), 5.00%, 7/1/24 | | | 1,000 | | | | 1,104,990 | |
Connecticut Health and Educational Facilities Authority, (Western Connecticut Health Network), 5.00%, 7/1/29 | | | 1,000 | | | | 1,077,400 | |
Connecticut Health and Educational Facilities Authority, (Yale-New Haven Health Services Corp.), 5.00%, 7/1/34 | | | 1,520 | | | | 1,688,735 | |
Connecticut Health and Educational Facilities Authority, (Yale-New Haven Hospital), 5.75%, 7/1/34 | | | 1,000 | | | | 1,233,710 | |
| | | | | | | | | |
| | | | | | $ | 6,183,895 | |
| | | | | | | | | |
|
Industrial Development Revenue — 8.2% | |
Connecticut Development Authority, (Signature Flight Support Corp.), (AMT), 6.625%, 12/1/14 | | $ | 525 | | | $ | 523,934 | |
Connecticut Resources Recovery Authority, (American REF-FUEL Co.), (AMT), 6.45%, 11/15/22 | | | 2,750 | | | | 2,754,400 | |
Eastern Connecticut Resource Recovery Authority, (Wheelabrator Lisbon), (AMT), 5.50%, 1/1/20 | | | 4,500 | | | | 4,507,695 | |
| | | | | | | | | |
| | | | | | $ | 7,786,029 | |
| | | | | | | | | |
|
Insured – Education — 17.7% | |
Connecticut Health and Educational Facilities Authority, (Loomis Chaffee School), (AMBAC), 5.25%, 7/1/30 | | $ | 1,950 | | | $ | 2,477,768 | |
Connecticut Health and Educational Facilities Authority, (Loomis Chaffee School), (AMBAC), 5.25%, 7/1/31 | | | 2,050 | | | | 2,609,589 | |
Connecticut Health and Educational Facilities Authority, (Quinnipiac University), (BHAC), (NPFG), 5.00%, 7/1/37 | | | 1,920 | | | | 2,136,710 | |
Connecticut Health and Educational Facilities Authority, (Quinnipiac University), (NPFG), 5.75%, 7/1/33 | | | 2,500 | | | | 2,842,375 | |
Connecticut Health and Educational Facilities Authority, (Sacred Heart University), (AGM), 5.00%, 7/1/28 | | | 500 | | | | 547,290 | |
Connecticut Health and Educational Facilities Authority, (Trinity College), (NPFG), 5.50%, 7/1/21 | | | 5,305 | | | | 6,189,343 | |
| | | | | | | | | |
| | | | | | $ | 16,803,075 | |
| | | | | | | | | |
| | | | |
| | 20 | | See Notes to Financial Statements. |
Eaton Vance
Connecticut Municipal Income Fund
July 31, 2014
Portfolio of Investments — continued
| | | | | | | | |
| Security | | Principal
Amount
(000’s omitted) | | | Value | |
| | | | | | | | |
|
Insured – Escrowed / Prerefunded — 1.2% | |
Connecticut Health and Educational Facilities Authority, (William W. Backus Hospital), (AGM), Prerefunded to 7/1/18, 5.125%, 7/1/35 | | $ | 1,000 | | | $ | 1,159,090 | |
| | | | | | | | | |
| | | | | | $ | 1,159,090 | |
| | | | | | | | | |
|
Insured – General Obligations — 6.0% | |
Bridgeport, (AGM), 4.00%, 8/15/21 | | $ | 1,500 | | | $ | 1,641,420 | |
Connecticut, (AMBAC), 5.25%, 6/1/20 | | | 1,000 | | | | 1,201,150 | |
Hartford, (AGC), 5.00%, 8/15/28 | | | 1,000 | | | | 1,087,260 | |
Hartford, (AGM), 5.00%, 4/1/31 | | | 440 | | | | 481,083 | |
Hartford, (AGM), Prerefunded to 4/1/22, 5.00%, 4/1/31 | | | 185 | | | | 225,295 | |
University of Connecticut, (NPFG), 5.00%, 2/15/24 | | | 1,000 | | | | 1,069,780 | |
| | | | | | | | | |
| | | | | | $ | 5,705,988 | |
| | | | | | | | | |
|
Insured – Special Tax Revenue — 0.1% | |
Puerto Rico Sales Tax Financing Corp., (NPFG), 0.00%, 8/1/46 | | $ | 1,085 | | | $ | 131,697 | |
| | | | | | | | | |
| | | | | | $ | 131,697 | |
| | | | | | | | | |
|
Insured – Transportation — 5.3% | |
Puerto Rico Highway and Transportation Authority, (AGC), (CIFG), 5.25%, 7/1/41 | | $ | 3,900 | | | $ | 3,467,451 | |
Puerto Rico Highway and Transportation Authority, (AMBAC), 0.00%, 7/1/16 | | | 1,750 | | | | 1,549,118 | |
| | | | | | | | | |
| | | | | | $ | 5,016,569 | |
| | | | | | | | | |
|
Insured – Water and Sewer — 5.9% | |
South Central Connecticut Regional Water Authority, (NPFG), 5.25%, 8/1/24 | | $ | 3,420 | | | $ | 4,216,381 | |
South Central Connecticut Regional Water Authority, (NPFG), 5.25%, 8/1/32 | | | 1,200 | | | | 1,327,452 | |
| | | | | | | | | |
| | | | | | $ | 5,543,833 | |
| | | | | | | | | |
|
Senior Living / Life Care — 1.1% | |
Connecticut Development Authority, (Alzheimers Resource Center), 5.50%, 8/15/27 | | $ | 1,000 | | | $ | 1,025,520 | |
| | | | | | | | | |
| | | | | | $ | 1,025,520 | |
| | | | | | | | | |
|
Special Tax Revenue — 2.8% | |
Connecticut, Special Tax Obligation, (Transportation Infrastructure), 5.00%, 1/1/29 | | $ | 2,000 | | | $ | 2,305,980 | |
Guam, Limited Obligation Bonds, 5.625%, 12/1/29 | | | 135 | | | | 147,911 | |
Guam, Limited Obligation Bonds, 5.75%, 12/1/34 | | | 150 | | | | 164,409 | |
| | | | | | | | | |
| | | | | | $ | 2,618,300 | |
| | | | | | | | | |
| | | | | | | | |
| Security | | Principal
Amount
(000’s omitted) | | | Value | |
| | | | | | | | |
|
Student Loan — 1.1% | |
Connecticut Higher Education Supplemental Loan Authority, (AMT), 4.00%, 11/15/30 | | $ | 1,000 | | | $ | 1,003,410 | |
| | | | | | | | | |
| | | | | | $ | 1,003,410 | |
| | | | | | | | | |
|
Water and Sewer — 3.0% | |
Greater New Haven Water Pollution Control Authority, 5.00%, 8/15/32 | | $ | 1,000 | | | $ | 1,129,200 | |
Hartford County Metropolitan District, (Clean Water), 5.00%, 4/1/36 | | | 1,500 | | | | 1,669,815 | |
| | | | | | | | | |
| | | | | | $ | 2,799,015 | |
| | | | | | | | | |
| |
Total Tax-Exempt Investments — 101.2%
(identified cost $89,133,914) | | | $ | 95,790,681 | |
| | | | | | | | | |
| |
Other Assets, Less Liabilities — (1.2)% | | | $ | (1,145,702 | ) |
| | | | | | | | | |
| |
Net Assets — 100.0% | | | $ | 94,644,979 | |
| | | | | | | | | |
The percentage shown for each investment category in the Portfolio of Investments is based on net assets.
| | | | |
| AGC | | – | | Assured Guaranty Corp. |
| AGM | | – | | Assured Guaranty Municipal Corp. |
| AMBAC | | – | | AMBAC Financial Group, Inc. |
| AMT | | – | | Interest earned from these securities may be considered a tax preference item for purposes of the Federal Alternative Minimum Tax. |
| BHAC | | – | | Berkshire Hathaway Assurance Corp. |
| CIFG | | – | | CIFG Assurance North America, Inc. |
| NPFG | | – | | National Public Finance Guaranty Corp. |
The Fund invests primarily in debt securities issued by Connecticut municipalities. The ability of the issuers of the debt securities to meet their obligations may be affected by economic developments in a specific industry or municipality. In order to reduce the risk associated with such economic developments, at July 31, 2014, 35.9% of total investments are backed by bond insurance of various financial institutions and financial guaranty assurance agencies. The aggregate percentage insured by an individual financial institution or financial guaranty assurance agency ranged from 2.2% to 18.7% of total investments.
| (1) | Security represents the municipal bond held by a trust that issues residual interest bonds (see Note 1I). |
| | | | |
| | 21 | | See Notes to Financial Statements. |
Eaton Vance
Minnesota Municipal Income Fund
July 31, 2014
Portfolio of Investments
| | | | | | | | |
| Tax-Exempt Investments — 97.9% | |
| | |
| | | | | | | | |
| Security | | Principal
Amount
(000’s omitted) | | | Value | |
| | | | | | | | |
|
Bond Bank — 2.2% | |
Minnesota Public Facilities Authority, (Revolving Fund), 5.00%, 3/1/22 | | $ | 2,000 | | | $ | 2,382,660 | |
| | | | | | | | | |
| | | | | | $ | 2,382,660 | |
| | | | | | | | | |
|
Education — 12.6% | |
Minnesota Higher Education Facilities Authority, (Carleton College), 5.00%, 1/1/28 | | $ | 1,000 | | | $ | 1,106,440 | |
Minnesota Higher Education Facilities Authority, (Carleton College), 5.00%, 3/1/40 | | | 1,500 | | | | 1,646,340 | |
Minnesota Higher Education Facilities Authority, (Gustavus Adolphus College), 5.00%, 10/1/31 | | | 1,000 | | | | 1,107,440 | |
Minnesota Higher Education Facilities Authority, (St. Catherine University), 5.00%, 10/1/26 | | | 280 | | | | 304,718 | |
Minnesota Higher Education Facilities Authority, (St. Catherine University), 5.00%, 10/1/27 | | | 310 | | | | 336,347 | |
Minnesota Higher Education Facilities Authority, (St. Catherine University), 5.00%, 10/1/32 | | | 700 | | | | 742,560 | |
Minnesota Higher Education Facilities Authority, (University of St. Thomas), 5.00%, 10/1/39 | | | 1,000 | | | | 1,085,550 | |
Minnesota Higher Education Facilities Authority, (University of St. Thomas), 5.25%, 4/1/39 | | | 1,475 | | | | 1,602,263 | |
Minnesota State Colleges and Universities, 5.00%, 10/1/28 | | | 1,375 | | | | 1,560,350 | |
Minnesota State Colleges and Universities, 5.00%, 10/1/30 | | | 1,455 | | | | 1,639,843 | |
University of Minnesota, 5.00%, 12/1/36 | | | 500 | | | | 573,830 | |
University of Minnesota, 5.125%, 4/1/34 | | | 1,000 | | | | 1,134,030 | |
University of Minnesota, (State Supported Stadium Debt), 5.00%, 8/1/29 | | | 1,000 | | | | 1,078,270 | |
| | | | | | | | | |
| | | | | | $ | 13,917,981 | |
| | | | | | | | | |
|
Electric Utilities — 7.7% | |
Central Minnesota Municipal Power Agency, 5.00%, 1/1/32 | | $ | 2,100 | | | $ | 2,287,677 | |
Hutchinson, Public Utility Revenue, 5.00%, 12/1/26 | | | 350 | | | | 398,031 | |
Minnesota Municipal Power Agency, 4.75%, 10/1/32 | | | 500 | | | | 529,175 | |
Minnesota Municipal Power Agency, 5.00%, 10/1/34 | | | 750 | | | | 755,377 | |
Minnesota Municipal Power Agency, 5.00%, 10/1/35 | | | 1,500 | | | | 1,559,925 | |
Rochester, Electric Utility Revenue, 5.00%, 12/1/30 | | | 1,000 | | | | 1,073,370 | |
Western Minnesota Municipal Power Agency, 5.00%, 1/1/26 | | | 665 | | | | 781,368 | |
Western Minnesota Municipal Power Agency, 5.00%, 1/1/34 | | | 1,000 | | | | 1,137,910 | |
| | | | | | | | | |
| | | | | | $ | 8,522,833 | |
| | | | | | | | | |
|
Escrowed / Prerefunded — 2.0% | |
Minnesota Public Facilities Authority, Clean Water Revenue, Prerefunded to 3/1/17, 5.00%, 3/1/26 | | $ | 2,000 | | | $ | 2,231,220 | |
| | | | | | | | | |
| | | | | | $ | 2,231,220 | |
| | | | | | | | | |
| | | | | | | | |
| Security | | Principal
Amount
(000’s omitted) | | | Value | |
| | | | | | | | |
|
General Obligations — 23.3% | |
Buffalo-Hanover-Montrose Independent School District No. 877, 4.00%, 2/1/24 | | $ | 2,000 | | | $ | 2,218,060 | |
Burnsville-Eagan-Savage Independent School District No. 191, 4.75%, 2/1/29 | | | 1,000 | | | | 1,097,690 | |
Chaska Independent School District No. 112, 4.00%, 2/1/23 | | | 2,000 | | | | 2,235,280 | |
Dakota County Community Development Agency, (Senior Housing Facilities), 5.125%, 1/1/35 | | | 500 | | | | 545,615 | |
Duluth, 5.00%, 2/1/34 | | | 2,000 | | | | 2,195,720 | |
Fairmont Independent School District No. 2752, 5.00%, 2/1/34 | | | 2,000 | | | | 2,225,500 | |
Hennepin County Regional Railroad Authority, 4.00%, 12/1/29 | | | 1,500 | | | | 1,584,360 | |
Hopkins Independent School District No. 270, 4.00%, 2/1/25 | | | 1,250 | | | | 1,388,550 | |
Jordan Independent School District No. 717, 5.00%, 2/1/35 | | | 1,000 | | | | 1,131,050 | |
Minnesota, 5.00%, 6/1/21 | | | 1,155 | | | | 1,324,635 | |
Minnesota, 5.00%, 8/1/22 | | | 1,000 | | | | 1,176,090 | |
Minnesota, 5.00%, 11/1/26 | | | 185 | | | | 202,457 | |
Minnesota, 5.00%, 10/1/27 | | | 2,000 | | | | 2,354,860 | |
Minnesota, Prerefunded to 11/1/16, 5.00%, 11/1/26 | | | 815 | | | | 899,165 | |
Ramsey County, Series 2011A, 4.00%, 2/1/24 | | | 500 | | | | 553,830 | |
Ramsey County, Series 2012A, 4.00%, 2/1/24 | | | 500 | | | | 555,605 | |
Shakopee Independent School District No. 720, 5.00%, 2/1/21 | | | 1,000 | | | | 1,195,390 | |
St. Paul Independent School District No. 625, 4.00%, 2/1/25 | | | 1,000 | | | | 1,088,110 | |
Washington County, 3.50%, 2/1/28 | | | 1,000 | | | | 1,015,220 | |
Zumbrota-Mazeppa Independent School District No. 2805, 4.50%, 2/1/28 | | | 750 | | | | 833,797 | |
| | | | | | | | | |
| | | | | | $ | 25,820,984 | |
| | | | | | | | | |
|
Health Care – Miscellaneous — 0.9% | |
Minneapolis, (National Marrow Donor Program), 4.875%, 8/1/25 | | $ | 1,000 | | | $ | 1,033,360 | |
| | | | | | | | | |
| | | | | | $ | 1,033,360 | |
| | | | | | | | | |
|
Hospital — 12.5% | |
Douglas County, (Douglas County Hospital), 6.25%, 7/1/38 | | $ | 1,000 | | | $ | 1,061,790 | |
Minneapolis and St. Paul Housing and Redevelopment Authority, (Children’s Health Care), 5.25%, 8/15/35 | | | 1,000 | | | | 1,107,980 | |
Rochester, (Mayo Clinic), 5.00%, 11/15/36 | | | 2,000 | | | | 2,105,760 | |
Rochester, (Mayo Clinic), 5.00%, 11/15/38 | | | 1,000 | | | | 1,120,810 | |
Rochester, (Olmsted Medical Center), 5.875%, 7/1/30 | | | 1,500 | | | | 1,672,305 | |
St. Cloud, (CentraCare Health System), 5.125%, 5/1/30 | | | 1,000 | | | | 1,111,700 | |
St. Louis Park, (Park Nicollet Health Services), 5.75%, 7/1/30 | | | 1,000 | | | | 1,087,380 | |
St. Louis Park, (Park Nicollet Health Services), 5.75%, 7/1/39 | | | 1,000 | | | | 1,095,590 | |
St. Paul Housing and Redevelopment Authority, (Allina Health System), 5.25%, 11/15/29 | | | 1,000 | | | | 1,129,700 | |
St. Paul Housing and Redevelopment Authority, (HealthEast), 6.00%, 11/15/35 | | | 750 | | | | 780,480 | |
| | | | |
| | 22 | | See Notes to Financial Statements. |
Eaton Vance
Minnesota Municipal Income Fund
July 31, 2014
Portfolio of Investments — continued
| | | | | | | | |
| Security | | Principal
Amount
(000’s omitted) | | | Value | |
| | | | | | | | |
|
Hospital (continued) | |
St. Paul Housing and Redevelopment Authority, (HealthPartners Obligated Group), 5.25%, 5/15/36 | | $ | 1,500 | | | $ | 1,546,500 | |
| | | | | | | | | |
| | | | | | $ | 13,819,995 | |
| | | | | | | | | |
|
Housing — 4.3% | |
Minnesota Housing Finance Agency, (AMT), 4.80%, 7/1/38 | | $ | 770 | | | $ | 774,451 | |
Minnesota Housing Finance Agency, (AMT), 4.85%, 7/1/38 | | | 730 | | | | 738,264 | |
Minnesota Housing Finance Agency, (AMT), 4.90%, 7/1/37 | | | 480 | | | | 481,925 | |
Minnesota Housing Finance Agency, (AMT), 5.00%, 8/1/40 | | | 500 | | | | 502,345 | |
Minnesota Housing Finance Agency, (AMT), 5.15%, 7/1/38 | | | 70 | | | | 70,634 | |
Minnesota Housing Finance Agency, (AMT), 5.25%, 7/1/33 | | | 540 | | | | 554,348 | |
Minnetonka, MFMR, (Archer Heights Apartments), (AMT), 6.00%, 1/20/27 | | | 1,650 | | | | 1,653,085 | |
| | | | | | | | | |
| | | | | | $ | 4,775,052 | |
| | | | | | | | | |
|
Industrial Development Revenue — 0.9% | |
Cloquet, (Potlach Corp.), 5.90%, 10/1/26 | | $ | 1,000 | | | $ | 1,000,660 | |
| | | | | | | | | |
| | | | | | $ | 1,000,660 | |
| | | | | | | | | |
|
Insured – Electric Utilities — 11.0% | |
Northern Municipal Power Agency, (AGC), 5.00%, 1/1/21 | | $ | 1,000 | | | $ | 1,117,370 | |
Puerto Rico Electric Power Authority, (NPFG), 5.25%, 7/1/32 | | | 1,150 | | | | 1,031,596 | |
Puerto Rico Electric Power Authority, (NPFG), 5.25%, 7/1/35 | | | 305 | | | | 269,007 | |
Rochester, Electric Utility Revenue, (NPFG), 4.50%, 12/1/26 | | | 2,000 | | | | 2,162,720 | |
Southern Minnesota Municipal Power Agency, (NPFG), 0.00%, 1/1/25 | | | 9,000 | | | | 6,519,060 | |
Western Minnesota Municipal Power Agency, (AGM), 5.00%, 1/1/36 | | | 1,000 | | | | 1,074,470 | |
| | | | | | | | | |
| | | | | | $ | 12,174,223 | |
| | | | | | | | | |
|
Insured – General Obligations — 2.7% | |
Alexandria Independent School District No. 206, (AGM), 5.00%, 2/1/27 | | $ | 700 | | | $ | 782,012 | |
Cambridge Independent School District No. 911, (NPFG), 0.00%, 2/1/29 | | | 2,245 | | | | 1,140,213 | |
St. Francis Independent School District No. 15, (NPFG), 5.00%, 2/1/27 | | | 1,000 | | | | 1,090,610 | |
| | | | | | | | | |
| | | | | | $ | 3,012,835 | |
| | | | | | | | | |
|
Insured – Hospital — 4.9% | |
Minneapolis and St. Paul Housing and Redevelopment Authority, (Children’s Hospitals and Clinics), (AGM), 5.00%, 8/15/34 | | $ | 750 | | | $ | 798,982 | |
| | | | | | | | |
| Security | | Principal
Amount
(000’s omitted) | | | Value | |
| | | | | | | | |
|
Insured – Hospital (continued) | |
Minneapolis, (Fairview Health Services), (AMBAC), 5.00%, 11/15/34 | | $ | 1,950 | | | $ | 1,973,400 | |
Minnesota Agricultural and Economic Development Board, (Essentia Health Obligated Group), (AGC), 5.00%, 2/15/37 | | | 2,000 | | | | 2,084,120 | |
St. Cloud, (CentraCare Health System), (AGC), 5.50%, 5/1/39 | | | 500 | | | | 544,410 | |
| | | | | | | | | |
| | | | | | $ | 5,400,912 | |
| | | | | | | | | |
|
Insured – Special Tax Revenue — 2.0% | |
St. Paul, Sales Tax Revenue, (XLCA), 5.00%, 11/1/30 | | $ | 2,000 | | | $ | 2,159,100 | |
| | | | | | | | | |
| | | | | | $ | 2,159,100 | |
| | | | | | | | | |
|
Insured – Transportation — 1.6% | |
Minneapolis - St. Paul Metropolitan Airports Commission, (AMBAC), (AMT), 5.00%, 1/1/22 | | $ | 1,000 | | | $ | 1,018,130 | |
Minneapolis - St. Paul Metropolitan Airports Commission, (AMBAC), (BHAC), 4.50%, 1/1/32 | | | 775 | | | | 796,871 | |
| | | | | | | | | |
| | | | | | $ | 1,815,001 | |
| | | | | | | | | |
|
Lease Revenue / Certificates of Participation — 2.1% | |
Anoka-Hennepin Independent School District No. 11, 5.00%, 2/1/34 | | $ | 1,000 | | | $ | 1,124,220 | |
Minneapolis Special School District No. 1, 5.00%, 2/1/20 | | | 505 | | | | 593,204 | |
Minnetonka Independent School District No. 276, 5.00%, 3/1/29 | | | 560 | | | | 610,243 | |
| | | | | | | | | |
| | | | | | $ | 2,327,667 | |
| | | | | | | | | |
|
Other Revenue — 1.2% | |
Center City, (Hazelden Betty Ford Foundation), 5.00%, 11/1/27 | | $ | 400 | | | $ | 459,084 | |
Center City, (Hazelden Betty Ford Foundation), 5.00%, 11/1/29 | | | 300 | | | | 339,846 | |
Minnesota, (Public Safety Radio Communications System), 5.00%, 6/1/22 | | | 485 | | | | 562,440 | |
| | | | | | | | | |
| | | | | | $ | 1,361,370 | |
| | | | | | | | | |
|
Special Tax Revenue — 5.0% | |
Guam, Limited Obligation Bonds, 5.625%, 12/1/29 | | $ | 270 | | | $ | 295,823 | |
Guam, Limited Obligation Bonds, 5.75%, 12/1/34 | | | 295 | | | | 323,337 | |
Hennepin County, Sales Tax Revenue, 4.75%, 12/15/33 | | | 2,000 | | | | 2,196,320 | |
Hennepin County, Sales Tax Revenue, 4.75%, 12/15/37 | | | 2,000 | | | | 2,199,080 | |
Virgin Islands Public Finance Authority, 6.75%, 10/1/37 | | | 500 | | | | 550,970 | |
| | | | | | | | | |
| | | | | | $ | 5,565,530 | |
| | | | | | | | | |
| | | | |
| | 23 | | See Notes to Financial Statements. |
Eaton Vance
Minnesota Municipal Income Fund
July 31, 2014
Portfolio of Investments — continued
| | | | | | | | |
| Security | | Principal
Amount
(000’s omitted) | | | Value | |
| | | | | | | | |
|
Transportation — 1.0% | |
Minneapolis - St. Paul Metropolitan Airports Commission, 5.00%, 1/1/35 | | $ | 1,000 | | | $ | 1,129,410 | |
| | | | | | | | | |
| | | | | | $ | 1,129,410 | |
| | | | | | | | | |
| |
Total Tax-Exempt Investments — 97.9%
(identified cost $100,563,536) | | | $ | 108,450,793 | |
| | | | | | | | | |
| |
Other Assets, Less Liabilities — 2.1% | | | $ | 2,316,509 | |
| | | | | | | | | |
| |
Net Assets — 100.0% | | | $ | 110,767,302 | |
| | | | | | | | | |
The percentage shown for each investment category in the Portfolio of Investments is based on net assets.
| | | | |
| AGC | | – | | Assured Guaranty Corp. |
| AGM | | – | | Assured Guaranty Municipal Corp. |
| AMBAC | | – | | AMBAC Financial Group, Inc. |
| AMT | | – | | Interest earned from these securities may be considered a tax preference item for purposes of the Federal Alternative Minimum Tax. |
| BHAC | | – | | Berkshire Hathaway Assurance Corp. |
| MFMR | | – | | Multi-Family Mortgage Revenue |
| NPFG | | – | | National Public Finance Guaranty Corp. |
| XLCA | | – | | XL Capital Assurance, Inc. |
The Fund invests primarily in debt securities issued by Minnesota municipalities. The ability of the issuers of the debt securities to meet their obligations may be affected by economic developments in a specific industry or municipality. In order to reduce the risk associated with such economic developments, at July 31, 2014, 22.6% of total investments are backed by bond insurance of various financial institutions and financial guaranty assurance agencies. The aggregate percentage insured by an individual financial institution or financial guaranty assurance agency ranged from 0.7% to 11.3% of total investments.
| | | | |
| | 24 | | See Notes to Financial Statements. |
Eaton Vance
New Jersey Municipal Income Fund
July 31, 2014
Portfolio of Investments
| | | | | | | | |
| Tax-Exempt Investments — 96.7% | |
| | |
| | | | | | | | |
| Security | | Principal
Amount
(000’s omitted) | | | Value | |
| | | | | | | | |
|
Education — 11.1% | |
New Jersey Educational Facilities Authority, (Georgian Court University), 5.00%, 7/1/27 | | $ | 750 | | | $ | 777,435 | |
New Jersey Educational Facilities Authority, (Georgian Court University), 5.00%, 7/1/33 | | | 750 | | | | 768,045 | |
New Jersey Educational Facilities Authority, (Georgian Court University), 5.25%, 7/1/37 | | | 660 | | | | 677,266 | |
New Jersey Educational Facilities Authority, (Montclair State University), 5.00%, 7/1/30 | | | 1,765 | | | | 2,022,584 | |
New Jersey Educational Facilities Authority, (Princeton University), 5.00%, 7/1/26 | | | 5,000 | | | | 6,161,050 | |
New Jersey Educational Facilities Authority, (Stevens Institute of Technology), 5.00%, 7/1/27 | | | 3,575 | | | | 3,705,773 | |
New Jersey Educational Facilities Authority, (Stevens Institute of Technology), 5.00%, 7/1/34 | | | 880 | | | | 900,442 | |
New Jersey Educational Facilities Authority, (University of Medicine and Dentistry), Prerefunded to 6/1/19, 7.50%, 12/1/32 | | | 2,565 | | | | 3,318,751 | |
New Jersey Institute of Technology, 5.00%, 7/1/32 | | | 1,410 | | | | 1,552,537 | |
| | | | | | | | | |
| | | | | | $ | 19,883,883 | |
| | | | | | | | | |
|
Escrowed / Prerefunded — 1.5% | |
New Jersey Health Care Facilities Financing Authority, (Chilton Memorial Hospital), Prerefunded to 7/1/19, 5.50%, 7/1/29 | | $ | 1,135 | | | $ | 1,358,629 | |
New Jersey Health Care Facilities Financing Authority, (Chilton Memorial Hospital), Prerefunded to 7/1/19, 5.75%, 7/1/39 | | | 1,135 | | | | 1,372,079 | |
| | | | | | | | | |
| | | | | | $ | 2,730,708 | |
| | | | | | | | | |
|
General Obligations — 2.7% | |
Bergen County Improvement Authority, 5.00%, 2/15/26 | | $ | 1,000 | | | $ | 1,212,300 | |
Monroe Township Board of Education, Middlesex County, 4.00%, 8/1/23 | | | 3,000 | | | | 3,324,660 | |
Montclair Township, 5.00%, 1/1/28 | | | 350 | | | | 407,200 | |
| | | | | | | | | |
| | | | | | $ | 4,944,160 | |
| | | | | | | | | |
|
Hospital — 9.1% | |
Camden County Improvement Authority, (Cooper Health System), 5.75%, 2/15/34 | | $ | 830 | | | $ | 831,834 | |
Camden County Improvement Authority, (Cooper Health System), 5.75%, 2/15/42 | | | 1,100 | | | | 1,193,324 | |
New Jersey Health Care Facilities Financing Authority, (AHS Hospital Corp.), 5.00%, 7/1/27 | | | 6,195 | | | | 6,669,661 | |
New Jersey Health Care Facilities Financing Authority, (Atlanticare Regional Medical Center), 5.00%, 7/1/37 | | | 4,120 | | | | 4,332,469 | |
New Jersey Health Care Facilities Financing Authority, (Virtua Health), 5.75%, 7/1/33 | | | 3,000 | | | | 3,309,480 | |
| | | | | | | | | |
| | | | | | $ | 16,336,768 | |
| | | | | | | | | |
| | | | | | | | |
| Security | | Principal
Amount
(000’s omitted) | | | Value | |
| | | | | | | | |
|
Housing — 1.1% | |
New Jersey Housing and Mortgage Finance Agency, (Single Family Housing), (AMT), 4.95%, 10/1/32 | | $ | 1,915 | | | $ | 1,954,162 | |
| | | | | | | | | |
| | | | | | $ | 1,954,162 | |
| | | | | | | | | |
|
Industrial Development Revenue — 4.2% | |
New Jersey Economic Development Authority, (Continental Airlines), (AMT), 5.50%, 6/1/33 | | $ | 1,875 | | | $ | 1,973,587 | |
New Jersey Economic Development Authority, (Continental Airlines), (AMT), Series 2000 A, 5.625%, 11/15/30 | | | 255 | | | | 271,101 | |
New Jersey Economic Development Authority, (Continental Airlines), (AMT), Series 2000 B, 5.625%, 11/15/30 | | | 430 | | | | 458,621 | |
New Jersey Economic Development Authority, (New Jersey-American Water Co., Inc.), (AMT), 5.70%, 10/1/39 | | | 4,370 | | | | 4,793,934 | |
| | | | | | | | | |
| | | | | | $ | 7,497,243 | |
| | | | | | | | | |
|
Insured – Electric Utilities — 1.9% | |
Puerto Rico Electric Power Authority, (NPFG), 5.25%, 7/1/34 | | $ | 3,935 | | | $ | 3,489,991 | |
| | | | | | | | | |
| | | | | | $ | 3,489,991 | |
| | | | | | | | | |
|
Insured – Escrowed / Prerefunded — 0.9% | |
New Jersey Economic Development Authority, (School Facilities Construction), (AGC), Prerefunded to 12/15/18, 5.50%, 12/15/34 | | $ | 1,290 | | | $ | 1,542,943 | |
| | | | | | | | | |
| | | | | | $ | 1,542,943 | |
| | | | | | | | | |
|
Insured – Gas Utilities — 2.0% | |
New Jersey Economic Development Authority, (New Jersey Natural Gas Co.), (NPFG), (AMT), 4.90% to 10/1/25 (Put Date), 10/1/40 | | $ | 3,485 | | | $ | 3,660,539 | |
| | | | | | | | | |
| | | | | | $ | 3,660,539 | |
| | | | | | | | | |
|
Insured – General Obligations — 8.2% | |
Hudson County Improvement Authority, (Harrison Parking), (AGC), 5.25%, 1/1/39 | | $ | 2,785 | | | $ | 2,983,348 | |
Irvington Township, (AGM), 0.00%, 7/15/22 | | | 2,500 | | | | 1,988,275 | |
Irvington Township, (AGM), 0.00%, 7/15/23 | | | 5,075 | | | | 3,858,522 | |
Jackson Township School District, (NPFG), 2.50%, 6/15/27 | | | 5,230 | | | | 4,797,793 | |
Paterson, (BAM), 5.00%, 1/15/26 | | | 1,000 | | | | 1,120,730 | |
| | | | | | | | | |
| | | | | | $ | 14,748,668 | |
| | | | | | | | | |
|
Insured – Hospital — 2.0% | |
New Jersey Economic Development Authority, (Hillcrest Health Services), (AMBAC), 0.00%, 1/1/19 | | $ | 4,100 | | | $ | 3,653,141 | |
| | | | | | | | | |
| | | | | | $ | 3,653,141 | |
| | | | | | | | | |
| | | | |
| | 25 | | See Notes to Financial Statements. |
Eaton Vance
New Jersey Municipal Income Fund
July 31, 2014
Portfolio of Investments — continued
| | | | | | | | |
| Security | | Principal
Amount
(000’s omitted) | | | Value | |
| | | | | | | | |
|
Insured – Industrial Development Revenue — 3.3% | |
New Jersey Economic Development Authority, (United Water New Jersey, Inc.), (AMBAC), (AMT), 4.875%, 11/1/25 | | $ | 5,685 | | | $ | 5,968,227 | |
| | | | | | | | | |
| | | | | | $ | 5,968,227 | |
| | | | | | | | | |
|
Insured – Lease Revenue / Certificates of Participation — 1.1% | |
New Jersey Economic Development Authority, (School Facilities Construction), (AGC), 5.50%, 12/15/34 | | $ | 710 | | | $ | 803,677 | |
South Jersey Port Corp., (Marine Terminal), (AGC), 5.75%, 1/1/34 | | | 1,000 | | | | 1,090,240 | |
| | | | | | | | | |
| | | | | | $ | 1,893,917 | |
| | | | | | | | | |
|
Insured – Other Revenue — 1.2% | |
New Jersey Economic Development Authority, (The Goethals Bridge Replacement), (AGM), (AMT), 5.00%, 1/1/31 | | $ | 2,015 | | | $ | 2,190,708 | |
| | | | | | | | | |
| | | | | | $ | 2,190,708 | |
| | | | | | | | | |
|
Insured – Special Tax Revenue — 10.0% | |
Garden State Preservation Trust, (AGM), 0.00%, 11/1/24 | | $ | 7,870 | | | $ | 5,928,156 | |
New Jersey Economic Development Authority, (Motor Vehicle Surcharges), (NPFG), 5.25%, 7/1/26 | | | 2,000 | | | | 2,389,320 | |
New Jersey Economic Development Authority, (Motor Vehicle Surcharges), (XLCA), 0.00%, 7/1/26 | | | 11,695 | | | | 7,342,238 | |
New Jersey Economic Development Authority, (Motor Vehicle Surcharges), (XLCA), 0.00%, 7/1/27 | | | 3,590 | | | | 2,128,044 | |
Puerto Rico Sales Tax Financing Corp., (NPFG), 0.00%, 8/1/45 | | | 1,650 | | | | 215,193 | |
| | | | | | | | | |
| | | | | | $ | 18,002,951 | |
| | | | | | | | | |
|
Insured – Student Loan — 2.7% | |
New Jersey Higher Education Student Assistance Authority, (AGC), (AMT), 6.125%, 6/1/30 | | $ | 4,435 | | | $ | 4,818,317 | |
| | | | | | | | | |
| | | | | | $ | 4,818,317 | |
| | | | | | | | | |
|
Insured – Transportation — 0.5% | |
South Jersey Transportation Authority, (AGC), 5.50%, 11/1/33 | | $ | 850 | | | $ | 940,500 | |
| | | | | | | | | |
| | | | | | $ | 940,500 | |
| | | | | | | | | |
|
Lease Revenue / Certificates of Participation — 5.6% | |
Atlantic City, Public Facilities Lease Agreement, 8.875%, 1/15/15 | | $ | 785 | | | $ | 814,155 | |
New Jersey Economic Development Authority, (School Facilities Construction), 5.00%, 9/1/34 | | | 1,000 | | | | 1,072,400 | |
New Jersey Economic Development Authority, (School Facilities Construction), 5.25%, 12/15/33 | | | 3,000 | | | | 3,252,060 | |
New Jersey Health Care Facilities Financing Authority, (Hospital Asset Transformation Program), 5.25%, 10/1/38 | | | 4,605 | | | | 4,852,565 | |
| | | | | | | | | |
| | | | | | $ | 9,991,180 | |
| | | | | | | | | |
| | | | | | | | |
| Security | | Principal
Amount
(000’s omitted) | | | Value | |
| | | | | | | | |
|
Other Revenue — 2.4% | |
Children’s Trust Fund, PR, Tobacco Settlement, 0.00%, 5/15/55 | | $ | 34,960 | | | $ | 907,562 | |
New Jersey Economic Development Authority, (The Seeing Eye, Inc.), 5.00%, 6/1/32 | | | 3,250 | | | | 3,463,167 | |
| | | | | | | | | |
| | | | | | $ | 4,370,729 | |
| | | | | | | | | |
|
Senior Living / Life Care — 4.3% | |
New Jersey Economic Development Authority, (Cranes Mill, Inc.), 5.875%, 7/1/28 | | $ | 1,345 | | | $ | 1,403,803 | |
New Jersey Economic Development Authority, (Cranes Mill, Inc.), 6.00%, 7/1/38 | | | 2,230 | | | | 2,309,121 | |
New Jersey Economic Development Authority, (Seabrook Village), 5.25%, 11/15/36 | | | 1,935 | | | | 1,960,639 | |
New Jersey Economic Development Authority, (United Methodist Homes of New Jersey), 5.00%, 7/1/34 | | | 2,000 | | | | 2,078,660 | |
| | | | | | | | | |
| | | | | | $ | 7,752,223 | |
| | | | | | | | | |
|
Special Tax Revenue — 1.3% | |
New Jersey Economic Development Authority, (Newark Downtown District Management Corp.), 5.125%, 6/15/27 | | $ | 300 | | | $ | 310,377 | |
New Jersey Economic Development Authority, (Newark Downtown District Management Corp.), 5.125%, 6/15/37 | | | 525 | | | | 535,847 | |
Virgin Islands Public Finance Authority, 6.75%, 10/1/37 | | | 1,295 | | | | 1,427,012 | |
| | | | | | | | | |
| | | | | | $ | 2,273,236 | |
| | | | | | | | | |
|
Student Loan — 4.9% | |
New Jersey Higher Education Student Assistance Authority, (AMT), 1.177%, 6/1/36(1)(2)(3) | | $ | 8,625 | | | $ | 8,710,767 | |
New Jersey Higher Education Student Assistance Authority, (AMT), 1.177%, 6/1/36(2) | | | 15 | | | | 15,149 | |
| | | | | | | | | |
| | | | | | $ | 8,725,916 | |
| | | | | | | | | |
|
Transportation — 12.4% | |
Delaware River Port Authority of Pennsylvania and New Jersey, 5.00%, 1/1/28 | | $ | 2,000 | | | $ | 2,279,300 | |
New Jersey Transportation Trust Fund Authority, (Transportation Program), 5.25%, 6/15/30 | | | 1,890 | | | | 2,124,209 | |
New Jersey Transportation Trust Fund Authority, (Transportation System), 5.00%, 12/15/24 | | | 1,000 | | | | 1,146,180 | |
New Jersey Transportation Trust Fund Authority, (Transportation System), 5.875%, 12/15/38 | | | 2,500 | | | | 2,908,200 | |
New Jersey Turnpike Authority, Series 2012 B, 5.00%, 1/1/30 | | | 4,520 | | | | 5,078,807 | |
New Jersey Turnpike Authority, Series 2013 A, 5.00%, 1/1/30 | | | 1,465 | | | | 1,646,455 | |
Port Authority of New York and New Jersey, 6.125%, 6/1/94 | | | 6,160 | | | | 7,201,533 | |
| | | | | | | | | |
| | | | | | $ | 22,384,684 | |
| | | | | | | | | |
| | | | |
| | 26 | | See Notes to Financial Statements. |
Eaton Vance
New Jersey Municipal Income Fund
July 31, 2014
Portfolio of Investments — continued
| | | | | | | | |
| Security | | Principal
Amount
(000’s omitted) | | | Value | |
| | | | | | | | |
|
Water and Sewer — 2.3% | |
New Jersey Economic Development Authority, (Atlantic City Sewerage Co.), (AMT), 5.45%, 4/1/28 | | $ | 4,155 | | | $ | 4,159,570 | |
| | | | | | | | | |
| | | | | | $ | 4,159,570 | |
| | | | | | | | | |
| |
Total Tax-Exempt Investments — 96.7%
(identified cost $160,341,094) | | | $ | 173,914,364 | |
| | | | | | | | | |
| |
Other Assets, Less Liabilities — 3.3% | | | $ | 5,970,991 | |
| | | | | | | | | |
| |
Net Assets — 100.0% | | | $ | 179,885,355 | |
| | | | | | | | | |
The percentage shown for each investment category in the Portfolio of Investments is based on net assets.
| | | | |
| AGC | | – | | Assured Guaranty Corp. |
| AGM | | – | | Assured Guaranty Municipal Corp. |
| AMBAC | | – | | AMBAC Financial Group, Inc. |
| AMT | | – | | Interest earned from these securities may be considered a tax preference item for purposes of the Federal Alternative Minimum Tax. |
| BAM | | – | | Build America Mutual Assurance Co. |
| NPFG | | – | | National Public Finance Guaranty Corp. |
| XLCA | | – | | XL Capital Assurance, Inc. |
The Fund invests primarily in debt securities issued by New Jersey municipalities. The ability of the issuers of the debt securities to meet their obligations may be affected by economic developments in a specific industry or municipality. In order to reduce the risk associated with such economic developments, at July 31, 2014, 35.0% of total investments are backed by bond insurance of various financial institutions and financial guaranty assurance agencies. The aggregate percentage insured by an individual financial institution or financial guaranty assurance agency ranged from 0.6% to 8.4% of total investments.
| (1) | Security represents the municipal bond held by a trust that issues residual interest bonds (see Note 1I). |
| (2) | Variable rate security. The stated interest rate represents the rate in effect at July 31, 2014. |
| (3) | Security (or a portion thereof) has been pledged as collateral for residual interest bond transactions. The aggregate value of such collateral is $1,810,767. |
| | | | |
| | 27 | | See Notes to Financial Statements. |
Eaton Vance
Pennsylvania Municipal Income Fund
July 31, 2014
Portfolio of Investments
| | | | | | | | |
| Tax-Exempt Investments — 101.9% | |
| | |
| | | | | | | | |
| Security | | Principal
Amount (000’s omitted) | | | Value | |
| | | | | | | | |
|
Cogeneration — 0.5% | |
Northampton County Industrial Development Authority, (Northampton Generating), 5.00%, 12/31/23(1) | | $ | 1,323 | | | $ | 1,156,828 | |
| | | | | | | | | |
| | | | | | $ | 1,156,828 | |
| | | | | | | | | |
|
Education — 13.3% | |
Allegheny County Higher Education Building Authority, (Duquesne University), 5.00%, 3/1/33 | | $ | 1,150 | | | $ | 1,210,559 | |
Bucks County Industrial Development Authority, (George School), 5.00%, 9/15/34 | | | 1,000 | | | | 1,072,410 | |
Cumberland County Municipal Authority, (Dickinson College), 5.00%, 11/1/37 | | | 1,000 | | | | 1,083,140 | |
Northampton County General Purpose Authority, (Lafayette College), 5.00%, 11/1/34 | | | 3,000 | | | | 3,289,320 | |
Northampton County General Purpose Authority, (Lehigh University), 5.00%, 11/15/39 | | | 3,000 | | | | 3,202,800 | |
Pennsylvania Higher Educational Facilities Authority, (Bryn Mawr College), 5.00%, 12/1/26 | | | 255 | | | | 305,594 | |
Pennsylvania Higher Educational Facilities Authority, (Bryn Mawr College), 5.00%, 12/1/27 | | | 600 | | | | 714,690 | |
Pennsylvania Higher Educational Facilities Authority, (University of Pennsylvania), 4.75%, 7/15/35 | | | 3,800 | | | | 3,918,332 | |
State Public School Building Authority, (Northampton County Area Community College), 5.50%, 3/1/31 | | | 2,645 | | | | 2,934,707 | |
Union County Higher Educational Facilities Financing Authority, (Bucknell University), 5.00%, 4/1/37 | | | 2,000 | | | | 2,210,720 | |
University of Pittsburgh, 5.25%, 9/15/29 | | | 1,500 | | | | 1,733,325 | |
University of Pittsburgh, 5.25%, 9/15/30 | | | 2,500 | | | | 2,872,650 | |
Washington County Industrial Development Authority, (Washington and Jefferson College), 5.25%, 11/1/30 | | | 2,300 | | | | 2,491,038 | |
Wilkes-Barre Finance Authority, (University of Scranton), 5.00%, 11/1/35 | | | 2,500 | | | | 2,654,650 | |
| | | | | | | | | |
| | | | | | $ | 29,693,935 | |
| | | | | | | | | |
|
Electric Utilities — 0.9% | |
Beaver County Industrial Development Authority, (FirstEnergy Nuclear Generation), 3.50% to 6/1/20 (Put Date), 12/1/35 | | $ | 2,000 | | | $ | 2,029,500 | |
| | | | | | | | | |
| | | | | | $ | 2,029,500 | |
| | | | | | | | | |
|
Escrowed / Prerefunded — 0.1% | |
Montgomery County, Prerefunded to 6/1/19, 4.375%, 12/1/31 | | $ | 160 | | | $ | 183,701 | |
| | | | | | | | | |
| | | | | | $ | 183,701 | |
| | | | | | | | | |
| | | | | | | | |
| Security | | Principal
Amount (000’s omitted) | | | Value | |
| | | | | | | | |
|
General Obligations — 4.3% | |
Chester County, 5.00%, 7/15/27 | | $ | 1,000 | | | $ | 1,151,130 | |
Chester County, 5.00%, 7/15/28 | | | 410 | | | | 469,372 | |
Delaware Valley Regional Finance Authority, 5.75%, 7/1/32 | | | 5,000 | | | | 5,951,250 | |
Montgomery County, 4.375%, 12/1/31 | | | 1,840 | | | | 1,954,264 | |
| | | | | | | | | |
| | | | | | $ | 9,526,016 | |
| | | | | | | | | |
|
Hospital — 17.8% | |
Allegheny County Hospital Development Authority, (University of Pittsburgh Medical Center), 5.50%, 8/15/34 | | $ | 3,000 | | | $ | 3,409,950 | |
Chester County Health and Education Facilities Authority, (Jefferson Health System), 5.00%, 5/15/40 | | | 2,940 | | | | 3,105,199 | |
Dauphin County General Authority, (Pinnacle Health System), 6.00%, 6/1/29 | | | 4,220 | | | | 4,709,013 | |
Franklin County Industrial Development Authority, (The Chambersburg Hospital), 5.375%, 7/1/42 | | | 1,000 | | | | 1,056,660 | |
Indiana County Hospital Authority, (Indiana Regional Medical Center), 6.00%, 6/1/39 | | | 1,245 | | | | 1,375,974 | |
Lancaster County Hospital Authority, (Lancaster General Hospital), 5.00%, 3/15/22 | | | 1,000 | | | | 1,094,230 | |
Lebanon County Health Facilities Authority, (Good Samaritan Hospital), 6.00%, 11/15/35 | | | 1,050 | | | | 1,050,042 | |
Lehigh County General Purpose Authority, (Lehigh Valley Health Network), 4.00%, 7/1/33 | | | 2,700 | | | | 2,710,854 | |
Lycoming County Authority, (Susquehanna Health System), 5.75%, 7/1/39 | | | 3,250 | | | | 3,434,600 | |
Monroe County Hospital Authority, (Pocono Medical Center), 5.125%, 1/1/37 | | | 2,000 | | | | 2,047,100 | |
Pennsylvania Higher Educational Facilities Authority, (University of Pennsylvania Health System), 6.00%, 8/15/26(2) | | | 9,000 | | | | 10,409,130 | |
Pennsylvania Higher Educational Facilities Authority, (UPMC Health System), 5.00%, 5/15/31 | | | 2,550 | | | | 2,734,237 | |
Philadelphia Hospitals and Higher Education Facilities Authority, (Children’s Hospital of Philadelphia), 5.00%, 7/1/28 | | | 690 | | | | 771,717 | |
South Fork Municipal Authority, (Conemaugh Health System), 5.50%, 7/1/29 | | | 1,500 | | | | 1,624,020 | |
| | | | | | | | | |
| | | | | | $ | 39,532,726 | |
| | | | | | | | | |
|
Housing — 0.5% | |
Pennsylvania Housing Finance Agency, SFMR, (AMT), 4.75%, 10/1/25 | | $ | 945 | | | $ | 993,951 | |
| | | | | | | | | |
| | | | | | $ | 993,951 | |
| | | | | | | | | |
| | | | |
| | 28 | | See Notes to Financial Statements. |
Eaton Vance
Pennsylvania Municipal Income Fund
July 31, 2014
Portfolio of Investments — continued
| | | | | | | | |
| Security | | Principal
Amount (000’s omitted) | | | Value | |
| | | | | | | | |
|
Industrial Development Revenue — 1.8% | |
Luzerne County Industrial Development Authority, (Pennsylvania-American Water Co.), 5.50%, 12/1/39 | | $ | 1,200 | | | $ | 1,325,916 | |
Pennsylvania Economic Development Financing Authority, (Pennsylvania-American Water Co.), 6.20%, 4/1/39 | | | 1,000 | | | | 1,147,500 | |
Pennsylvania Economic Development Financing Authority, (Waste Management, Inc.), (AMT), 5.10%, 10/1/27 | | | 1,500 | | | | 1,558,815 | |
| | | | | | | | | |
| | | | | | $ | 4,032,231 | |
| | | | | | | | | |
|
Insured – Education — 4.6% | |
Lycoming County Authority, (Pennsylvania College of Technology), (AGC), 5.50%, 10/1/37 | | $ | 3,000 | | | $ | 3,191,340 | |
Pennsylvania Higher Educational Facilities Authority, (State System of Higher Education), (NPFG), 5.00%, 6/15/23 | | | 2,500 | | | | 2,701,575 | |
Pennsylvania Higher Educational Facilities Authority, (Temple University), (NPFG), 5.00%, 4/1/25 | | | 1,350 | | | | 1,444,473 | |
Pennsylvania Higher Educational Facilities Authority, (University of Sciences in Philadelphia), (AGC), 5.00%, 11/1/32 | | | 2,765 | | | | 2,908,891 | |
| | | | | | | | | |
| | | | | | $ | 10,246,279 | |
| | | | | | | | | |
|
Insured – Electric Utilities — 0.7% | |
Puerto Rico Electric Power Authority, (NPFG), 5.25%, 7/1/34 | | $ | 1,475 | | | $ | 1,308,192 | |
Puerto Rico Electric Power Authority, (NPFG), 5.25%, 7/1/35 | | | 340 | | | | 299,877 | |
| | | | | | | | | |
| | | | | | $ | 1,608,069 | |
| | | | | | | | | |
|
Insured – Escrowed / Prerefunded — 13.7% | |
Allegheny County Hospital Development Authority, (Magee-Women’s Hospital), (FGIC), (NPFG), Escrowed to Maturity, 0.00%, 10/1/15 | | $ | 3,750 | | | $ | 3,736,237 | |
Centre County Hospital Authority, (Mount Nittany Medical Center), (AGC), Prerefunded to 11/15/14, 6.25%, 11/15/44 | | | 3,000 | | | | 3,052,650 | |
Erie School District, (NPFG), Escrowed to Maturity, 0.00%, 5/1/19 | | | 2,500 | | | | 2,349,700 | |
Erie School District, (NPFG), Escrowed to Maturity, 0.00%, 5/1/20 | | | 2,625 | | | | 2,395,654 | |
Erie School District, (NPFG), Escrowed to Maturity, 0.00%, 5/1/21 | | | 2,625 | | | | 2,304,356 | |
Erie School District, (NPFG), Escrowed to Maturity, 0.00%, 5/1/22 | | | 3,625 | | | | 3,058,159 | |
McKeesport Area School District, (AMBAC), Escrowed to Maturity, 0.00%, 10/1/25 | | | 2,320 | | | | 1,732,437 | |
Philadelphia, (AGC), Prerefunded to 7/15/16, 7.00%, 7/15/28 | | | 1,500 | | | | 1,694,805 | |
Westmoreland Municipal Authority, Series A, (FGIC), Escrowed to Maturity, 0.00%, 8/15/20 | | | 5,780 | | | | 5,232,576 | |
Westmoreland Municipal Authority, Series C, (FGIC), Escrowed to Maturity, 0.00%, 8/15/20 | | | 5,400 | | | | 4,888,566 | |
| | | | | | | | | |
| | | | | | $ | 30,445,140 | |
| | | | | | | | | |
| | | | | | | | |
| Security | | Principal
Amount (000’s omitted) | | | Value | |
| | | | | | | | |
|
Insured – General Obligations — 11.9% | |
Beaver County, (AGM), 5.55%, 11/15/31 | | $ | 2,045 | | | $ | 2,288,089 | |
Beaver County, (AGM), Prerefunded to 11/15/17, 5.55%, 11/15/31 | | | 105 | | | | 121,836 | |
Bethlehem Area School District, (AGM), 5.25%, 1/15/25 | | | 1,885 | | | | 2,114,197 | |
Bethlehem Area School District, (AGM), 5.25%, 1/15/26 | | | 940 | | | | 1,047,254 | |
Centennial School District, (AGM), 5.25%, 12/15/37 | | | 3,000 | | | | 3,406,260 | |
Elizabeth Forward School District, (NPFG), 0.00%, 9/1/21 | | | 2,170 | | | | 1,748,369 | |
Elizabeth Forward School District, (NPFG), 0.00%, 9/1/22 | | | 2,170 | | | | 1,662,003 | |
Elizabeth Forward School District, (NPFG), 0.00%, 9/1/23 | | | 2,170 | | | | 1,578,198 | |
Harrisburg, (AMBAC), 0.00%, 3/15/17 | | | 2,180 | | | | 1,848,531 | |
Harrisburg School District, (AGC), 5.00%, 11/15/33 | | | 2,000 | | | | 2,098,260 | |
Hazelton School District, (NPFG), 0.00%, 3/1/21 | | | 4,000 | | | | 3,387,800 | |
Hopewell School District, (AGM), 0.00%, 9/1/22 | | | 1,000 | | | | 811,760 | |
Hopewell School District, (AGM), 0.00%, 9/1/26 | | | 1,000 | | | | 684,100 | |
Lake-Lehman School District, (NPFG), 0.00%, 4/1/26 | | | 1,315 | | | | 880,537 | |
McKeesport Area School District, (AGM), 5.00%, 3/1/38 | | | 60 | | | | 65,413 | |
McKeesport Area School District, (AMBAC), 0.00%, 10/1/25 | | | 1,100 | | | | 728,662 | |
State Public School Building Authority, (Harrisburg School District), (AGC), 4.75%, 11/15/33 | | | 2,000 | | | | 2,076,600 | |
| | | | | | | | | |
| | | | | | $ | 26,547,869 | |
| | | | | | | | | |
|
Insured – Hospital — 5.0% | |
Allegheny County Hospital Development Authority, (UPMC Health System), (NPFG), 6.00%, 7/1/24 | | $ | 2,000 | | | $ | 2,500,580 | |
Lehigh County General Purpose Authority, (Lehigh Valley Health Network), (AGM), 5.00%, 7/1/35 | | | 6,930 | | | | 7,274,074 | |
Washington County Hospital Authority, (Washington Hospital), (AMBAC), 5.50%, 7/1/17 | | | 1,310 | | | | 1,455,004 | |
| | | | | | | | | |
| | | | | | $ | 11,229,658 | |
| | | | | | | | | |
|
Insured – Lease Revenue / Certificates of Participation — 5.6% | |
Commonwealth Financing Authority, (AGC), 5.00%, 6/1/31 | | $ | 1,000 | | | $ | 1,096,970 | |
State Public School Building Authority, (Philadelphia School District), (AGM), 5.50%, 6/1/28(2) | | | 6,250 | | | | 7,410,562 | |
State Public School Building Authority, (Philadelphia School District), (AGM), 5.50%, 6/1/28 | | | 3,250 | | | | 3,853,493 | |
| | | | | | | | | |
| | | | | | $ | 12,361,025 | |
| | | | | | | | | |
|
Insured – Special Tax Revenue — 1.1% | |
Puerto Rico Infrastructure Financing Authority, (BHAC), (FGIC), 5.50%, 7/1/20 | | $ | 2,000 | | | $ | 2,306,680 | |
Puerto Rico Sales Tax Financing Corp., (NPFG), 0.00%, 8/1/45 | | | 1,490 | | | | 194,326 | |
| | | | | | | | | |
| | | | | | $ | 2,501,006 | |
| | | | | | | | | |
| | | | |
| | 29 | | See Notes to Financial Statements. |
Eaton Vance
Pennsylvania Municipal Income Fund
July 31, 2014
Portfolio of Investments — continued
| | | | | | | | |
| Security | | Principal
Amount (000’s omitted) | | | Value | |
| | | | | | | | |
|
Insured – Transportation — 3.5% | |
Philadelphia, Airport Revenue, (AGM), (AMT), 5.00%, 6/15/27 | | $ | 5,750 | | | $ | 6,247,720 | |
Puerto Rico Highway and Transportation Authority, (AGC), 5.50%, 7/1/31 | | | 1,500 | | | | 1,439,355 | |
| | | | | | | | | |
| | | | | | $ | 7,687,075 | |
| | | | | | | | | |
|
Insured – Water and Sewer — 1.4% | |
Allegheny County Sanitary Authority, (BAM), 5.00%, 12/1/28 | | $ | 1,000 | | | $ | 1,141,170 | |
Westmoreland Municipal Authority, (FGIC), 0.00%, 8/15/19 | | | 2,235 | | | | 2,023,569 | |
| | | | | | | | | |
| | | | | | $ | 3,164,739 | |
| | | | | | | | | |
|
Other Revenue — 1.8% | |
Southeastern Pennsylvania Transportation Authority, Federal Grant Receipts, 5.00%, 6/1/28 | | $ | 1,875 | | | $ | 2,061,882 | |
Southeastern Pennsylvania Transportation Authority, Federal Grant Receipts, 5.00%, 6/1/29 | | | 1,775 | | | | 1,943,962 | |
| | | | | | | | | |
| | | | | | $ | 4,005,844 | |
| | | | | | | | | |
|
Senior Living / Life Care — 1.4% | |
Cliff House Trust, (AMT), 6.625%, 6/1/27(3) | | $ | 2,500 | | | $ | 960,325 | |
Lancaster Industrial Development Authority, (Garden Spot Village), 5.375%, 5/1/28 | | | 300 | | | | 316,791 | |
Montgomery County Industrial Development Authority, (Foulkeways at Gwynedd), 5.00%, 12/1/24 | | | 600 | | | | 616,356 | |
Montgomery County Industrial Development Authority, (Foulkeways at Gwynedd), 5.00%, 12/1/30 | | | 1,300 | | | | 1,318,551 | |
| | | | | | | | | |
| | | | | | $ | 3,212,023 | |
| | | | | | | | | |
|
Special Tax Revenue — 1.1% | |
Puerto Rico Sales Tax Financing Corp., 0.00%, 8/1/38 | | $ | 7,500 | | | $ | 932,100 | |
Puerto Rico Sales Tax Financing Corp., 5.00%, 8/1/40 | | | 525 | | | | 407,300 | |
Puerto Rico Sales Tax Financing Corp., 5.25%, 8/1/40 | | | 240 | | | | 192,494 | |
Virgin Islands Public Finance Authority, 6.75%, 10/1/37 | | | 810 | | | | 892,572 | |
| | | | | | | | | |
| | | | | | $ | 2,424,466 | |
| | | | | | | | | |
|
Transportation — 6.9% | |
Delaware River Port Authority of Pennsylvania and New Jersey, 5.00%, 1/1/35 | | $ | 775 | | | $ | 832,877 | |
Delaware River Port Authority of Pennsylvania and New Jersey, 5.00%, 1/1/40 | | | 415 | | | | 441,353 | |
Pennsylvania Economic Development Financing Authority, (Amtrak), (AMT), 5.00%, 11/1/41 | | | 1,960 | | | | 2,068,956 | |
Pennsylvania Turnpike Commission, 5.25%, 6/1/36 | | | 4,500 | | | | 4,770,855 | |
Pennsylvania Turnpike Commission, 5.45%, (0.00% until 12/1/15), 12/1/35 | | | 4,220 | | | | 4,313,811 | |
| | | | | | | | |
| Security | | Principal
Amount (000’s omitted) | | | Value | |
| | | | | | | | |
|
Transportation (continued) | |
Pennsylvania Turnpike Commission, 6.375%, (0.00% until 12/1/17), 12/1/38 | | $ | 2,000 | | | $ | 2,064,300 | |
Philadelphia, Airport Revenue, (AMT), 5.00%, 6/15/27 | | | 815 | | | | 885,603 | |
| | | | | | | | | |
| | | | | | $ | 15,377,755 | |
| | | | | | | | | |
|
Water and Sewer — 4.0% | |
Delaware County Regional Water Quality Control Authority, 5.00%, 5/1/33 | | $ | 1,750 | | | $ | 1,953,980 | |
Harrisburg Water Authority, 5.25%, 7/15/31 | | | 1,750 | | | | 1,665,982 | |
Philadelphia, Water and Wastewater Revenue, 5.00%, 1/1/36 | | | 1,250 | | | | 1,346,837 | |
Philadelphia, Water and Wastewater Revenue, 5.25%, 1/1/32 | | | 1,235 | | | | 1,330,293 | |
Westmoreland County Municipal Authority, 5.00%, 8/15/32 | | | 2,345 | | | | 2,555,722 | |
| | | | | | | | | |
| | | | | | $ | 8,852,814 | |
| | | | | | | | | |
| |
Total Tax-Exempt Investments — 101.9%
(identified cost $207,858,964) | | | $ | 226,812,650 | |
| | | | | | | | | |
| |
Other Assets, Less Liabilities — (1.9)% | | | $ | (4,244,671 | ) |
| | | | | | | | | |
| | |
Net Assets — 100.0% | | | | | | $ | 222,567,979 | |
| | | | | | | | | |
The percentage shown for each investment category in the Portfolio of Investments is based on net assets.
| | | | |
| AGC | | – | | Assured Guaranty Corp. |
| AGM | | – | | Assured Guaranty Municipal Corp. |
| AMBAC | | – | | AMBAC Financial Group, Inc. |
| AMT | | – | | Interest earned from these securities may be considered a tax preference item for purposes of the Federal Alternative Minimum Tax. |
| BAM | | – | | Build America Mutual Assurance Co. |
| BHAC | | – | | Berkshire Hathaway Assurance Corp. |
| FGIC | | – | | Financial Guaranty Insurance Company |
| NPFG | | – | | National Public Finance Guaranty Corp. |
| SFMR | | – | | Single Family Mortgage Revenue |
The Fund invests primarily in debt securities issued by Pennsylvania municipalities. The ability of the issuers of the debt securities to meet their obligations may be affected by economic developments in a specific industry or municipality. In order to reduce the risk associated with such economic developments, at July 31, 2014, 46.6% of total investments are backed by bond insurance of various financial institutions and financial guaranty assurance agencies. The aggregate percentage insured by an individual financial institution or financial guaranty assurance agency ranged from 0.5% to 15.6% of total investments.
| (1) | Represents a payment-in-kind security which may pay interest in additional principal at the issuer’s discretion. |
| (2) | Security represents the municipal bond held by a trust that issues residual interest bonds (see Note 1I). |
| | | | |
| | 30 | | See Notes to Financial Statements. |
Eaton Vance
Municipal Income Funds
July 31, 2014
Statements of Assets and Liabilities
| | | | | | | | | | | | |
| | | July 31, 2014 | |
| Assets | | Arizona Fund | | | Connecticut Fund | | | Minnesota Fund | |
Investments — | | | | | | | | | | | | |
Identified cost | | $ | 61,583,406 | | | $ | 89,133,914 | | | $ | 100,563,536 | |
Unrealized appreciation | | | 4,952,238 | | | | 6,656,767 | | | | 7,887,257 | |
Investments, at value | | $ | 66,535,644 | | | $ | 95,790,681 | | | $ | 108,450,793 | |
Cash | | $ | 1,419,077 | | | $ | 2,234,816 | | | $ | 1,465,126 | |
Restricted cash* | | | 114,500 | | | | 39,000 | | | | 141,000 | |
Interest receivable | | | 416,119 | | | | 737,813 | | | | 1,275,517 | |
Receivable for investments sold | | | 100,000 | | | | — | | | | 15,062 | |
Receivable for Fund shares sold | | | 23,512 | | | | 91,758 | | | | 42,290 | |
Receivable for variation margin on open financial futures contracts | | | 3,562 | | | | 1,219 | | | | 4,406 | |
Total assets | | $ | 68,612,414 | | | $ | 98,895,287 | | | $ | 111,394,194 | |
| Liabilities | | | | | | | | | | | | |
Payable for floating rate notes issued | | $ | — | | | $ | 4,000,000 | | | $ | — | |
Payable for when-issued securities | | | 376,033 | | | | — | | | | — | |
Payable for Fund shares redeemed | | | 129,430 | | | | 79,324 | | | | 454,876 | |
Distributions payable | | | 44,975 | | | | 60,685 | | | | 59,031 | |
Payable to affiliates: | | | | | | | | | | | | |
Investment adviser fee | | | 17,203 | | | | 27,239 | | | | 32,180 | |
Distribution and service fees | | | 14,123 | | | | 19,425 | | | | 22,033 | |
Interest expense and fees payable | | | — | | | | 1,619 | | | | — | |
Accrued expenses | | | 55,626 | | | | 62,016 | | | | 58,772 | |
Total liabilities | | $ | 637,390 | | | $ | 4,250,308 | | | $ | 626,892 | |
Net Assets | | $ | 67,975,024 | | | $ | 94,644,979 | | | $ | 110,767,302 | |
| Sources of Net Assets | | | | | | | | | | | | |
Paid-in capital | | $ | 67,910,844 | | | $ | 94,320,515 | | | $ | 106,388,572 | |
Accumulated net realized loss | | | (4,796,107 | ) | | | (6,255,548 | ) | | | (3,495,256 | ) |
Accumulated undistributed (distributions in excess of) net investment income | | | (44,975 | ) | | | (60,684 | ) | | | 44,831 | |
Net unrealized appreciation | | | 4,905,262 | | | | 6,640,696 | | | | 7,829,155 | |
Net Assets | | $ | 67,975,024 | | | $ | 94,644,979 | | | $ | 110,767,302 | |
| Class A Shares | | | | | | | | | | | | |
Net Assets | | $ | 52,491,373 | | | $ | 76,772,314 | | | $ | 73,246,064 | |
Shares Outstanding | | | 5,441,562 | | | | 7,498,777 | | | | 7,644,226 | |
Net Asset Value and Redemption Price Per Share | | | | | | | | | | | | |
(net assets ÷ shares of beneficial interest outstanding) | | $ | 9.65 | | | $ | 10.24 | | | $ | 9.58 | |
Maximum Offering Price Per Share | | | | | | | | | | | | |
(100 ÷ 95.25 of net asset value per share) | | $ | 10.13 | | | $ | 10.75 | | | $ | 10.06 | |
| Class B Shares | | | | | | | | | | | | |
Net Assets | | $ | 554,963 | | | $ | 1,438,858 | | | $ | 535,340 | |
Shares Outstanding | | | 51,766 | | | | 141,213 | | | | 51,925 | |
Net Asset Value and Offering Price Per Share** | | | | | | | | | | | | |
(net assets ÷ shares of beneficial interest outstanding) | | $ | 10.72 | | | $ | 10.19 | | | $ | 10.31 | |
| Class C Shares | | | | | | | | | | | | |
Net Assets | | $ | 5,792,482 | | | $ | 6,446,860 | | | $ | 11,098,049 | |
Shares Outstanding | | | 539,959 | | | | 631,965 | | | | 1,077,092 | |
Net Asset Value and Offering Price Per Share** | | | | | | | | | | | | |
(net assets ÷ shares of beneficial interest outstanding) | | $ | 10.73 | | | $ | 10.20 | | | $ | 10.30 | |
| Class I Shares | | | | | | | | | | | | |
Net Assets | | $ | 9,136,206 | | | $ | 9,986,947 | | | $ | 25,887,849 | |
Shares Outstanding | | | 947,325 | | | | 975,196 | | | | 2,701,529 | |
Net Asset Value, Offering Price and Redemption Price Per Share | | | | | | | | | | | | |
(net assets ÷ shares of beneficial interest outstanding) | | $ | 9.64 | | | $ | 10.24 | | | $ | 9.58 | |
On sales of $50,000 or more, the offering price of Class A shares is reduced.
| * | Represents restricted cash on deposit at the broker for open financial futures contracts. |
| ** | Redemption price per share is equal to the net asset value less any applicable contingent deferred sales charge. |
| | | | |
| | 31 | | See Notes to Financial Statements. |
Eaton Vance
Municipal Income Funds
July 31, 2014
Statements of Assets and Liabilities — continued
| | | | | | | | |
| | | July 31, 2014 | |
| Assets | | New Jersey Fund | | | Pennsylvania Fund | |
Investments — | | | | | | | | |
Identified cost | | $ | 160,341,094 | | | $ | 207,858,964 | |
Unrealized appreciation | | | 13,573,270 | | | | 18,953,686 | |
Investments, at value | | $ | 173,914,364 | | | $ | 226,812,650 | |
Cash | | $ | 10,833,260 | | | $ | 5,112,696 | |
Restricted cash* | | | 697,000 | | | | 990,000 | |
Interest receivable | | | 1,112,038 | | | | 1,777,886 | |
Receivable for investments sold | | | — | | | | 147,766 | |
Receivable for Fund shares sold | | | 994,626 | | | | 191,141 | |
Receivable for variation margin on open financial futures contracts | | | 21,563 | | | | 30,938 | |
Total assets | | $ | 187,572,851 | | | $ | 235,063,077 | |
| | |
| Liabilities | | | | | | | | |
Payable for floating rate notes issued | | $ | 6,900,000 | | | $ | 11,750,000 | |
Payable for Fund shares redeemed | | | 461,014 | | | | 319,841 | |
Distributions payable | | | 124,496 | | | | 167,065 | |
Payable to affiliates: | | | | | | | | |
Investment adviser fee | | | 57,802 | | | | 75,688 | |
Distribution and service fees | | | 42,570 | | | | 53,740 | |
Interest expense and fees payable | | | 5,804 | | | | 22,912 | |
Accrued expenses | | | 95,810 | | | | 105,852 | |
Total liabilities | | $ | 7,687,496 | | | $ | 12,495,098 | |
Net Assets | | $ | 179,885,355 | | | $ | 222,567,979 | |
| | |
| Sources of Net Assets | | | | | | | | |
Paid-in capital | | $ | 207,722,361 | | | $ | 242,206,203 | |
Accumulated net realized loss | | | (42,463,865 | ) | | | (38,144,562 | ) |
Accumulated undistributed (distributions in excess of) net investment income | | | 1,238,008 | | | | (39,400 | ) |
Net unrealized appreciation | | | 13,388,851 | | | | 18,545,738 | |
Net Assets | | $ | 179,885,355 | | | $ | 222,567,979 | |
| | |
| Class A Shares | | | | | | | | |
Net Assets | | $ | 135,264,542 | | | $ | 147,461,130 | |
Shares Outstanding | | | 14,531,223 | | | | 16,473,917 | |
Net Asset Value and Redemption Price Per Share | | | | | | | | |
(net assets ÷ shares of beneficial interest outstanding) | | $ | 9.31 | | | $ | 8.95 | |
Maximum Offering Price Per Share | | | | | | | | |
(100 ÷ 95.25 of net asset value per share) | | $ | 9.77 | | | $ | 9.40 | |
| | |
| Class B Shares | | | | | | | | |
Net Assets | | $ | — | | | $ | 3,011,581 | |
Shares Outstanding | | | — | | | | 325,042 | |
Net Asset Value and Offering Price Per Share** | | | | | | | | |
(net assets ÷ shares of beneficial interest outstanding) | | $ | — | | | $ | 9.27 | |
| | |
| Class C Shares | | | | | | | | |
Net Assets | | $ | 24,441,915 | | | $ | 32,341,690 | |
Shares Outstanding | | | 2,516,228 | | | | 3,489,175 | |
Net Asset Value and Offering Price Per Share** | | | | | | | | |
(net assets ÷ shares of beneficial interest outstanding) | | $ | 9.71 | | | $ | 9.27 | |
| | |
| Class I Shares | | | | | | | | |
Net Assets | | $ | 20,178,898 | | | $ | 39,753,578 | |
Shares Outstanding | | | 2,166,984 | | | | 4,424,188 | |
Net Asset Value, Offering Price and Redemption Price Per Share | | | | | | | | |
(net assets ÷ shares of beneficial interest outstanding) | | $ | 9.31 | | | $ | 8.99 | |
On sales of $50,000 or more, the offering price of Class A shares is reduced.
| * | Represents restricted cash on deposit at the broker for open financial futures contracts. |
| ** | Redemption price per share is equal to the net asset value less any applicable contingent deferred sales charge. |
| | | | |
| | 32 | | See Notes to Financial Statements. |
Eaton Vance
Municipal Income Funds
July 31, 2014
Statements of Operations
| | | | | | | | | | | | |
| | | Year Ended July 31, 2014 | |
| Investment Income | | Arizona Fund | | | Connecticut Fund | | | Minnesota Fund | |
Interest | | $ | 3,218,314 | | | $ | 4,512,123 | | | $ | 4,500,655 | |
Total investment income | | $ | 3,218,314 | | | $ | 4,512,123 | | | $ | 4,500,655 | |
| | | |
| Expenses | | | | | | | | | | | | |
Investment adviser fee | | $ | 208,030 | | | $ | 336,729 | | | $ | 378,158 | |
Distribution and service fees | | | | | | | | | | | | |
Class A | | | 106,305 | | | | 161,870 | | | | 147,279 | |
Class B | | | 6,659 | | | | 14,389 | | | | 6,897 | |
Class C | | | 61,181 | | | | 58,576 | | | | 104,044 | |
Trustees’ fees and expenses | | | 3,385 | | | | 4,623 | | | | 5,156 | |
Custodian fee | | | 32,551 | | | | 39,157 | | | | 41,747 | |
Transfer and dividend disbursing agent fees | | | 19,653 | | | | 37,138 | | | | 43,954 | |
Legal and accounting services | | | 53,070 | | | | 45,416 | | | | 44,173 | |
Printing and postage | | | 10,855 | | | | 13,392 | | | | 16,804 | |
Registration fees | | | 13,080 | | | | 5,258 | | | | 11,533 | |
Interest expense and fees | | | 18,772 | | | | 64,085 | | | | — | |
Miscellaneous | | | 16,598 | | | | 20,101 | | | | 21,197 | |
Total expenses | | $ | 550,139 | | | $ | 800,734 | | | $ | 820,942 | |
Deduct — | | | | | | | | | | | | |
Reduction of custodian fee | | $ | 149 | | | $ | 217 | | | $ | 794 | |
Total expense reductions | | $ | 149 | | | $ | 217 | | | $ | 794 | |
| | | |
Net expenses | | $ | 549,990 | | | $ | 800,517 | | | $ | 820,148 | |
| | | |
Net investment income | | $ | 2,668,324 | | | $ | 3,711,606 | | | $ | 3,680,507 | |
| | | |
| Realized and Unrealized Gain (Loss) | | | | | | | | | | | | |
Net realized gain (loss) — | | | | | | | | | | | | |
Investment transactions | | $ | (534,616 | ) | | $ | (610,517 | ) | | $ | 76,303 | |
Financial futures contracts | | | (26,681 | ) | | | 108,444 | | | | (33,001 | ) |
Net realized gain (loss) | | $ | (561,297 | ) | | $ | (502,073 | ) | | $ | 43,302 | |
Change in unrealized appreciation (depreciation) — | | | | | | | | | | | | |
Investments | | $ | 3,215,877 | | | $ | 3,835,163 | | | $ | 4,367,816 | |
Financial futures contracts | | | (296,875 | ) | | | (226,512 | ) | | | (367,188 | ) |
Net change in unrealized appreciation (depreciation) | | $ | 2,919,002 | | | $ | 3,608,651 | | | $ | 4,000,628 | |
| | | |
Net realized and unrealized gain | | $ | 2,357,705 | | | $ | 3,106,578 | | | $ | 4,043,930 | |
| | | |
Net increase in net assets from operations | | $ | 5,026,029 | | | $ | 6,818,184 | | | $ | 7,724,437 | |
| | | | |
| | 33 | | See Notes to Financial Statements. |
Eaton Vance
Municipal Income Funds
July 31, 2014
Statements of Operations — continued
| | | | | | | | |
| | | Year Ended July 31, 2014 | |
| Investment Income | | New Jersey Fund | | | Pennsylvania Fund | |
Interest | | $ | 8,344,259 | | | $ | 10,927,103 | |
Total investment income | | $ | 8,344,259 | | | $ | 10,927,103 | |
| | |
| Expenses | | | | | | | | |
Investment adviser fee | | $ | 696,411 | | | $ | 885,492 | |
Distribution and service fees | | | | | | | | |
Class A | | | 276,710 | | | | 298,358 | |
Class B | | | — | | | | 34,766 | |
Class C | | | 224,052 | | | | 306,579 | |
Trustees’ fees and expenses | | | 8,183 | | | | 9,955 | |
Custodian fee | | | 57,201 | | | | 65,765 | |
Transfer and dividend disbursing agent fees | | | 74,015 | | | | 95,801 | |
Legal and accounting services | | | 74,196 | | | | 79,306 | |
Printing and postage | | | 20,855 | | | | 25,651 | |
Registration fees | | | 5,225 | | | | 5,943 | |
Interest expense and fees | | | 51,329 | | | | 76,476 | |
Miscellaneous | | | 21,296 | | | | 25,880 | |
Total expenses | | $ | 1,509,473 | | | $ | 1,909,972 | |
Deduct — | | | | | | | | |
Reduction of custodian fee | | $ | 2,575 | | | $ | 812 | |
Total expense reductions | | $ | 2,575 | | | $ | 812 | |
| | |
Net expenses | | $ | 1,506,898 | | | $ | 1,909,160 | |
| | |
Net investment income | | $ | 6,837,361 | | | $ | 9,017,943 | |
| | |
| Realized and Unrealized Gain (Loss) | | | | | | | | |
Net realized gain (loss) — | | | | | | | | |
Investment transactions | | $ | 2,794,189 | | | $ | (167,234 | ) |
Financial futures contracts | | | 13,723 | | | | 371,129 | |
Net realized gain | | $ | 2,807,912 | | | $ | 203,895 | |
Change in unrealized appreciation (depreciation) — | | | | | | | | |
Investments | | $ | 4,760,148 | | | $ | 7,980,805 | |
Financial futures contracts | | | (1,894,808 | ) | | | (3,531,688 | ) |
Net change in unrealized appreciation (depreciation) | | $ | 2,865,340 | | | $ | 4,449,117 | |
| | |
Net realized and unrealized gain | | $ | 5,673,252 | | | $ | 4,653,012 | |
| | |
Net increase in net assets from operations | | $ | 12,510,613 | | | $ | 13,670,955 | |
| | | | |
| | 34 | | See Notes to Financial Statements. |
Eaton Vance
Municipal Income Funds
July 31, 2014
Statements of Changes in Net Assets
| | | | | | | | | | | | |
| | | Year Ended July 31, 2014 | |
| Increase (Decrease) in Net Assets | | Arizona Fund | | | Connecticut Fund | | | Minnesota Fund | |
From operations — | | | | | | | | | | | | |
Net investment income | | $ | 2,668,324 | | | $ | 3,711,606 | | | $ | 3,680,507 | |
Net realized gain (loss) from investment transactions and financial futures contracts | | | (561,297 | ) | | | (502,073 | ) | | | 43,302 | |
Net change in unrealized appreciation (depreciation) from investments and financial futures contracts | | | 2,919,002 | | | | 3,608,651 | | | | 4,000,628 | |
Net increase in net assets from operations | | $ | 5,026,029 | | | $ | 6,818,184 | | | $ | 7,724,437 | |
Distributions to shareholders — | | | | | | | | | | | | |
From net investment income | | | | | | | | | | | | |
Class A | | $ | (2,060,201 | ) | | $ | (3,103,261 | ) | | $ | (2,495,977 | ) |
Class B | | | (22,002 | ) | | | (46,673 | ) | | | (19,230 | ) |
Class C | | | (201,900 | ) | | | (189,884 | ) | | | (289,617 | ) |
Class I | | | (292,297 | ) | | | (342,830 | ) | | | (862,944 | ) |
Total distributions to shareholders | | $ | (2,576,400 | ) | | $ | (3,682,648 | ) | | $ | (3,667,768 | ) |
Transactions in shares of beneficial interest — | | | | | | | | | | | | |
Proceeds from sale of shares | | | | | | | | | | | | |
Class A | | $ | 2,900,723 | | | $ | 4,125,148 | | | $ | 13,153,082 | |
Class B | | | 1,643 | | | | 15,228 | | | | — | |
Class C | | | 681,079 | | | | 1,149,219 | | | | 1,914,150 | |
Class I | | | 4,549,745 | | | | 3,866,354 | | | | 19,685,506 | |
Net asset value of shares issued to shareholders in payment of distributions declared | | | | | | | | | | | | |
Class A | | | 1,768,461 | | | | 2,529,934 | | | | 2,345,420 | |
Class B | | | 18,196 | | | | 27,839 | | | | 18,280 | |
Class C | | | 181,276 | | | | 139,207 | | | | 251,141 | |
Class I | | | 47,767 | | | | 173,553 | | | | 162,563 | |
Cost of shares redeemed | | | | | | | | | | | | |
Class A | | | (9,128,459 | ) | | | (21,490,066 | ) | | | (22,608,101 | ) |
Class B | | | (220,314 | ) | | | (148,448 | ) | | | (138,984 | ) |
Class C | | | (3,021,243 | ) | | | (1,822,903 | ) | | | (3,757,092 | ) |
Class I | | | (2,575,182 | ) | | | (2,788,873 | ) | | | (16,237,761 | ) |
Net asset value of shares exchanged | | | | | | | | | | | | |
Class A | | | 58,857 | | | | 147,120 | | | | 216,980 | |
Class B | | | (58,857 | ) | | | (147,120 | ) | | | (216,980 | ) |
Net decrease in net assets from Fund share transactions | | $ | (4,796,308 | ) | | $ | (14,223,808 | ) | | $ | (5,211,796 | ) |
| | | |
Net decrease in net assets | | $ | (2,346,679 | ) | | $ | (11,088,272 | ) | | $ | (1,155,127 | ) |
| | | |
| Net Assets | | | | | | | | | | | | |
At beginning of year | | $ | 70,321,703 | | | $ | 105,733,251 | | | $ | 111,922,429 | |
At end of year | | $ | 67,975,024 | | | $ | 94,644,979 | | | $ | 110,767,302 | |
| | | |
Accumulated undistributed (distributions in excess of) net investment income included in net assets | | | | | | | | | | | | |
At end of year | | $ | (44,975 | ) | | $ | (60,684 | ) | | $ | 44,831 | |
| | | | |
| | 35 | | See Notes to Financial Statements. |
Eaton Vance
Municipal Income Funds
July 31, 2014
Statements of Changes in Net Assets — continued
| | | | | | | | |
| | | Year Ended July 31, 2014 | |
| Increase (Decrease) in Net Assets | | New Jersey Fund | | | Pennsylvania Fund | |
From operations — | | | | | | | | |
Net investment income | | $ | 6,837,361 | | | $ | 9,017,943 | |
Net realized gain from investment transactions and financial futures contracts | | | 2,807,912 | | | | 203,895 | |
Net change in unrealized appreciation (depreciation) from investments and financial futures contracts | | | 2,865,340 | | | | 4,449,117 | |
Net increase in net assets from operations | | $ | 12,510,613 | | | $ | 13,670,955 | |
Distributions to shareholders — | | | | | | | | |
From net investment income | | | | | | | | |
Class A | | $ | (5,406,774 | ) | | $ | (6,293,812 | ) |
Class B | | | — | | | | (127,373 | ) |
Class C | | | (742,678 | ) | | | (1,118,889 | ) |
Class I | | | (675,037 | ) | | | (1,419,925 | ) |
Total distributions to shareholders | | $ | (6,824,489 | ) | | $ | (8,959,999 | ) |
Transactions in shares of beneficial interest — | | | | | | | | |
Proceeds from sale of shares | | | | | | | | |
Class A | | $ | 8,893,718 | | | $ | 9,685,291 | |
Class B | | | — | | | | 52,980 | |
Class C | | | 4,205,184 | | | | 4,008,418 | |
Class I | | | 13,530,237 | | | | 17,388,526 | |
Net asset value of shares issued to shareholders in payment of distributions declared | | | | | | | | |
Class A | | | 4,391,583 | | | | 5,451,719 | |
Class B | | | — | | | | 119,630 | |
Class C | | | 528,064 | | | | 985,754 | |
Class I | | | 314,999 | | | | 474,908 | |
Cost of shares redeemed | | | | | | | | |
Class A | | | (28,927,439 | ) | | | (28,019,692 | ) |
Class B | | | — | | | | (877,472 | ) |
Class C | | | (6,810,939 | ) | | | (7,396,419 | ) |
Class I | | | (7,714,891 | ) | | | (8,241,138 | ) |
Net asset value of shares exchanged | | | | | | | | |
Class A | | | — | | | | 876,255 | |
Class B | | | — | | | | (876,255 | ) |
Net decrease in net assets from Fund share transactions | | $ | (11,589,484 | ) | | $ | (6,367,495 | ) |
| | |
Net decrease in net assets | | $ | (5,903,360 | ) | | $ | (1,656,539 | ) |
| | |
| Net Assets | | | | | | | | |
At beginning of year | | $ | 185,788,715 | | | $ | 224,224,518 | |
At end of year | | $ | 179,885,355 | | | $ | 222,567,979 | |
| | |
Accumulated undistributed (distributions in excess of) net investment income included in net assets | | | | | | | | |
At end of year | | $ | 1,238,008 | | | $ | (39,400 | ) |
| | | | |
| | 36 | | See Notes to Financial Statements. |
Eaton Vance
Municipal Income Funds
July 31, 2014
Statements of Changes in Net Assets — continued
| | | | | | | | | | | | |
| | | Year Ended July 31, 2013 | |
| Increase (Decrease) in Net Assets | | Arizona Fund | | | Connecticut Fund | | | Minnesota Fund | |
From operations — | | | | | | | | | | | | |
Net investment income | | $ | 2,927,529 | | | $ | 4,243,901 | | | $ | 3,747,145 | |
Net realized gain (loss) from investment transactions and financial futures contracts | | | 8,011 | | | | (432,112 | ) | | | 236,677 | |
Net change in unrealized appreciation (depreciation) from investments and financial futures contracts | | | (5,830,828 | ) | | | (9,257,696 | ) | | | (6,968,180 | ) |
Net decrease in net assets from operations | | $ | (2,895,288 | ) | | $ | (5,445,907 | ) | | $ | (2,984,358 | ) |
Distributions to shareholders — | | | | | | | | | | | | |
From net investment income | | | | | | | | | | | | |
Class A | | $ | (2,253,384 | ) | | $ | (3,565,984 | ) | | $ | (2,658,543 | ) |
Class B | | | (32,416 | ) | | | (63,797 | ) | | | (28,568 | ) |
Class C | | | (271,863 | ) | | | (222,287 | ) | | | (320,437 | ) |
Class I | | | (285,894 | ) | | | (349,047 | ) | | | (713,235 | ) |
Tax return of capital | | | | | | | | | | | | |
Class A | | | — | | | | (16,354 | ) | | | — | |
Class B | | | — | | | | (293 | ) | | | — | |
Class C | | | — | | | | (1,019 | ) | | | — | |
Class I | | | — | | | | (1,601 | ) | | | — | |
Total distributions to shareholders | | $ | (2,843,557 | ) | | $ | (4,220,382 | ) | | $ | (3,720,783 | ) |
Transactions in shares of beneficial interest — | | | | | | | | | | | | |
Proceeds from sale of shares | | | | | | | | | | | | |
Class A | | $ | 4,972,125 | | | $ | 7,262,417 | | | $ | 13,377,161 | |
Class B | | | 20,731 | | | | 18,391 | | | | — | |
Class C | | | 1,342,052 | | | | 2,081,277 | | | | 2,637,133 | |
Class I | | | 7,856,768 | | | | 2,990,011 | | | | 14,072,736 | |
Net asset value of shares issued to shareholders in payment of distributions declared | | | | | | | | | | | | |
Class A | | | 1,877,198 | | | | 2,877,171 | | | | 2,497,058 | |
Class B | | | 26,594 | | | | 39,646 | | | | 24,694 | |
Class C | | | 249,561 | | | | 152,600 | | | | 277,643 | |
Class I | | | 51,044 | | | | 201,719 | | | | 110,271 | |
Cost of shares redeemed | | | | | | | | | | | | |
Class A | | | (10,348,453 | ) | | | (15,295,627 | ) | | | (20,646,128 | ) |
Class B | | | (348,701 | ) | | | (451,601 | ) | | | (333,610 | ) |
Class C | | | (2,805,482 | ) | | | (2,567,330 | ) | | | (2,824,756 | ) |
Class I | | | (3,135,225 | ) | | | (4,651,312 | ) | | | (13,175,618 | ) |
Net asset value of shares exchanged | | | | | | | | | | | | |
Class A | | | 295,574 | | | | 379,590 | | | | 108,000 | |
Class B | | | (295,574 | ) | | | (379,590 | ) | | | (108,000 | ) |
Net decrease in net assets from Fund share transactions | | $ | (241,788 | ) | | $ | (7,342,638 | ) | | $ | (3,983,416 | ) |
| | | |
Net decrease in net assets | | $ | (5,980,633 | ) | | $ | (17,008,927 | ) | | $ | (10,688,557 | ) |
| | | |
| Net Assets | | | | | | | | | | | | |
At beginning of year | | $ | 76,302,336 | | | $ | 122,742,178 | | | $ | 122,610,986 | |
At end of year | | $ | 70,321,703 | | | $ | 105,733,251 | | | $ | 111,922,429 | |
| | | |
Accumulated undistributed (distributions in excess of) net investment income
included in net assets | | | | | | | | | | | | |
At end of year | | $ | (47,032 | ) | | $ | (72,531 | ) | | $ | 44,831 | |
| | | | |
| | 37 | | See Notes to Financial Statements. |
Eaton Vance
Municipal Income Funds
July 31, 2014
Statements of Changes in Net Assets — continued
| | | | | | | | |
| | | Year Ended July 31, 2013 | |
| Increase (Decrease) in Net Assets | | New Jersey Fund | | | Pennsylvania Fund | |
From operations — | | | | | | | | |
Net investment income | | $ | 8,177,845 | | | $ | 9,660,926 | |
Net realized gain (loss) from investment transactions and financial futures contracts | | | (485,309 | ) | | | 2,727,337 | |
Net change in unrealized appreciation (depreciation) from investments and financial futures contracts | | | (11,540,027 | ) | | | (13,595,697 | ) |
Net decrease in net assets from operations | | $ | (3,847,491 | ) | | $ | (1,207,434 | ) |
Distributions to shareholders — | | | | | | | | |
From net investment income | | | | | | | | |
Class A | | $ | (6,674,991 | ) | | $ | (6,866,187 | ) |
Class B | | | — | | | | (191,726 | ) |
Class C | | | (944,435 | ) | | | (1,222,749 | ) |
Class I | | | (562,023 | ) | | | (1,322,510 | ) |
Total distributions to shareholders | | $ | (8,181,449 | ) | | $ | (9,603,172 | ) |
Transactions in shares of beneficial interest — | | | | | | | | |
Proceeds from sale of shares | | | | | | | | |
Class A | | $ | 7,636,417 | | | $ | 9,861,659 | |
Class B | | | — | | | | 113,435 | |
Class C | | | 5,293,400 | | | | 4,749,660 | |
Class I | | | 6,399,999 | | | | 13,938,803 | |
Net asset value of shares issued to shareholders in payment of distributions declared | | | | | | | | |
Class A | | | 5,442,841 | | | | 5,873,902 | |
Class B | | | — | | | | 172,161 | |
Class C | | | 672,955 | | | | 1,059,592 | |
Class I | | | 269,832 | | | | 369,286 | |
Cost of shares redeemed | | | | | | | | |
Class A | | | (30,284,141 | ) | | | (32,995,155 | ) |
Class B | | | — | | | | (1,832,115 | ) |
Class C | | | (6,488,155 | ) | | | (8,332,158 | ) |
Class I | | | (3,167,682 | ) | | | (12,859,884 | ) |
Net asset value of shares exchanged | | | | | | | | |
Class A | | | — | | | | 984,547 | |
Class B | | | — | | | | (984,547 | ) |
Net decrease in net assets from Fund share transactions | | $ | (14,224,534 | ) | | $ | (19,880,814 | ) |
| | |
Net decrease in net assets | | $ | (26,253,474 | ) | | $ | (30,691,420 | ) |
| | |
| Net Assets | | | | | | | | |
At beginning of year | | $ | 212,042,189 | | | $ | 254,915,938 | |
At end of year | | $ | 185,788,715 | | | $ | 224,224,518 | |
| | |
Accumulated undistributed (distributions in excess of) net investment income
included in net assets | | | | | | | | |
At end of year | | $ | 1,238,007 | | | $ | (39,400 | ) |
| | | | |
| | 38 | | See Notes to Financial Statements. |
Eaton Vance
Municipal Income Funds
July 31, 2014
Financial Highlights
| | | | | | | | | | | | | | | | | | | | |
| | | Arizona Fund — Class A | |
| | | Year Ended July 31, | |
| | | 2014 | | | 2013 | | | 2012 | | | 2011 | | | 2010 | |
Net asset value — Beginning of year | | $ | 9.300 | | | $ | 10.030 | | | $ | 9.280 | | | $ | 9.400 | | | $ | 8.960 | |
| | | | | |
| Income (Loss) From Operations | | | | | | | | | | | | | | | | | | | | |
Net investment income(1) | | $ | 0.378 | | | $ | 0.374 | | | $ | 0.404 | | | $ | 0.429 | | | $ | 0.400 | |
Net realized and unrealized gain (loss) | | | 0.337 | | | | (0.741 | ) | | | 0.736 | | | | (0.133 | ) | | | 0.427 | |
| | | | | |
Total income (loss) from operations | | $ | 0.715 | | | $ | (0.367 | ) | | $ | 1.140 | | | $ | 0.296 | | | $ | 0.827 | |
| | | | | |
| Less Distributions | | | | | | | | | | | | | | | | | | | | |
From net investment income | | $ | (0.365 | ) | | $ | (0.363 | ) | | $ | (0.387 | ) | | $ | (0.416 | ) | | $ | (0.387 | ) |
Tax return of capital | | | — | | | | — | | | | (0.003 | ) | | | — | | | | — | |
| | | | | |
Total distributions | | $ | (0.365 | ) | | $ | (0.363 | ) | | $ | (0.390 | ) | | $ | (0.416 | ) | | $ | (0.387 | ) |
| | | | | |
Net asset value — End of year | | $ | 9.650 | | | $ | 9.300 | | | $ | 10.030 | | | $ | 9.280 | | | $ | 9.400 | |
| | | | | |
Total Return(2) | | | 7.84 | % | | | (3.82 | )% | | | 12.51 | % | | | 3.28 | % | | | 9.35 | % |
| | | | | |
| Ratios/Supplemental Data | | | | | | | | | | | | | | | | | | | | |
Net assets, end of year (000’s omitted) | | $ | 52,491 | | | $ | 54,949 | | | $ | 62,591 | | | $ | 67,029 | | | $ | 83,120 | |
Ratios (as a percentage of average daily net assets): | | | | | | | | | | | | | | | | | | | | |
Expenses excluding interest and fees | | | 0.73 | % | | | 0.74 | % | | | 0.74 | % | | | 0.75 | % | | | 0.75 | % |
Interest and fee expense(3) | | | 0.03 | % | | | 0.02 | % | | | 0.02 | % | | | 0.02 | % | | | 0.01 | % |
Total expenses(4) | | | 0.76 | % | | | 0.76 | % | | | 0.76 | % | | | 0.77 | % | | | 0.76 | % |
Net investment income | | | 4.01 | % | | | 3.77 | % | | | 4.17 | % | | | 4.65 | % | | | 4.30 | % |
Portfolio Turnover | | | 4 | % | | | 14 | % | | | 8 | % | | | 1 | % | | | 5 | % |
| (1) | Computed using average shares outstanding. |
| (2) | Returns are historical and are calculated by determining the percentage change in net asset value with all distributions reinvested and do not reflect the effect of sales charges. |
| (3) | Interest and fee expense relates to the liability for floating rate notes issued in conjunction with residual interest bond transactions (see Note 1I). |
| (4) | Excludes the effect of custody fee credits, if any, of less than 0.005%. |
| | | | |
| | 39 | | See Notes to Financial Statements. |
Eaton Vance
Municipal Income Funds
July 31, 2014
Financial Highlights — continued
| | | | | | | | | | | | | | | | | | | | |
| | | Arizona Fund — Class B | |
| | | Year Ended July 31, | |
| | | 2014 | | | 2013 | | | 2012 | | | 2011 | | | 2010 | |
Net asset value — Beginning of year | | $ | 10.330 | | | $ | 11.140 | | | $ | 10.310 | | | $ | 10.440 | | | $ | 9.960 | |
| | | | | |
| Income (Loss) From Operations | | | | | | | | | | | | | | | | | | | | |
Net investment income(1) | | $ | 0.343 | | | $ | 0.334 | | | $ | 0.368 | | | $ | 0.398 | | | $ | 0.367 | |
Net realized and unrealized gain (loss) | | | 0.374 | | | | (0.823 | ) | | | 0.815 | | | | (0.143 | ) | | | 0.468 | |
| | | | | |
Total income (loss) from operations | | $ | 0.717 | | | $ | (0.489 | ) | | $ | 1.183 | | | $ | 0.255 | | | $ | 0.835 | |
| | | | | |
| Less Distributions | | | | | | | | | | | | | | | | | | | | |
From net investment income | | $ | (0.327 | ) | | $ | (0.321 | ) | | $ | (0.350 | ) | | $ | (0.385 | ) | | $ | (0.355 | ) |
Tax return of capital | | | — | | | | — | | | | (0.003 | ) | | | — | | | | — | |
| | | | | |
Total distributions | | $ | (0.327 | ) | | $ | (0.321 | ) | | $ | (0.353 | ) | | $ | (0.385 | ) | | $ | (0.355 | ) |
| | | | | |
Net asset value — End of year | | $ | 10.720 | | | $ | 10.330 | | | $ | 11.140 | | | $ | 10.310 | | | $ | 10.440 | |
| | | | | |
Total Return(2) | | | 7.05 | % | | | (4.53 | )% | | | 11.64 | % | | | 2.55 | % | | | 8.47 | % |
| | | | | |
| Ratios/Supplemental Data | | | | | | | | | | | | | | | | | | | | |
Net assets, end of year (000’s omitted) | | $ | 555 | | | $ | 789 | | | $ | 1,451 | | | $ | 1,693 | | | $ | 3,086 | |
Ratios (as a percentage of average daily net assets): | | | | | | | | | | | | | | | | | | | | |
Expenses excluding interest and fees | | | 1.48 | % | | | 1.49 | % | | | 1.49 | % | | | 1.50 | % | | | 1.50 | % |
Interest and fee expense(3) | | | 0.03 | % | | | 0.02 | % | | | 0.02 | % | | | 0.02 | % | | | 0.01 | % |
Total expenses(4) | | | 1.51 | % | | | 1.51 | % | | | 1.51 | % | | | 1.52 | % | | | 1.51 | % |
Net investment income | | | 3.28 | % | | | 3.02 | % | | | 3.42 | % | | | 3.88 | % | | | 3.55 | % |
Portfolio Turnover | | | 4 | % | | | 14 | % | | | 8 | % | | | 1 | % | | | 5 | % |
| (1) | Computed using average shares outstanding. |
| (2) | Returns are historical and are calculated by determining the percentage change in net asset value with all distributions reinvested and do not reflect the effect of sales charges. |
| (3) | Interest and fee expense relates to the liability for floating rate notes issued in conjunction with residual interest bond transactions (see Note 1I). |
| (4) | Excludes the effect of custody fee credits, if any, of less than 0.005%. |
| | | | |
| | 40 | | See Notes to Financial Statements. |
Eaton Vance
Municipal Income Funds
July 31, 2014
Financial Highlights — continued
| | | | | | | | | | | | | | | | | | | | |
| | | Arizona Fund — Class C | |
| | | Year Ended July 31, | |
| | | 2014 | | | 2013 | | | 2012 | | | 2011 | | | 2010 | |
Net asset value — Beginning of year | | $ | 10.340 | | | $ | 11.150 | | | $ | 10.320 | | | $ | 10.450 | | | $ | 9.970 | |
| | | | | |
| Income (Loss) From Operations | | | | | | | | | | | | | | | | | | | | |
Net investment income(1) | | $ | 0.343 | | | $ | 0.333 | | | $ | 0.366 | | | $ | 0.400 | | | $ | 0.367 | |
Net realized and unrealized gain (loss) | | | 0.374 | | | | (0.822 | ) | | | 0.817 | | | | (0.144 | ) | | | 0.468 | |
| | | | | |
Total income (loss) from operations | | $ | 0.717 | | | $ | (0.489 | ) | | $ | 1.183 | | | $ | 0.256 | | | $ | 0.835 | |
| | | | | |
| Less Distributions | | | | | | | | | | | | | | | | | | | | |
From net investment income | | $ | (0.327 | ) | | $ | (0.321 | ) | | $ | (0.350 | ) | | $ | (0.386 | ) | | $ | (0.355 | ) |
Tax return of capital | | | — | | | | — | | | | (0.003 | ) | | | — | | | | — | |
| | | | | |
Total distributions | | $ | (0.327 | ) | | $ | (0.321 | ) | | $ | (0.353 | ) | | $ | (0.386 | ) | | $ | (0.355 | ) |
| | | | | |
Net asset value — End of year | | $ | 10.730 | | | $ | 10.340 | | | $ | 11.150 | | | $ | 10.320 | | | $ | 10.450 | |
| | | | | |
Total Return(2) | | | 7.05 | % | | | (4.52 | )% | | | 11.63 | % | | | 2.55 | % | | | 8.46 | % |
| | | | | |
| Ratios/Supplemental Data | | | | | | | | | | | | | | | | | | | | |
Net assets, end of year (000’s omitted) | | $ | 5,792 | | | $ | 7,733 | | | $ | 9,602 | | | $ | 7,060 | | | $ | 8,765 | |
Ratios (as a percentage of average daily net assets): | | | | | | | | | | | | | | | | | | | | |
Expenses excluding interest and fees | | | 1.48 | % | | | 1.49 | % | | | 1.49 | % | | | 1.50 | % | | | 1.50 | % |
Interest and fee expense(3) | | | 0.03 | % | | | 0.02 | % | | | 0.02 | % | | | 0.02 | % | | | 0.01 | % |
Total expenses(4) | | | 1.51 | % | | | 1.51 | % | | | 1.51 | % | | | 1.52 | % | | | 1.51 | % |
Net investment income | | | 3.28 | % | | | 3.01 | % | | | 3.39 | % | | | 3.91 | % | | | 3.54 | % |
Portfolio Turnover | | | 4 | % | | | 14 | % | | | 8 | % | | | 1 | % | | | 5 | % |
| (1) | Computed using average shares outstanding. |
| (2) | Returns are historical and are calculated by determining the percentage change in net asset value with all distributions reinvested and do not reflect the effect of sales charges. |
| (3) | Interest and fee expense relates to the liability for floating rate notes issued in conjunction with residual interest bond transactions (see Note 1I). |
| (4) | Excludes the effect of custody fee credits, if any, of less than 0.005%. |
| | | | |
| | 41 | | See Notes to Financial Statements. |
Eaton Vance
Municipal Income Funds
July 31, 2014
Financial Highlights — continued
| | | | | | | | | | | | | | | | |
| | | Arizona Fund — Class I | |
| | | Year Ended July 31, | | | Period Ended July 31, 2011(1) | |
| | | 2014 | | | 2013 | | | 2012 | | |
Net asset value — Beginning of period | | $ | 9.300 | | | $ | 10.020 | | | $ | 9.270 | | | $ | 9.400 | |
| | | | |
| Income (Loss) From Operations | | | | | | | | | | | | | | | | |
Net investment income | | $ | 0.396 | (2) | | $ | 0.392 | (2) | | $ | 0.423 | (2) | | $ | 0.433 | |
Net realized and unrealized gain (loss) | | | 0.328 | | | | (0.729 | ) | | | 0.736 | | | | (0.134 | ) |
| | | | |
Total income (loss) from operations | | $ | 0.724 | | | $ | (0.337 | ) | | $ | 1.159 | | | $ | 0.299 | |
| | | | |
| Less Distributions | | | | | | | | | | | | | | | | |
From net investment income | | $ | (0.384 | ) | | $ | (0.383 | ) | | $ | (0.406 | ) | | $ | (0.429 | ) |
Tax return of capital | | | — | | | | — | | | | (0.003 | ) | | | — | |
| | | | |
Total distributions | | $ | (0.384 | ) | | $ | (0.383 | ) | | $ | (0.409 | ) | | $ | (0.429 | ) |
| | | | |
Net asset value — End of period | | $ | 9.640 | | | $ | 9.300 | | | $ | 10.020 | | | $ | 9.270 | |
| | | | |
Total Return(3) | | | 7.94 | % | | | (3.53 | )% | | | 12.74 | % | | | 3.33 | %(4) |
| | | | |
| Ratios/Supplemental Data | | | | | | | | | | | | | | | | |
Net assets, end of period (000’s omitted) | | $ | 9,136 | | | $ | 6,852 | | | $ | 2,658 | | | $ | 1,397 | |
Ratios (as a percentage of average daily net assets): | | | | | | | | | | | | | | | | |
Expenses excluding interest and fees | | | 0.53 | % | | | 0.54 | % | | | 0.54 | % | | | 0.55 | %(6) |
Interest and fee expense(5) | | | 0.03 | % | | | 0.02 | % | | | 0.02 | % | | | 0.02 | %(6) |
Total expenses(7) | | | 0.56 | % | | | 0.56 | % | | | 0.56 | % | | | 0.57 | %(6) |
Net investment income | | | 4.20 | % | | | 3.95 | % | | | 4.35 | % | | | 4.65 | %(6) |
Portfolio Turnover | | | 4 | % | | | 14 | % | | | 8 | % | | | 1 | %(8) |
| (1) | For the period from the commencement of operations on August 3, 2010 to July 31, 2011. |
| (2) | Computed using average shares outstanding. |
| (3) | Returns are historical and are calculated by determining the percentage change in net asset value with all distributions reinvested. |
| (5) | Interest and fee expense relates to the liability for floating rate notes issued in conjunction with residual interest bond transactions (see Note 1I). |
| (7) | Excludes the effect of custody fee credits, if any, of less than 0.005%. |
| (8) | For the year ended July 31, 2011. |
| | | | |
| | 42 | | See Notes to Financial Statements. |
Eaton Vance
Municipal Income Funds
July 31, 2014
Financial Highlights — continued
| | | | | | | | | | | | | | | | | | | | |
| | | Connecticut Fund — Class A | |
| | | Year Ended July 31, | |
| | | 2014 | | | 2013 | | | 2012 | | | 2011 | | | 2010 | |
Net asset value — Beginning of year | | $ | 9.890 | | | $ | 10.750 | | | $ | 10.050 | | | $ | 10.200 | | | $ | 9.750 | |
| | | | | |
| Income (Loss) From Operations | | | | | | | | | | | | | | | | | | | | |
Net investment income(1) | | $ | 0.386 | | | $ | 0.383 | | | $ | 0.415 | | | $ | 0.434 | | | $ | 0.425 | |
Net realized and unrealized gain (loss) | | | 0.347 | | | | (0.862 | ) | | | 0.700 | | | | (0.154 | ) | | | 0.455 | |
| | | | | |
Total income (loss) from operations | | $ | 0.733 | | | $ | (0.479 | ) | | $ | 1.115 | | | $ | 0.280 | | | $ | 0.880 | |
| | | | | |
| Less Distributions | | | | | | | | | | | | | | | | | | | | |
From net investment income | | $ | (0.383 | ) | | $ | (0.379 | ) | | $ | (0.412 | ) | | $ | (0.430 | ) | | $ | (0.430 | ) |
Tax return of capital | | | — | | | | (0.002 | ) | | | (0.003 | ) | | | — | | | | — | |
| | | | | |
Total distributions | | $ | (0.383 | ) | | $ | (0.381 | ) | | $ | (0.415 | ) | | $ | (0.430 | ) | | $ | (0.430 | ) |
| | | | | |
Net asset value — End of year | | $ | 10.240 | | | $ | 9.890 | | | $ | 10.750 | | | $ | 10.050 | | | $ | 10.200 | |
| | | | | |
Total Return(2) | | | 7.56 | % | | | (4.62 | )% | | | 11.29 | % | | | 2.85 | % | | | 9.14 | % |
| | | | | |
| Ratios/Supplemental Data | | | | | | | | | | | | | | | | | | | | |
Net assets, end of year (000’s omitted) | | $ | 76,772 | | | $ | 88,850 | | | $ | 101,699 | | | $ | 99,007 | | | $ | 110,955 | |
Ratios (as a percentage of average daily net assets): | | | | | | | | | | | | | | | | | | | | |
Expenses excluding interest and fees | | | 0.71 | % | | | 0.73 | % | | | 0.75 | % | | | 0.75 | % | | | 0.76 | % |
Interest and fee expense(3) | | | 0.07 | % | | | 0.05 | % | | | 0.05 | % | | | 0.05 | % | | | 0.05 | % |
Total expenses(4) | | | 0.78 | % | | | 0.78 | % | | | 0.80 | % | | | 0.80 | % | | | 0.81 | % |
Net investment income | | | 3.87 | % | | | 3.62 | % | | | 3.98 | % | | | 4.34 | % | | | 4.20 | % |
Portfolio Turnover | | | 6 | % | | | 13 | % | | | 13 | % | | | 5 | % | | | 10 | % |
| (1) | Computed using average shares outstanding. |
| (2) | Returns are historical and are calculated by determining the percentage change in net asset value with all distributions reinvested and do not reflect the effect of sales charges. |
| (3) | Interest and fee expense relates to the liability for floating rate notes issued in conjunction with residual interest bond transactions (see Note 1I). |
| (4) | Excludes the effect of custody fee credits, if any, of less than 0.005%. |
| | | | |
| | 43 | | See Notes to Financial Statements. |
Eaton Vance
Municipal Income Funds
July 31, 2014
Financial Highlights — continued
| | | | | | | | | | | | | | | | | | | | |
| | | Connecticut Fund — Class B | |
| | | Year Ended July 31, | |
| | | 2014 | | | 2013 | | | 2012 | | | 2011 | | | 2010 | |
Net asset value — Beginning of year | | $ | 9.850 | | | $ | 10.700 | | | $ | 10.000 | | | $ | 10.160 | | | $ | 9.700 | |
| | | | | |
| Income (Loss) From Operations | | | | | | | | | | | | | | | | | | | | |
Net investment income(1) | | $ | 0.309 | | | $ | 0.303 | | | $ | 0.336 | | | $ | 0.356 | | | $ | 0.348 | |
Net realized and unrealized gain (loss) | | | 0.337 | | | | (0.853 | ) | | | 0.699 | | | | (0.163 | ) | | | 0.465 | |
| | | | | |
Total income (loss) from operations | | $ | 0.646 | | | $ | (0.550 | ) | | $ | 1.035 | | | $ | 0.193 | | | $ | 0.813 | |
| | | | | |
| Less Distributions | | | | | | | | | | | | | | | | | | | | |
From net investment income | | $ | (0.306 | ) | | $ | (0.299 | ) | | $ | (0.333 | ) | | $ | (0.353 | ) | | $ | (0.353 | ) |
Tax return of capital | | | — | | | | (0.001 | ) | | | (0.002 | ) | | | — | | | | — | |
| | | | | |
Total distributions | | $ | (0.306 | ) | | $ | (0.300 | ) | | $ | (0.335 | ) | | $ | (0.353 | ) | | $ | (0.353 | ) |
| | | | | |
Net asset value — End of year | | $ | 10.190 | | | $ | 9.850 | | | $ | 10.700 | | | $ | 10.000 | | | $ | 10.160 | |
| | | | | |
Total Return(2) | | | 6.67 | % | | | (5.28 | )% | | | 10.49 | % | | | 1.98 | % | | | 8.46 | % |
| | | | | |
| Ratios/Supplemental Data | | | | | | | | | | | | | | | | | | | | |
Net assets, end of year (000’s omitted) | | $ | 1,439 | | | $ | 1,642 | | | $ | 2,576 | | | $ | 2,927 | | | $ | 5,619 | |
Ratios (as a percentage of average daily net assets): | | | | | | | | | | | | | | | | | | | | |
Expenses excluding interest and fees | | | 1.46 | % | | | 1.49 | % | | | 1.50 | % | | | 1.51 | % | | | 1.51 | % |
Interest and fee expense(3) | | | 0.07 | % | | | 0.05 | % | | | 0.05 | % | | | 0.05 | % | | | 0.05 | % |
Total expenses(4) | | | 1.53 | % | | | 1.54 | % | | | 1.55 | % | | | 1.56 | % | | | 1.56 | % |
Net investment income | | | 3.11 | % | | | 2.87 | % | | | 3.24 | % | | | 3.57 | % | | | 3.46 | % |
Portfolio Turnover | | | 6 | % | | | 13 | % | | | 13 | % | | | 5 | % | | | 10 | % |
| (1) | Computed using average shares outstanding. |
| (2) | Returns are historical and are calculated by determining the percentage change in net asset value with all distributions reinvested and do not reflect the effect of sales charges. |
| (3) | Interest and fee expense relates to the liability for floating rate notes issued in conjunction with residual interest bond transactions (see Note 1I). |
| (4) | Excludes the effect of custody fee credits, if any, of less than 0.005%. |
| | | | |
| | 44 | | See Notes to Financial Statements. |
Eaton Vance
Municipal Income Funds
July 31, 2014
Financial Highlights — continued
| | | | | | | | | | | | | | | | | | | | |
| | | Connecticut Fund — Class C | |
| | | Year Ended July 31, | |
| | | 2014 | | | 2013 | | | 2012 | | | 2011 | | | 2010 | |
Net asset value — Beginning of year | | $ | 9.860 | | | $ | 10.710 | | | $ | 10.010 | | | $ | 10.170 | | | $ | 9.710 | |
| | | | | |
| Income (Loss) From Operations | | | | | | | | | | | | | | | | | | | | |
Net investment income(1) | | $ | 0.310 | | | $ | 0.302 | | | $ | 0.335 | | | $ | 0.357 | | | $ | 0.347 | |
Net realized and unrealized gain (loss) | | | 0.337 | | | | (0.852 | ) | | | 0.700 | | | | (0.163 | ) | | | 0.466 | |
| | | | | |
Total income (loss) from operations | | $ | 0.647 | | | $ | (0.550 | ) | | $ | 1.035 | | | $ | 0.194 | | | $ | 0.813 | |
| | | | | |
| Less Distributions | | | | | | | | | | | | | | | | | | | | |
From net investment income | | $ | (0.307 | ) | | $ | (0.299 | ) | | $ | (0.333 | ) | | $ | (0.354 | ) | | $ | (0.353 | ) |
Tax return of capital | | | — | | | | (0.001 | ) | | | (0.002 | ) | | | — | | | | — | |
| | | | | |
Total distributions | | $ | (0.307 | ) | | $ | (0.300 | ) | | $ | (0.335 | ) | | $ | (0.354 | ) | | $ | (0.353 | ) |
| | | | | |
Net asset value — End of year | | $ | 10.200 | | | $ | 9.860 | | | $ | 10.710 | | | $ | 10.010 | | | $ | 10.170 | |
| | | | | |
Total Return(2) | | | 6.67 | % | | | (5.27 | )% | | | 10.49 | % | | | 1.98 | % | | | 8.46 | % |
| | | | | |
| Ratios/Supplemental Data | | | | | | | | | | | | | | | | | | | | |
Net assets, end of year (000’s omitted) | | $ | 6,447 | | | $ | 6,787 | | | $ | 7,766 | | | $ | 6,516 | | | $ | 7,684 | |
Ratios (as a percentage of average daily net assets): | | | | | | | | | | | | | | | | | | | | |
Expenses excluding interest and fees | | | 1.46 | % | | | 1.48 | % | | | 1.50 | % | | | 1.50 | % | | | 1.51 | % |
Interest and fee expense(3) | | | 0.07 | % | | | 0.05 | % | | | 0.05 | % | | | 0.05 | % | | | 0.05 | % |
Total expenses(4) | | | 1.53 | % | | | 1.53 | % | | | 1.55 | % | | | 1.55 | % | | | 1.56 | % |
Net investment income | | | 3.11 | % | | | 2.86 | % | | | 3.22 | % | | | 3.58 | % | | | 3.44 | % |
Portfolio Turnover | | | 6 | % | | | 13 | % | | | 13 | % | | | 5 | % | | | 10 | % |
| (1) | Computed using average shares outstanding. |
| (2) | Returns are historical and are calculated by determining the percentage change in net asset value with all distributions reinvested and do not reflect the effect of sales charges. |
| (3) | Interest and fee expense relates to the liability for floating rate notes issued in conjunction with residual interest bond transactions (see Note 1I). |
| (4) | Excludes the effect of custody fee credits, if any, of less than 0.005%. |
| | | | |
| | 45 | | See Notes to Financial Statements. |
Eaton Vance
Municipal Income Funds
July 31, 2014
Financial Highlights — continued
| | | | | | | | | | | | | | | | | | | | |
| | | Connecticut Fund — Class I | |
| | | Year Ended July 31, | |
| | | 2014 | | | 2013 | | | 2012 | | | 2011 | | | 2010 | |
Net asset value — Beginning of year | | $ | 9.890 | | | $ | 10.760 | | | $ | 10.050 | | | $ | 10.210 | | | $ | 9.750 | |
| | | | | |
| Income (Loss) From Operations | | | | | | | | | | | | | | | | | | | | |
Net investment income | | $ | 0.406 | (1) | | $ | 0.404 | (1) | | $ | 0.438 | | | $ | 0.455 | (1) | | $ | 0.446 | (1) |
Net realized and unrealized gain (loss) | | | 0.347 | | | | (0.872 | ) | | | 0.708 | | | | (0.165 | ) | | | 0.464 | |
| | | | | |
Total income (loss) from operations | | $ | 0.753 | | | $ | (0.468 | ) | | $ | 1.146 | | | $ | 0.290 | | | $ | 0.910 | |
| | | | | |
| Less Distributions | | | | | | | | | | | | | | | | | | | | |
From net investment income | | $ | (0.403 | ) | | $ | (0.400 | ) | | $ | (0.433 | ) | | $ | (0.450 | ) | | $ | (0.450 | ) |
Tax return of capital | | | — | | | | (0.002 | ) | | | (0.003 | ) | | | — | | | | — | |
| | | | | |
Total distributions | | $ | (0.403 | ) | | $ | (0.402 | ) | | $ | (0.436 | ) | | $ | (0.450 | ) | | $ | (0.450 | ) |
| | | | | |
Net asset value — End of year | | $ | 10.240 | | | $ | 9.890 | | | $ | 10.760 | | | $ | 10.050 | | | $ | 10.210 | |
| | | | | |
Total Return(2) | | | 7.78 | % | | | (4.52 | )% | | | 11.61 | % | | | 2.96 | % | | | 9.46 | % |
| | | | | |
| Ratios/Supplemental Data | | | | | | | | | | | | | | | | | | | | |
Net assets, end of year (000’s omitted) | | $ | 9,987 | | | $ | 8,454 | | | $ | 10,701 | | | $ | 5,283 | | | $ | 6,684 | |
Ratios (as a percentage of average daily net assets): | | | | | | | | | | | | | | | | | | | | |
Expenses excluding interest and fees | | | 0.51 | % | | | 0.53 | % | | | 0.54 | % | | | 0.56 | % | | | 0.56 | % |
Interest and fee expense(3) | | | 0.07 | % | | | 0.05 | % | | | 0.05 | % | | | 0.05 | % | | | 0.05 | % |
Total expenses(4) | | | 0.58 | % | | | 0.58 | % | | | 0.59 | % | | | 0.61 | % | | | 0.61 | % |
Net investment income | | | 4.05 | % | | | 3.82 | % | | | 4.11 | % | | | 4.55 | % | | | 4.40 | % |
Portfolio Turnover | | | 6 | % | | | 13 | % | | | 13 | % | | | 5 | % | | | 10 | % |
| (1) | Computed using average shares outstanding. |
| (2) | Returns are historical and are calculated by determining the percentage change in net asset value with all distributions reinvested. |
| (3) | Interest and fee expense relates to the liability for floating rate notes issued in conjunction with residual interest bond transactions (see Note 1I). |
| (4) | Excludes the effect of custody fee credits, if any, of less than 0.005%. |
| | | | |
| | 46 | | See Notes to Financial Statements. |
Eaton Vance
Municipal Income Funds
July 31, 2014
Financial Highlights — continued
| | | | | | | | | | | | | | | | | | | | |
| | | Minnesota Fund — Class A | |
| | | Year Ended July 31, | |
| | | 2014 | | | 2013 | | | 2012 | | | 2011 | | | 2010 | |
Net asset value — Beginning of year | | $ | 9.230 | | | $ | 9.760 | | | $ | 9.160 | | | $ | 9.280 | | | $ | 8.900 | |
| | | | | |
| Income (Loss) From Operations | | | | | | | | | | | | | | | | | | | | |
Net investment income(1) | | $ | 0.319 | | | $ | 0.306 | | | $ | 0.341 | | | $ | 0.373 | | | $ | 0.375 | |
Net realized and unrealized gain (loss) | | | 0.349 | | | | (0.533 | ) | | | 0.598 | | | | (0.123 | ) | | | 0.364 | |
| | | | | |
Total income (loss) from operations | | $ | 0.668 | | | $ | (0.227 | ) | | $ | 0.939 | | | $ | 0.250 | | | $ | 0.739 | |
| | | | | |
| Less Distributions | | | | | | | | | | | | | | | | | | | | |
From net investment income | | $ | (0.318 | ) | | $ | (0.303 | ) | | $ | (0.339 | ) | | $ | (0.370 | ) | | $ | (0.359 | ) |
| | | | | |
Total distributions | | $ | (0.318 | ) | | $ | (0.303 | ) | | $ | (0.339 | ) | | $ | (0.370 | ) | | $ | (0.359 | ) |
| | | | | |
Net asset value — End of year | | $ | 9.580 | | | $ | 9.230 | | | $ | 9.760 | | | $ | 9.160 | | | $ | 9.280 | |
| | | | | |
Total Return(2) | | | 7.36 | % | | | (2.43 | )% | | | 10.41 | % | | | 2.80 | % | | | 8.40 | % |
| | | | | |
| Ratios/Supplemental Data | | | | | | | | | | | | | | | | | | | | |
Net assets, end of year (000’s omitted) | | $ | 73,246 | | | $ | 77,456 | | | $ | 86,725 | | | $ | 78,909 | | | $ | 89,036 | |
Ratios (as a percentage of average daily net assets): | | | | | | | | | | | | | | | | | | | | |
Total expenses(3) | | | 0.71 | % | | | 0.72 | % | | | 0.72 | % | | | 0.74 | % | | | 0.73 | % |
Net investment income | | | 3.40 | % | | | 3.15 | % | | | 3.59 | % | | | 4.10 | % | | | 4.08 | % |
Portfolio Turnover | | | 4 | % | | | 5 | % | | | 8 | % | | | 6 | % | | | 3 | % |
| (1) | Computed using average shares outstanding. |
| (2) | Returns are historical and are calculated by determining the percentage change in net asset value with all distributions reinvested and do not reflect the effect of sales charges. |
| (3) | Excludes the effect of custody fee credits, if any, of less than 0.005%. |
| | | | |
| | 47 | | See Notes to Financial Statements. |
Eaton Vance
Municipal Income Funds
July 31, 2014
Financial Highlights — continued
| | | | | | | | | | | | | | | | | | | | |
| | | Minnesota Fund — Class B | |
| | | Year Ended July 31, | |
| | | 2014 | | | 2013 | | | 2012 | | | 2011 | | | 2010 | |
Net asset value — Beginning of year | | $ | 9.930 | | | $ | 10.500 | | | $ | 9.860 | | | $ | 9.990 | | | $ | 9.580 | |
| | | | | |
| Income (Loss) From Operations | | | | | | | | | | | | | | | | | | | | |
Net investment income(1) | | $ | 0.268 | | | $ | 0.251 | | | $ | 0.295 | | | $ | 0.327 | | | $ | 0.330 | |
Net realized and unrealized gain (loss) | | | 0.378 | | | | (0.573 | ) | | | 0.633 | | | | (0.132 | ) | | | 0.393 | |
| | | | | |
Total income (loss) from operations | | $ | 0.646 | | | $ | (0.322 | ) | | $ | 0.928 | | | $ | 0.195 | | | $ | 0.723 | |
| | | | | |
| Less Distributions | | | | | | | | | | | | | | | | | | | | |
From net investment income | | $ | (0.266 | ) | | $ | (0.248 | ) | | $ | (0.288 | ) | | $ | (0.325 | ) | | $ | (0.313 | ) |
| | | | | |
Total distributions | | $ | (0.266 | ) | | $ | (0.248 | ) | | $ | (0.288 | ) | | $ | (0.325 | ) | | $ | (0.313 | ) |
| | | | | |
Net asset value — End of year | | $ | 10.310 | | | $ | 9.930 | | | $ | 10.500 | | | $ | 9.860 | | | $ | 9.990 | |
| | | | | |
Total Return(2) | | | 6.59 | % | | | (3.15 | )% | | | 9.53 | % | | | 2.02 | % | | | 7.62 | % |
| | | | | |
| Ratios/Supplemental Data | | | | | | | | | | | | | | | | | | | | |
Net assets, end of year (000’s omitted) | | $ | 535 | | | $ | 846 | | | $ | 1,323 | | | $ | 1,882 | | | $ | 4,038 | |
Ratios (as a percentage of average daily net assets): | | | | | | | | | | | | | | | | | | | | |
Total expenses(3) | | | 1.47 | % | | | 1.47 | % | | | 1.47 | % | | | 1.50 | % | | | 1.49 | % |
Net investment income | | | 2.66 | % | | | 2.40 | % | | | 2.89 | % | | | 3.33 | % | | | 3.33 | % |
Portfolio Turnover | | | 4 | % | | | 5 | % | | | 8 | % | | | 6 | % | | | 3 | % |
| (1) | Computed using average shares outstanding. |
| (2) | Returns are historical and are calculated by determining the percentage change in net asset value with all distributions reinvested and do not reflect the effect of sales charges. |
| (3) | Excludes the effect of custody fee credits, if any, of less than 0.005%. |
| | | | |
| | 48 | | See Notes to Financial Statements. |
Eaton Vance
Municipal Income Funds
July 31, 2014
Financial Highlights — continued
| | | | | | | | | | | | | | | | | | | | |
| | | Minnesota Fund — Class C | |
| | | Year Ended July 31, | |
| | | 2014 | | | 2013 | | | 2012 | | | 2011 | | | 2010 | |
Net asset value — Beginning of year | | $ | 9.920 | | | $ | 10.490 | | | $ | 9.850 | | | $ | 9.980 | | | $ | 9.570 | |
| | | | | |
| Income (Loss) From Operations | | | | | | | | | | | | | | | | | | | | |
Net investment income(1) | | $ | 0.268 | | | $ | 0.250 | | | $ | 0.289 | | | $ | 0.327 | | | $ | 0.329 | |
Net realized and unrealized gain (loss) | | | 0.378 | | | | (0.572 | ) | | | 0.639 | | | | (0.132 | ) | | | 0.394 | |
| | | | | |
Total income (loss) from operations | | $ | 0.646 | | | $ | (0.322 | ) | | $ | 0.928 | | | $ | 0.195 | | | $ | 0.723 | |
| | | | | |
| Less Distributions | | | | | | | | | | | | | | | | | | | | |
From net investment income | | $ | (0.266 | ) | | $ | (0.248 | ) | | $ | (0.288 | ) | | $ | (0.325 | ) | | $ | (0.313 | ) |
| | | | | |
Total distributions | | $ | (0.266 | ) | | $ | (0.248 | ) | | $ | (0.288 | ) | | $ | (0.325 | ) | | $ | (0.313 | ) |
| | | | | |
Net asset value — End of year | | $ | 10.300 | | | $ | 9.920 | | | $ | 10.490 | | | $ | 9.850 | | | $ | 9.980 | |
| | | | | |
Total Return(2) | | | 6.60 | % | | | (3.16 | )% | | | 9.54 | % | | | 2.03 | % | | | 7.63 | % |
| | | | | |
| Ratios/Supplemental Data | | | | | | | | | | | | | | | | | | | | |
Net assets, end of year (000’s omitted) | | $ | 11,098 | | | $ | 12,298 | | | $ | 12,955 | | | $ | 11,116 | | | $ | 15,291 | |
Ratios (as a percentage of average daily net assets): | | | | | | | | | | | | | | | | | | | | |
Total expenses(3) | �� | | 1.47 | % | | | 1.47 | % | | | 1.47 | % | | | 1.50 | % | | | 1.48 | % |
Net investment income | | | 2.66 | % | | | 2.39 | % | | | 2.83 | % | | | 3.34 | % | | | 3.32 | % |
Portfolio Turnover | | | 4 | % | | | 5 | % | | | 8 | % | | | 6 | % | | | 3 | % |
| (1) | Computed using average shares outstanding. |
| (2) | Returns are historical and are calculated by determining the percentage change in net asset value with all distributions reinvested and do not reflect the effect of sales charges. |
| (3) | Excludes the effect of custody fee credits, if any, of less than 0.005%. |
| | | | |
| | 49 | | See Notes to Financial Statements. |
Eaton Vance
Municipal Income Funds
July 31, 2014
Financial Highlights — continued
| | | | | | | | | | | | | | | | |
| | | Minnesota Fund — Class I | |
| | | Year Ended July 31, | | | Period Ended
July 31, 2011(1) | |
| | | 2014 | | | 2013 | | | 2012 | | |
Net asset value — Beginning of period | | $ | 9.230 | | | $ | 9.760 | | | $ | 9.160 | | | $ | 9.290 | |
| | | | |
| Income (Loss) From Operations | | | | | | | | | | | | | | | | |
Net investment income | | $ | 0.337 | (2) | | $ | 0.325 | (2) | | $ | 0.358 | | | $ | 0.385 | |
Net realized and unrealized gain (loss) | | | 0.349 | | | | (0.532 | ) | | | 0.600 | | | | (0.130 | ) |
| | | | |
Total income (loss) from operations | | $ | 0.686 | | | $ | (0.207 | ) | | $ | 0.958 | | | $ | 0.255 | |
| | | | |
| Less Distributions | | | | | | | | | | | | | | | | |
From net investment income | | $ | (0.336 | ) | | $ | (0.323 | ) | | $ | (0.358 | ) | | $ | (0.385 | ) |
| | | | |
Total distributions | | $ | (0.336 | ) | | $ | (0.323 | ) | | $ | (0.358 | ) | | $ | (0.385 | ) |
| | | | |
Net asset value — End of period | | $ | 9.580 | | | $ | 9.230 | | | $ | 9.760 | | | $ | 9.160 | |
| | | | |
Total Return(3) | | | 7.57 | % | | | (2.23 | )% | | | 10.63 | % | | | 2.86 | %(4) |
| | | | |
| Ratios/Supplemental Data | | | | | | | | | | | | | | | | |
Net assets, end of period (000’s omitted) | | $ | 25,888 | | | $ | 21,323 | | | $ | 21,608 | | | $ | 2,746 | |
Ratios (as a percentage of average daily net assets): | | | | | | | | | | | | | | | | |
Total expenses(5) | | | 0.51 | % | | | 0.52 | % | | | 0.52 | % | | | 0.54 | %(6) |
Net investment income | | | 3.60 | % | | | 3.35 | % | | | 3.54 | % | | | 4.28 | %(6) |
Portfolio Turnover | | | 4 | % | | | 5 | % | | | 8 | % | | | 6 | %(7) |
| (1) | For the period from the commencement of operations on August��3, 2010 to July 31, 2011. |
| (2) | Computed using average shares outstanding. |
| (3) | Returns are historical and are calculated by determining the percentage change in net asset value with all distributions reinvested. |
| (5) | Excludes the effect of custody fee credits, if any, of less than 0.005%. |
| (7) | For the year ended July 31, 2011. |
| | | | |
| | 50 | | See Notes to Financial Statements. |
Eaton Vance
Municipal Income Funds
July 31, 2014
Financial Highlights — continued
| | | | | | | | | | | | | | | | | | | | |
| | | New Jersey Fund — Class A | |
| | | Year Ended July 31, | |
| | | 2014 | | | 2013 | | | 2012 | | | 2011 | | | 2010 | |
Net asset value — Beginning of year | | $ | 9.010 | | | $ | 9.580 | | | $ | 8.830 | | | $ | 9.220 | | | $ | 8.580 | |
| | | | | |
| Income (Loss) From Operations | | | | | | | | | | | | | | | | | | | | |
Net investment income(1) | | $ | 0.357 | | | $ | 0.382 | | | $ | 0.396 | | | $ | 0.444 | | | $ | 0.454 | |
Net realized and unrealized gain (loss) | | | 0.299 | | | | (0.570 | ) | | | 0.748 | | | | (0.393 | ) | | | 0.627 | |
| | | | | |
Total income (loss) from operations | | $ | 0.656 | | | $ | (0.188 | ) | | $ | 1.144 | | | $ | 0.051 | | | $ | 1.081 | |
| | | | | |
| Less Distributions | | | | | | | | | | | | | | | | | | | | |
From net investment income | | $ | (0.356 | ) | | $ | (0.382 | ) | | $ | (0.394 | ) | | $ | (0.441 | ) | | $ | (0.441 | ) |
| | | | | |
Total distributions | | $ | (0.356 | ) | | $ | (0.382 | ) | | $ | (0.394 | ) | | $ | (0.441 | ) | | $ | (0.441 | ) |
| | | | | |
Net asset value — End of year | | $ | 9.310 | | | $ | 9.010 | | | $ | 9.580 | | | $ | 8.830 | | | $ | 9.220 | |
| | | | | |
Total Return(2) | | | 7.43 | % | | | (2.12 | )% | | | 13.24 | % | | | 0.65 | % | | | 12.76 | % |
| | | | | |
| Ratios/Supplemental Data | | | | | | | | | | | | | | | | | | | | |
Net assets, end of year (000’s omitted) | | $ | 135,265 | | | $ | 146,499 | | | $ | 173,054 | | | $ | 171,001 | | | $ | 214,220 | |
Ratios (as a percentage of average daily net assets): | | | | | | | | | | | | | | | | | | | | |
Expenses excluding interest and fees | | | 0.74 | % | | | 0.75 | % | | | 0.76 | % | | | 0.79 | % | | | 0.79 | % |
Interest and fee expense(3) | | | 0.03 | % | | | 0.07 | % | | | 0.07 | % | | | 0.12 | % | | | 0.11 | % |
Total expenses(4) | | | 0.77 | % | | | 0.82 | % | | | 0.83 | % | | | 0.91 | % | | | 0.90 | % |
Net investment income | | | 3.92 | % | | | 3.98 | % | | | 4.31 | % | | | 5.00 | % | | | 4.98 | % |
Portfolio Turnover | | | 16 | % | | | 6 | % | | | 15 | % | | | 1 | % | | | 13 | % |
| (1) | Computed using average shares outstanding. |
| (2) | Returns are historical and are calculated by determining the percentage change in net asset value with all distributions reinvested and do not reflect the effect of sales charges. |
| (3) | Interest and fee expense relates to the liability for floating rate notes issued in conjunction with residual interest bond transactions (see Note 1I). |
| (4) | Excludes the effect of custody fee credits, if any, of less than 0.005%. |
| | | | |
| | 51 | | See Notes to Financial Statements. |
Eaton Vance
Municipal Income Funds
July 31, 2014
Financial Highlights — continued
| | | | | | | | | | | | | | | | | | | | |
| | | New Jersey Fund — Class C | |
| | | Year Ended July 31, | |
| | | 2014 | | | 2013 | | | 2012 | | | 2011 | | | 2010 | |
Net asset value — Beginning of year | | $ | 9.400 | | | $ | 9.990 | | | $ | 9.210 | | | $ | 9.620 | | | $ | 8.960 | |
| | | | | |
| Income (Loss) From Operations | | | | | | | | | | | | | | | | | | | | |
Net investment income(1) | | $ | 0.300 | | | $ | 0.323 | | | $ | 0.340 | | | $ | 0.394 | | | $ | 0.402 | |
Net realized and unrealized gain (loss) | | | 0.310 | | | | (0.590 | ) | | | 0.780 | | | | (0.413 | ) | | | 0.652 | |
| | | | | |
Total income (loss) from operations | | $ | 0.610 | | | $ | (0.267 | ) | | $ | 1.120 | | | $ | (0.019 | ) | | $ | 1.054 | |
| | | | | |
| Less Distributions | | | | | | | | | | | | | | | | | | | | |
From net investment income | | $ | (0.300 | ) | | $ | (0.323 | ) | | $ | (0.340 | ) | | $ | (0.391 | ) | | $ | (0.394 | ) |
| | | | | |
Total distributions | | $ | (0.300 | ) | | $ | (0.323 | ) | | $ | (0.340 | ) | | $ | (0.391 | ) | | $ | (0.394 | ) |
| | | | | |
Net asset value — End of year | | $ | 9.710 | | | $ | 9.400 | | | $ | 9.990 | | | $ | 9.210 | | | $ | 9.620 | |
| | | | | |
Total Return(2) | | | 6.59 | % | | | (2.81 | )% | | | 12.37 | % | | | (0.13 | )% | | | 11.89 | % |
| | | | | |
| Ratios/Supplemental Data | | | | | | | | | | | | | | | | | | | | |
Net assets, end of year (000’s omitted) | | $ | 24,442 | | | $ | 25,796 | | | $ | 28,066 | | | $ | 24,768 | | | $ | 31,491 | |
Ratios (as a percentage of average daily net assets): | | | | | | | | | | | | | | | | | | | | |
Expenses excluding interest and fees | | | 1.49 | % | | | 1.50 | % | | | 1.51 | % | | | 1.54 | % | | | 1.53 | % |
Interest and fee expense(3) | | | 0.03 | % | | | 0.07 | % | | | 0.07 | % | | | 0.12 | % | | | 0.11 | % |
Total expenses(4) | | | 1.52 | % | | | 1.57 | % | | | 1.58 | % | | | 1.66 | % | | | 1.64 | % |
Net investment income | | | 3.16 | % | | | 3.23 | % | | | 3.55 | % | | | 4.25 | % | | | 4.21 | % |
Portfolio Turnover | | | 16 | % | | | 6 | % | | | 15 | % | | | 1 | % | | | 13 | % |
| (1) | Computed using average shares outstanding. |
| (2) | Returns are historical and are calculated by determining the percentage change in net asset value with all distributions reinvested and do not reflect the effect of sales charges. |
| (3) | Interest and fee expense relates to the liability for floating rate notes issued in conjunction with residual interest bond transactions (see Note 1I). |
| (4) | Excludes the effect of custody fee credits, if any, of less than 0.005%. |
| | | | |
| | 52 | | See Notes to Financial Statements. |
Eaton Vance
Municipal Income Funds
July 31, 2014
Financial Highlights — continued
| | | | | | | | | | | | | | | | | | | | |
| | | New Jersey Fund — Class I | |
| | | Year Ended July 31, | |
| | | 2014 | | | 2013 | | | 2012 | | | 2011 | | | 2010 | |
Net asset value — Beginning of year | | $ | 9.010 | | | $ | 9.580 | | | $ | 8.830 | | | $ | 9.220 | | | $ | 8.580 | |
| | | | | |
| Income (Loss) From Operations | | | | | | | | | | | | | | | | | | | | |
Net investment income(1) | | $ | 0.372 | | | $ | 0.401 | | | $ | 0.412 | | | $ | 0.463 | | | $ | 0.473 | |
Net realized and unrealized gain (loss) | | | 0.302 | | | | (0.570 | ) | | | 0.751 | | | | (0.394 | ) | | | 0.625 | |
| | | | | |
Total income (loss) from operations | | $ | 0.674 | | | $ | (0.169 | ) | | $ | 1.163 | | | $ | 0.069 | | | $ | 1.098 | |
| | | | | |
| Less Distributions | | | | | | | | | | | | | | | | | | | | |
From net investment income | | $ | (0.374 | ) | | $ | (0.401 | ) | | $ | (0.413 | ) | | $ | (0.459 | ) | | $ | (0.458 | ) |
| | | | | |
Total distributions | | $ | (0.374 | ) | | $ | (0.401 | ) | | $ | (0.413 | ) | | $ | (0.459 | ) | | $ | (0.458 | ) |
| | | | | |
Net asset value — End of year | | $ | 9.310 | | | $ | 9.010 | | | $ | 9.580 | | | $ | 8.830 | | | $ | 9.220 | |
| | | | | |
Total Return(2) | | | 7.64 | % | | | (1.93 | )% | | | 13.46 | % | | | 0.85 | % | | | 12.96 | % |
| | | | | |
| Ratios/Supplemental Data | | | | | | | | | | | | | | | | | | | | |
Net assets, end of year (000’s omitted) | | $ | 20,179 | | | $ | 13,493 | | | $ | 10,922 | | | $ | 7,419 | | | $ | 8,386 | |
Ratios (as a percentage of average daily net assets): | | | | | | | | | | | | | | | | | | | | |
Expenses excluding interest and fees | | | 0.53 | % | | | 0.55 | % | | | 0.56 | % | | | 0.59 | % | | | 0.58 | % |
Interest and fee expense(3) | | | 0.03 | % | | | 0.07 | % | | | 0.07 | % | | | 0.12 | % | | | 0.11 | % |
Total expenses(4) | | | 0.56 | % | | | 0.62 | % | | | 0.63 | % | | | 0.71 | % | | | 0.69 | % |
Net investment income | | | 4.07 | % | | | 4.18 | % | | | 4.47 | % | | | 5.21 | % | | | 5.16 | % |
Portfolio Turnover | | | 16 | % | | | 6 | % | | | 15 | % | | | 1 | % | | | 13 | % |
| (1) | Computed using average shares outstanding. |
| (2) | Returns are historical and are calculated by determining the percentage change in net asset value with all distributions reinvested. |
| (3) | Interest and fee expense relates to the liability for floating rate notes issued in conjunction with residual interest bond transactions (see Note 1I). |
| (4) | Excludes the effect of custody fee credits, if any, of less than 0.005%. |
| | | | |
| | 53 | | See Notes to Financial Statements. |
Eaton Vance
Municipal Income Funds
July 31, 2014
Financial Highlights — continued
| | | | | | | | | | | | | | | | | | | | |
| | | Pennsylvania Fund — Class A | |
| | | Year Ended July 31, | |
| | | 2014 | | | 2013 | | | 2012 | | | 2011 | | | 2010 | |
Net asset value — Beginning of year | | $ | 8.750 | | | $ | 9.170 | | | $ | 8.800 | | | $ | 9.060 | | | $ | 8.650 | |
| | | | | |
| Income (Loss) From Operations | | | | | | | | | | | | | | | | | | | | |
Net investment income(1) | | $ | 0.375 | | | $ | 0.369 | | | $ | 0.380 | | | $ | 0.437 | | | $ | 0.431 | |
Net realized and unrealized gain (loss) | | | 0.197 | | | | (0.423 | ) | | | 0.370 | | | | (0.262 | ) | | | 0.391 | |
| | | | | |
Total income (loss) from operations | | $ | 0.572 | | | $ | (0.054 | ) | | $ | 0.750 | | | $ | 0.175 | | | $ | 0.822 | |
| | | | | |
| Less Distributions | | | | | | | | | | | | | | | | | | | | |
From net investment income | | $ | (0.372 | ) | | $ | (0.366 | ) | | $ | (0.380 | ) | | $ | (0.435 | ) | | $ | (0.412 | ) |
| | | | | |
Total distributions | | $ | (0.372 | ) | | $ | (0.366 | ) | | $ | (0.380 | ) | | $ | (0.435 | ) | | $ | (0.412 | ) |
| | | | | |
Net asset value — End of year | | $ | 8.950 | | | $ | 8.750 | | | $ | 9.170 | | | $ | 8.800 | | | $ | 9.060 | |
| | | | | |
Total Return(2) | | | 6.68 | % | | | (0.70 | )% | | | 8.70 | % | | | 2.07 | % | | | 9.60 | % |
| | | | | |
| Ratios/Supplemental Data | | | | | | | | | | | | | | | | | | | | |
Net assets, end of year (000’s omitted) | | $ | 147,461 | | | $ | 156,219 | | | $ | 179,909 | | | $ | 175,176 | | | $ | 210,024 | |
Ratios (as a percentage of average daily net assets): | | | | | | | | | | | | | | | | | | | | |
Expenses excluding interest and fees | | | 0.74 | % | | | 0.76 | % | | | 0.77 | % | | | 0.80 | % | | | 0.79 | % |
Interest and fee expense(3) | | | 0.04 | % | | | 0.05 | % | | | 0.05 | % | | | 0.10 | % | | | 0.09 | % |
Total expenses(4) | | | 0.78 | % | | | 0.81 | % | | | 0.82 | % | | | 0.90 | % | | | 0.88 | % |
Net investment income | | | 4.25 | % | | | 4.01 | % | | | 4.25 | % | | | 4.97 | % | | | 4.74 | % |
Portfolio Turnover | | | 4 | % | | | 12 | % | | | 6 | % | | | 5 | % | | | 10 | % |
| (1) | Computed using average shares outstanding. |
| (2) | Returns are historical and are calculated by determining the percentage change in net asset value with all distributions reinvested and do not reflect the effect of sales charges. |
| (3) | Interest and fee expense relates to the liability for floating rate notes issued in conjunction with residual interest bond transactions (see Note 1I). |
| (4) | Excludes the effect of custody fee credits, if any, of less than 0.005%. |
| | | | |
| | 54 | | See Notes to Financial Statements. |
Eaton Vance
Municipal Income Funds
July 31, 2014
Financial Highlights — continued
| | | | | | | | | | | | | | | | | | | | |
| | | Pennsylvania Fund — Class B | |
| | | Year Ended July 31, | |
| | | 2014 | | | 2013 | | | 2012 | | | 2011 | | | 2010 | |
Net asset value — Beginning of year | | $ | 9.060 | | | $ | 9.490 | | | $ | 9.110 | | | $ | 9.380 | | | $ | 8.960 | |
| | | | | |
| Income (Loss) From Operations | | | | | | | | | | | | | | | | | | | | |
Net investment income(1) | | $ | 0.321 | | | $ | 0.310 | | | $ | 0.326 | | | $ | 0.384 | | | $ | 0.375 | |
Net realized and unrealized gain (loss) | | | 0.206 | | | | (0.432 | ) | | | 0.377 | | | | (0.272 | ) | | | 0.404 | |
| | | | | |
Total income (loss) from operations | | $ | 0.527 | | | $ | (0.122 | ) | | $ | 0.703 | | | $ | 0.112 | | | $ | 0.779 | |
| | | | | |
| Less Distributions | | | | | | | | | | | | | | | | | | | | |
From net investment income | | $ | (0.317 | ) | | $ | (0.308 | ) | | $ | (0.323 | ) | | $ | (0.382 | ) | | $ | (0.359 | ) |
| | | | | |
Total distributions | | $ | (0.317 | ) | | $ | (0.308 | ) | | $ | (0.323 | ) | | $ | (0.382 | ) | | $ | (0.359 | ) |
| | | | | |
Net asset value — End of year | | $ | 9.270 | | | $ | 9.060 | | | $ | 9.490 | | | $ | 9.110 | | | $ | 9.380 | |
| | | | | |
Total Return(2) | | | 5.92 | % | | | (1.39 | )% | | | 7.86 | % | | | 1.29 | % | | | 8.75 | % |
| | | | | |
| Ratios/Supplemental Data | | | | | | | | | | | | | | | | | | | | |
Net assets, end of year (000’s omitted) | | $ | 3,012 | | | $ | 4,517 | | | $ | 7,255 | | | $ | 10,191 | | | $ | 17,328 | |
Ratios (as a percentage of average daily net assets): | | | | | | | | | | | | | | | | | | | | |
Expenses excluding interest and fees | | | 1.50 | % | | | 1.52 | % | | | 1.52 | % | | | 1.56 | % | | | 1.55 | % |
Interest and fee expense(3) | | | 0.04 | % | | | 0.05 | % | | | 0.05 | % | | | 0.10 | % | | | 0.09 | % |
Total expenses(4) | | | 1.54 | % | | | 1.57 | % | | | 1.57 | % | | | 1.66 | % | | | 1.64 | % |
Net investment income | | | 3.51 | % | | | 3.26 | % | | | 3.52 | % | | | 4.22 | % | | | 3.99 | % |
Portfolio Turnover | | | 4 | % | | | 12 | % | | | 6 | % | | | 5 | % | | | 10 | % |
| (1) | Computed using average shares outstanding. |
| (2) | Returns are historical and are calculated by determining the percentage change in net asset value with all distributions reinvested and do not reflect the effect of sales charges. |
| (3) | Interest and fee expense relates to the liability for floating rate notes issued in conjunction with residual interest bond transactions (see Note 1I). |
| (4) | Excludes the effect of custody fee credits, if any, of less than 0.005%. |
| | | | |
| | 55 | | See Notes to Financial Statements. |
Eaton Vance
Municipal Income Funds
July 31, 2014
Financial Highlights — continued
| | | | | | | | | | | | | | | | | | | | |
| | | Pennsylvania Fund — Class C | |
| | | Year Ended July 31, | |
| | | 2014 | | | 2013 | | | 2012 | | | 2011 | | | 2010 | |
Net asset value — Beginning of year | | $ | 9.060 | | | $ | 9.490 | | | $ | 9.110 | | | $ | 9.380 | | | $ | 8.960 | |
| | | | | |
| Income (Loss) From Operations | | | | | | | | | | | | | | | | | | | | |
Net investment income(1) | | $ | 0.319 | | | $ | 0.310 | | | $ | 0.324 | | | $ | 0.384 | | | $ | 0.375 | |
Net realized and unrealized gain (loss) | | | 0.208 | | | | (0.432 | ) | | | 0.380 | | | | (0.271 | ) | | | 0.404 | |
| | | | | |
Total income (loss) from operations | | $ | 0.527 | | | $ | (0.122 | ) | | $ | 0.704 | | | $ | 0.113 | | | $ | 0.779 | |
| | | | | |
| Less Distributions | | | | | | | | | | | | | | | | | | | | |
From net investment income | | $ | (0.317 | ) | | $ | (0.308 | ) | | $ | (0.324 | ) | | $ | (0.383 | ) | | $ | (0.359 | ) |
| | | | | |
Total distributions | | $ | (0.317 | ) | | $ | (0.308 | ) | | $ | (0.324 | ) | | $ | (0.383 | ) | | $ | (0.359 | ) |
| | | | | |
Net asset value — End of year | | $ | 9.270 | | | $ | 9.060 | | | $ | 9.490 | | | $ | 9.110 | | | $ | 9.380 | |
| | | | | |
Total Return(2) | | | 5.92 | % | | | (1.39 | )% | | | 7.86 | % | | | 1.30 | % | | | 8.75 | % |
| | | | | |
| Ratios/Supplemental Data | | | | | | | | | | | | | | | | | | | | |
Net assets, end of year (000’s omitted) | | $ | 32,342 | | | $ | 34,045 | | | $ | 38,268 | | | $ | 36,409 | | | $ | 46,080 | |
Ratios (as a percentage of average daily net assets): | | | | | | | | | | | | | | | | | | | | |
Expenses excluding interest and fees | | | 1.49 | % | | | 1.51 | % | | | 1.52 | % | | | 1.55 | % | | | 1.54 | % |
Interest and fee expense(3) | | | 0.04 | % | | | 0.05 | % | | | 0.05 | % | | | 0.10 | % | | | 0.09 | % |
Total expenses(4) | | | 1.53 | % | | | 1.56 | % | | | 1.57 | % | | | 1.65 | % | | | 1.63 | % |
Net investment income | | | 3.49 | % | | | 3.26 | % | | | 3.49 | % | | | 4.21 | % | | | 3.98 | % |
Portfolio Turnover | | | 4 | % | | | 12 | % | | | 6 | % | | | 5 | % | | | 10 | % |
| (1) | Computed using average shares outstanding. |
| (2) | Returns are historical and are calculated by determining the percentage change in net asset value with all distributions reinvested and do not reflect the effect of sales charges. |
| (3) | Interest and fee expense relates to the liability for floating rate notes issued in conjunction with residual interest bond transactions (see Note 1I). |
| (4) | Excludes the effect of custody fee credits, if any, of less than 0.005%. |
| | | | |
| | 56 | | See Notes to Financial Statements. |
Eaton Vance
Municipal Income Funds
July 31, 2014
Financial Highlights — continued
| | | | | | | | | | | | | | | | | | | | |
| | | Pennsylvania Fund — Class I | |
| | | Year Ended July 31, | |
| | | 2014 | | | 2013 | | | 2012 | | | 2011 | | | 2010 | |
Net asset value — Beginning of year | | $ | 8.790 | | | $ | 9.200 | | | $ | 8.830 | | | $ | 9.100 | | | $ | 8.680 | |
| | | | | |
| Income (Loss) From Operations | | | | | | | | | | | | | | | | | | | | |
Net investment income(1) | | $ | 0.393 | | | $ | 0.388 | | | $ | 0.400 | | | $ | 0.456 | | | $ | 0.450 | |
Net realized and unrealized gain (loss) | | | 0.198 | | | | (0.412 | ) | | | 0.369 | | | | (0.271 | ) | | | 0.401 | |
| | | | | |
Total income (loss) from operations | | $ | 0.591 | | | $ | (0.024 | ) | | $ | 0.769 | | | $ | 0.185 | | | $ | 0.851 | |
| | | | | |
| Less Distributions | | | | | | | | | | | | | | | | | | | | |
From net investment income | | $ | (0.391 | ) | | $ | (0.386 | ) | | $ | (0.399 | ) | | $ | (0.455 | ) | | $ | (0.431 | ) |
| | | | | |
Total distributions | | $ | (0.391 | ) | | $ | (0.386 | ) | | $ | (0.399 | ) | | $ | (0.455 | ) | | $ | (0.431 | ) |
| | | | | |
Net asset value — End of year | | $ | 8.990 | | | $ | 8.790 | | | $ | 9.200 | | | $ | 8.830 | | | $ | 9.100 | |
| | | | | |
Total Return(2) | | | 6.88 | % | | | (0.37 | )% | | | 8.91 | % | | | 2.17 | % | | | 9.91 | % |
| | | | | |
| Ratios/Supplemental Data | | | | | | | | | | | | | | | | | | | | |
Net assets, end of year (000’s omitted) | | $ | 39,754 | | | $ | 29,443 | | | $ | 29,484 | | | $ | 30,082 | | | $ | 35,367 | |
Ratios (as a percentage of average daily net assets): | | | | | | | | | | | | | | | | | | | | |
Expenses excluding interest and fees | | | 0.54 | % | | | 0.56 | % | | | 0.57 | % | | | 0.60 | % | | | 0.60 | % |
Interest and fee expense(3) | | | 0.04 | % | | | 0.05 | % | | | 0.05 | % | | | 0.10 | % | | | 0.09 | % |
Total expenses(4) | | | 0.58 | % | | | 0.61 | % | | | 0.62 | % | | | 0.70 | % | | | 0.69 | % |
Net investment income | | | 4.43 | % | | | 4.21 | % | | | 4.45 | % | | | 5.16 | % | | | 4.93 | % |
Portfolio Turnover | | | 4 | % | | | 12 | % | | | 6 | % | | | 5 | % | | | 10 | % |
| (1) | Computed using average shares outstanding. |
| (2) | Returns are historical and are calculated by determining the percentage change in net asset value with all distributions reinvested. |
| (3) | Interest and fee expense relates to the liability for floating rate notes issued in conjunction with residual interest bond transactions (see Note 1I). |
| (4) | Excludes the effect of custody fee credits, if any, of less than 0.005%. |
| | | | |
| | 57 | | See Notes to Financial Statements. |
Eaton Vance
Municipal Income Funds
July 31, 2014
Notes to Financial Statements
1 Significant Accounting Policies
Eaton Vance Municipals Trust (the Trust) is a Massachusetts business trust registered under the Investment Company Act of 1940, as amended (the 1940 Act), as an open-end management investment company. The Trust presently consists of eighteen funds, five of which, each non-diversified, are included in these financial statements. They include Eaton Vance Arizona Municipal Income Fund (Arizona Fund), Eaton Vance Connecticut Municipal Income Fund (Connecticut Fund), Eaton Vance Minnesota Municipal Income Fund (Minnesota Fund), Eaton Vance New Jersey Municipal Income Fund (New Jersey Fund) and Eaton Vance Pennsylvania Municipal Income Fund (Pennsylvania Fund), (each individually referred to as the Fund, and collectively, the Funds). The Funds’ investment objective is to provide current income exempt from regular federal income tax and from particular state or local income or other taxes. The New Jersey Fund offers three classes of shares and the Arizona Fund, Connecticut Fund, Minnesota Fund and Pennsylvania Fund offer four classes of shares. Class A shares are generally sold subject to a sales charge imposed at time of purchase. Class B and Class C shares are sold at net asset value and are generally subject to a contingent deferred sales charge (see Note 5). Class I shares are sold at net asset value and are not subject to a sales charge. Class B shares of each Fund automatically convert to Class A shares eight years after their purchase as described in each Fund’s prospectus. Beginning January 1, 2012, Class B shares are only available for purchase upon exchange from another Eaton Vance fund or through reinvestment of distributions. Each class represents a pro-rata interest in the Fund, but votes separately on class-specific matters and (as noted below) is subject to different expenses. Realized and unrealized gains and losses are allocated daily to each class of shares based on the relative net assets of each class to the total net assets of the Fund. Net investment income, other than class-specific expenses, is allocated daily to each class of shares based upon the ratio of the value of each class’s paid shares to the total value of all paid shares. Each class of shares differs in its distribution plan and certain other class-specific expenses.
The following is a summary of significant accounting policies of the Funds. The policies are in conformity with accounting principles generally accepted in the United States of America.
A Investment Valuation — The following methodologies are used to determine the market value or fair value of investments.
Debt Obligations. Debt obligations (including short-term obligations with a remaining maturity of more than sixty days) are generally valued on the basis of valuations provided by third party pricing services, as derived from such services’ pricing models. Inputs to the models may include, but are not limited to, reported trades, executable bid and asked prices, broker/dealer quotations, prices or yields of securities with similar characteristics, benchmark curves or information pertaining to the issuer, as well as industry and economic events. The pricing services may use a matrix approach, which considers information regarding securities with similar characteristics to determine the valuation for a security. Short-term obligations purchased with a remaining maturity of sixty days or less are generally valued at amortized cost, which approximates market value.
Derivatives. Financial futures contracts are valued at the closing settlement price established by the board of trade or exchange on which they are traded.
Fair Valuation. Investments for which valuations or market quotations are not readily available or are deemed unreliable are valued at fair value using methods determined in good faith by or at the direction of the Trustees of a Fund in a manner that fairly reflects the security’s value, or the amount that the Fund might reasonably expect to receive for the security upon its current sale in the ordinary course. Each such determination is based on a consideration of relevant factors, which are likely to vary from one pricing context to another. These factors may include, but are not limited to, the type of security, the existence of any contractual restrictions on the security’s disposition, the price and extent of public trading in similar securities of the issuer or of comparable entities, quotations or relevant information obtained from broker/dealers or other market participants, information obtained from the issuer, analysts, and/or the appropriate stock exchange (for exchange-traded securities), an analysis of the entity’s financial condition, and an evaluation of the forces that influence the issuer and the market(s) in which the security is purchased and sold.
B Investment Transactions and Related Income — Investment transactions for financial statement purposes are accounted for on a trade date basis. Realized gains and losses on investments sold are determined on the basis of identified cost. Interest income is recorded on the basis of interest accrued, adjusted for amortization of premium or accretion of discount.
C Federal Taxes — Each Fund’s policy is to comply with the provisions of the Internal Revenue Code applicable to regulated investment companies and to distribute to shareholders each year substantially all of its taxable, if any, and tax-exempt net investment income, and all or substantially all of its net realized capital gains. Accordingly, no provision for federal income or excise tax is necessary. Each Fund intends to satisfy conditions which will enable it to designate distributions from the interest income generated by its investments in municipal obligations, which are exempt from regular federal income tax when received by each Fund, as exempt-interest dividends. The portion of such interest, if any, earned on private activity bonds issued after August 7, 1986, may be considered a tax preference item to shareholders.
At July 31, 2014, the following Funds, for federal income tax purposes, had capital loss carryforwards and deferred capital losses which will reduce the respective Fund’s taxable income arising from future net realized gains on investment transactions, if any, to the extent permitted by the Internal Revenue Code, and thus will reduce the amount of distributions to shareholders, which would otherwise be necessary to relieve the Funds of any liability for federal income or excise tax. The deferred capital losses are treated as arising on the first day of the Funds’ next taxable year and are treated as realized prior to
Eaton Vance
Municipal Income Funds
July 31, 2014
Notes to Financial Statements — continued
the utilization of the capital loss carryforward. The amounts and expiration dates of the capital loss carryforwards, whose character is short-term, and the amounts of the deferred capital losses are as follows:
| | | | | | | | | | | | | | | | | | | | |
| Expiration Date | | Arizona
Fund | | | Connecticut
Fund | | | Minnesota
Fund | | | New Jersey
Fund | | | Pennsylvania
Fund | |
| | | | | |
July 31, 2016 | | $ | 160,306 | | | $ | 329,657 | | | $ | 410,833 | | | $ | 3,716,712 | | | $ | 1,414,955 | |
July 31, 2017 | | | 997,387 | | | | 662,277 | | | | 566,758 | | | | 6,120,511 | | | | 5,414,612 | |
July 31, 2018 | | | 3,471,707 | | | | 2,387,746 | | | | 1,523,293 | | | | 20,873,952 | | | | 10,375,222 | |
July 31, 2019 | | | — | | | | 685,091 | | | | 723,202 | | | | 3,741,998 | | | | 10,492,996 | |
| | | | | |
Total capital loss carryforward | | $ | 4,629,400 | | | $ | 4,064,771 | | | $ | 3,224,086 | | | $ | 34,453,173 | | | $ | 27,697,785 | |
| | | | | |
Deferred capital losses: | | | | | | | | | | | | | | | | | | | | |
Short-term | | $ | 232,516 | | | $ | 1,288,504 | | | $ | 388,216 | | | $ | 3,280,840 | | | $ | 4,264,644 | |
Long-term | | $ | 604,788 | | | $ | 1,157,265 | | | $ | 166,262 | | | $ | 4,998,267 | | | $ | 7,290,286 | |
As of July 31, 2014, the Funds had no uncertain tax positions that would require financial statement recognition, de-recognition, or disclosure. Each Fund files a U.S. federal income tax return annually after its fiscal year-end, which is subject to examination by the Internal Revenue Service for a period of three years from the date of filing.
D Expenses — The majority of expenses of the Trust are directly identifiable to an individual fund. Expenses which are not readily identifiable to a specific fund are allocated taking into consideration, among other things, the nature and type of expense and the relative size of the funds.
E Expense Reduction — State Street Bank and Trust Company (SSBT) serves as custodian of the Funds. Pursuant to the custodian agreement, SSBT receives a fee reduced by credits, which are determined based on the average daily cash balance each Fund maintains with SSBT. All credit balances, if any, used to reduce each Fund’s custodian fees are reported as a reduction of expenses in the Statements of Operations.
F Legal Fees — Legal fees and other related expenses incurred as part of negotiations of the terms and requirement of capital infusions, or that are expected to result in the restructuring of, or a plan of reorganization for, an investment are recorded as realized losses. Ongoing expenditures to protect or enhance an investment are treated as operating expenses.
G Use of Estimates — The preparation of the financial statements in conformity with accounting principles generally accepted in the United States of America requires management to make estimates and assumptions that affect the reported amounts of assets and liabilities at the date of the financial statements and the reported amounts of income and expense during the reporting period. Actual results could differ from those estimates.
H Indemnifications — Under the Trust’s organizational documents, its officers and Trustees may be indemnified against certain liabilities and expenses arising out of the performance of their duties to the Funds. Under Massachusetts law, if certain conditions prevail, shareholders of a Massachusetts business trust (such as the Trust) could be deemed to have personal liability for the obligations of the Trust. However, the Trust’s Declaration of Trust contains an express disclaimer of liability on the part of Fund shareholders and the By-laws provide that the Trust shall assume the defense on behalf of any Fund shareholders. Moreover, the By-laws also provide for indemnification out of Fund property of any shareholder held personally liable solely by reason of being or having been a shareholder for all loss or expense arising from such liability. Additionally, in the normal course of business, each Fund enters into agreements with service providers that may contain indemnification clauses. Each Fund’s maximum exposure under these arrangements is unknown as this would involve future claims that may be made against each Fund that have not yet occurred.
I Floating Rate Notes Issued in Conjunction with Securities Held — The Funds may invest in residual interest bonds, also referred to as inverse floating rate securities, whereby a Fund may sell a variable or fixed rate bond to a broker for cash. At the same time, the Fund buys a residual interest in the assets and cash flows of a Special-Purpose Vehicle (the SPV), (which is generally organized as a trust), set up by the broker. The broker deposits a bond into the SPV with the same CUSIP number as the bond sold to the broker by the Fund, and which may have been, but is not required to be, the bond purchased from the Fund (the Bond). The SPV also issues floating rate notes (Floating Rate Notes) which are sold to third-parties. The residual interest bond held by a Fund gives the Fund the right (1) to cause the holders of the Floating Rate Notes to generally tender their notes at par, and (2) to have the broker transfer the Bond held by the SPV to the Fund, thereby terminating the SPV. Should the Fund exercise such right, it would generally pay the broker the par amount due on the Floating Rate Notes and exchange the residual interest bond for the underlying Bond. Pursuant to generally accepted accounting principles for transfers and servicing of financial assets and extinguishment of liabilities, the Funds account for the transaction described above as a secured borrowing by including the Bond in their Portfolio of Investments and the Floating Rate Notes as a liability under the caption “Payable for floating rate notes issued” in their Statement of Assets and Liabilities. The Floating Rate Notes have interest rates that generally reset weekly and their holders have the option to tender their notes to the broker for redemption at par at each reset date. Accordingly, the fair value of the payable for floating rate notes
Eaton Vance
Municipal Income Funds
July 31, 2014
Notes to Financial Statements — continued
issued approximates its carrying value. If measured at fair value, the payable for floating rate notes would have been considered as Level 2 in the fair value hierarchy (see Note 11) at July 31, 2014. Interest expense related to the Funds’ liability with respect to Floating Rate Notes is recorded as incurred. The SPV may be terminated by the Fund, as noted above, or by the broker upon the occurrence of certain termination events as defined in the trust agreement, such as a downgrade in the credit quality of the underlying Bond, bankruptcy of or payment failure by the issuer of the underlying Bond, the inability to remarket Floating Rate Notes that have been tendered due to insufficient buyers in the market, or the failure by the SPV to obtain renewal of the liquidity agreement under which liquidity support is provided for the Floating Rate Notes up to one year. At July 31, 2014, the amounts of the Funds’ Floating Rate Notes and related interest rates and collateral were as follows:
| | | | | | | | | | | | |
| | | Connecticut
Fund | | | New Jersey
Fund | | | Pennsylvania
Fund | |
| | | |
Floating Rate Notes Outstanding | | $ | 4,000,000 | | | $ | 6,900,000 | | | $ | 11,750,000 | |
Interest Rate or Range of Interest Rates (%) | | | 0.11 | | | | 0.19 | | | | 0.07 - 0.21 | |
Collateral for Floating Rate Notes Outstanding | | $ | 5,436,600 | | | $ | 8,710,767 | | | $ | 17,819,692 | |
For the year ended July 31, 2014, the Funds’ average Floating Rate Notes outstanding and the average interest rate including fees were as follows:
| | | | | | | | | | | | | | | | |
| | | Arizona
Fund | | | Connecticut
Fund | | | New Jersey
Fund | | | Pennsylvania
Fund | |
| | | | |
Average Floating Rate Notes Outstanding | | $ | 1,232,877 | | | $ | 6,385,000 | | | $ | 8,634,466 | | | $ | 12,547,808 | |
Average Interest Rate | | | 1.52 | % | | | 1.00 | % | | | 0.59 | % | | | 0.61 | % |
The Funds may enter into shortfall and forbearance agreements with the broker by which a Fund agrees to reimburse the broker, in certain circumstances, for the difference between the liquidation value of the Bond held by the SPV and the liquidation value of the Floating Rate Notes, as well as any shortfalls in interest cash flows. The Funds had no shortfalls as of July 31, 2014.
The Funds may also purchase residual interest bonds from brokers in a secondary market transaction without first owning the underlying bond. Such transactions are not required to be treated as secured borrowings. Shortfall agreements, if any, related to residual interest bonds purchased in a secondary market transaction are disclosed in the Portfolio of Investments.
The Funds’ investment policies and restrictions expressly permit investments in residual interest bonds. Such bonds typically offer the potential for yields exceeding the yields available on fixed rate bonds with comparable credit quality and maturity. These securities tend to underperform the market for fixed rate bonds in a rising long-term interest rate environment, but tend to outperform the market for fixed rate bonds when long-term interest rates decline. The value and income of residual interest bonds are generally more volatile than that of a fixed rate bond. The Funds’ investment policies do not allow the Funds to borrow money except as permitted by the 1940 Act. Management believes that the Funds’ restrictions on borrowing money and issuing senior securities (other than as specifically permitted) do not apply to Floating Rate Notes issued by the SPV and included as a liability in the Funds’ Statement of Assets and Liabilities. As secured indebtedness issued by an SPV, Floating Rate Notes are distinct from the borrowings and senior securities to which the Funds’ restrictions apply. Residual interest bonds held by the Funds are securities exempt from registration under Rule 144A of the Securities Act of 1933.
On December 10, 2013, five U.S. federal agencies published final rules implementing section 619 of the Dodd-Frank Wall Street Reform and Consumer Protection Act (the “Volcker Rule”). The Volcker Rule prohibits banking entities from engaging in proprietary trading of certain instruments and limits such entities’ investments in, and relationships with, covered funds, as defined in the rules. The compliance date for the Volcker Rule is July 21, 2015. The Volcker Rule may preclude banking entities and their affiliates from (i) sponsoring residual interest bond programs (as such programs are presently structured) and (ii) continuing relationships with or services for existing residual interest bond programs. As a result, residual interest bond trusts may need to be restructured or unwound. There can be no assurances that residual interest bond trusts can be restructured, that new sponsors of residual interest bond programs will develop, or that alternative forms of leverage will be available to the Funds. The effects of the Volcker Rule may make it more difficult for the Funds to maintain current or desired levels of leverage and may cause the Funds to incur additional expenses to maintain their leverage.
J Financial Futures Contracts — Upon entering into a financial futures contract, a Fund is required to deposit with the broker, either in cash or securities, an amount equal to a certain percentage of the contract amount (initial margin). Subsequent payments, known as variation margin, are made or received by the Fund each business day, depending on the daily fluctuations in the value of the underlying security, and are recorded as unrealized gains or losses by the Fund. Gains (losses) are realized upon the expiration or closing of the financial futures contracts. Should market conditions change unexpectedly, the Fund may not achieve the anticipated benefits of the financial futures contracts and may realize a loss. Futures contracts have minimal counterparty risk as they are exchange traded and the clearinghouse for the exchange is substituted as the counterparty, guaranteeing counterparty performance.
Eaton Vance
Municipal Income Funds
July 31, 2014
Notes to Financial Statements — continued
K When-Issued Securities and Delayed Delivery Transactions — The Funds may purchase or sell securities on a delayed delivery or when-issued basis. Payment and delivery may take place after the customary settlement period for that security. At the time the transaction is negotiated, the price of the security that will be delivered is fixed. The Funds maintain security positions for these commitments such that sufficient liquid assets will be available to make payments upon settlement. Securities purchased on a delayed delivery or when-issued basis are marked-to-market daily and begin earning interest on settlement date. Losses may arise due to changes in the market value of the underlying securities or if the counterparty does not perform under the contract.
2 Distributions to Shareholders
The net investment income of each Fund is determined daily and substantially all of the net investment income so determined is declared as a dividend to shareholders of record at the time of declaration. Distributions are declared separately for each class of shares. Distributions are paid monthly. Distributions of realized capital gains (reduced by available capital loss carryforwards) are made at least annually. Shareholders may reinvest income and capital gain distributions in additional shares of the same class of a Fund at the net asset value as of the reinvestment date or, at the election of the shareholder, receive distributions in cash. The Funds distinguish between distributions on a tax basis and a financial reporting basis. Accounting principles generally accepted in the United States of America require that only distributions in excess of tax basis earnings and profits be reported in the financial statements as a return of capital. Permanent differences between book and tax accounting relating to distributions are reclassified to paid-in capital. For tax purposes, distributions from short-term capital gains are considered to be from ordinary income.
The tax character of distributions declared for the years ended July 31, 2014 and July 31, 2013 was as follows:
| | | | | | | | | | | | | | | | | | | | |
| | | Year Ended July 31, 2014 | |
| | | Arizona
Fund | | | Connecticut
Fund | | | Minnesota
Fund | | | New Jersey
Fund | | | Pennsylvania
Fund | |
| | | | | |
Distributions declared from: | | | | | | | | | | | | | | | | | | | | |
Tax-exempt income | | $ | 2,576,306 | | | $ | 3,682,490 | | | $ | 3,655,701 | | | $ | 6,796,445 | | | $ | 8,938,451 | |
Ordinary income | | $ | 94 | | | $ | 158 | | | $ | 12,067 | | | $ | 28,044 | | | $ | 21,548 | |
| | | | | |
| | | | | | | | | | | | | | | | | | | | |
| | | Year Ended July 31, 2013 | |
| | | Arizona
Fund | | | Connecticut
Fund | | | Minnesota
Fund | | | New Jersey
Fund | | | Pennsylvania
Fund | |
| | | | | |
Distributions declared from: | | | | | | | | | | | | | | | | | | | | |
Tax-exempt income | | $ | 2,843,557 | | | $ | 4,192,590 | | | $ | 3,718,197 | | | $ | 8,142,993 | | | $ | 9,578,406 | |
Ordinary income | | $ | — | | | $ | 8,525 | | | $ | 2,586 | | | $ | 38,456 | | | $ | 24,766 | |
Tax return of capital | | $ | — | | | $ | 19,267 | | | $ | — | | | $ | — | | | $ | — | |
During the year ended July 31, 2014, the following amounts were reclassified due to expired capital loss carryforwards, the tax treatment of distributions in excess of net tax-exempt income and differences between book and tax accounting, primarily for accretion of market discount.
| | | | | | | | | | | | | | | | | | | | |
| | | Arizona
Fund | | | Connecticut
Fund | | | Minnesota
Fund | | | New Jersey
Fund | | | Pennsylvania
Fund | |
| | | | | |
Change in: | | | | | | | | | | | | | | | | | | | | |
Paid-in capital | | $ | (738,761 | ) | | $ | (11,848 | ) | | $ | — | | | $ | — | | | $ | — | |
Accumulated net realized loss | | $ | 828,628 | | | $ | 28,959 | | | $ | 12,739 | | | $ | 12,871 | | | $ | 57,944 | |
Accumulated undistributed (distributions in excess of) net investment income | | $ | (89,867 | ) | | $ | (17,111 | ) | | $ | (12,739 | ) | | $ | (12,871 | ) | | $ | (57,944 | ) |
These reclassifications had no effect on the net assets or net asset value per share of the Funds.
Eaton Vance
Municipal Income Funds
July 31, 2014
Notes to Financial Statements — continued
As of July 31, 2014, the components of distributable earnings (accumulated losses) and unrealized appreciation (depreciation) on a tax basis were as follows:
| | | | | | | | | | | | | | | | | | | | |
| | | Arizona
Fund | | | Connecticut
Fund | | | Minnesota
Fund | | | New Jersey
Fund | | | Pennsylvania
Fund | |
| | | | | |
Undistributed tax-exempt income | | $ | — | | | $ | — | | | $ | 103,862 | | | $ | 1,362,504 | | | $ | 234,869 | |
Capital loss carryforward and deferred capital losses | | $ | (5,466,704 | ) | | $ | (6,510,540 | ) | | $ | (3,778,564 | ) | | $ | (42,732,280 | ) | | $ | (39,252,715 | ) |
Net unrealized appreciation | | $ | 5,575,859 | | | $ | 6,895,689 | | | $ | 8,112,463 | | | $ | 13,657,266 | | | $ | 19,546,687 | |
Other temporary differences | | $ | (44,975 | ) | | $ | (60,685 | ) | | $ | (59,031 | ) | | $ | (124,496 | ) | | $ | (167,065 | ) |
The differences between components of distributable earnings (accumulated losses) on a tax basis and the amounts reflected in the Statements of Assets and Liabilities are primarily due to futures contracts, residual interest bonds, defaulted bond interest, accretion of market discount, the timing of recognizing distributions to shareholders and expenditures on defaulted bonds.
3 Investment Adviser Fee and Other Transactions with Affiliates
The investment adviser fee is earned by Boston Management and Research (BMR), a subsidiary of Eaton Vance Management (EVM), as compensation for management and investment advisory services rendered to each Fund. The fee is based upon a percentage of average daily net assets plus a percentage of gross income (i.e., income other than gains from the sale of securities) as presented in the following table and is payable monthly.
| | | | | | | | |
| Daily Net Assets | | Annual Asset
Rate | | | Daily Income
Rate | |
| | |
Up to $20 million | | | 0.10 | % | | | 1.00 | % |
$20 million up to $40 million | | | 0.20 | | | | 2.00 | |
$40 million up to $500 million | | | 0.30 | | | | 3.00 | |
On average daily net assets of $500 million or more, the rates are reduced.
For the year ended July 31, 2014, investment adviser fees incurred by the Funds and the effective annual rates, as a percentage of average daily net assets, were as follows:
| | | | | | | | | | | | | | | | | | | | |
| | | Arizona Fund | | | Connecticut Fund | | | Minnesota Fund | | | New Jersey Fund | | | Pennsylvania Fund | |
| | | | | |
Investment Adviser Fee | | $ | 208,030 | | | $ | 336,729 | | | $ | 378,158 | | | $ | 696,411 | | | $ | 885,492 | |
Effective Annual Rate | | | 0.31 | % | | | 0.35 | % | | | 0.35 | % | | | 0.39 | % | | | 0.41 | % |
EVM serves as administrator of each Fund, but receives no compensation. EVM provides sub-transfer agency and related services to the Funds pursuant to a Sub-Transfer Agency Support Services Agreement. Eaton Vance Distributors, Inc. (EVD), an affiliate of EVM and the Funds’ principal underwriter, received a portion of the sales charge on sales of Class A shares of the Funds. EVD also received distribution and service fees from Class A, Class B and Class C shares (see Note 4) and contingent deferred sales charges (see Note 5). Sub-transfer agent fees earned by EVM, which are included in transfer and dividend disbursing agent fees on the Statements of Operations, and Class A sales charges that the Funds were informed were received by EVD for the year ended July 31, 2014 were as follows:
| | | | | | | | | | | | | | | | | | | | |
| | | Arizona Fund | | | Connecticut Fund | | | Minnesota Fund | | | New Jersey Fund | | | Pennsylvania Fund | |
| | | | | |
EVM’s Sub-Transfer Agent Fees | | $ | 1,812 | | | $ | 4,013 | | | $ | 3,810 | | | $ | 6,339 | | | $ | 8,467 | |
EVD’s Class A Sales Charges | | $ | 6,106 | | | $ | 5,767 | | | $ | 5,132 | | | $ | 25,927 | | | $ | 21,599 | |
Eaton Vance
Municipal Income Funds
July 31, 2014
Notes to Financial Statements — continued
Trustees and officers of the Funds who are members of EVM’s or BMR’s organizations receive remuneration for their services to the Funds out of the investment adviser fee. Trustees of the Funds who are not affiliated with the investment adviser may elect to defer receipt of all or a percentage of their annual fees in accordance with the terms of the Trustees Deferred Compensation Plan. For the year ended July 31, 2014, no significant amounts have been deferred. Certain officers and Trustees of the Funds are officers of the above organizations.
4 Distribution Plans
Each Fund has in effect a distribution plan for Class A shares (Class A Plan) pursuant to Rule 12b-1 under the 1940 Act. The Class A Plan provides that each Fund will pay EVD a distribution and service fee not exceeding 0.25% per annum of its average daily net assets attributable to Class A shares for distribution services and facilities provided to each Fund by EVD, as well as for personal services and/or the maintenance of shareholder accounts. The Trustees approved distribution and service fee payments equal to 0.20% per annum of each Fund’s average daily net assets attributable to Class A shares. Distribution and service fees paid or accrued to EVD for the year ended July 31, 2014 for Class A shares amounted to the following:
| | | | | | | | | | | | | | | | | | | | |
| | | Arizona Fund | | | Connecticut Fund | | | Minnesota Fund | | | New Jersey Fund | | | Pennsylvania Fund | |
| | | | | |
Class A Distribution and Service Fees | | $ | 106,305 | | | $ | 161,870 | | | $ | 147,279 | | | $ | 276,710 | | | $ | 298,358 | |
Each Fund also has in effect distribution plans for Class B shares (Class B Plan) and Class C shares (Class C Plan) pursuant to Rule 12b-1 under the 1940 Act. Pursuant to the Class B and Class C Plans, each Fund pays EVD amounts equal to 0.75% per annum of its average daily net assets attributable to Class B and Class C shares for providing ongoing distribution services and facilities to the respective Funds. For the year ended July 31, 2014, the Funds paid or accrued to EVD the following distribution fees:
| | | | | | | | | | | | | | | | | | | | |
| | | Arizona Fund | | | Connecticut Fund | | | Minnesota Fund | | | New Jersey Fund | | | Pennsylvania Fund | |
| | | | | |
Class B Distribution Fees | | $ | 5,257 | | | $ | 11,360 | | | $ | 5,445 | | | $ | — | | | $ | 27,447 | |
Class C Distribution Fees | | $ | 48,301 | | | $ | 46,244 | | | $ | 82,140 | | | $ | 176,883 | | | $ | 242,036 | |
The Class B and Class C Plans also authorize the Funds to make payments of service fees to EVD, financial intermediaries and other persons in amounts not exceeding 0.25% per annum of the average daily net assets attributable to that class. The Trustees approved service fee payments equal to 0.20% per annum of each Fund’s average daily net assets attributable to Class B and Class C shares. Service fees paid or accrued are for personal services and/or the maintenance of shareholder accounts. They are separate and distinct from the Class B and Class C sales commissions and distribution fees payable to EVD. Service fees paid or accrued for the year ended July 31, 2014 amounted to the following:
| | | | | | | | | | | | | | | | | | | | |
| | | Arizona Fund | | | Connecticut Fund | | | Minnesota Fund | | | New Jersey Fund | | | Pennsylvania Fund | |
| | | | | |
Class B Service Fees | | $ | 1,402 | | | $ | 3,029 | | | $ | 1,452 | | | $ | — | | | $ | 7,319 | |
Class C Service Fees | | $ | 12,880 | | | $ | 12,332 | | | $ | 21,904 | | | $ | 47,169 | | | $ | 64,543 | |
Distribution and service fees are subject to the limitations contained in the Financial Industry Regulatory Authority’s NASD Conduct Rule 2830(d) and for Class B, are further limited to a 5% maximum sales charge as determined in accordance with such rule.
5 Contingent Deferred Sales Charges
A contingent deferred sales charge (CDSC) generally is imposed on redemptions of Class B shares made within six years of purchase and on redemptions of Class C shares made within one year of purchase. Class A shares may be subject to a 1% CDSC if redeemed within eighteen months of purchase (depending on the circumstances of purchase). Generally, the CDSC is based upon the lower of the net asset value at date of redemption or date of purchase. No charge is levied on shares acquired by reinvestment of dividends or capital gain distributions. The CDSC for Class B shares is imposed at declining rates that begin at 5% in the case of redemptions in the first and second year after purchase, declining one percentage point each subsequent
Eaton Vance
Municipal Income Funds
July 31, 2014
Notes to Financial Statements — continued
year. Class C shares are subject to a 1% CDSC if redeemed within one year of purchase. For the year ended July 31, 2014, the Funds were informed that EVD received approximately the following amounts of CDSCs paid by Class A, Class B and Class C shareholders:
| | | | | | | | | | | | | | | | | | | | |
| | | Arizona Fund | | | Connecticut Fund | | | Minnesota Fund | | | New Jersey Fund | | | Pennsylvania Fund | |
| | | | | |
Class A | | $ | — | | | $ | 10 | | | $ | 600 | | | $ | 200 | | | $ | 1,100 | |
Class B | | $ | 400 | | | $ | 1,800 | | | $ | 3,200 | | | $ | — | | | $ | 8,700 | |
Class C | | $ | 700 | | | $ | 900 | | | $ | 1,700 | | | $ | 1,300 | | | $ | 2,300 | |
6 Purchases and Sales of Investments
Purchases and sales of investments, other than short-term obligations, for the year ended July 31, 2014 were as follows:
| | | | | | | | | | | | | | | | | | | | |
| | | Arizona Fund | | | Connecticut Fund | | | Minnesota Fund | | | New Jersey Fund | | | Pennsylvania Fund | |
| | | | | |
Purchases | | $ | 2,946,353 | | | $ | 6,077,519 | | | $ | 4,127,562 | | | $ | 29,068,999 | | | $ | 9,590,601 | |
Sales | | $ | 10,868,275 | | | $ | 25,211,939 | | | $ | 10,230,025 | | | $ | 70,003,249 | | | $ | 25,541,129 | |
7 Shares of Beneficial Interest
Each Fund’s Declaration of Trust permits the Trustees to issue an unlimited number of full and fractional shares of beneficial interest (without par value). Such shares may be issued in a number of different series (such as the Funds) and classes. Transactions in Fund shares were as follows:
| | | | | | | | | | | | | | | | |
Arizona Fund | | | | | | | | | | | | |
| | | Year Ended July 31, 2014 | |
| | | Class A | | | Class B | | | Class C | | | Class I | |
| | | | |
Sales | | | 309,014 | | | | 157 | | | | 64,370 | | | | 479,634 | |
Issued to shareholders electing to receive payments of distributions in Fund shares | | | 187,270 | | | | 1,736 | | | | 17,284 | | | | 5,047 | |
Redemptions | | | (971,456 | ) | | | (20,927 | ) | | | (289,607 | ) | | | (274,474 | ) |
Exchange from Class B shares | | | 6,133 | | | | — | | | | — | | | | — | |
Exchange to Class A shares | | | — | | | | (5,517 | ) | | | — | | | | — | |
| | | | |
Net increase (decrease) | | | (469,039 | ) | | | (24,551 | ) | | | (207,953 | ) | | | 210,207 | |
| | | | |
| | | | | | | | | | | | | | | | |
| | | Year Ended July 31, 2013 | |
| | | Class A | | | Class B | | | Class C | | | Class I | |
| | | | |
Sales | | | 495,272 | | | | 1,872 | | | | 120,655 | | | | 783,726 | |
Issued to shareholders electing to receive payments of distributions in Fund shares | | | 189,688 | | | | 2,411 | | | | 22,649 | | | | 5,147 | |
Redemptions | | | (1,047,249 | ) | | | (31,482 | ) | | | (256,632 | ) | | | (316,999 | ) |
Exchange from Class B shares | | | 29,690 | | | | — | | | | — | | | | — | |
Exchange to Class A shares | | | — | | | | (26,709 | ) | | | — | | | | — | |
| | | | |
Net increase (decrease) | | | (332,599 | ) | | | (53,908 | ) | | | (113,328 | ) | | | 471,874 | |
| | | | |
| | | | | | | | | | | | | | | | |
Eaton Vance
Municipal Income Funds
July 31, 2014
Notes to Financial Statements — continued
| | | | | | | | | | | | | | | | |
Connecticut Fund | | | | | | | | | | | | |
| | | Year Ended July 31, 2014 | |
| | | Class A | | | Class B | | | Class C | | | Class I | |
| | | | |
Sales | | | 413,874 | | | | 1,527 | | | | 114,377 | | | | 384,350 | |
Issued to shareholders electing to receive payments of distributions in Fund shares | | | 252,680 | | | | 2,795 | | | | 13,948 | | | | 17,293 | |
Redemptions | | | (2,164,421 | ) | | | (15,108 | ) | | | (184,992 | ) | | | (280,858 | ) |
Exchange from Class B shares | | | 14,718 | | | | — | | | | — | | | | — | |
Exchange to Class A shares | | | — | | | | (14,779 | ) | | | — | | | | — | |
| | | | |
Net increase (decrease) | | | (1,483,149 | ) | | | (25,565 | ) | | | (56,667 | ) | | | 120,785 | |
| | | | |
| | | | | | | | | | | | | | | | |
| | | Year Ended July 31, 2013 | |
| | | Class A | | | Class B | | | Class C | | | Class I | |
| | | | |
Sales | | | 681,261 | | | | 1,755 | | | | 196,093 | | | | 280,659 | |
Issued to shareholders electing to receive payments of distributions in Fund shares | | | 272,683 | | | | 3,767 | | | | 14,529 | | | | 19,117 | |
Redemptions | | | (1,466,675 | ) | | | (43,145 | ) | | | (246,925 | ) | | | (440,328 | ) |
Exchange from Class B shares | | | 36,124 | | | | — | | | | — | | | | — | |
Exchange to Class A shares | | | — | | | | (36,295 | ) | | | — | | | | — | |
| | | | |
Net decrease | | | (476,607 | ) | | | (73,918 | ) | | | (36,303 | ) | | | (140,552 | ) |
| | | | |
| | | | | | | | | | | | | | | | |
Minnesota Fund | | | | | | | | | | | | |
| | | Year Ended July 31, 2014 | |
| | | Class A | | | Class B | | | Class C | | | Class I | |
| | | | |
Sales | | | 1,398,866 | | | | — | | | | 188,691 | | | | 2,094,149 | |
Issued to shareholders electing to receive payments of distributions in Fund shares | | | 249,687 | | | | 1,813 | | | | 24,885 | | | | 17,214 | |
Redemptions | | | (2,422,671 | ) | | | (13,707 | ) | | | (376,051 | ) | | | (1,721,009 | ) |
Exchange from Class B shares | | | 23,024 | | | | — | | | | — | | | | — | |
Exchange to Class A shares | | | — | | | | (21,395 | ) | | | — | | | | — | |
| | | | |
Net increase (decrease) | | | (751,094 | ) | | | (33,289 | ) | | | (162,475 | ) | | | 390,354 | |
| | | | |
| | | | | | | | | | | | | | | | |
| | | Year Ended July 31, 2013 | |
| | | Class A | | | Class B | | | Class C | | | Class I | |
| | | | |
Sales | | | 1,373,087 | | | | — | | | | 250,574 | | | | 1,442,644 | |
Issued to shareholders electing to receive payments of distributions in Fund shares | | | 257,448 | | | | 2,365 | | | | 26,622 | | | | 11,367 | |
Redemptions | | | (2,132,414 | ) | | | (32,814 | ) | | | (272,027 | ) | | | (1,356,881 | ) |
Exchange from Class B shares | | | 11,101 | | | | — | | | | — | | | | — | |
Exchange to Class A shares | | | — | | | | (10,317 | ) | | | — | | | | — | |
| | | | |
Net increase (decrease) | | | (490,778 | ) | | | (40,766 | ) | | | 5,169 | | | | 97,130 | |
| | | | |
| | | | | | | | | | | | | | | | |
Eaton Vance
Municipal Income Funds
July 31, 2014
Notes to Financial Statements — continued
| | | | | | | | | | | | | | | | |
New Jersey Fund | | | | | | | | | | | | |
| | | Year Ended July 31, 2014 | |
| | | Class A | | | Class B | | | Class C | | | Class I | |
| | | | |
Sales | | | 973,254 | | | | — | | | | 438,713 | | | | 1,481,165 | |
Issued to shareholders electing to receive payments of distributions in Fund shares | | | 481,336 | | | | — | | | | 55,468 | | | | 34,403 | |
Redemptions | | | (3,183,942 | ) | | | — | | | | (721,769 | ) | | | (845,729 | ) |
| | | | |
Net increase (decrease) | | | (1,729,352 | ) | | | — | | | | (227,588 | ) | | | 669,839 | |
| | | | |
| | | | | | | | | | | | | | | | |
| | | Year Ended July 31, 2013 | |
| | | Class A | | | Class B | | | Class C | | | Class I | |
| | | | |
Sales | | | 794,210 | | | | — | | | | 526,583 | | | | 664,547 | |
Issued to shareholders electing to receive payments of distributions in Fund shares | | | 569,596 | | | | — | | | | 67,513 | | | | 28,267 | |
Redemptions | | | (3,176,711 | ) | | | — | | | | (659,038 | ) | | | (335,929 | ) |
| | | | |
Net increase (decrease) | | | (1,812,905 | ) | | | — | | | | (64,942 | ) | | | 356,885 | |
| | | | |
| | | | | | | | | | | | | | | | |
Pennsylvania Fund | | | | | | | | | | | | |
| | | Year Ended July 31, 2014 | |
| | | Class A | | | Class B | | | Class C | | | Class I | |
| | | | |
Sales | | | 1,095,482 | | | | 5,773 | | | | 438,194 | | | | 1,953,989 | |
Issued to shareholders electing to receive payments of distributions in Fund shares | | | 617,103 | | | | 13,101 | | | | 107,749 | | | | 53,471 | |
Redemptions | | | (3,186,399 | ) | | | (96,541 | ) | | | (813,078 | ) | | | (934,541 | ) |
Exchange from Class B shares | | | 99,269 | | | | — | | | | — | | | | — | |
Exchange to Class A shares | | | — | | | | (95,884 | ) | | | — | | | | — | |
| | | | |
Net increase (decrease) | | | (1,374,545 | ) | | | (173,551 | ) | | | (267,135 | ) | | | 1,072,919 | |
| | | | |
| | | | | | | | | | | | | | | | |
| | | Year Ended July 31, 2013 | |
| | | Class A | | | Class B | | | Class C | | | Class I | |
| | | | |
Sales | | | 1,070,858 | | | | 11,888 | | | | 496,182 | | | | 1,493,458 | |
Issued to shareholders electing to receive payments of distributions in Fund shares | | | 640,495 | | | | 18,116 | | | | 111,602 | | | | 40,154 | |
Redemptions | | | (3,592,624 | ) | | | (192,564 | ) | | | (882,138 | ) | | | (1,385,940 | ) |
Exchange from Class B shares | | | 106,994 | | | | — | | | | — | | | | — | |
Exchange to Class A shares | | | — | | | | (103,344 | ) | | | — | | | | — | |
| | | | |
Net increase (decrease) | | | (1,774,277 | ) | | | (265,904 | ) | | | (274,354 | ) | | | 147,672 | |
Eaton Vance
Municipal Income Funds
July 31, 2014
Notes to Financial Statements — continued
8 Federal Income Tax Basis of Investments
The cost and unrealized appreciation (depreciation) of investments of each Fund at July 31, 2014, as determined on a federal income tax basis, were as follows:
| | | | | | | | | | | | | | | | | | | | |
| | | Arizona Fund | | | Connecticut Fund | | | Minnesota
Fund | | | New Jersey Fund | | | Pennsylvania Fund | |
| | | | | |
Aggregate cost | | $ | 60,959,785 | | | $ | 84,894,992 | | | $ | 100,338,330 | | | $ | 153,357,098 | | | $ | 195,515,963 | |
| | | | | |
Gross unrealized appreciation | | $ | 5,836,781 | | | $ | 7,235,342 | | | $ | 8,441,900 | | | $ | 15,069,375 | | | $ | 22,471,706 | |
Gross unrealized depreciation | | | (260,922 | ) | | | (339,653 | ) | | | (329,437 | ) | | | (1,412,109 | ) | | | (2,925,019 | ) |
| | | | | |
Net unrealized appreciation | | $ | 5,575,859 | | | $ | 6,895,689 | | | $ | 8,112,463 | | | $ | 13,657,266 | | | $ | 19,546,687 | |
9 Line of Credit
The Funds participate with other portfolios and funds managed by EVM and its affiliates in a $750 million unsecured line of credit agreement with a group of banks. Borrowings are made by the Funds solely to facilitate the handling of unusual and/or unanticipated short-term cash requirements. Interest is charged to each Fund based on its borrowings at an amount above either the Eurodollar rate or Federal Funds rate. In addition, a fee computed at an annual rate of 0.08% on the daily unused portion of the line of credit is allocated among the participating portfolios and funds at the end of each quarter. Because the line of credit is not available exclusively to the Funds, a Fund may be unable to borrow some or all of its requested amounts at any particular time. The Funds did not have any significant borrowings or allocated fees during the year ended July 31, 2014.
10 Financial Instruments
The Funds may trade in financial instruments with off-balance sheet risk in the normal course of their investing activities. These financial instruments may include financial futures contracts and may involve, to a varying degree, elements of risk in excess of the amounts recognized for financial statement purposes. The notional or contractual amounts of these instruments represent the investment a Fund has in particular classes of financial instruments and do not necessarily represent the amounts potentially subject to risk. The measurement of the risks associated with these instruments is meaningful only when all related and offsetting transactions are considered.
A summary of obligations under these financial instruments at July 31, 2014 is as follows:
| | | | | | | | | | | | | | | | | | | | |
| Futures Contracts | |
| Fund | | Expiration
Month/Year | | | Contracts | | Position | | Aggregate
Cost | | | Value | | | Net Unrealized
Appreciation
(Depreciation) | |
| | | | | | |
| Arizona | | | 9/14 | | | 38
U.S. Long Treasury Bond | | Short | | $ | (5,174,462 | ) | | $ | (5,221,438 | ) | | $ | (46,976 | ) |
| Connecticut | | | 9/14 | | | 13
U.S. Long Treasury Bond | | Short | | $ | (1,770,210 | ) | | $ | (1,786,281 | ) | | $ | (16,071 | ) |
| Minnesota | | | 9/14 | | | 47
U.S. Long Treasury Bond | | Short | | $ | (6,399,992 | ) | | $ | (6,458,094 | ) | | $ | (58,102 | ) |
| New Jersey | | | 9/14 | | | 100
U.S. 10-Year Treasury Note | | Short | | $ | (12,499,036 | ) | | $ | (12,460,938 | ) | | $ | 38,098 | |
| | | | 9/14 | | | 180
U.S. Long Treasury Bond | | Short | | | (24,510,608 | ) | | | (24,733,125 | ) | | | (222,517 | ) |
| Pennsylvania | | | 9/14 | | | 330
U.S. Long Treasury Bond | | Short | | $ | (44,936,115 | ) | | $ | (45,344,063 | ) | | $ | (407,948 | ) |
Eaton Vance
Municipal Income Funds
July 31, 2014
Notes to Financial Statements — continued
At July 31, 2014, the Funds had sufficient cash and/or securities to cover commitments under these contracts.
Each Fund is subject to interest rate risk in the normal course of pursuing its investment objective. Because the Funds hold fixed-rate bonds, the value of these bonds may decrease if interest rates rise. The Funds purchase and sell U.S. Treasury futures contracts to hedge against changes in interest rates.
The fair values of open derivative instruments (not considered to be hedging instruments for accounting disclosure purposes) and whose primary underlying risk exposure is interest rate risk at July 31, 2014 were as follows:
| | | | | | | | | | | | | | | | | | | | |
| | | Arizona Fund | | | Connecticut Fund | | | Minnesota Fund | | | New Jersey Fund | | | Pennsylvania Fund | |
| | | | | |
Asset Derivative: | | | | | | | | | | | | | | | | | | | | |
Futures Contracts | | $ | — | | | $ | — | | | $ | — | | | $ | 38,098 | (1) | | $ | — | |
| | | | | |
Total | | $ | — | | | $ | — | | | $ | — | | | $ | 38,098 | | | $ | — | |
| | | | | |
Liability Derivative: | | | | | | | | | | | | | | | | | | | | |
Futures Contracts | | $ | (46,976 | )(1) | | $ | (16,071 | )(1) | | $ | (58,102 | )(1) | | $ | (222,517 | )(1) | | $ | (407,948 | )(1) |
| | | | | |
Total | | $ | (46,976 | ) | | $ | (16,071 | ) | | $ | (58,102 | ) | | $ | (222,517 | ) | | $ | (407,948 | ) |
| (1) | Amount represents cumulative unrealized appreciation or (depreciation) on futures contracts in the Futures Contracts table above. Only the current day’s variation margin on open futures contracts is reported within the Statement of Assets and Liabilities as Receivable or Payable for variation margin, as applicable. |
The effect of derivative instruments (not considered to be hedging instruments for accounting disclosure purposes) on the Statement of Operations and whose primary underlying risk exposure is interest rate risk for the year ended July 31, 2014 was as follows:
| | | | | | | | | | | | | | | | | | | | |
| | | Arizona Fund | | | Connecticut Fund | | | Minnesota Fund | | | New Jersey Fund | | | Pennsylvania Fund | |
| | | | | |
Realized Gain (Loss) on Derivatives Recognized in Income | | $ | (26,681 | )(1) | | $ | 108,444 | (1) | | $ | (33,001 | )(1) | | $ | 13,723 | (1) | | $ | 371,129 | (1) |
Change in Unrealized Appreciation (Depreciation) on Derivatives Recognized in Income | | $ | (296,875 | )(2) | | $ | (226,512 | )(2) | | $ | (367,188 | )(2) | | $ | (1,894,808 | )(2) | | $ | (3,531,688 | )(2) |
| (1) | Statement of Operations location: Net realized gain (loss) – Financial futures contracts. |
| (2) | Statement of Operations location: Change in unrealized appreciation (depreciation) – Financial futures contracts. |
The average notional amounts of futures contracts outstanding during the year ended July 31, 2014, which are indicative of the volume of this derivative type, were approximately as follows:
| | | | | | | | | | | | | | | | | | | | |
| | | Arizona Fund | | | Connecticut Fund | | | Minnesota Fund | | | New Jersey Fund | | | Pennsylvania Fund | |
| | | |
Average Notional Amount: | | | | | | | | | | | | |
Futures Contracts — Short | | $ | 5,055,000 | | | $ | 2,513,000 | | | $ | 6,252,000 | | | $ | 37,058,000 | | | $ | 52,739,000 | |
11 Fair Value Measurements
Under generally accepted accounting principles for fair value measurements, a three-tier hierarchy to prioritize the assumptions, referred to as inputs, is used in valuation techniques to measure fair value. The three-tier hierarchy of inputs is summarized in the three broad levels listed below.
| Ÿ | | Level 1 – quoted prices in active markets for identical investments |
| Ÿ | | Level 2 – other significant observable inputs (including quoted prices for similar investments, interest rates, prepayment speeds, credit risk, etc.) |
| Ÿ | | Level 3 – significant unobservable inputs (including a fund’s own assumptions in determining the fair value of investments) |
Eaton Vance
Municipal Income Funds
July 31, 2014
Notes to Financial Statements — continued
In cases where the inputs used to measure fair value fall in different levels of the fair value hierarchy, the level disclosed is determined based on the lowest level input that is significant to the fair value measurement in its entirety. The inputs or methodology used for valuing securities are not necessarily an indication of the risk associated with investing in those securities.
At July 31, 2014, the hierarchy of inputs used in valuing the Funds’ investments and open derivative instruments, which are carried at value, were as follows:
| | | | | | | | | | | | | | | | |
Arizona Fund | |
| Asset Description | | Level 1 | | | Level 2 | | | Level 3 | | | Total | |
| | | | |
Tax-Exempt Investments | | $ | — | | | $ | 66,535,644 | | | $ | — | | | $ | 66,535,644 | |
| | | | |
Total Investments | | $ | — | | | $ | 66,535,644 | | | $ | — | | | $ | 66,535,644 | |
| | | | |
Liability Description | | | | | | | | | | | | | | | | |
| | | | |
Futures Contracts | | $ | (46,976 | ) | | $ | — | | | $ | — | | | $ | (46,976 | ) |
| | | | |
Total | | $ | (46,976 | ) | | $ | — | | | $ | — | | | $ | (46,976 | ) |
| | | | |
| | | | | | | | | | | | | | | | |
Connecticut Fund | |
| Asset Description | | Level 1 | | | Level 2 | | | Level 3 | | | Total | |
| | | | |
Tax-Exempt Investments | | $ | — | | | $ | 95,790,681 | | | $ | — | | | $ | 95,790,681 | |
| | | | |
Total Investments | | $ | — | | | $ | 95,790,681 | | | $ | — | | | $ | 95,790,681 | |
| | | | |
Liability Description | | | | | | | | | | | | | | | | |
| | | | |
Futures Contracts | | $ | (16,071 | ) | | $ | — | | | $ | — | | | $ | (16,071 | ) |
| | | | |
Total | | $ | (16,071 | ) | | $ | — | | | $ | — | | | $ | (16,071 | ) |
| | | | |
| | | | | | | | | | | | | | | | |
Minnesota Fund | |
| Asset Description | | Level 1 | | | Level 2 | | | Level 3 | | | Total | |
| | | | |
Tax-Exempt Investments | | $ | — | | | $ | 108,450,793 | | | $ | — | | | $ | 108,450,793 | |
| | | | |
Total Investments | | $ | — | | | $ | 108,450,793 | | | $ | — | | | $ | 108,450,793 | |
| | | | |
Liability Description | | | | | | | | | | | | | | | | |
| | | | |
Futures Contracts | | $ | (58,102 | ) | | $ | — | | | $ | — | | | $ | (58,102 | ) |
| | | | |
Total | | $ | (58,102 | ) | | $ | — | | | $ | — | | | $ | (58,102 | ) |
| | | | |
| | | | | | | | | | | | | | | | |
Eaton Vance
Municipal Income Funds
July 31, 2014
Notes to Financial Statements — continued
| | | | | | | | | | | | | | | | |
New Jersey Fund | |
| Asset Description | | Level 1 | | | Level 2 | | | Level 3 | | | Total | |
| | | | |
Tax-Exempt Investments | | $ | — | | | $ | 173,914,364 | | | $ | — | | | $ | 173,914,364 | |
| | | | |
Total Investments | | $ | — | | | $ | 173,914,364 | | | $ | — | | | $ | 173,914,364 | |
| | | | |
Futures Contracts | | $ | 38,098 | | | $ | — | | | $ | — | | | $ | 38,098 | |
| | | | |
Total | | $ | 38,098 | | | $ | 173,914,364 | | | $ | — | | | $ | 173,952,462 | |
| | | | |
Liability Description | | | | | | | | | | | | | | | | |
| | | | |
Futures Contracts | | $ | (222,517 | ) | | $ | — | | | $ | — | | | $ | (222,517 | ) |
| | | | |
Total | | $ | (222,517 | ) | | $ | — | | | $ | — | | | $ | (222,517 | ) |
| | | | |
| | | | | | | | | | | | | | | | |
Pennsylvania Fund | |
| Asset Description | | Level 1 | | | Level 2 | | | Level 3 | | | Total | |
| | | | |
Tax-Exempt Investments | | $ | — | | | $ | 226,812,650 | | | $ | — | | | $ | 226,812,650 | |
| | | | |
Total Investments | | $ | — | | | $ | 226,812,650 | | | $ | — | | | $ | 226,812,650 | |
| | | | |
Liability Description | | | | | | | | | | | | | | | | |
| | | | |
Futures Contracts | | $ | (407,948 | ) | | $ | — | | | $ | — | | | $ | (407,948 | ) |
| | | | |
Total | | $ | (407,948 | ) | | $ | — | | | $ | — | | | $ | (407,948 | ) |
The Funds held no investments or other financial instruments as of July 31, 2013 whose fair value was determined using Level 3 inputs. At July 31, 2014, there were no investments transferred between Level 1 and Level 2 during the year then ended.
Eaton Vance
Municipal Income Funds
July 31, 2014
Report of Independent Registered Public Accounting Firm
To the Trustees of Eaton Vance Municipals Trust and Shareholders of Eaton Vance Arizona Municipal Income Fund, Eaton Vance Connecticut Municipal Income Fund, Eaton Vance Minnesota Municipal Income Fund, Eaton Vance New Jersey Municipal Income Fund and Eaton Vance Pennsylvania Municipal Income Fund:
We have audited the accompanying statements of assets and liabilities of Eaton Vance Arizona Municipal Income Fund, Eaton Vance Connecticut Municipal Income Fund, Eaton Vance Minnesota Municipal Income Fund, Eaton Vance New Jersey Municipal Income Fund and Eaton Vance Pennsylvania Municipal Income Fund (collectively, the “Funds”) (certain of the funds constituting Eaton Vance Municipals Trust), including the portfolios of investments, as of July 31, 2014, and the related statements of operations for the year then ended, the statements of changes in net assets for each of the two years in the period then ended, and the financial highlights for the periods presented. These financial statements and financial highlights are the responsibility of the Funds’ management. Our responsibility is to express an opinion on these financial statements and financial highlights based on our audits.
We conducted our audits in accordance with the standards of the Public Company Accounting Oversight Board (United States). Those standards require that we plan and perform the audits to obtain reasonable assurance about whether the financial statements and financial highlights are free of material misstatement. The Funds are not required to have, nor were we engaged to perform, an audit of their internal control over financial reporting. Our audits included consideration of internal control over financial reporting as a basis for designing audit procedures that are appropriate in the circumstances, but not for the purpose of expressing an opinion on the effectiveness of the Funds’ internal control over financial reporting. Accordingly, we express no such opinion. An audit also includes examining, on a test basis, evidence supporting the amounts and disclosures in the financial statements, assessing the accounting principles used and significant estimates made by management, as well as evaluating the overall financial statement presentation. Our procedures included confirmation of securities owned as of July 31, 2014, by correspondence with the custodian and brokers; where replies were not received from brokers, we performed other auditing procedures. We believe that our audits provide a reasonable basis for our opinion.
In our opinion, the financial statements and financial highlights referred to above present fairly, in all material respects, the financial positions of Eaton Vance Arizona Municipal Income Fund, Eaton Vance Connecticut Municipal Income Fund, Eaton Vance Minnesota Municipal Income Fund, Eaton Vance New Jersey Municipal Income Fund and Eaton Vance Pennsylvania Municipal Income Fund as of July 31, 2014, the results of their operations for the year then ended, the changes in their net assets for each of the two years in the period then ended, and the financial highlights for the periods presented, in conformity with accounting principles generally accepted in the United States of America.
DELOITTE & TOUCHE LLP
Boston, Massachusetts
September 16, 2014
Eaton Vance
Municipal Income Funds
July 31, 2014
Federal Tax Information (Unaudited)
The Form 1099-DIV you receive in February 2015 will show the tax status of all distributions paid to your account in calendar year 2014. Shareholders are advised to consult their own tax adviser with respect to the tax consequences of their investment in the Funds. As required by the Internal Revenue Code and/or regulations, shareholders must be notified regarding exempt-interest dividends.
Exempt-Interest Dividends. For the fiscal year ended July 31, 2014, the Funds designate the following percentages of distributions from net investment income as exempt-interest dividends:
| | | | |
Arizona Municipal Income Fund | | | 100.00 | % |
Connecticut Municipal Income Fund | | | 100.00 | % |
Minnesota Municipal Income Fund | | | 99.67 | % |
New Jersey Municipal Income Fund | | | 99.59 | % |
Pennsylvania Municipal Income Fund | | | 99.76 | % |
Eaton Vance
Municipal Income Funds
July 31, 2014
Special Meeting of Shareholders (Unaudited)
Each Fund held a Special Meeting of Shareholders on May 29, 2014 to elect five Trustees. The results of the vote were as follows:
| | | | | | | | | | | | | | | | |
| | | Arizona Fund | | | Connecticut Fund | |
| | | Number of Shares(1) | | | Number of Shares(1) | |
| Nominee for Trustee | | For | | | Withheld | | | For | | | Withheld | |
Scott E. Eston | | | 6,199,481 | | | | 16,634 | | | | 7,985,349 | | | | 23,310 | |
Cynthia E. Frost | | | 6,203,780 | | | | 12,335 | | | | 7,985,349 | | | | 23,310 | |
George J. Gorman | | | 6,187,854 | | | | 28,261 | | | | 7,956,839 | | | | 51,820 | |
Valerie A. Mosley | | | 6,203,780 | | | | 12,335 | | | | 7,985,349 | | | | 23,310 | |
Harriett Tee Taggart | | | 6,203,780 | | | | 12,335 | | | | 7,985,349 | | | | 23,310 | |
| (1) | Excludes fractional shares. |
| | | | | | | | | | | | | | | | |
| | | Minnesota Fund | | | New Jersey Fund | |
| | | Number of Shares(1) | | | Number of Shares(1) | |
| Nominee for Trustee | | For | | | Withheld | | | For | | | Withheld | |
Scott E. Eston | | | 10,362,585 | | | | 216,306 | | | | 16,141,603 | | | | 256,574 | |
Cynthia E. Frost | | | 10,362,585 | | | | 216,306 | | | | 16,141,603 | | | | 256,574 | |
George J. Gorman | | | 10,332,245 | | | | 246,646 | | | | 16,063,763 | | | | 334,414 | |
Valerie A. Mosley | | | 10,332,245 | | | | 246,646 | | | | 16,141,603 | | | | 256,574 | |
Harriett Tee Taggart | | | 10,332,245 | | | | 246,646 | | | | 16,055,418 | | | | 342,759 | |
| (1) | Excludes fractional shares. |
| | | | | | | | |
| | | Pennsylvania Fund | |
| | | Number of Shares(1) | |
| Nominee for Trustee | | For | | | Withheld | |
Scott E. Eston | | | 20,613,214 | | | | 216,068 | |
Cynthia E. Frost | | | 20,603,922 | | | | 225,360 | |
George J. Gorman | | | 20,608,898 | | | | 220,384 | |
Valerie A. Mosley | | | 20,584,223 | | | | 245,060 | |
Harriett Tee Taggart | | | 20,535,922 | | | | 293,361 | |
| (1) | Excludes fractional shares. |
Eaton Vance
Municipal Income Funds
July 31, 2014
Board of Trustees’ Contract Approval
Overview of the Contract Review Process
The Investment Company Act of 1940, as amended (the “1940 Act”), provides, in substance, that each investment advisory agreement between a fund and its investment adviser will continue in effect from year to year only if its continuation is approved at least annually by the fund’s board of trustees, including by a vote of a majority of the trustees who are not “interested persons” of the fund (“Independent Trustees”), cast in person at a meeting called for the purpose of considering such approval.
At a meeting of the Boards of Trustees (each a “Board”) of the Eaton Vance group of mutual funds (the “Eaton Vance Funds”) held on April 28, 2014, the Board, including a majority of the Independent Trustees, voted to approve continuation of existing advisory and sub-advisory agreements for the Eaton Vance Funds for an additional one-year period. In voting its approval, the Board relied upon the affirmative recommendation of the Contract Review Committee of the Board, which is a committee comprised exclusively of Independent Trustees. Prior to making its recommendation, the Contract Review Committee reviewed information furnished by each adviser to the Eaton Vance Funds (including information specifically requested by the Board) for a series of meetings of the Contract Review Committee held between February and April 2014, as well as information considered throughout the year at meetings of the Board and its committees. Such information included, among other things, the following:
Information about Fees, Performance and Expenses
| Ÿ | | An independent report comparing the advisory and related fees paid by each fund with fees paid by comparable funds; |
| Ÿ | | An independent report comparing each fund’s total expense ratio and its components to comparable funds; |
| Ÿ | | An independent report comparing the investment performance of each fund (including, where relevant, yield data, Sharpe ratios and information ratios) to the investment performance of comparable funds over various time periods; |
| Ÿ | | Data regarding investment performance in comparison to benchmark indices and customized peer groups identified by the adviser in consultation with the Board; |
| Ÿ | | For each fund, comparative information concerning the fees charged and the services provided by each adviser in managing other accounts (including mutual funds, other collective investment funds and institutional accounts) using investment strategies and techniques similar to those used in managing such fund; |
| Ÿ | | Profitability analyses for each adviser with respect to each fund; |
Information about Portfolio Management and Trading
| Ÿ | | Descriptions of the investment management services provided to each fund, including the investment strategies and processes employed, and any changes in portfolio management processes and personnel; |
| Ÿ | | Information about the allocation of brokerage and the benefits received by each adviser as a result of brokerage allocation, including information concerning the acquisition of research through client commission arrangements and the fund’s policies with respect to “soft dollar” arrangements; |
| Ÿ | | Data relating to portfolio turnover rates of each fund; |
| Ÿ | | The procedures and processes used to determine the fair value of fund assets and actions taken to monitor and test the effectiveness of such procedures and processes; |
| Ÿ | | Information about each adviser’s processes for monitoring best execution of portfolio transactions, and other policies and practices of each adviser with respect to trading; |
Information about each Adviser
| Ÿ | | Reports detailing the financial results and condition of each adviser; |
| Ÿ | | Descriptions of the qualifications, education and experience of the individual investment professionals whose responsibilities include portfolio management and investment research for the funds, and information relating to their compensation and responsibilities with respect to managing other mutual funds and investment accounts; |
| Ÿ | | Copies of the Codes of Ethics of each adviser and its affiliates, together with information relating to compliance with and the administration of such codes; |
| Ÿ | | Copies of or descriptions of each adviser’s policies and procedures relating to proxy voting, the handling of corporate actions and class actions; |
| Ÿ | | Information concerning the resources devoted to compliance efforts undertaken by each adviser and its affiliates on behalf of the funds (including descriptions of various compliance programs) and their record of compliance with investment policies and restrictions, including policies with respect to market-timing, late trading and selective portfolio disclosure, and with policies on personal securities transactions; |
| Ÿ | | Descriptions of the business continuity and disaster recovery plans of each adviser and its affiliates; |
| Ÿ | | A description of Eaton Vance Management’s procedures for overseeing third party advisers and sub-advisers, including with respect to regulatory and compliance issues, investment management and other matters; |
Eaton Vance
Municipal Income Funds
July 31, 2014
Board of Trustees’ Contract Approval — continued
Other Relevant Information
| Ÿ | | Information concerning the nature, cost and character of the administrative and other non-investment management services provided by Eaton Vance Management and its affiliates; |
| Ÿ | | Information concerning management of the relationship with the custodian, subcustodians and fund accountants by each adviser or the funds’ administrator; and |
| Ÿ | | The terms of each advisory agreement. |
Over the course of the twelve-month period ended April 30, 2014, with respect to one or more funds, the Board met nine times and the Contract Review Committee, the Audit Committee, the Governance Committee, the Portfolio Management Committee and the Compliance Reports and Regulatory Matters Committee, each of which is a Committee comprised solely of Independent Trustees, met seven, seventeen, eleven, six and ten times respectively. At such meetings, the Trustees participated in investment and performance reviews with the portfolio managers and other investment professionals of each adviser relating to each fund, and considered the investment and trading strategies used in pursuing each fund’s investment objective, including, where relevant, the use of derivative instruments, as well as processes for monitoring best execution of portfolio transactions and risk management techniques. The Board and its Committees also evaluated issues pertaining to industry and regulatory developments, compliance procedures, fund governance and other issues with respect to the funds, and received and participated in reports and presentations provided by Eaton Vance Management and other fund advisers with respect to such matters.
For funds that invest through one or more underlying portfolios, the Board considered similar information about the portfolio(s) when considering the approval of advisory agreements. In addition, in cases where the fund’s investment adviser has engaged a sub-adviser, the Board considered similar information about the sub-adviser when considering the approval of any sub-advisory agreement.
The Contract Review Committee was assisted throughout the contract review process by Goodwin Procter LLP, legal counsel for the Independent Trustees. The members of the Contract Review Committee relied upon the advice of such counsel and their own business judgment in determining the material factors to be considered in evaluating each advisory and sub-advisory agreement and the weight to be given to each such factor. The conclusions reached with respect to each advisory and sub-advisory agreement were based on a comprehensive evaluation of all the information provided and not any single factor. Moreover, each member of the Contract Review Committee may have placed varying emphasis on particular factors in reaching conclusions with respect to each advisory and sub-advisory agreement. In evaluating each advisory and sub-advisory agreement, including the specific fee structures and other terms of the agreements, the Contract Review Committee was informed by multiple years of analysis and discussion among the Independent Trustees and the Funds’ advisers and sub-advisers.
Results of the Process
Based on its consideration of the foregoing, and such other information as it deemed relevant, including the factors and conclusions described below, the Contract Review Committee concluded that the continuation of the investment advisory agreements of the following funds:
| Ÿ | | Eaton Vance Arizona Municipal Income Fund |
| Ÿ | | Eaton Vance Connecticut Municipal Income Fund |
| Ÿ | | Eaton Vance Minnesota Municipal Income Fund |
| Ÿ | | Eaton Vance New Jersey Municipal Income Fund |
| Ÿ | | Eaton Vance Pennsylvania Municipal Income Fund |
(the “Funds”), each with Boston Management and Research (the “Adviser”), an affiliate of Eaton Vance Management, including their fee structures, is in the interests of shareholders and, therefore, the Contract Review Committee recommended to the Board approval of each agreement. The Board accepted the recommendation of the Contract Review Committee as well as the factors considered and conclusions reached by the Contract Review Committee with respect to each agreement. Accordingly, the Board, including a majority of the Independent Trustees, voted to approve continuation of the investment advisory agreement for each Fund.
Nature, Extent and Quality of Services
In considering whether to approve the investment advisory agreements of the Funds, the Board evaluated the nature, extent and quality of services provided to the Funds by the Adviser.
The Board considered the Adviser’s management capabilities and investment process with respect to the types of investments held by each Fund, including the education, experience and number of its investment professionals and other personnel who provide portfolio management, investment research, and similar services to the Funds. In particular, the Board considered, where relevant, the abilities and experience of such investment personnel in analyzing factors such as credit risk, tax efficiency, and special considerations relevant to investing in municipal bonds. The Board considered the Adviser’s large municipal bond team, which includes portfolio managers and credit specialists who provide services to the Funds. The Board also took into account the resources dedicated to portfolio management and other services, including the compensation methods of the Adviser to recruit and retain investment personnel, and the time and attention devoted to each Fund by senior management.
Eaton Vance
Municipal Income Funds
July 31, 2014
Board of Trustees’ Contract Approval — continued
The Board reviewed the compliance programs of the Adviser and relevant affiliates thereof. Among other matters, the Board considered compliance and reporting matters relating to personal trading by investment personnel, selective disclosure of portfolio holdings, late trading, frequent trading, portfolio valuation, business continuity and the allocation of investment opportunities. The Board also evaluated the responses of the Adviser and its affiliates to requests in recent years from regulatory authorities such as the Securities and Exchange Commission and the Financial Industry Regulatory Authority.
The Board considered shareholder and other administrative services provided or managed by Eaton Vance Management and its affiliates, including transfer agency and accounting services. The Board evaluated the benefits to shareholders of investing in a fund that is a part of a large family of funds, including the ability, in many cases, to exchange an investment among different funds without incurring additional sales charges.
After consideration of the foregoing factors, among others, the Board concluded that the nature, extent and quality of services provided by the Adviser, taken as a whole, are appropriate and consistent with the terms of the investment advisory agreements.
Fund Performance
The Board compared each Fund’s investment performance to a relevant universe of similarly managed funds identified by an independent data provider and appropriate benchmark indices and, where relevant, a customized peer group of similarly managed funds, and assessed each Fund’s performance on the basis of total return and current income return. The Board’s review included comparative performance data for the one-, three-, five- and ten-year periods ended September 30, 2013 for each Fund. The Board considered, among other things, the Adviser’s efforts to generate competitive levels of tax exempt current income over time through investments that, relative to its peer universe, focus on higher quality municipal bonds with longer maturities. The Board noted that the Adviser had taken action to restructure each Fund’s portfolio as part of a long-term strategy for managing interest rate risk, consistent with each Fund’s objective of providing current income. The Board concluded that each Fund’s performance had been satisfactory on the basis of current income return. The Board also concluded it would continue to monitor the effectiveness of steps taken by the Adviser to improve fund performance on the basis of total return.
Management Fees and Expenses
The Board reviewed contractual fee rates for investment advisory and administrative services payable by each Fund (referred to as “management fees”). As part of its review, the Board considered the management fees and the Fund’s total expense ratio for the year ended September 30, 2013, as compared to a group of similarly managed funds selected by an independent data provider. The Board also considered factors that had an impact on Fund expense ratios, as identified by management in response to inquiries from the Contract Review Committee, as well as actions taken by management in recent years to reduce expenses at the fund complex level, including the negotiation of reduced fees for transfer agency and custody services.
After reviewing the foregoing information, and in light of the nature, extent and quality of the services provided by the Adviser, the Board concluded that the management fees charged for advisory and related services are reasonable.
Profitability
The Board reviewed the level of profits realized by the Adviser and relevant affiliates thereof in providing investment advisory and administrative services to each Fund and to all Eaton Vance Funds as a group. The Board considered the level of profits realized without regard to revenue sharing or other payments by the Adviser and its affiliates to third parties in respect of distribution services. The Board also considered other direct or indirect benefits received by the Adviser and its affiliates in connection with their relationships with the Funds, including the benefits of research services that may be available to the Adviser as a result of securities transactions effected for the Funds and other investment advisory clients.
The Board concluded that, in light of the foregoing factors and the nature, extent and quality of the services rendered, the profits realized by the Adviser and its affiliates are reasonable.
Economies of Scale
In reviewing management fees and profitability, the Board also considered the extent to which the Adviser and its affiliates, on the one hand, and each Fund, on the other hand, can expect to realize benefits from economies of scale as the assets of each Fund increase. The Board acknowledged the difficulty in accurately measuring the benefits resulting from the economies of scale with respect to the management of any specific fund or group of funds. The Board reviewed data summarizing the increases and decreases in the assets of each Fund and of all Eaton Vance Funds as a group over various time periods, and evaluated the extent to which the total expense ratio of each Fund and the profitability of the Adviser and its affiliates may have been affected by such increases or decreases. Based upon the foregoing, the Board concluded that each Fund currently shares in the benefits from economies of scale. The Board also concluded that, assuming reasonably foreseeable increases in the assets of each Fund, the structure of each advisory fee, which includes breakpoints at several asset levels, will allow each Fund to continue to benefit from economies of scale in the future.
Eaton Vance
Municipal Income Funds
July 31, 2014
Management and Organization
Fund Management. The Trustees of Eaton Vance Municipals Trust (the Trust) are responsible for the overall management and supervision of the Trust’s affairs. The Trustees and officers of the Trust are listed below. Except as indicated, each individual has held the office shown or other offices in the same company for the last five years. Trustees and officers of the Trust hold indefinite terms of office. The “Noninterested Trustees” consist of those Trustees who are not “interested persons” of the Trust, as that term is defined under the 1940 Act. The business address of each Trustee and officer is Two International Place, Boston, Massachusetts 02110. As used below, “EVC” refers to Eaton Vance Corp., “EV” refers to Eaton Vance, Inc., “EVM” refers to Eaton Vance Management, “BMR” refers to Boston Management and Research and “EVD” refers to Eaton Vance Distributors, Inc. EVC and EV are the corporate parent and trustee, respectively, of EVM and BMR. EVD is the Funds’ principal underwriter and a wholly-owned subsidiary of EVC. Each officer affiliated with Eaton Vance may hold a position with other Eaton Vance affiliates that is comparable to his or her position with EVM listed below. Each Trustee oversees 177 portfolios in the Eaton Vance Complex (including all master and feeder funds in a master feeder structure). Each officer serves as an officer of certain other Eaton Vance funds. Each Trustee and officer serves until his or her successor is elected.
| | | | | | |
| Name and Year of Birth | | Position(s) with the Trust | | Trustee Since(1) | | Principal Occupation(s) and Directorships During Past Five Years and Other Relevant Experience |
Interested Trustee |
| | | |
Thomas E. Faust Jr. 1958 | | Trustee | | 2007 | | Chairman, Chief Executive Officer and President of EVC, Director and President of EV, Chief Executive Officer and President of EVM and BMR, and Director of EVD. Trustee and/or officer of 177 registered investment companies. Mr. Faust is an interested person because of his positions with EVM, BMR, EVD, EVC and EV, which are affiliates of the Trust. Directorships in the Last Five Years.(2) Director of EVC and Hexavest Inc. |
| | | |
| | | | | | |
Noninterested Trustees |
| | | |
Scott E. Eston 1956 | | Trustee | | 2011 | | Private investor. Formerly held various positions at Grantham, Mayo, Van Otterloo and Co., L.L.C. (investment management firm) (1997-2009), including Chief Operating Officer (2002-2009), Chief Financial Officer (1997-2009) and Chairman of the Executive Committee (2002-2008); President and Principal Executive Officer, GMO Trust (open-end registered investment company) (2006-2009). Former Partner, Coopers and Lybrand L.L.P. (now PricewaterhouseCoopers) (public accounting firm) (1987-1997). Directorships in the Last Five Years.(2) None. |
| | | |
Cynthia E. Frost(3) 1961 | | Trustee | | 2014 | | Private investor. Formerly, Chief Investment Officer of Brown University (university endowment) (2000-2012); Portfolio Strategist for Duke Management Company (university endowment manager) (1995-2000); Managing Director, Cambridge Associates (1989-1995); Consultant, Bain and Company (1987-1989); Senior Equity Analyst, BA Investment Management Company (1983-1985). Directorships in the Last Five Years. None. |
| | | |
George J. Gorman(3) 1952 | | Trustee | | 2014 | | Principal at George J. Gorman LLC (consulting firm). Formerly, Senior Partner at Ernst & Young LLP (public accounting firm) (1974-2009). Directorships in the Last Five Years. Trustee of the Bank of America Money Market Funds Series Trust (2011-2014) and of the Ashmore Funds (since 2010). |
| | | |
Valerie A. Mosley(4) 1960 | | Trustee | | 2014 | | Chairwoman and Chief Executive Officer of Valmo Ventures (a consulting and investment firm). Former Partner and Senior Vice President, Portfolio Manager and Investment Strategist at Wellington Management Company, LLP (investment management firm) (1992-2012). Former Chief Investment Officer, PG Corbin Asset Management (1990-1992). Formerly worked in institutional corporate bond sales at Kidder Peabody (1986-1990). Directorships in the Last Five Years.(2) Director of Dynex Capital, Inc. (mortgage REIT) (since 2013). |
| | | |
William H. Park 1947 | | Trustee | | 2003 | | Consultant and private investor. Formerly, Chief Financial Officer, Aveon Group L.P. (investment management firm) (2010-2011). Formerly, Vice Chairman, Commercial Industrial Finance Corp. (specialty finance company) (2006-2010). Formerly, President and Chief Executive Officer, Prizm Capital Management, LLC (investment management firm) (2002-2005). Formerly, Executive Vice President and Chief Financial Officer, United Asset Management Corporation (investment management firm) (1982-2001). Formerly, Senior Manager, Price Waterhouse (now PricewaterhouseCoopers) (an independent registered public accounting firm) (1972-1981). Directorships in the Last Five Years.(2) None. |
Eaton Vance
Municipal Income Funds
July 31, 2014
Management and Organization — continued
| | | | | | |
| Name and Year of Birth | | Position(s) with the Trust | | Trustee Since(1) | | Principal Occupation(s) and Directorships During Past Five Years and Other Relevant Experience |
Noninterested Trustees (continued) |
| | | |
Ronald A. Pearlman 1940 | | Trustee | | 2003 | | Lawyer and consultant. Formerly, Professor of Law, Georgetown University Law Center (1999-2014). Formerly, Partner, Covington & Burling LLP (law firm) (1991-2000). Formerly, Chief of Staff, Joint Committee on Taxation, U.S. Congress (1988-1990). Formerly, Deputy Assistant Secretary (Tax Policy) and Assistant Secretary (Tax Policy), U.S. Department of the Treasury (1983-1985). Directorships in the Last Five Years.(2) None. |
| | | |
Helen Frame Peters 1948 | | Trustee | | 2008 | | Professor of Finance, Carroll School of Management, Boston College. Formerly, Dean, Carroll School of Management, Boston College (2000-2002). Formerly, Chief Investment Officer, Fixed Income, Scudder Kemper Investments (investment management firm) (1998-1999). Formerly, Chief Investment Officer, Equity and Fixed Income, Colonial Management Associates (investment management firm) (1991-1998). Directorships in the Last Five Years.(2) Formerly, Director of BJ’s Wholesale Club, Inc. (wholesale club retailer) (2004-2011). Formerly, Trustee of SPDR Index Shares Funds and SPDR Series Trust (exchange traded funds) (2000-2009). Formerly, Director of Federal Home Loan Bank of Boston (a bank for banks) (2007-2009). |
| | | |
Harriett Tee Taggart 1948 | | Trustee | | 2011 | | Managing Director, Taggart Associates (a professional practice firm). Formerly, Partner and Senior Vice President, Wellington Management Company, LLP (investment management firm) (1983-2006). Directorships in the Last Five Years.(2) Director of Albemarle Corporation (chemicals manufacturer) (since 2007) and The Hanover Group (specialty property and casualty insurance company) (since 2009). Formerly, Director of Lubrizol Corporation (specialty chemicals) (2007-2011). |
| | | |
Ralph F. Verni 1943 | | Chairman of the Board and Trustee | | 2007 (Chairman);
2005 (Trustee) | | Consultant and private investor. Formerly, Chief Investment Officer (1982-1992), Chief Financial Officer (1988-1990) and Director (1982-1992), New England Life. Formerly, Chairperson, New England Mutual Funds (1982-1992). Formerly, President and Chief Executive Officer, State Street Management & Research (1992-2000). Formerly, Chairperson, State Street Research Mutual Funds (1992-2000). Formerly, Director, W.P. Carey, LLC (1998-2004) and First Pioneer Farm Credit Corp. (2002-2006). Directorships in the Last Five Years.(2) None. |
| | | |
| | | | | | |
Principal Officers who are not Trustees |
| Name and Year of Birth | | Position(s) with the Trust | | Officer Since(5) | | Principal Occupation(s) During Past Five Years |
Payson F. Swaffield 1956 | | President | | 2003 | | Vice President and Chief Income Investment Officer of EVM and BMR. |
| | | |
Maureen A. Gemma 1960 | | Vice President, Secretary and Chief Legal Officer | | 2005 | | Vice President of EVM and BMR. |
| | | |
James F. Kirchner 1967 | | Treasurer | | 2007 | | Vice President of EVM and BMR. |
| | | |
Paul M. O’Neil 1953 | | Chief Compliance Officer | | 2004 | | Vice President of EVM and BMR. |
| (1) | Year first appointed to serve as Trustee for a fund in the Eaton Vance family of funds. Each Trustee has served continuously since appointment unless indicated otherwise. |
| (2) | During their respective tenures, the Trustees (except for Ms. Frost and Mr. Gorman) also served as Board members of one or more of the following funds (which operated in the years noted): eUnitsTM 2 Year U.S. Market Participation Trust: Upside to Cap / Buffered Downside (launched in 2012 and terminated in 2014); eUnitsTM 2 Year U.S. Market Participation Trust II: Upside to Cap / Buffered Downside (launched in 2012 and terminated in 2014); Eaton Vance Credit Opportunities Fund (launched in 2005 and terminated in 2010); Eaton Vance Insured Florida Plus Municipal Bond Fund (launched in 2002 and terminated in 2009); and Eaton Vance National Municipal Income Trust (launched in 1998 and terminated in 2009). However, Ms. Mosley did not serve as a Board member of eUnitsTM 2 Year U.S. Market Participation Trust: Upside to Cap / Buffered Downside (launched in 2012 and terminated in 2014). |
Eaton Vance
Municipal Income Funds
July 31, 2014
Management and Organization — continued
| (3) | Ms. Frost and Mr. Gorman began serving as Trustees effective May 29, 2014. |
| (4) | Ms. Mosley began serving as a Trustee effective January 1, 2014. |
| (5) | Year first elected to serve as officer of a fund in the Eaton Vance family of funds when the officer has served continuously. Otherwise, year of most recent election as an officer of a fund in the Eaton Vance family of funds. Titles may have changed since initial election. |
The SAI for the Funds includes additional information about the Trustees and officers of the Funds and can be obtained without charge on Eaton Vance’s website at www.eatonvance.com or by calling 1-800-262-1122.
Eaton Vance Funds
IMPORTANT NOTICES
Privacy. The Eaton Vance organization is committed to ensuring your financial privacy. Each of the financial institutions identified below has in effect the following policy (“Privacy Policy”) with respect to nonpublic personal information about its customers:
| Ÿ | | Only such information received from you, through application forms or otherwise, and information about your Eaton Vance fund transactions will be collected. This may include information such as name, address, social security number, tax status, account balances and transactions. |
| Ÿ | | None of such information about you (or former customers) will be disclosed to anyone, except as permitted by law (which includes disclosure to employees necessary to service your account). In the normal course of servicing a customer’s account, Eaton Vance may share information with unaffiliated third parties that perform various required services such as transfer agents, custodians and broker-dealers. |
| Ÿ | | Policies and procedures (including physical, electronic and procedural safeguards) are in place that are designed to protect the confidentiality of such information. |
| Ÿ | | We reserve the right to change our Privacy Policy at any time upon proper notification to you. Customers may want to review our Privacy Policy periodically for changes by accessing the link on our homepage: www.eatonvance.com. |
Our pledge of privacy applies to the following entities within the Eaton Vance organization: the Eaton Vance Family of Funds, Eaton Vance Management, Eaton Vance Investment Counsel, Eaton Vance Distributors, Inc., Eaton Vance Trust Company, Eaton Vance Management’s Real Estate Investment Group and Boston Management and Research. In addition, our Privacy Policy applies only to those Eaton Vance customers who are individuals and who have a direct relationship with us. If a customer’s account (i.e., fund shares) is held in the name of a third-party financial advisor/broker-dealer, it is likely that only such advisor’s privacy policies apply to the customer. This notice supersedes all previously issued privacy disclosures. For more information about Eaton Vance’s Privacy Policy, please call 1-800-262-1122.
Delivery of Shareholder Documents. The Securities and Exchange Commission (SEC) permits funds to deliver only one copy of shareholder documents, including prospectuses, proxy statements and shareholder reports, to fund investors with multiple accounts at the same residential or post office box address. This practice is often called “householding” and it helps eliminate duplicate mailings to shareholders. Eaton Vance, or your financial advisor, may household the mailing of your documents indefinitely unless you instruct Eaton Vance, or your financial advisor, otherwise. If you would prefer that your Eaton Vance documents not be householded, please contact Eaton Vance at 1-800-262-1122, or contact your financial advisor. Your instructions that householding not apply to delivery of your Eaton Vance documents will be effective within 30 days of receipt by Eaton Vance or your financial advisor.
Portfolio Holdings. Each Eaton Vance Fund and its underlying Portfolio(s) (if applicable) will file a schedule of portfolio holdings on Form N-Q with the SEC for the first and third quarters of each fiscal year. The Form N-Q will be available on the Eaton Vance website at www.eatonvance.com, by calling Eaton Vance at 1-800-262-1122 or in the EDGAR database on the SEC’s website at www.sec.gov. Form N-Q may also be reviewed and copied at the SEC’s public reference room in Washington, D.C. (call 1-800-732-0330 for information on the operation of the public reference room).
Proxy Voting. From time to time, funds are required to vote proxies related to the securities held by the funds. The Eaton Vance Funds or their underlying Portfolios (if applicable) vote proxies according to a set of policies and procedures approved by the Funds’ and Portfolios’ Boards. You may obtain a description of these policies and procedures and information on how the Funds or Portfolios voted proxies relating to portfolio securities during the most recent 12-month period ended June 30, without charge, upon request, by calling 1-800-262-1122 and by accessing the SEC’s website at www.sec.gov.
Investment Adviser
Boston Management and Research
Two International Place
Boston, MA 02110
Administrator
Eaton Vance Management
Two International Place
Boston, MA 02110
Principal Underwriter*
Eaton Vance Distributors, Inc.
Two International Place
Boston, MA 02110
(617) 482-8260
Custodian
State Street Bank and Trust Company
State Street Financial Center, One Lincoln Street
Boston, MA 02111
Transfer Agent
BNY Mellon Investment Servicing (US) Inc.
Attn: Eaton Vance Funds
P.O. Box 9653
Providence, RI 02940-9653
(800) 262-1122
Independent Registered Public Accounting Firm
Deloitte & Touche LLP
200 Berkeley Street
Boston, MA 02116-5022
Fund Offices
Two International Place
Boston, MA 02110
| * | FINRA BrokerCheck. Investors may check the background of their Investment Professional by contacting the Financial Industry Regulatory Authority (FINRA). FINRA BrokerCheck is a free tool to help investors check the professional background of current and former FINRA-registered securities firms and brokers. FINRA BrokerCheck is available by calling 1-800-289-9999 and at www.FINRA.org. The FINRA BrokerCheck brochure describing the program is available to investors at www.FINRA.org. |
313 7.31.14

| | |
Eaton Vance Municipal Opportunities Fund Annual Report July 31, 2014 | | |

Commodity Futures Trading Commission Registration. Effective December 31, 2012, the Commodity Futures Trading Commission (“CFTC”) adopted certain regulatory changes that subject registered investment companies and advisers to regulation by the CFTC if a fund invests more than a prescribed level of its assets in certain CFTC-regulated instruments (including futures, certain options and swap agreements) or markets itself as providing investment exposure to such instruments. The Fund has claimed an exclusion from the definition of the term “commodity pool operator” under the Commodity Exchange Act. Accordingly, neither the Fund nor the adviser with respect to the operation of the Fund is subject to CFTC regulation. Because of its management of other strategies, the Fund’s adviser is registered with the CFTC as a commodity pool operator and a commodity trading advisor.
Fund shares are not insured by the FDIC and are not deposits or other obligations of, or guaranteed by, any depository institution. Shares are subject to investment risks, including possible loss of principal invested.
This report must be preceded or accompanied by a current summary prospectus or prospectus. Before investing, investors should consider carefully the investment objective, risks, and charges and expenses of a mutual fund. This and other important information is contained in the summary prospectus and prospectus, which can be obtained from a financial advisor. Prospective investors should read the prospectus carefully before investing. For further information, please call 1-800-262-1122.
Annual Report July 31, 2014
Eaton Vance
Municipal Opportunities Fund
Table of Contents
| | | | |
Management’s Discussion of Fund Performance | | | 2 | |
| |
Performance | | | 3 | |
| |
Fund Profile | | | 4 | |
| |
Endnotes and Additional Disclosures | | | 5 | |
| |
Fund Expenses | | | 6 | |
| |
Financial Statements | | | 7 | |
| |
Report of Independent Registered Public Accounting Firm | | | 22 | |
| |
Federal Tax Information | | | 23 | |
| |
Special Meeting of Shareholders | | | 24 | |
| |
Board of Trustees’ Contract Approval | | | 25 | |
| |
Management and Organization | | | 28 | |
| |
Important Notices | | | 31 | |
Eaton Vance
Municipal Opportunities Fund
July 31, 2014
Management’s Discussion of Fund Performance1
Economic and Market Conditions
As the fiscal year began on August 1, 2013, the municipal market was in the midst of a dramatic selloff that had begun in May 2013, after then-U.S. Federal Reserve (the Fed) Chairman Ben Bernanke surprised the markets by indicating that the Fed’s $85 billion in monthly asset purchases could be tapered sooner than most investors had expected. Investors rushed to sell fixed-income assets in anticipation of rising interest rates, causing nearly every fixed-income asset class to decline in value.
Even after the Fed tried to temper its comments and calm the markets, moderating the outflows in other fixed-income asset classes, heavy selling in municipals continued through August 2013, causing a significant increase in municipal bond yields. Additional pressure on the municipal market came from the City of Detroit’s bankruptcy filing on July 18, 2013 and Puerto Rico’s increasing fiscal challenges.
Selling of municipals abated somewhat in September 2013, after the Fed surprised the markets again by postponing its tapering of asset purchases, but the municipal markets continued to experience net outflows through December 2013.
As the new year began, however, municipals turned a corner. From January 1 through July 31, 2014, municipals rallied back from 2013 lows. Contrary to what many investors had expected, Treasury rates declined and municipal rates followed. A principal driver was a global “flight to quality,” as investors sought the relative safety of Treasurys in the face of increased geopolitical risk overseas. And while the anticipation of the Fed’s tapering of asset purchases spooked the markets in 2013, the actual tapering in 2014 had little further effect on bond prices.
Fund Performance
For the fiscal year ended July 31, 2014, Eaton Vance Municipal Opportunities Fund (the Fund) Class A shares at net asset value (NAV) had a total return of 11.69%, outperforming the 7.27% return of the Fund’s benchmark, the Barclays Municipal Bond Index (the Index)2.
In seeking to achieve its primary objective of maximizing after-tax total return, the Fund employs a flexible investment strategy that allows it to seek opportunities virtually anywhere on the yield curve and anywhere on the credit curve, across different sectors and different state issuers. Management has the ability to be opportunistic in pursuing the Fund’s total return objective, trading holdings whenever opportunities arise, with the ability to invest up to 20% of net assets in debt obligations other than tax-exempt municipal bonds, including (but not limited to) taxable municipal obligations, U.S. treasury securities and obligations of the U.S. Government, its agencies and instrumentalities (“agency securities”). Up to 50% of net assets may be invested in below-investment-grade securities. The Fund may also hedge interest-rate risk and hold leveraged investments.
For the 12-month period, the primary contributor to the Fund’s outperformance versus the Index was opportunistic trading of securities across the yield curve and across various rating categories and sectors. An overweight and security selection in the health care and industrial development revenue sectors also contributed to Fund performance relative to the Index, as did an overweight and security selection in bonds rated BBB6 and below. In contrast, detractors from Fund performance versus the Index included an underweight in bonds with maturities of 20 years and longer and a small loss from a short term Treasury hedge. Management has the ability to hedge the portfolio to various degrees against the potential risk of interest rate volatility by using Treasury futures. As a risk management strategy, hedging is intended to moderate performance on both the upside and the downside. During the short period that the Fund employed a hedge, municipal and Treasury bond prices rose, causing the hedge to mitigate a portion of the Fund’s positive performance.
See Endnotes and Additional Disclosures in this report.
Past performance is no guarantee of future results. Returns are historical and are calculated by determining the percentage change in net asset value (NAV) or offering price (as applicable) with all distributions reinvested. Investment return and principal value will fluctuate so that shares, when redeemed, may be worth more or less than their original cost. Performance less than one year is cumulative. Performance is for the stated time period only; due to market volatility, the Fund’s current performance may be lower or higher than quoted. Returns are before taxes unless otherwise noted. For performance as of the most recent month end, please refer to eatonvance.com.
Eaton Vance
Municipal Opportunities Fund
July 31, 2014
Performance2,3
Portfolio Manager Adam A. Weigold, CFA
| | | | | | | | | | | | | | | | | | | | |
| % Average Annual Total Returns | | Class
Inception Date | | | Performance
Inception Date | | | One Year | | | Five Years | | | Since
Inception | |
Class A at NAV | | | 05/31/2011 | | | | 05/31/2011 | | | | 11.69 | % | | | — | | | | 6.79 | % |
Class A with 4.75% Maximum Sales Charge | | | — | | | | — | | | | 6.39 | | | | — | | | | 5.16 | |
Class I at NAV | | | 05/31/2011 | | | | 05/31/2011 | | | | 11.96 | | | | — | | | | 7.09 | |
Barclays Municipal Bond Index | | | — | | | | — | | | | 7.27 | % | | | 5.49 | % | | | 5.23 | % |
| | | | | |
| | | | | | | | | | | | | | | | | | | | |
| % Total Annual Operating Expense Ratios4 | | | | | | | | | Class A | | | Class I | |
Gross | | | | | | | | | | | | | | | 1.34 | % | | | 1.09 | % |
Net | | | | | | | | | | | | | | | 1.00 | | | | 0.75 | |
| | | | | |
| | | | | | | | | | | | | | | | | | | | |
| % Distribution Rates/Yields5 | | | | | | | | | Class A | | | Class I | |
Distribution Rate | | | | | | | | | | | | | | | 1.79 | % | | | 2.04 | % |
Taxable-Equivalent Distribution Rate | | | | | | | | | | | | | | | 3.16 | | | | 3.60 | |
SEC 30-day Yield | | | | | | | | | | | | | | | 1.66 | | | | 2.02 | |
Taxable-Equivalent SEC 30-day Yield | | | | | | | | | | | | | | | 2.93 | | | | 3.56 | |
Growth of $10,000
This graph shows the change in value of a hypothetical investment of $10,000 in Class A of the Fund for the period indicated. For comparison, the same investment is shown in the indicated index.
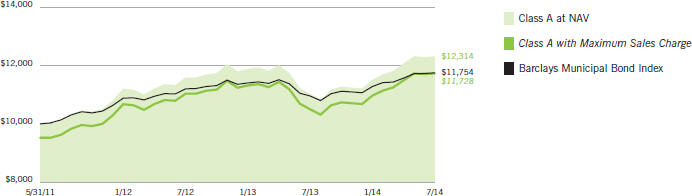
| | | | | | | | | | | | | | | | |
| Growth of Investment | | Amount Invested | | | Period Beginning | | | At NAV | | | With Maximum Sales Charge | |
Class I | | $ | 250,000 | | | | 05/31/2011 | | | $ | 310,618 | | | | N.A. | |
See Endnotes and Additional Disclosures in this report.
Past performance is no guarantee of future results. Returns are historical and are calculated by determining the percentage change in net asset value (NAV) or offering price (as applicable) with all distributions reinvested. Investment return and principal value will fluctuate so that shares, when redeemed, may be worth more or less than their original cost. Performance less than one year is cumulative. Performance is for the stated time period only; due to market volatility, the Fund’s current performance may be lower or higher than quoted. Returns are before taxes unless otherwise noted. For performance as of the most recent month end, please refer to eatonvance.com.
Eaton Vance
Municipal Opportunities Fund
July 31, 2014
Fund Profile
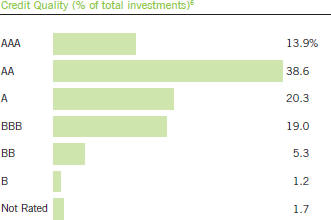
See Endnotes and Additional Disclosures in this report.
Eaton Vance
Municipal Opportunities Fund
July 31, 2014
Endnotes and Additional Disclosures
| 1 | The views expressed in this report are those of the portfolio manager(s) and are current only through the date stated at the top of this page. These views are subject to change at any time based upon market or other conditions, and Eaton Vance and the Fund(s) disclaim any responsibility to update such views. These views may not be relied upon as investment advice and, because investment decisions are based on many factors, may not be relied upon as an indication of trading intent on behalf of any Eaton Vance fund. This commentary may contain statements that are not historical facts, referred to as “forward looking statements”. The Fund’s actual future results may differ significantly from those stated in any forward looking statement, depending on factors such as changes in securities or financial markets or general economic conditions, the volume of sales and purchases of Fund shares, the continuation of investment advisory, administrative and service contracts, and other risks discussed from time to time in the Fund’s filings with the Securities and Exchange Commission. |
| 2 | Barclays Municipal Bond Index is an unmanaged index of municipal bonds traded in the U.S. Unless otherwise stated, index returns do not reflect the effect of any applicable sales charges, commissions, expenses, taxes or leverage, as applicable. It is not possible to invest directly in an index. |
| 3 | Total Returns at NAV do not include applicable sales charges. If sales charges were deducted, the returns would be lower. Total Returns shown with maximum sales charge reflect the stated maximum sales charge. Unless otherwise stated, performance does not reflect the deduction of taxes on Fund distributions or redemptions of Fund shares. Performance since inception for an index, if presented, is the performance since the Fund’s or oldest share class’ inception, as applicable. |
| 4 | Source: Fund prospectus. Net expense ratio reflects a contractual expense reimbursement that continues through 11/30/15. Without the reimbursement, if applicable, performance would have been lower. |
| 5 | The Distribution Rate is based on the Fund’s last regular distribution per share in the period (annualized) divided by the Fund’s NAV at the end of the period. The Fund’s distributions may be comprised of amounts characterized for federal income tax purposes as tax-exempt income, qualified and non-qualified ordinary dividends, capital gains and nondividend distributions, also known as return of capital. The Fund will determine the federal income tax character of distributions paid to a shareholder after the end of the calendar year. This is reported on the IRS form 1099- DIV and provided to the shareholder shortly after each year-end. The Fund’s distributions are determined by the investment adviser based on its current assessment of the Fund’s long-term return potential. As portfolio and market conditions change, the rate of distributions paid by the Fund could change. Taxable-equivalent performance is based on the highest combined federal and state income tax rates, where applicable. Lower tax rates would result in lower tax-equivalent performance. Actual tax rates will vary depending on your income, exemptions and deductions. Rates do not include local taxes. SEC Yield is a standardized measure based on the estimated yield to maturity of a fund’s investments over a 30-day period and is based on the maximum offer price at the date specified. The SEC Yield is not based on the distributions made by the Fund, which may differ. Yield reflects the effect of fee waivers and expense reimbursements. |
| 6 | Ratings are based on Moody’s, S&P or Fitch, as applicable. If securities are rated differently by the rating agencies, the higher rating is applied. Ratings, which are subject to change, apply to the creditworthiness of the issuers of the underlying securities and not to the Fund or its shares. Credit ratings measure the quality of a bond based on the issuer’s creditworthiness, with ratings ranging from AAA, being the highest, to D, being the lowest based on S&P’s measures. Ratings of BBB or higher by S&P or Fitch (Baa or higher by Moody’s) are considered to be investment grade quality. Credit ratings are based largely on the rating agency’s analysis at the time of rating. The rating assigned to any particular security is not necessarily a reflection of the issuer’s current financial condition and does not necessarily reflect its assessment of the volatility of a security’s market value or of the liquidity of an investment in the security. Holdings designated as “Not Rated” are not rated by the national rating agencies stated above. |
| | Fund profile subject to change due to active management. |
Eaton Vance
Municipal Opportunities Fund
July 31, 2014
Fund Expenses
Example: As a Fund shareholder, you incur two types of costs: (1) transaction costs, including sales charges (loads) on purchases and redemption fees (if applicable); and (2) ongoing costs, including management fees; distribution and/or service fees; and other Fund expenses. This Example is intended to help you understand your ongoing costs (in dollars) of Fund investing and to compare these costs with the ongoing costs of investing in other mutual funds. The Example is based on an investment of $1,000 invested at the beginning of the period and held for the entire period (February 1, 2014 – July 31, 2014).
Actual Expenses: The first section of the table below provides information about actual account values and actual expenses. You may use the information in this section, together with the amount you invested, to estimate the expenses that you paid over the period. Simply divide your account value by $1,000 (for example, an $8,600 account value divided by $1,000 = 8.6), then multiply the result by the number in the first section under the heading entitled “Expenses Paid During Period” to estimate the expenses you paid on your account during this period.
Hypothetical Example for Comparison Purposes: The second section of the table below provides information about hypothetical account values and hypothetical expenses based on the actual Fund expense ratio and an assumed rate of return of 5% per year (before expenses), which is not the actual Fund return. The hypothetical account values and expenses may not be used to estimate the actual ending account balance or expenses you paid for the period. You may use this information to compare the ongoing costs of investing in your Fund and other funds. To do so, compare this 5% hypothetical example with the 5% hypothetical examples that appear in the shareholder reports of the other funds.
Please note that the expenses shown in the table are meant to highlight your ongoing costs only and do not reflect any transactional costs, such as sales charges (loads) or redemption fees (if applicable). Therefore, the second section of the table is useful in comparing ongoing costs only, and will not help you determine the relative total costs of owning different funds. In addition, if these transactional costs were included, your costs would be higher.
| | | | | | | | | | | | | | | | | | |
| | | Beginning
Account Value
(2/1/14) | | | Ending
Account Value
(7/31/14) | | | Expenses Paid
During Period*
(2/1/14 – 7/31/14) | | | Annualized
Expense
Ratio | | | |
| | | | | |
| | | | | | | | | | | | | | | | | | |
Actual | | | | | | | | | | | | | | | |
Class A | | $ | 1,000.00 | | | $ | 1,068.70 | | | $ | 5.59 | ** | | | 1.09 | % | | |
Class I | | $ | 1,000.00 | | | $ | 1,070.00 | | | $ | 4.26 | ** | | | 0.83 | % | | |
| | | | | | | | | | | | | | | | | | | |
| | | | | |
| | | | | | | | | | | | | | | | | | |
Hypothetical | | | | | | | | | | | | | | | |
(5% return per year before expenses) | | | | | | | | | | | | | | | |
Class A | | $ | 1,000.00 | | | $ | 1,019.40 | | | $ | 5.46 | ** | | | 1.09 | % | | |
Class I | | $ | 1,000.00 | | | $ | 1,020.70 | | | $ | 4.16 | ** | | | 0.83 | % | | |
Effective July 10, 2014, the contractual expense caps of the Fund changed. If these changes had been in place during the entire reporting period, the actual and hypothetical ending account values, expenses paid and annualized expense ratios would have been as follows:
| | | | | | | | | | | | | | | | | | |
| | | Beginning
Account Value
(2/1/14) | | | Ending
Account Value
(7/31/14) | | | Expenses Paid
During Period*
(2/1/14 – 7/31/14) | | | Annualized
Expense
Ratio | | | |
| | | | | |
| | | | | | | | | | | | | | | | | | |
Actual | | | | | | | | | | | | | | | |
Class A | | $ | 1,000.00 | | | $ | 1,068.70 | | | $ | 5.13 | ** | | | 1.00 | % | | |
Class I | | $ | 1,000.00 | | | $ | 1,070.00 | | | $ | 3.85 | ** | | | 0.75 | % | | |
| | | | | | | | | | | | | | | | | | | |
| | | | | |
| | | | | | | | | | | | | | | | | | |
Hypothetical | | | | | | | | | | | | | | | |
(5% return per year before expenses) | | | | | | | | | | | | | | | |
Class A | | $ | 1,000.00 | | | $ | 1,019.80 | | | $ | 5.01 | ** | | | 1.00 | % | | |
Class I | | $ | 1,000.00 | | | $ | 1,021.10 | | | $ | 3.76 | ** | | | 0.75 | % | | |
| * | Expenses are equal to the Fund’s annualized expense ratio for the indicated Class, multiplied by the average account value over the period, multiplied by 181/365 (to reflect the one-half year period). The Example assumes that the $1,000 was invested at the net asset value per share determined at the close of business on January 31, 2014. |
| ** | Absent an allocation of certain expenses to an affiliate, expenses would be higher. |
Eaton Vance
Municipal Opportunities Fund
July 31, 2014
Portfolio of Investments
| | | | | | | | |
| Tax-Exempt Municipal Securities — 90.1% | |
| | |
| | | | | | | | |
| Security | | Principal
Amount
(000’s omitted) | | | Value | |
| | | | | | | | |
|
Bond Bank — 0.3% | |
Arkansas Development Finance Authority, (Revolving Loan Fund), 5.00%, 6/1/24 | | $ | 170 | | | $ | 200,840 | |
| | | | | | | | | |
| | | | | | $ | 200,840 | |
| | | | | | | | | |
|
Education — 6.1% | |
Delaware County Authority, PA, (Villanova University), 5.00%, 8/1/21(1) | | $ | 550 | | | $ | 656,101 | |
Delaware County Authority, PA, (Villanova University), 5.00%, 8/1/22(1) | | | 600 | | | | 720,276 | |
Forest Grove, OR, (Pacific University), 4.50%, 5/1/29 | | | 300 | | | | 318,624 | |
Houston Higher Education Finance Corp., TX, (KIPP, Inc.), (PSF Guaranteed), 5.00%, 2/15/25 | | | 400 | | | | 480,080 | |
Houston Higher Education Finance Corp., TX, (KIPP, Inc.), (PSF Guaranteed), 5.00%, 2/15/27 | | | 415 | | | | 489,775 | |
Saratoga County Capital Resource Corp., NY, (Skidmore College), 5.00%, 7/1/22 | | | 150 | | | | 179,043 | |
University of Nebraska, 5.00%, 5/15/26 | | | 625 | | | | 748,612 | |
| | | | | | | | | |
| | | | | | $ | 3,592,511 | |
| | | | | | | | | |
|
Electric Utilities — 9.5% | |
Beaver County, PA, Industrial Development Authority, (FirstEnergy Nuclear Generation), 3.50% to 6/1/20 (Put Date), 12/1/35 | | $ | 3,075 | | | $ | 3,120,356 | |
Escambia County, FL, (Gulf Power Co.), 2.10% to 4/11/19 (Put Date), 7/1/22 | | | 250 | | | | 251,855 | |
Monroe County, GA, Development Authority, (Georgia Power Co.), 2.00% to 6/13/19 (Put Date), 7/1/25 | | | 2,000 | | | | 2,007,380 | |
Vernon, CA, Electric System Revenue, 5.125%, 8/1/21 | | | 250 | | | | 278,573 | |
| | | | | | | | | |
| | | | | | $ | 5,658,164 | |
| | | | | | | | | |
|
General Obligations — 11.5% | |
Beaverton School District 48J, Washington and Multnomah Counties, OR, 5.00%, 6/15/22(1) | | $ | 1,000 | | | $ | 1,211,640 | |
California, 5.00%, 12/1/26(2) | | | 570 | | | | 675,262 | |
Chicago Park District, IL, 5.00%, 1/1/24 | | | 500 | | | | 589,355 | |
Laredo, TX, Independent School District, (PSF Guaranteed), 0.00%, 8/1/22(1) | | | 1,425 | | | | 1,171,920 | |
New York, NY, 5.00%, 8/1/25 | | | 1,000 | | | | 1,184,070 | |
New York, NY, 5.00%, 8/1/29 | | | 450 | | | | 516,893 | |
Northside Independent School District, TX, (PSF Guaranteed), 2.00% to 8/1/19 (Put Date), 8/1/44 | | | 785 | | | | 799,954 | |
Pittsburg, CA, Unified School District, 5.00%, 8/1/22 | | | 570 | | | | 686,576 | |
| | | | | | | | | |
| | | | | | $ | 6,835,670 | |
| | | | | | | | | |
| | | | | | | | |
| Security | | Principal
Amount
(000’s omitted) | | | Value | |
| | | | | | | | |
|
Hospital — 19.4% | |
California Health Facilities Financing Authority, (Lucile Packard Children’s Hospital), 5.00%, 8/15/27 | | $ | 350 | | | $ | 409,790 | |
Decatur, TX, Hospital Authority, (Wise Regional Health System), 4.00%, 9/1/20 | | | 225 | | | | 239,742 | |
Decatur, TX, Hospital Authority, (Wise Regional Health System), 5.00%, 9/1/21 | | | 330 | | | | 364,511 | |
Decatur, TX, Hospital Authority, (Wise Regional Health System), 5.00%, 9/1/22 | | | 150 | | | | 163,076 | |
Decatur, TX, Hospital Authority, (Wise Regional Health System), 5.00%, 9/1/23 | | | 200 | | | | 215,574 | |
Fredericksburg, VA, Economic Development Authority, (Mary Washington Healthcare), 5.00%, 6/15/24(2) | | | 1,000 | | | | 1,127,170 | |
Massachusetts Development Finance Agency, (Milford Regional Medical Center), 5.00%, 7/15/27 | | | 125 | | | | 130,876 | |
Massachusetts Health and Educational Facilities Authority, (Lowell General Hospital), 4.75%, 7/1/25 | | | 285 | | | | 297,224 | |
Michigan Finance Authority, (Oakwood Obligated Group), 5.00%, 11/1/27 | | | 1,400 | | | | 1,558,830 | |
Missouri Health and Educational Facilities Authority, (SSM Health Care), 5.00%, 6/1/26(2) | | | 1,000 | | | | 1,158,040 | |
Nassau County Local Economic Assistance Corp., NY, (Catholic Health Services of Long Island), 5.00%, 7/1/29 | | | 1,000 | | | | 1,105,310 | |
New Jersey Health Care Facilities Financing Authority, (Virtua Health), 5.00%, 7/1/27 | | | 500 | | | | 571,785 | |
Norfolk, VA, Economic Development Authority, (Bon Secours Health System, Inc.), 5.00%, 11/1/28 | | | 225 | | | | 249,842 | |
Oklahoma Development Finance Authority, (St. John Health System), 5.00%, 2/15/26 | | | 750 | | | | 847,965 | |
Onondaga Civic Development Corp., NY, (St. Joseph’s Hospital Health Center), 5.00%, 7/1/25(2) | | | 1,000 | | | | 1,045,560 | |
Oregon Facilities Authority, (PeaceHealth), 5.00%, 11/15/29 | | | 500 | | | | 563,010 | |
Washington Health Care Facilities Authority, (PeaceHealth), 5.00%, 11/15/26(2) | | | 1,000 | | | | 1,149,870 | |
Yavapai County, AZ, Industrial Development Authority, (Yavapai Regional Medical Center), 5.25%, 8/1/33 | | | 250 | | | | 272,438 | |
| | | | | | | | | |
| | | | | | $ | 11,470,613 | |
| | | | | | | | | |
|
Housing — 2.6% | |
East Hempfield Township, PA, Industrial Development Authority, (Student Services, Inc.), 5.00%, 7/1/29 | | $ | 500 | | | $ | 533,000 | |
New Hope Cultural Education Facilities Finance Corp., TX, (CHF-Collegiate Housing Galveston I, LLC), 5.00%, 4/1/23 | | | 910 | | | | 998,689 | |
| | | | | | | | | |
| | | | | | $ | 1,531,689 | |
| | | | | | | | | |
|
Industrial Development Revenue — 3.5% | |
California Pollution Control Financing Authority, (Waste Management, Inc.), (AMT), 5.125%, 11/1/23 | | $ | 250 | | | $ | 262,330 | |
| | | | |
| | 7 | | See Notes to Financial Statements. |
Eaton Vance
Municipal Opportunities Fund
July 31, 2014
Portfolio of Investments — continued
| | | | | | | | |
| Security | | Principal
Amount
(000’s omitted) | | | Value | |
| | | | | | | | |
|
Industrial Development Revenue (continued) | |
New Jersey Economic Development Authority, (Continental Airlines), (AMT), Series 2000 A, 5.625%, 11/15/30 | | $ | 130 | | | $ | 138,208 | |
New Jersey Economic Development Authority, (Continental Airlines), (AMT), Series 2000 B, 5.625%, 11/15/30 | | | 215 | | | | 229,311 | |
Niagara Area Development Corp., NY, (Covanta Energy), 4.00%, 11/1/24 | | | 370 | | | | 373,241 | |
Richland County, SC, (International Paper Co.), (AMT), 3.875%, 4/1/23(2) | | | 1,000 | | | | 1,056,600 | |
| | | | | | | | | |
| | | | | | $ | 2,059,690 | |
| | | | | | | | | |
|
Insured – Electric Utilities — 1.0% | |
Puerto Rico Electric Power Authority, (NPFG), 5.25%, 7/1/26 | | $ | 115 | | | $ | 108,849 | |
Puerto Rico Electric Power Authority, (NPFG), 5.25%, 7/1/29 | | | 500 | | | | 457,360 | |
| | | | | | | | | |
| | | | | | $ | 566,209 | |
| | | | | | | | | |
|
Insured – General Obligations — 8.0% | |
Allegheny Valley School District, PA, (BAM), 5.00%, 11/1/22(1) | | $ | 350 | | | $ | 410,617 | |
Allegheny Valley School District, PA, (BAM), 5.00%, 11/1/25(1) | | | 450 | | | | 524,992 | |
Detroit, MI, (AGC), 5.00%, 4/1/20 | | | 250 | | | | 246,125 | |
McHenry County, IL, Community Unit School District No. 12, (AGM), 5.00%, 1/1/25(1) | | | 890 | | | | 980,896 | |
McHenry County, IL, Community Unit School District No. 12, (AGM), 5.00%, 1/1/26(1) | | | 925 | | | | 1,010,239 | |
Monroe County Industrial Development Corp., NY, (Monroe Community College Association, Inc.), (AGM), 5.00%, 1/15/25 | | | 750 | | | | 837,427 | |
Puerto Rico, (AGM), 5.00%, 7/1/35 | | | 365 | | | | 339,895 | |
Rockland County, NY, (AGM), 5.00%, 3/1/24 | | | 350 | | | | 414,274 | |
| | | | | | | | | |
| | | | | | $ | 4,764,465 | |
| | | | | | | | | |
|
Insured – Housing — 1.5% | |
New Hope Cultural Education Facilities Finance Corp., TX, (CHF-Collegiate Housing College Station I, LLC), (AGM), 4.00%, 4/1/22 | | $ | 445 | | | $ | 475,269 | |
New Hope Cultural Education Facilities Finance Corp., TX, (CHF-Collegiate Housing College Station I, LLC), (AGM), 4.00%, 4/1/24 | | | 400 | | | | 420,208 | |
| | | | | | | | | |
| | | | | | $ | 895,477 | |
| | | | | | | | | |
|
Insured – Other Revenue — 0.3% | |
New Jersey Economic Development Authority, (The Goethals Bridge Replacement), (AGM), (AMT), 5.00%, 1/1/31 | | $ | 185 | | | $ | 201,132 | |
| | | | | | | | | |
| | | | | | $ | 201,132 | |
| | | | | | | | | |
| | | | | | | | |
| Security | | Principal
Amount
(000’s omitted) | | | Value | |
| | | | | | | | |
|
Insured – Special Tax Revenue — 4.5% | |
Illinois Sports Facilities Authority, (AMBAC), 0.00%, 6/15/22(2) | | $ | 500 | | | $ | 382,000 | |
Puerto Rico Convention Center District Authority, (AMBAC), 5.00%, 7/1/31 | | | 415 | | | | 349,405 | |
Successor Agency to Dinuba Redevelopment Agency, CA, (BAM), 5.00%, 9/1/28(2) | | | 1,000 | | | | 1,117,030 | |
Successor Agency to San Pablo Redevelopment Agency, CA, (AGM), 5.00%, 6/15/25 | | | 700 | | | | 825,006 | |
| | | | | | | | | |
| | | | | | $ | 2,673,441 | |
| | | | | | | | | |
|
Insured – Transportation — 1.0% | |
Puerto Rico Highway and Transportation Authority, (AGC), 5.25%, 7/1/36 | | $ | 245 | | | $ | 220,103 | |
Puerto Rico Highway and Transportation Authority, (AGM), 5.25%, 7/1/36 | | | 210 | | | | 191,138 | |
Puerto Rico Highway and Transportation Authority, (NPFG), 5.25%, 7/1/33 | | | 200 | | | | 185,162 | |
| | | | | | | | | |
| | | | | | $ | 596,403 | |
| | | | | | | | | |
|
Insured – Water and Sewer — 0.5% | |
Detroit, MI, Sewage Disposal System, (AGM), 5.00%, 7/1/39 | | $ | 175 | | | $ | 172,903 | |
Puerto Rico Aqueduct and Sewer Authority, (AGC), 5.00%, 7/1/28 | | | 100 | | | | 94,433 | |
| | | | | | | | | |
| | | | | | $ | 267,336 | |
| | | | | | | | | |
|
Lease Revenue / Certificates of Participation — 2.0% | |
Michigan Strategic Fund, (Facility for Rare Isotope Beams), 5.00%, 3/1/27(2) | | $ | 1,000 | | | $ | 1,155,290 | |
| | | | | | | | | |
| | | | | | $ | 1,155,290 | |
| | | | | | | | | |
|
Other Revenue — 2.3% | |
Center City, MN, (Hazelden Betty Ford Foundation), 5.00%, 11/1/25 | | $ | 255 | | | $ | 297,251 | |
District of Columbia, (Association of American Medical Colleges), 5.00%, 10/1/30 | | | 570 | | | | 626,903 | |
New Mexico Municipal Energy Acquisition Authority, 0.854%, Variable to 8/1/19 (Put Date), 11/1/39(1)(3) | | | 300 | | | | 300,855 | |
Texas Municipal Gas Acquisition and Supply Corp. III, Gas Supply Revenue, 5.00%, 12/15/30 | | | 100 | | | | 107,124 | |
| | | | | | | | | |
| | | | | | $ | 1,332,133 | |
| | | | | | | | | |
|
Senior Living / Life Care — 2.7% | |
Lee County, FL, Industrial Development Authority, (Shell Point), 5.50%, 11/15/21 | | $ | 150 | | | $ | 168,324 | |
New Jersey Economic Development Authority, (Lions Gate), 4.375%, 1/1/24 | | | 650 | | | | 645,645 | |
| | | | |
| | 8 | | See Notes to Financial Statements. |
Eaton Vance
Municipal Opportunities Fund
July 31, 2014
Portfolio of Investments — continued
| | | | | | | | |
| Security | | Principal
Amount
(000’s omitted) | | | Value | |
| | | | | | | | |
|
Senior Living / Life Care (continued) | |
Palm Beach County, FL, Health Facilities Authority, (Sinai Residences of Boca Raton), 6.00%, 6/1/21 | | $ | 70 | | | $ | 74,421 | |
Palm Beach County, FL, Health Facilities Authority, (Sinai Residences of Boca Raton), 6.25%, 6/1/23 | | | 250 | | | | 266,195 | |
Westchester County Local Development Corp., NY, (Kendal on Hudson), 4.00%, 1/1/23 | | | 450 | | | | 467,437 | |
| | | | | | | | | |
| | | | | | $ | 1,622,022 | |
| | | | | | | | | |
|
Special Tax Revenue — 4.4% | |
Jurupa Public Financing Authority, CA, 5.00%, 9/1/22(1) | | $ | 465 | | | $ | 542,125 | |
Jurupa Public Financing Authority, CA, 5.00%, 9/1/25(1) | | | 735 | | | | 845,830 | |
Oregon Department of Transportation, Highway User Tax Revenue, 5.00%, 11/15/23 | | | 500 | | | | 614,140 | |
VIA Metropolitan Transit Advanced Transportation District, TX, Sales Tax Revenue, 5.00%, 8/1/23 | | | 500 | | | | 609,680 | |
| | | | | | | | | |
| | | | | | $ | 2,611,775 | |
| | | | | | | | | |
|
Student Loan — 1.2% | |
Massachusetts Educational Financing Authority, (AMT), 5.00%, 1/1/23 | | $ | 500 | | | $ | 559,475 | |
New Jersey Higher Education Student Assistance Authority, (AMT), 5.00%, 12/1/27 | | | 170 | | | | 170,267 | |
| | | | | | | | | |
| | | | | | $ | 729,742 | |
| | | | | | | | | |
|
Transportation — 7.1% | |
Chicago, IL, (Midway International Airport), (AMT), 5.00%, 1/1/27 | | $ | 1,000 | | | $ | 1,107,150 | |
Dallas and Fort Worth, TX, (Dallas/Fort Worth International Airport), 5.00%, 11/1/24 | | | 500 | | | | 588,690 | |
Greater Orlando Aviation Authority, FL, (AMT), 5.00%, 10/1/21 | | | 250 | | | | 296,308 | |
Illinois Toll Highway Authority, 5.00%, 1/1/27 | | | 1,250 | | | | 1,457,637 | |
Metropolitan Washington, D.C., Airports Authority, (AMT), 5.00%, 10/1/23 | | | 450 | | | | 534,136 | |
Port Authority of New York and New Jersey, (AMT), 5.00%, 12/1/28 | | | 200 | | | | 228,942 | |
| | | | | | | | | |
| | | | | | $ | 4,212,863 | |
| | | | | | | | | |
|
Water and Sewer — 0.7% | |
Detroit, MI, Sewage Disposal System, 5.00%, 7/1/32 | | $ | 125 | | | $ | 121,747 | |
Detroit, MI, Water Supply System, 5.25%, 7/1/41 | | | 295 | | | | 289,770 | |
| | | | | | | | | |
| | | | | | $ | 411,517 | |
| | |
| |
Total Tax-Exempt Municipal Securities — 90.1%
(identified cost $52,398,376) | | | $ | 53,388,982 | |
| | |
| | | | | | | | |
| Taxable Municipal Securities — 6.0% | |
| | |
| | | | | | | | |
| Security | | Principal
Amount
(000’s omitted) | | | Value | |
| | | | | | | | |
|
General Obligations — 1.9% | |
Texas, (Texas Transportation Commission), 4.631%, 4/1/33(4) | | $ | 1,000 | | | $ | 1,112,670 | |
| | | | | | | | | |
| | | | | | $ | 1,112,670 | |
| | | | | | | | | |
|
Special Tax Revenue — 2.0% | |
New York Dormitory Authority, Personal Income Tax Revenue, 5.427%, 3/15/39(4) | | $ | 1,000 | | | $ | 1,178,730 | |
| | | | | | | | | |
| | | | | | $ | 1,178,730 | |
| | | | | | | | | |
|
Water and Sewer — 2.1% | |
East Bay, CA, Municipal Utility District, Water System Revenue, 5.874%, 6/1/40(4) | | $ | 1,000 | | | $ | 1,267,680 | |
| | | | | | | | | |
| | | | | | $ | 1,267,680 | |
| | |
| |
Total Taxable Municipal Securities — 6.0%
(identified cost $3,530,979) | | | $ | 3,559,080 | |
| | |
| |
Total Investments — 96.1%
(identified cost $55,929,355) | | | $ | 56,948,062 | |
| | |
| |
Other Assets, Less Liabilities — 3.9% | | | $ | 2,315,936 | |
| | |
| |
Net Assets — 100.0% | | | $ | 59,263,998 | |
| | |
The percentage shown for each investment category in the Portfolio of Investments is based on net assets.
| | | | |
| AGC | | – | | Assured Guaranty Corp. |
| AGM | | – | | Assured Guaranty Municipal Corp. |
| AMBAC | | – | | AMBAC Financial Group, Inc. |
| AMT | | – | | Interest earned from these securities may be considered a tax preference item for purposes of the Federal Alternative Minimum Tax. |
| BAM | | – | | Build America Mutual Assurance Co. |
| NPFG | | – | | National Public Finance Guaranty Corp. |
| PSF | | – | | Permanent School Fund |
At July 31, 2014, the concentration of the Fund’s investments in the various states, determined as a percentage of net assets, is as follows:
| | | | |
| Texas | | | 13.9% | |
| New York | | | 12.7% | |
| California | | | 11.6% | |
| Pennsylvania | | | 10.1% | |
| Others, representing less than 10% individually | | | 47.8% | |
The Fund invests primarily in debt securities issued by municipalities. The ability of the issuers of the debt securities to meet their obligations may be affected by economic developments in a specific industry or
| | | | |
| | 9 | | See Notes to Financial Statements. |
Eaton Vance
Municipal Opportunities Fund
July 31, 2014
Portfolio of Investments — continued
municipality. In order to reduce the risk associated with such economic developments, at July 31, 2014, 17.5% of total investments are backed by bond insurance of various financial institutions and financial guaranty assurance agencies. The aggregate percentage insured by an individual financial institution or financial guaranty assurance agency ranged from 1.0% to 10.3% of total investments.
| (1) | When-issued security. |
| (2) | Security (or a portion thereof) has been segregated to cover payable for when-issued securities. |
| (3) | Variable rate security. The stated interest rate represents the rate in effect at July 31, 2014. |
| (4) | Build America Bond. Represents taxable municipal obligation issued pursuant to the America Recovery and Reinvestment Act of 2009 or other legislation providing for the issuance of taxable municipal debt on which the issuer receives federal support. |
| | | | |
| | 10 | | See Notes to Financial Statements. |
Eaton Vance
Municipal Opportunities Fund
July 31, 2014
Statement of Assets and Liabilities
| | | | |
| Assets | | July 31, 2014 | |
Investments, at value (identified cost, $55,929,355) | | $ | 56,948,062 | |
Cash | | | 9,264,040 | |
Restricted cash* | | | 55,000 | |
Interest receivable | | | 379,539 | |
Receivable for Fund shares sold | | | 1,454,050 | |
Receivable from affiliate | | | 7,096 | |
Receivable for variation margin on open financial futures contracts | | | 1,406 | |
Total assets | | $ | 68,109,193 | |
|
| Liabilities | |
Payable for investments purchased | | $ | 351,366 | |
Payable for when-issued securities | | | 8,339,695 | |
Payable for Fund shares redeemed | | | 30,344 | |
Distributions payable | | | 49,098 | |
Payable to affiliates: | | | | |
Investment adviser and administration fee | | | 28,093 | |
Distribution and service fees | | | 3,592 | |
Accrued expenses | | | 43,007 | |
Total liabilities | | $ | 8,845,195 | |
Net Assets | | $ | 59,263,998 | |
|
| Sources of Net Assets | |
Paid-in capital | | $ | 58,185,879 | |
Accumulated net realized gain | | | 41,681 | |
Accumulated distributions in excess of net investment income | | | (495 | ) |
Net unrealized appreciation | | | 1,036,933 | |
Net Assets | | $ | 59,263,998 | |
|
| Class A Shares | |
Net Assets | | $ | 16,714,906 | |
Shares Outstanding | | | 1,495,648 | |
Net Asset Value and Redemption Price Per Share | | | | |
(net assets ÷ shares of beneficial interest outstanding) | | $ | 11.18 | |
Maximum Offering Price Per Share | | | | |
(100 ÷ 95.25 of net asset value per share) | | $ | 11.74 | |
|
| Class I Shares | |
Net Assets | | $ | 42,549,092 | |
Shares Outstanding | | | 3,802,786 | |
Net Asset Value, Offering Price and Redemption Price Per Share | | | | |
(net assets ÷ shares of beneficial interest outstanding) | | $ | 11.19 | |
On sales of $50,000 or more, the offering price of Class A shares is reduced.
| * | Represents restricted cash on deposit at the broker for open financial futures contracts. |
| | | | |
| | 11 | | See Notes to Financial Statements. |
Eaton Vance
Municipal Opportunities Fund
July 31, 2014
Statement of Operations
| | | | |
| Investment Income | | Year Ended
July 31, 2014 | |
Interest | | $ | 1,114,512 | |
Total investment income | | $ | 1,114,512 | |
|
| Expenses | |
Investment adviser and administration fee | | $ | 201,599 | |
Distribution and service fees | | | | |
Class A | | | 37,024 | |
Trustees’ fees and expenses | | | 2,305 | |
Custodian fee | | | 27,661 | |
Transfer and dividend disbursing agent fees | | | 8,490 | |
Legal and accounting services | | | 33,277 | |
Printing and postage | | | 13,862 | |
Registration fees | | | 41,980 | |
Miscellaneous | | | 20,374 | |
Total expenses | | $ | 386,572 | |
Deduct — | | | | |
Allocation of expenses to affiliate | | $ | 65,973 | |
Reduction of custodian fee | | | 1,144 | |
Total expense reductions | | $ | 67,117 | |
| |
Net expenses | | $ | 319,455 | |
| |
Net investment income | | $ | 795,057 | |
|
| Realized and Unrealized Gain (Loss) | |
Net realized gain (loss) — | | | | |
Investment transactions | | $ | 753,090 | |
Financial futures contracts | | | (72,522 | ) |
Net realized gain | | $ | 680,568 | |
Change in unrealized appreciation (depreciation) — | | | | |
Investments | | $ | 2,112,458 | |
Financial futures contracts | | | 18,226 | |
Net change in unrealized appreciation (depreciation) | | $ | 2,130,684 | |
| |
Net realized and unrealized gain | | $ | 2,811,252 | |
| |
Net increase in net assets from operations | | $ | 3,606,309 | |
| | | | |
| | 12 | | See Notes to Financial Statements. |
Eaton Vance
Municipal Opportunities Fund
July 31, 2014
Statements of Changes in Net Assets
| | | | | | | | |
| | | Year Ended July 31, | |
| Increase (Decrease) in Net Assets | | 2014 | | | 2013 | |
From operations — | | | | | | | | |
Net investment income | | $ | 795,057 | | | $ | 622,869 | |
Net realized gain (loss) on investment transactions and financial futures contracts | | | 680,568 | | | | (571,796 | ) |
Net change in unrealized appreciation (depreciation) from investments and financial futures contracts | | | 2,130,684 | | | | (2,283,049 | ) |
Net increase (decrease) in net assets from operations | | $ | 3,606,309 | | | $ | (2,231,976 | ) |
Distributions to shareholders — | | | | | | | | |
From net investment income | | | | | | | | |
Class A | | $ | (335,511 | ) | | $ | (263,244 | ) |
Class I | | | (463,386 | ) | | | (352,439 | ) |
From net realized gain | | | | | | | | |
Class A | | | — | | | | (211,992 | ) |
Class I | | | — | | | | (343,486 | ) |
Total distributions to shareholders | | $ | (798,897 | ) | | $ | (1,171,161 | ) |
Transactions in shares of beneficial interest — | | | | | | | | |
Proceeds from sale of shares | | | | | | | | |
Class A | | $ | 10,286,244 | | | $ | 15,630,611 | |
Class I | | | 30,334,633 | | | | 8,845,796 | |
Net asset value of shares issued to shareholders in payment of distributions declared | | | | | | | | |
Class A | | | 334,676 | | | | 474,738 | |
Class I | | | 159,625 | | | | 169,987 | |
Cost of shares redeemed | | | | | | | | |
Class A | | | (10,782,546 | ) | | | (5,679,638 | ) |
Class I | | | (5,840,669 | ) | | | (3,505,849 | ) |
Net increase in net assets from Fund share transactions | | $ | 24,491,963 | | | $ | 15,935,645 | |
| | |
Net increase in net assets | | $ | 27,299,375 | | | $ | 12,532,508 | |
|
| Net Assets | |
At beginning of year | | $ | 31,964,623 | | | $ | 19,432,115 | |
At end of year | | $ | 59,263,998 | | | $ | 31,964,623 | |
|
Accumulated distributions in excess of net investment income included in net assets | |
At end of year | | $ | (495 | ) | | $ | (321 | ) |
| | | | |
| | 13 | | See Notes to Financial Statements. |
Eaton Vance
Municipal Opportunities Fund
July 31, 2014
Financial Highlights
| | | | | | | | | | | | | | | | |
| | | Class A | |
| | | Year Ended July 31, | | | Period Ended July 31, 2011(1) | |
| | | 2014 | | | 2013 | | | 2012 | | |
Net asset value — Beginning of period | | $ | 10.240 | | | $ | 11.240 | | | $ | 10.090 | | | $ | 10.000 | |
| | | | |
| Income (Loss) From Operations | | | | | | | | | | | | | | | | |
Net investment income | | $ | 0.242 | | | $ | 0.225 | | | $ | 0.257 | | | $ | 0.015 | |
Net realized and unrealized gain (loss) | | | 0.940 | | | | (0.739 | ) | | | 1.205 | | | | 0.090 | |
| | | | |
Total income (loss) from operations | | $ | 1.182 | | | $ | (0.514 | ) | | $ | 1.462 | | | $ | 0.105 | |
| | | | |
| Less Distributions | | | | | | | | | | | | | | | | |
From net investment income | | $ | (0.242 | ) | | $ | (0.225 | ) | | $ | (0.257 | ) | | $ | (0.015 | ) |
From net realized gain | | | — | | | | (0.261 | ) | | | (0.055 | ) | | | — | |
| | | | |
Total distributions | | $ | (0.242 | ) | | $ | (0.486 | ) | | $ | (0.312 | ) | | $ | (0.015 | ) |
| | | | |
Net asset value — End of period | | $ | 11.180 | | | $ | 10.240 | | | $ | 11.240 | | | $ | 10.090 | |
| | | | |
Total Return(2) | | | 11.69 | % | | | (4.87 | )% | | | 14.69 | % | | | 1.05 | %(3) |
|
| Ratios/Supplemental Data | |
Net assets, end of period (000’s omitted) | | $ | 16,715 | | | $ | 15,596 | | | $ | 6,886 | | | $ | 217 | |
Ratios (as a percentage of average daily net assets): | | | | | | | | | | | | | | | | |
Expenses(4)(5) | | | 1.09 | % | | | 1.10 | % | | | 1.10 | % | | | 1.10 | %(6) |
Net investment income | | | 2.25 | % | | | 2.02 | % | | | 2.36 | % | | | 0.96 | %(6) |
Portfolio Turnover | | | 283 | % | | | 85 | % | | | 85 | % | | | 21 | %(3) |
| (1) | For the period from the start of business, May 31, 2011, to July 31, 2011. |
| (2) | Returns are historical and are calculated by determining the percentage change in net asset value with all distributions reinvested and do not reflect the effect of sales charges. |
| (4) | The investment adviser and administrator reimbursed operating expenses (equal to 0.20%, 0.24%, 0.54% and 4.13% of average daily net assets for the years ended July 31, 2014, 2013 and 2012 and the period ended July 31, 2011, respectively). Absent this reimbursement, total return would have been lower. |
| (5) | Excludes the effect of custody fee credits, if any, of less than 0.005%. |
| | | | |
| | 14 | | See Notes to Financial Statements. |
Eaton Vance
Municipal Opportunities Fund
July 31, 2014
Financial Highlights — continued
| | | | | | | | | | | | | | | | |
| | | Class I | |
| | | Year Ended July 31, | | | Period Ended
July 31, 2011(1) | |
| | | 2014 | | | 2013 | | | 2012 | | |
Net asset value — Beginning of period | | $ | 10.250 | | | $ | 11.250 | | | $ | 10.090 | | | $ | 10.000 | |
| | | | |
| Income (Loss) From Operations | | | | | | | | | | | | | | | | |
Net investment income | | $ | 0.269 | | | $ | 0.253 | | | $ | 0.286 | | | $ | 0.018 | |
Net realized and unrealized gain (loss) | | | 0.939 | | | | (0.738 | ) | | | 1.215 | | | | 0.090 | |
| | | | |
Total income (loss) from operations | | $ | 1.208 | | | $ | (0.485 | ) | | $ | 1.501 | | | $ | 0.108 | |
| | | | |
| Less Distributions | | | | | | | | | | | | | | | | |
From net investment income | | $ | (0.268 | ) | | $ | (0.254 | ) | | $ | (0.286 | ) | | $ | (0.018 | ) |
From net realized gain | | | — | | | | (0.261 | ) | | | (0.055 | ) | | | — | |
| | | | |
Total distributions | | $ | (0.268 | ) | | $ | (0.515 | ) | | $ | (0.341 | ) | | $ | (0.018 | ) |
| | | | |
Net asset value — End of period | | $ | 11.190 | | | $ | 10.250 | | | $ | 11.250 | | | $ | 10.090 | |
| | | | |
Total Return(2) | | | 11.96 | % | | | (4.62 | )% | | | 15.10 | % | | | 1.08 | %(3) |
|
| Ratios/Supplemental Data | |
Net assets, end of period (000’s omitted) | | $ | 42,549 | | | $ | 16,369 | | | $ | 12,546 | | | $ | 10,336 | |
Ratios (as a percentage of average daily net assets): | | | | | | | | | | | | | | | | |
Expenses(4)(5) | | | 0.84 | % | | | 0.85 | % | | | 0.85 | % | | | 0.85 | %(6) |
Net investment income | | | 2.44 | % | | | 2.30 | % | | | 2.68 | % | | | 1.07 | %(6) |
Portfolio Turnover | | | 283 | % | | | 85 | % | | | 85 | % | | | 21 | %(3) |
| (1) | For the period from the start of business, May 31, 2011, to July 31, 2011. |
| (2) | Returns are historical and are calculated by determining the percentage change in net asset value with all distributions reinvested. |
| (4) | The investment adviser and administrator reimbursed operating expenses (equal to 0.20%, 0.24%, 0.54% and 4.13% of average daily net assets for the years ended July 31, 2014, 2013 and 2012 and the period ended July 31, 2011, respectively). Absent this reimbursement, total return would have been lower. |
| (5) | Excludes the effect of custody fee credits, if any, of less than 0.005%. |
| | | | |
| | 15 | | See Notes to Financial Statements. |
Eaton Vance
Municipal Opportunities Fund
July 31, 2014
Notes to Financial Statements
1 Significant Accounting Policies
Eaton Vance Municipal Opportunities Fund (the Fund) is a diversified series of Eaton Vance Municipals Trust (the Trust). The Trust is a Massachusetts business trust registered under the Investment Company Act of 1940, as amended (the 1940 Act), as an open-end management investment company. The Fund seeks to maximize after-tax total return. As of July 31, 2014, the Fund offered two classes of shares. Effective August 18, 2014, the Fund began offering Class C shares. Class A shares are generally sold subject to a sales charge imposed at time of purchase. Class I shares are sold at net asset value and are not subject to a sales charge. Each class represents a pro-rata interest in the Fund, but votes separately on class-specific matters and (as noted below) is subject to different expenses. Realized and unrealized gains and losses are allocated daily to each class of shares based on the relative net assets of each class to the total net assets of the Fund. Net investment income, other than class-specific expenses, is allocated daily to each class of shares based upon the ratio of the value of each class’s paid shares to the total value of all paid shares. Each class of shares differs in its distribution plan and certain other class-specific expenses.
The following is a summary of significant accounting policies of the Fund. The policies are in conformity with accounting principles generally accepted in the United States of America.
A Investment Valuation — The following methodologies are used to determine the market value or fair value of investments.
Debt Obligations. Debt obligations (including short-term obligations with a remaining maturity of more than sixty days) are generally valued on the basis of valuations provided by third party pricing services, as derived from such services’ pricing models. Inputs to the models may include, but are not limited to, reported trades, executable bid and asked prices, broker/dealer quotations, prices or yields of securities with similar characteristics, benchmark curves or information pertaining to the issuer, as well as industry and economic events. The pricing services may use a matrix approach, which considers information regarding securities with similar characteristics to determine the valuation for a security. Short-term obligations purchased with a remaining maturity of sixty days or less are generally valued at amortized cost, which approximates market value.
Derivatives. Financial futures contracts are valued at the closing settlement price established by the board of trade or exchange on which they are traded.
Fair Valuation. Investments for which valuations or market quotations are not readily available or are deemed unreliable are valued at fair value using methods determined in good faith by or at the direction of the Trustees of the Fund in a manner that fairly reflects the security’s value, or the amount that the Fund might reasonably expect to receive for the security upon its current sale in the ordinary course. Each such determination is based on a consideration of relevant factors, which are likely to vary from one pricing context to another. These factors may include, but are not limited to, the type of security, the existence of any contractual restrictions on the security’s disposition, the price and extent of public trading in similar securities of the issuer or of comparable entities, quotations or relevant information obtained from broker/dealers or other market participants, information obtained from the issuer, analysts, and/or the appropriate stock exchange (for exchange-traded securities), an analysis of the entity’s financial condition, and an evaluation of the forces that influence the issuer and the market(s) in which the security is purchased and sold.
B Investment Transactions and Related Income — Investment transactions for financial statement purposes are accounted for on a trade date basis. Realized gains and losses on investments sold are determined on the basis of identified cost. Interest income is recorded on the basis of interest accrued, adjusted for amortization of premium or accretion of discount.
C Federal Taxes — The Fund’s policy is to comply with the provisions of the Internal Revenue Code applicable to regulated investment companies and to distribute to shareholders each year substantially all of its taxable, if any, and tax-exempt net investment income, and all or substantially all of its net realized capital gains. Accordingly, no provision for federal income or excise tax is necessary. The Fund intends to satisfy conditions which will enable it to designate distributions from the interest income generated by its investments in non-taxable municipal securities, which are exempt from regular federal income tax when received by the Fund, as exempt-interest dividends. The portion of such interest, if any, earned on private activity bonds issued after August 7, 1986, may be considered a tax preference item to shareholders.
As of July 31, 2014, the Fund had no uncertain tax positions that would require financial statement recognition, de-recognition, or disclosure. The Fund files a U.S. federal income tax return annually after its fiscal year-end, which is subject to examination by the Internal Revenue Service for a period of three years from the date of filing.
D Expenses — The majority of expenses of the Trust are directly identifiable to an individual fund. Expenses which are not readily identifiable to a specific fund are allocated taking into consideration, among other things, the nature and type of expense and the relative size of the funds.
E Expense Reduction — State Street Bank and Trust Company (SSBT) serves as custodian of the Fund. Pursuant to the custodian agreement, SSBT receives a fee reduced by credits, which are determined based on the average daily cash balance the Fund maintains with SSBT. All credit balances, if any, used to reduce the Fund’s custodian fees are reported as a reduction of expenses in the Statement of Operations.
F Legal Fees — Legal fees and other related expenses incurred as part of negotiations of the terms and requirement of capital infusions, or that are expected to result in the restructuring of, or a plan of reorganization for, an investment are recorded as realized losses. Ongoing expenditures to protect or enhance an investment are treated as operating expenses.
G Use of Estimates — The preparation of the financial statements in conformity with accounting principles generally accepted in the United States of America requires management to make estimates and assumptions that affect the reported amounts of assets and liabilities at the date of the financial statements and the reported amounts of income and expense during the reporting period. Actual results could differ from those estimates.
Eaton Vance
Municipal Opportunities Fund
July 31, 2014
Notes to Financial Statements — continued
H Indemnifications — Under the Trust’s organizational documents, its officers and Trustees may be indemnified against certain liabilities and expenses arising out of the performance of their duties to the Fund. Under Massachusetts law, if certain conditions prevail, shareholders of a Massachusetts business trust (such as the Trust) could be deemed to have personal liability for the obligations of the Trust. However, the Trust’s Declaration of Trust contains an express disclaimer of liability on the part of Fund shareholders and the By-laws provide that the Trust shall assume the defense on behalf of any Fund shareholders. Moreover, the By-laws also provide for indemnification out of Fund property of any shareholder held personally liable solely by reason of being or having been a shareholder for all loss or expense arising from such liability. Additionally, in the normal course of business, the Fund enters into agreements with service providers that may contain indemnification clauses. The Fund’s maximum exposure under these arrangements is unknown as this would involve future claims that may be made against the Fund that have not yet occurred.
I Financial Futures Contracts — Upon entering into a financial futures contract, the Fund is required to deposit with the broker, either in cash or securities, an amount equal to a certain percentage of the contract amount (initial margin). Subsequent payments, known as variation margin, are made or received by the Fund each business day, depending on the daily fluctuations in the value of the underlying security, and are recorded as unrealized gains or losses by the Fund. Gains (losses) are realized upon the expiration or closing of the financial futures contracts. Should market conditions change unexpectedly, the Fund may not achieve the anticipated benefits of the financial futures contracts and may realize a loss. Futures contracts have minimal counterparty risk as they are exchange traded and the clearinghouse for the exchange is substituted as the counterparty, guaranteeing counterparty performance.
J When-Issued Securities and Delayed Delivery Transactions — The Fund may purchase or sell securities on a delayed delivery or when-issued basis. Payment and delivery may take place after the customary settlement period for that security. At the time the transaction is negotiated, the price of the security that will be delivered is fixed. The Fund maintains security positions for these commitments such that sufficient liquid assets will be available to make payments upon settlement. Securities purchased on a delayed delivery or when-issued basis are marked-to-market daily and begin earning interest on settlement date. Losses may arise due to changes in the market value of the underlying securities or if the counterparty does not perform under the contract.
2 Distributions to Shareholders
The net investment income of the Fund is determined daily and substantially all of the net investment income so determined is declared as a dividend to shareholders of record at the time of declaration. Distributions are declared separately for each class of shares. Distributions are paid monthly. Distributions of realized capital gains are made at least annually. Shareholders may reinvest income and capital gain distributions in additional shares of the same class of the Fund at the net asset value as of the reinvestment date or, at the election of the shareholder, receive distributions in cash. The Fund distinguishes between distributions on a tax basis and a financial reporting basis. Accounting principles generally accepted in the United States of America require that only distributions in excess of tax basis earnings and profits be reported in the financial statements as a return of capital. Permanent differences between book and tax accounting relating to distributions are reclassified to paid-in capital. For tax purposes, distributions from short-term capital gains are considered to be from ordinary income.
The tax character of distributions declared for the years ended July 31, 2014 and July 31, 2013 was as follows:
| | | | | | | | |
| | | Year Ended July 31, | |
| | | 2014 | | | 2013 | |
| | |
Distributions declared from: | | | | | | | | |
Tax-exempt income | | $ | 761,666 | | | $ | 594,674 | |
Ordinary income | | $ | 37,231 | | | $ | 554,737 | |
Long-term capital gains | | $ | — | | | $ | 21,750 | |
During the year ended July 31, 2014, accumulated undistributed net realized gain was decreased by $14,216, accumulated distributions in excess of net investment income was decreased by $3,666 and paid-in capital was increased by $10,550 due to differences between book and tax accounting, primarily for accretion of market discount and the Fund’s use of equalization accounting. Tax equalization accounting allows the Fund to treat as a distribution that portion of redemption proceeds representing a redeeming shareholder’s portion of undistributed taxable income and net capital gains. These reclassifications had no effect on the net assets or net asset value per share of the Fund.
Eaton Vance
Municipal Opportunities Fund
July 31, 2014
Notes to Financial Statements — continued
As of July 31, 2014, the components of distributable earnings (accumulated losses) and unrealized appreciation (depreciation) on a tax basis were as follows:
| | | | |
Undistributed ordinary income | | $ | 13,353 | |
Undistributed tax-exempt income | | $ | 48,603 | |
Undistributed long-term capital gains | | $ | 40,380 | |
Net unrealized appreciation | | $ | 1,024,881 | |
Other temporary differences | | $ | (49,098 | ) |
The differences between components of distributable earnings (accumulated losses) on a tax basis and the amounts reflected in the Statement of Assets and Liabilities are primarily due to accretion of market discount, the timing of recognizing distributions to shareholders, the tax treatment of short-term capital gains and futures contracts.
3 Investment Adviser and Administration Fee and Other Transactions with Affiliates
The investment adviser and administration fee is earned by Eaton Vance Management (EVM) as compensation for investment advisory and administrative services rendered to the Fund. The fee is computed at an annual rate of 0.60% of the Fund’s average daily net assets up to $500 million and is payable monthly. On net assets of $500 million and over, the annual fee is reduced. For the year ended July 31, 2014, the investment adviser and administration fee amounted to $201,599 or 0.60% of the Fund’s average daily net assets. EVM has agreed to reimburse the Fund’s expenses to the extent that total annual operating expenses (relating to ordinary operating expenses only) exceed 1.00% and 0.75% (1.10% and 0.85% prior to July 10, 2014) of the Fund’s average daily net assets for Class A and Class I, respectively. This agreement may be changed or terminated after November 30, 2015. Pursuant to this agreement, EVM was allocated $65,973 of the Fund’s operating expenses for the year ended July 31, 2014. EVM provides sub-transfer agency and related services to the Fund pursuant to a Sub-Transfer Agency Support Services Agreement. For the year ended July 31, 2014, EVM earned $328 from the Fund pursuant to such agreement, which is included in transfer and dividend disbursing agent fees on the Statement of Operations. The Fund was informed that Eaton Vance Distributors, Inc. (EVD), an affiliate of EVM and the Fund’s principal underwriter, received $6,825 as its portion of the sales charge on sales of Class A shares for the year ended July 31, 2014. EVD also received distribution and service fees from Class A shares (see Note 4) and contingent deferred sales charges (see Note 5).
Trustees and officers of the Fund who are members of EVM’s organization receive remuneration for their services to the Fund out of the investment adviser and administration fee. Trustees of the Fund who are not affiliated with EVM may elect to defer receipt of all or a percentage of their annual fees in accordance with the terms of the Trustees Deferred Compensation Plan. For the year ended July 31, 2014, no significant amounts have been deferred. Certain officers and Trustees of the Fund are officers of EVM.
4 Distribution Plan
The Fund has in effect a distribution plan for Class A shares (Class A Plan) pursuant to Rule 12b-1 under the 1940 Act. Pursuant to the Class A Plan, the Fund pays EVD a distribution and service fee of 0.25% per annum of its average daily net assets attributable to Class A shares for distribution services and facilities provided to the Fund by EVD, as well as for personal services and/or the maintenance of shareholder accounts. Distribution and service fees paid or accrued to EVD for the year ended July 31, 2014 amounted to $37,024 for Class A shares.
Distribution and service fees are subject to the limitations contained in the Financial Industry Regulatory Authority’s NASD Conduct Rule 2830(d).
5 Contingent Deferred Sales Charges
Class A shares may be subject to a 1% contingent deferred sales charge (CDSC) if redeemed within 18 months of purchase (depending on the circumstances of purchase). Generally, the CDSC is based upon the lower of the net asset value at date of redemption or date of purchase. No charge is levied on shares acquired by reinvestment of dividends or capital gain distributions. For the year ended July 31, 2014, the Fund was informed that EVD received approximately $3,000 of CDSCs paid by Class A shareholders.
6 Purchases and Sales of Investments
Purchases and sales of investments, other than short-term obligations, aggregated $113,336,911 and $91,086,744, respectively, for the year ended July 31, 2014.
Eaton Vance
Municipal Opportunities Fund
July 31, 2014
Notes to Financial Statements — continued
7 Shares of Beneficial Interest
The Fund’s Declaration of Trust permits the Trustees to issue an unlimited number of full and fractional shares of beneficial interest (without par value). Such shares may be issued in a number of different series (such as the Fund) and classes. Transactions in Fund shares were as follows:
| | | | | | | | |
| | | Year Ended July 31, | |
| Class A | | 2014 | | | 2013 | |
| | |
Sales | | | 958,954 | | | | 1,402,209 | |
Issued to shareholders electing to receive payments of distributions in Fund shares | | | 31,456 | | | | 42,922 | |
Redemptions | | | (1,018,035 | ) | | | (534,685 | ) |
| | |
Net increase (decrease) | | | (27,625 | ) | | | 910,446 | |
| | |
| | | | | | | | |
| | | Year Ended July 31, | |
| Class I | | 2014 | | | 2013 | |
| | |
Sales | | | 2,748,838 | | | | 797,928 | |
Issued to shareholders electing to receive payments of distributions in Fund shares | | | 14,981 | | | | 15,400 | |
Redemptions | | | (558,191 | ) | | | (331,527 | ) |
| | |
Net increase | | | 2,205,628 | | | | 481,801 | |
At July 31, 2014, an affiliate of EVM owned 47.7% of the value of the outstanding shares of the Fund.
8 Federal Income Tax Basis of Investments
The cost and unrealized appreciation (depreciation) of investments of the Fund at July 31, 2014, as determined on a federal income tax basis, were as follows:
| | | | |
| |
Aggregate cost | | $ | 55,923,181 | |
| |
Gross unrealized appreciation | | $ | 1,060,695 | |
Gross unrealized depreciation | | | (35,814 | ) |
| |
Net unrealized appreciation | | $ | 1,024,881 | |
9 Line of Credit
The Fund participates with other portfolios and funds managed by EVM and its affiliates in a $750 million unsecured line of credit agreement with a group of banks. Borrowings are made by the Fund solely to facilitate the handling of unusual and/or unanticipated short-term cash requirements. Interest is charged to the Fund based on its borrowings at an amount above either the Eurodollar rate or Federal Funds rate. In addition, a fee computed at an annual rate of 0.08% on the daily unused portion of the line of credit is allocated among the participating portfolios and funds at the end of each quarter. Because the line of credit is not available exclusively to the Fund, it may be unable to borrow some or all of its requested amounts at any particular time. The Fund did not have any significant borrowings or allocated fees during the year ended July 31, 2014.
10 Financial Instruments
The Fund may trade in financial instruments with off-balance sheet risk in the normal course of its investing activities. These financial instruments may include financial futures contracts and may involve, to a varying degree, elements of risk in excess of the amounts recognized for financial statement purposes. The notional or contractual amounts of these instruments represent the investment the Fund has in particular classes of financial instruments and do not necessarily represent the amounts potentially subject to risk. The measurement of the risks associated with these instruments is meaningful only when all related and offsetting transactions are considered.
Eaton Vance
Municipal Opportunities Fund
July 31, 2014
Notes to Financial Statements — continued
A summary of obligations under these financial instruments at July 31, 2014 is as follows:
| | | | | | | | | | | | | | | | |
| Futures Contracts | |
Expiration
Month/Year | | Contracts | | Position | | Aggregate
Cost | | | Value | | | Net
Unrealized
Appreciation | |
| | | | | |
| 9/14 | | 30 U.S. 10-Year Treasury Note | | Short | | $ | (3,756,507 | ) | | $ | (3,738,281 | ) | | $ | 18,226 | |
At July 31, 2014, the Fund had sufficient cash and/or securities to cover commitments under these contracts.
The Fund is subject to interest rate risk in the normal course of pursuing its investment objective. Because the Fund holds fixed-rate bonds, the value of these bonds may decrease if interest rates rise. The Fund purchases and sells U.S. Treasury futures contracts to hedge against changes in interest rates.
The fair value of open derivative instruments (not considered to be hedging instruments for accounting disclosure purposes) and whose primary underlying risk exposure is interest rate risk at July 31, 2014 was as follows:
| | | | | | |
| | | Fair Value | |
| | | Asset Derivative | | Liability Derivative | |
| | |
Futures Contracts | | $18,226(1) | | $ | — | |
| | |
Total | | $18,226 | | $ | — | |
| (1) | Amount represents cumulative unrealized appreciation on futures contracts in the Futures Contracts table above. Only the current day’s variation margin on open futures contracts is reported within the Statement of Assets and Liabilities as Receivable or Payable for variation margin, as applicable. |
The effect of derivative instruments (not considered to be hedging instruments for accounting disclosure purposes) on the Statement of Operations and whose primary underlying risk exposure is interest rate risk for the year ended July 31, 2014 was as follows:
| | | | | | | | |
| | | Realized Gain (Loss)
on Derivatives Recognized
in Income(1) | | | Change in Unrealized
Appreciation (Depreciation) on
Derivatives Recognized in Income(2) | |
| | |
Futures Contracts | | $ | (72,522 | ) | | $ | 18,226 | |
| (1) | Statement of Operations location: Net realized gain (loss) – Financial futures contracts. |
| (2) | Statement of Operations location: Change in unrealized appreciation (depreciation) – Financial futures contracts. |
The average notional amount of futures contracts outstanding during the year ended July 31, 2014, which is indicative of the volume of this derivative type, was approximately $341,000.
11 Fair Value Measurements
Under generally accepted accounting principles for fair value measurements, a three-tier hierarchy to prioritize the assumptions, referred to as inputs, is used in valuation techniques to measure fair value. The three-tier hierarchy of inputs is summarized in the three broad levels listed below.
| Ÿ | | Level 1 – quoted prices in active markets for identical investments |
| Ÿ | | Level 2 – other significant observable inputs (including quoted prices for similar investments, interest rates, prepayment speeds, credit risk, etc.) |
| Ÿ | | Level 3 – significant unobservable inputs (including a fund’s own assumptions in determining the fair value of investments) |
In cases where the inputs used to measure fair value fall in different levels of the fair value hierarchy, the level disclosed is determined based on the lowest level input that is significant to the fair value measurement in its entirety. The inputs or methodology used for valuing securities are not necessarily an indication of the risk associated with investing in those securities.
Eaton Vance
Municipal Opportunities Fund
July 31, 2014
Notes to Financial Statements — continued
At July 31, 2014, the hierarchy of inputs used in valuing the Fund’s investments and open derivatives, which are carried at value, were as follows:
| | | | | | | | | | | | | | | | |
| Asset Description | | Level 1 | | | Level 2 | | | Level 3 | | | Total | |
| | | | |
Tax-Exempt Municipal Securities | | $ | — | | | $ | 53,388,982 | | | $ | — | | | $ | 53,388,982 | |
Taxable Municipal Securities | | | — | | | | 3,559,080 | | | | — | | | | 3,559,080 | |
| | | | |
Total Investments | | $ | — | | | $ | 56,948,062 | | | $ | — | | | $ | 56,948,062 | |
| | | | |
Futures Contracts | | $ | 18,226 | | | $ | — | | | $ | — | | | $ | 18,226 | |
| | | | |
Total | | $ | 18,226 | | | $ | 56,948,062 | | | $ | — | | | $ | 56,966,288 | |
The Fund held no investments or other financial instruments as of July 31, 2013 whose fair value was determined using Level 3 inputs. At July 31, 2014, there were no investments transferred between Level 1 and Level 2 during the year then ended.
Eaton Vance
Municipal Opportunities Fund
July 31, 2014
Report of Independent Registered Public Accounting Firm
To the Trustees of Eaton Vance Municipals Trust and Shareholders of Eaton Vance Municipal Opportunities Fund:
We have audited the accompanying statement of assets and liabilities of Eaton Vance Municipal Opportunities Fund (the “Fund”) (one of the funds constituting Eaton Vance Municipals Trust), including the portfolio of investments, as of July 31, 2014, and the related statement of operations for the year then ended, the statements of changes in net assets for each of the two years in the period then ended, and the financial highlights for each of the three years in the period then ended and for the period from the start of business, May 31, 2011, to July 31, 2011. These financial statements and financial highlights are the responsibility of the Fund’s management. Our responsibility is to express an opinion on these financial statements and financial highlights based on our audits.
We conducted our audits in accordance with the standards of the Public Company Accounting Oversight Board (United States). Those standards require that we plan and perform the audit to obtain reasonable assurance about whether the financial statements and financial highlights are free of material misstatement. The Fund is not required to have, nor were we engaged to perform, an audit of its internal control over financial reporting. Our audits included consideration of internal control over financial reporting as a basis for designing audit procedures that are appropriate in the circumstances, but not for the purpose of expressing an opinion on the effectiveness of the Fund’s internal control over financial reporting. Accordingly, we express no such opinion. An audit also includes examining, on a test basis, evidence supporting the amounts and disclosures in the financial statements, assessing the accounting principles used and significant estimates made by management, as well as evaluating the overall financial statement presentation. Our procedures included confirmation of securities owned as of July 31, 2014, by correspondence with the custodian and brokers; where replies were not received from brokers, we performed other auditing procedures. We believe that our audits provide a reasonable basis for our opinion.
In our opinion, such financial statements and financial highlights referred to above present fairly, in all material respects, the financial position of Eaton Vance Municipal Opportunities Fund as of July 31, 2014, the results of its operations for the year then ended, the changes in its net assets for each of the two years in the period then ended, and the financial highlights for each of the three years in the period then ended and for the period from the start of business, May 31, 2011, to July 31, 2011, in conformity with accounting principles generally accepted in the United States of America.
DELOITTE & TOUCHE LLP
Boston, Massachusetts
September 16, 2014
Eaton Vance
Municipal Opportunities Fund
July 31, 2014
Federal Tax Information (Unaudited)
The Form 1099-DIV you receive in February 2015 will show the tax status of all distributions paid to your account in calendar year 2014. Shareholders are advised to consult their own tax adviser with respect to the tax consequences of their investment in the Fund. As required by the Internal Revenue Code and/or regulations, shareholders must be notified regarding exempt-interest dividends.
Exempt-Interest Dividends. For the fiscal year ended July 31, 2014, the Fund designates 95.34% of distributions from net investment income as an exempt-interest dividend.
Eaton Vance
Municipal Opportunities Fund
July 31, 2014
Special Meeting of Shareholders (Unaudited)
The Fund held a Special Meeting of Shareholders on May 29, 2014 to elect five Trustees. The results of the vote were as follows:
| | | | | | | | |
| | | Number of Shares(1) | |
| Nominee for Trustee | | For | | | Withheld | |
Scott E. Eston | | | 2,665,333 | | | | 6,733 | |
Cynthia E. Frost | | | 2,665,333 | | | | 6,733 | |
George J. Gorman | | | 2,665,333 | | | | 6,733 | |
Valerie A. Mosley | | | 2,665,333 | | | | 6,733 | |
Harriett Tee Taggart | | | 2,665,333 | | | | 6,733 | |
| (1) | Excludes fractional shares. |
Eaton Vance
Municipal Opportunities Fund
July 31, 2014
Board of Trustees’ Contract Approval
Overview of the Contract Review Process
The Investment Company Act of 1940, as amended (the “1940 Act”), provides, in substance, that each investment advisory agreement between a fund and its investment adviser will continue in effect from year to year only if its continuation is approved at least annually by the fund’s board of trustees, including by a vote of a majority of the trustees who are not “interested persons” of the fund (“Independent Trustees”), cast in person at a meeting called for the purpose of considering such approval.
At a meeting of the Boards of Trustees (each a “Board”) of the Eaton Vance group of mutual funds (the “Eaton Vance Funds”) held on April 28, 2014, the Board, including a majority of the Independent Trustees, voted to approve continuation of existing advisory and sub-advisory agreements for the Eaton Vance Funds for an additional one-year period. In voting its approval, the Board relied upon the affirmative recommendation of the Contract Review Committee of the Board, which is a committee comprised exclusively of Independent Trustees. Prior to making its recommendation, the Contract Review Committee reviewed information furnished by each adviser to the Eaton Vance Funds (including information specifically requested by the Board) for a series of meetings of the Contract Review Committee held between February and April 2014, as well as information considered throughout the year at meetings of the Board and its committees. Such information included, among other things, the following:
Information about Fees, Performance and Expenses
| Ÿ | | An independent report comparing the advisory and related fees paid by each fund with fees paid by comparable funds; |
| Ÿ | | An independent report comparing each fund’s total expense ratio and its components to comparable funds; |
| Ÿ | | An independent report comparing the investment performance of each fund (including, where relevant, yield data, Sharpe ratios and information ratios) to the investment performance of comparable funds over various time periods; |
| Ÿ | | Data regarding investment performance in comparison to benchmark indices and customized peer groups identified by the adviser in consultation with the Board; |
| Ÿ | | For each fund, comparative information concerning the fees charged and the services provided by each adviser in managing other accounts (including mutual funds, other collective investment funds and institutional accounts) using investment strategies and techniques similar to those used in managing such fund; |
| Ÿ | | Profitability analyses for each adviser with respect to each fund; |
Information about Portfolio Management and Trading
| Ÿ | | Descriptions of the investment management services provided to each fund, including the investment strategies and processes employed, and any changes in portfolio management processes and personnel; |
| Ÿ | | Information about the allocation of brokerage and the benefits received by each adviser as a result of brokerage allocation, including information concerning the acquisition of research through client commission arrangements and the fund’s policies with respect to “soft dollar” arrangements; |
| Ÿ | | Data relating to portfolio turnover rates of each fund; |
| Ÿ | | The procedures and processes used to determine the fair value of fund assets and actions taken to monitor and test the effectiveness of such procedures and processes; |
| Ÿ | | Information about each adviser’s processes for monitoring best execution of portfolio transactions, and other policies and practices of each adviser with respect to trading; |
Information about each Adviser
| Ÿ | | Reports detailing the financial results and condition of each adviser; |
| Ÿ | | Descriptions of the qualifications, education and experience of the individual investment professionals whose responsibilities include portfolio management and investment research for the funds, and information relating to their compensation and responsibilities with respect to managing other mutual funds and investment accounts; |
| Ÿ | | Copies of the Codes of Ethics of each adviser and its affiliates, together with information relating to compliance with and the administration of such codes; |
| Ÿ | | Copies of or descriptions of each adviser’s policies and procedures relating to proxy voting, the handling of corporate actions and class actions; |
| Ÿ | | Information concerning the resources devoted to compliance efforts undertaken by each adviser and its affiliates on behalf of the funds (including descriptions of various compliance programs) and their record of compliance with investment policies and restrictions, including policies with respect to market-timing, late trading and selective portfolio disclosure, and with policies on personal securities transactions; |
| Ÿ | | Descriptions of the business continuity and disaster recovery plans of each adviser and its affiliates; |
| Ÿ | | A description of Eaton Vance Management’s procedures for overseeing third party advisers and sub-advisers, including with respect to regulatory and compliance issues, investment management and other matters; |
Eaton Vance
Municipal Opportunities Fund
July 31, 2014
Board of Trustees’ Contract Approval — continued
Other Relevant Information
| Ÿ | | Information concerning the nature, cost and character of the administrative and other non-investment management services provided by Eaton Vance Management and its affiliates; |
| Ÿ | | Information concerning management of the relationship with the custodian, subcustodians and fund accountants by each adviser or the funds’ administrator; and |
| Ÿ | | The terms of each advisory agreement. |
Over the course of the twelve-month period ended April 30, 2014, with respect to one or more funds, the Board met nine times and the Contract Review Committee, the Audit Committee, the Governance Committee, the Portfolio Management Committee and the Compliance Reports and Regulatory Matters Committee, each of which is a Committee comprised solely of Independent Trustees, met seven, seventeen, eleven, six and ten times respectively. At such meetings, the Trustees participated in investment and performance reviews with the portfolio managers and other investment professionals of each adviser relating to each fund, and considered the investment and trading strategies used in pursuing each fund’s investment objective, including, where relevant, the use of derivative instruments, as well as processes for monitoring best execution of portfolio transactions and risk management techniques. The Board and its Committees also evaluated issues pertaining to industry and regulatory developments, compliance procedures, fund governance and other issues with respect to the funds, and received and participated in reports and presentations provided by Eaton Vance Management and other fund advisers with respect to such matters.
For funds that invest through one or more underlying portfolios, the Board considered similar information about the portfolio(s) when considering the approval of advisory agreements. In addition, in cases where the fund’s investment adviser has engaged a sub-adviser, the Board considered similar information about the sub-adviser when considering the approval of any sub-advisory agreement.
The Contract Review Committee was assisted throughout the contract review process by Goodwin Procter LLP, legal counsel for the Independent Trustees. The members of the Contract Review Committee relied upon the advice of such counsel and their own business judgment in determining the material factors to be considered in evaluating each advisory and sub-advisory agreement and the weight to be given to each such factor. The conclusions reached with respect to each advisory and sub-advisory agreement were based on a comprehensive evaluation of all the information provided and not any single factor. Moreover, each member of the Contract Review Committee may have placed varying emphasis on particular factors in reaching conclusions with respect to each advisory and sub-advisory agreement. In evaluating each advisory and sub-advisory agreement, including the specific fee structures and other terms of the agreements, the Contract Review Committee was informed by multiple years of analysis and discussion among the Independent Trustees and the Funds’ advisers and sub-advisers.
Results of the Process
Based on its consideration of the foregoing, and such other information as it deemed relevant, including the factors and conclusions described below, the Contract Review Committee concluded that the continuation of the investment advisory and administrative agreement of Eaton Vance Municipal Opportunities Fund (the “Fund”) with Eaton Vance Management (the “Adviser”), including its fee structure, is in the interests of shareholders and, therefore, the Contract Review Committee recommended to the Board approval of the agreement. The Board accepted the recommendation of the Contract Review Committee as well as the factors considered and conclusions reached by the Contract Review Committee with respect to the agreement. Accordingly, the Board, including a majority of the Independent Trustees, voted to approve continuation of the investment advisory and administrative agreement for the Fund
Nature, Extent and Quality of Services
In considering whether to approve the investment advisory and administrative agreement of the Fund, the Board evaluated the nature, extent and quality of services provided to the Fund by the Adviser.
The Board considered the Adviser’s management capabilities and investment process with respect to the types of investments held by the Fund, including the education, experience and number of its investment professionals and other personnel who provide portfolio management, investment research, and similar services to the Fund, including recent changes to such personnel. In particular, the Board considered, where relevant, the abilities and experience of such investment personnel in analyzing factors relevant to investing in municipal bonds, Treasury securities and other securities backed by the U.S. government or its agencies. The Board considered the Adviser’s large municipal bond team, which includes portfolio managers and credit specialists who provide services to the Fund. The Board also took into account the resources dedicated to portfolio management and other services, including the compensation methods of the Adviser to recruit and retain investment personnel, and the time and attention devoted to the Fund by senior management.
The Board reviewed the compliance programs of the Adviser and relevant affiliates thereof. Among other matters, the Board considered compliance and reporting matters relating to personal trading by investment personnel, selective disclosure of portfolio holdings, late trading, frequent trading, portfolio valuation, business continuity and the allocation of investment opportunities. The Board also evaluated the responses of the Adviser and its affiliates to requests in recent years from regulatory authorities such as the Securities and Exchange Commission and the Financial Industry Regulatory Authority.
Eaton Vance
Municipal Opportunities Fund
July 31, 2014
Board of Trustees’ Contract Approval — continued
The Board considered shareholder and other administrative services provided or managed by Eaton Vance Management and its affiliates, including transfer agency and accounting services. The Board evaluated the benefits to shareholders of investing in a fund that is a part of a large family of funds, including the ability, in many cases, to exchange an investment among different funds without incurring additional sales charges.
After consideration of the foregoing factors, among others, the Board concluded that the nature, extent and quality of services provided by the Adviser, taken as a whole, are appropriate and consistent with the terms of the investment advisory and administrative agreement.
Fund Performance
The Board compared the Fund’s investment performance to a relevant universe of similarly managed funds identified by an independent data provider and appropriate benchmark indices. The Board reviewed comparative performance data for the one-year period ended September 30, 2013 for the Fund. In light of the Fund’s relatively brief operating history, the Board concluded that additional time is required to evaluate Fund performance.
Management Fees and Expenses
The Board reviewed contractual fee rates for investment advisory and administrative services payable\by the Fund (referred to as “management fees”). As part of its review, the Board considered the management fees and the Fund’s total expense ratio for the year ended September 30, 2013, as compared to a group of similarly managed funds selected by an independent data provider (the “peer group”). The Board noted that the Adviser had waived fees and/or paid expenses for the Fund. The Board considered certain Fund specific factors that had an impact on Fund expense ratios relative to the peer group, as identified by management in response to inquiries from the Contract Review Committee. The Board also considered actions taken by management in recent years to reduce expenses at the fund complex level, including the negotiation of reduced fees for transfer agency and custody services.
After reviewing the foregoing information, and in light of the nature, extent and quality of the services provided by the Adviser, the Board concluded that the management fees charged for advisory and related services are reasonable.
Profitability
The Board reviewed the level of profits realized by the Adviser and relevant affiliates thereof in providing investment advisory and administrative services to the Fund and to all Eaton Vance Funds as a group. The Board considered the level of profits realized without regard to revenue sharing or other payments by the Adviser and its affiliates to third parties in respect of distribution services. The Board also considered other direct or indirect benefits received by the Adviser and its affiliates in connection with their relationships with the Fund, including the benefits of research services that may be available to the Adviser as a result of securities transactions effected for the Fund and other investment advisory clients.
The Board concluded that, in light of the foregoing factors and the nature, extent and quality of the services rendered, the profits realized by the Adviser and its affiliates are reasonable.
Economies of Scale
In reviewing management fees and profitability, the Board also considered the extent to which the Adviser and its affiliates, on the one hand, and the Fund, on the other hand, can expect to realize benefits from economies of scale as the assets of the Fund increase. The Board acknowledged the difficulty in accurately measuring the benefits resulting from the economies of scale with respect to the management of any specific fund or group of funds. The Board reviewed data summarizing the increases and decreases in the assets of the Fund and of all Eaton Vance Funds as a group over various time periods, and evaluated the extent to which the total expense ratio of the Fund and the profitability of the Adviser and its affiliates may have been affected by such increases or decreases. Based upon the foregoing, the Board concluded that the Fund currently shares in the benefits from economies of scale. The Board also concluded that, assuming reasonably foreseeable increases in the assets of the Fund, the structure of the advisory fee, which includes breakpoints at several asset levels, will allow the Fund to continue to benefit from economies of scale in the future.
Eaton Vance
Municipal Opportunities Fund
July 31, 2014
Management and Organization
Fund Management. The Trustees of Eaton Vance Municipals Trust (the Trust) are responsible for the overall management and supervision of the Trust’s affairs. The Trustees and officers of the Trust are listed below. Except as indicated, each individual has held the office shown or other offices in the same company for the last five years. Trustees and officers of the Trust hold indefinite terms of office. The “Noninterested Trustees” consist of those Trustees who are not “interested persons” of the Trust, as that term is defined under the 1940 Act. The business address of each Trustee and officer is Two International Place, Boston, Massachusetts 02110. As used below, “EVC” refers to Eaton Vance Corp., “EV” refers to Eaton Vance, Inc., “EVM” refers to Eaton Vance Management, “BMR” refers to Boston Management and Research and “EVD” refers to Eaton Vance Distributors, Inc. EVC and EV are the corporate parent and trustee, respectively, of EVM and BMR. EVD is the Fund’s principal underwriter and a wholly-owned subsidiary of EVC. Each officer affiliated with Eaton Vance may hold a position with other Eaton Vance affiliates that is comparable to his or her position with EVM listed below. Each Trustee oversees 177 portfolios in the Eaton Vance Complex (including all master and feeder funds in a master feeder structure). Each officer serves as an officer of certain other Eaton Vance funds. Each Trustee and officer serves until his or her successor is elected.
| | | | | | |
| Name and Year of Birth | | Position(s) with the Trust | | Trustee Since(1) | | Principal Occupation(s) and Directorships During Past Five Years and Other Relevant Experience |
Interested Trustee |
| | | |
Thomas E. Faust Jr. 1958 | | Trustee | | 2007 | | Chairman, Chief Executive Officer and President of EVC, Director and President of EV, Chief Executive Officer and President of EVM and BMR, and Director of EVD. Trustee and/or officer of 177 registered investment companies. Mr. Faust is an interested person because of his positions with EVM, BMR, EVD, EVC and EV, which are affiliates of the Trust. Directorships in the Last Five Years.(2) Director of EVC and Hexavest Inc. |
| | | |
| | | | | | |
Noninterested Trustees |
| | | |
Scott E. Eston 1956 | | Trustee | | 2011 | | Private investor. Formerly held various positions at Grantham, Mayo, Van Otterloo and Co., L.L.C. (investment management firm) (1997-2009), including Chief Operating Officer (2002-2009), Chief Financial Officer (1997-2009) and Chairman of the Executive Committee (2002-2008); President and Principal Executive Officer, GMO Trust (open-end registered investment company) (2006-2009). Former Partner, Coopers and Lybrand L.L.P. (now PricewaterhouseCoopers) (public accounting firm) (1987-1997). Directorships in the Last Five Years.(2) None. |
| | | |
Cynthia E. Frost(3) 1961 | | Trustee | | 2014 | | Private investor. Formerly, Chief Investment Officer of Brown University (university endowment) (2000-2012); Portfolio Strategist for Duke Management Company (university endowment manager) (1995-2000); Managing Director, Cambridge Associates (1989-1995); Consultant, Bain and Company (1987-1989); Senior Equity Analyst, BA Investment Management Company (1983-1985). Directorships in the Last Five Years. None. |
| | | |
George J. Gorman(3) 1952 | | Trustee | | 2014 | | Principal at George J. Gorman LLC (consulting firm). Formerly, Senior Partner at Ernst & Young LLP (public accounting firm) (1974-2009). Directorships in the Last Five Years. Trustee of the Bank of America Money Market Funds Series Trust (2011-2014) and of the Ashmore Funds (since 2010). |
| | | |
Valerie A. Mosley(4) 1960 | | Trustee | | 2014 | | Chairwoman and Chief Executive Officer of Valmo Ventures (a consulting and investment firm). Former Partner and Senior Vice President, Portfolio Manager and Investment Strategist at Wellington Management Company, LLP (investment management firm) (1992-2012). Former Chief Investment Officer, PG Corbin Asset Management (1990-1992). Formerly worked in institutional corporate bond sales at Kidder Peabody (1986-1990). Directorships in the Last Five Years.(2) Director of Dynex Capital, Inc. (mortgage REIT) (since 2013). |
| | | |
William H. Park 1947 | | Trustee | | 2003 | | Consultant and private investor. Formerly, Chief Financial Officer, Aveon Group L.P. (investment management firm) (2010-2011). Formerly, Vice Chairman, Commercial Industrial Finance Corp. (specialty finance company) (2006-2010). Formerly, President and Chief Executive Officer, Prizm Capital Management, LLC (investment management firm) (2002-2005). Formerly, Executive Vice President and Chief Financial Officer, United Asset Management Corporation (investment management firm) (1982-2001). Formerly, Senior Manager, Price Waterhouse (now PricewaterhouseCoopers) (an independent registered public accounting firm) (1972-1981). Directorships in the Last Five Years.(2) None. |
Eaton Vance
Municipal Opportunities Fund
July 31, 2014
Management and Organization — continued
| | | | | | |
| Name and Year of Birth | | Position(s) with the
Trust | | Trustee Since(1) | | Principal Occupation(s) and Directorships During Past Five Years and Other Relevant Experience |
Noninterested Trustees (continued) |
| | | |
Ronald A. Pearlman 1940 | | Trustee | | 2003 | | Lawyer and consultant. Formerly, Professor of Law, Georgetown University Law Center (1999-2014). Formerly, Partner, Covington & Burling LLP (law firm) (1991-2000). Formerly, Chief of Staff, Joint Committee on Taxation, U.S. Congress (1988-1990). Formerly, Deputy Assistant Secretary (Tax Policy) and Assistant Secretary (Tax Policy), U.S. Department of the Treasury (1983-1985). Directorships in the Last Five Years.(2) None. |
| | | |
Helen Frame Peters 1948 | | Trustee | | 2008 | | Professor of Finance, Carroll School of Management, Boston College. Formerly, Dean, Carroll School of Management, Boston College (2000-2002). Formerly, Chief Investment Officer, Fixed Income, Scudder Kemper Investments (investment management firm) (1998-1999). Formerly, Chief Investment Officer, Equity and Fixed Income, Colonial Management Associates (investment management firm) (1991-1998). Directorships in the Last Five Years.(2) Formerly, Director of BJ’s Wholesale Club, Inc. (wholesale club retailer) (2004-2011). Formerly, Trustee of SPDR Index Shares Funds and SPDR Series Trust (exchange traded funds) (2000-2009). Formerly, Director of Federal Home Loan Bank of Boston (a bank for banks) (2007-2009). |
| | | |
Harriett Tee Taggart 1948 | | Trustee | | 2011 | | Managing Director, Taggart Associates (a professional practice firm). Formerly, Partner and Senior Vice President, Wellington Management Company, LLP (investment management firm) (1983-2006). Directorships in the Last Five Years.(2) Director of Albemarle Corporation (chemicals manufacturer) (since 2007) and The Hanover Group (specialty property and casualty insurance company) (since 2009). Formerly, Director of Lubrizol Corporation (specialty chemicals) (2007-2011). |
| | | |
Ralph F. Verni 1943 | | Chairman of the Board and Trustee | | 2007 (Chairman); 2005 (Trustee) | | Consultant and private investor. Formerly, Chief Investment Officer (1982-1992), Chief Financial Officer (1988-1990) and Director (1982-1992), New England Life. Formerly, Chairperson, New England Mutual Funds (1982-1992). Formerly, President and Chief Executive Officer, State Street Management & Research (1992-2000). Formerly, Chairperson, State Street Research Mutual Funds (1992-2000). Formerly, Director, W.P. Carey, LLC (1998-2004) and First Pioneer Farm Credit Corp. (2002-2006). Directorships in the Last Five Years.(2) None. |
| | | |
| | | | | | |
Principal Officers who are not Trustees |
| Name and Year of Birth | | Position(s) with the Trust | | Officer Since(5) | | Principal Occupation(s) During Past Five Years |
Payson F. Swaffield 1956 | | President | | 2003 | | Vice President and Chief Income Investment Officer of EVM and BMR. |
| | | |
Maureen A. Gemma 1960 | | Vice President, Secretary and Chief Legal Officer | | 2005 | | Vice President of EVM and BMR. |
| | | |
James F. Kirchner 1967 | | Treasurer | | 2007 | | Vice President of EVM and BMR. |
| | | |
Paul M. O’Neil 1953 | | Chief Compliance Officer | | 2004 | | Vice President of EVM and BMR. |
| (1) | Year first appointed to serve as Trustee for a fund in the Eaton Vance family of funds. Each Trustee has served continuously since appointment unless indicated otherwise. |
| (2) | During their respective tenures, the Trustees (except for Ms. Frost and Mr. Gorman) also served as Board members of one or more of the following funds (which operated in the years noted): eUnitsTM 2 Year U.S. Market Participation Trust: Upside to Cap / Buffered Downside (launched in 2012 and terminated in 2014); eUnitsTM 2 Year U.S. Market Participation Trust II: Upside to Cap / Buffered Downside (launched in 2012 and terminated in 2014); Eaton Vance Credit Opportunities Fund (launched in 2005 and terminated in 2010); Eaton Vance Insured Florida Plus Municipal Bond Fund (launched in 2002 and terminated in 2009); and Eaton Vance National Municipal Income Trust (launched in 1998 and terminated in 2009). However, Ms. Mosley did not serve as a Board member of eUnitsTM 2 Year U.S. Market Participation Trust: Upside to Cap / Buffered Downside (launched in 2012 and terminated in 2014). |
Eaton Vance
Municipal Opportunities Fund
July 31, 2014
Management and Organization — continued
| (3) | Ms. Frost and Mr. Gorman began serving as Trustees effective May 29, 2014. |
| (4) | Ms. Mosley began serving as a Trustee effective January 1, 2014. |
| (5) | Year first elected to serve as officer of a fund in the Eaton Vance family of funds when the officer has served continuously. Otherwise, year of most recent election as an officer of a fund in the Eaton Vance family of funds. Titles may have changed since initial election. |
The SAI for the Fund includes additional information about the Trustees and officers of the Fund and can be obtained without charge on Eaton Vance’s website at www.eatonvance.com or by calling 1-800-262-1122.
Eaton Vance Funds
IMPORTANT NOTICES
Privacy. The Eaton Vance organization is committed to ensuring your financial privacy. Each of the financial institutions identified below has in effect the following policy (“Privacy Policy”) with respect to nonpublic personal information about its customers:
| Ÿ | | Only such information received from you, through application forms or otherwise, and information about your Eaton Vance fund transactions will be collected. This may include information such as name, address, social security number, tax status, account balances and transactions. |
| Ÿ | | None of such information about you (or former customers) will be disclosed to anyone, except as permitted by law (which includes disclosure to employees necessary to service your account). In the normal course of servicing a customer’s account, Eaton Vance may share information with unaffiliated third parties that perform various required services such as transfer agents, custodians and broker-dealers. |
| Ÿ | | Policies and procedures (including physical, electronic and procedural safeguards) are in place that are designed to protect the confidentiality of such information. |
| Ÿ | | We reserve the right to change our Privacy Policy at any time upon proper notification to you. Customers may want to review our Privacy Policy periodically for changes by accessing the link on our homepage: www.eatonvance.com. |
Our pledge of privacy applies to the following entities within the Eaton Vance organization: the Eaton Vance Family of Funds, Eaton Vance Management, Eaton Vance Investment Counsel, Eaton Vance Distributors, Inc., Eaton Vance Trust Company, Eaton Vance Management’s Real Estate Investment Group and Boston Management and Research. In addition, our Privacy Policy applies only to those Eaton Vance customers who are individuals and who have a direct relationship with us. If a customer’s account (i.e., fund shares) is held in the name of a third-party financial advisor/broker-dealer, it is likely that only such advisor’s privacy policies apply to the customer. This notice supersedes all previously issued privacy disclosures. For more information about Eaton Vance’s Privacy Policy, please call 1-800-262-1122.
Delivery of Shareholder Documents. The Securities and Exchange Commission (SEC) permits funds to deliver only one copy of shareholder documents, including prospectuses, proxy statements and shareholder reports, to fund investors with multiple accounts at the same residential or post office box address. This practice is often called “householding” and it helps eliminate duplicate mailings to shareholders. Eaton Vance, or your financial advisor, may household the mailing of your documents indefinitely unless you instruct Eaton Vance, or your financial advisor, otherwise. If you would prefer that your Eaton Vance documents not be householded, please contact Eaton Vance at 1-800-262-1122, or contact your financial advisor. Your instructions that householding not apply to delivery of your Eaton Vance documents will be effective within 30 days of receipt by Eaton Vance or your financial advisor.
Portfolio Holdings. Each Eaton Vance Fund and its underlying Portfolio(s) (if applicable) will file a schedule of portfolio holdings on Form N-Q with the SEC for the first and third quarters of each fiscal year. The Form N-Q will be available on the Eaton Vance website at www.eatonvance.com, by calling Eaton Vance at 1-800-262-1122 or in the EDGAR database on the SEC’s website at www.sec.gov. Form N-Q may also be reviewed and copied at the SEC’s public reference room in Washington, D.C. (call 1-800-732-0330 for information on the operation of the public reference room).
Proxy Voting. From time to time, funds are required to vote proxies related to the securities held by the funds. The Eaton Vance Funds or their underlying Portfolios (if applicable) vote proxies according to a set of policies and procedures approved by the Funds’ and Portfolios’ Boards. You may obtain a description of these policies and procedures and information on how the Funds or Portfolios voted proxies relating to portfolio securities during the most recent 12-month period ended June 30, without charge, upon request, by calling 1-800-262-1122 and by accessing the SEC’s website at www.sec.gov.
This Page Intentionally Left Blank
Investment Advisor and Administrator
Eaton Vance Management
Two International Place
Boston, MA 02110
Principal Underwriter*
Eaton Vance Distributors, Inc.
Two International Place
Boston, MA 02110
(617) 482-8260
Custodian
State Street Bank and Trust Company
State Street Financial Center, One Lincoln Street
Boston, MA 02111
Transfer Agent
BNY Mellon Investment Servicing (US) Inc.
Attn: Eaton Vance Funds
P.O. Box 9653
Providence, RI 02940-9653
(800) 262-1122
Independent Registered Public Accounting Firm
Deloitte & Touche LLP
200 Berkeley Street
Boston, MA 02116-5022
Fund Offices
Two International Place
Boston, MA 02110
| * | FINRA BrokerCheck. Investors may check the background of their Investment Professional by contacting the Financial Industry Regulatory Authority (FINRA). FINRA BrokerCheck is a free tool to help investors check the professional background of current and former FINRA-registered securities firms and brokers. FINRA BrokerCheck is available by calling 1-800-289-9999 and at www.FINRA.org. The FINRA BrokerCheck brochure describing the program is available to investors at www.FINRA.org. |
Item 2. Code of Ethics
The registrant has adopted a code of ethics applicable to its Principal Executive Officer, Principal Financial Officer and Principal Accounting Officer. The registrant undertakes to provide a copy of such code of ethics to any person upon request, without charge, by calling 1-800-262-1122.
Item 3. Audit Committee Financial Expert
The registrant’s Board has designated William H. Park, an independent trustee, as its audit committee financial expert. Mr. Park is a certified public accountant who is a consultant and private investor. Previously, he served as the Chief Financial Officer of Aveon Group, L.P. (an investment management firm), as the Vice Chairman of Commercial Industrial Finance Corp. (specialty finance company), as President and Chief Executive Officer of Prizm Capital Management, LLC (investment management firm), as Executive Vice President and Chief Financial Officer of United Asset Management Corporation (an institutional investment management firm) and as a Senior Manager at Price Waterhouse (now PricewaterhouseCoopers) (an independent registered public accounting firm).
Item 4. Principal Accountant Fees and Services
(a)-(d)
Eaton Vance Arizona Municipal Income Fund, Eaton Vance Connecticut Municipal Income Fund, Eaton Vance Minnesota Municipal Income Fund, Eaton Vance Municipal Opportunities Fund, Eaton Vance New Jersey Municipal Income Fund, Eaton Vance Pennsylvania Municipal Income Fund (the “Fund(s)”) are series of Eaton Vance Municipals Trust (the “Trust”), a Massachusetts business trust, which, including the Funds, contains a total of 18 series (the “Series”). The Trust is registered under the Investment Company Act of 1940 as an open-end management investment company. This Form N-CSR relates to the Funds’ annual reports.
The following tables represent the aggregate fees billed to each Fund for the Funds’ fiscal years ended July 31, 2013 and July 31, 2014 by the Funds’ principal accountant, Deloitte and Touche LLP (“D&T”) for professional services rendered for the audit of the Funds’ annual financial statements and fees billed for other services rendered by D&T during those periods.
Eaton Vance Arizona Municipal Income Fund
| | | | | | | | |
Fiscal Years Ended | | 7/31/2013 | | | 7/31/2014 | |
Audit Fees | | $ | 31,420 | | | $ | 32,420 | |
Audit-Related Fees(1) | | $ | 0 | | | $ | 0 | |
Tax Fees(2) | | $ | 9,140 | | | $ | 9,720 | |
All Other Fees(3) | | $ | 0 | | | $ | 0 | |
| | | | | | | | |
Total | | $ | 40,560 | | | $ | 42,140 | |
| | | | | | | | |
Eaton Vance Connecticut Municipal Income Fund
| | | | | | | | |
Fiscal Years Ended | | 7/31/2013 | | | 7/31/2014 | |
Audit Fees | | $ | 32,590 | | | $ | 33,690 | |
Audit-Related Fees(1) | | $ | 0 | | | $ | 0 | |
Tax Fees(2) | | $ | 9,240 | | | $ | 9,820 | |
All Other Fees(3) | | $ | 0 | | | $ | 0 | |
| | | | | | | | |
Total | | $ | 41,830 | | | $ | 43,510 | |
| | | | | | | | |
Eaton Vance Minnesota Municipal Income Fund
| | | | | | | | |
Fiscal Years Ended | | 7/31/2013 | | | 7/31/2014 | |
Audit Fees | | $ | 27,600 | | | $ | 28,500 | |
Audit-Related Fees(1) | | $ | 0 | | | $ | 0 | |
Tax Fees(2) | | $ | 8,440 | | | $ | 8,990 | |
All Other Fees(3) | | $ | 0 | | | $ | 0 | |
| | | | | | | | |
Total | | $ | 36,040 | | | $ | 37,490 | |
| | | | | | | | |
Eaton Vance Municipal Opportunities Fund
| | | | | | | | |
Fiscal Year Ended | | 7/31/2013 | | | 7/31/2014 | |
Audit Fees | | $ | 18,720 | | | $ | 19,920 | |
Audit-Related Fees(1) | | $ | 0 | | | $ | 0 | |
Tax Fees(2) | | $ | 8,610 | | | $ | 9,370 | |
All Other Fees(3) | | $ | 0 | | | $ | 0 | |
| | | | | | | | |
Total | | $ | 27,330 | | | $ | 29,290 | |
| | | | | | | | |
Eaton Vance New Jersey Municipal Income Fund
| | | | | | | | |
Fiscal Years Ended | | 7/31/2013 | | | 7/31/2014 | |
Audit Fees | | $ | 53,360 | | | $ | 55,160 | |
Audit-Related Fees(1) | | $ | 0 | | | $ | 0 | |
Tax Fees(2) | | $ | 9,790 | | | $ | 10,390 | |
All Other Fees(3) | | $ | 0 | | | $ | 0 | |
| | | | | | | | |
Total | | $ | 63,150 | | | $ | 65,550 | |
| | | | | | | | |
Eaton Vance Pennsylvania Municipal Income Fund
| | | | | | | | |
Fiscal Years Ended | | 7/31/2013 | | | 7/31/2014 | |
Audit Fees | | $ | 54,770 | | | $ | 57,170 | |
Audit-Related Fees(1) | | $ | 0 | | | $ | 0 | |
Tax Fees(2) | | $ | 10,590 | | | $ | 11,220 | |
All Other Fees(3) | | $ | 0 | | | $ | 0 | |
| | | | | | | | |
Total | | $ | 65,360 | | | $ | 68,390 | |
| | | | | | | | |
| (1) | Audit-related fees consist of the aggregate fees billed for assurance and related services that are reasonably related to the performance of the audit of the registrant’s financial statements and are not reported under the category of audit fees. |
| (2) | Tax fees consist of the aggregate fees billed for professional services rendered by the principal accountant relating to tax compliance, tax advice, and tax planning and specifically include fees for tax return preparation and other related tax compliance/planning matters. |
| (3) | All other fees consist of the aggregate fees billed for products and services provided by the principal accountant other than audit, audit-related, and tax services. |
The Series comprising the Trust have varying fiscal year ends (July 31, August 31, and September 30). The following table presents the aggregate audit, audit-related, tax, and other fees billed to all of the Series in the Trust by D&T, for the last two fiscal years of each Series.
| | | | | | | | | | | | | | | | | | | | | | | | |
Fiscal Years Ended | | 8/31/12 | | | 9/30/12 | | | 7/31/13 | | | 8/31/13 | | | 9/30/13 | | | 7/31/14 | |
Audit Fees | | $ | 358,770 | | | $ | 298,710 | | | $ | 218,460 | | | $ | 362,120 | | | $ | 305,610 | | | $ | 226,860 | |
Audit-Related Fees(1) | | $ | 0 | | | $ | 0 | | | $ | 0 | | | $ | 0 | | | $ | 0 | | | $ | 0 | |
Tax Fees(2) | | $ | 99,280 | | | $ | 67,300 | | | $ | 55,810 | | | $ | 103,790 | | | $ | 69,550 | | | $ | 59,510 | |
All Other Fees(3) | | $ | 3,410 | | | $ | 1,550 | | | $ | 0 | | | $ | 0 | | | $ | 0 | | | $ | 0 | |
| | | | | | | | | | | | | | | | | | | | | | | | |
Total | | $ | 461,460 | | | $ | 367,560 | | | $ | 274,270 | | | $ | 465,910 | | | $ | 375,160 | | | $ | 286,370 | |
| | | | | | | | | | | | | | | | | | | | | | | | |
| (1) | Audit-related fees consist of the aggregate fees billed for assurance and related services that are reasonable related to the performance of the audit of the registrant’s financial statements and are not reported under the category of audit fees. |
| (2) | Tax fees consist of the aggregate fees billed for professional services rendered by the principal accountant relating to tax compliance, tax advice, and tax planning and specifically include fees for tax return preparation and other related tax compliance/planning matters. |
| (3) | All other fees consist of the aggregate fees billed for products and services provided by the principal accountant other than audit, audit-related, and tax services. |
(e)(1) The registrant’s audit committee has adopted policies and procedures relating to the pre-approval of services provided by the registrant’s principal accountant (the “Pre-Approval Policies”). The Pre-Approval Policies establish a framework intended to assist the audit committee in the proper discharge of its pre-approval responsibilities. As a general matter, the Pre-Approval Policies (i) specify certain types of audit, audit-related, tax, and other services determined to be pre-approved by the audit committee; and (ii) delineate specific procedures governing the mechanics of the pre-approval process, including the approval and monitoring of audit and non-audit service fees. Unless a service is specifically pre-approved under the Pre-Approval Policies, it must be separately pre-approved by the audit committee.
The Pre-Approval Policies and the types of audit and non-audit services pre-approved therein must be reviewed and ratified by the registrant’s audit committee at least annually. The registrant’s audit committee maintains full responsibility for the appointment, compensation, and oversight of the work of the registrant’s principal accountant.
(e)(2) No services described in paragraphs (b)-(d) above were approved by the registrant’s audit committee pursuant to the “de minimis exception” set forth in Rule 2-01 (c)(7)(i)(C) of Regulation S-X.
(f) Not applicable.
(g) The following table presents (i) the aggregate non-audit fees (i.e., fees for audit-related, tax, and other services) billed for services rendered to all of the Series in the Trust by D&T for the last two fiscal years of each Series; and (ii) the aggregate non-audit fees (i.e., fees for audit-related, tax, and other services) billed for services rendered to the Eaton Vance organization by D&T for the same time period.
| | | | | | | | | | | | | | | | | | | | | | | | |
Fiscal Years Ended | | 8/31/12 | | | 9/30/12 | | | 7/31/13 | | | 8/31/13 | | | 9/30/13 | | | 7/31/14 | |
Registrant(1) | | $ | 102,690 | | | $ | 68,850 | | | $ | 55,810 | | | $ | 103,790 | | | $ | 69,550 | | | $ | 59,510 | |
Eaton Vance(2) | | $ | 606,619 | | | $ | 606,619 | | | $ | 276,151 | | | $ | 417,309 | | | $ | 369,820 | | | $ | 397,473 | |
| (1) | Includes all of the Series in the Trust. |
| (2) | The investment adviser to the Series, as well as any of its affiliates that provide ongoing services to the Series, are subsidiaries of Eaton Vance Corp. |
(h) The registrant’s audit committee has considered whether the provision by the registrant’s principal accountant of non-audit services to the registrant’s investment adviser and any entity controlling, controlled by, or under common control with the adviser that provides ongoing services to the registrant that were not pre-approved pursuant to Rule 2-01(c)(7)(ii) of Regulation S-X is compatible with maintaining the principal accountant’s independence.
Item 5. Audit Committee of Listed Registrants
Not applicable.
Item 6. Schedule of Investments
Please see schedule of investments contained in the Report to Stockholders included under Item 1 of this Form N-CSR.
Item 7. Disclosure of Proxy Voting Policies and Procedures for Closed-End Management Investment Companies
Not applicable.
Item 8. Portfolio Managers of Closed-End Management Investment Companies
Not applicable.
Item 9. Purchases of Equity Securities by Closed-End Management Investment Company and Affiliated Purchasers
Not applicable.
Item 10. Submission of Matters to a Vote of Security Holders
No material changes.
Item 11. Controls and Procedures
(a) It is the conclusion of the registrant’s principal executive officer and principal financial officer that the effectiveness of the registrant’s current disclosure controls and procedures (such disclosure controls and procedures having been evaluated within 90 days of the date of this filing) provide reasonable assurance that the information required to be disclosed by the registrant has been recorded, processed, summarized and reported within the time period specified in the Commission’s rules and forms and that the information required to be disclosed by the registrant has been accumulated and communicated to the registrant’s principal executive officer and principal financial officer in order to allow timely decisions regarding required disclosure.
(b) There have been no changes in the registrant’s internal controls over financial reporting during the second fiscal quarter of the period covered by this report that has materially affected, or is reasonably likely to materially affect, the registrant’s internal control over financial reporting.
Item 12. Exhibits
| | |
| (a)(1) | | Registrant’s Code of Ethics – Not applicable (please see Item 2). |
| |
| (a)(2)(i) | | Treasurer’s Section 302 certification. |
| |
| (a)(2)(ii) | | President’s Section 302 certification. |
| |
| (b) | | Combined Section 906 certification. |
Signatures
Pursuant to the requirements of the Securities Exchange Act of 1934 and the Investment Company Act of 1940, the registrant has duly caused this report to be signed on its behalf by the undersigned, thereunto duly authorized.
Eaton Vance Municipals Trust
| | |
| By: | | /s/ Payson F. Swaffield |
| | Payson F. Swaffield |
| | President |
| |
Date: | | September 10, 2014 |
Pursuant to the requirements of the Securities Exchange Act of 1934 and the Investment Company Act of 1940, this report has been signed below by the following persons on behalf of the registrant and in the capacities and on the dates indicated.
| | |
| By: | | /s/ James F. Kirchner |
| | James F. Kirchner |
| | Treasurer |
| |
| Date: | | September 10, 2014 |
| | |
| By: | | /s/ Payson F. Swaffield |
| | Payson F. Swaffield |
| | President |
| |
| Date: | | September 10, 2014 |