UNITED STATES
SECURITIES AND EXCHANGE COMMISSION
Washington, D.C. 20549
Form N-CSR
CERTIFIED SHAREHOLDER REPORT OF REGISTERED
MANAGEMENT INVESTMENT COMPANIES
Investment Company Act File Number: 811-04409
Eaton Vance Municipals Trust
(Exact Name of Registrant as Specified in Charter)
Two International Place, Boston, Massachusetts 02110
(Address of Principal Executive Offices)
Maureen A. Gemma
Two International Place, Boston, Massachusetts 02110
(Name and Address of Agent for Services)
(617) 482-8260
(Registrant’s Telephone Number)
September 30
Date of Fiscal Year End
September 30, 2018
Date of Reporting Period
Item 1. Reports to Stockholders

Eaton Vance
Municipal Income Funds
Annual Report
September 30, 2018
AMT-Free • National

Commodity Futures Trading Commission Registration. Effective December 31, 2012, the Commodity Futures Trading Commission (“CFTC”) adopted certain regulatory changes that subject registered investment companies and advisers to regulation by the CFTC if a fund invests more than a prescribed level of its assets in certain CFTC-regulated instruments (including futures, certain options and swap agreements) or markets itself as providing investment exposure to such instruments. Each Fund has claimed an exclusion from the definition of the term “commodity pool operator” under the Commodity Exchange Act. Accordingly, neither the Funds nor the adviser with respect to the operation of the Funds is subject to CFTC regulation. Because of its management of other strategies, each Fund’s adviser is registered with the CFTC as a commodity pool operator and a commodity trading advisor.
Fund shares are not insured by the FDIC and are not deposits or other obligations of, or guaranteed by, any depository institution. Shares are subject to investment risks, including possible loss of principal invested.
This report must be preceded or accompanied by a current summary prospectus or prospectus. Before investing, investors should consider carefully the investment objective, risks, and charges and expenses of a mutual fund. This and other important information is contained in the summary prospectus and prospectus, which can be obtained from a financial advisor. Prospective investors should read the prospectus carefully before investing. For further information, please call 1-800-262-1122.
Annual Report September 30, 2018
Eaton Vance
Municipal Income Funds
Table of Contents
| | | | |
Management’s Discussion of Fund Performance | | | 2 | |
| |
Performance and Fund Profile | | | | |
| |
| | | | |
AMT-Free Municipal Income Fund | | | 3 | |
National Municipal Income Fund | | | 5 | |
| |
| | | | |
| |
Endnotes and Additional Disclosures | | | 7 | |
| |
Fund Expenses | | | 8 | |
| |
Financial Statements | | | 10 | |
| |
Report of Independent Registered Public Accounting Firm | | | 44 | |
| |
Federal Tax Information | | | 46 | |
| |
Special Meeting of Shareholders | | | 47 | |
| |
Board of Trustees’ Contract Approval | | | 48 | |
| |
Management and Organization | | | 52 | |
| |
Important Notices | | | 55 | |
Eaton Vance
Municipal Income Funds
September 30, 2018
Management’s Discussion of Fund Performance1
Economic and Market Conditions
The fiscal year that began October 1, 2017 was characterized by a flattening of the municipal bond yield curve. Long-term interest rates drifted downward in the first month of the period — despite the U.S. Federal Reserve Board (the Fed) rate hikes the previous March and June 2017 that put upward pressure on short-term rates.
In November and December 2017, however, the municipal market experienced considerable volatility after the GOP-controlled House and Senate released and then passed new tax legislation. The most significant change to the municipal market was the elimination of an issuer’s ability to refinance debt prior to its call date through the issuance of advanced refunding bonds — which accounted for just under 20% of new issuance over the past 10 years. As a result, December 2017 witnessed the largest-ever one-month issuance of new municipal debt, as issuers rushed to beat the December 31, 2017 deadline. Investors sold short maturity bonds to buy new-issue longer maturity bonds in anticipation of lower supply going forward. The net result was rising prices on longer-term debt that drove more flattening of the yield curve in December 2017.
But as the new year began, bond prices reversed direction. Signs of increasing inflation, higher wage growth, and fears that the new tax legislation might overheat the economy pushed interest rates up and caused longer-term bond prices to decline.
Upward pressure on short-term rates continued in March and June 2018 as the Fed delivered its first two rate hikes of the year. At the long end of the curve, however, fluctuating perceptions of geopolitical risk were a primary driver of rates from April through the end of August 2018. Investors toggled between concern that the U.S. was initiating a global trade war and optimism about economic growth and a potential detente between the U.S. and North Korea. Meanwhile, ongoing lower yields for German and Japanese bonds, compared with U.S. Treasurys, weighed on longer-term U.S. yields. In September 2018, however, the Fed hiked rates again and both U.S. Treasury and municipal rates rose across the curve. The net result for the period was a continued flattening of the yield curve, as the spread between two-year and 10-year rates narrowed significantly.
For the 12-month period, the Bloomberg Barclays Municipal Bond Index (the Index),2 a broad measure of the asset class, returned 0.35%. For the period as a whole, the municipal bond yield curve flattened. Rates for AAA-rated7 bonds rose across the curve, but rate increases were greater at the short end of the curve than the long end. On a total return basis, longer maturities in general outperformed shorter maturities, and lower-rated bonds generally outperformed higher-rated issues. Across most of the curve, municipal bonds generally outperformed U.S. Treasurys.
Fund Performance
For the fiscal year ended September 30, 2018, AMT-Free Municipal Income Fund Class A shares at net asset value (NAV) and National Municipal Income Fund Class A shares at NAV both outperformed the 0.35% return of the Funds’ primary benchmark, the Index.
The Funds’ overall strategy is to normally invest in bonds with maturities of 10 years or more, in order to capture their typically
higher yields and a greater income stream compared with shorter-maturity issues.
The Funds seek to enhance tax-exempt income through the use of leveraged investments by purchasing residual interest bonds.6 Leverage has the effect of magnifying the Funds’ exposure to their underlying investments in both up and down markets. During this period of rising rates and falling bond prices, residual interest bonds were a detractor from performance versus the Index — which does not employ leverage — for both Funds.
By using Treasury futures and/or interest-rate swaps, management hedges, to various degrees, against the greater potential risk of volatility caused by the use of leveraged investments and investing in bonds at the long end of the yield curve. As a risk management tactic within the Funds’ overall strategies, interest rate hedging is intended to moderate performance on both the upside and the downside of the market. In a period when municipal and Treasury bonds generally declined in price, the Funds’ Treasury futures hedge mitigated a portion of that decline and was a contributor to relative performance versus the unhedged Index for both Funds.
Fund-Specific Results
Eaton Vance AMT-Free Municipal Income Fund Class A shares at NAV returned 0.83%, outperforming the 0.35% return of the Index. Contributors to Fund performance versus the Index included the Fund’s hedging strategy, as noted above; security selection and an overweight, relative to the Index, in BBB-rated bonds and below; and holdings in insured and uninsured Puerto Rico bonds. This was due to strong performance of Puerto Rico’s debt in the second half of the period, as ongoing bankruptcy negotiations led to anticipation that bondholder recoveries could exceed those originally anticipated by the market. The Fund’s insured Puerto Rico holdings were insured by various municipal bond insurers. It should be noted that most uninsured bonds issued by the Commonwealth of Puerto Rico and its various conduit issuers were no longer included in the Index. As Puerto Rico continued to deal with an ongoing fiscal crisis, bonds issued by its various legal entities were impacted by a number of factors throughout the period, including monetary default. As the period ended, Puerto Rico continued to negotiate with creditors and address its current debt structure under the Puerto Rico Oversight, Management, and Economic Stability Act passed by the U.S. Congress.
In contrast, detractors from results relative to the Index included leveraged investments, as noted earlier; an overweight in prerefunded, or escrowed bonds; and security selection in the education sector.
Eaton Vance National Municipal Income Fund Class A shares at NAV returned 0.76%, outperforming the 0.35% return of the Index. Contributors to performance relative to the Index included the Fund’s hedging strategy; security selection in insured Puerto Rico bonds; and security selection and an overweight in the health care sector, which was the best-performing sector in the Index during the period. Detractors from performance versus the Index included leveraged investments, security selection in state general obligation bonds, and security selection in the electric power sector.
See Endnotes and Additional Disclosures in this report.
Past performance is no guarantee of future results. Returns are historical and are calculated by determining the percentage change in net asset value (NAV) or offering price (as applicable) with all distributions reinvested. Investment return and principal value will fluctuate so that shares, when redeemed, may be worth more or less than their original cost. Performance less than or equal to one year is cumulative. Performance is for the stated time period only; due to market volatility, the Fund’s current performance may be lower or higher than quoted. Returns are before taxes unless otherwise noted. For performance as of the most recent month-end, please refer to eatonvance.com.
Eaton Vance
AMT-Free Municipal Income Fund
September 30, 2018
Performance2,3
Portfolio Manager Cynthia J. Clemson
| | | | | | | | | | | | | | | | | | | | |
| % Average Annual Total Returns | | Class
Inception Date | | | Performance
Inception Date | | | One Year | | | Five Years | | | Ten Years | |
Class A at NAV | | | 01/06/1998 | | | | 03/16/1978 | | | | 0.83 | % | | | 4.49 | % | | | 5.28 | % |
Class A with 4.75% Maximum Sales Charge | | | — | | | | — | | | | –4.01 | | | | 3.49 | | | | 4.76 | |
Class C at NAV | | | 05/02/2006 | | | | 03/16/1978 | | | | 0.06 | | | | 3.72 | | | | 4.49 | |
Class C with 1% Maximum Sales Charge | | | — | | | | — | | | | –0.91 | | | | 3.72 | | | | 4.49 | |
Class I at NAV | | | 03/16/1978 | | | | 03/16/1978 | | | | 1.02 | | | | 4.74 | | | | 5.52 | |
Bloomberg Barclays Municipal Bond Index | | | — | | | | — | | | | 0.35 | % | | | 3.54 | % | | | 4.75 | % |
Bloomberg Barclays Long (22+) Year Municipal Bond Index | | | — | | | | — | | | | 1.07 | | | | 5.43 | | | | 6.33 | |
| | | | | |
| | | | | | | | | | | | | | | | | | | | |
| % Total Annual Operating Expense Ratios4 | | | | | | | | Class A | | | Class C | | | Class I | |
| | | | | | | | | | | 0.98 | % | | | 1.73 | % | | | 0.73 | % |
| | | | | |
| | | | | | | | | | | | | | | | | | | | |
| % Distribution Rates/Yields5 | | | | | | | | Class A | | | Class C | | | Class I | |
Distribution Rate | | | | | | | | | | | 3.71 | % | | | 2.97 | % | | | 3.96 | % |
Taxable-Equivalent Distribution Rate | | | | | | | | | | | 6.27 | | | | 5.02 | | | | 6.69 | |
SEC 30-day Yield | | | | | | | | | | | 2.14 | | | | 1.50 | | | | 2.50 | |
Taxable-Equivalent SEC 30-day Yield | | | | | | | | | | | 3.61 | | | | 2.53 | | | | 4.22 | |
| | | | | |
| | | | | | | | | | | | | | | | | | | | |
| % Total Leverage6 | | | | | | | | | | | | | | | |
Residual Interest Bond (RIB) Financing | | | | | | | | | | | | | | | | | | | 10.95 | % |
Growth of $10,000
This graph shows the change in value of a hypothetical investment of $10,000 in Class A of the Fund for the period indicated. For comparison, the same investment is shown in the indicated index.
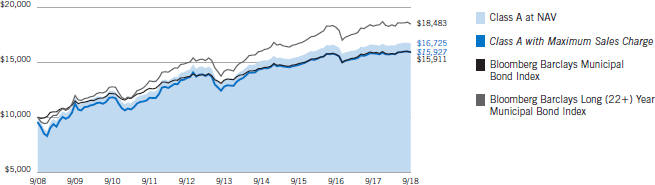
| | | | | | | | | | | | | | | | |
| Growth of Investment | | Amount Invested | | | Period Beginning | | | At NAV | | | With Maximum Sales Charge | |
Class C | | $ | 10,000 | | | | 09/30/2008 | | | $ | 15,511 | | | | N.A. | |
Class I | | $ | 250,000 | | | | 09/30/2008 | | | $ | 428,081 | | | | N.A. | |
See Endnotes and Additional Disclosures in this report.
Past performance is no guarantee of future results. Returns are historical and are calculated by determining the percentage change in net asset value (NAV) or offering price (as applicable) with all distributions reinvested. Investment return and principal value will fluctuate so that shares, when redeemed, may be worth more or less than their original cost. Performance less than or equal to one year is cumulative. Performance is for the stated time period only; due to market volatility, the Fund’s current performance may be lower or higher than quoted. Returns are before taxes unless otherwise noted. For performance as of the most recent month-end, please refer to eatonvance.com.
Eaton Vance
AMT-Free Municipal Income Fund
September 30, 2018
Fund Profile
Credit Quality (% of total investments)7,8
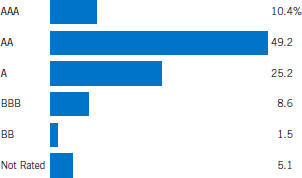
See Endnotes and Additional Disclosures in this report.
Eaton Vance
National Municipal Income Fund
September 30, 2018
Performance2,3
Portfolio Manager Craig R. Brandon, CFA
| | | | | | | | | | | | | | | | | | | | |
| % Average Annual Total Returns | | Class
Inception Date | | | Performance
Inception Date | | | One Year | | | Five Years | | | Ten Years | |
Class A at NAV | | | 04/05/1994 | | | | 12/19/1985 | | | | 0.76 | % | | | 5.10 | % | | | 5.46 | % |
Class A with 4.75% Maximum Sales Charge | | | — | | | | — | | | | –4.07 | | | | 4.07 | | | | 4.95 | |
Class B at NAV | | | 12/19/1985 | | | | 12/19/1985 | | | | 0.01 | | | | 4.32 | | | | 4.67 | |
Class B with 5% Maximum Sales Charge | | | — | | | | — | | | | –4.85 | | | | 3.98 | | | | 4.67 | |
Class C at NAV | | | 12/03/1993 | | | | 12/19/1985 | | | | 0.01 | | | | 4.32 | | | | 4.67 | |
Class C with 1% Maximum Sales Charge | | | — | | | | — | | | | –0.96 | | | | 4.32 | | | | 4.67 | |
Class I at NAV | | | 07/01/1999 | | | | 12/19/1985 | | | | 1.01 | | | | 5.34 | | | | 5.72 | |
Bloomberg Barclays Municipal Bond Index | | | — | | | | — | | | | 0.35 | % | | | 3.54 | % | | | 4.75 | % |
Bloomberg Barclays Long (22+) Year Municipal Bond Index | | | — | | | | — | | | | 1.07 | | | | 5.43 | | | | 6.33 | |
| | | | | |
| | | | | | | | | | | | | | | | | | | | |
| % Total Annual Operating Expense Ratios4 | | | | | Class A | | | Class B | | | Class C | | | Class I | |
| | | | | | | 0.84 | % | | | 1.59 | % | | | 1.59 | % | | | 0.59 | % |
| | | | | |
| | | | | | | | | | | | | | | | | | | | |
| % Distribution Rates/Yields5 | | | | | Class A | | | Class B | | | Class C | | | Class I | |
Distribution Rate | | | | | | | 3.60 | % | | | 2.84 | % | | | 2.86 | % | | | 3.85 | % |
Taxable-Equivalent Distribution Rate | | | | | | | 6.08 | | | | 4.80 | | | | 4.83 | | | | 6.50 | |
SEC 30-day Yield | | | | | | | 2.40 | | | | 1.75 | | | | 1.77 | | | | 2.77 | |
Taxable-Equivalent SEC 30-day Yield | | | | | | | 4.05 | | | | 2.96 | | | | 2.99 | | | | 4.68 | |
| | | | | |
| | | | | | | | | | | | | | | | | | | | |
| % Total Leverage6 | | | | | | | | | | | | | | | |
RIB Financing | | | | | | | | | | | | | | | | | | | 6.63 | % |
Growth of $10,000
This graph shows the change in value of a hypothetical investment of $10,000 in Class A of the Fund for the period indicated. For comparison, the same investment is shown in the indicated index.

| | | | | | | | | | | | | | | | |
| Growth of Investment | | Amount Invested | | | Period Beginning | | | At NAV | | | With Maximum Sales Charge | |
Class B | | $ | 10,000 | | | | 09/30/2008 | | | $ | 15,795 | | | | N.A. | |
Class C | | $ | 10,000 | | | | 09/30/2008 | | | $ | 15,794 | | | | N.A. | |
Class I | | $ | 250,000 | | | | 09/30/2008 | | | $ | 436,158 | | | | N.A. | |
See Endnotes and Additional Disclosures in this report.
Past performance is no guarantee of future results. Returns are historical and are calculated by determining the percentage change in net asset value (NAV) or offering price (as applicable) with all distributions reinvested. Investment return and principal value will fluctuate so that shares, when redeemed, may be worth more or less than their original cost. Performance less than or equal to one year is cumulative. Performance is for the stated time period only; due to market volatility, the Fund’s current performance may be lower or higher than quoted. Returns are before taxes unless otherwise noted. For performance as of the most recent month-end, please refer to eatonvance.com.
Eaton Vance
National Municipal Income Fund
September 30, 2018
Fund Profile
Credit Quality (% of total investments)7,8
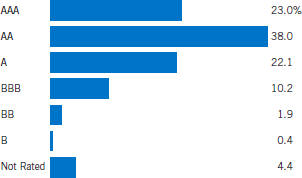
See Endnotes and Additional Disclosures in this report.
Eaton Vance
Municipal Income Funds
September 30, 2018
Endnotes and Additional Disclosures
| 1 | The views expressed in this report are those of the portfolio manager(s) and are current only through the date stated at the top of this page. These views are subject to change at any time based upon market or other conditions, and Eaton Vance and the Fund(s) disclaim any responsibility to update such views. These views may not be relied upon as investment advice and, because investment decisions are based on many factors, may not be relied upon as an indication of trading intent on behalf of any Eaton Vance fund. This commentary may contain statements that are not historical facts, referred to as “forward looking statements.” The Fund’s actual future results may differ significantly from those stated in any forward looking statement, depending on factors such as changes in securities or financial markets or general economic conditions, the volume of sales and purchases of Fund shares, the continuation of investment advisory, administrative and service contracts, and other risks discussed from time to time in the Fund’s filings with the Securities and Exchange Commission. |
| 2 | Bloomberg Barclays Municipal Bond Index is an unmanaged index of municipal bonds traded in the U.S. Bloomberg Barclays Long (22+) Year Municipal Bond Index is an unmanaged index of municipal bonds traded in the U.S. with maturities of 22 years or more. Unless otherwise stated, index returns do not reflect the effect of any applicable sales charges, commissions, expenses, taxes or leverage, as applicable. It is not possible to invest directly in an index. |
| 3 | Total Returns at NAV do not include applicable sales charges. If sales charges were deducted, the returns would be lower. Total Returns shown with maximum sales charge reflect the stated maximum sales charge. Unless otherwise stated, performance does not reflect the deduction of taxes on Fund distributions or redemptions of Fund shares. Performance since inception for an index, if presented, is the performance since the Fund’s or oldest share class’ inception, as applicable. |
| 4 | Source: Fund prospectus. The expense ratios for the current reporting period can be found in the Financial Highlights section of this report. |
| 5 | The Distribution Rate is based on the Fund’s last regular distribution per share in the period (annualized) divided by the Fund’s NAV at the end of the period. The Fund’s distributions may be comprised of amounts characterized for federal income tax purposes as tax-exempt income, qualified and non-qualified ordinary dividends, capital gains and nondividend distributions, also known as return of capital. The Fund will determine the federal income tax character of distributions paid to a shareholder after the end of the calendar year. This is reported on the IRS form 1099-DIV and provided to the shareholder shortly after each year-end. The Fund’s distributions are determined by the investment adviser based on its current assessment of the Fund’s long-term return potential. As portfolio and market conditions change, the rate of distributions paid by the Fund could change. Taxable-equivalent performance is based on the highest combined federal and state income tax rates, where applicable. Lower tax rates would result in lower tax-equivalent performance. Actual tax rates will vary depending on your income, exemptions and deductions. Rates do not include local taxes. The SEC Yield is a standardized measure based on the estimated yield to maturity of a fund’s investments over a 30-day period and is based on the maximum offer price at the date specified. The SEC Yield is not based on the distributions made by the Fund, which may differ. |
| 6 | Fund employs RIB financing. The leverage created by RIB investments provides an opportunity for increased income but, at the same time, creates special risks (including the likelihood of greater volatility of NAV). The cost of leverage rises and falls with changes in short-term interest rates. See “Floating Rate Notes Issued in Conjunction with Securities Held” in the notes to the financial statements for more information about RIB financing. RIB leverage represents the amount of Floating Rate Notes outstanding at period end as a percentage of Fund net assets plus Floating Rate Notes. |
| 7 | Ratings are based on Moody’s Investors Service, Inc. (“Moody’s”), S&P Global Ratings (“S&P”) or Fitch Ratings (“Fitch”), as applicable. If securities are rated differently by the ratings agencies, the highest rating is applied. Ratings, which are subject to change, apply to the creditworthiness of the issuers of the underlying securities and not to the Fund or its shares. Credit ratings measure the quality of a bond based on the issuer’s creditworthiness, with ratings ranging from AAA, being the highest, to D, being the lowest based on S&P’s measures. Ratings of BBB or higher by S&P or Fitch (Baa or higher by Moody’s) are considered to be investment-grade quality. Credit ratings are based largely on the ratings agency’s analysis at the time of rating. The rating assigned to any particular security is not necessarily a reflection of the issuer’s current financial condition and does not necessarily reflect its assessment of the volatility of a security’s market value or of the liquidity of an investment in the security. Holdings designated as “Not Rated” (if any) are not rated by the national ratings agencies stated above. |
| 8 | The chart includes the municipal bonds held by a trust that issues residual interest bonds, consistent with the Portfolio of Investments. |
| | Fund profiles subject to change due to active management. |
Eaton Vance
Municipal Income Funds
September 30, 2018
Fund Expenses
Example: As a Fund shareholder, you incur two types of costs: (1) transaction costs, including sales charges (loads) on purchases and redemption fees (if applicable); and (2) ongoing costs, including management fees; distribution and/or service fees; and other Fund expenses. This Example is intended to help you understand your ongoing costs (in dollars) of Fund investing and to compare these costs with the ongoing costs of investing in other mutual funds. The Example is based on an investment of $1,000 invested at the beginning of the period and held for the entire period (April 1, 2018 – September 30, 2018).
Actual Expenses: The first section of each table below provides information about actual account values and actual expenses. You may use the information in this section, together with the amount you invested, to estimate the expenses that you paid over the period. Simply divide your account value by $1,000 (for example, an $8,600 account value divided by $1,000 = 8.6), then multiply the result by the number in the first section under the heading entitled “Expenses Paid During Period” to estimate the expenses you paid on your account during this period.
Hypothetical Example for Comparison Purposes: The second section of each table below provides information about hypothetical account values and hypothetical expenses based on the actual Fund expense ratio and an assumed rate of return of 5% per year (before expenses), which is not the actual Fund return. The hypothetical account values and expenses may not be used to estimate the actual ending account balance or expenses you paid for the period. You may use this information to compare the ongoing costs of investing in your Fund and other funds. To do so, compare this 5% hypothetical example with the 5% hypothetical examples that appear in the shareholder reports of the other funds.
Please note that the expenses shown in each table are meant to highlight your ongoing costs only and do not reflect any transactional costs, such as sales charges (loads) or redemption fees (if applicable). Therefore, the second section of each table is useful in comparing ongoing costs only, and will not help you determine the relative total costs of owning different funds. In addition, if these transactional costs were included, your costs would be higher.
Eaton Vance AMT-Free Municipal Income Fund
| | | | | | | | | | | | | | | | |
| | | Beginning
Account Value
(4/1/18) | | | Ending
Account Value
(9/30/18) | | | Expenses Paid
During Period*
(4/1/18 – 9/30/18) | | | Annualized
Expense
Ratio | |
| | | | |
Actual | | | | | | | | | | | | | | | | |
Class A | | $ | 1,000.00 | | | $ | 1,010.70 | | | $ | 5.29 | | | | 1.05 | % |
Class C | | $ | 1,000.00 | | | $ | 1,006.90 | | | $ | 9.06 | | | | 1.80 | % |
Class I | | $ | 1,000.00 | | | $ | 1,011.60 | | | $ | 4.03 | | | | 0.80 | % |
| | | | | |
Hypothetical | | | | | | | | | | | | | | | | |
(5% return per year before expenses) | | | | | | | | | | | | | | | | |
Class A | | $ | 1,000.00 | | | $ | 1,019.80 | | | $ | 5.32 | | | | 1.05 | % |
Class C | | $ | 1,000.00 | | | $ | 1,016.00 | | | $ | 9.10 | | | | 1.80 | % |
Class I | | $ | 1,000.00 | | | $ | 1,021.10 | | | $ | 4.05 | | | | 0.80 | % |
| * | Expenses are equal to the Fund’s annualized expense ratio for the indicated Class, multiplied by the average account value over the period, multiplied by 183/365 (to reflect the one-half year period). The Example assumes that the $1,000 was invested at the net asset value per share determined at the close of business on March 31, 2018. |
Eaton Vance
Municipal Income Funds
September 30, 2018
Fund Expenses — continued
Eaton Vance National Municipal Income Fund
| | | | | | | | | | | | | | | | |
| | | Beginning
Account Value
(4/1/18) | | | Ending
Account Value
(9/30/18) | | | Expenses Paid
During Period*
(4/1/18 – 9/30/18) | | | Annualized
Expense
Ratio | |
| | | | |
Actual | | | | | | | | | | | | | | | | |
Class A | | $ | 1,000.00 | | | $ | 1,013.40 | | | $ | 4.49 | | | | 0.89 | % |
Class B | | $ | 1,000.00 | | | $ | 1,009.60 | | | $ | 8.26 | | | | 1.64 | % |
Class C | | $ | 1,000.00 | | | $ | 1,009.60 | | | $ | 8.26 | | | | 1.64 | % |
Class I | | $ | 1,000.00 | | | $ | 1,014.60 | | | $ | 3.18 | | | | 0.63 | % |
| | | | | |
Hypothetical | | | | | | | | | | | | | | | | |
(5% return per year before expenses) | | | | | | | | | | | | | | | | |
Class A | | $ | 1,000.00 | | | $ | 1,020.60 | | | $ | 4.51 | | | | 0.89 | % |
Class B | | $ | 1,000.00 | | | $ | 1,016.80 | | | $ | 8.29 | | | | 1.64 | % |
Class C | | $ | 1,000.00 | | | $ | 1,016.80 | | | $ | 8.29 | | | | 1.64 | % |
Class I | | $ | 1,000.00 | | | $ | 1,021.90 | | | $ | 3.19 | | | | 0.63 | % |
| * | Expenses are equal to the Fund’s annualized expense ratio for the indicated Class, multiplied by the average account value over the period, multiplied by 183/365 (to reflect the one-half year period). The Example assumes that the $1,000 was invested at the net asset value per share determined at the close of business on March 31, 2018. |
Eaton Vance
AMT-Free Municipal Income Fund
September 30, 2018
Portfolio of Investments
| | | | | | | | |
| Tax-Exempt Investments — 109.3% | |
| Security | | Principal
Amount
(000’s omitted) | | | Value | |
|
| Bond Bank — 3.4% | |
New York State Environmental Facilities Corp., 5.00%, 10/15/35(1) | | $ | 9,900 | | | $ | 10,325,502 | |
| | | | | | | $ | 10,325,502 | |
|
| Education — 10.2% | |
Connecticut Health and Educational Facilities Authority, (Fairfield University), 5.00%, 7/1/46 | | $ | 5,000 | | | $ | 5,434,100 | |
Connecticut Health and Educational Facilities Authority, (Sacred Heart University), 5.00%, 7/1/42 | | | 2,125 | | | | 2,334,716 | |
Monroe County Industrial Development Corp., NY, (University of Rochester), Series 2017C, 4.00%, 7/1/43 | | | 1,950 | | | | 1,994,752 | |
North Carolina Capital Facilities Finance Agency, (Duke University), 5.00%, 10/1/41 | | | 4,170 | | | | 4,676,113 | |
Oregon Facilities Authority, (Lewis & Clark College), 5.625%, 10/1/36 | | | 1,050 | | | | 1,145,456 | |
Pennsylvania Higher Educational Facilities Authority, (Drexel University), 5.00%, 5/1/37 | | | 1,750 | | | | 1,938,283 | |
Shelby County Health, Educational and Housing Facility Board, TN, (Rhodes College), 5.00%, 8/1/30 | | | 625 | | | | 721,650 | |
Shelby County Health, Educational and Housing Facility Board, TN, (Rhodes College), 5.00%, 8/1/31 | | | 325 | | | | 373,552 | |
Shelby County Health, Educational and Housing Facility Board, TN, (Rhodes College), 5.00%, 8/1/32 | | | 500 | | | | 572,515 | |
University of California, 5.25%, 5/15/35 | | | 3,555 | | | | 4,050,460 | |
University of Nebraska, 5.00%, 5/15/35 | | | 1,000 | | | | 1,121,780 | |
University of Nebraska, 5.00%, 7/1/35 | | | 3,000 | | | | 3,371,700 | |
West Virginia University, 5.00%, 10/1/31 | | | 3,000 | | | | 3,262,170 | |
| | | | | | | $ | 30,997,247 | |
|
| Electric Utilities — 4.4% | |
Apache County Industrial Development Authority, AZ, (Tucson Electric Power Co.), 4.50%, 3/1/30 | | $ | 1,605 | | | $ | 1,697,512 | |
Chula Vista, CA, (San Diego Gas and Electric), 5.875%, 2/15/34 | | | 3,520 | | | | 3,611,309 | |
Northern Municipal Power Agency, MN, 5.00%, 1/1/31 | | | 200 | | | | 225,132 | |
Northern Municipal Power Agency, MN, 5.00%, 1/1/32 | | | 210 | | | | 235,421 | |
Northern Municipal Power Agency, MN, 5.00%, 1/1/33 | | | 235 | | | | 262,549 | |
Northern Municipal Power Agency, MN, 5.00%, 1/1/34 | | | 210 | | | | 234,137 | |
Northern Municipal Power Agency, MN, 5.00%, 1/1/35 | | | 170 | | | | 189,152 | |
Northern Municipal Power Agency, MN, 5.00%, 1/1/36 | | | 160 | | | | 177,661 | |
Pima County Industrial Development Authority, AZ, (Tucson Electric Power Co.), 5.25%, 10/1/40 | | | 1,410 | | | | 1,489,045 | |
Utility Debt Securitization Authority, NY, 5.00%, 12/15/33 | | | 2,895 | | | | 3,225,001 | |
Vernon, CA, Electric System Revenue, 5.125%, 8/1/21 | | | 2,035 | | | | 2,084,491 | |
| | | | | | | $ | 13,431,410 | |
| | | | | | | | |
| Security | | Principal
Amount
(000’s omitted) | | | Value | |
|
| Escrowed / Prerefunded — 10.5% | |
Brooklyn Arena Local Development Corp., NY, (Barclays Center), Prerefunded to 1/15/20, 6.00%, 7/15/30 | | $ | 880 | | | $ | 926,288 | |
Brooklyn Arena Local Development Corp., NY, (Barclays Center), Prerefunded to 1/15/20, 6.25%, 7/15/40 | | | 1,320 | | | | 1,393,603 | |
Kansas Development Finance Authority, (Adventist Health System), Prerefunded to 11/15/19, 5.75%, 11/15/38 | | | 5,115 | | | | 5,328,500 | |
Massachusetts Development Finance Agency, (Tufts Medical Center), Prerefunded to 1/1/21, 6.75%, 1/1/36 | | | 470 | | | | 518,363 | |
Metropolitan Transportation Authority, NY, Prerefunded to 11/15/18, 6.50%, 11/15/28 | | | 310 | | | | 311,758 | |
Metropolitan Transportation Authority, NY, Prerefunded to 11/15/18, 6.50%, 11/15/28 | | | 1,000 | | | | 1,005,670 | |
New Jersey Turnpike Authority, Prerefunded to 7/1/22, 5.00%, 1/1/30 | | | 3,060 | | | | 3,379,250 | |
Oklahoma Development Finance Authority, (St. John Health System), Prerefunded to 2/15/22, 5.00%, 2/15/34 | | | 2,035 | | | | 2,222,485 | |
Savannah Economic Development Authority, GA, Escrowed to Maturity, 0.00%, 12/1/21 | | | 6,000 | | | | 5,598,720 | |
Triborough Bridge and Tunnel Authority, NY, Prerefunded to 11/15/18, 5.25%, 11/15/34(1) | | | 3,745 | | | | 3,760,691 | |
Vernon, CA, Electric System Revenue, Prerefunded to 8/1/19, 5.125%, 8/1/21 | | | 930 | | | | 955,510 | |
Washington, Prerefunded to 2/1/21, 5.25%, 2/1/36(1) | | | 6,000 | | | | 6,443,100 | |
| | | | | | | $ | 31,843,938 | |
|
| General Obligations — 14.3% | |
Beaverton School District No. 48J, Washington and Multnomah Counties, OR, 5.00%, 6/15/36 | | $ | 1,000 | | | $ | 1,139,000 | |
California, 5.00%, 10/1/26 | | | 1,300 | | | | 1,497,158 | |
California, 5.00%, 10/1/27 | | | 630 | | | | 723,259 | |
California, 5.25%, 10/1/29 | | | 560 | | | | 612,864 | |
California, 5.25%, 10/1/32 | | | 3,480 | | | | 3,797,863 | |
Chicago Board of Education, IL, 5.00%, 12/1/21 | | | 230 | | | | 238,351 | |
Corvallis School District No. 509J, OR, 5.00%, (0.00% until 6/15/20), 6/15/38 | | | 1,680 | | | | 1,755,415 | |
District of Columbia, 5.00%, 6/1/37(1) | | | 7,000 | | | | 7,957,880 | |
Erie County, PA, 5.00%, 9/1/25 | | | 500 | | | | 573,095 | |
Fennville Public Schools, MI, 4.00%, 5/1/34 | | | 1,000 | | | | 1,075,140 | |
Foothill-De Anza Community College District, CA, 5.00%, 8/1/34 | | | 1,150 | | | | 1,300,385 | |
Foothill-De Anza Community College District, CA, 5.00%, 8/1/36 | | | 1,150 | | | | 1,297,718 | |
Illinois, 5.00%, 1/1/26 | | | 5,000 | | | | 5,272,950 | |
Kane, Cook and DuPage Counties School District No. 46, IL, 5.00%, 1/1/31 | | | 4,470 | | | | 4,932,824 | |
Salem-Keizer School District No. 24J, OR, 0.00%, 6/15/24 | | | 1,220 | | | | 1,052,287 | |
| | | | |
| | 10 | | See Notes to Financial Statements. |
Eaton Vance
AMT-Free Municipal Income Fund
September 30, 2018
Portfolio of Investments — continued
| | | | | | | | |
| Security | | Principal
Amount
(000’s omitted) | | | Value | |
|
| General Obligations (continued) | |
Santa Clara County, CA, (Election of 2008), Prerefunded to 8/1/19, 5.00%, 8/1/39(1) | | $ | 7,700 | | | $ | 7,906,591 | |
Springfield School District No. 19, OR, 5.00%, 6/15/30 | | | 1,085 | | | | 1,234,893 | |
University of Connecticut, 5.00%, 2/15/32 | | | 650 | | | | 707,278 | |
Wentzville R-IV School District, MO, 0.00%, 3/1/29 | | | 475 | | | | 338,841 | |
| | | | | | | $ | 43,413,792 | |
|
| Hospital — 15.7% | |
California Health Facilities Financing Authority, (Catholic Healthcare West), 5.25%, 3/1/28 | | $ | 535 | | | $ | 573,279 | |
California Health Facilities Financing Authority, (Providence Health System), 5.50%, 10/1/39 | | | 5,175 | | | | 5,351,364 | |
California Health Facilities Financing Authority, (St. Joseph Health System), 5.00%, 7/1/33 | | | 1,720 | | | | 1,898,313 | |
California Health Facilities Financing Authority, (St. Joseph Health System), 5.00%, 7/1/37 | | | 2,300 | | | | 2,520,156 | |
California Health Facilities Financing Authority, (Sutter Health), 5.25%, 8/15/31 | | | 1,325 | | | | 1,437,903 | |
California Statewide Communities Development Authority, (John Muir Health), Prerefunded to 7/1/19, 5.00%, 7/1/29 | | | 1,330 | | | | 1,361,814 | |
California Statewide Communities Development Authority, (Loma Linda University Medical Center), 5.25%, 12/1/34 | | | 3,000 | | | | 3,267,840 | |
Colorado Health Facilities Authority, (Vail Valley Medical Center), 4.00%, 1/15/45 | | | 2,155 | | | | 2,130,692 | |
Colorado Health Facilities Authority, (Vail Valley Medical Center), 5.00%, 1/15/35 | | | 2,000 | | | | 2,214,400 | |
Henrico County Economic Development Authority, VA, (Bon Secours Health System, Inc.), 5.00%, 11/1/30 | | | 1,185 | | | | 1,294,411 | |
Illinois Finance Authority, (Presence Health Network), 4.00%, 2/15/36 | | | 5,345 | | | | 5,455,481 | |
Massachusetts Development Finance Agency, (Children’s Hospital), 5.00%, 10/1/31 | | | 2,110 | | | | 2,384,532 | |
Massachusetts Development Finance Agency, (Tufts Medical Center), 6.75%, 1/1/36 | | | 315 | | | | 345,369 | |
Missouri Health and Educational Facilities Authority, (Mercy Health), 5.00%, 11/15/47 | | | 3,000 | | | | 3,304,290 | |
New Jersey Health Care Facilities Financing Authority, (Princeton HealthCare System), 5.00%, 7/1/29 | | | 1,450 | | | | 1,664,194 | |
New York Dormitory Authority, (Orange Regional Medical Center), Prerefunded to 12/1/18, 6.25%, 12/1/37 | | | 3,380 | | | | 3,404,302 | |
Ohio, (University Hospitals Health Systems, Inc.), 5.00%, 1/15/36 | | | 2,500 | | | | 2,714,075 | |
Orange County Health Facilities Authority, FL, (Orlando Health, Inc.), 5.375%, 10/1/23 | | | 1,000 | | | | 1,033,660 | |
Tarrant County Cultural Education Facilities Finance Corp., TX, (Cook Children’s Medical Center), 5.25%, 12/1/39(1) | | | 5,000 | | | | 5,514,150 | |
| | | | | | | $ | 47,870,225 | |
| | | | | | | | |
| Security | | Principal
Amount
(000’s omitted) | | | Value | |
|
| Housing — 0.7% | |
Phoenix Industrial Development Authority, AZ, (Downtown Phoenix Student Housing, LLC - Arizona State University), 5.00%, 7/1/37 | | $ | 500 | | | $ | 543,790 | |
Phoenix Industrial Development Authority, AZ, (Downtown Phoenix Student Housing, LLC - Arizona State University), 5.00%, 7/1/42 | | | 1,250 | | | | 1,351,050 | |
Texas Student Housing Corp., (University of North Texas), 9.375%, 7/1/06(2) | | | 285 | | | | 252,225 | |
| | | | | | | $ | 2,147,065 | |
|
| Industrial Development Revenue — 0.9% | |
Selma Industrial Development Board, AL, (International Paper Co.), 5.80%, 5/1/34 | | $ | 2,670 | | | $ | 2,821,442 | |
| | | | | | | $ | 2,821,442 | |
|
| Insured – Education — 0.7% | |
Virginia College Building Authority, (Washington and Lee University), (NPFG), 5.25%, 1/1/31 | | $ | 1,750 | | | $ | 2,065,577 | |
| | | | | | | $ | 2,065,577 | |
|
| Insured – Electric Utilities — 2.5% | |
Long Island Power Authority, NY, Electric System Revenue, (BHAC), Prerefunded to 4/1/19, 5.75%, 4/1/33 | | $ | 5,415 | | | $ | 5,520,646 | |
Ohio Municipal Electric Generation Agency, (NPFG), 0.00%, 2/15/29 | | | 2,865 | | | | 1,993,152 | |
| | | | | | | $ | 7,513,798 | |
|
| Insured – Escrowed / Prerefunded — 0.8% | |
New Orleans Aviation Board, LA, (AGC), Prerefunded to 1/1/19, 6.00%, 1/1/23 | | $ | 1,040 | | | $ | 1,050,785 | |
Texas Transportation Commission, (Central Texas Turnpike System), (AMBAC), Escrowed to Maturity, 0.00%, 8/15/21 | | | 1,560 | | | | 1,462,157 | |
| | | | | | | $ | 2,512,942 | |
|
| Insured – General Obligations — 0.2% | |
Atlantic City, NJ, (AGM), 4.00%, 3/1/42 | | $ | 145 | | | $ | 145,613 | |
Chicago Board of Education, IL, (AGM), 5.00%, 12/1/24 | | | 505 | | | | 556,056 | |
| | | | | | | $ | 701,669 | |
|
| Insured – Lease Revenue / Certificates of Participation — 1.7% | |
Anaheim Public Financing Authority, CA, (Anaheim Public Improvements), (AGM), 0.00%, 9/1/31 | | $ | 8,680 | | | $ | 5,311,292 | |
| | | | | | | $ | 5,311,292 | |
| | | | |
| | 11 | | See Notes to Financial Statements. |
Eaton Vance
AMT-Free Municipal Income Fund
September 30, 2018
Portfolio of Investments — continued
| | | | | | | | |
| Security | | Principal
Amount
(000’s omitted) | | | Value | |
|
| Insured – Other Revenue — 1.7% | |
Harris County-Houston Sports Authority, TX, (AGM), (NPFG), 0.00%, 11/15/34 | | $ | 10,600 | | | $ | 5,307,632 | |
| | | | | | | $ | 5,307,632 | |
|
| Insured – Special Tax Revenue — 6.5% | |
Alabama Public School and College Authority, (AGM), 2.50%, 12/1/27 | | $ | 5,265 | | | $ | 5,117,211 | |
Massachusetts, Special Obligation, Dedicated Tax Revenue, (NPFG), 5.50%, 1/1/27 | | | 6,000 | | | | 7,264,020 | |
Massachusetts, Special Obligation, Dedicated Tax Revenue, (NPFG), 5.50%, 1/1/30 | | | 2,565 | | | | 3,162,158 | |
Puerto Rico Sales Tax Financing Corp., (NPFG), 0.00%, 8/1/46 | | | 12,295 | | | | 2,961,497 | |
Successor Agency to San Francisco City and County Redevelopment Agency, CA, (NPFG), 5.00%, 8/1/43 | | | 1,100 | | | | 1,224,850 | |
| | | | | | | $ | 19,729,736 | |
|
| Insured – Transportation — 8.2% | |
Chicago, IL, (O’Hare International Airport), (AGM), 5.00%, 1/1/28 | | $ | 1,000 | | | $ | 1,090,410 | |
Chicago, IL, (O’Hare International Airport), (AGM), 5.125%, 1/1/31 | | | 1,000 | | | | 1,089,100 | |
Chicago, IL, (O’Hare International Airport), (AGM), 5.25%, 1/1/32 | | | 785 | | | | 861,804 | |
E-470 Public Highway Authority, CO, (NPFG), 0.00%, 9/1/39 | | | 7,120 | | | | 2,736,359 | |
Pennsylvania Turnpike Commission, (AGM), 6.375%, 12/1/38 | | | 11,500 | | | | 14,163,630 | |
Texas Transportation Commission, (Central Texas Turnpike System), (AMBAC), 0.00%, 8/15/21 | | | 5,285 | | | | 4,926,941 | |
| | | | | | | $ | 24,868,244 | |
|
| Insured – Water and Sewer — 2.4% | |
Detroit, MI, Sewage Disposal System, (AGM), 5.00%, 7/1/39 | | $ | 4,825 | | | $ | 5,146,731 | |
Michigan Finance Authority, (Detroit Water and Sewerage Department), (AGM), 5.00%, 7/1/32 | | | 655 | | | | 722,563 | |
Michigan Finance Authority, (Detroit Water and Sewerage Department), (AGM), 5.00%, 7/1/33 | | | 565 | | | | 621,715 | |
Michigan Finance Authority, (Detroit Water and Sewerage Department), (AGM), 5.00%, 7/1/35 | | | 280 | | | | 306,561 | |
Michigan Finance Authority, (Detroit Water and Sewerage Department), (AGM), 5.00%, 7/1/37 | | | 565 | | | | 615,189 | |
| | | | | | | $ | 7,412,759 | |
|
| Other Revenue — 1.2% | |
Austin Convention Enterprises, Inc., TX, (Convention Center Hotel), 5.00%, 1/1/22 | | $ | 400 | | | $ | 432,940 | |
Central Falls Detention Facility Corp., RI, 7.25%, 7/15/35(3) | | | 1,200 | | | | 216,000 | |
| | | | | | | | |
| Security | | Principal
Amount
(000’s omitted) | | | Value | |
|
| Other Revenue (continued) | |
Cleveland-Cuyahoga County Port Authority, OH, (Playhouse Square Foundation), 5.25%, 12/1/38 | | $ | 970 | | | $ | 1,048,492 | |
Cleveland-Cuyahoga County Port Authority, OH, (Playhouse Square Foundation), 5.50%, 12/1/43 | | | 355 | | | | 388,839 | |
White Earth Band of Chippewa Indians, MN, 6.375%, 12/1/26(4) | | | 1,685 | | | | 1,685,657 | |
| | | | | | | $ | 3,771,928 | |
|
| Senior Living / Life Care — 4.0% | |
North Miami, FL, (Imperial Club), 6.125%, 1/1/42 | | $ | 1,480 | | | $ | 1,475,249 | |
Palm Beach County Health Facilities Authority, FL, (Sinai Residences of Boca Raton), 7.25%, 6/1/39 | | | 570 | | | | 645,297 | |
Palm Beach County Health Facilities Authority, FL, (Sinai Residences of Boca Raton), 7.50%, 6/1/49 | | | 2,690 | | | | 3,064,152 | |
Saint Louis County Industrial Development Authority, MO, (St. Andrew’s Resources for Seniors Obligated Group), 5.00%, 12/1/35 | | | 1,700 | | | | 1,767,286 | |
Tempe Industrial Development Authority, AZ, (Friendship Village of Tempe), 6.00%, 12/1/32 | | | 160 | | | | 169,851 | |
Tempe Industrial Development Authority, AZ, (Friendship Village of Tempe), 6.25%, 12/1/42 | | | 660 | | | | 701,864 | |
Washington Housing Finance Commission, (Horizon House), 5.00%, 1/1/32(4) | | | 1,575 | | | | 1,731,350 | |
Washington Housing Finance Commission, (Horizon House), 5.00%, 1/1/38(4) | | | 2,325 | | | | 2,527,833 | |
| | | | | | | $ | 12,082,882 | |
|
| Special Tax Revenue — 2.9% | |
Bridgeville, DE, (Heritage Shores Special Development District), 5.45%, 7/1/35 | | $ | 982 | | | $ | 968,655 | |
Jurupa Public Financing Authority, CA, 5.00%, 9/1/31 | | | 1,200 | | | | 1,333,260 | |
New York Convention Center Development Corp., Hotel Unit Fee, 0.00%, 11/15/27 | | | 800 | | | | 593,552 | |
New York Dormitory Authority, Personal Income Tax Revenue, 5.00%, 2/15/43 | | | 4,360 | | | | 4,772,456 | |
River Hall Community Development District, FL, (Capital Improvements), 5.45%, 5/1/36 | | | 1,000 | | | | 999,940 | |
| | | | | | | $ | 8,667,863 | |
|
| Transportation — 13.3% | |
Central Texas Regional Mobility Authority, Prerefunded to 1/1/21, 5.75%, 1/1/31 | | $ | 415 | | | $ | 447,208 | |
Chicago, IL, (Midway International Airport), 5.00%, 1/1/41 | | | 4,225 | | | | 4,576,731 | |
Dallas and Fort Worth, TX, (Dallas/Fort Worth International Airport), 5.25%, 11/1/30 | | | 1,100 | | | | 1,227,325 | |
Dallas and Fort Worth, TX, (Dallas/Fort Worth International Airport), 5.25%, 11/1/31 | | | 1,455 | | | | 1,621,234 | |
| | | | |
| | 12 | | See Notes to Financial Statements. |
Eaton Vance
AMT-Free Municipal Income Fund
September 30, 2018
Portfolio of Investments — continued
| | | | | | | | |
| Security | | Principal
Amount
(000’s omitted) | | | Value | |
|
| Transportation (continued) | |
Delaware River Port Authority of Pennsylvania and New Jersey, 5.00%, 1/1/31 | | $ | 685 | | | $ | 760,864 | |
Denver City and County, CO, Airport System Revenue, 2.34%, (70% of 1 mo. USD LIBOR + 0.86%), 11/15/19 (Put Date), 11/15/31(5) | | | 1,000 | | | | 1,001,800 | |
Grand Parkway Transportation Corp., TX, 5.125%, 10/1/43 | | | 1,100 | | | | 1,193,368 | |
Metropolitan Transportation Authority, NY, 5.00%, 11/15/35 | | | 490 | | | | 548,148 | |
Metropolitan Transportation Authority, NY, 6.25%, 11/15/23 | | | 430 | | | | 432,283 | |
Metropolitan Transportation Authority, NY, 6.50%, 11/15/28 | | | 960 | | | | 965,386 | |
Miami-Dade County, FL, Aviation Revenue, 5.00%, 10/1/33 | | | 6,450 | | | | 7,175,690 | |
New Orleans Aviation Board, LA, 5.00%, 1/1/43 | | | 1,555 | | | | 1,716,067 | |
San Joaquin Hills Transportation Corridor Agency, CA, 5.00%, 1/15/34 | | | 5,235 | | | | 5,720,703 | |
Texas Private Activity Bond Surface Transportation Corp., (LBJ Express Managed Lanes Project), 7.00%, 6/30/34 | | | 3,500 | | | | 3,759,560 | |
Texas Private Activity Bond Surface Transportation Corp., (North Tarrant Express Managed Lanes Project), 6.875%, 12/31/39 | | | 2,980 | | | | 3,135,556 | |
Triborough Bridge and Tunnel Authority, NY, 5.25%, 11/15/34(1) | | | 6,255 | | | | 6,280,833 | |
| | | | | | | $ | 40,562,756 | |
|
| Water and Sewer — 3.1% | |
Atlanta, GA, Water and Wastewater Revenue, 5.00%, 11/1/35(1) | | $ | 6,990 | | | $ | 8,057,862 | |
El Paso, TX, Water and Sewer Revenue, 5.00%, 3/1/31 | | | 1,080 | | | | 1,238,674 | |
| | | | | | | $ | 9,296,536 | |
| | |
Total Tax-Exempt Investments — 109.3%
(identified cost $316,164,103) | | | | | | $ | 332,656,235 | |
| |
Other Assets, Less Liabilities — (9.3)% | | | $ | (28,175,575 | ) |
| |
Net Assets — 100.0% | | | $ | 304,480,660 | |
The percentage shown for each investment category in the Portfolio of Investments is based on net assets.
At September 30, 2018, the concentration of the Fund’s investments in the various states and territories, determined as a percentage of net assets, is as follows:
| | | | |
| California | | | 19.0% | |
| New York | | | 14.9% | |
| Texas | | | 10.0% | |
| Others, representing less than 10% individually | | | 65.4% | |
The Fund invests primarily in debt securities issued by municipalities. The ability of the issuers of the debt securities to meet their obligations may be affected by economic developments in a specific industry or municipality. In order to reduce the risk associated with such economic developments, at September 30, 2018, 22.7% of total investments are backed by bond insurance of various financial institutions and financial guaranty assurance agencies. The aggregate percentage insured by an individual financial institution or financial guaranty assurance agency ranged from 0.3% to 12.3% of total investments.
| (1) | Security represents the municipal bond held by a trust that issues residual interest bonds (see Note 1H). |
| (2) | The issuer is in default on the payment of principal but continues to pay interest. |
| (3) | Defaulted security. Issuer has defaulted on the payment of interest and/or principal or has filed for bankruptcy. |
| (4) | Security exempt from registration pursuant to Rule 144A under the Securities Act of 1933, as amended. These securities may be sold in certain transactions in reliance on an exemption from registration (normally to qualified institutional buyers). At September 30, 2018, the aggregate value of these securities is $5,944,840 or 2.0% of the Fund’s net assets. |
| (5) | Floating rate security. The stated interest rate represents the rate in effect at September 30, 2018. |
| | | | |
| | 13 | | See Notes to Financial Statements. |
Eaton Vance
AMT-Free Municipal Income Fund
September 30, 2018
Portfolio of Investments — continued
| | | | | | | | | | | | | | | | | | | | |
| Futures Contracts | |
| Description | | Number of
Contracts | | | Position | | | Expiration
Month/Year | | | Notional
Amount | | | Value/Net
Unrealized
Appreciation | |
| | | | | |
Interest Rate Futures | | | | | | | | | | | | | | | | | | | | |
| U.S. 10-Year Treasury Note | | | 145 | | | | Short | | | | Dec-18 | | | $ | (17,223,281 | ) | | $ | 199,102 | |
| U.S. Long Treasury Bond | | | 121 | | | | Short | | | | Dec-18 | | | | (17,000,500 | ) | | | 405,857 | |
| | | | | |
| | | | | | | | | | | | | | | | | | | $ | 604,959 | |
Abbreviations:
| | | | |
| AGC | | – | | Assured Guaranty Corp. |
| AGM | | – | | Assured Guaranty Municipal Corp. |
| AMBAC | | – | | AMBAC Financial Group, Inc. |
| BHAC | | – | | Berkshire Hathaway Assurance Corp. |
| LIBOR | | – | | London Interbank Offered Rate |
| NPFG | | – | | National Public Finance Guaranty Corp. |
|
| Currency Abbreviations: |
| | |
| USD | | – | | United States Dollar |
| | | | |
| | 14 | | See Notes to Financial Statements. |
Eaton Vance
National Municipal Income Fund
September 30, 2018
Portfolio of Investments
| | | | | | | | |
| Tax-Exempt Municipal Securities — 102.9% | |
| Security | | Principal
Amount
(000’s omitted) | | | Value | |
|
| Bond Bank — 1.6% | |
Connecticut, (State Revolving Fund), Green Bonds, 5.00%, 3/1/28 | | $ | 10,000 | | | $ | 11,511,200 | |
New York State Environmental Facilities Corp., (New York City Municipal Water Finance Authority), 5.00%, 6/15/42 | | | 8,500 | | | | 9,633,050 | |
Rickenbacker Port Authority, OH, (OASBO Expanded Asset Pooled Financing Program), 5.375%, 1/1/32 | | | 18,195 | | | | 20,095,286 | |
| | | | | | | $ | 41,239,536 | |
|
| Cogeneration — 0.2% | |
Northampton County Industrial Development Authority, PA, (Northampton Generating), (AMT), 5.00%, 12/31/23(1) | | $ | 14,652 | | | $ | 4,395,695 | |
| | | | | | | $ | 4,395,695 | |
|
| Education — 10.6% | |
Connecticut Health and Educational Facilities Authority, (Yale University), 5.00%, 7/1/25 | | $ | 6,500 | | | $ | 7,590,830 | |
Florida Higher Educational Facilities Financing Authority, (Jacksonville University), 4.75%, 6/1/38(2) | | | 2,245 | | | | 2,318,681 | |
Massachusetts Development Finance Agency, (Harvard University), 5.00%, 7/15/33 | | | 14,415 | | | | 16,673,831 | |
Massachusetts Development Finance Agency, (Harvard University), 5.00%, 7/15/34 | | | 18,920 | | | | 21,813,057 | |
Monroe County Industrial Development Corp., NY, (University of Rochester), Series 2017C, 4.00%, 7/1/43 | | | 7,770 | | | | 7,948,322 | |
New Jersey Educational Facilities Authority, (Princeton University), 5.00%, 7/1/33 | | | 5,870 | | | | 6,900,361 | |
New Jersey Educational Facilities Authority, (Princeton University), 2017 Series B, 5.00%, 7/1/30 | | | 3,865 | | | | 4,576,469 | |
New Jersey Educational Facilities Authority, (Princeton University), 2017 Series I, 5.00%, 7/1/30 | | | 3,000 | | | | 3,552,240 | |
New York Dormitory Authority, (Columbia University), 5.00%, 10/1/38 | | | 25,685 | | | | 29,719,086 | |
New York Dormitory Authority, (State University of New York Dormitory Facilities), 5.00%, 7/1/43(3) | | | 4,200 | | | | 4,741,044 | |
Ohio Higher Educational Facility Commission, (Case Western Reserve University), 5.00%, 12/1/30 | | | 2,165 | | | | 2,513,370 | |
Oregon Facilities Authority, (Lewis & Clark College), 5.625%, 10/1/36 | | | 9,930 | | | | 10,832,736 | |
Rutgers State University, NJ, 5.00%, 5/1/43(4) | | | 37,000 | | | | 40,559,030 | |
University of California, 5.25%, 5/15/36 | | | 7,080 | | | | 8,054,845 | |
University of California, 5.25%, 5/15/37 | | | 13,000 | | | | 14,768,130 | |
University of California, 5.25%, 5/15/38 | | | 7,700 | | | | 8,738,653 | |
University of Nebraska Facilities Corp., 5.00%, 7/15/22 | | | 2,780 | | | | 3,068,647 | |
University of Texas, 3.00%, 8/15/35 | | | 1,750 | | | | 1,637,055 | |
| | | | | | | | |
| Security | | Principal
Amount
(000’s omitted) | | | Value | |
|
| Education (continued) | |
University of Virginia, 5.00%, 4/1/38 | | $ | 31,535 | | | $ | 36,056,804 | |
University of Virginia, 5.00%, 4/1/39 | | | 32,640 | | | | 37,267,699 | |
| | | | | | | $ | 269,330,890 | |
|
| Electric Utilities — 5.4% | |
Hawaii Department of Budget and Finance, (Hawaiian Electric Co.), 6.50%, 7/1/39 | | $ | 8,600 | | | $ | 8,869,610 | |
Omaha Public Power District, NE, 5.00%, 2/1/39 | | | 14,005 | | | | 15,565,857 | |
Public Power Generation Agency, NE, (Whelan Energy Center Unit 2), 5.00%, 1/1/28 | | | 6,025 | | | | 6,728,358 | |
Public Power Generation Agency, NE, (Whelan Energy Center Unit 2), 5.00%, 1/1/31 | | | 3,880 | | | | 4,290,970 | |
Unified Government of Wyandotte County/Kansas City, KS, Utility System Revenue, 5.00%, 9/1/32 | | | 10,000 | | | | 10,875,800 | |
Utility Debt Securitization Authority, NY, 5.00%, 12/15/30(4) | | | 22,500 | | | | 25,146,000 | |
Utility Debt Securitization Authority, NY, 5.00%, 12/15/31(4) | | | 27,500 | | | | 30,691,375 | |
Utility Debt Securitization Authority, NY, 5.00%, 12/15/40 | | | 13,260 | | | | 15,114,941 | |
Vernon, CA, Electric System Revenue, 5.125%, 8/1/21 | | | 18,955 | | | | 19,415,986 | |
| | | | | | | $ | 136,698,897 | |
|
| Escrowed / Prerefunded — 6.6% | |
Bexar County Health Facilities Development Corp., TX, (St. Luke’s Lutheran Hospital), Escrowed to Maturity, 7.00%, 5/1/21 | | $ | 2,400 | | | $ | 2,568,216 | |
Brooklyn Arena Local Development Corp., NY, (Barclays Center), Prerefunded to 1/15/20, 6.00%, 7/15/30 | | | 9,530 | | | | 10,031,278 | |
Brooklyn Arena Local Development Corp., NY, (Barclays Center), Prerefunded to 1/15/20, 6.25%, 7/15/40 | | | 14,295 | | | | 15,092,089 | |
Massachusetts Development Finance Agency, (Tufts Medical Center), Prerefunded to 1/1/21, 6.75%, 1/1/36 | | | 4,505 | | | | 4,968,565 | |
North Carolina, Capital Improvement Limited Obligation Bonds, Prerefunded to 5/1/20, 5.25%, 5/1/31 | | | 16,475 | | | | 17,319,508 | |
Pennsylvania Turnpike Commission, Prerefunded to 6/1/19, 5.25%, 6/1/39 | | | 4,800 | | | | 4,905,120 | |
Pennsylvania Turnpike Commission, Prerefunded to 6/1/19, 5.25%, 6/1/39 | | | 3,900 | | | | 3,985,410 | |
Pennsylvania Turnpike Commission, Prerefunded to 6/1/19, 5.25%, 6/1/39 | | | 605 | | | | 618,250 | |
Pennsylvania Turnpike Commission, Prerefunded to 12/1/20, 5.35%, 12/1/30 | | | 3,490 | | | | 3,733,218 | |
Pennsylvania Turnpike Commission, Prerefunded to 12/1/20, 5.35%, 12/1/30 | | | 4,515 | | | | 4,829,650 | |
Pennsylvania Turnpike Commission, Prerefunded to 12/1/20, 5.45%, 12/1/35 | | | 12,125 | | | | 13,008,913 | |
| | | | |
| | 15 | | See Notes to Financial Statements. |
Eaton Vance
National Municipal Income Fund
September 30, 2018
Portfolio of Investments — continued
| | | | | | | | |
| Security | | Principal
Amount
(000’s omitted) | | | Value | |
|
| Escrowed / Prerefunded (continued) | |
Pennsylvania Turnpike Commission, Prerefunded to 12/1/20, 6.00%, 12/1/34 | | $ | 3,795 | | | $ | 4,111,427 | |
Pennsylvania Turnpike Commission, Prerefunded to 12/1/20, 6.00%, 12/1/34 | | | 17,620 | | | | 19,050,039 | |
Pennsylvania Turnpike Commission, Prerefunded to 12/1/20, 6.00%, 12/1/34 | | | 3,585 | | | | 3,883,917 | |
Pennsylvania Turnpike Commission, Prerefunded to 12/1/20, 6.50%, 12/1/36 | | | 10,000 | | | | 10,950,200 | |
Southwestern Illinois Development Authority, (Memorial Group, Inc.), Prerefunded to 11/1/23, 7.25%, 11/1/33 | | | 9,170 | | | | 11,314,680 | |
Tarrant County Cultural Education Facilities Finance Corp., TX, (Scott & White Healthcare), Prerefunded to 8/15/20, 5.25%, 8/15/40 | | | 1,000 | | | | 1,057,800 | |
Tarrant County Cultural Education Facilities Finance Corp., TX, (Scott & White Healthcare), Prerefunded to 8/15/20, 5.25%, 8/15/40 | | | 12,500 | | | | 13,246,250 | |
Triborough Bridge and Tunnel Authority, NY, Prerefunded to 11/15/18,
5.25%, 11/15/34(4) | | | 14,590 | | | | 14,651,132 | |
Vernon, CA, Electric System Revenue, Prerefunded to 8/1/19, 5.125%, 8/1/21 | | | 8,705 | | | | 8,943,778 | |
| | | | | | | $ | 168,269,440 | |
|
| General Obligations — 17.3% | |
Albany County, NY, 4.00%, 4/1/29 | | $ | 4,210 | | | $ | 4,603,130 | |
California, 5.00%, 11/1/31 | | | 10,000 | | | | 11,205,900 | |
California, 5.00%, 10/1/39 | | | 11,545 | | | | 13,018,835 | |
Chicago Board of Education, IL, 5.00%, 12/1/21 | | | 1,980 | | | | 2,051,894 | |
Clackamas Community College District, OR, 5.00%, (0.00% until 6/15/20), 6/15/38 | | | 760 | | | | 781,417 | |
Clackamas Community College District, OR, 5.00%, (0.00% until 6/15/20), 6/15/39 | | | 1,000 | | | | 1,026,610 | |
Clackamas Community College District, OR, 5.00%, (0.00% until 6/15/20), 6/15/40 | | | 1,250 | | | | 1,281,312 | |
Coast Community College District, CA, (Election of 2012), 5.00%, 8/1/36 | | | 4,890 | | | | 5,660,028 | |
Delaware, 5.00%, 1/1/27 | | | 9,255 | | | | 10,976,893 | |
Desert Community College District, CA, 5.00%, 8/1/37 | | | 6,950 | | | | 7,907,293 | |
Georgetown Independent School District, TX, 2.50% to 8/1/19 (Put Date), 8/1/34 | | | 750 | | | | 752,445 | |
Georgia, 5.00%, 7/1/23 | | | 4,000 | | | | 4,507,880 | |
Glendale Community College District, CA, (Election of 2016), 5.25%, 8/1/41 | | | 10,000 | | | | 11,649,300 | |
Hawaii, 5.00%, 1/1/34 | | | 14,200 | | | | 16,403,556 | |
Highland Local School District, OH, 5.00%, 12/1/34 | | | 500 | | | | 547,535 | |
Highland Local School District, OH, 5.00%, 12/1/38 | | | 970 | | | | 1,056,902 | |
Illinois, 5.00%, 2/1/24 | | | 10,705 | | | | 11,282,107 | |
Illinois, 5.00%, 11/1/24 | | | 11,295 | | | | 11,936,443 | |
| | | | | | | | |
| Security | | Principal
Amount
(000’s omitted) | | | Value | |
|
| General Obligations (continued) | |
Illinois, 5.00%, 2/1/27 | | $ | 18,500 | | | $ | 19,235,005 | |
Illinois, 5.00%, 11/1/29 | | | 15,000 | | | | 15,735,900 | |
Illinois, 5.25%, 7/1/30 | | | 6,150 | | | | 6,473,551 | |
Kane, Cook and DuPage Counties School District No. 46, IL, 5.00%, 1/1/29 | | | 1,920 | | | | 2,127,686 | |
Kane, Cook and DuPage Counties School District No. 46, IL, 5.00%, 1/1/30 | | | 4,105 | | | | 4,540,582 | |
Klein Independent School District, TX, (PSF Guaranteed), 5.00%, 2/1/36 | | | 14,180 | | | | 15,000,455 | |
Massachusetts, 5.00%, 7/1/35 | | | 10,000 | | | | 11,219,500 | |
Massachusetts, 5.00%, 3/1/37 | | | 10,900 | | | | 12,050,495 | |
New York, NY, 4.00%, 3/1/36 | | | 8,000 | | | | 8,285,760 | |
New York, NY, 4.00%, 10/1/41 | | | 5,000 | | | | 5,090,900 | |
New York, NY, 5.00%, 8/1/33 | | | 10,000 | | | | 11,363,700 | |
Pittsburg Unified School District, CA, (Election of 2014), 5.00%, 8/1/47(3) | | | 7,345 | | | | 8,149,718 | |
Portland Community College District, OR, 5.00%, 6/15/32 | | | 2,700 | | | | 3,102,840 | |
Portland Community College District, OR, 5.00%, 6/15/33 | | | 1,875 | | | | 2,147,775 | |
Santa Clara County, CA, (Election of 2008), Prerefunded to 8/1/19, 5.00%, 8/1/39(4) | | | 57,400 | | | | 58,940,042 | |
Santa Monica-Malibu Unified School District, CA, (Election of 2012), 5.00%, 8/1/43 | | | 3,000 | | | | 3,321,900 | |
Washington, 5.00%, 2/1/33 | | | 16,800 | | | | 18,644,136 | |
Washington, 5.00%, 2/1/34 | | | 14,600 | | | | 16,857,744 | |
Washington, 5.00%, 2/1/36 | | | 11,110 | | | | 12,321,212 | |
Washington, 5.00%, 2/1/40 | | | 28,390 | | | | 31,856,987 | |
Will County Community Unit School District No. 365-U, IL, (Valley View), 5.75%, 11/1/31 | | | 12,995 | | | | 14,365,583 | |
Wisconsin, 5.00%, 5/1/32 | | | 6,650 | | | | 7,515,032 | |
Wisconsin, 5.00%, 5/1/38 | | | 25,000 | | | | 28,028,500 | |
Wisconsin, 2017 Series 1, 5.00%, 11/1/28 | | | 5,000 | | | | 5,879,650 | |
Wisconsin, 2017 Series 2, 5.00%, 11/1/28 | | | 1,000 | | | | 1,175,930 | |
| | | | | | | $ | 440,080,063 | |
|
| Hospital — 11.4% | |
California Health Facilities Financing Authority, (Catholic Healthcare West), 5.25%, 3/1/28 | | $ | 5,700 | | | $ | 6,107,835 | |
California Health Facilities Financing Authority, (Providence Health System), 5.50%, 10/1/39(4) | | | 36,700 | | | | 37,950,736 | |
California Health Facilities Financing Authority, (St. Joseph Health System), 5.00%, 7/1/33 | | | 17,530 | | | | 19,347,335 | |
California Health Facilities Financing Authority, (St. Joseph Health System), 5.00%, 7/1/37 | | | 25,465 | | | | 27,902,510 | |
California Health Facilities Financing Authority, (Sutter Health), 5.00%, 11/15/46 | | | 31,695 | | | | 35,384,615 | |
California Health Facilities Financing Authority, (Sutter Health), 5.25%, 8/15/31 | | | 13,675 | | | | 14,840,247 | |
| | | | |
| | 16 | | See Notes to Financial Statements. |
Eaton Vance
National Municipal Income Fund
September 30, 2018
Portfolio of Investments — continued
| | | | | | | | |
| Security | | Principal
Amount
(000’s omitted) | | | Value | |
|
| Hospital (continued) | |
Idaho Health Facilities Authority, (Trinity Health Credit Group), 5.00%, 12/1/45 | | $ | 2,200 | | | $ | 2,407,658 | |
Illinois Finance Authority, (Presence Health Network), 4.00%, 2/15/33 | | | 10,000 | | | | 10,323,000 | |
Illinois Finance Authority, (Presence Health Network), 5.00%, 2/15/26 | | | 7,500 | | | | 8,661,750 | |
Illinois Finance Authority, (Presence Health Network), 5.00%, 2/15/33 | | | 2,500 | | | | 2,833,925 | |
Massachusetts Development Finance Agency, (Tufts Medical Center), 6.75%, 1/1/36 | | | 3,005 | | | | 3,294,712 | |
Michigan Finance Authority, (Trinity Health Credit Group), 5.00%, 12/1/42 | | | 2,500 | | | | 2,777,200 | |
Minneapolis, MN, (Fairview Health Services), 5.00%, 11/15/33(3) | | | 2,000 | | | | 2,269,660 | |
Missouri Health and Educational Facilities Authority, (SSM Health Care), 5.00%, 6/1/30 | | | 7,505 | | | | 8,310,061 | |
New Jersey Health Care Facilities Financing Authority, (Inspira Health Obligated Group), 5.00%, 7/1/37 | | | 1,100 | | | | 1,221,594 | |
New York Dormitory Authority, (Montefiore Obligated Group), 5.00%, 8/1/28 | | | 1,700 | | | | 1,943,933 | |
Oklahoma Development Finance Authority, (OU Medicine), 5.00%, 8/15/38 | | | 1,750 | | | | 1,907,867 | |
Oklahoma Development Finance Authority, (OU Medicine), 5.25%, 8/15/43 | | | 5,200 | | | | 5,698,836 | |
Oregon Facilities Authority, (Samaritan Health Services), 5.00%, 10/1/35 | | | 2,260 | | | | 2,471,604 | |
University of California, Medical Center Revenue, 5.00%, 5/15/47 | | | 20,930 | | | | 23,190,231 | |
University of Kansas Hospital Authority, 5.00%, 9/1/45 | | | 25,500 | | | | 27,797,550 | |
Washington Health Care Facilities Authority, (Overlake Hospital Medical Center), 5.00%, 7/1/42 | | | 2,250 | | | | 2,451,420 | |
Washington Township Health Care District, CA, 6.25%, 7/1/39 | | | 16,675 | | | | 17,054,023 | |
West Virginia Hospital Finance Authority, (West Virginia United Health System Obligated Group), 5.375%, 6/1/38 | | | 21,895 | | | | 23,803,587 | |
| | | | | | | $ | 289,951,889 | |
|
| Housing — 0.4% | |
Texas Student Housing Corp., (University of Northern Texas), 6.85%, 7/1/31 | | $ | 10,640 | | | $ | 10,317,927 | |
| | | | | | | $ | 10,317,927 | |
|
| Industrial Development Revenue — 1.5% | |
Amelia County Industrial Development Authority, VA, (Waste Management, Inc.), (AMT), 2.125% to 4/1/20 (Put Date), 4/1/27 | | $ | 8,155 | | | $ | 8,124,582 | |
| | | | | | | | |
| Security | | Principal
Amount
(000’s omitted) | | | Value | |
|
| Industrial Development Revenue (continued) | |
Metropolitan Nashville Airport Authority, TN, (Aero Nashville), 5.20%, 7/1/26 | | $ | 335 | | | $ | 345,817 | |
New Jersey Economic Development Authority, (New Jersey-American Water Co., Inc.), (AMT), 5.70%, 10/1/39 | | | 28,150 | | | | 28,964,098 | |
Vermont Economic Development Authority, (Casella Waste Systems, Inc.), (AMT), 4.625% to 4/3/28 (Put Date), 4/1/36(2) | | | 475 | | | | 469,428 | |
| | | | | | | $ | 37,903,925 | |
|
| Insured – Education — 0.0%(5) | |
Metropolitan Government of Nashville and Davidson County Health and Educational Facilities Board, TN, (Meharry Medical College), (AMBAC), 6.00%, 12/1/19 | | $ | 845 | | | $ | 859,720 | |
| | | | | | | $ | 859,720 | |
|
| Insured – General Obligations — 0.4% | |
Santa Rosa High School District, CA, (Election of 2014), (AGM), 5.00%, 8/1/43 | | $ | 8,090 | | | $ | 9,133,125 | |
| | | | | | | $ | 9,133,125 | |
|
| Insured – Hospital — 0.5% | |
Medford Hospital Facilities Authority, OR, (Asante Health System), (AGM), 5.50%, 8/15/28 | | $ | 12,000 | | | $ | 12,696,120 | |
| | | | | | | $ | 12,696,120 | |
|
| Insured – Other Revenue — 1.1% | |
Harris County-Houston Sports Authority, TX, (AGM), (NPFG), 0.00%, 11/15/34 | | $ | 58,155 | | | $ | 29,119,372 | |
| | | | | | | $ | 29,119,372 | |
|
| Insured – Special Tax Revenue — 2.2% | |
Massachusetts, Special Obligation, Dedicated Tax Revenue, (NPFG), 5.50%, 1/1/29 | | $ | 11,000 | | | $ | 13,508,220 | |
Massachusetts, Special Obligation, Dedicated Tax Revenue, (NPFG), 5.50%, 1/1/30 | | | 3,080 | | | | 3,797,055 | |
Puerto Rico Sales Tax Financing Corp., (NPFG), 0.00%, 8/1/45 | | | 153,860 | | | | 39,001,971 | |
| | | | | | | $ | 56,307,246 | |
|
| Insured – Transportation — 2.1% | |
E-470 Public Highway Authority, CO, (NPFG), 0.00%, 9/1/37 | | $ | 13,335 | | | $ | 5,693,912 | |
New York Transportation Development Corp., (LaGuardia Airport Terminal B Redevelopment), (AGM), (AMT), 4.00%, 7/1/41 | | | 2,940 | | | | 2,953,348 | |
| | | | |
| | 17 | | See Notes to Financial Statements. |
Eaton Vance
National Municipal Income Fund
September 30, 2018
Portfolio of Investments — continued
| | | | | | | | |
| Security | | Principal
Amount
(000’s omitted) | | | Value | |
|
| Insured – Transportation (continued) | |
North Texas Tollway Authority, (AGC), 6.20%, 1/1/42 | | $ | 37,070 | | | $ | 43,756,686 | |
| | | | | | | $ | 52,403,946 | |
|
| Lease Revenue / Certificates of Participation — 0.6% | |
Texas, 4.00%, 8/29/19 | | $ | 10,000 | | | $ | 10,185,000 | |
Virginia Public Building Authority, (AMT), 5.00%, 8/1/26 | | | 5,015 | | | | 5,781,994 | |
| | | | | | | $ | 15,966,994 | |
|
| Nursing Home — 0.3% | |
Mississippi Business Finance Corp., (Magnolia Healthcare), 7.99%, 7/1/25 | | $ | 6,440 | | | $ | 6,500,665 | |
| | | | | | | $ | 6,500,665 | |
|
| Other Revenue — 3.1% | |
Central Falls Detention Facility Corp., RI, 7.25%, 7/15/35(6) | | $ | 250 | | | $ | 45,000 | |
Cleveland-Cuyahoga County Port Authority, OH, (Playhouse Square Foundation), 5.50%, 12/1/53 | | | 1,840 | | | | 2,004,312 | |
Kalispel Tribe of Indians, WA, Series A, 5.25%, 1/1/38(2) | | | 1,865 | | | | 1,924,120 | |
Kalispel Tribe of Indians, WA, Series B, 5.25%, 1/1/38(2) | | | 1,000 | | | | 1,031,700 | |
New York City Transitional Finance Authority, NY, (Building Aid), 5.00%, 7/15/33 | | | 10,000 | | | | 11,149,700 | |
Texas Municipal Gas Acquisition and Supply Corp. I, Gas Supply Revenue, 6.25%, 12/15/26 | | | 21,135 | | | | 24,317,720 | |
Texas Municipal Gas Acquisition and Supply Corp. III, Gas Supply Revenue, 5.00%, 12/15/30 | | | 4,845 | | | | 5,204,935 | |
Texas Municipal Gas Acquisition and Supply Corp. III, Gas Supply Revenue, 5.00%, 12/15/32 | | | 29,755 | | | | 31,868,498 | |
Washington Health Care Facilities Authority, (Fred Hutchinson Cancer Research Center), 2.594%, (67% of 1 mo. USD LIBOR + 1.10%), 7/1/22 (Put Date),
1/1/42(7) | | | 1,000 | | | | 1,011,150 | |
| | | | | | | $ | 78,557,135 | |
|
| Senior Living / Life Care — 1.2% | |
Delaware Economic Development Authority, (ACTS Retirement-Life Communities, Inc. Obligated Group), 5.00%, 11/15/48 | | $ | 2,500 | | | $ | 2,728,025 | |
Logan County, CO, (TLC Care Choices, Inc.), 6.875%, 12/1/23(8) | | | 409 | | | | 110,475 | |
New Hope Cultural Education Facilities Finance Corp., TX, (Longhorn Village), 5.00%, 1/1/47 | | | 7,500 | | | | 7,626,150 | |
North Miami, FL, (Imperial Club), 6.125%, 1/1/42 | | | 16,435 | | | | 16,382,244 | |
Rockville, MD, (Ingleside at King Farm), 5.00%, 11/1/31 | | | 1,010 | | | | 1,099,324 | |
Rockville, MD, (Ingleside at King Farm), 5.00%, 11/1/32 | | | 525 | | | | 569,929 | |
Wisconsin Health and Educational Facilities Authority, (Saint John’s Communities, Inc.), 5.00%, 9/15/40 | | | 750 | | | | 780,990 | |
| | | | | | | $ | 29,297,137 | |
| | | | | | | | |
| Security | | Principal
Amount
(000’s omitted) | | | Value | |
|
| Special Tax Revenue — 7.8% | |
Lafayette Parish School Board, LA, Sales Tax Revenue, 4.00%, 4/1/35 | | $ | 500 | | | $ | 518,240 | |
Lafayette Parish School Board, LA, Sales Tax Revenue, 5.00%, 4/1/48 | | | 3,000 | | | | 3,330,630 | |
New River Community Development District, FL, (Capital Improvements), 5.00%, 5/1/13(6) | | | 230 | | | | 0 | |
New River Community Development District, FL, (Capital Improvements), 5.35%, 5/1/38(6) | | | 80 | | | | 0 | |
New River Community Development District, FL, (Capital Improvements), Series 2010A-2, 5.75%, 5/1/38 | | | 390 | | | | 389,973 | |
New York City Transitional Finance Authority, NY, Future Tax Revenue, 4.00%, 8/1/37 | | | 4,970 | | | | 5,101,009 | |
New York City Transitional Finance Authority, NY, Future Tax Revenue, 4.00%, 8/1/41 | | | 6,750 | | | | 6,867,923 | |
New York City Transitional Finance Authority, NY, Future Tax Revenue, 5.00%, 2/1/34 | | | 6,355 | | | | 7,235,231 | |
New York City Transitional Finance Authority, NY, Future Tax Revenue, 5.00%, 2/1/36 | | | 5,000 | | | | 5,637,750 | |
New York City Transitional Finance Authority, NY, Future Tax Revenue, 5.00%, 5/1/36 | | | 14,900 | | | | 17,031,445 | |
New York City Transitional Finance Authority, NY, Future Tax Revenue, 5.00%, 8/1/36 | | | 10,000 | | | | 11,141,600 | |
New York City Transitional Finance Authority, NY, Future Tax Revenue, 5.00%, 8/1/38 | | | 8,550 | | | | 9,453,307 | |
New York City Transitional Finance Authority, NY, Future Tax Revenue, 5.00%, 5/1/39 | | | 4,240 | | | | 4,761,223 | |
New York City Transitional Finance Authority, NY, Future Tax Revenue, 5.00%, 8/1/39 | | | 11,845 | | | | 13,337,470 | |
New York City Transitional Finance Authority, NY, Future Tax Revenue, 5.00%, 8/1/40 | | | 5,000 | | | | 5,621,850 | |
New York Dormitory Authority, Personal Income Tax Revenue, 5.00%, 2/15/41 | | | 7,520 | | | | 8,446,614 | |
New York Dormitory Authority, Personal Income Tax Revenue, 5.00%, 2/15/43 | | | 21,520 | | | | 23,555,795 | |
New York Dormitory Authority, Personal Income Tax Revenue, 5.00%, 2/15/45 | | | 10,000 | | | | 10,945,000 | |
New York Dormitory Authority, Sales Tax Revenue, 5.00%, 3/15/36 | | | 8,000 | | | | 9,033,840 | |
New York Dormitory Authority, Sales Tax Revenue, 5.00%, 3/15/41 | | | 10,000 | | | | 11,237,100 | |
New York Dormitory Authority, Sales Tax Revenue, 5.00%, 3/15/43 | | | 7,610 | | | | 8,259,742 | |
New York State Urban Development Corp., Personal Income Tax Revenue, 5.00%, 3/15/35 | | | 10,000 | | | | 11,226,600 | |
Sales Tax Asset Receivables Corp., NY, 5.00%, 10/15/31 | | | 10,000 | | | | 11,362,500 | |
Southern Hills Plantation I Community Development District, FL, Series A1, 5.80%, 5/1/35 | | | 470 | | | | 469,953 | |
Southern Hills Plantation I Community Development District, FL, Series A2, 5.80%, 5/1/35 | | | 345 | | | | 314,816 | |
| | | | |
| | 18 | | See Notes to Financial Statements. |
Eaton Vance
National Municipal Income Fund
September 30, 2018
Portfolio of Investments — continued
| | | | | | | | |
| Security | | Principal
Amount
(000’s omitted) | | | Value | |
|
| Special Tax Revenue (continued) | |
Sterling Hill Community Development District, FL, 6.20%, 5/1/35 | | $ | 1,532 | | | $ | 980,254 | |
Texas Transportation Commission, 5.00%, 4/1/33(4) | | | 10,000 | | | | 11,216,600 | |
| | | | | | | $ | 197,476,465 | |
|
| Student Loan — 0.3% | |
Iowa Student Loan Liquidity Corp., 5.25%, 12/1/22 | | $ | 2,030 | | | $ | 2,074,985 | |
New Jersey Higher Education Student Assistance Authority, (AMT), 4.00%, 12/1/28 | | | 5,340 | | | | 5,498,651 | |
| | | | | | | $ | 7,573,636 | |
|
| Transportation — 22.0% | |
Central Texas Regional Mobility Authority, 5.00%, 1/1/40 | | $ | 2,105 | | | $ | 2,295,818 | |
Charleston County Airport District, SC, (AMT), 5.50%, 7/1/38 | | | 10,000 | | | | 10,995,700 | |
Chicago, IL, (Midway International Airport), 5.00%, 1/1/33 | | | 6,025 | | | | 6,526,581 | |
Chicago, IL, (Midway International Airport), (AMT), 5.00%, 1/1/34 | | | 5,250 | | | | 5,626,845 | |
Chicago, IL, (O’Hare International Airport), (AMT), 5.00%, 1/1/23 | | | 1,125 | | | | 1,232,865 | |
Chicago, IL, (O’Hare International Airport), (AMT), 5.00%, 1/1/25 | | | 16,100 | | | | 17,508,428 | |
Chicago, IL, (O’Hare International Airport), (AMT), 5.00%, 1/1/33 | | | 7,300 | | | | 7,892,249 | |
Chicago, IL, (O’Hare International Airport), Series 2016C, 5.00%, 1/1/36 | | | 6,000 | | | | 6,599,640 | |
Chicago, IL, (O’Hare International Airport), Series 2017B, 5.00%, 1/1/36 | | | 8,000 | | | | 8,895,200 | |
Dallas and Fort Worth, TX, (Dallas/Fort Worth International Airport), 5.25%, 11/1/31 | | | 10,395 | | | | 11,582,629 | |
Dallas and Fort Worth, TX, (Dallas/Fort Worth International Airport), (AMT), 5.25%, 11/1/30 | | | 11,445 | | | | 12,655,538 | |
Delaware River Port Authority of Pennsylvania and New Jersey, 5.00%, 1/1/31 | | | 5,495 | | | | 6,103,571 | |
Denver City and County, CO, Airport System Revenue, (AMT), 5.00%, 12/1/37 | | | 10,000 | | | | 11,128,300 | |
Denver City and County, CO, Airport System Revenue, (AMT), 5.00%, 12/1/43 | | | 10,000 | | | | 11,056,800 | |
Hawaii, Airports System Revenue, (AMT), 5.00%, 7/1/41 | | | 2,935 | | | | 3,210,303 | |
Hawaii, Airports System Revenue, (AMT), 5.00%, 7/1/43 | | | 10,000 | | | | 11,063,800 | |
Houston, TX, (United Airlines, Inc.), (AMT), 5.00%, 7/1/29 | | | 7,670 | | | | 8,239,037 | |
Illinois Toll Highway Authority, 5.00%, 1/1/33 | | | 2,015 | | | | 2,215,392 | |
Illinois Toll Highway Authority, 5.00%, 1/1/40 | | | 1,000 | | | | 1,097,240 | |
Kansas Department of Transportation, 5.00%, 9/1/30 | | | 20,000 | | | | 22,626,800 | |
Los Angeles Department of Airports, CA, (Los Angeles International Airport), 5.00%, 5/15/35(4) | | | 7,200 | | | | 7,548,264 | |
| | | | | | | | |
| Security | | Principal
Amount
(000’s omitted) | | | Value | |
|
| Transportation (continued) | |
Los Angeles Department of Airports, CA, (Los Angeles International Airport), (AMT), 5.00%, 5/15/23 | | $ | 5,000 | | | $ | 5,592,950 | |
Los Angeles Department of Airports, CA, (Los Angeles International Airport), (AMT), 5.00%, 5/15/40 | | | 6,000 | | | | 6,560,820 | |
Los Angeles Department of Airports, CA, (Los Angeles International Airport), (AMT), 5.00%, 5/15/41 | | | 4,000 | | | | 4,392,480 | |
Louisiana Offshore Terminal Authority, (LOOP LLC), 2.00% to 10/1/22 (Put Date), 10/1/40 | | | 2,000 | | | | 1,966,680 | |
Louisville Regional Airport Authority, KY, (AMT), 5.00%, 7/1/23 | | | 2,250 | | | | 2,485,372 | |
Maryland Department of Transportation, 4.00%, 11/1/27 | | | 8,700 | | | | 9,396,087 | |
Maryland Economic Development Corp., (Transportation Facilities), 5.00%, 6/1/35 | | | 1,050 | | | | 1,160,008 | |
Memphis-Shelby County Airport Authority, TN, (AMT), 5.00%, 7/1/35 | | | 3,440 | | | | 3,850,805 | |
Memphis-Shelby County Airport Authority, TN, (AMT), 5.00%, 7/1/36 | | | 3,615 | | | | 4,030,906 | |
Metropolitan Transportation Authority, NY, 5.25%, 11/15/33 | | | 5,550 | | | | 6,240,031 | |
Metropolitan Transportation Authority, NY, 6.25%, 11/15/23 | | | 3,735 | | | | 3,754,833 | |
Metropolitan Transportation Authority, NY, Green Bonds, 0.00%, 11/15/32 | | | 16,710 | | | | 9,681,607 | |
Metropolitan Transportation Authority, NY, Green Bonds, 4.00%, 11/15/35 | | | 5,880 | | | | 6,050,285 | |
Metropolitan Washington Airports Authority, D.C., (AMT), 5.00%, 10/1/42 | | | 2,000 | | | | 2,208,720 | |
Miami-Dade County, FL, Aviation Revenue, (AMT), 5.00%, 10/1/33 | | | 23,600 | | | | 26,036,700 | |
Miami-Dade County, FL, Aviation Revenue, (AMT), 5.00%, 10/1/36 | | | 10,000 | | | | 10,980,900 | |
Miami-Dade County, FL, Aviation Revenue, (AMT), 5.00%, 10/1/38 | | | 2,560 | | | | 2,849,587 | |
Miami-Dade County, FL, Aviation Revenue, (AMT), 5.00%, 10/1/41 | | | 2,470 | | | | 2,738,489 | |
New Jersey Turnpike Authority, 4.00%, 1/1/43 | | | 5,000 | | | | 5,100,600 | |
New Jersey Turnpike Authority, 5.00%, 1/1/32 | | | 4,875 | | | | 5,627,261 | |
New Jersey Turnpike Authority, Series 2014A, 5.00%, 1/1/31 | | | 10,000 | | | | 11,160,000 | |
New Jersey Turnpike Authority, Series 2015E, 5.00%, 1/1/31 | | | 4,305 | | | | 4,817,984 | |
New Jersey Turnpike Authority, Series 2017B, 5.00%, 1/1/31 | | | 5,760 | | | | 6,678,950 | |
New York Transportation Development Corp., (LaGuardia Airport Terminal B Redevelopment), (AMT), 5.00%, 7/1/41 | | | 7,465 | | | | 7,895,507 | |
New York Transportation Development Corp., (LaGuardia Airport Terminal B Redevelopment), (AMT), 5.00%, 7/1/46 | | | 6,625 | | | | 6,989,574 | |
| | | | |
| | 19 | | See Notes to Financial Statements. |
Eaton Vance
National Municipal Income Fund
September 30, 2018
Portfolio of Investments — continued
| | | | | | | | |
| Security | | Principal
Amount
(000’s omitted) | | | Value | |
|
| Transportation (continued) | |
North Texas Tollway Authority, Series 2016A, 5.00%, 1/1/29 | | $ | 2,885 | | | $ | 3,276,293 | |
North Texas Tollway Authority, Series 2017A, 5.00%, 1/1/29 | | | 5,000 | | | | 5,678,150 | |
North Texas Tollway Authority, 5.00%, 1/1/31 | | | 4,120 | | | | 4,647,236 | |
Oregon Department of Transportation, 5.00%, 11/15/38 | | | 12,800 | | | | 14,204,928 | |
Orlando-Orange County Expressway Authority, FL, Prerefunded to 7/1/20, 5.00%, 7/1/35 | | | 11,855 | | | | 12,447,631 | |
Orlando-Orange County Expressway Authority, FL, Prerefunded to 7/1/20, 5.00%, 7/1/35 | | | 3,145 | | | | 3,302,219 | |
Pennsylvania Turnpike Commission, 5.00%, 12/1/35 | | | 1,250 | | | | 1,398,975 | |
Pennsylvania Turnpike Commission, Prerefunded to 12/1/20, 5.35%, 12/1/30 | | | 5,005 | | | | 5,337,332 | |
Port Authority of New York and New Jersey, 4.00%, 9/1/38 | | | 1,010 | | | | 1,043,411 | |
Port Authority of New York and New Jersey, 5.00%, 9/1/36 | | | 3,000 | | | | 3,463,830 | |
Port Authority of New York and New Jersey, (AMT), 4.00%, 9/1/34 | | | 10,800 | | | | 11,120,868 | |
Port Authority of New York and New Jersey, (AMT), 5.00%, 9/15/23 | | | 17,325 | | | | 19,373,508 | |
Port Authority of New York and New Jersey, (AMT), 5.00%, 9/15/32 | | | 10,000 | | | | 11,370,700 | |
Public Finance Authority, WI, (Denver International Airport Great Hall), (AMT), 5.00%, 9/30/37 | | | 2,480 | | | | 2,695,090 | |
San Francisco City and County Airport Commission, CA, (San Francisco International Airport), (AMT), 5.00%, 5/1/23 | | | 5,000 | | | | 5,565,200 | |
San Francisco City and County Airport Commission, CA, (San Francisco International Airport), (AMT), 5.00%, 5/1/41 | | | 21,165 | | | | 23,218,005 | |
San Jose, CA, Airport Revenue, (AMT), 5.00%, 3/1/47 | | | 14,390 | | | | 15,786,118 | |
Texas Private Activity Bond Surface Transportation Corp., (LBJ Express Managed Lanes Project), 7.00%, 6/30/34 | | | 29,200 | | | | 31,365,472 | |
Texas Private Activity Bond Surface Transportation Corp., (North Tarrant Express Managed Lanes Project), 6.875%, 12/31/39 | | | 24,110 | | | | 25,368,542 | |
Triborough Bridge and Tunnel Authority, NY, 5.25%, 11/15/34(4) | | | 24,390 | | | | 24,490,731 | |
| | | | | | | $ | 559,502,375 | |
|
| Water and Sewer — 6.3% | |
Detroit, MI, Sewage Disposal System, 5.25%, 7/1/39 | | $ | 22,500 | | | $ | 24,197,850 | |
Detroit, MI, Water Supply System, 5.00%, 7/1/41 | | | 2,185 | | | | 2,281,686 | |
Detroit, MI, Water Supply System, 5.25%, 7/1/41 | | | 56,420 | | | | 60,048,370 | |
East Bay Municipal Utility District, CA, Water System Revenue, 5.00%, 6/1/35 | | | 7,460 | | | | 8,702,090 | |
East Bay Municipal Utility District, CA, Water System Revenue, 5.00%, 6/1/37 | | | 8,330 | | | | 9,491,036 | |
| | | | | | | | |
| Security | | Principal
Amount
(000’s omitted) | | | Value | |
|
| Water and Sewer (continued) | |
Michigan Finance Authority, (Detroit Water and Sewerage Department), 5.00%, 7/1/33 | | $ | 8,095 | | | $ | 8,805,256 | |
Michigan Finance Authority, (Detroit Water and Sewerage Department), 5.00%, 7/1/44 | | | 8,095 | | | | 8,628,865 | |
New York City Municipal Water Finance Authority, NY, (Water and Sewer System), 5.00%, 6/15/35 | | | 9,955 | | | | 11,221,973 | |
Northeast Ohio Regional Sewer District, 5.00%, 11/15/44 | | | 10,000 | | | | 11,045,500 | |
San Francisco City and County Public Utilities Commission, CA, Water Revenue, 5.00%, 11/1/47 | | | 4,675 | | | | 5,174,617 | |
Santa Clara Valley Water District, CA, 5.00%, 6/1/41 | | | 9,700 | | | | 10,955,180 | |
| | | | | | | $ | 160,552,423 | |
| |
Total Tax-Exempt Municipal Securities — 102.9%
(identified cost $2,539,177,117) | | | $ | 2,614,134,621 | |
|
| Taxable Municipal Securities — 3.4% | |
| Security | | Principal
Amount
(000’s omitted) | | | Value | |
| | |
| Cogeneration — 0.0%(5) | | | | | | |
Northampton County Industrial Development Authority, PA, (Northampton Generating), 5.00%, 12/31/23(1) | | $ | 2,666 | | | $ | 799,863 | |
| | | | | | | $ | 799,863 | |
|
| General Obligations — 0.5% | |
Chicago, IL, 7.75%, 1/1/42 | | $ | 11,005 | | | $ | 11,806,274 | |
| | | | | | | $ | 11,806,274 | |
|
| Hospital — 1.4% | |
California Statewide Communities Development Authority, (Loma Linda University Medical Center), 6.00%, 12/1/24 | | $ | 34,250 | | | $ | 35,841,598 | |
| | | | | | | $ | 35,841,598 | |
| | | | |
| | 20 | | See Notes to Financial Statements. |
Eaton Vance
National Municipal Income Fund
September 30, 2018
Portfolio of Investments — continued
| | | | | | | | |
| Security | | Principal
Amount
(000’s omitted) | | | Value | |
|
| Insured – Transportation — 1.5% | |
Alameda Corridor Transportation Authority, CA, (AMBAC), 0.00%, 10/1/26 | | $ | 22,500 | | | $ | 15,717,600 | |
Alameda Corridor Transportation Authority, CA, (AMBAC), 0.00%, 10/1/27 | | | 34,390 | | | | 22,765,836 | |
| | | | | | | $ | 38,483,436 | |
| |
Total Taxable Municipal Securities — 3.4%
(identified cost $81,305,995) | | | $ | 86,931,171 | |
| |
Total Investments — 106.3%
(identified cost $2,620,483,112) | | | $ | 2,701,065,792 | |
| |
Other Assets, Less Liabilities — (6.3)% | | | $ | (160,390,488 | ) |
| | |
Net Assets — 100.0% | | | | | | $ | 2,540,675,304 | |
The percentage shown for each investment category in the Portfolio of Investments is based on net assets.
At September 30, 2018, the concentration of the Fund’s investments in the various states and territories, determined as a percentage of net assets, is as follows:
| | | | |
| California | | | 21.6% | |
| New York | | | 20.1% | |
| Texas | | | 12.3% | |
| Others, representing less than 10% individually | | | 52.3% | |
The Fund invests primarily in debt securities issued by municipalities. The ability of the issuers of the debt securities to meet their obligations may be affected by economic developments in a specific industry or municipality. In order to reduce the risk associated with such economic developments, at September 30, 2018, 7.4% of total investments are backed by bond insurance of various financial institutions and financial guaranty assurance agencies. The aggregate percentage insured by an individual financial institution or financial guaranty assurance agency ranged from 1.5% to 3.4% of total investments.
| (1) | Represents a payment-in-kind security which may pay interest in additional principal at the issuer’s discretion. |
| (2) | Security exempt from registration pursuant to Rule 144A under the Securities Act of 1933, as amended. These securities may be sold in certain transactions in reliance on an exemption from registration (normally to qualified institutional buyers). At September 30, 2018, the aggregate value of these securities is $5,743,929 or 0.2% of the Fund’s net assets. |
| (3) | When-issued security. |
| (4) | Security represents the municipal bond held by a trust that issues residual interest bonds (see Note 1H). |
| (5) | Amount is less than 0.05%. |
| (6) | Defaulted security. Issuer has defaulted on the payment of interest and/or principal or has filed for bankruptcy. |
| (7) | Floating rate security. The stated interest rate represents the rate in effect at September 30, 2018. |
| (8) | Security is in default and making only partial interest payments. |
| | | | | | | | | | | | | | | | | | | | |
| Futures Contracts | |
| Description | | Number of
Contracts | | | Position | | | Expiration
Month/Year | | | Notional
Amount | | | Value/Net
Unrealized
Appreciation | |
| | | | | |
Interest Rate Futures | | | | | | | | | | | | | | | | | | | | |
| U.S. Long Treasury Bond | | | 1,500 | | | | Short | | | | Dec-18 | | | $ | (210,750,000 | ) | | $ | 5,031,282 | |
| | | | | |
| | | | | | | | | | | | | | | | | | | $ | 5,031,282 | |
Abbreviations:
| | | | |
| AGC | | – | | Assured Guaranty Corp. |
| AGM | | – | | Assured Guaranty Municipal Corp. |
| AMBAC | | – | | AMBAC Financial Group, Inc. |
| AMT | | – | | Interest earned from these securities may be considered a tax preference item for purposes of the Federal Alternative Minimum Tax. |
| LIBOR | | – | | London Interbank Offered Rate |
| NPFG | | – | | National Public Finance Guaranty Corp. |
| PSF | | – | | Permanent School Fund |
|
| Currency Abbreviations: |
| | |
| USD | | – | | United States Dollar |
| | | | |
| | 21 | | See Notes to Financial Statements. |
Eaton Vance
Municipal Income Funds
September 30, 2018
Statements of Assets and Liabilities
| | | | | | | | |
| | | September 30, 2018 | |
| Assets | | AMT-Free Fund | | | National Fund | |
Investments — | | | | | | | | |
Identified cost | | $ | 316,164,103 | | | $ | 2,620,483,112 | |
Unrealized appreciation | | | 16,492,132 | | | | 80,582,680 | |
Investments, at value | | $ | 332,656,235 | | | $ | 2,701,065,792 | |
Cash | | $ | 5,942,688 | | | $ | 89,272 | |
Deposits for derivatives collateral — financial futures contracts | | | 430,565 | | | | 3,450,000 | |
Interest receivable | | | 4,575,046 | | | | 34,771,455 | |
Receivable for investments sold | | | — | | | | 60,913,817 | |
Receivable for Fund shares sold | | | 101,503 | | | | 11,554,909 | |
Receivable for variation margin on open financial futures contracts | | | 14,368 | | | | 234,339 | |
Total assets | | $ | 343,720,405 | | | $ | 2,812,079,584 | |
| |
| Liabilities | | | | | |
Payable for floating rate notes issued | | $ | 37,473,666 | | | $ | 180,544,572 | |
Due to broker for floating rate notes redeemed | | | — | | | | 31,215,000 | |
Demand note payable | | | — | | | | 17,400,000 | |
Payable for investments purchased | | | — | | | | 11,157,522 | |
Payable for when-issued securities | | | — | | | | 15,104,068 | |
Payable for Fund shares redeemed | | | 1,044,831 | | | | 11,559,027 | |
Distributions payable | | | 181,093 | | | | 1,240,530 | |
Payable to affiliates: | | | | | | | | |
Investment adviser fee | | | 108,681 | | | | 740,387 | |
Distribution and service fees | | | 55,704 | | | | 598,907 | |
Interest expense and fees payable | | | 257,116 | | | | 1,247,735 | |
Accrued expenses | | | 118,654 | | | | 596,532 | |
Total liabilities | | $ | 39,239,745 | | | $ | 271,404,280 | |
Net Assets | | $ | 304,480,660 | | | $ | 2,540,675,304 | |
| |
| Sources of Net Assets | | | | | |
Paid-in capital | | $ | 313,735,677 | | | $ | 2,720,762,222 | |
Accumulated loss | | | (9,255,017 | ) | | | (180,086,918 | ) |
Net Assets | | $ | 304,480,660 | | | $ | 2,540,675,304 | |
| |
| Class A Shares | | | | | |
Net Assets | | $ | 139,622,792 | | | $ | 1,419,239,143 | |
Shares Outstanding | | | 15,748,579 | | | | 147,009,667 | |
Net Asset Value and Redemption Price Per Share | | | | | | | | |
(net assets ÷ shares of beneficial interest outstanding) | | $ | 8.87 | | | $ | 9.65 | |
Maximum Offering Price Per Share | | | | | | | | |
(100 ÷ 95.25 of net asset value per share) | | $ | 9.31 | | | $ | 10.13 | |
| |
| Class B Shares | | | | | |
Net Assets | | $ | — | | | $ | 1,963,902 | |
Shares Outstanding | | | — | | | | 203,410 | |
Net Asset Value and Offering Price Per Share* | | | | | | | | |
(net assets ÷ shares of beneficial interest outstanding) | | $ | — | | | $ | 9.65 | |
| | | | |
| | 22 | | See Notes to Financial Statements. |
Eaton Vance
Municipal Income Funds
September 30, 2018
Statements of Assets and Liabilities — continued
| | | | | | | | |
| | | September 30, 2018 | |
| Class C Shares | | AMT-Free Fund | | | National Fund | |
Net Assets | | $ | 32,544,841 | | | $ | 363,026,270 | |
Shares Outstanding | | | 3,691,341 | | | | 37,605,642 | |
Net Asset Value and Offering Price Per Share* | | | | | | | | |
(net assets ÷ shares of beneficial interest outstanding) | | $ | 8.82 | | | $ | 9.65 | |
| |
| Class I Shares | | | | | |
Net Assets | | $ | 132,313,027 | | | $ | 756,445,989 | |
Shares Outstanding | | | 13,662,648 | | | | 78,355,651 | |
Net Asset Value, Offering Price and Redemption Price Per Share | | | | | | | | |
(net assets ÷ shares of beneficial interest outstanding) | | $ | 9.68 | | | $ | 9.65 | |
On sales of $50,000 or more, the offering price of Class A shares is reduced.
| * | Redemption price per share is equal to the net asset value less any applicable contingent deferred sales charge. |
| | | | |
| | 23 | | See Notes to Financial Statements. |
Eaton Vance
Municipal Income Funds
September 30, 2018
Statements of Operations
| | | | | | | | |
| | | Year Ended September 30, 2018 | |
| Investment Income | | AMT-Free Fund | | | National Fund | |
Interest | | $ | 15,258,208 | | | $ | 119,032,950 | |
Total investment income | | $ | 15,258,208 | | | $ | 119,032,950 | |
|
| Expenses | |
Investment adviser fee | | $ | 1,389,722 | | | $ | 9,427,244 | |
Distribution and service fees | | | | | | | | |
Class A | | | 365,510 | | | | 3,748,213 | |
Class B | | | — | | | | 40,577 | |
Class C | | | 354,844 | | | | 4,132,905 | |
Trustees’ fees and expenses | | | 13,943 | | | | 101,500 | |
Custodian fee | | | 84,387 | | | | 479,792 | |
Transfer and dividend disbursing agent fees | | | 93,496 | | | | 1,025,065 | |
Legal and accounting services | | | 69,210 | | | | 132,799 | |
Printing and postage | | | 19,463 | | | | 115,316 | |
Registration fees | | | 62,835 | | | | 104,590 | |
Interest expense and fees | | | 779,196 | | | | 5,109,758 | |
Miscellaneous | | | 38,862 | | | | 290,595 | |
Total expenses | | $ | 3,271,468 | | | $ | 24,708,354 | |
| | |
Net investment income | | $ | 11,986,740 | | | $ | 94,324,596 | |
|
| Realized and Unrealized Gain (Loss) | |
Net realized gain (loss) — | | | | | | | | |
Investment transactions | | $ | 78,790 | | | $ | 16,443,812 | |
Financial futures contracts | | | 1,692,615 | | | | 11,599,272 | |
Net realized gain | | $ | 1,771,405 | | | $ | 28,043,084 | |
Change in unrealized appreciation (depreciation) — | | | | | | | | |
Investments | | $ | (11,208,298 | ) | | $ | (104,011,599 | ) |
Financial futures contracts | | | 107,170 | | | | 1,272,384 | |
Net change in unrealized appreciation (depreciation) | | $ | (11,101,128 | ) | | $ | (102,739,215 | ) |
| | |
Net realized and unrealized loss | | $ | (9,329,723 | ) | | $ | (74,696,131 | ) |
| | |
Net increase in net assets from operations | | $ | 2,657,017 | | | $ | 19,628,465 | |
| | | | |
| | 24 | | See Notes to Financial Statements. |
Eaton Vance
Municipal Income Funds
September 30, 2018
Statements of Changes in Net Assets
| | | | | | | | |
| | | Year Ended September 30, 2018 | |
| Increase (Decrease) in Net Assets | | AMT-Free Fund | | | National Fund | |
From operations — | | | | | | | | |
Net investment income | | $ | 11,986,740 | | | $ | 94,324,596 | |
Net realized gain | | | 1,771,405 | | | | 28,043,084 | |
Net change in unrealized appreciation (depreciation) | | | (11,101,128 | ) | | | (102,739,215 | ) |
Net increase in net assets from operations | | $ | 2,657,017 | | | $ | 19,628,465 | |
Distributions to shareholders: | | | | | | | | |
Class A | | $ | (5,434,533 | ) | | $ | (54,168,530 | ) |
Class B | | | — | | | | (114,881 | ) |
Class C | | | (1,052,649 | ) | | | (11,822,767 | ) |
Class I | | | (5,445,839 | ) | | | (29,156,764 | ) |
Total distributions to shareholders | | $ | (11,933,021 | ) | | $ | (95,262,942 | ) |
Transactions in shares of beneficial interest — | | | | | | | | |
Proceeds from sale of shares | | | | | | | | |
Class A | | $ | 12,660,956 | | | $ | 82,515,984 | |
Class B | | | — | | | | 9,791 | |
Class C | | | 1,973,015 | | | | 15,416,908 | |
Class I | | | 24,004,715 | | | | 222,154,004 | |
Net asset value of shares issued to shareholders in payment of distributions declared | | | | | | | | |
Class A | | | 4,918,893 | | | | 45,334,073 | |
Class B | | | — | | | | 100,314 | |
Class C | | | 896,217 | | | | 10,049,803 | |
Class I | | | 4,020,654 | | | | 24,393,212 | |
Cost of shares redeemed | | | | | | | | |
Class A | | | (29,294,897 | ) | | | (270,017,892 | ) |
Class B | | | — | | | | (1,148,393 | ) |
Class C | | | (8,383,713 | ) | | | (112,912,789 | ) |
Class I | | | (45,904,121 | ) | | | (245,761,233 | ) |
Net asset value of shares exchanged | | | | | | | | |
Class A | | | — | | | | 3,587,952 | |
Class B | | | — | | | | (3,587,952 | ) |
Net decrease in net assets from Fund share transactions | | $ | (35,108,281 | ) | | $ | (229,866,218 | ) |
| | |
Net decrease in net assets | | $ | (44,384,285 | ) | | $ | (305,500,695 | ) |
|
| Net Assets | |
At beginning of year | | $ | 348,864,945 | | | $ | 2,846,175,999 | |
At end of year | | $ | 304,480,660 | | | $ | 2,540,675,304 | |
| | | | |
| | 25 | | See Notes to Financial Statements. |
Eaton Vance
Municipal Income Funds
September 30, 2018
Statements of Changes in Net Assets — continued
| | | | | | | | |
| | | Year Ended September 30, 2017 | |
| Increase (Decrease) in Net Assets | | AMT-Free Fund | | | National Fund | |
From operations — | | | | | | | | |
Net investment income | | $ | 13,682,275 | | | $ | 105,975,740 | |
Net realized gain | | | 4,559,831 | | | | 31,025,039 | |
Net change in unrealized appreciation (depreciation) | | | (17,779,322 | ) | | | (109,786,377 | ) |
Net increase in net assets from operations | | $ | 462,784 | | | $ | 27,214,402 | |
Distributions to shareholders:(1) | | | | | | | | |
Class A | | $ | (6,820,357 | ) | | $ | (61,522,253 | ) |
Class B | | | (9,554 | ) | | | (340,756 | ) |
Class C | | | (1,288,630 | ) | | | (15,020,929 | ) |
Class I | | | (5,640,830 | ) | | | (28,735,950 | ) |
Total distributions to shareholders | | $ | (13,759,371 | ) | | $ | (105,619,888 | ) |
Transactions in shares of beneficial interest — | | | | | | | | |
Proceeds from sale of shares | | | | | | | | |
Class A | �� | $ | 19,621,044 | | | $ | 126,339,026 | |
Class B | | | 2,952 | | | | 97,636 | |
Class C | | | 2,335,395 | | | | 23,900,574 | |
Class I | | | 65,424,212 | | | | 374,243,229 | |
Net asset value of shares issued to shareholders in payment of distributions declared | | | | | | | | |
Class A | | | 6,287,424 | | | | 52,070,599 | |
Class B | | | 5,012 | | | | 289,706 | |
Class C | | | 1,036,787 | | | | 11,985,618 | |
Class I | | | 4,250,282 | | | | 23,093,780 | |
Cost of shares redeemed | | | | | | | | |
Class A | | | (62,858,604 | ) | | | (395,385,791 | ) |
Class B | | | (76,797 | ) | | | (2,352,032 | ) |
Class C | | | (8,361,832 | ) | | | (135,670,059 | ) |
Class I | | | (64,803,824 | ) | | | (305,867,231 | ) |
Net asset value of shares exchanged | | | | | | | | |
Class A | | | 181,803 | | | | 7,478,483 | |
Class B | | | (181,803 | ) | | | (7,478,483 | ) |
Net asset value of shares merged(2) | | | | | | | | |
Class A | | | 205,964 | | | | — | |
Class B | | | (205,964 | ) | | | — | |
Net decrease in net assets from Fund share transactions | | $ | (37,137,949 | ) | | $ | (227,254,945 | ) |
| | |
Net decrease in net assets | | $ | (50,434,536 | ) | | $ | (305,660,431 | ) |
|
| Net Assets | |
At beginning of year | | $ | 399,299,481 | | | $ | 3,151,836,430 | |
At end of year(3) | | $ | 348,864,945 | | | $ | 2,846,175,999 | |
| (1) | For the year ended September 30, 2017, the source of distributions was from net investment income. |
| (2) | At the close of business on September 20, 2017, Class B shares of AMT-Free Fund were merged into Class A shares. |
| (3) | Includes accumulated undistributed net investment income of $1,527,723 and $10,219,475, respectively, at September 30, 2017. The requirement to disclose the corresponding amounts as of September 30, 2018 was eliminated. |
| | | | |
| | 26 | | See Notes to Financial Statements. |
Eaton Vance
Municipal Income Funds
September 30, 2018
Statements of Cash Flows
| | | | | | | | |
| | | Year Ended September 30, 2018 | |
| Cash Flows From Operating Activities | | AMT-Free Fund | | | National Fund | |
Net increase in net assets from operations | | $ | 2,657,017 | | | $ | 19,628,465 | |
Adjustments to reconcile net increase in net assets from operations to net cash provided by operating activities: | | | | | | | | |
Investments purchased | | | (73,233,137 | ) | | | (1,997,347,418 | ) |
Investments sold | | | 104,092,088 | | | | 2,264,986,227 | |
Net amortization/accretion of premium (discount) | | | (271,586 | ) | | | 10,095,450 | |
Decrease in deposits for derivatives collateral — financial futures contracts | | | 99,205 | | | | 1,050,000 | |
Decrease in interest receivable | | | 84,255 | | | | 2,307,350 | |
Decrease (increase) in receivable for variation margin on open financial futures contracts | | | 15,836 | | | | (234,339 | ) |
Decrease in payable for variation margin on open financial futures contracts | | | — | | | | (46,875 | ) |
Decrease in payable to affiliate for investment adviser fee | | | (15,852 | ) | | | (79,955 | ) |
Decrease in payable to affiliate for distribution and service fees | | | (8,856 | ) | | | (120,520 | ) |
Increase (decrease) in interest expense and fees payable | | | 56,821 | | | | (139,697 | ) |
Decrease in accrued expenses | | | (26,931 | ) | | | (100,561 | ) |
Net change in unrealized (appreciation) depreciation from investments | | | 11,208,298 | | | | 104,011,599 | |
Net realized gain from investments | | | (78,790 | ) | | | (16,443,812 | ) |
Net cash provided by operating activities | | $ | 44,578,368 | | | $ | 387,565,914 | |
|
| Cash Flows From Financing Activities | |
Proceeds from Fund shares sold | | $ | 38,675,215 | | | $ | 310,481,384 | |
Fund shares redeemed | | | (83,040,042 | ) | | | (624,175,024 | ) |
Cash distributions paid | | | (2,072,865 | ) | | | (15,575,387 | ) |
Repayment of secured borrowings | | | (3,520,000 | ) | | | (85,290,000 | ) |
Increase in demand note payable | | | — | | | | 17,400,000 | |
Net cash used in financing activities | | $ | (49,957,692 | ) | | $ | (397,159,027 | ) |
| | |
Net decrease in cash | | $ | (5,379,324 | ) | | $ | (9,593,113 | ) |
| | |
Cash at beginning of year | | $ | 11,322,012 | | | $ | 9,682,385 | |
| | |
Cash at end of year | | $ | 5,942,688 | | | $ | 89,272 | |
|
| Supplemental disclosure of cash flow information: | |
Noncash financing activities not included herein consist of: | | | | | | | | |
Reinvestment of dividends and distributions | | $ | 9,835,764 | | | $ | 79,877,402 | |
Cash paid for interest and fees | | $ | 722,375 | | | $ | 5,249,455 | |
| | | | |
| | 27 | | See Notes to Financial Statements. |
Eaton Vance
Municipal Income Funds
September 30, 2018
Financial Highlights
| | | | | | | | | | | | | | | | | | | | |
| | | AMT-Free Fund — Class A | |
| | | Year Ended September 30, | |
| | | 2018 | | | 2017 | | | 2016 | | | 2015 | | | 2014 | |
Net asset value — Beginning of year | | $ | 9.130 | | | $ | 9.430 | | | $ | 9.210 | | | $ | 9.350 | | | $ | 8.670 | |
| | | | | |
| Income (Loss) From Operations | | | | | | | | | | | | | | | | | | | | |
Net investment income(1) | | $ | 0.336 | | | $ | 0.351 | | | $ | 0.358 | | | $ | 0.374 | | | $ | 0.395 | |
Net realized and unrealized gain (loss) | | | (0.262 | ) | | | (0.298 | ) | | | 0.218 | | | | (0.142 | ) | | | 0.677 | |
| | | | | |
Total income from operations | | $ | 0.074 | | | $ | 0.053 | | | $ | 0.576 | | | $ | 0.232 | | | $ | 1.072 | |
| | | | | |
| Less Distributions | | | | | | | | | | | | | | | | | | | | |
From net investment income | | $ | (0.334 | ) | | $ | (0.353 | ) | | $ | (0.356 | ) | | $ | (0.372 | ) | | $ | (0.392 | ) |
| | | | | |
Total distributions | | $ | (0.334 | ) | | $ | (0.353 | ) | | $ | (0.356 | ) | | $ | (0.372 | ) | | $ | (0.392 | ) |
| | | | | |
Net asset value — End of year | | $ | 8.870 | | | $ | 9.130 | | | $ | 9.430 | | | $ | 9.210 | | | $ | 9.350 | |
| | | | | |
Total Return(2) | | | 0.83 | % | | | 0.64 | % | | | 6.33 | % | | | 2.52 | % | | | 12.63 | % |
| | | |
| Ratios/Supplemental Data | | | | | | | | | | | | | |
Net assets, end of year (000’s omitted) | | $ | 139,623 | | | $ | 155,589 | | | $ | 198,762 | | | $ | 194,227 | | | $ | 200,408 | |
Ratios (as a percentage of average daily net assets): | | | | | | | | | | | | | | | | | | | | |
Expenses excluding interest and fees(3) | | | 0.81 | % | | | 0.82 | % | | | 0.81 | % | | | 0.82 | % | | | 0.83 | % |
Interest and fee expense(4) | | | 0.24 | % | | | 0.16 | % | | | 0.10 | % | | | 0.08 | % | | | 0.09 | % |
Total expenses(3) | | | 1.05 | % | | | 0.98 | % | | | 0.91 | % | | | 0.90 | % | | | 0.92 | % |
Net investment income | | | 3.74 | % | | | 3.86 | % | | | 3.81 | % | | | 4.02 | % | | | 4.40 | % |
Portfolio Turnover | | | 18 | % | | | 33 | % | | | 21 | % | | | 17 | % | | | 24 | % |
| (1) | Computed using average shares outstanding. |
| (2) | Returns are historical and are calculated by determining the percentage change in net asset value with all distributions reinvested and do not reflect the effect of sales charges. |
| (3) | Excludes the effect of custody fee credits, if any, of less than 0.005%. Effective September 1, 2015, custody fee credits, which were earned on cash deposit balances, were discontinued by the custodian. |
| (4) | Interest and fee expense relates to the liability for floating rate notes issued in conjunction with residual interest bond transactions (see Note 1H). |
| | | | |
| | 28 | | See Notes to Financial Statements. |
Eaton Vance
Municipal Income Funds
September 30, 2018
Financial Highlights — continued
| | | | | | | | | | | | | | | | | | | | |
| | | AMT-Free Fund — Class C | |
| | | Year Ended September 30, | |
| | | 2018 | | | 2017 | | | 2016 | | | 2015 | | | 2014 | |
Net asset value — Beginning of year | | $ | 9.080 | | | $ | 9.380 | | | $ | 9.160 | | | $ | 9.300 | | | $ | 8.620 | |
| | | | | |
| Income (Loss) From Operations | | | | | | | | | | | | | | | | | | | | |
Net investment income(1) | | $ | 0.267 | | | $ | 0.281 | | | $ | 0.286 | | | $ | 0.302 | | | $ | 0.326 | |
Net realized and unrealized gain (loss) | | | (0.262 | ) | | | (0.298 | ) | | | 0.218 | | | | (0.142 | ) | | | 0.677 | |
| | | | | |
Total income (loss) from operations | | $ | 0.005 | | | $ | (0.017 | ) | | $ | 0.504 | | | $ | 0.160 | | | $ | 1.003 | |
| | | | | |
| Less Distributions | | | | | | | | | | | | | | | | | | | | |
From net investment income | | $ | (0.265 | ) | | $ | (0.283 | ) | | $ | (0.284 | ) | | $ | (0.300 | ) | | $ | (0.323 | ) |
| | | | | |
Total distributions | | $ | (0.265 | ) | | $ | (0.283 | ) | | $ | (0.284 | ) | | $ | (0.300 | ) | | $ | (0.323 | ) |
| | | | | |
Net asset value — End of year | | $ | 8.820 | | | $ | 9.080 | | | $ | 9.380 | | | $ | 9.160 | | | $ | 9.300 | |
| | | | | |
Total Return(2) | | | 0.06 | % | | | (0.12 | )% | | | 5.56 | % | | | 1.75 | % | | | 11.84 | % |
| | | |
| Ratios/Supplemental Data | | | | | | | | | | | | | |
Net assets, end of year (000’s omitted) | | $ | 32,545 | | | $ | 39,099 | | | $ | 45,606 | | | $ | 41,903 | | | $ | 37,193 | |
Ratios (as a percentage of average daily net assets): | | | | | | | | | | | | | | | | | | | | |
Expenses excluding interest and fees(3) | | | 1.56 | % | | | 1.57 | % | | | 1.56 | % | | | 1.57 | % | | | 1.58 | % |
Interest and fee expense(4) | | | 0.24 | % | | | 0.16 | % | | | 0.10 | % | | | 0.08 | % | | | 0.09 | % |
Total expenses(3) | | | 1.80 | % | | | 1.73 | % | | | 1.66 | % | | | 1.65 | % | | | 1.67 | % |
Net investment income | | | 2.99 | % | | | 3.11 | % | | | 3.06 | % | | | 3.27 | % | | | 3.65 | % |
Portfolio Turnover | | | 18 | % | | | 33 | % | | | 21 | % | | | 17 | % | | | 24 | % |
| (1) | Computed using average shares outstanding. |
| (2) | Returns are historical and are calculated by determining the percentage change in net asset value with all distributions reinvested and do not reflect the effect of sales charges. |
| (3) | Excludes the effect of custody fee credits, if any, of less than 0.005%. Effective September 1, 2015, custody fee credits, which were earned on cash deposit balances, were discontinued by the custodian. |
| (4) | Interest and fee expense relates to the liability for floating rate notes issued in conjunction with residual interest bond transactions (see Note 1H). |
| | | | |
| | 29 | | See Notes to Financial Statements. |
Eaton Vance
Municipal Income Funds
September 30, 2018
Financial Highlights — continued
| | | | | | | | | | | | | | | | | | | | |
| | | AMT-Free Fund — Class I | |
| | | Year Ended September 30, | |
| | | 2018 | | | 2017 | | | 2016 | | | 2015 | | | 2014 | |
Net asset value — Beginning of year | | $ | 9.970 | | | $ | 10.300 | | | $ | 10.060 | | | $ | 10.210 | | | $ | 9.470 | |
| | | | | |
| Income (Loss) From Operations | | | | | | | | | | | | | | | | | | | | |
Net investment income(1) | | $ | 0.391 | | | $ | 0.407 | | | $ | 0.415 | | | $ | 0.434 | | | $ | 0.455 | |
Net realized and unrealized gain (loss) | | | (0.292 | ) | | | (0.327 | ) | | | 0.240 | | | | (0.152 | ) | | | 0.737 | |
| | | | | |
Total income from operations | | $ | 0.099 | | | $ | 0.080 | | | $ | 0.655 | | | $ | 0.282 | | | $ | 1.192 | |
| | | | | |
| Less Distributions | | | | | | | | | | | | | | | | | | | | |
From net investment income | | $ | (0.389 | ) | | $ | (0.410 | ) | | $ | (0.415 | ) | | $ | (0.432 | ) | | $ | (0.452 | ) |
| | | | | |
Total distributions | | $ | (0.389 | ) | | $ | (0.410 | ) | | $ | (0.415 | ) | | $ | (0.432 | ) | | $ | (0.452 | ) |
| | | | | |
Net asset value — End of year | | $ | 9.680 | | | $ | 9.970 | | | $ | 10.300 | | | $ | 10.060 | | | $ | 10.210 | |
| | | | | |
Total Return(2) | | | 1.02 | % | | | 0.87 | % | | | 6.60 | % | | | 2.70 | % | | | 12.99 | % |
| | | |
| Ratios/Supplemental Data | | | | | | | | | | | | | |
Net assets, end of year (000’s omitted) | | $ | 132,313 | | | $ | 154,177 | | | $ | 154,458 | | | $ | 109,937 | | | $ | 102,404 | |
Ratios (as a percentage of average daily net assets): | | | | | | | | | | | | | | | | | | | | |
Expenses excluding interest and fees(3) | | | 0.56 | % | | | 0.57 | % | | | 0.56 | % | | | 0.57 | % | | | 0.58 | % |
Interest and fee expense(4) | | | 0.24 | % | | | 0.16 | % | | | 0.10 | % | | | 0.08 | % | | | 0.09 | % |
Total expenses(3) | | | 0.80 | % | | | 0.73 | % | | | 0.66 | % | | | 0.65 | % | | | 0.67 | % |
Net investment income | | | 3.98 | % | | | 4.09 | % | | | 4.04 | % | | | 4.27 | % | | | 4.64 | % |
Portfolio Turnover | | | 18 | % | | | 33 | % | | | 21 | % | | | 17 | % | | | 24 | % |
| (1) | Computed using average shares outstanding. |
| (2) | Returns are historical and are calculated by determining the percentage change in net asset value with all distributions reinvested. |
| (3) | Excludes the effect of custody fee credits, if any, of less than 0.005%. Effective September 1, 2015, custody fee credits, which were earned on cash deposit balances, were discontinued by the custodian. |
| (4) | Interest and fee expense relates to the liability for floating rate notes issued in conjunction with residual interest bond transactions (see Note 1H). |
| | | | |
| | 30 | | See Notes to Financial Statements. |
Eaton Vance
Municipal Income Funds
September 30, 2018
Financial Highlights — continued
| | | | | | | | | | | | | | | | | | | | |
| | | National Fund — Class A | |
| | | Year Ended September 30, | |
| | | 2018 | | | 2017 | | | 2016 | | | 2015 | | | 2014 | |
Net asset value — Beginning of year | | $ | 9.930 | | | $ | 10.170 | | | $ | 9.810 | | | $ | 9.870 | | | $ | 9.170 | |
| | | | | |
| Income (Loss) From Operations | | | | | | | | | | | | | | | | | | | | |
Net investment income(1) | | $ | 0.350 | | | $ | 0.366 | | | $ | 0.385 | | | $ | 0.389 | | | $ | 0.446 | |
Net realized and unrealized gain (loss) | | | (0.277 | ) | | | (0.242 | ) | | | 0.357 | | | | (0.064 | ) | | | 0.707 | |
| | | | | |
Total income from operations | | $ | 0.073 | | | $ | 0.124 | | | $ | 0.742 | | | $ | 0.325 | | | $ | 1.153 | |
| | | | | |
| Less Distributions | | | | | | | | | | | | | | | | | | | | |
From net investment income | | $ | (0.353 | ) | | $ | (0.364 | ) | | $ | (0.382 | ) | | $ | (0.385 | ) | | $ | (0.453 | ) |
| | | | | |
Total distributions | | $ | (0.353 | ) | | $ | (0.364 | ) | | $ | (0.382 | ) | | $ | (0.385 | ) | | $ | (0.453 | ) |
| | | | | |
Net asset value — End of year | | $ | 9.650 | | | $ | 9.930 | | | $ | 10.170 | | | $ | 9.810 | | | $ | 9.870 | |
| | | | | |
Total Return(2) | | | 0.76 | % | | | 1.31 | % | | | 7.68 | % | | | 3.35 | % | | | 12.89 | % |
| | | |
| Ratios/Supplemental Data | | | | | | | | | | | | | |
Net assets, end of year (000’s omitted) | | $ | 1,419,239 | | | $ | 1,600,127 | | | $ | 1,857,375 | | | $ | 1,899,324 | | | $ | 2,126,465 | |
Ratios (as a percentage of average daily net assets): | | | | | | | | | | | | | | | | | | | | |
Expenses excluding interest and fees(3) | | | 0.69 | % | | | 0.68 | % | | | 0.67 | % | | | 0.67 | % | | | 0.71 | % |
Interest and fee expense(4) | | | 0.19 | % | | | 0.16 | % | | | 0.12 | % | | | 0.09 | % | | | 0.09 | % |
Total expenses(3) | | | 0.88 | % | | | 0.84 | % | | | 0.79 | % | | | 0.76 | % | | | 0.80 | % |
Net investment income | | | 3.58 | % | | | 3.71 | % | | | 3.83 | % | | | 3.94 | % | | | 4.71 | % |
Portfolio Turnover | | | 67 | % | | | 70 | % | | | 71 | % | | | 57 | % | | | 47 | % |
| (1) | Computed using average shares outstanding. |
| (2) | Returns are historical and are calculated by determining the percentage change in net asset value with all distributions reinvested and do not reflect the effect of sales charges. |
| (3) | Excludes the effect of custody fee credits, if any, of less than 0.005%. Effective September 1, 2015, custody fee credits, which were earned on cash deposit balances, were discontinued by the custodian. |
| (4) | Interest and fee expense relates to the liability for floating rate notes issued in conjunction with residual interest bond transactions (see Note 1H). |
| | | | |
| | 31 | | See Notes to Financial Statements. |
Eaton Vance
Municipal Income Funds
September 30, 2018
Financial Highlights — continued
| | | | | | | | | | | | | | | | | | | | |
| | | National Fund — Class B | |
| | | Year Ended September 30, | |
| | | 2018 | | | 2017 | | | 2016 | | | 2015 | | | 2014 | |
Net asset value — Beginning of year | | $ | 9.930 | | | $ | 10.170 | | | $ | 9.810 | | | $ | 9.870 | | | $ | 9.170 | |
| | | | | |
| Income (Loss) From Operations | | | | | | | | | | | | | | | | | | | | |
Net investment income(1) | | $ | 0.275 | | | $ | 0.292 | | | $ | 0.311 | | | $ | 0.315 | | | $ | 0.379 | |
Net realized and unrealized gain (loss) | | | (0.275 | ) | | | (0.242 | ) | | | 0.356 | | | | (0.064 | ) | | | 0.704 | |
| | | | | |
Total income from operations | | $ | — | | �� | $ | 0.050 | | | $ | 0.667 | | | $ | 0.251 | | | $ | 1.083 | |
| | | | | |
| Less Distributions | | | | | | | | | | | | | | | | | | | | |
From net investment income | | $ | (0.280 | ) | | $ | (0.290 | ) | | $ | (0.307 | ) | | $ | (0.311 | ) | | $ | (0.383 | ) |
| | | | | |
Total distributions | | $ | (0.280 | ) | | $ | (0.290 | ) | | $ | (0.307 | ) | | $ | (0.311 | ) | | $ | (0.383 | ) |
| | | | | |
Net asset value — End of year | | $ | 9.650 | | | $ | 9.930 | | | $ | 10.170 | | | $ | 9.810 | | | $ | 9.870 | |
| | | | | |
Total Return(2) | | | 0.01 | % | | | 0.55 | % | | | 6.88 | % | | | 2.58 | % | | | 12.06 | % |
| | | |
| Ratios/Supplemental Data | | | | | | | | | | | | | |
Net assets, end of year (000’s omitted) | | $ | 1,964 | | | $ | 6,718 | | | $ | 16,644 | | | $ | 25,732 | | | $ | 42,655 | |
Ratios (as a percentage of average daily net assets): | | | | | | | | | | | | | | | | | | | | |
Expenses excluding interest and fees(3) | | | 1.44 | % | | | 1.43 | % | | | 1.42 | % | | | 1.42 | % | | | 1.46 | % |
Interest and fee expense(4) | | | 0.19 | % | | | 0.16 | % | | | 0.12 | % | | | 0.09 | % | | | 0.09 | % |
Total expenses(3) | | | 1.63 | % | | | 1.59 | % | | | 1.54 | % | | | 1.51 | % | | | 1.55 | % |
Net investment income | | | 2.81 | % | | | 2.96 | % | | | 3.10 | % | | | 3.20 | % | | | 4.01 | % |
Portfolio Turnover | | | 67 | % | | | 70 | % | | | 71 | % | | | 57 | % | | | 47 | % |
| (1) | Computed using average shares outstanding. |
| (2) | Returns are historical and are calculated by determining the percentage change in net asset value with all distributions reinvested and do not reflect the effect of sales charges. |
| (3) | Excludes the effect of custody fee credits, if any, of less than 0.005%. Effective September 1, 2015, custody fee credits, which were earned on cash deposit balances, were discontinued by the custodian. |
| (4) | Interest and fee expense relates to the liability for floating rate notes issued in conjunction with residual interest bond transactions (see Note 1H). |
| | | | |
| | 32 | | See Notes to Financial Statements. |
Eaton Vance
Municipal Income Funds
September 30, 2018
Financial Highlights — continued
| | | | | | | | | | | | | | | | | | | | |
| | | National Fund — Class C | |
| | | Year Ended September 30, | |
| | | 2018 | | | 2017 | | | 2016 | | | 2015 | | | 2014 | |
Net asset value — Beginning of year | | $ | 9.930 | | | $ | 10.170 | | | $ | 9.810 | | | $ | 9.870 | | | $ | 9.170 | |
| | | | | |
| Income (Loss) From Operations | | | | | | | | | | | | | | | | | | | | |
Net investment income(1) | | $ | 0.276 | | | $ | 0.292 | | | $ | 0.310 | | | $ | 0.315 | | | $ | 0.376 | |
Net realized and unrealized gain (loss) | | | (0.276 | ) | | | (0.242 | ) | | | 0.357 | | | | (0.064 | ) | | | 0.707 | |
| | | | | |
Total income from operations | | $ | — | | | $ | 0.050 | | | $ | 0.667 | | | $ | 0.251 | | | $ | 1.083 | |
| | | | | |
| Less Distributions | | | | | | | | | | | | | | | | | | | | |
From net investment income | | $ | (0.280 | ) | | $ | (0.290 | ) | | $ | (0.307 | ) | | $ | (0.311 | ) | | $ | (0.383 | ) |
| | | | | |
Total distributions | | $ | (0.280 | ) | | $ | (0.290 | ) | | $ | (0.307 | ) | | $ | (0.311 | ) | | $ | (0.383 | ) |
| | | | | |
Net asset value — End of year | | $ | 9.650 | | | $ | 9.930 | | | $ | 10.170 | | | $ | 9.810 | | | $ | 9.870 | |
| | | | | |
Total Return(2) | | | 0.01 | % | | | 0.56 | % | | | 6.88 | % | | | 2.58 | % | | | 12.06 | % |
| | | |
| Ratios/Supplemental Data | | | | | | | | | | | | | |
Net assets, end of year (000’s omitted) | | $ | 363,026 | | | $ | 462,269 | | | $ | 576,664 | | | $ | 585,346 | | | $ | 645,801 | |
Ratios (as a percentage of average daily net assets): | | | | | | | | | | | | | | | | | | | | |
Expenses excluding interest and fees(3) | | | 1.44 | % | | | 1.43 | % | | | 1.42 | % | | | 1.42 | % | | | 1.46 | % |
Interest and fee expense(4) | | | 0.19 | % | | | 0.16 | % | | | 0.12 | % | | | 0.09 | % | | | 0.09 | % |
Total expenses(3) | | | 1.63 | % | | | 1.59 | % | | | 1.54 | % | | | 1.51 | % | | | 1.55 | % |
Net investment income | | | 2.83 | % | | | 2.96 | % | | | 3.08 | % | | | 3.19 | % | | | 3.98 | % |
Portfolio Turnover | | | 67 | % | | | 70 | % | | | 71 | % | | | 57 | % | | | 47 | % |
| (1) | Computed using average shares outstanding. |
| (2) | Returns are historical and are calculated by determining the percentage change in net asset value with all distributions reinvested and do not reflect the effect of sales charges. |
| (3) | Excludes the effect of custody fee credits, if any, of less than 0.005%. Effective September 1, 2015, custody fee credits, which were earned on cash deposit balances, were discontinued by the custodian. |
| (4) | Interest and fee expense relates to the liability for floating rate notes issued in conjunction with residual interest bond transactions (see Note 1H). |
| | | | |
| | 33 | | See Notes to Financial Statements. |
Eaton Vance
Municipal Income Funds
September 30, 2018
Financial Highlights — continued
| | | | | | | | | | | | | | | | | | | | |
| | | National Fund — Class I | |
| | | Year Ended September 30, | |
| | | 2018 | | | 2017 | | | 2016 | | | 2015 | | | 2014 | |
Net asset value — Beginning of year | | $ | 9.930 | | | $ | 10.170 | | | $ | 9.810 | | | $ | 9.870 | | | $ | 9.180 | |
| | | | | |
| Income (Loss) From Operations | | | | | | | | | | | | | | | | | | | | |
Net investment income(1) | | $ | 0.374 | | | $ | 0.390 | | | $ | 0.410 | | | $ | 0.413 | | | $ | 0.478 | |
Net realized and unrealized gain (loss) | | | (0.277 | ) | | | (0.241 | ) | | | 0.357 | | | | (0.063 | ) | | | 0.690 | |
| | | | | |
Total income from operations | | $ | 0.097 | | | $ | 0.149 | | | $ | 0.767 | | | $ | 0.350 | | | $ | 1.168 | |
| | | | | |
| Less Distributions | | | | | | | | | | | | | | | | | | | | |
From net investment income | | $ | (0.377 | ) | | $ | (0.389 | ) | | $ | (0.407 | ) | | $ | (0.410 | ) | | $ | (0.478 | ) |
| | | | | |
Total distributions | | $ | (0.377 | ) | | $ | (0.389 | ) | | $ | (0.407 | ) | | $ | (0.410 | ) | | $ | (0.478 | ) |
| | | | | |
Net asset value — End of year | | $ | 9.650 | | | $ | 9.930 | | | $ | 10.170 | | | $ | 9.810 | | | $ | 9.870 | |
| | | | | |
Total Return(2) | | | 1.01 | % | | | 1.56 | % | | | 7.94 | % | | | 3.50 | % | | | 13.17 | % |
| | | |
| Ratios/Supplemental Data | | | | | | | | | | | | | |
Net assets, end of year (000’s omitted) | | $ | 756,446 | | | $ | 777,063 | | | $ | 701,153 | | | $ | 674,696 | | | $ | 686,514 | |
Ratios (as a percentage of average daily net assets): | | | | | | | | | | | | | | | | | | | | |
Expenses excluding interest and fees(3) | | | 0.44 | % | | | 0.43 | % | | | 0.42 | % | | | 0.42 | % | | | 0.46 | % |
Interest and fee expense(4) | | | 0.19 | % | | | 0.16 | % | | | 0.12 | % | | | 0.09 | % | | | 0.09 | % |
Total expenses(3) | | | 0.63 | % | | | 0.59 | % | | | 0.54 | % | | | 0.51 | % | | | 0.55 | % |
Net investment income | | | 3.83 | % | | | 3.95 | % | | | 4.09 | % | | | 4.19 | % | | | 5.07 | % |
Portfolio Turnover | | | 67 | % | | | 70 | % | | | 71 | % | | | 57 | % | | | 47 | % |
| (1) | Computed using average shares outstanding. |
| (2) | Returns are historical and are calculated by determining the percentage change in net asset value with all distributions reinvested. |
| (3) | Excludes the effect of custody fee credits, if any, of less than 0.005%. Effective September 1, 2015, custody fee credits, which were earned on cash deposit balances, were discontinued by the custodian. |
| (4) | Interest and fee expense relates to the liability for floating rate notes issued in conjunction with residual interest bond transactions (see Note 1H). |
| | | | |
| | 34 | | See Notes to Financial Statements. |
Eaton Vance
Municipal Income Funds
September 30, 2018
Notes to Financial Statements
1 Significant Accounting Policies
Eaton Vance AMT-Free Municipal Income Fund (AMT-Free Fund) and Eaton Vance National Municipal Income Fund (National Fund) (each individually referred to as the Fund, and collectively, the Funds) are a diversified series of Eaton Vance Mutual Funds Trust and Eaton Vance Municipals Trust, respectively (collectively, the Trusts). The Trusts are Massachusetts business trusts registered under the Investment Company Act of 1940, as amended (the 1940 Act), as open-end management investment companies. The Funds’ investment objective is to provide current income exempt from regular federal income tax. The AMT-Free Fund offers three classes of shares. The National Fund offers four classes of shares. Class A shares are generally sold subject to a sales charge imposed at time of purchase. Class B and Class C shares are sold at net asset value and are generally subject to a contingent deferred sales charge (see Note 5). Class I shares are sold at net asset value and are not subject to a sales charge. Class B shares of National Fund automatically convert to Class A shares eight years after their purchase as described in National Fund’s prospectus. Beginning January 1, 2012, Class B shares are only available for purchase upon exchange from another Eaton Vance fund or through reinvestment of distributions. Each class represents a pro-rata interest in the Fund, but votes separately on class-specific matters and (as noted below) is subject to different expenses. Realized and unrealized gains and losses are allocated daily to each class of shares based on the relative net assets of each class to the total net assets of the Fund. Net investment income, other than class-specific expenses, is allocated daily to each class of shares based upon the ratio of the value of each class’s paid shares to the total value of all paid shares. Each class of shares differs in its distribution plan and certain other class-specific expenses.
The following is a summary of significant accounting policies of the Funds. The policies are in conformity with accounting principles generally accepted in the United States of America (U.S. GAAP). Each Fund is an investment company and follows accounting and reporting guidance in the Financial Accounting Standards Board (FASB) Accounting Standards Codification Topic 946.
A Investment Valuation — The following methodologies are used to determine the market value or fair value of investments.
Debt Obligations. Debt obligations are generally valued on the basis of valuations provided by third party pricing services, as derived from such services’ pricing models. Inputs to the models may include, but are not limited to, reported trades, executable bid and asked prices, broker/dealer quotations, prices or yields of securities with similar characteristics, interest rates, anticipated prepayments, benchmark curves or information pertaining to the issuer, as well as industry and economic events. The pricing services may use a matrix approach, which considers information regarding securities with similar characteristics to determine the valuation for a security. Short-term obligations purchased with a remaining maturity of sixty days or less for which a valuation from a third party pricing service is not readily available may be valued at amortized cost, which approximates fair value.
Derivatives. Financial futures contracts are valued at the closing settlement price established by the board of trade or exchange on which they are traded.
Fair Valuation. Investments for which valuations or market quotations are not readily available or are deemed unreliable are valued at fair value using methods determined in good faith by or at the direction of the Trustees of a Fund in a manner that fairly reflects the security’s value, or the amount that a Fund might reasonably expect to receive for the security upon its current sale in the ordinary course. Each such determination is based on a consideration of relevant factors, which are likely to vary from one pricing context to another. These factors may include, but are not limited to, the type of security, the existence of any contractual restrictions on the security’s disposition, the price and extent of public trading in similar securities of the issuer or of comparable entities, quotations or relevant information obtained from broker/dealers or other market participants, information obtained from the issuer, analysts, and/or the appropriate stock exchange (for exchange-traded securities), an analysis of the entity’s financial condition, and an evaluation of the forces that influence the issuer and the market(s) in which the security is purchased and sold.
B Investment Transactions and Related Income — Investment transactions for financial statement purposes are accounted for on a trade date basis. Realized gains and losses on investments sold are determined on the basis of identified cost. Interest income is recorded on the basis of interest accrued, adjusted for amortization of premium or accretion of discount.
C Federal Taxes — Each Fund’s policy is to comply with the provisions of the Internal Revenue Code applicable to regulated investment companies and to distribute to shareholders each year substantially all of its taxable, if any, and tax-exempt net investment income, and all or substantially all of its net realized capital gains. Accordingly, no provision for federal income or excise tax is necessary. Each Fund intends to satisfy conditions which will enable it to designate distributions from the interest income generated by its investments in non-taxable municipal securities, which are exempt from regular federal income tax when received by each Fund, as exempt-interest dividends. For National Fund, the portion of such interest, if any, earned on private activity bonds issued after August 7, 1986, may be considered a tax preference item to shareholders.
As of September 30, 2018, the Funds had no uncertain tax positions that would require financial statement recognition, de-recognition, or disclosure. Each Fund files a U.S. federal income tax return annually after its fiscal year-end, which is subject to examination by the Internal Revenue Service for a period of three years from the date of filing.
D Expenses — The majority of expenses of the Trusts are directly identifiable to an individual fund. Expenses which are not readily identifiable to a specific fund are allocated taking into consideration, among other things, the nature and type of expense and the relative size of the funds.
E Legal Fees — Legal fees and other related expenses incurred as part of negotiations of the terms and requirement of capital infusions, or that are expected to result in the restructuring of, or a plan of reorganization for, an investment are recorded as realized losses. Ongoing expenditures to protect or enhance an investment are treated as operating expenses.
Eaton Vance
Municipal Income Funds
September 30, 2018
Notes to Financial Statements — continued
F Use of Estimates — The preparation of the financial statements in conformity with U.S. GAAP requires management to make estimates and assumptions that affect the reported amounts of assets and liabilities at the date of the financial statements and the reported amounts of income and expense during the reporting period. Actual results could differ from those estimates.
G Indemnifications — Under each Trust’s organizational documents, its officers and Trustees may be indemnified against certain liabilities and expenses arising out of the performance of their duties to the Funds. Under Massachusetts law, if certain conditions prevail, shareholders of a Massachusetts business trust (such as a Trust) could be deemed to have personal liability for the obligations of the Trust. However, each Trust’s Declaration of Trust contains an express disclaimer of liability on the part of Fund shareholders and the By-laws provide that the Trust shall assume the defense on behalf of any Fund shareholders. Moreover, the By-laws also provide for indemnification out of Fund property of any shareholder held personally liable solely by reason of being or having been a shareholder for all loss or expense arising from such liability. Additionally, in the normal course of business, each Fund enters into agreements with service providers that may contain indemnification clauses. Each Fund’s maximum exposure under these arrangements is unknown as this would involve future claims that may be made against each Fund that have not yet occurred.
H Floating Rate Notes Issued in Conjunction with Securities Held — The Funds may invest in residual interest bonds, also referred to as inverse floating rate securities, whereby a Fund may sell a variable or fixed rate bond for cash to a Special-Purpose Vehicle (the SPV), (which is generally organized as a trust), while at the same time, buying a residual interest in the assets and cash flows of the SPV. The bond is deposited into the SPV with the same CUSIP number as the bond sold to the SPV by the Fund, and which may have been, but is not required to be, the bond purchased from the Fund (the Bond). The SPV also issues floating rate notes (Floating Rate Notes) which are sold to third-parties. The residual interest bond held by a Fund gives the Fund the right (1) to cause the holders of the Floating Rate Notes to generally tender their notes at par, and (2) to have the Bond held by the SPV transferred to the Fund, thereby terminating the SPV. Should the Fund exercise such right, it would generally pay the SPV the par amount due on the Floating Rate Notes and exchange the residual interest bond for the underlying Bond. Pursuant to generally accepted accounting principles for transfers and servicing of financial assets and extinguishment of liabilities, the Funds account for the transaction described above as a secured borrowing by including the Bond in their Portfolio of Investments and the Floating Rate Notes as a liability under the caption “Payable for floating rate notes issued” in their Statement of Assets and Liabilities. The Floating Rate Notes have interest rates that generally reset weekly and their holders have the option to tender their notes to the SPV for redemption at par at each reset date. Accordingly, the fair value of the payable for floating rate notes issued approximates its carrying value. If measured at fair value, the payable for floating rate notes would have been considered as Level 2 in the fair value hierarchy (see Note 10) at September 30, 2018. Interest expense related to a Fund’s liability with respect to Floating Rate Notes is recorded as incurred. The SPV may be terminated by the Fund, as noted above, or by the occurrence of certain termination events as defined in the trust agreement, such as a downgrade in the credit quality of the underlying Bond, bankruptcy of or payment failure by the issuer of the underlying Bond, the inability to remarket Floating Rate Notes that have been tendered due to insufficient buyers in the market, or the failure by the SPV to obtain renewal of the liquidity agreement under which liquidity support is provided for the Floating Rate Notes up to one year. At September 30, 2018, the amounts of the Funds’ Floating Rate Notes and related interest rates and collateral were as follows:
| | | | | | | | |
| | | AMT-Free
Fund | | | National Fund | |
| | |
Floating Rate Notes Outstanding | | $ | 37,473,666 | | | $ | 180,544,572 | |
Interest Rate or Range of Interest Rates (%) | | | 1.58 - 1.61 | | | | 1.58 - 1.59 | |
Collateral for Floating Rate Notes Outstanding | | $ | 56,246,609 | | | $ | 251,193,910 | |
For the year ended September 30, 2018, the Funds’ average settled Floating Rate Notes outstanding and the average interest rate including fees were as follows:
| | | | | | | | |
| | | AMT-Free
Fund | | | National Fund | |
| | |
Average Floating Rate Notes Outstanding | | $ | 39,928,466 | | | $ | 265,330,164 | |
Average Interest Rate | | | 1.95 | % | | | 1.93 | % |
In certain circumstances, the Funds may enter into shortfall and forbearance agreements with brokers by which a Fund agrees to reimburse the broker for the difference between the liquidation value of the Bond held by the SPV and the liquidation value of the Floating Rate Notes, as well as any shortfalls in interest cash flows. The Funds had no shortfalls as of September 30, 2018.
The Funds may also purchase residual interest bonds in a secondary market transaction without first owning the underlying bond. Such transactions are not required to be treated as secured borrowings. Shortfall agreements, if any, related to residual interest bonds purchased in a secondary market transaction are disclosed in the Portfolio of Investments.
Eaton Vance
Municipal Income Funds
September 30, 2018
Notes to Financial Statements — continued
The Funds’ investment policies and restrictions expressly permit investments in residual interest bonds. Such bonds typically offer the potential for yields exceeding the yields available on fixed rate bonds with comparable credit quality and maturity. These securities tend to underperform the market for fixed rate bonds in a rising long-term interest rate environment, but tend to outperform the market for fixed rate bonds when long-term interest rates decline. The value and income of residual interest bonds are generally more volatile than that of a fixed rate bond. The Funds’ investment policies do not allow the Funds to borrow money except as permitted by the 1940 Act. Management believes that the Funds’ restrictions on borrowing money and issuing senior securities (other than as specifically permitted) do not apply to Floating Rate Notes issued by the SPV and included as a liability in the Funds’ Statement of Assets and Liabilities. As secured indebtedness issued by an SPV, Floating Rate Notes are distinct from the borrowings and senior securities to which the Funds’ restrictions apply. Residual interest bonds held by the Funds are securities exempt from registration under Rule 144A of the Securities Act of 1933.
I Financial Futures Contracts — Upon entering into a financial futures contract, a Fund is required to deposit with the broker, either in cash or securities, an amount equal to a certain percentage of the contract amount (initial margin). Subsequent payments, known as variation margin, are made or received by the Fund each business day, depending on the daily fluctuations in the value of the underlying security, and are recorded as unrealized gains or losses by the Fund. Gains (losses) are realized upon the expiration or closing of the financial futures contracts. Should market conditions change unexpectedly, the Fund may not achieve the anticipated benefits of the financial futures contracts and may realize a loss. Futures contracts have minimal counterparty risk as they are exchange traded and the clearinghouse for the exchange is substituted as the counterparty, guaranteeing counterparty performance.
J When-Issued Securities and Delayed Delivery Transactions — The Funds may purchase or sell securities on a delayed delivery or when-issued basis. Payment and delivery may take place after the customary settlement period for that security. At the time the transaction is negotiated, the price of the security that will be delivered is fixed. The Funds maintain cash and/or security positions for these commitments such that sufficient liquid assets will be available to make payments upon settlement. Securities purchased on a delayed delivery or when-issued basis are marked-to-market daily and begin earning interest on settlement date. Losses may arise due to changes in the market value of the underlying securities or if the counterparty does not perform under the contract.
K Statement of Cash Flows — The cash amount shown in the Statement of Cash Flows of a Fund is the amount included in the Fund’s Statement of Assets and Liabilities and represents the unrestricted cash on hand at its custodian and does not include any short-term investments.
2 Distributions to Shareholders and Income Tax Information
The net investment income of each Fund is determined daily and substantially all of the net investment income so determined is declared as a dividend to shareholders of record at the time of declaration. Distributions are declared separately for each class of shares. Distributions are paid monthly. Distributions of realized capital gains (reduced by available capital loss carryforwards from prior years) are made at least annually. Shareholders may reinvest income and capital gain distributions in additional shares of the same class of a Fund at the net asset value as of the reinvestment date or, at the election of the shareholder, receive distributions in cash. Distributions to shareholders are determined in accordance with income tax regulations, which may differ from U.S. GAAP. As required by U.S. GAAP, only distributions in excess of tax basis earnings and profits are reported in the financial statements as a return of capital. Permanent differences between book and tax accounting relating to distributions are reclassified to paid-in capital. For tax purposes, distributions from short-term capital gains are considered to be from ordinary income.
The tax character of distributions declared for the years ended September 30, 2018 and September 30, 2017 was as follows:
| | | | | | | | | | | | | | | | |
| | | AMT-Free Fund | | | National Fund | |
| | | Year Ended September 30, | | | Year Ended September 30, | |
| | | 2018 | | | 2017 | | | 2018 | | | 2017 | |
| | | | |
Tax-exempt income | | $ | 11,929,426 | | | $ | 13,629,608 | | | $ | 88,289,992 | | | $ | 99,639,707 | |
Ordinary income | | $ | 3,595 | | | $ | 129,763 | | | $ | 6,972,950 | | | $ | 5,980,181 | |
During the year ended September 30, 2018, the following amounts were reclassified due to expired capital loss carryforwards.
| | | | | | | | |
| | | AMT-Free
Fund | | | National Fund | |
| | |
Change in: | | | | | | | | |
Paid-in capital | | $ | (10,549,691 | ) | | $ | (797,269,778 | ) |
Accumulated loss | | $ | 10,549,691 | | | $ | 797,269,778 | |
These reclassifications had no effect on the net assets or net asset value per share of the Funds.
Eaton Vance
Municipal Income Funds
September 30, 2018
Notes to Financial Statements — continued
As of September 30, 2018, the components of distributable earnings (accumulated loss) on a tax basis were as follows:
| | | | | | | | |
| | | AMT-Free
Fund | | | National Fund | |
| | |
Undistributed tax-exempt income | | $ | 1,708,817 | | | $ | 11,502,329 | |
Capital loss carryforwards and deferred capital losses | | $ | (27,565,059 | ) | | $ | (303,314,491 | ) |
Net unrealized appreciation | | $ | 16,782,318 | | | $ | 112,965,774 | |
Other temporary differences | | $ | (181,093 | ) | | $ | (1,240,530 | ) |
At September 30, 2018, the following Funds, for federal income tax purposes, had capital loss carryforwards and deferred capital losses which would reduce the respective Fund’s taxable income arising from future net realized gains on investment transactions, if any, to the extent permitted by the Internal Revenue Code, and thus would reduce the amount of distributions to shareholders, which would otherwise be necessary to relieve the Funds of any liability for federal income or excise tax. Under tax regulations, capital losses incurred in taxable years beginning after December 2010 are considered deferred capital losses and are treated as arising on the first day of a Fund’s next taxable year, retaining the same short-term or long-term character as when originally deferred. Deferred capital losses are required to be used prior to capital loss carryforwards, which carry an expiration date. As a result of this ordering rule, capital loss carryforwards may be more likely to expire unused. The amounts and expiration dates of the capital loss carryforwards, whose character is short-term, and the amounts of the deferred capital losses are as follows:
| | | | | | | | |
| Expiration Date | | AMT-Free
Fund | | | National Fund | |
September 30, 2019 | | $ | — | | | $ | 56,374,590 | |
| | |
Total capital loss carryforwards | | $ | — | | | $ | 56,374,590 | |
| | |
Deferred capital losses: | | | | | | | | |
Short-term | | $ | 13,995,870 | | | $ | 150,318,092 | |
Long-term | | $ | 13,569,189 | | | $ | 96,621,809 | |
The cost and unrealized appreciation (depreciation) of investments, including open derivative contracts, of each Fund at September 30, 2018, as determined on a federal income tax basis, were as follows:
| | | | | | | | |
| | | AMT-Free
Fund | | | National Fund | |
| | |
Aggregate cost | | $ | 278,400,251 | | | $ | 2,407,555,446 | |
| | |
Gross unrealized appreciation | | $ | 19,207,095 | | | $ | 138,302,615 | |
Gross unrealized depreciation | | | (2,424,777 | ) | | | (25,336,841 | ) |
| | |
Net unrealized appreciation | | $ | 16,782,318 | | | $ | 112,965,774 | |
Eaton Vance
Municipal Income Funds
September 30, 2018
Notes to Financial Statements — continued
3 Investment Adviser Fee and Other Transactions with Affiliates
The investment adviser fee is earned by Eaton Vance Management (EVM) for AMT-Free Fund and Boston Management and Research (BMR), a subsidiary of EVM, for National Fund as compensation for management and investment advisory services rendered to each Fund. The fee is based upon a percentage of average daily net assets plus a percentage of gross income (i.e., income other than gains from the sale of securities) as presented in the following table and is payable monthly.
| | | | | | | | |
| Daily Net Assets | | Annual Asset
Rate | | | Daily Income
Rate | |
| | |
Up to $500 million | | | 0.300 | % | | | 3.00 | % |
$500 million up to $1 billion | | | 0.275 | | | | 2.75 | |
$1 billion up to $1.5 billion | | | 0.250 | | | | 2.50 | |
$1.5 billion up to $2 billion | | | 0.225 | | | | 2.25 | |
$2 billion up to $3 billion | | | 0.200 | | | | 2.00 | |
$3 billion and over | | | 0.175 | | | | 1.75 | |
For the year ended September 30, 2018, investment adviser fees incurred by the Funds and the effective annual rates, as a percentage of average daily net assets, were as follows:
| | | | | | | | |
| | | AMT-Free
Fund | | | National
Fund | |
| | |
Investment Adviser Fee | | $ | 1,389,722 | | | $ | 9,427,244 | |
Effective Annual Rate | | | 0.44 | % | | | 0.35 | % |
EVM serves as the administrator of each Fund, but receives no compensation. EVM provides sub-transfer agency and related services to the Funds pursuant to a Sub-Transfer Agency Support Services Agreement. Eaton Vance Distributors, Inc. (EVD), an affiliate of EVM and the Funds’ principal underwriter, received a portion of the sales charge on sales of Class A shares of the Funds. EVD also received distribution and service fees from Class A, Class B and Class C shares (see Note 4) and contingent deferred sales charges (see Note 5). Sub-transfer agent fees earned by EVM, which are included in transfer and dividend disbursing agent fees on the Statements of Operations, and Class A sales charges that the Funds were informed were received by EVD for the year ended September 30, 2018 were as follows:
| | | | | | | | |
| | | AMT-Free
Fund | | | National
Fund | |
| | |
EVM’s Sub-Transfer Agent Fees | | $ | 12,080 | | | $ | 124,917 | |
EVD’s Class A Sales Charges | | $ | 12,575 | | | $ | 86,883 | |
Trustees and officers of the Funds who are members of EVM’s or BMR’s organizations receive remuneration for their services to the Funds out of the investment adviser fee. Trustees of the Funds who are not affiliated with the investment advisers may elect to defer receipt of all or a percentage of their annual fees in accordance with the terms of the Trustees Deferred Compensation Plan. For the year ended September 30, 2018, no significant amounts have been deferred. Certain officers and Trustees of the Funds are officers of the above organizations.
4 Distribution Plans
Each Fund has in effect a distribution plan for Class A shares (Class A Plan) pursuant to Rule 12b-1 under the 1940 Act. Pursuant to the Class A Plan, each Fund pays EVD a distribution and service fee of 0.25% per annum of its average daily net assets attributable to Class A shares for distribution services and facilities provided to each Fund by EVD, as well as for personal services and/or the maintenance of shareholder accounts. Distribution and service fees paid or accrued to EVD for the year ended September 30, 2018 for Class A shares amounted to the following:
| | | | | | | | |
| | | AMT-Free
Fund | | | National
Fund | |
| | |
Class A Distribution and Service Fees | | $ | 365,510 | | | $ | 3,748,213 | |
Eaton Vance
Municipal Income Funds
September 30, 2018
Notes to Financial Statements — continued
Each Fund also has in effect distribution plans for Class B shares (Class B Plan) and/or Class C shares (Class C Plan) pursuant to Rule 12b-1 under the 1940 Act. Pursuant to the Class B and Class C Plans, each Fund pays EVD amounts equal to 0.75% per annum of its average daily net assets attributable to Class B and Class C shares for providing ongoing distribution services and facilities to the respective Funds. For the year ended September 30, 2018, the Funds paid or accrued to EVD the following distribution fees:
| | | | | | | | |
| | | AMT-Free Fund | | | National Fund | |
| | |
Class B Distribution Fees | | $ | — | | | $ | 30,433 | |
Class C Distribution Fees | | $ | 266,133 | | | $ | 3,099,679 | |
Pursuant to the Class B and Class C Plans, each Fund also makes payments of service fees to EVD, financial intermediaries and other persons in amounts equal to 0.25% per annum of the average daily net assets attributable to that class. Service fees paid or accrued are for personal services and/or the maintenance of shareholder accounts. They are separate and distinct from the Class B and Class C sales commissions and distribution fees payable to EVD. Service fees paid or accrued for the year ended September 30, 2018 amounted to the following:
| | | | | | | | |
| | | AMT-Free Fund | | | National Fund | |
| | |
Class B Service Fees | | $ | — | | | $ | 10,144 | |
Class C Service Fees | | $ | 88,711 | | | $ | 1,033,226 | |
Distribution and service fees are subject to the limitations contained in the Financial Industry Regulatory Authority Rule 2341(d) and for Class B, are further limited to a 5% maximum sales charge as determined in accordance with such rule.
5 Contingent Deferred Sales Charges
A contingent deferred sales charge (CDSC) generally is imposed on redemptions of Class B shares made within six years of purchase and on redemptions of Class C shares made within one year of purchase. Class A shares may be subject to a 1% CDSC if redeemed within eighteen months of purchase (depending on the circumstances of purchase). Generally, the CDSC is based upon the lower of the net asset value at date of redemption or date of purchase. No charge is levied on shares acquired by reinvestment of dividends or capital gain distributions. The CDSC for Class B shares is imposed at declining rates that begin at 5% in the case of redemptions in the first and second year after purchase, declining one percentage point each subsequent year. Class C shares are subject to a 1% CDSC if redeemed within one year of purchase. For the year ended September 30, 2018, the Funds were informed that EVD received approximately the following amounts of CDSCs paid by Class A, Class B and Class C shareholders:
| | | | | | | | |
| | | AMT-Free
Fund | | | National
Fund | |
| | |
Class A | | $ | 4,000 | | | $ | 1,000 | |
Class B | | $ | — | | | $ | 2,000 | |
Class C | | $ | 2,000 | | | $ | 11,000 | |
6 Purchases and Sales of Investments
Purchases and sales of investments, other than short-term obligations, for the year ended September 30, 2018 were as follows:
| | | | | | | | |
| | | AMT-Free
Fund | | | National Fund | |
| | |
Purchases | | $ | 62,797,916 | | | $ | 1,960,553,329 | |
Sales | | $ | 101,828,293 | | | $ | 2,293,321,534 | |
Eaton Vance
Municipal Income Funds
September 30, 2018
Notes to Financial Statements — continued
7 Shares of Beneficial Interest
Each Fund’s Declaration of Trust permits the Trustees to issue an unlimited number of full and fractional shares of beneficial interest (without par value). Such shares may be issued in a number of different series (such as the Funds) and classes. Transactions in Fund shares were as follows:
| | | | | | | | | | | | | | | | |
AMT-Free Fund | | | | | | | | | | | | |
| | | Year Ended September 30, 2018 | |
| | | Class A | | | Class B | | | Class C | | | Class I | |
| | | | |
Sales | | | 1,410,160 | | | | — | | | | 219,922 | | | | 2,442,370 | |
Issued to shareholders electing to receive payments of distributions in Fund shares | | | 548,382 | | | | — | | | | 100,461 | | | | 410,172 | |
Redemptions | | | (3,256,501 | ) | | | — | | | | (936,704 | ) | | | (4,654,134 | ) |
| | | | |
Net decrease | | | (1,297,959 | ) | | | — | | | | (616,321 | ) | | | (1,801,592 | ) |
| |
| | | Year Ended September 30, 2017 | |
| | | Class A | | | Class B(1) | | | Class C | | | Class I | |
| | | | |
Sales | | | 2,163,432 | | | | 327 | | | | 257,467 | | | | 6,592,820 | |
Issued to shareholders electing to receive payments of distributions in Fund shares | | | 692,435 | | | | 556 | | | | 114,812 | | | | 428,335 | |
Redemptions | | | (6,933,019 | ) | | | (8,583 | ) | | | (928,788 | ) | | | (6,554,849 | ) |
Exchange from Class B shares | | | 20,078 | | | | — | | | | — | | | | — | |
Exchange to Class A shares | | | — | | | | (20,212 | ) | | | — | | | | — | |
Merger from Class B shares | | | 22,496 | | | | — | | | | — | | | | — | |
Merger to Class A shares | | | — | | | | (22,636 | ) | | | — | | | | — | |
| | | | |
Net increase (decrease) | | | (4,034,578 | ) | | | (50,548 | ) | | | (556,509 | ) | | | 466,306 | |
| (1) | At the close of business on September 20, 2017, Class B shares of AMT-Free Fund were merged into Class A shares. |
| | | | | | | | | | | | | | | | |
National Fund | | | | | | | | | | | | |
| | | Year Ended September 30, 2018 | |
| | | Class A | | | Class B | | | Class C | | | Class I | |
| | | | |
Sales | | | 8,446,990 | | | | 998 | | | | 1,578,271 | | | | 22,766,344 | |
Issued to shareholders electing to receive payments of distributions in Fund shares | | | 4,651,612 | | | | 10,278 | | | | 1,031,149 | | | | 2,503,247 | |
Redemptions | | | (27,655,284 | ) | | | (117,456 | ) | | | (11,575,817 | ) | | | (25,198,655 | ) |
Exchange from Class B shares | | | 367,236 | | | | — | | | | — | | | | — | |
Exchange to Class A shares | | | — | | | | (367,220 | ) | | | — | | | | — | |
| | | | |
Net increase (decrease) | | | (14,189,446 | ) | | | (473,400 | ) | | | (8,966,397 | ) | | | 70,936 | |
| |
| | | Year Ended September 30, 2017 | |
| | | Class A | | | Class B | | | Class C | | | Class I | |
| | | | |
Sales | | | 12,835,603 | | | | 10,004 | | | | 2,428,369 | | | | 38,187,835 | |
Issued to shareholders electing to receive payments of distributions in Fund shares | | | 5,288,742 | | | | 29,457 | | | | 1,217,398 | | | | 2,344,480 | |
Redemptions | | | (40,305,026 | ) | | | (238,801 | ) | | | (13,773,358 | ) | | | (31,184,190 | ) |
Exchange from Class B shares | | | 760,362 | | | | — | | | | — | | | | — | |
Exchange to Class A shares | | | — | | | | (760,484 | ) | | | — | | | | — | |
| | | | |
Net increase (decrease) | | | (21,420,319 | ) | | | (959,824 | ) | | | (10,127,591 | ) | | | 9,348,125 | |
Eaton Vance
Municipal Income Funds
September 30, 2018
Notes to Financial Statements — continued
8 Line of Credit
The Funds participate with other portfolios and funds managed by EVM and its affiliates in a $625 million unsecured line of credit agreement with a group of banks, which is in effect through October 30, 2018. Borrowings are made by the Funds solely to facilitate the handling of unusual and/or unanticipated short-term cash requirements. Interest is charged to each Fund based on its borrowings at an amount above either the Eurodollar rate or Federal Funds rate. In addition, a fee computed at an annual rate of 0.15% on the daily unused portion of the line of credit is allocated among the participating portfolios and funds at the end of each quarter. Because the line of credit is not available exclusively to the Funds, a Fund may be unable to borrow some or all of its requested amounts at any particular time. At September 30, 2018, the National Fund had a balance outstanding pursuant to this line of credit of $17,400,000 at an interest rate of 2.93%. Based on the short-term nature of the borrowings under the line of credit and variable interest rate, the carrying value of the borrowings approximated its fair value at September 30, 2018. If measured at fair value, borrowings under the line of credit would have been considered as Level 2 in the fair value hierarchy (see Note 10) at September 30, 2018. The Funds’ average borrowings or allocated fees during the year ended September 30, 2018 were not significant.
Effective October 30, 2018, the Funds renewed their line of credit agreement, which expires October 29, 2019, at substantially the same terms.
9 Financial Instruments
The Funds may trade in financial instruments with off-balance sheet risk in the normal course of their investing activities. These financial instruments may include financial futures contracts and may involve, to a varying degree, elements of risk in excess of the amounts recognized for financial statement purposes. The notional or contractual amounts of these instruments represent the investment a Fund has in particular classes of financial instruments and do not necessarily represent the amounts potentially subject to risk. The measurement of the risks associated with these instruments is meaningful only when all related and offsetting transactions are considered. A summary of obligations under these financial instruments at September 30, 2018 is included in the Portfolio of Investments. At September 30, 2018, the Funds had sufficient cash and/or securities to cover commitments under these contracts.
Each Fund is subject to interest rate risk in the normal course of pursuing its investment objective. Because the Funds hold fixed-rate bonds, the value of these bonds may decrease if interest rates rise. The Funds enter into U.S. Treasury futures contracts to hedge against changes in interest rates.
The fair values of open derivative instruments (not considered to be hedging instruments for accounting disclosure purposes) and whose primary underlying risk exposure is interest rate risk at September 30, 2018 were as follows:
| | | | | | | | |
| | | AMT-Free
Fund | | | National
Fund | |
| | |
Asset Derivative: | | | | | | | | |
Futures Contracts | | $ | 604,959 | (1) | | $ | 5,031,282 | (1) |
| | |
Total | | $ | 604,959 | | | $ | 5,031,282 | |
| (1) | Amount represents cumulative unrealized appreciation on futures contracts. Only the current day’s variation margin on open futures contracts is reported within the Statement of Assets and Liabilities as Receivable or Payable for variation margin on open financial futures contracts, as applicable. |
The effect of derivative instruments (not considered to be hedging instruments for accounting disclosure purposes) on the Statement of Operations and whose primary underlying risk exposure is interest rate risk for the year ended September 30, 2018 was as follows:
| | | | | | | | |
| | | AMT-Free
Fund | | | National
Fund | |
| | |
Realized Gain (Loss) on Derivatives Recognized in Income | | $ | 1,692,615 | (1) | | $ | 11,599,272 | (1) |
Change in Unrealized Appreciation (Depreciation) on Derivatives Recognized in Income | | $ | 107,170 | (2) | | $ | 1,272,384 | (2) |
| (1) | Statement of Operations location: Net realized gain (loss) – Financial futures contracts. |
| (2) | Statement of Operations location: Change in unrealized appreciation (depreciation) – Financial futures contracts. |
Eaton Vance
Municipal Income Funds
September 30, 2018
Notes to Financial Statements — continued
The average notional cost of futures contracts outstanding during the year ended September 30, 2018, which is indicative of the volume of this derivative type, was approximately as follows:
| | | | | | | | |
| | | AMT-Free
Fund | | | National Fund | |
| | |
Average Notional Cost: | | | | | | | | |
Futures Contracts — Short | | $ | 35,515,000 | | | $ | 221,027,000 | |
10 Fair Value Measurements
Under generally accepted accounting principles for fair value measurements, a three-tier hierarchy to prioritize the assumptions, referred to as inputs, is used in valuation techniques to measure fair value. The three-tier hierarchy of inputs is summarized in the three broad levels listed below.
| • | | Level 1 – quoted prices in active markets for identical investments |
| • | | Level 2 – other significant observable inputs (including quoted prices for similar investments, interest rates, prepayment speeds, credit risk, etc.) |
| • | | Level 3 – significant unobservable inputs (including a fund’s own assumptions in determining the fair value of investments) |
In cases where the inputs used to measure fair value fall in different levels of the fair value hierarchy, the level disclosed is determined based on the lowest level input that is significant to the fair value measurement in its entirety. The inputs or methodology used for valuing securities are not necessarily an indication of the risk associated with investing in those securities.
At September 30, 2018, the hierarchy of inputs used in valuing the Funds’ investments and open derivative instruments, which are carried at value, were as follows:
| | | | | | | | | | | | | | | | |
AMT-Free Fund | |
| Asset Description | | Level 1 | | | Level 2 | | | Level 3 | | | Total | |
| | | | |
Tax-Exempt Investments | | $ | — | | | $ | 332,656,235 | | | $ | — | | | $ | 332,656,235 | |
| | | | |
Total Investments | | $ | — | | | $ | 332,656,235 | | | $ | — | | | $ | 332,656,235 | |
| | | | |
Futures Contracts | | $ | 604,959 | | | $ | — | | | $ | — | | | $ | 604,959 | |
| | | | |
Total | | $ | 604,959 | | | $ | 332,656,235 | | | $ | — | | | $ | 333,261,194 | |
|
National Fund | |
| Asset Description | | Level 1 | | | Level 2 | | | Level 3 | | | Total | |
Tax-Exempt Municipal Securities | | $ | — | | | $ | 2,614,134,621 | | | $ | — | | | $ | 2,614,134,621 | |
| | | | |
Taxable Municipal Securities | | | — | | | | 86,931,171 | | | | — | | | | 86,931,171 | |
| | | | |
Total Investments | | $ | — | | | $ | 2,701,065,792 | | | $ | — | | | $ | 2,701,065,792 | |
| | | | |
Futures Contracts | | $ | 5,031,282 | | | $ | — | | | $ | — | | | $ | 5,031,282 | |
| | | | |
Total | | $ | 5,031,282 | | | $ | 2,701,065,792 | | | $ | — | | | $ | 2,706,097,074 | |
Eaton Vance
AMT-Free Municipal Income Fund
September 30, 2018
Report of Independent Registered Public Accounting Firm
To the Trustees of Eaton Vance Mutual Funds Trust and Shareholders of Eaton Vance AMT-Free Municipal Income Fund:
Opinion on the Financial Statements and Financial Highlights
We have audited the accompanying statement of assets and liabilities of Eaton Vance AMT-Free Municipal Income Fund (the “Fund”) (one of the funds constituting Eaton Vance Mutual Funds Trust), including the portfolio of investments, as of September 30, 2018, and the related statements of operations and cash flows for the year then ended, the statements of changes in net assets for each of the two years in the period then ended, the financial highlights for each of the five years in the period then ended, and the related notes. In our opinion, the financial statements and financial highlights present fairly, in all material respects, the financial position of the Fund as of September 30, 2018, the results of its operations and its cash flows for the year then ended, the changes in its net assets for each of the two years in the period then ended, and the financial highlights for each of the five years in the period then ended, in conformity with accounting principles generally accepted in the United States of America.
Basis for Opinion
These financial statements and financial highlights are the responsibility of the Fund’s management. Our responsibility is to express an opinion on the Fund’s financial statements and financial highlights based on our audits. We are a public accounting firm registered with the Public Company Accounting Oversight Board (United States) (PCAOB) and are required to be independent with respect to the Fund in accordance with the U.S. federal securities laws and the applicable rules and regulations of the Securities and Exchange Commission and the PCAOB.
We conducted our audits in accordance with the standards of the PCAOB. Those standards require that we plan and perform the audit to obtain reasonable assurance about whether the financial statements and financial highlights are free of material misstatement, whether due to error or fraud. The Fund is not required to have, nor were we engaged to perform, an audit of its internal control over financial reporting. As part of our audits we are required to obtain an understanding of internal control over financial reporting but not for the purpose of expressing an opinion on the effectiveness of the Fund’s internal control over financial reporting. Accordingly, we express no such opinion.
Our audits included performing procedures to assess the risks of material misstatement of the financial statements and financial highlights, whether due to error or fraud, and performing procedures that respond to those risks. Such procedures included examining, on a test basis, evidence regarding the amounts and disclosures in the financial statements and financial highlights. Our audits also included evaluating the accounting principles used and significant estimates made by management, as well as evaluating the overall presentation of the financial statements and financial highlights. Our procedures included confirmation of securities owned as of September 30, 2018, by correspondence with the custodian and brokers; when replies were not received from brokers, we performed other auditing procedures. We believe that our audits provide a reasonable basis for our opinion.
/s/ Deloitte & Touche LLP
Boston, Massachusetts
November 19, 2018
We have served as the auditor of one or more Eaton Vance investment companies since 1959.
Eaton Vance
National Municipal Income Fund
September 30, 2018
Report of Independent Registered Public Accounting Firm
To the Trustees of Eaton Vance Municipals Trust and Shareholders of Eaton Vance National Municipal Income Fund:
Opinion on the Financial Statements and Financial Highlights
We have audited the accompanying statement of assets and liabilities of Eaton Vance National Municipal Income Fund (the “Fund”) (one of the funds constituting Eaton Vance Municipals Trust), including the portfolio of investments, as of September 30, 2018, and the related statements of operations and cash flows for the year then ended, the statements of changes in net assets for each of the two years in the period then ended, the financial highlights for each of the five years in the period then ended, and the related notes. In our opinion, the financial statements and financial highlights present fairly, in all material respects, the financial position of the Fund as of September 30, 2018, the results of its operations and its cash flows for the year then ended, the changes in its net assets for each of the two years in the period then ended, and the financial highlights for each of the five years in the period then ended, in conformity with accounting principles generally accepted in the United States of America.
Basis for Opinion
These financial statements and financial highlights are the responsibility of the Fund’s management. Our responsibility is to express an opinion on the Fund’s financial statements and financial highlights based on our audits. We are a public accounting firm registered with the Public Company Accounting Oversight Board (United States) (PCAOB) and are required to be independent with respect to the Fund in accordance with the U.S. federal securities laws and the applicable rules and regulations of the Securities and Exchange Commission and the PCAOB.
We conducted our audits in accordance with the standards of the PCAOB. Those standards require that we plan and perform the audit to obtain reasonable assurance about whether the financial statements and financial highlights are free of material misstatement, whether due to error or fraud. The Fund is not required to have, nor were we engaged to perform, an audit of its internal control over financial reporting. As part of our audits we are required to obtain an understanding of internal control over financial reporting but not for the purpose of expressing an opinion on the effectiveness of the Fund’s internal control over financial reporting. Accordingly, we express no such opinion.
Our audits included performing procedures to assess the risks of material misstatement of the financial statements and financial highlights, whether due to error or fraud, and performing procedures that respond to those risks. Such procedures included examining, on a test basis, evidence regarding the amounts and disclosures in the financial statements and financial highlights. Our audits also included evaluating the accounting principles used and significant estimates made by management, as well as evaluating the overall presentation of the financial statements and financial highlights. Our procedures included confirmation of securities owned as of September 30, 2018, by correspondence with the custodian and brokers; when replies were not received from brokers, we performed other auditing procedures. We believe that our audits provide a reasonable basis for our opinion.
/s/ Deloitte & Touche LLP
Boston, Massachusetts
November 19, 2018
We have served as the auditor of one or more Eaton Vance investment companies since 1959.
Eaton Vance
Municipal Income Funds
September 30, 2018
Federal Tax Information (Unaudited)
The Form 1099-DIV you receive in February 2019 will show the tax status of all distributions paid to your account in calendar year 2018. Shareholders are advised to consult their own tax adviser with respect to the tax consequences of their investment in the Funds. As required by the Internal Revenue Code and/or regulations, shareholders must be notified regarding exempt-interest dividends.
Exempt-Interest Dividends. For the fiscal year ended September 30, 2018, the Funds designate the following percentages of distributions from net investment income as exempt-interest dividends:
| | | | |
AMT-Free Municipal Income Fund | | | 99.97 | % |
National Municipal Income Fund | | | 92.68 | % |
Eaton Vance
Municipal Income Funds
September 30, 2018
Special Meeting of Shareholders (Unaudited)
Each Fund held a Special Meeting of Shareholders on September 20, 2018 to elect the five Trustees listed below. The other Trustees named herein continue to serve as Trustees. The results of the vote with respect to each Fund were as follows:
| | | | | | | | | | | | | | | | |
| | | AMT-Free Municipal Income Fund | | | National Municipal Income Fund | |
| | | Number of Shares | | | Number of Shares | |
| Nominee for Trustee | | For | | | Withheld | | | For | | | Withheld | |
Mark R. Fetting | | | 28,401,084 | | | | 335,931 | | | | 232,423,404 | | | | 4,803,972 | |
Keith Quinton | | | 28,632,361 | | | | 104,655 | | | | 232,212,264 | | | | 5,015,112 | |
Marcus L. Smith | | | 28,618,951 | | | | 118,065 | | | | 232,325,182 | | | | 4,902,194 | |
Susan J. Sutherland | | | 28,632,248 | | | | 104,767 | | | | 232,138,978 | | | | 5,088,398 | |
Scott E. Wennerholm | | | 28,612,291 | | | | 124,724 | | | | 232,346,101 | | | | 4,881,275 | |
| Results | are rounded to the nearest whole number. |
Eaton Vance
Municipal Income Funds
September 30, 2018
Board of Trustees’ Contract Approval
Overview of the Contract Review Process
The Investment Company Act of 1940, as amended (the “1940 Act”), provides, in substance, that each investment advisory agreement between a fund and its investment adviser will continue in effect from year to year only if its continuation is approved at least annually by the fund’s board of trustees, including by a vote of a majority of the trustees who are not “interested persons” of the fund (“Independent Trustees”), cast in person at a meeting called for the purpose of considering such approval.
At a meeting of the Boards of Trustees (each a “Board”) of the registered investment companies advised by either Eaton Vance Management or its affiliate, Boston Management and Research, (the “Eaton Vance Funds”) held on April 24, 2018, the Board, including a majority of the Independent Trustees, voted to approve continuation of existing investment advisory and sub-advisory agreements for the Eaton Vance Funds for an additional one-year period. In voting its approval, the Board relied upon the affirmative recommendation of its Contract Review Committee, which is a committee comprised exclusively of Independent Trustees. Prior to making its recommendation, the Contract Review Committee reviewed information furnished by each adviser to the Eaton Vance Funds (including information specifically requested by the Board) for a series of meetings of the Contract Review Committee held between February and April 2018. The Contract Review Committee also considered information received at prior meetings of the Board and its committees, as relevant to its annual evaluation of the investment advisory and sub-advisory agreements.
The information that the Board considered included, among other things, the following (for funds that invest through one or more underlying portfolio(s), references to “each fund” in this section may include information that was considered at the portfolio-level):
Information about Fees, Performance and Expenses
| • | | A report from an independent data provider comparing the advisory and related fees paid by each fund with fees paid by comparable funds as identified by the independent data provider (“comparable funds”); |
| • | | A report from an independent data provider comparing each fund’s total expense ratio and its components to comparable funds; |
| • | | A report from an independent data provider comparing the investment performance of each fund (including, where relevant, yield data, Sharpe ratios and information ratios) to the investment performance of comparable funds over various time periods; |
| • | | Data regarding investment performance in comparison to benchmark indices, as well as customized groups of peer funds and blended indices identified by the adviser in consultation with the Board; |
| • | | For each fund, comparative information concerning the fees charged and the services provided by each adviser in managing other accounts (including mutual funds, other collective investment funds and institutional accounts) using investment strategies and techniques similar to those used in managing such fund; |
| • | | Profitability analyses for each adviser with respect to each fund; |
Information about Portfolio Management and Trading
| • | | Descriptions of the investment management services provided to each fund, including the fund’s investment strategies and policies; |
| • | | The procedures and processes used to determine the fair value of fund assets and actions taken to monitor and test the effectiveness of such procedures and processes; |
| • | | Information about each adviser’s policies and practices with respect to trading, including each adviser’s processes for monitoring best execution of portfolio transactions; |
| • | | Information about the allocation of brokerage transactions and the benefits received by each adviser as a result of brokerage allocation, including information concerning the acquisition of research through client commission arrangements and policies with respect to “soft dollars”; |
| • | | Data relating to portfolio turnover rates of each fund; |
Information about each Adviser
| • | | Reports detailing the financial results and condition of each adviser; |
| • | | Descriptions of the qualifications, education and experience of the individual investment professionals whose responsibilities include portfolio management and investment research for the funds, and information relating to their responsibilities with respect to managing other mutual funds and investment accounts; |
| • | | The Code of Ethics of each adviser and its affiliates, together with information relating to compliance with and the administration of such codes; |
| • | | Policies and procedures relating to proxy voting and the handling of corporate actions and class actions; |
| • | | Information concerning the resources devoted to compliance efforts undertaken by each adviser and its affiliates (including descriptions of various compliance programs) and their record of compliance; |
| • | | Information concerning the business continuity and disaster recovery plans of each adviser and its affiliates; |
| • | | A description of Eaton Vance Management’s procedures for overseeing third party advisers and sub-advisers, including with respect to regulatory and compliance issues, investment management and other matters; |
Eaton Vance
Municipal Income Funds
September 30, 2018
Board of Trustees’ Contract Approval — continued
Other Relevant Information
| • | | Information concerning the nature, cost and character of the administrative and other non-investment advisory services provided by Eaton Vance Management and its affiliates; |
| • | | Information concerning management of the relationship with the custodian, subcustodians and fund accountants by each adviser or the funds’ administrator; and |
| • | | The terms of each investment advisory agreement. |
Over the course of the twelve-month period ended April 30, 2018, with respect to one or more funds, the Board met seven times and the Contract Review Committee, the Audit Committee, the Governance Committee, the Portfolio Management Committee and the Compliance Reports and Regulatory Matters Committee, each of which is a Committee comprised solely of Independent Trustees, met seven, thirteen, six, eight and nine times, respectively. At such meetings, the Trustees participated in investment and performance reviews with the portfolio managers and other investment professionals of each investment adviser relating to each fund, and considered various investment and trading strategies used in pursuing each fund’s investment objective, such as the use of derivative instruments, as well as risk management techniques. The Board and its Committees also evaluated issues pertaining to industry and regulatory developments, compliance procedures, fund governance and other issues with respect to the funds, and received and participated in reports and presentations provided by Eaton Vance Management and other fund advisers with respect to such matters. In addition to the formal meetings of the Board and its Committees, the Independent Trustees hold regular teleconferences in between meetings to discuss, among other topics, matters relating to the continuation of investment advisory and sub-advisory agreements.
For funds that invest through one or more underlying portfolios, the Board considered similar information about the portfolio(s) when considering the approval of investment advisory agreements. In addition, in cases where the fund’s investment adviser has engaged a sub-adviser, the Board considered similar information about the sub-adviser when considering the approval of any sub-advisory agreement.
The Contract Review Committee was assisted throughout the contract review process by Goodwin Procter LLP, independent legal counsel for the Independent Trustees. The members of the Contract Review Committee relied upon the advice of such counsel and their own business judgment in determining the material factors to be considered in evaluating each investment advisory and sub-advisory agreement and the weight to be given to each such factor. The conclusions reached with respect to each investment advisory and sub-advisory agreement were based on a comprehensive evaluation of all the information provided and not any single factor. Moreover, each member of the Contract Review Committee may have placed varying emphasis on particular factors in reaching conclusions with respect to each investment advisory and sub-advisory agreement. In evaluating each investment advisory and sub-advisory agreement, including the specific fee structures and other terms of the agreements, the Contract Review Committee was informed by multiple years of analysis and discussion among the Independent Trustees and the Eaton Vance Funds’ advisers and sub-advisers.
Results of the Process
Based on its consideration of the foregoing, and such other information as it deemed relevant, including the factors and conclusions described below, the Contract Review Committee concluded that (i) the continuation of the investment advisory agreement of Eaton Vance AMT-Free Municipal Income Fund (the “AMT-Free Muni Income Fund”) with Eaton Vance Management (“EVM”) and (ii) the continuation of the investment advisory agreement of Eaton Vance National Municipal Income Fund (the “National Muni Income Fund”, together with the AMT-Free Muni Income Fund, the “Funds” and each, a “Fund”) with Boston Management and Research (“BMR”) (EVM, with respect to the AMT-Free Muni Income Fund, and BMR, with respect to the National Muni Income Fund, are each referred to herein as the “Adviser”), including their fee structures, is in the interests of shareholders and, therefore, the Contract Review Committee recommended to the Board approval of each agreement. The Board accepted the recommendation of the Contract Review Committee based on the material factors considered and conclusions reached by the Contract Review Committee with respect to each agreement. Accordingly, the Board, including a majority of the Independent Trustees, voted to approve continuation of the investment advisory agreement for each Fund.
Nature, Extent and Quality of Services
In considering whether to approve the investment advisory agreement of each Fund, the Board evaluated the nature, extent and quality of services provided to the Funds by the applicable Adviser.
The Board considered each Adviser’s management capabilities and investment process with respect to the types of investments held by each Fund, respectively, including the education, experience and number of its investment professionals and other personnel who provide portfolio management, investment research, and similar services to the Funds. In particular, the Board considered, where relevant, the abilities and experience of each Adviser’s investment professionals in analyzing factors such as credit risk, tax efficiency, and special considerations relevant to investing in municipal obligations. The Board considered each Adviser’s municipal bond team, which includes investment professionals and credit specialists who provide services to the applicable Fund. The Board also took into account the resources dedicated to portfolio management and other services, as well as the compensation methods of each Adviser and other factors, such as the reputation and resources of the Adviser to recruit and retain highly qualified research, advisory and supervisory investment professionals. In addition, the Board considered the time and attention devoted to the Eaton Vance Funds, including each Fund, by senior management, as well as the infrastructure, operational capabilities and support staff in place to assist in the portfolio management and operations of the Funds, including the provision of administrative services. The Board also considered the business-related and other risks to which the Advisers or its affiliates may be subject in managing the Funds.
Eaton Vance
Municipal Income Funds
September 30, 2018
Board of Trustees’ Contract Approval — continued
The Board considered the compliance programs of each Adviser and relevant affiliates thereof. Among other matters, the Board considered compliance and reporting matters relating to personal trading by investment professionals, selective disclosure of portfolio holdings, late trading, frequent trading, portfolio valuation, business continuity and the allocation of investment opportunities. The Board also considered the responses of each Adviser and its affiliates to requests in recent years from regulatory authorities such as the Securities and Exchange Commission and the Financial Industry Regulatory Authority.
The Board considered shareholder and other administrative services provided or managed by Eaton Vance Management and its affiliates, including transfer agency and accounting services. The Board evaluated the benefits to shareholders of investing in a fund that is a part of a large fund complex offering exposure to a variety of asset classes and investment disciplines, as well as the ability, in many cases, to exchange an investment among different funds without incurring additional sales charges.
After consideration of the foregoing factors, among others, the Board concluded that the nature, extent and quality of services provided by each Adviser, taken as a whole, are appropriate and consistent with the terms of the applicable investment advisory agreement.
Fund Performance
The Board compared each Fund’s investment performance to that of comparable funds and appropriate benchmark indices and assessed each Fund’s performance on the basis of total return and current income return. The Board’s review included comparative performance data for the one-, three-, five- and ten-year periods ended September 30, 2017 for each Fund.
In this regard, the Board noted each Fund’s performance relative to its peer group, primary benchmark index and secondary benchmark index for the three-year period, as follows:
| | | | | | | | | | | | |
| Fund | | Performance Relative to: | |
| | Median of Peers | | | Primary Index | | | Secondary Index | |
Eaton Vance AMT-Free Municipal Income Fund | | | Higher | | | | Lower | | | | Lower | |
Eaton Vance National Municipal Income Fund | | | Higher | | | | Higher | | | | Lower | |
The Board considered, among other things, each Adviser’s efforts to generate competitive levels of tax-exempt current income over time through investments that, relative to comparable funds, focus on higher quality municipal bonds with longer maturities. The Board concluded that the performance of each Fund was satisfactory.
Management Fees and Expenses
The Board considered contractual fee rates payable by each Fund for advisory and administrative services (referred to collectively as “management fees”). As part of its review, the Board considered each Fund’s management fees and total expense ratio for the one year period ended September 30, 2017, as compared to those of comparable funds, before and after giving effect to any undertaking to waive fees or reimburse expenses. The Board also considered factors that had an impact on Fund expense ratios relative to comparable funds.
After considering the foregoing information, and in light of the nature, extent and quality of the services provided by each Adviser, the Board concluded that the management fees charged for advisory and related services are reasonable.
Profitability and Other “Fall-Out” Benefits
The Board considered the level of profits realized by each Adviser and relevant affiliates thereof in providing investment advisory and administrative services to each Fund and to all Eaton Vance Funds as a group. The Board considered the level of profits realized without regard to marketing support or other payments by each Adviser and its affiliates to third parties in respect of distribution services. The Board also considered other direct or indirect fall-out benefits received by each Adviser and its affiliates in connection with their relationships with the Funds, including the benefits of research services that may be available to each Adviser as a result of securities transactions effected for the Funds and other investment advisory clients.
The Board concluded that, in light of the foregoing factors and the nature, extent and quality of the services rendered, the profits realized by each Adviser and its affiliates are deemed not to be excessive.
Eaton Vance
Municipal Income Funds
September 30, 2018
Board of Trustees’ Contract Approval — continued
Economies of Scale
In reviewing management fees and profitability, the Board also considered the extent to which the applicable Adviser and its affiliates, on the one hand, and each Fund, on the other hand, can expect to realize benefits from economies of scale as the assets of each Fund increase. The Board acknowledged the difficulty in accurately measuring the benefits resulting from economies of scale, if any, with respect to the management of any specific fund or group of funds. The Board reviewed data summarizing the increases and decreases in the assets of each Fund and of all Eaton Vance Funds as a group over various time periods, and evaluated the extent to which the total expense ratio of each Fund and the profitability of each Adviser and its affiliates may have been affected by such increases or decreases. Based upon the foregoing, the Board concluded that each Fund currently shares in any benefits from economies of scale. The Board also concluded that, assuming reasonably foreseeable increases in the assets of each Fund, the structure of each advisory fee, which includes breakpoints at several asset levels, will allow each Fund to continue to benefit from any economies of scale in the future.
Eaton Vance
Municipal Income Funds
September 30, 2018
Management and Organization
Fund Management. The Trustees of Eaton Vance Municipals Trust and Eaton Vance Mutual Funds Trust (collectively, the Trusts) are responsible for the overall management and supervision of the Trusts’ affairs. The Trustees and officers of the Trusts are listed below. Except as indicated, each individual has held the office shown or other offices in the same company for the last five years. Trustees and officers of the Trusts hold indefinite terms of office. The “Noninterested Trustees” consist of those Trustees who are not “interested persons” of the Trusts, as that term is defined under the 1940 Act. The business address of each Trustee and officer is Two International Place, Boston, Massachusetts 02110. As used below, “EVC” refers to Eaton Vance Corp., “EV” refers to Eaton Vance, Inc., “EVM” refers to Eaton Vance Management, “BMR” refers to Boston Management and Research and “EVD” refers to Eaton Vance Distributors, Inc. EVC and EV are the corporate parent and trustee, respectively, of EVM and BMR. EVD is the Funds’ principal underwriter and a wholly-owned subsidiary of EVC. Each officer affiliated with Eaton Vance may hold a position with other Eaton Vance affiliates that is comparable to his or her position with EVM listed below. Each Trustee oversees 174 portfolios in the Eaton Vance Complex (including all master and feeder funds in a master feeder structure). Each officer serves as an officer of certain other Eaton Vance funds. Each Trustee and officer serves until his or her successor is elected.
| | | | | | |
| Name and Year of Birth | | Position(s) with the Trusts | | Trustee Since(1) | | Principal Occupation(s) and Directorships During Past Five Years and Other Relevant Experience |
| Interested Trustee |
| | | |
Thomas E. Faust Jr. 1958 | | Trustee | | 2007 | | Chairman, Chief Executive Officer and President of EVC, Director and President of EV, Chief Executive Officer and President of EVM and BMR, and Director of EVD. Trustee and/or officer of 174 registered investment companies. Mr. Faust is an interested person because of his positions with EVM, BMR, EVD, EVC and EV, which are affiliates of the Trusts. Directorships in the Last Five Years.(2) Director of EVC and Hexavest Inc. (investment management firm). |
|
| Noninterested Trustees |
| | | |
Mark R. Fetting 1954 | | Trustee | | 2016 | | Private investor. Formerly held various positions at Legg Mason, Inc. (investment management firm) (2000-2012), including President, Chief Executive Officer, Director and Chairman (2008-2012), Senior Executive Vice President (2004-2008) and Executive Vice President (2001-2004). Formerly, President of Legg Mason family of funds (2001-2008). Formerly, Division President and Senior Officer of Prudential Financial Group, Inc. and related companies (investment management firm) (1991-2000). Directorships in the Last Five Years. None. |
| | | |
Cynthia E. Frost 1961 | | Trustee | | 2014 | | Private investor. Formerly, Chief Investment Officer of Brown University (university endowment) (2000-2012); Formerly, Portfolio Strategist for Duke Management Company (university endowment manager) (1995-2000); Formerly, Managing Director, Cambridge Associates (investment consulting company) (1989-1995); Formerly, Consultant, Bain and Company (management consulting firm) (1987-1989); Formerly, Senior Equity Analyst, BA Investment Management Company (1983-1985). Directorships in the Last Five Years. None. |
| | | |
George J. Gorman 1952 | | Trustee | | 2014 | | Principal at George J. Gorman LLC (consulting firm). Formerly, Senior Partner at Ernst & Young LLP (a registered public accounting firm) (1974-2009). Directorships in the Last Five Years. Formerly, Trustee of the BofA Funds Series Trust (11 funds) (2011-2014) and of the Ashmore Funds (9 funds) (2010-2014). |
| | | |
Valerie A. Mosley 1960 | | Trustee | | 2014 | | Chairwoman and Chief Executive Officer of Valmo Ventures (a consulting and investment firm). Former Partner and Senior Vice President, Portfolio Manager and Investment Strategist at Wellington Management Company, LLP (investment management firm) (1992-2012). Former Chief Investment Officer, PG Corbin Asset Management (1990-1992). Formerly worked in institutional corporate bond sales at Kidder Peabody (1986-1990). Directorships in the Last Five Years.(2) Director of Dynex Capital, Inc. (mortgage REIT) (since 2013). |
| | | |
William H. Park 1947 | | Chairperson of the Board and Trustee | | 2016 (Chairperson); 2003 (Trustee) | | Private investor. Formerly, Consultant (management and transactional) (2012-2014). Formerly, Chief Financial Officer, Aveon Group L.P. (investment management firm) (2010-2011). Formerly, Vice Chairman, Commercial Industrial Finance Corp. (specialty finance company) (2006-2010). Formerly, President and Chief Executive Officer, Prizm Capital Management, LLC (investment management firm) (2002-2005). Formerly, Executive Vice President and Chief Financial Officer, United Asset Management Corporation (investment management firm) (1982-2001). Formerly, Senior Manager, Price Waterhouse (now PricewaterhouseCoopers) (a registered public accounting firm) (1972-1981). Directorships in the Last Five Years.(2) None. |
Eaton Vance
Municipal Income Funds
September 30, 2018
Management and Organization — continued
| | | | | | |
| Name and Year of Birth | | Position(s) with the Trusts | | Trustee Since(1) | | Principal Occupation(s) and Directorships During Past Five Years and Other Relevant Experience |
| Noninterested Trustees (continued) |
| | | |
Helen Frame Peters 1948 | | Trustee | | 2008 | | Professor of Finance, Carroll School of Management, Boston College. Formerly, Dean, Carroll School of Management, Boston College (2000-2002). Formerly, Chief Investment Officer, Fixed Income, Scudder Kemper Investments (investment management firm) (1998-1999). Formerly, Chief Investment Officer, Equity and Fixed Income, Colonial Management Associates (investment management firm) (1991-1998). Directorships in the Last Five Years.(2) None. |
| | | |
Keith Quinton(3) 1958 | | Trustee | | 2018 | | Independent Investment Committee Member at New Hampshire Retirement System (since 2017). Advisory Committee member at Northfield Information Services, Inc. (risk management analytics provider) (since 2016). Formerly, Portfolio Manager and Senior Quantitative Analyst at Fidelity Investments (investment management firm) (2001-2014). Directorships in the Last Five Years. Director of New Hampshire Municipal Bond Bank (since 2016). |
| | | |
Marcus L. Smith(3) 1966 | | Trustee | | 2018 | | Member of Posse Boston Advisory Board (foundation) (since 2015); Trustee at University of Mount Union (since 2008). Formerly, Portfolio Manager at MFS Investment Management (investment management firm) (1994-2017). Directorships in the Last Five Years. Director of MSCI Inc. (global provider of investment decision support tools) (since 2017). Director of DCT Industrial Trust Inc. (logistics real estate company) (since 2017). |
| | | |
Susan J. Sutherland 1957 | | Trustee | | 2015 | | Private investor. Formerly, Associate, Counsel and Partner at Skadden, Arps, Slate, Meagher & Flom LLP (law firm) (1982-2013). Directorships in the Last Five Years. Formerly, Director of Montpelier Re Holdings Ltd. (global provider of customized insurance and reinsurance products) (2013-2015). |
| | | |
Harriett Tee Taggart 1948 | | Trustee | | 2011 | | Managing Director, Taggart Associates (a professional practice firm). Formerly, Partner and Senior Vice President, Wellington Management Company, LLP (investment management firm) (1983-2006). Ms. Taggart has apprised the Board of Trustees that she intends to retire as a Trustee of all Eaton Vance Funds effective December 31, 2018. Directorships in the Last Five Years.(2) Director of Albemarle Corporation (chemicals manufacturer) (since 2007) and The Hanover Group (specialty property and casualty insurance company) (since 2009). |
| | | |
Scott E. Wennerholm 1959 | | Trustee | | 2016 | | Formerly, Trustee at Wheelock College (postsecondary institution) (2012-2018). Formerly, Consultant at GF Parish Group (executive recruiting firm) (2016-2017). Formerly, Chief Operating Officer and Executive Vice President at BNY Mellon Asset Management (investment management firm) (2005-2011). Formerly, Chief Operating Officer and Chief Financial Officer at Natixis Global Asset Management (investment management firm) (1997-2004). Formerly, Vice President at Fidelity Investments Institutional Services (investment management firm) (1994-1997). Directorships in the Last Five Years. None. |
| | | | | | |
| Name and Year of Birth | | Position(s) with the Trusts | | Officer
Since(4) | | Principal Occupation(s) During Past Five Years |
| Principal Officers who are not Trustees |
| | | |
Payson F. Swaffield 1956 | | President | | 2003 | | Vice President and Chief Income Investment Officer of EVM and BMR. Also Vice President of Calvert Research and Management (“CRM”). |
| | | |
Maureen A. Gemma 1960 | | Vice President, Secretary and Chief Legal Officer | | 2005 | | Vice President of EVM and BMR. Also Vice President of CRM. |
Eaton Vance
Municipal Income Funds
September 30, 2018
Management and Organization — continued
| | | | | | |
| Name and Year of Birth | | Position(s) with the Trusts | | Officer
Since(4) | | Principal Occupation(s) During Past Five Years |
| Principal Officers who are not Trustees (continued) |
| | | |
James F. Kirchner 1967 | | Treasurer | | 2007 | | Vice President of EVM and BMR. Also Vice President of CRM. |
| | | |
Richard F. Froio 1968 | | Chief Compliance Officer | | 2017 | | Vice President of EVM and BMR since 2017. Formerly Deputy Chief Compliance Officer (Adviser/Funds) and Chief Compliance Officer (Distribution) at PIMCO (2012-2017) and Managing Director at BlackRock/Barclays Global Investors (2009-2012). |
| (1) | Year first appointed to serve as Trustee for a fund in the Eaton Vance family of funds. Each Trustee has served continuously since appointment unless indicated otherwise. |
| (2) | During their respective tenures, the Trustees (except for Mmes. Frost and Sutherland and Messrs. Fetting, Gorman, Quinton, Smith and Wennerholm) also served as Board members of one or more of the following funds (which operated in the years noted): eUnitsTM 2 Year U.S. Market Participation Trust: Upside to Cap / Buffered Downside (launched in 2012 and terminated in 2014); and eUnitsTM 2 Year U.S. Market Participation Trust II: Upside to Cap / Buffered Downside (launched in 2012 and terminated in 2014). However, Ms. Mosley did not serve as a Board member of eUnitsTM 2 Year U.S. Market Participation Trust: Upside to Cap / Buffered Downside (launched in 2012 and terminated in 2014). |
| (3) | Messrs. Quinton and Smith began serving as Trustees effective October 1, 2018. |
| (4) | Year first elected to serve as officer of a fund in the Eaton Vance family of funds when the officer has served continuously. Otherwise, year of most recent election as an officer of a fund in the Eaton Vance family of funds. Titles may have changed since initial election. |
The SAI for the Funds includes additional information about the Trustees and officers of the Funds and can be obtained without charge on Eaton Vance’s website at www.eatonvance.com or by calling 1-800-262-1122.
Eaton Vance Funds
IMPORTANT NOTICES
Privacy. The Eaton Vance organization is committed to ensuring your financial privacy. Each of the financial institutions identified below has in effect the following policy (“Privacy Policy”) with respect to nonpublic personal information about its customers:
| • | | Only such information received from you, through application forms or otherwise, and information about your Eaton Vance fund transactions will be collected. This may include information such as name, address, social security number, tax status, account balances and transactions. |
| • | | None of such information about you (or former customers) will be disclosed to anyone, except as permitted by law (which includes disclosure to employees necessary to service your account). In the normal course of servicing a customer’s account, Eaton Vance may share information with unaffiliated third parties that perform various required services such as transfer agents, custodians and broker-dealers. |
| • | | Policies and procedures (including physical, electronic and procedural safeguards) are in place that are designed to protect the confidentiality of such information. |
| • | | We reserve the right to change our Privacy Policy at any time upon proper notification to you. Customers may want to review our Privacy Policy periodically for changes by accessing the link on our homepage: www.eatonvance.com. |
Our pledge of privacy applies to the following entities within the Eaton Vance organization: the Eaton Vance Family of Funds, Eaton Vance Management, Eaton Vance Investment Counsel, Eaton Vance Distributors, Inc., Eaton Vance Trust Company, Eaton Vance Management (International) Limited, Eaton Vance Advisers International Ltd., Eaton Vance Management’s Real Estate Investment Group and Boston Management and Research. In addition, our Privacy Policy applies only to those Eaton Vance customers who are individuals and who have a direct relationship with us. If a customer’s account (i.e., fund shares) is held in the name of a third-party financial advisor/broker-dealer, it is likely that only such advisor’s privacy policies apply to the customer. This notice supersedes all previously issued privacy disclosures. For more information about Eaton Vance’s Privacy Policy, please call 1-800-262-1122.
Delivery of Shareholder Documents. The Securities and Exchange Commission (SEC) permits funds to deliver only one copy of shareholder documents, including prospectuses, proxy statements and shareholder reports, to fund investors with multiple accounts at the same residential or post office box address. This practice is often called “householding” and it helps eliminate duplicate mailings to shareholders. Eaton Vance, or your financial advisor, may household the mailing of your documents indefinitely unless you instruct Eaton Vance, or your financial advisor, otherwise. If you would prefer that your Eaton Vance documents not be householded, please contact Eaton Vance at 1-800-262-1122, or contact your financial advisor. Your instructions that householding not apply to delivery of your Eaton Vance documents will typically be effective within 30 days of receipt by Eaton Vance or your financial advisor.
Portfolio Holdings. Each Eaton Vance Fund and its underlying Portfolio(s) (if applicable) will file a schedule of portfolio holdings on Form N-Q with the SEC for the first and third quarters of each fiscal year. The Form N-Q will be available on the Eaton Vance website at www.eatonvance.com, by calling Eaton Vance at 1-800-262-1122 or in the EDGAR database on the SEC’s website at www.sec.gov. Form N-Q may also be reviewed and copied at the SEC’s public reference room in Washington, D.C. (call 1-800-732-0330 for information on the operation of the public reference room).
Proxy Voting. From time to time, funds are required to vote proxies related to the securities held by the funds. The Eaton Vance Funds or their underlying Portfolios (if applicable) vote proxies according to a set of policies and procedures approved by the Funds’ and Portfolios’ Boards. You may obtain a description of these policies and procedures and information on how the Funds or Portfolios voted proxies relating to portfolio securities during the most recent 12-month period ended June 30, without charge, upon request, by calling 1-800-262-1122 and by accessing the SEC’s website at www.sec.gov.
This Page Intentionally Left Blank
Investment Advisers
AMT-Free Municipal Income Fund
Eaton Vance Management
Two International Place
Boston, MA 02110
National Municipal Income Fund
Boston Management and Research
Two International Place
Boston, MA 02110
Administrator
Eaton Vance Management
Two International Place
Boston, MA 02110
Principal Underwriter*
Eaton Vance Distributors, Inc.
Two International Place
Boston, MA 02110
(617) 482-8260
Custodian
State Street Bank and Trust Company
State Street Financial Center, One Lincoln Street
Boston, MA 02111
Transfer Agent
BNY Mellon Investment Servicing (US) Inc.
Attn: Eaton Vance Funds
P.O. Box 9653
Providence, RI 02940-9653
(800) 262-1122
Independent Registered Public Accounting Firm
Deloitte & Touche LLP
200 Berkeley Street
Boston, MA 02116-5022
Fund Offices
Two International Place
Boston, MA 02110
| * | FINRA BrokerCheck. Investors may check the background of their Investment Professional by contacting the Financial Industry Regulatory Authority (FINRA). FINRA BrokerCheck is a free tool to help investors check the professional background of current and former FINRA-registered securities firms and brokers. FINRA BrokerCheck is available by calling 1-800-289-9999 and at www.FINRA.org. The FINRA BrokerCheck brochure describing this program is available to investors at www.FINRA.org. |

448 9.30.18

Eaton Vance
Municipals Trust
Annual Report
September 30, 2018
California Opportunities • Massachusetts • New York • Ohio

Commodity Futures Trading Commission Registration. Effective December 31, 2012, the Commodity Futures Trading Commission (“CFTC”) adopted certain regulatory changes that subject registered investment companies and advisers to regulation by the CFTC if a fund invests more than a prescribed level of its assets in certain CFTC-regulated instruments (including futures, certain options and swap agreements) or markets itself as providing investment exposure to such instruments. Each Fund has claimed an exclusion from the definition of the term “commodity pool operator” under the Commodity Exchange Act. Accordingly, neither the Funds nor the adviser with respect to the operation of the Funds is subject to CFTC regulation. Because of its management of other strategies, each Fund’s adviser is registered with the CFTC as a commodity pool operator and a commodity trading advisor.
Fund shares are not insured by the FDIC and are not deposits or other obligations of, or guaranteed by, any depository institution. Shares are subject to investment risks, including possible loss of principal invested.
This report must be preceded or accompanied by a current summary prospectus or prospectus. Before investing, investors should consider carefully the investment objective, risks, and charges and expenses of a mutual fund. This and other important information is contained in the summary prospectus and prospectus, which can be obtained from a financial advisor. Prospective investors should read the prospectus carefully before investing. For further information, please call 1-800-262-1122.
Annual Report September 30, 2018
Eaton Vance
Municipal Income Funds
Table of Contents
| | | | |
Management’s Discussion of Fund Performance | | | 2 | |
| |
Performance and Fund Profile | | | | |
| |
| | | | |
California Municipal Opportunities Fund | | | 4 | |
Massachusetts Municipal Income Fund | | | 6 | |
New York Municipal Income Fund | | | 8 | |
Ohio Municipal Income Fund | | | 10 | |
| |
| | | | |
| |
Endnotes and Additional Disclosures | | | 12 | |
| |
Fund Expenses | | | 13 | |
| |
Financial Statements | | | 16 | |
| |
Report of Independent Registered Public Accounting Firm | | | 60 | |
| |
Federal Tax Information | | | 61 | |
| |
Special Meeting of Shareholders | | | 62 | |
| |
Board of Trustees’ Contract Approval | | | 63 | |
| |
Management and Organization | | | 67 | |
| |
Important Notices | | | 70 | |
Eaton Vance
Municipal Income Funds
September 30, 2018
Management’s Discussion of Fund Performance1
Economic and Market Conditions
The fiscal year that began October 1, 2017 was characterized by a flattening of the municipal bond yield curve. Long-term interest rates drifted downward in the first month of the period — despite the U.S. Federal Reserve Board (the Fed) rate hikes the previous March and June 2017 that put upward pressure on short-term rates.
In November and December 2017, however, the municipal market experienced considerable volatility after the GOP-controlled House and Senate released and then passed new tax legislation. The most significant change to the municipal market was the elimination of an issuer’s ability to refinance debt prior to its call date through the issuance of advanced refunding bonds — which accounted for just under 20% of new issuance over the past 10 years. As a result, December 2017 witnessed the largest-ever one-month issuance of new municipal debt, as issuers rushed to beat the December 31, 2017 deadline. Investors sold short maturity bonds to buy new-issue longer maturity bonds in anticipation of lower supply going forward. The net result was rising prices on longer-term debt that drove more flattening of the yield curve in December 2017.
But as the new year began, bond prices reversed direction. Signs of increasing inflation, higher wage growth, and fears that the new tax legislation might overheat the economy pushed interest rates up and caused longer-term bond prices to decline.
Upward pressure on short-term rates continued in March and June 2018 as the Fed delivered its first two rate hikes of the year. At the long end of the curve, however, fluctuating perceptions of geopolitical risk were a primary driver of rates from April through the end of August 2018. Investors toggled between concern that the U.S. was initiating a global trade war and optimism about economic growth and a potential detente between the U.S. and North Korea. Meanwhile, ongoing lower yields for German and Japanese bonds, compared with U.S. Treasurys, weighed on longer-term U.S. yields. In September 2018, however, the Fed hiked rates again and both U.S. Treasury and municipal rates rose across the curve. The net result for the period was a continued flattening of the yield curve, as the spread between two-year and 10-year rates narrowed significantly.
For the 12-month period, the Bloomberg Barclays Municipal Bond Index (the Index),2 a broad measure of the asset class, returned 0.35%. For the period as a whole, the municipal bond yield curve flattened. Rates for AAA-rated7 bonds rose across the curve, but rate increases were greater at the short end of the curve than the long end. On a total return basis, longer maturities in general outperformed shorter maturities,
and lower-rated bonds generally outperformed higher-rated issues. Across most of the curve, municipal bonds generally outperformed U.S. Treasurys.
Fund Performance
For the fiscal year ended September 30, 2018, the California Opportunities Fund’s Class A shares at net asset value (NAV) outperformed the 0.35% return of the Funds’ primary benchmark, the Index, while the Massachusetts, New York, and Ohio Funds’ Class A shares at NAV underperformed the Index.
The Massachusetts, New York, and Ohio Funds’ overall strategy is to normally invest in bonds with maturities of 10 years or more to pursue higher yields and greater income streams compared with shorter-maturity issues. The California Municipal Opportunities Fund uses a flexible investment strategy to seek opportunities virtually anywhere on the yield curve, the credit curve, and across different sectors.
Management has the ability to be opportunistic in pursuing the California Municipal Opportunities Fund’s after-tax total return objective, trading holdings whenever opportunities arise, with the ability to invest up to 20% of net assets in debt obligations other than tax-exempt municipal bonds, including, but not limited to, taxable municipal obligations, U.S. Treasury securities and obligations of the U.S. government, its agencies and instrumentalities. Up to 50% of the California Municipal Opportunities Fund’s net assets may be invested in below-investment-grade securities.
The Funds seek to enhance tax-exempt income through the use of leveraged investments by purchasing residual interest bonds.6 Leverage has the effect of magnifying the Funds’ exposure to its underlying investments in both up and down markets. During this period of rising rates and falling bond prices, residual interest bonds were a slight detractor from performance versus the Index — which does not employ leverage — for all four Funds.
By using Treasury futures and/or interest-rate swaps, management may hedge, to various degrees, against the greater potential risk of volatility caused by the use of leveraged investments and investing in bonds at the long end of the yield curve. As a risk management tactic within the Funds’ overall strategies, interest rate hedging is intended to moderate performance on both the upside and downside of the market. In a period when municipal and Treasury bonds generally declined in price, the Funds’ Treasury futures hedge mitigated a portion of that decline — and was a contributor to relative results versus the unhedged Index — for the Massachusetts, New York, and Ohio Funds. The California Fund did not use an interest rate hedge for the period.
See Endnotes and Additional Disclosures in this report.
Past performance is no guarantee of future results. Returns are historical and are calculated by determining the percentage change in net asset value (NAV) or offering price (as applicable) with all distributions reinvested. Investment return and principal value will fluctuate so that shares, when redeemed, may be worth more or less than their original cost. Performance less than or equal to one year is cumulative. Performance is for the stated time period only; due to market volatility, the Fund’s current performance may be lower or higher than quoted. Returns are before taxes unless otherwise noted. For performance as of the most recent month-end, please refer to eatonvance.com.
Eaton Vance
Municipal Income Funds
September 30, 2018
Management’s Discussion of Fund Performance — continued
State-specific Results
Eaton Vance California Municipal Opportunities Fund’s Class A shares at NAV returned 0.52% during the fiscal year ended September 30, 2018, outperforming the 0.35% return of the Index. Contributors to performance relative to the Index included security selection in general obligation (GO) bonds, security selection in the water and sewer sector, and security selection in insured and uninsured Puerto Rico bonds. This was due to strong performance of Puerto Rico’s debt in the second half of the period, as ongoing bankruptcy negotiations led to anticipation that bondholder recoveries could exceed those originally anticipated by the market. The Fund’s insured Puerto Rico holdings were insured by various municipal bond insurers. It should be noted that most uninsured bonds issued by the Commonwealth of Puerto Rico and its various conduit issuers were no longer included in the Index. As Puerto Rico continued to deal with an ongoing fiscal crisis, bonds issued by various legal entities were impacted by a number of factors throughout the period, including monetary default. As the period ended, Puerto Rico continued to negotiate with creditors and address its current debt structure under the Puerto Rico Oversight, Management, and Economic Stability Act passed by the U.S. Congress.
In contrast, the main detractors from performance versus the Index were security selection in the education sector, security selection in taxable municipal bonds, and security selection in the industrial development revenue (IDR) sector.
Eaton Vance Massachusetts Municipal Income Fund’s Class A shares at NAV returned –0.17%, underperforming the 0.35% return of the Index. Security selection in GO bonds, security selection in the special tax sector, and security selection in zero-coupon bonds all detracted from performance versus the Index. In contrast, contributors to results versus the Index included the Fund’s hedging strategy; security selection in the health care sector, the best-performing sector in the Index during the period; and security selection in the water and sewer sector.
Eaton Vance New York Municipal Income Fund’s Class A shares at NAV returned –0.26%, underperforming the 0.35% return of the Index. Detractors from performance relative to the Index included security selection and an overweight, relative to the Index, in zero-coupon bonds; security selection in prerefunded bonds; and an overweight and security selection in the special tax sector. Contributors to performance versus the Index included the Fund’s hedging strategy, an overweight in the IDR sector, and security selection in the health care sector.
Eaton Vance Ohio Municipal Income Fund’s Class A shares at NAV returned –0.45%, underperforming the 0.35% return of the Index. Security selection in GO bonds, an overweight and security selection in zero-coupon bonds, and leveraged investments all detracted from performance versus the Index. Contributors to performance relative to the Index included the Fund’s hedging strategy, security selection in insured Puerto Rico bonds, and security selection and an overweight in the IDR sector.
See Endnotes and Additional Disclosures in this report.
Past performance is no guarantee of future results. Returns are historical and are calculated by determining the percentage change in net asset value (NAV) or offering price (as applicable) with all distributions reinvested. Investment return and principal value will fluctuate so that shares, when redeemed, may be worth more or less than their original cost. Performance less than or equal to one year is cumulative. Performance is for the stated time period only; due to market volatility, the Fund’s current performance may be lower or higher than quoted. Returns are before taxes unless otherwise noted. For performance as of the most recent month-end, please refer to eatonvance.com.
Eaton Vance
California Municipal Opportunities Fund
September 30, 2018
Performance2,3
Portfolio Managers Craig R. Brandon, CFA and Adam A. Weigold, CFA
| | | | | | | | | | | | | | | | | | | | |
| % Average Annual Total Returns | | Class Inception Date | | | Performance Inception Date | | | One Year | | | Five Years | | | Ten Years | |
Class A at NAV | | | 05/27/1994 | | | | 12/19/1985 | | | | 0.52 | % | | | 4.45 | % | | | 4.92 | % |
Class A with 4.75% Maximum Sales Charge | | | — | | | | — | | | | –4.26 | | | | 3.44 | | | | 4.41 | |
Class C at NAV | | | 08/31/2004 | | | | 12/19/1985 | | | | –0.08 | | | | 3.69 | | | | 4.15 | |
Class C with 1% Maximum Sales Charge | | | — | | | | — | | | | –1.06 | | | | 3.69 | | | | 4.15 | |
Class I at NAV | | | 03/03/2008 | | | | 12/19/1985 | | | | 0.77 | | | | 4.71 | | | | 5.19 | |
Bloomberg Barclays Municipal Bond Index | | | — | | | | — | | | | 0.35 | % | | | 3.54 | % | | | 4.75 | % |
| | | | | |
| | | | | | | | | | | | | | | | | | | | |
| % Total Annual Operating Expense Ratios4 | | | | | | | | Class A | | | Class C | | | Class I | |
| | | | | | | | | | | 0.83 | % | | | 1.58 | % | | | 0.58 | % |
| | | | | |
| | | | | | | | | | | | | | | | | | | | |
| % Distribution Rates/Yields5 | | | | | | | | Class A | | | Class C | | | Class I | |
Distribution Rate | | | | | | | | | | | 2.62 | % | | | 1.88 | % | | | 2.87 | % |
Taxable-Equivalent Distribution Rate | | | | | | | | | | | 5.10 | | | | 3.66 | | | | 5.59 | |
SEC 30-day Yield | | | | | | | | | | | 2.03 | | | | 1.38 | | | | 2.38 | |
Taxable-Equivalent SEC 30-day Yield | | | | | | | | | | | 3.96 | | | | 2.70 | | | | 4.64 | |
| | | | | |
| | | | | | | | | | | | | | | | | | | | |
| % Total Leverage6 | | | | | | | | | | | | | | | |
Residual Interest Bond (RIB) Financing | | | | | | | | | | | | | | | | | | | 2.49 | % |
Growth of $10,000
This graph shows the change in value of a hypothetical investment of $10,000 in Class A of the Fund for the period indicated. For comparison, the same investment is shown in the indicated index.
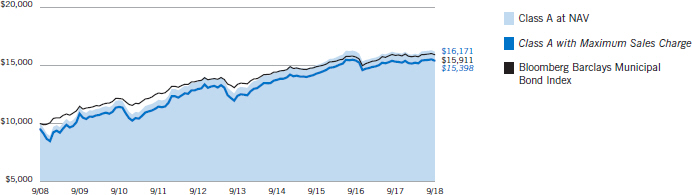
| | | | | | | | | | | | | | | | |
| Growth of Investment | | Amount Invested | | | Period Beginning | | | At NAV | | | With Maximum Sales Charge | |
Class C | | $ | 10,000 | | | | 09/30/2008 | | | $ | 15,019 | | | | N.A. | |
Class I | | $ | 250,000 | | | | 09/30/2008 | | | $ | 414,845 | | | | N.A. | |
See Endnotes and Additional Disclosures in this report.
Past performance is no guarantee of future results. Returns are historical and are calculated by determining the percentage change in net asset value (NAV) or offering price (as applicable) with all distributions reinvested. Investment return and principal value will fluctuate so that shares, when redeemed, may be worth more or less than their original cost. Performance less than or equal to one year is cumulative. Performance is for the stated time period only; due to market volatility, the Fund’s current performance may be lower or higher than quoted. Returns are before taxes unless otherwise noted. For performance as of the most recent month-end, please refer to eatonvance.com.
Eaton Vance
California Municipal Opportunities Fund
September 30, 2018
Fund Profile
Credit Quality (% of total investments)7,8
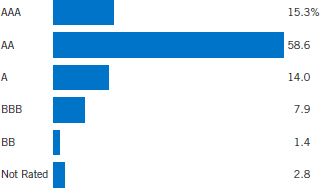
See Endnotes and Additional Disclosures in this report.
Eaton Vance
Massachusetts Municipal Income Fund
September 30, 2018
Performance2,3
Portfolio Manager Craig R. Brandon, CFA
| | | | | | | | | | | | | | | | | | | | |
| % Average Annual Total Returns | | Class Inception Date | | | Performance Inception Date | | | One Year | | | Five Years | | | Ten Years | |
Class A at NAV | | | 12/07/1993 | | | | 04/18/1991 | | | | –0.17 | % | | | 3.61 | % | | | 4.75 | % |
Class A with 4.75% Maximum Sales Charge | | | — | | | | — | | | | –4.88 | | | | 2.60 | | | | 4.24 | |
Class C at NAV | | | 05/02/2006 | | | | 04/18/1991 | | | | –0.80 | | | | 2.87 | | | | 3.98 | |
Class C with 1% Maximum Sales Charge | | | — | | | | — | | | | –1.77 | | | | 2.87 | | | | 3.98 | |
Class I at NAV | | | 06/17/1993 | | | | 04/18/1991 | | | | 0.15 | | | | 3.82 | | | | 4.96 | |
Bloomberg Barclays Municipal Bond Index | | | — | | | | — | | | | 0.35 | % | | | 3.54 | % | | | 4.75 | % |
Bloomberg Barclays 20 Year Municipal Bond Index | | | — | | | | — | | | | 1.03 | | | | 4.83 | | | | 6.07 | |
| | | | | |
| | | | | | | | | | | | | | | | | | | | |
| % Total Annual Operating Expense Ratios4 | | | | | | | | Class A | | | Class C | | | Class I | |
| | | | | | | | | | | 0.76 | % | | | 1.52 | % | | | 0.56 | % |
| | | | | |
| | | | | | | | | | | | | | | | | | | | |
| % Distribution Rates/Yields5 | | | | | | | | Class A | | | Class C | | | Class I | |
Distribution Rate | | | | | | | | | | | 2.99 | % | | | 2.25 | % | | | 3.19 | % |
Taxable-Equivalent Distribution Rate | | | | | | | | | | | 5.32 | | | | 4.00 | | | | 5.68 | |
SEC 30-day Yield | | | | | | | | | | | 1.93 | | | | 1.28 | | | | 2.23 | |
Taxable-Equivalent SEC 30-day Yield | | | | | | | | | | | 3.44 | | | | 2.28 | | | | 3.97 | |
| | | | | |
| | | | | | | | | | | | | | | | | | | | |
| % Total Leverage6 | | | | | | | | | | | | | | | |
RIB Financing | | | | | | | | | | | | | | | | | | | 2.47 | % |
Growth of $10,000
This graph shows the change in value of a hypothetical investment of $10,000 in Class A of the Fund for the period indicated. For comparison, the same investment is shown in the indicated index.
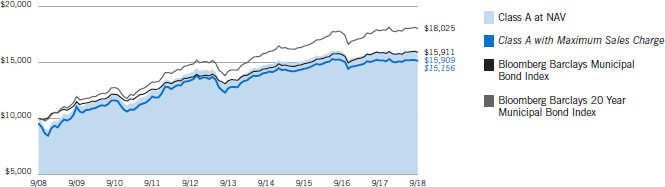
| | | | | | | | | | | | | | | | |
| Growth of Investment | | Amount Invested | | | Period Beginning | | | At NAV | | | With Maximum Sales Charge | |
Class C | | $ | 10,000 | | | | 09/30/2008 | | | $ | 14,782 | | | | N.A. | |
Class I | | $ | 250,000 | | | | 09/30/2008 | | | $ | 405,742 | | | | N.A. | |
See Endnotes and Additional Disclosures in this report.
Past performance is no guarantee of future results. Returns are historical and are calculated by determining the percentage change in net asset value (NAV) or offering price (as applicable) with all distributions reinvested. Investment return and principal value will fluctuate so that shares, when redeemed, may be worth more or less than their original cost. Performance less than or equal to one year is cumulative. Performance is for the stated time period only; due to market volatility, the Fund’s current performance may be lower or higher than quoted. Returns are before taxes unless otherwise noted. For performance as of the most recent month-end, please refer to eatonvance.com.
Eaton Vance
Massachusetts Municipal Income Fund
September 30, 2018
Fund Profile
Credit Quality (% of total investments)7,8
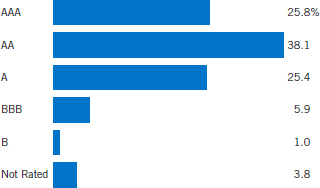
See Endnotes and Additional Disclosures in this report.
Eaton Vance
New York Municipal Income Fund
September 30, 2018
Performance2,3
Portfolio Manager Craig R. Brandon, CFA
| | | | | | | | | | | | | | | | | | | | |
| % Average Annual Total Returns | | Class Inception Date | | | Performance Inception Date | | | One Year | | | Five Years | | | Ten Years | |
Class A at NAV | | | 04/15/1994 | | | | 08/30/1990 | | | | –0.26 | % | | | 4.02 | % | | | 5.13 | % |
Class A with 4.75% Maximum Sales Charge | | | — | | | | — | | | | –4.96 | | | | 3.02 | | | | 4.62 | |
Class C at NAV | | | 09/30/2003 | | | | 08/30/1990 | | | | –1.10 | | | | 3.22 | | | | 4.34 | |
Class C with 1% Maximum Sales Charge | | | — | | | | — | | | | –2.07 | | | | 3.22 | | | | 4.34 | |
Class I at NAV | | | 03/03/2008 | | | | 08/30/1990 | | | | –0.06 | | | | 4.22 | | | | 5.34 | |
Bloomberg Barclays Municipal Bond Index | | | — | | | | — | | | | 0.35 | % | | | 3.54 | % | | | 4.75 | % |
Bloomberg Barclays 20 Year Municipal Bond Index | | | — | | | | — | | | | 1.03 | | | | 4.83 | | | | 6.07 | |
| | | | | |
| | | | | | | | | | | | | | | | | | | | |
| % Total Annual Operating Expense Ratios4 | | | | | | | | Class A | | | Class C | | | Class I | |
| | | | | | | | | | | 0.77 | % | | | 1.52 | % | | | 0.57 | % |
| | | | | |
| | | | | | | | | | | | | | | | | | | | |
| % Distribution Rates/Yields5 | | | | | | | | Class A | | | Class C | | | Class I | |
Distribution Rate | | | | | | | | | | | 2.91 | % | | | 2.17 | % | | | 3.11 | % |
Taxable-Equivalent Distribution Rate | | | | | | | | | | | 5.39 | | | | 4.02 | | | | 5.76 | |
SEC 30-day Yield | | | | | | | | | | | 2.19 | | | | 1.55 | | | | 2.50 | |
Taxable-Equivalent SEC 30-day Yield | | | | | | | | | | | 4.05 | | | | 2.87 | | | | 4.63 | |
| | | | | |
| | | | | | | | | | | | | | | | | | | | |
| % Total Leverage6 | | | | | | | | | | | | | | | |
RIB Financing | | | | | | | | | | | | | | | | | | | 3.46 | % |
Growth of $10,000
This graph shows the change in value of a hypothetical investment of $10,000 in Class A of the Fund for the period indicated. For comparison, the same investment is shown in the indicated index.
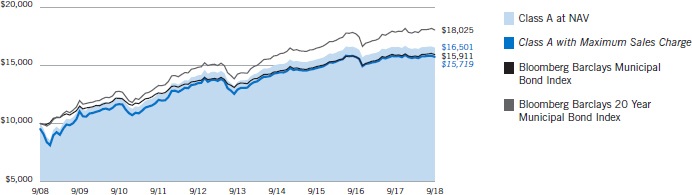
| | | | | | | | | | | | | | | | |
| Growth of Investment | | Amount Invested | | | Period Beginning | | | At NAV | | | With Maximum Sales Charge | |
Class C | | $ | 10,000 | | | | 09/30/2008 | | | $ | 15,298 | | | | N.A. | |
Class I | | $ | 250,000 | | | | 09/30/2008 | | | $ | 420,761 | | | | N.A. | |
See Endnotes and Additional Disclosures in this report.
Past performance is no guarantee of future results. Returns are historical and are calculated by determining the percentage change in net asset value (NAV) or offering price (as applicable) with all distributions reinvested. Investment return and principal value will fluctuate so that shares, when redeemed, may be worth more or less than their original cost. Performance less than or equal to one year is cumulative. Performance is for the stated time period only; due to market volatility, the Fund’s current performance may be lower or higher than quoted. Returns are before taxes unless otherwise noted. For performance as of the most recent month-end, please refer to eatonvance.com.
Eaton Vance
New York Municipal Income Fund
September 30, 2018
Fund Profile
Credit Quality (% of total investments)7,8
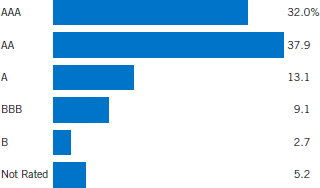
See Endnotes and Additional Disclosures in this report.
Eaton Vance
Ohio Municipal Income Fund
September 30, 2018
Performance2,3
Portfolio Manager Cynthia J. Clemson
| | | | | | | | | | | | | | | | | | | | |
| % Average Annual Total Returns | | Class Inception Date | | | Performance Inception Date | | | One Year | | | Five Years | | | Ten Years | |
Class A at NAV | | | 12/07/1993 | | | | 04/18/1991 | | | | –0.45 | % | | | 3.90 | % | | | 4.67 | % |
Class A with 4.75% Maximum Sales Charge | | | — | | | | — | | | | –5.18 | | | | 2.89 | | | | 4.15 | |
Class C at NAV | | | 02/03/2006 | | | | 04/18/1991 | | | | –1.09 | | | | 3.12 | | | | 3.90 | |
Class C with 1% Maximum Sales Charge | | | — | | | | — | | | | –2.05 | | | | 3.12 | | | | 3.90 | |
Class I at NAV | | | 08/03/2010 | | | | 04/18/1991 | | | | –0.14 | | | | 4.10 | | | | 4.84 | |
Bloomberg Barclays Municipal Bond Index | | | — | | | | — | | | | 0.35 | % | | | 3.54 | % | | | 4.75 | % |
Bloomberg Barclays 20 Year Municipal Bond Index | | | — | | | | — | | | | 1.03 | | | | 4.83 | | | | 6.07 | |
| | | | | |
| | | | | | | | | | | | | | | | | | | | |
| % Total Annual Operating Expense Ratios4 | | | | | | | | Class A | | | Class C | | | Class I | |
| | | | | | | | | | | 0.83 | % | | | 1.58 | % | | | 0.63 | % |
| | | | | |
| | | | | | | | | | | | | | | | | | | | |
| % Distribution Rates/Yields5 | | | | | | | | Class A | | | Class C | | | Class I | |
Distribution Rate | | | | | | | | | | | 3.10 | % | | | 2.36 | % | | | 3.30 | % |
Taxable-Equivalent Distribution Rate | | | | | | | | | | | 5.51 | | | | 4.20 | | | | 5.87 | |
SEC 30-day Yield | | | | | | | | | | | 2.33 | | | | 1.70 | | | | 2.64 | |
Taxable-Equivalent SEC 30-day Yield | | | | | | | | | | | 4.14 | | | | 3.02 | | | | 4.70 | |
| | | | | |
| | | | | | | | | | | | | | | | | | | | |
| % Total Leverage6 | | | | | | | | | | | | | | | |
RIB Financing | | | | | | | | | | | | | | | | | | | 5.64 | % |
Growth of $10,000
This graph shows the change in value of a hypothetical investment of $10,000 in Class A of the Fund for the period indicated. For comparison, the same investment is shown in the indicated index.
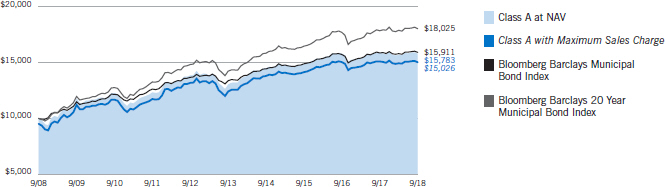
| | | | | | | | | | | | | | | | |
| Growth of Investment3 | | Amount Invested | | | Period Beginning | | | At NAV | | | With Maximum Sales Charge | |
Class C | | $ | 10,000 | | | | 09/30/2008 | | | $ | 14,668 | | | | N.A. | |
Class I | | $ | 250,000 | | | | 09/30/2008 | | | $ | 401,348 | | | | N.A. | |
See Endnotes and Additional Disclosures in this report.
Past performance is no guarantee of future results. Returns are historical and are calculated by determining the percentage change in net asset value (NAV) or offering price (as applicable) with all distributions reinvested. Investment return and principal value will fluctuate so that shares, when redeemed, may be worth more or less than their original cost. Performance less than or equal to one year is cumulative. Performance is for the stated time period only; due to market volatility, the Fund’s current performance may be lower or higher than quoted. Returns are before taxes unless otherwise noted. For performance as of the most recent month-end, please refer to eatonvance.com.
Eaton Vance
Ohio Municipal Income Fund
September 30, 2018
Fund Profile
Credit Quality (% of total investments)7,8
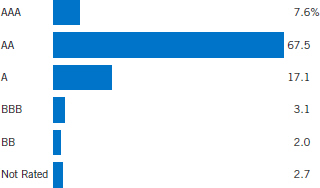
See Endnotes and Additional Disclosures in this report.
Eaton Vance
Municipal Income Funds
September 30, 2018
Endnotes and Additional Disclosures
| 1 | The views expressed in this report are those of the portfolio manager(s) and are current only through the date stated at the top of this page. These views are subject to change at any time based upon market or other conditions, and Eaton Vance and the Fund(s) disclaim any responsibility to update such views. These views may not be relied upon as investment advice and, because investment decisions are based on many factors, may not be relied upon as an indication of trading intent on behalf of any Eaton Vance fund. This commentary may contain statements that are not historical facts, referred to as “forward looking statements.” The Fund’s actual future results may differ significantly from those stated in any forward looking statement, depending on factors such as changes in securities or financial markets or general economic conditions, the volume of sales and purchases of Fund shares, the continuation of investment advisory, administrative and service contracts, and other risks discussed from time to time in the Fund’s filings with the Securities and Exchange Commission. |
| 2 | Bloomberg Barclays Municipal Bond Index is an unmanaged index of municipal bonds traded in the U.S. Bloomberg Barclays 20 Year Municipal Bond Index is an unmanaged index of municipal bonds traded in the U.S. with maturities ranging from 17-22 years. Unless otherwise stated, index returns do not reflect the effect of any applicable sales charges, commissions, expenses, taxes or leverage, as applicable. It is not possible to invest directly in an index. |
| 3 | Total Returns at NAV do not include applicable sales charges. If sales charges were deducted, the returns would be lower. Total Returns shown with maximum sales charge reflect the stated maximum sales charge. Unless otherwise stated, performance does not reflect the deduction of taxes on Fund distributions or redemptions of Fund shares. |
| | Performance prior to the inception date of a class may be linked to the performance of an older class of the Fund. This linked performance is adjusted for any applicable sales charge, but is not adjusted for class expense differences. If adjusted for such differences, the performance would be different. For Ohio Municipal Income Fund, the performance of Class I is linked to Class A. Performance since inception for an index, if presented, is the performance since the Fund’s or oldest share class’ inception, as applicable. Performance presented in the Financial Highlights included in the financial statements is not linked. |
| 4 | Source: Fund prospectus. The expense ratios for the current reporting period can be found in the Financial Highlights section of this report. |
| 5 | The Distribution Rate is based on the Fund’s last regular distribution per share in the period (annualized) divided by the Fund’s NAV at the end of the period. The Fund’s distributions may be comprised of amounts characterized for federal income tax purposes as tax-exempt income, qualified and non-qualified ordinary dividends, capital gains and nondividend distributions, also known as return of capital. The Fund will determine the federal income tax character of distributions paid to a shareholder after the end of the calendar year. This is reported on the IRS form 1099-DIV and provided to the shareholder shortly after each year-end. The Fund’s distributions are determined by the investment adviser based on its current assessment of the Fund’s long-term return potential. As portfolio and market conditions change, the rate of distributions paid by the Fund could change. Taxable-equivalent performance is based on the highest combined federal and state income tax rates, where applicable. Lower tax rates would result in lower tax-equivalent performance. Actual tax rates will vary depending on your income, exemptions and deductions. Rates do not include local taxes. The SEC Yield is a standardized measure based on the estimated yield to maturity of a fund’s investments over a 30-day period and is based on the maximum offer price at the date specified. The SEC Yield is not based on the distributions made by the Fund, which may differ. |
| 6 | Fund employs RIB financing. The leverage created by RIB investments provides an opportunity for increased income but, at the same time, creates special risks (including the likelihood of greater volatility of NAV). The cost of leverage rises and falls with changes in short-term interest rates. See “Floating Rate Notes Issued in Conjunction with Securities Held” in the notes to the financial statements for more information about RIB financing. RIB leverage represents the amount of Floating Rate Notes outstanding at period end as a percentage of Fund net assets plus Floating Rate Notes. |
| 7 | Ratings are based on Moody’s Investors Service, Inc. (“Moody’s”), S&P Global Ratings (“S&P”) or Fitch Ratings (“Fitch”), as applicable. If securities are rated differently by the ratings agencies, the highest rating is applied. Ratings, which are subject to change, apply to the creditworthiness of the issuers of the underlying securities and not to the Fund or its shares. Credit ratings measure the quality of a bond based on the issuer’s creditworthiness, with ratings ranging from AAA, being the highest, to D, being the lowest based on S&P’s measures. Ratings of BBB or higher by S&P or Fitch (Baa or higher by Moody’s) are considered to be investment-grade quality. Credit ratings are based largely on the ratings agency’s analysis at the time of rating. The rating assigned to any particular security is not necessarily a reflection of the issuer’s current financial condition and does not necessarily reflect its assessment of the volatility of a security’s market value or of the liquidity of an investment in the security. Holdings designated as “Not Rated” (if any) are not rated by the national ratings agencies stated above. |
| 8 | The chart includes the municipal bonds held by a trust that issues residual interest bonds, consistent with the Portfolio of Investments. |
| | Fund profiles subject to change due to active management. |
Eaton Vance
Municipal Income Funds
September 30, 2018
Fund Expenses
Example: As a Fund shareholder, you incur two types of costs: (1) transaction costs, including sales charges (loads) on purchases and redemption fees (if applicable); and (2) ongoing costs, including management fees; distribution and/or service fees; and other Fund expenses. This Example is intended to help you understand your ongoing costs (in dollars) of Fund investing and to compare these costs with the ongoing costs of investing in other mutual funds. The Example is based on an investment of $1,000 invested at the beginning of the period and held for the entire period (April 1, 2018 – September 30, 2018).
Actual Expenses: The first section of each table below provides information about actual account values and actual expenses. You may use the information in this section, together with the amount you invested, to estimate the expenses that you paid over the period. Simply divide your account value by $1,000 (for example, an $8,600 account value divided by $1,000 = 8.6), then multiply the result by the number in the first section under the heading entitled “Expenses Paid During Period” to estimate the expenses you paid on your account during this period.
Hypothetical Example for Comparison Purposes: The second section of each table below provides information about hypothetical account values and hypothetical expenses based on the actual Fund expense ratio and an assumed rate of return of 5% per year (before expenses), which is not the actual Fund return. The hypothetical account values and expenses may not be used to estimate the actual ending account balance or expenses you paid for the period. You may use this information to compare the ongoing costs of investing in your Fund and other funds. To do so, compare this 5% hypothetical example with the 5% hypothetical examples that appear in the shareholder reports of the other funds.
Please note that the expenses shown in each table are meant to highlight your ongoing costs only and do not reflect any transactional costs, such as sales charges (loads) or redemption fees (if applicable). Therefore, the second section of each table is useful in comparing ongoing costs only, and will not help you determine the relative total costs of owning different funds. In addition, if these transactional costs were included, your costs would be higher.
Eaton Vance California Municipal Opportunities Fund
| | | | | | | | | | | | | | | | |
| | | Beginning
Account Value
(4/1/18) | | | Ending
Account Value
(9/30/18) | | | Expenses Paid
During Period*
(4/1/18 – 9/30/18) | | | Annualized
Expense
Ratio | |
| | | | |
Actual | | | | | | | | | | | | | | | | |
Class A | | $ | 1,000.00 | | | $ | 1,011.10 | | | $ | 4.23 | | | | 0.84 | % |
Class C | | $ | 1,000.00 | | | $ | 1,008.20 | | | $ | 8.00 | | | | 1.59 | % |
Class I | | $ | 1,000.00 | | | $ | 1,012.40 | | | $ | 2.98 | | | | 0.59 | % |
| | | | | |
Hypothetical | | | | | | | | | | | | | | | | |
(5% return per year before expenses) | | | | | | | | | | | | | | | | |
Class A | | $ | 1,000.00 | | | $ | 1,020.90 | | | $ | 4.26 | | | | 0.84 | % |
Class C | | $ | 1,000.00 | | | $ | 1,017.10 | | | $ | 8.04 | | | | 1.59 | % |
Class I | | $ | 1,000.00 | | | $ | 1,022.10 | | | $ | 2.99 | | | | 0.59 | % |
| * | Expenses are equal to the Fund’s annualized expense ratio for the indicated Class, multiplied by the average account value over the period, multiplied by 183/365 (to reflect the one-half year period). The Example assumes that the $1,000 was invested at the net asset value per share determined at the close of business on March 31, 2018. |
Eaton Vance
Municipal Income Funds
September 30, 2018
Fund Expenses — continued
Eaton Vance Massachusetts Municipal Income Fund
| | | | | | | | | | | | | | | | |
| | | Beginning
Account Value
(4/1/18) | | | Ending
Account Value
(9/30/18) | | | Expenses Paid
During Period*
(4/1/18 – 9/30/18) | | | Annualized
Expense
Ratio | |
| | | | |
Actual | | | | | | | | | | | | | | | | |
Class A | | $ | 1,000.00 | | | $ | 1,003.30 | | | $ | 3.87 | | | | 0.77 | % |
Class C | | $ | 1,000.00 | | | $ | 999.60 | | | $ | 7.62 | | | | 1.52 | % |
Class I | | $ | 1,000.00 | | | $ | 1,004.30 | | | $ | 2.86 | | | | 0.57 | % |
| | | | | |
Hypothetical | | | | | | | | | | | | | | | | |
(5% return per year before expenses) | | | | | | | | | | | | | | | | |
Class A | | $ | 1,000.00 | | | $ | 1,021.20 | | | $ | 3.90 | | | | 0.77 | % |
Class C | | $ | 1,000.00 | | | $ | 1,017.40 | | | $ | 7.69 | | | | 1.52 | % |
Class I | | $ | 1,000.00 | | | $ | 1,022.20 | | | $ | 2.89 | | | | 0.57 | % |
| * | Expenses are equal to the Fund’s annualized expense ratio for the indicated Class, multiplied by the average account value over the period, multiplied by 183/365 (to reflect the one-half year period). The Example assumes that the $1,000 was invested at the net asset value per share determined at the close of business on March 31, 2018. |
Eaton Vance New York Municipal Income Fund
| | | | | | | | | | | | | | | | |
| | | Beginning
Account Value
(4/1/18) | | | Ending
Account Value
(9/30/18) | | | Expenses Paid
During Period*
(4/1/18 – 9/30/18) | | | Annualized
Expense
Ratio | |
| | | | |
Actual | | | | | | | | | | | | | | | | |
Class A | | $ | 1,000.00 | | | $ | 1,003.20 | | | $ | 3.97 | | | | 0.79 | % |
Class C | | $ | 1,000.00 | | | $ | 999.40 | | | $ | 7.72 | | | | 1.54 | % |
Class I | | $ | 1,000.00 | | | $ | 1,004.20 | | | $ | 2.96 | | | | 0.59 | % |
| | | | | |
Hypothetical | | | | | | | | | | | | | | | | |
(5% return per year before expenses) | | | | | | | | | | | | | | | | |
Class A | | $ | 1,000.00 | | | $ | 1,021.10 | | | $ | 4.00 | | | | 0.79 | % |
Class C | | $ | 1,000.00 | | | $ | 1,017.30 | | | $ | 7.79 | | | | 1.54 | % |
Class I | | $ | 1,000.00 | | | $ | 1,022.10 | | | $ | 2.99 | | | | 0.59 | % |
| * | Expenses are equal to the Fund’s annualized expense ratio for the indicated Class, multiplied by the average account value over the period, multiplied by 183/365 (to reflect the one-half year period). The Example assumes that the $1,000 was invested at the net asset value per share determined at the close of business on March 31, 2018. |
Eaton Vance
Municipal Income Funds
September 30, 2018
Fund Expenses — continued
Eaton Vance Ohio Municipal Income Fund
| | | | | | | | | | | | | | | | |
| | | Beginning
Account Value
(4/1/18) | | | Ending
Account Value
(9/30/18) | | | Expenses Paid
During Period*
(4/1/18 – 9/30/18) | | | Annualized
Expense
Ratio | |
| | | | |
Actual | | | | | | | | | | | | | | | | |
Class A | | $ | 1,000.00 | | | $ | 1,006.30 | | | $ | 4.22 | | | | 0.84 | % |
Class C | | $ | 1,000.00 | | | $ | 1,002.50 | | | $ | 7.98 | | | | 1.59 | % |
Class I | | $ | 1,000.00 | | | $ | 1,007.30 | | | $ | 3.22 | | | | 0.64 | % |
| | | | | |
Hypothetical | | | | | | | | | | | | | | | | |
(5% return per year before expenses) | | | | | | | | | | | | | | | | |
Class A | | $ | 1,000.00 | | | $ | 1,020.90 | | | $ | 4.26 | | | | 0.84 | % |
Class C | | $ | 1,000.00 | | | $ | 1,017.10 | | | $ | 8.04 | | | | 1.59 | % |
Class I | | $ | 1,000.00 | | | $ | 1,021.90 | | | $ | 3.24 | | | | 0.64 | % |
| * | Expenses are equal to the Fund’s annualized expense ratio for the indicated Class, multiplied by the average account value over the period, multiplied by 183/365 (to reflect the one-half year period). The Example assumes that the $1,000 was invested at the net asset value per share determined at the close of business on March 31, 2018. |
Eaton Vance
California Municipal Opportunities Fund
September 30, 2018
Portfolio of Investments
| | | | | | | | |
| Tax-Exempt Municipal Securities — 107.3% | |
| Security | | Principal
Amount
(000’s omitted) | | | Value | |
|
| Education — 9.0% | |
California Educational Facilities Authority, (Art Center College of Design), 5.00%, 12/1/24 | | $ | 225 | | | $ | 256,390 | |
California Educational Facilities Authority, (Art Center College of Design), 5.00%, 12/1/25 | | | 240 | | | | 276,403 | |
California Educational Facilities Authority, (Art Center College of Design), 5.00%, 12/1/26 | | | 250 | | | | 290,675 | |
California Educational Facilities Authority, (Claremont McKenna College), 5.25%, 1/1/30 | | | 1,000 | | | | 1,068,300 | |
California Educational Facilities Authority, (Loyola Marymount University), 5.00%, 10/1/30 | | | 2,895 | | | | 2,978,289 | |
California Educational Facilities Authority, (Mount Saint Mary’s University), 5.00%, 10/1/23 | | | 115 | | | | 130,334 | |
California Educational Facilities Authority, (Mount Saint Mary’s University), 5.00%, 10/1/24 | | | 100 | | | | 114,924 | |
California Educational Facilities Authority, (Mount Saint Mary’s University), 5.00%, 10/1/25 | | | 100 | | | | 116,446 | |
California Educational Facilities Authority, (Mount Saint Mary’s University), 5.00%, 10/1/26 | | | 100 | | | | 117,861 | |
California Educational Facilities Authority, (Mount Saint Mary’s University), 5.00%, 10/1/27 | | | 100 | | | | 118,967 | |
California Educational Facilities Authority, (Santa Clara University), 5.00%, 4/1/33 | | | 1,000 | | | | 1,136,860 | |
California Educational Facilities Authority, (University of the Pacific), 5.00%, 11/1/36 | | | 3,685 | | | | 4,124,473 | |
California Municipal Finance Authority, (California Lutheran University), 5.00%, 10/1/25 | | | 275 | | | | 314,328 | |
California Municipal Finance Authority, (California Lutheran University), 5.00%, 10/1/26 | | | 300 | | | | 345,603 | |
California Municipal Finance Authority, (California Lutheran University), 5.00%, 10/1/27 | | | 300 | | | | 348,288 | |
California Municipal Finance Authority, (University of San Diego), 5.25%, 10/1/27 | | | 915 | | | | 994,129 | |
California Municipal Finance Authority, (University of San Diego), 5.25%, 10/1/28 | | | 960 | | | | 1,041,859 | |
California School Finance Authority, (Green Dot Public Schools), 5.00%, 8/1/28(1)(2) | | | 380 | | | | 427,284 | |
California School Finance Authority, (Green Dot Public Schools), 5.00%, 8/1/38(1)(2) | | | 1,000 | | | | 1,082,930 | |
California State University, 5.00%, 11/1/41 | | | 2,735 | | | | 3,069,846 | |
California State University, 5.25%, 11/1/31 | | | 1,465 | | | | 1,595,078 | |
University of California, 5.00%, 5/15/38 | | | 2,040 | | | | 2,302,650 | |
| | | | | | | $ | 22,251,917 | |
|
| Electric Utilities — 4.2% | |
Chula Vista, (San Diego Gas and Electric), 5.875%, 2/15/34 | | $ | 895 | | | $ | 918,216 | |
| | | | | | | | |
| Security | | Principal
Amount
(000’s omitted) | | | Value | |
|
| Electric Utilities (continued) | |
Los Angeles Department of Water and Power, Power System Revenue, 5.00%, 7/1/40 | | $ | 1,395 | | | $ | 1,571,579 | |
Los Angeles Department of Water and Power, Power System Revenue, 5.00%, 7/1/42 | | | 2,000 | | | | 2,250,400 | |
Sacramento Municipal Utility District, 5.00%, 8/15/27 | | | 1,080 | | | | 1,168,636 | |
Sacramento Municipal Utility District, 5.00%, 8/15/28 | | | 1,455 | | | | 1,572,709 | |
Southern California Public Power Authority, (Tieton Hydropower), 5.00%, 7/1/35 | | | 2,160 | | | | 2,263,421 | |
Vernon, Electric System Revenue, 5.125%, 8/1/21 | | | 800 | | | | 819,456 | |
| | | | | | | $ | 10,564,417 | |
|
| Escrowed / Prerefunded — 1.1% | |
California, Prerefunded to 4/1/19, 6.00%, 4/1/38 | | $ | 355 | | | $ | 362,650 | |
California Health Facilities Financing Authority, (Catholic Healthcare West), Prerefunded to 7/1/19, 6.00%, 7/1/29 | | | 1,855 | | | | 1,913,080 | |
Vernon, Electric System Revenue, Prerefunded to 8/1/19, 5.125%, 8/1/21 | | | 365 | | | | 375,012 | |
| | | | | | | $ | 2,650,742 | |
|
| General Obligations — 29.9% | |
Berryessa Union School District, (Election of 2014), 5.00%, 8/1/36 | | $ | 400 | | | $ | 457,932 | |
Cabrillo Unified School District, (Election of 2018), 3.75%, 8/1/42(1) | | | 3,510 | | | | 3,514,563 | |
Cabrillo Unified School District, (Election of 2018), 4.00%, 8/1/25(1) | | | 120 | | | | 133,987 | |
Cabrillo Unified School District, (Election of 2018), 4.00%, 8/1/26(1) | | | 180 | | | | 202,437 | |
Cabrillo Unified School District, (Election of 2018), 4.00%, 8/1/27(1) | | | 240 | | | | 267,730 | |
Cabrillo Unified School District, (Election of 2018), 4.00%, 8/1/28(1) | | | 305 | | | | 337,034 | |
Cabrillo Unified School District, (Election of 2018), 4.00%, 8/1/29(1) | | | 375 | | | | 409,102 | |
Cabrillo Unified School District, (Election of 2018), 4.00%, 8/1/30(1) | | | 450 | | | | 485,982 | |
Cabrillo Unified School District, (Election of 2018), 4.00%, 8/1/37(1) | | | 250 | | | | 260,375 | |
Cabrillo Unified School District, (Election of 2018), 4.00%, 8/1/40(1) | | | 1,530 | | | | 1,579,694 | |
Cabrillo Unified School District, (Election of 2018), 5.00%, 8/1/39(1) | | | 250 | | | | 282,708 | |
Cabrillo Unified School District, (Election of 2018), 5.00%, 8/1/45(1) | | | 3,000 | | | | 3,359,340 | |
California, 5.00%, 11/1/31 | | | 1,000 | | | | 1,120,590 | |
California, 5.00%, 8/1/36 | | | 2,030 | | | | 2,315,946 | |
| | | | |
| | 16 | | See Notes to Financial Statements. |
Eaton Vance
California Municipal Opportunities Fund
September 30, 2018
Portfolio of Investments — continued
| | | | | | | | |
| Security | | Principal
Amount
(000’s omitted) | | | Value | |
|
| General Obligations (continued) | |
California, 5.00%, 8/1/38 | | $ | 2,925 | | | $ | 3,317,330 | |
California, 5.00%, 10/1/39 | | | 1,830 | | | | 2,063,618 | |
California, 5.50%, 11/1/35 | | | 2,500 | | | | 2,685,900 | |
California, 6.00%, 4/1/38 | | | 645 | | | | 657,958 | |
Campbell Union High School District, (Election of 2016), 5.00%, 8/1/35 | | | 6,400 | | | | 7,373,952 | |
Desert Community College District, 5.00%, 8/1/37 | | | 6,440 | | | | 7,327,046 | |
Glendale Community College District, (Election of 2016), 5.00%, 8/1/33 | | | 750 | | | | 880,192 | |
Glendale Community College District, (Election of 2016), 5.00%, 8/1/35 | | | 1,000 | | | | 1,163,380 | |
Glendale Community College District, (Election of 2016), 5.00%, 8/1/36 | | | 1,000 | | | | 1,158,310 | |
Lawndale Elementary School District, (Election of 2016), 5.00%, 8/1/31 | | | 255 | | | | 295,163 | |
Lawndale Elementary School District, (Election of 2016), 5.00%, 8/1/43 | | | 2,095 | | | | 2,354,277 | |
Los Angeles Unified School District, (Election of 2008), 5.00%, 7/1/40 | | | 2,890 | | | | 3,255,585 | |
Mountain View-Los Altos Union High School District, (Election of 2018), 4.00%, 8/1/33 | | | 1,350 | | | | 1,457,244 | |
Mountain View-Los Altos Union High School District, (Election of 2018), 4.00%, 8/1/34 | | | 1,250 | | | | 1,342,937 | |
Mt. San Antonio Community College District, (Election of 2008), 5.00%, 6/1/33 | | | 750 | | | | 862,920 | |
Pittsburg Unified School District, (Election of 2014), 4.00%, 8/1/34(1) | | | 585 | | | | 614,601 | |
Pittsburg Unified School District, (Election of 2014), 4.00%, 8/1/35(1) | | | 680 | | | | 711,538 | |
Pittsburg Unified School District, (Election of 2014), 4.00%, 8/1/36(1) | | | 500 | | | | 520,745 | |
Pittsburg Unified School District, (Election of 2014), 5.00%, 8/1/40(1) | | | 1,235 | | | | 1,381,990 | |
Pittsburg Unified School District, (Election of 2014), 5.00%, 8/1/42(1) | | | 1,545 | | | | 1,726,615 | |
Pittsburg Unified School District, (Election of 2014), 5.00%, 8/1/44(1) | | | 2,025 | | | | 2,255,668 | |
Redding School District, (Election of 2018), 5.00%, 8/1/42(1) | | | 1,545 | | | | 1,730,014 | |
Santa Barbara Unified School District, (Election of 2016), 5.00%, 8/1/35 | | | 500 | | | | 582,535 | |
Santa Clara County, (Election of 2008), Prerefunded to 8/1/19, 5.00%, 8/1/39(3) | | | 5,400 | | | | 5,544,882 | |
Santa Monica Community College District, (Election of 2008), 5.00%, 8/1/30 | | | 60 | | | | 71,870 | |
Santa Monica Community College District, (Election of 2008), 5.00%, 8/1/32 | | | 700 | | | | 833,595 | |
Santa Monica Community College District, (Election of 2008), 5.00%, 8/1/34 | | | 500 | | | | 591,525 | |
| | | | | | | | |
| Security | | Principal
Amount
(000’s omitted) | | | Value | |
|
| General Obligations (continued) | |
Santa Monica Community College District, (Election of 2016), 4.00%, 8/1/38 | | $ | 650 | | | $ | 681,226 | |
Santa Monica-Malibu Unified School District, (Election of 2012), 4.00%, 8/1/35 | | | 1,000 | | | | 1,060,680 | |
Santa Monica-Malibu Unified School District, (Election of 2012), 5.00%, 8/1/43 | | | 3,000 | | | | 3,321,900 | |
Tahoe-Truckee Unified School District, (Election of 2014), 5.00%, 8/1/33 | | | 500 | | | | 581,045 | |
Tahoe-Truckee Unified School District, (Election of 2014), 5.00%, 8/1/36 | | | 1,000 | | | | 1,145,370 | |
| | | | | | | $ | 74,279,031 | |
|
| Hospital — 15.4% | |
California Health Facilities Financing Authority, (Cedars-Sinai Medical Center), 5.00%, 8/15/36 | | $ | 2,725 | | | $ | 3,108,516 | |
California Health Facilities Financing Authority, (City of Hope), 5.00%, 11/15/32 | | | 735 | | | | 807,089 | |
California Health Facilities Financing Authority, (City of Hope), 5.00%, 11/15/35 | | | 1,050 | | | | 1,151,252 | |
California Health Facilities Financing Authority, (Kaiser Permanente), 4.00%, 11/1/38 | | | 5,000 | | | | 5,126,300 | |
California Health Facilities Financing Authority, (Providence Health & Services), 5.00%, 10/1/44 | | | 4,100 | | | | 4,518,610 | |
California Health Facilities Financing Authority, (Providence St. Joseph Health), 4.00%, 10/1/35 | | | 1,000 | | | | 1,031,090 | |
California Health Facilities Financing Authority, (St. Joseph Health System), 5.00%, 7/1/33 | | | 1,500 | | | | 1,655,505 | |
California Health Facilities Financing Authority, (St. Joseph Health System), 5.50%, 7/1/29 | | | 1,500 | | | | 1,542,780 | |
California Health Facilities Financing Authority, (Sutter Health), 4.00%, 11/15/38 | | | 2,000 | | | | 2,048,740 | |
California Health Facilities Financing Authority, (Sutter Health), 5.00%, 11/15/41 | | | 2,000 | | | | 2,227,520 | |
California Municipal Finance Authority, (NorthBay Healthcare Group), 5.00%, 11/1/24 | | | 800 | | | | 881,296 | |
California Municipal Finance Authority, (NorthBay Healthcare Group), Series 2015, 5.00%, 11/1/25 | | | 200 | | | | 219,744 | |
California Municipal Finance Authority, (NorthBay Healthcare Group), Series 2017A, 5.00%, 11/1/25 | | | 800 | | | | 887,896 | |
California Municipal Finance Authority, (NorthBay Healthcare Group), 5.00%, 11/1/26 | | | 500 | | | | 557,970 | |
California Municipal Finance Authority, (NorthBay Healthcare Group), 5.00%, 11/1/27 | | | 165 | | | | 180,050 | |
California Municipal Finance Authority, (NorthBay Healthcare Group), 5.00%, 11/1/29 | | | 105 | | | | 113,796 | |
California Municipal Finance Authority, (NorthBay Healthcare Group), 5.00%, 11/1/30 | | | 150 | | | | 162,138 | |
| | | | |
| | 17 | | See Notes to Financial Statements. |
Eaton Vance
California Municipal Opportunities Fund
September 30, 2018
Portfolio of Investments — continued
| | | | | | | | |
| Security | | Principal
Amount
(000’s omitted) | | | Value | |
|
| Hospital (continued) | |
California Public Finance Authority, (Henry Mayo Newhall Hospital), 5.00%, 10/15/33 | | $ | 425 | | | $ | 462,175 | |
California Statewide Communities Development Authority, (Cottage Health System), 5.25%, 11/1/30 | | | 500 | | | | 530,945 | |
California Statewide Communities Development Authority, (Kaiser Permanente), 5.00%, 4/1/42 | | | 7,210 | | | | 7,722,487 | |
University of California, Medical Center Revenue, 5.00%, 5/15/47 | | | 1,955 | | | | 2,166,120 | |
Washington Township Health Care District, 5.25%, 7/1/30 | | | 1,240 | | | | 1,294,634 | |
| | | | | | | $ | 38,396,653 | |
|
| Housing — 0.2% | |
California Municipal Finance Authority, (Caritas Corp.), Mobile Home Park Revenue, 5.00%, 8/15/25 | | $ | 525 | | | $ | 594,253 | |
| | | | | | | $ | 594,253 | |
|
| Insured – Electric Utilities — 1.9% | |
Puerto Rico Electric Power Authority, (NPFG), 5.00%, 7/1/23 | | $ | 125 | | | $ | 125,561 | |
Puerto Rico Electric Power Authority, (NPFG), 5.25%, 7/1/22 | | | 1,500 | | | | 1,587,030 | |
Puerto Rico Electric Power Authority, (NPFG), 5.25%, 7/1/32 | | | 2,000 | | | | 2,153,100 | |
Puerto Rico Electric Power Authority, (NPFG), Series QQ, 5.00%, 7/1/22 | | | 180 | | | | 181,168 | |
Puerto Rico Electric Power Authority, (NPFG), Series RR, 5.00%, 7/1/22 | | | 140 | | | | 140,909 | |
Puerto Rico Electric Power Authority, (NPFG), Series RR, 5.00%, 7/1/24 | | | 300 | | | | 301,230 | |
Puerto Rico Electric Power Authority, (NPFG), Series SS, 5.00%, 7/1/24 | | | 130 | | | | 130,533 | |
| | | | | | | $ | 4,619,531 | |
|
| Insured – General Obligations — 6.1% | |
Coalinga-Huron Recreation and Park District, (Election of 2016), (BAM), 5.00%, 8/1/48 | | $ | 1,000 | | | $ | 1,111,320 | |
Coalinga-Huron Recreation and Park District, (Election of 2016), (BAM), 5.00%, 8/1/50 | | | 1,080 | | | | 1,195,528 | |
Grass Valley School District, (Election of 2018), (BAM), 4.00%, 8/1/32 | | | 555 | | | | 588,283 | |
Grass Valley School District, (Election of 2018), (BAM), 4.00%, 8/1/35 | | | 290 | | | | 302,676 | |
Grass Valley School District, (Election of 2018), (BAM), 4.00%, 8/1/36 | | | 500 | | | | 519,405 | |
Grass Valley School District, (Election of 2018), (BAM), 4.00%, 8/1/37 | | | 500 | | | | 516,975 | |
Lennox School District, (Election of 1998), (NPFG), 0.00%, 8/1/23 | | | 750 | | | | 655,732 | |
| | | | | | | | |
| Security | | Principal
Amount
(000’s omitted) | | | Value | |
|
| Insured – General Obligations (continued) | |
Sanger Unified School District, (Election of 2016), (BAM), 5.00%, 8/1/25 | | $ | 150 | | | $ | 175,358 | |
Sanger Unified School District, (Election of 2016), (BAM), 5.00%, 8/1/27 | | | 250 | | | | 289,352 | |
Sanger Unified School District, (Election of 2016), (BAM), 5.00%, 8/1/28 | | | 110 | | | | 126,867 | |
Sanger Unified School District, (Election of 2016), (BAM), 5.00%, 8/1/32 | | | 115 | | | | 130,855 | |
Sanger Unified School District, (Election of 2016), (BAM), 5.00%, 8/1/34 | | | 250 | | | | 282,642 | |
Sanger Unified School District, (Election of 2016), (BAM), 5.00%, 8/1/35 | | | 225 | | | | 253,634 | |
Sanger Unified School District, (Election of 2016), (BAM), 5.00%, 8/1/36 | | | 200 | | | | 224,794 | |
Sanger Unified School District, (Election of 2016), (BAM), 5.00%, 8/1/45 | | | 4,790 | | | | 5,327,486 | |
Santa Rosa High School District, (Election of 2014), (AGM), 5.00%, 8/1/39 | | | 2,945 | | | | 3,342,222 | |
| | | | | | | $ | 15,043,129 | |
|
| Insured – Special Tax Revenue — 1.1% | |
Successor Agency to San Francisco City and County Redevelopment Agency, (NPFG), 5.00%, 8/1/41 | | $ | 1,320 | | | $ | 1,471,747 | |
Successor Agency to San Francisco City and County Redevelopment Agency, (NPFG), 5.00%, 8/1/41 | | | 1,045 | | | | 1,167,432 | |
| | | | | | | $ | 2,639,179 | |
|
| Insured – Transportation — 0.6% | |
San Joaquin Hills Transportation Corridor Agency, (NPFG), 0.00%, 1/15/24 | | $ | 1,800 | | | $ | 1,538,640 | |
| | | | | | | $ | 1,538,640 | |
|
| Other Revenue — 5.6% | |
California Infrastructure and Economic Development Bank, (Academy of Motion Picture Arts and Sciences Obligated Group), 5.00%, 11/1/33 | | $ | 1,740 | | | $ | 1,940,152 | |
California Infrastructure and Economic Development Bank, (Academy of Motion Picture Arts and Sciences Obligated Group), 5.00%, 11/1/34 | | | 2,290 | | | | 2,547,648 | |
California Infrastructure and Economic Development Bank, (California Academy of Sciences), 1.941%, (70% of 1 mo. USD LIBOR + 0.38%), 8/1/21 (Put Date), 8/1/47(4) | | | 2,500 | | | | 2,501,750 | |
California Infrastructure and Economic Development Bank, (The J. Paul Getty Trust), 1.68%, (70% of 1 mo. USD LIBOR + 0.20%), 4/1/21 (Put Date), 10/1/47(4) | | | 7,000 | | | | 7,000,000 | |
| | | | | | | $ | 13,989,550 | |
| | | | |
| | 18 | | See Notes to Financial Statements. |
Eaton Vance
California Municipal Opportunities Fund
September 30, 2018
Portfolio of Investments — continued
| | | | | | | | |
| Security | | Principal
Amount
(000’s omitted) | | | Value | |
|
| Senior Living / Life Care — 1.7% | |
ABAG Finance Authority for Nonprofit Corporations, (Episcopal Senior Communities), 6.00%, 7/1/31 | | $ | 615 | | | $ | 667,170 | |
California Municipal Finance Authority, (Channing House), 5.00%, 5/15/37 | | | 250 | | | | 284,238 | |
California Statewide Communities Development Authority, (American Baptist Homes of the West), 5.00%, 10/1/26 | | | 500 | | | | 558,345 | |
California Statewide Communities Development Authority, (American Baptist Homes of the West), 5.00%, 10/1/27 | | | 780 | | | | 866,362 | |
California Statewide Communities Development Authority, (Southern California Presbyterian Homes), 7.25%, 11/15/41(2) | | | 1,000 | | | | 1,052,650 | |
California Statewide Communities Development Authority, (The Redwoods, a Community of Seniors), 5.125%, 11/15/35 | | | 715 | | | | 795,194 | |
| | | | | | | $ | 4,223,959 | |
|
| Special Tax Revenue — 7.9% | |
Chula Vista Municipal Financing Authority, 5.50%, 9/1/30 | | $ | 1,525 | | | $ | 1,704,599 | |
Contra Costa Transportation Authority, Sales Tax Revenue, 1.702%, (70% of 1 mo. USD LIBOR + 0.25%), 9/1/21 (Put Date), 3/1/34(4) | | | 5,000 | | | | 4,993,000 | |
Irvine Community Facilities District No. 2013-3, (Great Park), 5.00%, 9/1/30 | | | 580 | | | | 634,195 | |
Irvine Community Facilities District No. 2013-3, (Great Park), 5.00%, 9/1/31 | | | 465 | | | | 507,143 | |
Irvine Community Facilities District No. 2013-3, (Great Park), 5.00%, 9/1/32 | | | 450 | | | | 489,524 | |
Irvine Community Facilities District No. 2013-3, (Great Park), 5.00%, 9/1/32(1) | | | 625 | | | | 703,869 | |
Irvine Community Facilities District No. 2013-3, (Great Park), 5.00%, 9/1/33 | | | 545 | | | | 591,647 | |
Irvine Community Facilities District No. 2013-3, (Great Park), 5.00%, 9/1/34 | | | 360 | | | | 390,211 | |
Irvine Community Facilities District No. 2013-3, (Great Park), 5.00%, 9/1/34(1) | | | 765 | | | | 854,949 | |
Irvine Community Facilities District No. 2013-3, (Great Park), 5.00%, 9/1/35(1) | | | 1,150 | | | | 1,281,433 | |
Irvine Community Facilities District No. 2013-3, (Great Park), 5.00%, 9/1/38(1) | | | 1,000 | | | | 1,105,140 | |
Los Angeles County Community Facilities District No. 3, (Valencia/Newhall Area), 5.00%, 9/1/23 | | | 520 | | | | 563,472 | |
San Dieguito School Facilities Financing Authority, Special Tax Revenue, 3.50%, 3/1/36(1) | | | 2,435 | | | | 2,376,024 | |
San Dieguito School Facilities Financing Authority, Special Tax Revenue, 3.625%, 3/1/38(1) | | | 1,500 | | | | 1,468,245 | |
South Orange County Public Financing Authority, Special Tax Revenue, (Ladera Ranch), 5.00%, 8/15/27 | | | 515 | | | | 563,940 | |
South Orange County Public Financing Authority, Special Tax Revenue, (Ladera Ranch), 5.00%, 8/15/28 | | | 775 | | | | 842,286 | |
| | | | | | | | |
| Security | | Principal
Amount
(000’s omitted) | | | Value | |
|
| Special Tax Revenue (continued) | |
Torrance Redevelopment Agency, 5.625%, 9/1/28 | | $ | 665 | | | $ | 665,698 | |
| | | | | | | $ | 19,735,375 | |
|
| Transportation — 15.1% | |
Burbank-Glendale-Pasadena Airport Authority, (AMT), 5.00%, 7/1/22 | | $ | 970 | | | $ | 1,063,479 | |
California Municipal Finance Authority, (LINXS Automated People Mover), (AMT), 5.00%, 12/31/37 | | | 3,375 | | | | 3,722,321 | |
Los Angeles Department of Airports, (Los Angeles International Airport), 5.00%, 5/15/35(3) | | | 3,080 | | | | 3,228,980 | |
Los Angeles Department of Airports, (Los Angeles International Airport), (AMT), 5.00%, 5/15/35 | | | 3,465 | | | | 3,844,071 | |
Los Angeles Department of Airports, (Los Angeles International Airport), (AMT), 5.00%, 5/15/36 | | | 4,700 | | | | 5,200,879 | |
Los Angeles Department of Airports, (Los Angeles International Airport), (AMT), 5.00%, 5/15/41 | | | 1,810 | | | | 1,978,059 | |
Port of Oakland, (AMT), 5.00%, 11/1/24 | | | 3,000 | | | | 3,384,480 | |
San Francisco City and County Airport Commission, (San Francisco International Airport), (AMT), 5.00%, 5/1/24 | | | 3,600 | | | | 3,851,460 | |
San Francisco City and County Airport Commission, (San Francisco International Airport), (AMT), 5.00%, 5/1/41 | | | 6,120 | | | | 6,713,640 | |
San Jose, Airport Revenue, (AMT), 5.00%, 3/1/25 | | | 1,000 | | | | 1,135,860 | |
San Jose, Airport Revenue, (AMT), 5.00%, 3/1/28 | | | 935 | | | | 1,079,130 | |
San Jose, Airport Revenue, (AMT), 5.00%, 3/1/29 | | | 285 | | | | 327,328 | |
San Jose, Airport Revenue, (AMT), 5.00%, 3/1/37 | | | 1,735 | | | | 1,935,254 | |
| | | | | | | $ | 37,464,941 | |
|
| Water and Sewer — 7.5% | |
California Department of Water Resources, (Central Valley Project), 1.78%, (SIFMA+ 0.22%), 12/1/20 (Put Date), 12/1/35(4) | | $ | 3,700 | | | $ | 3,701,850 | |
Eastern Municipal Water District, Water and Wastewater Revenue, 1.81%, (SIFMA + 0.25%), 10/1/21 (Put Date), 7/1/46(4) | | | 2,000 | | | | 2,000,480 | |
Eastern Municipal Water District, Water and Wastewater Revenue, 1.861%, (70% of 1 mo. USD LIBOR + 0.30%), 10/1/21 (Put Date), 7/1/30(4) | | | 2,500 | | | | 2,499,325 | |
Los Angeles Department of Water and Power, Water System Revenue, 5.00%, 7/1/38 | | | 2,000 | | | | 2,261,500 | |
Ross Valley Public Financing Authority, (Sanitary District No. 1 of Marin County), 5.00%, 1/1/32 | | | 150 | | | | 170,907 | |
Ross Valley Public Financing Authority, (Sanitary District No. 1 of Marin County), 5.00%, 1/1/37 | | | 425 | | | | 478,750 | |
Ross Valley Public Financing Authority, (Sanitary District No. 1 of Marin County), 5.00%, 1/1/39 | | | 500 | | | | 561,710 | |
San Francisco City and County Public Utilities Commission, Water Revenue, 5.00%, 11/1/35 | | | 3,315 | | | | 3,815,764 | |
| | | | |
| | 19 | | See Notes to Financial Statements. |
Eaton Vance
California Municipal Opportunities Fund
September 30, 2018
Portfolio of Investments — continued
| | | | | | | | |
| Security | | Principal
Amount
(000’s omitted) | | | Value | |
|
| Water and Sewer (continued) | |
San Francisco City and County Public Utilities Commission, Water Revenue, 5.00%, 11/1/40 | | $ | 1,565 | | | $ | 1,747,886 | |
San Francisco City and County Public Utilities Commission, Water Revenue, Green Bonds, 5.00%, 11/1/39 | | | 1,290 | | | | 1,448,399 | |
| | | | | | | $ | 18,686,571 | |
| |
Total Tax-Exempt Municipal Securities — 107.3%
(identified cost $263,572,683) | | | $ | 266,677,888 | |
|
| Taxable Municipal Securities — 3.1% | |
| Security | | Principal
Amount
(000’s omitted) | | | Value | |
|
| Hospital — 1.6% | |
California Statewide Communities Development Authority, (Loma Linda University Medical Center), 6.00%, 12/1/24 | | $ | 3,750 | | | $ | 3,924,262 | |
| | | | | | | $ | 3,924,262 | |
|
| Insured – Special Tax Revenue — 0.9% | |
Industry, Sales Tax Revenue, (AGM), 2.50%, 1/1/20 | | $ | 235 | | | $ | 233,515 | |
Successor Agency to Pittsburg Redevelopment Agency, (AGM), 2.698%, 8/1/19 | | | 880 | | | | 877,052 | |
Successor Agency to Pittsburg Redevelopment Agency, (AGM), 3.388%, 8/1/22 | | | 955 | | | | 950,292 | |
Successor Agency to Stanton Redevelopment Agency, (BAM), 2.75%, 12/1/22 | | | 130 | | | | 125,780 | |
Successor Agency to Stanton Redevelopment Agency, (BAM), 3.00%, 12/1/23 | | | 150 | | | | 145,515 | |
| | | | | | | $ | 2,332,154 | |
| | | | | | | | |
| Security | | Principal
Amount
(000’s omitted) | | | Value | |
|
| Special Tax Revenue — 0.6% | |
Successor Agency to San Diego Redevelopment Agency, 2.875%, 9/1/21 | | $ | 300 | | | $ | 297,120 | |
Successor Agency to San Diego Redevelopment Agency, 3.25%, 9/1/22 | | | 250 | | | | 249,465 | |
Successor Agency to San Diego Redevelopment Agency, 3.375%, 9/1/23 | | | 250 | | | | 249,932 | |
Successor Agency to San Diego Redevelopment Agency, 3.50%, 9/1/24 | | | 250 | | | | 249,350 | |
Successor Agency to San Diego Redevelopment Agency, 3.625%, 9/1/25 | | | 250 | | | | 249,568 | |
Successor Agency to San Diego Redevelopment Agency, 3.75%, 9/1/26 | | | 250 | | | | 251,432 | |
| | | | | | | $ | 1,546,867 | |
| |
Total Taxable Municipal Securities — 3.1%
(identified cost $7,780,297) | | | $ | 7,803,283 | |
| |
Total Investments — 110.4%
(identified cost $271,352,980) | | | $ | 274,481,171 | |
| |
Other Assets, Less Liabilities — (10.4)% | | | $ | (25,899,789 | ) |
| | |
Net Assets — 100.0% | | | | | | $ | 248,581,382 | |
The percentage shown for each investment category in the Portfolio of Investments is based on net assets.
The Fund invests primarily in debt securities issued by California municipalities. The ability of the issuers of the debt securities to meet their obligations may be affected by economic developments in a specific industry or municipality. In order to reduce the risk associated with such economic developments, at September 30, 2018, 9.5% of total investments are backed by bond insurance of various financial institutions and financial guaranty assurance agencies. The aggregate percentage insured by an individual financial institution or financial guaranty assurance agency ranged from 2.0% to 4.1% of total investments.
| (1) | When-issued security. |
| (2) | Security exempt from registration pursuant to Rule 144A under the Securities Act of 1933, as amended. These securities may be sold in certain transactions in reliance on an exemption from registration (normally to qualified institutional buyers). At September 30, 2018, the aggregate value of these securities is $2,562,864 or 1.0% of the Fund’s net assets. |
| (3) | Security represents the municipal bond held by a trust that issues residual interest bonds (see Note 1H). |
| (4) | Floating rate security. The stated interest rate represents the rate in effect at September 30, 2018. |
| | | | |
| | 20 | | See Notes to Financial Statements. |
Eaton Vance
California Municipal Opportunities Fund
September 30, 2018
Portfolio of Investments — continued
Abbreviations:
| | | | |
| AGM | | – | | Assured Guaranty Municipal Corp. |
| AMT | | – | | Interest earned from these securities may be considered a tax preference item for purposes of the Federal Alternative Minimum Tax. |
| BAM | | – | | Build America Mutual Assurance Co. |
| LIBOR | | – | | London Interbank Offered Rate |
| NPFG | | – | | National Public Finance Guaranty Corp. |
| SIFMA | | – | | Securities Industry and Financial Markets Association Municipal Swap Index |
Currency Abbreviations:
| | | | |
| USD | | – | | United States Dollar |
| | | | |
| | 21 | | See Notes to Financial Statements. |
Eaton Vance
Massachusetts Municipal Income Fund
September 30, 2018
Portfolio of Investments
| | | | | | | | |
| Tax-Exempt Investments — 100.8% | |
| Security | | Principal
Amount
(000’s omitted) | | | Value | |
|
| Bond Bank — 5.6% | |
Massachusetts Water Pollution Abatement Trust, 5.00%, 8/1/32 | | $ | 4,000 | | | $ | 4,091,240 | |
Massachusetts Water Pollution Abatement Trust, 5.25%, 8/1/34 | | | 3,105 | | | | 3,908,325 | |
| | | | | | | $ | 7,999,565 | |
|
| Education — 25.0% | |
Massachusetts Development Finance Agency, (Babson College), 5.00%, 10/1/42 | | $ | 2,000 | | | $ | 2,218,440 | |
Massachusetts Development Finance Agency, (Berklee College of Music), 5.00%, 10/1/37 | | | 2,000 | | | | 2,234,300 | |
Massachusetts Development Finance Agency, (Boston University), 5.00%, 10/1/46 | | | 2,000 | | | | 2,226,860 | |
Massachusetts Development Finance Agency, (Brandeis University), 5.00%, 10/1/24 | | | 315 | | | | 361,059 | |
Massachusetts Development Finance Agency, (Brandeis University), 5.00%, 10/1/25 | | | 330 | | | | 383,348 | |
Massachusetts Development Finance Agency, (Brandeis University), 5.00%, 10/1/26 | | | 265 | | | | 311,492 | |
Massachusetts Development Finance Agency, (College of the Holy Cross), 5.00%, 9/1/21 | | | 450 | | | | 487,224 | |
Massachusetts Development Finance Agency, (College of the Holy Cross), 5.00%, 9/1/22 | | | 325 | | | | 359,713 | |
Massachusetts Development Finance Agency, (College of the Holy Cross), 5.00%, 9/1/23 | | | 400 | | | | 451,488 | |
Massachusetts Development Finance Agency, (College of the Holy Cross), 5.00%, 9/1/24 | | | 725 | | | | 831,350 | |
Massachusetts Development Finance Agency, (College of the Holy Cross), (LOC: JPMorgan Chase Bank, N.A.), 1.51%, 9/1/37(1) | | | 1,550 | | | | 1,550,000 | |
Massachusetts Development Finance Agency, (Dexter Southfield), 5.00%, 5/1/33 | | | 1,550 | | | | 1,699,870 | |
Massachusetts Development Finance Agency, (Dexter Southfield), 5.00%, 5/1/35 | | | 1,660 | | | | 1,810,280 | |
Massachusetts Development Finance Agency, (Harvard University), 5.00%, 7/15/34 | | | 2,570 | | | | 2,962,979 | |
Massachusetts Development Finance Agency, (Milton Academy), 5.00%, 9/1/35 | | | 1,100 | | | | 1,155,275 | |
Massachusetts Development Finance Agency, (Northeastern University), 5.00%, 3/1/33 | | | 1,950 | | | | 2,136,361 | |
Massachusetts Development Finance Agency, (Olin College), 5.00%, 11/1/38 | | | 1,750 | | | | 1,902,565 | |
Massachusetts Development Finance Agency, (Wentworth Institute of Technology), 5.00%, 10/1/36 | | | 1,575 | | | | 1,720,183 | |
Massachusetts Development Finance Agency, (Williams College), 5.00%, 7/1/46 | | | 2,000 | | | | 2,239,360 | |
| | | | | | | | |
| Security | | Principal
Amount
(000’s omitted) | | | Value | |
|
| Education (continued) | |
Massachusetts Health and Educational Facilities Authority, (Boston College), 5.50%, 6/1/27 | | $ | 1,925 | | | $ | 2,372,293 | |
Massachusetts Health and Educational Facilities Authority, (Massachusetts Institute of Technology), 5.50%, 7/1/32 | | | 5,000 | | | | 6,451,800 | |
| | | | | | | $ | 35,866,240 | |
|
| Escrowed / Prerefunded — 6.6% | |
Massachusetts Development Finance Agency, (Tufts Medical Center), Prerefunded to 1/1/21, 7.25%, 1/1/32 | | $ | 1,140 | | | $ | 1,269,755 | |
Massachusetts Development Finance Agency, (UMass Memorial), Prerefunded to 7/1/21, 5.50%, 7/1/31 | | | 1,040 | | | | 1,135,046 | |
Massachusetts Health and Educational Facilities Authority, (Baystate Medical Center, Inc.), Prerefunded to 7/1/19, 5.75%, 7/1/36 | | | 2,120 | | | | 2,180,674 | |
Massachusetts Health and Educational Facilities Authority, (Isabella Stewart Gardner Museum), Prerefunded to 5/1/19, 5.00%, 5/1/22 | | | 1,590 | | | | 1,617,841 | |
Massachusetts Health and Educational Facilities Authority, (Isabella Stewart Gardner Museum), Prerefunded to 5/1/19, 5.00%, 5/1/23 | | | 1,195 | | | | 1,215,924 | |
Massachusetts Health and Educational Facilities Authority, (Isabella Stewart Gardner Museum), Prerefunded to 5/1/19, 5.00%, 5/1/25 | | | 1,580 | | | | 1,607,666 | |
Massachusetts Turnpike Authority, Escrowed to Maturity, 5.00%, 1/1/20 | | | 480 | | | | 489,451 | |
| | | | | | | $ | 9,516,357 | |
|
| General Obligations — 16.2% | |
Brookline, 5.00%, 3/15/25 | | $ | 1,740 | | | $ | 2,023,620 | |
Cambridge, 5.00%, 2/15/27 | | | 750 | | | | 897,037 | |
Danvers, 5.25%, 7/1/36 | | | 2,800 | | | | 3,022,460 | |
Lexington, 4.00%, 2/1/23 | | | 970 | | | | 1,044,215 | |
Massachusetts, 5.00%, 3/1/31 | | | 4,000 | | | | 4,481,800 | |
Plymouth, 5.00%, 5/1/26 | | | 710 | | | | 760,147 | |
Plymouth, 5.00%, 5/1/28 | | | 1,160 | | | | 1,241,328 | |
Plymouth, 5.00%, 5/1/31 | | | 1,090 | | | | 1,163,869 | |
Plymouth, 5.00%, 5/1/32 | | | 1,000 | | | | 1,067,250 | |
Swampscott, 5.00%, 1/15/25 | | | 310 | | | | 358,521 | |
Swampscott, 5.00%, 1/15/26 | | | 355 | | | | 416,351 | |
Wayland, 5.00%, 2/1/33 | | | 1,790 | | | | 1,899,011 | |
Wayland, 5.00%, 2/1/36 | | | 2,680 | | | | 2,840,076 | |
Westborough, 4.00%, 8/1/28 | | | 1,170 | | | | 1,284,473 | |
Winchester, 5.00%, 4/15/36 | | | 775 | | | | 825,267 | |
| | | | | | | $ | 23,325,425 | |
| | | | |
| | 22 | | See Notes to Financial Statements. |
Eaton Vance
Massachusetts Municipal Income Fund
September 30, 2018
Portfolio of Investments — continued
| | | | | | | | |
| Security | | Principal
Amount
(000’s omitted) | | | Value | |
|
| Hospital — 11.6% | |
Massachusetts Development Finance Agency, (Berkshire Health Systems), 5.00%, 10/1/27 | | $ | 1,100 | | | $ | 1,181,246 | |
Massachusetts Development Finance Agency, (Children’s Hospital), 5.00%, 10/1/31 | | | 1,840 | | | | 2,079,402 | |
Massachusetts Development Finance Agency, (Dana-Farber Cancer Institute), 5.00%, 12/1/36 | | | 1,690 | | | | 1,896,636 | |
Massachusetts Development Finance Agency, (Dana-Farber Cancer Institute), 5.00%, 12/1/41 | | | 1,060 | | | | 1,177,575 | |
Massachusetts Development Finance Agency, (Lahey Health System Obligated Group), 5.00%, 8/15/40 | | | 2,000 | | | | 2,161,400 | |
Massachusetts Development Finance Agency, (Partners HealthCare System), 5.00%, 7/1/37 | | | 1,600 | | | | 1,807,008 | |
Massachusetts Development Finance Agency, (South Shore Hospital), 5.00%, 7/1/41 | | | 2,795 | | | | 3,002,585 | |
Massachusetts Development Finance Agency, (Tufts Medical Center), 7.25%, 1/1/32 | | | 760 | | | | 841,715 | |
Massachusetts Development Finance Agency, (UMass Memorial), 5.50%, 7/1/31 | | | 55 | | | | 58,808 | |
Massachusetts Health and Educational Facilities Authority, (Lowell General Hospital), 5.125%, 7/1/35 | | | 1,645 | | | | 1,710,274 | |
Massachusetts Health and Educational Facilities Authority, (Southcoast Health System), 5.00%, 7/1/29 | | | 750 | | | | 765,847 | |
| | | | | | | $ | 16,682,496 | |
|
| Industrial Development Revenue — 1.0% | |
National Finance Authority, NH, (Covanta), 4.625%, 11/1/42(2) | | $ | 670 | | | $ | 669,491 | |
National Finance Authority, NH, (Covanta), (AMT), 4.875%, 11/1/42(2) | | | 740 | | | | 741,347 | |
| | | | | | | $ | 1,410,838 | |
|
| Insured – Education — 4.7% | |
Massachusetts Development Finance Agency, (College of the Holy Cross), (AMBAC), 5.25%, 9/1/32(3) | | $ | 5,460 | | | $ | 6,764,394 | |
| | | | | | | $ | 6,764,394 | |
|
| Insured – Escrowed / Prerefunded — 1.0% | |
Massachusetts Health and Educational Facilities Authority, (Cape Cod Healthcare), (AGC), Prerefunded to 11/15/19, 5.00%, 11/15/25 | | $ | 1,395 | | | $ | 1,441,705 | |
Massachusetts Turnpike Authority, (NPFG), Escrowed to Maturity, 5.00%, 1/1/20 | | | 65 | | | | 66,503 | |
| | | | | | | $ | 1,508,208 | |
| | | | | | | | |
| Security | | Principal
Amount
(000’s omitted) | | | Value | |
|
| Insured – Special Tax Revenue — 5.7% | |
Martha’s Vineyard Land Bank, (BAM), 5.00%, 5/1/26 | | $ | 1,760 | | | $ | 2,015,288 | |
Massachusetts, Special Obligation, Dedicated Tax Revenue, (NPFG), 5.50%, 1/1/30 | | | 4,955 | | | | 6,108,574 | |
| | | | | | | $ | 8,123,862 | |
|
| Insured – Transportation — 7.1% | |
Massachusetts Port Authority, (Bosfuel Project), (NPFG), (AMT), 5.00%, 7/1/32 | | $ | 2,790 | | | $ | 2,795,161 | |
Massachusetts Turnpike Authority, Metropolitan Highway System, (NPFG), 0.00%, 1/1/22 | | | 8,000 | | | | 7,406,000 | |
| | | | | | | $ | 10,201,161 | |
|
| Other Revenue — 0.6% | |
Massachusetts Development Finance Agency, (WGBH Educational Foundation), 5.00%, 1/1/23 | | $ | 775 | | | $ | 857,530 | |
| | | | | | | $ | 857,530 | |
|
| Senior Living / Life Care — 2.5% | |
Massachusetts Development Finance Agency, (Carleton-Willard Village), 5.625%, 12/1/30 | | $ | 525 | | | $ | 542,640 | |
Massachusetts Development Finance Agency, (VOA Concord Assisted Living, Inc.), 5.125%, 11/1/27(2) | | | 615 | | | | 615,166 | |
Massachusetts Development Finance Agency, (VOA Concord Assisted Living, Inc.), 5.20%, 11/1/41(2) | | | 2,465 | | | | 2,464,877 | |
| | | | | | | $ | 3,622,683 | |
|
| Special Tax Revenue — 4.4% | |
Massachusetts, (Rail Enhancement and Accelerated Bridge Programs), 5.00%, 6/1/40 | | $ | 4,250 | | | $ | 4,831,570 | |
Massachusetts Bay Transportation Authority, Sales Tax Revenue, 5.25%, 7/1/31 | | | 1,240 | | | | 1,550,125 | |
| | | | | | | $ | 6,381,695 | |
|
| Student Loan — 2.8% | |
Massachusetts Educational Financing Authority, (AMT), 5.00%, 7/1/23 | | $ | 3,700 | | | $ | 4,078,362 | |
| | | | | | | $ | 4,078,362 | |
| | | | |
| | 23 | | See Notes to Financial Statements. |
Eaton Vance
Massachusetts Municipal Income Fund
September 30, 2018
Portfolio of Investments — continued
| | | | | | | | |
| Security | | Principal
Amount
(000’s omitted) | | | Value | |
|
| Transportation — 6.0% | |
Massachusetts, (Accelerated Bridge Program), 5.00%, 6/15/27 | | $ | 2,000 | | | $ | 2,272,100 | |
Massachusetts Port Authority, 5.00%, 7/1/28 | | | 3,750 | | | | 3,941,438 | |
Massachusetts Port Authority, (AMT), 5.00%, 7/1/34 | | | 2,110 | | | | 2,380,502 | |
| | | | | | | $ | 8,594,040 | |
| |
Total Tax-Exempt Investments — 100.8%
(identified cost $138,004,539) | | | $ | 144,932,856 | |
| |
Other Assets, Less Liabilities — (0.8)% | | | $ | (1,189,375 | ) |
| |
Net Assets — 100.0% | | | $ | 143,743,481 | |
The percentage shown for each investment category in the Portfolio of Investments is based on net assets.
The Fund invests primarily in debt securities issued by Massachusetts municipalities. The ability of the issuers of the debt securities to meet their obligations may be affected by economic developments in a specific industry or municipality. In order to reduce the risk associated with such economic developments, at September 30, 2018, 18.4% of total investments are backed by bond insurance of various financial institutions and financial guaranty assurance agencies. The aggregate percentage insured by an individual financial institution or financial guaranty assurance agency ranged from 1.0% to 11.3% of total investments.
| (1) | Variable rate demand obligation that may be tendered at par on any day for payment the same or next business day. The stated interest rate, which generally resets daily, is determined by the remarketing agent and represents the rate in effect at September 30, 2018. |
| (2) | Security exempt from registration pursuant to Rule 144A under the Securities Act of 1933, as amended. These securities may be sold in certain transactions in reliance on an exemption from registration (normally to qualified institutional buyers). At September 30, 2018, the aggregate value of these securities is $4,490,881 or 3.1% of the Fund’s net assets. |
| (3) | Security represents the municipal bond held by a trust that issues residual interest bonds (see Note 1H). |
| | | | | | | | | | | | | | | | |
| Futures Contracts | |
| | | | | |
| Description | | Number of Contracts | | | Position | | Expiration
Month/Year | | Notional
Amount | | | Value/Net
Unrealized
Appreciation | |
| | | | | |
Interest Rate Futures | | | | | | | | | | | | | | | | |
| U.S. Long Treasury Bond | | | 50 | | | Short | | Dec-18 | | $ | (7,025,000 | ) | | $ | 167,709 | |
| | | | | |
| | | | | | | | | | | | | | | $ | 167,709 | |
Abbreviations:
| | | | |
| AGC | | – | | Assured Guaranty Corp. |
| AMBAC | | – | | AMBAC Financial Group, Inc. |
| AMT | | – | | Interest earned from these securities may be considered a tax preference item for purposes of the Federal Alternative Minimum Tax. |
| BAM | | – | | Build America Mutual Assurance Co. |
| LOC | | – | | Letter of Credit |
| NPFG | | – | | National Public Finance Guaranty Corp. |
| | | | |
| | 24 | | See Notes to Financial Statements. |
Eaton Vance
New York Municipal Income Fund
September 30, 2018
Portfolio of Investments
| | | | | | | | |
| Tax-Exempt Investments — 101.1% | |
| Security | | Principal
Amount
(000’s omitted) | | | Value | |
|
| Bond Bank — 3.1% | |
New York State Environmental Facilities Corp., 5.00%, 10/15/39 | | $ | 5,910 | | | $ | 6,151,246 | |
New York State Environmental Facilities Corp., Green Bonds, 4.00%, 8/15/34 | | | 490 | | | | 515,323 | |
New York State Environmental Facilities Corp., Green Bonds, 5.00%, 8/15/38 | | | 1,000 | | | | 1,140,490 | |
New York State Environmental Facilities Corp., (New York City Municipal Water Finance Authority), 5.00%, 6/15/36 | | | 4,000 | | | | 4,636,080 | |
| | | | | | | $ | 12,443,139 | |
|
| Cogeneration — 1.4% | |
New York City Industrial Development Agency, (Brooklyn Navy Yard Cogeneration Partners, L.P.), (AMT), 5.65%, 10/1/28 | | $ | 2,850 | | | $ | 2,877,303 | |
Suffolk County Industrial Development Agency, (Nissequogue Cogeneration Partners Facility), (AMT), 5.50%, 1/1/23 | | | 2,580 | | | | 2,580,722 | |
| | | | | | | $ | 5,458,025 | |
|
| Education — 15.6% | |
Albany Capital Resource Corp., (Albany College of Pharmacy and Health Sciences), 5.00%, 12/1/30 | | $ | 250 | | | $ | 273,810 | |
Build NYC Resource Corp., (Ethical Culture Fieldston School), 5.00%, 6/1/32 | | | 300 | | | | 333,687 | |
Build NYC Resource Corp., (Ethical Culture Fieldston School), 5.00%, 6/1/33 | | | 295 | | | | 326,813 | |
Dutchess County Local Development Corp., (Culinary Institute of America), 5.00%, 7/1/29 | | | 150 | | | | 168,061 | |
Dutchess County Local Development Corp., (Culinary Institute of America), 5.00%, 7/1/30 | | | 185 | | | | 206,604 | |
Dutchess County Local Development Corp., (Culinary Institute of America), 5.00%, 7/1/31 | | | 180 | | | | 200,110 | |
Dutchess County Local Development Corp., (Culinary Institute of America), 5.00%, 7/1/32 | | | 200 | | | | 221,624 | |
Dutchess County Local Development Corp., (Marist College), 5.00%, 7/1/38(1) | | | 690 | | | | 780,252 | |
Geneva Development Corp., (Hobart and William Smith Colleges), Series 2012, 5.00%, 9/1/32 | | | 1,250 | | | | 1,357,050 | |
Monroe County Industrial Development Corp., (Nazareth College of Rochester), 5.00%, 10/1/31 | | | 235 | | | | 262,199 | |
Monroe County Industrial Development Corp., (Nazareth College of Rochester), 5.00%, 10/1/32 | | | 260 | | | | 289,032 | |
Monroe County Industrial Development Corp., (University of Rochester), Series 2017C, 4.00%, 7/1/43 | | | 2,850 | | | | 2,915,407 | |
Monroe County Industrial Development Corp., (University of Rochester), Series 2017D, 4.00%, 7/1/43 | | | 1,500 | | | | 1,534,425 | |
New York City Cultural Resources Trust, (The Juilliard School), 5.00%, 1/1/34 | | | 5,725 | | | | 5,770,056 | |
| | | | | | | | |
| Security | | Principal
Amount
(000’s omitted) | | | Value | |
|
| Education (continued) | |
New York Dormitory Authority, (Brooklyn Law School), 5.75%, 7/1/33 | | $ | 1,650 | | | $ | 1,686,646 | |
New York Dormitory Authority, (City University), 6.00%, 7/1/20 | | | 5,000 | | | | 5,237,400 | |
New York Dormitory Authority, (Columbia University), 5.00%, 10/1/38 | | | 9,880 | | | | 11,431,753 | |
New York Dormitory Authority, (Cornell University), 5.00%, 7/1/34(2) | | | 10,000 | | | | 10,220,300 | |
New York Dormitory Authority, (Cornell University), 5.00%, 7/1/39 | | | 2,500 | | | | 2,554,150 | |
New York Dormitory Authority, (Culinary Institute of America), 5.50%, 7/1/33 | | | 350 | | | | 389,413 | |
New York Dormitory Authority, (New York University), 5.00%, 7/1/34 | | | 1,500 | | | | 1,719,300 | |
New York Dormitory Authority, (Skidmore College), 5.25%, 7/1/31 | | | 250 | | | | 269,377 | |
New York Dormitory Authority, (State University of New York Dormitory Facilities), 5.00%, 7/1/37(1) | | | 525 | | | | 596,815 | |
New York Dormitory Authority, (State University of New York Dormitory Facilities), 5.00%, 7/1/38(1) | | | 750 | | | | 849,930 | |
New York Dormitory Authority, (State University), 5.50%, 5/15/19 | | | 670 | | | | 685,102 | |
New York Dormitory Authority, (The New School), Prerefunded to 7/1/20, 5.50%, 7/1/40 | | | 5,500 | | | | 5,834,620 | |
Onondaga Civic Development Corp., (Le Moyne College), 5.20%, 7/1/29 | | | 970 | | | | 1,012,593 | |
Onondaga Civic Development Corp., (Le Moyne College), 5.375%, 7/1/40 | | | 2,515 | | | | 2,611,450 | |
Onondaga County Cultural Resources Trust, (Syracuse University), 5.00%, 12/1/33 | | | 1,775 | | | | 1,979,551 | |
Tompkins County Development Corp., (Ithaca College), 5.00%, 7/1/32 | | | 150 | | | | 172,104 | |
Tompkins County Development Corp., (Ithaca College), 5.00%, 7/1/34 | | | 70 | | | | 79,594 | |
| | | | | | | $ | 61,969,228 | |
|
| Electric Utilities — 2.2% | |
Long Island Power Authority, Electric System Revenue, 5.00%, 9/1/29 | | $ | 625 | | | $ | 727,431 | |
New York Power Authority, 5.00%, 11/15/31 | | | 1,000 | | | | 1,083,630 | |
Utility Debt Securitization Authority, 5.00%, 12/15/33 | | | 2,895 | | | | 3,225,001 | |
Utility Debt Securitization Authority, 5.00%, 12/15/34 | | | 1,465 | | | | 1,629,725 | |
Utility Debt Securitization Authority, 5.00%, 12/15/40 | | | 1,740 | | | | 1,983,409 | |
| | | | | | | $ | 8,649,196 | |
| | | | |
| | 25 | | See Notes to Financial Statements. |
Eaton Vance
New York Municipal Income Fund
September 30, 2018
Portfolio of Investments — continued
| | | | | | | | |
| Security | | Principal
Amount
(000’s omitted) | | | Value | |
|
| Escrowed / Prerefunded — 2.7% | |
Brooklyn Arena Local Development Corp., (Barclays Center), Prerefunded to 1/15/20, 6.25%, 7/15/40 | | $ | 1,260 | | | $ | 1,330,258 | |
Metropolitan Transportation Authority, Prerefunded to 11/15/21, 5.00%, 11/15/27 | | | 940 | | | | 1,026,038 | |
New York City, Prerefunded to 4/1/19, 5.30%, 4/1/27 | | | 85 | | | | 86,470 | |
New York City, Prerefunded to 4/1/19, 5.375%, 4/1/36 | | | 4,810 | | | | 4,894,993 | |
Triborough Bridge and Tunnel Authority, Prerefunded to 11/15/18,
5.25%, 11/15/34(2) | | | 3,370 | | | | 3,384,120 | |
| | | | | | | $ | 10,721,879 | |
|
| General Obligations — 8.5% | |
Albany County, 4.00%, 4/1/29 | | $ | 7,370 | | | $ | 8,058,211 | |
Islip, 4.00%, 10/15/24 | | | 750 | | | | 825,915 | |
Longwood Central School District, 4.00%, 6/15/29 | | | 1,490 | | | | 1,626,022 | |
Longwood Central School District, 4.00%, 6/15/30 | | | 1,550 | | | | 1,682,494 | |
Nassau County, 5.00%, 10/1/30 | | | 2,000 | | | | 2,292,980 | |
Nassau County, 5.00%, 10/1/37 | | | 215 | | | | 239,708 | |
New York City, 4.00%, 8/1/32 | | | 1,490 | | | | 1,564,560 | |
New York City, 4.00%, 8/1/34 | | | 3,445 | | | | 3,578,700 | |
New York City, 4.00%, 10/1/40 | | | 565 | | | | 575,701 | |
New York City, 5.00%, 8/1/28 | | | 3,595 | | | | 4,164,772 | |
New York City, 5.00%, 8/1/32 | | | 705 | | | | 789,085 | |
New York City, 5.25%, 3/1/35 | | | 4,000 | | | | 4,683,160 | |
New York City, 5.30%, 4/1/27 | | | 10 | | | | 10,163 | |
New York City, 5.375%, 4/1/36 | | | 190 | | | | 193,156 | |
New York City, 6.25%, 10/15/28 | | | 170 | | | | 170,280 | |
Southampton Union Free School District, 4.00%, 6/1/25 | | | 1,540 | | | | 1,708,892 | |
Westchester County, 4.00%, 7/1/33 | | | 1,445 | | | | 1,584,529 | |
| | | | | | | $ | 33,748,328 | |
|
| Hospital — 5.3% | |
Dutchess County Local Development Corp., (Health Quest Systems, Inc.), 5.00%, 7/1/35 | | $ | 1,150 | | | $ | 1,275,166 | |
Dutchess County Local Development Corp., (Health Quest Systems, Inc.), 5.75%, 7/1/30 | | | 370 | | | | 396,411 | |
Dutchess County Local Development Corp., (Health Quest Systems, Inc.), 5.75%, 7/1/40 | | | 2,435 | | | | 2,599,192 | |
Jefferson County Civic Facility Development Corp., (Samaritan Medical Center), 5.00%, 11/1/37 | | | 1,140 | | | | 1,229,650 | |
New York Dormitory Authority, (Mount Sinai Hospital), 5.00%, 7/1/26 | | | 2,500 | | | | 2,617,050 | |
New York Dormitory Authority, (North Shore-Long Island Jewish Obligated Group), 5.00%, 5/1/33 | | | 1,500 | | | | 1,667,490 | |
New York Dormitory Authority, (NYU Hospitals Center), 5.00%, 7/1/30 | | | 3,480 | | | | 3,887,612 | |
| | | | | | | | |
| Security | | Principal
Amount
(000’s omitted) | | | Value | |
|
| Hospital (continued) | |
New York Dormitory Authority, (Orange Regional Medical Center), 5.00%, 12/1/30(3) | | $ | 4,500 | | | $ | 4,986,315 | |
Suffolk County Economic Development Corp., (Catholic Health Services of Long Island Obligated Group), 5.00%, 7/1/28 | | | 2,190 | | | | 2,339,818 | |
| | | | | | | $ | 20,998,704 | |
|
| Housing — 2.2% | |
Albany Capital Resource Corp., (Empire Commons Student Housing, Inc.), 5.00%, 5/1/28 | | $ | 300 | | | $ | 341,496 | |
Albany Capital Resource Corp., (Empire Commons Student Housing, Inc.), 5.00%, 5/1/29 | | | 785 | | | | 890,159 | |
Albany Capital Resource Corp., (Empire Commons Student Housing, Inc.), 5.00%, 5/1/30 | | | 635 | | | | 717,309 | |
Albany Capital Resource Corp., (Empire Commons Student Housing, Inc.), 5.00%, 5/1/31 | | | 450 | | | | 506,385 | |
Albany Capital Resource Corp., (Empire Commons Student Housing, Inc.), 5.00%, 5/1/32 | | | 1,095 | | | | 1,229,061 | |
New York Housing Finance Agency, 5.25%, 11/1/41 | | | 2,000 | | | | 2,030,880 | |
New York Mortgage Agency, 3.65%, 4/1/32 | | | 1,000 | | | | 1,020,190 | |
Westchester County Local Development Corp., (Purchase Housing Corp. II), 5.00%, 6/1/27 | | | 235 | | | | 268,111 | |
Westchester County Local Development Corp., (Purchase Housing Corp. II), 5.00%, 6/1/28 | | | 200 | | | | 227,206 | |
Westchester County Local Development Corp., (Purchase Housing Corp. II), 5.00%, 6/1/29 | | | 200 | | | | 226,074 | |
Westchester County Local Development Corp., (Purchase Housing Corp. II), 5.00%, 6/1/42 | | | 1,250 | | | | 1,362,675 | |
| | | | | | | $ | 8,819,546 | |
|
| Industrial Development Revenue — 4.5% | |
New York Energy Research and Development Authority, (New York Electric and Gas Corp.), 2.00% to 5/1/20 (Put Date), 6/1/29 | | $ | 6,000 | | | $ | 5,966,640 | |
New York Energy Research and Development Authority, (Rochester Gas and Electric Corp.), 2.875% to 7/1/25 (Put Date), 5/15/32 | | | 3,845 | | | | 3,822,699 | |
New York State Environmental Facilities Corp., (Casella Waste Systems, Inc.), (AMT), 3.75% to 12/2/19 (Put Date), 12/1/44(3) | | | 4,020 | | | | 4,022,573 | |
Niagara Area Development Corp., (Covanta), (AMT), 4.75%, 11/1/42(3) | | | 4,000 | | | | 4,003,080 | |
| | | | | | | $ | 17,814,992 | |
|
| Insured – Education — 2.0% | |
New York Dormitory Authority, (City University), (AMBAC), 5.50%, 7/1/35 | | $ | 6,600 | | | $ | 8,050,086 | |
| | | | | | | $ | 8,050,086 | |
| | | | |
| | 26 | | See Notes to Financial Statements. |
Eaton Vance
New York Municipal Income Fund
September 30, 2018
Portfolio of Investments — continued
| | | | | | | | |
| Security | | Principal
Amount
(000’s omitted) | | | Value | |
|
| Insured – Escrowed / Prerefunded — 3.7% | |
Brentwood Union Free School District, (AGC), Prerefunded to 11/15/19, 4.75%, 11/15/21 | | $ | 1,875 | | | $ | 1,934,719 | |
Brentwood Union Free School District, (AGC), Prerefunded to 11/15/19, 4.75%, 11/15/22 | | | 2,700 | | | | 2,785,995 | |
New York Dormitory Authority, (Memorial Sloan Kettering Cancer Center), (NPFG), Escrowed to Maturity, 0.00%, 7/1/30 | | | 14,030 | | | | 10,214,682 | |
| | | | | | | $ | 14,935,396 | |
|
| Insured – General Obligations — 1.5% | |
Oyster Bay, (AGM), 4.00%, 8/1/28 | | $ | 3,245 | | | $ | 3,387,812 | |
Syracuse, (AGM), 4.00%, 5/1/26 | | | 500 | | | | 551,130 | |
Syracuse, (AGM), 4.00%, 5/1/27 | | | 595 | | | | 650,680 | |
Syracuse, (AGM), 4.00%, 5/1/28 | | | 680 | | | | 737,793 | |
Syracuse, (AGM), 4.00%, 5/1/29 | | | 510 | | | | 548,281 | |
| | | | | | | $ | 5,875,696 | |
|
| Insured – Other Revenue — 0.3% | |
New York City Industrial Development Agency, (Yankee Stadium), (AGC), 0.00%, 3/1/31 | | $ | 1,690 | | | $ | 1,085,250 | |
| | | | | | | $ | 1,085,250 | |
|
| Insured – Transportation — 0.2% | |
New York Transportation Development Corp., (LaGuardia Airport Terminal B Redevelopment), (AGM), (AMT), 4.00%, 7/1/41 | | $ | 920 | | | $ | 924,177 | |
| | | | | | | $ | 924,177 | |
|
| Lease Revenue / Certificates of Participation — 3.9% | |
Hudson Yards Infrastructure Corp., 4.00%, 2/15/36 | | $ | 2,390 | | | $ | 2,444,588 | |
Hudson Yards Infrastructure Corp., 5.00%, 2/15/34 | | | 3,000 | | | | 3,412,530 | |
Hudson Yards Infrastructure Corp., 5.00%, 2/15/38 | | | 2,900 | | | | 3,253,365 | |
Monroe County Industrial Development Agency, (Rochester Schools Modernization), 5.00%, 5/1/30 | | | 1,500 | | | | 1,764,555 | |
New York State Urban Development Corp., 5.70%, 4/1/20 | | | 4,745 | | | | 4,912,593 | |
| | | | | | | $ | 15,787,631 | |
|
| Other Revenue — 5.2% | |
Battery Park City Authority, 4.00%, 11/1/31 | | $ | 3,665 | | | $ | 3,911,251 | |
Brooklyn Arena Local Development Corp., (Barclays Center), 5.00%, 7/15/28 | | | 1,500 | | | | 1,685,790 | |
New York City Transitional Finance Authority, (Building Aid), 4.00%, 7/15/36 | | | 805 | | | | 831,485 | |
New York City Transitional Finance Authority, (Building Aid), 5.00%, 7/15/37 | | | 1,025 | | | | 1,165,989 | |
| | | | | | | | |
| Security | | Principal
Amount
(000’s omitted) | | | Value | |
|
| Other Revenue (continued) | |
New York City Transitional Finance Authority, (Building Aid), 5.00%, 7/15/43 | | $ | 3,500 | | | $ | 3,875,200 | |
New York City Transitional Finance Authority, (Building Aid), 5.25%, 1/15/39 | | | 1,000 | | | | 1,009,070 | |
New York City Trust for Cultural Resources, (Alvin Ailey Dance Foundation), 4.00%, 7/1/24 | | | 345 | | | | 368,336 | |
New York City Trust for Cultural Resources, (Alvin Ailey Dance Foundation), 4.00%, 7/1/25 | | | 455 | | | | 487,473 | |
New York City Trust for Cultural Resources, (Alvin Ailey Dance Foundation), 4.00%, 7/1/26 | | | 590 | | | | 633,872 | |
New York City Trust for Cultural Resources, (Alvin Ailey Dance Foundation), 4.00%, 7/1/34 | | | 750 | | | | 776,250 | |
New York City Trust for Cultural Resources, (Alvin Ailey Dance Foundation), 5.00%, 7/1/30 | | | 365 | | | | 412,421 | |
New York Liberty Development Corp., (7 World Trade Center), 5.00%, 9/15/32 | | | 5,000 | | | | 5,440,350 | |
| | | | | | | $ | 20,597,487 | |
|
| Senior Living / Life Care — 2.8% | |
Brookhaven Local Development Corp., (Jefferson’s Ferry), 5.25%, 11/1/30 | | $ | 650 | | | $ | 740,727 | |
Brookhaven Local Development Corp., (Jefferson’s Ferry), 5.25%, 11/1/31 | | | 650 | | | | 738,751 | |
Buffalo and Erie County Industrial Land Development Corp., (Orchard Park CCRC, Inc.), 5.00%, 11/15/37 | | | 4,500 | | | | 4,781,925 | |
New York Dormitory Authority, (Miriam Osborn Memorial Home Association), 5.00%, 7/1/29 | | | 720 | | | | 732,895 | |
New York Dormitory Authority, (Miriam Osborn Memorial Home Association), 5.00%, 7/1/42 | | | 305 | | | | 309,822 | |
Suffolk County Economic Development Corp., (Peconic Landing at Southold, Inc.), 6.00%, 12/1/40 | | | 2,395 | | | | 2,544,328 | |
Tompkins County Development Corp., (Kendal at Ithaca), 5.00%, 7/1/34 | | | 100 | | | | 106,616 | |
Westchester County Local Development Corp., (Kendal on Hudson), 5.00%, 1/1/34 | | | 1,000 | | | | 1,061,920 | |
| | | | | | | $ | 11,016,984 | |
|
| Special Tax Revenue — 21.4% | |
Metropolitan Transportation Authority, Dedicated Tax Revenue, Green Bonds, 5.00%, 11/15/35 | | $ | 5,170 | | | $ | 5,886,872 | |
New York City Transitional Finance Authority, Future Tax Revenue, 4.00%, 8/1/37 | | | 4,435 | | | | 4,551,907 | |
New York City Transitional Finance Authority, Future Tax Revenue, 4.00%, 8/1/41 | | | 1,350 | | | | 1,373,585 | |
New York City Transitional Finance Authority, Future Tax Revenue, 4.25%, 11/1/33 | | | 1,020 | | | | 1,091,063 | |
New York City Transitional Finance Authority, Future Tax Revenue, 5.00%, 5/1/36 | | | 1,605 | | | | 1,630,937 | |
| | | | |
| | 27 | | See Notes to Financial Statements. |
Eaton Vance
New York Municipal Income Fund
September 30, 2018
Portfolio of Investments — continued
| | | | | | | | |
| Security | | Principal
Amount
(000’s omitted) | | | Value | |
|
| Special Tax Revenue (continued) | |
New York City Transitional Finance Authority, Future Tax Revenue, 5.00%, 5/1/39 | | $ | 2,160 | | | $ | 2,425,529 | |
New York City Transitional Finance Authority, Future Tax Revenue, 5.00%, 8/1/39 | | | 1,500 | | | | 1,655,100 | |
New York City Transitional Finance Authority, Future Tax Revenue, 5.00%, 11/1/39 | | | 5,000 | | | | 5,262,200 | |
New York City Transitional Finance Authority, Future Tax Revenue, 5.00%, 2/1/41 | | | 1,750 | | | | 1,924,930 | |
New York Convention Center Development Corp., Hotel Unit Fee, 0.00%, 11/15/28 | | | 415 | | | | 294,745 | |
New York Dormitory Authority, Personal Income Tax Revenue, 4.25%, 8/15/41 | | | 3,180 | | | | 3,293,749 | |
New York Dormitory Authority, Personal Income Tax Revenue, 5.00%, 2/15/28 | | | 2,500 | | | | 2,905,125 | |
New York Dormitory Authority, Personal Income Tax Revenue, 5.00%, 2/15/29 | | | 60 | | | | 67,044 | |
New York Dormitory Authority, Personal Income Tax Revenue, 5.00%, 2/15/41 | | | 3,505 | | | | 3,936,886 | |
New York Dormitory Authority, Personal Income Tax Revenue, 5.00%, 2/15/43 | | | 4,800 | | | | 5,254,080 | |
New York Dormitory Authority, Personal Income Tax Revenue, Prerefunded to 3/15/19, 5.25%, 3/15/38 | | | 5,500 | | | | 5,584,865 | |
New York Dormitory Authority, Personal Income Tax Revenue, Series 2011A, 5.00%, 3/15/33 | | | 725 | | | | 772,132 | |
New York Dormitory Authority, Personal Income Tax Revenue, Series 2015A, 5.00%, 3/15/33 | | | 2,570 | | | | 2,887,112 | |
New York Dormitory Authority, Personal Income Tax Revenue, Series 2016A, 5.00%, 2/15/43 | | | 5,000 | | | | 5,559,050 | |
New York Dormitory Authority, Sales Tax Revenue, 5.00%, 3/15/29 | | | 4,400 | | | | 4,964,608 | |
New York Dormitory Authority, Sales Tax Revenue, 5.00%, 3/15/34 | | | 4,600 | | | | 5,133,048 | |
New York Dormitory Authority, Sales Tax Revenue, 5.00%, 3/15/35 | | | 4,600 | | | | 5,170,354 | |
New York Dormitory Authority, Sales Tax Revenue, 5.00%, 3/15/36 | | | 2,000 | | | | 2,258,460 | |
Sales Tax Asset Receivables Corp., 5.00%, 10/15/27 | | | 5,000 | | | | 5,720,350 | |
Sales Tax Asset Receivables Corp., 5.00%, 10/15/28 | | | 5,000 | | | | 5,714,350 | |
| | | | | | | $ | 85,318,081 | |
|
| Transportation — 11.9% | |
Buffalo and Fort Erie Public Bridge Authority, 5.00%, 1/1/37 | | $ | 250 | | | $ | 280,263 | |
Metropolitan Transportation Authority, 5.00%, 11/15/27 | | | 1,390 | | | | 1,499,268 | |
Metropolitan Transportation Authority, 5.00%, 11/15/35 | | | 835 | | | | 934,089 | |
Metropolitan Transportation Authority, Green Bonds, 0.00%, 11/15/32 | | | 595 | | | | 344,737 | |
Metropolitan Transportation Authority, Green Bonds, 0.00%, 11/15/33 | | | 4,925 | | | | 2,723,870 | |
| | | | | | | | |
| Security | | Principal
Amount
(000’s omitted) | | | Value | |
|
| Transportation (continued) | |
Metropolitan Transportation Authority, Green Bonds, 4.00%, 11/15/35 | | $ | 2,350 | | | $ | 2,418,056 | |
Nassau County Bridge Authority, 5.00%, 10/1/40 | | | 1,915 | | | | 2,005,790 | |
New York Thruway Authority, 5.00%, 1/1/31 | | | 2,000 | | | | 2,319,080 | |
New York Thruway Authority, 5.00%, 1/1/33 | | | 1,380 | | | | 1,584,557 | |
New York Thruway Authority, 5.00%, 1/1/37 | | | 2,050 | | | | 2,316,971 | |
New York Thruway Authority, 5.00%, 1/1/42 | | | 1,000 | | | | 1,070,680 | |
New York Transportation Development Corp., (LaGuardia Airport Terminal B Redevelopment), (AMT), 5.00%, 7/1/41 | | | 3,100 | | | | 3,278,777 | |
New York Transportation Development Corp., (LaGuardia Airport Terminal B Redevelopment), (AMT), 5.00%, 7/1/46 | | | 5,000 | | | | 5,275,150 | |
Niagara Frontier Transportation Authority, (Buffalo Niagara International Airport), (AMT), 5.00%, 4/1/26 | | | 1,210 | | | | 1,334,388 | |
Port Authority of New York and New Jersey, 4.00%, 9/1/38 | | | 420 | | | | 433,894 | |
Port Authority of New York and New Jersey, 6.125%, 6/1/94 | | | 2,500 | | | | 2,921,050 | |
Port Authority of New York and New Jersey, (AMT), 4.00%, 7/15/31 | | | 7,795 | | | | 8,055,275 | |
Port Authority of New York and New Jersey, (AMT), 5.00%, 9/15/32 | | | 1,500 | | | | 1,705,605 | |
Triborough Bridge and Tunnel Authority, 5.00%, 11/15/42 | | | 1,000 | | | | 1,127,400 | |
Triborough Bridge and Tunnel Authority, 5.25%, 11/15/34(2) | | | 5,630 | | | | 5,653,252 | |
| | | | | | | $ | 47,282,152 | |
|
| Water and Sewer — 2.7% | |
New York City Municipal Water Finance Authority, (Water and Sewer System), 5.00%, 6/15/35 | | $ | 3,980 | | | $ | 4,486,535 | |
New York City Municipal Water Finance Authority, (Water and Sewer System), 5.00%, 6/15/46 | | | 555 | | | | 617,487 | |
New York City Municipal Water Finance Authority, (Water and Sewer System), 5.25%, 6/15/40 | | | 1,000 | | | | 1,022,610 | |
Suffolk County Water Authority, 5.00%, 6/1/36 | | | 3,900 | | | | 4,557,112 | |
| | | | | | | $ | 10,683,744 | |
| |
Total Tax-Exempt Investments — 101.1%
(identified cost $395,373,502) | | | $ | 402,179,721 | |
| | | | |
| | 28 | | See Notes to Financial Statements. |
Eaton Vance
New York Municipal Income Fund
September 30, 2018
Portfolio of Investments — continued
| | | | | | | | |
| Miscellaneous — 0.3% | |
| Security | | Units | | | Value | |
|
| Real Estate — 0.3% | |
CMS Liquidating Trust(3)(4)(5) | | | 400 | | | $ | 1,146,071 | |
| |
Total Miscellaneous — 0.3%
(identified cost $1,280,000) | | | $ | 1,146,071 | |
| |
Total Investments — 101.4%
(identified cost $396,653,502) | | | $ | 403,325,792 | |
| |
Other Assets, Less Liabilities — (1.4)% | | | $ | (5,497,094 | ) |
| |
Net Assets — 100.0% | | | $ | 397,828,698 | |
The percentage shown for each investment category in the Portfolio of Investments is based on net assets.
The Fund invests primarily in debt securities issued by New York municipalities. The ability of the issuers of the debt securities to meet their obligations may be affected by economic developments in a specific industry or municipality. In order to reduce the risk associated with such economic developments, at September 30, 2018, 7.7% of total investments are backed by bond insurance of various financial institutions and financial guaranty assurance agencies. The aggregate percentage insured by an individual financial institution or financial guaranty assurance agency ranged from 1.4% to 2.5% of total investments.
| (1) | When-issued security. |
| (2) | Security represents the municipal bond held by a trust that issues residual interest bonds (see Note 1H). |
| (3) | Security exempt from registration pursuant to Rule 144A under the Securities Act of 1933, as amended. These securities may be sold in certain transactions in reliance on an exemption from registration (normally to qualified institutional buyers). At September 30, 2018, the aggregate value of these securities is $14,158,039 or 3.6% of the Fund’s net assets. |
| (4) | Non-income producing. |
| (5) | For fair value measurement disclosure purposes, security is categorized as Level 3 (see Note 10). |
| | | | | | | | | | | | | | | | |
| Futures Contracts | |
| | | | | |
| Description | | Number of
Contracts | | | Position | | Expiration
Month/Year | | Notional
Amount | | | Value/Net
Unrealized
Appreciation | |
| | | | | |
Interest Rate Futures | | | | | | | | | | | | | | | | |
| U.S. Long Treasury Bond | | | 128 | | | Short | | Dec-18 | | $ | (17,984,000 | ) | | $ | 429,336 | |
| | | | | |
| | | | | | | | | | | | | | | $ | 429,336 | |
Abbreviations:
| | | | |
| AGC | | – | | Assured Guaranty Corp. |
| AGM | | – | | Assured Guaranty Municipal Corp. |
| AMBAC | | – | | AMBAC Financial Group, Inc. |
| AMT | | – | | Interest earned from these securities may be considered a tax preference item for purposes of the Federal Alternative Minimum Tax. |
| NPFG | | – | | National Public Finance Guaranty Corp. |
| | | | |
| | 29 | | See Notes to Financial Statements. |
Eaton Vance
Ohio Municipal Income Fund
September 30, 2018
Portfolio of Investments
| | | | | | | | |
| Tax-Exempt Investments — 102.9% | |
| Security | | Principal
Amount
(000’s omitted) | | | Value | |
|
| Bond Bank — 6.4% | |
Ohio Water Development Authority, 4.00%, 6/1/36 | | $ | 1,500 | | | $ | 1,567,440 | |
Ohio Water Development Authority, 5.00%, 12/1/35 | | | 2,000 | | | | 2,270,500 | |
Ohio Water Development Authority, Water Pollution Control Loan Fund, 1.78%, (SIFMA + 0.22%), 12/1/20(1) | | | 1,700 | | | | 1,698,657 | |
Ohio Water Development Authority, Water Pollution Control Loan Fund, (Water Quality), 5.25%, 6/1/20 | | | 1,000 | | | | 1,053,400 | |
Rickenbacker Port Authority, (OASBO Expanded Asset Pooled Financing Program), 5.375%, 1/1/32 | | | 2,860 | | | | 3,158,698 | |
| | | | | | | $ | 9,748,695 | |
|
| Education — 8.8% | |
Kent State University, 5.00%, 5/1/30 | | $ | 1,185 | | | $ | 1,347,179 | |
Ohio Higher Educational Facility Commission, (Case Western Reserve University), 5.00%, 12/1/26 | | | 350 | | | | 409,455 | |
Ohio Higher Educational Facility Commission, (Case Western Reserve University), 5.00%, 12/1/27 | | | 300 | | | | 349,284 | |
Ohio Higher Educational Facility Commission, (Case Western Reserve University), 5.00%, 12/1/40 | | | 1,000 | | | | 1,113,940 | |
Ohio Higher Educational Facility Commission, (Case Western Reserve University), 6.50%, 10/1/20 | | | 210 | | | | 218,268 | |
Ohio Higher Educational Facility Commission, (Denison University), 5.25%, 11/1/46 | | | 1,355 | | | | 1,540,161 | |
Ohio Higher Educational Facility Commission, (Oberlin College), 5.00%, 10/1/33 | | | 2,000 | | | | 2,197,980 | |
Ohio Higher Educational Facility Commission, (Oberlin College), 5.00%, 10/1/38 | | | 910 | | | | 992,555 | |
Ohio Higher Educational Facility Commission, (University of Dayton), 5.00%, 12/1/32 | | | 550 | | | | 611,407 | |
Ohio State University, 5.00%, 12/1/29 | | | 1,060 | | | | 1,278,826 | |
Ohio University, 5.00%, 12/1/35 | | | 500 | | | | 565,185 | |
University of Cincinnati, 5.00%, 6/1/34 | | | 585 | | | | 658,154 | |
University of Cincinnati, 5.00%, 6/1/45 | | | 2,000 | | | | 2,228,780 | |
| | | | | | | $ | 13,511,174 | |
|
| Electric Utilities — 2.5% | |
American Municipal Power, Inc., (Greenup Hydroelectric Facility), 5.00%, 2/15/41 | | $ | 1,000 | | | $ | 1,090,550 | |
American Municipal Power, Inc., (Meldahl Hydroelectric), 4.00%, 2/15/34 | | | 2,005 | | | | 2,036,940 | |
American Municipal Power, Inc., (Meldahl Hydroelectric), 5.00%, 2/15/33 | | | 595 | | | | 659,028 | |
| | | | | | | $ | 3,786,518 | |
| | | | | | | | |
| Security | | Principal
Amount
(000’s omitted) | | | Value | |
|
| Escrowed / Prerefunded — 2.8% | |
Cleveland, Income Tax Revenue, (Bridges and Roadways Improvements), Prerefunded to 10/1/22, 5.00%, 10/1/32 | | $ | 1,000 | | | $ | 1,106,990 | |
Lakewood City School District, Prerefunded to 11/1/22, 5.00%, 11/1/36 | | | 1,330 | | | | 1,477,856 | |
Ohio Higher Educational Facility Commission, (Summa Health System), Prerefunded to 5/15/20, 5.75%, 11/15/40 | | | 1,495 | | | | 1,582,876 | |
Ohio State University, Escrowed to Maturity, 5.00%, 12/1/29 | | | 45 | | | | 54,820 | |
| | | | | | | $ | 4,222,542 | |
|
| General Obligations — 5.3% | |
Butler County, Special Tax Assessment, 5.50%, 12/1/28 | | $ | 1,000 | | | $ | 1,005,860 | |
Columbus City School District, 5.00%, 12/1/30 | | | 1,500 | | | | 1,726,140 | |
Cuyahoga Community College District, 3.50%, 12/1/39 | | | 1,400 | | | | 1,335,320 | |
Highland Local School District, 5.00%, 12/1/37 | | | 540 | | | | 588,870 | |
Highland Local School District, 5.00%, 12/1/39 | | | 1,100 | | | | 1,197,537 | |
Northwest Local School District, 5.00%, 12/1/40 | | | 500 | | | | 551,770 | |
Ohio, 5.00%, 5/1/33 | | | 1,500 | | | | 1,730,340 | |
| | | | | | | $ | 8,135,837 | |
|
| Hospital — 18.8% | |
Akron, Bath and Copley Joint Township Hospital District, (Children’s Hospital Medical Center of Akron), 5.00%, 11/15/32 | | $ | 2,450 | | | $ | 2,646,514 | |
Akron, Bath and Copley Joint Township Hospital District, (Children’s Hospital Medical Center of Akron), 5.00%, 11/15/38 | | | 1,155 | | | | 1,245,125 | |
Allen County, (Mercy Health), 4.00%, 8/1/47(2) | | | 5,150 | | | | 5,097,573 | |
Bluffton, (Blanchard Valley Health System), 5.00%, 12/1/31 | | | 750 | | | | 840,008 | |
Butler County, (Kettering Health Network Obligated Group), 5.25%, 4/1/31 | | | 2,500 | | | | 2,651,075 | |
Butler County, (UC Health), 4.00%, 11/15/37 | | | 920 | | | | 909,061 | |
Butler County, (UC Health), 5.00%, 11/15/28 | | | 590 | | | | 678,943 | |
Franklin County, (Nationwide Children’s Hospital), 5.00%, 11/1/34 | | | 750 | | | | 848,775 | |
Franklin County, (Nationwide Children’s Hospital), Prerefunded to 11/1/19, 5.00%, 11/1/34 | | | 950 | | | | 980,200 | |
Franklin County, (OhioHealth Corp.), 5.00%, 5/15/40 | | | 1,200 | | | | 1,318,128 | |
Franklin County, (Trinity Health Credit Group), 5.00%, 12/1/47 | | | 2,000 | | | | 2,213,520 | |
Lucas County, (ProMedica Healthcare Obligated Group), 4.00%, 11/15/45 | | | 1,725 | | | | 1,575,460 | |
Montgomery County, (Catholic Health Initiatives), 5.50%, 5/1/34 | | | 650 | | | | 660,472 | |
Muskingum County, (Genesis HealthCare System Obligated Group), 5.00%, 2/15/33 | | | 460 | | | | 479,003 | |
Ohio, (Cleveland Clinic Health System), 4.00%, 1/1/43 | | | 2,210 | | | | 2,237,205 | |
| | | | |
| | 30 | | See Notes to Financial Statements. |
Eaton Vance
Ohio Municipal Income Fund
September 30, 2018
Portfolio of Investments — continued
| | | | | | | | |
| Security | | Principal
Amount
(000’s omitted) | | | Value | |
|
| Hospital (continued) | |
Ohio Higher Educational Facility Commission, (Cleveland Clinic Health System), (SPA: Barclays Bank PLC), 1.67%, 1/1/43(3) | | $ | 1,000 | | | $ | 1,000,000 | |
Ohio Higher Educational Facility Commission, (Summa Health System), 5.75%, 11/15/40 | | | 870 | | | | 908,497 | |
Ohio Higher Educational Facility Commission, (University Hospitals Health System, Inc.), 5.00%, 1/15/27 | | | 1,500 | | | | 1,632,345 | |
Ohio Higher Educational Facility Commission, (University Hospitals Health System, Inc.), 5.00%, 1/15/29 | | | 450 | | | | 485,172 | |
Southeastern Ohio Port Authority, (Memorial Health System Obligated Group), 5.00%, 12/1/24 | | | 215 | | | | 228,319 | |
| | | | | | | $ | 28,635,395 | |
|
| Industrial Development Revenue — 2.7% | |
Cleveland, (Continental Airlines), (AMT), 5.375%, 9/15/27 | | $ | 2,380 | | | $ | 2,386,902 | |
Ohio Air Quality Development Authority, (Pratt Paper, LLC), (AMT), 4.25%, 1/15/38(4) | | | 1,700 | | | | 1,716,813 | |
| | | | | | | $ | 4,103,715 | |
|
| Insured – Education — 0.1% | |
Kent State University, (AGC), 5.00%, 5/1/29 | | $ | 175 | | | $ | 177,910 | |
| | | | | | | $ | 177,910 | |
|
| Insured – Electric Utilities — 8.1% | |
Cleveland, Public Power System Revenue, (AGM), 5.00%, 11/15/24 | | $ | 1,500 | | | $ | 1,696,065 | |
Cleveland, Public Power System Revenue, (NPFG), 0.00%, 11/15/27 | | | 2,540 | | | | 1,847,723 | |
Ohio Municipal Electric Generation Agency, (NPFG), 0.00%, 2/15/26 | | | 3,000 | | | | 2,363,880 | |
Ohio Municipal Electric Generation Agency, (NPFG), 0.00%, 2/15/27 | | | 2,500 | | | | 1,891,575 | |
Ohio Municipal Electric Generation Agency, (NPFG), 0.00%, 2/15/28 | | | 4,750 | | | | 3,450,685 | |
Puerto Rico Electric Power Authority, (NPFG), 5.25%, 7/1/34 | | | 1,005 | | | | 1,077,732 | |
| | | | | | | $ | 12,327,660 | |
|
| Insured – General Obligations — 24.7% | |
Cincinnati City School District, (AGM), (FGIC), 5.25%, 12/1/29(2) | | $ | 7,500 | | | $ | 9,146,325 | |
Cleveland, (AMBAC), 5.50%, 10/1/23 | | | 2,105 | | | | 2,409,509 | |
Kettering City School District, (AGM), 5.25%, 12/1/31 | | | 6,705 | | | | 7,948,442 | |
Mason City School District, (AGM), 5.25%, 12/1/31 | | | 3,525 | | | | 4,284,638 | |
Springboro Community City School District, (AGM), 5.25%, 12/1/30 | | | 5,000 | | | | 5,992,400 | |
Westerville City School District, (XLCA), 5.00%, 12/1/27 | | | 6,705 | | | | 7,879,314 | |
| | | | | | | $ | 37,660,628 | |
| | | | | | | | |
| Security | | Principal
Amount
(000’s omitted) | | | Value | |
|
| Insured – Transportation — 7.9% | |
Cleveland, Airport System Revenue, (AGM), 5.00%, 1/1/30 | | $ | 1,170 | | | $ | 1,258,744 | |
Cleveland, Airport System Revenue, (AGM), (AMT), 5.00%, 1/1/43(5) | | | 1,000 | | | | 1,085,010 | |
Ohio, (Portsmouth Gateway Group, LLC), (AGM), (AMT), 5.00%, 12/31/35 | | | 1,500 | | | | 1,631,235 | |
Ohio Turnpike Commission, (NPFG), 5.50%, 2/15/24 | | | 5,000 | | | | 5,610,850 | |
Puerto Rico Highway and Transportation Authority, (AGC), 5.25%, 7/1/41 | | | 2,250 | | | | 2,550,150 | |
| | | | | | | $ | 12,135,989 | |
|
| Other Revenue — 2.7% | |
Riversouth Authority, (Lazarus Building Redevelopment), 5.75%, 12/1/27 | | $ | 2,535 | | | $ | 2,540,045 | |
Summit County Port Authority, 5.00%, 12/1/31 | | | 1,410 | | | | 1,546,192 | |
| | | | | | | $ | 4,086,237 | |
|
| Senior Living / Life Care — 1.1% | |
Lorain County Port Authority, (Kendal at Oberlin), 5.00%, 11/15/30 | | $ | 580 | | | $ | 628,349 | |
Warren County, (Otterbein Homes Obligated Group), 5.75%, 7/1/33 | | | 905 | | | | 1,015,591 | |
| | | | | | | $ | 1,643,940 | |
|
| Special Tax Revenue — 6.0% | |
Cleveland, Income Tax Revenue, (Parks and Recreation Facilities Improvements), 5.00%, 10/1/35 | | $ | 1,000 | | | $ | 1,078,720 | |
Cuyahoga County, (Quicken Loans Arena), Sales Tax Revenue, 4.00%, 1/1/27 | | | 250 | | | | 268,427 | |
Cuyahoga County, Sales Tax Revenue, 5.00%, 12/1/35 | | | 1,000 | | | | 1,120,710 | |
Delaware County, Sales Tax Revenue, 5.00%, 12/1/28 | | | 2,000 | | | | 2,276,140 | |
Franklin County Convention Facilities Authority, 5.00%, 12/1/26 | | | 1,000 | | | | 1,130,970 | |
Greater Cleveland Regional Transit Authority, Sales Tax Revenue, 5.00%, 12/1/31 | | | 435 | | | | 498,245 | |
Green, Income Tax Revenue, (Community Learning Centers), 5.00%, 12/1/26 | | | 570 | | | | 633,395 | |
Green, Income Tax Revenue, (Community Learning Centers), 5.00%, 12/1/28 | | | 940 | | | | 1,042,169 | |
Hamilton County, Sales Tax Revenue, 5.00%, 12/1/30 | | | 1,000 | | | | 1,144,610 | |
| | | | | | | $ | 9,193,386 | |
| | | | |
| | 31 | | See Notes to Financial Statements. |
Eaton Vance
Ohio Municipal Income Fund
September 30, 2018
Portfolio of Investments — continued
| | | | | | | | |
| Security | | Principal
Amount
(000’s omitted) | | | Value | |
|
| Water and Sewer — 5.0% | |
Cleveland, Water Pollution Control Revenue, 5.00%, 11/15/41 | | $ | 945 | | | $ | 1,039,859 | |
Columbus, Sewerage System Revenue, 5.00%, 6/1/32 | | | 1,500 | | | | 1,713,915 | |
Lancaster, Wastewater System Revenue, 4.00%, 12/1/33 | | | 1,265 | | | | 1,320,217 | |
Northeast Ohio Regional Sewer District, 5.00%, 11/15/44 | | | 1,255 | | | | 1,386,211 | |
Toledo, Water System Revenue, 5.00%, 11/15/41 | | | 2,000 | | | | 2,225,300 | |
| | | | | | | $ | 7,685,502 | |
| |
Total Tax-Exempt Investments — 102.9%
(identified cost $149,091,845) | | | $ | 157,055,128 | |
| |
Other Assets, Less Liabilities — (2.9)% | | | $ | (4,406,801 | ) |
| |
Net Assets — 100.0% | | | $ | 152,648,327 | |
The percentage shown for each investment category in the Portfolio of Investments is based on net assets.
The Fund invests primarily in debt securities issued by Ohio municipalities. The ability of the issuers of the debt securities to meet their obligations may be affected by economic developments in a specific industry or municipality. In order to reduce the risk associated with such economic developments, at September 30, 2018, 39.7% of total investments are backed by bond insurance of various financial institutions and financial guaranty assurance agencies. The aggregate percentage insured by an individual financial institution or financial guaranty assurance agency ranged from 1.5% to 21.0% of total investments.
| (1) | Floating rate security. The stated interest rate represents the rate in effect at September 30, 2018. |
| (2) | Security represents the municipal bond held by a trust that issues residual interest bonds (see Note 1H). |
| (3) | Variable rate demand obligation that may be tendered at par on any day for payment the same or next business day. The stated interest rate, which generally resets daily, is determined by the remarking agent and represents the rate in effect at September 30, 2018. |
| (4) | Security exempt from registration pursuant to Rule 144A under the Securities Act of 1933, as amended. These securities may be sold in certain transactions in reliance on an exemption from registration (normally to qualified institutional buyers). At September 30, 2018, the aggregate value of these securities is $1,716,813 or 1.1% of the Fund’s net assets. |
| (5) | When-issued security. |
| | | | | | | | | | | | | | | | |
| Futures Contracts | |
| | | | | |
| Description | | Number of
Contracts | | | Position | | Expiration
Month/Year | | Notional
Amount | | | Value/Net
Unrealized
Appreciation | |
| | | | | |
Interest Rate Futures | | | | | | | | | | | | | | | | |
| U.S. Long Treasury Bond | | | 55 | | | Short | | Dec-18 | | $ | (7,727,500 | ) | | $ | 184,480 | |
| | | | | |
| | | | | | | | | | | | | | | $ | 184,480 | |
Abbreviations:
| | | | |
| AGC | | – | | Assured Guaranty Corp. |
| AGM | | – | | Assured Guaranty Municipal Corp. |
| AMBAC | | – | | AMBAC Financial Group, Inc. |
| AMT | | – | | Interest earned from these securities may be considered a tax preference item for purposes of the Federal Alternative Minimum Tax. |
| FGIC | | – | | Financial Guaranty Insurance Company |
| NPFG | | – | | National Public Finance Guaranty Corp. |
| SIFMA | | – | | Securities Industry and Financial Markets Association Municipal Swap Index |
| SPA | | – | | Standby Bond Purchase Agreement |
| XLCA | | – | | XL Capital Assurance, Inc. |
| | | | |
| | 32 | | See Notes to Financial Statements. |
Eaton Vance
Municipal Income Funds
September 30, 2018
Statements of Assets and Liabilities
| | | | | | | | | | | | | | | | |
| | | September 30, 2018 | |
| Assets | | California
Opportunities Fund | | | Massachusetts Fund | | | New York Fund | | | Ohio Fund | |
Investments — | | | | | | | | | | | | | | | | |
Identified cost | | $ | 271,352,980 | | | $ | 138,004,539 | | | $ | 396,653,502 | | | $ | 149,091,845 | |
Unrealized appreciation | | | 3,128,191 | | | | 6,928,317 | | | | 6,672,290 | | | | 7,963,283 | |
Investments, at value | | $ | 274,481,171 | | | $ | 144,932,856 | | | $ | 403,325,792 | | | $ | 157,055,128 | |
Cash | | $ | 4,640,057 | | | $ | 838,037 | | | $ | 7,184,461 | | | $ | 4,042,953 | |
Deposits for derivatives collateral — financial futures contracts | | | — | | | | 115,000 | | | | 294,400 | | | | 126,500 | |
Interest receivable | | | 2,864,507 | | | | 1,665,585 | | | | 4,662,430 | | | | 2,093,068 | |
Receivable for investments sold | | | 12,009,203 | | | | — | | | | — | | | | 90,000 | |
Receivable for Fund shares sold | | | 538,938 | | | | 272,806 | | | | 421,193 | | | | 187,688 | |
Receivable for variation margin on open financial futures contracts | | | — | | | | 7,810 | | | | 19,997 | | | | 8,592 | |
Total assets | | $ | 294,533,876 | | | $ | 147,832,094 | | | $ | 415,908,273 | | | $ | 163,603,929 | |
|
| Liabilities | |
Payable for floating rate notes issued | | $ | 6,360,035 | | | $ | 3,659,783 | | | $ | 14,249,950 | | | $ | 9,148,696 | |
Payable for investments purchased | | | 9,501,250 | | | | — | | | | — | | | | — | |
Payable for when-issued securities | | | 28,942,063 | | | | — | | | | 2,217,166 | | | | 1,109,780 | |
Payable for Fund shares redeemed | | | 797,513 | | | | 199,207 | | | | 1,009,953 | | | | 421,306 | |
Distributions payable | | | 78,714 | | | | 61,183 | | | | 153,853 | | | | 62,783 | |
Payable to affiliates: | | | | | | | | | | | | | | | | |
Investment adviser fee | | | 82,070 | | | | 42,302 | | | | 126,591 | | | | 45,571 | |
Distribution and service fees | | | 42,534 | | | | 26,495 | | | | 80,039 | | | | 31,267 | |
Interest expense and fees payable | | | 31,252 | | | | 7,321 | | | | 90,239 | | | | 48,421 | |
Accrued expenses | | | 117,063 | | | | 92,322 | | | | 151,784 | | | | 87,778 | |
Total liabilities | | $ | 45,952,494 | | | $ | 4,088,613 | | | $ | 18,079,575 | | | $ | 10,955,602 | |
Net Assets | | $ | 248,581,382 | | | $ | 143,743,481 | | | $ | 397,828,698 | | | $ | 152,648,327 | |
|
| Sources of Net Assets | |
Paid-in capital | | $ | 247,450,465 | | | $ | 141,055,533 | | | $ | 398,202,490 | | | $ | 156,458,953 | |
Distributable earnings (accumulated loss) | | | 1,130,917 | | | | 2,687,948 | | | | (373,792 | ) | | | (3,810,626 | ) |
Net Assets | | $ | 248,581,382 | | | $ | 143,743,481 | | | $ | 397,828,698 | | | $ | 152,648,327 | |
|
| Class A Shares | |
Net Assets | | $ | 107,204,447 | | | $ | 88,205,286 | | | $ | 218,892,499 | | | $ | 97,735,854 | |
Shares Outstanding | | | 10,504,907 | | | | 10,251,377 | | | | 22,337,358 | | | | 11,232,803 | |
Net Asset Value and Redemption Price Per Share | | | | | | | | | | | | | | | | |
(net assets ÷ shares of beneficial interest outstanding) | | $ | 10.21 | | | $ | 8.60 | | | $ | 9.80 | | | $ | 8.70 | |
Maximum Offering Price Per Share | | | | | | | | | | | | | | | | |
(100 ÷ 95.25 of net asset value per share) | | $ | 10.72 | | | $ | 9.03 | | | $ | 10.29 | | | $ | 9.13 | |
|
| Class C Shares | |
Net Assets | | $ | 24,436,907 | | | $ | 14,847,542 | | | $ | 55,816,718 | | | $ | 19,190,922 | |
Shares Outstanding | | | 2,589,518 | | | | 1,724,740 | | | | 5,693,470 | | | | 2,207,023 | |
Net Asset Value and Offering Price Per Share* | | | | | | | | | | | | | | | | |
(net assets ÷ shares of beneficial interest outstanding) | | $ | 9.44 | | | $ | 8.61 | | | $ | 9.80 | | | $ | 8.70 | |
|
| Class I Shares | |
Net Assets | | $ | 116,940,028 | | | $ | 40,690,653 | | | $ | 123,119,481 | | | $ | 35,721,551 | |
Shares Outstanding | | | 11,451,137 | | | | 4,729,962 | | | | 12,565,925 | | | | 4,102,804 | |
Net Asset Value, Offering Price and Redemption Price Per Share | | | | | | | | | | | | | | | | |
(net assets ÷ shares of beneficial interest outstanding) | | $ | 10.21 | | | $ | 8.60 | | | $ | 9.80 | | | $ | 8.71 | |
On sales of $50,000 or more, the offering price of Class A shares is reduced.
| * | Redemption price per share is equal to the net asset value less any applicable contingent deferred sales charge. |
| | | | |
| | 33 | | See Notes to Financial Statements. |
Eaton Vance
Municipal Income Funds
September 30, 2018
Statements of Operations
| | | | | | | | | | | | | | | | |
| | | Year Ended September 30, 2018 | |
| Investment Income | | California
Opportunities Fund | | | Massachusetts Fund | | | New York Fund | | | Ohio Fund | |
Interest | | $ | 8,831,398 | | | $ | 5,767,590 | | | $ | 15,315,551 | | | $ | 6,434,431 | |
Total investment income | | $ | 8,831,398 | | | $ | 5,767,590 | | | $ | 15,315,551 | | | $ | 6,434,431 | |
|
| Expenses | |
Investment adviser fee | | $ | 1,041,473 | | | $ | 549,061 | | | $ | 1,625,821 | | | $ | 578,422 | |
Distribution and service fees | | | | | | | | | | | | | | | | |
Class A | | | 294,923 | | | | 188,117 | | | | 465,928 | | | | 208,403 | |
Class C | | | 269,347 | | | | 159,432 | | | | 585,338 | | | | 199,067 | |
Trustees’ fees and expenses | | | 11,619 | | | | 6,981 | | | | 18,521 | | | | 7,281 | |
Custodian fee | | | 74,384 | | | | 48,185 | | | | 108,527 | | | | 48,993 | |
Transfer and dividend disbursing agent fees | | | 81,537 | | | | 65,208 | | | | 166,584 | | | | 71,024 | |
Legal and accounting services | | | 67,768 | | | | 70,958 | | | | 79,887 | | | | 55,076 | |
Printing and postage | | | 19,556 | | | | 13,602 | | | | 23,752 | | | | 13,154 | |
Registration fees | | | 1,680 | | | | 11,760 | | | | 4,773 | | | | 8,475 | |
Interest expense and fees | | | 185,357 | | | | 73,015 | | | | 388,755 | | | | 225,881 | |
Miscellaneous | | | 40,907 | | | | 22,312 | | | | 42,463 | | | | 22,771 | |
Total expenses | | $ | 2,088,551 | | | $ | 1,208,631 | | | $ | 3,510,349 | | | $ | 1,438,547 | |
| | | | |
Net investment income | | $ | 6,742,847 | | | $ | 4,558,959 | | | $ | 11,805,202 | | | $ | 4,995,884 | |
|
| Realized and Unrealized Gain (Loss) | |
Net realized gain (loss) — | | | | | | | | | | | | | | | | |
Investment transactions | | $ | 2,206,400 | | | $ | 2,707,570 | | | $ | 5,753,585 | | | $ | 670,790 | |
Financial futures contracts | | | — | | | | 386,642 | | | | 989,804 | | | | 425,307 | |
Net realized gain | | $ | 2,206,400 | | | $ | 3,094,212 | | | $ | 6,743,389 | | | $ | 1,096,097 | |
Change in unrealized appreciation (depreciation) — | | | | | | | | | | | | | | | | |
Investments | | $ | (7,420,882 | ) | | $ | (7,835,969 | ) | | $ | (20,006,169 | ) | | $ | (6,871,718 | ) |
Financial futures contracts | | | — | | | | 42,412 | | | | 108,577 | | | | 46,654 | |
Net change in unrealized appreciation (depreciation) | | $ | (7,420,882 | ) | | $ | (7,793,557 | ) | | $ | (19,897,592 | ) | | $ | (6,825,064 | ) |
| | | | |
Net realized and unrealized loss | | $ | (5,214,482 | ) | | $ | (4,699,345 | ) | | $ | (13,154,203 | ) | | $ | (5,728,967 | ) |
| | | | |
Net increase (decrease) in net assets from operations | | $ | 1,528,365 | | | $ | (140,386 | ) | | $ | (1,349,001 | ) | | $ | (733,083 | ) |
| | | | |
| | 34 | | See Notes to Financial Statements. |
Eaton Vance
Municipal Income Funds
September 30, 2018
Statements of Changes in Net Assets
| | | | | | | | | | | | | | | | |
| | | Year Ended September 30, 2018 | |
| Increase (Decrease) in Net Assets | | California
Opportunities Fund | | | Massachusetts Fund | | | New York Fund | | | Ohio Fund | |
From operations — | | | | | | | | | | | | | | | | |
Net investment income | | $ | 6,742,847 | | | $ | 4,558,959 | | | $ | 11,805,202 | | | $ | 4,995,884 | |
Net realized gain | | | 2,206,400 | | | | 3,094,212 | | | | 6,743,389 | | | | 1,096,097 | |
Net change in unrealized appreciation (depreciation) | | | (7,420,882 | ) | | | (7,793,557 | ) | | | (19,897,592 | ) | | | (6,825,064 | ) |
Net increase (decrease) in net assets from operations | | $ | 1,528,365 | | | $ | (140,386 | ) | | $ | (1,349,001 | ) | | $ | (733,083 | ) |
Distributions to shareholders: | | | | | | | | | | | | | | | | |
Class A | | $ | (3,013,590 | ) | | $ | (2,959,978 | ) | | $ | (6,653,133 | ) | | $ | (3,294,370 | ) |
Class C | | | (485,446 | ) | | | (404,158 | ) | | | (1,297,368 | ) | | | (505,143 | ) |
Class I | | | (3,244,322 | ) | | | (1,379,044 | ) | | | (3,830,117 | ) | | | (1,135,170 | ) |
Total distributions to shareholders | | $ | (6,743,358 | ) | | $ | (4,743,180 | ) | | $ | (11,780,618 | ) | | $ | (4,934,683 | ) |
Transactions in shares of beneficial interest — | | | | | | | | | | | | | | | | |
Proceeds from sale of shares | | | | | | | | | | | | | | | | |
Class A | | $ | 12,280,171 | | | $ | 3,555,230 | | | $ | 15,552,774 | | | $ | 6,773,006 | |
Class C | | | 3,210,719 | | | | 1,531,574 | | | | 4,241,493 | | | | 2,642,369 | |
Class I | | | 39,067,238 | | | | 13,471,402 | | | | 40,578,182 | | | | 12,189,449 | |
Net asset value of shares issued to shareholders in payment of distributions declared | | | | | | | | | | | | | | | | |
Class A | | | 2,509,191 | | | | 2,463,443 | | | | 5,721,590 | | | | 2,787,395 | |
Class C | | | 422,135 | | | | 329,011 | | | | 1,047,284 | | | | 427,522 | |
Class I | | | 2,805,557 | | | | 1,104,872 | | | | 3,039,413 | | | | 900,087 | |
Cost of shares redeemed | | | | | | | | | | | | | | | | |
Class A | | | (30,080,999 | ) | | | (14,729,507 | ) | | | (42,253,399 | ) | | | (22,414,432 | ) |
Class C | | | (8,667,428 | ) | | | (5,687,396 | ) | | | (14,283,135 | ) | | | (5,341,493 | ) |
Class I | | | (41,327,858 | ) | | | (18,116,073 | ) | | | (43,096,872 | ) | | | (8,225,952 | ) |
Net decrease in net assets from Fund share transactions | | $ | (19,781,274 | ) | | $ | (16,077,444 | ) | | $ | (29,452,670 | ) | | $ | (10,262,049 | ) |
| | | | |
Net decrease in net assets | | $ | (24,996,267 | ) | | $ | (20,961,010 | ) | | $ | (42,582,289 | ) | | $ | (15,929,815 | ) |
|
| Net Assets | |
At beginning of year | | $ | 273,577,649 | | | $ | 164,704,491 | | | $ | 440,410,987 | | | $ | 168,578,142 | |
At end of year | | $ | 248,581,382 | | | $ | 143,743,481 | | | $ | 397,828,698 | | | $ | 152,648,327 | |
| | | | |
| | 35 | | See Notes to Financial Statements. |
Eaton Vance
Municipal Income Funds
September 30, 2018
Statements of Changes in Net Assets — continued
| | | | | | | | | | | | | | | | |
| | | Year Ended September 30, 2017 | |
| Increase (Decrease) in Net Assets | | California
Opportunities Fund | | | Massachusetts Fund | | | New York Fund | | | Ohio Fund | |
From operations — | | | | | | | | | | | | | | | | |
Net investment income | | $ | 6,915,526 | | | $ | 5,383,136 | | | $ | 12,981,494 | | | $ | 5,829,363 | |
Net realized gain (loss) | | | (4,611,452 | ) | | | 673,583 | | | | 7,523,875 | | | | 1,125,266 | |
Net change in unrealized appreciation (depreciation) | | | (4,806,038 | ) | | | (6,838,532 | ) | | | (20,556,784 | ) | | | (6,929,232 | ) |
Net increase (decrease) in net assets from operations | | $ | (2,501,964 | ) | | $ | (781,813 | ) | | $ | (51,415 | ) | | $ | 25,397 | |
Distributions to shareholders:(1) | | | | | | | | | | | | | | | | |
Class A | | $ | (3,297,967 | ) | | $ | (3,358,988 | ) | | $ | (7,918,075 | ) | | $ | (4,196,284 | ) |
Class B | | | — | | | | — | | | | (3,299 | ) | | | — | |
Class C | | | (553,952 | ) | | | (516,153 | ) | | | (1,691,615 | ) | | | (623,724 | ) |
Class I | | | (3,025,069 | ) | | | (1,478,479 | ) | | | (3,578,576 | ) | | | (947,992 | ) |
Total distributions to shareholders | | $ | (6,876,988 | ) | | $ | (5,353,620 | ) | | $ | (13,191,565 | ) | | $ | (5,768,000 | ) |
Transactions in shares of beneficial interest — | | | | | | | | | | | | | | | | |
Proceeds from sale of shares | | | | | | | | | | | | | | | | |
Class A | | $ | 14,941,125 | | | $ | 5,793,864 | | | $ | 19,482,318 | | | $ | 7,552,899 | |
Class C | | | 5,671,177 | | | | 1,568,652 | | | | 7,793,000 | | | | 2,315,945 | |
Class I | | | 80,833,225 | | | | 19,172,312 | | | | 57,878,971 | | | | 18,155,119 | |
Net asset value of shares issued to shareholders in payment of distributions declared | | | | | | | | | | | | | | | | |
Class A | | | 2,796,101 | | | | 2,822,818 | | | | 6,815,052 | | | | 3,510,338 | |
Class C | | | 463,871 | | | | 412,558 | | | | 1,313,186 | | | | 518,768 | |
Class I | | | 2,551,780 | | | | 1,127,255 | | | | 2,707,572 | | | | 699,270 | |
Cost of shares redeemed | | | | | | | | | | | | | | | | |
Class A | | | (36,693,851 | ) | | | (21,641,833 | ) | | | (63,628,165 | ) | | | (28,612,421 | ) |
Class B | | | — | | | | — | | | | (18,716 | ) | | | — | |
Class C | | | (9,971,647 | ) | | | (6,108,126 | ) | | | (20,481,180 | ) | | | (4,666,011 | ) |
Class I | | | (70,485,012 | ) | | | (18,350,759 | ) | | | (36,178,830 | ) | | | (7,204,192 | ) |
Net asset value of shares exchanged | | | | | | | | | | | | | | | | |
Class A | | | — | | | | — | | | | 8,915 | | | | — | |
Class B | | | — | | | | — | | | | (8,915 | ) | | | — | |
Net asset value of shares merged(2) | | | | | | | | | | | | | | | | |
Class A | | | — | | | | — | | | | 1,830,276 | | | | — | |
Class B | | | — | | | | — | | | | (1,830,276 | ) | | | — | |
Net decrease in net assets from Fund share transactions | | $ | (9,893,231 | ) | | $ | (15,203,259 | ) | | $ | (24,316,792 | ) | | $ | (7,730,285 | ) |
| | | | |
Net decrease in net assets | | $ | (19,272,183 | ) | | $ | (21,338,692 | ) | | $ | (37,559,772 | ) | | $ | (13,472,888 | ) |
|
| Net Assets | |
At beginning of year | | $ | 292,849,832 | | | $ | 186,043,183 | | | $ | 477,970,759 | | | $ | 182,051,030 | |
At end of year(3) | | $ | 273,577,649 | | | $ | 164,704,491 | | | $ | 440,410,987 | | | $ | 168,578,142 | |
| (1) | For the year ended September 30, 2017, the source of distributions was from net investment income. |
| (2) | At the close of business on October 21, 2016, Class B shares of New York Fund were merged into Class A shares. |
| (3) | Includes accumulated undistributed (distributions in excess of) net investment income of $369,009, $687,753, $467,044 and $(82,132), respectively, at September 30, 2017. The requirement to disclose the corresponding amounts as of September 30, 2018 was eliminated. |
| | | | |
| | 36 | | See Notes to Financial Statements. |
Eaton Vance
Municipal Income Funds
September 30, 2018
Financial Highlights
| | | | | | | | | | | | | | | | | | | | |
| | | California Opportunities Fund — Class A | |
| | | Year Ended September 30, | |
| | | 2018 | | | 2017 | | | 2016 | | | 2015 | | | 2014 | |
Net asset value — Beginning of year | | $ | 10.410 | | | $ | 10.740 | | | $ | 10.250 | | | $ | 10.230 | | | $ | 9.580 | |
| | | | | |
| Income (Loss) From Operations | | | | | | | | | | | | | | | | | | | | |
Net investment income(1) | | $ | 0.263 | | | $ | 0.262 | | | $ | 0.302 | | | $ | 0.377 | | | $ | 0.394 | |
Net realized and unrealized gain (loss) | | | (0.200 | ) | | | (0.332 | ) | | | 0.491 | | | | 0.018 | | | | 0.647 | |
| | | | | |
Total income (loss) from operations | | $ | 0.063 | | | $ | (0.070 | ) | | $ | 0.793 | | | $ | 0.395 | | | $ | 1.041 | |
| | | | | |
| Less Distributions | | | | | | | | | | | | | | | | | | | | |
From net investment income | | $ | (0.263 | ) | | $ | (0.260 | ) | | $ | (0.303 | ) | | $ | (0.375 | ) | | $ | (0.391 | ) |
| | | | | |
Total distributions | | $ | (0.263 | ) | | $ | (0.260 | ) | | $ | (0.303 | ) | | $ | (0.375 | ) | | $ | (0.391 | ) |
| | | | | |
Net asset value — End of year | | $ | 10.210 | | | $ | 10.410 | | | $ | 10.740 | | | $ | 10.250 | | | $ | 10.230 | |
| | | | | |
Total Return(2) | | | 0.52 | % | | | (0.60 | )% | | | 7.83 | % | | | 3.92 | % | | | 11.07 | % |
| | | | | |
| Ratios/Supplemental Data | | | | | | | | | | | | | | | | | | | | |
Net assets, end of year (000’s omitted) | | $ | 107,204 | | | $ | 124,821 | | | $ | 148,675 | | | $ | 122,727 | | | $ | 120,695 | |
Ratios (as a percentage of average daily net assets): | | | | | | | | | | | | | | | | | | | | |
Expenses excluding interest and fees(3) | | | 0.77 | % | | | 0.77 | % | | | 0.78 | % | | | 0.84 | % | | | 0.85 | % |
Interest and fee expense(4) | | | 0.07 | % | | | 0.05 | % | | | 0.04 | % | | | 0.04 | % | | | 0.04 | % |
Total expenses(3) | | | 0.84 | % | | | 0.82 | % | | | 0.82 | % | | | 0.88 | % | | | 0.89 | % |
Net investment income | | | 2.56 | % | | | 2.53 | % | | | 2.86 | % | | | 3.68 | % | | | 3.99 | % |
Portfolio Turnover | | | 293 | % | | | 146 | % | | | 219 | % | | | 66 | % | | | 12 | % |
| (1) | Computed using average shares outstanding. |
| (2) | Returns are historical and are calculated by determining the percentage change in net asset value with all distributions reinvested and do not reflect the effect of sales charges. |
| (3) | Excludes the effect of custody fee credits, if any, of less than 0.005%. Effective September 1, 2015, custody fee credits, which were earned on cash deposit balances, were discontinued by the custodian. |
| (4) | Interest and fee expense relates to the liability for floating rate notes issued in conjunction with residual interest bond transactions (see Note 1H). |
| | | | |
| | 37 | | See Notes to Financial Statements. |
Eaton Vance
Municipal Income Funds
September 30, 2018
Financial Highlights — continued
| | | | | | | | | | | | | | | | | | | | |
| | | California Opportunities Fund — Class C | |
| | | Year Ended September 30, | |
| | | 2018 | | | 2017 | | | 2016 | | | 2015 | | | 2014 | |
Net asset value — Beginning of year | | $ | 9.620 | | | $ | 9.930 | | | $ | 9.480 | | | $ | 9.460 | | | $ | 8.860 | |
| | | | | |
| Income (Loss) From Operations | | | | | | | | | | | | | | | | | | | | |
Net investment income(1) | | $ | 0.172 | | | $ | 0.170 | | | $ | 0.198 | | | $ | 0.277 | | | $ | 0.296 | |
Net realized and unrealized gain (loss) | | | (0.180 | ) | | | (0.311 | ) | | | 0.459 | | | | 0.019 | | | | 0.597 | |
| | | | | |
Total income (loss) from operations | | $ | (0.008 | ) | | $ | (0.141 | ) | | $ | 0.657 | | | $ | 0.296 | | | $ | 0.893 | |
| | | | | |
| Less Distributions | | | | | | | | | | | | | | | | | | | | |
From net investment income | | $ | (0.172 | ) | | $ | (0.169 | ) | | $ | (0.207 | ) | | $ | (0.276 | ) | | $ | (0.293 | ) |
| | | | | |
Total distributions | | $ | (0.172 | ) | | $ | (0.169 | ) | | $ | (0.207 | ) | | $ | (0.276 | ) | | $ | (0.293 | ) |
| | | | | |
Net asset value — End of year | | $ | 9.440 | | | $ | 9.620 | | | $ | 9.930 | | | $ | 9.480 | | | $ | 9.460 | |
| | | | | |
Total Return(2) | | | (0.08 | )% | | | (1.40 | )% | | | 6.98 | % | | | 3.17 | % | | | 10.23 | % |
| | | | | |
| Ratios/Supplemental Data | | | | | | | | | | | | | | | | | | | | |
Net assets, end of year (000’s omitted) | | $ | 24,437 | | | $ | 30,020 | | | $ | 35,006 | | | $ | 15,343 | | | $ | 10,297 | |
Ratios (as a percentage of average daily net assets): | | | | | | | | | | | | | | | | | | | | |
Expenses excluding interest and fees(3) | | | 1.52 | % | | | 1.52 | % | | | 1.53 | % | | | 1.59 | % | | | 1.60 | % |
Interest and fee expense(4) | | | 0.07 | % | | | 0.05 | % | | | 0.04 | % | | | 0.04 | % | | | 0.04 | % |
Total expenses(3) | | | 1.59 | % | | | 1.57 | % | | | 1.57 | % | | | 1.63 | % | | | 1.64 | % |
Net investment income | | | 1.80 | % | | | 1.78 | % | | | 2.02 | % | | | 2.92 | % | | | 3.24 | % |
Portfolio Turnover | | | 293 | % | | | 146 | % | | | 219 | % | | | 66 | % | | | 12 | % |
| (1) | Computed using average shares outstanding. |
| (2) | Returns are historical and are calculated by determining the percentage change in net asset value with all distributions reinvested and do not reflect the effect of sales charges. |
| (3) | Excludes the effect of custody fee credits, if any, of less than 0.005%. Effective September 1, 2015, custody fee credits, which were earned on cash deposit balances, were discontinued by the custodian. |
| (4) | Interest and fee expense relates to the liability for floating rate notes issued in conjunction with residual interest bond transactions (see Note 1H). |
| | | | |
| | 38 | | See Notes to Financial Statements. |
Eaton Vance
Municipal Income Funds
September 30, 2018
Financial Highlights — continued
| | | | | | | | | | | | | | | | | | | | |
| | | California Opportunities Fund — Class I | |
| | | Year Ended September 30, | |
| | | 2018 | | | 2017 | | | 2016 | | | 2015 | | | 2014 | |
Net asset value — Beginning of year | | $ | 10.420 | | | $ | 10.750 | | | $ | 10.260 | | | $ | 10.240 | | | $ | 9.590 | |
| | | | | |
| Income (Loss) From Operations | | | | | | | | | | | | | | | | | | | | |
Net investment income(1) | | $ | 0.289 | | | $ | 0.287 | | | $ | 0.312 | | | $ | 0.403 | | | $ | 0.419 | |
Net realized and unrealized gain (loss) | | | (0.210 | ) | | | (0.331 | ) | | | 0.507 | | | | 0.018 | | | | 0.647 | |
| | | | | |
Total income (loss) from operations | | $ | 0.079 | | | $ | (0.044 | ) | | $ | 0.819 | | | $ | 0.421 | | | $ | 1.066 | |
| | | | | |
| Less Distributions | | | | | | | | | | | | | | | | | | | | |
From net investment income | | $ | (0.289 | ) | | $ | (0.286 | ) | | $ | (0.329 | ) | | $ | (0.401 | ) | | $ | (0.416 | ) |
| | | | | |
Total distributions | | $ | (0.289 | ) | | $ | (0.286 | ) | | $ | (0.329 | ) | | $ | (0.401 | ) | | $ | (0.416 | ) |
| | | | | |
Net asset value — End of year | | $ | 10.210 | | | $ | 10.420 | | | $ | 10.750 | | | $ | 10.260 | | | $ | 10.240 | |
| | | | | |
Total Return(2) | | | 0.77 | % | | | (0.35 | )% | | | 8.09 | % | | | 4.18 | % | | | 11.33 | % |
| | | | | |
| Ratios/Supplemental Data | | | | | | | | | | | | | | | | | | | | |
Net assets, end of year (000’s omitted) | | $ | 116,940 | | | $ | 118,737 | | | $ | 109,169 | | | $ | 21,945 | | | $ | 23,320 | |
Ratios (as a percentage of average daily net assets): | | | | | | | | | | | | | | | | | | | | |
Expenses excluding interest and fees(3) | | | 0.51 | % | | | 0.52 | % | | | 0.52 | % | | | 0.59 | % | | | 0.60 | % |
Interest and fee expense(4) | | | 0.07 | % | | | 0.05 | % | | | 0.04 | % | | | 0.04 | % | | | 0.04 | % |
Total expenses(3) | | | 0.58 | % | | | 0.57 | % | | | 0.56 | % | | | 0.63 | % | | | 0.64 | % |
Net investment income | | | 2.80 | % | | | 2.77 | % | | | 2.93 | % | | | 3.92 | % | | | 4.25 | % |
Portfolio Turnover | | | 293 | % | | | 146 | % | | | 219 | % | | | 66 | % | | | 12 | % |
| (1) | Computed using average shares outstanding. |
| (2) | Returns are historical and are calculated by determining the percentage change in net asset value with all distributions reinvested. |
| (3) | Excludes the effect of custody fee credits, if any, of less than 0.005%. Effective September 1, 2015, custody fee credits, which were earned on cash deposit balances, were discontinued by the custodian. |
| (4) | Interest and fee expense relates to the liability for floating rate notes issued in conjunction with residual interest bond transactions (see Note 1H). |
| | | | |
| | 39 | | See Notes to Financial Statements. |
Eaton Vance
Municipal Income Funds
September 30, 2018
Financial Highlights — continued
| | | | | | | | | | | | | | | | | | | | |
| | | Massachusetts Fund — Class A | |
| | | Year Ended September 30, | |
| | | 2018 | | | 2017 | | | 2016 | | | 2015 | | | 2014 | |
Net asset value — Beginning of year | | $ | 8.890 | | | $ | 9.180 | | | $ | 9.030 | | | $ | 9.120 | | | $ | 8.560 | |
| | | | | |
| Income (Loss) From Operations | | | | | | | | | | | | | | | | | | | | |
Net investment income(1) | | $ | 0.265 | | | $ | 0.285 | | | $ | 0.304 | | | $ | 0.322 | | | $ | 0.347 | |
Net realized and unrealized gain (loss) | | | (0.280 | ) | | | (0.292 | ) | | | 0.160 | | | | (0.088 | ) | | | 0.566 | |
| | | | | |
Total income (loss) from operations | | $ | (0.015 | ) | | $ | (0.007 | ) | | $ | 0.464 | | | $ | 0.234 | | | $ | 0.913 | |
| | | | | |
| Less Distributions | | | | | | | | | | | | | | | | | | | | |
From net investment income | | $ | (0.275 | ) | | $ | (0.283 | ) | | $ | (0.314 | ) | | $ | (0.324 | ) | | $ | (0.353 | ) |
| | | | | |
Total distributions | | $ | (0.275 | ) | | $ | (0.283 | ) | | $ | (0.314 | ) | | $ | (0.324 | ) | | $ | (0.353 | ) |
| | | | | |
Net asset value — End of year | | $ | 8.600 | | | $ | 8.890 | | | $ | 9.180 | | | $ | 9.030 | | | $ | 9.120 | |
| | | | | |
Total Return(2) | | | (0.17 | )% | | | (0.02 | )% | | | 5.20 | % | | | 2.60 | % | | | 10.86 | % |
| | | | | |
| Ratios/Supplemental Data | | | | | | | | | | | | | | | | | | | | |
Net assets, end of year (000’s omitted) | | $ | 88,205 | | | $ | 99,934 | | | $ | 116,883 | | | $ | 109,990 | | | $ | 115,002 | |
Ratios (as a percentage of average daily net assets): | | | | | | | | | | | | | | | | | | | | |
Expenses excluding interest and fees(3) | | | 0.72 | % | | | 0.70 | % | | | 0.72 | % | | | 0.72 | % | | | 0.73 | % |
Interest and fee expense(4) | | | 0.05 | % | | | 0.06 | % | | | 0.06 | % | | | 0.05 | % | | | 0.05 | % |
Total expenses(3) | | | 0.77 | % | | | 0.76 | % | | | 0.78 | % | | | 0.77 | % | | | 0.78 | % |
Net investment income | | | 3.03 | % | | | 3.21 | % | | | 3.31 | % | | | 3.54 | % | | | 3.93 | % |
Portfolio Turnover | | | 41 | % | | | 28 | % | | | 17 | % | | | 10 | % | | | 6 | % |
| (1) | Computed using average shares outstanding. |
| (2) | Returns are historical and are calculated by determining the percentage change in net asset value with all distributions reinvested and do not reflect the effect of sales charges. |
| (3) | Excludes the effect of custody fee credits, if any, of less than 0.005%. Effective September 1, 2015, custody fee credits, which were earned on cash deposit balances, were discontinued by the custodian. |
| (4) | Interest and fee expense relates to the liability for floating rate notes issued in conjunction with residual interest bond transactions (see Note 1H). |
| | | | |
| | 40 | | See Notes to Financial Statements. |
Eaton Vance
Municipal Income Funds
September 30, 2018
Financial Highlights — continued
| | | | | | | | | | | | | | | | | | | | |
| | | Massachusetts Fund — Class C | |
| | | Year Ended September 30, | |
| | | 2018 | | | 2017 | | | 2016 | | | 2015 | | | 2014 | |
Net asset value — Beginning of year | | $ | 8.890 | | | $ | 9.190 | | | $ | 9.040 | | | $ | 9.120 | | | $ | 8.560 | |
| | | | | |
| Income (Loss) From Operations | | | | | | | | | | | | | | | | | | | | |
Net investment income(1) | | $ | 0.200 | | | $ | 0.219 | | | $ | 0.234 | | | $ | 0.252 | | | $ | 0.281 | |
Net realized and unrealized gain (loss) | | | (0.270 | ) | | | (0.302 | ) | | | 0.162 | | | | (0.076 | ) | | | 0.566 | |
| | | | | |
Total income (loss) from operations | | $ | (0.070 | ) | | $ | (0.083 | ) | | $ | 0.396 | | | $ | 0.176 | | | $ | 0.847 | |
| | | | | |
| Less Distributions | | | | | | | | | | | | | | | | | | | | |
From net investment income | | $ | (0.210 | ) | | $ | (0.217 | ) | | $ | (0.246 | ) | | $ | (0.256 | ) | | $ | (0.287 | ) |
| | | | | |
Total distributions | | $ | (0.210 | ) | | $ | (0.217 | ) | | $ | (0.246 | ) | | $ | (0.256 | ) | | $ | (0.287 | ) |
| | | | | |
Net asset value — End of year | | $ | 8.610 | | | $ | 8.890 | | | $ | 9.190 | | | $ | 9.040 | | | $ | 9.120 | |
| | | | | |
Total Return(2) | | | (0.80 | )% | | | (0.87 | )% | | | 4.41 | % | | | 1.95 | % | | | 10.04 | % |
| | | | | |
| Ratios/Supplemental Data | | | | | | | | | | | | | | | | | | | | |
Net assets, end of year (000’s omitted) | | $ | 14,848 | | | $ | 19,219 | | | $ | 24,165 | | | $ | 21,074 | | | $ | 18,787 | |
Ratios (as a percentage of average daily net assets): | | | | | | | | | | | | | | | | | | | | |
Expenses excluding interest and fees(3) | | | 1.47 | % | | | 1.46 | % | | | 1.47 | % | | | 1.47 | % | | | 1.48 | % |
Interest and fee expense(4) | | | 0.05 | % | | | 0.06 | % | | | 0.06 | % | | | 0.05 | % | | | 0.05 | % |
Total expenses(3) | | | 1.52 | % | | | 1.52 | % | | | 1.53 | % | | | 1.52 | % | | | 1.53 | % |
Net investment income | | | 2.29 | % | | | 2.47 | % | | | 2.55 | % | | | 2.78 | % | | | 3.18 | % |
Portfolio Turnover | | | 41 | % | | | 28 | % | | | 17 | % | | | 10 | % | | | 6 | % |
| (1) | Computed using average shares outstanding. |
| (2) | Returns are historical and are calculated by determining the percentage change in net asset value with all distributions reinvested and do not reflect the effect of sales charges. |
| (3) | Excludes the effect of custody fee credits, if any, of less than 0.005%. Effective September 1, 2015, custody fee credits, which were earned on cash deposit balances, were discontinued by the custodian. |
| (4) | Interest and fee expense relates to the liability for floating rate notes issued in conjunction with residual interest bond transactions (see Note 1H). |
| | | | |
| | 41 | | See Notes to Financial Statements. |
Eaton Vance
Municipal Income Funds
September 30, 2018
Financial Highlights — continued
| | | | | | | | | | | | | | | | | | | | |
| | | Massachusetts Fund — Class I | |
| | | Year Ended September 30, | |
| | | 2018 | | | 2017 | | | 2016 | | | 2015 | | | 2014 | |
Net asset value — Beginning of year | | $ | 8.880 | | | $ | 9.180 | | | $ | 9.030 | | | $ | 9.120 | | | $ | 8.560 | |
| | | | | |
| Income (Loss) From Operations | | | | | | | | | | | | | | | | | | | | |
Net investment income(1) | | $ | 0.283 | | | $ | 0.302 | | | $ | 0.320 | | | $ | 0.338 | | | $ | 0.361 | |
Net realized and unrealized gain (loss) | | | (0.270 | ) | | | (0.301 | ) | | | 0.162 | | | | (0.086 | ) | | | 0.570 | |
| | | | | |
Total income from operations | | $ | 0.013 | | | $ | 0.001 | | | $ | 0.482 | | | $ | 0.252 | | | $ | 0.931 | |
| | | | | |
| Less Distributions | | | | | | | | | | | | | | | | | | | | |
From net investment income | | $ | (0.293 | ) | | $ | (0.301 | ) | | $ | (0.332 | ) | | $ | (0.342 | ) | | $ | (0.371 | ) |
| | | | | |
Total distributions | | $ | (0.293 | ) | | $ | (0.301 | ) | | $ | (0.332 | ) | | $ | (0.342 | ) | | $ | (0.371 | ) |
| | | | | |
Net asset value — End of year | | $ | 8.600 | | | $ | 8.880 | | | $ | 9.180 | | | $ | 9.030 | | | $ | 9.120 | |
| | | | | |
Total Return(2) | | | 0.15 | % | | | 0.07 | % | | | 5.40 | % | | | 2.80 | % | | | 11.09 | % |
| | | | | |
| Ratios/Supplemental Data | | | | | | | | | | | | | | | | | | | | |
Net assets, end of year (000’s omitted) | | $ | 40,691 | | | $ | 45,551 | | | $ | 44,995 | | | $ | 32,876 | | | $ | 26,026 | |
Ratios (as a percentage of average daily net assets): | | | | | | | | | | | | | | | | | | | | |
Expenses excluding interest and fees(3) | | | 0.52 | % | | | 0.50 | % | | | 0.52 | % | | | 0.52 | % | | | 0.53 | % |
Interest and fee expense(4) | | | 0.05 | % | | | 0.06 | % | | | 0.06 | % | | | 0.05 | % | | | 0.05 | % |
Total expenses(3) | | | 0.57 | % | | | 0.56 | % | | | 0.58 | % | | | 0.57 | % | | | 0.58 | % |
Net investment income | | | 3.23 | % | | | 3.41 | % | | | 3.49 | % | | | 3.72 | % | | | 4.07 | % |
Portfolio Turnover | | | 41 | % | | | 28 | % | | | 17 | % | | | 10 | % | | | 6 | % |
| (1) | Computed using average shares outstanding. |
| (2) | Returns are historical and are calculated by determining the percentage change in net asset value with all distributions reinvested. |
| (3) | Excludes the effect of custody fee credits, if any, of less than 0.005%. Effective September 1, 2015, custody fee credits, which were earned on cash deposit balances, were discontinued by the custodian. |
| (4) | Interest and fee expense relates to the liability for floating rate notes issued in conjunction with residual interest bond transactions (see Note 1H). |
| | | | |
| | 42 | | See Notes to Financial Statements. |
Eaton Vance
Municipal Income Funds
September 30, 2018
Financial Highlights — continued
| | | | | | | | | | | | | | | | | | | | |
| | | New York Fund — Class A | |
| | | Year Ended September 30, | |
| | | 2018 | | | 2017 | | | 2016 | | | 2015 | | | 2014 | |
Net asset value — Beginning of year | | $ | 10.110 | | | $ | 10.390 | | | $ | 10.070 | | | $ | 10.140 | | | $ | 9.510 | |
| | | | | |
| Income (Loss) From Operations | | | | | | | | | | | | | | | | | | | | |
Net investment income(1) | | $ | 0.285 | | | $ | 0.304 | | | $ | 0.326 | | | $ | 0.365 | | | $ | 0.400 | |
Net realized and unrealized gain (loss) | | | (0.311 | ) | | | (0.276 | ) | | | 0.320 | | | | (0.072 | ) | | | 0.629 | |
| | | | | |
Total income (loss) from operations | | $ | (0.026 | ) | | $ | 0.028 | | | $ | 0.646 | | | $ | 0.293 | | | $ | 1.029 | |
| | | | | |
| Less Distributions | | | | | | | | | | | | | | | | | | | | |
From net investment income | | $ | (0.284 | ) | | $ | (0.308 | ) | | $ | (0.326 | ) | | $ | (0.363 | ) | | $ | (0.399 | ) |
| | | | | |
Total distributions | | $ | (0.284 | ) | | $ | (0.308 | ) | | $ | (0.326 | ) | | $ | (0.363 | ) | | $ | (0.399 | ) |
| | | | | |
Net asset value — End of year | | $ | 9.800 | | | $ | 10.110 | | | $ | 10.390 | | | $ | 10.070 | | | $ | 10.140 | |
| | | | | |
Total Return(2) | | | (0.26 | )% | | | 0.33 | % | | | 6.49 | % | | | 2.93 | % | | | 11.02 | % |
| | | | | |
| Ratios/Supplemental Data | | | | | | | | | | | | | | | | | | | | |
Net assets, end of year (000’s omitted) | | $ | 218,892 | | | $ | 247,160 | | | $ | 291,077 | | | $ | 265,348 | | | $ | 246,418 | |
Ratios (as a percentage of average daily net assets): | | | | | | | | | | | | | | | | | | | | |
Expenses excluding interest and fees(3) | | | 0.70 | % | | | 0.70 | % | | | 0.70 | % | | | 0.71 | % | | | 0.73 | % |
Interest and fee expense(4) | | | 0.09 | % | | | 0.07 | % | | | 0.05 | % | | | 0.05 | % | | | 0.06 | % |
Total expenses(3) | | | 0.79 | % | | | 0.77 | % | | | 0.75 | % | | | 0.76 | % | | | 0.79 | % |
Net investment income | | | 2.86 | % | | | 3.02 | % | | | 3.16 | % | | | 3.61 | % | | | 4.08 | % |
Portfolio Turnover | | | 75 | % | | | 56 | % | | | 38 | % | | | 8 | % | | | 4 | % |
| (1) | Computed using average shares outstanding. |
| (2) | Returns are historical and are calculated by determining the percentage change in net asset value with all distributions reinvested and do not reflect the effect of sales charges. |
| (3) | Excludes the effect of custody fee credits, if any, of less than 0.005%. Effective September 1, 2015, custody fee credits, which were earned on cash deposit balances, were discontinued by the custodian. |
| (4) | Interest and fee expense relates to the liability for floating rate notes issued in conjunction with residual interest bond transactions (see Note 1H). |
| | | | |
| | 43 | | See Notes to Financial Statements. |
Eaton Vance
Municipal Income Funds
September 30, 2018
Financial Highlights — continued
| | | | | | | | | | | | | | | | | | | | |
| | | New York Fund — Class C | |
| | | Year Ended September 30, | |
| | | 2018 | | | 2017 | | | 2016 | | | 2015 | | | 2014 | |
Net asset value — Beginning of year | | $ | 10.120 | | | $ | 10.390 | | | $ | 10.070 | | | $ | 10.140 | | | $ | 9.520 | |
| | | | | |
| Income (Loss) From Operations | | | | | | | | | | | | | | | | | | | | |
Net investment income(1) | | $ | 0.211 | | | $ | 0.229 | | | $ | 0.248 | | | $ | 0.288 | | | $ | 0.327 | |
Net realized and unrealized gain (loss) | | | (0.321 | ) | | | (0.266 | ) | | | 0.320 | | | | (0.071 | ) | | | 0.618 | |
| | | | | |
Total income (loss) from operations | | $ | (0.110 | ) | | $ | (0.037 | ) | | $ | 0.568 | | | $ | 0.217 | | | $ | 0.945 | |
| | | | | |
| Less Distributions | | | | | | | | | | | | | | | | | | | | |
From net investment income | | $ | (0.210 | ) | | $ | (0.233 | ) | | $ | (0.248 | ) | | $ | (0.287 | ) | | $ | (0.325 | ) |
| | | | | |
Total distributions | | $ | (0.210 | ) | | $ | (0.233 | ) | | $ | (0.248 | ) | | $ | (0.287 | ) | | $ | (0.325 | ) |
| | | | | |
Net asset value — End of year | | $ | 9.800 | | | $ | 10.120 | | | $ | 10.390 | | | $ | 10.070 | | | $ | 10.140 | |
| | | | | |
Total Return(2) | | | (1.10 | )% | | | (0.32 | )% | | | 5.69 | % | | | 2.17 | % | | | 10.08 | % |
| | | | | |
| Ratios/Supplemental Data | | | | | | | | | | | | | | | | | | | | |
Net assets, end of year (000’s omitted) | | $ | 55,817 | | | $ | 66,727 | | | $ | 80,371 | | | $ | 62,713 | | | $ | 48,653 | |
Ratios (as a percentage of average daily net assets): | | | | | | | | | | | | | | | | | | | | |
Expenses excluding interest and fees(3) | | | 1.45 | % | | | 1.45 | % | | | 1.44 | % | | | 1.46 | % | | | 1.48 | % |
Interest and fee expense(4) | | | 0.09 | % | | | 0.07 | % | | | 0.05 | % | | | 0.05 | % | | | 0.06 | % |
Total expenses(3) | | | 1.54 | % | | | 1.52 | % | | | 1.49 | % | | | 1.51 | % | | | 1.54 | % |
Net investment income | | | 2.11 | % | | | 2.27 | % | | | 2.40 | % | | | 2.85 | % | | | 3.32 | % |
Portfolio Turnover | | | 75 | % | | | 56 | % | | | 38 | % | | | 8 | % | | | 4 | % |
| (1) | Computed using average shares outstanding. |
| (2) | Returns are historical and are calculated by determining the percentage change in net asset value with all distributions reinvested and do not reflect the effect of sales charges. |
| (3) | Excludes the effect of custody fee credits, if any, of less than 0.005%. Effective September 1, 2015, custody fee credits, which were earned on cash deposit balances, were discontinued by the custodian. |
| (4) | Interest and fee expense relates to the liability for floating rate notes issued in conjunction with residual interest bond transactions (see Note 1H). |
| | | | |
| | 44 | | See Notes to Financial Statements. |
Eaton Vance
Municipal Income Funds
September 30, 2018
Financial Highlights — continued
| | | | | | | | | | | | | | | | | | | | |
| | | New York Fund — Class I | |
| | | Year Ended September 30, | |
| | | 2018 | | | 2017 | | | 2016 | | | 2015 | | | 2014 | |
Net asset value — Beginning of year | | $ | 10.110 | | | $ | 10.390 | | | $ | 10.070 | | | $ | 10.140 | | | $ | 9.510 | |
| | | | | |
| Income (Loss) From Operations | | | | | | | | | | | | | | | | | | | | |
Net investment income(1) | | $ | 0.305 | | | $ | 0.322 | | | $ | 0.342 | | | $ | 0.384 | | | $ | 0.418 | |
Net realized and unrealized gain (loss) | | | (0.311 | ) | | | (0.274 | ) | | | 0.324 | | | | (0.071 | ) | | | 0.630 | |
| | | | | |
Total income (loss) from operations | | $ | (0.006 | ) | | $ | 0.048 | | | $ | 0.666 | | | $ | 0.313 | | | $ | 1.048 | |
| | | | | |
| Less Distributions | | | | | | | | | | | | | | | | | | | | |
From net investment income | | $ | (0.304 | ) | | $ | (0.328 | ) | | $ | (0.346 | ) | | $ | (0.383 | ) | | $ | (0.418 | ) |
| | | | | |
Total distributions | | $ | (0.304 | ) | | $ | (0.328 | ) | | $ | (0.346 | ) | | $ | (0.383 | ) | | $ | (0.418 | ) |
| | | | | |
Net asset value — End of year | | $ | 9.800 | | | $ | 10.110 | | | $ | 10.390 | | | $ | 10.070 | | | $ | 10.140 | |
| | | | | |
Total Return(2) | | | (0.06 | )% | | | 0.53 | % | | | 6.70 | % | | | 3.14 | % | | | 11.24 | % |
| | | | | |
| Ratios/Supplemental Data | | | | | | | | | | | | | | | | | | | | |
Net assets, end of year (000’s omitted) | | $ | 123,119 | | | $ | 126,524 | | | $ | 104,643 | | | $ | 52,507 | | | $ | 34,125 | |
Ratios (as a percentage of average daily net assets): | | | | | | | | | | | | | | | | | | | | |
Expenses excluding interest and fees(3) | | | 0.50 | % | | | 0.50 | % | | | 0.49 | % | | | 0.51 | % | | | 0.53 | % |
Interest and fee expense(4) | | | 0.09 | % | | | 0.07 | % | | | 0.05 | % | | | 0.05 | % | | | 0.06 | % |
Total expenses(3) | | | 0.59 | % | | | 0.57 | % | | | 0.54 | % | | | 0.56 | % | | | 0.59 | % |
Net investment income | | | 3.06 | % | | | 3.20 | % | | | 3.31 | % | | | 3.80 | % | | | 4.25 | % |
Portfolio Turnover | | | 75 | % | | | 56 | % | | | 38 | % | | | 8 | % | | | 4 | % |
| (1) | Computed using average shares outstanding. |
| (2) | Returns are historical and are calculated by determining the percentage change in net asset value with all distributions reinvested. |
| (3) | Excludes the effect of custody fee credits, if any, of less than 0.005%. Effective September 1, 2015, custody fee credits, which were earned on cash deposit balances, were discontinued by the custodian. |
| (4) | Interest and fee expense relates to the liability for floating rate notes issued in conjunction with residual interest bond transactions (see Note 1H). |
| | | | |
| | 45 | | See Notes to Financial Statements. |
Eaton Vance
Municipal Income Funds
September 30, 2018
Financial Highlights — continued
| | | | | | | | | | | | | | | | | | | | |
| | | Ohio Fund — Class A | |
| | | Year Ended September 30, | |
| | | 2018 | | | 2017 | | | 2016 | | | 2015 | | | 2014 | |
Net asset value — Beginning of year | | $ | 9.020 | | | $ | 9.300 | | | $ | 9.060 | | | $ | 9.180 | | | $ | 8.600 | |
| | | | | |
| Income (Loss) From Operations | | | | | | | | | | | | | | | | | | | | |
Net investment income(1) | | $ | 0.283 | | | $ | 0.313 | | | $ | 0.329 | | | $ | 0.348 | | | $ | 0.366 | |
Net realized and unrealized gain (loss) | | | (0.324 | ) | | | (0.283 | ) | | | 0.237 | | | | (0.123 | ) | | | 0.579 | |
| | | | | |
Total income (loss) from operations | | $ | (0.041 | ) | | $ | 0.030 | | | $ | 0.566 | | | $ | 0.225 | | | $ | 0.945 | |
| | | | | |
| Less Distributions | | | | | | | | | | | | | | | | | | | | |
From net investment income | | $ | (0.279 | ) | | $ | (0.310 | ) | | $ | (0.326 | ) | | $ | (0.345 | ) | | $ | (0.365 | ) |
| | | | | |
Total distributions | | $ | (0.279 | ) | | $ | (0.310 | ) | | $ | (0.326 | ) | | $ | (0.345 | ) | | $ | (0.365 | ) |
| | | | | |
Net asset value — End of year | | $ | 8.700 | | | $ | 9.020 | | | $ | 9.300 | | | $ | 9.060 | | | $ | 9.180 | |
| | | | | |
Total Return(2) | | | (0.45 | )% | | | 0.39 | % | | | 6.33 | % | | | 2.48 | % | | | 11.19 | % |
| | | | | |
| Ratios/Supplemental Data | | | | | | | | | | | | | | | | | | | | |
Net assets, end of year (000’s omitted) | | $ | 97,736 | | | $ | 114,303 | | | $ | 136,271 | | | $ | 130,016 | | | $ | 132,578 | |
Ratios (as a percentage of average daily net assets): | | | | | | | | | | | | | | | | | | | | |
Expenses excluding interest and fees(3) | | | 0.71 | % | | | 0.72 | % | | | 0.71 | % | | | 0.72 | % | | | 0.69 | % |
Interest and fee expense(4) | | | 0.14 | % | | | 0.11 | % | | | 0.05 | % | | | 0.02 | % | | | 0.04 | % |
Total expenses(3) | | | 0.85 | % | | | 0.83 | % | | | 0.76 | % | | | 0.74 | % | | | 0.73 | % |
Net investment income | | | 3.20 | % | | | 3.48 | % | | | 3.56 | % | | | 3.81 | % | | | 4.11 | % |
Portfolio Turnover | | | 13 | % | | | 10 | % | | | 9 | % | | | 4 | % | | | 5 | % |
| (1) | Computed using average shares outstanding. |
| (2) | Returns are historical and are calculated by determining the percentage change in net asset value with all distributions reinvested and do not reflect the effect of sales charges. |
| (3) | Excludes the effect of custody fee credits, if any, of less than 0.005%. Effective September 1, 2015, custody fee credits, which were earned on cash deposit balances, were discontinued by the custodian. |
| (4) | Interest and fee expense relates to the liability for floating rate notes issued in conjunction with residual interest bond transactions (see Note 1H). |
| | | | |
| | 46 | | See Notes to Financial Statements. |
Eaton Vance
Municipal Income Funds
September 30, 2018
Financial Highlights — continued
| | | | | | | | | | | | | | | | | | | | |
| | | Ohio Fund — Class C | |
| | | Year Ended September 30, | |
| | | 2018 | | | 2017 | | | 2016 | | | 2015 | | | 2014 | |
Net asset value — Beginning of year | | $ | 9.010 | | | $ | 9.300 | | | $ | 9.060 | | | $ | 9.170 | | | $ | 8.600 | |
| | | | | |
| Income (Loss) From Operations | | | | | | | | | | | | | | | | | | | | |
Net investment income(1) | | $ | 0.217 | | | $ | 0.245 | | | $ | 0.259 | | | $ | 0.279 | | | $ | 0.298 | |
Net realized and unrealized gain (loss) | | | (0.314 | ) | | | (0.293 | ) | | | 0.237 | | | | (0.113 | ) | | | 0.570 | |
| | | | | |
Total income (loss) from operations | | $ | (0.097 | ) | | $ | (0.048 | ) | | $ | 0.496 | | | $ | 0.166 | | | $ | 0.868 | |
| | | | | |
| Less Distributions | | | | | | | | | | | | | | | | | | | | |
From net investment income | | $ | (0.213 | ) | | $ | (0.242 | ) | | $ | (0.256 | ) | | $ | (0.276 | ) | | $ | (0.298 | ) |
| | | | | |
Total distributions | | $ | (0.213 | ) | | $ | (0.242 | ) | | $ | (0.256 | ) | | $ | (0.276 | ) | | $ | (0.298 | ) |
| | | | | |
Net asset value — End of year | | $ | 8.700 | | | $ | 9.010 | | | $ | 9.300 | | | $ | 9.060 | | | $ | 9.170 | |
| | | | | |
Total Return(2) | | | (1.09 | )% | | | (0.47 | )% | | | 5.53 | % | | | 1.83 | % | | | 10.24 | % |
| | | | | |
| Ratios/Supplemental Data | | | | | | | | | | | | | | | | | | | | |
Net assets, end of year (000’s omitted) | | $ | 19,191 | | | $ | 22,210 | | | $ | 24,822 | | | $ | 21,899 | | | $ | 20,094 | |
Ratios (as a percentage of average daily net assets): | | | | | | | | | | | | | | | | | | | | |
Expenses excluding interest and fees(3) | | | 1.46 | % | | | 1.47 | % | | | 1.46 | % | | | 1.47 | % | | | 1.44 | % |
Interest and fee expense(4) | | | 0.14 | % | | | 0.11 | % | | | 0.05 | % | | | 0.02 | % | | | 0.04 | % |
Total expenses(3) | | | 1.60 | % | | | 1.58 | % | | | 1.51 | % | | | 1.49 | % | | | 1.48 | % |
Net investment income | | | 2.45 | % | | | 2.73 | % | | | 2.80 | % | | | 3.06 | % | | | 3.35 | % |
Portfolio Turnover | | | 13 | % | | | 10 | % | | | 9 | % | | | 4 | % | | | 5 | % |
| (1) | Computed using average shares outstanding. |
| (2) | Returns are historical and are calculated by determining the percentage change in net asset value with all distributions reinvested and do not reflect the effect of sales charges. |
| (3) | Excludes the effect of custody fee credits, if any, of less than 0.005%. Effective September 1, 2015, custody fee credits, which were earned on cash deposit balances, were discontinued by the custodian. |
| (4) | Interest and fee expense relates to the liability for floating rate notes issued in conjunction with residual interest bond transactions (see Note 1H). |
| | | | |
| | 47 | | See Notes to Financial Statements. |
Eaton Vance
Municipal Income Funds
September 30, 2018
Financial Highlights — continued
| | | | | | | | | | | | | | | | | | | | |
| | | Ohio Fund — Class I | |
| | | Year Ended September 30, | |
| | | 2018 | | | 2017 | | | 2016 | | | 2015 | | | 2014 | |
Net asset value — Beginning of year | | $ | 9.020 | | | $ | 9.310 | | | $ | 9.070 | | | $ | 9.180 | | | $ | 8.610 | |
| | | | | |
| Income (Loss) From Operations | | | | | | | | | | | | | | | | | | | | |
Net investment income(1) | | $ | 0.300 | | | $ | 0.331 | | | $ | 0.346 | | | $ | 0.366 | | | $ | 0.382 | |
Net realized and unrealized gain (loss) | | | (0.313 | ) | | | (0.293 | ) | | | 0.239 | | | | (0.113 | ) | | | 0.571 | |
| | | | | |
Total income (loss) from operations | | $ | (0.013 | ) | | $ | 0.038 | | | $ | 0.585 | | | $ | 0.253 | | | $ | 0.953 | |
| | | | | |
| Less Distributions | | | | | | | | | | | | | | | | | | | | |
From net investment income | | $ | (0.297 | ) | | $ | (0.328 | ) | | $ | (0.345 | ) | | $ | (0.363 | ) | | $ | (0.383 | ) |
| | | | | |
Total distributions | | $ | (0.297 | ) | | $ | (0.328 | ) | | $ | (0.345 | ) | | $ | (0.363 | ) | | $ | (0.383 | ) |
| | | | | |
Net asset value — End of year | | $ | 8.710 | | | $ | 9.020 | | | $ | 9.310 | | | $ | 9.070 | | | $ | 9.180 | |
| | | | | |
Total Return(2) | | | (0.14 | )% | | | 0.48 | % | | | 6.54 | % | | | 2.80 | % | | | 11.28 | % |
| | | | | |
| Ratios/Supplemental Data | | | | | | | | | | | | | | | | | | | | |
Net assets, end of year (000’s omitted) | | $ | 35,722 | | | $ | 32,065 | | | $ | 20,957 | | | $ | 12,552 | | | $ | 8,882 | |
Ratios (as a percentage of average daily net assets): | | | | | | | | | | | | | | | | | | | | |
Expenses excluding interest and fees(3) | | | 0.51 | % | | | 0.52 | % | | | 0.51 | % | | | 0.52 | % | | | 0.50 | % |
Interest and fee expense(4) | | | 0.14 | % | | | 0.11 | % | | | 0.05 | % | | | 0.02 | % | | | 0.04 | % |
Total expenses(3) | | | 0.65 | % | | | 0.63 | % | | | 0.56 | % | | | 0.54 | % | | | 0.54 | % |
Net investment income | | | 3.39 | % | | | 3.68 | % | | | 3.73 | % | | | 4.00 | % | | | 4.28 | % |
Portfolio Turnover | | | 13 | % | | | 10 | % | | | 9 | % | | | 4 | % | | | 5 | % |
| (1) | Computed using average shares outstanding. |
| (2) | Returns are historical and are calculated by determining the percentage change in net asset value with all distributions reinvested. |
| (3) | Excludes the effect of custody fee credits, if any, of less than 0.005%. Effective September 1, 2015, custody fee credits, which were earned on cash deposit balances, were discontinued by the custodian. |
| (4) | Interest and fee expense relates to the liability for floating rate notes issued in conjunction with residual interest bond transactions (see Note 1H). |
| | | | |
| | 48 | | See Notes to Financial Statements. |
Eaton Vance
Municipal Income Funds
September 30, 2018
Notes to Financial Statements
1 Significant Accounting Policies
Eaton Vance Municipals Trust (the Trust) is a Massachusetts business trust registered under the Investment Company Act of 1940, as amended (the 1940 Act), as an open-end management investment company. The Trust presently consists of eighteen funds, four of which, each non-diversified, are included in these financial statements. They include Eaton Vance California Municipal Opportunities Fund (California Opportunities Fund), Eaton Vance Massachusetts Municipal Income Fund (Massachusetts Fund), Eaton Vance New York Municipal Income Fund (New York Fund) and Eaton Vance Ohio Municipal Income Fund (Ohio Fund), (each individually referred to as the Fund, and collectively, the Funds). The investment objective of the Massachusetts Fund, New York Fund and Ohio Fund is to provide current income exempt from regular federal income tax and from particular state or local income or other taxes. The investment objective of the California Opportunities Fund is to seek to maximize after-tax total return. The Funds offer three classes of shares. Class A shares are generally sold subject to a sales charge imposed at time of purchase. Class C shares are sold at net asset value and are generally subject to a contingent deferred sales charge (see Note 5). Class I shares are sold at net asset value and are not subject to a sales charge. Each class represents a pro-rata interest in the Fund, but votes separately on class-specific matters and (as noted below) is subject to different expenses. Realized and unrealized gains and losses are allocated daily to each class of shares based on the relative net assets of each class to the total net assets of the Fund. Net investment income, other than class-specific expenses, is allocated daily to each class of shares based upon the ratio of the value of each class’s paid shares to the total value of all paid shares. Each class of shares differs in its distribution plan and certain other class-specific expenses.
The following is a summary of significant accounting policies of the Funds. The policies are in conformity with accounting principles generally accepted in the United States of America (U.S. GAAP). Each Fund is an investment company and follows accounting and reporting guidance in the Financial Accounting Standards Board (FASB) Accounting Standards Codification Topic 946.
A Investment Valuation — The following methodologies are used to determine the market value or fair value of investments.
Debt Obligations. Debt obligations are generally valued on the basis of valuations provided by third party pricing services, as derived from such services’ pricing models. Inputs to the models may include, but are not limited to, reported trades, executable bid and asked prices, broker/dealer quotations, prices or yields of securities with similar characteristics, interest rates, anticipated prepayments, benchmark curves or information pertaining to the issuer, as well as industry and economic events. The pricing services may use a matrix approach, which considers information regarding securities with similar characteristics to determine the valuation for a security. Short-term obligations purchased with a remaining maturity of sixty days or less for which a valuation from a third party pricing service is not readily available may be valued at amortized cost, which approximates fair value.
Derivatives. Financial futures contracts are valued at the closing settlement price established by the board of trade or exchange on which they are traded.
Fair Valuation. Investments for which valuations or market quotations are not readily available or are deemed unreliable are valued at fair value using methods determined in good faith by or at the direction of the Trustees of a Fund in a manner that fairly reflects the security’s value, or the amount that a Fund might reasonably expect to receive for the security upon its current sale in the ordinary course. Each such determination is based on a consideration of relevant factors, which are likely to vary from one pricing context to another. These factors may include, but are not limited to, the type of security, the existence of any contractual restrictions on the security’s disposition, the price and extent of public trading in similar securities of the issuer or of comparable entities, quotations or relevant information obtained from broker/dealers or other market participants, information obtained from the issuer, analysts, and/or the appropriate stock exchange (for exchange-traded securities), an analysis of the entity’s financial condition, and an evaluation of the forces that influence the issuer and the market(s) in which the security is purchased and sold.
B Investment Transactions and Related Income — Investment transactions for financial statement purposes are accounted for on a trade date basis. Realized gains and losses on investments sold are determined on the basis of identified cost. Interest income is recorded on the basis of interest accrued, adjusted for amortization of premium or accretion of discount.
C Federal Taxes — Each Fund’s policy is to comply with the provisions of the Internal Revenue Code applicable to regulated investment companies and to distribute to shareholders each year substantially all of its taxable, if any, and tax-exempt net investment income, and all or substantially all of its net realized capital gains. Accordingly, no provision for federal income or excise tax is necessary. Each Fund intends to satisfy conditions which will enable it to designate distributions from the interest income generated by its investments in non-taxable municipal securities, which are exempt from regular federal income tax when received by each Fund, as exempt-interest dividends. The portion of such interest, if any, earned on private activity bonds issued after August 7, 1986, may be considered a tax preference item to shareholders.
As of September 30, 2018, the Funds had no uncertain tax positions that would require financial statement recognition, de-recognition, or disclosure. Each Fund files a U.S. federal income tax return annually after its fiscal year-end, which is subject to examination by the Internal Revenue Service for a period of three years from the date of filing.
D Expenses — The majority of expenses of the Trust are directly identifiable to an individual fund. Expenses which are not readily identifiable to a specific fund are allocated taking into consideration, among other things, the nature and type of expense and the relative size of the funds.
E Legal Fees — Legal fees and other related expenses incurred as part of negotiations of the terms and requirement of capital infusions, or that are expected to result in the restructuring of, or a plan of reorganization for, an investment are recorded as realized losses. Ongoing expenditures to protect or enhance an investment are treated as operating expenses.
Eaton Vance
Municipal Income Funds
September 30, 2018
Notes to Financial Statements — continued
F Use of Estimates — The preparation of the financial statements in conformity with U.S. GAAP requires management to make estimates and assumptions that affect the reported amounts of assets and liabilities at the date of the financial statements and the reported amounts of income and expense during the reporting period. Actual results could differ from those estimates.
G Indemnifications — Under the Trust’s organizational documents, its officers and Trustees may be indemnified against certain liabilities and expenses arising out of the performance of their duties to the Funds. Under Massachusetts law, if certain conditions prevail, shareholders of a Massachusetts business trust (such as the Trust) could be deemed to have personal liability for the obligations of the Trust. However, the Trust’s Declaration of Trust contains an express disclaimer of liability on the part of Fund shareholders and the By-laws provide that the Trust shall assume the defense on behalf of any Fund shareholders. Moreover, the By-laws also provide for indemnification out of Fund property of any shareholder held personally liable solely by reason of being or having been a shareholder for all loss or expense arising from such liability. Additionally, in the normal course of business, each Fund enters into agreements with service providers that may contain indemnification clauses. Each Fund’s maximum exposure under these arrangements is unknown as this would involve future claims that may be made against each Fund that have not yet occurred.
H Floating Rate Notes Issued in Conjunction with Securities Held — The Funds may invest in residual interest bonds, also referred to as inverse floating rate securities, whereby a Fund may sell a variable or fixed rate bond for cash to a Special-Purpose Vehicle (the SPV), (which is generally organized as a trust), while at the same time, buying a residual interest in the assets and cash flows of the SPV. The bond is deposited into the SPV with the same CUSIP number as the bond sold to the SPV by the Fund, and which may have been, but is not required to be, the bond purchased from the Fund (the Bond). The SPV also issues floating rate notes (Floating Rate Notes) which are sold to third-parties. The residual interest bond held by a Fund gives the Fund the right (1) to cause the holders of the Floating Rate Notes to generally tender their notes at par, and (2) to have the Bond held by the SPV transferred to the Fund, thereby terminating the SPV. Should the Fund exercise such right, it would generally pay the SPV the par amount due on the Floating Rate Notes and exchange the residual interest bond for the underlying Bond. Pursuant to generally accepted accounting principles for transfers and servicing of financial assets and extinguishment of liabilities, the Funds account for the transaction described above as a secured borrowing by including the Bond in their Portfolio of Investments and the Floating Rate Notes as a liability under the caption “Payable for floating rate notes issued” in their Statement of Assets and Liabilities. The Floating Rate Notes have interest rates that generally reset weekly and their holders have the option to tender their notes to the SPV for redemption at par at each reset date. Accordingly, the fair value of the payable for floating rate notes issued approximates its carrying value. If measured at fair value, the payable for floating rate notes would have been considered as Level 2 in the fair value hierarchy (see Note 10) at September 30, 2018. Interest expense related to a Fund’s liability with respect to Floating Rate Notes is recorded as incurred. The SPV may be terminated by the Fund, as noted above, or by the occurrence of certain termination events as defined in the trust agreement, such as a downgrade in the credit quality of the underlying Bond, bankruptcy of or payment failure by the issuer of the underlying Bond, the inability to remarket Floating Rate Notes that have been tendered due to insufficient buyers in the market, or the failure by the SPV to obtain renewal of the liquidity agreement under which liquidity support is provided for the Floating Rate Notes up to one year. At September 30, 2018, the amounts of the Funds’ Floating Rate Notes and related interest rates and collateral were as follows:
| | | | | | | | | | | | | | | | |
| | | California
Opportunities
Fund | | | Massachusetts
Fund | | | New York
Fund | | | Ohio Fund | |
| | | | |
Floating Rate Notes Outstanding | | $ | 6,360,035 | | | $ | 3,659,783 | | | $ | 14,249,950 | | | $ | 9,148,696 | |
Interest Rate or Range of Interest Rates (%) | | | 1.58 | | | | 1.69 | | | | 1.59 | | | | 1.59 - 1.66 | |
Collateral for Floating Rate Notes Outstanding | | $ | 8,773,862 | | | $ | 6,764,394 | | | $ | 19,257,672 | | | $ | 14,243,898 | |
For the year ended September 30, 2018, the Funds’ average settled Floating Rate Notes outstanding and the average interest rate including fees were as follows:
| | | | | | | | | | | | | | | | |
| | | California
Opportunities
Fund | | | Massachusetts
Fund | | | New York
Fund | | | Ohio Fund | |
| | | | |
Average Floating Rate Notes Outstanding | | $ | 9,756,384 | | | $ | 3,640,000 | | | $ | 20,175,726 | | | $ | 11,378,096 | |
Average Interest Rate | | | 1.90 | % | | | 2.01 | % | | | 1.93 | % | | | 1.99 | % |
In certain circumstances, the Funds may enter into shortfall and forbearance agreements with brokers by which a Fund agrees to reimburse the broker for the difference between the liquidation value of the Bond held by the SPV and the liquidation value of the Floating Rate Notes, as well as any shortfalls in interest cash flows. The Funds had no shortfalls as of September 30, 2018.
Eaton Vance
Municipal Income Funds
September 30, 2018
Notes to Financial Statements — continued
The Funds may also purchase residual interest bonds in a secondary market transaction without first owning the underlying bond. Such transactions are not required to be treated as secured borrowings. Shortfall agreements, if any, related to residual interest bonds purchased in a secondary market transaction are disclosed in the Portfolio of Investments.
The Funds’ investment policies and restrictions expressly permit investments in residual interest bonds. Such bonds typically offer the potential for yields exceeding the yields available on fixed rate bonds with comparable credit quality and maturity. These securities tend to underperform the market for fixed rate bonds in a rising long-term interest rate environment, but tend to outperform the market for fixed rate bonds when long-term interest rates decline. The value and income of residual interest bonds are generally more volatile than that of a fixed rate bond. The Funds’ investment policies do not allow the Funds to borrow money except as permitted by the 1940 Act. Management believes that the Funds’ restrictions on borrowing money and issuing senior securities (other than as specifically permitted) do not apply to Floating Rate Notes issued by the SPV and included as a liability in the Funds’ Statement of Assets and Liabilities. As secured indebtedness issued by an SPV, Floating Rate Notes are distinct from the borrowings and senior securities to which the Funds’ restrictions apply. Residual interest bonds held by the Funds are securities exempt from registration under Rule 144A of the Securities Act of 1933.
I Financial Futures Contracts — Upon entering into a financial futures contract, a Fund is required to deposit with the broker, either in cash or securities, an amount equal to a certain percentage of the contract amount (initial margin). Subsequent payments, known as variation margin, are made or received by the Fund each business day, depending on the daily fluctuations in the value of the underlying security, and are recorded as unrealized gains or losses by the Fund. Gains (losses) are realized upon the expiration or closing of the financial futures contracts. Should market conditions change unexpectedly, the Fund may not achieve the anticipated benefits of the financial futures contracts and may realize a loss. Futures contracts have minimal counterparty risk as they are exchange traded and the clearinghouse for the exchange is substituted as the counterparty, guaranteeing counterparty performance.
J When-Issued Securities and Delayed Delivery Transactions — The Funds may purchase or sell securities on a delayed delivery or when-issued basis. Payment and delivery may take place after the customary settlement period for that security. At the time the transaction is negotiated, the price of the security that will be delivered is fixed. The Funds maintain cash and/or security positions for these commitments such that sufficient liquid assets will be available to make payments upon settlement. Securities purchased on a delayed delivery or when-issued basis are marked-to-market daily and begin earning interest on settlement date. Losses may arise due to changes in the market value of the underlying securities or if the counterparty does not perform under the contract.
2 Distributions to Shareholders and Income Tax Information
The net investment income of each Fund is determined daily and substantially all of the net investment income so determined is declared as a dividend to shareholders of record at the time of declaration. Distributions are declared separately for each class of shares. Distributions are paid monthly. Distributions of realized capital gains (reduced by available capital loss carryforwards from prior years) are made at least annually. Shareholders may reinvest income and capital gain distributions in additional shares of the same class of a Fund at the net asset value as of the reinvestment date or, at the election of the shareholder, receive distributions in cash. Distributions to shareholders are determined in accordance with income tax regulations, which may differ from U.S. GAAP. As required by U.S. GAAP, only distributions in excess of tax basis earnings and profits are reported in the financial statements as a return of capital. Permanent differences between book and tax accounting relating to distributions are reclassified to paid-in capital. For tax purposes, distributions from short-term capital gains are considered to be from ordinary income.
The tax character of distributions declared for the years ended September 30, 2018 and September 30, 2017 was as follows:
| | | | | | | | | | | | | | | | |
| | | Year Ended September 30, 2018 | |
| | | California
Opportunities
Fund | | | Massachusetts
Fund | | | New York Fund | | | Ohio Fund | |
Tax-exempt income | | $ | 6,244,450 | | | $ | 4,707,875 | | | $ | 11,743,382 | | | $ | 4,934,683 | |
Ordinary income | | $ | 498,908 | | | $ | 35,305 | | | $ | 37,236 | | | $ | — | |
| |
| | | Year Ended September 30, 2017 | |
| | | California
Opportunities
Fund | | | Massachusetts
Fund | | | New York
Fund | | | Ohio Fund | |
Tax-exempt income | | $ | 6,380,715 | | | $ | 5,194,031 | | | $ | 12,934,732 | | | $ | 5,768,000 | |
Ordinary income | | $ | 496,273 | | | $ | 159,589 | | | $ | 256,833 | | | $ | — | |
Eaton Vance
Municipal Income Funds
September 30, 2018
Notes to Financial Statements — continued
During the year ended September 30, 2018, the following amounts were reclassified due to expired capital loss carryforwards and the tax treatment of distributions in excess of net tax-exempt income.
| | | | | | | | | | | | | | | | |
| | | California
Opportunities
Fund | | | Massachusetts
Fund | | | New York
Fund | | | Ohio Fund | |
| | | | |
Change in: | | | | | | | | | | | | | | | | |
Paid-in capital | | $ | (12,351,720 | ) | | $ | (18,940,017 | ) | | $ | (16,893,045 | ) | | $ | (10,237,206 | ) |
Distributable earnings (accumulated loss) | | $ | 12,351,720 | | | $ | 18,940,017 | | | $ | 16,893,045 | | | $ | 10,237,206 | |
These reclassifications had no effect on the net assets or net asset value per share of the Funds.
As of September 30, 2018, the components of distributable earnings (accumulated loss) on a tax basis were as follows:
| | | | | | | | | | | | | | | | |
| | | California
Opportunities
Fund | | | Massachusetts
Fund | | | New York
Fund | | | Ohio Fund | |
| | | | |
Undistributed tax-exempt income | | $ | 447,721 | | | $ | 578,230 | | | $ | 654,524 | | | $ | — | |
Capital loss carryforwards, deferred capital losses and post October capital losses | | $ | (2,105,681 | ) | | $ | (5,026,049 | ) | | $ | (7,124,899 | ) | | $ | (12,054,513 | ) |
Net unrealized appreciation | | $ | 2,867,591 | | | $ | 7,196,950 | | | $ | 6,250,436 | | | $ | 8,306,670 | |
Other temporary differences | | $ | (78,714 | ) | | $ | (61,183 | ) | | $ | (153,853 | ) | | $ | (62,783 | ) |
At September 30, 2018, the following Funds, for federal income tax purposes, had capital loss carryforwards and deferred capital losses which would reduce the respective Fund’s taxable income arising from future net realized gains on investment transactions, if any, to the extent permitted by the Internal Revenue Code, and thus would reduce the amount of distributions to shareholders, which would otherwise be necessary to relieve the Funds of any liability for federal income or excise tax. Under tax regulations, capital losses incurred in taxable years beginning after December 2010 are considered deferred capital losses and are treated as arising on the first day of a Fund’s next taxable year, retaining the same short-term or long-term character as when originally deferred. Deferred capital losses are required to be used prior to capital loss carryforwards, which carry an expiration date. As a result of this ordering rule, capital loss carryforwards may be more likely to expire unused. The amounts and expiration dates of the capital loss carryforwards, whose character is short-term, and the amounts of the deferred capital losses are as follows:
| | | | | | | | | | | | | | | | |
| Expiration Date | | California
Opportunities
Fund | | | Massachusetts
Fund | | | New York Fund | | | Ohio Fund | |
September 30, 2019 | | $ | — | | | $ | 4,877,692 | | | $ | 7,036,080 | | | $ | 3,163,804 | |
| | | | |
Total capital loss carryforwards | | $ | — | | | $ | 4,877,692 | | | $ | 7,036,080 | | | $ | 3,163,804 | |
| | | | |
Deferred capital losses: | | | | | | | | | | | | | | | | |
Short-term | | $ | 2,105,681 | | | $ | — | | | $ | — | | | $ | 4,325,815 | |
Long-term | | $ | — | | | $ | — | | | $ | — | | | $ | 4,564,894 | |
During the year ended September 30, 2018, capital loss carryforwards of $1,299,975 and $6,106,375 were utilized to offset net realized gains by the Massachusetts Fund and New York Fund, respectively.
Additionally, at September 30, 2018, the Massachusetts Fund and New York Fund had a net capital loss of $148,357 and $88,819, respectively, attributable to security transactions incurred after October 31, 2017 that the Funds have elected to defer. These net capital losses are treated as arising on the first day of the Funds’ taxable year ending September 30, 2019.
Eaton Vance
Municipal Income Funds
September 30, 2018
Notes to Financial Statements — continued
The cost and unrealized appreciation (depreciation) of investments, including open derivative contracts, of each Fund at September 30, 2018, as determined on a federal income tax basis, were as follows:
| | | | | | | | | | | | | | | | |
| | | California
Opportunities
Fund | | | Massachusetts
Fund | | | New York Fund | | | Ohio Fund | |
| | | | |
Aggregate cost | | $ | 265,253,545 | | | $ | 134,076,123 | | | $ | 382,825,405 | | | $ | 139,599,762 | |
| | | | |
Gross unrealized appreciation | | $ | 3,446,946 | | | $ | 7,950,555 | | | $ | 9,755,827 | | | $ | 9,835,974 | |
Gross unrealized depreciation | | | (579,355 | ) | | | (753,605 | ) | | | (3,505,390 | ) | | | (1,529,304 | ) |
| | | | |
Net unrealized appreciation | | $ | 2,867,591 | | | $ | 7,196,950 | | | $ | 6,250,437 | | | $ | 8,306,670 | |
3 Investment Adviser Fee and Other Transactions with Affiliates
The investment adviser fee is earned by Boston Management and Research (BMR), a subsidiary of Eaton Vance Management (EVM), as compensation for management and investment advisory services rendered to each Fund. The fee is based upon a percentage of average daily net assets plus a percentage of gross income (i.e., income other than gains from the sale of securities) as presented in the following table (except for California Opportunities Fund) and is payable monthly.
| | | | | | | | |
| Daily Net Assets | | Annual Asset
Rate | | | Daily Income
Rate | |
| | |
Up to $20 million | | | 0.10 | % | | | 1.00 | % |
$20 million up to $40 million | | | 0.20 | | | | 2.00 | |
$40 million up to $500 million | | | 0.30 | | | | 3.00 | |
On average daily net assets of $500 million or more, the rates are reduced. For California Opportunities Fund, the annual asset rate and daily income rate are 0.30% and 3.00%, respectively, on average daily net assets of up to $500 million and at reduced rates on daily net assets of $500 million or more.
For the year ended September 30, 2018, investment adviser fees incurred by the Funds and the effective annual rates, as a percentage of average daily net assets, were as follows:
| | | | | | | | | | | | | | | | |
| | | California Opportunities Fund | | | Massachusetts
Fund | | | New York Fund | | | Ohio Fund | |
| | | | |
Investment Adviser Fee | | $ | 1,041,473 | | | $ | 549,061 | | | $ | 1,625,821 | | | $ | 578,422 | |
Effective Annual Rate | | | 0.40 | % | | | 0.36 | % | | | 0.39 | % | | | 0.36 | % |
EVM serves as the administrator of each Fund, but receives no compensation. EVM provides sub-transfer agency and related services to the Funds pursuant to a Sub-Transfer Agency Support Services Agreement. Eaton Vance Distributors, Inc. (EVD), an affiliate of EVM and the Funds’ principal underwriter, received a portion of the sales charge on sales of Class A shares of the Funds. EVD also received distribution and service fees from Class A and Class C shares (see Note 4) and contingent deferred sales charges (see Note 5). Sub-transfer agent fees earned by EVM, which are included in transfer and dividend disbursing agent fees on the Statements of Operations, and Class A sales charges that the Funds were informed were received by EVD for the year ended September 30, 2018 were as follows:
| | | | | | | | | | | | | | | | |
| | | California
Opportunities Fund | | | Massachusetts
Fund | | | New York
Fund | | | Ohio
Fund | |
| | | | |
EVM’s Sub-Transfer Agent Fees | | $ | 11,583 | | | $ | 13,086 | | | $ | 32,914 | | | $ | 10,673 | |
EVD’s Class A Sales Charges | | $ | 11,197 | | | $ | 6,736 | | | $ | 26,025 | | | $ | 16,371 | |
Eaton Vance
Municipal Income Funds
September 30, 2018
Notes to Financial Statements — continued
Trustees and officers of the Funds who are members of EVM’s or BMR’s organizations receive remuneration for their services to the Funds out of the investment adviser fee. Trustees of the Funds who are not affiliated with the investment adviser may elect to defer receipt of all or a percentage of their annual fees in accordance with the terms of the Trustees Deferred Compensation Plan. For the year ended September 30, 2018, no significant amounts have been deferred. Certain officers and Trustees of the Funds are officers of the above organizations.
4 Distribution Plans
Each Fund has in effect a distribution plan for Class A shares (Class A Plan) pursuant to Rule 12b-1 under the 1940 Act. The Class A Plan provides that each Fund will pay EVD a distribution and service fee not exceeding 0.25% per annum of its average daily net assets attributable to Class A shares for distribution services and facilities provided to each Fund by EVD, as well as for personal services and/or the maintenance of shareholder accounts. The Trustees approved distribution and service fee payments equal to 0.20% (0.25% for California Opportunities Fund) per annum of each Fund’s average daily net assets attributable to Class A shares. Distribution and service fees paid or accrued to EVD for the year ended September 30, 2018 for Class A shares amounted to the following:
| | | | | | | | | | | | | | | | |
| | | California
Opportunities
Fund | | | Massachusetts
Fund | | | New York
Fund | | | Ohio
Fund | |
| | | | |
Class A Distribution and Service Fees | | $ | 294,923 | | | $ | 188,117 | | | $ | 465,928 | | | $ | 208,403 | |
Each Fund also has in effect a distribution plan for Class C shares (Class C Plan) pursuant to Rule 12b-1 under the 1940 Act. Pursuant to the Class C Plan, each Fund pays EVD amounts equal to 0.75% per annum of its average daily net assets attributable to Class C shares for providing ongoing distribution services and facilities to the respective Funds. For the year ended September 30, 2018, the Funds paid or accrued to EVD the following distribution fees:
| | | | | | | | | | | | | | | | |
| | | California
Opportunities
Fund | | | Massachusetts
Fund | | | New York
Fund | | | Ohio Fund | |
| | | | |
Class C Distribution Fees | | $ | 202,010 | | | $ | 125,867 | | | $ | 462,109 | | | $ | 157,158 | |
The Class C Plan also authorizes each Fund to make payments of service fees to EVD, financial intermediaries and other persons in amounts not exceeding 0.25% per annum of the average daily net assets attributable to Class C shares. The Trustees approved service fee payments equal to 0.20% (0.25% for California Opportunities Fund) per annum of each Fund’s average daily net assets attributable to Class C shares. Service fees paid or accrued are for personal services and/or the maintenance of shareholder accounts. They are separate and distinct from the Class C sales commissions and distribution fees payable to EVD. Service fees paid or accrued for the year ended September 30, 2018 amounted to the following:
| | | | | | | | | | | | | | | | |
| | | California
Opportunities
Fund | | | Massachusetts
Fund | | | New York
Fund | | | Ohio
Fund | |
| | | | |
Class C Service Fees | | $ | 67,337 | | | $ | 33,565 | | | $ | 123,229 | | | $ | 41,909 | |
Distribution and service fees are subject to the limitations contained in the Financial Industry Regulatory Authority Rule 2341(d).
Eaton Vance
Municipal Income Funds
September 30, 2018
Notes to Financial Statements — continued
5 Contingent Deferred Sales Charges
A contingent deferred sales charge (CDSC) of 1% generally is imposed on redemptions of Class C shares made within one year of purchase. Class A shares may be subject to a 1% CDSC if redeemed within eighteen months of purchase (depending on the circumstances of purchase). Generally, the CDSC is based upon the lower of the net asset value at date of redemption or date of purchase. No charge is levied on shares acquired by reinvestment of dividends or capital gain distributions. For the year ended September 30, 2018, the Funds were informed that EVD received approximately the following amounts of CDSCs paid by Class A and Class C shareholders:
| | | | | | | | | | | | | | | | |
| | | California
Opportunities
Fund | | | Massachusetts
Fund | | | New York
Fund | | | Ohio
Fund | |
| | | | |
Class A | | $ | 3,000 | | | $ | 400 | | | $ | — | | | $ | 1,000 | |
Class C | | $ | 4,000 | | | $ | 300 | | | $ | 1,000 | | | $ | 1,000 | |
6 Purchases and Sales of Investments
Purchases and sales of investments, other than short-term obligations, for the year ended September 30, 2018 were as follows:
| | | | | | | | | | | | | | | | |
| | | California
Opportunities
Fund | | | Massachusetts
Fund | | | New York
Fund | | | Ohio Fund | |
| | | | |
Purchases | | $ | 812,242,149 | | | $ | 63,456,169 | | | $ | 322,809,228 | | | $ | 21,754,623 | |
Sales | | $ | 809,555,988 | | | $ | 76,990,638 | | | $ | 350,766,313 | | | $ | 38,038,305 | |
7 Shares of Beneficial Interest
Each Fund’s Declaration of Trust permits the Trustees to issue an unlimited number of full and fractional shares of beneficial interest (without par value). Such shares may be issued in a number of different series (such as the Funds) and classes. Transactions in Fund shares were as follows:
| | | | | | | | | | | | |
California Opportunities Fund | | | | | | | | | |
| | | Year Ended September 30, 2018 | |
| | | Class A | | | Class C | | | Class I | |
| | | |
Sales | | | 1,194,802 | | | | 337,323 | | | | 3,793,229 | |
Issued to shareholders electing to receive payments of distributions in Fund shares | | | 244,297 | | | | 44,440 | | | | 272,911 | |
Redemptions | | | (2,927,165 | ) | | | (911,448 | ) | | | (4,015,513 | ) |
| | | |
Net increase (decrease) | | | (1,488,066 | ) | | | (529,685 | ) | | | 50,627 | |
| |
| | | Year Ended September 30, 2017 | |
| | | Class A | | | Class C | | | Class I | |
| | | |
Sales | | | 1,447,360 | | | | 592,126 | | | | 7,843,944 | |
Issued to shareholders electing to receive payments of distributions in Fund shares | | | 270,620 | | | | 48,553 | | | | 246,587 | |
Redemptions | | | (3,567,739 | ) | | | (1,046,168 | ) | | | (6,847,120 | ) |
| | | |
Net increase (decrease) | | | (1,849,759 | ) | | | (405,489 | ) | | | 1,243,411 | |
Eaton Vance
Municipal Income Funds
September 30, 2018
Notes to Financial Statements — continued
| | | | | | | | | | | | |
Massachusetts Fund | | | | | | | | | |
| | | Year Ended September 30, 2018 | |
| | | Class A | | | Class C | | | Class I | |
| | | |
Sales | | | 407,332 | | | | 175,192 | | | | 1,544,602 | |
Issued to shareholders electing to receive payments of distributions in Fund shares | | | 282,300 | | | | 37,656 | | | | 126,633 | |
Redemptions | | | (1,684,904 | ) | | | (649,916 | ) | | | (2,068,490 | ) |
| | | |
Net decrease | | | (995,272 | ) | | | (437,068 | ) | | | (397,255 | ) |
| |
| | | Year Ended September 30, 2017 | |
| | | Class A | | | Class C | | | Class I | |
| | | |
Sales | | | 652,940 | | | | 176,580 | | | | 2,177,079 | |
Issued to shareholders electing to receive payments of distributions in Fund shares | | | 318,881 | | | | 46,592 | | | | 127,306 | |
Redemptions | | | (2,453,009 | ) | | | (691,421 | ) | | | (2,077,643 | ) |
| | | |
Net increase (decrease) | | | (1,481,188 | ) | | | (468,249 | ) | | | 226,742 | |
| | | |
New York Fund | | | | | | | | | |
| | | Year Ended September 30, 2018 | |
| | | Class A | | | Class C | | | Class I | |
| | | |
Sales | | | 1,558,852 | | | | 424,217 | | | | 4,073,876 | |
Issued to shareholders electing to receive payments of distributions in Fund shares | | | 575,605 | | | | 105,320 | | | | 305,824 | |
Redemptions | | | (4,242,782 | ) | | | (1,432,854 | ) | | | (4,329,550 | ) |
| | | |
Net increase (decrease) | | | (2,108,325 | ) | | | (903,317 | ) | | | 50,150 | |
| | | | | | | | | | | | | | | | |
| | | Year Ended September 30, 2017 | |
| | | Class A | | | Class B(1) | | | Class C | | | Class I | |
| | | | |
Sales | | | 1,941,465 | | | | — | | | | 776,508 | | | | 5,796,836 | |
Issued to shareholders electing to receive payments of distributions in Fund shares | | | 679,823 | | | | — | | | | 130,953 | | | | 269,822 | |
Redemptions | | | (6,372,077 | ) | | | (1,818 | ) | | | (2,043,159 | ) | | | (3,623,976 | ) |
Exchange from Class B shares | | | 868 | | | | — | | | | — | | | | — | |
Exchange to Class A shares | | | — | | | | (867 | ) | | | — | | | | — | |
Merger from Class B shares | | | 178,237 | | | | — | | | | — | | | | — | |
Merger to Class A shares | | | — | | | | (178,001 | ) | | | — | | | | — | |
| | | | |
Net increase (decrease) | | | (3,571,684 | ) | | | (180,686 | ) | | | (1,135,698 | ) | | | 2,442,682 | |
Eaton Vance
Municipal Income Funds
September 30, 2018
Notes to Financial Statements — continued
| | | | | | | | | | | | |
Ohio Fund | | | | | | | | | |
| | | Year Ended September 30, 2018 | |
| | | Class A | | | Class C | | | Class I | |
| | | |
Sales | | | 763,291 | | | | 297,487 | | | | 1,376,741 | |
Issued to shareholders electing to receive payments of distributions in Fund shares | | | 315,765 | | | | 48,460 | | | | 101,977 | |
Redemptions | | | (2,523,978 | ) | | | (603,942 | ) | | | (930,203 | ) |
| | | |
Net increase (decrease) | | | (1,444,922 | ) | | | (257,995 | ) | | | 548,515 | |
| |
| | | Year Ended September 30, 2017 | |
| | | Class A | | | Class C | | | Class I | |
| | | |
Sales | | | 842,160 | | | | 257,271 | | | | 2,028,886 | |
Issued to shareholders electing to receive payments of distributions in Fund shares | | | 391,218 | | | | 57,851 | | | | 77,809 | |
Redemptions | | | (3,201,723 | ) | | | (519,637 | ) | | | (803,429 | ) |
| | | |
Net increase (decrease) | | | (1,968,345 | ) | | | (204,515 | ) | | | 1,303,266 | |
| (1) | At the close of business on October 21, 2016, Class B shares of New York Fund were merged into Class A shares. |
8 Line of Credit
The Funds participate with other portfolios and funds managed by EVM and its affiliates in a $625 million unsecured line of credit agreement with a group of banks, which is in effect through October 30, 2018. Borrowings are made by the Funds solely to facilitate the handling of unusual and/or unanticipated short-term cash requirements. Interest is charged to each Fund based on its borrowings at an amount above either the Eurodollar rate or Federal Funds rate. In addition, a fee computed at an annual rate of 0.15% on the daily unused portion of the line of credit is allocated among the participating portfolios and funds at the end of each quarter. Because the line of credit is not available exclusively to the Funds, a Fund may be unable to borrow some or all of its requested amounts at any particular time. The Funds did not have any significant borrowings or allocated fees during the year ended September 30, 2018.
Effective October 30, 2018, the Funds renewed their line of credit agreement, which expires October 29, 2019, at substantially the same terms.
9 Financial Instruments
The Funds may trade in financial instruments with off-balance sheet risk in the normal course of their investing activities. These financial instruments may include financial futures contracts and may involve, to a varying degree, elements of risk in excess of the amounts recognized for financial statement purposes. The notional or contractual amounts of these instruments represent the investment a Fund has in particular classes of financial instruments and do not necessarily represent the amounts potentially subject to risk. The measurement of the risks associated with these instruments is meaningful only when all related and offsetting transactions are considered. A summary of obligations under these financial instruments at September 30, 2018 is included in the Portfolio of Investments. At September 30, 2018, the Funds had sufficient cash and/or securities to cover commitments under these contracts.
Each Fund is subject to interest rate risk in the normal course of pursuing its investment objective. Because the Funds hold fixed-rate bonds, the value of these bonds may decrease if interest rates rise. The Funds enter into U.S. Treasury futures contracts to hedge against changes in interest rates.
The fair values of open derivative instruments (not considered to be hedging instruments for accounting disclosure purposes) and whose primary underlying risk exposure is interest rate risk at September 30, 2018 were as follows:
| | | | | | | | | | | | |
| | | Massachusetts
Fund | | | New York
Fund | | | Ohio Fund | |
| | |
Asset Derivative: | | | | | | | | |
Futures Contracts | | $ | 167,709 | (1) | | $ | 429,336 | (1) | | $ | 184,480 | (1) |
| | | |
Total | | $ | 167,709 | | | $ | 429,336 | | | $ | 184,480 | |
| (1) | Amount represents cumulative unrealized appreciation on futures contracts. Only the current day’s variation margin on open futures contracts is reported within the Statement of Assets and Liabilities as Receivable or Payable for variation margin on open financial futures contracts, as applicable. |
Eaton Vance
Municipal Income Funds
September 30, 2018
Notes to Financial Statements — continued
The effect of derivative instruments (not considered to be hedging instruments for accounting disclosure purposes) on the Statement of Operations and whose primary underlying risk exposure is interest rate risk for the year ended September 30, 2018 was as follows:
| | | | | | | | | | | | |
| | | Massachusetts
Fund | | | New York
Fund | | | Ohio Fund | |
| | | |
Realized Gain (Loss) on Derivatives Recognized in Income | | $ | 386,642 | (1) | | $ | 989,804 | (1) | | $ | 425,307 | (1) |
Change in Unrealized Appreciation (Depreciation) on Derivatives Recognized in Income | | $ | 42,412 | (2) | | $ | 108,577 | (2) | | $ | 46,654 | (2) |
| (1) | Statement of Operations location: Net realized gain (loss) – Financial futures contracts. |
| (2) | Statement of Operations location: Change in unrealized appreciation (depreciation) – Financial futures contracts. |
The average notional cost of futures contracts outstanding during the year ended September 30, 2018, which is indicative of the volume of this derivative type, was approximately as follows:
| | | | | | | | | | | | |
| | | Massachusetts
Fund | | | New York
Fund | | | Ohio Fund | |
| | |
Average Notional Cost: | | | | | | | | |
Futures Contracts — Short | | $ | 7,368,000 | | | $ | 18,861,000 | | | $ | 8,104,000 | |
10 Fair Value Measurements
Under generally accepted accounting principles for fair value measurements, a three-tier hierarchy to prioritize the assumptions, referred to as inputs, is used in valuation techniques to measure fair value. The three-tier hierarchy of inputs is summarized in the three broad levels listed below.
| • | | Level 1 – quoted prices in active markets for identical investments |
| • | | Level 2 – other significant observable inputs (including quoted prices for similar investments, interest rates, prepayment speeds, credit risk, etc.) |
| • | | Level 3 – significant unobservable inputs (including a fund’s own assumptions in determining the fair value of investments) |
In cases where the inputs used to measure fair value fall in different levels of the fair value hierarchy, the level disclosed is determined based on the lowest level input that is significant to the fair value measurement in its entirety. The inputs or methodology used for valuing securities are not necessarily an indication of the risk associated with investing in those securities.
At September 30, 2018, the hierarchy of inputs used in valuing the Funds’ investments and open derivative instruments, which are carried at value, were as follows:
| | | | | | | | | | | | | | | | |
California Opportunities Fund | |
| Asset Description | | Level 1 | | | Level 2 | | | Level 3 | | | Total | |
Tax-Exempt Municipal Securities | | $ | — | | | $ | 266,677,888 | | | $ | — | | | $ | 266,677,888 | |
Taxable Municipal Securities | | | — | | | | 7,803,283 | | | | — | | | | 7,803,283 | |
| | | | |
Total Investments | | $ | — | | | $ | 274,481,171 | | | $ | — | | | $ | 274,481,171 | |
|
Massachusetts Fund | |
| Asset Description | | Level 1 | | | Level 2 | | | Level 3 | | | Total | |
| | | | |
Tax-Exempt Investments | | $ | — | | | $ | 144,932,856 | | | $ | — | | | $ | 144,932,856 | |
| | | | |
Total Investments | | $ | — | | | $ | 144,932,856 | | | $ | — | | | $ | 144,932,856 | |
| | | | |
Futures Contracts | | $ | 167,709 | | | $ | — | | | $ | — | | | $ | 167,709 | |
| | | | |
Total | | $ | 167,709 | | | $ | 144,932,856 | | | $ | — | | | $ | 145,100,565 | |
Eaton Vance
Municipal Income Funds
September 30, 2018
Notes to Financial Statements — continued
| | | | | | | | | | | | | | | | |
|
New York Fund | |
| Asset Description | | Level 1 | | | Level 2 | | | Level 3* | | | Total | |
Tax-Exempt Investments | | $ | — | | | $ | 402,179,721 | | | $ | — | | | $ | 402,179,721 | |
Miscellaneous | | | — | | | | — | | | | 1,146,071 | | | | 1,146,071 | |
| | | | |
Total Investments | | $ | — | | | $ | 402,179,721 | | | $ | 1,146,071 | | | $ | 403,325,792 | |
| | | | |
Futures Contracts | | $ | 429,336 | | | $ | — | | | $ | — | | | $ | 429,336 | |
| | | | |
Total | | $ | 429,336 | | | $ | 402,179,721 | | | $ | 1,146,071 | | | $ | 403,755,128 | |
|
Ohio Fund | |
| Asset Description | | Level 1 | | | Level 2 | | | Level 3 | | | Total | |
| | | | |
Tax-Exempt Investments | | $ | — | | | $ | 157,055,128 | | | $ | — | | | $ | 157,055,128 | |
| | | | |
Total Investments | | $ | — | | | $ | 157,055,128 | | | $ | — | | | $ | 157,055,128 | |
| | | | |
Futures Contracts | | $ | 184,480 | | | $ | — | | | $ | — | | | $ | 184,480 | |
| | | | |
Total | | $ | 184,480 | | | $ | 157,055,128 | | | $ | — | | | $ | 157,239,608 | |
| * | None of the unobservable inputs for Level 3 assets, individually or collectively, had a material impact on the New York Fund. |
Level 3 investments held by the New York Fund at the beginning and/or end of the period in relation to net assets were not significant and accordingly, a reconciliation of Level 3 assets for the year ended September 30, 2018 is not presented.
Eaton Vance
Municipal Income Funds
September 30, 2018
Report of Independent Registered Public Accounting Firm
To the Trustees of Eaton Vance Municipals Trust and Shareholders of Eaton Vance California Municipal Opportunities Fund, Eaton Vance Massachusetts Municipal Income Fund, Eaton Vance New York Municipal Income Fund and Eaton Vance Ohio Municipal Income Fund:
Opinion on the Financial Statements and Financial Highlights
We have audited the accompanying statements of assets and liabilities of Eaton Vance California Municipal Opportunities Fund, Eaton Vance Massachusetts Municipal Income Fund, Eaton Vance New York Municipal Income Fund, and Eaton Vance Ohio Municipal Income Fund (collectively, the “Funds”) (certain of the funds constituting Eaton Vance Municipals Trust), including the portfolios of investments, as of September 30, 2018, the related statements of operations for the year then ended, the statements of changes in net assets for each of the two years in the period then ended, the financial highlights for each of the five years in the period then ended, and the related notes. In our opinion, the financial statements and financial highlights present fairly, in all material respects, the financial positions of the Funds as of September 30, 2018, and the results of their operations for the year then ended, the changes in their net assets for each of the two years in the period then ended, and the financial highlights for each of the five years in the period then ended, in conformity with accounting principles generally accepted in the United States of America.
Basis for Opinion
These financial statements and financial highlights are the responsibility of the Funds’ management. Our responsibility is to express an opinion on the Funds’ financial statements and financial highlights based on our audits. We are a public accounting firm registered with the Public Company Accounting Oversight Board (United States) (PCAOB) and are required to be independent with respect to the Funds in accordance with the U.S. federal securities laws and the applicable rules and regulations of the Securities and Exchange Commission and the PCAOB.
We conducted our audits in accordance with the standards of the PCAOB. Those standards require that we plan and perform the audits to obtain reasonable assurance about whether the financial statements and financial highlights are free of material misstatement, whether due to error or fraud. The Funds are not required to have, nor were we engaged to perform, an audit of their internal control over financial reporting. As part of our audits we are required to obtain an understanding of internal control over financial reporting but not for the purpose of expressing an opinion on the effectiveness of the Funds’ internal control over financial reporting. Accordingly, we express no such opinion.
Our audits included performing procedures to assess the risks of material misstatement of the financial statements and financial highlights, whether due to error or fraud, and performing procedures that respond to those risks. Such procedures included examining, on a test basis, evidence regarding the amounts and disclosures in the financial statements and financial highlights. Our audits also included evaluating the accounting principles used and significant estimates made by management, as well as evaluating the overall presentation of the financial statements and financial highlights. Our procedures included confirmation of securities owned as of September 30, 2018, by correspondence with the custodian and brokers; when replies were not received from brokers, we performed other auditing procedures. We believe that our audits provide a reasonable basis for our opinion.
/s/ Deloitte & Touche LLP
Boston, Massachusetts
November 21, 2018
We have served as the auditor of one or more Eaton Vance investment companies since 1959.
Eaton Vance
Municipal Income Funds
September 30, 2018
Federal Tax Information (Unaudited)
The Form 1099-DIV you receive in February 2019 will show the tax status of all distributions paid to your account in calendar year 2018. Shareholders are advised to consult their own tax adviser with respect to the tax consequences of their investment in the Funds. As required by the Internal Revenue Code and/or regulations, shareholders must be notified regarding exempt-interest dividends.
Exempt-Interest Dividends. For the fiscal year ended September 30, 2018, the Funds designate the following percentages of distributions from net investment income as exempt-interest dividends:
| | | | |
California Municipal Opportunities Fund | | | 92.60 | % |
Massachusetts Municipal Income Fund | | | 99.26 | % |
New York Municipal Income Fund | | | 99.68 | % |
Ohio Municipal Income Fund | | | 100.00 | % |
Eaton Vance
Municipal Income Funds
September 30, 2018
Special Meeting of Shareholders (Unaudited)
Each Fund held a Special Meeting of Shareholders on September 20, 2018 to elect the five Trustees listed below. The other Trustees named herein continue to serve as Trustees. The results of the vote with respect to each Fund were as follows:
| | | | | | | | | | | | | | | | |
| | | California Municipal
Opportunities Fund | | | Massachusetts Municipal
Income Fund | |
Nominee for Trustee | | Number of Shares | | | Number of Shares | |
| | For | | | Withheld | | | For | | | Withheld | |
Mark R. Fetting | | | 20,741,620 | | | | 259,687 | | | | 13,292,276 | | | | 674,310 | |
Keith Quinton | | | 20,748,525 | | | | 252,783 | | | | 13,284,269 | | | | 682,317 | |
Marcus L. Smith | | | 20,711,960 | | | | 289,348 | | | | 13,287,148 | | | | 679,439 | |
Susan J. Sutherland | | | 20,856,167 | | | | 145,141 | | | | 13,334,003 | | | | 632,583 | |
Scott E. Wennerholm | | | 20,738,434 | | | | 262,873 | | | | 13,284,269 | | | | 682,317 | |
| Results | are rounded to the nearest whole number. |
| | | | | | | | | | | | | | | | |
| | | New York Municipal
Income Fund | | | Ohio Municipal
Income Fund | |
Nominee for Trustee | | Number of Shares | | | Number of Shares | |
| | For | | | Withheld | | | For | | | Withheld | |
Mark R. Fetting | | | 34,051,959 | | | | 748,697 | | | | 15,559,353 | | | | 169,882 | |
Keith Quinton | | | 34,214,164 | | | | 586,492 | | | | 15,559,353 | | | | 169,882 | |
Marcus L. Smith | | | 34,197,010 | | | | 603,646 | | | | 15,560,799 | | | | 168,436 | |
Susan J. Sutherland | | | 34,043,613 | | | | 757,043 | | | | 15,560,799 | | | | 168,436 | |
Scott E. Wennerholm | | | 34,034,928 | | | | 765,728 | | | | 15,556,724 | | | | 172,511 | |
| Results | are rounded to the nearest whole number. |
Eaton Vance
Municipal Income Funds
September 30, 2018
Board of Trustees’ Contract Approval
Overview of the Contract Review Process
The Investment Company Act of 1940, as amended (the “1940 Act”), provides, in substance, that each investment advisory agreement between a fund and its investment adviser will continue in effect from year to year only if its continuation is approved at least annually by the fund’s board of trustees, including by a vote of a majority of the trustees who are not “interested persons” of the fund (“Independent Trustees”), cast in person at a meeting called for the purpose of considering such approval.
At a meeting of the Boards of Trustees (each a “Board”) of the registered investment companies advised by either Eaton Vance Management or its affiliate, Boston Management and Research, (the “Eaton Vance Funds”) held on April 24, 2018, the Board, including a majority of the Independent Trustees, voted to approve continuation of existing investment advisory and sub-advisory agreements for the Eaton Vance Funds for an additional one-year period. In voting its approval, the Board relied upon the affirmative recommendation of its Contract Review Committee, which is a committee comprised exclusively of Independent Trustees. Prior to making its recommendation, the Contract Review Committee reviewed information furnished by each adviser to the Eaton Vance Funds (including information specifically requested by the Board) for a series of meetings of the Contract Review Committee held between February and April 2018. The Contract Review Committee also considered information received at prior meetings of the Board and its committees, as relevant to its annual evaluation of the investment advisory and sub-advisory agreements.
The information that the Board considered included, among other things, the following (for funds that invest through one or more underlying portfolio(s), references to “each fund” in this section may include information that was considered at the portfolio-level):
Information about Fees, Performance and Expenses
| • | | A report from an independent data provider comparing the advisory and related fees paid by each fund with fees paid by comparable funds as identified by the independent data provider (“comparable funds”); |
| • | | A report from an independent data provider comparing each fund’s total expense ratio and its components to comparable funds; |
| • | | A report from an independent data provider comparing the investment performance of each fund (including, where relevant, yield data, Sharpe ratios and information ratios) to the investment performance of comparable funds over various time periods; |
| • | | Data regarding investment performance in comparison to benchmark indices, as well as customized groups of peer funds and blended indices identified by the adviser in consultation with the Board; |
| • | | For each fund, comparative information concerning the fees charged and the services provided by each adviser in managing other accounts (including mutual funds, other collective investment funds and institutional accounts) using investment strategies and techniques similar to those used in managing such fund; |
| • | | Profitability analyses for each adviser with respect to each fund; |
Information about Portfolio Management and Trading
| • | | Descriptions of the investment management services provided to each fund, including the fund’s investment strategies and policies; |
| • | | The procedures and processes used to determine the fair value of fund assets and actions taken to monitor and test the effectiveness of such procedures and processes; |
| • | | Information about each adviser’s policies and practices with respect to trading, including each adviser’s processes for monitoring best execution of portfolio transactions; |
| • | | Information about the allocation of brokerage transactions and the benefits received by each adviser as a result of brokerage allocation, including information concerning the acquisition of research through client commission arrangements and policies with respect to “soft dollars”; |
| • | | Data relating to portfolio turnover rates of each fund; |
Information about each Adviser
| • | | Reports detailing the financial results and condition of each adviser; |
| • | | Descriptions of the qualifications, education and experience of the individual investment professionals whose responsibilities include portfolio management and investment research for the funds, and information relating to their responsibilities with respect to managing other mutual funds and investment accounts; |
| • | | The Code of Ethics of each adviser and its affiliates, together with information relating to compliance with and the administration of such codes; |
| • | | Policies and procedures relating to proxy voting and the handling of corporate actions and class actions; |
| • | | Information concerning the resources devoted to compliance efforts undertaken by each adviser and its affiliates (including descriptions of various compliance programs) and their record of compliance; |
| • | | Information concerning the business continuity and disaster recovery plans of each adviser and its affiliates; |
| • | | A description of Eaton Vance Management’s procedures for overseeing third party advisers and sub-advisers, including with respect to regulatory and compliance issues, investment management and other matters; |
Eaton Vance
Municipal Income Funds
September 30, 2018
Board of Trustees’ Contract Approval — continued
Other Relevant Information
| • | | Information concerning the nature, cost and character of the administrative and other non-investment advisory services provided by Eaton Vance Management and its affiliates; |
| • | | Information concerning management of the relationship with the custodian, subcustodians and fund accountants by each adviser or the funds’ administrator; and |
| • | | The terms of each investment advisory agreement. |
Over the course of the twelve-month period ended April 30, 2018, with respect to one or more funds, the Board met seven times and the Contract Review Committee, the Audit Committee, the Governance Committee, the Portfolio Management Committee and the Compliance Reports and Regulatory Matters Committee, each of which is a Committee comprised solely of Independent Trustees, met seven, thirteen, six, eight and nine times, respectively. At such meetings, the Trustees participated in investment and performance reviews with the portfolio managers and other investment professionals of each investment adviser relating to each fund, and considered various investment and trading strategies used in pursuing each fund’s investment objective, such as the use of derivative instruments, as well as risk management techniques. The Board and its Committees also evaluated issues pertaining to industry and regulatory developments, compliance procedures, fund governance and other issues with respect to the funds, and received and participated in reports and presentations provided by Eaton Vance Management and other fund advisers with respect to such matters. In addition to the formal meetings of the Board and its Committees, the Independent Trustees hold regular teleconferences in between meetings to discuss, among other topics, matters relating to the continuation of investment advisory and sub-advisory agreements.
For funds that invest through one or more underlying portfolios, the Board considered similar information about the portfolio(s) when considering the approval of investment advisory agreements. In addition, in cases where the fund’s investment adviser has engaged a sub-adviser, the Board considered similar information about the sub-adviser when considering the approval of any sub-advisory agreement.
The Contract Review Committee was assisted throughout the contract review process by Goodwin Procter LLP, independent legal counsel for the Independent Trustees. The members of the Contract Review Committee relied upon the advice of such counsel and their own business judgment in determining the material factors to be considered in evaluating each investment advisory and sub-advisory agreement and the weight to be given to each such factor. The conclusions reached with respect to each investment advisory and sub-advisory agreement were based on a comprehensive evaluation of all the information provided and not any single factor. Moreover, each member of the Contract Review Committee may have placed varying emphasis on particular factors in reaching conclusions with respect to each investment advisory and sub-advisory agreement. In evaluating each investment advisory and sub-advisory agreement, including the specific fee structures and other terms of the agreements, the Contract Review Committee was informed by multiple years of analysis and discussion among the Independent Trustees and the Eaton Vance Funds’ advisers and sub-advisers.
Results of the Process
Based on its consideration of the foregoing, and such other information as it deemed relevant, including the factors and conclusions described below, the Contract Review Committee concluded that the continuation of the investment advisory agreements of the following funds:
| • | | Eaton Vance California Municipal Opportunities Fund |
| • | | Eaton Vance Massachusetts Municipal Income Fund |
| • | | Eaton Vance New York Municipal Income Fund |
| • | | Eaton Vance Ohio Municipal Income Fund |
(the “Funds”), each with Boston Management and Research (the “Adviser”), including their fee structures, is in the interests of shareholders and, therefore, the Contract Review Committee recommended to the Board approval of each agreement. The Board accepted the recommendation of the Contract Review Committee based on the material factors considered and conclusions reached by the Contract Review Committee with respect to each agreement. Accordingly, the Board, including a majority of the Independent Trustees, voted to approve continuation of the investment advisory agreement for each Fund.
Nature, Extent and Quality of Services
In considering whether to approve the investment advisory agreements of the Funds, the Board evaluated the nature, extent and quality of services provided to the Funds by the Adviser.
The Board considered the Adviser’s management capabilities and investment process with respect to the types of investments held by each Fund, including the education, experience and number of its investment professionals and other personnel who provide portfolio management, investment research, and similar services to the Funds. In particular, the Board considered, where relevant, the abilities and experience of the Adviser’s investment professionals in analyzing factors such as credit risk, tax efficiency, and special considerations relevant to investing in municipal obligations. The Board considered the Adviser’s municipal bond team, which includes investment professionals and credit specialists who provide services to the Funds. The Board also took into account the resources dedicated to portfolio management and other services, as well as the compensation methods of the Adviser and other factors, such as the reputation and resources of the Adviser to recruit and retain highly qualified research, advisory and supervisory investment professionals. In addition,
Eaton Vance
Municipal Income Funds
September 30, 2018
Board of Trustees’ Contract Approval — continued
the Board considered the time and attention devoted to the Eaton Vance Funds, including each Fund, by senior management, as well as the infrastructure, operational capabilities and support staff in place to assist in the portfolio management and operations of the Funds, including the provision of administrative services. The Board also considered the business-related and other risks to which the Adviser or its affiliates may be subject in managing the Funds.
The Board considered the compliance programs of the Adviser and relevant affiliates thereof. Among other matters, the Board considered compliance and reporting matters relating to personal trading by investment professionals, selective disclosure of portfolio holdings, late trading, frequent trading, portfolio valuation, business continuity and the allocation of investment opportunities. The Board also considered the responses of the Adviser and its affiliates to requests in recent years from regulatory authorities such as the Securities and Exchange Commission and the Financial Industry Regulatory Authority.
The Board considered shareholder and other administrative services provided or managed by Eaton Vance Management and its affiliates, including transfer agency and accounting services. The Board evaluated the benefits to shareholders of investing in a fund that is a part of a large fund complex offering exposure to a variety of asset classes and investment disciplines, as well as the ability, in many cases, to exchange an investment among different funds without incurring additional sales charges.
After consideration of the foregoing factors, among others, the Board concluded that the nature, extent and quality of services provided by the Adviser, taken as a whole, are appropriate and consistent with the terms of the investment advisory agreements.
Fund Performance
The Board compared each Fund’s investment performance to that of comparable funds and appropriate benchmark indices and assessed each Fund’s performance on the basis of total return and current income return. The Board’s review included comparative performance data for the one-, three-, five- and ten-year periods ended September 30, 2017 for each Fund.
In this regard, the Board noted each Fund’s performance relative to its peer group, primary benchmark index and, if applicable, secondary benchmark index for the three-year period, as follows:
| | | | | | | | | | | | |
| Fund | | Performance Relative to: | |
| | Median of
Peers | | | Primary
Index | | | Secondary
Index | |
Eaton Vance California Municipal Opportunities Fund | | | Higher | | | | Higher | | | | n/a | |
Eaton Vance Massachusetts Municipal Income Fund | | | Lower | | | | Lower | | | | Lower | |
Eaton Vance New York Municipal Income Fund | | | Higher | | | | Higher | | | | Lower | |
Eaton Vance Ohio Municipal Income Fund | | | Higher | | | | Lower | | | | Lower | |
The Board considered, among other things, the Adviser’s efforts to generate competitive levels of tax exempt current income over time through investments that, relative to comparable funds, focus on higher quality municipal bonds with longer maturities. The Board concluded that the performance of each Fund was satisfactory.
Management Fees and Expenses
The Board considered contractual fee rates payable by each Fund for advisory and administrative services (referred to collectively as “management fees”). As part of its review, the Board considered each Fund’s management fees and total expense ratio for the one year period ended September 30, 2017, as compared to those of comparable funds, before and after giving effect to any undertaking to waive fees or reimburse expenses. The Board also considered factors that had an impact on Fund expense ratios relative to comparable funds.
After considering the foregoing information, and in light of the nature, extent and quality of the services provided by the Adviser, the Board concluded that the management fees charged for advisory and related services are reasonable.
Profitability and Other “Fall-Out” Benefits
The Board considered the level of profits realized by the Adviser and relevant affiliates thereof in providing investment advisory and administrative services to each Fund and to all Eaton Vance Funds as a group. The Board considered the level of profits realized without regard to marketing support or other payments by the Adviser and its affiliates to third parties in respect of distribution services. The Board also considered other direct or indirect fall-out benefits received by the Adviser and its affiliates in connection with their relationships with the Funds, including the benefits of research services that may be available to the Adviser as a result of securities transactions effected for the Funds and other investment advisory clients.
The Board concluded that, in light of the foregoing factors and the nature, extent and quality of the services rendered, the profits realized by the Adviser and its affiliates are deemed not to be excessive.
Eaton Vance
Municipal Income Funds
September 30, 2018
Board of Trustees’ Contract Approval — continued
Economies of Scale
In reviewing management fees and profitability, the Board also considered the extent to which the Adviser and its affiliates, on the one hand, and each Fund, on the other hand, can expect to realize benefits from economies of scale as the assets of each Fund increase. The Board acknowledged the difficulty in accurately measuring the benefits resulting from economies of scale, if any, with respect to the management of any specific fund or group of funds. The Board reviewed data summarizing the increases and decreases in the assets of each Fund and of all Eaton Vance Funds as a group over various time periods, and evaluated the extent to which the total expense ratio of each Fund and the profitability of the Adviser and its affiliates may have been affected by such increases or decreases. Based upon the foregoing, the Board concluded that each Fund currently shares in any benefits from economies of scale. The Board also concluded that, assuming reasonably foreseeable increases in the assets of each Fund, the structure of each advisory fee, which includes breakpoints at several asset levels, will allow each Fund to continue to benefit from any economies of scale in the future.
Eaton Vance
Municipal Income Funds
September 30, 2018
Management and Organization
Fund Management. The Trustees of Eaton Vance Municipals Trust (the Trust) are responsible for the overall management and supervision of the Trust’s affairs. The Trustees and officers of the Trust are listed below. Except as indicated, each individual has held the office shown or other offices in the same company for the last five years. Trustees and officers of the Trust hold indefinite terms of office. The “Noninterested Trustees” consist of those Trustees who are not “interested persons” of the Trust, as that term is defined under the 1940 Act. The business address of each Trustee and officer is Two International Place, Boston, Massachusetts 02110. As used below, “EVC” refers to Eaton Vance Corp., “EV” refers to Eaton Vance, Inc., “EVM” refers to Eaton Vance Management, “BMR” refers to Boston Management and Research and “EVD” refers to Eaton Vance Distributors, Inc. EVC and EV are the corporate parent and trustee, respectively, of EVM and BMR. EVD is the Funds’ principal underwriter and a wholly-owned subsidiary of EVC. Each officer affiliated with Eaton Vance may hold a position with other Eaton Vance affiliates that is comparable to his or her position with EVM listed below. Each Trustee oversees 174 portfolios in the Eaton Vance Complex (including all master and feeder funds in a master feeder structure). Each officer serves as an officer of certain other Eaton Vance funds. Each Trustee and officer serves until his or her successor is elected.
| | | | | | |
| Name and Year of Birth | | Position(s) with the Trust | | Trustee Since(1) | | Principal Occupation(s) and Directorships
During Past Five Years and Other Relevant Experience |
| Interested Trustee |
| | | |
Thomas E. Faust Jr. 1958 | | Trustee | | 2007 | | Chairman, Chief Executive Officer and President of EVC, Director and President of EV, Chief Executive Officer and President of EVM and BMR, and Director of EVD. Trustee and/or officer of 174 registered investment companies. Mr. Faust is an interested person because of his positions with EVM, BMR, EVD, EVC and EV, which are affiliates of the Trust. Directorships in the Last Five Years.(2) Director of EVC and Hexavest Inc. (investment management firm). |
|
| Noninterested Trustees |
| | | |
Mark R. Fetting 1954 | | Trustee | | 2016 | | Private investor. Formerly held various positions at Legg Mason, Inc. (investment management firm) (2000-2012), including President, Chief Executive Officer, Director and Chairman (2008-2012), Senior Executive Vice President (2004-2008) and Executive Vice President (2001-2004). Formerly, President of Legg Mason family of funds (2001-2008). Formerly, Division President and Senior Officer of Prudential Financial Group, Inc. and related companies (investment management firm) (1991-2000). Directorships in the Last Five Years. None. |
| | | |
Cynthia E. Frost 1961 | | Trustee | | 2014 | | Private investor. Formerly, Chief Investment Officer of Brown University (university endowment) (2000-2012); Formerly, Portfolio Strategist for Duke Management Company (university endowment manager) (1995-2000); Formerly, Managing Director, Cambridge Associates (investment consulting company) (1989-1995); Formerly, Consultant, Bain and Company (management consulting firm) (1987-1989); Formerly, Senior Equity Analyst, BA Investment Management Company (1983-1985). Directorships in the Last Five Years. None. |
| | | |
George J. Gorman 1952 | | Trustee | | 2014 | | Principal at George J. Gorman LLC (consulting firm). Formerly, Senior Partner at Ernst & Young LLP (a registered public accounting firm) (1974-2009). Directorships in the Last Five Years. Formerly, Trustee of the BofA Funds Series Trust (11 funds) (2011-2014) and of the Ashmore Funds (9 funds) (2010-2014). |
| | | |
Valerie A. Mosley 1960 | | Trustee | | 2014 | | Chairwoman and Chief Executive Officer of Valmo Ventures (a consulting and investment firm). Former Partner and Senior Vice President, Portfolio Manager and Investment Strategist at Wellington Management Company, LLP (investment management firm) (1992-2012). Former Chief Investment Officer, PG Corbin Asset Management (1990-1992). Formerly worked in institutional corporate bond sales at Kidder Peabody (1986-1990). Directorships in the Last Five Years.(2) Director of Dynex Capital, Inc. (mortgage REIT) (since 2013). |
Eaton Vance
Municipal Income Funds
September 30, 2018
Management and Organization — continued
| | | | | | |
| Name and Year of Birth | | Position(s) with the Trust | | Trustee Since(1) | | Principal Occupation(s) and Directorships
During Past Five Years and Other Relevant Experience |
| Noninterested Trustees (continued) |
| | | |
William H. Park 1947 | | Chairperson of the Board and Trustee | | 2016 (Chairperson); 2003 (Trustee) | | Private investor. Formerly, Consultant (management and transactional) (2012-2014). Formerly, Chief Financial Officer, Aveon Group L.P. (investment management firm) (2010-2011). Formerly, Vice Chairman, Commercial Industrial Finance Corp. (specialty finance company) (2006-2010). Formerly, President and Chief Executive Officer, Prizm Capital Management, LLC (investment management firm) (2002-2005). Formerly, Executive Vice President and Chief Financial Officer, United Asset Management Corporation (investment management firm) (1982-2001). Formerly, Senior Manager, Price Waterhouse (now PricewaterhouseCoopers) (a registered public accounting firm) (1972-1981). Directorships in the Last Five Years.(2) None. |
| | | |
Helen Frame Peters 1948 | | Trustee | | 2008 | | Professor of Finance, Carroll School of Management, Boston College. Formerly, Dean, Carroll School of Management, Boston College (2000-2002). Formerly, Chief Investment Officer, Fixed Income, Scudder Kemper Investments (investment management firm) (1998-1999). Formerly, Chief Investment Officer, Equity and Fixed Income, Colonial Management Associates (investment management firm) (1991-1998). Directorships in the Last Five Years.(2) None. |
| | | |
Keith Quinton(3) 1958 | | Trustee | | 2018 | | Independent Investment Committee Member at New Hampshire Retirement System (since 2017). Advisory Committee member at Northfield Information Services, Inc. (risk management analytics provider) (since 2016). Formerly, Portfolio Manager and Senior Quantitative Analyst at Fidelity Investments (investment management firm) (2001-2014). Directorships in the Last Five Years. Director of New Hampshire Municipal Bond Bank (since 2016). |
| | | |
Marcus L. Smith(3) 1966 | | Trustee | | 2018 | | Member of Posse Boston Advisory Board (foundation) (since 2015); Trustee at University of Mount Union (since 2008). Formerly, Portfolio Manager at MFS Investment Management (investment management firm) (1994-2017). Directorships in the Last Five Years. Director of MSCI Inc. (global provider of investment decision support tools) (since 2017). Director of DCT Industrial Trust Inc. (logistics real estate company) (since 2017). |
| | | |
Susan J. Sutherland 1957 | | Trustee | | 2015 | | Private investor. Formerly, Associate, Counsel and Partner at Skadden, Arps, Slate, Meagher & Flom LLP (law firm) (1982-2013). Directorships in the Last Five Years. Formerly, Director of Montpelier Re Holdings Ltd. (global provider of customized insurance and reinsurance products) (2013-2015). |
| | | |
Harriett Tee Taggart 1948 | | Trustee | | 2011 | | Managing Director, Taggart Associates (a professional practice firm). Formerly, Partner and Senior Vice President, Wellington Management Company, LLP (investment management firm) (1983-2006). Ms. Taggart has apprised the Board of Trustees that she intends to retire as a Trustee of all Eaton Vance Funds effective December 31, 2018. Directorships in the Last Five Years.(2) Director of Albemarle Corporation (chemicals manufacturer) (since 2007) and The Hanover Group (specialty property and casualty insurance company) (since 2009). |
| | | |
Scott E. Wennerholm 1959 | | Trustee | | 2016 | | Formerly, Trustee at Wheelock College (postsecondary institution) (2012-2018). Formerly, Consultant at GF Parish Group (executive recruiting firm) (2016-2017). Formerly, Chief Operating Officer and Executive Vice President at BNY Mellon Asset Management (investment management firm) (2005-2011). Formerly, Chief Operating Officer and Chief Financial Officer at Natixis Global Asset Management (investment management firm) (1997-2004). Formerly, Vice President at Fidelity Investments Institutional Services (investment management firm) (1994-1997). Directorships in the Last Five Years. None. |
Eaton Vance
Municipal Income Funds
September 30, 2018
Management and Organization — continued
| | | | | | |
| Name and Year of Birth | | Position(s) with the Trust | | Officer Since(4) | | Principal Occupation(s)
During Past Five Years |
| Principal Officers who are not Trustees |
| | | |
Payson F. Swaffield 1956 | | President | | 2003 | | Vice President and Chief Income Investment Officer of EVM and BMR. Also Vice President of Calvert Research and Management (“CRM”). |
| | | |
Maureen A. Gemma 1960 | | Vice President, Secretary and Chief Legal Officer | | 2005 | | Vice President of EVM and BMR. Also Vice President of CRM. |
| | | |
James F. Kirchner 1967 | | Treasurer | | 2007 | | Vice President of EVM and BMR. Also Vice President of CRM. |
| | | |
Richard F. Froio 1968 | | Chief Compliance Officer | | 2017 | | Vice President of EVM and BMR since 2017. Formerly Deputy Chief Compliance Officer (Adviser/Funds) and Chief Compliance Officer (Distribution) at PIMCO (2012-2017) and Managing Director at BlackRock/Barclays Global Investors (2009-2012). |
| (1) | Year first appointed to serve as Trustee for a fund in the Eaton Vance family of funds. Each Trustee has served continuously since appointment unless indicated otherwise. |
| (2) | During their respective tenures, the Trustees (except for Mmes. Frost and Sutherland and Messrs. Fetting, Gorman, Quinton, Smith and Wennerholm) also served as Board members of one or more of the following funds (which operated in the years noted): eUnitsTM 2 Year U.S. Market Participation Trust: Upside to Cap / Buffered Downside (launched in 2012 and terminated in 2014); and eUnitsTM 2 Year U.S. Market Participation Trust II: Upside to Cap / Buffered Downside (launched in 2012 and terminated in 2014). However, Ms. Mosley did not serve as a Board member of eUnitsTM 2 Year U.S. Market Participation Trust: Upside to Cap / Buffered Downside (launched in 2012 and terminated in 2014). |
| (3) | Messrs. Quinton and Smith began serving as Trustees effective October 1, 2018. |
| (4) | Year first elected to serve as officer of a fund in the Eaton Vance family of funds when the officer has served continuously. Otherwise, year of most recent election as an officer of a fund in the Eaton Vance family of funds. Titles may have changed since initial election. |
The SAI for the Funds includes additional information about the Trustees and officers of the Funds and can be obtained without charge on Eaton Vance’s website at www.eatonvance.com or by calling 1-800-262-1122.
Eaton Vance Funds
IMPORTANT NOTICES
Privacy. The Eaton Vance organization is committed to ensuring your financial privacy. Each of the financial institutions identified below has in effect the following policy (“Privacy Policy”) with respect to nonpublic personal information about its customers:
| • | | Only such information received from you, through application forms or otherwise, and information about your Eaton Vance fund transactions will be collected. This may include information such as name, address, social security number, tax status, account balances and transactions. |
| • | | None of such information about you (or former customers) will be disclosed to anyone, except as permitted by law (which includes disclosure to employees necessary to service your account). In the normal course of servicing a customer’s account, Eaton Vance may share information with unaffiliated third parties that perform various required services such as transfer agents, custodians and broker-dealers. |
| • | | Policies and procedures (including physical, electronic and procedural safeguards) are in place that are designed to protect the confidentiality of such information. |
| • | | We reserve the right to change our Privacy Policy at any time upon proper notification to you. Customers may want to review our Privacy Policy periodically for changes by accessing the link on our homepage: www.eatonvance.com. |
Our pledge of privacy applies to the following entities within the Eaton Vance organization: the Eaton Vance Family of Funds, Eaton Vance Management, Eaton Vance Investment Counsel, Eaton Vance Distributors, Inc., Eaton Vance Trust Company, Eaton Vance Management (International) Limited, Eaton Vance Advisers International Ltd., Eaton Vance Management’s Real Estate Investment Group and Boston Management and Research. In addition, our Privacy Policy applies only to those Eaton Vance customers who are individuals and who have a direct relationship with us. If a customer’s account (i.e., fund shares) is held in the name of a third-party financial advisor/broker-dealer, it is likely that only such advisor’s privacy policies apply to the customer. This notice supersedes all previously issued privacy disclosures. For more information about Eaton Vance’s Privacy Policy, please call 1-800-262-1122.
Delivery of Shareholder Documents. The Securities and Exchange Commission (SEC) permits funds to deliver only one copy of shareholder documents, including prospectuses, proxy statements and shareholder reports, to fund investors with multiple accounts at the same residential or post office box address. This practice is often called “householding” and it helps eliminate duplicate mailings to shareholders. Eaton Vance, or your financial advisor, may household the mailing of your documents indefinitely unless you instruct Eaton Vance, or your financial advisor, otherwise. If you would prefer that your Eaton Vance documents not be householded, please contact Eaton Vance at 1-800-262-1122, or contact your financial advisor. Your instructions that householding not apply to delivery of your Eaton Vance documents will typically be effective within 30 days of receipt by Eaton Vance or your financial advisor.
Portfolio Holdings. Each Eaton Vance Fund and its underlying Portfolio(s) (if applicable) will file a schedule of portfolio holdings on Form N-Q with the SEC for the first and third quarters of each fiscal year. The Form N-Q will be available on the Eaton Vance website at www.eatonvance.com, by calling Eaton Vance at 1-800-262-1122 or in the EDGAR database on the SEC’s website at www.sec.gov. Form N-Q may also be reviewed and copied at the SEC’s public reference room in Washington, D.C. (call 1-800-732-0330 for information on the operation of the public reference room).
Proxy Voting. From time to time, funds are required to vote proxies related to the securities held by the funds. The Eaton Vance Funds or their underlying Portfolios (if applicable) vote proxies according to a set of policies and procedures approved by the Funds’ and Portfolios’ Boards. You may obtain a description of these policies and procedures and information on how the Funds or Portfolios voted proxies relating to portfolio securities during the most recent 12-month period ended June 30, without charge, upon request, by calling 1-800-262-1122 and by accessing the SEC’s website at www.sec.gov.
This Page Intentionally Left Blank
This Page Intentionally Left Blank
Investment Adviser
Boston Management and Research
Two International Place
Boston, MA 02110
Administrator
Eaton Vance Management
Two International Place
Boston, MA 02110
Principal Underwriter*
Eaton Vance Distributors, Inc.
Two International Place
Boston, MA 02110
(617) 482-8260
Custodian
State Street Bank and Trust Company
State Street Financial Center, One Lincoln Street
Boston, MA 02111
Transfer Agent
BNY Mellon Investment Servicing (US) Inc.
Attn: Eaton Vance Funds
P.O. Box 9653
Providence, RI 02940-9653
(800) 262-1122
Independent Registered Public Accounting Firm
Deloitte & Touche LLP
200 Berkeley Street
Boston, MA 02116-5022
Fund Offices
Two International Place
Boston, MA 02110
| * | FINRA BrokerCheck. Investors may check the background of their Investment Professional by contacting the Financial Industry Regulatory Authority (FINRA). FINRA BrokerCheck is a free tool to help investors check the professional background of current and former FINRA-registered securities firms and brokers. FINRA BrokerCheck is available by calling 1-800-289-9999 and at www.FINRA.org. The FINRA BrokerCheck brochure describing this program is available to investors at www.FINRA.org. |

438 9.30.18
Item 2. Code of Ethics
The registrant has adopted a code of ethics applicable to its Principal Executive Officer, Principal Financial Officer and Principal Accounting Officer. The registrant undertakes to provide a copy of such code of ethics to any person upon request, without charge, by calling 1-800-262-1122. The registrant has not amended the code of ethics as described in Form N-CSR during the period covered by this report. The registrant has not granted any waiver, including an implicit waiver, from a provision of the code of ethics as described in Form N-CSR during the period covered by this report.
Item 3. Audit Committee Financial Expert
The registrant’s Board has designated George J. Gorman and William H. Park, each an independent trustee, as audit committee financial experts. Mr. Gorman is a certified public accountant who is the Principal at George J. Gorman LLC (a consulting firm). Previously, Mr. Gorman served in various capacities at Ernst & Young LLP (a registered public accounting firm), including as Senior Partner. Mr. Gorman also has experience serving as an independent trustee and audit committee financial expert of other mutual fund complexes. Mr. Park is a certified public accountant who is a private investor. Previously, he served as a consultant, as the Chief Financial Officer of Aveon Group, L.P. (an investment management firm), as the Vice Chairman of Commercial Industrial Finance Corp. (specialty finance company), as President and Chief Executive Officer of Prizm Capital Management, LLC (investment management firm), as Executive Vice President and Chief Financial Officer of United Asset Management Corporation (an institutional investment management firm) and as a Senior Manager at Price Waterhouse (now PricewaterhouseCoopers) (a registered public accounting firm).
Item 4. Principal Accountant Fees and Services
Eaton Vance National Municipal Income Fund, Eaton Vance California Municipal Opportunities Fund, Eaton Vance Massachusetts Municipal Income Fund, Eaton Vance New York Municipal Income Fund and Eaton Vance Ohio Municipal Income Fund (the “Fund(s)”) are series of Eaton Vance Municipals Trust (the “Trust”), a Massachusetts business trust, which, including the Funds, contains a total of 18 series (the “Series”). The Trust is registered under the Investment Company Act of 1940 as an open-end management investment company. This Form N-CSR relates to the Funds’ annual reports.
(a)-(d)
The following tables present the aggregate fees billed to each Fund for the Fund’s respective fiscal years ended September 30, 2017 and September 30, 2018 by D&T for professional services rendered for the audit of the Funds’ annual financial statements and fees billed for other services rendered by D&T for the same time periods.
Eaton Vance National Municipal Income Fund
| | | | | | | | |
Fiscal Years Ended | | 9/30/17 | | | 9/30/18 | |
Audit Fees | | $ | 91,820 | | | $ | 92,483 | |
Audit-Related Fees(1) | | $ | 0 | | | $ | 0 | |
Tax Fees(2) | | $ | 21,258 | | | $ | 21,258 | |
All Other Fees(3) | | $ | 0 | | | $ | 0 | |
| | | | | | | | |
Total | | $ | 113,078 | | | $ | 113,741 | |
| | | | | | | | |
Eaton Vance California Municipal Opportunities Fund
| | | | | | | | |
Fiscal Years Ended | | 9/30/17 | | | 9/30/18 | |
Audit Fees | | $ | 50,760 | | | $ | 50,823 | |
Audit-Related Fees(1) | | $ | 0 | | | $ | 0 | |
Tax Fees(2) | | $ | 10,991 | | | $ | 10,991 | |
All Other Fees(3) | | $ | 0 | | | $ | 0 | |
| | | | | | | | |
Total | | $ | 61,751 | | | $ | 61,814 | |
| | | | | | | | |
Eaton Vance Massachusetts Municipal Income Fund
| | | | | | | | |
Fiscal Years Ended | | 9/30/17 | | | 9/30/18 | |
Audit Fees | | $ | 48,170 | | | $ | 48,170 | |
Audit-Related Fees(1) | | $ | 0 | | | $ | 0 | |
Tax Fees(2) | | $ | 11,647 | | | $ | 11,647 | |
All Other Fees(3) | | $ | 0 | | | $ | 0 | |
| | | | | | | | |
Total | | $ | 59,817 | | | $ | 59,817 | |
| | | | | | | | |
Eaton Vance New York Municipal Income Fund
| | | | | | | | |
Fiscal Years Ended | | 9/30/17 | | | 9/30/18 | |
Audit Fees | | $ | 55,500 | | | $ | 56,400 | |
Audit-Related Fees(1) | | $ | 0 | | | $ | 0 | |
Tax Fees(2) | | $ | 12,523 | | | $ | 12,523 | |
All Other Fees(3) | | $ | 0 | | | $ | 0 | |
| | | | | | | | |
Total | | $ | 68,023 | | | $ | 68,923 | |
| | | | | | | | |
Eaton Vance Ohio Municipal Income Fund
| | | | | | | | |
Fiscal Years Ended | | 9/30/17 | | | 9/30/18 | |
Audit Fees | | $ | 41,260 | | | $ | 41,260 | |
Audit-Related Fees(1) | | $ | 0 | | | $ | 0 | |
Tax Fees(2) | | $ | 10,115 | | | $ | 10,115 | |
All Other Fees(3) | | $ | 0 | | | $ | 0 | |
| | | | | | | | |
Total | | $ | 51,375 | | | $ | 51,375 | |
| | | | | | | | |
| (1) | Audit-related fees consist of the aggregate fees billed for assurance and related services that are reasonably related to the performance of the audit of the registrant’s financial statements and are not reported under the category of audit fees. |
| (2) | Tax fees consist of the aggregate fees billed for professional services rendered by the principal accountant relating to tax compliance, tax advice, and tax planning and specifically include fees for tax return preparation and other related tax compliance/planning matters. |
| (3) | All other fees consist of the aggregate fees billed for products and services provided by the principal accountant other than audit, audit-related, and tax services. |
The Series comprising the Trust have varying fiscal year ends (July 31, August 31, and September 30). The following table presents the aggregate audit, audit-related, tax, and other fees billed to all of the Series in the Trust by D&T for the last two fiscal years of each Series.
| | | | | | | | | | | | | | | | | | | | | | | | |
Fiscal Years Ended | | 7/31/17 | | | 8/31/17 | | | 9/30/17 | | | 7/31/18 | | | 8/31/18 | | | 9/30/18 | |
Audit Fees | | $ | 251,060 | | | $ | 253,910 | | | $ | 287,510 | | | $ | 254,535 | | | $ | 256,285 | | | $ | 289,136 | |
Audit-Related Fees(1) | | $ | 0 | | | $ | 0 | | | $ | 0 | | | $ | 0 | | | $ | 0 | | | $ | 0 | |
Tax Fees(2) | | $ | 60,918 | | | $ | 72,584 | | | $ | 66,534 | | | $ | 59,668 | | | $ | 72,584 | | | $ | 66,534 | |
All Other Fees(3) | | $ | 0 | | | $ | 0 | | | $ | 0 | | | $ | 0 | | | $ | 0 | | | $ | 0 | |
| | | | | | | | | | | | | | | | | | | | | | | | |
Total | | $ | 311,978 | | | $ | 326,494 | | | $ | 354,044 | | | $ | 314,203 | | | $ | 328,869 | | | $ | 355,670 | |
| | | | | | | | | | | | | | | | | | | | | | | | |
| (1) | Audit-related fees consist of the aggregate fees billed for assurance and related services that are reasonably related to the performance of the audit of the registrant’s financial statements and are not reported under the category of audit fees. |
| (2) | Tax fees consist of the aggregate fees billed for professional services rendered by the principal accountant relating to tax compliance, tax advice, and tax planning and specifically include fees for tax return preparation and other related tax compliance/planning matters. |
| (3) | All other fees consist of the aggregate fees billed for products and services provided by the principal accountant other than audit, audit-related, and tax services. |
(e)(1) The registrant’s audit committee has adopted policies and procedures relating to the pre-approval of services provided by the registrant’s principal accountant (the “Pre-Approval Policies”). The Pre-Approval Policies establish a framework intended to assist the audit committee in the proper discharge of its pre-approval responsibilities. As a general matter, the Pre-Approval Policies (i) specify certain types of audit, audit-related, tax, and other services determined to be pre-approved by the audit committee; and (ii) delineate specific procedures governing the mechanics of the pre-approval process, including the approval and monitoring of audit and non-audit service fees. Unless a service is specifically pre-approved under the Pre-Approval Policies, it must be separately pre-approved by the audit committee.
The Pre-Approval Policies and the types of audit and non-audit services pre-approved therein must be reviewed and ratified by the registrant’s audit committee at least annually. The registrant’s audit committee maintains full responsibility for the appointment, compensation, and oversight of the work of the registrant’s principal accountant.
(e)(2) No services described in paragraphs (b)-(d) above were approved by the registrant’s audit committee pursuant to the “de minimis exception” set forth in Rule 2-01(c)(7)(i)(C) of Regulation S-X.
(f) Not applicable.
(g) The following table presents (i) the aggregate non-audit fees (i.e., fees for audit-related, tax, and other services) billed for services rendered to all of the Series in the Trust by the Series’ principal accountant for the
last two fiscal years of each Series; and (ii) the aggregate non-audit fees (i.e., fees for audit-related, tax, and other services) billed for services rendered to the Eaton Vance organization by D&T for the last two fiscal years of each Series.
| | | | | | | | | | | | | | | | | | | | | | | | |
Fiscal Years Ended | | 7/31/17 | | | 8/31/17 | | | 9/30/17 | | | 7/31/18 | | | 8/31/18 | | | 9/30/18 | |
Registrant(1) | | $ | 60,918 | | | $ | 72,584 | | | $ | 66,534 | | | $ | 59,668 | | | $ | 72,584 | | | $ | 66,534 | |
Eaton Vance(2) | | $ | 148,018 | | | $ | 148,018 | | | $ | 148,018 | | | $ | 51,855 | | | $ | 74,355 | | | $ | 126,485 | |
| (1) | Includes all of the Series of the Trust. |
| (2) | The investment adviser to the Series, as well as any of its affiliates that provide ongoing services to the Series, are subsidiaries of Eaton Vance Corp. |
(h) The registrant’s audit committee has considered whether the provision by the registrant’s principal accountant of non-audit services to the registrant’s investment adviser and any entity controlling, controlled by, or under common control with the adviser that provides ongoing services to the registrant that were not pre-approved pursuant to Rule 2-01(c)(7)(ii) of Regulation S-X is compatible with maintaining the principal accountant’s independence.
Item 5. Audit Committee of Listed Registrants
Not applicable.
Item 6. Schedule of Investments
Please see schedule of investments contained in the Report to Stockholders included under Item 1 of this Form N-CSR.
Item 7. Disclosure of Proxy Voting Policies and Procedures for Closed-End Management Investment Companies
Not applicable.
Item 8. Portfolio Managers of Closed-End Management Investment Companies
Not applicable.
Item 9. Purchases of Equity Securities by Closed-End Management Investment Company and Affiliated Purchasers
Not applicable.
Item 10. Submission of Matters to a Vote of Security Holders
No material changes.
Item 11. Controls and Procedures
(a) It is the conclusion of the registrant’s principal executive officer and principal financial officer that the effectiveness of the registrant’s current disclosure controls and procedures (such disclosure controls and
procedures having been evaluated within 90 days of the date of this filing) provide reasonable assurance that the information required to be disclosed by the registrant has been recorded, processed, summarized and reported within the time period specified in the Commission’s rules and forms and that the information required to be disclosed by the registrant has been accumulated and communicated to the registrant’s principal executive officer and principal financial officer in order to allow timely decisions regarding required disclosure.
(b) There have been no changes in the registrant’s internal controls over financial reporting during the second fiscal quarter of the period covered by this report that has materially affected, or is reasonably likely to materially affect, the registrant’s internal control over financial reporting.
Item��12. Disclosure of Securities Lending Activities for Closed-End Management Investment Companies
Not applicable.
Item 13. Exhibits
| | |
| (a)(1) | | Registrant’s Code of Ethics – Not applicable (please see Item 2). |
| |
| (a)(2)(i) | | Treasurer’s Section 302 certification. |
| |
| (a)(2)(ii) | | President’s Section 302 certification. |
| |
| (b) | | Combined Section 906 certification. |
Signatures
Pursuant to the requirements of the Securities Exchange Act of 1934 and the Investment Company Act of 1940, the registrant has duly caused this report to be signed on its behalf by the undersigned, thereunto duly authorized.
Eaton Vance Municipals Trust
| | |
| By: | | /s/ Payson F. Swaffield |
| | Payson F. Swaffield |
| | President |
| |
| Date: | | November 26, 2018 |
Pursuant to the requirements of the Securities Exchange Act of 1934 and the Investment Company Act of 1940, this report has been signed below by the following persons on behalf of the registrant and in the capacities and on the dates indicated.
| | |
| By: | | /s/ James F. Kirchner |
| | James F. Kirchner |
| | Treasurer |
| |
| Date: | | November 26, 2018 |
| |
| By: | | /s/ Payson F. Swaffield |
| | Payson F. Swaffield |
| | President |
| |
Date: | | November 26, 2018 |